Table of Contents
UNITED STATES
SECURITIES AND EXCHANGE COMMISSION
Washington, D.C. 20549
FORM N-CSR
CERTIFIED SHAREHOLDER REPORT OF REGISTERED
MANAGEMENT INVESTMENT COMPANIES
Investment Company Act file number: 811-07170
TCW Funds, Inc.
(Exact name of registrant as specified in charter)
865 South Figueroa Street, Suite 1800, Los Angeles, CA 90017
(Address of principal executive offices)
Peter Davidson, Esq.
Vice President and Assistant Secretary
865 South Figueroa Street, Suite 1800
Los Angeles, CA 90017
(Name and address of agent for service)
Registrant’s telephone number, including area code: (213) 244-0000
Date of fiscal year end: October 31
Date of reporting period: October 31, 2022
Table of Contents
| Item 1. | Reports to Shareholders. |
| (a) | The following is a copy of the report transmitted to shareholders pursuant to Rule 30e-1 under the Investment Company Act of 1940, as amended (the “1940 Act”): |
Table of Contents

EQUITY FUNDS
TCW Artificial Intelligence Equity Fund
TCW Global Real Estate Fund
TCW New America Premier Equities Fund
TCW Relative Value Dividend Appreciation Fund
TCW Relative Value Large Cap Fund
TCW Relative Value Mid Cap Fund
TCW Select Equities Fund
ASSET ALLOCATION FUND
TCW Conservative Allocation Fund
Table of Contents
TCW Funds, Inc.
| 2 | ||||
| 4 | ||||
| 32 | ||||
| 32 | ||||
| 36 | ||||
| 40 | ||||
| 44 | ||||
| 47 | ||||
| 51 | ||||
| 55 | ||||
| 59 | ||||
| 62 | ||||
| 64 | ||||
| 66 | ||||
| 70 | ||||
| 89 | ||||
| 105 | ||||
| 106 | ||||
| 108 | ||||
Investment Management and Advisory Agreement Disclosure (Unaudited) | 110 | |||
Proxy Voting Guidelines and Availability of Quarterly Portfolio Schedule | 117 | |||
| 118 | ||||
| 119 | ||||
Table of Contents
| The Letter to Shareholders and/or Management Discussions contained in this Annual Report are the opinions of each Fund’s portfolio managers and are not the opinions of TCW Funds, Inc. or its Board of Directors. Various matters discussed in the Letter to Shareholders and/or Management Discussions constitute forward-looking statements within the meaning of the federal securities laws. Actual results and the timing of certain events could differ materially from those projected or contemplated by these forward-looking statements due to a number of factors, including general economic conditions, overall availability of securities for investment by a Fund, the level of volatility in the securities markets and in the share price of a Fund, and other risk factors discussed in the SEC filings of TCW Funds, Inc. The data presented in the Letter to Shareholders and/or Management Discussions represents past performance and cannot be used to predict future results. |
Table of Contents
|
|
| David B. Lippman President, Chief Executive Officer and Director |

Dear Valued Investors,
I am pleased to present the 2022 annual report for the TCW Funds, Inc. covering the 12-month period ended October 31, 2022. I would like to express our appreciation for your continued investment in the TCW Funds as well as to welcome new shareholders to our fund family. As of October 31, 2022, the TCW Funds held total net assets of approximately $9.7 billion.
This report contains information and portfolio management discussions of our Equity Funds and the TCW Conservative Allocation Fund.
The U.S. Stock Market
U.S. stocks declined 14.6% (S&P 500 Total Return Index) during the one-year period ending October 31, 2022, as a dramatic spike in inflation forced the U.S. Federal Reserve to aggressively hike interest rates and shift its monetary policy from one of quantitative easing to that of quantitative tightening. In the Fall of 2021, the Fed had been content to allow inflation to run above its 2% target given the challenge which the COVID-19 pandemic posed for the economic growth outlook, but Fed Chair Powell was ultimately forced to acknowledge that inflationary pressures were extending beyond supply chain-related “transitory” factors. As unemployment dipped below 5% and inflation surged to a 30-year high, the Fed announced a tapering of its asset purchase program that was to extend through the first quarter of this year, but by January, stocks and most other risk assets endured sharp sell-offs upon the realization that the Fed would be forced to aggressively hike interest rates to contend with still-accelerating inflation. Russia’s invasion of Ukraine in February served to exacerbate inflation worries, as the adoption of sanctions by most Western nations led to a sharp increase in energy prices and the prospect of recession in Europe. At its March policy-setting meeting, the Fed hiked its reference rate by 25 basis points and followed that up with 5 successive rate hikes over the following eight months for a cumulative 3.75% rate rise.
Over that same time frame, the yield on the 10-year U.S. Treasury Note surged from 2.15% to 4.05%, forcing interest rates higher across the broader economy. Most macroeconomic data in the U.S. began to exhibit weakness, with the notable exception of the labor market, which remained tight with unemployment below 4% and job creation still robust. However, the near-doubling of 30-year mortgage rates began to weigh heavily on the housing market, and elsewhere companies highlighted the need to boost prices given the sharp rise in most input prices. The reality of higher interest rates — and thus higher discount rates and lower stock multiples — coupled with worries about persistent inflation and rising economic recession risk, drove equity prices lower, with growth stocks and technology names bearing the brunt of the sell-off. Central banks across the globe were also forced to hike rates to address inflation pressures and to defend their currencies relative to the skyrocketing U.S. dollar (the U.S. Dollar Index (DXY) which advanced 16.6% in the first 10 months of calendar year 2022). While Europe’s economic growth prospects looked grim given the ongoing war in Ukraine, China’s growth trajectory was hit by strict enforcement of a zero-COVID policy as well as a severe downturn in the property sector.
Looking Ahead
Looking forward, it remains quite likely that the Fed will follow through on its stated intention of hiking its reference rate to at least the 5% level between now and year end. However, investors are betting that the Fed will be able to “pivot” from its aggressive cycle of rate hikes to a pause whereby the lagged effect of the Fed’s policy might lead to a reassuring decline in the pace of inflation. Indeed, most commodity prices are showing sharp declines as supply chain bottlenecks show more definitive signs of resolution, and most macroeconomic indicators are reflecting a substantial fall-off in economic activity, even if the labor market has yet to soften. And, should inflation modulate in the coming months, the avoidance of
2
Table of Contents
Letter to Shareholders (Continued) |
|
further rate hikes could limit the magnitude and duration of an economic slowdown or recession. Encouragingly, U.S. corporate earnings reports for the third quarter have been more resilient than expected (with a few noteworthy exceptions). At the same time, stock multiples have already experienced substantial compression during the course of the year (P/E’s (price to earnings ratios) are now at roughly 17 times forward earnings). Naturally, an important consideration is the extent to which the economic slowdown will force corporate earnings growth expectations lower for next year — they are presently at around 5% per the Bloomberg consensus. Given the fact that the trajectories of inflation, growth, and central bank policy remain in flux across the globe — with considerable uncertainty associated with the war in Ukraine — we underscore the potential for a period of protracted choppiness in the equity markets. Against this backdrop, our equity portfolio managers and analysts continue to seek out those quality companies which possess resilience, strong balance sheets, and skilled management that will ultimately separate the winners from the losers during such a period of heightened uncertainty.
In closing, I’d like to express my personal appreciation for your present and historical sponsorship of the TCW Funds. Following more than 20 years at the Advisor, I will be retiring at the end of the year, turning that role over to Katie Koch, who will arrive in early 2023 as the CEO of TCW/Metropolitan West. It has been my honor to preside
over the growth of the Funds and gratifying to work with the disciplined investment professionals in their management through good and more difficult circumstances alike. We manage our entire business on the basis of team management to help ensure seamless transitions to the next generation, and I am certain that Katie will collaborate closely with our long-tenured colleagues to continue to build on the excellence of the Firm. Most importantly, I take my leave with great confidence in knowing that the stewardship of the Funds and your assets are in good hands.
We truly value our relationship with you and thank you for making the TCW Funds part of your long-term investment plan. If you have any questions or require further information, we invite you to visit our website at www.tcw.com, or call our shareholder services department at 800-386-3829.
We look forward to further correspondence with you through our semi-annual report next year.
Sincerely,

David B. Lippman
President, Chief Executive Officer and Director
3
Table of Contents
TCW Artificial Intelligence Equity Fund
For the year ended October 31, 2022, the TCW Artificial Intelligence Equity Fund (the “Fund”) returned -37.81% and -37.85% on its I Class and N Class shares, respectively, while the Russell 3000 Growth Index returned -24.67% over the same period.
Strongest and Weakest Performers
As the global economy reopened post-COVID, inflationary pressures have led to the highest inflation rates in the last 40 years. As a result, central banks globally have increased interest rates to combat inflation. The higher rates have caused concerns for the overall equity market. A major concern is a potential recession caused by a tightening of the money supply leading to lower growth rates. The higher discount rate used to value companies has also decreased the value of the overall equity market. Valuations of companies with high growth rates have declined more than the broader market, because they are more sensitive to changes in discount rate assumptions.
While the investment environment has been challenging, the pace of innovation has not changed and we continue to see Artificial Intelligence as a multi-decade growth opportunity. We believe there are still exciting developments of many AI technologies across various industries and believe the investable opportunities will continue to exist.
Our two biggest stock contributors during the year were Enphase Energy and Check Point Software Technologies.
Enphase Energy was our top performer in the period as energy stocks soared, along with energy prices. Along with inflation generally driving up prices of many goods and services around the world, Enphase shares continued their strong run as the company reported second quarter earnings and offered an optimistic outlook for coming quarters. This was driven by a steep increase in sales, particularly in Europe, which grew 69% quarter-over-quarter. The increase is mostly attributable to the soaring energy prices across the continent, a consequence of Russia’s invasion of Ukraine, which has led many European countries to reduce the amount of fuel they purchase from Russia. Still, approximately 80% of Enphase’s revenues came from the U.S., suggesting there may be ample room for further growth in Europe as energy prices are expected to stay elevated.
Check Point Software was a second-best performer in the period after we initiated a position in the company in the third quarter in order to increase our exposure to international companies. Check Point is an Israel-based company that offers a variety of software and hardware cybersecurity products and services to help its customers protect their data and networks.
Check Point shares surged late in October following a strong third quarter earnings report. Notably, analysts were impressed with the growth of billings (8% year-over-year versus 6% in the second quarter), as well as revenues and margin that beat consensus expectations. The strong performance is especially impressive, given the company’s exposure to European markets, although we believe this is a testament to the company’s critical products and recession-resistant qualities.
Our two weakest stock contributors during the year were Meta Platforms and Alphabet.
Meta Platforms’ and Alphabet’s shares both struggled in the period as inflation hit 40-year highs, interest rates were hiked, and big tech companies were scrutinized for their data collection practices and security protocols.
4
Table of Contents
TCW Artificial Intelligence Equity Fund
Management Discussions (Continued)
Meta’s difficult year culminated in October, after the company reported third quarter earnings that missed estimates. Notably, investors were concerned with Meta’s rising costs, especially its investments into the future of the metaverse, and the expectation for lower revenues in the coming quarter. CEO Mark Zuckerberg said the company has seen weakness from marketers as the economy has seen turmoil this year, and expects total expenses to grow by approximately $10 billion next year (more than a 10% increase from the current year). Much of this spending would be for research and development of virtual reality and the metaverse, which as of now is not bringing any meaningful revenues to the company. Zuckerberg pleaded to investors, asking them to stay “patient” with the company, he still fully believes in the future of the metaverse and expects the cost/reward issues to be resolved over time.
While the company has faced increased pressure from analysts and investors recently, we still believe that Meta is a key player in the development of artificial intelligence and the supporting technologies that make it possible. While weakening economic conditions have impacted the company, we still have conviction in the business model and company management.
Alphabet, the parent company of Google, has been impacted similarly by the difficult economic landscape. Notably, the demand for digital advertising, which has held up relatively well this year, has been questioned as analysts expect companies to cut back on spending. Company executives did recognize that ad spending is correlated with macroeconomic trends although executives reassured investors that ad sales continued to show resilience. In August, news also broke that the Biden administration is preparing to sue the company for alleged anticompetitive behavior within the digital advertising market, but CEO Sundar Pichai noted that TikTok’s surging popularity and Apple and Microsoft’s performance in recent years contradicted the administration’s position.
While there are numerous macroeconomic and geopolitical trends that have hindered growth within the economy and hurt equity markets, we still believe that artificial intelligence will have a major impact on how we do business and experience everyday life. We will remain diligent in our outlook of artificial intelligence and analysis of the companies that are driving the continued evolution of the technology.
AI Outlook and Recent Developments
We believe AI will be the foundational technology of the information age. The leap from computing built on the foundation of humans telling computers how to act, to computing built on the foundation of computers learning how to act, has significant implications for every industry.
In our view, there are many structural drivers that are accelerating the need for AI. These include:
| • | Trend in demographics towards an aging global population |
| • | Need for greater energy efficiency |
| • | Drive for greater urbanization as demand for convenience increases |
| • | Efforts to increase human capital productivity |
The broad applicability of AI also leads us to believe that it is a paradigm-shifting technology for the global economy and a driver behind improving productivity. AI very well could end the period of stagnant productivity growth in the U.S. We believe that AI-technology-driven improvements to productivity could, similar to the 1990’s, drive corporations to invest in more capital and labor intensive projects, accelerating
5
Table of Contents
TCW Artificial Intelligence Equity Fund
Management Discussions (Continued)
growth, improving profitability, and expanding equity valuations. We believe the trend towards AI-enhanced products is accelerating and we highlight recent developments as evidence:
Alphabet’s CEO Expect Next $1 Trillion Will Come From Search and Artificial Intelligence. In a recent interview, Sundar Pichai proclaimed Alphabet’s next trillion dollars in market cap valuation would come from Search, powered by AI. Pichai noted that even though Search is the company’s oldest service, humans have more need for information than ever before. He believes that AI will be essential in improving search results and providing consumers with relevant data and information as quickly as possible. Aside from Search, Pichai also mentioned how AI played an important role in Google’s cloud, YouTube and app store business segments. Mark Bergen and Bloomberg. Fortune. Google CEO Sundar Pichai says the company’s next $1 trillion will come from its oldest product. November 17, 2021 (https://fortune.com/2021/11/17/alphabet-google-ceo-sundar-pichai-next-trillion-internet-search-cloud-ai/)
Meta Platforms is Building its First Supercomputer. Meta announced that it has spent the last two years quietly working on a new AI supercomputer named the AI Research SuperCluster (RSC). Meta has speculated for years that artificial intelligence may be the answer to assisting the company in monitoring and controlling hateful and dangerous posts on Facebook and the RSC project may potentially fill that role, and others. Meta believes the finished product will result in the RSC being the fastest supercomputer in the world, capable of performing five quintillion operations per second. Microsoft and NVIDIA are other notable tech companies that possess their own supercomputers, both companies have various uses and end goals with the technology. Rachel Metz. CNN Business. Meta is building an AI supercomputer. January 24, 2022 (https://www.cnn.com/2022/01/24/tech/meta-supercomputer/index.html)
Apple Acquires Startup that Creates Music Using Artificial Intelligence. In February, Apple announced that it had acquired AI Music, a startup that uses artificial intelligence to create or select music for a user depending on the user’s mood. The idea is that the music can adapt depending on the situation: if, for example, the user is exercising, the music can be upbeat; if the user is playing a video game, the music can match the mood. The technology has numerous applications, AI Music states their goal is to “give consumers the power to choose the music they want” in any situation. The acquisition is especially notable as Apple reportedly decreased its acquisition spending to $33 million in 2021, down $1.5 billion in 2020. Mark Gurman. Time. Apple Has Bought a Startup That Uses AI to Make Music to Fit Your Mood. February 7, 2022 (https://time.com/6146000/apple-ai-music/)
NVIDIA Launches Mapping Platform for Autonomous Vehicles. At the company’s GTC Event in March, NVIDIA announced it would offer a mapping platform intended to improve the driving capabilities of fully autonomous vehicles across the world. NVIDIA’s CEO, Jensen Huang said that the new product, Drive Map, would provide ground-truth coverage of over 300,000 miles of roadway across North America, Europe, and Asia by 2024. Last year, NVIDIA acquired DeepMap, a mapping startup that provides centimeter-level accuracy of roads and their conditions. Coupled with the announcement, NVIDIA highlighted the future of its Drive Hyperion product, which Mercedes, Volvo, Lucid and other companies in the self-driving industry use for driver assistance features. Rebecca Bellan. TechCrunch. NVIDIA launched a mapping product for the autonomous vehicle industry. March 22, 2022 (https://techcrunch.com/2022/03/22/nvidia-launched-a-mapping-product-for-the-autonomous-vehicle-industry/)
Tesla’s Full Self-Driving Technology has Made Big Leaps Since its Release. Years ago, the company predicted that full self-driving (FSD) would be available between 2019 and 2020, although certain obstacles
6
Table of Contents
TCW Artificial Intelligence Equity Fund
Management Discussions (Continued)
have arisen that have pushed those estimates back. In September of 2021, Tesla began offering its FSD software to certain drivers based off their car model and safety ratings. Since its release, there are now over 100,000 FSD testers on the road, with the growing number being part of what has improved the software; as Teslas gather and share data, the software becomes more powerful and intelligent. The FSD equipped models still require a human ready to intervene, but with proper precautions, already seem capable of handling 95% of situations that one may run into on the road. Al Root. Dow Jones Newswires. Tesla’s ‘Full Self Driving’ Is Getting Better. Why that’s Good for the Stock. April 8, 2022 (https://blinks.bloomberg.com/news/stories/RA0TCI073NCX)
Cruise Starts Charging Fees for Autonomous Taxis in San Francisco. After many hurdles, mostly related to safety regulations, GM’s Cruise officially began charging patrons for autonomous taxi services in San Francisco in June. The company offered free autonomous taxi services and autonomous taxi services with safety drivers, but this marks a big milestone for the company, which can now fully operate in San Francisco with very few limitations. As of now, Cruise is only using 30 cars and operating in a small area of the city, but the program is expected to ramp up exponentially as the AI behind the driverless vehicles gets better and better. Cruise’s CEO recently commented that the company expects to have hundreds of taxis in operation by the end of the year. Jameson Dow. Electrek. GM Cruise takes first fares for paid driverless taxi in San Francisco. June 23, 2022 (https://electrek.co/2022/06/23/gm-cruise-takes-first-fares-for-paid-driverless-taxi-in-san-francisco/)
Uber Partners with Motional to Offer Driverless Taxi Rides and Deliveries. In October, Uber announced that it had reached an agreement to partner with Motional to offer driverless rides and deliveries, almost two years after the company sold its autonomous driving division. Motional, which is a joint venture between Hyundai and Aptiv, will provide IONIQ 5 robotaxis to Uber to be used for the rides. Executives claimed this was a big move in the widespread adoption of autonomous driving services. The companies have a history together as well, previously partnering for driverless Uber Eats deliveries back in May of this year. Jackie Davalos. Bloomberg. Uber Revives Self-Driving Taxi Dreams, Plans to Start This Year. October 6, 2022 (https://blinks.bloomberg.com/news/stories/RJAR27DWLU68)
Concluding Remarks
Finally, we continuously survey the artificial intelligence investment landscape by drawing upon our deep technical knowledge and fundamental research efforts. Our research effort seeks the most attractive opportunities in the AI ecosystem. We appreciate your confidence in and support of the TCW Artificial Intelligence Equity Fund.
7
Table of Contents
TCW Artificial Intelligence Equity Fund
Management Discussions (Continued)
| Annualized Total Return as of October 31, 2022(1) | ||||||||||||||||||||
| 1 Yr Return | 3 Yr Return | 5 Yr Return | 10 Yr Return | Inception to Date | ||||||||||||||||
TCW Artificial Intelligence Equity Fund | ||||||||||||||||||||
Class I (Inception: 09/01/2017) | (37.81 | )% | 6.96 | % | 7.88 | % | — | 8.91 | % | |||||||||||
Class N (Inception: 09/01/2017) | (37.85 | )% | 6.85 | % | 7.79 | % | — | 8.83 | % | |||||||||||
Russell 3000 Growth Index | (24.67 | )% | 11.31 | % | 12.07 | % | — | 12.79 | % | |||||||||||

| (1) | The total returns do not reflect taxes that a shareholder would pay on fund distribution or on the redemption of fund shares. |
8
Table of Contents
TCW Conservative Allocation Fund
Management Discussions
For the year ended October 31, 2022, the TCW Conservative Allocation Fund (the “Fund”) posted a return of -16.80% for the I Class and -17.08% for the N Class shares. The performance of the Fund’s classes varies because of differing expenses. The Fund’s blended benchmark of 40% S&P 500 Index and 60% Bloomberg U.S. Aggregate Bond Index returned -14.94% over the same time period.
The Fund posted negative returns over the past year with the biggest detractors coming from the TCW Select Equity Fund and the TCW Artificial Intelligence Equity Fund. The best returns within equities came from the TCW Relative Value Large Cap Fund. Within Fixed Income, the strongest returns came from the Metropolitan West Low Duration Bond Fund and the Metropolitan West Unconstrained Bond Fund.
As of the end of October, the allocation for the Fund was 31% equities, 9% alternatives and 60% fixed income. The fund had an underweight to equities along with overweight allocations to fixed income and alternatives relative to its blended index. The baseline allocation is 40% Equities and 60% Fixed Income. Over the past 12 months, the Fund had decreased the allocation to equities, specifically large growth funds. Within Equities, the allocation to large and mid cap value funds were increased giving the Fund an overweight allocation to value and a slight underweight to growth. In Fixed Income, the allocation to shorter duration, higher-quality U.S Fixed income funds were increased along with increasing the allocation to commodities.
U.S. stocks rebounded 8.1% in October, moderating their year-to-date decline to 17.7% (S&P 500 Total Return Index). As the yield on the 10-Year U.S. Treasury Note spiked above 4.5% to its highest level in 15 years, Fed Governor Mary Daly commented that the Fed has to do everything in its power not to “overtighten,” and that “the time is now to start talking about stepping down” from the pace of 75 basis point rate hike increments. Her comments were broadly interpreted as an acknowledgment that the Fed was getting close to a “pivot” from its aggressive monetary tightening campaign to a potential pause after completing a series of anticipated rate hikes over the next few months. Investors cheered the modulation in the Fed’s messaging, given that most macroeconomic data were signaling an economic slowdown, with recession expectations moving upward — the Bloomberg median economist forecast now stands at a 60% probability over the next twelve months. While September data releases did not point to a substantive decline in the pace of inflation, both Core CPI (Consumer Price Index) and the Fed’s preferred Core Personal Consumption Expenditure (PCE) Index showed year-over-year inflation essentially holding steady at 6.6% and 5.1%, respectively. Meanwhile, the housing market showed further weakness in the face of 30-year mortgage rates breaching the 7% level, with housing starts declining 8.1% in September and Case-Shiller home price data falling for the second month in a row. Even so, the labor market remained quite resilient, with weekly initial jobless claims staying subdued at around the 222K level. Third-quarter GDP, boosted by a narrowing of the trade deficit, came in stronger than expectations at 2.6% quarter-over-quarter — hardly a recessionary reading. In essence, stocks rallied sharply at the prospect of the Fed relenting before pushing the economy into recession, which would be a welcome relief for the corporate earnings outlook.
Globally, inflation remains high, though central banks took a modest pause, with the European Central Bank (ECB) press conference including a number of dovish elements (notwithstanding a 75 bps hike, as expected) and the Bank of Canada hiking 50 bps instead of 75 bps. In the U.S., financial markets were largely pricing in another 75 bps hike in November, but risk assets, including stocks (the S&P 500 Index gained 8% for the month), rallied on reporting and rhetoric suggesting a slowing in the pace of rate hikes beyond November.
9
Table of Contents
TCW Conservative Allocation Fund
Management Discussions (Continued)
Though the September Core CPI number came in higher than expected and real GDP turned positive (+2.3% for Q3), housing demand has slowed on mortgage rates surpassing 7%, more than double the level at the start of the year, and employment growth is decelerating (but remains positive). These diverging economic indicators suggest a slowing in economic activity.
Against this backdrop, market pricing for the Fed’s terminal rate peaked near 5% during the month and 2-Year Treasury yields reached their highest level since 2007 before settling somewhat lower by month-end. Potential for higher terminal rates but a slower pace of hikes to get there left the front end of the curve flatter (2-Year yields +20 bps, 5-Year yields +14 bps), while the long-end steepened (30-Year yield +39 bps).
Fixed income performance was generally negative given the rise in yields, with the Bloomberg U.S. Aggregate Index down 1.3%. However, duration-adjusted performance was mixed. Corporate credit led, outpacing Treasuries by 60 bps on a duration-adjusted basis, while securitized sectors trailed Treasuries, with commercial mortgage-backed securities (CMBS) lagging the most (-100 bps vs UST).
After trading near their widest credit spreads of the year in October, corporate credit improved near the end of the month on the solid U.S. GDP print and hopes for a more dovish central bank calendar. While higher rates resulted in a negative 1.0% return for the sector, yields climbed 24 bps to end the month at a decade high of 5.81%. Long credit led as higher yields and lower prices drove demand, while top performers included energy and cable, while banks and REITs (real estate investment trusts) underperformed.
Among securitized, agency mortgage-backed securities (MBS) continued to struggle, but performed the best, falling 1.4% but lagging Treasuries by only 29 bps versus asset-backed securities (ABS) and CMBS, which trailed Treasuries by 72 bps and over 100 bps, respectively.
Risk budgets have generally expanded as sustained spread and rate volatility have led to improved valuations and a more symmetric risk and reward profile, though the strategy remains disciplined and will de-risk as spreads remediate.
Looking forward, following the Fed’s just concluded November Federal Open Market Committee (FOMC) meeting, Chair Powell made it clear that the Fed cannot yet relent and is quite likely to follow through on its stated intention of hiking its reference rate to at least the 5% level between now and early next year. It remains true, however, that a Fed “pause” in rate hikes may come in the next few months to allow the lagged effect of the Fed’s cumulative tightening policy to lead to a reassuring decline in the pace of inflation. Indeed, most commodity prices are showing sharp declines as supply chain bottlenecks show more definitive signs of resolution and most macroeconomic indicators are reflecting a substantial fall-off in economic activity, even if the labor market has yet to soften. Should inflation modulate in the coming months, the avoidance of further rate hikes could limit the magnitude and duration of an economic slowdown or recession. Encouragingly, U.S. corporate earnings reports for the third quarter have been more resilient than expected (with a few noteworthy exceptions). At the same time, stock multiples have already experienced substantial compression during the course of the year (price-to-earnings, P/E’s, are now at roughly 15.5 times forward earnings). Naturally, an important consideration is the extent to which the economic slowdown will force corporate earnings growth expectations lower for next year — they are presently at around 6% per the Bloomberg consensus. Given the fact that the trajectories of inflation, growth, and central bank policy remain in flux across the globe — with considerable uncertainty associated with the war in Ukraine, we underscore the potential for a period of protracted choppiness in the equity and fixed income markets.
10
Table of Contents
TCW Conservative Allocation Fund
Management Discussions (Continued)
| Annualized Total Return as of October 31, 2022(1) | ||||||||||||||||||||
| 1 Yr Return | 3 Yr Return | 5 Yr Return | 10 Yr Return | Inception to Date | ||||||||||||||||
TCW Conservative Allocation Fund | ||||||||||||||||||||
Class I (Inception: 11/16/2006) | (16.80 | )% | 1.43 | % | 2.89 | % | 4.22 | % | 4.49 | % | ||||||||||
Class N (Inception: 11/16/2006) | (17.08 | )% | 1.12 | % | 2.57 | % | 3.80 | % | 4.21 | % | ||||||||||
40% S&P 500 Index/60% Bloomberg U.S. Aggregate Bond Index | (14.94 | )% | 2.03 | % | 4.10 | % | 5.66 | % | 5.43 | % | ||||||||||
| (1) | The total returns do not reflect taxes that a shareholder would pay on fund distribution or on the redemption of fund shares. |
11
Table of Contents
TCW Global Real Estate Fund
Management Discussions
For the year ended October 31, 2022, the TCW Global Real Estate Fund (the “Fund”) returned -26.38% and -26.43% on its I Class and N Class shares, respectively. The performance of the Fund’s classes varies because of differing expenses. The Fund’s benchmark, the S&P Global REIT Index, had a return of -21.28% over the same period.
On an attribution basis, the Fund’s underperformance relative to its benchmark during the period was predominantly driven by sector allocation. The Fund’s largest sector overweight was in Mortgage REITs (average weight of 7.31% and down 15.72% for the Fund vs. an average weight of 0% for the index), which detracted from performance. From a relative standpoint, the Fund’s largest sector underweight was in Retail REITs (average weight of 3.84% and down 5.40% for the Fund vs. average weight of 17.08% and down 15.26% for the index), which benefitted performance. From a stock selection perspective, positive contributors included CoreSite Realty (COR) and Vanguard REIT Index Put Options (VNQ Puts). Conversely, notable detractors from performance included Segro PLC (SGRO LN) and Cellnex Telecom (CLNX SM).
U.S. stocks sank 14.6% in the twelve months ending October 31, 2022. The main driver of the declines were related to the increased expectations for prolonged inflation and the ensuing rate hikes from the Fed. The market continues to hope that data would confirm peak inflation had been reached, but headline CPI continues to stay elevated. Fed Chair Powell reiterated the Fed’s determination to stay aggressive until there’s a sustainable decline in inflation. The prospect of the Fed continuing to hike rates until achieving a “restrictive” Fed Funds interest rate on the order of 4.5-4.75% the end of this year prompted a spike in the 10-Year U.S. Treasury Note yield to approximately 4% — a level not witnessed in over 14 years. Further complicating the Fed’s job, the labor market remained surprisingly resilient, with initial jobless claims dipping beneath the 200k level for the first time since May. Yet, most other macro data have begun to reflect the impact of the Fed’s tight monetary policy stance. Building permits declined 10% month-over-month in August, and the rate on 30-year fixed rate mortgages spiraled upward to over 7% by the end of September. Importantly, GDP growth for 2Q was a negative 0.6%, following a similar contraction in the first quarter. The reality of higher interest rates, coupled with the rising risk of an economic recession, led to a sharp sell-off in risk assets, including stocks.
Global REIT indices underperformed the broader markets (as measured by the MSCI World Index), declining 21.30% through October 31, 2022 compared to 18.06% for the MSCI World Index. Drivers of the underperformance may include the premium valuation of real estate in recent years, increasing interest rates, and above average inflation, which may not be passed through in rental increases at the same relative rate as other equity asset classes. Moving forward, there is still much uncertainty with respect to the longer-lasting impacts of the pandemic. For example, the office sub-sector is an industry that has historically been saddled with relatively high maintenance capital expenditure requirements in addition to high tenant improvement expenditures and leasing costs. Couple these overhangs with a significant change in consumer preference to work from home, and what will undoubtedly be a long period of future technological improvement in telecommuting and virtual meetings, and it becomes very risky to deploy capital in this space. We believe that there are other potentially disrupted areas of the real estate market. While there are counterbalancing forces which may sustain demand in certain sectors/geographies, real estate seems to be more prone to disruption today than it ever has been in our recent memory.
That said, our strategy for navigating the current environment remains largely unchanged. We source most of our holdings from two separate pools. The first is in underappreciated, undervalued companies that
12
Table of Contents
TCW Global Real Estate Fund
Management Discussions (Continued)
could benefit from a change in sentiment. The issues facing these businesses are typically transitory and the discount is largely unfounded when viewed on a longer time horizon. The second set is in the quality franchises which exhibit high barriers to entry and sustainably generate strong cash flows. These companies generally also have an ability to invest capital at high rates of return and typically will compound capital at a pace that exceeds that of their peers. While in prior years the portfolio was more heavily weighted towards the second set of high-quality companies, we have found more compelling opportunities this year in the first group of “value” businesses. In a prior year’s letter we mentioned that we would not be taking risks by owning lower-quality businesses at lower valuations because we believed that risk was not appropriately priced at the time. This year, as we continued to navigate through the impact of the pandemic, we continued to cycle out of some of our more fully valued “quality” holdings into more misunderstood value names at very deep discounts. We believe the disruption caused by the pandemic remains pronounced and that the dispersion in company valuations is still very high. This should continue to be a great opportunity for active stock selection.
13
Table of Contents
TCW Global Real Estate Fund
Management Discussions (Continued)
| Annualized Total Return as of October 31, 2022(1) | ||||||||||||||||||||
| 1 Yr Return | 3 Yr Return | 5 Yr Return | 10 Yr Return | Inception to Date | ||||||||||||||||
TCW Global Real Estate Fund | ||||||||||||||||||||
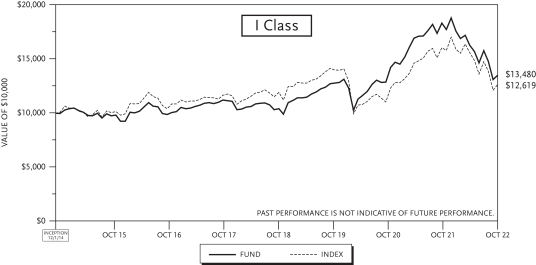
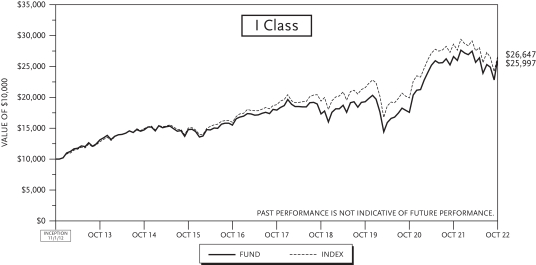
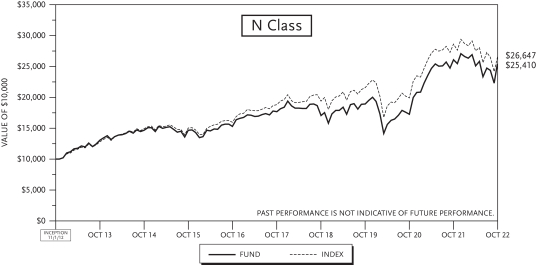
Class I (Inception: 12/01/2014) | (26.38 | )% | 1.95 | % | 4.16 | % | — | 3.84 | % | |||||||||||
Class N (Inception: 12/01/2014) | (26.43 | )% | 1.81 | % | 4.03 | % | — | 3.76 | % | |||||||||||
S&P Global REIT Index | (21.28 | )% | (3.72 | )% | 2.25 | % | — | 2.98 | % | |||||||||||

| (1) | The total returns do not reflect taxes that a shareholder would pay on fund distribution or on the redemption of fund shares. |
14
Table of Contents
TCW New America Premier Equities Fund
Management Discussions
For the fiscal year that ended October 31, 2022, the TCW New America Premier Equities Fund (the “Fund”) returned -21.95% and -22.18% on the I Class and N Class shares. The Fund’s benchmark, the Russell 1000 Index, returned -16.38% over the same period.
The Fund’s performance benefited from investments in HEICO Corporation, PepsiCo, Inc., Oracle Corporation, Alimentation Couche-Tard Inc., and Fiserv, Inc. The Fund’s performance was negatively impacted by investments in Dye & Durham Ltd., Constellation Software Inc., Microsoft Corporation, MSCI Inc., and Morningstar, Inc.
As we have indicated in the past we eschew a reliance on macroeconomic forecasts and projections of the future direction of markets — our view is that these factors are unknowable. We therefore focus on what we think is knowable. We believe that a careful assessment of investment opportunities at the security level will provide us, in some cases, with a high probability view of the future free cash flows of a business. Risk-adjusted cash flow stream is a key determinant of the future returns of an investment and therefore a key determinant of the portfolio’s future returns. We believe that we have made good decisions in this respect and that the portfolio of companies is built to weather most market environments.
Investment Philosophy
The Fund seeks to outperform the broad U.S. indices in both rising and falling markets with less risk and volatility. We seek to accomplish this objective by investing in a concentrated portfolio of businesses that carefully manage their environmental and social resources and that employ best in class corporate governance practices. We invest in businesses that have high barriers to entry, are stable, generate substantial free cash flow and are managed by prudent leaders.
Risk control: Our primary objective, as stewards of your capital, is to control risk while seeking attractive returns. We control risk in a unique manner; initially we apply our proprietary ESG quantitative framework to identify better-managed businesses that have lower quantifiable and unquantifiable risks. Subsequently we hone our efforts on those businesses that we believe operate in stable industries with attractive industry structures, businesses that produce products that are critical to their customers, and businesses that we believe are led by proven, appropriately incentivized leaders. We endeavor to further control valuation risk by purchasing securities at attractive prices relative to the current free cash flow generation of the businesses. We believe that businesses that fit our profile produce fairly stable cash flow streams and are less prone to macroeconomic fluctuations, competitive pressures and valuation risks.
Consistency: It is also our objective to deliver a consistently positive outcome. We would view outsized outperformance in one year and poor performance in the subsequent year as a poor outcome for our clients. Our bottom-up investment process is focused on selecting undervalued businesses that we believe should perform well in most market environments and hold up well in negative periods. We believe consistency in approach and consistency in outcome gives us the best chance of minimizing a left-tail outcome in any given year. It is our view that if we can consistently deliver above average risk-adjusted performance over a long period of time the outcome likely would be outperformance relative to our peers over the full period. That is our goal.
Environmental, Social, Governance Analysis: Traditional fundamental analysis does not capture risks associated with managing environmental resources nor does it assess the performance of businesses from the perspective of resource efficiency. Traditional analysis does not typically assess the risks associated with
15
Table of Contents
TCW New America Premier Equities Fund
Management Discussions (Continued)
a heterogeneous workforce nor does it assess the competence, quality and engagement level of the Board of Directors. Our investment framework not only pays close attention to these issues, we quantify, score, and rank companies and exclude businesses based on these risk factors.
While those risks are not quantified through traditional financial analysis, we have found a significant correlation between companies that manage their resources prudently and businesses that sport strong financial metrics. Businesses that meet our rigorous ESG performance requirements typically have higher free cash flow yields, higher total yields, higher margins and lower levels of financial leverage.
Focus on Dominant, Predictable Businesses with High Barriers to Entry: In the long run the investment performance of a portfolio is inextricably linked to the underlying performance of the earnings and cash flows of the businesses comprising the portfolio. We believe one of the greatest risks in investing is valuing a business based on an erroneous view of the future free cash flows of the business. Such a circumstance results in an investor typically overpaying for a business and therefore generating a poor return on the investment.
In fast-growing businesses or in industries that are undergoing rapid changes it is extraordinarily difficult and often dangerous to make an investment in a business when the long-term cash generation potential of the enterprise has a wide spectrum of outcomes. We seek to avoid companies and industries that are undergoing rapid changes.
What we do seek, however, are stable businesses that have dominant market positions, and whose long-term cash flows we believe can be predicted reasonably well. The qualitative characteristics that we seek, including attractive industry structures, pricing power and dominant market positions, make us confident in our forecast of the future cash flows of the businesses and therefore provide greater confidence that our valuation of the business is reasonably accurate.
The famed value investor Benjamin Graham once said, “In the short run, the market is a voting machine but in the long run, it is a weighing machine.” Our view is that the market weighs cash flows and in order to consistently purchase a security for less than what it is worth, one should have high confidence in the future free cash flows of a business.
Thank you for joining us as fellow shareholders in the TCW New America Premier Equities Fund. We will continue to work hard to justify your confidence in us.
16
Table of Contents
TCW New America Premier Equities Fund
Management Discussions (Continued)
| Annualized Total Return as of October 31, 2022(1) | ||||||||||||||||||||
| 1 Yr Return | 3 Yr Return | 5 Yr Return | 10 Yr Return | Inception to Date | ||||||||||||||||
TCW New America Premier Equities Fund | ||||||||||||||||||||
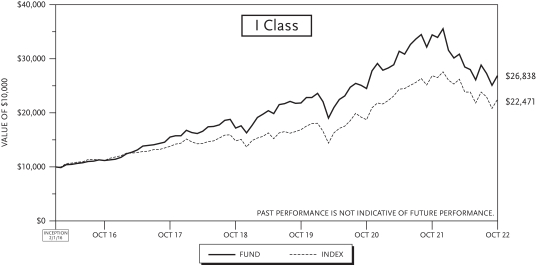
Class I (Inception: 02/01/2016) | (21.95 | )% | 7.18 | % | 11.54 | % | — | 15.75 | % | |||||||||||
Class N (Inception: 02/01/2016) | (22.18 | )% | 6.88 | % | 11.32 | % | — | 15.58 | % | |||||||||||
Russell 1000 Index | (16.38 | )% | 9.99 | % | 10.19 | % | — | 12.74 | % | |||||||||||

| (1) | The total returns do not reflect taxes that a shareholder would pay on fund distribution or on the redemption of fund shares. |
17
Table of Contents
TCW Relative Value Dividend Appreciation Fund
Management Discussions
For the year ended October 31, 2022, the TCW Relative Value Dividend Appreciation Fund (the “Fund”) posted a return of -2.36% and -2.52% on its I Class and N Class shares, respectively, an outperformance of the benchmark by 4.5 percentage points (pps). The performance of the Fund’s classes varies because of differing expenses. The Fund’s benchmark, the Russell 1000 Value Index, returned -7.00% over the same period.
Market Outlook
The U.S. economy is strong and resilient, yet it is showing signs of slowing due to the headwinds facing the entire globe. The October ISM Manufacturing Index slipped a bit further but is still in expansion territory at 50.2. Third quarter earnings reports are nearly complete. Results for Tech+ and FAANG have been particularly weak. Even so, expectations for the S&P 500 are 10.9% and 4.3% for revenues and earnings per share (EPS) growth, respectively, even after ~30% downward revisions since the beginning of the year. Value, continuing the trend that started in 1Q21, is delivering stronger revenue and EPS growth (11.6% and 7.7%) than growth (9.1% and -1.0%) in 3Q22. At present, of the companies that revised their forecasts, nearly three-fourths have actually moved higher rather than lower. That compares to a five-year average period pre-Covid of 42%. “It’s not particularly optimistic or pessimistic, but better than the last three quarters and the pre-Covid five-year average, …estimates are still too low,” said Wendy Soong of Bloomberg. Per Dennis DeBusschere, founder of 22V Research, the net percentage of S&P 500 companies that have reduced their sales and EPS guidance is in the 90th percentile (as such, many more than usual) but has stabilized recently. Using a natural-language processing tool, earnings sentiment is near recession levels. He added, 3Q22 estimates have “come down enough that companies should be able to beat Street numbers by a few percent.” Investors can focus on earnings rather than monetary policy for now. With earnings per share rising for the year, the entire market decline could be attributed to falling multiples due to higher interest rates. Another important factor in 3Q22 earnings is the strength of the U.S. dollar which will have the effect of shrinking multinationals’ non-U.S. earnings while lowering the costs of U.S. imports. More domestically-oriented U.S. value indices should benefit on a relative basis.
While the rest of the world is battling inflation with raising interest rates, China is fighting deflation and cutting rates. Its economy is experiencing a housing crisis with slowing sales, falling home prices, borrowers refusing to make/defaulting on mortgage payments, and a number of property developers with overwhelming debt levels. China’s Caixin manufacturing PMI (Purchasing Managers’ Index) fell back into contraction territory (49.2) with its services activity softening more than expected. One week after stating it would adhere “unswervingly” to its Covid strategy, Chinese officials are beginning to provide a “roadmap” on how it will relax its policy by shortening quarantine rules for inbound travelers. It will also stop trying to identify “secondary” contacts. Additionally, even though U.S./China relations remain thorny, Presidents Biden and Xi held talks at the G20 summit in Bali. While they had spoken by phone numerous times, this was their first in-person meeting since Mr. Biden took office in 2020. The two sides are at odds on many issues, but they are determined to ”firmly defend interests, manage differences, and promote mutually beneficial cooperation and avoid miscalculation.” Secretary of State Blinken will be visiting China in early 2023 to keep the lines of communication open and continue to work out important issues to elude conflict. Finally, a deal was made recently averting a mass delisting of Chinese companies from U.S. exchanges. China continues its stimulus policies and is one of the few major economies looking to spur growth into year-end coinciding with Mr. Xi’s start of an unprecedented third term.
18
Table of Contents
TCW Relative Value Dividend Appreciation Fund
Management Discussions (Continued)
The fourth quarter, particularly November and December, tends to be a seasonally strong period for equity markets. Investor optimism has perked up after the release of the October CPI (consumer price index) report which showed inflation cooling. Headline CPI year-over-year has fallen for four consecutive months and now stands at 7.7% for the year ending October 31, down from the 40-year high of 9.1% reached in June. Core CPI (excluding food and energy) also declined to 6.3% year-over-year from the prior month reading of 6.6% and below median economist estimates. Highlights from the report show moderation in shelter and declines in used car and apparel prices. Investors took this as a sign the Fed does not have to opt for the most aggressive path as it works to stem the still stubbornly high inflation. Additionally, there is more certainty as it pertains to the makeup of the U.S. Congress. House control has shifted to the Republicans, albeit by a much slimmer margin, as the “red wave” was more of a trickle, and Democrats have retained control of the Senate. Since 1950, the mid-term elections have brought outperformance for stocks, no matter which party has won and no matter the issues. Per Ned Davis Research, S&P 500 and predecessor returns for 1948 through 2021 have averaged 16.7% for the year after mid-terms. Also boding well is the expectation for increased holiday spending; the National Retail Federation estimates for 2022 holiday sales are expected to be 5% higher than last year while Mastercard SpendingPulse is estimated to be a bit more elevated.
We believe value is poised for multiple years of outperformance over growth similar to the results post the 1970, 1975, 1982, 1991, and 2000 recessions. Value is an early cycle play, and early cycle stocks such as those in the Consumer Discretionary space are starting to outperform; within the Russell 1000 Value Index (R1V), it was the third best sector in October. Growth prices and their multiples, while off their historical highs, are still expensive. The current price-to-book ratio for the Russell 1000 Growth (R1G) versus the R1V is almost at a two standard deviation high. We believe we are still in the early stages of a value super cycle although it is never a straight line. Even with the nearly 18 pps outperformance for the fiscal year through October 31, there is still room to go given the R1G outperformed the R1V (on the back of low rates) by over 14 pps per year for the five calendar years ending December 2021. Although we expect value to outperform with positive total returns, it is worth noting the value style can outperform by going down less than the more expensive stocks. This is exactly what happened post the dotcom bust and represented a large value rally. Value can work when ‘expensive’ underperforms too.
Recent volatility has demonstrated market timing can be a destructive exercise, and there are opportunity costs to standing on the sidelines. JPMorgan notes that 70% of the best days in the U.S. stock market occur within two weeks of the worst days. Despite headwinds facing the globe, the U.S. economy is resilient. The Atlanta Fed’s GDP estimate for 4Q22 is 4%. The unemployment rate is at historic lows and investment grade corporate balance sheets are in good shape. Banks are making loans and inflation expectations are tethered at 2-3%. There are tail risks and potential exogenous events but we believe each portfolio holding has the economic wherewithal to withstand a one- to two-year recession. It is highly likely the economy will grow over the long term and equities, over time, historically have produced attractive returns. For the periods following the nadirs post the global financial crisis and dot-com bust, the S&P 500 Index rose 18.3% (3/9/09 – 2/19/20) and 17.1% (10/9/02 – 10/9/07) on an annualized basis, respectively.
We remain true to our diversified portfolio strategy, diligent, and ever watchful for changes. We are busy and actively working to make the best portfolio decisions possible with the information we have. While circumstances were different, the fear in 2008 concerning money center banks’ fragile economic backbone
19
Table of Contents
TCW Relative Value Dividend Appreciation Fund
Management Discussions (Continued)
worldwide was similar. At that time, Warren Buffett stated “A simple rule dictates my buying: Be fearful when others are greedy, and be greedy when others are fearful.”
Fund Review
Over the course of the one-year period ending October 31, 2022, stock selection contributed quite favorably (by over 500 bps) relative to the benchmark. The Fund’s top ten holdings by average weight outperformed the portfolio and its benchmark index returning +4.5% with a mixture of solid gains from McKesson, IBM, and MetLife and lagging results from JPMorgan Chase, Johnson Controls, and UPS. The preponderance of the outperformance came from stock selection in Health Care and Information Technology. McKesson, AbbVie, Elevance Health, and Gilead led to the outperformance in Health Care where the portfolio’s names gained 29.6% versus their peers’ rise of 2.6% and were the best relative performers. Led by IBM, the Fund’s Information Technology names outperformed returning -3.2% far outpacing the group loss of -23.0%. To a lesser effect, the portfolio benefited from stock selection in Consumer Staples due largely to PepsiCo while MetLife highlighted in Financials.
On the downside, while returning an admirable +46.3%, the portfolio’s Energy names did not keep pace with its peers which rose 64.9%. The portfolio’s Industrials names underperformed -14.1% versus -9.7% with lagging returns from Johnson Controls, General Electric, and UPS. To a lesser extent, the portfolio lost value with its Consumer Discretionary and Real Estate stock selection due to Target and Simon Property Group. Other notable detractors included Intercontinental Exchange and Fox.
In addition to stock selection being noticeably additive, the portfolio’s relative sector weights added value led by the underweights in Communication Services and Real Estate along with the overweight in Energy. The overweight in Consumer Discretionary and underweights Consumer Staples detracted.
20
Table of Contents
TCW Relative Value Dividend Appreciation Fund
Management Discussions (Continued)
| Annualized Total Return as of October 31, 2022(1) | ||||||||||||||||||||||||
| 1 Yr Return | 3 Yr Return | 5 Yr Return | 10 Yr Return | Inception to Date | Inception Index | |||||||||||||||||||
TCW Relative Value Dividend Appreciation Fund | ||||||||||||||||||||||||
Class I (Inception: 11/01/2004) | (2.36 | )% | 10.46 | % | 7.72 | % | 10.03 | % | 7.53 | % | 9.90 | % | ||||||||||||
Class N (Inception: 09/19/1986) | (2.52 | )% | 10.26 | % | 7.50 | % | 9.77 | % | 9.01 | % | 7.72 | % | ||||||||||||
Russell 1000 Value Index | (7.00 | )% | 7.31 | % | 7.21 | % | 10.30 | % | ||||||||||||||||
| (1) | The total returns do not reflect taxes that a shareholder would pay on fund distribution or on the redemption of fund shares. |
21
Table of Contents
TCW Relative Value Large Cap Fund
Management Discussions
For the year ended October 31, 2022, the TCW Relative Value Large Cap Fund (the “Fund”) posted a return of -5.56% and -5.72% on its I Class and N Class shares, respectively, an outperformance of the benchmark by over 125 bps. The performance of the Fund’s classes varies because of differing expenses. The Fund’s benchmark, the Russell 1000 Value Index, returned -7.00% over the same period.
Market Outlook
The U.S. economy is strong and resilient, yet it is showing signs of slowing due to the headwinds facing the entire globe. The October ISM Manufacturing Index slipped a bit further but is still in expansion territory at 50.2. Third quarter earnings reports are nearly complete. Results for Tech+ and FAANG have been particularly weak. Even so, expectations for the S&P 500 are 10.9% and 4.3% for revenues and earnings per share (EPS) growth, respectively, even after ~30% downward revisions since the beginning of the year. Value, continuing the trend that started in 1Q21, is delivering stronger revenue and EPS growth (11.6% and 7.7%) than growth (9.1% and -1.0%) in 3Q22. At present, of the companies that revised their forecasts, nearly three-fourths have actually moved higher rather than lower. That compares to a five-year average period pre-Covid of 42%. “It’s not particularly optimistic or pessimistic, but better than the last three quarters and the pre-Covid five-year average, …estimates are still too low,” said Wendy Soong of Bloomberg. Per Dennis DeBusschere, founder of 22V Research, the net percentage of S&P 500 companies that have reduced their sales and EPS guidance is in the 90th percentile (as such, many more than usual) but has stabilized recently. Using a natural-language processing tool, earnings sentiment is near recession levels. He added, 3Q22 estimates have “come down enough that companies should be able to beat Street numbers by a few percent.” Investors can focus on earnings rather than monetary policy for now. With earnings per share rising for the year, the entire market decline could be attributed to falling multiples due to higher interest rates. Another important factor in 3Q22 earnings is the strength of the U.S. dollar which will have the effect of shrinking multinationals’ non-U.S. earnings while lowering the costs of U.S. imports. More domestically-oriented U.S. value indices should benefit on a relative basis.
While the rest of the world is battling inflation with raising interest rates, China is fighting deflation and cutting rates. Its economy is experiencing a housing crisis with slowing sales, falling home prices, borrowers refusing to make/defaulting on mortgage payments, and a number of property developers with overwhelming debt levels. China’s Caixin manufacturing PMI fell back into contraction territory (49.2) with its services activity softening more than expected. One week after stating it would adhere “unswervingly” to its Covid strategy, Chinese officials are providing a “roadmap” on how it will relax its policy by shortening quarantine rules for inbound travelers. It will also stop trying to identify “secondary” contacts. Additionally, even though U.S./China relations remain thorny, Presidents Biden and Xi held talks at the G20 summit in Bali. While they had spoken by phone numerous times, this was their first in-person meeting since Mr. Biden took office in 2020. The two sides are at odds on many issues, but they are determined to ”firmly defend interests, manage differences, and promote mutually beneficial cooperation and avoid miscalculation.” Secretary of State Blinken will be visiting China in early 2023 to keep the lines of communication open and continue to work out important issues to elude conflict. Finally, a deal was made recently averting a mass delisting of Chinese companies from U.S. exchanges. China continues its stimulus policies and is one of the few major economies looking to spur growth into year-end coinciding with Mr. Xi’s start of an unprecedented third term.
22
Table of Contents
TCW Relative Value Large Cap Fund
Management Discussions (Continued)
The fourth quarter, particularly November and December, tends to be a seasonally strong period for equity markets. Investor optimism has perked up after the release of the October CPI report which showed inflation cooling. Headline CPI year-over-year has fallen for four consecutive months and now stands at 7.7% for the year ending October 31, down from the 40-year high of 9.1% reached in June. Core CPI (excluding food and energy) also declined to 6.3% year-over-year from the prior month reading of 6.6% and below median economist estimates. Highlights from the report show moderation in shelter and declines in used car and apparel prices. Investors took this as a sign the Fed does not have to opt for the most aggressive path as it works to stem the still stubbornly high inflation. Additionally, there is more certainty as it pertains to the makeup of the U.S. Congress. House control has shifted to the Republicans, albeit by a much slimmer margin, as the “red wave” was more of a trickle, and Democrats have retained control of the Senate. Since 1950, the mid-term elections have brought outperformance for stocks, no matter which party has won and no matter the issues. Per Ned Davis Research, S&P 500 and predecessor returns for 1948 through 2021 have averaged 16.7% for the year after mid-terms. Also boding well is the expectation for increased holiday spending; the National Retail Federation estimates for 2022 holiday sales are expected to be 5% higher than last year while Mastercard SpendingPulse is estimated to be a bit more elevated.
We believe value is poised for multiple years of outperformance over growth similar to the results post the 1970, 1975, 1982, 1991, and 2000 recessions. Value is an early cycle play, and early cycle stocks such as those in the Consumer Discretionary space are starting to outperform; within the Russell 1000 Value (R1V), it was the third best sector in October. Growth prices and their multiples, while off their historical highs, are still expensive. The current price-to-book ratio for the Russell 1000 Growth Index (R1G) versus the R1V is almost at a two standard deviation high. We believe we are still in the early stages of a value super cycle although it is never a straight line. Even with the nearly 18 pps outperformance for the fiscal year through October 31, there is still room to go given the R1G outperformed the R1V (on the back of low rates) by over 14 pps per year for the five calendar years ending December 2021. Although we expect value to outperform with positive total returns, it is worth noting the value style can outperform by going down less than the more expensive stocks. This is exactly what happened post the dotcom bust and represented a large value rally. Value can work when ‘expensive’ underperforms too.
Recent volatility has demonstrated market timing can be a destructive exercise, and there are opportunity costs to standing on the sidelines. JPMorgan notes that 70% of the best days in the U.S. stock market occur within two weeks of the worst days. Despite headwinds facing the globe, the U.S. economy is resilient. The Atlanta Fed’s GDP estimate for 4Q22 is 4%. The unemployment rate is at historic lows and investment grade corporate balance sheets are in good shape. Banks are making loans and inflation expectations are tethered at 2-3%. There are tail risks and potential exogenous events but we believe each portfolio holding has the economic wherewithal to withstand a one- to two-year recession. It is highly likely the economy will grow over the long term and equities, over time, historically have produced attractive returns. For the periods following the nadirs post the global financial crisis and dot-com bust, the S&P 500 Index rose 18.3% (3/9/09 – 2/19/20) and 17.1% (10/9/02 – 10/9/07) on an annualized basis, respectively.
We remain true to our diversified portfolio strategy, diligent, and ever watchful for changes. We are busy and actively working to make the best portfolio decisions possible with the information we have. While circumstances were different, the fear in 2008 concerning money center banks’ fragile economic backbone worldwide was similar. At that time, Warren Buffett stated “A simple rule dictates my buying: Be fearful when others are greedy, and be greedy when others are fearful.”
23
Table of Contents
TCW Relative Value Large Cap Fund
Management Discussions (Continued)
Fund Review
Over the course of the one-year period ending October 31, 2022, stock selection contributed quite favorably (by over 500 bps) relative to the benchmark. The Fund’s top ten holdings by average weight (over the course of the fiscal year) outperformed the portfolio and its benchmark index returning 3.9% with a mixture of solid gains from McKesson, onsemi, and Molina Healthcare and lagging results from Intercontinental Exchange, JPMorgan Chase, and Johnson Controls. The preponderance of the outperformance came from stock selection in Information Technology and Health Care. Led by onsemi and with support from IBM and Flex, the Fund’s Information Technology names were the best relative performers returning 9.2% far outpacing the group loss of -23.0%. McKesson, Molina Healthcare, AbbVie, and Centene led to the outperformance in Health Care where the portfolio’s names gained 30.4% versus their peers’ rise of 2.6%. To a lesser effect, the portfolio benefited from stock selection in Consumer Staples due largely to PepsiCo while AES added value in Utilities.
On the downside, the portfolio’s Financials stocks returned -19.5% versus the group’s fall of -13.1% due largely to Signature Bank and Intercontinental Exchange. The portfolio’s Industrials names underperformed -18.1% versus -9.7% with lagging returns from Johnson Controls, General Electric, and UPS. While returning an admirable 47.7%, the portfolio’s Energy names did not keep pace with its peers which rose 64.9%, by far the best performing sector over the course of the year. Paramount Global, Warner Brothers Discovery, and Comcast (along with media companies in general) struggled over the one-year period and were largely responsible for the underperformance in Communication Services while International Flavors & Fragrances disappointed in Materials; the stock was completely sold post the fiscal year-end. While stock selection was noticeably additive, the portfolio’s relative sector weights detracted due to the overweights in Information Technology and Consumer Discretionary and underweights in Energy, Consumer Staples, and Utilities.
24
Table of Contents
TCW Relative Value Large Cap Fund
Management Discussions (Continued)
| Annualized Total Return as of October 31, 2022(1) | ||||||||||||||||||||||||
| 1 Yr Return | 3 Yr Return | 5 Yr Return | 10 Yr Return | Inception to Date | Inception Index | |||||||||||||||||||
TCW Relative Value Large Cap Fund | ||||||||||||||||||||||||
Class I (Inception: 01/02/2004) | (5.56 | )% | 9.82 | % | 6.33 | % | 9.95 | % | 7.55 | % | 7.21 | % | ||||||||||||
Class N (Inception: 01/02/1998) | (5.72 | )% | 9.63 | % | 6.12 | % | 9.71 | % | 6.55 | % | 7.77 | % | ||||||||||||
Russell 1000 Value Index | (7.00 | )% | 7.31 | % | 7.21 | % | 10.30 | % | ||||||||||||||||


| (1) | The total returns do not reflect taxes that a shareholder would pay on fund distribution or on the redemption of fund shares. |
25
Table of Contents
TCW Relative Value Mid Cap Fund
Management Discussions
For the year ended October 31, 2022, the TCW Relative Value Mid Cap Fund (the “Fund”) posted a return of -10.35% and -10.45% on its I Class and N Class shares, respectively. The performance of the Fund’s classes varies because of differing expenses. The Fund’s benchmark, the Russell Midcap Value Index, returned -10.18% over the same period.
Midcap stocks, historically, have outperformed large caps and we believe the asset class represents the sweet spot of higher growth potential than large caps but with less volatility than small caps. For the 25-year period ending October 31, 2022, the Russell Midcap has outperformed the S&P 500 by 1.3 pps (9.23% vs. 7.93%) on an annualized basis but with a lesser standard deviation versus the Russell 2000 (17.60% vs. 20.52%) as well as outperforming that benchmark by an even wider (1.9 pps) margin.
Market Outlook
The U.S. economy is strong and resilient, yet it is showing signs of slowing due to the headwinds facing the entire globe. The October ISM Manufacturing Index slipped a bit further but is still in expansion territory at 50.2. Third quarter earnings reports are nearly complete. Results for Tech+ and FAANG have been particularly weak. Even so, expectations for the S&P 500 are 10.9% and 4.3% for revenues and earnings per share (EPS) growth, respectively, even after ~30% downward revisions since the beginning of the year. Value, continuing the trend that started in 1Q21, is delivering stronger revenue and EPS growth (11.6% and 7.7%) than growth (9.1% and -1.0%) in 3Q22. At present, of the companies that revised their forecasts, nearly three-fourths have actually moved higher rather than lower. That compares to a five-year average period pre-Covid of 42%. “It’s not particularly optimistic or pessimistic, but better than the last three quarters and the pre-Covid five-year average, …estimates are still too low,” said Wendy Soong of Bloomberg. Per Dennis DeBusschere, founder of 22V Research, the net percentage of S&P 500 companies that have reduced their sales and EPS guidance is in the 90th percentile (as such, many more than usual) but has stabilized recently. Using a natural-language processing tool, earnings sentiment is near recession levels. He added, 3Q22 estimates have “come down enough that companies should be able to beat Street numbers by a few percent.” Investors can focus on earnings rather than monetary policy for now. With earnings per share rising for the year, the entire market decline could be attributed to falling multiples due to higher interest rates. Another important factor in 3Q22 earnings is the strength of the U.S. dollar which will have the effect of shrinking multinationals’ non-U.S. earnings while lowering the costs of U.S. imports. More domestically-oriented U.S. value indices should benefit on a relative basis.
While the rest of the world is battling inflation with raising interest rates, China is fighting deflation and cutting rates. Its economy is experiencing a housing crisis with slowing sales, falling home prices, borrowers refusing to make/defaulting on mortgage payments, and a number of property developers with overwhelming debt levels. China’s Caixin manufacturing PMI fell back into contraction territory (49.2) with its services activity softening more than expected. One week after stating it would adhere “unswervingly” to its Covid strategy, Chinese officials are beginning to provide a “roadmap” on how it will relax its policy by shortening quarantine rules for inbound travelers. It will also stop trying to identify “secondary” contacts. Additionally, even though U.S./China relations remain thorny, Presidents Biden and Xi held talks at the G20 summit in Bali. While they had spoken by phone numerous times, this was their first in-person meeting since Mr. Biden took office in 2020. The two sides are at odds on many issues, but they are determined to ”firmly defend interests, manage differences, and promote mutually beneficial cooperation and avoid miscalculation.” Secretary of State Blinken will be visiting China in early 2023 to keep the lines of communication open and continue to work out important issues to elude conflict. Finally, a
26
Table of Contents
TCW Relative Value Mid Cap Fund
Management Discussions (Continued)
deal was made recently averting a mass delisting of Chinese companies from U.S. exchanges. China continues its stimulus policies and is one of the few major economies looking to spur growth into year-end coinciding with Mr. Xi’s start of an unprecedented third term.
The fourth quarter, particularly November and December, tends to be a seasonally strong period for equity markets. Investor optimism has perked up after the release of the October CPI report which showed inflation cooling. Headline CPI year-over-year has fallen for four consecutive months and now stands at 7.7% for the year ending October 31, down from the 40-year high of 9.1% reached in June. Core CPI (excluding food and energy) also declined to 6.3% year-over-year from the prior month reading of 6.6% and below median economist estimates. Highlights from the report show moderation in shelter and declines in used car and apparel prices. Investors took this as a sign the Fed does not have to opt for the most aggressive path as it works to stem the still stubbornly high inflation. Additionally, there is more certainty as it pertains to the makeup of the U.S. Congress. House control has shifted to the Republicans, albeit by a much slimmer margin, as the “red wave” was more of a trickle, and Democrats have retained control of the Senate. Since 1950, the mid-term elections have brought outperformance for stocks, no matter which party has won and no matter the issues. Per Ned Davis Research, S&P 500 and predecessor returns for 1948 through 2021 have averaged 16.7% for the year after mid-terms. Also boding well is the expectation for increased holiday spending; the National Retail Federation estimates for 2022 holiday sales are expected to be 5% higher than last year while Mastercard SpendingPulse is estimated to be a bit more elevated.
We believe value is poised for multiple years of outperformance over growth similar to the results post the 1970, 1975, 1982, 1991, and 2000 recessions. Value is an early cycle play, and early cycle stocks such as those in the Consumer Discretionary space are starting to outperform; within the Russell Midcap Value Index (RMCV), it was the second best sector in October. Growth prices and their multiples, while off their historical highs, are still expensive. We believe we are still in the early stages of a value super cycle although it is never a straight line. Even with the nearly 19 pps outperformance for the fiscal year through October 31, there is still room to go given the Russell Midcap Growth outperformed the RMCV (on the back of low rates) by over 7 pps per year for the five calendar years ending December 2021. Although we expect value to outperform with positive total returns, it is worth noting the value style can outperform by going down less than the more expensive stocks. This is exactly what happened post the dotcom bust and represented a large value rally. Value can work when ‘expensive’ underperforms too.
Recent volatility has demonstrated market timing can be a destructive exercise, and there are opportunity costs to standing on the sidelines. JPMorgan notes that 70% of the best days in the U.S. stock market occur within two weeks of the worst days. Despite headwinds facing the globe, the U.S. economy is resilient. The Atlanta Fed’s GDP estimate for 4Q22 is 4%. The unemployment rate is at historic lows and investment grade corporate balance sheets are in good shape. Banks are making loans and inflation expectations are tethered at 2-3%. There are tail risks and potential exogenous events but we believe each portfolio holding has the economic wherewithal to withstand a one- to two-year recession. It is highly likely the economy will grow over the long term and equities, over time, historically have produced attractive returns. For the periods following the nadirs post the global financial crisis and dot-com bust, the S&P 500 Index rose 18.3% (3/9/09 – 2/19/20) and 17.1% (10/9/02 – 10/9/07) on an annualized basis, respectively.
We remain true to our diversified portfolio strategy, diligent, and ever watchful for changes. We are busy and actively working to make the best portfolio decisions possible with the information we have. While circumstances were different, the fear in 2008 concerning money center banks’ fragile economic backbone
27
Table of Contents
TCW Relative Value Mid Cap Fund
Management Discussions (Continued)
worldwide was similar. At that time, Warren Buffett stated “A simple rule dictates my buying: Be fearful when others are greedy, and be greedy when others are fearful.”
Fund Review
Over the course of the one-year period ending October 31, 2022, stock selection contributed quite favorably (by nearly 275 bps) relative to the benchmark. The Fund’s top ten holdings by average weight (over the course of the fiscal year) outperformed the portfolio and its benchmark index returning -0.8% with a mixture of solid gains from healthcare companies Acadia Healthcare, Molina Healthcare, and Centene and lagging results from KeyCorp, Lennar, and Jacobs Solutions. The preponderance of the outperformance came from stock selection in Health Care and Information Technology. The aforementioned healthcare names led to the outperformance in Health Care and as a group were the best relative performers returning 8.4% versus their peers’ decline of -16.4%. Led by Flex, TTM Technologies, and Avnet, the Fund’s Information Technology names returned 1.9% far outpacing the group loss of -20.9%. To a lesser effect, the portfolio benefited from stock selection in Industrials, Consumer Discretionary, and Utilities led by Arcosa, Darden Restaurants, and AES. Other notable contributors included Arch Capital and energy names Marathon Petroleum and ConocoPhillips.
On the downside, the portfolio’s Real Estate stocks returned -42.8% versus the group’s fall of -19.1% due largely to Innovative Industrial Properties and secondarily Jones Lang LaSalle. Signature Bank and Evercore were the biggest detractors among the portfolio’s Financials holdings with stock selection in the sector falling -14.9% versus -11.0% while Coty in Consumer Staples and International Flavors & Fragrances were the main detractors in their respective sectors. Other notable detractors included eBay and Manitowoc. While stock selection was additive, the portfolio’s relative sector weights detracted due largely to the overweight in Consumer Discretionary and underweight in Utilities.
28
Table of Contents
TCW Relative Value Mid Cap Fund
Management Discussions (Continued)
| Annualized Total Return as of October 31, 2022(1) | ||||||||||||||||||||||||
| 1 Yr Return | 3 Yr Return | 5 Yr Return | 10 Yr Return | Inception to Date | Inception Index | |||||||||||||||||||
TCW Relative Value Mid Cap Fund | ||||||||||||||||||||||||
Class I (Inception: 11/01/1996) | (10.35 | )% | 9.18 | % | 4.66 | % | 9.13 | % | 9.64 | %(2) | 9.92 | % | ||||||||||||
Class N (Inception: 11/01/2000) | (10.45 | )% | 9.07 | % | 4.55 | % | 8.94 | % | 7.52 | % | 9.30 | % | ||||||||||||
Russell Midcap Value Index | (10.18 | )% | 7.50 | % | 6.49 | % | 10.42 | % | ||||||||||||||||
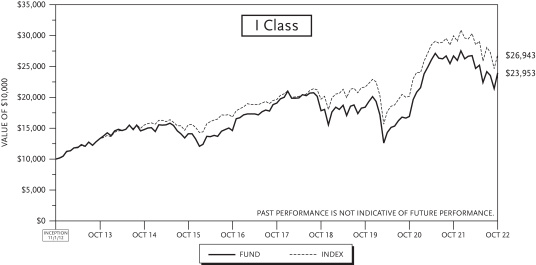
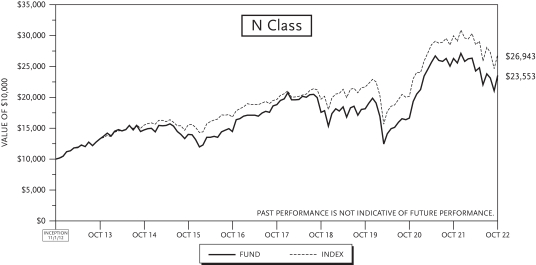
| (1) | The total returns do not reflect taxes that a shareholder would pay on fund distribution or on the redemption of fund shares. |
| (2) | Performance data includes the performance of the predecessor entity for periods before the Fund’s registration became effective. The predecessor entity was not registered under the 1940 Act and, therefore, was not subject to certain investment restrictions that are imposed by the 1940 Act. If the predecessor entity had been registered under the 1940 Act, the predecessor entity’s performance may have been lower. |
29
Table of Contents
TCW Select Equities Fund
Management Discussions
For the year ended October 31, 2022, the TCW Select Equities Fund (the “Fund”) returned -34.93% and -35.03% on its I Class and N Class shares, respectively. The performance of the Fund’s classes varies because of differing expenses. The Fund’s benchmark, Russell 1000 Growth Index, returned -24.60% over the same period.
Whereas last year was marked by improving consumer confidence, fiscal stimulus and a world awash in liquidity, Fiscal 2022 was marked by a bear market, persistently high inflation and arguably the fastest tightening of financial conditions in over 40 years. Over the course of six months (March 2022 – September 2022), the Fed increased rates 300bps, while at the same time swinging the direction of its balance sheet from QE (Quantitative Easing) to QT (Quantitative Tightening) at a ~$2.5 trillion annual rate. Mortgage rates have spiked (highest level since 2006), which has predictably cooled housing, an interest rate sensitive sector and leading indicator. Consumer sentiment is challenged, credit card balances have begun to spike, yet the labor market remains stubbornly resilient (most recent Job Opening and Labor Turnover Survey results showed there are still more job openings than unemployed individuals). Investor focus now turns to the pace of further Fed rate hikes, any signs inflation has peaked and whether a “Fed pivot” may occur in 2023.
Net of expenses, the Fund underperformed for the year primarily due to negative security selection effects. Our biggest stock detractors relative to the benchmark came from the healthcare and information technology sectors. In the healthcare sector, shares of Align Technology, Inc. (ALGN) moved lower after a series of mixed earnings reports over the past year. Waning consumer confidence driven by increasing inflationary pressures and supply chain disruptions, macro concerns due to lockdowns in China and the war in Ukraine as well as unfavorable foreign exchange rates negatively affected ALGN over the past year. While we believe ALGN’s competitive moat remains sturdy, the sharp deceleration in end-market demand is a concern and we have placed shares of ALGN under review. Shares of Adobe Inc. (ADBE) also moved lower after the company announced a proposed $20 billion acquisition of Figma, a collaborative product design platform. The price paid (50x estimated calendar year 2022 ARR (annual recurring revenue) of ~$400 million) and dilutive nature of the acquisition were notable in an environment where early-stage growth companies are seeing rapid declines in valuation. We have placed shares of ADBE under review.
Our biggest stock contributors during the year came from the information technology and consumer discretionary sectors. Shares of Enphase Energy, Inc. (ENPH) rallied after a series of strong earnings reports and the news that the Inflation Reduction Act of 2022 includes clean energy tax credits (restores a 30% tax credit for residential solar systems and extends the program to Jan. 1, 2034). With oil prices moving to multi-year highs, we believe the market demand for Clean Energy will continue to grow and ENPH is a clear beneficiary. We remain positive on shares. In the midst of a bear market, shares of Ulta Beauty, Inc. (ULTA) bucked the trend within the consumer discretionary sector and moved higher over the past year. Despite an increasingly challenging macro environment and lapping difficult comps due to the pandemic (i.e., a +56.3% comp from 2Q21), comp store sales trends remained strong in 2022 and management noted healthy growth across all income levels and little trade-down by the consumer. We remain constructive on ULTA shares, as we are attracted to the company’s omnichannel capabilities, very loyal and growing member base, proprietary vendors as well as its unique non-mall store footprint.
30
Table of Contents
TCW Select Equities Fund
Management Discussions (Continued)
| Annualized Total Return as of October 31, 2022(1) | ||||||||||||||||||||||||
| 1 Yr Return | 3 Yr Return | 5 Yr Return | 10 Yr Return | Inception to Date | Inception Index | |||||||||||||||||||
TCW Select Equities Fund | ||||||||||||||||||||||||
Class I (Inception: 07/01/1991) | (34.93 | )% | 7.12 | % | 10.49 | % | 12.12 | % | 10.10 | %(2) | 9.92 | % | ||||||||||||
Class N (Inception: 03/01/1999) | (35.03 | )% | 6.91 | % | 10.27 | % | 11.86 | % | 6.91 | % | 6.75 | % | ||||||||||||
Russell 1000 Growth Index | (24.60 | )% | 11.75 | % | 12.59 | % | 14.69 | % | ||||||||||||||||
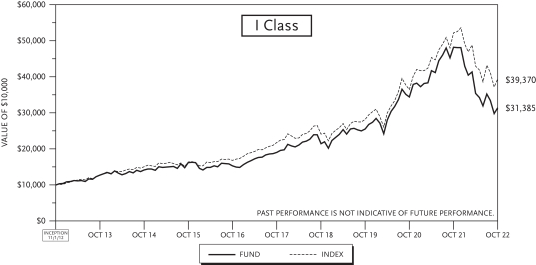

| (1) | The total returns do not reflect taxes that a shareholder would pay on fund distribution or on the redemption of fund shares. |
| (2) | Performance data includes the performance of the predecessor entity for periods before the Fund’s registration became effective. The predecessor entity was not registered under the 1940 Act and, therefore, was not subject to certain investment restrictions that are imposed by the 1940 Act. If the predecessor entity had been registered under the 1940 Act, the predecessor entity’s performance may have been lower. |
31
Table of Contents
TCW Artificial Intelligence Equity Fund
| Issues | Shares | Value | ||||||
COMMON STOCK — 95.9% of Net Assets |
| |||||||
| Agricultural & Farm Machinery — 4.4% | ||||||||
Deere & Co. | 780 | $ | 308,740 | |||||
Enphase Energy, Inc. (1) | 579 | 177,753 | ||||||
|
| |||||||
| 486,493 | ||||||||
|
| |||||||
| Apparel, Accessories & Luxury Goods — 2.3% | ||||||||
Lululemon Athletica, Inc. (1) | 766 | 252,045 | ||||||
|
| |||||||
| Application Software — 5.1% | ||||||||
Bill.Com Holdings, Inc. (1) | 2,231 | 297,526 | ||||||
Salesforce, Inc. (1) | 1,244 | 202,262 | ||||||
UiPath, Inc. (1) | 4,712 | 59,607 | ||||||
|
| |||||||
| 559,395 | ||||||||
|
| |||||||
| Automobile Manufacturers — 3.4% | ||||||||
Tesla Inc. (1) | 1,612 | 366,794 | ||||||
|
| |||||||
| Communications Equipment — 13.3% | ||||||||
Arista Networks, Inc. (1) | 3,592 | 434,129 | ||||||
Cisco Systems, Inc. | 4,115 | 186,945 | ||||||
Motorola Solutions, Inc. | 1,493 | 372,817 | ||||||
Palo Alto Networks, Inc. (1) | 2,726 | 467,754 | ||||||
|
| |||||||
| 1,461,645 | ||||||||
|
| |||||||
| Electrical Components & Equipment — 2.3% | ||||||||
Eaton Corp. PLC | 1,678 | 251,817 | ||||||
|
| |||||||
| Electronic Equipment & Instruments — 2.8% | ||||||||
Cognex Corp. | 3,990 | 184,458 | ||||||
Mobileye Global, Inc. (1) | 358 | 9,444 | ||||||
Trimble, Inc. (1) | 1,881 | 113,161 | ||||||
|
| |||||||
| 307,063 | ||||||||
|
| |||||||
| General Merchandise Stores — 2.1% | ||||||||
Costco Wholesale Corp. | 467 | 234,201 | ||||||
|
| |||||||
| Interactive Home Entertainment — 1.5% | ||||||||
Nintendo Co., Ltd. (Japan) | 4,000 | 162,462 | ||||||
|
| |||||||
| Internet & Direct Marketing Retail — 3.7% | ||||||||
Amazon.com, Inc. (1) | 2,422 | 248,110 | ||||||
JD.com, Inc. (ADR) (China) | 4,178 | 155,797 | ||||||
|
| |||||||
| 403,907 | ||||||||
|
| |||||||
| Internet Services & Infrastructure — 9.9% | ||||||||
Alphabet, Inc. (1) | 4,556 | 430,587 | ||||||
Baidu, Inc. (SP ADR) (China) (1) | 1,407 | 107,734 | ||||||
Meta Platforms, Inc. (1) | 2,436 | 226,938 | ||||||
Snowflake, Inc. (1) | 1,378 | 220,893 | ||||||
ZoomInfo Technologies, Inc. (1) | 2,341 | 104,245 | ||||||
|
| |||||||
| 1,090,397 | ||||||||
|
| |||||||
| IT Consulting & Other Services — 2.5% | ||||||||
EPAM Systems, Inc. (1) | 471 | 164,850 | ||||||
| Issues | Shares | Value | ||||||
| IT Consulting & Other Services (Continued) | ||||||||
Globant S.A. (1) | 591 | $ | 111,510 | |||||
|
| |||||||
| 276,360 | ||||||||
|
| |||||||
| Semiconductor Equipment — 4.5% | ||||||||
ASML Holding NV (Netherlands) | 592 | 279,673 | ||||||
Lam Research Corp. | 534 | 216,152 | ||||||
|
| |||||||
| 495,825 | ||||||||
|
| |||||||
| Semiconductors — 14.8% | ||||||||
Intel Corp. | 3,283 | 93,336 | ||||||
Marvell Technology, Inc. | 3,909 | 155,109 | ||||||
Micron Technology, Inc. | 6,795 | 367,609 | ||||||
NVIDIA Corp. | 2,331 | 314,615 | ||||||
NXP Semiconductors NV (Netherlands) | 1,151 | 168,138 | ||||||
ON Semiconductor Corp. (1) | 3,061 | 188,037 | ||||||
QUALCOMM, Inc. | 2,074 | 244,027 | ||||||
Taiwan Semiconductor Manufacturing Co., Ltd. (SP ADR) (Taiwan) | 1,534 | 94,418 | ||||||
|
| |||||||
| 1,625,289 | ||||||||
|
| |||||||
| Systems Software — 18.0% | ||||||||
Check Point Software Technologies, Ltd. (1) | 2,013 | 260,140 | ||||||
Crowdstrike Holdings, Inc. (1) | 2,243 | 361,571 | ||||||
CyberArk Software, Ltd. (1) | 1,167 | 183,114 | ||||||
Datadog, Inc. (1) | 2,578 | 207,555 | ||||||
Microsoft Corp. | 1,875 | 435,244 | ||||||
ServiceNow, Inc. (1) | 801 | 337,013 | ||||||
Zscaler, Inc. (1) | 1,210 | 186,461 | ||||||
|
| |||||||
| 1,971,098 | ||||||||
|
| |||||||
| Technology Hardware, Storage & Peripherals — 5.3% | ||||||||
Apple, Inc. | 2,227 | 341,488 | ||||||
Samsung Electronics Co., Ltd. (South Korea) | 5,809 | 241,770 | ||||||
|
| |||||||
| 583,258 | ||||||||
|
| |||||||
Total Common Stock |
| |||||||
(Cost: $9,837,311) |
| 10,528,049 | ||||||
|
| |||||||
MONEY MARKET INVESTMENTS — 4.5% |
| |||||||
State Street Institutional U.S. Government Money Market Fund — Premier Class, 3.01% (2) | 490,721 | 490,721 | ||||||
|
| |||||||
Total Money Market Investments |
| |||||||
(Cost: $490,721) |
| 490,721 | ||||||
|
| |||||||
Total Investments (100.4%) | ||||||||
(Cost: $10,328,032) |
| 11,018,770 | ||||||
Liabilities In Excess Of Other Assets (-0.4%) |
| (44,635 | ) | |||||
|
| |||||||
Net Assets (100.0%) |
| $ | 10,974,135 | |||||
|
| |||||||
See accompanying Notes to Financial Statements.
32
Table of Contents
TCW Artificial Intelligence Equity Fund
October 31, 2022
Notes to the Schedule of Investments:
| REIT | Real Estate Investment Trust. |
| SP ADR | Sponsored American Depositary Receipt. ADRs are receipts, typically issued by a U.S. bank or trust company, evidencing ownership of underlying securities issued by a foreign corporation. Sponsored ADRs are ADRs issued with the cooperation of the foreign corporation. |
| (1) | Non-income producing security. |
| (2) | Rate disclosed is the 7-day net yield as of October 31, 2022. |
See accompanying Notes to Financial Statements.
33
Table of Contents
TCW Artificial Intelligence Equity Fund
Investments by Sector | October 31, 2022 |
| Sector | Percentage of Net Assets | |||
Agricultural & Farm Machinery | 4.4 | % | ||
Apparel, Accessories & Luxury Goods | 2.3 | |||
Application Software | 5.1 | |||
Automobile Manufacturers | 3.4 | |||
Communications Equipment | 13.3 | |||
Electrical Components & Equipment | 2.3 | |||
Electronic Equipment & Instruments | 2.8 | |||
General Merchandise Stores | 2.1 | |||
Interactive Home Entertainment | 1.5 | |||
Internet & Direct Marketing Retail | 3.7 | |||
Internet Services & Infrastructure | 9.9 | |||
IT Consulting & Other Services | 2.5 | |||
Semiconductor Equipment | 4.5 | |||
Semiconductors | 14.8 | |||
Systems Software | 18.0 | |||
Technology Hardware, Storage & Peripherals | 5.3 | |||
Money Market Investments | 4.5 | |||
|
| |||
Total | 100.4 | % | ||
|
| |||
See accompanying Notes to Financial Statements.
34
Table of Contents
TCW Artificial Intelligence Equity Fund
Fair Valuation Summary | October 31, 2022 |
The following is a summary of the fair valuations according to the inputs used as of October 31, 2022 in valuing the Fund’s investments:
Description | Quoted Prices in Active Markets for Identical Assets (Level 1) | Other Significant Observable Inputs (Level 2) | Significant Unobservable Inputs (Level 3) | Total | ||||||||||||
Common Stock | ||||||||||||||||
Agricultural & Farm Machinery | $ | 486,493 | $ | — | $ | — | $ | 486,493 | ||||||||
Apparel, Accessories & Luxury Goods | 252,045 | — | — | 252,045 | ||||||||||||
Application Software | 559,395 | — | — | 559,395 | ||||||||||||
Automobile Manufacturers | 366,794 | — | — | 366,794 | ||||||||||||
Communications Equipment | 1,461,645 | — | — | 1,461,645 | ||||||||||||
Electrical Components & Equipment | 251,817 | — | — | 251,817 | ||||||||||||
Electronic Equipment & Instruments | 307,063 | — | — | 307,063 | ||||||||||||
General Merchandise Stores | 234,201 | — | — | 234,201 | ||||||||||||
Interactive Home Entertainment | — | 162,462 | — | 162,462 | ||||||||||||
Internet & Direct Marketing Retail | 403,907 | — | — | 403,907 | ||||||||||||
Internet Services & Infrastructure | 1,090,397 | — | — | 1,090,397 | ||||||||||||
IT Consulting & Other Services | 276,360 | — | — | 276,360 | ||||||||||||
Semiconductor Equipment | 495,825 | — | — | 495,825 | ||||||||||||
Semiconductors | 1,625,289 | — | — | 1,625,289 | ||||||||||||
Systems Software | 1,971,098 | — | — | 1,971,098 | ||||||||||||
Technology Hardware, Storage & Peripherals | 341,488 | 241,770 | — | 583,258 | ||||||||||||
|
|
|
|
|
|
|
| |||||||||
Total Common Stock | 10,123,817 | 404,232 | — | 10,528,049 | ||||||||||||
|
|
|
|
|
|
|
| |||||||||
Money Market Investments | 490,721 | — | — | 490,721 | ||||||||||||
|
|
|
|
|
|
|
| |||||||||
Total Investments | $ | 10,614,538 | $ | 404,232 | $ | — | $ | 11,018,770 | ||||||||
|
|
|
|
|
|
|
| |||||||||
See accompanying Notes to Financial Statements.
35
Table of Contents
TCW Conservative Allocation Fund
Schedule of Investments
| Issues | Shares | Value | ||||||
EXCHANGE-TRADED FUNDS — 3.6% of Net Assets |
| |||||||
iShares Gold Trust (1) | 9,725 | $ | 301,280 | |||||
iShares MSCI EAFE Index Fund | 11,810 | 700,451 | ||||||
|
| |||||||
Total Exchange-traded Funds | ||||||||
(Cost: $1,112,439) | 1,001,731 | |||||||
|
| |||||||
INVESTMENT COMPANIES — 95.9% |
| |||||||
| Diversified Equity Funds — 33.4% | ||||||||
TCW Artificial Intelligence Equity Fund — I Class (2) | 16,557 | 246,362 | ||||||
TCW Global Real Estate Fund — I Class (2) | 125,004 | 1,288,789 | ||||||
TCW New America Premier Equities Fund — I Class (2) | 119,893 | 2,644,841 | ||||||
TCW Relative Value Large Cap Fund — I Class (2) | 183,410 | 2,402,673 | ||||||
TCW Relative Value Mid Cap Fund — I Class (2) | 29,012 | 683,804 | ||||||
TCW Select Equities Fund — I Class (2) | 80,409 | 2,073,749 | ||||||
|
| |||||||
| 9,340,218 | ||||||||
|
| |||||||
| Diversified Fixed Income Funds — 62.5% | ||||||||
Metropolitan West High Yield Bond Fund — I Class (2) | 33,267 | 296,743 | ||||||
Metropolitan West Low Duration Bond Fund — I Class (2) | 361,954 | 2,935,445 | ||||||
Metropolitan West Total Return Bond Fund — I Class (2) | 389,676 | 3,429,147 | ||||||
Metropolitan West Unconstrained Bond Fund — I Class (2) | 536,140 | 5,409,655 | ||||||
| Issues | Shares | Value | ||||||
| Diversified Fixed Income Funds (Continued) | ||||||||
TCW Emerging Markets Income Fund — I Class (2) | 62,956 | $ | 356,961 | |||||
TCW Enhanced Commodity Strategy Fund — I Class (2) | 117,547 | 745,247 | ||||||
TCW Global Bond Fund — I Class (2) | 89,956 | 697,163 | ||||||
TCW Total Return Bond Fund — I Class (2) | 453,621 | 3,606,284 | ||||||
|
| |||||||
| 17,476,645 | ||||||||
|
| |||||||
Total Investment Companies | ||||||||
(Cost: $27,876,612) | 26,816,863 | |||||||
|
| |||||||
MONEY MARKET INVESTMENTS — 0.6% |
| |||||||
State Street Institutional U.S. Government Money Market Fund — Premier Class, 3.01% (3) | 171,980 | 171,980 | ||||||
|
| |||||||
Total Money Market Investments |
| |||||||
(Cost: $171,980) | 171,980 | |||||||
|
| |||||||
Total Investments (100.1%) |
| |||||||
(Cost: $29,161,031) | 27,990,574 | |||||||
Liabilities in Excess of Other Assets (-0.1%) |
| (19,678 | ) | |||||
|
| |||||||
Net Assets (100.0%) |
| $ | 27,970,896 | |||||
|
| |||||||
Notes to the Schedule of Investments:
| (1) | Non-income producing security. |
| (2) | Affiliated issuer. |
| (3) | Rate disclosed is the 7-day net yield as of October 31, 2022. |
See accompanying Notes to Financial Statements.
36
Table of Contents
TCW Conservative Allocation Fund
October 31, 2022
The summary of the TCW Conservative Allocation Fund transactions in the affiliated funds for the year ended October 31, 2022 is as follows:
Name of | Value at October 31, 2021 | Purchases at Cost | Proceeds from Sales | Number of Shares Held October 31, 2022 | Value at October 31, 2022 | Dividends and Interest Income Received | Distributions Received from Net Realized Gain | Net Realized Gain (Loss) on Investments | Net change in Unrealized Gain (Loss) on Investments | |||||||||||||||||||||||||||
Metropolitan West High Yield Bond Fund—I Class |
| |||||||||||||||||||||||||||||||||||
| $ | 364,123 | $ | 21,623 | $ | 31,101 | 33,267 | $ | 296,743 | $ | 16,080 | $ | — | $ | (762 | ) | $ | (57,140 | ) | ||||||||||||||||||
Metropolitan West Low Duration Bond Fund—I Class |
| |||||||||||||||||||||||||||||||||||
| 3,882,060 | 125,285 | 757,382 | 361,954 | 2,935,445 | 65,784 | — | (44,883 | ) | (269,635 | ) | ||||||||||||||||||||||||||
Metropolitan West Total Return Bond Fund—I Class |
| |||||||||||||||||||||||||||||||||||
| 4,151,099 | 443,500 | 355,601 | 389,676 | 3,429,147 | 89,378 | 1,039 | (31,831 | ) | (778,020 | ) | ||||||||||||||||||||||||||
Metropolitan West Unconstrained Bond Fund—I Class |
| |||||||||||||||||||||||||||||||||||
| 6,522,352 | 423,512 | 563,583 | 536,140 | 5,409,655 | 251,359 | 73,306 | (28,993 | ) | (943,633 | ) | ||||||||||||||||||||||||||
TCW Artificial Intelligence Fund—I Class |
| |||||||||||||||||||||||||||||||||||
| 427,681 | 24,998 | 33,084 | 16,557 | 246,362 | — | 18,136 | (2,116 | ) | (171,117 | ) | ||||||||||||||||||||||||||
TCW Emerging Markets Income Fund—I Class |
| |||||||||||||||||||||||||||||||||||
| 327,872 | 205,498 | 40,437 | 62,956 | 356,961 | 19,232 | — | (3,982 | ) | (131,990 | ) | ||||||||||||||||||||||||||
TCW Enhanced Commodity Strategy Fund—I Class |
| |||||||||||||||||||||||||||||||||||
| 909,113 | 66,681 | 249,086 | 117,547 | 745,247 | 52,783 | — | 18,271 | 268 | ||||||||||||||||||||||||||||
TCW Global Bond Fund—I Class |
| |||||||||||||||||||||||||||||||||||
| 778,031 | 164,301 | 65,212 | 89,956 | 697,163 | 12,694 | — | (5,961 | ) | (173,996 | ) | ||||||||||||||||||||||||||
TCW Global Real Estate Fund—I Class |
| |||||||||||||||||||||||||||||||||||
| 1,889,665 | 203,034 | 157,919 | 125,004 | 1,288,789 | 70,465 | 103,053 | (8,273 | ) | (637,718 | ) | ||||||||||||||||||||||||||
TCW New America Premier Equities Fund—I Class |
| |||||||||||||||||||||||||||||||||||
| 3,024,172 | 1,150,504 | 592,730 | 119,893 | 2,644,841 | — | 345,481 | 75,884 | (1,012,989 | ) | |||||||||||||||||||||||||||
TCW Relative Value Large Cap Fund—I Class |
| |||||||||||||||||||||||||||||||||||
| 3,840,642 | 538,367 | 1,395,663 | 183,410 | 2,402,673 | 47,526 | 262,523 | (58,149 | ) | (522,524 | ) | ||||||||||||||||||||||||||
TCW Relative Value Mid Cap Fund—I Class |
| |||||||||||||||||||||||||||||||||||
| 1,009,693 | 132,486 | 228,559 | 29,012 | 683,804 | 5,650 | 110,727 | (37,966 | ) | (191,850 | ) | ||||||||||||||||||||||||||
TCW Select Equities Fund—I Class |
| |||||||||||||||||||||||||||||||||||
| 3,474,300 | 803,653 | 556,627 | 80,409 | 2,073,749 | — | 411,123 | (148,098 | ) | (1,499,479 | ) | ||||||||||||||||||||||||||
TCW Total Return Bond Fund—I Class |
| |||||||||||||||||||||||||||||||||||
| 4,079,515 | 765,308 | 348,811 | 453,621 | 3,606,284 | 94,047 | — | (30,367 | ) | (859,361 | ) | ||||||||||||||||||||||||||
|
|
|
|
|
|
|
|
|
| |||||||||||||||||||||||||||
Total | $ | 26,816,863 | $ | 724,998 | $ | 1,325,388 | $ | (307,226 | ) | $ | (7,249,184 | ) | ||||||||||||||||||||||||
|
|
|
|
|
|
|
|
|
| |||||||||||||||||||||||||||
See accompanying Notes to Financial Statements.
37
Table of Contents
TCW Conservative Allocation Fund
Investments by Sector | October 31, 2022 |
| Sector | Percentage of Net Assets | |||
Diversified Fixed Income Funds | 62.5 | % | ||
Diversified Equity Funds | 33.4 | |||
Exchange-Traded Funds | 3.6 | |||
Money Market Investments | 0.6 | |||
|
| |||
Total | 100.1 | % | ||
|
| |||
See accompanying Notes to Financial Statements.
38
Table of Contents
TCW Conservative Allocation Fund
Fair Valuation Summary | October 31, 2022 |
The following is a summary of the fair valuations according to the inputs used as of October 31, 2022 in valuing the Fund’s investments:
Description | Quoted Prices in Active Markets for Identical Assets (Level 1) | Other Significant Observable Inputs (Level 2) | Significant Unobservable Inputs (Level 3) | Total | ||||||||||||
Exchange-Traded Funds | $ | 1,001,731 | $ | — | $ | — | $ | 1,001,731 | ||||||||
Investment Companies | 26,816,863 | — | — | 26,816,863 | ||||||||||||
Money Market Investments | 171,980 | — | — | 171,980 | ||||||||||||
|
|
|
|
|
|
|
| |||||||||
Total Investments | $ | 27,990,574 | $ | — | $ | — | $ | 27,990,574 | ||||||||
|
|
|
|
|
|
|
| |||||||||
See accompanying Notes to Financial Statements.
39
Table of Contents
Schedule of Investments
| Issues | Shares | Value | ||||||
COMMON STOCK — 88.4% of Net Assets |
| |||||||
| Australia — 3.0% (Cost: $1,256,166) | ||||||||
Goodman Group | 80,817 | $ | 879,071 | |||||
|
| |||||||
| Canada — 3.3% (Cost: $1,403,270) | ||||||||
Killam Apartment Real Estate Investment Trust | 85,078 | 984,848 | ||||||
|
| |||||||
| China — 1.3% (Cost: $516,784) | ||||||||
China Resources Land, Ltd. | 120,000 | 375,444 | ||||||
|
| |||||||
| Germany — 2.2% (Cost: $661,344) | ||||||||
Stroeer SE & Co. KGaA | 16,069 | 655,182 | ||||||
|
| |||||||
| Japan — 11.3% | ||||||||
Mitsubishi Estate Co., Ltd. | 90,700 | 1,141,040 | ||||||
Mitsui Fudosan Co., Ltd. | 59,300 | 1,135,956 | ||||||
Nippon Prologis REIT, Inc. | 495 | 1,039,074 | ||||||
|
| |||||||
Total Japan | ||||||||
(Cost: $4,064,843) |
| 3,316,070 | ||||||
|
| |||||||
| Singapore — 1.7% (Cost: $685,190) | ||||||||
Capitaland Investment Ltd | 231,100 | 491,641 | ||||||
|
| |||||||
| Spain — 4.1% (Cost: $1,640,745) | ||||||||
Cellnex Telecom SA | 36,649 | 1,199,653 | ||||||
|
| |||||||
| United Kingdom — 3.1% (Cost: $1,326,370) | ||||||||
Segro PLC | 101,297 | 915,290 | ||||||
|
| |||||||
Total United Kingdom |
| |||||||
(Cost: $1,326,370) |
| 915,290 | ||||||
|
| |||||||
| United States — 58.4% | ||||||||
Alexandria Real Estate Equities, Inc. | 10,487 | 1,523,761 | ||||||
American Tower Corp. | 4,849 | 1,004,664 | ||||||
Apartment Investment and Management Co. | 68,690 | 545,399 | ||||||
Brixmor Property Group, Inc. | 76,247 | 1,624,824 | ||||||
Equinix, Inc. | 2,911 | 1,648,907 | ||||||
Gaming and Leisure Properties, Inc. | 24,223 | 1,214,057 | ||||||
Invitation Homes, Inc. | 16,704 | 529,350 | ||||||
Kite Realty Group Trust | 39,744 | 780,572 | ||||||
| Issues | Shares | Value | ||||||
| United States (Continued) | ||||||||
LXP Industrial Trust | 126,109 | $ | 1,220,735 | |||||
Mid-America Apartment Communities, Inc. | 4,560 | 717,972 | ||||||
Pebblebrook Hotel Trust | 25,407 | 407,528 | ||||||
Prologis, Inc. | 5,535 | 613,001 | ||||||
Public Storage | 2,807 | 869,468 | ||||||
Rexford Industrial Realty, Inc. | 16,436 | 908,582 | ||||||
Taylor Morrison Home Corp. (1) | 43,675 | 1,150,399 | ||||||
VICI Properties, Inc. | 42,850 | 1,372,057 | ||||||
Welltower, Inc. | 6,972 | 425,571 | ||||||
Wyndham Hotels & Resorts, Inc. | 7,719 | 586,104 | ||||||
|
| |||||||
Total United States |
| |||||||
(Cost: $17,761,598) |
| 17,142,951 | ||||||
|
| |||||||
Total Common Stock |
| |||||||
(Cost: $29,316,310) |
| 25,960,150 | ||||||
|
| |||||||
| CLOSED-END FUND — 4.4% | ||||||||
| United States — 4.4% | ||||||||
NexPoint Diversified Real Estate Trust | 99,981 | 1,280,756 | ||||||
|
| |||||||
Total Closed-end Fund |
| |||||||
(Cost: $1,503,062) |
| 1,280,756 | ||||||
|
| |||||||
Total Purchased Options (2) (1.2%) |
| |||||||
(Cost: $211,413) |
| 349,500 | ||||||
|
| |||||||
MONEY MARKET INVESTMENTS — 6.5% |
| |||||||
State Street Institutional U.S. Government Money Market Fund — Premier Class, 3.01% (3) | 1,898,315 | 1,898,315 | ||||||
|
| |||||||
Total Money Market Investments |
| |||||||
(Cost: $1,898,315) | 1,898,315 | |||||||
|
| |||||||
Total Investments (100.5%) |
| |||||||
(Cost: $32,929,100) | 29,488,721 | |||||||
Liabilities in Excess of Other Assets (-0.5%) |
| (139,823 | ) | |||||
|
| |||||||
Net Assets (100.0%) |
| $ | 29,348,898 | |||||
|
| |||||||
See accompanying Notes to Financial Statements.
40
Table of Contents
TCW Global Real Estate Fund
October 31, 2022
| Purchased Options — Exchange Traded | ||||||||||||||||||||||||||||
| Description | Exercise Price | Expiration Date | Number of Contracts | Notional Amount | Market Value | Premiums Paid (Received) by Fund | Unrealized Appreciation (Depreciation) | |||||||||||||||||||||
Put | ||||||||||||||||||||||||||||
Realty Income Corp. | $ | 65.00 | 3/17/23 | 300 | $ | 1,868,100 | $ | 151,500 | $ | 107,979 | $ | 43,521 | ||||||||||||||||
Vanguard Real Estate | 95.00 | 3/17/23 | 150 | 1,244,700 | 198,000 | 103,434 | 94,566 | |||||||||||||||||||||
|
|
|
|
|
| |||||||||||||||||||||||
| $ | 349,500 | $ | 211,413 | $ | 138,087 | |||||||||||||||||||||||
|
|
|
|
|
| |||||||||||||||||||||||
| Written Options — Exchange Traded | ||||||||||||||||||||||||||||
| Description | Exercise Price | Expiration Date | Number of Contracts | Notional Amount | Market Value | Premiums Paid (Received) by Fund | Unrealized Appreciation (Depreciation) | |||||||||||||||||||||
Put | ||||||||||||||||||||||||||||
Realty Income Corp. | $ | 55.00 | 3/17/23 | (300 | ) | $ | (1,868,100 | ) | $ | (43,500 | ) | $ | (32,361 | ) | $ | (11,139 | ) | |||||||||||
Vanguard Real Estate | 60.00 | 3/17/23 | (150 | ) | (1,244,700 | ) | (10,500 | ) | (17,620 | ) | 7,120 | |||||||||||||||||
|
|
|
|
|
| |||||||||||||||||||||||
| $ | (54,000 | ) | $ | (49,981 | ) | $ | (4,019 | ) | ||||||||||||||||||||
|
|
|
|
|
| |||||||||||||||||||||||
Notes to the Schedule of Investments:
| REIT | Real Estate Investment Trust. |
| (1) | Non-income producing security. |
| (2) | See options table for description of purchased options. |
| (3) | Rate disclosed is the 7-day net yield as of October 31, 2022. |
See accompanying Notes to Financial Statements.
41
Table of Contents
TCW Global Real Estate Fund
Investments by Sector | October 31, 2022 |
| Sector | Percentage of Net Assets | |||
Advertising | 2.2 | % | ||
Diversified Real Estate Activities | 12.2 | |||
Health Care REITs | 1.4 | |||
Homebuilding | 3.9 | |||
Hotel & Resort REITs | 3.4 | |||
Industrial REITs | 19.0 | |||
Office REITs | 5.2 | |||
Purchased Options | 1.2 | |||
Real Estate Development | 1.3 | |||
Real Estate Operating Companies | 1.7 | |||
Residential REITs | 9.4 | |||
Retail REITs | 8.2 | |||
Specialized REITs | 20.8 | |||
Wireless Telecommunication Services | 4.1 | |||
Money Market Investments | 6.5 | |||
|
| |||
Total | 100.5 | % | ||
|
| |||
See accompanying Notes to Financial Statements.
42
Table of Contents
TCW Global Real Estate Fund
Fair Valuation Summary | October 31, 2022 |
The following is a summary of the fair valuations according to the inputs used as of October 31, 2022 in valuing the Fund’s investments:
Description | Quoted Prices in Active Markets for Identical Assets (Level 1) | Other Significant Observable Inputs (Level 2) | Significant Unobservable Inputs (Level 3) | Total | ||||||||||||
Common Stock | ||||||||||||||||
Advertising | $ | — | $ | 655,182 | $ | — | $ | 655,182 | ||||||||
Diversified Real Estate Activities | — | 2,276,996 | — | 2,276,996 | ||||||||||||
Health Care REITs | 425,571 | — | — | 425,571 | ||||||||||||
Homebuilding | 1,150,399 | — | — | 1,150,399 | ||||||||||||
Hotel & Resort REITs | 993,632 | — | — | 993,632 | ||||||||||||
Industrial REITs | 2,742,318 | 2,833,435 | — | 5,575,753 | ||||||||||||
Office REITs | 1,523,761 | — | — | 1,523,761 | ||||||||||||
Real Estate Development | — | 375,444 | — | 375,444 | ||||||||||||
Real Estate Operating Companies | — | 491,641 | — | 491,641 | ||||||||||||
Residential REITs | 2,777,569 | — | — | 2,777,569 | ||||||||||||
Retail REITs | 2,405,396 | — | — | 2,405,396 | ||||||||||||
Specialized REITs | 6,109,153 | — | — | 6,109,153 | ||||||||||||
Wireless Telecommunication Services | — | 1,199,653 | — | 1,199,653 | ||||||||||||
|
|
|
|
|
|
|
| |||||||||
Total Common Stock | 18,127,799 | 7,832,351 | — | 25,960,150 | ||||||||||||
|
|
|
|
|
|
|
| |||||||||
Closed-end Fund | 1,280,756 | — | — | 1,280,756 | ||||||||||||
Purchased Options | 349,500 | — | — | 349,500 | ||||||||||||
Money Market Investments | 1,898,315 | — | — | 1,898,315 | ||||||||||||
|
|
|
|
|
|
|
| |||||||||
Total Investments | $ | 21,656,370 | $ | 7,832,351 | $ | — | $ | 29,488,721 | ||||||||
|
|
|
|
|
|
|
| |||||||||
Liability Derivatives | ||||||||||||||||
Written Options | ||||||||||||||||
Equity Risk | $ | (54,000 | ) | $ | — | $ | — | $ | (54,000 | ) | ||||||
|
|
|
|
|
|
|
| |||||||||
Total | $ | (54,000 | ) | $ | — | $ | — | $ | (54,000 | ) | ||||||
|
|
|
|
|
|
|
| |||||||||
See accompanying Notes to Financial Statements.
43
Table of Contents
TCW New America Premier Equities Fund
Schedule of Investments
| Issues | Shares | Value | ||||||
COMMON STOCK — 100.1% of Net Assets |
| |||||||
| Aerospace & Defense — 7.1% | ||||||||
HEICO Corp. | 64,681 | $ | 10,519,718 | |||||
|
| |||||||
| Application Software — 15.7% | ||||||||
Constellation Software, Inc. | 14,570 | 21,041,236 | ||||||
Trade Desk, Inc. (The) (1) | 41,979 | 2,234,962 | ||||||
|
| |||||||
| 23,276,198 | ||||||||
|
| |||||||
| Data Processing & Outsourced Services — 6.3% | ||||||||
Fiserv, Inc. (1) | 38,587 | 3,964,429 | ||||||
Visa, Inc. | 26,214 | 5,430,492 | ||||||
|
| |||||||
| 9,394,921 | ||||||||
|
| |||||||
| Electrical Equipment — 3.9% | ||||||||
AMETEK, Inc. | 44,002 | 5,705,299 | ||||||
|
| |||||||
| Environmental & Facilities Services — 6.7% | ||||||||
Waste Connections, Inc. (Canada) | 74,704 | 9,854,205 | ||||||
|
| |||||||
| Financial Exchanges & Data — 15.1% | ||||||||
FactSet Research Systems, Inc. | 19,489 | 8,292,375 | ||||||
Morningstar, Inc. | 34,691 | 8,054,556 | ||||||
S&P Global, Inc. | 18,545 | 5,957,581 | ||||||
|
| |||||||
| 22,304,512 | ||||||||
|
| |||||||
| Food Retail — 3.8% | ||||||||
Alimentation Couche-Tard, Inc. | 124,948 | 5,587,646 | ||||||
|
| |||||||
| Health Care Equipment — 3.9% | ||||||||
Danaher Corp. | 23,239 | 5,848,559 | ||||||
|
| |||||||
| Home Entertainment Software — 3.0% | ||||||||
Activision Blizzard, Inc. | 60,811 | 4,427,041 | ||||||
|
| |||||||
| Household Products — 1.3% | ||||||||
Church & Dwight Co., Inc. | 25,438 | 1,885,719 | ||||||
|
| |||||||
| Industrial Conglomerates — 3.7% | ||||||||
Roper Technologies, Inc. | 13,158 | 5,454,517 | ||||||
|
| |||||||
| Industrial Gases — 3.0% | ||||||||
Linde PLC (Ireland) | 14,821 | 4,407,024 | ||||||
|
| |||||||
| Issues | Shares | Value | ||||||
| Internet Services & Infrastructure — 1.0% | ||||||||
Dye & Durham, Ltd. | 129,032 | $ | 1,425,543 | |||||
|
| |||||||
| Life Sciences Tools & Services — 6.3% | ||||||||
Agilent Technologies, Inc. | 25,815 | 3,571,505 | ||||||
Mettler-Toledo International, Inc. (1) | 4,508 | 5,702,305 | ||||||
|
| |||||||
| 9,273,810 | ||||||||
|
| |||||||
| Multi-Sector Holdings — 1.0% | ||||||||
Berkshire Hathaway, Inc. — Class B (1) | 5,147 | 1,518,828 | ||||||
|
| |||||||
| Semiconductors — 3.8% | ||||||||
Broadcom, Inc. | 11,941 | 5,613,703 | ||||||
|
| |||||||
| Soft Drinks — 1.8% | ||||||||
PepsiCo, Inc. | 14,682 | 2,665,958 | ||||||
|
| |||||||
| Systems Software — 12.7% | ||||||||
Microsoft Corp. | 46,748 | 10,851,613 | ||||||
Oracle Corp. | 102,217 | 7,980,081 | ||||||
|
| |||||||
| 18,831,694 | ||||||||
|
| |||||||
Total Common Stock |
| |||||||
(Cost: $111,584,662) |
| 147,994,895 | ||||||
|
| |||||||
MONEY MARKET INVESTMENTS — 0.1% |
| |||||||
State Street Institutional U.S. Government Money Market Fund — Premier Class 3.01% (2) | 116,592 | 116,592 | ||||||
|
| |||||||
Total Money Market Investments |
| |||||||
(Cost: $116,592) |
| 116,592 | ||||||
|
| |||||||
Total Investments (100.2%) | ||||||||
(Cost: $111,701,254) |
| 148,111,487 | ||||||
|
| |||||||
Liabilities in Excess of Other Assets (-0.2%) |
| (244,588 | ) | |||||
|
| |||||||
Net Assets (100.0%) |
| $ | 147,866,899 | |||||
|
| |||||||
Notes to the Schedule of Investments:
| (1) | Non-income producing security. |
| (2) | Rate disclosed is the 7-day net yield as of October 31, 2022. |
See accompanying Notes to Financial Statements.
44
Table of Contents
TCW New America Premier Equities Fund
Investments by Sector | October 31, 2022 |
| Sector | Percentage of Net Assets | |||
Aerospace & Defense | 7.1 | % | ||
Application Software | 15.7 | |||
Data Processing & Outsourced Services | 6.3 | |||
Electrical Equipment | 3.9 | |||
Environmental & Facilities Services | 6.7 | |||
Financial Exchanges & Data | 15.1 | |||
Food Retail | 3.8 | |||
Health Care Equipment | 3.9 | |||
Home Entertainment Software | 3.0 | |||
Household Products | 1.3 | |||
Industrial Conglomerates | 3.7 | |||
Industrial Gases | 3.0 | |||
Internet Services & Infrastructure | 1.0 | |||
Life Sciences Tools & Services | 6.3 | |||
Multi-Sector Holdings | 1.0 | |||
Semiconductors | 3.8 | |||
Soft Drinks | 1.8 | |||
Systems Software | 12.7 | |||
Money Market Investments | 0.1 | |||
|
| |||
Total | 100.2 | % | ||
|
| |||
See accompanying Notes to Financial Statements.
45
Table of Contents
TCW New America Premier Equities Fund
Fair Valuation Summary | October 31, 2022 |
The following is a summary of the fair valuations according to the inputs used as of October 31, 2022 in valuing the Fund’s investments:
Description | Quoted Prices in Active Markets for Identical Assets (Level 1) | Other Significant Observable Inputs (Level 2) | Significant Unobservable Inputs (Level 3) | Total | ||||||||||||
Common Stock | ||||||||||||||||
Aerospace & Defense | $ | 10,519,718 | $ | — | $ | — | $ | 10,519,718 | ||||||||
Application Software | 23,276,198 | — | — | 23,276,198 | ||||||||||||
Data Processing & Outsourced Services | 9,394,921 | — | — | 9,394,921 | ||||||||||||
Electrical Equipment | 5,705,299 | — | — | 5,705,299 | ||||||||||||
Environmental & Facilities Services | 9,854,205 | — | — | 9,854,205 | ||||||||||||
Financial Exchanges & Data | 22,304,512 | — | — | 22,304,512 | ||||||||||||
Food Retail | 5,587,646 | — | — | 5,587,646 | ||||||||||||
Health Care Equipment | 5,848,559 | — | — | 5,848,559 | ||||||||||||
Home Entertainment Software | 4,427,041 | — | — | 4,427,041 | ||||||||||||
Household Products | 1,885,719 | — | — | 1,885,719 | ||||||||||||
Industrial Conglomerates | 5,454,517 | — | — | 5,454,517 | ||||||||||||
Industrial Gases | 4,407,024 | — | — | 4,407,024 | ||||||||||||
Internet Services & Infrastructure | 1,425,543 | — | — | 1,425,543 | ||||||||||||
Life Sciences Tools & Services | 9,273,810 | — | — | 9,273,810 | ||||||||||||
Multi-Sector Holdings | 1,518,828 | — | — | 1,518,828 | ||||||||||||
Semiconductors | 5,613,703 | — | — | 5,613,703 | ||||||||||||
Soft Drinks | 2,665,958 | — | — | 2,665,958 | ||||||||||||
Systems Software | 18,831,694 | — | — | 18,831,694 | ||||||||||||
|
|
|
|
|
|
|
| |||||||||
Total Common Stock | 147,994,895 | — | — | 147,994,895 | ||||||||||||
|
|
|
|
|
|
|
| |||||||||
Money Market Investments | 116,592 | — | — | 116,592 | ||||||||||||
|
|
|
|
|
|
|
| |||||||||
Total Investments | $ | 148,111,487 | $ | — | $ | — | $ | 148,111,487 | ||||||||
|
|
|
|
|
|
|
| |||||||||
See accompanying Notes to Financial Statements.
46
Table of Contents
TCW Relative Value Dividend Appreciation Fund
Schedule of Investments | October 31, 2022 |
| Issues | Shares | Value | ||||||
COMMON STOCK — 97.5% of Net Assets |
| |||||||
| Aerospace & Defense — 1.0% | ||||||||
Textron, Inc. | 36,518 | $ | 2,499,292 | |||||
|
| |||||||
| Air Freight & Logistics — 2.8% | ||||||||
United Parcel Service, Inc. — Class B | 41,809 | 7,014,296 | ||||||
|
| |||||||
| Auto Components — 1.5% | ||||||||
BorgWarner, Inc. | 98,032 | 3,679,141 | ||||||
|
| |||||||
| Banks — 6.8% | ||||||||
JPMorgan Chase & Co. | 66,260 | 8,340,809 | ||||||
Wells Fargo & Co. | 188,040 | 8,647,959 | ||||||
|
| |||||||
| 16,988,768 | ||||||||
|
| |||||||
| Beverages — 4.3% | ||||||||
Keurig Dr Pepper, Inc. | 84,376 | 3,277,164 | ||||||
PepsiCo, Inc. | 41,301 | 7,499,435 | ||||||
|
| |||||||
| 10,776,599 | ||||||||
|
| |||||||
| Biotechnology — 8.4% | ||||||||
AbbVie, Inc. | 50,247 | 7,356,161 | ||||||
Amgen, Inc. | 18,766 | 5,073,388 | ||||||
Gilead Sciences, Inc. | 108,599 | 8,520,677 | ||||||
|
| |||||||
| 20,950,226 | ||||||||
|
| |||||||
| Building Products — 4.2% | ||||||||
Carlisle Cos., Inc. | 11,426 | 2,728,529 | ||||||
Johnson Controls International PLC (Ireland) | 134,775 | 7,795,386 | ||||||
|
| |||||||
| 10,523,915 | ||||||||
|
| |||||||
| Capital Markets — 8.4% | ||||||||
Ameriprise Financial, Inc. | 25,183 | 7,784,569 | ||||||
Blackstone, Inc. | 26,478 | 2,413,205 | ||||||
Intercontinental Exchange, Inc. | 47,167 | 4,507,750 | ||||||
Morgan Stanley | 76,019 | 6,246,481 | ||||||
|
| |||||||
| 20,952,005 | ||||||||
|
| |||||||
| Chemicals — 2.8% | ||||||||
Corteva, Inc. | 45,344 | 2,962,777 | ||||||
DuPont de Nemours, Inc. | 71,148 | 4,069,666 | ||||||
|
| |||||||
| 7,032,443 | ||||||||
|
| |||||||
| Diversified Telecommunication Services — 1.3% | ||||||||
AT&T, Inc. | 176,579 | 3,219,035 | ||||||
|
| |||||||
| Electrical Equipment — 2.3% | ||||||||
nVent Electric PLC (Ireland) | 157,312 | 5,741,888 | ||||||
|
| |||||||
| Electronic Equipment, Instruments & Components — 1.2% | ||||||||
Corning, Inc. | 92,346 | 2,970,771 | ||||||
|
| |||||||
| Energy Equipment & Services — 2.7% | ||||||||
Baker Hughes Co. | 246,820 | 6,827,041 | ||||||
|
| |||||||
| Entertainment — 0.9% | ||||||||
Warner Bros Discovery, Inc. (1) | 173,943 | 2,261,259 | ||||||
|
| |||||||
| Issues | Shares | Value | ||||||
| Equity Real Estate — 1.8% | ||||||||
Simon Property Group, Inc. | 40,776 | $ | 4,443,769 | |||||
|
| |||||||
| Food Products — 0.9% | ||||||||
Conagra Brands, Inc. | 63,695 | 2,337,607 | ||||||
|
| |||||||
| Health Care Equipment & Supplies — 0.9% | ||||||||
Medtronic PLC (Ireland) | 26,580 | 2,321,497 | ||||||
|
| |||||||
| Health Care Providers & Services — 8.0% | ||||||||
Elevance Health, Inc. | 15,549 | 8,501,727 | ||||||
McKesson Corp. | 29,683 | 11,557,669 | ||||||
|
| |||||||
| 20,059,396 | ||||||||
|
| |||||||
| Hotels, Restaurants & Leisure — 1.7% | ||||||||
Darden Restaurants, Inc. | 28,892 | 4,135,601 | ||||||
|
| |||||||
| Household Durables — 2.5% | ||||||||
Lennar Corp. | 76,925 | 6,207,848 | ||||||
|
| |||||||
| Independent Power and Renewable Electricity Producers — 3.4% | ||||||||
AES Corp. (The) | 321,410 | 8,408,086 | ||||||
|
| |||||||
| Industrial Conglomerates — 2.7% | ||||||||
General Electric Co. | 85,850 | 6,679,989 | ||||||
|
| |||||||
| Insurance — 4.4% | ||||||||
MetLife, Inc. | 149,256 | 10,927,032 | ||||||
|
| |||||||
| IT Services — 3.4% | ||||||||
International Business Machines Corp. | 61,960 | 8,568,448 | ||||||
|
| |||||||
| Media — 3.1% | ||||||||
Comcast Corp. | 96,029 | 3,047,960 | ||||||
Fox Corp. | 161,327 | 4,657,511 | ||||||
|
| |||||||
| 7,705,471 | ||||||||
|
| |||||||
| Metals & Mining — 0.9% | ||||||||
Freeport-McMoRan, Inc. | 72,273 | 2,290,331 | ||||||
|
| |||||||
| Multiline Retail — 1.3% | ||||||||
Target Corp. | 19,441 | 3,193,184 | ||||||
|
| |||||||
| Oil, Gas & Consumable Fuels — 5.5% | ||||||||
Chevron Corp. | 31,049 | 5,616,764 | ||||||
Exxon Mobil Corp. | 73,118 | 8,102,206 | ||||||
|
| |||||||
| 13,718,970 | ||||||||
|
| |||||||
| Pharmaceuticals — 4.2% | ||||||||
Johnson & Johnson | 28,138 | 4,895,168 | ||||||
Novartis AG (SP ADR) (Switzerland) | 70,200 | 5,695,326 | ||||||
|
| |||||||
| 10,590,494 | ||||||||
|
| |||||||
| Semiconductors & Semiconductor Equipment — 2.7% | ||||||||
Broadcom, Inc. | 14,612 | 6,869,393 | ||||||
|
| |||||||
| Specialty Retail — 1.5% | ||||||||
Dick’s Sporting Goods, Inc. | 33,266 | 3,784,340 | ||||||
|
| |||||||
Total Common Stock |
| |||||||
(Cost: $167,584,357) |
| 243,678,135 | ||||||
|
| |||||||
See accompanying Notes to Financial Statements.
47
Table of Contents
TCW Relative Value Dividend Appreciation Fund
Schedule of Investments (Continued)
| Issues | Shares | Value | ||||||
MONEY MARKET INVESTMENTS — 2.4% |
| |||||||
State Street Institutional U.S. Government Money Market Fund — Premier Class, 3.01% (2) | 5,969,187 | $ | 5,969,187 | |||||
|
| |||||||
Total Money Market Investments |
| |||||||
(Cost: $5,969,187) |
| 5,969,187 | ||||||
|
| |||||||
Total Investments (99.9%) | ||||||||
(Cost: $173,553,544) |
| 249,647,322 | ||||||
Excess of Other Assets over Liabilities (0.1%) |
| 129,561 | ||||||
|
| |||||||
Net Assets (100.0%) |
| $ | 249,776,883 | |||||
|
| |||||||
Notes to the Schedule of Investments:
| SP ADR | Sponsored American Depositary Receipt. ADRs are receipts, typically issued by a U.S. bank or trust company, evidencing ownership of underlying securities issued by a foreign corporation. Sponsored ADRs are ADRs issued with the cooperation of the foreign corporation. |
| (1) | Non-income producing security. |
| (2) | Rate disclosed is the 7-day net yield as of October 31, 2022. |
See accompanying Notes to Financial Statements.
48
Table of Contents
TCW Relative Value Dividend Appreciation Fund
Investments by Sector | October 31, 2022 |
| Sector | Percentage of Net Assets | |||
Aerospace & Defense | 1.0 | % | ||
Air Freight & Logistics | 2.8 | |||
Auto Components | 1.5 | |||
Banks | 6.8 | |||
Beverages | 4.3 | |||
Biotechnology | 8.4 | |||
Building Products | 4.2 | |||
Capital Markets | 8.4 | |||
Chemicals | 2.8 | |||
Diversified Telecommunication Services | 1.3 | |||
Electrical Equipment | 2.3 | |||
Electronic Equipment, Instruments & Components | 1.2 | |||
Energy Equipment & Services | 2.7 | |||
Entertainment | 0.9 | |||
Equity Real Estate | 1.8 | |||
Food Products | 0.9 | |||
Health Care Equipment & Supplies | 0.9 | |||
Health Care Providers & Services | 8.0 | |||
Hotels, Restaurants & Leisure | 1.7 | |||
Household Durables | 2.5 | |||
Independent Power and Renewable Electricity Producers | 3.4 | |||
Industrial Conglomerates | 2.7 | |||
Insurance | 4.4 | |||
IT Services | 3.4 | |||
Media | 3.1 | |||
Metals & Mining | 0.9 | |||
Multiline Retail | 1.3 | |||
Oil, Gas & Consumable Fuels | 5.5 | |||
Pharmaceuticals | 4.2 | |||
Semiconductors & Semiconductor Equipment | 2.7 | |||
Specialty Retail | 1.5 | |||
Money Market Investments | 2.4 | |||
|
| |||
Total | 99.9 | % | ||
|
| |||
See accompanying Notes to Financial Statements.
49
Table of Contents
TCW Relative Value Dividend Appreciation Fund
Fair Valuation Summary | October 31, 2022 |
The following is a summary of the fair valuations according to the inputs used as of October 31, 2022 in valuing the Fund’s investments:
Description | Quoted Prices in Active Markets for Identical Assets (Level 1) | Other Significant Observable Inputs (Level 2) | Significant Unobservable Inputs (Level 3) | Total | ||||||||||||
Common Stock | ||||||||||||||||
Aerospace & Defense | $ | 2,499,292 | $ | — | $ | — | $ | 2,499,292 | ||||||||
Air Freight & Logistics | 7,014,296 | — | — | 7,014,296 | ||||||||||||
Auto Components | 3,679,141 | — | — | 3,679,141 | ||||||||||||
Banks | 16,988,768 | — | — | 16,988,768 | ||||||||||||
Beverages | 10,776,599 | — | — | 10,776,599 | ||||||||||||
Biotechnology | 20,950,226 | — | — | 20,950,226 | ||||||||||||
Building Products | 10,523,915 | — | — | 10,523,915 | ||||||||||||
Capital Markets | 20,952,005 | — | — | 20,952,005 | ||||||||||||
Chemicals | 7,032,443 | — | — | 7,032,443 | ||||||||||||
Diversified Telecommunication Services | 3,219,035 | — | — | 3,219,035 | ||||||||||||
Electrical Equipment | 5,741,888 | — | — | 5,741,888 | ||||||||||||
Electronic Equipment, Instruments & Components | 2,970,771 | — | — | 2,970,771 | ||||||||||||
Energy Equipment & Services | 6,827,041 | — | — | 6,827,041 | ||||||||||||
Entertainment | 2,261,259 | — | — | 2,261,259 | ||||||||||||
Equity Real Estate | 4,443,769 | — | — | 4,443,769 | ||||||||||||
Food Products | 2,337,607 | — | — | 2,337,607 | ||||||||||||
Health Care Equipment & Supplies | 2,321,497 | — | — | 2,321,497 | ||||||||||||
Health Care Providers & Services | 20,059,396 | — | — | 20,059,396 | ||||||||||||
Hotels, Restaurants & Leisure | 4,135,601 | — | — | 4,135,601 | ||||||||||||
Household Durables | 6,207,848 | — | — | 6,207,848 | ||||||||||||
Independent Power and Renewable Electricity Producers | 8,408,086 | — | — | 8,408,086 | ||||||||||||
Industrial Conglomerates | 6,679,989 | — | — | 6,679,989 | ||||||||||||
Insurance | 10,927,032 | — | — | 10,927,032 | ||||||||||||
IT Services | 8,568,448 | — | — | 8,568,448 | ||||||||||||
Media | 7,705,471 | — | — | 7,705,471 | ||||||||||||
Metals & Mining | 2,290,331 | — | — | 2,290,331 | ||||||||||||
Multiline Retail | 3,193,184 | — | — | 3,193,184 | ||||||||||||
Oil, Gas & Consumable Fuels | 13,718,970 | — | — | 13,718,970 | ||||||||||||
Pharmaceuticals | 10,590,494 | — | — | 10,590,494 | ||||||||||||
Semiconductors & Semiconductor Equipment | 6,869,393 | — | — | 6,869,393 | ||||||||||||
Specialty Retail | 3,784,340 | — | — | 3,784,340 | ||||||||||||
|
|
|
|
|
|
|
| |||||||||
Total Common Stock | 243,678,135 | — | — | 243,678,135 | ||||||||||||
|
|
|
|
|
|
|
| |||||||||
Money Market Investments | 5,969,187 | — | — | 5,969,187 | ||||||||||||
|
|
|
|
|
|
|
| |||||||||
Total Investments | $ | 249,647,322 | $ | — | $ | — | $ | 249,647,322 | ||||||||
|
|
|
|
|
|
|
| |||||||||
See accompanying Notes to Financial Statements.
50
Table of Contents
TCW Relative Value Large Cap Fund
Schedule of Investments | October 31, 2022 |
| Issues | Shares | Value | ||||||
COMMON STOCK — 99.4% of Net Assets |
| |||||||
| Aerospace & Defense — 2.6% | ||||||||
Textron, Inc. | 42,261 | $ | 2,892,343 | |||||
|
| |||||||
| Air Freight & Logistics — 2.6% | ||||||||
United Parcel Service, Inc. — Class B | 16,773 | 2,814,006 | ||||||
|
| |||||||
| Banks — 5.2% | ||||||||
Citigroup, Inc. | 18,995 | 871,110 | ||||||
JPMorgan Chase & Co. | 29,401 | 3,700,998 | ||||||
Signature Bank | 7,560 | 1,198,487 | ||||||
|
| |||||||
| 5,770,595 | ||||||||
|
| |||||||
| Beverages — 3.8% | ||||||||
Keurig Dr Pepper, Inc. | 39,071 | 1,517,518 | ||||||
PepsiCo, Inc. | 14,600 | 2,651,068 | ||||||
|
| |||||||
| 4,168,586 | ||||||||
|
| |||||||
| Biotechnology — 6.8% | ||||||||
AbbVie, Inc. | 19,774 | 2,894,914 | ||||||
Amgen, Inc. | 7,497 | 2,026,814 | ||||||
Gilead Sciences, Inc. | 32,444 | 2,545,556 | ||||||
|
| |||||||
| 7,467,284 | ||||||||
|
| |||||||
| Building Products — 3.1% | ||||||||
Johnson Controls International PLC (Ireland) | 59,082 | 3,417,303 | ||||||
|
| |||||||
| Capital Markets — 7.0% | ||||||||
Ameriprise Financial, Inc. | 10,100 | 3,122,112 | ||||||
Intercontinental Exchange, Inc. | 27,052 | 2,585,360 | ||||||
Morgan Stanley | 24,500 | 2,013,165 | ||||||
|
| |||||||
| 7,720,637 | ||||||||
|
| |||||||
| Chemicals — 1.4% | ||||||||
DuPont de Nemours, Inc. | 27,506 | 1,573,343 | ||||||
|
| |||||||
| Communications Equipment — 1.6% | ||||||||
Juniper Networks, Inc. | 58,810 | 1,799,586 | ||||||
|
| |||||||
| Diversified Financial Services — 1.3% | ||||||||
Apollo Global Management, Inc. | 25,479 | 1,410,517 | ||||||
|
| |||||||
| Diversified Telecommunication Services — 1.2% | ||||||||
AT&T, Inc. | 70,444 | 1,284,194 | ||||||
|
| |||||||
| Electronic Equipment, Instruments & Components — 3.2% | ||||||||
Corning, Inc. | 39,334 | 1,265,375 | ||||||
Flex Ltd. (1) | 113,447 | 2,221,292 | ||||||
|
| |||||||
| 3,486,667 | ||||||||
|
| |||||||
| Energy Equipment & Services — 2.2% | ||||||||
Baker Hughes Co. | 86,864 | 2,402,658 | ||||||
|
| |||||||
| Entertainment — 1.3% | ||||||||
Warner Bros Discovery, Inc. (1) | 110,924 | 1,442,012 | ||||||
|
| |||||||
| Issues | Shares | Value | ||||||
| Equity Real Estate — 1.8% | ||||||||
Simon Property Group, Inc. | 7,122 | $ | 776,156 | |||||
Weyerhaeuser Co. | 38,057 | 1,177,103 | ||||||
|
| |||||||
| 1,953,259 | ||||||||
|
| |||||||
| Food Products — 1.2% | ||||||||
Conagra Brands, Inc. | 35,961 | 1,319,769 | ||||||
|
| |||||||
| Health Care Equipment & Supplies — 0.9% | ||||||||
Medtronic PLC (Ireland) | 11,153 | 974,103 | ||||||
|
| |||||||
| Health Care Providers & Services — 12.4% | ||||||||
Centene Corp. (1) | 50,807 | 4,325,200 | ||||||
McKesson Corp. | 12,230 | 4,761,995 | ||||||
Molina Healthcare, Inc. (1) | 12,765 | 4,580,848 | ||||||
|
| |||||||
| 13,668,043 | ||||||||
|
| |||||||
| Hotels, Restaurants & Leisure — 2.6% | ||||||||
Darden Restaurants, Inc. | 19,790 | 2,832,741 | ||||||
|
| |||||||
| Household Durables — 3.0% | ||||||||
Lennar Corp. | 41,417 | 3,342,352 | ||||||
|
| |||||||
| Independent Power and Renewable Electricity Producers — 2.7% | ||||||||
AES Corp. (The) | 114,500 | 2,995,320 | ||||||
|
| |||||||
| Industrial Conglomerates — 2.2% | ||||||||
General Electric Co. | 31,641 | 2,461,986 | ||||||
|
| |||||||
| Insurance — 3.2% | ||||||||
MetLife, Inc. | 48,363 | 3,540,655 | ||||||
|
| |||||||
| Interactive Media & Services — 0.1% | ||||||||
Meta Platforms, Inc. (1) | 1,590 | 148,124 | ||||||
|
| |||||||
| IT Services — 5.8% | ||||||||
Fiserv, Inc. (1) | 28,268 | 2,904,254 | ||||||
International Business Machines Corp. | 24,752 | 3,422,954 | ||||||
|
| |||||||
| 6,327,208 | ||||||||
|
| |||||||
| Media — 4.2% | ||||||||
Comcast Corp. | 61,075 | 1,938,520 | ||||||
Fox Corp. | 58,302 | 1,683,179 | ||||||
Paramount Global — Class B | 53,524 | 980,560 | ||||||
|
| |||||||
| 4,602,259 | ||||||||
|
| |||||||
| Metals & Mining — 1.6% | ||||||||
Freeport-McMoRan, Inc. | 56,860 | 1,801,893 | ||||||
|
| |||||||
| Multiline Retail — 1.6% | ||||||||
Target Corp. | 10,629 | 1,745,813 | ||||||
|
| |||||||
| Oil, Gas & Consumable Fuels — 4.4% | ||||||||
Chevron Corp. | 6,955 | 1,258,160 | ||||||
Exxon Mobil Corp. | 32,630 | 3,615,730 | ||||||
|
| |||||||
| 4,873,890 | ||||||||
|
| |||||||
See accompanying Notes to Financial Statements.
51
Table of Contents
TCW Relative Value Large Cap Fund
Schedule of Investments (Continued)
| Issues | Shares | Value | ||||||
| Real Estate Management & Development — 1.4% | ||||||||
Jones Lang LaSalle, Inc. (1) | 9,517 | $ | 1,514,060 | |||||
|
| |||||||
| Semiconductors & Semiconductor Equipment — 5.3% | ||||||||
Broadcom, Inc. | 5,562 | 2,614,808 | ||||||
ON Semiconductor Corp. (1) | 52,159 | 3,204,127 | ||||||
|
| |||||||
| 5,818,935 | ||||||||
|
| |||||||
| Specialty Retail — 1.7% | ||||||||
Dick’s Sporting Goods, Inc. | 16,498 | 1,876,813 | ||||||
|
| |||||||
Total Common Stock |
| |||||||
(Cost: $67,324,228) |
| 109,446,954 | ||||||
|
| |||||||
MONEY MARKET INVESTMENTS — 0.4% |
| |||||||
State Street Institutional U.S. Government Money Market Fund — Premier Class, 3.01% (2) | 477,089 | 477,089 | ||||||
|
| |||||||
Total Money Market Investments |
| |||||||
(Cost: $477,089) |
| 477,089 | ||||||
|
| |||||||
Total Investments (99.8%) | ||||||||
(Cost: $67,801,317) |
| 109,924,043 | ||||||
Excess of Other Assets over Liabilities (0.2%) |
| 171,296 | ||||||
|
| |||||||
Net Assets (100.0%) |
| $ | 110,095,339 | |||||
|
| |||||||
Notes to the Schedule of Investments:
| (1) | Non-income producing security. |
| (2) | Rate disclosed is the 7-day net yield as of October 31, 2022. |
See accompanying Notes to Financial Statements.
52
Table of Contents
TCW Relative Value Large Cap Fund
Investments by Sector | October 31, 2022 |
| Sector | Percentage of Net Assets | |||
Aerospace & Defense | 2.6 | % | ||
Air Freight & Logistics | 2.6 | |||
Banks | 5.2 | |||
Beverages | 3.8 | |||
Biotechnology | 6.8 | |||
Building Products | 3.1 | |||
Capital Markets | 7.0 | |||
Chemicals | 1.4 | |||
Communications Equipment | 1.6 | |||
Diversified Financial Services | 1.3 | |||
Diversified Telecommunication Services | 1.2 | |||
Electronic Equipment, Instruments & Components | 3.2 | |||
Energy Equipment & Services | 2.2 | |||
Entertainment | 1.3 | |||
Equity Real Estate | 1.8 | |||
Food Products | 1.2 | |||
Health Care Equipment & Supplies | 0.9 | |||
Health Care Providers & Services | 12.4 | |||
Hotels, Restaurants & Leisure | 2.6 | |||
Household Durables | 3.0 | |||
Independent Power and Renewable Electricity Producers | 2.7 | |||
Industrial Conglomerates | 2.2 | |||
Insurance | 3.2 | |||
Interactive Media & Services | 0.1 | |||
IT Services | 5.8 | |||
Media | 4.2 | |||
Metals & Mining | 1.6 | |||
Multiline Retail | 1.6 | |||
Oil, Gas & Consumable Fuels | 4.4 | |||
Real Estate Management & Development | 1.4 | |||
Semiconductors & Semiconductor Equipment | 5.3 | |||
Specialty Retail | 1.7 | |||
Money Market Investments | 0.4 | |||
|
| |||
Total | 99.8 | % | ||
|
| |||
See accompanying Notes to Financial Statements.
53
Table of Contents
TCW Relative Value Large Cap Fund
Fair Valuation Summary | October 31, 2022 |
The following is a summary of the fair valuations according to the inputs used as of October 31, 2022 in valuing the Fund’s investments:
Description | Quoted Prices in Active Markets for Identical Assets (Level 1) | Other Significant Observable Inputs (Level 2) | Significant Unobservable Inputs (Level 3) | Total | ||||||||||||
Common Stock | ||||||||||||||||
Aerospace & Defense | $ | 2,892,343 | $ | — | $ | — | $ | 2,892,343 | ||||||||
Air Freight & Logistics | 2,814,006 | — | — | 2,814,006 | ||||||||||||
Banks | 5,770,595 | — | — | 5,770,595 | ||||||||||||
Beverages | 4,168,586 | — | — | 4,168,586 | ||||||||||||
Biotechnology | 7,467,284 | — | — | 7,467,284 | ||||||||||||
Building Products | 3,417,303 | — | — | 3,417,303 | ||||||||||||
Capital Markets | 7,720,637 | — | — | 7,720,637 | ||||||||||||
Chemicals | 1,573,343 | — | — | 1,573,343 | ||||||||||||
Communications Equipment | 1,799,586 | — | — | 1,799,586 | ||||||||||||
Diversified Financial Services | 1,410,517 | — | — | 1,410,517 | ||||||||||||
Diversified Telecommunication Services | 1,284,194 | — | — | 1,284,194 | ||||||||||||
Electronic Equipment, Instruments & Components | 3,486,667 | — | — | 3,486,667 | ||||||||||||
Energy Equipment & Services | 2,402,658 | — | — | 2,402,658 | ||||||||||||
Entertainment | 1,442,012 | — | — | 1,442,012 | ||||||||||||
Equity Real Estate | 1,953,259 | — | — | 1,953,259 | ||||||||||||
Food Products | 1,319,769 | — | — | 1,319,769 | ||||||||||||
Health Care Equipment & Supplies | 974,103 | — | — | 974,103 | ||||||||||||
Health Care Providers & Services | 13,668,043 | — | — | 13,668,043 | ||||||||||||
Hotels, Restaurants & Leisure | 2,832,741 | — | — | 2,832,741 | ||||||||||||
Household Durables | 3,342,352 | — | — | 3,342,352 | ||||||||||||
Independent Power and Renewable Electricity Producers | 2,995,320 | — | — | 2,995,320 | ||||||||||||
Industrial Conglomerates | 2,461,986 | — | — | 2,461,986 | ||||||||||||
Insurance | 3,540,655 | — | — | 3,540,655 | ||||||||||||
Interactive Media & Services | 148,124 | — | — | 148,124 | ||||||||||||
IT Services | 6,327,208 | — | — | 6,327,208 | ||||||||||||
Media | 4,602,259 | — | — | 4,602,259 | ||||||||||||
Metals & Mining | 1,801,893 | — | — | 1,801,893 | ||||||||||||
Multiline Retail | 1,745,813 | — | — | 1,745,813 | ||||||||||||
Oil, Gas & Consumable Fuels | 4,873,890 | — | — | 4,873,890 | ||||||||||||
Real Estate Management & Development | 1,514,060 | — | — | 1,514,060 | ||||||||||||
Semiconductors & Semiconductor Equipment | 5,818,935 | — | — | 5,818,935 | ||||||||||||
Specialty Retail | 1,876,813 | — | — | 1,876,813 | ||||||||||||
|
|
|
|
|
|
|
| |||||||||
Total Common Stock | 109,446,954 | — | — | 109,446,954 | ||||||||||||
|
|
|
|
|
|
|
| |||||||||
Money Market Investments | 477,089 | — | — | 477,089 | ||||||||||||
|
|
|
|
|
|
|
| |||||||||
Total Investments | $ | 109,924,043 | $ | — | $ | — | $ | 109,924,043 | ||||||||
|
|
|
|
|
|
|
| |||||||||
See accompanying Notes to Financial Statements.
54
Table of Contents
TCW Relative Value Mid Cap Fund
Schedule of Investments | October 31, 2022 |
| Issues | Shares | Value | ||||||
COMMON STOCK — 94.9% of Net Assets |
| |||||||
| Aerospace & Defense — 2.9% | ||||||||
Textron, Inc. | 32,088 | $ | 2,196,103 | |||||
|
| |||||||
| Air Freight & Logistics — 0.7% | ||||||||
FedEx Corp. | 3,238 | 518,987 | ||||||
|
| |||||||
| Airlines — 1.3% | ||||||||
United Airlines Holdings, Inc. (1) | 23,021 | 991,745 | ||||||
|
| |||||||
| Auto Components — 1.3% | ||||||||
BorgWarner, Inc. | 26,545 | 996,234 | ||||||
|
| |||||||
| Banks — 9.6% | ||||||||
First Citizens BancShares, Inc. | 1,447 | 1,189,607 | ||||||
KeyCorp | 133,523 | 2,386,056 | ||||||
Popular, Inc. | 42,897 | 3,033,676 | ||||||
Signature Bank | 4,417 | 700,227 | ||||||
|
| |||||||
| 7,309,566 | ||||||||
|
| |||||||
| Building Products — 0.3% | ||||||||
Carlisle Cos., Inc. | 945 | 225,666 | ||||||
|
| |||||||
| Capital Markets — 1.0% | ||||||||
Evercore, Inc. | 7,054 | 741,375 | ||||||
|
| |||||||
| Chemicals — 2.0% | ||||||||
Corteva, Inc. | 13,900 | 908,226 | ||||||
DuPont de Nemours, Inc. | 11,100 | 634,920 | ||||||
|
| |||||||
| 1,543,146 | ||||||||
|
| |||||||
| Communications Equipment — 2.2% | ||||||||
Juniper Networks, Inc. | 55,312 | 1,692,547 | ||||||
|
| |||||||
| Construction & Engineering — 1.8% | ||||||||
Arcosa, Inc. | 21,271 | 1,365,598 | ||||||
|
| |||||||
| Consumer Finance — 1.2% | ||||||||
OneMain Holdings, Inc. | 24,403 | 940,980 | ||||||
|
| |||||||
| Diversified Financial Services — 3.8% | ||||||||
Apollo Global Management, Inc. | 24,971 | 1,382,395 | ||||||
Equitable Holdings, Inc. | 48,344 | 1,480,293 | ||||||
|
| |||||||
| 2,862,688 | ||||||||
|
| |||||||
| Electronic Equipment, Instruments & Components — 5.8% | ||||||||
Avnet, Inc. | 31,854 | 1,280,212 | ||||||
Flex Ltd. (1) | 87,662 | 1,716,422 | ||||||
TTM Technologies, Inc. (1) | 93,155 | 1,426,203 | ||||||
|
| |||||||
| 4,422,837 | ||||||||
|
| |||||||
| Energy Equipment & Services — 2.9% | ||||||||
Baker Hughes Co. | 52,026 | 1,439,039 | ||||||
NOV, Inc. | 34,938 | 782,611 | ||||||
|
| |||||||
| 2,221,650 | ||||||||
|
| |||||||
| Entertainment — 1.2% | ||||||||
Warner Bros Discovery, Inc. (1) | 67,651 | 879,463 | ||||||
|
| |||||||
| Issues | Shares | Value | ||||||
| Equity Real Estate — 2.2% | ||||||||
Innovative Industrial Properties, Inc. | 5,426 | $ | 586,551 | |||||
SITE Centers Corp. | 84,971 | 1,051,941 | ||||||
|
| |||||||
| 1,638,492 | ||||||||
|
| |||||||
| Food & Staples Retailing — 0.8% | ||||||||
Sprouts Farmers Market, Inc. (1) | 19,248 | 567,816 | ||||||
|
| |||||||
| Food Products — 1.1% | ||||||||
Conagra Brands, Inc. | 21,684 | 795,803 | ||||||
|
| |||||||
| Health Care Equipment & Supplies — 0.6% | ||||||||
Envista Holdings Corp. (1) | 14,700 | 485,247 | ||||||
|
| |||||||
| Health Care Providers & Services — 12.6% | ||||||||
Acadia Healthcare Co., Inc. (1) | 27,848 | 2,264,042 | ||||||
AdaptHealth Corp. (1) | 23,000 | 524,400 | ||||||
Centene Corp. (1) | 34,298 | 2,919,789 | ||||||
Henry Schein, Inc. (1) | 13,995 | 958,098 | ||||||
Molina Healthcare, Inc. (1) | 8,000 | 2,870,880 | ||||||
|
| |||||||
| 9,537,209 | ||||||||
|
| |||||||
| Hotels, Restaurants & Leisure — 2.8% | ||||||||
Darden Restaurants, Inc. | 12,682 | 1,815,301 | ||||||
Travel + Leisure Co. | 8,307 | 315,500 | ||||||
|
| |||||||
| 2,130,801 | ||||||||
|
| |||||||
| Household Durables — 5.4% | ||||||||
DR Horton, Inc. | 15,882 | 1,221,008 | ||||||
Lennar Corp. | 19,177 | 1,547,584 | ||||||
Toll Brothers, Inc. | 29,968 | 1,291,021 | ||||||
|
| |||||||
| 4,059,613 | ||||||||
|
| |||||||
| Independent Power and Renewable Electricity Producers — 3.1% | ||||||||
AES Corp. (The) | 90,535 | 2,368,396 | ||||||
|
| |||||||
| Insurance — 3.8% | ||||||||
Arch Capital Group, Ltd. (1) | 35,349 | 2,032,567 | ||||||
Assured Guaranty, Ltd. | 14,408 | 852,810 | ||||||
|
| |||||||
| 2,885,377 | ||||||||
|
| |||||||
| Internet & Direct Marketing Retail — 0.6% | ||||||||
eBay, Inc. | 11,859 | 472,463 | ||||||
|
| |||||||
| IT Services — 1.0% | ||||||||
DXC Technology Co. (1) | 27,348 | 786,255 | ||||||
|
| |||||||
| Machinery — 3.6% | ||||||||
AGCO Corp. | 5,099 | 633,143 | ||||||
Manitowoc Co., Inc. (The) (1) | 24,450 | 222,984 | ||||||
Terex Corp. | 8,934 | 362,184 | ||||||
Westinghouse Air Brake Technologies Corp. | 16,395 | 1,529,326 | ||||||
|
| |||||||
| 2,747,637 | ||||||||
|
| |||||||
| Marine — 1.2% | ||||||||
Kirby Corp. (1) | 12,891 | 899,147 | ||||||
|
| |||||||
See accompanying Notes to Financial Statements.
55
Table of Contents
TCW Relative Value Mid Cap Fund
Schedule of Investments (Continued)
| Issues | Shares | Value | ||||||
| Media — 1.4% | ||||||||
Interpublic Group of Cos., Inc. (The) | 28,826 | $ | 858,727 | |||||
Paramount Global — Class B | 11,319 | 207,364 | ||||||
|
| |||||||
| 1,066,091 | ||||||||
|
| |||||||
| Metals & Mining — 1.6% | ||||||||
Freeport-McMoRan, Inc. | 38,299 | 1,213,695 | ||||||
|
| |||||||
| Multi-Utilities — 1.1% | ||||||||
Sempra Energy | 5,690 | 858,849 | ||||||
|
| |||||||
| Multiline Retail — 1.4% | ||||||||
Dollar Tree, Inc. (1) | 6,879 | 1,090,321 | ||||||
|
| |||||||
| Oil, Gas & Consumable Fuels — 2.7% | ||||||||
ConocoPhillips | 8,313 | 1,048,186 | ||||||
Marathon Petroleum Corp. | 8,829 | 1,003,151 | ||||||
|
| |||||||
| 2,051,337 | ||||||||
|
| |||||||
| Personal Products — 1.5% | ||||||||
Coty, Inc. (1) | 163,959 | 1,100,165 | ||||||
|
| |||||||
| Pharmaceuticals — 1.4% | ||||||||
Perrigo Co. PLC | 25,930 | 1,044,460 | ||||||
|
| |||||||
| Professional Services — 1.3% | ||||||||
Jacobs Solutions, Inc. | 8,768 | 1,010,249 | ||||||
|
| |||||||
| Real Estate Management & Development — 1.8% | ||||||||
Jones Lang LaSalle, Inc. (1) | 8,572 | 1,363,719 | ||||||
|
| |||||||
| Road & Rail — 0.8% | ||||||||
Hertz Global Holdings, Inc. (1) | 31,834 | 585,746 | ||||||
|
| |||||||
| Issues | Shares | Value | ||||||
| Semiconductors & Semiconductor Equipment — 0.6% | ||||||||
Analog Devices, Inc. | 3,040 | $ | 433,565 | |||||
|
| |||||||
| Specialty Retail — 2.5% | ||||||||
Dick’s Sporting Goods, Inc. | 8,351 | 950,010 | ||||||
Guess?, Inc. | 25,455 | 432,226 | ||||||
Williams-Sonoma, Inc. | 4,408 | 545,842 | ||||||
|
| |||||||
| 1,928,078 | ||||||||
|
| |||||||
Total Common Stock |
| |||||||
(Cost: $48,885,959) |
| 72,029,116 | ||||||
|
| |||||||
| MONEY MARKET INVESTMENTS — 6.3% | ||||||||
State Street Institutional U.S. Government Money Market Fund — Premier Class, 3.01% (2) | 4,773,681 | 4,773,681 | ||||||
|
| |||||||
Total Money Market Investments |
| |||||||
(Cost: $4,773,681) |
| 4,773,681 | ||||||
|
| |||||||
Total Investments (101.2%) | ||||||||
(Cost: $53,659,640) | 76,802,797 | |||||||
Liabilities in Excess of Other Assets (-1.2%) |
| (895,471 | ) | |||||
|
| |||||||
Net Assets (100.0%) |
| $ | 75,907,326 | |||||
|
| |||||||
Notes to the Schedule of Investments:
| (1) | Non-income producing security. |
| (2) | Rate disclosed is the 7-day net yield as of October 31, 2022. |
See accompanying Notes to Financial Statements.
56
Table of Contents
TCW Relative Value Mid Cap Fund
Investments by Sector | October 31, 2022 |
| Sector | Percentage of Net Assets | |||
Aerospace & Defense | 2.9 | % | ||
Air Freight & Logistics | 0.7 | |||
Airlines | 1.3 | |||
Auto Components | 1.3 | |||
Banks | 9.6 | |||
Building Products | 0.3 | |||
Capital Markets | 1.0 | |||
Chemicals | 2.0 | |||
Communications Equipment | 2.2 | |||
Construction & Engineering | 1.8 | |||
Consumer Finance | 1.2 | |||
Diversified Financial Services | 3.8 | |||
Electronic Equipment, Instruments & Components | 5.8 | |||
Energy Equipment & Services | 2.9 | |||
Entertainment | 1.2 | |||
Equity Real Estate | 2.2 | |||
Food & Staples Retailing | 0.8 | |||
Food Products | 1.1 | |||
Health Care Equipment & Supplies | 0.6 | |||
Health Care Providers & Services | 12.6 | |||
Hotels, Restaurants & Leisure | 2.8 | |||
Household Durables | 5.4 | |||
Independent Power and Renewable Electricity Producers | 3.1 | |||
Insurance | 3.8 | |||
Internet & Direct Marketing Retail | 0.6 | |||
IT Services | 1.0 | |||
Machinery | 3.6 | |||
Marine | 1.2 | |||
Media | 1.4 | |||
Metals & Mining | 1.6 | |||
Multi-Utilities | 1.1 | |||
Multiline Retail | 1.4 | |||
Oil, Gas & Consumable Fuels | 2.7 | |||
Personal Products | 1.5 | |||
Pharmaceuticals | 1.4 | |||
Professional Services | 1.3 | |||
Real Estate Management & Development | 1.8 | |||
Road & Rail | 0.8 | |||
Semiconductors & Semiconductor Equipment | 0.6 | |||
Specialty Retail | 2.5 | |||
Money Market Investments | 6.3 | |||
|
| |||
Total | 101.2 | % | ||
|
| |||
See accompanying Notes to Financial Statements.
57
Table of Contents
TCW Relative Value Mid Cap Fund
Fair Valuation Summary | October 31, 2022 |
The following is a summary of the fair valuations according to the inputs used as of October 31, 2022 in valuing the Fund’s investments:
Description | Quoted Prices in Active Markets for Identical Assets (Level 1) | Other Significant Observable Inputs (Level 2) | Significant Unobservable Inputs (Level 3) | Total | ||||||||||||
Common Stock | ||||||||||||||||
Aerospace & Defense | $ | 2,196,103 | $ | — | $ | — | $ | 2,196,103 | ||||||||
Air Freight & Logistics | 518,987 | — | — | 518,987 | ||||||||||||
Airlines | 991,745 | — | — | 991,745 | ||||||||||||
Auto Components | 996,234 | — | — | 996,234 | ||||||||||||
Banks | 7,309,566 | — | — | 7,309,566 | ||||||||||||
Building Products | 225,666 | — | — | 225,666 | ||||||||||||
Capital Markets | 741,375 | — | — | 741,375 | ||||||||||||
Chemicals | 1,543,146 | — | — | 1,543,146 | ||||||||||||
Communications Equipment | 1,692,547 | — | — | 1,692,547 | ||||||||||||
Construction & Engineering | 1,365,598 | — | — | 1,365,598 | ||||||||||||
Consumer Finance | 940,980 | — | — | 940,980 | ||||||||||||
Diversified Financial Services | 2,862,688 | — | — | 2,862,688 | ||||||||||||
Electronic Equipment, Instruments & Components | 4,422,837 | — | — | 4,422,837 | ||||||||||||
Energy Equipment & Services | 2,221,650 | — | — | 2,221,650 | ||||||||||||
Entertainment | 879,463 | — | — | 879,463 | ||||||||||||
Equity Real Estate | 1,638,492 | — | — | 1,638,492 | ||||||||||||
Food & Staples Retailing | 567,816 | — | — | 567,816 | ||||||||||||
Food Products | 795,803 | — | — | 795,803 | ||||||||||||
Health Care Equipment & Supplies | 485,247 | — | — | 485,247 | ||||||||||||
Health Care Providers & Services | 9,537,209 | — | — | 9,537,209 | ||||||||||||
Hotels, Restaurants & Leisure | 2,130,801 | — | — | 2,130,801 | ||||||||||||
Household Durables | 4,059,613 | — | — | 4,059,613 | ||||||||||||
Independent Power and Renewable Electricity Producers | 2,368,396 | — | — | 2,368,396 | ||||||||||||
Insurance | 2,885,377 | — | — | 2,885,377 | ||||||||||||
Internet & Direct Marketing Retail | 472,463 | — | — | 472,463 | ||||||||||||
IT Services | 786,255 | — | — | 786,255 | ||||||||||||
Machinery | 2,747,637 | — | — | 2,747,637 | ||||||||||||
Marine | 899,147 | — | — | 899,147 | ||||||||||||
Media | 1,066,091 | — | — | 1,066,091 | ||||||||||||
Metals & Mining | 1,213,695 | — | — | 1,213,695 | ||||||||||||
Multi-Utilities | 858,849 | — | — | 858,849 | ||||||||||||
Multiline Retail | 1,090,321 | — | — | 1,090,321 | ||||||||||||
Oil, Gas & Consumable Fuels | 2,051,337 | — | — | 2,051,337 | ||||||||||||
Personal Products | 1,100,165 | — | — | 1,100,165 | ||||||||||||
Pharmaceuticals | 1,044,460 | — | — | 1,044,460 | ||||||||||||
Professional Services | 1,010,249 | — | — | 1,010,249 | ||||||||||||
Real Estate Management & Development | 1,363,719 | — | — | 1,363,719 | ||||||||||||
Road & Rail | 585,746 | — | — | 585,746 | ||||||||||||
Semiconductors & Semiconductor Equipment | 433,565 | — | — | 433,565 | ||||||||||||
Specialty Retail | 1,928,078 | — | — | 1,928,078 | ||||||||||||
|
|
|
|
|
|
|
| |||||||||
Total Common Stock | 72,029,116 | — | — | 72,029,116 | ||||||||||||
|
|
|
|
|
|
|
| |||||||||
Money Market Investments | 4,773,681 | — | — | 4,773,681 | ||||||||||||
|
|
|
|
|
|
|
| |||||||||
Total Investments | $ | 76,802,797 | $ | — | $ | — | $ | 76,802,797 | ||||||||
|
|
|
|
|
|
|
| |||||||||
See accompanying Notes to Financial Statements.
58
Table of Contents
Schedule of Investments | October 31, 2022 |
| Issues | Shares | Value | ||||||
COMMON STOCK — 97.4% of Net Assets |
| |||||||
Capital Markets — 7.5% |
| |||||||
Charles Schwab Corp. (The) | 229,168 | $ | 18,257,815 | |||||
S&P Global, Inc. | 75,586 | 24,282,002 | ||||||
|
| |||||||
| 42,539,817 | ||||||||
|
| |||||||
| Commercial Services & Supplies — 2.4% | ||||||||
Waste Connections, Inc. (Canada) | 103,432 | 13,643,715 | ||||||
|
| |||||||
| Equity Real Estate — 4.2% | ||||||||
American Tower Corp. | 115,907 | 24,014,771 | ||||||
|
| |||||||
| Food & Staples Retailing — 3.7% | ||||||||
Costco Wholesale Corp. | 41,737 | 20,931,105 | ||||||
|
| |||||||
| Health Care Equipment & Supplies — 7.0% | ||||||||
Align Technology, Inc. (1) | 41,973 | 8,155,354 | ||||||
Boston Scientific Corp. (1) | 323,179 | 13,932,246 | ||||||
DexCom, Inc. (1) | 145,528 | 17,576,872 | ||||||
|
| |||||||
| 39,664,472 | ||||||||
|
| |||||||
| Interactive Media & Services — 6.4% | ||||||||
Alphabet, Inc. — Class C (1) | 380,624 | 36,029,868 | ||||||
|
| |||||||
| Internet & Direct Marketing Retail — 5.6% | ||||||||
Amazon.com, Inc. (1) | 312,040 | 31,965,378 | ||||||
|
| |||||||
| IT Services — 13.5% | ||||||||
Mastercard, Inc. | 63,855 | 20,955,934 | ||||||
PayPal Holdings, Inc. (1) | 124,560 | 10,410,725 | ||||||
Snowflake, Inc. (1) | 46,329 | 7,426,538 | ||||||
Twilio, Inc. (1) | 93,116 | 6,925,037 | ||||||
Visa, Inc. | 149,369 | 30,943,282 | ||||||
|
| |||||||
| 76,661,516 | ||||||||
|
| |||||||
| Life Sciences Tools & Services — 3.4% | ||||||||
IQVIA Holdings, Inc. (1) | 91,407 | 19,165,306 | ||||||
|
| |||||||
| Pharmaceuticals — 3.2% | ||||||||
Zoetis, Inc. | 122,039 | 18,401,040 | ||||||
|
| |||||||
| Professional Services — 1.8% | ||||||||
TransUnion | 174,080 | 10,317,722 | ||||||
|
| |||||||
| Issues | Shares | Value | ||||||
| Semiconductors & Semiconductor Equipment — 9.4% | ||||||||
ASML Holding NV (Netherlands) | 29,773 | $ | 14,065,361 | |||||
Enphase Energy, Inc. (1) | 50,736 | 15,575,952 | ||||||
NVIDIA Corp. | 175,401 | 23,673,873 | ||||||
|
| |||||||
| 53,315,186 | ||||||||
|
| |||||||
| Software — 21.9% | ||||||||
Adobe, Inc. (1) | 57,142 | 18,199,727 | ||||||
Crowdstrike Holdings, Inc. (1) | 74,656 | 12,034,547 | ||||||
Microsoft Corp. | 119,801 | 27,809,406 | ||||||
Salesforce, Inc. (1) | 129,653 | 21,080,282 | ||||||
ServiceNow, Inc. (1) | 77,403 | 32,566,538 | ||||||
Trade Desk, Inc. (The) (1) | 240,699 | 12,814,815 | ||||||
|
| |||||||
| 124,505,315 | ||||||||
|
| |||||||
| Specialty Retail — 5.3% | ||||||||
Home Depot, Inc. (The) | 57,219 | 16,944,263 | ||||||
Ulta Beauty, Inc. (1) | 31,709 | 13,297,803 | ||||||
|
| |||||||
| 30,242,066 | ||||||||
|
| |||||||
| Textiles, Apparel & Luxury Goods — 2.1% | ||||||||
NIKE, Inc. — Class B | 126,524 | 11,726,244 | ||||||
|
| |||||||
| Total Common Stock | ||||||||
(Cost: $255,402,043) |
| 553,123,521 | ||||||
|
| |||||||
| MONEY MARKET INVESTMENTS — 2.7% | ||||||||
State Street Institutional U.S. Government Money Market Fund — Premier Class, 3.01% (2) | 15,139,852 | 15,139,852 | ||||||
|
| |||||||
Total Money Market Investments |
| |||||||
(Cost: $15,139,852) |
| 15,139,852 | ||||||
|
| |||||||
Total Investments (100.1%) | ||||||||
(Cost: $270,541,895) |
| 568,263,373 | ||||||
Liabilities in Excess of Other Assets (-0.1%) |
| (736,925 | ) | |||||
|
| |||||||
| Net Assets (100.0%) | $567,526,448 | |||||||
|
| |||||||
Notes to the Schedule of Investments:
| (1) | Non-income producing security. |
| (2) | Rate disclosed is the 7-day net yield as of October 31, 2022. |
See accompanying Notes to Financial Statements.
59
Table of Contents
TCW Select Equities Fund
Investments by Sector | October 31, 2022 |
| Sector | Percentage of Net Assets | |||
Capital Markets | 7.5 | % | ||
Commercial Services & Supplies | 2.4 | |||
Equity Real Estate | 4.2 | |||
Food & Staples Retailing | 3.7 | |||
Health Care Equipment & Supplies | 7.0 | |||
Interactive Media & Services | 6.4 | |||
Internet & Direct Marketing Retail | 5.6 | |||
IT Services | 13.5 | |||
Life Sciences Tools & Services | 3.4 | |||
Pharmaceuticals | 3.2 | |||
Professional Services | 1.8 | |||
Semiconductors & Semiconductor Equipment | 9.4 | |||
Software | 21.9 | |||
Specialty Retail | 5.3 | |||
Textiles, Apparel & Luxury Goods | 2.1 | |||
Money Market Investments | 2.7 | |||
|
| |||
Total | 100.1 | % | ||
|
| |||
See accompanying Notes to Financial Statements.
60
Table of Contents
TCW Select Equities Fund
Fair Valuation Summary | October 31, 2022 |
The following is a summary of the fair valuations according to the inputs used as of October 31, 2022 in valuing the Fund’s investments:
Description | Quoted Prices in Active Markets for Identical Assets (Level 1) | Other Significant Observable Inputs (Level 2) | Significant Unobservable Inputs (Level 3) | Total | ||||||||||||
Common Stock | ||||||||||||||||
Capital Markets | $ | 42,539,817 | $ | — | $ | — | $ | 42,539,817 | ||||||||
Commercial Services & Supplies | 13,643,715 | — | — | 13,643,715 | ||||||||||||
Equity Real Estate | 24,014,771 | — | — | 24,014,771 | ||||||||||||
Food & Staples Retailing | 20,931,105 | — | — | 20,931,105 | ||||||||||||
Health Care Equipment & Supplies | 39,664,472 | — | — | 39,664,472 | ||||||||||||
Interactive Media & Services | 36,029,868 | — | — | 36,029,868 | ||||||||||||
Internet & Direct Marketing Retail | 31,965,378 | — | — | 31,965,378 | ||||||||||||
IT Services | 76,661,516 | — | — | 76,661,516 | ||||||||||||
Life Sciences Tools & Services | 19,165,306 | — | — | 19,165,306 | ||||||||||||
Pharmaceuticals | 18,401,040 | — | — | 18,401,040 | ||||||||||||
Professional Services | 10,317,722 | — | — | 10,317,722 | ||||||||||||
Semiconductors & Semiconductor Equipment | 53,315,186 | — | — | 53,315,186 | ||||||||||||
Software | 124,505,315 | — | — | 124,505,315 | ||||||||||||
Specialty Retail | 30,242,066 | — | — | 30,242,066 | ||||||||||||
Textiles, Apparel & Luxury Goods | 11,726,244 | — | — | 11,726,244 | ||||||||||||
|
|
|
|
|
|
|
| |||||||||
Total Common Stock | 553,123,521 | — | — | 553,123,521 | ||||||||||||
|
|
|
|
|
|
|
| |||||||||
Money Market Investments | 15,139,852 | — | — | 15,139,852 | ||||||||||||
|
|
|
|
|
|
|
| |||||||||
Total Investments | $ | 568,263,373 | $ | — | $ | — | $ | 568,263,373 | ||||||||
|
|
|
|
|
|
|
| |||||||||
See accompanying Notes to Financial Statements.
61
Table of Contents
TCW Funds, Inc.
Statements of Assets and Liabilities | October 31, 2022 |
| TCW Artificial Intelligence Equity Fund | TCW Conservative Allocation Fund | TCW Global Real Estate Fund | TCW New America Premier Equities Fund | |||||||||||||
ASSETS |
| |||||||||||||||
Investments, at Value (1) | $ | 11,018,770 | $ | 1,173,711 | $ | 29,488,721 | $ | 148,111,487 | ||||||||
Investment in Affiliated Issuers, at Value | — | 26,816,863 | (2) | — | — | |||||||||||
Foreign Currency, at Value (3) | — | — | 8,532 | 2,382 | ||||||||||||
Receivable for Securities Sold | — | — | — | 1,889,203 | ||||||||||||
Receivable for Fund Shares Sold | 1,084 | — | 239 | 8,608 | ||||||||||||
Interest and Dividends Receivable | 5,297 | 13,449 | 29,330 | 721 | ||||||||||||
Foreign Tax Reclaims Receivable | — | — | 7,350 | — | ||||||||||||
Receivable from Investment Advisor | 10,172 | 1,535 | 22,428 | 2,188 | ||||||||||||
Cash Collateral Held for Brokers | — | — | — | 3 | ||||||||||||
Prepaid Expenses | 9,503 | 25,575 | 28,157 | 15,734 | ||||||||||||
|
|
|
|
|
|
|
| |||||||||
Total Assets | 11,044,826 | 28,031,133 | 29,584,757 | 150,030,326 | ||||||||||||
|
|
|
|
|
|
|
| |||||||||
LIABILITIES |
| |||||||||||||||
Payable for Securities Purchased | — | — | — | 1,839,141 | ||||||||||||
Payable for Fund Shares Redeemed | 5,000 | — | 80,954 | 117,907 | ||||||||||||
Accrued Directors’ Fees and Expenses | 11,634 | 11,634 | 11,634 | 11,634 | ||||||||||||
Deferred Accrued Directors’ Fees and Expenses | 1,586 | 1,587 | 1,587 | 1,587 | ||||||||||||
Accrued Management Fees | 6,474 | — | 20,067 | 78,319 | ||||||||||||
Accrued Distribution Fees | 668 | 80 | 2,400 | 4,048 | ||||||||||||
Options Written, at Value (4) | — | — | 54,000 | — | ||||||||||||
Transfer Agent Fees Payable | 5,022 | 4,732 | 14,444 | 35,219 | ||||||||||||
Administration Fee Payable | 8,162 | 8,626 | 9,751 | 17,665 | ||||||||||||
Audit Fees Payable | 16,377 | 13,613 | 18,014 | 20,298 | ||||||||||||
Accounting Fees Payable | 1,518 | 2,286 | 2,848 | 8,346 | ||||||||||||
Custodian Fees Payable | 4,580 | 4,229 | 9,008 | 5,583 | ||||||||||||
Legal Fees Payable | 256 | 368 | 428 | 1,308 | ||||||||||||
Other Accrued Expenses | 9,414 | 13,082 | 10,724 | 22,372 | ||||||||||||
|
|
|
|
|
|
|
| |||||||||
Total Liabilities | 70,691 | 60,237 | 235,859 | 2,163,427 | ||||||||||||
|
|
|
|
|
|
|
| |||||||||
NET ASSETS | $ | 10,974,135 | $ | 27,970,896 | $ | 29,348,898 | $ | 147,866,899 | ||||||||
|
|
|
|
|
|
|
| |||||||||
NET ASSETS CONSIST OF: |
| |||||||||||||||
Paid-in Capital | $ | 11,947,726 | $ | 28,240,459 | $ | 40,604,403 | $ | 117,833,510 | ||||||||
Accumulated Earnings (Loss) | (973,591 | ) | (269,563 | ) | (11,255,505 | ) | 30,033,389 | |||||||||
|
|
|
|
|
|
|
| |||||||||
NET ASSETS | $ | 10,974,135 | $ | 27,970,896 | $ | 29,348,898 | $ | 147,866,899 | ||||||||
|
|
|
|
|
|
|
| |||||||||
NET ASSETS ATTRIBUTABLE TO: |
| |||||||||||||||
I Class Share | $ | 7,780,172 | $ | 27,623,520 | $ | 17,740,812 | $ | 128,086,153 | ||||||||
|
|
|
|
|
|
|
| |||||||||
N Class Share | $ | 3,193,963 | $ | 347,376 | $ | 11,608,086 | $ | 19,780,746 | ||||||||
|
|
|
|
|
|
|
| |||||||||
CAPITAL SHARES OUTSTANDING: (5) |
| |||||||||||||||
I Class Share | 522,736 | 2,614,487 | 1,720,717 | 5,807,110 | ||||||||||||
|
|
|
|
|
|
|
| |||||||||
N Class Share | 215,495 | 32,851 | 1,127,247 | 904,392 | ||||||||||||
|
|
|
|
|
|
|
| |||||||||
NET ASSET VALUE PER SHARE: (6) |
| |||||||||||||||
I Class Share | $ | 14.88 | $ | 10.57 | $ | 10.31 | $ | 22.06 | ||||||||
|
|
|
|
|
|
|
| |||||||||
N Class Share | $ | 14.82 | $ | 10.57 | $ | 10.30 | $ | 21.87 | ||||||||
|
|
|
|
|
|
|
| |||||||||
| (1) | The identified cost for the TCW Artificial Intelligence Equity Fund, the TCW Conservative Allocation Fund, the TCW Global Real Estate Fund and the TCW New America Premier Equities Fund at October 31, 2022 was $10,328,032, $1,284,419, $32,929,100 and $111,701,254, respectively. |
| (2) | The identified cost for investments in affiliated issuers of the TCW Conservative Allocation Fund was $27,876,612. |
| (3) | The identified cost for the TCW Global Real Estate Fund and the TCW New America Premier Equities Fund at October 31, 2022 was $8,532 and $2,430, respectively. |
| (4) | Premium received $49,981. |
| (5) | The number of authorized shares, with a par value of $0.001 per share, is 4,000,000,000 for each of the I Class and N Class shares. |
| (6) | Represents offering price and redemption price per share. |
See accompanying Notes to Financial Statements.
62
Table of Contents
TCW Funds, Inc.
Statements of Assets and Liabilities | October 31, 2022 |
| TCW Relative Value Dividend Appreciation Fund | TCW Relative Value Large Cap Fund | TCW Relative Value Mid Cap Fund | TCW Select Equities Fund | |||||||||||||
ASSETS |
| |||||||||||||||
Investments, at Value (1) | $ | 249,647,322 | $ | 109,924,043 | $ | 76,802,797 | $ | 568,263,373 | ||||||||
Receivable for Securities Sold | 3,139,362 | 191,676 | 566,091 | — | ||||||||||||
Receivable for Fund Shares Sold | 55,213 | 125,801 | 440 | 152,700 | ||||||||||||
Interest and Dividends Receivable | 317,436 | 120,324 | 51,793 | 132,400 | ||||||||||||
Foreign Tax Reclaims Receivable | 150,770 | — | — | — | ||||||||||||
Receivable from Investment Advisor | 24,894 | 14,973 | 14,368 | 7,104 | ||||||||||||
Prepaid Expenses | 32,220 | 27,493 | 24,435 | 25,399 | ||||||||||||
|
|
|
|
|
|
|
| |||||||||
Total Assets | 253,367,217 | 110,404,310 | 77,459,924 | 568,580,976 | ||||||||||||
|
|
|
|
|
|
|
| |||||||||
LIABILITIES |
| |||||||||||||||
Payable for Securities Purchased | 3,058,424 | 129,417 | 1,414,185 | — | ||||||||||||
Payable for Fund Shares Redeemed | 212,106 | 14,394 | 25 | 359,476 | ||||||||||||
Accrued Directors’ Fees and Expenses | 11,634 | 11,634 | 11,634 | 11,634 | ||||||||||||
Deferred Accrued Directors’ Fees and Expenses | 1,587 | 1,587 | 1,587 | 1,587 | ||||||||||||
Accrued Management Fees | 118,902 | 52,828 | 42,667 | 302,419 | ||||||||||||
Accrued Distribution Fees | 35,598 | 1,792 | 2,656 | 21,595 | ||||||||||||
Transfer Agent Fees Payable | 65,788 | 31,934 | 22,113 | 197,353 | ||||||||||||
Administration Fee Payable | 22,200 | 13,897 | 11,930 | 49,903 | ||||||||||||
Audit Fees Payable | 20,327 | 20,020 | 20,275 | 21,745 | ||||||||||||
Accounting Fees Payable | 12,193 | 5,988 | 4,414 | 31,702 | ||||||||||||
Custodian Fees Payable | 5,545 | 5,574 | 5,864 | 6,700 | ||||||||||||
Legal Fees Payable | 1,803 | 906 | 677 | 4,893 | ||||||||||||
Other Accrued Expenses | 24,227 | 19,000 | 14,571 | 45,521 | ||||||||||||
|
|
|
|
|
|
|
| |||||||||
Total Liabilities | 3,590,334 | 308,971 | 1,552,598 | 1,054,528 | ||||||||||||
|
|
|
|
|
|
|
| |||||||||
NET ASSETS | $ | 249,776,883 | $ | 110,095,339 | $ | 75,907,326 | $ | 567,526,448 | ||||||||
|
|
|
|
|
|
|
| |||||||||
NET ASSETS CONSIST OF: |
| |||||||||||||||
Paid-in Capital | $ | 166,365,009 | $ | 61,794,938 | $ | 52,038,961 | $ | 181,406,478 | ||||||||
Accumulated Earnings (Loss) | 83,411,874 | 48,300,401 | 23,868,365 | 386,119,970 | ||||||||||||
|
|
|
|
|
|
|
| |||||||||
NET ASSETS | $ | 249,776,883 | $ | 110,095,339 | $ | 75,907,326 | $ | 567,526,448 | ||||||||
|
|
|
|
|
|
|
| |||||||||
NET ASSETS ATTRIBUTABLE TO: |
| |||||||||||||||
I Class Share | $ | 70,447,750 | $ | 101,088,000 | $ | 62,726,097 | $ | 462,670,459 | ||||||||
|
|
|
|
|
|
|
| |||||||||
N Class Share | $ | 179,329,133 | $ | 9,007,339 | $ | 13,181,229 | $ | 104,855,989 | ||||||||
|
|
|
|
|
|
|
| |||||||||
CAPITAL SHARES OUTSTANDING: (2) |
| |||||||||||||||
I Class Share | 3,649,310 | 7,717,359 | 2,661,215 | 17,937,678 | ||||||||||||
|
|
|
|
|
|
|
| |||||||||
N Class Share | 9,094,156 | 690,722 | 578,356 | 4,789,066 | ||||||||||||
|
|
|
|
|
|
|
| |||||||||
NET ASSET VALUE PER SHARE: (3) |
| |||||||||||||||
I Class Share | $ | 19.30 | $ | 13.10 | $ | 23.57 | $ | 25.79 | ||||||||
|
|
|
|
|
|
|
| |||||||||
N Class Share | $ | 19.72 | $ | 13.04 | $ | 22.79 | $ | 21.89 | ||||||||
|
|
|
|
|
|
|
| |||||||||
| (1) | The identified cost for the TCW Relative Value Dividend Appreciation Fund, the TCW Relative Value Large Cap Fund, the TCW Relative Value Mid Cap Fund and the TCW Select Equities Fund at October 31, 2022 was $173,553,544, $67,801,317, $53,659,640 and $270,541,895, respectively. |
| (2) | The number of authorized shares, with a par value of $0.001 per share, is 4,000,000,000 for each of the I Class and N Class shares. |
| (3) | Represents offering price and redemption price per share. |
See accompanying Notes to Financial Statements.
63
Table of Contents
TCW Funds, Inc.
Statements of Operations | Year Ended October 31, 2022 |
| TCW Artificial Intelligence Equity Fund | TCW Conservative Allocation Fund | TCW Global Real Estate Fund | TCW New America Premier Equities Fund | |||||||||||||
INVESTMENT INCOME |
| |||||||||||||||
Income: |
| |||||||||||||||
Dividends | $ | 73,551 | (1) | $ | 30,213 | $ | 1,255,920 | (1) | $ | 1,062,671 | (1) | |||||
Non-Cash Dividend Income | — | — | — | 60,772 | ||||||||||||
Dividends from Investment in Affiliated Issuers | — | 724,998 | — | — | ||||||||||||
|
|
|
|
|
|
|
| |||||||||
Total | 73,551 | 755,211 | 1,255,920 | 1,123,443 | ||||||||||||
|
|
|
|
|
|
|
| |||||||||
Expenses: |
| |||||||||||||||
Management Fees | 98,619 | — | 335,405 | 1,175,142 | ||||||||||||
Accounting Services Fees | 3,020 | 3,979 | 5,588 | 15,636 | ||||||||||||
Administration Fees | 14,632 | 14,999 | 17,885 | 32,407 | ||||||||||||
Transfer Agent Fees: |
| |||||||||||||||
I Class | 11,701 | 10,088 | 34,370 | 93,769 | ||||||||||||
N Class | 8,538 | 6,899 | 19,597 | 35,370 | ||||||||||||
Custodian Fees | 7,988 | 6,208 | 14,416 | 9,087 | ||||||||||||
Professional Fees | 25,762 | 21,900 | 30,081 | 35,169 | ||||||||||||
Directors’ Fees and Expenses | 46,666 | 46,667 | 46,667 | 46,667 | ||||||||||||
Registration Fees: |
| |||||||||||||||
I Class | 15,669 | 17,579 | 21,331 | 19,310 | ||||||||||||
N Class | 19,201 | 17,595 | 20,128 | 18,225 | ||||||||||||
Distribution Fees: |
| |||||||||||||||
N Class | 10,289 | 1,713 | 37,543 | 60,184 | ||||||||||||
Shareholder Reporting Expense | 1,746 | 1,416 | 1,777 | 4,359 | ||||||||||||
Other | 13,420 | 7,297 | 17,467 | 15,358 | ||||||||||||
|
|
|
|
|
|
|
| |||||||||
Total | 277,251 | 156,340 | 602,255 | 1,560,683 | ||||||||||||
|
|
|
|
|
|
|
| |||||||||
Less Expenses Borne by Investment Advisor: |
| |||||||||||||||
I Class | 87,576 | 21 | 113,843 | — | ||||||||||||
N Class | 58,767 | 24,023 | 96,082 | 36,539 | ||||||||||||
|
|
|
|
|
|
|
| |||||||||
Net Expenses | 130,908 | 132,296 | 392,330 | 1,524,144 | ||||||||||||
|
|
|
|
|
|
|
| |||||||||
Net Investment Income (Loss) | (57,357 | ) | 622,915 | 863,590 | (400,701 | ) | ||||||||||
|
|
|
|
|
|
|
| |||||||||
NET REALIZED AND UNREALIZED GAIN (LOSS) ON INVESTMENTS | ||||||||||||||||
Net Realized Gain (Loss) on: | ||||||||||||||||
Investments | (1,563,466 | ) | — | (6,930,647 | ) | (5,905,413 | ) | |||||||||
Investments in Affiliated Issuers | — | (307,226 | ) | — | — | |||||||||||
Realized Gain Received as Distribution from Affiliated Issuers | — | 1,325,388 | — | — | ||||||||||||
Foreign Currency | 2,292 | — | (27,030 | ) | (44,638 | ) | ||||||||||
Options Written | — | — | (178,523 | ) | — | |||||||||||
Change in Unrealized Appreciation (Depreciation) on: | ||||||||||||||||
Investments | (5,292,869 | ) | (249,936 | ) | (6,917,422 | ) | (41,047,957 | ) | ||||||||
Foreign Currency | (25 | ) | — | (792 | ) | (48 | ) | |||||||||
Investments in Affiliated Issuers | — | (7,249,184 | ) | — | — | |||||||||||
Options Written | — | — | (43,909 | ) | — | |||||||||||
|
|
|
|
|
|
|
| |||||||||
Net Realized and Unrealized Gain (Loss) on Investments and Foreign Currency Transactions | (6,854,068 | ) | (6,480,958 | ) | (14,098,323 | ) | (46,998,056 | ) | ||||||||
|
|
|
|
|
|
|
| |||||||||
DECREASE IN NET ASSETS RESULTING FROM OPERATIONS | $ | (6,911,425 | ) | $ | (5,858,043 | ) | $ | (13,234,733 | ) | $ | (47,398,757 | ) | ||||
|
|
|
|
|
|
|
| |||||||||
| (1) | Net of foreign taxes withheld. Total amounts withheld for the TCW Artificial Intelligence Equity Fund, the TCW Global Real Estate Fund and the TCW New America Premier Equities Fund were $1,622, $29,183 and $25,775. |
See accompanying Notes to Financial Statements.
64
Table of Contents
TCW Funds, Inc.
Statements of Operations | Year Ended October 31, 2022 |
| TCW Relative Value Dividend Appreciation Fund | TCW Relative Value Large Cap Fund | TCW Relative Value Mid Cap Fund | TCW Select Equities Fund | |||||||||||||
INVESTMENT INCOME | ||||||||||||||||
Income: | ||||||||||||||||
Dividends | $ | 6,798,515 | (1) | $ | 2,495,960 | $ | 1,301,871 | (1) | $ | 3,105,517 | (1) | |||||
|
|
|
|
|
|
|
| |||||||||
Total | 6,798,515 | 2,495,960 | 1,301,871 | 3,105,517 | ||||||||||||
|
|
|
|
|
|
|
| |||||||||
Expenses: | ||||||||||||||||
Management Fees | 1,564,399 | 704,499 | 568,339 | 4,856,480 | ||||||||||||
Accounting Services Fees | 22,810 | 11,495 | 8,257 | 58,551 | ||||||||||||
Administration Fees | 41,805 | 26,176 | 21,673 | 92,633 | ||||||||||||
Transfer Agent Fees: | ||||||||||||||||
I Class | 46,302 | 88,969 | 75,377 | 585,102 | ||||||||||||
N Class | 207,508 | 14,324 | 18,982 | 169,523 | ||||||||||||
Custodian Fees | 9,132 | 8,057 | 10,866 | 11,494 | ||||||||||||
Professional Fees | 36,716 | 33,424 | 33,142 | 47,437 | ||||||||||||
Directors’ Fees and Expenses | 46,667 | 46,667 | 46,667 | 46,667 | ||||||||||||
Registration Fees: | ||||||||||||||||
I Class | 18,884 | 24,290 | 17,831 | 24,627 | ||||||||||||
N Class | 20,322 | 19,573 | 17,901 | 22,375 | ||||||||||||
Distribution Fees: | ||||||||||||||||
N Class | 468,626 | 23,836 | 35,557 | 349,240 | ||||||||||||
Shareholder Reporting Expense | 3,980 | 4,127 | 3,983 | 6,804 | ||||||||||||
Other | 30,524 | 19,632 | 18,413 | 56,507 | ||||||||||||
|
|
|
|
|
|
|
| |||||||||
Total | 2,517,675 | 1,025,069 | 876,988 | 6,327,440 | ||||||||||||
|
|
|
|
|
|
|
| |||||||||
Less Expenses Borne by Investment Advisor: | ||||||||||||||||
I Class | 44,900 | 142,373 | 110,231 | — | ||||||||||||
N Class | 272,842 | 41,754 | 62,426 | 193,066 | ||||||||||||
|
|
|
|
|
|
|
| |||||||||
Net Expenses | 2,199,933 | 840,942 | 704,331 | 6,134,374 | ||||||||||||
|
|
|
|
|
|
|
| |||||||||
Net Investment Income (Loss) | 4,598,582 | 1,655,018 | 597,540 | (3,028,857 | ) | |||||||||||
|
|
|
|
|
|
|
| |||||||||
NET REALIZED AND UNREALIZED GAIN (LOSS) ON INVESTMENTS | ||||||||||||||||
Net Realized Gain (Loss) on: | ||||||||||||||||
Investments | 10,945,801 | 6,315,555 | 1,053,361 | 101,011,832 | ||||||||||||
Foreign Currency | — | — | — | 6 | ||||||||||||
Change in Unrealized Appreciation (Depreciation) on: | ||||||||||||||||
Investments | (22,428,051 | ) | (14,397,777 | ) | (10,556,257 | ) | (428,876,001 | ) | ||||||||
|
|
|
|
|
|
|
| |||||||||
Net Realized and Unrealized Gain (Loss) on Investments | (11,482,250 | ) | (8,082,222 | ) | (9,502,896 | ) | (327,864,163 | ) | ||||||||
|
|
|
|
|
|
|
| |||||||||
DECREASE IN NET ASSETS RESULTING FROM OPERATIONS | $ | (6,883,668 | ) | $ | (6,427,204 | ) | $ | (8,905,356 | ) | $ | (330,893,020 | ) | ||||
|
|
|
|
|
|
|
| |||||||||
| (1) | Net of foreign taxes withheld. Total amounts withheld for the TCW Relative Value Dividend Appreciation Fund, the TCW Relative Value Mid Cap Fund and the TCW Select Equities Fund were $38,488, $9,199 and $51,874. |
See accompanying Notes to Financial Statements.
65
Table of Contents
TCW Funds, Inc.
Statements of Changes in Net Assets
| TCW Artificial Intelligence Equity Fund | TCW Conservative Allocation Fund | |||||||||||||||
| Year Ended October 31, 2022 | Year Ended October 31, 2021 | Year Ended October 31, 2022 | Year Ended October 31, 2021 | |||||||||||||
OPERATIONS | ||||||||||||||||
Net Investment Income (Loss) | $ | (57,357 | ) | $ | (88,494 | ) | $ | 622,915 | $ | 357,656 | ||||||
Net Realized Gain (Loss) on Investments and Foreign Currency Transactions | (1,561,174 | ) | 1,118,544 | 1,018,162 | 3,079,251 | |||||||||||
Change in Unrealized Appreciation (Depreciation) on Investments and Foreign Currency Transactions | (5,292,894 | ) | 3,428,225 | (7,499,120 | ) | 2,226,386 | ||||||||||
|
|
|
|
|
|
|
| |||||||||
Increase (Decrease) in Net Assets Resulting from Operations | (6,911,425 | ) | 4,458,275 | (5,858,043 | ) | 5,663,293 | ||||||||||
|
|
|
|
|
|
|
| |||||||||
DISTRIBUTIONS TO SHAREHOLDERS | ||||||||||||||||
Distributions to Shareholders | (815,308 | ) | — | (3,251,567 | ) | (575,016 | ) | |||||||||
|
|
|
|
|
|
|
| |||||||||
NET CAPITAL SHARE TRANSACTIONS | ||||||||||||||||
I Class | (208,373 | ) | 3,584,599 | 1,248,923 | (6,446,027 | ) | ||||||||||
N Class | (26,162 | ) | 527,992 | (167,827 | ) | 190,512 | ||||||||||
|
|
|
|
|
|
|
| |||||||||
Increase (Decrease) in Net Assets Resulting from Net Capital Shares Transactions | (234,535 | ) | 4,112,591 | 1,081,096 | (6,255,515 | ) | ||||||||||
|
|
|
|
|
|
|
| |||||||||
Increase (Decrease) in Net Assets | (7,961,268 | ) | 8,570,866 | (8,028,514 | ) | (1,167,238 | ) | |||||||||
NET ASSETS | ||||||||||||||||
Beginning of year | 18,935,403 | 10,364,537 | 35,999,410 | 37,166,648 | ||||||||||||
|
|
|
|
|
|
|
| |||||||||
End of year | $ | 10,974,135 | $ | 18,935,403 | $ | 27,970,896 | $ | 35,999,410 | ||||||||
|
|
|
|
|
|
|
| |||||||||
See accompanying Notes to Financial Statements.
66
Table of Contents
TCW Funds, Inc.
Statements of Changes in Net Assets
| TCW Global Real Estate Fund | TCW New America Premier Equities Fund | |||||||||||||||
| Year Ended October 31, 2022 | Year Ended October 31, 2021 | Year Ended October 31, 2022 | Year Ended October 31, 2021 | |||||||||||||
OPERATIONS | ||||||||||||||||
Net Investment Income (Loss) | $ | 863,590 | $ | 613,331 | $ | (400,701 | ) | $ | 712,832 | |||||||
Net Realized Gain (Loss) on Investments, Options Written and Foreign Currency Transactions | (7,136,200 | ) | 3,250,760 | (5,950,051 | ) | 33,494,351 | ||||||||||
Change in Unrealized Appreciation (Depreciation) on Investments, Options Written and Foreign Currency Transactions | (6,962,123 | ) | 2,994,939 | (41,048,005 | ) | 35,985,483 | ||||||||||
|
|
|
|
|
|
|
| |||||||||
Increase (Decrease) in Net Assets Resulting from Operations | (13,234,733 | ) | 6,859,030 | (47,398,757 | ) | 70,192,666 | ||||||||||
|
|
|
|
|
|
|
| |||||||||
DISTRIBUTIONS TO SHAREHOLDERS | ||||||||||||||||
Distributions to Shareholders | (3,597,946 | ) | (564,453 | ) | (26,427,279 | ) | (7,812 | ) | ||||||||
Return of Capital | (447,356 | ) | — | — | — | |||||||||||
|
|
|
|
|
|
|
| |||||||||
Total Distributions to Shareholders | (4,045,302 | ) | (564,453 | ) | (26,427,279 | ) | (7,812 | ) | ||||||||
|
|
|
|
|
|
|
| |||||||||
NET CAPITAL SHARE TRANSACTIONS | ||||||||||||||||
I Class | 3,859,420 | 11,493,157 | (9,546,382 | ) | (12,185,199 | ) | ||||||||||
N Class | 3,186,663 | 8,250,122 | (631,927 | ) | (9,645,097 | ) | ||||||||||
|
|
|
|
|
|
|
| |||||||||
Increase (Decrease) in Net Assets Resulting from Net Capital Shares Transactions | 7,046,083 | 19,743,279 | (10,178,309 | ) | (21,830,296 | ) | ||||||||||
|
|
|
|
|
|
|
| |||||||||
Increase (Decrease) in Net Assets | (10,233,952 | ) | 26,037,856 | (84,004,345 | ) | 48,354,558 | ||||||||||
NET ASSETS | ||||||||||||||||
Beginning of year | 39,582,850 | 13,544,994 | 231,871,244 | 183,516,686 | ||||||||||||
|
|
|
|
|
|
|
| |||||||||
End of year | $ | 29,348,898 | $ | 39,582,850 | $ | 147,866,899 | $ | 231,871,244 | ||||||||
|
|
|
|
|
|
|
| |||||||||
See accompanying Notes to Financial Statements.
67
Table of Contents
TCW Funds, Inc.
Statements of Changes in Net Assets
| TCW Relative Value Dividend Appreciation Fund | TCW Relative Value Large Cap Fund | |||||||||||||||
| Year Ended October 31, 2022 | Year Ended October 31, 2021 | Year Ended October 31, 2022 | Year Ended October 31, 2021 | |||||||||||||
OPERATIONS | ||||||||||||||||
Net Investment Income | $ | 4,598,582 | $ | 4,547,141 | $ | 1,655,018 | $ | 1,609,103 | ||||||||
Net Realized Gain on Investments | 10,945,801 | 31,551,258 | 6,315,555 | 11,175,560 | ||||||||||||
Change in Unrealized Appreciation (Depreciation) on Investments | (22,428,051 | ) | 65,949,490 | (14,397,777 | ) | 33,219,423 | ||||||||||
|
|
|
|
|
|
|
| |||||||||
Increase (Decrease) in Net Assets Resulting from Operations | (6,883,668 | ) | 102,047,889 | (6,427,204 | ) | 46,004,086 | ||||||||||
|
|
|
|
|
|
|
| |||||||||
DISTRIBUTIONS TO SHAREHOLDERS | ||||||||||||||||
Distributions to Shareholders | (29,507,424 | ) | (4,599,952 | ) | (10,172,684 | ) | (8,614,565 | ) | ||||||||
|
|
|
|
|
|
|
| |||||||||
NET CAPITAL SHARE TRANSACTIONS | ||||||||||||||||
I Class | 2,823,123 | (3,786,668 | ) | (877,613 | ) | (275,969 | ) | |||||||||
N Class | 3,156,898 | (21,732,783 | ) | (137,752 | ) | (2,445,033 | ) | |||||||||
|
|
|
|
|
|
|
| |||||||||
Increase (Decrease) in Net Assets Resulting from Net Capital Shares Transactions | 5,980,021 | (25,519,451 | ) | (1,015,365 | ) | (2,721,002 | ) | |||||||||
|
|
|
|
|
|
|
| |||||||||
Increase (Decrease) in Net Assets | (30,411,071 | ) | 71,928,486 | (17,615,253 | ) | 34,668,519 | ||||||||||
NET ASSETS | ||||||||||||||||
Beginning of year | 280,187,954 | 208,259,468 | 127,710,592 | 93,042,073 | ||||||||||||
|
|
|
|
|
|
|
| |||||||||
End of year | $ | 249,776,883 | $ | 280,187,954 | $ | 110,095,339 | $ | 127,710,592 | ||||||||
|
|
|
|
|
|
|
| |||||||||
See accompanying Notes to Financial Statements.
68
Table of Contents
TCW Funds, Inc.
Statements of Changes in Net Assets
| TCW Relative Value Mid Cap Fund | TCW Select Equities Fund | |||||||||||||||
| Year Ended October 31, 2022 | Year Ended October 31, 2021 | Year Ended October 31, 2022 | Year Ended October 31, 2021 | |||||||||||||
OPERATIONS | ||||||||||||||||
Net Investment Income (Loss) | $ | 597,540 | $ | 478,760 | $ | (3,028,857 | ) | $ | (3,646,354 | ) | ||||||
Net Realized Gain on Investments and Foreign Currency Transactions | 1,053,361 | 12,750,073 | 101,011,838 | 126,960,390 | ||||||||||||
Change in Unrealized Appreciation (Depreciation) on Investments | (10,556,257 | ) | 19,424,042 | (428,876,001 | ) | 175,902,597 | ||||||||||
|
|
|
|
|
|
|
| |||||||||
Increase (Decrease) in Net Assets Resulting from Operations | (8,905,356 | ) | 32,652,875 | (330,893,020 | ) | 299,216,633 | ||||||||||
|
|
|
|
|
|
|
| |||||||||
DISTRIBUTIONS TO SHAREHOLDERS | ||||||||||||||||
Distributions to Shareholders | (10,250,919 | ) | (522,819 | ) | (115,374,235 | ) | (59,131,560 | ) | ||||||||
|
|
|
|
|
|
|
| |||||||||
NET CAPITAL SHARE TRANSACTIONS | ||||||||||||||||
I Class | 5,957,013 | (4,606,270 | ) | 20,168,808 | (27,266,527 | ) | ||||||||||
N Class | (145,718 | ) | (194,515 | ) | (1,698,839 | ) | (12,802,651 | ) | ||||||||
|
|
|
|
|
|
|
| |||||||||
Increase (Decrease) in Net Assets Resulting from Net Capital Shares Transactions | 5,811,295 | (4,800,785 | ) | 18,469,969 | (40,069,178 | ) | ||||||||||
|
|
|
|
|
|
|
| |||||||||
Increase (Decrease) in Net Assets | (13,344,980 | ) | 27,329,271 | (427,797,286 | ) | 200,015,895 | ||||||||||
NET ASSETS | ||||||||||||||||
Beginning of year | 89,252,306 | 61,923,035 | 995,323,734 | 795,307,839 | ||||||||||||
|
|
|
|
|
|
|
| |||||||||
End of year | $ | 75,907,326 | $ | 89,252,306 | $ | 567,526,448 | $ | 995,323,734 | ||||||||
|
|
|
|
|
|
|
| |||||||||
See accompanying Notes to Financial Statements.
69
Table of Contents
TCW Funds, Inc.
Note 1 — Organization
TCW Funds, Inc. (the “Company”), a Maryland corporation, is an open-end management investment company registered under the Investment Company Act of 1940, as amended (the “1940 Act”), that currently offers 18 no-load mutual funds (each series, a “Fund” and collectively, the “Funds”). TCW Investment Management Company LLC (the “Advisor”) is the investment advisor to and an affiliate of the Funds and is registered under the Investment Advisers Act of 1940, as amended. Each Fund has its own investment objective and strategies. The following is a brief description of the investment objectives and principal investment strategies for the Funds that are covered in this report:
TCW Fund | Investment Objectives and Principal Investment | |
| Diversified U.S. Equity Funds | ||
| TCW Artificial Intelligence Equity Fund | Seeks long-term capital appreciation by investing at least 80% of the value of its net assets, plus any borrowings for investment purposes, in publicly traded equity securities of businesses that the portfolio managers believe are benefitting from or have the potential to benefit from advances in the use of artificial intelligence. | |
| TCW Global Real Estate Fund | Seeks to maximize total return from current income and long-term capital growth by investing at least 80% of the value of its net assets, plus any borrowings for investment purposes, in equity securities of real estate investment trusts (“REITs”) and real estate companies. Under normal market conditions, the Fund invests in securities of issuers located in at least three different countries (one of which may be the United States) and invests at least 30% of its net assets, plus any borrowings for investment purposes, in securities of issuers domiciled outside the United States or whose primary business operations are outside the United States, including pooled investment vehicles domiciled in the United States that invest principally in non-U.S. securities. | |
| TCW New America Premier Equities Fund | Seeks to provide long-term capital appreciation by investing at least 80% of the value of its net assets, plus any borrowings for investment purposes, in equity securities of U.S. companies; intends to achieve its objective by investing primarily in a portfolio of companies the portfolio manager believes are enduring, cash generating businesses whose leaders prudently manage their environmental, social, and financial resources and whose shares are attractively valued relative to free cash flow generated by the businesses. | |
70
Table of Contents
TCW Funds, Inc.
October 31, 2022
Note 1 — Organization (Continued)
TCW Fund | Investment Objectives and Principal Investment | |
| TCW Relative Value Dividend Appreciation Fund | Seeks to realize a high level of dividend income consistent with prudent investment management, with a secondary objective of capital appreciation, by investing at least 80% of the value of its net assets, plus any borrowings for investment purposes, in equity securities of companies that have a record of paying dividends. | |
| TCW Relative Value Large Cap Fund | Seeks capital appreciation, with a secondary goal of current income, by investing at least 80% of the value of its net assets, plus any borrowings for investment purposes, in equity securities of large-capitalization companies (i.e., companies with a market capitalization of greater than $1 billion at the time of purchase). | |
| TCW Relative Value Mid Cap Fund | Seeks to provide long-term capital appreciation by investing at least 80% of the value of its net assets, plus any borrowings for investment purposes, in equity securities of mid-capitalization companies (i.e., companies with market capitalizations, at the time of acquisition, within the capitalization range of the companies comprising the Russell MidCap® Index). | |
| TCW Select Equities Fund | Seeks to provide long-term capital appreciation by investing at least 80% of the value of its net assets, plus any borrowings for investment purposes, in equity securities. The Fund invests primarily in equity securities of mid- and large-capitalization companies. | |
| Fund of Funds | ||
| TCW Conservative Allocation Fund | Seeks to provide current income, and secondarily, long-term capital appreciation by investing in a combination of fixed income funds and equity funds that utilize diverse investment styles, such as growth and/or value investing. | |
All of the Funds currently offer two classes of shares: I Class and N Class. The two classes of a Fund are substantially the same except that the N Class shares are subject to a distribution fee (see Note 7).
The TCW Conservative Allocation Fund is a “fund of funds” that invests in affiliated and unaffiliated funds which are identified on the Schedule of Investments.
71
Table of Contents
TCW Funds, Inc.
Notes to Financial Statements (Continued)
Note 2 — Significant Accounting Policies
The following is a summary of significant accounting policies which are in conformity with accounting principles generally accepted in the United States of America (“GAAP”) and which are consistently followed by the Funds in the preparation of their financial statements. Each Fund is considered an investment company under the Financial Accounting Standards Board (“FASB”) Accounting Standards Codification (“ASC”) No. 946, Financial Services — Investment Companies. Subsequent events, if any, have been evaluated through the date of issuance in the preparation of the financial statements.
Principles of Accounting: The Funds use the accrual method of accounting for financial reporting purposes.
Net Asset Value: The net asset value (“NAV”) per share of each class of a Fund is determined by dividing the Fund’s net assets attributable to each class by the number of shares issued and outstanding of that class on each day the New York Stock Exchange (“NYSE”) is open for trading.
Security Valuations: Equity securities listed or traded on the NYSE and other stock exchanges were valued at the latest sale price on the exchange. Securities traded on the NASDAQ stock market (“NASDAQ”) were valued during the period using official closing prices as reported by NASDAQ, which may not have been the last sale price. Options on equity securities and options on indexes were valued using mid prices (average of bid and ask prices) as reported by the exchange or pricing service. Investments in open-end mutual funds including money market funds were valued based on the NAV per share as reported by the investment companies. All other securities for which over-the-counter (“OTC”) market quotations were readily available, including short-term securities, swap agreements and forward currency contracts, were valued with prices furnished by independent pricing services or by broker-dealers.
Pursuant to Rule 2a-5 under the 1940 Act, the Company’s Board of Directors (the “Board”, and each member thereof, a “Director”) has designated the Advisor as the “valuation designee” with respect to the fair valuation of the Fund’s portfolio securities, subject to oversight by and periodic reporting to the Board. Fair valued securities are those for which market quotations were not readily available, including in circumstances under which it was determined by the Advisor that prices received were not reflective of their market values.
The Advisor, as the valuation designee, uses a fair valuation methodology for foreign equity securities (exclusive of certain Latin American and Canadian equity securities). This methodology is designed to address the effect of movements in the U.S. market on the securities traded on foreign exchanges that have been closed for a period of time due to time zones differences. The utilization of the fair value model may result in the adjustment of prices taking into account fluctuations in the U.S. market. The fair value model was utilized each trading day and was not dependent on certain thresholds or triggers.
Fair value is defined as the price that a Fund would receive upon selling an investment in a timely transaction to an independent buyer in the principal or most advantageous market for the investment. In accordance with the authoritative guidance on fair value measurements and disclosures under GAAP, the Funds disclose investments in their financial statements in a three-tier hierarchy. This hierarchy is utilized to establish classification of fair value measurements based on inputs. Inputs that go into fair value measurement refer broadly to the assumptions that market participants would use in pricing the asset or liability, including assumptions about risk. Inputs may be observable or unobservable. Observable inputs are inputs that reflect the assumptions market participants would use in pricing the asset or liability, developed based on market
72
Table of Contents
TCW Funds, Inc.
October 31, 2022
Note 2 — Significant Accounting Policies (Continued)
data obtained from sources independent of the reporting entity. Unobservable inputs are inputs that reflect the reporting entity’s own assumptions about the inputs market participants would use in pricing the asset or liability, developed based on the best information available in the circumstances.
The three-tier hierarchy of inputs is summarized in the three broad levels listed below.
| Level 1 — | quoted prices in active markets for identical investments. | |
| Level 2 — | other significant observable inputs (including quoted prices for similar investments, interest rates, prepayment speeds, credit risk, etc.). | |
| Level 3 — | significant unobservable inputs (including the Funds’ own assumptions in determining the fair value of investments). |
Changes in valuation techniques may result in transfers in or out of an investment’s assigned Level within the hierarchy. The inputs or methodologies used for valuing investments are not necessarily an indication of the risk associated with investing in those investments and the determination of the significance of a particular input to the fair value measurement in its entirety requires judgment and consideration of factors specific to each security.
The availability of observable inputs can vary from security to security and is affected by a wide variety of factors, including, for example, the type of security, whether the security is new and not yet established in the marketplace, the liquidity of markets, and other characteristics particular to the security. To the extent that valuation is based on models or inputs that are less observable or unobservable in the market, the determination of fair value requires more judgment. Accordingly, the degree of judgment exercised in determining fair value is greatest for instruments categorized as Level 3.
In periods of market dislocation, the observability of prices and inputs may be reduced for many instruments. This condition, as well as changes related to liquidity of investments, could cause a security to be reclassified between Level 1, Level 2, or Level 3.
In certain cases, the inputs used to measure fair value may fall into different levels of the fair value hierarchy. In such cases, for disclosure purposes the level in the fair value hierarchy within which the fair value measurement falls in its entirety is determined based on the lowest level input that is significant to the fair value measurement.
Fair Value Measurements: Descriptions of the valuation techniques applied to the Funds’ major categories of assets and liabilities measured at fair value on a recurring basis are as follows:
Equity securities. Securities are generally valued based on quoted prices from the applicable exchange. To the extent these securities are actively traded and valuation adjustments are not applied, they are generally categorized as Level 1 of the fair value hierarchy. Restricted securities issued by publicly held companies are generally categorized as Level 2 of the fair value hierarchy; if a discount is applied and significant, they are categorized as Level 3. Restricted securities held in non-public entities are categorized as Level 3 of the fair value hierarchy because they trade infrequently, and therefore the inputs are unobservable. Certain foreign securities that are fair valued using a pricing service that considers the correlation of the trading patterns of the foreign security to the intraday trading in the U.S. markets are categorized as Level 2 of the fair value hierarchy.
73
Table of Contents
TCW Funds, Inc.
Notes to Financial Statements (Continued)
Note 2 — Significant Accounting Policies (Continued)
Mutual funds. Open-end mutual funds including money market funds are valued using the NAV as reported by the fund companies. As such, they are categorized as Level 1.
Options contracts. Options contracts traded on securities exchanges are fair valued using market mid prices; as such, they are categorized as Level 1. Option contracts traded OTC are fair valued based on pricing models and incorporate various inputs such as interest rates, credit spreads, currency exchange rates and volatility measurements for in-the-money, at-the-money, and out-of-money contracts on a given strike price. To the extent that these inputs are observable and timely, the fair value of OTC option contracts would be categorized as Level 2; otherwise, the fair values would be categorized as Level 3.
Restricted securities. Restricted securities, including illiquid Rule 144A securities, issued by non-public entities are categorized as Level 3 of the fair value hierarchy because they trade infrequently, and therefore the inputs are unobservable. Any other restricted securities valued similar to publicly traded securities may be categorized as Level 2 or 3 of the fair value hierarchy depending on whether a discount is applied and significant to the fair value.
Warrants. Warrants are generally valued based on quoted prices from the applicable exchange. To the extent these securities are actively traded, and valuation adjustments are not applied, they are generally categorized as Level 1 of the fair value hierarchy.
The summary of the inputs used as of October 31, 2022 in valuing the Funds’ investments is listed after the Schedule of Investments for each Fund.
The Funds held no investments or other financial instruments at October 31, 2022 for which fair value was calculated using Level 3 inputs.
Security Transactions and Related Investment Income: Security transactions are recorded as of the trade date. Dividend income is recorded on the ex-dividend date. Interest income is recognized on an accrual basis. Realized gains and losses on investments are recorded on the basis of specific identification.
Allocation of Operating Activity for Multiple Classes: Investment income, common expenses and realized and unrealized gains and losses are allocated among the share classes of the Funds based on the relative net assets of each class. Distribution fees, which are directly attributable to a class of shares, are charged to the operations of that class. All other expenses are charged to each Fund or class as incurred on a specific identification basis. Differences in class- specific fees and expenses will result in differences in net investment income for each class, and in turn differences in dividends paid by each class.
Dividends and Distributions: Dividends and distributions to shareholders are recorded on the ex-dividend date. The TCW Global Real Estate Fund and the TCW Relative Value Dividend Appreciation Fund declare and pay, or reinvest, dividends from net investment income quarterly. The other Equity Funds and TCW Conservative Allocation Fund declare and pay, or reinvest, dividends from net investment income annually. Capital gains realized by a Fund will be distributed at least annually.
Income and capital gain distributions are determined in accordance with income tax regulations which may differ from GAAP. These differences are primarily due to differing treatments for foreign currency transactions, derivative transactions, market discount and premium, losses deferred due to wash sales, excise tax regulations and employing equalization in determining amounts to be distributed to Fund shareholders. Permanent book and tax basis differences relating to shareholder distributions will result in reclassifications
74
Table of Contents
TCW Funds, Inc.
October 31, 2022
Note 2 — Significant Accounting Policies (Continued)
between paid-in capital, undistributed net investment income (loss), and/or undistributed accumulated realized gain (loss). Undistributed net investment income or loss may include temporary book and tax basis differences which will reverse in subsequent periods. Any taxable income or capital gain remaining at fiscal year-end is distributed in the following year. Distributions received from real estate investment trusts may include return of capital which is treated as a reduction in the cost basis of those investments. Distributions received, if any, in excess of the cost basis of a security is recognized as capital gain.
Use of Estimates: The preparation of the accompanying financial statements requires management to make estimates and assumptions that affect the reported amount of assets and liabilities at the date of the financial statements and the reported amounts of income and expenses during the reporting period. Actual results could differ from these estimates.
Foreign Currency Translation: The books and records of each Fund are maintained in U.S. dollars as follows: (1) foreign currency denominated securities and other assets and liabilities stated in foreign currencies, are translated using the daily spot rate; and (2) purchases, sales, income and expenses are translated at the rate of exchange prevailing on the respective dates of such transactions. The resultant exchange gains and losses are included in net realized or net unrealized gain (loss) in the Statements of Operations. Pursuant to U.S. federal income tax regulations, certain foreign exchange gains and losses included in realized and unrealized gains and losses are included in, or are a reduction of, ordinary income for federal income tax purposes.
Foreign Taxes: The Funds may be subject to withholding taxes on income and capital gains imposed by certain countries in which they invest. The withholding tax on income is netted against the income accrued or received. Any reclaimable taxes are recorded as income. The withholding tax on realized or unrealized gain is recorded as a liability.
Derivative Instruments: Derivatives are financial instruments which are valued based on the values of one or more indicators, such as a security, asset, currency, interest rate, or index. Derivative transactions can create investment leverage and may be highly volatile. A derivative contract may result in a mark-to-market loss if the value of the contract decreases due to an unfavorable change in the market rates or values of the underlying instrument. It is possible that a derivative transaction will result in a loss greater than the principal amount invested. The Funds may not be able to close out a derivative transaction at a favorable time or price.
75
Table of Contents
TCW Funds, Inc.
Notes to Financial Statements (Continued)
Note 2 — Significant Accounting Policies (Continued)
For the year ended October 31, 2022, the TCW Global Real Estate Fund had the following derivatives and transactions in derivatives, grouped in the following risk categories:
| Equity Risk | ||||
Statement of Assets and Liabilities: |
| |||
Asset Derivatives |
| |||
Investments (1) | $ | 349,500 | ||
|
| |||
Total Value | $ | 349,500 | ||
|
| |||
Liability Derivatives |
| |||
Written Options | $ | (54,000 | ) | |
|
| |||
Total Value | $ | (54,000 | ) | |
|
| |||
Statement of Operations: |
| |||
Net Realized Gain (Loss) |
| |||
Investments (2) | $ | 368,496 | ||
Options Written | (178,523 | ) | ||
|
| |||
Net Realized Gain (Loss) | $ | 189,973 | ||
|
| |||
Net Change in Appreciation (Depreciation) |
| |||
Investments (3) | $ | 219,997 | ||
Options Written | (43,909 | ) | ||
|
| |||
Net Change in Appreciation (Depreciation) | $ | 176,088 | ||
|
| |||
Number of Contracts (4) |
| |||
Options Purchased | 745 | |||
Options Written | 473 | |||
| (1) | Represents purchased options, at value. |
| (2) | Represents realized gain (loss) for purchased options. |
| (3) | Represents change in unrealized appreciation (depreciation) for purchased options during the year. |
| (4) | Amount disclosed represents average notional amounts which are representative of the volume traded for the year ended October 31, 2022. |
Counterparty Credit Risk: Derivative contracts may be exposed to counterparty risk. Losses can occur if the counterparty does not perform under the contract.
The Funds’ risk of loss from counterparty credit risk on OTC derivatives is generally limited to the aggregate unrealized gain netted against any collateral held by the Funds.
With exchange-traded futures and centrally cleared swaps, there is less counterparty credit risk to the Funds since the exchange or clearinghouse, as counterparty to such instruments, guarantees against a possible default. The clearinghouse stands between the buyer and the seller of the contract; therefore, the credit risk is limited to failure of the clearinghouse. While offset rights may exist under applicable law, the Funds do not have a contractual right of offset against a clearing broker or clearinghouse in the event of a default (including the bankruptcy or insolvency) of the clearing broker or clearinghouse. Additionally, credit risk exists in exchange-traded futures and centrally cleared swaps with respect to initial and variation margin that is held in a clearing broker’s customer accounts. While clearing brokers are required to segregate customer margin from their own assets, in the event that a clearing broker becomes insolvent or goes into bankruptcy and at that time there is a shortfall in the aggregate amount of margin held by the clearing broker for all its clients, typically the shortfall would be allocated on a pro rata basis across all the clearing broker’s customers, potentially resulting in losses to the Funds.
76
Table of Contents
TCW Funds, Inc.
October 31, 2022
Note 2 — Significant Accounting Policies (Continued)
For OTC derivatives, the Funds mitigate their counterparty risk by entering into an International Swaps and Derivatives Association, Inc. Master Agreement (“ISDA Master Agreement”) or similar agreement with each counterparty. An ISDA Master Agreement is a bilateral agreement between the Funds and a counterparty that governs OTC derivatives and typically contains, among other things, collateral posting terms and netting provisions in the event of a default and/ or termination event. Under an ISDA Master Agreement, the Funds may, under certain circumstances, offset with the counterparty certain derivative financial instruments’ payables and/or receivables with collateral held and/or posted and create one single net payment. The provisions of the ISDA Master Agreement typically permit a single net payment in the event of default including the bankruptcy or insolvency of the counterparty. However, bankruptcy or insolvency laws of a particular jurisdiction may impose restrictions on or prohibitions against the right of offset in bankruptcy, insolvency or other events. In addition, certain ISDA Master Agreements allow counterparties to OTC derivatives to terminate derivative contracts prior to maturity in the event a Fund’s net assets declines by a stated percentage or a Fund fails to meet the terms of its ISDA Master Agreements, which would cause the Fund to accelerate payment of any net liability owed to the counterparty.
Collateral requirements: For derivatives traded under an ISDA Master Agreement, the collateral requirements are typically calculated by netting the mark-to-market amount for each transaction under such agreement and comparing that amount to the value of any collateral pledged or received by a Fund.
Cash collateral that has been pledged to cover obligations of a Fund is reported separately on the Statement of Assets and Liabilities. Non-cash collateral pledged by a Fund, if any, is noted in the Schedule of Investments. Generally, the amount of collateral due from or to a party has to exceed a minimum transfer amount threshold, typically $250,000 or $500,000, before a transfer is required, which is determined at the close of each business day and the collateral is transferred on the next business day. To the extent amounts due to a Fund from its counterparties are not fully collateralized, contractually or otherwise, the Fund bears the risk of loss from counterparty non-performance. The Funds attempt to mitigate counterparty risk by entering into agreements only with counterparties that the Advisor believes have the financial resources to honor their obligations and by monitoring the financial stability of those counterparties. For financial reporting purposes, the Funds do not offset derivative assets and derivative liabilities that are subject to netting arrangements in the Statement of Assets and Liabilities. The Funds have implemented the disclosure requirements pursuant to FASB Accounting Standards Update (“ASU”) No. 2011-11, Disclosures about Offsetting Assets and Liabilities that requires disclosures to make financial statements that are prepared under GAAP more comparable to those prepared under International Financial Reporting Standards.
Master Agreements and Netting Arrangements. Certain Funds are parties to various agreements, including but not limited to International Swaps and Derivatives Association Agreements and related Credit Support Annex, Master Repurchase Agreements, and Master Securities Forward Transactions Agreements (collectively “Master Agreements”), which govern the terms of certain transactions with select counterparties. These Master Agreements generally include provisions for general obligations, representations, agreements, collateral, and certain events of default or termination. These Master Agreements also include provisions for netting arrangements that help reduce credit and counterparty risk associated with relevant transactions (“netting arrangements”). The netting arrangements are generally tied to credit-related events that, if triggered, would cause an event of default or termination giving a Fund
77
Table of Contents
TCW Funds, Inc.
Notes to Financial Statements (Continued)
Note 2 — Significant Accounting Policies (Continued)
or counterparty the right to terminate early and cause settlement, on a net basis, of all transactions under the applicable Master Agreement. In the event of an early termination as a result of an event of default under the Master Agreement, the total value exposure of all transactions will be offset against collateral exchanged to date, which would result in a net receivable or payable that would be due from or to the counterparty. However, bankruptcy or insolvency laws of a particular jurisdiction may impose restrictions on or prohibitions against the right of offset in the event of a bankruptcy or insolvency of the counterparty. Credit related events include, but are not limited to, bankruptcy, failure to make timely payments, restructuring, obligation acceleration, obligation default, a material decline in net assets, decline in credit rating or repudiation/moratorium. Any election made by a counterparty to early terminate the transactions under a Master Agreement could have a material adverse impact on a Fund’s financial statements. A Fund’s overall exposure to credit risk, subject to netting arrangements, can change substantially within a short period, as it is affected by each transaction subject to the arrangement.
Master Agreements can also help limit counterparty risk by specifying collateral posting arrangements at pre-arranged exposure levels. Under the Master Agreements, collateral is routinely transferred if the total net exposure to certain transactions under the relevant Master Agreement with a counterparty in a given Fund exceeds a specified threshold, net of collateral already in place, typically $250,000 or $500,000 depending on the counterparty and the type of Master Agreement. Collateral under the Master Agreements is usually in the form of cash or U.S. Treasury Bills but could include other types of securities. If permitted under the Master Agreement, certain funds may rehypothecate cash collateral received from a counterparty. The value of all derivative transactions outstanding under a Master Agreement is calculated daily to determine the amount of collateral to be received or pledged by the counterparty. Posting of collateral for OTC derivative transactions are covered under tri-party collateral agreements between the Fund, the Fund’s custodian, and each counterparty. Collateral for centrally cleared derivatives transactions are posted with the applicable derivatives clearing organization.
The Funds had no OTC derivatives for offset under an ISDA Master Agreement as of October 31, 2022.
Note 3 — Portfolio Investments
When-Issued, Delayed-Delivery and Forward Commitment Transactions: The Funds, with the exception of the TCW Conservative Allocation Fund, may enter into when-issued, delayed-delivery, or forward commitment transactions in order to lock in the purchase price of the underlying security or to adjust the interest rate exposure of each Fund’s existing portfolio. In when-issued, delayed-delivery, or forward commitment transactions, a Fund commits to purchase or sell particular securities, with payment and delivery to take place at a future date. Although the Fund does not pay for the securities or start earning interest on them until they are delivered, it immediately assumes the risks of ownership, including the risk of price fluctuation. If a Fund’s counterparty fails to deliver a security purchased on a when issued, delayed-delivery, or forward commitment basis, there may be a loss, and the Fund may have missed an opportunity to make an alternative investment.
Prior to settlement of these transactions, the value of the subject securities will fluctuate with market conditions. In addition, because the Fund is not required to pay for when-issued, delayed-delivery or forward commitment securities until the delivery date, they may result in a form of leverage to the extent the Fund does not set aside liquid assets to cover the commitment. To guard against this deemed leverage,
78
Table of Contents
TCW Funds, Inc.
October 31, 2022
Note 3 — Portfolio Investments (Continued)
the Fund monitors the obligations under these transactions on a daily basis and ensures that the Fund has sufficient liquid assets to cover them. There were no when-issued, delayed-delivery or forward commitment transactions in the Funds during the year ended October 31, 2022.
Repurchase Agreements: The Funds may enter into repurchase agreements under the terms of a Master Repurchase Agreement (“MRA”). In a repurchase agreement, the Funds purchase a security from a counterparty who agrees to repurchase the same security at a mutually agreed upon date and price. The MRA permits each Fund, under certain circumstances including an event of default (such as bankruptcy or insolvency), to offset payables and/or receivables under the MRA with collateral held and/or posted to the counterparty and create one single net payment due to or from each Fund. However, bankruptcy or insolvency laws of a particular jurisdiction may impose restrictions on or prohibitions against such a right of offset in the event of the MRA counterparty’s bankruptcy or insolvency. Pursuant to the terms of the MRA, each Fund receives securities as collateral with a market value in excess of the repurchase price. Upon a bankruptcy or insolvency of the MRA counterparty, the Fund recognizes a liability with respect to such excess collateral to reflect the Fund’s obligation under bankruptcy law to return the excess to the counterparty. There were no repurchase agreements outstanding as of October 31, 2022.
Securities Lending: The Funds may lend their securities to qualified brokers. The loans must be collateralized at all times primarily with cash although the Funds can accept money market instruments or U.S. Government securities with a market value at least equal to the market value of the securities on loan. As with any extensions of credit, the Funds may bear the risk of delay in recovery or even loss of rights in the collateral if the borrowers of the securities fail financially. The Funds earn additional income for lending their securities by investing the cash collateral in short-term investments. The Funds did not lend any securities during the year ended October 31, 2022.
Derivatives:
Options: The Funds may purchase and sell put and call options on a security or an index of securities to enhance investment performance and/or to protect against changes in market prices. The Funds may also enter into currency options to hedge against or to take advantage of currency fluctuations.
A call option gives the holder the right to purchase, and obligates the writer to sell, a security at the strike price at any time before the expiration date. A put option gives the holder the right to sell, and obligates the writer to buy, a security at the exercise price at any time before the expiration date. A Fund may purchase put options to protect portfolio holdings against a decline in market value of a security or securities held by it. A Fund may also purchase a put option hoping to profit from an anticipated decline in the value of the underlying security. If a Fund holds the security underlying the option, the option premium and any transaction costs will reduce any profit the Fund might have realized had it sold the underlying security instead of buying the put option. A Fund may purchase call options to hedge against an increase in the price of securities that the Fund ultimately wants to buy. A Fund may also purchase a call option as a long directional investment hoping to profit from an anticipated increase in the value of the underlying security. In order for a call option to be profitable, the market price of the underlying security must rise sufficiently above the exercise price to cover the premium and transaction costs. These costs will reduce any profit a Fund might have realized had it bought the underlying security at the time it purchased the call option.
79
Table of Contents
TCW Funds, Inc.
Notes to Financial Statements (Continued)
Note 3 — Portfolio Investments (Continued)
Purchasing foreign currency options gives a Fund the right, but not the obligation, to buy or sell specified amounts of currency at a rate of exchange that may be exercised by a certain date. These currency options may be used as a short or long hedge against possible variations in foreign exchange rates or to gain exposure to foreign currencies.
When a Fund purchases an option, it runs the risk that it will lose its entire investment in the option in a relatively short period of time, unless the Fund exercises the option or enters into a closing sale transaction before the option’s expiration. If the price of the underlying security does not rise (in the case of a call) or fall (in the case of a put) to an extent sufficient to cover the option premium and transaction costs, the Fund will lose part or all of its investment in the option. Premiums paid for purchasing options that expire are treated as realized losses.
Options purchased or sold by a Fund may be traded on a securities or options exchange. Such options typically have minimal exposure to counterparty risk. However, an exchange or market may at times find it necessary to impose restrictions on particular types of options transactions, such as opening transactions. If an underlying security ceases to meet qualifications imposed by an exchange or the Options Clearing Corporation, new series of options on that security will no longer be opened to replace the expiring series, and opening transactions in existing series may be prohibited.
OTC options are options not traded on exchanges or backed by clearinghouses. Rather, they are entered into directly between a Fund and the counterparty to the option. In the case of an OTC option purchased by a Fund, the value of the option to the Fund will depend on the willingness and ability of the option writer to perform its obligations to the Fund. In addition, OTC options may not be transferable and there may be little or no secondary market for them, so they may be considered illiquid. It may not be possible to enter into closing transactions with respect to OTC options or otherwise to terminate such options, and as a result a Fund may be required to remain obligated on an unfavorable OTC option until its expiration.
During the year ended October 31, 2022, TCW Global Real Estate Fund entered into option contracts to hedge the Fund’s investments from market volatility in the real estate sector.
Note 4 — Risk Considerations
Market Risk: The Funds’ investments will fluctuate with market conditions, and so will the value of your investment in the Funds. You could lose money on your investment in the Funds or the Funds could underperform other investments.
Liquidity Risk: The Funds’ investments in illiquid securities may reduce the returns of the Funds because they may not be able to sell the illiquid securities at an advantageous time or price. Investments in high-yield securities, foreign securities, derivatives or other securities with substantial market and/or credit risk tend to have the greatest exposure to liquidity risk. Certain investments in private placements and Rule 144A securities may be considered illiquid investments. The Funds may invest in private placements and Rule 144A securities.
Counterparty Risk: The Funds may be exposed to counterparty risk, the risk that an entity with which the Funds have unsettled or open transactions may not fulfill its obligations.
Investment Style Risk: Certain Funds may also be subject to investment style risk. The Advisor’s investment styles may be out of favor at times or may not produce the best results over short or longer time periods and may increase the volatility of a Fund’s share price.
80
Table of Contents
TCW Funds, Inc.
October 31, 2022
Note 4 — Risk Considerations (Continued)
Equity Risk: Equity securities may include common stock, preferred stock or other securities representing an ownership interest or the right to acquire an ownership interest in an issuer. Equity risk is the risk that stocks and other equity securities generally fluctuate in value more than bonds and can decline in value over short or extended periods. The value of stocks and other equity securities will be affected by changes in a company’s financial condition and in overall market, economic and political conditions.
Public Health Emergencies Risk and Impact of the Coronavirus (COVID-19): Pandemics and other local, national, and international public health emergencies, including outbreaks of infectious diseases such as SARS, H1N1/09 Flu, the Avian Flu, Ebola and the current outbreak of the novel coronavirus (“COVID-19”), can result, and in the case of COVID-19 is resulting, in market volatility and disruption, and any similar future emergencies may materially and adversely impact economic production and activity in ways that cannot be predicted, all of which could result in substantial investment losses.
The COVID-19 outbreak has caused a worldwide public health emergency, straining healthcare resources and resulting in extensive and growing numbers of infections, hospitalizations and deaths. In an effort to contain COVID-19, local, regional, and national governments, as well as private businesses and other organizations, imposed and in some cases continue to impose severely restrictive measures, including instituting local and regional quarantines, restricting travel (including closing certain international borders), prohibiting public activity (including “stay-at-home,” “shelter-in-place,” and similar orders), and ordering the closure of a wide range of offices, businesses, schools, and other public venues. Consequently, COVID-19 has significantly diminished and disrupted global economic production and activity of all kinds and has contributed to both volatility and a severe decline in financial markets.
The ultimate impact of COVID-19 (and of the resulting precipitous decline and disruption in economic and commercial activity across many of the world’s economies) on global economic conditions, and on the operations, financial condition, and performance of any particular market, industry or business, is impossible to predict. However, ongoing and potential additional materially adverse effects, including further global, regional and local economic downturns (including recessions) of indeterminate duration and severity, are possible. It is difficult to assess what the longer-term impacts of an extended period of unprecedented economic dislocation and disruption will be on future economic developments, the health of certain markets, industries and businesses, and commercial and consumer behavior. The ongoing COVID-19 crisis and any other public health emergency that may arise in the future could have a significant adverse impact on the Funds’ investments and result in significant investment losses.
For more information on risks related to investing in the Funds, please refer to the Funds’ prospectus and the Statement of Additional Information which can be obtained on the Funds’ website (www.tcw.com) or by calling customer service at 800-FUND-TCW (800-386-3829).
Note 5 — Federal Income Taxes
It is the policy of each Fund to comply with the requirements under Subchapter M of the Internal Revenue Code applicable to regulated investment companies and to distribute all of its net taxable income, including any net realized gains on investments, to its shareholders. Therefore, no federal income tax provision is required.
81
Table of Contents
TCW Funds, Inc.
Notes to Financial Statements (Continued)
Note 5 — Federal Income Taxes (Continued)
At October 31, 2022, the components of distributable earnings on a tax basis were as follows:
| Undistributed Ordinary Income | Undistributed Long-Term Gain | Total Distributable Earnings | ||||||||||
TCW Conservative Allocation Fund | $ | 408,519 | $ | 733,388 | $ | 1,141,907 | ||||||
TCW Relative Value Dividend Appreciation Fund | 161,358 | 10,751,733 | 10,913,091 | |||||||||
TCW Relative Value Large Cap Fund | 1,357,088 | 6,011,662 | 7,368,750 | |||||||||
TCW Relative Value Mid Cap Fund | 112,160 | 1,259,325 | 1,371,485 | |||||||||
TCW Select Equities Fund | — | 90,954,258 | 90,954,258 | |||||||||
At the end of the previous fiscal year ended October 31, 2021, the components of distributable earnings on a tax basis were as follows:
| Undistributed Ordinary Income | Undistributed Long-Term Gain | Total Distributable Earnings | ||||||||||
TCW Artificial Intelligence Equity Fund | $ | 48,966 | $ | 766,227 | $ | 815,193 | ||||||
TCW Conservative Allocation Fund | 755,142 | 1,974,573 | 2,729,715 | |||||||||
TCW Global Real Estate Fund | 2,797,620 | 444,438 | 3,242,058 | |||||||||
TCW New America Premier Equities Fund | 13,074,757 | 13,352,129 | 26,426,886 | |||||||||
TCW Relative Value Dividend Appreciation Fund | 309,485 | 24,822,229 | 25,131,714 | |||||||||
TCW Relative Value Large Cap Fund | 1,978,411 | 7,970,616 | 9,949,027 | |||||||||
TCW Relative Value Mid Cap Fund | — | 9,768,687 | 9,768,687 | |||||||||
TCW Select Equities Fund | — | 115,373,781 | 115,373,781 | |||||||||
Permanent differences incurred during the year ended October 31, 2022 resulting from differences in book and tax accounting, have been reclassified at year-end between undistributed net investment income (loss), undistributed (accumulated) net realized gain (loss) and paid-in capital as follows, with no impact to the net asset value per share:
| Undistributed Net Investment Income (Loss) | Undistributed Accumulated Net Realized Gain (Loss) | Paid-in Capital | ||||||||||
TCW Artificial Intelligence Equity Fund | $ | 14,673 | $ | (1,860 | ) | $ | (12,813 | ) | ||||
TCW Conservative Allocation Fund | 307,095 | (331,258 | ) | 24,163 | ||||||||
TCW Global Real Estate Fund | 324,646 | (324,804 | ) | 158 | ||||||||
TCW New America Premier Equities Fund | 143,916 | 45,031 | (188,947 | ) | ||||||||
TCW Relative Value Dividend Appreciation Fund | (61,912 | ) | (471,003 | ) | 532,915 | |||||||
TCW Relative Value Large Cap Fund | (75,259 | ) | (544,159 | ) | 619,418 | |||||||
TCW Relative Value Mid Cap Fund | (3,367 | ) | (23,493 | ) | 26,860 | |||||||
TCW Select Equities Fund | 4,419,326 | (10,242,096 | ) | 5,822,770 | ||||||||
82
Table of Contents
TCW Funds, Inc.
October 31, 2022
Note 5 — Federal Income Taxes (Continued)
During the year ended October 31, 2022, the tax character of distributions paid was as follows:
| Ordinary Income | Long-Term Capital Gain | Return of Capital | Total Distributions | |||||||||||||
TCW Artificial Intelligence Equity Fund | $ | 49,033 | $ | 766,275 | — | $ | 815,308 | |||||||||
TCW Conservative Allocation Fund | 1,276,879 | 1,974,688 | — | 3,251,567 | ||||||||||||
TCW Global Real Estate Fund | 3,083,570 | 514,376 | 447,356 | 4,045,302 | ||||||||||||
TCW New America Premier Equities Fund | 13,075,005 | 13,352,274 | — | 26,427,279 | ||||||||||||
TCW Relative Value Dividend Appreciation Fund | 4,684,797 | 24,822,627 | — | 29,507,424 | ||||||||||||
TCW Relative Value Large Cap Fund | 2,201,494 | 7,971,190 | — | 10,172,684 | ||||||||||||
TCW Relative Value Mid Cap Fund | 482,013 | 9,768,906 | — | 10,250,919 | ||||||||||||
TCW Select Equities Fund | — | 115,374,235 | — | 115,374,235 | ||||||||||||
During the previous fiscal year ended October 31, 2021, the tax character of distributions paid was as follows:
| Ordinary Income | Long-Term Capital Gain | Total Distributions | ||||||||||
TCW Conservative Allocation Fund | $ | 367,007 | $ | 208,009 | $ | 575,016 | ||||||
TCW Global Real Estate Fund | 564,453 | — | 564,453 | |||||||||
TCW New American Premier Equities Fund | 7,812 | — | 7,812 | |||||||||
TCW Relative Value Dividend Appreciation Fund | 4,599,952 | — | 4,599,952 | |||||||||
TCW Relative Value Large Cap Fund | 1,781,283 | 6,833,282 | 8,614,565 | |||||||||
TCW Relative Value Mid Cap Fund | 511,122 | 11,697 | 522,819 | |||||||||
TCW Select Equities Fund | — | 59,131,560 | 59,131,560 | |||||||||
At October 31, 2022, net unrealized appreciation (depreciation) on investments for federal income tax purposes was as follows:
| Unrealized Appreciation | Unrealized (Depreciation) | Net Unrealized Appreciation (Depreciation) | Cost of Investments for Federal Income Tax Purposes | |||||||||||||
TCW Artificial Intelligence Equity Fund | $ | 1,721,636 | $ | (1,089,957 | ) | $ | 631,679 | $ | 10,387,091 | |||||||
TCW Conservative Allocation Fund | 1,801,890 | (3,213,359 | ) | (1,411,469 | ) | 29,402,043 | ||||||||||
TCW Global Real Estate Fund | 737,696 | (4,837,394 | ) | (4,099,698 | ) | 33,588,419 | ||||||||||
TCW New America Premier Equities Fund | 38,093,745 | (1,978,658 | ) | 36,115,087 | 111,996,400 | |||||||||||
TCW Relative Value Dividend Appreciation Fund | 78,235,454 | (5,736,672 | ) | 72,498,782 | 177,148,540 | |||||||||||
TCW Relative Value Large Cap Fund | 44,080,339 | (3,148,687 | ) | 40,931,652 | 68,992,391 | |||||||||||
TCW Relative Value Mid Cap Fund | 24,710,606 | (2,213,730 | ) | 22,496,876 | 54,305,921 | |||||||||||
TCW Select Equities Fund | 328,303,570 | (30,767,085 | ) | 297,536,485 | 270,726,888 | |||||||||||
At October 31, 2022, the following Funds had net realized losses that will be carried forward indefinitely for federal income tax purposes:
| Short-Term Capital Losses | Long-Term Capital Losses | Total | ||||||||||
TCW Artificial Intelligence Equity Fund | $ | 861,465 | $ | 699,047 | $ | 1,560,512 | ||||||
TCW Global Real Estate Fund | 6,781,915 | 273,589 | 7,055,504 | |||||||||
TCW New America Premier Equities Fund | 5,824,865 | — | 5,824,865 | |||||||||
The Funds did not have any unrecognized tax benefits at October 31, 2022, nor were there any increases or decreases in unrecognized tax benefits for the year ended October 31, 2022. The Funds are subject to examination by the U.S. Federal and state tax authorities for returns filed for the prior three and four fiscal years, respectively.
83
Table of Contents
TCW Funds, Inc.
Notes to Financial Statements (Continued)
Note 6 — Fund Management Fees and Other Expenses
The Funds pay to the Advisor, as compensation for services rendered, facilities furnished and expenses borne by it, the following annual management fees as a percentage of daily net assets:
TCW Artificial Intelligence Equity Fund | 0.70% | |||
TCW Global Real Estate Fund | 0.80% | |||
TCW New America Premier Equities Fund | 0.65% | |||
TCW Relative Value Dividend Appreciation Fund | 0.60% | |||
TCW Relative Value Large Cap Fund | 0.60% | |||
TCW Relative Value Mid Cap Fund | 0.70% | |||
TCW Select Equities Fund | 0.65% |
The TCW Conservative Allocation Fund does not pay management fees to the Advisor; however, the Fund pays management fees indirectly as a shareholder in the underlying affiliated funds.
The Advisor limits the operating expenses of the Funds not to exceed the following expense ratios relative to the Funds’ average daily net assets:
TCW Artificial Intelligence Equity Fund | ||||
I Class | 0.90 | % (1) | ||
N Class | 1.00 | % (1) | ||
TCW Conservative Allocation Fund | ||||
I Class | 0.85 | % (1) | ||
N Class | 0.85 | % (1) | ||
TCW Global Real Estate Fund | ||||
I Class | 0.90 | % (1) | ||
N Class | 1.00 | % (1) | ||
TCW New America Premier Equities Fund | ||||
I Class | 1.05 | % (2) | ||
N Class | 1.05 | % (2) | ||
TCW Relative Value Dividend Appreciation Fund | ||||
I Class | 0.70 | % (1) | ||
N Class | 0.90 | % (1) | ||
TCW Relative Value Large Cap Fund | ||||
I Class | 0.70 | % (1) | ||
N Class | 0.90 | % (1) | ||
TCW Relative Value Mid Cap Fund | ||||
I Class | 0.85 | % (1) | ||
N Class | 0.95 | % (1) | ||
TCW Select Equities Fund | ||||
I Class | 0.80 | % (1) | ||
N Class | 1.00 | % (1) |
| (1) | These limitations are based on an agreement between the Advisor and the Company. |
| (2) | Limitation based on average expense ratio as reported by Lipper, Inc., which is subject to change on a monthly basis. This ratio was in effect as of October 31, 2022. These limitations are voluntary and terminable in a six months’ notice. |
The amount borne by the Advisor during the fiscal year when the operating expenses of a Fund are in excess of the expense limitation cannot be recaptured in the subsequent fiscal years should the expenses drop below the expense limitation in the subsequent years. The Advisor can only recapture expenses within a given fiscal year for that year’s operating expenses.
Directors’ Fees: Directors who are not affiliated with the Advisor receive compensation from the Funds which are shown on the Statements of Operations. Directors may elect to defer receipt of their fees in
84
Table of Contents
TCW Funds, Inc.
October 31, 2022
Note 6 — Fund Management Fees and Other Expenses (Continued)
accordance with the terms of a Non-Qualified Deferred Compensation Plan. Deferred compensation is included within directors’ fees and expenses in the Statements of Assets and Liabilities.
Note 7 — Distribution Plan
TCW Funds Distributors LLC (“Distributor”), an affiliate of the Advisor and the Funds, serves as the nonexclusive distributor of each class of the Funds’ shares. The Funds have a distribution plan pursuant to Rule 12b-1 under the 1940 Act with respect to the N Class shares of each Fund. Under the terms of the plan, each Fund compensates the Distributor at a rate equal to 0.25% of the average daily net assets of the Fund attributable to its N Class shares for distribution and related services.
Note 8 — Transactions with Affiliates
The ownership percentage of the TCW Conservative Allocation Fund in each of the affiliated underlying funds at October 31, 2022 is as follows:
Name of Affiliated Fund | Ownership Percentage (1) | |||
Metropolitan West High Yield Bond Fund | 0.05 | % | ||
Metropolitan West Low Duration Bond Fund | 0.14 | % | ||
Metropolitan West Total Return Bond Fund | 0.01 | % | ||
Metropolitan West Unconstrained Bond Fund | 0.18 | % | ||
TCW Artificial Intelligence Equity Fund | 2.24 | % | ||
TCW Emerging Markets Income Fund | 0.01 | % | ||
TCW Enhanced Commodity Strategy Fund | 1.83 | % | ||
TCW Global Bond Fund | 4.26 | % | ||
TCW Global Real Estate Fund | 4.39 | % | ||
TCW New America Premier Equities Fund | 1.79 | % | ||
TCW Relative Value Large Cap Fund | 2.18 | % | ||
TCW Relative Value Mid Cap Fund | 0.90 | % | ||
TCW Select Equities Fund | 0.37 | % | ||
TCW Total Return Bond Fund | 0.12 | % | ||
| (1) | Percentage ownership based on total net assets of the underlying fund. |
The financial statements of the Funds not contained in this report are available by calling 800-FUND-TCW (800-386-3829) or by going to the SEC website at www.sec.gov.
Note 9 — Purchases and Sales of Securities
Investment transactions (excluding short-term investments) for the year ended October 31, 2022 were as follows:
| Purchases at Cost | Sales or Maturity Proceeds | U.S. Government Purchases at Cost | U.S. Government Sales or Maturity Proceeds | |||||||||||||
TCW Artificial Intelligence Equity Fund | $ | 6,205,817 | $ | 6,845,162 | $ | — | $ | — | ||||||||
TCW Conservative Allocation Fund | 5,152,550 | 5,375,796 | — | — | ||||||||||||
TCW Global Real Estate Fund | 70,045,764 | 66,657,907 | — | — | ||||||||||||
TCW New America Premier Equities Fund | 93,778,841 | 128,706,548 | — | — | ||||||||||||
TCW Relative Value Dividend Appreciation Fund | 37,982,296 | 61,154,782 | — | — | ||||||||||||
TCW Relative Value Large Cap Fund | 20,682,772 | 29,605,511 | — | — | ||||||||||||
TCW Relative Value Mid Cap Fund | 22,968,083 | 30,702,561 | — | — | ||||||||||||
TCW Select Equities Fund | 89,185,908 | 188,870,621 | — | — | ||||||||||||
85
Table of Contents
TCW Funds, Inc.
Notes to Financial Statements (Continued)
Note 10 — Capital Share Transactions
Transactions in each Fund’s shares were as follows:
| TCW Artificial Intelligence Equity Fund | Year Ended October 31, 2022 | Year Ended October 31, 2021 | ||||||||||||||
| I Class | Shares | Amount | Shares | Amount | ||||||||||||
Shares Sold | 165,492 | $ | 2,990,723 | 309,702 | $ | 6,792,040 | ||||||||||
Shares Issued upon Reinvestment of Dividends | 20,832 | 500,393 | — | — | ||||||||||||
Shares Redeemed | (201,952 | ) | (3,699,489 | ) | (144,091 | ) | (3,207,441 | ) | ||||||||
|
|
|
|
|
|
|
| |||||||||
Net Increase (Decrease) | (15,628 | ) | $ | (208,373 | ) | 165,611 | $ | 3,584,599 | ||||||||
|
|
|
|
|
|
|
| |||||||||
| N Class | Shares | Amount | Shares | Amount | ||||||||||||
Shares Sold | 21,781 | $ | 444,037 | 95,479 | $ | 2,092,816 | ||||||||||
Shares Issued upon Reinvestment of Dividends | 9,882 | 236,567 | — | — | ||||||||||||
Shares Redeemed | (36,276 | ) | (706,766 | ) | (69,019 | ) | (1,564,824 | ) | ||||||||
|
|
|
|
|
|
|
| |||||||||
Net Increase (Decrease) | (4,613 | ) | $ | (26,162 | ) | 26,460 | $ | 527,992 | ||||||||
|
|
|
|
|
|
|
| |||||||||
| TCW Conservative Allocation Fund | Year Ended October 31, 2022 | Year Ended October 31, 2021 | ||||||||||||||
| I Class | Shares | Amount | Shares | Amount | ||||||||||||
Shares Sold | 111,098 | $ | 1,437,247 | 181,547 | $ | 2,391,227 | ||||||||||
Shares Issued upon Reinvestment of Dividends | 246,578 | 3,156,193 | 41,608 | 539,660 | ||||||||||||
Shares Redeemed | (269,101 | ) | (3,344,517 | ) | (702,396 | ) | (9,376,914 | ) | ||||||||
|
|
|
|
|
|
|
| |||||||||
Net Increase (Decrease) | 88,575 | $ | 1,248,923 | (479,241 | ) | $ | (6,446,027 | ) | ||||||||
|
|
|
|
|
|
|
| |||||||||
| N Class | Shares | Amount | Shares | Amount | ||||||||||||
Shares Sold | 21,102 | $ | 286,952 | 27,941 | $ | 359,099 | ||||||||||
Shares Issued upon Reinvestment of Dividends | 6,087 | 78,156 | 647 | 8,418 | ||||||||||||
Shares Redeemed | (46,990 | ) | (532,935 | ) | (12,962 | ) | (177,005 | ) | ||||||||
|
|
|
|
|
|
|
| |||||||||
Net Increase (Decrease) | (19,801 | ) | $ | (167,827 | ) | 15,626 | $ | 190,512 | ||||||||
|
|
|
|
|
|
|
| |||||||||
| TCW Global Real Estate Fund | Year Ended October 31, 2022 | Year Ended October 31, 2021 | ||||||||||||||
| I Class | Shares | Amount | Shares | Amount | ||||||||||||
Shares Sold | 1,238,351 | $ | 16,219,964 | 1,273,852 | $ | 18,692,927 | ||||||||||
Shares Issued upon Reinvestment of Dividends | 155,575 | 2,152,811 | 24,035 | 344,526 | ||||||||||||
Shares Redeemed | (1,288,095 | ) | (14,513,355 | ) | (511,725 | ) | (7,544,296 | ) | ||||||||
|
|
|
|
|
|
|
| |||||||||
Net Increase | 105,831 | $ | 3,859,420 | 786,162 | $ | 11,493,157 | ||||||||||
|
|
|
|
|
|
|
| |||||||||
| N Class | Shares | Amount | Shares | Amount | ||||||||||||
Shares Sold | 591,337 | $ | 8,396,532 | 637,111 | $ | 9,467,842 | ||||||||||
Shares Issued upon Reinvestment of Dividends | 108,782 | 1,518,023 | 11,222 | 160,691 | ||||||||||||
Shares Redeemed | (521,226 | ) | (6,727,892 | ) | (94,985 | ) | (1,378,411 | ) | ||||||||
|
|
|
|
|
|
|
| |||||||||
Net Increase | 178,893 | $ | 3,186,663 | 553,348 | $ | 8,250,122 | ||||||||||
|
|
|
|
|
|
|
| |||||||||
| TCW New America Premier Equities Fund | Year Ended October 31, 2022 | Year Ended October 31, 2021 | ||||||||||||||
| I Class | Shares | Amount | Shares | Amount | ||||||||||||
Shares Sold | 1,335,475 | $ | 31,722,034 | 1,394,893 | $ | 38,541,475 | ||||||||||
Shares Issued upon Reinvestment of Dividends | 741,908 | 21,708,216 | 227 | 6,065 | ||||||||||||
Shares Redeemed | (2,607,753 | ) | (62,976,632 | ) | (1,845,496 | ) | (50,732,739 | ) | ||||||||
|
|
|
|
|
|
|
| |||||||||
Net Decrease | (530,370 | ) | $ | (9,546,382 | ) | (450,376 | ) | $ | (12,185,199 | ) | ||||||
|
|
|
|
|
|
|
| |||||||||
| N Class | Shares | Amount | Shares | Amount | ||||||||||||
Shares Sold | 87,491 | $ | 2,218,831 | 112,163 | $ | 3,146,542 | ||||||||||
Shares Issued upon Reinvestment of Dividends | 119,270 | 3,468,380 | 44 | 1,183 | ||||||||||||
Shares Redeemed | (261,655 | ) | (6,319,138 | ) | (475,416 | ) | (12,792,822 | ) | ||||||||
|
|
|
|
|
|
|
| |||||||||
Net Decrease | (54,894 | ) | $ | (631,927 | ) | (363,209 | ) | $ | (9,645,097 | ) | ||||||
|
|
|
|
|
|
|
| |||||||||
86
Table of Contents
TCW Funds, Inc.
October 31, 2022
Note 10 — Capital Share Transactions (Continued)
| TCW Relative Value Dividend Appreciation Fund | Year Ended October 31, 2022 | Year Ended October 31, 2021 | ||||||||||||||
| I Class | Shares | Amount | Shares | Amount | ||||||||||||
Shares Sold | 188,052 | $ | 3,811,463 | 278,183 | $ | 5,364,754 | ||||||||||
Shares Issued upon Reinvestment of Dividends | 371,904 | 7,643,438 | 60,207 | 1,192,525 | ||||||||||||
Shares Redeemed | (436,937 | ) | (8,631,778 | ) | (523,686 | ) | (10,343,947 | ) | ||||||||
|
|
|
|
|
|
|
| |||||||||
Net Increase (Decrease) | 123,019 | $ | 2,823,123 | (185,296 | ) | $ | (3,786,668 | ) | ||||||||
|
|
|
|
|
|
|
| |||||||||
| N Class | Shares | Amount | Shares | Amount | ||||||||||||
Shares Sold | 161,356 | $ | 3,323,686 | 112,874 | $ | 2,300,844 | ||||||||||
Shares Issued upon Reinvestment of Dividends | 990,940 | 20,804,992 | 158,146 | 3,191,091 | ||||||||||||
Shares Redeemed | (1,023,676 | ) | (20,971,780 | ) | (1,369,844 | ) | (27,224,718 | ) | ||||||||
|
|
|
|
|
|
|
| |||||||||
Net Increase (Decrease) | 128,620 | $ | 3,156,898 | (1,098,824 | ) | $ | (21,732,783 | ) | ||||||||
|
|
|
|
|
|
|
| |||||||||
| TCW Relative Value Large Cap Fund | Year Ended October 31, 2022 | Year Ended October 31, 2021 | ||||||||||||||
| I Class | Shares | Amount | Shares | Amount | ||||||||||||
Shares Sold | 880,500 | $ | 11,372,198 | 2,034,463 | $ | 28,169,006 | ||||||||||
Shares Issued upon Reinvestment of Dividends | 635,407 | 9,226,109 | 623,997 | 7,469,240 | ||||||||||||
Shares Redeemed | (1,591,829 | ) | (21,475,920 | ) | (2,590,672 | ) | (35,914,215 | ) | ||||||||
|
|
|
|
|
|
|
| |||||||||
Net Increase (Decrease) | (75,922 | ) | $ | (877,613 | ) | 67,788 | $ | (275,969 | ) | |||||||
|
|
|
|
|
|
|
| |||||||||
| N Class | Shares | Amount | Shares | Amount | ||||||||||||
Shares Sold | 39,830 | $ | 539,623 | 276,683 | $ | 3,832,606 | ||||||||||
Shares Issued upon Reinvestment of Dividends | 52,608 | 761,768 | 71,171 | 849,069 | ||||||||||||
Shares Redeemed | (103,493 | ) | (1,439,143 | ) | (505,506 | ) | (7,126,708 | ) | ||||||||
|
|
|
|
|
|
|
| |||||||||
Net Decrease | (11,055 | ) | $ | (137,752 | ) | (157,652 | ) | $ | (2,445,033 | ) | ||||||
|
|
|
|
|
|
|
| |||||||||
| TCW Relative Value Mid Cap Fund | Year Ended October 31, 2022 | Year Ended October 31, 2021 | ||||||||||||||
| I Class | Shares | Amount | Shares | Amount | ||||||||||||
Shares Sold | 58,374 | $ | 1,440,544 | 514,977 | $ | 14,595,767 | ||||||||||
Shares Issued upon Reinvestment of Dividends | 303,691 | 8,248,263 | 18,931 | 432,563 | ||||||||||||
Shares Redeemed | (150,047 | ) | (3,731,794 | ) | (784,303 | ) | (19,634,600 | ) | ||||||||
|
|
|
|
|
|
|
| |||||||||
Net Increase (Decrease) | 212,018 | $ | 5,957,013 | (250,395 | ) | $ | (4,606,270 | ) | ||||||||
|
|
|
|
|
|
|
| |||||||||
| N Class | Shares | Amount | Shares | Amount | ||||||||||||
Shares Sold | 17,121 | $ | 449,871 | 63,908 | $ | 1,804,264 | ||||||||||
Shares Issued upon Reinvestment of Dividends | 68,096 | 1,789,559 | 3,625 | 80,472 | ||||||||||||
Shares Redeemed | (88,053 | ) | (2,385,148 | ) | (80,738 | ) | (2,079,251 | ) | ||||||||
|
|
|
|
|
|
|
| |||||||||
Net Decrease | (2,836 | ) | $ | (145,718 | ) | (13,205 | ) | $ | (194,515 | ) | ||||||
|
|
|
|
|
|
|
| |||||||||
| TCW Select Equities Fund | Year Ended October 31, 2022 | Year Ended October 31, 2021 | ||||||||||||||
| I Class | Shares | Amount | Shares | Amount | ||||||||||||
Shares Sold | 3,549,198 | $ | 117,409,079 | 2,176,136 | $ | 84,266,235 | ||||||||||
Shares Issued upon Reinvestment of Dividends | 1,506,568 | 59,886,076 | 865,922 | 30,506,419 | ||||||||||||
Shares Redeemed | (5,050,028 | ) | (157,126,347 | ) | (3,676,735 | ) | (142,039,181 | ) | ||||||||
|
|
|
|
|
|
|
| |||||||||
Net Increase (Decrease) | 5,738 | $ | 20,168,808 | (634,677 | ) | $ | (27,266,527 | ) | ||||||||
|
|
|
|
|
|
|
| |||||||||
| N Class | Shares | Amount | Shares | Amount | ||||||||||||
Shares Sold | 251,469 | $ | 7,452,701 | 501,368 | $ | 17,766,764 | ||||||||||
Shares Issued upon Reinvestment of Dividends | 714,063 | 24,121,038 | 398,820 | 12,199,905 | ||||||||||||
Shares Redeemed | (1,174,290 | ) | (33,272,578 | ) | (1,298,645 | ) | (42,769,320 | ) | ||||||||
|
|
|
|
|
|
|
| |||||||||
Net Decrease | (208,758 | ) | $ | (1,698,839 | ) | (398,457 | ) | $ | (12,802,651 | ) | ||||||
|
|
|
|
|
|
|
| |||||||||
87
Table of Contents
TCW Funds, Inc.
Notes to Financial Statements (Continued)
Note 11 — Affiliate Ownership
As of October 31, 2022, affiliates of the Funds and Advisor owned 39.79%, 36.23% and 5.55% of the net assets of the TCW Artificial Intelligence Equity Fund, the TCW Global Real Estate Fund, and the TCW Relative Value Large Cap Fund, respectively.
Note 12 — Restricted Securities
The Funds are permitted to invest in securities that have legal or contractual restrictions on resale. These securities may be sold privately, but are required to be registered before being sold to the public (exemption rules apply). Private placement securities are generally considered to be restricted except for those securities traded between qualified institutional investors under the provisions of Rule 144A of the Securities Act of 1933, as amended (the “Securities Act”). However, the Company considers 144A securities to be restricted if those securities have been deemed illiquid. Disposal of these securities may involve time-consuming negotiations and expense, and prompt sale at an acceptable price may be difficult. There were no restricted securities held by the Funds at October 31, 2022.
Note 13 — Committed Line Of Credit
The Funds have entered into a $100,000,000 committed revolving line of credit agreement with State Street Bank and Trust Company (the “Bank”) for temporary borrowing purposes, renewable annually. The interest rate on borrowing is the higher of the Federal Funds rate plus 0.10% plus 1.25% or the Overnight Bank Funding rate plus 0.10% plus 1.25%. There were no borrowings from the line of credit as of or during the year ended October 31, 2022. The Funds pay the Bank a commitment fee equal to 0.25% per annum on the daily unused portion of the committed line amount. The commitment fees incurred by the Funds are presented in the Statements of Operations. The commitment fees are allocated to each applicable portfolio in proportion to its relative average daily net assets and the interest expenses are charged directly to the applicable portfolio.
Note 14 — Indemnifications
Under the Company’s organizational documents, its Officers and Directors may be indemnified against certain liabilities and expenses arising out of the performance of their duties to the Company. In addition, the Company entered into an agreement with each of the Directors which provides that the Company will indemnify and hold harmless each Director against any expenses actually and reasonably incurred by such Director in any proceeding arising out of or in connection with the Director’s services to the Company, to the fullest extent permitted by the Company’s Articles of Incorporation and By-Laws, the Maryland General Corporation Law, the Securities Act, and the 1940 Act, each as now or hereinafter in force. Additionally, in the normal course of business, the Company enters into agreements with service providers that may contain indemnification clauses. The Company’s maximum exposure under these arrangements is unknown as this would involve future claims that may be made against the Company that have not yet occurred. However, based on experience, the Company expects the risk of loss to be remote. The Company has not accrued any liability in connection with such indemnification.
Note 15 — New Accounting Pronouncement
In June 2022, the FASB issued ASU No. 2022-03, “Fair Value Measurement of Equity Securities Subject to Contractual Sale Restrictions” (“ASU 2022-03”). ASU 2022-03 (1) clarifies the guidance in ASC 820 on the fair value measurement of an equity security that is subject to a contractual sale restriction and (2) requires specific disclosures related to such an equity security. ASU 2022-03 is effective for fiscal years beginning after December 15, 2023 and interim periods within that fiscal year, with early adoption permitted. We are currently evaluating the impact of the adoption of ASU 2022-03 on our consolidated financial statements.
88
Table of Contents
TCW Artificial Intelligence Equity Fund
Financial Highlights — I Class
| Year Ended October 31, | ||||||||||||||||||||
| 2022 | 2021 | 2020 | 2019 | 2018 | ||||||||||||||||
Net Asset Value per Share, Beginning of year | $ | 24.99 | $ | 18.31 | $ | 12.70 | $ | 11.18 | $ | 10.64 | ||||||||||
|
|
|
|
|
|
|
|
|
| |||||||||||
Income (Loss) from Investment Operations: |
| |||||||||||||||||||
Net Investment Loss | (0.07 | ) | (0.11 | ) | (0.06 | ) | (0.02 | ) | (0.04 | ) | ||||||||||
Net Realized and Unrealized Gain (Loss) on Investments (1) | (8.97 | ) | 6.79 | 5.67 | 1.54 | 0.58 | ||||||||||||||
|
|
|
|
|
|
|
|
|
| |||||||||||
Total from Investment Operations | (9.04 | ) | 6.68 | 5.61 | 1.52 | 0.54 | ||||||||||||||
|
|
|
|
|
|
|
|
|
| |||||||||||
Less Distributions: |
| |||||||||||||||||||
Distributions from Net Investment Income | — | — | — | — | (0.00 | ) (2) | ||||||||||||||
Distributions from Net Realized Gain | (1.07 | ) | — | — | — | — | ||||||||||||||
|
|
|
|
|
|
|
|
|
| |||||||||||
Total Distributions | (1.07 | ) | — | — | — | (0.00 | ) (2) | |||||||||||||
|
|
|
|
|
|
|
|
|
| |||||||||||
Net Asset Value per Share, End of year | $ | 14.88 | $ | 24.99 | $ | 18.31 | $ | 12.70 | $ | 11.18 | ||||||||||
|
|
|
|
|
|
|
|
|
| |||||||||||
Total Return | (37.81 | )% | 36.48 | % | 44.17 | % | 13.60 | % | 5.09 | % | ||||||||||
Ratios/Supplemental Data: |
| |||||||||||||||||||
Net Assets, End of year (in thousands) | $ | 7,780 | $ | 13,452 | $ | 6,826 | $ | 2,940 | $ | 1,364 | ||||||||||
Ratio of Expenses to Average Net Assets: | ||||||||||||||||||||
Before Expense Reimbursement | 1.78 | % | 1.66 | % | 2.81 | % | 6.36 | % | 8.32 | % | ||||||||||
After Expense Reimbursement | 0.90 | % | 0.90 | % | 0.90 | % | 0.92 | % | 1.05 | % | ||||||||||
Ratio of Net Investment Loss to Average Net Assets | (0.38 | )% | (0.51 | )% | (0.41 | )% | (0.17 | )% | (0.34 | )% | ||||||||||
Portfolio Turnover Rate | 46.67 | % | 87.71 | % | 24.16 | % | 61.09 | % | 74.22 | % | ||||||||||
| (1) | Computed using average shares outstanding throughout the period. |
| (2) | Amount rounds to less than $0.01 per share. |
See accompanying Notes to Financial Statements.
89
Table of Contents
TCW Artificial Intelligence Equity Fund
Financial Highlights — N Class
| Year Ended October 31, | ||||||||||||||||||||
| 2022 | 2021 | 2020 | 2019 | 2018 | ||||||||||||||||
Net Asset Value per Share, Beginning of year | $ | 24.91 | $ | 18.27 | $ | 12.69 | $ | 11.17 | $ | 10.64 | ||||||||||
|
|
|
|
|
|
|
|
|
| |||||||||||
Income (Loss) from Investment Operations: |
| |||||||||||||||||||
Net Investment Loss | (0.09 | ) | (0.14 | ) | (0.08 | ) | (0.03 | ) | (0.04 | ) | ||||||||||
Net Realized and Unrealized Gain (Loss) on Investments (1) | (8.93 | ) | 6.78 | 5.66 | 1.55 | 0.57 | ||||||||||||||
|
|
|
|
|
|
|
|
|
| |||||||||||
Total from Investment Operations | (9.02 | ) | 6.64 | 5.58 | 1.52 | 0.53 | ||||||||||||||
|
|
|
|
|
|
|
|
|
| |||||||||||
Less Distributions: |
| |||||||||||||||||||
Distributions from Net Investment Income | — | — | — | — | (0.00 | ) (2) | ||||||||||||||
Distributions from Net Realized Gain | (1.07 | ) | — | — | — | — | ||||||||||||||
|
|
|
|
|
|
|
|
|
| |||||||||||
Total Distributions | (1.07 | ) | — | — | — | (0.00 | ) (2) | |||||||||||||
|
|
|
|
|
|
|
|
|
| |||||||||||
Net Asset Value per Share, End of year | $ | 14.82 | $ | 24.91 | $ | 18.27 | $ | 12.69 | $ | 11.17 | ||||||||||
|
|
|
|
|
|
|
|
|
| |||||||||||
Total Return | (37.85 | )% | 36.34 | % | 43.97 | % | 13.61 | % | 5.00 | % | ||||||||||
Ratios/Supplemental Data: |
| |||||||||||||||||||
Net Assets, End of year (in thousands) | $ | 3,194 | $ | 5,483 | $ | 3,539 | $ | 989 | $ | 693 | ||||||||||
Ratio of Expenses to Average Net Assets: | ||||||||||||||||||||
Before Expense Reimbursement | 2.43 | % | 2.21 | % | 3.83 | % | 7.99 | % | 9.60 | % | ||||||||||
After Expense Reimbursement | 1.00 | % | 1.00 | % | 1.00 | % | 1.01 | % | 1.05 | % | ||||||||||
Ratio of Net Investment Loss to Average Net Assets | (0.48 | )% | (0.61 | )% | (0.53 | )% | (0.25 | )% | (0.33 | )% | ||||||||||
Portfolio Turnover Rate | 46.67 | % | 87.71 | % | 24.16 | % | 61.09 | % | 74.22 | % | ||||||||||
| (1) | Computed using average shares outstanding throughout the period. |
| (2) | Amount rounds to less than $0.01 per share. |
See accompanying Notes to Financial Statements.
90
Table of Contents
TCW Conservative Allocation Fund
Financial Highlights — I Class
| Year Ended October 31, | ||||||||||||||||||||
| 2022 | 2021 | 2020 | 2019 | 2018 | ||||||||||||||||
Net Asset Value per Share, Beginning of year | $ | 13.96 | $ | 12.22 | $ | 12.09 | $ | 11.68 | $ | 12.17 | ||||||||||
|
|
|
|
|
|
|
|
|
| |||||||||||
Income (Loss) from Investment Operations: |
| |||||||||||||||||||
Net Investment Income (1) | 0.23 | 0.13 | 0.18 | 0.24 | 0.20 | |||||||||||||||
Net Realized and Unrealized Gain (Loss) on Investments | (2.35 | ) | 1.80 | 0.76 | 0.89 | (0.19 | ) | |||||||||||||
|
|
|
|
|
|
|
|
|
| |||||||||||
Total from Investment Operations | (2.12 | ) | 1.93 | 0.94 | 1.13 | 0.01 | ||||||||||||||
|
|
|
|
|
|
|
|
|
| |||||||||||
Less Distributions: |
| |||||||||||||||||||
Distributions from Net Investment Income | (0.30 | ) | (0.12 | ) | (0.71 | ) | (0.21 | ) | (0.20 | ) | ||||||||||
Distributions from Net Realized Gain | (0.97 | ) | (0.07 | ) | (0.10 | ) | (0.51 | ) | (0.30 | ) | ||||||||||
|
|
|
|
|
|
|
|
|
| |||||||||||
Total Distributions | (1.27 | ) | (0.19 | ) | (0.81 | ) | (0.72 | ) | (0.50 | ) | ||||||||||
|
|
|
|
|
|
|
|
|
| |||||||||||
Net Asset Value per Share, End of year | $ | 10.57 | $ | 13.96 | $ | 12.22 | $ | 12.09 | $ | 11.68 | ||||||||||
|
|
|
|
|
|
|
|
|
| |||||||||||
Total Return | (16.80 | )% | 15.92 | % | 8.19 | % | 10.46 | % | 0.04 | % | ||||||||||
Ratios/Supplemental Data: |
| |||||||||||||||||||
Net Assets, End of year (in thousands) | $ | 27,624 | $ | 35,264 | $ | 36,714 | $ | 29,565 | $ | 27,925 | ||||||||||
Ratio of Expenses to Average Net Assets: (2) |
| |||||||||||||||||||
Before Expense Reimbursement | 0.41 | % | 0.44 | % | 0.39 | % | 0.44 | % | 0.37 | % | ||||||||||
After Expense Reimbursement | 0.41 | % | N/A | N/A | N/A | N/A | ||||||||||||||
Ratio of Net Investment Income to Average Net Assets | 1.96 | % | 0.94 | % | 1.56 | % | 2.03 | % | 1.68 | % | ||||||||||
Portfolio Turnover Rate | 16.20 | % | 26.34 | % | 26.22 | % | 21.66 | % | 19.79 | % | ||||||||||
| (1) | Computed using average shares outstanding throughout the period. |
| (2) | Does not include expenses of the underlying affiliated funds. |
See accompanying Notes to Financial Statements.
91
Table of Contents
TCW Conservative Allocation Fund
Financial Highlights — N Class
| Year Ended October 31, | ||||||||||||||||||||
| 2022 | 2021 | 2020 | 2019 | 2018 | ||||||||||||||||
Net Asset Value per Share, Beginning of year | $ | 13.97 | $ | 12.22 | $ | 12.09 | $ | 11.67 | $ | 12.15 | ||||||||||
|
|
|
|
|
|
|
|
|
| |||||||||||
Income (Loss) from Investment Operations: |
| |||||||||||||||||||
Net Investment Income (1) | 0.17 | 0.09 | 0.15 | 0.20 | 0.15 | |||||||||||||||
Net Realized and Unrealized Gain (Loss) on Investments | (2.34 | ) | 1.81 | 0.75 | 0.90 | (0.18 | ) | |||||||||||||
|
|
|
|
|
|
|
|
|
| |||||||||||
Total from Investment Operations | (2.17 | ) | 1.90 | 0.90 | 1.10 | (0.03 | ) | |||||||||||||
|
|
|
|
|
|
|
|
|
| |||||||||||
Less Distributions: |
| |||||||||||||||||||
Distributions from Net Investment Income | (0.26 | ) | (0.08 | ) | (0.67 | ) | (0.17 | ) | (0.15 | ) | ||||||||||
Distributions from Net Realized Gain | (0.97 | ) | (0.07 | ) | (0.10 | ) | (0.51 | ) | (0.30 | ) | ||||||||||
|
|
|
|
|
|
|
|
|
| |||||||||||
Total Distributions | (1.23 | ) | (0.15 | ) | (0.77 | ) | (0.68 | ) | (0.45 | ) | ||||||||||
|
|
|
|
|
|
|
|
|
| |||||||||||
Net Asset Value per Share, End of year | $ | 10.57 | $ | 13.97 | $ | 12.22 | $ | 12.09 | $ | 11.67 | ||||||||||
|
|
|
|
|
|
|
|
|
| |||||||||||
Total Return | (17.08 | )% | 15.64 | % | 7.85 | % | 10.16 | % | (0.35 | )% | ||||||||||
Ratios/Supplemental Data: |
| |||||||||||||||||||
Net Assets, End of year (in thousands) | $ | 347 | $ | 736 | $ | 452 | $ | 350 | $ | 518 | ||||||||||
Ratio of Expenses to Average Net Assets: (2) |
| |||||||||||||||||||
Before Expense Reimbursement | 4.18 | % | 3.73 | % | 6.06 | % | 6.89 | % | 5.14 | % | ||||||||||
After Expense Reimbursement | 0.67 | % | 0.68 | % | 0.70 | % | 0.74 | % | 0.76 | % | ||||||||||
Ratio of Net Investment Income to Average Net Assets | 1.41 | % | 0.70 | % | 1.23 | % | 1.75 | % | 1.28 | % | ||||||||||
Portfolio Turnover Rate | 16.20 | % | 26.34 | % | 26.22 | % | 21.66 | % | 19.79 | % | ||||||||||
| (1) | Computed using average shares outstanding throughout the period. |
| (2) | Does not include expenses of the underlying affiliated funds. |
See accompanying Notes to Financial Statements.
92
Table of Contents
TCW Global Real Estate Fund
Financial Highlights — I Class
| Year Ended October 31, | ||||||||||||||||||||
| 2022 | 2021 | 2020 | 2019 | 2018 | ||||||||||||||||
Net Asset Value per Share, Beginning of year | $ | 15.45 | $ | 11.07 | $ | 11.16 | $ | 9.30 | $ | 10.10 | ||||||||||
|
|
|
|
|
|
|
|
|
| |||||||||||
Income (Loss) from Investment Operations: |
| |||||||||||||||||||
Net Investment Income (1) | 0.27 | 0.36 | 0.17 | 0.33 | 0.25 | |||||||||||||||
Net Realized and Unrealized Gain (Loss) on Investments | (3.98 | ) | 4.30 | (0.05 | ) | 1.78 | (0.85 | ) | ||||||||||||
|
|
|
|
|
|
|
|
|
| |||||||||||
Total from Investment Operations | (3.71 | ) | 4.66 | 0.12 | 2.11 | (0.60 | ) | |||||||||||||
|
|
|
|
|
|
|
|
|
| |||||||||||
Less Distributions: |
| |||||||||||||||||||
Distributions from Net Investment Income | (0.45 | ) | (0.28 | ) | (0.16 | ) | (0.25 | ) | (0.20 | ) | ||||||||||
Distributions from Return of Capital | (0.13 | ) | — | (0.05 | ) | — | — | |||||||||||||
Distributions from Net Realized Gain | (0.85 | ) | — | — | — | — | ||||||||||||||
|
|
|
|
|
|
|
|
|
| |||||||||||
Total Distributions | (1.43 | ) | (0.28 | ) | (0.21 | ) | (0.25 | ) | (0.20 | ) | ||||||||||
|
|
|
|
|
|
|
|
|
| |||||||||||
Net Asset Value per Share, End of year | $ | 10.31 | $ | 15.45 | $ | 11.07 | $ | 11.16 | $ | 9.30 | ||||||||||
|
|
|
|
|
|
|
|
|
| |||||||||||
Total Return | (26.38 | )% | 42.32 | % | 1.15 | % | 23.17 | % | (6.06 | )% | ||||||||||
Ratios/Supplemental Data: |
| |||||||||||||||||||
Net Assets, End of year (in thousands) | $ | 17,741 | $ | 24,949 | $ | 9,175 | $ | 6,518 | $ | 2,886 | ||||||||||
Ratio of Expenses to Average Net Assets: |
| |||||||||||||||||||
Before Expense Reimbursement | 1.32 | % | 1.45 | % | 2.80 | % | 3.15 | % | 3.78 | % | ||||||||||
After Expense Reimbursement | 0.90 | % | 0.92 | % | 1.00 | % | 1.00 | % | 1.12 | % | ||||||||||
Ratio of Net Investment Income to Average Net Assets | 2.12 | % | 2.50 | % | 1.59 | % | 3.25 | % | 2.55 | % | ||||||||||
Portfolio Turnover Rate | 167.41 | % | 164.29 | % | 136.71 | % | 85.18 | % | 121.67 | % | ||||||||||
| (1) | Computed using average shares outstanding throughout the period. |
See accompanying Notes to Financial Statements.
93
Table of Contents
TCW Global Real Estate Fund
Financial Highlights — N Class
| Year Ended October 31, | ||||||||||||||||||||
| 2022 | 2021 | 2020 | 2019 | 2018 | ||||||||||||||||
Net Asset Value per Share, Beginning of year | $ | 15.43 | $ | 11.06 | $ | 11.16 | $ | 9.30 | $ | 10.10 | ||||||||||
|
|
|
|
|
|
|
|
|
| |||||||||||
Income (Loss) from Investment Operations: |
| |||||||||||||||||||
Net Investment Income (1) | 0.25 | 0.33 | 0.13 | 0.39 | 0.24 | |||||||||||||||
Net Realized and Unrealized Gain (Loss) on Investments | (3.97 | ) | 4.30 | (0.03 | ) | 1.71 | (0.85 | ) | ||||||||||||
|
|
|
|
|
|
|
|
|
| |||||||||||
Total from Investment Operations | (3.72 | ) | 4.63 | 0.10 | 2.10 | (0.61 | ) | |||||||||||||
|
|
|
|
|
|
|
|
|
| |||||||||||
Less Distributions: |
| |||||||||||||||||||
Distributions from Net Investment Income | (0.44 | ) | (0.26 | ) | (0.15 | ) | (0.24 | ) | (0.19 | ) | ||||||||||
Distributions from Net Realized Gain | (0.85 | ) | — | — | — | — | ||||||||||||||
Distributions from Return of Capital | (0.12 | ) | — | (0.05 | ) | — | — | |||||||||||||
|
|
|
|
|
|
|
|
|
| |||||||||||
Total Distributions | (1.41 | ) | (0.26 | ) | (0.20 | ) | (0.24 | ) | (0.19 | ) | ||||||||||
|
|
|
|
|
|
|
|
|
| |||||||||||
Net Asset Value per Share, End of year | $ | 10.30 | $ | 15.43 | $ | 11.06 | $ | 11.16 | $ | 9.30 | ||||||||||
|
|
|
|
|
|
|
|
|
| |||||||||||
Total Return | (26.43 | )% | 42.10 | % | 0.94 | % | 22.99 | % | (6.14 | )% | ||||||||||
Ratios/Supplemental Data: |
| |||||||||||||||||||
Net Assets, End of year (in thousands) | $ | 11,608 | $ | 14,634 | $ | 4,370 | $ | 658 | $ | 536 | ||||||||||
Ratio of Expenses to Average Net Assets: |
| |||||||||||||||||||
Before Expense Reimbursement | 1.64 | % | 1.90 | % | 5.14 | % | 7.17 | % | 7.65 | % | ||||||||||
After Expense Reimbursement | 1.00 | % | 1.03 | % | 1.15 | % | 1.15 | % | 1.22 | % | ||||||||||
Ratio of Net Investment Income to Average Net Assets | 1.95 | % | 2.36 | % | 1.21 | % | 3.88 | % | 2.46 | % | ||||||||||
Portfolio Turnover Rate | 167.41 | % | 164.29 | % | 136.71 | % | 85.18 | % | 121.67 | % | ||||||||||
| (1) | Computed using average shares outstanding throughout the period. |
See accompanying Notes to Financial Statements.
94
Table of Contents
TCW New America Premier Equities Fund
Financial Highlights — I Class
| Year Ended October 31, | ||||||||||||||||||||
| 2022 | 2021 | 2020 | 2019 | 2018 | ||||||||||||||||
Net Asset Value per Share, Beginning of year | $ | 31.80 | $ | 22.64 | $ | 20.34 | $ | 16.27 | $ | 15.24 | ||||||||||
|
|
|
|
|
|
|
|
|
| |||||||||||
Income (Loss) from Investment Operations: |
| |||||||||||||||||||
Net Investment Income (Loss) (1) | (0.05 | ) | 0.11 | 0.01 | 0.11 | (0.02 | ) | |||||||||||||
Net Realized and Unrealized Gain (Loss) on Investments | (6.03 | ) | 9.05 | 2.48 | 4.18 | 1.59 | ||||||||||||||
|
|
|
|
|
|
|
|
|
| |||||||||||
Total from Investment Operations | (6.08 | ) | 9.16 | 2.49 | 4.29 | 1.57 | ||||||||||||||
|
|
|
|
|
|
|
|
|
| |||||||||||
Less Distributions: |
| |||||||||||||||||||
Distributions from Net Investment Income | — | (0.00 | ) (2) | (0.10 | ) | (0.01 | ) | — | ||||||||||||
Distributions from Net Realized Gain | (3.66 | ) | — | (0.09 | ) | (0.21 | ) | (0.54 | ) | |||||||||||
|
|
|
|
|
|
|
|
|
| |||||||||||
Total Distributions | (3.66 | ) | (0.00 | ) (2) | (0.19 | ) | (0.22 | ) | (0.54 | ) | ||||||||||
|
|
|
|
|
|
|
|
|
| |||||||||||
Net Asset Value per Share, End of year | $ | 22.06 | $ | 31.80 | $ | 22.64 | $ | 20.34 | $ | 16.27 | ||||||||||
|
|
|
|
|
|
|
|
|
| |||||||||||
Total Return | (21.95 | )% | 40.46 | % | 12.31 | % | 26.79 | % | 10.60 | % | ||||||||||
Ratios/Supplemental Data: |
| |||||||||||||||||||
Net Assets, End of year (in thousands) | $ | 128,086 | $ | 201,523 | $ | 153,647 | $ | 103,442 | $ | 28,486 | ||||||||||
Ratio of Expenses to Average Net Assets: |
| |||||||||||||||||||
Before Expense Reimbursement | 0.81 | % | 0.80 | % | 0.83 | % | 0.93 | % | 1.28 | % | ||||||||||
After Expense Reimbursement | N/A | N/A | N/A | 0.82 | % | 1.04 | % | |||||||||||||
Ratio of Net Investment Income (Loss) to Average Net Assets | (0.19 | )% | 0.37 | % | 0.03 | % | 0.56 | % | (0.13 | )% | ||||||||||
Portfolio Turnover Rate | 52.08 | % | 135.09 | % | 88.08 | % | 105.28 | % | 49.68 | % | ||||||||||
| (1) | Computed using average shares outstanding throughout the period. |
| (2) | Amount rounds to less than $0.01 per share. |
See accompanying Notes to Financial Statements.
95
Table of Contents
TCW New America Premier Equities Fund
Financial Highlights — N Class
| Year Ended October 31, | ||||||||||||||||||||
| 2022 | 2021 | 2020 | 2019 | 2018 | ||||||||||||||||
Net Asset Value per Share, Beginning of year | $ | 31.64 | $ | 22.59 | $ | 20.31 | $ | 16.27 | $ | 15.24 | ||||||||||
|
|
|
|
|
|
|
|
|
| |||||||||||
Income (Loss) from Investment Operations: | ||||||||||||||||||||
Net Investment Income (Loss) (1) | (0.11 | ) | 0.03 | (0.01 | ) | 0.06 | (0.02 | ) | ||||||||||||
Net Realized and Unrealized Gain (Loss) on Investments | (6.00 | ) | 9.02 | 2.44 | 4.20 | 1.59 | ||||||||||||||
|
|
|
|
|
|
|
|
|
| |||||||||||
Total from Investment Operations | (6.11 | ) | 9.05 | 2.43 | 4.26 | 1.57 | ||||||||||||||
|
|
|
|
|
|
|
|
|
| |||||||||||
Less Distributions: | ||||||||||||||||||||
Distributions from Net Investment Income | — | (0.00 | ) (2) | (0.06 | ) | (0.01 | ) | — | ||||||||||||
Distributions from Net Realized Gain | (3.66 | ) | — | (0.09 | ) | (0.21 | ) | (0.54 | ) | |||||||||||
|
|
|
|
|
|
|
|
|
| |||||||||||
Total Distributions | (3.66 | ) | (0.00 | ) (2) | (0.15 | ) | (0.22 | ) | (0.54 | ) | ||||||||||
|
|
|
|
|
|
|
|
|
| |||||||||||
Net Asset Value per Share, End of year | $ | 21.87 | $ | 31.64 | $ | 22.59 | $ | 20.31 | $ | 16.27 | ||||||||||
|
|
|
|
|
|
|
|
|
| |||||||||||
Total Return | (22.18 | )% | 40.07 | % | 12.02 | % | 26.60 | % | 10.60 | % | ||||||||||
Ratios/Supplemental Data: | ||||||||||||||||||||
Net Assets, End of year (in thousands) | $ | 19,781 | $ | 30,348 | $ | 29,870 | $ | 52,130 | $ | 4,879 | ||||||||||
Ratio of Expenses to Average Net Assets: | ||||||||||||||||||||
Before Expense Reimbursement | 1.22 | % | 1.20 | % | 1.17 | % | 1.28 | % | 2.14 | % | ||||||||||
After Expense Reimbursement | 1.07 | % | 1.09 | % | 1.05 | % | 1.00 | % | 1.04 | % | ||||||||||
Ratio of Net Investment Income (Loss) to Average Net Assets | (0.45 | )% | 0.10 | % | (0.05 | )% | 0.32 | % | (0.13 | )% | ||||||||||
Portfolio Turnover Rate | 52.08 | % | 135.09 | % | 88.08 | % | 105.28 | % | 49.68 | % | ||||||||||
| (1) | Computed using average shares outstanding throughout the period. |
| (2) | Amount rounds to less than $0.01 per share. |
See accompanying Notes to Financial Statements.
96
Table of Contents
TCW Relative Value Dividend Appreciation Fund
Financial Highlights — I Class
| Year Ended October 31, | ||||||||||||||||||||
| 2022 | 2021 | 2020 | 2019 | 2018 | ||||||||||||||||
Net Asset Value per Share, Beginning of year | $ | 22.12 | $ | 14.91 | $ | 17.92 | $ | 17.47 | $ | 19.14 | ||||||||||
|
|
|
|
|
|
|
|
|
| |||||||||||
Income (Loss) from Investment Operations: | ||||||||||||||||||||
Net Investment Income (1) | 0.38 | 0.37 | 0.40 | 0.39 | 0.35 | |||||||||||||||
Net Realized and Unrealized Gain (Loss) on Investments | (0.79 | ) | 7.22 | (1.81 | ) | 1.37 | (0.90 | ) | ||||||||||||
|
|
|
|
|
|
|
|
|
| |||||||||||
Total from Investment Operations | (0.41 | ) | 7.59 | (1.41 | ) | 1.76 | (0.55 | ) | ||||||||||||
|
|
|
|
|
|
|
|
|
| |||||||||||
Less Distributions: | ||||||||||||||||||||
Distributions from Net Investment Income | (0.39 | ) | (0.38 | ) | (0.41 | ) | (0.39 | ) | (0.40 | ) | ||||||||||
Distributions from Net Realized Gain | (2.02 | ) | — | (1.19 | ) | (0.92 | ) | (0.72 | ) | |||||||||||
|
|
|
|
|
|
|
|
|
| |||||||||||
Total Distributions | (2.41 | ) | (0.38 | ) | (1.60 | ) | (1.31 | ) | (1.12 | ) | ||||||||||
|
|
|
|
|
|
|
|
|
| |||||||||||
Net Asset Value per Share, End of year | $ | 19.30 | $ | 22.12 | $ | 14.91 | $ | 17.92 | $ | 17.47 | ||||||||||
|
|
|
|
|
|
|
|
|
| |||||||||||
Total Return | (2.36 | )% | 51.22 | % | (8.71 | )% | 11.27 | % | (3.28 | )% | ||||||||||
Ratios/Supplemental Data: | ||||||||||||||||||||
Net Assets, End of year (in thousands) | $ | 70,448 | $ | 78,001 | $ | 55,326 | $ | 88,314 | $ | 95,108 | ||||||||||
Ratio of Expenses to Average Net Assets: | ||||||||||||||||||||
Before Expense Reimbursement | 0.76 | % | 0.75 | % | 0.75 | % | 0.75 | % | 0.78 | % | ||||||||||
After Expense Reimbursement | 0.70 | % | 0.70 | % | 0.71 | % | 0.74 | % | N/A | |||||||||||
Ratio of Net Investment Income to Average Net Assets | 1.91 | % | 1.86 | % | 2.53 | % | 2.28 | % | 1.84 | % | ||||||||||
Portfolio Turnover Rate | 14.76 | % | 17.00 | % | 19.68 | % | 17.71 | % | 18.48 | % | ||||||||||
| (1) | Computed using average shares outstanding throughout the period. |
See accompanying Notes to Financial Statements.
97
Table of Contents
TCW Relative Value Dividend Appreciation Fund
Financial Highlights — N Class
| Year Ended October 31, | ||||||||||||||||||||
| 2022 | 2021 | 2020 | 2019 | 2018 | ||||||||||||||||
Net Asset Value per Share, Beginning of year | $ | 22.55 | $ | 15.20 | $ | 18.24 | $ | 17.77 | $ | 19.46 | ||||||||||
|
|
|
|
|
|
|
|
|
| |||||||||||
Income (Loss) from Investment Operations: |
| |||||||||||||||||||
Net Investment Income (1) | 0.35 | 0.34 | 0.37 | 0.37 | 0.32 | |||||||||||||||
Net Realized and Unrealized Gain (Loss) on Investments | (0.80 | ) | 7.35 | (1.84 | ) | 1.38 | (0.93 | ) | ||||||||||||
|
|
|
|
|
|
|
|
|
| |||||||||||
Total from Investment Operations | (0.45 | ) | 7.69 | (1.47 | ) | 1.75 | (0.61 | ) | ||||||||||||
|
|
|
|
|
|
|
|
|
| |||||||||||
Less Distributions: |
| |||||||||||||||||||
Distributions from Net Investment Income | (0.36 | ) | (0.34 | ) | (0.38 | ) | (0.36 | ) | (0.36 | ) | ||||||||||
Distributions from Net Realized Gain | (2.02 | ) | — | (1.19 | ) | (0.92 | ) | (0.72 | ) | |||||||||||
|
|
|
|
|
|
|
|
|
| |||||||||||
Total Distributions | (2.38 | ) | (0.34 | ) | (1.57 | ) | (1.28 | ) | (1.08 | ) | ||||||||||
|
|
|
|
|
|
|
|
|
| |||||||||||
Net Asset Value per Share, End of year | $ | 19.72 | $ | 22.55 | $ | 15.20 | $ | 18.24 | $ | 17.77 | ||||||||||
|
|
|
|
|
|
|
|
|
| |||||||||||
Total Return | (2.52 | )% | 50.90 | % | (8.88 | )% | 11.02 | % | (3.52 | )% | ||||||||||
Ratios/Supplemental Data: |
| |||||||||||||||||||
Net Assets, End of year (in thousands) | $ | 179,329 | $ | 202,187 | $ | 152,934 | $ | 223,322 | $ | 411,123 | ||||||||||
Ratio of Expenses to Average Net Assets: |
| |||||||||||||||||||
Before Expense Reimbursement | 1.05 | % | 1.04 | % | 1.02 | % | 1.04 | % | 1.05 | % | ||||||||||
After Expense Reimbursement | 0.90 | % | 0.90 | % | 0.92 | % | 0.96 | % | 1.00 | % | ||||||||||
Ratio of Net Investment Income to Average Net Assets | 1.71 | % | 1.66 | % | 2.32 | % | 2.10 | % | 1.62 | % | ||||||||||
Portfolio Turnover Rate | 14.76 | % | 17.00 | % | 19.68 | % | 17.71 | % | 18.48 | % | ||||||||||
| (1) | Computed using average shares outstanding throughout the period. |
See accompanying Notes to Financial Statements.
98
Table of Contents
TCW Relative Value Large Cap Fund
Financial Highlights — I Class
| Year Ended October 31, | ||||||||||||||||||||
| 2022 | 2021 | 2020 | 2019 | 2018 | ||||||||||||||||
Net Asset Value per Share, Beginning of year | $ | 15.04 | $ | 10.84 | $ | 18.69 | $ | 19.82 | $ | 24.30 | ||||||||||
|
|
|
|
|
|
|
|
|
| |||||||||||
Income (Loss) from Investment Operations: |
| |||||||||||||||||||
Net Investment Income (1) | 0.19 | 0.18 | 0.22 | 0.33 | 0.28 | |||||||||||||||
Net Realized and Unrealized Gain (Loss) on Investments | (0.90 | ) | 5.07 | (0.57 | ) | 0.84 | (1.18 | ) | ||||||||||||
|
|
|
|
|
|
|
|
|
| |||||||||||
Total from Investment Operations | (0.71 | ) | 5.25 | (0.35 | ) | 1.17 | (0.90 | ) | ||||||||||||
|
|
|
|
|
|
|
|
|
| |||||||||||
Less Distributions: |
| |||||||||||||||||||
Distributions from Net Investment Income | (0.19 | ) | (0.22 | ) | (0.49 | ) | (0.31 | ) | (0.47 | ) | ||||||||||
Distributions from Net Realized Gain | (1.04 | ) | (0.83 | ) | (7.01 | ) | (1.99 | ) | (3.11 | ) | ||||||||||
|
|
|
|
|
|
|
|
|
| |||||||||||
Total Distributions | (1.23 | ) | (1.05 | ) | (7.50 | ) | (2.30 | ) | (3.58 | ) | ||||||||||
|
|
|
|
|
|
|
|
|
| |||||||||||
Net Asset Value per Share, End of year | $ | 13.10 | $ | 15.04 | $ | 10.84 | $ | 18.69 | $ | 19.82 | ||||||||||
|
|
|
|
|
|
|
|
|
| |||||||||||
Total Return | (5.56 | )% | 50.84 | % | (7.02 | )% | 8.13 | % | (5.11 | )% | ||||||||||
Ratios/Supplemental Data: |
| |||||||||||||||||||
Net Assets, End of year (in thousands) | $ | 101,088 | $ | 117,205 | $ | 83,765 | $ | 136,917 | $ | 402,035 | ||||||||||
Ratio of Expenses to Average Net Assets: |
| |||||||||||||||||||
Before Expense Reimbursement | 0.83 | % | 0.80 | % | 0.80 | % | 0.78 | % | 0.77 | % | ||||||||||
After Expense Reimbursement | 0.70 | % | 0.70 | % | 0.71 | % | 0.74 | % | N/A | |||||||||||
Ratio of Net Investment Income to Average Net Assets | 1.43 | % | 1.31 | % | 1.88 | % | 1.79 | % | 1.28 | % | ||||||||||
Portfolio Turnover Rate | 17.81 | % | 17.16 | % | 31.17 | % | 19.47 | % | 20.47 | % | ||||||||||
| (1) | Computed using average shares outstanding throughout the period. |
See accompanying Notes to Financial Statements.
99
Table of Contents
TCW Relative Value Large Cap Fund
Financial Highlights — N Class
| Year Ended October 31, | ||||||||||||||||||||
| 2022 | 2021 | 2020 | 2019 | 2018 | ||||||||||||||||
Net Asset Value per Share, Beginning of year | $ | 14.97 | $ | 10.79 | $ | 18.62 | $ | 19.74 | $ | 24.21 | ||||||||||
|
|
|
|
|
|
|
|
|
| |||||||||||
Income (Loss) from Investment Operations: |
| |||||||||||||||||||
Net Investment Income (1) | 0.17 | 0.15 | 0.19 | 0.28 | 0.23 | |||||||||||||||
Net Realized and Unrealized Gain (Loss) on Investments | (0.91 | ) | 5.05 | (0.56 | ) | 0.86 | (1.18 | ) | ||||||||||||
|
|
|
|
|
|
|
|
|
| |||||||||||
Total from Investment Operations | (0.74 | ) | 5.20 | (0.37 | ) | 1.14 | (0.95 | ) | ||||||||||||
|
|
|
|
|
|
|
|
|
| |||||||||||
Less Distributions: |
| |||||||||||||||||||
Distributions from Net Investment Income | (0.15 | ) | (0.19 | ) | (0.45 | ) | (0.27 | ) | (0.41 | ) | ||||||||||
Distributions from Net Realized Gain | (1.04 | ) | (0.83 | ) | (7.01 | ) | (1.99 | ) | (3.11 | ) | ||||||||||
|
|
|
|
|
|
|
|
|
| |||||||||||
Total Distributions | (1.19 | ) | (1.02 | ) | (7.46 | ) | (2.26 | ) | (3.52 | ) | ||||||||||
|
|
|
|
|
|
|
|
|
| |||||||||||
Net Asset Value per Share, End of year | $ | 13.04 | $ | 14.97 | $ | 10.79 | $ | 18.62 | $ | 19.74 | ||||||||||
|
|
|
|
|
|
|
|
|
| |||||||||||
Total Return | (5.72 | )% | 50.56 | % | (7.17 | )% | 7.92 | % | (5.35 | )% | ||||||||||
Ratios/Supplemental Data: |
| |||||||||||||||||||
Net Assets, End of year (in thousands) | $ | 9,007 | $ | 10,506 | $ | 9,277 | $ | 11,535 | $ | 13,003 | ||||||||||
Ratio of Expenses to Average Net Assets: |
| |||||||||||||||||||
Before Expense Reimbursement | 1.34 | % | 1.30 | % | 1.32 | % | 1.24 | % | 1.21 | % | ||||||||||
After Expense Reimbursement | 0.90 | % | 0.90 | % | 0.91 | % | 0.95 | % | 0.99 | % | ||||||||||
Ratio of Net Investment Income to Average Net Assets | 1.23 | % | 1.11 | % | 1.67 | % | 1.52 | % | 1.05 | % | ||||||||||
Portfolio Turnover Rate | 17.81 | % | 17.16 | % | 31.17 | % | 19.47 | % | 20.47 | % | ||||||||||
| (1) | Computed using average shares outstanding throughout the period. |
See accompanying Notes to Financial Statements.
100
Table of Contents
TCW Relative Value Mid Cap Fund
Financial Highlights — I Class
| Year Ended October 31, | ||||||||||||||||||||
| 2022 | 2021 | 2020 | 2019 | 2018 | ||||||||||||||||
Net Asset Value per Share, Beginning of year | $ | 29.62 | $ | 18.90 | $ | 21.06 | $ | 22.44 | $ | 25.96 | ||||||||||
|
|
|
|
|
|
|
|
|
| |||||||||||
Income (Loss) from Investment Operations: |
| |||||||||||||||||||
Net Investment Income (1) | 0.19 | 0.17 | 0.17 | 0.18 | 0.12 | |||||||||||||||
Net Realized and Unrealized Gain (Loss) on Investments | (2.80 | ) | 10.72 | (1.78 | ) | 0.21 | (1.56 | ) | ||||||||||||
|
|
|
|
|
|
|
|
|
| |||||||||||
Total from Investment Operations | (2.61 | ) | 10.89 | (1.61 | ) | 0.39 | (1.44 | ) | ||||||||||||
|
|
|
|
|
|
|
|
|
| |||||||||||
Less Distributions: |
| |||||||||||||||||||
Distributions from Net Investment Income | (0.16 | ) | (0.17 | ) | (0.18 | ) | (0.15 | ) | (0.13 | ) | ||||||||||
Distributions from Net Realized Gain | (3.28 | ) | — | (0.37 | ) | (1.62 | ) | (1.95 | ) | |||||||||||
|
|
|
|
|
|
|
|
|
| |||||||||||
Total Distributions | (3.44 | ) | (0.17 | ) | (0.55 | ) | (1.77 | ) | (2.08 | ) | ||||||||||
|
|
|
|
|
|
|
|
|
| |||||||||||
Net Asset Value per Share, End of year | $ | 23.57 | $ | 29.62 | $ | 18.90 | $ | 21.06 | $ | 22.44 | ||||||||||
|
|
|
|
|
|
|
|
|
| |||||||||||
Total Return | (10.35 | )% | 57.90 | % | (8.07 | )% | 3.18 | % | (6.48 | )% | ||||||||||
Ratios/Supplemental Data: |
| |||||||||||||||||||
Net Assets, End of year (in thousands) | $ | 62,726 | $ | 72,545 | $ | 51,021 | $ | 63,957 | $ | 72,527 | ||||||||||
Ratio of Expenses to Average Net Assets: |
| |||||||||||||||||||
Before Expense Reimbursement | 1.01 | % | 0.97 | % | 0.97 | % | 0.95 | % | 0.92 | % | ||||||||||
After Expense Reimbursement | 0.85 | % | 0.85 | % | 0.87 | % | 0.90 | % | N/A | |||||||||||
Ratio of Net Investment Income to Average Net Assets | 0.75 | % | 0.63 | % | 0.90 | % | 0.86 | % | 0.48 | % | ||||||||||
Portfolio Turnover Rate | 28.82 | % | 44.33 | % | 42.07 | % | 25.89 | % | 22.60 | % | ||||||||||
| (1) | Computed using average shares outstanding throughout the period. |
See accompanying Notes to Financial Statements.
101
Table of Contents
TCW Relative Value Mid Cap Fund
Financial Highlights — N Class
| Year Ended October 31, | ||||||||||||||||||||
| 2022 | 2021 | 2020 | 2019 | 2018 | ||||||||||||||||
Net Asset Value per Share, Beginning of year | $ | 28.75 | $ | 18.34 | $ | 20.45 | $ | 21.82 | $ | 25.28 | ||||||||||
|
|
|
|
|
|
|
|
|
| |||||||||||
Income (Loss) from Investment Operations: |
| |||||||||||||||||||
Net Investment Income (1) | 0.16 | 0.14 | 0.15 | 0.15 | 0.09 | |||||||||||||||
Net Realized and Unrealized Gain (Loss) on Investments | (2.71 | ) | 10.42 | (1.74 | ) | 0.21 | (1.52 | ) | ||||||||||||
|
|
|
|
|
|
|
|
|
| |||||||||||
Total from Investment Operations | (2.55 | ) | 10.56 | (1.59 | ) | 0.36 | (1.43 | ) | ||||||||||||
|
|
|
|
|
|
|
|
|
| |||||||||||
Less Distributions: |
| |||||||||||||||||||
Distributions from Net Investment Income | (0.13 | ) | (0.15 | ) | (0.15 | ) | (0.11 | ) | (0.08 | ) | ||||||||||
Distributions from Net Realized Gain | (3.28 | ) | — | (0.37 | ) | (1.62 | ) | (1.95 | ) | |||||||||||
|
|
|
|
|
|
|
|
|
| |||||||||||
Total Distributions | (3.41 | ) | (0.15 | ) | (0.52 | ) | (1.73 | ) | (2.03 | ) | ||||||||||
|
|
|
|
|
|
|
|
|
| |||||||||||
Net Asset Value per Share, End of year | $ | 22.79 | $ | 28.75 | $ | 18.34 | $ | 20.45 | $ | 21.82 | ||||||||||
|
|
|
|
|
|
|
|
|
| |||||||||||
Total Return | (10.45 | )% | 57.78 | % | (8.18 | )% | 3.12 | % | (6.61 | )% | ||||||||||
Ratios/Supplemental Data: |
| |||||||||||||||||||
Net Assets, End of year (in thousands) | $ | 13,181 | $ | 16,708 | $ | 10,902 | $ | 14,448 | $ | 18,040 | ||||||||||
Ratio of Expenses to Average Net Assets: |
| |||||||||||||||||||
Before Expense Reimbursement | 1.39 | % | 1.37 | % | 1.42 | % | 1.37 | % | 1.31 | % | ||||||||||
After Expense Reimbursement | 0.95 | % | 0.95 | % | 0.97 | % | 1.00 | % | 1.04 | % | ||||||||||
Ratio of Net Investment Income to Average Net Assets | 0.65 | % | 0.54 | % | 0.81 | % | 0.76 | % | 0.36 | % | ||||||||||
Portfolio Turnover Rate | 28.82 | % | 44.33 | % | 42.07 | % | 25.89 | % | 22.60 | % | ||||||||||
| (1) | Computed using average shares outstanding throughout the period. |
See accompanying Notes to Financial Statements.
102
Table of Contents
TCW Select Equities Fund
Financial Highlights — I Class
| Year Ended October 31, | ||||||||||||||||||||
| 2022 | 2021 | 2020 | 2019 | 2018 | ||||||||||||||||
Net Asset Value per Share, Beginning of year | $ | 44.70 | $ | 34.13 | $ | 27.64 | $ | 27.13 | $ | 30.42 | ||||||||||
|
|
|
|
|
|
|
|
|
| |||||||||||
Income (Loss) from Investment Operations: |
| |||||||||||||||||||
Net Investment Loss (1) | (0.12 | ) | (0.14 | ) | (0.08 | ) | (0.06 | ) | (0.08 | ) | ||||||||||
Net Realized and Unrealized Gain (Loss) on Investments | (13.71 | ) | 13.23 | 9.04 | 4.21 | 3.37 | ||||||||||||||
|
|
|
|
|
|
|
|
|
| |||||||||||
Total from Investment Operations | (13.83 | ) | 13.09 | 8.96 | 4.15 | 3.29 | ||||||||||||||
|
|
|
|
|
|
|
|
|
| |||||||||||
Less Distributions: |
| |||||||||||||||||||
Distributions from Net Realized Gain | (5.08 | ) | (2.52 | ) | (2.47 | ) | (3.64 | ) | (6.58 | ) | ||||||||||
|
|
|
|
|
|
|
|
|
| |||||||||||
Net Asset Value per Share, End of year | $ | 25.79 | $ | 44.70 | $ | 34.13 | $ | 27.64 | $ | 27.13 | ||||||||||
|
|
|
|
|
|
|
|
|
| |||||||||||
Total Return | (34.93 | )% | 40.32 | % | 34.59 | % | 18.98 | % | 12.59 | % | ||||||||||
Ratios/Supplemental Data: |
| |||||||||||||||||||
Net Assets, End of year (in thousands) | $ | 462,670 | $ | 801,597 | $ | 633,683 | $ | 770,079 | $ | 740,485 | ||||||||||
Ratio of Expenses to Average Net Assets | 0.79 | % | 0.77 | % | 0.76 | % | 0.80 | % | 0.87 | % | ||||||||||
Ratio of Net Investment Loss to Average Net Assets | (0.38 | )% | (0.37 | )% | (0.28 | )% | (0.25 | )% | (0.29 | )% | ||||||||||
Portfolio Turnover Rate | 12.12 | % | 8.17 | % | 4.09 | % | 6.41 | % | 15.43 | % | ||||||||||
| (1) | Computed using average shares outstanding throughout the period. |
See accompanying Notes to Financial Statements.
103
Table of Contents
TCW Select Equities Fund
Financial Highlights — N Class
| Year Ended October 31, | ||||||||||||||||||||
| 2022 | 2021 | 2020 | 2019 | 2018 | ||||||||||||||||
Net Asset Value per Share, Beginning of year | $ | 38.76 | $ | 29.95 | $ | 24.59 | $ | 24.61 | $ | 28.23 | ||||||||||
|
|
|
|
|
|
|
|
|
| |||||||||||
Income (Loss) from Investment Operations: |
| |||||||||||||||||||
Net Investment Loss (1) | (0.15 | ) | (0.19 | ) | (0.13 | ) | (0.11 | ) | (0.13 | ) | ||||||||||
Net Realized and Unrealized Gain (Loss) on Investments | (11.64 | ) | 11.52 | 7.96 | 3.73 | 3.09 | ||||||||||||||
|
|
|
|
|
|
|
|
|
| |||||||||||
Total from Investment Operations | (11.79 | ) | 11.33 | 7.83 | 3.62 | 2.96 | ||||||||||||||
|
|
|
|
|
|
|
|
|
| |||||||||||
Less Distributions: |
| |||||||||||||||||||
Distributions from Net Realized Gain | (5.08 | ) | (2.52 | ) | (2.47 | ) | (3.64 | ) | (6.58 | ) | ||||||||||
|
|
|
|
|
|
|
|
|
| |||||||||||
Net Asset Value per Share, End of year | $ | 21.89 | $ | 38.76 | $ | 29.95 | $ | 24.59 | $ | 24.61 | ||||||||||
|
|
|
|
|
|
|
|
|
| |||||||||||
Total Return | (35.03 | )% | 40.06 | % | 34.26 | % | 18.74 | % | 12.36 | % | ||||||||||
Ratios/Supplemental Data: |
| |||||||||||||||||||
Net Assets, End of year (in thousands) | $ | 104,856 | $ | 193,727 | $ | 161,625 | $ | 132,332 | $ | 133,252 | ||||||||||
Ratio of Expenses to Average Net Assets: |
| |||||||||||||||||||
Before Expense Reimbursement | 1.08 | % | 1.04 | % | 1.06 | % | 1.08 | % | 1.15 | % | ||||||||||
After Expense Reimbursement | 0.94 | % | 0.96 | % | 0.99 | % | 1.01 | % | 1.08 | % | ||||||||||
Ratio of Net Investment Loss to Average Net Assets | (0.53 | )% | (0.56 | )% | (0.51 | )% | (0.45 | )% | (0.50 | )% | ||||||||||
Portfolio Turnover Rate | 12.12 | % | 8.17 | % | 4.09 | % | 6.41 | % | 15.43 | % | ||||||||||
| (1) | Computed using average shares outstanding throughout the period. |
See accompanying Notes to Financial Statements.
104
Table of Contents
TCW Funds, Inc.
Report of Independent Registered Public Accounting Firm
To the Board of Directors and Shareholders of
TCW Funds, Inc.:
Opinion on the Financial Statements and Financial Highlights
We have audited the accompanying statements of assets and liabilities of TCW Artificial Intelligence Equity Fund, TCW Conservative Allocation Fund, TCW Global Real Estate Fund, TCW New America Premier Equities Fund, TCW Relative Value Dividend Appreciation Fund, TCW Relative Value Large Cap Fund, TCW Relative Value Mid Cap Fund, and TCW Select Equities Fund (collectively, the “TCW Equity and Asset Allocation Funds”) (eight of eighteen funds comprising TCW Funds, Inc.), including the schedules of investments, as of October 31, 2022, the related statements of operations for the year then ended, the statements of changes in net assets for each of the two years in the period then ended, the financial highlights for each of the five years in the period then ended for the TCW Equity and Asset Allocation Funds, and the related notes. In our opinion, the financial statements and financial highlights present fairly, in all material respects, the financial position of each of the respective TCW Equity and Asset Allocation Funds as of October 31, 2022, and the results of their operations for the year then ended, the changes in their net assets for each of the two years in the period then ended, and the financial highlights for each of the five years in the period then ended for the TCW Equity and Asset Allocation Funds, in conformity with accounting principles generally accepted in the United States of America.
Basis for Opinion
These financial statements and financial highlights are the responsibility of the TCW Equity and Asset Allocation Funds’ management. Our responsibility is to express an opinion on the TCW Equity and Asset Allocation Funds’ financial statements and financial highlights based on our audits. We are a public accounting firm registered with the Public Company Accounting Oversight Board (United States) (PCAOB) and are required to be independent with respect to the TCW Equity and Asset Allocation Funds in accordance with the U.S. federal securities laws and the applicable rules and regulations of the Securities and Exchange Commission and the PCAOB.
We conducted our audits in accordance with the standards of the PCAOB. Those standards require that we plan and perform the audits to obtain reasonable assurance about whether the financial statements and financial highlights are free of material misstatement, whether due to error or fraud. The TCW Equity and Asset Allocation Funds are not required to have, nor were we engaged to perform, an audit of their internal control over financial reporting. As part of our audits we are required to obtain an understanding of internal control over financial reporting but not for the purpose of expressing an opinion on the effectiveness of the TCW Equity and Asset Allocation Funds’ internal control over financial reporting. Accordingly, we express no such opinion.
Our audits included performing procedures to assess the risks of material misstatement of the financial statements and financial highlights, whether due to error or fraud, and performing procedures that respond to those risks. Such procedures included examining, on a test basis, evidence regarding the amounts and disclosures in the financial statements and financial highlights. Our audits also included evaluating the accounting principles used and significant estimates made by management, as well as evaluating the overall presentation of the financial statements and financial highlights. Our procedures included confirmation of securities owned as of October 31, 2022, by correspondence with the custodian and brokers; when replies were not received from brokers, we performed other auditing procedures. We believe that our audits provide a reasonable basis for our opinion.

Los Angeles, California
December 20, 2022
We have served as the auditor of one or more TCW/Metropolitan West Funds investment companies since 1990.
105
Table of Contents
TCW Funds, Inc.
Shareholder Expenses (Unaudited)
As a shareholder of a Fund, you incur ongoing operational costs of the Fund, including management fees and other fund expenses. The following example is intended to help you understand your ongoing costs (in dollars and cents) of investing in a Fund and to compare these costs with the ongoing costs of investing in other funds.
The example is based on an investment of $1,000 invested at the beginning of the period and held for the entire period from May 1, 2022 to October 31, 2022 (184 days).
Actual Expenses: The first line under each Fund in the table below provides information about the actual account values and actual expenses. You may use the information in this line, together with the amount you invested, to estimate the expenses that you paid over the period. Simply divide your account value by $1,000 (for example, an $8,600 account value divided by $1,000 = 8.6), then multiply the result by the number in the first line for your Fund under the heading entitled “Expenses Paid During Period” to estimate the expenses you paid on your account during this period.
Hypothetical Example for Comparison Purposes: The second line under each Fund in the table below provides information about the hypothetical expenses based on each Fund’s actual expense ratio and an assumed rate of return of 5% per year before expenses, which is not the Fund’s actual return. The hypothetical account value and expenses may not be used to estimate the actual ending account balance or expenses you paid for the period. You may use this information to compare the ongoing costs of investing in your Fund and other funds. To do so, compare this 5% hypothetical example with the 5% hypothetical examples that appear in the shareholder reports of the other funds.
TCW Funds, Inc. | Beginning Account Value May 1, 2022 | Ending Account Value October 31, 2022 | Annualized Expense Ratio | Expenses Paid During Period (May 1, 2022 to October 31, 2022) | ||||||||||||
| TCW Artificial Intelligence Equity Fund | ||||||||||||||||
I Class Shares | ||||||||||||||||
Actual | $ | 1,000.00 | $ | 856.60 | 0.90 | % | $ | 4.21 | ||||||||
Hypothetical (5% return before expenses) | 1,000.00 | 1,020.67 | 0.90 | % | 4.58 | |||||||||||
N Class Shares | ||||||||||||||||
Actual | $ | 1,000.00 | $ | 856.60 | 1.00 | % | $ | 4.68 | ||||||||
Hypothetical (5% return before expenses) | 1,000.00 | 1,020.16 | 1.00 | % | 5.09 | |||||||||||
| TCW Conservative Allocation Fund | ||||||||||||||||
I Class Shares | ||||||||||||||||
Actual | $ | 1,000.00 | $ | 923.10 | 0.40 | % (1) | $ | 1.94 | (1) | |||||||
Hypothetical (5% return before expenses) | 1,000.00 | 1,023.19 | 0.40 | % (1) | 2.04 | (1) | ||||||||||
N Class Shares | ||||||||||||||||
Actual | $ | 1,000.00 | $ | 921.50 | 0.68 | % (1) | $ | 3.29 | (1) | |||||||
Hypothetical (5% return before expenses) | 1,000.00 | 1,021.78 | 0.68 | % (1) | 3.47 | (1) | ||||||||||
| TCW Global Real Estate Fund | ||||||||||||||||
I Class Shares | ||||||||||||||||
Actual | $ | 1,000.00 | $ | 828.90 | 0.90 | % | $ | 4.15 | ||||||||
Hypothetical (5% return before expenses) | 1,000.00 | 1,020.67 | 0.90 | % | 4.58 | |||||||||||
N Class Shares | ||||||||||||||||
Actual | $ | 1,000.00 | $ | 828.30 | 1.00 | % | $ | 4.61 | ||||||||
Hypothetical (5% return before expenses) | 1,000.00 | 1,020.16 | 1.00 | % | 5.09 | |||||||||||
106
Table of Contents
TCW Funds, Inc.
Shareholder Expenses (Unaudited) (Continued)
TCW Funds, Inc. | Beginning Account Value May 1, 2022 | Ending Account Value October 31, 2022 | Annualized Expense Ratio | Expenses Paid During Period (May 1, 2022 to October 31, 2022) | ||||||||||||
| TCW New America Premier Equities Fund | ||||||||||||||||
I Class Shares | ||||||||||||||||
Actual | $ | 1,000.00 | $ | 943.10 | 0.83 | % | $ | 4.07 | ||||||||
Hypothetical (5% return before expenses) | 1,000.00 | 1,021.02 | 0.83 | % | 4.23 | |||||||||||
N Class Shares | ||||||||||||||||
Actual | $ | 1,000.00 | $ | 941.90 | 1.06 | % | $ | 5.19 | ||||||||
Hypothetical (5% return before expenses) | 1,000.00 | 1,019.86 | 1.06 | % | 5.40 | |||||||||||
| TCW Relative Value Dividend Appreciation Fund | ||||||||||||||||
I Class Shares | ||||||||||||||||
Actual | $ | 1,000.00 | $ | 1,013.60 | 0.70 | % | $ | 3.55 | ||||||||
Hypothetical (5% return before expenses) | 1,000.00 | 1,021.68 | 0.70 | % | 3.57 | |||||||||||
N Class Shares | ||||||||||||||||
Actual | $ | 1,000.00 | $ | 1,012.50 | 0.90 | % | $ | 4.57 | ||||||||
Hypothetical (5% return before expenses) | 1,000.00 | 1,020.67 | 0.90 | % | 4.58 | |||||||||||
| TCW Relative Value Large Cap Fund | ||||||||||||||||
I Class Shares | ||||||||||||||||
Actual | $ | 1,000.00 | $ | 995.40 | 0.70 | % | $ | 3.52 | ||||||||
Hypothetical (5% return before expenses) | 1,000.00 | 1,021.68 | 0.70 | % | 3.57 | |||||||||||
N Class Shares | ||||||||||||||||
Actual | $ | 1,000.00 | $ | 994.70 | 0.90 | % | $ | 4.52 | ||||||||
Hypothetical (5% return before expenses) | 1,000.00 | 1,020.67 | 0.90 | % | 4.58 | |||||||||||
| TCW Relative Value Mid Cap Fund | ||||||||||||||||
I Class Shares | ||||||||||||||||
Actual | $ | 1,000.00 | $ | 971.20 | 0.85 | % | $ | 4.22 | ||||||||
Hypothetical (5% return before expenses) | 1,000.00 | 1,020.92 | 0.85 | % | 4.33 | |||||||||||
N Class Shares | ||||||||||||||||
Actual | $ | 1,000.00 | $ | 970.60 | 0.95 | % | $ | 4.72 | ||||||||
Hypothetical (5% return before expenses) | 1,000.00 | 1,020.42 | 0.95 | % | 4.84 | |||||||||||
| TCW Select Equities Fund | ||||||||||||||||
I Class Shares | ||||||||||||||||
Actual | $ | 1,000.00 | $ | 887.50 | 0.83 | % | $ | 3.95 | ||||||||
Hypothetical (5% return before expenses) | 1,000.00 | 1,021.02 | 0.83 | % | 4.23 | |||||||||||
N Class Shares | ||||||||||||||||
Actual | $ | 1,000.00 | $ | 887.00 | 0.94 | % | $ | 4.47 | ||||||||
Hypothetical (5% return before expenses) | 1,000.00 | 1,020.47 | 0.94 | % | 4.79 | |||||||||||
| (1) | Does not include expenses of the underlying affiliated investments. |
107
Table of Contents

The TCW Group, Inc. and Subsidiaries
TCW Investment Management Company LLC
TCW Asset Management Company LLC
Metropolitan West Asset Management, LLC
TCW Funds, Inc. TCW Strategic Income Fund, Inc. Metropolitan West Funds Sepulveda Management LLC | TCW Direct Lending LLC TCW Direct Lending VII LLC TCW Direct Lending VIII LLC |
Effective May 2021
WHAT YOU SHOULD KNOW
At TCW, we recognize the importance of keeping information about you secure and confidential. We do not sell or share your nonpublic personal and financial information with marketers or others outside our affiliated group of companies.
We carefully manage information among our affiliated group of companies to safeguard your privacy and to provide you with consistently excellent service.
We are providing this notice to you to comply with the requirements of Regulation S-P, “Privacy of Consumer Financial information,” issued by the United States Securities and Exchange Commission.
OUR PRIVACY POLICY
We, The TCW Group, Inc. and its subsidiaries, the TCW Funds, Inc., TCW Strategic Income Fund, Inc., the Metropolitan West Funds, Sepulveda Management LLC, TCW Direct Lending LLC, TCW Direct Lending VII LLC, and TCW Direct Lending VIII LLC (collectively, “TCW”) are committed to protecting the nonpublic personal and financial information of our customers and consumers who obtain or seek to obtain financial products or services primarily for personal, family or household purposes. We fulfill our commitment by establishing and implementing policies and systems to protect the security and confidentiality of this information.
In our offices, we limit access to nonpublic personal and financial information about you to those TCW personnel who need to know the information in order to provide products or services to you. We maintain physical, electronic, and procedural safeguards to protect your nonpublic personal and financial information.
CATEGORIES OF INFORMATION WE COLLECT
We may collect the following types of nonpublic personal and financial information about you from the following sources:
| ◾ | Your name, address and identifying numbers, and other personal and financial information, from you and from identification cards and papers you submit to us, on applications, subscription agreements or other forms or communications. |
| ◾ | Information about your account balances and financial transactions with us, our affiliated entities, or nonaffiliated third parties, from our internal sources, from affiliated entities and from nonaffiliated third parties. |
| ◾ | Information about your account balances and financial transactions and other personal and financial information, from consumer credit reporting agencies or other nonaffiliated third parties, to verify information received from you or others. |
108
Table of Contents
CATEGORIES OF INFORMATION WE DISCLOSE TO NONAFFILIATED THIRD PARTIES
We may disclose your name, address and account and other identifying numbers, as well as information about your pending or past transactions and other personal financial information, to nonaffiliated third parties, for our everyday business purposes such as necessary to execute, process, service and confirm your securities transactions and mutual fund transactions, to administer and service your account and commingled investment vehicles in which you are invested, to market our products and services through joint marketing arrangements or to respond to court orders and legal investigations.
We may disclose nonpublic personal and financial information concerning you to law enforcement agencies, federal regulatory agencies, self-regulatory organizations or other nonaffiliated third parties, if required or requested to do so by a court order, judicial subpoena or regulatory inquiry.
We do not otherwise disclose your nonpublic personal and financial information to nonaffiliated third parties, except where we believe in good faith that disclosure is required or permitted by law. Because we do not disclose your nonpublic personal and financial information to nonaffiliated third parties, our Customer Privacy Policy does not contain opt-out provisions.
CATEGORIES OF INFORMATION WE DISCLOSE TO OUR AFFILIATED ENTITIES
| ◾ | We may disclose your name, address and account and other identifying numbers, account balances, information about your pending or past transactions and other personal financial information to our affiliated entities for any purpose. |
| ◾ | We regularly disclose your name, address and account and other identifying numbers, account balances and information about your pending or past transactions to our affiliates to execute, process and confirm securities transactions or mutual fund transactions for you, to administer and service your account and commingled investment vehicles in which you are invested, or to market our products and services to you. |
INFORMATION ABOUT FORMER CUSTOMERS
We do not disclose nonpublic personal and financial information about former customers to nonaffiliated third parties unless required or requested to do so by a court order, judicial subpoena or regulatory inquiry, or otherwise where we believe in good faith that disclosure is required or permitted by law.
QUESTIONS
Should you have any questions about our Customer Privacy Policy, please contact us by email or by regular mail at the address at the end of this policy.
REMINDER ABOUT TCW’S FINANCIAL PRODUCTS
Financial products offered by The TCW Group, Inc. and its subsidiaries, the TCW Funds, Inc., TCW Strategic Income Fund, Inc., the Metropolitan West Funds, Sepulveda Management LLC, TCW Direct Lending LLC, TCW Direct Lending VII LLC, and TCW Direct Lending VIII LLC.
| ◾ | Are not guaranteed by a bank; |
| ◾ | Are not obligations of The TCW Group, Inc. or of its subsidiaries; |
| ◾ | Are not insured by the Federal Deposit Insurance Corporation; and |
| ◾ | Are subject to investment risks, including possible loss of the principal amount committed or invested, and earnings thereon. |
THE TCW GROUP, INC. TCW FUNDS, INC. TCW STRATEGIC INCOME FUND, INC. METROPOLITAN WEST FUNDS | SEPULVEDA MANAGEMENT LLC TCW DIRECT LENDING LLC TCW DIRECT LENDING VII LLC TCW DIRECT LENDING VIII LLC |
Attention: Privacy Officer | 865 South Figueroa Street, Suite 1800 | Los Angeles, CA 90017 | email: privacy@tcw.com
109
Table of Contents
TCW Funds, Inc.
Investment Management and Advisory Agreement Disclosure (Unaudited)
Renewal of Investment Advisory and Management Agreement
TCW Funds, Inc. (the “Corporation”) and TCW Investment Management Company LLC (the “Advisor”) are parties to an Investment Advisory and Management Agreement (“Agreement”), pursuant to which the Advisor is responsible for managing the investments of each separate investment series (each, a “Fund” and collectively, the “Funds”) of the Corporation. Unless terminated by either party, the Agreement continues in effect from year to year provided that the continuance is specifically approved at least annually by the vote of the holders of at least a majority of the outstanding shares of the Funds, or by the Board of Directors of the Corporation (the “Board”), and, in either event, by a majority of the Directors who are not “interested persons” of the Corporation, as such term is defined in Section 2(a)(19) of the Investment Company Act of 1940, as amended (the “Independent Directors”), casting votes in person at a meeting called for that purpose.
At an in-person meeting on September 12, 2022, the Board approved the renewal of the Agreement for an additional one-year term from February 6, 2023 through February 5, 2024. The renewal of the Agreement was approved by the Board (including by a majority of the Independent Directors) upon the recommendation of the Independent Directors. The Independent Directors also met by videoconference in a working session on August 24, 2022 to hear presentations by representatives of the Advisor, to ask related questions, to review and discuss materials provided by the Advisor for their consideration, and to meet separately with their independent legal counsel. On September 12, 2022 they also met separately with their independent legal counsel to review and discuss supplemental information that had been requested on their behalf by their independent legal counsel and presented by the Advisor. The information, material facts, and conclusions that formed the basis for the Independent Directors’ recommendation and the Board’s subsequent approval are described below.
1. Information received
Materials reviewed — During the course of each year, the Directors receive a wide variety of materials relating to the services provided by the Advisor, including reports on the Advisor’s investment processes, as well as on each Fund’s investment results, portfolio composition, portfolio trading practices, compliance monitoring, shareholder services, and other information relating to the nature, extent, and quality of services provided by the Advisor to the Funds. In addition, the Board reviewed information furnished to the Independent Directors in response to a detailed request sent to the Advisor on their behalf. The information in the Advisor’s responses included extensive materials regarding each Fund’s investment results, advisory fee comparisons to advisory fees charged by the Advisor to its institutional clients, financial and profitability information regarding the Advisor, descriptions of various services provided to the Funds and to other advisory and sub-advisory clients, descriptions of functions such as compliance monitoring and portfolio trading practices, and information about the personnel providing investment management services to each Fund. The Directors also considered information provided by an independent data provider, Broadridge, comparing the investment performance and the fee and expense levels of each Fund to those of appropriate peer groups of mutual funds selected by Broadridge. After reviewing this information, the Directors requested additional financial, profitability and service information from the Advisor, which the Advisor provided and the Directors considered.
Review process — The Directors’ determinations were made on the basis of each Director’s business judgment after consideration of all the information presented. The Independent Directors were advised by their independent legal counsel throughout the renewal process and received and reviewed advice from
110
Table of Contents
TCW Funds, Inc.
their independent legal counsel regarding legal and industry standards applicable to the renewal of the Agreement, including a legal memorandum from their independent legal counsel discussing their fiduciary duties related to their approval of the continuation of the Agreement. The Independent Directors also discussed the renewal of the Agreement with the Advisor’s representatives and in private sessions at which no representatives of the Advisor were present. In deciding to recommend the renewal of the Agreement with respect to each Fund, the Independent Directors did not identify any single piece of information or particular factor that, in isolation, was the controlling factor. Each Independent Director may also have weighed factors differently. This summary describes the most important, but not all, of the factors considered by the Board and the Independent Directors.
2. Nature, extent, and quality of services provided by the Advisor
The Board and the Independent Directors considered the depth and quality of the Advisor’s investment management process, including its research and strong analytical capabilities; the experience, capability, and integrity of its senior management and other personnel; the continuity in management of client assets; the overall resources available to the Advisor; and the ability of its organizational structure to address the fluctuations in assets that have been experienced over the past several years. The Board and the Independent Directors considered the Advisor’s continued commitment and ability to attract and retain well-qualified investment professionals, noting in particular the Advisor’s hiring of professionals in various areas over the past several years, continued upgrading of resources in its middle office and back office operations and other areas, as well as a continuing and extensive program of infrastructure and systems enhancements, including business continuity and cyber security, as well as budgeting for certain future initiatives. The Board and the Independent Directors also considered that the Advisor made available to its investment professionals a variety of resources and systems relating to investment management, compliance, trading, operations, administration, research, portfolio accounting, and legal matters. They noted the substantial additional resources made available by The TCW Group, Inc., the parent company of the Advisor. The Board and the Independent Directors examined and discussed a detailed description of the extensive additional services provided to the Funds to support their operations and compliance, as compared to the much narrower range of services provided to the Advisor’s institutional and sub-advised clients, as well as the Advisor’s oversight and coordination of numerous outside service providers to the Funds. They further noted the high level of regular communication between the Advisor and the Independent Directors. The Advisor explained its responsibility to supervise the activities of the Funds’ various service providers, as well as supporting the Independent Directors and their meetings, regulatory filings, and various operational personnel, and the related costs.
The Board and the Independent Directors concluded that the nature, extent, and quality of the services provided by the Advisor are of a high quality and have benefited and should continue to benefit the Funds and their shareholders.
3. Investment results
The Board and the Independent Directors considered the investment results of each Fund in light of its investment objective(s) and principal investment strategies. They compared each Fund’s total returns with the total returns of other mutual funds in peer group reports prepared by Broadridge with respect to various longer and more recent periods all ended May 31, 2022. The Board and the Independent Directors reviewed information as to peer group selections presented by Broadridge and discussed the methodology
111
Table of Contents
TCW Funds, Inc.
Investment Management and Advisory Agreement Disclosure (Unaudited) (Continued)
for those selections with Broadridge. In reviewing each Fund’s relative performance, the Board and the Independent Directors took into account each Fund’s investment strategies, distinct characteristics, asset size and diversification.
The Board and the Independent Directors noted that most Funds’ performance was satisfactory over the relevant periods. The Board and the Independent Directors noted that the investment performance of most of the Funds was generally close to or above the median performance of the applicable peer group during the three-year period emphasized by Broadridge in the supplemental materials, but six Funds ranked in the fourth or fifth quintile of their peer groups for that three-year period. For those Funds that lagged peer group averages, they noted that the Advisor had discussed with the Board the reasons for the underperformance, including the investment climate and prevailing market conditions during relevant periods as well as the Advisor’s discipline in maintaining a consistent investment style. The Board indicated that it would continue to monitor portfolio investment performance on a regular basis and discuss with the Advisor from time to time any instances of long-term underperformance as appropriate. The Board and the Independent Directors noted that the performance of some Funds for periods when they lagged their peer group averages remained satisfactory when assessed on a risk-adjusted basis because performance quintiles do not necessarily reflect the degree of risk employed by peer funds to achieve their returns. The Board also considered the Advisor’s assessment of the Funds’ performance during the recent period of significant market volatility.
With respect to the fixed income Funds, the Board and the Independent Directors recognized the Advisor’s deliberate strategy to manage risk in light of its critical view of the fixed income securities markets and overall investment market conditions at present and in the near term. For that reason, the Board and the Independent Directors believed that relative performance also should be considered in light of future market conditions expected by the Advisor. The Board and the Independent Directors noted the Advisor’s view that longer term performance can be more meaningful for active fixed income funds than shorter term performance because fixed income market cycles are generally longer than three years.
For the U.S. fixed income Funds, the Board and the Independent Directors noted the conservative profile of these Funds, which generally experienced less volatility compared to various other funds in the applicable peer group (except for the relative volatility of Total Return Bond Fund, which is a mortgage-focused Fund). They also noted the Advisor’s conservative posture for these Funds with respect to credit and interest rate risks.
For the Total Return Bond Fund, the Board and the Independent Directors noted that the Fund’s performance was in the first quintile for the ten-year period, second quintile for the five-year period, third quintile for the three-year period and fifth quintile for the one-year period.
For the Core Fixed Income Fund, the Board and the Independent Directors noted that the Fund’s performance was in the third quintile for the ten-year period, second quintile for the five- and three-year periods and third quintile for the one-year period.
For the High Yield Bond Fund, the Board and the Independent Directors noted that the Fund’s performance was in the first quintile for the ten-, five- and three-year periods and second quintile for the one-year period.
For the Global Bond Fund, the Board and the Independent Directors noted that the Fund’s performance was in the third quintile for the ten-, five- and three-year periods and fourth quintile for the one-year period.
112
Table of Contents
TCW Funds, Inc.
For the Short Term Bond Fund, the Board and the Independent Directors noted that the Fund’s performance was in the fourth quintile for the ten-year period, second quintile for the five- and three-year periods and first quintile for the one-year period.
For the Enhanced Commodity Strategy Fund, the Board and the Independent Directors noted that the Fund’s performance was in the second quintile for the ten-, five- and three-year periods and third quintile for the one-year period.
With respect to the U.S. equity Funds, the Board and the Independent Directors noted that the performance of certain of the Funds for most of the various periods reviewed ranked in the first, second or third quintiles, while other Funds ranked in the fourth and fifth quintiles over various periods.
The Select Equities Fund ranked in the fourth quintile for the ten-year period, second quintile for the five-year period and fourth quintile for the three- and one-year periods. The Board and the Independent Directors considered the Advisor’s explanation that underperformance was driven by negative security selection, primarily in the information technology, healthcare and consumer discretionary sectors. The Board and the Independent Directors also considered the Advisor’s explanation that the underperformance for the one-year period was due to a variety of reasons that can be categorized as realized basis risk, which the Advisor believes, measured over longer periods, tends to decline and that the Fund should be positioned for outperformance going forward.
The Relative Value Dividend Appreciation Fund ranked in the third quintile for the ten-year period, fourth quintile for the five-year period, second quintile for the three-year period and fourth quintile for the one-year period. The Relative Value Large Cap Fund ranked in the third quintile for the ten-year period, fourth quintile for the five-year period, third quintile for the three-year period and fifth quintile for the one-year period. The Relative Value Mid Cap Fund ranked in the fourth quintile for the ten- and five-year periods, third quintile for the three-year period and fifth quintile for the one-year period.
The New America Premier Equities Fund ranked in the first quintile for the five-year period, third quintile for the three-year period and second quintile for the one-year period.
The Global Real Estate Fund ranked in the first quintile for the five- and three-year periods and fifth quintile for the one-year period.
The Artificial Intelligence Equity Fund ranked in the fourth quintile for the three- and one-year periods. The Board and the Independent Directors considered the Advisor’s explanation that the peer funds had greater exposure to the information technology sector, making the peer group less useful in comparing relative performance than if those funds’ principal investment strategies were more closely aligned with the Fund’s investment focus. The Board and the Independent Directors noted that the Fund held only modest positions in companies that were key contributors to the competitor funds’ returns. The Board and the Independent Directors also noted the relatively short operating history of the Fund and determined to continue to closely monitor its performance.
For the asset allocation Fund, the Board and the Independent Directors noted that the Conservative Allocation Fund’s performance was in the first quintile for the ten-, five- and three-year periods and fourth quintile for the one-year period.
With respect to the international and emerging markets Funds, the Board and the Independent Directors noted that the performance of a majority of these Funds ranked in the fourth or fifth quintiles over many of the various time periods reviewed. The Emerging Markets Income Fund ranked in the second quintile for
113
Table of Contents
TCW Funds, Inc.
Investment Management and Advisory Agreement Disclosure (Unaudited) (Continued)
the ten-year period, third quintile for the five-year period and fourth quintile for the three- and one-year periods. The Emerging Markets Local Currency Income Fund ranked in the third quintile for the ten-year period, fourth quintile for the five-year period and the fifth quintile for the three- and one-year periods. The Emerging Markets Multi-Asset Opportunities Fund ranked in the third quintile for the five-year period, the fourth quintile for the three-year period and the third quintile for the one-year period. The Developing Markets Equity Fund ranked in the fifth quintile for the five-year period, fourth quintile for the three-year period and fifth quintile for the one-year period. The Board and the Independent Directors considered the Advisor’s discussion of performance, including that the challenging international and emerging market conditions in recent years weighed on performance for the Funds in line with other funds in the universe.
The Board and the Independent Directors concluded that the Advisor was implementing each Fund’s investment objective(s) and that the Advisor’s record in managing the Funds indicated that its continued management should benefit each Fund and its shareholders over the long term.
4. Advisory fees and total expenses
The Board and the Independent Directors compared the management fees (which Broadridge defines to include the advisory fee and the administrative fee) and total expenses of each Fund (each as a percentage of average net assets) with the median management fee and operating expense level of the other mutual funds in the relevant Broadridge peer groups. These comparisons assisted the Board and the Independent Directors by providing a reasonable statistical measure to assess each Fund’s fees relative to its relevant peers. The Board and the Independent Directors observed that each Fund’s management fee, after giving effect to applicable waivers and/or reimbursements, was below or near the median of the peer group funds on a current basis. It was noted that the Emerging Markets Multi-Asset Opportunities Fund does not have a quintile ranking for management or total expenses because its peer group of three was too small. The Board and the Independent Directors also observed that each Fund’s total expenses, after giving effect to applicable waivers and/or reimbursements, were below or at the median of the peer group funds. The Board and the Independent Directors also noted the contractual expense limitations to which the Advisor has agreed with respect to each Fund and that the Advisor historically has absorbed any expenses in excess of these limits. The Board and the Independent Directors noted that for several Funds, their below-median management fee and total expenses were in part due to substantial waiver and/or reimbursement pursuant to the contractual expense limitations. The Board and the Independent Directors concluded that the competitive fees charged by the Advisor, and competitive expense ratios, should continue to benefit each Fund and its shareholders.
The Board and the Independent Directors also reviewed information regarding the advisory fees charged by the Advisor to its institutional and sub-advisory clients with similar investment mandates. The Board and the Independent Directors concluded that, although the fees paid by those clients generally were lower than advisory fees paid by the Funds, the differences appropriately reflected the more extensive services provided by the Advisor to the Funds and the Advisor’s significantly greater responsibilities and expenses with respect to the Funds, including the additional time spent by portfolio managers for reasons such as managing the more active cash flows from purchases and redemptions by shareholders, the additional risks of managing a pool of assets for public investors, administrative burdens, daily pricing, valuation and liquidity responsibilities, the supervision of vendors and service providers, and the costs of additional infrastructure and operational resources and personnel and of complying with and supporting the more comprehensive regulatory and governance regime applicable to mutual funds.
114
Table of Contents
TCW Funds, Inc.
5. The Advisor’s costs, level of profits, and economies of scale
The Board and the Independent Directors reviewed information regarding the Advisor’s costs of providing services to the Funds, as well as the resulting level of profits to the Advisor. They reviewed the Advisor’s stated assumptions and methods of allocating certain costs, such as personnel costs, which constitute the Advisor’s largest operating cost. The Board and the Independent Directors recognized that the Advisor should be entitled to earn a reasonable level of profits for the services that it provides to each Fund. The Board and the Independent Directors also reviewed a comparison of the Advisor’s profitability with respect to the Funds to the profitability of certain unaffiliated publicly traded asset managers, which the Advisor believed supported its view that the Advisor’s profitability was reasonable. Based on their review, the Board and the Independent Directors concluded that they were satisfied that the Advisor’s level of profitability from its relationship with each Fund was not unreasonable or excessive.
The Board and the Independent Directors considered the extent to which potential economies of scale could be realized as the Funds grow and whether the advisory fees reflect those potential economies of scale. They recognized that the advisory fees for the Funds do not have breakpoints, which would otherwise result in lower advisory fee rates as the Funds grow larger. They also recognized the Advisor’s view that the advisory fees compare favorably to peer group fees and expenses and remain competitive even at higher asset levels and that the relatively low advisory fees reflect the potential economies of scale. The Board and the Independent Directors recognized the benefits of the Advisor’s substantial past and ongoing investment in the advisory business, such as successfully recruiting and retaining key professional talent, systems and technology upgrades, added resources dedicated to legal, compliance and cybersecurity programs, and improvements to the overall firm infrastructure, as well as the financial pressures of competing against much larger firms and passive investment products. The Board and the Independent Directors further noted the Advisor’s past and current subsidies of the operating expenses of newer and smaller Funds and the Advisor’s commitment to maintain reasonable overall operating expenses for each Fund. The Board and the Independent Directors also recognized that the Funds benefit from receiving investment advice from an organization with other types of advisory clients in addition to mutual funds. The Board and the Independent Directors considered the risk borne by the Advisor that the Funds’ net assets and thus the Advisor’s fees might decline in the event of redemptions and that smaller Funds might not grow to become profitable. The Board and the Independent Directors concluded that the Advisor was satisfactorily sharing potential economies of scale with the Funds through low fees and expenses, and through reinvesting in its capabilities for serving the Funds and their shareholders.
6. Ancillary benefits
The Board and the Independent Directors also considered ancillary benefits received or to be received by the Advisor and its affiliates as a result of the relationship of the Advisor with the Funds. The Board and the Independent Directors noted that, in addition to the fees the Advisor receives under the Agreement, the Advisor receives additional benefits in connection with management of the Funds in the form of reports, research and other services from brokers and their affiliates in return for brokerage commissions paid to such brokers. The Board and the Independent Directors concluded that any potential benefits received or to be derived by the Advisor from its relationships with the Funds are reasonably related to the services provided by the Advisor to the Funds.
115
Table of Contents
TCW Funds, Inc.
Investment Management and Advisory Agreement Disclosure (Unaudited) (Continued)
7. Conclusions
Based on their overall review, including their consideration of each of the factors referred to above (and others), the Board and the Independent Directors concluded that the Agreement is fair and reasonable to each Fund and its shareholders, that each Fund’s shareholders received reasonable value in return for the advisory fees and other amounts paid to the Advisor by each Fund, and that the renewal of the Agreement was in the best interests of each Fund and its shareholders.
116
Table of Contents
TCW Funds, Inc.
Supplemental Information
The policies and procedures that the Company uses to determine how to vote proxies are available without charge. The Board has delegated the Company’s proxy voting authority to the Advisor.
Disclosure of Proxy Voting Guidelines
The proxy voting guidelines of the Advisor are available:
| 1. | By calling 800-FUND-TCW (800-386-3829) to obtain a hard copy; or |
| 2. | By going to the SEC website at http://www.sec.gov. |
When the Company receives a request for a description of the Advisor’s proxy voting guidelines, it will deliver the description that is disclosed in the Company’s Statement of Additional Information. This information will be sent out via first class mail (or other means designed to ensure equally prompt delivery) within three business days of receiving the request.
The Advisor, on behalf of the Company, prepares and files Form N-PX with the SEC not later than August 31 of each year, which includes the Company’s proxy voting record for the most recent twelve-month period ended June 30 of that year. The Company’s proxy voting record for the most recent twelve-month period ended June 30 is available:
| 1. | By calling 800-FUND-TCW (800-386-3829) to obtain a hard copy; or |
| 2. | By going to the SEC website at http://www.sec.gov. |
When the Company receives a request for the Company’s proxy voting record, it will send the information disclosed in the Company’s most recently filed report on Form N-PX via first class mail (or other means designed to ensure equally prompt delivery) within three business days of receiving the request.
The Company also discloses its proxy voting record on its website as soon as is reasonably practicable after its report on Form N-PX is filed with the SEC.
Availability of Quarterly Portfolio Schedule
The Company files a complete schedule of its portfolio holdings with the SEC for the first and third quarters of its fiscal year on Form NPORT-P. Such filings occur no later than 60 days after the end of the Funds’ first and third quarters and are available on the SEC’s website at www.sec.gov.
117
Table of Contents
TCW Funds, Inc.
Tax Information Notice (Unaudited)
On account of the year ended October 31, 2022, the following Funds paid a capital gain distribution within the meaning 852(b)(3)(c) of the Code. Each fund also designates as a capital gain distribution a portion of earnings and profits paid to shareholders in redemption of their shares.
Fund | Amounts per Share | |||
TCW Conservative Allocation Fund | $ | 0.28 | ||
TCW Relative Value Dividend Appreciation Fund | $ | 0.84 | ||
TCW Relative Value Large Cap Fund | $ | 0.71 | ||
TCW Relative Value Mid Cap Fund | $ | 0.39 | ||
TCW Select Equities Fund | $ | 4.40 | ||
Under Section 854(b)(2) of the Code, the Funds hereby designate the following maximum amounts as qualified dividends for purposes of the maximum rate under Section 1(h)(11) of the Code for the fiscal year ended October 31, 2022:
Fund | Qualified Dividend Income | |||
TCW Artificial Intelligence Equity Fund | $ | 57,242 | ||
TCW Conservative Allocation Fund | $ | 27,100 | ||
TCW Global Real Estate Fund | $ | 113,870 | ||
TCW New America Premier Equities Fund | $ | 1,136,873 | ||
TCW Relative Value Dividend Appreciation Fund | $ | 6,493,404 | ||
TCW Relative Value Large Cap Fund | $ | 2,379,427 | ||
TCW Relative Value Mid Cap Fund | $ | 1,203,123 | ||
The following are dividend received deduction percentages for the Funds’ corporate shareholders:
Fund | Dividends Received Deductions | |||
TCW Artificial Intelligence Equity Fund | 95.32% | |||
TCW New America Premier Equities Fund | 4.36% | |||
TCW Relative Value Dividend Appreciation Fund | 100.00% | |||
TCW Relative Value Large Cap Fund | 100.00% | |||
TCW Relative Value Mid Cap Fund | 100.00% | |||
This information is given to meet certain requirements of the Code and should not be used by shareholders for preparing their income tax returns. In February 2023, shareholders will receive Form 1099-DIV which will show the actual distribution received and include their share of qualified dividends during the calendar year of 2022. Shareholders are advised to check with their tax advisors for information on the treatment of these amounts on their individual tax returns.
118
Table of Contents
TCW Funds, Inc.
Directors and Officers of the Company
A board of six directors is responsible for overseeing the operations of the Company, which consists of 18 Funds at October 31, 2022. The directors of the Company, and their business addresses and their principal occupation for the last five years are set forth below.
Independent Directors
Name, and Year of Birth (1) | Term of Office and Length of Time Served | Principal Occupation(s) During Past 5 Years | Other Directorships held by Director | |||
| Samuel P. Bell (1936) | Mr. Bell has served as a director of TCW Funds, Inc. since October 2002. | Private Investor. | TCW Strategic Income Fund, Inc. (closed-end fund). | |||
Patrick C. Haden (1953) Chairman of the Board | Mr. Haden has served as a director of TCW Funds, Inc. since May 2001. | President (since 2003), Wilson Ave. Consulting (business consulting firm); Senior Advisor to President (July 2016 – June 2017), University of Southern California. | Auto Club (affiliate of AAA); Metropolitan West Funds (mutual fund); TCW Strategic Income Fund, Inc. (closed end fund). | |||
| Peter McMillan (1957) | Mr. McMillan has served as a director of TCW Funds, Inc. since August 2010. | Co-founder (since 2019), Pacific Oak Capital Advisors (investment advisory firm); Co-founder, Managing Partner and Chief Investment Officer (since May 2013), Temescal Canyon Partners (investment advisory firm); Co-founder and Executive Vice President (2005 – 2019), KBS Capital Advisors (a manager of real estate investment trusts). | Pacific Oak Strategic Opportunity REIT (real estate investments); Keppel Pacific Oak U.S. REIT (real estate investments); Pacific Oak Residential Trust (real estate investments); Metropolitan West Funds (mutual fund); TCW DL VII Financing LLC (private fund): TCW Strategic Income Fund, Inc. (closed-end fund). | |||
| Victoria B. Rogers (1961) | Ms. Rogers has served as a director of the TCW Funds, Inc. since October 2011. | President and Chief Executive Officer (since 1996), The Rose Hills Foundation (charitable foundation). | Norton Simon Museum (art museum); Stanford University (university); Causeway Capital Management Trust (mutual fund); Causeway ETML Trust (mutual fund); The Rose Hills Foundation (charitable foundation); TCW Strategic Income Fund, Inc. (closed-end fund). | |||
| Andrew Tarica (1959) | Mr. Tarica has served as a director of the TCW Funds, Inc. since March 2012. | Director of Fixed Income (since February 2022), Forest Road Securities (broker-dealer); Chief Executive Officer (since February 2001), Meadowbrook Capital Management (asset management company); Employee (2003 – January 2022), Cowen Prime Services (broker dealer). | Metropolitan West Funds (mutual fund); TCW Strategic Income Fund, Inc. (closed-end fund); TCW Direct Lending VII, LLC (business development company); TCW Direct Lending VIII, LLC (business development company). |
| (1) | The address of each Independent Director is c/o Morgan Lewis, & Bockius LLP, Counsel to the Independent Directors of TCW Funds, Inc., 300 South Grand Avenue, Los Angeles, CA 90071. |
119
Table of Contents
TCW Funds, Inc.
Directors and Officers of the Company (Continued)
Interested Director
This Director is an “interested person” of the Company as defined in the 1940 Act because he is a director and officer of the Advisor, and shareholder and director of The TCW Group, Inc., the parent company of the Advisor.
Name and Year of Birth | Term of Office and Length of Time Served | Principal Occupation(s) During Past 5 Years | Other Directorships held by Director | |||
| Marc I. Stern (1944) | Mr. Stern has served as a director since inception of TCW Funds, Inc. in September 1992. | Chairman (since January 2016), TCW LLC; Chairman (since February 2013), The TCW Group Inc., TCW Investment Management Company LLC, TCW Asset Management Company LLC and Metropolitan West Asset Management, LLC. | N/A |
The officers of the Company who are not directors of the Company are:
| Name and Year of Birth (1) | Position(s) Held with Company | Principal Occupation(s) During Past 5 Years (2) | ||
David Lippman (1958) President and Chief Executive Officer | Mr. Lippman has served as President and Chief Executive Officer of TCW Funds, Inc. since February 2021. | President and Chief Executive Officer (since August 2012), The TCW Group, Inc. (since February 2013), TCW LLC, the Advisor and TCW Asset Management Company LLC, and (since February 2021), TCW Strategic Income Fund, Inc.; Chief Executive Officer (since November 2008), Metropolitan West Asset Management, LLC; President and Principal Executive Officer (since November 2008), Metropolitan West Funds. | ||
Lisa Eisen (1963) Tax Officer | Ms. Eisen has served as Tax Officer of TCW Funds, Inc. since December 2016. | Tax Officer (since December 2016), Metropolitan West Funds and TCW Strategic Income Fund, Inc.; Managing Director and Director of Tax (since August 2016), TCW LLC. | ||
Meredith S. Jackson (1959) Senior Vice President, General Counsel and Secretary | Ms. Jackson has served as Senior Vice President since January 2016 and General Counsel and Secretary of TCW Funds, Inc. since February 2013. | Executive Vice President, General Counsel and Secretary (since January 2016), TCW LLC; Executive Vice President, General Counsel and Secretary (since February 2013), TCW Investment Management Company LLC, The TCW Group Inc., TCW Asset Management Company LLC and Metropolitan West Asset Management, LLC; Senior Vice President, General Counsel and Secretary (since February 2013), TCW Strategic Income Fund, Inc., Vice President and Secretary (since February 2013), Metropolitan West Funds. |
120
Table of Contents
TCW Funds, Inc.
| Name and Year of Birth (1) | Position(s) Held with Company | Principal Occupation(s) During Past 5 Years (2) | ||
Gladys Xiques (1973) Chief Compliance Officer and AML Officer | Ms. Xiques has served as Chief Compliance Officer and AML Officer of TCW Funds, Inc. since January 2021. | Chief Compliance Officer and AML Officer (since January 2021), TCW Strategic Income Fund, Inc. and Metropolitan West Funds; Managing Director and Global Chief Compliance Officer (since January 2021), TCW LLC, TCW Investment Management Company LLC, Metropolitan West Asset Management, LLC and TCW Asset Management Company LLC; Global Chief Compliance Officer (since January 2021), The TCW Group, Inc.; Senior Vice President (February 2015 –December 2020), TCW LLC, TCW Investment Management Company LLC, Metropolitan West Asset Management, LLC and TCW Asset Management Company LLC. | ||
Richard M. Villa (1964) Treasurer Principal Financial and Accounting Officer | Mr. Villa has served as Treasurer and Principal Financial and Accounting Officer of TCW Funds, Inc. since February 2014. | Executive Vice President, Chief Financial Officer and Assistant Secretary (since July 2008), TCW Investment Management Company LLC, The TCW Group, Inc., TCW Asset Management Company LLC, Metropolitan West Asset Management, LLC, (since January 2016), TCW LLC, and (since February 2021), Metropolitan West Funds; Treasurer and Principal Financial and Accounting Officer (since February 2014), TCW Strategic Income Fund, Inc. |
| (1) | The address of the Interested Director and each officer is c/o the TCW Group, Inc., 865 South Figueroa Street, Suite 1800, Los Angeles, CA 90017. |
| (2) | Positions with The TCW Group, Inc. and its affiliates may have changed over time. |
In addition, Eric Chan, Managing Director of Fund Operations for the Advisor, TCW Asset Management Company LLC, TCW LLC (since 2009), and Metropolitan West Asset Management, LLC (since November 2006), is Assistant Treasurer of the Company and TCW Strategic Income Fund, Inc. (since 2009) and Metropolitan West Funds (since 2010). Mr. Chan is a Certified Public Accountant. Peter Davidson, Senior Vice President, Associate General Counsel and Assistant Secretary of TCW Asset Management Company LLC, Metropolitan West Asset Management, LLC, TCW LLC, the Advisor (since July 2022), is Vice President and Assistant Secretary of the Company, TCW Strategic Income Fund, Inc. and Metropolitan West Funds (since September 2022).
The SAI (Statement of Additional Information) has additional information regarding the Board of Directors. A copy is available without charge by calling 1-800-FUND-TCW (1-800-386-3829) to obtain a hard copy or by going to the SEC website at http://www.sec.gov.
121
Table of Contents
TCW Funds, Inc.
865 South Figueroa Street, Suite 1800
Los Angeles, California 90017
800 FUND TCW
(800 386 3829)
www.TCW.com
INVESTMENT ADVISOR
TCW Investment Management Company LLC
865 South Figueroa Street, Suite 1800
Los Angeles, California 90017
TRANSFER AGENT
U.S. Bancorp Fund Services, LLC
615 E. Michigan Street
Milwaukee, Wisconsin 53202
INDEPENDENT REGISTERED PUBLIC ACCOUNTING FIRM
Deloitte & Touche LLP
555 West 5th Street
Los Angeles, California 90013
CUSTODIAN & ADMINISTRATOR
State Street Bank & Trust Company
One Lincoln Street
Boston, Massachusetts 02111
DISTRIBUTOR
TCW Funds Distributors LLC
865 South Figueroa Street, Suite 1800
Los Angeles, California 90017
DIRECTORS
Patrick C. Haden
Director and Chairman of the Board
Samuel P. Bell
Director
Peter McMillan
Director
Victoria B. Rogers
Director
Marc I. Stern
Director
Andrew Tarica
Director
OFFICERS
David Lippman
President and Chief Executive Officer
Meredith S. Jackson
Senior Vice President,
General Counsel and Secretary
Richard M. Villa
Treasurer and Principal Financial and Accounting Officer
Gladys Xiques
Chief Compliance Officer and Anti-Money Laundering Officer
Lisa Eisen
Tax Officer
Eric W. Chan
Assistant Treasurer
TCW FAMILY OF FUNDS
EQUITY FUNDS
TCW Artificial Intelligence Equity Fund
TCW Global Real Estate Fund
TCW New America Premier Equities Fund
TCW Relative Value Dividend Appreciation Fund
TCW Relative Value Large Cap Fund
TCW Relative Value Mid Cap Fund
TCW Select Equities Fund
ASSET ALLOCATION FUND
TCW Conservative Allocation Fund
FIXED INCOME FUNDS
TCW Core Fixed Income Fund
TCW Enhanced Commodity Strategy Fund
TCW Global Bond Fund
TCW High Yield Bond Fund
TCW Short Term Bond Fund
TCW Total Return Bond Fund
INTERNATIONAL FUNDS
TCW Developing Markets Equity Fund
TCW Emerging Markets Income Fund
TCW Emerging Markets Local Currency Income Fund
TCW Emerging Markets Multi-Asset Opportunities Fund
FUNDarEQ1022
Table of Contents


FIXED INCOME FUNDS
TCW Core Fixed Income Fund
TCW Enhanced Commodity Strategy Fund
TCW Global Bond Fund
TCW High Yield Bond Fund
TCW Short Term Bond Fund
TCW Total Return Bond Fund
Table of Contents
TCW Funds, Inc.
| 1 | ||||
| 3 | ||||
| 17 | ||||
| 17 | ||||
| 33 | ||||
| 54 | ||||
| 68 | ||||
| 77 | ||||
| 86 | ||||
| 104 | ||||
| 106 | ||||
| 108 | ||||
| 111 | ||||
| 144 | ||||
| 157 | ||||
| 159 | ||||
| 161 | ||||
Investment Management and Advisory Agreements Disclosure (Unaudited) | 163 | |||
Proxy Voting Guidelines and Availability of Quarterly Portfolio Schedule | 169 | |||
| 170 | ||||
Table of Contents
| The Letter to Shareholders and/or Management Discussions contained in this Annual Report are the opinions of each Fund’s portfolio managers and are not the opinions of TCW Funds, Inc. or its Board of Directors. Various matters discussed in the Letter to Shareholders and/or Management Discussions constitute forward-looking statements within the meaning of the federal securities laws. Actual results and the timing of certain events could differ materially from those projected or contemplated by these forward-looking statements due to a number of factors, including general economic conditions, overall availability of securities for investment by a Fund, the level of volatility in the securities markets and in the share price of a Fund, and other risk factors discussed in the SEC filings of TCW Funds, Inc. The data presented in the Letter to Shareholders and/or Management Discussions represents past performance and cannot be used to predict future results. |
Table of Contents
|
|
| David B. Lippman President, Chief Executive Officer and Director |

Dear Valued Investors,
I am pleased to present the 2022 Annual Report for the TCW Funds, Inc. covering the 12-month period ended October 31, 2022. I would like to express our appreciation for your continued investment in the TCW Funds as well as to welcome new shareholders to our fund family.
With 375 basis points (bps) of tightening in the Federal Funds rate from March to November of this year in an attempt to curb persistent inflation, fixed income pricing has faced considerable weakness, reflected in the asset levels of the TCW Fund complex, which ended October 31, 2022 with total net assets of approximately $9.7 billion. These challenges notwithstanding, higher yields do imply an improved return outlook going forward and the attendant volatility brings opportunity for the TCW teams to apply their hallmark discipline to find value for client assets across the Fund strategies.
This report contains information and portfolio management discussions of our TCW Fixed Income Funds.
Economic Review and Market Environment
Persistently high inflation and the resultant tightening across global central bank policy were the defining themes of the trailing one-year period, leading to a volatile return backdrop for markets as investors parsed out conflicting macroeconomic indicators. More specifically, there was mounting evidence of a pronounced slowing of the U.S. economy, from two consecutive quarterly GDP growth contractions to a sharp collapse in consumer sentiment and manufacturing metrics. In contrast, the labor market in the U.S. has remained tight with a historically low unemployment rate of 3.7%, while consumer spending has been thus far largely resilient. On the inflation front, there were some signs of moderating pressures towards the end of the period, though September’s CPI (consumer price index) report still reflected a stubbornly elevated year-over-year headline print of 8.2%. Against this backdrop, the Fed was tasked with threading the needle of policy pull-back and delivered on a series of four consecutive 75 bps hikes to its Federal Funds rate target range starting in March in an effort to combat pricing pressures, sharply reversing the policy support coming out of the coronavirus pandemic. Treasury yields consequently rose across the curve, led by the more policy sensitive front-end, with the 2-Year nearly 400 bps higher during the period to close
October at roughly 4.49%, while 10- and 30-Year Treasury yields closed approximately 250 and 223 bps higher to 4.05% and 4.17%, respectively. Thus, yield curves moved into inversion territory, a perhaps unsurprising outcome given how the Fed’s dramatic shift in policy resulted in significantly tighter financial conditions, with the pace of that tightening the fastest in over 40 years. With markets bracing over the economic data and the appropriately hawkish central bank posture, a rout ensued on the belief that an aggressive, persistent Fed would heighten recession risk, delivering one of the most challenging periods for investors on record.
With recessionary fears coming to the forefront, equity returns were broadly negative, with the S&P 500 Index dropping over 14.5% during the period. Meanwhile, fixed income markets did not offer any investor respite as total returns were challenged in the backdrop of sharply higher Treasury yields, with the Bloomberg U.S. Aggregate Bond Index down 15.7% during the trailing twelve-month period, approximately 193 bps behind duration-matched Treasuries. Corporate credit endured a particularly harsh drawdown that wiped out 19.6% of value, with over 325 bps of negative excess returns. Communications, transportation and utilities were among the worst performing credit sectors, while airlines, lodging and banking outperformed. High yield credit fared slightly better than investment grade on an absolute basis, though still was down 11.8% and the sector trailed Treasuries by 278 bps. The lower-quality cohort of CCC-rated issues underperformed amid the risk-off backdrop, losing 15.0% while BB- and B-rated issues were down 11.7% and 10.8%, respectively. Within securitized, agency mortgage-backed securities (MBS) were particularly affected by rate volatility, and the sector delivered an Index-like 15.0% decline that was over 350 bps behind comparable Treasuries. Among other securitized sectors, commercial MBS (CMBS) was down approximately 13.4% and trailed Treasuries by just under 220 bps, with outperformance from agency CMBS on duration-adjusted terms. Finally, asset-backed securities (ABS) were one of the top-performing fixed income sectors, down 6.1% but with just 84 bps of negative excess returns relative to comparable treasuries.
1
Table of Contents
To Our Valued Shareholders (Continued) |
|
The Economy and Market Ahead
Any attempt to understand the full economic fallout of a tightening cycle this aggressive against the competing crosswinds of a still-resilient consumer is a near impossible task. Clouding the outlook further will be the often overlooked but impactful repercussions of quantitative tightening, which will take many more months to become apparent. Meanwhile, unlike in recessions past, there is no major economy well positioned to pull the rest of the world along on coattails of strong growth. Moreover, exogenous shocks on the global stage such as the conflict in Russia/Ukraine and, more recently, U.K LDI issues alongside synchronized global tightening and the lagged effects of policy likely means that volatility will come in a generally declining market with credit of all types weakening as the cumulative impact of these changes takes hold. As long as economic and monetary policy continues to shift, the expectation is that this persists. On the positive side, however, these market conditions create opportunities that we believe can be exploited by disciplined active managers, setting the stage for potentially strong performance as the volatility ultimately subsides.
Specific to duration profiles, positioning was extended throughout the quarter ended October 31, 2022 as rates continued to move higher and Index-relative strategies are now at an increasingly long position as rates already reflect an aggressive Fed, with 10-Year yields above our estimate of long-term sustainable levels. Among spread sector exposures, corporate spreads at these levels look attractive, particularly considering the deep discounts at which much of the market trades. Sub-par pricing provides positive credit convexity and additional protection for investors, though careful issue selection is still critical amid uncertain conditions. Yield spreads in the near term are likely to continue widening should the economy slow, and in that environment, additions will be made in a disciplined, incremental fashion. Outside of corporate credit, the team is generally constructive on securitized assets, and believe there is value in many subsectors of the market. In particular, agency MBS looks compelling at current wide spreads, as do areas of the non-agency market, given embedded home price appreciation in many deals with even modest seasoning. Even so, allocations remain up in the capital structure with cash flow priority and credit enhancement to reduce downside risks. CMBS emphasizes high quality as well, but focused on single asset, single borrower deals where exposures can be targeted to newer, more efficient, in-demand developments. Similarly, senior
tranche ABS provide fair compensation given robust structures, even as possibility of recession looms.
As we manage through this cycle of Fed tightening and the uncertainty over its eventual transition to a pause or easing, expectations remain for a continuation of unsettled conditions. Through this, our team will adhere to the same disciplined approach employed over the past decades, namely, to attempt to ensure appropriate compensation for the risks assumed as market volatility creates opportunities that we believe can be exploited by disciplined active managers. We believe these difficult periods will demonstrate the benefit of the active, disciplined style practiced by our team.
In closing, I’d like to express my personal appreciation for your present and historical sponsorship of the TCW Funds. Following more than 20 years at the Advisor, I will be retiring at the end of the year, turning that role over to Katie Koch, who will arrive in early 2023 as the CEO of TCW/Metropolitan West. It has been my honor to preside over the growth of the Funds and gratifying to work with the disciplined investment professionals in their management through good and more difficult circumstances alike. We manage our entire business on the basis of team management to help ensure seamless transitions to the next generation, and I am certain that Katie will collaborate closely with our long-tenured colleagues to continue to build on the excellence of the Firm. Most importantly, I take my leave with great confidence in knowing that the stewardship of the Funds and your assets are in good hands.
We truly value our relationship with you and thank you for making the TCW Funds part of your long-term investment plan. If you have any questions or require further information, we invite you to visit our website at www.tcw.com, or call our shareholder services department at 800-386-3829.
We look forward to further correspondence with you through our semi-annual report next year.
Sincerely,

David B. Lippman
President, Chief Executive Officer and Director
2
Table of Contents
TCW Core Fixed Income Bond Fund
The TCW Core Fixed Income Fund — I Class (“Fund”) fell 17.10% (net of fees) for the one-year period ended October 31, 2022, trailing the Bloomberg U.S. Aggregate Bond Index by 142 basis points (bps). Relative underperformance was driven in part by the longer-than-benchmark duration position and a curve steepening bias (overweight to 2- and 5-Year parts of the curve) as the rise in rates was led by the short-end. Meanwhile, the Fund’s overweight to securitized issues produced a sizable headwind to performance, with residential mortgage exposure the primary source of the drag. Agency MBS came under pressure from rising rates, extended durations, and the prospect of active selling by the Fed, and lagged Treasuries by over 350 bps on a duration-adjusted basis during the period. Non-agency backed collateral also struggled, falling approximately 8% as broader market volatility and reduced trading in the space weighed on pricing. Despite the drag from these holdings, the team remains constructive on mortgage credit overall with continued home price appreciation (the slower pace notwithstanding), declining loan-to-value ratios, strong borrower profiles and stricter underwriting standards. As such, underperformance presented attractive opportunities to add exposure at attractive yield levels. Additionally, a small overweight to asset-backed securities (ABS) focused on high quality collateralized loan obligations (CLOs) and government-guaranteed student loan collateral weighed on relative returns, while issue selection among commercial mortgage-backed securities (CMBS) with a preference for private label issues further detracted on the margin. Away from securitized, the overweight to credit expanded modestly throughout the year as yield premiums increased, with buys executed across a variety of sectors that we view as more defensive, particularly banking. While many additions were made incrementally into widening markets — thus resulting in short-term negative performance — these additions were made at levels we believe to be fundamentally compelling, and are expected to be accretive to prospective returns over the medium to longer term.
Looking forward, adherence to philosophical consistency and rigorous analysis remains key. So, where does that lead from a positioning perspective? Given the further move higher in Treasury yields, the duration profile of the strategy has been extended throughout the period alongside the rise in rates, ending at approximately 0.6 years long the Index as 10-Year rates appear above long-term equilibrium. Among the sectors, corporate spreads at these levels look attractive, particularly considering the deep discounts at which much of the market trades. Sub-par pricing provides positive credit convexity and additional protection for investors, though careful issue selection is still critical amid uncertain conditions. Outside of corporate credit, the team is generally constructive on securitized assets, and believe there is value in many subsectors of the market. In particular, agency mortgage-backed securities (MBS) looks compelling at current wide spreads, as do areas of the non-agency MBS market given embedded home price appreciation in many deals with even modest seasoning. Even so, allocations remain up in the capital structure with cash flow priority and credit enhancement to reduce downside risks. CMBS emphasizes high quality as
3
Table of Contents
TCW Core Fixed Income Bond Fund
Management Discussions (Continued)
well, but focused on single asset, single borrower (SASB) deals where exposures can be targeted to newer, more efficient, in-demand developments. Similarly, senior tranche ABS provide fair compensation given robust structures, even as possibility of recession looms.
| Annualized Total Return as of October 31, 2022(1) | ||||||||||||||||||||
| One Year | Three Years | Five Years | Ten Years | Inception To Date | ||||||||||||||||
TCW Core Fixed Income Fund | ||||||||||||||||||||
Class I (Inception: January 1, 1990) | -17.10 | % | -3.82 | % | -0.54 | % | 0.67 | % | 5.03 | %(2) | ||||||||||
Bloomberg U.S. Aggregate Bond Index | -15.68 | % | -3.77 | % | -0.54 | % | 0.74 | % | 5.02 | % | ||||||||||
Class N (Inception: March 1, 1999) | -17.22 | % | -3.99 | % | -0.73 | % | 0.42 | % | 3.86 | % | ||||||||||
Bloomberg U.S. Aggregate Bond Index | -15.68 | % | -3.77 | % | -0.54 | % | 0.74 | % | 3.74 | % | ||||||||||
Class P (Inception: February 28, 2020) | -17.07 | % | — | — | — | -5.39 | % | |||||||||||||
Bloomberg U.S. Aggregate Bond Index | -15.68 | % | -3.77 | % | -0.54 | % | 0.74 | % | -5.49 | % | ||||||||||
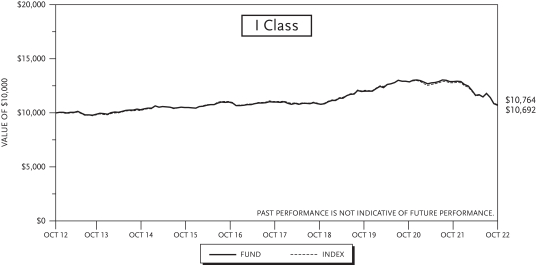
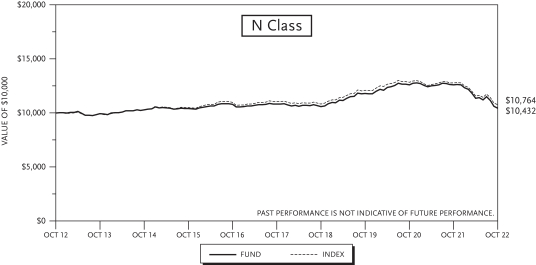
4
Table of Contents
TCW Core Fixed Income Bond Fund
Management Discussions (Continued)
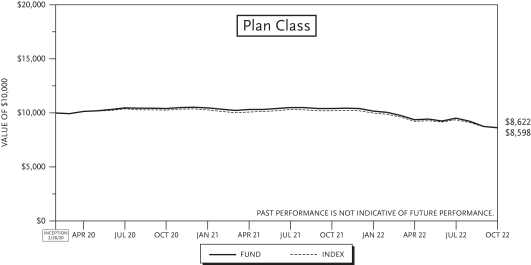
| (1) | The total returns do not reflect taxes that a shareholder would pay on fund distributions or on the redemption of fund shares. |
| (2) | Performance data includes the performance of the predecessor entity for periods before the Fund’s registration became effective. The predecessor entity was not registered under the 1940 Act and, therefore, was not subject to certain investment restrictions that are imposed by the 1940 Act. If the predecessor entity had been registered under the 1940 Act, the predecessor entity’s performance may have been lower. |
5
Table of Contents
TCW Enhanced Commodity Strategy Fund
Management Discussions
For the one-year period ending October 31, 2022, the TCW Enhanced Commodity Strategy Fund — I Class (“Fund”) returned 6.82% (net of fees), but trailed the Bloomberg Commodity Total Return Index (“Index”) by 433 bps. Performance benefitted during the period from strategic rolling of the futures contracts that provide passive exposure to commodities. More specifically, contracts in the Fund are rolled at a different time than the standard Index roll in order to avoid price swings associated with the heightened demand during the congested, pre-specified days. The timing of the rolls in the Funds has been accretive to relative performance over the 12-month period. However, relative returns were held back by the short fixed income portfolio. With a small, but growing, positive duration profile of just over 1.5 years, the rise in Treasury yields across the maturity spectrum during the period weighed on returns. Additionally, the allocations to credit (both corporates and municipals) and securitized assets, particularly agency MBS, held back performance as fixed income sectors broadly trailed Treasuries on a duration-adjusted basis for the period.
Though the immediate term may indeed be marked by decreased demand given global headwinds to growth and geopolitical conflict, opportunities remain plentiful across commodity sectors. Secular supply tailwinds continue to propel traditional energy components, while increased de-carbonization efforts and a continued focus on alternative energy sources likely bode well for the long-term strength of metals that could be used in batteries, as well as biodiesel components like soybean oil and corn, to name a few. Meanwhile, across the commodity complex, many innovations and resources aimed at enhancing supply availability are not easily implemented in the near-term, keeping supply and demand fundamentals tight while also supporting higher spot prices. Further, tight supplies may also contribute to continued backwardation, which can lead to a continuation of positive roll yields. Deglobalization and onshoring exhibited in the prior few years (exacerbated by both the pandemic and the war in Russia/Ukraine) could lead to local inflationary pressures, where an investment in commodities and their protection against inflationary effects could have benefits. The TCW Enhanced Commodities Strategy Fund achieves this investment in the commodity index via derivative instruments, with the investment fully collateralized by a high quality, short duration fixed income portfolio to generate incremental portable alpha over time. Total return swaps used to gain commodity exposure are rolled at a “non-traditional” time (off period from when indexers typically roll), which has historically produced incremental alpha, while a focus on low risk, structural opportunities, such as holding positions at alternate points on the forward curve, is implemented with a goal of generating additional return.
| Annualized Total Return as of October 31, 2022(1) | ||||||||||||||||||||
| One Year | Three Years | Five Years | Ten Years | Inception To Date | ||||||||||||||||
TCW Enhanced Commodity Strategy Fund | ||||||||||||||||||||
Class I (Inception: April 1, 2011) | 6.82 | % | 14.24 | % | 7.68 | % | -0.33 | % | -1.31 | % | ||||||||||
Class N (Inception: April 1, 2011) | 6.93 | % | 14.25 | % | 7.64 | % | -0.35 | % | -1.33 | % | ||||||||||
Bloomberg Commodity Total Return Index | 11.15 | % | 13.44 | % | 6.92 | % | -1.56 | % | -2.79 | % | ||||||||||
6
Table of Contents
TCW Enhanced Commodity Strategy Fund
Management Discussions (Continued)
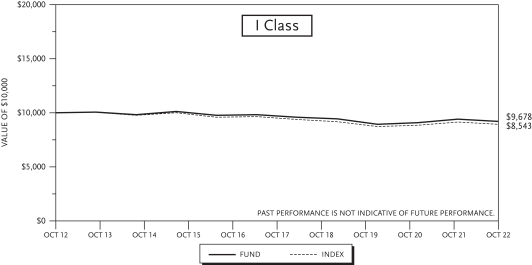
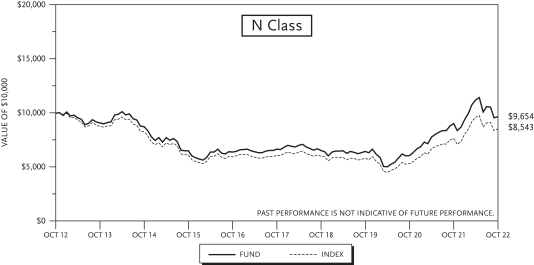
| (1) | The total returns do not reflect taxes that a shareholder would pay on fund distributions or on the redemption of fund shares. |
7
Table of Contents
TCW Global Bond Fund
Management Discussions
For the one-year period ending October 31, 2022, the TCW Global Bond Fund — I Class (“Fund”) fell 22.45% (net of fees), trailing the Bloomberg Global Aggregate Bond Index (“Index”) by 166 bps. Returns were held back by the allocation to securitized products, particularly residential MBS. The Fund’s overweight to securitized issues produced a sizable headwind to performance, with residential mortgage exposure the primary source of the drag. Agency MBS came under pressure from rising rates, extended durations, and the prospect of active selling by the Fed, and lagged Treasuries by over 350 bps on a duration-adjusted basis during the period. Non-agency backed collateral also struggled, falling approximately 8% as broader market volatility and reduced trading in the space weighed on pricing. Despite the drag from these holdings, the team remains constructive on mortgage credit overall with continued home price appreciation (the slower pace notwithstanding), declining loan-to-value ratios, strong borrower profiles and stricter underwriting standards. As such, underperformance presented attractive opportunities to add exposure at attractive yield levels. Albeit more modest, issue selection among ABS weighed on relative performance as student loans and CLOs widened, while CMBS holdings focused on non-agency collateral also detracted as these issues trailed Treasuries. Away from securitized, the overweight to corporate credit also detracted given widening in the sector, though favorable issue selection offset the drag, particularly credit selection outside the U.S. Non-corporate credit, however, weighed on relative performance, particularly emerging market quasi-sovereign debt. Meanwhile, an overweight to U.S. rates duration weighed on relative performance as rates rose across the curve for the year, though some of this drag was offset by an underweight to other countries where rates rose, particularly the Eurozone. Finally, currency exposure boosted relative returns, with the biggest contributions coming from the underweight to the Euro and Japanese Yen, and overweight to the U.S. dollar which outperformed a wide range of currencies amid weakness in global growth, tighter liquidity conditions, lower exposure to energy shortages in the U.S., and aggressive tightening by the Federal Reserve.
Global economies still face a challenging economic outlook with downside risks, and as such, careful country selection is important. A mix of upside inflation risks and downside growth risk informs a focus on higher-quality sovereign issuers with strong macroeconomic positions that can weather uncertainties, while caution is warranted in countries with weaker economic fundamentals. Given the further move higher in global sovereign yields, the duration profile of the strategy has been extended, with additions focused in U.S. 10- and 20-Year tenors and Eurozone 5-, 10-, and 30-Year tenors. Duration positioning maintains a preference for U.S. dollar rates duration, while Yen rates risk remains underweight. Additionally, the portfolio has select rates overweights in other G-10 markets (Canada, Australia, New Zealand, Norway), while Euro duration was extended from an underweight to a small overweight position versus the benchmark given the sizable policy moves since tightening began in July. Currency positioning also favors markets with strong fundamentals (such as the U.S. dollar, Singapore dollar, and Canadian dollar), and where central banks are removing accommodation. Ongoing concerns about the potential for a global recession informs cautious positioning among currencies of trade-oriented economies and commodity exporters (Mexican peso and Hungarian forint). Among the sectors, U.S. corporate spreads at current levels look attractive, particularly considering the deep discounts at which much of the market trades. Sub-par pricing provides positive credit convexity and additional protection for investors, though careful issue selection is still critical amid uncertain conditions. Similarly, high yield spreads near 500 bps have historically been a good entry point. However, it is important to note that though credit risk premiums are elevated, so too are the risk factors; thus, a cautious expansion is warranted. Outside of corporate credit, the team is generally constructive on securitized assets, and believe there is value in many subsectors of
8
Table of Contents
TCW Global Bond Fund
Management Discussions (Continued)
the market. In particular, U.S. agency MBS looks compelling at current wide spreads, as do areas of the non-agency market, given embedded home price appreciation in many deals with even modest seasoning. Even so, allocations remain up in the capital structure with cash flow priority and credit enhancement to reduce downside risks. CMBS emphasizes high quality as well, but focused on single asset, single borrower deals where exposures can be targeted to newer, more efficient, in-demand developments. Similarly, senior tranche ABS provide fair compensation given robust structures, even as possibility of recession looms.
| Annualized Total Return as of October 31, 2022(1) | ||||||||||||||||||||
| One Year | Three Years | Five Years | Ten Years | Inception To Date | ||||||||||||||||
TCW Global Bond Fund | ||||||||||||||||||||
Class I (Inception: December 1, 2011) | -22.45 | % | -5.79 | % | -2.09 | % | -0.88 | % | 0.29 | % | ||||||||||
Class N (Inception: December 1, 2011) | -22.45 | % | -5.88 | % | -2.16 | % | -0.91 | % | 0.26 | % | ||||||||||
Bloomberg Global Aggregate Bond Index | -20.79 | % | -6.16 | % | -2.38 | % | -0.98 | % | -0.42 | % | ||||||||||
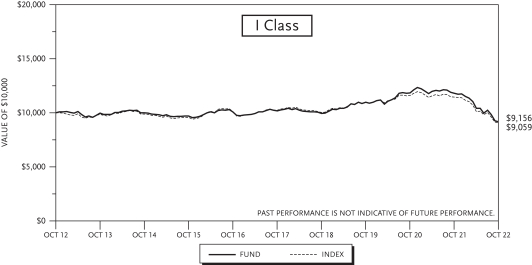

| (1) | The total returns do not reflect taxes that a shareholder would pay on fund distributions or on the redemption of fund shares. |
9
Table of Contents
TCW High Yield Bond Fund
Management Discussions
While the TCW High Yield Fund — I Class (“Fund”) fell 9.97% (net of fees) for the one-year period ended October 31, 2022, this was nearly 80 bps ahead of the FTSE U.S. High Yield Cash Pay Custom Index (“Index”) return. The largest drag on returns came from the emphasis on communications and consumer non-cyclicals, given they were among the worst performing sectors in the high yield universe (weighed down in particular by pharmaceuticals and wireless). However, this drag was somewhat offset by positive issue selection as Fund holdings in these sectors outpaced those in the Index. In addition to these contributions, finance company, electric utility, energy, and consumer cyclical names boosted relative returns. Meanwhile, the Fund’s focus on higher-quality issues benefitted returns as the CCC-rated cohort fell roughly 15% for the period, trailing BB and B-rated issues, which were down 11.7% and 10.8%, respectively. Finally, the Fund’s duration profile was a slight tailwind to performance, as the relative position was underweight the Index for most of the period, though it was extended as rates rose across the curve.
Looking forward, adherence to philosophical consistency and rigorous analysis remains key. So, where does that lead from a positioning perspective? Given the further move higher in Treasury yields, the duration profile of the strategy was extended to end the period at approximately 4.0 years, as 10-Year rates appear above long-term equilibrium. Turning towards sector positioning, though credit risk premiums are elevated versus the start of the year, so too are the risk factors. These fundamental variable changes must be considered in calibrating the prevailing attractiveness of high yield bonds. With that in mind, a cautious expansion is warranted and the team will continue to take advantage of rallies as a means to optimize/reduce risk where appropriate. Yield spreads in the near-term are likely to continue widening should the economy slow, and in that environment, additions will be made in a disciplined, incremental fashion to avoid vulnerable capital structures. Discount syndications will likely continue to represent opportunities for investment opportunities going forward, to take advantage of relative value versus existing bonds. The team will continue to be very deliberate in its additions, with an overall emphasis on defensive areas of the market with less economically sensitive demand drivers such as consumer non-cyclicals while energy, retail and technology credits represent relative underweights. Overall, an environment of higher yields, dollar price discounts and wider spreads certainly broaden out the opportunity set and the team will put emphasis on credit-specific idea generation around mispricings.
| Annualized Total Return as of October 31, 2022(1) | ||||||||||||||||||||
| One Year | Three Years | Five Years | Ten Years | Inception To Date | ||||||||||||||||
TCW High Yield Bond Fund | ||||||||||||||||||||
Class I (Inception: February 1, 1989) | -9.97 | % | 1.04 | % | 2.92 | % | 3.98 | % | 6.60 | %(2) | ||||||||||
FTSE U.S. High Yield Cash Pay Custom Index | -10.75 | % | 0.26 | % | 1.85 | % | 3.78 | % | 7.11 | % | ||||||||||
Class N (Inception: March 1, 1999) | -10.24 | % | 0.81 | % | 2.66 | % | 3.73 | % | 4.77 | % | ||||||||||
FTSE U.S. High Yield Cash Pay Custom Index | -10.75 | % | 0.26 | % | 1.85 | % | 3.78 | % | 5.76 | % | ||||||||||
10
Table of Contents
TCW High Yield Bond Fund
Management Discussions (Continued)

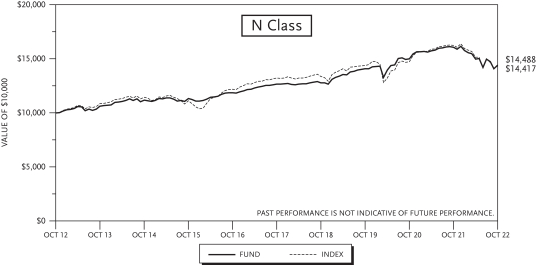
| (1) | The total returns do not reflect taxes that a shareholder would pay on fund distributions or on the redemption of fund shares. |
| (2) | Performance data includes the performance of the predecessor entity for periods before the Fund’s registration became effective. The predecessor entity was not registered under the 1940 Act and, therefore, was not subject to certain investment restrictions that are imposed by the 1940 Act. If the predecessor entity had been registered under the 1940 Act, the predecessor entity’s performance may have been lower. |
11
Table of Contents
TCW Short Term Bond Fund
Management Discussions
Against a rising rate backdrop, the TCW Short Term Bond Fund — I Class (“Fund”) fell 3.61% (net of fees) for the one-year period ended October 31, 2022, trailing the FTSE 1-Year Treasury Index (“Index”) by just over 180 bps. The biggest drag on performance came from the Fund’s allocation to residential MBS, with the agency MBS allocation the largest negative contributor. Continued volatility, surging rates and near fully-extended durations (especially among lower coupons) resulted in a sharp downward repricing across the sector, with yield spreads widening to levels not seen since the GFC (global financial crisis) providing favorable entry points for the Fund to meaningfully add to the mortgage basis. Despite the sector drag, the emphasis on TBA (to-be-announced) securities helped to blunt the impact, while the smaller allocation to non-agency MBS resulted in a more muted effect as favorable issue selection among loans backed by subprime legacy collateral largely offset the negative impact of yield premiums rising in the sector. Elsewhere in securitized, the Fund’s CMBS holdings – led by single asset, single borrower deals – were a tailwind, while the ABS allocation had little impact. Meanwhile, the Fund’s exposure to corporate credit resulted in a mixed effect; while short corporates trailed duration-matched Treasuries during the period (with financials among the Fund’s worst performers), favorable issue selection among insurance, healthcare, transportation and communications names positively contributed to performance. Finally, the Fund’s duration profile, which was extended throughout the period to a still-modest 1.8 years alongside the continued rise in U.S. Treasury yields (the 2-year rate rose nearly 400 bps while the 5-year increased 305 bps), produced a sizeable headwind that weighed on returns.
Looking forward, adherence to philosophical consistency and rigorous analysis remains key. So, where does that lead from a positioning perspective? Given that rates already reflect an aggressive Fed with 10-year yields appearing above long-term equilibrium, the duration profile remains modest at approximately 1.8 years. Turning towards sector positioning, corporate spreads at these levels look attractive, particularly considering the deep discounts at which much of the market trades. These discounts provide positive credit convexity and additional protection for investors, though careful issue selection is still critical amid uncertain conditions. Outside of corporate credit, the team is generally constructive on securitized assets, and believe there is value in many subsectors of the market. In particular, agency MBS looks compelling at current wide spreads, as do areas of the non-agency market, given embedded home price appreciation in many deals with even modest seasoning. Even so, allocations remain up in the capital structure with cash flow priority and credit enhancement to reduce downside risks. CMBS emphasizes high quality as well, but focused on single asset, single borrower deals where exposures can be targeted to newer, more efficient, in-demand developments. Similarly, senior tranche ABS provide fair compensation given robust structures, even as possibility of recession looms.
| Annualized Total Return as of October 31, 2022(1) | ||||||||||||||||||||
| One Year | Three Years | Five Years | Ten Years | Inception To Date | ||||||||||||||||
TCW Short Term Bond Fund | ||||||||||||||||||||
Class X (Inception: February 1, 1990) | -3.61 | % | -0.28 | % | 0.84 | % | 0.74 | % | 3.48 | %(2) | ||||||||||
FTSE 1-Year Treasury Index | -1.80 | % | 0.12 | % | 0.98 | % | 0.70 | % | 3.16 | % | ||||||||||
12
Table of Contents
TCW Short Term Bond Fund
Management Discussions (Continued)
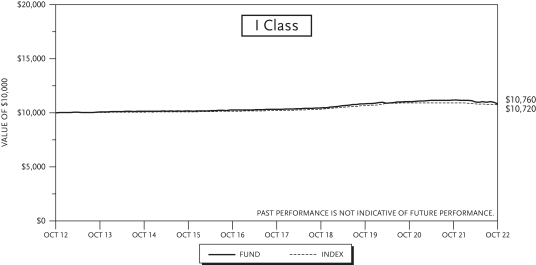
| (1) | The total returns do not reflect taxes that a shareholder would pay on fund distributions or on the redemption of fund shares. |
| (2) | Performance data includes the performance of the predecessor entity for periods before the Fund’s registration became effective. The predecessor entity was not registered under the 1940 Act and, therefore, was not subject to certain investment restrictions that are imposed by the 1940 Act. If the predecessor entity had been registered under the 1940 Act, the predecessor entity’s performance may have been lower. |
13
Table of Contents
TCW Total Return Bond Fund
Management Discussions
The TCW Total Return Bond Fund — I Class (“Fund”) was down 19.58% (net of fees) for the one-year ending October 31, 2022, trailing the Bloomberg U.S. Aggregate Bond Index (“Index”) by approximately 390 bps. The largest driver of relative underperformance was the Fund’s sizeable allocation to residential mortgages, with the overweight to agency MBS especially challenging to performance as the sector came under pressure from rising rates, extended durations, and the prospect of active selling by the Fed, and lagged Treasuries by over 350 bps on a duration-adjusted basis during the period. Non-agency backed collateral also struggled, falling approximately 8% as broader market volatility and reduced trading in the space weighed on pricing. Despite the drag from these holdings, the team remains constructive on mortgage credit overall with continued home price appreciation (the slower pace notwithstanding), declining loan-to-value ratios, strong borrower profiles and stricter underwriting standards. As such, underperformance presented attractive opportunities to add exposure at attractive yield levels. Additional headwinds came from the smaller ABS and CMBS overweights as both sectors struggled amid broader macro uncertainty and emerging cracks in consumer strength. Meanwhile, the lack of exposure to corporate credit (given the mortgage focus of the Fund) resulted in a boost to relative performance as corporate bonds saw yield premiums march higher with the sector weighing heavily on index returns. Finally, yield curve positioning detracted modestly given the emphasis on the steepening bias (overweight 2 to 5-Year parts of the curve) where yields rose the most. However, the duration position was marginally additive as contributions from being underweight during the first half of the period offset the drag associated with lengthening the position alongside the rise in rates over the latter half.
Looking forward, adherence to philosophical consistency and rigorous analysis remains key. So, where does that lead from a positioning perspective? Given the move higher in Treasury yields, the duration profile of the strategy was extended to approximately 0.9 years long the Index as 10-Year rates appear above long-term equilibrium. The team is generally constructive on securitized assets, and believe there is value in many subsectors of the market. In particular, agency MBS looks compelling at current wide spreads, as do areas of the non-agency market, given embedded home price appreciation in many deals with even modest seasoning. While the significant allocation to non-agency MBS is largely focused on deeply-discounted senior legacy issues given ongoing fundamental improvements in borrower profiles, newer vintage deals backed by re-performing loans, non-performing loans, jumbo prime loans and CRT (credit risk transfer) deals are also appealing. Away from residential MBS, CMBS exposure focuses on non-agency collateral including top-of the-capital structure positions in single asset, single borrower (SASB) issues where exposures can be targeted to newer, more efficient, in-demand developments, and CRE CLOs (commercial real estate collateralized loan obligations). CMBS exposure also includes select positions further down the capital structure with attractive loan-to-value (LTV) ratios, i.e., substantial equity, good spread compensation, and strong sponsorship. Finally, ABS at the top of the capital structure provides fair
14
Table of Contents
TCW Total Return Bond Fund
Management Discussions (Continued)
compensation given robust structures, even with the possibility of recession. Exposure favors AAA-rated CLOs, while other ABS exposure includes government-guaranteed FFELP student loans, credit cards, and single family rentals.
| Annualized Total Return as of October 31, 2022(1) | ||||||||||||||||||||
| One Year | Three Years | Five Years | Ten Years | Inception To Date | ||||||||||||||||
TCW Total Return Bond Fund | ||||||||||||||||||||
Class I (Inception: June 17, 1993) | -19.58 | % | -4.99 | % | -1.34 | % | 0.74 | % | 5.10 | % | ||||||||||
Bloomberg U.S. Aggregate Bond Index | -15.68 | % | -3.77 | % | -0.54 | % | 0.74 | % | 4.32 | % | ||||||||||
Class N (Inception: March 1, 1999) | -19.70 | % | -5.16 | % | -1.57 | % | 0.47 | % | 4.32 | % | ||||||||||
Bloomberg U.S. Aggregate Bond Index | -15.68 | % | -3.77 | % | -0.54 | % | 0.74 | % | 3.74 | % | ||||||||||
Class P (Inception: February 28, 2020) | -19.43 | % | — | — | — | -6.74 | % | |||||||||||||
Bloomberg U.S. Aggregate Bond Index | -15.68 | % | -3.77 | % | -0.54 | % | 0.74 | % | -5.49 | % | ||||||||||

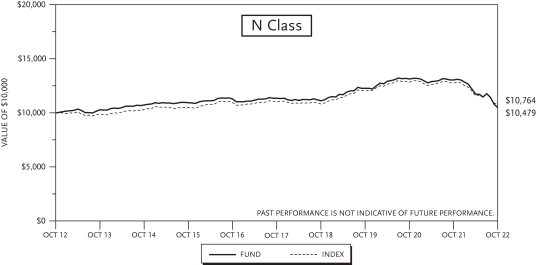
15
Table of Contents
TCW Total Return Bond Fund
Management Discussions (Continued)

| (1) | The total returns do not reflect taxes that a shareholder would pay on fund distributions or on the redemption of fund shares. |
16
Table of Contents
Schedule of Investments | October 31, 2022 |
| Issues | Maturity Date | Principal Amount | Value | |||||||||
FIXED INCOME SECURITIES — 117.3% of Net Assets |
| |||||||||||
CORPORATE BONDS — 31.3% |
| |||||||||||
| Aerospace & Defense — 0.3% | ||||||||||||
Boeing Co. (The) |
| |||||||||||
1.43% | 02/04/24 | $ | 2,650,000 | $ | 2,514,532 | |||||||
4.88% | 05/01/25 | 560,000 | 547,204 | |||||||||
|
| |||||||||||
| 3,061,736 | ||||||||||||
|
| |||||||||||
| Agriculture — 0.7% | ||||||||||||
BAT Capital Corp. |
| |||||||||||
2.73% | 03/25/31 | 695,000 | 509,782 | |||||||||
4.39% | 08/15/37 | 470,000 | 341,201 | |||||||||
4.54% | 08/15/47 | 1,270,000 | 822,441 | |||||||||
5.28% | 04/02/50 | 1,285,000 | 919,899 | |||||||||
5.65% | 03/16/52 | 1,020,000 | 773,160 | |||||||||
Imperial Brands Finance PLC (United Kingdom) |
| |||||||||||
3.13% (1) | 07/26/24 | 2,300,000 | 2,179,112 | |||||||||
3.88% (1) | 07/26/29 | 35,000 | 29,471 | |||||||||
Reynolds American, Inc. |
| |||||||||||
5.70% | 08/15/35 | 260,000 | 220,341 | |||||||||
5.85% | 08/15/45 | 2,770,000 | 2,176,472 | |||||||||
|
| |||||||||||
| 7,971,879 | ||||||||||||
|
| |||||||||||
| Airlines — 0.2% | ||||||||||||
Delta Air Lines Pass-Through Trust (19-1-AA) |
| |||||||||||
3.20% | 10/25/25 | 1,500,000 | 1,440,165 | |||||||||
US Airways Group, Inc. Pass-Through Certificates (10-1A) (EETC) |
| |||||||||||
6.25% | 10/22/24 | 177,723 | 175,793 | |||||||||
US Airways Group, Inc. Pass-Through Certificates (12-1-A) (EETC) |
| |||||||||||
5.90% | 04/01/26 | 928,442 | 896,212 | |||||||||
US Airways Group, Inc. Pass-Through Certificates (12-2-A) (EETC) |
| |||||||||||
4.63% | 12/03/26 | 414,813 | 370,507 | |||||||||
|
| |||||||||||
| 2,882,677 | ||||||||||||
|
| |||||||||||
| Banks — 11.6% | ||||||||||||
ABN AMRO Bank NV |
| |||||||||||
2.47% (U.S. 1-year Treasury Constant Maturity Rate + 1.100%) (1),(2) | 12/13/29 | 1,700,000 | 1,322,702 | |||||||||
Bank of America Corp. |
| |||||||||||
1.66% (SOFR + 0.910%) (2) | 03/11/27 | 6,355,000 | 5,504,691 | |||||||||
1.73% (SOFR + 0.960%) (2) | 07/22/27 | 2,535,000 | 2,167,755 | |||||||||
1.92% (SOFR + 1.370%) (2) | 10/24/31 | 410,000 | 301,457 | |||||||||
2.09% (SOFR + 1.060%) (2) | 06/14/29 | 2,200,000 | 1,781,582 | |||||||||
| Issues | Maturity Date | Principal Amount | Value | |||||||||
| Banks (Continued) | ||||||||||||
2.57% (SOFR + 1.210%) (2) | 10/20/32 | $ | 320,000 | $ | 241,856 | |||||||
2.59% (SOFR + 2.150%) (2) | 04/29/31 | 1,955,000 | 1,545,381 | |||||||||
2.69% (SOFR + 1.320%) (2) | 04/22/32 | 3,535,000 | 2,732,696 | |||||||||
2.97% (SOFR + 1.330%) (2) | 02/04/33 | 930,000 | 721,903 | |||||||||
3.00% (3 mo. USD LIBOR + | 12/20/23 | 5,425,000 | 5,405,640 | |||||||||
3.97% (3 mo. USD LIBOR + | 02/07/30 | 1,125,000 | 996,044 | |||||||||
Citigroup, Inc. |
| |||||||||||
2.56% (SOFR + 1.167%) (2) | 05/01/32 | 2,050,000 | 1,564,384 | |||||||||
2.57% (SOFR + 2.107%) (2) | 06/03/31 | 1,040,000 | 814,353 | |||||||||
2.98% (SOFR + 1.422%) (2) | 11/05/30 | 1,395,000 | 1,139,757 | |||||||||
3.06% (SOFR + 1.351%) (2) | 01/25/33 | 4,885,000 | 3,819,093 | |||||||||
4.41% (SOFR + 3.914%) (2) | 03/31/31 | 1,000,000 | 893,502 | |||||||||
Credit Suisse Group AG (Switzerland) |
| |||||||||||
0.63% (3) | 01/18/33 | 515,000 | 306,773 | |||||||||
1.31% (SOFR + 0.980%) (1),(2) | 02/02/27 | 2,500,000 | 1,980,950 | |||||||||
2.19% (SOFR + 2.044%) (1),(2) | 06/05/26 | 895,000 | 757,072 | |||||||||
3.09% (SOFR + 1.730%) (1),(2) | 05/14/32 | 2,560,000 | 1,760,870 | |||||||||
6.44% (SOFR + 3.700%) (1),(2) | 08/11/28 | 1,360,000 | 1,240,038 | |||||||||
6.54% (SOFR + 3.920%) (1),(2) | 08/12/33 | 3,655,000 | 3,158,625 | |||||||||
DNB Bank ASA |
| |||||||||||
1.61% (U.S. 1-year Treasury Constant Maturity Rate + 0.680%) (1),(2) | 03/30/28 | 2,570,000 | 2,117,619 | |||||||||
Goldman Sachs Group, Inc. (The) |
| |||||||||||
1.09% (SOFR + 0.789%) (2) | 12/09/26 | 705,000 | 607,379 | |||||||||
1.22% | 12/06/23 | 4,225,000 | 4,043,578 | |||||||||
1.43% (SOFR + 0.798%) (2) | 03/09/27 | 5,260,000 | 4,504,296 | |||||||||
1.54% (SOFR + 0.818%) (2) | 09/10/27 | 880,000 | 739,455 | |||||||||
1.95% (SOFR + 0.913%) (2) | 10/21/27 | 1,695,000 | 1,441,174 | |||||||||
2.38% (SOFR + 1.248%) (2) | 07/21/32 | 2,215,000 | 1,650,995 | |||||||||
2.65% (SOFR + 1.264%) (2) | 10/21/32 | 1,075,000 | 815,164 | |||||||||
See accompanying Notes to Financial Statements.
17
Table of Contents
TCW Core Fixed Income Fund
Schedule of Investments (Continued)
| Issues | Maturity Date | Principal Amount | Value | |||||||||
| Banks (Continued) | ||||||||||||
HSBC Holdings PLC (United Kingdom) |
| |||||||||||
1.59% (SOFR + 1.290%) (2) | 05/24/27 | $ | 4,240,000 | $ | 3,486,794 | |||||||
2.01% (SOFR + 1.732%) (2) | 09/22/28 | 2,900,000 | 2,281,111 | |||||||||
2.21% (SOFR+ 1.285%) (2) | 08/17/29 | 2,570,000 | 1,951,067 | |||||||||
2.80% (SOFR + 1.187%) (2) | 05/24/32 | 845,000 | 606,423 | |||||||||
4.76% (SOFR + 2.110%) (2) | 06/09/28 | 1,045,000 | 942,381 | |||||||||
5.40% (SOFR + 2.870%) (2) | 08/11/33 | 745,000 | 647,733 | |||||||||
JPMorgan Chase & Co. | ||||||||||||
0.97% (SOFR + 0.580%) (2) | 06/23/25 | 6,625,000 | 6,094,934 | |||||||||
1.56% (SOFR + 0.605%) (2) | 12/10/25 | 2,080,000 | 1,898,936 | |||||||||
1.58% (SOFR + 0.885%) (2) | 04/22/27 | 4,360,000 | 3,751,300 | |||||||||
1.95% (SOFR + 1.065%) (2) | 02/04/32 | 3,330,000 | 2,442,775 | |||||||||
2.55% (SOFR + 1.180%) (2) | 11/08/32 | 1,455,000 | 1,101,624 | |||||||||
2.58% (SOFR + | 04/22/32 | 530,000 | 408,407 | |||||||||
2.74% (SOFR + 1.510%) (2) | 10/15/30 | 1,070,000 | 864,306 | |||||||||
2.95% (SOFR + 1.170%) (2) | 02/24/28 | 750,000 | 660,833 | |||||||||
Lloyds Banking Group PLC (United Kingdom) |
| |||||||||||
1.63% (U.S. 1-year Treasury Constant Maturity Rate + 0.850%) (2) | 05/11/27 | 1,500,000 | 1,258,605 | |||||||||
2.91% (3 mo. USD LIBOR + | 11/07/23 | 3,060,000 | 3,058,365 | |||||||||
3.75% (U.S. 1-year Treasury Constant Maturity Rate + 1.800%) (2) | 03/18/28 | 955,000 | 843,781 | |||||||||
3.87% (U.S. 1-year Treasury Constant Maturity Rate + 3.500%) (2) | 07/09/25 | 1,600,000 | 1,525,420 | |||||||||
4.98% (U.S. 1-year Treasury Constant Maturity Rate + 2.300%) (2) | 08/11/33 | 465,000 | 398,780 | |||||||||
Macquarie Group, Ltd. (Australia) |
| |||||||||||
1.34% (SOFR + 1.069%) (1),(2) | 01/12/27 | 2,510,000 | 2,130,666 | |||||||||
2.87% (SOFR + 1.532%) (1),(2) | 01/14/33 | 1,740,000 | 1,285,823 | |||||||||
| Issues | Maturity Date | Principal Amount | Value | |||||||||
| Banks (Continued) | ||||||||||||
Macquarie Group, Ltd. (Australia) |
| |||||||||||
4.44% (SOFR + 2.405%) (1),(2) | 06/21/33 | $ | 600,000 | $ | 502,986 | |||||||
Macquarie Group, Ltd. (Australia) |
| |||||||||||
5.03% (3 mo. USD LIBOR + | 01/15/30 | 505,000 | 465,467 | |||||||||
Morgan Stanley |
| |||||||||||
0.79% (SOFR + 0.509%) (2) | 01/22/25 | 1,020,000 | 952,438 | |||||||||
1.51% (SOFR + 0.858%) (2) | 07/20/27 | 4,985,000 | 4,228,526 | |||||||||
1.79% (SOFR + 1.034%) (2) | 02/13/32 | 860,000 | 621,112 | |||||||||
1.93% (SOFR + 1.020%) (2) | 04/28/32 | 2,710,000 | 1,963,670 | |||||||||
2.24% (SOFR + 1.178%) (2) | 07/21/32 | 1,265,000 | 939,199 | |||||||||
2.48% (SOFR + 1.000%) (2) | 01/21/28 | 2,470,000 | 2,137,637 | |||||||||
2.48% (SOFR + 1.360%) (2) | 09/16/36 | 1,050,000 | 746,403 | |||||||||
2.51% (SOFR + 1.200%) (2) | 10/20/32 | 165,000 | 124,530 | |||||||||
2.94% (SOFR + 1.290%) (2) | 01/21/33 | 495,000 | 386,186 | |||||||||
NatWest Group PLC (United Kingdom) |
| |||||||||||
4.27% (3 mo. USD LIBOR + | 03/22/25 | 3,140,000 | 3,027,902 | |||||||||
PNC Financial Services Group, Inc. |
| |||||||||||
6.04% (SOFR + 2.140%) (2) | 10/28/33 | 1,140,000 | 1,147,729 | |||||||||
Santander UK Group Holdings PLC |
| |||||||||||
2.90% (SOFR + 1.475%) (2) | 03/15/32 | 1,175,000 | 852,819 | |||||||||
Santander UK Group Holdings PLC (United Kingdom) |
| |||||||||||
1.09% (SOFR + 0.787%) (2) | 03/15/25 | 3,265,000 | 2,997,694 | |||||||||
1.67% (SOFR + 0.989%) (2) | 06/14/27 | 285,000 | 233,099 | |||||||||
2.47% (SOFR + 1.220%) (2) | 01/11/28 | 465,000 | 382,314 | |||||||||
3.37% (3 mo. USD LIBOR + 1.080%) (2) | 01/05/24 | 190,000 | 188,625 | |||||||||
4.80% (3 mo. USD LIBOR +1.570%) (2) | 11/15/24 | 960,000 | 939,452 | |||||||||
Santander UK PLC (United Kingdom) |
| |||||||||||
5.00% (1) | 11/07/23 | 2,460,000 | 2,433,383 | |||||||||
U.S. Bancorp |
| |||||||||||
5.85% (SOFR + 2.090%) (2) | 10/21/33 | 1,160,000 | 1,159,107 | |||||||||
See accompanying Notes to Financial Statements.
18
Table of Contents
TCW Core Fixed Income Fund
October 31, 2022
| Issues | Maturity Date | Principal Amount | Value | |||||||||
| Banks (Continued) | ||||||||||||
UBS Group AG |
| |||||||||||
4.49% (U.S. 1-year Treasury Constant Maturity Rate + 1.550%) (1),(2) | 05/12/26 | $ | 855,000 | $ | 811,951 | |||||||
Wells Fargo & Co. |
| |||||||||||
2.16% (3 mo. USD LIBOR + 0.750%) (2) | 02/11/26 | 1,850,000 | 1,700,176 | |||||||||
2.19% (SOFR + 2.000%) (2) | 04/30/26 | 645,000 | 587,298 | |||||||||
2.39% (SOFR + 2.100%) (2) | 06/02/28 | 630,000 | 538,612 | |||||||||
2.88% (SOFR + 1.432%) (2) | 10/30/30 | 285,000 | 233,999 | |||||||||
3.35% (SOFR + 1.500%) (2) | 03/02/33 | 4,715,000 | 3,811,134 | |||||||||
3.53% (SOFR + 1.510%) (2) | 03/24/28 | 3,760,000 | 3,393,475 | |||||||||
3.58% (3 mo. USD LIBOR + 1.310%) (2) | 05/22/28 | 1,015,000 | 914,370 | |||||||||
4.90% (SOFR + 2.100%) (2) | 07/25/33 | 2,015,000 | 1,843,573 | |||||||||
5.01% (SOFR + 4.502%) (2) | 04/04/51 | 625,000 | 531,227 | |||||||||
|
| |||||||||||
| 134,512,941 | ||||||||||||
|
| |||||||||||
| Beverages — 0.4% | ||||||||||||
Anheuser-Busch Cos LLC / Anheuser-Busch InBev Worldwide, Inc. |
| |||||||||||
4.90% | 02/01/46 | 3,325,000 | 2,856,036 | |||||||||
Bacardi, Ltd. |
| |||||||||||
2.75% (1) | 07/15/26 | 750,000 | 669,705 | |||||||||
4.45% (1) | 05/15/25 | 1,780,000 | 1,708,901 | |||||||||
|
| |||||||||||
| 5,234,642 | ||||||||||||
|
| |||||||||||
| Chemicals — 0.1% | ||||||||||||
International Flavors & Fragrances, Inc. |
| |||||||||||
5.00% | 09/26/48 | 1,975,000 | 1,581,036 | |||||||||
|
| |||||||||||
| Commercial Services — 0.1% | ||||||||||||
Global Payments, Inc. |
| |||||||||||
5.40% | 08/15/32 | 710,000 | 657,119 | |||||||||
5.95% | 08/15/52 | 899,000 | 778,247 | |||||||||
|
| |||||||||||
| 1,435,366 | ||||||||||||
|
| |||||||||||
| Computers — 0.1% | ||||||||||||
Lenovo Group, Ltd. |
| |||||||||||
6.54% (1) | 07/27/32 | 725,000 | 619,230 | |||||||||
|
| |||||||||||
| Diversified Financial Services — 1.4% | ||||||||||||
AerCap Ireland Capital DAC / AerCap Global Aviation Trust (Ireland) |
| |||||||||||
2.45% | 10/29/26 | 1,655,000 | 1,401,040 | |||||||||
3.00% | 10/29/28 | 4,345,000 | 3,511,108 | |||||||||
3.88% | 01/23/28 | 430,000 | 370,672 | |||||||||
| Issues | Maturity Date | Principal Amount | Value | |||||||||
| Diversified Financial Services (Continued) | ||||||||||||
Air Lease Corp. |
| |||||||||||
3.25% | 03/01/25 | $ | 1,300,000 | $ | 1,214,127 | |||||||
3.63% | 12/01/27 | 640,000 | 549,973 | |||||||||
Avolon Holdings Funding, Ltd. |
| |||||||||||
2.53% (1) | 11/18/27 | 884,000 | 675,441 | |||||||||
2.88% (1) | 02/15/25 | 1,550,000 | 1,388,288 | |||||||||
3.95% (1) | 07/01/24 | 405,000 | 379,943 | |||||||||
Capital One Financial Corp. |
| |||||||||||
1.34% (SOFR + 0.690%) (2) | 12/06/24 | 2,535,000 | 2,399,732 | |||||||||
Cboe Global Markets, Inc. |
| |||||||||||
3.00% | 03/16/32 | 595,000 | 481,992 | |||||||||
ORIX Corp. |
| |||||||||||
5.20% | 09/13/32 | 1,405,000 | 1,305,484 | |||||||||
Park Aerospace Holdings, Ltd. |
| |||||||||||
4.50% (1) | 03/15/23 | 2,715,000 | 2,702,647 | |||||||||
5.50% (1) | 02/15/24 | 108,000 | 105,464 | |||||||||
Raymond James Financial, Inc. |
| |||||||||||
4.95% | 07/15/46 | 460,000 | 390,011 | |||||||||
|
| |||||||||||
| 16,875,922 | ||||||||||||
|
| |||||||||||
| Electric — 1.8% | ||||||||||||
Appalachian Power Co. |
| |||||||||||
4.45% | 06/01/45 | 690,000 | 535,580 | |||||||||
Duke Energy Corp. |
| |||||||||||
3.75% | 09/01/46 | 1,290,000 | 886,819 | |||||||||
3.85% | 06/15/34 | 800,000 | 705,342 | |||||||||
Duke Energy Progress LLC |
| |||||||||||
3.70% | 10/15/46 | 1,325,000 | 961,340 | |||||||||
Indiana Michigan Power Co. |
| |||||||||||
4.55% | 03/15/46 | 920,000 | 734,054 | |||||||||
ITC Holdings Corp. |
| |||||||||||
2.95% (1) | 05/14/30 | 2,000,000 | 1,632,211 | |||||||||
Jersey Central Power & Light Co. |
| |||||||||||
2.75% (1) | 03/01/32 | 2,575,000 | 2,010,483 | |||||||||
Metropolitan Edison Co. |
| |||||||||||
3.50% (1) | 03/15/23 | 3,030,000 | 3,012,376 | |||||||||
MidAmerican Energy Co. |
| |||||||||||
5.80% | 10/15/36 | 1,655,000 | 1,643,714 | |||||||||
NextEra Energy Capital Holdings, Inc. |
| |||||||||||
3.25% (3 mo. USD LIBOR + | 02/22/23 | 3,000,000 | 2,994,450 | |||||||||
Niagara Mohawk Power Corp. |
| |||||||||||
2.72% (1) | 11/28/22 | 920,000 | 918,671 | |||||||||
Tucson Electric Power Co. |
| |||||||||||
4.00% | 06/15/50 | 1,500,000 | 1,092,105 | |||||||||
Xcel Energy, Inc. |
| |||||||||||
4.60% | 06/01/32 | 3,620,000 | 3,343,722 | |||||||||
|
| |||||||||||
| 20,470,867 | ||||||||||||
|
| |||||||||||
See accompanying Notes to Financial Statements.
19
Table of Contents
TCW Core Fixed Income Fund
Schedule of Investments (Continued)
| Issues | Maturity Date | Principal Amount | Value | |||||||||
| Engineering & Construction — 0.1% | ||||||||||||
Heathrow Funding Ltd. |
| |||||||||||
1.88% (3) | 03/14/36 | $ | 1,755,000 | $ | 1,198,954 | |||||||
|
| |||||||||||
| Entertainment — 0.6% | ||||||||||||
WarnerMedia Holdings, Inc. |
| |||||||||||
4.28% (1) | 03/15/32 | 200,000 | 161,772 | |||||||||
5.05% (1) | 03/15/42 | 3,135,000 | 2,295,227 | |||||||||
5.14% (1) | 03/15/52 | 5,934,000 | 4,159,141 | |||||||||
|
| |||||||||||
| 6,616,140 | ||||||||||||
|
| |||||||||||
| Food — 0.7% | ||||||||||||
JBS USA LUX SA / JBS USA Food Co. / JBS USA Finance, Inc. |
| |||||||||||
3.00% (1) | 02/02/29 | 1,445,000 | 1,175,190 | |||||||||
3.00% (1) | 05/15/32 | 1,875,000 | 1,390,093 | |||||||||
6.50% (1) | 12/01/52 | 1,575,000 | 1,383,480 | |||||||||
Kraft Heinz Foods Co. |
| |||||||||||
4.88% | 10/01/49 | 537,000 | 447,214 | |||||||||
5.00% | 06/04/42 | 2,133,000 | 1,848,970 | |||||||||
5.20% | 07/15/45 | 775,000 | 678,822 | |||||||||
Smithfield Foods, Inc. |
| |||||||||||
2.63% (1) | 09/13/31 | 2,565,000 | 1,826,023 | |||||||||
|
| |||||||||||
| 8,749,792 | ||||||||||||
|
| |||||||||||
| Gas — 0.2% | ||||||||||||
KeySpan Gas East Corp. |
| |||||||||||
3.59% (1) | 01/18/52 | 1,150,000 | 717,071 | |||||||||
5.82% (1) | 04/01/41 | 1,551,000 | 1,407,269 | |||||||||
|
| |||||||||||
| 2,124,340 | ||||||||||||
|
| |||||||||||
| Health Care-Products — 0.1% | ||||||||||||
DENTSPLY SIRONA, Inc. |
| |||||||||||
3.25% | 06/01/30 | 1,400,000 | 1,094,051 | |||||||||
|
| |||||||||||
| Health Care-Services — 1.3% | ||||||||||||
Centene Corp. |
| |||||||||||
3.00% | 10/15/30 | 3,888,000 | 3,136,177 | |||||||||
CommonSpirit Health |
| |||||||||||
2.78% | 10/01/30 | 955,000 | 743,210 | |||||||||
4.35% | 11/01/42 | 600,000 | 467,820 | |||||||||
Fresenius Finance Ireland PLC, |
| |||||||||||
0.88% (3) | 10/01/31 | 920,000 | 643,508 | |||||||||
Fresenius Medical Care US Finance III, Inc. |
| |||||||||||
1.88% (1) | 12/01/26 | 1,650,000 | 1,357,224 | |||||||||
HCA, Inc. |
| |||||||||||
3.13% (1) | 03/15/27 | 455,000 | 402,647 | |||||||||
3.63% (1) | 03/15/32 | 1,156,000 | 940,452 | |||||||||
4.13% | 06/15/29 | 3,946,000 | 3,484,634 | |||||||||
4.63% (1) | 03/15/52 | 800,000 | 589,384 | |||||||||
5.25% | 04/15/25 | 770,000 | 757,207 | |||||||||
5.25% | 06/15/49 | 600,000 | 487,247 | |||||||||
5.38% | 09/01/26 | 930,000 | 908,564 | |||||||||
| Issues | Maturity Date | Principal Amount | Value | |||||||||
| Health Care-Services (Continued) | ||||||||||||
5.50% | 06/15/47 | $ | 1,970,000 | $ | 1,664,768 | |||||||
|
| |||||||||||
| 15,582,842 | ||||||||||||
|
| |||||||||||
| Insurance — 1.6% | ||||||||||||
Aon Corp. / Aon Global Holdings PLC |
| |||||||||||
2.05% | 08/23/31 | 940,000 | 701,993 | |||||||||
3.90% | 02/28/52 | 805,000 | 571,606 | |||||||||
5.00% | 09/12/32 | 1,000,000 | 943,894 | |||||||||
Athene Global Funding |
| |||||||||||
1.99% (1) | 08/19/28 | 4,000,000 | 3,166,800 | |||||||||
2.72% (1) | 01/07/29 | 240,000 | 194,789 | |||||||||
3.21% (1) | 03/08/27 | 815,000 | 717,332 | |||||||||
Farmers Exchange Capital |
| |||||||||||
7.20% (1) | 07/15/48 | 1,495,000 | 1,498,556 | |||||||||
Farmers Exchange Capital II |
| |||||||||||
6.15% (3 mo. USD LIBOR + 3.744%) (1),(2) | 11/01/53 | 2,065,000 | 1,963,317 | |||||||||
Nationwide Mutual Insurance Co. |
| |||||||||||
5.58% (3 mo. USD LIBOR + 2.290%) (1),(2) | 12/15/24 | 4,000,000 | 4,000,906 | |||||||||
New York Life Insurance Co. |
| |||||||||||
3.75% (1) | 05/15/50 | 1,475,000 | 1,043,570 | |||||||||
Teachers Insurance & Annuity Association of America |
| |||||||||||
3.30% (1) | 05/15/50 | 2,980,000 | 1,920,702 | |||||||||
4.27% (1) | 05/15/47 | 130,000 | 101,805 | |||||||||
Willis North America, Inc. |
| |||||||||||
4.50% | 09/15/28 | 1,445,000 | 1,330,452 | |||||||||
|
| |||||||||||
| 18,155,722 | ||||||||||||
|
| |||||||||||
| Internet — 0.2% | ||||||||||||
Netflix, Inc. |
| |||||||||||
4.63% | 05/15/29 | 670,000 | 647,386 | |||||||||
Tencent Holdings, Ltd. |
| |||||||||||
3.68% (1) | 04/22/41 | 825,000 | 521,058 | |||||||||
3.84% (1) | 04/22/51 | 825,000 | 486,717 | |||||||||
3.98% (1) | 04/11/29 | 740,000 | 624,780 | |||||||||
|
| |||||||||||
| 2,279,941 | ||||||||||||
|
| |||||||||||
| Media — 0.7% | ||||||||||||
Charter Communications Operating LLC / Charter Communications Operating Capital |
| |||||||||||
3.90% | 06/01/52 | 1,000,000 | 625,240 | |||||||||
4.80% | 03/01/50 | 495,000 | 352,108 | |||||||||
5.13% | 07/01/49 | 1,080,000 | 803,509 | |||||||||
5.25% | 04/01/53 | 1,530,000 | 1,153,437 | |||||||||
5.38% | 04/01/38 | 1,475,000 | 1,193,393 | |||||||||
5.38% | 05/01/47 | 2,755,000 | 2,128,072 | |||||||||
5.75% | 04/01/48 | 1,028,000 | 832,187 | |||||||||
Paramount Global |
| |||||||||||
4.20% | 05/19/32 | 1,460,000 | 1,170,847 | |||||||||
|
| |||||||||||
| 8,258,793 | ||||||||||||
|
| |||||||||||
See accompanying Notes to Financial Statements.
20
Table of Contents
TCW Core Fixed Income Fund
October 31, 2022
| Issues | Maturity Date | Principal Amount | Value | |||||||||
| Miscellaneous Manufacturers — 0.3% | ||||||||||||
GE Capital International Funding Co. Unlimited Co. (Ireland) |
| |||||||||||
4.42% | 11/15/35 | $ | 220,000 | $ | 195,259 | |||||||
General Electric Co. |
| |||||||||||
3.39% (3 mo. USD LIBOR + 0.480%) (2) | 08/15/36 | 3,045,000 | 2,451,580 | |||||||||
6.75% | 03/15/32 | 539,000 | 586,244 | |||||||||
|
| |||||||||||
| 3,233,083 | ||||||||||||
|
| |||||||||||
| Oil & Gas — 0.2% | ||||||||||||
Petroleos Mexicanos |
| |||||||||||
6.75% | 09/21/47 | 2,625,000 | 1,585,738 | |||||||||
6.95% | 01/28/60 | 510,000 | 306,000 | |||||||||
7.69% | 01/23/50 | 1,565,000 | 1,022,345 | |||||||||
|
| |||||||||||
| 2,914,083 | ||||||||||||
|
| |||||||||||
| Packaging & Containers — 0.3% | ||||||||||||
Berry Global, Inc. |
| |||||||||||
1.57% | 01/15/26 | 1,645,000 | 1,427,037 | |||||||||
1.65% | 01/15/27 | 1,670,000 | 1,377,583 | |||||||||
4.88% (1) | 07/15/26 | 580,000 | 546,247 | |||||||||
|
| |||||||||||
| 3,350,867 | ||||||||||||
|
| |||||||||||
| Pharmaceuticals — 1.2% | ||||||||||||
AbbVie, Inc. |
| |||||||||||
4.40% | 11/06/42 | 1,840,000 | 1,509,370 | |||||||||
4.45% | 05/14/46 | 1,035,000 | 833,341 | |||||||||
4.50% | 05/14/35 | 267,000 | 237,030 | |||||||||
Bayer US Finance II LLC |
| |||||||||||
4.38% (1) | 12/15/28 | 5,023,000 | 4,576,876 | |||||||||
4.63% (1) | 06/25/38 | 500,000 | 409,570 | |||||||||
4.88% (1) | 06/25/48 | 2,430,000 | 1,962,833 | |||||||||
Cigna Corp. |
| |||||||||||
3.40% | 03/15/51 | 500,000 | 333,195 | |||||||||
CVS Health Corp. |
| |||||||||||
5.05% | 03/25/48 | 4,505,000 | 3,831,908 | |||||||||
|
| |||||||||||
| 13,694,123 | ||||||||||||
|
| |||||||||||
| Pipelines — 1.2% | ||||||||||||
Energy Transfer LP |
| |||||||||||
4.95% | 06/15/28 | 200,000 | 186,475 | |||||||||
5.00% | 05/15/50 | 1,780,000 | 1,355,256 | |||||||||
5.15% | 03/15/45 | 1,870,000 | 1,452,648 | |||||||||
5.40% | 10/01/47 | 2,568,000 | 2,044,333 | |||||||||
5.95% | 10/01/43 | 630,000 | 540,727 | |||||||||
Plains All American Pipeline LP / PAA Finance Corp. |
| |||||||||||
3.80% | 09/15/30 | 375,000 | 313,072 | |||||||||
Rockies Express Pipeline LLC |
| |||||||||||
4.95% (1) | 07/15/29 | 2,000,000 | 1,765,160 | |||||||||
6.88% (1) | 04/15/40 | 350,000 | 287,000 | |||||||||
| Issues | Maturity Date | Principal Amount | Value | |||||||||
| Pipelines (Continued) | ||||||||||||
Ruby Pipeline LLC |
| |||||||||||
8.00% (1),(4),(5),(6) | 04/01/22 | $ | 1,353,030 | $ | 1,160,224 | |||||||
Sabine Pass Liquefaction LLC |
| |||||||||||
4.50% | 05/15/30 | 1,500,000 | 1,369,543 | |||||||||
Southern Natural Gas Co. LLC |
| |||||||||||
7.35% | 02/15/31 | 2,380,000 | 2,488,813 | |||||||||
TC PipeLines LP |
| |||||||||||
4.38% | 03/13/25 | 710,000 | 689,592 | |||||||||
TransCanada PipeLines, Ltd. |
| |||||||||||
6.10% | 06/01/40 | 375,000 | 358,605 | |||||||||
|
| |||||||||||
| 14,011,448 | ||||||||||||
|
| |||||||||||
| Real Estate — 0.1% | ||||||||||||
Annington Funding PLC |
| |||||||||||
2.31% (3) | 10/06/32 | 720,000 | 582,029 | |||||||||
Vonovia SE | ||||||||||||
1.50% (3) | 06/14/41 | 300,000 | 155,385 | |||||||||
|
| |||||||||||
| 737,414 | ||||||||||||
|
| |||||||||||
| REIT — 2.0% | ||||||||||||
American Assets Trust LP |
| |||||||||||
3.38% | 02/01/31 | 1,655,000 | 1,291,198 | |||||||||
CapLand Ascendas REIT |
| |||||||||||
0.75% (3) | 06/23/28 | 870,000 | 655,011 | |||||||||
Digital Dutch Finco BV, |
| |||||||||||
1.25% (3) | 02/01/31 | 1,830,000 | 1,273,492 | |||||||||
Digital Intrepid Holding BV |
| |||||||||||
1.38% (3) | 07/18/32 | 105,000 | 69,857 | |||||||||
GLP Capital LP / GLP Financing II, Inc. |
| |||||||||||
4.00% | 01/15/30 | 265,000 | 219,863 | |||||||||
4.00% | 01/15/31 | 23,000 | 18,656 | |||||||||
5.30% | 01/15/29 | 1,280,000 | 1,158,054 | |||||||||
5.38% | 11/01/23 | 1,000,000 | 989,120 | |||||||||
5.38% | 04/15/26 | 1,823,000 | 1,742,442 | |||||||||
5.75% | 06/01/28 | 1,600,000 | 1,486,396 | |||||||||
Healthcare Realty Holdings LP |
| |||||||||||
2.00% | 03/15/31 | 2,970,000 | 2,142,337 | |||||||||
3.10% | 02/15/30 | 1,705,000 | 1,380,171 | |||||||||
Hudson Pacific Properties LP |
| |||||||||||
3.25% | 01/15/30 | 405,000 | 311,000 | |||||||||
5.95% | 02/15/28 | 1,240,000 | 1,164,608 | |||||||||
Invitation Homes Operating Partnership LP |
| |||||||||||
2.00% | 08/15/31 | 275,000 | 193,727 | |||||||||
4.15% | 04/15/32 | 1,265,000 | 1,053,340 | |||||||||
Kilroy Realty LP |
| |||||||||||
2.65% | 11/15/33 | 891,000 | 604,755 | |||||||||
Lexington Realty Trust |
| |||||||||||
2.38% | 10/01/31 | 855,000 | 620,978 | |||||||||
Life Storage LP |
| |||||||||||
2.40% | 10/15/31 | 1,820,000 | 1,344,770 | |||||||||
See accompanying Notes to Financial Statements.
21
Table of Contents
TCW Core Fixed Income Fund
Schedule of Investments (Continued)
| Issues | Maturity Date | Principal Amount | Value | |||||||||
| REIT (Continued) | ||||||||||||
Prologis Euro Finance LLC |
| |||||||||||
0.50% | 02/16/32 | $ | 400,000 | $ | 273,836 | |||||||
0.63% | 09/10/31 | 100,000 | 70,769 | |||||||||
1.00% | 02/08/29 | 750,000 | 604,418 | |||||||||
1.00% | 02/16/41 | 400,000 | 214,714 | |||||||||
SELP Finance Sarl |
| |||||||||||
0.88% (3) | 05/27/29 | 900,000 | 631,556 | |||||||||
VICI Properties LP |
| |||||||||||
4.95% | 02/15/30 | 100,000 | 90,105 | |||||||||
5.13% | 05/15/32 | 1,530,000 | 1,358,365 | |||||||||
5.63% | 05/15/52 | 810,000 | 663,333 | |||||||||
VICI Properties LP / VICI Note Co., Inc. |
| |||||||||||
3.75% (1) | 02/15/27 | 75,000 | 65,880 | |||||||||
3.88% (1) | 02/15/29 | 890,000 | 751,382 | |||||||||
4.50% (1) | 09/01/26 | 380,000 | 352,779 | |||||||||
4.50% (1) | 01/15/28 | 285,000 | 250,281 | |||||||||
4.63% (1) | 06/15/25 | 180,000 | 169,832 | |||||||||
5.75% (1) | 02/01/27 | 400,000 | 378,176 | |||||||||
|
| |||||||||||
| 23,595,201 | ||||||||||||
|
| |||||||||||
| Retail — 0.1% | ||||||||||||
Alimentation Couche-Tard, Inc. |
| |||||||||||
3.55% (1) | 07/26/27 | 1,710,000 | 1,528,984 | |||||||||
|
| |||||||||||
| Savings & Loans — 0.4% | ||||||||||||
Nationwide Building Society (United Kingdom) |
| |||||||||||
2.97% (SOFR + 1.290%) (1),(2) | 02/16/28 | 1,630,000 | 1,381,849 | |||||||||
3.77% (3 mo. USD LIBOR + 1.064%) (1),(2) | 03/08/24 | 2,670,000 | 2,642,386 | |||||||||
4.36% (3 mo. USD LIBOR + 1.392%) (1),(2) | 08/01/24 | 400,000 | 393,007 | |||||||||
|
| |||||||||||
| 4,417,242 | ||||||||||||
|
| |||||||||||
| Semiconductors — 0.2% | ||||||||||||
Broadcom, Inc. |
| |||||||||||
2.60% (1) | 02/15/33 | 1,465,000 | 1,043,886 | |||||||||
3.42% (1) | 04/15/33 | 1,100,000 | 839,674 | |||||||||
|
| |||||||||||
| 1,883,560 | ||||||||||||
|
| |||||||||||
| Software — 0.4% | ||||||||||||
Oracle Corp. |
| |||||||||||
3.60% | 04/01/50 | 2,000,000 | 1,233,893 | |||||||||
3.80% | 11/15/37 | 905,000 | 662,433 | |||||||||
3.95% | 03/25/51 | 2,425,000 | 1,588,957 | |||||||||
Take Two Interactive |
| |||||||||||
4.00% | 04/14/32 | 1,525,000 | 1,315,953 | |||||||||
|
| |||||||||||
| 4,801,236 | ||||||||||||
|
| |||||||||||
| Telecommunications — 2.6% | ||||||||||||
AT&T, Inc. |
| |||||||||||
2.55% | 12/01/33 | 1,200,000 | 888,379 | |||||||||
| Issues | Maturity Date | Principal Amount | Value | |||||||||
| Telecommunications (Continued) | ||||||||||||
3.80% | 12/01/57 | $ | 4,376,000 | $ | 2,889,066 | |||||||
4.75% | 05/15/46 | 1,130,000 | 924,312 | |||||||||
4.85% | 03/01/39 | 1,554,000 | 1,334,078 | |||||||||
5.25% | 03/01/37 | 2,155,000 | 1,982,816 | |||||||||
Global Switch Finance BV |
| |||||||||||
1.38% (3) | 10/07/30 | 695,000 | 570,115 | |||||||||
Level 3 Financing, Inc. |
| |||||||||||
3.40% (1) | 03/01/27 | 575,000 | 496,283 | |||||||||
3.88% (1) | 11/15/29 | 4,170,000 | 3,436,309 | |||||||||
Qwest Corp. |
| |||||||||||
7.25% | 09/15/25 | 920,000 | 931,307 | |||||||||
Sprint Spectrum Co. LLC / Sprint Spectrum Co. II LLC / Sprint Spectrum Co. III LLC |
| |||||||||||
4.74% (1) | 09/20/29 | 3,956,250 | 3,901,622 | |||||||||
5.15% (1) | 09/20/29 | 2,505,000 | 2,438,777 | |||||||||
T-Mobile USA, Inc. |
| |||||||||||
2.55% | 02/15/31 | 2,882,000 | 2,281,982 | |||||||||
3.88% | 04/15/30 | 4,155,000 | 3,679,038 | |||||||||
4.38% | 04/15/40 | 1,990,000 | 1,624,524 | |||||||||
Vodafone Group PLC (United Kingdom) |
| |||||||||||
4.88% | 06/19/49 | 1,897,000 | 1,472,077 | |||||||||
5.25% | 05/30/48 | 1,390,000 | 1,139,535 | |||||||||
|
| |||||||||||
| 29,990,220 | ||||||||||||
|
| |||||||||||
| Water — 0.1% | ||||||||||||
American Water Capital Corp. |
| |||||||||||
3.45% | 05/01/50 | 2,385,000 | 1,639,067 | |||||||||
|
| |||||||||||
Total Corporate Bonds |
| |||||||||||
(Cost: $429,619,278) |
| 364,503,399 | ||||||||||
|
| |||||||||||
| MUNICIPAL BONDS — 0.7% | ||||||||||||
California Health Facilities Financing Authority, Revenue Bond |
| |||||||||||
3.00% | 08/15/51 | 955,000 | 649,922 | |||||||||
City of New York NY |
| |||||||||||
1.82% | 08/01/30 | 1,325,000 | 1,023,132 | |||||||||
City of New York NY, General Obligation Unlimited |
| |||||||||||
3.00% | 08/01/34 | 380,000 | 294,730 | |||||||||
Metropolitan Transportation Authority, Revenue Bonds |
| |||||||||||
5.18% | 11/15/49 | 335,000 | 276,034 | |||||||||
New York City Transitional Finance Authority Future Tax Secured Revenue |
| |||||||||||
2.00% | 08/01/35 | 1,000,000 | 670,382 | |||||||||
2.40% | 11/01/32 | 585,000 | 447,189 | |||||||||
2.45% | 11/01/34 | 2,485,000 | 1,818,991 | |||||||||
Regents of the University of California Medical Center Pooled Revenue |
| |||||||||||
3.26% | 05/15/60 | 3,115,000 | 1,884,955 | |||||||||
See accompanying Notes to Financial Statements.
22
Table of Contents
TCW Core Fixed Income Fund
October 31, 2022
| Issues | Maturity Date | Principal Amount | Value | |||||||||
| MUNICIPAL BONDS (Continued) | ||||||||||||
University of Michigan |
| |||||||||||
3.50% | 04/01/52 | $ | 805,000 | $ | 591,558 | |||||||
|
| |||||||||||
Total Municipal Bonds |
| |||||||||||
(Cost: $10,804,953) |
| 7,656,893 | ||||||||||
|
| |||||||||||
| ASSET-BACKED SECURITIES — 8.6% | ||||||||||||
321 Henderson Receivables I LLC (13-3A-A) |
| |||||||||||
4.08% (1) | 01/17/73 | 1,135,124 | 1,019,231 | |||||||||
AGL CLO, Ltd. (20-7A-BR) |
| |||||||||||
5.78% (3 mo. USD LIBOR + 1.700%) (1),(2) | 07/15/34 | 4,235,000 | 3,966,924 | |||||||||
AIG CLO, Ltd. (18-1A-A1R) |
| |||||||||||
5.36% (3 mo. USD LIBOR + 1.120%) (1),(2) | 04/20/32 | 4,300,000 | 4,171,989 | |||||||||
Aligned Data Centers Issuer LLC (21-1A-A2) |
| |||||||||||
1.94% (1) | 08/15/46 | 3,372,000 | 2,835,816 | |||||||||
AMMC CLO XIII, Ltd. (13-13A-A1R2) |
| |||||||||||
5.37% (3 mo. USD LIBOR + 1.050%) (1),(2) | 07/24/29 | 3,771,432 | 3,709,316 | |||||||||
Ares LXII CLO, Ltd. (21-62A-B) |
| |||||||||||
6.01% (3 mo. USD LIBOR + 1.650%) (1),(2) | 01/25/34 | 4,000,000 | 3,735,200 | |||||||||
Brazos Education Loan Authority, Inc. (12-1-A1) |
| |||||||||||
4.29% (1 mo. USD LIBOR + 0.700%) (2) | 12/26/35 | 384,799 | 377,622 | |||||||||
Brazos Higher Education Authority, Inc. (10-1-A2) |
| |||||||||||
4.20% (3 mo. USD LIBOR + 1.200%) (2) | 02/25/35 | 667,281 | 662,686 | |||||||||
CF Hippolyta Issuer LLC (20-1-B1) |
| |||||||||||
2.28% (1) | 07/15/60 | 3,974,729 | 3,417,939 | |||||||||
CIFC Funding, Ltd (21-7A-A1) |
| |||||||||||
5.45% (3 mo. USD LIBOR + 1.130%) (1),(2) | 01/23/35 | 4,300,000 | 4,093,170 | |||||||||
Dryden XXVI Senior Loan Fund (13-26A-AR) |
| |||||||||||
4.98% (3 mo. USD LIBOR + 0.900%) (1),(2) | 04/15/29 | 1,981,717 | 1,944,005 | |||||||||
Educational Funding of the South, Inc. (11-1-A2) |
| |||||||||||
5.01% (3 mo. USD LIBOR + 0.650%) (2) | 04/25/35 | 376,657 | 373,029 | |||||||||
Educational Services of America, Inc. (12-2-A) |
| |||||||||||
4.32% (1 mo. USD LIBOR + 0.730%) (1),(2) | 04/25/39 | 236,768 | 233,408 | |||||||||
Global SC Finance SRL (14-1A-A2) |
| |||||||||||
3.09% (1) | 07/17/29 | 536,440 | 520,388 | |||||||||
GoldenTree Loan Opportunities IX, Ltd. (14-9A-AR2) |
| |||||||||||
5.52% (3 mo. USD LIBOR + 1.110%) (1),(2) | 10/29/29 | 2,921,854 | 2,877,150 | |||||||||
Higher Education Funding I (14-1-A) |
| |||||||||||
4.05% (3 mo. USD LIBOR + 1.050%) (1),(2) | 05/25/34 | 644,516 | 643,696 | |||||||||
JGWPT XXX LLC (14-2A-A) |
| |||||||||||
3.61% (1) | 01/17/73 | 1,359,108 | 1,197,093 | |||||||||
| Issues | Maturity Date | Principal Amount | Value | |||||||||
| ASSET-BACKED SECURITIES (Continued) | ||||||||||||
Madison Park Funding XLVIII, Ltd. (21-48A-A) |
| |||||||||||
5.38% (3 mo. USD LIBOR + | 04/19/33 | $ | 4,320,000 | $ | 4,201,416 | |||||||
Navient Private Education Refi Loan Trust (21-GA-A) |
| |||||||||||
1.58% (1) | 04/15/70 | 3,230,477 | 2,668,326 | |||||||||
Navient Student Loan Trust (14-3-A) |
| |||||||||||
4.21% (1 mo. USD LIBOR + | 03/25/83 | 2,652,201 | 2,504,375 | |||||||||
Navient Student Loan Trust (14-4-A) |
| |||||||||||
4.21% (1 mo. USD LIBOR + | 03/25/83 | 1,344,579 | 1,280,054 | |||||||||
Nelnet Student Loan Trust (14-4A-A2) |
| |||||||||||
4.54% (1 mo. USD LIBOR + | 11/25/48 | 2,965,000 | 2,919,152 | |||||||||
New Economy Assets Phase 1 Sponsor LLC (21-1-B1) |
| |||||||||||
2.41% (1) | 10/20/61 | 3,904,000 | 3,172,429 | |||||||||
OCP CLO 2020-19, Ltd. (20-19A-AR) |
| |||||||||||
5.39% (3 mo. USD LIBOR + | 10/20/34 | 3,600,000 | 3,436,560 | |||||||||
Octagon Investment Partners XIV, Ltd. (12-1A-AARR) |
| |||||||||||
5.03% (3 mo. USD LIBOR + 0.950%) (1),(2) | 07/15/29 | 4,078,843 | 3,998,490 | |||||||||
PHEAA Student Loan Trust (15-1A-A) |
| |||||||||||
4.19% (1 mo. USD LIBOR + 0.600%) (1),(2) | 10/25/41 | 972,667 | 933,085 | |||||||||
Skyline Trust (2020-1 A) |
| |||||||||||
3.23% (5) | 07/03/38 | 4,536,882 | 3,965,873 | |||||||||
SLM Student Loan Trust (03-7A-A5A) |
| |||||||||||
4.49% (3 mo. USD LIBOR + 1.200%) (1),(2) | 12/15/33 | 1,829,596 | 1,780,700 | |||||||||
SLM Student Loan Trust (08-2-B) |
| |||||||||||
5.56% (3 mo. USD LIBOR + 1.200%) (2) | 01/25/83 | 710,000 | 577,371 | |||||||||
SLM Student Loan Trust (08-3-B) |
| |||||||||||
5.56% (3 mo. USD LIBOR + 1.200%) (2) | 04/26/83 | 710,000 | 652,516 | |||||||||
SLM Student Loan Trust (08-4-A4) |
| |||||||||||
6.01% (3 mo. USD LIBOR + 1.650%) (2) | 07/25/22 | 3,153,878 | 3,125,740 | |||||||||
SLM Student Loan Trust (08-4-B) |
| |||||||||||
6.21% (3 mo. USD LIBOR + 1.850%) (2) | 04/25/73 | 710,000 | 685,384 | |||||||||
SLM Student Loan Trust (08-5-B) |
| |||||||||||
6.21% (3 mo. USD LIBOR + 1.850%) (2) | 07/25/73 | 710,000 | 664,183 | |||||||||
SLM Student Loan Trust (08-6-A4) |
| |||||||||||
5.46% (3 mo. USD LIBOR + 1.100%) (2) | 07/25/23 | 2,701,752 | 2,628,123 | |||||||||
SLM Student Loan Trust (08-6-B) |
| |||||||||||
6.21% (3 mo. USD LIBOR + 1.850%) (2) | 07/26/83 | 710,000 | 660,285 | |||||||||
See accompanying Notes to Financial Statements.
23
Table of Contents
TCW Core Fixed Income Fund
Schedule of Investments (Continued)
| Issues | Maturity Date | Principal Amount | Value | |||||||||
| ASSET-BACKED SECURITIES (Continued) | ||||||||||||
SLM Student Loan Trust (08-7-B) |
| |||||||||||
6.21% (3 mo. USD LIBOR + 1.850%) (2) | 07/26/83 | $ | 710,000 | $ | 609,381 | |||||||
SLM Student Loan Trust (08-8-B) |
| |||||||||||
6.61% (3 mo. USD LIBOR + 2.250%) (2) | 10/25/75 | 710,000 | 683,398 | |||||||||
SLM Student Loan Trust (08-9-A) |
| |||||||||||
5.86% (3 mo. USD LIBOR + 1.500%) (2) | 04/25/23 | 939,710 | 927,459 | |||||||||
SLM Student Loan Trust (08-9-B) |
| |||||||||||
6.61% (3 mo. USD LIBOR + 2.250%) (2) | 10/25/83 | 710,000 | 706,575 | |||||||||
SLM Student Loan Trust (11-2-A2) |
| |||||||||||
4.79% (1 mo. USD LIBOR + 1.200%) (2) | 10/25/34 | 1,591,762 | 1,583,554 | |||||||||
SLM Student Loan Trust (12-7-A3) |
| |||||||||||
4.24% (1 mo. USD LIBOR + 0.650%) (2) | 05/26/26 | 1,522,213 | 1,426,599 | |||||||||
Small Business Administration (22-25G) |
| |||||||||||
3.93% | 07/01/47 | 6,250,000 | 5,876,117 | |||||||||
Store Master Funding LLC (21-1A-A1) |
| |||||||||||
2.12% (1) | 06/20/51 | 1,837,667 | 1,513,188 | |||||||||
United States Small Business Administration (22-25H-1) |
| |||||||||||
3.80% | 08/01/47 | 3,469,000 | 3,189,498 | |||||||||
United States Small Business Administration (22-25J-1) |
| |||||||||||
5.04% | 10/01/47 | 3,496,000 | 3,474,018 | |||||||||
Vantage Data Centers Issuer LLC (18-2A-A2) |
| |||||||||||
4.20% (1) | 11/15/43 | 4,121,974 | 4,022,763 | |||||||||
|
| |||||||||||
Total Asset-backed Securities |
| |||||||||||
(Cost: $105,040,263) |
| 99,645,274 | ||||||||||
|
| |||||||||||
COMMERCIAL MORTGAGE-BACKED SECURITIES — |
| |||||||||||
Fannie Mae, Pool #AN0245 |
| |||||||||||
3.42% | 11/01/35 | 1,856,658 | 1,699,398 | |||||||||
Fannie Mae, Pool #BL6060 |
| |||||||||||
2.46% | 04/01/40 | 1,840,000 | 1,272,667 | |||||||||
Freddie Mac Multifamily Structured Pass-Through Certificates (K155-A3) |
| |||||||||||
3.75% | 04/25/33 | 4,045,000 | 3,659,228 | |||||||||
|
| |||||||||||
Total Commercial Mortgage-Backed Securities — Agency |
| |||||||||||
(Cost: $7,855,118) |
| 6,631,293 | ||||||||||
|
| |||||||||||
| COMMERCIAL MORTGAGE-BACKED SECURITIES — NON-AGENCY — 3.5% | ||||||||||||
Arbor Realty Commercial Real Estate Note, Ltd. (21-FL3-A) |
| |||||||||||
4.48% (1 mo. USD LIBOR + 1.070%) (1),(2) | 08/15/34 | 3,882,000 | 3,701,187 | |||||||||
| Issues | Maturity Date | Principal Amount | Value | |||||||||
| COMMERCIAL MORTGAGE-BACKED SECURITIES — NON-AGENCY (Continued) | ||||||||||||
BAMLL Commercial Mortgage Securities Trust (18-PARK-A) |
| |||||||||||
4.09% (1),(7) | 08/10/38 | $ | 1,930,000 | $ | 1,735,601 | |||||||
BANK 2022-BNK42 (22-BNK42-A5) |
| |||||||||||
4.49% (7) | 06/15/55 | 3,593,000 | 3,295,336 | |||||||||
BDS, Ltd. (19-FL4-A) |
| |||||||||||
4.51% (1 mo. USD LIBOR + 1.100%) (1),(2) | 08/15/36 | 412,374 | 409,791 | |||||||||
BPR Trust (22-OANA A) |
| |||||||||||
5.27% (SOFR + 1.898%) (1),(2) | 04/15/37 | 3,678,000 | 3,572,674 | |||||||||
BX Commercial Mortgage Trust (20-VIV4-A) |
| |||||||||||
2.84% (1) | 03/09/44 | 2,415,000 | 1,887,094 | |||||||||
BX Trust (19-OC11-A) |
| |||||||||||
3.20% (1) | 12/09/41 | 1,485,000 | 1,223,487 | |||||||||
BXHPP Trust (21-FILM-A) |
| |||||||||||
4.06% (1 mo. USD LIBOR + 0.650%) (1),(2) | 08/15/36 | 3,000,000 | 2,823,690 | |||||||||
CALI Mortgage Trust (19-101C-A) |
| |||||||||||
3.96% (1) | 03/10/39 | 1,285,000 | 1,104,877 | |||||||||
CD 2017-CD3 Mortgage Trust (17-CD3-AS) |
| |||||||||||
3.83% | 02/10/50 | 4,645,000 | 4,194,179 | |||||||||
COMM 2015-CCRE27 Mortgage Trust (15-CR27-A3) |
| |||||||||||
3.35% | 10/10/48 | 3,680,044 | 3,451,717 | |||||||||
CSAIL Commercial Mortgage Trust (20-C19-A3) |
| |||||||||||
2.56% | 03/15/53 | 3,004,000 | 2,430,578 | |||||||||
DC Office Trust (19-MTC-A) |
| |||||||||||
2.97% (1) | 09/15/45 | 1,180,000 | 943,488 | |||||||||
GS Mortgage Securities Corp. II (21-ARDN-B) |
| |||||||||||
5.06% (1 mo. USD LIBOR + 1.650%) (1),(2) | 11/15/36 | 2,015,000 | 1,926,806 | |||||||||
Hudson Yards Mortgage Trust (19-30HY-A) |
| |||||||||||
3.23% (1) | 07/10/39 | 2,185,000 | 1,839,945 | |||||||||
Hudson Yards Mortgage Trust (19-55HY-A) |
| |||||||||||
2.94% (1),(7) | 12/10/41 | 1,180,000 | 977,163 | |||||||||
JPMorgan Chase Commercial Mortgage Securities Trust (19-OSB-A) |
| |||||||||||
3.40% (1) | 06/05/39 | 1,160,000 | 984,362 | |||||||||
Manhattan West Mortgage Trust (20-1MW-A) |
| |||||||||||
2.13% (1) | 09/10/39 | 1,720,000 | 1,444,948 | |||||||||
MKT Mortgage Trust (20-525M-A) |
| |||||||||||
2.69% (1) | 02/12/40 | 850,000 | 658,746 | |||||||||
One Bryant Park Trust (19-OBP-A) |
| |||||||||||
2.52% (1) | 09/15/54 | 1,495,000 | 1,184,983 | |||||||||
SFAVE Commercial Mortgage Securities Trust (15-5AVE-A1) |
| |||||||||||
3.87% (1),(7) | 01/05/43 | 1,710,000 | 1,201,516 | |||||||||
See accompanying Notes to Financial Statements.
24
Table of Contents
TCW Core Fixed Income Fund
October 31, 2022
| Issues | Maturity Date | Principal Amount | Value | |||||||||
| COMMERCIAL MORTGAGE-BACKED SECURITIES — NON-AGENCY (Continued) | ||||||||||||
SFAVE Commercial Mortgage Securities Trust (15-5AVE-A2B) |
| |||||||||||
4.14% (1),(7) | 01/05/43 | $ | 70,000 | $ | 49,587 | |||||||
|
| |||||||||||
Total Commercial Mortgage-Backed Securities — Non-Agency |
| |||||||||||
(Cost: $46,022,950) |
| 41,041,755 | ||||||||||
|
| |||||||||||
| RESIDENTIAL MORTGAGE-BACKED SECURITIES — AGENCY — 36.5% | ||||||||||||
Fannie Mae, Pool #BN7755 |
| |||||||||||
3.00% | 09/01/49 | 2,934,303 | 2,541,323 | |||||||||
Fannie Mae, Pool #FM2318 |
| |||||||||||
3.50% | 09/01/49 | 287,772 | 258,712 | |||||||||
Fannie Mae, Pool #MA4152 |
| |||||||||||
2.00% | 10/01/40 | 5,421,227 | 4,459,955 | |||||||||
Fannie Mae, Pool #MA4387 |
| |||||||||||
2.00% | 07/01/41 | 2,979,846 | 2,455,788 | |||||||||
Fannie Mae (19-79-FA) |
| |||||||||||
4.09% (1 mo. USD LIBOR + 0.500%) (2) | 01/25/50 | 1,591,748 | 1,566,585 | |||||||||
Fannie Mae (01-14-SH) (I/F) |
| |||||||||||
15.28% (-1 mo. USD LIBOR + 27.825%) (2) | 03/25/30 | 54,926 | 63,664 | |||||||||
Fannie Mae (01-34-FV) |
| |||||||||||
4.09% (1 mo. USD LIBOR + 0.500%) (2) | 08/25/31 | 72,868 | 72,414 | |||||||||
Fannie Mae (04-W10-A6) (PAC) |
| |||||||||||
5.75% | 08/25/34 | 745,299 | 741,605 | |||||||||
Fannie Mae (07-89-GF) |
| |||||||||||
4.11% (1 mo. USD LIBOR + 0.520%) (2) | 09/25/37 | 314,356 | 313,751 | |||||||||
Fannie Mae (08-30-SA) (I/O) (I/F) |
| |||||||||||
3.26% (-1 mo. USD LIBOR + 6.850%) (2) | 04/25/38 | 53,230 | 5,800 | |||||||||
Fannie Mae (08-62-SN) (I/O) (I/F) |
| |||||||||||
2.61% (-1 mo. USD LIBOR + 6.200%) (2) | 07/25/38 | 47,508 | 2,817 | |||||||||
Fannie Mae (09-64-TB) |
| |||||||||||
4.00% | 08/25/29 | 610,854 | 593,750 | |||||||||
Fannie Mae (09-68-SA) (I/O) (I/F) |
| |||||||||||
3.16% (-1 mo. USD LIBOR + 6.750%) (2) | 09/25/39 | 39,785 | 4,510 | |||||||||
Fannie Mae (10-26-AS) (I/O) (I/F) |
| |||||||||||
2.74% (-1 mo. USD LIBOR + 6.330%) (2) | 03/25/40 | 566,276 | 32,535 | |||||||||
Fannie Mae (11-111-DB) |
| |||||||||||
4.00% | 11/25/41 | 1,229,453 | 1,174,843 | |||||||||
Fannie Mae (18-38-LA) |
| |||||||||||
3.00% | 06/25/48 | 927,828 | 836,689 | |||||||||
Fannie Mae (18-43-CT) |
| |||||||||||
3.00% | 06/25/48 | 692,458 | 623,568 | |||||||||
| Issues | Maturity Date | Principal Amount | Value | |||||||||
| RESIDENTIAL MORTGAGE-BACKED SECURITIES — AGENCY (Continued) | ||||||||||||
Fannie Mae, Pool #254634 |
| |||||||||||
5.50% | 02/01/23 | $ | 162 | $ | 162 | |||||||
Fannie Mae, Pool #596686 |
| |||||||||||
6.50% | 11/01/31 | 8,937 | 9,055 | |||||||||
Fannie Mae, Pool #727575 |
| |||||||||||
5.00% | 06/01/33 | 14,584 | 14,504 | |||||||||
Fannie Mae, Pool #748751 |
| |||||||||||
5.50% | 10/01/33 | 34,683 | 34,052 | |||||||||
Fannie Mae, Pool #AB2127 |
| |||||||||||
3.50% | 01/01/26 | 208,903 | 201,974 | |||||||||
Fannie Mae, Pool #AL0209 |
| |||||||||||
4.50% | 05/01/41 | 329,774 | 319,740 | |||||||||
Fannie Mae, Pool #AL0851 |
| |||||||||||
6.00% | 10/01/40 | 292,089 | 302,947 | |||||||||
Fannie Mae, Pool #AS9830 |
| |||||||||||
4.00% | 06/01/47 | 546,255 | 507,236 | |||||||||
Fannie Mae, Pool #BQ6913 |
| |||||||||||
2.00% | 12/01/51 | 9,119,975 | 7,213,969 | |||||||||
Fannie Mae, Pool #BQ7006 |
| |||||||||||
2.00% | 01/01/52 | 7,338,430 | 5,802,460 | |||||||||
Fannie Mae, Pool #BV8464 |
| |||||||||||
3.00% | 04/01/52 | 4,155,209 | 3,531,278 | |||||||||
Fannie Mae, Pool #CA1710 |
| |||||||||||
4.50% | 05/01/48 | 1,397,618 | 1,335,047 | |||||||||
Fannie Mae, Pool #CA1711 |
| |||||||||||
4.50% | 05/01/48 | 993,815 | 949,322 | |||||||||
Fannie Mae, Pool #CA2208 |
| |||||||||||
4.50% | 08/01/48 | 779,998 | 745,078 | |||||||||
Fannie Mae, Pool #CA2327 |
| |||||||||||
4.00% | 09/01/48 | 485,166 | 452,320 | |||||||||
Fannie Mae, Pool #CB2313 |
| |||||||||||
2.50% | 12/01/51 | 7,986,316 | 6,561,506 | |||||||||
Fannie Mae, Pool #CB3289 |
| |||||||||||
2.00% | 04/01/52 | 10,144,896 | 8,024,689 | |||||||||
Fannie Mae, Pool #FM2870 |
| |||||||||||
3.00% | 03/01/50 | 1,926,292 | 1,668,311 | |||||||||
Fannie Mae, Pool #FS1598 |
| |||||||||||
2.00% | 04/01/52 | 8,272,989 | 6,518,534 | |||||||||
Fannie Mae, Pool #MA1146 |
| |||||||||||
4.00% | 08/01/42 | 647,871 | 603,958 | |||||||||
Fannie Mae, Pool #MA1561 |
| |||||||||||
3.00% | 09/01/33 | 1,324,909 | 1,197,568 | |||||||||
Fannie Mae, Pool #MA1584 |
| |||||||||||
3.50% | 09/01/33 | 1,941,901 | 1,794,198 | |||||||||
Fannie Mae, Pool #MA3182 |
| |||||||||||
3.50% | 11/01/47 | 328,013 | 294,138 | |||||||||
Fannie Mae, Pool #MA4093 |
| |||||||||||
2.00% | 08/01/40 | 4,348,720 | 3,578,590 | |||||||||
See accompanying Notes to Financial Statements.
25
Table of Contents
TCW Core Fixed Income Fund
Schedule of Investments (Continued)
| Issues | Maturity Date | Principal Amount | Value | |||||||||
| RESIDENTIAL MORTGAGE-BACKED SECURITIES — AGENCY (Continued) | ||||||||||||
Fannie Mae, Pool #MA4465 |
| |||||||||||
2.00% | 11/01/51 | $ | 2,259,103 | $ | 1,784,525 | |||||||
Fannie Mae, Pool #MA4512 |
| |||||||||||
2.50% | 01/01/52 | 8,370,035 | 6,883,245 | |||||||||
Fannie Mae, Pool #MA4548 |
| |||||||||||
2.50% | 02/01/52 | 7,671,963 | 6,300,857 | |||||||||
Fannie Mae, Pool #MA4579 |
| |||||||||||
3.00% | 04/01/52 | 7,573,500 | 6,440,122 | |||||||||
Freddie Mac, Pool #SD0231 |
| |||||||||||
3.00% | 01/01/50 | 4,444,712 | 3,849,449 | |||||||||
Freddie Mac, Pool #ZM1779 |
| |||||||||||
3.00% | 09/01/46 | 1,186,133 | 1,034,322 | |||||||||
Freddie Mac (2439-KZ) |
| |||||||||||
6.50% | 04/15/32 | 64,257 | 66,026 | |||||||||
Freddie Mac (2575-FD) (PAC) |
| |||||||||||
3.86% (1 mo. USD LIBOR + 0.450%) (2) | 02/15/33 | 164,187 | 163,933 | |||||||||
Freddie Mac (2662-MT) (TAC) |
| |||||||||||
4.50% | 08/15/33 | 63,068 | 62,136 | |||||||||
Freddie Mac (3315-S) (I/O) (I/F) |
| |||||||||||
3.00% (-1 mo. USD LIBOR + | 05/15/37 | 8,406 | 648 | |||||||||
Freddie Mac (3339-JS) (I/F) |
| |||||||||||
20.66% (-1 mo. USD LIBOR + 42.835%) (2) | 07/15/37 | 216,852 | 292,400 | |||||||||
Freddie Mac (3351-ZC) |
| |||||||||||
5.50% | 07/15/37 | 157,917 | 156,547 | |||||||||
Freddie Mac (3380-SM) (I/O) (I/F) |
| |||||||||||
3.00% (-1 mo. USD LIBOR + | 10/15/37 | 255,054 | 24,107 | |||||||||
Freddie Mac (3382-FL) |
| |||||||||||
4.11% (1 mo. USD LIBOR + | 11/15/37 | 64,236 | 64,027 | |||||||||
Freddie Mac (3439-SC) (I/O) (I/F) |
| |||||||||||
2.49% (-1 mo. USD LIBOR + 5.900%) (2) | 04/15/38 | 1,054,211 | 55,067 | |||||||||
Freddie Mac (3578-DI) (I/O) (I/F) |
| |||||||||||
3.24% (-1 mo. USD LIBOR + | 04/15/36 | 365,416 | 23,608 | |||||||||
Freddie Mac (4818-CA) |
| |||||||||||
3.00% | 04/15/48 | 483,592 | 421,063 | |||||||||
Freddie Mac, Pool #A97179 |
| |||||||||||
4.50% | 03/01/41 | 1,076,033 | 1,043,644 | |||||||||
Freddie Mac, Pool #G06360 |
| |||||||||||
4.00% | 03/01/41 | 1,222,190 | 1,149,569 | |||||||||
Freddie Mac, Pool #G06498 |
| |||||||||||
4.00% | 04/01/41 | 878,987 | 826,760 | |||||||||
Freddie Mac, Pool #G06499 |
| |||||||||||
4.00% | 03/01/41 | 561,967 | 527,628 | |||||||||
| Issues | Maturity Date | Principal Amount | Value | |||||||||
| RESIDENTIAL MORTGAGE-BACKED SECURITIES — AGENCY (Continued) | ||||||||||||
Freddie Mac, Pool #G07849 |
| |||||||||||
3.50% | 05/01/44 | $ | 706,996 | $ | 642,124 | |||||||
Freddie Mac, Pool #G07924 |
| |||||||||||
3.50% | 01/01/45 | 1,059,740 | 961,840 | |||||||||
Freddie Mac, Pool #G08710 |
| |||||||||||
3.00% | 06/01/46 | 1,261,085 | 1,094,371 | |||||||||
Freddie Mac, Pool #G08711 |
| |||||||||||
3.50% | 06/01/46 | 2,043,549 | 1,841,990 | |||||||||
Freddie Mac, Pool #G08715 |
| |||||||||||
3.00% | 08/01/46 | 2,428,978 | 2,107,869 | |||||||||
Freddie Mac, Pool #G08716 |
| |||||||||||
3.50% | 08/01/46 | 1,386,137 | 1,244,642 | |||||||||
Freddie Mac, Pool #G08721 |
| |||||||||||
3.00% | 09/01/46 | 1,958,445 | 1,709,452 | |||||||||
Freddie Mac, Pool #G08722 |
| |||||||||||
3.50% | 09/01/46 | 560,868 | 505,198 | |||||||||
Freddie Mac, Pool #G08726 |
| |||||||||||
3.00% | 10/01/46 | 1,870,247 | 1,632,467 | |||||||||
Freddie Mac, Pool #G08732 |
| |||||||||||
3.00% | 11/01/46 | 1,884,560 | 1,644,961 | |||||||||
Freddie Mac, Pool #G08792 |
| |||||||||||
3.50% | 12/01/47 | 1,513,226 | 1,358,388 | |||||||||
Freddie Mac, Pool #G08816 |
| |||||||||||
3.50% | 06/01/48 | 286,044 | 256,718 | |||||||||
Freddie Mac, Pool #G08826 |
| |||||||||||
5.00% | 06/01/48 | 246,884 | 241,665 | |||||||||
Freddie Mac, Pool #G08843 |
| |||||||||||
4.50% | 10/01/48 | 1,035,764 | 988,516 | |||||||||
Freddie Mac, Pool #G16584 |
| |||||||||||
3.50% | 08/01/33 | 1,198,721 | 1,139,666 | |||||||||
Freddie Mac, Pool #G18592 |
| |||||||||||
3.00% | 03/01/31 | 652,893 | 614,532 | |||||||||
Freddie Mac, Pool #G18670 |
| |||||||||||
3.00% | 12/01/32 | 436,959 | 409,875 | |||||||||
Freddie Mac, Pool #G18713 |
| |||||||||||
3.50% | 11/01/33 | 803,839 | 763,736 | |||||||||
Freddie Mac, Pool #G60038 |
| |||||||||||
3.50% | 01/01/44 | 992,549 | 902,096 | |||||||||
Freddie Mac, Pool #G60344 |
| |||||||||||
4.00% | 12/01/45 | 510,968 | 478,666 | |||||||||
Freddie Mac, Pool #G67700 |
| |||||||||||
3.50% | 08/01/46 | 824,419 | 747,742 | |||||||||
Freddie Mac, Pool #G67703 |
| |||||||||||
3.50% | 04/01/47 | 4,921,117 | 4,458,806 | |||||||||
Freddie Mac, Pool #G67706 |
| |||||||||||
3.50% | 12/01/47 | 3,162,838 | 2,863,731 | |||||||||
Freddie Mac, Pool #G67707 |
| |||||||||||
3.50% | 01/01/48 | 6,570,352 | 5,919,320 | |||||||||
See accompanying Notes to Financial Statements.
26
Table of Contents
TCW Core Fixed Income Fund
October 31, 2022
| Issues | Maturity Date | Principal Amount | Value | |||||||||
| RESIDENTIAL MORTGAGE-BACKED SECURITIES — AGENCY (Continued) | ||||||||||||
Freddie Mac, Pool #G67708 |
| |||||||||||
3.50% | 03/01/48 | $ | 5,632,903 | $ | 5,056,527 | |||||||
Freddie Mac, Pool #G67710 |
| |||||||||||
3.50% | 03/01/48 | 4,473,466 | 4,015,727 | |||||||||
Freddie Mac, Pool #G67711 |
| |||||||||||
4.00% | 03/01/48 | 1,625,111 | 1,520,347 | |||||||||
Freddie Mac, Pool #G67718 |
| |||||||||||
4.00% | 01/01/49 | 1,515,452 | 1,404,878 | |||||||||
Freddie Mac, Pool #Q05261 |
| |||||||||||
3.50% | 12/01/41 | 1,090,247 | 991,417 | |||||||||
Freddie Mac, Pool #Q20178 |
| |||||||||||
3.50% | 07/01/43 | 2,142,209 | 1,942,474 | |||||||||
Freddie Mac, Pool #QE0312 |
| |||||||||||
2.00% | 04/01/52 | 5,505,447 | 4,337,863 | |||||||||
Freddie Mac, Pool #SD7513 |
| |||||||||||
3.50% | 04/01/50 | 567,284 | 510,353 | |||||||||
Freddie Mac, Pool #SD8178 |
| |||||||||||
2.50% | 11/01/51 | 5,645,366 | 4,639,042 | |||||||||
Freddie Mac, Pool #SD8193 |
| |||||||||||
2.00% | 02/01/52 | 8,233,427 | 6,499,684 | |||||||||
Freddie Mac, Pool #SD8194 |
| |||||||||||
2.50% | 02/01/52 | 7,634,118 | 6,269,736 | |||||||||
Freddie Mac, Pool #SD8205 |
| |||||||||||
2.50% | 04/01/52 | 2,228,344 | 1,826,855 | |||||||||
Freddie Mac, Pool #SD8212 |
| |||||||||||
2.50% | 05/01/52 | 7,928,915 | 6,500,333 | |||||||||
Freddie Mac, Pool #ZT1703 |
| |||||||||||
4.00% | 01/01/49 | 1,031,797 | 955,578 | |||||||||
Ginnie Mae (08-27-SI) (I/O) (I/F) |
| |||||||||||
2.98% (-1 mo. USD LIBOR + | 03/20/38 | 159,987 | 16,643 | |||||||||
Ginnie Mae (08-81-S) (I/O) (I/F) |
| |||||||||||
2.71% (-1 mo. USD LIBOR + | 09/20/38 | 617,382 | 60,125 | |||||||||
Ginnie Mae (10-1-S) (I/O) (I/F) |
| |||||||||||
2.26% (-1 mo. USD LIBOR + | 01/20/40 | 904,202 | 67,295 | |||||||||
Ginnie Mae (18-124-NW) |
| |||||||||||
3.50% | 09/20/48 | 826,027 | 771,713 | |||||||||
Ginnie Mae, Pool #608259 |
| |||||||||||
4.50% | 08/15/33 | 16,832 | 16,237 | |||||||||
Ginnie Mae, Pool #782114 |
| |||||||||||
5.00% | 09/15/36 | 62,390 | 62,892 | |||||||||
Ginnie Mae, Pool #MA4127 |
| |||||||||||
3.50% | 12/20/46 | 1,277,069 | 1,165,930 | |||||||||
Ginnie Mae II, Pool #MA6030 |
| |||||||||||
3.50% | 07/20/49 | 85,316 | 75,092 | |||||||||
Ginnie Mae II, Pool #MA3521 |
| |||||||||||
3.50% | 03/20/46 | 940,919 | 860,798 | |||||||||
| Issues | Maturity Date | Principal Amount | Value | |||||||||
| RESIDENTIAL MORTGAGE-BACKED SECURITIES — AGENCY (Continued) | ||||||||||||
Ginnie Mae II, Pool #MA3597 |
| |||||||||||
3.50% | 04/20/46 | $ | 910,523 | $ | 832,137 | |||||||
Ginnie Mae II, Pool #MA3662 |
| |||||||||||
3.00% | 05/20/46 | 407,502 | 361,189 | |||||||||
Ginnie Mae II, Pool #MA3663 |
| |||||||||||
3.50% | 05/20/46 | 894,714 | 817,689 | |||||||||
Ginnie Mae II, Pool #MA4126 |
| |||||||||||
3.00% | 12/20/46 | 2,425,397 | 2,145,202 | |||||||||
Ginnie Mae II, Pool #MA4196 |
| |||||||||||
3.50% | 01/20/47 | 748,055 | 682,019 | |||||||||
Ginnie Mae II, Pool #MA4454 |
| |||||||||||
5.00% | 05/20/47 | 312,865 | 311,199 | |||||||||
Ginnie Mae II, Pool #MA4510 |
| |||||||||||
3.50% | 06/20/47 | 362,944 | 330,281 | |||||||||
Ginnie Mae II, Pool #MA4589 |
| |||||||||||
5.00% | 07/20/47 | 724,145 | 723,367 | |||||||||
Ginnie Mae II, Pool #MA4722 |
| |||||||||||
5.00% | 09/20/47 | 245,505 | 245,087 | |||||||||
Ginnie Mae II, Pool #MA4777 |
| |||||||||||
3.00% | 10/20/47 | 292,640 | 259,441 | |||||||||
Ginnie Mae II, Pool #MA4836 |
| |||||||||||
3.00% | 11/20/47 | 1,136,577 | 1,004,563 | |||||||||
Ginnie Mae II, Pool #MA4837 |
| |||||||||||
3.50% | 11/20/47 | 2,353,499 | 2,142,798 | |||||||||
Ginnie Mae II, Pool #MA4838 |
| |||||||||||
4.00% | 11/20/47 | 677,744 | 633,195 | |||||||||
Ginnie Mae II, Pool #MA4901 |
| |||||||||||
4.00% | 12/20/47 | 1,148,222 | 1,072,748 | |||||||||
Ginnie Mae II, Pool #MA5078 |
| |||||||||||
4.00% | 03/20/48 | 828,646 | 776,938 | |||||||||
Ginnie Mae II, Pool #MA5399 |
| |||||||||||
4.50% | 08/20/48 | 1,645,716 | 1,583,640 | |||||||||
Ginnie Mae II, Pool #MA5466 |
| |||||||||||
4.00% | 09/20/48 | 56,410 | 52,473 | |||||||||
Ginnie Mae II, Pool #MA5467 |
| |||||||||||
4.50% | 09/20/48 | 100,264 | 96,267 | |||||||||
Ginnie Mae II, Pool #MA6209 |
| |||||||||||
3.00% | 10/20/49 | 602,043 | 514,242 | |||||||||
Ginnie Mae II TBA, 30-Year |
| |||||||||||
2.50% (8) | 01/01/52 | 18,600,000 | 15,747,992 | |||||||||
Uniform Mortgage-Backed Securities TBA, 30-Year |
| |||||||||||
2.00% (8) | 01/01/52 | 35,275,000 | 27,774,249 | |||||||||
2.00% (8) | 01/01/52 | 26,950,000 | 21,222,225 | |||||||||
2.50% (8) | 01/01/52 | 18,075,000 | 14,797,559 | |||||||||
2.50% (8) | 01/01/52 | 26,625,000 | 21,800,443 | |||||||||
3.00% (8) | 03/01/52 | 11,175,000 | 9,501,369 | |||||||||
3.00% (8) | 03/01/52 | 19,075,000 | 16,216,730 | |||||||||
3.50% (8) | 04/01/52 | 10,350,000 | 9,102,729 | |||||||||
See accompanying Notes to Financial Statements.
27
Table of Contents
TCW Core Fixed Income Fund
Schedule of Investments (Continued)
| Issues | Maturity Date | Principal Amount | Value | |||||||||
| RESIDENTIAL MORTGAGE-BACKED SECURITIES — AGENCY (Continued) | ||||||||||||
4.00% (8) | 06/01/52 | $ | 13,350,000 | $ | 12,144,322 | |||||||
4.50% (8) | 07/01/52 | 53,800,000 | 50,471,059 | |||||||||
5.00% (8) | 08/01/52 | 19,325,000 | 18,640,321 | |||||||||
5.50% (8) | 08/01/52 | 10,250,000 | 10,108,494 | |||||||||
|
| |||||||||||
Total Residential Mortgage-Backed |
| |||||||||||
(Cost: $451,636,447) |
| 424,786,505 | ||||||||||
|
| |||||||||||
RESIDENTIAL MORTGAGE-BACKED SECURITIES — NON-AGENCY — 5.5% |
| |||||||||||
Ajax Mortgage Loan Trust (19-F-A1) |
| |||||||||||
2.86% (1) | 07/25/59 | 2,178,055 | 2,049,774 | |||||||||
CIM Trust (17-7-A) |
| |||||||||||
3.00% (1),(7) | 04/25/57 | 145,664 | 145,252 | |||||||||
CIM Trust (21-J1-A1) |
| |||||||||||
2.50% (1),(7) | 03/25/51 | 9,948,783 | 7,727,407 | |||||||||
Citigroup Mortgage Loan Trust (06-AMC1-A1) |
| |||||||||||
3.88% (1 mo. USD LIBOR + 0.290%) (1),(2) | 09/25/36 | 7,435,436 | 7,072,505 | |||||||||
Citigroup Mortgage Loan Trust, Inc. (05-5-2A2) |
| |||||||||||
5.75% (9) | 08/25/35 | 196,448 | 131,564 | |||||||||
Credit Suisse First Boston Mortgage Securities Corp. (03-8-4PPA) |
| |||||||||||
5.75% | 04/22/33 | 3,438 | 3,035 | |||||||||
CSMC 2022-ATH2 (22-ATH2-A1) |
| |||||||||||
4.55% (1),(7) | 05/25/67 | 3,734,595 | 3,474,414 | |||||||||
CSMC Series, Ltd. (15-5R-1A1) |
| |||||||||||
2.02% (1),(7) | 09/27/46 | 52,749 | 52,428 | |||||||||
CSMC Trust (18-RPL9-A) |
| |||||||||||
3.85% (1),(7) | 09/25/57 | 2,471,668 | 2,287,210 | |||||||||
Fremont Home Loan Trust (05-E-2A4) |
| |||||||||||
4.25% (1 mo. USD LIBOR + 0.660%) (2) | 01/25/36 | 5,574,730 | 5,319,489 | |||||||||
GS Mortgage-Backed Securities Trust (18-RPL1-A1A) |
| |||||||||||
3.75% (1) | 10/25/57 | 2,178,631 | 2,060,469 | |||||||||
GSAA Home Equity Trust (05-11-2A2) |
| |||||||||||
4.23% (1 mo. USD LIBOR + 0.640%) (2) | 10/25/35 | 926,781 | 886,513 | |||||||||
IndyMac Index Mortgage Loan Trust (05-AR6-2A1) |
| |||||||||||
4.07% (1 mo. USD LIBOR + 0.480%) (2) | 04/25/35 | 483,090 | 400,121 | |||||||||
JPMorgan Mortgage Trust (21-14-A3) |
| |||||||||||
2.50% (1),(7) | 05/25/52 | 5,169,939 | 4,022,051 | |||||||||
JPMorgan Mortgage Trust (22-1 A3) |
| |||||||||||
2.50% (1),(7) | 07/25/52 | 8,920,633 | 6,889,796 | |||||||||
Morgan Stanley Capital, Inc. (04-WMC2-M1) |
| |||||||||||
4.50% (1 mo. USD LIBOR + 0.915%) (2) | 07/25/34 | 609,019 | 567,204 | |||||||||
Morgan Stanley Mortgage Loan Trust (04-3-4A) |
| |||||||||||
5.65% (7) | 04/25/34 | 86,914 | 82,458 | |||||||||
| Issues | Maturity Date | Principal Amount | Value | |||||||||
| RESIDENTIAL MORTGAGE-BACKED SECURITIES — AGENCY (Continued) | ||||||||||||
New Century Home Equity Loan Trust (05-D-A1) |
| |||||||||||
4.03% (1 mo. USD LIBOR + | 02/25/36 | $ | 474,489 | $ | 472,926 | |||||||
Option One Mortgage Loan Trust (05-2-M1) |
| |||||||||||
4.25% (1 mo. USD LIBOR + 0.660%) (2) | 05/25/35 | 505,300 | 499,907 | |||||||||
Park Place Securities, Inc. Asset-Backed Pass-Through Certificates (05-WCW2-M3) |
| |||||||||||
4.41% (1 mo. USD LIBOR + 0.825%) (2) | 07/25/35 | 10,000,000 | 9,270,904 | |||||||||
RASC Series Trust (06-KS7-A4) |
| |||||||||||
3.83% (1 mo. USD LIBOR + 0.240%) (2) | 09/25/36 | 122,301 | 122,084 | |||||||||
Structured Asset Investment Loan Trust (04-6-A3) |
| |||||||||||
4.39% (1 mo. USD LIBOR + 0.800%) (2) | 07/25/34 | 1,948,774 | 1,817,884 | |||||||||
Structured Asset Securities Corp. (03-34A-5A4) |
| |||||||||||
3.77% (7) | 11/25/33 | 183,322 | 167,886 | |||||||||
WaMu Mortgage Pass-Through Certificates |
| |||||||||||
4.11% (1 mo. USD LIBOR + 0.52%) (2) | 11/25/45 | 4,334,432 | 3,819,349 | |||||||||
WaMu Mortgage Pass-Through Certificates |
| |||||||||||
2.83% (7) | 03/25/35 | 518,658 | 501,285 | |||||||||
Wells Fargo Alternative Loan Trust (07-PA3-2A1) |
| |||||||||||
6.00% (9) | 07/25/37 | 44,706 | 37,011 | |||||||||
Wells Fargo Home Equity Asset-Backed Securities Trust (05-3-M6) |
| |||||||||||
4.59% (1 mo. USD LIBOR + 1.005%) (2) | 11/25/35 | 1,112,562 | 1,109,839 | |||||||||
Wells Fargo Home Equity Trust (04-2-A33) |
| |||||||||||
4.59% (1 mo. USD LIBOR + 1.000%) (2) | 10/25/34 | 2,486,195 | 2,393,287 | |||||||||
|
| |||||||||||
Total Residential Mortgage-Backed Securities — Non-Agency |
| |||||||||||
(Cost: $69,795,563) |
| 63,384,052 | ||||||||||
|
| |||||||||||
| U.S. TREASURY SECURITIES—27.9% | ||||||||||||
U.S. Treasury Bond | ||||||||||||
2.00% | 11/15/41 | 49,787,000 | 34,067,646 | |||||||||
U.S. Treasury Inflation Indexed Bond (TIPS) |
| |||||||||||
3.00% | 08/15/52 | 37,792,000 | 30,286,745 | |||||||||
0.63% | 07/15/32 | 1,832,809 | 1,680,718 | |||||||||
U.S. Treasury Note | ||||||||||||
2.38% | 02/15/42 | 45,830,000 | 33,484,544 | |||||||||
2.75% | 08/15/32 | 27,075,000 | 24,249,047 | |||||||||
4.13% | 09/30/27 | 53,030,000 | 52,746,207 | |||||||||
4.13% | 10/31/27 | 50,665,000 | 50,413,654 | |||||||||
4.25% | 09/30/24 | 20,150,000 | 20,049,643 | |||||||||
See accompanying Notes to Financial Statements.
28
Table of Contents
TCW Core Fixed Income Fund
October 31, 2022
| Issues | Maturity Date | Principal Amount | Value | |||||||||
| U.S. TREASURY SECURITIES (Continued) | ||||||||||||
4.25% | 10/15/25 | $ | 38,660,000 | $ | 38,468,210 | |||||||
4.38% | 10/31/24 | 39,295,000 | 39,215,949 | |||||||||
|
| |||||||||||
Total U.S. Treasury Securities |
| |||||||||||
(Cost: $343,247,746) |
| 324,662,363 | ||||||||||
|
| |||||||||||
U.S. GOVERNMENT AGENCY OBLIGATIONS — 2.7% |
| |||||||||||
Federal Home Loan Banks |
| |||||||||||
1.04% | 06/14/24 | 16,850,000 | 15,867,300 | |||||||||
1.20% | 12/23/24 | 16,820,000 | 15,591,804 | |||||||||
|
| |||||||||||
| 31,459,104 | ||||||||||||
|
| |||||||||||
Total U.S. Government Agency Obligations |
| |||||||||||
(Cost: $33,670,000) |
| 31,459,104 | ||||||||||
|
| |||||||||||
Total Fixed Income Securities |
| |||||||||||
(Cost: $1,497,692,318) |
| 1,363,770,638 | ||||||||||
|
| |||||||||||
| Issues | Shares | Value | ||||||||||
MONEY MARKET INVESTMENTS —1.7% |
| |||||||||||
State Street Institutional U.S. Government Money Market Fund — Premier Class, 3.01% (10) |
| 20,014,422 | $ | 20,014,422 | ||||||||
|
| |||||||||||
Total Money Market Investments |
| |||||||||||
(Cost: $20,014,422) | 20,014,422 | |||||||||||
|
| |||||||||||
Total Investments (119.0%) |
| |||||||||||
(Cost: $1,517,706,740) | 1,383,785,060 | |||||||||||
Liabilities In Excess Of Other Assets (-19.0%) |
| (220,667,334 | ) | |||||||||
|
| |||||||||||
Net Assets (100.0%) | $ | 1,163,117,726 | ||||||||||
|
| |||||||||||
| Futures Contracts | ||||||||||||||||||
| Number of Contracts | Type | Expiration Date | Notional | Market Value | Net Unrealized Appreciation (Depreciation) | |||||||||||||
Long Futures |
| |||||||||||||||||
| 1,032 | 2-Year U.S Treasury Note Futures | 12/30/22 | $ | 214,498,935 | $ | 210,923,062 | $ | (3,575,873 | ) | |||||||||
| 52 | 5-Year U.S Treasury Note Futures | 12/30/22 | 5,548,668 | 5,542,875 | (5,793 | ) | ||||||||||||
|
|
|
|
|
| |||||||||||||
| $ | 220,047,603 | $ | 216,465,937 | $ | (3,581,666 | ) | ||||||||||||
|
|
|
|
|
| |||||||||||||
Short Futures |
| |||||||||||||||||
| 393 | 10-Year U.S. Treasury Note Futures | 12/20/22 | $ | (46,925,949 | ) | $ | (45,581,860 | ) | $ | 1,344,089 | ||||||||
| 36 | Euro-Bund Future | 12/8/22 | (5,016,569 | ) | (4,925,780 | ) | 90,789 | |||||||||||
| 26 | Euro-Bobl Futures | 12/8/22 | (3,078,181 | ) | (3,075,173 | ) | 3,008 | |||||||||||
| 139 | U.S. Ultra Long Bond Futures | 12/20/22 | (18,416,439 | ) | (17,744,218 | ) | 672,221 | |||||||||||
|
|
|
|
|
| |||||||||||||
| $ | (73,437,138 | ) | $ | (71,327,031 | ) | $ | 2,110,107 | |||||||||||
|
|
|
|
|
| |||||||||||||
| Forward Currency Exchange Contracts | ||||||||||||||||||||||||
| Counterparty | Contracts to Deliver | Units of Currency | Settlement Date | In Exchange for U.S. Dollars | Contracts at Value | Unrealized Appreciation (Depreciation) | ||||||||||||||||||
| SELL (11) | ||||||||||||||||||||||||
Citibank N.A. | EUR | 214,000 | 01/13/23 | $ | 208,870 | $ | 212,809 | $ | (3,939 | ) | ||||||||||||||
Goldman Sachs & Co. | GBP | 484,000 | 01/13/23 | 551,714 | 558,683 | (6,969 | ) | |||||||||||||||||
Goldman Sachs & Co. | EUR | 343,000 | 01/13/23 | 338,058 | 341,092 | (3,034 | ) | |||||||||||||||||
Bank of America N.A. | EUR | 7,749,000 | 01/13/23 | 7,671,711 | 7,705,893 | (34,182 | ) | |||||||||||||||||
|
|
|
|
|
| |||||||||||||||||||
| $ | 8,770,353 | $ | 8,818,477 | $ | (48,124 | ) | ||||||||||||||||||
|
|
|
|
|
| |||||||||||||||||||
See accompanying Notes to Financial Statements.
29
Table of Contents
TCW Core Fixed Income Fund
Schedule of Investments (Continued)
| Centrally Cleared — Interest Rate Swap Agreements | ||||||||||||||||||||||||||||||
| Notional Amount | Expiration Date | Payment Made by Fund Frequency | Payment Made by Fund | Payment Received by Fund Frequency | Payment Received by Fund | Unrealized Appreciation (Depreciation) | Premium Paid | Value | ||||||||||||||||||||||
| 38,150,000 | (12) | 07/24/25 | Quarterly | 3-Month USD LIBOR | Semi-Annual | 1.026% | $ | (2,450,161 | ) | $ — | $ | (2,450,161 | ) | |||||||||||||||||
| 28,215,000 | (12) | 07/24/25 | Quarterly | 3-Month USD LIBOR | Semi-Annual | 1.034% | (1,807,961 | ) | $ — | (1,807,961 | ) | |||||||||||||||||||
| 19,075,000 | (12) | 07/24/25 | Quarterly | 3-Month USD LIBOR | Semi-Annual | 1.073% | (1,208,670 | ) | $ — | (1,208,670 | ) | |||||||||||||||||||
| 45,870,000 | (12) | 09/28/25 | Quarterly | 3-Month USD LIBOR | Semi-Annual | 1.390% | (2,521,089 | ) | $ — | (2,521,089 | ) | |||||||||||||||||||
| 79,680,000 | 06/10/24 | Annual | 12-Month SOFR | Annual | 1.9500% | (3,347,476 | ) | $ — | (3,347,476 | ) | ||||||||||||||||||||
| 1,595,000 | (12) | 07/24/53 | Semi-Annual | 1.808% | Quarterly | 3-Month USD LIBOR | 528,056 | $ — | 528,056 | |||||||||||||||||||||
| 2,355,000 | (12) | 07/24/53 | Semi-Annual | 1.785% | Quarterly | 3-Month USD LIBOR | 788,997 | $ — | 788,997 | |||||||||||||||||||||
| 3,190,000 | (12) | 07/24/53 | Semi-Annual | 1.773% | Quarterly | 3-Month USD LIBOR | 1,075,767 | $ — | 1,075,767 | |||||||||||||||||||||
| 3,915,000 | (12) | 09/28/53 | Semi-Annual | 1.870% | Quarterly | 3-Month USD LIBOR | 1,231,596 | $ — | 1,231,596 | |||||||||||||||||||||
|
|
|
|
|
| |||||||||||||||||||||||||
| $ | (7,710,941 | ) | $ | — | $ | (7,710,941 | ) | |||||||||||||||||||||||
|
|
|
|
|
| |||||||||||||||||||||||||
Notes to the Schedule of Investments:
| CLO | Collateralized Loan Obligation. |
| EETC | Enhanced Equipment Trust Certificate. |
| I/F | Inverse Floating rate security whose interest rate moves in the opposite direction of prevailing interest rates. |
| I/O | Interest Only Security. |
| JPY | Japanese Yen. |
| PAC | Planned Amortization Class. |
| REIT | Real Estate Investment Trust. |
| SOFR | Secured Overnight Financing Rate. |
| TAC | Target Amortization Class. |
| TBA | To Be Announced. |
| EUR | Euro Currency |
| (1) | Security exempt from registration under Rule 144A of the Securities Act of 1933, as amended. These securities may be resold, normally only to qualified institutional buyers. At October 31, 2022, the value of these securities amounted to $229,287,102 or 19.7% of net assets. These securities are determined to be liquid by the Fund’s investment advisor, unless otherwise noted, under procedures established by and under the general supervision of the Company’s Board of Directors. |
| (2) | Floating or variable rate security. The interest shown reflects the rate in effect at October 31, 2022. |
| (3) | Investments issued under Regulation S of the Securities Act of 1933, as amended, may not be offered, sold, or delivered within the United States except under special exemptions. At October 31, 2022, the value of these securities amounted to $6,086,680 or 0.5% of net assets. |
| (4) | Restricted security (Note 11). |
| (5) | For fair value measurement disclosure purposes, security is categorized as Level 3. Security is valued using significant unobservable inputs. |
| (6) | Security is currently in default due to bankruptcy or failure to make payment of principal or interest of the issuer. Income is not being accrued. |
| (7) | Variable rate security. Interest rate disclosed is as of the most recent information available. Certain variable rate securities are not based on a published reference rate and spread but are determined by the issuer or agent and are based on current market conditions. These securities do not indicate a reference rate and spread in their description above. |
| (8) | Security purchased on a forward commitment with an approximate principal amount. The actual principal amount and maturity date will be determined upon settlement when the security is delivered. |
| (9) | A portion of the principal balance has been written-off during the period due to defaults in the underlying loans. Cost basis has been adjusted. |
| (10) | Rate disclosed is the 7-day net yield as of October 31, 2022. |
| (11) | Fund sells foreign currency, buys U.S. Dollar. |
| (12) | This instrument has a forward starting effective date. See Note 2, Significant Accounting Policies in the Notes to Financial Statements for further information. |
See accompanying Notes to Financial Statements.
30
Table of Contents
TCW Core Fixed Income Fund
Investments by Sector | October 31, 2022 |
| Sector | Percentage of Net Assets | |||
Residential Mortgage-Backed Securities — Agency | 36.5 | % | ||
Corporate Bonds | 31.3 | |||
U.S. Treasury Securities | 27.9 | |||
Asset-Backed Securities | 8.6 | |||
Residential Mortgage-Backed Securities — Non-Agency | 5.5 | |||
Commercial Mortgage-Backed Securities — Non-Agency | 3.5 | |||
U.S. Government Agency Obligations | 2.7 | |||
Money Market Investments | 1.7 | |||
Municipal Bonds | 0.7 | |||
Commercial Mortgage-Backed Securities — Agency | 0.6 | |||
Other* | (19.0 | ) | ||
|
| |||
Total | 100.0 | % | ||
|
| |||
| * | Includes futures, swap agreements, pending trades, interest receivable, fund share transactions and accrued expenses payable. |
See accompanying Notes to Financial Statements.
31
Table of Contents
TCW Core Fixed Income Fund
Fair Valuation Summary | October 31, 2022 |
The following is a summary of the fair valuations according to the inputs used as of October 31, 2022 in valuing the Fund’s investments:
Description | Quoted Prices in Active Markets for Identical Assets (Level 1) | Other Significant Observable Inputs (Level 2) | Significant Unobservable Inputs (Level 3) | Total | ||||||||||||
Fixed Income Securities | ||||||||||||||||
Corporate Bonds* | $ | — | $ | 363,343,175 | $ | 1,160,224 | $ | 364,503,399 | ||||||||
Municipal Bonds | — | 7,656,893 | — | 7,656,893 | ||||||||||||
Asset-Backed Securities | — | 95,679,401 | 3,965,873 | 99,645,274 | ||||||||||||
Commercial Mortgage-Backed Securities — Agency | — | 6,631,293 | — | 6,631,293 | ||||||||||||
Commercial Mortgage-Backed Securities — Non-Agency | — | 41,041,755 | — | 41,041,755 | ||||||||||||
Residential Mortgage-Backed Securities — Agency | — | 424,786,505 | — | 424,786,505 | ||||||||||||
Residential Mortgage-Backed Securities — Non-Agency | — | 63,384,052 | — | 63,384,052 | ||||||||||||
U.S. Treasury Securities | 322,981,645 | 1,680,718 | — | 324,662,363 | ||||||||||||
U.S. Government Agency Obligations | — | 31,459,104 | — | 31,459,104 | ||||||||||||
|
|
|
|
|
|
|
| |||||||||
Total Fixed Income Securities | 322,981,645 | 1,035,662,896 | 5,126,097 | 1,363,770,638 | ||||||||||||
|
|
|
|
|
|
|
| |||||||||
Money Market Investments | 20,014,422 | — | — | 20,014,422 | ||||||||||||
|
|
|
|
|
|
|
| |||||||||
Total Investments | $ | 342,996,067 | $ | 1,035,662,896 | $ | 5,126,097 | $ | 1,383,785,060 | ||||||||
|
|
|
|
|
|
|
| |||||||||
Asset Derivatives | ||||||||||||||||
Futures Contracts | ||||||||||||||||
Interest Rate Risk | 2,110,107 | — | — | 2,110,107 | ||||||||||||
Swap Agreements | ||||||||||||||||
Interest Rate Risk | — | 3,624,416 | — | 3,624,416 | ||||||||||||
|
|
|
|
|
|
|
| |||||||||
Total | $ | 345,106,174 | $ | 1,039,287,312 | $ | 5,126,097 | $ | 1,389,519,583 | ||||||||
|
|
|
|
|
|
|
| |||||||||
Liability Derivatives | ||||||||||||||||
Futures Contracts | ||||||||||||||||
Interest Rate Risk | $ | (3,581,666 | ) | $ | — | $ | — | $ | (3,581,666 | ) | ||||||
Forward Currency Contracts | ||||||||||||||||
Foreign Currency Risk | — | (48,124 | ) | — | (48,124 | ) | ||||||||||
Swap Agreements | ||||||||||||||||
Interest Rate Risk | — | (11,335,357 | ) | — | (11,335,357 | ) | ||||||||||
|
|
|
|
|
|
|
| |||||||||
Total | $ | (3,581,666 | ) | $ | (11,383,481 | ) | $ | — | $ | (14,965,147 | ) | |||||
|
|
|
|
|
|
|
| |||||||||
| * | See Schedule of Investments for corresponding industries. |
See accompanying Notes to Financial Statements.
32
Table of Contents
TCW Enhanced Commodity Strategy Fund
Consolidated Schedule of Investments | October 31, 2022 |
| Issues | Maturity Date | Principal Amount | Value | |||||||||
FIXED INCOME SECURITIES — 74.5% |
| |||||||||||
| ASSET-BACKED SECURITIES — 18.2% | ||||||||||||
Aimco CLO, Ltd. (20-11A-AR) |
| |||||||||||
5.21% (3 mo. USD LIBOR + | 10/17/34 | $ | 5,000 | $ | 4,769 | |||||||
Americredit Automobile Receivables Trust (19-1-D) |
| |||||||||||
3.62% | 03/18/25 | 355,000 | 349,323 | |||||||||
AmeriCredit Automobile Receivables Trust (20-1-C) |
| |||||||||||
1.59% | 10/20/25 | 350,000 | 334,754 | |||||||||
Ammc CLO 19, Ltd. (16-19A-AR) |
| |||||||||||
5.22% (3 mo. USD LIBOR + | 10/16/28 | 136,478 | 135,318 | |||||||||
Barings CLO, Ltd. (13-IA-AR) |
| |||||||||||
5.04% (3 mo. USD LIBOR + | 01/20/28 | 46,087 | 45,303 | |||||||||
Brazos Higher Education Authority, Inc. (11-1-A2) |
| |||||||||||
3.80% (3 mo. USD LIBOR + 0.800%) (2) | 02/25/30 | 5,747 | 5,718 | |||||||||
Carvana Auto Receivables Trust (22-P3-A3) |
| |||||||||||
4.61% | 11/10/27 | 240,000 | 232,999 | |||||||||
CF Hippolyta Issuer LLC (20-1-A1) |
| |||||||||||
1.69% (1) | 07/15/60 | 182,872 | 160,762 | |||||||||
CF Hippolyta Issuer LLC (21-1A-A1) |
| |||||||||||
1.53% (1) | 03/15/61 | 277,840 | 238,552 | |||||||||
Drive Auto Receivables Trust (21-1-D) |
| |||||||||||
1.45% | 01/16/29 | 427,000 | 400,910 | |||||||||
Drive Auto Receivables Trust (21-2-C) |
| |||||||||||
0.87% | 10/15/27 | 300,000 | 283,377 | |||||||||
Dryden 30 Senior Loan Fund (13-30A-AR) |
| |||||||||||
3.73% (3 mo. USD LIBOR + 0.820%) (1),(2) | 11/15/28 | 68,414 | 67,189 | |||||||||
Educational Services of America, Inc. (12-2-A) |
| |||||||||||
4.32% (1 mo. USD LIBOR + | 04/25/39 | 2,368 | 2,334 | |||||||||
Exeter Automobile Receivables Trust (21-1A-D) |
| |||||||||||
1.08% | 11/16/26 | 340,000 | 318,969 | |||||||||
Exeter Automobile Receivables Trust (21-4A-C) |
| |||||||||||
1.46% | 10/15/27 | 515,000 | 478,514 | |||||||||
Flagship Credit Auto Trust (19-4-D) |
| |||||||||||
3.12% (1) | 01/15/26 | 430,000 | 406,031 | |||||||||
Global SC Finance II SRL (14-1A-A2) |
| |||||||||||
3.09% (1) | 07/17/29 | 15,302 | 14,844 | |||||||||
LCM XXI LP (21A-AR) |
| |||||||||||
5.12% (3 mo. USD LIBOR + 0.880%) (1),(2) | 04/20/28 | 165,115 | 163,540 | |||||||||
Madison Park Funding, Ltd. (18-30A-A) |
| |||||||||||
4.83% (3 mo. USD LIBOR + | 04/15/29 | 71,773 | 70,165 | |||||||||
Magnetite XVI, Ltd. (15-16A-AR) |
| |||||||||||
4.99% (3 mo. USD LIBOR + | 01/18/28 | 43,731 | 43,049 | |||||||||
| Issues | Maturity Date | Principal Amount | Value | |||||||||
| ASSET-BACKED SECURITIES (Continued) | ||||||||||||
Magnetite XVIII, Ltd. (16-18A-AR2) | ||||||||||||
3.79% (3 mo. USD LIBOR + | 11/15/28 | $ | 53,933 | $ | 52,875 | |||||||
Navient Private Education Refi Loan Trust (20-BA-A2) |
| |||||||||||
2.12% (1) | 01/15/69 | 19,506 | 17,298 | |||||||||
Navient Private Education Refi Loan Trust (21-BA-A) |
| |||||||||||
0.94% (1) | 07/15/69 | 234,149 | 196,634 | |||||||||
Navient Private Education Refi Loan Trust (21-CA-A) |
| |||||||||||
1.06% (1) | 10/15/69 | 113,194 | 96,657 | |||||||||
Navient Student Loan Trust (16-6A-A2) |
| |||||||||||
4.34% (1 mo. USD LIBOR + | 03/25/66 | 24,418 | 24,339 | |||||||||
Nelnet Student Loan Trust (12-5A-A) |
| |||||||||||
4.19% (1 mo. USD LIBOR + | 10/27/36 | 2,049 | 1,973 | |||||||||
NYACK Park CLO, Ltd. (21-1A-X) |
| |||||||||||
4.89% (3 mo. USD LIBOR + 0.650%) (1),(2) | 10/20/34 | 3,125 | 3,046 | |||||||||
Oak Street Investment Grade Net Lease Fund (20-1A-A1) |
| |||||||||||
1.85% (1) | 11/20/50 | 125,655 | 109,245 | |||||||||
Octagon Investment Partners XIV, Ltd. (12-1A-AARR) |
| |||||||||||
5.03% (3 mo. USD LIBOR + | 07/15/29 | 109,432 | 107,277 | |||||||||
Palmer Square Loan Funding, Ltd. (20-1A-A1) |
| |||||||||||
3.78% (3 mo. USD LIBOR + | 02/20/28 | 86,033 | 84,845 | |||||||||
Palmer Square Loan Funding, Ltd. (21-2A-A1) |
| |||||||||||
3.78% (3 mo. USD LIBOR + | 05/20/29 | 100,440 | 98,491 | |||||||||
PFS Financing Corp. (22-B-A) |
| |||||||||||
3.39% (SOFR30A + 0.600%) (1),(2) | 02/15/26 | 145,000 | 143,956 | |||||||||
Progress Residential Trust (19-SFR3-A) |
| |||||||||||
2.27% (1) | 09/17/36 | 9,901 | 9,318 | |||||||||
Progress Residential Trust (21-SFR1-C) |
| |||||||||||
1.56% (1) | 04/17/38 | 252,000 | 211,056 | |||||||||
ReadyCap Commercial Mortgage Trust (18-4-A) |
| |||||||||||
3.39% (1) | 02/27/51 | 153,704 | 145,795 | |||||||||
ReadyCap Commercial Mortgage Trust (19-6-A) |
| |||||||||||
2.83% (1) | 10/25/52 | 115,462 | 108,136 | |||||||||
Santander Drive Auto Receivables Trust (19-2-D) |
| |||||||||||
3.22% | 07/15/25 | 247,203 | 245,173 | |||||||||
Santander Drive Auto Receivables Trust (20-4-C) |
| |||||||||||
1.01% | 01/15/26 | 327,168 | 322,949 | |||||||||
Santander Drive Auto Receivables Trust (21-1-D) |
| |||||||||||
1.13% | 11/16/26 | 330,000 | 312,718 | |||||||||
Santander Drive Auto Receivables Trust (21-2-B) |
| |||||||||||
0.59% | 09/15/25 | 109,342 | 108,803 | |||||||||
See accompanying Notes to Financial Statements.
33
Table of Contents
TCW Enhanced Commodity Strategy Fund
Consolidated Schedule of Investments (Continued)
| Issues | Maturity Date | Principal Amount | Value | |||||||||
| ASSET-BACKED SECURITIES (Continued) | ||||||||||||
SLC Student Loan Trust (08-1-A4A) |
| |||||||||||
4.89% (3 mo. USD LIBOR + | 12/15/32 | $ | 111,011 | $ | 110,241 | |||||||
SLM Student Loan Trust (05-4-A3) |
| |||||||||||
4.48% (3 mo. USD LIBOR + | 01/25/27 | 1,028 | 1,025 | |||||||||
SLM Student Loan Trust (05-7-A4) |
| |||||||||||
4.51% (3 mo. USD LIBOR + | 10/25/29 | 6,689 | 6,630 | |||||||||
SLM Student Loan Trust (08-3-A3) |
| |||||||||||
5.36% (3 mo. USD LIBOR + | 10/25/21 | 6,843 | 6,629 | |||||||||
SLM Student Loan Trust (08-3-B) |
| |||||||||||
5.56% (3 mo. USD LIBOR + | 04/26/83 | 10,000 | 9,190 | |||||||||
SLM Student Loan Trust (13-4-A) |
| |||||||||||
4.14% (1 mo. USD LIBOR + | 06/25/43 | 6,497 | 6,241 | |||||||||
SLM Student Loan Trust (13-6-A3) |
| |||||||||||
4.24% (1 mo. USD LIBOR + | 06/26/28 | 7,442 | 7,142 | |||||||||
SoFi Professional Loan Program LLC (17-A-A1) |
| |||||||||||
4.29% (1 mo. USD LIBOR + | 03/26/40 | 13,144 | 13,098 | |||||||||
SoFi Professional Loan Program LLC (17-F-A2FX) |
| |||||||||||
2.84% (1) | 01/25/41 | 146,087 | 139,522 | |||||||||
Sofi Professional Loan Program LLC (19-A-A2FX) |
| |||||||||||
3.69% (1) | 06/15/48 | 149,059 | 145,315 | |||||||||
SoFi Professional Loan Program Trust (21-B-AFX) |
| |||||||||||
1.14% (1) | 02/15/47 | 196,301 | 161,634 | |||||||||
Stack Infrastructure Issuer LLC (19-2A-A2) |
| |||||||||||
3.08% (1) | 10/25/44 | 84,000 | 78,616 | |||||||||
Stack Infrastructure Issuer LLC (20-1A-A2) |
| |||||||||||
1.89% (1) | 08/25/45 | 200,000 | 176,517 | |||||||||
Tricon American Homes Trust (17-SFR2-B) |
| |||||||||||
3.28% (1) | 01/17/36 | 5,000 | 4,805 | |||||||||
United States Small Business Administration (09-20G-1) |
| |||||||||||
4.30% | 07/01/29 | 47,303 | 45,176 | |||||||||
United States Small Business Administration (10-20E-1) |
| |||||||||||
4.11% | 05/01/30 | 26,992 | 25,642 | |||||||||
VOYA CLO (17-2A-A1R) |
| |||||||||||
5.06% (3 mo. USD LIBOR + | 06/07/30 | 326,709 | 319,224 | |||||||||
|
| |||||||||||
Total Asset-Backed Securities |
| |||||||||||
(Cost: $7,627,063) |
| 7,413,651 | ||||||||||
|
| |||||||||||
| COMMERCIAL MORTGAGE-BACKED SECURITIES — AGENCY — 2.5% | ||||||||||||
Fannie Mae Pool #AM1671 |
| |||||||||||
2.10% | 12/01/27 | 22,374 | 20,561 | |||||||||
| Issues | Maturity Date | Principal Amount | Value | |||||||||
| COMMERCIAL MORTGAGE-BACKED SECURITIES — AGENCY (Continued) | ||||||||||||
Freddie Mac Multifamily Structured Pass Through Certificates (KJ28-A1) |
| |||||||||||
1.77% | 02/25/25 | $ | 92,693 | $ | 92,693 | |||||||
Freddie Mac Multifamily Structured Pass-Through Certificates |
| |||||||||||
3.66% (1 mo. USD LIBOR + | 07/25/29 | 52,265 | 52,006 | |||||||||
Freddie Mac Multifamily Structured Pass-Through Certificates (KC01-X1) (I/O) |
| |||||||||||
0.44% (3) | 12/25/22 | 197,510 | 66 | |||||||||
Freddie Mac Multifamily Structured Pass-Through Certificates (KF57-A) |
| |||||||||||
3.68% (1 mo. USD LIBOR + | 12/25/28 | 72,021 | 71,296 | |||||||||
Freddie Mac Multifamily Structured Pass-Through Certificates (K026-X1) (I/O) |
| |||||||||||
0.88% (3) | 11/25/22 | 654,089 | 69 | |||||||||
Freddie Mac Multifamily Structured Pass-Through Certificates (K033-X1) (I/O) |
| |||||||||||
0.28% (3) | 07/25/23 | 15,629,890 | 21,054 | |||||||||
Freddie Mac Multifamily Structured Pass-Through Certificates (K726-X1) (I/O) |
| |||||||||||
0.90% (3) | 04/25/24 | 9,288,998 | 85,261 | |||||||||
Freddie Mac Multifamily Structured Pass-Through Certificates (KJ27-A1) |
| |||||||||||
2.09% | 07/25/24 | 1,521 | 1,510 | |||||||||
Freddie Mac Multifamily Structured Pass-Through Certificates (KJ30-A1) |
| |||||||||||
0.53% | 01/25/25 | 15,068 | 14,626 | |||||||||
Freddie Mac Multifamily Structured Pass-Through Certificates (KJ31-A1) |
| |||||||||||
0.57% | 05/25/26 | 17,270 | 16,520 | |||||||||
Freddie Mac Multifamily Structured Pass-Through Certificates (KJ32-A1) |
| |||||||||||
0.52% | 06/25/25 | 30,590 | 28,621 | |||||||||
Freddie Mac Multifamily Structured Pass-Through Certificates (KS07-X) (I/O) |
| |||||||||||
0.63% (3) | 09/25/25 | 482,630 | 7,719 | |||||||||
Freddie Mac Multifamily Structured Pass-Through Certificates (Q004-A2H) |
| |||||||||||
2.88% (3) | 01/25/46 | 95,168 | 94,606 | |||||||||
Freddie Mac Multifamily Structured Pass-Through Certificates (Q004-AFL) |
| |||||||||||
2.43% (12 mo. Monthly Treasury Average Index + 0.740%) (2) | 05/25/44 | 77,173 | 77,214 | |||||||||
Freddie Mac Multifamily Structured Pass-Through Certificates (Q008-A) |
| |||||||||||
3.53% (1 mo. USD LIBOR + 0.390%) (2) | 10/25/45 | 63,211 | 62,626 | |||||||||
See accompanying Notes to Financial Statements.
34
Table of Contents
TCW Enhanced Commodity Strategy Fund
October 31, 2022
| Issues | Maturity Date | Principal Amount | Value | |||||||||
| COMMERCIAL MORTGAGE-BACKED SECURITIES — AGENCY (Continued) | ||||||||||||
Freddie Mac Multifamily Structured Pass-Through Certificates (Q013-APT1) |
| |||||||||||
1.29% (3) | 05/25/50 | $ | 77,319 | $ | 72,992 | |||||||
Ginnie Mae, Pool #776870 |
| |||||||||||
4.90% | 12/15/52 | 39,100 | 38,990 | |||||||||
Ginnie Mae, Pool #767414 |
| |||||||||||
5.55% | 02/15/26 | 10,933 | 10,856 | |||||||||
Ginnie Mae, Pool #669551 |
| |||||||||||
5.75% | 10/15/32 | 36,271 | 35,517 | |||||||||
Ginnie Mae, Pool #589256 |
| |||||||||||
6.00% | 12/15/32 | 25,527 | 25,033 | |||||||||
Ginnie Mae, Pool #625835 |
| |||||||||||
6.00% | 11/15/34 | 25,648 | 25,175 | |||||||||
Ginnie Mae, Pool #669522 |
| |||||||||||
6.00% | 07/15/43 | 26,176 | 25,523 | |||||||||
Ginnie Mae, Pool #749547 |
| |||||||||||
6.00% | 04/15/53 | 52,877 | 52,562 | |||||||||
Ginnie Mae (12-123-IO) (I/O) |
| |||||||||||
0.63% (3) | 12/16/51 | 88,328 | 1,139 | |||||||||
Ginnie Mae (13-1-IO) (I/O) |
| |||||||||||
0.58% (3) | 02/16/54 | 41,721 | 494 | |||||||||
Ginnie Mae (14-157-C) |
| |||||||||||
3.15% (3) | 10/16/54 | 77,584 | 75,607 | |||||||||
|
| |||||||||||
Total Commercial Mortgage-Backed Securities — Agency |
| |||||||||||
(Cost: $1,020,791) |
| 1,010,336 | ||||||||||
|
| |||||||||||
| COMMERCIAL MORTGAGE-BACKED SECURITIES — NON-AGENCY — 6.2% | ||||||||||||
AREIT 2019-CRE3 Trust (19-CRE3-A) |
| |||||||||||
4.76% (SOFR + 1.384%) (1),(2) | 09/14/36 | 40,586 | 39,650 | |||||||||
BANK (18-BN14-A2) |
| |||||||||||
4.13% | 09/15/60 | 2,031 | 1,971 | |||||||||
BB-UBS Trust (12-SHOW-XA) (I/O) |
| |||||||||||
0.60% (1),(3) | 11/05/36 | 6,396,000 | 69,830 | |||||||||
BBCMS Trust (18-BXH-A) |
| |||||||||||
4.41% (1 mo. USD LIBOR + 1.000%) (1),(2) | 10/15/37 | 8,346 | 8,021 | |||||||||
Benchmark Mortgage Trust (18-B6-A2) |
| |||||||||||
4.20% | 10/10/51 | 6,599 | 6,443 | |||||||||
BSPRT Issuer, Ltd. (19-FL5-A) |
| |||||||||||
4.56% (1 mo. USD LIBOR + 1.150%) (1),(2) | 05/15/29 | 29,771 | 29,628 | |||||||||
BX Commercial Mortgage Trust (20-VKNG-A) |
| |||||||||||
4.34% (1 mo. USD LIBOR + | 10/15/37 | 208,323 | 200,887 | |||||||||
BX Commercial Mortgage Trust (21-CIP-A) |
| |||||||||||
4.33% (1 mo. USD LIBOR + | 12/15/38 | 110,000 | 105,160 | |||||||||
| Issues | Maturity Date | Principal Amount | Value | |||||||||
| COMMERCIAL MORTGAGE-BACKED SECURITIES — NON-AGENCY (Continued) | ||||||||||||
BX Trust (21-MFM1-A) |
| |||||||||||
4.11% (1 mo. USD LIBOR + 0.700%) (1),(2) | 01/15/34 | $ | 20,000 | $ | 19,201 | |||||||
BXHPP Trust (21-FILM-A) |
| |||||||||||
4.06% (1 mo. USD LIBOR + 0.650%) (1),(2) | 08/15/36 | 100,000 | 94,123 | |||||||||
BXMT, Ltd. (20-FL3-A) |
| |||||||||||
4.31% (SOFR30A + 1.514%) (1),(2) | 11/15/37 | 100,000 | 98,372 | |||||||||
Citigroup Commercial Mortgage Trust (13-GC11-AAB) |
| |||||||||||
2.69% | 04/10/46 | 210 | 210 | |||||||||
Citigroup Commercial Mortgage Trust (14-GC21-XA) (I/O) |
| |||||||||||
1.14% (3) | 05/10/47 | 5,176,758 | 66,783 | |||||||||
Citigroup Commercial Mortgage Trust (15-GC27-XA) (I/O) |
| |||||||||||
1.31% (3) | 02/10/48 | 1,915,236 | 42,485 | |||||||||
Cold Storage Trust (20-ICE5-A) |
| |||||||||||
4.31% (1 mo. USD LIBOR + 0.900%) (1),(2) | 11/15/37 | 137,619 | 133,594 | |||||||||
COMM Mortgage Trust (12-CR4-XA) (I/O) |
| |||||||||||
1.47% (3) | 10/15/45 | 192,303 | 1 | |||||||||
COMM Mortgage Trust (13-CR11-XA) (I/O) |
| |||||||||||
0.90% (3) | 08/10/50 | 526,147 | 2,435 | |||||||||
COMM Mortgage Trust (13-LC6-XB) (I/O) |
| |||||||||||
0.33% (1),(3) | 01/10/46 | 100,000 | 5 | |||||||||
COMM Mortgage Trust (14-CR14-A2) |
| |||||||||||
3.15% | 02/10/47 | 49,645 | 49,089 | |||||||||
COMM Mortgage Trust (14-CR17-XA) (I/O) |
| |||||||||||
0.95% (3) | 05/10/47 | 5,270,558 | 53,628 | |||||||||
COMM Mortgage Trust (15-LC23-A2) |
| |||||||||||
3.22% | 10/10/48 | 1,379 | 1,309 | |||||||||
COMM Mortgage Trust (15-PC1-A4) |
| |||||||||||
3.62% | 07/10/50 | 63,680 | 61,364 | |||||||||
DBGS Mortgage Trust (18-BIOD-A) |
| |||||||||||
4.12% (1 mo. USD LIBOR + 0.803%) (1),(2) | 05/15/35 | 137,064 | 133,456 | |||||||||
FS Rialto (19-FL1-A) |
| |||||||||||
4.61% (1 mo. USD LIBOR + | 12/16/36 | 66,612 | 65,367 | |||||||||
GS Mortgage Securities Trust (11-GC5-XA) (I/O) |
| |||||||||||
0.00% (1),(3) | 08/10/44 | 179,582 | 2 | |||||||||
GS Mortgage Securities Trust (13-GC13-AAB) |
| |||||||||||
3.72% (3) | 07/10/46 | 920 | 916 | |||||||||
GS Mortgage Securities Trust (14-GC18-AAB) |
| |||||||||||
3.65% | 01/10/47 | 107,664 | 106,022 | |||||||||
Houston Galleria Mall Trust (15-HGLR A1A1) |
| |||||||||||
3.09% (1) | 03/05/37 | 250,000 | 228,615 | |||||||||
JPMBB Commercial Mortgage Securities Trust (13-C17-XA) (I/O) |
| |||||||||||
0.69% (3) | 01/15/47 | 112,460 | 601 | |||||||||
JPMBB Commercial Mortgage Securities Trust (14-C19-A3) |
| |||||||||||
3.67% | 04/15/47 | 1,419 | 1,352 | |||||||||
See accompanying Notes to Financial Statements.
35
Table of Contents
TCW Enhanced Commodity Strategy Fund
Consolidated Schedule of Investments (Continued)
| Issues | Maturity Date | Principal Amount | Value | |||||||||
| COMMERCIAL MORTGAGE-BACKED SECURITIES — NON-AGENCY (Continued) | ||||||||||||
JPMBB Commercial Mortgage Securities Trust (14-C21-ASB) |
| |||||||||||
3.43% | 08/15/47 | $ | 11,018 | $ | 10,788 | |||||||
JPMorgan Chase Commercial Mortgage Securities Trust (13-LC11-XA) (I/O) |
| |||||||||||
1.21% (3) | 04/15/46 | 6,219,162 | 11,640 | |||||||||
LB-UBS Commercial Mortgage Trust (06-C6-XCL) (I/O) |
| |||||||||||
0.43% (1),(3),(4) | 09/15/39 | 289,760 | 35 | |||||||||
MBRT (19-MBR-A) |
| |||||||||||
4.51% (1 mo. USD LIBOR + 1.100%) (1),(2) | 11/15/36 | 125,000 | 121,867 | |||||||||
MF1, Ltd. (20-FL4-A) |
| |||||||||||
5.19% (SOFR + 1.814) (1),(2) | 11/15/35 | 89,792 | 87,612 | |||||||||
Morgan Stanley Bank of America Merrill Lynch Trust (13-C10-A3) |
| |||||||||||
3.96% (3) | 07/15/46 | 20,432 | 20,257 | |||||||||
Morgan Stanley Bank of America Merrill Lynch Trust (13-C10-A4) |
| |||||||||||
4.07% (3) | 07/15/46 | 44,588 | 44,074 | |||||||||
Morgan Stanley Bank of America Merrill Lynch Trust (13-C11-AAB) (TAC) |
| |||||||||||
3.85% | 08/15/46 | 29,374 | 29,151 | |||||||||
Morgan Stanley Bank of America Merrill Lynch Trust (14-C15-XA) (I/O) |
| |||||||||||
0.87% (3) | 04/15/47 | 767,568 | 4,801 | |||||||||
Morgan Stanley Capital I Trust (15-MS1-ASB) |
| |||||||||||
3.46% | 05/15/48 | 5,367 | 5,212 | |||||||||
SREIT Trust (21-MFP2-A) |
| |||||||||||
4.23% (1 mo. USD LIBOR + 0.822%) (1),(2) | 11/15/36 | 100,000 | 95,321 | |||||||||
STWD Trust (21-FLWR-A) |
| |||||||||||
3.99% (1 mo. USD LIBOR + 0.577%) (1),(2) | 07/15/36 | 110,000 | 104,236 | |||||||||
TRTX Issuer, Ltd. (19-FL3-A) |
| |||||||||||
4.64% (SOFR + 1.26%) (1),(2) | 10/15/34 | 33,165 | 31,670 | |||||||||
UBS-Barclays Commercial Mortgage Trust (13-C5-A4) |
| |||||||||||
3.18% | 03/10/46 | 49,587 | 49,374 | |||||||||
Wells Fargo Commercial Mortgage Trust (17-SMP-A) |
| |||||||||||
4.29% (1 mo. USD LIBOR + 0.875%) (1),(2) | 12/15/34 | 100,000 | 96,351 | |||||||||
Wells Fargo Commercial Mortgage Trust (20-C55-A1) |
| |||||||||||
1.86% | 02/15/53 | 106,834 | 101,804 | |||||||||
WFRBS Commercial Mortgage Trust (13-C11-XA) (I/O) |
| |||||||||||
1.07% (1),(3) | 03/15/45 | 2,037,583 | 20 | |||||||||
WFRBS Commercial Mortgage Trust (13-C14-XA) (I/O) |
| |||||||||||
0.65% (3) | 06/15/46 | 887,714 | 1,215 | |||||||||
WFRBS Commercial Mortgage Trust (14-C20-A4) |
| |||||||||||
3.72% | 05/15/47 | 4,459 | 4,331 | |||||||||
WFRBS Commercial Mortgage Trust (14-C20-XA) (I/O) |
| |||||||||||
0.90% (3) | 05/15/47 | 960,824 | 9,714 | |||||||||
| Issues | Maturity Date | Principal Amount | Value | |||||||||
| COMMERCIAL MORTGAGE-BACKED SECURITIES — NON-AGENCY (Continued) | ||||||||||||
WFRBS Commercial Mortgage Trust (14-C21-XA) (I/O) |
| |||||||||||
1.01% (3) | 08/15/47 | $ | 3,733,929 | $ | 50,124 | |||||||
|
| |||||||||||
Total Commercial Mortgage-Backed Securities — |
| |||||||||||
(Cost: $2,588,778) |
| 2,500,117 | ||||||||||
|
| |||||||||||
| RESIDENTIAL MORTGAGE-BACKED SECURITIES — AGENCY — 4.1% | ||||||||||||
Fannie Mae (02-41-F) | ||||||||||||
4.14% (1 mo. USD LIBOR + 0.550%) (2) | 07/25/32 | 13,962 | 14,022 | |||||||||
Fannie Mae (05-90-FC) (PAC) |
| |||||||||||
3.84% (1 mo. USD LIBOR + 0.250%) (2) | 10/25/35 | 229,853 | 229,178 | |||||||||
Fannie Mae (05-W3-2AF) |
| |||||||||||
3.81% (1 mo. USD LIBOR + 0.220%) (2) | 03/25/45 | 5,812 | 5,750 | |||||||||
Fannie Mae (11-110-FE) (PAC) |
| |||||||||||
3.99% (1 mo. USD LIBOR + 0.400%) (2) | 04/25/41 | 10,862 | 10,868 | |||||||||
Fannie Mae (11-84-F) (PAC) | ||||||||||||
3.94% (1 mo. USD LIBOR + 0.350%) (2) | 01/25/40 | 4,581 | 4,578 | |||||||||
Fannie Mae (18-94-KD) (PAC) |
| |||||||||||
3.50% | 12/25/48 | 48,177 | 44,420 | |||||||||
Fannie Mae (13-130-BF) |
| |||||||||||
3.84% (1 mo. USD LIBOR + 0.250%) (2) | 07/25/43 | 108,918 | 107,693 | |||||||||
Freddie Mac (3016-GF) |
| |||||||||||
3.76% (1 mo. USD LIBOR + 0.350%) (2) | 08/15/25 | 47,950 | 47,858 | |||||||||
Freddie Mac (3153-FJ) |
| |||||||||||
3.20% (1 mo. USD LIBOR + 0.380%) (2) | 05/15/36 | 262,046 | 260,536 | |||||||||
Freddie Mac (3954-PF) (PAC) |
| |||||||||||
3.91% (1 mo. USD LIBOR + 0.500%) (2) | 07/15/41 | 254,093 | 252,434 | |||||||||
Freddie Mac (2631-DF) |
| |||||||||||
3.81% ((1mo. USD LIBOR + 0.400)) (2) | 06/15/33 | 243,722 | 242,851 | |||||||||
Freddie Mac (3055-MF) |
| |||||||||||
3.81% (1 mo. USD LIBOR + 0.400%) (2) | 10/15/35 | 304,049 | 301,878 | |||||||||
Freddie Mac (3320 FC) |
| |||||||||||
3.58% (1 mo. USD LIBOR + 0.170%) (2) | 05/15/37 | 82,936 | 82,554 | |||||||||
Ginnie Mae (02-72-FB) (PAC) |
| |||||||||||
3.89% (1 mo. USD LIBOR + 0.400%) (2) | 10/20/32 | 17,507 | 17,511 | |||||||||
Ginnie Mae (02-72-FC) (PAC) |
| |||||||||||
3.89% (1 mo. USD LIBOR + 0.400%) (2) | 10/20/32 | 17,080 | 17,084 | |||||||||
See accompanying Notes to Financial Statements.
36
Table of Contents
TCW Enhanced Commodity Strategy Fund
October 31, 2022
| Issues | Maturity Date | Principal Amount | Value | |||||||||
| RESIDENTIAL MORTGAGE-BACKED SECURITIES — AGENCY (Continued) | ||||||||||||
Ginnie Mae II, Pool #MA6081 |
| |||||||||||
3.50% | 08/20/49 | $ | 52,333 | $ | 46,061 | |||||||
|
| |||||||||||
Total Residential Mortgage-backed Securities — Agency |
| |||||||||||
(Cost: $1,694,370) |
| 1,685,276 | ||||||||||
|
| |||||||||||
| RESIDENTIAL MORTGAGE-BACKED SECURITIES — NON-AGENCY — 8.7% | ||||||||||||
Alternative Loan Trust (05-56-4A1) |
| |||||||||||
4.21% (1 mo. USD LIBOR + 0.620%) (2) | 11/25/35 | 22,044 | 19,180 | |||||||||
American Home Mortgage Investment Trust (04-3-4A) |
| |||||||||||
3.55% (6 mo. USD LIBOR + 1.500%) (2) | 10/25/34 | 55,736 | 54,589 | |||||||||
Angel Oak Mortgage Trust (22-2-A1) |
| |||||||||||
3.35% (1),(3) | 01/25/67 | 181,873 | 158,158 | |||||||||
Asset Backed Securities Corp. Home Equity Loan Trust (05-HE6-M4) |
| |||||||||||
4.55% (1 mo. USD LIBOR + 0.960%) (2) | 07/25/35 | 10,007 | 9,957 | |||||||||
Bear Stearns Asset Backed Securities (04-AC1-A2) |
| |||||||||||
4.09% (1 mo. USD LIBOR + 0.500%) (2) | 03/25/34 | 50,159 | 49,352 | |||||||||
Bear Stearns Asset-Backed Securities Trust |
| |||||||||||
3.73% (1mo. USD LIBOR + 0.14%) (2) | 11/25/36 | 112,307 | 108,430 | |||||||||
BNC Mortgage Loan Trust (06-2-A4) |
| |||||||||||
3.91% (1 mo. USD LIBOR + 0.320%) (2) | 11/25/36 | 39,522 | 38,108 | |||||||||
Centex Home Equity Loan Trust (05-A-M1) |
| |||||||||||
4.31% (1 mo. USD LIBOR + 0.720%) (2) | 01/25/35 | 47,931 | 47,210 | |||||||||
Centex Home Equity Loan Trust (05-B-M3) |
| |||||||||||
4.28% (1 mo. USD LIBOR + 0.690%) (2) | 03/25/35 | 54,563 | 52,636 | |||||||||
Centex Home Equity Loan Trust (05-D-M5) |
| |||||||||||
4.55% (1 mo. USD LIBOR + 0.960%) (2) | 10/25/35 | 300,000 | 292,564 | |||||||||
CHL Mortgage Pass-Through Trust (04-25-1A1) |
| |||||||||||
4.25% (1 mo. USD LIBOR + 0.660%) (2) | 02/25/35 | 91,076 | 83,566 | |||||||||
Citigroup Mortgage Loan Trust (04-OPT1-M3) |
| |||||||||||
4.53% (1 mo. USD LIBOR + 0.945%)(2) | 10/25/34 | 78,045 | 74,714 | |||||||||
Citigroup Mortgage Loan Trust, Inc. (06-WFH3-M2) |
| |||||||||||
4.04% (1 mo. USD LIBOR + 0.450%) (2) | 10/25/36 | 23,635 | 23,639 | |||||||||
COLT Mortgage Loan Trust (21-2-A1) |
| |||||||||||
0.92% (1),(3) | 08/25/66 | 549,289 | 426,205 | |||||||||
CWABS Asset-Backed Certificates Trust (04-7-MV4) |
| |||||||||||
4.06% (1 mo. USD LIBOR + 1.650%) (2) | 12/25/34 | 82,025 | 80,101 | |||||||||
| Issues | Maturity Date | Principal Amount | Value | |||||||||
| RESIDENTIAL MORTGAGE-BACKED SECURITIES — NON-AGENCY (Continued) | ||||||||||||
DSLA Mortgage Loan Trust (05-AR1-2A1A) |
| |||||||||||
3.98% (1 mo. USD LIBOR + 0.500%) (2) | 02/19/45 | $ | 91,142 | $ | 86,450 | |||||||
Encore Credit Receivables Trust (05-3-M4) |
| |||||||||||
4.49% (1 mo. USD LIBOR + 0.900%) (2) | 10/25/35 | 20,671 | 19,883 | |||||||||
First Franklin Mortgage Loan Asset-Backed Certificates (04-FF5-A3C) |
| |||||||||||
4.59% (1 mo. USD LIBOR + 1.000%) (2) | 08/25/34 | 4,763 | 4,516 | |||||||||
GSAMP Trust |
| |||||||||||
4.17% (1mo. USD LIBOR + 0.58%) (2) | 02/25/36 | 10,138 | 10,129 | |||||||||
GSAMP Trust (06-HE3-A2C) |
| |||||||||||
3.91% (1 mo. USD LIBOR + 0.320%) (2) | 05/25/46 | 3,813 | 3,809 | |||||||||
Impac CMB Trust (04-6-1A1) |
| |||||||||||
4.39% (1 mo. USD LIBOR + 0.800%) (2) | 10/25/34 | 60,420 | 57,543 | |||||||||
Impac CMB Trust (05-5-A1) |
| |||||||||||
4.23% (1 mo. USD LIBOR + 0.320%) (2) | 08/25/35 | 134,585 | 122,666 | |||||||||
JPMorgan Alternative Loan Trust (07-S1-A1) |
| |||||||||||
4.15% (1 mo. USD LIBOR + 0.560%) (2) | 04/25/47 | 67,691 | 61,553 | |||||||||
JPMorgan Mortgage Acquisition Trust (06-ACC1-M1) |
| |||||||||||
3.99% (1 mo. USD LIBOR + 0.405%) (2) | 05/25/36 | 39,406 | 39,379 | |||||||||
JPMorgan Mortgage Trust (05-A5-TA1) |
| |||||||||||
3.28% (3) | 08/25/35 | 521 | 480 | |||||||||
JPMorgan Mortgage Trust (05-A6-7A1) |
| |||||||||||
3.96% (3),(5) | 08/25/35 | 6,451 | 5,353 | |||||||||
MASTR Adjustable Rate Mortgages Trust |
| |||||||||||
3.91% (1mo. USD LIBOR + 0.32%) (2) | 01/25/47 | 106,770 | 102,981 | |||||||||
MASTR Adjustable Rate Mortgages Trust (04-13-3A1) |
| |||||||||||
3.88% (3) | 11/21/34 | 11,726 | 10,895 | |||||||||
MASTR Seasoned Securitization Trust (05-1-4A1) |
| |||||||||||
4.32% (3) | 10/25/32 | 9,472 | 8,895 | |||||||||
Morgan Stanley ABS Capital I, Inc. (05-HE1-M1) |
| |||||||||||
4.26% (1 mo. USD LIBOR + 0.675%) (2) | 12/25/34 | 34,970 | 33,698 | |||||||||
Morgan Stanley Mortgage Loan Trust (07-6XS-1A2S) |
| |||||||||||
6.00% | 02/25/47 | 103 | 102 | |||||||||
MortgageIT Trust (05-3-A1) |
| |||||||||||
4.19% (1 mo. USD LIBOR + 0.600%) (2) | 08/25/35 | 2,991 | 2,798 | |||||||||
MortgageIT Trust (05-3-A2) |
| |||||||||||
4.29% (1 mo. USD LIBOR + 0.700%) (2) | 08/25/35 | 14,957 | 13,985 | |||||||||
See accompanying Notes to Financial Statements.
37
Table of Contents
TCW Enhanced Commodity Strategy Fund
Consolidated Schedule of Investments (Continued)
| Issues | Maturity Date | Principal Amount | Value | |||||||||
| RESIDENTIAL MORTGAGE-BACKED SECURITIES — NON-AGENCY (Continued) | ||||||||||||
MortgageIT Trust (05-5-A1) |
| |||||||||||
4.11% (1 mo. USD LIBOR + 0.520%) (2) | 12/25/35 | $ | 13,887 | $ | 13,116 | |||||||
Nationstar Home Equity Loan Trust (07-A-M1) |
| |||||||||||
3.86% (1 mo. USD LIBOR + 0.270%) (2) | 03/25/37 | 415,000 | 397,743 | |||||||||
Nationstar Home Equity Loan Trust (07-B-2AV4) |
| |||||||||||
3.91% (1 mo. USD LIBOR + 0.320%) (2) | 04/25/37 | 56,126 | 54,772 | |||||||||
Nationstar Home Equity Loan Trust (07-C-1AV1) |
| |||||||||||
3.76% (1 mo. USD LIBOR + 0.175%) (2) | 06/25/37 | 43,749 | 42,464 | |||||||||
Nomura Home Equity Loan, Inc. Home Equity Loan Trust (06-HE1-M1) |
| |||||||||||
4.20% (1 mo. USD LIBOR + 0.615%) (2) | 02/25/36 | 31,736 | 31,697 | |||||||||
Ownit Mortgage Loan Asset-Backed Certificates (06-3-A2D) | ||||||||||||
4.13% (1 mo. USD LIBOR + 0.540%) (2) | 03/25/37 | 150,159 | 143,897 | |||||||||
Park Place Securities, Inc. (05-WHQ2-M3) |
| |||||||||||
4.31% (1 mo. USD LIBOR + 0.720%) (2) | 05/25/35 | 51,972 | 50,139 | |||||||||
Park Place Securities, Inc. (05-WHQ3-M4) |
| |||||||||||
4.53% (1 mo. USD LIBOR + 0.945%) (2) | 06/25/35 | 63,901 | 63,463 | |||||||||
RASC Trust (05-AHL2-M1) |
| |||||||||||
4.22% (1 mo. USD LIBOR + 0.630%) (2) | 10/25/35 | 21,701 | 21,597 | |||||||||
Securitized Asset Backed Receivables LLC Trust (06-CB5-A3) | ||||||||||||
3.87% (1 mo. USD LIBOR + 0.280%) (2) | 06/25/36 | 70,301 | 45,364 | |||||||||
Structured Adjustable Rate Mortgage Loan Trust (05-17-3A1) |
| |||||||||||
3.61% (3) | 08/25/35 | 11,585 | 9,920 | |||||||||
Structured Asset Investment Loan Trust (05-HE2-M2) |
| |||||||||||
4.34% (1 mo. USD LIBOR + 0.750%) (2) | 07/25/35 | 127,220 | 118,623 | |||||||||
Structured Asset Securities Corp. (07-BC1-A4) |
| |||||||||||
3.72% (1 mo. USD LIBOR + 0.130%) (2) | 02/25/37 | 54,654 | 54,341 | |||||||||
Towd Point Mortgage Trust (17-1-A1) |
| |||||||||||
2.75% (1),(3) | 10/25/56 | 20,804 | 20,424 | |||||||||
WaMu Mortgage Pass-Through Certificates (05-AR13-A1A1) |
| |||||||||||
4.17% (1 mo. USD LIBOR + 0.580%) (2) | 10/25/45 | 47,463 | 44,014 | |||||||||
WaMu Mortgage Pass-Through Certificates (05-AR2-2A1B) |
| |||||||||||
4.33% (1 mo. USD LIBOR + 0.740%) (2) | 01/25/45 | 64,433 | 61,992 | |||||||||
| Issues | Maturity Date | Principal Amount | Value | |||||||||
| RESIDENTIAL MORTGAGE-BACKED SECURITIES — NON-AGENCY (Continued) | ||||||||||||
WaMu Mortgage Pass-Through Certificates (05-AR8-2A1A) |
| |||||||||||
4.17% (1 mo. USD LIBOR + 0.580%) (2),(5) | 07/25/45 | $ | 207,305 | $ | 187,262 | |||||||
WaMu Mortgage Pass-Through Certificates (06-AR1-2A1A) |
| |||||||||||
2.44% (12 mo. Monthly Treasury Average Index + 1.070%) (2) | 01/25/46 | 50,529 | 45,247 | |||||||||
Wells Fargo Home Equity Asset-Backed Securities Trust (07-2-A3) |
| |||||||||||
3.82% (1 mo. USD LIBOR + 0.230%) (2) | 04/25/37 | 42,249 | 40,711 | |||||||||
|
| |||||||||||
Total Residential Mortgage-Backed Securities — Non-Agency |
| |||||||||||
(Cost: $3,671,361) |
| 3,550,310 | ||||||||||
|
| |||||||||||
CORPORATE BONDS — 34.7% |
| |||||||||||
| Aerospace & Defense — 0.3% | ||||||||||||
BAE Systems Holdings, Inc. |
| |||||||||||
3.85% (1) | 12/15/25 | 85,000 | 80,586 | |||||||||
Boeing Co. (The) |
| |||||||||||
1.43% | 02/04/24 | 45,000 | 42,699 | |||||||||
|
| |||||||||||
| 123,285 | ||||||||||||
|
| |||||||||||
| Agriculture — 0.8% | ||||||||||||
BAT Capital Corp. |
| |||||||||||
3.56% | 08/15/27 | 220,000 | 192,777 | |||||||||
Imperial Brands Finance PLC |
| |||||||||||
3.13% (1) | 07/26/24 | 120,000 | 113,693 | |||||||||
|
| |||||||||||
| 306,470 | ||||||||||||
|
| |||||||||||
| Airlines — 0.0% | ||||||||||||
US Airways Group, Inc. Pass-Through Certificates (12-1-A) (EETC) |
| |||||||||||
5.90% | 04/01/26 | 4,751 | 4,586 | |||||||||
|
| |||||||||||
| Auto Manufacturers — 0.0% | ||||||||||||
Mercedes-Benz Finance North America LLC |
| |||||||||||
1.75% (1) | 03/10/23 | 15,000 | 14,834 | |||||||||
|
| |||||||||||
| Banks — 13.8% | ||||||||||||
ABN AMRO Bank NV |
| |||||||||||
2.47% (U.S. 1-year Treasury Constant Maturity Rate + 1.100%) (1),(2) | 12/13/29 | 75,000 | 58,354 | |||||||||
Bank of America Corp. |
| |||||||||||
0.98% (SOFR + 0.690%) (2) | 04/22/25 | 180,000 | 166,862 | |||||||||
1.32% (SOFR + 1.150%) (2) | 06/19/26 | 135,000 | 119,143 | |||||||||
1.73% (SOFR + 0.960%) (2) | 07/22/27 | 540,000 | 461,770 | |||||||||
3.00% (3.004% until 12/20/22 then 3 mo. USD LIBOR + 0.790%) (2) | 12/20/23 | 100,000 | 99,643 | |||||||||
See accompanying Notes to Financial Statements.
38
Table of Contents
TCW Enhanced Commodity Strategy Fund
October 31, 2022
| Issues | Maturity Date | Principal Amount | Value | |||||||||
| Banks (Continued) | ||||||||||||
3.37% (3 mo. USD LIBOR + 0.810%) (2) | 01/23/26 | $ | 10,000 | $ | 9,430 | |||||||
4.38% (U.S. 5-year Treasury Constant Maturity Rate + 2.760%) (2),(6) | 12/31/99 | 10,000 | 8,051 | |||||||||
Citigroup, Inc. |
| |||||||||||
3.07% (SOFR + 1.280%) (2) | 02/24/28 | 320,000 | 282,707 | |||||||||
3.11% (SOFR + 2.842%) (2) | 04/08/26 | 50,000 | 46,693 | |||||||||
3.67% (3 mo. USD LIBOR + 1.390%) (2) | 07/24/28 | 110,000 | 98,787 | |||||||||
Credit Suisse Group AG (Switzerland) |
| |||||||||||
1.31% (SOFR + 0.980%) (1),(2) | 02/02/27 | 80,000 | 63,390 | |||||||||
3.09% (SOFR + 1.730%) (1),(2) | 05/14/32 | 260,000 | 178,838 | |||||||||
Discover Bank |
| |||||||||||
4.20% | 08/08/23 | 10,000 | 9,894 | |||||||||
DNB Bank ASA |
| |||||||||||
1.13% (U.S. 1-year Treasury Constant Maturity Rate + 0.850%) (1),(2) | 09/16/26 | 150,000 | 129,843 | |||||||||
Goldman Sachs Group, Inc. (The) |
| |||||||||||
1.43% (SOFR + 0.798%) (2) | 03/09/27 | 5,000 | 4,282 | |||||||||
2.38% (SOFR + 1.248%) (2) | 07/21/32 | 5,000 | 3,727 | |||||||||
2.64% (SOFR + 1.114%) (2) | 02/24/28 | 370,000 | 320,287 | |||||||||
3.27% (3 mo. USD LIBOR + 1.201%) (2) | 09/29/25 | 60,000 | 56,916 | |||||||||
HSBC Holdings PLC (United Kingdom) |
| |||||||||||
0.98% (SOFR + 0.708%) (2) | 05/24/25 | 250,000 | 227,365 | |||||||||
2.21% (SOFR + 1.285%) (2) | 08/17/29 | 75,000 | 56,938 | |||||||||
2.80% (SOFR + 1.187%) (2) | 05/24/32 | 110,000 | 78,943 | |||||||||
ING Groep NV | ||||||||||||
3.87% (SOFR + 1.640%) (2) | 03/28/26 | 100,000 | 94,006 | |||||||||
JPMorgan Chase & Co. |
| |||||||||||
0.56% (SOFR + 0.420%) (2) | 02/16/25 | 65,000 | 60,610 | |||||||||
0.70% (SOFR + 0.580%) (2) | 03/16/24 | 50,000 | 49,017 | |||||||||
1.95% (SOFR + 1.065%) (2) | 02/04/32 | 35,000 | 25,675 | |||||||||
2.55% (SOFR + 1.180%) (2) | 11/08/32 | 25,000 | 18,928 | |||||||||
2.58% (SOFR + 1.250%) (2) | 04/22/32 | 10,000 | 7,706 | |||||||||
2.95% (SOFR + 1.170%) (2) | 02/24/28 | 605,000 | 533,071 | |||||||||
Lloyds Banking Group PLC (United Kingdom) |
| |||||||||||
2.91% (3 mo. USD LIBOR +0.810%) (2) | 11/07/23 | 245,000 | 244,869 | |||||||||
Macquarie Group, Ltd. (Australia) |
| |||||||||||
1.20% (SOFR + 0.694%) (1),(2) | 10/14/25 | 140,000 | 126,858 | |||||||||
1.34% (SOFR + 1.069%) (1),(2) | 01/12/27 | 100,000 | 84,887 | |||||||||
2.87% (SOFR + 1.532%) (1),(2) | 01/14/33 | 5,000 | 3,695 | |||||||||
3.19% (3 mo. USD LIBOR + 1.023%) (1),(2) | 11/28/23 | 20,000 | 19,966 | |||||||||
| Issues | Maturity Date | Principal Amount | Value | |||||||||
| Banks (Continued) | ||||||||||||
Morgan Stanley |
| |||||||||||
0.79% (SOFR + 0.509%) (2) | 01/22/25 | $ | 5,000 | $ | 4,669 | |||||||
1.51% (SOFR + 0.858%) (2) | 07/20/27 | 175,000 | 148,444 | |||||||||
2.48% (SOFR + 1.000%) (2) | 01/21/28 | 525,000 | 454,356 | |||||||||
NatWest Group PLC (United Kingdom) |
| |||||||||||
4.27% (3 mo. USD LIBOR + 1.762%) (2) | 03/22/25 | 135,000 | 130,180 | |||||||||
4.52% (3 mo. USD LIBOR + 1.550%) (2) | 06/25/24 | 75,000 | 73,950 | |||||||||
Santander UK Group Holdings PLC (United Kingdom) |
| |||||||||||
1.53% (U.S. 1-year Treasury Constant Maturity Rate + 1.250%) (2) | 08/21/26 | 130,000 | 110,748 | |||||||||
3.37% (3 mo. USD LIBOR + 1.080%) (2) | 01/05/24 | 105,000 | 104,240 | |||||||||
4.80% (3 mo. USD LIBOR +1.570%) (2) | 11/15/24 | 45,000 | 44,037 | |||||||||
UBS Group AG (Switzerland) |
| |||||||||||
4.70% (U.S. 1-year Treasury Constant Maturity Rate + 2.050%) (1),(2) | 08/05/27 | 150,000 | 139,626 | |||||||||
Wells Fargo & Co. | ||||||||||||
2.19% (SOFR + 2.000%) (2) | 04/30/26 | 100,000 | 91,054 | |||||||||
2.39% (SOFR + 2.100%) (2) | 06/02/28 | 275,000 | 235,109 | |||||||||
3.53% (SOFR + 1.510%) (2) | 03/24/28 | 365,000 | 329,420 | |||||||||
|
| |||||||||||
| 5,616,984 | ||||||||||||
|
| |||||||||||
| Beverages — 0.1% | ||||||||||||
Bacardi, Ltd. | ||||||||||||
4.45% (1) | 05/15/25 | 40,000 | 38,402 | |||||||||
|
| |||||||||||
Chemicals — 0.3% | ||||||||||||
International Flavors & Fragrances, Inc. |
| |||||||||||
1.23% (1) | 10/01/25 | 125,000 | 108,436 | |||||||||
|
| |||||||||||
| Commercial Services — 0.1% | ||||||||||||
Global Payments, Inc. |
| |||||||||||
4.45% | 06/01/28 | 55,000 | 50,082 | |||||||||
|
| |||||||||||
| Diversified Financial Services — 2.1% | ||||||||||||
AerCap Ireland Capital DAC / AerCap Global Aviation Trust (Ireland) |
| |||||||||||
2.45% | 10/29/26 | 155,000 | 131,215 | |||||||||
3.15% | 02/15/24 | 50,000 | 47,956 | |||||||||
Air Lease Corp. |
| |||||||||||
2.88% | 01/15/26 | 30,000 | 26,689 | |||||||||
3.25% | 03/01/25 | 95,000 | 88,725 | |||||||||
American Express Co. |
| |||||||||||
2.55% | 03/04/27 | 100,000 | 87,911 | |||||||||
Avolon Holdings Funding, Ltd. |
| |||||||||||
2.53% (1) | 11/18/27 | 25,000 | 19,102 | |||||||||
Capital One Financial Co. |
| |||||||||||
2.64% (SOFR + 1.290%) (2) | 03/03/26 | 40,000 | 36,702 | |||||||||
See accompanying Notes to Financial Statements.
39
Table of Contents
TCW Enhanced Commodity Strategy Fund
Consolidated Schedule of Investments (Continued)
| Issues | Maturity Date | Principal Amount | Value | |||||||||
| Diversified Financial Services (Continued) | ||||||||||||
Capital One Financial Corp. |
| |||||||||||
3.27% (SOFR + 1.790%) (2) | 03/01/30 | $ | 40,000 | $ | 32,935 | |||||||
Cboe Global Markets, Inc. |
| |||||||||||
3.00% | 03/16/32 | 65,000 | 52,655 | |||||||||
Intercontinental Exchange, Inc. |
| |||||||||||
1.85% | 09/15/32 | 15,000 | 10,905 | |||||||||
ORIX Corp. | ||||||||||||
5.00% | 09/13/27 | 160,000 | 155,086 | |||||||||
Park Aerospace Holdings, Ltd. |
| |||||||||||
4.50% (1) | 03/15/23 | 147,000 | 146,331 | |||||||||
|
| |||||||||||
| 836,212 | ||||||||||||
|
| |||||||||||
| Electric — 3.2% | ||||||||||||
Alliant Energy Finance LLC |
| |||||||||||
1.40% (1) | 03/15/26 | 225,000 | 190,188 | |||||||||
American Electric Power |
| |||||||||||
2.03% | 03/15/24 | 130,000 | 124,141 | |||||||||
Dominion Energy, Inc. |
| |||||||||||
3.30% | 03/15/25 | 125,000 | 119,635 | |||||||||
Duke Energy Corp. |
| |||||||||||
2.55% | 06/15/31 | 5,000 | 3,921 | |||||||||
2.65% | 09/01/26 | 175,000 | 158,383 | |||||||||
Eversource Energy |
| |||||||||||
2.90% | 03/01/27 | 50,000 | 44,903 | |||||||||
Exelon Corp. |
| |||||||||||
3.40% | 04/15/26 | 125,000 | 116,928 | |||||||||
ITC Holdings Corp. |
| |||||||||||
4.95% (1) | 09/22/27 | 100,000 | 97,089 | |||||||||
Jersey Central Power & Light Co. |
| |||||||||||
4.30% (1) | 01/15/26 | 125,000 | 119,373 | |||||||||
4.70% (1) | 04/01/24 | 100,000 | 98,177 | |||||||||
Nextera Energy Capital Co. |
| |||||||||||
2.94% | 03/21/24 | 25,000 | 24,227 | |||||||||
NextEra Energy Capital Holdings, Inc. |
| |||||||||||
1.90% | 06/15/28 | 85,000 | 70,377 | |||||||||
3.25% (3 mo. USD LIBOR + 0.270%)(2) | 02/22/23 | 55,000 | 54,898 | |||||||||
4.20% | 06/20/24 | 100,000 | 98,431 | |||||||||
|
| |||||||||||
| 1,320,671 | ||||||||||||
|
| |||||||||||
| Entertainment — 0.5% | ||||||||||||
WarnerMedia Holdings, Inc. |
| |||||||||||
3.76% (1) | 03/15/27 | 200,000 | 178,092 | |||||||||
4.28% (1) | 03/15/32 | 10,000 | 8,089 | |||||||||
5.05% (1) | 03/15/42 | 45,000 | 32,946 | |||||||||
|
| |||||||||||
| 219,127 | ||||||||||||
|
| |||||||||||
| Food — 0.8% | ||||||||||||
JBS USA LUX SA / JBS USA Food Co. / JBS USA Finance, Inc. |
| |||||||||||
3.00% (1) | 05/15/32 | 95,000 | 70,431 | |||||||||
| Issues | Maturity Date | Principal Amount | Value | |||||||||
| Food (Continued) | ||||||||||||
5.13% (1) | 02/01/28 | $ | 75,000 | $ | 70,305 | |||||||
Kraft Heinz Foods Co. |
| |||||||||||
3.88% | 05/15/27 | — | — | |||||||||
5.00% | 07/15/35 | 85,000 | 78,625 | |||||||||
Smithfield Foods, Inc. |
| |||||||||||
4.25% (1) | 02/01/27 | 95,000 | 86,592 | |||||||||
|
| |||||||||||
| 305,953 | ||||||||||||
|
| |||||||||||
| Gas — 0.4% | ||||||||||||
Southern Co. Gas Capital Corp. |
| |||||||||||
3.25% | 06/15/26 | 175,000 | 161,364 | |||||||||
|
| |||||||||||
| Health Care-Products — 0.3% | ||||||||||||
PerkinElmer, Inc. |
| |||||||||||
0.85% | 09/15/24 | 125,000 | 115,463 | |||||||||
|
| |||||||||||
| Health Care-Services — 1.5% | ||||||||||||
Centene Corp. |
| |||||||||||
3.00% | 10/15/30 | 28,000 | 22,586 | |||||||||
CommonSpirit Health |
| |||||||||||
2.76% | 10/01/24 | 5,000 | 4,752 | |||||||||
Fresenius Medical Care US Finance III, Inc. |
| |||||||||||
1.88% (1) | 12/01/26 | 135,000 | 111,046 | |||||||||
HCA, Inc. | ||||||||||||
3.13% (1) | 03/15/27 | 135,000 | 119,466 | |||||||||
5.00% | 03/15/24 | 10,000 | 9,917 | |||||||||
5.25% | 06/15/26 | 100,000 | 97,031 | |||||||||
5.38% | 09/01/26 | 75,000 | 73,271 | |||||||||
Premier Health Partners |
| |||||||||||
2.91% | 11/15/26 | 125,000 | 108,765 | |||||||||
Universal Health Services, Inc. |
| |||||||||||
1.65% (1) | 09/01/26 | 85,000 | 71,899 | |||||||||
|
| |||||||||||
| 618,733 | ||||||||||||
|
| |||||||||||
| Insurance — 1.7% | ||||||||||||
Athene Global Funding |
| |||||||||||
2.51% (1) | 03/08/24 | 20,000 | 19,080 | |||||||||
3.21% (1) | 03/08/27 | 70,000 | 61,611 | |||||||||
3.49% (SOFR + 0.700%) (1),(2) | 05/24/24 | 95,000 | 93,083 | |||||||||
Equitable Financial Life Global Funding |
| |||||||||||
0.80% (1) | 08/12/24 | 5,000 | 4,610 | |||||||||
Metropolitan Life Global Funding I |
| |||||||||||
3.45% (1) | 12/18/26 | 331,000 | 305,264 | |||||||||
Nationwide Mutual Insurance Co. |
| |||||||||||
5.58% (3 mo. USD LIBOR + 2.290%) (1),(2) | 12/15/24 | 70,000 | 70,016 | |||||||||
Willis North America, Inc. |
| |||||||||||
2.95% | 09/15/29 | 20,000 | 16,202 | |||||||||
3.60% | 05/15/24 | 40,000 | 39,038 | |||||||||
4.65% | 06/15/27 | 95,000 | 89,564 | |||||||||
|
| |||||||||||
| 698,468 | ||||||||||||
|
| |||||||||||
See accompanying Notes to Financial Statements.
40
Table of Contents
TCW Enhanced Commodity Strategy Fund
October 31, 2022
| Issues | Maturity Date | Principal Amount | Value | |||||||||
| Internet — 0.2% | ||||||||||||
Netflix, Inc. |
| |||||||||||
5.88% | 02/15/25 | $ | 95,000 | $ | 95,728 | |||||||
|
| |||||||||||
| Lodging — 0.2% | ||||||||||||
Hyatt Hotels Corp. |
| |||||||||||
1.30% | 10/01/23 | 85,000 | 81,638 | |||||||||
|
| |||||||||||
| Media — 0.6% | ||||||||||||
Charter Communications Operating LLC / Charter Communications Operating Capital |
| |||||||||||
4.91% | 07/23/25 | 50,000 | 48,569 | |||||||||
6.09% (3 mo. USD LIBOR + 1.650%) (2) | 02/01/24 | 94,000 | 94,634 | |||||||||
Cox Communications, Inc. |
| |||||||||||
3.15% (1) | 08/15/24 | 100,000 | 95,732 | |||||||||
|
| |||||||||||
| 238,935 | ||||||||||||
|
| |||||||||||
| Miscellaneous Manufacturers — 0.0% | ||||||||||||
General Electric Co. |
| |||||||||||
3.39% (3 mo. USD LIBOR + 0.480%) (2) | 08/15/36 | 10,000 | 8,051 | |||||||||
|
| |||||||||||
| Packaging & Containers — 0.8% | ||||||||||||
Amcor Flexibles North America, Inc. |
| |||||||||||
4.00% | 05/17/25 | 210,000 | 202,263 | |||||||||
Berry Global, Inc. |
| |||||||||||
4.88% (1) | 07/15/26 | 130,000 | 122,435 | |||||||||
|
| |||||||||||
| 324,698 | ||||||||||||
|
| |||||||||||
| Pharmaceuticals — 1.3% | ||||||||||||
AbbVie, Inc. |
| |||||||||||
3.80% | 03/15/25 | 105,000 | 101,453 | |||||||||
Bayer US Finance II LLC |
| |||||||||||
2.85% (1) | 04/15/25 | 50,000 | 46,530 | |||||||||
3.88% (1) | 12/15/23 | 3,000 | 2,943 | |||||||||
4.25% (1) | 12/15/25 | 75,000 | 71,761 | |||||||||
4.38% (1) | 12/15/28 | 145,000 | 132,122 | |||||||||
Cigna Corp. |
| |||||||||||
4.13% | 11/15/25 | 80,000 | 77,390 | |||||||||
CVS Health Corp. |
| |||||||||||
2.88% | 06/01/26 | 100,000 | 92,056 | |||||||||
|
| |||||||||||
| 524,255 | ||||||||||||
|
| |||||||||||
| Pipelines — 0.9% | ||||||||||||
Energy Transfer LP |
| |||||||||||
4.05% | 03/15/25 | 50,000 | 47,890 | |||||||||
4.95% | 06/15/28 | 170,000 | 158,504 | |||||||||
Plains All American Pipeline LP / PAA Finance Corp. |
| |||||||||||
4.50% | 12/15/26 | 102,000 | 95,842 | |||||||||
4.65% | 10/15/25 | 50,000 | 48,182 | |||||||||
|
| |||||||||||
| 350,418 | ||||||||||||
|
| |||||||||||
| Issues | Maturity Date | Principal Amount | Value | |||||||||
| REIT — 1.2% | ||||||||||||
American Assets Trust LP |
| |||||||||||
3.38% | 02/01/31 | $ | 10,000 | $ | 7,802 | |||||||
Camden Property Trust |
| |||||||||||
2.95% | 12/15/22 | 5,000 | 4,992 | |||||||||
CubeSmart LP |
| |||||||||||
2.25% | 12/15/28 | 10,000 | 8,026 | |||||||||
GLP Capital LP / GLP Financing II, Inc. |
| |||||||||||
3.25% | 01/15/32 | 26,000 | 19,446 | |||||||||
5.25% | 06/01/25 | 65,000 | 63,294 | |||||||||
5.38% | 11/01/23 | 60,000 | 59,347 | |||||||||
Hudson Pacific Properties LP |
| |||||||||||
3.95% | 11/01/27 | 30,000 | 25,390 | |||||||||
5.95% | 02/15/28 | 25,000 | 23,480 | |||||||||
Piedmont Operating Partnership LP |
| |||||||||||
3.40% | 06/01/23 | 75,000 | 73,961 | |||||||||
Ventas Realty LP |
| |||||||||||
2.65% | 01/15/25 | 5,000 | 4,678 | |||||||||
VICI Properties LP / VICI Note Co., Inc. |
| |||||||||||
5.75% (1) | 02/01/27 | 150,000 | 141,816 | |||||||||
Weyerhaeuser Co. |
| |||||||||||
3.38% | 03/09/33 | 90,000 | 71,943 | |||||||||
|
| |||||||||||
| 504,175 | ||||||||||||
|
| |||||||||||
| Retail — 0.3% | ||||||||||||
Alimentation Couche-Tard, Inc. |
| |||||||||||
3.55% (1) | 07/26/27 | 55,000 | 49,178 | |||||||||
Dollar Tree, Inc. |
| |||||||||||
4.00% | 05/15/25 | 80,000 | 77,638 | |||||||||
|
| |||||||||||
| 126,816 | ||||||||||||
|
| |||||||||||
| Savings & Loans — 0.6% | ||||||||||||
Nationwide Building Society (United Kingdom) |
| |||||||||||
3.77% (3 mo. USD LIBOR + 1.064%) (1),(2) | 03/08/24 | 215,000 | 212,776 | |||||||||
4.36% (3 mo. USD LIBOR + 1.392%) (1),(2) | 08/01/24 | 5,000 | 4,913 | |||||||||
TIAA FSB Holdings, Inc. |
| |||||||||||
5.75% | 07/02/25 | 10,000 | 9,807 | |||||||||
|
| |||||||||||
| 227,496 | ||||||||||||
|
| |||||||||||
| Software — 0.6% | ||||||||||||
Fidelity National Information Services, Inc. |
| |||||||||||
4.50% | 07/15/25 | 100,000 | 97,358 | |||||||||
Oracle Corp. |
| |||||||||||
2.80% | 04/01/27 | 170,000 | 150,370 | |||||||||
|
| |||||||||||
| 247,728 | ||||||||||||
|
| |||||||||||
| Telecommunications — 2.0% | ||||||||||||
AT&T, Inc. |
| |||||||||||
4.42% (3 mo. USD LIBOR + 1.180%) (2) | 06/12/24 | 210,000 | 210,658 | |||||||||
See accompanying Notes to Financial Statements.
41
Table of Contents
TCW Enhanced Commodity Strategy Fund
Consolidated Schedule of Investments (Continued)
| Issues | Maturity Date | Principal Amount | Value | |||||||||
| Telecommunications (Continued) | ||||||||||||
Level 3 Financing, Inc. |
| |||||||||||
3.40% (1) | 03/01/27 | $ | 100,000 | $ | 86,310 | |||||||
3.88% (1) | 11/15/29 | 45,000 | 37,082 | |||||||||
Sprint Spectrum Co. LLC / Sprint Spectrum Co. II LLC / Sprint Spectrum Co. III LLC |
| |||||||||||
4.74% (1) | 03/20/25 | 125,000 | 123,274 | |||||||||
5.15% (1) | 09/20/29 | 65,000 | 63,282 | |||||||||
T-Mobile USA, Inc. |
| |||||||||||
3.75% | 04/15/27 | 250,000 | 230,865 | |||||||||
Verizon Communications, Inc. |
| |||||||||||
1.45% | 03/20/26 | 50,000 | 44,061 | |||||||||
|
| |||||||||||
| 795,532 | ||||||||||||
|
| |||||||||||
| Transportation — 0.1% | ||||||||||||
Canadian Pacific Railway Co. |
| |||||||||||
1.35% | 12/02/24 | 35,000 | 32,322 | |||||||||
|
| |||||||||||
Total Corporate Bonds |
| |||||||||||
(Cost: $15,110,131) |
| 14,096,862 | ||||||||||
|
| |||||||||||
MUNICIPAL BONDS — 0.1% |
| |||||||||||
City of Baltimore MD, General Obligation Unlimited |
| |||||||||||
5.00% | 10/15/25 | 5,000 | 5,013 | |||||||||
Los Angeles Unified School District |
| |||||||||||
5.75% | 07/01/34 | 15,000 | 15,245 | |||||||||
Massachusetts School Building Authority |
| |||||||||||
2.50% | 02/15/37 | 20,000 | 13,940 | |||||||||
New York State Urban Development Corp, Revenue Bond |
| |||||||||||
2.54% | 03/15/34 | 15,000 | 11,219 | |||||||||
| Issues | Maturity Date | Principal Amount | Value | |||||||||
| MUNICIPAL BONDS (Continued) | ||||||||||||
Regents of the University of California Medical Center Pooled Revenue |
| |||||||||||
3.26% | 05/15/60 | $ | 5,000 | $ | 3,026 | |||||||
|
| |||||||||||
Total Municipal Bonds |
| |||||||||||
(Cost: $63,282) | 48,443 | |||||||||||
|
| |||||||||||
Total Fixed Income Securities |
| |||||||||||
(Cost: $31,775,776) |
| 30,304,995 | ||||||||||
|
| |||||||||||
| Shares | ||||||||||||
| MONEY MARKET INVESTMENTS — 9.5% | ||||||||||||
(Cost: $3,848,776) | ||||||||||||
State Street Institutional U.S. Government Money Market Fund — Premier Class | ||||||||||||
3.01% (7) | 3,848,776 | 3,848,776 | ||||||||||
|
| |||||||||||
| Principal Amount | ||||||||||||
SHORT TERM INVESTMENTS — 4.6% |
| |||||||||||
| U.S. TREASURY SECURITIES — 4.6% | ||||||||||||
(Cost: $1,890,395) | ||||||||||||
U.S. Treasury Bill | ||||||||||||
2.81% (8) | 01/05/23 | $ | 1,900,000 | 1,887,015 | ||||||||
|
| |||||||||||
Total Investments (88.6%) |
| |||||||||||
(Cost: $37,514,947) | 36,040,786 | |||||||||||
Excess Of Other Assets Over Liabilities (11.4%) |
| 4,650,938 | ||||||||||
|
| |||||||||||
Net Assets (100.0%) | $ | 40,691,724 | ||||||||||
|
| |||||||||||
| Total Return Swaps (9) | ||||||||||||||||||||||||||||
| Notional Amount | Expiration Date | Counterparty | Payment Made by Fund | Payment Received by Fund | Payment Frequency | Unrealized Appreciation (Depreciation) | Premium Paid | Value | ||||||||||||||||||||
OTC Swaps | ||||||||||||||||||||||||||||
| $34,719,403 | 11/18/22 | Credit Suisse International | 3-Month U.S. Treasury Bills plus 0.2% | Credit Suisse Custom 24 Total Return Index (10) | Monthly | $ 691,201 | $ — | $ 691,201 | ||||||||||||||||||||
| 6,177,488 | 11/18/22 | Credit Suisse International | 3-Month U.S. Treasury Bills plus 0.2% | Credit Suisse Custom 66 Total Return Index (10) | Monthly | 50,906 | — | 50,906 | ||||||||||||||||||||
| 85,000 | 11/18/22 | Credit Suisse International | Credit Suisse Custom 24 Total Return Index (10) | 3-Month U.S. Treasury Bills plus 0.2% | Monthly | (1,377) | — | (1,377 | ) | |||||||||||||||||||
| 264,000 | 11/18/22 | Credit Suisse International | Credit Suisse Custom 24 Total Return Index (10) | 3-Month U.S. Treasury Bills plus 0.2% | Monthly | (1,325) | — | (1,325 | ) | |||||||||||||||||||
| 100,000 | 11/18/22 | Credit Suisse International | Credit Suisse Custom 66 Total Return Index (10) | 3-Month U.S. Treasury Bills plus 0.2% | Monthly | (55) | — | (55 | ) | |||||||||||||||||||
| 120,000 | 11/18/22 | Credit Suisse International | Credit Suisse Custom 24 Total Return Index (10) | 3-Month U.S. Treasury Bills plus 0.2% | Monthly | (123) | — | (123 | ) | |||||||||||||||||||
| 52,000 | 11/18/22 | Credit Suisse International | Credit Suisse Custom 24 Total Return Index (10) | 3-Month U.S. Treasury Bills plus 0.2% | Monthly | (749) | — | (749 | ) | |||||||||||||||||||
| 85,000 | 11/18/22 | Credit Suisse International | Credit Suisse Custom 24 Total Return Index (10) | 3-Month U.S. Treasury Bills plus 0.2% | Monthly | — | — | — | ||||||||||||||||||||
|
|
|
|
|
| |||||||||||||||||||||||
| $ | 738,478 | $ | — | $ | 738,478 | |||||||||||||||||||||||
|
|
|
|
|
| |||||||||||||||||||||||
See accompanying Notes to Financial Statements.
42
Table of Contents
TCW Enhanced Commodity Strategy Fund
October 31, 2022
Notes to the Schedule of Investments:
| ABS | Asset-Backed Securities. |
| CLO | Collateralized Loan Obligation. |
| EETC | Enhanced Equipment Trust Certificate. |
| I/O | Interest Only Security. |
| PAC | Planned Amortization Class. |
| REIT | Real Estate Investment Trust. |
| SOFR | Secured Overnight Financing Rate. |
| (1) | Security exempt from registration under Rule 144A of the Securities Act of 1933, as amended. These securities may be resold, normally only to qualified institutional buyers. At October 31, 2022, the value of these securities amounted to $10,493,690 or 25.8% of net assets. These securities are determined to be liquid by the Fund’s investment advisor, unless otherwise noted, under procedures established by and under the general supervision of the Company’s Board of Directors. |
| (2) | Floating or variable rate security. The interest shown reflects the rate in effect at October 31, 2022. |
| (3) | Variable rate security. Interest rate disclosed is as of the most recent information available. Certain variable rate securities are not based on a published reference rate and spread but are determined by the issuer or agent and are based on current market conditions. These securities do not indicate a reference rate and spread in their description above. |
| (4) | Restricted security (Note 11). |
| (5) | A portion of the principal balance has been written-off during the period due to defaults in the underlying loans. Cost basis has been adjusted. |
| (6) | Perpetual maturity. |
| (7) | Rate disclosed is the 7-day net yield as of October 31, 2022. |
| (8) | Rate shown represents yield-to-maturity. |
| (9) | All or a portion of this security is owned by TCW Cayman Enhanced Commodity Fund, Ltd. |
| (10) | Custom Index has exposure to the following commodities as shown on the next page. |
See accompanying Notes to Financial Statements.
43
Table of Contents
TCW Enhanced Commodity Strategy Fund
Consolidated Schedule of Investments
Components of Total Return Swap | October 31, 2022 |
| Description (1) | Notional Amount | Weight % | Unrealized Appreciation (Depreciation) | |||||||||
Natural Gas | $ | 4,635,040 | 13.35 | % | $ | 610,112 | ||||||
Gold | 4,492,690 | 12.94 | % | (42,787 | ) | |||||||
WTI Crude Oil | 2,815,743 | 8.11 | % | 48,754 | ||||||||
Brent Crude Oil | 2,461,606 | 7.09 | % | 38,678 | ||||||||
Corn | 2,090,108 | 6.02 | % | 19,852 | ||||||||
Soybeans | 1,916,511 | 5.52 | % | 20,636 | ||||||||
Copper High Grade | 1,347,113 | 3.88 | % | (41,254 | ) | |||||||
Silver | 1,336,697 | 3.85 | % | 3,770 | ||||||||
Live Cattle | 1,315,865 | 3.79 | % | 1,726 | ||||||||
Soybean Oil | 1,232,539 | 3.55 | % | 29,138 | ||||||||
Gasoil | 1,204,763 | 3.47 | % | 36,657 | ||||||||
Soybean Meal | 1,163,100 | 3.35 | % | 24,851 | ||||||||
SRW Wheat | 1,111,021 | 3.20 | % | 36,883 | ||||||||
Aluminium Primary | 1,045,054 | 3.01 | % | 6,843 | ||||||||
Heating Oil | 951,312 | 2.74 | % | 17,645 | ||||||||
Nickel Primary | �� | 937,424 | 2.70 | % | (6,936 | ) | ||||||
Sugar #11 | 892,289 | 2.57 | % | (20,786 | ) | |||||||
Zinc High Grade | 767,299 | 2.21 | % | (66,290 | ) | |||||||
RBOB Gasoline | 749,939 | 2.16 | % | 15,398 | ||||||||
HRW Wheat | 683,972 | 1.97 | % | 19,187 | ||||||||
Coffee ‘C’ Arabica | 663,141 | 1.91 | % | (49,724 | ) | |||||||
Lean Hogs | 604,118 | 1.74 | % | (19,801 | ) | |||||||
Cotton | 302,059 | 0.87 | % | (30,131 | ) | |||||||
United States Treasury Bill | — | — | 38,780 | |||||||||
|
|
|
|
|
| |||||||
| $ | 34,719,403 | 100.00 | % | $ | 691,201 | |||||||
|
|
|
|
|
| |||||||
| (1) | Commodity Exposures of the Credit Suisse Custom 24 Total Return Index. |
See accompanying Notes to Financial Statements.
44
Table of Contents
TCW Enhanced Commodity Strategy Fund
Consolidated Schedule of Investments
Components of Total Return Swap | October 31, 2022 |
| Description (1) | Notional Amount | Weight % | Unrealized Appreciation (Depreciation) | |||||||||
Gold | $ | 855,582 | 13.85 | % | $ | (7,672 | ) | |||||
Natural Gas | 629,486 | 10.19 | % | 39,782 | ||||||||
WTI Crude Oil | 499,141 | 8.08 | % | 9,130 | ||||||||
Brent Crude Oil | 442,926 | 7.17 | % | 8,076 | ||||||||
Corn | 388,564 | 6.29 | % | 3,262 | ||||||||
Soybeans | 361,383 | 5.85 | % | 3,725 | ||||||||
Silver | 253,895 | 4.11 | % | 1,107 | ||||||||
Copper High Grade | 252,042 | 4.08 | % | (7,486 | ) | |||||||
Live Cattle | 244,011 | 3.95 | % | 691 | ||||||||
Soybean Oil | 219,301 | 3.55 | % | 5,960 | ||||||||
Soybean Meal | 212,506 | 3.44 | % | 3,883 | ||||||||
SRW Wheat | 208,181 | 3.37 | % | 6,234 | ||||||||
Gasoil | 200,768 | 3.25 | % | 2,810 | ||||||||
Aluminium Primary | 197,680 | 3.20 | % | 1,155 | ||||||||
Nickel Primary | 176,058 | 2.85 | % | (1,299 | ) | |||||||
Sugar #11 | 156,908 | 2.54 | % | (5,526 | ) | |||||||
Heating Oil | 155,055 | 2.51 | % | 474 | ||||||||
RBOB Gasoline | 148,260 | 2.40 | % | 2,803 | ||||||||
Zinc High Grade | 142,082 | 2.30 | % | (11,725 | ) | |||||||
HRW Wheat | 126,638 | 2.05 | % | 3,319 | ||||||||
Lean Hogs | 126,638 | 2.05 | % | (1,048 | ) | |||||||
Coffee ‘C’ Arabica | 123,550 | 2.00 | % | (8,068 | ) | |||||||
Cotton | 56,833 | 0.92 | % | (5,522 | ) | |||||||
United States Treasury Bill | — | — | 6,841 | |||||||||
|
|
|
|
|
| |||||||
| $ | 6,177,488 | 100.00 | % | $ | 50,906 | |||||||
|
|
|
|
|
| |||||||
| (1) | Commodity Exposures of the Credit Suisse Custom 66 Total Return Index. |
See accompanying Notes to Financial Statements.
45
Table of Contents
TCW Enhanced Commodity Strategy Fund
Consolidated Schedule of Investments
Components of Total Return Swap | October 31, 2022 |
| Description (1) | Notional Amount | Weight % | Unrealized Appreciation (Depreciation) | |||||||||
Natural Gas | $ | 11,347 | 13.35 | % | $ | (1,000 | ) | |||||
Gold | 10,998 | 12.94 | % | 90 | ||||||||
WTI Crude Oil | 6,893 | 8.11 | % | (149 | ) | |||||||
Brent Crude Oil | 6,026 | 7.09 | % | (100 | ) | |||||||
Corn | 5,116 | 6.02 | % | (69 | ) | |||||||
Soybeans | 4,691 | 5.52 | % | (128 | ) | |||||||
Copper High Grade | 3,297 | 3.88 | % | 58 | ||||||||
Silver | 3,273 | 3.85 | % | 12 | ||||||||
Live Cattle | 3,222 | 3.79 | % | 30 | ||||||||
Soybean Oil | 3,018 | 3.55 | % | (63 | ) | |||||||
Gasoil | 2,950 | 3.47 | % | (14 | ) | |||||||
Soybean Meal | 2,848 | 3.35 | % | (115 | ) | |||||||
SRW Wheat | 2,720 | 3.20 | % | (126 | ) | |||||||
Aluminium Primary | 2,559 | 3.01 | % | (54 | ) | |||||||
Heating Oil | 2,329 | 2.74 | % | (37 | ) | |||||||
Nickel Primary | 2,295 | 2.70 | % | 48 | ||||||||
Sugar #11 | 2,185 | 2.57 | % | 20 | ||||||||
Zinc High Grade | 1,879 | 2.21 | % | 185 | ||||||||
RBOB Gasoline | 1,836 | 2.16 | % | (25 | ) | |||||||
HRW Wheat | 1,675 | 1.97 | % | (64 | ) | |||||||
Coffee ‘C’ Arabica | 1,624 | 1.91 | % | 116 | ||||||||
Lean Hogs | 1,479 | 1.74 | % | 33 | ||||||||
Cotton | 740 | 0.87 | % | 42 | ||||||||
United States Treasury Bill | — | — | (67 | ) | ||||||||
|
|
|
|
|
| |||||||
| $ | 85,000 | 100.00 | % | $ | (1,377 | ) | ||||||
|
|
|
|
|
| |||||||
| (1) | Commodity Exposures of the Credit Suisse Custom 24 Total Return Index. |
See accompanying Notes to Financial Statements.
46
Table of Contents
TCW Enhanced Commodity Strategy Fund
Consolidated Schedule of Investments
Components of Total Return Swap | October 31, 2022 |
| Description (1) | Notional Amount | Weight % | Unrealized Appreciation (Depreciation) | |||||||||
Natural Gas | $ | 35,243 | 13.35 | % | $ | (965 | ) | |||||
Gold | 34,162 | 12.94 | % | 359 | ||||||||
WTI Crude Oil | 21,410 | 8.11 | % | (275 | ) | |||||||
Brent Crude Oil | 18,718 | 7.09 | % | (172 | ) | |||||||
Corn | 15,893 | 6.02 | % | (106 | ) | |||||||
Soybeans | 14,573 | 5.52 | % | (281 | ) | |||||||
Copper High Grade | 10,243 | 3.88 | % | 77 | ||||||||
Silver | 10,164 | 3.85 | % | 125 | ||||||||
Live Cattle | 10,006 | 3.79 | % | 57 | ||||||||
Soybean Oil | 9,372 | 3.55 | % | (152 | ) | |||||||
Gasoil | 9,161 | 3.47 | % | (93 | ) | |||||||
Soybean Meal | 8,844 | 3.35 | % | (246 | ) | |||||||
SRW Wheat | 8,448 | 3.20 | % | (426 | ) | |||||||
Aluminium Primary | 7,946 | 3.01 | % | (24 | ) | |||||||
Heating Oil | 7,234 | 2.74 | % | (87 | ) | |||||||
Nickel Primary | 7,128 | 2.70 | % | 170 | ||||||||
Sugar #11 | 6,785 | 2.57 | % | 53 | ||||||||
Zinc High Grade | 5,834 | 2.21 | % | 454 | ||||||||
RBOB Gasoline | 5,702 | 2.16 | % | 19 | ||||||||
HRW Wheat | 5,201 | 1.97 | % | (215 | ) | |||||||
Coffee ‘C’ Arabica | 5,042 | 1.91 | % | 253 | ||||||||
Lean Hogs | 4,594 | 1.74 | % | 120 | ||||||||
Cotton | 2,297 | 0.87 | % | 205 | ||||||||
United States Treasury Bill | — | — | (175 | ) | ||||||||
|
|
|
|
|
| |||||||
| $ | 264,000 | 100.00 | % | $ | (1,325 | ) | ||||||
|
|
|
|
|
| |||||||
| (1) | Commodity Exposures of the Credit Suisse Custom 24 Total Return Index. |
See accompanying Notes to Financial Statements.
47
Table of Contents
TCW Enhanced Commodity Strategy Fund
Consolidated Schedule of Investments
Components of Total Return Swap | October 31, 2022 |
| Description (1) | Notional Amount | Weight % | Unrealized Appreciation (Depreciation) | |||||||||
Gold | $ | 13,850 | 13.85 | % | $ | 140 | ||||||
Natural Gas | 10,190 | 10.19 | % | (70 | ) | |||||||
WTI Crude Oil | 8,080 | 8.08 | % | (63 | ) | |||||||
Brent Crude Oil | 7,170 | 7.17 | % | (43 | ) | |||||||
Corn | 6,290 | 6.29 | % | (37 | ) | |||||||
Soybeans | 5,850 | 5.85 | % | (109 | ) | |||||||
Silver | 4,110 | 4.11 | % | 47 | ||||||||
Copper High Grade | 4,080 | 4.08 | % | 33 | ||||||||
Live Cattle | 3,950 | 3.95 | % | 18 | ||||||||
Soybean Oil | 3,550 | 3.55 | % | (67 | ) | |||||||
Soybean Meal | 3,440 | 3.44 | % | (88 | ) | |||||||
SRW Wheat | 3,370 | 3.37 | % | (156 | ) | |||||||
Gasoil | 3,250 | 3.25 | % | 8 | ||||||||
Aluminium Primary | 3,200 | 3.20 | % | (9 | ) | |||||||
Nickel Primary | 2,850 | 2.85 | % | 69 | ||||||||
Sugar #11 | 2,540 | 2.54 | % | 44 | ||||||||
Heating Oil | 2,510 | 2.51 | % | 17 | ||||||||
RBOB Gasoline | 2,400 | 2.40 | % | (7 | ) | |||||||
Zinc High Grade | 2,300 | 2.30 | % | 173 | ||||||||
HRW Wheat | 2,050 | 2.05 | % | (80 | ) | |||||||
Lean Hogs | 2,050 | 2.05 | % | 20 | ||||||||
Coffee ‘C’ Arabica | 2,000 | 2.00 | % | 93 | ||||||||
Cotton | 920 | 0.92 | % | 81 | ||||||||
United States Treasury Bill | — | — | (69 | ) | ||||||||
|
|
|
|
|
| |||||||
| $ | 100,000 | 100.00 | % | $ | (55 | ) | ||||||
|
|
|
|
|
| |||||||
| (1) | Commodity Exposures of the Credit Suisse Custom 66 Total Return Index. |
See accompanying Notes to Financial Statements.
48
Table of Contents
TCW Enhanced Commodity Strategy Fund
Consolidated Schedule of Investments
Components of Total Return Swap | October 31, 2022 |
| Description (1) | Notional Amount | Weight % | Unrealized Appreciation (Depreciation) | |||||||||
Natural Gas | $ | 16,020 | 13.35 | % | $ | (1,143 | ) | |||||
Gold | 15,528 | 12.94 | % | 236 | ||||||||
WTI Crude Oil | 9,732 | 8.11 | % | 277 | ||||||||
Brent Crude Oil | 8,508 | 7.09 | % | 209 | ||||||||
Corn | 7,224 | 6.02 | % | (93 | ) | |||||||
Soybeans | 6,624 | 5.52 | % | (122 | ) | |||||||
Copper High Grade | 4,656 | 3.88 | % | 201 | ||||||||
Silver | 4,620 | 3.85 | % | 92 | ||||||||
Live Cattle | 4,548 | 3.79 | % | 30 | ||||||||
Soybean Oil | 4,260 | 3.55 | % | (63 | ) | |||||||
Gasoil | 4,164 | 3.47 | % | 64 | ||||||||
Soybean Meal | 4,020 | 3.35 | % | (107 | ) | |||||||
SRW Wheat | 3,840 | 3.20 | % | (176 | ) | |||||||
Aluminium Primary | 3,612 | 3.01 | % | 109 | ||||||||
Heating Oil | 3,288 | 2.74 | % | 60 | ||||||||
Nickel Primary | 3,240 | 2.70 | % | 86 | ||||||||
Sugar #11 | 3,084 | 2.57 | % | (45 | ) | |||||||
Zinc High Grade | 2,652 | 2.21 | % | 241 | ||||||||
RBOB Gasoline | 2,592 | 2.16 | % | 98 | ||||||||
HRW Wheat | 2,364 | 1.97 | % | (103 | ) | |||||||
Coffee ‘C’ Arabica | 2,292 | 1.91 | % | 38 | ||||||||
Lean Hogs | 2,088 | 1.74 | % | (7 | ) | |||||||
Cotton | 1,044 | 0.87 | % | 47 | ||||||||
United States Treasury Bill | — | — | (52 | ) | ||||||||
|
|
|
|
|
| |||||||
| $ | 120,000 | 100.00 | % | $ | (123 | ) | ||||||
|
|
|
|
|
| |||||||
| (1) | Commodity Exposures of the Credit Suisse Custom 24 Total Return Index. |
See accompanying Notes to Financial Statements.
49
Table of Contents
TCW Enhanced Commodity Strategy Fund
Consolidated Schedule of Investments
Components of Total Return Swap | October 31, 2022 |
| Description (1) | Notional Amount | Weight % | Unrealized Appreciation (Depreciation) | |||||||||
Natural Gas | $ | 6,943 | 13.35 | % | $ | (697 | ) | |||||
Gold | 6,729 | 12.94 | % | 17 | ||||||||
WTI Crude Oil | 4,218 | 8.11 | % | 61 | ||||||||
Brent Crude Oil | 3,687 | 7.09 | % | 32 | ||||||||
Corn | 3,130 | 6.02 | % | (46 | ) | |||||||
Soybeans | 2,870 | 5.52 | % | (40 | ) | |||||||
Copper High Grade | 2,018 | 3.88 | % | 34 | ||||||||
Silver | 2,002 | 3.85 | % | 3 | ||||||||
Live Cattle | 1,971 | 3.79 | % | 6 | ||||||||
Soybean Oil | 1,846 | 3.55 | % | (37 | ) | |||||||
Gasoil | 1,804 | 3.47 | % | 32 | ||||||||
Soybean Meal | 1,742 | 3.35 | % | (12 | ) | |||||||
SRW Wheat | 1,664 | 3.20 | % | (94 | ) | |||||||
Aluminium Primary | 1,565 | 3.01 | % | (8 | ) | |||||||
Heating Oil | 1,425 | 2.74 | % | 37 | ||||||||
Nickel Primary | 1,404 | 2.70 | % | 21 | ||||||||
Sugar #11 | 1,336 | 2.57 | % | (29 | ) | |||||||
Zinc High Grade | 1,149 | 2.21 | % | 54 | ||||||||
RBOB Gasoline | 1,123 | 2.16 | % | 15 | ||||||||
HRW Wheat | 1,024 | 1.97 | % | (53 | ) | |||||||
Coffee ‘C’ Arabica | 993 | 1.91 | % | (37 | ) | |||||||
Lean Hogs | 905 | 1.74 | % | 4 | ||||||||
Cotton | 452 | 0.87 | % | 3 | ||||||||
United States Treasury Bill | — | — | (15 | ) | ||||||||
|
|
|
|
|
| |||||||
| $ | 52,000 | 100.00 | % | $ | (749 | ) | ||||||
|
|
|
|
|
| |||||||
| (1) | Commodity Exposures of the Credit Suisse Custom 24 Total Return Index. |
See accompanying Notes to Financial Statements.
50
Table of Contents
TCW Enhanced Commodity Strategy Fund
Consolidated Schedule of Investments
Components of Total Return Swap | October 31, 2022 |
| Description (1) | Notional Amount | Weight % | Unrealized Appreciation (Depreciation) | |||||||||
Natural Gas | $ | 11,347 | 13.35 | % | $ | 0 | ||||||
Gold | 10,998 | 12.94 | % | 0 | ||||||||
WTI Crude Oil | 6,893 | 8.11 | % | 0 | ||||||||
Brent Crude Oil | 6,026 | 7.09 | % | 0 | ||||||||
Corn | 5,116 | 6.02 | % | 0 | ||||||||
Soybeans | 4,691 | 5.52 | % | 0 | ||||||||
Copper High Grade | 3,297 | 3.88 | % | 0 | ||||||||
Silver | 3,273 | 3.85 | % | 0 | ||||||||
Live Cattle | 3,222 | 3.79 | % | 0 | ||||||||
Soybean Oil | 3,018 | 3.55 | % | 0 | ||||||||
Gasoil | 2,950 | 3.47 | % | 0 | ||||||||
Soybean Meal | 2,848 | 3.35 | % | 0 | ||||||||
SRW Wheat | 2,720 | 3.20 | % | 0 | ||||||||
Aluminium Primary | 2,559 | 3.01 | % | 0 | ||||||||
Heating Oil | 2,329 | 2.74 | % | 0 | ||||||||
Nickel Primary | 2,295 | 2.70 | % | 0 | ||||||||
Sugar #11 | 2,185 | 2.57 | % | 0 | ||||||||
Zinc High Grade | 1,879 | 2.21 | % | 0 | ||||||||
RBOB Gasoline | 1,836 | 2.16 | % | 0 | ||||||||
HRW Wheat | 1,675 | 1.97 | % | 0 | ||||||||
Coffee ‘C’ Arabica | 1,624 | 1.91 | % | 0 | ||||||||
Lean Hogs | 1,479 | 1.74 | % | 0 | ||||||||
Cotton | 740 | 0.87 | % | 0 | ||||||||
United States Treasury Bill | — | — | 0 | |||||||||
|
|
|
|
|
| |||||||
| $ | 85,000 | 100.00 | % | $ | 0 | |||||||
|
|
|
|
|
| |||||||
| (1) | Commodity Exposures of the Credit Suisse Custom 24 Total Return Index. |
See accompanying Notes to Financial Statements.
51
Table of Contents
TCW Enhanced Commodity Strategy Fund
Consolidated Investments by Sector | October 31, 2022 |
| Sector | Percentage of Net Assets | |||
Corporate Bonds | 34.7 | % | ||
Asset-Backed Securities | 18.2 | |||
Money Market Investments | 9.5 | |||
Residential Mortgage-Backed Securities — Non-Agency | 8.7 | |||
Commercial Mortgage-Backed Securities — Non-Agency | 6.2 | |||
U.S. Treasury Securities | 4.6 | |||
Residential Mortgage-Backed Securities — Agency | 4.1 | |||
Commercial Mortgage-Backed Securities — Agency | 2.5 | |||
Municipal Bonds | 0.1 | |||
Other* | 11.4 | |||
|
| |||
Total | 100.0 | % | ||
|
| |||
| * | Includes swaps, interest receivable and accrued expenses payable. |
See accompanying Notes to Financial Statements.
52
Table of Contents
TCW Enhanced Commodity Strategy Fund
Fair Valuation Summary | October 31, 2022 |
The following is a summary of the fair valuations according to the inputs used as of October 31, 2022 in valuing the Fund’s investments:
Description | Quoted Prices in Active Markets for Identical Assets (Level 1) | Other Significant Observable Inputs (Level 2) | Significant Unobservable Inputs (Level 3) | Total | ||||||||||||
Fixed Income Securities | ||||||||||||||||
Asset-Backed Securities | $ | — | $ | 7,413,651 | $ | — | $ | 7,413,651 | ||||||||
Commercial Mortgage-Backed Securities — Agency | — | 1,010,336 | — | 1,010,336 | ||||||||||||
Commercial Mortgage-Backed Securities — Non-Agency | — | 2,500,117 | — | 2,500,117 | ||||||||||||
Residential Mortgage-Backed Securities — Agency | — | 1,685,276 | — | 1,685,276 | ||||||||||||
Residential Mortgage-Backed Securities — Non-Agency | — | 3,550,310 | — | 3,550,310 | ||||||||||||
Corporate Bonds* | — | 14,096,862 | — | 14,096,862 | ||||||||||||
Municipal Bonds | — | 48,443 | — | 48,443 | ||||||||||||
|
|
|
|
|
|
|
| |||||||||
Total Fixed Income Securities | — | 30,304,995 | — | 30,304,995 | ||||||||||||
|
|
|
|
|
|
|
| |||||||||
Money Market Investments | 3,848,776 | — | — | 3,848,776 | ||||||||||||
Short Term Investments | 1,887,015 | — | — | 1,887,015 | ||||||||||||
|
|
|
|
|
|
|
| |||||||||
Total Investments | $ | 5,735,791 | $ | 30,304,995 | $ | — | $ | 36,040,786 | ||||||||
|
|
|
|
|
|
|
| |||||||||
Asset Derivatives | ||||||||||||||||
Swap Agreements | ||||||||||||||||
Commodity Risk | — | 742,107 | — | 742,107 | ||||||||||||
|
|
|
|
|
|
|
| |||||||||
Total | $ | 5,735,791 | $ | 31,047,102 | $ | — | $ | 36,782,893 | ||||||||
|
|
|
|
|
|
|
| |||||||||
Liability Derivatives | ||||||||||||||||
Swap Agreements | ||||||||||||||||
Commodity Risk | $ | — | $ | (3,629 | ) | $ | — | $ | (3,629 | ) | ||||||
|
|
|
|
|
|
|
| |||||||||
Total | $ | — | $ | (3,629 | ) | $ | — | $ | (3,629 | ) | ||||||
|
|
|
|
|
|
|
| |||||||||
| * | See Schedule of Investments for corresponding industries. |
See accompanying Notes to Financial Statements.
53
Table of Contents
Schedule of Investments
| Issues | Maturity Date | Principal Amount | Value | |||||||||
FIXED INCOME SECURITIES — 108.6% of Net Assets |
| |||||||||||
| CORPORATE BONDS — 30.6% | ||||||||||||
| Agriculture — 1.6% | ||||||||||||
Altria Group, Inc. |
| |||||||||||
1.00% | 02/15/23 | $ | 100,000 | $ | 98,340 | |||||||
BAT Capital Corp. |
| |||||||||||
4.54% | 08/15/47 | 25,000 | 16,190 | |||||||||
BAT International Finance PLC (United Kingdom) |
| |||||||||||
2.25% (1) | 01/16/30 | 100,000 | 76,854 | |||||||||
Imperial Brands Finance PLC (United Kingdom) |
| |||||||||||
3.88% (2) | 07/26/29 | 13,000 | 10,946 | |||||||||
8.13% (1) | 03/15/24 | GBP | 50,000 | 59,047 | ||||||||
|
| |||||||||||
| 261,377 | ||||||||||||
|
| |||||||||||
| Airlines — 0.6% | ||||||||||||
Delta Air Lines, Inc. Pass-Through Certificates (20-1A-AA) |
| |||||||||||
2.00% | 12/10/29 | 79,237 | 67,054 | |||||||||
US Airways Group, Inc. Pass-Through Certificates (10-1A) (EETC) |
| |||||||||||
6.25% | 10/22/24 | 6,439 | 6,369 | |||||||||
US Airways Group, Inc. Pass-Through Certificates (12-1-A) (EETC) |
| |||||||||||
5.90% | 04/01/26 | 23,755 | 22,931 | |||||||||
|
| |||||||||||
| 96,354 | ||||||||||||
|
| |||||||||||
| Banks — 8.4% | ||||||||||||
Bank Leumi Le-Israel BM |
| |||||||||||
5.13% (1) | 07/27/27 | 200,000 | 195,204 | |||||||||
Bank of America Corp. |
| |||||||||||
2.97% (SOFR + 1.330%) (3) | 02/04/33 | 145,000 | 112,555 | |||||||||
China Development Bank |
| |||||||||||
3.09% | 06/18/30 | CNY | 1,290,000 | 179,555 | ||||||||
3.48% | 01/08/29 | CNY | 200,000 | 28,530 | ||||||||
Citigroup, Inc. |
| |||||||||||
2.98% (SOFR + 1.422%) (3) | 11/05/30 | $ | 25,000 | 20,426 | ||||||||
3.06% (SOFR + 1.350%) (3) | 01/25/33 | 80,000 | 62,544 | |||||||||
Credit Suisse Group AG (Switzerland) |
| |||||||||||
3.09% (SOFR + 1.730%) (2),(3) | 05/14/32 | 20,000 | 13,757 | |||||||||
6.54% (SOFR + 3.920%) (2),(3) | 08/12/33 | 95,000 | 82,098 | |||||||||
Goldman Sachs Group, Inc. (The) |
| |||||||||||
2.38% (SOFR + 1.248%) (3) | 07/21/32 | 110,000 | 81,991 | |||||||||
HSBC Holdings PLC (United Kingdom) |
| |||||||||||
1.75% (SONIO/N + 1.307%) (3) | 07/24/27 | GBP | 100,000 | 97,196 | ||||||||
5.40% (SOFR + 2.870%) (3) | 08/11/33 | $ | 15,000 | 13,041 | ||||||||
| Issues | Maturity Date | Principal Amount | Value | |||||||||
| Banks (Continued) | ||||||||||||
JPMorgan Chase & Co. |
| |||||||||||
2.55% (SOFR + 1.180%) (3) | 11/08/32 | $ | 170,000 | $ | 128,712 | |||||||
Lloyds Banking Group PLC (United Kingdom) |
| |||||||||||
4.98% (1-year Treasury Constant Maturity Rate + 2.300%) (3) | 08/11/33 | 10,000 | 8,576 | |||||||||
Macquarie Group, Ltd. (Australia) |
| |||||||||||
2.87% (SOFR + 1.532%) (2),(3) | 01/14/33 | 50,000 | 36,949 | |||||||||
Morgan Stanley |
| |||||||||||
2.24% (SOFR + 1.178%) (3) | 07/21/32 | 115,000 | 85,382 | |||||||||
Santander UK Group Holdings PLC (United Kingdom) |
| |||||||||||
4.80% (3 mo. USD LIBOR + 1.570%) (3) | 11/15/24 | 90,000 | 88,074 | |||||||||
Santander UK PLC (United Kingdom) |
| |||||||||||
5.00% (2) | 11/07/23 | 20,000 | 19,783 | |||||||||
Wells Fargo & Co. |
| |||||||||||
3.35% (SOFR + 1.500%) (3) | 03/02/33 | 155,000 | 125,286 | |||||||||
|
| |||||||||||
| 1,379,659 | ||||||||||||
|
| |||||||||||
| Beverages — 0.4% | ||||||||||||
Anheuser-Busch Cos LLC / Anheuser-Busch InBev Worldwide, Inc. |
| |||||||||||
4.90% | 02/01/46 | 30,000 | 25,769 | |||||||||
Anheuser-Busch InBev Worldwide, Inc. |
| |||||||||||
4.60% | 04/15/48 | 10,000 | 8,315 | |||||||||
Bacardi, Ltd. |
| |||||||||||
4.45% (2) | 05/15/25 | 25,000 | 24,001 | |||||||||
|
| |||||||||||
| 58,085 | ||||||||||||
|
| |||||||||||
| Biotechnology — 0.2% | ||||||||||||
Amgen, Inc. |
| |||||||||||
4.88% | 03/01/53 | 35,000 | 29,728 | |||||||||
|
| |||||||||||
| Chemicals — 0.7% | ||||||||||||
International Flavors & Fragrances, Inc. |
| |||||||||||
1.75% | 03/14/24 | 100,000 | 94,825 | |||||||||
Valvoline, Inc. |
| |||||||||||
4.25% (2) | 02/15/30 | 18,000 | 17,352 | |||||||||
|
| |||||||||||
| 112,177 | ||||||||||||
|
| |||||||||||
| Computers — 0.1% | ||||||||||||
NCR Corp. |
| |||||||||||
5.13% (2) | 04/15/29 | 18,000 | 15,114 | |||||||||
|
| |||||||||||
| Diversified Financial Services — 0.8% | ||||||||||||
AerCap Ireland Capital DAC / AerCap Global Aviation Trust (Ireland) |
| |||||||||||
2.45% | 10/29/26 | 20,000 | 16,931 | |||||||||
3.30% | 01/30/32 | 35,000 | 26,309 | |||||||||
3.88% | 01/23/28 | 10,000 | 8,620 | |||||||||
See accompanying Notes to Financial Statements.
54
Table of Contents
TCW Global Bond Fund
October 31, 2022
| Issues | Maturity Date | Principal Amount | Value | |||||||||
| Diversified Financial Services (Continued) | ||||||||||||
Air Lease Corp. |
| |||||||||||
3.25% | 03/01/25 | $ | 20,000 | $ | 18,679 | |||||||
Avolon Holdings Funding, Ltd. |
| |||||||||||
2.53% (2) | 11/18/27 | 24,000 | 18,338 | |||||||||
2.88% (2) | 02/15/25 | 30,000 | 26,870 | |||||||||
Orix Corp. |
| |||||||||||
4.00% | 04/13/32 | 25,000 | 21,351 | |||||||||
|
| |||||||||||
| 137,098 | ||||||||||||
|
| |||||||||||
| Electric — 0.4% | ||||||||||||
FirstEnergy Transmission LLC |
| |||||||||||
2.87% (2) | 09/15/28 | 78,000 | 66,073 | |||||||||
|
| |||||||||||
| Engineering & Construction — 0.6% | ||||||||||||
Artera Services LLC |
| |||||||||||
9.03% (2) | 12/04/25 | 16,000 | 13,462 | |||||||||
Heathrow Funding, Ltd. |
| |||||||||||
5.23% (2) | 02/15/23 | 75,000 | 86,290 | |||||||||
|
| |||||||||||
| 99,752 | ||||||||||||
|
| |||||||||||
| Entertainment — 0.4% | ||||||||||||
Caesars Entertainment, Inc. |
| |||||||||||
4.63% (2) | 10/15/29 | 6,000 | 4,808 | |||||||||
WarnerMedia Holdings, Inc. |
| |||||||||||
5.05% (2) | 03/15/42 | 10,000 | 7,321 | |||||||||
WarnerMedia Holdings, Inc. |
| |||||||||||
5.14% (2) | 03/15/52 | 85,000 | 59,577 | |||||||||
|
| |||||||||||
| 71,706 | ||||||||||||
|
| |||||||||||
| Environmental Control — 0.0% | ||||||||||||
GFL Environmental, Inc. (Canada) |
| |||||||||||
3.75% (2) | 08/01/25 | 7,000 | 6,632 | |||||||||
|
| |||||||||||
| Food — 0.9% | ||||||||||||
Chobani LLC / Chobani Finance Corp, Inc. |
| |||||||||||
4.63% (2) | 11/15/28 | 19,000 | 16,527 | |||||||||
JBS USA LUX SA / JBS USA Food Co. / JBS USA Finance, Inc. |
| |||||||||||
4.38% (2) | 02/02/52 | 20,000 | 12,994 | |||||||||
Kraft Heinz Foods Co. |
| |||||||||||
4.38% | 06/01/46 | 15,000 | 11,741 | |||||||||
5.20% | 07/15/45 | 15,000 | 13,138 | |||||||||
Pilgrim’s Pride Corp. |
| |||||||||||
4.25% (2) | 04/15/31 | 37,000 | 31,024 | |||||||||
5.88% (2) | 09/30/27 | 16,000 | 15,666 | |||||||||
Post Holdings, Inc. |
| |||||||||||
4.63% (2) | 04/15/30 | 47,000 | 39,744 | |||||||||
|
| |||||||||||
| 140,834 | ||||||||||||
|
| |||||||||||
| Health Care-Products — 0.7% | ||||||||||||
American Medical System Europe BV |
| |||||||||||
1.63% | 03/08/31 | 100,000 | 83,097 | |||||||||
| Issues | Maturity Date | Principal Amount | Value | |||||||||
| Health Care-Products (Continued) | ||||||||||||
DENTSPLY SIRONA, Inc. |
| |||||||||||
3.25% | 06/01/30 | $ | 40,000 | $ | 31,259 | |||||||
|
| |||||||||||
| 114,356 | ||||||||||||
|
| |||||||||||
| Health Care-Services — 1.6% | ||||||||||||
Centene Corp. |
| |||||||||||
4.25% | 12/15/27 | 65,000 | 60,061 | |||||||||
CommonSpirit Health |
| |||||||||||
2.78% | 10/01/30 | 25,000 | 19,456 | |||||||||
HCA, Inc. |
| |||||||||||
3.50% | 09/01/30 | 21,000 | 17,426 | |||||||||
4.13% | 06/15/29 | 24,000 | 21,194 | |||||||||
4.63% (2) | 03/15/52 | 15,000 | 11,051 | |||||||||
5.25% | 04/15/25 | 2,000 | 1,967 | |||||||||
5.25% | 06/15/49 | 64,000 | 51,973 | |||||||||
Molina Healthcare, Inc. |
| |||||||||||
3.88% (2) | 11/15/30 | 63,000 | 54,653 | |||||||||
Tenet Healthcare Corp. |
| |||||||||||
4.25% (2) | 06/01/29 | 19,000 | 16,036 | |||||||||
|
| |||||||||||
| 253,817 | ||||||||||||
|
| |||||||||||
| Household Products/Wares — 0.2% | ||||||||||||
Clorox Co. (The) |
| |||||||||||
4.60% | 05/01/32 | 25,000 | 23,221 | |||||||||
Spectrum Brands, Inc. |
| |||||||||||
5.50% (2) | 07/15/30 | 20,000 | 16,100 | |||||||||
|
| |||||||||||
| 39,321 | ||||||||||||
|
| |||||||||||
| Insurance — 0.9% | ||||||||||||
Acrisure LLC / Acrisure Finance, Inc. |
| |||||||||||
4.25% (2) | 02/15/29 | 9,000 | 7,368 | |||||||||
Aon Corp. / Aon Global Holdings PLC |
| |||||||||||
3.90% | 02/28/52 | 30,000 | 21,302 | |||||||||
Athene Global Funding |
| |||||||||||
1.99% (2) | 08/19/28 | 70,000 | 55,419 | |||||||||
Farmers Exchange Capital II |
| |||||||||||
6.15% (3 mo. USD LIBOR + 3.744%) (2),(3) | 11/01/53 | 55,000 | 52,292 | |||||||||
Teachers Insurance & Annuity Association of America |
| |||||||||||
4.27% (2) | 05/15/47 | 20,000 | 15,662 | |||||||||
|
| |||||||||||
| 152,043 | ||||||||||||
|
| |||||||||||
| Internet — 0.4% | ||||||||||||
Alibaba Group Holding, Ltd. |
| |||||||||||
2.13% | 02/09/31 | 50,000 | 36,006 | |||||||||
Tencent Holdings, Ltd. |
| |||||||||||
3.60% (2) | 01/19/28 | 40,000 | 34,159 | |||||||||
|
| |||||||||||
| 70,165 | ||||||||||||
|
| |||||||||||
See accompanying Notes to Financial Statements.
55
Table of Contents
TCW Global Bond Fund
Schedule of Investments (Continued)
| Issues | Maturity Date | Principal Amount | Value | |||||||||
| Media — 0.4% | ||||||||||||
Charter Communications Operating LLC / Charter Communications Operating Capital |
| |||||||||||
5.38% | 05/01/47 | $ | 81,000 | $ | 62,568 | |||||||
|
| |||||||||||
| Miscellaneous Manufacturers — 0.7% | ||||||||||||
General Electric Co. |
| |||||||||||
3.39% (3 mo. USD LIBOR + 0.480%) (3) | 08/15/36 | 150,000 | 120,768 | |||||||||
|
| |||||||||||
| Oil & Gas — 2.3% | ||||||||||||
Petroleos Mexicanos |
| |||||||||||
5.95% | 01/28/31 | 30,000 | 21,674 | |||||||||
7.69% | 01/23/50 | 15,000 | 9,799 | |||||||||
Qatar Energy |
| |||||||||||
1.38% (1) | 09/12/26 | 200,000 | 175,999 | |||||||||
SA Global Sukuk, Ltd. |
| |||||||||||
2.69% (2) | 06/17/31 | 200,000 | 163,540 | |||||||||
Transocean Poseidon, Ltd. |
| |||||||||||
6.88% (2) | 02/01/27 | 6,125 | 5,874 | |||||||||
|
| |||||||||||
| 376,886 | ||||||||||||
|
| |||||||||||
| Oil & Gas Services — 0.1% | ||||||||||||
Transocean Phoenix 2, Ltd. |
| |||||||||||
7.75% (2) | 10/15/24 | 10,000 | 9,956 | |||||||||
|
| |||||||||||
| Packaging & Containers — 0.8% | ||||||||||||
Berry Global, Inc. |
| |||||||||||
1.00% (1) | 01/15/25 | 100,000 | 91,101 | |||||||||
Graphic Packaging International LLC |
| |||||||||||
4.13% | 08/15/24 | 27,000 | 26,257 | |||||||||
4.88% | 11/15/22 | 8,000 | 7,982 | |||||||||
Trivium Packaging Finance BV |
| |||||||||||
8.50% (2) | 08/15/27 | 2,000 | 1,912 | |||||||||
|
| |||||||||||
| 127,252 | ||||||||||||
|
| |||||||||||
| Pharmaceuticals — 1.3% | ||||||||||||
180 Medical, Inc. |
| |||||||||||
3.88% (2) | 10/15/29 | 19,000 | 16,150 | |||||||||
AbbVie, Inc. |
| |||||||||||
4.50% | 05/14/35 | 53,000 | 47,051 | |||||||||
Bayer US Finance II LLC |
| |||||||||||
4.63% (2) | 06/25/38 | 25,000 | 20,478 | |||||||||
4.88% (2) | 06/25/48 | 70,000 | 56,542 | |||||||||
Cigna Corp. |
| |||||||||||
3.40% | 03/15/51 | 30,000 | 19,992 | |||||||||
CVS Health Corp. |
| |||||||||||
5.05% | 03/25/48 | 45,000 | 38,277 | |||||||||
Prestige Brands, Inc. |
| |||||||||||
3.75% (2) | 04/01/31 | 22,000 | 17,692 | |||||||||
|
| |||||||||||
| 216,182 | ||||||||||||
|
| |||||||||||
| Issues | Maturity Date | Principal Amount | Value | |||||||||
| Pipelines — 0.6% | ||||||||||||
Energy Transfer LP |
| |||||||||||
5.15% | 03/15/45 | $ | 100,000 | $ | 77,682 | |||||||
Kinder Morgan Energy Partners LP |
| |||||||||||
5.00% | 08/15/42 | 15,000 | 12,080 | |||||||||
|
| |||||||||||
| 89,762 | ||||||||||||
|
| |||||||||||
| REIT — 1.6% | ||||||||||||
American Assets Trust LP |
| |||||||||||
3.38% | 02/01/31 | 40,000 | 31,207 | |||||||||
American Homes 4 Rent LP |
| |||||||||||
3.38% | 07/15/51 | 35,000 | 20,651 | |||||||||
4.30% | 04/15/52 | 10,000 | 6,930 | |||||||||
GLP Capital LP / GLP Financing II, Inc. |
| |||||||||||
3.35% | 09/01/24 | 15,000 | 14,213 | |||||||||
5.25% | 06/01/25 | 15,000 | 14,606 | |||||||||
5.38% | 04/15/26 | 25,000 | 23,895 | |||||||||
5.75% | 06/01/28 | 5,000 | 4,645 | |||||||||
Healthcare Realty Holdings LP |
| |||||||||||
3.10% | 02/15/30 | 75,000 | 60,712 | |||||||||
Hudson Pacific Properties LP |
| |||||||||||
3.25% | 01/15/30 | 20,000 | 15,358 | |||||||||
Kilroy Realty LP |
| |||||||||||
2.65% | 11/15/33 | 15,000 | 10,181 | |||||||||
LXP Industrial Trust |
| |||||||||||
2.70% | 09/15/30 | 20,000 | 15,327 | |||||||||
VICI Properties LP / VICI Note Co., Inc. |
| |||||||||||
5.75% (2) | 02/01/27 | 55,000 | 51,999 | |||||||||
|
| |||||||||||
| 269,724 | ||||||||||||
|
| |||||||||||
| Retail — 0.5% | ||||||||||||
Alimentation Couche-Tard, Inc. |
| |||||||||||
3.06% | 07/26/24 | 95,000 | 67,271 | |||||||||
Michaels Cos, Inc. (The) |
| |||||||||||
5.25% (2) | 05/01/28 | 20,000 | 14,251 | |||||||||
|
| |||||||||||
| 81,522 | ||||||||||||
|
| |||||||||||
| Savings & Loans — 0.4% | ||||||||||||
Nationwide Building Society (United Kingdom) |
| |||||||||||
3.77% (3 mo. USD LIBOR + 1.064%) (2),(3) | 03/08/24 | 65,000 | 64,328 | |||||||||
|
| |||||||||||
| Software — 0.3% | ||||||||||||
Oracle Corp. |
| |||||||||||
3.95% | 03/25/51 | 74,000 | 48,488 | |||||||||
|
| |||||||||||
| Telecommunications — 2.7% | ||||||||||||
CommScope, Inc. |
| |||||||||||
6.00% (2) | 03/01/26 | 18,000 | 17,394 | |||||||||
Frontier Communications Holdings LLC |
| |||||||||||
5.00% (2) | 05/01/28 | 11,000 | 9,637 | |||||||||
See accompanying Notes to Financial Statements.
56
Table of Contents
TCW Global Bond Fund
October 31, 2022
| Issues | Maturity Date | Principal Amount | Value | |||||||||
| Telecommunications (Continued) | ||||||||||||
Intelsat Jackson Holding S. A. (Escrow) |
| |||||||||||
8.50% (4) | 10/15/24 | $ | 21,000 | $ | — | |||||||
9.75% (4) | 07/15/25 | 15,000 | — | |||||||||
Intelsat Jackson Holdings S. A. |
| |||||||||||
6.50% (2),(5) | 03/15/30 | 54,000 | 49,695 | |||||||||
Level 3 Financing, Inc. |
| |||||||||||
3.63% (2) | 01/15/29 | 15,000 | 11,463 | |||||||||
3.88% (2) | 11/15/29 | 45,000 | 37,083 | |||||||||
4.63% (2) | 09/15/27 | 3,000 | 2,610 | |||||||||
Qwest Corp. |
| |||||||||||
7.25% | 09/15/25 | 33,000 | 33,406 | |||||||||
Sprint Corp. |
| |||||||||||
7.88% | 09/15/23 | 16,000 | 16,284 | |||||||||
Sprint Spectrum Co. LLC / Sprint Spectrum Co. II LLC /Sprint Spectrum Co. III LLC |
| |||||||||||
4.74% (2) | 03/20/25 | 131,250 | 129,438 | |||||||||
T-Mobile USA, Inc. |
| |||||||||||
2.55% | 02/15/31 | 10,000 | 7,918 | |||||||||
2.63% | 04/15/26 | 55,000 | 49,724 | |||||||||
3.75% | 04/15/27 | 20,000 | 18,469 | |||||||||
3.88% | 04/15/30 | 20,000 | 17,709 | |||||||||
Vodafone Group PLC (United Kingdom) |
| |||||||||||
4.88% | 06/19/49 | 48,000 | 37,248 | |||||||||
|
| |||||||||||
| 438,078 | ||||||||||||
|
| |||||||||||
Total Corporate Bonds |
| |||||||||||
(Cost: $5,924,296) |
| 5,009,805 | ||||||||||
|
| |||||||||||
| MUNICIPAL BONDS — 0.7% | ||||||||||||
Alabama Economic Settlement Authority, Revenue Bond |
| |||||||||||
4.26% | 09/15/32 | 40,000 | 36,768 | |||||||||
City of New York NY, General Obligation Unlimited |
| |||||||||||
3.00% | 08/01/34 | 55,000 | 42,658 | |||||||||
County of Miami-Dade FL Aviation Revenue, Revenue Bond |
| |||||||||||
2.86% | 10/01/35 | 50,000 | 37,351 | |||||||||
|
| |||||||||||
Total Municipal Bonds |
| |||||||||||
(Cost: $149,633) |
| 116,777 | ||||||||||
|
| |||||||||||
| FOREIGN GOVERNMENT BONDS — 39.2% | ||||||||||||
Australia Government Bond |
| |||||||||||
1.25% | 05/21/32 | AUD | 184,000 | 94,325 | ||||||||
2.75% (1) | 05/21/41 | AUD | 189,000 | 99,668 | ||||||||
4.75% (1) | 04/21/27 | AUD | 251,000 | 169,461 | ||||||||
Bundesrepublik Deutschland Bundesanleihe |
| |||||||||||
0.00% (1),(6) | 11/15/27 | EUR | 138,000 | 123,585 | ||||||||
0.00% (1),(6) | 02/15/32 | EUR | 203,000 | 165,317 | ||||||||
0.00% (1),(6) | 08/15/52 | EUR | 67,000 | 35,398 | ||||||||
| Issues | Maturity Date | Principal Amount | Value | |||||||||
| FOREIGN GOVERNMENT BONDS (Continued) | ||||||||||||
Canadian Government Bond |
| |||||||||||
1.25% | 03/01/27 | CAD | 280,000 | $ | 186,869 | |||||||
2.00% | 06/01/32 | CAD | 149,000 | 97,917 | ||||||||
2.00% | 12/01/51 | CAD | 91,000 | 50,129 | ||||||||
China Government Bond |
| |||||||||||
2.85% | 06/04/27 | CNY | 810,000 | 113,000 | ||||||||
3.02% | 05/27/31 | CNY | 270,000 | 37,947 | ||||||||
3.13% | 11/21/29 | CNY | 2,350,000 | 332,669 | ||||||||
3.72% | 04/12/51 | CNY | 980,000 | 148,760 | ||||||||
Colombian TES (Treasury) Bond, Series B |
| |||||||||||
7.00% | 06/30/32 | COP | 105,300,000 | 13,934 | ||||||||
European Union |
| |||||||||||
0.00% (1),(6) | 07/04/29 | EUR | 150,000 | 123,671 | ||||||||
0.20% (1) | 06/04/36 | EUR | 223,000 | 149,644 | ||||||||
French Republic Government Bond OAT |
| |||||||||||
0.00% (1),(6) | 02/25/27 | EUR | 277,000 | 248,788 | ||||||||
0.00% (1),(6) | 11/25/29 | EUR | 56,000 | 47,015 | ||||||||
0.00% (1),(6) | 11/25/31 | EUR | 163,000 | 128,468 | ||||||||
0.50% (1) | 06/25/44 | EUR | 55,000 | 33,124 | ||||||||
0.75% (1) | 05/25/52 | EUR | 85,000 | 47,567 | ||||||||
0.75% (1) | 05/25/53 | EUR | 53,000 | 29,062 | ||||||||
1.00% (1) | 05/25/27 | EUR | 373,000 | 349,090 | ||||||||
Hungary Government Bond |
| |||||||||||
3.00% | 10/27/27 | HUF | 15,560,000 | 25,815 | ||||||||
3.00% | 08/21/30 | HUF | 2,250,000 | 3,371 | ||||||||
Indonesia Treasury Bond |
| |||||||||||
6.63% | 05/15/33 | IDR | 1,242,000,000 | 73,445 | ||||||||
International Bank for Reconstruction & Development |
| |||||||||||
1.75% (1) | 03/13/25 | NOK | 650,000 | 59,893 | ||||||||
Ireland Government Bond |
| |||||||||||
0.55% (1) | 04/22/41 | EUR | 45,000 | 28,950 | ||||||||
1.30% (1) | 05/15/33 | EUR | 65,000 | 56,226 | ||||||||
1.50% (1) | 05/15/50 | EUR | 40,000 | 28,368 | ||||||||
Israel Government Bond |
| |||||||||||
3.75% | 03/31/47 | ILS | 94,000 | 28,035 | ||||||||
Italy Buoni Poliennali Del Tesoro |
| |||||||||||
1.10% (1) | 04/01/27 | EUR | 184,000 | 164,575 | ||||||||
1.75% (1) | 07/01/24 | EUR | 52,000 | 50,604 | ||||||||
Japan Government Thirty-Year Bond |
| |||||||||||
0.40% | 03/20/50 | JPY | 44,000,000 | 232,486 | ||||||||
Japan Government Twenty-Year Bond |
| |||||||||||
0.50% | 09/20/36 | JPY | 11,500,000 | 75,892 | ||||||||
Korea Treasury Bond |
| |||||||||||
1.88% | 03/10/51 | KRW | 31,160,000 | 13,769 | ||||||||
2.00% | 06/10/31 | KRW | 477,140,000 | 280,746 | ||||||||
2.38% | 03/10/27 | KRW | 63,350,000 | 41,270 | ||||||||
Malaysia Government Bond |
| |||||||||||
4.64% | 11/07/33 | MYR | 302,000 | 63,971 | ||||||||
Mexico Government Bond (BONOS) |
| |||||||||||
7.75% | 05/29/31 | MXN | 1,700,000 | 75,866 | ||||||||
See accompanying Notes to Financial Statements.
57
Table of Contents
TCW Global Bond Fund
Schedule of Investments (Continued)
| Issues | Maturity Date | Principal Amount | Value | |||||||||
| FOREIGN GOVERNMENT BONDS (Continued) | ||||||||||||
Netherlands Government Bond |
| |||||||||||
0.00% (1),(6) | 01/15/52 | EUR | 78,000 | $ | 39,581 | |||||||
0.50% (1) | 07/15/32 | EUR | 194,000 | 160,172 | ||||||||
New Zealand Government Bond |
| |||||||||||
1.75% | 05/15/41 | NZD | 180,000 | 68,650 | ||||||||
2.00% | 05/15/32 | NZD | 71,000 | 34,240 | ||||||||
4.50% (1) | 04/15/27 | NZD | 580,000 | 340,239 | ||||||||
Norway Government Bond |
| |||||||||||
1.38% (1) | 08/19/30 | NOK | 1,490,000 | 122,619 | ||||||||
1.50% (1) | 02/19/26 | NOK | 2,265,000 | 204,207 | ||||||||
Panama Government International Bond |
| |||||||||||
2.25% | 09/29/32 | $ | 200,000 | 139,292 | ||||||||
3.75% (1) | 04/17/26 | 18,000 | 16,912 | |||||||||
Peru Government Bond |
| |||||||||||
5.40% | 08/12/34 | PEN | 164,000 | 31,395 | ||||||||
Portugal Obrigacoes do Tesouro OT |
| |||||||||||
1.15% (1) | 04/11/42 | EUR | 71,000 | 47,335 | ||||||||
1.65% (1) | 07/16/32 | EUR | 76,000 | 65,894 | ||||||||
Province of Ontario Canada |
| |||||||||||
1.85% | 02/01/27 | CAD | 155,000 | 104,897 | ||||||||
2.05% | 06/02/30 | CAD | 70,000 | 44,901 | ||||||||
Romania Government Bond |
| |||||||||||
6.70% | 02/25/32 | RON | 90,000 | 15,409 | ||||||||
Singapore Government Bond |
| |||||||||||
1.63% | 07/01/31 | SGD | 75,000 | 45,864 | ||||||||
2.38% | 07/01/39 | SGD | 89,000 | 55,314 | ||||||||
South Africa Government Bond |
| |||||||||||
8.88% | 02/28/35 | ZAR | 599,000 | 26,616 | ||||||||
Spain Government Bond |
| |||||||||||
0.70% (1) | 04/30/32 | EUR | 24,000 | 19,034 | ||||||||
0.80% (1) | 07/30/27 | EUR | 42,000 | 38,198 | ||||||||
1.85% (1) | 07/30/35 | EUR | 98,000 | 81,805 | ||||||||
Sweden Government Bond |
| |||||||||||
0.75% | 05/12/28 | SEK | 690,000 | 57,371 | ||||||||
Thailand Government Bond |
| |||||||||||
1.59% | 12/17/35 | THB | 2,007,000 | 41,695 | ||||||||
United Kingdom Gilt |
| |||||||||||
1.25% (1) | 07/22/27 | GBP | 168,000 | 173,846 | ||||||||
1.25% (1) | 10/22/41 | GBP | 70,000 | 52,875 | ||||||||
1.25% (1) | 07/31/51 | GBP | 134,000 | 89,387 | ||||||||
1.75% (1) | 09/07/37 | GBP | 95,000 | 83,451 | ||||||||
4.25% (1) | 06/07/32 | GBP | 80,000 | 97,730 | ||||||||
|
| |||||||||||
Total Foreign Government Bonds |
| |||||||||||
(Cost: $7,653,232) |
| 6,427,619 | ||||||||||
|
| |||||||||||
| ASSET-BACKED SECURITIES — 5.3% | ||||||||||||
Dryden Senior Loan Fund (19-72A-BR) |
| |||||||||||
4.56% (3 mo. USD LIBOR + 1.650%) (2),(3) | 05/15/32 | 185,000 | 174,649 | |||||||||
| Issues | Maturity Date | Principal Amount | Value | |||||||||
| ASSET-BACKED SECURITIES (Continued) | ||||||||||||
OCP CLO 2020-19, Ltd. (20-19A-AR) |
| |||||||||||
5.39% (3 mo. USD LIBOR + 1.150%) (2),(3) | 10/20/34 | $ | 100,000 | $ | 95,460 | |||||||
Rockford Tower CLO, Ltd. (21-1A-B) |
| |||||||||||
5.89% (3 mo. USD LIBOR + 1.650%) (2),(3) | 07/20/34 | 180,000 | 166,572 | |||||||||
Sixth Street CLO XVII, Ltd. (21-17A-A) |
| |||||||||||
5.48% (3 mo. USD LIBOR + 1.240%) (2),(3) | 01/20/34 | 150,000 | 144,694 | |||||||||
SLM Student Loan Trust (08-5-B) |
| |||||||||||
6.21% (3 mo. USD LIBOR + 1.850%)(3) | 07/25/73 | 50,000 | 46,774 | |||||||||
SLM Student Loan Trust (08-8-B) |
| |||||||||||
6.61% (3 mo. USD LIBOR + 2.250%) (3) | 10/25/75 | 57,000 | 54,864 | |||||||||
SLM Student Loan Trust (08-9-B) |
| |||||||||||
6.61% (3 mo. USD LIBOR + 2.250%) (3) | 10/25/83 | 57,000 | 56,725 | |||||||||
Student Loan Consolidation Center (02-2-B2) |
| |||||||||||
1.65% (28-Day Auction Rate) (2),(3) | 07/01/42 | 50,000 | 46,182 | |||||||||
Textainer Marine Containers VII, Ltd. (21-2A-A) |
| |||||||||||
2.23% (2) | 04/20/46 | 101,200 | 84,807 | |||||||||
|
| |||||||||||
Total Asset-backed Securities |
| |||||||||||
(Cost: $907,161) |
| 870,727 | ||||||||||
|
| |||||||||||
| COMMERCIAL MORTGAGE-BACKED SECURITIES — AGENCY — 0.2% | ||||||||||||
Fannie Mae (16-M2-X3) (I/O) |
| |||||||||||
2.09% (7) | 04/25/36 | 199,211 | 1,794 | |||||||||
Fannie Mae (16-M4-X2) (I/O) |
| |||||||||||
2.67% (7) | 01/25/39 | 464,584 | 7,684 | |||||||||
Freddie Mac Multifamily Structured Pass Through Certificates (K028-X1) (I/O) |
| |||||||||||
0.19% (7) | 02/25/23 | 2,651,130 | 261 | |||||||||
Ginnie Mae (11-147-IO) (I/O) |
| |||||||||||
0.00% (7) | 10/16/44 | 161,404 | 2 | |||||||||
Ginnie Mae (12-144-IO) (I/O) |
| |||||||||||
0.32% (7) | 01/16/53 | 1,593,279 | 13,723 | |||||||||
|
| |||||||||||
Total Commercial Mortgage-Backed Securities — Agency |
| |||||||||||
(Cost: $59,475) |
| 23,464 | ||||||||||
|
| |||||||||||
| COMMERCIAL MORTGAGE-BACKED SECURITIES — NON-AGENCY — 1.0% | ||||||||||||
COMM Mortgage Trust (13-CR7-XA) (I/O) |
| |||||||||||
1.14% (7) | 03/10/46 | 602,451 | 627 | |||||||||
COMM Mortgage Trust (12-CR4-XA) (I/O) |
| |||||||||||
1.47% (7) | 10/15/45 | 228,576 | 1 | |||||||||
GS Mortgage Securities Trust (10-C1-X) (I/O) |
| |||||||||||
0.46% (2),(7) | 08/10/43 | 980,891 | 2,689 | |||||||||
See accompanying Notes to Financial Statements.
58
Table of Contents
TCW Global Bond Fund
October 31, 2022
| Issues | Maturity Date | Principal Amount | Value | |||||||||
| COMMERCIAL MORTGAGE-BACKED SECURITIES — NON-AGENCY (Continued) | ||||||||||||
GS Mortgage Securities Trust (11-GC3-X) (I/O) |
| |||||||||||
0.00% (2),(7) | 03/10/44 | $ | 164,659 | $ | 2 | |||||||
GS Mortgage Securities Trust (13-GC12-XA) (I/O) |
| |||||||||||
1.38% (7) | 06/10/46 | 4,240,217 | 8,679 | |||||||||
GS Mortgage Securities Trust (14-GC20-XA) (I/O) |
| |||||||||||
1.01% (7) | 04/10/47 | 1,003,516 | 9,662 | |||||||||
JPMorgan Chase Commercial Mortgage Securities Trust (11-C3-XB) (I/O) |
| |||||||||||
0.39% (2),(7) | 02/15/46 | 6,208,436 | 31,254 | |||||||||
JPMorgan Chase Commercial Mortgage Securities Trust (14-C19-XA) (I/O) |
| |||||||||||
0.62% (7) | 04/15/47 | 2,299,204 | 14,428 | |||||||||
Morgan Stanley Bank of America Merrill Lynch Trust (13-C7-XA) (I/O) |
| |||||||||||
1.19% (7) | 02/15/46 | 977,878 | 52 | |||||||||
Taurus CMBS (21-UK4A-B) |
| |||||||||||
3.46% (SONIO/N + 1.500%) (2),(3) | 08/17/31 | 95,498 | 101,630 | |||||||||
|
| |||||||||||
Total Commercial Mortgage-Backed |
| |||||||||||
(Cost: $133,123) |
| 169,024 | ||||||||||
|
| |||||||||||
| RESIDENTIAL MORTGAGE-BACKED SECURITIES — AGENCY — 21.9% | ||||||||||||
Fannie Mae, Pool #MA4152 |
| |||||||||||
2.00% | 10/01/40 | 71,900 | 59,151 | |||||||||
Fannie Mae (07-52-LS) (I/O) (I/F) |
| |||||||||||
2.46% (-1 mo. USD LIBOR + 6.050%) (3) | 06/25/37 | 39,839 | 1,921 | |||||||||
Fannie Mae (08-18-SM) (I/O) (I/F) |
| |||||||||||
3.41% (-1 mo. USD LIBOR + 7.000%) (3) | 03/25/38 | 43,910 | 2,082 | |||||||||
Fannie Mae (09-115-SB) (I/O) (I/F) |
| |||||||||||
2.66% (-1 mo. USD LIBOR + 6.250%) (3) | 01/25/40 | 24,232 | 1,766 | |||||||||
Fannie Mae (10-116-SE) (I/O) (I/F) |
| |||||||||||
3.01% (-1 mo. USD LIBOR + 6.600%) (3) | 10/25/40 | 46,437 | 4,494 | |||||||||
Fannie Mae, Pool #AB3679 |
| |||||||||||
3.50% | 10/01/41 | 46,797 | 42,502 | |||||||||
Fannie Mae, Pool #AB4045 |
| |||||||||||
3.50% | 12/01/41 | 69,078 | 62,666 | |||||||||
Fannie Mae, Pool #AT5914 |
| |||||||||||
3.50% | 06/01/43 | 22,028 | 19,775 | |||||||||
Fannie Mae, Pool #BD7081 |
| |||||||||||
4.00% | 03/01/47 | 16,806 | 15,586 | |||||||||
Fannie Mae, Pool #BV2994 |
| |||||||||||
2.50% | 04/01/52 | 97,279 | 79,871 | |||||||||
Fannie Mae, Pool #CA0996 |
| |||||||||||
3.50% | 01/01/48 | 51,372 | 46,341 | |||||||||
| Issues | Maturity Date | Principal Amount | Value | |||||||||
| RESIDENTIAL MORTGAGE-BACKED SECURITIES — AGENCY (Continued) | ||||||||||||
Fannie Mae, Pool #CA2208 |
| |||||||||||
4.50% | 08/01/48 | $ | 1,515 | $ | 1,447 | |||||||
Fannie Mae, Pool #CB2610 |
| |||||||||||
2.00% | 01/01/52 | 71,451 | 56,555 | |||||||||
Fannie Mae, Pool #CB3347 |
| |||||||||||
2.00% | 01/01/52 | 192,187 | 151,754 | |||||||||
Fannie Mae, Pool #FM2870 |
| |||||||||||
3.00% | 03/01/50 | 132,278 | 114,562 | |||||||||
Fannie Mae, Pool #MA1527 |
| |||||||||||
3.00% | 08/01/33 | 12,631 | 11,564 | |||||||||
Fannie Mae, Pool #MA1652 |
| |||||||||||
3.50% | 11/01/33 | 20,343 | 19,101 | |||||||||
Fannie Mae, Pool #MA2705 |
| |||||||||||
3.00% | 08/01/46 | 61,922 | 53,677 | |||||||||
Fannie Mae, Pool #MA4204 |
| |||||||||||
2.00% | 12/01/40 | 58,956 | 48,480 | |||||||||
Fannie Mae, Pool #MA4563 |
| |||||||||||
2.50% | 03/01/52 | 95,960 | 78,684 | |||||||||
Freddie Mac, Pool #SD0231 |
| |||||||||||
3.00% | 01/01/50 | 98,771 | 85,543 | |||||||||
Freddie Mac (3439-SC) (I/O) (I/F) |
| |||||||||||
2.49% (-1 mo. USD LIBOR + 5.900%)(3) | 04/15/38 | 40,256 | 2,103 | |||||||||
Freddie Mac, Pool #G08681 |
| |||||||||||
3.50% | 12/01/45 | 17,475 | 15,704 | |||||||||
Freddie Mac, Pool #G08698 |
| |||||||||||
3.50% | 03/01/46 | 16,332 | 14,726 | |||||||||
Freddie Mac, Pool #G08716 |
| |||||||||||
3.50% | 08/01/46 | 16,680 | 14,978 | |||||||||
Freddie Mac, Pool #G08721 |
| |||||||||||
3.00% | 09/01/46 | 3,365 | 2,937 | |||||||||
Freddie Mac, Pool #G08722 |
| |||||||||||
3.50% | 09/01/46 | 1,726 | 1,554 | |||||||||
Freddie Mac, Pool #G08732 |
| |||||||||||
3.00% | 11/01/46 | 4,738 | 4,136 | |||||||||
Freddie Mac, Pool #G08762 |
| |||||||||||
4.00% | 05/01/47 | 15,193 | 14,218 | |||||||||
Freddie Mac, Pool #G08833 |
| |||||||||||
5.00% | 07/01/48 | 2,285 | 2,237 | |||||||||
Freddie Mac, Pool #G18592 |
| |||||||||||
3.00% | 03/01/31 | 2,959 | 2,785 | |||||||||
Freddie Mac, Pool #ZT1703 |
| |||||||||||
4.00% | 01/01/49 | 41,272 | 38,223 | |||||||||
Freddie Mac., Pool #SD8189 |
| |||||||||||
2.50% | 01/01/52 | 47,143 | 38,757 | |||||||||
Ginnie Mae (11-146-EI) (I/O) (PAC) |
| |||||||||||
5.00% | 11/16/41 | 37,473 | 6,918 | |||||||||
See accompanying Notes to Financial Statements.
59
Table of Contents
TCW Global Bond Fund
Schedule of Investments (Continued)
| Issues | Maturity Date | Principal Amount | Value | |||||||||
| RESIDENTIAL MORTGAGE-BACKED SECURITIES — AGENCY (Continued) | ||||||||||||
Ginnie Mae II, Pool #MA3597 |
| |||||||||||
3.50% | 04/20/46 | $ | 10,712 | $ | 9,790 | |||||||
Ginnie Mae II, Pool #MA3662 |
| |||||||||||
3.00% | 05/20/46 | 29,407 | 26,065 | |||||||||
Ginnie Mae II, Pool #MA3663 |
| |||||||||||
3.50% | 05/20/46 | 1,548 | 1,415 | |||||||||
Ginnie Mae II, Pool #MA3803 |
| |||||||||||
3.50% | 07/20/46 | 7,161 | 6,545 | |||||||||
Ginnie Mae II, Pool #MA4454 |
| |||||||||||
5.00% | 05/20/47 | 7,709 | 7,668 | |||||||||
Ginnie Mae II, Pool #MA4900 |
| |||||||||||
3.50% | 12/20/47 | 32,775 | 29,810 | |||||||||
Ginnie Mae II, Pool #MA5399 |
| |||||||||||
4.50% | 08/20/48 | 13,733 | 13,215 | |||||||||
Ginnie Mae II TBA, 30-Year |
| |||||||||||
2.50% (8) | 01/01/52 | 150,000 | 127,000 | |||||||||
Uniform Mortgage-Backed Securities TBA, 30-Year |
| |||||||||||
3.00% (8) | 03/01/52 | 150,000 | 127,535 | |||||||||
3.50% (8) | 04/01/52 | 50,000 | 43,974 | |||||||||
2.00% (8) | 01/01/52 | 250,000 | 196,841 | |||||||||
2.00% (8) | 01/01/52 | 200,000 | 157,493 | |||||||||
2.50% (8) | 01/01/52 | 150,000 | 122,801 | |||||||||
2.50% (8) | 01/01/52 | 150,000 | 122,819 | |||||||||
5.00% (8) | 08/01/52 | 325,000 | 313,485 | |||||||||
5.50% (8) | 08/01/52 | 175,000 | 172,584 | |||||||||
4.00% (8) | 06/01/52 | 75,000 | 68,226 | |||||||||
3.00% (8) | 03/01/52 | 225,000 | 191,285 | |||||||||
4.50% (8) | 07/01/52 | 775,000 | 727,046 | |||||||||
|
| |||||||||||
Total Residential Mortgage-Backed |
| |||||||||||
(Cost: $3,810,061) |
| 3,582,395 | ||||||||||
|
| |||||||||||
| RESIDENTIAL MORTGAGE-BACKED SECURITIES — NON-AGENCY — 9.6% | ||||||||||||
Banc of America Funding Trust (05-C-A3) |
| |||||||||||
3.79% (1 mo. USD LIBOR + 0.300%) (3) | 05/20/35 | 9,514 | 9,408 | |||||||||
BCMSC Trust (00-A-A4) |
| |||||||||||
8.29% (7) | 06/15/30 | 189,525 | 30,955 | |||||||||
Bear Stearns ALT-A Trust (04-8-M2) |
| |||||||||||
5.31% (1 mo. USD LIBOR + 1.725%) (3) | 09/25/34 | 102,093 | 90,092 | |||||||||
Bear Stearns ALT-A Trust (05-8-11A1) |
| |||||||||||
4.13% (1 mo. USD LIBOR + 0.540%) (3) | 10/25/35 | 26,460 | 24,044 | |||||||||
Deephaven Residential Mortgage Trust (21-3-A1) |
| |||||||||||
1.19% (2),(7) | 08/25/66 | 107,998 | 85,090 | |||||||||
DSLA Mortgage Loan Trust (04-AR1-A1A) |
| |||||||||||
4.32% (1 mo. USD LIBOR + 0.840%) (3) | 09/19/44 | 63,448 | 59,323 | |||||||||
| Issues | Maturity Date | Principal Amount | Value | |||||||||
| RESIDENTIAL MORTGAGE-BACKED SECURITIES — NON-AGENCY (Continued) | ||||||||||||
First Horizon Mortgage Pass-Through Trust (05-AR4-2A1) |
| |||||||||||
3.99% (7),(9) | 10/25/35 | $ | 16,141 | $ | 15,094 | |||||||
GS Mortgage-Backed Securities Corp Trust (21-PJ5-A1) |
| |||||||||||
2.00% (2),(7) | 10/25/51 | 86,740 | 63,773 | |||||||||
GS Mortgage-Backed Securities Corp. Trust (22-PJ2-A4) |
| |||||||||||
2.50% (2),(7) | 06/25/52 | 93,543 | 72,248 | |||||||||
HSI Asset Securitization Corp. (06-WMC1-A3) |
| |||||||||||
3.89% (1 mo. USD LIBOR + 0.300%) (3) | 07/25/36 | 278,768 | 129,792 | |||||||||
IndyMac INDX Mortgage Loan Trust (05-AR15-A2) |
| |||||||||||
3.23% (7),(9) | 09/25/35 | 45,825 | 34,840 | |||||||||
JP Morgan Mortgage Trust (21-8-A3) |
| |||||||||||
2.50% (2),(7) | 12/25/51 | 107,487 | 83,402 | |||||||||
JPMorgan Mortgage Acquisition Trust (06-CH2-AF3) |
| |||||||||||
5.46% | 09/25/29 | 177,779 | 113,647 | |||||||||
JPMorgan Mortgage Trust (05-A6-7A1) |
| |||||||||||
3.96% (7),(9) | 08/25/35 | 11,438 | 9,491 | |||||||||
Lehman XS Trust (06-9-A1B) |
| |||||||||||
3.91% (1 mo. USD LIBOR + 0.320%) (3),(4) | 05/25/46 | 30 | — | |||||||||
Merrill Lynch Alternative Note Asset Trust (07-A1-A2B) |
| |||||||||||
3.89% (1 mo. USD LIBOR + 0.300%) (3) | 01/25/37 | 283,911 | 86,748 | |||||||||
Merrill Lynch Alternative Note Asset Trust (07-A3-A2D) |
| |||||||||||
4.25% (1 mo. USD LIBOR + 0.660%) (3),(4) | 04/25/37 | 1,251,739 | 54,941 | |||||||||
MFA Trust (21-RPL1-A2) |
| |||||||||||
2.07% (2),(7) | 07/25/60 | 100,000 | 74,398 | |||||||||
Morgan Stanley ABS Capital I, Inc. Trust (06-HE4-A4) |
| |||||||||||
4.07% (1 mo. USD LIBOR + 0.480%) (3) | 06/25/36 | 241,829 | 130,782 | |||||||||
Morgan Stanley Capital, Inc. (07-HE2-A2B) |
| |||||||||||
3.68% (1 mo. USD LIBOR + 0.090%) (3) | 01/25/37 | 150,092 | 73,379 | |||||||||
MortgageIT Trust (05-1-1A1) |
| |||||||||||
4.23% (1 mo. USD LIBOR + 0.640%) (3) | 02/25/35 | 13,956 | 13,394 | |||||||||
Ownit Mortgage Loan Asset-Backed Certificates (06-3-A2D) |
| |||||||||||
4.13% (1 mo. USD LIBOR + 0.540%) (3) | 03/25/37 | 67,035 | 64,240 | |||||||||
RESIMAC Premier Series (21-1A-A1) |
| |||||||||||
4.00% (1 mo. USD LIBOR + 0.700%) (2),(3) | 07/10/52 | 149,170 | 147,891 | |||||||||
Structured Adjustable Rate Mortgage Loan Trust (04-18-4A1) |
| |||||||||||
3.07% (7) | 12/25/34 | 18,753 | 18,097 | |||||||||
Structured Asset Mortgage Investments II Trust (05-AR6-2A1) |
| |||||||||||
4.21% (1 mo. USD LIBOR + 0.620%) (3) | 09/25/45 | 23,921 | 20,949 | |||||||||
See accompanying Notes to Financial Statements.
60
Table of Contents
TCW Global Bond Fund
October 31, 2022
| Issues | Maturity Date | Principal Amount | Value | |||||||||
| RESIDENTIAL MORTGAGE-BACKED SECURITIES — NON-AGENCY (Continued) | ||||||||||||
Structured Asset Mortgage Investments, Inc. (06-AR3-22A1) |
| |||||||||||
3.13% (7),(9) | 05/25/36 | $ | 132,106 | $ | 73,029 | |||||||
|
| |||||||||||
Total Residential Mortgage-Backed |
| |||||||||||
(Cost: $2,068,709) |
| 1,579,047 | ||||||||||
|
| |||||||||||
| U.S. TREASURY SECURITY — 0.1% | ||||||||||||
(Cost: $10,973) | ||||||||||||
U.S. Treasury Note |
| |||||||||||
4.13% | 10/31/27 | 11,000 | 10,945 | |||||||||
|
| |||||||||||
Total Fixed Income Securities |
| |||||||||||
(Cost: $20,716,663) |
| 17,789,803 | ||||||||||
|
| |||||||||||
| Shares | ||||||||||||
MONEY MARKET INVESTMENTS — 2.0% |
| |||||||||||
State Street Institutional U.S. Government Money Market Fund — Premier Class, 3.01% (10) |
| 323,603 | 323,603 | |||||||||
|
| |||||||||||
Total Money Market Investments |
| |||||||||||
(Cost: $323,603) | 323,603 | |||||||||||
|
| |||||||||||
| Issues | Shares | Value | ||||||||||
INVESTMENT COMPANIES — 3.4% |
| |||||||||||
TCW Emerging Markets Income Fund — I |
| |||||||||||
Class (11) |
| 98,943 | $ | 561,009 | ||||||||
|
| |||||||||||
Total Investment Companies |
| |||||||||||
(Cost: $766,941) | 561,009 | |||||||||||
|
| |||||||||||
COMMON STOCK — 0.1% |
| |||||||||||
TELECOMMUNICATIONS — 0.1% |
| |||||||||||
Intelsat S.A. (4),(12) |
| 344 | 9,150 | |||||||||
|
| |||||||||||
Total Common Stock |
| |||||||||||
(Cost: $32,007) | 9,150 | |||||||||||
|
| |||||||||||
RIGHTS — 0.0% |
| |||||||||||
Intelsat S.A. (4),(12) |
| 35 | — | |||||||||
Intelsat S.A. (4),(12) |
| 35 | — | |||||||||
|
| |||||||||||
Total Rights |
| |||||||||||
(Cost: $ — ) | — | |||||||||||
|
| |||||||||||
Total Investments (114.1%) |
| |||||||||||
(Cost: $21,839,214) | 18,683,565 | |||||||||||
Liabilities In Excess Of Other Assets (-14.1%) |
| (2,303,558 | ) | |||||||||
|
| |||||||||||
Net Assets (100.0%) | $ | 16,380,007 | ||||||||||
|
| |||||||||||
| Forward Currency Exchange Contracts | ||||||||||||||||||||||||
| Counterparty | Contracts to Deliver | Units of Currency | Settlement Date | In Exchange for U.S. Dollars | Contracts at Value | Unrealized Appreciation (Depreciation) | ||||||||||||||||||
| BUY (13) | ||||||||||||||||||||||||
State Street Bank & Trust Co. | AUD | 375,299 | 01/13/23 | $ | 243,846 | $ | 240,578 | $ | (3,268 | ) | ||||||||||||||
Goldman Sachs & Co. | AUD | 157,000 | 01/13/23 | 97,598 | 100,642 | 3,044 | ||||||||||||||||||
Goldman Sachs & Co. | CAD | 56,232 | 01/13/23 | 41,227 | 41,265 | 38 | ||||||||||||||||||
Goldman Sachs & Co. | CHF | 98,000 | 01/13/23 | 99,901 | 98,805 | (1,096 | ) | |||||||||||||||||
Goldman Sachs & Co. | CLP | 7,240,000 | 01/13/23 | 7,421 | 7,578 | 157 | ||||||||||||||||||
Goldman Sachs & Co. | CNH | 4,871,032 | 02/21/23 | 720,317 | 669,294 | (51,023 | ) | |||||||||||||||||
Citibank N.A. | CNH | 217,074 | 02/21/23 | 32,323 | 29,826 | (2,497 | ) | |||||||||||||||||
State Street Bank & Trust Co. | CNH | 4,226,744 | 02/21/23 | 655,675 | 584,296 | (71,379 | ) | |||||||||||||||||
Bank of America N.A. | EUR | 694,324 | 01/13/23 | 687,581 | 690,462 | 2,881 | ||||||||||||||||||
Goldman Sachs & Co. | EUR | 43,000 | 01/13/23 | 42,593 | 42,761 | 168 | ||||||||||||||||||
State Street Bank & Trust Co. | EUR | 17,000 | 01/13/23 | 16,952 | 16,906 | (46 | ) | |||||||||||||||||
State Street Bank & Trust Co. | JPY | 243,089,000 | 01/13/23 | 1,701,095 | 1,651,193 | (49,902 | ) | |||||||||||||||||
Goldman Sachs & Co. | KRW | 160,260,384 | 02/21/23 | 130,346 | 112,924 | (17,422 | ) | |||||||||||||||||
Goldman Sachs & Co. | MXN | 947,596 | 01/13/23 | 46,356 | 47,131 | 775 | ||||||||||||||||||
State Street Bank & Trust Co. | NZD | 33,000 | 01/13/23 | 18,697 | 19,192 | 495 | ||||||||||||||||||
Citibank N.A. | PLN | 87,605 | 01/13/23 | 17,571 | 18,111 | 540 | ||||||||||||||||||
Goldman Sachs & Co. | RON | 78,558 | 01/13/23 | 15,590 | 15,707 | 117 | ||||||||||||||||||
Goldman Sachs & Co. | SGD | 201,470 | 02/21/23 | 145,116 | 142,554 | (2,562 | ) | |||||||||||||||||
Citibank N.A. | SGD | 60,423 | 02/21/23 | 43,655 | 42,753 | (902 | ) | |||||||||||||||||
|
|
|
|
|
| |||||||||||||||||||
| $ | 4,763,860 | $ | 4,571,978 | $ | (191,882 | ) | ||||||||||||||||||
|
|
|
|
|
| |||||||||||||||||||
See accompanying Notes to Financial Statements.
61
Table of Contents
TCW Global Bond Fund
Schedule of Investments (Continued)
| Counterparty | Contracts to Deliver | Units of Currency | Settlement Date | In Exchange for U.S. Dollars | Contracts at Value | Unrealized Appreciation (Depreciation) | ||||||||||||||||||
| SELL (14) | ||||||||||||||||||||||||
Citibank N.A. | AUD | 375,299 | 01/13/23 | $ | 244,539 | $ | 240,578 | $ | 3,961 | |||||||||||||||
State Street Bank & Trust Co. | AUD | 375,299 | 01/13/23 | 245,131 | 240,579 | 4,552 | ||||||||||||||||||
Goldman Sachs & Co. | CAD | 154,000 | 01/13/23 | 112,414 | 113,010 | (596 | ) | |||||||||||||||||
Goldman Sachs & Co. | CNH | 1,657,922 | 02/21/23 | 242,694 | 227,804 | 14,890 | ||||||||||||||||||
State Street Bank & Trust Co. | CNH | 4,328,744 | 02/21/23 | 670,025 | 598,397 | 71,628 | ||||||||||||||||||
Goldman Sachs & Co. | COP | 4,853,486 | 01/13/23 | 1,055 | 981 | 74 | ||||||||||||||||||
Citibank N.A. | CZK | 595,516 | 01/13/23 | 23,704 | 23,938 | (234 | ) | |||||||||||||||||
Goldman Sachs & Co. | EUR | 127,000 | 01/13/23 | 127,652 | 126,294 | 1,358 | ||||||||||||||||||
State Street Bank & Trust Co. | EUR | 62,000 | 01/13/23 | 61,785 | 61,655 | 130 | ||||||||||||||||||
Goldman Sachs & Co. | GBP | 2,000 | 01/13/23 | 2,229 | 2,309 | (80 | ) | |||||||||||||||||
Citibank N.A. | GBP | 298,242 | 01/13/23 | 337,684 | 344,261 | (6,577 | ) | |||||||||||||||||
Goldman Sachs & Co. | IDR | 73,249,220 | 01/13/23 | 4,767 | 4,689 | 78 | ||||||||||||||||||
Citibank N.A. | ILS | 13,674 | 01/13/23 | 3,887 | 3,911 | (24 | ) | |||||||||||||||||
Goldman Sachs & Co. | JPY | 3,967,000 | 01/13/23 | 27,747 | 26,946 | 801 | ||||||||||||||||||
State Street Bank & Trust Co. | JPY | 2,797,000 | 01/13/23 | 18,875 | 18,999 | (124 | ) | |||||||||||||||||
Goldman Sachs & Co. | KRW | 298,134,085 | 02/21/23 | 234,456 | 210,074 | 24,382 | ||||||||||||||||||
Citibank N.A. | KRW | 140,547,618 | 02/21/23 | 111,610 | 99,033 | 12,577 | ||||||||||||||||||
Goldman Sachs & Co. | MXN | 422,122 | 01/13/23 | 20,734 | 20,995 | (261 | ) | |||||||||||||||||
Goldman Sachs & Co. | MYR | 70,630 | 01/13/23 | 15,192 | 15,017 | 175 | ||||||||||||||||||
Goldman Sachs & Co. | NOK | 3,745,000 | 01/13/23 | 350,977 | 361,136 | (10,159 | ) | |||||||||||||||||
Citibank N.A. | NZD | 740,000 | 01/13/23 | 422,925 | 430,379 | (7,454 | ) | |||||||||||||||||
Goldman Sachs & Co. | PEN | 132,484 | 01/13/23 | 33,070 | 32,973 | 97 | ||||||||||||||||||
Goldman Sachs & Co. | RON | 251,071 | 01/13/23 | 49,278 | 50,198 | (920 | ) | |||||||||||||||||
Goldman Sachs & Co. | SGD | 180,000 | 02/21/23 | 134,489 | 127,362 | 7,127 | ||||||||||||||||||
Citibank N.A. | THB | 447,732 | 01/13/23 | 11,916 | 11,843 | 73 | ||||||||||||||||||
Citibank N.A. | ZAR | 560,894 | 01/13/23 | 31,165 | 30,355 | 810 | ||||||||||||||||||
|
|
|
|
|
| |||||||||||||||||||
| $ | 3,540,000 | $ | 3,423,716 | $ | 116,284 | |||||||||||||||||||
|
|
|
|
|
| |||||||||||||||||||
| Futures Contracts | ||||||||||||||||||
| Number of Contracts | Type | Expiration Date | Notional | Market Value | Net Unrealized Appreciation (Depreciation) | |||||||||||||
Long Futures |
| |||||||||||||||||
| 4 | 5-Year Canadian Bond Futures | 12/19/22 | $ | 331,228 | $ | 328,052 | $ | (3,176 | ) | |||||||||
| 6 | 2-Year Canadian Bond Futures | 12/19/22 | 453,958 | 454,580 | 622 | |||||||||||||
| 4 | 2-Year U.S Treasury Note Futures | 12/30/22 | 830,960 | 817,532 | (13,428 | ) | ||||||||||||
| 7 | 5-Year U.S Treasury Note Futures | 12/30/22 | 745,295 | 746,156 | 861 | |||||||||||||
| 1 | Euro-Bobl Futures | 12/8/22 | 120,739 | 118,276 | (2,463 | ) | ||||||||||||
| 1 | U.S. Ultra Long Bond Futures | 12/20/22 | 150,148 | 127,656 | (22,492 | ) | ||||||||||||
|
|
|
|
|
| |||||||||||||
| $ | 2,632,328 | $ | 2,592,252 | $ | (40,076 | ) | ||||||||||||
|
|
|
|
|
| |||||||||||||
Short Futures |
| |||||||||||||||||
| 11 | 10-Year U.S. Treasury Note Futures | 12/20/22 | $ | (1,377,687 | ) | $ | (1,275,828 | ) | $ | 101,859 | ||||||||
| 1 | Long Gilt Futures | 12/28/22 | (126,578 | ) | (117,587 | ) | 8,991 | |||||||||||
|
|
|
|
|
| |||||||||||||
| $ | (1,504,265 | ) | $ | (1,393,415 | ) | $ | 110,850 | |||||||||||
|
|
|
|
|
| |||||||||||||
| Centrally Cleared — Interest Rate Swap Agreements | ||||||||||||||||||||||||||||||
| Notional Amount | Expiration Date | Payment Made by Fund Frequency | Payment Made by Fund | Payment Received by Fund Frequency | Payment Received by Fund | Unrealized Appreciation (Depreciation) | Premium Paid | Value | ||||||||||||||||||||||
| $1,460,000 | 06/10/24 | Annual | 12-Month SOFR | Annual | 1.950% | $ | (61,337 | ) | $ — | $ (61,337) | ||||||||||||||||||||
| EUR 180,000 | 12/21/27 | Annual | 5-Year Euro Short-Term Rate | Annual | 3.000% | 2,246 | 434 | 2,680 | ||||||||||||||||||||||
|
|
|
|
|
| |||||||||||||||||||||||||
| $ | (59,091 | ) | $ 434 | $ (58,657) | ||||||||||||||||||||||||||
|
|
|
|
|
| |||||||||||||||||||||||||
See accompanying Notes to Financial Statements.
62
Table of Contents
TCW Global Bond Fund
October 31, 2022
Notes to the Schedule of Investments:
| ABS | Asset-Backed Securities. |
| CLO | Collateralized Loan Obligation. |
| COP | Colombian Peso. |
| EETC | Enhanced Equipment Trust Certificate. |
| I/F | Inverse Floating rate security whose interest rate moves in the opposite direction of prevailing interest rates. |
| I/O | Interest Only Security. |
| PAC | Planned Amortization Class. |
| REIT | Real Estate Investment Trust. |
| RON | New Romanian Leu. |
| SOFR | Secured Overnight Financing Rate. |
| TBA | To Be Announced. |
| AUD | Australian Dollar. |
| CAD | Canadian Dollar. |
| CHF | Swiss Franc. |
| CLP | Chilean Peso. |
| CNH | Chinese Yuan Renminbi. |
| CNY | Chinese Yuan. |
| COP | Colombian Peso. |
| CZK | Czech Koruna. |
| EUR | Euro Currency. |
| GBP | British Pound Sterling. |
| HUF | Hungarian Forint. |
| IDR | Indonesian Rupiah. |
| ILS | Israeli Shekel. |
| JPY | Japanese Yen. |
| KRW | South Korean Won. |
| MXN | Mexican Peso. |
| MYR | Malaysian Ringgit. |
| NOK | Norwegian Krona. |
| NZD | New Zealand Dollar. |
| PEN | Peruvian Nuevo Sol. |
| PLN | Polish Zloty. |
| RON | Romanian New Leu. |
| SEK | Swedish Krona. |
| SGD | Singapore Dollar. |
| ZAR | South African Rand. |
| (1) | Investments issued under Regulation S of the Securities Act of 1933, as amended, may not be offered, sold, or delivered within the United States except under special exemptions. At October 31, 2022, the value of these securities amounted to $4,369,964 or 26.7% of net assets. |
| (2) | Security exempt from registration under Rule 144A of the Securities Act of 1933, as amended. These securities may be resold, normally only to qualified institutional buyers. At October 31, 2022, the value of these securities amounted to $2,942,849 or 18.0% of net assets. These securities are determined to be liquid by the Fund’s investment advisor, unless otherwise noted, under procedures established by and under the general supervision of the Company’s Board of Directors. |
| (3) | Floating or variable rate security. The interest shown reflects the rate in effect at October 31, 2022. |
| (4) | For fair value measurement disclosure purposes, security is categorized as Level 3. Security is valued using significant unobservable inputs. |
| (5) | Restricted security (Note 11). |
| (6) | Security is not accruing interest. |
| (7) | Variable rate security. Interest rate disclosed is as of the most recent information available. Certain variable rate securities are not based on a published reference rate and spread but are determined by the issuer or agent and are based on current market conditions. These securities do not indicate a reference rate and spread in their description above. |
| (8) | Security purchased on a forward commitment with an approximate principal amount. The actual principal amount and maturity date will be determined upon settlement when the security is delivered. |
| (9) | A portion of the principal balance has been written-off during the period due to defaults in the underlying loans. Cost basis has been adjusted. |
| (10) | Rate disclosed is the 7-day net yield as of October 31, 2022. |
| (11) | Affiliated issuer. |
| (12) | Non-income producing security. |
| (13) | Fund buys foreign currency, sells U.S. Dollar. |
| (14) | Fund sells foreign currency, buys U.S. Dollar. |
See accompanying Notes to Financial Statements.
63
Table of Contents
TCW Global Bond Fund
Schedule of Investments (Continued)
The summary of the TCW Global Bond Fund transactions in the affiliated fund for the year ended October 31, 2022 is as follows:
Name of | Value at October 31, 2021 | Purchases at Cost | Proceeds from Sales | Number of Shares Held October 31, 2022 | Value at October 31, 2022 | Dividends and Interest Income Received | Distributions Received from Net Realized Gain | Net Realized Gain (Loss) on Investments | Net change in Unrealized Gain (Loss) on Investments | |||||||||||||||||||||||||||
TCW Emerging Markets Income Fund — I Class |
| |||||||||||||||||||||||||||||||||||
| $ | 1,142,121 | $ | 76,194 | $ | 415,000 | 98,943 | $ | 561,009 | $ | 33,497 | $ | — | $ | (75,538 | ) | $ | (166,768 | ) | ||||||||||||||||||
|
|
|
|
|
|
|
|
|
| |||||||||||||||||||||||||||
Total | $ | 561,009 | $ | 33,497 | $ | — | $ | (75,538 | ) | $ | (166,768 | ) | ||||||||||||||||||||||||
|
|
|
|
|
|
|
|
|
| |||||||||||||||||||||||||||
See accompanying Notes to Financial Statements.
64
Table of Contents
TCW Global Bond Fund
Investments by Sector | October 31, 2022 |
| Sector | Percentage of Net Assets | |||
Foreign Government Bonds | 39.2 | % | ||
Corporate Bonds | 30.6 | |||
Residential Mortgage-Backed Securities — Agency | 21.9 | |||
Residential Mortgage-Backed Securities — Non-Agency | 9.6 | |||
Asset-Backed Securities | 5.3 | |||
Investment Companies | 3.4 | |||
Money Market Investments | 2.0 | |||
Commercial Mortgage-Backed Securities — Non-Agency | 1.0 | |||
Municipal Bonds | 0.7 | |||
Commercial Mortgage-Backed Securities — Agency | 0.2 | |||
U.S. Treasury Securities | 0.1 | |||
Common Stock | 0.1 | |||
Rights | 0.0 | |||
Other* | (14.1 | ) | ||
|
| |||
Total | 100.0 | % | ||
|
| |||
| * | Includes futures, swap agreements, pending trades, interest receivable, fund share transactions and accrued expenses payable. |
See accompanying Notes to Financial Statements.
65
Table of Contents
TCW Global Bond Fund
Investments by Country | October 31, 2022 |
| Country | Percentage of Net Assets | |||
Australia | 3.3 | % | ||
Bermuda | 0.7 | |||
Canada | 3.4 | |||
Cayman Islands | 4.4 | |||
China | 5.1 | |||
Colombia | 0.1 | |||
France | 5.4 | |||
Germany | 2.0 | |||
Great Britain | 5.9 | |||
Hungary | 0.2 | |||
Indonesia | 0.4 | |||
Ireland | 1.6 | |||
Israel | 1.4 | |||
Italy | 1.3 | |||
Japan | 2.0 | |||
Jersey | 0.5 | |||
Luxembourg | 0.4 | |||
Malaysia | 0.4 | |||
Mexico | 0.7 | |||
Netherlands | 1.7 | |||
New Zealand | 2.7 | |||
Norway | 2.0 | |||
Panama | 1.0 | |||
Peru | 0.2 | |||
Portugal | 0.7 | |||
Qatar | 1.1 | |||
Romania | 0.1 | |||
Saudi Arabia | 1.0 | |||
Singapore | 0.6 | |||
South Africa | 0.2 | |||
South Korea | 2.1 | |||
Spain | 0.8 | |||
Supranational | 1.9 | |||
Sweden | 0.4 | |||
Switzerland | 0.6 | |||
Thailand | 0.3 | |||
United States | 57.5 | |||
|
| |||
Total | 114.1 | % | ||
|
| |||
See accompanying Notes to Financial Statements.
66
Table of Contents
TCW Global Bond Fund
Fair Valuation Summary | October 31, 2022 |
The following is a summary of the fair valuations according to the inputs used as of October 31, 2022 in valuing the Fund’s investments:
Description | Quoted Prices in Active Markets for Identical Assets (Level 1) | Other Significant Observable Inputs (Level 2) | Significant Unobservable Inputs (Level 3) | Total | ||||||||||||
Fixed Income Securities | ||||||||||||||||
Corporate Bonds | $ | — | $ | 5,009,805 | $ | — | $ | 5,009,805 | ||||||||
Municipal Bonds | — | 116,777 | — | 116,777 | ||||||||||||
Foreign Government Bonds | — | 6,427,619 | — | 6,427,619 | ||||||||||||
Asset-Backed Securities | — | 870,727 | — | 870,727 | ||||||||||||
Commercial Mortgage-Backed Securities — Agency | — | 23,464 | — | 23,464 | ||||||||||||
Commercial Mortgage-Backed Securities — Non-Agency | — | 169,024 | — | 169,024 | ||||||||||||
Residential Mortgage-Backed Securities — Agency | — | 3,582,395 | — | 3,582,395 | ||||||||||||
Residential Mortgage-Backed Securities — Non-Agency | — | 1,524,106 | 54,941 | 1,579,047 | ||||||||||||
U.S. Treasury Securities | 10,945 | — | — | 10,945 | ||||||||||||
|
|
|
|
|
|
|
| |||||||||
Total Fixed Income Securities | 10,945 | 17,723,917 | 54,941 | 17,789,803 | ||||||||||||
|
|
|
|
|
|
|
| |||||||||
Money Market Investments | 323,603 | — | — | 323,603 | ||||||||||||
Investment Companies | 561,009 | — | — | 561,009 | ||||||||||||
Common Stock | — | — | 9,150 | 9,150 | ||||||||||||
Rights | — | — | — | — | ||||||||||||
|
|
|
|
|
|
|
| |||||||||
Total Investments | $ | 895,557 | $ | 17,723,917 | $ | 64,091 | $ | 18,683,565 | ||||||||
|
|
|
|
|
|
|
| |||||||||
Asset Derivatives | ||||||||||||||||
Forward Currency Contracts | ||||||||||||||||
Foreign Currency Risk | — | 150,928 | — | 150,928 | ||||||||||||
Futures Contracts | ||||||||||||||||
Interest Rate Risk | 112,333 | — | — | 112,333 | ||||||||||||
Swap Agreements | ||||||||||||||||
Interest Rate Risk | — | 2,680 | — | 2,680 | ||||||||||||
|
|
|
|
|
|
|
| |||||||||
Total | $ | 1,007,890 | $ | 17,877,525 | $ | 64,091 | $ | 18,949,506 | ||||||||
|
|
|
|
|
|
|
| |||||||||
Liability Derivatives | ||||||||||||||||
Forward Currency Contracts | ||||||||||||||||
Foreign Currency Risk | $ | — | $ | (226,526 | ) | $ | — | $ | (226,526 | ) | ||||||
Futures Contracts | ||||||||||||||||
Interest Rate Risk | (41,559 | ) | — | — | (41,559 | ) | ||||||||||
Swap Agreements | ||||||||||||||||
Interest Rate Risk | — | (61,337 | ) | — | (61,337 | ) | ||||||||||
|
|
|
|
|
|
|
| |||||||||
Total | $ | (41,559 | ) | $ | (287,863 | ) | $ | — | $ | (329,422 | ) | |||||
|
|
|
|
|
|
|
| |||||||||
See accompanying Notes to Financial Statements.
67
Table of Contents
Schedule of Investments
| Issues | Maturity Date | Principal Amount | Value | |||||||||
FIXED INCOME SECURITIES — 90.5% of Net Assets |
| |||||||||||
BANK LOANS — 7.5% |
| |||||||||||
| Airlines — 0.1% | ||||||||||||
AAdvantage Loyalty IP Ltd. 2021 Term Loan |
| |||||||||||
8.99% (3 mo. USD LIBOR + 4.750%) (1) | 04/20/28 | $ | 70,000 | $ | 69,438 | |||||||
|
| |||||||||||
| Chemicals — 0.5% | ||||||||||||
IRIS Holdings, Inc. Term Loan |
| |||||||||||
8.94% (SOFR + 4.75%) (1) | 06/28/28 | 101,000 | 92,794 | |||||||||
Zep, Inc. 2017 1st Lien Term Loan |
| |||||||||||
7.67% (3 mo. USD LIBOR + 4.000%) (1) | 08/11/24 | 257,087 | 224,951 | |||||||||
|
| |||||||||||
| 317,745 | ||||||||||||
|
| |||||||||||
| Commercial Services — 0.6% | ||||||||||||
Spin Holdco, Inc. 2021 Term Loan |
| |||||||||||
7.14% (3 mo. USD LIBOR + 4.000%) (1) | 03/04/28 | 417,563 | 369,109 | |||||||||
|
| |||||||||||
| Computers — 0.3% | ||||||||||||
TierPoint LLC 2021 Term Loan |
| |||||||||||
7.50% (1 mo. USD LIBOR + 3.750%) (1) | 05/05/26 | 192,109 | 178,205 | |||||||||
|
| |||||||||||
| Electric — 0.1% | ||||||||||||
Vistra Operations Co. LLC 1st Lien Term Loan B3 |
| |||||||||||
5.16% (1 mo. USD LIBOR + 1.750%) (1) | 12/31/25 | 66,371 | 65,937 | |||||||||
|
| |||||||||||
| Entertainment — 0.7% | ||||||||||||
Crown Finance US, Inc. 2022 DIP Delayed Draw Term Loan |
| |||||||||||
0.00% (1),(2) | 09/07/23 | 19,380 | 19,435 | |||||||||
Crown Finance US, Inc. 2022 DIP Term Loan |
| |||||||||||
0.00% (1),(2) | 09/07/23 | 368,992 | 370,050 | |||||||||
|
| |||||||||||
| 389,485 | ||||||||||||
|
| |||||||||||
| Health Care-Products — 0.0% | ||||||||||||
Auris Luxembourg III Sarl 2019 USD Term Loan B2 |
| |||||||||||
7.82% (3 mo. USD LIBOR + 3.750%) (1) | 02/27/26 | 15,923 | 13,674 | |||||||||
|
| |||||||||||
| Health Care-Services — 0.6% | ||||||||||||
ADMI Corp. 2021 Term Loan B2 |
| |||||||||||
7.13% (1 mo. USD LIBOR + 3.375%) (1) | 12/23/27 | 270,875 | 242,433 | |||||||||
eResearchTechnology, Inc. 2020 1st Lien Term Loan |
| |||||||||||
8.25% (1 mo. USD LIBOR + 4.500%) (1) | 02/04/27 | 127,714 | 119,213 | |||||||||
|
| |||||||||||
| 361,646 | ||||||||||||
|
| |||||||||||
| Insurance — 0.1% | ||||||||||||
Asurion LLC 2021 2nd Lien Term Loan B3 |
| |||||||||||
9.00% (1 mo. USD LIBOR + 5.250%) (1) | 02/03/28 | 100,000 | 70,938 | |||||||||
|
| |||||||||||
| Issues | Maturity Date | Principal Amount | Value | |||||||||
| Machinery-Diversified — 1.1% | ||||||||||||
ASP Blade Holdings, Inc. Initial Term Loan |
| |||||||||||
7.67% (3 mo. USD LIBOR + 4.000%) (1) | 10/15/28 | $ | 556,047 | $ | 453,178 | |||||||
Titan Acquisition Ltd. 2018 Term Loan B |
| |||||||||||
5.88% (6 mo. USD LIBOR + 3.000%) (1) | 03/28/25 | 196,544 | 180,523 | |||||||||
|
| |||||||||||
| 633,701 | ||||||||||||
|
| |||||||||||
| Media — 0.3% | ||||||||||||
DirecTV Financing LLC Term Loan |
| |||||||||||
8.75% (1 mo. USD LIBOR + 5.000%) (1) | 08/02/27 | 151,970 | 145,207 | |||||||||
|
| |||||||||||
| Packaging & Containers — 1.4% | ||||||||||||
Clydesdale Acquisition Holdings, Inc. Term Loan B |
| |||||||||||
8.00% (SOFR + 4.175%) (1) | 04/13/29 | 299,250 | 288,730 | |||||||||
Plaze, Inc. 2020 Incremental Term Loan |
| |||||||||||
7.50% (1 mo. USD LIBOR + 3.750%) (1) | 08/03/26 | 210,709 | 191,482 | |||||||||
Proampac PG Borrower LLC 2020 Term Loan |
| |||||||||||
7.83% (3 mo. USD LIBOR + 3.750%) (1) | 11/03/25 | 374,319 | 357,085 | |||||||||
|
| |||||||||||
| 837,297 | ||||||||||||
|
| |||||||||||
| Pharmaceuticals — 0.4% | ||||||||||||
Elanco Animal Health, Inc. Term Loan B |
| |||||||||||
4.88% (1 mo. USD LIBOR + 1.750%) (1) | 08/01/27 | 264,609 | 255,532 | |||||||||
|
| |||||||||||
| Retail — 0.2% | ||||||||||||
1011778 B.C. Unlimited Liability Co. Term Loan B4 |
| |||||||||||
5.50% (1 mo. USD LIBOR + 1.750%) (1) | 11/19/26 | 78,412 | 76,412 | |||||||||
Staples, Inc. Term Loan B2 |
| |||||||||||
7.28% (3 mo. USD LIBOR + 4.500%) (1) | 09/12/24 | 44,884 | 43,407 | |||||||||
|
| |||||||||||
| 119,819 | ||||||||||||
|
| |||||||||||
| Software — 0.5% | ||||||||||||
CDK Global, Inc. 2022 USD Term Loan B |
| |||||||||||
8.11% (SOFR + 4.50%) (1) | 07/06/29 | 175,000 | 171,719 | |||||||||
CT Technologies Intermediate Holdings, Inc. 2021 Term Loan B |
| |||||||||||
8.00% (1 mo. USD LIBOR + 4.250%) (1) | 12/16/25 | 142,825 | 131,879 | |||||||||
|
| |||||||||||
| 303,598 | ||||||||||||
|
| |||||||||||
| Telecommunications — 0.6% | ||||||||||||
Level 3 Financing, Inc. 2019 Term Loan B |
| |||||||||||
5.50% (1 mo. USD LIBOR + 1.750%) (1) | 03/01/27 | 107,180 | 102,105 | |||||||||
See accompanying Notes to Financial Statements.
68
Table of Contents
TCW High Yield Bond Fund
October 31, 2022
| Issues | Maturity Date | Principal Amount | Value | |||||||||
| Telecommunications (Continued) | ||||||||||||
SBA Senior Finance II LLC 2018 Term Loan B |
| |||||||||||
5.51% (1 mo. USD LIBOR + 1.750%) (1) | 04/11/25 | $ | 260,755 | $ | 258,962 | |||||||
|
| |||||||||||
| 361,067 | ||||||||||||
|
| |||||||||||
Total Bank Loans |
| |||||||||||
(Cost: $4,779,426) | 4,492,398 | |||||||||||
|
| |||||||||||
CORPORATE BONDS — 83.0% |
| |||||||||||
| Aerospace/Defense — 0.4% | ||||||||||||
TransDigm, Inc. |
| |||||||||||
5.50% | 11/15/27 | 250,000 | 227,303 | |||||||||
|
| |||||||||||
| Agriculture — 0.5% | ||||||||||||
BAT Capital Corp. |
| |||||||||||
5.28% | 04/02/50 | 401,000 | 287,066 | |||||||||
|
| |||||||||||
| Airlines — 0.3% | ||||||||||||
Delta Air Lines, Inc. / SkyMiles IP, Ltd. |
| |||||||||||
4.75% (3) | 10/20/28 | 222,000 | 206,671 | |||||||||
|
| |||||||||||
| Auto Manufacturers — 2.0% | ||||||||||||
Allison Transmission, Inc. |
| |||||||||||
3.75% (3) | 01/30/31 | 200,000 | 161,500 | |||||||||
Ford Motor Credit Co. LLC |
| |||||||||||
3.37% | 11/17/23 | 1,100,000 | 1,067,000 | |||||||||
|
| |||||||||||
| 1,228,500 | ||||||||||||
|
| |||||||||||
| Banks — 2.1% | ||||||||||||
Bank of America Corp. |
| |||||||||||
4.38% (U.S. 5-year Treasury Constant Maturity Rate + 2.760%) (1),(4) | 01/27/27 | 225,000 | 181,159 | |||||||||
Bank of New York Mellon Corp. (The) |
| |||||||||||
3.75% (U.S. 5-year Treasury Constant Maturity Rate + 2.630%) (1),(4) | 12/20/26 | 285,000 | 221,053 | |||||||||
Citigroup, Inc. |
| |||||||||||
2.52% (SOFR + 1.177%)(1) | 11/03/32 | 11,000 | 8,256 | |||||||||
3.06% (SOFR + 1.35%) | 01/25/33 | 26,000 | 20,327 | |||||||||
3.79% (SOFR + 1.939%)(1) | 03/17/33 | 180,000 | 149,071 | |||||||||
Credit Suisse Group AG (Switzerland) |
| |||||||||||
6.54% (SOFR + 3.920%) (3),(1) | 08/12/33 | 405,000 | 349,998 | |||||||||
JPMorgan Chase & Co. |
| |||||||||||
3.65% (U.S. 5-year Treasury Constant Maturity Rate + 2.850%) (1),(4) | 06/01/26 | 95,000 | 78,845 | |||||||||
| Issues | Maturity Date | Principal Amount | Value | |||||||||
| Banks (Continued) | ||||||||||||
US Bancorp |
| |||||||||||
3.70% (U.S. 5-year Treasury Constant Maturity Rate + 2.541%) (1),(4) | 01/15/27 | $ | 300,000 | $ | 230,469 | |||||||
|
| |||||||||||
| 1,239,178 | ||||||||||||
|
| |||||||||||
| Beverages — 0.4% | ||||||||||||
Primo Water Holdings, Inc. |
| |||||||||||
4.38% (3) | 04/30/29 | 300,000 | 252,096 | |||||||||
|
| |||||||||||
| Biotechnology — 0.6% | ||||||||||||
Grifols Escrow Issuer SA |
| |||||||||||
4.75% (3) | 10/15/28 | 467,000 | 365,451 | |||||||||
|
| |||||||||||
| Chemicals — 3.6% | ||||||||||||
ASP Unifrax Holdings, Inc. |
| |||||||||||
5.25% (3) | 09/30/28 | 412,000 | 331,652 | |||||||||
Axalta Coating Systems LLC |
| |||||||||||
3.38% (3) | 02/15/29 | 250,000 | 206,695 | |||||||||
Cheever Escrow Issuer LLC |
| |||||||||||
7.13% (3) | 10/01/27 | 200,000 | 183,740 | |||||||||
EverArc Escrow Sarl |
| |||||||||||
5.00% (3) | 10/30/29 | 422,000 | 346,076 | |||||||||
Herens Holdco Sarl |
| |||||||||||
4.75% (3) | 05/15/28 | 575,000 | 471,471 | |||||||||
SCIH Salt Holdings, Inc. |
| |||||||||||
4.88% (3) | 05/01/28 | 70,000 | 61,008 | |||||||||
SCIL IV LLC / SCIL USA Holdings LLC |
| |||||||||||
5.38% (3) | 11/01/26 | 64,000 | 51,206 | |||||||||
Valvoline, Inc. |
| |||||||||||
3.63% (3) | 06/15/31 | 620,000 | 490,051 | |||||||||
|
| |||||||||||
| 2,141,899 | ||||||||||||
|
| |||||||||||
| Commercial Services — 2.9% | ||||||||||||
Adtalem Global Education, Inc. |
| |||||||||||
5.50% (3) | 03/01/28 | 198,000 | 180,786 | |||||||||
Carriage Services, Inc. |
| |||||||||||
4.25% (3) | 05/15/29 | 277,000 | 209,819 | |||||||||
Gartner, Inc. |
| |||||||||||
3.75% (3) | 10/01/30 | 80,000 | 68,052 | |||||||||
4.50% (3) | 07/01/28 | 296,000 | 274,909 | |||||||||
Global Payments, Inc. |
| |||||||||||
5.30% | 08/15/29 | 110,000 | 103,765 | |||||||||
HealthEquity, Inc. |
| |||||||||||
4.50% (3) | 10/01/29 | 110,000 | 96,263 | |||||||||
Prime Security Services Borrower LLC / Prime Finance, Inc. |
| |||||||||||
3.38% (3) | 08/31/27 | 412,000 | 359,005 | |||||||||
Rent-A-Center, Inc. |
| |||||||||||
6.38% (3) | 02/15/29 | 500,000 | 390,985 | |||||||||
See accompanying Notes to Financial Statements.
69
Table of Contents
TCW High Yield Bond Fund
Schedule of Investments (Continued)
| Issues | Maturity Date | Principal Amount | Value | |||||||||
| Commercial Services (Continued) | ||||||||||||
WASH Multifamily Acquisition, Inc. |
| |||||||||||
5.75% (3) | 04/15/26 | $ | 80,000 | $ | 74,970 | |||||||
|
| |||||||||||
| 1,758,554 | ||||||||||||
|
| |||||||||||
| Computers — 2.7% | ||||||||||||
Booz Allen Hamilton, Inc. |
| |||||||||||
3.88% (3) | 09/01/28 | 468,000 | 413,197 | |||||||||
NCR Corp. |
| |||||||||||
5.13% (3) | 04/15/29 | 330,000 | 277,081 | |||||||||
5.25% (3) | 10/01/30 | 476,000 | 385,163 | |||||||||
5.75% (3) | 09/01/27 | 215,000 | 207,791 | |||||||||
6.13% (3) | 09/01/29 | 65,000 | 62,044 | |||||||||
Science Applications International Corp. |
| |||||||||||
4.88% (3) | 04/01/28 | 275,000 | 251,680 | |||||||||
|
| |||||||||||
| 1,596,956 | ||||||||||||
|
| |||||||||||
| Diversified Financial Services — 1.5% | ||||||||||||
American Express Co. | ||||||||||||
3.55% (U.S. 5-year Treasury Constant Maturity Rate + 2.854%) (1),(4) | 09/15/26 | 230,000 | 179,641 | |||||||||
Charles Schwab Corp. (The) | ||||||||||||
5.00% (U.S. 5-year Treasury Constant Maturity Rate + 3.256%) (1),(4) | 06/01/27 | 265,000 | 235,850 | |||||||||
Jane Street Group / JSG Finance, Inc. |
| |||||||||||
4.50% (3) | 11/15/29 | 540,000 | 476,555 | |||||||||
|
| |||||||||||
| 892,046 | ||||||||||||
|
| |||||||||||
| Electric — 1.4% | ||||||||||||
American Electric Power Co., Inc. |
| |||||||||||
5.95% | 11/01/32 | 150,000 | 148,975 | |||||||||
FirstEnergy Corp. | ||||||||||||
2.65% | 03/01/30 | 395,000 | 320,209 | |||||||||
5.35% | 07/15/47 | 96,000 | 79,688 | |||||||||
Pike Corp. | ||||||||||||
5.50% (3) | 09/01/28 | 375,000 | 321,096 | |||||||||
|
| |||||||||||
| 869,968 | ||||||||||||
|
| |||||||||||
| Electrical Components & Equipment — 0.6% | ||||||||||||
Energizer Holdings, Inc. | ||||||||||||
4.38% (3) | 03/31/29 | 465,000 | 376,650 | |||||||||
|
| |||||||||||
| Electronics — 0.1% | ||||||||||||
Coherent Corp. | ||||||||||||
5.00% (3) | 12/15/29 | 65,000 | 55,799 | |||||||||
|
| |||||||||||
| Engineering & Construction — 0.3% | ||||||||||||
Artera Services LLC | ||||||||||||
9.03% (3) | 12/04/25 | 195,000 | 164,075 | |||||||||
|
| |||||||||||
| Issues | Maturity Date | Principal Amount | Value | |||||||||
| Entertainment — 2.3% | ||||||||||||
Churchill Downs, Inc. | ||||||||||||
4.75% (3) | 01/15/28 | $ | 70,000 | $ | 61,980 | |||||||
Cinemark USA, Inc. | ||||||||||||
5.25% (3) | 07/15/28 | 70,000 | 54,426 | |||||||||
Everi Holdings, Inc. | ||||||||||||
5.00% (3) | 07/15/29 | 225,000 | 197,156 | |||||||||
Live Nation Entertainment, Inc. |
| |||||||||||
4.75% (3) | 10/15/27 | 115,000 | 102,638 | |||||||||
Penn Entertainment, Inc. |
| |||||||||||
4.13% (3) | 07/01/29 | 410,000 | 322,875 | |||||||||
5.63% (3) | 01/15/27 | 65,000 | 59,199 | |||||||||
WarnerMedia Holdings, Inc. |
| |||||||||||
5.14% (3) | 03/15/52 | 850,000 | 595,765 | |||||||||
|
| |||||||||||
| 1,394,039 | ||||||||||||
|
| |||||||||||
| Food — 6.6% | ||||||||||||
JBS USA LUX SA / JBS USA Food Co. / JBS USA Finance, Inc. |
| |||||||||||
3.75% (3) | 12/01/31 | 130,000 | 102,265 | |||||||||
4.38% (3) | 02/02/52 | 1,070,000 | 695,168 | |||||||||
Kraft Heinz Foods Co. |
| |||||||||||
4.38% | 06/01/46 | 200,000 | 156,542 | |||||||||
5.00% | 06/04/42 | 90,000 | 78,016 | |||||||||
5.20% | 07/15/45 | 725,000 | 635,027 | |||||||||
Nathan’s Famous, Inc. |
| |||||||||||
6.63% (3) | 11/01/25 | 11,000 | 10,945 | |||||||||
Pilgrim’s Pride Corp. |
| |||||||||||
3.50% (3) | 03/01/32 | 1,400,000 | 1,077,986 | |||||||||
5.88% (3) | 09/30/27 | 170,000 | 166,449 | |||||||||
Post Holdings, Inc. |
| |||||||||||
5.75% (3) | 03/01/27 | 576,000 | 558,720 | |||||||||
Simmons Foods, Inc./Simmons Prepared Foods, Inc./Simmons Pet Food, Inc./Simmons Feed |
| |||||||||||
4.63% (3) | 03/01/29 | 360,000 | 300,744 | |||||||||
Smithfield Foods, Inc. |
| |||||||||||
5.20% (3) | 04/01/29 | 217,000 | 200,348 | |||||||||
|
| |||||||||||
| 3,982,210 | ||||||||||||
|
| |||||||||||
| Forest Products & Paper — 0.5% | ||||||||||||
Clearwater Paper Corp. |
| |||||||||||
4.75% (3) | 08/15/28 | 364,000 | 319,734 | |||||||||
|
| |||||||||||
| Health Care-Products — 1.9% | ||||||||||||
Hologic, Inc. |
| |||||||||||
3.25% (3) | 02/15/29 | 55,000 | 46,856 | |||||||||
Medline Borrower LP |
| |||||||||||
3.88% (3) | 04/01/29 | 580,000 | 474,579 | |||||||||
Teleflex, Inc. |
| |||||||||||
4.25% (3) | 06/01/28 | 687,000 | 622,776 | |||||||||
|
| |||||||||||
| 1,144,211 | ||||||||||||
|
| |||||||||||
See accompanying Notes to Financial Statements.
70
Table of Contents
TCW High Yield Bond Fund
October 31, 2022
| Issues | Maturity Date | Principal Amount | Value | |||||||||
| Health Care-Services — 12.3% | ||||||||||||
Catalent Pharma Solutions, Inc. |
| |||||||||||
3.50% (3) | 04/01/30 | $ | 425,000 | $ | 344,180 | |||||||
5.00% (3) | 07/15/27 | 350,000 | 329,686 | |||||||||
Centene Corp. |
| |||||||||||
2.45% | 07/15/28 | 855,000 | 703,981 | |||||||||
2.63% | 08/01/31 | 250,000 | 191,063 | |||||||||
3.00% | 10/15/30 | 75,000 | 60,497 | |||||||||
4.25% | 12/15/27 | 1,020,000 | 942,500 | |||||||||
Encompass Health Corp. |
| |||||||||||
4.75% | 02/01/30 | 266,000 | 227,353 | |||||||||
HCA, Inc. |
| |||||||||||
3.50% | 09/01/30 | 440,000 | 365,114 | |||||||||
5.25% | 04/15/25 | 65,000 | 63,920 | |||||||||
5.38% | 02/01/25 | 275,000 | 271,950 | |||||||||
5.63% | 09/01/28 | 95,000 | 91,896 | |||||||||
5.88% | 02/01/29 | 615,000 | 602,730 | |||||||||
IQVIA, Inc. |
| |||||||||||
5.00% (3) | 05/15/27 | 228,000 | 218,397 | |||||||||
ModivCare Escrow Issuer, Inc. |
| |||||||||||
5.00% (3) | 10/01/29 | 325,000 | 278,896 | |||||||||
ModivCare, Inc. |
| |||||||||||
5.88% (3) | 11/15/25 | 70,000 | 66,599 | |||||||||
Molina Healthcare, Inc. |
| |||||||||||
3.88% (3) | 11/15/30 | 1,964,000 | 1,703,770 | |||||||||
Prime Healthcare Services, Inc. |
| |||||||||||
7.25% (3) | 11/01/25 | 420,000 | 368,155 | |||||||||
Tenet Healthcare Corp. |
| |||||||||||
4.88% (3) | 01/01/26 | 200,000 | 189,320 | |||||||||
6.13% (3) | 06/15/30 | 360,000 | 335,138 | |||||||||
|
| |||||||||||
| 7,355,145 | ||||||||||||
|
| |||||||||||
| Household Products/Wares — 0.8% | ||||||||||||
Central Garden & Pet Co. |
| |||||||||||
4.13% | 10/15/30 | 240,000 | 199,142 | |||||||||
Spectrum Brands, Inc. |
| |||||||||||
3.88% (3) | 03/15/31 | 320,000 | 236,093 | |||||||||
5.00% (3) | 10/01/29 | 35,000 | 28,481 | |||||||||
|
| |||||||||||
| 463,716 | ||||||||||||
|
| |||||||||||
| Housewares — 0.7% | ||||||||||||
Newell Brands, Inc. |
| |||||||||||
4.88% | 06/01/25 | 349,000 | 337,434 | |||||||||
5.75% | 04/01/46 | 80,000 | 61,735 | |||||||||
|
| |||||||||||
| 399,169 | ||||||||||||
|
| |||||||||||
| Insurance — 0.8% | ||||||||||||
Acrisure LLC / Acrisure Finance, Inc. |
| |||||||||||
4.25% (3) | 02/15/29 | 420,000 | 343,846 | |||||||||
| Issues | Maturity Date | Principal Amount | Value | |||||||||
| Insurance (Continued) | ||||||||||||
AmWINS Group, Inc. |
| |||||||||||
4.88% (3) | 06/30/29 | $ | 130,000 | $ | 112,954 | |||||||
|
| |||||||||||
| 456,800 | ||||||||||||
|
| |||||||||||
| Internet — 0.6% | ||||||||||||
Cogent Communications Group, Inc. |
| |||||||||||
7.00% (3) | 06/15/27 | 105,000 | 100,491 | |||||||||
Netflix, Inc. |
| |||||||||||
4.63% | 05/15/29 | 100,000 | 96,625 | |||||||||
NortonLifeLock, Inc. |
| |||||||||||
6.75% (3) | 09/30/27 | 165,000 | 162,908 | |||||||||
|
| |||||||||||
| 360,024 | ||||||||||||
|
| |||||||||||
| Iron & Steel — 0.1% | ||||||||||||
ATI, Inc. |
| |||||||||||
5.13% | 10/01/31 | 95,000 | 79,216 | |||||||||
|
| |||||||||||
| Lodging — 0.7% | ||||||||||||
Boyd Gaming Corp. |
| |||||||||||
4.75% (3) | 06/15/31 | 115,000 | 97,463 | |||||||||
Hilton Domestic Operating Co., Inc. |
| |||||||||||
3.63% (3) | 02/15/32 | 200,000 | 159,619 | |||||||||
Wyndham Hotels & Resorts, Inc. |
| |||||||||||
4.38% (3) | 08/15/28 | 212,000 | 186,723 | |||||||||
|
| |||||||||||
| 443,805 | ||||||||||||
|
| |||||||||||
| Machinery-Construction & Mining — 0.5% | ||||||||||||
BWX Technologies, Inc. |
| |||||||||||
4.13% (3) | 06/30/28 | 330,000 | 291,502 | |||||||||
|
| |||||||||||
| Media — 6.3% | ||||||||||||
Block Communications, Inc. |
| |||||||||||
4.88% (3) | 03/01/28 | 355,000 | 311,069 | |||||||||
Cable One, Inc. |
| |||||||||||
4.00% (3) | 11/15/30 | 565,000 | 462,678 | |||||||||
CCO Holdings LLC / CCO Holdings Capital Corp. |
| |||||||||||
4.50% (3) | 06/01/33 | 400,000 | 305,204 | |||||||||
CSC Holdings LLC |
| |||||||||||
6.50% (3) | 02/01/29 | 180,000 | 169,941 | |||||||||
7.50% (3) | 04/01/28 | 150,000 | 130,235 | |||||||||
Diamond Sports Group LLC / Diamond Sports Finance Co. |
| |||||||||||
5.38% (3) | 08/15/26 | 1,095,000 | 220,369 | |||||||||
DISH DBS Corp. |
| |||||||||||
5.25% (3) | 12/01/26 | 550,000 | 478,844 | |||||||||
7.38% | 07/01/28 | 607,000 | 462,091 | |||||||||
7.75% | 07/01/26 | 30,000 | 25,575 | |||||||||
Gray Escrow II, Inc. |
| |||||||||||
5.38% (3) | 11/15/31 | 400,000 | 321,824 | |||||||||
Sirius XM Radio, Inc. |
| |||||||||||
3.13% (3) | 09/01/26 | 460,000 | 412,042 | |||||||||
See accompanying Notes to Financial Statements.
71
Table of Contents
TCW High Yield Bond Fund
Schedule of Investments (Continued)
| Issues | Maturity Date | Principal Amount | Value | |||||||||
| Media (Continued) | ||||||||||||
Virgin Media Secured Finance PLC (United Kingdom) |
| |||||||||||
4.50% (3) | 08/15/30 | $ | 200,000 | $ | 168,422 | |||||||
VZ Secured Financing BV |
| |||||||||||
5.00% (3) | 01/15/32 | 400,000 | 321,420 | |||||||||
|
| |||||||||||
| 3,789,714 | ||||||||||||
|
| |||||||||||
| Miscellaneous Manufacturers — 0.1% | ||||||||||||
General Electric Co. |
| |||||||||||
3.39% (3 mo. USD LIBOR + 0.480%) (1) | 08/15/36 | 52,000 | 41,866 | |||||||||
|
| |||||||||||
| Oil & Gas — 0.6% | ||||||||||||
Petroleos Mexicanos |
| |||||||||||
7.69% | 01/23/50 | 65,000 | 42,462 | |||||||||
SM Energy Co. |
| |||||||||||
6.50% | 07/15/28 | 330,000 | 321,476 | |||||||||
Valaris, Ltd. |
| |||||||||||
8.25% | 04/30/28 | 5,000 | 4,926 | |||||||||
|
| |||||||||||
| 368,864 | ||||||||||||
|
| |||||||||||
| Oil & Gas Services — 2.6% | ||||||||||||
Archrock Partners LP / Archrock Partners Finance Corp. |
| |||||||||||
6.25% (3) | 04/01/28 | 492,000 | 459,971 | |||||||||
Transocean Proteus, Ltd. |
| |||||||||||
6.25% (3) | 12/01/24 | 630,000 | 615,003 | |||||||||
USA Compression Partners LP / USA Compression Finance Corp. |
| |||||||||||
6.88% | 09/01/27 | 534,000 | 511,254 | |||||||||
|
| |||||||||||
| 1,586,228 | ||||||||||||
|
| |||||||||||
| Packaging & Containers — 2.7% | ||||||||||||
Ardagh Packaging Finance PLC / Ardagh Holdings USA, Inc. |
| |||||||||||
5.25% (3) | 08/15/27 | 600,000 | 417,720 | |||||||||
Graphic Packaging International LLC |
| |||||||||||
4.13% | 08/15/24 | 725,000 | 705,062 | |||||||||
Sealed Air Corp. |
| |||||||||||
4.00% (3) | 12/01/27 | 362,000 | 326,546 | |||||||||
Silgan Holdings, Inc. |
| |||||||||||
4.13% | 02/01/28 | 125,000 | 114,701 | |||||||||
Trivium Packaging Finance BV (Netherlands) |
| |||||||||||
5.50% (3) | 08/15/26 | 55,000 | 50,713 | |||||||||
|
| |||||||||||
| 1,614,742 | ||||||||||||
|
| |||||||||||
| Pharmaceuticals — 2.8% | ||||||||||||
180 Medical, Inc. |
| |||||||||||
3.88% (3) | 10/15/29 | 500,000 | 425,000 | |||||||||
Bausch Health Cos, Inc. (Canada) |
| |||||||||||
5.75% (3) | 08/15/27 | 18,000 | 11,475 | |||||||||
Embecta Corp. |
| |||||||||||
6.75% (3) | 02/15/30 | 500,000 | 457,835 | |||||||||
| Issues | Maturity Date | Principal Amount | Value | |||||||||
| Pharmaceuticals (Continued) | ||||||||||||
Organon & Co. / Organon Foreign Debt Co-Issuer BV |
| |||||||||||
5.13% (3) | 04/30/31 | $ | 465,000 | $ | 397,235 | |||||||
Prestige Brands, Inc. |
| |||||||||||
3.75% (3) | 04/01/31 | 485,000 | 390,025 | |||||||||
|
| |||||||||||
| 1,681,570 | ||||||||||||
|
| |||||||||||
| Pipelines — 6.3% | ||||||||||||
DCP Midstream Operating LP |
| |||||||||||
5.60% | 04/01/44 | 136,000 | 120,342 | |||||||||
Energy Transfer LP |
| |||||||||||
5.00% | 05/15/50 | 135,000 | 102,786 | |||||||||
5.35% | 05/15/45 | 126,000 | 100,402 | |||||||||
5.40% | 10/01/47 | 40,000 | 31,843 | |||||||||
6.63% (3 mo. USD LIBOR + 4.155%) (1),(4) | 02/15/28 | 897,000 | 645,840 | |||||||||
Global Partners LP / GLP Finance Corp. |
| |||||||||||
6.88% | 01/15/29 | 540,000 | 489,291 | |||||||||
NGL Energy Operating LLC / NGL Energy Finance Corp. |
| |||||||||||
7.50% (3) | 02/01/26 | 260,000 | 235,664 | |||||||||
Rockies Express Pipeline LLC |
| |||||||||||
4.80% (3) | 05/15/30 | 30,000 | 25,211 | |||||||||
6.88% (3) | 04/15/40 | 541,000 | 443,620 | |||||||||
Ruby Pipeline LLC |
| |||||||||||
8.00% (3),(5),(6),(7) | 04/01/22 | 210,152 | 180,205 | |||||||||
TransMontaigne Partners LP / TLP Finance Corp. |
| |||||||||||
6.13% | 02/15/26 | 712,000 | 615,880 | |||||||||
Venture Global Calcasieu Pass LLC |
| |||||||||||
3.88% (3) | 11/01/33 | 65,000 | 52,282 | |||||||||
4.13% (3) | 08/15/31 | 880,000 | 753,245 | |||||||||
|
| |||||||||||
| 3,796,611 | ||||||||||||
|
| |||||||||||
| REIT — 3.5% | ||||||||||||
American Assets Trust LP |
| |||||||||||
3.38% | 02/01/31 | 475,000 | 370,586 | |||||||||
GLP Capital LP / GLP Financing II, Inc. |
| |||||||||||
5.75% | 06/01/28 | 473,000 | 439,416 | |||||||||
Iron Mountain, Inc. |
| |||||||||||
4.50% (3) | 02/15/31 | 100,000 | 81,775 | |||||||||
5.25% (3) | 07/15/30 | 265,000 | 231,266 | |||||||||
VICI Properties LP / VICI Note Co., Inc. |
| |||||||||||
3.88% (3) | 02/15/29 | 34,000 | 28,704 | |||||||||
4.50% (3) | 01/15/28 | 40,000 | 35,127 | |||||||||
4.63% (3) | 06/15/25 | 512,000 | 483,077 | |||||||||
5.63% (3) | 05/01/24 | 106,000 | 104,761 | |||||||||
5.75% (3) | 02/01/27 | 339,000 | 320,504 | |||||||||
|
| |||||||||||
| 2,095,216 | ||||||||||||
|
| |||||||||||
| Retail — 3.5% | ||||||||||||
Bloomin’ Brands, Inc. / OSI Restaurant Partners LLC |
| |||||||||||
5.13% (3) | 04/15/29 | 400,000 | 340,000 | |||||||||
See accompanying Notes to Financial Statements.
72
Table of Contents
TCW High Yield Bond Fund
October 31, 2022
| Issues | Maturity Date | Principal Amount | Value | |||||||||
| Retail (Continued) | ||||||||||||
Fertitta Entertainment |
| |||||||||||
4.63% (3) | 01/15/29 | $ | 325,000 | $ | 282,838 | |||||||
FirstCash, Inc. |
| |||||||||||
5.63% (3) | 01/01/30 | 285,000 | 255,371 | |||||||||
Michaels Cos, Inc. (The) |
| |||||||||||
5.25% (3) | 05/01/28 | 855,000 | 609,247 | |||||||||
7.88% (3) | 05/01/29 | 125,000 | 70,023 | |||||||||
Papa John’s International, Inc. |
| |||||||||||
3.88% (3) | 09/15/29 | 270,000 | 220,479 | |||||||||
Sonic Automotive, Inc. |
| |||||||||||
4.88% (3) | 11/15/31 | 395,000 | 301,263 | |||||||||
|
| |||||||||||
| 2,079,221 | ||||||||||||
|
| |||||||||||
| Telecommunications — 7.4% | ||||||||||||
Altice France SA |
| |||||||||||
5.13% (3) | 01/15/29 | 200,000 | 150,250 | |||||||||
5.50% (3) | 10/15/29 | 450,000 | 343,552 | |||||||||
8.13% (3) | 02/01/27 | 250,000 | 229,562 | |||||||||
CommScope, Inc. |
| |||||||||||
4.75% (3) | 09/01/29 | 595,000 | 504,441 | |||||||||
Global Switch Finance BV |
| |||||||||||
1.38% (8) | 10/07/30 | 115,000 | 94,336 | |||||||||
Intelsat Jackson Holdings S. A. |
| |||||||||||
6.50% (3),(6) | 03/15/30 | 239,000 | 219,945 | |||||||||
Lumen Technologies, Inc. |
| |||||||||||
4.00% (3) | 02/15/27 | 75,000 | 63,919 | |||||||||
4.50% (3) | 01/15/29 | 335,000 | 237,524 | |||||||||
SES GLOBAL Americas Holdings, Inc. |
| |||||||||||
5.30% (3) | 03/25/44 | 559,000 | 410,845 | |||||||||
Sprint Corp. |
| |||||||||||
7.88% | 09/15/23 | 775,000 | 788,751 | |||||||||
T-Mobile USA, Inc. |
| |||||||||||
2.25% | 02/15/26 | 600,000 | 539,622 | |||||||||
2.63% | 04/15/26 | 185,000 | 167,255 | |||||||||
2.63% | 02/15/29 | 370,000 | 307,522 | |||||||||
Zayo Group Holdings, Inc. |
| |||||||||||
4.00% (3) | 03/01/27 | 525,000 | 406,526 | |||||||||
|
| |||||||||||
| 4,464,050 | ||||||||||||
|
| |||||||||||
Total Corporate Bonds |
| |||||||||||
(Cost: $57,268,982) |
| 49,869,865 | ||||||||||
|
| |||||||||||
Total Fixed Income Securities |
| |||||||||||
(Cost: $62,048,408) |
| 54,362,263 | ||||||||||
|
| |||||||||||
| Issues | Shares | Value | ||||||||||
COMMON STOCK — 0.1% |
| |||||||||||
| Electric — 0.0% | ||||||||||||
Homer City Holdings LLC — Series A (5),(9) |
| 5,610 | $ | — | ||||||||
|
| |||||||||||
| Oil & Gas — 0.1% | ||||||||||||
Valaris, Ltd. (9) |
| 668 | 44,709 | |||||||||
|
| |||||||||||
Total Common Stock |
| |||||||||||
(Cost: $340,348) |
| 44,709 | ||||||||||
|
| |||||||||||
| WARRANTS — % (Cost: $ — ) | ||||||||||||
| Entertainment — 0.0% | ||||||||||||
Cineworld Group PLC (9) |
| 42,717 | 2,136 | |||||||||
|
| |||||||||||
Total Warrants |
| |||||||||||
(Cost: $ — ) |
| 2,136 | ||||||||||
|
| |||||||||||
| MONEY MARKET INVESTMENTS — 4.1% | ||||||||||||
State Street Institutional U.S. Government Money Market Fund — Premier Class, 3.01% (10) |
| 2,442,529 | 2,442,529 | |||||||||
|
| |||||||||||
Total Money Market Investments |
| |||||||||||
(Cost: $2,442,529) |
| 2,442,529 | ||||||||||
|
| |||||||||||
| Maturity Date | Principal Amount | |||||||||||
SHORT TERM INVESTMENTS (1.2% ) |
| |||||||||||
| U.S. Treasury Security — 1.2% | ||||||||||||
(Cost: $745,334) | ||||||||||||
U.S. Treasury Bill |
| |||||||||||
2.86% (11) | 01/19/23 | $ | 750,000 | 743,499 | ||||||||
|
| |||||||||||
Total Investments (95.9%) |
| |||||||||||
(Cost: $65,576,619) |
| 57,595,136 | ||||||||||
|
| |||||||||||
Excess Of Other Assets Over Liabilities (4.1%) |
| 2,440,067 | ||||||||||
Net Assets (100.0%) |
| $ | 60,035,203 | |||||||||
|
| |||||||||||
See accompanying Notes to Financial Statements.
73
Table of Contents
TCW High Yield Bond Fund
Schedule of Investments (Continued)
| Futures Contracts | ||||||||||||||||||
| Number of Contracts | Type | Expiration Date | Notional | Market Value | Net Unrealized Appreciation (Depreciation) | |||||||||||||
Long Futures |
| |||||||||||||||||
| 84 | 5-Year U.S Treasury Note Futures | 12/30/22 | $ | 9,348,122 | $ | 8,953,875 | $ | (394,247 | ) | |||||||||
|
|
|
|
|
| |||||||||||||
| $ | 9,348,122 | $ | 8,953,875 | $ | (394,247 | ) | ||||||||||||
|
|
|
|
|
| |||||||||||||
Short Futures |
| |||||||||||||||||
| 15 | 10-Year U.S. Treasury Note Futures | 12/20/22 | $ | (1,813,734 | ) | $ | (1,739,766 | ) | $ | 73,968 | ||||||||
| 1 | Euro-Bobl Futures | 12/8/22 | (118,392 | ) | (118,276 | ) | 116 | |||||||||||
| 14 | U.S. Ultra Long Bond Futures | 12/20/22 | (2,097,427 | ) | (1,787,187 | ) | 310,240 | |||||||||||
|
|
|
|
|
| |||||||||||||
| $ | (4,029,553 | ) | $ | (3,645,229 | ) | $ | 384,324 | |||||||||||
|
|
|
|
|
| |||||||||||||
| Forward Currency Exchange Contracts | ||||||||||||||||||||||||
| Counterparty | Contracts to Deliver | Units of Currency | Settlement Date | In Exchange for U.S. Dollars | Contracts at Value | Unrealized Appreciation (Depreciation) | ||||||||||||||||||
| BUY (12) | ||||||||||||||||||||||||
Goldman Sachs & Co. | EUR | 12,000 | 01/13/23 | $ | 11,873 | $ | 11,933 | $ | 60 | |||||||||||||||
|
|
|
|
|
| |||||||||||||||||||
| SELL (13) | ||||||||||||||||||||||||
Bank of America N.A. | EUR | 204,000 | 01/13/23 | $ | 201,965 | $ | 202,865 | $ | (900 | ) | ||||||||||||||
|
|
|
|
|
| |||||||||||||||||||
Notes to the Schedule of Investments:
| EETC | Enhanced Equipment Trust Certificate. |
| REIT | Real Estate Investment Trust. |
| EUR | Euro Currency. |
| (1) | Floating or variable rate security. The interest shown reflects the rate in effect at October 31, 2022. |
| (2) | This position represents an unsettled bank loan at period end. Certain details associated with this purchase are not known prior to the settlement date, including coupon rate, which will be adjusted on settlement date. |
| (3) | Security exempt from registration under Rule 144A of the Securities Act of 1933, as amended. These securities may be resold, normally only to qualified institutional buyers. At October 31, 2022, the value of these securities amounted to $34,123,162 or 56.8% of net assets. These securities are determined to be liquid by the Fund’s investment advisor, unless otherwise noted, under procedures established by and under the general supervision of the Company’s Board of Directors. |
| (4) | Perpetual maturity. |
| (5) | For fair value measurement disclosure purposes, security is categorized as Level 3. Security is valued using significant unobservable inputs. |
| (6) | Restricted security (Note 11). |
| (7) | Security is currently in default due to bankruptcy or failure to make payment of principal or interest of the issuer. Income is not being accrued. |
| (8) | Investments issued under Regulation S of the Securities Act of 1933, as amended, may not be offered, sold, or delivered within the United States except under special exemptions. At October 31, 2022, the value of these securities amounted to $94,336 or 0.2% of net assets. |
| (9) | Non-income producing security. |
| (10) | Rate disclosed is the 7-day net yield as of October 31, 2022. |
| (11) | Rate shown represents yield-to-maturity. |
| (12) | Fund buys foreign currency, sells U.S. Dollar. |
| (13) | Fund sells foreign currency, buys U.S. Dollar. |
See accompanying Notes to Financial Statements.
74
Table of Contents
TCW High Yield Bond Fund
Investments by Sector | October 31, 2022 |
| Sector | Percentage of Net Assets | |||
Corporate Bonds | 83.0 | % | ||
Bank Loans | 7.5 | |||
Money Market Investments | 4.1 | |||
U.S. Treasury Securities | 1.2 | |||
Common Stock | 0.1 | |||
Warrants | 0.0 | |||
Other* | 4.1 | |||
|
| |||
Total | 100.0 | % | ||
|
| |||
| * | Includes capstock, futures, pending trades, interest receivable and accrued expenses payable. |
| ** | Amount rounds to less than 0.1%. |
See accompanying Notes to Financial Statements.
75
Table of Contents
TCW High Yield Bond Fund
Fair Valuation Summary | October 31, 2022 |
The following is a summary of the fair valuations according to the inputs used as of October 31, 2022 in valuing the Fund’s investments:
Description | Quoted Prices in Active Markets for Identical Assets (Level 1) | Other Significant Observable Inputs (Level 2) | Significant Unobservable Inputs (Level 3) | Total | ||||||||||||
Fixed Income Securities | ||||||||||||||||
Bank Loans* | $ | — | $ | 4,492,398 | $ | — | $ | 4,492,398 | ||||||||
Corporate Bonds* | — | 49,689,660 | 180,205 | 49,869,865 | ||||||||||||
|
|
|
|
|
|
|
| |||||||||
Total Fixed Income Securities | — | 54,182,058 | 180,205 | 54,362,263 | ||||||||||||
|
|
|
|
|
|
|
| |||||||||
Common Stock* | 44,709 | — | — | 44,709 | ||||||||||||
Warrants* | — | 2,136 | — | 2,136 | ||||||||||||
Money Market Investments | 2,442,529 | — | — | 2,442,529 | ||||||||||||
Short-Term Investments | 743,499 | — | — | 743,499 | ||||||||||||
|
|
|
|
|
|
|
| |||||||||
Total Investments | $ | 3,230,737 | $ | 54,184,194 | $ | 180,205 | $ | 57,595,136 | ||||||||
|
|
|
|
|
|
|
| |||||||||
Asset Derivatives | ||||||||||||||||
Forward Currency Contracts | ||||||||||||||||
Foreign Currency Risk | — | 60 | — | 60 | ||||||||||||
Futures Contracts | ||||||||||||||||
Interest Rate Risk | 384,324 | — | — | 384,324 | ||||||||||||
|
|
|
|
|
|
|
| |||||||||
Total Investments | $ | 3,615,061 | $ | 54,184,254 | $ | 180,205 | $ | 57,979,520 | ||||||||
|
|
|
|
|
|
|
| |||||||||
Liability Derivatives | ||||||||||||||||
Futures Contracts | ||||||||||||||||
Interest Rate Risk | $ | (394,247 | ) | $ | — | $ | — | $ | (394,247 | ) | ||||||
Forward Currency Contracts | ||||||||||||||||
Foreign Currency Risk | — | (900 | ) | — | (900 | ) | ||||||||||
|
|
|
|
|
|
|
| |||||||||
Total | $ | (394,247 | ) | $ | (900 | ) | $ | — | $ | (395,147 | ) | |||||
|
|
|
|
|
|
|
| |||||||||
| * | See Schedule of Investments for corresponding industries. |
See accompanying Notes to Financial Statements.
76
Table of Contents
Schedule of Investments | October 31, 2022 |
| Issues | Maturity Date | Principal Amount | Value | |||||||||
FIXED INCOME SECURITIES —119.5% of Net Assets |
| |||||||||||
| COMMERCIAL MORTGAGE-BACKED SECURITIES — AGENCY — 3.0% | ||||||||||||
Fannie Mae (14-M11-1A) |
| |||||||||||
3.12% (1) | 08/25/24 | $ | 21,461 | $ | 20,656 | |||||||
Freddie Mac Multifamily Structured Pass Through Certificates (K030-X1) (I/O) |
| |||||||||||
0.14% (1) | 04/25/23 | 17,130,791 | 5,780 | |||||||||
Freddie Mac Multifamily Structured Pass Through Certificates (KF68-A) |
| |||||||||||
3.63% (1 mo. USD LIBOR + 0.490%) (2) | 07/25/26 | 45,886 | 45,690 | |||||||||
Freddie Mac Multifamily Structured Pass Through Certificates (KJ28-A1) |
| |||||||||||
1.77% | 02/25/25 | 12,296 | 12,296 | |||||||||
Freddie Mac Multifamily Structured Pass Through Certificates (KJ34-A1) |
| |||||||||||
0.68% | 06/25/26 | 15,784 | 14,262 | |||||||||
Freddie Mac Multifamily Structured Pass Through Certificates (KL05-X1HG) (I/O) |
| |||||||||||
1.22% (1) | 12/25/27 | 500,000 | 23,512 | |||||||||
Freddie Mac Multifamily Structured Pass Through Certificates (KS06-X) (I/O) |
| |||||||||||
1.05% (1) | 08/25/26 | 557,453 | 14,903 | |||||||||
Freddie Mac Multifamily Structured Pass Through Certificates (KJ29-A1) |
| |||||||||||
0.74% | 01/25/26 | 25,091 | 23,547 | |||||||||
Freddie Mac Multifamily Structured Pass-Through Certificates (K723-X1) (I/O) |
| |||||||||||
0.91% (1) | 08/25/23 | 1,537,398 | 6,846 | |||||||||
Freddie Mac Multifamily Structured Pass-Through Certificates (KC01-X1) (I/O) |
| |||||||||||
0.44% (1) | 12/25/22 | 2,774,478 | 925 | |||||||||
Freddie Mac Multifamily Structured Pass-Through Certificates (K031-X1) (I/O) |
| |||||||||||
0.17% (1) | 04/25/23 | 769,957 | 376 | |||||||||
Freddie Mac Multifamily Structured Pass-Through Certificates (K722-X1) (I/O) |
| |||||||||||
1.31% (1) | 03/25/23 | 478,336 | 697 | |||||||||
Freddie Mac Multifamily Structured Pass-Through Certificates (KJ27-A1) |
| |||||||||||
2.09% | 07/25/24 | 456 | 453 | |||||||||
Freddie Mac Multifamily Structured Pass-Through Certificates (KJ31-A1) |
| |||||||||||
0.57% | 05/25/26 | 20,571 | 19,678 | |||||||||
Freddie Mac Multifamily Structured Pass-Through Certificates (KJ32-A1) |
| |||||||||||
0.52% | 06/25/25 | 36,708 | 34,345 | |||||||||
Freddie Mac Multifamily Structured Pass-Through Certificates (KS07-X) (I/O) |
| |||||||||||
0.63% (1) | 09/25/25 | 241,315 | 3,860 | |||||||||
FRESB Mortgage Trust (15-SB3-A3) |
| |||||||||||
3.69% (1 mo. USD LIBOR + 0.550%) (2) | 01/25/43 | 2,126 | 2,120 | |||||||||
| Issues | Maturity Date | Principal Amount | Value | |||||||||
| COMMERCIAL MORTGAGE-BACKED SECURITIES — AGENCY (Continued) | ||||||||||||
Ginnie Mae (07-12-C) |
| |||||||||||
5.28% (1) | 04/16/41 | $ | 2,097 | $ | 2,090 | |||||||
Ginnie Mae (08-92-E) |
| |||||||||||
5.56% (1) | 03/16/44 | 5,440 | 5,387 | |||||||||
Ginnie Mae (10-159-D) |
| |||||||||||
4.56% (1) | 09/16/44 | 12,658 | 12,250 | |||||||||
Ginnie Mae (11-165-IO) (I/O) |
| |||||||||||
0.00% (1) | 10/16/51 | 242,218 | 2 | |||||||||
|
| |||||||||||
Total Commercial Mortgage-Backed Securities — Agency |
| |||||||||||
(Cost: $351,228) |
| 249,675 | ||||||||||
|
| |||||||||||
| COMMERCIAL MORTGAGE-BACKED SECURITIES — NON-AGENCY — 7.8% | ||||||||||||
BBCMS Trust (15-SRCH-XB) (I/O) |
| |||||||||||
0.19% (1),(3) | 08/10/35 | 2,000,000 | 17,523 | |||||||||
BFLD Trust (20-OBRK-A) |
| |||||||||||
5.46% (1 mo. USD LIBOR + 2.050%) (2),(3) | 11/15/28 | 100,000 | 98,418 | |||||||||
BSPRT Issuer, Ltd. (19-FL5-A) |
| |||||||||||
4.56% (1 mo. USD LIBOR + 1.150%) (2),(3) | 05/15/29 | 23,221 | 23,110 | |||||||||
Citigroup Commercial Mortgage Trust |
| |||||||||||
1.31% (1) | 04/10/46 | 1,011,744 | 1,771 | |||||||||
Citigroup Commercial Mortgage Trust |
| |||||||||||
0.21% (1) | 07/10/47 | 3,784,000 | 12,376 | |||||||||
COMM Mortgage Trust (12-CR3-XA) (I/O) |
| |||||||||||
1.54% (1) | 10/15/45 | 568,929 | 1,427 | |||||||||
COMM Mortgage Trust (12-CR4-XA) (I/O) |
| |||||||||||
1.47% (1) | 10/15/45 | 273,714 | 1 | |||||||||
COMM Mortgage Trust (13-CR6-XA) (I/O) |
| |||||||||||
0.99% (1) | 03/10/46 | 1,971,136 | 20 | |||||||||
COMM Mortgage Trust (13-CR9-ASB) |
| |||||||||||
3.83% | 07/10/45 | 7,243 | 7,183 | |||||||||
COMM Mortgage Trust (13-LC6-XA) (I/O) |
| |||||||||||
1.15% (1) | 01/10/46 | 126,512 | 1 | |||||||||
COMM Mortgage Trust (14-CR14-A2) |
| |||||||||||
3.15% | 02/10/47 | 61,639 | 60,948 | |||||||||
COMM Mortgage Trust (14-CR19-XA) (I/O) |
| |||||||||||
0.93% (1) | 08/10/47 | 77,442 | 948 | |||||||||
COMM Mortgage Trust (14-CR20-A3) |
| |||||||||||
3.33% | 11/10/47 | 14,873 | 14,152 | |||||||||
COMM Mortgage Trust (15-CR23-A2) |
| |||||||||||
2.85% | 05/10/48 | 19,163 | 18,772 | |||||||||
COMM Mortgage Trust (16-DC2-XA) (I/O) |
| |||||||||||
0.94% (1) | 02/10/49 | 747,650 | 17,352 | |||||||||
FS Rialto (19-FL1-A) |
| |||||||||||
4.61% (1 mo. USD LIBOR + 1.200%) (2),(3) | 12/16/36 | 117,852 | 115,650 | |||||||||
See accompanying Notes to Financial Statements.
77
Table of Contents
TCW Short Term Bond Fund
Schedule of Investments (Continued)
| Issues | Maturity Date | Principal Amount | Value | |||||||||
| COMMERCIAL MORTGAGE-BACKED SECURITIES — NON-AGENCY (Continued) | ||||||||||||
GS Mortgage Securities Trust (13-GC14-A4) |
| |||||||||||
3.96% | 08/10/46 | $ | 24,823 | $ | 24,519 | |||||||
JPMBB Commercial Mortgage Securities Trust |
| |||||||||||
0.75% (1) | 02/15/47 | 1,028,707 | 6,591 | |||||||||
LoanCore Issuer, Ltd. (19-CRE3-AS) |
| |||||||||||
4.78% (1 mo. USD LIBOR + 1.370%) (2),(3) | 04/15/34 | 34,502 | 34,361 | |||||||||
MF1, Ltd. (20-FL4-A) |
| |||||||||||
5.19% (SOFR + 1.814) (2),(3) | 11/15/35 | 13,034 | 12,718 | |||||||||
Morgan Stanley Bank of America Merrill Lynch Trust (13-C12-XA) (I/O) |
| |||||||||||
0.55% (1) | 10/15/46 | 316,308 | 777 | |||||||||
Morgan Stanley Bank of America Merrill Lynch Trust (13-C7-XA) (I/O) |
| |||||||||||
1.19% (1) | 02/15/46 | 1,038,055 | 55 | |||||||||
Morgan Stanley Bank of America Merrill Lynch Trust (14-C15-A3) |
| |||||||||||
3.77% | 04/15/47 | 3,927 | 3,837 | |||||||||
SREIT Trust (21-MFP-A) |
| |||||||||||
4.14% (1 mo. USD LIBOR + 0.731%) (2),(3) | 11/15/38 | 100,000 | 95,287 | |||||||||
Wells Fargo Commercial Mortgage Trust |
| |||||||||||
0.61% (1) | 07/15/58 | 1,432,240 | 17,889 | |||||||||
WFRBS Commercial Mortgage Trust (14-C21-XA) (I/O) |
| |||||||||||
1.01% (1) | 08/15/47 | 1,502,824 | 20,174 | |||||||||
WFRBS Commercial Mortgage Trust (14-C24-A3) |
| |||||||||||
3.43% | 11/15/47 | 37,918 | 36,087 | |||||||||
|
| |||||||||||
Total Commercial Mortgage-Backed Securities — Non-Agency |
| |||||||||||
(Cost: $810,710) |
| 641,947 | ||||||||||
|
| |||||||||||
| RESIDENTIAL MORTGAGE-BACKED SECURITIES — AGENCY — 28.3% | ||||||||||||
Fannie Mae (03-11-FA) |
| |||||||||||
4.59% (1 mo. USD LIBOR + 1.000%) (2) | 09/25/32 | 6,934 | 6,845 | |||||||||
Fannie Mae (06-23-FP) (PAC) |
| |||||||||||
3.89% (1 mo. USD LIBOR + 0.300%) (2) | 04/25/36 | 9,762 | 9,640 | |||||||||
Fannie Mae (07-64-FA) |
| |||||||||||
4.06% (1 mo. USD LIBOR + 0.470%) (2) | 07/25/37 | 14,403 | 14,271 | |||||||||
Fannie Mae (08-24-PF) (PAC) |
| |||||||||||
4.24% (1 mo. USD LIBOR + 0.650%) (2) | 02/25/38 | 6,785 | 6,836 | |||||||||
Fannie Mae (10-118-GF) (PAC) |
| |||||||||||
4.14% (1 mo. USD LIBOR + 0.550%) (2) | 10/25/39 | 6,923 | 6,920 | |||||||||
| Issues | Maturity Date | Principal Amount | Value | |||||||||
| RESIDENTIAL MORTGAGE-BACKED SECURITIES — AGENCY (Continued) | ||||||||||||
Fannie Mae (11-75-HP) (PAC) |
| |||||||||||
2.50% | 07/25/40 | $ | 2,142 | $ | 2,119 | |||||||
Fannie Mae (12-93-GF) (PAC) |
| |||||||||||
3.84% (1 mo. USD LIBOR + 0.250%) (2) | 07/25/40 | 853 | 853 | |||||||||
Fannie Mae (20-10-FA) |
| |||||||||||
4.09% (1 mo. USD LIBOR + 0.500%) (2) | 03/25/50 | 17,049 | 16,730 | |||||||||
Fannie Mae (17-10-FA) |
| |||||||||||
3.99% (1 mo. USD LIBOR + 0.400%) (2) | 03/25/47 | 37,848 | 37,198 | |||||||||
Fannie Mae, Pool #254548 |
| |||||||||||
5.50% | 12/01/32 | 5,528 | 5,616 | |||||||||
Fannie Mae, Pool #600187 |
| |||||||||||
7.00% | 07/01/31 | 12,326 | 12,481 | |||||||||
Fannie Mae, Pool #995364 |
| |||||||||||
6.00% | 10/01/38 | 4,312 | 4,432 | |||||||||
Fannie Mae, Pool #AL0851 |
| |||||||||||
6.00% | 10/01/40 | 3,313 | 3,436 | |||||||||
Fannie Mae, Pool #MA4492 |
| |||||||||||
2.00% | 12/01/51 | 47,432 | 37,559 | |||||||||
Freddie Mac (3071-TF) (PAC) |
| |||||||||||
3.71% (1 mo. USD LIBOR + 0.300%) (2) | 04/15/35 | 9,179 | 9,146 | |||||||||
Freddie Mac (3300-FA) |
| |||||||||||
3.71% (1 mo. USD LIBOR + 0.300%) (2) | 08/15/35 | 16,979 | 16,824 | |||||||||
Freddie Mac (3318-F) |
| |||||||||||
3.66% (1 mo. USD LIBOR + 0.250%) (2) | 05/15/37 | 19,625 | 19,159 | |||||||||
Freddie Mac (3946-FG) (PAC) |
| |||||||||||
3.76% (1 mo. USD LIBOR + 0.350%) (2) | 10/15/39 | 588 | 588 | |||||||||
Freddie Mac (4231-FD) |
| |||||||||||
3.76% (1 mo. USD LIBOR + 0.350%) (2) | 10/15/32 | 23,349 | 23,182 | |||||||||
Freddie Mac, Pool #SD8194 |
| |||||||||||
2.50% | 02/01/52 | 47,565 | 39,064 | |||||||||
Freddie Mac, Pool #SD8199 |
| |||||||||||
2.00% | 03/01/52 | 48,309 | 38,063 | |||||||||
Freddie Mac (263-F5) |
| |||||||||||
3.91% (1 mo. USD LIBOR + 0.500%) (2) | 06/15/42 | 15,618 | 15,410 | |||||||||
Freddie Mac., Pool #SD8189 |
| |||||||||||
2.50% | 01/01/52 | 47,143 | 38,757 | |||||||||
Ginnie Mae II, Pool #80022 |
| |||||||||||
1.75% (U.S. 1-year Treasury Constant Maturity Rate + 1.500%) (2) | 12/20/26 | 5,263 | 5,159 | |||||||||
See accompanying Notes to Financial Statements.
78
Table of Contents
TCW Short Term Bond Fund
October 31, 2022
| Issues | Maturity Date | Principal Amount | Value | |||||||||
| RESIDENTIAL MORTGAGE-BACKED SECURITIES — AGENCY (Continued) | ||||||||||||
Ginnie Mae II, Pool #80636 |
| |||||||||||
2.63% (U.S. 1-year Treasury Constant Maturity Rate + 1.500%) (2) | 09/20/32 | $ | 3,570 | $ | 3,479 | |||||||
Ginnie Mae II, Pool #80757 |
| |||||||||||
2.63% (U.S. 1-year Treasury Constant Maturity Rate + 1.500%) (2) | 10/20/33 | 1,301 | 1,257 | |||||||||
Ginnie Mae II, Pool #80797 |
| |||||||||||
2.63% (U.S. 1-year Treasury Constant Maturity Rate + 1.500%) (2) | 01/20/34 | 16,959 | 16,557 | |||||||||
Ginnie Mae II, Pool #80937 |
| |||||||||||
2.88% (U.S. 1-year Treasury Constant Maturity Rate + 1.500%) (2) | 06/20/34 | 7,497 | 7,366 | |||||||||
Ginnie Mae II TBA, 30-Year |
| |||||||||||
2.50% | 01/01/52 | 400,000 | 338,666 | |||||||||
Uniform Mortgage-Backed Securities TBA, 30-Year |
| |||||||||||
4.50% (4) | 07/01/52 | 225,000 | 211,078 | |||||||||
3.00% (4) | 03/01/52 | 225,000 | 191,303 | |||||||||
3.50% (4) | 04/01/52 | 25,000 | 21,987 | |||||||||
2.00% (4) | 01/01/52 | 200,000 | 157,473 | |||||||||
2.00% (4) | 01/01/52 | 75,000 | 59,060 | |||||||||
2.50% (4) | 01/01/52 | 125,000 | 102,334 | |||||||||
2.50% (4) | 01/01/52 | 200,000 | 163,759 | |||||||||
5.00% (4) | 08/01/52 | 325,000 | 313,485 | |||||||||
5.50% (4) | 08/01/52 | 100,000 | 98,619 | |||||||||
4.00% (4) | 06/01/52 | 75,000 | 68,227 | |||||||||
3.00% (4) | 03/01/52 | 250,000 | 212,539 | |||||||||
|
| |||||||||||
Total Residential Mortgage-Backed Securities — Agency |
| |||||||||||
(Cost: $2,383,305) |
| 2,337,477 | ||||||||||
|
| |||||||||||
| RESIDENTIAL MORTGAGE-BACKED SECURITIES — NON-AGENCY — 10.1% | ||||||||||||
ABFC Trust (02-WF2-A2) |
| |||||||||||
4.71% (1 mo. USD LIBOR + 1.125%) (2) | 05/25/32 | 22,194 | 21,741 | |||||||||
Accredited Mortgage Loan Trust (05-1-M2) |
| |||||||||||
4.62% (1 mo. USD LIBOR + 1.035%) (2) | 04/25/35 | 5,333 | 5,334 | |||||||||
BNC Mortgage Loan Trust (06-2-A4) |
| |||||||||||
3.91% (1 mo. USD LIBOR + 0.320%) (2) | 11/25/36 | 27,916 | 26,918 | |||||||||
CIT Mortgage Loan Trust (07-1-1A) |
| |||||||||||
4.94% (1 mo. USD LIBOR + 1.350%) (2),(3) | 10/25/37 | 40,853 | 40,578 | |||||||||
| Issues | Maturity Date | Principal Amount | Value | |||||||||
| RESIDENTIAL MORTGAGE-BACKED SECURITIES — NON-AGENCY (Continued) | ||||||||||||
Credit Suisse First Boston Mortgage Securities Corp. (02-AR31-6A1) |
| |||||||||||
3.25% (1) | 11/25/32 | $ | 7,539 | $ | 7,037 | |||||||
First Franklin Mortgage Loan Asset-Backed Certificates (04-FF5-A3C) |
| |||||||||||
4.59% (1 mo. USD LIBOR + 1.000%) (2) | 08/25/34 | 9,525 | 9,032 | |||||||||
JPMorgan Mortgage Acquisition Trust (06-ACC1-M1) |
| |||||||||||
3.99% (1 mo. USD LIBOR + 0.405%) (2) | 05/25/36 | 17,942 | 17,930 | |||||||||
JPMorgan Mortgage Acquisition Trust (07-CH4-A5) |
| |||||||||||
3.83% (1 mo. USD LIBOR + 0.240%) (2) | 05/25/37 | 55,447 | 54,811 | |||||||||
JPMorgan Mortgage Trust (18-8-A3) |
| |||||||||||
4.00% (1),(3) | 01/25/49 | 46,466 | 42,522 | |||||||||
Morgan Stanley Capital I, Inc. Trust (06-NC2-A2D) |
| |||||||||||
4.17% (1 mo. USD LIBOR + 0.580%) (2) | 02/25/36 | 33,032 | 32,949 | |||||||||
New Century Home Equity Loan Trust (05-1-M1) |
| |||||||||||
4.26% (1 mo. USD LIBOR + 0.675%) (2) | 03/25/35 | 51,113 | 50,790 | |||||||||
NovaStar Mortgage Funding Trust Series (05-1-M5) |
| |||||||||||
4.67% (1 mo. USD LIBOR + 1.080%) (2) | 06/25/35 | 24,882 | 25,258 | |||||||||
Opteum Mortgage Acceptance Corp. Asset Backed Pass-Through Certificates (05-2-M5) |
| |||||||||||
4.56% (1 mo. USD LIBOR + 0.975%) (2) | 04/25/35 | 67,922 | 66,865 | |||||||||
Ownit Mortgage Loan Asset-Backed Certificates |
| |||||||||||
4.13% (1 mo. USD LIBOR + 0.540%) (2) | 03/25/37 | 41,562 | 39,829 | |||||||||
Park Place Securities, Inc. Asset-Backed Pass-Through Certificates (04-WHQ2-M4) |
| |||||||||||
5.16% (1 mo. USD LIBOR + 1.575%) (2) | 02/25/35 | 34,627 | 33,070 | |||||||||
PRPM LLC (21-6-A1) |
| |||||||||||
1.79% (3) | 07/25/26 | 36,438 | 33,041 | |||||||||
RASC Series Trust (05-EMX1-M1) |
| |||||||||||
4.23% (1 mo. USD LIBOR + 0.645%) (2) | 03/25/35 | 26,179 | 25,889 | |||||||||
RASC Series Trust (06-KS3-M1) |
| |||||||||||
4.08% (1 mo. USD LIBOR + 0.330%) (2) | 04/25/36 | 32,920 | 32,511 | |||||||||
Residential Accredit Loans, Inc. (02-QS16-A2) |
| |||||||||||
4.14% (1 mo. USD LIBOR + 0.550%) (2),(5) | 10/25/17 | 68 | 36 | |||||||||
Soundview Home Loan Trust (05-OPT1-M2) |
| |||||||||||
4.26% (1 mo. USD LIBOR + 0.675%) (2) | 06/25/35 | 20,922 | 20,640 | |||||||||
See accompanying Notes to Financial Statements.
79
Table of Contents
TCW Short Term Bond Fund
Schedule of Investments (Continued)
| Issues | Maturity Date | Principal Amount | Value | |||||||||
| RESIDENTIAL MORTGAGE-BACKED SECURITIES — NON-AGENCY (Continued) | ||||||||||||
Structured Asset Investment Loan Trust (05-11-A3) |
| |||||||||||
4.19% (1 mo. USD LIBOR + 0.600%) (2) | 01/25/36 | $ | 14,767 | $ | 14,036 | |||||||
Structured Asset Investment Loan Trust (05-HE3-M1) |
| |||||||||||
4.31% (1 mo. USD LIBOR + 0.720%) (2) | 09/25/35 | 22,212 | 21,813 | |||||||||
VOLT XCIV LLC (21-NPL3-A1) |
| |||||||||||
2.24% (3) | 02/27/51 | 133,768 | 116,691 | |||||||||
Wells Fargo Home Equity Asset-Backed Securities Trust (05-4-M3) |
| |||||||||||
4.34% (1 mo. USD LIBOR + 0.750%) (2) | 12/25/35 | 100,000 | 97,242 | |||||||||
|
| |||||||||||
Total Residential Mortgage-Backed Securities — Non-Agency |
| |||||||||||
(Cost: $858,959) |
| 836,563 | ||||||||||
|
| |||||||||||
CORPORATE BONDS — 22.2% |
| |||||||||||
| Aerospace & Defense — 0.4% | ||||||||||||
BAE Systems Holdings, Inc. |
| |||||||||||
3.85% (3) | 12/15/25 | 20,000 | 18,962 | |||||||||
Boeing Co. (The) |
| |||||||||||
1.43% | 02/04/24 | 15,000 | 14,233 | |||||||||
|
| |||||||||||
| 33,195 | ||||||||||||
|
| |||||||||||
| Agriculture — 0.2% | ||||||||||||
Imperial Brands Finance PLC |
| |||||||||||
4.25% (3) | 07/21/25 | 20,000 | 19,016 | |||||||||
|
| |||||||||||
| Auto Manufacturers — 0.3% | ||||||||||||
Mercedes-Benz Finance North America LLC |
| |||||||||||
1.75% (3) | 03/10/23 | 25,000 | 24,723 | |||||||||
|
| |||||||||||
| Banks — 11.7% | ||||||||||||
Bank of America Corp. |
| |||||||||||
1.32% (SOFR + 1.150%) (2) | 06/19/26 | 45,000 | 39,714 | |||||||||
1.73% (SOFR + 0.960%) (2) | 07/22/27 | 100,000 | 85,513 | |||||||||
Citigroup, Inc. |
| |||||||||||
1.46% (SOFR + 0.770%) (2) | 06/09/27 | 40,000 | 33,990 | |||||||||
3.29% (SOFR + 1.528%) (2) | 03/17/26 | 10,000 | 9,382 | |||||||||
3.67% (3 mo. USD LIBOR + 1.390%) (2) | 07/24/28 | 45,000 | 40,413 | |||||||||
Credit Suisse Group AG (Switzerland) |
| |||||||||||
3.80% | 06/09/23 | 20,000 | 19,471 | |||||||||
3.09% (SOFR + 1.730%) (2),(3) | 05/14/32 | 10,000 | 6,878 | |||||||||
DNB Bank ASA |
| |||||||||||
0.86% (U.S. 1-year Treasury Constant Maturity Rate + 0.330%) (2),(3) | 09/30/25 | 30,000 | 27,170 | |||||||||
| Issues | Maturity Date | Principal Amount | Value | |||||||||
| Banks (Continued) | ||||||||||||
Goldman Sachs Group, Inc. (The) |
| |||||||||||
0.93% (SOFR + 0.486%) (2) | 10/21/24 | $ | 10,000 | $ | 9,467 | |||||||
1.22% | 12/06/23 | 95,000 | 90,921 | |||||||||
HSBC Holdings PLC (United Kingdom) |
| |||||||||||
0.98% (SOFR + 0.708%) (2) | 05/24/25 | 90,000 | 81,851 | |||||||||
JPMorgan Chase & Co. |
| |||||||||||
0.56% (SOFR + 0.420%) (2) | 02/16/25 | 55,000 | 51,285 | |||||||||
2.60% (SOFR + 0.915%) (2) | 02/24/26 | 55,000 | 50,953 | |||||||||
3.96% (3 mo. USD LIBOR + 1.245%) (2) | 01/29/27 | 5,000 | 4,686 | |||||||||
Lloyds Banking Group PLC (United Kingdom) |
| |||||||||||
2.91% (3 mo. USD LIBOR +0.810%) (2) | 11/07/23 | 15,000 | 14,992 | |||||||||
3.87% (1-year Treasury Constant Maturity Rate + 3.500%) (2) | 07/09/25 | 40,000 | 38,136 | |||||||||
Macquarie Group, Ltd. (Australia) |
| |||||||||||
1.20% (SOFR + 0.694%) (2),(3) | 10/14/25 | 15,000 | 13,592 | |||||||||
3.19% (3 mo. USD LIBOR + 1.023%) (2),(3) | 11/28/23 | 45,000 | 44,923 | |||||||||
Morgan Stanley |
| |||||||||||
0.53% (SOFR + 0.455%) (2) | 01/25/24 | 35,000 | 34,482 | |||||||||
1.16% (SOFR + 0.560%) (2) | 10/21/25 | 75,000 | 67,961 | |||||||||
1.51% (SOFR + 0.858%) (2) | 07/20/27 | 25,000 | 21,206 | |||||||||
NatWest Group PLC (United Kingdom) |
| |||||||||||
4.52% (3 mo. USD LIBOR + 1.550%) (2) | 06/25/24 | 25,000 | 24,650 | |||||||||
Santander UK Group Holdings PLC (United Kingdom) |
| |||||||||||
3.37% (3 mo. USD LIBOR + 1.080%) (2) | 01/05/24 | 85,000 | 84,385 | |||||||||
Wells Fargo & Co. |
| |||||||||||
2.19% (SOFR + 2.000%) (2) | 04/30/26 | 65,000 | 59,185 | |||||||||
3.53% (SOFR + 1.510%) (2) | 03/24/28 | 15,000 | 13,538 | |||||||||
|
| |||||||||||
| 968,744 | ||||||||||||
|
| |||||||||||
| Biotechnology — 0.1% | ||||||||||||
Royalty Pharma PLC |
| |||||||||||
0.75% | 09/02/23 | 10,000 | 9,649 | |||||||||
|
| |||||||||||
| Commercial Services — 0.3% | ||||||||||||
Global Payments, Inc. |
| |||||||||||
4.45% | 06/01/28 | 30,000 | 27,317 | |||||||||
|
| |||||||||||
| Diversified Financial Services — 0.6% | ||||||||||||
AerCap Ireland Capital DAC / AerCap Global Aviation Trust (Ireland) |
| |||||||||||
4.88% | 01/16/24 | 10,000 | 9,819 | |||||||||
American Express Co. |
| |||||||||||
2.25% | 03/04/25 | 20,000 | 18,584 | |||||||||
Capital One Financial Corp. |
| |||||||||||
1.34% (SOFR + 0.690%) (2) | 12/06/24 | 20,000 | 18,933 | |||||||||
See accompanying Notes to Financial Statements.
80
Table of Contents
TCW Short Term Bond Fund
October 31, 2022
| Issues | Maturity Date | Principal Amount | Value | |||||||||
| Diversified Financial Services (Continued) | ||||||||||||
Park Aerospace Holdings, Ltd. |
| |||||||||||
4.50% (3) | 03/15/23 | $ | 5,000 | $ | 4,977 | |||||||
|
| |||||||||||
| 52,313 | ||||||||||||
|
| |||||||||||
| Electric — 1.0% | ||||||||||||
American Electric Power |
| |||||||||||
2.03% | 03/15/24 | 30,000 | 28,648 | |||||||||
Dominion Energy, Inc. | ||||||||||||
3.30% | 03/15/25 | 25,000 | 23,927 | |||||||||
Metropolitan Edison Co. | ||||||||||||
4.00% (3) | 04/15/25 | 30,000 | 28,454 | |||||||||
|
| |||||||||||
| 81,029 | ||||||||||||
|
| |||||||||||
| Health Care-Products — 0.8% | ||||||||||||
Baxter International, Inc. |
| |||||||||||
0.87% | 12/01/23 | 25,000 | 23,888 | |||||||||
Fresenius US Finance II, Inc. |
| |||||||||||
4.50% (3) | 01/15/23 | 15,000 | 14,967 | |||||||||
Thermo Fisher Scientific, Inc. |
| |||||||||||
1.22% | 10/18/24 | 25,000 | 23,282 | |||||||||
|
| |||||||||||
| 62,137 | ||||||||||||
|
| |||||||||||
| Health Care-Services — 0.9% | ||||||||||||
CommonSpirit Health |
| |||||||||||
2.76% | 10/01/24 | 10,000 | 9,504 | |||||||||
Dignity Health |
| |||||||||||
3.13% | 11/01/22 | 10,000 | 10,000 | |||||||||
HCA, Inc. | ||||||||||||
5.25% | 04/15/25 | 10,000 | 9,834 | |||||||||
5.25% | 06/15/26 | 45,000 | 43,664 | |||||||||
|
| |||||||||||
| 73,002 | ||||||||||||
|
| |||||||||||
| Insurance — 1.0% | ||||||||||||
Athene Global Funding |
| |||||||||||
3.49% (SOFR + 0.700%) (2),(3) | 05/24/24 | 30,000 | 29,394 | |||||||||
Metropolitan Life Global Funding I |
| |||||||||||
3.00% (3) | 01/10/23 | 20,000 | 19,948 | |||||||||
Trinity Acquisition PLC |
| |||||||||||
4.63% | 08/15/23 | 35,000 | 34,793 | |||||||||
|
| |||||||||||
| 84,135 | ||||||||||||
|
| |||||||||||
| Miscellaneous Manufacturers — 0.1% | ||||||||||||
General Electric Co. |
| |||||||||||
3.21% (3 mo. USD LIBOR + 0.380%) (2) | 05/05/26 | 5,000 | 4,769 | |||||||||
|
| |||||||||||
| Oil & Gas — 0.1% | ||||||||||||
Petroleos Mexicanos Co. |
| |||||||||||
6.70% | 02/16/32 | 13,000 | 9,853 | |||||||||
|
| |||||||||||
| Issues | Maturity Date | Principal Amount | Value | |||||||||
| Packaging & Containers — 0.5% | ||||||||||||
Amcor Flexibles North America, Inc. |
| |||||||||||
4.00% | 05/17/25 | $ | 25,000 | $ | 24,079 | |||||||
Berry Global, Inc. |
| |||||||||||
0.95% | 02/15/24 | 15,000 | 14,126 | |||||||||
|
| |||||||||||
| 38,205 | ||||||||||||
|
| |||||||||||
| Pharmaceuticals — 0.7% | ||||||||||||
Bayer US Finance II LLC |
| |||||||||||
4.25% (3) | 12/15/25 | 30,000 | 28,704 | |||||||||
Bayer US Finance LLC |
| |||||||||||
3.38% (3) | 07/15/24 | 10,000 | 9,664 | |||||||||
Becton Dickinson and Co. |
| |||||||||||
3.73% | 12/15/24 | 20,000 | 19,402 | |||||||||
|
| |||||||||||
| 57,770 | ||||||||||||
|
| |||||||||||
| REIT — 1.8% | ||||||||||||
Camden Property Trust |
| |||||||||||
2.95% | 12/15/22 | 25,000 | 24,960 | |||||||||
GLP Capital LP / GLP Financing II, Inc. |
| |||||||||||
5.38% | 11/01/23 | 25,000 | 24,728 | |||||||||
Kilroy Realty LP |
| |||||||||||
3.45% | 12/15/24 | 40,000 | 37,884 | |||||||||
Piedmont Operating Partnership LP |
| |||||||||||
3.40% | 06/01/23 | 30,000 | 29,585 | |||||||||
VICI Properties LP / VICI Note Co., Inc. |
| |||||||||||
4.25% (3) | 12/01/26 | 10,000 | 9,073 | |||||||||
4.63% (3) | 06/15/25 | 10,000 | 9,435 | |||||||||
5.75% (3) | 02/01/27 | 10,000 | 9,454 | |||||||||
|
| |||||||||||
| 145,119 | ||||||||||||
|
| |||||||||||
| Software — 0.3% | ||||||||||||
Take-Two Interactive Software, Inc. |
| |||||||||||
3.30% | 03/28/24 | 25,000 | 24,276 | |||||||||
|
| |||||||||||
| Telecommunications — 1.4% | ||||||||||||
SES SA |
| |||||||||||
3.60% (3) | 04/04/23 | 35,000 | 34,598 | |||||||||
Sprint Spectrum Co. LLC / Sprint Spectrum Co. II LLC / Sprint Spectrum Co. III LLC |
| |||||||||||
4.74% (3) | 03/20/25 | 62,500 | 61,637 | |||||||||
T-Mobile USA, Inc. |
| |||||||||||
3.88% | 04/15/30 | 25,000 | 22,136 | |||||||||
|
| |||||||||||
| 118,371 | ||||||||||||
|
| |||||||||||
Total Corporate Bonds |
| |||||||||||
(Cost: $1,908,759) | 1,833,623 | |||||||||||
|
| |||||||||||
| MUNICIPAL BONDS — 1.0% | ||||||||||||
City and County of Denver Co. Airport System Revenue, Revenue Bond |
| |||||||||||
1.12% | 11/15/24 | 10,000 | 9,227 | |||||||||
See accompanying Notes to Financial Statements.
81
Table of Contents
TCW Short Term Bond Fund
Schedule of Investments (Continued)
| Issues | Maturity Date | Principal Amount | Value | |||||||||
| MUNICIPAL BONDS (Continued) | ||||||||||||
City of Baltimore MD, General Obligation Unlimited |
| |||||||||||
5.00% | 10/15/25 | $ | 40,000 | $ | 40,101 | |||||||
New York City Transitional Finance Authority Future Tax Secured Revenue, Revenue Bond |
| |||||||||||
2.31% | 11/01/26 | 25,000 | 22,602 | |||||||||
New York State Dormitory Authority, Revenue Bond |
| |||||||||||
5.00% | 03/15/24 | 15,000 | 14,980 | |||||||||
|
| |||||||||||
Total Municipal Bonds |
| |||||||||||
(Cost: $96,196) | 86,910 | |||||||||||
|
| |||||||||||
| U.S. TREASURY SECURITIES — 33.8% | ||||||||||||
U.S. Treasury Note |
| |||||||||||
2.75% | 08/15/32 | 15,000 | 13,434 | |||||||||
3.00% | 07/31/24 | 155,000 | 150,888 | |||||||||
3.25% | 08/31/24 | 41,000 | 40,070 | |||||||||
4.13% | 09/30/27 | 55,000 | 54,706 | |||||||||
4.13% | 10/31/27 | 54,000 | 53,732 | |||||||||
4.25% | 09/30/24 | 688,000 | 684,574 | |||||||||
4.25% | 10/15/25 | 542,000 | 539,311 | |||||||||
4.38% | 10/31/24 | 1,259,000 | 1,256,467 | |||||||||
|
| |||||||||||
Total U.S. Treasury Securities |
| |||||||||||
(Cost: $2,802,179) |
| 2,793,182 | ||||||||||
|
| |||||||||||
| ASSET-BACKED SECURITIES — 5.9% | ||||||||||||
Apidos CLO XXII (15-22A-A1R) |
| |||||||||||
5.30% (3 mo. USD LIBOR + 1.060%) (2),(3) | 04/20/31 | 45,000 | 43,739 | |||||||||
Carvana Auto Receivables Trust (22-P3-A3) |
| |||||||||||
4.61% | 11/10/27 | 50,000 | 48,541 | |||||||||
CoreVest American Finance Trust (19-1-XA) (I/O) |
| |||||||||||
2.28% (1),(3) | 03/15/52 | 70,747 | 2,640 | |||||||||
Madison Park Funding, Ltd. (18-30A-A) |
| |||||||||||
4.83% (3 mo. USD LIBOR + 0.750%) (2),(3) | 04/15/29 | 47,849 | 46,777 | |||||||||
Magnetite XVIII, Ltd. (16-18A-AR2) |
| |||||||||||
3.79% (3 mo. USD LIBOR + 0.880%) (2),(3) | 11/15/28 | 93,156 | 91,330 | |||||||||
Navient Private Education Refi Loan Trust (20-BA-A2) |
| |||||||||||
2.12% (3) | 01/15/69 | 55,733 | 49,423 | |||||||||
Navient Private Education Refi Loan Trust (21-BA-A) |
| |||||||||||
0.94% (3) | 07/15/69 | 66,900 | 56,181 | |||||||||
Navient Private Education Refi Loan Trust (21-CA-A) |
| |||||||||||
1.06% (3) | 10/15/69 | 73,243 | 62,543 | |||||||||
Tricon American Homes Trust (17-SFR2-A) |
| |||||||||||
2.93% (3) | 01/17/36 | 36,686 | 35,337 | |||||||||
Tricon American Homes Trust (17-SFR2-B) |
| |||||||||||
3.28% (3) | 01/17/36 | 39,000 | 37,475 | |||||||||
| Issues | Maturity Date | Principal Amount | Value | |||||||||
| ASSET-BACKED SECURITIES (Continued) | ||||||||||||
United States Small Business Administration (05-20B-1) |
| |||||||||||
4.63% | 02/01/25 | $ | 17,427 | $ | 16,899 | |||||||
|
| |||||||||||
Total Asset-backed Securities |
| |||||||||||
(Cost: $531,044) |
| 490,885 | ||||||||||
|
| |||||||||||
| U.S. GOVERNMENT AGENCY OBLIGATIONS — 7.4% | ||||||||||||
Federal Home Loan Banks | ||||||||||||
1.04% | 06/14/24 | 185,000 | 174,211 | |||||||||
1.20% | 12/23/24 | 285,000 | 264,189 | |||||||||
1.61% | 09/04/24 | 40,000 | 37,762 | |||||||||
United States International Development Finance Corp. |
| |||||||||||
1.49% | 08/15/31 | 155,676 | 135,354 | |||||||||
|
| |||||||||||
Total U.S. Government Agency Obligations |
| |||||||||||
(Cost: $666,619) |
| 611,516 | ||||||||||
|
| |||||||||||
| Total Fixed Income Securities | ||||||||||||
(Cost: $10,408,999) |
| 9,881,778 | ||||||||||
|
| |||||||||||
| Shares | ||||||||||||
| MONEY MARKET INVESTMENTS — 8.0% | ||||||||||||
State Street Institutional U.S. Government Money Market Fund — Premier Class, 3.01% (6) | 664,097 | 664,097 | ||||||||||
|
| |||||||||||
Total Money Market Investments |
| |||||||||||
(Cost: $664,097) | 664,097 | |||||||||||
|
| |||||||||||
| Principal Amount | ||||||||||||
SHORT TERM INVESTMENTS — 2.4% |
| |||||||||||
| U.S. Treasury Securities — 2.4% (Cost: $197,928) | ||||||||||||
U.S. Treasury Bill |
| |||||||||||
1.33% (7) | 11/10/22 | $ | 198,000 | 197,872 | ||||||||
|
| |||||||||||
| Total Investments (129.9%) | ||||||||||||
(Cost: $11,271,024) | 10,743,747 | |||||||||||
Liabilities In Excess Of Other Assets (-29.9%) |
| (2,474,246 | ) | |||||||||
|
| |||||||||||
Net Assets (100.0%) | $ | 8,269,501 | ||||||||||
|
| |||||||||||
See accompanying Notes to Financial Statements.
82
Table of Contents
TCW Short Term Bond Fund
October 31, 2022
| Futures Contracts | ||||||||||||||||||
| Number of Contracts | Type | Expiration Date | Notional | Market Value | Net Unrealized Appreciation (Depreciation) | |||||||||||||
Long Futures |
| |||||||||||||||||
| 7 | 2-Year U.S Treasury Note Futures | 12/30/22 | $ | 1,458,573 | $ | 1,430,680 | $ | (27,893 | ) | |||||||||
|
|
|
|
|
| |||||||||||||
Short Futures |
| |||||||||||||||||
| 5 | 10-Year U.S. Treasury Note Futures | 12/20/22 | $ | (615,601 | ) | $ | (579,922 | ) | $ | 35,679 | ||||||||
| 14 | 5-Year U.S Treasury Note Futures | 12/30/22 | (1,557,964 | ) | (1,492,313 | ) | 65,651 | |||||||||||
| 1 | U.S. Ultra Long Bond Futures | 12/20/22 | (150,131 | ) | (127,656 | ) | 22,475 | |||||||||||
|
|
|
|
|
| |||||||||||||
| $ | (2,323,696 | ) | $ | (2,199,891 | ) | $ | 123,805 | |||||||||||
|
|
|
|
|
| |||||||||||||
Notes to the Schedule of Investments:
| ABS | Asset-Backed Securities. |
| CLO | Collateralized Loan Obligation. |
| I/O | Interest Only Security. |
| PAC | Planned Amortization Class. |
| REIT | Real Estate Investment Trust. |
| SOFR | Secured Overnight Financing Rate. |
| TBA | To Be Announced. |
| (1) | Variable rate security. Interest rate disclosed is as of the most recent information available. Certain variable rate securities are not based on a published reference rate and spread but are determined by the issuer or agent and are based on current market conditions. These securities do not indicate a reference rate and spread in their description above. |
| (2) | Floating or variable rate security. The interest shown reflects the rate in effect at October 31, 2022. |
| (3) | Security exempt from registration under Rule 144A of the Securities Act of 1933, as amended. These securities may be resold, normally only to qualified institutional buyers. At October 31, 2022, the value of these securities amounted to $1,470,913 or 17.8% of net assets. These securities are determined to be liquid by the Fund’s investment advisor, unless otherwise noted, under procedures established by and under the general supervision of the Company’s Board of Directors. |
| (4) | Security purchased on a forward commitment with an approximate principal amount. The actual principal amount and maturity date will be determined upon settlement when the security is delivered. |
| (5) | The maturity date of the security has been extended past the date disclosed. The new maturity date is not known as of October 31, 2022. |
| (6) | Rate disclosed is the 7-day net yield as of October 31, 2022. |
| (7) | Rate shown represents yield-to-maturity. |
See accompanying Notes to Financial Statements.
83
Table of Contents
TCW Short Term Bond Fund
Investments by Sector | October 31, 2022 |
| Sector | Percentage of Net Assets | |||
U.S. Treasury Securities | 36.2 | % | ||
Residential Mortgage-Backed Securities — Agency | 28.3 | |||
Corporate Bonds | 22.2 | |||
Residential Mortgage-Backed Securities — Non-Agency | 10.1 | |||
Money Market Investments | 8.0 | |||
Commercial Mortgage-Backed Securities — Non-Agency | 7.8 | |||
U.S. Government Agency Obligations | 7.4 | |||
Asset-Backed Securities | 5.9 | |||
Commercial Mortgage-Backed Securities — Agency | 3.0 | |||
Municipal Bonds | 1.0 | |||
Other* | (29.9 | ) | ||
|
| |||
Total | 100.0 | % | ||
|
| |||
| * | Includes futures, pending trades, interest receivable and accrued expenses payable. |
See accompanying Notes to Financial Statements.
84
Table of Contents
TCW Short Term Bond Fund
Fair Valuation Summary | October 31, 2022 |
The following is a summary of the fair valuations according to the inputs used as of October 31, 2022 in valuing the Fund’s investments:
Description | Quoted Prices in Active Markets for Identical Assets (Level 1) | Other Significant Observable Inputs (Level 2) | Significant Unobservable Inputs (Level 3) | Total | ||||||||||||
Fixed Income Securities | ||||||||||||||||
Commercial Mortgage-Backed Securities — Agency | $ | — | $ | 249,675 | $ | — | $ | 249,675 | ||||||||
Commercial Mortgage-Backed Securities — Non-Agency | — | 641,947 | — | 641,947 | ||||||||||||
Residential Mortgage-Backed Securities — Agency | — | 2,337,477 | — | 2,337,477 | ||||||||||||
Residential Mortgage-Backed Securities — Non-Agency | — | 836,563 | — | 836,563 | ||||||||||||
Corporate Bonds* | — | 1,833,623 | — | 1,833,623 | ||||||||||||
Municipal Bonds | — | 86,910 | — | 86,910 | ||||||||||||
U.S. Treasury Securities | 2,793,182 | — | — | 2,793,182 | ||||||||||||
Asset-Backed Securities | — | 490,885 | — | 490,885 | ||||||||||||
U.S. Government Agency Obligations | — | 611,516 | — | 611,516 | ||||||||||||
|
|
|
|
|
|
|
| |||||||||
Total Fixed Income Securities | 2,793,182 | 7,088,596 | — | 9,881,778 | ||||||||||||
|
|
|
|
|
|
|
| |||||||||
Money Market Investments | 664,097 | — | — | 664,097 | ||||||||||||
Short-Term Investments | 197,872 | — | — | 197,872 | ||||||||||||
|
|
|
|
|
|
|
| |||||||||
Total Investments | $ | 3,655,151 | $ | 7,088,596 | $ | — | $ | 10,743,747 | ||||||||
|
|
|
|
|
|
|
| |||||||||
Asset Derivatives | ||||||||||||||||
Futures Contracts | ||||||||||||||||
Interest Rate Risk | 123,805 | — | — | 123,805 | ||||||||||||
|
|
|
|
|
|
|
| |||||||||
Total Investments | $ | 3,778,956 | $ | 7,088,596 | $ | — | $ | 10,867,552 | ||||||||
|
|
|
|
|
|
|
| |||||||||
Liability Derivatives | ||||||||||||||||
Futures Contracts | ||||||||||||||||
Interest Rate Risk | $ | (27,893 | ) | $ | — | $ | — | $ | (27,893 | ) | ||||||
|
|
|
|
|
|
|
| |||||||||
Total | $ | (27,893 | ) | $ | — | $ | — | $ | (27,893 | ) | ||||||
|
|
|
|
|
|
|
| |||||||||
| * | See Schedule of Investments for corresponding industries. |
See accompanying Notes to Financial Statements.
85
Table of Contents
Schedule of Investments
| Issues | Maturity Date | Principal Amount | Value | |||||||||
FIXED INCOME SECURITIES — 126.5% of Net Assets |
| |||||||||||
| ASSET-BACKED SECURITIES — 13.4% | ||||||||||||
321 Henderson Receivables I LLC (13-3A-A) |
| |||||||||||
4.08% (1) | 01/17/73 | $ | 5,534,708 | $ | 4,969,631 | |||||||
AGL CLO, Ltd. (21-13A-B) |
| |||||||||||
5.89% (3 mo. USD LIBOR + 1.650%) (1),(2) | 10/20/34 | 16,585,000 | 15,420,733 | |||||||||
Allegro CLO XII, Ltd. (20-1A-A1) |
| |||||||||||
5.53% (3 mo. USD LIBOR + 1.250%) (1),(2) | 01/21/32 | 17,125,000 | 16,693,108 | |||||||||
AMSR 2020-SFR2 Trust (20-SFR2-E2) |
| |||||||||||
4.28% (1) | 07/17/37 | 7,713,000 | 7,121,569 | |||||||||
Amsr Trust (20-SFR3-F) |
| |||||||||||
3.55% (1) | 09/17/37 | 2,682,000 | 2,373,243 | |||||||||
Amsr Trust (20-SFR3-G) |
| |||||||||||
4.99% (1) | 09/17/37 | 9,512,000 | 8,652,622 | |||||||||
Apidos CLO XXXVII (21-37A-B) |
| |||||||||||
5.92% (3 mo. USD LIBOR + 1.600%) (1),(2) | 10/22/34 | 17,000,000 | 15,840,600 | |||||||||
Barings CLO, Ltd. (20-4A-A) |
| |||||||||||
5.46% (3 mo. USD LIBOR + 1.220%) (1),(2) | 01/20/32 | 8,500,000 | 8,264,550 | |||||||||
Carvana Auto Receivables Trust (21-N2-R) |
| |||||||||||
0.00% (1),(3) | 03/10/28 | 26,650 | 6,562,655 | |||||||||
Carvana Auto Receivables Trust (21-N3-R) |
| |||||||||||
1.00% (1),(3) | 06/12/28 | 25,650 | 6,249,110 | |||||||||
CIFC Funding, Ltd. (22-2A-INCB) |
| |||||||||||
1.00% (1),(4) | 04/19/35 | 3,300,000 | 2,689,005 | |||||||||
Cologix Data Centers US Issuer LLC (21-1A-A2) |
| |||||||||||
3.30% (1) | 12/26/51 | 12,065,000 | 10,427,270 | |||||||||
CoreVest American Finance Trust (20-1-XA) (I/O) |
| |||||||||||
2.61% (1),(4) | 03/15/50 | 36,534,085 | 2,278,309 | |||||||||
CoreVest American Finance Trust (20-1-XB) (I/O) |
| |||||||||||
2.08% (1),(4) | 03/15/50 | 38,948,500 | 4,072,420 | |||||||||
CoreVest American Finance Trust (20-4-XA) (I/O) |
| |||||||||||
3.85% (1),(4) | 12/15/52 | 52,401,568 | 5,171,133 | |||||||||
CoreVest American Finance Trust (20-4-XB) (I/O) |
| |||||||||||
2.80% (1),(4) | 12/15/52 | 27,500,000 | 3,075,526 | |||||||||
CoreVest American Finance Trust (21-1-XA) (I/O) |
| |||||||||||
2.95% (1),(4) | 04/15/53 | 73,067,864 | 5,438,463 | |||||||||
Dryden CLO, Ltd. (20-83A-A) |
| |||||||||||
5.41% (3 mo. USD LIBOR + 1.220%) (1),(2) | 01/18/32 | 8,000,000 | 7,773,072 | |||||||||
EFS Volunteer No 2 LLC (12-1-A2) |
| |||||||||||
4.94% (1 mo. USD LIBOR + 1.350%) (1),(2) | 03/25/36 | 3,376,013 | 3,330,653 | |||||||||
FirstKey Homes Trust (21-SFR3-E1) |
| |||||||||||
2.99% (1) | 12/17/38 | 5,500,000 | 4,627,772 | |||||||||
Flatiron RR CLO, LLC (21-2A-B) |
| |||||||||||
5.68% (3 mo. USD LIBOR + 1.600%) (1),(2) | 10/15/34 | 15,600,000 | 14,529,840 | |||||||||
| Issues | Maturity Date | Principal Amount | Value | |||||||||
| ASSET-BACKED SECURITIES (Continued) | ||||||||||||
Flexential Issuer 2021-1 (21-1A-A2) |
| |||||||||||
3.25% (1) | 11/27/51 | $ | 10,950,000 | $ | 9,337,610 | |||||||
GCI Funding I LLC (21-1-A) |
| |||||||||||
2.38% (1) | 06/18/46 | 24,216,449 | 20,372,187 | |||||||||
Global SC Finance II SRL (14-1A-A2) |
| |||||||||||
3.09% (1) | 07/17/29 | 2,845,655 | 2,760,500 | |||||||||
GoldenTree Loan Management US CLO, Ltd. (19-4A-AR) |
| |||||||||||
5.43% (3 mo. USD LIBOR + 1.110%) (1),(2) | 04/24/31 | 15,800,000 | 15,332,320 | |||||||||
Higher Education Funding I (14-1-A) |
| |||||||||||
4.05% (3 mo. USD LIBOR + 1.050%) (1),(2) | 05/25/34 | 4,347 | 4,342 | |||||||||
HOA Funding LLC (21-1A-A2) |
| |||||||||||
4.72% (1) | 08/20/51 | 12,152,250 | 9,334,002 | |||||||||
HPS Loan Management, Ltd. (0A-16-A2RR) |
| |||||||||||
5.89% (3 mo. USD LIBOR + 1.650%) (1),(2) | 04/20/34 | 20,000,000 | 18,580,000 | |||||||||
Lucali CLO, Ltd. (20-1A-A) |
| |||||||||||
5.29% (3 mo. USD LIBOR + 1.210%) (1),(2) | 01/15/33 | 18,000,000 | 17,499,420 | |||||||||
Madison Park Funding XLVIII, Ltd. (21-48A-A) |
| |||||||||||
5.38% (3 mo. USD LIBOR + 1.150%) (1),(2) | 04/19/33 | 13,100,000 | 12,740,405 | |||||||||
Madison Park Funding XXXVIII, Ltd. (21-38A-B) |
| |||||||||||
5.73% (3 mo. USD LIBOR + 1.650%) (1),(2) | 07/17/34 | 10,000,000 | 9,376,000 | |||||||||
Navient Student Loan Trust (14-3-A) |
| |||||||||||
4.21% (1 mo. USD LIBOR + 0.620%) (2) | 03/25/83 | 17,809,865 | 16,817,191 | |||||||||
Navient Student Loan Trust (14-4-A) |
| |||||||||||
4.21% (1 mo. USD LIBOR + 0.620%) (2) | 03/25/83 | 9,808,191 | 9,337,507 | |||||||||
Neuberger Berman Loan Advisers CLO, Ltd. (20-36A-A1R) |
| |||||||||||
5.49% (3 mo. USD LIBOR + 1.250%) (1),(2) | 04/20/33 | 18,750,000 | 18,173,437 | |||||||||
OHA Credit Funding 3, Ltd. (19-3A-BR) |
| |||||||||||
5.89% (3 mo. USD LIBOR + 1.650%) (1),(2) | 07/02/35 | 13,000,000 | 12,221,950 | |||||||||
OHA Credit Funding, Ltd. (21-9A-B) |
| |||||||||||
5.93% (3 mo. USD LIBOR + 1.700%) (1),(2) | 07/19/35 | 17,500,000 | 16,439,500 | |||||||||
Park Avenue Institutional Advisers CLO, Ltd. (21-1A-A1A) |
| |||||||||||
5.63% (3 mo. USD LIBOR + 1.390%) (1),(2) | 01/20/34 | 19,000,000 | 18,337,983 | |||||||||
Progress Residential Trust (19-SFR3-E) |
| |||||||||||
3.37% (1) | 09/17/36 | 8,681,000 | 8,094,022 | |||||||||
Progress Residential Trust (20-SFR2-F) |
| |||||||||||
6.15% (1) | 06/17/37 | 9,332,000 | 8,809,468 | |||||||||
See accompanying Notes to Financial Statements.
86
Table of Contents
TCW Total Return Bond Fund
October 31, 2022
| Issues | Maturity Date | Principal Amount | Value | |||||||||
| ASSET-BACKED SECURITIES (Continued) | ||||||||||||
Progress Residential Trust (20-SFR3-F) |
| |||||||||||
2.80% (1) | 10/17/27 | $ | 3,299,000 | $ | 2,835,784 | |||||||
Progress Residential Trust (21-SFR1-H) |
| |||||||||||
5.00% (1) | 04/17/38 | 4,890,000 | 4,144,372 | |||||||||
Progress Residential Trust (21-SFR11-F) |
| |||||||||||
4.42% (1) | 01/17/39 | 2,874,000 | 2,259,685 | |||||||||
Progress Residential Trust (21-SFR2-G) |
| |||||||||||
4.25% (1) | 04/19/38 | 8,369,000 | 7,017,017 | |||||||||
Progress Residential Trust (21-SFR7-F) |
| |||||||||||
3.83% (1) | 08/17/40 | 7,500,000 | 5,946,919 | |||||||||
Sixth Street CLO XVII, Ltd. (21-17A-A) |
| |||||||||||
5.48% (3 mo. USD LIBOR + 1.240%) (1),(2) | 01/20/34 | 8,000,000 | 7,717,016 | |||||||||
SLM Student Loan Trust (08-5-A4) |
| |||||||||||
6.06% (3 mo. USD LIBOR + 1.700%) (2) | 07/25/23 | 1,491,692 | 1,476,018 | |||||||||
SLM Student Loan Trust (08-8-B) |
| |||||||||||
6.61% (3 mo. USD LIBOR + 2.250%) (2) | 10/25/75 | 5,706,000 | 5,492,207 | |||||||||
|
| |||||||||||
Total Asset-backed Securities |
| |||||||||||
(Cost: $458,162,053) |
| 416,018,146 | ||||||||||
|
| |||||||||||
| COMMERCIAL MORTGAGE-BACKED SECURITIES — AGENCY — 0.5% | ||||||||||||
Freddie Mac Multifamily Structured Pass-Through Certificates (K038-X3) (I/O) |
| |||||||||||
2.49% (4) | 06/25/42 | 78,039,937 | 2,543,271 | |||||||||
Freddie Mac Multifamily Structured Pass-Through Certificates (K040-X3) (I/O) |
| |||||||||||
2.04% (4) | 11/25/42 | 77,991,835 | 2,780,748 | |||||||||
Freddie Mac Multifamily Structured Pass-Through Certificates (K042-X3) (I/O) |
| |||||||||||
1.60% (4) | 01/25/43 | 76,625,000 | 2,300,034 | |||||||||
Freddie Mac Multifamily Structured Pass-Through Certificates (K045-X3) (I/O) |
| |||||||||||
1.50% (4) | 04/25/43 | 126,630,757 | 3,981,943 | |||||||||
Freddie Mac Multifamily Structured Pass-Through Certificates (K046-X3) (I/O) |
| |||||||||||
1.51% (4) | 04/25/43 | 94,964,072 | 3,120,049 | |||||||||
|
| |||||||||||
Total Commercial Mortgage-Backed Securities — Agency |
| |||||||||||
(Cost: $35,285,763) |
| 14,726,045 | ||||||||||
|
| |||||||||||
| COMMERCIAL MORTGAGE-BACKED SECURITIES — NON-AGENCY — 9.6% | ||||||||||||
1345 Avenue of the Americas & Park Avenue Plaza Trust (05-1-A3) |
| |||||||||||
5.28% (1) | 08/10/35 | 9,834,081 | 9,441,722 | |||||||||
Arbor Realty Commercial Real Estate Note, Ltd. (21-FL4-AS) |
| |||||||||||
5.11% (1 mo. USD LIBOR + 1.700%) (1),(2) | 11/15/36 | 11,800,000 | 11,186,970 | |||||||||
| Issues | Maturity Date | Principal Amount | Value | |||||||||
| COMMERCIAL MORTGAGE-BACKED SECURITIES — NON-AGENCY (Continued) | ||||||||||||
BAMLL Commercial Mortgage Securities Trust (20-BOC-A) |
| |||||||||||
2.63% (1) | 01/15/32 | $ | 14,275,000 | $ | 12,203,098 | |||||||
BDS, Ltd. (20-FL5-A) |
| |||||||||||
4.68% (SOFR + 1.264%) (1),(2) | 02/16/37 | 7,162,791 | 7,109,623 | |||||||||
BDS, Ltd. (20-FL6-C) |
| |||||||||||
5.18% (SOFR30A + 2.364%) (1),(2) | 09/15/35 | 10,870,676 | 10,820,347 | |||||||||
Benchmark Mortgage Trust (19-B14-225C) |
| |||||||||||
3.29% (1),(4) | 12/15/62 | 8,734,000 | 7,371,849 | |||||||||
Benchmark Mortgage Trust (19-B14-225D) |
| |||||||||||
3.29% (1),(4) | 12/15/62 | 20,303,000 | 16,820,788 | |||||||||
BFLD Trust (20-OBRK-A) |
| |||||||||||
5.46% (1 mo. USD LIBOR + 2.050%) (1),(2) | 11/15/28 | 17,940,000 | 17,656,189 | |||||||||
BPR Trust (21-WILL-A) |
| |||||||||||
5.16% (1 mo. USD LIBOR + 1.750%) (1),(2) | 06/15/38 | 4,800,514 | 4,647,628 | |||||||||
BX Commercial Mortgage Trust (20-VIV4-A) |
| |||||||||||
2.84% (1) | 03/09/44 | 15,285,000 | 11,943,783 | |||||||||
BX Trust (19-OC11-A) |
| |||||||||||
3.20% (1) | 12/09/41 | 8,270,000 | 6,813,627 | |||||||||
BX Trust (21-SDMF-J) |
| |||||||||||
7.45% (1 mo. USD LIBOR + 4.033%) (1),(2) | 09/15/34 | 13,000,000 | 12,029,334 | |||||||||
CAMB Commercial Mortgage Trust (19-LIFE-D) |
| |||||||||||
5.16% (1 mo. USD LIBOR + 1.750%) (1),(2) | 12/15/37 | 14,425,000 | 13,808,153 | |||||||||
Capital Funding Multifamily Mortgage Trust (22-PM01-A) |
| |||||||||||
5.33% (SOFR + 2.310%) (1),(2) | 02/27/25 | 10,000,000 | 9,824,926 | |||||||||
Credit Suisse Mortgage Trust (21-BPNY-A) |
| |||||||||||
7.13% (1 mo. USD LIBOR + 3.714%) (1),(2) | 08/15/23 | 19,780,000 | 18,946,080 | |||||||||
DBGS Mortgage Trust (18-BIOD-E) |
| |||||||||||
5.01% (1 mo. USD LIBOR + 1.700%) (1),(2) | 05/15/35 | 9,137,627 | 8,604,043 | |||||||||
DBWF Mortgage Trust (16-85T-A) |
| |||||||||||
3.79% (1) | 12/10/36 | 6,385,000 | 5,750,447 | |||||||||
European Loan Conduit Euro |
| |||||||||||
3.68% (3 mo. EURIBOR + 3.350%) (1),(2) | 02/17/30 | 9,197,227 | 8,206,944 | |||||||||
Grace Trust (20-GRCE-A) |
| |||||||||||
2.35% (1) | 12/10/40 | 10,000,000 | 7,498,127 | |||||||||
Houston Galleria Mall Trust (15-HGLR-D) |
| |||||||||||
3.98% (1) | 03/05/37 | 9,500,000 | 8,306,970 | |||||||||
Hudson Yards Mortgage Trust (19-55HY-A) |
| |||||||||||
2.94% (1),(4) | 12/10/41 | 5,750,000 | 4,761,599 | |||||||||
See accompanying Notes to Financial Statements.
87
Table of Contents
TCW Total Return Bond Fund
Schedule of Investments (Continued)
| Issues | Maturity Date | Principal Amount | Value | |||||||||
| COMMERCIAL MORTGAGE-BACKED SECURITIES — NON-AGENCY (Continued) | ||||||||||||
JPMorgan Chase Commercial Mortgage Securities Trust (19-OSB-A) |
| |||||||||||
3.40% (1) | 06/05/39 | $ | 13,765,000 | $ | 11,680,815 | |||||||
Life Mortgage Trust (21-BMR-G) |
| |||||||||||
6.36% (1 mo. USD LIBOR + 2.950%) (1),(2) | 03/15/38 | 21,126,977 | 19,762,175 | |||||||||
MFT Trust (20-ABC-D) |
| |||||||||||
3.48% (1),(4) | 02/10/42 | 1,973,000 | 1,344,396 | |||||||||
Morgan Stanley Capital I Trust (18-MP-A) |
| |||||||||||
4.28% (1),(4) | 07/11/40 | 4,635,000 | 4,052,763 | |||||||||
Morgan Stanley Capital I Trust (20-CNP-A) |
| |||||||||||
2.43% (1),(4) | 04/05/42 | 18,000,000 | 13,682,476 | |||||||||
One Bryant Park Trust (19-OBP-A) |
| |||||||||||
2.52% (1) | 09/15/54 | 13,570,000 | 10,756,001 | |||||||||
SFAVE Commercial Mortgage Securities Trust (15-5AVE-A2A) |
| |||||||||||
3.66% (1),(4) | 01/05/43 | 20,935,000 | 14,118,773 | |||||||||
SLG Office Trust (21-OVA-G) |
| |||||||||||
2.85% (1) | 07/15/41 | 16,460,000 | 9,957,653 | |||||||||
|
| |||||||||||
Total Commercial Mortgage-Backed Securities — Non-Agency |
| |||||||||||
(Cost: $351,807,447) |
| 299,107,299 | ||||||||||
|
| |||||||||||
| RESIDENTIAL MORTGAGE-BACKED SECURITIES — AGENCY — 64.8% | ||||||||||||
Fannie Mae, Pool #MA4152 |
| |||||||||||
2.00% | 10/01/40 | 51,480,582 | 42,352,236 | |||||||||
Fannie Mae , Pool #BM5979 |
| |||||||||||
3.50% | 09/01/45 | 6,419,786 | 5,829,174 | |||||||||
Fannie Mae , Pool #FM2342 |
| |||||||||||
3.50% | 12/01/46 | 3,891,651 | 3,539,692 | |||||||||
Fannie Mae (01-40-Z) |
| |||||||||||
6.00% | 08/25/31 | 62,088 | 62,614 | |||||||||
Fannie Mae (03-117-TG) (PAC) |
| |||||||||||
4.75% | 08/25/33 | 104,599 | 106,488 | |||||||||
Fannie Mae (04-52-SW) (I/O) (I/F) |
| |||||||||||
3.51% (-1 x 1 mo. USD LIBOR + 7.100%) (2) | 07/25/34 | 336,564 | 9,697 | |||||||||
Fannie Mae (04-65-LT) |
| |||||||||||
4.50% | 08/25/24 | 155,880 | 154,169 | |||||||||
Fannie Mae (04-68-LC) |
| |||||||||||
5.00% | 09/25/29 | 673,819 | 670,543 | |||||||||
Fannie Mae (05-117-LC) (PAC) |
| |||||||||||
5.50% | 11/25/35 | 223,098 | 223,814 | |||||||||
Fannie Mae (05-74-CP) (I/F) (PAC) |
| |||||||||||
11.60% (-1 x 1 mo. USD LIBOR + 24.750%) (2) | 05/25/35 | 63,112 | 64,473 | |||||||||
Fannie Mae (07-103-AI) (I/O) (I/F) |
| |||||||||||
2.91% (-1 x 1 mo. USD LIBOR + 6.500%) (2) | 03/25/37 | 2,472,298 | 152,116 | |||||||||
| Issues | Maturity Date | Principal Amount | Value | |||||||||
| RESIDENTIAL MORTGAGE-BACKED SECURITIES — AGENCY (Continued) | ||||||||||||
Fannie Mae (07-20-SI) (I/O) (I/F) |
| |||||||||||
2.86% (-1 x 1 mo. USD LIBOR + 6.450%) (2) | 03/25/37 | $ | 622,867 | $ | 45,141 | |||||||
Fannie Mae (07-21-SE) (I/O) (I/F) |
| |||||||||||
2.85% (-1 x 1 mo. USD LIBOR + 6.440%) (2) | 03/25/37 | 374,298 | 26,816 | |||||||||
Fannie Mae (07-56-SG) (I/O) (I/F) |
| |||||||||||
2.82% (-1 x 1 mo. USD LIBOR + 6.410%) (2) | 06/25/37 | 588,175 | 17,548 | |||||||||
Fannie Mae (07-58-SV) (I/O) (I/F) |
| |||||||||||
3.16% (-1 x 1 mo. USD LIBOR + 6.750%) (2) | 06/25/37 | 2,852,975 | 193,114 | |||||||||
Fannie Mae (07-65-S) (I/O) (I/F) |
| |||||||||||
3.01% (-1 x 1 mo. USD LIBOR + 6.600%) (2) | 07/25/37 | 313,549 | 18,497 | |||||||||
Fannie Mae (07-88-FY) |
| |||||||||||
4.05% (1 mo. USD LIBOR + 0.460%) (2) | 09/25/37 | 341,436 | 339,174 | |||||||||
Fannie Mae (07-B2-ZA) |
| |||||||||||
5.50% | 06/25/37 | 5,504,624 | 5,552,313 | |||||||||
Fannie Mae (08-1-AI) (I/O) (I/F) |
| |||||||||||
2.66% (-1 x 1 mo. USD LIBOR + 6.250%) (2) | 05/25/37 | 2,099,118 | 64,910 | |||||||||
Fannie Mae (08-13-SB) (I/O) (I/F) |
| |||||||||||
2.65% (-1 x 1 mo. USD LIBOR + 6.240%) (2) | 03/25/38 | 2,356,694 | 225,464 | |||||||||
Fannie Mae (08-23-SB) (I/O) (I/F) |
| |||||||||||
3.26% (-1 x 1 mo. USD LIBOR + 6.850%) (2) | 04/25/38 | 3,203,104 | 191,303 | |||||||||
Fannie Mae (08-35-SD) (I/O) (I/F) |
| |||||||||||
2.86% (-1 x 1 mo. USD LIBOR + 6.450%) (2) | 05/25/38 | 225,655 | 3,324 | |||||||||
Fannie Mae (08-66-SG) (I/O) (I/F) |
| |||||||||||
2.48% (-1 x 1 mo. USD LIBOR + 6.070%) (2) | 08/25/38 | 5,290,828 | 438,924 | |||||||||
Fannie Mae (08-68-SA) (I/O) (I/F) |
| |||||||||||
2.38% (-1 x 1 mo. USD LIBOR + 5.970%) (2) | 08/25/38 | 1,705,867 | 55,802 | |||||||||
Fannie Mae (09-3-SH) (I/O) (I/F) |
| |||||||||||
1.86% (-1 x 1 mo. USD LIBOR + 5.450%) (2) | 06/25/37 | 595,650 | 28,999 | |||||||||
Fannie Mae (09-47-SV) (I/O) (I/F) |
| |||||||||||
3.16% (-1 x 1 mo. USD LIBOR + 6.750%) (2) | 07/25/39 | 335,846 | 13,936 | |||||||||
Fannie Mae (09-51-SA) (I/O) (I/F) |
| |||||||||||
3.16% (-1 x 1 mo. USD LIBOR + 6.750%) (2) | 07/25/39 | 1,951,580 | 114,813 | |||||||||
Fannie Mae (09-6-SD) (I/O) (I/F) |
| |||||||||||
1.96% (-1 x 1 mo. USD LIBOR + 5.550%) (2) | 02/25/39 | 485,613 | 25,094 | |||||||||
See accompanying Notes to Financial Statements.
88
Table of Contents
TCW Total Return Bond Fund
October 31, 2022
| Issues | Maturity Date | Principal Amount | Value | |||||||||
| RESIDENTIAL MORTGAGE-BACKED SECURITIES — AGENCY (Continued) | ||||||||||||
Fannie Mae (09-68-KB) |
| |||||||||||
4.00% | 09/25/24 | $ | 594,232 | $ | 597,216 | |||||||
Fannie Mae (09-71-LB) |
| |||||||||||
4.00% | 09/25/29 | 4,544,776 | 4,415,414 | |||||||||
Fannie Mae (09-72-AC) |
| |||||||||||
4.00% | 09/25/29 | 5,904,168 | 5,758,277 | |||||||||
Fannie Mae (09-72-JS) (I/O) (I/F) |
| |||||||||||
3.66% (-1 x 1 mo. USD LIBOR + 7.250%) (2) | 09/25/39 | 344,241 | 40,081 | |||||||||
Fannie Mae (10-136-CX) (PAC) |
| |||||||||||
4.00% | 08/25/39 | 3,273,059 | 3,247,416 | |||||||||
Fannie Mae (11-111-DB) |
| |||||||||||
4.00% | 11/25/41 | 7,684,082 | 7,342,769 | |||||||||
Fannie Mae (12-128-UY) (PAC) |
| |||||||||||
2.50% | 11/25/42 | 11,738,000 | 9,708,327 | |||||||||
Fannie Mae (12-133-GC) (PAC) |
| |||||||||||
2.50% | 08/25/41 | 4,993,563 | 4,730,834 | |||||||||
Fannie Mae (12-153-PC) (PAC) |
| |||||||||||
2.00% | 05/25/42 | 1,307,143 | 1,217,868 | |||||||||
Fannie Mae (13-101-BO) (P/O) |
| |||||||||||
0.00% (5) | 10/25/43 | 3,293,901 | 2,407,613 | |||||||||
Fannie Mae (13-101-CO) (P/O) |
| |||||||||||
0.00% (5) | 10/25/43 | 7,246,576 | 5,287,296 | |||||||||
Fannie Mae (13-95-PN) (PAC) |
| |||||||||||
3.00% | 01/25/43 | 17,914,862 | 16,350,810 | |||||||||
Fannie Mae (16-106-EF) |
| |||||||||||
4.09% (1 mo. USD LIBOR + 0.500%) (2) | 01/25/47 | 11,797,493 | 11,651,610 | |||||||||
Fannie Mae (16-63-AF) |
| |||||||||||
4.09% (1 mo. USD LIBOR + 0.500%) (2) | 09/25/46 | 7,416,301 | 7,283,159 | |||||||||
Fannie Mae (18-25-FA) |
| |||||||||||
3.89% (1 mo. USD LIBOR + 0.300%) (2) | 04/25/48 | 13,523,535 | 13,164,120 | |||||||||
Fannie Mae (18-52 PZ) (PAC) |
| |||||||||||
4.00% | 07/25/48 | 1,782,191 | 1,624,596 | |||||||||
Fannie Mae (18-55 PA) (PAC) |
| |||||||||||
3.50% | 01/25/47 | 2,311,083 | 2,232,272 | |||||||||
Fannie Mae (19-57) |
| |||||||||||
2.50% | 10/25/49 | 7,953,365 | 6,839,948 | |||||||||
Fannie Mae (20-10-FA) |
| |||||||||||
4.09% (1 mo. USD LIBOR + 0.500%) (2) | 03/25/50 | 6,837,247 | 6,708,988 | |||||||||
Fannie Mae (20-12-FL) |
| |||||||||||
4.04% (1 mo. USD LIBOR + 0.450%) (2) | 03/25/50 | 16,048,697 | 15,700,222 | |||||||||
Fannie Mae (93-202-SZ) (I/F) (PAC) |
| |||||||||||
10.00% (2) | 11/25/23 | 4,722 | 4,743 | |||||||||
| Issues | Maturity Date | Principal Amount | Value | |||||||||
| RESIDENTIAL MORTGAGE-BACKED SECURITIES — AGENCY (Continued) | ||||||||||||
Fannie Mae (95-21-C) (P/O) |
| |||||||||||
0.00% (5) | 05/25/24 | $ | 39,664 | $ | 38,535 | |||||||
Fannie Mae, Pool #254634 |
| |||||||||||
5.50% | 02/01/23 | 1,299 | 1,296 | |||||||||
Fannie Mae, Pool #257536 |
| |||||||||||
5.00% | 01/01/29 | 527,348 | 524,828 | |||||||||
Fannie Mae, Pool #310033 |
| |||||||||||
6.00% | 07/01/47 | 372,161 | 381,190 | |||||||||
Fannie Mae, Pool #555424 |
| |||||||||||
5.50% | 05/01/33 | 1,418,413 | 1,434,111 | |||||||||
Fannie Mae, Pool #661856 |
| |||||||||||
3.87% (12 mo. USD LIBOR + 1.623%) (2) | 10/01/32 | 21,133 | 20,764 | |||||||||
Fannie Mae, Pool #671133 |
| |||||||||||
2.66% (6 mo. USD LIBOR + 1.413%) (2) | 02/01/33 | 58,896 | 58,551 | |||||||||
Fannie Mae, Pool #687847 |
| |||||||||||
2.18% (12 mo. USD LIBOR + 1.614%) (2) | 02/01/33 | 10,123 | 9,922 | |||||||||
Fannie Mae, Pool #692104 |
| |||||||||||
2.79% (6 mo. USD LIBOR + 1.413%) (2) | 02/01/33 | 319,009 | 316,527 | |||||||||
Fannie Mae, Pool #699866 |
| |||||||||||
2.59% (12 mo. USD LIBOR + 1.545%) (2) | 04/01/33 | 130,055 | 130,614 | |||||||||
Fannie Mae, Pool #704454 |
| |||||||||||
3.08% (12 mo. USD LIBOR + 1.684%) (2) | 05/01/33 | 19,899 | 19,625 | |||||||||
Fannie Mae, Pool #728824 |
| |||||||||||
3.87% (12 mo. USD LIBOR + 1.621%) (2) | 07/01/33 | 46,893 | 45,967 | |||||||||
Fannie Mae, Pool #734384 |
| |||||||||||
5.50% | 07/01/33 | 203,433 | 203,205 | |||||||||
Fannie Mae, Pool #888593 |
| |||||||||||
7.00% | 06/01/37 | 174,894 | 187,619 | |||||||||
Fannie Mae, Pool #934103 |
| |||||||||||
5.00% | 07/01/38 | 136,292 | 130,847 | |||||||||
Fannie Mae, Pool #979563 |
| |||||||||||
5.00% | 04/01/28 | 324,575 | 320,046 | |||||||||
Fannie Mae, Pool #995040 |
| |||||||||||
5.00% | 06/01/23 | 15,638 | 15,585 | |||||||||
Fannie Mae, Pool #995425 |
| |||||||||||
6.00% | 01/01/24 | 68,013 | 68,057 | |||||||||
Fannie Mae, Pool #995573 |
| |||||||||||
6.00% | 01/01/49 | 1,054,751 | 1,069,632 | |||||||||
Fannie Mae, Pool #995953 |
| |||||||||||
6.00% | 11/01/28 | 1,395,912 | 1,406,663 | |||||||||
Fannie Mae, Pool #995954 |
| |||||||||||
6.00% | 03/01/29 | 757,696 | 763,531 | |||||||||
See accompanying Notes to Financial Statements.
89
Table of Contents
TCW Total Return Bond Fund
Schedule of Investments (Continued)
| Issues | Maturity Date | Principal Amount | Value | |||||||||
| RESIDENTIAL MORTGAGE-BACKED SECURITIES — AGENCY (Continued) | ||||||||||||
Fannie Mae, Pool #AA3303 |
| |||||||||||
5.50% | 06/01/38 | $ | 1,855,247 | $ | 1,888,257 | |||||||
Fannie Mae, Pool #AB6210 |
| |||||||||||
3.00% | 09/01/42 | 18,897,266 | 16,594,577 | |||||||||
Fannie Mae, Pool #AE0588 |
| |||||||||||
6.00% | 08/01/37 | 3,328,943 | 3,416,628 | |||||||||
Fannie Mae, Pool #AL0851 |
| |||||||||||
6.00% | 10/01/40 | 2,088,795 | 2,166,444 | |||||||||
Fannie Mae, Pool #AL1594 |
| |||||||||||
6.00% | 07/01/40 | 1,650,600 | 1,711,960 | |||||||||
Fannie Mae, Pool #AL9106 |
| |||||||||||
4.50% | 02/01/46 | 8,075,360 | 7,801,839 | |||||||||
Fannie Mae, Pool #AS7241 |
| |||||||||||
3.50% | 05/01/46 | 6,612,329 | 5,983,340 | |||||||||
Fannie Mae, Pool #AS9454 |
| |||||||||||
4.00% | 04/01/47 | 807,792 | 748,447 | |||||||||
Fannie Mae, Pool #BN4316 |
| |||||||||||
4.00% | 01/01/49 | 131,885 | 121,969 | |||||||||
Fannie Mae, Pool #BN6264 |
| |||||||||||
4.00% | 04/01/49 | 2,797,676 | 2,581,984 | |||||||||
Fannie Mae, Pool #BQ6913 |
| |||||||||||
2.00% | 12/01/51 | 21,950,176 | 17,362,755 | |||||||||
Fannie Mae, Pool #BQ7056 |
| |||||||||||
2.00% | 01/01/52 | 47,246,010 | 37,357,186 | |||||||||
Fannie Mae, Pool #BU7102 |
| |||||||||||
2.50% | 12/01/51 | 11,848,407 | 9,743,294 | |||||||||
Fannie Mae, Pool #BV7761 |
| |||||||||||
2.50% | 03/01/52 | 13,847,911 | 11,397,269 | |||||||||
Fannie Mae, Pool #BV8459 |
| |||||||||||
3.00% | 04/01/52 | 19,498,930 | 16,571,042 | |||||||||
Fannie Mae, Pool #BV8463 |
| |||||||||||
2.50% | 04/01/52 | 26,769,475 | 21,932,710 | |||||||||
Fannie Mae, Pool #BV8464 |
| |||||||||||
3.00% | 04/01/52 | 20,140,542 | 17,116,313 | |||||||||
Fannie Mae, Pool #BV8515 |
| |||||||||||
3.00% | 05/01/52 | 29,226,842 | 24,836,698 | |||||||||
Fannie Mae, Pool #CA1540 |
| |||||||||||
4.00% | 04/01/48 | 12,415,421 | 11,498,166 | |||||||||
Fannie Mae, Pool #CA1710 |
| |||||||||||
4.50% | 05/01/48 | 5,764,249 | 5,506,187 | |||||||||
Fannie Mae, Pool #CA1711 |
| |||||||||||
4.50% | 05/01/48 | 5,415,016 | 5,172,590 | |||||||||
Fannie Mae, Pool #CA2208 |
| |||||||||||
4.50% | 08/01/48 | 5,501,638 | 5,255,333 | |||||||||
Fannie Mae, Pool #CB2852 |
| |||||||||||
2.00% | 11/01/51 | 19,332,267 | 15,291,969 | |||||||||
Fannie Mae, Pool #CB3151 |
| |||||||||||
2.00% | 03/01/52 | 44,129,031 | 34,865,025 | |||||||||
| Issues | Maturity Date | Principal Amount | Value | |||||||||
| RESIDENTIAL MORTGAGE-BACKED SECURITIES — AGENCY (Continued) | ||||||||||||
Fannie Mae, Pool #FM9515 |
| |||||||||||
2.50% | 11/01/51 | $ | 21,404,573 | $ | 17,563,021 | |||||||
Fannie Mae, Pool #FS0139 |
| |||||||||||
2.50% | 01/01/52 | 29,410,707 | 24,184,577 | |||||||||
Fannie Mae, Pool #FS1598 |
| |||||||||||
2.00% | 04/01/52 | 31,961,500 | 25,183,415 | |||||||||
Fannie Mae, Pool #MA1561 |
| |||||||||||
3.00% | 09/01/33 | 18,223,024 | 16,471,543 | |||||||||
Fannie Mae, Pool #MA1584 |
| |||||||||||
3.50% | 09/01/33 | 11,650,314 | 10,764,178 | |||||||||
Fannie Mae, Pool #MA2995 |
| |||||||||||
4.00% | 05/01/47 | 3,412,738 | 3,164,096 | |||||||||
Fannie Mae, Pool #MA4548 |
| |||||||||||
2.50% | 02/01/52 | 19,370,515 | 15,908,686 | |||||||||
Fannie Mae, Pool #MA4579 |
| |||||||||||
3.00% | 04/01/52 | 36,706,067 | 31,212,987 | |||||||||
Freddie Mac (4896-DA) |
| |||||||||||
3.00% | 01/15/49 | 1,512,279 | 1,379,763 | |||||||||
Freddie Mac (4648-FA) |
| |||||||||||
3.91% (1 mo. USD LIBOR + 0.500%) (2) | 01/15/47 | 6,736,474 | 6,627,679 | |||||||||
Freddie Mac (4929-FB) |
| |||||||||||
4.04% (1 mo. USD LIBOR + 0.450%) (2) | 09/25/49 | 14,134,958 | 13,911,537 | |||||||||
Freddie Mac (1829-ZB) |
| |||||||||||
6.50% | 03/15/26 | 10,845 | 10,878 | |||||||||
Freddie Mac (2367-ZK) |
| |||||||||||
6.00% | 10/15/31 | 50,182 | 50,894 | |||||||||
Freddie Mac (2514-PZ) (PAC) |
| |||||||||||
5.50% | 10/15/32 | 942,243 | 953,519 | |||||||||
Freddie Mac (2571-PZ) (PAC) |
| |||||||||||
5.50% | 02/15/33 | 2,236,736 | 2,242,590 | |||||||||
Freddie Mac (2642-AR) |
| |||||||||||
4.50% | 07/15/23 | 26,331 | 26,431 | |||||||||
Freddie Mac (2647-OV) (P/O) |
| |||||||||||
0.00% (5) | 07/15/33 | 481,888 | 353,181 | |||||||||
Freddie Mac (2662-MT) (TAC) |
| |||||||||||
4.50% | 08/15/33 | 695,733 | 685,458 | |||||||||
Freddie Mac (2666-BD) |
| |||||||||||
4.50% | 08/15/23 | 69,499 | 69,797 | |||||||||
Freddie Mac (2700-B) |
| |||||||||||
4.50% | 11/15/23 | 111,469 | 111,033 | |||||||||
Freddie Mac (277-30) |
| |||||||||||
3.00% | 09/15/42 | 9,812,885 | 8,947,459 | |||||||||
Freddie Mac (2903-PO) (P/O) |
| |||||||||||
0.00% (5) | 11/15/23 | 26,101 | 25,638 | |||||||||
Freddie Mac (3045-HZ) |
| |||||||||||
4.50% | 10/15/35 | 637,307 | 596,359 | |||||||||
See accompanying Notes to Financial Statements.
90
Table of Contents
TCW Total Return Bond Fund
October 31, 2022
| Issues | Maturity Date | Principal Amount | Value | |||||||||
| RESIDENTIAL MORTGAGE-BACKED SECURITIES — AGENCY (Continued) | ||||||||||||
Freddie Mac (3063-YG) (PAC) |
| |||||||||||
5.50% | 11/15/35 | $ | 9,876,234 | $ | 9,977,299 | |||||||
Freddie Mac (3114-KZ) |
| |||||||||||
5.00% | 02/15/36 | 7,308,463 | 7,287,639 | |||||||||
Freddie Mac (3146-GE) |
| |||||||||||
5.50% | 04/15/26 | 1,203,239 | 1,203,804 | |||||||||
Freddie Mac (3149-OD) (P/O) (PAC) |
| |||||||||||
0.00% (5) | 05/15/36 | 2,551,974 | 2,043,890 | |||||||||
Freddie Mac (3315-S) (I/O) (I/F) |
| |||||||||||
3.00% (-1 x 1 mo. USD LIBOR + 6.410%) (2) | 05/15/37 | 412,626 | 31,806 | |||||||||
Freddie Mac (3376-SX) (I/O) (I/F) |
| |||||||||||
2.63% (-1 x 1 mo. USD LIBOR + 6.040%) (2) | 10/15/37 | 1,495,897 | 76,643 | |||||||||
Freddie Mac (3410-IS) (I/O) (I/F) |
| |||||||||||
2.86% (-1 x 1 mo. USD LIBOR + 6.270%) (2) | 02/15/38 | 1,922,151 | 106,650 | |||||||||
Freddie Mac (3424-BI) (I/O) (I/F) |
| |||||||||||
3.39% (-1 x 1 mo. USD LIBOR + 6.800%) (2) | 04/15/38 | 2,470,635 | 267,269 | |||||||||
Freddie Mac (3519-SH) (I/O) (I/F) |
| |||||||||||
2.09% (-1 x 1 mo. USD LIBOR + 5.500%) (2) | 07/15/37 | 147,334 | 10,468 | |||||||||
Freddie Mac (3531-SC) (I/O) (I/F) |
| |||||||||||
2.89% (-1 x 1 mo. USD LIBOR + 6.300%) (2) | 05/15/39 | 3,129,638 | 67,957 | |||||||||
Freddie Mac (3541-SA) (I/O) (I/F) |
| |||||||||||
3.34% (-1 x 1 mo. USD LIBOR + 6.750%) (2) | 06/15/39 | 1,104,987 | 106,239 | |||||||||
Freddie Mac (3550-GS) (I/O) (I/F) |
| |||||||||||
3.34% (-1 x 1 mo. USD LIBOR + 6.750%) (2) | 07/15/39 | 2,923,178 | 298,891 | |||||||||
Freddie Mac (3551-VZ) |
| |||||||||||
5.50% | 12/15/32 | 1,166,245 | 1,178,375 | |||||||||
Freddie Mac (3557-KB) |
| |||||||||||
4.50% | 07/15/29 | 2,034,408 | 1,996,739 | |||||||||
Freddie Mac (3557-NB) |
| |||||||||||
4.50% | 07/15/29 | 4,697,598 | 4,656,032 | |||||||||
Freddie Mac (3558-KB) |
| |||||||||||
4.00% | 08/15/29 | 2,127,589 | 2,070,650 | |||||||||
Freddie Mac (3565-XB) |
| |||||||||||
4.00% | 08/15/24 | 1,173,909 | 1,159,929 | |||||||||
Freddie Mac (3575-D) |
| |||||||||||
4.50% | 03/15/37 | 263,117 | 255,530 | |||||||||
Freddie Mac (3788-SB) (I/O) (I/F) |
| |||||||||||
3.07% (-1 x 1 mo. USD LIBOR + 6.480%) (2) | 01/15/41 | 4,107,184 | 452,626 | |||||||||
Freddie Mac (3885-PO) (P/O) (PAC) |
| |||||||||||
0.00% (5) | 11/15/33 | 911,975 | 750,252 | |||||||||
| Issues | Maturity Date | Principal Amount | Value | |||||||||
| RESIDENTIAL MORTGAGE-BACKED SECURITIES — AGENCY (Continued) | ||||||||||||
Freddie Mac (3930-KE) (PAC) |
| |||||||||||
4.00% | 09/15/41 | $ | 10,470,000 | $ | 9,898,033 | |||||||
Freddie Mac (4030-HS) (I/O) (I/F) |
| |||||||||||
3.20% (-1 x 1 mo. USD LIBOR + 6.610%) (2) | 04/15/42 | 1,535,457 | 147,265 | |||||||||
Freddie Mac (4604-PB) (PAC) |
| |||||||||||
3.00% | 01/15/46 | 2,201,517 | 1,948,379 | |||||||||
Freddie Mac (4846-PA) |
| |||||||||||
4.00% | 06/15/47 | 754,866 | 759,902 | |||||||||
Freddie Mac (5210-LB) |
| |||||||||||
3.00% | 08/25/50 | 16,601,979 | 12,072,770 | |||||||||
Freddie Mac (R002-ZA) |
| |||||||||||
5.50% | 06/15/35 | 2,137,546 | 2,160,258 | |||||||||
Freddie Mac, Pool #A91162 |
| |||||||||||
5.00% | 02/01/40 | 10,478,243 | 10,512,098 | |||||||||
Freddie Mac, Pool #A92195 |
| |||||||||||
5.00% | 05/01/40 | 2,587,462 | 2,586,547 | |||||||||
Freddie Mac, Pool #G01959 |
| |||||||||||
5.00% | 12/01/35 | 53,707 | 53,880 | |||||||||
Freddie Mac, Pool #G06173 |
| |||||||||||
4.00% | 11/01/40 | 12,535,327 | 11,790,589 | |||||||||
Freddie Mac, Pool #G07556 |
| |||||||||||
4.00% | 11/01/43 | 3,810,004 | 3,575,607 | |||||||||
Freddie Mac, Pool #G07786 |
| |||||||||||
4.00% | 08/01/44 | 12,733,182 | 11,956,093 | |||||||||
Freddie Mac, Pool #G07848 |
| |||||||||||
3.50% | 04/01/44 | 33,556,098 | 30,427,398 | |||||||||
Freddie Mac, Pool #G08710 |
| |||||||||||
3.00% | 06/01/46 | 1,034,611 | 897,836 | |||||||||
Freddie Mac, Pool #G08833 |
| |||||||||||
5.00% | 07/01/48 | 2,555,228 | 2,501,210 | |||||||||
Freddie Mac, Pool #G08840 |
| |||||||||||
5.00% | 08/01/48 | 403,677 | 394,606 | |||||||||
Freddie Mac, Pool #G08843 |
| |||||||||||
4.50% | 10/01/48 | 3,562,045 | 3,399,559 | |||||||||
Freddie Mac, Pool #G08848 |
| |||||||||||
4.50% | 11/01/48 | 1,700,786 | 1,626,131 | |||||||||
Freddie Mac, Pool #G08849 |
| |||||||||||
5.00% | 11/01/48 | 3,037,016 | 2,973,365 | |||||||||
Freddie Mac, Pool #G13390 |
| |||||||||||
6.00% | 01/01/24 | 8,057 | 8,044 | |||||||||
Freddie Mac, Pool #G16085 |
| |||||||||||
2.50% | 02/01/32 | 3,211,035 | 2,991,035 | |||||||||
Freddie Mac, Pool #G16598 |
| |||||||||||
2.50% | 12/01/31 | 2,916,261 | 2,707,603 | |||||||||
Freddie Mac, Pool #G30450 |
| |||||||||||
6.00% | 01/01/29 | 542,874 | 547,629 | |||||||||
Freddie Mac, Pool #G30452 |
| |||||||||||
6.00% | 10/01/28 | 529,197 | 533,833 | |||||||||
See accompanying Notes to Financial Statements.
91
Table of Contents
TCW Total Return Bond Fund
Schedule of Investments (Continued)
| Issues | Maturity Date | Principal Amount | Value | |||||||||
| RESIDENTIAL MORTGAGE-BACKED SECURITIES — AGENCY (Continued) | ||||||||||||
Freddie Mac, Pool #G30454 |
| |||||||||||
5.00% | 05/01/29 | $ | 566,931 | $ | 559,685 | |||||||
Freddie Mac, Pool #G60238 |
| |||||||||||
3.50% | 10/01/45 | 3,530,053 | 3,203,940 | |||||||||
Freddie Mac, Pool #G60440 |
| |||||||||||
3.50% | 03/01/46 | 25,178,799 | 22,852,738 | |||||||||
Freddie Mac, Pool #G67707 |
| |||||||||||
3.50% | 01/01/48 | 13,860,567 | 12,487,175 | |||||||||
Freddie Mac, Pool #G67709 |
| |||||||||||
3.50% | 03/01/48 | 20,324,232 | 18,244,595 | |||||||||
Freddie Mac, Pool #G67717 |
| |||||||||||
4.00% | 11/01/48 | 29,104,555 | 27,182,820 | |||||||||
Freddie Mac, Pool #N70081 |
| |||||||||||
5.50% | 07/01/38 | 1,655,020 | 1,622,830 | |||||||||
Freddie Mac, Pool #P51350 |
| |||||||||||
5.00% | 03/01/36 | 1,439,786 | 1,437,149 | |||||||||
Freddie Mac, Pool #QE0312 |
| |||||||||||
2.00% | 04/01/52 | 12,204,552 | 9,616,236 | |||||||||
Freddie Mac, Pool #RA6528 |
| |||||||||||
2.50% | 02/01/52 | 8,688,905 | 7,136,010 | |||||||||
Freddie Mac, Pool #SD7513 |
| |||||||||||
3.50% | 04/01/50 | 15,251,917 | 13,721,264 | |||||||||
Freddie Mac, Pool #SD8194 |
| |||||||||||
2.50% | 02/01/52 | 19,216,097 | 15,781,765 | |||||||||
Freddie Mac, Pool #SD8199 |
| |||||||||||
2.00% | 03/01/52 | 7,777,668 | 6,128,196 | |||||||||
Freddie Mac, Pool #SD8205 |
| |||||||||||
2.50% | 04/01/52 | 3,197,189 | 2,621,139 | |||||||||
Freddie Mac, Pool #SD8212 |
| |||||||||||
2.50% | 05/01/52 | 19,907,675 | 16,320,835 | |||||||||
Freddie Mac, Pool #ZT1491 |
| |||||||||||
3.50% | 11/01/48 | 8,458,036 | 7,629,689 | |||||||||
Ginnie Mae (11-70-BO) (P/O) |
| |||||||||||
0.00% (5) | 05/20/41 | 3,874,051 | 2,931,415 | |||||||||
Ginnie Mae (15-42-ZB) |
| |||||||||||
3.00% | 03/20/45 | 20,024,461 | 17,343,018 | |||||||||
Ginnie Mae (15-43-DM) |
| |||||||||||
2.50% | 03/20/45 | 19,265,337 | 17,126,757 | |||||||||
Ginnie Mae (15-44-Z) |
| |||||||||||
3.00% | 03/20/45 | 13,550,730 | 11,458,379 | |||||||||
Ginnie Mae II, Pool #80963 |
| |||||||||||
2.63% (U.S. 1-year Treasury Constant Maturity Rate + 1.500%) (2) | 07/20/34 | 64,212 | 62,645 | |||||||||
Ginnie Mae II, Pool #MA2374 |
| |||||||||||
5.00% | 11/20/44 | 214,131 | 214,369 | |||||||||
Ginnie Mae II, Pool #MA2828 |
| |||||||||||
4.50% | 05/20/45 | 150,291 | 147,598 | |||||||||
| Issues | Maturity Date | Principal Amount | Value | |||||||||
| RESIDENTIAL MORTGAGE-BACKED SECURITIES — AGENCY (Continued) | ||||||||||||
Ginnie Mae II, Pool #MA3456 |
| |||||||||||
4.50% | 02/20/46 | $ | 797,184 | $ | 782,887 | |||||||
Ginnie Mae II, Pool #MA3521 |
| |||||||||||
3.50% | 03/20/46 | 19,705,633 | 18,027,670 | |||||||||
Ginnie Mae II, Pool #MA3662 |
| |||||||||||
3.00% | 05/20/46 | 5,822,983 | 5,161,198 | |||||||||
Ginnie Mae II, Pool #MA3663 |
| |||||||||||
3.50% | 05/20/46 | 9,447,899 | 8,634,539 | |||||||||
Ginnie Mae II, Pool #MA3665 |
| |||||||||||
4.50% | 05/20/46 | 1,294,548 | 1,261,552 | |||||||||
Ginnie Mae II, Pool #MA3735 |
| |||||||||||
3.00% | 06/20/46 | 73,851 | 65,704 | |||||||||
Ginnie Mae II, Pool #MA3739 |
| |||||||||||
5.00% | 06/20/46 | 2,639,656 | 2,651,510 | |||||||||
Ginnie Mae II, Pool #MA3876 |
| |||||||||||
4.50% | 08/20/46 | 80,132 | 78,089 | |||||||||
Ginnie Mae II, Pool #MA3877 |
| |||||||||||
5.00% | 08/20/46 | 1,111,787 | 1,106,237 | |||||||||
Ginnie Mae II, Pool #MA4006 |
| |||||||||||
4.50% | 10/20/46 | 37,193 | 36,245 | |||||||||
Ginnie Mae II, Pool #MA4007 |
| |||||||||||
5.00% | 10/20/46 | 2,282,710 | 2,293,006 | |||||||||
Ginnie Mae II, Pool #MA4071 |
| |||||||||||
4.50% | 11/20/46 | 165,219 | 162,952 | |||||||||
Ginnie Mae II, Pool #MA4129 |
| |||||||||||
4.50% | 12/20/46 | 59,023 | 57,323 | |||||||||
Ginnie Mae II, Pool #MA4199 |
| |||||||||||
5.00% | 01/20/47 | 2,352,463 | 2,363,075 | |||||||||
Ginnie Mae II, Pool #MA4264 |
| |||||||||||
4.50% | 02/20/47 | 5,891,068 | 5,715,433 | |||||||||
Ginnie Mae II, Pool #MA4265 |
| |||||||||||
5.00% | 02/20/47 | 1,951,609 | 1,960,298 | |||||||||
Ginnie Mae II, Pool #MA4324 |
| |||||||||||
5.00% | 03/20/47 | 2,210,558 | 2,218,059 | |||||||||
Ginnie Mae II, Pool #MA4385 |
| |||||||||||
5.00% | 04/20/47 | 450,311 | 450,531 | |||||||||
Ginnie Mae II, Pool #MA4454 |
| |||||||||||
5.00% | 05/20/47 | 348,726 | 346,869 | |||||||||
Ginnie Mae II, Pool #MA4513 |
| |||||||||||
5.00% | 06/20/47 | 1,290,906 | 1,278,877 | |||||||||
Ginnie Mae II, Pool #MA4781 |
| |||||||||||
5.00% | 10/20/47 | 1,402,897 | 1,401,390 | |||||||||
Ginnie Mae II, Pool #MA4836 |
| |||||||||||
3.00% | 11/20/47 | 7,659,058 | 6,769,455 | |||||||||
Ginnie Mae II, Pool #MA4838 |
| |||||||||||
4.00% | 11/20/47 | 7,297,110 | 6,817,459 | |||||||||
Ginnie Mae II, Pool #MA4900 |
| |||||||||||
3.50% | 12/20/47 | 5,462,468 | 4,968,311 | |||||||||
See accompanying Notes to Financial Statements.
92
Table of Contents
TCW Total Return Bond Fund
October 31, 2022
| Issues | Maturity Date | Principal Amount | Value | |||||||||
| RESIDENTIAL MORTGAGE-BACKED SECURITIES — AGENCY (Continued) | ||||||||||||
Ginnie Mae II, Pool #MA4901 |
| |||||||||||
4.00% | 12/20/47 | $ | 499,349 | $ | 466,526 | |||||||
Ginnie Mae II, Pool #MA5467 |
| |||||||||||
4.50% | 09/20/48 | 467,680 | 449,037 | |||||||||
Ginnie Mae II, Pool #MA6080 |
| |||||||||||
3.00% | 08/20/49 | 197,456 | 168,660 | |||||||||
Ginnie Mae II, Pool #MA6209 |
| |||||||||||
3.00% | 10/20/49 | 2,967,319 | 2,534,571 | |||||||||
Ginnie Mae II TBA, 30-Year |
| |||||||||||
2.50% (6) | 01/01/52 | 110,825,000 | 93,831,787 | |||||||||
Uniform Mortgage-Backed Securities TBA, 30-Year |
| |||||||||||
3.00% (6) | 03/01/52 | 16,625,000 | 14,135,147 | |||||||||
3.50% (6) | 04/01/52 | 18,000,000 | 15,830,832 | |||||||||
2.00% (6) | 01/01/52 | 139,675,000 | 109,975,002 | |||||||||
2.00% (6) | 01/01/52 | 137,100,000 | 107,961,669 | |||||||||
2.50% (6) | 01/01/52 | 142,075,000 | 116,313,315 | |||||||||
2.50% (6) | 01/01/52 | 83,900,000 | 68,696,984 | |||||||||
5.00% (6) | 08/01/52 | 109,000,000 | 105,138,164 | |||||||||
5.50% (6) | 08/01/52 | 32,250,000 | 31,804,774 | |||||||||
4.00% (6) | 06/01/52 | 94,100,000 | 85,601,551 | |||||||||
3.00% (6) | 03/01/52 | 46,125,000 | 39,213,457 | |||||||||
4.50% (6) | 07/01/52 | 134,500,000 | 126,177,647 | |||||||||
|
| |||||||||||
Total Residential Mortgage-Backed Securities — Agency |
| |||||||||||
(Cost: $2,190,028,905) |
| 2,010,553,980 | ||||||||||
|
| |||||||||||
| RESIDENTIAL MORTGAGE-BACKED SECURITIES — NON-AGENCY — 35.6% | ||||||||||||
ACE Securities Corp. (07-ASP1-A2C) |
| |||||||||||
4.11% (1 mo. USD LIBOR + 0.520%) (2) | 03/25/37 | 11,061,209 | 5,333,268 | |||||||||
ACE Securities Corp. (07-ASP1-A2D) |
| |||||||||||
4.35% (1 mo. USD LIBOR + 0.760%) (2) | 03/25/37 | 5,945,282 | 2,866,256 | |||||||||
ACE Securities Corp. (07-HE1-A1) |
| |||||||||||
3.89% (1 mo. USD LIBOR + 0.300%) (2) | 01/25/37 | 28,015,785 | 14,749,305 | |||||||||
Argent Securities Trust (06-M1-A2C) |
| |||||||||||
3.89% (1 mo. USD LIBOR + 0.300%) (2) | 07/25/36 | 46,595,012 | 13,254,380 | |||||||||
Argent Securities Trust (06-W4-A2C) |
| |||||||||||
3.91% (1 mo. USD LIBOR + 0.320%) (2) | 05/25/36 | 17,230,025 | 4,359,083 | |||||||||
Argent Securities, Inc. Asset-Backed Pass-Through Certificates (05-W3-M2) |
| |||||||||||
4.28% (1 mo. USD LIBOR + 0.690%) (2) | 11/25/35 | 29,183,398 | 24,516,290 | |||||||||
Asset-Backed Funding Certificates (07-WMC1-A2A) |
| |||||||||||
4.34% (1 mo. USD LIBOR + 0.750%) (2) | 06/25/37 | 9,631,908 | 7,748,575 | |||||||||
| Issues | Maturity Date | Principal Amount | Value | |||||||||
| RESIDENTIAL MORTGAGE-BACKED SECURITIES — NON-AGENCY (Continued) | ||||||||||||
Banc of America Funding Corp. (04-B-3A1) |
| |||||||||||
2.62% (4),(7) | 12/20/34 | $ | 147,704 | $ | 120,844 | |||||||
Banc of America Funding Corp. (06-D-2A1) |
| |||||||||||
3.50% (4),(7) | 05/20/36 | 48,125 | 41,708 | |||||||||
Banc of America Funding Corp. (06-D-3A1) |
| |||||||||||
3.41% (4),(7) | 05/20/36 | 1,464,304 | 1,277,512 | |||||||||
Banc of America Funding Corp. (15-R8-1A1) |
| |||||||||||
1.94% (1),(4) | 11/26/46 | 172,190 | 172,148 | |||||||||
Banc of America Funding Trust (06-3-4A14) |
| |||||||||||
6.00% | 03/25/36 | 285,458 | 240,549 | |||||||||
Banc of America Funding Trust (06-3-5A3) |
| |||||||||||
5.50% (7) | 03/25/36 | 1,277,776 | 1,069,922 | |||||||||
BCAP LLC Trust (06-AA2-A1) |
| |||||||||||
3.93% (1 mo. USD LIBOR + 0.340%) (2) | 01/25/37 | 11,044,264 | 9,356,291 | |||||||||
Bear Stearns Alt-A Trust (05-2-2A4) |
| |||||||||||
3.18% (4) | 04/25/35 | 1,318 | 1,190 | |||||||||
Bear Stearns Alt-A Trust (05-4-23A1) |
| |||||||||||
3.11% (4),(7) | 05/25/35 | 2,246,372 | 2,054,134 | |||||||||
Bear Stearns Alt-A Trust (06-4-32A1) |
| |||||||||||
3.46% (4),(7) | 07/25/36 | 318,602 | 166,264 | |||||||||
Bear Stearns ARM Trust (04-12-1A1) |
| |||||||||||
2.88% (4) | 02/25/35 | 214,512 | 200,010 | |||||||||
Bear Stearns ARM Trust (05-10-A3) |
| |||||||||||
3.74% (4) | 10/25/35 | 1,452,858 | 1,337,194 | |||||||||
Bear Stearns ARM Trust (06-2-2A1) |
| |||||||||||
3.28% (4),(7) | 07/25/36 | 752,403 | 635,610 | |||||||||
Bear Stearns ARM Trust (07-1-1A1) |
| |||||||||||
3.09% (4) | 02/25/47 | 7,678,337 | 6,797,059 | |||||||||
Bear Stearns ARM Trust (07-1-2A1) |
| |||||||||||
2.78% (4),(7) | 02/25/47 | 113,275 | 98,758 | |||||||||
Bear Stearns Asset-Backed Securities I Trust (05-AC6-1A3) |
| |||||||||||
5.50% (4) | 09/25/35 | 912,516 | 791,270 | |||||||||
Bear Stearns Asset-Backed Securities I Trust (05-AC6-1A4) |
| |||||||||||
5.40% (4) | 09/25/35 | 1,951,115 | 1,686,482 | |||||||||
Bear Stearns Mortgage Funding Trust (06-AR1-2A1) |
| |||||||||||
4.03% (1 mo. USD LIBOR + 0.440%) (2) | 08/25/36 | 9,009,103 | 7,558,972 | |||||||||
Bear Stearns Mortgage Funding Trust (06-AR3-1A1) |
| |||||||||||
3.77% (1 mo. USD LIBOR + 0.180%) (2) | 10/25/36 | 284,910 | 226,316 | |||||||||
C-BASS Mortgage Loan Trust (07-CB2-A2B) |
| |||||||||||
3.54% | �� | 02/25/37 | 2,421,009 | 1,483,610 | ||||||||
C-BASS Mortgage Loan Trust (07-CB2-A2C) |
| |||||||||||
3.54% | 02/25/37 | 8,327,804 | 5,043,191 | |||||||||
Chase Mortgage Finance Corp. (06-A1-2A1) |
| |||||||||||
3.99% (4),(7) | 09/25/36 | 356,918 | 308,088 | |||||||||
See accompanying Notes to Financial Statements.
93
Table of Contents
TCW Total Return Bond Fund
Schedule of Investments (Continued)
| Issues | Maturity Date | Principal Amount | Value | |||||||||
| RESIDENTIAL MORTGAGE-BACKED SECURITIES — NON-AGENCY (Continued) | ||||||||||||
Chase Mortgage Finance Corp. (07-A1-8A1) |
| |||||||||||
3.88% (4) | 02/25/37 | $ | 1,263,702 | $ | 1,207,648 | |||||||
Chaseflex Trust (05-1-1A5) |
| |||||||||||
6.50% (7) | 02/25/35 | 2,213,935 | 1,806,117 | |||||||||
CIM Trust |
| |||||||||||
5.00% | 07/25/62 | 5,000,000 | 4,375,000 | |||||||||
CIM Trust (18-R5-A1) |
| |||||||||||
3.75% (1),(4) | 07/25/58 | 8,464,936 | 8,139,455 | |||||||||
CIM Trust (18-R6-A1) |
| |||||||||||
4.20% (1 mo. USD LIBOR + 1.076%) (1),(2) | 09/25/58 | 7,495,454 | 7,350,315 | |||||||||
CIM Trust (19-R3-A) |
| |||||||||||
2.63% (1),(4) | 06/25/58 | 12,063,486 | 10,716,649 | |||||||||
CIM Trust (20-NR1-A) |
| |||||||||||
3.45% (1) | 06/26/62 | 24,811,070 | 24,226,246 | |||||||||
CIM Trust (20-R1-A1) |
| |||||||||||
2.85% (1),(4) | 10/27/59 | 20,867,918 | 18,178,432 | |||||||||
CIM Trust (20-R3-A1A) |
| |||||||||||
4.00% (1),(4) | 01/26/60 | 15,596,998 | 14,550,553 | |||||||||
CIM Trust (20-R4-A1A) |
| |||||||||||
3.30% (1),(4) | 06/25/60 | 19,101,763 | 17,156,865 | |||||||||
CIM Trust (20-R6-A1A) |
| |||||||||||
2.25% (1),(4) | 12/25/60 | 12,600,804 | 10,922,033 | |||||||||
CIM Trust (20-R7-A1A) |
| |||||||||||
2.25% (1),(4) | 12/27/61 | 20,634,334 | 18,232,000 | |||||||||
CIM Trust (21-NR2-A1) |
| |||||||||||
2.57% (1) | 07/25/59 | 16,767,197 | 15,708,599 | |||||||||
CIM Trust (21-NR3-A1) |
| |||||||||||
2.57% (1) | 06/25/57 | 8,691,276 | 8,126,017 | |||||||||
CIM Trust (21-R3-A1A) |
| |||||||||||
1.95% (1),(4) | 06/25/57 | 22,449,790 | 19,959,713 | |||||||||
Citigroup Mortgage Loan Trust (06-HE3-A1) |
| |||||||||||
3.87% (1 mo. USD LIBOR + 0.280%) (1),(2) | 12/25/36 | 7,113,878 | 6,920,042 | |||||||||
Citigroup Mortgage Loan Trust, Inc. (06-AR5-1A1A) |
| |||||||||||
3.08% (4),(7) | 07/25/36 | 1,690,677 | 1,223,316 | |||||||||
Citigroup Mortgage Loan Trust, Inc. (07-12-2A1) |
| |||||||||||
6.50% (1),(4),(7) | 10/25/36 | 2,267,168 | 1,267,307 | |||||||||
CitiMortgage Alternative Loan Trust (07-A5-1A6) |
| |||||||||||
6.00% (7) | 05/25/37 | 8,743,949 | 7,770,658 | |||||||||
Connecticut Avenue Securities Trust (19-R01-2B1) |
| |||||||||||
7.94% (1 mo. USD LIBOR + 4.350%) (1),(2) | 07/25/31 | 4,000,000 | 3,925,961 | |||||||||
Connecticut Avenue Securities Trust (19-R02-1B1) |
| |||||||||||
7.74% (1 mo. USD LIBOR + 4.150%) (1),(2) | 08/25/31 | 2,000,000 | 1,957,670 | |||||||||
Connecticut Avenue Securities Trust (19-R06-2B1) |
| |||||||||||
7.34% (1 mo. USD LIBOR + 3.750%) (1),(2) | 09/25/39 | 9,175,000 | 8,598,827 | |||||||||
| Issues | Maturity Date | Principal Amount | Value | |||||||||
| RESIDENTIAL MORTGAGE-BACKED SECURITIES — NON-AGENCY (Continued) | ||||||||||||
Connecticut Avenue Securities Trust (21-R01-1B2) |
| |||||||||||
9.00% (SOFR30A + 6.000%) (1),(2) | 10/25/41 | $ | 10,500,000 | $ | 9,081,387 | |||||||
Connecticut Avenue Securities Trust (21-R03-1M2) |
| |||||||||||
4.65% (SOFR30A + 1.650%) (1),(2) | 12/25/41 | 14,450,000 | 13,089,619 | |||||||||
Conseco Finance Securitizations Corp. (00-4-A5) |
| |||||||||||
7.97% | 05/01/32 | 45,277,023 | 9,913,055 | |||||||||
Conseco Financial Corp. (99-2-A7) |
| |||||||||||
6.44% | 12/01/30 | 1,275,458 | 1,296,078 | |||||||||
Countrywide Alternative Loan Trust (05-84-1A1) |
| |||||||||||
2.69% (4),(7) | 02/25/36 | 89,944 | 80,072 | |||||||||
Countrywide Alternative Loan Trust (05-J1-2A1) |
| |||||||||||
5.50% | 02/25/25 | 128,759 | 124,488 | |||||||||
Countrywide Alternative Loan Trust (07-19-1A34) |
| |||||||||||
6.00% (7) | 08/25/37 | 11,299,169 | 5,620,233 | |||||||||
Countrywide Home Loans Mortgage Pass-Through Trust (04-13-1A3) |
| |||||||||||
5.50% | 08/25/34 | 2,883,511 | 2,641,339 | |||||||||
Countrywide Home Loans Mortgage Pass-Through Trust (05-9-1A1) |
| |||||||||||
4.19% (1 mo. USD LIBOR + 0.600%) (2) | 05/25/35 | 6,070,580 | 5,022,402 | |||||||||
Countrywide Home Loans Mortgage Pass-Through Trust (05-HYB5-4A1) |
| |||||||||||
3.57% (4),(7) | 09/20/35 | 11,066 | 9,007 | |||||||||
Countrywide Home Loans Mortgage Pass-Through Trust (07-HY5-1A1) |
| |||||||||||
3.97% (4),(7) | 09/25/47 | 3,536 | 2,829 | |||||||||
Countrywide Home Loans Mortgage Pass-Through Trust (07-HYB1-1A1) |
| |||||||||||
3.47% (4),(7) | 03/25/37 | 30,688 | 23,689 | |||||||||
Credit Suisse First Boston Mortgage Securities Corp. (03-8-4PPA) |
| |||||||||||
5.75% | 04/22/33 | 13,752 | 12,141 | |||||||||
Credit Suisse First Boston Mortgage Securities Corp. (05-11-1A1) |
| |||||||||||
6.50% (7) | 12/25/35 | 1,517,551 | 807,318 | |||||||||
Credit Suisse First Boston Mortgage Securities Corp. (05-12-1A1) |
| |||||||||||
6.50% | 01/25/36 | 6,027,637 | 1,536,727 | |||||||||
Credit Suisse Mortgage Trust (21-RP11-PT) |
| |||||||||||
3.77% (1),(4),(7) | 10/25/61 | 13,911,516 | 10,367,537 | |||||||||
Credit-Based Asset Servicing and Securitization LLC (06-CB7-A4) |
| |||||||||||
3.91% (1 mo. USD LIBOR + 0.320%) (2) | 10/25/36 | 17,713,672 | 11,787,008 | |||||||||
Credit-Based Asset Servicing and Securitization LLC (06-CB9-A4) |
| |||||||||||
4.05% (1 mo. USD LIBOR + 0.230%) (2) | 11/25/36 | 12,198,928 | 5,770,624 | |||||||||
See accompanying Notes to Financial Statements.
94
Table of Contents
TCW Total Return Bond Fund
October 31, 2022
| Issues | Maturity Date | Principal Amount | Value | |||||||||
| RESIDENTIAL MORTGAGE-BACKED SECURITIES — NON-AGENCY (Continued) | ||||||||||||
CSMC Mortgage-Backed Trust (06-8-3A1) |
| |||||||||||
6.00% | 10/25/21 | $ | 756,851 | $ | 378,612 | |||||||
CSMC Mortgage-Backed Trust (06-9-5A1) |
| |||||||||||
5.50% | 11/25/36 | 305,084 | 244,003 | |||||||||
CSMC Mortgage-Backed Trust (07-2-3A4) |
| |||||||||||
5.50% (7) | 03/25/37 | 4,171,417 | 2,330,443 | |||||||||
CSMC Mortgage-Backed Trust (22-RPL1-PT) |
| |||||||||||
4.34% (1),(4) | 04/25/61 | 13,656,868 | 12,289,123 | |||||||||
CSMCM Trust Certificates (21-RP11-CERT) |
| |||||||||||
3.78% (1) | 10/27/61 | 588,703 | 453,952 | |||||||||
CSMCM Trust Certificates (22-RPL1-CERT) |
| |||||||||||
4.23% (1) | 04/25/61 | 576,789 | 502,423 | |||||||||
Deutsche Alt-A Securities, Inc. Mortgage Loan Trust (05-1-1A3) |
| |||||||||||
4.09% (1 mo. USD LIBOR + 0.500%) (2) | 02/25/35 | 3,649,986 | 3,488,093 | |||||||||
Deutsche Alt-A Securities, Inc. Mortgage Loan Trust (06-AR6-A6) |
| |||||||||||
3.97% (1 mo. USD LIBOR + 0.380%) (2) | 02/25/37 | 173,488 | 149,351 | |||||||||
DSLA Mortgage Loan Trust (05-AR6-2A1A) |
| |||||||||||
4.06% (1 mo. USD LIBOR + 0.580%) (2) | 10/19/45 | 1,689,456 | 1,435,555 | |||||||||
DSLA Mortgage Loan Trust (06-AR2-2A1A) |
| |||||||||||
3.68% (1 mo. USD LIBOR + 0.200%) (2) | 10/19/36 | 20,055,398 | 13,767,499 | |||||||||
DSLA Mortgage Loan Trust (07-AR1-2A1A) |
| |||||||||||
3.62% (1 mo. USD LIBOR + 0.140%) (2) | 03/19/37 | 4,358,501 | 3,445,807 | |||||||||
Fieldstone Mortgage Investment Corp. (07-1-2A2) |
| |||||||||||
3.62% (1 mo. USD LIBOR + 0.270%) (2) | 04/25/47 | 2,697,545 | 1,896,623 | |||||||||
First Franklin Mortgage Loan Asset-Backed Certificates (06-FF18-A2C) |
| |||||||||||
3.75% (1 mo. USD LIBOR + 0.160%) (2) | 12/25/37 | 10,184,078 | 8,952,041 | |||||||||
First Franklin Mortgage Loan Asset-Backed Certificates (07-FF1-A2C) |
| |||||||||||
3.73% (1 mo. USD LIBOR + 0.140%) (2) | 01/25/38 | 3,270,576 | 1,727,227 | |||||||||
First Franklin Mortgage Loan Asset-Backed Certificates (07-FF1-A2D) |
| |||||||||||
3.81% (1 mo. USD LIBOR + 0.220%) (2) | 01/25/38 | 16,008,142 | 8,456,165 | |||||||||
First Franklin Mortgage Loan Trust (06-FF12-A1) |
| |||||||||||
3.69% (1 mo. USD LIBOR + 0.105%) (2) | 09/25/36 | 5,682,212 | 5,205,893 | |||||||||
First Franklin Mortgage Loan Trust (06-FF9-2A4) |
| |||||||||||
4.09% (1 mo. USD LIBOR + 0.500%) (2) | 06/25/36 | 9,068,000 | 7,792,636 | |||||||||
| Issues | Maturity Date | Principal Amount | Value | |||||||||
| RESIDENTIAL MORTGAGE-BACKED SECURITIES — NON-AGENCY (Continued) | ||||||||||||
First Franklin Mortgage Loan Trust (07-FF2-A1) |
| |||||||||||
3.73% (1 mo. USD LIBOR + 0.140%) (2) | 03/25/37 | $ | 33,928,196 | $ | 18,114,520 | |||||||
First Franklin Mortgage Loan Trust (07-FF2-A2C) |
| |||||||||||
3.74% (1 mo. USD LIBOR + 0.150%) (2) | 03/25/37 | 36,808,220 | 18,629,994 | |||||||||
First Horizon Alternative Mortgage Securities Trust (05-AA3-3A1) |
| |||||||||||
4.11% (4),(7) | 05/25/35 | 1,339,950 | 1,208,660 | |||||||||
First Horizon Alternative Mortgage Securities Trust (05-AA7-1A1) |
| |||||||||||
3.53% (4),(7) | 09/25/35 | 1,487,619 | 1,304,351 | |||||||||
First Horizon Alternative Mortgage Securities Trust (05-AA7-2A1) |
| |||||||||||
3.72% (4),(7) | 09/25/35 | 923,902 | 800,372 | |||||||||
First Horizon Alternative Mortgage Securities Trust (06-AA7-A1) |
| |||||||||||
3.26% (4),(7) | 01/25/37 | 4,589,320 | 3,513,049 | |||||||||
Freddie Mac (21-DNA7-B1) |
| |||||||||||
6.65% (SOFR30A + 3.650%) (1),(2) | 11/25/41 | 11,650,000 | 10,164,034 | |||||||||
Freddie Mac (21-HQA2-B1) |
| |||||||||||
6.15% (SOFR30A + 3.150%) (1),(2) | 12/25/33 | 3,000,000 | 2,427,876 | |||||||||
Freddie Mac (22-DNA1-M2) |
| |||||||||||
5.50% (SOFR30A + 2.500%) (1),(2) | 01/25/42 | 13,850,000 | 11,968,867 | |||||||||
Fremont Home Loan Trust (05-E-2A4) |
| |||||||||||
4.25% (1 mo. USD LIBOR + 0.660%) (2) | 01/25/36 | 9,532,788 | 9,096,326 | |||||||||
GMACM Mortgage Loan Trust (05-AR5-2A1) |
| |||||||||||
4.20% (4) | 09/19/35 | 1,774,853 | 1,234,364 | |||||||||
GreenPoint Mortgage Funding Trust (05-AR3-1A1) |
| |||||||||||
4.07% (1 mo. USD LIBOR + 0.480%) (2) | 08/25/45 | 219,236 | 167,339 | |||||||||
GS Mortgage-Backed Securities Trust |
| |||||||||||
2.50% (1),(4) | 01/25/53 | 5,964,320 | 4,826,125 | |||||||||
GSAA Home Equity Trust (05-7-AF5) |
| |||||||||||
5.11% | 05/25/35 | 80,252 | 76,665 | |||||||||
GSR Mortgage Loan Trust (04-9-3A1) |
| |||||||||||
3.50% (4) | 08/25/34 | 1,175,045 | 1,055,066 | |||||||||
GSR Mortgage Loan Trust (06-OA1-2A2) |
| |||||||||||
4.11% (1 mo. USD LIBOR + 0.520%) (2) | 08/25/46 | 42,649,434 | 11,498,138 | |||||||||
GSR Mortgage Loan Trust (07-3F-3A7) |
| |||||||||||
6.00% (7) | 05/25/37 | 4,674,589 | 3,306,913 | |||||||||
GSR Mortgage Loan Trust (07-AR2-2A1) |
| |||||||||||
3.15% (4) | 05/25/37 | 1,574,919 | 985,309 | |||||||||
GSR Mortgage Loan Trust (07-AR2-5A1A) |
| |||||||||||
3.90% (4),(7) | 05/25/37 | 613,282 | 531,657 | |||||||||
See accompanying Notes to Financial Statements.
95
Table of Contents
TCW Total Return Bond Fund
Schedule of Investments (Continued)
| Issues | Maturity Date | Principal Amount | Value | |||||||||
| RESIDENTIAL MORTGAGE-BACKED SECURITIES — NON-AGENCY (Continued) | ||||||||||||
HarborView Mortgage Loan Trust (06-1-1A1A) |
| |||||||||||
4.00% (1 mo. USD LIBOR + 0.520%) (2),(7) | 03/19/36 | $ | 22,680,944 | $ | 14,146,200 | |||||||
HarborView Mortgage Loan Trust (07-3-1A1A) |
| |||||||||||
3.88% (1 mo. USD LIBOR + 0.200%) (2) | 05/19/47 | 9,592,184 | 7,911,919 | |||||||||
HSI Asset Loan Obligation Trust (07-2-2A12) |
| |||||||||||
6.00% | 09/25/37 | 575,139 | 441,788 | |||||||||
HSI Asset Securitization Corp. (06-HE2-1A) |
| |||||||||||
3.85% (1 mo. USD LIBOR + 0.260%) (2) | 12/25/36 | 36,021,050 | 15,479,160 | |||||||||
HSI Asset Securitization Corp. (06-WMC1-A3) |
| |||||||||||
3.89% (1 mo. USD LIBOR + 0.300%) (2) | 07/25/36 | 24,515,298 | 11,414,129 | |||||||||
Impac CMB Trust (05-1-1A1) |
| |||||||||||
4.11% (1 mo. USD LIBOR + 0.520%) (2) | 04/25/35 | 441,167 | 407,280 | |||||||||
Impac CMB Trust (05-5-A2) |
| |||||||||||
4.03% (1 mo. USD LIBOR + 0.220%) (2) | 08/25/35 | 2,211,490 | 1,979,970 | |||||||||
Impac Secured Assets Trust (06-3-A1) |
| |||||||||||
3.93% (1 mo. USD LIBOR + 0.340%) (2),(7) | 11/25/36 | 3,873,538 | 3,377,682 | |||||||||
IndyMac Index Mortgage Loan Trust (04-AR4-2A) |
| |||||||||||
3.61% (4) | 08/25/34 | 2,504,448 | 2,372,028 | |||||||||
IndyMac Index Mortgage Loan Trust (04-AR9-4A) |
| |||||||||||
3.94% (4) | 11/25/34 | 247,725 | 223,588 | |||||||||
IndyMac Index Mortgage Loan Trust (05-AR17-3A1) |
| |||||||||||
3.27% (4),(7) | 09/25/35 | 2,555,732 | 1,778,699 | |||||||||
IndyMac Index Mortgage Loan Trust (05-AR23-2A1) |
| |||||||||||
3.44% (4) | 11/25/35 | 1,651,317 | 1,366,583 | |||||||||
IndyMac Index Mortgage Loan Trust (05-AR23-6A1) |
| |||||||||||
3.20% (4),(7) | 11/25/35 | 2,480,574 | 2,038,453 | |||||||||
IndyMac Index Mortgage Loan Trust (05-AR25-2A1) |
| |||||||||||
3.17% (4) | 12/25/35 | 1,275,883 | 1,140,890 | |||||||||
IndyMac Index Mortgage Loan Trust (05-AR7-2A1) |
| |||||||||||
2.72% (4),(7) | 06/25/35 | 782,557 | 619,439 | |||||||||
IndyMac Index Mortgage Loan Trust (06-AR39-A1) |
| |||||||||||
3.95% (1 mo. USD LIBOR + 0.180%) (2) | 02/25/37 | 4,412,868 | 3,737,079 | |||||||||
IndyMac Index Mortgage Loan Trust (07-AR11-1A1) |
| |||||||||||
2.86% (4),(7) | 06/25/37 | 11,841 | 9,345 | |||||||||
IndyMac Index Mortgage Loan Trust (07-AR5-2A1) |
| |||||||||||
3.03% (4),(7) | 05/25/37 | 8,519,992 | 6,912,637 | |||||||||
IndyMac Index Mortgage Loan Trust (07-AR7-1A1) |
| |||||||||||
3.08% (4),(7) | 11/25/37 | 1,662,792 | 1,359,671 | |||||||||
IndyMac INDX Mortgage Loan Trust (06-AR6-2A1A) |
| |||||||||||
3.99% (1 mo. USD LIBOR + 0.400%) (2),(7) | 06/25/46 | 7,562,073 | 6,683,020 | |||||||||
| Issues | Maturity Date | Principal Amount | Value | |||||||||
| RESIDENTIAL MORTGAGE-BACKED SECURITIES — NON-AGENCY (Continued) | ||||||||||||
JPMorgan Alternative Loan Trust (06-A2-5A1) |
| |||||||||||
3.39% (4),(7) | 05/25/36 | $ | 3,256,256 | $ | 1,920,270 | |||||||
JPMorgan Alternative Loan Trust (06-A4-A8) |
| |||||||||||
3.49% (4),(7) | 09/25/36 | 252,005 | 265,401 | |||||||||
JPMorgan Mortgage Acquisition Corp. (06-CH2-AF4) |
| |||||||||||
5.76% | 10/25/36 | 3,949,693 | 2,523,890 | |||||||||
JPMorgan Mortgage Acquisition Trust (06-WMC4-A3) |
| |||||||||||
3.71% (1 mo. USD LIBOR + 0.120%) (2) | 12/25/36 | 26,150,424 | 13,430,860 | |||||||||
JPMorgan Mortgage Trust (05-A6-7A1) |
| |||||||||||
3.96% (4),(7) | 08/25/35 | 113,012 | 93,780 | |||||||||
JPMorgan Mortgage Trust (06-A2-5A3) |
| |||||||||||
3.71% (4) | 11/25/33 | 551,440 | 523,456 | |||||||||
JPMorgan Mortgage Trust (06-A4-1A4) |
| |||||||||||
3.40% (4),(7) | 06/25/36 | 205,112 | 152,675 | |||||||||
JPMorgan Mortgage Trust (06-A7-2A4R) |
| |||||||||||
3.39% (4),(7) | 01/25/37 | 8,554 | 6,663 | |||||||||
JPMorgan Mortgage Trust (06-S2-2A2) |
| |||||||||||
5.88% (7) | 06/25/21 | 9,071 | 9,148 | |||||||||
Lehman Mortgage Trust (06-4-4A1) |
| |||||||||||
6.00% (7) | 08/25/21 | 521,794 | 367,141 | |||||||||
Lehman XS Trust (06-10N-1A3A) |
| |||||||||||
4.01% (1 mo. USD LIBOR + 0.420%) (2) | 07/25/46 | 6,771,720 | 6,234,130 | |||||||||
Lehman XS Trust (06-12N-A31A) |
| |||||||||||
3.99% (1 mo. USD LIBOR + 0.400%) (2) | 08/25/46 | 2,071,402 | 1,973,824 | |||||||||
Lehman XS Trust (06-9-A1B) |
| |||||||||||
3.91% (1 mo. USD LIBOR + 0.320%) (2),(8) | 05/25/46 | 3,503 | — | |||||||||
Lehman XS Trust (06-GP2-3A1) |
| |||||||||||
3.99% (1 mo. USD LIBOR + 0.400%) (2) | 06/25/46 | 10,779,766 | 9,506,810 | |||||||||
Lehman XS Trust (06-GP4-3A2A) |
| |||||||||||
3.91% (1 mo. USD LIBOR + 0.160%) (2),(8) | 08/25/46 | 6 | — | |||||||||
Lehman XS Trust (06-GP4-3A5) |
| |||||||||||
4.04% (1 mo. USD LIBOR + 0.450%) (2) | 08/25/46 | 7,325,040 | 6,699,182 | |||||||||
LHOME Mortgage Trust (21-RTL3-A1) |
| |||||||||||
2.36% (1) | 09/25/26 | 21,225,000 | 19,950,180 | |||||||||
MASTR Alternative Loans Trust (05-4-1A1) |
| |||||||||||
6.50% | 05/25/35 | 4,200,308 | 3,354,207 | |||||||||
MASTR Alternative Loans Trust (06-2-2A1) |
| |||||||||||
3.99% (1 mo. USD LIBOR + 0.400%) (2),(7),(8) | 03/25/36 | 65,546 | 7,640 | |||||||||
MASTR Asset Securitization Trust (06-3-2A1) |
| |||||||||||
4.04% (1 mo. USD LIBOR + 0.450%) (2) | 10/25/36 | 28,197 | 5,278 | |||||||||
See accompanying Notes to Financial Statements.
96
Table of Contents
TCW Total Return Bond Fund
October 31, 2022
| Issues | Maturity Date | Principal Amount | Value | |||||||||
| RESIDENTIAL MORTGAGE-BACKED SECURITIES — NON-AGENCY (Continued) | ||||||||||||
MASTR Asset-Backed Securities Trust (06-AB1-A4) |
| |||||||||||
6.22% | 02/25/36 | $ | 220,287 | $ | 172,206 | |||||||
MASTR Asset-Backed Securities Trust (06-HE5-A3) |
| |||||||||||
3.75% (1 mo. USD LIBOR + 0.160%) (2) | 11/25/36 | 14,624,630 | 8,564,651 | |||||||||
MASTR Seasoned Securitization Trust (04-1-4A1) |
| |||||||||||
4.22% (4) | 10/25/32 | 3,556 | 3,409 | |||||||||
Merrill Lynch Alternative Note Asset Trust (07-A1-A2C) |
| |||||||||||
4.05% (1 mo. USD LIBOR + 0.460%) (2) | 01/25/37 | 1,526,441 | 466,926 | |||||||||
Merrill Lynch Alternative Note Asset Trust (07-A1-A3) |
| |||||||||||
3.91% (1 mo. USD LIBOR + 0.320%) (2) | 01/25/37 | 785,201 | 259,072 | |||||||||
Merrill Lynch First Franklin Mortgage Loan Trust (07-1-A2B) |
| |||||||||||
3.93% (1 mo. USD LIBOR + 0.340%) (2) | 04/25/37 | 35,186,464 | 14,478,146 | |||||||||
Merrill Lynch First Franklin Mortgage Loan Trust (07-1-A2C) |
| |||||||||||
4.09% (1 mo. USD LIBOR + 0.500%) (2) | 04/25/37 | 19,635,725 | 8,131,293 | |||||||||
Merrill Lynch First Franklin Mortgage Loan Trust (07-1-A2D) |
| |||||||||||
4.27% (1 mo. USD LIBOR + 0.680%) (2) | 04/25/37 | 5,013,464 | 2,090,119 | |||||||||
Merrill Lynch First Franklin Mortgage Loan Trust (07-2-A2C) |
| |||||||||||
4.07% (1 mo. USD LIBOR + 0.240%) (2) | 05/25/37 | 4,392,972 | 3,413,508 | |||||||||
Merrill Lynch First Franklin Mortgage Loan Trust (07-3-A2B) |
| |||||||||||
3.72% (1 mo. USD LIBOR + 0.130%) (2) | 06/25/37 | 1,871,520 | 1,103,005 | |||||||||
Merrill Lynch First Franklin Mortgage Loan Trust (07-4-2A3) |
| |||||||||||
3.75% (1 mo. USD LIBOR + 0.160%) (2) | 07/25/37 | 25,231,555 | 17,337,420 | |||||||||
Merrill Lynch Mortgage-Backed Securities Trust (07-2-1A1) |
| |||||||||||
6.38% (U.S. 1-year Treasury Constant Maturity Rate + 2.400%) (2),(7) | 08/25/36 | 556,246 | 489,247 | |||||||||
Mid-State Trust (05-1-A) |
| |||||||||||
5.75% | 01/15/40 | 1,359,734 | 1,331,052 | |||||||||
Morgan Stanley ABS Capital I, Inc. Trust (04-NC8-M2) |
| |||||||||||
4.55% (1 mo. USD LIBOR + 0.960%) (2) | 09/25/34 | 416,038 | 400,975 | |||||||||
Morgan Stanley Home Equity Loan Trust (06-2-A4) |
| |||||||||||
4.15% (1 mo. USD LIBOR + 0.560%) (2) | 02/25/36 | 696,971 | 683,840 | |||||||||
| Issues | Maturity Date | Principal Amount | Value | |||||||||
| RESIDENTIAL MORTGAGE-BACKED SECURITIES — NON-AGENCY (Continued) | ||||||||||||
Morgan Stanley Mortgage Loan Trust (07-3XS-2A6) |
| |||||||||||
6.26% | 01/25/47 | $ | 2,140,028 | $ | 670,862 | |||||||
Morgan Stanley Mortgage Loan Trust (07-7AX-2A1) |
| |||||||||||
3.83% (1 mo. USD LIBOR + 0.240%) (2) | 04/25/37 | 2,723,247 | 821,990 | |||||||||
MortgageIT Trust (05-4-A1) |
| |||||||||||
4.15% (1 mo. USD LIBOR + 0.560%) (2) | 10/25/35 | 654,731 | 627,148 | |||||||||
New Century Home Equity Loan Trust (06-1-A2B) |
| |||||||||||
3.95% (1 mo. USD LIBOR + 0.360%) (2) | 05/25/36 | 12,761,990 | 12,427,573 | |||||||||
Oakwood Mortgage Investors, Inc. (02-A-A4) |
| |||||||||||
6.97% (4) | 03/15/32 | 334,447 | 331,298 | |||||||||
Oakwood Mortgage Investors, Inc. (99-E-A1) |
| |||||||||||
7.61% (4) | 03/15/30 | 6,063,703 | 3,953,259 | |||||||||
Ownit Mortgage Loan Asset-Backed Certificates (06-3-A2D) |
| |||||||||||
4.13% (1 mo. USD LIBOR + 0.540%) (2) | 03/25/37 | 8,625,218 | 8,265,502 | |||||||||
Ownit Mortgage Loan Asset-Backed Certificates (06-6-A2C) |
| |||||||||||
3.91% (1 mo. USD LIBOR + 0.320%) (2) | 09/25/37 | 15,350,919 | 7,006,659 | |||||||||
PRET LLC (21-RN3-A1) |
| |||||||||||
1.84% (1) | 09/25/51 | 8,320,000 | 7,529,166 | |||||||||
PRET LLC (22-RN1-A1) |
| |||||||||||
3.72% (1) | 07/25/51 | 17,917,610 | 16,648,309 | |||||||||
Pretium Mortgage Credit Partners LLC (22-RN3-A2) |
| |||||||||||
6.50% (1),(4) | 08/25/52 | 17,115,000 | 15,341,895 | |||||||||
PRPM LLC (21-10-A1) |
| |||||||||||
2.49% (1) | 10/25/26 | 15,234,782 | 13,743,450 | |||||||||
PRPM LLC (21-9-A1) |
| |||||||||||
2.36% (1) | 10/25/26 | 8,389,423 | 7,432,290 | |||||||||
PRPM LLC (22-1-A1) |
| |||||||||||
3.72% (1) | 02/25/27 | 13,886,675 | 12,932,355 | |||||||||
PRPM LLC (22-2-A1) |
| |||||||||||
5.00% (1),(7) | 03/25/27 | 13,275,764 | 12,602,065 | |||||||||
PRPM LLC (22-3-A1) |
| |||||||||||
5.56% (1) | 06/25/27 | 17,394,171 | 16,676,861 | |||||||||
RAAC Series Trust (05-SP1-4A1) |
| |||||||||||
7.00% | 09/25/34 | 1,183,842 | 1,076,969 | |||||||||
RALI Trust (05-QA13-2A1) |
| |||||||||||
4.25% (4),(7) | 12/25/35 | 404,196 | 323,621 | |||||||||
RALI Trust (05-QA7-A21) |
| |||||||||||
3.61% (4),(7) | 07/25/35 | 1,097,676 | 1,003,059 | |||||||||
Residential Accredit Loans, Inc. (05-QA8-CB21) |
| |||||||||||
4.11% (4),(7) | 07/25/35 | 2,889,777 | 1,687,063 | |||||||||
Residential Accredit Loans, Inc. (06-QA1-A21) |
| |||||||||||
4.59% (4),(7) | 01/25/36 | 9,435 | 7,387 | |||||||||
See accompanying Notes to Financial Statements.
97
Table of Contents
TCW Total Return Bond Fund
Schedule of Investments (Continued)
| Issues | Maturity Date | Principal Amount | Value | |||||||||
| RESIDENTIAL MORTGAGE-BACKED SECURITIES — NON-AGENCY (Continued) | ||||||||||||
Residential Accredit Loans, Inc. (06-QA10-A2) |
| |||||||||||
3.95% (1 mo. USD LIBOR + 0.360%) (2) | 12/25/36 | $ | 7,710,330 | $ | 6,183,938 | |||||||
Residential Accredit Loans, Inc. (06-QA2-1A1) |
| |||||||||||
3.84% (1 mo. USD LIBOR + | 02/25/36 | 12,038 | 8,262 | |||||||||
Residential Accredit Loans, Inc. (06-QS10-AV) (I/O) |
| |||||||||||
0.57% (4),(8) | 08/25/36 | 19,975,020 | 371,631 | |||||||||
Residential Accredit Loans, Inc. (06-QS5-A5) |
| |||||||||||
6.00% (7) | 05/25/36 | 2,351,636 | 1,886,179 | |||||||||
Residential Accredit Loans, Inc. (06-QS6-1AV) (I/O) |
| |||||||||||
0.77% (4),(8) | 06/25/36 | 26,793,620 | 575,018 | |||||||||
Residential Accredit Loans, Inc. (06-QS7-AV) (I/O) |
| |||||||||||
0.71% (4),(8) | 06/25/36 | 5,371,280 | 59,991 | |||||||||
Residential Accredit Loans, Inc. (07-QS1-2AV) (I/O) |
| |||||||||||
0.17% (4),(8) | 01/25/37 | 1,414,440 | 8,020 | |||||||||
Residential Accredit Loans, Inc. (07-QS2-AV) (I/O) |
| |||||||||||
0.33% (4),(8) | 01/25/37 | 9,748,400 | 105,272 | |||||||||
Residential Accredit Loans, Inc. (07-QS3-AV) (I/O) |
| |||||||||||
0.36% (4),(8) | 02/25/37 | 43,875,071 | 511,022 | |||||||||
Residential Accredit Loans, Inc. (07-QS4-3AV) (I/O) |
| |||||||||||
0.36% (4),(8) | 03/25/37 | 5,114,252 | 58,499 | |||||||||
Residential Accredit Loans, Inc. (07-QS5-AV) (I/O) |
| |||||||||||
0.29% (4),(8) | 03/25/37 | 6,523,292 | 53,886 | |||||||||
Residential Accredit Loans, Inc. (07-QS6-A45) |
| |||||||||||
5.75% (7) | 04/25/37 | 1,465,084 | 1,211,729 | |||||||||
Residential Accredit Loans, Inc. (07-QS8-AV) (I/O) |
| |||||||||||
0.42% (4),(8) | 06/25/37 | 10,453,526 | 156,407 | |||||||||
Residential Asset Securitization Trust (07-A3-1A4) |
| |||||||||||
5.75% (7) | 04/25/37 | 2,301,147 | 1,206,159 | |||||||||
Residential Funding Mortgage Securities I (05-SA5-2A) | ||||||||||||
4.03% (4),(7) | 11/25/35 | 8,521 | 7,202 | |||||||||
Residential Funding Mortgage Securities I (06-S9-A3) (PAC) |
| |||||||||||
5.75% (7) | 09/25/36 | 318,347 | 246,170 | |||||||||
Residential Funding Mortgage Securities I (07-S2-A9) |
| |||||||||||
6.00% (7) | 02/25/37 | 3,221,226 | 2,517,735 | |||||||||
Residential Funding Mortgage Securities I (07-SA2-2A2) |
| |||||||||||
3.51% (4),(7) | 04/25/37 | 8,992 | 6,800 | |||||||||
Roc Mortgage Trust (21-RTL1-A1) |
| |||||||||||
2.49% (1),(4) | 08/25/26 | 16,300,000 | 15,396,339 | |||||||||
Saxon Asset Securities Trust (06-3-A3) |
| |||||||||||
3.76% (1 mo. USD LIBOR + 0.170%) (2) | 10/25/46 | 3,770,104 | 3,663,377 | |||||||||
Saxon Asset Securities Trust (07-2-A2C) |
| |||||||||||
3.83% (1 mo. USD LIBOR + 0.240%) (2) | 05/25/47 | 10,826,322 | 7,276,745 | |||||||||
| Issues | Maturity Date | Principal Amount | Value | |||||||||
| RESIDENTIAL MORTGAGE-BACKED SECURITIES — NON-AGENCY (Continued) | ||||||||||||
Saxon Asset Securities Trust (07-2-A2D) |
| |||||||||||
3.89% (1 mo. USD LIBOR + 0.300%) (2) | 05/25/47 | $ | 12,593,628 | $ | 8,467,269 | |||||||
Securitized Asset Backed Receivables LLC Trust (06-WM4-A1) |
| |||||||||||
3.97% (1 mo. USD LIBOR + 0.380%) (1),(2) | 11/25/36 | 27,396,400 | 12,321,126 | |||||||||
Securitized Asset Backed Receivables LLC Trust (07-BR2-A1) |
| |||||||||||
3.77% (1 mo. USD LIBOR + 0.180%) (1),(2) | 02/25/37 | 20,538,913 | 17,153,718 | |||||||||
Securitized Asset-Backed Receivables LLC Trust (06-CB1-AF2) |
| |||||||||||
2.89% | 01/25/36 | 2,850,082 | 2,249,221 | |||||||||
Securitized Asset-Backed Receivables LLC Trust (07-BR1-A2C) |
| |||||||||||
3.93% (1 mo. USD LIBOR + 0.340%) (2) | 02/25/37 | 7,728,123 | 3,243,696 | |||||||||
Securitized Asset-Backed Receivables LLC Trust (07-BR2-A2) |
| |||||||||||
3.82% (1 mo. USD LIBOR + 0.230%) (2) | 02/25/37 | 26,716,776 | 12,489,796 | |||||||||
Securitized Asset-Backed Receivables LLC Trust (07-NC2-A2B) |
| |||||||||||
3.73% (1 mo. USD LIBOR + 0.140%) (2) | 01/25/37 | 12,514,135 | 10,234,471 | |||||||||
Sequoia Mortgage Trust (03-8-A1) |
| |||||||||||
4.13% (1 mo. USD LIBOR + 0.640%) (2) | 01/20/34 | 372,818 | 353,497 | |||||||||
SG Mortgage Securities Trust (07-NC1-A2) |
| |||||||||||
3.83% (1 mo. USD LIBOR + 0.240%) (1),(2) | 12/25/36 | 15,580,222 | 9,552,811 | |||||||||
Soundview Home Equity Loan Trust (07-OPT3-2A4) |
| |||||||||||
3.84% (1 mo. USD LIBOR + 0.250%) (2) | 08/25/37 | 4,000,000 | 3,501,149 | |||||||||
Structured Adjustable Rate Mortgage Loan Trust (04-12-2A) |
| |||||||||||
3.79% (4) | 09/25/34 | 495,886 | 478,929 | |||||||||
Structured Adjustable Rate Mortgage Loan Trust (04-14-2A) |
| |||||||||||
4.10% (4) | 10/25/34 | 1,012,243 | 973,737 | |||||||||
Structured Adjustable Rate Mortgage Loan Trust (06-2-3A1) |
| |||||||||||
3.73% (4),(7) | 03/25/36 | 7,798,632 | 7,408,468 | |||||||||
Structured Adjustable Rate Mortgage Loan Trust (06-2-5A1) |
| |||||||||||
3.35% (4),(7) | 03/25/36 | 232,684 | 172,553 | |||||||||
Structured Adjustable Rate Mortgage Loan Trust (06-4-5A1) |
| |||||||||||
3.62% (4),(7) | 05/25/36 | 1,345,522 | 1,010,129 | |||||||||
See accompanying Notes to Financial Statements.
98
Table of Contents
TCW Total Return Bond Fund
October 31, 2022
| Issues | Maturity Date | Principal Amount | Value | |||||||||
| RESIDENTIAL MORTGAGE-BACKED SECURITIES — NON-AGENCY (Continued) | ||||||||||||
Structured Adjustable Rate Mortgage Loan Trust (06-5-1A1) |
| |||||||||||
3.15% (4),(7) | 06/25/36 | $ | 1,544,869 | $ | 1,353,136 | |||||||
Structured Adjustable Rate Mortgage Loan Trust (07-1-1A1) |
| |||||||||||
2.57% (4) | 02/25/37 | 1,514,289 | 835,422 | |||||||||
Structured Asset Mortgage Investments II Trust (07-AR4-A5) |
| |||||||||||
3.81% (1 mo. USD LIBOR + 0.220%) (2) | 09/25/47 | 13,532,730 | 12,004,275 | |||||||||
Structured Asset Securities Corp. (05-2XS-1A5B) |
| |||||||||||
5.15% | 02/25/35 | 1 | 1 | |||||||||
SunTrust Adjustable Rate Mortgage Loan Trust (07-2-2A1) |
| |||||||||||
2.59% (4) | 04/25/37 | 93,448 | 58,883 | |||||||||
SunTrust Adjustable Rate Mortgage Loan Trust (07-3-1A1) |
| |||||||||||
3.10% (4) | 06/25/37 | 2,554 | 1,762 | |||||||||
SunTrust Adjustable Rate Mortgage Loan Trust (07-S1-2A1) |
| |||||||||||
3.37% (4) | 01/25/37 | 234,314 | 226,316 | |||||||||
Wachovia Mortgage Loan Trust LLC (06-AMN1-A3) |
| |||||||||||
1.62% (1 mo. USD LIBOR + 0.480%) (2) | 08/25/36 | 5,708,853 | 2,269,183 | |||||||||
WaMu Mortgage Pass-Through Certificates (04-AR14-A1) |
| |||||||||||
2.81% (4) | 01/25/35 | 2,552,698 | 2,344,173 | |||||||||
WaMu Mortgage Pass-Through Certificates (05-AR14-2A1) |
| |||||||||||
3.14% (4) | 12/25/35 | 570,396 | 519,919 | |||||||||
WaMu Mortgage Pass-Through Certificates (05-AR18-1A1) |
| |||||||||||
2.99% (4) | 01/25/36 | 868,484 | 780,015 | |||||||||
WaMu Mortgage Pass-Through Certificates (06-AR1-2A1A) |
| |||||||||||
2.44% (12 mo. Monthly Treasury Average Index + 1.070%) (2) | 01/25/46 | 5,955,227 | 5,332,712 | |||||||||
WaMu Mortgage Pass-Through Certificates (06-AR11-1A) |
| |||||||||||
2.33% (12 mo. Monthly Treasury Average Index + 0.960%) (2),(7) | 09/25/46 | 2,058,277 | 1,676,191 | |||||||||
WaMu Mortgage Pass-Through Certificates (06-AR17-1A1A) |
| |||||||||||
1.91% (12 mo. Monthly Treasury Average Index + 0.810%) (2) | 12/25/46 | 2,174,834 | 1,897,254 | |||||||||
Washington Mutual Alternative Mortgage Pass-Through Certificates (02-AR1-1A1) |
| |||||||||||
2.73% (4) | 11/25/30 | 26,007 | 25,415 | |||||||||
| Issues | Maturity Date | Principal Amount | Value | |||||||||
| RESIDENTIAL MORTGAGE-BACKED SECURITIES — NON-AGENCY (Continued) | ||||||||||||
Washington Mutual Alternative Mortgage Pass-Through Certificates (06-1-3A2) |
| |||||||||||
5.75% (7) | 02/25/36 | $ | 517,389 | $ | 458,786 | |||||||
Washington Mutual Alternative Mortgage Pass-Through Certificates (06-5-1A1) |
| |||||||||||
4.19% (1 mo. USD LIBOR + 0.600%) (2),(7) | 07/25/36 | 1,145,970 | 752,899 | |||||||||
Washington Mutual Alternative Mortgage Pass-Through Certificates (06-AR10-A2A) |
| |||||||||||
3.93% (1 mo. USD LIBOR + 0.340%) (2) | 12/25/36 | 1,763,666 | 1,543,347 | |||||||||
Washington Mutual Alternative Mortgage Pass-Through Certificates (07-OA3-5A) |
| |||||||||||
2.62% (12 mo. Monthly Treasury Average Index + 0.960%) (2),(7) | 04/25/47 | 930,295 | 769,438 | |||||||||
Washington Mutual Alternative Mortgage Pass-Through Certificates (07-OC2-A3) |
| |||||||||||
4.21% (1 mo. USD LIBOR + 0.620%) (2) | 06/25/37 | 2,562,489 | 2,291,782 | |||||||||
Washington Mutual Asset-Backed Certificates (06-HE1-2A4) |
| |||||||||||
4.15% (1 mo. USD LIBOR + 0.560%) (2) | 04/25/36 | 1,937,605 | 1,853,676 | |||||||||
Washington Mutual Asset-Backed Certificates (07-HE2-2A1) |
| |||||||||||
3.69% (1 mo. USD LIBOR + 0.100%) (2) | 02/25/37 | 15,621,548 | 4,492,918 | |||||||||
Wells Fargo Home Equity Asset-Backed Securities (07-1-A3) |
| |||||||||||
4.23% (1 mo. USD LIBOR + 0.640%) (2) | 03/25/37 | 5,521,000 | 4,700,168 | |||||||||
Wells Fargo Mortgage-Backed Securities Trust (06-AR11-A6) |
| |||||||||||
4.06% (4),(7) | 08/25/36 | 1,031,636 | 931,266 | |||||||||
Wells Fargo Mortgage-Backed Securities Trust (07-AR4-A1) |
| |||||||||||
4.10% (4),(7) | 08/25/37 | 47,288 | 39,412 | |||||||||
|
| |||||||||||
Total Residential Mortgage-Backed Securities — Non-Agency |
| |||||||||||
(Cost: $1,155,433,896) |
| 1,105,161,371 | ||||||||||
|
| |||||||||||
| U.S. GOVERNMENT AGENCY OBLIGATION — 0.3% (Cost: $11,500,000) | ||||||||||||
Federal Home Loan Banks |
| |||||||||||
1.61% (5) | 09/04/24 | 11,500,000 | 10,856,570 | |||||||||
|
| |||||||||||
| U.S. TREASURY SECURITIES — 2.3% | ||||||||||||
U.S. Treasury Bond | ||||||||||||
3.00% | 08/15/52 | 3,700,000 | 2,965,203 | |||||||||
U.S. Treasury Note | ||||||||||||
2.38% | 02/15/42 | 13,965,000 | 10,203,178 | |||||||||
See accompanying Notes to Financial Statements.
99
Table of Contents
TCW Total Return Bond Fund
Schedule of Investments (Continued)
| Issues | Maturity Date | Principal Amount | Value | |||||||||
| U.S. TREASURY SECURITIES (Continued) | ||||||||||||
2.75% | 08/15/32 | $ | 32,495,000 | $ | 29,103,335 | |||||||
4.13% | 10/31/27 | 23,400,000 | 23,283,914 | |||||||||
4.25% | 09/30/24 | 1,350,000 | 1,343,276 | |||||||||
4.38% | 10/31/24 | 4,530,000 | 4,520,887 | |||||||||
|
| |||||||||||
Total U.S. Treasury Securities |
| |||||||||||
(Cost: $74,198,328) |
| 71,419,793 | ||||||||||
|
| |||||||||||
Total Fixed Income Securities |
| |||||||||||
(Cost: $4,276,416,392) |
| 3,927,843,204 | ||||||||||
|
| |||||||||||
| Shares | ||||||||||||
MONEY MARKET INVESTMENTS — 1.8% |
| |||||||||||
State Street Institutional U.S. Government Money Market Fund — Premier Class, 3.01% (9) |
| 56,353,130 | 56,353,130 | |||||||||
|
| |||||||||||
Total Money Market Investments |
| |||||||||||
(Cost: $56,353,130) |
| 56,353,130 | ||||||||||
|
| |||||||||||
| Issues | Maturity Date | Principal Amount | Value | |||||||||
SHORT TERM INVESTMENTS — 1.3% |
| |||||||||||
| U.S. Government Agency Obligations — 1.3% | ||||||||||||
Federal Home Loan Banks | ||||||||||||
4.01% | 04/14/23 | $ | 25,000,000 | $ | 24,499,418 | |||||||
4.15% | 01/25/23 | 15,000,000 | 14,856,869 | |||||||||
|
| |||||||||||
Total U.S. Government Agency Obligations |
| |||||||||||
(Cost: $39,415,920) |
| 39,356,287 | ||||||||||
|
| |||||||||||
Total Short Term Investments |
| |||||||||||
(Cost: $39,415,919) |
| 39,356,287 | ||||||||||
|
| |||||||||||
Total Investments (129.6%) |
| |||||||||||
(Cost: $4,372,185,442) |
| 4,023,552,621 | ||||||||||
Liabilities In Excess Of Other Assets (-29.6%) |
| (919,298,346 | ) | |||||||||
|
| |||||||||||
Net Assets (100.0%) |
| $ | 3,104,254,275 | |||||||||
|
| |||||||||||
| Futures Contracts | ||||||||||||||||||
| Number of Contracts | Type | Expiration Date | Notional | Market Value | Net Unrealized Appreciation (Depreciation) | |||||||||||||
Long Futures | ||||||||||||||||||
| 2,099 | U.S. Ultra Long Bond Futures | 12/20/22 | $ | 310,462,080 | $ | 267,950,469 | $ | (42,511,611 | ) | |||||||||
| 13 | 10-Year U.S. Treasury Note Futures | 12/20/22 | 1,523,465 | 1,507,797 | (15,668 | ) | ||||||||||||
| 3,097 | 5-Year U.S Treasury Note Futures | 12/30/22 | 343,102,800 | 330,120,844 | (12,981,956 | ) | ||||||||||||
| 3,579 | 2-Year U.S Treasury Note Futures | 12/30/22 | 745,081,402 | 731,486,083 | (13,595,319 | ) | ||||||||||||
|
|
|
|
|
| |||||||||||||
| $ | 1,400,169,747 | $ | 1,331,065,193 | $ | (69,104,554 | ) | ||||||||||||
|
|
|
|
|
| |||||||||||||
| Forward Currency Exchange Contracts | ||||||||||||||||||||||||
| Counterparty | Contracts to Deliver | Units of Currency | Settlement Date | In Exchange for U.S. Dollars | Contracts at Value | Unrealized Appreciation (Depreciation) | ||||||||||||||||||
SELL (10) | ||||||||||||||||||||||||
Citibank N.A. | EUR | 8,569,000 | 01/13/23 | $ | 8,486,909 | $ | 8,521,333 | $ | (34,424 | ) | ||||||||||||||
|
|
|
|
|
| |||||||||||||||||||
See accompanying Notes to Financial Statements.
100
Table of Contents
TCW Total Return Bond Fund
October 31, 2022
Notes to the Schedule of Investments:
| ABS | Asset-Backed Securities. |
| ARM | Adjustable Rate Mortgage. |
| CLO | Collateralized Loan Obligation. |
| I/F | Inverse Floating rate security whose interest rate moves in the opposite direction of prevailing interest rates. |
| I/O | Interest Only Security. |
| PAC | Planned Amortization Class. |
| P/O | Principal Only Security. |
| SOFR | Secured Overnight Financing Rate. |
| TAC | Target Amortization Class. |
| TBA | To Be Announced. |
| EUR | Euro Currency. |
| (1) | Security exempt from registration under Rule 144A of the Securities Act of 1933, as amended. These securities may be resold, normally only to qualified institutional buyers. At October 31, 2022, the value of these securities amounted to $1,130,562,862 or 36.4% of net assets. These securities are determined to be liquid by the Fund’s investment advisor, unless otherwise noted, under procedures established by and under the general supervision of the Company’s Board of Directors. |
| (2) | Floating or variable rate security. The interest shown reflects the rate in effect at October 31, 2022. |
| (3) | This security is a residual or equity position that does not have a stated interest rate. This residual or equity position is entitled to recurring distributions which are generally equal to the remaining cash flow of payments made by underlying securities less contractual payments to debt holders and fund expenses. |
| (4) | Variable rate security. Interest rate disclosed is as of the most recent information available. Certain variable rate securities are not based on a published reference rate and spread but are determined by the issuer or agent and are based on current market conditions. These securities do not indicate a reference rate and spread in their description above. |
| (5) | Security is not accruing interest. |
| (6) | Security purchased on a forward commitment with an approximate principal amount. The actual principal amount and maturity date will be determined upon settlement when the security is delivered. |
| (7) | A portion of the principal balance has been written-off during the period due to defaults in the underlying loans. Cost basis has been adjusted. |
| (8) | For fair value measurement disclosure purposes, security is categorized as Level 3. Security is valued using significant unobservable inputs. |
| (9) | Rate disclosed is the 7-day net yield as of October 31, 2022. |
| (10) | Fund sells foreign currency, buys U.S. Dollar. |
See accompanying Notes to Financial Statements.
101
Table of Contents
TCW Total Return Bond Fund
Investments by Sector | October 31, 2022 |
| Sector | Percentage of Net Assets | |||
Residential Mortgage-Backed Securities — Agency | 64.8 | % | ||
Residential Mortgage-Backed Securities — Non-Agency | 35.6 | |||
Asset-Backed Securities | 13.4 | |||
Commercial Mortgage-Backed Securities — Non-Agency | 9.6 | |||
U.S. Treasury Securities | 2.3 | |||
Money Market Investments | 1.8 | |||
U.S. Government Agency Obligations | 1.6 | |||
Commercial Mortgage-Backed Securities — Agency | 0.5 | |||
Other* | (29.6 | ) | ||
|
| |||
Total | 100.0 | % | ||
|
| |||
| * | Includes futures, pending trades, interest receivable and accrued expenses payable. |
See accompanying Notes to Financial Statements.
102
Table of Contents
TCW Total Return Bond Fund
Fair Valuation Summary | October 31, 2022 |
The following is a summary of the fair valuations according to the inputs used as of October 31, 2022 in valuing the Fund’s investments:
Description | Quoted Prices in Active Markets for Identical Assets (Level 1) | Other Significant Observable Inputs (Level 2) | Significant Unobservable Inputs (Level 3) | Total | ||||||||||||
Fixed Income Securities | ||||||||||||||||
Asset-Backed Securities | $ | — | $ | 416,018,146 | $ | — | $ | 416,018,146 | ||||||||
Commercial Mortgage-Backed Securities — Agency | — | 14,726,045 | — | 14,726,045 | ||||||||||||
Commercial Mortgage-Backed Securities — Non-Agency | — | 299,107,299 | — | 299,107,299 | ||||||||||||
Residential Mortgage-Backed Securities — Agency | — | 2,010,553,980 | — | 2,010,553,980 | ||||||||||||
Residential Mortgage-Backed Securities — Non-Agency | — | 1,103,253,985 | 1,907,386 | 1,105,161,371 | ||||||||||||
U.S. Government Agency Obligations | — | 10,856,570 | — | 10,856,570 | ||||||||||||
U.S. Treasury Securities | 71,419,793 | — | — | 71,419,793 | ||||||||||||
|
|
|
|
|
|
|
| |||||||||
Total Fixed Income Securities | 71,419,793 | 3,854,516,025 | 1,907,386 | 3,927,843,204 | ||||||||||||
|
|
|
|
|
|
|
| |||||||||
Money Market Investments | 56,353,130 | — | — | 56,353,130 | ||||||||||||
Short-Term Investments | — | 39,356,287 | — | 39,356,287 | ||||||||||||
|
|
|
|
|
|
|
| |||||||||
Total Investments | $ | 127,772,923 | $ | 3,893,872,312 | $ | 1,907,386 | $ | 4,023,552,621 | ||||||||
|
|
|
|
|
|
|
| |||||||||
Liability Derivatives | ||||||||||||||||
Futures Contracts | ||||||||||||||||
Interest Rate Risk | $ | (69,104,554 | ) | $ | — | $ | — | $ | (69,104,554 | ) | ||||||
Forward Currency Contracts | ||||||||||||||||
Foreign Currency Risk | — | (34,424 | ) | — | (34,424 | ) | ||||||||||
|
|
|
|
|
|
|
| |||||||||
Total | $ | (69,104,554 | ) | $ | (34,424 | ) | $ | — | $ | (69,138,978 | ) | |||||
|
|
|
|
|
|
|
| |||||||||
See accompanying Notes to Financial Statements.
103
Table of Contents
TCW Funds, Inc.
Statements of Assets and Liabilities | October 31, 2022 |
| TCW Core Fixed Income Fund | TCW Enhanced Commodity Strategy Fund (1) | TCW Global Bond Fund | ||||||||||
ASSETS |
| |||||||||||
Investments, at Value (2) | $ | 1,383,785,060 | $ | 36,040,786 | $ | 18,122,556 | ||||||
Investment in Affiliated Issuers, at Value | — | — | 561,009 | (3) | ||||||||
Cash | 413,237 | 1,094 | 5,621 | |||||||||
Receivable for Securities Sold | 397,584 | 51,353 | 1 | |||||||||
Receivable for Sale of When-Issued Securities | 108,194,248 | — | 471,414 | |||||||||
Receivable for Fund Shares Sold | 2,254,864 | 23,815 | 3,737 | |||||||||
Interest and Dividends Receivable | 6,592,093 | 196,323 | 142,396 | |||||||||
Receivable from Investment Advisor | 78,563 | 50,115 | 33,222 | |||||||||
Unrealized Appreciation on Open Forward Foreign Currency Contracts | — | — | 150,928 | |||||||||
Receivable for Daily Variation Margin on Open Financial Futures Contracts | 231,254 | — | 2,187 | |||||||||
Cash Collateral Held for Brokers | 15,649,282 | — | 194,617 | |||||||||
Open Swap Agreements, at Value | — | 742,107 | — | |||||||||
Cash Collateral on Deposit | — | 3,920,000 | — | |||||||||
Prepaid Expenses | 53,446 | 18,782 | 25,534 | |||||||||
|
|
|
|
|
| |||||||
Total Assets | 1,517,649,631 | 41,044,375 | 19,713,222 | |||||||||
|
|
|
|
|
| |||||||
LIABILITIES |
| |||||||||||
Distributions Payable | 2,772,876 | — | 27,822 | |||||||||
Payable for Securities Purchased | — | — | 47,058 | |||||||||
Payable for Purchase of When-Issued Securities | 344,324,195 | — | 2,901,491 | |||||||||
Payable for Fund Shares Redeemed | 6,025,080 | 84,722 | 31 | |||||||||
Accrued Directors’ Fees and Expenses | 11,634 | 11,634 | 11,634 | |||||||||
Deferred Accrued Directors’ Fees and Expenses | 1,587 | 1,587 | 1,587 | |||||||||
Accrued Management Fees | 429,565 | 17,677 | 6,958 | |||||||||
Accrued Distribution Fees | 36,665 | 2,493 | 1,642 | |||||||||
Interest Payable on Swap Agreements | — | 44,877 | — | |||||||||
Payable for Daily Variation Margin on Open Centrally Cleared Swap Contracts | 157,829 | — | 1,660 | |||||||||
Open Swap Agreements, at Value | — | 3,629 | — | |||||||||
Unrealized Depreciation on Open Forward Foreign Currency Contracts | 48,124 | — | 226,526 | |||||||||
Transfer Agent Fees Payable | 406,738 | 9,708 | 5,031 | |||||||||
Administration Fee Payable | 97,781 | 53,985 | 9,295 | |||||||||
Audit Fees Payable | 48,520 | 32,232 | 38,197 | |||||||||
Accounting Fees Payable | 66,890 | 23,033 | 1,838 | |||||||||
Custodian Fees Payable | 45,788 | 50,530 | 39,172 | |||||||||
Legal Fees Payable | 9,771 | 370 | 312 | |||||||||
Other Accrued Expenses | 48,862 | 16,174 | 12,961 | |||||||||
|
|
|
|
|
| |||||||
Total Liabilities | 354,531,905 | 352,651 | 3,333,215 | |||||||||
|
|
|
|
|
| |||||||
NET ASSETS | $ | 1,163,117,726 | $ | 40,691,724 | $ | 16,380,007 | ||||||
|
|
|
|
|
| |||||||
NET ASSETS CONSIST OF: |
| |||||||||||
Paid-in Capital | $ | 1,443,246,297 | $ | 44,138,871 | $ | 21,374,918 | ||||||
Accumulated Earnings (Loss) | (280,128,571 | ) | (3,447,147 | ) | (4,994,911 | ) | ||||||
|
|
|
|
|
| |||||||
NET ASSETS | $ | 1,163,117,726 | $ | 40,691,724 | $ | 16,380,007 | ||||||
|
|
|
|
|
| |||||||
NET ASSETS ATTRIBUTABLE TO: |
| |||||||||||
I Class Share | $ | 911,212,596 | $ | 29,511,114 | $ | 8,649,980 | ||||||
|
|
|
|
|
| |||||||
N Class Share | $ | 170,497,229 | $ | 11,180,610 | $ | 7,730,027 | ||||||
|
|
|
|
|
| |||||||
Plan Class Share | $ | 81,407,901 | $ | — | $ | — | ||||||
|
|
|
|
|
| |||||||
CAPITAL SHARES OUTSTANDING: (4) |
| |||||||||||
I Class Share | 96,991,084 | 4,652,144 | 1,115,741 | |||||||||
|
|
|
|
|
| |||||||
N Class Share | 18,180,788 | 1,763,300 | 997,303 | |||||||||
|
|
|
|
|
| |||||||
Plan Class Share | 8,622,881 | — | — | |||||||||
|
|
|
|
|
| |||||||
NET ASSET VALUE PER SHARE: (5) |
| |||||||||||
I Class Share | $ | 9.39 | $ | 6.34 | $ | 7.75 | ||||||
|
|
|
|
|
| |||||||
N Class Share | $ | 9.38 | $ | 6.34 | $ | 7.75 | ||||||
|
|
|
|
|
| |||||||
Plan Class Share | $ | 9.44 | $ | — | $ | — | ||||||
|
|
|
|
|
| |||||||
| (1) | Consolidated Statement of Assets and Liabilities (See Note 2). |
| (2) | The identified cost for the TCW Core Fixed Income Fund, the TCW Enhanced Commodity Strategy Fund and the TCW Global Bond Fund at October 31, 2022 was $1,517,706,740, $37,514,947 and $21,072,273, respectively. |
| (3) | The identified cost for the TCW Global Bond Fund at October 31, 2022 was $766,941. |
| (4) | The number of authorized shares, with a par value of $0.001 per share is 4,000,000,000 for each of the I Class, N Class and Plan Class shares. |
| (5) | Represents offering price and redemption price per share. |
See accompanying Notes to Financial Statements.
104
Table of Contents
TCW Funds, Inc.
Statements of Assets and Liabilities | October 31, 2022 |
| TCW High Yield Bond Fund | TCW Short Term Bond Fund | TCW Total Return Bond Fund | ||||||||||
ASSETS | ||||||||||||
Investments, at Value (1) | $ | 57,595,136 | $ | 10,743,747 | $ | 4,023,552,621 | ||||||
Cash | 4,765 | 1,366 | 6,970,570 | |||||||||
Receivable for Securities Sold | 2,730,268 | — | 130,337 | |||||||||
Receivable for Sale of When-Issued Securities | — | 433,792 | 402,333,688 | |||||||||
Receivable for Fund Shares Sold | 24,368 | 88 | 4,444,592 | |||||||||
Interest and Dividends Receivable | 717,691 | 44,914 | 9,443,411 | |||||||||
Receivable from Investment Advisor | 14,738 | 23,420 | — | |||||||||
Unrealized Appreciation on Open Forward Foreign Currency Contracts | 60 | — | — | |||||||||
Receivable for Daily Variation Margin on Open Financial Futures Contracts | 9,091 | 6,750 | — | |||||||||
Cash Collateral Held for Brokers | 289,000 | 68,000 | 57,190,976 | |||||||||
Prepaid Expenses | 15,078 | 11,919 | 100,552 | |||||||||
|
|
|
|
|
| |||||||
Total Assets | 61,400,195 | 11,333,996 | 4,504,166,747 | |||||||||
|
|
|
|
|
| |||||||
LIABILITIES | ||||||||||||
Distributions Payable | 282,812 | 17,904 | 8,682,053 | |||||||||
Payable for Securities Purchased | 894,116 | 506,971 | 27,089,985 | |||||||||
Payable for Purchase of When-Issued Securities | — | 2,419,713 | 1,348,273,490 | |||||||||
Payable for Fund Shares Redeemed | 27,361 | 21 | 6,361,163 | |||||||||
Accrued Directors’ Fees and Expenses | 11,634 | 11,634 | 11,634 | |||||||||
Deferred Accrued Directors’ Fees and Expenses | 1,587 | 1,587 | 1,587 | |||||||||
Accrued Management Fees | 23,102 | 2,512 | 1,184,193 | |||||||||
Accrued Distribution Fees | 1,909 | — | 110,807 | |||||||||
Payable for Daily Variation Margin on Open Financial Futures Contracts | — | — | 5,483,938 | |||||||||
Unrealized Depreciation on Open Forward Foreign Currency Contracts | 900 | — | 34,424 | |||||||||
Transfer Agent Fees Payable | 26,505 | 4,144 | 1,540,019 | |||||||||
Administration Fee Payable | 12,976 | 8,909 | 315,413 | |||||||||
Audit Fees Payable | 27,250 | 61,201 | 136,322 | |||||||||
Accounting Fees Payable | 16,593 | 1,476 | 202,111 | |||||||||
Custodian Fees Payable | 24,492 | 17,365 | 56,846 | |||||||||
Legal Fees Payable | 687 | 245 | 26,312 | |||||||||
Other Accrued Expenses | 13,068 | 10,813 | 402,175 | |||||||||
|
|
|
|
|
| |||||||
Total Liabilities | 1,364,992 | 3,064,495 | 1,399,912,472 | |||||||||
|
|
|
|
|
| |||||||
NET ASSETS | $ | 60,035,203 | $ | 8,269,501 | $ | 3,104,254,275 | ||||||
|
|
|
|
|
| |||||||
NET ASSETS CONSIST OF: | ||||||||||||
Paid-in Capital | $ | 70,990,905 | $ | 9,206,336 | $ | 3,935,236,943 | ||||||
Accumulated Earnings (Loss) | (10,955,702 | ) | (936,835 | ) | (830,982,668 | ) | ||||||
|
|
|
|
|
| |||||||
NET ASSETS | $ | 60,035,203 | $ | 8,269,501 | $ | 3,104,254,275 | ||||||
|
|
|
|
|
| |||||||
NET ASSETS ATTRIBUTABLE TO: | ||||||||||||
I Class Share | $ | 50,991,994 | $ | 8,269,501 | $ | 2,595,866,054 | ||||||
|
|
|
|
|
| |||||||
N Class Share | $ | 9,043,209 | $ | — | $ | 506,866,467 | ||||||
|
|
|
|
|
| |||||||
Plan Class Share | $ | — | $ | — | $ | 1,521,754 | ||||||
|
|
|
|
|
| |||||||
CAPITAL SHARES OUTSTANDING: (2) | ||||||||||||
I Class Share | 8,792,330 | 1,023,111 | 326,274,396 | |||||||||
|
|
|
|
|
| |||||||
N Class Share | 1,549,586 | — | 61,743,554 | |||||||||
|
|
|
|
|
| |||||||
Plan Class Share | — | — | 190,251 | |||||||||
|
|
|
|
|
| |||||||
NET ASSET VALUE PER SHARE: (3) | ||||||||||||
I Class Share | $ | 5.80 | $ | 8.08 | $ | 7.96 | ||||||
|
|
|
|
|
| |||||||
N Class Share | $ | 5.84 | $ | — | $ | 8.21 | ||||||
|
|
|
|
|
| |||||||
Plan Class Share | $ | — | $ | — | $ | 8.00 | ||||||
|
|
|
|
|
| |||||||
| (1) | The identified cost for the TCW High Yield Bond Fund, the TCW Short Term Bond Fund and the TCW Total Return Bond Fund at October 31, 2022 was $65,576,619, $11,271,024 and $4,372,185,442, respectively. |
| (2) | The number of authorized shares, with a par value of $0.001 per share is 4,000,000,000 for each of the I Class, N Class and Plan Class shares. |
| (3) | Represents offering price and redemption price per share. |
See accompanying Notes to Financial Statements.
105
Table of Contents
TCW Funds, Inc.
Statements of Operations | Year Ended October 31, 2022 |
| TCW Core Fixed Income Fund | TCW Enhanced Commodity Strategy Fund (1) | TCW Global Bond Fund | ||||||||||
INVESTMENT INCOME | ||||||||||||
Income: | ||||||||||||
Dividends from Investment in Affiliated Issuers | $ | — | $ | — | $ | 33,497 | ||||||
Interest | 36,536,989 | 722,125 | 733,116 | |||||||||
|
|
|
|
|
| |||||||
Total | 36,536,989 | 722,125 | 766,613 | |||||||||
|
|
|
|
|
| |||||||
Expenses: | ||||||||||||
Management Fees | 6,065,084 | 174,082 | 111,848 | |||||||||
Accounting Services Fees | 114,438 | 38,764 | 4,134 | |||||||||
Administration Fees | 172,522 | 36,425 | 17,577 | |||||||||
Transfer Agent Fees: | ||||||||||||
I Class | 1,148,372 | 21,005 | 8,508 | |||||||||
N Class | 246,744 | 15,414 | 8,963 | |||||||||
Plan Class | 8,145 | — | — | |||||||||
Custodian Fees | 72,861 | 78,169 | 78,099 | |||||||||
Professional Fees | 103,873 | 53,817 | 67,096 | |||||||||
Directors’ Fees and Expenses | 46,667 | 46,667 | 46,667 | |||||||||
Registration Fees: | ||||||||||||
I Class | 40,078 | 23,738 | 19,071 | |||||||||
N Class | 20,589 | 25,746 | 18,366 | |||||||||
Plan Class | 18,242 | — | — | |||||||||
Distribution Fees: | ||||||||||||
N Class | 503,103 | 20,121 | 23,271 | |||||||||
Compliance Expense | 6,328 | 6,328 | 6,328 | |||||||||
Shareholder Reporting Expense | 10,155 | 1,551 | 1,404 | |||||||||
Other | 99,407 | 12,622 | 19,850 | |||||||||
|
|
|
|
|
| |||||||
Total | 8,676,608 | 554,449 | 431,182 | |||||||||
|
|
|
|
|
| |||||||
Less Expenses Borne by Investment Advisor: | ||||||||||||
I Class | 563,924 | 223,248 | 147,789 | |||||||||
N Class | 363,874 | 119,771 | 135,394 | |||||||||
Plan Class | 31,757 | — | — | |||||||||
|
|
|
|
|
| |||||||
Net Expenses | 7,717,053 | 211,430 | 147,999 | |||||||||
|
|
|
|
|
| |||||||
Net Investment Income | 28,819,936 | 510,695 | 618,614 | |||||||||
|
|
|
|
|
| |||||||
NET REALIZED AND UNREALIZED GAIN (LOSS) ON INVESTMENTS | ||||||||||||
Net Realized Gain (Loss) on: | ||||||||||||
Investments | (135,779,342 | ) | (100,924 | ) | (2,210,225 | ) | ||||||
Investments in Affiliated Issuers | — | — | (75,538 | ) | ||||||||
Foreign Currency | (190,998 | ) | — | (23,412 | ) | |||||||
Foreign Currency Forward Contracts | 1,140,106 | — | (629,498 | ) | ||||||||
Futures Contracts | 2,075,978 | — | (38,872 | ) | ||||||||
Options Written | (4,409,531 | ) | — | 4,380 | ||||||||
Swap Agreements | (35,378 | ) | (2,988,340 | ) | (820 | ) | ||||||
Change in Unrealized (Depreciation) on: | ||||||||||||
Investments | (165,894,822 | ) | (1,488,761 | ) | (2,828,921 | ) | ||||||
Foreign Currency | (1,995 | ) | — | (1,388 | ) | |||||||
Foreign Currency Forward Contracts | (48,124 | ) | — | (74,656 | ) | |||||||
Futures contracts | (1,674,943 | ) | — | 92,721 | ||||||||
Investments in Affiliated Issuers | — | — | (166,768 | ) | ||||||||
Options Written | 986,072 | — | — | |||||||||
Swap Agreements | (6,773,509 | ) | 748,867 | (59,091 | ) | |||||||
|
|
|
|
|
| |||||||
Net Realized and Unrealized Gain (Loss) on Investments and Foreign Currency Transactions | (310,606,486 | ) | (3,829,158 | ) | (6,012,088 | ) | ||||||
|
|
|
|
|
| |||||||
DECREASE IN NET ASSETS RESULTING FROM OPERATIONS | $ | (281,786,550 | ) | $ | (3,318,463 | ) | $ | (5,393,474 | ) | |||
|
|
|
|
|
| |||||||
| (1) | Consolidated Statement of Operations (See Note 2). |
See accompanying Notes to Financial Statements.
106
Table of Contents
TCW Funds, Inc.
Statements of Operations | Year Ended October 31, 2022 |
| TCW High Yield Bond Fund | TCW Short Term Bond Fund | TCW Total Return Bond Fund | ||||||||||
INVESTMENT INCOME | ||||||||||||
Income: | ||||||||||||
Interest | $ | 4,139,190 | $ | 209,887 | $ | 168,148,876 | ||||||
|
|
|
|
|
| |||||||
Total | 4,139,190 | 209,887 | 168,148,876 | |||||||||
|
|
|
|
|
| |||||||
Expenses: | ||||||||||||
Management Fees | 371,147 | 44,495 | 16,467,298 | |||||||||
Accounting Services Fees | 30,381 | 2,765 | 300,676 | |||||||||
Administration Fees | 23,675 | 15,787 | 458,746 | |||||||||
Transfer Agent Fees: | ||||||||||||
I Class | 82,051 | 20,163 | 3,734,209 | |||||||||
N Class | 18,665 | — | 672,370 | |||||||||
Plan Class | — | — | 6,232 | |||||||||
Custodian Fees | 26,756 | 33,453 | 93,641 | |||||||||
Professional Fees | 46,683 | 103,950 | 279,613 | |||||||||
Directors’ Fees and Expenses | 46,667 | 46,667 | 46,667 | |||||||||
Registration Fees: | ||||||||||||
I Class | 24,425 | 22,778 | 80,216 | |||||||||
N Class | 19,432 | — | 33,780 | |||||||||
Plan Class | — | — | 19,514 | |||||||||
Distribution Fees: | ||||||||||||
N Class | 29,297 | — | 1,690,858 | |||||||||
Compliance Expense | 6,328 | 6,328 | 6,328 | |||||||||
Shareholder Reporting Expense | 4,096 | — | 25,116 | |||||||||
Other | 15,662 | 8,772 | 477,637 | |||||||||
|
|
|
|
|
| |||||||
Total | 745,265 | 305,158 | 24,392,901 | |||||||||
|
|
|
|
|
| |||||||
Less Expenses Borne by Investment Advisor: | ||||||||||||
I Class | 206,979 | 249,221 | 2,135,991 | |||||||||
N Class | 55,374 | — | 639,422 | |||||||||
Plan Class | — | — | 25,782 | |||||||||
|
|
|
|
|
| |||||||
Net Expenses | 482,912 | 55,937 | 21,591,706 | |||||||||
|
|
|
|
|
| |||||||
Net Investment Income | 3,656,278 | 153,950 | 146,557,170 | |||||||||
|
|
|
|
|
| |||||||
NET REALIZED AND UNREALIZED GAIN (LOSS) ON INVESTMENTS | ||||||||||||
Net Realized (Loss) on: | ||||||||||||
Investments | (3,815,224 | ) | (659,093 | ) | (265,587,258 | ) | ||||||
Foreign Currency | (481 | ) | (4,780 | ) | 126,067 | |||||||
Foreign Currency Forward Contracts | 24,133 | 9,216 | 1,822,507 | |||||||||
Futures Contracts | 932,732 | 291,660 | (164,653,189 | ) | ||||||||
Change in Unrealized (Depreciation) on: | ||||||||||||
Investments | (9,452,964 | ) | (273,807 | ) | (503,521,049 | ) | ||||||
Foreign Currency | (64 | ) | — | (177 | ) | |||||||
Foreign Currency Forward Contracts | (840 | ) | — | (34,424 | ) | |||||||
Futures contracts | (12,003 | ) | 72,524 | (68,110,829 | ) | |||||||
|
|
|
|
|
| |||||||
Net Realized and Unrealized Gain (Loss) on Investments and Foreign Currency Transactions | (12,324,711 | ) | (564,280 | ) | (999,958,352 | ) | ||||||
|
|
|
|
|
| |||||||
DECREASE IN NET ASSETS RESULTING FROM OPERATIONS | $ | (8,668,433 | ) | $ | (410,330 | ) | $ | (853,401,182 | ) | |||
|
|
|
|
|
| |||||||
See accompanying Notes to Financial Statements.
107
Table of Contents
TCW Funds, Inc.
Statements of Changes in Net Assets
| TCW Core Fixed Income Fund | TCW Enhanced Commodity Strategy Fund (1) | |||||||||||||||
| Year Ended October 31, 2022 | Year Ended October 31, 2021 | Year Ended October 31, 2022 | Year Ended October 31, 2021 | |||||||||||||
OPERATIONS |
| |||||||||||||||
Net Investment Income | $ | 28,819,936 | $ | 15,183,912 | $ | 510,695 | $ | 12,917 | ||||||||
Net Realized Gain (Loss) on Investments, Futures Contracts, Options Written, Swap Contracts and Foreign Currency Transactions | (137,199,165 | ) | (817,901 | ) | (3,089,264 | ) | 563,271 | |||||||||
Change in Unrealized Appreciation (Depreciation) on Investments, Futures Contracts, Options Written, Foreign Currency Transactions and Swap Contracts | (173,407,321 | ) | (12,278,658 | ) | (739,894 | ) | 13,182 | |||||||||
|
|
|
|
|
|
|
| |||||||||
Increase (Decrease) in Net Assets Resulting from Operations | (281,786,550 | ) | 2,087,353 | (3,318,463 | ) | 589,370 | ||||||||||
|
|
|
|
|
|
|
| |||||||||
DISTRIBUTIONS TO SHAREHOLDERS |
| |||||||||||||||
Distributions to Shareholders | (23,342,013 | ) | (54,874,147 | ) | (1,055,936 | ) | (31,504 | ) | ||||||||
Return of Capital | (4,452,370 | ) | (6,135,591 | ) | — | — | ||||||||||
|
|
|
|
|
|
|
| |||||||||
Total Distributions to Shareholders | (27,794,383 | ) | (61,009,738 | ) | (1,055,936 | ) | (31,504 | ) | ||||||||
|
|
|
|
|
|
|
| |||||||||
NET CAPITAL SHARE TRANSACTIONS |
| |||||||||||||||
I Class | (301,442,390 | ) | 176,664,657 | 30,246,122 | 952,173 | |||||||||||
N Class | (12,158,536 | ) | (9,836,433 | ) | 11,926,112 | 218,346 | ||||||||||
Plan Class | 90,797,662 | 870,109 | — | — | ||||||||||||
|
|
|
|
|
|
|
| |||||||||
Increase (Decrease) in Net Assets Resulting from Net Capital Shares Transactions | (222,803,264 | ) | 167,698,333 | 42,172,234 | 1,170,519 | |||||||||||
|
|
|
|
|
|
|
| |||||||||
Increase (Decrease) in Net Assets | (532,384,197 | ) | 108,775,948 | 37,797,835 | 1,728,385 | |||||||||||
NET ASSETS |
| |||||||||||||||
Beginning of year | 1,695,501,923 | 1,586,725,975 | 2,893,889 | 1,165,504 | ||||||||||||
|
|
|
|
|
|
|
| |||||||||
End of year | $ | 1,163,117,726 | $ | 1,695,501,923 | $ | 40,691,724 | $ | 2,893,889 | ||||||||
|
|
|
|
|
|
|
| |||||||||
| (1) | Consolidated Statement of Changes in Net Assets (See Note 2). |
See accompanying Notes to Financial Statements.
108
Table of Contents
TCW Funds, Inc.
Statements of Changes in Net Assets
| TCW Global Bond Fund | TCW High Yield Bond Fund | |||||||||||||||
| Year Ended October 31, 2022 | Year Ended October 31, 2021 | Year Ended October 31, 2022 | Year Ended October 31, 2021 | |||||||||||||
OPERATIONS |
| |||||||||||||||
Net Investment Income | $ | 618,614 | $ | 646,393 | $ | 3,656,278 | $ | 3,905,918 | ||||||||
Net Realized Gain (Loss) on Investments, Futures Contracts, Options Written, Swap Contracts and Foreign Currency Transactions | (2,973,985 | ) | (314,696 | ) | (2,858,840 | ) | 3,161,035 | |||||||||
Change in Unrealized Appreciation (Depreciation) on Investments, Futures Contracts, Foreign Currency Transactions and Swap Contracts | (3,038,103 | ) | (960,771 | ) | (9,465,871 | ) | 784,193 | |||||||||
|
|
|
|
|
|
|
| |||||||||
Increase (Decrease) in Net Assets Resulting from Operations | (5,393,474 | ) | (629,074 | ) | (8,668,433 | ) | 7,851,146 | |||||||||
|
|
|
|
|
|
|
| |||||||||
DISTRIBUTIONS TO SHAREHOLDERS |
| |||||||||||||||
Distributions to Shareholders | (98,875 | ) | (1,403,091 | ) | (5,890,701 | ) | (4,114,958 | ) | ||||||||
Return of Capital | (298,881 | ) | (207,034 | ) | — | — | ||||||||||
|
|
|
|
|
|
|
| |||||||||
Total Distributions to Shareholders | (397,756 | ) | (1,610,125 | ) | (5,890,701 | ) | (4,114,958 | ) | ||||||||
|
|
|
|
|
|
|
| |||||||||
NET CAPITAL SHARE TRANSACTIONS |
| |||||||||||||||
I Class | (12,356,627 | ) | 15,202,934 | (32,767,878 | ) | 7,118,045 | ||||||||||
N Class | (546,364 | ) | 316,428 | (3,908,789 | ) | (3,378,540 | ) | |||||||||
|
|
|
|
|
|
|
| |||||||||
Increase (Decrease) in Net Assets Resulting from Net Capital Shares Transactions | (12,902,991 | ) | 15,519,362 | (36,676,667 | ) | 3,739,505 | ||||||||||
|
|
|
|
|
|
|
| |||||||||
Increase (Decrease) in Net Assets | (18,694,221 | ) | 13,280,163 | (51,235,801 | ) | 7,475,693 | ||||||||||
NET ASSETS |
| |||||||||||||||
Beginning of year | 35,074,228 | 21,794,065 | 111,271,004 | 103,795,311 | ||||||||||||
|
|
|
|
|
|
|
| |||||||||
End of year | $ | 16,380,007 | $ | 35,074,228 | $ | 60,035,203 | $ | 111,271,004 | ||||||||
|
|
|
|
|
|
|
| |||||||||
See accompanying Notes to Financial Statements.
109
Table of Contents
TCW Funds, Inc.
Statements of Changes in Net Assets
| TCW Short Term Bond Fund | TCW Total Return Bond Fund | |||||||||||||||
| Year Ended October 31, 2022 | Year Ended October 31, 2021 | Year Ended October 31, 2022 | Year Ended October 31, 2021 | |||||||||||||
OPERATIONS |
| |||||||||||||||
Net Investment Income | $ | 153,950 | $ | 309,248 | $ | 146,557,170 | $ | 144,428,513 | ||||||||
Net Realized Loss on Investments, Futures Contracts and Foreign Currency Transactions | (362,997 | ) | (6,742 | ) | (428,291,873 | ) | (99,687,888 | ) | ||||||||
Change in Unrealized Appreciation (Depreciation) on Investments, Futures Contracts and Foreign Currency Transactions | (201,283 | ) | (229,234 | ) | (571,666,479 | ) | (89,012,024 | ) | ||||||||
|
|
|
|
|
|
|
| |||||||||
Increase (Decrease) in Net Assets Resulting from Operations | (410,330 | ) | 73,272 | (853,401,182 | ) | (44,271,399 | ) | |||||||||
|
|
|
|
|
|
|
| |||||||||
DISTRIBUTIONS TO SHAREHOLDERS |
| |||||||||||||||
Distributions to Shareholders | (252,893 | ) | (116,060 | ) | (98,490,713 | ) | (180,514,941 | ) | ||||||||
Return of Capital | (80,452 | ) | — | — | (7,936,807 | ) | ||||||||||
|
|
|
|
|
|
|
| |||||||||
Total Distributions to Shareholders | (333,345 | ) | (116,060 | ) | (98,490,713 | ) | (188,451,748 | ) | ||||||||
|
|
|
|
|
|
|
| |||||||||
NET CAPITAL SHARE TRANSACTIONS |
| |||||||||||||||
I Class | (9,048,272 | ) | 10,406,189 | (873,138,545 | ) | (1,286,832,084 | ) | |||||||||
N Class | — | — | (155,694,602 | ) | (979,184,016 | ) | ||||||||||
Plan Class | — | — | 1,217,353 | 595,978 | ||||||||||||
|
|
|
|
|
|
|
| |||||||||
Increase (Decrease) in Net Assets Resulting from Net Capital Shares Transactions | (9,048,272 | ) | 10,406,189 | (1,027,615,794 | ) | (2,265,420,122 | ) | |||||||||
|
|
|
|
|
|
|
| |||||||||
Increase (Decrease) in Net Assets | (9,791,947 | ) | 10,363,401 | (1,979,507,689 | ) | (2,498,143,269 | ) | |||||||||
NET ASSETS |
| |||||||||||||||
Beginning of year | 18,061,448 | 7,698,047 | 5,083,761,964 | 7,581,905,233 | ||||||||||||
|
|
|
|
|
|
|
| |||||||||
End of year | $ | 8,269,501 | $ | 18,061,448 | $ | 3,104,254,275 | $ | 5,083,761,964 | ||||||||
|
|
|
|
|
|
|
| |||||||||
See accompanying Notes to Financial Statements.
110
Table of Contents
TCW Funds, Inc.
Notes to Financial Statements | October 31, 2022 |
Note 1 — Organization
TCW Funds, Inc. (the “Company”), a Maryland corporation, is an open-end management investment company registered under the Investment Company Act of 1940, as amended (the “1940 Act”), that currently offers 18 no-load mutual funds (each series a “Fund” and collectively the “Funds”). TCW Investment Management Company LLC (the “Advisor”) is the investment advisor to and an affiliate of the Funds and is registered under the Investment Advisers Act of 1940, as amended. Each Fund has its own investment objective and strategies. The following is a brief description of the investment objectives and principal investment strategies for the Funds that are covered in this report:
TCW Fund | Investment Objectives and Principal Investment | |
| Diversified Fixed Income Funds | ||
| TCW Core Fixed Income Fund | Seeks to maximize current income and achieve above average total return consistent with prudent investment management over a full market cycle by investing at least 80% of the value of its net assets, plus any borrowings for investment purposes, in debt securities. The Fund may also invest up to 5% of its net assets in below investment grade bonds (commonly known as “junk bonds”). | |
| TCW Enhanced Commodity Strategy Fund | Seeks total return which exceeds that of its commodity benchmark by investing primarily in commodity-linked derivative instruments backed by a portfolio of Fixed Income Instruments. The average duration of the Fixed Income Instruments held by the Fund is not expected to exceed 3 years, under normal market conditions. The Fund may invest up to 5% of its net assets in below investment grade bonds (commonly known as “junk bonds”). The Fund may invest up to 15% of its assets in foreign securities that are denominated in U.S. dollars. The Fund may invest up to 5% of its assets in securities of foreign issuers that are not denominated in U.S. dollars. The Fund may invest up to 5% of its assets in emerging market securities. | |
| TCW Global Bond Fund | Seeks total return by investing at least 80% of the value of its net assets, plus any borrowings for investment purposes, in debt securities. Under normal market conditions, the Fund invests in securities of issuers located in at least three different countries (one of which may be the United States) and invests at least 30% of its net assets in securities of issuers located outside the United States. The Fund does not limit its investments to a particular credit or ratings category and may invest up to 35% of its net assets in below investment grade bonds (commonly known as “junk bonds”). | |
111
Table of Contents
TCW Funds, Inc.
Notes to Financial Statements (Continued)
Note 1 — Organization (Continued)
TCW Fund | Investment Objectives and Principal Investment | |
| TCW High Yield Bond Fund | Seeks to maximize income and achieve above average total return consistent with reasonable risk over a full market cycle by investing at least 80% of the value of its net assets, plus any borrowings for investment purposes, in high yield/below investment grade bonds (commonly known as “junk bonds”). The Fund may invest up to 20% of its net assets in equity securities (including common stock and convertible and non-convertible preferred stocks) and bank loans of companies in the high yield universe. | |
| TCW Short Term Bond Fund | Seeks to maximize current income by investing at least 80% of the value of its net assets, plus any borrowings for investment purposes, in a diversified portfolio of debt securities of varying maturities, including bonds, notes and other similar fixed income instruments issued by governmental or private sector issuers. The Fund may invest up to 10% of its net assets in below investment grade bonds (commonly known as “junk bonds”). Under normal market conditions, the portfolio managers seek to construct an investment portfolio with a dollar-weighted average duration of no more than two years. | |
| TCW Total Return Bond Fund | Seeks to maximize current income and achieve above average total return consistent with prudent investment management over a full market cycle by investing at least 80% of the value of its net assets, plus any borrowings for investment purposes, in debt securities. At least 50% of the Fund’s net assets will be invested in securitized obligations guaranteed by the U.S. government or its agencies, instrumentalities or sponsored corporations; privately issued mortgage-backed and asset-backed securities rated at time of investment Aa3 or higher by Moody’s Investors Service, Inc., AA- or higher by S&P Global Ratings or the equivalent by any other nationally recognized statistical organization; other obligations of the U.S. government or its agencies, instrumentalities or sponsored corporations; and money market instruments. Under normal market conditions, the portfolio managers seek to construct an investment portfolio with a weighted average duration of no more than eight years. | |
112
Table of Contents
TCW Funds, Inc.
October 31, 2022
Note 1 — Organization (Continued)
All of the Funds currently offer two classes of shares: I Class and N Class, except for the TCW Short Term Bond Fund, which only offers I Class shares, and the TCW Core Fixed Income Fund and TCW Total Return Bond Fund, which also offer Plan Class shares. The three classes of a Fund are substantially the same except that the N Class shares are subject to a distribution fee (see Note 7).
Note 2 — Significant Accounting Policies
The following is a summary of significant accounting policies, which are in conformity with accounting principles generally accepted in the United States of America (“GAAP”) and which are consistently followed by the Funds in the preparation of their financial statements. Each Fund is considered an investment company under the Financial Accounting Standards Board (“FASB”) Accounting Standards Codification (“ASC”) No. 946, Financial Services — Investment Companies. Subsequent events, if any, have been evaluated through the date of issuance in the preparation of the financial statements.
Principles of Accounting: The Funds use the accrual method of accounting for financial reporting purposes.
Principles of Consolidation: The TCW Cayman Enhanced Commodity Fund, Ltd. (the “Subsidiary”), a Cayman Islands exempted company, was incorporated as a wholly owned subsidiary acting as an investment vehicle for the TCW Enhanced Commodity Strategy Fund (the “Parent”) in order to effect certain investments for the Parent consistent with the Parent’s investment objectives and policies as specified in its prospectus and statement of additional information. The accompanying financial statements are consolidated and include the accounts of the Subsidiary. The Parent’s investment in the Subsidiary will normally not exceed 25% of the value of the Parent’s total assets tested at the time of making an investment. The net assets of the Subsidiary at October 31, 2022 were $6,442,979 or 15.83% of the Parent’s consolidated net assets. Intercompany balances and transactions have been eliminated in consolidation.
Net Asset Value: The net asset value (“NAV”) per share of each class of a Fund is determined by dividing the Fund’s net assets attributable to each class by the number of shares issued and outstanding of that class on each day the New York Stock Exchange (“NYSE”) is open for trading.
Security Valuations: Securities listed or traded on the NYSE and other stock exchanges were valued at the latest sale price on the exchange. Securities traded on the NASDAQ stock market (“NASDAQ”) were valued during the period using official closing prices as reported by NASDAQ, which may not have been the last sale price. Investments in open-end mutual funds including money market funds were valued based on the NAV per share as reported by the investment companies. All other securities for which over-the-counter (“OTC”) market quotations were readily available, including short-term securities, swap agreements and forward currency contracts, were valued with prices furnished by independent pricing services or by broker-dealers.
Pursuant to Rule 2a-5 under the 1940 Act, the Company’s Board of Directors (the “Board”, and each member thereof, a “Director”) has designated the Advisor as the “valuation designee” with respect to the fair valuation of the Fund’s portfolio securities, subject to oversight by and periodic reporting to the Board. Fair valued securities are those for which market quotations were not readily available, including in circumstances under which it was determined by the Advisor that prices received were not reflective of their market values.
113
Table of Contents
TCW Funds, Inc.
Notes to Financial Statements (Continued)
Note 2 — Significant Accounting Policies (Continued)
Fair value is defined as the price that a Fund would receive upon selling an investment in a timely transaction to an independent buyer in the principal or most advantageous market for the investment. In accordance with the authoritative guidance on fair value measurements and disclosures under GAAP, the Funds disclose investments in their financial statements in a three-tier hierarchy. This hierarchy is utilized to establish classification of fair value measurements based on inputs. Inputs that go into fair value measurement refer broadly to the assumptions that market participants would use in pricing the asset or liability, including assumptions about risk. Inputs may be observable or unobservable. Observable inputs are inputs that reflect the assumptions market participants would use in pricing the asset or liability, developed based on market data obtained from sources independent of the reporting entity. Unobservable inputs are inputs that reflect the reporting entity’s own assumptions about the inputs market participants would use in pricing the asset or liability, developed based on the best information available in the circumstances.
The three-tier hierarchy of inputs is summarized in the three broad levels listed below.
| Level 1 — | quoted prices in active markets for identical investments. | |
| Level 2 — | other significant observable inputs (including quoted prices for similar investments, interest rates, prepayment speeds, credit risk, etc.). | |
| Level 3 — | significant unobservable inputs (including the Funds’ own assumptions in determining the fair value of investments). |
Changes in valuation techniques may result in transfers in or out of an investment’s assigned Level within the hierarchy. The inputs or methodologies used for valuing investments are not necessarily an indication of the risk associated with investing in those investments and the determination of the significance of a particular input to the fair value measurement in its entirety requires judgment and consideration of factors specific to each security.
The availability of observable inputs can vary from security to security and is affected by a wide variety of factors, including, for example, the type of security, whether the security is new and not yet established in the marketplace, the liquidity of markets, and other characteristics particular to the security. To the extent that valuation is based on models or inputs that are less observable or unobservable in the market, the determination of fair value requires more judgment. Accordingly, the degree of judgment exercised in determining fair value is greatest for instruments categorized as Level 3.
In periods of market dislocation, the observability of prices and inputs may be reduced for many instruments. This condition, as well as changes related to liquidity of investments, could cause a security to be reclassified between Level 1, Level 2, or Level 3.
In certain cases, the inputs used to measure fair value may fall into different levels of the fair value hierarchy. In such cases, for disclosure purposes the level in the fair value hierarchy within which the fair value measurement falls in its entirety is determined based on the lowest level input that is significant to the fair value measurement.
Fair Value Measurements: Descriptions of the valuation techniques applied to the Funds’ major categories of assets and liabilities measured at fair value on a recurring basis are as follows:
Asset-backed securities (“ABS”) and mortgage-backed securities (“MBS”). The fair value of ABS and MBS is estimated based on pricing models that consider the estimated cash flows of each debt tranche of the
114
Table of Contents
TCW Funds, Inc.
October 31, 2022
Note 2 — Significant Accounting Policies (Continued)
issuer, establish a benchmark yield, and develop an estimated tranche-specific spread to the benchmark yield based on the unique attributes of the tranche including, but not limited to, the prepayment speed assumptions and attributes of the collateral. To the extent the inputs are observable and timely, the values would be categorized as Level 2 of the fair value hierarchy; otherwise, they would be categorized as Level 3.
Bank loans. The fair value of bank loans is estimated using recently executed transactions, market price quotations, credit/market events, and cross-asset pricing. Inputs are generally observable and are obtained from independent sources. Bank loans are generally categorized as Level 2 of the fair value hierarchy.
Corporate bonds. The fair value of corporate bonds is estimated using recently executed transactions, market price quotations (where observable), bond spreads, or credit default swap spreads adjusted for any basis difference between cash and derivative instruments. Corporate bonds are generally categorized as Level 2 of the fair value hierarchy; in instances where prices, spreads, or any of the other aforementioned key inputs are unobservable, they are categorized as Level 3 of the hierarchy.
Foreign currency contracts. The fair values of foreign currency contracts are derived from indices, reference rates, and other inputs or a combination of these factors. To the extent that these factors can be observed, foreign currency contracts are categorized as Level 2 of the fair value hierarchy.
Futures contracts. Futures contracts are generally valued at the settlement price established at the close of business each day by the exchange on which they are traded. They are categorized as Level 1.
Government and agency securities. Government and agency securities are normally valued using a model that incorporates market observable data such as reported sales of similar securities, broker quotes, yields, bids, offers, quoted market prices, and reference data. Accordingly, government and agency securities are normally categorized as Level 1 or 2 of the fair value hierarchy depending on the liquidity and transparency of the market.
Money market funds. Money market funds are open-end mutual funds that invest in short-term debt securities. To the extent that these funds are valued based upon the reported NAV, they are categorized as Level 1 of the fair value hierarchy.
Municipal bonds. Municipal bonds are fair valued based on pricing models that take into account, among other factors, information received from market makers and broker-dealers, current trades, bid-wanted lists, offerings, market movements, the callability of the bond, state of issuance, benchmark yield curves, and bond insurance. To the extent that these inputs are observable and timely, the fair values of municipal bonds are categorized as Level 2; otherwise, the fair values are categorized as Level 3.
Options and Swaptions contracts. Exchange-listed options contracts are traded on securities exchanges and are fair valued based on quoted prices from the applicable exchange, and to the extent valuation adjustments are not applied, they are categorized as Level 1. If valuation adjustments are applied and such adjustments are observable and timely, the fair values of exchange-listed options contracts would be categorized as Level 2; otherwise the fair values would be categorized as Level 3. Options and swaptions contracts traded over-the-counter (“OTC”) are fair valued based on pricing models and incorporate various inputs such as interest rates, credit spreads, currency exchange rates and volatility measurements for in-the-money, at-the-money, and out-of-the-money contracts based on a given strike price. To the extent that these inputs are observable and timely, the fair values of OTC options and swaptions contracts would be categorized as Level 2; otherwise the fair values would be categorized as Level 3.
115
Table of Contents
TCW Funds, Inc.
Notes to Financial Statements (Continued)
Note 2 — Significant Accounting Policies (Continued)
Restricted securities. Restricted securities, including illiquid Rule 144A securities, issued by non-public entities are categorized as Level 3 of the fair value hierarchy because they trade infrequently, and therefore the inputs are unobservable. Any other restricted securities valued similar to publicly traded securities may be categorized as Level 2 or 3 of the fair value hierarchy depending on whether a discount is applied and significant to the fair value.
Short-term investments. Short-term investments are valued using market price quotations, and are categorized as Level 1 or Level 2 of the fair value hierarchy.
Total return swaps. Total return swaps are fair valued using pricing models that take into account, among other factors, index spread curves, nominal values, modified duration values and cash flows. To the extent that these inputs are observable and timely, the fair values of credit default swaps would be categorized as Level 2; otherwise, the fair values would be categorized as Level 3.
Warrants. Warrants are generally valued based on quoted prices from the applicable exchange. To the extent these securities are actively traded, and valuation adjustments are not applied, they are generally categorized as Level 1 of the fair value hierarchy.
The summary of the inputs used as of October 31, 2022 in valuing the Funds’ investments is listed after the Schedule of Investments for each Fund.
Following is a reconciliation of investments in which significant unobservable inputs (Level 3) were used in determining value:
TCW CORE FIXED INCOME FUND
| Asset-Backed Securities | Corporate Bonds | |||||||
Balance as of October 31, 2021 | $ | 4,765,793 | $ | 1,275,231 | ||||
Accrued Discounts (Premiums) | — | 137,820 | ||||||
Realized Gain (Loss) | — | — | ||||||
Change in Unrealized Appreciation (Depreciation)* | (519,067 | ) | (252,827 | ) | ||||
Purchases | — | — | ||||||
Sales | (280,853 | ) | — | |||||
Transfers in to Level 3 | — | — | ||||||
Transfers out of Level 3 | — | — | ||||||
|
|
|
| |||||
Balance as of October 31, 2022 | $ | 3,965,873 | $ | 1,160,224 | ||||
|
|
|
| |||||
| * | The change in unrealized appreciation (depreciation) on securities still held at October 31, 2022 was $(771,894) and is included in the related net realized gains (losses) and net change in appreciation (depreciation) in the Statements of Operations. |
116
Table of Contents
TCW Funds, Inc.
October 31, 2022
Note 2 — Significant Accounting Policies (Continued)
TCW GLOBAL BOND FUND
| Common Stock | Residential Mortgage- Backed Securities— Non-Agency | |||||||
Balance as of October 31, 2021 | $ | — | $ | 65,382 | ||||
Accrued Discounts (Premiums) | — | 24,050 | ||||||
Realized Gain (Loss) | (51 | ) | 256 | |||||
Change in Unrealized Appreciation (Depreciation)* | (22,857 | ) | (34,521 | ) | ||||
Purchases | 32,058 | 982 | ||||||
Sales | — | (1,208 | ) | |||||
Transfers in to Level 3 | — | — | ||||||
Transfers out of Level 3 | — | — | ||||||
|
|
|
| |||||
Balance as of October 31, 2022 | $ | 9,150 | $ | 54,941 | ||||
|
|
|
| |||||
| * | The change in unrealized appreciation (depreciation) on securities still held at October 31, 2022 was $(57,378) and is included in the related net realized gains (losses) and net change in appreciation (depreciation) in the Statements of Operations. |
TCW HIGH YIELD BOND FUND
| Corporate Bonds | ||||
Balance as of October 31, 2021 | $ | 198,068 | ||
Accrued Discounts (Premiums) | (10,072 | ) | ||
Realized Gain (Loss) | — | |||
Change in Unrealized Appreciation (Depreciation)* | (7,791 | ) | ||
Purchases | — | |||
Sales | — | |||
Transfers in to Level 3 | — | |||
Transfers out of Level 3 | — | |||
|
| |||
Balance as of October 31, 2022 | $ | 180,205 | ||
|
| |||
| * | The change in unrealized appreciation (depreciation) on securities still held at October 31, 2022 was $(7,791) and is included in the related net realized gains (losses) and net change in appreciation (depreciation) in the Statements of Operations. |
TCW TOTAL RETURN BOND FUND
| Residential Mortgage- Backed Securities— Non-Agency | ||||
Balance as of October 31, 2021 | $ | 2,751,676 | ||
Accrued Discounts (Premiums) | (465,596 | ) | ||
Realized Gain (Loss) | (63,975 | ) | ||
Change in Unrealized Appreciation (Depreciation)* | (41,856 | ) | ||
Purchases | 311,028 | |||
Sales | (583,891 | ) | ||
Transfers in to Level 3 | — | |||
Transfers out of Level 3 | — | |||
|
| |||
Balance as of October 31, 2022 | $ | 1,907,386 | ||
|
| |||
| * | The change in unrealized appreciation (depreciation) on securities still held at October 31, 2022 was $(56,701) and is included in the related net realized gains (losses) and net change in appreciation (depreciation) in the Statements of Operations. |
117
Table of Contents
TCW Funds, Inc.
Notes to Financial Statements (Continued)
Note 2 — Significant Accounting Policies (Continued)
Significant unobservable valuation inputs for Level 3 investments as of October 31, 2022 are as follows:
Description | Fair Value at 10/31/2022 | Valuation | Unobservable | Price or Price Range | Average Weighted Price | Input to Valuation If Input Increases | ||||||||
TCW Core Fixed Income Fund | ||||||||||||||
Asset-backed Securities | $ | 3,965,873 | Broker Quote | Offered Quote | $87.414 | $87.414 | Increase | |||||||
Corporate Bonds | $ | 1,160,224 | Third-party Vendor | Vendor Prices | $85.750 | $85.750 | Increase | |||||||
TCW Global Bond Fund | ||||||||||||||
Common Stock | 9,150 | Third-party Vendor | Vendor Prices | $26.600 | $26.600 | Increase | ||||||||
Residential Mortgage-Backed Securities —Non-Agency | $ | 54,941 | Third-party Vendor | Vendor Prices | $4.389 | $4.389 | Increase | |||||||
Rights | �� | $ | 0 | Third-party Vendor | Vendor Prices | $0 | $0 | Increase | ||||||
TCW High Yield Bond Fund | ||||||||||||||
Common Stock | $ | 0 | Third-party Vendor | Vendor Prices | $0 | $0 | Increase | |||||||
Corporate Bonds | $ | 180,205 | Third-party Vendor | Vendor Prices | $85.750 | $85.750 | Increase | |||||||
TCW Total Return Bond Fund | ||||||||||||||
Residential Mortgage-Backed Securities — Non- Agency | $ | 7,640 | Third-party Vendor | Vendor Prices | $11.656 | $11.656 | Increase | |||||||
Residential Mortgage-Backed Securities — Non-Agency (Interest Only, Collateral Strip Rate Securities) | $ | 1,899,746 | Third-party Vendor | Vendor Prices | $0.567–$2.146 | $1.470 | Increase | |||||||
Security Transactions and Related Investment Income: Security transactions are recorded as of the trade date. Dividend income is recorded on the ex-dividend date. Interest income is recognized on an accrual basis. Realized gains and losses on investments are recorded on the basis of specific identification.
Allocation of Operating Activity for Multiple Classes: Investment income, common expenses and realized and unrealized gains and losses are allocated among the share classes of the Funds based on the relative net assets of each class. Distribution fees, which are directly attributable to a class of shares, are charged to the operations of that class. All other expenses are charged to each Fund or class as incurred on a specific identification basis. Differences in class-specific fees and expenses will result in differences in net investment income for each class, and in turn differences in dividends paid by each class.
Dividends and Distributions: Dividends and distributions to shareholders are recorded on the ex-dividend date. The TCW Enhanced Commodity Strategy Fund declares and pays, or reinvests, dividends from net investment income quarterly. The other Fixed Income Funds declare and pay, or reinvest, dividends from net investment income monthly. Capital gains realized by a Fund will be distributed at least annually.
Income and capital gain distributions are determined in accordance with income tax regulations which may differ from GAAP. These differences are primarily due to differing treatments for foreign currency transactions, derivative transactions, market discount and premium, losses deferred due to wash sales, excise tax regulations and employing equalization in determining amounts to be distributed to Fund shareholders. Permanent book and tax basis differences relating to shareholder distributions will result in reclassifications between paid-in capital, undistributed net investment income (loss), and/or undistributed accumulated realized gain (loss). Undistributed net investment income or loss may include temporary book and tax basis differences which will reverse in subsequent periods. Any taxable income or capital gain remaining at fiscal year-end is distributed in the following year.
Use of Estimates: The preparation of the accompanying financial statements requires management to make estimates and assumptions that affect the reported amount of assets and liabilities at the date of the
118
Table of Contents
TCW Funds, Inc.
October 31, 2022
Note 2 — Significant Accounting Policies (Continued)
financial statements and the reported amounts of income and expenses during the reporting period. Actual results could differ from these estimates.
Foreign Currency Translation: The books and records of each Fund are maintained in U.S. dollars as follows: (1) foreign currency denominated securities and other assets and liabilities stated in foreign currencies are translated using the daily spot rate; and (2) purchases, sales, income and expenses are translated at the rate of exchange prevailing on the respective dates of such transactions. The resultant exchange gains and losses are included in net realized or net unrealized gain (loss) in the Statements of Operations. Pursuant to U.S. federal income tax regulations, certain foreign exchange gains and losses included in realized and unrealized gains and losses are included in, or are a reduction of, ordinary income for federal income tax purposes.
Foreign Taxes: The Funds may be subject to withholding taxes on income and capital gains imposed by certain countries in which they invest. The withholding tax on income is netted against the income accrued or received. Any reclaimable taxes are recorded as income. The withholding tax on realized or unrealized gain is recorded as a liability.
Derivative Instruments: Derivatives are financial instruments which are valued based on the values of one or more indicators, such as a security, asset, currency, interest rate, or index. Derivative transactions can create investment leverage and may be highly volatile. A derivative contract may result in a mark-to-market loss if the value of the contract decreases due to an unfavorable change in the market rates or values of the underlying instrument. It is possible that a derivative transaction will result in a loss greater than the principal amount invested. The Funds may not be able to close out a derivative transaction at a favorable time or price.
119
Table of Contents
TCW Funds, Inc.
Notes to Financial Statements (Continued)
Note 2 — Significant Accounting Policies (Continued)
For the year ended October 31, 2022, the following Funds had derivatives and transactions in derivatives, grouped in the following risk categories:
TCW Core Fixed Income Fund
| Credit Risk | Commodity Risk | Foreign Currency Risk | Interest Rate Risk | Total | ||||||||||||||||
Statement of Assets and Liabilities: | ||||||||||||||||||||
Asset Derivatives | ||||||||||||||||||||
Futures Contracts (1) | $ | — | $ | — | $ | — | $ | 2,110,107 | $ | 2,110,107 | ||||||||||
Swap Agreements (2) | — | — | — | 3,624,416 | 3,624,416 | |||||||||||||||
|
|
|
|
|
|
|
|
|
| |||||||||||
Total Value | $ | — | $ | — | $ | — | $ | 5,734,523 | $ | 5,734,523 | ||||||||||
|
|
|
|
|
|
|
|
|
| |||||||||||
Liability Derivatives |
| |||||||||||||||||||
Forward Contracts | $ | — | $ | — | $ | (48,124 | ) | $ | — | $ | (48,124 | ) | ||||||||
Swap Agreements (2) | — | — | — | (11,335,357 | ) | (11,335,357 | ) | |||||||||||||
Futures Contracts (1) | — | — | — | (3,581,666 | ) | (3,581,666 | ) | |||||||||||||
|
|
|
|
|
|
|
|
|
| |||||||||||
Total Value | $ | — | $ | — | $ | (48,124 | ) | $ | (14,917,023 | ) | $ | (14,965,147 | ) | |||||||
|
|
|
|
|
|
|
|
|
| |||||||||||
Statement of Operations: |
| |||||||||||||||||||
Net Realized Gain (Loss) |
| |||||||||||||||||||
Forward Contracts | $ | — | $ | — | $ | 1,140,106 | $ | — | $ | 1,140,106 | ||||||||||
Futures Contracts | — | — | — | 2,075,978 | 2,075,978 | |||||||||||||||
Investments (3) | — | — | (12,377 | ) | 441,670 | 429,293 | ||||||||||||||
Options Written | — | — | (149,737 | ) | (4,259,794 | ) | (4,409,531 | ) | ||||||||||||
Swap Agreements | — | — | — | (35,378 | ) | (35,378 | ) | |||||||||||||
|
|
|
|
|
|
|
|
|
| |||||||||||
Net Realized Gain (Loss) | $ | — | $ | — | $ | 977,992 | $ | (1,777,524 | ) | $ | (799,532 | ) | ||||||||
|
|
|
|
|
|
|
|
|
| |||||||||||
Net Change in Appreciation (Depreciation) |
| |||||||||||||||||||
Forward Contracts | $ | — | $ | — | $ | (48,124 | ) | $ | — | $ | (48,124 | ) | ||||||||
Futures Contracts | — | — | — | (1,674,493 | ) | (1,674,493 | ) | |||||||||||||
Investments (4) | — | — | — | (865,402 | ) | (865,402 | ) | |||||||||||||
Options Written | — | — | — | 986,072 | 986,072 | |||||||||||||||
Swap Agreements | — | — | — | (6,773,509 | ) | (6,773,509 | ) | |||||||||||||
|
|
|
|
|
|
|
|
|
| |||||||||||
Net Change in Appreciation (Depreciation) | $ | — | $ | — | $ | (48,124 | ) | $ | (8,327,332 | ) | $ | (8,375,456 | ) | |||||||
|
|
|
|
|
|
|
|
|
| |||||||||||
Number of Contracts or Notional Amounts (5) | ||||||||||||||||||||
Forward Currency Contracts | $ — | $ — | $17,874,877 | $ — | $17,874,877 | |||||||||||||||
Options Purchased | — | — | 490 | 798 | 1,288 | |||||||||||||||
Options Written | — | — | 490 | 2,286 | 2,776 | |||||||||||||||
Swaptions Purchased | $ — | $ — | $ — | $6,580,000 | $6,580,000 | |||||||||||||||
Swaptions Written | 79,680,000 | 79,680,000 | ||||||||||||||||||
Futures Contracts | — | — | — | 466 | 466 | |||||||||||||||
Swap Agreements | $ — | $ — | $ — | $204,241,667 | $204,241,667 | |||||||||||||||
120
Table of Contents
TCW Funds, Inc.
October 31, 2022
Note 2 — Significant Accounting Policies (Continued)
TCW Enhanced Commodity Strategy Fund
| Credit Risk | Commodity Risk | Foreign Currency Risk | Interest Rate Risk | Total | ||||||||||||||||
Statement of Assets and Liabilities: | ||||||||||||||||||||
Asset Derivatives | ||||||||||||||||||||
Swap Agreements | $ | — | $ | 742,107 | $ | — | $ | — | $ | 742,107 | ||||||||||
|
|
|
|
|
|
|
|
|
| |||||||||||
Total Value | $ | — | $ | 742,107 | $ | — | $ | — | $ | 742,107 | ||||||||||
|
|
|
|
|
|
|
|
|
| |||||||||||
Liability Derivatives | ||||||||||||||||||||
Swap Agreements | $ | $ | (3,629 | ) | $ | $ | $ | (3,629 | ) | |||||||||||
|
|
|
|
|
|
|
|
|
| |||||||||||
Total Value | $ | $ | (3,629 | ) | $ | $ | $ | (3,629 | ) | |||||||||||
|
|
|
|
|
|
|
|
|
| |||||||||||
Statement of Operations: | ||||||||||||||||||||
Net Realized Gain (Loss) | ||||||||||||||||||||
Swap Agreements | $ | — | $ | (2,988,340 | ) | $ | — | $ | — | $ | (2,988,340 | ) | ||||||||
|
|
|
|
|
|
|
|
|
| |||||||||||
Net Realized Gain (Loss) | $ | — | $ | (2,988,340 | ) | $ | — | $ | — | $ | (2,988,340 | ) | ||||||||
|
|
|
|
|
|
|
|
|
| |||||||||||
Net Change in Appreciation (Depreciation) | ||||||||||||||||||||
Swap Agreements | $ | — | $ | 748,867 | $ | — | $ | — | $ | 748,867 | ||||||||||
|
|
|
|
|
|
|
|
|
| |||||||||||
Net Change in Appreciation (Depreciation) | $ | — | $ | 748,867 | $ | — | $ | — | $ | 748,867 | ||||||||||
|
|
|
|
|
|
|
|
|
| |||||||||||
Number of Contracts (5) | ||||||||||||||||||||
Swap Agreements | $ — | $31,403,079 | $ — | $ — | $31,403,079 | |||||||||||||||
TCW Global Bond Fund
| Credit Risk | Commodity Risk | Foreign Currency Risk | Interest Rate Risk | Total | ||||||||||||||||
Statement of Assets and Liabilities: |
| |||||||||||||||||||
Asset Derivatives |
| |||||||||||||||||||
Swap Agreements (2) | $ | — | $ | — | $ | — | $ | 2,680 | $ | 2,680 | ||||||||||
Futures Contracts (1) | — | — | — | 112,333 | 112,333 | |||||||||||||||
Forward Contracts | — | — | 150,928 | — | 150,928 | |||||||||||||||
|
|
|
|
|
|
|
|
|
| |||||||||||
Total Value | $ | — | $ | — | $ | 150,928 | $ | 115,013 | $ | 265,941 | ||||||||||
|
|
|
|
|
|
|
|
|
| |||||||||||
Liability Derivatives |
| |||||||||||||||||||
Forward Contracts | $ | — | $ | — | $ | (226,526 | ) | $ | — | $ | (226,526 | ) | ||||||||
Swap Agreements (2) | — | — | — | (61,337 | ) | (61,337 | ) | |||||||||||||
Futures Contracts (1) | — | — | — | (41,559 | ) | (41,559 | ) | |||||||||||||
|
|
|
|
|
|
|
|
|
| |||||||||||
Total Value | $ | — | $ | — | $ | (226,526 | ) | $ | (102,896 | ) | $ | (329,422 | ) | |||||||
|
|
|
|
|
|
|
|
|
| |||||||||||
Statement of Operations: |
| |||||||||||||||||||
Net Realized Gain (Loss) |
| |||||||||||||||||||
Forward Contracts | $ | — | $ | — | $ | (629,498 | ) | $ | — | $ | (629,498 | ) | ||||||||
Futures Contracts | — | — | — | (38,872 | ) | (38,872 | ) | |||||||||||||
Options Written | 4,380 | 4,380 | ||||||||||||||||||
Swap Agreements | — | — | — | (820 | ) | (820 | ) | |||||||||||||
|
|
|
|
|
|
|
|
|
| |||||||||||
Net Realized Gain (Loss) | $ | — | $ | — | $ | (629,498 | ) | $ | (35,312 | ) | $ | (664,810 | ) | |||||||
|
|
|
|
|
|
|
|
|
| |||||||||||
Net Change in Appreciation (Depreciation) |
| |||||||||||||||||||
Forward Contracts | $ | — | $ | — | $ | (74,656 | ) | $ | — | $ | (74,656 | ) | ||||||||
Futures Contracts | — | — | — | 92,721 | 92,721 | |||||||||||||||
Swap Agreements | — | — | — | (59,091 | ) | (59,091 | ) | |||||||||||||
|
|
|
|
|
|
|
|
|
| |||||||||||
Net Change in Appreciation (Depreciation) | $ | — | $ | — | $ | (74,656 | ) | $ | 33,630 | $ | (41,026 | ) | ||||||||
|
|
|
|
|
|
|
|
|
| |||||||||||
Number of Contracts or Notional Amounts (5) |
| |||||||||||||||||||
Forward Currency Contracts | $ — | $ — | $17,185,526 | $ — | $17,185,526 | |||||||||||||||
Futures Contracts | — | — | — | 26 | 26 | |||||||||||||||
Swaptions Written | $ — | $ — | $ — | $1,460,000 | $1,460,000 | |||||||||||||||
Swap Agreements | $ — | $ — | $ — | $1,495,354 | $1,495,354 | |||||||||||||||
121
Table of Contents
TCW Funds, Inc.
Notes to Financial Statements (Continued)
Note 2 — Significant Accounting Policies (Continued)
TCW High Yield Bond Fund
| Credit Risk | Commodity Risk | Foreign Currency Risk | Interest Rate Risk | Total | ||||||||||||||||
Statement of Assets and Liabilities: |
| |||||||||||||||||||
Asset Derivatives |
| |||||||||||||||||||
Futures Contracts (1) | $ | — | $ | — | $ | — | $ | 384,324 | $ | 384,324 | ||||||||||
Forward Contracts | — | — | 60 | — | 60 | |||||||||||||||
|
|
|
|
|
|
|
|
|
| |||||||||||
Total Value | $ | — | $ | — | $ | 60 | $ | 384,324 | $ | 384,384 | ||||||||||
|
|
|
|
|
|
|
|
|
| |||||||||||
Liability Derivatives |
| |||||||||||||||||||
Forward Contracts | $ | — | $ | — | $ | (900 | ) | $ | — | $ | (900 | ) | ||||||||
Futures Contracts (1) | — | — | — | (394,247 | ) | (394,247 | ) | |||||||||||||
|
|
|
|
|
|
|
|
|
| |||||||||||
Total Value | $ | — | $ | — | $ | (900 | ) | $ | (394,247 | ) | $ | (395,147 | ) | |||||||
|
|
|
|
|
|
|
|
|
| |||||||||||
Statement of Operations: |
| |||||||||||||||||||
Net Realized Gain (Loss) |
| |||||||||||||||||||
Forward Contracts | $ | — | $ | — | $ | 24,133 | $ | — | $ | 24,133 | ||||||||||
Futures Contracts | — | — | — | 932,732 | 932,732 | |||||||||||||||
|
|
|
|
|
|
|
|
|
| |||||||||||
Net Realized Gain (Loss) | $ | — | $ | — | $ | 24,133 | $ | 932,732 | $ | 956,865 | ||||||||||
|
|
|
|
|
|
|
|
|
| |||||||||||
Net Change in Appreciation (Depreciation) |
| |||||||||||||||||||
Forward Contracts | $ | — | $ | — | $ | (840 | ) | $ | — | $ | (840 | ) | ||||||||
Futures Contracts | — | — | — | (12,003 | ) | (12,003 | ) | |||||||||||||
|
|
|
|
|
|
|
|
|
| |||||||||||
Net Change in Appreciation (Depreciation) | $ | — | $ | — | $ | (840 | ) | $ | (12,003 | ) | $ | (12,843 | ) | |||||||
|
|
|
|
|
|
|
|
|
| |||||||||||
Number of Contracts or Notional Amounts (5) |
| |||||||||||||||||||
Forward Currency Contracts | $ — | $ — | $464,201 | $ — | $464,201 | |||||||||||||||
Futures Contracts | — | — | — | 77 | 77 | |||||||||||||||
TCW Short Term Bond Fund
| Credit Risk | Commodity Risk | Foreign Currency Risk | Interest Rate Risk | Total | ||||||||||||||||
Statement of Assets and Liabilities: |
| |||||||||||||||||||
Asset Derivatives |
| |||||||||||||||||||
Futures Contracts (1) | $ | — | $ | — | $ | — | $ | 123,805 | $ | 123,805 | ||||||||||
|
|
|
|
|
|
|
|
|
| |||||||||||
Total Value | $ | — | $ | — | $ | — | $ | 123,805 | $ | 123,805 | ||||||||||
|
|
|
|
|
|
|
|
|
| |||||||||||
Liability Derivatives |
| |||||||||||||||||||
Futures Contracts (1) | $ | — | $ | — | $ | — | $ | (27,893 | ) | $ | (27,893 | ) | ||||||||
|
|
|
|
|
|
|
|
|
| |||||||||||
Total Value | $ | — | $ | — | $ | — | $ | (27,893 | ) | $ | (27,893 | ) | ||||||||
|
|
|
|
|
|
|
|
|
| |||||||||||
Statement of Operations: |
| |||||||||||||||||||
Net Realized Gain (Loss) |
| |||||||||||||||||||
Forward Contracts | $ | — | $ | — | $ | 9,216 | $ | — | $ | 9,216 | ||||||||||
Futures Contracts | — | — | — | 291,660 | 291,660 | |||||||||||||||
|
|
|
|
|
|
|
|
|
| |||||||||||
Net Realized Gain (Loss) | $ | — | $ | — | $ | 9,216 | $ | 291,660 | $ | 300,876 | ||||||||||
|
|
|
|
|
|
|
|
|
| |||||||||||
Net Change in Appreciation (Depreciation) |
| |||||||||||||||||||
Futures Contracts | $ | — | $ | — | $ | — | $ | 72,524 | $ | 72,524 | ||||||||||
|
|
|
|
|
|
|
|
|
| |||||||||||
Net Change in Appreciation (Depreciation) | $ | — | $ | — | $ | — | $ | 72,524 | $ | 72,524 | ||||||||||
|
|
|
|
|
|
|
|
|
| |||||||||||
Number of Contracts or Notional Amounts (5) |
| |||||||||||||||||||
Forward Currency Contracts | $ — | $ — | $251,725 | $ — | $251,725 | |||||||||||||||
Futures Contracts | — | — | — | 22 | 22 | |||||||||||||||
122
Table of Contents
TCW Funds, Inc.
October 31, 2022
Note 2 — Significant Accounting Policies (Continued)
TCW Total Return Bond Fund
| Credit Risk | Commodity Risk | Foreign Currency Risk | Interest Rate Risk | Total | ||||||||||||||||
Statement of Assets and Liabilities: |
| |||||||||||||||||||
Liability Derivatives |
| |||||||||||||||||||
Forward Contracts (1) | $ | — | $ | — | $ | (34,424 | ) | $ | — | $ | (34,424 | ) | ||||||||
Futures Contracts | — | — | — | (69,104,554 | ) | (69,104,554 | ) | |||||||||||||
|
|
|
|
|
|
|
|
|
| |||||||||||
Total Value | $ | — | $ | — | $ | (34,424 | ) | $ | (69,104,554 | ) | $ | (69,138,978 | ) | |||||||
|
|
|
|
|
|
|
|
|
| |||||||||||
Statement of Operations: |
| |||||||||||||||||||
Net Realized Gain (Loss) |
| |||||||||||||||||||
Forward Contracts | $ | — | $ | — | $ | 1,822,507 | $ | — | $ | 1,822,507 | ||||||||||
Futures Contracts | — | — | — | (164,653,189 | ) | (164,653,189 | ) | |||||||||||||
|
|
|
|
|
|
|
|
|
| |||||||||||
Net Realized Gain (Loss) | $ | — | $ | — | $ | 1,822,507 | $ | (164,653,189 | ) | $ | (162,830,682 | ) | ||||||||
|
|
|
|
|
|
|
|
|
| |||||||||||
Net Change in Appreciation (Depreciation) |
| |||||||||||||||||||
Forward Contracts | $ | — | $ | — | $ | (34,424 | ) | $ | — | $ | (34,424 | ) | ||||||||
Futures Contracts | — | — | — | (68,110,829 | ) | (68,110,829 | ) | |||||||||||||
|
|
|
|
|
|
|
|
|
| |||||||||||
Net Change in Appreciation (Depreciation) | $ | — | $ | — | $ | (34,424 | ) | $ | (68,110,829 | ) | $ | (68,145,253 | ) | |||||||
|
|
|
|
|
|
|
|
|
| |||||||||||
Number of Contracts or Notional Amounts (5) |
| |||||||||||||||||||
Forward Currency Contracts | $ — | $ — | $24,888,580 | $ — | $24,888,580 | |||||||||||||||
Futures Contracts | — | — | — | 7,032 | 7,032 | |||||||||||||||
| (1) | Includes cumulative appreciation (depreciation) of futures contracts as reported in the Schedule of Investments. Only variation margin on October 31, 2022 is reported within the Statement of Assets and Liabilities. |
| (2) | Includes cumulative appreciation (depreciation) of swap agreements as reported in the Schedule of Investments. Only variation margin on October 31, 2022 is reported within the Statement of Assets and Liabilities. |
| (3) | Represents realized gain (loss) for purchased options. |
| (4) | Represents change in unrealized appreciation (depreciation) for purchased options during the year. |
| (5) | Amount disclosed represents average number of contracts or notional amounts, which are representative of the volume traded for the year ended October 31, 2022. |
Counterparty Credit Risk: Derivative contracts may be exposed to counterparty risk. Losses can occur if the counterparty does not perform under the contract.
The Funds’ risk of loss from counterparty credit risk on OTC derivatives is generally limited to the aggregate unrealized gain netted against any collateral held by the Funds.
With exchange-traded futures and centrally cleared swaps, there is less counterparty credit risk to the Funds since the exchange or clearinghouse, as counterparty to such instruments, guarantees against a possible default. The clearinghouse stands between the buyer and the seller of the contract; therefore, the credit risk is limited to failure of the clearinghouse. While offset rights may exist under applicable law, the Funds do not have a contractual right of offset against a clearing broker or clearinghouse in the event of a default (including the bankruptcy or insolvency) of the clearing broker or clearinghouse. Additionally, credit risk exists in exchange-traded futures and centrally cleared swaps with respect to initial and variation margin that is held in a clearing broker’s customer accounts. While clearing brokers are required to segregate customer margin from their own assets, in the event that a clearing broker becomes insolvent or goes into bankruptcy and at that time there is a shortfall in the aggregate amount of margin held by the clearing broker for all its clients, typically the shortfall would be allocated on a pro rata basis across all the clearing broker’s customers, potentially resulting in losses to the Funds.
123
Table of Contents
TCW Funds, Inc.
Notes to Financial Statements (Continued)
Note 2 — Significant Accounting Policies (Continued)
For OTC derivatives, the Funds mitigate their counterparty risk by entering into an International Swaps and Derivatives Association, Inc. Master Agreement (“ISDA Master Agreement”) or similar agreement with each counterparty. An ISDA Master Agreement is a bilateral agreement between the Funds and a counterparty that governs OTC derivatives and typically contains, among other things, collateral posting terms and netting provisions in the event of a default and/or termination event. Under an ISDA Master Agreement, the Funds may, under certain circumstances, offset with the counterparty certain derivative financial instruments’ payables and/or receivables with collateral held and/or posted and create one single net payment. The provisions of the ISDA Master Agreement typically permit a single net payment in the event of default including the bankruptcy or insolvency of the counterparty. However, bankruptcy or insolvency laws of a particular jurisdiction may impose restrictions on or prohibitions against the right of offset in bankruptcy, insolvency or other events. In addition, certain ISDA Master Agreements allow counterparties to OTC derivatives to terminate derivative contracts prior to maturity in the event a Fund’s net assets declines by a stated percentage or a Fund fails to meet the terms of its ISDA Master Agreements, which would cause the Fund to accelerate payment of any net liability owed to the counterparty.
Collateral requirements: For derivatives traded under an ISDA Master Agreement, the collateral requirements are typically calculated by netting the mark-to-market amount for each transaction under such agreement and comparing that amount to the value of any collateral pledged or received by a Fund.
Cash collateral that has been pledged to cover obligations of a Fund is reported separately on the Statement of Assets and Liabilities. Non-cash collateral pledged by a Fund, if any, is noted in the Schedule of Investments. Generally, the amount of collateral due from or to a party has to exceed a minimum transfer amount threshold, typically $250,000 or $500,000, before a transfer is required, which is determined at the close of each business day and the collateral is transferred on the next business day. To the extent amounts due to a Fund from its counterparties are not fully collateralized, contractually or otherwise, the Fund bears the risk of loss from counterparty non-performance. The Funds attempt to mitigate counterparty risk by entering into agreements only with counterparties that the Advisor believes have the financial resources to honor their obligations and by monitoring the financial stability of those counterparties. For financial reporting purposes, the Funds do not offset derivative assets and derivative liabilities that are subject to netting arrangements in the Statement of Assets and Liabilities. The Funds have implemented the disclosure requirements pursuant to FASB Accounting Standards Update (“ASU”) No. 2011-11, Disclosures about Offsetting Assets and Liabilities that requires disclosures to make financial statements that are prepared under GAAP more comparable to those prepared under International Financial Reporting Standards.
Master Agreements and Netting Arrangements. Certain Funds are parties to various agreements, including but not limited to International Swaps and Derivatives Association Agreements and related Credit Support Annex, Master Repurchase Agreements, and Master Securities Forward Transactions Agreements (collectively “Master Agreements”), which govern the terms of certain transactions with select counterparties. These Master Agreements generally include provisions for general obligations, representations, agreements, collateral, and certain events of default or termination. These Master Agreements also include provisions for netting arrangements that help reduce credit and counterparty risk associated with relevant transactions (“netting arrangements”). The netting arrangements are generally tied to credit-related events that, if triggered, would cause an event of default or termination giving a Fund
124
Table of Contents
TCW Funds, Inc.
October 31, 2022
Note 2 — Significant Accounting Policies (Continued)
or counterparty the right to terminate early and cause settlement, on a net basis, of all transactions under the applicable Master Agreement. In the event of an early termination as a result of an event of default under the Master Agreement, the total value exposure of all transactions will be offset against collateral exchanged to date, which would result in a net receivable or payable that would be due from or to the counterparty. However, bankruptcy or insolvency laws of a particular jurisdiction may impose restrictions on or prohibitions against the right of offset in the event of a bankruptcy or insolvency of the counterparty. Credit related events include, but are not limited to, bankruptcy, failure to make timely payments, restructuring, obligation acceleration, obligation default, a material decline in net assets, decline in credit rating or repudiation/moratorium. Any election made by a counterparty to early terminate the transactions under a Master Agreement could have a material adverse impact on a Fund’s financial statements. A Fund’s overall exposure to credit risk, subject to netting arrangements can change substantially within a short period, as it is affected by each transaction subject to the arrangement.
Master Agreements can also help limit counterparty risk by specifying collateral posting arrangements at pre-arranged exposure levels. Under the Master Agreements, collateral is routinely transferred if the total net exposure to certain transactions under the relevant Master Agreement with a counterparty in a given Fund exceeds a specified threshold, net of collateral already in place, typically $250,000 or $500,000 depending on the counterparty and the type of Master Agreement. Collateral under the Master Agreements is usually in the form of cash or U.S. Treasury Bills but could include other types of securities. If permitted under the Master Agreement, certain funds may rehypothecate cash collateral received from a counterparty. The value of all derivative transactions outstanding under a Master Agreement is calculated daily to determine the amount of collateral to be received or pledged by the counterparty. Posting of collateral for OTC derivative transactions are covered under tri-party collateral agreements between the Fund, the Fund’s custodian, and each counterparty. Collateral for centrally cleared derivatives transactions are posted with the applicable derivatives clearing organization.
The following table presents the Funds’ OTC derivatives assets and liabilities by counterparty net of amounts available for offset under an ISDA Master Agreement and net of the related collateral received by the Funds as of October 31, 2022:
TCW Core Fixed Income Fund
Counterparty | Gross Assets Subject to Master Agreements | Gross Liabilities Subject to Master Agreements | Net Assets (Liabilities) Subject to Master Agreements | Collateral Pledged (Received) | Net Amount (1) | |||||||||||||||
Bank of America N.A | $ | — | $ | (34,182 | ) | $ | (34,182 | ) | $ | — | $ | (34,182 | ) | |||||||
Citibank N.A. | — | (3,939 | ) | (3,939 | ) | 3,939 | (2) | — | ||||||||||||
Goldman Sachs & Co. | — | (10,003 | ) | (10,003 | ) | — | (10,003 | ) | ||||||||||||
|
|
|
|
|
|
|
|
|
| |||||||||||
Total | $ | — | $ | (48,124 | ) | $ | (48,124 | ) | $ | 3,939 | $ | (44,185 | ) | |||||||
|
|
|
|
|
|
|
|
|
| |||||||||||
| (1) | Represents the net amount receivable (payable) from (to) the counterparty in the event of default. |
| (2) | Amount does not include excess collateral pledged or received. |
125
Table of Contents
TCW Funds, Inc.
Notes to Financial Statements (Continued)
Note 2 — Significant Accounting Policies (Continued)
TCW Enhanced Commodity Strategy Fund
Counterparty | Gross Assets Subject to Master Agreements | Gross Liabilities Subject to Master Agreements | Net Assets (Liabilities) Subject to Master Agreements | Collateral Pledged (Received) | Net Amount (1) | |||||||||||||||
Credit Suisse International | $ | 742,107 | $ | (3,629 | ) | $ | 738,478 | $ | — | $ | 738,478 | |||||||||
|
|
|
|
|
|
|
|
|
| |||||||||||
Total | $ | 742,107 | $ | (3,629 | ) | $ | 738,478 | $ | — | $ | 738,478 | |||||||||
|
|
|
|
|
|
|
|
|
| |||||||||||
| (1) | Represents the net amount receivable (payable) from (to) the counterparty in the event of default. |
TCW Global Bond Fund
Counterparty | Gross Assets Subject to Master Agreements | Gross Liabilities Subject to Master Agreements | Net Assets (Liabilities) Subject to Master Agreements | Collateral Pledged (Received) | Net Amount (1) | |||||||||||||||
Bank of America N.A. | $ | 2,881 | $ | — | $ | 2,881 | $ | — | $ | 2,881 | ||||||||||
Citibank N.A. | 17,961 | (17,688 | ) | 273 | — | 273 | ||||||||||||||
Goldman Sachs & Co. | 53,281 | (84,119 | ) | (30,838 | ) | — | (30,838 | ) | ||||||||||||
State Street Bank & Trust Co. | 76,805 | (124,719 | ) | (47,914 | ) | — | (47,914 | ) | ||||||||||||
|
|
|
|
|
|
|
|
|
| |||||||||||
Total | $ | 150,928 | $ | (226,526 | ) | $ | (75,598 | ) | $ | — | $ | (75,598 | ) | |||||||
|
|
|
|
|
|
|
|
|
| |||||||||||
| (1) | Represents the net amount receivable (payable) from (to) the counterparty in the event of default. |
TCW High Yield Bond Fund
Counterparty | Gross Assets Subject to Master Agreements | Gross Liabilities Subject to Master Agreements | Net Assets (Liabilities) Subject to Master Agreements | Collateral Pledged (Received) | Net Amount (1) | |||||||||||||||
Bank of America N.A. | $ | — | $ | (900 | ) | $ | (900 | ) | $ | — | $ | (900 | ) | |||||||
Goldman Sachs & Co. | 60 | — | 60 | — | 60 | |||||||||||||||
|
|
|
|
|
|
|
|
|
| |||||||||||
Total | $ | 60 | $ | (900 | ) | $ | (840 | ) | $ | — | $ | (840 | ) | |||||||
|
|
|
|
|
|
|
|
|
| |||||||||||
| (1) | Represents the net amount receivable (payable) from (to) the counterparty in the event of default. |
TCW Total Return Bond Fund
Counterparty | Gross Assets Subject to Master Agreements | Gross Liabilities Subject to Master Agreements | Net Assets (Liabilities) Subject to Master Agreements | Collateral Pledged (Received) | Net Amount (1) | |||||||||||||||
Citibank N.A. | $ | — | $ | (34,424 | ) | $ | (34,424 | ) | $ | 34,424 | (2) | $ | — | |||||||
|
|
|
|
|
|
|
|
|
| |||||||||||
Total | $ | — | $ | (34,424 | ) | $ | (34,424 | ) | $ | 34,424 | $ | — | ||||||||
|
|
|
|
|
|
|
|
|
| |||||||||||
| (1) | Represents the net amount receivable (payable) from (to) the counterparty in the event of default. |
| (2) | Amount does not include excess collateral pledged or received. |
Note 3 — Portfolio Investments
Mortgage-Backed Securities: The Funds may invest in MBS which represent interests in pools of mortgages in which payments of both principal and interest on the securities are generally made monthly, in effect “passing through” monthly payments made by borrowers on the residential or commercial mortgage loans which underlie the securities (net of any fees paid to the issuer or guarantor of the securities). Mortgage pass-through securities differ from other forms of debt securities which normally provide for periodic payment of interest in fixed amounts with principal payments at maturity or specified
126
Table of Contents
TCW Funds, Inc.
October 31, 2022
Note 3 — Portfolio Investments (Continued)
call dates. The Funds may also invest in Collateralized Mortgage Obligations (“CMOs”). CMOs are debt obligations collateralized by residential or commercial mortgage loans or residential or commercial mortgage pass-through securities. Interest and principal are generally paid monthly. CMOs may be collateralized by whole mortgage loans or private mortgage pass-through securities but are more typically collateralized by portfolios of mortgage pass-through securities guaranteed by Ginnie Mae, Freddie Mac or Fannie Mae. The issuer of a series of CMOs may elect to be treated for tax purposes as a Real Estate Mortgage Investment Conduit. CMOs are structured into multiple classes, each bearing a different stated maturity. Monthly payment of principal received from the pool of underlying mortgages, including prepayments, is first returned to investors holding the shortest maturity class. Investors holding the longer maturity classes usually receive principal only after shorter classes have been retired. An investor may be partially protected against a sooner than desired return of principal because of the sequential payments. The Funds may invest in stripped MBS. Stripped MBS are usually structured with two classes that receive different proportions of the interest and principal distributions on a pool of mortgage assets. In certain cases, one class will receive all of the interest (the interest only or “IO” class), while the other class will receive all of the principal (the principal only or “PO” class). The yield to maturity on IOs is sensitive to the rate of principal repayments (including prepayments) on the related underlying mortgage assets, and principal payments may have a material effect on yield to maturity. If the underlying mortgage assets experience greater than anticipated prepayments of principal, a Fund may not fully recoup its initial investment in IOs.
Inflation-Indexed Bonds: The Funds may invest in inflation-indexed bonds, which are fixed income securities whose principal value or coupon is periodically adjusted according to the rate of inflation. Any increase or decrease in the principal amount of an inflation-indexed bond will be included as interest income.
Inflation-indexed securities issued by the U.S. Treasury have maturities of five, ten, twenty, or thirty years, although it is possible that securities with other maturities will be issued in the future. The U.S. Treasury securities pay interest on a semi-annual basis, equal to a fixed percentage of the inflation-adjusted principal amount.
If the periodic adjustment rate measuring inflation falls, the principal value of inflation-indexed bonds will be adjusted downward, and consequently the interest payable on these securities (calculated with respect to a smaller principal amount) will be reduced. Repayment of the original bond principal upon maturity (as adjusted for inflation) is guaranteed in the case of U.S. Treasury inflation-indexed bonds, even during a period of deflation. However, the current market value of the bonds is not guaranteed, and will fluctuate. The Funds may also invest in other inflation- related bonds which may or may not provide a similar guarantee. If a guarantee of principal is not provided, the adjusted principal value of the bond repaid at maturity may be less than the original principal.
The value of inflation-indexed bonds is expected to change in response to changes in real interest rates. Real interest rates in turn are tied to the relationship between nominal interest rates and the rate of inflation. Therefore, if inflation were to rise at a faster rate than nominal interest rates, real interest rates might decline, leading to an increase in value of inflation-indexed bonds. In contrast, if nominal interest rates increased at a faster rate than inflation, real interest rates might rise, leading to a decrease in value of inflation-indexed bonds.
127
Table of Contents
TCW Funds, Inc.
Notes to Financial Statements (Continued)
Note 3 — Portfolio Investments (Continued)
While the values of these securities are expected to be protected from long-term inflationary trends, short-term increases in inflation may lead to declines in values. If interest rates rise due to reasons other than inflation (for example, due to changes in currency exchange rates), investors in these securities may not be protected to the extent that the increase is not reflected in the bond’s inflation measure.
When-Issued, Delayed-Delivery, To Be Announced (“TBA”) and Forward Commitment Transactions: The Funds may enter into when-issued, delayed-delivery, TBA or forward commitment transactions in order to lock in the purchase price of the underlying security or to adjust the interest rate exposure of each Fund’s existing portfolio. In when-issued, delayed-delivery, TBA or forward commitment transactions, a Fund commits to purchase or sell particular securities, with payment and delivery to take place at a future date. Although the Fund does not pay for the securities or start earning interest on them until they are delivered, it immediately assumes the risks of ownership, including the risk of price fluctuation. If a Fund’s counterparty fails to deliver a security purchased on a when-issued, delayed-delivery, TBA or forward commitment basis, there may be a loss, and the Fund may have missed an opportunity to make an alternative investment.
Prior to settlement of these transactions, the value of the subject securities will fluctuate with market conditions. In addition, because the Fund is not required to pay for when-issued, delayed-delivery, TBA or forward commitment securities until the delivery date, they may result in a form of leverage to the extent the Fund does not set aside liquid assets to cover the commitment. To guard against this deemed leverage, the Fund monitors the obligations under these transactions on a daily basis and ensures that the Fund has sufficient liquid assets to cover them.
Dollar Roll Transactions: The Funds may enter into dollar roll transactions with financial institutions to take advantage of opportunities in the MBS market. A dollar roll transaction involves a simultaneous sale of securities by a Fund with an agreement to repurchase substantially similar securities at an agreed upon price and date, but generally will be collateralized at time of delivery by different pools of mortgages with different prepayment histories than those securities sold. These transactions are accounted for as financing transactions as opposed to sales and purchases. The differential between the sale price and the repurchase price is recorded as deferred income and recognized between the settlement dates of the sale and repurchase. During the period between the sale and repurchase, a Fund will not be entitled to receive interest and principal payments on the securities sold. Dollar roll transactions involve risk that the market value of the security sold by a Fund may decline below the repurchase price of the security and the counterparties may potentially be unable to complete the transaction. There were no such transactions by the Funds for the year ended October 31, 2022.
Repurchase Agreements: The Funds may enter into repurchase agreements under the terms of a Master Repurchase Agreement (“MRA”). In a repurchase agreement, the Funds purchase a security from a counterparty who agrees to repurchase the same security at a mutually agreed upon date and price. The MRA permits each Fund, under certain circumstances including an event of default (such as bankruptcy or insolvency), to offset payables and/or receivables under the MRA with collateral held and/or posted to the counterparty and create one single net payment due to or from each Fund. However, bankruptcy or insolvency laws of a particular jurisdiction may impose restrictions on or prohibitions against such a right of offset in the event of the MRA counterparty’s bankruptcy or insolvency. Pursuant to the terms of the MRA, each Fund receives securities as collateral with a market value in excess of the repurchase price. Upon a bankruptcy or insolvency of the MRA counterparty, the Fund recognizes a liability with respect to
128
Table of Contents
TCW Funds, Inc.
October 31, 2022
Note 3 — Portfolio Investments (Continued)
such excess collateral to reflect the Fund’s obligation under bankruptcy law to return the excess to the counterparty. There were no repurchase agreements outstanding as of October 31, 2022.
Reverse Repurchase Agreements: The Funds may enter into reverse repurchase agreements. Under a reverse repurchase agreement, a Fund sells portfolio assets subject to an agreement by the Fund to repurchase the same assets at an agreed upon price and date. The Funds may utilize reverse repurchase agreements when it is anticipated that the interest income to be earned from the investment of the proceeds of the transaction is greater than the interest expense of the transaction. During the term of the reverse repurchase agreement, the Funds continue to receive the principal and interest payments on the securities sold. There were no reverse repurchase agreements outstanding during the year ended October 31, 2022.
Securities Lending: The Funds may lend their securities to qualified brokers. The loans must be collateralized at all times primarily with cash although the Funds can accept money market instruments or U.S. Government securities with a market value at least equal to the market value of the securities on loan. As with any extensions of credit, the Funds may bear the risk of delay in recovery or even loss of rights in the collateral if the borrowers of the securities fail financially. The Funds earn additional income for lending their securities by investing the cash collateral in short-term investments. The Funds did not lend any securities during the year ended October 31, 2022.
Derivatives:
Forward Foreign Currency Contracts: The Funds enter into forward foreign currency contracts as a hedge against fluctuations in foreign exchange rates. Forward foreign currency contracts are marked-to-market daily and the change in market value is recorded by the Funds as unrealized gains or losses in the Statement of Assets and Liabilities. When a contract is closed or delivery is taken, a Fund records a realized gain or loss equal to the difference between the value of the contract at the time it was opened and the value at the time it was closed. Risks may arise upon entering into these contracts from the potential inability of counterparties to meet the terms of their contracts and from unanticipated movements in the value of the foreign currency relative to the U.S. dollar. The TCW Core Fixed Income Fund, the TCW Global Bond Fund, the TCW Short Term Bond Fund, and the TCW Total Return Bond Fund entered into forward foreign currency contracts during the year ended October 31, 2022 to hedge against the foreign currency exposure within the Funds. Outstanding foreign currency forward contracts at October 31, 2022 are disclosed in the Schedule of Investments.
Futures Contracts: The Funds may enter into futures contracts. A Fund may seek to manage a variety of different risks through the use of futures contracts, such as interest rate risk, equity price risk, and currency risk. A Fund may use index futures to hedge against broad market risks to its portfolio or to gain broad market exposure. Securities index futures contracts are contracts to buy or sell units of a securities index at a specified future date at a price agreed upon when the contract is made, and are settled in cash. Positions in futures may be closed out only on an exchange or board of trade which provides a secondary market for such futures. Because futures contracts are exchange-traded, they typically have minimal exposure to counterparty risk. Parties to a futures contract are not required to post the entire notional amount of the contract, but rather a small percentage of that amount (by way of margin), both at the time they enter into futures transactions, and then on a daily basis if their positions decline in value; as a result, futures contracts are highly leveraged. Such payments are known as variation margin and are recorded by a Fund as unrealized gains or losses. Because futures markets are highly leveraged, they can be extremely volatile,
129
Table of Contents
TCW Funds, Inc.
Notes to Financial Statements (Continued)
Note 3 — Portfolio Investments (Continued)
and there can be no assurance that the pricing of a futures contract will correlate precisely with the pricing of the asset or index underlying it or the asset or liability of a Fund that is the subject of the hedge. It may not always be possible for a Fund to enter into a closing transaction with respect to a futures contract it has entered into at a favorable time or price. When a Fund enters into a futures transaction, it is subject to the risk that the value of the futures contract will move in a direction unfavorable to it.
When a Fund uses futures contracts for hedging purposes, it is likely that the Fund will have an asset or liability that will offset any loss (or gain) on the transactions, at least in part. When a futures contract is closed, the Fund records a realized gain or loss equal to the difference between the value of the contract at the time it was opened and the value at the time it was closed. The TCW Core Fixed Income Fund, the TCW Global Bond Fund, the TCW High Yield Bond Fund, the TCW Short Term Bond Fund, and the TCW Total Return Bond Fund utilized futures during the year ended October 31, 2022 to help manage interest rate duration of those Funds. Futures contracts outstanding at October 31, 2022 are listed on the Schedule of Investments.
Options: The Funds may purchase and sell put and call options on a security or an index of securities to enhance investment performance and/or to protect against changes in market prices. The Funds may also enter into currency options to hedge against or to take advantage of currency fluctuations.
A call option gives the holder the right to purchase, and obligates the writer to sell, a security at the strike price at any time before the expiration date. A put option gives the holder the right to sell, and obligates the writer to buy, a security at the exercise price at any time before the expiration date. A Fund may purchase put options to protect portfolio holdings against a decline in market value of a security or securities held by it. A Fund may also purchase a put option hoping to profit from an anticipated decline in the value of the underlying security. If a Fund holds the security underlying the option, the option premium and any transaction costs will reduce any profit the Fund might have realized had it sold the underlying security instead of buying the put option. A Fund may purchase call options to hedge against an increase in the price of securities that the Fund ultimately wants to buy. A Fund may also purchase a call option as a long directional investment hoping to profit from an anticipated increase in the value of the underlying security. In order for a call option to be profitable, the market price of the underlying security must rise sufficiently above the exercise price to cover the premium and transaction costs. These costs will reduce any profit a Fund might have realized had it bought the underlying security at the time it purchased the call option.
Purchasing foreign currency options gives a Fund the right, but not the obligation, to buy or sell specified amounts of currency at a rate of exchange that may be exercised by a certain date. These currency options may be used as a short or long hedge against possible variations in foreign exchange rates or to gain exposure to foreign currencies.
When a Fund purchases an option, it runs the risk that it will lose its entire investment in the option in a relatively short period of time, unless the Fund exercises the option or enters into a closing sale transaction before the option’s expiration. If the price of the underlying security does not rise (in the case of a call) or fall (in the case of a put) to an extent sufficient to cover the option premium and transaction costs, the Fund will lose part or all of its investment in the option. Premiums paid for purchasing options that expire are treated as realized losses.
Options purchased or sold by a Fund may be traded on a securities or options exchange. Such options typically have minimal exposure to counterparty risk. However, an exchange or market may at times find it
130
Table of Contents
TCW Funds, Inc.
October 31, 2022
Note 3 — Portfolio Investments (Continued)
necessary to impose restrictions on particular types of options transactions, such as opening transactions. If an underlying security ceases to meet qualifications imposed by an exchange or the Options Clearing Corporation, new series of options on that security will no longer be opened to replace the expiring series, and opening transactions in existing series may be prohibited.
OTC options are options not traded on exchanges or backed by clearinghouses. Rather, they are entered into directly between a Fund and the counterparty to the option. In the case of an OTC option purchased by a Fund, the value of the option to the Fund will depend on the willingness and ability of the option writer to perform its obligations to the Fund. In addition, OTC options may not be transferable and there may be little or no secondary market for them, so they may be considered illiquid. It may not be possible to enter into closing transactions with respect to OTC options or otherwise to terminate such options, and as a result a Fund may be required to remain obligated on an unfavorable OTC option until its expiration.
Swap Agreements: The Funds may enter into swap agreements. Swap agreements are typically two-party contracts entered into primarily by institutional investors. In a standard “swap” transaction, two parties agree to exchange the returns (or differentials in rates of return) earned or realized on particular predetermined investments or instruments, which may be adjusted for an interest factor. The gross returns to be exchanged or “swapped” between the parties are generally calculated with respect to a “notional amount” (i.e., the return on or increase in value of a particular dollar amount invested at a particular interest rate or in a “basket” of securities representing a particular index).
In a total return swap, one party typically agrees to pay to the other a short-term interest rate in return for a payment at one or more times in the future based on the increase in the value of an underlying security or other asset, or index of securities or assets; if the underlying security, asset, or index declines in value, the party that pays the short-term interest rate must also pay to its counterparty a payment based on the amount of the decline. A Fund may take either side of such a swap, and so may take a long or short position in the underlying security, asset, or index. A Fund may enter into a total return swap to hedge against an exposure in its portfolio — such as interest rate risk (including to adjust the duration or credit quality of a Fund’s bond portfolio), equity risk, or credit risk — or generally to put cash to work efficiently in the markets in anticipation of, or as a replacement for, cash investments. A Fund may also enter into a total return swap to gain exposure to securities or markets in which it might not be able to invest directly (in so-called market access transactions).
Interest rate swaps are agreements in which one party pays a floating rate of interest on a notional principal amount and receives a fixed rate of interest on the same notional principal amount for a specified period of time. Alternatively, a party may pay a fixed rate and receive a floating rate. In more complex swaps, the notional principal amount may decline (or amortize) over time. A Fund’s maximum risk of loss due to counterparty default is the discounted NAV of the cash flows paid to/received from the counterparty over the interest rate swap’s remaining life.
The Funds may write (sell) and purchase put and call swaptions. Swaption contracts written by the Funds represent an option that gives the purchaser the right, but not the obligation, to enter into a new swap agreement, or to shorten, extend, cancel or modify an existing swap agreement, on a future date on specified terms. See “Swap Agreements” below. Depending on the terms of the particular option agreement, a Fund will generally incur a greater degree of risk when it writes a swaption than it will incur when it purchases a swaption. When a Fund purchases a swaption, it risks losing only the amount of the premium it has paid should it decide to let the option expire unexercised. However, when a Fund writes a
131
Table of Contents
TCW Funds, Inc.
Notes to Financial Statements (Continued)
Note 3 — Portfolio Investments (Continued)
swaption, upon exercise of the option the Fund will become obligated according to the terms of the underlying agreement. During the year ended October 31, 2022, the TCW Core Fixed Income Fund and the TCW Global Bond Fund held written swaptions.
A Fund may enter into credit default swap transactions as a “buyer” or “seller” of credit protection. In a credit default swap, one party provides what is in effect insurance against a default or other adverse credit event affecting an issuer of debt securities (typically referred to as a “reference entity”). In general, the buyer of credit protection is obligated to pay the protection seller an upfront amount or a periodic stream of payments over the term of the swap. If a “credit event” occurs, the buyer has the right to deliver to the seller bonds (or other obligations of the reference entity with a value up to the full notional value of the swap), and to receive a payment equal to the par value of the bonds or other obligations. Credit events that would trigger a request that the seller make payment are specific to each credit default swap agreement, but generally include bankruptcy, failure to pay, restructuring, obligation acceleration, obligation default, or repudiation/moratorium. When a Fund buys protection, it may or may not own securities of the reference entity. When a Fund sells protection under a credit default swap, the position may have the effect of creating leverage in the Fund’s portfolio through the Fund’s indirect long exposure to the issuer or securities on which the swap is written. When a Fund sells protection, it may do so either to earn additional income or to create such a “synthetic” long position.
Whenever a Fund enters into a swap agreement, it takes on counterparty risk — the risk that its counterparty will be unable or unwilling to meet its obligations under the swap agreement. A Fund also takes the risk that the market will move against its position in the swap agreement. In the case of a total return swap, the swap will change in value depending on the change in value of the asset or index on which the swap is written. When a Fund enters into any type of swap for hedging purposes, it is likely that the Fund will have an asset or liability that will offset any loss (or gain) on the swap, at least in part. Swap agreements may be non-transferable or otherwise highly illiquid, and a Fund may not be able to terminate or transfer a swap agreement at any particular time or at an acceptable price.
During the term of a swap transaction, changes in the value of the swap are recognized as unrealized gains or losses by marking-to-market to reflect the market value of the swap. When the swap is terminated, a Fund will record a realized gain or loss equal to the difference, if any, between the proceeds from (or cost of) the closing transaction and the Fund’s basis in the agreement. Upfront swap premium payments paid or received by a Fund, if any, are recorded within the value of the open swap agreement on the Fund’s Statement of Assets and Liabilities and represent payments paid or received upon entering into the swap agreement to compensate for differences between stated terms of the swap agreement and prevailing market conditions (credit spreads, currency exchange rates, and other relevant factors). These upfront payments are recorded as realized gains or losses on each Fund’s Statement of Operations upon termination or maturity of the swap agreement.
During the term of a swap transaction, the periodic net payments can be made for a set period of time or may be triggered by a predetermined credit event. The net periodic payments may be based on a fixed or variable interest rate, the change in market value of a specified security, basket of securities or index, or the return generated by a security. These periodic payments received or made by the Funds are recorded as realized gains and losses, respectively. During the year ended October 31, 2022, the TCW Core Fixed Income Fund and the TCW Global Bond Fund entered into interest rate swaps to manage duration, the yield curve or interest rate risk by economically hedging the value of the fixed rate bonds which may
132
Table of Contents
TCW Funds, Inc.
October 31, 2022
Note 3 — Portfolio Investments (Continued)
decrease when interest rates rise (interest rate risk); the TCW Enhanced Commodity Strategy Fund used total return swap agreements to gain exposure to the commodity market.
Note 4 — Risk Considerations
Market Risk: The Funds’ investments will fluctuate with market conditions, and so will the value of your investment in the Funds. You could lose money on your investment in the Funds or the Funds could underperform other investments.
Liquidity Risk: The Funds’ investments in illiquid securities may reduce the returns of the Funds because they may not be able to sell the illiquid securities at an advantageous time or price. Investments in high-yield securities, foreign securities, derivatives or other securities with substantial market and/or credit risk tend to have the greatest exposure to liquidity risk. Certain investments in private placements and Rule 144A securities may be considered illiquid investments. The Funds may invest in private placements and Rule 144A securities.
Interest Rate Risk: The values of the Funds’ investments fluctuate in response to movements in interest rates. If rates rise, the values of debt securities generally fall. The longer the average duration of a Fund’s investment portfolio, the greater the change in value.
Mortgage-Backed Securities Risk: Each Fund may invest in mortgage-backed securities. The values of some mortgage-backed securities may expose a Fund to a lower rate of return upon reinvestment of principal. When interest rates rise, the value of mortgage-related securities generally will decline; however, when interest rates are declining, the value of mortgage-related securities with prepayment features may not increase as much as other fixed-income securities. The rate of prepayments on underlying mortgages will affect the price and volatility of a mortgage-related security, and may shorten or extend the effective maturity of the security beyond what was anticipated at the time of purchase. The value of these securities may fluctuate in response to the market’s perception of the creditworthiness of the issuers. Additionally, although mortgages and mortgage-related securities are generally supported by some form of government or private guarantee and/or insurance, there is no assurance that private guarantors or insurers will meet their obligations.
Derivatives Risk: Use of derivatives, which at times is an important part of the Funds’ investment strategies, involves risks different from, or possibly greater than, the risks associated with investing directly in securities and other traditional investments. Investments in derivatives could cause the Funds to lose more than the principal amount invested. Also, suitable derivative transactions may not be available in all circumstances and there can be no assurance that the Funds will achieve their objective through the use of the derivatives.
Credit Risk: The values of any of the Funds’ investments may also decline in response to events affecting the issuer or its credit rating. The lower-rated debt securities in which a Fund may invest are considered speculative and are subject to greater volatility and risk of loss than investment-grade securities, particularly in deteriorating economic conditions. The value of some mortgage-related securities in which the Funds invest also may fall because of unanticipated levels of principal prepayments that can occur when interest rates decline. Certain Funds invest a material portion of their assets in securities of issuers that hold mortgage- and asset-backed securities and direct investments in securities backed by commercial and residential mortgage loans and other financial assets. The value and related income of these securities are sensitive to changes in economic conditions, including delinquencies and/or defaults. Continuing shifts
133
Table of Contents
TCW Funds, Inc.
Notes to Financial Statements (Continued)
Note 4 — Risk Considerations (Continued)
in the market’s perception of credit quality on securities backed by commercial and residential mortgage loans and other financial assets may result in increased volatility of market price and periods of illiquidity that can negatively impact the valuation of certain issuers held by the Funds.
MBS and ABS are characterized and classified in a variety of different ways. These classifications include a view of the securities’ cash flow structure (pass-through, sequential pay, prepayment-protected, interest only, principal only, etc.), the security of the claim on the underlying assets (senior, mezzanine and subordinated), as well as types of underlying collateral (prime conforming loans, prime non-conforming loans, Alt-A loans, subprime loans, commercial loans, etc.). In many cases, the classification incorporates a degree of subjectivity: a particular loan might be categorized as “prime” by the underwriting standards of one mortgage issuer while another might classify the loan as “subprime.” In addition to other functions, the risk associated with an investment in a mortgage loan must take into account the nature of the collateral, the form and the level of credit enhancement, the vintage of the loan, the geography of the loan, the purpose of the loan (refinance versus purchase versus equity takeout), the borrower’s credit quality (e.g., FICO score), and whether the loan is a first trust deed or a second lien.
Counterparty Risk: The Funds may be exposed to counterparty risk, the risk that an entity with which the Funds have unsettled or open transactions may not fulfill its obligations.
Commodities Risk: The TCW Enhanced Commodity Strategy Fund has exposure to commodity markets through its investments in total return swap agreements. Therefore, the price of its shares is affected by factors particular to the commodity markets and may decline and fluctuate more than the price of shares of a fund with a broader range of investments. Commodity prices can be extremely volatile and are affected by many factors, including changes in overall market movements, real or perceived inflationary trends, commodity index volatility, changes in interest rates or currency exchange rates, population growth and changing demographics, nationalization, expropriation, or other confiscation, international regulatory, political and economic developments (e.g., regime changes and changes in economic activity levels), and developments affecting a particular industry or commodity, such as drought, floods or other weather conditions, livestock disease, trade embargoes, competition from substitute products, transportation bottlenecks or shortages, fluctuations in supply and demand, and tariffs.
Foreign Currency Risk: The Funds may be exposed to the risk that the value of the Funds’ investments denominated in foreign currencies will decline in value because the foreign currencies have declined in value relative to the U.S. dollar.
Foreign Investing Risk: The Funds may be exposed to the risk that the Funds’ share prices will fluctuate with market conditions, currency exchange rates and the economic and political climates in countries where the Funds invest.
Investment Style Risk: Certain Funds may also be subject to investment style risk. The Advisor’s investment styles may be out of favor at times or may not produce the best results over short or longer time periods and may increase the volatility of a Fund’s share price.
LIBOR Risk: The London Interbank Offer Rate (“LIBOR”) historically has been and currently is used extensively in the U.S. and globally as a “benchmark” or “reference rate” for various commercial and financial contracts, including corporate and municipal bonds, bank loans, asset-backed and mortgage-related securities, interest rate swaps and other derivatives. For example, debt securities in which a Fund invests may pay interest at floating rates based on LIBOR or may be subject to interest caps or floors based
134
Table of Contents
TCW Funds, Inc.
October 31, 2022
Note 4 — Risk Considerations (Continued)
on LIBOR. A Fund’s derivative investments may also reference LIBOR. In July 2017, the head of the United Kingdom Financial Conduct Authority announced the intention to phase out the use of LIBOR by the end of 2021. However, the ICE Benchmark Administration, in its capacity as administrator of USD LIBOR, announced it would extend publication of 1-month, 3-month, and 6-month USD LIBOR by 19 months to June 2023. It is expected that market participants will transition to the use of different alternative reference or benchmark rates. However, although regulators have encouraged the development and adoption of alternative rates such as the Secured Overnight Financing Rate (“SOFR”), there is currently no definitive information regarding the future utilization of LIBOR or of any particular replacement reference rate. Abandonment of or modifications to LIBOR could have adverse impacts on newly issued financial instruments and existing financial instruments that reference LIBOR. The expected discontinuation of LIBOR could have a significant impact on the financial markets and may present a material risk for certain market participants, including investment companies such as the Funds. Abandonment of or modifications to LIBOR could lead to significant short- and long-term uncertainty and market instability. The risks associated with this discontinuation and transition may be exacerbated if the work necessary to effect an orderly transition to an alternative reference rate is not completed in a timely manner. It remains uncertain how such changes would be implemented and the effects such changes would have on the Funds, issuers of instruments in which the Funds invest, and the financial markets generally.
Public Health Emergencies Risk and Impact of the Coronavirus (COVID-19): Pandemics and other local, national, and international public health emergencies, including outbreaks of infectious diseases such as SARS, H1N1/09 Flu, the Avian Flu, Ebola and the current outbreak of the novel coronavirus (“COVID-19”), can result, and in the case of COVID-19 is resulting, in market volatility and disruption, and any similar future emergencies may materially and adversely impact economic production and activity in ways that cannot be predicted, all of which could result in substantial investment losses.
The COVID-19 outbreak has caused a worldwide public health emergency, straining healthcare resources and resulting in extensive and growing numbers of infections, hospitalizations and deaths. In an effort to contain COVID-19, local, regional, and national governments, as well as private businesses and other organizations, imposed and in some cases continue to impose severely restrictive measures, including instituting local and regional quarantines, restricting travel (including closing certain international borders), prohibiting public activity (including “stay-at-home,” “shelter-in-place,” and similar orders), and ordering the closure of a wide range of offices, businesses, schools, and other public venues. Consequently, COVID-19 has significantly diminished and disrupted global economic production and activity of all kinds and has contributed to both volatility and a severe decline in financial markets.
The ultimate impact of COVID-19 (and of the resulting precipitous decline and disruption in economic and commercial activity across many of the world’s economies) on global economic conditions, and on the operations, financial condition, and performance of any particular market, industry or business, is impossible to predict. However, ongoing and potential additional materially adverse effects, including further global, regional and local economic downturns (including recessions) of indeterminate duration and severity, are possible. It is difficult to assess what the longer-term impacts of an extended period of unprecedented economic dislocation and disruption will be on future economic developments, the health of certain markets, industries and businesses, and commercial and consumer behavior. The ongoing COVID-19 crisis and any other public health emergency that may arise in the future could have a significant adverse impact on the Funds’ investments and result in significant investment losses.
135
Table of Contents
TCW Funds, Inc.
Notes to Financial Statements (Continued)
Note 4 — Risk Considerations (Continued)
Bank Loan Risk: There is a risk of investing in corporate loans made by commercial banks and other financial institutions or institutional investors to companies that need capital to grow or restructure, which includes interest rate risk, liquidity risk and prepayment risk. A Fund may also be subject to the credit risk of other financial institutions and the risks associated with insufficient collateral securing a bank loan, limited available public information about a bank loan, delayed settlement, and less protection for holders of bank loans as compared to holders of registered securities. Bank loans are not registered and otherwise may not be treated as securities under the federal securities laws, meaning investors in loans have less protection against improper practices than investors in securities that are registered under or are otherwise subject to the protections of the securities laws.
For more information on risks related to investing in the Funds, please refer to the Funds’ prospectus and the Statement of Additional Information which can be obtained on the Funds’ website (www.tcw.com) or by calling customer service at 800-FUND-TCW (800-386-3829).
Note 5 — Federal Income Taxes
It is the policy of each Fund to comply with the requirements under Subchapter M of the Internal Revenue Code applicable to regulated investment companies and to distribute all of its net taxable income, including any net realized gains on investments, to its shareholders. Therefore, no federal income tax provision is required.
At October 31, 2022, the components of distributable earnings on a tax basis were as follows:
| Undistributed Ordinary Income | Undistributed Long-Term Gain | Total Distributable Earnings | ||||||||||
TCW Enhanced Commodity Strategy Fund | $ | 30,589 | $ | — | $ | 30,589 | ||||||
TCW High Yield Bond Fund | 537,060 | — | 537,060 | |||||||||
TCW Total Return Bond Fund | 26,232,316 | — | 26,232,316 | |||||||||
At the end of the previous fiscal year ended October 31, 2021, the components of distributable earnings on a tax basis were as follows:
| Undistributed Ordinary Income | Undistributed Long-Term Gain | Total Distributable Earnings | ||||||||||
TCW Enhanced Commodity Strategy Fund | $ | 562,329 | $ | — | $ | 562,329 | ||||||
TCW High Yield Bond Fund | 2,254,610 | 406,774 | 2,661,384 | |||||||||
TCW Short Term Bond Fund | 43,732 | — | 43,732 | |||||||||
136
Table of Contents
TCW Funds, Inc.
October 31, 2022
Note 5 — Federal Income Taxes (Continued)
Permanent differences incurred during the year ended October 31, 2022, resulting from differences in book and tax accounting, have been reclassified at year-end between undistributed net investment income (loss), undistributed (accumulated) net realized gain (loss) and paid-in capital as follows, with no impact to the net asset value per share:
| Undistributed Net Investment Income (Loss) | Undistributed (Accumulated) Net Realized Gain (Loss) | Paid-in Capital | ||||||||||
TCW Core Fixed Income Fund | $ | 617,794 | $ | (558,585 | ) | $ | (59,209 | ) | ||||
TCW Enhanced Commodity Strategy Fund | 9,187 | (9,187 | ) | — | ||||||||
TCW Global Bond Fund | (88,705 | ) | 1,210,496 | (1,121,791 | ) | |||||||
TCW High Yield Bond Fund | 145,386 | (145,386 | ) | — | ||||||||
TCW Short Term Bond Fund | 11,703 | (11,703 | ) | — | ||||||||
TCW Total Return Bond Fund | (188,910 | ) | 1,524,909 | (1,335,999 | ) | |||||||
During the year ended October 31, 2022, the tax character of distributions paid was as follows:
| Ordinary Income | Long-Term Capital Gain | Return of Capital | Total Distributions | |||||||||||||
TCW Core Fixed Income Fund | $ | 23,342,013 | $ | — | $ | 4,452,370 | $ | 27,794,383 | ||||||||
TCW Enhanced Commodity Strategy Fund | 1,055,936 | — | — | 1,055,936 | ||||||||||||
TCW Global Bond Fund | 98,875 | — | 298,881 | 397,756 | ||||||||||||
TCW High Yield Bond Fund | 5,483,927 | 406,774 | — | 5,890,701 | ||||||||||||
TCW Short Term Bond Fund | 252,893 | — | 80,452 | 333,345 | ||||||||||||
TCW Total Return Bond Fund | 98,490,713 | — | — | 98,490,713 | ||||||||||||
During the previous fiscal year ended October 31, 2021, the tax character of distributions paid was as follows:
| Ordinary Income | Long-Term Capital Gain | Return of Capital | Total Distributions | |||||||||||||
TCW Core Fixed Income Fund | $ | 44,348,481 | $ | 10,525,666 | $ | 6,135,591 | $ | 61,009,738 | ||||||||
TCW Enhanced Commodity Strategy Fund | 29,411 | 2,093 | — | 31,504 | ||||||||||||
TCW Global Bond Fund | 1,103,630 | 299,461 | 207,034 | 1,610,125 | ||||||||||||
TCW High Yield Bond Fund | 4,114,958 | — | — | 4,114,958 | ||||||||||||
TCW Short Term Bond Fund | 116,060 | — | — | 116,060 | ||||||||||||
TCW Total Return Bond Fund | 143,133,613 | 37,381,328 | 7,936,807 | 188,451,748 | ||||||||||||
At October 31, 2022, net unrealized appreciation (depreciation) on investments for federal income tax purposes was as follows:
| Unrealized Appreciation | Unrealized (Depreciation) | Net Unrealized Appreciation (Depreciation) | Cost of Investments for Federal Income Tax Purposes | |||||||||||||
TCW Core Fixed Income Fund | $ | 2,188,819 | $ | (149,433,760 | ) | $ | (147,244,941 | ) | $ | 1,531,030,001 | ||||||
TCW Enhanced Commodity Strategy Fund | 39,740 | (1,520,236 | ) | (1,480,496 | ) | 37,521,282 | ||||||||||
TCW Global Bond Fund | 167,725 | (3,560,102 | ) | (3,392,377 | ) | 22,075,942 | ||||||||||
TCW High Yield Bond Fund | 131,054 | (8,013,433 | ) | (7,882,379 | ) | 65,477,515 | ||||||||||
TCW Short Term Bond Fund | 37,649 | (413,401 | ) | (375,752 | ) | 11,119,499 | ||||||||||
TCW Total Return Bond Fund | 94,036,533 | (382,488,019 | ) | (288,451,486 | ) | 4,312,004,107 | ||||||||||
137
Table of Contents
TCW Funds, Inc.
Notes to Financial Statements (Continued)
Note 5 — Federal Income Taxes (Continued)
At October 31, 2022, the following Funds had net realized loss carryforwards for federal income tax purposes:
| No Expiration | ||||||||||||
| Short-Term Capital Losses | Long-Term Capital Losses | Total | ||||||||||
TCW Core Fixed Income Fund | $ | 123,663,890 | $ | 6,444,868 | $ | 130,108,758 | ||||||
TCW Enhanced Commodity Strategy Fund | 102,334 | 1,606 | 103,940 | |||||||||
TCW Global Bond Fund | 953,859 | 617,424 | 1,571,283 | |||||||||
TCW High Yield Bond Fund | 1,845,863 | 1,481,646 | 3,327,509 | |||||||||
TCW Short Term Bond Fund | 528,906 | 14,274 | 543,180 | |||||||||
TCW Total Return Bond Fund | 419,221,210 | 140,860,057 | 560,081,267 | |||||||||
The Funds did not have any unrecognized tax benefits at October 31, 2022, nor were there any increases or decreases in unrecognized tax benefits for the year ended October 31, 2022. The Funds are subject to examination by the U.S. Federal and state tax authorities for returns filed for the prior three and four fiscal years, respectively.
Note 6 — Fund Management Fees and Other Expenses
The Funds pay to the Advisor, as compensation for services rendered, facilities furnished and expenses borne by it, the following annual management fees as a percentage of daily net assets:
TCW Core Fixed Income Fund | 0.40 | % | ||
TCW Enhanced Commodity Strategy Fund | 0.50 | % | ||
TCW Global Bond Fund | 0.50 | % | ||
TCW High Yield Bond Fund | 0.45 | % | ||
TCW Short Term Bond Fund | 0.35 | % | ||
TCW Total Return Bond Fund | 0.40 | % |
The Advisor limits the operating expenses of the Funds not to exceed the following expense ratios relative to the Funds’ average daily net assets:
TCW Core Fixed Income Fund | ||||
I Class | 0.49% (1) | |||
N Class | 0.70% (1) | |||
P Class | 0.44% (1) | |||
TCW Enhanced Commodity Strategy Fund | ||||
I Class | 0.70% (1) | |||
N Class | 0.75% (1) | |||
TCW Global Bond Fund | ||||
I Class | 0.60% (1) | |||
N Class | 0.70% (1) | |||
TCW High Yield Bond Fund | ||||
I Class | 0.55% (1) | |||
N Class | 0.80% (1) | |||
TCW Short Term Bond Fund | ||||
I Class | 0.44% (1) | |||
TCW Total Return Bond Fund | ||||
I Class | 0.49% (1) | |||
N Class | 0.70% (1) | |||
P Class | 0.44% (1) |
| (1) | These limitations are based on an agreement between the Advisor and Company. |
138
Table of Contents
TCW Funds, Inc.
October 31, 2022
Note 6 — Fund Management Fees and Other Expenses (Continued)
The amount borne by the Advisor during the fiscal year when the operating expenses of a Fund are in excess of the expense limitation cannot be recaptured in the subsequent fiscal years should the expenses drop below the expense limitation in the subsequent years. The Advisor can only recapture expenses within a given fiscal year for that year’s operating expenses.
Directors’ Fees: Directors who are not affiliated with the Advisor receive compensation from the Funds which are shown on the Statements of Operations. Directors may elect to defer receipt of their fees in accordance with the terms of a Non-Qualified Deferred Compensation Plan. Deferred compensation is included within directors’ fees and expenses in the Statements of Assets and Liabilities.
Note 7 — Distribution Plan
TCW Funds Distributors LLC (“Distributor”), an affiliate of the Advisor and the Funds, serves as the nonexclusive distributor of each class of the Funds’ shares. The Funds have a distribution plan pursuant to Rule 12b-1 under the 1940 Act with respect to the N Class shares of each Fund. Under the terms of the plan, each Fund compensates the Distributor at a rate equal to 0.25% of the average daily net assets of the Fund attributable to its N Class shares for distribution and related services.
Note 8 — Purchases and Sales of Securities
Investment transactions (excluding short-term investments) for the year ended October 31, 2022 were as follows:
| Purchases at Cost | Sales or Maturity Proceeds | U.S. Government Purchases at Cost | U.S. Government Sales or Maturity Proceeds | |||||||||||||
TCW Core Fixed Income Fund | $ | 363,663,836 | $ | 253,950,907 | $ | 7,559,467,073 | $ | 7,825,225,020 | ||||||||
TCW Enhanced Commodity Strategy Fund | 36,627,938 | 8,719,143 | 3,934,150 | 1,173,633 | ||||||||||||
TCW Global Bond Fund | 15,008,375 | 27,029,287 | 36,705,846 | 38,854,857 | ||||||||||||
TCW High Yield Bond Fund | 72,646,188 | 111,262,746 | — | — | ||||||||||||
TCW Short Term Bond Fund | 4,548,591 | 5,869,051 | 59,827,176 | 58,892,981 | ||||||||||||
TCW Total Return Bond Fund | 330,185,348 | (1) | 657,542,605 | 18,867,144,768 | 20,204,688,349 | |||||||||||
| (1) | Purchases include the TCW Total Return Bond Fund’s purchase of certain securities from affiliated investment accounts for a total of $4,775,786. These trades were settled for cash in accordance with the valuation and other requirements set forth in Rule 17a-7 under the 1940 Act. There were no sales to affiliates, and no associated realized gains or losses to report during the period. |
139
Table of Contents
TCW Funds, Inc.
Notes to Financial Statements (Continued)
Note 9 — Capital Share Transactions
Transactions in each Fund’s shares were as follows:
| TCW Core Fixed Income Fund | Year Ended October 31, 2022 | Year Ended October 31, 2021 | ||||||||||||||
| I Class | Shares | Amount | Shares | Amount | ||||||||||||
Shares Sold | 41,973,338 | $ | 439,381,120 | 40,059,152 | $ | 468,851,971 | ||||||||||
Shares Issued upon Reinvestment of Dividends | 2,085,134 | 22,123,909 | 4,179,662 | 49,203,339 | ||||||||||||
Shares Redeemed | (74,327,281 | ) | (762,947,419 | ) | (29,229,681 | ) | (341,390,653 | ) | ||||||||
|
|
|
|
|
|
|
| |||||||||
Net Increase (Decrease) | (30,268,809 | ) | $ | (301,442,390 | ) | 15,009,133 | $ | 176,664,657 | ||||||||
|
|
|
|
|
|
|
| |||||||||
| N Class | Shares | Amount | Shares | Amount | ||||||||||||
Shares Sold | 4,859,021 | $ | 52,088,741 | 3,576,675 | $ | 41,843,125 | ||||||||||
Shares Issued upon Reinvestment of Dividends | 240,584 | 2,540,892 | 568,214 | 6,678,123 | ||||||||||||
Shares Redeemed | (6,301,496 | ) | (66,788,169 | ) | (5,004,587 | ) | (58,357,681 | ) | ||||||||
|
|
|
|
|
|
|
| |||||||||
Net Decrease | (1,201,891 | ) | $ | (12,158,536 | ) | (859,698 | ) | $ | (9,836,433 | ) | ||||||
|
|
|
|
|
|
|
| |||||||||
| Plan Class | Shares | Amount | Shares | Amount | ||||||||||||
Shares Sold | 9,236,640 | $ | 97,872,378 | 75,065 | $ | 874,695 | ||||||||||
Shares Issued upon Reinvestment of Dividends | 85,060 | 872,216 | 337 | 3,924 | ||||||||||||
Shares Redeemed | (773,500 | ) | (7,946,932 | ) | (730 | ) | (8,510 | ) | ||||||||
|
|
|
|
|
|
|
| |||||||||
Net Increase | 8,548,200 | $ | 90,797,662 | 74,672 | $ | 870,109 | ||||||||||
|
|
|
|
|
|
|
| |||||||||
| TCW Enhanced Commodity Strategy Fund | Year Ended October 31, 2022 | Year Ended October 31, 2021 | ||||||||||||||
| I Class | Shares | Amount | Shares | Amount | ||||||||||||
Shares Sold | 4,919,117 | $ | 34,467,759 | 153,532 | $ | 947,024 | ||||||||||
Shares Issued upon Reinvestment of Dividends | 141,890 | 865,371 | 3,538 | 18,500 | ||||||||||||
Shares Redeemed | (722,809 | ) | (5,087,008 | ) | (2,235 | ) | (13,351 | ) | ||||||||
|
|
|
|
|
|
|
| |||||||||
Net Increase | 4,338,198 | $ | 30,246,122 | 154,835 | $ | 952,173 | ||||||||||
|
|
|
|
|
|
|
| |||||||||
| N Class | Shares | Amount | Shares | Amount | ||||||||||||
Shares Sold | 3,032,140 | $ | 21,739,302 | 73,674 | $ | 461,830 | ||||||||||
Shares Issued upon Reinvestment of Dividends | 30,109 | 189,179 | 2,470 | 13,004 | ||||||||||||
Shares Redeemed | (1,443,330 | ) | (10,002,369 | ) | (40,284 | ) | (256,488 | ) | ||||||||
|
|
|
|
|
|
|
| |||||||||
Net Increase | 1,618,919 | $ | 11,926,112 | 35,860 | $ | 218,346 | ||||||||||
|
|
|
|
|
|
|
| |||||||||
| TCW Global Bond Fund | Year Ended October 31, 2022 | Year Ended October 31, 2021 | ||||||||||||||
| I Class | Shares | Amount | Shares | Amount | ||||||||||||
Shares Sold | 137,846 | $ | 1,244,126 | 1,544,800 | $ | 16,933,404 | ||||||||||
Shares Issued upon Reinvestment of Dividends | 27,221 | 256,389 | 103,067 | 1,097,918 | ||||||||||||
Shares Redeemed | (1,440,495 | ) | (13,857,142 | ) | (271,622 | ) | (2,828,388 | ) | ||||||||
|
|
|
|
|
|
|
| |||||||||
Net Increase (Decrease) | (1,275,428 | ) | $ | (12,356,627 | ) | 1,376,245 | $ | 15,202,934 | ||||||||
|
|
|
|
|
|
|
| |||||||||
| N Class | Shares | Amount | Shares | Amount | ||||||||||||
Shares Sold | 52,009 | $ | 479,155 | 245,971 | $ | 2,628,308 | ||||||||||
Shares Issued upon Reinvestment of Dividends | 17,714 | 162,796 | 45,955 | 489,935 | ||||||||||||
Shares Redeemed | (128,525 | ) | (1,188,315 | ) | (265,154 | ) | (2,801,815 | ) | ||||||||
|
|
|
|
|
|
|
| |||||||||
Net Increase (Decrease) | (58,802 | ) | $ | (546,364 | ) | 26,772 | $ | 316,428 | ||||||||
|
|
|
|
|
|
|
| |||||||||
140
Table of Contents
TCW Funds, Inc.
October 31, 2022
Note 9 — Capital Share Transactions (Continued)
| TCW High Yield Bond Fund | Year Ended October 31, 2022 | Year Ended October 31, 2021 | ||||||||||||||
| I Class | Shares | Amount | Shares | Amount | ||||||||||||
Shares Sold | 4,268,413 | $ | 27,306,196 | 7,898,749 | $ | 54,409,602 | ||||||||||
Shares Issued upon Reinvestment of Dividends | 742,643 | 4,814,705 | 483,371 | 3,322,825 | ||||||||||||
Shares Redeemed | (10,179,417 | ) | (64,888,779 | ) | (7,331,570 | ) | (50,614,382 | ) | ||||||||
|
|
|
|
|
|
|
| |||||||||
Net Increase (Decrease) | (5,168,361 | ) | $ | (32,767,878 | ) | 1,050,550 | $ | 7,118,045 | ||||||||
|
|
|
|
|
|
|
| |||||||||
| N Class | Shares | Amount | Shares | Amount | ||||||||||||
Shares Sold | 286,375 | $ | 1,838,132 | 1,243,245 | $ | 8,611,914 | ||||||||||
Shares Issued upon Reinvestment of Dividends | 116,794 | 759,914 | 86,314 | 596,820 | ||||||||||||
Shares Redeemed | (1,023,537 | ) | (6,506,835 | ) | (1,816,274 | ) | (12,587,274 | ) | ||||||||
|
|
|
|
|
|
|
| |||||||||
Net Decrease | (620,368 | ) | $ | (3,908,789 | ) | (486,715 | ) | $ | (3,378,540 | ) | ||||||
|
|
|
|
|
|
|
| |||||||||
| TCW Short Term Bond Fund | Year Ended October 31, 2022 | Year Ended October 31, 2021 | ||||||||||||||
| I Class | Shares | Amount | Shares | Amount | ||||||||||||
Shares Sold | 508,442 | $ | 4,271,112 | 1,738,075 | $ | 14,995,761 | ||||||||||
Shares Issued upon Reinvestment of Dividends | 38,685 | 326,721 | 11,244 | 96,996 | ||||||||||||
Shares Redeemed | (1,624,862 | ) | (13,646,105 | ) | (543,340 | ) | (4,686,568 | ) | ||||||||
|
|
|
|
|
|
|
| |||||||||
Net Increase (Decrease) | (1,077,735 | ) | $ | (9,048,272 | ) | 1,205,979 | $ | 10,406,189 | ||||||||
|
|
|
|
|
|
|
| |||||||||
| TCW Total Return Bond Fund | Year Ended October 31, 2022 | Year Ended October 31, 2021 | ||||||||||||||
| I Class | Shares | Amount | Shares | Amount | ||||||||||||
Shares Sold | 113,029,676 | $ | 1,040,830,995 | 188,016,709 | $ | 1,933,064,305 | ||||||||||
Shares Issued upon Reinvestment of Dividends | 6,016,012 | 55,983,910 | 8,526,674 | 87,801,346 | ||||||||||||
Shares Redeemed | (213,416,239 | ) | (1,969,953,450 | ) | (324,676,223 | ) | (3,307,697,735 | ) | ||||||||
|
|
|
|
|
|
|
| |||||||||
Net Decrease | (94,370,551 | ) | $ | (873,138,545 | ) | (128,132,840 | ) | $ | (1,286,832,084 | ) | ||||||
|
|
|
|
|
|
|
| |||||||||
| N Class | Shares | Amount | Shares | Amount | ||||||||||||
Shares Sold | 11,733,040 | $ | 110,570,624 | 28,822,122 | $ | 305,072,756 | ||||||||||
Shares Issued upon Reinvestment of Dividends | 1,442,633 | 13,819,002 | 3,127,881 | 33,277,305 | ||||||||||||
Shares Redeemed | (29,721,329 | ) | (280,084,228 | ) | (124,781,438 | ) | (1,317,534,077 | ) | ||||||||
|
|
|
|
|
|
|
| |||||||||
Net Decrease | (16,545,656 | ) | $ | (155,694,602 | ) | (92,831,435 | ) | $ | (979,184,016 | ) | ||||||
|
|
|
|
|
|
|
| |||||||||
| Plan Class | Shares | Amount | Shares | Amount | ||||||||||||
Shares Sold | 177,262 | $ | 1,617,758 | 122,910 | $ | 1,278,533 | ||||||||||
Shares Issued upon Reinvestment of Dividends | 1,414 | 12,941 | 1,263 | 13,045 | ||||||||||||
Shares Redeemed | (44,422 | ) | (413,346 | ) | (68,186 | ) | (695,600 | ) | ||||||||
|
|
|
|
|
|
|
| |||||||||
Net Increase | 134,254 | $ | 1,217,353 | 55,987 | $ | 595,978 | ||||||||||
|
|
|
|
|
|
|
| |||||||||
Note 10 — Affiliate Ownership
As of October 31, 2022, affiliates of the Funds and Advisor owned 29.40% and 87.62% of the net assets of the TCW Enhanced Commodity Strategy Fund and the TCW Global Bond Fund, respectively.
Note 11 — Restricted Securities
The Funds are permitted to invest in securities that have legal or contractual restrictions on resale. These securities may be sold privately, but are required to be registered before being sold to the public (exemption rules apply). Private placement securities are generally considered to be restricted except for those securities traded between qualified institutional investors under the provisions of Rule 144A of the Securities Act of 1933, as amended (the “Securities Act”). However, the Company considers 144A securities
141
Table of Contents
TCW Funds, Inc.
Notes to Financial Statements (Continued)
Note 11 — Restricted Securities (Continued)
to be restricted if those securities have been deemed illiquid. Disposal of these securities may involve time-consuming negotiations and expense, and prompt sale at an acceptable price may be difficult. Restricted securities held by the Funds at October 31, 2022 are listed below.
| TCW Core Fixed Income Fund | ||||||||||||||||
Issuer Description | Acquisition Date | Acquisition Cost | Aggregate Value | Percentage of Net Assets | ||||||||||||
Ruby Pipeline LLC, 8.00%, due 04/01/22 | 4/4/13 | $ | 1,499,659 | $ | 1,160,224 | 0.10 | % | |||||||||
|
|
|
|
|
| |||||||||||
| TCW Enhanced Commodity Strategy Fund | ||||||||||||||||
Issuer Description | Acquisition Date | Acquisition Cost | Aggregate Value | Percentage of Net Assets | ||||||||||||
LB-UBS Commercial Mortgage Trust (06-C6 XCL) (I/O), | 7/15/16 | $ | 543 | $ | 35 | 0.00 | % | |||||||||
|
|
|
|
|
| |||||||||||
| TCW Global Bond Fund | ||||||||||||||||
Issuer Description | Acquisition Date | Acquisition Cost | Aggregate Value | Percentage of Net Assets | ||||||||||||
Intelsat Jackson Holdings S. A., 6.50%, due 03/15/30 | 1/27/22 | $ | 52,747 | $ | 49,695 | 0.30 | % | |||||||||
|
|
|
|
|
| |||||||||||
| TCW High Yield Bond Fund | ||||||||||||||||
Issuer Description | Acquisition Date | Acquisition Cost | Aggregate Value | Percentage of Net Assets | ||||||||||||
Intelsat Jackson Holdings S. A., 6.50%, due 03/15/30 | 1/27/22 | $ | 233,455 | $ | 219,945 | 0.37 | % | |||||||||
Ruby Pipeline LLC, 8.00%, due 04/01/22 | 2/11/21-2/17/21 | 193,771 | 180,205 | 0.30 | % | |||||||||||
|
|
|
|
|
| |||||||||||
| $ | 427,226 | $ | 400,150 | 0.67 | % | |||||||||||
|
|
|
|
|
| |||||||||||
Note 12 — Committed Line Of Credit
The Funds have entered into a $100,000,000 committed revolving line of credit agreement with State Street Bank and Trust Company (the “Bank”) for temporary borrowing purposes, renewable annually. The interest rate on borrowing is the higher of the Federal Funds rate plus 0.10% plus 1.25% or the Overnight Bank Funding rate plus 0.10% plus 1.25%. There were no borrowings from the line of credit as of or during the year ended October 31, 2022. The Funds pay the Bank a commitment fee equal to 0.25% per annum on the daily unused portion of the committed line amount. The commitment fees incurred by the Funds are presented in the Statements of Operations. The commitment fees are allocated to each applicable portfolio in proportion to its relative average daily net assets and the interest expenses are charged directly to the applicable portfolio.
Note 13 — Indemnifications
Under the Company’s organizational documents, its Officers and Directors may be indemnified against certain liabilities and expenses arising out of the performance of their duties to the Company. In addition, the Company entered into an agreement with each of the Directors which provides that the Company will indemnify and hold harmless each Director against any expenses actually and reasonably incurred by such Director in any proceeding arising out of or in connection with the Director’s services to the Company, to the fullest extent permitted by the Company’s Articles of Incorporation and By-Laws, the Maryland General Corporation Law, the Securities Act, and the 1940 Act, each as now or hereinafter in force. Additionally, in the normal course of business, the Company enters into agreements with service providers that may contain indemnification clauses. The Company’s maximum exposure under these arrangements is
142
Table of Contents
TCW Funds, Inc.
October 31, 2022
Note 13 — Indemnifications (Continued)
unknown as this would involve future claims that may be made against the Company that have not yet occurred. However, based on experience, the Company expects the risk of loss to be remote. The Company has not accrued any liability in connection with such indemnification.
Note 14 — New Accounting Pronouncements
In January 2021, the Financial Accounting Standards Board issued Accounting Standards Update No. 2021-01 (“ASU 2021-01”), “Reference Rate Reform (Topic 848)”. ASU 2021-01 is an update of ASU 2020-04, which is in response to concerns about structural risks of interbank offered rates, and particularly the risk of cessation of LIBOR; regulators have undertaken reference rate reform initiatives to identify alternative reference rates that are more observable or transaction based and less susceptible to manipulation. ASU 2020-04 provides optional guidance for a limited period of time to ease the potential burden in accounting for (or recognizing the effects of) reference rate reform on financial reporting. ASU 2020-04 is elective and applies to all entities, subject to meeting certain criteria, that have contracts, hedging relationships, and other transactions that reference LIBOR or another reference rate expected to be discontinued because of reference rate reform. The ASU 2021-01 update clarifies that certain optional expedients and exceptions in Topic 848 for contract modifications and hedge accounting apply to derivatives that are affected by the discounting transition. The amendments in this update are effective immediately through December 31, 2022, for all entities. Management is currently evaluating the implications, if any, of the additional requirements and its impact on the Funds’ financial statements.
In June 2022, the FASB issued ASU No. 2022-03, “Fair Value Measurement of Equity Securities Subject to Contractual Sale Restrictions” (“ASU 2022-03”). ASU 2022-03 (1) clarifies the guidance in ASC 820 on the fair value measurement of an equity security that is subject to a contractual sale restriction and (2) requires specific disclosures related to such an equity security. ASU 2022-03 is effective for fiscal years beginning after December 15, 2023 and interim periods within that fiscal year, with early adoption permitted. We are currently evaluating the impact of the adoption of ASU 2022-03 on our consolidated financial statements.
143
Table of Contents
TCW Core Fixed Income Fund
Financial Highlights — I Class
| Year Ended October 31, | ||||||||||||||||||||
| 2022 | 2021 | 2020 | 2019 | 2018 | ||||||||||||||||
Net Asset Value per Share, Beginning of year | $ | 11.56 | $ | 11.98 | $ | 11.41 | $ | 10.52 | $ | 10.99 | ||||||||||
|
|
|
|
|
|
|
|
|
| |||||||||||
Income (Loss) from Investment Operations: |
| |||||||||||||||||||
Net Investment Income (1) | 0.20 | 0.11 | 0.20 | 0.30 | 0.25 | |||||||||||||||
Net Realized and Unrealized Gain (Loss) on Investments | (2.17 | ) | (0.09 | ) | 0.61 | 0.89 | (0.45 | ) | ||||||||||||
|
|
|
|
|
|
|
|
|
| |||||||||||
Total from Investment Operations | (1.97 | ) | 0.02 | 0.81 | 1.19 | (0.20 | ) | |||||||||||||
|
|
|
|
|
|
|
|
|
| |||||||||||
Less Distributions: |
| |||||||||||||||||||
Distributions from Net Investment Income | (0.17 | ) | (0.14 | ) | (0.24 | ) | (0.30 | ) | (0.27 | ) | ||||||||||
Distributions from Return of Capital | (0.03 | ) | (0.04 | ) | — | — | — | |||||||||||||
Distributions from Net Realized Gain | (0.00 | ) (2) | (0.26 | ) | — | — | — | |||||||||||||
|
|
|
|
|
|
|
|
|
| |||||||||||
Total Distributions | (0.20 | ) | (0.44 | ) | (0.24 | ) | (0.30 | ) | (0.27 | ) | ||||||||||
|
|
|
|
|
|
|
|
|
| |||||||||||
Net Asset Value per Share, End of year | $ | 9.39 | $ | 11.56 | $ | 11.98 | $ | 11.41 | $ | 10.52 | ||||||||||
|
|
|
|
|
|
|
|
|
| |||||||||||
Total Return | (17.10 | )% | 0.19 | % | 7.14 | % | 11.48 | % | (1.87 | )% | ||||||||||
Ratios/Supplemental Data: |
| |||||||||||||||||||
Net Assets, End of year (in thousands) | $ | 911,213 | $ | 1,471,072 | $ | 1,344,787 | $ | 946,896 | $ | 975,741 | ||||||||||
Ratio of Expenses to Average Net Assets: |
| |||||||||||||||||||
Before Expense Reimbursement | 0.53 | % | 0.51 | % | 0.51 | % | 0.51 | % | 0.51 | % | ||||||||||
After Expense Reimbursement | 0.49 | % | 0.49 | % | 0.49 | % | 0.49 | % | 0.49 | % | ||||||||||
Ratio of Net Investment Income to Average Net Assets | 1.90 | % | 0.94 | % | 1.66 | % | 2.69 | % | 2.34 | % | ||||||||||
Portfolio Turnover Rate | 473.72 | % | 469.87 | % | 371.22 | % | 214.76 | % | 267.96 | % | ||||||||||
| (1) | Computed using average shares outstanding throughout the period. |
| (2) | Amount rounds to less than $0.01 per share. |
See accompanying Notes to Financial Statements.
144
Table of Contents
TCW Core Fixed Income Fund
Financial Highlights — N Class
| Year Ended October 31, | ||||||||||||||||||||
| 2022 | 2021 | 2020 | 2019 | 2018 | ||||||||||||||||
Net Asset Value per Share, Beginning of year | $ | 11.53 | $ | 11.95 | $ | 11.38 | $ | 10.49 | $ | 10.96 | ||||||||||
|
|
|
|
|
|
|
|
|
| |||||||||||
Income (Loss) from Investment Operations: |
| |||||||||||||||||||
Net Investment Income (1) | 0.19 | 0.09 | 0.18 | 0.27 | 0.23 | |||||||||||||||
Net Realized and Unrealized Gain (Loss) on Investments | (2.16 | ) | (0.09 | ) | 0.60 | 0.90 | (0.46 | ) | ||||||||||||
|
|
|
|
|
|
|
|
|
| |||||||||||
Total from Investment Operations | (1.97 | ) | 0.78 | 1.17 | (0.23 | ) | ||||||||||||||
|
|
|
|
|
|
|
|
|
| |||||||||||
Less Distributions: |
| |||||||||||||||||||
Distributions from Net Investment Income | (0.15 | ) | (0.12 | ) | (0.21 | ) | (0.28 | ) | (0.24 | ) | ||||||||||
Distributions from Net Realized Gain | (0.00 | ) (2) | (0.26 | ) | — | — | — | |||||||||||||
Distributions from Return of Capital | (0.03 | ) | (0.04 | ) | — | — | — | |||||||||||||
|
|
|
|
|
|
|
|
|
| |||||||||||
Total Distributions | (0.18 | ) | (0.42 | ) | (0.21 | ) | (0.28 | ) | (0.24 | ) | ||||||||||
|
|
|
|
|
|
|
|
|
| |||||||||||
Net Asset Value per Share, End of year | $ | 9.38 | $ | 11.53 | $ | 11.95 | $ | 11.38 | $ | 10.49 | ||||||||||
|
|
|
|
|
|
|
|
|
| |||||||||||
Total Return | (17.22 | )% | 0.00 | % | 6.92 | % | 11.27 | % | (2.10 | )% | ||||||||||
Ratios/Supplemental Data: |
| |||||||||||||||||||
Net Assets, End of year (in thousands) | $ | 170,497 | $ | 223,562 | $ | 241,938 | $ | 240,107 | $ | 270,477 | ||||||||||
Ratio of Expenses to Average Net Assets: |
| |||||||||||||||||||
Before Expense Reimbursement | 0.82 | % | 0.80 | % | 0.80 | % | 0.81 | % | 0.81 | % | ||||||||||
After Expense Reimbursement | 0.64 | % | 0.65 | % | 0.67 | % | 0.70 | % | 0.72 | % | ||||||||||
Ratio of Net Investment Income to Average Net Assets | 1.77 | % | 0.78 | % | 1.53 | % | 2.48 | % | 2.12 | % | ||||||||||
Portfolio Turnover Rate | 473.72 | % | 469.87 | % | 371.22 | % | 214.76 | % | 267.96 | % | ||||||||||
| (1) | Computed using average shares outstanding throughout the period. |
| (2) | Amount rounds to less than $0.01 per share. |
See accompanying Notes to Financial Statements.
145
Table of Contents
TCW Core Fixed Income Fund
Financial Highlights — Plan Class
| Year Ended October 31, | February 28, 2020 (Commencement of Operations) through October 31, 2020 | |||||||||||
| 2022 | 2021 | |||||||||||
Net Asset Value per Share, Beginning of year | $ | 11.61 | $ | 12.06 | $ | 11.72 | ||||||
|
|
|
|
|
| |||||||
Income (Loss) from Investment Operations: |
| |||||||||||
Net Investment Income (1) | 0.25 | 0.11 | 0.18 | |||||||||
Net Realized and Unrealized Gain (Loss) on Investments | (2.21 | ) | (0.11 | ) | 0.29 | |||||||
|
|
|
|
|
| |||||||
Total from Investment Operations | (1.96 | ) | 0.00 | 0.47 | ||||||||
|
|
|
|
|
| |||||||
Less Distributions: |
| |||||||||||
Distributions from Net Investment Income | (0.18 | ) | (0.14 | ) | (0.13 | ) | ||||||
Distributions from Net Realized Gain | (0.00 | ) (2) | (0.26 | ) | — | |||||||
Distributions from Return of Capital | (0.03 | ) | (0.05 | ) | — | |||||||
|
|
|
|
|
| |||||||
Total distributions | (0.21 | ) | (0.45 | ) | (0.13 | ) | ||||||
|
|
|
|
|
| |||||||
Net Asset Value per Share, End of year | $ | 9.44 | $ | 11.61 | $ | 12.06 | ||||||
|
|
|
|
|
| |||||||
Total Return | (17.07 | )% | (0.01 | )% | 3.98 | % (3) | ||||||
Ratios/Supplemental Data: |
| |||||||||||
Net assets, end of year (in thousands) | $ | 81,408 | $ | 867 | $ | 0.00 | (4) | |||||
Ratio of Expenses to Average Net Assets: |
| |||||||||||
Before Expense Reimbursement | 0.51 | % | 7.54 | % | 14,703.31 | % (5) | ||||||
After Expense Reimbursement | 0.44 | % | 0.44 | % | 0.44 | % (5) | ||||||
Ratio of Net Investment Income to Average Net Assets | 2.46 | % | 0.97 | % | 2.20 | % (5) | ||||||
Portfolio Turnover Rate | 473.72 | % | 469.87 | % | 371.22 | % (3) | ||||||
| (1) | Computed using average shares outstanding throughout the period. |
| (2) | Amount rounds to less than $0.01 per share. |
| (3) | For the period February 28, 2020 (Commencement of Operations) through October 31, 2020. |
| (4) | Amount Rounds to less than $1,000. |
| (5) | Annualized. |
See accompanying Notes to Financial Statements.
146
Table of Contents
TCW Enhanced Commodity Strategy Fund
Consolidated Financial Highlights — I Class
| Year Ended October 31, | ||||||||||||||||||||
| 2022 | 2021 | 2020 | 2019 | 2018 | ||||||||||||||||
Net Asset Value per Share, Beginning of year | $ | 6.32 | $ | 4.36 | $ | 4.84 | $ | 5.01 | $ | 5.20 | ||||||||||
|
|
|
|
|
|
|
|
|
| |||||||||||
Income (Loss) from Investment Operations: |
| |||||||||||||||||||
Net Investment Income (1) | 0.12 | 0.05 | 0.10 | 0.17 | 0.11 | |||||||||||||||
Net Realized and Unrealized Gain (Loss) on Investments | 0.28 | 2.02 | (0.41 | ) | (0.20 | ) | (0.20 | ) | ||||||||||||
|
|
|
|
|
|
|
|
|
| |||||||||||
Total from Investment Operations | 0.40 | 2.07 | (0.31 | ) | (0.03 | ) | (0.09 | ) | ||||||||||||
|
|
|
|
|
|
|
|
|
| |||||||||||
Less Distributions: |
| |||||||||||||||||||
Distributions from Net Investment Income | (0.38 | ) | (0.09 | ) | (0.15 | ) | (0.14 | ) | (0.10 | ) | ||||||||||
Distributions from Net Realized Gain | — | (0.02 | ) | (0.02 | ) | — | — | |||||||||||||
|
|
|
|
|
|
|
|
|
| |||||||||||
Total Distributions | (0.38 | ) | (0.11 | ) | (0.17 | ) | (0.14 | ) | (0.10 | ) | ||||||||||
|
|
|
|
|
|
|
|
|
| |||||||||||
Net Asset Value per Share, End of year | $ | 6.34 | $ | 6.32 | $ | 4.36 | $ | 4.84 | $ | 5.01 | ||||||||||
|
|
|
|
|
|
|
|
|
| |||||||||||
Total Return | 6.82 | % | 48.18 | % | (5.82 | )% | (0.96 | )% | (1.96 | )% | ||||||||||
Ratios/Supplemental Data: |
| |||||||||||||||||||
Net Assets, End of year (in thousands) | $ | 29,511 | $ | 1,983 | $ | 693 | $ | 740 | $ | 1,208 | ||||||||||
Ratio of Expenses to Average Net Assets: |
| |||||||||||||||||||
Before Expense Reimbursement | 1.73 | % | 15.84 | % | 16.92 | % | 17.82 | % | 11.53 | % | ||||||||||
After Expense Reimbursement | 0.70 | % | 0.70 | % | 0.70 | % | 0.70 | % | 0.70 | % | ||||||||||
Ratio of Net Investment Income to Average Net Assets | 1.70 | % | 0.84 | % | 2.29 | % | 3.45 | % | 2.06 | % | ||||||||||
Portfolio Turnover Rate | 53.15 | % | 32.09 | % | 54.50 | % | 122.23 | % | 75.52 | % | ||||||||||
| (1) | Computed using average shares outstanding throughout the period. |
See accompanying Notes to Financial Statements.
147
Table of Contents
TCW Enhanced Commodity Strategy Fund
Consolidated Financial Highlights — N Class
| Year Ended October 31, | ||||||||||||||||||||
| 2022 | 2021 | 2020 | 2019 | 2018 | ||||||||||||||||
Net Asset Value per Share, Beginning of year | $ | 6.31 | $ | 4.35 | $ | 4.84 | $ | 5.01 | $ | 5.21 | ||||||||||
|
|
|
|
|
|
|
|
|
| |||||||||||
Income (Loss) from Investment Operations: |
| |||||||||||||||||||
Net Investment Income (1) | 0.12 | 0.04 | 0.10 | 0.17 | 0.11 | |||||||||||||||
Net Realized and Unrealized Gain (Loss) on Investments | 0.29 | 2.03 | (0.42 | ) | (0.20 | ) | (0.21 | ) | ||||||||||||
|
|
|
|
|
|
|
|
|
| |||||||||||
Total from Investment Operations | 0.41 | 2.07 | (0.32 | ) | (0.03 | ) | (0.10 | ) | ||||||||||||
|
|
|
|
|
|
|
|
|
| |||||||||||
Less Distributions: |
| |||||||||||||||||||
Distributions from Net Investment Income | (0.38 | ) | (0.09 | ) | (0.15 | ) | (0.14 | ) | (0.10 | ) | ||||||||||
Distributions from Net Realized Gain | — | (0.02 | ) | (0.02 | ) | — | — | |||||||||||||
|
|
|
|
|
|
|
|
|
| |||||||||||
Total Distributions | (0.38 | ) | (0.11 | ) | (0.17 | ) | (0.14 | ) | (0.10 | ) | ||||||||||
|
|
|
|
|
|
|
|
|
| |||||||||||
Net Asset Value per Share, End of year | $ | 6.34 | $ | 6.31 | $ | 4.35 | $ | 4.84 | $ | 5.01 | ||||||||||
|
|
|
|
|
|
|
|
|
| |||||||||||
Total Return | 6.93 | % | 48.21 | % | (5.90 | )% | (1.16 | )% | (1.96 | )% | ||||||||||
Ratios/Supplemental Data: |
| |||||||||||||||||||
Net Assets, End of year (in thousands) | $ | 11,181 | $ | 911 | $ | 472 | $ | 504 | $ | 507 | ||||||||||
Ratio of Expenses to Average Net Assets: |
| |||||||||||||||||||
Before Expense Reimbursement | 2.26 | % | 16.76 | % | 17.60 | % | 19.14 | % | 12.59 | % | ||||||||||
After Expense Reimbursement | 0.75 | % | 0.75 | % | 0.75 | % | 0.75 | % | 0.75 | % | ||||||||||
Ratio of Net Investment Income to Average Net Assets | 1.79 | % | 0.82 | % | 2.24 | % | 3.57 | % | 2.02 | % | ||||||||||
Portfolio Turnover Rate | 53.15 | % | 32.09 | % | 54.50 | % | 122.23 | % | 75.52 | % | ||||||||||
| (1) | Computed using average shares outstanding throughout the period. |
See accompanying Notes to Financial Statements.
148
Table of Contents
TCW Global Bond Fund
Financial Highlights — I Class
| Year Ended October 31, | ||||||||||||||||||||
| 2022 | 2021 | 2020 | 2019 | 2018 | ||||||||||||||||
Net Asset Value per Share, Beginning of year | $ | 10.18 | $ | 10.66 | $ | 10.26 | $ | 9.45 | $ | 9.75 | ||||||||||
|
|
|
|
|
|
|
|
|
| |||||||||||
Income (Loss) from Investment Operations: |
| |||||||||||||||||||
Net Investment Income (1) | 0.24 | 0.20 | 0.25 | 0.24 | 0.19 | |||||||||||||||
Net Realized and Unrealized Gain (Loss) on Investments | (2.50 | ) | (0.20 | ) | 0.54 | 0.73 | (0.43 | ) | ||||||||||||
|
|
|
|
|
|
|
|
|
| |||||||||||
Total from Investment Operations | (2.26 | ) | 0.00 | 0.79 | 0.97 | (0.24 | ) | |||||||||||||
|
|
|
|
|
|
|
|
|
| |||||||||||
Less Distributions: |
| |||||||||||||||||||
Distributions from Net Investment Income | (0.03 | ) | (0.20 | ) | (0.15 | ) | (0.16 | ) | (0.05 | ) | ||||||||||
Distributions from Return of Capital | (0.13 | ) | (0.06 | ) | �� | — | — | — | ||||||||||||
Distributions from Net Realized Gain | (0.01 | ) | (0.22 | ) | (0.24 | ) | — | (0.01 | ) | |||||||||||
|
|
|
|
|
|
|
|
|
| |||||||||||
Total Distributions | (0.17 | ) | (0.48 | ) | (0.39 | ) | (0.16 | ) | (0.06 | ) | ||||||||||
|
|
|
|
|
|
|
|
|
| |||||||||||
Net Asset Value per Share, End of year | $ | 7.75 | $ | 10.18 | $ | 10.66 | $ | 10.26 | $ | 9.45 | ||||||||||
|
|
|
|
|
|
|
|
|
| |||||||||||
Total Return | (22.45 | )% | (0.18 | )% | 7.99 | % | 10.42 | % | (2.54 | )% | ||||||||||
Ratios/Supplemental Data: |
| |||||||||||||||||||
Net Assets, End of year (in thousands) | $ | 8,650 | $ | 24,332 | $ | 10,822 | $ | 9,384 | $ | 8,505 | ||||||||||
Ratio of Expenses to Average Net Assets: |
| |||||||||||||||||||
Before Expense Reimbursement | 1.67 | % | 1.15 | % | 1.66 | % | 1.79 | % | 1.63 | % | ||||||||||
After Expense Reimbursement | 0.60 | % | 0.60 | % | 0.60 | % | 0.66 | % | 1.00 | % | ||||||||||
Ratio of Net Investment Income to Average Net Assets | 2.59 | % | 1.87 | % | 2.40 | % | 2.48 | % | 1.99 | % | ||||||||||
Portfolio Turnover Rate | 208.60 | % | 245.94 | % | 228.14 | % | 83.18 | % | 102.42 | % | ||||||||||
| (1) | Computed using average shares outstanding throughout the period. |
See accompanying Notes to Financial Statements.
149
Table of Contents
TCW Global Bond Fund
Financial Highlights — N Class
| Year Ended October 31, | ||||||||||||||||||||
| 2022 | 2021 | 2020 | 2019 | 2018 | ||||||||||||||||
Net Asset Value per Share, Beginning of year | $ | 10.17 | $ | 10.66 | $ | 10.26 | $ | 9.45 | $ | 9.75 | ||||||||||
|
|
|
|
|
|
|
|
|
| |||||||||||
Income (Loss) from Investment Operations: |
| |||||||||||||||||||
Net Investment Income (1) | 0.26 | 0.19 | 0.24 | 0.24 | 0.19 | |||||||||||||||
Net Realized and Unrealized Gain (Loss) on Investments | (2.52 | ) | (0.21 | ) | 0.55 | 0.72 | (0.43 | ) | ||||||||||||
|
|
|
|
|
|
|
|
|
| |||||||||||
Total from Investment Operations | (2.26 | ) | (0.02 | ) | 0.79 | 0.96 | (0.24 | ) | ||||||||||||
|
|
|
|
|
|
|
|
|
| |||||||||||
Less Distributions: |
| |||||||||||||||||||
Distributions from Net Investment Income | (0.03 | ) | (0.19 | ) | (0.15 | ) | (0.15 | ) | (0.05 | ) | ||||||||||
Distributions from Net Realized Gain | (0.01 | ) | (0.22 | ) | (0.24 | ) | — | (0.01 | ) | |||||||||||
Distributions from Return of Capital | (0.12 | ) | (0.06 | ) | — | — | — | |||||||||||||
|
|
|
|
|
|
|
|
|
| |||||||||||
Total Distributions | (0.16 | ) | (0.47 | ) | (0.39 | ) | (0.15 | ) | (0.06 | ) | ||||||||||
|
|
|
|
|
|
|
|
|
| |||||||||||
Net Asset Value per Share, End of year | $ | 7.75 | $ | 10.17 | $ | 10.66 | $ | 10.26 | $ | 9.45 | ||||||||||
|
|
|
|
|
|
|
|
|
| |||||||||||
Total Return | (22.45 | )% | (0.38 | )% | 7.93 | % | 10.32 | % | (2.54 | )% | ||||||||||
Ratios/Supplemental Data: |
| |||||||||||||||||||
Net Assets, End of year (in thousands) | $ | 7,730 | $ | 10,742 | $ | 10,972 | $ | 8,282 | $ | 7,476 | ||||||||||
Ratio of Expenses to Average Net Assets: |
| |||||||||||||||||||
Before Expense Reimbursement | 2.15 | % | 1.53 | % | 1.94 | % | 2.09 | % | 1.92 | % | ||||||||||
After Expense Reimbursement | 0.70 | % | 0.70 | % | 0.70 | % | 0.74 | % | 1.00 | % | ||||||||||
Ratio of Net Investment Income to Average Net Assets | 2.80 | % | 1.77 | % | 2.29 | % | 2.39 | % | 1.99 | % | ||||||||||
Portfolio Turnover Rate | 208.60 | % | 245.94 | % | 228.14 | % | 83.18 | % | 102.42 | % | ||||||||||
| (1) | Computed using average shares outstanding throughout the period. |
See accompanying Notes to Financial Statements.
150
Table of Contents
TCW High Yield Bond Fund
Financial Highlights — I Class
| Year Ended October 31, | ||||||||||||||||||||
| 2022 | 2021 | 2020 | 2019 | 2018 | ||||||||||||||||
Net Asset Value per Share, Beginning of year | $ | 6.89 | $ | 6.66 | $ | 6.49 | $ | 6.15 | $ | 6.37 | ||||||||||
|
|
|
|
|
|
|
|
|
| |||||||||||
Income (Loss) from Investment Operations: |
| |||||||||||||||||||
Net Investment Income (1) | 0.28 | 0.23 | 0.24 | 0.27 | 0.26 | |||||||||||||||
Net Realized and Unrealized Gain (Loss) on Investments | (0.94 | ) | 0.24 | 0.19 | 0.36 | (0.17 | ) | |||||||||||||
|
|
|
|
|
|
|
|
|
| |||||||||||
Total from Investment Operations | (0.66 | ) | 0.47 | 0.43 | 0.63 | 0.09 | ||||||||||||||
|
|
|
|
|
|
|
|
|
| |||||||||||
Less Distributions: |
| |||||||||||||||||||
Distributions from Net Investment Income | (0.30 | ) | (0.24 | ) | (0.26 | ) | (0.29 | ) | (0.31 | ) | ||||||||||
Distributions from Net Realized Gain | (0.13 | ) | — | — | — | — | ||||||||||||||
|
|
|
|
|
|
|
|
|
| |||||||||||
Total Distributions | (0.43 | ) | (0.24 | ) | (0.26 | ) | (0.29 | ) | (0.31 | ) | ||||||||||
|
|
|
|
|
|
|
|
|
| |||||||||||
Net Asset Value per Share, End of year | $ | 5.80 | $ | 6.89 | $ | 6.66 | $ | 6.49 | $ | 6.15 | ||||||||||
|
|
|
|
|
|
|
|
|
| |||||||||||
Total Return | (9.97 | )% | 7.18 | % | 6.88 | % | 10.44 | % | 1.40 | % | ||||||||||
Ratios/Supplemental Data: |
| |||||||||||||||||||
Net Assets, End of year (in thousands) | $ | 50,992 | $ | 96,223 | $ | 85,990 | $ | 19,563 | $ | 7,749 | ||||||||||
Ratio of Expenses to Average Net Assets: |
| |||||||||||||||||||
Before Expense Reimbursement | 0.84 | % | 0.76 | % | 0.97 | % | 1.68 | % | 1.50 | % | ||||||||||
After Expense Reimbursement | 0.55 | % | 0.55 | % | 0.55 | % | 0.55 | % | 0.55 | % | ||||||||||
Ratio of Net Investment Income to Average Net Assets | 4.46 | % | 3.36 | % | 3.67 | % | 4.18 | % | 4.13 | % | ||||||||||
Portfolio Turnover Rate | 94.04 | % | 82.13 | % | 111.34 | % | 121.56 | % | 104.21 | % | ||||||||||
| (1) | Computed using average shares outstanding throughout the period. |
See accompanying Notes to Financial Statements.
151
Table of Contents
TCW High Yield Bond Fund
Financial Highlights — N Class
| Year Ended October 31, | ||||||||||||||||||||
| 2022 | 2021 | 2020 | 2019 | 2018 | ||||||||||||||||
Net Asset Value per Share, Beginning of year | $ | 6.93 | $ | 6.70 | $ | 6.54 | $ | 6.19 | $ | 6.42 | ||||||||||
|
|
|
|
|
|
|
|
|
| |||||||||||
Income (Loss) from Investment Operations: |
| |||||||||||||||||||
Net Investment Income (1) | 0.27 | 0.22 | 0.23 | 0.25 | 0.25 | |||||||||||||||
Net Realized and Unrealized Gain (Loss) on Investments | (0.94 | ) | 0.23 | 0.18 | 0.38 | (0.18 | ) | |||||||||||||
|
|
|
|
|
|
|
|
|
| |||||||||||
Total from Investment Operations | (0.67 | ) | 0.45 | 0.41 | 0.63 | 0.07 | ||||||||||||||
|
|
|
|
|
|
|
|
|
| |||||||||||
Less Distributions: |
| |||||||||||||||||||
Distributions from Net Investment Income | (0.29 | ) | (0.22 | ) | (0.25 | ) | (0.28 | ) | (0.30 | ) | ||||||||||
Distributions from Net Realized Gain | (0.13 | ) | — | — | — | — | ||||||||||||||
|
|
|
|
|
|
|
|
|
| |||||||||||
Total Distributions | (0.42 | ) | (0.22 | ) | (0.25 | ) | (0.28 | ) | (0.30 | ) | ||||||||||
|
|
|
|
|
|
|
|
|
| |||||||||||
Net Asset Value per Share, End of year | $ | 5.84 | $ | 6.93 | $ | 6.70 | $ | 6.54 | $ | 6.19 | ||||||||||
|
|
|
|
|
|
|
|
|
| |||||||||||
Total Return | (10.24 | )% | 7.05 | % | 6.61 | % | 10.16 | % | 1.04 | % | ||||||||||
Ratios/Supplemental Data: |
| |||||||||||||||||||
Net Assets, End of year (in thousands) | $ | 9,043 | $ | 15,048 | $ | 17,805 | $ | 9,923 | $ | 5,041 | ||||||||||
Ratio of Expenses to Average Net Assets: |
| |||||||||||||||||||
Before Expense Reimbursement | 1.27 | % | 1.14 | % | 1.47 | % | 2.05 | % | 1.98 | % | ||||||||||
After Expense Reimbursement | 0.80 | % | 0.80 | % | 0.80 | % | 0.80 | % | 0.80 | % | ||||||||||
Ratio of Net Investment Income to Average Net Assets | 4.25 | % | 3.11 | % | 3.46 | % | 3.96 | % | 3.90 | % | ||||||||||
Portfolio Turnover Rate | 94.04 | % | 82.13 | % | 111.34 | % | 121.56 | % | 104.21 | % | ||||||||||
| (1) | Computed using average shares outstanding throughout the period. |
See accompanying Notes to Financial Statements.
152
Table of Contents
TCW Short Term Bond Fund
Financial Highlights — I Class
| Year Ended October 31, | ||||||||||||||||||||
| 2022 | 2021 | 2020 | 2019 | 2018 | ||||||||||||||||
Net Asset Value per Share, Beginning of year | $ | 8.60 | $ | 8.60 | $ | 8.59 | $ | 8.54 | $ | 8.62 | ||||||||||
|
|
|
|
|
|
|
|
|
| |||||||||||
Income (Loss) from Investment Operations: |
| |||||||||||||||||||
Net Investment Income (1) | 0.10 | 0.29 | 0.16 | 0.25 | 0.15 | |||||||||||||||
Net Realized and Unrealized Gain (Loss) on Investments | (0.41 | ) | (0.19 | ) | (0.01 | ) | 0.07 | (0.04 | ) | |||||||||||
|
|
|
|
|
|
|
|
|
| |||||||||||
Total from Investment Operations | (0.31 | ) | 0.10 | 0.15 | 0.32 | 0.11 | ||||||||||||||
|
|
|
|
|
|
|
|
|
| |||||||||||
Less Distributions: |
| |||||||||||||||||||
Distributions from Net Investment Income | (0.15 | ) | (0.10 | ) | (0.11 | ) | (0.27 | ) | (0.19 | ) | ||||||||||
Distributions from Return of Capital | (0.06 | ) | — | (0.03 | ) | — | — | |||||||||||||
|
|
|
|
|
|
|
|
|
| |||||||||||
Total Distributions | (0.21 | ) | (0.10 | ) | (0.14 | ) | (0.27 | ) | (0.19 | ) | ||||||||||
|
|
|
|
|
|
|
|
|
| |||||||||||
Net Asset Value per Share, End of year | $ | 8.08 | $ | 8.60 | $ | 8.60 | $ | 8.59 | $ | 8.54 | ||||||||||
|
|
|
|
|
|
|
|
|
| |||||||||||
Total Return | (3.61 | )% | 1.16 | % | 1.70 | % | 3.83 | % | 1.26 | % | ||||||||||
Ratios/Supplemental Data: |
| |||||||||||||||||||
Net Assets, End of year (in thousands) | $ | 8,270 | $ | 18,061 | $ | 7,698 | $ | 5,644 | $ | 7,280 | ||||||||||
Ratio of Expenses to Average Net Assets: |
| |||||||||||||||||||
Before Expense Reimbursement | 2.40 | % | 2.77 | % | 2.77 | % | 3.37 | % | 2.28 | % | ||||||||||
After Expense Reimbursement | 0.44 | % | 0.44 | % | 0.44 | % | 0.44 | % | 0.44 | % | ||||||||||
Ratio of Net Investment Income to Average Net Assets | 1.21 | % | 3.35 | % | 1.83 | % | 2.94 | % | 1.70 | % | ||||||||||
Portfolio Turnover Rate | 542.69 | % | 369.54 | % | 191.22 | % | 248.19 | % | 199.55 | % | ||||||||||
| (1) | Computed using average shares outstanding throughout the period. |
See accompanying Notes to Financial Statements.
153
Table of Contents
TCW Total Return Bond Fund
Financial Highlights — I Class
| Year Ended October 31, | ||||||||||||||||||||
| 2022 | 2021 | 2020 | 2019 | 2018 | ||||||||||||||||
Net Asset Value per Share, Beginning of year | $ | 10.14 | $ | 10.46 | $ | 10.07 | $ | 9.46 | $ | 9.98 | ||||||||||
|
|
|
|
|
|
|
|
|
| |||||||||||
Income (Loss) from Investment Operations: |
| |||||||||||||||||||
Net Investment Income (1) | 0.33 | 0.21 | 0.26 | 0.34 | 0.31 | |||||||||||||||
Net Realized and Unrealized Gain (Loss) on Investments | (2.28 | ) | (0.25 | ) | 0.44 | 0.68 | (0.48 | ) | ||||||||||||
|
|
|
|
|
|
|
|
|
| |||||||||||
Total from Investment Operations | (1.95 | ) | (0.04 | ) | 0.70 | 1.02 | (0.17 | ) | ||||||||||||
|
|
|
|
|
|
|
|
|
| |||||||||||
Less Distributions: |
| |||||||||||||||||||
Distributions from Net Investment Income | (0.23 | ) | (0.20 | ) | (0.31 | ) | (0.41 | ) | (0.35 | ) | ||||||||||
Distributions from Return of Capital | — | (0.01 | ) | — | — | — | ||||||||||||||
Distributions from Net Realized Gain | — | (0.07 | ) | — | — | — | ||||||||||||||
|
|
|
|
|
|
|
|
|
| |||||||||||
Total Distributions | (0.23 | ) | (0.28 | ) | (0.31 | ) | (0.41 | ) | (0.35 | ) | ||||||||||
|
|
|
|
|
|
|
|
|
| |||||||||||
Net Asset Value per Share, End of year | $ | 7.96 | $ | 10.14 | $ | 10.46 | $ | 10.07 | $ | 9.46 | ||||||||||
|
|
|
|
|
|
|
|
|
| |||||||||||
Total Return | (19.58 | )% | (0.40 | )% | 7.08 | % | 10.82 | % | (1.67 | )% | ||||||||||
Ratios/Supplemental Data: |
| |||||||||||||||||||
Net Assets, End of year (in thousands) | $ | 2,595,866 | $ | 4,264,583 | $ | 5,737,736 | $ | 4,898,103 | $ | 5,587,668 | ||||||||||
Ratio of Expenses to Average Net Assets: |
| |||||||||||||||||||
Before Expense Reimbursement | 0.55 | % | 0.52 | % | 0.55 | % | 0.62 | % | 0.62 | % | ||||||||||
After Expense Reimbursement | 0.49 | % | 0.49 | % | 0.49 | % | 0.49 | % | 0.49 | % | ||||||||||
Ratio of Net Investment Income to Average Net Assets | 3.59 | % | 2.07 | % | 2.50 | % | 3.47 | % | 3.20 | % | ||||||||||
Portfolio Turnover Rate | 386.85 | % | 493.39 | % | 269.04 | % | 177.80 | % | 241.76 | % | ||||||||||
| (1) | Computed using average shares outstanding throughout the period. |
See accompanying Notes to Financial Statements.
154
Table of Contents
TCW Total Return Bond Fund
Financial Highlights — N Class
| Year Ended October 31, | ||||||||||||||||||||
| 2022 | 2021 | 2020 | 2019 | 2018 | ||||||||||||||||
Net Asset Value per Share, Beginning of year | $ | 10.46 | $ | 10.78 | $ | 10.37 | $ | 9.76 | $ | 10.29 | ||||||||||
|
|
|
|
|
|
|
|
|
| |||||||||||
Income (Loss) from Investment Operations: |
| |||||||||||||||||||
Net Investment Income (1) | 0.33 | 0.19 | 0.23 | 0.32 | 0.29 | |||||||||||||||
Net Realized and Unrealized Gain (Loss) on Investments | (2.37 | ) | (0.25 | ) | 0.47 | 0.69 | (0.49 | ) | ||||||||||||
|
|
|
|
|
|
|
|
|
| |||||||||||
Total from Investment Operations | (2.04 | ) | (0.06 | ) | 0.70 | 1.01 | (0.20 | ) | ||||||||||||
|
|
|
|
|
|
|
|
|
| |||||||||||
Less Distributions: |
| |||||||||||||||||||
Distributions from Net Investment Income | (0.21 | ) | (0.18 | ) | (0.29 | ) | (0.40 | ) | (0.33 | ) | ||||||||||
Distributions from Net Realized Gain | — | (0.07 | ) | — | — | — | ||||||||||||||
Distributions from Return of Capital | — | (0.01 | ) | — | — | — | ||||||||||||||
|
|
|
|
|
|
|
|
|
| |||||||||||
Total Distributions | (0.21 | ) | (0.26 | ) | (0.29 | ) | (0.40 | ) | (0.33 | ) | ||||||||||
|
|
|
|
|
|
|
|
|
| |||||||||||
Net Asset Value per Share, End of year | $ | 8.21 | $ | 10.46 | $ | 10.78 | $ | 10.37 | $ | 9.76 | ||||||||||
|
|
|
|
|
|
|
|
|
| |||||||||||
Total Return | (19.70 | )% | (0.58 | )% | 6.86 | % | 10.46 | % | (1.96 | )% | ||||||||||
Ratios/Supplemental Data: |
| |||||||||||||||||||
Net Assets, End of year (in thousands) | $ | 506,866 | $ | 818,608 | $ | 1,844,170 | $ | 963,512 | $ | 1,121,741 | ||||||||||
Ratio of Expenses to Average Net Assets: |
| |||||||||||||||||||
Before Expense Reimbursement | 0.79 | % | 0.81 | % | 0.79 | % | 0.88 | % | 0.88 | % | ||||||||||
After Expense Reimbursement | 0.70 | % | 0.70 | % | 0.73 | % | 0.79 | % | 0.79 | % | ||||||||||
Ratio of Net Investment Income to Average Net Assets | 3.40 | % | 1.83 | % | 2.21 | % | 3.16 | % | 2.89 | % | ||||||||||
Portfolio Turnover Rate | 386.85 | % | 493.39 | % | 269.04 | % | 177.80 | % | 241.76 | % | ||||||||||
| (1) | Computed using average shares outstanding throughout the period. |
See accompanying Notes to Financial Statements.
155
Table of Contents
TCW Total Return Bond Fund
Financial Highlights — Plan Class
| Year Ended October 31, | February 28, 2020 (Commencement of Operations) through October 31, 2020 | |||||||||||
| 2022 | 2021 | |||||||||||
Net Asset Value per Share, Beginning of year | $ | 10.19 | $ | 10.50 | $ | 10.33 | ||||||
|
|
|
|
|
| |||||||
Income (Loss) from Investment Operations: |
| |||||||||||
Net Investment Income (1) | 0.36 | 0.22 | 0.20 | |||||||||
Net Realized and Unrealized Gain (Loss) on Investments | (2.31 | ) | (0.24 | ) | 0.13 | |||||||
|
|
|
|
|
| |||||||
Total from Investment Operations | (1.95 | ) | (0.02 | ) | 0.33 | |||||||
|
|
|
|
|
| |||||||
Less Distributions: |
| |||||||||||
Distributions from Net Investment Income | (0.24 | ) | (0.21 | ) | (0.16 | ) | ||||||
Distributions from Net Realized Gain | — | (0.07 | ) | — | ||||||||
Distributions from Return of Capital | — | (0.01 | ) | — | ||||||||
|
|
|
|
|
| |||||||
Total distributions | (0.24 | ) | (0.29 | ) | (0.16 | ) | ||||||
|
|
|
|
|
| |||||||
Net Asset Value per Share, End of year | $ | 8.00 | $ | 10.19 | $ | 10.50 | ||||||
|
|
|
|
|
| |||||||
Total Return | (19.43 | )% | (0.25 | )% | 3.22 | % (2) | ||||||
Ratios/Supplemental Data: |
| |||||||||||
Net assets, end of year (in thousands) | $ | 1,522 | $ | 571 | $ | 0.00 | (3) | |||||
Ratio of Expenses to Average Net Assets: |
| |||||||||||
Before Expense Reimbursement | 2.98 | % | 6.69 | % | 14,761.71 | % (4) | ||||||
After Expense Reimbursement | 0.44 | % | 0.44 | % | 0.44 | % (4) | ||||||
Ratio of Net Investment Income to Average Net Assets | 3.88 | % | 2.13 | % | 2.84 | % (4) | ||||||
Portfolio Turnover Rate | 386.85 | % | 493.39 | % | 269.04 | % (2) | ||||||
| (1) | Computed using average shares outstanding throughout the period. |
| (2) | For the period February 28, 2020 (Commencement of Operations) through October 31, 2020. |
| (3) | Amount Rounds to less than $1,000. |
| (4) | Annualized. |
See accompanying Notes to Financial Statements.
156
Table of Contents
TCW Funds, Inc.
Report of Independent Registered Public Accounting Firm
To the Board of Directors and Shareholders of
TCW Funds, Inc.
Opinion on the Financial Statements and Financial Highlights
We have audited the accompanying statements of assets and liabilities of TCW Core Fixed Income Fund, TCW Global Bond Fund, TCW High Yield Bond Fund, TCW Short Term Bond Fund, and TCW Total Return Bond Fund and the consolidated statement of assets and liabilities of TCW Enhanced Commodity Strategy Fund (collectively, the “TCW Fixed Income Funds”) (six of eighteen funds comprising the TCW Funds, Inc.), including the schedules of investments of TCW Core Fixed Income Fund, TCW Global Bond Fund, TCW High Yield Bond Fund, TCW Short Term Bond Fund, and TCW Total Return Bond Fund and the consolidated schedule of investments of TCW Enhanced Commodity Strategy Fund, as of October 31, 2022, and the related statements of operations for TCW Core Fixed Income Fund, TCW Global Bond Fund, TCW High Yield Bond Fund, TCW Short Term Bond Fund, and TCW Total Return Bond Fund and the related consolidated statement of operations for TCW Enhanced Commodity Strategy Fund for the year then ended, the statements of changes in net assets for TCW Core Fixed Income Fund, TCW Global Bond Fund, TCW High Yield Bond Fund, TCW Short Term Bond Fund, and TCW Total Return Bond Fund and the consolidated statements of changes in net assets for TCW Enhanced Commodity Strategy Fund for each of the two years in the period then ended, the financial highlights for TCW Core Fixed Income Fund, TCW Global Bond Fund, TCW High Yield Bond Fund, TCW Short Term Bond Fund, and TCW Total Return Bond Fund and the consolidated financial highlights for TCW Enhanced Commodity Strategy Fund for each of the five years in the period then ended, and the related notes. In our opinion, the financial statements and financial highlights for TCW Core Fixed Income Fund, TCW Global Bond Fund, TCW High Yield Bond Fund, TCW Short Term Bond Fund, and TCW Total Return Bond Fund and the consolidated financial statements and consolidated financial highlights for TCW Enhanced Commodity Strategy Fund present fairly, in all material respects, the financial position of each of the respective TCW Fixed Income Funds as of October 31, 2022, the results of their operations for the year then ended, the changes in their net assets for each of the two years in the period then ended and the financial highlights for each of the five years in the period then ended, in conformity with accounting principles generally accepted in the United States of America.
Basis for Opinion
These financial statements and financial highlights are the responsibility of the TCW Fixed Income Funds’ management. Our responsibility is to express an opinion on the TCW Fixed Income Funds’ financial statements and financial highlights based on our audits. We are a public accounting firm registered with the Public Company Accounting Oversight Board (United States) (PCAOB) and are required to be independent with respect to the TCW Fixed Income Funds in accordance with the U.S. federal securities laws and the applicable rules and regulations of the Securities and Exchange Commission and the PCAOB.
We conducted our audits in accordance with the standards of the PCAOB. Those standards require that we plan and perform the audits to obtain reasonable assurance about whether the financial statements and financial highlights are free of material misstatement, whether due to error or fraud. The TCW Fixed Income Funds are not required to have, nor were we engaged to perform, an audit of their internal control over financial reporting. As part of our audits we are required to obtain an understanding of internal control over financial reporting but not for the purpose of expressing an opinion on the effectiveness of the TCW Fixed Income Funds’ internal control over financial reporting. Accordingly, we express no such opinion.
157
Table of Contents
TCW Funds, Inc.
Report of Independent Registered Public Accounting Firm (Continued)
Our audits included performing procedures to assess the risks of material misstatement of the financial statements and financial highlights, whether due to error or fraud, and performing procedures that respond to those risks. Such procedures included examining, on a test basis, evidence regarding the amounts and disclosures in the financial statements and financial highlights. Our audits also included evaluating the accounting principles used and significant estimates made by management, as well as evaluating the overall presentation of the financial statements and financial highlights. Our procedures included confirmation of securities owned as of October 31, 2022, by correspondence with the custodian and brokers; when replies were not received from brokers, we performed other auditing procedures. We believe that our audits provide a reasonable basis for our opinion.

Los Angeles, California
December 20, 2022
We have served as the auditor of one or more TCW/Metropolitan West Funds investment companies since 1990.
158
Table of Contents
TCW Funds, Inc.
Shareholder Expenses (Unaudited)
As a shareholder of a Fund, you incur ongoing operational costs of the Fund, including management fees and other fund expenses. The following example is intended to help you understand your ongoing costs (in dollars and cents) of investing in a Fund and to compare these costs with the ongoing costs of investing in other funds.
The example is based on an investment of $1,000 invested at the beginning of the period and held for the entire period from May 1, 2022 to October 31, 2022 (184 days).
Actual Expenses: The first line under each Fund in the table below provides information about the actual account values and actual expenses. You may use the information in this line, together with the amount you invested, to estimate the expenses that you paid over the period. Simply divide your account value by $1,000 (for example, an $8,600 account value divided by $1,000 = 8.6), then multiply the result by the number in the first line for your Fund under the heading entitled “Expenses Paid During Period” to estimate the expenses you paid on your account during this period.
Hypothetical Example for Comparison Purposes: The second line under each Fund in the table below provides information about the hypothetical expenses based on each Fund’s actual expense ratio and an assumed rate of return of 5% per year before expenses, which is not the Fund’s actual return. The hypothetical account value and expenses may not be used to estimate the actual ending account balance or expenses you paid for the period. You may use this information to compare the ongoing costs of investing in your Fund and other funds. To do so, compare this 5% hypothetical example with the 5% hypothetical examples that appear in the shareholder reports of the other funds.
TCW Funds, Inc. | Beginning Account Value May 1, 2022 | Ending Account Value October 31, 2022 | Annualized Expense Ratio | Expenses Paid During Period (May 1, 2022 to October 31, 2022) | ||||||||||||
| TCW Core Fixed Income Fund | ||||||||||||||||
I Class Shares | ||||||||||||||||
Actual | $ | 1,000.00 | $ | 921.00 | 0.49 | % | $ | 2.37 | ||||||||
Hypothetical (5% return before expenses) | 1,000.00 | 1,022.74 | 0.49 | % | 2.50 | |||||||||||
N Class Shares | ||||||||||||||||
Actual | $ | 1,000.00 | $ | 920.00 | 0.64 | % | $ | 3.10 | ||||||||
Hypothetical (5% return before expenses) | 1,000.00 | 1,021.98 | 0.64 | % | 3.26 | |||||||||||
Plan Class Shares | ||||||||||||||||
Actual | $ | 1,000.00 | $ | 920.70 | 0.44 | % | $ | 2.13 | ||||||||
Hypothetical (5% return before expenses) | 1,000.00 | 1,023.00 | 0.44 | % | 2.24 | |||||||||||
| TCW Enhanced Commodity Strategy Fund | ||||||||||||||||
I Class Shares | ||||||||||||||||
Actual | $ | 1,000.00 | $ | 859.10 | 0.70 | % | $ | 3.28 | ||||||||
Hypothetical (5% return before expenses) | 1,000.00 | $ | 1,021.68 | 0.70 | % | 3.57 | ||||||||||
N Class Shares | ||||||||||||||||
Actual | $ | 1,000.00 | $ | 858.90 | 0.75 | % | $ | 3.51 | ||||||||
Hypothetical (5% return before expenses) | 1,000.00 | $ | 1,021.42 | 0.75 | % | 3.82 | ||||||||||
159
Table of Contents
TCW Funds, Inc.
Shareholder Expenses (Unaudited) (Continued)
TCW Funds, Inc. | Beginning Account Value May 1, 2022 | Ending Account Value October 31, 2022 | Annualized Expense Ratio | Expenses Paid During Period (May 1, 2022 to October 31, 2022) | ||||||||||||
| TCW Global Bond Fund | ||||||||||||||||
I Class Shares | ||||||||||||||||
Actual | $ | 1,000.00 | $ | 881.30 | 0.60 | % (1) | $ | 2.85 | (1) | |||||||
Hypothetical (5% return before expenses) | 1,000.00 | 1,022.18 | 0.60 | % (1) | 3.06 | (1) | ||||||||||
N Class Shares | ||||||||||||||||
Actual | $ | 1,000.00 | $ | 881.80 | 0.70 | % (1) | $ | 3.32 | (1) | |||||||
Hypothetical (5% return before expenses) | 1,000.00 | 1,021.68 | 0.70 | % (1) | 3.57 | (1) | ||||||||||
| TCW High Yield Bond Fund | ||||||||||||||||
I Class Shares | ||||||||||||||||
Actual | $ | 1,000.00 | $ | 964.90 | 0.55 | % | $ | 2.72 | ||||||||
Hypothetical (5% return before expenses) | 1,000.00 | 1,022.43 | 0.55 | % | 2.80 | |||||||||||
N Class Shares | ||||||||||||||||
Actual | $ | 1,000.00 | $ | 964.10 | 0.80 | % | $ | 3.96 | ||||||||
Hypothetical (5% return before expenses) | 1,000.00 | 1,021.17 | 0.80 | % | 4.08 | |||||||||||
| TCW Short Term Bond Fund | ||||||||||||||||
I Class Shares | ||||||||||||||||
Actual | $ | 1,000.00 | $ | 981.80 | 0.44 | % | $ | 2.20 | ||||||||
Hypothetical (5% return before expenses) | 1,000.00 | 1,022.99 | 0.44 | % | 2.24 | |||||||||||
| TCW Total Return Bond Fund | ||||||||||||||||
I Class Shares | ||||||||||||||||
Actual | $ | 1,000.00 | $ | 893.30 | 0.49 | % | $ | 2.34 | ||||||||
Hypothetical (5% return before expenses) | 1,000.00 | 1,022.74 | 0.49 | % | 2.50 | |||||||||||
N Class Shares | ||||||||||||||||
Actual | $ | 1,000.00 | $ | 893.70 | 0.70 | % | $ | 3.34 | ||||||||
Hypothetical (5% return before expenses) | 1,000.00 | 1,021.68 | 0.70 | % | 3.57 | |||||||||||
Plan Class Shares | ||||||||||||||||
Actual | $ | 1,000.00 | $ | 894.20 | 0.44 | % | $ | 2.10 | ||||||||
Hypothetical (5% return before expenses) | 1,000.00 | 1,023.00 | 0.44 | % | 2.24 | |||||||||||
| (1) | Does not include expenses of the underlying affiliated investments. |
160
Table of Contents

The TCW Group, Inc. and Subsidiaries
TCW Investment Management Company LLC
TCW Asset Management Company LLC
Metropolitan West Asset Management, LLC
TCW Funds, Inc. TCW Strategic Income Fund, Inc. Metropolitan West Funds Sepulveda Management LLC | TCW Direct Lending LLC TCW Direct Lending VII LLC TCW Direct Lending VIII LLC |
Effective May 2021
WHAT YOU SHOULD KNOW
At TCW, we recognize the importance of keeping information about you secure and confidential. We do not sell or share your nonpublic personal and financial information with marketers or others outside our affiliated group of companies.
We carefully manage information among our affiliated group of companies to safeguard your privacy and to provide you with consistently excellent service.
We are providing this notice to you to comply with the requirements of Regulation S-P, “Privacy of Consumer Financial information,” issued by the United States Securities and Exchange Commission.
OUR PRIVACY POLICY
We, The TCW Group, Inc. and its subsidiaries, the TCW Funds, Inc., TCW Strategic Income Fund, Inc., the Metropolitan West Funds, Sepulveda Management LLC, TCW Direct Lending LLC, TCW Direct Lending VII LLC, and TCW Direct Lending VIII LLC (collectively, “TCW”) are committed to protecting the nonpublic personal and financial information of our customers and consumers who obtain or seek to obtain financial products or services primarily for personal, family or household purposes. We fulfill our commitment by establishing and implementing policies and systems to protect the security and confidentiality of this information.
In our offices, we limit access to nonpublic personal and financial information about you to those TCW personnel who need to know the information in order to provide products or services to you. We maintain physical, electronic, and procedural safeguards to protect your nonpublic personal and financial information.
CATEGORIES OF INFORMATION WE COLLECT
We may collect the following types of nonpublic personal and financial information about you from the following sources:
| ◾ | Your name, address and identifying numbers, and other personal and financial information, from you and from identification cards and papers you submit to us, on applications, subscription agreements or other forms or communications. |
| ◾ | Information about your account balances and financial transactions with us, our affiliated entities, or nonaffiliated third parties, from our internal sources, from affiliated entities and from nonaffiliated third parties. |
| ◾ | Information about your account balances and financial transactions and other personal and financial information, from consumer credit reporting agencies or other nonaffiliated third parties, to verify information received from you or others. |
161
Table of Contents
CATEGORIES OF INFORMATION WE DISCLOSE TO NONAFFILIATED THIRD PARTIES
We may disclose your name, address and account and other identifying numbers, as well as information about your pending or past transactions and other personal financial information, to nonaffiliated third parties, for our everyday business purposes such as necessary to execute, process, service and confirm your securities transactions and mutual fund transactions, to administer and service your account and commingled investment vehicles in which you are invested, to market our products and services through joint marketing arrangements or to respond to court orders and legal investigations.
We may disclose nonpublic personal and financial information concerning you to law enforcement agencies, federal regulatory agencies, self-regulatory organizations or other nonaffiliated third parties, if required or requested to do so by a court order, judicial subpoena or regulatory inquiry.
We do not otherwise disclose your nonpublic personal and financial information to nonaffiliated third parties, except where we believe in good faith that disclosure is required or permitted by law. Because we do not disclose your nonpublic personal and financial information to nonaffiliated third parties, our Customer Privacy Policy does not contain opt-out provisions.
CATEGORIES OF INFORMATION WE DISCLOSE TO OUR AFFILIATED ENTITIES
| ◾ | We may disclose your name, address and account and other identifying numbers, account balances, information about your pending or past transactions and other personal financial information to our affiliated entities for any purpose. |
| ◾ | We regularly disclose your name, address and account and other identifying numbers, account balances and information about your pending or past transactions to our affiliates to execute, process and confirm securities transactions or mutual fund transactions for you, to administer and service your account and commingled investment vehicles in which you are invested, or to market our products and services to you. |
INFORMATION ABOUT FORMER CUSTOMERS
We do not disclose nonpublic personal and financial information about former customers to nonaffiliated third parties unless required or requested to do so by a court order, judicial subpoena or regulatory inquiry, or otherwise where we believe in good faith that disclosure is required or permitted by law.
QUESTIONS
Should you have any questions about our Customer Privacy Policy, please contact us by email or by regular mail at the address at the end of this policy.
REMINDER ABOUT TCW’S FINANCIAL PRODUCTS
Financial products offered by The TCW Group, Inc. and its subsidiaries, the TCW Funds, Inc., TCW Strategic Income Fund, Inc., the Metropolitan West Funds, Sepulveda Management LLC, TCW Direct Lending LLC, TCW Direct Lending VII LLC, and TCW Direct Lending VIII LLC.
| ◾ | Are not guaranteed by a bank; |
| ◾ | Are not obligations of The TCW Group, Inc. or of its subsidiaries; |
| ◾ | Are not insured by the Federal Deposit Insurance Corporation; and |
| ◾ | Are subject to investment risks, including possible loss of the principal amount committed or invested, and earnings thereon. |
THE TCW GROUP, INC. TCW FUNDS, INC. TCW STRATEGIC INCOME FUND, INC. METROPOLITAN WEST FUNDS | SEPULVEDA MANAGEMENT LLC TCW DIRECT LENDING LLC TCW DIRECT LENDING VII LLC TCW DIRECT LENDING VIII LLC |
Attention: Privacy Officer | 865 South Figueroa Street, Suite 1800 | Los Angeles, CA 90017 | email: privacy@tcw.com
162
Table of Contents
TCW Funds, Inc.
Investment Management and Advisory Agreement Disclosure (Unaudited)
Renewal of Investment Advisory and Management Agreement
TCW Funds, Inc. (the “Corporation”) and TCW Investment Management Company LLC (the “Advisor”) are parties to an Investment Advisory and Management Agreement (“Agreement”), pursuant to which the Advisor is responsible for managing the investments of each separate investment series (each, a “Fund” and collectively, the “Funds”) of the Corporation. Unless terminated by either party, the Agreement continues in effect from year to year provided that the continuance is specifically approved at least annually by the vote of the holders of at least a majority of the outstanding shares of the Funds, or by the Board of Directors of the Corporation (the “Board”), and, in either event, by a majority of the Directors who are not “interested persons” of the Corporation, as such term is defined in Section 2(a)(19) of the Investment Company Act of 1940, as amended (the “Independent Directors”), casting votes in person at a meeting called for that purpose.
At an in-person meeting on September 12, 2022, the Board approved the renewal of the Agreement for an additional one-year term from February 6, 2023 through February 5, 2024. The renewal of the Agreement was approved by the Board (including by a majority of the Independent Directors) upon the recommendation of the Independent Directors. The Independent Directors also met by videoconference in a working session on August 24, 2022 to hear presentations by representatives of the Advisor, to ask related questions, to review and discuss materials provided by the Advisor for their consideration, and to meet separately with their independent legal counsel. On September 12, 2022 they also met separately with their independent legal counsel to review and discuss supplemental information that had been requested on their behalf by their independent legal counsel and presented by the Advisor. The information, material facts, and conclusions that formed the basis for the Independent Directors’ recommendation and the Board’s subsequent approval are described below.
1. Information received
Materials reviewed — During the course of each year, the Directors receive a wide variety of materials relating to the services provided by the Advisor, including reports on the Advisor’s investment processes, as well as on each Fund’s investment results, portfolio composition, portfolio trading practices, compliance monitoring, shareholder services, and other information relating to the nature, extent, and quality of services provided by the Advisor to the Funds. In addition, the Board reviewed information furnished to the Independent Directors in response to a detailed request sent to the Advisor on their behalf. The information in the Advisor’s responses included extensive materials regarding each Fund’s investment results, advisory fee comparisons to advisory fees charged by the Advisor to its institutional clients, financial and profitability information regarding the Advisor, descriptions of various services provided to the Funds and to other advisory and sub-advisory clients, descriptions of functions such as compliance monitoring and portfolio trading practices, and information about the personnel providing investment management services to each Fund. The Directors also considered information provided by an independent data provider, Broadridge, comparing the investment performance and the fee and expense levels of each Fund to those of appropriate peer groups of mutual funds selected by Broadridge. After reviewing this information, the Directors requested additional financial, profitability and service information from the Advisor, which the Advisor provided and the Directors considered.
Review process — The Directors’ determinations were made on the basis of each Director’s business judgment after consideration of all the information presented. The Independent Directors were advised by their independent legal counsel throughout the renewal process and received and reviewed advice from their independent legal counsel regarding legal and industry standards applicable to the renewal of the
163
Table of Contents
TCW Funds, Inc.
Investment Management and Advisory Agreement Disclosure (Unaudited) (Continued)
Agreement, including a legal memorandum from their independent legal counsel discussing their fiduciary duties related to their approval of the continuation of the Agreement. The Independent Directors also discussed the renewal of the Agreement with the Advisor’s representatives and in private sessions at which no representatives of the Advisor were present. In deciding to recommend the renewal of the Agreement with respect to each Fund, the Independent Directors did not identify any single piece of information or particular factor that, in isolation, was the controlling factor. Each Independent Director may also have weighed factors differently. This summary describes the most important, but not all, of the factors considered by the Board and the Independent Directors.
2. Nature, extent, and quality of services provided by the Advisor
The Board and the Independent Directors considered the depth and quality of the Advisor’s investment management process, including its research and strong analytical capabilities; the experience, capability, and integrity of its senior management and other personnel; the continuity in management of client assets; the overall resources available to the Advisor; and the ability of its organizational structure to address the fluctuations in assets that have been experienced over the past several years. The Board and the Independent Directors considered the Advisor’s continued commitment and ability to attract and retain well-qualified investment professionals, noting in particular the Advisor’s hiring of professionals in various areas over the past several years, continued upgrading of resources in its middle office and back office operations and other areas, as well as a continuing and extensive program of infrastructure and systems enhancements, including business continuity and cyber security, as well as budgeting for certain future initiatives. The Board and the Independent Directors also considered that the Advisor made available to its investment professionals a variety of resources and systems relating to investment management, compliance, trading, operations, administration, research, portfolio accounting, and legal matters. They noted the substantial additional resources made available by The TCW Group, Inc., the parent company of the Advisor. The Board and the Independent Directors examined and discussed a detailed description of the extensive additional services provided to the Funds to support their operations and compliance, as compared to the much narrower range of services provided to the Advisor’s institutional and sub-advised clients, as well as the Advisor’s oversight and coordination of numerous outside service providers to the Funds. They further noted the high level of regular communication between the Advisor and the Independent Directors. The Advisor explained its responsibility to supervise the activities of the Funds’ various service providers, as well as supporting the Independent Directors and their meetings, regulatory filings, and various operational personnel, and the related costs.
The Board and the Independent Directors concluded that the nature, extent, and quality of the services provided by the Advisor are of a high quality and have benefited and should continue to benefit the Funds and their shareholders.
3. Investment results
The Board and the Independent Directors considered the investment results of each Fund in light of its investment objective(s) and principal investment strategies. They compared each Fund’s total returns with the total returns of other mutual funds in peer group reports prepared by Broadridge with respect to various longer and more recent periods all ended May 31, 2022. The Board and the Independent Directors reviewed information as to peer group selections presented by Broadridge and discussed the methodology for those selections with Broadridge. In reviewing each Fund’s relative performance, the Board and the Independent Directors took into account each Fund’s investment strategies, distinct characteristics, asset size and diversification.
164
Table of Contents
TCW Funds, Inc.
The Board and the Independent Directors noted that most Funds’ performance was satisfactory over the relevant periods. The Board and the Independent Directors noted that the investment performance of most of the Funds was generally close to or above the median performance of the applicable peer group during the three-year period emphasized by Broadridge in the supplemental materials, but six Funds ranked in the fourth or fifth quintile of their peer groups for that three-year period. For those Funds that lagged peer group averages, they noted that the Advisor had discussed with the Board the reasons for the underperformance, including the investment climate and prevailing market conditions during relevant periods as well as the Advisor’s discipline in maintaining a consistent investment style. The Board indicated that it would continue to monitor portfolio investment performance on a regular basis and discuss with the Advisor from time to time any instances of long-term underperformance as appropriate. The Board and the Independent Directors noted that the performance of some Funds for periods when they lagged their peer group averages remained satisfactory when assessed on a risk-adjusted basis because performance quintiles do not necessarily reflect the degree of risk employed by peer funds to achieve their returns. The Board also considered the Advisor’s assessment of the Funds’ performance during the recent period of significant market volatility.
With respect to the fixed income Funds, the Board and the Independent Directors recognized the Advisor’s deliberate strategy to manage risk in light of its critical view of the fixed income securities markets and overall investment market conditions at present and in the near term. For that reason, the Board and the Independent Directors believed that relative performance also should be considered in light of future market conditions expected by the Advisor. The Board and the Independent Directors noted the Advisor’s view that longer term performance can be more meaningful for active fixed income funds than shorter term performance because fixed income market cycles are generally longer than three years.
For the U.S. fixed income Funds, the Board and the Independent Directors noted the conservative profile of these Funds, which generally experienced less volatility compared to various other funds in the applicable peer group (except for the relative volatility of Total Return Bond Fund, which is a mortgage-focused Fund). They also noted the Advisor’s conservative posture for these Funds with respect to credit and interest rate risks.
For the Total Return Bond Fund, the Board and the Independent Directors noted that the Fund’s performance was in the first quintile for the ten-year period, second quintile for the five-year period, third quintile for the three-year period and fifth quintile for the one-year period.
For the Core Fixed Income Fund, the Board and the Independent Directors noted that the Fund’s performance was in the third quintile for the ten-year period, second quintile for the five- and three-year periods and third quintile for the one-year period.
For the High Yield Bond Fund, the Board and the Independent Directors noted that the Fund’s performance was in the first quintile for the ten-, five- and three-year periods and second quintile for the one-year period.
For the Global Bond Fund, the Board and the Independent Directors noted that the Fund’s performance was in the third quintile for the ten-, five- and three-year periods and fourth quintile for the one-year period.
For the Short Term Bond Fund, the Board and the Independent Directors noted that the Fund’s performance was in the fourth quintile for the ten-year period, second quintile for the five- and three-year periods and first quintile for the one-year period.
165
Table of Contents
TCW Funds, Inc.
Investment Management and Advisory Agreement Disclosure (Unaudited) (Continued)
For the Enhanced Commodity Strategy Fund, the Board and the Independent Directors noted that the Fund’s performance was in the second quintile for the ten-, five- and three-year periods and third quintile for the one-year period.
With respect to the U.S. equity Funds, the Board and the Independent Directors noted that the performance of certain of the Funds for most of the various periods reviewed ranked in the first, second or third quintiles, while other Funds ranked in the fourth and fifth quintiles over various periods.
The Select Equities Fund ranked in the fourth quintile for the ten-year period, second quintile for the five-year period and fourth quintile for the three- and one-year periods. The Board and the Independent Directors considered the Advisor’s explanation that underperformance was driven by negative security selection, primarily in the information technology, healthcare and consumer discretionary sectors. The Board and the Independent Directors also considered the Advisor’s explanation that the underperformance for the one-year period was due to a variety of reasons that can be categorized as realized basis risk, which the Advisor believes, measured over longer periods, tends to decline and that the Fund should be positioned for outperformance going forward.
The Relative Value Dividend Appreciation Fund ranked in the third quintile for the ten-year period, fourth quintile for the five-year period, second quintile for the three-year period and fourth quintile for the one-year period. The Relative Value Large Cap Fund ranked in the third quintile for the ten-year period, fourth quintile for the five-year period, third quintile for the three-year period and fifth quintile for the one-year period. The Relative Value Mid Cap Fund ranked in the fourth quintile for the ten- and five-year periods, third quintile for the three-year period and fifth quintile for the one-year period.
The New America Premier Equities Fund ranked in the first quintile for the five-year period, third quintile for the three-year period and second quintile for the one-year period.
The Global Real Estate Fund ranked in the first quintile for the five- and three-year periods and fifth quintile for the one-year period.
The Artificial Intelligence Equity Fund ranked in the fourth quintile for the three- and one-year periods. The Board and the Independent Directors considered the Advisor’s explanation that the peer funds had greater exposure to the information technology sector, making the peer group less useful in comparing relative performance than if those funds’ principal investment strategies were more closely aligned with the Fund’s investment focus. The Board and the Independent Directors noted that the Fund held only modest positions in companies that were key contributors to the competitor funds’ returns. The Board and the Independent Directors also noted the relatively short operating history of the Fund and determined to continue to closely monitor its performance.
For the asset allocation Fund, the Board and the Independent Directors noted that the Conservative Allocation Fund’s performance was in the first quintile for the ten-, five- and three-year periods and fourth quintile for the one-year period.
With respect to the international and emerging markets Funds, the Board and the Independent Directors noted that the performance of a majority of these Funds ranked in the fourth or fifth quintiles over many of the various time periods reviewed. The Emerging Markets Income Fund ranked in the second quintile for the ten-year period, third quintile for the five-year period and fourth quintile for the three- and one-year periods. The Emerging Markets Local Currency Income Fund ranked in the third quintile for the ten-year period, fourth quintile for the five-year period and the fifth quintile for the three- and one-year periods. The
166
Table of Contents
TCW Funds, Inc.
Emerging Markets Multi-Asset Opportunities Fund ranked in the third quintile for the five-year period, the fourth quintile for the three-year period and the third quintile for the one-year period. The Developing Markets Equity Fund ranked in the fifth quintile for the five-year period, fourth quintile for the three-year period and fifth quintile for the one-year period. The Board and the Independent Directors considered the Advisor’s discussion of performance, including that the challenging international and emerging market conditions in recent years weighed on performance for the Funds in line with other funds in the universe.
The Board and the Independent Directors concluded that the Advisor was implementing each Fund’s investment objective(s) and that the Advisor’s record in managing the Funds indicated that its continued management should benefit each Fund and its shareholders over the long term.
4. Advisory fees and total expenses
The Board and the Independent Directors compared the management fees (which Broadridge defines to include the advisory fee and the administrative fee) and total expenses of each Fund (each as a percentage of average net assets) with the median management fee and operating expense level of the other mutual funds in the relevant Broadridge peer groups. These comparisons assisted the Board and the Independent Directors by providing a reasonable statistical measure to assess each Fund’s fees relative to its relevant peers. The Board and the Independent Directors observed that each Fund’s management fee, after giving effect to applicable waivers and/or reimbursements, was below or near the median of the peer group funds on a current basis. It was noted that the Emerging Markets Multi-Asset Opportunities Fund does not have a quintile ranking for management or total expenses because its peer group of three was too small. The Board and the Independent Directors also observed that each Fund’s total expenses, after giving effect to applicable waivers and/or reimbursements, were below or at the median of the peer group funds. The Board and the Independent Directors also noted the contractual expense limitations to which the Advisor has agreed with respect to each Fund and that the Advisor historically has absorbed any expenses in excess of these limits. The Board and the Independent Directors noted that for several Funds, their below-median management fee and total expenses were in part due to substantial waiver and/or reimbursement pursuant to the contractual expense limitations. The Board and the Independent Directors concluded that the competitive fees charged by the Advisor, and competitive expense ratios, should continue to benefit each Fund and its shareholders.
The Board and the Independent Directors also reviewed information regarding the advisory fees charged by the Advisor to its institutional and sub-advisory clients with similar investment mandates. The Board and the Independent Directors concluded that, although the fees paid by those clients generally were lower than advisory fees paid by the Funds, the differences appropriately reflected the more extensive services provided by the Advisor to the Funds and the Advisor’s significantly greater responsibilities and expenses with respect to the Funds, including the additional time spent by portfolio managers for reasons such as managing the more active cash flows from purchases and redemptions by shareholders, the additional risks of managing a pool of assets for public investors, administrative burdens, daily pricing, valuation and liquidity responsibilities, the supervision of vendors and service providers, and the costs of additional infrastructure and operational resources and personnel and of complying with and supporting the more comprehensive regulatory and governance regime applicable to mutual funds.
5. The Advisor’s costs, level of profits, and economies of scale
The Board and the Independent Directors reviewed information regarding the Advisor’s costs of providing services to the Funds, as well as the resulting level of profits to the Advisor. They reviewed the Advisor’s
167
Table of Contents
TCW Funds, Inc.
Investment Management and Advisory Agreement Disclosure (Unaudited) (Continued)
stated assumptions and methods of allocating certain costs, such as personnel costs, which constitute the Advisor’s largest operating cost. The Board and the Independent Directors recognized that the Advisor should be entitled to earn a reasonable level of profits for the services that it provides to each Fund. The Board and the Independent Directors also reviewed a comparison of the Advisor’s profitability with respect to the Funds to the profitability of certain unaffiliated publicly traded asset managers, which the Advisor believed supported its view that the Advisor’s profitability was reasonable. Based on their review, the Board and the Independent Directors concluded that they were satisfied that the Advisor’s level of profitability from its relationship with each Fund was not unreasonable or excessive.
The Board and the Independent Directors considered the extent to which potential economies of scale could be realized as the Funds grow and whether the advisory fees reflect those potential economies of scale. They recognized that the advisory fees for the Funds do not have breakpoints, which would otherwise result in lower advisory fee rates as the Funds grow larger. They also recognized the Advisor’s view that the advisory fees compare favorably to peer group fees and expenses and remain competitive even at higher asset levels and that the relatively low advisory fees reflect the potential economies of scale. The Board and the Independent Directors recognized the benefits of the Advisor’s substantial past and ongoing investment in the advisory business, such as successfully recruiting and retaining key professional talent, systems and technology upgrades, added resources dedicated to legal, compliance and cybersecurity programs, and improvements to the overall firm infrastructure, as well as the financial pressures of competing against much larger firms and passive investment products. The Board and the Independent Directors further noted the Advisor’s past and current subsidies of the operating expenses of newer and smaller Funds and the Advisor’s commitment to maintain reasonable overall operating expenses for each Fund. The Board and the Independent Directors also recognized that the Funds benefit from receiving investment advice from an organization with other types of advisory clients in addition to mutual funds. The Board and the Independent Directors considered the risk borne by the Advisor that the Funds’ net assets and thus the Advisor’s fees might decline in the event of redemptions and that smaller Funds might not grow to become profitable. The Board and the Independent Directors concluded that the Advisor was satisfactorily sharing potential economies of scale with the Funds through low fees and expenses, and through reinvesting in its capabilities for serving the Funds and their shareholders.
6. Ancillary benefits
The Board and the Independent Directors also considered ancillary benefits received or to be received by the Advisor and its affiliates as a result of the relationship of the Advisor with the Funds. The Board and the Independent Directors noted that, in addition to the fees the Advisor receives under the Agreement, the Advisor receives additional benefits in connection with management of the Funds in the form of reports, research and other services from brokers and their affiliates in return for brokerage commissions paid to such brokers. The Board and the Independent Directors concluded that any potential benefits received or to be derived by the Advisor from its relationships with the Funds are reasonably related to the services provided by the Advisor to the Funds.
7. Conclusions
Based on their overall review, including their consideration of each of the factors referred to above (and others), the Board and the Independent Directors concluded that the Agreement is fair and reasonable to each Fund and its shareholders, that each Fund’s shareholders received reasonable value in return for the advisory fees and other amounts paid to the Advisor by each Fund, and that the renewal of the Agreement was in the best interests of each Fund and its shareholders.
168
Table of Contents
TCW Funds, Inc.
Supplemental Information
The policies and procedures that the Company uses to determine how to vote proxies are available without charge. The Board has delegated the Company’s proxy voting authority to the Advisor.
Disclosure of Proxy Voting Guidelines
The proxy voting guidelines of the Advisor are available:
| 1. | By calling 800-FUND-TCW (800-386-3829) to obtain a hard copy; or |
| 2. | By going to the SEC website at http://www.sec.gov. |
When the Company receives a request for a description of the Advisor’s proxy voting guidelines, it will deliver the description that is disclosed in the Company’s Statement of Additional Information. This information will be sent out via first class mail (or other means designed to ensure equally prompt delivery) within three business days of receiving the request.
The Advisor, on behalf of the Company, prepares and files Form N-PX with the SEC not later than August 31 of each year, which includes the Company’s proxy voting record for the most recent twelve-month period ended June 30 of that year. The Company’s proxy voting record for the most recent twelve-month period ended June 30 is available:
| 1. | By calling 800-FUND-TCW (800-386-3829) to obtain a hard copy; or |
| 2. | By going to the SEC website at http://www.sec.gov. |
When the Company receives a request for the Company’s proxy voting record, it will send the information disclosed in the Company’s most recently filed report on Form N-PX via first class mail (or other means designed to ensure equally prompt delivery) within three business days of receiving the request.
The Company also discloses its proxy voting record on its website as soon as is reasonably practicable after its report on Form N-PX is filed with the SEC.
Availability of Quarterly Portfolio Schedule
The Company files a complete schedule of its portfolio holdings with the SEC for the first and third quarters of its fiscal year on Form NPORT-P. Such filings occur no later than 60 days after the end of the Funds’ first and third quarters and are available on the SEC’s website at www.sec.gov.
169
Table of Contents
TCW Funds, Inc.
Directors and Officers of the Company
A board of six directors is responsible for overseeing the operations of the Company, which consists of 18 Funds at October 31, 2022. The directors of the Company, and their business addresses and their principal occupation for the last five years are set forth below.
Independent Directors
Name, and Year of Birth (1) | Term of Office and Length of Time Served | Principal Occupation(s) During Past 5 Years | Other Directorships held by Director | |||
| Samuel P. Bell (1936) | Mr. Bell has served as a director of TCW Funds, Inc. since October 2002. | Private Investor. | TCW Strategic Income Fund, Inc. (closed-end fund). | |||
Patrick C. Haden (1953) Chairman of the Board | Mr. Haden has served as a director of TCW Funds, Inc. since May 2001. | President (since 2003), Wilson Ave. Consulting (business consulting firm); Senior Advisor to President (July 2016 – June 2017), University of Southern California. | Auto Club (affiliate of AAA); Metropolitan West Funds (mutual fund); TCW Strategic Income Fund, Inc. (closed end fund). | |||
| Peter McMillan (1957) | Mr. McMillan has served as a director of TCW Funds, Inc. since August 2010. | Co-founder (since 2019), Pacific Oak Capital Advisors (investment advisory firm); Co-founder, Managing Partner and Chief Investment Officer (since May 2013), Temescal Canyon Partners (investment advisory firm); Co-founder and Executive Vice President (2005 – 2019), KBS Capital Advisors (a manager of real estate investment trusts). | Pacific Oak Strategic Opportunity REIT (real estate investments); Keppel Pacific Oak U.S. REIT (real estate investments); Pacific Oak Residential Trust (real estate investments); Metropolitan West Funds (mutual fund); TCW DL VII Financing LLC (private fund): TCW Strategic Income Fund, Inc. (closed-end fund). | |||
| Victoria B. Rogers (1961) | Ms. Rogers has served as a director of the TCW Funds, Inc. since October 2011. | President and Chief Executive Officer (since 1996), The Rose Hills Foundation (charitable foundation). | Norton Simon Museum (art museum); Stanford University (university); Causeway Capital Management Trust (mutual fund); Causeway ETML Trust (mutual fund); The Rose Hills Foundation (charitable foundation); TCW Strategic Income Fund, Inc. (closed-end fund). | |||
| Andrew Tarica (1959) | Mr. Tarica has served as a director of the TCW Funds, Inc. since March 2012. | Director of Fixed Income (since February 2022), Forest Road Securities (broker-dealer); Chief Executive Officer (since February 2001), Meadowbrook Capital Management (asset management company); Employee (2003 – January 2022), Cowen Prime Services (broker dealer). | Metropolitan West Funds (mutual fund); TCW Strategic Income Fund, Inc. (closed-end fund); TCW Direct Lending VII, LLC (business development company); TCW Direct Lending VIII, LLC (business development company). |
| (1) | The address of each Independent Director is c/o Morgan Lewis, & Bockius LLP, Counsel to the Independent Directors of TCW Funds, Inc., 300 South Grand Avenue, Los Angeles, CA 90071. |
170
Table of Contents
TCW Funds, Inc.
Interested Director
This Director is an “interested person” of the Company as defined in the 1940 Act because he is a director and officer of the Advisor, and shareholder and director of The TCW Group, Inc., the parent company of the Advisor.
Name and Year of Birth | Term of Office and Length of Time Served | Principal Occupation(s) During Past 5 Years | Other Directorships held by Director | |||
| Marc I. Stern (1944) | Mr. Stern has served as a director since inception of TCW Funds, Inc. in September 1992. | Chairman (since January 2016), TCW LLC; Chairman (since February 2013), The TCW Group Inc., TCW Investment Management Company LLC, TCW Asset Management Company LLC and Metropolitan West Asset Management, LLC. | N/A |
The officers of the Company who are not directors of the Company are:
| Name and Year of Birth (1) | Position(s) Held with Company | Principal Occupation(s) During Past 5 Years (2) | ||
David Lippman (1958) President and Chief Executive Officer | Mr. Lippman has served as President and Chief Executive Officer of TCW Funds, Inc. since February 2021. | President and Chief Executive Officer (since August 2012), The TCW Group, Inc. (since February 2013), TCW LLC, the Advisor and TCW Asset Management Company LLC, and (since February 2021), TCW Strategic Income Fund, Inc.; Chief Executive Officer (since November 2008), Metropolitan West Asset Management, LLC; President and Principal Executive Officer (since November 2008), Metropolitan West Funds. | ||
Lisa Eisen (1963) Tax Officer | Ms. Eisen has served as Tax Officer of TCW Funds, Inc. since December 2016. | Tax Officer (since December 2016), Metropolitan West Funds and TCW Strategic Income Fund, Inc.; Managing Director and Director of Tax (since August 2016), TCW LLC. | ||
Meredith S. Jackson (1959) Senior Vice President, General Counsel and Secretary | Ms. Jackson has served as Senior Vice President since January 2016 and General Counsel and Secretary of TCW Funds, Inc. since February 2013. | Executive Vice President, General Counsel and Secretary (since January 2016), TCW LLC; Executive Vice President, General Counsel and Secretary (since February 2013), TCW Investment Management Company LLC, The TCW Group Inc., TCW Asset Management Company LLC and Metropolitan West Asset Management, LLC; Senior Vice President, General Counsel and Secretary (since February 2013), TCW Strategic Income Fund, Inc., Vice President and Secretary (since February 2013), Metropolitan West Funds. |
171
Table of Contents
TCW Funds, Inc.
Directors and Officers of the Company (Continued)
| Name and Year of Birth (1) | Position(s) Held with Company | Principal Occupation(s) During Past 5 Years (2) | ||
Gladys Xiques (1973) Chief Compliance Officer and AML Officer | Ms. Xiques has served as Chief Compliance Officer and AML Officer of TCW Funds, Inc. since January 2021. | Chief Compliance Officer and AML Officer (since January 2021), TCW Strategic Income Fund, Inc. and Metropolitan West Funds; Managing Director and Global Chief Compliance Officer (since January 2021), TCW LLC, TCW Investment Management Company LLC, Metropolitan West Asset Management, LLC and TCW Asset Management Company LLC; Global Chief Compliance Officer (since January 2021), The TCW Group, Inc.; Senior Vice President (February 2015 – December 2020), TCW LLC, TCW Investment Management Company LLC, Metropolitan West Asset Management, LLC and TCW Asset Management Company LLC. | ||
Richard M. Villa (1964) Treasurer Principal Financial and Accounting Officer | Mr. Villa has served as Treasurer and Principal Financial and Accounting Officer of TCW Funds, Inc. since February 2014. | Executive Vice President, Chief Financial Officer and Assistant Secretary (since July 2008), TCW Investment Management Company LLC, The TCW Group, Inc., TCW Asset Management Company LLC, Metropolitan West Asset Management, LLC, (since January 2016), TCW LLC, and (since February 2021), Metropolitan West Funds; Treasurer and Principal Financial and Accounting Officer (since February 2014), TCW Strategic Income Fund, Inc. |
| (1) | The address of the Interested Director and each officer is c/o the TCW Group, Inc., 865 South Figueroa Street, Suite 1800, Los Angeles, CA 90017. |
| (2) | Positions with The TCW Group, Inc. and its affiliates may have changed over time. |
In addition, Eric Chan, Managing Director of Fund Operations for the Advisor, TCW Asset Management Company LLC, TCW LLC (since 2009), and Metropolitan West Asset Management, LLC (since November 2006), is Assistant Treasurer of the Company and TCW Strategic Income Fund, Inc. (since 2009) and Metropolitan West Funds (since 2010). Mr. Chan is a Certified Public Accountant. Peter Davidson, Senior Vice President, Associate General Counsel and Assistant Secretary of TCW Asset Management Company LLC, Metropolitan West Asset Management, LLC, TCW LLC, the Advisor (since July 2022), is Vice President and Assistant Secretary of the Company, TCW Strategic Income Fund, Inc. and Metropolitan West Funds (since September 2022).
The SAI (Statement of Additional Information) has additional information regarding the Board of Directors. A copy is available without charge by calling 1-800-FUND-TCW (1-800-386-3829) to obtain a hard copy or by going to the SEC website at http://www.sec.gov.
172
Table of Contents
TCW Funds, Inc.
865 South Figueroa Street, Suite 1800
Los Angeles, California 90017
800 FUND TCW
(800 386 3829)
www.TCW.com
INVESTMENT ADVISOR
TCW Investment Management Company LLC
865 South Figueroa Street, Suite 1800
Los Angeles, California 90017
TRANSFER AGENT
U.S. Bancorp Fund Services, LLC
615 E. Michigan Street
Milwaukee, Wisconsin 53202
INDEPENDENT REGISTERED PUBLIC ACCOUNTING FIRM
Deloitte & Touche LLP
555 West 5th Street
Los Angeles, California 90013
CUSTODIAN & ADMINISTRATOR
State Street Bank & Trust Company
One Lincoln Street
Boston, Massachusetts 02111
DISTRIBUTOR
TCW Funds Distributors LLC
865 South Figueroa Street, Suite 1800
Los Angeles, California 90017
DIRECTORS
Patrick C. Haden
Director and Chairman of the Board
Samuel P. Bell
Director
Peter McMillan
Director
Victoria B. Rogers
Director
Marc I. Stern
Director
Andrew Tarica
Director
OFFICERS
David Lippman
President and Chief Executive Officer
Meredith S. Jackson
Senior Vice President,
General Counsel and Secretary
Richard M. Villa
Treasurer and Principal Financial and Accounting Officer
Gladys Xiques
Chief Compliance Officer and Anti-Money Laundering Officer
Lisa Eisen
Tax Officer
Eric W. Chan
Assistant Treasurer
TCW FAMILY OF FUNDS
EQUITY FUNDS
TCW Artificial Intelligence Equity Fund
TCW Global Real Estate Fund
TCW New America Premier Equities Fund
TCW Relative Value Dividend Appreciation Fund
TCW Relative Value Large Cap Fund
TCW Relative Value Mid Cap Fund
TCW Select Equities Fund
ASSET ALLOCATION FUND
TCW Conservative Allocation Fund
FIXED INCOME FUNDS
TCW Core Fixed Income Fund
TCW Enhanced Commodity Strategy Fund
TCW Global Bond Fund
TCW High Yield Bond Fund
TCW Short Term Bond Fund
TCW Total Return Bond Fund
INTERNATIONAL FUNDS
TCW Developing Markets Equity Fund
TCW Emerging Markets Income Fund
TCW Emerging Markets Local Currency Income Fund
TCW Emerging Markets Multi-Asset Opportunities Fund
FUNDarFI1021
Table of Contents

OCTOBER 31

A N N U A L
R E P O R T
INTERNATIONAL FUNDS
TCW Developing Markets Equity Fund
TCW Emerging Markets Income Fund
TCW Emerging Markets Local Currency Income Fund
TCW Emerging Markets Multi-Asset Opportunities Fund
Table of Contents
TCW Funds, Inc.
| 1 | ||||
| 3 | ||||
| 12 | ||||
| 12 | ||||
| 16 | ||||
| 24 | ||||
| 30 | ||||
| 41 | ||||
| 43 | ||||
| 44 | ||||
| 46 | ||||
| 71 | ||||
| 80 | ||||
| 81 | ||||
| 83 | ||||
Investment Management and Advisory Agreement Disclosure (Unaudited) | 85 | |||
Proxy Voting Guidelines and Availability of Quarterly Portfolio Schedule | 92 | |||
| 93 | ||||
| 94 | ||||
Table of Contents
| The Letter to Shareholders and/or Management Discussions contained in this Annual Report are the opinions of each Fund’s portfolio managers and are not the opinions of TCW Funds, Inc. or its Board of Directors. Various matters discussed in the Letter to Shareholders and/or Management Discussions constitute forward-looking statements within the meaning of the federal securities laws. Actual results and the timing of certain events could differ materially from those projected or contemplated by these forward-looking statements due to a number of factors, including general economic conditions, overall availability of securities for investment by a Fund, the level of volatility in the securities markets and in the share price of a Fund, and other risk factors discussed in the SEC filings of TCW Funds, Inc. The data presented in the Letter to Shareholders and/or Management Discussions represents past performance and cannot be used to predict future results. |
Table of Contents
|
|
| David B. Lippman President, Chief Executive Officer and Director |

Dear Valued Investors,
I am pleased to present the 2022 annual report for the TCW Funds, Inc. covering the 12-month period ended October 31, 2022. I would like to express our appreciation for your continued investment in the TCW Funds as well as to welcome new shareholders to our fund family. As of October 31, 2022, the TCW Funds held total net assets of approximately $9.7 billion.
This report contains information and portfolio management discussions of our TCW International Funds.
The International Markets
2022 has been a challenging year for Emerging Markets (EM). While uncertainties remain, we do believe that the bulk of the downtrade has occurred, given the extent of the repricing this year.
In order to add risk, there are several data points we are monitoring. First, we are looking for a decline in U.S. inflation, which is forecast to occur in the fourth quarter of 2022 and more meaningfully in the first quarter of 2023. A reduction in inflation, followed by more clarity around the Fed Funds terminal rate will go a long way to removing one of the major headwinds plaguing risk assets, in our view.
In addition, U.S. Treasury volatility has spiked to levels seen briefly in 2020, and before that, not since the Global Financial Crisis in 2008. In our view, risk aversion is likely to persist amidst high Treasury volatility. While a decline in volatility may take another few months to materialize, we believe this will coincide with a bottoming in the performance of risk assets, including EM credit.
Economic growth rates have been rapidly adjusting lower this year due to tightening of global financial conditions, fiscal consolidation, the Russia/Ukraine war and China’s zero-COVID policy and property downturn. Importantly, recent data confirms our assessment that the Chinese economy likely bottomed in 2022 and we do forecast improvement for 2023, with the potential for zero-COVID
policies to ease in the spring of 2023. A bottoming of global growth expectations should also present opportunities to add risk. Further, economic growth differentials continue to favor EM over Developed Markets (DM) and this growth differential between EM and DM is forecast to widen in 2023, which could provide additional support to the asset class.
In the aggregate, EM sovereign fundamentals have deteriorated over the past three years: EM sovereign credit ratings are lower, debt/GDP ratios and fiscal deficits are higher, FX reserves levels are somewhat lower (though still quite robust in many cases), and current accounts are less well balanced (although again significantly stronger than in previous periods of market stress). Lower income economies in particular have been negatively impacted by both energy and food shocks, and there are a number of more vulnerable sovereigns already trading at distressed levels. We anticipate that this segment of the market will remain under pressure, with further differentiation between high and low quality sovereigns.
EM corporate balance sheets appear to be in their strongest position over the last decade (lowest net leverage since Q1 2012 and lowest gross leverage since Q4 2013). Spreads per turn of leverage in EM, an indicator of investor compensation per unit of credit risk, remain multiples above those in the U.S. credit market across each rating category.
Further, with EM sovereign and corporate issuance down around 50-60% year-over-year (YoY), and forecasts of negative net new issuance in 2022 for both sovereigns and corporates, technicals appear supportive.
There remain, of course, risks to the global economy, ranging from a severe U.S. recession to Chinese growth downside to a significant escalation in the Russia/Ukraine war. In our base case, we anticipate only a soft landing or modest recession in the U.S., especially as the labor
1
Table of Contents
Letter to Shareholders (Continued) |
|
market is at historically tight levels, wage growth remains elevated, and both household and corporate balance sheets appear healthy. As for China, recent headlines have been supportive of phasing out zero-COVID policies, but we acknowledge the potential for further downside given challenges in the property sector and weaker exports. Finally, we anticipate that the Russia/Ukraine war will persist at least until the spring, if not beyond.
To reiterate, in order to more meaningfully add risk, we are looking for signs of U.S. inflation coming down, a decline in U.S. rates volatility, and a bottoming in global growth expectations. We believe that over the coming months, as more data is released, we will get a clearer picture of the opportunities in 2023 and that better entry points will emerge.
In closing, I’d like to express my personal appreciation for your present and historical sponsorship of the TCW Funds. Following more than 20 years at the Advisor, I will be retiring at the end of the year, turning that role over to Katie Koch, who will arrive in early 2023 as the CEO of TCW/Metropolitan West. It has been my honor to preside over the growth of the Funds and gratifying to work with the disciplined investment professionals in their management through good and more difficult circumstances alike. We manage our entire business on the basis of team management to help ensure seamless transitions to the next generation, and I am certain that Katie will collaborate closely with our long-tenured colleagues to continue to build on the excellence of the Firm. Most importantly, I take my leave with great confidence in knowing that the stewardship of the Funds and your assets are in good hands.
We truly value our relationship with you and thank you for making the TCW Funds part of your long-term investment plan. If you have any questions or require further information, we invite you to visit our website at www.tcw.com, or call our shareholder services department at 800-386-3829.
We look forward to further correspondence with you through our semi-annual report next year.
Sincerely,

David B. Lippman
President, Chief Executive Officer and Director
2
Table of Contents
TCW Developing Markets Equity Fund
For the year ended October 31, 2022, the TCW Developing Markets Equity Fund (the “Fund”) returned -43.40% and -43.10% on its I Class and N Class shares, respectively. Performance of the Fund’s classes varies because of differing expenses. The Fund’s benchmark, the MSCI Emerging Markets Net Total Return Index (“Index”), returned -31.03% over the same period.
Underperformance for the one-year period was primarily driven by the portfolio’s exposure in China and Russia, and the growth bias of our research framework. Chinese equities were under significant pressure due to a combination of growth disappointment stemming from zero-COVID policies and lack of support for the property market, as well as heightened U.S./China tensions. We exited part of Russia exposure in an illiquid market, and have written down the remaining amount to zero.
During the year, we have increased the allocation to positions generated by our proprietary quantitative models, which have a value bias. This, we believe, allows for more balanced positioning between growth and value.
There remain, of course, risks to the global economy, ranging from a severe U.S. recession to Chinese growth downside to a significant escalation in the Russia/Ukraine war. In our base case, we anticipate either a soft landing or only a modest recession in the U.S. This assumes that inflation cools somewhat over the next quarter or so, enabling the market to get comfortable around estimates of the Fed’s terminal rate and the Fed to slow the pace of rate increases to an eventual pause, most likely in the second quarter of 2023. Moreover, both household and consumer balance sheets appear healthy. As for China, recent headlines have been supportive of phasing out zero-COVID policies, but we do not believe there will be a meaningful move in this direction until the second quarter of 2023 when a local mRNA vaccine is expected to become available. In addition, there is the potential for further weakness given challenges in the property sector and slowing exports. Finally, we anticipate that the Russia/Ukraine war will persist at least until the spring, if not beyond.
We see value in select segments of the market, but in order to more meaningfully add risk, we are looking for signs of U.S. inflation coming down, a decline in U.S. rates volatility, and a bottoming in global growth expectations. We believe that over the coming months, as more data is released, we will get a clearer picture of the opportunities in 2023 and that better entry points will emerge.
3
Table of Contents
TCW Developing Markets Equity Fund
Management Discussions (Continued)
| Annualized Total Return as of October 31, 2022(1) | ||||||||||||||||||||
1 Yr Return | 3 Yr Return | 5 Yr Return | 10 Yr Return | Inception to Date | ||||||||||||||||
TCW Developing Markets Equity Fund | ||||||||||||||||||||
Class I (Inception: 07/01/2015) | (43.40 | )% | (7.56 | )% | (6.26 | )% | — | (2.72 | )% | |||||||||||
Class N (Inception: 07/01/2015) | (43.10 | )% | (7.44 | )% | (6.19 | )% | — | (2.67 | )% | |||||||||||
MSCI Emerging Markets Net Total Return Index | (31.03 | )% | (4.42 | )% | (3.10 | )% | — | 0.52 | % | |||||||||||

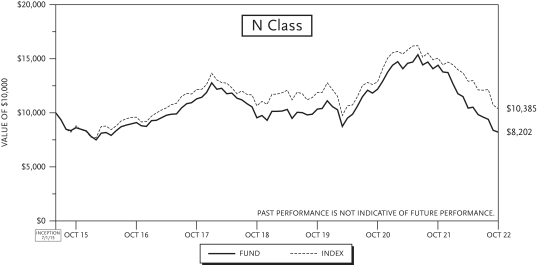
| (1) | The total returns do not reflect taxes that a shareholder would pay on fund distributions or on the redemption of fund shares. |
4
Table of Contents
TCW Emerging Markets Income Fund
Management Discussions
For the year ended October 31, 2022, the TCW Emerging Markets Income Fund (the “Fund”) returned -24.47%, -24.57% and -24.41% net of fees on its I Class, N Class and P Class shares, respectively. Performance of the Fund’s classes varies because of differing expenses. The Fund’s benchmark, the JPMorgan EMBI Global Diversified Index (“EMBI”), returned -24.19% over the same period.
Underperformance for the one-year period stems from the portfolio’s China positioning, overweight positioning to Ukraine and underweight positioning to Turkey. We continue to remain underweight China and Turkey and have exited Ukraine. Underweight positioning to Russia, Belarus and Sri Lanka, in addition to overweight positioning and security selection in Saudi Arabia, helped mitigate the underperformance.
We believe that the bulk of the downtrade has occurred, given the extent to which both rates and credit spreads have repriced this year. Emerging Markets (EM) sovereign spreads ended October at approximately 540 basis points (bps), which represents the 92nd percentile since 2002 (i.e. sovereign spreads have traded at these levels or wider on just 8% of all trading days in the last twenty years). Over the same two decade timeframe, EM sovereign spreads have on average tightened 200bps in the succeeding six months when at current levels or wider, and have tightened roughly 300bps (basic points) on average from these levels looking 12 months out.
There remain, of course, risks to the global economy, ranging from a severe U.S. recession to Chinese growth downside to a significant escalation in the Russia/Ukraine war. In our base case, we anticipate either a soft landing or only a modest recession in the U.S. This assumes that inflation cools somewhat over the next quarter or so, enabling the market to get comfortable around estimates of the Fed’s terminal rate and the Fed to slow the pace of rate increases to an eventual pause, most likely in the second quarter of 2023. Moreover, both household and consumer balance sheets appear healthy. As for China, recent headlines have been supportive of phasing out zero-COVID policies, but we do not expect a meaningful move in this direction until the second quarter of 2023 when a local mRNA vaccine is expected to become available. In addition, there is the potential for further weakness given challenges in the property sector and slowing exports. Finally, we anticipate that the Russia/Ukraine war will persist at least until the spring, if not beyond.
In order to more meaningfully add risk, we are looking for signs of U.S. inflation coming down, a decline in U.S. rates volatility, and a bottoming in global growth expectations. We believe that over the coming months, as more data is released, we will get a clearer picture of the opportunities in 2023 and that better entry points will emerge.
5
Table of Contents
TCW Emerging Markets Income Fund
Management Discussions (Continued)
| Annualized Total Return as of October 31, 2022(1) | ||||||||||||||||||||||||
1 Yr Return | 3 Yr Return | 5 Yr Return | 10 Yr Return | Inception to Date | Inception Index | |||||||||||||||||||
TCW Emerging Markets Income Fund | ||||||||||||||||||||||||
Class I (Inception: 09/01/1996) | (24.47 | )% | (7.93 | )% | (3.42 | )% | 0.24 | % | 7.01 | % (2) | 7.09 | % | ||||||||||||
Class N (Inception: 03/01/2004) | (24.57 | )% | (7.99 | )% | (3.58 | )% | 0.02 | % | 4.95 | % | 5.00 | % | ||||||||||||
Class P (Inception: 02/28/2020) | (24.41 | )% | — | — | — | (9.45 | )% | (8.74 | )% | |||||||||||||||
JPMorgan EMBI Global Diversified Index | (24.19 | )% | (7.19 | )% | (2.66 | )% | 1.01 | % | ||||||||||||||||
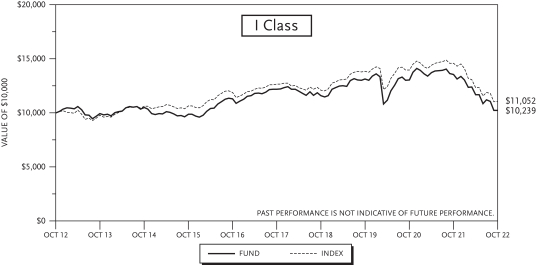

6
Table of Contents
TCW Emerging Markets Income Fund
Management Discussions (Continued)
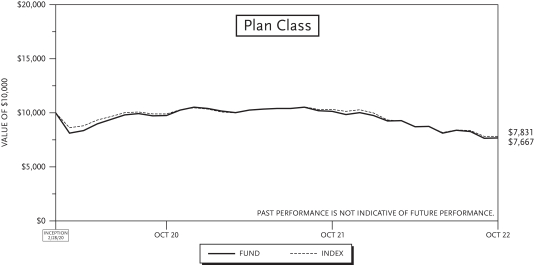
| (1) | The total returns do not reflect taxes that a shareholder would pay on fund distributions or on the redemption of fund shares. |
| (2) | Performance data includes the performance of the predecessor entity for periods before the Fund’s registration became effective. The predecessor entity was not registered under the 1940 Act, and therefore, was not subject to certain investment restrictions that we imposed by the 1940 Act. If the predecessor entity had been registered under the 1940 Act, the predecessor entity’s performance may have been lower. |
7
Table of Contents
TCW Emerging Markets Local Currency Income Fund
Management Discussions
For the year ended October 31, 2022, the TCW Emerging Markets Local Currency Income Fund (the “Fund”) returned -20.57% and -20.66% net of fees on its I Class and N Class shares, respectively. Performance of the Fund’s classes varies because of differing expenses. The Fund’s benchmark, the JPMorgan GBI-EM Global Diversified Index (“GBI-EM GD”), returned -20.27% over the same period.
Relative underperformance for the one-year period was driven by our underweight to Turkey, where local bonds rallied due largely to technical factors. We remain underweight in light of unorthodox monetary policy, with high inflation and significantly negative real rates. The timing of certain trades in South Africa and off-index exposure to Ukraine earlier in the year also hurt relative performance. We exited the Ukraine position in early February as the potential for a Russia/Ukraine conflict grew.
On the other hand, underweight positioning in Egypt, which reflected our expectation of weaker fundamentals on the back of both food and energy shocks, and our forecast of currency devaluation helped mitigate the underperformance. In addition, the portfolio’s Russia local exposure outperformed, as the index marked bonds at zero, but we were able to exit the position in an illiquid market at a higher level. In addition, overweight positioning in Brazil and Mexico, predicated upon our view of attractive risk-adjusted carry and a supportive commodity environment, was also beneficial to relative performance.
There remain, of course, risks to the global economy, ranging from a severe U.S. recession to Chinese growth downside to a significant escalation in the Russia/Ukraine war. In our base case, we anticipate either a soft landing or only a modest recession in the U.S. This assumes that inflation cools somewhat over the next quarter or so, enabling the market to get comfortable around estimates of the Fed’s terminal rate and the Fed to slow the pace of rate increases to an eventual pause, most likely in the second quarter of 2023. Moreover, both household and consumer balance sheets appear healthy. As for China, recent headlines have been supportive of phasing out zero-COVID policies, but we do not expect a meaningful move in this direction until the second quarter of 2023 when a local mRNA vaccine is expected to become available. In addition, there is the potential for further weakness given challenges in the property sector and slowing exports. Finally, we anticipate that the Russia/Ukraine war will persist at least until the spring, if not beyond.
The dollar tends to be a safe haven during periods of risk aversion. We see value in local rates and Emerging Markets currencies, but in order to more meaningfully add risk, we are looking for signs of U.S. inflation coming down, a decline in U.S. rates volatility, and a bottoming in global growth expectations. We believe that over the coming months, as more data is released, we will get a clearer picture of the opportunities in 2023 and that better entry points will emerge.
8
Table of Contents
TCW Emerging Markets Local Currency Income Fund
Management Discussions (Continued)
| Annualized Total Return as of October 31, 2022(1) | ||||||||||||||||||||
1 Yr Return | 3 Yr Return | 5 Yr Return | 10 Yr Return | Inception to Date | ||||||||||||||||
TCW Emerging Markets Local Currency Income Fund | ||||||||||||||||||||
Class I (Inception: 12/15/2010) | (20.57 | )% | (8.64 | )% | (4.27 | )% | (2.53 | )% | (1.07 | )% | ||||||||||
Class N (Inception: 12/15/2010) | (20.66 | )% | (8.69 | )% | (4.33 | )% | (2.57 | )% | (1.11 | )% | ||||||||||
JPMorgan GBI-EM Global Diversified Index | (20.27 | )% | (8.21 | )% | (3.54 | )% | (2.56 | )% | (1.23 | )% | ||||||||||
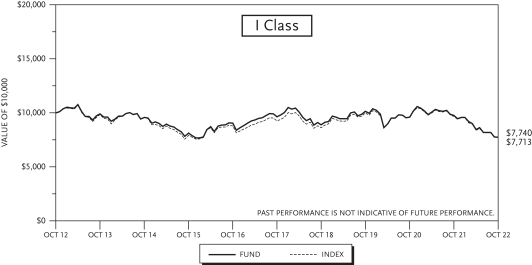
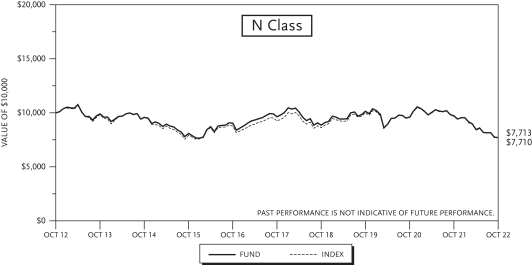
| (1) | The total returns do not reflect taxes that a shareholder would pay on fund distributions or on the redemption of fund shares. |
9
Table of Contents
TCW Emerging Markets Multi-Asset Opportunities Fund
Management Discussions
For the year ended October 31, 2022, the TCW Emerging Markets Multi-Asset Opportunities Fund (the “Fund”) returned -34.64% and -35.05% on its I Class and N Class shares, respectively. The performance of the Fund’s classes varies because of differing expenses. The Fund’s blended benchmark, 50% JPMorgan EMBI Global Diversified Index (“EMBI”) and 50% MSCI Emerging Markets Net Total Return Index (“MSCI EM”) returned -27.62% over the same period.
Underperformance for the one-year period was driven primarily by security selection in equities, particularly in China and Russia. Chinese equities were under significant pressure due to a combination of growth disappointment stemming from zero-COVID policies and lack of support for the property market, as well as heightened U.S./China tensions. We have since shifted to an underweight. In addition, we exited part of Russia equity exposure in an illiquid market and wrote down the remaining amount to zero. Further, during the course of the year, we shifted to an overweight in fixed income relative to an underweight in equities, reflecting a more defensive bias. However, Emerging Markets fixed income returns underperformed initial forecasts, yielding a less than expected return benefit.
There remain, of course, risks to the global economy, ranging from a severe U.S. recession to Chinese growth downside to a significant escalation in the Russia/Ukraine war. In our base case, we anticipate either a soft landing or only a modest recession in the U.S. This assumes that inflation cools somewhat over the next quarter or so, enabling the market to get comfortable around estimates of the Fed’s terminal rate and the Fed to slow the pace of rate increases to an eventual pause, most likely in the second quarter of 2023. Moreover, both household and consumer balance sheets appear healthy. As for China, recent headlines have been supportive of phasing out zero-COVID policies, but we do not believe there will be a meaningful move in this direction until the second quarter of 2023 when a local mRNA vaccine is expected to become available. In addition, there is the potential for further weakness given challenges in the property sector and slowing exports. Finally, we anticipate that the Russia/Ukraine war will persist at least until the spring, if not beyond.
We see value in select segments of the market, but in order to more meaningfully add risk, we are looking for signs of U.S. inflation coming down, a decline in U.S. rates volatility, and a bottoming in global growth expectations. We believe that over the coming months, as more data is released, we will get a clearer picture of the opportunities in 2023 and that better entry points will emerge.
10
Table of Contents
TCW Emerging Markets Multi-Asset Opportunities Fund
Management Discussions (Continued)
| Annualized Total Return as of October 31, 2022(1) | ||||||||||||||||||||
1 Yr Return | 3 Yr Return | 5 Yr Return | 10 Yr Return | Inception to Date | ||||||||||||||||
TCW EM Multi-Asset Opportunities Fund | ||||||||||||||||||||
Class I (Inception: 07/01/2013) | (34.64 | )% | (6.79 | )% | (4.07 | )% | — | 0.43 | % | |||||||||||
Class N (Inception: 07/01/2013) | (35.05 | )% | (7.12 | )% | (4.33 | )% | — | 0.25 | % | |||||||||||
50% JPMorgan EMBI Global Diversified Index/ | (27.62 | )% | (5.65 | )% | (2.69 | )% | — | 1.70 | % | |||||||||||
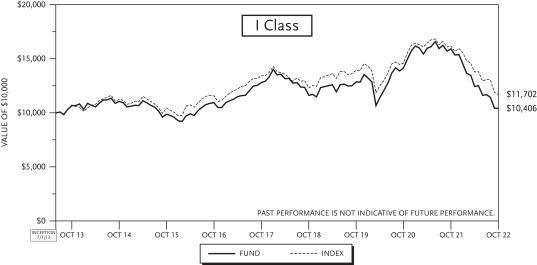
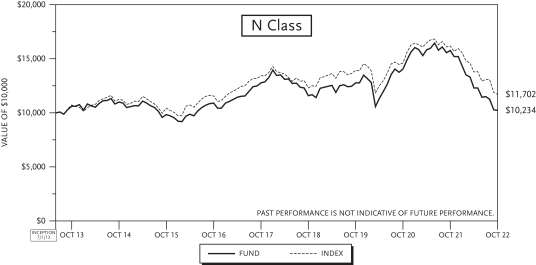
| (1) | The total returns do not reflect taxes that a shareholder would pay on fund distributions or on the redemption of fund shares. |
11
Table of Contents
TCW Developing Markets Equity Fund
| Issues | Shares | Value | ||||||
COMMON STOCK — 88.9% of Net Assets |
| |||||||
| Argentina — 2.4% (Cost: $68,420) | ||||||||
MercadoLibre, Inc. (1) | 110 | $ | 99,178 | |||||
|
| |||||||
| Brazil — 11.4% | ||||||||
CCR S.A. | 40,000 | 98,794 | ||||||
CPFL Energia S.A. | 9,500 | 64,127 | ||||||
Engie Brasil Energia S.A. | 9,000 | 68,985 | ||||||
Pet Center Comercio e Participacoes S.A. | 15,200 | 25,375 | ||||||
Petroleo Brasileiro S.A. | 10,500 | 66,555 | ||||||
Sendas Distribuidora S.A. | 18,000 | 67,990 | ||||||
Tres Tentos Agroindustrial S.A. | 33,000 | 79,745 | ||||||
|
| |||||||
Total Brazil |
| |||||||
(Cost: $471,398) |
| 471,571 | ||||||
|
| |||||||
| China — 29.5% | ||||||||
BYD Co., Ltd. | 2,700 | 60,487 | ||||||
CanSino Biologics, Inc. | 4,600 | 42,778 | ||||||
China Longyuan Power Group Corp. Ltd. | 17,000 | 41,320 | ||||||
China Shenhua Energy Co., Ltd. — Class H | 15,000 | 39,459 | ||||||
China State Construction Engineering Corp., Ltd. | 60,000 | 39,049 | ||||||
Contemporary Amperex Technology Co., Ltd. | 1,500 | 76,980 | ||||||
Daqin Railway Co., Ltd. | 46,000 | 40,400 | ||||||
Fujian Funeng Co., Ltd. | 28,000 | 41,049 | ||||||
Galaxy Entertainment Group, Ltd. | 8,000 | 36,548 | ||||||
Henan Shenhuo Coal & Power Co., Ltd. | 20,000 | 38,446 | ||||||
Huaibei Mining Holdings Co., Ltd. | 23,000 | 41,061 | ||||||
JD.com, Inc. | 5,200 | 94,692 | ||||||
Koolearn Technology Holding, Ltd. (1) | 4,000 | 19,389 | ||||||
Kweichow Moutai Co., Ltd. | 100 | 18,535 | ||||||
Ping An Insurance Group Co. of China, Ltd. — Class H | 36,990 | 148,082 | ||||||
Pylon Technologies Co., Ltd. | 1,150 | 48,609 | ||||||
Shanxi Lu’an Environmental Energy Development Co., Ltd. | 17,144 | 39,503 | ||||||
Shenzhen SC New Energy Technology Corp. | 2,100 | 39,056 | ||||||
Sichuan Road & Bridge Co., Ltd. | 31,979 | 49,405 | ||||||
Sinotrans, Ltd. | 125,000 | 60,799 | ||||||
Swire Pacific, Ltd. | 6,000 | 39,800 | ||||||
Tianqi Lithium Corp. (1) | 3,300 | 43,202 | ||||||
Tianqi Lithium Corp. (1) | 5,000 | 40,765 | ||||||
Wuxi Lead Intelligent Equipment Co., Ltd. | 5,500 | 37,815 | ||||||
Yunnan Energy New Material Co., Ltd. | 2,200 | 44,617 | ||||||
|
| |||||||
Total China |
| |||||||
(Cost: $1,483,581) |
| 1,221,846 | ||||||
|
| |||||||
| France — 3.0% (Cost: $80,645) | ||||||||
Hermes International | 95 | 122,979 | ||||||
|
| |||||||
| Greece — 1.3% (Cost: $44,556) | ||||||||
Mytilineos S.A. | 3,300 | 55,341 | ||||||
|
| |||||||
| Issues | Shares | Value | ||||||
| India — 8.2% | ||||||||
Apollo Hospitals Enterprise, Ltd. | 800 | $ | 43,611 | |||||
Avenue Supermarts, Ltd. (1) | 1,170 | 61,151 | ||||||
Coal India, Ltd. | 21,000 | 62,396 | ||||||
Jindal Steel & Power Ltd (1) | 11,500 | 63,885 | ||||||
KPIT Technologies, Ltd. | 6,900 | 59,391 | ||||||
Persistent Systems, Ltd. | 1,100 | 49,109 | ||||||
|
| |||||||
Total India |
| |||||||
(Cost: $307,365) |
| 339,543 | ||||||
|
| |||||||
| Indonesia — 3.0% | ||||||||
Adaro Energy Tbk PT | 252,800 | 64,494 | ||||||
Indo Tambangraya Megah Tbk PT | 20,000 | 57,613 | ||||||
|
| |||||||
Total Indonesia |
| |||||||
(Cost: $100,970) |
| 122,107 | ||||||
|
| |||||||
| Philippines — 1.2% (Cost: $54,015) | ||||||||
Wilcon Depot, Inc. | 100,000 | 50,823 | ||||||
|
| |||||||
| Poland — 1.1% (Cost: $44,002) | ||||||||
Dino Polska S.A. (1) | 700 | 45,717 | ||||||
|
| |||||||
| Russia — 0.0% | ||||||||
Magnitogorsk Iron & Steel Works PJSC (1)(2) | 79,000 | 117 | ||||||
Yandex N.V. (1)(2) | 3,100 | 140 | ||||||
|
| |||||||
Total Russia |
| |||||||
(Cost: $225,147) |
| 257 | ||||||
|
| |||||||
| Singapore — 4.0% | ||||||||
City Developments, Ltd. | 11,500 | 62,025 | ||||||
Sembcorp Industries, Ltd. | 31,000 | 63,748 | ||||||
Yangzijiang Shipbuilding Holdings, Ltd. | 49,000 | 41,552 | ||||||
|
| |||||||
Total Singapore |
| |||||||
(Cost: $167,782) |
| 167,325 | ||||||
|
| |||||||
| South Africa — 6.7% | ||||||||
Clicks Group, Ltd. | 4,900 | 82,989 | ||||||
Discovery, Ltd. (1) | 6,000 | 39,226 | ||||||
Exxaro Resources, Ltd. | 5,600 | 62,372 | ||||||
MultiChoice Group | 14,000 | 91,439 | ||||||
|
| |||||||
Total South Africa |
| |||||||
(Cost: $319,611) |
| 276,026 | ||||||
|
| |||||||
| South Korea — 4.5% | ||||||||
GS Holdings Corp. | 1,900 | 61,285 | ||||||
HD Hyundai Co., Ltd. | 1,500 | 64,034 | ||||||
KT Corp. (SP ADR) | 4,900 | 62,279 | ||||||
|
| |||||||
Total South Korea |
| |||||||
(Cost: $200,390) |
| 187,598 | ||||||
|
| |||||||
| Taiwan — 9.7% | ||||||||
Alchip Technologies, Ltd. | 1,900 | 38,049 | ||||||
E Ink Holdings, Inc. | 21,600 | 137,250 | ||||||
eMemory Technology, Inc. | 1,000 | 33,160 | ||||||
See accompanying Notes to Financial Statements.
12
Table of Contents
TCW Developing Markets Equity Fund
October 31, 2022
| Issues | Shares | Value | ||||||
| Taiwan (Continued) | ||||||||
Taiwan Semiconductor Manufacturing Co., Ltd. | 16,000 | $ | 192,355 | |||||
|
| |||||||
Total Taiwan |
| |||||||
(Cost: $357,104) |
| 400,814 | ||||||
|
| |||||||
| Thailand — 1.5% (Cost: $63,616) | ||||||||
Central Pattana PCL | 35,000 | 63,223 | ||||||
|
| |||||||
| Turkey — 0.7% (Cost: $21,840) | ||||||||
Turkcell Iletisim Hizmetleri A.S. | 20,000 | 27,622 | ||||||
|
| |||||||
| United States — 0.7% (Cost: $34,435) | ||||||||
Samsonite International S.A. (1) | 13,986 | 30,047 | ||||||
|
| |||||||
Total Common Stock |
| |||||||
(Cost: $4,044,877) |
| 3,682,017 | ||||||
|
| |||||||
PREFERRED STOCK — 2.5% |
| |||||||
| South Korea — 2.5% | ||||||||
Hyundai Motor Co. | 1,150 | 64,337 | ||||||
Samsung Electronics Co., Ltd. | 1,100 | 41,109 | ||||||
|
| |||||||
Total South Korea |
| |||||||
(Cost: $112,139) |
| 105,446 | ||||||
|
| |||||||
Total Preferred Stock |
| |||||||
(Cost: $112,139) |
| 105,446 | ||||||
|
| |||||||
| MONEY MARKET INVESTMENTS — 16.2% | ||||||||
State Street Institutional U.S. Government Money Market Fund — Premier Class, 3.01% (3) | 669,364 | 669,364 | ||||||
|
| |||||||
Total Money Market Investments |
| |||||||
(Cost: $669,364) |
| 669,364 | ||||||
|
| |||||||
Total Investments (107.6%) | ||||||||
(Cost: $4,826,380) |
| 4,456,827 | ||||||
Liabilities In Excess Of Other Assets (-7.6%) |
| (313,358 | ) | |||||
|
| |||||||
Total Net Assets (100.0%) |
| $ | 4,143,469 | |||||
|
| |||||||
Notes to the Schedule of Investments:
| PJSC | Private Joint-Stock Company. |
| SP ADR | Sponsored American Depositary Receipt. ADRs are receipts, typically issued by a U.S. bank or trust company, evidencing ownership of underlying securities issued by a foreign corporation. Sponsored ADRs are ADRs issued with the cooperation of the foreign corporation. |
| (1) | Non-income producing security. |
| (2) | For fair value measurement disclosure purposes, security is categorized as Level 3. Security is valued using significant unobservable inputs. |
| (3) | Rate disclosed is the 7-day net yield as of October 31, 2022. |
See accompanying Notes to Financial Statements.
13
Table of Contents
TCW Developing Markets Equity Fund
Investments by Sector | October 31, 2022 |
| Sector | Percentage of Net Assets | |||
Air Freight & Logistics | 1.5 | % | ||
Automobiles | 3.0 | |||
Beverages | 0.4 | |||
Chemicals | 3.1 | |||
Construction & Engineering | 2.1 | |||
Diversified Consumer Services | 0.5 | |||
Diversified Telecommunication Services | 1.5 | |||
Electric Utilities | 1.6 | |||
Electrical Equipment | 3.1 | |||
Electronic Equipment, Instruments & Components | 3.3 | |||
Food & Staples Retailing | 6.2 | |||
Food Products | 1.9 | |||
Health Care Providers & Services | 1.1 | |||
Hotels, Restaurants & Leisure | 0.9 | |||
IT Services | 1.2 | |||
Independent Power and Renewable Electricity Producers | 3.7 | |||
Industrial Conglomerates | 2.8 | |||
Insurance | 4.6 | |||
Interactive Media & Services | 0.0 | |||
Internet & Direct Marketing Retail | 4.7 | |||
Machinery | 1.9 | |||
Media | 2.2 | |||
Metals & Mining | 3.4 | |||
Multi-Utilities | 1.5 | |||
Oil, Gas & Consumable Fuels | 10.9 | |||
Pharmaceuticals | 1.0 | |||
Real Estate Management & Development | 4.0 | |||
Road & Rail | 1.0 | |||
Semiconductors & Semiconductor Equipment | 7.3 | |||
Software | 1.4 | |||
Specialty Retail | 1.8 | |||
Technology Hardware, Storage & Peripherals | 1.0 | |||
Textiles, Apparel & Luxury Goods | 3.7 | |||
Transportation Infrastructure | 2.4 | |||
Wireless Telecommunication Services | 0.7 | |||
Money Market Investments | 16.2 | |||
|
| |||
Total | 107.6 | % | ||
|
| |||
See accompanying Notes to Financial Statements.
14
Table of Contents
TCW Developing Markets Equity Fund
Fair Valuation Summary | October 31, 2022 |
The following is a summary of the fair valuations according to the inputs used as of October 31, 2022 in valuing the Fund’s investments:
Description | Quoted Prices in Active Markets for Identical Assets (Level 1) | Other Significant Observable Inputs (Level 2) | Significant Unobservable Inputs (Level 3) | Total | ||||||||||||
Common Stock | ||||||||||||||||
Air Freight & Logistics | $ | 60,799 | $ | — | $ | — | $ | 60,799 | ||||||||
Automobiles | — | 60,487 | — | 60,487 | ||||||||||||
Beverages | — | 18,535 | — | 18,535 | ||||||||||||
Chemicals | 83,967 | 44,617 | — | 128,584 | ||||||||||||
Construction & Engineering | 39,049 | 49,404 | — | 88,453 | ||||||||||||
Diversified Consumer Services | 19,389 | — | — | 19,389 | ||||||||||||
Diversified Telecommunication Services | 62,279 | — | — | 62,279 | ||||||||||||
Electric Utilities | 64,127 | — | — | 64,127 | ||||||||||||
Electrical Equipment | 48,609 | 76,979 | — | 125,588 | ||||||||||||
Electronic Equipment, Instruments & Components | — | 137,250 | — | 137,250 | ||||||||||||
Food & Staples Retailing | 150,979 | 106,868 | — | 257,847 | ||||||||||||
Food Products | 79,745 | — | — | 79,745 | ||||||||||||
Health Care Providers & Services | — | 43,611 | — | 43,611 | ||||||||||||
Hotels, Restaurants & Leisure | — | 36,548 | — | 36,548 | ||||||||||||
Independent Power and Renewable Electricity Producers | 151,354 | — | — | 151,354 | ||||||||||||
Industrial Conglomerates | — | 116,626 | — | 116,626 | ||||||||||||
Insurance | — | 187,308 | — | 187,308 | ||||||||||||
Interactive Media & Services | — | — | 140 | 140 | ||||||||||||
Internet & Direct Marketing Retail | 99,178 | 94,692 | — | 193,870 | ||||||||||||
IT Services | — | 49,109 | — | 49,109 | ||||||||||||
Machinery | 41,552 | 37,814 | — | 79,366 | ||||||||||||
Media | 91,439 | — | — | 91,439 | ||||||||||||
Metals & Mining | 143,392 | — | 117 | 143,509 | ||||||||||||
Multi-Utilities | — | 63,748 | — | 63,748 | ||||||||||||
Oil, Gas & Consumable Fuels | 168,410 | 288,016 | — | 456,426 | ||||||||||||
Pharmaceuticals | 42,778 | — | — | 42,778 | ||||||||||||
Real Estate Management & Development | 63,223 | 101,825 | — | 165,048 | ||||||||||||
Road & Rail | — | 40,400 | — | 40,400 | ||||||||||||
Semiconductors & Semiconductor Equipment | 39,056 | 263,564 | — | 302,620 | ||||||||||||
Software | — | 59,391 | — | 59,391 | ||||||||||||
Specialty Retail | 25,376 | 50,823 | — | 76,199 | ||||||||||||
Textiles, Apparel & Luxury Goods | — | 153,027 | — | 153,027 | ||||||||||||
Transportation Infrastructure | 98,795 | — | — | 98,795 | ||||||||||||
Wireless Telecommunication Services | — | 27,622 | — | 27,622 | ||||||||||||
|
|
|
|
|
|
|
| |||||||||
Total Common Stock | 1,573,496 | 2,108,264 | 257 | 3,682,017 | ||||||||||||
|
|
|
|
|
|
|
| |||||||||
Preferred Stock | ||||||||||||||||
Automobiles | — | 64,337 | — | 64,337 | ||||||||||||
Technology Hardware, Storage & Peripherals | — | 41,109 | — | 41,109 | ||||||||||||
|
|
|
|
|
|
|
| |||||||||
Total Preferred Stock | — | 105,446 | — | 105,446 | ||||||||||||
|
|
|
|
|
|
|
| |||||||||
Money Market Investments | 669,364 | — | — | 669,364 | ||||||||||||
|
|
|
|
|
|
|
| |||||||||
Total Investments | $ | 2,242,860 | $ | 2,213,710 | $ | 257 | $ | 4,456,827 | ||||||||
|
|
|
|
|
|
|
| |||||||||
See accompanying Notes to Financial Statements.
15
Table of Contents
TCW Emerging Markets Income Fund
Schedule of Investments
| Issues | Maturity Date | Principal Amount | Value | |||||||||
FIXED INCOME SECURITIES — 94.9% of Net Assets |
| |||||||||||
| Angola — 1.8% | ||||||||||||
Angolan Government International Bond |
| |||||||||||
8.25% (1) | 05/09/28 | $ | 23,005,000 | $ | 19,492,136 | |||||||
8.75% (1) | 04/14/32 | 60,835,000 | 48,972,175 | |||||||||
|
| |||||||||||
Total Angola |
| |||||||||||
(Cost: $77,988,174) |
| 68,464,311 | ||||||||||
|
| |||||||||||
| Argentina — 1.1% | ||||||||||||
Argentine Republic Government International Bond |
| |||||||||||
3.50% | 07/09/41 | 81,565,456 | 19,592,470 | |||||||||
3.88% | 01/09/38 | 96,632,818 | 25,201,839 | |||||||||
|
| |||||||||||
Total Argentina |
| |||||||||||
(Cost: $66,415,338) |
| 44,794,309 | ||||||||||
|
| |||||||||||
| Bahrain — 3.1% | ||||||||||||
Bahrain Government International Bond |
| |||||||||||
5.25% (1) | 01/25/33 | 49,810,000 | 39,048,350 | |||||||||
5.63% (1) | 09/30/31 | 19,512,000 | 16,473,982 | |||||||||
Oil and Gas Holding Co. BSCC (The) |
| |||||||||||
7.50% (2) | 10/25/27 | 25,435,000 | 24,674,621 | |||||||||
7.63% (2) | 11/07/24 | 39,939,000 | 39,695,771 | |||||||||
|
| |||||||||||
Total Bahrain |
| |||||||||||
(Cost: $132,022,959) |
| 119,892,724 | ||||||||||
|
| |||||||||||
| Benin — 0.2% (Cost: $8,983,178) | ||||||||||||
Benin Government International Bond |
| |||||||||||
4.88% (2) | 01/19/32 | EU | R 13,125,000 | 8,983,178 | ||||||||
|
| |||||||||||
| Brazil — 4.1% | ||||||||||||
Acu Petroleo Luxembourg Sarl |
| |||||||||||
7.50% (1) | 07/13/35 | $ | 24,316,000 | 19,201,009 | ||||||||
Brazil Notas do Tesouro Nacional, Series F |
| |||||||||||
10.00% | 01/01/25 | BRL | 50,000,000 | 9,220,947 | ||||||||
10.00% | 01/01/27 | BRL | 53,400,000 | 9,645,196 | ||||||||
Brazilian Government International Bond |
| |||||||||||
3.88% | 06/12/30 | $ | 15,900,000 | 13,414,004 | ||||||||
5.00% | 01/27/45 | 48,019,000 | 34,722,539 | |||||||||
7.13% | 01/20/37 | 21,575,000 | 21,639,725 | |||||||||
CSN Resources S.A. |
| |||||||||||
4.63% (1) | 06/10/31 | 13,844,000 | 9,283,786 | |||||||||
5.88% (1) | 04/08/32 | 1,925,000 | 1,398,705 | |||||||||
Globo Communicacoes Part |
| |||||||||||
5.50% (1) | 01/14/32 | 17,848,000 | 13,627,930 | |||||||||
MC Brazil Downstream Trading Sarl |
| |||||||||||
7.25% (1) | 06/30/31 | 14,653,000 | 11,196,357 | |||||||||
MV24 Capital B.V. |
| |||||||||||
6.75% (1) | 06/01/34 | 22,706,951 | 18,826,333 | |||||||||
|
| |||||||||||
Total Brazil |
| |||||||||||
(Cost: $178,389,929) |
| 162,176,531 | ||||||||||
|
| |||||||||||
| Issues | Maturity Date | Principal Amount | Value | |||||||||
| Chile — 3.6% | ||||||||||||
AES Andes S.A. |
| |||||||||||
7.13% (USD 5-year Swap rate + 4.644%) (1),(3) | 03/26/79 | $ | 20,856,000 | $ | 17,218,714 | |||||||
Chile Government International Bond |
| |||||||||||
2.55% | 01/27/32 | 54,480,000 | 42,865,954 | |||||||||
2.55% | 07/27/33 | 23,947,000 | 17,876,435 | |||||||||
2.75% | 01/31/27 | 19,350,000 | 17,393,110 | |||||||||
3.10% | 05/07/41 | 42,935,000 | 28,457,318 | |||||||||
3.50% | 01/31/34 | 23,060,000 | 18,644,010 | |||||||||
|
| |||||||||||
Total Chile |
| |||||||||||
(Cost: $167,613,509) |
| 142,455,541 | ||||||||||
|
| |||||||||||
| China — 0.4% | ||||||||||||
Alibaba Group Holding, Ltd. |
| |||||||||||
4.50% | 11/28/34 | 4,377,000 | 3,390,074 | |||||||||
Tencent Holdings, Ltd. |
| |||||||||||
3.93% (2) | 01/19/38 | 15,990,000 | 10,912,324 | |||||||||
|
| |||||||||||
Total China |
| |||||||||||
(Cost: $17,666,732) |
| 14,302,398 | ||||||||||
|
| |||||||||||
| Colombia — 3.0% | ||||||||||||
Banco GNB Sudameris S.A. |
| |||||||||||
7.50% (U.S. 5-year Treasury Constant Maturity Rate + 6.660%) (1),(3) | 04/16/31 | 10,550,000 | 7,203,909 | |||||||||
Colombia Government International Bond |
| |||||||||||
3.13% | 04/15/31 | 38,765,000 | 26,871,898 | |||||||||
4.13% | 02/22/42 | 76,770,000 | 43,340,261 | |||||||||
Ecopetrol S.A. |
| |||||||||||
4.63% | 11/02/31 | 13,411,000 | 9,296,505 | |||||||||
Gran Tierra Energy International Holdings, Ltd. |
| |||||||||||
6.25% (2) | 02/15/25 | 14,397,000 | 12,310,551 | |||||||||
Gran Tierra Energy, Inc. |
| |||||||||||
7.75% (2) | 05/23/27 | 13,143,000 | 10,202,912 | |||||||||
Millicom International Cellular S.A. |
| |||||||||||
5.13% (2) | 01/15/28 | 8,235,000 | 7,081,277 | |||||||||
|
| |||||||||||
Total Colombia |
| |||||||||||
(Cost: $137,208,444) |
| 116,307,313 | ||||||||||
|
| |||||||||||
| Costa Rica — 0.4% (Cost: $15,811,531) | ||||||||||||
Instituto Costarricense de Electricidad |
| |||||||||||
6.75% (1) | 10/07/31 | 15,954,000 | 14,114,464 | |||||||||
|
| |||||||||||
| Dominican Republic — 3.8% | ||||||||||||
Dominican Republic International Bond |
| |||||||||||
4.50% (1) | 01/30/30 | 15,736,000 | 12,670,718 | |||||||||
4.88% (1) | 09/23/32 | 77,329,000 | 59,872,394 | |||||||||
5.30% (1) | 01/21/41 | 22,180,000 | 15,360,234 | |||||||||
5.50% (1) | 02/22/29 | 47,300,000 | 41,476,635 | |||||||||
See accompanying Notes to Financial Statements.
16
Table of Contents
TCW Emerging Markets Income Fund
October 31, 2022
| Issues | Maturity Date | Principal Amount | Value | |||||||||
| Dominican Republic (Continued) | ||||||||||||
6.00% (2) | 07/19/28 | $ | 22,370,000 | $ | 20,496,662 | |||||||
|
| |||||||||||
Total Dominican Republic |
| |||||||||||
(Cost: $163,109,691) |
| 149,876,643 | ||||||||||
|
| |||||||||||
| Ecuador — 1.0% | ||||||||||||
Ecuador Government International Bond |
| |||||||||||
2.50% (1) | 07/31/35 | 19,864,699 | 7,356,398 | |||||||||
5.50% (2) | 07/31/30 | 62,173,094 | 33,271,931 | |||||||||
|
| |||||||||||
Total Ecuador |
| |||||||||||
(Cost: $62,486,269) |
| 40,628,329 | ||||||||||
|
| |||||||||||
| Egypt — 1.5% | ||||||||||||
Egypt Government International Bond |
| |||||||||||
7.05% (1) | 01/15/32 | 53,112,000 | 33,849,446 | |||||||||
7.30% (2) | 09/30/33 | 16,441,000 | 10,296,176 | |||||||||
7.60% (2) | 03/01/29 | 14,030,000 | 10,053,898 | |||||||||
Energean PLC |
| |||||||||||
6.50% (1) | 04/30/27 | 2,850,000 | 2,537,355 | |||||||||
|
| |||||||||||
Total Egypt |
| |||||||||||
(Cost: $82,352,613) |
| 56,736,875 | ||||||||||
|
| |||||||||||
| El Salvador — 0.8% | ||||||||||||
El Salvador Government International Bond |
| |||||||||||
6.38% (2) | 01/18/27 | 40,314,000 | 16,077,223 | |||||||||
7.12% (2) | 01/20/50 | 22,000,000 | 7,580,650 | |||||||||
8.25% (2) | 04/10/32 | 18,820,000 | 7,622,100 | |||||||||
|
| |||||||||||
Total El Salvador |
| |||||||||||
(Cost: $65,880,321) |
| 31,279,973 | ||||||||||
|
| |||||||||||
| Gabon — 0.6% (Cost: $30,504,783) | ||||||||||||
Gabon Government International Bond |
| |||||||||||
6.63% (2) | 02/06/31 | 31,213,000 | 21,977,073 | |||||||||
|
| |||||||||||
| Guatemala — 1.9% | ||||||||||||
Banco Industrial S.A. |
| |||||||||||
4.88% (U.S. 5-year Treasury Constant Maturity Rate + 4.442%) (1),(3) | 01/29/31 | 15,400,000 | 14,092,809 | |||||||||
CT Trust |
| |||||||||||
5.13% (2) | 02/03/32 | 15,051,000 | 12,105,519 | |||||||||
Guatemala Government Bond |
| |||||||||||
3.70% (1) | 10/07/33 | 23,470,000 | 17,900,041 | |||||||||
4.90% (2) | 06/01/30 | 14,400,000 | 13,141,558 | |||||||||
5.25% (2) | 08/10/29 | 20,100,000 | 18,578,430 | |||||||||
|
| |||||||||||
Total Guatemala |
| |||||||||||
(Cost: $83,510,712) |
| 75,818,357 | ||||||||||
|
| |||||||||||
| Hungary — 0.6% (Cost: $24,775,754) | ||||||||||||
Hungary Government International Bond |
| |||||||||||
5.25% (1) | 06/16/29 | 26,075,000 | 24,022,715 | |||||||||
|
| |||||||||||
| Issues | Maturity Date | Principal Amount | Value | |||||||||
| India — 1.4% | ||||||||||||
Adani Green Energy, Ltd. |
| |||||||||||
4.38% (2) | 09/08/24 | $ | 16,348,000 | $ | 12,342,740 | |||||||
Greenko Investment Co. |
| |||||||||||
4.88% (2) | 08/16/23 | 10,540,000 | 10,116,002 | |||||||||
Greenko Power II, Ltd. |
| |||||||||||
4.30% (2) | 12/13/28 | 13,782,750 | 10,647,175 | |||||||||
India Airport Infra |
| |||||||||||
6.25% (2) | 10/25/25 | 10,950,000 | 9,710,022 | |||||||||
India Green Power Holdings |
| |||||||||||
4.00% (2) | 02/22/27 | 13,970,000 | 10,617,200 | |||||||||
|
| |||||||||||
Total India |
| |||||||||||
(Cost: $55,913,557) |
| 53,433,139 | ||||||||||
|
| |||||||||||
| Indonesia — 6.7% | ||||||||||||
Freeport Indonesia PT |
| |||||||||||
4.76% (1) | 04/14/27 | 23,525,000 | 21,187,203 | |||||||||
5.32% (1) | 04/14/32 | 34,455,000 | 29,007,664 | |||||||||
Indonesia Asahan Aluminium Persero PT |
| |||||||||||
4.75% (1) | 05/15/25 | 39,540,000 | 37,958,400 | |||||||||
5.45% (1) | 05/15/30 | 46,536,000 | 41,351,890 | |||||||||
Indonesia Government International Bond |
| |||||||||||
5.25% (2) | 01/17/42 | 17,011,000 | 15,433,442 | |||||||||
Perusahaan Penerbit SBSN Indonesia III |
| |||||||||||
2.55% (2) | 06/09/31 | 21,378,000 | 17,172,947 | |||||||||
3.80% (1) | 06/23/50 | 9,619,000 | 6,820,733 | |||||||||
4.15% (2) | 03/29/27 | 23,050,000 | 21,952,590 | |||||||||
4.70% (1) | 06/06/32 | 40,155,000 | 37,695,506 | |||||||||
Perusahaan Perseroan Persero PT Perusahaan Listrik Negara |
| |||||||||||
3.00% (2) | 06/30/30 | 6,950,000 | 5,284,433 | |||||||||
3.38% (2) | 02/05/30 | 9,850,000 | 7,814,941 | |||||||||
4.88% (2) | 07/17/49 | 14,900,000 | 10,024,869 | |||||||||
5.25% (2) | 05/15/47 | 13,450,000 | 9,689,380 | |||||||||
|
| |||||||||||
Total Indonesia |
| |||||||||||
(Cost: $301,403,498) |
| 261,393,998 | ||||||||||
|
| |||||||||||
| Iraq — 1.6% (Cost: $70,911,982) | ||||||||||||
Iraq International Bond |
| |||||||||||
5.80% (2) | 01/15/28 | 74,448,688 | 63,616,403 | |||||||||
|
| |||||||||||
| Israel — 2.0% | ||||||||||||
Bank Leumi Le-Israel BM |
| |||||||||||
5.13% (2) | 07/27/27 | 14,075,000 | 13,737,485 | |||||||||
Energean Israel Finance, Ltd. |
| |||||||||||
4.88% (2) | 03/30/26 | 9,005,000 | 8,127,012 | |||||||||
5.38% (2) | 03/30/28 | 16,230,000 | 14,319,729 | |||||||||
5.88% (2) | 03/30/31 | 43,642,700 | 37,096,295 | |||||||||
Leviathan Bond, Ltd. |
| |||||||||||
6.75% (2) | 06/30/30 | 4,715,000 | 4,221,776 | |||||||||
|
| |||||||||||
Total Israel |
| |||||||||||
(Cost: $84,484,118) |
| 77,502,297 | ||||||||||
|
| |||||||||||
See accompanying Notes to Financial Statements.
17
Table of Contents
TCW Emerging Markets Income Fund
Schedule of Investments (Continued)
| Issues | Maturity Date | Principal Amount | Value | |||||||||
| Ivory Coast — 0.8% | ||||||||||||
Ivory Coast Government International Bond |
| |||||||||||
4.88% (1) | 01/30/32 | EUR | 29,810,000 | $ | 20,785,951 | |||||||
6.88% (1) | 10/17/40 | EUR | 18,557,000 | 12,334,199 | ||||||||
|
| |||||||||||
Total Ivory Coast |
| |||||||||||
(Cost: $44,910,648) |
| 33,120,150 | ||||||||||
|
| |||||||||||
| Jordan — 1.0% | ||||||||||||
Jordan Government International Bond |
| |||||||||||
4.95% (2) | 07/07/25 | $ | 11,235,000 | 10,522,532 | ||||||||
7.75% (1) | 01/15/28 | 31,020,000 | 30,191,766 | |||||||||
|
| |||||||||||
Total Jordan |
| |||||||||||
(Cost: $41,141,191) |
| 40,714,298 | ||||||||||
|
| |||||||||||
| Kazakhstan — 2.1% | ||||||||||||
KazMunayGas National Co. JSC |
| |||||||||||
3.50% (1) | 04/14/33 | 63,920,000 | 43,305,800 | |||||||||
5.38% (2) | 04/24/30 | 22,665,000 | 18,634,596 | |||||||||
Tengizchevroil Finance Co. International Ltd. |
| |||||||||||
3.25% (2) | 08/15/30 | 13,875,000 | 9,507,844 | |||||||||
4.00% (2) | 08/15/26 | 15,204,000 | 12,412,470 | |||||||||
|
| |||||||||||
Total Kazakhstan |
| |||||||||||
(Cost: $110,500,424) |
| 83,860,710 | ||||||||||
|
| |||||||||||
| Kenya — 0.4% (Cost: $16,320,075) | ||||||||||||
Republic of Kenya Government International Bond |
| |||||||||||
7.25% (2) | 02/28/28 | 20,365,000 | 15,477,400 | |||||||||
|
| |||||||||||
| Mexico — 10.1% | ||||||||||||
America Movil SAB de CV |
| |||||||||||
5.38% (1) | 04/04/32 | 27,470,000 | 23,333,018 | |||||||||
Banco Mercantil del Norte S.A. |
| |||||||||||
5.88% (U.S. 5-year Treasury Constant Maturity Rate + 4.643%) (1),(3),(4) | 01/24/27 | 6,750,000 | 5,162,499 | |||||||||
7.50% (U.S. 10-year Treasury Constant Maturity Rate + 5.470%) (1),(3),(4) | 06/27/29 | 32,094,000 | 25,100,109 | |||||||||
BBVA Bancomer S.A. |
| |||||||||||
5.13% (U.S. 5-year Treasury Constant Maturity Rate + 2.650%) (2),(3) | 01/18/33 | 11,061,000 | 9,004,207 | |||||||||
Braskem Idesa SAPI |
| |||||||||||
6.99% (1) | 02/20/32 | 3,670,000 | 2,454,790 | |||||||||
Cemex SAB de CV |
| |||||||||||
5.13% (U.S. 5-year Treasury Constant Maturity Rate + 4.534%) (1),(3),(4) | 06/08/26 | 22,593,000 | 18,651,651 | |||||||||
Comision Federal de Electricidad |
| |||||||||||
4.69% (1) | 05/15/29 | 5,015,000 | 4,251,567 | |||||||||
| Issues | Maturity Date | Principal Amount | Value | |||||||||
| Mexico (Continued) | ||||||||||||
6.26% (2) | 02/15/52 | $ | 25,365,000 | $ | 18,899,444 | |||||||
Electricidad Firme de Mexico Holdings SA de CV |
| |||||||||||
4.90% (1) | 11/20/26 | 18,998,000 | 15,293,390 | |||||||||
Mexico Government International Bond |
| |||||||||||
4.28% | 08/14/41 | 13,821,000 | 10,068,253 | |||||||||
4.50% | 04/22/29 | 40,102,000 | 37,395,115 | |||||||||
4.88% | 05/19/33 | 68,570,000 | 60,633,022 | |||||||||
Petroleos Mexicanos |
| |||||||||||
5.35% | 02/12/28 | 58,935,000 | 47,072,976 | |||||||||
6.63% | 06/15/35 | 24,043,000 | 16,640,160 | |||||||||
6.84% | 01/23/30 | 45,595,000 | 36,421,286 | |||||||||
Petroleos Mexicanos Co. |
| |||||||||||
6.70% | 02/16/32 | 31,308,000 | 23,728,646 | |||||||||
United Mexican States |
| |||||||||||
3.50% | 02/12/34 | 57,053,000 | 43,731,125 | |||||||||
|
| |||||||||||
Total Mexico |
| |||||||||||
(Cost: $428,906,350) |
| 397,841,258 | ||||||||||
|
| |||||||||||
| Mozambique — 0.5% (Cost: $20,863,442) | ||||||||||||
Mozambique International Bond |
| |||||||||||
5.00% (2) | 09/15/31 | 30,080,000 | 20,491,323 | |||||||||
|
| |||||||||||
| Nigeria — 1.8% | ||||||||||||
Nigeria Government International Bond |
| |||||||||||
6.13% (1) | 09/28/28 | 40,316,000 | 26,632,750 | |||||||||
7.38% (2) | 09/28/33 | 26,705,000 | 16,223,287 | |||||||||
7.70% (1) | 02/23/38 | 45,120,000 | 26,593,728 | |||||||||
|
| |||||||||||
Total Nigeria |
| |||||||||||
(Cost: $101,808,035) |
| 69,449,765 | ||||||||||
|
| |||||||||||
| Oman — 4.3% | ||||||||||||
Oman Government International Bond |
| |||||||||||
4.75% (2) | 06/15/26 | 18,664,000 | 17,704,670 | |||||||||
5.63% (2) | 01/17/28 | 19,179,000 | 18,348,549 | |||||||||
6.00% (2) | 08/01/29 | 37,710,000 | 35,965,913 | |||||||||
6.25% (1) | 01/25/31 | 47,204,000 | 45,254,475 | |||||||||
OQ SAOC |
| |||||||||||
5.13% (2) | 05/06/28 | 58,664,000 | 53,110,983 | |||||||||
|
| |||||||||||
Total Oman |
| |||||||||||
(Cost: $180,042,234) |
| 170,384,590 | ||||||||||
|
| |||||||||||
| Pakistan — 0.6% | ||||||||||||
Pakistan Government International Bond |
| |||||||||||
6.00% (1) | 04/08/26 | 37,215,000 | 12,001,837 | |||||||||
6.88% (2) | 12/05/27 | 36,093,000 | 11,607,509 | |||||||||
|
| |||||||||||
Total Pakistan |
| |||||||||||
(Cost: $68,315,376) |
| 23,609,346 | ||||||||||
|
| |||||||||||
| Panama — 4.7% | ||||||||||||
Panama Government International Bond |
| |||||||||||
2.25% | 09/29/32 | 20,521,000 | 14,292,076 | |||||||||
See accompanying Notes to Financial Statements.
18
Table of Contents
TCW Emerging Markets Income Fund
October 31, 2022
| Issues | Maturity Date | Principal Amount | Value | |||||||||
| Panama (Continued) | ||||||||||||
3.16% | 01/23/30 | $ | 66,973,000 | $ | 54,804,006 | |||||||
3.75% | 03/16/25 | 17,500,000 | 16,738,706 | |||||||||
3.88% | 03/17/28 | 56,040,000 | 50,920,052 | |||||||||
Republic of Panama |
| |||||||||||
6.70% | 01/26/36 | 47,060,000 | 46,043,504 | |||||||||
|
| |||||||||||
Total Panama |
| |||||||||||
(Cost: $198,254,331) |
| 182,798,344 | ||||||||||
|
| |||||||||||
| Paraguay — 1.1% | ||||||||||||
Paraguay Government International Bond |
| |||||||||||
2.74% (2) | 01/29/33 | 9,100,000 | 6,829,920 | |||||||||
3.85% (2) | 06/28/33 | 29,090,000 | 23,718,555 | |||||||||
5.60% (2) | 03/13/48 | 18,257,000 | 14,318,492 | |||||||||
|
| |||||||||||
Total Paraguay |
| |||||||||||
(Cost: $47,885,739) |
| 44,866,967 | ||||||||||
|
| |||||||||||
| Peru — 3.6% | ||||||||||||
Peruvian Government International Bond |
| |||||||||||
2.78% | 01/23/31 | 71,965,000 | 57,010,673 | |||||||||
3.00% | 01/15/34 | 87,016,000 | 65,296,806 | |||||||||
3.30% | 03/11/41 | 30,042,000 | 20,368,476 | |||||||||
|
| |||||||||||
Total Peru |
| |||||||||||
(Cost: $173,047,920) |
| 142,675,955 | ||||||||||
|
| |||||||||||
| Philippines — 2.8% | ||||||||||||
Philippine Government International Bond |
| |||||||||||
1.95% | 01/06/32 | 29,715,000 | 22,458,147 | |||||||||
3.20% | 07/06/46 | 30,424,000 | 20,180,239 | |||||||||
3.56% | 09/29/32 | 47,255,000 | 40,662,927 | |||||||||
5.95% | 10/13/47 | 11,585,000 | 11,408,142 | |||||||||
6.38% | 10/23/34 | 13,800,000 | 14,296,592 | |||||||||
|
| |||||||||||
Total Philippines |
| |||||||||||
(Cost: $126,320,234) |
| 109,006,047 | ||||||||||
|
| |||||||||||
| Qatar — 3.8% | ||||||||||||
Qatar Energy |
| |||||||||||
1.38% (2) | 09/12/26 | 36,360,000 | 31,996,618 | |||||||||
2.25% (1) | 07/12/31 | 35,240,000 | 28,192,000 | |||||||||
3.13% (1) | 07/12/41 | 51,681,000 | 36,595,316 | |||||||||
Qatar Government International Bond |
| |||||||||||
3.75% (1) | 04/16/30 | 57,994,000 | 54,027,211 | |||||||||
|
| |||||||||||
Total Qatar |
| |||||||||||
(Cost: $175,824,919) |
| 150,811,145 | ||||||||||
|
| |||||||||||
| Romania — 1.1% | ||||||||||||
Romanian Government International Bond |
| |||||||||||
3.00% (1) | 02/27/27 | 45,882,000 | 39,527,343 | |||||||||
3.00% (1) | 02/14/31 | 7,166,000 | 5,328,573 | |||||||||
|
| |||||||||||
Total Romania |
| |||||||||||
(Cost: $50,777,689) |
| 44,855,916 | ||||||||||
|
| |||||||||||
| Issues | Maturity Date | Principal Amount | Value | |||||||||
| Saudi Arabia — 5.1% | ||||||||||||
KSA Sukuk, Ltd. |
| |||||||||||
5.27% (1) | 10/25/28 | $ | 32,987,000 | $ | 33,230,279 | |||||||
Saudi Arabian Oil Co. |
| |||||||||||
2.25% (2) | 11/24/30 | 48,920,000 | 38,646,800 | |||||||||
3.50% (2) | 04/16/29 | 57,345,000 | 50,979,705 | |||||||||
Saudi Government International Bond |
| |||||||||||
3.63% (2) | 03/04/28 | 38,835,000 | 36,208,007 | |||||||||
5.50% (1) | 10/25/32 | 41,000,000 | 41,589,375 | |||||||||
|
| |||||||||||
Total Saudi Arabia |
| |||||||||||
(Cost: $212,278,895) |
| 200,654,166 | ||||||||||
|
| |||||||||||
| Senegal — 0.7% (Cost: $36,447,028) | ||||||||||||
Senegal Government International Bond |
| |||||||||||
5.38% (1) | 06/08/37 | EUR | 42,225,000 | 25,665,852 | ||||||||
|
| |||||||||||
| South Africa — 5.1% | ||||||||||||
Eskom Holdings SOC, Ltd. |
| |||||||||||
4.31% (2) | 07/23/27 | $ | 24,360,000 | 20,535,480 | ||||||||
6.35% (2) | 08/10/28 | 49,522,000 | 44,617,341 | |||||||||
7.13% (2) | 02/11/25 | 18,375,000 | 17,241,262 | |||||||||
8.45% (2) | 08/10/28 | 31,892,000 | 28,061,771 | |||||||||
Republic of South Africa Government International Bond |
| |||||||||||
4.85% | 09/30/29 | 44,125,000 | 37,620,975 | |||||||||
5.88% | 04/20/32 | 58,305,000 | 50,049,595 | |||||||||
|
| |||||||||||
Total South Africa |
| |||||||||||
(Cost: $216,932,454) |
| 198,126,424 | ||||||||||
|
| |||||||||||
| Sri Lanka — 0.3% | ||||||||||||
Sri Lanka Government International Bond |
| |||||||||||
6.20% (2),(5) | 05/11/27 | 14,675,000 | 3,265,188 | |||||||||
6.75% (2),(5) | 04/18/28 | 36,568,000 | 8,484,873 | |||||||||
|
| |||||||||||
Total Sri Lanka |
| |||||||||||
(Cost: $36,927,349) |
| 11,750,061 | ||||||||||
|
| |||||||||||
| Thailand — 0.4% (Cost: $23,749,635) | ||||||||||||
GC Treasury Centre Co. |
| |||||||||||
5.20% (1) | 03/30/52 | 24,125,000 | 17,210,775 | |||||||||
|
| |||||||||||
| Turkey — 1.2% (Cost: $43,903,118) | ||||||||||||
Turkey Government International Bond |
| |||||||||||
4.88% | 04/16/43 | 78,538,000 | 46,239,248 | |||||||||
|
| |||||||||||
| United Arab Emirates — 3.4% | ||||||||||||
DP World Salaam |
| |||||||||||
6.00% (U.S. 5-year Treasury Constant Maturity Rate + 5.750%) (2),(3),(4) | 10/01/25 | 49,513,000 | 48,131,587 | |||||||||
Galaxy Pipeline Assets Bidco, Ltd. |
| |||||||||||
2.63% (1) | 03/31/36 | 94,416,000 | 71,915,015 | |||||||||
2.94% (1) | 09/30/40 | 16,373,018 | 12,328,883 | |||||||||
|
| |||||||||||
Total United Arab Emirates |
| |||||||||||
(Cost: $153,858,701) |
| 132,375,485 | ||||||||||
|
| |||||||||||
See accompanying Notes to Financial Statements.
19
Table of Contents
TCW Emerging Markets Income Fund
Schedule of Investments (Continued)
| Issues | Maturity Date | Principal Amount | Value | |||||||||
| Venezuela — 0.3% | ||||||||||||
Venezuela Government International Bond |
| |||||||||||
8.25% (2),(5),(6) | 10/13/24 | $ | 60,057,200 | $ | 4,654,433 | |||||||
9.25% (5),(6) | 09/15/27 | 60,955,000 | 4,724,013 | |||||||||
9.25% (2),(5),(6) | 05/07/28 | 49,048,000 | 3,801,220 | |||||||||
|
| |||||||||||
Total Venezuela |
| |||||||||||
(Cost: $55,533,009) |
| 13,179,666 | ||||||||||
|
| |||||||||||
| Zambia — 0.1% (Cost: $8,161,646) | ||||||||||||
Zambia Government International Bond |
| |||||||||||
5.38% (2) | 09/20/22 | 11,247,000 | 4,052,294 | |||||||||
|
| |||||||||||
Total Fixed Income Securities |
| |||||||||||
(Cost: $4,400,143,534) |
| 3,726,993,756 | ||||||||||
|
| |||||||||||
| PURCHASED OPTIONS (7) (0.1%) (Cost: $6,941,402) | 3,547,084 | |||||||||||
|
| |||||||||||
| Issues | Shares | Value | ||||||||||
| Money Market Investments (6.9% ) | ||||||||||||
State Street Institutional U.S. Government Money Market Fund — Premier Class, 3.01% (8) | 270,041,180 | $ | 270,041,180 | |||||||||
|
| |||||||||||
Total Money Market Investments |
| |||||||||||
(Cost: $270,041,180) |
| 270,041,180 | ||||||||||
|
| |||||||||||
Total Investments (101.9%) |
| |||||||||||
(Cost: $4,677,126,116) |
| 4,000,582,020 | ||||||||||
| Liabilities In Excess Of Other Assets (-1.9%) | (73,766,975) | |||||||||||
|
| |||||||||||
| Total Net Assets (100.0%) | $3,926,815,045 | |||||||||||
|
| |||||||||||
| Purchased Options — OTC | ||||||||||||||||||||||||||||||||||
| Description | Counterparty | Exercise Price | Expiration Date | Number of Contracts | Notional Amount | Market Value | Premiums Paid (Received) by Fund | Unrealized Appreciation (Depreciation) | ||||||||||||||||||||||||||
CURRENCY OPTIONS |
| |||||||||||||||||||||||||||||||||
EUR Put / USD Call | Goldman Sachs | EUR | 0.97 | 1/5/23 | $ | 248,250,000 | $ | 248,250,000 | $ | 2,453,334 | $ | 4,630,068 | $ | (2,176,734 | ) | |||||||||||||||||||
|
|
|
|
|
| |||||||||||||||||||||||||||||
| Purchased Options — Exchange Traded | ||||||||||||||||||||||||||||||||||
| Description | Exercise Price | Expiration Date | Number of Contracts | Notional Amount | Market Value | Premiums Paid (Received) by Fund | Unrealized Appreciation (Depreciation) | |||||||||||||||||||||||||||
Call | ||||||||||||||||||||||||||||||||||
U.S. Treasury 10-Year Future Option | $ | 117.50 | 12/23/22 | 8,750 | $ | 8,750,000 | $ | 1,093,750 | $ | 2,311,334 | $ | (1,217,584 | ) | |||||||||||||||||||||
|
|
|
|
|
| |||||||||||||||||||||||||||||
| Written Options — OTC | ||||||||||||||||||||||||||||||||||
| Description | Counterparty | Exercise Price | Expiration Date | Number of Contracts | Notional Amount | Market Value | Premiums Paid (Received) by Fund | Unrealized Appreciation (Depreciation) | ||||||||||||||||||||||||||
EUR Put / USD Call | Goldman Sachs | EUR | 0.90 | 1/5/23 | (248,250,000 | ) | $ | (248,250,000 | ) | $ | (330,988 | ) | $ | (907,681 | ) | $ | 576,693 | |||||||||||||||||
|
|
|
|
|
| |||||||||||||||||||||||||||||
See accompanying Notes to Financial Statements.
20
Table of Contents
TCW Emerging Markets Income Fund
October 31, 2022
| Forward Currency Exchange Contracts | ||||||||||||||||||||||||
| Counterparty | Contracts to Deliver | Units of Currency | Settlement Date | In Exchange for U.S. Dollars | Contracts at Value | Unrealized Appreciation (Depreciation) | ||||||||||||||||||
BUY (9) | ||||||||||||||||||||||||
BNP Paribas S.A. | EUR | 10,698,000 | 01/06/23 | $ | 10,682,274 | $ | 10,633,165 | $ | (49,109 | ) | ||||||||||||||
|
|
|
|
|
| |||||||||||||||||||
SELL (10) | ||||||||||||||||||||||||
Bank of America | EUR | 48,435,000 | 01/06/23 | $ | 47,795,823 | $ | 48,141,460 | $ | (345,637 | ) | ||||||||||||||
Citibank N.A. | EUR | 4,130,000 | 01/06/23 | 4,185,908 | 4,104,970 | 80,938 | ||||||||||||||||||
Goldman Sachs & Co. | EUR | 14,114,067 | 01/06/23 | 14,167,700 | 14,028,528 | 139,172 | ||||||||||||||||||
Standard Chartered Bank | EUR | 14,171,455 | 01/06/23 | 14,167,700 | 14,085,570 | 82,130 | ||||||||||||||||||
|
|
|
|
|
| |||||||||||||||||||
| $ | 80,317,131 | $ | 80,360,528 | $ | (43,397 | ) | ||||||||||||||||||
|
|
|
|
|
| |||||||||||||||||||
Notes to the Schedule of Investments:
| BRL | Brazilian Real. |
| EUR | Euro Currency. |
| USD | U.S. Dollar. |
| (1) | Security exempt from registration under Rule 144A of the Securities Act of 1933, as amended. These securities may be resold, normally only to qualified institutional buyers. At October 31, 2022, the value of these securities amounted to $1,316,176,142 or 33.5% of net assets. These securities are determined to be liquid by the Fund’s investment advisor, unless otherwise noted, under procedures established by and under the general supervision of the Company’s Board of Directors. |
| (2) | Investments issued under Regulation S of the Securities Act of 1933, as amended, may not be offered, sold, or delivered within the United States except under special exemptions. At October 31, 2022, the value of these securities amounted to $1,220,440,568 or 31.1% of net assets. |
| (3) | Floating or variable rate security. The interest shown reflects the rate in effect at October 31, 2022. |
| (4) | Perpetual maturity. |
| (5) | Security is currently in default due to bankruptcy or failure to make payment of principal or interest of the issuer. Income is not being accrued. |
| (6) | For fair value measurement disclosure purposes, security is categorized as Level 3. Security is valued using significant unobservable inputs. |
| (7) | See options table for description of purchased options. |
| (8) | Rate disclosed is the 7-day net yield as of October 31, 2022. |
| (9) | Fund buys foreign currency, sells U.S. Dollar. |
| (10) | Fund sells foreign currency, buys U.S. Dollar. |
See accompanying Notes to Financial Statements.
21
Table of Contents
TCW Emerging Markets Income Fund
Investments by Sector | October 31, 2022 |
| Sector | Percentage of Net Assets | |||
Banks | 1.9 | % | ||
Building Materials | 0.5 | |||
Chemicals | 0.5 | |||
Commercial Services | 1.2 | |||
Electric | 5.7 | |||
Energy-Alternate Sources | 0.8 | |||
Engineering & Construction | 0.3 | |||
Foreign Government Bonds | 59.7 | |||
Internet | 0.4 | |||
Iron & Steel | 0.3 | |||
Media | 0.3 | |||
Mining | 3.3 | |||
Oil & Gas | 15.8 | |||
Pipelines | 2.6 | |||
Purchased Options | 0.1 | |||
Telecommunications | 1.1 | |||
Transportation | 0.5 | |||
Money Market Investments | 6.9 | |||
|
| |||
Total | 101.9 | % | ||
|
| |||
See accompanying Notes to Financial Statements.
22
Table of Contents
TCW Emerging Markets Income Fund
Fair Valuation Summary | October 31, 2022 |
The following is a summary of the fair valuations according to the inputs used as of October 31, 2022 in valuing the Fund’s investments:
Description | Quoted Prices in Active Markets for Identical Assets (Level 1) | Other Significant Observable Inputs (Level 2) | Significant Unobservable Inputs (Level 3) | Total | ||||||||||||
Fixed Income Securities | ||||||||||||||||
Banks | $ | — | $ | 74,301,018 | $ | — | $ | 74,301,018 | ||||||||
Building Materials | — | 18,651,651 | — | 18,651,651 | ||||||||||||
Chemicals | — | 19,665,565 | — | 19,665,565 | ||||||||||||
Commercial Services | — | 48,131,587 | — | 48,131,587 | ||||||||||||
Electric | — | 225,389,795 | — | 225,389,795 | ||||||||||||
Energy-Alternate Sources | — | 31,380,377 | — | 31,380,377 | ||||||||||||
Engineering & Construction | — | 9,710,022 | — | 9,710,022 | ||||||||||||
Foreign Government Bonds | — | 2,332,750,961 | 13,179,666 | 2,345,930,627 | ||||||||||||
Internet | — | 14,302,398 | — | 14,302,398 | ||||||||||||
Iron & Steel | — | 10,682,491 | — | 10,682,491 | ||||||||||||
Media | — | 13,627,930 | — | 13,627,930 | ||||||||||||
Mining | — | 129,505,157 | — | 129,505,157 | ||||||||||||
Oil & Gas | — | 620,924,085 | — | 620,924,085 | ||||||||||||
Pipelines | — | 103,444,906 | — | 103,444,906 | ||||||||||||
Telecommunications | — | 42,519,814 | — | 42,519,814 | ||||||||||||
Transportation | — | 18,826,333 | — | 18,826,333 | ||||||||||||
|
|
|
|
|
|
|
| |||||||||
Total Fixed Income Securities | — | 3,713,814,090 | 13,179,666 | 3,726,993,756 | ||||||||||||
|
|
|
|
|
|
|
| |||||||||
Purchased Options | 1,093,750 | 2,453,334 | — | 3,547,084 | ||||||||||||
|
|
|
|
|
|
|
| |||||||||
Money Market Investments | 270,041,180 | — | — | 270,041,180 | ||||||||||||
|
|
|
|
|
|
|
| |||||||||
Total Investments | $ | 271,134,930 | $ | 3,716,267,424 | $ | 13,179,666 | $ | 4,000,582,020 | ||||||||
|
|
|
|
|
|
|
| |||||||||
Asset Derivatives | ||||||||||||||||
Forward Currency Contracts | ||||||||||||||||
Foreign Currency Risk | — | 302,240 | — | 302,240 | ||||||||||||
|
|
|
|
|
|
|
| |||||||||
Total | $ | 271,134,930 | $ | 3,716,569,664 | $ | 13,179,666 | $ | 4,000,884,260 | ||||||||
|
|
|
|
|
|
|
| |||||||||
Liability Derivatives | ||||||||||||||||
Forward Currency Contracts | ||||||||||||||||
Foreign Currency Risk | $ | — | $ | (394,746 | ) | $ | — | $ | (394,746 | ) | ||||||
Written Options | ||||||||||||||||
Foreign Currency Risk | — | (330,988 | ) | — | (330,988 | ) | ||||||||||
|
|
|
|
|
|
|
| |||||||||
Total | $ | — | $ | (725,734 | ) | $ | — | $ | (725,734 | ) | ||||||
|
|
|
|
|
|
|
| |||||||||
See accompanying Notes to Financial Statements.
23
Table of Contents
TCW Emerging Markets Local Currency Income Fund
Schedule of Investments
| Issues | Maturity Date | Principal Amount | Value | |||||||||||||
FIXED INCOME SECURITIES — 94.2% of Net Assets |
| |||||||||||||||
| Brazil — 11.5% | ||||||||||||||||
Brazil Notas do Tesouro Nacional, Series F |
| |||||||||||||||
10.00% | 01/01/25 | BRL | 43,118,000 | $ | 7,951,776 | |||||||||||
10.00% | 01/01/27 | BRL | 25,320,000 | 4,573,340 | ||||||||||||
10.00% | 01/01/29 | BRL | 15,217,000 | 2,684,517 | ||||||||||||
10.00% | 01/01/31 | BRL | 5,762,000 | 998,246 | ||||||||||||
|
| |||||||||||||||
Total Brazil |
| |||||||||||||||
(Cost: $16,579,822) |
| 16,207,879 | ||||||||||||||
|
| |||||||||||||||
| Chile — 2.0% | ||||||||||||||||
Bonos de la Tesoreria de la Republica en pesos |
| |||||||||||||||
2.50% | 03/01/25 | CLP | 120,000,000 | 114,359 | ||||||||||||
4.50% | 03/01/26 | CLP | 655,000,000 | 645,206 | ||||||||||||
4.70% (1) | 09/01/30 | CLP | 1,435,000,000 | 1,354,088 | ||||||||||||
5.00% (1) | 10/01/28 | CLP | 370,000,000 | 360,117 | ||||||||||||
5.00% | 03/01/35 | CLP | 435,000,000 | 408,979 | ||||||||||||
|
| |||||||||||||||
Total Chile |
| |||||||||||||||
(Cost: $3,183,978) |
| 2,882,749 | ||||||||||||||
|
| |||||||||||||||
| China — 9.7% | ||||||||||||||||
Agricultural Development Bank of China |
| |||||||||||||||
2.25% | 04/22/25 | CNY | 19,270,000 | 2,638,236 | ||||||||||||
China Government Bond |
| |||||||||||||||
2.75% | 06/15/29 | CNY | 11,460,000 | 1,579,867 | ||||||||||||
2.85% | 06/04/27 | CNY | 11,110,000 | 1,549,914 | ||||||||||||
3.27% | 11/19/30 | CNY | 35,460,000 | 5,082,650 | ||||||||||||
3.28% | 12/03/27 | CNY | 19,890,000 | 2,838,350 | ||||||||||||
|
| |||||||||||||||
Total China |
| |||||||||||||||
(Cost: $14,870,709) |
| 13,689,017 | ||||||||||||||
|
| |||||||||||||||
| Colombia — 3.8% | ||||||||||||||||
Colombian TES |
| |||||||||||||||
5.75% | 11/03/27 | COP | 4,750,000,000 | 706,294 | ||||||||||||
Colombian TES (Treasury) Bond, Series B |
| |||||||||||||||
6.00% | 04/28/28 | COP | 4,960,700,000 | 725,615 | ||||||||||||
7.00% | 06/30/32 | COP | 12,072,600,000 | 1,597,582 | ||||||||||||
7.50% | 08/26/26 | COP | 7,502,800,000 | 1,275,562 | ||||||||||||
7.75% | 09/18/30 | COP | 7,408,200,000 | 1,088,766 | ||||||||||||
|
| |||||||||||||||
Total Colombia |
| |||||||||||||||
(Cost: $8,471,151) |
| 5,393,819 | ||||||||||||||
|
| |||||||||||||||
| Czech Republic — 3.4% | ||||||||||||||||
Czech Republic Government Bond |
| |||||||||||||||
0.95% (1) | 05/15/30 | CZK | 19,490,000 | 554,472 | ||||||||||||
1.00% (1) | 06/26/26 | CZK | 24,630,000 | 832,697 | ||||||||||||
1.25% | 02/14/25 | CZK | 14,220,000 | 514,663 | ||||||||||||
1.75% | 06/23/32 | CZK | 35,920,000 | 1,023,616 | ||||||||||||
2.00% | 10/13/33 | CZK | 30,900,000 | 871,466 | ||||||||||||
2.40% (1) | 09/17/25 | CZK | 12,100,000 | 442,174 | ||||||||||||
3.50% | 05/30/35 | CZK | 15,880,000 | 515,430 | ||||||||||||
|
| |||||||||||||||
Total Czech Republic |
| |||||||||||||||
(Cost: $6,044,958) |
| 4,754,518 | ||||||||||||||
|
| |||||||||||||||
| Issues | Maturity Date | Principal Amount | Value | |||||||||||||
Hungary — 2.3% |
| |||||||||||||||
Hungary Government Bond |
| |||||||||||||||
1.00% | 11/26/25 | HUF | 166,480,000 | $ | 292,267 | |||||||||||
2.75% | 12/22/26 | HUF | 183,000,000 | 312,037 | ||||||||||||
3.00% | 06/26/24 | HUF | 876,650,000 | 1,802,226 | ||||||||||||
3.00% | 10/27/27 | HUF | 139,470,000 | 231,386 | ||||||||||||
3.00% | 10/27/38 | HUF | 108,420,000 | 125,508 | ||||||||||||
3.25% | 10/22/31 | HUF | 309,560,000 | 452,952 | ||||||||||||
|
| |||||||||||||||
Total Hungary |
| |||||||||||||||
(Cost: $4,491,316) |
| 3,216,376 | ||||||||||||||
|
| |||||||||||||||
Indonesia — 11.0% |
| |||||||||||||||
Indonesia Treasury Bond |
| |||||||||||||||
6.13% | 05/15/28 | IDR | 21,800,000,000 | 1,318,273 | ||||||||||||
6.38% | 04/15/32 | IDR | 35,039,000,000 | 2,078,101 | ||||||||||||
6.50% | 02/15/31 | IDR | 45,684,000,000 | 2,740,015 | ||||||||||||
7.00% | 09/15/30 | IDR | 36,103,000,000 | 2,245,018 | ||||||||||||
7.50% | 08/15/32 | IDR | 31,222,000,000 | 1,992,263 | ||||||||||||
7.50% | 06/15/35 | IDR | 5,097,000,000 | 323,724 | ||||||||||||
8.38% | 09/15/26 | IDR | 21,483,000,000 | 1,428,986 | ||||||||||||
8.38% | 03/15/34 | IDR | 15,833,000,000 | 1,064,331 | ||||||||||||
9.00% | 03/15/29 | IDR | 34,988,000,000 | 2,420,436 | ||||||||||||
|
| |||||||||||||||
Total Indonesia |
| |||||||||||||||
(Cost: $16,678,876) |
| 15,611,147 | ||||||||||||||
|
| |||||||||||||||
Malaysia — 9.8% |
| |||||||||||||||
Malaysia Government Bond |
| |||||||||||||||
3.58% | 07/15/32 | MYR | 12,992,000 | 2,580,059 | ||||||||||||
3.73% | 06/15/28 | MYR | 8,517,000 | 1,748,255 | ||||||||||||
3.76% | 05/22/40 | MYR | 3,750,000 | 689,245 | ||||||||||||
3.89% | 08/15/29 | MYR | 11,642,000 | 2,387,123 | ||||||||||||
3.90% | 11/16/27 | MYR | 9,010,000 | 1,881,848 | ||||||||||||
3.90% | 11/30/26 | MYR | 4,400,000 | 924,577 | ||||||||||||
3.96% | 09/15/25 | MYR | 6,482,000 | 1,373,723 | ||||||||||||
4.18% | 07/15/24 | MYR | 3,942,000 | 842,719 | ||||||||||||
4.76% | 04/07/37 | MYR | 3,313,000 | 708,882 | ||||||||||||
Malaysia Government Investment Issue |
| |||||||||||||||
3.47% | 10/15/30 | MYR | 3,583,000 | 708,188 | ||||||||||||
|
| |||||||||||||||
Total Malaysia |
| |||||||||||||||
(Cost: $15,642,815) |
| 13,844,619 | ||||||||||||||
|
| |||||||||||||||
Mexico — 11.9% |
| |||||||||||||||
Mexican Bonos |
| |||||||||||||||
5.00% | 03/06/25 | MXN | 29,840,000 | 1,341,351 | ||||||||||||
Mexico Government Bond (BONOS) |
| |||||||||||||||
5.75% | 03/05/26 | MXN | 58,280,800 | 2,602,068 | ||||||||||||
7.50% | 06/03/27 | MXN | 76,413,700 | 3,535,996 | ||||||||||||
7.75% | 05/29/31 | MXN | 57,480,300 | 2,565,169 | ||||||||||||
8.50% | 05/31/29 | MXN | 69,350,700 | 3,273,150 | ||||||||||||
8.50% | 11/18/38 | MXN | 48,784,800 | 2,167,638 | ||||||||||||
See accompanying Notes to Financial Statements.
24
Table of Contents
TCW Emerging Markets Local Currency Income Fund
October 31, 2022
| Issues | Maturity Date | Principal Amount | Value | |||||||||||||
| Mexico (Continued) | ||||||||||||||||
10.00% | 12/05/24 | MXN | 14,110,600 | $ | 708,765 | |||||||||||
10.00% | 11/20/36 | MXN | 12,300,000 | 623,298 | ||||||||||||
|
| |||||||||||||||
Total Mexico |
| |||||||||||||||
(Cost: $17,799,016) |
| 16,817,435 | ||||||||||||||
|
| |||||||||||||||
Peru — 2.3% |
| |||||||||||||||
Peru Government Bond |
| |||||||||||||||
5.35% | 08/12/40 | PEN | 2,905,000 | 509,260 | ||||||||||||
Peruvian Government International Bond |
| |||||||||||||||
5.94% | 02/12/29 | PEN | 946,000 | 211,783 | ||||||||||||
6.15% | 08/12/32 | PEN | 5,272,000 | 1,118,756 | ||||||||||||
6.35% (1) | 08/12/28 | PEN | 2,110,000 | 490,527 | ||||||||||||
6.90% (1) | 08/12/37 | PEN | 2,396,000 | 509,290 | ||||||||||||
6.95% (1) | 08/12/31 | PEN | 2,136,000 | 489,444 | ||||||||||||
|
| |||||||||||||||
Total Peru |
| |||||||||||||||
(Cost: $4,313,025) |
| 3,329,060 | ||||||||||||||
|
| |||||||||||||||
Poland — 4.5% |
| |||||||||||||||
Poland Government Bond |
| |||||||||||||||
2.25% | 10/25/24 | PLN | 7,462,000 | 1,390,620 | ||||||||||||
Republic of Poland Government Bond |
| |||||||||||||||
0.75% | 04/25/25 | PLN | 6,749,000 | 1,175,861 | ||||||||||||
1.25% | 10/25/30 | PLN | 3,910,000 | 492,013 | ||||||||||||
2.50% | 07/25/26 | PLN | 11,554,000 | 1,964,048 | ||||||||||||
2.50% | 07/25/27 | PLN | 3,942,000 | 638,803 | ||||||||||||
2.75% | 10/25/29 | PLN | 4,301,000 | 644,521 | ||||||||||||
|
| |||||||||||||||
Total Poland |
| |||||||||||||||
(Cost: $7,576,630) |
| 6,305,866 | ||||||||||||||
|
| |||||||||||||||
Romania — 3.4% |
| |||||||||||||||
Romania Government Bond |
| |||||||||||||||
3.25% | 06/24/26 | RON | 7,680,000 | 1,272,825 | ||||||||||||
3.25% | 04/29/24 | RON | 4,165,000 | 776,535 | ||||||||||||
4.15% | 01/26/28 | RON | 2,720,000 | 436,958 | ||||||||||||
4.25% | 06/28/23 | RON | 485,000 | 95,062 | ||||||||||||
4.75% | 02/24/25 | RON | 2,275,000 | 418,207 | ||||||||||||
5.85% | 04/26/23 | RON | 5,360,000 | 1,065,861 | ||||||||||||
6.70% | 02/25/32 | RON | 4,035,000 | 690,829 | ||||||||||||
|
| |||||||||||||||
Total Romania |
| |||||||||||||||
(Cost: $5,911,509) |
| 4,756,277 | ||||||||||||||
|
| |||||||||||||||
South Africa — 9.9% |
| |||||||||||||||
South Africa Government Bond |
| |||||||||||||||
6.25% | 03/31/36 | ZAR | 62,402,550 | 2,154,335 | ||||||||||||
7.00% | 02/28/31 | ZAR | 53,010,519 | 2,237,901 | ||||||||||||
8.00% | 01/31/30 | ZAR | 57,890,250 | 2,706,935 | ||||||||||||
8.25% | 03/31/32 | ZAR | 31,473,704 | 1,411,457 | ||||||||||||
8.50% | 01/31/37 | ZAR | 67,831,852 | 2,844,137 | ||||||||||||
8.88% | 02/28/35 | ZAR | 37,702,065 | 1,675,283 | ||||||||||||
10.50% | 12/21/26 | ZAR | 16,160,000 | 921,733 | ||||||||||||
|
| |||||||||||||||
Total South Africa |
| |||||||||||||||
(Cost: $18,274,093) |
| 13,951,781 | ||||||||||||||
|
| |||||||||||||||
| Issues | Maturity Date | Principal Amount | Value | |||||||||||||
Thailand — 8.7% |
| |||||||||||||||
Thailand Government Bond |
| |||||||||||||||
0.75% | 06/17/24 | THB | 13,248,000 | $ | 342,652 | |||||||||||
1.00% | 06/17/27 | THB | 119,677,000 | 2,921,510 | ||||||||||||
1.59% | 12/17/35 | THB | 23,500,000 | 488,207 | ||||||||||||
1.60% | 12/17/29 | THB | 51,440,000 | 1,235,709 | ||||||||||||
2.00% | 12/17/31 | THB | 97,134,000 | 2,330,437 | ||||||||||||
2.13% | 12/17/26 | THB | 47,859,000 | 1,236,618 | ||||||||||||
2.88% | 12/17/28 | THB | 114,966,000 | 3,026,391 | ||||||||||||
3.30% | 06/17/38 | THB | 31,910,000 | 785,096 | ||||||||||||
|
| |||||||||||||||
Total Thailand |
| |||||||||||||||
(Cost: $15,067,373) |
| 12,366,620 | ||||||||||||||
|
| |||||||||||||||
Total Fixed Income Securities |
| |||||||||||||||
(Cost: $154,905,271) |
| 133,127,163 | ||||||||||||||
|
| |||||||||||||||
| Shares | ||||||||||||||||
| MONEY MARKET INVESTMENTS — 2.9% | ||||||||||||||||
State Street Institutional U.S. Government Money Market Fund — Premier Class, 3.01% |
| 4,051,056 | 4,051,056 | |||||||||||||
|
| |||||||||||||||
Total Money Market Investments |
| |||||||||||||||
(Cost: $4,051,056) |
| 4,051,056 | ||||||||||||||
|
| |||||||||||||||
| Principal Amount | ||||||||||||||||
SHORT TERM INVESTMENTS — 0.7% |
| |||||||||||||||
FOREIGN GOVERNMENT BONDS (0.7% ) |
| |||||||||||||||
| Brazil — 0.7% | ||||||||||||||||
Brazil Letras do Tesouro Nacional Bills |
| |||||||||||||||
0.00% (3) | 01/01/23 | BRL | 4,992,000 | 931,110 | ||||||||||||
|
| |||||||||||||||
Total Brazil |
| |||||||||||||||
(Cost: $913,784) |
| 931,110 | ||||||||||||||
|
| |||||||||||||||
Total Short Term Investments |
| |||||||||||||||
(Cost: $913,784) |
| 931,110 | ||||||||||||||
|
| |||||||||||||||
Total Investments (97.8%) |
| |||||||||||||||
(Cost: $159,870,111) |
| 138,109,329 | ||||||||||||||
Excess Of Other Assets Over Liabilities (2.2%) |
| 3,129,534 | ||||||||||||||
|
| |||||||||||||||
Total Net Assets (100.0%) |
| $ | 141,238,863 | |||||||||||||
|
| |||||||||||||||
See accompanying Notes to Financial Statements.
25
Table of Contents
TCW Emerging Markets Local Currency Income Fund
Schedule of Investments (Continued)
| Forward Currency Contracts | ||||||||||||||||||||||||
| Counterparty | Contracts to Deliver | Units of Currency | Settlement Date | In Exchange for U.S. Dollars | Contracts at Value | Unrealized Appreciation (Depreciation) | ||||||||||||||||||
| BUY (4) | ||||||||||||||||||||||||
Bank of America | COP | 2,656,133,760 | 11/01/22 | $ | 599,200 | $ | 543,933 | $ | (55,267 | ) | ||||||||||||||
Bank of America | HUF | 257,763,000 | 01/04/23 | 642,000 | 610,409 | (31,591 | ) | |||||||||||||||||
Barclays Capital | MXN | 30,562,000 | 02/21/23 | 1,480,000 | 1,508,782 | 28,782 | ||||||||||||||||||
Barclays Capital | MYR | 7,799,845 | 11/03/22 | 1,756,511 | 1,649,756 | (106,755 | ) | |||||||||||||||||
BNP Paribas S.A. | CNH | 8,988,723 | 11/14/22 | 1,341,000 | 1,227,172 | (113,828 | ) | |||||||||||||||||
BNP Paribas S.A. | CZK | 59,496,665 | 12/08/22 | 2,367,148 | 2,395,463 | 28,315 | ||||||||||||||||||
BNP Paribas S.A. | HUF | 1,183,100,350 | 01/04/23 | 2,816,641 | 2,801,702 | (14,939 | ) | |||||||||||||||||
BNP Paribas S.A. | PLN | 4,315,292 | 12/06/22 | 902,518 | 900,776 | (1,742 | ) | |||||||||||||||||
BNP Paribas S.A. | PLN | 9,137,656 | 01/12/23 | 1,794,668 | 1,889,379 | 94,711 | ||||||||||||||||||
Citibank N.A. | HUF | 259,214,594 | 01/04/23 | 624,824 | 613,846 | (10,978 | ) | |||||||||||||||||
JP Morgan Chase Bank | COP | 2,656,133,760 | 11/01/22 | 551,132 | 543,934 | (7,198 | ) | |||||||||||||||||
JP Morgan Chase Bank | HUF | 196,554,506 | 01/04/23 | 474,769 | 465,461 | (9,308 | ) | |||||||||||||||||
|
|
|
|
|
| |||||||||||||||||||
| $ | 15,350,411 | $ | 15,150,613 | $ | (199,798 | ) | ||||||||||||||||||
|
|
|
|
|
| |||||||||||||||||||
| SELL (5) | ||||||||||||||||||||||||
Bank of America | COP | 2,656,133,760 | 11/01/22 | $ | 551,132 | $ | 543,933 | $ | 7,199 | |||||||||||||||
Bank of America | EUR | 2,452,849 | 11/08/22 | 2,520,400 | 2,425,266 | 95,134 | ||||||||||||||||||
Bank of America | HUF | 875,027,400 | 01/04/23 | 1,979,700 | 2,072,154 | (92,454 | ) | |||||||||||||||||
Bank of America | MXN | 30,562,000 | 02/21/23 | 1,470,140 | 1,508,782 | (38,642 | ) | |||||||||||||||||
Barclays Capital | CNH | 8,988,723 | 11/14/22 | 1,325,086 | 1,227,172 | 97,914 | ||||||||||||||||||
Barclays Capital | CNH | 4,286,143 | 12/07/22 | 627,000 | 585,936 | 41,064 | ||||||||||||||||||
Barclays Capital | MYR | 7,799,845 | 11/03/22 | 1,751,200 | 1,649,756 | 101,444 | ||||||||||||||||||
BNP Paribas S.A. | CNH | 5,169,217 | 12/07/22 | 707,300 | 706,656 | 644 | ||||||||||||||||||
BNP Paribas S.A. | EUR | 2,389,848 | 01/04/23 | 2,374,196 | 2,375,024 | (828 | ) | |||||||||||||||||
BNP Paribas S.A. | HUF | 514,248,186 | 01/04/23 | 1,183,608 | 1,217,792 | (34,184 | ) | |||||||||||||||||
Goldman Sachs & Co. | HUF | 221,433,298 | 01/04/23 | 511,098 | 524,376 | (13,278 | ) | |||||||||||||||||
JP Morgan Chase Bank | COP | 2,656,133,760 | 11/01/22 | 602,913 | 543,934 | 58,979 | ||||||||||||||||||
Morgan Stanley & Co. | MYR | 3,281,152 | 12/01/22 | 732,400 | 694,614 | 37,786 | ||||||||||||||||||
Morgan Stanley & Co. | TWD | 22,772,470 | 01/30/23 | 707,000 | 712,633 | (5,633 | ) | |||||||||||||||||
|
|
|
|
|
| |||||||||||||||||||
| $ | 17,043,173 | $ | 16,788,028 | $ | 255,145 | |||||||||||||||||||
|
|
|
|
|
| |||||||||||||||||||
See accompanying Notes to Financial Statements.
26
Table of Contents
TCW Emerging Markets Local Currency Income Fund
October 31, 2022
Notes to the Schedule of Investments:
| BRL | Brazilian Real. |
| CLP | Chilean Peso. |
| CNH | Chinese Yuan Renminbi. |
| CNY | Chinese Yuan. |
| COP | Colombian Peso. |
| CZK | Czech Koruna. |
| EUR | Euro Currency. |
| HUF | Hungarian Forint. |
| IDR | Indonesian Rupiah. |
| MXN | Mexican Peso. |
| MYR | Malaysian Ringgit. |
| PEN | Peruvian Nuevo Sol. |
| PLN | Polish Zloty. |
| RON | Romanian New Leu. |
| THB | Thai Baht. |
| TWD | Taiwan Dollar. |
| ZAR | South African Rand. |
| (1) | Investments issued under Regulation S of the Securities Act of 1933, as amended, may not be offered, sold, or delivered within the United States except under special exemptions. At October 31, 2022, the value of these securities amounted to $5,032,809 or 3.6% of net assets. |
| (2) | Rate disclosed is the 7-day net yield as of October 31, 2022. |
| (3) | Security is not accruing interest. |
| (4) | Fund buys foreign currency, sells U.S. Dollar. |
| (5) | Fund sells foreign currency, buys U.S. Dollar. |
See accompanying Notes to Financial Statements.
27
Table of Contents
TCW Emerging Markets Local Currency Income Fund
Investments by Sector | October 31, 2022 |
| Sector | Percentage of Net Assets | |||
Banks | 1.9 | % | ||
Foreign Government Bonds | 92.4 | |||
Short Term Investments | 0.6 | |||
Money Market Investments | 2.9 | |||
|
| |||
Total | 97.8 | % | ||
|
| |||
See accompanying Notes to Financial Statements.
28
Table of Contents
TCW Emerging Markets Local Currency Income Fund
Fair Valuation Summary | October 31, 2022 |
The following is a summary of the fair valuations according to the inputs used as of October 31, 2022 in valuing the Fund’s investments:
Description | Quoted Prices in Active Markets for Identical Assets (Level 1) | Other Significant Observable Inputs (Level 2) | Significant Unobservable Inputs (Level 3) | Total | ||||||||||||
Fixed Income Securities | ||||||||||||||||
Banks | $ | — | $ | 2,638,236 | $ | — | $ | 2,638,236 | ||||||||
Foreign Government Bonds | — | 130,488,927 | — | 130,488,927 | ||||||||||||
|
|
|
|
|
|
|
| |||||||||
Total Fixed Income Securities | — | 133,127,163 | — | 133,127,163 | ||||||||||||
|
|
|
|
|
|
|
| |||||||||
Money Market Investments | 4,051,056 | — | — | 4,051,056 | ||||||||||||
Short Term Investments | — | 931,110 | — | 931,110 | ||||||||||||
|
|
|
|
|
|
|
| |||||||||
Total Investments | $ | 4,051,056 | $ | 134,058,273 | $ | — | $ | 138,109,329 | ||||||||
|
|
|
|
|
|
|
| |||||||||
Asset Derivatives | ||||||||||||||||
Forward Currency Contracts | ||||||||||||||||
Foreign Currency Risk | — | 591,972 | — | 591,972 | ||||||||||||
|
|
|
|
|
|
|
| |||||||||
Total | $ | 4,051,056 | $ | 134,650,245 | $ | — | $ | 138,701,301 | ||||||||
|
|
|
|
|
|
|
| |||||||||
Liability Derivatives | ||||||||||||||||
Forward Currency Contracts | ||||||||||||||||
Foreign Currency Risk | $ | — | $ | (536,625 | ) | $ | — | $ | (536,625 | ) | ||||||
|
|
|
|
|
|
|
| |||||||||
Total | $ | — | $ | (536,625 | ) | $ | — | $ | (536,625 | ) | ||||||
|
|
|
|
|
|
|
| |||||||||
See accompanying Notes to Financial Statements.
29
Table of Contents
TCW Emerging Markets Multi-Asset Opportunities Fund
Schedule of Investments
| Issues | Maturity Date | Principal Amount | Value | |||||||||
FIXED INCOME SECURITIES — 55.5% of Net Assets |
| |||||||||||
| Angola — 0.6% (Cost: $301,736) | ||||||||||||
Angolan Government International Bond |
| |||||||||||
8.75% (1) | 04/14/32 | $ | 300,000 | $ | 241,500 | |||||||
|
| |||||||||||
| Argentina — 0.6% | ||||||||||||
Argentine Republic Government International Bond |
| |||||||||||
3.50% | 07/09/41 | 421,094 | 101,149 | |||||||||
3.88% | 01/09/38 | 466,364 | 121,628 | |||||||||
|
| |||||||||||
Total Argentina | ||||||||||||
(Cost: $334,580) | 222,777 | |||||||||||
|
| |||||||||||
| Bahrain — 1.5% | ||||||||||||
Bahrain Government International Bond |
| |||||||||||
5.63% (1) | 09/30/31 | 200,000 | 168,860 | |||||||||
Oil and Gas Holding Co. BSCC (The) |
| |||||||||||
7.63% (2) | 11/07/24 | 400,000 | 397,564 | |||||||||
|
| |||||||||||
Total Bahrain | ||||||||||||
(Cost: $596,896) | 566,424 | |||||||||||
|
| |||||||||||
Benin — 0.2% (Cost: $68,443) |
| |||||||||||
Benin Government International Bond |
| |||||||||||
4.88% (2) | 01/19/32 | EUR | 100,000 | 68,443 | ||||||||
|
| |||||||||||
| Brazil — 2.9% | ||||||||||||
Acu Petroleo Luxembourg Sarl |
| |||||||||||
7.50% (1) | 07/13/35 | 250,000 | 197,411 | |||||||||
Brazil Notas do Tesouro Nacional, Series F |
| |||||||||||
10.00% | 01/01/25 | BRL | 500,000 | 92,209 | ||||||||
10.00% | 01/01/27 | BRL | 530,000 | 95,730 | ||||||||
Brazilian Government International Bond |
| |||||||||||
3.88% | 06/12/30 | 200,000 | 168,730 | |||||||||
5.00% | 01/27/45 | 200,000 | 144,620 | |||||||||
CSN Resources S.A. | ||||||||||||
4.63% (1) | 06/10/31 | 200,000 | 134,120 | |||||||||
Globo Communicacoes Part | ||||||||||||
5.50% (1) | 01/14/32 | 200,000 | 152,711 | |||||||||
MV24 Capital B.V. | ||||||||||||
6.75% (1) | 06/01/34 | 177,780 | 147,397 | |||||||||
|
| |||||||||||
| Total Brazil | ||||||||||||
(Cost: $1,360,993) | 1,132,928 | |||||||||||
|
| |||||||||||
| Chile — 2.4% | ||||||||||||
Chile Government International Bond |
| |||||||||||
2.55% | 07/27/33 | 250,000 | 186,625 | |||||||||
2.75% | 01/31/27 | 250,000 | 224,717 | |||||||||
3.10% | 05/07/41 | 315,000 | 208,782 | |||||||||
3.50% | 01/31/34 | 400,000 | 323,400 | |||||||||
|
| |||||||||||
Total Chile | ||||||||||||
(Cost: $1,078,407) | 943,524 | |||||||||||
|
| |||||||||||
| Issues | Maturity Date | Principal Amount | Value | |||||||||
| China — 0.3% (Cost: $170,092) | ||||||||||||
Tencent Holdings, Ltd. | ||||||||||||
3.93% (2) | 01/19/38 | $ | 200,000 | $ | 136,489 | |||||||
|
| |||||||||||
| Colombia — 2.0% | ||||||||||||
Banco GNB Sudameris S.A. |
| |||||||||||
7.50% (U.S. 5-year Treasury Constant Maturity Rate + 6.660%) (1),(3) | 04/16/31 | 150,000 | 102,425 | |||||||||
Colombia Government International Bond |
| |||||||||||
3.13% | 04/15/31 | 350,000 | 242,620 | |||||||||
4.13% | 02/22/42 | 400,000 | 225,819 | |||||||||
Ecopetrol S.A. | ||||||||||||
4.63% | 11/02/31 | 46,000 | 31,887 | |||||||||
Gran Tierra Energy, Inc. | ||||||||||||
7.75% (2) | 05/23/27 | 200,000 | 155,260 | |||||||||
|
| |||||||||||
Total Colombia | ||||||||||||
(Cost: $948,169) | 758,011 | |||||||||||
|
| |||||||||||
| Dominican Republic — 2.3% | ||||||||||||
Dominican Republic International Bond |
| |||||||||||
4.50% (1) | 01/30/30 | 300,000 | 241,562 | |||||||||
4.88% (1) | 09/23/32 | 245,000 | 189,692 | |||||||||
5.50% (1) | 02/22/29 | 150,000 | 131,533 | |||||||||
6.00% (2) | 07/19/28 | 350,000 | 320,690 | |||||||||
|
| |||||||||||
Total Dominican Republic | ||||||||||||
(Cost: $950,430) | 883,477 | |||||||||||
|
| |||||||||||
| Ecuador — 0.6% | ||||||||||||
Ecuador Government International Bond |
| |||||||||||
2.50% (1) | 07/31/35 | 145,458 | 53,867 | |||||||||
5.50% (2) | 07/31/30 | 308,233 | 164,951 | |||||||||
|
| |||||||||||
Total Ecuador | ||||||||||||
(Cost: $347,522) | 218,818 | |||||||||||
|
| |||||||||||
| Egypt — 0.8% | ||||||||||||
Egypt Government International Bond |
| |||||||||||
7.05% (1) | 01/15/32 | 200,000 | 127,464 | |||||||||
7.30% (2) | 09/30/33 | 275,000 | 172,219 | |||||||||
|
| |||||||||||
Total Egypt | ||||||||||||
(Cost: $446,322) | 299,683 | |||||||||||
|
| |||||||||||
| El Salvador — 0.4% | ||||||||||||
El Salvador Government International Bond |
| |||||||||||
6.38% (2) | 01/18/27 | 135,000 | 53,838 | |||||||||
7.12% (2) | 01/20/50 | 150,000 | 51,686 | |||||||||
8.25% (2) | 04/10/32 | 95,000 | 38,475 | |||||||||
|
| |||||||||||
Total El Salvador | ||||||||||||
(Cost: $272,160) | 143,999 | |||||||||||
|
| |||||||||||
See accompanying Notes to Financial Statements.
30
Table of Contents
TCW Emerging Markets Multi-Asset Opportunities Fund
October 31, 2022
| Issues | Maturity Date | Principal Amount | Value | |||||||||
| Gabon — 0.4% (Cost: $184,856) | ||||||||||||
Gabon Government International Bond |
| |||||||||||
6.63% (2) | 02/06/31 | $ | 200,000 | $ | 140,820 | |||||||
|
| |||||||||||
| Guatemala — 1.3% | ||||||||||||
CT Trust | ||||||||||||
5.13% (2) | 02/03/32 | 200,000 | 160,860 | |||||||||
Guatemala Government Bond | ||||||||||||
3.70% (1) | 10/07/33 | 200,000 | 152,536 | |||||||||
5.25% (2) | 08/10/29 | 200,000 | 184,860 | |||||||||
|
| |||||||||||
Total Guatemala | ||||||||||||
(Cost: $517,070) | 498,256 | |||||||||||
|
| |||||||||||
| Hungary — 0.5% (Cost: $197,584) | ||||||||||||
Hungary Government International Bond |
| |||||||||||
5.25% (1) | 06/16/29 | 200,000 | 184,259 | |||||||||
|
| |||||||||||
| India — 1.4% | ||||||||||||
Adani Green Energy, Ltd. | ||||||||||||
4.38% (2) | 09/08/24 | 200,000 | 151,000 | |||||||||
Greenko Power II, Ltd. | ||||||||||||
4.30% (2) | 12/13/28 | 195,500 | 151,024 | |||||||||
India Airport Infra | ||||||||||||
6.25% (2) | 10/25/25 | 250,000 | 221,690 | |||||||||
|
| |||||||||||
Total India | ||||||||||||
(Cost: $551,459) | 523,714 | |||||||||||
|
| |||||||||||
| Indonesia — 4.2% | ||||||||||||
Freeport Indonesia PT | ||||||||||||
5.32% (1) | 04/14/32 | 200,000 | 168,380 | |||||||||
Indonesia Asahan Aluminium Persero PT |
| |||||||||||
4.75% (1) | 05/15/25 | 225,000 | 216,000 | |||||||||
5.45% (1) | 05/15/30 | 200,000 | 177,720 | |||||||||
Perusahaan Penerbit SBSN Indonesia III |
| |||||||||||
2.55% (2) | 06/09/31 | 200,000 | 160,660 | |||||||||
3.80% (1) | 06/23/50 | 250,000 | 177,272 | |||||||||
4.15% (2) | 03/29/27 | 200,000 | 190,478 | |||||||||
4.40% (1) | 06/06/27 | 200,000 | 191,360 | |||||||||
4.70% (1) | 06/06/32 | 200,000 | 187,750 | |||||||||
Perusahaan Perseroan Persero PT Perusahaan Listrik Negara |
| |||||||||||
4.88% (2) | 07/17/49 | 200,000 | 134,562 | |||||||||
|
| |||||||||||
Total Indonesia | ||||||||||||
(Cost: $1,873,893) | 1,604,182 | |||||||||||
|
| |||||||||||
| Iraq — 0.8% (Cost: $331,866) | ||||||||||||
Iraq International Bond | ||||||||||||
5.80% (2) | 01/15/28 | 343,750 | 293,734 | |||||||||
|
| |||||||||||
| Israel — 1.1% | ||||||||||||
Bank Leumi Le-Israel BM | ||||||||||||
5.13% (2) | 07/27/27 | 200,000 | 195,204 | |||||||||
| Issues | Maturity Date | Principal Amount | Value | |||||||||
| Israel (Continued) | ||||||||||||
Energean Israel Finance, Ltd. | ||||||||||||
4.88% (2) | 03/30/26 | $ | 25,000 | $ | 22,563 | |||||||
5.38% (2) | 03/30/28 | 45,000 | 39,703 | |||||||||
5.88% (2) | 03/30/31 | 189,300 | 160,905 | |||||||||
|
| |||||||||||
Total Israel | ||||||||||||
(Cost: $455,037) | 418,375 | |||||||||||
|
| |||||||||||
| Ivory Coast — 0.3% | ||||||||||||
Ivory Coast Government International Bond |
| |||||||||||
4.88% (1) | 01/30/32 | EUR | 100,000 | 69,728 | ||||||||
6.88% (1) | 10/17/40 | EUR | 100,000 | 66,467 | ||||||||
|
| |||||||||||
Total Ivory Coast | ||||||||||||
(Cost: $209,196) | 136,195 | |||||||||||
|
| |||||||||||
| Jordan — 0.5% (Cost: $194,325) | ||||||||||||
Jordan Government International Bond |
| |||||||||||
7.75% (1) | 01/15/28 | 200,000 | 194,660 | |||||||||
|
| |||||||||||
| Kazakhstan — 0.7% | ||||||||||||
KazMunayGas National Co. JSC |
| |||||||||||
3.50% (1) | 04/14/33 | 200,000 | 135,500 | |||||||||
Tengizchevroil Finance Co. International, Ltd. |
| |||||||||||
3.25% (2) | 08/15/30 | 200,000 | 137,050 | |||||||||
|
| |||||||||||
Total Kazakhstan | ||||||||||||
(Cost: $346,694) | 272,550 | |||||||||||
|
| |||||||||||
| Mexico — 6.1% | ||||||||||||
America Movil SAB de CV | ||||||||||||
5.38% (1) | 04/04/32 | 200,000 | 169,880 | |||||||||
Banco Mercantil del Norte S.A. |
| |||||||||||
5.88% (U.S. 5 year Treasury Constant Maturity Rate + 4.643%) (1),(3),(4) | 12/31/99 | 200,000 | 152,963 | |||||||||
7.50% (U.S. 10-year Treasury Constant Maturity Rate + | 06/27/29 | 200,000 | 156,416 | |||||||||
Cemex SAB de CV | ||||||||||||
5.13% (U.S. 5-year Treasury Constant Maturity Rate + 4.534%) (1),(3),(4) | 12/31/99 | 200,000 | 165,110 | |||||||||
Comision Federal de Electricidad |
| |||||||||||
6.26% (2) | 02/15/52 | 200,000 | 149,020 | |||||||||
Electricidad Firme de Mexico Holdings SA de CV |
| |||||||||||
4.90% (1) | 11/20/26 | 200,000 | 161,000 | |||||||||
Mexico Government International Bond |
| |||||||||||
4.50% | 04/22/29 | 200,000 | 186,500 | |||||||||
4.88% | 05/19/33 | 600,000 | 530,550 | |||||||||
Petroleos Mexicanos | ||||||||||||
5.35% | 02/12/28 | 167,000 | 133,388 | |||||||||
6.63% | 06/15/35 | 112,000 | 77,515 | |||||||||
See accompanying Notes to Financial Statements.
31
Table of Contents
TCW Emerging Markets Multi-Asset Opportunities Fund
Schedule of Investments (Continued)
| Issues | Maturity Date | Principal Amount | Value | |||||||||
| Mexico (Continued) | ||||||||||||
6.70% | 02/16/32 | $ | 175,000 | $ | 132,634 | |||||||
6.84% | 01/23/30 | 225,000 | 179,730 | |||||||||
United Mexican States | ||||||||||||
3.50% | 02/12/34 | 200,000 | 153,300 | |||||||||
|
| |||||||||||
Total Mexico |
| |||||||||||
(Cost: $2,595,182) |
| 2,348,006 | ||||||||||
|
| |||||||||||
| Mozambique — 0.3% (Cost: $138,923) | ||||||||||||
Mozambique International Bond | ||||||||||||
5.00% (2) | 09/15/31 | 200,000 | 136,246 | |||||||||
|
| |||||||||||
| Nigeria — 0.7% (Cost: $391,831) | ||||||||||||
Nigeria Government International Bond |
| |||||||||||
6.13% (1) | 09/28/28 | 400,000 | 264,240 | |||||||||
|
| |||||||||||
| Oman — 2.7% | ||||||||||||
Oman Government International Bond |
| |||||||||||
5.63% (2) | 01/17/28 | 200,000 | 191,340 | |||||||||
6.00% (2) | 08/01/29 | 400,000 | 381,500 | |||||||||
6.25% (1) | 01/25/31 | 300,000 | 287,610 | |||||||||
OQ SAOC | ||||||||||||
5.13% (2) | 05/06/28 | 200,000 | 181,068 | |||||||||
|
| |||||||||||
Total Oman |
| |||||||||||
(Cost: $1,101,016) |
| 1,041,518 | ||||||||||
|
| |||||||||||
| Pakistan — 0.2% (Cost: $240,952) | ||||||||||||
Pakistan Government International Bond |
| |||||||||||
6.88% (2) | 12/05/27 | 235,000 | 75,576 | |||||||||
|
| |||||||||||
| Panama — 2.1% | ||||||||||||
Panama Government International Bond |
| |||||||||||
3.16% | 01/23/30 | 200,000 | 163,660 | |||||||||
3.88% | 03/17/28 | 400,000 | 363,455 | |||||||||
Republic of Panama | ||||||||||||
6.70% | 01/26/36 | 300,000 | 293,520 | |||||||||
|
| |||||||||||
Total Panama |
| |||||||||||
(Cost: $912,579) |
| 820,635 | ||||||||||
|
| |||||||||||
| Paraguay — 0.4% (Cost: $183,931) | ||||||||||||
Paraguay Government International Bond |
| |||||||||||
2.74% (2) | 01/29/33 | 200,000 | 150,108 | |||||||||
|
| |||||||||||
| Peru — 1.8% | ||||||||||||
Peruvian Government International Bond |
| |||||||||||
2.78% | 01/23/31 | 130,000 | 102,986 | |||||||||
3.00% | 01/15/34 | 815,000 | 611,576 | |||||||||
|
| |||||||||||
Total Peru |
| |||||||||||
(Cost: $856,572) |
| 714,562 | ||||||||||
|
| |||||||||||
| Philippines — 1.6% | ||||||||||||
Philippine Government International Bond |
| |||||||||||
3.20% | 07/06/46 | 200,000 | 132,660 | |||||||||
3.56% | 09/29/32 | 200,000 | 172,100 | |||||||||
| Issues | Maturity Date | Principal Amount | Value | |||||||||
| Philippines (Continued) | ||||||||||||
5.95% | 10/13/47 | $ | 200,000 | $ | 196,947 | |||||||
6.38% | 10/23/34 | 100,000 | 103,598 | |||||||||
|
| |||||||||||
Total Philippines |
| |||||||||||
(Cost: $643,158) |
| 605,305 | ||||||||||
|
| |||||||||||
| Qatar — 2.8% | ||||||||||||
Qatar Energy | ||||||||||||
1.38% (2) | 09/12/26 | 425,000 | 373,998 | |||||||||
2.25% (1) | 07/12/31 | 200,000 | 160,000 | |||||||||
Qatar Government International Bond |
| |||||||||||
3.75% (1) | 04/16/30 | 600,000 | 558,960 | |||||||||
|
| |||||||||||
Total Qatar |
| |||||||||||
(Cost: $1,230,690) |
| 1,092,958 | ||||||||||
|
| |||||||||||
| Romania — 0.9% | ||||||||||||
Romanian Government International Bond |
| |||||||||||
3.00% (1) | 02/27/27 | 338,000 | 291,187 | |||||||||
3.00% (1) | 02/14/31 | 100,000 | 74,359 | |||||||||
|
| |||||||||||
Total Romania |
| |||||||||||
(Cost: $418,317) |
| 365,546 | ||||||||||
|
| |||||||||||
| Saudi Arabia — 3.0% | ||||||||||||
KSA Sukuk, Ltd. | ||||||||||||
5.27% (1) | 10/25/28 | 400,000 | 402,950 | |||||||||
Saudi Arabian Oil Co. | ||||||||||||
2.25% (2) | 11/24/30 | 400,000 | 316,000 | |||||||||
3.50% (2) | 04/16/29 | 200,000 | 177,800 | |||||||||
Saudi Government International Bond |
| |||||||||||
3.63% (2) | 03/04/28 | 300,000 | 279,706 | |||||||||
|
| |||||||||||
Total Saudi Arabia |
| |||||||||||
(Cost: $1,249,854) |
| 1,176,456 | ||||||||||
|
| |||||||||||
| Senegal — 0.5% (Cost: $225,251) | ||||||||||||
Senegal Government International Bond |
| |||||||||||
5.38% (1) | 06/08/37 | EUR | 300,000 | 182,351 | ||||||||
|
| |||||||||||
| South Africa — 2.7% | ||||||||||||
Eskom Holdings SOC, Ltd. | ||||||||||||
6.35% (2) | 08/10/28 | 200,000 | 180,192 | |||||||||
8.45% (2) | 08/10/28 | 400,000 | 351,960 | |||||||||
Republic of South Africa Government International Bond |
| |||||||||||
4.85% | 09/30/29 | 400,000 | 341,040 | |||||||||
5.88% | 04/20/32 | 200,000 | 171,682 | |||||||||
|
| |||||||||||
Total South Africa |
| |||||||||||
(Cost: $1,104,550) |
| 1,044,874 | ||||||||||
|
| |||||||||||
| Sri Lanka — 0.1% (Cost: $119,250) | ||||||||||||
Sri Lanka Government International Bond |
| |||||||||||
6.20% (2),(5) | 05/11/27 | 200,000 | 44,500 | |||||||||
|
| |||||||||||
See accompanying Notes to Financial Statements.
32
Table of Contents
TCW Emerging Markets Multi-Asset Opportunities Fund
October 31, 2022
| Issues | Maturity Date | Principal Amount | Value | |||||||||
| Thailand — 0.4% (Cost: $205,632) | ||||||||||||
GC Treasury Centre Co. | ||||||||||||
5.20% (1) | 03/30/52 | $ | 200,000 | $ | 142,680 | |||||||
|
| |||||||||||
Turkey — 0.5% (Cost: $181,668) |
| |||||||||||
Turkey Government International Bond |
| |||||||||||
4.88% | 04/16/43 | 325,000 | 191,344 | |||||||||
|
| |||||||||||
| United Arab Emirates — 2.6% | ||||||||||||
Abu Dhabi Government International Bond |
| |||||||||||
1.63% (2) | 06/02/28 | 400,000 | 339,800 | |||||||||
DP World Salaam | ||||||||||||
6.00% (U.S. 5-year Treasury Constant Maturity Rate + 5.750%) (2),(3),(4) | 10/01/25 | 200,000 | 194,420 | |||||||||
Galaxy Pipeline Assets Bidco, Ltd. |
| |||||||||||
2.63% (1) | 03/31/36 | 600,000 | 457,009 | |||||||||
|
| |||||||||||
Total United Arab Emirates |
| |||||||||||
(Cost: $1,134,390) |
| 991,229 | ||||||||||
|
| |||||||||||
| Venezuela — 0.3% | ||||||||||||
Venezuela Government International Bond |
| |||||||||||
9.25% (5),(6) | 09/15/27 | 550,000 | 42,625 | |||||||||
9.25% (2),(5),(6) | 05/07/28 | 787,000 | 60,993 | |||||||||
|
| |||||||||||
Total Venezuela |
| |||||||||||
(Cost: $413,469) |
| 103,618 | ||||||||||
|
| |||||||||||
Total Fixed Income Securities |
| |||||||||||
(Cost: $25,084,945) |
| 21,374,570 | ||||||||||
|
| |||||||||||
| Shares | ||||||||||||
COMMON STOCK — 38.7% |
| |||||||||||
| Argentina — 1.1% (Cost: $263,245) | ||||||||||||
MercadoLibre, Inc. (7) |
| 470 | 423,761 | |||||||||
|
| |||||||||||
| Brazil — 5.2% | ||||||||||||
CCR S.A. | 165,000 | 407,528 | ||||||||||
CPFL Energia S.A. | 40,000 | 270,008 | ||||||||||
Engie Brasil Energia S.A. | 39,000 | 298,933 | ||||||||||
Pet Center Comercio e Participacoes S.A. | 87,000 | 145,242 | ||||||||||
Petroleo Brasileiro S.A. | 39,000 | 247,204 | ||||||||||
Sendas Distribuidora S.A. | 75,000 | 283,291 | ||||||||||
Tres Tentos Agroindustrial S.A. | 143,000 | 345,560 | ||||||||||
|
| |||||||||||
Total Brazil | ||||||||||||
(Cost: $2,008,851) | 1,997,766 | |||||||||||
|
| |||||||||||
China — 11.7% | ||||||||||||
BYD Co., Ltd. | 6,505 | 145,729 | ||||||||||
CanSino Biologics, Inc. | 19,000 | 176,691 | ||||||||||
China Longyuan Power Group Corp. Ltd. | 70,000 | 170,142 | ||||||||||
China Shenhua Energy Co., Ltd. — Class H | 60,000 | 157,837 | ||||||||||
| Issues | Shares | Value | ||||||||||
| China (Continued) | ||||||||||||
China State Construction Engineering Corp., Ltd. | $ | 260,000 | $ | 169,211 | ||||||||
Contemporary Amperex Technology Co., Ltd. | 6,284 | 322,493 | ||||||||||
Daqin Railway Co., Ltd. | 200,000 | 175,654 | ||||||||||
Fujian Funeng Co., Ltd. | 120,000 | 175,924 | ||||||||||
Galaxy Entertainment Group, Ltd. (7) | 37,000 | 169,036 | ||||||||||
Henan Shenhuo Coal & Power Co., Ltd. | 85,000 | 163,394 | ||||||||||
Huaibei Mining Holdings Co., Ltd. | 95,000 | 169,601 | ||||||||||
JD.com, Inc. | 8,300 | 151,143 | ||||||||||
Koolearn Technology Holding, Ltd. (7) | 17,000 | 82,403 | ||||||||||
Kweichow Moutai Co., Ltd. | 500 | 92,677 | ||||||||||
Ping An Insurance Group Co. of China, Ltd. — Class H | 102,500 | 410,337 | ||||||||||
Pylon Technologies Co., Ltd. | 4,700 | 198,661 | ||||||||||
Shanxi Lu’an Environmental Energy Development Co., Ltd. | 59,357 | 136,770 | ||||||||||
Shenzhen SC New Energy Technology Corp. | 9,000 | 167,383 | ||||||||||
Sichuan Road & Bridge Co., Ltd. | 119,927 | 185,276 | ||||||||||
Sinotrans, Ltd. | 510,000 | 248,061 | ||||||||||
Swire Pacific, Ltd. | 26,000 | 172,467 | ||||||||||
Tianqi Lithium Corp. (7) | 13,974 | 182,941 | ||||||||||
Tianqi Lithium Corp. (7) | 21,000 | 171,214 | ||||||||||
Wuxi Lead Intelligent Equipment Co., Ltd. | 22,000 | 151,258 | ||||||||||
Yunnan Energy New Material Co., Ltd. | 7,400 | 150,076 | ||||||||||
|
| |||||||||||
Total China | ||||||||||||
(Cost: $5,197,515) | 4,496,379 | |||||||||||
|
| |||||||||||
| France — 1.3% (Cost: $260,931) | ||||||||||||
Hermes International | 400 | 517,807 | ||||||||||
|
| |||||||||||
| Greece — 0.6% (Cost: $189,025) | ||||||||||||
Mytilineos S.A. | 14,000 | 234,779 | ||||||||||
|
| |||||||||||
| India — 3.2% | ||||||||||||
Apollo Hospitals Enterprise, Ltd. | 4,600 | 250,761 | ||||||||||
Avenue Supermarts, Ltd. (7) | 4,705 | 245,912 | ||||||||||
Coal India, Ltd. | 90,000 | 267,410 | ||||||||||
Jindal Steel & Power Ltd (7) | 47,000 | 261,097 | ||||||||||
Persistent Systems, Ltd. | 5,000 | 223,222 | ||||||||||
|
| |||||||||||
Total India | ||||||||||||
(Cost: $1,095,153) | 1,248,402 | |||||||||||
|
| |||||||||||
| Indonesia — 1.3% | ||||||||||||
Adaro Energy Tbk PT | 1,039,800 | 265,272 | ||||||||||
Indo Tambangraya Megah Tbk PT | 86,000 | 247,737 | ||||||||||
|
| |||||||||||
Total Indonesia | ||||||||||||
(Cost: $425,813) | 513,009 | |||||||||||
|
| |||||||||||
See accompanying Notes to Financial Statements.
33
Table of Contents
TCW Emerging Markets Multi-Asset Opportunities Fund
Schedule of Investments (Continued)
| Issues | Shares | Value | ||||||||||
| Poland — 0.8% (Cost: $295,441) | ||||||||||||
Dino Polska S.A. (7) | 4,700 | $ | 306,957 | |||||||||
|
| |||||||||||
| Russia — 0.0% | ||||||||||||
Magnitogorsk Iron & Steel Works PJSC (6),(7) | 580,000 | 857 | ||||||||||
Yandex NV (6),(7) | 24,400 | 1,101 | ||||||||||
|
| |||||||||||
Total Russia | ||||||||||||
(Cost: $1,370,247) | 1,958 | |||||||||||
|
| |||||||||||
| Singapore — 1.8% | ||||||||||||
City Developments, Ltd. | 49,000 | 264,282 | ||||||||||
Sembcorp Industries, Ltd. | 130,100 | 267,535 | ||||||||||
Yangzijiang Shipbuilding Holdings, Ltd. | 200,000 | 169,599 | ||||||||||
|
| |||||||||||
Total Singapore | ||||||||||||
(Cost: $703,338) | 701,416 | |||||||||||
|
| |||||||||||
| South Africa — 3.7% | ||||||||||||
Clicks Group, Ltd. | 34,500 | 584,308 | ||||||||||
Discovery, Ltd.(7) | 28,500 | 186,325 | ||||||||||
Exxaro Resources, Ltd. | 23,000 | 256,172 | ||||||||||
MultiChoice Group | 59,000 | 385,350 | ||||||||||
|
| |||||||||||
Total South Africa | ||||||||||||
(Cost: $1,647,139) | 1,412,155 | |||||||||||
|
| |||||||||||
| South Korea — 2.1% | ||||||||||||
GS Holdings Corp. | 8,300 | 267,721 | ||||||||||
HD Hyundai Co., Ltd. | 6,156 | 262,795 | ||||||||||
KT Corp. (SP ADR) | 20,300 | 258,013 | ||||||||||
|
| |||||||||||
Total South Korea | ||||||||||||
(Cost: $836,094) | 788,529 | |||||||||||
|
| |||||||||||
| Taiwan — 4.6% | ||||||||||||
Alchip Technologies, Ltd. | 14,900 | 298,385 | ||||||||||
E Ink Holdings, Inc. | 77,000 | 489,271 | ||||||||||
eMemory Technology, Inc. | 5,700 | 189,009 | ||||||||||
Taiwan Semiconductor Manufacturing Co., Ltd. | 66,590 | 800,559 | ||||||||||
|
| |||||||||||
Total Taiwan | ||||||||||||
(Cost: $1,632,589) | 1,777,224 | |||||||||||
|
| |||||||||||
| Thailand — 0.7% (Cost: $263,552) | ||||||||||||
Central Pattana PCL | 145,000 | 261,922 | ||||||||||
|
| |||||||||||
| Turkey — 0.3% (Cost: $98,282) | ||||||||||||
Turkcell Iletisim Hizmetleri A.S. | 90,000 | 124,297 | ||||||||||
|
| |||||||||||
| United States — 0.3% (Cost: $147,583) | ||||||||||||
Samsonite International S.A. (7) | 59,942 | 128,779 | ||||||||||
|
| |||||||||||
Total Common Stock | ||||||||||||
(Cost: $16,434,798) | 14,935,140 | |||||||||||
|
| |||||||||||
| Issues | Shares | Value | ||||||||||
| PREFERRED STOCK — 1.2% | ||||||||||||
South Korea — 1.2% | ||||||||||||
Hyundai Motor Co. | 4,700 | $ | 262,942 | |||||||||
Samsung Electronics Co., Ltd. | 5,500 | 205,545 | ||||||||||
|
| |||||||||||
Total South Korea | ||||||||||||
(Cost: $502,368) | 468,487 | |||||||||||
|
| |||||||||||
Total Preferred Stock | ||||||||||||
(Cost: $502,368) | 468,487 | |||||||||||
|
| |||||||||||
| PURCHASED OPTIONS (8) (0.0%) (Cost: $36,133) | 18,472 | |||||||||||
|
| |||||||||||
MONEY MARKET INVESTMENTS — 8.6% |
| |||||||||||
State Street Institutional U.S. Government Money Market Fund — Premier Class, 3.01% (9) | 3,301,930 | 3,301,930 | ||||||||||
|
| |||||||||||
Total Money Market Investments |
| |||||||||||
(Cost: $3,301,930) | 3,301,930 | |||||||||||
|
| |||||||||||
Total Investments (104.0%) |
| |||||||||||
(Cost: $45,360,174) | 40,098,599 | |||||||||||
Liabilities In Excess Of Other Assets (-4.0%) |
| (1,542,970 | ) | |||||||||
|
| |||||||||||
Total Net Assets (100.0%) | $ | 38,555,629 | ||||||||||
|
| |||||||||||
See accompanying Notes to Financial Statements.
34
Table of Contents
TCW Emerging Markets Multi-Asset Opportunities Fund
October 31, 2022
| Purchased Options — OTC | ||||||||||||||||||||||||||||||
| Description | Counterparty | Exercise Price | Expiration Date | Number of Contracts | Notional Amount | Market Value | Premiums Paid (Received) by Fund | Unrealized Appreciation (Depreciation) | ||||||||||||||||||||||
CURRENCY OPTIONS |
| |||||||||||||||||||||||||||||
EUR Put / USD Call | Goldman Sachs | EUR 0.97 | 1/5/23 | 1,300,000 | $ | 1,300,000 | $ | 12,847 | $ | 24,246 | $ | (11,399 | ) | |||||||||||||||||
|
|
|
|
|
| |||||||||||||||||||||||||
| Purchased Options — Exchange Traded | ||||||||||||||||||||||||||||||
| Description | Exercise Price | Expiration Date | Number of Contracts | Notional Amount | Market Value | Premiums Paid (Received) by Fund | Unrealized Appreciation (Depreciation) | |||||||||||||||||||||||
Call | ||||||||||||||||||||||||||||||
U.S. Treasury 10-Year Future Option | $ | 117.50 | 12/23/22 | 45 | $ | 45,000 | $ | 5,625 | $ | 11,887 | $ | (6,262 | ) | |||||||||||||||||
|
|
|
|
|
| |||||||||||||||||||||||||
| Written Options — OTC | ||||||||||||||||||||||||||||||
| Description | Counterparty | Exercise Price | Expiration Date | Number of Contracts | Notional Amount | Market Value | Premiums Paid (Received) by Fund | Unrealized Appreciation (Depreciation) | ||||||||||||||||||||||
EUR Put / USD Call | Goldman Sachs | EUR 0.90 | 1/5/23 | (1,300,000 | ) | $ | (1,300,000 | ) | $ | (1,733 | ) | $ | (4,753 | ) | $ | 3,020 | ||||||||||||||
|
|
|
|
|
| |||||||||||||||||||||||||
| Forward Currency Contracts | ||||||||||||||||||||||||
| Counterparty | Contracts to Deliver | Units of Currency | Settlement Date | In Exchange for U.S. Dollars | Contracts at Value | Unrealized Appreciation (Depreciation) | ||||||||||||||||||
| SELL (10) | ||||||||||||||||||||||||
Bank of America N.A. | EUR | 263,000 | 01/06/23 | $ | 259,529 | $ | 261,406 | $ | (1,877 | ) | ||||||||||||||
Citibank N.A. | EUR | 51,000 | 01/06/23 | 51,691 | 50,691 | 1,000 | ||||||||||||||||||
|
|
|
|
|
| |||||||||||||||||||
| $ | 311,220 | $ | 312,097 | $ | (877 | ) | ||||||||||||||||||
|
|
|
|
|
| |||||||||||||||||||
See accompanying Notes to Financial Statements.
35
Table of Contents
TCW Emerging Markets Multi-Asset Opportunities Fund
Schedule of Investments (Continued)
Notes to the Schedule of Investments:
| ADR | American Depositary Receipt. ADRs are receipts typically issued by a U.S. bank or trust company, evidencing ownership of underlying securities issued by a foreign corporation. |
| PJSC | Private Joint-Stock Company. |
| BRL | Brazilian Real. |
| EUR | Euro Currency. |
| USD | U.S. Dollar. |
| (1) | Security exempt from registration under Rule 144A of the Securities Act of 1933, as amended. These securities may be resold, normally only to qualified institutional buyers. At October 31, 2022, the value of these securities amounted to $7,436,889 or 19.3% of net assets. These securities are determined to be liquid by the Fund’s investment advisor, unless otherwise noted, under procedures established by and under the general supervision of the Company’s Board of Directors. |
| (2) | Investments issued under Regulation S of the Securities Act of 1933, as amended, may not be offered, sold, or delivered within the United States except under special exemptions. At October 31, 2022, the value of these securities amounted to $7,488,955 or 19.4% of net assets. |
| (3) | Floating or variable rate security. The interest shown reflects the rate in effect at October 31, 2022. |
| (4) | Perpetual maturity. |
| (5) | Security is currently in default due to bankruptcy or failure to make payment of principal or interest of the issuer. Income is not being accrued. |
| (6) | For fair value measurement disclosure purposes, security is categorized as Level 3. Security is valued using significant unobservable inputs. |
| (7) | Non-income producing security. |
| (8) | See options table for description of purchased options. |
| (9) | Rate disclosed is the 7-day net yield as of October 31, 2022. |
| (10) | Fund sells foreign currency, buys U.S. Dollar. |
See accompanying Notes to Financial Statements.
36
Table of Contents
TCW Emerging Markets Multi-Asset Opportunities Fund
Investments by Sector | October 31, 2022 |
| Sector | Percentage of Net Assets | |||
Agriculture | 0.9 | % | ||
Apparel | 1.7 | |||
Auto Manufacturers | 1.1 | |||
Auto Parts & Equipment | 0.8 | |||
Banks | 1.6 | |||
Beverages | 0.2 | |||
Biotechnology | 0.5 | |||
Building Materials | 0.4 | |||
Chemicals | 1.7 | |||
Coal | 3.9 | |||
Commercial Services | 1.8 | |||
Computers | 0.6 | |||
Distribution &Wholesale | 0.7 | |||
Electric | 6.6 | |||
Electrical Components & Equipment | 0.4 | |||
Electronics | 1.3 | |||
Energy-Alternate Sources | 0.9 | |||
Engineering & Construction | 1.5 | |||
Entertainment | 1.0 | |||
Food | 2.1 | |||
Foreign Government Bonds | 35.9 | |||
Health Care-Services | 0.7 | |||
Holding Companies — Diversified | 0.4 | |||
Insurance | 1.5 | |||
Internet | 1.8 | |||
Iron & Steel | 1.0 | |||
Lodging | 1.1 | |||
Machinery-Diversified | 0.4 | |||
Media | 0.4 | |||
Mining | 1.9 | |||
Oil & Gas | 8.6 | |||
Pipelines | 1.7 | |||
Real Estate | 0.7 | |||
Retail | 1.9 | |||
Semiconductors | 3.9 | |||
Shipbuilding | 0.4 | |||
Telecommunications | 1.9 | |||
Transportation | 1.5 | |||
Money Market Investments | 8.6 | |||
|
| |||
Total | 104.0 | % | ||
|
| |||
See accompanying Notes to Financial Statements.
37
Table of Contents
TCW Emerging Markets Multi-Asset Opportunities Fund
Investments by Country | October 31, 2022 |
| Country | Percentage of Net Assets | |||
Angola | 0.6 | % | ||
Argentina | 1.7 | |||
Bahrain | 1.5 | |||
Benin | 0.2 | |||
Brazil | 8.0 | |||
Chile | 2.4 | |||
China | 11.9 | |||
Colombia | 2.0 | |||
Dominican Republic | 2.3 | |||
Ecuador | 0.6 | |||
Egypt | 0.8 | |||
El Salvador | 0.4 | |||
France | 1.3 | |||
Gabon | 0.4 | |||
Greece | 0.6 | |||
Guatemala | 1.3 | |||
Hungary | 0.5 | |||
India | 4.5 | |||
Indonesia | 5.5 | |||
Iraq | 0.8 | |||
Israel | 1.1 | |||
Ivory Coast | 0.4 | |||
Jordan | 0.5 | |||
Kazakhstan | 0.7 | |||
Mexico | 6.1 | |||
Mozambique | 0.4 | |||
Nigeria | 0.7 | |||
Oman | 2.7 | |||
Pakistan | 0.2 | |||
Panama | 2.1 | |||
Paraguay | 0.4 | |||
Peru | 1.9 | |||
Philippines | 1.6 | |||
Poland | 0.8 | |||
Qatar | 2.8 | |||
Romania | 0.9 | |||
Russia | 0.0 | |||
Saudi Arabia | 3.1 | |||
Senegal | 0.5 | |||
Singapore | 1.8 | |||
South Africa | 6.4 | |||
South Korea | 3.3 | |||
Sri Lanka | 0.1 | |||
Taiwan | 4.6 | |||
Thailand | 1.0 | |||
Turkey | 0.8 | |||
United Arab Emirates | 2.6 | |||
United States | 8.9 | |||
Venezuela | 0.3 | |||
|
| |||
Total | 104.0 | % | ||
|
| |||
See accompanying Notes to Financial Statements.
38
Table of Contents
TCW Emerging Markets Multi-Asset Opportunities Fund
Fair Valuation Summary | October 31, 2022 |
The following is a summary of the fair valuations according to the inputs used as of October 31, 2022 in valuing the Fund’s investments:
Description | Quoted Prices in Active Markets for Identical Assets (Level 1) | Other Significant Observable Inputs (Level 2) | Significant Unobservable Inputs (Level 3) | Total | ||||||||||||
Fixed Income Securities | ||||||||||||||||
Banks | $ | — | $ | 607,009 | $ | — | $ | 607,009 | ||||||||
Building Materials | — | 165,110 | — | 165,110 | ||||||||||||
Chemicals | — | 142,680 | — | 142,680 | ||||||||||||
Commercial Services | — | 194,420 | — | 194,420 | ||||||||||||
Electric | — | 1,127,734 | — | 1,127,734 | ||||||||||||
Energy-Alternate Sources | — | 151,024 | — | 151,024 | ||||||||||||
Engineering & Construction | — | 221,690 | — | 221,690 | ||||||||||||
Foreign Government Bonds | — | 13,730,742 | 103,618 | 13,834,360 | ||||||||||||
Internet | — | 136,489 | — | 136,489 | ||||||||||||
Iron & Steel | — | 134,120 | — | 134,120 | ||||||||||||
Media | — | 152,711 | — | 152,711 | ||||||||||||
Mining | — | 562,100 | — | 562,100 | ||||||||||||
Oil & Gas | — | 2,812,564 | — | 2,812,564 | ||||||||||||
Pipelines | — | 654,421 | — | 654,421 | ||||||||||||
Telecommunications | — | 330,740 | — | 330,740 | ||||||||||||
Transportation | — | 147,398 | — | 147,398 | ||||||||||||
|
|
|
|
|
|
|
| |||||||||
Total Fixed Income Securities | — | 21,270,952 | 103,618 | 21,374,570 | ||||||||||||
|
|
|
|
|
|
|
| |||||||||
Preferred Stock | ||||||||||||||||
Auto Manufacturers | — | 262,942 | — | 262,942 | ||||||||||||
Semiconductors | — | 205,545 | — | 205,545 | ||||||||||||
|
|
|
|
|
|
|
| |||||||||
Total Preferred Stock | — | 468,487 | — | 468,487 | ||||||||||||
|
|
|
|
|
|
|
| |||||||||
Common Stock | ||||||||||||||||
Agriculture | 345,560 | — | — | 345,560 | ||||||||||||
Apparel | — | 646,586 | — | 646,586 | ||||||||||||
Auto Manufacturers | — | 145,729 | — | 145,729 | ||||||||||||
Auto Parts & Equipment | — | 322,493 | — | 322,493 | ||||||||||||
Beverages | — | 92,677 | — | 92,677 | ||||||||||||
Biotechnology | 176,691 | — | — | 176,691 | ||||||||||||
Chemicals | 354,155 | 150,075 | — | 504,230 | ||||||||||||
Coal | 594,848 | 905,952 | — | 1,500,800 | ||||||||||||
Commercial Services | 489,931 | — | — | 489,931 | ||||||||||||
Computers | — | 223,222 | — | 223,222 | ||||||||||||
Distribution &Wholesale | 283,291 | — | — | 283,291 | ||||||||||||
Electric | 915,008 | 502,314 | — | 1,417,322 | ||||||||||||
Electrical Components & Equipment | — | 151,258 | — | 151,258 | ||||||||||||
Electronics | — | 489,271 | — | 489,271 | ||||||||||||
Energy-Alternate Sources | 198,661 | — | — | 198,661 | ||||||||||||
Engineering & Construction | 169,210 | 185,276 | — | 354,486 | ||||||||||||
Entertainment | 385,350 | — | — | 385,350 | ||||||||||||
Food | — | 820,590 | — | 820,590 | ||||||||||||
Health Care-Services | — | 250,761 | — | 250,761 | ||||||||||||
Holding Companies — Diversified | — | 172,467 | — | 172,467 | ||||||||||||
Insurance | — | 596,662 | — | 596,662 | ||||||||||||
Internet | 423,761 | 151,143 | 1,101 | 576,005 | ||||||||||||
See accompanying Notes to Financial Statements.
39
Table of Contents
TCW Emerging Markets Multi-Asset Opportunities Fund
Fair Valuation Summary (Continued) | October 31, 2022 |
Description | Quoted Prices in Active Markets for Identical Assets (Level 1) | Other Significant Observable Inputs (Level 2) | Significant Unobservable Inputs (Level 3) | Total | ||||||||||||
Iron & Steel | $ | 261,097 | $ | — | $ | 857 | $ | 261,954 | ||||||||
Lodging | — | 433,318 | — | 433,318 | ||||||||||||
Machinery-Diversified | 167,383 | — | — | 167,383 | ||||||||||||
Mining | 163,394 | — | — | 163,394 | ||||||||||||
Oil & Gas | 247,204 | 262,795 | — | 509,999 | ||||||||||||
Real Estate | 261,922 | — | — | 261,922 | ||||||||||||
Retail | 729,550 | — | — | 729,550 | ||||||||||||
Semiconductors | — | 1,287,953 | — | 1,287,953 | ||||||||||||
Shipbuilding | 169,599 | — | — | 169,599 | ||||||||||||
Telecommunications | 258,013 | 124,297 | — | 382,310 | ||||||||||||
Transportation | 248,061 | 175,654 | — | 423,715 | ||||||||||||
|
|
|
|
|
|
|
| |||||||||
Total Common Stock | 6,842,689 | 8,090,493 | 1,958 | 14,935,140 | ||||||||||||
|
|
|
|
|
|
|
| |||||||||
Purchased Options | 5,625 | 12,847 | — | 18,472 | ||||||||||||
|
|
|
|
|
|
|
| |||||||||
Money Market Investments | 3,301,930 | — | — | 3,301,930 | ||||||||||||
|
|
|
|
|
|
|
| |||||||||
Total Investments | $ | 10,150,244 | $ | 29,842,779 | $ | 105,576 | $ | 40,098,599 | ||||||||
|
|
|
|
|
|
|
| |||||||||
Asset Derivatives | ||||||||||||||||
Forward Currency Contracts | ||||||||||||||||
Foreign Currency Risk | — | 1,000 | — | 1,000 | ||||||||||||
|
|
|
|
|
|
|
| |||||||||
Total | $ | 10,150,244 | $ | 29,843,779 | $ | 105,576 | $ | 40,099,599 | ||||||||
|
|
|
|
|
|
|
| |||||||||
Liability Derivatives | ||||||||||||||||
Written Options | ||||||||||||||||
Foreign Currency Risk | $ | — | $ | (1,733 | ) | $ | — | $ | (1,733 | ) | ||||||
Forward Currency Contracts | ||||||||||||||||
Foreign Currency Risk | — | (1,877 | ) | — | (1,877 | ) | ||||||||||
|
|
|
|
|
|
|
| |||||||||
Total | $ | — | $ | (3,610 | ) | $ | — | $ | (3,610 | ) | ||||||
|
|
|
|
|
|
|
| |||||||||
See accompanying Notes to Financial Statements.
40
Table of Contents
TCW Funds, Inc.
Statements of Assets and Liabilities | October 31, 2022 |
| TCW Developing Markets Equity Fund | TCW Emerging Markets Income Fund | TCW Emerging Markets Local Currency Income Fund | TCW Emerging Markets Multi-Asset Opportunities Fund | |||||||||||||
ASSETS |
| |||||||||||||||
Investments, at Value (1) | $ | 4,456,827 | $ | 4,000,582,020 | $ | 138,109,329 | $ | 40,098,599 | ||||||||
Foreign Currency, at Value (2) | 180 | 1,632,033 | 832,621 | 60,709 | ||||||||||||
Cash | — | 62,500 | — | — | ||||||||||||
Receivable for Securities Sold | 925,165 | 41,669,004 | — | 4,079,372 | ||||||||||||
Receivable for Fund Shares Sold | — | 8,743,412 | 62,747 | — | ||||||||||||
Interest and Dividends Receivable | 2,900 | 54,450,221 | 2,854,490 | 326,846 | ||||||||||||
Foreign Tax Reclaims Receivable | 256 | — | — | 3,354 | ||||||||||||
Receivable from Investment Advisor | 20,785 | 74,493 | 29,075 | 24,651 | ||||||||||||
Unrealized Appreciation on Open Forward Foreign Currency Contracts | — | 302,240 | 591,972 | 1,000 | ||||||||||||
Cash Collateral Held for Brokers | — | 2,640,000 | — | — | ||||||||||||
Prepaid Expenses | 18,123 | 135,800 | 42,707 | 17,823 | ||||||||||||
|
|
|
|
|
|
|
| |||||||||
Total Assets | 5,424,236 | 4,110,291,723 | 142,522,941 | 44,612,354 | ||||||||||||
|
|
|
|
|
|
|
| |||||||||
LIABILITIES |
| |||||||||||||||
Distributions Payable | — | 16,230,915 | 292,076 | — | ||||||||||||
Payable for Securities Purchased | 1,185,356 | 151,294,060 | — | 5,785,660 | ||||||||||||
Payable for Fund Shares Redeemed | — | 8,171,733 | 136,661 | 59,446 | ||||||||||||
Accrued Capital Gain Withholding Taxes | 4,917 | — | 3,352 | 9,221 | ||||||||||||
Accrued Directors’ Fees and Expenses | 11,634 | 11,634 | 11,634 | 11,634 | ||||||||||||
Deferred Accrued Directors’ Fees and Expenses | 1,587 | 1,587 | 1,587 | 1,587 | ||||||||||||
Accrued Management Fees | 2,897 | 2,523,119 | 90,821 | 30,222 | ||||||||||||
Accrued Distribution Fees | 273 | 83,589 | 8,298 | 821 | ||||||||||||
Options Written, at Value | — | 330,988 | (3) | — | 1,733 | (3) | ||||||||||
Collateral Pledged by Brokers | — | 1,760,000 | — | — | ||||||||||||
Unrealized Depreciation on Open Forward Foreign Currency Contracts | — | 394,746 | 536,625 | 1,877 | ||||||||||||
Transfer Agent Fees Payable | 3,159 | 1,463,926 | 44,359 | 20,481 | ||||||||||||
Administration Fee Payable | 7,748 | 328,797 | 18,958 | 11,911 | ||||||||||||
Audit Fees Payable | 23,135 | 43,410 | 26,812 | 31,617 | ||||||||||||
Accounting Fees Payable | 1,229 | 227,473 | 8,400 | 3,558 | ||||||||||||
Custodian Fees Payable | 28,812 | 139,839 | 80,173 | 67,709 | ||||||||||||
Legal Fees Payable | 202 | 34,856 | 1,310 | 539 | ||||||||||||
Other Accrued Expenses | 9,818 | 436,006 | 23,012 | 18,709 | ||||||||||||
|
|
|
|
|
|
|
| |||||||||
Total Liabilities | 1,280,767 | 183,476,678 | 1,284,078 | 6,056,725 | ||||||||||||
|
|
|
|
|
|
|
| |||||||||
NET ASSETS | $ | 4,143,469 | $ | 3,926,815,045 | $ | 141,238,863 | $ | 38,555,629 | ||||||||
|
|
|
|
|
|
|
| |||||||||
See accompanying Notes to Financial Statements.
41
Table of Contents
TCW Funds, Inc.
Statements of Assets and Liabilities (Continued) | October 31, 2022 |
| TCW Developing Markets Equity Fund | TCW Emerging Markets Income Fund | TCW Emerging Markets Local Currency Income Fund | TCW Emerging Markets Multi-Asset Opportunities Fund | |||||||||||||
NET ASSETS CONSIST OF: |
| |||||||||||||||
Paid-in Capital | $ | 5,649,762 | $ | 6,715,070,371 | $ | 218,651,605 | $ | 50,484,000 | ||||||||
Accumulated Earnings (Loss) | (1,506,293 | ) | (2,788,255,326 | ) | (77,412,742 | ) | (11,928,371 | ) | ||||||||
|
|
|
|
|
|
|
| |||||||||
NET ASSETS | $ | 4,143,469 | $ | 3,926,815,045 | $ | 141,238,863 | $ | 38,555,629 | ||||||||
|
|
|
|
|
|
|
| |||||||||
NET ASSETS ATTRIBUTABLE TO: |
| |||||||||||||||
I Class Share | $ | 2,893,075 | $ | 2,500,688,975 | $ | 101,529,872 | $ | 34,757,802 | ||||||||
|
|
|
|
|
|
|
| |||||||||
N Class Share | $ | 1,250,394 | $ | 390,155,469 | $ | 39,708,991 | $ | 3,797,827 | ||||||||
|
|
|
|
|
|
|
| |||||||||
Plan Class Share | $ | — | $ | 1,035,970,601 | $ | — | $ | — | ||||||||
|
|
|
|
|
|
|
| |||||||||
CAPITAL SHARES OUTSTANDING: (4) |
| |||||||||||||||
I Class Share | 390,720 | 440,959,336 | 15,629,338 | 4,187,022 | ||||||||||||
|
|
|
|
|
|
|
| |||||||||
N Class Share | 167,942 | 53,288,544 | 6,127,727 | 462,400 | ||||||||||||
|
|
|
|
|
|
|
| |||||||||
Plan Class Share | — | 182,801,002 | — | — | ||||||||||||
|
|
|
|
|
|
|
| |||||||||
NET ASSET VALUE PER SHARE: (5) |
| |||||||||||||||
I Class Share | $ | 7.40 | $ | 5.67 | $ | 6.50 | $ | 8.30 | ||||||||
|
|
|
|
|
|
|
| |||||||||
N Class Share | $ | 7.45 | $ | 7.32 | $ | 6.48 | $ | 8.21 | ||||||||
|
|
|
|
|
|
|
| |||||||||
Plan Class Share | $ | — | $ | 5.67 | $ | — | $ | — | ||||||||
|
|
|
|
|
|
|
| |||||||||
| (1) | The identified cost for the TCW Developing Markets Equity Fund, the TCW Emerging Markets Income Fund, the TCW Emerging Markets Local Currency Income Fund and the TCW Emerging Markets Multi-Asset Opportunities Fund at October 31, 2022 was $4,826,380, $4,677,126,116, $159,870,111 and $45,360,174, respectively. |
| (2) | The identified cost for the TCW Developing Markets Equity Fund, the TCW Emerging Markets Income Fund, the TCW Emerging Markets Local Currency Income Fund and the TCW Emerging Markets Multi-Asset Opportunities Fund at October 31, 2022 was $181, $1,632,859, $842,842 and $61,117, respectively. |
| (3) | Premium received for the TCW Emerging Markets Income Fund and the TCW Emerging Markets Multi-Asset Opportunities Fund at October 31, 2022 was $907,681 and $4,753, respectively. |
| (4) | The number of authorized shares, with a par value of $0.001 per share is 4,000,000,000 for each of the I Class, N Class and Plan Class shares. |
| (5) | Represents offering price and redemption price per share. |
See accompanying Notes to Financial Statements.
42
Table of Contents
TCW Funds, Inc.
Statements of Operations | Year Ended October 31, 2022 |
| TCW Developing Markets Equity Fund | TCW Emerging Markets Income Fund | TCW Emerging Markets Local Currency Income Fund | TCW Emerging Markets Multi-Asset Opportunities Fund | |||||||||||||
INVESTMENT INCOME |
| |||||||||||||||
Income: |
| |||||||||||||||
Dividends | $ | 197,572 | (1) | $ | — | $ | — | $ | 1,148,045 | (1) | ||||||
Interest | — | 308,940,984 | 10,262,421 | (2) | 1,493,375 | (2) | ||||||||||
|
|
|
|
|
|
|
| |||||||||
Total | 197,572 | 308,940,984 | 10,262,421 | 2,641,420 | ||||||||||||
|
|
|
|
|
|
|
| |||||||||
Expenses: |
| |||||||||||||||
Management Fees | 45,032 | 41,112,363 | 1,398,052 | 535,785 | ||||||||||||
Accounting Services Fees | 2,220 | 437,344 | 16,358 | 6,100 | ||||||||||||
Administration Fees | 13,511 | 635,486 | 35,539 | 20,505 | ||||||||||||
Transfer Agent Fees: |
| |||||||||||||||
I Class | 6,230 | 3,928,828 | 100,834 | 42,500 | ||||||||||||
N Class | 6,243 | 614,751 | 52,614 | 12,991 | ||||||||||||
Plan Class | — | 209,778 | — | — | ||||||||||||
Custodian Fees | 52,986 | 284,909 | 156,661 | 124,141 | ||||||||||||
Professional Fees | 33,516 | 176,185 | 45,639 | 47,291 | ||||||||||||
Directors’ Fees and Expenses | 46,667 | 46,667 | 46,667 | 46,667 | ||||||||||||
Registration Fees: |
| |||||||||||||||
I Class | 17,245 | 56,926 | 24,608 | 18,069 | ||||||||||||
N Class | 17,245 | 28,636 | 23,387 | 18,077 | ||||||||||||
Plan Class | — | 55,250 | — | — | ||||||||||||
Distribution Fees: |
| |||||||||||||||
N Class | 4,272 | 1,205,077 | 96,564 | 13,615 | ||||||||||||
Compliance Expense | 6,328 | 6,328 | 6,328 | 6,328 | ||||||||||||
Shareholder Reporting Expense | 1,143 | 28,576 | 4,365 | 2,423 | ||||||||||||
Other | 11,791 | 563,597 | 30,265 | 18,375 | ||||||||||||
|
|
|
|
|
|
|
| |||||||||
Total | 264,429 | 49,390,701 | 2,037,881 | 912,867 | ||||||||||||
|
|
|
|
|
|
|
| |||||||||
Less Expenses Borne by Investment Advisor: | ||||||||||||||||
I Class | 134,767 | 1,811,832 | 247,143 | 252,993 | ||||||||||||
N Class | 72,770 | 1,073,652 | 186,907 | 53,672 | ||||||||||||
Plan Class | — | 595,608 | — | — | ||||||||||||
|
|
|
|
|
|
|
| |||||||||
Net Expenses | 56,892 | 45,909,609 | 1,603,831 | 606,202 | ||||||||||||
|
|
|
|
|
|
|
| |||||||||
Net Investment Income | 140,680 | 263,031,375 | 8,658,590 | 2,035,218 | ||||||||||||
|
|
|
|
|
|
|
| |||||||||
NET REALIZED AND UNREALIZED GAIN (LOSS) ON INVESTMENTS | ||||||||||||||||
Net Realized (Loss) on: |
| |||||||||||||||
Investments | (1,136,565 | ) (3) | (1,247,212,013 | ) | (35,201,155 | ) | (7,070,041 | ) (3) | ||||||||
Foreign Currency | (29,647 | ) | (409,516 | ) | (711,199 | ) | (182,763 | ) | ||||||||
Foreign Currency Forward Contracts | 33 | 6,532,802 | (3,095,767 | ) | 28,927 | |||||||||||
Futures Contracts | — | 485,133 | 4,278 | 2,235 | ||||||||||||
Swap Agreements | — | 3,719,992 | — | 10,282 | ||||||||||||
Change in Unrealized (Depreciation) on: |
| |||||||||||||||
Investments | (2,159,887 | ) (4) | (541,721,359 | ) | (13,179,306 | ) (4) | (20,312,225 | ) (4) | ||||||||
Foreign Currency | (2,595 | ) | 94,412 | (72,256 | ) | (8,938 | ) | |||||||||
Foreign Currency Forward Contracts | — | (2,772,613 | ) | 477,380 | (12,963 | ) | ||||||||||
Futures contracts | — | (767,718 | ) | — | (3,089 | ) | ||||||||||
Options Written | — | 576,693 | — | 3,020 | ||||||||||||
Swap Agreements | — | (2,607,610 | ) | — | (9,575 | ) | ||||||||||
|
|
|
|
|
|
|
| |||||||||
Net Realized and Unrealized Gain (Loss) on Investments and Foreign Currency Transactions | (3,328,661 | ) | (1,784,081,797 | ) | (51,778,025 | ) | (27,555,130 | ) | ||||||||
|
|
|
|
|
|
|
| |||||||||
DECREASE IN NET ASSETS RESULTING FROM OPERATIONS | $ | (3,187,981 | ) | $ | (1,521,050,422 | ) | $ | (43,119,435 | ) | $ | (25,519,912 | ) | ||||
|
|
|
|
|
|
|
| |||||||||
| (1) | Net of foreign taxes withheld. Total amounts withheld for the TCW Developing Markets Equity Fund and the TCW Emerging Markets Multi-Asset Opportunities Fund were $19,497 and $117,129, respectively. |
| (2) | Net of foreign taxes withheld of $87,400 and $265 for the TCW Emerging Markets Local Currency Income Fund and the TCW Emerging Markets Multi-Asset Opportunities Fund, respectively. |
| (3) | Net of capital gain withholding taxes of $15,167 and $152,563 for the TCW Developing Markets Equity Fund and the TCW Emerging Markets Multi-Asset Opportunities Fund, respectively. |
| (4) | Net of capital gain withholding taxes of $4,917, $1,121 and $9,221 for the TCW Developing Markets Equity Fund, the TCW Emerging Markets Local Currency Income Fund and the TCW Emerging Markets Multi-Asset Opportunities Fund, respectively. |
See accompanying Notes to Financial Statements.
43
Table of Contents
TCW Funds, Inc.
Statements of Changes in Net Assets
| TCW Developing Markets Equity Fund | TCW Emerging Markets Income Fund | |||||||||||||||
| Year Ended October 31, 2022 | Year Ended October 31, 2021 | Year Ended October 31, 2022 | Year Ended October 31, 2021 | |||||||||||||
OPERATIONS |
| |||||||||||||||
Net Investment Income | $ | 140,680 | $ | 39,189 | $ | 263,031,375 | $ | 324,179,008 | ||||||||
Net Realized Gain (Loss) on Investments, Futures Contracts, Swap Agreements and Foreign Currency Transactions | (1,166,179 | ) | 1,058,929 | (1,236,883,602 | ) | 94,738,229 | ||||||||||
Change in Unrealized Appreciation (Depreciation) on Investments, Futures Contracts, Options Written, Foreign Currency Transactions and Swap Agreements | (2,162,482 | ) | 27,753 | (547,198,195 | ) | (160,381,400 | ) | |||||||||
|
|
|
|
|
|
|
| |||||||||
Increase (Decrease) in Net Assets Resulting from Operations | (3,187,981 | ) | 1,125,871 | (1,521,050,422 | ) | 258,535,837 | ||||||||||
|
|
|
|
|
|
|
| |||||||||
DISTRIBUTIONS TO SHAREHOLDERS |
| |||||||||||||||
Distributions to Shareholders | (449,659 | ) | (8,519 | ) | (228,258,436 | ) | (343,231,435 | ) | ||||||||
Return of Capital | — | — | (22,694,796 | ) | (15,575,053 | ) | ||||||||||
|
|
|
|
|
|
|
| |||||||||
Total Distributions to Shareholders | (449,659 | ) | (8,519 | ) | (250,953,232 | ) | (358,806,488 | ) | ||||||||
|
|
|
|
|
|
|
| |||||||||
NET CAPITAL SHARE TRANSACTIONS |
| |||||||||||||||
I Class | 301,064 | 33,504 | (1,075,983,840 | ) | (1,136,294,277 | ) | ||||||||||
N Class | 53,381 | 100,948 | (289,669 | ) | 298,150,055 | |||||||||||
Plan Class | — | — | (488,386,713 | ) | 1,573,919,777 | |||||||||||
|
|
|
|
|
|
|
| |||||||||
Increase (Decrease) in Net Assets Resulting from Net Capital Shares Transactions | 354,445 | 134,452 | (1,564,660,222 | ) | 735,775,555 | |||||||||||
|
|
|
|
|
|
|
| |||||||||
Increase (Decrease) in Net Assets | (3,283,195 | ) | 1,251,804 | (3,336,663,876 | ) | 635,504,904 | ||||||||||
NET ASSETS |
| |||||||||||||||
Beginning of year | 7,426,664 | 6,174,860 | 7,263,478,921 | 6,627,974,017 | ||||||||||||
|
|
|
|
|
|
|
| |||||||||
End of year | $ | 4,143,469 | $ | 7,426,664 | $ | 3,926,815,045 | $ | 7,263,478,921 | ||||||||
|
|
|
|
|
|
|
| |||||||||
See accompanying Notes to Financial Statements.
44
Table of Contents
TCW Funds, Inc.
Statements of Changes in Net Assets
| TCW Emerging Markets Local Currency Income Fund | TCW Emerging Markets Multi-Asset Opportunities Fund | |||||||||||||||
| Year Ended October 31, 2022 | Year Ended October 31, 2021 | Year Ended October 31, 2022 | Year Ended October 31, 2021 | |||||||||||||
OPERATIONS | ||||||||||||||||
Net Investment Income | $ | 8,658,590 | $ | 10,335,450 | $ | 2,035,218 | $ | 1,567,643 | ||||||||
Net Realized Gain (Loss) on Investments, Futures Contracts, Swap Agreements and Foreign Currency Transactions | (39,003,843 | ) | (5,019,467 | ) | (7,211,360 | ) | 13,265,988 | |||||||||
Change in Unrealized Appreciation (Depreciation) on Investments, Futures Contracts, Options Written, Foreign Currency Transactions and Swap Agreements | (12,774,182 | ) | (3,804,860 | ) | (20,343,770 | ) | (3,357,968 | ) | ||||||||
|
|
|
|
|
|
|
| |||||||||
Increase (Decrease) in Net Assets Resulting from Operations | (43,119,435 | ) | 1,511,123 | (25,519,912 | ) | 11,475,663 | ||||||||||
|
|
|
|
|
|
|
| |||||||||
DISTRIBUTIONS TO SHAREHOLDERS | ||||||||||||||||
Distributions to Shareholders | (2,830,965 | ) | (6,333,475 | ) | (3,961,910 | ) | (1,350,163 | ) | ||||||||
Return of Capital | (3,893,084 | ) | — | — | — | |||||||||||
|
|
|
|
|
|
|
| |||||||||
Total Distributions to Shareholders | (6,724,049 | ) | (6,333,475 | ) | (3,961,910 | ) | (1,350,163 | ) | ||||||||
|
|
|
|
|
|
|
| |||||||||
NET CAPITAL SHARE TRANSACTIONS |
| |||||||||||||||
I Class | (58,769,672 | ) | 10,863,518 | (14,247,647 | ) | (17,784,910 | ) | |||||||||
N Class | 10,286,694 | 15,515,390 | (1,070,744 | ) | (2,174,933 | ) | ||||||||||
|
|
|
|
|
|
|
| |||||||||
Increase (Decrease) in Net Assets Resulting from Net Capital Shares Transactions | (48,482,978 | ) | 26,378,908 | (15,318,391 | ) | (19,959,843 | ) | |||||||||
|
|
|
|
|
|
|
| |||||||||
Increase (Decrease) in Net Assets | (98,326,462 | ) | 21,556,556 | (44,800,213 | ) | (9,834,343 | ) | |||||||||
NET ASSETS |
| |||||||||||||||
Beginning of year | 239,565,325 | 218,008,769 | 83,355,842 | 93,190,185 | ||||||||||||
|
|
|
|
|
|
|
| |||||||||
End of year | $ | 141,238,863 | $ | 239,565,325 | $ | 38,555,629 | $ | 83,355,842 | ||||||||
|
|
|
|
|
|
|
| |||||||||
See accompanying Notes to Financial Statements.
45
Table of Contents
TCW Funds, Inc.
Note 1 — Organization
TCW Funds, Inc., a Maryland corporation (the “Company”), is an open-end management investment company registered under the Investment Company Act of 1940, as amended (the “1940 Act”), that currently offers 18 no-load mutual funds (each series, a “Fund” and collectively, the “Funds”). TCW Investment Management Company LLC (the “Advisor”) is the investment advisor to and an affiliate of the Funds and is registered under the Investment Advisers Act of 1940, as amended. Each Fund has its own investment objective and strategies. The following is a brief description of the investment objectives and principal investment strategies for the Funds that are covered in this report:
TCW Fund | Investment Objectives and Principal Investment Strategies | |
| Diversified Fixed Income Fund | ||
| TCW Emerging Markets Income Fund | Seeks high total return from current income and capital appreciation by investing at least 80% of the value of its net assets, plus any borrowings for investment purposes, in debt securities issued or guaranteed by companies, financial institutions and government entities in emerging market countries. The Fund generally invests in at least four emerging market countries. | |
| Non-Diversified Fixed Income Fund | ||
TCW Emerging Markets Local Currency Income Fund | Seeks to provide high total return from current income and capital appreciation through investment in debt securities denominated in the local currencies of various emerging market countries; invests at least 80% of the value of its net assets, plus any borrowings for investment purposes, in debt securities issued or guaranteed by non-financial companies, financial institutions and government entities in emerging market countries denominated in the local currencies of an issuer, and in derivative instruments that provide investment exposure to such securities. | |
| Diversified International Equity Fund | ||
| TCW Developing Markets Equity Fund | Seeks long-term capital appreciation by investing at least 80% of the value of its net assets, plus any borrowings for investment purposes, in equity securities of companies or financial institutions domiciled or with primary business operations in, or with the majority of their net assets in or revenues or net income deriving from, a developing market country. The Fund may invest up to 20% of its net assets, plus any borrowings for investment purposes, in derivative instruments. | |
| Diversified Balanced Fund | ||
TCW Emerging Markets Multi-Asset Opportunities Fund | Seeks current income and long-term capital appreciation by investing at least 80% of the value of its net assets, plus any borrowings for investment purposes, in debt and equity securities issued or guaranteed by companies, financial institutions and government entities in emerging market countries. | |
46
Table of Contents
TCW Funds, Inc.
October 31, 2022
Note 1 — Organization (Continued)
All of the Funds currently offer two classes of shares: I Class and N Class, except for the TCW Emerging Markets Income Fund, which also offers Plan Class shares. The three classes of a Fund are substantially the same except that the Class N shares are subject to a distribution fee (see Note 7).
Note 2 — Significant Accounting Policies
The following is a summary of significant accounting policies, which are in conformity with accounting principles generally accepted in the United States of America (“GAAP”) and which are consistently followed by the Funds in the preparation of their financial statements. Each Fund is considered an investment company under the Financial Accounting Standards Board (“FASB”) Accounting Standards Codification (“ASC”) No. 946, Financial Services — Investment Companies. Subsequent events, if any, have been evaluated through the date of issuance in the preparation of the financial statements.
Principles of Accounting: The Funds use the accrual method of accounting for financial reporting purposes.
Net Asset Value: The net asset value (“NAV”) per share of each class of a Fund is determined by dividing the Fund’s net assets attributable to each class by the number of shares issued and outstanding of that class on each day the New York Stock Exchange (“NYSE”) is open for trading.
Security Valuations: Securities listed or traded on the NYSE and other stock exchanges were valued at the latest sale price on the exchange. Securities traded on the NASDAQ stock market (“NASDAQ”) were valued during the period using official closing prices as reported by NASDAQ, which may not have been the last sale price. Investments in open-end mutual funds including money market funds were valued based on the NAV per share as reported by the investment companies. All other securities for which over-the-counter (“OTC”) market quotations were readily available, including short-term securities, swap agreements and forward currency contracts, were valued with prices furnished by independent pricing services or by broker-dealers.
Pursuant to Rule 2a-5 under the 1940 Act, the Company’s Board of Directors (the “Board”, and each member thereof, a “Director”) has designated the Advisor as the “valuation designee” with respect to the fair valuation of the Fund’s portfolio securities, subject to oversight by and periodic reporting to the Board. Fair valued securities are those for which market quotations were not readily available, including in circumstances under which it was determined by the Advisor that prices received were not reflective of their market values.
The Advisor, as the valuation designee, uses a fair valuation methodology for foreign equity securities (exclusive of certain Latin American and Canadian equity securities). This methodology is designed to address the effect of movements in the U.S. market on the securities traded on foreign exchanges that have been closed for a period of time due to time zone differences. The utilization of the fair value model may result in the adjustment of prices taking into account fluctuations in the U.S. market. The fair value model was utilized each trading day and was not dependent on certain thresholds or triggers.
Fair value is defined as the price that a Fund would receive upon selling an investment in a timely transaction to an independent buyer in the principal or most advantageous market for the investment. In accordance with the authoritative guidance on fair value measurements and disclosures under GAAP, the Funds disclose investments in their financial statements in a three-tier hierarchy. This hierarchy is utilized to establish classification of fair value measurements based on inputs. Inputs that go into fair value
47
Table of Contents
TCW Funds, Inc.
Notes to Financial Statements (Continued)
Note 2 — Significant Accounting Policies (Continued)
measurement refer broadly to the assumptions that market participants would use in pricing the asset or liability, including assumptions about risk. Inputs may be observable or unobservable. Observable inputs are inputs that reflect the assumptions market participants would use in pricing the asset or liability, developed based on market data obtained from sources independent of the reporting entity. Unobservable inputs are inputs that reflect the reporting entity’s own assumptions about the inputs market participants would use in pricing the asset or liability, developed based on the best information available in the circumstances.
The three-tier hierarchy of inputs is summarized in the three broad levels listed below.
| Level 1 — | quoted prices in active markets for identical investments. | |
| Level 2 — | other significant observable inputs (including quoted prices for similar investments, interest rates, prepayment speeds, credit risk, etc.). | |
| Level 3 — | significant unobservable inputs (including the Funds’ own assumptions in determining the fair value of investments). |
Changes in valuation techniques may result in transfers in or out of an investment’s assigned Level within the hierarchy. The inputs or methodologies used for valuing investments are not necessarily an indication of the risk associated with investing in those investments and the determination of the significance of a particular input to the fair value measurement in its entirety requires judgment and consideration of factors specific to each security.
The availability of observable inputs can vary from security to security and is affected by a wide variety of factors, including, for example, the type of security, whether the security is new and not yet established in the marketplace, the liquidity of markets, and other characteristics particular to the security. To the extent that valuation is based on models or inputs that are less observable or unobservable in the market, the determination of fair value requires more judgment. Accordingly, the degree of judgment exercised in determining fair value is greatest for instruments categorized as Level 3.
In periods of market dislocation, the observability of prices and inputs may be reduced for many instruments. This condition, as well as changes related to liquidity of investments, could cause a security to be reclassified between Level 1, Level 2, or Level 3.
In certain cases, the inputs used to measure fair value may fall into different levels of the fair value hierarchy. In such cases, for disclosure purposes the level in the fair value hierarchy within which the fair value measurement falls in its entirety is determined based on the lowest level input that is significant to the fair value measurement.
Fair Value Measurements: Descriptions of the valuation techniques applied to the Funds’ major categories of assets and liabilities measured at fair value on a recurring basis are as follows:
Corporate bonds. The fair value of corporate bonds is estimated using recently executed transactions, market price quotations (where observable), bond spreads, or credit default swap spreads adjusted for any basis difference between cash and derivative instruments. Corporate bonds are generally categorized as Level 2 of the fair value hierarchy; in instances where prices, spreads, or any of the other aforementioned key inputs are unobservable, they are categorized as Level 3 of the hierarchy.
Credit default swaps. Credit default swaps are fair valued using pricing models that take into account, among other factors, index spread curves, nominal values, modified duration values and cash flows. To the
48
Table of Contents
TCW Funds, Inc.
October 31, 2022
Note 2 — Significant Accounting Policies (Continued)
extent that these inputs are observable and timely, the fair values of credit default swaps would be categorized as Level 2; otherwise, the fair values would be categorized as Level 3.
Equity securities. Securities are generally valued based on quoted prices from the applicable exchange. To the extent these securities are actively traded and valuation adjustments are not applied, they are generally categorized as Level 1 of the fair value hierarchy. Restricted securities issued by publicly held companies are generally categorized as Level 2 of the fair value hierarchy; if a discount is applied and significant, they are categorized as Level 3. Restricted securities held in non-public entities are categorized as Level 3 of the fair value hierarchy because they trade infrequently, and therefore the inputs are unobservable. Certain foreign securities that are fair valued using a pricing service that considers the correlation of the trading patterns of the foreign security to the intraday trading in the U.S. markets are categorized as Level 2 of the fair value hierarchy.
Foreign currency contracts. The fair values of foreign currency contracts are derived from indices, reference rates, and other inputs or a combination of these factors. To the extent that these factors can be observed, foreign currency contracts are categorized as Level 2 of the fair value hierarchy.
Futures contracts. Futures contracts are generally valued at the settlement price established at the close of business each day by the exchange on which they are traded. They are categorized as Level 1.
Money market funds. Money market funds are open-end mutual funds that invest in short-term debt securities. To the extent that these funds are valued based upon the reported NAV, they are categorized as Level 1 of the fair value hierarchy.
Options and Swaptions contracts. Exchange-listed options contracts are traded on securities exchanges and are fair valued based on quoted prices from the applicable exchange, and to the extent valuation adjustments are not applied, they are categorized as Level 1. If valuation adjustments are applied and such adjustments are observable and timely, the fair values of exchange-listed options contracts would be categorized as Level 2; otherwise the fair values would be categorized as Level 3. Options and swaptions contracts traded over-the-counter (“OTC”) are fair valued based on pricing models and incorporate various inputs such as interest rates, credit spreads, currency exchange rates and volatility measurements for in-the-money, at-the-money, and out-of-the-money contracts based on a given strike price. To the extent that these inputs are observable and timely, the fair values of OTC options and swaptions contracts would be categorized as Level 2; otherwise the fair values would be categorized as Level 3.
Restricted securities. Restricted securities, including illiquid Rule 144A securities, issued by non-public entities are categorized as Level 3 of the fair value hierarchy because they trade infrequently, and therefore the inputs are unobservable. Any other restricted securities valued similar to publicly traded securities may be categorized as Level 2 or 3 of the fair value hierarchy depending on whether a discount is applied and significant to the fair value.
Short-term investments. Short-term investments are valued using market price quotations, and are categorized as Level 1 or Level 2 of the fair value hierarchy.
U.S. and foreign government and agency securities. Government and agency securities are normally valued using a model that incorporates market observable data such as reported sales of similar securities, broker quotes, yields, bids, offers, quoted market prices, and reference data. Accordingly, U.S. and foreign government and agency securities are normally categorized as Level 1 or 2 of the fair value hierarchy depending on the liquidity and transparency of the market.
49
Table of Contents
TCW Funds, Inc.
Notes to Financial Statements (Continued)
Note 2 — Significant Accounting Policies (Continued)
The summary of the inputs used as of October 31, 2022 in valuing the Funds’ investments is listed after the Schedule of Investments for each Fund.
Following is a reconciliation of investments in which significant unobservable inputs (Level 3) were used in determining value:
TCW DEVELOPING MARKETS EQUITY FUND
| COMMON STOCK | ||||
Balance as of October 31, 2021 | $ | — | ||
Accrued Discounts (Premiums) | — | |||
Realized Gain (Loss) | — | |||
Change in Unrealized Appreciation (Depreciation)* | (320,290 | ) | ||
Purchases | 39,769 | |||
Sales | — | |||
Transfers in to Level 3 | 280,778 | (1) | ||
Transfers out of Level 3 | — | |||
|
| |||
Balance as of October 31, 2022 | $ | 257 | ||
|
| |||
| (1) | Financial assets transferred between Level 2 and Level 3 were due to a change in observable and/or unobservable inputs. |
| * | The change in unrealized appreciation (depreciation) on securities still held at October 31, 2022 was $(320,290) and is included in the related net realized gains (losses) and net change in appreciation (depreciation) in the Statements of Operations. |
TCW EMERGING MARKETS INCOME FUND
| FOREIGN GOVERNMENT BONDS | ||||
Balance as of October 31, 2021 | $ | 17,917,631 | ||
Accrued Discounts (Premiums) | — | |||
Realized Gain (Loss) | — | |||
Change in Unrealized Appreciation (Depreciation)* | (4,737,965 | ) | ||
Purchases | — | |||
Sales | — | |||
Transfers in to Level 3 | — | |||
Transfers out of Level 3 | — | |||
|
| |||
Balance as of October 31, 2022 | $ | 13,179,666 | ||
|
| |||
| * | The change in unrealized appreciation (depreciation) on securities still held at October 31, 2022 was $(4,737,965) and is included in the related net realized gains (losses) and net change in appreciation (depreciation) in the Statements of Operations. |
50
Table of Contents
TCW Funds, Inc.
October 31, 2022
Note 2 — Significant Accounting Policies (Continued)
TCW EMERGING MARKETS MULTI-ASSET OPPORTUNITIES FUND
| COMMON STOCK | FOREIGN GOVERNMENT BONDS | |||||||
Balance as of October 31, 2021 | $ | — | $ | 141,369 | ||||
Accrued Discounts (Premiums) | — | — | ||||||
Realized Gain (Loss) | — | — | ||||||
Change in Unrealized Appreciation (Depreciation)* | (2,560,267 | ) | (37,751 | ) | ||||
Purchases | — | — | ||||||
Sales | — | — | ||||||
Transfers in to Level 3 | 2,562,225 | (1) | — | |||||
Transfers out of Level 3 | — | — | ||||||
|
|
|
| |||||
Balance as of October 31, 2022 | $ | 1,958 | $ | 103,618 | ||||
|
|
|
| |||||
| (1) | Financial assets transferred between Level 2 and Level 3 were due to a change in observable and/or unobservable inputs. |
| * | The change in unrealized appreciation (depreciation) on securities still held at October 31, 2022 was $(2,598,018) and is included in the related net realized gains (losses) and net change in appreciation (depreciation) in the Statements of Operations. |
Significant unobservable valuation inputs for Level 3 investments as of October 31, 2022 are as follows:
Description | Fair Value at 10/31/2022 | Valuation Techniques | Unobservable Input | Price or Price Range | Average Weighted Price | Input to Valuation If Input Increases | ||||||||||||
TCW Developing Markets Equity Fund |
| |||||||||||||||||
Common Stock | $ | 257 | Fair Valuation | Last traded price, discounted by 99% | $0.001–$0.045 | $ | 0.003 | Increase | ||||||||||
TCW Emerging Markets Income Fund |
| |||||||||||||||||
Government Issues | $ | 13,179,666 | Third-party Vendor | Vendor Prices | $7.750 | $ | 7.750 | Increase | ||||||||||
TCW Emerging Markets Multi-Asset Opportunities Fund |
| |||||||||||||||||
Common Stock | $ | 1,958 | Fair Valuation | Last traded price, discounted by 99% | $0.001–$0.045 | $ | 0.003 | Increase | ||||||||||
Government Issues | $ | 103,618 | Third-party Vendor | Vendor Prices | $7.75 | $ | 7.75 | Increase | ||||||||||
Security Transactions and Related Investment Income: Security transactions are recorded as of the trade date. Dividend income is recorded on the ex-dividend date. Interest income is recognized on an accrual basis. Realized gains and losses on investments are recorded on the basis of specific identification.
Allocation of Operating Activity for Multiple Classes: Investment income, common expenses and realized and unrealized gains and losses are allocated among the share classes of the Funds based on the relative net assets of each class. Distribution fees, which are directly attributable to a class of shares, are charged to the operations of that class. All other expenses are charged to each Fund or class as incurred on a specific identification basis. Differences in class-specific fees and expenses will result in differences in net investment income for each class, and in turn differences in dividends paid by each class.
Dividends and Distributions: Dividends and distributions to shareholders are recorded on the ex-dividend date. The TCW Emerging Markets Income Fund and the TCW Emerging Markets Local Currency Income Fund declare and pay, or reinvest, dividends from net investment income monthly. The other International Funds declare and pay, or reinvest, dividends from net investment income annually. Capital gains realized by a Fund will be distributed at least annually.
Income and capital gain distributions are determined in accordance with income tax regulations which may differ from GAAP. These differences are primarily due to differing treatments for foreign currency transactions, derivative transactions, market discount and premium, losses deferred due to wash sales,
51
Table of Contents
TCW Funds, Inc.
Notes to Financial Statements (Continued)
Note 2 — Significant Accounting Policies (Continued)
excise tax regulations and employing equalization in determining amounts to be distributed to Fund shareholders. Permanent book and tax basis differences relating to shareholder distributions will result in reclassifications between paid-in capital, undistributed net investment income (loss), and/or undistributed accumulated realized gain (loss). Undistributed net investment income or loss may include temporary book and tax basis differences which will reverse in subsequent periods. Any taxable income or capital gain remaining at fiscal year-end is distributed in the following year.
Use of Estimates: The preparation of the accompanying financial statements requires management to make estimates and assumptions that affect the reported amount of assets and liabilities at the date of the financial statements and the reported amounts of income and expenses during the reporting period. Actual results could differ from these estimates.
Foreign Currency Translation: The books and records of each Fund are maintained in U.S. dollars as follows: (1) foreign currency denominated securities and other assets and liabilities stated in foreign currencies are translated using the daily spot rate; and (2) purchases, sales, income and expenses are translated at the rate of exchange prevailing on the respective dates of such transactions. The resultant exchange gains and losses are included in net realized or net unrealized gain (loss) in the Statements of Operations. Pursuant to U.S. federal income tax regulations, certain foreign exchange gains and losses included in realized and unrealized gains and losses are included in, or are a reduction of, ordinary income for federal income tax purposes.
Foreign Taxes: The Funds may be subject to withholding taxes on income and capital gains imposed by certain countries in which they invest. The withholding tax on income is netted against the income accrued or received. Any reclaimable taxes are recorded as income. The withholding tax on realized or unrealized gain is recorded as a liability.
Derivative Instruments: Derivatives are financial instruments which are valued based on the values of one or more indicators, such as a security, asset, currency, interest rate, or index. Derivative transactions can create investment leverage and may be highly volatile. A derivative contract may result in a mark -to -market loss if the value of the contract decreases due to an unfavorable change in the market rates or values of the underlying instrument. It is possible that a derivative transaction will result in a loss greater than the principal amount invested. The Funds may not be able to close out a derivative transaction at a favorable time or price.
52
Table of Contents
TCW Funds, Inc.
October 31, 2022
Note 2 — Significant Accounting Policies (Continued)
For the year ended October 31, 2022, the following Funds had derivatives and transactions in derivatives, grouped in the following risk categories:
TCW Emerging Markets Income Fund
| Credit Risk | Equity Risk | Foreign Currency Risk | Interest Rate Risk | Total | ||||||||||||||||
Statement of Assets and Liabilities: | ||||||||||||||||||||
Asset Derivatives |
| |||||||||||||||||||
Investments (1) | $ | — | $ | — | $ | 2,453,334 | $ | 1,093,750 | $ | 3,547,084 | ||||||||||
Forward Contracts | — | — | 302,240 | — | 302,240 | |||||||||||||||
|
|
|
|
|
|
|
|
|
| |||||||||||
Total Value | $ | — | $ | — | $ | 2,755,574 | $ | 1,093,750 | $ | 3,849,324 | ||||||||||
|
|
|
|
|
|
|
|
|
| |||||||||||
Liability Derivatives |
| |||||||||||||||||||
Forward Contracts | $ | — | $ | — | $ | (394,746 | ) | $ | — | $ | (394,746 | ) | ||||||||
Options Written | — | — | (330,988 | ) | — | (330,988 | ) | |||||||||||||
|
|
|
|
|
|
|
|
|
| |||||||||||
Total Value | $ | — | $ | — | $ | (725,734 | ) | $ | — | $ | (725,734 | ) | ||||||||
|
|
|
|
|
|
|
|
|
| |||||||||||
Statement of Operations: |
| |||||||||||||||||||
Net Realized Gain (Loss) |
| |||||||||||||||||||
Forward Contracts | $ | — | $ | — | $ | 6,532,802 | $ | — | $ | 6,532,802 | ||||||||||
Futures Contracts | — | 264,730 | — | 220,403 | 485,133 | |||||||||||||||
Investments (2) | — | — | — | (5,796,107 | ) | (5,796,107 | ) | |||||||||||||
Swap Agreements | 3,719,992 | — | — | — | 3,719,992 | |||||||||||||||
|
|
|
|
|
|
|
|
|
| |||||||||||
Net Realized Gain (Loss) | $ | 3,719,992 | $ | 264,730 | $ | 6,532,802 | $ | (5,575,704 | ) | $ | 4,941,820 | |||||||||
|
|
|
|
|
|
|
|
|
| |||||||||||
Net Change in Appreciation (Depreciation) |
| |||||||||||||||||||
Forward Contracts | $ | — | $ | — | $ | (2,772,613 | ) | $ | — | $ | (2,772,613 | ) | ||||||||
Futures Contracts | — | — | — | (767,718 | ) | (767,718 | ) | |||||||||||||
Investments (3) | — | — | (2,176,734 | ) | (1,217,584 | ) | (3,394,318 | ) | ||||||||||||
Options Written | — | — | 576,693 | — | 576,693 | |||||||||||||||
Swap Agreements | (2,607,610 | ) | — | — | — | (2,607,610 | ) | |||||||||||||
|
|
|
|
|
|
|
|
|
| |||||||||||
Net Change in Appreciation (Depreciation) | $ | (2,607,610 | ) | $ | — | $ | (4,372,654 | ) | $ | (1,985,302 | ) | $ | (8,965,566 | ) | ||||||
|
|
|
|
|
|
|
|
|
| |||||||||||
Number of Contracts or Notional Amounts (4) |
| |||||||||||||||||||
Forward Currency Contracts | $ — | $ — | $117,461,472 | $ — | $117,461,472 | |||||||||||||||
Futures Contracts | — | 1,980 | — | 497 | 2,477 | |||||||||||||||
Options Purchased | $ — | $ — | $248,250,000 | $15,714,667 | $263,964,667 | |||||||||||||||
Options Written | $ — | $ — | $248,250,000 | $ — | $248,250,000 | |||||||||||||||
Swap Agreements | $130,293,764 | $ — | $ — | $ — | $130,293,764 | |||||||||||||||
53
Table of Contents
TCW Funds, Inc.
Notes to Financial Statements (Continued)
Note 2 — Significant Accounting Policies (Continued)
TCW Emerging Markets Local Currency Income Fund
| Credit Risk | Equity Risk | Foreign Currency Risk | Interest Rate Risk | Total | ||||||||||||||||
Statement of Assets and Liabilities: | ||||||||||||||||||||
Asset Derivatives |
| |||||||||||||||||||
Forward Contracts | $ | — | $ | — | $ | 591,972 | $ | — | $ | 591,972 | ||||||||||
|
|
|
|
|
|
|
|
|
| |||||||||||
Total Value | $ | — | $ | — | $ | 591,972 | $ | — | $ | 591,972 | ||||||||||
|
|
|
|
|
|
|
|
|
| |||||||||||
Liability Derivatives |
| |||||||||||||||||||
Forward Contracts | $ | — | $ | — | $ | (536,625 | ) | $ | — | $ | (536,625 | ) | ||||||||
|
|
|
|
|
|
|
|
|
| |||||||||||
Total Value | $ | — | $ | — | $ | (536,625 | ) | $ | — | $ | (536,625 | ) | ||||||||
|
|
|
|
|
|
|
|
|
| |||||||||||
Statement of Operations: |
| |||||||||||||||||||
Net Realized Gain (Loss) |
| |||||||||||||||||||
Forward Contracts | $ | — | $ | — | $ | (3,095,767 | ) | $ | — | $ | (3,095,767 | ) | ||||||||
Futures Contracts | — | 4,278 | — | — | 4,278 | |||||||||||||||
|
|
|
|
|
|
|
|
|
| |||||||||||
Net Realized Gain (Loss) | $ | — | $ | 4,278 | $ | (3,095,767 | ) | $ | — | $ | (3,091,489 | ) | ||||||||
|
|
|
|
|
|
|
|
|
| |||||||||||
Net Change in Appreciation (Depreciation) |
| |||||||||||||||||||
Forward Contracts | $ | — | $ | — | $ | 477,380 | $ | — | $ | 477,380 | ||||||||||
|
|
|
|
|
|
|
|
|
| |||||||||||
Net Change in Appreciation (Depreciation) | $ | — | $ | — | $ | 477,380 | $ | — | $ | 477,380 | ||||||||||
|
|
|
|
|
|
|
|
|
| |||||||||||
Number of Contracts or Notional Amounts (4) |
| |||||||||||||||||||
Forward Currency Contracts | $ — | $ — | $50,225,815 | $ — | $50,225,815 | |||||||||||||||
Futures | — | 32 | — | — | 32 | |||||||||||||||
TCW Emerging Markets Multi-Asset Opportunities Fund
| Credit Risk | Equity Risk | Foreign Currency Risk | Interest Rate Risk | Total | ||||||||||||||||
Statement of Assets and Liabilities: | ||||||||||||||||||||
Asset Derivatives |
| |||||||||||||||||||
Investments (1) | $ | — | $ | — | $ | 12,847 | $ | 5,625 | $ | 18,472 | ||||||||||
Forward Contracts | — | — | 1,000 | — | 1,000 | |||||||||||||||
|
|
|
|
|
|
|
|
|
| |||||||||||
Total Value | $ | — | $ | — | $ | 13,847 | $ | 5,625 | $ | 19,472 | ||||||||||
|
|
|
|
|
|
|
|
|
| |||||||||||
Liability Derivatives |
| |||||||||||||||||||
Forward Contracts | $ | — | $ | — | $ | (1,877 | ) | $ | — | $ | (1,877 | ) | ||||||||
Options Written | — | — | (1,733 | ) | — | (1,733 | ) | |||||||||||||
|
|
|
|
|
|
|
|
|
| |||||||||||
Total Value | $ | — | $ | — | $ | (3,610 | ) | $ | — | $ | (3,610 | ) | ||||||||
|
|
|
|
|
|
|
|
|
| |||||||||||
Statement of Operations: |
| |||||||||||||||||||
Net Realized Gain (Loss) |
| |||||||||||||||||||
Forward Contracts | $ | — | $ | — | $ | 28,927 | $ | — | $ | 28,927 | ||||||||||
Futures Contracts | — | 1,337 | — | 898 | 2,235 | |||||||||||||||
Investments (2) | — | — | — | (27,046 | ) | (27,046 | ) | |||||||||||||
Swap Agreements | 10,282 | — | — | — | 10,282 | |||||||||||||||
|
|
|
|
|
|
|
|
|
| |||||||||||
Net Realized Gain (Loss) | $ | 10,282 | $ | 1,337 | $ | 28,927 | $ | (26,148 | ) | $ | 14,398 | |||||||||
|
|
|
|
|
|
|
|
|
| |||||||||||
Net Change in Appreciation (Depreciation) |
| |||||||||||||||||||
Forward Contracts | $ | — | $ | — | $ | (12,963 | ) | $ | — | $ | (12,963 | ) | ||||||||
Futures Contracts | — | — | — | (3,089 | ) | (3,089 | ) | |||||||||||||
Investments (3) | — | — | (11,399 | ) | (6,262 | ) | (17,661 | ) | ||||||||||||
Options Written | — | — | 3,020 | — | 3,020 | |||||||||||||||
Swap Agreements | (9,575 | ) | — | — | — | (9,575 | ) | |||||||||||||
|
|
|
|
|
|
|
|
|
| |||||||||||
Net Change in Appreciation (Depreciation) | $ | (9,575 | ) | $ | — | $ | (21,342 | ) | $ | (9,351 | ) | $ | (40,268 | ) | ||||||
|
|
|
|
|
|
|
|
|
| |||||||||||
54
Table of Contents
TCW Funds, Inc.
October 31, 2022
Note 2 — Significant Accounting Policies (Continued)
TCW Emerging Markets Multi-Asset Opportunities Fund (Continued)
| Credit Risk | Equity Risk | Foreign Currency Risk | Interest Rate Risk | Total | ||||||||||||||||
Number of Contracts or Notional Amounts (4) |
| |||||||||||||||||||
Forward Currency Contracts | $— | $— | $547,754 | $— | $547,754 | |||||||||||||||
Futures Contracts | $— | $10 | $— | $2 | $12 | |||||||||||||||
Options Purchased | $— | $— | $1,300,000 | $75,000 | $1,375,000 | |||||||||||||||
Options Written | $— | $— | $1,300,000 | $— | $1,300,000 | |||||||||||||||
Swap Agreements | $565,409 | $— | $— | $— | $565,409 | |||||||||||||||
| (1) | Represents purchased options, at value. |
| (2) | Represents realized gain (loss) for purchased options. |
| (3) | Represents change in unrealized appreciation (depreciation) for purchased options during the year. |
| (4) | Amount disclosed represents average number of contracts or notional amounts, which are representative of the volume traded for the year ended October 31, 2022. |
Counterparty Credit Risk: Derivative contracts may be exposed to counterparty risk. Losses can occur if the counterparty does not perform under the contract.
The Funds’ risk of loss from counterparty credit risk on OTC derivatives is generally limited to the aggregate unrealized gain netted against any collateral held by the Funds.
With exchange-traded futures and centrally cleared swaps, there is less counterparty credit risk to the Funds since the exchange or clearinghouse, as counterparty to such instruments, guarantees against a possible default. The clearinghouse stands between the buyer and the seller of the contract; therefore, the credit risk is limited to failure of the clearinghouse. While offset rights may exist under applicable law, the Funds do not have a contractual right of offset against a clearing broker or clearinghouse in the event of a default (including the bankruptcy or insolvency) of the clearing broker or clearinghouse. Additionally, credit risk exists in exchange-traded futures and centrally cleared swaps with respect to initial and variation margin that is held in a clearing broker’s customer accounts. While clearing brokers are required to segregate customer margin from their own assets, in the event that a clearing broker becomes insolvent or goes into bankruptcy and at that time there is a shortfall in the aggregate amount of margin held by the clearing broker for all its clients, typically the shortfall would be allocated on a pro rata basis across all the clearing broker’s customers, potentially resulting in losses to the Funds.
For OTC derivatives the Funds mitigate their counterparty risk by entering into an International Swaps and Derivatives Association, Inc. Master Agreement (“ISDA Master Agreement”) or similar agreement with each counterparty. An ISDA Master Agreement is a bilateral agreement between the Funds and a counterparty that governs OTC derivatives and typically contains, among other things, collateral posting terms and netting provisions in the event of a default and/or termination event. Under an ISDA Master Agreement, the Funds may, under certain circumstances, offset with the counterparty certain derivative financial instruments’ payables and/or receivables with collateral held and/or posted and create one single net payment. The provisions of the ISDA Master Agreement typically permit a single net payment in the event of default including the bankruptcy or insolvency of the counterparty. However, bankruptcy or insolvency laws of a particular jurisdiction may impose restrictions on or prohibitions against the right of offset in bankruptcy, insolvency or other events. In addition, certain ISDA Master Agreements allow counterparties to OTC derivatives to terminate derivative contracts prior to maturity in the event a Fund’s net assets declines by a stated percentage or a Fund fails to meet the terms of its ISDA Master Agreements, which would cause the Fund to accelerate payment of any net liability owed to the counterparty.
55
Table of Contents
TCW Funds, Inc.
Notes to Financial Statements (Continued)
Note 2 — Significant Accounting Policies (Continued)
Collateral requirements: For derivatives traded under an ISDA Master Agreement, the collateral requirements are typically calculated by netting the mark-to-market amount for each transaction under such agreement and comparing that amount to the value of any collateral pledged or received by a Fund.
Cash collateral that has been pledged to cover obligations of a Fund is reported separately on the Statement of Assets and Liabilities. Non-cash collateral pledged by a Fund, if any, is noted in the Schedule of Investments. Generally, the amount of collateral due from or to a party has to exceed a minimum transfer amount threshold, typically $250,000 or $500,000, before a transfer is required, which is determined at the close of each business day and the collateral is transferred on the next business day. To the extent amounts due to a Fund from its counterparties are not fully collateralized, contractually or otherwise, the Fund bears the risk of loss from counterparty non-performance. The Funds attempt to mitigate counterparty risk by entering into agreements only with counterparties that the Advisor believes have the financial resources to honor their obligations and by monitoring the financial stability of those counterparties. For financial reporting purposes, the Funds do not offset derivative assets and derivative liabilities that are subject to netting arrangements in the Statement of Assets and Liabilities. The Funds have implemented the disclosure requirements pursuant to FASB Accounting Standards Update (“ASU”) No. 2011-11, Disclosures about Offsetting Assets and Liabilities that requires disclosures to make financial statements that are prepared under GAAP more comparable to those prepared under International Financial Reporting Standards.
Master Agreements and Netting Arrangements. Certain Funds are parties to various agreements, including but not limited to International Swaps and Derivatives Association Agreements and related Credit Support Annex, Master Repurchase Agreements, and Master Securities Forward Transactions Agreements (collectively “Master Agreements”), which govern the terms of certain transactions with select counterparties. These Master Agreements generally include provisions for general obligations, representations, agreements, collateral, and certain events of default or termination. These Master Agreements also include provisions for netting arrangements that help reduce credit and counterparty risk associated with relevant transactions (“netting arrangements”). The netting arrangements are generally tied to credit-related events that, if triggered, would cause an event of default or termination giving a Fund or counterparty the right to terminate early and cause settlement, on a net basis, of all transactions under the applicable Master Agreement. In the event of an early termination as a result of an event of default under the Master Agreement, the total value exposure of all transactions will be offset against collateral exchanged to date, which would result in a net receivable or payable that would be due from or to the counterparty. However, bankruptcy or insolvency laws of a particular jurisdiction may impose restrictions on or prohibitions against the right of offset in the event of a bankruptcy or insolvency of the counterparty. Credit related events include, but are not limited to, bankruptcy, failure to make timely payments, restructuring, obligation acceleration, obligation default, a material decline in net assets, decline in credit rating or repudiation/moratorium. Any election made by a counterparty to early terminate the transactions under a Master Agreement could have a material adverse impact on a Fund’s financial statements. A Fund’s overall exposure to credit risk, subject to netting arrangements can change substantially within a short period, as it is affected by each transaction subject to the arrangement.
Master Agreements can also help limit counterparty risk by specifying collateral posting arrangements at pre-arranged exposure levels. Under the Master Agreements, collateral is routinely transferred if the total net exposure to certain transactions under the relevant Master Agreement with a counterparty in a given
56
Table of Contents
TCW Funds, Inc.
October 31, 2022
Note 2 — Significant Accounting Policies (Continued)
Fund exceeds a specified threshold, net of collateral already in place, typically $250,000 or $500,000 depending on the counterparty and the type of Master Agreement. Collateral under the Master Agreements is usually in the form of cash or U.S. Treasury Bills but could include other types of securities. If permitted under the Master Agreement, certain funds may rehypothecate cash collateral received from a counterparty. The value of all derivative transactions outstanding under a Master Agreement is calculated daily to determine the amount of collateral to be received or pledged by the counterparty. Posting of collateral for OTC derivative transactions are covered under tri-party collateral agreements between the Fund, the Fund’s custodian, and each counterparty. Collateral for centrally cleared derivatives transactions are posted with the applicable derivatives clearing organization.
The following table presents the Funds’ OTC derivatives assets and liabilities by counterparty net of amounts available for offset under an ISDA Master Agreement and net of the related collateral received by the Funds as of October 31, 2022:
TCW Emerging Markets Income Fund
Counterparty | Gross Assets Subject to Master Agreements | Gross Liabilities Subject to Master Agreements | Net Assets (Liabilities) Subject to Master Agreements | Collateral Pledged (Received) | Net Amount (1) | |||||||||||||||
Bank of America | $ | — | $ | (345,637 | ) | $ | (345,637 | ) | $ | 345,637 | (2) | $ | — | |||||||
BNP Paribas S.A. | — | (49,109 | ) | (49,109 | ) | — | (49,109 | ) | ||||||||||||
Citibank N.A. | 80,938 | — | 80,938 | — | 80,938 | |||||||||||||||
Goldman Sachs & Co. | 2,592,506 | (330,988 | ) | 2,261,518 | (1,760,000 | ) | 501,518 | |||||||||||||
Standard Chartered Bank | 82,130 | — | 82,130 | — | 82,130 | |||||||||||||||
|
|
|
|
|
|
|
|
|
| |||||||||||
Total | $ | 2,755,574 | $ | (725,734 | ) | $ | 2,029,840 | $ | (1,414,363 | ) | $ | 615,477 | ||||||||
|
|
|
|
|
|
|
|
|
| |||||||||||
| (1) | Represents the net amount receivable (payable) from (to) the counterparty in the event of default. |
| (2) | Amount does not include excess collateral pledged or received. |
TCW Emerging Markets Local Currency Income Fund
Counterparty | Gross Assets Subject to Master Agreements | Gross Liabilities Subject to Master Agreements | Net Assets (Liabilities) Subject to Master Agreements | Collateral Pledged (Received) | Net Amount (1) | |||||||||||||||
Bank of America | $ | 102,333 | $ | (217,954 | ) | $ | (115,621 | ) | $ | — | $ | (115,621 | ) | |||||||
Barclays Capital | 269,204 | (106,755 | ) | 162,449 | — | 162,449 | ||||||||||||||
BNP Paribas S.A. | 123,670 | (165,521 | ) | (41,851 | ) | — | (41,851 | ) | ||||||||||||
Citibank N.A. | — | (10,978 | ) | (10,978 | ) | — | (10,978 | ) | ||||||||||||
Goldman Sachs & Co. | — | (13,278 | ) | (13,278 | ) | — | (13,278 | ) | ||||||||||||
JP Morgan Chase Bank | 58,979 | (16,506 | ) | 42,473 | — | 42,473 | ||||||||||||||
Morgan Stanley & Co. | 37,786 | (5,633 | ) | 32,153 | — | 32,153 | ||||||||||||||
|
|
|
|
|
|
|
|
|
| |||||||||||
Total | $ | 591,972 | $ | (536,625 | ) | $ | 55,347 | $ | — | $ | 55,347 | |||||||||
|
|
|
|
|
|
|
|
|
| |||||||||||
| (1) | Represents the net amount receivable (payable) from (to) the counterparty in the event of default. |
57
Table of Contents
TCW Funds, Inc.
Notes to Financial Statements (Continued)
Note 2 — Significant Accounting Policies (Continued)
TCW Emerging Markets Multi-Asset Opportunities Fund
Counterparty | Gross Assets Subject to Master Agreements | Gross Liabilities Subject to Master Agreements | Net Assets (Liabilities) Subject to Master Agreements | Collateral Pledged (Received) | Net Amount (1) | |||||||||||||||
Bank of America N.A. | $ | — | $ | (1,877 | ) | $ | (1,877 | ) | $ | — | $ | (1,877 | ) | |||||||
Citibank N.A. | 1,000 | — | 1,000 | — | 1,000 | |||||||||||||||
Goldman Sachs & Co. | 12,847 | (1,733 | ) | 11,114 | — | 11,114 | ||||||||||||||
|
|
|
|
|
|
|
|
|
| |||||||||||
Total | $ | 13,847 | $ | (3,610 | ) | $ | 10,237 | $ | — | $ | 10,237 | |||||||||
|
|
|
|
|
|
|
|
|
| |||||||||||
| (1) | Represents the net amount receivable (payable) from (to) the counterparty in the event of default. |
Note 3 — Portfolio Investments
When-Issued, Delayed-Delivery, and Forward Commitment Transactions: The Funds may enter into when-issued, delayed-delivery, or forward commitment transactions in order to lock in the purchase price of the underlying security or to adjust the interest rate exposure of each Fund’s existing portfolio. In when-issued, delayed-delivery, or forward commitment transactions, a Fund commits to purchase or sell particular securities, with payment and delivery to take place at a future date. Although the Fund does not pay for the securities or start earning interest on them until they are delivered, it immediately assumes the risks of ownership, including the risk of price fluctuation. If a Fund’s counterparty fails to deliver a security purchased on a when-issued, delayed-delivery, or forward commitment basis, there may be a loss, and the Fund may have missed an opportunity to make an alternative investment.
Prior to settlement of these transactions, the value of the subject securities will fluctuate with market conditions. In addition, because the Fund is not required to pay for when-issued, delayed-delivery, or forward commitment securities until the delivery date, they may result in a form of leverage to the extent the Fund does not set aside liquid assets to cover the commitment. To guard against this deemed leverage, the Fund monitors the obligations under these transactions on a daily basis and ensures that the Fund has sufficient liquid assets to cover them.
Repurchase Agreements: The Funds may enter into repurchase agreements under the terms of a Master Repurchase Agreement (“MRA”). In a repurchase agreement, the Funds purchase a security from a counterparty who agrees to repurchase the same security at a mutually agreed upon date and price. The MRA permits each Fund, under certain circumstances, including an event of default (such as bankruptcy or insolvency), to offset payables and/or receivables under the MRA with collateral held and/or posted to the counterparty and create one single net payment due to or from each Fund. However, bankruptcy or insolvency laws of a particular jurisdiction may impose restrictions on or prohibitions against such a right of offset in the event of the MRA counterparty’s bankruptcy or insolvency. Pursuant to the terms of the MRA, each Fund receives securities as collateral with a market value in excess of the repurchase price. Upon a bankruptcy or insolvency of the MRA counterparty, the Fund recognizes a liability with respect to such excess collateral to reflect the Fund’s obligation under bankruptcy law to return the excess to the counterparty. There were no repurchase agreements outstanding as of October 31, 2022.
Participation Notes: The Funds may invest in participation notes of equity-linked instruments (collectively, participation notes), through which a counterparty provides exposure to common stock, in the form of an unsecured interest, in markets where direct investment by a Fund is not possible. Participation notes provide the economic benefit of common stock ownership to a Fund, while legal ownership and
58
Table of Contents
TCW Funds, Inc.
October 31, 2022
Note 3 — Portfolio Investments (Continued)
voting rights are retained by the counterparty. Although participation notes are usually structured with a defined maturity or termination date, early redemption may be possible. Risks associated with participation notes include possible failure of the counterparty to perform in accordance with the terms of the agreement, inability to transfer or liquidate the notes, potential delays or an inability to redeem before maturity under certain market conditions, and limited legal recourse against the issuer of the underlying common stock. None of the Funds held participation notes as of October 31, 2022.
Securities Lending: The Funds may lend their securities to qualified brokers. The loans must be collateralized at all times primarily with cash although the Funds can accept money market instruments or U.S. Government securities with a market value at least equal to the market value of the securities on loan. As with any extensions of credit, the Funds may bear the risk of delay in recovery or even loss of rights in the collateral if the borrowers of the securities fail financially. The Funds earn additional income for lending their securities by investing the cash collateral in short-term investments. The Funds did not lend any securities during the year ended October 31, 2022.
Derivatives:
Forward Foreign Currency Contracts: The Funds enter into forward foreign currency contracts as a hedge against fluctuations in foreign exchange rates. Forward foreign currency contracts are marked-to market daily and the change in market value is recorded by the Funds as unrealized gains or losses in the Statement of Assets and Liabilities. When a contract is closed or delivery is taken, a Fund records a realized gain or loss equal to the difference between the value of the contract at the time it was opened and the value at the time it was closed. Risks may arise upon entering into these contracts from the potential inability of counterparties to meet the terms of their contracts and from unanticipated movements in the value of the foreign currency relative to the U.S. dollar. Outstanding foreign currency forward contracts at October 31, 2022 are disclosed in the Schedule of Investments.
Futures Contracts: The Funds may enter into futures contracts. A Fund may seek to manage a variety of different risks through the use of futures contracts, such as interest rate risk, equity price risk, and currency risk. A Fund may use index futures to hedge against broad market risks to its portfolio or to gain broad market exposure. Securities index futures contracts are contracts to buy or sell units of a securities index at a specified future date at a price agreed upon when the contract is made and are settled in cash. Positions in futures may be closed out only on an exchange or board of trade which provides a secondary market for such futures. Because futures contracts are exchange-traded, they typically have minimal exposure to counterparty risk. Parties to a futures contract are not required to post the entire notional amount of the contract, but rather a small percentage of that amount (by way of margin), both at the time they enter into futures transactions, and then on a daily basis if their positions decline in value; as a result, futures contracts are highly leveraged. Such payments are known as variation margin and are recorded by a Fund as unrealized gains or losses. Because futures markets are highly leveraged, they can be extremely volatile, and there can be no assurance that the pricing of a futures contract will correlate precisely with the pricing of the asset or index underlying it or the asset or liability of a Fund that is the subject of the hedge. It may not always be possible for a Fund to enter into a closing transaction with respect to a futures contract it has entered into at a favorable time or price. When a Fund enters into a futures transaction, it is subject to the risk that the value of the futures contract will move in a direction unfavorable to it.
59
Table of Contents
TCW Funds, Inc.
Notes to Financial Statements (Continued)
Note 3 — Portfolio Investments (Continued)
When a Fund uses futures contracts for hedging purposes, it is likely that the Fund will have an asset or liability that will offset any loss (or gain) on the transactions, at least in part. When a futures contract is closed, the Fund records a realized gain or loss equal to the difference between the value of the contract at the time it was opened and the value at the time it was closed. There were no futures contracts outstanding at October 31, 2022.
Options: The Funds may purchase and sell put and call options on a security or an index of securities to enhance investment performance and/or to protect against changes in market prices. The Funds may also enter into currency options to hedge against or to take advantage of currency fluctuations.
A call option gives the holder the right to purchase, and obligates the writer to sell, a security at the strike price at any time before the expiration date. A put option gives the holder the right to sell, and obligates the writer to buy, a security at the exercise price at any time before the expiration date. A Fund may purchase put options to protect portfolio holdings against a decline in market value of a security or securities held by it. A Fund may also purchase a put option hoping to profit from an anticipated decline in the value of the underlying security. If a Fund holds the security underlying the option, the option premium and any transaction costs will reduce any profit the Fund might have realized had it sold the underlying security instead of buying the put option. A Fund may purchase call options to hedge against an increase in the price of securities that the Fund ultimately wants to buy. A Fund may also purchase a call option as a long directional investment hoping to profit from an anticipated increase in the value of the underlying security. In order for a call option to be profitable, the market price of the underlying security must rise sufficiently above the exercise price to cover the premium and transaction costs. These costs will reduce any profit a Fund might have realized had it bought the underlying security at the time it purchased the call option.
Purchasing foreign currency options gives a Fund the right, but not the obligation, to buy or sell specified amounts of currency at a rate of exchange that may be exercised by a certain date. These currency options may be used as a short or long hedge against possible variations in foreign exchange rates or to gain exposure to foreign currencies.
When a Fund purchases an option, it runs the risk that it will lose its entire investment in the option in a relatively short period of time, unless the Fund exercises the option or enters into a closing sale transaction before the option’s expiration. If the price of the underlying security does not rise (in the case of a call) or fall (in the case of a put) to an extent sufficient to cover the option premium and transaction costs, the Fund will lose part or all of its investment in the option. Premiums paid for purchasing options that expire are treated as realized losses.
Options purchased or sold by a Fund may be traded on a securities or options exchange. Such options typically have minimal exposure to counterparty risk. However, an exchange or market may at times find it necessary to impose restrictions on particular types of options transactions, such as opening transactions. If an underlying security ceases to meet qualifications imposed by an exchange or the Options Clearing Corporation, new series of options on that security will no longer be opened to replace the expiring series, and opening transactions in existing series may be prohibited.
OTC options are options not traded on exchanges or backed by clearinghouses. Rather, they are entered into directly between a Fund and the counterparty to the option. In the case of an OTC option purchased by a Fund, the value of the option to the Fund will depend on the willingness and ability of the option writer to perform its obligations to the Fund. In addition, OTC options may not be transferable and there may be
60
Table of Contents
TCW Funds, Inc.
October 31, 2022
Note 3 — Portfolio Investments (Continued)
little or no secondary market for them, so they may be considered illiquid. It may not be possible to enter into closing transactions with respect to OTC options or otherwise to terminate such options, and as a result a Fund may be required to remain obligated on an unfavorable OTC option until its expiration.
During the year ended October 31, 2022, the TCW Emerging Markets Income Fund and the TCW Emerging Markets Multi-Asset Opportunities Fund entered into options to hedge the currency exposure of the Funds.
Swap Agreements: The Funds may enter into swap agreements. Swap agreements are typically two-party contracts entered into primarily by institutional investors. In a standard “swap” transaction, two parties agree to exchange the returns (or differentials in rates of return) earned or realized on particular predetermined investments or instruments, which may be adjusted for an interest factor. The gross returns to be exchanged or “swapped” between the parties are generally calculated with respect to a “notional amount” (i.e., the return on or increase in value of a particular dollar amount invested at a particular interest rate or in a “basket” of securities representing a particular index).
In a total return swap, one party typically agrees to pay to the other a short-term interest rate in return for a payment at one or more times in the future based on the increase in the value of an underlying security or other asset, or index of securities or assets; if the underlying security, asset, or index declines in value, the party that pays the short-term interest rate must also pay to its counterparty a payment based on the amount of the decline. A Fund may take either side of such a swap, and so may take a long or short position in the underlying security, asset, or index. A Fund may enter into a total return swap to hedge against an exposure in its portfolio — such as interest rate risk (including to adjust the duration or credit quality of a Fund’s bond portfolio), equity risk, or credit risk — or generally to put cash to work efficiently in the markets in anticipation of, or as a replacement for, cash investments. A Fund may also enter into a total return swap to gain exposure to securities or markets in which it might not be able to invest directly (in so-called market access transactions).
Interest rate swaps are agreements in which one party pays a floating rate of interest on a notional principal amount and receives a fixed rate of interest on the same notional principal amount for a specified period of time. Alternatively, a party may pay a fixed rate and receive a floating rate. In more complex swaps, the notional principal amount may decline (or amortize) over time. A Fund’s maximum risk of loss due to counterparty default is the discounted NAV of the cash flows paid to/received from the counterparty over the interest rate swap’s remaining life.
A Fund may enter into credit default swap transactions as a “buyer” or “seller” of credit protection. In a credit default swap, one party provides what is in effect insurance against a default or other adverse credit event affecting an issuer of debt securities (typically referred to as a “reference entity”). In general, the buyer of credit protection is obligated to pay the protection seller an upfront amount or a periodic stream of payments over the term of the swap. If a “credit event” occurs, the buyer has the right to deliver to the seller bonds or other obligations of the reference entity (with a value up to the full notional value of the swap), and to receive a payment equal to the par value of the bonds or other obligations. Credit events that would trigger a request that the seller make payment are specific to each credit default swap agreement, but generally include bankruptcy, failure to pay, restructuring, obligation acceleration, obligation default, or repudiation/moratorium. When a Fund buys protection, it may or may not own securities of the reference entity. When a Fund sells protection under a credit default swap, the position may have the effect of creating leverage in the Fund’s portfolio through the Fund’s indirect long exposure to the issuer or
61
Table of Contents
TCW Funds, Inc.
Notes to Financial Statements (Continued)
Note 3 — Portfolio Investments (Continued)
securities on which the swap is written. When a Fund sells protection, it may do so either to earn additional income or to create such a “synthetic” long position.
Whenever a Fund enters into a swap agreement, it takes on counterparty risk — the risk that its counterparty will be unable or unwilling to meet its obligations under the swap agreement. A Fund also takes the risk that the market will move against its position in the swap agreement. In the case of a total return swap, the swap will change in value depending on the change in value of the asset or index on which the swap is written. When a Fund enters into any type of swap for hedging purposes, it is likely that the Fund will have an asset or liability that will offset any loss (or gain) on the swap, at least in part. Swap agreements may be non-transferable or otherwise highly illiquid, and a Fund may not be able to terminate or transfer a swap agreement at any particular time or at an acceptable price.
During the term of a swap transaction, changes in the value of the swap are recognized as unrealized gains or losses by marking-to-market to reflect the market value of the swap. When the swap is terminated, a Fund will record a realized gain or loss equal to the difference, if any, between the proceeds from (or cost of) the closing transaction and the Fund’s basis in the agreement. Upfront swap premium payments paid or received by a Fund, if any, are recorded within the value of the open swap agreement on the Fund’s Statement of Assets and Liabilities and represent payments paid or received upon entering into the swap agreement to compensate for differences between stated terms of the swap agreement and prevailing market conditions (credit spreads, currency exchange rates, and other relevant factors). These upfront payments are recorded as realized gains or losses on each Fund’s Statement of Operations upon termination or maturity of the swap agreement.
During the term of a swap transaction, the periodic net payments can be made for a set period of time or may be triggered by a predetermined credit event. The net periodic payments may be based on a fixed or variable interest rate, the change in market value of a specified security, basket of securities or index, or the return generated by a security. These periodic payments received or made by the Funds are recorded as realized gains and losses, respectively. During the year ended October 31, 2022, the TCW Emerging Markets Income Fund and the TCW Emerging Markets Multi-Asset Opportunities Fund used credit default swaps to limit certain credit exposure within each Fund.
Note 4 — Risk Considerations
Market Risk: The Funds’ investments will fluctuate with market conditions, and so will the value of your investment in the Funds. You could lose money on your investment in the Funds or the Funds could underperform other investments.
Liquidity Risk: The Funds’ investments in illiquid securities may reduce the returns of the Funds because they may not be able to sell the illiquid securities at an advantageous time or price. Investments in high-yield securities, foreign securities, derivatives or other securities with substantial market and/or credit risk tend to have the greatest exposure to liquidity risk. Certain investments in private placements and Rule 144A securities may be considered illiquid investments. The Funds may invest in private placements and Rule 144A securities.
Interest Rate Risk: The values of the Funds’ investments fluctuate in response to movements in interest rates. If rates rise, the values of debt securities generally fall. The longer the average duration of a Fund’s investment portfolio, the greater the change in value.
62
Table of Contents
TCW Funds, Inc.
October 31, 2022
Note 4 — Risk Considerations (Continued)
Investment Style Risk: Certain Funds may also be subject to investment style risk. The Advisor’s investment styles may be out of favor at times or may not produce the best results over short or longer time periods and may increase the volatility of a Fund’s share price.
LIBOR Risk: The London Interbank Offer Rate (“LIBOR”) historically has been and currently is used extensively in the U.S. and globally as a “benchmark” or “reference rate” for various commercial and financial contracts, including corporate and municipal bonds, bank loans, asset-backed and mortgage related securities, interest rate swaps and other derivatives. For example, debt securities in which a Fund invests may pay interest at floating rates based on LIBOR or may be subject to interest caps or floors based on LIBOR. A Fund’s derivative investments may also reference LIBOR. In July 2017, the head of the United Kingdom Financial Conduct Authority announced the intention to phase out the use of LIBOR by the end of 2021.Most LIBOR settings were published for the final time on December 31, 2021, although the publication of 1-month, 3-month, and 6-month USD LIBOR was extended until June 2023. It is expected that market participants will transition to the use of different alternative reference or benchmark rates. However, although regulators have encouraged the development and adoption of alternative rates such as the Secured Overnight Financing Rate (“SOFR”), there is currently no definitive information regarding the future utilization of LIBOR or of any particular replacement reference rate. Abandonment of or modifications to LIBOR could have adverse impacts on newly issued financial instruments and existing financial instruments that reference LIBOR. The expected discontinuation of LIBOR could have a significant impact on the financial markets and may present a material risk for certain market participants, including investment companies such as the Funds. Abandonment of or modifications to LIBOR could lead to significant short- and long-term uncertainty and market instability. The risks associated with this discontinuation and transition may be exacerbated if the work necessary to effect an orderly transition to an alternative reference rate is not completed in a timely manner. It remains uncertain how such changes would be implemented and the effects such changes would have on the Funds, issuers of instruments in which the Funds invest, and the financial markets generally.
Derivatives Risk: Use of derivatives, which at times is an important part of the Funds’ investment strategies, involves risks different from, or possibly greater than, the risks associated with investing directly in securities and other traditional investments. Investments in derivatives could cause the Funds to lose more than the principal amount invested. Also, suitable derivative transactions may not be available in all circumstances and there can be no assurance that the Funds will achieve their objective through the use of the derivatives.
Credit Risk: The values of any of the Funds’ investments may also decline in response to events affecting the issuer or its credit rating. The lower rated debt securities in which a Fund may invest are considered speculative and are subject to greater volatility and risk of loss than investment-grade securities, particularly in deteriorating economic conditions.
Counterparty Risk: The Funds may be exposed to counterparty risk, the risk that an entity with which the Funds have unsettled or open transactions may not fulfill its obligations.
Foreign Currency Risk: The Funds may be exposed to the risk that the value of the Funds’ investments denominated in foreign currencies will decline in value because the foreign currencies have declined in value relative to the U.S. dollar.
63
Table of Contents
TCW Funds, Inc.
Notes to Financial Statements (Continued)
Note 4 — Risk Considerations (Continued)
Foreign and Developing/Emerging Markets Investing Risk: The Funds may be exposed to the risk that the Funds’ share prices will fluctuate with market conditions, currency exchange rates and the economic and political climates in countries where the Funds invest. The Funds are also subject to risks associated with financial, economic and other global market developments and disruptions, including those arising from war, terrorism, market manipulation, government interventions, defaults and shutdowns, and political changes or diplomatic developments, which can all negatively impact the securities markets and cause a Fund to lose value. As one current example, Russia’s recent military incursions in Ukraine have led to sanctions being levied against Russia by the United States, European Union and other countries, which has adversely affected European and global energy and financial markets and thus could affect the value of a Fund’s investments.
Public Health Emergencies Risk and Impact of the Coronavirus (COVID-19): Pandemics and other local, national, and international public health emergencies, including outbreaks of infectious diseases such as SARS, H1N1/09 Flu, the Avian Flu, Ebola and the current outbreak of the novel coronavirus (“COVID-19”), can result, and in the case of COVID-19 is resulting, in market volatility and disruption, and any similar future emergencies may materially and adversely impact economic production and activity in ways that cannot be predicted, all of which could result in substantial investment losses.
The COVID-19 outbreak has caused a worldwide public health emergency, straining healthcare resources and resulting in extensive and growing numbers of infections, hospitalizations and deaths. In an effort to contain COVID-19, local, regional, and national governments, as well as private businesses and other organizations, imposed and in some cases continue to impose severely restrictive measures, including instituting local and regional quarantines, restricting travel (including closing certain international borders), prohibiting public activity (including “stay-at-home,” “shelter-in-place,” and similar orders), and ordering the closure of a wide range of offices, businesses, schools, and other public venues. Consequently, COVID-19 has significantly diminished and disrupted global economic production and activity of all kinds and has contributed to both volatility and a severe decline in financial markets.
The ultimate impact of COVID-19 (and of the resulting precipitous decline and disruption in economic and commercial activity across many of the world’s economies) on global economic conditions, and on the operations, financial condition, and performance of any particular market, industry or business, is impossible to predict. However, ongoing and potential additional materially adverse effects, including further global, regional and local economic downturns (including recessions) of indeterminate duration and severity, are possible. It is difficult to assess what the longer-term impacts of an extended period of unprecedented economic dislocation and disruption will be on future economic developments, the health of certain markets, industries and businesses, and commercial and consumer behavior. The ongoing COVID-19 crisis and any other public health emergency that may arise in the future could have a significant adverse impact on the Funds’ investments and result in significant investment losses.
For more information on risks related to investing in the Funds, please refer to the Funds’ prospectus and the Statement of Additional Information which can be obtained on the Funds’ website (www.tcw.com) or by calling customer service at 800-FUND-TCW (800-386-3829).
64
Table of Contents
TCW Funds, Inc.
October 31, 2022
Note 5 — Federal Income Taxes
It is the policy of each Fund to comply with the requirements under Subchapter M of the Internal Revenue Code applicable to regulated investment companies and to distribute all of its net taxable income, including any net realized gains on investments, to its shareholders. Therefore, no federal income tax provision is required.
At October 31, 2022, the components of distributable earnings on a tax basis were as follows:
| Undistributed Ordinary Income | Undistributed Long-Term Gain | Total Distributable Earnings | ||||||||||
TCW Developing Markets Equity Fund | $ | 76,614 | $ | — | $ | 76,614 | ||||||
TCW Emerging Markets Multi-Asset Opportunities Fund | 1,376,707 | — | 1,376,707 | |||||||||
At the end of the previous fiscal year ended October 31, 2021, the components of distributable earnings on a tax basis were as follows:
| Undistributed Ordinary Income | Undistributed Long-Term Gain | Total Distributable Earnings | ||||||||||
TCW Developing Markets Equity Fund | $ | 257,955 | $ | 173,036 | $ | 430,991 | ||||||
TCW Emerging Markets Local Currency Income Fund | 2,194,800 | — | 2,194,800 | |||||||||
TCW Emerging Markets Multi-Asset Opportunities Fund | 3,715,182 | — | 3,715,182 | |||||||||
Permanent differences incurred during the year ended October 31, 2022, resulting from differences in book and tax accounting, have been reclassified at year-end between undistributed net investment income (loss), undistributed (accumulated) net realized gain (loss) and paid-in capital as follows, with no impact to the NAV per share:
| Undistributed Net Investment Income (Loss) | Undistributed Accumulated Net Realized Gain (Loss) | Paid-in Capital | ||||||||||
TCW Developing Markets Equity Fund | $ | 40,400 | $ | (40,400 | ) | $ | — | |||||
TCW Emerging Markets Income Fund | (18,025,485 | ) | 18,025,485 | — | ||||||||
TCW Emerging Markets Local Currency Income Fund | (5,930,157 | ) | 14,626,616 | (8,696,459 | ) | |||||||
TCW Emerging Markets Multi-Asset Opportunities Fund | 439,876 | (439,876 | ) | — | ||||||||
During the year ended October 31, 2022, the tax character of distributions paid was as follows:
| Ordinary Income | Long-Term Capital Gain | Return of Capital Gain | Total Distributions | |||||||||||||
TCW Developing Markets Equity Fund | $ | 276,623 | $ | 173,036 | $ | — | $ | 449,659 | ||||||||
TCW Emerging Markets Income Fund | 228,258,436 | — | 22,694,796 | 250,953,232 | ||||||||||||
TCW Emerging Markets Local Currency Income Fund | 2,830,965 | — | 3,893,084 | 6,724,049 | ||||||||||||
TCW Emerging Markets Multi-Asset Opportunities Fund | 3,961,910 | — | — | 3,961,910 | ||||||||||||
During the previous fiscal year ended October 31, 2021, the tax character of distributions paid was as follows:
| Ordinary Income | Long-Term Capital Gain | Return of Capital Gain | Total Distributions | |||||||||||||
TCW Developing Markets Equity Fund | $ | 8,519 | $ | — | $ | — | $ | 8,519 | ||||||||
TCW Emerging Markets Income Fund | 343,231,435 | — | 15,575,053 | 358,806,488 | ||||||||||||
TCW Emerging Markets Local Currency Income Fund | 6,333,475 | — | — | 6,333,475 | ||||||||||||
TCW Emerging Markets Multi-Asset Opportunities Fund | 1,350,163 | — | — | 1,350,163 | ||||||||||||
65
Table of Contents
TCW Funds, Inc.
Notes to Financial Statements (Continued)
Note 5 — Federal Income Taxes (Continued)
At October 31, 2022, net unrealized appreciation (depreciation) on investments for federal income tax purposes was as follows :
| Unrealized Appreciation | Unrealized (Depreciation) | Net Unrealized Appreciation (Depreciation) | Cost of Investments for Federal Income Tax Purposes | |||||||||||||
TCW Developing Markets Equity Fund | $ | 230,378 | $ | (658,601 | ) | $ | (428,223 | ) | $ | 4,885,050 | ||||||
TCW Emerging Markets Income Fund | 8,298,292 | (728,296,586 | ) | (719,998,294 | ) | 4,720,580,314 | ||||||||||
TCW Emerging Markets Local Currency Income Fund | 409,546 | (26,499,105 | ) | (26,089,559 | ) | 164,198,888 | ||||||||||
TCW Emerging Markets Multi-Asset Opportunities Fund | 1,206,410 | (6,802,315 | ) | (5,595,905 | ) | 45,694,504 | ||||||||||
At October 31, 2022, the following Funds had net realized losses that will be carried forward indefinitely for federal income tax purposes:
| Short-Term Capital Losses | Long-Term Capital Losses | Total | ||||||||||
TCW Developing Markets Equity Fund | $ | 1,147,951 | $ | — | $ | 1,147,951 | ||||||
TCW Emerging Markets Income Fund | 1,336,151,864 | 717,620,745 | 2,053,772,609 | |||||||||
TCW Emerging Markets Local Currency Income Fund | 31,685,369 | 19,265,687 | 50,951,056 | |||||||||
TCW Emerging Markets Multi-Asset Opportunities Fund | 7,708,926 | — | 7,708,926 | |||||||||
The Funds did not have any unrecognized tax benefits at October 31, 2022, nor were there any increases or decreases in unrecognized tax benefits for the year ended October 31, 2022. The Funds are subject to examination by the U.S. Federal and state tax authorities for returns filed for the prior three and four fiscal years, respectively.
Note 6 — Fund Management Fees and Other Expenses
The Funds pay to the Advisor, as compensation for services rendered, facilities furnished and expenses borne by it, the following annual management fees as a percentage of daily net assets:
TCW Developing Markets Equity Fund | 0.80 | % | ||
TCW Emerging Markets Income Fund | 0.75 | % | ||
TCW Emerging Markets Local Currency Income Fund | 0.75 | % | ||
TCW Emerging Markets Multi-Asset Opportunities Fund | 0.90 | % |
The Advisor limits the operating expenses of the Funds not to exceed the following expense ratios relative to the Funds’ average daily net assets:
TCW Developing Markets Equity Fund | ||||
I Class | 0.95 | % (1) | ||
N Class | 1.15 | % (1) | ||
TCW Emerging Markets Income Fund | ||||
I Class | 0.85 | % (1) | ||
N Class | 0.95 | % (1) | ||
Plan Class | 0.77 | % (1) | ||
TCW Emerging Markets Local Currency Income Fund | ||||
I Class | 0.85 | % (1) | ||
N Class | 0.90 | % (1) | ||
TCW Emerging Markets Multi-Asset Opportunities Fund | ||||
I Class | 1.00 | % (1) | ||
N Class | 1.20 | % (1) |
| (1) | These limitations are based on an agreement between the Advisor and Company. |
66
Table of Contents
TCW Funds, Inc.
October 31, 2022
Note 6 — Fund Management Fees and Other Expenses (Continued)
The amount borne by the Advisor during the fiscal year when the operating expenses of a Fund are in excess of the expense limitation cannot be recaptured in the subsequent fiscal years should the expenses drop below the expense limitation in the subsequent years. The Advisor can only recapture expenses within a given fiscal year for that year’s operating expenses.
Directors’ Fees: Directors who are not affiliated with the Advisor receive compensation from the Funds which are shown on the Statements of Operations. Directors may elect to defer receipt of their fees in accordance with the terms of a Non-Qualified Deferred Compensation Plan. Deferred compensation is included within directors’ fees and expenses in the Statements of Assets and Liabilities.
Note 7 — Distribution Plan
TCW Funds Distributors LLC (“Distributor”), an affiliate of the Advisor and the Funds, serves as the nonexclusive distributor of each class of the Funds’ shares. The Funds have a distribution plan pursuant to Rule 12b-1 under the 1940 Act with respect to the N Class shares of each Fund. Under the terms of the plan, each Fund compensates the Distributor at a rate equal to 0.25% of the average daily net assets of the Fund attributable to its N Class shares for distribution and related services.
Note 8 — Purchases and Sales of Securities
Investment transactions (excluding short-term investments) for the year ended October 31, 2022 were as follows:
| Purchases at Cost | Sales or Maturity Proceeds | U.S. Government Purchases at Cost | U.S. Government Sales or Maturity Proceeds | |||||||||||||
TCW Developing Markets Equity Fund | $ | 17,826,896 | $ | 18,050,882 | $ | — | $ | — | ||||||||
TCW Emerging Markets Income Fund | 6,244,793,333 | 7,803,967,525 | — | — | ||||||||||||
TCW Emerging Markets Local Currency Income Fund | 216,952,171 | 264,464,666 | — | — | ||||||||||||
TCW Emerging Markets Multi-Asset Opportunities Fund | 134,155,076 | 152,317,935 | — | — | ||||||||||||
Note 9 — Capital Share Transactions
Transactions in each Fund’s shares were as follows:
| TCW Developing Markets Equity Fund | Year Ended October 31, 2022 | Year Ended October 31, 2021 | ||||||||||||||
| I Class | Shares | Amount | Shares | Amount | ||||||||||||
Shares Sold | 72 | $ | 549 | 1,862 | $ | 27,500 | ||||||||||
Shares Issued upon Reinvestment of Dividends | 25,395 | 313,375 | 459 | 6,004 | ||||||||||||
Shares Redeemed | (951 | ) | (12,860 | ) | — | — | ||||||||||
|
|
|
|
|
|
|
| |||||||||
Net Increase | 24,516 | $ | 301,064 | 2,321 | $ | 33,504 | ||||||||||
|
|
|
|
|
|
|
| |||||||||
| N Class | Shares | Amount | Shares | Amount | ||||||||||||
Shares Sold | 180 | $ | 1,944 | 7,241 | $ | 106,426 | ||||||||||
Shares Issued upon Reinvestment of Dividends | 11,044 | 136,285 | 192 | 2,515 | ||||||||||||
Shares Redeemed | (7,152 | ) | (84,848 | ) | (576 | ) | (7,993 | ) | ||||||||
|
|
|
|
|
|
|
| |||||||||
Net Increase | 4,072 | $ | 53,381 | 6,857 | $ | 100,948 | ||||||||||
|
|
|
|
|
|
|
| |||||||||
67
Table of Contents
TCW Funds, Inc.
Notes to Financial Statements (Continued)
Note 9 — Capital Share Transactions (Continued)
| TCW Emerging Markets Income Fund | Year Ended October 31, 2022 | Year Ended October 31, 2021 | ||||||||||||||
| I Class | Shares | Amount | Shares | Amount | ||||||||||||
Shares Sold | 216,629,505 | $ | 1,474,180,966 | 254,514,594 | $ | 2,100,119,594 | ||||||||||
Shares Issued upon Reinvestment of Dividends | 19,244,065 | 132,388,695 | 23,224,316 | 190,016,307 | ||||||||||||
Shares Redeemed | (394,714,567 | ) | (2,682,553,501 | ) | (418,769,744 | ) | (3,426,430,178 | ) | ||||||||
|
|
|
|
|
|
|
| |||||||||
Net Decrease | (158,840,997 | ) | $ | (1,075,983,840 | ) | (141,030,834 | ) | $ | (1,136,294,277 | ) | ||||||
|
|
|
|
|
|
|
| |||||||||
| N Class | Shares | Amount | Shares | Amount | ||||||||||||
Shares Sold | 21,222,788 | $ | 186,846,363 | 36,286,835 | $ | 382,971,050 | ||||||||||
Shares Issued upon Reinvestment of Dividends | 2,509,111 | 22,043,204 | 1,636,920 | 17,253,734 | ||||||||||||
Shares Redeemed | (24,289,272 | ) | (209,179,236 | ) | (9,637,238 | ) | (102,074,729 | ) | ||||||||
|
|
|
|
|
|
|
| |||||||||
Net Increase (Decrease) | (557,373 | ) | $ | (289,669 | ) | 28,286,517 | $ | 298,150,055 | ||||||||
|
|
|
|
|
|
|
| |||||||||
| Plan Class | Shares | Amount | Shares | Amount | ||||||||||||
Shares Sold | 51,708,975 | $ | 353,620,135 | 236,700,946 | $ | 1,937,124,302 | ||||||||||
Shares Issued upon Reinvestment of Dividends | 4,639,507 | 31,452,790 | 3,381,925 | 27,630,384 | ||||||||||||
Shares Redeemed | (127,362,071 | ) | (873,459,638 | ) | (47,977,217 | ) | (390,834,909 | ) | ||||||||
|
|
|
|
|
|
|
| |||||||||
Net Increase (Decrease) | (71,013,589 | ) | $ | (488,386,713 | ) | 192,105,654 | $ | 1,573,919,777 | ||||||||
|
|
|
|
|
|
|
| |||||||||
| TCW Emerging Markets Local Currency Income Fund | Year Ended October 31, 2022 | Year Ended October 31, 2021 | ||||||||||||||
| I Class | Shares | Amount | Shares | Amount | ||||||||||||
Shares Sold | 4,953,513 | $ | 38,450,053 | 8,138,840 | $ | 73,470,198 | ||||||||||
Shares Issued upon Reinvestment of Dividends | 709,095 | 5,526,890 | 537,045 | 4,790,678 | ||||||||||||
Shares Redeemed | (13,661,596 | ) | (102,746,615 | ) | (7,538,724 | ) | (67,397,358 | ) | ||||||||
|
|
|
|
|
|
|
| |||||||||
Net Increase (Decrease) | (7,998,988 | ) | $ | (58,769,672 | ) | 1,137,161 | $ | 10,863,518 | ||||||||
|
|
|
|
|
|
|
| |||||||||
| N Class | Shares | Amount | Shares | Amount | ||||||||||||
Shares Sold | 5,205,699 | $ | 37,181,265 | 2,843,918 | $ | 25,653,168 | ||||||||||
Shares Issued upon Reinvestment of Dividends | 175,441 | 1,344,419 | 88,058 | 782,686 | ||||||||||||
Shares Redeemed | (3,936,505 | ) | (28,238,990 | ) | (1,212,557 | ) | (10,920,464 | ) | ||||||||
|
|
|
|
|
|
|
| |||||||||
Net Increase | 1,444,635 | $ | 10,286,694 | 1,719,419 | $ | 15,515,390 | ||||||||||
|
|
|
|
|
|
|
| |||||||||
| TCW Emerging Markets Multi-Asset Opportunities Fund | Year Ended October 31, 2022 | Year Ended October 31, 2021 | ||||||||||||||
| I Class | Shares | Amount | Shares | Amount | ||||||||||||
Shares Sold | 59,544 | $ | 714,288 | 378,772 | $ | 5,137,434 | ||||||||||
Shares Issued upon Reinvestment of Dividends | 297,095 | 3,618,611 | 94,826 | 1,236,530 | ||||||||||||
Shares Redeemed | (1,831,153 | ) | (18,580,546 | ) | (1,789,062 | ) | (24,158,874 | ) | ||||||||
|
|
|
|
|
|
|
| |||||||||
Net Decrease | (1,474,514 | ) | $ | (14,247,647 | ) | (1,315,464 | ) | $ | (17,784,910 | ) | ||||||
|
|
|
|
|
|
|
| |||||||||
| N Class | Shares | Amount | Shares | Amount | ||||||||||||
Shares Sold | 22,044 | $ | 235,131 | 151,065 | $ | 2,009,132 | ||||||||||
Shares Issued upon Reinvestment of Dividends | 28,325 | 343,298 | 8,747 | 113,452 | ||||||||||||
Shares Redeemed | (156,631 | ) | (1,649,173 | ) | (323,857 | ) | (4,297,517 | ) | ||||||||
|
|
|
|
|
|
|
| |||||||||
Net Decrease | (106,262 | ) | $ | (1,070,744 | ) | (164,045 | ) | $ | (2,174,933 | ) | ||||||
|
|
|
|
|
|
|
| |||||||||
Note 10 — Affiliate Ownership
As of October 31, 2022, affiliates of the Funds and Advisor owned 99.18% and 13.21% of the net assets of the TCW Developing Markets Equity Fund and the TCW Emerging Markets Multi-Asset Opportunities Fund, respectively.
68
Table of Contents
TCW Funds, Inc.
October 31, 2022
Note 11 — Restricted Securities
The Funds are permitted to invest in securities that have legal or contractual restrictions on resale. These securities may be sold privately, but are required to be registered before being sold to the public (exemption rules apply). Private placement securities are generally considered to be restricted except for those securities traded between qualified institutional investors under the provisions of Rule 144A of the Securities Act of 1933, as amended (the “Securities Act”). However, the Company considers 144A securities to be restricted if those securities have been deemed illiquid. Disposal of these securities may involve time-consuming negotiations and expense, and prompt sale at an acceptable price may be difficult. There were no restricted securities held by the Funds at October 31, 2022.
Note 12 — Committed Line of Credit
The Funds have entered into a $100,000,000 committed revolving line of credit agreement with State Street Bank and Trust Company (the “Bank”) for temporary borrowing purposes, renewable annually. The interest rate on borrowing is the higher of the Federal Funds rate plus 0.10% plus 1.25% or the Overnight Bank Funding rate plus 0.10% plus 1.25%. There were no borrowings from the line of credit as of or during the year ended October 31, 2022. The Funds pay the Bank a commitment fee equal to 0.25% per annum on the daily unused portion of the committed line amount. The commitment fees incurred by the Funds are presented in the Statements of Operations. The commitment fees are allocated to each applicable portfolio in proportion to its relative average daily net assets and the interest expenses are charged directly to the applicable portfolio.
Note 13 — Indemnifications
Under the Company’s organizational documents, its Officers and Directors may be indemnified against certain liabilities and expenses arising out of the performance of their duties to the Company. In addition, the Company entered into an agreement with each of the Directors which provides that the Company will indemnify and hold harmless each Director against any expenses actually and reasonably incurred by such Director in any proceeding arising out of or in connection with the Director’s services to the Company, to the fullest extent permitted by the Company’s Articles of Incorporation and By-Laws, the Maryland General Corporation Law, the Securities Act, and the 1940 Act, each as now or hereinafter in force. Additionally, in the normal course of business, the Company enters into agreements with service providers that may contain indemnification clauses. The Company’s maximum exposure under these arrangements is unknown as this would involve future claims that may be made against the Company that have not yet occurred. However, based on experience, the Company expects the risk of loss to be remote. The Company has not accrued any liability in connection with such indemnification.
Note 14 — New Accounting Pronouncements
In January 2021, the Financial Accounting Standards Board issued Accounting Standards Update No. 2021-01 (“ASU 2021-01”), “Reference Rate Reform (Topic 848).” ASU 2021-01 is an update of ASU 2020-04, which is in response to concerns about structural risks of interbank offered rates, and particularly the risk of cessation of LIBOR; regulators have undertaken reference rate reform initiatives to identify alternative reference rates that are more observable or transaction based and less susceptible to manipulation. ASU 2020-04 provides optional guidance for a limited period of time to ease the potential burden in accounting for (or recognizing the effects of) reference rate reform on financial reporting. ASU 2020-04 is elective and applies to all entities, subject to meeting certain criteria, that have contracts, hedging relationships, and other transactions that reference LIBOR or another reference rate expected to be discontinued because of
69
Table of Contents
TCW Funds, Inc.
Notes to Financial Statements (Continued)
Note 14 — New Accounting Pronouncements (Continued)
reference rate reform. The ASU 2021-01 update clarifies that certain optional expedients and exceptions in Topic 848 for contract modifications and hedge accounting apply to derivatives that are affected by the discounting transition. The amendments in this update are effective immediately through December 31, 2022, for all entities. Management is currently evaluating the implications, if any, of the additional requirements and its impact on the Funds’ financial statements.
In June 2022, the FASB issued ASU No. 2022-03, “Fair Value Measurement of Equity Securities Subject to Contractual Sale Restrictions” (“ASU 2022-03”). ASU 2022-03 (1) clarifies the guidance in ASC 820 on the fair value measurement of an equity security that is subject to a contractual sale restriction and (2) requires specific disclosures related to such an equity security. ASU 2022-03 is effective for fiscal years beginning after December 15, 2023 and interim periods within that fiscal year, with early adoption permitted. We are currently evaluating the impact of the adoption of ASU 2022-03 on our consolidated financial statements.
70
Table of Contents
TCW Developing Markets Equity Fund
Financial Highlights — I Class
| Year Ended October 31, | ||||||||||||||||||||
| 2022 | 2021 | 2020 | 2019 | 2018 | ||||||||||||||||
Net Asset Value per Share, Beginning of year | $ | 14.02 | $ | 11.86 | $ | 10.14 | $ | 9.39 | $ | 11.17 | ||||||||||
|
|
|
|
|
|
|
|
|
| |||||||||||
Income (Loss) from Investment Operations: |
| |||||||||||||||||||
Net Investment Income (1) | 0.26 | 0.08 | 0.02 | 0.10 | 0.06 | |||||||||||||||
Net Realized and Unrealized Gain (Loss) on Investments | (6.02 | ) | 2.10 | 1.79 | 0.69 | (1.78 | ) | |||||||||||||
|
|
|
|
|
|
|
|
|
| |||||||||||
Total from Investment Operations | (5.76 | ) | 2.18 | 1.81 | 0.79 | (1.72 | ) | |||||||||||||
|
|
|
|
|
|
|
|
|
| |||||||||||
Less Distributions: |
| |||||||||||||||||||
Distributions from Net Investment Income | (0.53 | ) | (0.02 | ) | (0.09 | ) | (0.04 | ) | (0.06 | ) | ||||||||||
Distributions from Net Realized Gain | (0.33 | ) | — | — | — | — | ||||||||||||||
|
|
|
|
|
|
|
|
|
| |||||||||||
Total Distributions | (0.86 | ) | (0.02 | ) | (0.09 | ) | (0.04 | ) | (0.06 | ) | ||||||||||
|
|
|
|
|
|
|
|
|
| |||||||||||
Net Asset Value per Share, End of year | $ | 7.40 | $ | 14.02 | $ | 11.86 | $ | 10.14 | $ | 9.39 | ||||||||||
|
|
|
|
|
|
|
|
|
| |||||||||||
Total Return | (43.40 | )% | 18.36 | % | 17.90 | % | 8.46 | % | (15.51 | )% | ||||||||||
Ratios/Supplemental Data: |
| |||||||||||||||||||
Net Assets, End of year (in thousands) | $ | 2,893 | $ | 5,133 | $ | 4,314 | $ | 4,071 | $ | 3,750 | ||||||||||
Ratio of Expenses to Average Net Assets: |
| |||||||||||||||||||
Before Expense Reimbursement | 4.39 | % | 3.57 | % | 4.06 | % | 4.88 | % | 3.45 | % | ||||||||||
After Expense Reimbursement | 0.95 | % | 1.04 | % | 1.25 | % | 1.25 | % | 1.25 | % | ||||||||||
Ratio of Net Investment Income to Average Net Assets | 2.56 | % | 0.57 | % | 0.15 | % | 1.03 | % | 0.49 | % | ||||||||||
Portfolio Turnover Rate | 333.47 | % | 175.10 | % | 148.22 | % | 207.48 | % | 163.33 | % | ||||||||||
| (1) | Computed using average shares outstanding throughout the period. |
See accompanying Notes to Financial Statements.
71
Table of Contents
TCW Developing Markets Equity Fund
Financial Highlights — N Class
| Year Ended October 31, | ||||||||||||||||||||
| 2022 | 2021 | 2020 | 2019 | 2018 | ||||||||||||||||
Net Asset Value per Share, Beginning of year | $ | 14.00 | $ | 11.85 | $ | 10.14 | $ | 9.39 | $ | 11.17 | ||||||||||
|
|
|
|
|
|
|
|
|
| |||||||||||
Income (Loss) from Investment Operations: |
| |||||||||||||||||||
Net Investment Income (1) | 0.24 | 0.06 | 0.02 | 0.10 | 0.06 | |||||||||||||||
Net Realized and Unrealized Gain (Loss) on Investments | (5.95 | ) | 2.11 | 1.78 | 0.69 | (1.78 | ) | |||||||||||||
|
|
|
|
|
|
|
|
|
| |||||||||||
Total from Investment Operations | (5.71 | ) | 2.17 | 1.80 | 0.79 | (1.72 | ) | |||||||||||||
|
|
|
|
|
|
|
|
|
| |||||||||||
Less Distributions: |
| |||||||||||||||||||
Distributions from Net Investment Income | (0.51 | ) | (0.02 | ) | (0.09 | ) | (0.04 | ) | (0.06 | ) | ||||||||||
Distributions from Net Realized Gain | (0.33 | ) | — | — | — | — | ||||||||||||||
|
|
|
|
|
|
|
|
|
| |||||||||||
Total Distributions | (0.84 | ) | (0.02 | ) | (0.09 | ) | (0.04 | ) | (0.06 | ) | ||||||||||
|
|
|
|
|
|
|
|
|
| |||||||||||
Net Asset Value per Share, End of year | $ | 7.45 | $ | 14.00 | $ | 11.85 | $ | 10.14 | $ | 9.39 | ||||||||||
|
|
|
|
|
|
|
|
|
| |||||||||||
Total Return | (43.10 | )% | 18.29 | % | 17.80 | % | 8.46 | % | (15.51 | )% | ||||||||||
Ratios/Supplemental Data: |
| |||||||||||||||||||
Net Assets, End of year (in thousands) | $ | 1,250 | $ | 2,293 | $ | 1,861 | $ | 1,575 | $ | 1,468 | ||||||||||
Ratio of Expenses to Average Net Assets: |
| |||||||||||||||||||
Before Expense Reimbursement | 5.41 | % | 4.39 | % | 5.17 | % | 6.11 | % | 4.51 | % | ||||||||||
After Expense Reimbursement | 1.15 | % | 1.18 | % | 1.25 | % | 1.25 | % | 1.25 | % | ||||||||||
Ratio of Net Investment Income to Average Net Assets | 2.35 | % | 0.45 | % | 0.16 | % | 1.03 | % | 0.49 | % | ||||||||||
Portfolio Turnover Rate | 333.47 | % | 175.10 | % | 148.22 | % | 207.48 | % | 163.33 | % | ||||||||||
| (1) | Computed using average shares outstanding throughout the period. |
See accompanying Notes to Financial Statements.
72
Table of Contents
TCW Emerging Markets Income Fund
Financial Highlights — I Class
| Year Ended October 31, | ||||||||||||||||||||
| 2022 | 2021 | 2020 | 2019 | 2018 | ||||||||||||||||
Net Asset Value per Share, Beginning of year | $ | 7.87 | $ | 7.93 | $ | 8.33 | $ | 7.77 | $ | 8.54 | ||||||||||
|
|
|
|
|
|
|
|
|
| |||||||||||
Income (Loss) from Investment Operations: |
| |||||||||||||||||||
Net Investment Income (1) | 0.33 | 0.35 | 0.39 | 0.46 | 0.43 | |||||||||||||||
Net Realized and Unrealized Gain (Loss) on Investments | (2.22 | ) | (0.02 | ) | (0.46 | ) | 0.54 | (0.83 | ) | |||||||||||
|
|
|
|
|
|
|
|
|
| |||||||||||
Total from Investment Operations | (1.89 | ) | 0.33 | (0.07 | ) | 1.00 | (0.40 | ) | ||||||||||||
|
|
|
|
|
|
|
|
|
| |||||||||||
Less Distributions: |
| |||||||||||||||||||
Distributions from Net Investment Income | (0.28 | ) | (0.37 | ) | (0.33 | ) | (0.44 | ) | (0.37 | ) | ||||||||||
Distributions from Return of Capital | (0.03 | ) | (0.02 | ) | — | — | — | |||||||||||||
|
|
|
|
|
|
|
|
|
| |||||||||||
Total Distributions | (0.31 | ) | (0.39 | ) | (0.33 | ) | (0.44 | ) | (0.37 | ) | ||||||||||
|
|
|
|
|
|
|
|
|
| |||||||||||
Net Asset Value per Share, End of year | $ | 5.67 | $ | 7.87 | $ | 7.93 | $ | 8.33 | $ | 7.77 | ||||||||||
|
|
|
|
|
|
|
|
|
| |||||||||||
Total Return | (24.47 | )% | 4.04 | % | (0.69 | )% | 13.13 | % | (4.85 | )% | ||||||||||
Ratios/Supplemental Data: |
| |||||||||||||||||||
Net Assets, End of year (in thousands) | $ | 2,500,689 | $ | 4,720,489 | $ | 5,877,348 | $ | 5,668,552 | $ | 4,365,456 | ||||||||||
Ratio of Expenses to Average Net Assets: |
| |||||||||||||||||||
Before Expense Reimbursement | 0.90 | % | 0.85 | % | 0.85 | % | 0.84 | % | 0.86 | % | ||||||||||
After Expense Reimbursement | 0.85 | % | N/A | N/A | N/A | N/A | ||||||||||||||
Ratio of Net Investment Income to Average Net Assets | 4.79 | % | 4.23 | % | 4.95 | % | 5.62 | % | 5.33 | % | ||||||||||
Portfolio Turnover Rate | 119.10 | % | 150.31 | % | 135.46 | % | 136.47 | % | 149.50 | % | ||||||||||
| (1) | Computed using average shares outstanding throughout the period. |
See accompanying Notes to Financial Statements.
73
Table of Contents
TCW Emerging Markets Income Fund
Financial Highlights — N Class
| Year Ended October 31, | ||||||||||||||||||||
| 2022 | 2021 | 2020 | 2019 | 2018 | ||||||||||||||||
Net Asset Value per Share, Beginning of year | $ | 10.16 | $ | 10.23 | $ | 10.72 | $ | 10.00 | $ | 11.00 | ||||||||||
|
|
|
|
|
|
|
|
|
| |||||||||||
Income (Loss) from Investment Operations: |
| |||||||||||||||||||
Net Investment Income (1) | 0.41 | 0.44 | 0.49 | 0.57 | 0.53 | |||||||||||||||
Net Realized and Unrealized Gain (Loss) on Investments | (2.86 | ) | (0.03 | ) | (0.57 | ) | 0.69 | (1.08 | ) | |||||||||||
|
|
|
|
|
|
|
|
|
| |||||||||||
Total from Investment Operations | (2.45 | ) | 0.41 | (0.08 | ) | 1.26 | (0.55 | ) | ||||||||||||
|
|
|
|
|
|
|
|
|
| |||||||||||
Less Distributions: |
| |||||||||||||||||||
Distributions from Net Investment Income | (0.36 | ) | (0.46 | ) | (0.41 | ) | (0.54 | ) | (0.45 | ) | ||||||||||
Distributions from Return of Capital | (0.03 | ) | (0.02 | ) | — | — | — | |||||||||||||
|
|
|
|
|
|
|
|
|
| |||||||||||
Total Distributions | (0.39 | ) | (0.48 | ) | (0.41 | ) | (0.54 | ) | (0.45 | ) | ||||||||||
|
|
|
|
|
|
|
|
|
| |||||||||||
Net Asset Value per Share, End of year | $ | 7.32 | $ | 10.16 | $ | 10.23 | $ | 10.72 | $ | 10.00 | ||||||||||
|
|
|
|
|
|
|
|
|
| |||||||||||
Total Return | (24.57 | )% | 3.97 | % | (0.69 | )% | 12.85 | % | (5.16 | )% | ||||||||||
Ratios/Supplemental Data: |
| |||||||||||||||||||
Net Assets, End of year (in thousands) | $ | 390,155 | $ | 546,887 | $ | 261,520 | $ | 320,492 | $ | 342,660 | ||||||||||
Ratio of Expenses to Average Net Assets: |
| |||||||||||||||||||
Before Expense Reimbursement | 1.17 | % | 1.13 | % | 1.14 | % | 1.14 | % | 1.16 | % | ||||||||||
After Expense Reimbursement | 0.95 | % | 0.95 | % | 0.98 | % | 1.05 | % | 1.10 | % | ||||||||||
Ratio of Net Investment Income to Average Net Assets | 4.72 | % | 4.20 | % | 4.82 | % | 5.41 | % | 5.03 | % | ||||||||||
Portfolio Turnover Rate | 119.10 | % | 150.31 | % | 135.46 | % | 136.47 | % | 149.50 | % | ||||||||||
| (1) | Computed using average shares outstanding throughout the period. |
See accompanying Notes to Financial Statements.
74
Table of Contents
TCW Emerging Markets Income Fund
Financial Highlights — Plan Class
| Year Ended October 31, | March 2, 2020 (Commencement of Operations) through October 31, 2020 | |||||||||||
| 2022 | 2021 | |||||||||||
Net Asset Value per Share, Beginning of year | $ | 7.86 | $ | 7.93 | $ | 8.34 | ||||||
|
|
|
|
|
| |||||||
Income (Loss) from Investment Operations: |
| |||||||||||
Net Investment Income (1) | 0.33 | 0.36 | 0.26 | |||||||||
Net Realized and Unrealized Loss on Investments | (2.20 | ) | (0.04 | ) | (0.48 | ) | ||||||
|
|
|
|
|
| |||||||
Total from Investment Operations | (1.87 | ) | 0.32 | (0.22 | ) | |||||||
|
|
|
|
|
| |||||||
Less Distributions: |
| |||||||||||
Distributions from Net Investment Income | (0.29 | ) | (0.37 | ) | (0.19 | ) | ||||||
Distributions from Return of Capital | (0.03 | ) | (0.02 | ) | — | |||||||
|
|
|
|
|
| |||||||
Total Distributions | (0.32 | ) | (0.39 | ) | (0.19 | ) | ||||||
|
|
|
|
|
| |||||||
Net Asset Value per Share, End of year | $ | 5.67 | $ | 7.86 | $ | 7.93 | ||||||
|
|
|
|
|
| |||||||
Total Return | (24.41 | )% | 4.12 | % | (2.59 | )% (2) | ||||||
Ratios/Supplemental Data: |
| |||||||||||
Net assets, end of year (in thousands) | $ | 1,035,971 | $ | 1,996,103 | $ | 489,106 | ||||||
Ratio of Expenses to Average Net Assets: |
| |||||||||||
Before Expense Reimbursement | 0.81 | % | 0.80 | % | 0.79 | % (3) | ||||||
After Expense Reimbursement | 0.77 | % | 0.77 | % | 0.77 | % (3) | ||||||
Ratio of Net Investment Income to Average Net Assets | 4.86 | % | 4.43 | % | 4.96 | % (3) | ||||||
Portfolio Turnover Rate | 119.10 | % | 150.31 | % | 135.46 | % (2) | ||||||
| (1) | Computed using average shares outstanding throughout the period. |
| (2) | For the period March 2, 2020 (Commencement of Operations) through October 31, 2020. |
| (3) | Annualized. |
See accompanying Notes to Financial Statements.
75
Table of Contents
TCW Emerging Markets Local Currency Income Fund
Financial Highlights — I Class
| Year Ended October 31, | ||||||||||||||||||||
| 2022 | 2021 | 2020 | 2019 | 2018 | ||||||||||||||||
Net Asset Value per Share, Beginning of year | $ | 8.47 | $ | 8.57 | $ | 9.17 | $ | 8.14 | $ | 9.30 | ||||||||||
|
|
|
|
|
|
|
|
|
| |||||||||||
Income (Loss) from Investment Operations: |
| |||||||||||||||||||
Net Investment Income (1) | 0.35 | 0.37 | 0.42 | 0.58 | 0.53 | |||||||||||||||
Net Realized and Unrealized Gain (Loss) on Investments | (2.06 | ) | (0.25 | ) | (0.89 | ) | 0.57 | (1.19 | ) | |||||||||||
|
|
|
|
|
|
|
|
|
| |||||||||||
Total from Investment Operations | (1.71 | ) | 0.12 | (0.47 | ) | 1.15 | (0.66 | ) | ||||||||||||
|
|
|
|
|
|
|
|
|
| |||||||||||
Less Distributions: |
| |||||||||||||||||||
Distributions from Net Investment Income | (0.10 | ) | (0.22 | ) | (0.09 | ) | (0.12 | ) | (0.23 | ) | ||||||||||
Distributions from Return of Capital | (0.16 | ) | — | (0.04 | ) | — | (0.27 | ) | ||||||||||||
|
|
|
|
|
|
|
|
|
| |||||||||||
Total Distributions | (0.26 | ) | (0.22 | ) | (0.13 | ) | (0.12 | ) | (0.50 | ) | ||||||||||
|
|
|
|
|
|
|
|
|
| |||||||||||
Net Asset Value per Share, End of year | $ | 6.50 | $ | 8.47 | $ | 8.57 | $ | 9.17 | $ | 8.14 | ||||||||||
|
|
|
|
|
|
|
|
|
| |||||||||||
Total Return | (20.57 | )% | 1.34 | % | (5.26 | )% | 14.26 | % | (7.74 | )% | ||||||||||
Ratios/Supplemental Data: |
| |||||||||||||||||||
Net Assets, End of year (in thousands) | $ | 101,530 | $ | 200,019 | $ | 192,679 | $ | 220,968 | $ | 264,754 | ||||||||||
Ratio of Expenses to Average Net Assets: |
| |||||||||||||||||||
Before Expense Reimbursement | 1.02 | % | 0.96 | % | 0.97 | % | 1.03 | % | 0.95 | % | ||||||||||
After Expense Reimbursement | 0.85 | % | 0.85 | % | 0.85 | % | 0.88 | % | 0.00 | % | ||||||||||
Ratio of Net Investment Income to Average Net Assets | 4.65 | % | 4.14 | % | 4.90 | % | 6.66 | % | 5.90 | % | ||||||||||
Portfolio Turnover Rate | 122.49 | % | 117.18 | % | 135.99 | % | 127.74 | % | 185.72 | % | ||||||||||
| (1) | Computed using average shares outstanding throughout the period. |
See accompanying Notes to Financial Statements.
76
Table of Contents
TCW Emerging Markets Local Currency Income Fund
Financial Highlights — N Class
| Year Ended October 31, | ||||||||||||||||||||
| 2022 | 2021 | 2020 | 2019 | 2018 | ||||||||||||||||
Net Asset Value per Share, Beginning of year | $ | 8.44 | $ | 8.55 | $ | 9.15 | $ | 8.13 | $ | 9.29 | ||||||||||
|
|
|
|
|
|
|
|
|
| |||||||||||
Income (Loss) from Investment Operations: |
| |||||||||||||||||||
Net Investment Income (1) | 0.34 | 0.36 | 0.42 | 0.57 | 0.51 | |||||||||||||||
Net Realized and Unrealized Gain (Loss) on Investments | (2.04 | ) | (0.25 | ) | (0.89 | ) | 0.57 | (1.17 | ) | |||||||||||
|
|
|
|
|
|
|
|
|
| |||||||||||
Total from Investment Operations | (1.70 | ) | 0.11 | (0.47 | ) | 1.14 | (0.66 | ) | ||||||||||||
|
|
|
|
|
|
|
|
|
| |||||||||||
Less Distributions: |
| |||||||||||||||||||
Distributions from Net Investment Income | (0.10 | ) | (0.22 | ) | (0.09 | ) | (0.12 | ) | (0.23 | ) | ||||||||||
Distributions from Return of Capital | (0.16 | ) | — | (0.04 | ) | — | (0.27 | ) | ||||||||||||
|
|
|
|
|
|
|
|
|
| |||||||||||
Total Distributions | (0.26 | ) | (0.22 | ) | (0.13 | ) | (0.12 | ) | (0.50 | ) | ||||||||||
|
|
|
|
|
|
|
|
|
| |||||||||||
Net Asset Value per Share, End of year | $ | 6.48 | $ | 8.44 | $ | 8.55 | $ | 9.15 | $ | 8.13 | ||||||||||
|
|
|
|
|
|
|
|
|
| |||||||||||
Total Return | (20.66 | )% | 1.30 | % | (5.28 | )% | 14.14 | % | (7.75 | )% | ||||||||||
Ratios/Supplemental Data: |
| |||||||||||||||||||
Net Assets, End of year (in thousands) | $ | 39,709 | $ | 39,546 | $ | 25,329 | $ | 28,011 | $ | 47,664 | ||||||||||
Ratio of Expenses to Average Net Assets: |
| |||||||||||||||||||
Before Expense Reimbursement | 1.38 | % | 1.32 | % | 1.35 | % | 1.40 | % | 1.32 | % | ||||||||||
After Expense Reimbursement | 0.90 | % | 0.90 | % | 0.90 | % | 0.92 | % | 0.99 | % | ||||||||||
Ratio of Net Investment Income to Average Net Assets | 4.64 | % | 4.05 | % | 4.84 | % | 6.63 | % | 5.78 | % | ||||||||||
Portfolio Turnover Rate | 122.49 | % | 117.18 | % | 135.99 | % | 127.74 | % | 185.72 | % | ||||||||||
| (1) | Computed using average shares outstanding throughout the period. |
See accompanying Notes to Financial Statements.
77
Table of Contents
TCW Emerging Markets Multi-Asset Opportunities Fund
Financial Highlights — I Class
| Year Ended October 31, | ||||||||||||||||||||
| 2022 | 2021 | 2020 | 2019 | 2018 | ||||||||||||||||
Net Asset Value per Share, Beginning of year | $ | 13.39 | $ | 12.09 | $ | 11.31 | $ | 10.39 | $ | 11.70 | ||||||||||
|
|
|
|
|
|
|
|
|
| |||||||||||
Income (Loss) from Investment Operations: |
| |||||||||||||||||||
Net Investment Income (1) | 0.36 | 0.22 | 0.22 | 0.38 | 0.25 | |||||||||||||||
Net Realized and Unrealized Gain (Loss) on Investments | (4.80 | ) | 1.26 | 0.93 | 0.69 | (1.30 | ) | |||||||||||||
|
|
|
|
|
|
|
|
|
| |||||||||||
Total from Investment Operations | (4.44 | ) | 1.48 | 1.15 | 1.07 | (1.05 | ) | |||||||||||||
|
|
|
|
|
|
|
|
|
| |||||||||||
Less Distributions: |
| |||||||||||||||||||
Distributions from Net Investment Income | (0.65 | ) | (0.18 | ) | (0.37 | ) | (0.15 | ) | (0.26 | ) | ||||||||||
|
|
|
|
|
|
|
|
|
| |||||||||||
Net Asset Value per Share, End of year | $ | 8.30 | $ | 13.39 | $ | 12.09 | $ | 11.31 | $ | 10.39 | ||||||||||
|
|
|
|
|
|
|
|
|
| |||||||||||
Total Return | (34.64 | )% | 12.30 | % | 10.34 | % | 10.50 | % | (9.23 | )% | ||||||||||
Ratios/Supplemental Data: |
| |||||||||||||||||||
Net Assets, End of year (in thousands) | $ | 34,758 | $ | 75,793 | $ | 84,387 | $ | 87,430 | $ | 43,338 | ||||||||||
Ratio of Expenses to Average Net Assets: |
| |||||||||||||||||||
Before Expense Reimbursement | 1.47 | % | 1.29 | % | 1.28 | % | 1.31 | % | 1.34 | % | ||||||||||
After Expense Reimbursement | 1.00 | % | 1.00 | % | 1.00 | % | 1.02 | % | 1.23 | % | ||||||||||
Ratio of Net Investment Income to Average Net Assets | 3.43 | % | 1.67 | % | 2.01 | % | 3.51 | % | 2.13 | % | ||||||||||
Portfolio Turnover Rate | 234.29 | % | 165.68 | % | 164.55 | % | 188.64 | % | 160.85 | % | ||||||||||
| (1) | Computed using average shares outstanding throughout the period. |
See accompanying Notes to Financial Statements.
78
Table of Contents
TCW Emerging Markets Multi-Asset Opportunities Fund
Financial Highlights — N Class
| Year Ended October 31, | ||||||||||||||||||||
| 2022 | 2021 | 2020 | 2019 | 2018 | ||||||||||||||||
Net Asset Value per Share, Beginning of year | $ | 13.30 | $ | 12.01 | $ | 11.24 | $ | 10.35 | $ | 11.66 | ||||||||||
|
|
|
|
|
|
|
|
|
| |||||||||||
Income (Loss) from Investment Operations: |
| |||||||||||||||||||
Net Investment Income (1) | 0.34 | 0.20 | 0.20 | 0.28 | 0.26 | |||||||||||||||
Net Realized and Unrealized Gain (Loss) on Investments | (4.81 | ) | 1.25 | 0.92 | 0.76 | (1.31 | ) | |||||||||||||
|
|
|
|
|
|
|
|
|
| |||||||||||
Total from Investment Operations | (4.47 | ) | 1.45 | 1.12 | 1.04 | (1.05 | ) | |||||||||||||
|
|
|
|
|
|
|
|
|
| |||||||||||
Less Distributions: |
| |||||||||||||||||||
Distributions from Net Investment Income | (0.62 | ) | (0.16 | ) | (0.35 | ) | (0.15 | ) | (0.26 | ) | ||||||||||
|
|
|
|
|
|
|
|
|
| |||||||||||
Net Asset Value per Share, End of year | $ | 8.21 | $ | 13.30 | $ | 12.01 | $ | 11.24 | $ | 10.35 | ||||||||||
|
|
|
|
|
|
|
|
|
| |||||||||||
Total Return | (35.05 | )% | 12.06 | % | 10.08 | % | 10.25 | % | (9.26 | )% | ||||||||||
Ratios/Supplemental Data: |
| |||||||||||||||||||
Net Assets, End of year (in thousands) | $ | 3,798 | $ | 7,562 | $ | 8,803 | $ | 11,784 | $ | 74,677 | ||||||||||
Ratio of Expenses to Average Net Assets: |
| |||||||||||||||||||
Before Expense Reimbursement | 2.19 | % | 1.83 | % | 1.80 | % | 1.65 | % | 1.67 | % | ||||||||||
After Expense Reimbursement | 1.20 | % | 1.20 | % | 1.20 | % | 1.21 | % | 1.23 | % | ||||||||||
Ratio of Net Investment Income to Average Net Assets | 3.27 | % | 1.47 | % | 1.80 | % | 2.64 | % | 2.25 | % | ||||||||||
Portfolio Turnover Rate | 234.29 | % | 165.68 | % | 164.55 | % | 188.64 | % | 160.85 | % | ||||||||||
| (1) | Computed using average shares outstanding throughout the period. |
See accompanying Notes to Financial Statements.
79
Table of Contents
TCW Funds, Inc.
Report of Independent Registered Public Accounting Firm
To the Board of Directors and Shareholders of
TCW Funds, Inc.
Opinion on the Financial Statements and Financial Highlights
We have audited the accompanying statements of assets and liabilities of TCW Developing Markets Equity Fund, TCW Emerging Markets Income Fund, TCW Emerging Markets Local Currency Income Fund, and TCW Emerging Markets Multi-Asset Opportunities Fund (collectively, the “TCW International Funds”) (four of eighteen funds comprising TCW Funds, Inc.), including the schedules of investments, as of October 31, 2022, and the related statements of operations for the year then ended, the statements of changes in net assets for each of the two years in the period then ended, the financial highlights for each of the five years in the period then ended for the TCW International Funds, and the related notes. In our opinion, the financial statements and financial highlights present fairly, in all material respects, the financial position of each of the respective TCW International Funds as of October 31, 2022, the results of their operations for the year then ended, the changes in its net assets for each of the two years in the period then ended, and the financial highlights for each of the five years in the period then ended for the TCW International Funds, in conformity with accounting principles generally accepted in the United States of America.
Basis for Opinion
These financial statements and financial highlights are the responsibility of the TCW International Funds’ management. Our responsibility is to express an opinion on the TCW International Funds’ financial statements and financial highlights based on our audits. We are a public accounting firm registered with the Public Company Accounting Oversight Board (United States) (PCAOB) and are required to be independent with respect to the TCW International Funds in accordance with the U.S. federal securities laws and the applicable rules and regulations of the Securities and Exchange Commission and the PCAOB.
We conducted our audits in accordance with the standards of the PCAOB. Those standards require that we plan and perform the audits to obtain reasonable assurance about whether the financial statements and financial highlights are free of material misstatement, whether due to error or fraud. The TCW International Funds are not required to have, nor were we engaged to perform, an audit of their internal control over financial reporting. As part of our audits we are required to obtain an understanding of internal control over financial reporting but not for the purpose of expressing an opinion on the effectiveness of the TCW International Funds’ internal control over financial reporting. Accordingly, we express no such opinion.
Our audits included performing procedures to assess the risks of material misstatement of the financial statements and financial highlights, whether due to error or fraud, and performing procedures that respond to those risks. Such procedures included examining, on a test basis, evidence regarding the amounts and disclosures in the financial statements and financial highlights. Our audits also included evaluating the accounting principles used and significant estimates made by management, as well as evaluating the overall presentation of the financial statements and financial highlights. Our procedures included confirmation of securities owned as of October 31, 2022, by correspondence with the custodian and brokers; when replies were not received from brokers, we performed other auditing procedures. We believe that our audits provide a reasonable basis for our opinion.

Los Angeles, California
December 20, 2022
We have served as the auditor of one or more TCW/Metropolitan West Funds investment companies since 1990.
80
Table of Contents
TCW Funds, Inc.
Shareholder Expenses (Unaudited)
As a shareholder of a Fund, you incur ongoing operational costs of the Fund, including management fees and other fund expenses. The following example is intended to help you understand your ongoing costs (in dollars and cents) of investing in a Fund and to compare these costs with the ongoing costs of investing in other funds.
The example is based on an investment of $1,000 invested at the beginning of the period and held for the entire period from May 1, 2022 to October 31, 2022 (184 days).
Actual Expenses: The first line under each Fund in the table below provides information about the actual account values and actual expenses. You may use the information in this line, together with the amount you invested, to estimate the expenses that you paid over the period. Simply divide your account value by $1,000 (for example, an $8,600 account value divided by $1,000 = 8.6), then multiply the result by the number in the first line for your Fund under the heading entitled “Expenses Paid During Period” to estimate the expenses you paid on your account during this period.
Hypothetical Example for Comparison Purposes: The second line under each Fund in the table below provides information about the hypothetical expenses based on each Fund’s actual expense ratio and an assumed rate of return of 5% per year before expenses, which is not the Fund’s actual return. The hypothetical account value and expenses may not be used to estimate the actual ending account balance or expenses you paid for the period. You may use this information to compare the ongoing costs of investing in your Fund and other funds. To do so, compare this 5% hypothetical example with the 5% hypothetical examples that appear in the shareholder reports of the other funds.
TCW Funds, Inc. | Beginning Account Value May 1, 2022 | Ending Account Value October 31, 2022 | Annualized Expense Ratio | Expenses Paid During Period (May 1, 2022 to October 31, 2022) | ||||||||||||
| TCW Developing Markets Equity Fund | ||||||||||||||||
I Class Shares | ||||||||||||||||
Actual | $ | 1,000.00 | $ | 781.90 | 0.95 | % | $ | 4.27 | ||||||||
Hypothetical (5% return before expenses) | 1,000.00 | 1,020.42 | 0.95 | % | 4.84 | |||||||||||
N Class Shares | ||||||||||||||||
Actual | $ | 1,000.00 | $ | 786.90 | 1.15 | % | $ | 5.18 | ||||||||
Hypothetical (5% return before expenses) | 1,000.00 | 1,019.41 | 1.15 | % | 5.85 | |||||||||||
| TCW Emerging Markets Income Fund | ||||||||||||||||
I Class Shares | ||||||||||||||||
Actual | $ | 1,000.00 | $ | 877.90 | 0.85 | % | $ | 4.02 | ||||||||
Hypothetical (5% return before expenses) | 1,000.00 | 1,020.92 | 0.85 | % | 4.33 | |||||||||||
N Class Shares | ||||||||||||||||
Actual | $ | 1,000.00 | $ | 877.90 | 0.95 | % | $ | 4.50 | ||||||||
Hypothetical (5% return before expenses) | 1,000.00 | 1,020.42 | 0.95 | % | 4.84 | |||||||||||
Plan Class Shares | ||||||||||||||||
Actual | $ | 1,000.00 | $ | 879.50 | 0.77 | % | $ | 3.65 | ||||||||
Hypothetical (5% return before expenses) | 1,000.00 | 1,021.30 | 0.77 | % | 3.92 | |||||||||||
81
Table of Contents
TCW Funds, Inc.
Shareholder Expenses (Unaudited) (Continued)
TCW Funds, Inc. | Beginning Account Value May 1, 2022 | Ending Account Value October 31, 2022 | Annualized Expense Ratio | Expenses Paid During Period (May 1, 2022 to October 31, 2022) | ||||||||||||
| TCW Emerging Markets Local Currency Income Fund | ||||||||||||||||
I Class Shares | ||||||||||||||||
Actual | $ | 1,000.00 | $ | 915.40 | 0.85 | % | $ | 4.10 | ||||||||
Hypothetical (5% return before expenses) | 1,000.00 | 1,020.92 | 0.85 | % | 4.33 | |||||||||||
N Class Shares | ||||||||||||||||
Actual | $ | 1,000.00 | $ | 913.70 | 0.90 | % | $ | 4.34 | ||||||||
Hypothetical (5% return before expenses) | 1,000.00 | 1,020.67 | 0.90 | % | 4.58 | |||||||||||
| TCW Emerging Markets Multi-Asset Opportunities Fund | ||||||||||||||||
I Class Shares | ||||||||||||||||
Actual | $ | 1,000.00 | $ | 836.90 | 1.00 | % | $ | 4.63 | ||||||||
Hypothetical (5% return before expenses) | 1,000.00 | 1,020.16 | 1.00 | % | 5.09 | |||||||||||
N Class Shares | ||||||||||||||||
Actual | $ | 1,000.00 | $ | 832.80 | 1.20 | % | $ | 5.54 | ||||||||
Hypothetical (5% return before expenses) | 1,000.00 | 1,019.16 | 1.20 | % | 6.11 | |||||||||||
82
Table of Contents

The TCW Group, Inc. and Subsidiaries
TCW Investment Management Company LLC
TCW Asset Management Company LLC
Metropolitan West Asset Management, LLC
TCW Funds, Inc. TCW Strategic Income Fund, Inc. Metropolitan West Funds Sepulveda Management LLC | TCW Direct Lending LLC TCW Direct Lending VII LLC TCW Direct Lending VIII LLC |
Effective May 2021
WHAT YOU SHOULD KNOW
At TCW, we recognize the importance of keeping information about you secure and confidential. We do not sell or share your nonpublic personal and financial information with marketers or others outside our affiliated group of companies.
We carefully manage information among our affiliated group of companies to safeguard your privacy and to provide you with consistently excellent service.
We are providing this notice to you to comply with the requirements of Regulation S-P, “Privacy of Consumer Financial information,” issued by the United States Securities and Exchange Commission.
OUR PRIVACY POLICY
We, The TCW Group, Inc. and its subsidiaries, the TCW Funds, Inc., TCW Strategic Income Fund, Inc., the Metropolitan West Funds, Sepulveda Management LLC, TCW Direct Lending LLC, TCW Direct Lending VII LLC, and TCW Direct Lending VIII LLC (collectively, “TCW”) are committed to protecting the nonpublic personal and financial information of our customers and consumers who obtain or seek to obtain financial products or services primarily for personal, family or household purposes. We fulfill our commitment by establishing and implementing policies and systems to protect the security and confidentiality of this information.
In our offices, we limit access to nonpublic personal and financial information about you to those TCW personnel who need to know the information in order to provide products or services to you. We maintain physical, electronic, and procedural safeguards to protect your nonpublic personal and financial information.
CATEGORIES OF INFORMATION WE COLLECT
We may collect the following types of nonpublic personal and financial information about you from the following sources:
| ◾ | Your name, address and identifying numbers, and other personal and financial information, from you and from identification cards and papers you submit to us, on applications, subscription agreements or other forms or communications. |
| ◾ | Information about your account balances and financial transactions with us, our affiliated entities, or nonaffiliated third parties, from our internal sources, from affiliated entities and from nonaffiliated third parties. |
| ◾ | Information about your account balances and financial transactions and other personal and financial information, from consumer credit reporting agencies or other nonaffiliated third parties, to verify information received from you or others. |
83
Table of Contents
CATEGORIES OF INFORMATION WE DISCLOSE TO NONAFFILIATED THIRD PARTIES
We may disclose your name, address and account and other identifying numbers, as well as information about your pending or past transactions and other personal financial information, to nonaffiliated third parties, for our everyday business purposes such as necessary to execute, process, service and confirm your securities transactions and mutual fund transactions, to administer and service your account and commingled investment vehicles in which you are invested, to market our products and services through joint marketing arrangements or to respond to court orders and legal investigations.
We may disclose nonpublic personal and financial information concerning you to law enforcement agencies, federal regulatory agencies, self-regulatory organizations or other nonaffiliated third parties, if required or requested to do so by a court order, judicial subpoena or regulatory inquiry.
We do not otherwise disclose your nonpublic personal and financial information to nonaffiliated third parties, except where we believe in good faith that disclosure is required or permitted by law. Because we do not disclose your nonpublic personal and financial information to nonaffiliated third parties, our Customer Privacy Policy does not contain opt-out provisions.
CATEGORIES OF INFORMATION WE DISCLOSE TO OUR AFFILIATED ENTITIES
| ◾ | We may disclose your name, address and account and other identifying numbers, account balances, information about your pending or past transactions and other personal financial information to our affiliated entities for any purpose. |
| ◾ | We regularly disclose your name, address and account and other identifying numbers, account balances and information about your pending or past transactions to our affiliates to execute, process and confirm securities transactions or mutual fund transactions for you, to administer and service your account and commingled investment vehicles in which you are invested, or to market our products and services to you. |
INFORMATION ABOUT FORMER CUSTOMERS
We do not disclose nonpublic personal and financial information about former customers to nonaffiliated third parties unless required or requested to do so by a court order, judicial subpoena or regulatory inquiry, or otherwise where we believe in good faith that disclosure is required or permitted by law.
QUESTIONS
Should you have any questions about our Customer Privacy Policy, please contact us by email or by regular mail at the address at the end of this policy.
REMINDER ABOUT TCW’S FINANCIAL PRODUCTS
Financial products offered by The TCW Group, Inc. and its subsidiaries, the TCW Funds, Inc., TCW Strategic Income Fund, Inc., the Metropolitan West Funds, Sepulveda Management LLC, TCW Direct Lending LLC, TCW Direct Lending VII LLC, and TCW Direct Lending VIII LLC.
| ◾ | Are not guaranteed by a bank; |
| ◾ | Are not obligations of The TCW Group, Inc. or of its subsidiaries; |
| ◾ | Are not insured by the Federal Deposit Insurance Corporation; and |
| ◾ | Are subject to investment risks, including possible loss of the principal amount committed or invested, and earnings thereon. |
THE TCW GROUP, INC. TCW FUNDS, INC. TCW STRATEGIC INCOME FUND, INC. METROPOLITAN WEST FUNDS | SEPULVEDA MANAGEMENT LLC TCW DIRECT LENDING LLC TCW DIRECT LENDING VII LLC TCW DIRECT LENDING VIII LLC |
Attention: Privacy Officer | 865 South Figueroa Street, Suite 1800 | Los Angeles, CA 90017 | email: privacy@tcw.com
84
Table of Contents
TCW Funds, Inc.
Investment Management and Advisory Agreement Disclosure (Unaudited)
Renewal of Investment Advisory and Management Agreement
TCW Funds, Inc. (the “Corporation”) and TCW Investment Management Company LLC (the “Advisor”) are parties to an Investment Advisory and Management Agreement (“Agreement”), pursuant to which the Advisor is responsible for managing the investments of each separate investment series (each, a “Fund” and collectively, the “Funds”) of the Corporation. Unless terminated by either party, the Agreement continues in effect from year to year provided that the continuance is specifically approved at least annually by the vote of the holders of at least a majority of the outstanding shares of the Funds, or by the Board of Directors of the Corporation (the “Board”), and, in either event, by a majority of the Directors who are not “interested persons” of the Corporation, as such term is defined in Section 2(a)(19) of the Investment Company Act of 1940, as amended (the “Independent Directors”), casting votes in person at a meeting called for that purpose.
At an in-person meeting on September 12, 2022, the Board approved the renewal of the Agreement for an additional one-year term from February 6, 2023 through February 5, 2024. The renewal of the Agreement was approved by the Board (including by a majority of the Independent Directors) upon the recommendation of the Independent Directors. The Independent Directors also met by videoconference in a working session on August 24, 2022 to hear presentations by representatives of the Advisor, to ask related questions, to review and discuss materials provided by the Advisor for their consideration, and to meet separately with their independent legal counsel. On September 12, 2022 they also met separately with their independent legal counsel to review and discuss supplemental information that had been requested on their behalf by their independent legal counsel and presented by the Advisor. The information, material facts, and conclusions that formed the basis for the Independent Directors’ recommendation and the Board’s subsequent approval are described below.
1. Information received
Materials reviewed — During the course of each year, the Directors receive a wide variety of materials relating to the services provided by the Advisor, including reports on the Advisor’s investment processes, as well as on each Fund’s investment results, portfolio composition, portfolio trading practices, compliance monitoring, shareholder services, and other information relating to the nature, extent, and quality of services provided by the Advisor to the Funds. In addition, the Board reviewed information furnished to the Independent Directors in response to a detailed request sent to the Advisor on their behalf. The information in the Advisor’s responses included extensive materials regarding each Fund’s investment results, advisory fee comparisons to advisory fees charged by the Advisor to its institutional clients, financial and profitability information regarding the Advisor, descriptions of various services provided to the Funds and to other advisory and sub-advisory clients, descriptions of functions such as compliance monitoring and portfolio trading practices, and information about the personnel providing investment management services to each Fund. The Directors also considered information provided by an independent data provider, Broadridge, comparing the investment performance and the fee and expense levels of each Fund to those of appropriate peer groups of mutual funds selected by Broadridge. After reviewing this information, the Directors requested additional financial, profitability and service information from the Advisor, which the Advisor provided and the Directors considered.
Review process — The Directors’ determinations were made on the basis of each Director’s business judgment after consideration of all the information presented. The Independent Directors were advised by their independent legal counsel throughout the renewal process and received and reviewed advice from
85
Table of Contents
TCW Funds, Inc.
Investment Management and Advisory Agreement Disclosure (Unaudited) (Continued)
their independent legal counsel regarding legal and industry standards applicable to the renewal of the Agreement, including a legal memorandum from their independent legal counsel discussing their fiduciary duties related to their approval of the continuation of the Agreement. The Independent Directors also discussed the renewal of the Agreement with the Advisor’s representatives and in private sessions at which no representatives of the Advisor were present. In deciding to recommend the renewal of the Agreement with respect to each Fund, the Independent Directors did not identify any single piece of information or particular factor that, in isolation, was the controlling factor. Each Independent Director may also have weighed factors differently. This summary describes the most important, but not all, of the factors considered by the Board and the Independent Directors.
2. Nature, extent, and quality of services provided by the Advisor
The Board and the Independent Directors considered the depth and quality of the Advisor’s investment management process, including its research and strong analytical capabilities; the experience, capability, and integrity of its senior management and other personnel; the continuity in management of client assets; the overall resources available to the Advisor; and the ability of its organizational structure to address the fluctuations in assets that have been experienced over the past several years. The Board and the Independent Directors considered the Advisor’s continued commitment and ability to attract and retain well-qualified investment professionals, noting in particular the Advisor’s hiring of professionals in various areas over the past several years, continued upgrading of resources in its middle office and back office operations and other areas, as well as a continuing and extensive program of infrastructure and systems enhancements, including business continuity and cyber security, as well as budgeting for certain future initiatives. The Board and the Independent Directors also considered that the Advisor made available to its investment professionals a variety of resources and systems relating to investment management, compliance, trading, operations, administration, research, portfolio accounting, and legal matters. They noted the substantial additional resources made available by The TCW Group, Inc., the parent company of the Advisor. The Board and the Independent Directors examined and discussed a detailed description of the extensive additional services provided to the Funds to support their operations and compliance, as compared to the much narrower range of services provided to the Advisor’s institutional and sub-advised clients, as well as the Advisor’s oversight and coordination of numerous outside service providers to the Funds. They further noted the high level of regular communication between the Advisor and the Independent Directors. The Advisor explained its responsibility to supervise the activities of the Funds’ various service providers, as well as supporting the Independent Directors and their meetings, regulatory filings, and various operational personnel, and the related costs.
The Board and the Independent Directors concluded that the nature, extent, and quality of the services provided by the Advisor are of a high quality and have benefited and should continue to benefit the Funds and their shareholders.
3. Investment results
The Board and the Independent Directors considered the investment results of each Fund in light of its investment objective(s) and principal investment strategies. They compared each Fund’s total returns with the total returns of other mutual funds in peer group reports prepared by Broadridge with respect to various longer and more recent periods all ended May 31, 2022. The Board and the Independent Directors reviewed information as to peer group selections presented by Broadridge and discussed the methodology for those selections with Broadridge. In reviewing each Fund’s relative performance, the Board and the
86
Table of Contents
TCW Funds, Inc.
Independent Directors took into account each Fund’s investment strategies, distinct characteristics, asset size and diversification.
The Board and the Independent Directors noted that most Funds’ performance was satisfactory over the relevant periods. The Board and the Independent Directors noted that the investment performance of most of the Funds was generally close to or above the median performance of the applicable peer group during the three-year period emphasized by Broadridge in the supplemental materials, but six Funds ranked in the fourth or fifth quintile of their peer groups for that three-year period. For those Funds that lagged peer group averages, they noted that the Advisor had discussed with the Board the reasons for the underperformance, including the investment climate and prevailing market conditions during relevant periods as well as the Advisor’s discipline in maintaining a consistent investment style. The Board indicated that it would continue to monitor portfolio investment performance on a regular basis and discuss with the Advisor from time to time any instances of long-term underperformance as appropriate. The Board and the Independent Directors noted that the performance of some Funds for periods when they lagged their peer group averages remained satisfactory when assessed on a risk-adjusted basis because performance quintiles do not necessarily reflect the degree of risk employed by peer funds to achieve their returns. The Board also considered the Advisor’s assessment of the Funds’ performance during the recent period of significant market volatility.
With respect to the fixed income Funds, the Board and the Independent Directors recognized the Advisor’s deliberate strategy to manage risk in light of its critical view of the fixed income securities markets and overall investment market conditions at present and in the near term. For that reason, the Board and the Independent Directors believed that relative performance also should be considered in light of future market conditions expected by the Advisor. The Board and the Independent Directors noted the Advisor’s view that longer term performance can be more meaningful for active fixed income funds than shorter term performance because fixed income market cycles are generally longer than three years.
For the U.S. fixed income Funds, the Board and the Independent Directors noted the conservative profile of these Funds, which generally experienced less volatility compared to various other funds in the applicable peer group (except for the relative volatility of Total Return Bond Fund, which is a mortgage-focused Fund). They also noted the Advisor’s conservative posture for these Funds with respect to credit and interest rate risks.
For the Total Return Bond Fund, the Board and the Independent Directors noted that the Fund’s performance was in the first quintile for the ten-year period, second quintile for the five-year period, third quintile for the three-year period and fifth quintile for the one-year period.
For the Core Fixed Income Fund, the Board and the Independent Directors noted that the Fund’s performance was in the third quintile for the ten-year period, second quintile for the five- and three-year periods and third quintile for the one-year period.
For the High Yield Bond Fund, the Board and the Independent Directors noted that the Fund’s performance was in the first quintile for the ten-, five- and three-year periods and second quintile for the one-year period.
For the Global Bond Fund, the Board and the Independent Directors noted that the Fund’s performance was in the third quintile for the ten-, five- and three-year periods and fourth quintile for the one-year period.
87
Table of Contents
TCW Funds, Inc.
Investment Management and Advisory Agreement Disclosure (Unaudited) (Continued)
For the Short Term Bond Fund, the Board and the Independent Directors noted that the Fund’s performance was in the fourth quintile for the ten-year period, second quintile for the five- and three-year periods and first quintile for the one-year period.
For the Enhanced Commodity Strategy Fund, the Board and the Independent Directors noted that the Fund’s performance was in the second quintile for the ten-, five- and three-year periods and third quintile for the one-year period.
With respect to the U.S. equity Funds, the Board and the Independent Directors noted that the performance of certain of the Funds for most of the various periods reviewed ranked in the first, second or third quintiles, while other Funds ranked in the fourth and fifth quintiles over various periods.
The Select Equities Fund ranked in the fourth quintile for the ten-year period, second quintile for the five-year period and fourth quintile for the three- and one-year periods. The Board and the Independent Directors considered the Advisor’s explanation that underperformance was driven by negative security selection, primarily in the information technology, healthcare and consumer discretionary sectors. The Board and the Independent Directors also considered the Advisor’s explanation that the underperformance for the one-year period was due to a variety of reasons that can be categorized as realized basis risk, which the Advisor believes, measured over longer periods, tends to decline and that the Fund should be positioned for outperformance going forward.
The Relative Value Dividend Appreciation Fund ranked in the third quintile for the ten-year period, fourth quintile for the five-year period, second quintile for the three-year period and fourth quintile for the one-year period. The Relative Value Large Cap Fund ranked in the third quintile for the ten-year period, fourth quintile for the five-year period, third quintile for the three-year period and fifth quintile for the one-year period. The Relative Value Mid Cap Fund ranked in the fourth quintile for the ten- and five-year periods, third quintile for the three-year period and fifth quintile for the one-year period.
The New America Premier Equities Fund ranked in the first quintile for the five-year period, third quintile for the three-year period and second quintile for the one-year period.
The Global Real Estate Fund ranked in the first quintile for the five- and three-year periods and fifth quintile for the one-year period.
The Artificial Intelligence Equity Fund ranked in the fourth quintile for the three- and one-year periods. The Board and the Independent Directors considered the Advisor’s explanation that the peer funds had greater exposure to the information technology sector, making the peer group less useful in comparing relative performance than if those funds’ principal investment strategies were more closely aligned with the Fund’s investment focus. The Board and the Independent Directors noted that the Fund held only modest positions in companies that were key contributors to the competitor funds’ returns. The Board and the Independent Directors also noted the relatively short operating history of the Fund and determined to continue to closely monitor its performance.
For the asset allocation Fund, the Board and the Independent Directors noted that the Conservative Allocation Fund’s performance was in the first quintile for the ten-, five- and three-year periods and fourth quintile for the one-year period.
With respect to the international and emerging markets Funds, the Board and the Independent Directors noted that the performance of a majority of these Funds ranked in the fourth or fifth quintiles over many of the various time periods reviewed. The Emerging Markets Income Fund ranked in the second quintile for
88
Table of Contents
TCW Funds, Inc.
the ten-year period, third quintile for the five-year period and fourth quintile for the three- and one-year periods. The Emerging Markets Local Currency Income Fund ranked in the third quintile for the ten-year period, fourth quintile for the five-year period and the fifth quintile for the three- and one-year periods. The Emerging Markets Multi-Asset Opportunities Fund ranked in the third quintile for the five-year period, the fourth quintile for the three-year period and the third quintile for the one-year period. The Developing Markets Equity Fund ranked in the fifth quintile for the five-year period, fourth quintile for the three-year period and fifth quintile for the one-year period. The Board and the Independent Directors considered the Advisor’s discussion of performance, including that the challenging international and emerging market conditions in recent years weighed on performance for the Funds in line with other funds in the universe.
The Board and the Independent Directors concluded that the Advisor was implementing each Fund’s investment objective(s) and that the Advisor’s record in managing the Funds indicated that its continued management should benefit each Fund and its shareholders over the long term.
4. Advisory fees and total expenses
The Board and the Independent Directors compared the management fees (which Broadridge defines to include the advisory fee and the administrative fee) and total expenses of each Fund (each as a percentage of average net assets) with the median management fee and operating expense level of the other mutual funds in the relevant Broadridge peer groups. These comparisons assisted the Board and the Independent Directors by providing a reasonable statistical measure to assess each Fund’s fees relative to its relevant peers. The Board and the Independent Directors observed that each Fund’s management fee, after giving effect to applicable waivers and/or reimbursements, was below or near the median of the peer group funds on a current basis. It was noted that the Emerging Markets Multi-Asset Opportunities Fund does not have a quintile ranking for management or total expenses because its peer group of three was too small. The Board and the Independent Directors also observed that each Fund’s total expenses, after giving effect to applicable waivers and/or reimbursements, were below or at the median of the peer group funds. The Board and the Independent Directors also noted the contractual expense limitations to which the Advisor has agreed with respect to each Fund and that the Advisor historically has absorbed any expenses in excess of these limits. The Board and the Independent Directors noted that for several Funds, their below-median management fee and total expenses were in part due to substantial waiver and/or reimbursement pursuant to the contractual expense limitations. The Board and the Independent Directors concluded that the competitive fees charged by the Advisor, and competitive expense ratios, should continue to benefit each Fund and its shareholders.
The Board and the Independent Directors also reviewed information regarding the advisory fees charged by the Advisor to its institutional and sub-advisory clients with similar investment mandates. The Board and the Independent Directors concluded that, although the fees paid by those clients generally were lower than advisory fees paid by the Funds, the differences appropriately reflected the more extensive services provided by the Advisor to the Funds and the Advisor’s significantly greater responsibilities and expenses with respect to the Funds, including the additional time spent by portfolio managers for reasons such as managing the more active cash flows from purchases and redemptions by shareholders, the additional risks of managing a pool of assets for public investors, administrative burdens, daily pricing, valuation and liquidity responsibilities, the supervision of vendors and service providers, and the costs of additional infrastructure and operational resources and personnel and of complying with and supporting the more comprehensive regulatory and governance regime applicable to mutual funds.
89
Table of Contents
TCW Funds, Inc.
Investment Management and Advisory Agreement Disclosure (Unaudited) (Continued)
5. The Advisor’s costs, level of profits, and economies of scale
The Board and the Independent Directors reviewed information regarding the Advisor’s costs of providing services to the Funds, as well as the resulting level of profits to the Advisor. They reviewed the Advisor’s stated assumptions and methods of allocating certain costs, such as personnel costs, which constitute the Advisor’s largest operating cost. The Board and the Independent Directors recognized that the Advisor should be entitled to earn a reasonable level of profits for the services that it provides to each Fund. The Board and the Independent Directors also reviewed a comparison of the Advisor’s profitability with respect to the Funds to the profitability of certain unaffiliated publicly traded asset managers, which the Advisor believed supported its view that the Advisor’s profitability was reasonable. Based on their review, the Board and the Independent Directors concluded that they were satisfied that the Advisor’s level of profitability from its relationship with each Fund was not unreasonable or excessive.
The Board and the Independent Directors considered the extent to which potential economies of scale could be realized as the Funds grow and whether the advisory fees reflect those potential economies of scale. They recognized that the advisory fees for the Funds do not have breakpoints, which would otherwise result in lower advisory fee rates as the Funds grow larger. They also recognized the Advisor’s view that the advisory fees compare favorably to peer group fees and expenses and remain competitive even at higher asset levels and that the relatively low advisory fees reflect the potential economies of scale. The Board and the Independent Directors recognized the benefits of the Advisor’s substantial past and ongoing investment in the advisory business, such as successfully recruiting and retaining key professional talent, systems and technology upgrades, added resources dedicated to legal, compliance and cybersecurity programs, and improvements to the overall firm infrastructure, as well as the financial pressures of competing against much larger firms and passive investment products. The Board and the Independent Directors further noted the Advisor’s past and current subsidies of the operating expenses of newer and smaller Funds and the Advisor’s commitment to maintain reasonable overall operating expenses for each Fund. The Board and the Independent Directors also recognized that the Funds benefit from receiving investment advice from an organization with other types of advisory clients in addition to mutual funds. The Board and the Independent Directors considered the risk borne by the Advisor that the Funds’ net assets and thus the Advisor’s fees might decline in the event of redemptions and that smaller Funds might not grow to become profitable. The Board and the Independent Directors concluded that the Advisor was satisfactorily sharing potential economies of scale with the Funds through low fees and expenses, and through reinvesting in its capabilities for serving the Funds and their shareholders.
6. Ancillary benefits
The Board and the Independent Directors also considered ancillary benefits received or to be received by the Advisor and its affiliates as a result of the relationship of the Advisor with the Funds. The Board and the Independent Directors noted that, in addition to the fees the Advisor receives under the Agreement, the Advisor receives additional benefits in connection with management of the Funds in the form of reports, research and other services from brokers and their affiliates in return for brokerage commissions paid to such brokers. The Board and the Independent Directors concluded that any potential benefits received or to be derived by the Advisor from its relationships with the Funds are reasonably related to the services provided by the Advisor to the Funds.
90
Table of Contents
TCW Funds, Inc.
7. Conclusions
Based on their overall review, including their consideration of each of the factors referred to above (and others), the Board and the Independent Directors concluded that the Agreement is fair and reasonable to each Fund and its shareholders, that each Fund’s shareholders received reasonable value in return for the advisory fees and other amounts paid to the Advisor by each Fund, and that the renewal of the Agreement was in the best interests of each Fund and its shareholders.
91
Table of Contents
TCW Funds, Inc.
Proxy Voting Guidelines
The policies and procedures that the Company uses to determine how to vote proxies are available without charge. The Board has delegated the Company’s proxy voting authority to the Advisor.
Disclosure of Proxy Voting Guidelines
The proxy voting guidelines of the Advisor are available:
| 1. | By calling 800-FUND-TCW (800-386-3829) to obtain a hard copy; or |
| 2. | By going to the SEC website at http://www.sec.gov. |
When the Company receives a request for a description of the Advisor’s proxy voting guidelines, it will deliver the description that is disclosed in the Company’s Statement of Additional Information. This information will be sent out via first class mail (or other means designed to ensure equally prompt delivery) within three business days of receiving the request.
The Advisor, on behalf of the Company, prepares and files Form N-PX with the SEC not later than August 31 of each year, which includes the Company’s proxy voting record for the most recent twelve-month period ended June 30 of that year. The Company’s proxy voting record for the most recent twelve-month period ended June 30 is available:
| 1. | By calling 800-FUND-TCW (800-386-3829) to obtain a hard copy; or |
| 2. | By going to the SEC website at http://www.sec.gov. |
When the Company receives a request for the Company’s proxy voting record, it will send the information disclosed in the Company’s most recently filed report on Form N-PX via first class mail (or other means designed to ensure equally prompt delivery) within three business days of receiving the request.
The Company also discloses its proxy voting record on its website as soon as is reasonably practicable after its report on Form N-PX is filed with the SEC.
Availability of Quarterly Portfolio Schedule
The Company files a complete schedule of its portfolio holdings with the SEC for the first and third quarters of its fiscal year on Form NPORT-P. Such filings occur no later than 60 days after the end of the Funds’ first and third quarters and are available on the SEC’s website at www.sec.gov.
92
Table of Contents
TCW Funds, Inc.
Tax Information Notice (Unaudited)
Under Section 854(b)(2) of the Code, the Funds hereby designate the following maximum amounts as qualified dividends for purposes of the maximum rate under Section 1(h)(11) of the Code for the fiscal year ended October 31, 2022:
Fund | Qualified Dividend Income | |||
TCW Developing Markets Equity Fund | $ | 94,421 | ||
TCW Emerging Markets Multi-Asset Opportunities Fund | $ | 560,145 | ||
The following Fund paid foreign taxes during the year ended October 31, 2022 that are available as income tax credits:
Fund | Foreign Tax Credit | |||
TCW Developing Markets Equity Fund | $ | 34,664 | ||
TCW Emerging Markets Local Currency Income Fund | $ | 87,400 | ||
TCW Emerging Markets Multi-Asset Opportunities Fund | $ | 269,033 | ||
This information is given to meet certain requirements of the Code and should not be used by shareholders for preparing their income tax returns. In February 2023, shareholders will receive Form 1099-DIV which will show the actual distribution received and include their share of qualified dividends during the calendar year of 2022. Shareholders are advised to check with their tax advisors for information on the treatment of these amounts on their individual tax returns.
93
Table of Contents
TCW Funds, Inc.
Directors and Officers of the Company
A board of six directors is responsible for overseeing the operations of the Company, which consists of 18 Funds at October 31, 2022. The directors of the Company, and their business addresses and their principal occupation for the last five years are set forth below.
Independent Directors
Name, and Year of Birth (1) | Term of Office and Length of Time Served | Principal Occupation(s) During Past 5 Years | Other Directorships held by Director | |||
| Samuel P. Bell (1936) | Mr. Bell has served as a director of TCW Funds, Inc. since October 2002. | Private Investor. | TCW Strategic Income Fund, Inc. (closed-end fund). | |||
Patrick C. Haden (1953) Chairman of the Board | Mr. Haden has served as a director of TCW Funds, Inc. since May 2001. | President (since 2003), Wilson Ave. Consulting (business consulting firm); Senior Advisor to President (July 2016 – June 2017), University of Southern California. | Auto Club (affiliate of AAA); Metropolitan West Funds (mutual fund); TCW Strategic Income Fund, Inc. (closed end fund). | |||
| Peter McMillan (1957) | Mr. McMillan has served as a director of TCW Funds, Inc. since August 2010. | Co-founder (since 2019), Pacific Oak Capital Advisors (investment advisory firm); Co-founder, Managing Partner and Chief Investment Officer (since May 2013), Temescal Canyon Partners (investment advisory firm); Co-founder and Executive Vice President (2005 – 2019), KBS Capital Advisors (a manager of real estate investment trusts). | Pacific Oak Strategic Opportunity REIT (real estate investments); Keppel Pacific Oak U.S. REIT (real estate investments); Pacific Oak Residential Trust (real estate investments); Metropolitan West Funds (mutual fund); TCW DL VII Financing LLC (private fund): TCW Strategic Income Fund, Inc. (closed-end fund). | |||
| Victoria B. Rogers (1961) | Ms. Rogers has served as a director of the TCW Funds, Inc. since October 2011. | President and Chief Executive Officer (since 1996), The Rose Hills Foundation (charitable foundation). | Norton Simon Museum (art museum); Stanford University (university); Causeway Capital Management Trust (mutual fund); Causeway ETML Trust (mutual fund); The Rose Hills Foundation (charitable foundation); TCW Strategic Income Fund, Inc. (closed-end fund). | |||
| Andrew Tarica (1959) | Mr. Tarica has served as a director of the TCW Funds, Inc. since March 2012. | Director of Fixed Income (since February 2022), Forest Road Securities (broker-dealer); Chief Executive Officer (since February 2001), Meadowbrook Capital Management (asset management company); Employee (2003 – January 2022), Cowen Prime Services (broker dealer). | Metropolitan West Funds (mutual fund); TCW Strategic Income Fund, Inc. (closed-end fund); TCW Direct Lending VII, LLC (business development company); TCW Direct Lending VIII, LLC (business development company). |
| (1) | The address of each Independent Director is c/o Morgan Lewis, & Bockius LLP, Counsel to the Independent Directors of TCW Funds, Inc., 300 South Grand Avenue, Los Angeles, CA 90071. |
94
Table of Contents
TCW Funds, Inc.
Interested Director
This Director is an “interested person” of the Company as defined in the 1940 Act because he is a director and officer of the Advisor, and shareholder and director of The TCW Group, Inc., the parent company of the Advisor.
Name and Year of Birth | Term of Office and Length of Time Served | Principal Occupation(s) During Past 5 Years | Other Directorships held by Director | |||
| Marc I. Stern (1944) | Mr. Stern has served as a director since inception of TCW Funds, Inc. in September 1992. | Chairman (since January 2016), TCW LLC; Chairman (since February 2013), The TCW Group Inc., TCW Investment Management Company LLC, TCW Asset Management Company LLC and Metropolitan West Asset Management, LLC. | N/A |
The officers of the Company who are not directors of the Company are:
| Name and Year of Birth (1) | Position(s) Held with Company | Principal Occupation(s) During Past 5 Years (2) | ||
David Lippman (1958) President and Chief Executive Officer | Mr. Lippman has served as President and Chief Executive Officer of TCW Funds, Inc. since February 2021. | President and Chief Executive Officer (since August 2012), The TCW Group, Inc. (since February 2013), TCW LLC, the Advisor and TCW Asset Management Company LLC, and (since February 2021), TCW Strategic Income Fund, Inc.; Chief Executive Officer (since November 2008), Metropolitan West Asset Management, LLC; President and Principal Executive Officer (since November 2008), Metropolitan West Funds. | ||
Lisa Eisen (1963) Tax Officer | Ms. Eisen has served as Tax Officer of TCW Funds, Inc. since December 2016. | Tax Officer (since December 2016), Metropolitan West Funds and TCW Strategic Income Fund, Inc.; Managing Director and Director of Tax (since August 2016), TCW LLC. | ||
Meredith S. Jackson (1959) Senior Vice President, General Counsel and Secretary | Ms. Jackson has served as Senior Vice President since January 2016 and General Counsel and Secretary of TCW Funds, Inc. since February 2013. | Executive Vice President, General Counsel and Secretary (since January 2016), TCW LLC; Executive Vice President, General Counsel and Secretary (since February 2013), TCW Investment Management Company LLC, The TCW Group Inc., TCW Asset Management Company LLC and Metropolitan West Asset Management, LLC; Senior Vice President, General Counsel and Secretary (since February 2013), TCW Strategic Income Fund, Inc., Vice President and Secretary (since February 2013), Metropolitan West Funds. |
95
Table of Contents
TCW Funds, Inc.
Directors and Officers of the Company (Continued)
| Name and Year of Birth (1) | Position(s) Held with Company | Principal Occupation(s) During Past 5 Years (2) | ||
Gladys Xiques (1973) Chief Compliance Officer and AML Officer | Ms. Xiques has served as Chief Compliance Officer and AML Officer of TCW Funds, Inc. since January 2021. | Chief Compliance Officer and AML Officer (since January 2021), TCW Strategic Income Fund, Inc. and Metropolitan West Funds; Managing Director and Global Chief Compliance Officer (since January 2021), TCW LLC, TCW Investment Management Company LLC, Metropolitan West Asset Management, LLC and TCW Asset Management Company LLC; Global Chief Compliance Officer (since January 2021), The TCW Group, Inc.; Senior Vice President (February 2015 –December 2020), TCW LLC, TCW Investment Management Company LLC, Metropolitan West Asset Management, LLC and TCW Asset Management Company LLC. | ||
Richard M. Villa (1964) Treasurer Principal Financial and Accounting Officer | Mr. Villa has served as Treasurer and Principal Financial and Accounting Officer of TCW Funds, Inc. since February 2014. | Executive Vice President, Chief Financial Officer and Assistant Secretary (since July 2008), TCW Investment Management Company LLC, The TCW Group, Inc., TCW Asset Management Company LLC, Metropolitan West Asset Management, LLC, (since January 2016), TCW LLC, and (since February 2021), Metropolitan West Funds; Treasurer and Principal Financial and Accounting Officer (since February 2014), TCW Strategic Income Fund, Inc. |
| (1) | The address of the Interested Director and each officer is c/o the TCW Group, Inc., 865 South Figueroa Street, Suite 1800, Los Angeles, CA 90017. |
| (2) | Positions with The TCW Group, Inc. and its affiliates may have changed over time. |
In addition, Eric Chan, Managing Director of Fund Operations for the Advisor, TCW Asset Management Company LLC, TCW LLC (since 2009), and Metropolitan West Asset Management, LLC (since November 2006), is Assistant Treasurer of the Company and TCW Strategic Income Fund, Inc. (since 2009) and Metropolitan West Funds (since 2010). Mr. Chan is a Certified Public Accountant. Peter Davidson, Senior Vice President, Associate General Counsel and Assistant Secretary of TCW Asset Management Company LLC, Metropolitan West Asset Management, LLC, TCW LLC, the Advisor (since July 2022), is Vice President and Assistant Secretary of the Company, TCW Strategic Income Fund, Inc. and Metropolitan West Funds (since September 2022).
The SAI (Statement of Additional Information) has additional information regarding the Board of Directors. A copy is available without charge by calling 1-800-FUND-TCW (1-800-386-3829) to obtain a hard copy or by going to the SEC website at http://www.sec.gov.
96
Table of Contents
TCW Funds, Inc.
865 South Figueroa Street, Suite 1800
Los Angeles, California 90017
800 FUND TCW
(800 386 3829)
www.TCW.com
INVESTMENT ADVISOR
TCW Investment Management Company LLC
865 South Figueroa Street, Suite 1800
Los Angeles, California 90017
TRANSFER AGENT
U.S. Bancorp Fund Services, LLC
615 E. Michigan Street
Milwaukee, Wisconsin 53202
INDEPENDENT REGISTERED PUBLIC ACCOUNTING FIRM
Deloitte & Touche LLP
555 West 5th Street
Los Angeles, California 90013
CUSTODIAN & ADMINISTRATOR
State Street Bank & Trust Company
One Lincoln Street
Boston, Massachusetts 02111
DISTRIBUTOR
TCW Funds Distributors LLC
865 South Figueroa Street, Suite 1800
Los Angeles, California 90017
DIRECTORS
Patrick C. Haden
Director and Chairman of the Board
Samuel P. Bell
Director
Peter McMillan
Director
Victoria B. Rogers
Director
Marc I. Stern
Director
Andrew Tarica
Director
OFFICERS
David Lippman
President and Chief Executive Officer
Meredith S. Jackson
Senior Vice President,
General Counsel and Secretary
Richard M. Villa
Treasurer and Principal Financial and Accounting Officer
Gladys Xiques
Chief Compliance Officer and Anti-Money Laundering Officer
Lisa Eisen
Tax Officer
Eric W. Chan
Assistant Treasurer
TCW FAMILY OF FUNDS
EQUITY FUNDS
TCW Artificial Intelligence Equity Fund
TCW Global Real Estate Fund
TCW New America Premier Equities Fund
TCW Relative Value Dividend Appreciation Fund
TCW Relative Value Large Cap Fund
TCW Relative Value Mid Cap Fund
TCW Select Equities Fund
ASSET ALLOCATION FUND
TCW Conservative Allocation Fund
FIXED INCOME FUNDS
TCW Core Fixed Income Fund
TCW Enhanced Commodity Strategy Fund
TCW Global Bond Fund
TCW High Yield Bond Fund
TCW Short Term Bond Fund
TCW Total Return Bond Fund
INTERNATIONAL FUNDS
TCW Developing Markets Equity Fund
TCW Emerging Markets Income Fund
TCW Emerging Markets Local Currency Income Fund
TCW Emerging Markets Multi-Asset Opportunities Fund
FUNDarINT1021
Table of Contents
| (b) | Not applicable. |
| Item 2. | Code of Ethics. |
| (a) | The Registrant has adopted a code of ethics that applies to its principal executive officer and principal financial officer or persons performing similar functions. |
| (b) | No disclosures are required by this Item 2(b). |
| (c) | The Registrant has made no material changes to its code of ethics. |
| (d) | The Registrant has not granted any waivers from any provisions of its code of ethics during the period covered by this Form N-CSR. |
| (e) | Not applicable. |
| (f) | A copy of the Registrant’s code of ethics is filed as Exhibit 13(a)(1) to this Form N-CSR. |
| Item 3. | Audit Committee Financial Expert. |
| (a)(1) | The Registrant’s Board of Directors (the “Board”) has determined that the Registrant has two members serving on the Registrant’s Audit Committee that possess the attributes identified in Form N-CSR to qualify as an “audit committee financial expert.” |
| (a)(2) | The audit committee financial experts are Samuel P. Bell and Victoria B. Rogers. Each has been deemed to be “independent” as that term is defined in Form N-CSR. |
| (a)(3) | Not applicable. |
| Item 4. | Principal Accountant Fees and Services. |
The firm of Deloitte & Touche LLP (“Deloitte”) serves as the independent registered public accounting firm for the Registrant.
| (a) | Audit Fees |
For the fiscal years ended October 31, 2022 and October 31, 2021, the aggregate fees billed for professional services rendered by Deloitte for the audit of the Registrant’s annual financial
Table of Contents
statements or for services that are normally provided by Deloitte in connection with statutory and regulatory filings or engagements were:
2022 | 2021 | |
| $557,289 | $525,298 |
| (b) | Audit-Related Fees |
For the fiscal years October 31, 2022 and October 31, 2021, the aggregate fees billed for assurance and related services rendered by Deloitte that are reasonably related to the performance of the audit or review of the Registrant’s financial statements and that are not reported under Audit Fees above were:
2022 | 2021 | |
| $0 | $0 |
| (c) | Tax Fees |
For the fiscal years ended October 31, 2022 and October 31, 2021, the aggregate fees billed for tax compliance, tax advice and tax planning by Deloitte were:
2022 | 2021 | |
| $112,762 | $106,292 |
| (d) | All Other Fees |
For the fiscal years ended October 31, 2022 and October 31, 2021, the aggregate fees billed by Deloitte to the Registrant for all services other than services reported under Audit Fees, Audit-Related Fees, and Tax Fees were:
2022 | 2021 | |
| $17,798 | $13,910 |
Fees were for Passive Foreign Investment Company analysis.
| (e)(1) | The Registrant’s Audit Committee approves each specific service the auditor will perform for the Registrant. Accordingly, the Audit Committee has not established pre-approval policies or procedures for services that the auditor may perform for the Registrant. |
| (e)(2) | None of the services described in each of paragraphs (b) through (d) of this Item were approved by the Registrant’s Audit Committee pursuant to paragraph (c)(7)(i)(C) of Rule 2-01 of Regulation S-X. |
| (f) | Not applicable. |
| (g) | For the fiscal years ended October 31, 2022 and October 31, 2021, aggregate non-audit fees billed by Deloitte for services rendered to the Registrant were: |
Table of Contents
2022 | 2021 | |
| $130,560 | $120,202 |
For the twelve month periods ended October 31, 2022 and October 31, 2021, aggregate non-audit fees billed by Deloitte for services rendered to the Registrant’s investment adviser and any entity controlling, controlled by or under common control with the investment adviser that provides ongoing services to the Registrant were $652,316 and $709,570, respectively.
| (h) | Not applicable. |
| (i) | Not applicable. |
| (j) | Not applicable. |
| Item 5. | Audit Committee of Listed Registrants. |
Not applicable.
| Item 6. | Investments. |
| (a) | The Schedule of Investments is included as part of the Report to Shareholders filed under Item 1 of this Form N-CSR. |
| (b) | Not applicable. |
| Item 7. | Disclosure of Proxy Voting Policies and Procedures for Closed-End Management Investment Companies. |
Not applicable.
| Item 8. | Portfolio Managers of Closed-End Management Investment Companies. |
Not applicable.
| Item 9. | Purchases of Equity Securities by Closed-End Management Investment Company and Affiliated Purchasers. |
Not applicable.
| Item 10. | Submission of Matters to a Vote of Security Holders. |
There have been no material changes to the procedures by which shareholders may recommend nominees to the Registrant’s Board of Directors.
| Item 11. | Controls and Procedures. |
| (a) | The Chief Executive Officer and Principal Financial and Accounting Officer have concluded, as of a date within 90 days of the filing date of this report, that the Registrant’s disclosure controls and procedures (as defined in Rule 30a-3(c) under |
Table of Contents
the 1940 Act) are effective, as of such date, based on their evaluation of these controls and procedures required by Rule 30a-3(b) under the 1940 Act and 15d-15(b) under the Securities Exchange Act of 1934, as amended. |
| (b) | There were no changes in the Registrant’s internal control over financial reporting (as defined in Rule 30a-3(d) under the 1940 Act) that occurred during the period covered by this report that have materially affected, or are reasonably likely to materially affect, the Registrant’s internal control over financial reporting. |
| Item 12. | Disclosure of Securities Lending Activities for Closed-End Management Investment Companies. |
Not applicable.
| Item 13. | Exhibits. |
Table of Contents
SIGNATURES
Pursuant to the requirements of the Securities Exchange Act of 1934, as amended, and the Investment Company Act of 1940, as amended, the Registrant has duly caused this report to be signed on its behalf by the undersigned, thereunto duly authorized.
| (Registrant) | TCW Funds, Inc. | |
| By (Signature and Title) | ||
| /s/ David B. Lippman | ||
| David B. Lippman | ||
| President and Chief Executive Officer | ||
| Date | December 28, 2022 | |
Pursuant to the requirements of the Securities Exchange Act of 1934, as amended, and the Investment Company Act of 1940, as amended, this report has been signed below by the following persons on behalf of the Registrant and in the capacities and on the dates indicated.
| By (Signature and Title) | ||
| /s/ David B. Lippman | ||
| David B. Lippman | ||
| President and Chief Executive Officer | ||
| Date | December 28, 2022 | |
| By (Signature and Title) | ||
| /s/ Richard M. Villa | ||
| Richard M. Villa | ||
| Treasurer and Principal Financial and Accounting Officer | ||
| Date | December 28, 2022 | |