UNITED STATES
SECURITIES AND EXCHANGE COMMISSION
Washington, D.C. 20549
FORM N-CSR
CERTIFIED SHAREHOLDER REPORT OF REGISTERED
MANAGEMENT INVESTMENT COMPANIES
Investment Company Act file number: 811-07170
TCW Funds, Inc.
(Exact name of registrant as specified in charter)
515 South Flower Street, Los Angeles, CA 90071
(Address of principal executive offices)
Peter Davidson, Esq.
Vice President and Assistant Secretary
515 South Flower Street
Los Angeles, CA 90071
(Name and address of agent for service)
Registrant’s telephone number, including area code: (213) 244-0000
Date of fiscal year end: October 31
Date of reporting period: October 31, 2023
| Item 1. | Reports to Shareholders. |
| (a) | The following is a copy of the report transmitted to shareholders pursuant to Rule 30e-1 under the Investment Company Act of 1940, as amended (the “1940 Act”): |


EQUITY FUNDS
TCW Artificial Intelligence Equity Fund
TCW Global Real Estate Fund
TCW New America Premier Equities Fund
TCW Relative Value Dividend Appreciation Fund
TCW Relative Value Large Cap Fund
TCW Relative Value Mid Cap Fund
TCW Select Equities Fund
ASSET ALLOCATION FUND
TCW Conservative Allocation Fund
TCW Funds, Inc.
Table of Contents
|
| |
| The Letter to Shareholders and/or Management Discussions contained in this Annual Report are the opinions of each Fund’s portfolio managers and are not the opinions of TCW Funds, Inc. or its Board of Directors. Various matters discussed in the Letter to Shareholders and/or Management Discussions constitute forward-looking statements within the meaning of the federal securities laws. Actual results and the timing of certain events could differ materially from those projected or contemplated by these forward-looking statements due to a number of factors, including general economic conditions, overall availability of securities for investment by a Fund, the level of volatility in the securities markets and in the share price of a Fund, and other risk factors discussed in the SEC filings of TCW Funds, Inc. The data presented in the Letter to Shareholders and/or Management Discussions represents past performance and cannot be used to predict future results. |
| | |
To Our Valued Shareholders | | |
| | |

| | Kathryn Koch President and Chief Executive Officer |
Dear Valued Investors,
I am pleased to present the 2023 annual report for the TCW Funds, Inc. covering the 12-month period ended October 31, 2023. I would like to express our appreciation for your continued investment in the TCW Funds as well as to welcome new shareholders to our fund family. As of October 31, 2023, the TCW Funds held total net assets of approximately $8.6 billion.
This report contains information and portfolio management discussions of our Equity Funds and the TCW Conservative Allocation Fund.
The U.S. Stock Market
U.S. stocks advanced 10.1% (S&P 500 Total Return Index) during the one-year period ending October 31, 2023, as stock market investors cheered the deceleration of core inflation (CPI less food and energy) from its peak 6.6% annual rate in September of last year to the recent 4.1% pace in September of this year. Market participants were hopeful that a steady decline in inflation might lead the Fed to conclude that it was making adequate progress towards its 2% target and thus end its series of rate hikes. For a brief period last March, fears of an economic slowdown were prompted when a run on deposits forced regulators to close Silicon Valley Bank and Signature Bank, with the fallout from the banking sector turmoil amounting to a de facto tightening of financial conditions. However, the decisive response by regulatory authorities assuaged worries of a broader crisis and helped fuel a rebound in stock prices on hopes that the resulting reduction in credit availability would allow the Fed to relent from its rate hike campaign. For the equity market, the prospect of the real economy potentially achieving a “soft landing” rather than a painful recession stoked hopes that corporate earnings would remain resilient in the process. To be sure, macroeconomic data continued to reflect strength in the labor market, where job creation continued to be solid and unemployment claims remained muted. Importantly, corporate earnings reports for the first several
quarters of the calendar year came in better than expected, as companies were generally able to raise prices to cover rising input costs. As the year progressed, though, hopes for a “soft landing” gave way to worries that the Fed might have to hold interest rates “higher for longer” due to “sticky” core services inflation resulting from the tight labor market. At the same time, investors started to focus on heavy U.S. Treasury refunding needs due to the spiraling budget deficit, which reached an annual run-rate of nearly $2 trillion or close to 8% of U.S. GDP. These factors contributed to a surge in the 10-year U.S. Treasury Note yield from 3.84% to 4.93% during the final four months of the period under review, which in part explains the pullback in the equity market from its end-July peak.
Looking Ahead
Looking forward, the outlook for the stock market has been clouded by several key developments. Receding inflation, coupled with a gradual rise in the unemployment rate from a cycle low of 3.4% in January to 3.9% in October, may indeed signal the end of the Fed’s interest rate hike campaign but also portends a potential economic recession in the coming months. At the same time, the global macroeconomic backdrop has dimmed, with the Eurozone facing a near-recessionary growth outlook while China’s own growth prospects continue to disappoint. The attack on Israel by Hamas not only plunged that region into war, but also raised the risk of a broader regional conflict, with no end in sight to Russia’s war in Ukraine. Also, we are mindful that we are heading into a presidential election year, which may provide another catalyst for market volatility. So, while stocks are presently trading at around 18 times forward earnings, which is elevated relative to its five-decade average of just under 16, we are doubtful that the Bloomberg consensus estimate of 12% earnings growth for 2024 can be achieved. Given these headwinds, we believe that our active management approach to equity investing is particularly relevant in the present environment. Our equity portfolio managers and
2
| | |
Letter to Shareholders (Continued) | | |
analysts remain focused on identifying quality companies which possess resilient business models, strong balance sheets, and skilled management that will ultimately separate the winners from the losers during this period of heightened uncertainty.
We truly value our relationship with you and thank you for making the TCW Funds part of your long-term investment plan. If you have any questions or require further information, we invite you to visit our website
at www.tcw.com, or call our shareholder services department at 800-386-3829.
We look forward to further correspondence with you through our semi-annual report next year.
Sincerely,

Kathryn Koch
President and Chief Executive Officer
3
TCW Artificial Intelligence Equity Fund
Management Discussions
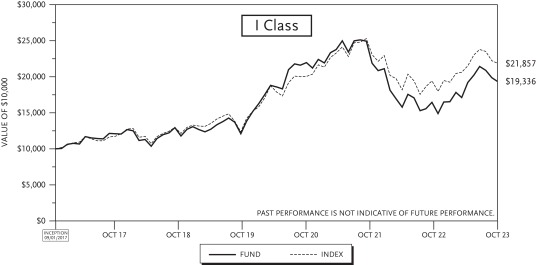
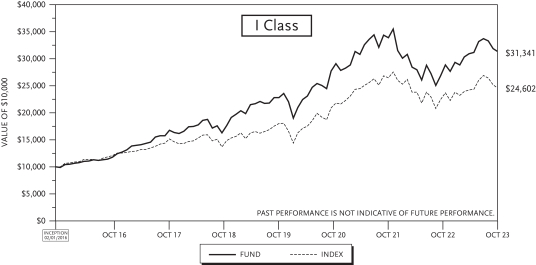
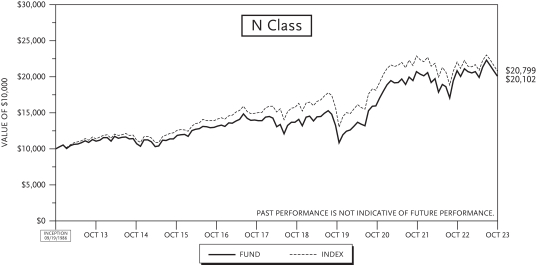
For the year ended October 31, 2023, the TCW Artificial Intelligence Equity Fund (the “Fund”) returned 24.40% and 24.22% on its I Class and N Class shares, respectively. The performance of the Fund’s classes varies because of differing expenses. The Fund’s benchmark, the Russell 3000 Growth Index, returned 17.32% over the same period.
Strongest and Weakest Performers
The last year has been a dynamic and volatile period in the market on many fronts. Geopolitical risks included one ongoing war and, late in the year, a second war that threatens to escalate into a regional conflict; heightened macro concerns early in the year around global recession gave way later in the year to a general feeling that a soft landing was possible; inflation peaked prior to the start of the fiscal year and has fallen steadily for most of the year but remains stubbornly above target; interest rates, as measured by the key 10-year U.S. treasury note, were stable for the first half of the year but started rising again in earnest in July, at one point reaching their highest level since 2007; employment, meanwhile, has been remarkably resilient in the face of so much economic data pulling in opposing directions.
Despite all of this market noise, the rapid pace of innovation continues with no better example than the commercial release of generative artificial technology early in the year. This exciting launch ushers in a new era of possibility with respect to productivity, efficiency, and cost structure for enterprises across all sectors of the economy. We continue to view this secular trend as a multi-decade growth opportunity and the beauty from an investing standpoint is that we are just getting started. We believe there are still exciting investable opportunities to be found and, in fact, that many more will come into existence as the technology and the companies developing it mature.
Our two biggest stock contributors during the year were NVIDIA and Meta Platforms.
NVIDIA was the top performer in the period as there was no shortage of good news. After a difficult run in 2022, the shares surged following the release of OpenAI’s ChatGPT late last year. The company emerged as the clear leader in AI-enabling semiconductors thanks to its state-of-the art chips. The release led to a sort of “AI Frenzy” across the market as investors digested the potential uses for AI in the workplace and beyond. The company offered strong guidance in subsequent quarters that was better than consensus estimates and proceeded to beat those forecasts. In the second quarter, revenues topped $13.5 billion, a 101% year-over-year increase. CEO Jensen Huang noted that there was potential for a “trillion-dollar upgrade” to datacenters in order to retool the underlying infrastructure to handle the accelerated computing needed for emerging AI technology like ChatGPT and other generative AI technologies.
Meta Platforms shares bounced back in the period following a difficult run where the company came under scrutiny for its spending and competition from rival social media platform, TikTok. As economic conditions tightened in 2022, Meta was ramping up research and development costs for its Metaverse projects, all while showing signs of slowing growth among its users. In the past year, CEO Mark Zuckerberg has led an aggressive cost-cutting campaign within the company, including multiple rounds of layoffs. The company also reported some growth in its user metrics across its family of apps, an important trend reversal coming out of the pandemic. The shares also benefitted as digital advertising held up throughout the period, even though many analysts trimmed expectations as macro conditions became more volatile.
Our two weakest stock contributors during the year were Enphase Energy and BILL Holdings.
Enphase Energy shares struggled in the period after a strong run in 2022. The shares fell early in the year after the company offered weaker-than-expected revenue guidance, which led to price target cuts from a
4
TCW Artificial Intelligence Equity Fund
Management Discussions (Continued)
number of analysts. Management cited weakening macro measures and higher interest rates leading to softness in demand, particularly within the U.S. We note that we closed our position in the stock in June.
BILL Holdings shares were down after the company offered a weak outlook early in the year, citing slowing demand among small businesses as the broader economy remained volatile. Small businesses, which make up most of BILL’s customer base, are among the first to feel the pinch of a slowing economy, and as concerns about recession rose, the stock sold off sharply. BILL’s shares suffered later in the year as investors reacted to the news that the company had approximately $300 million (of its $2.6 billion corporate cash, cash equivalents, and short-term investments) held at Silicon Valley Bank, which failed in March. Even though the shares sold off quickly, analysts were quick to note that the selloff was likely “overdone” as the cash at risk was equal to approximately $3 per share, and eventually all deposits at the bank were made whole. The shares recouped some of their losses as the story developed. We note that we closed the position subsequent to the fiscal year end.
AI Outlook and Recent Developments
We believe AI will be the foundational technology of the information age. The leap from computing built on the foundation of humans telling computers how to act, to computing built on the foundation of computers learning how to act has significant implications for every industry.
In our view, there are many structural drivers that are accelerating the need for AI. These include:
| • | | Trend in demographics towards an aging global population |
| • | | Need for greater energy efficiency |
| • | | Drive for greater urbanization as demand for convenience increases |
| • | | Efforts to increase human capital productivity |
| • | | And particularly in a down economy, the ability to take cost out of operations |
The broad applicability of AI also leads us to believe that it is a paradigm-shifting technology for the global economy and a driver of improving productivity. AI very well could end the period of stagnant productivity growth in the U.S. We believe that AI-driven improvements to productivity could, similar to the 1990’s, lead corporations to invest in more capital-intensive projects that would no longer be as labor-intensive, accelerating growth, improving profitability, and expanding equity valuations. Moreover, we believe AI and generative AI can have a positive impact on workplace equality. The jobs most at risk of displacement by AI tend to be higher-earning white-collar jobs. But the biggest impact may be that less-skilled workers will suddenly have the tools necessary to perform tasks they were not previously able to and thereby increase their upward mobility.
From an AI perspective, there were a number of recent developments that support our bullish view on the technology, which we highlight with excerpts from the articles cited in the following section.
Foxconn and NVIDIA to Collaborate on Autonomous Vehicle Platforms. In January, NVIDIA announced that it would be partnering with the world’s largest electronics manufacturer, Foxconn, in order to develop automated and autonomous vehicle platforms. The platform will use NVIDIA’s Orin semiconductor that is capable of 254 trillion operations per second and is the current standard for self-driving vehicle computers. Both companies are hoping that the partnership allows them to grab part of the market share for intelligent vehicles that is expected to boom in the coming years as the technology continues to develop. Zacks Equity
5
TCW Artificial Intelligence Equity Fund
Management Discussions (Continued)
Research. Nasdaq.com. NVIDIA (NVDA), Foxconn Team up for Autonomous Vehicle Platform. January 4, 2023 (https://www.nasdaq.com/articles/nvidia-nvda-foxconn-team-up-for-autonomous-vehicle-platform)
Microsoft Invests Billions into ChatGPT-Maker, OpenAI. After ChatGPT’s quick rise to fame, Microsoft announced that it was investing in the creator of the chatbot, OpenAI. While the specific dollar amount is not known, it is believed to be somewhere around $10 billion over the life of the deal. The recent investment actually marks the company’s third investment into OpenAI; in 2019, Microsoft injected $1 billion into the company in order to become the exclusive provider of cloud computing to OpenAI. Last month we wrote about ChatGPT’s capabilities; the chatbot only needs a few inputs, for example, a topic and essay length, and it will write an essay tailored to the specifications the user provides. Both companies hope the newest partnership will help AI technology advance and provide opportunities for commercialization of the technology. Ashley Capoot. CNBC. Microsoft announces new multibillion-dollar investment in ChatGPT-maker OpenAI. January 23, 2022 (https://www.cnbc.com/2023/01/23/microsoft-announces-multibillion-dollar-investment-in-chatgpt-maker-openai.html)
Google Introduces AI Chatbot ‘Bard’ to Challenge ChatGPT. As excitement surrounding artificial intelligence chatbots has continued to rage, Google unveiled its own AI chatbot, called ‘Bard,’ that it hopes will rival OpenAI’s ChatGPT. Recall, ChatGPT was released in recent months and social media, corporations, and news groups were abuzz as the technology seemed to stun anybody who used it. Seeing the success, Google quickly unveiled Bard with hopes to capture some of the excitement. Google and Microsoft have said they expect these AI systems to vastly improve their respective search engines, and there are likely many other uses of the technology. Q.ai contributing to Forbes. Google Announces Bard, Its Rival To Microsoft-Backed ChatGPT. February 8, 2023 (https://www.forbes.com/sites/qai/2023/02/08/google-announces-bard-its-rival-to-microsoft-backed-chatgpt/?sh=613917a33791)
GM’s Cruise Looks to Expand Driverless Vehicle Testing to all of California. General Motors’ Cruise is seeking permits from the California DMV to test its driverless cars across all of California, including San Francisco and Los Angeles. Cruise currently conducts autonomous vehicle testing in San Francisco and Phoenix, Arizona. The company aims to expand its testing beyond these locations. Cruise plans to test a fleet of self-driving cars without human safety drivers, according to the permit applications filed with the DMV. Overall, Cruise is looking to further advance its autonomous vehicle technology and operations in California. Mike Murphy. MarketWatch. GM’s Cruise seeks to test its driverless cars across all of California. March 20, 2023 (https://www.marketwatch.com/story/gms-cruise-seeks-to-test-its-driverless-cars-across-all-of-california-80df5724)
Bill Gates Weighs in on Self-Driving Vehicles. Bill Gates believes that self-driving cars could be as revolutionary as personal computers, as he sees autonomous vehicles bringing immense benefits in reducing accidents and emissions. Gates, who has previously invested in autonomous driving technology, also expressed his optimism about electric cars, noting the improvements in battery technology and range. However, he cautioned that there are still challenges to overcome, including the cost of electric vehicles, charging infrastructure, and the need for new regulations. Gates added that he believes artificial intelligence will play a key role in solving some of these challenges, such as optimizing transportation networks and reducing energy consumption. Tim Levin. Business Insider. Bill Gates says self-driving cars will be as revolutionary as the PC after riding in one. March 31, 2023 (https://www.businessinsider.com/bill-gates-ai-self-driving-cars-as-revolutionary-as-pc-2023-3)
6
TCW Artificial Intelligence Equity Fund
Management Discussions (Continued)
Elon Musk Says Tesla Will Invest More than $1 Billion on its Dojo Supercomputer in the Next Year. Elon Musk made headlines in July when he announced that Tesla would spend more than $1 billion on its Dojo supercomputer by the end of 2024. Dojo is ultimately being designed to handle the massive amount of data processing required for autonomous driving that the company has been working towards for years. Tesla has reported that it has collected data from over 300 million miles of driving that its cars have done, which the company believes will be key in training its autonomous vehicles. Dana Hull & Sean O’Kane. yahoo!finance & Bloomberg. Musk Says Tesla to Spend Over $1 Billion on Dojo Supercomputer. July 19, 2023 (https://finance.yahoo.com/news/musk-says-tesla-spend-over-233834154.html)
Apple Joins the Generative AI Race. In July, news broke that Apple was reportedly working on its own form of ChatGPT to take on OpenAI, Microsoft, Google, and Meta. The chatbot is currently being referred to as “Apple GPT” or AJAX and does not come as a huge surprise to many people within the tech world. Apple recently increased hiring for its generative AI division and collects a massive amount of data thanks to the big user base of its various products. The company did not comment on the news. Mark Gurman. Bloomberg. Apple Tests ‘Apple GPT,’ Develops Generative AI Tools to Catch OpenAI. July 19, 2023 (https://www.bloomberg.com/news/articles/2023-07-19/apple-preps-ajax-generative-ai-apple-gpt-to-rival-openai-and-google#xj4y7vzkg)
Microsoft to Begin Offering AI Assistant Software in November. In September, Microsoft announced that it would begin offering Microsoft 365 Copilot, an “AI assistant” to select customers starting in November. Copilot will supplement core apps like Word and Excel. Copilot is a result of the collaboration with OpenAI, which of course is the creator of ChatGPT, which really started the generative AI wave late in 2022. Microsoft has offered a beta version of the assistant to clients since March and as of May had customers from about 600 large organizations that it calls customers. Jordan Novet. CNBC. Microsoft to sell AI assistant software to biggest clients starting Nov. 1. September 21, 2023 (https://www.cnbc.com/2023/09/21/microsoft-365-copilot-software-becomes-available-to-enterprises-nov-1.html)
Mercedes Releases First Publicly Available Level 3 Autonomous Driving Vehicle. Mercedes announced that its S-Class and EQS Sedans will now have “Drive Pilot” systems, which are “level 3” on the autonomous driving scale. Currently Tesla and GM have level 2 autonomous driving systems available but with level 3, the car is fully in control of itself for certain periods of time. Mercedes Drive Pilot will be in control if the following conditions are met: Lane lines and/or Botts’ dots are present and clearly visible, lane width is sufficient, the road is dry and all sensors are free of obstruction, the car is on an approved freeway, and vehicle speed is 40 mph or lower. Karl Brauer. Forbes. Mercedes-Benz Drive Pilot: The Self-Driving Car Has (Sort Of) Arrived. September 27, 2023 (https://www.forbes.com/sites/kbrauer/2023/09/27/mercedes-benz-drive-pilot-the-self-driving-car-has-sort-of-arrived/?sh=23c15dccea67)
Jamie Dimon Says AI will Shorten the Standard Work Week. JPMorgan CEO Jamie Dimon said that thousands of employees at his bank have already begun using AI in a number of different way and predicted that the technology could eventually lead to a shortened work week thanks to the increased productivity it can add. Dimon had a number of other controversial opinions like the next generation of children will live to 100 and never have cancer thanks to technological advancements. While these were more ominous claims towards technology in general, Dimon expressed his bullishness towards tech and AI. CNBC. Jennifer Liu. JPMorgan CEO Jamie Dimon says AI could bring a 31⁄2-day workweek. October 3, 2023 (https://www.cnbc.com/2023/10/03/jpmorgan-ceo-jamie-dimon-says-ai-could-bring-a-3-day-workweek.html)
7
TCW Artificial Intelligence Equity Fund
Management Discussions (Continued)
Concluding Remarks
We have stated many times that stocks rarely go up in a straight line (at least not for long) and point out that during the smartphone super-cycle in tech, a basket of stocks in the midst of a triple-digit percentage gain experienced at least one 30% drawdown from a local peak. Even in secular moves, we can, and usually do, see broad pullbacks that make investors question whether the game is over. We seem to be in just such a period of stock market consolidation right now, with the SOX index down 18%, the NASDAQ Composite down 11%, the S&P 500 down 9% and the Russell 3000 Growth Index down 9% since the end of July. The SOX, a semiconductor index, is in bear market territory and the other indexes — all of which have high technology exposure — are at or near correction levels.
Fundamental analysis has taken a back seat to macroeconomic forces for many stocks. Results among S&P 500 technology companies that have reported 3Q23 earnings as of this writing have topped expectations far more often than missing (60% beat on revenue, 88% beat on EPS (Earnings per Share)), while 4Q23 earnings estimates went up for nearly half of the companies that have reported (but therefore down for slightly over half). The fundamentals suggest demand is holding up well, but management teams across the board are citing macro uncertainty, falling consumer confidence, and higher rates as reasons to be more cautious in their outlooks. Meanwhile, stocks that beat expectations are generally flat at best following earnings announcements, and those that missed have been routinely punished severely. Volatility feels extreme with even some of the largest market-cap companies suffering double-digit price moves following earnings. The market seems to be geared up for a downturn in the short run with the only question being whether the moves in individual stocks and indexes have adequately discounted the risks for the companies yet to report. Indeed, earnings results for companies that have reported more recently have been met with a much less harsh reaction. The glass is either half full or half empty, depending on which data you choose to focus on.
When we see situations where we think the market may be getting ahead of itself, we try to adjust accordingly without losing sight of the long-term objectives. We typically try to put excess cash to work when the market is feeling bearish, and take some profits when the market is acting overly bullish. Otherwise, we remain focused on the long-term objective of the fund, which is to generate significant capital appreciation by investing in companies at the leading edge of the AI revolution. Major technology cycles tend to run for 10 years or more, and we think AI is just such a super-cycle.
From the time the industry started shipping 10 million cell phones per year, it took around 25 years for unit sales to plateau. It took 30 years for PC sales to peak. The Internet of Things and public cloud are both about 15 years old and neither is showing any signs of peaking. The era of publicly available generative AI will celebrate its first birthday in about a month. As cost comes down and performance goes up, we expect AI to follow previous technology curves and enter a period of exponential growth — a period that could last into the next generation.
Of course, investors have to mark their portfolios to market, and saying “don’t worry, we’ll get through this” doesn’t feel like active management, even if it’s true. Our research effort seeks the most attractive opportunities in the AI ecosystem, and we believe there are many very attractive investment opportunities for the fund available to us today. Moreover, we expect the number of investment candidates to increase significantly when the market’s IPO window next opens, and as more companies outside of traditional technology and infrastructure providers find ways to use AI to create competitive advantages. We think we
8
TCW Artificial Intelligence Equity Fund
Management Discussions (Continued)
are still in the very early stages of this AI cycle; the game is definitely not over. There have been no changes to the objectives of the fund.
We thank you for the opportunity to provide our views on the TCW Global Artificial Intelligence Fund and for the trust that you have placed in us as managers.
| | | | | | | | | | | | | | | | | | | | |
| | | Annualized Total Return as of October 31, 2023(1) | |
| | | 1 Yr
Return | | | 3 Yr
Return | | | 5 Yr
Return | | | 10 Yr
Return | | | Inception
to Date | |
TCW Artificial Intelligence Equity Fund | | | | | | | | | | | | | | | | | | | | |
Class I (Inception: 09/01/2017) | | | 24.40 | % | | | 1.83 | % | | | 11.58 | % | | | — | | | | 11.28 | % |
Class N (Inception: 09/01/2017) | | | 24.22 | % | | | 1.72 | % | | | 11.48 | % | | | — | | | | 11.19 | % |
Russell 3000 Growth Index | | | 17.32 | % | | | 8.07 | % | | | 13.49 | % | | | | | | | 13.51 | % |

| (1) | The total returns do not reflect taxes that a shareholder would pay on fund distribution or on the redemption of fund shares. |
9
TCW Conservative Allocation Fund
Management Discussions
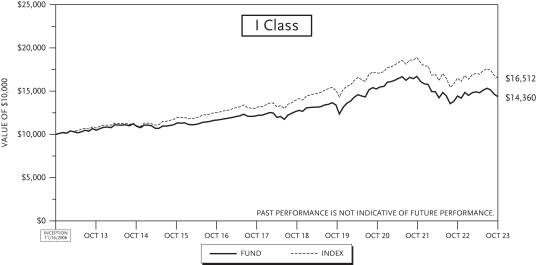
For the year ended October 31, 2023, the TCW Conservative Allocation Fund (the “Fund”) posted a gain of 3.97% for the I Class and 3.78% for the N Class shares. The performance of the Fund’s classes varies because of differing expenses. The Fund’s blended benchmark of 40% S&P 500 Index and 60% Bloomberg U.S. Aggregate Bond Index returned 4.30% over the same time period.
The Fund posted positive returns over the past year with the biggest contributors coming from the TCW Select Equities Fund and the TCW Artificial Intelligence Equities Fund. The best relative returns within the fixed income asset class came from the MetWest High Yield and MetWest Unconstrained Funds.
As of the end of October, the allocation for the Fund was 31% equities, 8% alternatives and 60% fixed income. The fund had an underweight to equities along with overweight allocations to fixed income and alternatives relative to its blended Index. The baseline allocation is 40% Equities and 60% Fixed Income. Over the past 12 months, the Fund had decreased the allocation to equities, specifically large cap stocks. In Fixed Income, the allocation to longer duration, higher-quality U.S fixed income funds were increased along with increasing the allocation to commodities.
U.S. stocks declined 2.1% during the month of October, trimming their year-to-date gain to 10.7% (S&P 500 Total Return Index). A number of strong macroeconomic readings pointed to a solid outlook for the economy, which in turn stoked fears that the Fed would need to leave interest rates “higher for longer.” For instance, third quarter GDP advanced 4.9% (year-over-year), well in advance of the 4.5% consensus expectation, and retail sales in September were up 0.6% sequentially, versus expectations for just 0.1% growth. Nonfarm payrolls, unemployment claims, and new home sales all came in better than expected, pushing the 10-year U.S. Treasury note yield above 5% for the first time in 16 years due, in part, to concern that it would be difficult for the Fed to achieve its 2% inflation target. Investors also fretted that rising yields in Japan, coupled with heavy U.S. Treasury refunding needs, might lead to continued upward pressure on U.S. interest rates. The surge in interest rates hurt equity market sentiment and prospects for the housing market, where the average 30-year fixed-rate mortgage hit 7.90% — its highest level since September 2000. The equity market’s “risk-off” mode was also reinforced by the fallout from Hamas’ attack on Israel, which prompted worries that a broader Mideast conflict might lead to a period of elevated energy prices.
Looking forward, early November macro data have revealed the first significant deterioration in the labor market, given weaker job creation and a higher unemployment rate, thereby permitting interest rates to decline from their October peak. If anything, we think it’s quite possible that the equity market narrative turns back to concerns about softening in the economy and the risk of recession. Target’s CEO recently expressed caution about consumers cutting back, and the increase in credit card debt and auto loan delinquencies appear to echo that concern. At the same time, the global outlook has dimmed considerably, with Eurozone economic growth barely above zero, and China’s PMI (Purchasing Manager’s Index) back in contractionary territory. To be sure, however, the bright spot in the outlook has been U.S. corporate earnings, with third-quarter earnings reports suggesting that most companies have been able to navigate the equation of higher input prices, higher interest rates and weaker global demand reasonably well. Bloomberg consensus figures are for flat EPS growth this year followed by 10% growth next year. While the economy has indeed been resilient, we do expect that the cumulative impact of tightening credit conditions and weakening consumer purchasing power is likely to translate into a recessionary economic backdrop at some point in the next few quarters. As such, we believe that earnings growth expectations for next year may be too optimistic. Stocks are trading on a forward price/earnings multiple of around 18 times, which is elevated relative to the median of the past few decades, so we remain cautious about the outlook and
10
TCW Conservative Allocation Fund
Management Discussions (Continued)
continue to focus on those all-weather businesses which exhibit proven management skill, low levels of indebtedness, strong free cash flow generation, and secular advantages which may help cushion the impact of a slowing economy.
The increased expectations for a soft landing notwithstanding, it has to be recognized that 525 bps of hikes to-date is not subtle and the sharply higher rates now coursing through the curve will increase the likelihood and hasten the timing of a hard landing. Higher costs of capital have yet to affect a broad swath of the economy; namely, the corporate credit market where only a small share of debt has been reset so far, while other COVID-related distortions have extended the typical lagged effect of monetary policy. Furthermore, the pandemic-related savings that fueled consumers have dwindled, implying a measure of belt-tightening ahead. Once it becomes clear that growth is slowing, unemployment is rising, and inflation is firmly on track to a 2% level, the Fed will likely be forced to ease. History would indicate that the Fed typically eases faster than they hike, so the gradual pace of rate cuts priced into markets isn’t likely. Instead, experience with the Fed suggests rates will be held high too long, with an aggressive ease once the slowdown is apparent. Though timing is notoriously difficult to predict, and the economy has been performing thus far, indications are that the hard landing becomes clear in the first half of 2024. Until then, portfolio construction will continue to be based on a foundation of bottom-up issue selection, a strong valuation framework and a disciplined allocation of capital until higher-yielding opportunities (at much more attractive prices) emerge.
With the continued rise in rates during the third quarter, the Fund added incrementally to the duration positioning. Though rates are not expected to move substantially higher from here, the approach will be patient, recognizing that it might be mid-next year before the Fed starts to ease and rates move lower. Once rates do start to fall, the long-duration position will be maintained for a time in an effort to maximize the benefit and recoup the losses generated thus far, before gradually trimming the position once rates have fallen to levels near or below what we would consider to be long-term fair value.
Sector positioning remains consistent; while corporate holdings bear a slight market value overweight, the exposure is a spread contribution (credit risk) underweight. Financials remain the most constructive theme, namely the U.S. money center bank issues, for which Dodd-Frank’s rigors kept clear of the trouble that visited the regional banks earlier this year. The securitized area is another area of focus, reflected in a market value and spread overweight to agency MBS (mortgage-backed securities). The cheapening of last year and persistent volatility have the market at wider spreads that the team finds attractive, especially given a government guarantee and pull-to-par convexity of discount pricing. Non-agency MBS remains among the best values in fixed income with good yields and solid fundamentals. Years of amortization and housing price appreciation have built up substantial equity in such properties, underscoring the fundamentals, and an overall lag in housing supply in the decade-plus since the GFC (Global Financial Crisis) have been supportive as well. Finally, CMBS (commercialized mortgage-backed securities) continues to be an area of concern, with significant declines in some office property valuations, given substantially higher rates and elevated vacancies given the work from home dynamic.
Expectations are for ongoing appraisals lower, more defaults, more delinquencies, and wider spreads for lower-quality deals with questionable collateral; however, there are also many parts of the CMBS market that don’t have these same challenging dynamics (logistics/warehouses, hospitality, multifamily, retail, and even high quality office space), and portfolio holdings reflect these more targeted positions, where we can get comfortable with the risk profile and the specific properties.
11
TCW Conservative Allocation Fund
Management Discussions (Continued)
| | | | | | | | | | | | | | | | | | | | |
| | | Annualized Total Return as of October 31, 2023(1) | |
| | | 1 Yr
Return | | | 3 Yr
Return | | | 5 Yr
Return | | | 10 Yr
Return | | | Inception
to Date | |
TCW Conservative Allocation Fund | | | | | | | | | | | | | | | | | | | | |
Class I (Inception: 11/16/2006) | | | 3.97 | % | | | 0.09 | % | | | 3.69 | % | | | 3.69 | % | | | 4.46 | % |
Class N (Inception: 11/16/2006) | | | 3.78 | % | | | (0.16 | %) | | | 3.40 | % | | | 3.29 | % | | | 4.19 | % |
40% S&P 500 Index/60% Bloomberg U.S. Aggregate Bond Index | | | 4.30 | % | | | 0.78 | % | | | 4.61 | % | | | 5.14 | % | | | 5.37 | % |

| (1) | The total returns do not reflect taxes that a shareholder would pay on fund distribution or on the redemption of fund shares. |
12
TCW Global Real Estate Fund
Management Discussions
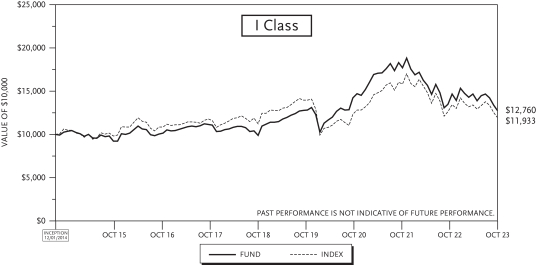
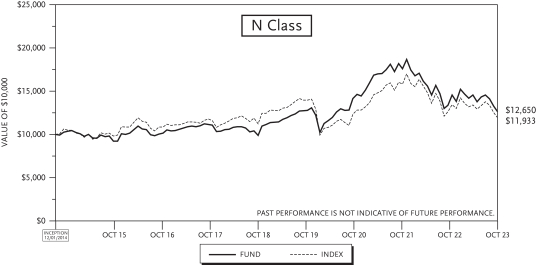
For the year ended October 31, 2023, the TCW Global Real Estate Fund (the “Fund”) generated losses of 5.34% and 5.54% on its I Class and N Class shares, respectively. The performance of the Fund’s classes varies because of differing expenses. The Fund’s benchmark, the S&P Global REIT Index, had a return of 5.43% over the same period.
On an attribution basis, the Fund’s underperformance relative to its benchmark during the period was predominantly driven by security selection. The Fund’s largest sector overweight was in Diversified Real Estate Activities (average weight of 5.43% and up 6.87% for the Fund vs. an average weight of 0% for the Index), which benefitted performance. From a relative standpoint, the Fund’s largest sector underweight was in Retail REITs (average weight of 8.97% and up 4.74% for the Fund vs. average weight of 18.30% and down 5.27% for the Index), which benefitted performance. From a stock selection perspective, positive contributors included Taylor Morrison Home (TMHC) and Equinix (EQIX). Conversely, notable detractors from performance included Independence Realty Trust (IRT) and Public Storage (PSA).
U.S. stocks gained 10.12% in the twelve months ending October 31, 2023 as the market climbed a wall of worry. A number of strong macroeconomic readings pointed to a solid outlook for the economy, which in turn stoked fears that the Fed would need to leave interest rates “higher for longer.” For instance, third quarter GDP advanced 4.9% (year-over-year), well in advance of the 4.5% consensus expectation, and retail sales in September were up 0.6% sequentially, versus expectations for just 0.1% growth. Nonfarm payrolls, unemployment claims, and new home sales all came in better than expected, pushing the 10-year U.S. Treasury note yield above 5% for the first time in 16 years due, in part, to concern that it would be difficult for the Fed to achieve its 2% inflation target. Investors also fretted that rising yields in Japan, coupled with heavy U.S. Treasury refunding needs, might lead to continued upward pressure on U.S. interest rates. The surge in interest rates hurt equity market sentiment and prospects for the housing market, where the average 30-year fixed-rate mortgage hit 7.90% — its highest level since September 2000. The equity market’s “risk-off” mode was also reinforced by the fallout from Hamas’ attack on Israel, which prompted worries that a broader Mideast conflict might lead to a period of elevated energy prices.
Global REIT indices underperformed the broader markets (as measured by the MSCI World Index), declining 5.43% through October 31, 2020 compared to gains of 11.07% for the MSCI World Index. Drivers of the underperformance likely include a more acute impact from rising rates on real estate valuations. Moving forward, there is still much uncertainty with respect to the longer-lasting impacts of the pandemic and the inflationary conditions that have ensued as a result of massive monetary accommodation. For example, the office subsector is an industry that has historically been saddled with relatively high maintenance capital expenditure requirements in addition to high tenant improvement expenditures and leasing costs. Couple these overhangs with a significant change in consumer preference to work from home, and what will undoubtedly be a long period of future technological improvement in telecommuting and virtual meetings, and it becomes very risky to deploy capital in this space. We believe that there are other potentially disrupted areas of the real estate market. While there are counterbalancing forces which may sustain demand in certain sectors/geographies, real estate seems to be more prone to disruption today than it ever has been in our recent memory.
That said, our strategy for navigating the current environment remains largely unchanged. We source most of our holdings from two separate pools. The first is in the quality franchises which exhibit high barriers to entry and sustainably generate strong cash flows. These companies generally also have an ability to invest capital at high rates of return and typically will compound capital at a pace that exceeds that of their peers.
13
TCW Global Real Estate Fund
Management Discussions (Continued)
The second set is in underappreciated, undervalued companies that could benefit from a change in sentiment. The issues facing these businesses are typically transitory and the discount is largely unfounded when viewed on a longer time horizon. In the current environment, it seems that the higher-quality, higher-growth businesses have been impacted as much as the lower-quality “value” names and accordingly we have added to some excellent companies that are as cheap as they have been in years. This should continue to be a great opportunity for active stock selection.
14
TCW Global Real Estate Fund
Management Discussions (Continued)
| | | | | | | | | | | | | | | | | | | | |
| | | Annualized Total Return as of October 31, 2023(1) | |
| | | 1 Yr
Return | | | 3 Yr
Return | | | 5 Yr
Return | | | 10 Yr
Return | | | Inception
to Date | |
TCW Global Real Estate Fund | | | | | | | | | | | | | | | | | | | | |
Class I (Inception: 12/01/2014) | | | (5.34 | %) | | | (0.27 | %) | | | 4.32 | % | | | — | | | | 2.77 | % |
Class N (Inception: 12/01/2014) | | | (5.54 | %) | | | (0.42 | %) | | | 4.16 | % | | | — | | | | 2.67 | % |
S&P Global REIT Index | | | (5.43 | %) | | | 2.67 | % | | | 0.76 | % | | | | | | | 2.00 | % |
| (1) | The total returns do not reflect taxes that a shareholder would pay on fund distribution or on the redemption of fund shares. |
15
TCW New America Premier Equities Fund
Management Discussions
For the fiscal year that ended October 31, 2023, the TCW New America Premier Equities Fund (the “Fund”) returned 16.78% and 16.47% on the I Class and N Class shares, respectively. The performance of the Fund’s classes varies because of differing expenses. The Fund’s benchmark, the Russell 1000 Index, returned 9.48% over the same period.
The Fund’s performance benefited from investments in Constellation Software, Broadcom, Oracle, Microsoft, and Linde. The Fund’s performance was negatively impacted by investments in Mettler-Toledo, HEICO, Danaher, Morningstar, and Waste Connections.
As we have indicated in the past, we eschew a reliance on macroeconomic forecasts and projections of the future direction of markets — our view is that these factors are unknowable. We therefore focus on what we think is knowable. We believe that a careful assessment of investment opportunities at the security level will provide us, in some cases, with a high probability view of the future free cash flows of a business. Risk-adjusted cash flow stream is a key determinant of the future returns of an investment and therefore a key determinant of the portfolio’s future returns. We believe that we have made good decisions in this respect and that the portfolio of companies is built to weather most market environments.
Investment Philosophy
The Fund seeks to outperform the broad U.S. indices in both rising and falling markets with less risk and volatility. We seek to accomplish this objective by investing in a concentrated portfolio of businesses that carefully manage their environmental and social resources and that employ best-in-class corporate governance practices. We invest in businesses that have high barriers to entry, are stable, generate substantial free cash flow and are managed by prudent leaders.
Focus on Dominant, Predictable Businesses with High Barriers to Entry: In the long run, the investment performance of a portfolio is inextricably linked to the underlying performance of the earnings and cash flows of the businesses comprising the portfolio. We believe one of the greatest risks in investing is valuing a business based on an erroneous view of the future free cash flows of the business. Such a circumstance results in an investor typically overpaying for a business and therefore generating a poor return on the investment.
In fast-growing businesses or in industries that are undergoing rapid changes it is extraordinarily difficult and often dangerous to make an investment in a business when the long-term cash generation potential of the enterprise has a wide spectrum of outcomes. We seek to avoid companies and industries that are undergoing rapid changes. What we do seek, however, are stable businesses that have dominant market positions, and whose long-term cash flows we believe can be predicted reasonably well. The qualitative characteristics that we seek, including attractive industry structures, pricing power and dominant market positions, make us confident in our forecast of the future cash flows of the businesses and therefore provide greater confidence that our valuation of the business is reasonably accurate. The famed value investor Benjamin Graham once said, “In the short run, the market is a voting machine but in the long run, it is a weighing machine.” Our view is that the market weighs cash flows and in order to consistently purchase a security for less than what it is worth, one should have high confidence in the future free cash flows of a business.
Risk control: Our primary objective, as stewards of your capital, is to control risk while seeking attractive returns. We hone our efforts on those businesses that we believe operate in stable industries with attractive industry structures, businesses that produce products that are critical to their customers, and businesses
16
TCW New America Premier Equities Fund
Management Discussions (Continued)
that we believe are led by proven, appropriately incentivized leaders. We endeavor to further control valuation risk by purchasing securities at attractive prices relative to the current free cash flow generation of the businesses. We believe that businesses that fit our profile produce fairly stable cash flow streams and are less prone to macroeconomic fluctuations, competitive pressures and valuation risks.
Consistency: It is also our objective to deliver a consistently positive outcome. We would view outsized outperformance in one year and poor performance in the subsequent year as a poor outcome for our clients. Our bottoms-up investment process is focused on selecting undervalued businesses that we believe should perform well in most market environments and hold up well in negative periods. We believe consistency in approach and consistency in outcome gives us the best chance of minimizing a left-tail outcome in any given year. It is our view that if we can consistently deliver above-average risk-adjusted performance over a long period of time the outcome likely would be outperformance relative to our peers over the full period. That is our goal.
Thank you for joining us as fellow shareholders in the TCW New America Premier Equities Fund. We will continue to work hard to justify your confidence in us.
17
TCW New America Premier Equities Fund
Management Discussions (Continued)
| | | | | | | | | | | | | | | | | | | | |
| | | Annualized Total Return as of October 31, 2023(1) | |
| | | 1 Yr
Return | | | 3 Yr
Return | | | 5 Yr
Return | | | 10 Yr
Return | | | Inception
to Date | |
TCW New America Premier Equities Fund | | | | | | | | | | | | | | | | | | | | |
Class I (Inception: 02/01/2016) | | | 16.78 | % | | | 8.58 | % | | | 12.76 | % | | | — | | | | 15.88 | % |
Class N (Inception: 02/01/2016) | | | 16.47 | % | | | 8.28 | % | | | 12.48 | % | | | — | | | | 15.69 | % |
Russell 1000 Index | | | 9.48 | % | | | 9.53 | % | | | 10.71 | % | | | | | | | 12.32 | % |

| (1) | The total returns do not reflect taxes that a shareholder would pay on fund distribution or on the redemption of fund shares. |
18
TCW Relative Value Dividend Appreciation Fund
Management Discussions
For the year ended October 31, 2023, the TCW Relative Value Dividend Appreciation Fund (the “Fund”) posted a return of 3.61% and 3.40% on its I Class and N Class shares, respectively, an outperformance of the benchmark by over 325 bps. The performance of the Fund’s classes varies because of differing expenses. The Fund’s benchmark, the Russell 1000 Value Index, returned 0.13% over the same period.
Market Outlook
U.S. recession timing has been put off. After the strong showing in 3Q23, the economy is expected to grow in 4Q23, albeit by 1-2%. While employment remains strong it is important to remember it is a lagging indicator, as is inflation. Average hourly earnings, a “sticky” inflation contributor, declined to 4.1% year-over-year but buoys consumers as wages are outpacing inflation with the latest CPI reading of 3.7% year-over-year.
Interest sensitive names and asset classes are adjusting to the normalization of rates to higher levels versus the zero lower bound experienced for most of the last 15 years. The drumbeat in the background is that higher rates will cause something to break, either consumers, banks, corporations, or all of the above. Certainly, mortgage rates close to 8% (significantly higher than the 5% average 30-year rate for the last 50 years) have given buyers pause. Providing some relief, well-financed homebuilders are offering “buydown” rates of 5.5-6.0% at current levels. Some U.S. consumers face a headwind with the resumption of student loan payments begun in September. We expect the repayment process to be gradual and it could be mitigated by President Biden’s proposed major expansion of the income-driven repayment program and 12-month payment postponements.
The spring regional banking crisis, with unrealized losses on bank assets available for sale and held to maturity outweighing deposit demands, turned into bank runs for those that could not satisfy withdrawals. So far, the Federal Home Loan Banking system, the Fed window, and the one-year March 2023 Fed Bank Term Funding Program have contained rolling bank funding crises at a cost to net interest income, but $3.0 billion of small bank mergers occurred in 3Q23 up from $600 million in the first half of 2023.
Corporations, as measured by constituents in Bloomberg U.S. Corporate Bond Index, prudently extended debt maturities at low interest rates with the Index’s average maturity of 10.5 years. High corporate cash levels are earning above 5% adding potentially as much as 1.5% to 3Q23 earnings. Third quarter sales and earnings to date have resoundingly best expectations although guidance is coming down. Both fourth quarter and calendar year 2024 EPS are still estimated to be high single-digit growth.
Wartime economies can crowd out traditional business investments but also provide growth for industries servicing war efforts. Dire events saturate the current economic outlook and with 5% interest rates available in money market funds and 2-year Treasuries, there are reliable safe havens. However, patience rewards the investor. The S&P 500 historically has averaged 10% per year, nearly twice the current short rates.
19
TCW Relative Value Dividend Appreciation Fund
Management Discussions (Continued)
If the U.S. has reached a peak in the fed funds rate, it is possible for further stock market gains ahead. The table below highlights how well the U.S. stock markets do one year post the peak fed funds rate in each of the last six Fed hike cycles.
Fed Hiking Cycles
| | | | | | | | | | | | | | | | | | | | |
| | | | | | Fed Funds Rate | | | 12 month return post | |
| Start Date | | End Date | | | Initial | | | Cycle Peak | | | Russ MC TR | | | SPX TR | |
03/30/83 | | | 08/09/84 | | | | 8.50 | % | | | 11.50 | % | | | n/a | | | | 18.0 | % |
01/04/87 | | | 02/24/89 | | | | 5.88 | % | | | 9.75 | % | | | 12.1 | % | | | 18.9 | % |
02/03/94 | | | 02/01/95 | | | | 3.00 | % | | | 6.00 | % | | | 34.5 | % | | | 38.2 | % |
06/29/99 | | | 05/16/00 | | | | 4.75 | % | | | 6.50 | % | | | 4.9 | % | | | (10.5 | %) |
06/29/04 | | | 06/29/06 | | | | 1.00 | % | | | 5.25 | % | | | 20.8 | % | | | 20.5 | % |
12/15/15 | | | 12/20/18 | | | | 0.13 | % | | | 2.38 | % | | | 30.5 | % | | | 31.3 | % |
03/17/22 | | | 07/26/23 | | | | 0.25 | % | | | 5.50 | % | | | n/a | | | | n/a | |
Average | | | | | | | | | | | | | | | 20.6 | % | | | 19.4 | % |
The inception date of the Russell Midcap® Index is November 1, 1991. All performance presented prior to the index inception date is back-tested performance. Source: TCW, Bloomberg
From the peak fed funds rate, starting with the Black Monday (1987) crisis and not including the seventh current cycle, mid-caps, as represented by the Russell Midcap (RMC) Index and the S&P 500 have returned 20.6% and 19.4%, on average, for the next twelve months. The lowest 12-month total return was 4.9% and -10.5% for the RMC and S&P 500, respectively post the 5/16/00 peak and the highest was 34.5% and 38.2% post the 2/1/95 peak. Mid-caps outperformed large caps by a 120 basis points (bps) margin per year. History and current extreme valuations indicate that the “era” for mega cap outperformance soon may be behind us.
Eurozone preliminary 3Q23 GDP contracted slightly (-0.1%) versus consensus estimates for flat growth and has been tepid since 4Q21. Germany was the weakest of the bloc contracting -0.3 in 3Q23 year-over-year, but there were upward revisions to the two prior quarters. Despite revisions, Germany is still lagging behind the broader Euro area economy. The statistics office noted that consumer spending was the main drag while equipment investment rose. Eurozone inflation data declined notably to 2.9% in October from prior month read of 4.3%, its lowest level since July 2021. The UK grew at a 0.6% annual rate in 3Q23 matching the prior quarter. The country’s CPI was unchanged from prior month at 6.7% while core inflation is at 6.1%. The BOE (Bank of England) held rates steady and signaled that they are to stay elevated for an “extended” period and that economic growth is expected to be flat over next 1-2 years. The ECB (European Central Bank) hiking cycle could be over, while the BOE signaled there is the potential for additional hikes should inflation not continue to fall.
China’s GDP grew at 4.9% in 3Q23 and is on target for 5% in 2023. The country’s manufacturing sector (PMI) unexpectedly swung back to contraction while non-manufacturing activity fell to the lowest level since the economy reopened from the lockdown earlier this year. Deflation remains a risk; CPI has essentially been flat for past six months ending September and youth unemployment (ages 16-24) is greater than 20% as of June (latest data point). The PBOC (People’s Bank of China) is likely to cut rates further before year end. Japan’s economy grew at 4.8% rate in 2Q23 due to surging exports and tourists flooding the country. The drop in domestic consumption has economists worried. The BOJ (Bank of Japan) is leaving short-term rates in negative territory and the YCC (Yield Curve Control) cap on 10-year
20
TCW Relative Value Dividend Appreciation Fund
Management Discussions (Continued)
JGBs (Japanese Government Bonds) unchanged at 1% with the upper bound “as a reference”. Japan CPI has exceeded the stated 2% target for 18 consecutive months with forecast inflation not to drop below 2% in 2025. The yen/USD is at the symbolic 150 mark after the YCC decision as traders focused on the BOJ’s dovish pledge to “patiently” maintain accommodative policy.
There are no worries about breaching the debt ceiling until early 2025, but the government faces a potential shutdown on November 17th. Back to school and Halloween sales holding up herald 2-4% for the holiday season, less than last year but still positive. Historically, the fourth quarter of the calendar year is the strongest for U.S. stocks with the S&P gaining 3.8%, on average, in price since 1945 and rising 77% of the time. That is something to look forward to. On the other hand, Middle East hostilities on top of the Ukraine/Russia war about to enter its third year pose risks; however, the U.S. continues to be a global safe haven for all asset classes.
We remain true to our diversified and disciplined portfolio strategy, diligent, and ever watchful for changes. All portfolio holdings are stress tested for a recession over the next two years. We are busy and actively working to make the best portfolio decisions possible with the information we have and will make adjustments should the “facts” change. We are excited about the future but maintain strong risk controls for unexpected events. We thank you for your continued confidence and look forward to better markets ahead.
Fund Review
Over the course of the one-year period ending October 31, 2023, stock selection contributed quite favorably (by nearly 450 bps) relative to the benchmark. The Fund’s top ten holdings by average weight (over the course of the fiscal year) outperformed the portfolio and its benchmark index returning 19.9% led by solid gains from Broadcom, General Electric, and Lennar.
The best contribution came from the portfolio’s Health Care stocks which outperformed the group 2.3% versus -10.1% led by Novartis and McKesson. The portfolio’s Information Technology rose 33.8% far ahead of their peers’ gain of 8.8% led largely by Broadcom while Lennar was the stalwart in Consumer Discretionary where that group returned 11.2% versus -4.0%. General Electric and nVent highlighted in Industrials and the portfolio also benefited from stock selection in Energy, Real Estate, and Financials led by Baker Hughes, Simon Property Group, and Intercontinental Exchange, respectively. One additional notable contributor was Dupont.
On the downside, the portfolio’s Communication Services stocks were the biggest detractors returning 6.3% versus the group’s strong gain of 30.4% (the best performing sector in the Russell 1000 Value) due mostly to not owning Meta Platforms which was up an astounding 223% over the course of the one-year period. It is to be noted that Meta exited the value benchmark at its June reconfiguration. To a lesser effect Warner Bros. Discovery dampened the Communications Services results. AES was key for the loss suffered in Utilities where the portfolio’s names returned -41.6% versus -8.0% while each of the portfolio’s Consumer Staples names struggled with the group as a whole returning -17.5% versus their peers’ slight -1.7% decline with Target, Keurig Dr Pepper, PepsiCo, and Conagra the biggest laggards. Both Target and Conagra were eliminated in August. Other notable detractors included MetLife, Elevance Health, UPS, and Johnson Controls.
21
TCW Relative Value Dividend Appreciation Fund
Management Discussions (Continued)
The Fund’s sector weights detracted 29 bps to relative performance due to the overweights in Health Care and Consumer Discretionary and underweight in Communication Services. The positive underweights in Utilities and Real Estate and overweight in Industrials were a partial offset.
| | | | | | | | | | | | | | | | | | | | | | | | |
| | | Annualized Total Return as of October 31, 2023(1) | |
| | | 1 Yr
Return | | | 3 Yr
Return | | | 5 Yr
Return | | | 10 Yr
Return | | | Inception
to Date | | | Inception
Index | |
TCW Relative Value Dividend Appreciation Fund | | | | | | | | | | | | | | | | | | | | | | | | |
Class I (Inception: 11/01/2004) | | | 3.61 | % | | | 15.22 | % | | | 9.22 | % | | | 7.47 | % | | | 7.32 | % | | | 9.63 | % |
Class N (Inception: 09/19/1986) | | | 3.40 | % | | | 15.00 | % | | | 9.00 | % | | | 7.23 | % | | | 8.85 | % | | | 7.31 | % |
Russell 1000 Value Index | | | 0.13 | % | | | 10.21 | % | | | 6.60 | % | | | 7.60 | % | | | | | | | | |

| (1) | The total returns do not reflect taxes that a shareholder would pay on fund distribution or on the redemption of fund shares. |
22
TCW Relative Value Large Cap Fund
Management Discussions
For the year ended October 31, 2023, the TCW Relative Value Large Cap Fund (the “Fund”) posted a return of 3.61% and 3.41% on its I Class and N Class shares, respectively, an outperformance of the benchmark by over 325 bps. The performance of the Fund’s classes varies because of differing expenses. The Fund’s benchmark, the Russell 1000 Value Index, returned 0.13% over the same period.
Market Outlook
U.S. recession timing has been put off. After the strong showing in 3Q23, the economy is expected to grow in 4Q23, albeit by 1-2%. While employment remains strong it is important to remember it is a lagging indicator, as is inflation. Average hourly earnings, a “sticky” inflation contributor, declined to 4.1% year-over-year but buoys consumers as wages are outpacing inflation with the latest CPI reading of 3.7% year-over-year.
Interest sensitive names and asset classes are adjusting to the normalization of rates to higher levels versus the zero lower bound experienced for most of the last 15 years. The drumbeat in the background is that higher rates will cause something to break, either consumers, banks, corporations, or all of the above. Certainly, mortgage rates close to 8% (significantly higher than the 5% average 30-year rate for the last 50 years) have given buyers pause. Providing some relief, well-financed homebuilders are offering “buydown” rates of 5.5-6.0% at current levels. Some U.S. consumers face a headwind with the resumption of student loan payments begun in September. We expect the repayment process to be gradual and it could be mitigated by President Biden’s proposed major expansion of the income-driven repayment program and 12-month payment postponements.
The spring regional banking crisis, with unrealized losses on bank assets available for sale and held to maturity outweighing deposit demands, turned into bank runs for those that could not satisfy withdrawals. So far, the Federal Home Loan Banking system, the Fed window, and the one-year March 2023 Fed Bank Term Funding Program have contained rolling bank funding crises at a cost to net interest income, but $3.0 billion of small bank mergers occurred in 3Q23 up from $600 million in the first half of 2023.
Corporations, as measured by constituents in Bloomberg U.S. Corporate Bond Index, prudently extended debt maturities at low interest rates with the Index’s average maturity of 10.5 years. High corporate cash levels are earning above 5% adding potentially as much as 1.5% to 3Q23 earnings. Third quarter sales and earnings to date have resoundingly best expectations although guidance is coming down. Both fourth quarter and calendar year 2024 EPS are still estimated to be high single-digit growth.
Wartime economies can crowd out traditional business investments but also provide growth for industries servicing war efforts. Dire events saturate the current economic outlook and with 5% interest rates available in money market funds and 2-year Treasuries, there are reliable safe havens. However, patience rewards the investor. The S&P 500 historically has averaged 10% per year, nearly twice the current short rates.
23
TCW Relative Value Large Cap Fund
Management Discussions (Continued)
If the U.S. has reached a peak in the fed funds rate, it is possible for further stock market gains ahead. The table below highlights how well the U.S. stock markets do one year post the peak fed funds rate in each of the last six Fed hike cycles.
Fed Hiking Cycles
| | | | | | | | | | | | | | | | | | | | |
| | | | | | Fed Funds Rate | | | 12 month return post | |
| Start Date | | End Date | | | Initial | | | Cycle Peak | | | Russ MC TR | | | SPX TR | |
03/30/83 | | | 08/09/84 | | | | 8.50 | % | | | 11.50 | % | | | n/a | | | | 18.0 | % |
01/04/87 | | | 02/24/89 | | | | 5.88 | % | | | 9.75 | % | | | 12.1 | % | | | 18.9 | % |
02/03/94 | | | 02/01/95 | | | | 3.00 | % | | | 6.00 | % | | | 34.5 | % | | | 38.2 | % |
06/29/99 | | | 05/16/00 | | | | 4.75 | % | | | 6.50 | % | | | 4.9 | % | | | (10.5 | %) |
06/29/04 | | | 06/29/06 | | | | 1.00 | % | | | 5.25 | % | | | 20.8 | % | | | 20.5 | % |
12/15/15 | | | 12/20/18 | | | | 0.13 | % | | | 2.38 | % | | | 30.5 | % | | | 31.3 | % |
03/17/22 | | | 07/26/23 | | | | 0.25 | % | | | 5.50 | % | | | n/a | | | | n/a | |
Average | | | | | | | | | | | | | | | 20.6 | % | | | 19.4 | % |
The inception date of the Russell Midcap® Index is November 1, 1991. All performance presented prior to the index inception date is back-tested performance. Source: TCW, Bloomberg
From the peak fed funds rate, starting with the Black Monday (1987) crisis and not including the seventh current cycle, mid-caps, as represented by the Russell Midcap (RMC) Index and the S&P 500 have returned 20.6% and 19.4%, on average, for the next twelve months. The lowest 12-month total return was 4.9% and -10.5% for the RMC and S&P 500, respectively post the 5/16/00 peak and the highest was 34.5% and 38.2% post the 2/1/95 peak. Mid-caps outperformed large caps by a 120 bps margin per year. History and current extreme valuations indicate that the “era” for mega cap outperformance soon may be behind us.
Eurozone preliminary 3Q23 GDP contracted slightly (-0.1%) versus consensus estimates for flat growth and has been tepid since 4Q21. Germany was the weakest of the bloc contracting -0.3 in 3Q23 year-over-year but there were upward revisions to the two prior quarters. Despite revisions, Germany is still lagging behind the broader Euro area economy. The statistics office noted that consumer spending was the main drag while equipment investment rose. Eurozone inflation data declined notably to 2.9% in October from prior month read of 4.3%, its lowest level since July 2021. The UK grew at a 0.6% annual rate in 3Q23 matching the prior quarter. The country’s CPI was unchanged from prior month at 6.7% while core inflation is at 6.1%. The BOE held rates steady and signaled that they are to stay elevated for an “extended” period and that economic growth is expected to be flat over next 1-2 years. The ECB hiking cycle could be over, while the BOE signaled there is the potential for additional hikes should inflation not continue to fall.
China’s GDP grew at 4.9% in 3Q23 and is on target for 5% in 2023. The country’s manufacturing sector (PMI) unexpectedly swung back to contraction while non-manufacturing activity fell to the lowest level since the economy reopened from the lockdown earlier this year. Deflation remains a risk; CPI has essentially been flat for past six months ending September and youth unemployment (ages 16-24) is greater than 20% as of June (latest data point). The PBOC is likely to cut rates further before year end. Japan’s economy grew at 4.8% rate in 2Q23 due to surging exports and tourists flooding the country. The drop in domestic consumption has economists worried. The BOJ is leaving short-term rates in negative territory and the YCC cap on 10-year JGBs unchanged at 1% with the upper bound “as a reference”. Japan CPI has exceeded the stated 2% target for 18 consecutive months with forecast inflation
24
TCW Relative Value Large Cap Fund
Management Discussions (Continued)
not to drop below 2% in 2025. The yen/USD is at the symbolic 150 mark after the YCC decision as traders focused on the BOJ’s dovish pledge to “patiently” maintain accommodative policy.
There are no worries about breaching the debt ceiling until early 2025, but the government faces a potential shutdown on November 17TH. Back to school and Halloween sales holding up herald 2-4% for the holiday season, less than last year but still positive. Historically, the fourth quarter of the calendar year is the strongest for U.S. stocks with the S&P gaining 3.8%, on average, in price since 1945 and rising 77% of the time. That is something to look forward to. On the other hand, Middle East hostilities on top of the Ukraine/Russia war about to enter its third year pose risks; however, the U.S. continues to be a global safe haven for all asset classes.
We remain true to our diversified and disciplined portfolio strategy, diligent, and ever watchful for changes. All portfolio holdings are stress tested for a recession over the next two years. We are busy and actively working to make the best portfolio decisions possible with the information we have and will make adjustments should the “facts” change. We are excited about the future but maintain strong risk controls for unexpected events. We thank you for your continued confidence and look forward to better markets ahead.
Fund Review
Over the course of the one-year period ending October 31, 2023, stock selection contributed quite favorably (by nearly 350 bps) relative to the benchmark. The Fund’s top ten holdings by average weight (over the course of the fiscal year) outperformed the portfolio and its benchmark index returning 20.3% led by solid gains from Broadcom, General Electric, and Lennar.
The best contribution came from the portfolio’s Information Technology stocks which outperformed the group 23.7% versus 8.8% led by Broadcom, Flex, and onsemi. Largely due to Lennar, the portfolio’s Consumer Discretionary names bested their peers 8.4% versus -4.0% while Apollo Global Management and McKesson were the stalwarts in Financials and Health Care, respectively. The portfolio also benefited from stock selection in Energy, Materials, and Industrials with Baker Hughes, Dupont, and General Electric the top performers in their respective sector.
On the downside, the portfolio’s Communication Services stocks were the biggest detractors returning 1.9% versus the group’s strong gain of 30.4% (the best performing sector in the Russell 1000 Value) due mostly to not owning Meta Platforms which was up an astounding 223% over the course of the one-year period. It is to be noted that Meta exited the value benchmark at its June reconfiguration. To a lesser effect Warner Bros. Discovery and Paramount Global both dampened the Communications Services results. Each of the portfolio’s Consumer Staples names struggled with the group returning -18.6% versus their peers’ slight -1.8% decline with Target, Keurig Dr Pepper, and Conagra the biggest laggards. Both Target and Conagra were eliminated in August. AES was almost solely responsible for the loss suffered in Utilities. Other notable detractors included managed care companies Centene and Molina Healthcare.
In addition to positive stock selection, the Fund also benefited from its sector weights which contributed 70 bps to relative performance. The overweight in Information Technology and underweights in Utilities and Financials were all additive. The underweight in Communication Services and overweight in Consumer Discretionary detracted.
25
TCW Relative Value Large Cap Fund
Management Discussions (Continued)
| | | | | | | | | | | | | | | | | | | | | | | | |
| | | Annualized Total Return as of October 31, 2023(1) | |
| | | 1 Yr
Return | | | 3 Yr
Return | | | 5 Yr
Return | | | 10 Yr
Return | | | Inception
to Date | | | Inception
Index | |
TCW Relative Value Large Cap Fund | | | | | | | | | | | | | | | | | | | | | | | | |
Class I (Inception: 01/02/2004) | | | 3.61 | % | | | 13.86 | % | | | 8.21 | % | | | 7.32 | % | | | 7.34 | % | | | 6.93 | % |
Class N (Inception: 01/02/1998) | | | 3.41 | % | | | 13.65 | % | | | 8.02 | % | | | 7.09 | % | | | 6.43 | % | | | 7.37 | % |
Russell 1000 Value Index | | | 0.13 | % | | | 10.21 | % | | | 6.60 | % | | | 7.60 | % | | | | | | | | |


| (1) | The total returns do not reflect taxes that a shareholder would pay on fund distribution or on the redemption of fund shares. |
26
TCW Relative Value Mid Cap Fund
Management Discussions
For the year ended October 31, 2023, the TCW Relative Value Mid Cap Fund (the “Fund”) posted a return of 1.15% and 1.05% on its I Class and N Class shares, respectively, an outperformance of the benchmark by over 460 bps. The performance of the Fund’s classes varies because of differing expenses. The Fund’s benchmark, the Russell Midcap Value Index, returned -3.56% over the same period.
Market Outlook
U.S. recession timing has been put off. After the strong showing in 3Q23, the economy is expected to grow in 4Q23, albeit by 1-2%. While employment remains strong it is important to remember it is a lagging indicator as is inflation. Average hourly earnings, a “sticky” inflation contributor, declined to 4.1% year-over-year but buoys consumers as wages are outpacing inflation with the latest CPI reading of 3.7% year-over-year.
Interest sensitive names and asset classes are adjusting to the normalization of rates to higher levels versus the zero lower bound experienced for most of the last 15 years. The drumbeat in the background is that higher rates will cause something to break, either consumers, banks, corporations, or all of the above. Certainly, mortgage rates close to 8% (significantly higher than the 5% average 30-year rate for the last 50 years) have given buyers pause. Providing some relief, well-financed homebuilders are offering “buydown” rates of 5.5-6.0% at current levels. Some U.S. consumers face a headwind with the resumption of student loan payments begun in September. We expect the repayment process to be gradual and it could be mitigated by President Biden’s proposed major expansion of the income-driven repayment program and 12-month payment postponements.
The spring regional banking crisis, with unrealized losses on bank assets available for sale and held to maturity outweighing deposit demands, turned into bank runs for those that could not satisfy withdrawals. So far, the Federal Home Loan Banking system, the Fed window, and the one-year March 2023 Fed Bank Term Funding Program have contained rolling bank funding crises at a cost to net interest income, but $3.0 billion of small bank mergers occurred in 3Q23 up from $600 million in the first half of 2023.
Corporations, as measured by constituents in Bloomberg U.S. Corporate Bond Index, prudently extended debt maturities at low interest rates with the Index’s average maturity of 10.5 years. High corporate cash levels are earning above 5% adding potentially as much as 1.5% to 3Q23 earnings. Third quarter sales and earnings to date have resoundingly best expectations although guidance is coming down. Both fourth quarter and calendar year 2024 EPS are still estimated to be high single-digit growth.
Wartime economies can crowd out traditional business investments but also provide growth for industries servicing war efforts. Dire events saturate the current economic outlook and with 5% interest rates available in money market funds and 2-year Treasuries, there are reliable safe havens. However, patience rewards the investor. The S&P 500 historically has averaged 10% per year, nearly twice the current short rates.
27
TCW Relative Value Mid Cap Fund
Management Discussions (Continued)
If the U.S. has reached a peak in the fed funds rate, it is possible for further stock market gains ahead. The table below highlights how well the U.S. stock markets do one year post the peak fed funds rate in each of the last six Fed hike cycles.
Fed Hiking Cycles
| | | | | | | | | | | | | | | | | | | | |
| | | | | | Fed Funds Rate | | | 12 month return post | |
| Start Date | | End Date | | | Initial | | | Cycle Peak | | | Russ MC TR | | | SPX TR | |
03/30/83 | | | 08/09/84 | | | | 8.50 | % | | | 11.50 | % | | | n/a | | | | 18.0 | % |
01/04/87 | | | 02/24/89 | | | | 5.88 | % | | | 9.75 | % | | | 12.1 | % | | | 18.9 | % |
02/03/94 | | | 02/01/95 | | | | 3.00 | % | | | 6.00 | % | | | 34.5 | % | | | 38.2 | % |
06/29/99 | | | 05/16/00 | | | | 4.75 | % | | | 6.50 | % | | | 4.9 | % | | | (10.5 | %) |
06/29/04 | | | 06/29/06 | | | | 1.00 | % | | | 5.25 | % | | | 20.8 | % | | | 20.5 | % |
12/15/15 | | | 12/20/18 | | | | 0.13 | % | | | 2.38 | % | | | 30.5 | % | | | 31.3 | % |
03/17/22 | | | 07/26/23 | | | | 0.25 | % | | | 5.50 | % | | | n/a | | | | n/a | |
Average | | | | | | | | | | | | | | | 20.6 | % | | | 19.4 | % |
The inception date of the Russell Midcap® Index is November 1, 1991. All performance presented prior to the index inception date is back-tested performance. Source: TCW, Bloomberg
From the peak fed funds rate, starting with the Black Monday (1987) crisis and not including the seventh current cycle, mid-caps, as represented by the Russell Midcap (RMC) Index and the S&P 500 have returned 20.6% and 19.4%, on average, for the next twelve months. The lowest 12-month total return was 4.9% and -10.5% for the RMC and S&P 500, respectively post the 5/16/00 peak and the highest was 34.5% and 38.2% post the 2/1/95 peak. Mid-caps outperformed large caps by a 120 bps margin per year. History and current extreme valuations indicate that the “era” for mega cap outperformance soon may be behind us.
Eurozone preliminary 3Q23 GDP contracted slightly (-0.1%) versus consensus estimates for flat growth and has been tepid since 4Q21. Germany was the weakest of the bloc contracting -0.3 in 3Q23 year-over-year, but there were upward revisions to the two prior quarters. Despite revisions, Germany is still lagging behind the broader Euro area economy. The statistics office noted that consumer spending was the main drag while equipment investment rose. Eurozone inflation data declined notably to 2.9% in October from prior month read of 4.3%, its lowest level since July 2021. The UK grew at a 0.6% annual rate in 3Q23 matching the prior quarter. The country’s CPI was unchanged from prior month at 6.7% while core inflation is at 6.1%. The BOE held rates steady and signaled that they are to stay elevated for an “extended” period and that economic growth is expected to be flat over next 1-2 years. The ECB hiking cycle could be over, while the BOE signaled there is the potential for additional hikes should inflation not continue to fall.
China’s GDP grew at 4.9% in 3Q23 and is on target for 5% in 2023. The country’s manufacturing sector (PMI) unexpectedly swung back to contraction while non-manufacturing activity fell to the lowest level since the economy reopened from the lockdown earlier this year. Deflation remains a risk; CPI has essentially been flat for past six months ending September and youth unemployment (ages 16-24) is greater than 20% as of June (latest data point). The PBOC is likely to cut rates further before year end. Japan’s economy grew at 4.8% rate in 2Q23 due to surging exports and tourists flooding the country. The drop in domestic consumption has economists worried. The BOJ is leaving short-term rates in negative territory and the YCC cap on 10-year JGBs unchanged at 1% with the upper bound “as a reference”. Japan CPI has exceeded the stated 2% target for 18 consecutive months with forecast inflation
28
TCW Relative Value Mid Cap Fund
Management Discussions (Continued)
not to drop below 2% in 2025. The yen/USD is at the symbolic 150 mark after the YCC decision as traders focused on the BOJ’s dovish pledge to “patiently” maintain accommodative policy.
There are no worries about breaching the debt ceiling until early 2025, but the government faces a potential shutdown on November 17TH. Back to school and Halloween sales holding up herald 2-4% for the holiday season, less than last year but still positive. Historically, the fourth quarter of the calendar year is the strongest for U.S. stocks with the S&P gaining 3.8%, on average, in price since 1945 and rising 77% of the time. That is something to look forward to. On the other hand, Middle East hostilities on top of the Ukraine/Russia war about to enter its third year pose risks; however, the U.S. continues to be a global safe haven for all asset classes.
We remain true to our diversified and disciplined portfolio strategy, diligent, and ever watchful for changes. All portfolio holdings are stress tested for a recession over the next two years. We are busy and actively working to make the best portfolio decisions possible with the information we have and will make adjustments should the “facts” change. We are excited about the future but maintain strong risk controls for unexpected events. We thank you for your continued confidence and look forward to better markets ahead.
Fund Review
Over the course of the one-year period ending October 31, 2023, stock selection contributed quite favorably (by over 500 bps) relative to the benchmark. The Fund’s top ten holdings by average weight (over the course of the fiscal year) outperformed the portfolio and its benchmark index returning 20.9% led by Toll Brothers, Arch Capital, and Apollo Global Management.
The preponderance of the outperformance came from stock selection in Financials and Consumer Discretionary. The aforementioned Arch Capital and Apollo Global Management along with First Citizens BancShares led to the outperformance in Financials where the portfolio’s stocks rose 12.1% far ahead of the group decline of -9.0%. Robust gains from homebuilders Toll Brothers, Lennar, and D.R. Horton were largely responsible for the outperformance in Consumer Discretionary where the portfolio’s holdings gained 13.3% versus -1.6%. The portfolio also benefited from stock selection in Consumer Staples, Energy, Information Technology, and Materials led by Coty, Baker Hughes, Flex, and Dupont, respectively.
The bulk of the underperformance was concentrated mainly in Health Care and Utilities. Managed care names Centene and Molina Healthcare along with Envista, Perrigo, and AdaptHealth were the most notable detractors in Health Care where the portfolio’s names fell -19.0% versus the group’s return of -9.8%. AES was key for the loss suffered in Utilities where the portfolio’s stocks returned -25.7% versus -4.1%. Other notable detractors included regional bank KeyCorp and Foot Locker both of which were completely sold.
The Fund also benefited from its sector weights which contributed 44 bps to relative performance led by the underweight in Real Estate and overweigh in Financials. The underweights in Energy and Materials detracted slightly.
29
TCW Relative Value Mid Cap Fund
Management Discussions (Continued)
| | | | | | | | | | | | | | | | | | | | | | | | |
| | | Annualized Total Return as of October 31, 2023(1) | |
| | | 1 Yr
Return | | | 3 Yr
Return | | | 5 Yr
Return | | | 10 Yr
Return | | | Inception
to Date | | | Inception
Index | |
TCW Relative Value Mid Cap Fund | | | | | | | | | | | | | | | | | | | | | | | | |
Class I (Inception: 11/01/1996) | | | 1.15 | % | | | 12.71 | % | | | 6.31 | % | | | 6.16 | % | | | 9.31 | %(2) | | | 9.39 | % |
Class N (Inception: 11/01/2000) | | | 1.05 | % | | | 12.61 | % | | | 6.22 | % | | | 6.00 | % | | | 7.23 | % | | | 8.70 | % |
Russell Midcap Value Index | | | (3.56 | %) | | | 8.78 | % | | | 5.69 | % | | | 6.89 | % | | | | | | | | |
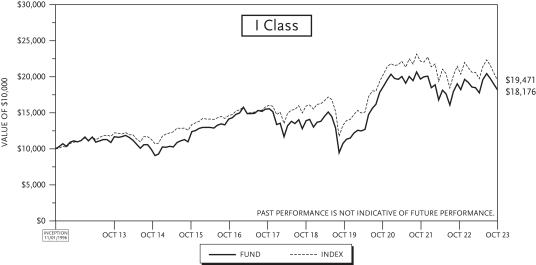

| (1) | The total returns do not reflect taxes that a shareholder would pay on fund distribution or on the redemption of fund shares. |
| (2) | Performance data includes the performance of the predecessor entity for periods before the Fund’s registration became effective. The predecessor entity was not registered under the 1940 Act and, therefore, was not subject to certain investment restrictions that are imposed by the 1940 Act. If the predecessor entity had been registered under the 1940 Act, the predecessor entity’s performance may have been lower. |
30
TCW Select Equities Fund
Management Discussions
For the year ended October 31, 2023, the TCW Select Equities Fund (the “Fund”) returned +18.60% and +18.50% on its I Class and N Class shares, respectively. The performance of the Fund’s classes varies because of differing expenses. The Fund’s benchmark, Russell 1000 Growth Index, returned +18.95% over the same period.
Whereas last year was marked by an equity bear market and arguably the fastest tightening of financial conditions in over 40 years, fiscal year 2023 was marked by cooling inflation data and an equity market rally that confounded many investors (2-year/10-year UST yield curve remained inverted, and every recession since 1957 has been preceded by a yield curve inversion). In early March, regional banks Silicon Valley Bank (SIVB) and Signature Bank (SBNY) were closed by regulators after the companies ran into liquidity issues due to a duration mismatch (years of a zero-interest rate backdrop and a sizable underwater securities portfolio). The Fed remained committed to fighting inflation, however, and tightened rates another 25 bps in its March, May and July meetings, bringing the Federal Funds rate to 5.25% to 5.50%. Higher rates have resulted in decreasing consumer confidence and homebuyer mortgage demand hit 28-year lows. Tighter bank lending standards are disinflationary and recent economic data portend to a Fed that may be done raising rates for the foreseeable future. Investor focus now turns to whether the Fed has indeed engineered a “soft landing” as we head into 2024.
Net of expenses, the Fund underperformed for the year despite positive security selection effects. Our biggest stock detractors relative to the benchmark came from the information technology and healthcare sectors. After being our best relative performer in fiscal year 2022, shares of Enphase Energy, Inc. (ENPH) moved lower in fiscal year 2023 as sales momentum decelerated in the face of the California NEM (net energy metering) 3.0 transition and higher financing costs. While we remain positive on ENPH’s product offering, we believe the company’s revenue opportunity is currently impaired, and we therefore elected to exit our position. Shares of Dexcom, Inc. (DXCM) moved lower after Novo Nordisk’s landmark SELECT trial readout showed Wegovy not only helped people lose weight, but also reduced the risk of suffering heart attacks, strokes, and cardiovascular deaths by 20% vs. placebo. Some investors concluded that the data meant that by lowering the obesity burden for the GLP-1 patients, the addressable market for DXCM could be impaired (fewer overweight people might mean fewer people developing Type 2 diabetes). Our countering view: GLP-1 use likely complements CGM (Continuous Glucose Monitoring) use, patients on insulin were excluded from the SELECT clinical trial and CGM devices are currently only recommended for patients using insulin, and the fact that GLP-1 labels include the risk of hypoglycemia for patients on insulin suggest to us an even greater need for a patient on insulin to use CGM. We remain positive on DXCM shares.
Our biggest stock contributors during the year came from the information technology sector. On November 30, 2022, OpenAI’s ChatGPT was launched, and within months ChatGPT had over 100 million users, signaling the dawn of the AI (Artificial Intelligence) era. Over 1,000 high-end NVIDIA Corporation (NVDA) GPUs (Graphics Processing Units) were used to train the large language model for ChatGPT. A string of positive NVDA quarterly earnings reports ensued, confirming accelerating demand for the company’s products. When we first purchased shares of NVDA over five years ago, we believed the company was the beneficiary of multiple secular tailwinds and could become the “WinTel” of Machine Learning. We believe our thesis is playing out and remain positive on shares. Another company benefiting from the AI trend is ServiceNow, Inc. (NOW). In May, enterprise workflow leader NOW laid out its strategy to leverage its platform and monetize AI via both general use cases (such as text generation) as well as domain-specific uses. The company’s Vancouver release with generative AI features became available on September 29th, and four large new deals were signed the last day of its quarter. We believe AI will continue to expand NOW’s total addressable market, and we remain constructive on shares.
31
TCW Select Equities Fund
Management Discussions (Continued)
| | | | | | | | | | | | | | | | | | | | | | | | |
| | | Annualized Total Return as of October 31, 2023(1) | |
| | | 1 Yr
Return | | | 3 Yr
Return | | | 5 Yr
Return | | | 10 Yr
Return | | | Inception
to Date | | | Inception
Index | |
TCW Select Equities Fund | | | | | | | | | | | | | | | | | | | | | | | | |
Class I (Inception: 07/01/1991) | | | 18.60 | % | | | 2.69 | % | | | 11.64 | % | | | 11.31 | % | | | 10.36 | %(2) | | | 10.19 | % |
Class N (Inception: 03/01/1999) | | | 18.50 | % | | | 2.55 | % | | | 11.45 | % | | | 11.07 | % | | | 7.36 | % | | | 7.21 | % |
Russell 1000 Growth Index | | | 18.95 | % | | | 8.70 | % | | | 14.22 | % | | | 13.82 | % | | | | | | | | |

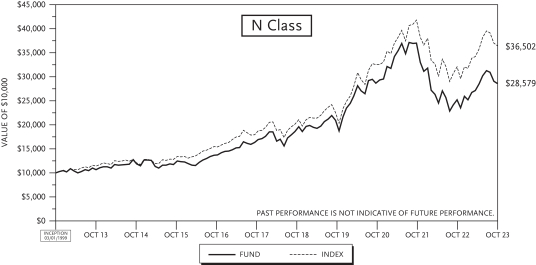
| (1) | The total returns do not reflect taxes that a shareholder would pay on fund distribution or on the redemption of fund shares. |
| (2) | Performance data includes the performance of the predecessor entity for periods before the Fund’s registration became effective. The predecessor entity was not registered under the 1940 Act and, therefore, was not subject to certain investment restrictions that are imposed by the 1940 Act. If the predecessor entity had been registered under the 1940 Act, the predecessor entity’s performance may have been lower. |
32
TCW Artificial Intelligence Equity Fund
Schedule of Investments | October 31, 2023 |
| | | | | | | | |
| Issues | | Shares | | | Value | |
|
COMMON STOCK — 97.1% of Net Assets | |
|
| Advertising — 1.9% | |
| | |
Trade Desk, Inc. (1) | | | 6,667 | | | $ | 473,090 | |
| | | | | | | | |
|
| Agricultural & Farm Machinery — 1.8% | |
| | |
Deere & Co. | | | 1,210 | | | | 442,086 | |
| | | | | | | | |
|
| Application Software — 4.9% | |
| | |
Bill Holdings, Inc. (1) | | | 2,414 | | | | 220,374 | |
| | |
Datadog, Inc. (1) | | | 5,499 | | | | 448,003 | |
| | |
Salesforce, Inc. (1) | | | 2,695 | | | | 541,237 | |
| | | | | | | | |
| |
| | | | 1,209,614 | |
| | | | | | | | |
|
| Automobile Manufacturers — 3.5% | |
| | |
Tesla, Inc. (1) | | | 4,364 | | | | 876,466 | |
| | | | | | | | |
|
| Automotive Parts & Equipment — 1.3% | |
| | |
Mobileye Global, Inc. (1) | | | 8,961 | | | | 319,639 | |
| | | | | | | | |
|
| Broadline Retail — 3.8% | |
| | |
Amazon.com, Inc. (1) | | | 7,037 | | | | 936,554 | |
| | | | | | | | |
|
| Communications Equipment — 10.1% | |
| | |
Arista Networks, Inc. (1) | | | 6,758 | | | | 1,354,100 | |
| | |
Cisco Systems, Inc. | | | 8,567 | | | | 446,598 | |
| | |
Motorola Solutions, Inc. | | | 2,530 | | | | 704,504 | |
| | | | | | | | |
| |
| | | | 2,505,202 | |
| | | | | | | | |
|
| Consumer Staples Merchandise Retail — 2.0% | |
| | |
Costco Wholesale Corp. | | | 872 | | | | 481,728 | |
| | | | | | | | |
|
| Electrical Components & Equipment — 1.7% | |
| | |
Eaton Corp. PLC | | | 2,065 | | | | 429,334 | |
| | | | | | | | |
|
| Electronic Equipment & Instruments — 1.1% | |
| | |
Cognex Corp. | | | 7,514 | | | | 270,429 | |
| | | | | | | | |
|
| Industrial Machinery & Supplies & Components — 1.4% | |
| | |
Symbotic, Inc. (1) | | | 9,896 | | | | 336,761 | |
| | | | | | | | |
|
| Interactive Media & Services — 12.5% | |
| | |
Alphabet, Inc. (1) | | | 8,576 | | | | 1,064,110 | |
| | |
Baidu, Inc. (SP ADR) (China) (1) | | | 2,651 | | | | 278,355 | |
| | |
Meta Platforms, Inc. (1) | | | 3,997 | | | | 1,204,176 | |
| | |
Pinterest, Inc. (1) | | | 17,930 | | | | 535,749 | |
| | | | | | | | |
| |
| | | | 3,082,390 | |
| | | | | | | | |
|
| Internet Services & Infrastructure — 1.5% | |
| | |
Snowflake, Inc. (1) | | | 2,598 | | | | 377,048 | |
| | | | | | | | |
|
| Semiconductor Materials & Equipment — 5.0% | |
| | |
ASML Holding NV (Netherlands) | | | 1,104 | | | | 661,086 | |
| | |
Lam Research Corp. | | | 996 | | | | 585,867 | |
| | | | | | | | |
| |
| | | �� | 1,246,953 | |
| | | | | | | | |
|
| Semiconductors — 18.1% | |
| | |
Intel Corp. | | | 6,196 | | | | 226,154 | |
| | |
Marvell Technology, Inc. | | | 7,357 | | | | 347,398 | |
| | | | | | | | |
| Issues | | Shares | | | Value | |
|
| Semiconductors (Continued) | |
| | |
Micron Technology, Inc. | | | 12,782 | | | $ | 854,732 | |
| | |
NVIDIA Corp. | | | 3,354 | | | | 1,367,761 | |
| | |
NXP Semiconductors NV (Netherlands) | | | 2,168 | | | | 373,828 | |
| | |
ON Semiconductor Corp. (1) | | | 7,678 | | | | 480,950 | |
| | |
QUALCOMM, Inc. | | | 3,714 | | | | 404,789 | |
| | |
Taiwan Semiconductor Manufacturing Co., Ltd. (SP ADR) (Taiwan) | | | 4,732 | | | | 408,419 | |
| | | | | | | | |
| |
| | | | 4,464,031 | |
| | | | | | | | |
|
| Systems Software — 21.4% | |
| | |
Check Point Software Technologies Ltd. (Israel)(1) | | | 3,787 | | | | 508,405 | |
| | |
Crowdstrike Holdings, Inc. (1) | | | 4,221 | | | | 746,146 | |
| | |
CyberArk Software Ltd. (1) | | | 2,202 | | | | 360,335 | |
| | |
Microsoft Corp. | | | 3,517 | | | | 1,189,133 | |
| | |
Palo Alto Networks, Inc. (1) | | | 5,136 | | | | 1,248,151 | |
| | |
ServiceNow, Inc. (1) | | | 1,494 | | | | 869,284 | |
| | |
Zscaler, Inc. (1) | | | 2,283 | | | | 362,289 | |
| | | | | | | | |
| |
| | | | 5,283,743 | |
| | | | | | | | |
|
| Technology Hardware, Storage & Peripherals — 5.1% | |
| | |
Apple, Inc. | | | 4,194 | | | | 716,209 | |
| | |
Samsung Electronics Co. Ltd. | | | 10,927 | | | | 543,890 | |
| | | | | | | | |
| |
| | | | 1,260,099 | |
| | | | | | | | |
|
Total Common Stock | |
| |
(Cost: $20,634,116) | | | | 23,995,167 | |
| | | | | | | | |
|
MONEY MARKET INVESTMENTS — 2.8% | |
| | |
State Street Institutional U.S. Government Money Market Fund — Premier Class, 5.30% (2) | | | 684,547 | | | | 684,547 | |
| | | | | | | | |
|
Total Money Market Investments | |
| |
(Cost: $684,547) | | | | 684,547 | |
| | | | | | | | |
| | |
Total Investments (99.9%) | | | | | | | | |
| |
(Cost: $21,318,663) | | | | 24,679,714 | |
| |
Excess Of Other Assets Over Liabilities (0.1%) | | | | 33,163 | |
| | | | | | | | |
| |
Net Assets (100.0%) | | | $ | 24,712,877 | |
| | | | | | | | |
Notes to the Schedule of Investments:
| REIT | | Real Estate Investment Trust. |
| SP ADR | | Sponsored American Depositary Receipt. ADRs are receipts, typically issued by a U.S. bank or trust company, evidencing ownership of underlying securities issued by a foreign corporation. Sponsored ADRs are ADRs issued with the cooperation of the foreign corporation. |
| (1) | | Non-income producing security. |
| (2) | | Rate disclosed is the 7-day net yield as of October 31, 2023. |
See accompanying Notes to Financial Statements.
33
TCW Artificial Intelligence Equity Fund
Investments by Sector | October 31, 2023 |
| | | | |
| Industry | | Percentage of
Net Assets | |
Advertising | | | 1.9 | % |
Agricultural & Farm Machinery | | | 1.8 | |
Application Software | | | 4.9 | |
Automobile Manufacturers | | | 3.5 | |
Automotive Parts & Equipment | | | 1.3 | |
Broadline Retail | | | 3.8 | |
Communications Equipment | | | 10.1 | |
Consumer Staples Merchandise Retail | | | 2.0 | |
Electrical Components & Equipment | | | 1.7 | |
Electronic Equipment & Instruments | | | 1.1 | |
Industrial Machinery & Supplies & Components | | | 1.4 | |
Interactive Media & Services | | | 12.5 | |
Internet Services & Infrastructure | | | 1.5 | |
Semiconductor Materials & Equipment | | | 5.0 | |
Semiconductors | | | 18.1 | |
Systems Software | | | 21.4 | |
Technology Hardware, Storage & Peripherals | | | 5.1 | |
Money Market Investments | | | 2.8 | |
| | | | |
Total | | | 99.9 | % |
| | | | |
See accompanying Notes to Financial Statements.
34
TCW Artificial Intelligence Equity Fund
Fair Valuation Summary | October 31, 2023 |
The following is a summary of the fair valuations according to the inputs used as of October 31, 2023 in valuing the Fund’s investments:
| | | | | | | | | | | | | | | | |
Description | | Quoted Prices
in Active
Markets for
Identical
Assets
(Level 1) | | | Other
Significant
Observable
Inputs
(Level 2) | | | Significant
Unobservable
Inputs
(Level 3) | | | Total | |
Common Stock | | | | | | | | | | | | | | | | |
Advertising | | $ | 473,090 | | | $ | — | | | $ | — | | | $ | 473,090 | |
Agricultural & Farm Machinery | | | 442,086 | | | | — | | | | — | | | | 442,086 | |
Application Software | | | 1,209,614 | | | | — | | | | — | | | | 1,209,614 | |
Automobile Manufacturers | | | 876,466 | | | | — | | | | — | | | | 876,466 | |
Automotive Parts & Equipment | | | 319,639 | | | | — | | | | — | | | | 319,639 | |
Broadline Retail | | | 936,554 | | | | — | | | | — | | | | 936,554 | |
Communications Equipment | | | 2,505,202 | | | | — | | | | — | | | | 2,505,202 | |
Consumer Staples Merchandise Retail | | | 481,728 | | | | — | | | | — | | | | 481,728 | |
Electrical Components & Equipment | | | 429,334 | | | | — | | | | — | | | | 429,334 | |
Electronic Equipment & Instruments | | | 270,429 | | | | — | | | | — | | | | 270,429 | |
Industrial Machinery & Supplies & Components | | | 336,761 | | | | — | | | | — | | | | 336,761 | |
Interactive Media & Services | | | 3,082,390 | | | | — | | | | — | | | | 3,082,390 | |
Internet Services & Infrastructure | | | 377,048 | | | | — | | | | — | | | | 377,048 | |
Semiconductor Materials & Equipment | | | 1,246,953 | | | | — | | | | — | | | | 1,246,953 | |
Semiconductors | | | 4,464,031 | | | | — | | | | — | | | | 4,464,031 | |
Systems Software | | | 5,283,743 | | | | — | | | | — | | | | 5,283,743 | |
Technology Hardware, Storage & Peripherals | | | 716,209 | | | | 543,890 | | | | — | | | | 1,260,099 | |
| | | | | | | | | | | | | | | | |
Total Common Stock | | | 23,451,277 | | | | 543,890 | | | | — | | | | 23,995,167 | |
| | | | | | | | | | | | | | | | |
Money Market Investments | | | 684,547 | | | | — | | | | — | | | | 684,547 | |
| | | | | | | | | | | | | | | | |
Total Investments | | $ | 24,135,824 | | | $ | 543,890 | | | $ | — | | | $ | 24,679,714 | |
| | | | | | | | | | | | | | | | |
See accompanying Notes to Financial Statements.
35
TCW Conservative Allocation Fund
Schedule of Investments
| | | | | | | | |
| Issues | | Shares | | | Value | |
|
EXCHANGE-TRADED FUNDS — 4.2% of Net Assets | |
| | |
iShares Gold Trust (1) | | | 9,725 | | | $ | 365,563 | |
| | |
iShares MSCI EAFE ETF | | | 11,810 | | | | 790,325 | |
| | | | | | | | |
| | |
Total Exchange-Traded Funds | | | | | | | | |
| | |
(Cost: $1,112,439) | | | | | | | 1,155,888 | |
| | | | | | | | |
|
INVESTMENT COMPANIES — 95.6% | |
|
| Diversified Equity Funds — 32.7% | |
| | |
TCW Artificial Intelligence Equity Fund — I Class (1)(2) | | | 15,601 | | | | 288,774 | |
| | |
TCW Global Real Estate Fund — I Class (2) | | | 119,663 | | | | 1,149,963 | |
| | |
TCW New America Premier Equities Fund — I Class (2) | | | 107,954 | | | | 2,780,908 | |
| | |
TCW Relative Value Large Cap Fund — I Class (2) | | | 173,542 | | | | 2,197,046 | |
| | |
TCW Relative Value Mid Cap Fund — I Class (2) | | | 16,012 | | | | 372,130 | |
| | |
TCW Select Equities Fund — I Class(2) | | | 86,770 | | | | 2,201,355 | |
| | | | | | | | |
| |
| | | | 8,990,176 | |
| | | | | | | | |
|
| Diversified Fixed Income Funds — 62.9% | |
| | |
Metropolitan West High Yield Bond Fund — I Class (2) | | | 33,461 | | | | 292,786 | |
| | |
Metropolitan West Low Duration Bond
Fund — I Class (2) | | | 210,517 | | | | 1,696,769 | |
| | |
Metropolitan West Total Return Bond
Fund — I Class (2) | | | 651,908 | | | | 5,502,102 | |
| | |
Metropolitan West Unconstrained Bond
Fund — I Class (2) | | | 262,814 | | | | 2,593,970 | |
| | |
TCW Emerging Markets Income
Fund — I Class (2) | | | 62,631 | | | | 365,767 | |
| | | | | | | | |
| Issues | | Shares | | | Value | |
|
| Diversified Fixed Income Funds (Continued) | |
| | |
TCW Enhanced Commodity Strategy
Fund — I Class (2) | | | 115,295 | | | $ | 683,702 | |
| | |
TCW Global Bond Fund — I Class (2) | | | 125,233 | | | | 958,033 | |
| | |
TCW Total Return Bond Fund — I Class (2) | | | 701,106 | | | | 5,181,172 | |
| | | | | | | | |
| |
| | | | 17,274,301 | |
| | | | | | | | |
|
Total Investment Companies | |
| |
(Cost: $26,949,590) | | | | 26,264,477 | |
| | | | | | | | |
|
MONEY MARKET INVESTMENTS — 0.2% | |
| | |
State Street Institutional U.S. Government Money Market Fund — Premier Class, 5.30% (3) | | | 67,408 | | | | 67,408 | |
| | | | | | | | |
|
Total Money Market Investments | |
| | |
(Cost: $67,408) | | | | | | | 67,408 | |
| | | | | | | | |
|
Total Investments (100.0%) | |
| | |
(Cost: $28,129,437) | | | | | | | 27,487,773 | |
| |
Liabilities In Excess Of Other Assets (0.0%) | | | | (4,988 | ) |
| | | | | | | | |
| |
Net Assets (100.0%) | | | $ | 27,482,785 | |
| | | | | | | | |
Notes to the Schedule of Investments:
| ETF | | Exchange-Traded Fund. |
| (1) | | Non-income producing security. |
| (3) | | Rate disclosed is the 7-day net yield as of October 31, 2023. |
See accompanying Notes to Financial Statements.
36
TCW Conservative Allocation Fund
October 31, 2023
The summary of the TCW Conservative Allocation Fund transactions in the affiliated funds for the year ended October 31, 2023 is as follows:
| | | | | | | | | | | | | | | | | | | | | | | | | | | | | | | | | | | | |
Name of
Affiliated
Fund | | Value at
October 31,
2022 | | | Purchases
at Cost | | | Proceeds
from Sales | | | Number
of Shares
Held
October 31,
2023 | | | Value at
October 31,
2023 | | | Dividends and
Interest
Income
Received | | | Distributions
Received from
Net Realized
Gain | | | Net Realized
Gain (Loss)
on
Investments | | | Net change in
Unrealized
Gain (Loss)
on
Investments | |
Metropolitan West High Yield Bond Fund—I Class | |
| | $ | 296,743 | | | $ | 22,742 | | | $ | 21,023 | | | | 33,461 | | | $ | 292,786 | | | $ | 19,337 | | | $ | — | | | $ | (1,280 | ) | | $ | (4,396 | ) |
Metropolitan West Low Duration Bond Fund—I Class | |
| | | 2,935,445 | | | | 138,000 | | | | 1,378,163 | | | | 210,517 | | | | 1,696,769 | | | | 104,394 | | | | — | | | | (116,261 | ) | | | 117,748 | |
Metropolitan West Total Return Bond Fund—I Class | |
| | | 3,429,147 | | | | 2,614,422 | | | | 269,931 | | | | 651,908 | | | | 5,502,102 | | | | 161,279 | | | | — | | | | (61,228 | ) | | | (210,308 | ) |
Metropolitan West Unconstrained Bond Fund—I Class | |
| | | 5,409,655 | | | | 368,606 | | | | 3,159,654 | | | | 262,814 | | | | 2,593,970 | | | | 305,340 | | | | — | | | | (503,268 | ) | | | 478,631 | |
TCW Artificial Intelligence Fund—I Class | |
| | | 246,362 | | | | 3,082 | | | | 18,546 | | | | 15,601 | | | | 288,774 | | | | — | | | | — | | | | (2,343 | ) | | | 60,219 | |
TCW Emerging Markets Income Fund—I Class | |
| | | 356,961 | | | | 24,673 | | | | 26,842 | | | | 62,631 | | | | 365,767 | | | | 20,470 | | | | — | | | | (6,679 | ) | | | 17,654 | |
TCW Enhanced Commodity Strategy Fund—I Class | |
| | | 745,247 | | | | 175,553 | | | | 191,962 | | | | 115,295 | | | | 683,702 | | | | 24,913 | | | | — | | | | (231 | ) | | | (44,905 | ) |
TCW Global Bond Fund—I Class | |
| | | 697,163 | | | | 341,448 | | | | 54,413 | | | | 125,233 | | | | 958,033 | | | | 27,382 | | | | — | | | | (11,824 | ) | | | (14,341 | ) |
TCW Global Real Estate Fund—I Class | |
| | | 1,288,789 | | | | 35,192 | | | | 94,092 | | | | 119,663 | | | | 1,149,963 | | | | 19,683 | | | | — | | | | (7,522 | ) | | | (72,404 | ) |
TCW New America Premier Equities Fund—I Class | |
| | | 2,644,841 | | | | 175,503 | | | | 501,751 | | | | 107,954 | | �� | | 2,780,908 | | | | 117 | | | | — | | | | 68,256 | | | | 394,059 | |
TCW Relative Value Large Cap Fund—I Class | |
| | | 2,402,673 | | | | 189,503 | | | | 340,518 | | | | 173,542 | | | | 2,197,046 | | | | 34,940 | | | | 126,016 | | | | 27,457 | | | | (82,069 | ) |
TCW Relative Value Mid Cap Fund—I Class | |
| | | 683,804 | | | | 22,649 | | | | 326,593 | | | | 16,012 | | | | 372,130 | | | | 5,725 | | | | 11,073 | | | | (23,779 | ) | | | 16,049 | |
TCW Select Equities Fund—I Class | |
| | | 2,073,749 | | | | 355,246 | | | | 282,132 | | | | 86,770 | | | | 2,201,355 | | | | — | | | | 329,914 | | | | (17,478 | ) | | | 71,970 | |
TCW Total Return Bond Fund—I Class | |
| | | 3,606,284 | | | | 2,272,967 | | | | 283,463 | | | | 701,106 | | | | 5,181,172 | | | | 238,979 | | | | — | | | | (61,345 | ) | | | (353,271 | ) |
| | | | | | | | | | | | | | | | | | | | | | | | | | | | | | | | | | | | |
Total | | | | | | | | | | | | | | | | | | $ | 26,264,477 | | | $ | 962,559 | | | $ | 467,003 | | | $ | (717,525 | ) | | $ | 374,636 | |
| | | | | | | | | | | | | | | | | | | | | | | | | | | | | | | | | | | | |
See accompanying Notes to Financial Statements.
37
TCW Conservative Allocation Fund
Investments by Sector | October 31, 2023 |
| | | | |
| Sector | | Percentage of
Net Assets | |
Diversified Fixed Income Funds | | | 62.9 | % |
Diversified Equity Funds | | | 32.7 | |
Exchange-Traded Funds | | | 4.2 | |
Money Market Investments | | | 0.2 | |
| | | | |
Total | | | 100.0 | % |
| | | | |
See accompanying Notes to Financial Statements.
38
TCW Conservative Allocation Fund
Fair Valuation Summary | October 31, 2023 |
The following is a summary of the fair valuations according to the inputs used as of October 31, 2023 in valuing the Fund’s investments:
| | | | | | | | | | | | | | | | |
Description | | Quoted Prices
in Active
Markets for
Identical
Assets
(Level 1) | | | Other
Significant
Observable
Inputs
(Level 2) | | | Significant
Unobservable
Inputs
(Level 3) | | | Total | |
Exchange-Traded Funds | | $ | 1,155,888 | | | $ | — | | | $ | — | | | $ | 1,155,888 | |
Investment Companies | | | 26,264,477 | | | | — | | | | — | | | | 26,264,477 | |
Money Market Investments | | | 67,408 | | | | — | | | | — | | | | 67,408 | |
| | | | | | | | | | | | | | | | |
Total Investments | | $ | 27,487,773 | | | $ | — | | | $ | — | | | $ | 27,487,773 | |
| | | | | | | | | | | | | | | | |
See accompanying Notes to Financial Statements.
39
TCW Global Real Estate Fund
Schedule of Investments
| | | | | | | | |
| Issues | | Shares | | | Value | |
|
COMMON STOCK — 94.1% of Net Assets | |
|
| Australia — 4.5% (Cost: $1,256,166) | |
| | |
Goodman Group | | | 80,817 | | | $ | 1,067,339 | |
| | | | | | | | |
|
| Canada — 8.7% | |
| | |
BSR Real Estate Investment Trust | | | 21,367 | | | | 225,422 | |
| | |
Killam Apartment Real Estate Investment Trust | | | 85,078 | | | | 960,326 | |
| | |
Minto Apartment Real Estate Investment Trust | | | 92,557 | | | | 866,732 | |
| | | | | | | | |
|
Total Canada | |
| |
(Cost: $2,857,019) | | | | 2,052,480 | |
| | | | | | | | |
|
| Germany — 3.6% (Cost: $780,509) | |
| | |
Stroeer SE & Co. KGaA | | | 18,684 | | | | 853,946 | |
| | | | | | | | |
|
| Japan — 9.2% | |
| | |
Mitsubishi Estate Co. Ltd. | | | 66,100 | | | | 846,828 | |
| | |
Mitsui Fudosan Co. Ltd. | | | 32,400 | | | | 702,868 | |
| | |
Nippon Prologis REIT, Inc. | | | 350 | | | | 623,316 | |
| | | | | | | | |
|
Total Japan | |
| |
(Cost: $2,599,009) | | | | 2,173,012 | |
| | | | | | | | |
|
| Singapore — 2.1% (Cost: $674,108) | |
| | |
CapitaLand Investment Ltd. | | | 231,100 | | | | 495,888 | |
| | | | | | | | |
|
| Spain — 2.1% (Cost: $677,740) | |
| | |
Cellnex Telecom SA | | | 16,523 | | | | 485,206 | |
| | | | | | | | |
|
| United Kingdom — 2.6% (Cost: $803,549) | |
| | |
Segro PLC | | | 70,545 | | | | 612,178 | |
| | | | | | | | |
|
| United States — 61.3% | |
| | |
American Tower Corp. | | | 6,385 | | | | 1,137,743 | |
| | |
Brixmor Property Group, Inc. | | | 27,214 | | | | 565,779 | |
| | |
Equinix, Inc. | | | 1,305 | | | | 952,180 | |
| | |
Gaming & Leisure Properties, Inc. | | | 21,324 | | | | 967,896 | |
| | | | | | | | |
| Issues | | Shares | | | Value | |
|
| United States (Continued) | |
| | |
Independence Realty Trust, Inc. | | | 51,744 | | | $ | 641,108 | |
| | |
Invitation Homes, Inc. | | | 24,821 | | | | 736,936 | |
| | |
Kite Realty Group Trust | | | 36,459 | | | | 777,306 | |
| | |
LXP Industrial Trust | | | 131,413 | | | | 1,039,477 | |
| | |
Mid-America Apartment Communities, Inc. | | | 8,260 | | | | 975,919 | |
| | |
Prologis, Inc. | | | 7,048 | | | | 710,086 | |
| | |
Public Storage | | | 3,900 | | | | 930,969 | |
| | |
Simon Property Group, Inc. | | | 5,217 | | | | 573,296 | |
| | |
Sun Communities, Inc. | | | 3,180 | | | | 353,743 | |
| | |
Taylor Morrison Home Corp. (1) | | | 26,270 | | | | 1,006,666 | |
| | |
Travel & Leisure Co. | | | 14,730 | | | | 501,262 | |
| | |
Ventas, Inc. | | | 19,760 | | | | 839,010 | |
| | |
VICI Properties, Inc. | | | 37,401 | | | | 1,043,488 | |
| | |
Wyndham Hotels & Resorts, Inc. | | | 9,920 | | | | 718,208 | |
| | | | | | | | |
|
Total United States | |
| |
(Cost: $15,346,173) | | | | 14,471,072 | |
| | | | | | | | |
|
| Total Common Stock | |
| |
(Cost: $24,994,273) | | | | 22,211,121 | |
| | | | | | | | |
| |
Total Purchased Options (2) (0.3%) | | | | | |
| |
(Cost: $54,227) | | | | 75,150 | |
| | | | | | | | |
|
MONEY MARKET INVESTMENTS — 2.9% | |
| | |
State Street Institutional U.S. Government Money Market Fund — Premier Class, 5.30% (3) | | | 682,385 | | | | 682,385 | |
| | | | | | | | |
| |
Total Money Market Investments | | | | | |
| | |
(Cost: $682,385) | | | | | | | 682,385 | |
| | | | | | | | |
| |
Total Investments (97.3%) | | | | | |
| | |
(Cost: $25,730,885) | | | | | | | 22,968,656 | |
| |
Excess Of Other Assets Over Liabilities (2.7%) | | | | 627,870 | |
| | | | | | | | |
| |
Net Assets (100.0%) | | | $ | 23,596,526 | |
| | | | | | | | |
| | | | | | | | | | | | | | | | | | | | | | | | | | | | |
| Purchased Options — Exchange Traded | | | | |
| | | | | | | |
| Description | | Exercise
Price | | | Expiration
Date | | | Number of
Contracts | | | Notional
Amount | | | Market
Value | | | Premiums
Paid
(Received)
by Fund | | | Unrealized
Appreciation
(Depreciation) | |
Call | | | | | | | | | | | | | | | | | | | | | | | | | | | | |
American Tower Corp. | | $ | 180.00 | | | | 1/19/24 | | | | 90 | | | $ | 1,603,710 | | | $ | 75,150 | | | $ | 54,227 | | | $ | 20,923 | |
| | | | | | | | | | | | | | | | | | | | | | | | | | | | |
| |
| WRITTEN OPTIONS — EXCHANGE TRADED | | | | |
Call | | | | | | | | | | | | | | | | | | | | | | | | | | | | |
American Tower Corp. | | $ | 230.00 | | | | 1/19/24 | | | | (90 | ) | | $ | (1,603,710 | ) | | $ | (1,125 | ) | | $ | (19,867 | ) | | $ | 18,742 | |
| | | | | | | | | | | | | | | | | | | | | | | | | | | | |
Notes to the Schedule of Investments:
| REIT | | Real Estate Investment Trust. |
| (1) | | Non-income producing security. |
| (2) | | See options table for description of purchased options. |
| (3) | | Rate disclosed is the 7-day net yield as of October 31, 2023. |
See accompanying Notes to Financial Statements.
40
TCW Global Real Estate Fund
Investments by Sector | October 31, 2023 |
| | | | |
| Sector | | Percentage of
Net Assets | |
Advertising | | | 3.6 | % |
Diversified Real Estate Activities | | | 6.6 | |
Health Care REITs | | | 3.6 | |
Homebuilding | | | 4.3 | |
Hotel & Resort REITs | | | 3.1 | |
Hotels, Resorts & Cruise Lines | | | 2.1 | |
Industrial REITs | | | 17.1 | |
Multi-Family Residential REITs | | | 15.5 | |
Real Estate Operating Companies | | | 2.1 | |
Retail REITs | | | 8.1 | |
Purchased Options | | | 0.3 | |
Single-Family Residential REITs | | | 4.6 | |
Specialized REITs | | | 21.3 | |
Wireless Telecommunication Services | | | 2.1 | |
Money Market Investments | | | 2.9 | |
| | | | |
Total | | | 97.3 | % |
| | | | |
See accompanying Notes to Financial Statements.
41
TCW Global Real Estate Fund
Investments by Country | October 31, 2023 |
| | | | |
| Country | | Percentage of
Net Assets | |
Australia | | | 4.5 | % |
Canada | | | 8.7 | |
Germany | | | 3.6 | |
Japan | | | 9.2 | |
Singapore | | | 2.1 | |
Spain | | | 2.1 | |
United Kingdom | | | 2.6 | |
United States | | | 64.5 | |
| | | | |
Total | | | 97.3 | % |
| | | | |
See accompanying Notes to Financial Statements.
42
TCW Global Real Estate Fund
Fair Valuation Summary | October 31, 2023 |
The following is a summary of the fair valuations according to the inputs used as of October 31, 2023 in valuing the Fund’s investments:
| | | | | | | | | | | | | | | | |
Description | | Quoted Prices
in Active
Markets for
Identical
Assets
(Level 1) | | | Other
Significant
Observable
Inputs
(Level 2) | | | Significant
Unobservable
Inputs
(Level 3) | | | Total | |
Common Stock | | | | | | | | | | | | | | | | |
Advertising | | $ | 853,946 | | | $ | — | | | $ | — | | | $ | 853,946 | |
Diversified Real Estate Activities | | | — | | | | 1,549,696 | | | | — | | | | 1,549,696 | |
Health Care REITs | | | 839,010 | | | | — | | | | — | | | | 839,010 | |
Homebuilding | | | 1,006,666 | | | | — | | | | — | | | | 1,006,666 | |
Hotel & Resort REITs | | | 718,208 | | | | — | | | | — | | | | 718,208 | |
Hotels, Resorts & Cruise Lines | | | 501,262 | | | | — | | | | — | | | | 501,262 | |
Industrial REITs | | | 1,749,563 | | | | 2,302,833 | | | | — | | | | 4,052,396 | |
Multi-Family Residential REITs | | | 3,444,085 | | | | 225,422 | | | | — | | | | 3,669,507 | |
Real Estate Operating Companies | | | — | | | | 495,888 | | | | — | | | | 495,888 | |
Retail REITs | | | 1,916,381 | | | | — | | | | — | | | | 1,916,381 | |
Single-Family Residential REITs | | | 1,090,679 | | | | — | | | | — | | | | 1,090,679 | |
Specialized REITs | | | 5,032,276 | | | | — | | | | — | | | | 5,032,276 | |
Wireless Telecommunication Services | | | — | | | | 485,206 | | | | — | | | | 485,206 | |
| | | | | | | | | | | | | | | | |
Total Common Stock | | | 17,152,076 | | | | 5,059,045 | | | | — | | | | 22,211,121 | |
| | | | | | | | | | | | | | | | |
Purchased Options | | | 75,150 | | | | — | | | | — | | | | 75,150 | |
Money Market Investments | | | 682,385 | | | | — | | | | — | | | | 682,385 | |
| | | | | | | | | | | | | | | | |
Total Investments | | $ | 17,909,611 | | | $ | 5,059,045 | | | $ | — | | | $ | 22,968,656 | |
| | | | | | | | | | | | | | | | |
Liability Derivatives | | | | | | | | | | | | | | | | |
Written Options | | | | | | | | | | | | | | | | |
Equity Risk | | $ | (1,125 | ) | | $ | — | | | $ | — | | | $ | (1,125 | ) |
| | | | | | | | | | | | | | | | |
Total | | $ | (1,125 | ) | | $ | — | | | $ | — | | | $ | (1,125 | ) |
| | | | | | | | | | | | | | | | |
See accompanying Notes to Financial Statements.
43
TCW New America Premier Equities Fund
Schedule of Investments
| | | | | | | | |
| Issues | | Shares | | | Value | |
|
COMMON STOCK — 96.3% of Net Assets | |
|
| Advertising — 1.8% | |
| | |
Trade Desk, Inc. (1) | | | 41,979 | | | $ | 2,978,830 | |
| | | | | | | | |
|
| Aerospace & Defense — 8.3% | |
| | |
HEICO Corp. | | | 64,681 | | | | 10,246,117 | |
| | |
TransDigm Group, Inc. (1) | | | 4,365 | | | | 3,614,613 | |
| | | | | | | | |
| |
| | | | 13,860,730 | |
| | | | | | | | |
|
| Application Software — 23.8% | |
| | |
Constellation Software, Inc. | | | 14,598 | | | | 29,232,909 | |
| | |
Fair Isaac Corp. (1) | | | 2,992 | | | | 2,530,843 | |
| | |
Roper Technologies, Inc. | | | 16,727 | | | | 8,172,311 | |
| | | | | | | | |
| |
| | | | 39,936,063 | |
| | | | | | | | |
|
| Data Processing & Outsourced Services — 3.7% | |
| | |
Visa, Inc. | | | 26,214 | | | | 6,162,911 | |
| | | | | | | | |
|
| Electrical Components & Equipment — 3.7% | |
| | |
AMETEK, Inc. | | | 44,002 | | | | 6,194,162 | |
| | | | | | | | |
|
| Environmental & Facilities Services — 5.0% | |
| | |
Waste Connections, Inc. (Canada) | | | 65,064 | | | | 8,425,788 | |
| | | | | | | | |
|
| Financial Exchanges & Data — 9.3% | |
| | |
FactSet Research Systems, Inc. | | | 8,386 | | | | 3,621,829 | |
| | |
MSCI, Inc. | | | 11,754 | | | | 5,542,599 | |
| | |
S&P Global, Inc. | | | 18,545 | | | | 6,477,954 | |
| | | | | | | | |
| |
| | | | 15,642,382 | |
| | | | | | | | |
|
| Food Retail — 4.1% | |
| | |
Alimentation Couche-Tard, Inc. | | | 124,948 | | | | 6,794,399 | |
| | | | | | | | |
|
| Industrial Gases — 4.2% | |
| | |
Linde PLC | | | 18,255 | | | | 6,976,331 | |
| | | | | | | | |
|
| Life Sciences Tools & Services — 1.8% | |
| | |
Danaher Corp. | | | 15,301 | | | | 2,938,098 | |
| | | | | | | | |
|
| Research & Consulting Services — 4.3% | |
| | |
Wolters Kluwer NV (Netherlands) | | | 55,631 | | | | 7,130,366 | |
| | | | | | | | |
|
| Semiconductors — 6.0% | |
| | |
Broadcom, Inc. | | | 11,941 | | | | 10,046,799 | |
| | | | | | | | |
| | | | | | | | |
| Issues | | Shares | | | Value | |
|
| Systems Software — 15.7% | |
| | |
Microsoft Corp. | | | 46,748 | | | $ | 15,805,966 | |
| | |
Oracle Corp. | | | 102,217 | | | | 10,569,238 | |
| | | | | | | | |
| |
| | | | 26,375,204 | |
| | | | | | | | |
|
| Transaction & Payment Processing Services — 4.6% | |
| | |
Fiserv, Inc. (1) | | | 68,035 | | | | 7,738,981 | |
| | | | | | | | |
|
Total Common Stock | |
| |
(Cost: $104,920,451) | | | | 161,201,044 | |
| | | | | | | | |
| |
WARRANTS — 0.0% | | | | | |
|
| Application Software — 0.0% | |
| | |
Constellation Software, Inc. (1)(2) | | | 14,592 | | | | 1 | |
| | | | | | | | |
| | |
| EXCHANGE-TRADED FUNDS — 2.7% | | | | | | |
| | |
iShares Russell 1000 ETF | | | 19,958 | | | | 4,576,569 | |
| | | | | | | | |
|
Total Exchange-Traded Funds | |
| |
(Cost: $4,631,283) | | | | 4,576,569 | |
| | | | | | | | |
|
MONEY MARKET INVESTMENTS — 1.1% | |
| | |
State Street Institutional U.S. Government Money Market Fund — Premier Class, 5.30% (3) | | | 1,801,652 | | | | 1,801,652 | |
| | | | | | | | |
|
Total Money Market Investments | |
| |
(Cost: $1,801,652) | | | | 1,801,652 | |
| | | | | | | | |
| | |
Total Investments (100.1%) | | | | | | | | |
(Cost: $111,353,386) | | | | 167,579,266 | |
| |
Liabilities In Excess Of Other Assets (-0.1%) | | | | (147,545 | ) |
| | | | | | | | |
| |
Net Assets (100.0%) | | | $ | 167,431,721 | |
| | | | | | | | |
Notes to the Schedule of Investments:
| ETF | | Exchange-Traded Fund. |
| (1) | | Non-income producing security. |
| (2) | | For fair value measurement disclosure purposes, security is categorized as Level 3. Security is valued using significant unobservable inputs. |
| (3) | | Rate disclosed is the 7-day net yield as of October 31, 2023. |
See accompanying Notes to Financial Statements.
44
TCW New America Premier Equities Fund
Investments by Sector | October 31, 2023 |
| | | | |
| Sector | | Percentage of
Net Assets | |
Advertising | | | 1.8 | % |
Aerospace & Defense | | | 8.3 | |
Application Software | | | 23.8 | |
Data Processing & Outsourced Services | | | 3.7 | |
Electrical Components & Equipment | | | 3.7 | |
Environmental & Facilities Services | | | 5.0 | |
Exchange-Traded Funds | | | 2.7 | |
Financial Exchanges & Data | | | 9.3 | |
Food Retail | | | 4.1 | |
Industrial Gases | | | 4.2 | |
Life Sciences Tools & Services | | | 1.8 | |
Research & Consulting Services | | | 4.3 | |
Semiconductors | | | 6.0 | |
Systems Software | | | 15.7 | |
Transaction & Payment Processing Services | | | 4.6 | |
Money Market Investments | | | 1.1 | |
| | | | |
Total | | | 100.1 | % |
| | | | |
See accompanying Notes to Financial Statements.
45
TCW New America Premier Equities Fund
Fair Valuation Summary | October 31, 2023 |
The following is a summary of the fair valuations according to the inputs used as of October 31, 2023 in valuing the Fund’s investments:
| | | | | | | | | | | | | | | | |
Description | | Quoted Prices
in Active
Markets for
Identical
Assets
(Level 1) | | | Other
Significant
Observable
Inputs
(Level 2) | | | Significant
Unobservable
Inputs
(Level 3) | | | Total | |
Common Stock | | | | | | | | | | | | | | | | |
Advertising | | $ | 2,978,830 | | | $ | — | | | $ | — | | | $ | 2,978,830 | |
Aerospace & Defense | | | 13,860,730 | | | | — | | | | — | | | | 13,860,730 | |
Application Software | | | 39,936,063 | | | | — | | | | — | | | | 39,936,063 | |
Data Processing & Outsourced Services | | | 6,162,911 | | | | — | | | | — | | | | 6,162,911 | |
Electrical Components & Equipment | | | 6,194,162 | | | | — | | | | — | | | | 6,194,162 | |
Environmental & Facilities Services | | | 8,425,788 | | | | — | | | | — | | | | 8,425,788 | |
Financial Exchanges & Data | | | 15,642,382 | | | | — | | | | — | | | | 15,642,382 | |
Food Retail | | | 6,794,399 | | | | — | | | | — | | | | 6,794,399 | |
Industrial Gases | | | 6,976,331 | | | | — | | | | — | | | | 6,976,331 | |
Life Sciences Tools & Services | | | 2,938,098 | | | | — | | | | — | | | | 2,938,098 | |
Research & Consulting Services | | | — | | | | 7,130,366 | | | | — | | | | 7,130,366 | |
Semiconductors | | | 10,046,799 | | | | — | | | | — | | | | 10,046,799 | |
Systems Software | | | 26,375,204 | | | | — | | | | — | | | | 26,375,204 | |
Transaction & Payment Processing Services | | | 7,738,981 | | | | — | | | | — | | | | 7,738,981 | |
| | | | | | | | | | | | | | | | |
Total Common Stock | | | 154,070,678 | | | | 7,130,366 | | | | — | | | | 161,201,044 | |
| | | | | | | | | | | | | | | | |
Warrants | | | — | | | | — | | | | 1 | | | | 1 | |
Exchange-Traded Funds | | | 4,576,569 | | | | — | | | | — | | | | 4,576,569 | |
Money Market Investments | | | 1,801,652 | | | | — | | | | — | | | | 1,801,652 | |
| | | | | | | | | | | | | | | | |
Total Investments | | $ | 160,448,899 | | | $ | 7,130,366 | | | $ | 1 | | | $ | 167,579,266 | |
| | | | | | | | | | | | | | | | |
See accompanying Notes to Financial Statements.
46
TCW Relative Value Dividend Appreciation Fund
Schedule of Investments | October 31, 2023 |
| | | | | | | | |
| Issues | | Shares | | | Value | |
|
COMMON STOCK — 99.3% of Net Assets | |
|
| Aerospace & Defense — 1.1% | |
| | |
Textron, Inc. | | | 35,674 | | | $ | 2,711,224 | |
| | | | | | | | |
|
| Air Freight & Logistics — 2.8% | |
| | |
United Parcel Service, Inc. — Class B | | | 47,843 | | | | 6,757,824 | |
| | | | | | | | |
|
| Automobile Components — 1.8% | |
| | |
BorgWarner, Inc. | | | 114,787 | | | | 4,235,640 | |
| | | | | | | | |
|
| Banks — 7.5% | |
| | |
JPMorgan Chase & Co. | | | 67,460 | | | | 9,380,987 | |
| | |
Wells Fargo & Co. | | | 215,110 | | | | 8,554,925 | |
| | | | | | | | |
| |
| | | | 17,935,912 | |
| | | | | | | | |
|
| Beverages — 4.2% | |
| | |
Keurig Dr Pepper, Inc. | | | 86,993 | | | | 2,638,498 | |
| | |
PepsiCo, Inc. | | | 45,222 | | | | 7,383,848 | |
| | | | | | | | |
| |
| | | | 10,022,346 | |
| | | | | | | | |
|
| Biotechnology — 8.1% | |
| | |
AbbVie, Inc. | | | 44,512 | | | | 6,284,204 | |
| | |
Amgen, Inc. | | | 21,720 | | | | 5,553,804 | |
| | |
Gilead Sciences, Inc. | | | 95,648 | | | | 7,512,194 | |
| | | | | | | | |
| |
| | | | 19,350,202 | |
| | | | | | | | |
|
| Building Products — 3.5% | |
| | |
Carlisle Cos., Inc. | | | 11,683 | | | | 2,968,533 | |
| | |
Johnson Controls International PLC (Ireland) | | | 111,842 | | | | 5,482,495 | |
| | | | | | | | |
| |
| | | | 8,451,028 | |
| | | | | | | | |
|
| Capital Markets — 10.5% | |
| | |
Ameriprise Financial, Inc. | | | 23,682 | | | | 7,449,647 | |
| | |
Bank of New York Mellon Corp. | | | 68,305 | | | | 2,902,962 | |
| | |
Blackstone, Inc. | | | 45,656 | | | | 4,216,332 | |
| | |
Intercontinental Exchange, Inc. | | | 54,783 | | | | 5,885,885 | |
| | |
Morgan Stanley | | | 68,019 | | | | 4,817,106 | |
| | | | | | | | |
| |
| | | | 25,271,932 | |
| | | | | | | | |
|
| Chemicals — 3.1% | |
| | |
Corteva, Inc. | | | 32,994 | | | | 1,588,331 | |
| | |
DuPont de Nemours, Inc. | | | 80,967 | | | | 5,900,875 | |
| | | | | | | | |
| |
| | | | 7,489,206 | |
| | | | | | | | |
|
| Electrical Equipment — 3.0% | |
| | |
nVent Electric PLC (Ireland) | | | 148,512 | | | | 7,147,883 | |
| | | | | | | | |
|
| Electronic Equipment, Instruments & Components — 0.3% | |
| | |
Corning, Inc. | | | 23,446 | | | | 627,415 | |
| | | | | | | | |
|
| Energy Equipment & Services — 3.4% | |
| | |
Baker Hughes Co. | | | 234,007 | | | | 8,054,521 | |
| | | | | | | | |
|
| Entertainment — 0.7% | |
| | |
Warner Bros Discovery, Inc. (1) | | | 165,433 | | | | 1,644,404 | |
| | | | | | | | |
| | | | | | | | |
| Issues | | Shares | | | Value | |
|
| Health Care Equipment & Supplies — 1.5% | |
| | |
GE HealthCare Technologies, Inc. | | | 54,357 | | | $ | 3,618,545 | |
| | | | | | | | |
|
| Health Care Providers & Services — 6.9% | |
| | |
Elevance Health, Inc. | | | 16,137 | | | | 7,263,102 | |
| | |
McKesson Corp. | | | 20,525 | | | | 9,346,264 | |
| | | | | | | | |
| |
| | | | 16,609,366 | |
| | | | | | | | |
|
| Hotels, Restaurants & Leisure — 2.3% | |
| | |
Darden Restaurants, Inc. | | | 37,884 | | | | 5,513,259 | |
| | | | | | | | |
|
| Household Durables — 3.1% | |
| | |
Lennar Corp. | | | 69,877 | | | | 7,454,478 | |
| | | | | | | | |
|
| Independent Power and Renewable Electricity Producers — 1.3% | |
| | |
AES Corp. | | | 207,460 | | | | 3,091,154 | |
| | | | | | | | |
|
| Industrial Conglomerates — 3.7% | |
| | |
General Electric Co. | | | 82,235 | | | | 8,933,188 | |
| | | | | | | | |
|
| Insurance — 2.4% | |
| | |
MetLife, Inc. | | | 96,608 | | | | 5,797,446 | |
| | | | | | | | |
|
| IT Services — 3.2% | |
| | |
International Business Machines Corp. | | | 53,662 | | | | 7,761,672 | |
| | | | | | | | |
|
| Media — 5.4% | |
| | |
Comcast Corp. | | | 197,819 | | | | 8,167,946 | |
| | |
Fox Corp. | | | 160,927 | | | | 4,890,572 | |
| | | | | | | | |
| |
| | | | 13,058,518 | |
| | | | | | | | |
|
| Metals & Mining — 1.0% | |
| | |
Freeport-McMoRan, Inc. | | | 72,025 | | | | 2,433,005 | |
| | | | | | | | |
|
| Multi-Utilities — 0.7% | |
| | |
NiSource, Inc. | | | 62,700 | | | | 1,577,532 | |
| | | | | | | | |
|
| Oil, Gas & Consumable Fuels — 3.5% | |
| | |
Chevron Corp. | | | 13,536 | | | | 1,972,601 | |
| | |
Exxon Mobil Corp. | | | 61,175 | | | | 6,475,374 | |
| | | | | | | | |
| |
| | | | 8,447,975 | |
| | | | | | | | |
|
| Personal Care Products — 0.5% | |
| | |
Kenvue, Inc. | | | 65,605 | | | | 1,220,253 | |
| | | | | | | | |
|
| Pharmaceuticals — 3.9% | |
| | |
Johnson & Johnson | | | 14,620 | | | | 2,168,731 | |
| | |
Novartis AG (SP ADR) (Switzerland) | | | 73,639 | | | | 6,891,138 | |
| | |
Sandoz Group AG (ADR) (Switzerland) (1) | | | 14,460 | | | | 373,357 | |
| | | | | | | | |
| |
| | | | 9,433,226 | |
| | | | | | | | |
|
| Retail REITs — 2.3% | |
| | |
Simon Property Group, Inc. | | | 50,904 | | | | 5,593,841 | |
| | | | | | | | |
|
| Semiconductors & Semiconductor Equipment — 4.4% | |
| | |
Broadcom, Inc. | | | 12,557 | | | | 10,565,083 | |
| | | | | | | | |
|
| Software — 1.3% | |
| | |
Salesforce, Inc. (1) | | | 16,103 | | | | 3,233,965 | |
| | | | | | | | |
See accompanying Notes to Financial Statements.
47
TCW Relative Value Dividend Appreciation Fund
Schedule of Investments (Continued)
| | | | | | | | |
| Issues | | Shares | | | Value | |
|
| Specialty Retail — 1.6% | |
| | |
Dick’s Sporting Goods, Inc. | | | 35,375 | | | $ | 3,783,356 | |
| | | | | | | | |
|
| Technology Hardware, Storage & Peripherals — 0.3% | |
| | |
Seagate Technology Holdings PLC | | | 10,500 | | | | 716,625 | |
| | | | | | | | |
|
Total Common Stock | |
| |
(Cost: $165,708,056) | | | | 238,542,024 | |
| | | | | | | | |
|
MONEY MARKET INVESTMENTS — 0.6% | |
| | |
State Street Institutional U.S. Government Money Market Fund — Premier Class, 5.30% (2) | | | 1,487,045 | | | | 1,487,045 | |
| | | | | | | | |
|
Total Money Market Investments | |
| |
(Cost: $1,487,045) | | | | 1,487,045 | |
| | | | | | | | |
| | |
Total Investments (99.9%) | | | | | | | | |
| |
(Cost: $167,195,101) | | | | 240,029,069 | |
| |
Excess Of Other Assets Over Liabilities (0.1%) | | | | 148,545 | |
| | | | | | | | |
| |
Net Assets (100.0%) | | | $ | 240,177,614 | |
| | | | | | | | |
Notes to the Schedule of Investments:
| REIT | | Real Estate Investment Trust. |
| SP ADR | | Sponsored American Depositary Receipt. ADRs are receipts, typically issued by a U.S. bank or trust company, evidencing ownership of underlying securities issued by a foreign corporation. Sponsored ADRs are ADRs issued with the cooperation of the foreign corporation. |
| (1) | | Non-income producing security. |
| (2) | | Rate disclosed is the 7-day net yield as of October 31, 2023. |
See accompanying Notes to Financial Statements.
48
TCW Relative Value Dividend Appreciation Fund
Investments by Sector | October 31, 2023 |
| | | | |
| Sector | | Percentage of
Net Assets | |
Aerospace & Defense | | | 1.1 | % |
Air Freight & Logistics | | | 2.8 | |
Automobile Components | | | 1.8 | |
Banks | | | 7.5 | |
Beverages | | | 4.2 | |
Biotechnology | | | 8.1 | |
Building Products | | | 3.5 | |
Capital Markets | | | 10.5 | |
Chemicals | | | 3.1 | |
Electrical Equipment | | | 3.0 | |
Electronic Equipment, Instruments & Components | | | 0.3 | |
Energy Equipment & Services | | | 3.4 | |
Entertainment | | | 0.7 | |
Health Care Equipment & Supplies | | | 1.5 | |
Health Care Providers & Services | | | 6.9 | |
Hotels, Restaurants & Leisure | | | 2.3 | |
Household Durables | | | 3.1 | |
Independent Power and Renewable Electricity Producers | | | 1.3 | |
Industrial Conglomerates | | | 3.7 | |
Insurance | | | 2.4 | |
IT Services | | | 3.2 | |
Media | | | 5.4 | |
Metals & Mining | | | 1.0 | |
Multi-Utilities | | | 0.7 | |
Oil, Gas & Consumable Fuels | | | 3.5 | |
Personal Care Products | | | 0.5 | |
Pharmaceuticals | | | 3.9 | |
Retail REITs | | | 2.3 | |
Semiconductors & Semiconductor Equipment | | | 4.4 | |
Software | | | 1.3 | |
Specialty Retail | | | 1.6 | |
Technology Hardware, Storage & Peripherals | | | 0.3 | |
Money Market Investments | | | 0.6 | |
| | | | |
Total | | | 99.9 | % |
| | | | |
See accompanying Notes to Financial Statements.
49
TCW Relative Value Dividend Appreciation Fund
Fair Valuation Summary | October 31, 2023 |
The following is a summary of the fair valuations according to the inputs used as of October 31, 2023 in valuing the Fund’s investments:
| | | | | | | | | | | | | | | | |
Description | | Quoted Prices
in Active
Markets for
Identical
Assets
(Level 1) | | | Other
Significant
Observable
Inputs
(Level 2) | | | Significant
Unobservable
Inputs
(Level 3) | | | Total | |
Common Stock | | | | | | | | | | | | | | | | |
Aerospace & Defense | | $ | 2,711,224 | | | $ | — | | | $ | — | | | $ | 2,711,224 | |
Air Freight & Logistics | | | 6,757,824 | | | | — | | | | — | | | | 6,757,824 | |
Automobile Components | | | 4,235,640 | | | | — | | | | — | | | | 4,235,640 | |
Banks | | | 17,935,912 | | | | — | | | | — | | | | 17,935,912 | |
Beverages | | | 10,022,346 | | | | — | | | | — | | | | 10,022,346 | |
Biotechnology | | | 19,350,202 | | | | — | | | | — | | | | 19,350,202 | |
Building Products | | | 8,451,028 | | | | — | | | | — | | | | 8,451,028 | |
Capital Markets | | | 25,271,932 | | | | — | | | | — | | | | 25,271,932 | |
Chemicals | | | 7,489,206 | | | | — | | | | — | | | | 7,489,206 | |
Electrical Equipment | | | 7,147,883 | | | | — | | | | — | | | | 7,147,883 | |
Electronic Equipment, Instruments & Components | | | 627,415 | | | | — | | | | — | | | | 627,415 | |
Energy Equipment & Services | | | 8,054,521 | | | | — | | | | — | | | | 8,054,521 | |
Entertainment | | | 1,644,404 | | | | — | | | | — | | | | 1,644,404 | |
Health Care Equipment & Supplies | | | 3,618,545 | | | | — | | | | — | | | | 3,618,545 | |
Health Care Providers & Services | | | 16,609,366 | | | | — | | | | — | | | | 16,609,366 | |
Hotels, Restaurants & Leisure | | | 5,513,259 | | | | — | | | | — | | | | 5,513,259 | |
Household Durables | | | 7,454,478 | | | | — | | | | — | | | | 7,454,478 | |
Independent Power and Renewable Electricity Producers | | | 3,091,154 | | | | — | | | | — | | | | 3,091,154 | |
Industrial Conglomerates | | | 8,933,188 | | | | — | | | | — | | | | 8,933,188 | |
Insurance | | | 5,797,446 | | | | — | | | | — | | | | 5,797,446 | |
IT Services | | | 7,761,672 | | | | — | | | | — | | | | 7,761,672 | |
Media | | | 13,058,518 | | | | — | | | | — | | | | 13,058,518 | |
Metals & Mining | | | 2,433,005 | | | | — | | | | — | | | | 2,433,005 | |
Multi-Utilities | | | 1,577,532 | | | | — | | | | — | | | | 1,577,532 | |
Oil, Gas & Consumable Fuels | | | 8,447,975 | | | | — | | | | — | | | | 8,447,975 | |
Personal Care Products | | | 1,220,253 | | | | — | | | | — | | | | 1,220,253 | |
Pharmaceuticals | | | 9,433,226 | | | | — | | | | — | | | | 9,433,226 | |
Retail REITs | | | 5,593,841 | | | | — | | | | — | | | | 5,593,841 | |
Semiconductors & Semiconductor Equipment | | | 10,565,083 | | | | — | | | | — | | | | 10,565,083 | |
Software | | | 3,233,965 | | | | — | | | | — | | | | 3,233,965 | |
Specialty Retail | | | 3,783,356 | | | | — | | | | — | | | | 3,783,356 | |
Technology Hardware, Storage & Peripherals | | | 716,625 | | | | — | | | | — | | | | 716,625 | |
| | | | | | | | | | | | | | | | |
Total Common Stock | | | 238,542,024 | | | | — | | | | — | | | | 238,542,024 | |
| | | | | | | | | | | | | | | | |
Money Market Investments | | | 1,487,045 | | | | — | | | | — | | | | 1,487,045 | |
| | | | | | | | | | | | | | | | |
Total Investments | | $ | 240,029,069 | | | $ | — | | | $ | — | | | $ | 240,029,069 | |
| | | | | | | | | | | | | | | | |
See accompanying Notes to Financial Statements.
50
TCW Relative Value Large Cap Fund
Schedule of Investments | October 31, 2023 |
| | | | | | | | |
| Issues | | Shares | | | Value | |
|
COMMON STOCK — 99.5% of Net Assets | |
|
| Aerospace & Defense — 2.8% | |
| | |
Textron, Inc. | | | 38,362 | | | $ | 2,915,512 | |
| | | | | | | | |
|
| Air Freight & Logistics — 2.6% | |
| | |
United Parcel Service, Inc. — Class B | | | 19,142 | | | | 2,703,808 | |
| | | | | | | | |
|
| Automobiles — 0.6% | |
| | |
General Motors Co. | | | 21,911 | | | | 617,890 | |
| | | | | | | | |
|
| Banks — 4.0% | |
| | |
JPMorgan Chase & Co. | | | 30,286 | | | | 4,211,571 | |
| | | | | | | | |
|
| Beverages — 3.6% | |
| | |
Keurig Dr Pepper, Inc. | | | 38,078 | | | | 1,154,906 | |
| | |
PepsiCo, Inc. | | | 16,313 | | | | 2,663,586 | |
| | | | | | | | |
| |
| | | | 3,818,492 | |
| | | | | | | | |
|
| Biotechnology — 6.7% | |
| | |
AbbVie, Inc. | | | 17,823 | | | | 2,516,251 | |
| | |
Amgen, Inc. | | | 7,973 | | | | 2,038,696 | |
| | |
Gilead Sciences, Inc. | | | 31,909 | | | | 2,506,133 | |
| | | | | | | | |
| |
| | | | 7,061,080 | |
| | | | | | | | |
|
| Building Products — 2.4% | |
| | |
Johnson Controls International PLC (Ireland) | | | 50,716 | | | | 2,486,098 | |
| | | | | | | | |
|
| Capital Markets — 8.1% | |
| | |
Ameriprise Financial, Inc. | | | 9,008 | | | | 2,833,647 | |
| | |
Bank of New York Mellon Corp. | | | 17,500 | | | | 743,750 | |
| | |
Intercontinental Exchange, Inc. | | | 29,969 | | | | 3,219,869 | |
| | |
Morgan Stanley | | | 24,500 | | | | 1,735,090 | |
| | | | | | | | |
| |
| | | | 8,532,356 | |
| | | | | | | | |
|
| Chemicals — 2.2% | |
| | |
DuPont de Nemours, Inc. | | | 31,366 | | | | 2,285,954 | |
| | | | | | | | |
|
| Communications Equipment — 1.0% | |
| | |
Juniper Networks, Inc. | | | 37,408 | | | | 1,007,023 | |
| | | | | | | | |
|
| Electronic Equipment, Instruments & Components — 3.7% | |
| | |
Corning, Inc. | | | 20,034 | | | | 536,110 | |
| | |
Flex Ltd. (1) | | | 130,567 | | | | 3,358,183 | |
| | | | | | | | |
| |
| | | | 3,894,293 | |
| | | | | | | | |
|
| Energy Equipment & Services — 2.8% | |
| | |
Baker Hughes Co. | | | 87,064 | | | | 2,996,743 | |
| | | | | | | | |
|
| Entertainment — 0.5% | |
| | |
Warner Bros Discovery, Inc. (1) | | | 52,533 | | | | 522,178 | |
| | | | | | | | |
|
| Financial Services — 6.6% | |
| | |
Apollo Global Management, Inc. | | | 39,879 | | | | 3,088,230 | |
| | |
Fiserv, Inc. (1) | | | 33,761 | | | | 3,840,314 | |
| | | | | | | | |
| |
| | | | 6,928,544 | |
| | | | | | | | |
| | | | | | | | |
| Issues | | Shares | | | Value | |
|
| Health Care Equipment & Supplies — 1.6% | |
| | |
GE HealthCare Technologies, Inc. | | | 25,585 | | | $ | 1,703,193 | |
| | | | | | | | |
|
| Health Care Providers & Services — 9.4% | |
| | |
Centene Corp. (1) | | | 48,907 | | | | 3,373,605 | |
| | |
McKesson Corp. | | | 10,042 | | | | 4,572,725 | |
| | |
Molina Healthcare, Inc. (1) | | | 6,081 | | | | 2,024,669 | |
| | | | | | | | |
| |
| | | | 9,970,999 | |
| | | | | | | | |
|
| Hotels, Restaurants & Leisure — 3.1% | |
| | |
Darden Restaurants, Inc. | | | 22,164 | | | | 3,225,527 | |
| | | | | | | | |
|
| Household Durables — 3.8% | |
| | |
Lennar Corp. | | | 37,598 | | | | 4,010,955 | |
| | | | | | | | |
|
| Independent Power and Renewable Electricity Producers — 1.0% | |
| | |
AES Corp. | | | 69,688 | | | | 1,038,351 | |
| | | | | | | | |
|
| Industrial Conglomerates — 3.3% | |
| | |
General Electric Co. | | | 32,341 | | | | 3,513,203 | |
| | | | | | | | |
|
| Insurance — 2.4% | |
| | |
MetLife, Inc. | | | 42,782 | | | | 2,567,348 | |
| | | | | | | | |
|
| IT Services — 3.6% | |
| | |
Akamai Technologies, Inc. (1) | | | 8,942 | | | | 923,977 | |
| | |
International Business Machines Corp. | | | 20,013 | | | | 2,894,680 | |
| | | | | | | | |
| |
| | | | 3,818,657 | |
| | | | | | | | |
|
| Media — 5.1% | |
| | |
Comcast Corp. | | | 90,369 | | | | 3,731,336 | |
| | |
Fox Corp. | | | 54,002 | | | | 1,641,121 | |
| | | | | | | | |
| |
| | | | 5,372,457 | |
| | | | | | | | |
|
| Metals & Mining — 1.8% | |
| | |
Freeport-McMoRan, Inc. | | | 56,244 | | | | 1,899,922 | |
| | | | | | | | |
|
| Multi-Utilities — 1.5% | |
| | |
NiSource, Inc. | | | 61,983 | | | | 1,559,492 | |
| | | | | | | | |
|
| Oil, Gas & Consumable Fuels — 2.9% | |
| | |
Exxon Mobil Corp. | | | 29,131 | | | | 3,083,516 | |
| | | | | | | | |
|
| Personal Care Products — 0.3% | |
| | |
Kenvue, Inc. | | | 16,600 | | | | 308,760 | |
| | | | | | | | |
|
| Real Estate Management & Development — 1.1% | |
| | |
Jones Lang LaSalle, Inc. (1) | | | 9,116 | | | | 1,166,119 | |
| | | | | | | | |
|
| Retail REITs — 1.3% | |
| | |
Simon Property Group, Inc. | | | 12,973 | | | | 1,425,603 | |
| | | | | | | | |
|
| Semiconductors & Semiconductor Equipment — 5.7% | |
| | |
Broadcom, Inc. | | | 5,099 | | | | 4,290,146 | |
| | |
ON Semiconductor Corp. (1) | | | 27,738 | | | | 1,737,508 | |
| | | | | | | | |
| |
| | | | 6,027,654 | |
| | | | | | | | |
|
| Software — 1.4% | |
| | |
Salesforce, Inc. (1) | | | 7,438 | | | | 1,493,774 | |
| | | | | | | | |
See accompanying Notes to Financial Statements.
51
TCW Relative Value Large Cap Fund
Schedule of Investments (Continued)
| | | | | | | | |
| Issues | | Shares | | | Value | |
|
| Specialized REITs — 1.0% | |
| | |
Weyerhaeuser Co. | | | 37,055 | | | $ | 1,063,108 | |
| | | | | | | | |
|
| Specialty Retail — 1.6% | |
| | |
Dick’s Sporting Goods, Inc. | | | 16,000 | | | | 1,711,200 | |
| | | | | | | | |
|
Total Common Stock | |
| |
(Cost: $64,734,685) | | | | 104,941,380 | |
| | | | | | | | |
|
MONEY MARKET INVESTMENTS — 0.7% | |
| | |
State Street Institutional U.S. Government Money Market Fund — Premier Class, 5.30% (2) | | | 745,728 | | | | 745,728 | |
| | | | | | | | |
|
Total Money Market Investments | |
| |
(Cost: $745,728) | | | | 745,728 | |
| | | | | | | | |
| | |
Total Investments (100.2%) | | | | | | | | |
| |
(Cost: $65,480,413) | | | | 105,687,108 | |
| |
Liabilities In Excess Of Other Assets (-0.2%) | | | | (180,802 | ) |
| | | | | | | | |
| |
Net Assets (100.0%) | | | $ | 105,506,306 | |
| | | | | | | | |
Notes to the Schedule of Investments:
| REIT | | Real Estate Investment Trust. |
| (1) | | Non-income producing security. |
| (2) | | Rate disclosed is the 7-day net yield as of October 31, 2023. |
See accompanying Notes to Financial Statements.
52
TCW Relative Value Large Cap Fund
Investments by Sector | October 31, 2023 |
| | | | |
| Sector | | Percentage of
Net Assets | |
Aerospace & Defense | | | 2.8 | % |
Air Freight & Logistics | | | 2.6 | |
Automobiles | | | 0.6 | |
Banks | | | 4.0 | |
Beverages | | | 3.6 | |
Biotechnology | | | 6.7 | |
Building Products | | | 2.4 | |
Capital Markets | | | 8.1 | |
Chemicals | | | 2.2 | |
Communications Equipment | | | 1.0 | |
Electronic Equipment, Instruments & Components | | | 3.7 | |
Energy Equipment & Services | | | 2.8 | |
Entertainment | | | 0.5 | |
Financial Services | | | 6.5 | |
Health Care Equipment & Supplies | | | 1.6 | |
Health Care Providers & Services | | | 9.4 | |
Hotels, Restaurants & Leisure | | | 3.1 | |
Household Durables | | | 3.8 | |
Independent Power and Renewable Electricity Producers | | | 1.0 | |
Industrial Conglomerates | | | 3.3 | |
Insurance | | | 2.4 | |
Media | | | 5.1 | |
IT Services | | | 3.6 | |
Metals & Mining | | | 1.8 | |
Multi-Utilities | | | 1.5 | |
Oil, Gas & Consumable Fuels | | | 2.9 | |
Personal Care Products | | | 0.3 | |
Real Estate Management & Development | | | 1.1 | |
Retail REITs | | | 1.4 | |
Semiconductors & Semiconductor Equipment | | | 5.7 | |
Software | | | 1.4 | |
Specialized REITs | | | 1.0 | |
Specialty Retail | | | 1.6 | |
Money Market Investments | | | 0.7 | |
| | | | |
Total | | | 100.2 | % |
| | | | |
See accompanying Notes to Financial Statements.
53
TCW Relative Value Large Cap Fund
Fair Valuation Summary | October 31, 2023 |
The following is a summary of the fair valuations according to the inputs used as of October 31, 2023 in valuing the Fund’s investments:
| | | | | | | | | | | | | | | | |
Description | | Quoted Prices
in Active
Markets for
Identical
Assets
(Level 1) | | | Other
Significant
Observable
Inputs
(Level 2) | | | Significant
Unobservable
Inputs
(Level 3) | | | Total | |
Common Stock | | | | | | | | | | | | | | | | |
Aerospace & Defense | | $ | 2,915,512 | | | $ | — | | | $ | — | | | $ | 2,915,512 | |
Air Freight & Logistics | | | 2,703,808 | | | | — | | | | — | | | | 2,703,808 | |
Automobiles | | | 617,890 | | | | — | | | | — | | | | 617,890 | |
Banks | | | 4,211,571 | | | | — | | | | — | | | | 4,211,571 | |
Beverages | | | 3,818,492 | | | | — | | | | — | | | | 3,818,492 | |
Biotechnology | | | 7,061,080 | | | | — | | | | — | | | | 7,061,080 | |
Building Products | | | 2,486,098 | | | | — | | | | — | | | | 2,486,098 | |
Capital Markets | | | 8,532,356 | | | | — | | | | — | | | | 8,532,356 | |
Chemicals | | | 2,285,954 | | | | — | | | | — | | | | 2,285,954 | |
Communications Equipment | | | 1,007,023 | | | | — | | | | — | | | | 1,007,023 | |
Electronic Equipment, Instruments & Components | | | 3,894,293 | | | | — | | | | — | | | | 3,894,293 | |
Energy Equipment & Services | | | 2,996,743 | | | | — | | | | — | | | | 2,996,743 | |
Entertainment | | | 522,178 | | | | — | | | | — | | | | 522,178 | |
Financial Services | | | 6,928,544 | | | | — | | | | — | | | | 6,928,544 | |
Health Care Equipment & Supplies | | | 1,703,193 | | | | — | | | | — | | | | 1,703,193 | |
Health Care Providers & Services | | | 9,970,999 | | | | — | | | | — | | | | 9,970,999 | |
Hotels, Restaurants & Leisure | | | 3,225,527 | | | | — | | | | — | | | | 3,225,527 | |
Household Durables | | | 4,010,955 | | | | — | | | | — | | | | 4,010,955 | |
Independent Power and Renewable Electricity Producers | | | 1,038,351 | | | | — | | | | — | | | | 1,038,351 | |
Industrial Conglomerates | | | 3,513,203 | | | | — | | | | — | | | | 3,513,203 | |
Insurance | | | 2,567,348 | | | | — | | | | — | | | | 2,567,348 | |
IT Services | | | 3,818,657 | | | | — | | | | — | | | | 3,818,657 | |
Media | | | 5,372,457 | | | | — | | | | — | | | | 5,372,457 | |
Metals & Mining | | | 1,899,922 | | | | — | | | | — | | | | 1,899,922 | |
Multi-Utilities | | | 1,559,492 | | | | — | | | | — | | | | 1,559,492 | |
Oil, Gas & Consumable Fuels | | | 3,083,516 | | | | — | | | | — | | | | 3,083,516 | |
Personal Care Products | | | 308,760 | | | | — | | | | — | | | | 308,760 | |
Real Estate Management & Development | | | 1,166,119 | | | | — | | | | — | | | | 1,166,119 | |
Retail REITs | | | 1,425,603 | | | | — | | | | — | | | | 1,425,603 | |
Semiconductors & Semiconductor Equipment | | | 6,027,654 | | | | — | | | | — | | | | 6,027,654 | |
Software | | | 1,493,774 | | | | — | | | | — | | | | 1,493,774 | |
Specialized REITs | | | 1,063,108 | | | | — | | | | — | | | | 1,063,108 | |
Specialty Retail | | | 1,711,200 | | | | — | | | | — | | | | 1,711,200 | |
| | | | | | | | | | | | | | | | |
Total Common Stock | | | 104,941,380 | | | | — | | | | — | | | | 104,941,380 | |
| | | | | | | | | | | | | | | | |
Money Market Investments | | | 745,728 | | | | — | | | | — | | | | 745,728 | |
| | | | | | | | | | | | | | | | |
Total Investments | | $ | 105,687,108 | | | $ | — | | | $ | — | | | $ | 105,687,108 | |
| | | | | | | | | | | | | | | | |
See accompanying Notes to Financial Statements.
54
TCW Relative Value Mid Cap Fund
Schedule of Investments | October 31, 2023 |
| | | | | | | | |
| Issues | | Shares | | | Value | |
|
COMMON STOCK — 98.7% of Net Assets | |
|
| Aerospace & Defense — 3.2% | |
| | |
Textron, Inc. | | | 30,488 | | | $ | 2,317,088 | |
| | | | | | | | |
|
| Air Freight & Logistics — 2.6% | |
| | |
CH Robinson Worldwide, Inc. | | | 4,500 | | | | 368,235 | |
| | |
FedEx Corp. | | | 6,298 | | | | 1,512,150 | |
| | | | | | | | |
| |
| | | | 1,880,385 | |
| | | | | | | | |
|
| Automobile Components — 2.2% | |
| | |
American Axle & Manufacturing Holdings, Inc. (1) | | | 63,300 | | | | 427,275 | |
| | |
BorgWarner, Inc. | | | 30,394 | | | | 1,121,539 | |
| | | | | | | | |
| |
| | | | 1,548,814 | |
| | | | | | | | |
|
| Banks — 5.7% | |
| | |
First Citizens BancShares, Inc. | | | 877 | | | | 1,210,909 | |
| | |
Popular, Inc. | | | 43,897 | | | | 2,855,061 | |
| | | | | | | | |
| |
| | | | 4,065,970 | |
| | | | | | | | |
|
| Broadline Retail — 1.1% | |
| | |
eBay, Inc. | | | 20,213 | | | | 792,956 | |
| | | | | | | | |
|
| Building Products — 0.4% | |
| | |
Carlisle Cos., Inc. | | | 1,046 | | | | 265,778 | |
| | | | | | | | |
|
| Capital Markets — 1.4% | |
| | |
Evercore, Inc. | | | 6,152 | | | | 800,867 | |
| | |
Interactive Brokers Group, Inc. | | | 2,600 | | | | 208,182 | |
| | | | | | | | |
| |
| | | | 1,009,049 | |
| | | | | | | | |
|
| Chemicals — 2.3% | |
| | |
Corteva, Inc. | | | 9,596 | | | | 461,951 | |
| | |
DuPont de Nemours, Inc. | | | 16,362 | | | | 1,192,463 | |
| | | | | | | | |
| |
| | | | 1,654,414 | |
| | | | | | | | |
|
| Communications Equipment — 1.1% | |
| | |
Juniper Networks, Inc. | | | 27,867 | | | | 750,180 | |
| | | | | | | | |
|
| Construction & Engineering — 1.9% | |
| | |
Arcosa, Inc. | | | 19,330 | | | | 1,335,123 | |
| | | | | | | | |
|
| Consumer Finance — 1.2% | |
| | |
OneMain Holdings, Inc. | | | 23,903 | | | | 858,835 | |
| | | | | | | | |
|
| Consumer Staples Distribution & Retail — 2.6% | |
| | |
Dollar Tree, Inc. (1) | | | 9,423 | | | | 1,046,801 | |
| | |
Sprouts Farmers Market, Inc. (1) | | | 18,883 | | | | 793,464 | |
| | | | | | | | |
| |
| | | | 1,840,265 | |
| | | | | | | | |
|
| Electronic Equipment, Instruments & Components — 5.5% | |
| | |
Avnet, Inc. | | | 29,445 | | | | 1,364,187 | |
| | |
Flex Ltd. (1) | | | 100,581 | | | | 2,586,943 | |
| | | | | | | | |
| |
| | | | 3,951,130 | |
| | | | | | | | |
|
| Energy Equipment & Services — 3.8% | |
| | |
Baker Hughes Co. | | | 50,247 | | | | 1,729,502 | |
| | | | | | | | |
| Issues | | Shares | | | Value | |
|
| Energy Equipment & Services (Continued) | |
| | |
NOV, Inc. | | | 47,551 | | | $ | 949,118 | |
| | | | | | | | |
| |
| | | | 2,678,620 | |
| | | | | | | | |
|
| Entertainment — 0.9% | |
| | |
Warner Bros Discovery, Inc. (1) | | | 63,765 | | | | 633,824 | |
| | | | | | | | |
|
| Financial Services — 7.7% | |
| | |
Apollo Global Management, Inc. | | | 33,671 | | | | 2,607,482 | |
| | |
Equitable Holdings, Inc. | | | 61,876 | | | | 1,644,045 | |
| | |
FleetCor Technologies, Inc. (1) | | | 5,662 | | | | 1,274,913 | |
| | | | | | | | |
| |
| | | | 5,526,440 | |
| | | | | | | | |
|
| Health Care Equipment & Supplies — 0.4% | |
| | |
Envista Holdings Corp. (1) | | | 11,563 | | | | 269,071 | |
| | | | | | | | |
|
| Health Care Providers & Services — 8.5% | |
| | |
Acadia Healthcare Co., Inc. (1) | | | 24,240 | | | | 1,781,882 | |
| | |
Amedisys, Inc. (1) | | | 3,799 | | | | 347,571 | |
| | |
Centene Corp. (1) | | | 32,698 | | | | 2,255,508 | |
| | |
Henry Schein, Inc. (1) | | | 10,145 | | | | 659,222 | |
| | |
Molina Healthcare, Inc. (1) | | | 3,033 | | | | 1,009,837 | |
| | | | | | | | |
| |
| | | | 6,054,020 | |
| | | | | | | | |
|
| Health Care REITs — 0.7% | |
| | |
Welltower, Inc. | | | 6,061 | | | | 506,760 | |
| | | | | | | | |
|
| Hotels, Restaurants & Leisure — 3.6% | |
| | |
Darden Restaurants, Inc. | | | 14,595 | | | | 2,124,011 | |
| | |
Travel & Leisure Co. | | | 12,207 | | | | 415,404 | |
| | | | | | | | |
| |
| | | | 2,539,415 | |
| | | | | | | | |
|
| Household Durables — 7.6% | |
| | |
DR Horton, Inc. | | | 15,882 | | | | 1,658,081 | |
| | |
Lennar Corp. | | | 16,563 | | | | 1,766,941 | |
| | |
Toll Brothers, Inc. | | | 28,468 | | | | 2,012,972 | |
| | | | | | | | |
| |
| | | | 5,437,994 | |
| | | | | | | | |
|
| Independent Power and Renewable Electricity Producers — 1.2% | |
| | |
AES Corp. | | | 59,400 | | | | 885,060 | |
| | | | | | | | |
|
| Insurance — 6.0% | |
| | |
Arch Capital Group Ltd. (1) | | | 37,740 | | | | 3,271,303 | |
| | |
Assured Guaranty Ltd. | | | 16,008 | | | | 998,899 | |
| | | | | | | | |
| |
| | | | 4,270,202 | |
| | | | | | | | |
|
| IT Services — 0.8% | |
| | |
Akamai Technologies, Inc. (1) | | | 5,658 | | | | 584,641 | |
| | | | | | | | |
|
| Machinery — 5.5% | |
| | |
AGCO Corp. | | | 7,793 | | | | 893,546 | |
| | |
Manitowoc Co., Inc. (1) | | | 67,869 | | | | 868,723 | |
| | |
Terex Corp. | | | 10,234 | | | | 468,717 | |
| | |
Westinghouse Air Brake Technologies Corp. | | | 16,249 | | | | 1,722,719 | |
| | | | | | | | |
| |
| | | | 3,953,705 | |
| | | | | | | | |
See accompanying Notes to Financial Statements.
55
TCW Relative Value Mid Cap Fund
Schedule of Investments (Continued)
| | | | | | | | |
| Issues | | Shares | | | Value | |
|
| Marine Transportation — 1.5% | |
| | |
Kirby Corp. (1) | | | 14,669 | | | $ | 1,095,774 | |
| | | | | | | | |
|
| Media — 1.2% | |
| | |
Interpublic Group of Cos., Inc. | | | 31,050 | | | | 881,820 | |
| | | | | | | | |
|
| Metals & Mining — 1.6% | |
| | |
Freeport-McMoRan, Inc. | | | 32,985 | | | | 1,114,233 | |
| | | | | | | | |
|
| Multi-Utilities — 3.0% | |
| | |
NiSource, Inc. | | | 42,907 | | | | 1,079,540 | |
| | |
Sempra | | | 15,580 | | | | 1,091,068 | |
| | | | | | | | |
| |
| | | | 2,170,608 | |
| | | | | | | | |
|
| Oil, Gas & Consumable Fuels — 1.5% | |
| | |
ConocoPhillips | | | 4,084 | | | | 485,179 | |
| | |
Marathon Petroleum Corp. | | | 4,094 | | | | 619,218 | |
| | | | | | | | |
| |
| | | | 1,104,397 | |
| | | | | | | | |
|
| Passenger Airlines — 1.2% | |
| | |
United Airlines Holdings, Inc. (1) | | | 24,836 | | | | 869,508 | |
| | | | | | | | |
|
| Personal Care Products — 1.6% | |
| | |
Coty, Inc. (1) | | | 125,485 | | | | 1,175,795 | |
| | | | | | | | |
|
| Pharmaceuticals — 0.6% | |
| | |
Perrigo Co. PLC | | | 14,152 | | | | 391,161 | |
| | | | | | | | |
|
| Professional Services — 1.0% | |
| | |
Jacobs Solutions, Inc. | | | 5,326 | | | | 709,956 | |
| | | | | | | | |
|
| Real Estate Management & Development — 1.7% | |
| | |
Jones Lang LaSalle, Inc. (1) | | | 9,274 | | | | 1,186,330 | |
| | | | | | | | |
|
| Retail REITs — 1.7% | |
| | |
SITE Centers Corp. | | | 107,020 | | | | 1,247,853 | |
| | | | | | | | |
| | | | | | | | |
| Issues | | Shares | | | Value | |
|
| Semiconductors & Semiconductor Equipment — 0.4% | |
| | |
Analog Devices, Inc. | | | 1,716 | | | $ | 269,978 | |
| | | | | | | | |
|
| Specialized REITs — 0.6% | |
| | |
Weyerhaeuser Co. | | | 15,745 | | | | 451,724 | |
| | | | | | | | |
|
| Specialty Retail — 2.8% | |
| | |
Dick’s Sporting Goods, Inc. | | | 8,311 | | | | 888,861 | |
| | |
Gap, Inc. | | | 26,014 | | | | 332,979 | |
| | |
Guess?, Inc. | | | 13,255 | | | | 284,983 | |
| | |
Williams-Sonoma, Inc. | | | 3,234 | | | | 485,876 | |
| | | | | | | | |
| |
| | | | 1,992,699 | |
| | | | | | | | |
|
| Technology Hardware, Storage & Peripherals — 0.4% | |
| | |
Seagate Technology Holdings PLC | | | 4,100 | | | | 279,825 | |
| | | | | | | | |
|
Total Common Stock | |
| |
(Cost: $48,349,611) | | | | 70,551,400 | |
| | | | | | | | |
| |
MONEY MARKET INVESTMENTS — 1.4% | | | | | |
| | |
State Street Institutional U.S. Government Money Market Fund — Premier Class, 5.30% (2) | | | 987,150 | | | | 987,150 | |
| | | | | | | | |
| |
Total Money Market Investments | | | | | |
| |
(Cost: $987,150) | | | | 987,150 | |
| | | | | | | | |
| | |
Total Investments (100.1%) | | | | | | | | |
| | |
(Cost: $49,336,761) | | | | | | | 71,538,550 | |
| |
Liabilities In Excess Of Other Assets (-0.1%) | | | | (90,943 | ) |
| | | | | | | | |
| |
Net Assets (100.0%) | | | $ | 71,447,607 | |
| | | | | | | | |
Notes to the Schedule of Investments:
| (1) | Non-income producing security. |
| (2) | Rate disclosed is the 7-day net yield as of October 31, 2023. |
See accompanying Notes to Financial Statements.
56
TCW Relative Value Mid Cap Fund
Investments by Sector | October 31, 2023 |
| | | | |
| Sector | | Percentage of
Net Assets | |
Aerospace & Defense | | | 3.2 | % |
Air Freight & Logistics | | | 2.6 | |
Automobile Components | | | 2.2 | |
Banks | | | 5.7 | |
Broadline Retail | | | 1.1 | |
Building Products | | | 0.4 | |
Capital Markets | | | 1.4 | |
Chemicals | | | 2.3 | |
Communications Equipment | | | 1.1 | |
Construction & Engineering | | | 1.9 | |
Consumer Finance | | | 1.2 | |
Consumer Staples Distribution & Retail | | | 2.6 | |
Electronic Equipment, Instruments & Components | | | 5.5 | |
Energy Equipment & Services | | | 3.8 | |
Entertainment | | | 0.9 | |
Financial Services | | | 7.7 | |
Health Care Equipment & Supplies | | | 0.4 | |
Health Care Providers & Services | | | 8.5 | |
Health Care REITs | | | 0.7 | |
Hotels, Restaurants & Leisure | | | 3.6 | |
Household Durables | | | 7.6 | |
IT Services | | | 0.8 | |
Independent Power and Renewable Electricity Producers | | | 1.2 | |
Insurance | | | 6.0 | |
Machinery | | | 5.5 | |
Marine Transportation | | | 1.5 | |
Media | | | 1.2 | |
Metals & Mining | | | 1.6 | |
Multi-Utilities | | | 3.0 | |
Oil, Gas & Consumable Fuels | | | 1.5 | |
Passenger Airlines | | | 1.2 | |
Personal Care Products | | | 1.6 | |
Pharmaceuticals | | | 0.6 | |
Professional Services | | | 1.0 | |
Real Estate Management & Development | | | 1.7 | |
Retail REITs | | | 1.7 | |
Semiconductors & Semiconductor Equipment | | | 0.4 | |
Specialized REITs | | | 0.6 | |
Specialty Retail | | | 2.8 | |
Technology Hardware, Storage & Peripherals | | | 0.4 | |
Money Market Investments | | | 1.4 | |
| | | | |
Total | | | 100.1 | % |
| | | | |
See accompanying Notes to Financial Statements.
57
TCW Relative Value Mid Cap Fund
Fair Valuation Summary | October 31, 2023 |
The following is a summary of the fair valuations according to the inputs used as of October 31, 2023 in valuing the Fund’s investments:
| | | | | | | | | | | | | | | | |
Description | | Quoted Prices
in Active
Markets for
Identical
Assets
(Level 1) | | | Other
Significant
Observable
Inputs
(Level 2) | | | Significant
Unobservable
Inputs
(Level 3) | | | Total | |
Common Stock | | | | | | | | | | | | | | | | |
Aerospace & Defense | | $ | 2,317,088 | | | $ | — | | | $ | — | | | $ | 2,317,088 | |
Air Freight & Logistics | | | 1,880,385 | | | | — | | | | — | | | | 1,880,385 | |
Automobile Components | | | 1,548,814 | | | | — | | | | — | | | | 1,548,814 | |
Banks | | | 4,065,970 | | | | — | | | | — | | | | 4,065,970 | |
Broadline Retail | | | 792,956 | | | | — | | | | — | | | | 792,956 | |
Building Products | | | 265,778 | | | | — | | | | — | | | | 265,778 | |
Capital Markets | | | 1,009,049 | | | | — | | | | — | | | | 1,009,049 | |
Chemicals | | | 1,654,414 | | | | — | | | | — | | | | 1,654,414 | |
Communications Equipment | | | 750,180 | | | | — | | | | — | | | | 750,180 | |
Construction & Engineering | | | 1,335,123 | | | | — | | | | — | | | | 1,335,123 | |
Consumer Finance | | | 858,835 | | | | — | | | | — | | | | 858,835 | |
Consumer Staples Distribution & Retail | | | 1,840,265 | | | | — | | | | — | | | | 1,840,265 | |
Electronic Equipment, Instruments & Components | | | 3,951,130 | | | | — | | | | — | | | | 3,951,130 | |
Energy Equipment & Services | | | 2,678,620 | | | | — | | | | — | | | | 2,678,620 | |
Entertainment | | | 633,824 | | | | — | | | | — | | | | 633,824 | |
Financial Services | | | 5,526,440 | | | | — | | | | — | | | | 5,526,440 | |
Health Care Equipment & Supplies | | | 269,071 | | | | — | | | | — | | | | 269,071 | |
Health Care Providers & Services | | | 6,054,020 | | | | — | | | | — | | | | 6,054,020 | |
Health Care REITs | | | 506,760 | | | | — | | | | — | | | | 506,760 | |
Hotels, Restaurants & Leisure | | | 2,539,415 | | | | — | | | | — | | | | 2,539,415 | |
Household Durables | | | 5,437,994 | | | | — | | | | — | | | | 5,437,994 | |
Independent Power and Renewable Electricity Producers | | | 885,060 | | | | — | | | | — | | | | 885,060 | |
Insurance | | | 4,270,202 | | | | — | | | | — | | | | 4,270,202 | |
Machinery | | | 3,953,705 | | | | — | | | | — | | | | 3,953,705 | |
IT Services | | | 584,641 | | | | — | | | | — | | | | 584,641 | |
Marine Transportation | | | 1,095,774 | | | | — | | | | — | | | | 1,095,774 | |
Media | | | 881,820 | | | | — | | | | — | | | | 881,820 | |
Metals & Mining | | | 1,114,233 | | | | — | | | | — | | | | 1,114,233 | |
Multi-Utilities | | | 2,170,608 | | | | — | | | | — | | | | 2,170,608 | |
Oil, Gas & Consumable Fuels | | | 1,104,397 | | | | — | | | | — | | | | 1,104,397 | |
Passenger Airlines | | | 869,508 | | | | — | | | | — | | | | 869,508 | |
Personal Care Products | | | 1,175,795 | | | | — | | | | — | | | | 1,175,795 | |
Pharmaceuticals | | | 391,161 | | | | — | | | | — | | | | 391,161 | |
Professional Services | | | 709,956 | | | | — | | | | — | | | | 709,956 | |
Real Estate Management & Development | | | 1,186,330 | | | | — | | | | — | | | | 1,186,330 | |
Retail REITs | | | 1,247,853 | | | | — | | | | — | | | | 1,247,853 | |
Semiconductors & Semiconductor Equipment | | | 269,978 | | | | — | | | | — | | | | 269,978 | |
Specialized REITs | | | 451,724 | | | | — | | | | — | | | | 451,724 | |
Specialty Retail | | | 1,992,699 | | | | — | | | | — | | | | 1,992,699 | |
Technology Hardware, Storage & Peripherals | | | 279,825 | | | | — | | | | — | | | | 279,825 | |
| | | | | | | | | | | | | | | | |
Total Common Stock | | | 70,551,400 | | | | — | | | | — | | | | 70,551,400 | |
| | | | | | | | | | | | | | | | |
Money Market Investments | | | 987,150 | | | | — | | | | — | | | | 987,150 | |
| | | | | | | | | | | | | | | | |
Total Investments | | $ | 71,538,550 | | | $ | — | | | $ | — | | | $ | 71,538,550 | |
| | | | | | | | | | | | | | | | |
See accompanying Notes to Financial Statements.
58
TCW Select Equities Fund
Schedule of Investments | October 31, 2023 |
| | | | | | | | |
| Issues | | Shares | | | Value | |
|
COMMON STOCK — 98.5% of Net Assets | |
|
| Broadline Retail — 6.3% | |
| | |
Amazon.com, Inc. (1) | | | 253,366 | | | $ | 33,720,481 | |
| | | | | | | | |
|
| Capital Markets — 5.0% | |
| | |
Charles Schwab Corp. | | | 153,535 | | | | 7,989,961 | |
| | |
S&P Global, Inc. | | | 53,803 | | | | 18,793,926 | |
| | | | | | | | |
| |
| | | | 26,783,887 | |
| | | | | | | | |
|
| Commercial Services & Supplies — 2.0% | |
| | |
Waste Connections, Inc. (Canada) | | | 83,428 | | | | 10,803,926 | |
| | | | | | | | |
|
| Consumer Staples Distribution & Retail — 3.5% | |
| | |
Costco Wholesale Corp. | | | 33,672 | | | | 18,601,760 | |
| | | | | | | | |
|
| Financial Services — 9.8% | |
| | |
Mastercard, Inc. | | | 53,287 | | | | 20,054,563 | |
| | |
PayPal Holdings, Inc. (1) | | | 90,603 | | | | 4,693,235 | |
| | |
Visa, Inc. | | | 118,798 | | | | 27,929,410 | |
| | | | | | | | |
| |
| | | | 52,677,208 | |
| | | | | | | | |
|
| Health Care Equipment & Supplies — 6.5% | |
| | |
Boston Scientific Corp. (1) | | | 260,069 | | | | 13,312,932 | |
| | |
Dexcom, Inc. (1) | | | 117,469 | | | | 10,434,771 | |
| | |
Intuitive Surgical, Inc. (1) | | | 42,729 | | | | 11,204,399 | |
| | | | | | | | |
| |
| | | | 34,952,102 | |
| | | | | | | | |
|
| Health Care Providers & Services — 3.4% | |
| | |
UnitedHealth Group, Inc. | | | 33,583 | | | | 17,985,711 | |
| | | | | | | | |
|
| Interactive Media & Services — 7.1% | |
| | |
Alphabet, Inc. — Class C(1) | | | 303,995 | | | | 38,090,574 | |
| | | | | | | | |
|
| IT Services — 2.9% | |
| | |
Gartner, Inc. (1) | | | 30,427 | | | | 10,102,981 | |
| | |
Snowflake, Inc. (1) | | | 36,971 | | | | 5,365,601 | |
| | | | | | | | |
| |
| | | | 15,468,582 | |
| | | | | | | | |
|
| Life Sciences Tools & Services — 2.3% | |
| | |
IQVIA Holdings, Inc. (1) | | | 69,228 | | | | 12,518,499 | |
| | | | | | | | |
|
| Media — 2.3% | |
| | |
Trade Desk, Inc. (1) | | | 171,337 | | | | 12,158,074 | |
| | | | | | | | |
|
| Pharmaceuticals — 2.9% | |
| | |
Zoetis, Inc. | | | 98,185 | | | | 15,415,045 | |
| | | | | | | | |
|
| Semiconductors & Semiconductor Equipment — 10.9% | |
| | |
ASML Holding NV (Netherlands) | | | 22,374 | | | | 13,397,775 | |
| | |
NVIDIA Corp. | | | 109,813 | | | | 44,781,741 | |
| | | | | | | | |
| |
| | | | 58,179,516 | |
| | | | | | | | |
| | | | | | | | |
| Issues | | Shares | | | Value | |
|
| Software — 24.7% | |
| | |
Adobe, Inc. (1) | | | 32,063 | | | $ | 17,059,440 | |
| | |
Crowdstrike Holdings, Inc. (1) | | | 79,294 | | | | 14,016,800 | |
| | |
Microsoft Corp. | | | 112,399 | | | | 38,003,226 | |
| | |
Palo Alto Networks, Inc. (1) | | | 47,060 | | | | 11,436,521 | |
| | |
Salesforce, Inc. (1) | | | 77,018 | | | | 15,467,525 | |
| | |
ServiceNow, Inc. (1) | | | 62,712 | | | | 36,488,977 | |
| | | | | | | | |
| |
| | | | 132,472,489 | |
| | | | | | | | |
|
| Specialized REITs — 2.6% | |
| | |
American Tower Corp. | | | 78,385 | | | | 13,967,423 | |
| | | | | | | | |
|
| Specialty Retail — 4.0% | |
| | |
Home Depot, Inc. | | | 44,475 | | | | 12,661,588 | |
| | |
Ulta Beauty, Inc. (1) | | | 22,868 | | | | 8,719,797 | |
| | | | | | | | |
| |
| | | | 21,381,385 | |
| | | | | | | | |
|
| Textiles, Apparel & Luxury Goods — 2.3% | |
| | |
NIKE, Inc. — Class B | | | 118,528 | | | | 12,181,123 | |
| | | | | | | | |
|
Total Common Stock | |
| |
(Cost: $214,261,124) | | | | 527,357,785 | |
| | | | | | | | |
|
MONEY MARKET INVESTMENTS — 1.6% | |
| | |
State Street Institutional U.S. Government Money Market Fund — Premier Class, 5.30% (2) | | | 8,880,503 | | | | 8,880,503 | |
| | | | | | | | |
|
Total Money Market Investments | |
| |
(Cost: $8,880,503) | | | | 8,880,503 | |
| | | | | | | | |
| | |
Total Investments (100.1%) | | | | | | | | |
| |
(Cost: $223,141,627) | | | | 536,238,288 | |
| |
Liabilities In Excess Of Other Assets (-0.1%) | | | | (710,133 | ) |
| | | | | | | | |
| |
| Net Assets (100.0%) | | | $535,528,155 | |
| | | | | | | | |
Notes to the Schedule of Investments:
| REIT | | Real Estate Investment Trust. |
| (1) | | Non-income producing security. |
| (2) | | Rate disclosed is the 7-day net yield as of October 31, 2023. |
See accompanying Notes to Financial Statements.
59
TCW Select Equities Fund
Investments by Sector | October 31, 2023 |
| | | | |
| Sector | | Percentage of
Net Assets | |
Broadline Retail | | | 6.3 | % |
Capital Markets | | | 5.0 | |
Commercial Services & Supplies | | | 2.0 | |
Consumer Staples Distribution & Retail | | | 3.5 | |
Financial Services | | | 9.8 | |
Health Care Equipment & Supplies | | | 6.5 | |
Health Care Providers & Services | | | 3.4 | |
Interactive Media & Services | | | 7.1 | |
IT Services | | | 2.9 | |
Life Sciences Tools & Services | | | 2.3 | |
Media | | | 2.3 | |
Pharmaceuticals | | | 2.9 | |
Semiconductors & Semiconductor Equipment | | | 10.9 | |
Software | | | 24.7 | |
Specialized REITs | | | 2.6 | |
Specialty Retail | | | 4.0 | |
Textiles, Apparel & Luxury Goods | | | 2.3 | |
Money Market Investments | | | 1.6 | |
| | | | |
Total | | | 100.1 | % |
| | | | |
See accompanying Notes to Financial Statements.
60
TCW Select Equities Fund
Fair Valuation Summary | October 31, 2023 |
The following is a summary of the fair valuations according to the inputs used as of October 31, 2023 in valuing the Fund’s investments:
| | | | | | | | | | | | | | | | |
Description | | Quoted Prices
in Active
Markets for
Identical
Assets
(Level 1) | | | Other
Significant
Observable
Inputs
(Level 2) | | | Significant
Unobservable
Inputs
(Level 3) | | | Total | |
Common Stock | | | | | | | | | | | | | | | | |
Broadline Retail | | $ | 33,720,481 | | | $ | — | | | $ | — | | | $ | 33,720,481 | |
Capital Markets | | | 26,783,887 | | | | — | | | | — | | | | 26,783,887 | |
Commercial Services & Supplies | | | 10,803,926 | | | | — | | | | — | | | | 10,803,926 | |
Consumer Staples Distribution & Retail | | | 18,601,760 | | | | — | | | | — | | | | 18,601,760 | |
Financial Services | | | 52,677,208 | | | | — | | | | — | | | | 52,677,208 | |
Health Care Equipment & Supplies | | | 34,952,102 | | | | — | | | | — | | | | 34,952,102 | |
Health Care Providers & Services | | | 17,985,711 | | | | — | | | | — | | | | 17,985,711 | |
Interactive Media & Services | | | 38,090,574 | | | | — | | | | — | | | | 38,090,574 | |
IT Services | | | 15,468,582 | | | | — | | | | — | | | | 15,468,582 | |
Life Sciences Tools & Services | | | 12,518,499 | | | | — | | | | — | | | | 12,518,499 | |
Media | | | 12,158,074 | | | | — | | | | — | | | | 12,158,074 | |
Pharmaceuticals | | | 15,415,045 | | | | — | | | | — | | | | 15,415,045 | |
Semiconductors & Semiconductor Equipment | | | 58,179,516 | | | | — | | | | — | | | | 58,179,516 | |
Software | | | 132,472,489 | | | | — | | | | — | | | | 132,472,489 | |
Specialized REITs | | | 13,967,423 | | | | — | | | | — | | | | 13,967,423 | |
Specialty Retail | | | 21,381,385 | | | | — | | | | — | | | | 21,381,385 | |
Textiles, Apparel & Luxury Goods | | | 12,181,123 | | | | — | | | | — | | | | 12,181,123 | |
| | | | | | | | | | | | | | | | |
Total Common Stock | | | 527,357,785 | | | | — | | | | — | | | | 527,357,785 | |
| | | | | | | | | | | | | | | | |
Money Market Investments | | | 8,880,503 | | | | — | | | | — | | | | 8,880,503 | |
| | | | | | | | | | | | | | | | |
Total Investments | | $ | 536,238,288 | | | $ | — | | | $ | — | | | $ | 536,238,288 | |
| | | | | | | | | | | | | | | | |
See accompanying Notes to Financial Statements.
61
TCW Funds, Inc.
Statements of Assets and Liabilities | October 31, 2023 |
| | | | | | | | | | | | | | | | |
| | | TCW
Artificial
Intelligence
Equity
Fund | | | TCW
Conservative
Allocation
Fund | | | TCW
Global
Real Estate
Fund | | | TCW
New America
Premier
Equities
Fund | |
ASSETS | |
Investments, at Value (1) | | $ | 24,679,714 | | | $ | 1,223,296 | | | $ | 22,968,656 | | | $ | 167,579,266 | |
Investment in Affiliated Issuers, at Value | | | — | | | | 26,264,477 | (2) | | | — | | | | — | |
Foreign Currency, at Value (3) | | | — | | | | — | | | | — | | | | 8 | |
Receivable for Securities Sold | | | — | | | | — | | | | 1,023,717 | | | | — | |
Receivable for Fund Shares Sold | | | 108,156 | | | | — | | | | 1,704 | | | | 93,662 | |
Interest and Dividends Receivable | | | 7,058 | | | | 36,110 | | | | 22,852 | | | | 5,985 | |
Foreign Tax Reclaims Receivable | | | — | | | | — | | | | 13,857 | | | | — | |
Receivable from Investment Advisor | | | 12,737 | | | | 1,316 | | | | 10,591 | | | | 3,581 | |
Cash Collateral Held for Brokers | | | — | | | | — | | | | — | | | | 3 | |
Prepaid Expenses | | | 9,128 | | | | 22,502 | | | | 3,916 | | | | 12,237 | |
| | | | | | | | | | | | | | | | |
Total Assets | | | 24,816,793 | | | | 27,547,701 | | | | 24,045,293 | | | | 167,694,742 | |
| | | | | | | | | | | | | | | | |
LIABILITIES | |
Payable for Securities Purchased | | | — | | | | — | | | | 349,073 | | | | — | |
Payable for Fund Shares Redeemed | | | 24,843 | | | | — | | | | 8,623 | | | | 42,790 | |
Accrued Directors’ Fees and Expenses | | | 10,958 | | | | 10,956 | | | | 10,956 | | | | 10,945 | |
Deferred Accrued Directors’ Fees and Expenses | | | 1,310 | | | | 1,310 | | | | 1,310 | | | | 1,310 | |
Accrued Management Fees | | | 15,152 | | | | — | | | | 16,492 | | | | 94,561 | |
Accrued Distribution Fees | | | 892 | | | | 68 | | | | 1,654 | | | | 4,692 | |
Options Written, at Value (4) | | | — | | | | — | | | | 1,125 | | | | — | |
Transfer Agent Fees Payable | | | 8,731 | | | | 4,707 | | | | 6,972 | | | | 15,898 | |
Administration Fee Payable | | | 1,034 | | | | 2,563 | | | | 2,769 | | | | 13,766 | |
Audit Fees Payable | | | 17,373 | | | | 14,155 | | | | 18,511 | | | | 20,925 | |
Accounting Fees Payable | | | 1,092 | | | | 2,468 | | | | 3,261 | | | | 14,001 | |
Custodian Fees Payable | | | 5,969 | | | | 5,382 | | | | 9,256 | | | | 13,775 | |
Legal Fees Payable | | | 308 | | | | 493 | | | | 543 | | | | 1,868 | |
Other Accrued Expenses | | | 16,254 | | | | 22,814 | | | | 18,222 | | | | 28,490 | |
| | | | | | | | | | | | | | | | |
Total Liabilities | | | 103,916 | | | | 64,916 | | | | 448,767 | | | | 263,021 | |
| | | | | | | | | | | | | | | | |
NET ASSETS | | $ | 24,712,877 | | | $ | 27,482,785 | | | $ | 23,596,526 | | | $ | 167,431,721 | |
| | | | | | | | | | | | | | | | |
NET ASSETS CONSIST OF: | |
Paid-in Capital | | $ | 23,515,650 | | | $ | 27,914,900 | | | $ | 36,381,324 | | | $ | 112,828,926 | |
Accumulated Earnings (Loss) | | | 1,197,227 | | | | (432,115 | ) | | | (12,784,798 | ) | | | 54,602,795 | |
| | | | | | | | | | | | | | | | |
NET ASSETS | | $ | 24,712,877 | | | $ | 27,482,785 | | | $ | 23,596,526 | | | $ | 167,431,721 | |
| | | | | | | | | | | | | | | | |
NET ASSETS ATTRIBUTABLE TO: | |
I Class Share | | $ | 20,609,495 | | | $ | 27,165,305 | | | $ | 16,001,278 | | | $ | 145,705,014 | |
| | | | | | | | | | | | | | | | |
N Class Share | | $ | 4,103,382 | | | $ | 317,480 | | | $ | 7,595,248 | | | $ | 21,726,707 | |
| | | | | | | | | | | | | | | | |
CAPITAL SHARES OUTSTANDING: (5) | |
I Class Share | | | 1,113,673 | | | | 2,592,466 | | | | 1,666,152 | | | | 5,657,321 | |
| | | | | | | | | | | | | | | | |
N Class Share | | | 222,867 | | | | 30,262 | | | | 791,860 | | | | 852,866 | |
| | | | | | | | | | | | | | | | |
NET ASSET VALUE PER SHARE: (6) | |
I Class Share | | $ | 18.51 | | | $ | 10.48 | | | $ | 9.60 | | | $ | 25.76 | |
| | | | | | | | | | | | | | | | |
N Class Share | | $ | 18.41 | | | $ | 10.49 | | | $ | 9.59 | | | $ | 25.47 | |
| | | | | | | | | | | | | | | | |
| (1) | The identified cost for the TCW Artificial Intelligence Equity Fund, the TCW Conservative Allocation Fund, the TCW Global Real Estate Fund and the TCW New America Premier Equities Fund at October 31, 2023 was $21,318,663, $1,179,847, $25,730,885 and $111,353,386, respectively. |
| (2) | The identified cost for investments in affiliated issuers of the TCW Conservative Allocation Fund was $26,949,590. |
| (3) | The identified cost for the TCW New America Premier Equities Fund at October 31, 2023 was $8. |
| (4) | Premium received 19,867. |
| (5) | The number of authorized shares, with a par value of $0.001 per share, is 4,000,000,000 for each of the I Class and N Class shares. |
| (6) | Represents offering price and redemption price per share. |
See accompanying Notes to Financial Statements.
62
TCW Funds, Inc.
Statements of Assets and Liabilities | October 31, 2023 |
| | | | | | | | | | | | | | | | |
| | | TCW
Relative Value
Dividend
Appreciation
Fund | | | TCW
Relative Value
Large Cap
Fund | | | TCW
Relative Value
Mid Cap
Fund | | | TCW
Select Equities
Fund | |
ASSETS | |
Investments, at Value (1) | | $ | 240,029,069 | | | $ | 105,687,108 | | | $ | 71,538,550 | | | $ | 536,238,288 | |
Receivable for Securities Sold | | | 1,073,776 | | | | 103,922 | | | | 270,346 | | | | — | |
Receivable for Fund Shares Sold | | | 6,468 | | | | 10,642 | | | | 324 | | | | 307,461 | |
Interest and Dividends Receivable | | | 327,826 | | | | 120,206 | | | | 52,223 | | | | 95,873 | |
Foreign Tax Reclaims Receivable | | | 203,251 | | | | — | | | | — | | | | — | |
Receivable from Investment Advisor | | | 21,545 | | | | 10,060 | | | | 9,991 | | | | 13,659 | |
Prepaid Expenses | | | 13,025 | | | | 12,544 | | | | 20,087 | | | | 14,100 | |
| | | | | | | | | | | | | | | | |
Total Assets | | | 241,674,960 | | | | 105,944,482 | | | | 71,891,521 | | | | 536,669,381 | |
| | | | | | | | | | | | | | | | |
LIABILITIES | |
Payable for Securities Purchased | | | 1,162,193 | | | | 212,265 | | | | 308,065 | | | | — | |
Payable for Fund Shares Redeemed | | | 19,737 | | | | 24,391 | | | | 6 | | | | 499,380 | |
Accrued Directors’ Fees and Expenses | | | 10,937 | | | | 10,949 | | | | 10,952 | | | | 10,911 | |
Deferred Accrued Directors’ Fees and Expenses | | | 1,310 | | | | 1,310 | | | | 1,310 | | | | 1,310 | |
Accrued Management Fees | | | 124,664 | | | | 55,206 | | | | 43,194 | | | | 302,844 | |
Accrued Distribution Fees | | | 36,748 | | | | 1,825 | | | | 2,557 | | | | 23,129 | |
Transfer Agent Fees Payable | | | 26,178 | | | | 14,420 | | | | 11,695 | | | | 74,806 | |
Administration Fee Payable | | | 23,293 | | | | 10,345 | | | | 6,952 | | | | 49,992 | |
Audit Fees Payable | | | 21,096 | | | | 61,208 | | | | 20,978 | | | | 22,581 | |
Accounting Fees Payable | | | 20,091 | | | | 9,053 | | | | 6,261 | | | | 57,989 | |
Custodian Fees Payable | | | 19,514 | | | | 11,843 | | | | 10,838 | | | | 45,320 | |
Legal Fees Payable | | | 2,990 | | | | 1,418 | | | | 1,019 | | | | 6,356 | |
Other Accrued Expenses | | | 28,595 | | | | 23,943 | | | | 20,087 | | | | 46,608 | |
| | | | | | | | | | | | | | | | |
Total Liabilities | | | 1,497,346 | | | | 438,176 | | | | 443,914 | | | | 1,141,226 | |
| | | | | | | | | | | | | | | | |
NET ASSETS | | $ | 240,177,614 | | | $ | 105,506,306 | | | $ | 71,447,607 | | | $ | 535,528,155 | |
| | | | | | | | | | | | | | | | |
NET ASSETS CONSIST OF: | |
Paid-in Capital | | $ | 163,152,487 | | | $ | 61,020,946 | | | $ | 48,528,882 | | | $ | 152,000,031 | |
Accumulated Earnings (Loss) | | | 77,025,127 | | | | 44,485,360 | | | | 22,918,725 | | | | 383,528,124 | |
| | | | | | | | | | | | | | | | |
NET ASSETS | | $ | 240,177,614 | | | $ | 105,506,306 | | | $ | 71,447,607 | | | $ | 535,528,155 | |
| | | | | | | | | | | | | | | | |
NET ASSETS ATTRIBUTABLE TO: | |
I Class Share | | $ | 70,332,307 | | | $ | 97,169,301 | | | $ | 59,646,727 | | | $ | 429,235,965 | |
| | | | | | | | | | | | | | | | |
N Class Share | | $ | 169,845,307 | | | $ | 8,337,005 | | | $ | 11,800,880 | | | $ | 106,292,190 | |
| | | | | | | | | | | | | | | | |
CAPITAL SHARES OUTSTANDING: (2) | |
I Class Share | | | 3,742,515 | | | | 7,675,937 | | | | 2,566,279 | | | | 16,917,113 | |
| | | | | | | | | | | | | | | | |
N Class Share | | | 8,838,508 | | | | 661,636 | | | | 525,382 | | | | 5,128,182 | |
| | | | | | | | | | | | | | | | |
NET ASSET VALUE PER SHARE: (3) | |
I Class Share | | $ | 18.79 | | | $ | 12.66 | | | $ | 23.24 | | | $ | 25.37 | |
| | | | | | | | | | | | | | | | |
N Class Share | | $ | 19.22 | | | $ | 12.60 | | | $ | 22.46 | | | $ | 20.73 | |
| | | | | | | | | | | | | | | | |
| (1) | The identified cost for the TCW Relative Value Dividend Appreciation Fund, the TCW Relative Value Large Cap Fund, the TCW Relative Value Mid Cap Fund and the TCW Select Equities Fund at October 31, 2023 was $167,195,101, $65,480,413, $49,336,761 and $223,141,627, respectively. |
| (2) | The number of authorized shares, with a par value of $0.001 per share, is 4,000,000,000 for each of the I Class and N Class shares. |
| (3) | Represents offering price and redemption price per share. |
See accompanying Notes to Financial Statements.
63
TCW Funds, Inc.
Statements of Operations | Year Ended October 31, 2023 |
| | | | | | | | | | | | | | | | |
| | | TCW
Artificial
Intelligence
Equity
Fund | | | TCW
Conservative
Allocation
Fund | | | TCW
Global
Real Estate
Fund | | | TCW
New America
Premier
Equities
Fund | |
INVESTMENT INCOME | |
Income: | |
Dividends | | $ | 114,057 | (1) | | $ | 26,100 | | | $ | 1,007,016 | (1) | | $ | 1,124,328 | (1) |
Non-Cash Dividend Income | | | — | | | | — | | | | — | | | | 618,237 | |
Dividends from Investment in Affiliated Issuers | | | — | | | | 962,559 | | | | — | | | | — | |
Interest | | | — | | | | — | | | | — | | | | 27 | |
| | | | | | | | | | | | | | | | |
Total | | | 114,057 | | | | 988,659 | | | | 1,007,016 | | | | 1,742,592 | |
| | | | | | | | | | | | | | | | |
Expenses: | |
Management Fees | | | 115,408 | | | | — | | | | 233,450 | | | | 1,086,376 | |
Accounting Services Fees | | | 981 | | | | 2,282 | | | | 2,976 | | | | 12,927 | |
Administration Fees | | | 306 | | | | 2,335 | | | | 2,067 | | | | 11,706 | |
Transfer Agent Fees: | |
I Class | | | 16,773 | | | | 9,239 | | | | 11,332 | | | | 51,178 | |
N Class | | | 9,346 | | | | 6,205 | | | | 11,429 | | | | 25,509 | |
Custodian Fees | | | 4,477 | | | | 4,033 | | | | 7,132 | | | | 12,504 | |
Professional Fees | | | 24,577 | | | | 19,866 | | | | 26,238 | | | | 34,758 | |
Directors’ Fees and Expenses | | | 45,901 | | | | 45,901 | | | | 45,901 | | | | 45,907 | |
Registration Fees: | |
I Class | | | 17,790 | | | | 16,017 | | | | 17,874 | | | | 15,922 | |
N Class | | | 16,548 | | | | 16,017 | | | | 17,838 | | | | 15,515 | |
Distribution Fees: | |
N Class | | | 8,531 | | | | 845 | | | | 26,336 | | | | 54,540 | |
Compliance Expense | | | 12,485 | | | | 12,485 | | | | 6,241 | | | | 6,241 | |
Shareholder Reporting Expense | | | 3,736 | | | | 2,940 | | | | 3,769 | | | | 5,176 | |
Other | | | 9,825 | | | | 10,028 | | | | 16,609 | | | | 23,943 | |
| | | | | | | | | | | | | | | | |
Total | | | 286,684 | | | | 148,193 | | | | 429,192 | | | | 1,402,202 | |
| | | | | | | | | | | | | | | | |
Less Expenses Borne by Investment Advisor: | |
I Class | | | (87,861 | ) | | | — | | | | (81,336 | ) | | | — | |
N Class | | | (47,021 | ) | | | (21,985 | ) | | | (74,677 | ) | | | (30,770 | ) |
| | | | | | | | | | | | | | | | |
Net Expenses | | | 151,802 | | | | 126,208 | | | | 273,179 | | | | 1,371,432 | |
| | | | | | | | | | | | | | | | |
Net Investment Income (Loss) | | | (37,745 | ) | | | 862,451 | | | | 733,837 | | | | 371,160 | |
| | | | | | | | | | | | | | | | |
NET REALIZED AND UNREALIZED GAIN (LOSS) ON INVESTMENTS | | | | | | | | | | | | | | | | |
Net Realized Gain (Loss) on: | | | | | | | | | | | | | | | | |
Investments | | | (505,340 | ) | | | — | | | | (2,601,924 | ) | | | 4,376,184 | |
Investments in Affiliated Issuers | | | — | | | | (717,525 | ) | | | — | | | | — | |
Realized Gain Received as Distribution from Affiliated Issuers | | | — | | | | 467,003 | | | | — | | | | — | |
Foreign Currency | | | (579 | ) | | | — | | | | (10,807 | ) | | | 13,068 | |
Options Written | | | — | | | | — | | | | 72,770 | | | | — | |
Change in Unrealized Appreciation on: | | | | | | | | | | | | | | | | |
Investments | | | 2,670,313 | | | | 154,157 | | | | 678,150 | | | | 19,815,647 | |
Foreign Currency | | | 22 | | | | — | | | | 681 | | | | 48 | |
Investments in Affiliated Issuers | | | — | | | | 374,636 | | | | — | | | | — | |
Options Written | | | — | | | | — | | | | 22,761 | | | | — | |
| | | | | | | | | | | | | | | | |
Net Realized and Unrealized Gain (Loss) on Investments and Foreign Currency Transactions | | | 2,164,416 | | | | 278,271 | | | | (1,838,369 | ) | | | 24,204,947 | |
| | | | | | | | | | | | | | | | |
INCREASE (DECREASE) IN NET ASSETS RESULTING FROM OPERATIONS | | $ | 2,126,671 | | | $ | 1,140,722 | | | $ | (1,104,532 | ) | | $ | 24,576,107 | |
| | | | | | | | | | | | | | | | |
| (1) | Net of foreign taxes withheld. Total amounts withheld for the TCW Artificial Intelligence Equity Fund, the TCW Global Real Estate Fund and the TCW New America Premier Equities Fund were $3,886, $27,253 and $66,137, respectively. |
See accompanying Notes to Financial Statements.
64
TCW Funds, Inc.
Statements of Operations | Year Ended October 31, 2023 |
| | | | | | | | | | | | | | | | |
| | | TCW
Relative Value
Dividend
Appreciation
Fund | | | TCW
Relative Value
Large Cap Fund | | | TCW
Relative Value
Mid Cap
Fund | | | TCW
Select Equities
Fund | |
INVESTMENT INCOME | | | | | | | | | | | | | | | | |
Income: | | | | | | | | | | | | | | | | |
Dividends | | $ | 6,799,541 | (1) | | $ | 2,529,721 | | | $ | 1,315,501 | (1) | | $ | 3,459,387 | (1) |
| | | | | | | | | | | | | | | | |
Total | | | 6,799,541 | | | | 2,529,721 | | | | 1,315,501 | | | | 3,459,387 | |
| | | | | | | | | | | | | | | | |
Expenses: | | | | | | | | | | | | | | | | |
Management Fees | | | 1,563,958 | | | | 694,306 | | | | 538,738 | | | | 3,654,843 | |
Accounting Services Fees | | | 18,585 | | | | 8,374 | | | | 5,791 | | | | 53,421 | |
Administration Fees | | | 21,442 | | | | 9,314 | | | | 5,986 | | | | 43,425 | |
Transfer Agent Fees: | | | | | | | | | | | | | | | | |
I Class | | | 37,253 | | | | 57,368 | | | | 48,820 | | | | 294,144 | |
N Class | | | 154,800 | | | | 11,533 | | | | 14,561 | | | | 93,754 | |
Custodian Fees | | | 17,971 | | | | 10,823 | | | | 10,015 | | | | 42,257 | |
Professional Fees | | | 38,965 | | | | 73,742 | | | | 32,104 | | | | 51,280 | |
Directors’ Fees and Expenses | | | 45,911 | | | | 45,905 | | | | 45,903 | | | | 45,924 | |
Registration Fees: | | | | | | | | | | | | | | | | |
I Class | | | 17,513 | | | | 16,836 | | | | 16,136 | | | | 21,226 | |
N Class | | | 20,272 | | | | 16,922 | | | | 16,407 | | | | 17,686 | |
Distribution Fees: | | | | | | | | | | | | | | | | |
N Class | | | 466,406 | | | | 22,977 | | | | 32,207 | | | | 269,513 | |
Compliance Expense | | | 6,241 | | | | 6,241 | | | | 6,241 | | | | 6,241 | |
Shareholder Reporting Expense | | | 6,649 | | | | 5,405 | | | | 5,449 | | | | 7,083 | |
Other | | | 28,105 | | | | 18,474 | | | | 17,090 | | | | 60,330 | |
| | | | | | | | | | | | | | | | |
Total | | | 2,444,071 | | | | 998,220 | | | | 795,448 | | | | 4,661,127 | |
| | | | | | | | | | | | | | | | |
Less Expenses Borne by Investment Advisor: | | | | | | | | | | | | | | | | |
I Class | | | (32,860 | ) | | | (131,527 | ) | | | (75,574 | ) | | | — | |
N Class | | | (213,471 | ) | | | (38,263 | ) | | | (52,785 | ) | | | (139,470 | ) |
| | | | | | | | | | | | | | | | |
Net Expenses | | | 2,197,740 | | | | 828,430 | | | | 667,089 | | | | 4,521,657 | |
| | | | | | | | | | | | | | | | |
Net Investment Income (Loss) | | | 4,601,801 | | | | 1,701,291 | | | | 648,412 | | | | (1,062,270 | ) |
| | | | | | | | | | | | | | | | |
NET REALIZED AND UNREALIZED GAIN (LOSS) ON INVESTMENTS | | | | | | | | | | | | | | | | |
Net Realized Gain (Loss) on: | | | | | | | | | | | | | | | | |
Investments | | | 7,879,414 | | | | 4,506,070 | | | | 1,275,486 | | | | 79,884,913 | |
Foreign Currency | | | — | | | | — | | | | — | | | | (41 | ) |
Change in Unrealized Appreciation (Depreciation) on: | | | | | | | | | | | | | | | | |
Investments | | | (3,259,810 | ) | | | (1,916,031 | ) | | | (941,368 | ) | | | 15,375,183 | |
| | | | | | | | | | | | | | | | |
Net Realized and Unrealized Gain (Loss) on Investments | | | 4,619,604 | | | | 2,590,039 | | | | 334,118 | | | | 95,260,055 | |
| | | | | | | | | | | | | | | | |
INCREASE IN NET ASSETS RESULTING FROM OPERATIONS | | $ | 9,221,405 | | | $ | 4,291,330 | | | $ | 982,530 | | | $ | 94,197,785 | |
| | | | | | | | | | | | | | | | |
| (1) | Net of foreign taxes withheld. Total amounts withheld for the TCW Relative Value Dividend Appreciation Fund, the TCW Relative Value Mid Cap Fund and the TCW Select Equities Fund were $39,360, $9,767 and $38,196, respectively. |
See accompanying Notes to Financial Statements.
65
TCW Funds, Inc.
Statements of Changes in Net Assets
| | | | | | | | | | | | | | | | |
| | | TCW
Artificial Intelligence Equity
Fund | | | TCW
Conservative Allocation
Fund | |
| | | Year Ended
October 31,
2023 | | | Year Ended
October 31,
2022 | | | Year Ended
October 31,
2023 | | | Year Ended
October 31,
2022 | |
OPERATIONS | | | | | | | | | | | | | | | | |
Net Investment Income (Loss) | | $ | (37,745 | ) | | $ | (57,357 | ) | | $ | 862,451 | | | $ | 622,915 | |
Net Realized Gain (Loss) on Investments and Foreign Currency Transactions | | | (505,919 | ) | | | (1,561,174 | ) | | | (250,522 | ) | | | 1,018,162 | |
Change in Unrealized Appreciation (Depreciation) on Investments and Foreign Currency Transactions | | | 2,670,335 | | | | (5,292,894 | ) | | | 528,793 | | | | (7,499,120 | ) |
| | | | | | | | | | | | | | | | |
Increase (Decrease) in Net Assets Resulting from Operations | | | 2,126,671 | | | | (6,911,425 | ) | | | 1,140,722 | | | | (5,858,043 | ) |
| | | | | | | | | | | | | | | | |
DISTRIBUTIONS TO SHAREHOLDERS | | | | | | | | | | | | | | | | |
Distributions to Shareholders | | | — | | | | (815,308 | ) | | | (1,303,274 | ) | | | (3,251,567 | ) |
| | | | | | | | | | | | | | | | |
NET CAPITAL SHARE TRANSACTIONS | | | | | | | | | | | | | | | | |
I Class | | | 11,306,051 | | | | (208,373 | ) | | | (297,406 | ) | | | 1,248,923 | |
N Class | | | 306,020 | | | | (26,162 | ) | | | (28,153 | ) | | | (167,827 | ) |
| | | | | | | | | | | | | | | | |
Increase (Decrease) in Net Assets Resulting from Net Capital Shares Transactions | | | 11,612,071 | | | | (234,535 | ) | | | (325,559 | ) | | | 1,081,096 | |
| | | | | | | | | | | | | | | | |
Increase (Decrease) in Net Assets | | | 13,738,742 | | | | (7,961,268 | ) | | | (488,111 | ) | | | (8,028,514 | ) |
NET ASSETS | | | | | | | | | | | | | | | | |
Beginning of year | | | 10,974,135 | | | | 18,935,403 | | | | 27,970,896 | | | | 35,999,410 | |
| | | | | | | | | | | | | | | | |
End of year | | $ | 24,712,877 | | | $ | 10,974,135 | | | $ | 27,482,785 | | | $ | 27,970,896 | |
| | | | | | | | | | | | | | | | |
See accompanying Notes to Financial Statements.
66
TCW Funds, Inc.
Statements of Changes in Net Assets
| | | | | | | | | | | | | | | | |
| | | TCW
Global Real Estate
Fund | | | TCW
New America Premier Equities
Fund | |
| | | Year Ended
October 31,
2023 | | | Year Ended
October 31,
2022 | | | Year Ended
October 31,
2023 | | | Year Ended
October 31,
2022 | |
OPERATIONS | | | | | | | | | | | | | | | | |
Net Investment Income (Loss) | | $ | 733,837 | | | $ | 863,590 | | | $ | 371,160 | | | $ | (400,701 | ) |
Net Realized Gain (Loss) on Investments, Options Written and Foreign Currency Transactions | | | (2,539,961 | ) | | | (7,136,200 | ) | | | 4,389,252 | | | | (5,950,051 | ) |
Change in Unrealized Appreciation (Depreciation) on Investments, Options Written and Foreign Currency Transactions | | | 701,592 | | | | (6,962,123 | ) | | | 19,815,695 | | | | (41,048,005 | ) |
| | | | | | | | | | | | | | | | |
Increase (Decrease) in Net Assets Resulting from Operations | | | (1,104,532 | ) | | | (13,234,733 | ) | | | 24,576,107 | | | | (47,398,757 | ) |
| | | | | | | | | | | | | | | | |
DISTRIBUTIONS TO SHAREHOLDERS | | | | | | | | | | | | | | | | |
Distributions to Shareholders | | | (424,761 | ) | | | (3,597,946 | ) | | | (6,701 | ) | | | (26,427,279 | ) |
Return of Capital | | | — | | | | (447,356 | ) | | | — | | | | — | |
| | | | | | | | | | | | | | | | |
Total Distributions to Shareholders | | | (424,761 | ) | | | (4,045,302 | ) | | | (6,701 | ) | | | (26,427,279 | ) |
| | | | | | | | | | | | | | | | |
NET CAPITAL SHARE TRANSACTIONS | | | | | | | | | | | | | | | | |
I Class | | | (609,032 | ) | | | 3,859,420 | | | | (3,710,481 | ) | | | (9,546,382 | ) |
N Class | | | (3,614,047 | ) | | | 3,186,663 | | | | (1,294,103 | ) | | | (631,927 | ) |
| | | | | | | | | | | | | | | | |
Increase (Decrease) in Net Assets Resulting from Net Capital Shares Transactions | | | (4,223,079 | ) | | | 7,046,083 | | | | (5,004,584 | ) | | | (10,178,309 | ) |
| | | | | | | | | | | | | | | | |
Increase (Decrease) in Net Assets | | | (5,752,372 | ) | | | (10,233,952 | ) | | | 19,564,822 | | | | (84,004,345 | ) |
NET ASSETS | | | | | | | | | | | | | | | | |
Beginning of year | | | 29,348,898 | | | | 39,582,850 | | | | 147,866,899 | | | | 231,871,244 | |
| | | | | | | | | | | | | | | | |
End of year | | $ | 23,596,526 | | | $ | 29,348,898 | | | $ | 167,431,721 | | | $ | 147,866,899 | |
| | | | | | | | | | | | | | | | |
See accompanying Notes to Financial Statements.
67
TCW Funds, Inc.
Statements of Changes in Net Assets
| | | | | | | | | | | | | | | | |
| | | TCW
Relative Value
Dividend Appreciation Fund | | | TCW
Relative Value
Large Cap Fund | |
| | | Year Ended
October 31,
2023 | | | Year Ended
October 31,
2022 | | | Year Ended
October 31,
2023 | | | Year Ended
October 31,
2022 | |
OPERATIONS | | | | | | | | | | | | | | | | |
Net Investment Income | | $ | 4,601,801 | | | $ | 4,598,582 | | | $ | 1,701,291 | | | $ | 1,655,018 | |
Net Realized Gain on Investments | | | 7,879,414 | | | | 10,945,801 | | | | 4,506,070 | | | | 6,315,555 | |
Change in Unrealized Depreciation on Investments | | | (3,259,810 | ) | | | (22,428,051 | ) | | | (1,916,031 | ) | | | (14,397,777 | ) |
| | | | | | | | | | | | | | | | |
Increase (Decrease) in Net Assets Resulting from Operations | | | 9,221,405 | | | | (6,883,668 | ) | | | 4,291,330 | | | | (6,427,204 | ) |
| | | | | | | | | | | | | | | | |
DISTRIBUTIONS TO SHAREHOLDERS | | | | | | | | | | | | | | | | |
Distributions to Shareholders | | | (15,095,694 | ) | | | (29,507,424 | ) | | | (7,648,805 | ) | | | (10,172,684 | ) |
| | | | | | | | | | | | | | | | |
NET CAPITAL SHARE TRANSACTIONS | | | | | | | | | | | | | | | | |
I Class | | | 1,735,314 | | | | 2,823,123 | | | | (825,922 | ) | | | (877,613 | ) |
N Class | | | (5,460,294 | ) | | | 3,156,898 | | | | (405,636 | ) | | | (137,752 | ) |
| | | | | | | | | | | | | | | | |
Increase (Decrease) in Net Assets Resulting from Net Capital Shares Transactions | | | (3,724,980 | ) | | | 5,980,021 | | | | (1,231,558 | ) | | | (1,015,365 | ) |
| | | | | | | | | | | | | | | | |
Decrease in Net Assets | | | (9,599,269 | ) | | | (30,411,071 | ) | | | (4,589,033 | ) | | | (17,615,253 | ) |
NET ASSETS | | | | | | | | | | | | | | | | |
Beginning of year | | | 249,776,883 | | | | 280,187,954 | | | | 110,095,339 | | | | 127,710,592 | |
| | | | | | | | | | | | | | | | |
End of year | | $ | 240,177,614 | | | $ | 249,776,883 | | | $ | 105,506,306 | | | $ | 110,095,339 | |
| | | | | | | | | | | | | | | | |
See accompanying Notes to Financial Statements.
68
TCW Funds, Inc.
Statements of Changes in Net Assets
| | | | | | | | | | | | | | | | |
| | | TCW
Relative Value
Mid Cap Fund | | | TCW
Select Equities
Fund | |
| | | Year Ended
October 31,
2023 | | | Year Ended
October 31,
2022 | | | Year Ended
October 31,
2023 | | | Year Ended
October 31,
2022 | |
OPERATIONS | | | | | | | | | | | | | | | | |
Net Investment Income (Loss) | | $ | 648,412 | | | $ | 597,540 | | | $ | (1,062,270 | ) | | $ | (3,028,857 | ) |
Net Realized Gain on Investments and Foreign Currency Transactions | | | 1,275,486 | | | | 1,053,361 | | | | 79,884,872 | | | | 101,011,838 | |
Change in Unrealized Appreciation (Depreciation) on Investments | | | (941,368 | ) | | | (10,556,257 | ) | | | 15,375,183 | | | | (428,876,001 | ) |
| | | | | | | | | | | | | | | | |
Increase (Decrease) in Net Assets Resulting from Operations | | | 982,530 | | | | (8,905,356 | ) | | | 94,197,785 | | | | (330,893,020 | ) |
| | | | | | | | | | | | | | | | |
DISTRIBUTIONS TO SHAREHOLDERS | | | | | | | | | | | | | | | | |
Distributions to Shareholders | | | (1,893,519 | ) | | | (10,250,919 | ) | | | (90,886,566 | ) | | | (115,374,235 | ) |
| | | | | | | | | | | | | | | | |
NET CAPITAL SHARE TRANSACTIONS | | | | | | | | | | | | | | | | |
I Class | | | (2,312,629 | ) | | | 5,957,013 | | | | (38,612,039 | ) | | | 20,168,808 | |
N Class | | | (1,236,101 | ) | | | (145,718 | ) | | | 3,302,527 | | | | (1,698,839 | ) |
| | | | | | | | | | | | | | | | |
Increase (Decrease) in Net Assets Resulting from Net Capital Shares Transactions | | | (3,548,730 | ) | | | 5,811,295 | | | | (35,309,512 | ) | | | 18,469,969 | |
| | | | | | | | | | | | | | | | |
Decrease in Net Assets | | | (4,459,719 | ) | | | (13,344,980 | ) | | | (31,998,293 | ) | | | (427,797,286 | ) |
NET ASSETS | | | | | | | | | | | | | | | | |
Beginning of year | | | 75,907,326 | | | | 89,252,306 | | | | 567,526,448 | | | | 995,323,734 | |
| | | | | | | | | | | | | | | | |
End of year | | $ | 71,447,607 | | | $ | 75,907,326 | | | $ | 535,528,155 | | | $ | 567,526,448 | |
| | | | | | | | | | | | | | | | |
See accompanying Notes to Financial Statements.
69
TCW Funds, Inc.
Notes to Financial Statements
Note 1 — Organization
TCW Funds, Inc. (the “Company”), a Maryland corporation, is an open-end management investment company registered under the Investment Company Act of 1940, as amended (the “1940 Act”), that currently offers 16 no-load mutual funds (each series, a “Fund” and collectively, the “Funds”). TCW Investment Management Company LLC (the “Advisor”) is the investment advisor to and an affiliate of the Funds and is registered under the Investment Advisers Act of 1940, as amended. Each Fund has its own investment objective and strategies. The following is a brief description of the investment objectives and principal investment strategies for the Funds that are covered in this report:
| | |
TCW Fund | | Investment Objectives and Principal Investment
Strategies |
| Diversified U.S. Equity Funds |
| |
| TCW Artificial Intelligence Equity Fund | | Seeks long-term capital appreciation by investing at least 80% of the value of its net assets, plus any borrowings for investment purposes, in publicly traded equity securities of businesses that the portfolio managers believe are benefitting from or have the potential to benefit from advances in the use of artificial intelligence. |
| |
| TCW Global Real Estate Fund | | Seeks to maximize total return from current income and long-term capital growth by investing at least 80% of the value of its net assets, plus any borrowings for investment purposes, in equity securities of real estate investment trusts (“REITs”) and real estate companies. Under normal market conditions, the Fund invests in securities of issuers located in at least three different countries (one of which may be the United States) and invests at least 30% of its net assets, plus any borrowings for investment purposes, in securities of issuers domiciled outside the United States or whose primary business operations are outside the United States, including pooled investment vehicles domiciled in the United States that invest principally in non-U.S. securities. |
| |
| TCW New America Premier Equities Fund | | Seeks to provide long-term capital appreciation by investing at least 80% of the value of its net assets, plus any borrowings for investment purposes, in equity securities of U.S. companies; intends to achieve its objective by investing primarily in a portfolio of companies the portfolio manager believes are enduring, cash generating businesses whose leaders prudently manage their environmental, social, and financial resources and whose shares are attractively valued relative to free cash flow generated by the businesses. |
70
TCW Funds, Inc.
October 31, 2023
Note 1 — Organization (Continued)
| | |
TCW Fund | | Investment Objectives and Principal Investment
Strategies |
| TCW Relative Value Dividend Appreciation Fund | | Seeks to realize a high level of dividend income consistent with prudent investment management, with a secondary objective of capital appreciation, by investing at least 80% of the value of its net assets, plus any borrowings for investment purposes, in equity securities of companies that have a record of paying dividends. |
| Diversified U.S. Equity Funds |
| TCW Relative Value Large Cap Fund | | Seeks capital appreciation, with a secondary goal of current income, by investing at least 80% of the value of its net assets, plus any borrowings for investment purposes, in equity securities of large-capitalization companies (i.e., companies with a market capitalization of greater than $1 billion at the time of purchase). |
| |
| TCW Relative Value Mid Cap Fund | | Seeks to provide long-term capital appreciation by investing at least 80% of the value of its net assets, plus any borrowings for investment purposes, in equity securities of mid-capitalization companies (i.e., companies with market capitalizations, at the time of acquisition, within the capitalization range of the companies comprising the Russell MidCap® Index). |
| |
| TCW Select Equities Fund | | Seeks to provide long-term capital appreciation by investing at least 80% of the value of its net assets, plus any borrowings for investment purposes, in equity securities. The Fund invests primarily in equity securities of mid- and large-capitalization companies. |
| Fund of Funds |
| TCW Conservative Allocation Fund | | Seeks to provide current income, and secondarily, long-term capital appreciation by investing in a combination of fixed income funds and equity funds that utilize diverse investment styles, such as growth and/or value investing. |
All of the Funds currently offer two classes of shares: I Class and N Class. The two classes of a Fund are substantially the same except that the N Class shares are subject to a distribution fee (see Note 7).
The TCW Conservative Allocation Fund is a “fund of funds” that invests in affiliated and unaffiliated funds which are identified on the Schedule of Investments.
71
TCW Funds, Inc.
Notes to Financial Statements (Continued)
Note 2 — Significant Accounting Policies
The following is a summary of significant accounting policies which are in conformity with accounting principles generally accepted in the United States of America (“GAAP”) and which are consistently followed by the Funds in the preparation of their financial statements. Each Fund is considered an investment company under the Financial Accounting Standards Board (“FASB”) Accounting Standards Codification (“ASC”) No. 946, Financial Services — Investment Companies. Subsequent events, if any, have been evaluated through the date of issuance in the preparation of the financial statements.
Principles of Accounting: The Funds use the accrual method of accounting for financial reporting purposes.
Net Asset Value: The net asset value (“NAV”) per share of each class of a Fund is determined by dividing the Fund’s net assets attributable to each class by the number of shares issued and outstanding of that class on each day the New York Stock Exchange (“NYSE”) is open for trading.
Security Valuations: Securities listed or traded on the NYSE and other stock exchanges were valued at the latest sale price on the exchange. Securities traded on the NASDAQ stock market (“NASDAQ”) were valued during the period using official closing prices as reported by NASDAQ, which may not have been the last sale price. Options on equity securities and options on indexes were valued using mid prices (average of bid and ask prices) as reported by the exchange or pricing service. Investments in open-end mutual funds including money market funds were valued based on the NAV per share as reported by the investment companies. All other securities for which over-the-counter (“OTC”) market quotations were readily available, including short-term securities, swap agreements and forward currency exchange contracts, were valued with prices furnished by independent pricing services or by broker-dealers.
Pursuant to Rule 2a-5 under the 1940 Act, the Company’s Board of Directors (the “Board”, and each member thereof, a “Director”) has designated the Advisor as the “valuation designee” with respect to the fair valuation of the Fund’s portfolio securities, subject to oversight by and periodic reporting to the Board. Fair valued securities are those for which market quotations were not readily available, including in circumstances under which it was determined by the Advisor that prices received were not reflective of their market values.
The Advisor, as the valuation designee, uses a fair valuation methodology for foreign equity securities (exclusive of certain Latin American and Canadian equity securities). This methodology is designed to address the effect of movements in the U.S. market on the securities traded on foreign exchanges that have been closed for a period of time due to time zone differences. The utilization of the fair value model may result in the adjustment of prices taking into account fluctuations in the U.S. market. The fair value model was utilized each trading day and was not dependent on certain thresholds or triggers.
Fair value is defined as the price that a Fund would receive upon selling an investment in a timely transaction to an independent buyer in the principal or most advantageous market for the investment. In accordance with the authoritative guidance on fair value measurements and disclosures under GAAP, the Funds disclose investments in their financial statements in a three-tier hierarchy. This hierarchy is utilized to establish classification of fair value measurements based on inputs. Inputs that go into fair value measurement refer broadly to the assumptions that market participants would use in pricing the asset or liability, including assumptions about risk. Inputs may be observable or unobservable. Observable inputs are inputs that reflect the assumptions market participants would use in pricing the asset or liability, developed based on market data obtained from sources independent of the reporting entity. Unobservable
72
TCW Funds, Inc.
October 31, 2023
Note 2 — Significant Accounting Policies (Continued)
inputs are inputs that reflect the reporting entity’s own assumptions about the inputs market participants would use in pricing the asset or liability, developed based on the best information available in the circumstances.
The three-tier hierarchy of inputs is summarized in the three broad levels listed below.
| | |
| Level 1 — | | quoted prices in active markets for identical investments. |
| Level 2 — | | other significant observable inputs (including quoted prices for similar investments, interest rates, prepayment speeds, credit risk, etc.). |
| Level 3 — | | significant unobservable inputs (including the Funds’ own assumptions in determining the fair value of investments). |
Changes in valuation techniques may result in transfers in or out of an investment’s assigned Level within the hierarchy. The inputs or methodologies used for valuing investments are not necessarily an indication of the risk associated with investing in those investments and the determination of the significance of a particular input to the fair value measurement in its entirety requires judgment and consideration of factors specific to each security.
The availability of observable inputs can vary from security to security and is affected by a wide variety of factors, including, for example, the type of security, whether the security is new and not yet established in the marketplace, the liquidity of markets, and other characteristics particular to the security. To the extent that valuation is based on models or inputs that are less observable or unobservable in the market, the determination of fair value requires more judgment. Accordingly, the degree of judgment exercised in determining fair value is greatest for instruments categorized as Level 3.
In periods of market dislocation, the observability of prices and inputs may be reduced for many instruments. This condition, as well as changes related to liquidity of investments, could cause a security to be reclassified between Level 1, Level 2, or Level 3.
In certain cases, the inputs used to measure fair value may fall into different levels of the fair value hierarchy. In such cases, for disclosure purposes the level in the fair value hierarchy within which the fair value measurement falls in its entirety is determined based on the lowest level input that is significant to the fair value measurement.
Fair Value Measurements: Descriptions of the valuation techniques applied to the Funds’ major categories of assets and liabilities measured at fair value on a recurring basis are as follows:
Equity securities. Securities are generally valued based on quoted prices from the applicable exchange. To the extent these securities are actively traded and valuation adjustments are not applied, they are generally categorized as Level 1 of the fair value hierarchy. Restricted securities issued by publicly held companies are generally categorized as Level 2 of the fair value hierarchy; if a discount is applied and significant, they are categorized as Level 3. Restricted securities held in non-public entities are categorized as Level 3 of the fair value hierarchy because they trade infrequently, and therefore the inputs are unobservable. Certain foreign securities that are fair valued using a pricing service that considers the correlation of the trading patterns of the foreign security to the intraday trading in the U.S. markets are categorized as Level 2 of the fair value hierarchy.
73
TCW Funds, Inc.
Notes to Financial Statements (Continued)
Note 2 — Significant Accounting Policies (Continued)
Mutual funds. Open-end mutual funds including money market funds are valued using the NAV as reported by the fund companies. As such, they are categorized as Level 1.
Options contracts. Options contracts traded on securities exchanges are fair valued using market mid prices; as such, they are categorized as Level 1. Option contracts traded OTC are fair valued based on pricing models and incorporate various inputs such as interest rates, credit spreads, currency exchange rates and volatility measurements for in-the-money, at-the-money, and out-of-the-money contracts on a given strike price. To the extent that these inputs are observable and timely, the fair value of OTC option contracts would be categorized as Level 2; otherwise, the fair values would be categorized as Level 3.
Restricted securities. Restricted securities, including illiquid Rule 144A securities, issued by non-public entities are categorized as Level 3 of the fair value hierarchy because they trade infrequently, and therefore the inputs are unobservable. Any other restricted securities valued similar to publicly traded securities may be categorized as Level 2 or 3 of the fair value hierarchy depending on whether a discount is applied and significant to the fair value.
Warrants. Warrants are generally valued based on quoted prices from the applicable exchange. To the extent these securities are actively traded, and valuation adjustments are not applied, they are generally categorized as Level 1 of the fair value hierarchy.
The summary of the inputs used as of October 31, 2023 in valuing the Funds’ investments is listed after the Schedule of Investments for each Fund.
Following is a reconciliation of investments in which significant unobservable inputs (Level 3) were used in determining value:
| | | | | | | | |
TCW NEW AMERICA PREMIER EQUITIES FUND | | WARRANTS | | | TOTAL | |
Balance as of October 31, 2022 | | $ | — | | | $ | — | |
Accrued Discounts (Premiums) | | | — | | | | — | |
Realized Gain (Loss) | | | — | | | | — | |
Change in Unrealized Appreciation (Depreciation)* | | | 1 | | | | 1 | |
Purchases | | | — | | | | — | |
Sales | | | — | | | | — | |
Transfers in to Level 3 | | | — | | | | — | |
Transfers out of Level 3 | | | — | | | | — | |
| | | | | | | | |
Balance as of October 31, 2023 | | $ | 1 | | | $ | 1 | |
| | | | | | | | |
| * | The change in unrealized appreciation (depreciation) on securities still held at October 31, 2023 was $1 and is included in the related net realized gains (losses) and net change in appreciation (depreciation) in the Statements of Operations. |
Significant unobservable valuation inputs for Level 3 investments as of October 31, 2023 are as follows:
| | | | | | | | | | | | | | | | | | | | |
Description | | Fair Value
at
10/31/2023 | | | Valuation
Techniques | | Unobservable
Input | | Price
or
Price
Range | | | Average
Weighted
Price | | | Input to
Valuation
If Input
Increases | |
TCW New America Premier Equities Fund | | | | | | | | | | | | | | | | | |
Warrants | | $ | 1 | | | Broker Quote
| | Offered Quote | | $ | 0.000 | * | | $ | 0.000 | * | | | Increase | |
| * | Amount rounds to less than $0.0005. |
Security Transactions and Related Investment Income: Security transactions are recorded as of the trade date. Dividend income is recorded on the ex-dividend date. Interest income is recognized on an accrual basis. Realized gains and losses on investments are recorded on the basis of specific identification.
74
TCW Funds, Inc.
October 31, 2023
Note 2 — Significant Accounting Policies (Continued)
Allocation of Operating Activity for Multiple Classes: Investment income, common expenses and realized and unrealized gains and losses are allocated among the share classes of the Funds based on the relative net assets of each class. Distribution fees, which are directly attributable to a class of shares, are charged to the operations of that class. All other expenses are charged to each Fund or class as incurred on a specific identification basis. Differences in class- specific fees and expenses will result in differences in net investment income for each class, and in turn differences in dividends paid by each class.
Dividends and Distributions: Dividends and distributions to shareholders are recorded on the ex-dividend date. The TCW Global Real Estate Fund and the TCW Relative Value Dividend Appreciation Fund declare and pay, or reinvest, dividends from net investment income quarterly. The other Equity Funds and TCW Conservative Allocation Fund declare and pay, or reinvest, dividends from net investment income annually. Capital gains realized by a Fund will be distributed at least annually.
Income and capital gain distributions are determined in accordance with income tax regulations which may differ from GAAP. These differences are primarily due to differing treatments for foreign currency transactions, derivative transactions, market discount and premium, losses deferred due to wash sales, excise tax regulations and employing equalization in determining amounts to be distributed to Fund shareholders. Permanent book and tax basis differences relating to shareholder distributions will result in reclassifications between paid-in capital, undistributed net investment income (loss), and/or undistributed accumulated realized gain (loss). Undistributed net investment income or loss may include temporary book and tax basis differences which will reverse in subsequent periods. Any taxable income or capital gain remaining at fiscal year-end is distributed in the following year. Distributions received from real estate investment trusts may include return of capital which is treated as a reduction in the cost basis of those investments. Distributions received, if any, in excess of the cost basis of a security is recognized as capital gain.
Use of Estimates: The preparation of the accompanying financial statements requires management to make estimates and assumptions that affect the reported amount of assets and liabilities at the date of the financial statements and the reported amounts of income and expenses during the reporting period. Actual results could differ from these estimates.
Foreign Currency Translation: The books and records of each Fund are maintained in U.S. dollars as follows: (1) foreign currency denominated securities and other assets and liabilities stated in foreign currencies, are translated using the daily spot rate; and (2) purchases, sales, income and expenses are translated at the rate of exchange prevailing on the respective dates of such transactions. The resultant exchange gains and losses are included in net realized or net unrealized gain (loss) in the Statements of Operations. Pursuant to U.S. federal income tax regulations, certain foreign exchange gains and losses included in realized and unrealized gains and losses are included in, or are a reduction of, ordinary income for federal income tax purposes.
Foreign Taxes: The Funds may be subject to withholding taxes on income and capital gains imposed by certain countries in which they invest. The withholding tax on income is netted against the income accrued or received. Any reclaimable taxes are recorded as income. The withholding tax on realized or unrealized gain is recorded as a liability.
Derivative Instruments: Derivatives are financial instruments which are valued based on the values of one or more indicators, such as a security, asset, currency, interest rate, or index. Derivative transactions can create investment leverage and may be highly volatile. A derivative contract may result in a mark-to
75
TCW Funds, Inc.
Notes to Financial Statements (Continued)
Note 2 — Significant Accounting Policies (Continued)
-market loss if the value of the contract decreases due to an unfavorable change in the market rates or values of the underlying instrument. It is possible that a derivative transaction will result in a loss greater than the principal amount invested. The Funds may not be able to close out a derivative transaction at a favorable time or price.
For the year ended October 31, 2023, the TCW Global Real Estate Fund had the following derivatives and transactions in derivatives, grouped in the following risk categories:
| | | | |
| TCW Global Real Estate Fund | | Equity Risk | |
Statement of Assets and Liabilities: | |
Asset Derivatives | |
Investments (1) | | $ | 75,150 | |
| | | | |
Total Value | | $ | 75,150 | |
| | | | |
Liability Derivatives | |
Written Options | | $ | (1,125 | ) |
| | | | |
Total Value | | $ | (1,125 | ) |
| | | | |
Statement of Operations: | |
Net Realized Gain (Loss) | |
Investments (2) | | $ | (37,922 | ) |
Options Written | | | 72,770 | |
| | | | |
Net Realized Gain (Loss) | | $ | 34,848 | |
| | | | |
Net Change in Appreciation (Depreciation) | |
Investments (3) | | | (117,164 | ) |
Options Written | | | 22,761 | |
| | | | |
Net Change in Appreciation (Depreciation) | | $ | (94,403 | ) |
| | | | |
Number of Contracts (4) | |
Options Purchased | | | 270 | |
Options Written | | | 270 | |
| (1) | Represents purchased options, at value. |
| (2) | Represents realized gain (loss) for purchased options. |
| (3) | Represents change in unrealized appreciation (depreciation) for purchased options during the year. |
| (4) | Amount disclosed represents average notional amounts which are representative of the volume traded for the year ended October 31, 2023. |
Counterparty Credit Risk: Derivative contracts may be exposed to counterparty risk. Losses can occur if the counterparty does not perform under the contract.
The Funds’ risk of loss from counterparty credit risk on OTC derivatives is generally limited to the aggregate unrealized gain netted against any collateral held by the Funds.
With exchange-traded futures and centrally cleared swaps, there is less counterparty credit risk to the Funds since the exchange or clearinghouse, as counterparty to such instruments, guarantees against a possible default. The clearinghouse stands between the buyer and the seller of the contract; therefore, the credit risk is limited to failure of the clearinghouse. While offset rights may exist under applicable law, the Funds do not have a contractual right of offset against a clearing broker or clearinghouse in the event of a default (including the bankruptcy or insolvency) of the clearing broker or clearinghouse. Additionally, credit risk exists in exchange-traded futures and centrally cleared swaps with respect to initial and variation margin that is held in a clearing broker’s customer accounts. While clearing brokers are required to segregate
76
TCW Funds, Inc.
October 31, 2023
Note 2 — Significant Accounting Policies (Continued)
customer margin from their own assets, in the event that a clearing broker becomes insolvent or goes into bankruptcy and at that time there is a shortfall in the aggregate amount of margin held by the clearing broker for all its clients, typically the shortfall would be allocated on a pro rata basis across all the clearing
broker’s customers, potentially resulting in losses to the Funds.
For OTC derivatives, the Funds mitigate their counterparty risk by entering into an International Swaps and Derivatives Association, Inc. Master Agreement (“ISDA Master Agreement”) or similar agreement with each counterparty. An ISDA Master Agreement is a bilateral agreement between the Funds and a counterparty that governs OTC derivatives and typically contains, among other things, collateral posting terms and netting provisions in the event of a default and/ or termination event. Under an ISDA Master Agreement, the Funds may, under certain circumstances, offset with the counterparty certain derivative financial instruments’ payables and/or receivables with collateral held and/or posted and create one single net payment. The provisions of the ISDA Master Agreement typically permit a single net payment in the event of default including the bankruptcy or insolvency of the counterparty. However, bankruptcy or insolvency laws of a particular jurisdiction may impose restrictions on or prohibitions against the right of offset in bankruptcy, insolvency or other events. In addition, certain ISDA Master Agreements allow counterparties to OTC derivatives to terminate derivative contracts prior to maturity in the event a Fund’s net assets declines by a stated percentage or a Fund fails to meet the terms of its ISDA Master Agreements, which would cause the Fund to accelerate payment of any net liability owed to the counterparty.
Collateral requirements: For derivatives traded under an ISDA Master Agreement, the collateral requirements are typically calculated by netting the mark-to-market amount for each transaction under such agreement and comparing that amount to the value of any collateral pledged or received by a Fund.
Cash collateral that has been pledged to cover obligations of a Fund is reported separately on the Statement of Assets and Liabilities. Non-cash collateral pledged by a Fund, if any, is noted in the Schedule of Investments. Generally, the amount of collateral due from or to a party has to exceed a minimum transfer amount threshold, typically $250,000 or $500,000, before a transfer is required, which is determined at the close of each business day and the collateral is transferred on the next business day. To the extent amounts due to a Fund from its counterparties are not fully collateralized, contractually or otherwise, the Fund bears the risk of loss from counterparty non-performance. The Funds attempt to mitigate counterparty risk by entering into agreements only with counterparties that the Advisor believes have the financial resources to honor their obligations and by monitoring the financial stability of those counterparties. For financial reporting purposes, the Funds do not offset derivative assets and derivative liabilities that are subject to netting arrangements in the Statement of Assets and Liabilities. The Funds have implemented the disclosure requirements pursuant to FASB Accounting Standards Update (“ASU”) No. 2011-11, Disclosures about Offsetting Assets and Liabilities that requires disclosures to make financial statements that are prepared under GAAP more comparable to those prepared under International Financial Reporting Standards.
Master Agreements and Netting Arrangements. Certain Funds are parties to various agreements, including but not limited to International Swaps and Derivatives Association Agreements and related Credit Support Annex, Master Repurchase Agreements, and Master Securities Forward Transactions Agreements (collectively “Master Agreements”), which govern the terms of certain transactions with select counterparties. These Master Agreements generally include provisions for general obligations,
77
TCW Funds, Inc.
Notes to Financial Statements (Continued)
Note 2 — Significant Accounting Policies (Continued)
representations, agreements, collateral, and certain events of default or termination. These Master Agreements also include provisions for netting arrangements that help reduce credit and counterparty risk associated with relevant transactions (“netting arrangements”). The netting arrangements are generally tied to credit-related events that, if triggered, would cause an event of default or termination giving a Fund or counterparty the right to terminate early and cause settlement, on a net basis, of all transactions under the applicable Master Agreement. In the event of an early termination as a result of an event of default under the Master Agreement, the total value exposure of all transactions will be offset against collateral exchanged to date, which would result in a net receivable or payable that would be due from or to the counterparty. However, bankruptcy or insolvency laws of a particular jurisdiction may impose restrictions on or prohibitions against the right of offset in the event of a bankruptcy or insolvency of the counterparty. Credit-related events include, but are not limited to, bankruptcy, failure to make timely payments, restructuring, obligation acceleration, obligation default, a material decline in net assets, decline in credit rating or repudiation/moratorium. Any election made by a counterparty to early terminate the transactions under a Master Agreement could have a material adverse impact on a Fund’s financial statements. A Fund’s overall exposure to credit risk, subject to netting arrangements, can change substantially within a short period, as it is affected by each transaction subject to the arrangement.
Master Agreements can also help limit counterparty risk by specifying collateral posting arrangements at pre-arranged exposure levels. Under the Master Agreements, collateral is routinely transferred if the total net exposure to certain transactions under the relevant Master Agreement with a counterparty in a given Fund exceeds a specified threshold, net of collateral already in place, typically $250,000 or $500,000 depending on the counterparty and the type of Master Agreement. Collateral under the Master Agreements is usually in the form of cash or U.S. Treasury Bills but could include other types of securities. If permitted under the Master Agreement, certain funds may rehypothecate cash collateral received from a counterparty. The value of all derivative transactions outstanding under a Master Agreement is calculated daily to determine the amount of collateral to be received or pledged by the counterparty. Posting of collateral for OTC derivative transactions are covered under tri-party collateral agreements between the Fund, the Fund’s custodian, and each counterparty. Collateral for centrally cleared derivatives transactions are posted with the applicable derivatives clearing organization.
The Funds had no OTC derivatives for offset under an ISDA Master Agreement as of October 31, 2023.
Note 3 — Portfolio Investments
When-Issued, Delayed-Delivery and Forward Commitment Transactions: The Funds, with the exception of the TCW Conservative Allocation Fund, may enter into when-issued, delayed-delivery, or forward commitment transactions in order to lock in the purchase price of the underlying security or to adjust the interest rate exposure of each Fund’s existing portfolio. In when-issued, delayed-delivery, or forward commitment transactions, a Fund commits to purchase or sell particular securities, with payment and delivery to take place at a future date. Although the Fund does not pay for the securities or start earning interest on them until they are delivered, it immediately assumes the risks of ownership, including the risk of price fluctuation. If a Fund’s counterparty fails to deliver a security purchased on a when issued, delayed-delivery, or forward commitment basis, there may be a loss, and the Fund may have missed an opportunity to make an alternative investment.
78
TCW Funds, Inc.
October 31, 2023
Note 3 — Portfolio Investments (Continued)
Prior to settlement of these transactions, the value of the subject securities will fluctuate with market conditions. In addition, because the Fund is not required to pay for when-issued, delayed-delivery or forward commitment securities until the delivery date, they may result in a form of leverage to the extent the Fund does not set aside liquid assets to cover the commitment. To guard against this deemed leverage, the Fund monitors the obligations under these transactions on a daily basis and ensures that the Fund has sufficient liquid assets to cover them. There were no when-issued, delayed-delivery or forward commitment transactions in the Funds during the year ended October 31, 2023.
Repurchase Agreements: The Funds may enter into repurchase agreements under the terms of a Master Repurchase Agreement (“MRA”). In a repurchase agreement, the Funds purchase a security from a counterparty who agrees to repurchase the same security at a mutually agreed upon date and price. The MRA permits each Fund, under certain circumstances including an event of default (such as bankruptcy or insolvency), to offset payables and/or receivables under the MRA with collateral held and/or posted to the counterparty and create one single net payment due to or from each Fund. However, bankruptcy or insolvency laws of a particular jurisdiction may impose restrictions on or prohibitions against such a right of offset in the event of the MRA counterparty’s bankruptcy or insolvency. Pursuant to the terms of the MRA, each Fund receives securities as collateral with a market value in excess of the repurchase price. Upon a bankruptcy or insolvency of the MRA counterparty, the Fund recognizes a liability with respect to such excess collateral to reflect the Fund’s obligation under bankruptcy law to return the excess to the counterparty. There were no repurchase agreements outstanding as of October 31, 2023.
Securities Lending: The Funds may lend their securities to qualified brokers. The loans must be collateralized at all times primarily with cash although the Funds can accept money market instruments or U.S. Government securities with a market value at least equal to the market value of the securities on loan. As with any extensions of credit, the Funds may bear the risk of delay in recovery or even loss of rights in the collateral if the borrowers of the securities fail financially. The Funds earn additional income for lending their securities by investing the cash collateral in short-term investments. The Funds did not lend any securities during the year ended October 31, 2023.
Derivatives:
Options: The Funds may purchase and sell put and call options on a security or an index of securities to enhance investment performance and/or to protect against changes in market prices. The Funds may also enter into currency options to hedge against or to take advantage of currency fluctuations.
A call option gives the holder the right to purchase, and obligates the writer to sell, a security at the strike price at any time before the expiration date. A put option gives the holder the right to sell, and obligates the writer to buy, a security at the exercise price at any time before the expiration date. A Fund may purchase put options to protect portfolio holdings against a decline in market value of a security or securities held by it. A Fund may also purchase a put option hoping to profit from an anticipated decline in the value of the underlying security. If a Fund holds the security underlying the option, the option premium and any transaction costs will reduce any profit the Fund might have realized had it sold the underlying security instead of buying the put option. A Fund may purchase call options to hedge against an increase in the price of securities that the Fund ultimately wants to buy. A Fund may also purchase a call option as a long directional investment hoping to profit from an anticipated increase in the value of the underlying security. In order for a call option to be profitable, the market price of the underlying security must rise sufficiently
79
TCW Funds, Inc.
Notes to Financial Statements (Continued)
Note 3 — Portfolio Investments (Continued)
above the exercise price to cover the premium and transaction costs. These costs will reduce any profit a Fund might have realized had it bought the underlying security at the time it purchased the call option.
Purchasing foreign currency options gives a Fund the right, but not the obligation, to buy or sell specified amounts of currency at a rate of exchange that may be exercised by a certain date. These currency options may be used as a short or long hedge against possible variations in foreign exchange rates or to gain exposure to foreign currencies.
When a Fund purchases an option, it runs the risk that it will lose its entire investment in the option in a relatively short period of time, unless the Fund exercises the option or enters into a closing sale transaction before the option’s expiration. If the price of the underlying security does not rise (in the case of a call) or fall (in the case of a put) to an extent sufficient to cover the option premium and transaction costs, the Fund will lose part or all of its investment in the option. Premiums paid for purchasing options that expire are treated as realized losses.
Options purchased or sold by a Fund may be traded on a securities or options exchange. Such options typically have minimal exposure to counterparty risk. However, an exchange or market may at times find it necessary to impose restrictions on particular types of options transactions, such as opening transactions. If an underlying security ceases to meet qualifications imposed by an exchange or the Options Clearing Corporation, new series of options on that security will no longer be opened to replace the expiring series, and opening transactions in existing series may be prohibited.
OTC options are options not traded on exchanges or backed by clearinghouses. Rather, they are entered into directly between a Fund and the counterparty to the option. In the case of an OTC option purchased by a Fund, the value of the option to the Fund will depend on the willingness and ability of the option writer to perform its obligations to the Fund. In addition, OTC options may not be transferable and there may be little or no secondary market for them, so they may be considered illiquid. It may not be possible to enter into closing transactions with respect to OTC options or otherwise to terminate such options, and as a result a Fund may be required to remain obligated on an unfavorable OTC option until its expiration.
During the year ended October 31, 2023, the TCW Global Real Estate Fund entered into option contracts to hedge the Fund’s investments from market volatility in the real estate sector.
Note 4 — Risk Considerations
Market Risk: The Funds’ investments will fluctuate with market conditions, and so will the value of your investment in the Funds. You could lose money on your investment in the Funds or the Funds could underperform other investments.
Liquidity Risk: The Funds’ investments in illiquid securities may reduce the returns of the Funds because they may not be able to sell the illiquid securities at an advantageous time or price. Investments in high-yield securities, foreign securities, derivatives or other securities with substantial market and/or credit risk tend to have the greatest exposure to liquidity risk. Certain investments in private placements and Rule 144A securities may be considered illiquid investments. The Funds may invest in private placements and Rule 144A securities.
Counterparty Risk: The Funds may be exposed to counterparty risk, the risk that an entity with which the Funds have unsettled or open transactions may not fulfill its obligations.
80
TCW Funds, Inc.
October 31, 2023
Note 4 — Risk Considerations (Continued)
Investment Style Risk: Certain Funds may also be subject to investment style risk. The Advisor’s investment styles may be out of favor at times or may not produce the best results over short or longer time periods and may increase the volatility of a Fund’s share price.
Equity Risk: Equity securities may include common stock, preferred stock or other securities representing an ownership interest or the right to acquire an ownership interest in an issuer. Equity risk is the risk that stocks and other equity securities generally fluctuate in value more than bonds and can decline in value over short or extended periods. The value of stocks and other equity securities will be affected by changes in a company’s financial condition and in overall market, economic and political conditions.
Concentration Risk: Although the TCW New America Premier Equities Fund and TCW Select Equities Fund technically remain diversified funds, the relative increase in the market value of certain holdings has made each Fund’s portfolio sufficiently concentrated that investors in the Fund are now subject to the same risks as investing in a non-diversified mutual fund. Non-diversification risk is the risk that the Fund may be more susceptible to any single economic, political or regulatory event than a diversified fund because a higher percentage of the Fund’s assets may be invested in the securities of a limited number of issuers. There can be no assurances as to when or whether each Fund will become less concentrated.
For more information on risks related to investing in the Funds, please refer to the Funds’ prospectus and the Statement of Additional Information which can be obtained on the Funds’ website (www.tcw.com) or by calling customer service at 800-FUND-TCW (800-386-3829).
Note 5 — Federal Income Taxes
It is the policy of each Fund to comply with the requirements under Subchapter M of the Internal Revenue Code applicable to regulated investment companies and to distribute all of its net taxable income, including any net realized gains on investments, to its shareholders. Therefore, no federal income tax provision is required.
At October 31, 2023, the components of distributable earnings on a tax basis were as follows:
| | | | | | | | | | | | |
| | | Undistributed
Ordinary
Income | | | Undistributed
Long-Term
Gain | | | Total
Distributable
Earnings | |
TCW Conservative Allocation Fund | | $ | 673,081 | | | $ | — | | | $ | 673,081 | |
TCW New America Premier Equities Fund | | | 120,742 | | | | — | | | | 120,742 | |
TCW Global Real Estate Fund | | | 96,484 | | | | — | | | | 96,484 | |
TCW Relative Value Dividend Appreciation Fund | | | 354,565 | | | | 7,477,960 | | | | 7,832,525 | |
TCW Relative Value Large Cap Fund | | | 1,311,495 | | | | 3,949,839 | | | | 5,261,334 | |
TCW Relative Value Mid Cap Fund | | | 114,490 | | | | 1,266,145 | | | | 1,380,635 | |
TCW Select Equities Fund | | | — | | | | 71,729,770 | | | | 71,729,770 | |
At the end of the previous fiscal year ended October 31, 2022, the components of distributable earnings on a tax basis were as follows:
| | | | | | | | | | | | |
| | | Undistributed
Ordinary
Income | | | Undistributed
Long-Term
Gain | | | Total
Distributable
Earnings | |
TCW Conservative Allocation Fund | | $ | 408,519 | | | $ | 733,388 | | | $ | 1,141,907 | |
TCW Relative Value Dividend Appreciation Fund | | | 161,358 | | | | 10,751,733 | | | | 10,913,091 | |
TCW Relative Value Large Cap Fund | | | 1,357,088 | | | | 6,011,662 | | | | 7,368,750 | |
TCW Relative Value Mid Cap Fund | | | 112,160 | | | | 1,259,325 | | | | 1,371,485 | |
TCW Select Equities Fund | | | — | | | | 90,954,258 | | | | 90,954,258 | |
81
TCW Funds, Inc.
Notes to Financial Statements (Continued)
Note 5 — Federal Income Taxes (Continued)
Permanent differences incurred during the year ended October 31, 2023, resulting from differences in book and tax accounting, have been reclassified at year-end between undistributed net investment income (loss), undistributed (accumulated) net realized gain (loss) and paid-in capital as follows, with no impact to the net asset value per share:
| | | | | | | | | | | | |
| | | Undistributed
Income (Loss) | | | Undistributed
Accumulated
Net Realized
Gain (Loss) | | | Paid-in
Capital | |
TCW Artificial Intelligence Equity Fund | | $ | 43,568 | | | $ | 579 | | | $ | (44,147 | ) |
TCW Conservative Allocation Fund | | | (28,374 | ) | | | 28,374 | | | | — | |
TCW Global Real Estate Fund | | | (212,592 | ) | | | 212,592 | | | | — | |
TCW New America Premier Equities Fund | | | 13,068 | | | | (13,068 | ) | | | — | |
TCW Relative Value Dividend Appreciation Fund | | | (64,840 | ) | | | (447,618 | ) | | | 512,458 | |
TCW Relative Value Large Cap Fund | | | (101,475 | ) | | | (356,091 | ) | | | 457,566 | |
TCW Relative Value Mid Cap Fund | | | (11,874 | ) | | | (26,777 | ) | | | 38,651 | |
TCW Select Equities Fund | | | 2,389,065 | | | | (8,292,130 | ) | | | 5,903,065 | |
During the year ended October 31, 2023, the tax character of distributions paid was as follows:
| | | | | | | | | | | | |
| | | Ordinary
Income | | | Long-Term
Capital Gain | | | Total
Distributions | |
TCW Conservative Allocation Fund | | $ | 569,886 | | | $ | 733,388 | | | $ | 1,303,274 | |
TCW Global Real Estate Fund | | | 424,761 | | | | — | | | | 424,761 | |
TCW New America Premier Equities Fund | | | 6,701 | | | | — | | | | 6,701 | |
TCW Relative Value Dividend Appreciation Fund | | | 4,343,754 | | | | 10,751,940 | | | | 15,095,694 | |
TCW Relative Value Large Cap Fund | | | 1,637,144 | | | | 6,011,662 | | | | 7,648,806 | |
TCW Relative Value Mid Cap Fund | | | 634,208 | | | | 1,259,311 | | | | 1,893,519 | |
TCW Select Equities Fund | | | — | | | | 90,886,566 | | | | 90,886,566 | |
During the previous fiscal year ended October 31, 2022, the tax character of distributions paid was as follows:
| | | | | | | | | | | | | | | | |
| | | Ordinary
Income | | | Long-Term
Capital Gain | | | Return of
Capital | | | Total
Distributions | |
TCW Artificial Intelligence Equity Fund | | $ | 49,033 | | | $ | 766,275 | | | $ | — | | | $ | 815,308 | |
TCW Conservative Allocation Fund | | | 1,276,879 | | | | 1,974,688 | | | | — | | | | 3,251,567 | |
TCW Global Real Estate Fund | | | 3,083,570 | | | | 514,376 | | | | 447,356 | | | | 4,045,302 | |
TCW New America Premier Equities Fund | | | 13,075,005 | | | | 13,352,274 | | | | — | | | | 26,427,279 | |
TCW Relative Value Dividend Appreciation Fund | | | 4,684,797 | | | | 24,822,627 | | | | — | | | | 29,507,424 | |
TCW Relative Value Large Cap Fund | | | 2,201,494 | | | | 7,971,190 | | | | — | | | | 10,172,684 | |
TCW Relative Value Mid Cap Fund | | | 482,013 | | | | 9,768,906 | | | | — | | | | 10,250,919 | |
TCW Select Equities Fund | | | — | | | | 115,374,235 | | | | — | | | | 115,374,235 | |
82
TCW Funds, Inc.
October 31, 2023
Note 5 — Federal Income Taxes (Continued)
At October 31, 2023, net unrealized appreciation (depreciation) on investments for federal income tax purposes was as follows:
| | | | | | | | | | | | | | | | |
| | | Unrealized
Appreciation | | | Unrealized
(Depreciation) | | | Net
Unrealized
Appreciation
(Depreciation) | | | Cost of
Investments for
Federal Income
Tax Purposes | |
TCW Artificial Intelligence Equity Fund | | $ | 4,084,859 | | | $ | (884,243 | ) | | $ | 3,200,616 | | | $ | 21,479,098 | |
TCW Conservative Allocation Fund | | | 2,109,113 | | | | (3,141,950 | ) | | | (1,032,837 | ) | | | 28,520,610 | |
TCW Global Real Estate Fund | | | 824,862 | | | | (4,113,831 | ) | | | (3,288,969 | ) | | | 26,257,625 | |
TCW New America Premier Equities Fund | | | 56,366,439 | | | | (435,408 | ) | | | 55,931,031 | | | | 111,648,235 | |
TCW Relative Value Dividend Appreciation Fund | | | 71,594,931 | | | | (2,402,330 | ) | | | 69,192,601 | | | | 170,836,468 | |
TCW Relative Value Large Cap Fund | | | 40,233,625 | | | | (1,009,599 | ) | | | 39,224,026 | | | | 66,463,082 | |
TCW Relative Value Mid Cap Fund | | | 23,236,324 | | | | (1,698,238 | ) | | | 21,538,086 | | | | 50,000,464 | |
TCW Select Equities Fund | | | 320,441,592 | | | | (7,599,260 | ) | | | 312,842,332 | | | | 223,395,956 | |
At October 31, 2023, the following Funds had net realized losses that will be carried forward indefinitely for federal income tax purposes:
| | | | | | | | | | | | |
| | | Short- Term
Capital Losses | | | Long-Term
Capital Losses | | | Total | |
TCW Artificial Intelligence Equity Fund | | $ | 918,550 | | | $ | 1,045,926 | | | $ | 1,964,476 | |
TCW Conservative Allocation Fund | | | — | | | | 72,358 | | | | 72,358 | |
TCW Global Real Estate Fund | | | 8,247,454 | | | | 1,304,928 | | | | 9,552,382 | |
TCW New America Premier Equities Fund | | | 1,448,978 | | | | — | | | | 1,448,978 | |
The Funds did not have any unrecognized tax benefits at October 31, 2023, nor were there any increases or decreases in unrecognized tax benefits for the year ended October 31, 2023. The Funds are subject to examination by the U.S. Federal and state tax authorities for returns filed for the prior three and four fiscal years, respectively.
Note 6 — Fund Management Fees and Other Expenses
The Funds pay to the Advisor, as compensation for services rendered, facilities furnished and expenses borne by it, the following annual management fees as a percentage of daily net assets:
| | | | |
TCW Artificial Intelligence Equity Fund | | | 0.70 | % |
TCW Global Real Estate Fund | | | 0.80 | % |
TCW New America Premier Equities Fund | | | 0.65 | % |
TCW Relative Value Dividend Appreciation Fund | | | 0.60 | % |
TCW Relative Value Large Cap Fund | | | 0.60 | % |
TCW Relative Value Mid Cap Fund | | | 0.70 | % |
TCW Select Equities Fund | | | 0.65 | % |
The TCW Conservative Allocation Fund does not pay management fees to the Advisor; however, the Fund pays management fees indirectly as a shareholder in the underlying affiliated funds.
83
TCW Funds, Inc.
Notes to Financial Statements (Continued)
Note 6 — Fund Management Fees and Other Expenses (Continued)
The Advisor limits the operating expenses of the Funds not to exceed the following expense ratios relative to the Funds’ average daily net assets:
| | | | |
TCW Artificial Intelligence Equity Fund | | | | |
I Class | | | 0.90 | % (1) |
N Class | | | 1.00 | % (1) |
TCW Conservative Allocation Fund | | | | |
I Class | | | 0.85 | % (1) |
N Class | | | 0.85 | % (1) |
TCW Global Real Estate Fund | | | | |
I Class | | | 0.90 | % (1) |
N Class | | | 1.00 | % (1) |
TCW New America Premier Equities Fund | | | | |
I Class | | | 1.04 | % (2) |
N Class | | | 1.04 | % (2) |
TCW Relative Value Dividend Appreciation Fund | | | | |
I Class | | | 0.70 | % (1) |
N Class | | | 0.90 | % (1) |
TCW Relative Value Large Cap Fund | | | | |
I Class | | | 0.70 | % (1) |
N Class | | | 0.90 | % (1) |
TCW Relative Value Mid Cap Fund | | | | |
I Class | | | 0.85 | % (1) |
N Class | | | 0.95 | % (1) |
TCW Select Equities Fund | | | | |
I Class | | | 0.80 | % (1) |
N Class | | | 1.00 | % (1) |
| (1) | These limitations are based on an agreement between the Advisor and the Company. |
| (2) | Limitation based on average expense ratio as reported by Lipper, Inc., which is subject to change on a monthly basis. This ratio was in effect as of October 31, 2023. These limitations are voluntary and terminable in a six months’ notice. |
Any advisory fee reduced or withheld, or expense reimbursement paid, pursuant to the Expense Limitation Agreement will be reimbursed by the appropriate Fund to the Advisor in the first, second or third fiscal year after the fiscal year of the reduction or reimbursement. The Advisor may not receive reimbursement for previous reductions or reimbursements before payment of a Fund’s operating expenses for the current year, and cannot cause a Fund to exceed the expense limitation in effect for that Fund (i) at the time the fees and expenses would have been incurred or (ii) at the time the Advisor would recoup that reduction or reimbursement. In addition, any recoupment may not exceed any more restrictive limitation to which the Advisor has agreed.
84
TCW Funds, Inc.
October 31, 2023
Note 6 — Fund Management Fees and Other Expenses (Continued)
At October 31, 2023, the balance of recoupable expenses with expiration dates for the Funds were as follows:
| | | | |
Fund | | Expires
10/31/2026 | |
TCW Artificial Intelligence Equity Fund | | $ | 70,312 | |
TCW Conservative Allocation Fund | | | 21,985 | |
TCW Global Real Estate Fund | | | 78,729 | |
TCW New America Premier Equities Fund | | | 30,770 | |
TCW Relative Value Dividend Appreciation Fund | | | 246,331 | |
TCW Relative Value Large Cap Fund | | | 110,649 | |
TCW Relative Value Mid Cap Fund | | | 120,182 | |
TCW Select Equities Fund | | | 139,470 | |
| | | | |
Total | | | 818,428 | |
| | | | |
Directors’ Fees: Directors who are not affiliated with the Advisor receive compensation from the Funds which are shown on the Statements of Operations. Directors may elect to defer receipt of their fees in accordance with the terms of a Non-Qualified Deferred Compensation Plan. Deferred compensation is included within directors’ fees and expenses in the Statements of Assets and Liabilities.
Note 7 — Distribution Plan
TCW Funds Distributors LLC (“Distributor”), an affiliate of the Advisor and the Funds, serves as the nonexclusive distributor of each class of the Funds’ shares. The Funds have a distribution plan pursuant to Rule 12b-1 under the 1940 Act with respect to the N Class shares of each Fund. Under the terms of the plan, each Fund compensates the Distributor at a rate equal to 0.25% of the average daily net assets of the Fund attributable to its N Class shares for distribution and related services.
Note 8 — Transactions with Affiliates
The ownership percentage of the TCW Conservative Allocation Fund in each of the affiliated underlying funds at October 31, 2023 is as follows:
| | | | |
Name of Affiliated Fund | | Ownership
Percentage (1) | |
Metropolitan West High Yield Bond Fund | | | 0.06 | % |
Metropolitan West Low Duration Bond Fund | | | 0.13 | % |
Metropolitan West Total Return Bond Fund | | | 0.01 | % |
Metropolitan West Unconstrained Bond Fund | | | 0.10 | % |
TCW Artificial Intelligence Equity Fund | | | 1.17 | % |
TCW Emerging Markets Income Fund | | | 0.01 | % |
TCW Enhanced Commodity Strategy Fund | | | 3.10 | % |
TCW Global Bond Fund | | | 5.38 | % |
TCW Global Real Estate Fund | | | 4.87 | % |
TCW New America Premier Equities Fund | | | 1.66 | % |
TCW Relative Value Large Cap Fund | | | 2.08 | % |
TCW Relative Value Mid Cap Fund | | | 0.52 | % |
TCW Select Equities Fund | | | 0.41 | % |
TCW Total Return Bond Fund | | | 0.20 | % |
| (1) | Percentage ownership based on total net assets of the underlying fund. |
The financial statements of the Funds not contained in this report are available by calling 800-FUND-TCW (800-386-3829) or by going to the SEC website at www.sec.gov.
85
TCW Funds, Inc.
Notes to Financial Statements (Continued)
Note 9 — Purchases and Sales of Securities
Investment transactions (excluding short-term investments) for the year ended October 31, 2023 were as follows:
| | | | | | | | | | | | | | | | |
| | | Purchases
at Cost | | | Sales or Maturity
Proceeds | | | U.S. Government
Purchases at Cost | | | U.S. Government
Sales or Maturity
Proceeds | |
TCW Artificial Intelligence Equity Fund | | $ | 16,466,294 | | | $ | 5,164,040 | | | $ | — | | | $ | — | |
TCW Conservative Allocation Fund | | | 6,739,586 | | | | 6,949,083 | | | | — | | | | — | |
TCW Global Real Estate Fund | | | 18,211,378 | | | | 21,470,862 | | | | — | | | | — | |
TCW New America Premier Equities Fund | | | 55,808,084 | | | | 62,221,911 | | | | — | | | | — | |
TCW Relative Value Dividend Appreciation Fund | | | 47,406,044 | | | | 57,085,264 | | | | — | | | | — | |
TCW Relative Value Large Cap Fund | | | 22,590,250 | | | | 29,633,658 | | | | — | | | | — | |
TCW Relative Value Mid Cap Fund | | | 20,822,088 | | | | 22,607,497 | | | | — | | | | — | |
TCW Select Equities Fund | | | 57,521,826 | | | | 178,516,348 | | | | — | | | | — | |
Note 10 — Capital Share Transactions
Transactions in each Fund’s shares were as follows:
| | | | | | | | | | | | | | | | |
| TCW Artificial Intelligence Equity Fund | | Year Ended
October 31, 2023 | | | Year Ended
October 31, 2022 | |
| I Class | | Shares | | | Amount | | | Shares | | | Amount | |
Shares Sold | | | 1,045,470 | | | $ | 19,419,928 | | | | 165,492 | | | $ | 2,990,723 | |
Shares Issued upon Reinvestment of Dividends | | | — | | | | — | | | | 20,832 | | | | 500,393 | |
Shares Redeemed | | | (454,533 | ) | | | (8,113,877 | ) | | | (201,952 | ) | | | (3,699,489 | ) |
| | | | | | | | | | | | | | | | |
Net Increase | | | 590,937 | | | $ | 11,306,051 | | | | (15,628 | ) | | $ | (208,373 | ) |
| | | | | | | | | | | | | | | | |
| | | | |
| N Class | | Shares | | | Amount | | | Shares | | | Amount | |
Shares Sold | | | 183,641 | | | $ | 3,284,464 | | | | 21,781 | | | $ | 444,037 | |
Shares Issued upon Reinvestment of Dividends | | | — | | | | — | | | | 9,882 | | | | 236,567 | |
Shares Redeemed | | | (176,269 | ) | | | (2,978,444 | ) | | | (36,276 | ) | | | (706,766 | ) |
| | | | | | | | | | | | | | | | |
Net Increase | | | 7,372 | | | $ | 306,020 | | | | (4,613 | ) | | $ | (26,162 | ) |
| | | | | | | | | | | | | | | | |
| | |
| TCW Conservative Allocation Fund | | Year Ended
October 31, 2023 | | | Year Ended
October 31, 2022 | |
| I Class | | Shares | | | Amount | | | Shares | | | Amount | |
Shares Sold | | | 60,434 | | | $ | 653,546 | | | | 111,098 | | | $ | 1,437,247 | |
Shares Issued upon Reinvestment of Dividends | | | 122,846 | | | | 1,271,450 | | | | 246,578 | | | | 3,156,193 | |
Shares Redeemed | | | (205,301 | ) | | | (2,222,402 | ) | | | (269,101 | ) | | | (3,344,517 | ) |
| | | | | | | | | | | | | | | | |
Net Decrease | | | (22,021 | ) | | $ | (297,406 | ) | | | 88,575 | | | $ | 1,248,923 | |
| | | | | | | | | | | | | | | | |
| | | | |
| N Class | | Shares | | | Amount | | | Shares | | | Amount | |
Shares Sold | | | 2,051 | | | $ | 22,475 | | | | 21,102 | | | $ | 286,952 | |
Shares Issued upon Reinvestment of Dividends | | | 1,353 | | | | 14,048 | | | | 6,087 | | | | 78,156 | |
Shares Redeemed | | | (5,993 | ) | | | (64,676 | ) | | | (46,990 | ) | | | (532,935 | ) |
| | | | | | | | | | | | | | | | |
Net Decrease | | | (2,589 | ) | | $ | (28,153 | ) | | | (19,801 | ) | | $ | (167,827 | ) |
| | | | | | | | | | | | | | | | |
86
TCW Funds, Inc.
October 31, 2023
Note 10 — Capital Share Transactions (Continued)
| | | | | | | | | | | | | | | | |
| TCW Global Real Estate Fund | | Year Ended
October 31, 2023 | | | Year Ended
October 31, 2022 | |
| I Class | | Shares | | | Amount | | | Shares | | | Amount | |
Shares Sold | | | 484,788 | | | $ | 5,181,030 | | | | 1,238,351 | | | $ | 16,219,964 | |
Shares Issued upon Reinvestment of Dividends | | | 24,560 | | | | 259,411 | | | | 155,575 | | | | 2,152,811 | |
Shares Redeemed | | | (563,913 | ) | | | (6,049,473 | ) | | | (1,288,095 | ) | | | (14,513,355 | ) |
| | | | | | | | | | | | | | | | |
Net Decrease | | | (54,565 | ) | | $ | (609,032 | ) | | | 105,831 | | | $ | 3,859,420 | |
| | | | | | | | | | | | | | | | |
| | | | |
| N Class | | Shares | | | Amount | | | Shares | | | Amount | |
Shares Sold | | | 134,772 | | | $ | 1,495,099 | | | | 591,337 | | | $ | 8,396,532 | |
Shares Issued upon Reinvestment of Dividends | | | 13,699 | | | | 144,573 | | | | 108,782 | | | | 1,518,023 | |
Shares Redeemed | | | (483,858 | ) | | | (5,253,719 | ) | | | (521,226 | ) | | | (6,727,892 | ) |
| | | | | | | | | | | | | | | | |
Net Decrease | | | (335,387 | ) | | $ | (3,614,047 | ) | | | 178,893 | | | $ | 3,186,663 | |
| | | | | | | | | | | | | | | | |
| | |
| TCW New America Premier Equities Fund | | Year Ended
October 31, 2023 | | | Year Ended
October 31, 2022 | |
| I Class | | Shares | | | Amount | | | Shares | | | Amount | |
Shares Sold | | | 1,054,217 | | | $ | 26,274,178 | | | | 1,335,475 | | | $ | 31,722,034 | |
Shares Issued upon Reinvestment of Dividends | | | 243 | | | | 5,457 | | | | 741,908 | | | | 21,708,216 | |
Shares Redeemed | | | (1,204,249 | ) | | | (29,990,116 | ) | | | (2,607,753 | ) | | | (62,976,632 | ) |
| | | | | | | | | | | | | | | | |
Net Decrease | | | (149,789 | ) | | $ | (3,710,481 | ) | | | (530,370 | ) | | $ | (9,546,382 | ) |
| | | | | | | | | | | | | | | | |
| | | | |
| N Class | | Shares | | | Amount | | | Shares | | | Amount | |
Shares Sold | | | 94,467 | | | $ | 2,371,333 | | | | 87,491 | | | $ | 2,218,831 | |
Shares Issued upon Reinvestment of Dividends | | | 40 | | | | 888 | | | | 119,270 | | | | 3,468,380 | |
Shares Redeemed | | | (146,033 | ) | | | (3,666,324 | ) | | | (261,655 | ) | | | (6,319,138 | ) |
| | | | | | | | | | | | | | | | |
Net Decrease | | | (51,526 | ) | | $ | (1,294,103 | ) | | | (54,894 | ) | | $ | (631,927 | ) |
| | | | | | | | | | | | | | | | |
| | |
| TCW Relative Value Dividend Appreciation Fund | | Year Ended
October 31, 2023 | | | Year Ended
October 31, 2022 | |
| I Class | | Shares | | | Amount | | | Shares | | | Amount | |
Shares Sold | | | 292,316 | | | $ | 5,755,665 | | | | 188,052 | | | $ | 3,811,463 | |
Shares Issued upon Reinvestment of Dividends | | | 217,906 | | | | 4,121,241 | | | | 371,904 | | | | 7,643,438 | |
Shares Redeemed | | | (417,017 | ) | | | (8,141,592 | ) | | | (436,937 | ) | | | (8,631,778 | ) |
| | | | | | | | | | | | | | | | |
Net Increase | | | 93,205 | | | $ | 1,735,314 | | | | 123,019 | | | $ | 2,823,123 | |
| | | | | | | | | | | | | | | | |
| | | | |
| N Class | | Shares | | | Amount | | | Shares | | | Amount | |
Shares Sold | | | 671,198 | | | $ | 13,451,783 | | | | 161,356 | | | $ | 3,323,686 | |
Shares Issued upon Reinvestment of Dividends | | | 548,000 | | | | 10,600,521 | | | | 990,940 | | | | 20,804,992 | |
Shares Redeemed | | | (1,474,846 | ) | | | (29,512,598 | ) | | | (1,023,676 | ) | | | (20,971,780 | ) |
| | | | | | | | | | | | | | | | |
Net Decrease | | | (255,648 | ) | | $ | (5,460,294 | ) | | | 128,620 | | | $ | 3,156,898 | |
| | | | | | | | | | | | | | | | |
| | |
| TCW Relative Value Large Cap Fund | | Year Ended
October 31, 2023 | | | Year Ended
October 31, 2022 | |
| I Class | | Shares | | | Amount | | | Shares | | | Amount | |
Shares Sold | | | 888,849 | | | $ | 11,933,526 | | | | 880,500 | | | $ | 11,372,198 | |
Shares Issued upon Reinvestment of Dividends | | | 554,769 | | | | 6,906,873 | | | | 635,407 | | | | 9,226,109 | |
Shares Redeemed | | | (1,485,040 | ) | | | (19,666,321 | ) | | | (1,591,829 | ) | | | (21,475,920 | ) |
| | | | | | | | | | | | | | | | |
Net Decrease | | | (41,422 | ) | | $ | (825,922 | ) | | | (75,922 | ) | | $ | (877,613 | ) |
| | | | | | | | | | | | | | | | |
| | | | |
| N Class | | Shares | | | Amount | | | Shares | | | Amount | |
Shares Sold | | | 58,321 | | | $ | 772,836 | | | | 39,830 | | | $ | 539,623 | |
Shares Issued upon Reinvestment of Dividends | | | 47,736 | | | | 592,398 | | | | 52,608 | | | | 761,768 | |
Shares Redeemed | | | (135,143 | ) | | | (1,770,870 | ) | | | (103,493 | ) | | | (1,439,143 | ) |
| | | | | | | | | | | | | | | | |
Net Decrease | | | (29,086 | ) | | $ | (405,636 | ) | | | (11,055 | ) | | $ | (137,752 | ) |
| | | | | | | | | | | | | | | | |
87
TCW Funds, Inc.
Notes to Financial Statements (Continued)
Note 10 — Capital Share Transactions (Continued)
| | | | | | | | | | | | | | | | |
| TCW Relative Value Mid Cap Fund | | Year Ended
October 31, 2023 | | | Year Ended
October 31, 2022 | |
| I Class | | Shares | | | Amount | | | Shares | | | Amount | |
Shares Sold | | | 52,011 | | | $ | 1,283,356 | | | | 58,374 | | | $ | 1,440,544 | |
Shares Issued upon Reinvestment of Dividends | | | 67,268 | | | | 1,543,805 | | | | 303,691 | | | | 8,248,263 | |
Shares Redeemed | | | (214,215 | ) | | | (5,139,790 | ) | | | (150,047 | ) | | | (3,731,794 | ) |
| | | | | | | | | | | | | | | | |
Net Decrease | | | (94,936 | ) | | $ | (2,312,629 | ) | | | 212,018 | | | $ | 5,957,013 | |
| | | | | | | | | | | | | | | | |
| | | | |
| N Class | | Shares | | | Amount | | | Shares | | | Amount | |
Shares Sold | | | 6,703 | | | $ | 152,630 | | | | 17,121 | | | $ | 449,871 | |
Shares Issued upon Reinvestment of Dividends | | | 14,014 | | | | 311,117 | | | | 68,096 | | | | 1,789,559 | |
Shares Redeemed | | | (73,691 | ) | | | (1,699,848 | ) | | | (88,053 | ) | | | (2,385,148 | ) |
| | | | | | | | | | | | | | | | |
Net Decrease | | | (52,974 | ) | | $ | (1,236,101 | ) | | | (2,836 | ) | | $ | (145,718 | ) |
| | | | | | | | | | | | | | | | |
| | |
| TCW Select Equities Fund | | Year Ended
October 31, 2023 | | | Year Ended
October 31, 2022 | |
| I Class | | Shares | | | Amount | | | Shares | | | Amount | |
Shares Sold | | | 2,779,100 | | | $ | 66,010,765 | | | | 3,549,198 | | | $ | 117,409,079 | |
Shares Issued upon Reinvestment of Dividends | | | 2,479,457 | | | | 50,630,514 | | | | 1,506,568 | | | | 59,886,076 | |
Shares Redeemed | | | (6,279,122 | ) | | | (155,253,318 | ) | | | (5,050,028 | ) | | | (157,126,347 | ) |
| | | | | | | | | | | | | | | | |
Net Decrease | | | (1,020,565 | ) | | $ | (38,612,039 | ) | | | 5,738 | | | $ | 20,168,808 | |
| | | | | | | | | | | | | | | | |
| | | | |
| N Class | | Shares | | | Amount | | | Shares | | | Amount | |
Shares Sold | | | 223,311 | | | $ | 4,640,869 | | | | 251,469 | | | $ | 7,452,701 | |
Shares Issued upon Reinvestment of Dividends | | | 1,132,993 | | | | 18,932,316 | | | | 714,063 | | | | 24,121,038 | |
Shares Redeemed | | | (1,017,188 | ) | | | (20,270,658 | ) | | | (1,174,290 | ) | | | (33,272,578 | ) |
| | | | | | | | | | | | | | | | |
Net Increase | | | 339,116 | | | $ | 3,302,527 | | | | (208,758 | ) | | $ | (1,698,839 | ) |
| | | | | | | | | | | | | | | | |
Note 11 — Affiliate Ownership
As of October 31, 2023, affiliates of the Funds and Advisor owned 33.98%, and 5.26% of the net assets of the TCW Global Real Estate Fund and the TCW Relative Value Large Cap Fund, respectively.
Note 12 — Restricted Securities
The Funds are permitted to invest in securities that have legal or contractual restrictions on resale. These securities may be sold privately, but are required to be registered before being sold to the public (exemption rules apply). Private placement securities are generally considered to be restricted except for those securities traded between qualified institutional investors under the provisions of Rule 144A of the Securities Act of 1933, as amended (the “Securities Act”). However, the Company considers 144A securities to be restricted if those securities have been deemed illiquid. Disposal of these securities may involve time-consuming negotiations and expense, and prompt sale at an acceptable price may be difficult. There were no restricted securities held by the Funds at October 31, 2023.
Note 13 — Committed Line Of Credit
The Funds have entered into a $100,000,000 committed revolving line of credit agreement with State Street Bank and Trust Company (the “Bank”) for temporary borrowing purposes, renewable annually. The interest rate on borrowing is the higher of the Federal Funds Effective Rate plus 0.10% plus 1.25% or the Overnight Bank Funding Rate plus 0.10% plus 1.25%. There were no borrowings from the line of credit as of or during the year ended October 31, 2023. The Funds pay the Bank a commitment fee equal to 0.25% per annum on any unused portion of the committed line amount. The commitment fees incurred by the Funds are presented in the Statements of Operations. The commitment fees are allocated to each applicable portfolio in proportion to its relative average daily net assets and the interest expenses are charged directly to the applicable portfolio.
88
TCW Funds, Inc.
October 31, 2023
Note 14 — Indemnifications
Under the Company’s organizational documents, its Officers and Directors may be indemnified against certain liabilities and expenses arising out of the performance of their duties to the Company. In addition, the Company entered into an agreement with each of the Directors which provides that the Company will indemnify and hold harmless each Director against any expenses actually and reasonably incurred by such Director in any proceeding arising out of or in connection with the Director’s services to the Company, to the fullest extent permitted by the Company’s Articles of Incorporation and By-Laws, the Maryland General Corporation Law, the Securities Act, and the 1940 Act, each as now or hereinafter in force. Additionally, in the normal course of business, the Company enters into agreements with service providers that may contain indemnification clauses. The Company’s maximum exposure under these arrangements is unknown as this would involve future claims that may be made against the Company that have not yet occurred. However, based on experience, the Company expects the risk of loss to be remote. The Company has not accrued any liability in connection with such indemnification.
Note 15 — New Accounting Pronouncement
In June 2022, the FASB issued ASU No. 2022-03, “Fair Value Measurement of Equity Securities Subject to Contractual Sale Restrictions” (“ASU 2022-03”). ASU 2022-03 (1) clarifies the guidance in ASC 820 on the fair value measurement of an equity security that is subject to a contractual sale restriction and (2) requires specific disclosures related to such an equity security. ASU 2022-03 is effective for fiscal years beginning after December 15, 2023 and interim periods within that fiscal year, with early adoption permitted. We are currently evaluating the impact of the adoption of ASU 2022-03 on our financial statements.
89
TCW Artificial Intelligence Equity Fund
Financial Highlights — I Class
| | | | | | | | | | | | | | | | | | | | |
| | | Year Ended October 31, | |
| | | 2023 | | | 2022 | | | 2021 | | | 2020 | | | 2019 | |
Net Asset Value per Share, Beginning of year | | $ | 14.88 | | | $ | 24.99 | | | $ | 18.31 | | | $ | 12.70 | | | $ | 11.18 | |
| | | | | | | | | | | | | | | | | | | | |
Income (Loss) from Investment Operations: | |
Net Investment Loss | | | (0.04 | ) | | | (0.07 | ) | | | (0.11 | ) | | | (0.06 | ) | | | (0.02 | ) |
Net Realized and Unrealized Gain (Loss) on Investments (1) | | | 3.67 | | | | (8.97 | ) | | | 6.79 | | | | 5.67 | | | | 1.54 | |
| | | | | | | | | | | | | | | | | | | | |
Total from Investment Operations | | | 3.63 | | | | (9.04 | ) | | | 6.68 | | | | 5.61 | | | | 1.52 | |
| | | | | | | | | | | | | | | | | | | | |
Less Distributions: | |
Distributions from Net Realized Gain | | | — | | | | (1.07 | ) | | | — | | | | — | | | | — | |
| | | | | | | | | | | | | | | | | | | | |
Net Asset Value per Share, End of year | | $ | 18.51 | | | $ | 14.88 | | | $ | 24.99 | | | $ | 18.31 | | | $ | 12.70 | |
| | | | | | | | | | | | | | | | | | | | |
Total Return | | | 24.40 | % | | | (37.81 | %) | | | 36.48 | % | | | 44.17 | % | | | 13.60 | % |
|
Ratios/Supplemental Data: | |
| | | | | |
Net Assets, End of year (in thousands) | | $ | 20,609 | | | $ | 7,780 | | | $ | 13,452 | | | $ | 6,826 | | | $ | 2,940 | |
| | | | | |
Ratio of Expenses to Average Net Assets: | | | | | | | | | | | | | | | | | | | | |
| | | | | |
Before Expense Reimbursement | | | 1.57 | % | | | 1.78 | % | | | 1.66 | % | | | 2.81 | % | | | 6.36 | % |
| | | | | |
After Expense Reimbursement | | | 0.90 | % | | | 0.90 | % | | | 0.90 | % | | | 0.90 | % | | | 0.92 | % |
| | | | | |
Ratio of Net Investment Loss to Average Net Assets | | | (0.21 | %) | | | (0.38 | %) | | | (0.51 | %) | | | (0.41 | %) | | | (0.17 | %) |
| | | | | |
Portfolio Turnover Rate | | | 32.46 | % | | | 46.67 | % | | | 87.71 | % | | | 24.16 | % | | | 61.09 | % |
| (1) | Computed using average shares outstanding throughout the period. |
See accompanying Notes to Financial Statements.
90
TCW Artificial Intelligence Equity Fund
Financial Highlights — N Class
| | | | | | | | | | | | | | | | | | | | |
| | | Year Ended October 31, | |
| | | 2023 | | | 2022 | | | 2021 | | | 2020 | | | 2019 | |
Net Asset Value per Share, Beginning of year | | $ | 14.82 | | | $ | 24.91 | | | $ | 18.27 | | | $ | 12.69 | | | $ | 11.17 | |
| | | | | | | | | | | | | | | | | | | | |
Income (Loss) from Investment Operations: | |
Net Investment Loss | | | (0.05 | ) | | | (0.09 | ) | | | (0.14 | ) | | | (0.08 | ) | | | (0.03 | ) |
Net Realized and Unrealized Gain (Loss) on Investments (1) | | | 3.64 | | | | (8.93 | ) | | | 6.78 | | | | 5.66 | | | | 1.55 | |
| | | | | | | | | | | | | | | | | | | | |
Total from Investment Operations | | | 3.59 | | | | (9.02 | ) | | | 6.64 | | | | 5.58 | | | | 1.52 | |
| | | | | | | | | | | | | | | | | | | | |
Less Distributions: | |
Distributions from Net Realized Gain | | | — | | | | (1.07 | ) | | | — | | | | — | | | | — | |
| | | | | | | | | | | | | | | | | | | | |
Net Asset Value per Share, End of year | | $ | 18.41 | | | $ | 14.82 | | | $ | 24.91 | | | $ | 18.27 | | | $ | 12.69 | |
| | | | | | | | | | | | | | | | | | | | |
Total Return | | | 24.22 | % | | | (37.85 | %) | | | 36.34 | % | | | 43.97 | % | | | 13.61 | % |
|
Ratios/Supplemental Data: | |
| | | | | |
Net Assets, End of year (in thousands) | | $ | 4,103 | | | $ | 3,194 | | | $ | 5,483 | | | $ | 3,539 | | | $ | 989 | |
| | | | | |
Ratio of Expenses to Average Net Assets: | | | | | | | | | | | | | | | | | | | | |
| | | | | |
Before Expense Reimbursement | | | 2.38 | % | | | 2.43 | % | | | 2.21 | % | | | 3.83 | % | | | 7.99 | % |
| | | | | |
After Expense Reimbursement | | | 1.00 | % | | | 1.00 | % | | | 1.00 | % | | | 1.00 | % | | | 1.01 | % |
| | | | | |
Ratio of Net Investment Loss to Average Net Assets | | | (0.29 | %) | | | (0.48 | %) | | | (0.61 | %) | | | (0.53 | %) | | | (0.25 | %) |
| | | | | |
Portfolio Turnover Rate | | | 32.46 | % | | | 46.67 | % | | | 87.71 | % | | | 24.16 | % | | | 61.09 | % |
| (1) | Computed using average shares outstanding throughout the period. |
See accompanying Notes to Financial Statements.
91
TCW Conservative Allocation Fund
Financial Highlights — I Class
| | | | | | | | | | | | | | | | | | | | |
| | | Year Ended October 31, | |
| | | 2023 | | | 2022 | | | 2021 | | | 2020 | | | 2019 | |
Net Asset Value per Share, Beginning of year | | $ | 10.57 | | | $ | 13.96 | | | $ | 12.22 | | | $ | 12.09 | | | $ | 11.68 | |
| | | | | | | | | | | | | | | | | | | | |
Income (Loss) from Investment Operations: | |
Net Investment Income (1) | | | 0.32 | | | | 0.23 | | | | 0.13 | | | | 0.18 | | | | 0.24 | |
Net Realized and Unrealized Gain (Loss) on Investments | | | 0.09 | | | | (2.35 | ) | | | 1.80 | | | | 0.76 | | | | 0.89 | |
| | | | | | | | | | | | | | | | | | | | |
Total from Investment Operations | | | 0.41 | | | | (2.12 | ) | | | 1.93 | | | | 0.94 | | | | 1.13 | |
| | | | | | | | | | | | | | | | | | | | |
Less Distributions: | |
Distributions from Net Investment Income | | | (0.22 | ) | | | (0.30 | ) | | | (0.12 | ) | | | (0.71 | ) | | | (0.21 | ) |
Distributions from Net Realized Gain | | | (0.28 | ) | | | (0.97 | ) | | | (0.07 | ) | | | (0.10 | ) | | | (0.51 | ) |
| | | | | | | | | | | | | | | | | | | | |
Total Distributions | | | (0.50 | ) | | | (1.27 | ) | | | (0.19 | ) | | | (0.81 | ) | | | (0.72 | ) |
| | | | | | | | | | | | | | | | | | | | |
Net Asset Value per Share, End of year | | $ | 10.48 | | | $ | 10.57 | | | $ | 13.96 | | | $ | 12.22 | | | $ | 12.09 | |
| | | | | | | | | | | | | | | | | | | | |
Total Return | | | 3.97 | % | | | (16.80 | %) | | | 15.92 | % | | | 8.19 | % | | | 10.46 | % |
|
Ratios/Supplemental Data: | |
| | | | | |
Net Assets, End of year (in thousands) | | $ | 27,165 | | | $ | 27,624 | | | $ | 35,264 | | | $ | 36,714 | | | $ | 29,565 | |
| | | | | |
Ratio of Expenses to Average Net Assets: (2) | | | | | | | | | | | | | | | | | | | | |
| | | | | |
Before Expense Reimbursement | | | 0.44 | % | | | 0.41 | % | | | 0.44 | % | | | 0.39 | % | | | 0.44 | % |
| | | | | |
After Expense Reimbursement | | | N/A | | | | 0.41 | % | | | N/A | | | | N/A | | | | N/A | |
| | | | | |
Ratio of Net Investment Income to Average Net Assets | | | 3.00 | % | | | 1.96 | % | | | 0.94 | % | | | 1.56 | % | | | 2.03 | % |
| | | | | |
Portfolio Turnover Rate | | | 23.57 | % | | | 16.20 | % | | | 26.34 | % | | | 26.22 | % | | | 21.66 | % |
| (1) | Computed using average shares outstanding throughout the period. |
| (2) | Does not include expenses of the underlying affiliated funds. |
See accompanying Notes to Financial Statements.
92
TCW Conservative Allocation Fund
Financial Highlights — N Class
| | | | | | | | | | | | | | | | | | | | |
| | | Year Ended October 31, | |
| | | 2023 | | | 2022 | | | 2021 | | | 2020 | | | 2019 | |
Net Asset Value per Share, Beginning of year | | $ | 10.57 | | | $ | 13.97 | | | $ | 12.22 | | | $ | 12.09 | | | $ | 11.67 | |
| | | | | | | | | | | | | | | | | | | | |
Income (Loss) from Investment Operations: | |
Net Investment Income (1) | | | 0.30 | | | | 0.17 | | | | 0.09 | | | | 0.15 | | | | 0.20 | |
Net Realized and Unrealized Gain (Loss) on Investments | | | 0.09 | | | | (2.34 | ) | | | 1.81 | | | | 0.75 | | | | 0.90 | |
| | | | | | | | | | | | | | | | | | | | |
Total from Investment Operations | | | 0.39 | | | | (2.17 | ) | | | 1.90 | | | | 0.90 | | | | 1.10 | |
| | | | | | | | | | | | | | | | | | | | |
Less Distributions: | |
Distributions from Net Investment Income | | | (0.19 | ) | | | (0.26 | ) | | | (0.08 | ) | | | (0.67 | ) | | | (0.17 | ) |
Distributions from Net Realized Gain | | | (0.28 | ) | | | (0.97 | ) | | | (0.07 | ) | | | (0.10 | ) | | | (0.51 | ) |
| | | | | | | | | | | | | | | | | | | | |
Total Distributions | | | (0.47 | ) | | | (1.23 | ) | | | (0.15 | ) | | | (0.77 | ) | | | (0.68 | ) |
| | | | | | | | | | | | | | | | | | | | |
Net Asset Value per Share, End of year | | $ | 10.49 | | | $ | 10.57 | | | $ | 13.97 | | | $ | 12.22 | | | $ | 12.09 | |
| | | | | | | | | | | | | | | | | | | | |
Total Return | | | 3.78 | % | | | (17.08 | %) | | | 15.64 | % | | | 7.85 | % | | | 10.16 | % |
|
Ratios/Supplemental Data: | |
| | | | | |
Net Assets, End of year (in thousands) | | $ | 317 | | | $ | 347 | | | $ | 736 | | | $ | 452 | | | $ | 350 | |
| | | | | |
Ratio of Expenses to Average Net Assets: (2) | | | | | | | | | | | | | | | | | | | | |
| | | | | |
Before Expense Reimbursement | | | 7.18 | % | | | 4.18 | % | | | 3.73 | % | | | 6.06 | % | | | 6.89 | % |
| | | | | |
After Expense Reimbursement | | | 0.67 | % | | | 0.67 | % | | | 0.68 | % | | | 0.70 | % | | | 0.74 | % |
| | | | | |
Ratio of Net Investment Income to Average Net Assets | | | 2.75 | % | | | 1.41 | % | | | 0.70 | % | | | 1.23 | % | | | 1.75 | % |
| | | | | |
Portfolio Turnover Rate | | | 23.57 | % | | | 16.20 | % | | | 26.34 | % | | | 26.22 | % | | | 21.66 | % |
| (1) | Computed using average shares outstanding throughout the period. |
| (2) | Does not include expenses of the underlying affiliated funds. |
See accompanying Notes to Financial Statements.
93
TCW Global Real Estate Fund
Financial Highlights — I Class
| | | | | | | | | | | | | | | | | | | | |
| | | Year Ended October 31, | |
| | | 2023 | | | 2022 | | | 2021 | | | 2020 | | | 2019 | |
Net Asset Value per Share, Beginning of year | | $ | 10.31 | | | $ | 15.45 | | | $ | 11.07 | | | $ | 11.16 | | | $ | 9.30 | |
| | | | | | | | | | | | | | | | | | | | |
Income (Loss) from Investment Operations: | |
Net Investment Income (1) | | | 0.28 | | | | 0.27 | | | | 0.36 | | | | 0.17 | | | | 0.33 | |
Net Realized and Unrealized Gain (Loss) on Investments | | | (0.83 | ) | | | (3.98 | ) | | | 4.30 | | | | (0.05 | ) | | | 1.78 | |
| | | | | | | | | | | | | | | | | | | | |
Total from Investment Operations | | | (0.55 | ) | | | (3.71 | ) | | | 4.66 | | | | 0.12 | | | | 2.11 | |
| | | | | | | | | | | | | | | | | | | | |
Less Distributions: | |
Distributions from Net Investment Income | | | (0.16 | ) | | | (0.45 | ) | | | (0.28 | ) | | | (0.16 | ) | | | (0.25 | ) |
Distributions from Return of Capital | | | — | | | | (0.13 | ) | | | — | | | | (0.05 | ) | | | — | |
Distributions from Net Realized Gain | | | — | | | | (0.85 | ) | | | — | | | | — | | | | — | |
| | | | | | | | | | | | | | | | | | | | |
Total Distributions | | | (0.16 | ) | | | (1.43 | ) | | | (0.28 | ) | | | (0.21 | ) | | | (0.25 | ) |
| | | | | | | | | | | | | | | | | | | | |
Net Asset Value per Share, End of year | | $ | 9.60 | | | $ | 10.31 | | | $ | 15.45 | | | $ | 11.07 | | | $ | 11.16 | |
| | | | | | | | | | | | | | | | | | | | |
Total Return | | | (5.34 | %) | | | (26.38 | %) | | | 42.32 | % | | | 1.15 | % | | | 23.17 | % |
|
Ratios/Supplemental Data: | |
| | | | | |
Net Assets, End of year (in thousands) | | $ | 16,001 | | | $ | 17,741 | | | $ | 24,949 | | | $ | 9,175 | | | $ | 6,518 | |
| | | | | |
Ratio of Expenses to Average Net Assets: | | | | | | | | | | | | | | | | | | | | |
| | | | | |
Before Expense Reimbursement | | | 1.34 | % | | | 1.32 | % | | | 1.45 | % | | | 2.80 | % | | | 3.15 | % |
| | | | | |
After Expense Reimbursement | | | 0.90 | % | | | 0.90 | % | | | 0.92 | % | | | 1.00 | % | | | 1.00 | % |
| | | | | |
Ratio of Net Investment Income to Average Net Assets | | | 2.57 | % | | | 2.12 | % | | | 2.50 | % | | | 1.59 | % | | | 3.25 | % |
| | | | | |
Portfolio Turnover Rate | | | 65.26 | % | | | 167.41 | % | | | 164.29 | % | | | 136.71 | % | | | 85.18 | % |
| (1) | Computed using average shares outstanding throughout the period. |
See accompanying Notes to Financial Statements.
94
TCW Global Real Estate Fund
Financial Highlights — N Class
| | | | | | | | | | | | | | | | | | | | |
| | | Year Ended October 31, | |
| | | 2023 | | | 2022 | | | 2021 | | | 2020 | | | 2019 | |
Net Asset Value per Share, Beginning of year | | $ | 10.30 | | | $ | 15.43 | | | $ | 11.06 | | | $ | 11.16 | | | $ | 9.30 | |
| | | | | | | | | | | | | | | | | | | | |
Income (Loss) from Investment Operations: | |
Net Investment Income (1) | | | 0.26 | | | | 0.25 | | | | 0.33 | | | | 0.13 | | | | 0.39 | |
Net Realized and Unrealized Gain (Loss) on Investments | | | (0.82 | ) | | | (3.97 | ) | | | 4.30 | | | | (0.03 | ) | | | 1.71 | |
| | | | | | | | | | | | | | | | | | | | |
Total from Investment Operations | | | (0.56 | ) | | | (3.72 | ) | | | 4.63 | | | | 0.10 | | | | 2.10 | |
| | | | | | | | | | | | | | | | | | | | |
Less Distributions: | |
Distributions from Net Investment Income | | | (0.15 | ) | | | (0.44 | ) | | | (0.26 | ) | | | (0.15 | ) | | | (0.24 | ) |
Distributions from Net Realized Gain | | | — | | | | (0.85 | ) | | | — | | | | — | | | | — | |
Distributions from Return of Capital | | | — | | | | (0.12 | ) | | | — | | | | (0.05 | ) | | | — | |
| | | | | | | | | | | | | | | | | | | | |
Total Distributions | | | (0.15 | ) | | | (1.41 | ) | | | (0.26 | ) | | | (0.20 | ) | | | (0.24 | ) |
| | | | | | | | | | | | | | | | | | | | |
Net Asset Value per Share, End of year | | $ | 9.59 | | | $ | 10.30 | | | $ | 15.43 | | | $ | 11.06 | | | $ | 11.16 | |
| | | | | | | | | | | | | | | | | | | | |
Total Return | | | (5.54 | %) | | | (26.43 | %) | | | 42.10 | % | | | 0.94 | % | | | 22.99 | % |
|
Ratios/Supplemental Data: | |
| | | | | |
Net Assets, End of year (in thousands) | | $ | 7,595 | | | $ | 11,608 | | | $ | 14,634 | | | $ | 4,370 | | | $ | 658 | |
| | | | | |
Ratio of Expenses to Average Net Assets: | | | | | | | | | | | | | | | | | | | | |
| | | | | |
Before Expense Reimbursement | | | 1.71 | % | | | 1.64 | % | | | 1.90 | % | | | 5.14 | % | | | 7.17 | % |
| | | | | |
After Expense Reimbursement | | | 1.00 | % | | | 1.00 | % | | | 1.03 | % | | | 1.15 | % | | | 1.15 | % |
| | | | | |
Ratio of Net Investment Income to Average Net Assets | | | 2.42 | % | | | 1.95 | % | | | 2.36 | % | | | 1.21 | % | | | 3.88 | % |
| | | | | |
Portfolio Turnover Rate | | | 65.26 | % | | | 167.41 | % | | | 164.29 | % | | | 136.71 | % | | | 85.18 | % |
| (1) | Computed using average shares outstanding throughout the period. |
See accompanying Notes to Financial Statements.
95
TCW New America Premier Equities Fund
Financial Highlights — I Class
| | | | | | | | | | | | | | | | | | | | |
| | | Year Ended October 31, | |
| | | 2023 | | | 2022 | | | 2021 | | | 2020 | | | 2019 | |
Net Asset Value per Share, Beginning of year | | $ | 22.06 | | | $ | 31.80 | | | $ | 22.64 | | | $ | 20.34 | | | $ | 16.27 | |
| | | | | | | | | | | | | | | | | | | | |
Income (Loss) from Investment Operations: | |
Net Investment Income (Loss) (1) | | | 0.06 | | | | (0.05 | ) | | | 0.11 | | | | 0.01 | | | | 0.11 | |
Net Realized and Unrealized Gain (Loss) on Investments | | | 3.64 | | | | (6.03 | ) | | | 9.05 | | | | 2.48 | | | | 4.18 | |
| | | | | | | | | | | | | | | | | | | | |
Total from Investment Operations | | | 3.70 | | | | (6.08 | ) | | | 9.16 | | | | 2.49 | | | | 4.29 | |
| | | | | | | | | | | | | | | | | | | | |
Less Distributions: | |
Distributions from Net Investment Income | | | (0.00 | )(2) | | | — | | | | (0.00 | ) (2) | | | (0.10 | ) | | | (0.01 | ) |
Distributions from Net Realized Gain | | | — | | | | (3.66 | ) | | | — | | | | (0.09 | ) | | | (0.21 | ) |
| | | | | | | | | | | | | | | | | | | | |
Total Distributions | | | (0.00 | )(2) | | | (3.66 | ) | | | (0.00 | ) (2) | | | (0.19 | ) | | | (0.22 | ) |
| | | | | | | | | | | | | | | | | | | | |
Net Asset Value per Share, End of year | | $ | 25.76 | | | $ | 22.06 | | | $ | 31.80 | | | $ | 22.64 | | | $ | 20.34 | |
| | | | | | | | | | | | | | | | | | | | |
Total Return | | | 16.78 | % | | | (21.95 | %) | | | 40.46 | % | | | 12.31 | % | | | 26.79 | % |
|
Ratios/Supplemental Data: | |
| | | | | |
Net Assets, End of year (in thousands) | | $ | 145,705 | | | $ | 128,086 | | | $ | 201,523 | | | $ | 153,647 | | | $ | 103,442 | |
| | | | | |
Ratio of Expenses to Average Net Assets: | | | | | | | | | | | | | | | | | | | | |
| | | | | |
Before Expense Reimbursement | | | 0.79 | % | | | 0.81 | % | | | 0.80 | % | | | 0.83 | % | | | 0.93 | % |
| | | | | |
After Expense Reimbursement | | | N/A | | | | N/A | | | | N/A | | | | N/A | | | | 0.82 | % |
| | | | | |
Ratio of Net Investment Income (Loss) to Average Net Assets | | | 0.25 | % | | | (0.19 | %) | | | 0.37 | % | | | 0.03 | % | | | 0.56 | % |
| | | | | |
Portfolio Turnover Rate | | | 33.77 | % | | | 52.08 | % | | | 135.09 | % | | | 88.08 | % | | | 105.28 | % |
| (1) | Computed using average shares outstanding throughout the period. |
| (2) | Amount rounds to less than $0.01 per share. |
See accompanying Notes to Financial Statements.
96
TCW New America Premier Equities Fund
Financial Highlights — N Class
| | | | | | | | | | | | | | | | | | | | |
| | | Year Ended October 31, | |
| | | 2023 | | | 2022 | | | 2021 | | | 2020 | | | 2019 | |
Net Asset Value per Share, Beginning of year | | $ | 21.87 | | | $ | 31.64 | | | $ | 22.59 | | | $ | 20.31 | | | $ | 16.27 | |
| | | | | | | | | | | | | | | | | | | | |
Income (Loss) from Investment Operations: | |
Net Investment Income (Loss) (1) | | | 0.00 | | | | (0.11 | ) | | | 0.03 | | | | (0.01 | ) | | | 0.06 | |
Net Realized and Unrealized Gain (Loss) on Investments | | | 3.60 | | | | (6.00 | ) | | | 9.02 | | | | 2.44 | | | | 4.20 | |
| | | | | | | | | | | | | | | | | | | | |
Total from Investment Operations | | | 3.60 | | | | (6.11 | ) | | | 9.05 | | | | 2.43 | | | | 4.26 | |
| | | | | | | | | | | | | | | | | | | | |
Less Distributions: | |
Distributions from Net Investment Income | | | (0.00 | ) (2) | | | — | | | | (0.00 | ) (2) | | | (0.06 | ) | | | (0.01 | ) |
Distributions from Net Realized Gain | | | — | | | | (3.66 | ) | | | — | | | | (0.09 | ) | | | (0.21 | ) |
| | | | | | | | | | | | | | | | | | | | |
Total Distributions | | | (0.00 | ) (2) | | | (3.66 | ) | | | (0.00 | ) (2) | | | (0.15 | ) | | | (0.22 | ) |
| | | | | | | | | | | | | | | | | | | | |
Net Asset Value per Share, End of year | | $ | 25.47 | | | $ | 21.87 | | | $ | 31.64 | | | $ | 22.59 | | | $ | 20.31 | |
| | | | | | | | | | | | | | | | | | | | |
Total Return | | | 16.47 | % | |
| (22.18
| %)
| | | 40.07 | % | | | 12.02 | % | | | 26.60 | % |
|
Ratios/Supplemental Data: | |
| | | | | |
Net Assets, End of year (in thousands) | | $ | 21,727 | | | $ | 19,781 | | | $ | 30,348 | | | $ | 29,870 | | | $ | 52,130 | |
| | | | | |
Ratio of Expenses to Average Net Assets: | | | | | | | | | | | | | | | | | | | | |
| | | | | |
Before Expense Reimbursement | | | 1.18 | % | | | 1.22 | % | | | 1.20 | % | | | 1.17 | % | | | 1.28 | % |
| | | | | |
After Expense Reimbursement | | | 1.04 | % | | | 1.07 | % | | | 1.09 | % | | | 1.05 | % | | | 1.00 | % |
| | | | | |
Ratio of Net Investment Income (Loss) to Average Net Assets | | | 0.00 | % | | | (0.45 | %) | | | 0.10 | % | | | (0.05 | %) | | | 0.32 | % |
| | | | | |
Portfolio Turnover Rate | | | 33.77 | % | | | 52.08 | % | | | 135.09 | % | | | 88.08 | % | | | 105.28 | % |
| (1) | Computed using average shares outstanding throughout the period. |
| (2) | Amount rounds to less than $0.01 per share. |
See accompanying Notes to Financial Statements.
97
TCW Relative Value Dividend Appreciation Fund
Financial Highlights — I Class
| | | | | | | | | | | | | | | | | | | | |
| | | Year Ended October 31, | |
| | | 2023 | | | 2022 | | | 2021 | | | 2020 | | | 2019 | |
Net Asset Value per Share, Beginning of year | | $ | 19.30 | | | $ | 22.12 | | | $ | 14.91 | | | $ | 17.92 | | | $ | 17.47 | |
| | | | | | | | | | | | | | | | | | | | |
Income (Loss) from Investment Operations: | |
Net Investment Income (1) | | | 0.38 | | | | 0.38 | | | | 0.37 | | | | 0.40 | | | | 0.39 | |
Net Realized and Unrealized Gain (Loss) on Investments | | | 0.31 | | | | (0.79 | ) | | | 7.22 | | | | (1.81 | ) | | | 1.37 | |
| | | | | | | | | | | | | | | | | | | | |
Total from Investment Operations | | | 0.69 | | | | (0.41 | ) | | | 7.59 | | | | (1.41 | ) | | | 1.76 | |
| | | | | | | | | | | | | | | | | | | | |
Less Distributions: | |
Distributions from Net Investment Income | | | (0.36 | ) | | | (0.39 | ) | | | (0.38 | ) | | | (0.41 | ) | | | (0.39 | ) |
Distributions from Net Realized Gain | | | (0.84 | ) | | | (2.02 | ) | | | — | | | | (1.19 | ) | | | (0.92 | ) |
| | | | | | | | | | | | | | | | | | | | |
Total Distributions | | | (1.20 | ) | | | (2.41 | ) | | | (0.38 | ) | | | (1.60 | ) | | | (1.31 | ) |
| | | | | | | | | | | | | | | | | | | | |
Net Asset Value per Share, End of year | | $ | 18.79 | | | $ | 19.30 | | | $ | 22.12 | | | $ | 14.91 | | | $ | 17.92 | |
| | | | | | | | | | | | | | | | | | | | |
Total Return | | | 3.61 | % | | | (2.36 | %) | | | 51.22 | % | | | (8.71 | %) | | | 11.27 | % |
|
Ratios/Supplemental Data: | |
| | | | | |
Net Assets, End of year (in thousands) | | $ | 70,332 | | | $ | 70,448 | | | $ | 78,001 | | | $ | 55,326 | | | $ | 88,314 | |
| | | | | |
Ratio of Expenses to Average Net Assets: | | | | | | | | | | | | | | | | | | | | |
| | | | | |
Before Expense Reimbursement | | | 0.74 | % | | | 0.76 | % | | | 0.75 | % | | | 0.75 | % | | | 0.75 | % |
| | | | | |
After Expense Reimbursement | | | 0.70 | % | | | 0.70 | % | | | 0.70 | % | | | 0.71 | % | | | 0.74 | % |
| | | | | |
Ratio of Net Investment Income to Average Net Assets | | | 1.91 | % | | | 1.91 | % | | | 1.86 | % | | | 2.53 | % | | | 2.28 | % |
| | | | | |
Portfolio Turnover Rate | | | 18.44 | % | | | 14.76 | % | | | 17.00 | % | | | 19.68 | % | | | 17.71 | % |
| (1) | Computed using average shares outstanding throughout the period. |
See accompanying Notes to Financial Statements.
98
TCW Relative Value Dividend Appreciation Fund
Financial Highlights — N Class
| | | | | | | | | | | | | | | | | | | | |
| | | Year Ended October 31, | |
| | | 2023 | | | 2022 | | | 2021 | | | 2020 | | | 2019 | |
Net Asset Value per Share, Beginning of year | | $ | 19.72 | | | $ | 22.55 | | | $ | 15.20 | | | $ | 18.24 | | | $ | 17.77 | |
| | | | | | | | | | | | | | | | | | | | |
Income (Loss) from Investment Operations: | |
Net Investment Income (1) | | | 0.34 | | | | 0.35 | | | | 0.34 | | | | 0.37 | | | | 0.37 | |
Net Realized and Unrealized Gain (Loss) on Investments | | | 0.33 | | | | (0.80 | ) | | | 7.35 | | | | (1.84 | ) | | | 1.38 | |
| | | | | | | | | | | | | | | | | | | | |
Total from Investment Operations | | | 0.67 | | | | (0.45 | ) | | | 7.69 | | | | (1.47 | ) | | | 1.75 | |
| | | | | | | | | | | | | | | | | | | | |
Less Distributions: | |
Distributions from Net Investment Income | | | (0.33 | ) | | | (0.36 | ) | | | (0.34 | ) | | | (0.38 | ) | | | (0.36 | ) |
Distributions from Net Realized Gain | | | (0.84 | ) | | | (2.02 | ) | | | — | | | | (1.19 | ) | | | (0.92 | ) |
| | | | | | | | | | | | | | | | | | | | |
Total Distributions | | | (1.17 | ) | | | (2.38 | ) | | | (0.34 | ) | | | (1.57 | ) | | | (1.28 | ) |
| | | | | | | | | | | | | | | | | | | | |
Net Asset Value per Share, End of year | | $ | 19.22 | | | $ | 19.72 | | | $ | 22.55 | | | $ | 15.20 | | | $ | 18.24 | |
| | | | | | | | | | | | | | | | | | | | |
Total Return | | | 3.40 | % | | | (2.52 | %) | | | 50.90 | % | | | (8.88 | %) | | | 11.02 | % |
|
Ratios/Supplemental Data: | |
| | | | | |
Net Assets, End of year (in thousands) | | $ | 169,845 | | | $ | 179,329 | | | $ | 202,187 | | | $ | 152,934 | | | $ | 223,322 | |
| | | | | |
Ratio of Expenses to Average Net Assets: | | | | | | | | | | | | | | | | | | | | |
| | | | | |
Before Expense Reimbursement | | | 1.01 | % | | | 1.05 | % | | | 1.04 | % | | | 1.02 | % | | | 1.04 | % |
| | | | | |
After Expense Reimbursement | | | 0.90 | % | | | 0.90 | % | | | 0.90 | % | | | 0.92 | % | | | 0.96 | % |
| | | | | |
Ratio of Net Investment Income to Average Net Assets | | | 1.71 | % | | | 1.71 | % | | | 1.66 | % | | | 2.32 | % | | | 2.10 | % |
| | | | | |
Portfolio Turnover Rate | | | 18.44 | % | | | 14.76 | % | | | 17.00 | % | | | 19.68 | % | | | 17.71 | % |
| (1) | Computed using average shares outstanding throughout the period. |
See accompanying Notes to Financial Statements.
99
TCW Relative Value Large Cap Fund
Financial Highlights — I Class
| | | | | | | | | | | | | | | | | | | | |
| | | Year Ended October 31, | |
| | | 2023 | | | 2022 | | | 2021 | | | 2020 | | | 2019 | |
Net Asset Value per Share, Beginning of year | | $ | 13.10 | | | $ | 15.04 | | | $ | 10.84 | | | $ | 18.69 | | | $ | 19.82 | |
| | | | | | | | | | | | | | | | | | | | |
Income (Loss) from Investment Operations: | |
Net Investment Income (1) | | | 0.20 | | | | 0.19 | | | | 0.18 | | | | 0.22 | | | | 0.33 | |
Net Realized and Unrealized Gain (Loss) on Investments | | | 0.26 | | | | (0.90 | ) | | | 5.07 | | | | (0.57 | ) | | | 0.84 | |
| | | | | | | | | | | | | | | | | | | | |
Total from Investment Operations | | | 0.46 | | | | (0.71 | ) | | | 5.25 | | | | (0.35 | ) | | | 1.17 | |
| | | | | | | | | | | | | | | | | | | | |
Less Distributions: | |
Distributions from Net Investment Income | | | (0.20 | ) | | | (0.19 | ) | | | (0.22 | ) | | | (0.49 | ) | | | (0.31 | ) |
Distributions from Net Realized Gain | | | (0.70 | ) | | | (1.04 | ) | | | (0.83 | ) | | | (7.01 | ) | | | (1.99 | ) |
| | | | | | | | | | | | | | | | | | | | |
Total Distributions | | | (0.90 | ) | | | (1.23 | ) | | | (1.05 | ) | | | (7.50 | ) | | | (2.30 | ) |
| | | | | | | | | | | | | | | | | | | | |
Net Asset Value per Share, End of year | | $ | 12.66 | | | $ | 13.10 | | | $ | 15.04 | | | $ | 10.84 | | | $ | 18.69 | |
| | | | | | | | | | | | | | | | | | | | |
Total Return | | | 3.61 | % | | | (5.56 | %) | | | 50.84 | % | | | (7.02 | %) | | | 8.13 | % |
|
Ratios/Supplemental Data: | |
| | | | | |
Net Assets, End of year (in thousands) | | $ | 97,169 | | | $ | 101,088 | | | $ | 117,205 | | | $ | 83,765 | | | $ | 136,917 | |
| | | | | |
Ratio of Expenses to Average Net Assets: | | | | | | | | | | | | | | | | | | | | |
| | | | | |
Before Expense Reimbursement | | | 0.82 | % | | | 0.83 | % | | | 0.80 | % | | | 0.80 | % | | | 0.78 | % |
| | | | | |
After Expense Reimbursement | | | 0.70 | % | | | 0.70 | % | | | 0.70 | % | | | 0.71 | % | | | 0.74 | % |
| | | | | |
Ratio of Net Investment Income to Average Net Assets | | | 1.49 | % | | | 1.43 | % | | | 1.31 | % | | | 1.88 | % | | | 1.79 | % |
| | | | | |
Portfolio Turnover Rate | | | 19.65 | % | | | 17.81 | % | | | 17.16 | % | | | 31.17 | % | | | 19.47 | % |
| (1) | Computed using average shares outstanding throughout the period. |
See accompanying Notes to Financial Statements.
100
TCW Relative Value Large Cap Fund
Financial Highlights — N Class
| | | | | | | | | | | | | | | | | | | | |
| | | Year Ended October 31, | |
| | | 2023 | | | 2022 | | | 2021 | | | 2020 | | | 2019 | |
Net Asset Value per Share, Beginning of year | | $ | 13.04 | | | $ | 14.97 | | | $ | 10.79 | | | $ | 18.62 | | | $ | 19.74 | |
| | | | | | | | | | | | | | | | | | | | |
Income (Loss) from Investment Operations: | |
Net Investment Income (1) | | | 0.17 | | | | 0.17 | | | | 0.15 | | | | 0.19 | | | | 0.28 | |
Net Realized and Unrealized Gain (Loss) on Investments | | | 0.26 | | | | (0.91 | ) | | | 5.05 | | | | (0.56 | ) | | | 0.86 | |
| | | | | | | | | | | | | | | | | | | | |
Total from Investment Operations | | | 0.43 | | | | (0.74 | ) | | | 5.20 | | | | (0.37 | ) | | | 1.14 | |
| | | | | | | | | | | | | | | | | | | | |
Less Distributions: | |
Distributions from Net Investment Income | | | (0.17 | ) | | | (0.15 | ) | | | (0.19 | ) | | | (0.45 | ) | | | (0.27 | ) |
Distributions from Net Realized Gain | | | (0.70 | ) | | | (1.04 | ) | | | (0.83 | ) | | | (7.01 | ) | | | (1.99 | ) |
| | | | | | | | | | | | | | | | | | | | |
Total Distributions | | | (0.87 | ) | | | (1.19 | ) | | | (1.02 | ) | | | (7.46 | ) | | | (2.26 | ) |
| | | | | | | | | | | | | | | | | | | | |
Net Asset Value per Share, End of year | | $ | 12.60 | | | $ | 13.04 | | | $ | 14.97 | | | $ | 10.79 | | | $ | 18.62 | |
| | | | | | | | | | | | | | | | | | | | |
Total Return | | | 3.41 | % | | | (5.72 | %) | | | 50.56 | % | | | (7.17 | %) | | | 7.92 | % |
|
Ratios/Supplemental Data: | |
| | | | | |
Net Assets, End of year (in thousands) | | $ | 8,337 | | | $ | 9,007 | | | $ | 10,506 | | | $ | 9,277 | | | $ | 11,535 | |
| | | | | |
Ratio of Expenses to Average Net Assets: | | | | | | | | | | | | | | | | | | | | |
| | | | | |
Before Expense Reimbursement | | | 1.32 | % | | | 1.34 | % | | | 1.30 | % | | | 1.32 | % | | | 1.24 | % |
| | | | | |
After Expense Reimbursement | | | 0.90 | % | | | 0.90 | % | | | 0.90 | % | | | 0.91 | % | | | 0.95 | % |
| | | | | |
Ratio of Net Investment Income to Average Net Assets | | | 1.29 | % | | | 1.23 | % | | | 1.11 | % | | | 1.67 | % | | | 1.52 | % |
| | | | | |
Portfolio Turnover Rate | | | 19.65 | % | | | 17.81 | % | | | 17.16 | % | | | 31.17 | % | | | 19.47 | % |
| (1) | Computed using average shares outstanding throughout the period. |
See accompanying Notes to Financial Statements.
101
TCW Relative Value Mid Cap Fund
Financial Highlights — I Class
| | | | | | | | | | | | | | | | | | | | |
| | | Year Ended October 31, | |
| | | 2023 | | | 2022 | | | 2021 | | | 2020 | | | 2019 | |
Net Asset Value per Share, Beginning of year | | $ | 23.57 | | | $ | 29.62 | | | $ | 18.90 | | | $ | 21.06 | | | $ | 22.44 | |
| | | | | | | | | | | | | | | | | | | | |
Income (Loss) from Investment Operations: | |
Net Investment Income (1) | | | 0.21 | | | | 0.19 | | | | 0.17 | | | | 0.17 | | | | 0.18 | |
Net Realized and Unrealized Gain (Loss) on Investments | | | 0.05 | | | | (2.80 | ) | | | 10.72 | | | | (1.78 | ) | | | 0.21 | |
| | | | | | | | | | | | | | | | | | | | |
Total from Investment Operations | | | 0.26 | | | | (2.61 | ) | | | 10.89 | | | | (1.61 | ) | | | 0.39 | |
| | | | | | | | | | | | | | | | | | | | |
Less Distributions: | |
Distributions from Net Investment Income | | | (0.20 | ) | | | (0.16 | ) | | | (0.17 | ) | | | (0.18 | ) | | | (0.15 | ) |
Distributions from Net Realized Gain | | | (0.39 | ) | | | (3.28 | ) | | | — | | | | (0.37 | ) | | | (1.62 | ) |
| | | | | | | | | | | | | | | | | | | | |
Total Distributions | | | (0.59 | ) | | | (3.44 | ) | | | (0.17 | ) | | | (0.55 | ) | | | (1.77 | ) |
| | | | | | | | | | | | | | | | | | | | |
Net Asset Value per Share, End of year | | $ | 23.24 | | | $ | 23.57 | | | $ | 29.62 | | | $ | 18.90 | | | $ | 21.06 | |
| | | | | | | | | | | | | | | | | | | | |
Total Return | | | 1.15 | % | | | (10.35 | %) | | | 57.90 | % | | | (8.07 | %) | | | 3.18 | % |
|
Ratios/Supplemental Data: | |
| | | | | |
Net Assets, End of year (in thousands) | | $ | 59,647 | | | $ | 62,726 | | | $ | 72,545 | | | $ | 51,021 | | | $ | 63,957 | |
| | | | | |
Ratio of Expenses to Average Net Assets: | | | | | | | | | | | | | | | | | | | | |
| | | | | |
Before Expense Reimbursement | | | 0.97 | % | | | 1.01 | % | | | 0.97 | % | | | 0.97 | % | | | 0.95 | % |
| | | | | |
After Expense Reimbursement | | | 0.85 | % | | | 0.85 | % | | | 0.85 | % | | | 0.87 | % | | | 0.90 | % |
| | | | | |
Ratio of Net Investment Income to Average Net Assets | | | 0.86 | % | | | 0.75 | % | | | 0.63 | % | | | 0.90 | % | | | 0.86 | % |
| | | | | |
Portfolio Turnover Rate | | | 27.55 | % | | | 28.82 | % | | | 44.33 | % | | | 42.07 | % | | | 25.89 | % |
| (1) | Computed using average shares outstanding throughout the period. |
See accompanying Notes to Financial Statements.
102
TCW Relative Value Mid Cap Fund
Financial Highlights — N Class
| | | | | | | | | | | | | | | | | | | | |
| | | Year Ended October 31, | |
| | | 2023 | | | 2022 | | | 2021 | | | 2020 | | | 2019 | |
Net Asset Value per Share, Beginning of year | | $ | 22.79 | | | $ | 28.75 | | | $ | 18.34 | | | $ | 20.45 | | | $ | 21.82 | |
| | | | | | | | | | | | | | | | | | | | |
Income (Loss) from Investment Operations: | |
Net Investment Income (1) | | | 0.18 | | | | 0.16 | | | | 0.14 | | | | 0.15 | | | | 0.15 | |
Net Realized and Unrealized Gain (Loss) on Investments | | | 0.05 | | | | (2.71 | ) | | | 10.42 | | | | (1.74 | ) | | | 0.21 | |
| | | | | | | | | | | | | | | | | | | | |
Total from Investment Operations | | | 0.23 | | | | (2.55 | ) | | | 10.56 | | | | (1.59 | ) | | | 0.36 | |
| | | | | | | | | | | | | | | | | | | | |
Less Distributions: | |
Distributions from Net Investment Income | | | (0.17 | ) | | | (0.13 | ) | | | (0.15 | ) | | | (0.15 | ) | | | (0.11 | ) |
Distributions from Net Realized Gain | | | (0.39 | ) | | | (3.28 | ) | | | — | | | | (0.37 | ) | | | (1.62 | ) |
| | | | | | | | | | | | | | | | | | | | |
Total Distributions | | | (0.56 | ) | | | (3.41 | ) | | | (0.15 | ) | | | (0.52 | ) | | | (1.73 | ) |
| | | | | | | | | | | | | | | | | | | | |
Net Asset Value per Share, End of year | | $ | 22.46 | | | $ | 22.79 | | | $ | 28.75 | | | $ | 18.34 | | | $ | 20.45 | |
| | | | | | | | | | | | | | | | | | | | |
Total Return | | | 1.05 | % | | | (10.45 | %) | | | 57.78 | % | | | (8.18 | %) | | | 3.12 | % |
|
Ratios/Supplemental Data: | |
| | | | | |
Net Assets, End of year (in thousands) | | $ | 11,801 | | | $ | 13,181 | | | $ | 16,708 | | | $ | 10,902 | | | $ | 14,448 | |
| | | | | |
Ratio of Expenses to Average Net Assets: | | | | | | | | | | | | | | | | | | | | |
| | | | | |
Before Expense Reimbursement | | | 1.36 | % | | | 1.39 | % | | | 1.37 | % | | | 1.42 | % | | | 1.37 | % |
| | | | | |
After Expense Reimbursement | | | 0.95 | % | | | 0.95 | % | | | 0.95 | % | | | 0.97 | % | | | 1.00 | % |
| | | | | |
Ratio of Net Investment Income to Average Net Assets | | | 0.76 | % | | | 0.65 | % | | | 0.54 | % | | | 0.81 | % | | | 0.76 | % |
| | | | | |
Portfolio Turnover Rate | | | 27.55 | % | | | 28.82 | % | | | 44.33 | % | | | 42.07 | % | | | 25.89 | % |
| (1) | Computed using average shares outstanding throughout the period. |
See accompanying Notes to Financial Statements.
103
TCW Select Equities Fund
Financial Highlights — I Class
| | | | | | | | | | | | | | | | | | | | |
| | | Year Ended October 31, | |
| | | 2023 | | | 2022 | | | 2021 | | | 2020 | | | 2019 | |
Net Asset Value per Share, Beginning of year | | $ | 25.79 | | | $ | 44.70 | | | $ | 34.13 | | | $ | 27.64 | | | $ | 27.13 | |
| | | | | | | | | | | | | | | | | | | | |
Income (Loss) from Investment Operations: | |
Net Investment Loss (1) | | | (0.04 | ) | | | (0.12 | ) | | | (0.14 | ) | | | (0.08 | ) | | | (0.06 | ) |
Net Realized and Unrealized Gain (Loss) on Investments | | | 3.82 | | | | (13.71 | ) | | | 13.23 | | | | 9.04 | | | | 4.21 | |
| | | | | | | | | | | | | | | | | | | | |
Total from Investment Operations | | | 3.78 | | | | (13.83 | ) | | | 13.09 | | | | 8.96 | | | | 4.15 | |
| | | | | | | | | | | | | | | | | | | | |
Less Distributions: | |
Distributions from Net Realized Gain | | | (4.20 | ) | | | (5.08 | ) | | | (2.52 | ) | | | (2.47 | ) | | | (3.64 | ) |
| | | | | | | | | | | | | | | | | | | | |
Net Asset Value per Share, End of year | | $ | 25.37 | | | $ | 25.79 | | | $ | 44.70 | | | $ | 34.13 | | | $ | 27.64 | |
| | | | | | | | | | | | | | | | | | | | |
Total Return | | | 18.60 | % | | | (34.93 | %) | | | 40.32 | % | | | 34.59 | % | | | 18.98 | % |
|
Ratios/Supplemental Data: | |
| | | | | |
Net Assets, End of year (in thousands) | | $ | 429,236 | | | $ | 462,670 | | | $ | 801,597 | | | $ | 633,683 | | | $ | 770,079 | |
| | | | | |
Ratio of Expenses to Average Net Assets | | | 0.77 | % | | | 0.79 | % | | | 0.77 | % | | | 0.76 | % | | | 0.80 | % |
| | | | | |
Ratio of Net Investment Loss to Average Net Assets | | | (0.16 | %) | | | (0.38 | %) | | | (0.37 | %) | | | (0.28 | %) | | | (0.25 | %) |
| | | | | |
Portfolio Turnover Rate | | | 10.42 | % | | | 12.12 | % | | | 8.17 | % | | | 4.09 | % | | | 6.41 | % |
| (1) | Computed using average shares outstanding throughout the period. |
See accompanying Notes to Financial Statements.
104
TCW Select Equities Fund
Financial Highlights — N Class
| | | | | | | | | | | | | | | | | | | | |
| | | Year Ended October 31, | |
| | | 2023 | | | 2022 | | | 2021 | | | 2020 | | | 2019 | |
Net Asset Value per Share, Beginning of year | | $ | 21.89 | | | $ | 38.76 | | | $ | 29.95 | | | $ | 24.59 | | | $ | 24.61 | |
| | | | | | | | | | | | | | | | | | | | |
Income (Loss) from Investment Operations: | |
Net Investment Loss (1) | | | (0.06 | ) | | | (0.15 | ) | | | (0.19 | ) | | | (0.13 | ) | | | (0.11 | ) |
Net Realized and Unrealized Gain (Loss) on Investments | | | 3.10 | | | | (11.64 | ) | | | 11.52 | | | | 7.96 | | | | 3.73 | |
| | | | | | | | | | | | | | | | | | | | |
Total from Investment Operations | | | 3.04 | | | | (11.79 | ) | | | 11.33 | | | | 7.83 | | | | 3.62 | |
| | | | | | | | | | | | | | | | | | | | |
Less Distributions: | |
Distributions from Net Realized Gain | | | (4.20 | ) | | | (5.08 | ) | | | (2.52 | ) | | | (2.47 | ) | | | (3.64 | ) |
| | | | | | | | | | | | | | | | | | | | |
Net Asset Value per Share, End of year | | $ | 20.73 | | | $ | 21.89 | | | $ | 38.76 | | | $ | 29.95 | | | $ | 24.59 | |
| | | | | | | | | | | | | | | | | | | | |
Total Return | | | 18.50 | % | | | (35.03 | %) | | | 40.06 | % | | | 34.26 | % | | | 18.74 | % |
|
Ratios/Supplemental Data: | |
| | | | | |
Net Assets, End of year (in thousands) | | $ | 106,292 | | | $ | 104,856 | | | $ | 193,727 | | | $ | 161,625 | | | $ | 132,332 | |
|
Ratio of Expenses to Average Net Assets: | |
| | | | | |
Before Expense Reimbursement | | | 1.06 | % | | | 1.08 | % | | | 1.04 | % | | | 1.06 | % | | | 1.08 | % |
| | | | | |
After Expense Reimbursement | | | 0.93 | % | | | 0.94 | % | | | 0.96 | % | | | 0.99 | % | | | 1.01 | % |
| | | | | |
Ratio of Net Investment Loss to Average Net Assets | | | (0.32 | %) | | | (0.53 | %) | | | (0.56 | %) | | | (0.51 | %) | | | (0.45 | %) |
| | | | | |
Portfolio Turnover Rate | | | 10.42 | % | | | 12.12 | % | | | 8.17 | % | | | 4.09 | % | | | 6.41 | % |
| (1) | Computed using average shares outstanding throughout the period. |
See accompanying Notes to Financial Statements.
105
TCW Funds, Inc.
Report of Independent Registered Public Accounting Firm
To the Board of Directors and Shareholders of
TCW Funds, Inc.:
Opinion on the Financial Statements and Financial Highlights
We have audited the accompanying statements of assets and liabilities of TCW Artificial Intelligence Equity Fund, TCW Conservative Allocation Fund, TCW Global Real Estate Fund, TCW New America Premier Equities Fund, TCW Relative Value Dividend Appreciation Fund, TCW Relative Value Large Cap Fund, TCW Relative Value Mid Cap Fund, and TCW Select Equities Fund (collectively, the “TCW Equity and Asset Allocation Funds”) (eight of sixteen funds comprising TCW Funds, Inc.), including the schedules of investments, as of October 31, 2023, the related statements of operations for the year then ended, the statements of changes in net assets for each of the two years in the period then ended, the financial highlights for each of the five years in the period then ended for the TCW Equity and Asset Allocation Funds, and the related notes. In our opinion, the financial statements and financial highlights present fairly, in all material respects, the financial position of each of the respective TCW Equity and Asset Allocation Funds as of October 31, 2023, and the results of their operations for the year then ended, the changes in their net assets for each of the two years in the period then ended, and the financial highlights for each of the five years in the period then ended for the TCW Equity and Asset Allocation Funds, in conformity with accounting principles generally accepted in the United States of America.
Basis for Opinion
These financial statements and financial highlights are the responsibility of the TCW Equity and Asset Allocation Funds’ management. Our responsibility is to express an opinion on the TCW Equity and Asset Allocation Funds’ financial statements and financial highlights based on our audits. We are a public accounting firm registered with the Public Company Accounting Oversight Board (United States) (PCAOB) and are required to be independent with respect to the TCW Equity and Asset Allocation Funds in accordance with the U.S. federal securities laws and the applicable rules and regulations of the Securities and Exchange Commission and the PCAOB.
We conducted our audits in accordance with the standards of the PCAOB. Those standards require that we plan and perform the audits to obtain reasonable assurance about whether the financial statements and financial highlights are free of material misstatement, whether due to error or fraud. The TCW Equity and Asset Allocation Funds are not required to have, nor were we engaged to perform, an audit of their internal control over financial reporting. As part of our audits we are required to obtain an understanding of internal control over financial reporting but not for the purpose of expressing an opinion on the effectiveness of the TCW Equity and Asset Allocation Funds’ internal control over financial reporting. Accordingly, we express no such opinion.
Our audits included performing procedures to assess the risks of material misstatement of the financial statements and financial highlights, whether due to error or fraud, and performing procedures that respond to those risks. Such procedures included examining, on a test basis, evidence regarding the amounts and disclosures in the financial statements and financial highlights. Our audits also included evaluating the accounting principles used and significant estimates made by management, as well as evaluating the overall presentation of the financial statements and financial highlights. Our procedures included confirmation of securities owned as of October 31, 2023, by correspondence with the custodian and brokers; when replies were not received from brokers, we performed other auditing procedures. We believe that our audits provide a reasonable basis for our opinion.

Los Angeles, California
December 20, 2023
We have served as the auditor of one or more TCW/Metropolitan West Funds investment companies since 1990.
106
TCW Funds, Inc.
Shareholder Expenses (Unaudited)
As a shareholder of a Fund, you incur ongoing operational costs of the Fund, including management fees and other fund expenses. The following example is intended to help you understand your ongoing costs (in dollars and cents) of investing in a Fund and to compare these costs with the ongoing costs of investing in other funds.
The example is based on an investment of $1,000 invested at the beginning of the period and held for the entire period from May 1, 2023 to October 31, 2023 (184 days).
Actual Expenses: The first line under each Fund in the table below provides information about the actual account values and actual expenses. You may use the information in this line, together with the amount you invested, to estimate the expenses that you paid over the period. Simply divide your account value by $1,000 (for example, an $8,600 account value divided by $1,000 = 8.6), then multiply the result by the number in the first line for your Fund under the heading entitled “Expenses Paid During Period” to estimate the expenses you paid on your account during this period.
Hypothetical Example for Comparison Purposes: The second line under each Fund in the table below provides information about the hypothetical expenses based on each Fund’s actual expense ratio and an assumed rate of return of 5% per year before expenses, which is not the Fund’s actual return. The hypothetical account value and expenses may not be used to estimate the actual ending account balance or expenses you paid for the period. You may use this information to compare the ongoing costs of investing in your Fund and other funds. To do so, compare this 5% hypothetical example with the 5% hypothetical examples that appear in the shareholder reports of the other funds.
| | | | | | | | | | | | | | | | |
TCW Funds, Inc. | | Beginning
Account Value
May 1, 2023 | | | Ending
Account Value
October 31, 2023 | | | Annualized
Expense Ratio | | | Expenses Paid
During Period
(May 1, 2023 to
October 31, 2023) | |
| TCW Artificial Intelligence Equity Fund | | | | | | | | | | | | | | | | |
I Class Shares | | | | | | | | | | | | | | | | |
Actual | | $ | 1,000.00 | | | $ | 1,129.30 | | | | 0.90 | % | | $ | 4.83 | |
Hypothetical (5% return before expenses) | | | 1,000.00 | | | | 1,020.67 | | | | 0.90 | % | | | 4.58 | |
| | | | |
N Class Shares | | | | | | | | | | | | | | | | |
Actual | | $ | 1,000.00 | | | $ | 1,128.10 | | | | 1.00 | % | | $ | 5.36 | |
Hypothetical (5% return before expenses) | | | 1,000.00 | | | | 1,020.16 | | | | 1.00 | % | | | 5.09 | |
| | | | |
| TCW Conservative Allocation Fund | | | | | | | | | | | | | | | | |
I Class Shares | | | | | | | | | | | | | | | | |
Actual | | $ | 1,000.00 | | | $ | 961.50 | | | | 0.43 | % (1) | | $ | 2.13 | (1) |
Hypothetical (5% return before expenses) | | | 1,000.00 | | | | 1,023.04 | | | | 0.43 | % (1) | | | 2.19 | (1) |
| | | | |
N Class Shares | | | | | | | | | | | | | | | | |
Actual | | $ | 1,000.00 | | | $ | 960.60 | | | | 0.67 | % (1) | | $ | 3.31 | (1) |
Hypothetical (5% return before expenses) | | | 1,000.00 | | | | 1,021.83 | | | | 0.67 | % (1) | | | 3.41 | (1) |
| | | | |
| TCW Global Real Estate Fund | | | | | | | | | | | | | | | | |
I Class Shares | | | | | | | | | | | | | | | | |
Actual | | $ | 1,000.00 | | | $ | 870.00 | | | | 0.90 | % | | $ | 4.24 | |
Hypothetical (5% return before expenses) | | | 1,000.00 | | | | 1,020.67 | | | | 0.90 | % | | | 4.58 | |
| | | | |
N Class Shares | | | | | | | | | | | | | | | | |
Actual | | $ | 1,000.00 | | | $ | 869.30 | | | | 1.00 | % | | $ | 4.71 | |
Hypothetical (5% return before expenses) | | | 1,000.00 | | | | 1,020.16 | | | | 1.00 | % | | | 5.09 | |
107
TCW Funds, Inc.
Shareholder Expenses (Unaudited) (Continued)
| | | | | | | | | | | | | | | | |
TCW Funds, Inc. | | Beginning
Account Value
May 1, 2023 | | | Ending
Account Value
October 31, 2023 | | | Annualized
Expense Ratio | | | Expenses Paid
During Period
(May 1, 2023 to
October 31, 2023) | |
| | | | |
| TCW New America Premier Equities Fund | | | | | | | | | | | | | | | | |
I Class Shares | | | | | | | | | | | | | | | | |
Actual | | $ | 1,000.00 | | | $ | 1,012.60 | | | | 0.78 | % | | $ | 3.96 | |
Hypothetical (5% return before expenses) | | | 1,000.00 | | | | 1,021.27 | | | | 0.78 | % | | | 3.97 | |
| | | | |
N Class Shares | | | | | | | | | | | | | | | | |
Actual | | $ | 1,000.00 | | | $ | 1,011.10 | | | | 1.04 | % | | $ | 5.27 | |
Hypothetical (5% return before expenses) | | | 1,000.00 | | | | 1,019.96 | | | | 1.04 | % | | | 5.30 | |
| | | | |
| TCW Relative Value Dividend Appreciation Fund | | | | | | | | | | | | | | | | |
I Class Shares | | | | | | | | | | | | | | | | |
Actual | | $ | 1,000.00 | | | $ | 971.40 | | | | 0.70 | % | | $ | 3.48 | |
Hypothetical (5% return before expenses) | | | 1,000.00 | | | | 1,021.68 | | | | 0.70 | % | | | 3.57 | |
| | | | |
N Class Shares | | | | | | | | | | | | | | | | |
Actual | | $ | 1,000.00 | | | $ | 971.20 | | | | 0.90 | % | | $ | 4.47 | |
Hypothetical (5% return before expenses) | | | 1,000.00 | | | | 1,020.67 | | | | 0.90 | % | | | 4.58 | |
| | | | |
| TCW Relative Value Large Cap Fund | | | | | | | | | | | | | | | | |
I Class Shares | | | | | | | | | | | | | | | | |
Actual | | $ | 1,000.00 | | | $ | 977.60 | | | | 0.70 | % | | $ | 3.49 | |
Hypothetical (5% return before expenses) | | | 1,000.00 | | | | 1,021.68 | | | | 0.70 | % | | | 3.57 | |
| | | | |
N Class Shares | | | | | | | | | | | | | | | | |
Actual | | $ | 1,000.00 | | | $ | 976.70 | | | | 0.90 | % | | $ | 4.48 | |
Hypothetical (5% return before expenses) | | | 1,000.00 | | | | 1,020.67 | | | | 0.90 | % | | | 4.58 | |
| | | | |
| TCW Relative Value Mid Cap Fund | | | | | | | | | | | | | | | | |
I Class Shares | | | | | | | | | | | | | | | | |
Actual | | $ | 1,000.00 | | | $ | 983.10 | | | | 0.85 | % | | $ | 4.25 | |
Hypothetical (5% return before expenses) | | | 1,000.00 | | | | 1,020.92 | | | | 0.85 | % | | | 4.33 | |
| | | | |
N Class Shares | | | | | | | | | | | | | | | | |
Actual | | $ | 1,000.00 | | | $ | 982.90 | | | | 0.95 | % | | $ | 4.75 | |
Hypothetical (5% return before expenses) | | | 1,000.00 | | | | 1,020.42 | | | | 0.95 | % | | | 4.84 | |
| | | | |
| TCW Select Equities Fund | | | | | | | | | | | | | | | | |
I Class Shares | | | | | | | | | | | | | | | | |
Actual | | $ | 1,000.00 | | | $ | 1,053.60 | | | | 0.76 | % | | $ | 3.93 | |
Hypothetical (5% return before expenses) | | | 1,000.00 | | | | 1,021.37 | | | | 0.76 | % | | | 3.87 | |
| | | | |
N Class Shares | | | | | | | | | | | | | | | | |
Actual | | $ | 1,000.00 | | | $ | 1,052.80 | | | | 0.93 | % | | $ | 4.81 | |
Hypothetical (5% return before expenses) | | | 1,000.00 | | | | 1,020.52 | | | | 0.93 | % | | | 4.74 | |
| (1) | Does not include expenses of the underlying affiliated investments. |
108

Privacy Policy
The TCW Group, Inc. and Subsidiaries
TCW Investment Management Company LLC
TCW Asset Management Company LLC
Metropolitan West Asset Management, LLC
| | |
TCW Funds, Inc. TCW Strategic Income Fund, Inc. Metropolitan West Funds Sepulveda Management LLC | | TCW Direct Lending LLC TCW Direct Lending VII LLC TCW Direct Lending VIII LLC TCW Star Direct Lending LLC |
Effective February 2023
WHAT YOU SHOULD KNOW
At TCW, we recognize the importance of keeping information about you secure and confidential. We do not sell or share your nonpublic personal and financial information with marketers or others outside our affiliated group of companies.
We carefully manage information among our affiliated group of companies to safeguard your privacy and to provide you with consistently excellent service.
We are providing this notice to you to comply with the requirements of Regulation S-P, “Privacy of Consumer Financial information,” issued by the United States Securities and Exchange Commission.
OUR PRIVACY POLICY
We, The TCW Group, Inc. and its subsidiaries, the TCW Funds, Inc., TCW Strategic Income Fund, Inc., the Metropolitan West Funds, Sepulveda Management LLC, TCW Direct Lending LLC, TCW Direct Lending VII LLC, TCW Direct Lending VIII LLC, and TCW Star Direct Lending LLC (collectively, “TCW”) are committed to protecting the nonpublic personal and financial information of our customers and consumers who obtain or seek to obtain financial products or services primarily for personal, family or household purposes. We fulfill our commitment by establishing and implementing policies and systems to protect the security and confidentiality of this information.
In our offices, we limit access to nonpublic personal and financial information about you to those TCW personnel who need to know the information in order to provide products or services to you. We maintain physical, electronic, and procedural safeguards to protect your nonpublic personal and financial information.
CATEGORIES OF INFORMATION WE COLLECT
We may collect the following types of nonpublic personal and financial information about you from the following sources:
| | ◾ | | Your name, address and identifying numbers, and other personal and financial information, from you and from identification cards and papers you submit to us, on applications, subscription agreements or other forms or communications. |
| | ◾ | | Information about your account balances and financial transactions with us, our affiliated entities, or nonaffiliated third parties, from our internal sources, from affiliated entities and from nonaffiliated third parties. |
| | ◾ | | Information about your account balances and financial transactions and other personal and financial information, from consumer credit reporting agencies or other nonaffiliated third parties, to verify information received from you or others. |
109
CATEGORIES OF INFORMATION WE DISCLOSE TO NONAFFILIATED THIRD PARTIES
We may disclose your name, address and account and other identifying numbers, as well as information about your pending or past transactions and other personal financial information, to nonaffiliated third parties, for our everyday business purposes such as necessary to execute, process, service and confirm your securities transactions and mutual fund transactions, to administer and service your account and commingled investment vehicles in which you are invested, to market our products and services through joint marketing arrangements or to respond to court orders and legal investigations.
We may disclose nonpublic personal and financial information concerning you to law enforcement agencies, federal regulatory agencies, self-regulatory organizations or other nonaffiliated third parties, if required or requested to do so by a court order, judicial subpoena or regulatory inquiry.
We do not otherwise disclose your nonpublic personal and financial information to nonaffiliated third parties, except where we believe in good faith that disclosure is required or permitted by law. Because we do not disclose your nonpublic personal and financial information to nonaffiliated third parties, our Customer Privacy Policy does not contain opt-out provisions.
CATEGORIES OF INFORMATION WE DISCLOSE TO OUR AFFILIATED ENTITIES
| | ◾ | | We may disclose your name, address and account and other identifying numbers, account balances, information about your pending or past transactions and other personal financial information to our affiliated entities for any purpose. |
| | ◾ | | We regularly disclose your name, address and account and other identifying numbers, account balances and information about your pending or past transactions to our affiliates to execute, process and confirm securities transactions or mutual fund transactions for you, to administer and service your account and commingled investment vehicles in which you are invested, or to market our products and services to you. |
INFORMATION ABOUT FORMER CUSTOMERS
We do not disclose nonpublic personal and financial information about former customers to nonaffiliated third parties unless required or requested to do so by a court order, judicial subpoena or regulatory inquiry, or otherwise where we believe in good faith that disclosure is required or permitted by law.
QUESTIONS
Should you have any questions about our Customer Privacy Policy, please contact us by email or by regular mail at the address at the end of this policy.
REMINDER ABOUT TCW’S FINANCIAL PRODUCTS
Financial products offered by The TCW Group, Inc. and its subsidiaries, the TCW Funds, Inc., TCW Strategic Income Fund, Inc., the Metropolitan West Funds, Sepulveda Management LLC, TCW Direct Lending LLC, TCW Direct Lending VII LLC, TCW Direct Lending VIII LLC, and TCW Star Direct Lending LLC.
| | ◾ | | Are not guaranteed by a bank; |
| | ◾ | | Are not obligations of The TCW Group, Inc. or of its subsidiaries; |
| | ◾ | | Are not insured by the Federal Deposit Insurance Corporation; and |
| | ◾ | | Are subject to investment risks, including possible loss of the principal amount committed or invested, and earnings thereon. |
| | |
THE TCW GROUP, INC. TCW FUNDS, INC. TCW STRATEGIC INCOME FUND, INC. METROPOLITAN WEST FUNDS SEPULVEDA MANAGEMENT LLC | | TCW DIRECT LENDING LLC TCW DIRECT LENDING VII LLC TCW DIRECT LENDING VIII LLC TCW STAR DIRECT LENDING LLC |
Attention: Privacy Officer | 515 South Flower Street | Los Angeles, CA 90071 | email: privacy@tcw.com
110
TCW Funds, Inc.
Investment Management and Advisory Agreement Disclosure (Unaudited)
Renewal of Investment Advisory and Management Agreement
TCW Funds, Inc. (the “Corporation”) and TCW Investment Management Company LLC (the “Advisor”) are parties to an Investment Advisory and Management Agreement (“Agreement”), pursuant to which the Advisor is responsible for managing the investments of each separate investment series (each, a “Fund” and collectively, the “Funds”) of the Corporation. Unless terminated by either party, the Agreement continues in effect from year to year provided that the continuance is specifically approved at least annually by the vote of the holders of at least a majority of the outstanding shares of the Funds, or by the Board of Directors of the Corporation (the “Board”), and, in either event, by a majority of the Directors who are not “interested persons” of the Corporation, as such term is defined in Section 2(a)(19) of the Investment Company Act of 1940, as amended (the “Independent Directors”), casting votes in person at a meeting called for that purpose.
At an in-person meeting on September 11, 2023, the Board approved the renewal of the Agreement for an additional one-year term from February 6, 2024 through February 5, 2025. The renewal of the Agreement was approved by the Board (including by a majority of the Independent Directors) upon the recommendation of the Independent Directors. The Independent Directors also met by videoconference in a working session on August 30, 2023 to hear presentations by representatives of the Advisor, to ask related questions, to review and discuss materials provided by the Advisor for their consideration, and to meet separately with their independent legal counsel. On September 11, 2023 they also met separately with their independent legal counsel to review and discuss supplemental information that had been requested on their behalf by their independent legal counsel and presented by the Advisor. The information, material facts, and conclusions that formed the basis for the Independent Directors’ recommendation and the Board’s subsequent approval are described below.
1. Information received
Materials reviewed — During the course of each year, the Directors receive a wide variety of materials relating to the services provided by the Advisor, including reports on the Advisor’s investment processes, as well as on each Fund’s investment results, portfolio composition, portfolio trading practices, compliance monitoring, shareholder services, and other information relating to the nature, extent, and quality of services provided by the Advisor to the Funds. In addition, the Board reviewed information furnished to the Independent Directors in response to a detailed request sent to the Advisor on their behalf. The information in the Advisor’s responses included extensive materials regarding each Fund’s investment results, advisory fee comparisons to advisory fees charged by the Advisor to its institutional clients, financial and profitability information regarding the Advisor, descriptions of various services provided to the Funds and to other advisory and sub-advisory clients, descriptions of functions such as compliance monitoring and portfolio trading practices, and information about the personnel providing investment management services to each Fund. The Directors also considered information provided by an independent data provider, Broadridge, comparing the investment performance and the fee and expense levels of each Fund to those of appropriate peer groups of mutual funds selected by Broadridge. After reviewing this information, the Directors requested additional financial, profitability and service information from the Advisor, which the Advisor provided and the Directors considered.
Review process — The Directors’ determinations were made on the basis of each Director’s business judgment after consideration of all the information presented. The Independent Directors were advised by their independent legal counsel throughout the renewal process and received and reviewed advice from
111
TCW Funds, Inc.
Investment Management and Advisory Agreement Disclosure (Unaudited)(Continued)
their independent legal counsel regarding legal and industry standards applicable to the renewal of the Agreement, including a legal memorandum from their independent legal counsel discussing their fiduciary duties related to their approval of the continuation of the Agreement. The Independent Directors also discussed the renewal of the Agreement with the Advisor’s representatives and in private sessions at which no representatives of the Advisor were present. In deciding to recommend the renewal of the Agreement with respect to each Fund, the Independent Directors did not identify any single piece of information or particular factor that, in isolation, was the controlling factor. Each Independent Director may also have weighed factors differently. This summary describes the most important, but not all, of the factors considered by the Board and the Independent Directors.
2. Nature, extent, and quality of services provided by the Advisor
The Board and the Independent Directors considered the depth and quality of the Advisor’s investment management process, including its research and strong analytical capabilities; the experience, capability, and integrity of its senior management and other personnel; the advance planning and transition arrangements put in place with respect to the changes in key portfolio management and other personnel; the overall resources available to the Advisor; and the ability of its organizational structure to address the fluctuations in assets that have been experienced over the past several years. The Board and the Independent Directors considered the Advisor’s continued commitment and ability to attract and retain well-qualified investment professionals, noting in particular the Advisor’s hiring of professionals in various areas over the past several years, including recruiting and hiring a highly qualified President and Chief Executive Officer to replace the outgoing head of The TCW Group, Inc., the parent company of the Advisor (“TCW”), continued upgrading of resources in its middle office and back office operations and other areas, as well as a continuing and extensive program of infrastructure and systems enhancements, including business continuity and cyber security, as well as budgeting for certain future initiatives. The Board and the Independent Directors also considered that the Advisor made available to its investment professionals a variety of resources and systems relating to investment management, compliance, trading, operations, administration, research, portfolio accounting, and legal matters. They noted the substantial additional resources made available by TCW. The Board and the Independent Directors examined and discussed a detailed description of the extensive additional services provided to the Funds to support their operations and compliance, as compared to the much narrower range of services provided to the Advisor’s institutional and sub-advised clients, as well as the Advisor’s oversight and coordination of numerous outside service providers to the Funds. They further noted the high level of regular communication between the Advisor and the Independent Directors. The Advisor explained its responsibility to supervise the activities of the Funds’ various service providers, as well as supporting the Independent Directors and their meetings, regulatory filings, and various operational personnel, and the related costs.
The Board and the Independent Directors concluded that the nature, extent, and quality of the services provided by the Advisor are of a high quality and have benefited and should continue to benefit the Funds and their shareholders.
3. Investment results
The Board and the Independent Directors considered the investment results of each Fund in light of its investment objective(s) and principal investment strategies. They compared each Fund’s total returns with the total returns of other mutual funds in peer group reports prepared by Broadridge with respect to various longer and more recent periods all ended May 31, 2023. The Board and the Independent Directors
112
TCW Funds, Inc.
reviewed information as to peer group selections presented by Broadridge and discussed the methodology for those selections with Broadridge. In reviewing each Fund’s relative performance, the Board and the Independent Directors took into account each Fund’s investment strategies, distinct characteristics, asset size and diversification.
The Board and the Independent Directors noted that most Funds’ performance was satisfactory over the relevant periods. The Board and the Independent Directors noted that the investment performance of the majority of the Funds was generally close to or above the median performance of the applicable peer group during the three-year period emphasized by Broadridge in the supplemental materials. For those Funds that lagged peer group averages, they noted that the Advisor had discussed with the Board the reasons for the underperformance, including the investment climate and prevailing market conditions during relevant periods as well as the Advisor’s discipline in maintaining a consistent investment style. The Board considered in particular the Advisor’s explanations for the performance of the eight Funds that ranked in the fourth or fifth quintile of their peer groups for the prior three-year period. The Board indicated that it would continue to monitor portfolio investment performance on a regular basis and discuss with the Advisor from time to time any instances of long-term underperformance as appropriate. The Board and the Independent Directors noted that the performance of some Funds for periods when they lagged their peer group averages remained satisfactory when assessed on a risk-adjusted basis because performance quintiles do not necessarily reflect the degree of risk employed by peer funds to achieve their returns. The Board also considered the Advisor’s assessment of the Funds’ performance during the recent period of significant market volatility and rising interest rates.
With respect to the fixed income Funds, the Board and the Independent Directors recognized the Advisor’s deliberate strategy to manage risk in light of its critical view of the fixed income securities markets and overall investment market conditions at present and in the near term. For that reason, the Board and the Independent Directors believed that relative performance also should be considered in light of future market conditions expected by the Advisor and positioning of the Funds’ portfolios in light of those expectations. The Board and the Independent Directors noted the Advisor’s view that longer term performance can be more meaningful for active fixed income funds than shorter term performance because fixed income market cycles are generally longer than three years.
For the U.S. fixed income Funds, the Board and the Independent Directors noted the conservative profile of these Funds, certain of which generally experienced less volatility compared to various other funds in the applicable peer group (except for the relative volatility of Total Return Bond Fund and Core Fixed Income Fund, which have greater exposure to mortgage-backed securities). They also noted the Advisor’s conservative posture for these Funds with respect to credit and interest rate risks.
For the Total Return Bond Fund, the Board and the Independent Directors noted that the Fund’s performance was in the second quintile for the ten- and five-year periods, fifth quintile for the three-year period and fourth quintile for the one-year period. The Board and the Independent Directors considered the Advisor’s explanation that underperformance was driven by the Fund’s higher duration and greater exposure to mortgage-backed securities than its peers, which the Advisor believes may position the Fund for outperformance going forward.
For the Core Fixed Income Fund, the Board and the Independent Directors noted that the Fund’s performance was in the third quintile for the ten-year period, second quintile for the five-year period and fourth quintile for the three-and one-year periods. The Board and the Independent Directors considered
113
TCW Funds, Inc.
Investment Management and Advisory Agreement Disclosure (Unaudited)(Continued)
the Advisor’s explanation that underperformance was driven by the Fund’s higher duration and greater exposure to mortgage-backed securities than its peers, which the Advisor believes may position the Fund for outperformance going forward. The Board and the Independent Directors also considered that despite its underperformance relative to its peers for the three-year period, the Fund outperformed its benchmark index for that period.
For the High Yield Bond Fund, the Board and the Independent Directors noted that the Fund’s performance was in the first quintile for the ten- and five-year periods, fourth quintile for the three-year period and second quintile for the one-year period. The Board and the Independent Directors considered the Advisor’s explanation that underperformance for the three-year period was driven by the Fund’s focus on higher-quality bonds than its peers, and further considered the Fund’s outperformance over the other periods reviewed.
For the Enhanced Commodity Strategy Fund, the Board and the Independent Directors noted that the Fund’s performance was in the third quintile for the ten-, three- and one-year periods and the second quintile for the five-year period.
For the Global Bond Fund, the Board and the Independent Directors noted that the Fund’s performance was in the fourth quintile for the ten-, three- and one-year periods and third quintile for the five-year period. The Board and the Independent Directors considered the Advisor’s explanation that underperformance for the three-year period was driven by the Fund’s higher duration as compared to many of its peers, and further considered that the Fund outperformed its benchmark index for the same period.
For the Short Term Bond Fund, the Board and the Independent Directors noted that the Fund’s performance was in the fourth quintile for the ten-year period, third quintile for the five-year period and second quintile for the three- and one-year periods.
With respect to the U.S. equity Funds, the Board and the Independent Directors noted that the performance of certain of the Funds for most of the various periods reviewed ranked in the first, second or third quintiles, while other Funds ranked in the fourth quintile over various periods.
The Select Equities Fund ranked in the third quintile for the ten-, five- and one-year periods and fourth quintile for the three-year period. The Board and the Independent Directors considered the Advisor’s explanation that underperformance for the three-year period was driven in part the Fund’s more modest positions in companies that were key contributors to the competitor funds’ returns. The Board and the Independent Directors also considered the Fund’s stronger performance over the other periods reviewed.
The Relative Value Dividend Appreciation Fund ranked in the third quintile for the ten- and five-year periods and the first quintile for the three- and one-year periods. The Relative Value Large Cap Fund ranked in the third quintile for the ten- and five-year periods and the first quintile for the three- and one-year periods. The Relative Value Mid Cap Fund ranked in the fourth quintile for the ten- and five-year periods, the second quintile for the three-year period and the first quintile for the one-year period.
The New America Premier Equities Fund ranked in the first quintile for the five-, three- and one-year periods.
The Global Real Estate Fund ranked in the first quintile for the five-, three- and one-year periods.
The Artificial Intelligence Equity Fund ranked in the fourth quintile for the five-year period, third quintile for the three-year period and second quintile for the one-year period.
114
TCW Funds, Inc.
For the asset allocation Fund, the Board and the Independent Directors noted that the Conservative Allocation Fund’s performance was in the first quintile for the ten-, five-, and three- and one-year periods.
With respect to the international and emerging markets Funds, the Board and the Independent Directors noted that the performance of a majority of these Funds ranked in the fourth or fifth quintiles over many of the various time periods reviewed. The Emerging Markets Income Fund ranked in the third quintile for the ten-year period, fourth quintile for the five- and three-year periods and fifth quintile for the one-year period. The Emerging Markets Local Currency Income Fund ranked in the fourth quintile for the ten-, five- and one-year periods and fifth quintile for the three-year period. The Emerging Markets Multi-Asset Opportunities Fund ranked in the fifth quintile for the five- and one-year periods and the fourth quintile for the three-year period. The Developing Markets Equity Fund ranked in the fifth quintile for the five-, three- and one-year periods. The Board and the Independent Directors considered the Advisor’s discussion of performance, including that the challenging international and emerging market conditions in recent years, including conditions in Russia and China, weighed on performance for the Funds in line with other funds in the universe. The Board and the Independent Directors further considered that the Advisor had recommended, and the Board had approved, the liquidation of the Emerging Markets Multi-Asset Opportunities Fund and the Developing Markets Equity Fund.
The Board and the Independent Directors concluded that the Advisor was implementing each Fund’s investment objective(s) and that the Advisor’s record in managing the Funds indicated that its continued management should benefit each Fund and its shareholders over the long term.
4. Advisory fees and total expenses
The Board and the Independent Directors compared the management fees (which Broadridge defines to include the advisory fee and the administrative fee) and total expenses of each Fund (each as a percentage of average net assets) with the median management fee and operating expense level of the other mutual funds in the relevant Broadridge peer groups. These comparisons assisted the Board and the Independent Directors by providing a reasonable statistical measure to assess each Fund’s fees relative to its relevant peers. The Board and the Independent Directors observed that each Fund’s management fee, after giving effect to applicable waivers and/or reimbursements, was below or near the median of the peer group funds on a current basis. The Board and the Independent Directors also observed that each Fund’s total expenses, after giving effect to applicable waivers and/or reimbursements, were below or near the median of the peer group funds. The Board and the Independent Directors also noted the contractual expense limitations to which the Advisor has agreed with respect to each Fund and that the Advisor historically has absorbed any expenses in excess of these limits. The Board and the Independent Directors noted that for several Funds, their below-median management fee and total expenses were in part due to substantial waiver and/or reimbursement pursuant to the contractual expense limitations. The Board and the Independent Directors concluded that the competitive fees charged by the Advisor, and competitive expense ratios, should continue to benefit each Fund and its shareholders.
The Board and the Independent Directors also reviewed information regarding the advisory fees charged by the Advisor to its institutional and sub-advisory clients with similar investment mandates. The Board and the Independent Directors concluded that, although the fees paid by those clients generally were lower than advisory fees paid by the Funds, the differences appropriately reflected the more extensive services provided by the Advisor to the Funds and the Advisor’s significantly greater responsibilities and expenses with respect to the Funds, including the additional time spent by portfolio managers for reasons such as
115
TCW Funds, Inc.
Investment Management and Advisory Agreement Disclosure (Unaudited)(Continued)
managing the more active cash flows from purchases and redemptions by shareholders, the additional risks of managing a pool of assets for public investors, administrative burdens, daily pricing, valuation and liquidity responsibilities, the supervision of vendors and service providers, and the costs of additional infrastructure and operational resources and personnel and of complying with and supporting the more comprehensive regulatory and governance regime applicable to mutual funds.
5. The Advisor’s costs, level of profits, and economies of scale
The Board and the Independent Directors reviewed information regarding the Advisor’s costs of providing services to the Funds, as well as the resulting level of profits to the Advisor. They reviewed the Advisor’s stated assumptions and methods of allocating certain costs, such as personnel costs, which constitute the Advisor’s largest operating cost. The Board and the Independent Directors recognized that the Advisor should be entitled to earn a reasonable level of profits for the services that it provides to each Fund. The Board and the Independent Directors also reviewed a comparison of the Advisor’s profitability with respect to the Funds to the profitability of certain unaffiliated publicly traded asset managers, which the Advisor believed supported its view that the Advisor’s profitability was reasonable. Based on their review, the Board and the Independent Directors concluded that they were satisfied that the Advisor’s level of profitability from its relationship with each Fund was not unreasonable or excessive.
The Board and the Independent Directors considered the extent to which potential economies of scale could be realized as the Funds grow and whether the advisory fees reflect those potential economies of scale. They recognized that the advisory fees for the Funds do not have breakpoints, which would otherwise result in lower advisory fee rates as the Funds grow larger. They also recognized the Advisor’s view that the advisory fees compare favorably to peer group fees and expenses and remain competitive even at higher asset levels and that the relatively low advisory fees reflect the potential economies of scale. The Board and the Independent Directors recognized the benefits of the Advisor’s substantial past and ongoing investment in the advisory business, such as successfully recruiting and retaining key professional talent, systems and technology upgrades, added resources dedicated to legal, compliance, risk management and cybersecurity programs, and improvements to the overall firm infrastructure, as well as the financial pressures of competing against much larger firms and passive investment products. The Board and the Independent Directors further noted the Advisor’s past and current subsidies of the operating expenses of newer and smaller Funds and the Advisor’s commitment to maintain reasonable overall operating expenses for each Fund. The Board and the Independent Directors also recognized that the Funds benefit from receiving investment advice from an organization with other types of advisory clients in addition to mutual funds. The Board and the Independent Directors considered the risk borne by the Advisor that the Funds’ net assets and thus the Advisor’s fees might decline in the event of redemptions and that smaller Funds might not grow to become profitable. The Board and the Independent Directors concluded that the Advisor was satisfactorily sharing potential economies of scale with the Funds through low fees and expenses, and through reinvesting in its capabilities for serving the Funds and their shareholders.
6. Ancillary benefits
The Board and the Independent Directors also considered ancillary benefits received or to be received by the Advisor and its affiliates as a result of the relationship of the Advisor with the Funds. The Board and the Independent Directors noted that, in addition to the fees the Advisor receives under the Agreement, the Advisor receives additional benefits in connection with management of the Funds in the form of reports, research and other services from brokers and their affiliates in return for brokerage commissions paid to
116
TCW Funds, Inc.
such brokers. The Board and the Independent Directors concluded that any potential benefits received or to be derived by the Advisor from its relationships with the Funds are reasonably related to the services provided by the Advisor to the Funds.
7. Conclusions
Based on their overall review, including their consideration of each of the factors referred to above (and others), the Board and the Independent Directors concluded that the Agreement is fair and reasonable to each Fund and its shareholders, that each Fund’s shareholders received reasonable value in return for the advisory fees and other amounts paid to the Advisor by each Fund, and that the renewal of the Agreement was in the best interests of each Fund and its shareholders.
117
TCW Funds, Inc.
Supplemental Information
Proxy Voting Guidelines
The policies and procedures that the Company uses to determine how to vote proxies are available without charge. The Board has delegated the Company’s proxy voting authority to the Advisor.
Disclosure of Proxy Voting Guidelines
The proxy voting guidelines of the Advisor are available:
| | 1. | By calling 800-FUND-TCW (800-386-3829) to obtain a hard copy; or |
| | 2. | By going to the SEC website at http://www.sec.gov. |
When the Company receives a request for a description of the Advisor’s proxy voting guidelines, it will deliver the description that is disclosed in the Company’s Statement of Additional Information. This information will be sent out via first class mail (or other means designed to ensure equally prompt delivery) within three business days of receiving the request.
The Advisor, on behalf of the Company, prepares and files Form N-PX with the SEC not later than August 31 of each year, which includes the Company’s proxy voting record for the most recent twelve-month period ended June 30 of that year. The Company’s proxy voting record for the most recent twelve-month period ended June 30 is available:
| | 1. | By calling 800-FUND-TCW (800-386-3829) to obtain a hard copy; or |
| | 2. | By going to the SEC website at http://www.sec.gov. |
When the Company receives a request for the Company’s proxy voting record, it will send the information disclosed in the Company’s most recently filed report on Form N-PX via first class mail (or other means designed to ensure equally prompt delivery) within three business days of receiving the request.
The Company also discloses its proxy voting record on its website as soon as is reasonably practicable after its report on Form N-PX is filed with the SEC.
Availability of Quarterly Portfolio Schedule
The Company files a complete schedule of its portfolio holdings with the SEC for the first and third quarters of its fiscal year on Form NPORT-P. Such filings occur no later than 60 days after the end of the Funds’ first and third quarters and are available on the SEC’s website at www.sec.gov.
118
TCW Funds, Inc.
Tax Information Notice (Unaudited)
On account of the year ended October 31, 2023, the following Funds paid a capital gain distribution within the meaning 852(b)(3)(c) of the Code. Each fund also designates as a capital gain distribution a portion of earnings and profits paid to shareholders in redemption of their shares.
| | | | |
Fund | | Amounts per
Share | |
TCW Relative Value Dividend Appreciation Fund | | $ | 0.59 | |
TCW Relative Value Large Cap Fund | | $ | 0.47 | |
TCW Relative Value Mid Cap Fund | | $ | 0.41 | |
TCW Select Equities Fund | | $ | 3.25 | |
Under Section 854(b)(2) of the Code, the Funds hereby designate the following maximum amounts as qualified dividends for purposes of the maximum rate under Section 1(h)(11) of the Code for the fiscal year ended October 31, 2023.
| | | | |
Fund | | Qualified
Dividend Income | |
TCW Conservative Allocation Fund | | $ | 58,964 | |
TCW Global Real Estate Fund | | | 205,157 | |
TCW New America Premier Equities Fund | | | 1,726,643 | |
TCW Relative Value Dividend Appreciation Fund | | | 6,350,728 | |
TCW Relative Value Large Cap Fund | | | 2,339,259 | |
TCW Relative Value Mid Cap Fund | | | 1,171,281 | |
The following are dividend received deduction percentages for the Funds’ corporate shareholders:
| | | | |
Fund | | Dividends
Received Deductions | |
TCW Conservative Allocation Fund | | | 7.19% | |
TCW Global Real Estate Fund | | | 10.25% | |
TCW New America Premier Equities Fund | | | 100.00% | |
TCW Relative Value Dividend Appreciation Fund | | | 100.00% | |
TCW Relative Value Large Cap Fund | | | 100.00% | |
TCW Relative Value Mid Cap Fund | | | 100.00% | |
This information is given to meet certain requirements of the Code and should not be used by shareholders for preparing their income tax returns. In February 2024, shareholders will receive Form 1099-DIV which will show the actual distribution received and include their share of qualified dividends during the calendar year of 2023. Shareholders are advised to check with their tax advisors for information on the treatment of these amounts on their individual tax returns.
119
TCW Funds, Inc.
Directors and Officers of the Company
A board of six directors is responsible for overseeing the operations of the Company, which consists of 16 Funds at October 31, 2023. The directors of the Company, and their business addresses and their principal occupation for the last five years are set forth below.
Independent Directors
| | | | | | |
Name, and Year of Birth (1) | | Term of Office and Length of Time Served | | Principal Occupation(s) During Past 5 Years | | Other Directorships held by Director |
| Samuel P. Bell (1936) | | Mr. Bell has served as a director of TCW Funds, Inc. since October 2002. | | Private Investor. | | TCW Strategic Income Fund, Inc. (closed-end fund). |
Patrick C. Haden (1953) Chairman of the Board | | Mr. Haden has served as a director of TCW Funds, Inc. since May 2001. | | President (since 2003), Wilson Ave. Consulting (business consulting firm); Senior Advisor to President (July 2016 – June 2017), University of Southern California. | | Auto Club (affiliate of AAA); Metropolitan West Funds (mutual fund); TCW Strategic Income Fund, Inc. (closed end fund). |
| Peter McMillan (1957) | | Mr. McMillan has served as a director of TCW Funds, Inc. since August 2010. | | Co-founder (since 2019), Pacific Oak Capital Advisors (investment advisory firm); Co-founder, Managing Partner and Chief Investment Officer (since May 2013), Temescal Canyon Partners (investment advisory firm); Co-founder and Executive Vice President (2005 – 2019), KBS Capital Advisors (a manager of real estate investment trusts). | | Pacific Oak Strategic Opportunity REIT (real estate investments); Keppel Pacific Oak U.S. REIT (real estate investments); Pacific Oak Residential Trust (real estate investments); Metropolitan West Funds (mutual fund); TCW DL VII Financing LLC (private fund); TCW Strategic Income Fund, Inc. (closed-end fund). |
| Victoria B. Rogers (1961) | | Ms. Rogers has served as a director of the TCW Funds, Inc. since October 2011. | | President and Chief Executive Officer (since 1996), The Rose Hills Foundation (charitable foundation). | | Norton Simon Museum (art museum); Stanford University (university); Causeway Capital Management Trust (mutual fund); Causeway ETML Trust (mutual fund); The Rose Hills Foundation (charitable foundation); TCW Strategic Income Fund, Inc. (closed-end fund). |
| Andrew Tarica (1959) | | Mr. Tarica has served as a director of the TCW Funds, Inc. since March 2012. | | Director of Fixed Income (since February 2022), Forest Road Securities (broker dealer); Chief Executive Officer (since February 2001), Meadowbrook Capital Management (asset management company); Employee (2003 – January 2022), Cowen Prime Services (broker dealer). | | Metropolitan West Funds (mutual fund); TCW Strategic Income Fund, Inc. (closed-end fund); TCW Direct Lending VII, LLC (business development company); TCW Direct Lending VIII, LLC (business development company); TCW Star Direct Lending, LLC (business development company); TCW ETF Trust (exchange–traded fund). |
| (1) | The address of each Independent Director is c/o Morgan Lewis, & Bockius LLP, Counsel to the Independent Directors of TCW Funds, Inc., 300 South Grand Avenue, Los Angeles, CA 90071. |
120
TCW Funds, Inc.
Interested Director
This Director is an “interested person” of the Company as defined in the 1940 Act because he is a director and officer of the Advisor, and shareholder and director of The TCW Group, Inc., the parent company of the Advisor.
| | | | | | |
Name and Year of Birth | | Term of Office and Length of Time Served | | Principal Occupation(s)
During Past 5 Years | | Other Directorships held by Director |
| Marc I. Stern (1944) | | Mr. Stern has served as a director since inception of TCW Funds, Inc. in September 1992. | | Chairman (since January 2016), TCW LLC; Chairman (since February 2013), The TCW Group Inc., the Advisor, TCW Asset Management Company LLC and Metropolitan West Asset Management, LLC. | | N/A |
The officers of the Company who are not directors of the Company are:
| | | | |
| Name and Year of Birth (1) | | Position(s) Held with Company | | Principal Occupation(s) During Past 5 Years (2) |
Kathryn Koch (1980) President and Chief Executive Officer | | Ms. Koch has served as President and Chief Executive Officer of TCW Funds, Inc. since February 2023. | | President and Chief Executive Officer (since February 2023), The TCW Group, Inc., TCW LLC, the Advisor, TCW Asset Management Company LLC, Metropolitan West Asset Management, LLC and TCW Strategic Income Fund, Inc.; President and Principal Executive Officer (since February 2023), Metropolitan West Funds; Chief Investment Officer of Public Equity (2004 – January 2023), Goldman Sachs. |
Lisa Eisen (1963) Tax Officer | | Ms. Eisen has served as Tax Officer of TCW Funds, Inc. since December 2016. | | Tax Officer (since December 2016), Metropolitan West Funds and TCW Strategic Income Fund, Inc.; Managing Director and Director of Tax (since August 2016), TCW LLC. |
Meredith S. Jackson (1959) Senior Vice President, General Counsel and Secretary | | Ms. Jackson has served as Senior Vice President since January 2016 and General Counsel and Secretary of TCW Funds, Inc. since February 2013. | | Executive Vice President, General Counsel and Secretary (since January 2016), TCW LLC; Executive Vice President, General Counsel and Secretary (since February 2013), the Advisor, The TCW Group, Inc., TCW Asset Management Company LLC and Metropolitan West Asset Management, LLC. Senior Vice President, General Counsel and Secretary (since February 2013), TCW Strategic Income Fund, Inc., Vice President and Secretary (since February 2013), Metropolitan West Funds. |
121
TCW Funds, Inc.
Directors and Officers of the Company (Continued)
| | | | |
| Name and Year of Birth (1) | | Position(s) Held with Company | | Principal Occupation(s) During Past 5 Years (2) |
Gladys Xiques (1973) Chief Compliance Officer and AML Officer | | Ms. Xiques has served as Chief Compliance Officer and AML Officer of TCW Funds, Inc. since January 2021. | | Chief Compliance Officer and AML Officer (since January 2021), TCW Strategic Income Fund, Inc. and Metropolitan West Funds; Managing Director and Global Chief Compliance Officer (since January 2021), TCW LLC, the Advisor, Metropolitan West Asset Management, LLC and TCW Asset Management Company LLC; Global Chief Compliance Officer (since January 2021), The TCW Group, Inc.; Senior Vice President (February 2015 – December 2020), TCW LLC, the Advisor, Metropolitan West Asset Management, LLC and TCW Asset Management Company LLC. |
Richard M. Villa (1964) Treasurer Principal Financial and Accounting Officer | | Mr. Villa has served as Treasurer and Principal Financial and Accounting Officer of TCW Funds, Inc. since February 2014. | | Executive Vice President, Chief Financial Officer and Assistant Secretary (since July 2008), the Advisor, The TCW Group, Inc., TCW Asset Management Company LLC, Metropolitan West Asset Management, LLC, and (since January 2016), TCW LLC; Treasurer and Principal Financial and Accounting Officer (since February 2014), TCW Strategic Income Fund, Inc. and (since February 2021), Metropolitan West Funds. |
| (1) | The address of the Interested Director and each officer is c/o the TCW Group, Inc., 515 South Flower Street, Los Angeles, CA 90071. |
| (2) | Positions with The TCW Group, Inc. and its affiliates may have changed over time. |
In addition, Eric Chan, Managing Director of Fund Operations for the Advisor, TCW Asset Management Company LLC, TCW LLC (since 2009), and Metropolitan West Asset Management, LLC (since November 2006), is Assistant Treasurer of the Company and TCW Strategic Income Fund, Inc. (since 2009) and Metropolitan West Funds (since 2010). Mr. Chan is a Certified Public Accountant. Peter Davidson, Senior Vice President, Associate General Counsel and Assistant Secretary of TCW Asset Management Company LLC, Metropolitan West Asset Management, LLC, TCW LLC, and the Advisor (since July 2022), is Vice President and Assistant Secretary of the Company, TCW Strategic Income Fund, Inc. and Metropolitan West Funds (since September 2022).
The SAI (Statement of Additional Information) has additional information regarding the Board of Directors. A copy is available without charge by calling 1-800-FUND-TCW (1-800-386-3829) to obtain a hard copy or by going to the SEC website at http://www.sec.gov.
122
TCW Funds, Inc.
515 South Flower Street
Los Angeles, California 90071
800 FUND TCW
(800 386 3829)
www.TCW.com
INVESTMENT ADVISOR
TCW Investment Management Company LLC
515 South Flower Street
Los Angeles, California 90071
TRANSFER AGENT
U.S. Bancorp Fund Services, LLC
615 E. Michigan Street
Milwaukee, Wisconsin 53202
INDEPENDENT REGISTERED PUBLIC ACCOUNTING FIRM
Deloitte & Touche LLP
555 West 5th Street
Los Angeles, California 90013
CUSTODIAN & ADMINISTRATOR
State Street Bank & Trust Company
One Congress Street, Suite 1
Boston, Massachusetts 02114-2016
DISTRIBUTOR
TCW Funds Distributors LLC
515 South Flower Street
Los Angeles, California 90071
DIRECTORS
Patrick C. Haden
Director and Chairman of the Board
Samuel P. Bell
Director
Peter McMillan
Director
Victoria B. Rogers
Director
Marc I. Stern
Director
Andrew Tarica
Director
OFFICERS
Kathryn Koch
President and Chief Executive Officer
Meredith S. Jackson
Senior Vice President,
General Counsel and Secretary
Richard M. Villa
Treasurer and Principal Financial and Accounting Officer
Gladys Xiques
Chief Compliance Officer and Anti-Money Laundering Officer
Lisa Eisen
Tax Officer
Eric W. Chan
Assistant Treasurer
Peter Davidson
Vice President and Assistant Secretary
TCW FAMILY OF FUNDS
EQUITY FUNDS
TCW Artificial Intelligence Equity Fund
TCW Global Real Estate Fund
TCW New America Premier Equities Fund
TCW Relative Value Dividend Appreciation Fund
TCW Relative Value Large Cap Fund
TCW Relative Value Mid Cap Fund
TCW Select Equities Fund
ASSET ALLOCATION FUND
TCW Conservative Allocation Fund
FIXED INCOME FUNDS
TCW Core Fixed Income Fund
TCW Enhanced Commodity Strategy Fund
TCW Global Bond Fund
TCW High Yield Bond Fund
TCW Short Term Bond Fund
TCW Total Return Bond Fund
INTERNATIONAL FUNDS
TCW Emerging Markets Income Fund
TCW Emerging Markets Local Currency Income Fund
FUNDarEQ1022


FIXED INCOME FUNDS
TCW Core Fixed Income Fund
TCW Enhanced Commodity Strategy Fund
TCW Global Bond Fund
TCW High Yield Bond Fund
TCW Short Term Bond Fund
TCW Total Return Bond Fund
TCW Funds, Inc.
Table of Contents
|
| |
| The Letter to Shareholders and/or Management Discussions contained in this Annual Report are the opinions of each Fund’s portfolio managers and are not the opinions of TCW Funds, Inc. or its Board of Directors. Various matters discussed in the Letter to Shareholders and/or Management Discussions constitute forward-looking statements within the meaning of the federal securities laws. Actual results and the timing of certain events could differ materially from those projected or contemplated by these forward-looking statements due to a number of factors, including general economic conditions, overall availability of securities for investment by a Fund, the level of volatility in the securities markets and in the share price of a Fund, and other risk factors discussed in the SEC filings of TCW Funds, Inc. The data presented in the Letter to Shareholders and/or Management Discussions represents past performance and cannot be used to predict future results. |
| | |

| | Kathryn Koch President and Chief Executive Officer |
Dear Valued Investors,
We are pleased to present the 2023 Annual Report for the TCW Funds, Inc. covering the 12-month period ended October 31, 2023, and express our appreciation for your continued investment in the TCW Funds as well as to welcome new shareholders to our fund family.
Given the continued move higher in rates across the curve amidst the now 525 basis points (bps) of tightening from the Federal Reserve, fixed income pricing faced pressure during the period, reflected in the asset levels of the Fund complex, which ended October 31, 2023 at approximately $8.6 billion. Despite the challenges, the team is confident in the long-term return prospects for our time-tested portfolio construction approach based on a foundation of bottom-up issue selection, a strong valuation framework and a disciplined allocation of capital until higher-yielding opportunities (at more attractive prices) emerge.
This report contains information and portfolio management discussions of our TCW Fixed Income Funds.
Economic Review and Market Environment
After a decidedly grim 2022 for capital markets, the beginning of 2023 was not without its own challenges, as a series of risk management missteps from regional banks led to the second and third largest bank failures in U.S. history (Silvergate Capital and Silicon Valley Bank). European banks, too, sowed fears as Credit Suisse, facing its own would-be solvency issues due to operational challenges despite strong capitalization metrics, was fated to a rescue by the Swiss National Bank (SNB) in a subsidized merger with UBS. However, decisive responses by authorities, such as deposit guarantees and funding programs, assuaged worries of a broader crisis and fueled a rebound into the end of March. Following this regional banking turmoil, pundit predictions of a historically elusive soft landing subsequently grew in prominence as inflation waned and economic data remained resilient, not least
employment, which continued to be robust. Perhaps most importantly for the Fed, core inflation came in at 4.1% year-over-year as of September, a significant improvement from last fall’s 6.6% pace, while core PCE (Personal Consumption Expenditures, the Fed’s preferred gauge) fell below 4% for the first time in two years. Though inflation has eased, rates have not yet. In fact, FOMC (Federal Open Market Committee) members reiterated a steadfast resolve to containing price pressures, and there was 225 bps of rate hikes during the reporting period, leaving the Fed Funds target in a range between 5.25% and 5.50%. Alongside the continued “higher for longer” rhetoric from policymakers, interest rates increased across the curve. Since the lows in late March spurred by bank failures and expectations of Fed liquidity, 2-Year U.S. Treasury (UST) yields have surged over 130 bps higher, closing October at 5.09%. Meanwhile, 10-and 30-Year UST yields rose to levels not seen since late 2007, and the curve remained inverted. With interest rates high, mortgage rates increased to near 8%, sending housing affordability rates to decade lows and slowing the pace of home turnover to abnormally suppressed levels. Notwithstanding the first order impacts of higher interest rates in the housing market, U.S. consumers have generally remained resilient, likely due to the buffer of excess savings built up during the COVID years as a result of government transfer payments and stimulus, allowing consumers to continue to spend even in the face of rampant inflation and higher rates. However, the stockpile of savings has been eroded per the San Francisco Fed, suggesting the ability of consumers to continue to spend freely is waning.
Equities rode the optimism wave to deliver strong returns during the period, reflected in a 10.1% gain for the S&P 500 Index. Meanwhile, fixed income markets offered more muted returns, though the Bloomberg U.S. Aggregate Bond Index was still in positive territory with a gain of 0.4% that outpaced duration-matched Treasuries by over 120 bps. Investment grade corporates returned 2.8%, led
1
| | |
Letter to Shareholders (Continued) | | |
by industrial segments such as energy and metals, while high yield corporates fared even better, delivering a 6.2% gain that was nearly 420 bps ahead of Treasuries as lower quality generally outperformed. While fixed income spreads generally tightened during the period, agency mortgage-backed securities (AMBS) and commercial MBS (CMBS) were exceptions. Agency MBS were particularly affected by the backdrop of rate volatility, and the sector was an outlier in posting a negative total return of -0.8% and only 8 bps of excess returns over Treasuries during the period, with additional headwinds coming from ongoing Fed paydowns and the absence of consistent demand from banks. CMBS was up 1.9%, though non-agency backed collateral trailed amid headline concerns. Most notably, bonds backed by properties viewed as under pressure, such as office buildings in large metropolitan areas which have experienced re-appraisals downward of 30-70% due to higher rates and lower occupancy, have underperformed and exhibit limited liquidity. In contrast, CMBS bonds backed by what is perceived to be clean collateral are readily liquid and performing well. Finally, asset-backed securities (ABS) gained 3.5%, with just nearly 120 bps of positive excess returns.
The Economy and Market Ahead
The increased expectations for a soft landing notwithstanding, it has to be recognized that 525 bps of hikes to date is not subtle and the sharply higher rates now coursing through the curve will increase the likelihood and hasten the timing of a hard landing. Higher costs of capital have yet to affect a broad swath of the economy; namely, the corporate credit market where only a small share of debt has been reset so far, while other COVID-related distortions have extended the typical lagged effect of monetary policy. Furthermore, the pandemic-related savings that fueled consumers have dwindled, implying a measure of belt-tightening ahead. Once it becomes clear that growth is slowing, unemployment is rising, and inflation is firmly on track to a 2% level, the Fed will likely be forced to ease. History would indicate that the Fed typically eases faster than they hike, so the gradual pace of rate cuts priced into markets isn’t likely. Instead, experience with the Fed suggests rates will be held high
too long, with an aggressive ease once the slowdown is apparent. Though timing is notoriously difficult to predict, and the economy has been resilient thus far, indications are that the hard landing becomes clear in the first half of 2024. On the positive side, however, these market conditions create opportunities that can be exploited by disciplined active managers, setting the stage for strong performance as the volatility ultimately subsides.
A silver lining in the clouds of the fixed income market is the price (downward) and yield (upward) adjustments that occur, with the rains that come bringing clear benefit to those prepared for the storm, not just to prevent severe portfolio damage when the squall hits, but to be ready for profitable opportunity in the inhospitable conditions that may follow. While the challenges of 2022 brought questions about the durability of the asset class in its return potential and diversification benefit, a restoration to more normal interest rates and risk premiums is a clear answer to such concerns. Add in a disciplined but active component of investment oversight and management that intently drives positioning toward better value, and more beneficial return outcomes emerge. We remain resolute in our approach, appreciative of our client commitments and optimistic for what we will see when the sun breaks through.
We truly value our relationship with you and thank you for making the TCW Funds part of your long-term investment plan. If you have any questions or require further information, I invite you to visit our website at www.tcw.com, or call our shareholder services department at 800-386-3829.
We look forward to further correspondence with you through our semi-annual report next year.
Sincerely,

Kathryn Koch
President and Chief Executive Officer
2
TCW Core Fixed Income Fund
Management Discussions
The TCW Core Fixed Income Fund — I Class (“Fund”) fell 0.29% (net of fees) for the one-year period ended October 31, 2023, trailing the Bloomberg U.S. Aggregate Bond Index by 64 basis points (bps). The largest detractor from relative performance was the Fund’s duration position, which began the period approximately 0.6 years longer than the Index before extending in a disciplined fashion alongside the continued climb in Treasury yields to finish at nearly 1.1 years long. Though this increased position created a headwind in the immediate term, it is informed by a belief that an inverted curve and rates at current levels are not long-run equilibrium conditions, and that an eventual pivot in Fed policy and re-steepening of the yield curve will provide significant prospective total return to the Fund. Turning to sector allocations, the Fund’s overweight to agency MBS was a drag to performance, largely due to the emphasis on lower coupon issues, which were the worst performers in the coupon stack. Non-agency MBS bonds rebounded in the latter half of the period on increased trading and renewed optimism for the future trajectory of home prices, rewarding Fund exposure. Elsewhere in securitized, Fund ABS holdings contributed to relative performance, led by CLOs (collateralized loan obligations) and floating rate student loans as these short duration, floating rate profile types saw continued demand in a rising rate environment, while CMBS holdings had minimal impact. Away from securitized, the Fund has maintained an overweight to corporate credit up until June, before trimming alongside the tightening of corporate yield spreads, benefitting relative performance as the sector outpaced duration-adjusted Treasuries by over 400 bps during the twelve-month period. Non-cyclicals and communications — two of the Fund’s preferred industrial sectors throughout much of the period — performed well, while favorable issue selection among financials provided the largest tailwind. In particular, an emphasis on large, money center banks was beneficial as these credits outperformed during 1Q23’s banking crisis, while the Fund was also able to capitalize on severe pricing dislocations that arose from the volatility to add to existing, high conviction positions at discounted prices, which benefitted from a subsequent rebound.
With the continued rise in rates during the third quarter, the team added incrementally to the duration positioning, reaching roughly 1.1 years long relative to the Index. Though rates are not expected to move substantially higher from here, the approach will be patient, recognizing that it might be mid-next year before the Fed starts to ease and rates move lower. Once rates do start to fall, the long-duration position will be maintained for a time in an effort to maximize the benefit and recoup the losses generated thus far, before gradually trimming the position once rates have fallen to levels near or below what we would consider to be long-term fair value. Sector positioning remains consistent; while corporate holdings bear a slight market value overweight, the exposure is a spread contribution (credit risk) underweight. Financials remain the most constructive theme, namely the U.S. money center bank issues, for which Dodd-Frank’s rigors kept clear of the trouble that visited the regional banks earlier this year. Other exposures lean toward communications and select non-cyclicals that would hold up relatively well on any realization of economic slowing. The securitized area is another area of focus, reflected in a market value and spread overweight to agency MBS. The cheapening of last year and persistent volatility have the market at wider spreads that the team finds attractive, especially given a government guarantee and pull-to-par convexity of discount pricing. Non-agency MBS remains among the best values in fixed income with good yields and solid fundamentals. Years of amortization and housing price appreciation have built up substantial equity in such properties, underscoring the fundamentals, and an overall lag in housing supply in the decade-plus since the GFC (Global Financial Crisis) have been supportive as well. Finally, CMBS continues to be an area of concern, with significant declines in some office property valuations, given substantially higher rates and elevated vacancies given the work from home dynamic. Expectations are for ongoing appraisals lower, more
3
TCW Core Fixed Income Fund
Management Discussions (Continued)
defaults, more delinquencies, and wider spreads for lower-quality deals with questionable collateral; however, there are also many parts of the CMBS market that don’t have these same challenging dynamics (logistics/warehouses, hospitality, multifamily, retail, and even high-quality office space), and portfolio holdings reflect these more targeted positions, where we can get comfortable with the risk profile and the specific properties.
| | | | | | | | | | | | | | | | | | | | |
| | | Annualized Total Return as of October 31, 2023(1) | |
| | | One Year | | | Three Years | | | Five Years | | | Ten Years | | | Inception To Date | |
TCW Core Fixed Income Fund | | | | | | | | | | | | | | | | | | | | |
Class I (Inception: January 1, 1990) | | | (0.29 | %) | | | (6.09 | %) | | | (0.22 | %) | | | 0.69 | % | | | 4.87 | %(2) |
Bloomberg U.S. Aggregate Bond Index | | | 0.36 | % | | | (5.57 | %) | | | (0.06 | %) | | | 0.88 | % | | | 5.76 | % |
Class N (Inception: March 1, 1999) | | | (0.56 | %) | | | (6.28 | %) | | | (0.42 | %) | | | 0.44 | % | | | 3.67 | % |
Bloomberg U.S. Aggregate Bond Index | | | 0.36 | % | | | (5.57 | %) | | | (0.06 | %) | | | 0.88 | % | | | 4.88 | % |
Class P (Inception: February 28, 2020) | | | (0.11 | %) | | | (6.09 | %) | | | — | | | | — | | | | (3.98 | %) |
Bloomberg U.S. Aggregate Bond Index | | | 0.36 | % | | | (5.57 | %) | | | (0.06 | %) | | | 0.88 | % | | | (3.93 | %) |
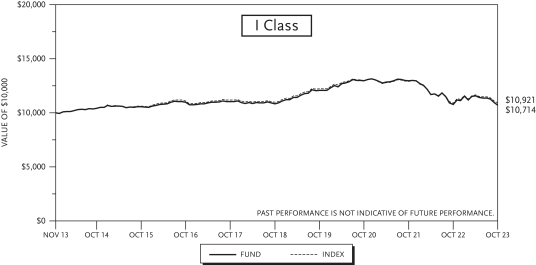

4
TCW Core Fixed Income Fund
Management Discussions (Continued)
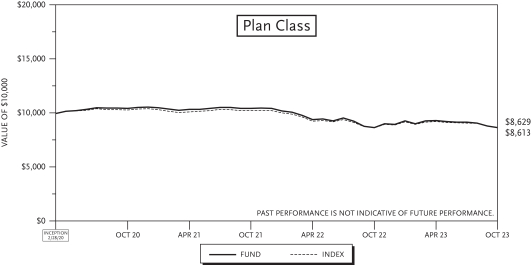
| (1) | The total returns do not reflect taxes that a shareholder would pay on fund distributions or on the redemption of fund shares. |
| (2) | Performance data includes the performance of the predecessor entity for periods before the Fund’s registration became effective. The predecessor entity was not registered under the 1940 Act and, therefore, was not subject to certain investment restrictions that are imposed by the 1940 Act. If the predecessor entity had been registered under the 1940 Act, the predecessor entity’s performance may have been lower. |
5
TCW Enhanced Commodity Strategy Fund
Management Discussions
The TCW Enhanced Commodity Strategy Fund — I Class (“Fund”) fell 3.32% (net of fees) during the one-year period ended October 31, 2023, trailing the Bloomberg Commodity Total Return Index by 35 bps. Underperformance for the period was due to the Fund’s portable alpha strategy (a short duration, high-quality fixed income portfolio that collateralizes the commodity exposure), as fixed income was weighed down by the significant rise in interest rates. Even with a duration at just 1.5 years, higher risk-free rates during the period produced a significant headwind to the Fund’s portable alpha portfolio. The allocation to corporate credit, however, boosted returns as investment grade corporates outpaced duration-adjusted Treasuries by over 400 bps, with favorable issue selection focused on banks, as well as non-cyclicals and energy credits within industrials contributing to returns. Away from corporates, solid performance in the non-agency MBS and CMBS sector also benefitted returns, along with ABS issues which also experienced yield spread compression given heightened investor demand for attractive yielding, short duration profile types, with the Fund’s auto, CLO, and student loan holdings producing the greatest benefit.
Meanwhile, Fund performance benefitted from a structural alpha component, which provides broad-based exposure to commodities via two main tenets. First, the Fund strategically rolled its commodity exposure outside of the pre-specified periods set forth by the Index and typically used by traditional index funds to replicate Index exposure. This was generally beneficial to relative returns because it allowed the Fund to avoid the programmatic richening of the commodity roll, with this strategy especially impactful in the early part of the period as traditional index funds saw heavy inflows amid higher inflation prints. However, significant price rallying in certain areas of the market, particularly oil, in the latter part of the period resulted in a drag on relative performance as the Fund gave up some spot price appreciation by rolling early. The second component of structural alpha involves diversifying exposure along the forward curve for commodities that exhibit a predictable degree of seasonality, with the Fund seeking to avoid some of the more volatile price action often associated with near-dated futures contracts. This strategy was especially beneficial to relative returns across the energy complex given falling spot prices and flattening futures curves, with the Fund’s longer-dated contracts generally suffering less of a price decline than the more volatile front-end contracts held by the Index. Similarly, downward spot price pressure on industrial metals and agricultural commodities (like wheat and corn) had a larger negative impact on Index returns as the Fund’s longer-dated contract positions insulated performance from these negative price movements, though upward fluctuations of spot and near-dated futures prices for lean hogs, soybean oil and fuel products modestly weighed on Fund returns.
Looking forward, one can expect (and rely on the idea) that the constant in all markets is change, and that is particularly true when it comes to sentiment and market expectations. In the near-term those expectations might relate to the impact of El Nino on crops, grain shipments from the Black Sea, a possible resurgence of the Chinese economy, changes in Fed policy, dollar strength or weakness, sanctions on Iranian crude oil shipments, or a plethora of other variables. Listing some of these variables illustrates how commodity markets are often subject to risk factors that are different from those affecting stocks and bonds, making the asset class an attractive diversifier for a portfolio. Those variables also help explain why commodities are often a useful hedge against inflation. But while these short-term variables are hard to predict, we can recognize some fundamental economic factors affecting commodity prices in the longer term — increasing global consumption, even if it grows at a slower rate; insufficient capex (capital expenditure) in many commodity industries (e.g., the U.S. oil rig count remains well below its high of 2022 in spite of the Q3 rise in oil prices); rising demand for some metals caused by the energy transition, though the IEA (International Energy Agency) projects that it will be more than a decade before that transition may
6
TCW Enhanced Commodity Strategy Fund
Management Discussions (Continued)
lead to an actual decline in petroleum demand. The unique nature of commodities makes a compelling argument for their inclusion within the real asset sleeve of a diversified portfolio.
| | | | | | | | | | | | | | | | | | | | |
| | | Annualized Total Return as of October 31, 2023(1) | |
| | | One
Year | | | Three
Years | | | Five
Years | | | Ten
Years | | | Inception
To Date | |
TCW Enhanced Commodity Strategy Fund | | | | | | | | | | | | | | | | | | | | |
Class I (Inception: April 1, 2011) | | | (3.32 | %) | | | 15.24 | % | | | 7.38 | % | | | 0.28 | % | | | (1.47 | %) |
Class N (Inception: April 1, 2011) | | | (3.37 | %) | | | 15.26 | % | | | 7.33 | % | | | 0.25 | % | | | (1.50 | %) |
Bloomberg Commodity Total Return Index | | | (2.97 | %) | | | 15.79 | % | | | 6.65 | % | | | (0.57 | %) | | | (2.81 | %) |
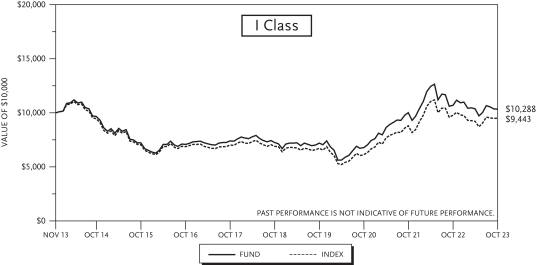

| (1) | The total returns do not reflect taxes that a shareholder would pay on fund distributions or on the redemption of fund shares. |
7
TCW Global Bond Fund
Management Discussions
The TCW Global Bond Fund — I Class (“Fund”) returned 2.22% (net of fees) for the one-year period ended October 31, 2023, outperforming the Bloomberg Global Aggregate Index by just over 50 bps. Although the Fund outperformed, the longer-than-index duration position in developed markets where central banks are finally nearing the end of their tightening cycles (U.S., New Zealand, Australia) resulted in a sizable headwind during the period as rates continued to rise amid steady global growth, persistent inflation, and continued tightening of central banks. Some of this headwind was offset by favorable yield curve positioning in the latter part of the period when front-end yields in the U.S. and Europe, where the Fund has an overweight, outperformed. Currency positioning had little impact on returns overall. Strong performance for the Mexican peso and Hungarian forint rewarded the overweight position, which was subsequently trimmed amid sizable gains, while a further boost came from the underweight to Chinese renminbi as the currency lagged broader developed market currencies over the period. These gains were offset by the overweight to the Japanese yen, which underperformed for much of the period.
Meanwhile, outperformance was driven by favorable issue selection and solid sector allocations. More specifically, the Fund maintained an overweight to U.S. corporate credit for most of the period, benefitting relative performance as the sector outpaced duration-adjusted Treasuries by over 400 bps during the twelve-month period, though the position was trimmed alongside the tightening of corporate yield spreads over the period. Non-cyclicals and communications — two of the Fund’s preferred industrial sectors throughout much of the period — performed well, while favorable issue selection among financials provided the largest tailwind. In particular, an emphasis on large, money center banks was beneficial as these credits outperformed during 1Q23’s banking crisis, while the Fund was also able to capitalize on severe pricing dislocations that arose from the volatility to add to existing, high-conviction positions at discounted prices, which benefitted from a subsequent rebound. Favorable issue selection among emerging market (EM) credit further boosted returns, particularly quasi-sovereign EM holdings. Away from corporates, the emphasis on higher-quality securitized areas was a further benefit to relative performance. The overweight to U.S. agency MBS modestly benefitted performance as the sector finished ahead of comparable Treasuries, though the Fund’s preference for lower-coupon issues detracted as they were the worst performers in the coupon stack. Non-agency MBS bonds rebounded in the latter half of the period on increased trading and renewed optimism for the future trajectory of home prices, rewarding Fund exposure. Elsewhere in securitized, Fund ABS and CMBS holdings contributed to relative performance, led by CLOs and floating rate student loans and single asset, single borrower deals as these short duration, floating rate profile types saw continued demand in a rising rate environment. In CMBS, interest only bonds also contributed as they were supported by strong cash flows.
Overall country exposure is focused on higher-quality sovereign issuers with strong macroeconomic positions that can weather uncertainties, while caution is warranted in countries with strained economic fundamentals, and weaker household consumption as families feel the effects of higher borrowing costs, particularly mortgages. Duration positioning reflects the team view that slowing growth, tightening credit conditions and an eventual pivot/reversal in central bank policy should lead to a re-steepening of the curve, with an overweight in advanced economies (such as the U.S. and New Zealand) and a focus on front-end maturities as a shift from tightening to easing will lead to a normalizing of the yield curve. Elsewhere, we remain underweight Japan and China due to the expected eventual easing of yield curve control and the potential for policy support given property market challenges and local government debt woes, respectively. As it relates to currency positioning, U.S. dollar strength has led to a reduction in positioning toward neutral, while moderating inflation in the UK and a lower terminal rate in England has resulted in a bias to
8
TCW Global Bond Fund
Management Discussions (Continued)
add, though cautiously as economic fundamentals remain weak. Positioning also favors the South Korean won and Japanese yen due to attractive valuations and potential for currency intervention by the Bank of Japan, while that overweight is funded by underweights to the Swiss franc and Chinese yuan. Sector positioning in corporate credit maintains a preference for high-conviction issuers, money center banks, and defensive sectors like communications and non-cyclicals, while relatively high rates and falling inflation make emerging market debt more attractive, though slowing growth and a tightening Fed has historically been a difficult environment for emerging market issuers, thus positioning remains selective, with an emphasis on higher-quality names with strong growth fundamentals. Among securitized, the emphasis remains on agency MBS given attractive relative value and strong liquidity, while opportunities can also be found in higher-quality legacy non-agency MBS bonds, as well as newer issues, especially those backed by legacy collateral with significant embedded home price appreciation. ABS holdings are focused on non-traditional sectors with better yields such as CLOs and select FFELP student loans, while CMBS exposure is cautious overall with an emphasis on super senior single asset, single borrower non-agency CMBS holdings.
| | | | | | | | | | | | | | | | | | | | | | | | | |
| | | Annualized Total Return as of October 31, 2023(1) |
| | | One
Year | | Three
Years | | Five
Years | | Ten
Years | | Inception
To Date |
TCW Global Bond Fund | | | | | | | | | | | | | | | | | | | | | | | | | |
Class I (Inception: December 1, 2011) | | | | 2.22 | % | | | | (7.50 | %) | | | | (1.15 | %) | | | | (0.61 | %) | | | | 0.45 | % |
Class N (Inception: December 1, 2011) | | | | 2.12 | % | | | | (7.60 | %) | | | | (1.24 | %) | | | | (0.66 | %) | | | | 0.41 | % |
Bloomberg Global Aggregate Index | | | | 1.72 | % | | | | (7.33 | %) | | | | (1.64 | %) | | | | (0.66 | %) | | | | (0.25 | %) |
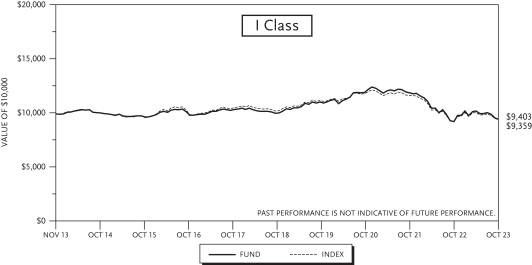
9
TCW Global Bond Fund
Management Discussions (Continued)
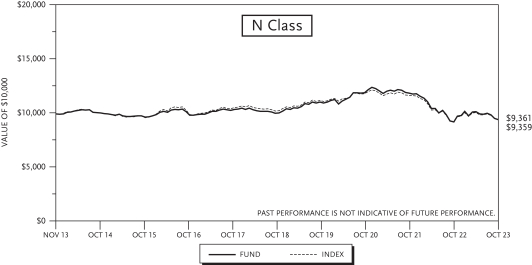
| (1) | The total returns do not reflect taxes that a shareholder would pay on fund distributions or on the redemption of fund shares. |
10
TCW High Yield Bond Fund
Management Discussions
While the TCW High Yield Bond Fund — I Class (“Fund”) returned 4.95% (net of fees) for the one-year period ended October 31, 2023, this was approximately 75 bps behind the FTSE U.S. High Yield Cash Pay Capped Custom Index return. The largest drag on returns came from the underweight to top-performing consumer cyclicals such as leisure and gaming, which were up an impressive 17.3% and 16.1%, respectively. An underweight to basic industry, which similarly outpaced the broader Index, weighed further on relative performance, as well as issue selection among brokerage and REIT (Real Estate Investment Trust) names. However, these factors were offset by an emphasis on consumer non-cyclicals such as healthcare which generated strong returns during the period. Insurance, technology and banking exposures also contributed positively. Finally, the Fund’s continued focus on higher-quality issues detracted from returns as the lower-quality (CCC-rated) cohort gained 7.4% for the period, with over 500 bps of excess returns, while B- and BB-rated credits trailed with gains of 4.4% and 3.3% (and excess returns of just over 450 and 350 bps, respectively).
As always, TCW’s high yield portfolio construction is informed by a survey of value in the marketplace. With relatively tight aggregate spread levels for the asset class, compensation for potential downside risks is minimal and thus the approach has been one of de-risking. Furthermore, as high yield companies tend to require regular access to capital markets given the maturity of their debt, this segment will soon face refinancing risks amid higher rates that will ultimately raise interest expenses and cut into profits, increasing vulnerability to an economic downturn. This concern is already hitting floating rate borrowers which have seen a material step in costs this year. Despite the limited spread compensation more broadly, the team will look to continue opportunistically adding to certain segments of the high yield universe with compelling themes that have experienced price dislocations, as well as high-conviction idiosyncratic mispricing. An up-in-quality bias also enhances the liquidity profile, leaving the Fund well-positioned to deploy capital into volatility. Until market valuations look more attractive, the strategy will remain focused on communications and consumer non-cyclicals (particularly healthcare and food & beverage) from an overall sector perspective, as well as insurance and banking names within financials while energy, retail and technology credits remain relative underweights.
| | | | | | | | | | | | | | | | | | | | |
| | | Annualized Total Return as of October 31, 2023(1) | |
| | | One
Year | | | Three
Years | | | Five
Years | | | Ten
Years | | | Inception
To Date | |
TCW High Yield Bond Fund | | | | | | | | | | | | | | | | | | | | |
Class I (Inception: February 1, 1989) | | | 4.95 | % | | | 0.42 | % | | | 3.63 | % | | | 3.83 | % | | | 6.55 | %(2) |
FTSE U.S. High Yield Cash Pay Capped Custom Index | | | 5.72 | % | | | 1.32 | % | | | 2.77 | % | | | 3.51 | % | | | 7.07 | % |
Class N (Inception: March 1, 1999) | | | 4.51 | % | | | 0.14 | % | | | 3.35 | % | | | 3.57 | % | | | 4.76 | % |
FTSE U.S. High Yield Cash Pay Capped Custom Index | | | 5.72 | % | | | 1.32 | % | | | 2.77 | % | | | 3.51 | % | | | 5.76 | % |
11
TCW High Yield Bond Fund
Management Discussions (Continued)
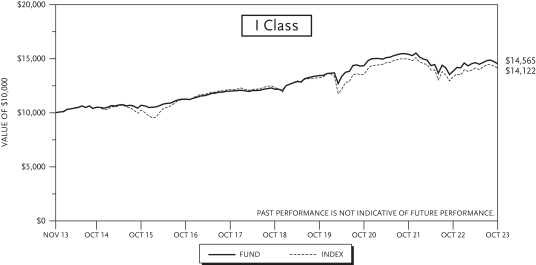

| (1) | The total returns do not reflect taxes that a shareholder would pay on fund distributions or on the redemption of fund shares. |
| (2) | Performance data includes the performance of the predecessor entity for periods before the Fund’s registration became effective. The predecessor entity was not registered under the 1940 Act and, therefore, was not subject to certain investment restrictions that are imposed by the 1940 Act. If the predecessor entity had been registered under the 1940 Act, the predecessor entity’s performance may have been lower. |
12
TCW Short Term Bond Fund
Management Discussions
For the one-year period ending October 31, 2023, the TCW Short Term Bond Fund — I Class (“Fund”) gained 4.01% (net of fees), though this trailed the FTSE 1-Year Treasury Index by a modest 22 bps. Despite the shorter-duration profile typically characterizing the Fund, front-end rates at current levels and persistence of the yield curve’s inversion informed a disciplined extension of the Fund’s duration position, reaching 1.0 years long relative to the Index and resulting in the largest headwind to both absolute and relative performance. Meanwhile, elevated volatility throughout the period and continued rise in yields weighed on the agency MBS sector, further detracting from Fund performance given the sizeable allocation to the sector. Non-agency MBS, however, fared better during the period as robust housing fundamentals and increased demand for non-agency MBS issues pushed prices higher across the sector, with Fund holdings backed by legacy (pre-2008 vintage) collateral contributing the most, helping to partially offset the drag from agency MBS. Away from residential MBS, non-agency CMBS issues benefitted performance, led by multifamily and other high-quality collateral with strong sponsorship. Contributions from the ABS sector stemmed from AAA-rated CLOs, which outperformed on the back of strong demand for short duration, floating rate instruments with strong structural protection and attractive yield spreads. Finally, an allocation to short corporates, despite being trimmed in the latter half of the period as credit spreads reached year-to-date tight levels, provided a tailwind as short corporate issues finished ahead of Treasuries by 101 bps. The Fund maintained a preference for more defensive sectors, including non-cyclicals like healthcare and pharmaceuticals, while financials represented the largest corporate allocation. In particular, an emphasis on senior positions among large, money center banks helped insulate performance from the challenges faced by the banking sector in the first quarter, with opportunistic trading among names that experienced outsized volatility providing a further boost as prices subsequently normalized.
With the continued rise in rates over the period, the team extended the duration position to roughly 1 year long versus the Index, with a continued emphasis on front-end maturities. Though rates are not expected to move substantially higher from here, the approach will be patient, recognizing that it might be mid-next year before the Fed starts to ease, rates move lower, and the curve re-steepens. Once rates do start to fall, the lengthened duration position will be maintained for a time in an effort to maximize the benefit and recoup the losses generated thus far, before gradually trimming the position once rates have fallen to levels near or below what we would consider to be long-term fair value. On corporate exposure, less-than-compelling yield spreads inform a reduced allocation at present, though sector positioning remains constant. Financials remain the most constructive theme, namely the U.S. money center banks, for which Dodd-Frank’s rigors kept these issuers clear of the trouble that visited the regional banks earlier this year. Other exposures lean toward select non-cyclicals that would hold up relatively well on any realization of economic slowing. The securitized area is another area of focus, reflected in a significant allocation to residential MBS. Last year’s agency MBS cheapening, and persistent volatility, have spreads at levels the team finds attractive, especially given the government guarantee and pull-to-par convexity of discount pricing. Meanwhile, non-agency MBS remains among the best values in fixed income with good yields and solid fundamentals; years of amortization and housing price appreciation have built up substantial equity in such properties, while an overall lag in housing supply in the decade-plus since the GFC have been supportive as well. Finally, CMBS continues to be an area of concern, with significant declines in some office property valuations, given substantially higher rates and elevated vacancies given the work from home dynamic. Expectations are for ongoing appraisals lower, more defaults, more delinquencies, and wider spreads for lower-quality deals with questionable collateral; however, there are also many parts of the CMBS market that don’t have these same challenging dynamics (logistics/warehouses, hospitality,
13
TCW Short Term Bond Fund
Management Discussions (Continued)
multifamily, retail, and even high-quality office space), and portfolio holdings reflect these more targeted positions, where we can get comfortable with the risk profile and the specific properties.
| | | | | | | | | | | | | | | | | | | | |
| | | Annualized Total Return as of October 31, 2023(1) | |
| | | One
Year | | | Three
Years | | | Five
Years | | | Ten
Years | | | Inception
To Date | |
TCW Short Term Bond Fund | | | | | | | | | | | | | | | | | | | | |
Class I (Inception: February 1, 1990) | | | 4.01 | % | | | 0.47 | % | | | 1.38 | % | | | 1.06 | % | | | 3.50 | %(2) |
FTSE 1-Year Treasury Index | | | 4.23 | % | | | 0.83 | % | | | 1.55 | % | | | 1.08 | % | | | 3.19 | % |

| (1) | The total returns do not reflect taxes that a shareholder would pay on fund distributions or on the redemption of fund shares. |
| (2) | Performance data includes the performance of the predecessor entity for periods before the Fund’s registration became effective. The predecessor entity was not registered under the 1940 Act and, therefore, was not subject to certain investment restrictions that are imposed by the 1940 Act. If the predecessor entity had been registered under the 1940 Act, the predecessor entity’s performance may have been lower. |
14
TCW Total Return Bond Fund
Management Discussions
For the one-year period ending October 31, 2023, the TCW Total Return Bond Fund — I Class (“Fund”) fell 1.51% (net of fees), trailing the Bloomberg U.S. Aggregate Bond Index by approximately 187 bps. While the Fund’s duration position remained longer than the Index throughout the period, the continued rise in Treasury yields — especially in the most recent quarter – informed a disciplined extension of the duration profile, significantly weighing on relative performance. Further impacting relative returns was the Fund’s emphasis on securitized issues in favor of corporates, as corporate credit was one of the better-performing sectors over the period with nearly 430 bps of outperformance relative to similar duration Treasuries. Within the securitized exposure, a heavy allocation to agency MBS also detracted given the sector’s struggles under higher rates, elevated volatility and reduced bank and overseas demand. However, yield spreads at historically wide levels, favorable liquidity and the government guarantee inform a continued sizeable allocation to the space and contribute to the compelling relative value argument of agency MBS. Non-agency MBS also represents a sector with attractive risk-adjusted returns given the strength of underlying collateral, underpinned by home price appreciation over recent years that lowered loan-to-value ratios, increased homeowner equity, and effectively de-leveraged many non-agency MBS deals. These dynamics resulted in strong performance and robust demand across non-agency MBS deal types during the period, more than offsetting the drag from agency MBS. Fund holdings of legacy and re-securitized legacy collateral contributed the most, followed by credit risk transfer deals, which saw a large compression in yield spreads as broader risk sentiment improved. Elsewhere in securitized, CLO holdings contributed favorably to Fund performance amid sustained demand from investors seeking high-quality offerings with structural protection, short durations, and floating rate profile types, though CMBS exposure detracted, weighed down primarily by non-agency collateral.
With the continued rise in rates over the period, the team added incrementally to the duration positioning, reaching roughly 7.4 years and remaining longer than the Index. Though rates are not expected to move substantially higher from here, the approach will be patient, recognizing that it might be mid-next year before the Fed starts to ease and rates move lower. Once rates do start to fall, the long-duration position will be maintained for a time in an effort to maximize the benefit and recoup the losses generated thus far, before gradually trimming the position once rates have fallen to levels near or below what we would consider to be long-term fair value. Turning to securitized allocations, residential MBS represents the largest exposure, reflected in a market value and spread overweight to agency MBS. The cheapening across the sector last year, and persistent volatility, have yield spreads at levels the team finds attractive, especially given the government guarantee and pull-to-par convexity of discount pricing. Meanwhile, non-agency MBS remains among the best values in fixed income with good yields and solid fundamentals; years of amortization and housing price appreciation have built up substantial equity in such properties, while an overall lag in housing supply in the decade-plus since the GFC have been supportive as well. Finally, CMBS is a sector with both prospective volatility and opportunity; market liquidity and demand remain plentiful for senior issues backed by trophy properties, while deals backed by weaker collateral are likely to see principal losses and falling prices on continued materialization of commercial market stress, especially in more subordinated tranches. As this stress unfolds, there will undoubtedly be forced sellers, helping
15
TCW Total Return Bond Fund
Management Discussions (Continued)
engender a wave of price discovery across issues that have thus far been more thinly traded, while also presenting potential opportunity to scale down the capital structure of deals backed by strong collateral.
| | | | | | | | | | | | | | | | | | | | |
| | | Annualized Total Return as of October 31, 2023(1) | |
| | | One
Year | | | Three
Years | | | Five
Years | | | Ten
Years | | | Inception
To Date | |
TCW Total Return Bond Fund | | | | | | | | | | | | | | | | | | | | |
Class I (Inception: June 17, 1993) | | | (1.51 | %) | | | (7.60 | %) | | | (1.31 | %) | | | 0.26 | % | | | 4.88 | % |
Bloomberg U.S. Aggregate Bond Index | | | 0.36 | % | | | (5.57 | %) | | | (0.06 | %) | | | 0.88 | % | | | 3.19 | % |
Class N (Inception: March 1, 1999) | | | (1.75 | %) | | | (7.77 | %) | | | (1.53 | %) | | | 0.00 | % | | | 4.07 | % |
Bloomberg U.S. Aggregate Bond Index | | | 0.36 | % | | | (5.57 | %) | | | (0.06 | %) | | | 0.88 | % | | | 4.18 | % |
Class P (Inception: February 28, 2020) | | | (1.68 | %) | | | (7.55 | %) | | | — | | | | — | | | | (5.39 | %) |
Bloomberg U.S. Aggregate Bond Index | | | 0.36 | % | | | (5.57 | %) | | | (0.06 | %) | | | 0.88 | % | | | 3.60 | % |
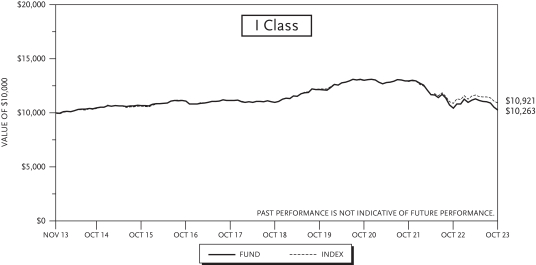
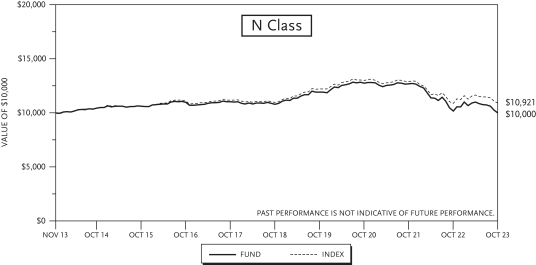
16
TCW Total Return Bond Fund
Management Discussions (Continued)
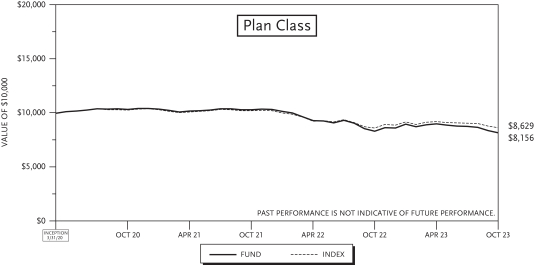
| (1) | The total returns do not reflect taxes that a shareholder would pay on fund distributions or on the redemption of fund shares. |
17
TCW Core Fixed Income Fund
Schedule of Investments
| | | | | | | | | | | | |
| Issues | | Maturity
Date | | | Principal
Amount | | | Value | |
|
FIXED INCOME SECURITIES — 111.0% of Net Assets | |
|
CORPORATE BONDS — 27.0% | |
|
| Aerospace & Defense — 0.3% | |
|
Boeing Co. | |
| | | |
1.43% | | | 02/04/24 | | | $ | 2,650,000 | | | $ | 2,617,855 | |
| | | |
4.88% | | | 05/01/25 | | | | 560,000 | | | | 550,290 | |
| | | | | | | | | | | | |
| | | |
| | | | | | | | | | | 3,168,145 | |
| | | | | | | | | | | | |
|
| Agriculture — 0.8% | |
|
BAT Capital Corp. (United Kingdom) | |
| | | |
2.73% | | | 03/25/31 | | | | 695,000 | | | | 524,503 | |
| | | |
4.39% | | | 08/15/37 | | | | 470,000 | | | | 341,824 | |
| | | |
4.54% | | | 08/15/47 | | | | 1,270,000 | | | | 822,254 | |
| | | |
4.76% | | | 09/06/49 | | | | 138,000 | | | | 91,813 | |
| | | |
5.28% | | | 04/02/50 | | | | 1,285,000 | | | | 914,611 | |
| | | |
5.65% | | | 03/16/52 | | | | 400,000 | | | | 300,900 | |
| |
Imperial Brands Finance Netherlands BV (United Kingdom) | | | | | |
| | | |
1.75% (1) | | | 03/18/33 | | | | 750,000 | | | | 563,546 | |
|
Imperial Brands Finance PLC (United Kingdom) | |
| | | |
3.13% (2) | | | 07/26/24 | | | | 2,300,000 | | | | 2,248,940 | |
| | | |
3.88% (2) | | | 07/26/29 | | | | 35,000 | | | | 30,560 | |
|
Reynolds American, Inc. (United Kingdom) | |
| | | |
5.70% | | | 08/15/35 | | | | 260,000 | | | | 222,699 | |
| | | |
5.85% | | | 08/15/45 | | | | 2,770,000 | | | | 2,170,461 | |
| | | | | | | | | | | | |
| | | |
| | | | | | | | | | | 8,232,111 | |
| | | | | | | | | | | | |
|
| Airlines — 0.4% | |
| |
Delta Air Lines Pass-Through Trust Series 2019-1, Class AA | | | | | |
| | | |
3.20% | | | 10/25/25 | | | | 1,500,000 | | | | 1,473,660 | |
| |
U.S. Airways Pass-Through Trust Series 2012-2, Class A | | | | | |
| | | |
(EETC) | | | | | | | | | | | | |
| | | |
4.63% | | | 12/03/26 | | | | 375,214 | | | | 353,343 | |
| |
United Airlines Pass-Through Trust Series 2023-1, Class A | | | | | |
| | | |
5.80% | | | 07/15/37 | | | | 2,300,000 | | | | 2,164,139 | |
| | | | | | | | | | | | |
| | | |
| | | | | | | | | | | 3,991,142 | |
| | | | | | | | | | | | |
|
| Banks — 10.5% | |
|
ABN AMRO Bank NV (Netherlands) | |
| | | |
2.47% (1 yr. CMT + 1.100%) (2),(3) | | | 12/13/29 | | | | 1,700,000 | | | | 1,384,531 | |
|
Bank of America Corp. | |
| | | |
1.66% (Secured Overnight Financing Rate + 0.910%) (3) | | | 03/11/27 | | | | 6,355,000 | | | | 5,686,251 | |
| | | |
1.73% (Secured Overnight Financing Rate + 0.960%) (3) | | | 07/22/27 | | | | 2,535,000 | | | | 2,237,949 | |
| | | |
1.92% (Secured Overnight Financing Rate + 1.370%) (3) | | | 10/24/31 | | | | 345,000 | | | | 254,603 | |
| | | |
2.09% (Secured Overnight Financing Rate + 1.060%) (3) | | | 06/14/29 | | | | 2,200,000 | | | | 1,816,386 | |
| | | |
2.30% (Secured Overnight Financing Rate + 1.220%) | | | 07/21/32 | | | | 3,595,000 | | | | 2,654,979 | |
| | | |
2.50% (3 mo. USD Term SOFR + 1.252%) (3) | | | 02/13/31 | | | | 930,000 | | | | 733,284 | |
| | | |
3.97% (3 mo. USD Term SOFR + 1.472%) (3) | | | 02/07/30 | | | | 195,000 | | | | 172,506 | |
| | | | | | | | | | | | |
| Issues | | Maturity
Date | | | Principal
Amount | | | Value | |
|
Citigroup, Inc. | |
| | | |
1.46% (Secured Overnight Financing Rate + 0.770%) (3) | | | 06/09/27 | | | $ | 340,000 | | | $ | 299,370 | |
| | | |
2.56% (Secured Overnight Financing Rate + 1.167%) (3) | | | 05/01/32 | | | | 2,060,000 | | | | 1,563,796 | |
| | | |
2.98% (Secured Overnight Financing Rate + 1.422%) | | | 11/05/30 | | | | 1,395,000 | | | | 1,145,253 | |
| | | |
3.06% (Secured Overnight Financing Rate + 1.351%) | | | 01/25/33 | | | | 3,895,000 | | | | 3,002,539 | |
| | | |
3.89% (3 mo. USD Term SOFR + 1.825%) (3) | | | 01/10/28 | | | | 45,000 | | | | 41,742 | |
| | | |
4.41% (Secured Overnight Financing Rate + 3.914%) (3) | | | 03/31/31 | | | | 500,000 | | | | 442,525 | |
|
Goldman Sachs Group, Inc. | |
| | | |
1.22% | | | 12/06/23 | | | | 3,945,000 | | | | 3,927,524 | |
| | | |
1.43% (Secured Overnight Financing Rate + 0.798%) (3) | | | 03/09/27 | | | | 4,260,000 | | | | 3,784,584 | |
| | | |
1.54% (Secured Overnight Financing Rate + 0.818%) (3) | | | 09/10/27 | | | | 1,585,000 | | | | 1,378,918 | |
| | | |
1.95% (Secured Overnight Financing Rate + 0.913%) (3) | | | 10/21/27 | | | | 1,000,000 | | | | 877,150 | |
| | | |
2.38% (Secured Overnight Financing Rate + 1.248%) | | | 07/21/32 | | | | 1,870,000 | | | | 1,390,139 | |
| | | |
2.65% (Secured Overnight Financing Rate + 1.264%) (3) | | | 10/21/32 | | | | 55,000 | | | | 41,370 | |
|
HSBC Holdings PLC (United Kingdom) | |
| | | |
1.59% (Secured Overnight Financing Rate + 1.290%) (3) | | | 05/24/27 | | | | 4,240,000 | | | | 3,735,645 | |
| | | |
2.01% (Secured Overnight Financing Rate + 1.732%) (3) | | | 09/22/28 | | | | 1,610,000 | | | | 1,353,624 | |
| | | |
2.21% (Secured Overnight Financing Rate + 1.285%) (3) | | | 08/17/29 | | | | 2,570,000 | | | | 2,091,260 | |
| | | |
2.36% (Secured Overnight Financing Rate + 1.947%) (3) | | | 08/18/31 | | | | 940,000 | | | | 709,296 | |
| | | |
6.33% (Secured Overnight Financing Rate + 2.650%) (3) | | | 03/09/44 | | | | 440,000 | | | | 408,778 | |
|
JPMorgan Chase & Co. | |
| | | |
0.97% (3 mo. USD Term SOFR + 0.580%) (3) | | | 06/23/25 | | | | 6,265,000 | | | | 6,037,581 | |
| | | |
1.56% (Secured Overnight Financing Rate + 0.605%) (3) | | | 12/10/25 | | | | 2,080,000 | | | | 1,969,698 | |
| | | |
1.58% (Secured Overnight Financing Rate + 0.885%) (3) | | | 04/22/27 | | | | 2,515,000 | | | | 2,243,430 | |
| | | |
1.95% (Secured Overnight Financing Rate + 1.065%) (3) | | | 02/04/32 | | | | 3,330,000 | | | | 2,474,763 | |
| | | |
2.55% (Secured Overnight Financing Rate + 1.180%) | | | 11/08/32 | | | | 70,000 | | | | 53,081 | |
See accompanying Notes to Financial Statements.
18
TCW Core Fixed Income Fund
October 31, 2023
| | | | | | | | | | | | |
| Issues | | Maturity
Date | | | Principal
Amount | | | Value | |
|
| Banks (Continued) | |
| | | |
2.58% (3 mo. USD Term SOFR + 1.250%) (3) | | | 04/22/32 | | | $ | 80,000 | | | $ | 61,827 | |
| | | |
2.74% (3 mo. USD Term SOFR + 1.510%) (3) | | | 10/15/30 | | | | 1,070,000 | | | | 879,394 | |
| | | |
2.95% (Secured Overnight Financing Rate + 1.170%) (3) | | | 02/24/28 | | | | 750,000 | | | | 675,585 | |
|
Lloyds Banking Group PLC (United Kingdom) | |
| | | |
1.63% (1 yr. CMT + 0.850%) (3) | | | 05/11/27 | | | | 1,500,000 | | | | 1,328,640 | |
| | | |
3.57% (3 mo. USD LIBOR + 1.205%) (3) | | | 11/07/28 | | | | 860,000 | | | | 764,007 | |
| | | |
3.87% (1 yr. CMT + 3.500%) (3) | | | 07/09/25 | | | | 1,600,000 | | | | 1,571,532 | |
| | | |
4.98% (1 yr. CMT + 2.300%) | | | 08/11/33 | | | | 465,000 | | | | 403,959 | |
|
Macquarie Group Ltd. (Australia) | |
| | | |
2.87% (Secured Overnight Financing Rate + 1.532%) (2) | | | 01/14/33 | | | | 540,000 | | | | 399,348 | |
| | | |
4.44% (Secured Overnight Financing Rate + 2.405%) (2),(3) | | | 06/21/33 | | | | 600,000 | | | | 498,954 | |
| | | |
5.03% (3 mo. USD LIBOR + 1.750%) (2),(3) | | | 01/15/30 | | | | 505,000 | | | | 476,088 | |
|
Morgan Stanley | |
| | | |
1.51% (Secured Overnight Financing Rate + 0.858%) (3) | | | 07/20/27 | | | | 1,145,000 | | | | 1,005,390 | |
| | | |
1.79% (Secured Overnight Financing Rate + 1.034%) (3) | | | 02/13/32 | | | | 860,000 | | | | 622,498 | |
| | | |
1.93% (Secured Overnight Financing Rate + 1.020%) (3) | | | 04/28/32 | | | | 1,825,000 | | | | 1,321,586 | |
| | | |
2.24% (Secured Overnight Financing Rate + 1.178%) | | | 07/21/32 | | | | 555,000 | | | | 409,868 | |
| | | |
2.48% (Secured Overnight Financing Rate + 1.360%) (3) | | | 09/16/36 | | | | 1,050,000 | | | | 744,587 | |
| | | |
3.77% (3 mo. USD Term SOFR + 1.402%) (3) | | | 01/24/29 | | | | 2,190,000 | | | | 1,978,206 | |
|
NatWest Group PLC (United Kingdom) | |
| | | |
4.27% (3 mo. USD LIBOR + 1.762%) (3) | | | 03/22/25 | | | | 715,000 | | | | 707,943 | |
|
PNC Financial Services Group, Inc. | |
| | | |
5.07% (Secured Overnight Financing Rate + 1.933%) (3) | | | 01/24/34 | | | | 2,785,000 | | | | 2,452,917 | |
| | | |
5.58% (Secured Overnight Financing Rate + 1.841%) (3) | | | 06/12/29 | | | | 615,000 | | | | 588,998 | |
| | | | | | | | | | | | |
| Issues | | Maturity
Date | | | Principal
Amount | | | Value | |
|
| Banks (Continued) | |
| | | |
6.88% (Secured Overnight Financing Rate + 2.284%) | | | 10/20/34 | | | $ | 585,000 | | | $ | 584,971 | |
| |
Santander U.K. Group Holdings PLC (United Kingdom) | | | | | |
| | | |
1.09% (Secured Overnight Financing Rate + 0.787%) | | | 03/15/25 | | | | 3,265,000 | | | | 3,188,632 | |
| | | |
1.67% (Secured Overnight Financing Rate + 0.989%) (3) | | | 06/14/27 | | | | 285,000 | | | | 248,546 | |
| | | |
2.47% (Secured Overnight Financing Rate + 1.220%) (3) | | | 01/11/28 | | | | 465,000 | | | | 402,118 | |
| | | |
2.90% (Secured Overnight Financing Rate + 1.475%) (3) | | | 03/15/32 | | | | 1,175,000 | | | | 889,032 | |
| | | |
4.80% (3 mo. USD LIBOR +1.570%) (3) | | | 11/15/24 | | | | 960,000 | | | | 959,471 | |
| | | |
5.00% (2) | | | 11/07/23 | �� | | | 2,460,000 | | | | 2,459,350 | |
| | | |
U.S. Bancorp | | | | | | | | | | | | |
| | | |
4.84% (Secured Overnight Financing Rate + 1.600%) | | | 02/01/34 | | | | 2,815,000 | | | | 2,407,810 | |
| | | |
5.84% (Secured Overnight Financing Rate + 2.260%) | | | 06/12/34 | | | | 710,000 | | | | 655,941 | |
| | | |
5.85% (Secured Overnight Financing Rate + 2.090%) (3) | | | 10/21/33 | | | | 545,000 | | | | 501,487 | |
| | | |
UBS Group AG (Switzerland) | | | | | | | | | | | | |
| | | |
0.63% (1) | | | 01/18/33 | | | | 515,000 | | | | 370,075 | |
| | | |
1.31% (Secured Overnight Financing Rate Index + 0.980%) (2),(3) | | | 02/02/27 | | | | 2,610,000 | | | | 2,316,375 | |
| | | |
1.49% (1 yr. CMT + 0.850%) (2),(3) | | | 08/10/27 | | | | 765,000 | | | | 663,049 | |
| | | |
2.13% (1 year EUR Swap + 1.600%) (1),(3) | | | 10/13/26 | | | | 165,000 | | | | 166,056 | |
| | | |
2.59% (Secured Overnight Financing Rate + 1.560%) (2) | | | 09/11/25 | | | | 85,000 | | | | 81,982 | |
| | | |
3.09% (Secured Overnight Financing Rate + 1.730%) (2) | | | 05/14/32 | | | | 2,810,000 | | | | 2,166,566 | |
| | | |
6.37% (Secured Overnight Financing Rate + 3.340%) (2),(3) | | | 07/15/26 | | | | 795,000 | | | | 790,310 | |
| | | |
6.54% (Secured Overnight Financing Rate + 3.920%) (2) | | | 08/12/33 | | | | 1,070,000 | | | | 1,028,217 | |
| | | |
7.75% (1 yr. EURIBOR ICE Swap + 4.950%) (1),(3) | | | 03/01/29 | | | | 505,000 | | | | 592,026 | |
| | | |
9.02% (Secured Overnight Financing Rate + 5.020%) (2) | | | 11/15/33 | | | | 4,980,000 | | | | 5,601,731 | |
See accompanying Notes to Financial Statements.
19
TCW Core Fixed Income Fund
Schedule of Investments (Continued)
| | | | | | | | | | | | |
| Issues | | Maturity
Date | | | Principal
Amount | | | Value | |
|
| Banks (Continued) | |
| | | |
Wells Fargo & Co. | | | | | | | | | | | | |
| | | |
2.16% (3 mo. USD Term SOFR + 1.012%) (3) | | | 02/11/26 | | | $ | 1,850,000 | | | $ | 1,750,316 | |
| | | |
2.88% (3 mo. USD Term SOFR + 1.432%) (3) | | | 10/30/30 | | | | 285,000 | | | | 233,067 | |
| | | |
3.35% (Secured Overnight Financing Rate + 1.500%) | | | 03/02/33 | | | | 4,340,000 | | | | 3,419,790 | |
| | | |
3.53% (Secured Overnight Financing Rate + 1.510%) (3) | | | 03/24/28 | | | | 3,760,000 | | | | 3,430,248 | |
| | | |
3.58% (3 mo. USD Term SOFR + 1.572%) (3) | | | 05/22/28 | | | | 1,320,000 | | | | 1,201,921 | |
| | | |
4.90% (Secured Overnight Financing Rate + 2.100%) | | | 07/25/33 | | | | 1,325,000 | | | | 1,165,112 | |
| | | |
5.01% (3 mo. USD Term SOFR + 4.502%) (3) | | | 04/04/51 | | | | 75,000 | | | | 59,520 | |
| | | |
5.39% (Secured Overnight Financing Rate + 2.020%) (3) | | | 04/24/34 | | | | 550,000 | | | | 498,564 | |
| | | | | | | | | | | | |
| | | |
| | | | | | | | | | | 108,636,165 | |
| | | | | | | | | | | | |
|
| Beverages — 0.2% | |
|
Bacardi Ltd. | |
| | | |
2.75% (2) | | | 07/15/26 | | | | 750,000 | | | | 687,082 | |
| | | |
4.45% (2) | | | 05/15/25 | | | | 1,095,000 | | | | 1,065,029 | |
| | | | | | | | | | | | |
| | | |
| | | | | | | | | | | 1,752,111 | |
| | | | | | | | | | | | |
|
| Biotechnology — 0.2% | |
|
Amgen, Inc. | |
| | | |
4.20% | | | 02/22/52 | | | | 505,000 | | | | 355,288 | |
| | | |
5.25% | | | 03/02/33 | | | | 1,165,000 | | | | 1,087,213 | |
| | | |
5.75% | | | 03/02/63 | | | | 709,000 | | | | 614,887 | |
| | | | | | | | | | | | |
| | | |
| | | | | | | | | | | 2,057,388 | |
| | | | | | | | | | | | |
|
| Chemicals — 0.3% | |
|
International Flavors & Fragrances, Inc. | |
| | | |
2.30% (2) | | | 11/01/30 | | | | 1,185,000 | | | | 880,502 | |
| | | |
3.27% (2) | | | 11/15/40 | | | | 235,000 | | | | 143,101 | |
| | | |
3.47% (2) | | | 12/01/50 | | | | 125,000 | | | | 69,761 | |
| | | |
4.38% | | | 06/01/47 | | | | 370,000 | | | | 240,985 | |
| | | |
5.00% | | | 09/26/48 | | | | 2,040,000 | | | | 1,469,835 | |
| | | | | | | | | | | | |
| | | |
| | | | | | | | | | | 2,804,184 | |
| | | | | | | | | | | | |
|
| Commercial Services — 0.1% | |
|
Global Payments, Inc. | |
| | | |
4.88% | | | 03/17/31 | | | | 225,000 | | | | 233,142 | |
| | | |
5.40% | | | 08/15/32 | | | | 540,000 | | | | 490,315 | |
| | | |
5.95% | | | 08/15/52 | | | | 899,000 | | | | 760,455 | |
| | | | | | | | | | | | |
| | | |
| | | | | | | | | | | 1,483,912 | |
| | | | | | | | | | | | |
| | | | | | | | | | | | |
| Issues | | Maturity
Date | | | Principal
Amount | | | Value | |
|
| Diversified Financial Services — 1.1% | |
| |
AerCap Ireland Capital DAC/AerCap Global Aviation Trust (Ireland) | | | | | |
| | | |
3.00% | | | 10/29/28 | | | $ | 3,225,000 | | | $ | 2,717,658 | |
| | | |
3.30% | | | 01/30/32 | | | | 874,000 | | | | 678,145 | |
|
Air Lease Corp. | |
| | | |
3.25% | | | 03/01/25 | | | | 1,300,000 | | | | 1,245,486 | |
| | | |
3.63% | | | 12/01/27 | | | | 640,000 | | | | 574,000 | |
| | | |
4.63% | | | 10/01/28 | | | | 1,500,000 | | | | 1,376,850 | |
|
Avolon Holdings Funding Ltd. (Ireland) | |
| | | |
2.53% (2) | | | 11/18/27 | | | | 884,000 | | | | 738,666 | |
| | | |
2.88% (2) | | | 02/15/25 | | | | 1,550,000 | | | | 1,465,944 | |
| | | |
3.95% (2) | | | 07/01/24 | | | | 405,000 | | | | 397,159 | |
|
Capital One Financial Corp. | |
| | | |
1.34% (Secured Overnight Financing Rate + 0.690%) (3) | | | 12/06/24 | | | | 2,535,000 | | | | 2,503,160 | |
|
Park Aerospace Holdings Ltd. (Ireland) | |
| | | |
5.50% (2) | | | 02/15/24 | | | | 108,000 | | | | 107,263 | |
| | | | | | | | | | | | |
| | | |
| | | | | | | | | | | 11,804,331 | |
| | | | | | | | | | | | |
|
| Electric — 1.4% | |
|
American Electric Power Co., Inc. | |
| | | |
5.95% | | | 11/01/32 | | | | 450,000 | | | | 435,488 | |
|
Appalachian Power Co. | |
| | | |
4.45% | | | 06/01/45 | | | | 690,000 | | | | 510,283 | |
|
Arizona Public Service Co. | |
| | | |
3.35% | | | 05/15/50 | | | | 1,675,000 | | | | 991,198 | |
|
Duke Energy Corp. | |
| | | |
3.75% | | | 09/01/46 | | | | 790,000 | | | | 519,026 | |
| | | |
3.85% | | | 06/15/34 | | | | 800,000 | | | | 763,703 | |
|
Duke Energy Progress LLC | |
| | | |
3.70% | | | 10/15/46 | | | | 1,325,000 | | | | 880,462 | |
| | | |
5.25% | | | 03/15/33 | | | | 505,000 | | | | 476,109 | |
|
Indiana Michigan Power Co. | |
| | | |
4.55% | | | 03/15/46 | | | | 420,000 | | | | 324,801 | |
|
ITC Holdings Corp. | |
| | | |
2.95% (2) | | | 05/14/30 | | | | 2,000,000 | | | | 1,635,358 | |
|
Jersey Central Power & Light Co. | |
| | | |
2.75% (2) | | | 03/01/32 | | | | 2,575,000 | | | | 1,978,347 | |
|
MidAmerican Energy Co. | |
| | | |
5.80% | | | 10/15/36 | | | | 1,655,000 | | | | 1,607,019 | |
|
Public Service Co. of Colorado | |
| | | |
5.25% | | | 04/01/53 | | | | 1,215,000 | | | | 1,016,870 | |
|
TenneT Holding BV (Netherlands) | |
| | | |
2.75% (1) | | | 05/17/42 | | | | 775,000 | | | | 710,978 | |
| | | |
4.50% (1) | | | 10/28/34 | | | | 410,000 | | | | 457,802 | |
| | | |
4.75% (1) | | | 10/28/42 | | | | 1,015,000 | | | | 1,132,203 | |
|
Tucson Electric Power Co. | |
| | | |
4.00% | | | 06/15/50 | | | | 1,500,000 | | | | 1,011,630 | |
| | | | | | | | | | | | |
| | | |
| | | | | | | | | | | 14,451,277 | |
| | | | | | | | | | | | |
See accompanying Notes to Financial Statements.
20
TCW Core Fixed Income Fund
October 31, 2023
| | | | | | | | | | | | |
| Issues | | Maturity
Date | | | Principal
Amount | | | Value | |
|
| Engineering & Construction — 0.0% | |
|
Cellnex Finance Co. SA (Spain) | |
| | | |
2.00% (1) | | | 09/15/32 | | | $ | 400,000 | | | $ | 326,583 | |
| | | | | | | | | | | | |
|
| Entertainment — 0.5% | |
|
WarnerMedia Holdings, Inc. | |
| | | |
4.28% | | | 03/15/32 | | | | 200,000 | | | | 165,892 | |
| | | |
5.05% | | | 03/15/42 | | | | 3,135,000 | | | | 2,322,126 | |
| | | |
5.14% | | | 03/15/52 | | | | 3,834,000 | | | | 2,716,964 | |
| | | | | | | | | | | | |
| | | |
| | | | | | | | | | | 5,204,982 | |
| | | | | | | | | | | | |
|
| Food — 0.8% | |
| |
JBS USA LUX SA/JBS USA Food Co./JBS Luxembourg SARL | | | | | |
| | | |
6.75% (2) | | | 03/15/34 | | | | 2,240,000 | | | | 2,097,379 | |
| |
JBS USA LUX SA/JBS USA Food Co./JBS USA Finance, Inc. | | | | | |
| | | |
3.00% | | | 02/02/29 | | | | 1,445,000 | | | | 1,190,362 | |
| | | |
3.00% | | | 05/15/32 | | | | 1,875,000 | | | | 1,358,901 | |
| | | |
6.50% | | | 12/01/52 | | | | 1,575,000 | | | | 1,284,917 | |
|
Pilgrim’s Pride Corp. | |
| | | |
6.25% | | | 07/01/33 | | | | 545,000 | | | | 502,370 | |
|
Smithfield Foods, Inc. | |
| | | |
2.63% (2) | | | 09/13/31 | | | | 2,565,000 | | | | 1,823,459 | |
| | | | | | | | | | | | |
| | | |
| | | | | | | | | | | 8,257,388 | |
| | | | | | | | | | | | |
|
| Gas — 0.4% | |
|
KeySpan Gas East Corp. | |
| | | |
3.59% (2) | | | 01/18/52 | | | | 1,150,000 | | | | 671,566 | |
| | | |
5.82% (2) | | | 04/01/41 | | | | 1,551,000 | | | | 1,344,717 | |
| | | |
5.99% (2) | | | 03/06/33 | | | | 530,000 | | | | 498,894 | |
|
National Gas Transmission PLC (United Kingdom) | |
| | | |
4.25% (1) | | | 04/05/30 | | | | 560,000 | | | | 583,609 | |
|
Piedmont Natural Gas Co., Inc. | |
| | | |
5.40% | | | 06/15/33 | | | | 705,000 | | | | 656,609 | |
| | | | | | | | | | | | |
| | | |
| | | | | | | | | | | 3,755,395 | |
| | | | | | | | | | | | |
|
| Health Care-Products — 0.0% | |
|
Medtronic Global Holdings SCA | |
| | | |
1.50% | | | 07/02/39 | | | | 500,000 | | | | 354,375 | |
| | | | | | | | | | | | |
|
| Health Care-Services — 1.2% | |
|
Centene Corp. | |
| | | |
3.00% | | | 10/15/30 | | | | 3,888,000 | | | | 3,080,416 | |
|
CommonSpirit Health | |
| | | |
2.78% | | | 10/01/30 | | | | 875,000 | | | | 702,135 | |
|
Fresenius Finance Ireland PLC | |
| | | |
0.88% (1) | | | 10/01/31 | | | | 920,000 | | | | 721,521 | |
|
Fresenius Medical Care U.S. Finance III, Inc. | |
| | | |
1.88% (2) | | | 12/01/26 | | | | 1,650,000 | | | | 1,427,300 | |
|
HCA, Inc. | |
| | | |
3.50% | | | 07/15/51 | | | | 746,000 | | | | 433,037 | |
| | | |
3.63% | | | 03/15/32 | | | | 656,000 | | | | 527,168 | |
| | | |
4.13% | | | 06/15/29 | | | | 3,946,000 | | | | 3,503,377 | |
| | | | | | | | | | | | |
| Issues | | Maturity
Date | | | Principal
Amount | | | Value | |
|
| Health Care-Services (Continued) | |
| | | |
5.25% | | | 06/15/49 | | | $ | 600,000 | | | $ | 461,590 | |
| | | |
5.50% | | | 06/15/47 | | | | 1,315,000 | | | | 1,063,506 | |
| | | | | | | | | | | | |
| | | |
| | | | | | | | | | | 11,920,050 | |
| | | | | | | | | | | | |
|
| Insurance — 1.4% | |
|
Aon Corp./Aon Global Holdings PLC | |
| | | |
2.60% | | | 12/02/31 | | | | 940,000 | | | | 720,529 | |
| | | |
3.90% | | | 02/28/52 | | | | 805,000 | | | | 543,150 | |
|
Athene Global Funding | |
| | | |
1.99% (2) | | | 08/19/28 | | | | 4,000,000 | | | | 3,245,160 | |
| | | |
2.72% (2) | | | 01/07/29 | | | | 240,000 | | | | 196,531 | |
| | | |
3.21% (2) | | | 03/08/27 | | | | 815,000 | | | | 724,823 | |
|
Farmers Exchange Capital | |
| | | |
7.20% (2) | | | 07/15/48 | | | | 1,495,000 | | | | 1,361,116 | |
|
Farmers Exchange Capital II | |
| | | |
6.15% (3 mo. USD LIBOR + 3.744%) (2) | | | 11/01/53 | | | | 2,065,000 | | | | 1,865,175 | |
|
Nationwide Mutual Insurance Co. | |
| | | |
7.96% (3 mo. USD LIBOR + 2.290%) (2),(3) | | | 12/15/24 | | | | 4,000,000 | | | | 3,992,966 | |
|
New York Life Insurance Co. | |
| | | |
3.75% (2) | | | 05/15/50 | | | | 70,000 | | | | 45,949 | |
|
Teachers Insurance & Annuity Association of America | |
| | | |
3.30% (2) | | | 05/15/50 | | | | 430,000 | | | | 258,200 | |
| | | |
4.27% (2) | | | 05/15/47 | | | | 130,000 | | | | 93,946 | |
|
Willis North America, Inc. | |
| | | |
4.50% | | | 09/15/28 | | | | 1,445,000 | | | | 1,343,909 | |
| | | |
5.35% | | | 05/15/33 | | | | 430,000 | | | | 392,263 | |
| | | | | | | | | | | | |
| | | |
| | | | | | | | | | | 14,783,717 | |
| | | | | | | | | | | | |
|
| Internet — 0.2% | |
|
Netflix, Inc. | |
| | | |
4.63% | | | 05/15/29 | | | | 670,000 | | | | 723,981 | |
|
Tencent Holdings Ltd.(China) | |
| | | |
3.68% (2) | | | 04/22/41 | | | | 825,000 | | | | 550,429 | |
| | | |
3.84% (2) | | | 04/22/51 | | | | 30,000 | | | | 18,443 | |
| | | |
3.98% (2) | | | 04/11/29 | | | | 740,000 | | | | 665,097 | |
| | | | | | | | | | | | |
| | | |
| | | | | | | | | | | 1,957,950 | |
| | | | | | | | | | | | |
|
| Media — 0.5% | |
| |
Charter Communications Operating LLC/Charter Communications Operating Capital | | | | | |
| | | |
3.90% | | | 06/01/52 | | | | 1,000,000 | | | | 568,900 | |
| | | |
4.80% | | | 03/01/50 | | | | 495,000 | | | | 326,520 | |
| | | |
5.13% | | | 07/01/49 | | | | 580,000 | | | | 407,334 | |
| | | |
5.25% | | | 04/01/53 | | | | 500,000 | | | | 354,830 | |
| | | |
5.38% | | | 04/01/38 | | | | 1,475,000 | | | | 1,168,672 | |
| | | |
5.38% | | | 05/01/47 | | | | 2,755,000 | | | | 1,994,758 | |
| | | |
5.75% | | | 04/01/48 | | | | 1,028,000 | | | | 780,484 | |
| | | | | | | | | | | | |
| | | |
| | | | | | | | | | | 5,601,498 | |
| | | | | | | | | | | | |
See accompanying Notes to Financial Statements.
21
TCW Core Fixed Income Fund
Schedule of Investments (Continued)
| | | | | | | | | | | | |
| Issues | | Maturity
Date | | | Principal
Amount | | | Value | |
|
| Miscellaneous Manufacturers — 0.3% | |
|
General Electric Co. | |
| | | |
6.11% (3 mo. USD Term SOFR + 0.742%) | | | 08/15/36 | | | $ | 3,045,000 | | | $ | 2,731,916 | |
| | | | | | | | | | | | |
|
| Oil & Gas — 0.1% | |
|
Petroleos Mexicanos | |
| | | |
6.63% | | | 06/15/35 | | | | 552,000 | | | | 365,700 | |
| | | |
6.75% | | | 09/21/47 | | | | 1,595,000 | | | | 904,865 | |
| | | | | | | | | | | | |
| | | |
| | | | | | | | | | | 1,270,565 | |
| | | | | | | | | | | | |
|
| Packaging & Containers — 0.3% | |
|
Berry Global, Inc. | |
| | | |
1.57% | | | 01/15/26 | | | | 1,584,000 | | | | 1,432,110 | |
| | | |
1.65% | | | 01/15/27 | | | | 1,716,000 | | | | 1,479,567 | |
| | | |
4.88% (2) | | | 07/15/26 | | | | 580,000 | | | | 554,086 | |
| | | | | | | | | | | | |
| | | |
| | | | | | | | | | | 3,465,763 | |
| | | | | | | | | | | | |
|
| Pharmaceuticals — 0.5% | |
|
Bayer U.S. Finance II LLC | |
| | | |
4.38% (2) | | | 12/15/28 | | | | 3,023,000 | | | | 2,771,301 | |
| | | |
4.63% (2) | | | 06/25/38 | | | | 500,000 | | | | 394,907 | |
| | | |
4.88% (2) | | | 06/25/48 | | | | 1,930,000 | | | | 1,447,635 | |
|
CVS Health Corp. | |
| | | |
5.05% | | | 03/25/48 | | | | 565,000 | | | | 445,096 | |
| | | | | | | | | | | | |
| | | |
| | | | | | | | | | | 5,058,939 | |
| | | | | | | | | | | | |
|
| Pipelines — 1.0% | |
|
Columbia Pipelines Operating Co. LLC | |
| | | |
5.93% (2) | | | 08/15/30 | | | | 830,000 | | | | 803,200 | |
|
Energy Transfer LP | |
| | | |
5.00% | | | 05/15/50 | | | | 740,000 | | | | 555,311 | |
| | | |
5.15% | | | 03/15/45 | | | | 985,000 | | | | 761,548 | |
| | | |
5.40% | | | 10/01/47 | | | | 1,538,000 | | | | 1,213,374 | |
| | | |
5.95% | | | 10/01/43 | | | | 630,000 | | | | 533,785 | |
| | | |
6.55% | | | 12/01/33 | | | | 344,000 | | | | 338,981 | |
|
Plains All American Pipeline LP/PAA Finance Corp. | |
| | | |
3.80% | | | 09/15/30 | | | | 375,000 | | | | 316,166 | |
|
Rockies Express Pipeline LLC | |
| | | |
4.95% (2) | | | 07/15/29 | | | | 2,000,000 | | | | 1,769,640 | |
| | | |
6.88% (2) | | | 04/15/40 | | | | 350,000 | | | | 292,089 | |
|
Southern Natural Gas Co. LLC | |
| | | |
7.35% | | | 02/15/31 | | | | 2,380,000 | | | | 2,433,353 | |
|
TC PipeLines LP | |
| | | |
4.38% | | | 03/13/25 | | | | 710,000 | | | | 693,238 | |
|
TransCanada PipeLines Ltd. | |
| | | |
4.63% | | | 03/01/34 | | | | 125,000 | | | | 105,966 | |
| | | |
6.10% | | | 06/01/40 | | | | 375,000 | | | | 346,305 | |
| | | | | | | | | | | | |
| | | |
| | | | | | | | | | | 10,162,956 | |
| | | | | | | | | | | | |
|
| Real Estate — 0.3% | |
|
Annington Funding PLC (United Kingdom) | |
| | | |
2.31% (1) | | | 10/06/32 | | | | 720,000 | | | | 614,025 | |
| | | |
3.18% (1) | | | 07/12/29 | | | | 325,000 | | | | 327,072 | |
| | | | | | | | | | | | |
| Issues | | Maturity
Date | | | Principal
Amount | | | Value | |
|
| Real Estate (Continued) | |
| |
Blackstone Property Partners Europe Holdings SARL (Luxembourg) | | | | | |
| | | |
1.00% (1) | | | 05/04/28 | | | $ | 425,000 | | | $ | 353,865 | |
| | | |
1.63% (1) | | | 04/20/30 | | | | 325,000 | | | | 251,787 | |
| | | |
1.75% (1) | | | 03/12/29 | | | | 550,000 | | | | 457,204 | |
|
Vonovia Finance BV (Germany) | |
| | | |
2.25% (1) | | | 04/07/30 | | | | 100,000 | | | | 88,476 | |
|
Vonovia SE (Germany) | |
| | | |
1.00% (1) | | | 06/16/33 | | | | 300,000 | | | | 217,740 | |
| | | |
1.50% (1) | | | 06/14/41 | | | | 300,000 | | | | 171,142 | |
| | | |
5.00% (1) | | | 11/23/30 | | | | 100,000 | | | | 103,917 | |
| | | | | | | | | | | | |
| | | |
| | | | | | | | | | | 2,585,228 | |
| | | | | | | | | | | | |
|
| REIT — 2.8% | |
|
American Assets Trust LP | |
| | | |
3.38% | | | 02/01/31 | | | | 1,655,000 | | | | 1,193,056 | |
|
American Homes 4 Rent LP | |
| | | |
3.38% | | | 07/15/51 | | | | 730,000 | | | | 412,151 | |
|
American Tower Corp. | |
| | | |
0.88% | | | 05/21/29 | | | | 725,000 | | | | 626,014 | |
| | | |
1.00% | | | 01/15/32 | | | | 500,000 | | | | 398,849 | |
| | | |
2.70% | | | 04/15/31 | | | | 310,000 | | | | 239,827 | |
| | | |
5.55% | | | 07/15/33 | | | | 1,445,000 | | | | 1,332,362 | |
| | | |
5.65% | | | 03/15/33 | | | | 880,000 | | | | 820,046 | |
|
CapitaLand Ascendas REIT (Singapore) | |
| | | |
0.75% (1) | | | 06/23/28 | | | | 870,000 | | | | 740,021 | |
|
CubeSmart LP | |
| | | |
3.00% | | | 02/15/30 | | | | 317,000 | | | | 259,550 | |
|
Digital Dutch Finco BV | |
| | | |
1.25% (1) | | | 02/01/31 | | | | 1,830,000 | | | | 1,474,660 | |
|
Digital Intrepid Holding BV | |
| | | |
1.38% (1) | | | 07/18/32 | | | | 105,000 | | | | 80,985 | |
|
Extra Space Storage LP | |
| | | |
2.35% | | | 03/15/32 | | | | 1,245,000 | | | | 913,152 | |
| | | |
2.40% | | | 10/15/31 | | | | 2,000,000 | | | | 1,494,780 | |
| | | |
3.90% | | | 04/01/29 | | | | 250,000 | | | | 221,735 | |
|
GLP Capital LP/GLP Financing II, Inc. | |
| | | |
3.25% | | | 01/15/32 | | | | 16,000 | | | | 12,100 | |
| | | |
4.00% | | | 01/15/30 | | | | 528,000 | | | | 443,805 | |
| | | |
4.00% | | | 01/15/31 | | | | 170,000 | | | | 138,349 | |
| | | |
5.30% | | | 01/15/29 | | | | 1,280,000 | | | | 1,172,800 | |
| | | |
5.75% | | | 06/01/28 | | | | 1,600,000 | | | | 1,501,544 | |
|
Healthcare Realty Holdings LP | |
| | | |
2.00% | | | 03/15/31 | | | | 2,600,000 | | | | 1,896,560 | |
| | | |
2.05% | | | 03/15/31 | | | | 164,000 | | | | 116,870 | |
| | | |
3.10% | | | 02/15/30 | | | | 1,705,000 | | | | 1,388,746 | |
|
Hudson Pacific Properties LP | |
| | | |
3.25% | | | 01/15/30 | | | | 655,000 | | | | 421,342 | |
| | | |
3.95% | | | 11/01/27 | | | | 245,000 | | | | 188,358 | |
| | | |
4.65% | | | 04/01/29 | | | | 135,000 | | | | 96,443 | |
| | | |
5.95% | | | 02/15/28 | | | | 1,205,000 | | | | 953,770 | |
See accompanying Notes to Financial Statements.
22
TCW Core Fixed Income Fund
October 31, 2023
| | | | | | | | | | | | |
| Issues | | Maturity
Date | | | Principal
Amount | | | Value | |
|
| REIT (Continued) | |
|
Invitation Homes Operating Partnership LP | |
| | | |
2.00% | | | 08/15/31 | | | $ | 1,776,000 | | | $ | 1,282,538 | |
| | | |
5.50% | | | 08/15/33 | | | | 215,000 | | | | 195,070 | |
|
Kilroy Realty LP | |
| | | |
2.65% | | | 11/15/33 | | | | 891,000 | | | | 583,089 | |
|
LXP Industrial Trust | |
| | | |
2.38% | | | 10/01/31 | | | | 1,592,000 | | | | 1,140,159 | |
|
Physicians Realty LP | |
| | | |
2.63% | | | 11/01/31 | | | | 940,000 | | | | 691,075 | |
|
Prologis Euro Finance LLC | |
| | | |
0.50% | | | 02/16/32 | | | | 400,000 | | | | 302,623 | |
| | | |
0.63% | | | 09/10/31 | | | | 100,000 | | | | 79,172 | |
| | | |
1.00% | | | 02/08/29 | | | | 750,000 | | | | 666,457 | |
| | | |
1.00% | | | 02/16/41 | | | | 400,000 | | | | 225,950 | |
| | | |
4.25% | | | 01/31/43 | | | | 450,000 | | | | 412,197 | |
|
Realty Income Corp. | |
| | | |
5.13% | | | 07/06/34 | | | | 620,000 | | | | 642,692 | |
|
Rexford Industrial Realty LP | |
| | | |
2.15% | | | 09/01/31 | | | | 25,000 | | | | 18,135 | |
|
SELP Finance SARL (Luxembourg) | |
| | | |
0.88% (1) | | | 05/27/29 | | | | 900,000 | | | | 753,525 | |
|
VICI Properties LP | |
| | | |
4.95% | | | 02/15/30 | | | | 30,000 | | | | 26,894 | |
| | | |
5.13% | | | 05/15/32 | | | | 1,657,000 | | | | 1,432,029 | |
| | | |
5.63% | | | 05/15/52 | | | | 320,000 | | | | 250,797 | |
|
VICI Properties LP/VICI Note Co., Inc. | |
| | | |
3.75% (2) | | | 02/15/27 | | | | 25,000 | | | | 22,528 | |
| | | |
3.88% (2) | | | 02/15/29 | | | | 805,000 | | | | 684,215 | |
| | | |
4.13% (2) | | | 08/15/30 | | | | 196,000 | | | | 162,065 | |
| | | |
4.50% (2) | | | 09/01/26 | | | | 380,000 | | | | 358,515 | |
| | | |
4.50% (2) | | | 01/15/28 | | | | 327,000 | | | | 296,223 | |
| | | |
4.63% (2) | | | 06/15/25 | | | | 180,000 | | | | 173,171 | |
| | | | | | | | | | | | |
| | | |
| | | | | | | | | | | 28,936,994 | |
| | | | | | | | | | | | |
|
| Savings & Loans — 0.1% | |
|
Nationwide Building Society (United Kingdom) | |
| | | |
2.97% (Secured Overnight Financing Rate + 1.290%) (2),(3) | | | 02/16/28 | | | | 1,630,000 | | | | 1,449,738 | |
| | | | | | | | | | | | |
|
| Semiconductors — 0.1% | |
|
Broadcom, Inc. | |
| | | |
2.60% (2) | | | 02/15/33 | | | | 1,115,000 | | | | 809,947 | |
| | | | | | | | | | | | |
|
| Software — 0.4% | |
|
Oracle Corp. | |
| | | |
3.60% | | | 04/01/50 | | | | 1,535,000 | | | | 941,392 | |
| | | |
3.80% | | | 11/15/37 | | | | 905,000 | | | | 668,472 | |
| | | |
3.95% | | | 03/25/51 | | | | 2,803,000 | | | | 1,823,352 | |
| | | |
6.90% | | | 11/09/52 | | | | 30,000 | | | | 29,626 | |
| | | | | | | | | | | | |
| Issues | | Maturity
Date | | | Principal
Amount | | | Value | |
|
| Software (Continued) | |
|
Take-Two Interactive Software, Inc. | |
| | | |
4.00% | | | 04/14/32 | | | $ | 1,000,000 | | | $ | 856,490 | |
| | | | | | | | | | | | |
| | | |
| | | | | | | | | | | 4,319,332 | |
| | | | | | | | | | | | |
|
| Telecommunications — 0.7% | |
|
Global Switch Finance BV (United Kingdom) | |
| | | |
1.38% (1) | | | 10/07/30 | | | | 695,000 | | | | 613,223 | |
|
Qwest Corp. | |
| | | |
7.25% | | | 09/15/25 | | | | 920,000 | | | | 887,800 | |
| |
Sprint Spectrum Co. LLC/Sprint Spectrum Co. II LLC/Sprint Spectrum Co. III LLC | | | | | |
| | | |
4.74% (2) | | | 09/20/29 | | | | 2,304,374 | | | | 2,278,643 | |
| | | |
5.15% (2) | | | 09/20/29 | | | | 2,254,500 | | | | 2,218,989 | |
|
T-Mobile USA, Inc. | |
| | | |
3.88% | | | 04/15/30 | | | | 1,200,000 | | | | 1,045,220 | |
|
Vodafone Group PLC (United Kingdom) | |
| | | |
4.88% | | | 06/19/49 | | | | 302,000 | | | | 228,606 | |
| | | | | | | | | | | | |
| | | |
| | | | | | | | | | | 7,272,481 | |
| | | | | | | | | | | | |
|
| Water — 0.1% | |
| |
Thames Water Utilities Finance PLC (United Kingdom) | | | | | |
| | | |
4.38% (1) | | | 01/18/31 | | | | 610,000 | | | | 581,552 | |
| | | | | | | | | | | | |
|
Total Corporate Bonds | |
| |
(Cost: $316,985,964) | | | | 279,188,115 | |
| | | | | | | | | | | | |
|
| MUNICIPAL BONDS — 0.5% | |
| |
California Health Facilities Financing Authority, Revenue Bond | | | | | |
| | | |
3.00% | | | 08/15/51 | | | | 955,000 | | | | 665,714 | |
|
City of New York, General Obligation Unlimited | |
| | | |
3.00% | | | 08/01/34 | | | | 380,000 | | | | 293,614 | |
| |
New York City Transitional Finance Authority Future Tax Secured Revenue | | | | | |
| | | |
2.00% | | | 08/01/35 | | | | 1,000,000 | | | | 666,891 | |
| | | |
2.40% | | | 11/01/32 | | | | 585,000 | | | | 446,580 | |
| | | |
2.45% | | | 11/01/34 | | | | 2,485,000 | | | | 1,781,130 | |
| |
Regents of the University of California Medical Center Pooled Revenue | | | | | |
| | | |
3.26% | | | 05/15/60 | | | | 3,060,000 | | | | 1,771,516 | |
| | | | | | | | | | | | |
|
Total Municipal Bonds | |
| |
(Cost: $8,265,603) | | | | 5,625,445 | |
| | | | | | | | | | | | |
|
| ASSET-BACKED SECURITIES — 7.5% | |
|
AGL CLO 7 Ltd. Series 2020-7A, Class BR | |
| | | |
7.36% (3 mo. USD Term SOFR + 1.962%) (2),(3) | | | 07/15/34 | | | | 4,235,000 | | | | 4,171,865 | |
| |
Aligned Data Centers Issuer LLC Series 2021-1A, Class A2 | | | | | |
| | | |
1.94% (2) | | | 08/15/46 | | | | 3,372,000 | | | | 2,942,658 | |
|
AMMC CLO XIII Ltd. Series 2013-13A, Class A1R2 | |
| | | |
6.71% (3 mo. USD Term SOFR + 1.312%) (2),(3) | | | 07/24/29 | | | | 696,220 | | | | 696,046 | |
See accompanying Notes to Financial Statements.
23
TCW Core Fixed Income Fund
Schedule of Investments (Continued)
| | | | | | | | | | | | |
| Issues | | Maturity
Date | | | Principal
Amount | | | Value | |
|
| ASSET-BACKED SECURITIES (Continued) | |
|
ARES LXII CLO Ltd. Series 2021-62A, Class B | |
| | | |
7.29% (3 mo. USD Term SOFR + 1.912%) (2),(3) | | | 01/25/34 | | | $ | 4,000,000 | | | $ | 3,914,596 | |
| |
Brazos Education Loan Authority, Inc. Series 2012-1, Class A1 | | | | | |
| | | |
6.14% (30 day USD SOFR Average + 0.814%) (3) | | | 12/26/35 | | | | 249,775 | | | | 247,621 | |
|
CF Hippolyta Issuer LLC Series 2020-1, Class B1 | |
| | | |
2.28% (2) | | | 07/15/60 | | | | 3,909,918 | | | | 3,457,759 | |
|
CIFC Funding Ltd. Series 2021-7A, Class A1 | |
| | | |
6.80% (3 mo. USD Term SOFR + 1.392%) (2),(3) | | | 01/23/35 | | | | 4,300,000 | | | | 4,262,663 | |
|
Clover CLO LLC Series 2018-1A, Class A1R | |
| | | |
6.80% (3 mo. USD Term SOFR + 1.382%) (2),(3) | | | 04/20/32 | | | | 4,300,000 | | | | 4,284,688 | |
| |
Dryden XXVI Senior Loan Fund Series 2013-26A, Class AR | | | | | |
| | | |
6.56% (3 mo. USD Term SOFR + 1.162%) (2),(3) | | | 04/15/29 | | | | 1,623,220 | | | | 1,613,865 | |
|
Global SC Finance II SRL Series 2014-1A, Class A2 | |
| | | |
3.09% (2) | | | 07/17/29 | | | | 230,964 | | | | 225,920 | |
| |
GoldenTree Loan Opportunities IX Ltd. Series 2014-9A, Class AR2 | | | | | |
| | | |
6.76% (3 mo. USD Term SOFR + 1.372%) (2),(3) | | | 10/29/29 | | | | 1,095,504 | | | | 1,093,368 | |
|
JGWPT XXX LLC Series 2013-3A, Class A | |
| | | |
4.08% (2) | | | 01/17/73 | | | | 1,033,347 | | | | 892,127 | |
|
JGWPT XXXII LLC Series 2014-2A, Class A | |
| | | |
3.61% (2) | | | 01/17/73 | | | | 1,183,475 | | | | 973,541 | |
|
LCM Loan Income Fund I Ltd. Series 1A, Class B | |
| | | |
7.13% (3 mo. USD Term SOFR + 1712%) (2) | | | 04/20/31 | | | | 50,000 | | | | 49,073 | |
| |
Madison Park Funding XLVIII Ltd. Series 2021-48A, Class A | | | | | |
| | | |
6.81% (3 mo. USD Term SOFR + 1.412%) (2),(3) | | | 04/19/33 | | | | 4,320,000 | | | | 4,302,504 | |
| |
Navient Private Education Refi Loan Trust Series 2021-GA, Class A | | | | | |
| | | |
1.58% (2) | | | 04/15/70 | | | | 2,794,081 | | | | 2,350,877 | |
|
Navient Student Loan Trust Series 2014-4, Class A | |
| | | |
6.06% (30 day USD SOFR Average + 0.734%) (3) | | | 03/25/83 | | | | 1,143,765 | | | | 1,113,496 | |
|
Nelnet Student Loan Trust Series 2014-4A, Class A2 | |
| | | |
6.39% (30 day USD SOFR Average + 1.064%) (2),(3) | | | 11/25/48 | | | | 2,709,551 | | | | 2,676,559 | |
| |
New Economy Assets Phase 1 Sponsor LLC Series 2021-1, Class B1 | | | | | |
| | | |
2.41% (2) | | | 10/20/61 | | | | 3,904,000 | | | | 3,146,926 | |
|
OCP CLO Ltd. Series 2020-19A, Class AR | |
| | | |
6.83% (3 mo. USD Term SOFR + 1.412%) (2) | | | 10/20/34 | | | | 3,600,000 | | | | 3,562,747 | |
| |
Octagon Investment Partners XIV Ltd. Series 2012-1A, Class AARR | | | | | |
| | | |
6.61% (3 mo. USD Term SOFR + 1.212%) (2),(3) | | | 07/15/29 | | | | 2,497,444 | | | | 2,487,447 | |
|
Skyline Aviation, Inc. Series 2004-1, Class A | |
| | | |
3.23% (4),(5) | | | 07/03/38 | | | | 4,246,826 | | | | 3,702,701 | |
| | | | | | | | | | | | |
| Issues | | Maturity
Date | | | Principal
Amount | | | Value | |
|
| ASSET-BACKED SECURITIES (Continued) | |
|
SLM Student Loan Trust Series 2003-7A, Class A5A | |
| | | |
6.68% (90 day USD SOFR Average + 1.462%) (2),(3) | | | 12/15/33 | | | $ | 1,516,523 | | | $ | 1,518,635 | |
|
SLM Student Loan Trust Series 2008-2, Class B | |
| | | |
6.80% (90 day USD SOFR Average + 1.462%) (3) | | | 01/25/83 | | | | 710,000 | | | | 662,366 | |
|
SLM Student Loan Trust Series 2008-3, Class B | |
| | | |
6.80% (90 day USD SOFR Average + 1.462%) (3) | | | 04/26/83 | | | | 710,000 | | | | 665,379 | |
|
SLM Student Loan Trust Series 2008-4, Class A4 | |
| | | |
7.25% (90 day USD SOFR Average + 1.912%) (3) | | | 07/25/22 | | | | 2,399,233 | | | | 2,399,900 | |
|
SLM Student Loan Trust Series 2008-4, Class B | |
| | | |
7.45% (90 day USD SOFR Average + 2.112%) (3) | | | 04/25/73 | | | | 710,000 | | | | 700,631 | |
|
SLM Student Loan Trust Series 2008-5, Class B | |
| | | |
7.45% (90 day USD SOFR Average + 2.112%) | | | 07/25/73 | | | | 710,000 | | | | 692,111 | |
|
SLM Student Loan Trust Series 2008-6, Class A4 | |
| | | |
6.70% (90 day USD SOFR Average + 1.362%) (3) | | | 07/25/23 | | | | 2,147,423 | | | | 2,120,338 | |
|
SLM Student Loan Trust Series 2008-6, Class B | |
| | | |
7.45% (90 day USD SOFR Average + 2.112%) (3) | | | 07/26/83 | | | | 710,000 | | | | 645,440 | |
|
SLM Student Loan Trust Series 2008-7, Class B | |
| | | |
7.45% (90 day USD SOFR Average + 2.112%) (3) | | | 07/26/83 | | | | 710,000 | | | | 652,026 | |
|
SLM Student Loan Trust Series 2011-2, Class A2 | |
| | | |
6.64% (30 day USD SOFR Average + 1.314%) (3) | | | 10/25/34 | | | | 1,218,557 | | | | 1,221,878 | |
|
SLM Student Loan Trust Series 2012-7, Class A3 | |
| | | |
6.09% (30 day USD SOFR Average + 0.764%) (3) | | | 05/26/26 | | | | 1,287,762 | | | | 1,228,895 | |
| |
Store Master Funding I-VII XIV XIX XX Series 2021-1A, Class A1 | | | | | |
| | | |
2.12% (2) | | | 06/20/51 | | | | 1,828,417 | | | | 1,501,207 | |
| |
U.S. Small Business Administration Series 2022-25G, Class 1 | | | | | |
| | | |
3.93% | | | 07/01/47 | | | | 6,002,512 | | | | 5,314,562 | |
| |
U.S. Small Business Administration Series 2022-25H, Class 1 | | | | | |
| | | |
3.80% | | | 08/01/47 | | | | 3,357,398 | | | | 2,949,371 | |
| |
U.S. Small Business Administration Series 2022-25J, Class 1 | | | | | |
| | | |
5.04% | | | 10/01/47 | | | | 3,393,727 | | | | 3,208,065 | |
| | | | | | | | | | | | |
|
Total Asset-backed Securities | |
| |
(Cost: $81,391,831) | | | | 77,649,851 | |
| | | | | | | | | | | | |
|
COMMERCIAL MORTGAGE-BACKED SECURITIES —
AGENCY — 0.6% | |
| |
Federal Home Loan Mortgage Corp. Multifamily Structured Pass-Through Certificates Series K155, Class A3 | | | | | |
| | | |
3.75% | | | 04/25/33 | | | | 4,045,000 | | | | 3,450,460 | |
|
Federal National Mortgage Association, Pool #AN0245 | |
| | | |
3.42% | | | 11/01/35 | | | | 1,752,399 | | | | 1,551,871 | |
See accompanying Notes to Financial Statements.
24
TCW Core Fixed Income Fund
October 31, 2023
| | | | | | | | | | | | |
| Issues | | Maturity
Date | | | Principal
Amount | | | Value | |
|
COMMERCIAL MORTGAGE-BACKED SECURITIES —
AGENCY (Continued) | |
| |
Federal National Mortgage Association, Pool #BL6060 | | | | | |
| | | |
2.46% | | | 04/01/40 | | | $ | 1,840,000 | | | $ | 1,162,720 | |
| | | | | | | | | | | | |
| |
Total Commercial Mortgage-Backed
Securities — Agency | | | | | |
| | | |
(Cost: $7,745,043) | | | | | | | | | | | 6,165,051 | |
| | | | | | | | | | | | |
|
COMMERCIAL MORTGAGE-BACKED SECURITIES —
NON-AGENCY —3.2% | |
| |
Arbor Realty Commercial Real Estate Notes Ltd. Series 2021-FL3, Class A | | | | | |
| | | |
6.52% (1 mo. USD Term SOFR + 1.184%) (2),(3) | | | 08/15/34 | | | | 3,882,000 | | | | 3,834,033 | |
| |
BAMLL Commercial Mortgage Securities Trust Series 2018-PARK, Class A | | | | | |
| | | |
4.09% (2),(6) | | | 08/10/38 | | | | 1,930,000 | | | | 1,682,662 | |
|
Bank Series 2022-BNK42, Class A5 | |
| | | |
4.49% (6) | | | 06/15/55 | | | | 3,593,000 | | | | 3,146,723 | |
|
BPR Trust Series 2022-OANA, Class A | |
| | | |
7.23% (1 mo. USD Term SOFR + 1.898%) (2),(3) | | | 04/15/37 | | | | 3,678,000 | | | | 3,602,122 | |
| |
BX Commercial Mortgage Trust Series 2020-VIV4, Class A | | | | | |
| | | |
2.84% (2) | | | 03/09/44 | | | | 2,415,000 | | | | 1,922,639 | |
|
BX Trust Series 2019-OC11, Class A | |
| | | |
3.20% (2) | | | 12/09/41 | | | | 1,485,000 | | | | 1,227,904 | |
|
BXHPP Trust Series 2021-FILM, Class A | |
| | | |
6.10% (1 mo. USD Term SOFR + 0.764%) (2),(3) | | | 08/15/36 | | | | 3,000,000 | | | | 2,830,280 | |
|
COMM Mortgage Trust Series 2015-CR27, Class A3 | |
| | | |
3.35% | | | 10/10/48 | | | | 1,840,022 | | | | 1,758,310 | |
| |
CSAIL Commercial Mortgage Trust Series 2020-C19, Class A3 | | | | | |
| | | |
2.56% | | | 03/15/53 | | | | 3,004,000 | | | | 2,371,855 | |
| |
Hudson Yards Mortgage Trust Series 2019-30HY, Class A | | | | | |
| | | |
3.23% (2) | | | 07/10/39 | | | | 2,185,000 | | | | 1,818,615 | |
| |
Hudson Yards Mortgage Trust Series 2019-55HY, Class A | | | | | |
| | | |
2.94% (2),(6) | | | 12/10/41 | | | | 1,180,000 | | | | 954,607 | |
| |
JPMorgan Chase Commercial Mortgage Securities Trust Series 2019-OSB, Class A | | | | | |
| | | |
3.40% (2) | | | 06/05/39 | | | | 1,160,000 | | | | 976,027 | |
| |
Manhattan West Mortgage Trust Series 2020-1MW, Class A | | | | | |
| | | |
2.13% (2) | | | 09/10/39 | | | | 1,720,000 | | | | 1,460,974 | |
|
One Bryant Park Trust Series 2019-OBP, Class A | |
| | | |
2.52% (2) | | | 09/15/54 | | | | 1,495,000 | | | | 1,173,558 | |
| |
SFAVE Commercial Mortgage Securities Trust Series 2015-5AVE, Class A1 | | | | | |
| | | |
3.87% (2),(6) | | | 01/05/43 | | | | 1,710,000 | | | | 1,143,312 | |
| |
SFAVE Commercial Mortgage Securities Trust Series 2015-5AVE, Class A2B | | | | | |
| | | |
4.14% (2),(6) | | | 01/05/43 | | | | 70,000 | | | | 45,562 | |
|
STWD Trust Series 2021-FLWR, Class B | |
| | | |
6.37% (1 mo. USD Term SOFR + 1.040%) (2),(3) | | | 07/15/36 | | | | 1,235,000 | | | | 1,204,037 | |
| | | | | | | | | | | | |
| Issues | | Maturity
Date | | | Principal
Amount | | | Value | |
|
COMMERCIAL MORTGAGE-BACKED SECURITIES —
NON-AGENCY (Continued) | |
| |
Wells Fargo Commercial Mortgage Trust Series 2015-C26, Class AS | | | | | |
| | | |
3.58% | | | 02/15/48 | | | $ | 2,100,000 | | | $ | 1,974,613 | |
| | | | | | | | | | | | |
| |
Total Commercial Mortgage-Backed
Securities — Non-Agency | | | | | |
| |
(Cost: $37,082,206) | | | | 33,127,833 | |
| | | | | | | | | | | | |
|
RESIDENTIAL MORTGAGE-BACKED SECURITIES —
AGENCY — 41.2% | |
|
Federal Home Loan Mortgage Corp., Pool #A97179 | |
| | | |
4.50% | | | 03/01/41 | | | | 934,570 | | | | 864,756 | |
|
Federal Home Loan Mortgage Corp., Pool #G06360 | |
| | | |
4.00% | | | 03/01/41 | | | | 1,117,641 | | | | 1,001,666 | |
|
Federal Home Loan Mortgage Corp., Pool #G06498 | |
| | | |
4.00% | | | 04/01/41 | | | | 757,032 | | | | 678,169 | |
|
Federal Home Loan Mortgage Corp., Pool #G06499 | |
| | | |
4.00% | | | 03/01/41 | | | | 500,253 | | | | 453,563 | |
|
Federal Home Loan Mortgage Corp., Pool #G07849 | |
| | | |
3.50% | | | 05/01/44 | | | | 633,259 | | | | 549,105 | |
|
Federal Home Loan Mortgage Corp., Pool #G07924 | |
| | | |
3.50% | | | 01/01/45 | | | | 941,459 | | | | 809,978 | |
|
Federal Home Loan Mortgage Corp., Pool #G08710 | |
| | | |
3.00% | | | 06/01/46 | | | | 1,148,512 | | | | 947,459 | |
|
Federal Home Loan Mortgage Corp., Pool #G08711 | |
| | | |
3.50% | | | 06/01/46 | | | | 1,856,178 | | | | 1,584,991 | |
|
Federal Home Loan Mortgage Corp., Pool #G08715 | |
| | | |
3.00% | | | 08/01/46 | | | | 2,218,938 | | | | 1,830,502 | |
|
Federal Home Loan Mortgage Corp., Pool #G08716 | |
| | | |
3.50% | | | 08/01/46 | | | | 1,250,167 | | | | 1,067,518 | |
|
Federal Home Loan Mortgage Corp., Pool #G08721 | |
| | | |
3.00% | | | 09/01/46 | | | | 1,783,145 | | | | 1,469,246 | |
|
Federal Home Loan Mortgage Corp., Pool #G08722 | |
| | | |
3.50% | | | 09/01/46 | | | | 505,295 | | | | 431,471 | |
|
Federal Home Loan Mortgage Corp., Pool #G08726 | |
| | | |
3.00% | | | 10/01/46 | | | | 1,713,507 | | | | 1,410,261 | |
|
Federal Home Loan Mortgage Corp., Pool #G08732 | |
| | | |
3.00% | | | 11/01/46 | | | | 1,720,888 | | | | 1,416,335 | |
|
Federal Home Loan Mortgage Corp., Pool #G08792 | |
| | | |
3.50% | | | 12/01/47 | | | | 1,368,737 | | | | 1,167,678 | |
|
Federal Home Loan Mortgage Corp., Pool #G08816 | |
| | | |
3.50% | | | 06/01/48 | | | | 257,057 | | | | 218,312 | |
|
Federal Home Loan Mortgage Corp., Pool #G08826 | |
| | | |
5.00% | | | 06/01/48 | | | | 230,537 | | | | 216,826 | |
|
Federal Home Loan Mortgage Corp., Pool #G08843 | |
| | | |
4.50% | | | 10/01/48 | | | | 911,112 | | | | 829,002 | |
|
Federal Home Loan Mortgage Corp., Pool #G16584 | |
| | | |
3.50% | | | 08/01/33 | | | | 1,012,884 | | | | 945,893 | |
|
Federal Home Loan Mortgage Corp., Pool #G18592 | |
| | | |
3.00% | | | 03/01/31 | | | | 528,566 | | | | 494,725 | |
|
Federal Home Loan Mortgage Corp., Pool #G18670 | |
| | | |
3.00% | | | 12/01/32 | | | | 362,789 | | | | 335,697 | |
See accompanying Notes to Financial Statements.
25
TCW Core Fixed Income Fund
Schedule of Investments (Continued)
| | | | | | | | | | | | |
| Issues | | Maturity
Date | | | Principal
Amount | | | Value | |
|
RESIDENTIAL MORTGAGE-BACKED SECURITIES —
AGENCY (Continued) | |
|
Federal Home Loan Mortgage Corp., Pool #G18713 | |
| | | |
3.50% | | | 11/01/33 | | | $ | 684,642 | | | $ | 637,007 | |
|
Federal Home Loan Mortgage Corp., Pool #G60038 | |
| | | |
3.50% | | | 01/01/44 | | | | 897,951 | | | | 779,932 | |
|
Federal Home Loan Mortgage Corp., Pool #G60344 | |
| | | |
4.00% | | | 12/01/45 | | | | 458,313 | | | | 408,930 | |
|
Federal Home Loan Mortgage Corp., Pool #G67700 | |
| | | |
3.50% | | | 08/01/46 | | | | 742,161 | | | | 640,196 | |
|
Federal Home Loan Mortgage Corp., Pool #G67706 | |
| | | |
3.50% | | | 12/01/47 | | | | 530,305 | | | | 455,252 | |
|
Federal Home Loan Mortgage Corp., Pool #G67707 | |
| | | |
3.50% | | | 01/01/48 | | | | 5,867,515 | | | | 5,054,943 | |
|
Federal Home Loan Mortgage Corp., Pool #G67711 | |
| | | |
4.00% | | | 03/01/48 | | | | 1,454,276 | | | | 1,291,671 | |
|
Federal Home Loan Mortgage Corp., Pool #G67718 | |
| | | |
4.00% | | | 01/01/49 | | | | 1,338,912 | | | | 1,179,925 | |
|
Federal Home Loan Mortgage Corp., Pool #Q05261 | |
| | | |
3.50% | | | 12/01/41 | | | | 986,956 | | | | 868,571 | |
|
Federal Home Loan Mortgage Corp., Pool #Q20178 | |
| | | |
3.50% | | | 07/01/43 | | | | 1,876,254 | | | | 1,627,971 | |
|
Federal Home Loan Mortgage Corp., Pool #QE0312 | |
| | | |
2.00% | | | 04/01/52 | | | | 5,256,530 | | | | 3,864,055 | |
|
Federal Home Loan Mortgage Corp., Pool #SD0231 | |
| | | |
3.00% | | | 01/01/50 | | | | 4,069,162 | | | | 3,312,632 | |
|
Federal Home Loan Mortgage Corp., Pool #SD7513 | |
| | | |
3.50% | | | 04/01/50 | | | | 509,000 | | | | 434,791 | |
|
Federal Home Loan Mortgage Corp., Pool #SD8178 | |
| | | |
2.50% | | | 11/01/51 | | | | 5,290,234 | | | | 4,073,427 | |
|
Federal Home Loan Mortgage Corp., Pool #SD8193 | |
| | | |
2.00% | | | 02/01/52 | | | | 7,823,735 | | | | 5,757,503 | |
|
Federal Home Loan Mortgage Corp., Pool #SD8194 | |
| | | |
2.50% | | | 02/01/52 | | | | 7,205,575 | | | | 5,542,950 | |
|
Federal Home Loan Mortgage Corp., Pool #SD8205 | |
| | | |
2.50% | | | 04/01/52 | | | | 2,110,707 | | | | 1,621,185 | |
|
Federal Home Loan Mortgage Corp., Pool #SD8212 | |
| | | |
2.50% | | | 05/01/52 | | | | 7,561,008 | | | | 5,807,433 | |
|
Federal Home Loan Mortgage Corp., Pool #ZM1779 | |
| | | |
3.00% | | | 09/01/46 | | | | 1,086,678 | | | | 893,984 | |
|
Federal Home Loan Mortgage Corp., Pool #ZT1703 | |
| | | |
4.00% | | | 01/01/49 | | | | 911,599 | | | | 804,378 | |
| |
Federal Home Loan Mortgage Corp. REMICS Series 2439, Class KZ | | | | | |
| | | |
6.50% | | | 04/15/32 | | | | 52,886 | | | | 53,737 | |
| |
Federal Home Loan Mortgage Corp. REMICS Series 2575, Class FD (PAC) | | | | | |
| | | |
5.88% (30 day USD SOFR Average + 0.564%)(3) | | | 02/15/33 | | | | 140,980 | | | | 138,815 | |
| | | | | | | | | | | | |
| Issues | | Maturity
Date | | | Principal
Amount | | | Value | |
|
RESIDENTIAL MORTGAGE-BACKED SECURITIES —
AGENCY (Continued) | |
| |
Federal Home Loan Mortgage Corp. REMICS Series 2662, Class MT (TAC) | | | | | |
| | | |
4.50% | | | 08/15/33 | | | $ | 39,001 | | | $ | 37,439 | |
| |
Federal Home Loan Mortgage Corp. REMICS Series 3315, Class S (I/O) (I/F) | | | | | |
| | | |
0.98% (-30 day USD SOFR Average + 6.296%) (3) | | | 05/15/37 | | | | 7,340 | | | | 450 | |
| |
Federal Home Loan Mortgage Corp. REMICS Series 3339, Class JS (I/F) | | | | | |
| | | |
7.51% (-30 day USD SOFR Average + 42.091%) (3) | | | 07/15/37 | | | | 179,666 | | | | 217,248 | |
| |
Federal Home Loan Mortgage Corp. REMICS Series 3351, Class ZC | | | | | |
| | | |
5.50% | | | 07/15/37 | | | | 139,292 | | | | 137,088 | |
| |
Federal Home Loan Mortgage Corp. REMICS Series 3380, Class SM (I/O) (I/F) | | | | | |
| | | |
0.98% (-30 day USD SOFR Average + 6.296%) (3) | | | 10/15/37 | | | | 215,494 | | | | 16,675 | |
| |
Federal Home Loan Mortgage Corp. REMICS Series 3382, Class FL | | | | | |
| | | |
6.13% (30 day USD SOFR Average + 0.814%) (3) | | | 11/15/37 | | | | 56,127 | | | | 55,341 | |
| |
Federal Home Loan Mortgage Corp. REMICS Series 3439, Class SC (I/O) (I/F) | | | | | |
| | | |
0.47% (-30 day USD SOFR Average + 5.786%) | | | 04/15/38 | | | | 864,679 | | | | 35,182 | |
| |
Federal Home Loan Mortgage Corp. REMICS Series 3578, Class DI (I/O) (I/F) | | | | | |
| | | |
1.22% (-30 day USD SOFR Average + 6.536%) (3) | | | 04/15/36 | | | | 310,824 | | | | 16,368 | |
| |
Federal Home Loan Mortgage Corp. REMICS Series 4818, Class CA | | | | | |
| | | |
3.00% | | | 04/15/48 | | | | 431,991 | | | | 353,672 | |
| |
Federal National Mortgage Association | | | | | |
| | | |
2.00% | | | 04/01/51 | | | | 7,163,701 | | | | 5,299,208 | |
| | | |
4.50% | | | 12/01/52 | | | | 6,451,403 | | | | 5,771,480 | |
| |
Federal National Mortgage Association, Pool #596686 | | | | | |
| | | |
6.50% | | | 11/01/31 | | | | 7,781 | | | | 7,812 | |
| |
Federal National Mortgage Association, Pool #727575 | | | | | |
| | | |
5.00% | | | 06/01/33 | | | | 11,451 | | | | 11,170 | |
| |
Federal National Mortgage Association, Pool #748751 | | | | | |
| | | |
5.50% | | | 10/01/33 | | | | 32,418 | | | | 31,912 | |
| |
Federal National Mortgage Association, Pool #AB2127 | | | | | |
| | | |
3.50% | | | 01/01/26 | | | | 118,222 | | | | 115,732 | |
| |
Federal National Mortgage Association, Pool #AL0209 | | | | | |
| | | |
4.50% | | | 05/01/41 | | | | 283,937 | | | | 263,222 | |
| |
Federal National Mortgage Association, Pool #AL0851 | | | | | |
| | | |
6.00% | | | 10/01/40 | | | | 255,422 | | | | 260,102 | |
See accompanying Notes to Financial Statements.
26
TCW Core Fixed Income Fund
October 31, 2023
| | | | | | | | | | | | |
| Issues | | Maturity
Date | | | Principal
Amount | | | Value | |
|
RESIDENTIAL MORTGAGE-BACKED SECURITIES —
AGENCY (Continued) | |
| |
Federal National Mortgage Association, Pool #AS9830 | | | | | |
| | | |
4.00% | | | 06/01/47 | | | $ | 489,803 | | | $ | 432,769 | |
| |
Federal National Mortgage Association, Pool #BN7755 | | | | | |
| | | |
3.00% | | | 09/01/49 | | | | 2,661,284 | | | | 2,167,336 | |
|
Federal National Mortgage Association, Pool #BQ6913 | |
| | | |
2.00% | | | 12/01/51 | | | | 8,636,646 | | | | 6,367,781 | |
|
Federal National Mortgage Association, Pool #BQ7006 | |
| | | |
2.00% | | | 01/01/52 | | | | 7,060,365 | | | | 5,205,592 | |
|
Federal National Mortgage Association, Pool #BV8464 | |
| | | |
3.00% | | | 04/01/52 | | | | 3,934,221 | | | | 3,151,804 | |
|
Federal National Mortgage Association, Pool #CA1710 | |
| | | |
4.50% | | | 05/01/48 | | | | 1,256,257 | | | | 1,144,561 | |
|
Federal National Mortgage Association, Pool #CA1711 | |
| | | |
4.50% | | | 05/01/48 | | | | 869,580 | | | | 792,264 | |
|
Federal National Mortgage Association, Pool #CA2208 | |
| | | |
4.50% | | | 08/01/48 | | | | 691,845 | | | | 630,332 | |
|
Federal National Mortgage Association, Pool #CA2327 | |
| | | |
4.00% | | | 09/01/48 | | | | 431,155 | | | | 382,091 | |
|
Federal National Mortgage Association, Pool #CB0610 | |
| | | |
2.50% | | | 05/01/51 | | | | 6,852,389 | | | | 5,309,416 | |
|
Federal National Mortgage Association, Pool #CB2313 | |
| | | |
2.50% | | | 12/01/51 | | | | 7,518,004 | | | | 5,824,685 | |
|
Federal National Mortgage Association, Pool #CB3289 | |
| | | |
2.00% | | | 04/01/52 | | | | 9,593,632 | | | | 7,097,348 | |
|
Federal National Mortgage Association, Pool #FM2318 | |
| | | |
3.50% | | | 09/01/49 | | | | 263,167 | | | | 223,823 | |
|
Federal National Mortgage Association, Pool #FM2870 | |
| | | |
3.00% | | | 03/01/50 | | | | 1,747,510 | | | | 1,422,616 | |
|
Federal National Mortgage Association, Pool #FS1598 | |
| | | |
2.00% | | | 04/01/52 | | | | 7,885,446 | | | | 5,796,561 | |
|
Federal National Mortgage Association, Pool #MA1146 | |
| | | |
4.00% | | | 08/01/42 | | | | 566,562 | | | | 509,086 | |
|
Federal National Mortgage Association, Pool #MA1561 | |
| | | |
3.00% | | | 09/01/33 | | | | 1,118,991 | | | | 991,902 | |
|
Federal National Mortgage Association, Pool #MA1584 | |
| | | |
3.50% | | | 09/01/33 | | | | 1,644,818 | | | | 1,491,584 | |
|
Federal National Mortgage Association, Pool #MA3182 | |
| | | |
3.50% | | | 11/01/47 | | | | 296,915 | | | | 252,907 | |
|
Federal National Mortgage Association, Pool #MA4093 | |
| | | |
2.00% | | | 08/01/40 | | | | 4,008,961 | | | | 3,185,061 | |
|
Federal National Mortgage Association, Pool #MA4152 | |
| | | |
2.00% | | | 10/01/40 | | | | 5,005,767 | | | | 3,977,008 | |
|
Federal National Mortgage Association, Pool #MA4281 | |
| | | |
2.00% | | | 03/01/51 | | | | 7,247,545 | | | | 5,361,718 | |
|
Federal National Mortgage Association, Pool #MA4387 | |
| | | |
2.00% | | | 07/01/41 | | | | 2,743,808 | | | | 2,170,484 | |
| | | | | | | | | | | | |
| Issues | | Maturity
Date | | | Principal
Amount | | | Value | |
|
RESIDENTIAL MORTGAGE-BACKED SECURITIES —
AGENCY (Continued) | |
|
Federal National Mortgage Association, Pool #MA4465 | |
| | | |
2.00% | | | 11/01/51 | | | $ | 2,137,278 | | | $ | 1,575,017 | |
|
Federal National Mortgage Association, Pool #MA4512 | |
| | | |
2.50% | | | 01/01/52 | | | | 7,865,836 | | | | 6,054,802 | |
|
Federal National Mortgage Association, Pool #MA4548 | |
| | | |
2.50% | | | 02/01/52 | | | | 7,231,254 | | | | 5,562,704 | |
| |
Federal National Mortgage Association, Pool #MA4579 | | | | | |
| | | |
3.00% | | | 04/01/52 | | | | 7,141,966 | | | | 5,722,914 | |
| |
Federal National Mortgage Association REMIC Trust Series 2004-W10, Class A6 (PAC) | | | | | |
| | | |
5.75% | | | 08/25/34 | | | | 623,546 | | | | 612,200 | |
| |
Federal National Mortgage Association REMICS Series 2001-14, Class SH (I/F) | | | | | |
| | | |
8.80% (-30 day USD SOFR Average + 27.424%) (3) | | | 03/25/30 | | | | 35,386 | | | | 38,659 | |
| |
Federal National Mortgage Association REMICS Series 2001-34, Class FV | | | | | |
| | | |
5.94% (30 day USD SOFR Average + 0.614%) (3) | | | 08/25/31 | | | | 55,387 | | | | 55,106 | |
| |
Federal National Mortgage Association REMICS Series 2007-89, Class GF | | | | | |
| | | |
5.96% (30 day USD SOFR Average + 0.634%) (3) | | | 09/25/37 | | | | 259,249 | | | | 255,234 | |
| |
Federal National Mortgage Association REMICS Series 2008-30, Class SA (I/O) (I/F) | | | | | |
| | | |
1.41% (-30 day USD SOFR Average + 6.736%) (3) | | | 04/25/38 | | | | 45,956 | | | | 3,949 | |
| |
Federal National Mortgage Association REMICS Series 2008-62, Class SN (I/O) (I/F) | | | | | |
| | | |
0.76% (-30 day USD SOFR Average + 6.086%) (3) | | | 07/25/38 | | | | 45,089 | | | | 2,086 | |
| |
Federal National Mortgage Association REMICS Series 2009-64, Class TB | | | | | |
| | | |
4.00% | | | 08/25/29 | | | | 454,153 | | | | 438,733 | |
| |
Federal National Mortgage Association REMICS Series 2009-68, Class SA (I/O) (I/F) | | | | | |
| | | |
1.31% (-30 day USD SOFR Average + 6.636%) (3) | | | 09/25/39 | | | | 35,010 | | | | 3,207 | |
| |
Federal National Mortgage Association REMICS Series 2010-26, Class AS (I/O) (I/F) | | | | | |
| | | |
0.89% (-30 day USD SOFR Average + 6.216%) (3) | | | 03/25/40 | | | | 513,889 | | | | 23,660 | |
| |
Federal National Mortgage Association REMICS Series 2011-111, Class DB | | | | | |
| | | |
4.00% | | | 11/25/41 | | | | 1,107,870 | | | | 1,000,702 | |
| |
Federal National Mortgage Association REMICS Series 2018-38, Class LA | | | | | |
| | | |
3.00% | | | 06/25/48 | | | | 832,257 | | | | 683,847 | |
| |
Federal National Mortgage Association REMICS Series 2018-43, Class CT | | | | | |
| | | |
3.00% | | | 06/25/48 | | | | 618,143 | | | | 517,994 | |
See accompanying Notes to Financial Statements.
27
TCW Core Fixed Income Fund
Schedule of Investments (Continued)
| | | | | | | | | | | | |
| Issues | | Maturity
Date | | | Principal
Amount | | | Value | |
|
RESIDENTIAL MORTGAGE-BACKED SECURITIES —
AGENCY (Continued) | |
| |
Federal National Mortgage Association REMICS Series 2019-79, Class FA | | | | | |
| | | |
5.94% (30 day USD SOFR Average + 0.614%) (3) | | | 01/25/50 | | | $ | 1,456,346 | | | $ | 1,397,722 | |
| |
Government National Mortgage Association, Pool #608259 | | | | | |
| | | |
4.50% | | | 08/15/33 | | | | 14,354 | | | | 13,492 | |
| |
Government National Mortgage Association, Pool #782114 | | | | | |
| | | |
5.00% | | | 09/15/36 | | | | 54,858 | | | | 53,025 | |
| |
Government National Mortgage Association, Pool #MA3521 | | | | | |
| | | |
3.50% | | | 03/20/46 | | | | 840,518 | | | | 729,836 | |
| |
Government National Mortgage Association, Pool #MA3597 | | | | | |
| | | |
3.50% | | | 04/20/46 | | | | 810,039 | | | | 702,865 | |
| |
Government National Mortgage Association, Pool #MA366 | | | | | |
| | | |
2 3.00% | | | 05/20/46 | | | | 362,952 | | | | 305,321 | |
| |
Government National Mortgage Association, Pool #MA3663 | | | | | |
| | | |
3.50% | | | 05/20/46 | | | | 798,433 | | | | 692,295 | |
| |
Government National Mortgage Association, Pool #MA4126 | | | | | |
| | | |
3.00% | | | 12/20/46 | | | | 2,175,629 | | | | 1,826,776 | |
| |
Government National Mortgage Association, Pool #MA4127 | | | | | |
| | | |
3.50% | | | 12/20/46 | | | | 1,141,058 | | | | 988,662 | |
| |
Government National Mortgage Association, Pool #MA4196 | | | | | |
| | | |
3.50% | | | 01/20/47 | | | | 667,634 | | | | 578,049 | |
| |
Government National Mortgage Association, Pool #MA4454 | | | | | |
| | | |
5.00% | | | 05/20/47 | | | | 275,518 | | | | 262,906 | |
| |
Government National Mortgage Association, Pool #MA4510 | | | | | |
| | | |
3.50% | | | 06/20/47 | | | | 322,983 | | | | 279,413 | |
| |
Government National Mortgage Association, Pool #MA4589 | | | | | |
| | | |
5.00% | | | 07/20/47 | | | | 642,920 | | | | 613,089 | |
| |
Government National Mortgage Association, Pool #MA4722 | | | | | |
| | | |
5.00% | | | 09/20/47 | | | | 217,251 | | | | 207,035 | |
| |
Government National Mortgage Association, Pool #MA4777 | | | | | |
| | | |
3.00% | | | 10/20/47 | | | | 260,326 | | | | 218,304 | |
| |
Government National Mortgage Association, Pool #MA4836 | | | | | |
| | | |
3.00% | | | 11/20/47 | | | | 1,016,113 | | | | 848,738 | |
| |
Government National Mortgage Association, Pool #MA4837 | | | | | |
| | | |
3.50% | | | 11/20/47 | | | | 2,092,573 | | | | 1,809,171 | |
| | | | | | | | | | | | |
| Issues | | Maturity
Date | | | Principal
Amount | | | Value | |
|
RESIDENTIAL MORTGAGE-BACKED SECURITIES —
AGENCY (Continued) | |
| |
Government National Mortgage Association, Pool #MA4838 | | | | | |
| | | |
4.00% | | | 11/20/47 | | | $ | 604,060 | | | $ | 538,609 | |
| |
Government National Mortgage Association, Pool #MA4901 | | | | | |
| | | |
4.00% | | | 12/20/47 | | | | 1,029,817 | | | | 918,234 | |
| |
Government National Mortgage Association, Pool #MA5078 | | | | | |
| | | |
4.00% | | | 03/20/48 | | | | 726,553 | | | | 651,429 | |
| |
Government National Mortgage Association, Pool #MA5399 | | | | | |
| | | |
4.50% | | | 08/20/48 | | | | 1,446,038 | | | | 1,324,050 | |
| |
Government National Mortgage Association, Pool #MA5466 | | | | | |
| | | |
4.00% | | | 09/20/48 | | | | 49,902 | | | | 44,489 | |
| |
Government National Mortgage Association, Pool #MA5467 | | | | | |
| | | |
4.50% | | | 09/20/48 | | | | 87,931 | | | | 80,307 | |
| |
Government National Mortgage Association, Pool #MA6030 | | | | | |
| | | |
3.50% | | | 07/20/49 | | | | 74,856 | | | | 62,823 | |
| |
Government National Mortgage Association, Pool #MA6209 | | | | | |
| | | |
3.00% | | | 10/20/49 | | | | 556,592 | | | | 446,647 | |
| |
Government National Mortgage Association REMICS Series 2008-27, Class SI (I/O) (I/F) | | | | | |
| | | |
1.02% (-1 mo. USD Term SOFR + 6.356%) (3) | | | 03/20/38 | | | | 140,732 | | | | 11,962 | |
| |
Government National Mortgage Association REMICS Series 2008-81, Class S (I/O) (I/F) | | | | | |
| | | |
0.75% (-1 mo. USD Term SOFR + 6.086%) (3) | | | 09/20/38 | | | | 548,913 | | | | 42,888 | |
| |
Government National Mortgage Association REMICS Series 2010-1, Class S (I/O) (I/F) | | | | | |
| | | |
0.30% (- 1 mo. USD Term SOFR + 5.636%) (3) | | | 01/20/40 | | | | 804,127 | | | | 46,651 | |
| |
Government National Mortgage Association REMICS Series 2018-124, Class NW | | | | | |
| | | |
3.50% | | | 09/20/48 | | | | 743,475 | | | | 645,455 | |
|
Government National Mortgage Association, TBA | |
| | | |
2.50% (7) | | | 12/01/51 | | | | 18,600,000 | | | | 14,784,520 | |
| | | |
4.50% (7) | | | 04/01/53 | | | | 6,250,000 | | | | 5,645,656 | |
| | | |
5.00% (7) | | | 05/01/53 | | | | 4,425,000 | | | | 4,117,431 | |
| | | |
5.50% (7) | | | 06/01/53 | | | | 9,350,000 | | | | 8,942,999 | |
|
Uniform Mortgage-Backed Security, TBA | |
| | | |
2.00% (7) | | | 12/01/51 | | | | 27,375,000 | | | | 20,111,602 | |
| | | |
2.50% (7) | | | 01/01/52 | | | | 9,025,000 | | | | 6,918,579 | |
| | | |
3.00% (7) | | | 02/01/52 | | | | 22,525,000 | | | | 18,006,803 | |
| | | |
3.50% (7) | | | 04/01/52 | | | | 15,800,000 | | | | 13,158,067 | |
| | | |
4.00% (7) | | | 05/01/52 | | | | 24,100,000 | | | | 20,824,818 | |
| | | |
4.50% (7) | | | 04/01/53 | | | | 29,400,000 | | | | 26,260,464 | |
| | | |
5.00% (7) | | | 04/01/53 | | | | 57,575,000 | | | | 53,088,880 | |
| | | |
5.50% (7) | | | 04/01/53 | | | | 58,050,000 | | | | 55,083,336 | |
| | | | | | | | | | | | |
| |
Total Residential Mortgage-Backed Securities — Agency | | | | | |
| |
(Cost: $461,635,092) | | | | 426,325,483 | |
| | | | | | | | | | | | |
See accompanying Notes to Financial Statements.
28
TCW Core Fixed Income Fund
October 31, 2023
| | | | | | | | | | | | |
| Issues | | Maturity
Date | | | Principal
Amount | | | Value | |
|
RESIDENTIAL MORTGAGE-BACKED SECURITIES —
NON-AGENCY — 6.6% | |
|
Ajax Mortgage Loan Trust Series 2019-F, Class A1 | |
| | | |
2.86% (2) | | | 07/25/59 | | | $ | 1,791,012 | | | $ | 1,670,994 | |
| |
Bayview MSR Opportunity Master Fund Trust Series 2021-5, Class A5 | | | | | |
| | | |
2.50% (2),(6) | | | 11/25/51 | | | | 3,923,302 | | | | 3,241,668 | |
|
CIM Trust Series 2021-J1, Class A1 | |
| | | |
2.50% (2),(6) | | | 03/25/51 | | | | 9,398,495 | | | | 6,900,551 | |
| |
Citigroup Mortgage Loan Trust, Inc. Series 2005-5, Class 2A2 | | | | | |
| | | |
5.75% (4) | | | 08/25/35 | | | | 148,504 | | | | 101,293 | |
| |
Citigroup Mortgage Loan Trust, Inc. Series 2006-AMC1, Class A1 | | | | | |
| | | |
5.73% (1 mo. USD Term SOFR + 0.404%) (2),(3) | | | 09/25/36 | | | | 6,081,045 | | | | 5,688,898 | |
|
CSMC Trust Series 2018-RPL9, Class A | |
| | | |
3.85% (2),(6) | | | 09/25/57 | | | | 2,195,110 | | | | 2,004,396 | |
|
CSMC Trust Series 2022-ATH2, Class A1 | |
| | | |
4.55% (2),(6) | | | 05/25/67 | | | | 3,425,028 | | | | 3,203,174 | |
|
Fremont Home Loan Trust Series 2005-E, Class 2A4 | |
| | | |
6.10% (1 mo. USD Term SOFR + 0.774%)(3) | | | 01/25/36 | | | | 4,615,185 | | | | 4,305,103 | |
| |
GS Mortgage-Backed Securities Trust Series 2018-RPL1, Class A1A | | | | | |
| | | |
3.75% (2) | | | 10/25/57 | | | | 1,807,932 | | | | 1,708,044 | |
| |
GS Mortgage-Backed Securities Trust Series 2021-INV1, Class A6 | | | | | |
| | | |
2.50% (2),(6) | | | 12/25/51 | | | | 3,635,379 | | | | 3,002,536 | |
|
GSAA Home Equity Trust Series 2005-11, Class 2A2 | |
| | | |
6.08% (1 mo. USD Term SOFR + 0.754%)(3) | | | 10/25/35 | | | | 682,237 | | | | 666,175 | |
| |
IndyMac INDX Mortgage Loan Trust Series 2005-AR6, Class 2A1 | | | | | |
| | | |
5.92% (1 mo. USD Term SOFR + 0.594%)(3) | | | 04/25/35 | | | | 440,977 | | | | 352,955 | |
|
JPMorgan Mortgage Trust Series 2021-14, Class A3 | |
| | | |
2.50% (2),(6) | | | 05/25/52 | | | | 4,859,574 | | | | 3,561,916 | |
|
JPMorgan Mortgage Trust Series 2021-INV3, Class A3 | |
| | | |
2.50% (2),(6) | | | 12/25/51 | | | | 7,132,398 | | | | 5,900,829 | |
|
JPMorgan Mortgage Trust Series 2022-1, Class A3 | |
| | | |
2.50% (2),(6) | | | 07/25/52 | | | | 8,422,157 | | | | 6,167,915 | |
| |
Morgan Stanley ABS Capital I, Inc. Trust Series 2004-WMC2, Class M1 | | | | | |
| | | |
6.35% (1 mo. USD Term SOFR + 1.029%)(3) | | | 07/25/34 | | | | 507,469 | | | | 489,185 | |
| |
Morgan Stanley Mortgage Loan Trust Series 2004-3, Class 4A | | | | | |
| | | |
5.64% (6) | | | 04/25/34 | | | | 71,620 | | | | 68,154 | |
| |
Park Place Securities, Inc. Asset-Backed Pass-Through Certificates Series 2005-WCW2, Class M3 | | | | | |
| | | |
6.26% (1 mo. USD Term SOFR + 0.939%)(3) | | | 07/25/35 | | | | 10,000,000 | | | | 9,295,243 | |
| | | | | | | | | | | | |
| Issues | | Maturity
Date | | | Principal
Amount | | | Value | |
|
RESIDENTIAL MORTGAGE-BACKED SECURITIES —
NON-AGENCY (Continued) | |
| |
Starwood Mortgage Residential Trust Series 2021-3, Class A1 | | | | | |
| | | |
1.13% (2),(6) | | | 06/25/56 | | | $ | 2,335,820 | | | $ | 1,813,985 | |
| |
Structured Asset Investment Loan Trust Series 2004-6, Class A3 | | | | | |
| | | |
6.24% (1 mo. USD Term SOFR + 0.914%)(3) | | | 07/25/34 | | | | 1,652,301 | | | | 1,609,347 | |
| |
Structured Asset Securities Corp. Mortgage Pass-Through Certificates Series 2003-34A, Class 5A4 | | | | | |
| | | |
6.21% (6) | | | 11/25/33 | | | | 139,666 | | | | 132,108 | |
| |
WaMu Mortgage Pass-Through Certificates Trust Series 2005-AR15, Class A1A1 | | | | | |
| | | |
5.96% (1 mo. USD Term SOFR + 0.634%)(3) | | | 11/25/45 | | | | 4,034,793 | | | | 3,587,282 | |
| |
WaMu Mortgage Pass-Through Certificates Trust Series 2005-AR3, Class A2 | | | | | |
| | | |
4.07% (6) | | | 03/25/35 | | | | 472,229 | | | | 446,124 | |
| |
Wells Fargo Alternative Loan Trust Series 2007-PA3, Class 2A1 | | | | | |
| | | |
6.00% (4) | | | 07/25/37 | | | | 41,245 | | | | 33,961 | |
| |
Wells Fargo Home Equity Asset-Backed Securities Trust Series 2004-2, Class A33 | | | | | |
| | | |
6.44% (1 mo. USD Term SOFR + 1.114%)(3) | | | 10/25/34 | | | | 2,486,195 | | | | 2,422,013 | |
| | | | | | | | | | | | |
| |
Total Residential Mortgage-Backed Securities — Non-Agency | | | | | |
| |
(Cost: $73,640,303) | | | | 68,373,849 | |
| | | | | | | | | | | | |
|
| U.S. TREASURY SECURITIES — 21.8% | |
|
U.S. Treasury Bonds | |
| | | |
4.13% | | | 08/15/53 | | | | 21,667,000 | | | | 18,541,009 | |
| | | |
4.38% | | | 08/15/43 | | | | 78,300,000 | | | | 69,818,184 | |
|
U.S. Treasury Notes | |
| | | |
3.88% | | | 08/15/33 | | | | 25,818,000 | | | | 23,762,515 | |
| | | |
4.63% | | | 10/15/26 | | | | 35,965,000 | | | | 35,696,667 | |
| | | |
4.63% | | | 09/30/28 | | | | 31,375,000 | | | | 31,088,598 | |
| | | |
4.88% | | | 10/31/28 | | | | 46,223,000 | | | | 46,325,918 | |
| | | | | | | | | | | | |
| | |
Total U.S. Treasury Securities | | | | | | | | | |
| |
(Cost: $233,610,090) | | | | 225,232,891 | |
| | | | | | | | | | | | |
|
| U.S. GOVERNMENT AGENCY OBLIGATIONS — 2.6% | |
|
Federal Home Loan Banks | |
| | | |
5.30% | | | 05/22/24 | | | | 13,370,000 | | | | 13,351,817 | |
| | | |
5.37% | | | 05/21/24 | | | | 13,200,000 | | | | 13,169,029 | |
| | | | | | | | | | | | |
| |
Total U.S. Government Agency Obligations | | | | | |
| | | |
(Cost: $26,570,000) | | | | | | | | | | | 26,520,846 | |
| | | | | | | | | | | | |
| | |
Total Fixed Income Securities | | | | | | | | | |
| | | |
(Cost: $1,246,926,132) | | | | | | | | | | | 1,148,209,364 | |
| | | | | | | | | | | | |
| |
See accompanying Notes to Financial Statements.
29
TCW Core Fixed Income Fund
Schedule of Investments (Continued)
| | | | | | | | | | | | |
| Issues | | | | | Shares | | | Value | |
|
| MONEY MARKET INVESTMENTS — 1.4% | |
| |
State Street Institutional U.S. Government Money Market Fund — Premier Class, | | | | | |
| | | |
5.30%, 5.30% (8) | | | | | | $ | 14,759,946 | | | $ | 14,759,946 | |
| | | | | | | | | | | | |
|
Total Money Market Investments | |
| | | |
(Cost: $14,759,946) | | | | | | | | | | | 14,759,946 | |
| | | | | | | | | | | | |
|
| |
| Issues | | Maturity
Date | | | Principal
Amount | | | Value | |
|
| SHORT TERM INVESTMENTS — 12.3% | |
|
| U.S. TREASURY SECURITIES — 12.3% | |
|
U.S. Treasury Bills | |
| | | |
5.49% (9) | | | 04/04/24 | | | $ | 25,000,000 | | | $ | 24,428,573 | |
| | | |
5.46% (9) | | | 03/21/24 | | | | 75,000,000 | | | | 73,440,187 | |
| | | |
5.43% (9) | | | 03/07/24 | | | | 5,000,000 | | | | 4,906,382 | |
| | | |
5.52% (9) | | | 04/11/24 | | | | 25,000,000 | | | | 24,403,300 | |
| | | | | | | | | | | | |
|
Total U.S. Treasury Securities | |
| | | |
(Cost: $127,173,036) | | | | | | | | | | | 127,178,442 | |
| | | | | | | | | | | | |
|
Total Short Term Investments | |
| | | |
(Cost: $127,173,036) | | | | | | | | | | | 127,178,442 | |
| | | | | | | | | | | | |
| | | |
Total Investments (124.7%) | | | | | | | | | | | | |
| |
(Cost: $1,388,859,114) | | | | 1,290,147,752 | |
| | | | | | | | | | | | |
| |
Liabilities In Excess Of Other Assets (-24.7%) | | | | (255,457,206 | ) |
| | | | | | | | | | | | |
| |
Net Assets (100.0%) | | | $ | 1,034,690,546 | |
| | | | | | | | | | | | |
See accompanying Notes to Financial Statements.
30
TCW Core Fixed Income Fund
October 31, 2023
| | | | | | | | | | | | | | | | | | |
| Futures Contracts | |
| | | | | |
Number of
Contracts | | Type | | Expiration
Date | | | Notional | | | Market Value | | | Net
Unrealized
Appreciation
(Depreciation) | |
|
| Long Futures | |
1,679 | | 2-Year U.S. Treasury Note Futures | | | 12/29/23 | | | $ | 341,460,003 | | | $ | 339,866,326 | | | $ | (1,593,677 | ) |
340 | | 5-Year U.S. Treasury Note Futures | | | 12/29/23 | | | | 36,084,520 | | | | 35,522,031 | | | | (562,489 | ) |
25 | | U.S. Ultra Long Bond Futures | | | 12/19/23 | | | | 3,130,875 | | | | 2,814,063 | | | | (316,812 | ) |
| | | | | | | | | | | | | | | | | | |
| | | | | | | | $ | 380,675,398 | | | $ | 378,202,420 | | | $ | (2,472,978 | ) |
| | | | | | | | | | | | | | | | | | |
|
| Short Futures | |
105 | | 10-Year U.S. Treasury Note Futures | | | 12/19/23 | | | $ | (12,049,390 | ) | | $ | (11,426,953 | ) | | $ | 622,437 | |
11 | | 30 Year Euro-Buxl Future | | | 12/7/23 | | | | (1,552,887 | ) | | | (1,400,123 | ) | | | 152,764 | |
40 | | Euro-Bobl Future | | | 12/7/23 | | | | (4,943,908 | ) | | | (4,916,740 | ) | | | 27,168 | |
40 | | Euro-Bund Future | | | 12/7/23 | | | | (5,606,702 | ) | | | (5,453,696 | ) | | | 153,006 | |
| | | | | | | | | | | | | | | | | | |
| | | | | | | | $ | (24,152,887 | ) | | $ | (23,197,512 | ) | | $ | 955,375 | |
| | | | | | | | | | | | | | | | | | |
| | | | | | | | | | | | | | | | | | | | | | |
| Forward Currency Exchange Contracts | |
| | | | | | |
| Counterparty | | Contracts to
Deliver | | Units of
Currency | | | Settlement
Date | | | In Exchange for
U.S. Dollars | | | Contracts at
Value | | | Unrealized
Appreciation
(Depreciation) | |
| | | | | |
| BUY (10) | | | | | | | | | | | | | | | |
Goldman Sachs & Co. | | EUR | | | 221,000 | | | | 01/12/24 | | | $ | 235,134 | | | $ | 234,399 | | | $ | (735 | ) |
| | | | | | | | | | | | | | | | | | | | | | |
| | | $ | 235,134 | | | $ | 234,399 | | | $ | (735 | ) |
| | | | | | | | | | | | | |
| | | | | |
| SELL (11) | | | | | | | | | | | | | | | |
Goldman Sachs & Co. | | EUR | | | 221,239 | | | | 11/01/23 | | | | 234,566 | | | | 233,849 | | | | 717 | |
Citibank N.A. | | EUR | | | 16,313,000 | | | | 01/12/24 | | | | 17,255,402 | | | | 17,302,031 | | | | (46,629 | ) |
Citibank N.A. | | GBP | | | 778,000 | | | | 01/12/24 | | | | 948,631 | | | | 944,629 | | | | 4,002 | |
| | | | | | | | | | | | | | | | | | | | | | |
| | | $ | 18,438,599 | | | $ | 18,480,509 | | | $ | (41,910 | ) |
| | | | | | | | | | | | | |
| | | | | | | | | | | | | | | | | | | | | | | | | | | | | | |
| Centrally Cleared — Interest Rate Swap Agreements | |
| | | | | | | | |
| Notional Amount | | Expiration
Date | | Payment
Made by
Fund
Frequency | | | Payment
Made by
Fund | | | Payment
Received by
FundFrequency | | | Payment
Received by
Fund | | | Unrealized
Appreciation
(Depreciation) | | | Premium
Paid | | | Value | |
$8,888,000 (12) | | 12/20/53 | | | Annual | | | | 3.520 | % | | | Annual | | | | 12 Month SOFR | | | $ | 1,108,608 | | | $ | — | | | $ | 1,108,608 | |
See accompanying Notes to Financial Statements.
31
TCW Core Fixed Income Fund
Schedule of Investments (Continued)
Notes to the Schedule of Investments:
| ABS | | Asset-Backed Securities. |
| CLO | | Collateralized Loan Obligation. |
| EETC | | Enhanced Equipment Trust Certificate. |
| I/F | | Inverse Floating rate security whose interest rate moves in the opposite direction of prevailing interest rates. |
| I/O | | Interest Only Security. |
| PAC | | Planned Amortization Class. |
| REIT | | Real Estate Investment Trust. |
| REMIC | | Real Estate Mortgage Investment Conduit. |
| SOFR | | Secured Overnight Financing Rate. |
| TAC | | Target Amortization Class. |
| GBP | | British Pound Sterling. |
| (1) | | Investments issued under Regulation S of the Securities Act of 1933, as amended, may not be offered, sold, or delivered within the United States except under special exemptions. At October 31, 2023, the value of these securities amounted to $12,453,593 or 1.2% of net assets. |
| (2) | | Security exempt from registration under Rule 144A of the Securities Act of 1933, as amended. These securities may be resold, normally only to qualified institutional buyers. At October 31, 2023, the value of these securities amounted to $185,548,564 or 17.9% of net assets. These securities are determined to be liquid by the Fund’s investment advisor, unless otherwise noted, under procedures established by and under the general supervision of the Company’s Board of Directors. |
| (3) | | Floating or variable rate security. The interest shown reflects the rate in effect at October 31, 2023. |
| (4) | | A portion of the principal balance has been written-off during the period due to defaults in the underlying loans. Cost basis has been adjusted. |
| (5) | | For fair value measurement disclosure purposes, security is categorized as Level 3. Security is valued using significant unobservable inputs. |
| (6) | | Variable rate security. Interest rate disclosed is as of the most recent information available. Certain variable rate securities are not based on a published reference rate and spread but are determined by the issuer or agent and are based on current market conditions. These securities do not indicate a reference rate and spread in their description above. |
| (7) | | Security purchased on a forward commitment with an approximate principal amount. The actual principal amount and maturity date will be determined upon settlement when the security is delivered. |
| (8) | | Rate disclosed is the 7-day net yield as of October 31, 2023. |
| (9) | | Rate shown represents yield-to-maturity. |
| (10) | | Fund buys foreign currency, sells U.S. Dollar. |
| (11) | | Fund sells foreign currency, buys U.S. Dollar. |
| (12) | | This instrument has a forward starting effective date. See Note 3, Portfolio Investments in the Notes to Financial Statements for further information. |
See accompanying Notes to Financial Statements.
32
TCW Core Fixed Income Fund
Investments by Sector | October 31, 2023 |
| | | | |
| Sector | | Percentage of
Net Assets | |
Residential Mortgage-Backed Securities — Agency | | | 41.2 | % |
U.S. Treasury Securities | | | 34.1 | |
Corporate Bonds | | | 27.0 | |
Asset-Backed Securities | | | 7.5 | |
Residential Mortgage-Backed Securities — Non-Agency | | | 6.6 | |
Commercial Mortgage-Backed Securities — Non-Agency | | | 3.2 | |
U.S. Government Agency Obligations | | | 2.6 | |
Money Market Investments | | | 1.4 | |
Commercial Mortgage-Backed Securities — Agency | | | 0.6 | |
Municipal Bonds | | | 0.5 | |
Other* | | | (24.7 | ) |
| | | | |
Total | | | 100.0 | % |
| | | | |
| * | Includes futures, swap agreements, pending trades, interest receivable, fund share transactions and accrued expenses payable. |
See accompanying Notes to Financial Statements.
33
TCW Core Fixed Income Fund
Fair Valuation Summary | October 31, 2023 |
The following is a summary of the fair valuations according to the inputs used as of October 31, 2023 in valuing the Fund’s investments:
| | | | | | | | | | | | | | | | |
Description | | Quoted Prices
in Active
Markets for
Identical
Assets
(Level 1) | | | Other
Significant
Observable
Inputs
(Level 2) | | | Significant
Unobservable
Inputs
(Level 3) | | | Total | |
Fixed Income Securities | | | | | | | | | | | | | | | | |
Corporate Bonds* | | $ | — | | | $ | 279,188,115 | | | $ | — | | | $ | 279,188,115 | |
Municipal Bonds | | | — | | | | 5,625,445 | | | | — | | | | 5,625,445 | |
Asset-Backed Securities | | | — | | | | 73,947,150 | | | | 3,702,701 | | | | 77,649,851 | |
Commercial Mortgage-Backed Securities — Agency | | | — | | | | 6,165,051 | | | | — | | | | 6,165,051 | |
Commercial Mortgage-Backed Securities — Non-Agency | | | — | | | | 33,127,833 | | | | — | | | | 33,127,833 | |
Residential Mortgage-Backed Securities — Agency | | | — | | | | 426,325,483 | | | | — | | | | 426,325,483 | |
Residential Mortgage-Backed Securities — Non-Agency | | | — | | | | 68,373,849 | | | | — | | | | 68,373,849 | |
U.S. Treasury Securities | | | 225,232,891 | | | | — | | | | — | | | | 225,232,891 | |
U.S. Government Agency Obligations | | | — | | | | 26,520,846 | | | | — | | | | 26,520,846 | |
| | | | | | | | | | | | | | | | |
Total Fixed Income Securities | | | 225,232,891 | | | | 919,273,772 | | | | 3,702,701 | | | | 1,148,209,364 | |
| | | | | | | | | | | | | | | | |
Money Market Investments | | | 14,759,946 | | | | — | | | | — | | | | 14,759,946 | |
| | | | | | | | | | | | | | | | |
Short Term Investments | | | 127,178,442 | | | | — | | | | — | | | | 127,178,442 | |
Total Investments | | $ | 367,171,279 | | | $ | 919,273,772 | | | $ | 3,702,701 | | | $ | 1,290,147,752 | |
| | | | | | | | | | | | | | | | |
Asset Derivatives | | | | | | | | | | | | | | | | |
Forward Currency Exchange Contracts | | | | | | | | | | | | | | | | |
Foreign Currency Risk | | | — | | | | 4,719 | | | | — | | | | 4,719 | |
Futures Contracts | | | | | | | | | | | | | | | | |
Interest Rate Risk | | | 955,375 | | | | — | | | | — | | | | 955,375 | |
Swap Agreements | | | | | | | | | | | | | | | | |
Interest Rate Risk | | | — | | | | 1,108,608 | | | | — | | | | 1,108,608 | |
| | | | | | | | | | | | | | | | |
Total | | $ | 368,126,654 | | | $ | 920,387,099 | | | $ | 3,702,701 | | | $ | 1,292,216,454 | |
| | | | | | | | | | | | | | | | |
Liability Derivatives | | | | | | | | | | | | | | | | |
Futures Contracts | | | | | | | | | | | | | | | | |
Interest Rate Risk | | $ | (2,472,978 | ) | | $ | — | | | $ | — | | | $ | (2,472,978 | ) |
Forward Currency Exchange Contracts | | | | | | | | | | | | | | | | |
Foreign Currency Risk | | | — | | | | (47,364 | ) | | | — | | | | (47,364 | ) |
| | | | | | | | | | | | | | | | |
Total | | $ | (2,472,978 | ) | | $ | (47,364 | ) | | $ | — | | | $ | (2,520,342 | ) |
| | | | | | | | | | | | | | | | |
| * | See Schedule of Investments for corresponding industries. |
See accompanying Notes to Financial Statements.
34
TCW Enhanced Commodity Strategy Fund
Consolidated Schedule of Investments | October 31, 2023 |
| | | | | | | | | | | | |
| Issues | | Maturity
Date | | | Principal
Amount | | | Value | |
|
FIXED INCOME SECURITIES — 69.7% | |
|
| ASSET-BACKED SECURITIES — 16.7% | |
| |
AIMCO CLO 11 Ltd. Series 2020-11A, Class AR | | | | | |
| | | |
6.79% (3 mo. USD Term SOFR + 1.392%) (1),(2) | | | 10/17/34 | | | $ | 5,000 | | | $ | 4,966 | |
| |
Carvana Auto Receivables Trust Series 2022-P3, Class A3 | | | | | |
| | | |
4.61% | | | 11/10/27 | | | | 240,000 | | | | 235,513 | |
| |
CF Hippolyta Issuer LLC Series 2020-1, Class A1 | | | | | |
| | | |
1.69% (1) | | | 07/15/60 | | | | 179,890 | | | | 163,315 | |
| |
CF Hippolyta Issuer LLC Series 2021-1A, Class A1 | | | | | |
| | | |
1.53% (1) | | | 03/15/61 | | | | 273,310 | | | | 239,597 | |
| |
Drive Auto Receivables Trust Series 2021-1, Class D | | | | | |
| | | |
1.45% | | | 01/16/29 | | | | 427,000 | | | | 405,615 | |
| |
Dryden 30 Senior Loan Fund Series 2013-30A, Class AR | | | | | |
| | | |
6.45% (3 mo. USD Term SOFR + 1.082%) (1),(2) | | | 11/15/28 | | | | 50,670 | | | | 50,517 | |
| |
Exeter Automobile Receivables Trust Series 2021-1A, Class D | | | | | |
| | | |
1.08% | | | 11/16/26 | | | | 340,000 | | | | 323,669 | |
| |
Flagship Credit Auto Trust Series 2019-4, Class D | | | | | |
| | | |
3.12% (1) | | | 01/15/26 | | | | 430,000 | | | | 419,137 | |
| |
Global SC Finance II SRL Series 2014-1A, Class A2 | | | | | |
| | | |
3.09% (1) | | | 07/17/29 | | | | 6,588 | | | | 6,444 | |
| |
Navient Private Education Refi Loan Trust Series 2020-BA, Class A2 | | | | | |
| | | |
2.12% (1) | | | 01/15/69 | | | | 15,762 | | | | 14,255 | |
| |
Navient Private Education Refi Loan Trust Series 2021-BA, Class A | | | | | |
| | | |
0.94% (1) | | | 07/15/69 | | | | 193,070 | | | | 164,116 | |
| |
Navient Private Education Refi Loan Trust Series 2021-CA, Class A | | | | | |
| | | |
1.06% (1) | | | 10/15/69 | | | | 94,829 | | | | 80,347 | |
| |
Nelnet Student Loan Trust Series 2012-5A, Class A | | | | | |
| | | |
6.04% (30 day USD SOFR Average + 0.714%) (1),(2) | | | 10/27/36 | | | | 1,566 | | | | 1,542 | |
| |
NYACK Park CLO Ltd. Series 2021-1A, Class X | | | | | |
| | | |
6.33% (3 mo. USD Term SOFR + 0.912%) (1),(2) | | | 10/20/34 | | | | 1,607 | | | | 1,589 | |
| |
Palmer Square Loan Funding Ltd. Series 2021-2A, Class A1 | | | | | |
| | | |
6.44% (3 mo. USD Term SOFR + 1.062%) (1),(2) | | | 05/20/29 | | | | 70,526 | | | | 70,158 | |
| |
PFS Financing Corp. Series 2022-B, Class A | | | | | |
| | | |
5.92% (30 day USD SOFR Average + 0.600%) (1),(2) | | | 02/15/26 | | | | 145,000 | | | | 145,254 | |
| |
Progress Residential Trust Series 2021-SFR1, Class C | | | | | |
| | | |
1.56% (1) | | | 04/17/38 | | | | 252,000 | | | | 223,012 | |
| |
ReadyCap Commercial Mortgage Trust Series 2018-4, Class A | | | | | |
| | | |
3.39% (1) | | | 02/27/51 | | | | 67,149 | | | | 63,913 | |
| |
Santander Drive Auto Receivables Trust Series 2021-1, Class D | | | | | |
| | | |
1.13% | | | 11/16/26 | | | | 330,000 | | | | 319,683 | |
| | | | | | | | | | | | |
| Issues | | Maturity
Date | | | Principal
Amount | | | Value | |
|
| ASSET-BACKED SECURITIES (Continued) | |
| |
SLC Student Loan Trust Series 2008-1, Class A4A | | | | | |
| | | |
7.08% (90 day USD SOFR Average + 1.862%) (2) | | | 12/15/32 | | | $ | 82,743 | | | $ | 83,296 | |
| |
SLM Student Loan Trust Series 2005-7, Class A4 | | | | | |
| | | |
5.75% (90 day USD SOFR Average + 0.412%) (2) | | | 10/25/29 | | | | 1,081 | | | | 1,079 | |
|
SLM Student Loan Trust Series 2008-3, Class A3 | |
| | | |
6.60% (90 day USD SOFR Average + 1.262%) (2) | | | 10/25/21 | | | | 5,300 | | | | 5,193 | |
| |
SLM Student Loan Trust Series 2008-3, Class B | | | | | |
| | | |
6.80% (90 day USD SOFR Average + 1.462%) (2) | | | 04/26/83 | | | | 10,000 | | | | 9,372 | |
| |
SLM Student Loan Trust Series 2013-6, Class A3 | | | | | |
| | | |
6.09% (30 day USD SOFR Average + 0.764%) (2) | | | 06/26/28 | | | | 6,205 | | | | 6,069 | |
| |
SoFi Professional Loan Program LLC Series 2017-F, Class A2FX | | | | | |
| | | |
2.84% (1) | | | 01/25/41 | | | | 93,074 | | | | 89,895 | |
| |
SoFi Professional Loan Program LLC Series 2019-A, Class A2FX | | | | | |
| | | |
3.69% (1) | | | 06/15/48 | | | | 106,863 | | | | 102,623 | |
| |
SoFi Professional Loan Program LLC Series 2021-B, Class AFX | | | | | |
| | | |
1.14% (1) | | | 02/15/47 | | | | 167,336 | | | | 136,059 | |
| |
Stack Infrastructure Issuer LLC Series 2019-2A, Class A2 | | | | | |
| | | |
3.08% (1) | | | 10/25/44 | | | | 84,000 | | | | 80,803 | |
| |
Stack Infrastructure Issuer LLC Series 2020-1A, Class A2 | | | | | |
| | | |
1.89% (1) | | | 08/25/45 | | | | 200,000 | | | | 182,028 | |
| |
Tricon American Homes Trust Series 2017-SFR2, Class B | | | | | |
| | | |
3.28% (1) | | | 01/17/36 | | | | 5,000 | | | | 4,962 | |
| |
U.S. Small Business Administration Series 2009-20G, Class 1 | | | | | |
| | | |
4.30% | | | 07/01/29 | | | | 37,746 | | | | 35,951 | |
| |
U.S. Small Business Administration Series 2010-20E, Class 1 | | | | | |
| | | |
4.11% | | | 05/01/30 | | | | 21,969 | | | | 20,765 | |
| | | | | | | | | | | | |
|
Total Asset-Backed Securities | |
| |
(Cost: $3,778,050) | | | | 3,690,737 | |
| | | | | | | | | | | | |
|
COMMERCIAL MORTGAGE-BACKED SECURITIES —
AGENCY — 2.8% | |
| |
Federal Home Loan Mortgage Corp. Multifamily Structured Pass-Through Certificates Series K726, Class X1 (I/O) | | | | | |
| | | |
0.91% (3) | | | 04/25/24 | | | | 8,945,113 | | | | 12,691 | |
| |
Federal Home Loan Mortgage Corp. Multifamily Structured Pass-Through Certificates Series KF57, Class A | | | | | |
| | | |
5.97% (30 day USD SOFR Average + 0.654%) (2) | | | 12/25/28 | | | | 53,050 | | | | 52,806 | |
See accompanying Notes to Financial Statements.
35
TCW Enhanced Commodity Strategy Fund
Consolidated Schedule of Investments (Continued)
| | | | | | | | | | | | |
| Issues | | Maturity
Date | | | Principal
Amount | | | Value | |
|
COMMERCIAL MORTGAGE-BACKED SECURITIES —
AGENCY (Continued) | |
| |
Federal Home Loan Mortgage Corp. Multifamily Structured Pass-Through Certificates Series KF66, Class A | | | | | |
| | | |
5.95% (30 day USD SOFR Average + 0.634%) (2) | | | 07/25/29 | | | $ | 35,417 | | | $ | 35,255 | |
| |
Federal Home Loan Mortgage Corp. Multifamily Structured Pass-Through Certificates Series KJ31, Class A1 | | | | | |
| | | |
0.57% | | | 05/25/26 | | | | 5,241 | | | | 5,117 | |
| |
Federal Home Loan Mortgage Corp. Multifamily Structured Pass-Through Certificates Series KS07, Class X (I/O) | | | | | |
| | | |
0.61% (3) | | | 09/25/25 | | | | 473,736 | | | | 5,056 | |
| |
Federal Home Loan Mortgage Corp. Multifamily Structured Pass-Through Certificates Series Q004, Class A2H | | | | | |
| | | |
4.84% (3) | | | 01/25/46 | | | | 86,606 | | | | 86,010 | |
| |
Federal Home Loan Mortgage Corp. Multifamily Structured Pass-Through Certificates Series Q004, Class AFL | | | | | |
| | | |
5.67% (1 yr. MTA + 0.740%) (2) | | | 05/25/44 | | | | 70,259 | | | | 69,516 | |
| |
Federal Home Loan Mortgage Corp. Multifamily Structured Pass-Through Certificates Series Q008, Class A | | | | | |
| | | |
5.82% (30 day USD SOFR Average + 0.504%) (2) | | | 10/25/45 | | | | 27,760 | | | | 27,633 | |
| |
Federal Home Loan Mortgage Corp. Multifamily Structured Pass-Through Certificates Series Q013, Class APT1 | | | | | |
| | | |
1.60% (3) | | | 05/25/50 | | | | 58,211 | | | | 55,706 | |
| |
Federal National Mortgage Association, Pool #AM1671 | | | | | |
| | | |
2.10% | | | 12/01/27 | | | | 18,400 | | | | 17,175 | |
| |
Government National Mortgage Association, Pool #776870 | | | | | |
| | | |
4.90% | | | 12/15/52 | | | | 38,545 | | | | 38,461 | |
| |
Government National Mortgage Association, Pool #767414 | | | | | |
| | | |
5.55% | | | 02/15/26 | | | | 7,871 | | | | 7,820 | |
| |
Government National Mortgage Association, Pool #669551 | | | | | |
| | | |
5.75% | | | 10/15/32 | | | | 33,540 | | | | 33,093 | |
| |
Government National Mortgage Association, Pool #625835 | | | | | |
| | | |
6.00% | | | 11/15/34 | | | | 24,180 | | | | 24,171 | |
| |
Government National Mortgage Association, Pool #669522 | | | | | |
| | | |
6.00% | | | 07/15/43 | | | | 25,539 | | | | 25,324 | |
| |
Government National Mortgage Association, Pool #749547 | | | | | |
| | | |
6.00% | | | 04/15/53 | | | | 52,281 | | | | 52,121 | |
| |
Government National Mortgage Association Series 2012-123, Class IO (I/O) | | | | | |
| | | |
0.62% (3) | | | 12/16/51 | | | | 84,527 | | | | 1,924 | |
| | | | | | | | | | | | |
| Issues | | Maturity
Date | | | Principal
Amount | | | Value | |
|
COMMERCIAL MORTGAGE-BACKED SECURITIES —
AGENCY (Continued) | |
| |
Government National Mortgage Association Series 2013-1, Class IO (I/O) | | | | | |
| | | |
0.58% (3) | | | 02/16/54 | | | $ | 39,128 | | | $ | 441 | |
| |
Government National Mortgage Association Series 2014-157, Class C | | | | | |
| | | |
3.15% (3) | | | 10/16/54 | | | | 72,898 | | | | 69,430 | |
| | | | | | | | | | | | |
|
Total Commercial Mortgage-Backed Securities — Agency | |
| |
(Cost: $620,107) | | | | 619,750 | |
| | | | | | | | | | | | |
|
COMMERCIAL MORTGAGE-BACKED SECURITIES —
NON-AGENCY — 4.2% | |
| |
Bank Series 2018-BN14, Class A2 | | | | | |
| | | |
4.13% | | | 09/15/60 | | | | 1,581 | | | | 1,518 | |
| |
BB-UBS Trust Series 2012-SHOW, Class XA (I/O) | | | | | |
| | | |
0.60% (1),(3) | | | 11/05/36 | | | | 6,396,000 | | | | 30,314 | |
| |
BBCMS Trust Series 2018-BXH, Class A | | | | | |
| | | |
6.51% (1 mo. USD Term SOFR + 1.047%) (1),(2) | | | 10/15/37 | | | | 431 | | | | 424 | |
| |
Benchmark Mortgage Trust Series 2018-B6, Class A2 | | | | | |
| | | |
4.20% | | | 10/10/51 | | | | 5,914 | | | | 5,722 | |
| |
BX Commercial Mortgage Trust Series 2021-CIP, Class A | | | | | |
| | | |
6.37% (1 mo. USD Term SOFR + 1.035%) (1),(2) | | | 12/15/38 | | | | 110,000 | | | | 107,253 | |
| |
BX Trust Series 2021-MFM1, Class A | | | | | |
| | | |
6.15% (1 mo. USD Term SOFR + 0.814%) (1),(2) | | | 01/15/34 | | | | 15,325 | | | | 15,056 | |
| |
BXHPP Trust Series 2021-FILM, Class A | | | | | |
| | | |
6.10% (1 mo. USD Term SOFR + 0.764%) (1),(2) | | | 08/15/36 | | | | 100,000 | | | | 94,343 | |
| |
Citigroup Commercial Mortgage Trust Series 2014-GC21, Class XA (I/O) | | | | | |
| | | |
1.12% (3) | | | 05/10/47 | | | | 4,939,316 | | | | 8,848 | |
| |
Citigroup Commercial Mortgage Trust Series 2015-GC27, Class XA (I/O) | | | | | |
| | | |
1.30% (3) | | | 02/10/48 | | | | 1,813,122 | | | | 18,766 | |
| |
COMM Mortgage Trust Series 2012-CR4, Class A3 | | | | | |
| | | |
2.85% | | | 10/15/45 | | | | 62,633 | | | | 58,531 | |
| |
COMM Mortgage Trust Series 2012-CR4, Class XA (I/O) | | | | | |
| | | |
1.14% (3) | | | 10/15/45 | | | | 140,668 | | | | 1 | |
| |
COMM Mortgage Trust Series 2014-CR17, Class XA (I/O) | | | | | |
| | | |
0.92% (3) | | | 05/10/47 | | | | 4,935,493 | | | | 11,361 | |
| |
COMM Mortgage Trust Series 2015-PC1, Class A4 | | | | | |
| | | |
3.62% | | | 07/10/50 | | | | 38,610 | | | | 37,440 | |
| |
FS Rialto Issuer LLC Series 2019-FL1, Class A | | | | | |
| | | |
6.65% (1 mo. USD Term SOFR + 1.314%) (1),(2) | | | 12/16/36 | | | | 52,844 | | | | 52,636 | |
| |
GS Mortgage Securities Trust Series 2011-GC5, Class XA (I/O) | | | | | |
| | | |
0.09% (1),(3) | | | 08/10/44 | | | | 139,878 | | | | 1 | |
See accompanying Notes to Financial Statements.
36
TCW Enhanced Commodity Strategy Fund
October 31, 2023
| | | | | | | | | | | | |
| Issues | | Maturity
Date | | | Principal
Amount | | | Value | |
|
COMMERCIAL MORTGAGE-BACKED SECURITIES —
NON-AGENCY (Continued) | |
| |
Houston Galleria Mall Trust Series 2015-HGLR, Class A1A1 | | | | | |
| | | |
3.09% (1) | | | 03/05/37 | | | $ | 250,000 | | | $ | 235,239 | |
| |
JPMBB Commercial Mortgage Securities Trust Series 2013-C17, Class XA (I/O) | | | | | |
| | | |
0.56% (3) | | | 01/15/47 | | | | 51,189 | | | | 2 | |
| |
JPMBB Commercial Mortgage Securities Trust Series 2014-C21, Class ASB | | | | | |
| | | |
3.43% | | | 08/15/47 | | | | 4,265 | | | | 4,237 | |
| |
JPMorgan Chase Commercial Mortgage Securities Trust Series 2013-LC11, Class XA (I/O) | | | | | |
| | | |
0.95% (3) | | | 04/15/46 | | | | 412,280 | | | | 1,911 | |
| |
LB-UBS Commercial Mortgage Trust Series 2006-C6, Class XCL (I/O) | | | | | |
| | | |
0.43% (1),(3),(4) | | | 09/15/39 | | | | 289,760 | | | | 1,182 | |
| |
MF1 Ltd. Series 2020-FL4, Class A | | | | | |
| | | |
7.15% (1 mo. USD Term SOFR + 1.814%) (1),(2) | | | 11/15/35 | | | | 64,384 | | | | 64,440 | |
| |
Morgan Stanley Bank of America Merrill Lynch Trust Series 2014-C15, Class XA (I/O) | | | | | |
| | | |
0.75% (3) | | | 04/15/47 | | | | 221,657 | | | | 9 | |
| |
Morgan Stanley Capital I Trust Series 2015-MS1, Class ASB | | | | | |
| | | |
3.46% | | | 05/15/48 | | | | 3,202 | | | | 3,110 | |
| |
Wells Fargo Commercial Mortgage Trust Series 2017-SMP, Class A | | | | | |
| | | |
6.26% (1 mo. USD Term SOFR + 0.922%) (1),(2) | | | 12/15/34 | | | | 100,000 | | | | 91,642 | |
| |
Wells Fargo Commercial Mortgage Trust Series 2020-C55, Class A1 | | | | | |
| | | |
1.86% | | | 02/15/53 | | | | 67,187 | | | | 65,108 | |
| |
WFRBS Commercial Mortgage Trust Series 2013-C14, Class XA (I/O) | | | | | |
| | | |
0.35% (3) | | | 06/15/46 | | | | 36,588 | | | | 68 | |
| |
WFRBS Commercial Mortgage Trust Series 2014-C20, Class A4 | | | | | |
| | | |
3.72% | | | 05/15/47 | | | | 3,775 | | | | 3,751 | |
| |
WFRBS Commercial Mortgage Trust Series 2014-C20, Class XA (I/O) | | | | | |
| | | |
0.88% (3) | | | 05/15/47 | | | | 883,589 | | | | 1,576 | |
| |
WFRBS Commercial Mortgage Trust Series 2014-C21, Class XA (I/O) | | | | | |
0.99% (3) | | | 08/15/47 | | | | 3,438,863 | | | | 13,113 | |
| |
Total Commercial Mortgage-Backed Securities —
Non-Agency | | | | | |
| | | | | | | | | | | | |
| |
(Cost: $1,011,097) | | | | 927,602 | |
| | | | | | | | | | | | |
|
RESIDENTIAL MORTGAGE-BACKED SECURITIES —
AGENCY — 5.6% | |
| |
Federal Home Loan Mortgage Corp. REMICS Series 3016, Class GF | | | | | |
5.78% (30 day USD SOFR Average + 0.464%) (2) | | | 08/15/25 | | | | 12,314 | | | | 12,307 | |
| | | | | | | | | | | | |
| Issues | | Maturity
Date | | | Principal
Amount | | | Value | |
|
RESIDENTIAL MORTGAGE-BACKED SECURITIES —
AGENCY (Continued) | |
| |
Federal Home Loan Mortgage Corp. REMICS Series 3954, Class PF (PAC) | | | | | |
5.93% (30 day USD SOFR Average + 0.614%) (2) | | | 07/15/41 | | | $ | 209,734 | | | $ | 206,801 | |
| |
Federal Home Loan Mortgage Corp. REMICS Series 3055, Class MF | | | | | |
5.83% (30 day USD SOFR Average + 0.514%) (2) | | | 10/15/35 | | | | 254,573 | | | | 248,649 | |
| |
Federal Home Loan Mortgage Corp. REMICS Series 3320, Class FC | | | | | |
5.60% (30 day USD SOFR Average + 0.284%) (2) | | | 05/15/37 | | | | 51,889 | | | | 52,050 | |
| |
Federal Home Loan Mortgage Corp. REMICS Series 3738, Class FD | | | | | |
5.73% (30 day USD SOFR Average + 0.414%) (2) | | | 08/15/40 | | | | 122,054 | | | | 120,823 | |
| |
Federal National Mortgage Association REMICS Series 2002-41, Class F | | | | | |
5.99% (30 day USD SOFR Average + 0.664%) (2) | | | 07/25/32 | | | | 9,992 | | | | 9,948 | |
| |
Federal National Mortgage Association REMICS Series 2005-90, Class FC (PAC) | | | | | |
5.69% (30 day USD SOFR Average + 0.364%) (2) | | | 10/25/35 | | | | 173,933 | | | | 173,629 | |
| |
Federal National Mortgage Association REMICS Series 2011-110, Class FE (PAC) | | | | | |
5.84% (30 day USD SOFR Average + 0.514%) (2) | | | 04/25/41 | | | | 8,256 | | | | 8,201 | |
| |
Federal National Mortgage Association REMICS Series 2018-94, Class KD (PAC) | | | | | |
3.50% | | | 12/25/48 | | | | 41,885 | | | | 35,875 | |
| |
Federal National Mortgage Association REMICS Series 2013-130, Class BF | | | | | |
5.69% (30 day USD SOFR Average + 0.364%) (2) | | | 07/25/43 | | | | 85,793 | | | | 84,934 | |
| |
Federal National Mortgage Association Trust Series 2005-W3, Class 2AF | | | | | |
5.66% (30 day USD SOFR Average + 0.334%) (2) | | | 03/25/45 | | | | 4,700 | | | | 4,655 | |
| |
Government National Mortgage Association, Pool #MA6081 | | | | | |
3.50% | | | 08/20/49 | | | | 47,459 | | | | 39,830 | |
| |
Government National Mortgage Association REMICS Series 2023-113, Class FD | | | | | |
6.50% (30 day USD SOFR Average + 1.35) (2) | | | 08/20/53 | | | | 123,970 | | | | 121,999 | |
| |
Government National Mortgage Association REMICS Series 2023-116, Class FL | | | | | |
6.47% (30 day USD SOFR Average + 1.15) (2) | | | 08/20/53 | | | | 124,388 | | | | 123,324 | |
|
Total Residential Mortgage-backed Securities — Agency | |
| | | | | | | | | | | | |
| |
(Cost: $1,264,598) | | | | 1,243,025 | |
| | | | | | | | | | | | |
See accompanying Notes to Financial Statements.
37
TCW Enhanced Commodity Strategy Fund
Consolidated Schedule of Investments (Continued)
| | | | | | | | | | | | |
| Issues | | Maturity
Date | | | Principal
Amount | | | Value | |
|
RESIDENTIAL MORTGAGE-BACKED SECURITIES —
NON-AGENCY — 9.2% | |
| |
American Home Mortgage Investment Trust Series 2004-3, Class 4A | | | | | |
4.46% (6 mo. USD Term SOFR + 1.928%) (2) | | | 10/25/34 | | | $ | 28,857 | | | $ | 28,636 | |
| |
Angel Oak Mortgage Trust Series 2022-2, Class A1 | | | | | |
3.35% (1),(3) | | | 01/25/67 | | | | 163,752 | | | | 140,723 | |
| |
Bear Stearns Asset-Backed Securities I Trust Series 2006-HE9, Class 3A | | | | | |
5.72% (1 mo. USD Term SOFR + 0.394%) (2) | | | 11/25/36 | | | | 92,921 | | | | 89,331 | |
| |
Bear Stearns Asset-Backed Securities Trust Series 2004-AC1, Class A2 | | | | | |
5.94% (1 mo. USD Term SOFR + 0.614%) (2) | | | 03/25/34 | | | | 34,802 | | | | 35,169 | |
| |
BNC Mortgage Loan Trust Series 2006-2, Class A4 | | | | | |
5.76% (1 mo. USD Term SOFR + 0.434%) (2) | | | 11/25/36 | | | | 30,090 | | | | 28,505 | |
| |
Centex Home Equity Loan Trust Series 2005-A, Class M1 | | | | | |
6.16% (1 mo. USD Term SOFR + 0.834%) (2) | | | 01/25/35 | | | | 28,241 | | | | 27,886 | |
| |
Centex Home Equity Loan Trust Series 2005-B, Class M3 | | | | | |
6.13% (1 mo. USD Term SOFR + 0.804%) (2) | | | 03/25/35 | | | | 54,563 | | | | 52,638 | |
| |
CHL Mortgage Pass-Through Trust Series 2004-25, Class 1A1 | | | | | |
6.10% (1 mo. USD Term SOFR + 0.774%) (2) | | | 02/25/35 | | | | 78,200 | | | | 72,875 | |
| |
Citigroup Mortgage Loan Trust Asset-Backed Pass-Through Certificates Series 2004-OPT1, Class M3 | | | | | |
6.38% (1 mo. USD Term SOFR + 1.059%) (2) | | | 10/25/34 | | | | 63,250 | | | | 59,617 | |
| |
Citigroup Mortgage Loan Trust, Inc. Series 2006-WFH3, Class M2 | | | | | |
5.89% (1 mo. USD Term SOFR + 0.564%) (2) | | | 10/25/36 | | | | 15,058 | | | | 14,961 | |
| |
COLT Mortgage Loan Trust Series 2021-2, Class A1 | | | | | |
0.92% (1),(3) | | | 08/25/66 | | | | 145,344 | | | | 111,583 | |
| |
Countrywide Alternative Loan Trust Series 2005-56, Class 4A1 | | | | | |
6.06% (1 mo. USD Term SOFR + 0.734%) (2) | | | 11/25/35 | | | | 20,969 | | | | 18,421 | |
| |
Countrywide Asset-Backed Certificates Trust Series 2004-7, Class MV4 | | | | | |
4.22% (1 mo. USD Term SOFR + 1.764%) (2) | | | 12/25/34 | | | | 59,470 | | | | 58,152 | |
| |
DSLA Mortgage Loan Trust Series 2005-AR1, Class 2A1A | | | | | |
5.95% (1 mo. USD Term SOFR + 0.614%) (2) | | | 02/19/45 | | | | 67,714 | | | | 66,268 | |
| |
Encore Credit Receivables Trust Series 2005-3, Class M4 | | | | | |
6.34% (1 mo. USD Term SOFR + 1.014%) (2) | | | 10/25/35 | | | | 14,483 | | | | 14,068 | |
| | | | | | | | | | | | |
| Issues | | Maturity
Date | | | Principal
Amount | | | Value | |
|
RESIDENTIAL MORTGAGE-BACKED SECURITIES —
NON-AGENCY (Continued) | |
| |
First Franklin Mortgage Loan Trust Series 2004-FF5, Class A3C | | | | | |
6.44% (1 mo. USD Term SOFR + 1.114%) (2) | | | 08/25/34 | | | $ | 3,556 | | | $ | 3,259 | |
|
Impac CMB Trust Series 2004-6, Class 1A1 | |
6.24% (1 mo. USD Term SOFR + 0.914%) (2) | | | 10/25/34 | | | | 42,013 | | | | 40,527 | |
|
Impac CMB Trust Series 2005-5, Class A1 | |
6.08% (1 mo. USD Term SOFR + 0.434%) (2) | | | 08/25/35 | | | | 118,421 | | | | 106,035 | |
| |
JPMorgan Alternative Loan Trust Series 2007-S1, Class A1 | | | | | |
6.00% (1 mo. USD Term SOFR + 0.674%) (2) | | | 04/25/47 | | | | 61,775 | | | | 57,236 | |
| |
JPMorgan Mortgage Trust Series 2005-A5, Class TA1 | | | | | |
5.31% (3) | | | 08/25/35 | | | | 444 | | | | 406 | |
| |
JPMorgan Mortgage Trust Series 2005-A6, Class 7A1 | | | | | |
5.05% (3) | | | 08/25/35 | | | | 5,487 | | | | 4,512 | |
| |
MASTR Adjustable Rate Mortgages Trust Series 2004-13, Class 3A1 | | | | | |
5.41% (3) | | | 11/21/34 | | | | 10,443 | | | | 9,672 | |
| |
MASTR Adjustable Rate Mortgages Trust Series 2007-1, Class I2A1 | | | | | |
5.76% (1 mo. USD Term SOFR + 0.434%) (2) | | | 01/25/47 | | | | 39,305 | | | | 38,945 | |
| |
MASTR Seasoned Securitization Trust Series 2005-1, Class 4A1 | | | | | |
6.30% (3) | | | 10/25/32 | | | | 4,587 | | | | 4,256 | |
| |
Morgan Stanley ABS Capital I, Inc. Trust Series 2005-HE1, Class M1 | | | | | |
6.11% (1 mo. USD Term SOFR + 0.789%) (2) | | | 12/25/34 | | | | 25,426 | | | | 24,257 | |
|
MortgageIT Trust Series 2005-3, Class A1 | |
6.04% (1 mo. USD Term SOFR + 0.714%) (2) | | | 08/25/35 | | | | 2,433 | | | | 2,274 | |
|
MortgageIT Trust Series 2005-3, Class A2 | |
6.14% (1 mo. USD Term SOFR + 0.814%) (2) | | | 08/25/35 | | | | 12,166 | | | | 11,372 | |
|
MortgageIT Trust Series 2005-5, Class A1 | |
5.96% (1 mo. USD Term SOFR + 0.634%) (2) | | | 12/25/35 | | | | 11,534 | | | | 11,111 | |
| |
Nationstar Home Equity Loan Trust Series 2007-A, Class M1 | | | | | |
5.71% (1 mo. USD Term SOFR + 0.384%) (2) | | | 03/25/37 | | | | 415,000 | | | | 402,933 | |
| |
Nationstar Home Equity Loan Trust Series 2007-C, Class 1AV1 | | | | | |
5.61% (1 mo. USD Term SOFR + 0.289%) (2) | | | 06/25/37 | | | | 35,559 | | | | 33,629 | |
|
Ownit Mortgage Loan Trust Series 2006-3, Class A2D | |
5.98% (1 mo. USD Term SOFR + 0.654%) | | | 03/25/37 | | | | 108,368 | | | | 101,559 | |
See accompanying Notes to Financial Statements.
38
TCW Enhanced Commodity Strategy Fund
October 31, 2023
| | | | | | | | | | | | |
| Issues | | Maturity
Date | | | Principal
Amount | | | Value | |
|
RESIDENTIAL MORTGAGE-BACKED SECURITIES —
NON-AGENCY (Continued) | |
| |
Park Place Securities, Inc. Asset-Backed Pass-Through Certificates Series 2005-WHQ2, Class M3 | | | | | |
6.16% (1 mo. USD Term SOFR + 0.834%) (2) | | | 05/25/35 | | | $ | 37,024 | | | $ | 35,890 | |
| |
Park Place Securities, Inc. Asset-Backed Pass-Through Certificates Series 2005-WHQ3, Class M4 | | | | | |
6.38% (1 mo. USD Term SOFR + 1.059%) (2) | | | 06/25/35 | | | | 16,120 | | | | 16,036 | |
| |
Securitized Asset-Backed Receivables LLC Trust Series 2006-CB5, Class A3 | | | | | |
5.72% (1 mo. USD Term SOFR + 0.394%) (2) | | | 06/25/36 | | | | 65,518 | | | | 41,230 | |
| |
Structured Adjustable Rate Mortgage Loan Trust Series 2005-17, Class 3A1 | | | | | |
4.69% (3) | | | 08/25/35 | | | | 10,179 | | | | 8,585 | |
| |
Structured Asset Investment Loan Trust Series 2005-HE2, Class M2 | | | | | |
6.19% (1 mo. USD Term SOFR + 0.864%) (2) | | | 07/25/35 | | | | 107,322 | | | | 99,615 | |
| |
WaMu Mortgage Pass-Through Certificates Trust Series 2005-AR13, Class A1A1 | | | | | |
6.02% (1 mo. USD Term SOFR + 0.694%) (2) | | | 10/25/45 | | | | 40,717 | | | | 37,976 | |
| |
WaMu Mortgage Pass-Through Certificates Trust Series 2005-AR2, Class 2A1B | | | | | |
6.18% (1 mo. USD Term SOFR + 0.854%) (2) | | | 01/25/45 | | | | 83,365 | | | | 80,715 | |
| |
Wells Fargo Home Equity Asset-Backed Securities Trust Series 2007-2, Class A3 | | | | | |
5.90% (1 mo. USD Term SOFR + 0.574%) (2) | | | 04/25/37 | | | | 35,541 | | | | 33,957 | |
| | | | | | | | | | | | |
|
Total Residential Mortgage-Backed Securities —
Non-Agency | |
| |
(Cost: $2,079,136) | | | | 2,024,820 | |
| | | | | | | | | | | | |
|
CORPORATE BONDS — 31.1% | |
|
| Agriculture — 0.8% | |
|
BAT Capital Corp. (United Kingdom) | |
3.56% | | | 08/15/27 | | | | 58,000 | | | | 52,629 | |
|
Imperial Brands Finance PLC (United Kingdom) | |
3.13% (1) | | | 07/26/24 | | | | 120,000 | | | | 117,336 | |
| | | | | | | | | | | | |
| | | |
| | | | | | | | | | | 169,965 | |
| | | | | | | | | | | | |
|
| Airlines — 0.0% | |
|
U.S. Airways Pass-Through Trust Series 2012-1, Class A (EETC) | |
5.90% | | | 04/01/26 | | | | 4,078 | | | | 4,105 | |
| | | | | | | | | | | | |
|
| Banks — 12.9% | |
|
ABN AMRO Bank NV (Netherlands) | |
2.47% (1 yr. CMT + 1.100%) (1),(2) | | | 12/13/29 | | | | 75,000 | | | | 61,082 | |
| | | | | | | | | | | | |
| Issues | | Maturity
Date | | | Principal
Amount | | | Value | |
|
| Banks (Continued) | |
|
Bank of America Corp. | |
1.73% (Secured Overnight Financing Rate + 0.960%) (2) | | | 07/22/27 | | | $ | 150,000 | | | $ | 132,423 | |
2.55% (Secured Overnight Financing Rate + 1.050%) (2) | | | 02/04/28 | | | | 135,000 | | | | 119,356 | |
3.82% (3 mo. USD Term SOFR + 1.837%) (2) | | | 01/20/28 | | | | 10,000 | | | | 9,232 | |
4.38% (5 yr. CMT + 2.760%) (2),(5) | | | 01/27/27 | | | | 10,000 | | | | 8,111 | |
|
Citigroup, Inc. | |
3.07% (Secured Overnight Financing Rate + 1.280%) (2) | | | 02/24/28 | | | | 370,000 | | | | 333,196 | |
|
Goldman Sachs Group, Inc. | |
3.81% (3 mo. USD Term SOFR + 1.420%) (2) | | | 04/23/29 | | | | 370,000 | | | | 332,633 | |
|
HSBC Holdings PLC (United Kingdom) | |
2.21% (Secured Overnight Financing Rate + 1.285%) (2) | | | 08/17/29 | | | | 75,000 | | | | 61,029 | |
2.80% (Secured Overnight Financing Rate + 1.187%) | | | 05/24/32 | | | | 110,000 | | | | 82,800 | |
|
ING Groep NV (Netherlands) | |
3.87% (Secured Overnight Financing Rate + 1.640%) (2) | | | 03/28/26 | | | | 100,000 | | | | 96,429 | |
|
JPMorgan Chase & Co. | |
1.95% (Secured Overnight Financing Rate + 1.065%) (2) | | | 02/04/32 | | | | 35,000 | | | | 26,011 | |
2.07% (Secured Overnight Financing Rate + 1.015%) (2) | | | 06/01/29 | | | | 205,000 | | | | 170,385 | |
2.55% (Secured Overnight Financing Rate + 1.180%) | | | 11/08/32 | | | | 20,000 | | | | 15,166 | |
|
Macquarie Group Ltd. (Australia) | |
1.34% (Secured Overnight Financing Rate + 1.069%)(1),(2) | | | 01/12/27 | | | | 100,000 | | | | 89,298 | |
2.87% (Secured Overnight Financing Rate + 1.532%) (1) | | | 01/14/33 | | | | 5,000 | | | | 3,698 | |
|
Morgan Stanley | |
1.51% (Secured Overnight Financing Rate + 0.858%) (2) | | | 07/20/27 | | | | 165,000 | | | | 144,882 | |
|
NatWest Group PLC (United Kingdom) | |
4.27% (3 mo. USD LIBOR + 1.762%) (2) | | | 03/22/25 | | | | 15,000 | | | | 14,852 | |
See accompanying Notes to Financial Statements.
39
TCW Enhanced Commodity Strategy Fund
Consolidated Schedule of Investments (Continued)
| | | | | | | | | | | | |
| Issues | | Maturity
Date | | | Principal
Amount | | | Value | |
|
| Banks (Continued) | |
|
PNC Financial Services Group, Inc. | |
5.58% (Secured Overnight Financing Rate + 1.841%) (2) | | | 06/12/29 | | | $ | 10,000 | | | $ | 9,577 | |
|
Santander U.K. Group Holdings PLC (United Kingdom) | |
1.09% (Secured Overnight Financing Rate + 0.787%) | | | 03/15/25 | | | | 175,000 | | | | 170,907 | |
|
U.S. Bancorp | |
5.84% (Secured Overnight Financing Rate + 2.260%) | | | 06/12/34 | | | | 5,000 | | | | 4,619 | |
|
UBS Group AG (Switzerland) | |
1.31% (Secured Overnight Financing Rate Index + 0.980%) (1),(2) | | | 02/02/27 | | | | 215,000 | | | | 190,813 | |
1.36% (1 yr. CMT + 1.080%) (1),(2) | | | 01/30/27 | | | | 150,000 | | | | 133,060 | |
3.09% (Secured Overnight Financing Rate + 1.730%) (1) | | | 05/14/32 | | | | 260,000 | | | | 200,465 | |
|
Wells Fargo & Co. | |
2.39% (Secured Overnight Financing Rate + 2.100%) (2) | | | 06/02/28 | | | | 100,000 | | | | 87,195 | |
3.53% (Secured Overnight Financing Rate + 1.510%) (2) | | | 03/24/28 | | | | 365,000 | | | | 332,990 | |
4.90% (Secured Overnight Financing Rate + 2.100%) | | | 07/25/33 | | | | 5,000 | | | | 4,397 | |
| | | | | | | | | | | | |
| | | |
| | | | | | | | | | | 2,834,606 | |
| | | | | | | | | | | | |
|
| Beverages — 0.2% | |
|
Bacardi Ltd. | |
4.45% (1) | | | 05/15/25 | | | | 40,000 | | | | 38,905 | |
| | | | | | | | | | | | |
|
| Biotechnology — 0.7% | |
|
Amgen, Inc. | |
5.15% | | | 03/02/28 | | | | 155,000 | | | | 151,334 | |
| | | | | | | | | | | | |
|
| Chemicals — 0.5% | |
|
International Flavors & Fragrances, Inc. | |
1.23% (1) | | | 10/01/25 | | | | 125,000 | | | | 112,811 | |
| | | | | | | | | | | | |
|
| Commercial Services — 0.2% | |
|
Global Payments, Inc. | |
4.45% | | | 06/01/28 | | | | 55,000 | | | | 50,756 | |
| | | | | | | | | | | | |
|
| Diversified Financial Services — 1.7% | |
| |
AerCap Ireland Capital DAC/AerCap Global Aviation Trust (Ireland) | | | | | |
2.45% | | | 10/29/26 | | | | 155,000 | | | | 137,911 | |
|
Air Lease Corp. | |
2.88% | | | 01/15/26 | | | | 30,000 | | | | 27,852 | |
3.25% | | | 03/01/25 | | | | 95,000 | | | | 91,016 | |
| | | | | | | | | | | | |
| Issues | | Maturity
Date | | | Principal
Amount | | | Value | |
|
| Diversified Financial Services (Continued) | |
|
Avolon Holdings Funding Ltd. (Ireland) | |
2.53% (1) | | | 11/18/27 | | | $ | 25,000 | | | $ | 20,890 | |
|
Capital One Financial Corp. | |
3.27% (Secured Overnight Financing Rate + 1.790%) (2) | | | 03/01/30 | | | | 40,000 | | | | 32,784 | |
|
Cboe Global Markets, Inc. | |
3.00% | | | 03/16/32 | | | | 65,000 | | | | 52,182 | |
|
Intercontinental Exchange, Inc. | |
1.85% | | | 09/15/32 | | | | 15,000 | | | | 10,683 | |
| | | | | | | | | | | | |
| | | |
| | | | | | | | | | | 373,318 | |
| | | | | | | | | | | | |
|
| Electric — 2.1% | |
|
Alliant Energy Finance LLC | |
1.40% (1) | | | 03/15/26 | | | | 225,000 | | | | 200,059 | |
|
Eversource Energy | |
2.90% | | | 03/01/27 | | | | 50,000 | | | | 45,405 | |
|
ITC Holdings Corp. | |
4.95% (1) | | | 09/22/27 | | | | 100,000 | | | | 96,565 | |
|
Jersey Central Power & Light Co. | |
4.30% (1) | | | 01/15/26 | | | | 125,000 | | | | 120,147 | |
| | | | | | | | | | | | |
| | | |
| | | | | | | | | | | 462,176 | |
| | | | | | | | | | | | |
|
| Entertainment — 0.6% | |
|
WarnerMedia Holdings, Inc. | |
3.76% | | | 03/15/27 | | | | 100,000 | | | | 92,094 | |
4.28% | | | 03/15/32 | | | | 10,000 | | | | 8,295 | |
5.05% | | | 03/15/42 | | | | 45,000 | | | | 33,332 | |
| | | | | | | | | | | | |
| | | |
| | | | | | | | | | | 133,721 | |
| | | | | | | | | | | | |
|
| Food — 1.0% | |
|
JBS USA LUX SA/JBS USA Food Co./JBS USA Finance, Inc. | |
3.00% | | | 05/15/32 | | | | 95,000 | | | | 68,851 | |
5.13% | | | 02/01/28 | | | | 75,000 | | | | 70,439 | |
|
Smithfield Foods, Inc. | |
4.25% (1) | | | 02/01/27 | | | | 95,000 | | | | 87,304 | |
| | | | | | | | | | | | |
| | | |
| | | | | | | | | | | 226,594 | |
| | | | | | | | | | | | |
|
| Health Care-Services — 2.2% | |
|
Centene Corp. | |
3.00% | | | 10/15/30 | | | | 28,000 | | | | 22,184 | |
|
Fresenius Medical Care U.S. Finance III, Inc. | |
1.88% (1) | | | 12/01/26 | | | | 135,000 | | | | 116,779 | |
|
HCA, Inc. | |
3.13% | | | 03/15/27 | | | | 95,000 | | | | 85,751 | |
5.00% | | | 03/15/24 | | | | 10,000 | | | | 9,960 | |
5.25% | | | 06/15/26 | | | | 65,000 | | | | 63,476 | |
|
Premier Health Partners | |
2.91% | | | 11/15/26 | | | | 125,000 | | | | 111,884 | |
|
Universal Health Services, Inc. | |
1.65% | | | 09/01/26 | | | | 85,000 | | | | 75,007 | |
| | | | | | | | | | | | |
| | | |
| | | | | | | | | | | 485,041 | |
| | | | | | | | | | | | |
See accompanying Notes to Financial Statements.
40
TCW Enhanced Commodity Strategy Fund
October 31, 2023
| | | | | | | | | | | | |
| Issues | | Maturity
Date | | | Principal
Amount | | | Value | |
|
| Insurance — 1.8% | |
|
Athene Global Funding | |
2.51% (1) | | | 03/08/24 | | | $ | 20,000 | | | $ | 19,731 | |
3.21% (1) | | | 03/08/27 | | | | 70,000 | | | | 62,255 | |
6.04% (Secured Overnight Financing Rate Index + 0.700%) (1),(2) | | | 05/24/24 | | | | 95,000 | | | | 94,616 | |
|
Nationwide Mutual Insurance Co. | |
7.96% (3 mo. USD LIBOR + 2.290%) (1),(2) | | | 12/15/24 | | | | 70,000 | | | | 69,877 | |
|
Willis North America, Inc. | |
2.95% | | | 09/15/29 | | | | 20,000 | | | | 16,780 | |
3.60% | | | 05/15/24 | | | | 40,000 | | | | 39,459 | |
4.65% | | | 06/15/27 | | | | 95,000 | | | | 90,454 | |
| | | | | | | | | | | | |
| | | |
| | | | | | | | | | | 393,172 | |
| | | | | | | | | | | | |
|
| Media — 0.4% | |
| |
Charter Communications Operating LLC/Charter Communications Operating Capital | | | | | |
7.29% (3 mo. USD Term SOFR + 1.912%) (2) | | | 02/01/24 | | | | 94,000 | | | | 94,190 | |
| | | | | | | | | | | | |
|
| Miscellaneous Manufacturers — 0.0% | |
|
General Electric Co. | |
6.11% (3 mo. USD Term SOFR + 0.742%) | | | 08/15/36 | | | | 10,000 | | | | 8,972 | |
| | | | | | | | | | | | |
|
| Packaging & Containers — 0.6% | |
|
Berry Global, Inc. | |
4.88% (1) | | | 07/15/26 | | | | 130,000 | | | | 124,192 | |
| | | | | | | | | | | | |
|
| Pharmaceuticals — 0.9% | |
|
Bayer U.S. Finance II LLC | |
2.85% (1) | | | 04/15/25 | | | | 50,000 | | | | 47,281 | |
4.25% (1) | | | 12/15/25 | | | | 25,000 | | | | 24,025 | |
4.38% (1) | | | 12/15/28 | | | | 145,000 | | | | 132,927 | |
| | | | | | | | | | | | |
| | | |
| | | | | | | | | | | 204,233 | |
| | | | | | | | | | | | |
|
| Pipelines — 1.2% | |
|
Energy Transfer LP | |
4.95% | | | 06/15/28 | | | | 135,000 | | | | 127,661 | |
|
Plains All American Pipeline LP/PAA Finance Corp. | |
4.50% | | | 12/15/26 | | | | 102,000 | | | | 97,234 | |
4.65% | | | 10/15/25 | | | | 50,000 | | | | 48,459 | |
| | | | | | | | | | | | |
| | | |
| | | | | | | | | | | 273,354 | |
| | | | | | | | | | | | |
|
| REIT — 1.9% | |
|
American Assets Trust LP | |
3.38% | | | 02/01/31 | | | | 10,000 | | | | 7,209 | |
|
Extra Space Storage LP | |
2.20% | | | 10/15/30 | | | | 8,000 | | | | 6,109 | |
2.40% | | | 10/15/31 | | | | 5,000 | | | | 3,737 | |
|
GLP Capital LP/GLP Financing II, Inc. | |
3.25% | | | 01/15/32 | | | | 26,000 | | | | 19,663 | |
5.25% | | | 06/01/25 | | | | 60,000 | | | | 58,819 | |
| | | | | | | | | | | | |
| Issues | | Maturity
Date | | | Principal
Amount | | | Value | |
|
| REIT (Continued) | |
|
Healthcare Realty Holdings LP | |
3.50% | | | 08/01/26 | | | $ | 10,000 | | | $ | 9,257 | |
3.63% | | | 01/15/28 | | | | 55,000 | | | | 48,874 | |
|
Hudson Pacific Properties LP | |
3.95% | | | 11/01/27 | | | | 55,000 | | | | 42,284 | |
|
Ventas Realty LP | |
2.65% | | | 01/15/25 | | | | 5,000 | | | | 4,784 | |
|
VICI Properties LP/VICI Note Co., Inc. | |
| | | |
5.75% (1) | | | 02/01/27 | | | | 150,000 | | | | 144,346 | |
Weyerhaeuser Co. | |
3.38% | | | 03/09/33 | | | | 90,000 | | | | 71,476 | |
| | | | | | | | | | | | |
| | | |
| | | | | | | | | | | 416,558 | |
| | | | | | | | | | | | |
|
| Savings & Loans — 0.0% | |
|
TIAA FSB Holdings, Inc. | |
5.75% | | | 07/02/25 | | | | 10,000 | | | | 9,316 | |
| | | | | | | | | | | | |
|
| Software — 0.3% | |
|
Oracle Corp. | |
2.80% | | | 04/01/27 | | | | 70,000 | | | | 63,349 | |
|
| Telecommunications — 1.1% | |
| |
Sprint Spectrum Co. LLC/Sprint Spectrum Co. II LLC/Sprint Spectrum Co. III LLC | | | | | |
5.15% (1) | | | 09/20/29 | | | | 58,500 | | | | 57,579 | |
|
T-Mobile USA, Inc. | |
3.75% | | | 04/15/27 | | | | 195,000 | | | | 181,389 | |
| | | | | | | | | | | | |
| | | |
| | | | | | | | | | | 238,968 | |
| | | | | | | | | | | | |
|
Total Corporate Bonds | |
| |
(Cost: $7,306,454) | | | | 6,869,636 | |
| | | | | | | | | | | | |
|
MUNICIPAL BONDS — 0.1% | |
|
City of Baltimore, General Obligation Unlimited | |
5.00% | | | 10/15/25 | | | | 5,000 | | | | 4,969 | |
|
Massachusetts School Building Authority, Revenue Bond | |
2.50% | | | 02/15/37 | | | | 20,000 | | | | 14,034 | |
|
New York State Urban Development Corp., Revenue Bond | |
2.54% | | | 03/15/34 | | | | 15,000 | | | | 11,203 | |
| | | | | | | | | | | | |
|
Total Municipal Bonds | |
| |
(Cost: $39,102) | | | | 30,206 | |
| | | | | | | | | | | | |
|
Total Fixed Income Securities | |
| |
(Cost: $16,098,544) | | | | 15,405,776 | |
| | | | | | | | | | | | |
| | | |
| | | | | | | | | | | | |
| | | | | | Shares | | | | |
|
| MONEY MARKET INVESTMENTS — 12.5% | |
| | | |
State Street Institutional U.S. Government Money Market Fund — Premier Class, | | | | | | | | | | | | |
5.30% (6) | | | | 2,750,913 | | | | 2,750,913 | |
| | | | | | | | | | | | |
|
Total Money Market Investments | |
| |
(Cost: $2,750,913) | | | | 2,750,913 | |
| | | | | | | | | | | | |
| | | |
| | | | | | | | | | | | |
See accompanying Notes to Financial Statements.
41
TCW Enhanced Commodity Strategy Fund
Consolidated Schedule of Investments (Continued)
| | | | | | | | | | | | |
| Issues | | Maturity
Date | | | Principal
Amount | | | Value | |
|
| MONEY MARKET INVESTMENTS (Continued) | |
|
SHORT TERM INVESTMENTS — 9.1% | |
|
| U.S. Treasury Securities — 9.1% | |
|
U.S. Treasury Bills | |
5.19% (7) | | | 11/28/23 | | | $ | 410,000 | | | $ | 408,375 | |
5.19% (7) | | | 11/28/23 | | | | 500,000 | | | | 498,018 | |
5.23% (7) | | | 12/05/23 | | | | 800,000 | | | | 796,006 | |
5.43% (7) | | | 03/07/24 | | | | 300,000 | | | | 294,383 | |
| | | | | | | | | | | | |
| | | |
Total U.S. Treasury Securities | | | | | | | | | | | | |
| |
(Cost: $1,996,791) | | | | 1,996,782 | |
| | | | | | | | | | | | |
| | | |
Total Investments (91.3%) | | | | | | | | | | | | |
| |
(Cost: $20,846,248) | | | | 20,153,471 | |
| | | | | | | | | | | | |
| |
Excess Of Other Assets Over Liabilities (8.7%) | | | | 1,912,405 | |
| |
Net Assets (100.0%) | | | $ | 22,065,876 | |
| | | | | | | | | | | | |
| | | | | | | | | | | | | | | | | | |
| Futures Contracts | | | | | | | | | | | | |
| | | | | |
Number of
Contracts | | Type | | Expiration
Date | | | Notional | | | Market
Value | | | Net Unrealized
Appreciation
(Depreciation) | |
Long Futures | |
| 57 | | Bloomberg Commodity Index Future (8) | | | 12/20/23 | | | $ | 610,232 | | | $ | 596,334 | | | $ | (13,898 | ) |
| | | | | | | | | | | | | | | | |
| | | | | | | | | | | | | | | | | | | | | | | | | | | | |
| Total Return Swaps (8) | |
| | | | | | | | |
Notional Amount | | | Expiration
Date | | | Counterparty | | Payment Made
by Fund | | Payment Received
by Fund | | Payment
Frequency | | | Unrealized
Appreciation
(Depreciation) | | | Premium
Paid | | | Value | |
| | OTC Swaps | |
| | $16,095,374 | | | | 11/17/2023 | | | Citigroup | | 0.14% | | Citigroup Commodity Total Return Index (9) | | | Monthly | | | | $ (209,666) | | | | $ — | | | | $ (209,666 | ) |
| | 5,600,000 | | | | 11/17/2023 | | | Citigroup | | 0.18% | | Citigroup Commodity Total Return Index (9) | | | Monthly | | | | (63,324) | | | | — | | | | (63,324 | ) |
| | | | | | | | | | | | | | | | | | | | | | | | | | | | |
| | | | | | | | | | | | | | | | | | | $ (272,990) | | | $ | — | | | | $ (272,990 | ) |
| | | | | | | | | | | | | | | | | | | | | | | | | | | | |
Notes to the Schedule of Investments:
| ABS | | Asset-Backed Securities. |
| CLO | | Collateralized Loan Obligation. |
| EETC | | Enhanced Equipment Trust Certificate. |
| I/O | | Interest Only Security. |
| PAC | | Planned Amortization Class. |
| REIT | | Real Estate Investment Trust. |
| SOFR | | Secured Overnight Financing Rate. |
| (1) | | Security exempt from registration under Rule 144A of the Securities Act of 1933, as amended. These securities may be resold, normally only to qualified institutional buyers. At October 31, 2023, the value of these securities amounted to $5,555,409 or 25.2% of net assets. These securities are determined to be liquid by the Fund’s investment advisor, unless otherwise noted, under procedures established by and under the general supervision of the Company’s Board of Directors. |
| (2) | | Floating or variable rate security. The interest shown reflects the rate in effect at October 31, 2023. |
See accompanying Notes to Financial Statements.
42
TCW Enhanced Commodity Strategy Fund
October 31, 2023
| (3) | | Variable rate security. Interest rate disclosed is as of the most recent information available. Certain variable rate securities are not based on a published reference rate and spread but are determined by the issuer or agent and are based on current market conditions. These securities do not indicate a reference rate and spread in their description above. |
| (4) | | Restricted security (Note 11). |
| (6) | | Rate disclosed is the 7-day net yield as of October 31, 2023. |
| (7) | | Rate shown represents yield-to-maturity. |
| (8) | | All or a portion of this security is owned by TCW Cayman Enhanced Commodity Fund, Ltd. |
| (9) | | Custom Index has exposure to the following commodities as shown on the next two pages. |
See accompanying Notes to Financial Statements.
43
TCW Enhanced Commodity Strategy Fund
Consolidated Schedule of Investments
Components of Total Return Swap | October 31, 2023 |
| | | | | | | | | | | | |
| Description (1) | | Notional
Amount | | | Weight % | | | Unrealized
Appreciation
(Depreciation) | |
Gold | | $ | 2,609,060 | | | | 16.21 | % | | $ | 140 | |
WTI Crude Oil | | | 1,237,734 | | | | 7.69 | % | | | (113,871 | ) |
Brent Crude Oil | | | 1,163,696 | | | | 7.23 | % | | | (78,524 | ) |
Natural Gas | | | 1,107,362 | | | | 6.88 | % | | | 97,388 | |
Soybeans | | | 991,475 | | | | 6.16 | % | | | (6,014 | ) |
Copper High Grade | | | 840,178 | | | | 5.22 | % | | | 18,996 | |
Corn | | | 799,940 | | | | 4.97 | % | | | (21,042 | ) |
Silver | | | 735,559 | | | | 4.57 | % | | | (17,883 | ) |
Aluminium Primary | | | 655,082 | | | | 4.07 | % | | | 19,919 | |
Live Cattle | | | 619,672 | | | | 3.85 | % | | | (9,251 | ) |
Sugar #11 | | | 535,976 | | | | 3.33 | % | | | 5,264 | |
Soybean Meal | | | 535,976 | | | | 3.33 | % | | | 6,604 | |
Soybean Oil | | | 508,614 | | | | 3.16 | % | | | (15,079 | ) |
Coffee ‘C’ Arabica | | | 487,690 | | | | 3.03 | % | | | 1,603 | |
RBOB Gasoline | | | 434,575 | | | | 2.70 | % | | | (20,725 | ) |
SRW Wheat | | | 399,165 | | | | 2.48 | % | | | (15,760 | ) |
Zinc High Grade | | | 387,898 | | | | 2.41 | % | | | (2,052 | ) |
Gasoil | | | 379,851 | | | | 2.36 | % | | | (30,964 | ) |
Lean Hogs | | | 344,441 | | | | 2.14 | % | | | 16,404 | |
Nickel Primary | | | 334,784 | | | | 2.08 | % | | | (7,820 | ) |
Heating Oil | | | 291,326 | | | | 1.81 | % | | | (21,016 | ) |
HRW Wheat | | | 286,498 | | | | 1.78 | % | | | (12,542 | ) |
Cotton | | | 255,916 | | | | 1.59 | % | | | (2,453 | ) |
Lead Standard | | | 152,906 | | | | 0.95 | % | | | (988 | ) |
| | | | | | | | | | | | |
| | $ | 16,095,374 | | | | 100.00 | % | | $ | (209,666 | ) |
| | | | | | | | | | | | |
| (1) | Commodity Exposures of the Citigroup Commodity Total Return Index. |
See accompanying Notes to Financial Statements.
44
TCW Enhanced Commodity Strategy Fund
Consolidated Schedule of Investments
Components of Total Return Swap October 31, 2023 |
| | | | | | | | | | | | |
| Description (1) | | Notional
Amount | | | Weight % | | | Unrealized
Appreciation
(Depreciation) | |
Gold | | $ | 915,040 | | | | 16.34 | % | | $ | 42 | |
WTI Crude Oil | | | 437,360 | | | | 7.80 | % | | | (29,002 | ) |
Brent Crude Oil | | | 409,920 | | | | 7.32 | % | | | (23,344 | ) |
Soybeans | | | 346,640 | | | | 6.19 | % | | | (1,141 | ) |
Copper High Grade | | | 291,760 | | | | 5.25 | % | | | 6,771 | |
Natural Gas | | | 352,800 | | | | 6.30 | % | | | 26,121 | |
Corn | | | 280,560 | | | | 5.01 | % | | | (6,637 | ) |
Silver | | | 258,160 | | | | 4.61 | % | | | (6,184 | ) |
Aluminium Primary | | | 226,800 | | | | 4.05 | % | | | 6,782 | |
Sugar #11 | | | 190,960 | | | | 3.40 | % | | | 1,215 | |
Live Cattle | | | 218,400 | | | | 3.90 | % | | | (4,282 | ) |
Coffee ‘C’ Arabica | | | 171,920 | | | | 3.07 | % | | | 331 | |
Soybean Meal | | | 188,160 | | | | 3.36 | % | | | 1,393 | |
Soybean Oil | | | 176,960 | | | | 3.16 | % | | | (4,925 | ) |
Zinc High Grade | | | 136,080 | | | | 2.43 | % | | | (506 | ) |
RBOB Gasoline | | | 148,960 | | | | 2.66 | % | | | (5,685 | ) |
Nickel Primary | | | 117,040 | | | | 2.09 | % | | | (2,664 | ) |
SRW Wheat | | | 139,440 | | | | 2.49 | % | | | (5,136 | ) |
Gasoil | | | 132,720 | | | | 2.37 | % | | | (8,309 | ) |
Lean Hogs | | | 113,120 | | | | 2.02 | % | | | 3,595 | |
Heating Oil | | | 101,920 | | | | 1.82 | % | | | (6,301 | ) |
HRW Wheat | | | 101,360 | | | | 1.80 | % | | | (4,127 | ) |
Cotton | | | 90,160 | | | | 1.60 | % | | | (1,036 | ) |
Lead Standard | | | 53,760 | | | | 0.96 | % | | | (295 | ) |
| | | | | | | | | | | | |
| | $ | 5,600,000 | | | | 100.00 | % | | $ | (63,324 | ) |
| | | | | | | | | | | | |
| (1) | Commodity Exposures of the Citigroup Commodity Total Return Index. |
See accompanying Notes to Financial Statements.
45
TCW Enhanced Commodity Strategy Fund
Consolidated Investments by Sector | October 31, 2023 |
| | | | |
| Sector | | Percentage of
Net Assets | |
Corporate Bonds | | | 31.1 | % |
Asset-Backed Securities | | | 16.7 | |
Money Market Investments | | | 12.5 | |
Residential Mortgage-Backed Securities — Non-Agency | | | 9.2 | |
U.S. Treasury Securities | | | 9.1 | |
Residential Mortgage-Backed Securities — Agency | | | 5.6 | |
Commercial Mortgage-Backed Securities — Non-Agency | | | 4.2 | |
Commercial Mortgage-Backed Securities — Agency | | | 2.8 | |
Municipal Bonds | | | 0.1 | |
Other* | | | 8.7 | |
| | | | |
Total | | | 100.0 | % |
| | | | |
| * | Includes swaps, futures, interest receivable and accrued expenses payable. |
See accompanying Notes to Financial Statements.
46
TCW Enhanced Commodity Strategy Fund
Fair Valuation Summary | October 31, 2023 |
The following is a summary of the fair valuations according to the inputs used as of October 31, 2023 in valuing the Fund’s investments:
| | | | | | | | | | | | | | | | |
Description | | Quoted Prices
in Active
Markets for
Identical
Assets
(Level 1) | | | Other
Significant
Observable
Inputs
(Level 2) | | | Significant
Unobservable
Inputs
(Level 3) | | | Total | |
Fixed Income Securities | | | | | | | | | | | | | | | | |
Asset-Backed Securities | | $ | — | | | $ | 3,690,737 | | | $ | — | | | $ | 3,690,737 | |
Commercial Mortgage-Backed Securities — Agency | | | — | | | | 619,750 | | | | — | | | | 619,750 | |
Commercial Mortgage-Backed Securities — Non-Agency | | | — | | | | 927,602 | | | | — | | | | 927,602 | |
Residential Mortgage-Backed Securities — Agency | | | — | | | | 1,243,025 | | | | — | | | | 1,243,025 | |
Residential Mortgage-Backed Securities — Non-Agency | | | — | | | | 2,024,820 | | | | — | | | | 2,024,820 | |
Corporate Bonds* | | | — | | | | 6,869,636 | | | | — | | | | 6,869,636 | |
Municipal Bonds | | | — | | | | 30,206 | | | | — | | | | 30,206 | |
| | | | | | | | | | | | | | | | |
Total Fixed Income Securities | | | — | | | | 15,405,776 | | | | — | | | | 15,405,776 | |
Money Market Investments | | | 2,750,913 | | | | — | | | | — | | | | 2,750,913 | |
Short Term Investments | | | 1,996,782 | | | | — | | | | — | | | | 1,996,782 | |
| | | | | | | | | | | | | | | | |
Total Investments | | $ | 4,747,695 | | | $ | 15,405,776 | | | $ | — | | | $ | 20,153,471 | |
| | | | | | | | | | | | | | | | |
Liability Derivatives | | | | | | | | | | | | | | | | |
Futures Contracts | | | | | | | | | | | | | | | | |
Equity Risk | | $ | (13,898 | ) | | $ | — | | | $ | — | | | $ | (13,898 | ) |
Swap Agreements | | | | | | | | | | | | | | | | |
Commodity Risk | | | — | | | | (272,990 | ) | | | — | | | | (272,990 | ) |
| | | | | | | | | | | | | | | | |
Total | | $ | (13,898 | ) | | $ | (272,990 | ) | | $ | — | | | $ | (286,888 | ) |
| | | | | | | | | | | | | | | | |
| * | See Schedule of Investments for corresponding industries. |
See accompanying Notes to Financial Statements.
47
TCW Global Bond Fund
Schedule of Investments
| | | | | | | | | | | | |
| Issues | | Maturity
Date | | | Principal
Amount | | | Value | |
| |
FIXED INCOME SECURITIES — 109.3% of Net Assets | | | | | |
| |
| CORPORATE BONDS — 27.6% | | | | |
| |
| Aerospace/Defense — 0.1% | | | | |
| |
TransDigm, Inc. | | | | | |
| | | |
6.75% (1) | | | 08/15/28 | | | $ | 18,000 | | | $ | 17,518 | |
| | | | | | | | | | | | |
|
| Agriculture — 1.0% | |
| |
BAT Capital Corp. (United Kingdom) | | | | | |
| | | |
4.54% | | | 08/15/47 | | | | 15,000 | | | | 9,712 | |
| |
BAT International Finance PLC (United Kingdom) | | | | | |
| | | |
2.25% (2) | | | 01/16/30 | | | | 100,000 | | | | 89,565 | |
| |
Imperial Brands Finance PLC (United Kingdom) | | | | | |
| | | |
3.88% (1) | | | 07/26/29 | | | $ | 13,000 | | | | 11,351 | |
| | | |
8.13% (2) | | | 03/15/24 | | | GBP | 50,000 | | | | 61,056 | |
| | | | | | | | | | | | |
| | | |
| | | | | | | | | | | 171,684 | |
| | | | | | | | | | | | |
| |
| Airlines — 0.4% | | | | |
| |
Delta Air Lines Pass-Through Trust Series 2020-1, Class AA | | | | | |
| | | |
2.00% | | | 12/10/29 | | | | 73,856 | | | | 63,831 | |
| | | | | | | | | | | | |
| |
| Banks — 8.2% | | | | |
| |
Bank of America Corp. | | | | | |
| | | |
2.30% (Secured Overnight Financing Rate + 1.220%) (3) | | | 07/21/32 | | | | 155,000 | | | | 114,471 | |
| |
China Development Bank | | | | | |
| | | |
2.77% | | | 10/24/32 | | | CNY | 160,000 | | | | 21,725 | |
| | | |
3.09% | | | 06/18/30 | | | CNY | 1,290,000 | | | | 179,413 | |
| | | |
3.48% | | | 01/08/29 | | | CNY | 200,000 | | | | 28,363 | |
| |
Citigroup, Inc. | | | | | |
| | | |
2.98% (Secured Overnight Financing Rate + 1.422%) (3) | | | 11/05/30 | | | $ | 25,000 | | | | 20,524 | |
| | | |
3.06% (Secured Overnight Financing Rate + 1.351%) (3) | | | 01/25/33 | | | | 60,000 | | | | 46,252 | |
| |
Goldman Sachs Group, Inc. | | | | | |
| | | |
2.38% (Secured Overnight Financing Rate + 1.248%) (3) | | | 07/21/32 | | | | 100,000 | | | | 74,339 | |
| |
HSBC Holdings PLC (United Kingdom) | | | | | |
| | | |
1.75% (Sterling Overnight Index Average + 1.307%) (3) | | | 07/24/27 | | | GBP | 100,000 | | | | 107,600 | |
| | | |
2.80% (Secured Overnight Financing Rate + 1.187%) (3) | | | 05/24/32 | | | $ | 15,000 | | | | 11,291 | |
| |
JPMorgan Chase & Co. | | | | | |
| | | |
2.55% (Secured Overnight Financing Rate + 1.180%) (3) | | | 11/08/32 | | | | 100,000 | | | | 75,830 | |
| | | | | | | | | | | | |
| Issues | | Maturity
Date | | | Principal
Amount | | | Value | |
| |
| Banks (Continued) | | | | |
| |
Kreditanstalt fuer Wiederaufbau (Germany) | | | | | |
| | | |
0.63% | | | 01/07/28 | | | $ | 181,000 | | | $ | 172,440 | |
| |
Lloyds Banking Group PLC (United Kingdom) | | | | | |
| | | |
4.98% (1 yr. CMT + 2.300%) (3) | | | 08/11/33 | | | | 10,000 | | | | 8,687 | |
| |
Macquarie Group Ltd. (Australia) | | | | | |
| | | |
2.87% (Secured Overnight Financing Rate + 1.532%) (1),(3) | | | 01/14/33 | | | | 25,000 | | | | 18,488 | |
| |
Morgan Stanley | | | | | |
| | | |
2.24% (Secured Overnight Financing Rate + 1.178%) (3) | | | 07/21/32 | | | | 105,000 | | | | 77,543 | |
| |
PNC Financial Services Group, Inc. | | | | | |
| | | |
6.88% (Secured Overnight Financing Rate + 2.284%) (3) | | | 10/20/34 | | | | 35,000 | | | | 34,998 | |
| |
Santander U.K. Group Holdings PLC (United Kingdom) | | | | | |
| | | |
1.09% (Secured Overnight Financing Rate + 0.787%) (3) | | | 03/15/25 | | | | 90,000 | | | | 87,895 | |
| | | |
5.00% (1) | | | 11/07/23 | | | | 20,000 | | | | 19,995 | |
| |
U.S. Bancorp | | | | | |
| | | |
4.84% (Secured Overnight Financing Rate + 1.600%) (3) | | | 02/01/34 | | | | 35,000 | | | | 29,937 | |
| | | |
5.84% (Secured Overnight Financing Rate + 2.260%) (3) | | | 06/12/34 | | | | 10,000 | | | | 9,239 | |
| |
UBS Group AG (Switzerland) | | | | | |
| | | |
2.59% (Secured Overnight Financing Rate + 1.560%) (1),(3) | | | 09/11/25 | | | | 15,000 | | | | 14,467 | |
| | | |
2.88% (1 year EUR Swap + 1.950%) (2),(3) | | | 04/02/32 | | | EUR | 100,000 | | | | 91,704 | |
| | | |
3.09% (Secured Overnight Financing Rate + 1.730%) (1),(3) | | | 05/14/32 | | | $ | 20,000 | | | | 15,420 | |
| | | |
6.54% (Secured Overnight Financing Rate + 3.920%) (1),(3) | | | 08/12/33 | | | | 75,000 | | | | 72,071 | |
| | | |
9.02% (Secured Overnight Financing Rate + 5.020%) (1),(3) | | | 11/15/33 | | | | 35,000 | | | | 39,370 | |
See accompanying Notes to Financial Statements.
48
TCW Global Bond Fund
October 31, 2023
| | | | | | | | | | | | |
| Issues | | Maturity
Date | | | Principal
Amount | | | Value | |
| |
| Banks (Continued) | | | | |
| |
Wells Fargo & Co. | | | | | |
| | | |
3.35% (Secured Overnight Financing Rate + 1.500%) (3) | | | 03/02/33 | | | $ | 110,000 | | | $ | 86,677 | |
| | | |
4.90% (Secured Overnight Financing Rate + 2.100%) (3) | | | 07/25/33 | | | | 5,000 | | | | 4,397 | |
| | | | | | | | | | | | |
| | | |
| | | | | | | | | | | 1,463,136 | |
| | | | | | | | | | | | |
|
| Beverages — 0.2% | |
| |
Bacardi Ltd. | | | | | |
| | | |
4.45% (1) | | | 05/15/25 | | | | 25,000 | | | | 24,316 | |
| |
Triton Water Holdings, Inc. | | | | | |
| | | |
6.25% (1) | | | 04/01/29 | | | | 20,000 | | | | 16,350 | |
| | | | | | | | | | | | |
| | | |
| | | | | | | | | | | 40,666 | |
| | | | | | | | | | | | |
|
| Building Materials — 1.1% | |
| |
Cemex SAB de CV (Mexico) | | | | | |
| | | |
9.13% (5 yr. CMT + 5.157%) (1),(3),(4) | | | 03/14/28 | | | | 200,000 | | | | 205,277 | |
| | | | | | | | | | | | |
|
| Chemicals — 0.6% | |
| |
International Flavors & Fragrances, Inc. | | | | | |
| | | |
1.80% | | | 09/25/26 | | | | 100,000 | | | | 98,302 | |
| |
Valvoline, Inc. | | | | | |
| | | |
3.63% (1) | | | 06/15/31 | | | | 10,000 | | | | 7,615 | |
| | | | | | | | | | | | |
| | | |
| | | | | | | | | | | 105,917 | |
| | | | | | | | | | | | |
|
| Commercial Services — 0.1% | |
| |
Adtalem Global Education, Inc. | | | | | |
| | | |
5.50% (1) | | | 03/01/28 | | | | 6,000 | | | | 5,503 | |
| |
WASH Multifamily Acquisition, Inc. | | | | | |
| | | |
5.75% (1) | | | 04/15/26 | | | | 4,000 | | | | 3,704 | |
| | | | | | | | | | | | |
| | | |
| | | | | | | | | | | 9,207 | |
| | | | | | | | | | | | |
|
| Computers — 0.1% | |
|
NCR Voyix Corp. | |
| | | |
5.13% (1) | | | 04/15/29 | | | | 18,000 | | | | 15,499 | |
| | | | | | | | | | | | |
|
| Diversified Financial Services — 0.8% | |
| |
AerCap Ireland Capital DAC/AerCap Global Aviation Trust (Ireland) | | | | | |
| | | |
2.45% | | | 10/29/26 | | | | 20,000 | | | | 17,795 | |
| | | |
3.30% | | | 01/30/32 | | | | 35,000 | | | | 27,157 | |
| | | |
3.88% | | | 01/23/28 | | | | 10,000 | | | | 8,997 | |
| |
Air Lease Corp. | | | | | |
| | | |
3.25% | | | 03/01/25 | | | | 20,000 | | | | 19,161 | |
| | | |
5.85% | | | 12/15/27 | | | | 20,000 | | | | 19,536 | |
| |
Avolon Holdings Funding Ltd. (Ireland) | | | | | |
| | | |
2.53% (1) | | | 11/18/27 | | | | 24,000 | | | | 20,054 | |
| | | |
2.88% (1) | | | 02/15/25 | | | | 30,000 | | | | 28,373 | |
| | | | | | | | | | | | |
| | | |
| | | | | | | | | | | 141,073 | |
| | | | | | | | | | | | |
| | | | | | | | | | | | |
| Issues | | Maturity
Date | | | Principal
Amount | | | Value | |
|
| Electric — 0.1% | |
| |
Arizona Public Service Co. | | | | | |
| | | |
5.55% | | | 08/01/33 | | | $ | 20,000 | | | $ | 18,801 | |
| | | | | | | | | | | | |
|
| Engineering & Construction — 0.1% | |
| |
Artera Services LLC | | | | | |
| | | |
9.03% (1) | | | 12/04/25 | | | | 16,000 | | | | 14,467 | |
| | | | | | | | | | | | |
|
| Entertainment — 0.4% | |
| |
WarnerMedia Holdings, Inc. | | | | | |
| | | |
5.05% | | | 03/15/42 | | | | 10,000 | | | | 7,407 | |
| | | |
5.14% | | | 03/15/52 | | | | 85,000 | | | | 60,235 | |
| | | | | | | | | | | | |
| | | |
| | | | | | | | | | | 67,642 | |
| | | | | | | | | | | | |
|
| Environmental Control — 0.0% | |
| |
GFL Environmental, Inc. (Canada) | | | | | |
| | | |
3.75% (1) | | | 08/01/25 | | | | 7,000 | | | | 6,628 | |
| | | | | | | | | | | | |
|
| Food — 0.5% | |
| |
JBS USA LUX SA/JBS USA Food Co./JBS USA Finance, Inc. | | | | | |
| | | |
4.38% | | | 02/02/52 | | | | 20,000 | | | | 12,172 | |
| |
Pilgrim’s Pride Corp. | | | | | |
| | | |
4.25% | | | 04/15/31 | | | | 37,000 | | | | 30,571 | |
| | | |
6.88% | | | 05/15/34 | | | | 40,000 | | | | 37,927 | |
| |
Post Holdings, Inc. | | | | | |
| | | |
4.63% (1) | | | 04/15/30 | | | | 12,000 | | | | 10,065 | |
| | | | | | | | | | | | |
| | | |
| | | | | | | | | | | 90,735 | |
| | | | | | | | | | | | |
|
| Health Care-Products — 0.1% | |
| |
DENTSPLY SIRONA, Inc. | | | | | |
| | | |
3.25% | | | 06/01/30 | | | | 20,000 | | | | 16,288 | |
| | | | | | | | | | | | |
|
| Health Care-Services — 1.1% | |
| |
Catalent Pharma Solutions, Inc. | | | | | |
| | | |
3.50% (1) | | | 04/01/30 | | | | 10,000 | | | | 7,860 | |
| |
Centene Corp. | | | | | |
| | | |
4.25% | | | 12/15/27 | | | | 65,000 | | | | 59,879 | |
| |
Fortrea Holdings, Inc. | | | | | |
| | | |
7.50% (1) | | | 07/01/30 | | | | 3,000 | | | | 2,906 | |
| |
HCA, Inc. | | | | | |
| | | |
5.25% | | | 06/15/49 | | | | 34,000 | | | | 26,157 | |
| |
Kedrion SpA (Italy) | | | | | |
| | | |
6.50% (1) | | | 09/01/29 | | | | 26,000 | | | | 21,775 | |
| |
ModivCare Escrow Issuer, Inc. | | | | | |
| | | |
5.00% (1) | | | 10/01/29 | | | | 12,000 | | | | 8,757 | |
| |
ModivCare, Inc. | | | | | |
| | | |
5.88% (1) | | | 11/15/25 | | | | 8,000 | | | | 7,568 | |
| |
Molina Healthcare, Inc. | | | | | |
| | | |
3.88% (1) | | | 11/15/30 | | | | 63,000 | | | | 51,424 | |
| |
Tenet Healthcare Corp. | | | | | |
| | | |
6.75% (1) | | | 05/15/31 | | | | 9,000 | | | | 8,559 | |
| | | | | | | | | | | | |
| | | |
| | | | | | | | | | | 194,885 | |
| | | | | | | | | | | | |
See accompanying Notes to Financial Statements.
49
TCW Global Bond Fund
Schedule of Investments (Continued)
| | | | | | | | | | | | |
| Issues | | Maturity
Date | | | Principal
Amount | | | Value | |
|
| Household Products/Wares — 0.1% | |
| |
Central Garden & Pet Co. | | | | | |
| | | |
4.13% | | | 10/15/30 | | | $ | 6,000 | | | $ | 4,901 | |
| |
Spectrum Brands, Inc. | | | | | |
| | | |
5.50% (1) | | | 07/15/30 | | | | 10,000 | | | | 9,100 | |
| | | | | | | | | | | | |
| | | |
| | | | | | | | | | | 14,001 | |
| | | | | | | | | | | | |
|
| Insurance — 0.6% | |
| |
Acrisure LLC/Acrisure Finance, Inc. | | | | | |
| | | |
4.25% (1) | | | 02/15/29 | | | | 9,000 | | | | 7,390 | |
| |
Athene Global Funding | | | | | |
| | | |
1.99% (1) | | | 08/19/28 | | | | 70,000 | | | | 56,790 | |
| |
Farmers Exchange Capital II | | | | | |
| | | |
6.15% (3 mo. USD LIBOR + 3.744%) (1),(3) | | | 11/01/53 | | | | 55,000 | | | | 49,678 | |
| | | | | | | | | | | | |
| | | |
| | | | | | | | | | | 113,858 | |
| | | | | | | | | | | | |
|
| Internet — 0.4% | |
| |
Alibaba Group Holding Ltd. (China) | | | | | |
| | | |
2.13% | | | 02/09/31 | | | | 50,000 | | | | 38,423 | |
| |
Tencent Holdings Ltd. (China) | | | | | |
| | | |
3.60% (1) | | | 01/19/28 | | | | 40,000 | | | | 36,580 | |
| | | | | | | | | | | | |
| | | |
| | | | | | | | | | | 75,003 | |
| | | | | | | | | | | | |
|
| Investment Companies — 0.9% | |
| |
Gaci First Investment Co. (Saudi Arabia) | | | | | |
| | | |
5.13% (2) | | | 02/14/53 | | | | 200,000 | | | | 154,750 | |
| |
Icahn Enterprises LP/Icahn Enterprises Finance Corp. | | | | | |
| | | |
5.25% | | | 05/15/27 | | | | 9,000 | | | | 7,729 | |
| | | |
6.25% | | | 05/15/26 | | | | 6,000 | | | | 5,490 | |
| | | |
6.38% | | | 12/15/25 | | | | 2,000 | | | | 1,884 | |
| | | | | | | | | | | | |
| | | |
| | | | | | | | | | | 169,853 | |
| | | | | | | | | | | | |
|
| Media — 0.6% | |
| |
Charter Communications Operating LLC/Charter Communications Operating Capital | | | | | |
| | | |
5.38% | | | 05/01/47 | | | | 81,000 | | | | 58,648 | |
| |
CSC Holdings LLC | | | | | |
| | | |
6.50% (1) | | | 02/01/29 | | | | 45,000 | | | | 35,644 | |
| |
Sirius XM Radio, Inc. | | | | | |
| | | |
3.88% (1) | | | 09/01/31 | | | | 7,000 | | | | 5,278 | |
| |
VZ Secured Financing BV (Netherlands) | | | | | |
| | | |
5.00% (1) | | | 01/15/32 | | | | 23,000 | | | | 17,528 | |
| | | | | | | | | | | | |
| | | |
| | | | | | | | | | | 117,098 | |
| | | | | | | | | | | | |
|
| Miscellaneous Manufacturers — 0.7% | |
| |
General Electric Co. | | | | | |
| | | |
6.11% (3 mo. USD Term SOFR + 0.742%) (3) | | | 08/15/36 | | | | 150,000 | | | | 134,577 | |
| | | | | | | | | | | | |
|
| Oil & Gas — 2.1% | |
| |
Empresa Nacional del Petroleo (Chile) | | | | | |
| | | |
6.15% (1) | | | 05/10/33 | | | | 200,000 | | | | 186,388 | |
| | | | | | | | | | | | |
| Issues | | Maturity
Date | | | Principal
Amount | | | Value | |
|
| Oil & Gas (Continued) | |
| |
KazMunayGas National Co. JSC (Kazakhstan) | | | | | |
| | | |
4.75% (2) | | | 04/19/27 | | | $ | 200,000 | | | $ | 187,140 | |
| | | | | | | | | | | | |
| | | |
| | | | | | | | | | | 373,528 | |
| | | | | | | | | | | | |
|
| Packaging & Containers — 0.8% | |
| |
Ball Corp. | | | | | |
| | | |
6.88% | | | 03/15/28 | | | | 8,000 | | | | 7,980 | |
| |
Berry Global, Inc. | | | | | |
| | | |
1.00% (2) | | | 01/15/25 | | | | 100,000 | | | | 101,503 | |
| |
Graphic Packaging International LLC | | | | | |
| | | |
4.13% | | | 08/15/24 | | | | 27,000 | | | | 26,460 | |
| |
Trivium Packaging Finance BV (Netherlands) | | | | | |
| | | |
8.50% (1) | | | 08/15/27 | | | | 2,000 | | | | 1,675 | |
| | | | | | | | | | | | |
| | | |
| | | | | | | | | | | 137,618 | |
| | | | | | | | | | | | |
|
| Pharmaceuticals — 0.4% | |
| |
Bayer U.S. Finance II LLC | | | | | |
| | | |
4.63% (1) | | | 06/25/38 | | | | 51,000 | | | | 40,280 | |
| | | |
4.88% (1) | | | 06/25/48 | | | | 10,000 | | | | 7,501 | |
| |
Prestige Brands, Inc. | | | | | |
| | | |
3.75% (1) | | | 04/01/31 | | | | 22,000 | | | | 17,496 | |
| | | | | | | | | | | | |
| | | |
| | | | | | | | | | | 65,277 | |
| | | | | | | | | | | | |
|
| Pipelines — 1.4% | |
| |
Energy Transfer LP | | | | | |
| | | |
5.15% | | | 03/15/45 | | | | 60,000 | | | | 46,389 | |
| | | |
6.55% | | | 12/01/33 | | | | 3,000 | | | | 2,956 | |
| |
Greensaif Pipelines Bidco SARL | | | | | |
| | | |
6.13% (1) | | | 02/23/38 | | | | 200,000 | | | | 186,540 | |
| |
Venture Global Calcasieu Pass LLC | | | | | |
| | | |
6.25% (1) | | | 01/15/30 | | | | 10,000 | | | | 9,447 | |
| |
Venture Global LNG, Inc. | | | | | |
| | | |
9.50% (1) | | | 02/01/29 | | | | 9,000 | | | | 9,135 | |
| | | | | | | | | | | | |
| | | |
| | | | | | | | | | | 254,467 | |
| | | | | | | | | | | | |
|
| Real Estate — 0.5% | |
| |
Blackstone Property Partners Europe Holdings SARL (Luxembourg) | | | | | |
| | | |
1.75% (2) | | | 03/12/29 | | | | 100,000 | | | | 83,128 | |
| | | | | | | | | | | | |
|
| REIT — 1.6% | |
| |
American Assets Trust LP | | | | | |
| | | |
3.38% | | | 02/01/31 | | | | 40,000 | | | | 28,835 | |
| |
American Homes 4 Rent LP | | | | | |
| | | |
3.38% | | | 07/15/51 | | | | 35,000 | | | | 19,761 | |
| | | |
4.30% | | | 04/15/52 | | | | 10,000 | | | | 6,788 | |
| |
American Tower Corp. | | | | | |
| | | |
2.70% | | | 04/15/31 | | | | 20,000 | | | | 15,473 | |
| | | |
5.65% | | | 03/15/33 | | | | 15,000 | | | | 13,978 | |
| |
GLP Capital LP/GLP Financing II, Inc. | | | | | |
| | | |
3.35% | | | 09/01/24 | | | | 15,000 | | | | 14,642 | |
| | | |
5.38% | | | 04/15/26 | | | | 20,000 | | | | 19,187 | |
| | | |
5.75% | | | 06/01/28 | | | | 5,000 | | | | 4,692 | |
See accompanying Notes to Financial Statements.
50
TCW Global Bond Fund
October 31, 2023
| | | | | | | | | | | | |
| Issues | | Maturity
Date | | | Principal
Amount | | | Value | |
|
| REIT (Continued) | |
| |
Healthcare Realty Holdings LP | | | | | |
| | | |
3.10% | | | 02/15/30 | | | $ | 75,000 | | | $ | 61,089 | |
| |
Hudson Pacific Properties LP | | | | | |
| | | |
3.25% | | | 01/15/30 | | | | 30,000 | | | | 19,298 | |
| | | |
4.65% | | | 04/01/29 | | | | 5,000 | | | | 3,572 | |
| |
Kilroy Realty LP | | | | | |
| | | |
2.65% | | | 11/15/33 | | | | 15,000 | | | | 9,816 | |
| |
LXP Industrial Trust | | | | | |
| | | |
2.70% | | | 09/15/30 | | | | 20,000 | | | | 15,206 | |
| |
VICI Properties LP/VICI Note Co., Inc. | | | | | |
| | | |
5.75% (1) | | | 02/01/27 | | | | 55,000 | | | | 52,927 | |
| | | | | | | | | | | | |
| | | |
| | | | | | | | | | | 285,264 | |
| | | | | | | | | | | | |
|
| Retail — 0.5% | |
| |
Alimentation Couche-Tard, Inc. (Canada) | | | | | |
| | | |
3.06% | | | 07/26/24 | | | | 95,000 | | | | 67,220 | |
| |
Ferrellgas LP/Ferrellgas Finance Corp. | | | | | |
| | | |
5.88% (1) | | | 04/01/29 | | | | 2,000 | | | | 1,777 | |
| |
Michaels Cos., Inc. | | | | | |
| | | |
5.25% (1) | | | 05/01/28 | | | | 20,000 | | | | 14,510 | |
| | | | | | | | | | | | |
| | | |
| | | | | | | | | | | 83,507 | |
| | | | | | | | | | | | |
|
| Semiconductors — 1.1% | |
| |
SK Hynix, Inc. | | | | | |
| | | |
6.38% (2) | | | 01/17/28 | | | | 200,000 | | | | 198,260 | |
| | | | | | | | | | | | |
|
| Software — 0.2% | |
| |
Open Text Corp. (Canada) | | | | | |
| | | |
6.90% (1) | | | 12/01/27 | | | | 5,000 | | | | 4,975 | |
| |
Oracle Corp. | | | | | |
| | | |
3.95% | | | 03/25/51 | | | | 44,000 | | | | 28,622 | |
| | | | | | | | | | | | |
| | | |
| | | | | | | | | | | 33,597 | |
| | | | | | | | | | | | |
|
| Telecommunications — 0.8% | |
| |
Frontier Communications Holdings LLC | | | | | |
| | | |
5.00% (1) | | | 05/01/28 | | | | 11,000 | | | | 9,547 | |
| | | |
8.63% (1) | | | 03/15/31 | | | | 10,000 | | | | 9,415 | |
| |
Intelsat Jackson Holdings SA (Escrow) | | | | | |
| | | |
8.50% (1),(5) | | | 10/15/24 | | | | 21,000 | | | | — | |
| | | |
9.75% (1),(5) | | | 07/15/25 | | | | 15,000 | | | | — | |
| |
Intelsat Jackson Holdings SA (Luxembourg) | | | | | |
| | | |
6.50% (1),(6) | | | 03/15/30 | | | | 12,000 | | | | 10,573 | |
| |
Qwest Corp. | | | | | |
| | | |
7.25% | | | 09/15/25 | | | | 33,000 | | | | 31,845 | |
| |
Sprint Spectrum Co. LLC/Sprint Spectrum Co. II LLC/Sprint Spectrum Co. III LLC | | | | | |
| | | |
4.74% (1) | | | 09/20/29 | | | | 26,250 | | | | 25,957 | |
| |
T-Mobile USA, Inc. | | | | | |
| | | |
2.63% | | | 04/15/26 | | | | 55,000 | | | | 50,877 | |
| | | | | | | | | | | | |
| | | |
| | | | | | | | | | | 138,214 | |
| | | | | | | | | | | | |
| |
Total Corporate Bonds | | | | | |
| |
(Cost: $5,439,965) | | | | 4,920,504 | |
| | | | | | | | | | | | |
| | | | | | | | | | | | |
| Issues | | Maturity
Date | | | Principal
Amount | | | Value | |
|
| MUNICIPAL BONDS — 0.4% | |
| |
Alabama Economic Settlement Authority, Revenue Bond | | | | | |
| | | |
4.26% | | | 09/15/32 | | | $ | 40,000 | | | $ | 36,398 | |
| |
County of Miami-Dade Aviation Revenue, Revenue Bond | | | | | |
| | | |
2.86% | | | 10/01/35 | | | | 50,000 | | | | 36,486 | |
| | | | | | | | | | | | |
| |
Total Municipal Bonds | | | | | |
| |
(Cost: $90,836) | | | | 72,884 | |
| | | | | | | | | | | | |
|
| FOREIGN GOVERNMENT BONDS — 40.2% | |
| |
Australia Government Bonds | | | | | |
| | | |
1.25% | | | 05/21/32 | | | AUD | 250,000 | | | | 118,779 | |
| | | |
1.75% (2) | | | 06/21/51 | | | AUD | 104,000 | | | | 32,070 | |
| | | |
2.75% (2) | | | 05/21/41 | | | AUD | 189,000 | | | | 85,448 | |
| |
Bundesrepublik Deutschland Bundesanleihe | | | | | |
| | | |
0.00% (2),(7) | | | 08/15/52 | | | EUR | 67,000 | | | | 30,032 | |
| |
Canada Government Bonds | | | | | |
| | | |
1.25% | | | 03/01/27 | | | CAD | 280,000 | | | | 182,802 | |
| | | |
2.00% | | | 12/01/51 | | | CAD | 91,000 | | | | 44,581 | |
| |
China Government Bonds | | | | | |
| | | |
2.85% | | | 06/04/27 | | | CNY | 810,000 | | | | 112,179 | |
| | | |
3.13% | | | 11/21/29 | | | CNY | 2,530,000 | | | | 356,702 | |
| | | |
3.72% | | | 04/12/51 | | | CNY | 980,000 | | | | 149,548 | |
| |
Colombia TES Series B | | | | | |
| | | |
7.00% | | | 06/30/32 | | | COP | 105,300,000 | | | | 19,251 | |
|
European Union | |
| | | |
0.00% (2),(7) | | | 06/02/28 | | | EUR | 129,000 | | | | 118,282 | |
| | | |
0.00% (2),(7) | | | 07/04/29 | | | EUR | 150,000 | | | | 132,412 | |
| | | |
0.20% (2) | | | 06/04/36 | | | EUR | 223,000 | | | | 154,247 | |
| | | |
2.75% (2) | | | 02/04/33 | | | EUR | 102,000 | | | | 102,161 | |
| |
French Republic Government Bonds OAT | | | | | |
| | | |
0.00% (2),(7) | | | 02/25/27 | | | EUR | 277,000 | | | | 265,153 | |
| | | |
0.00% (2),(7) | | | 11/25/29 | | | EUR | 56,000 | | | | 49,254 | |
| | | |
0.00% (2),(7) | | | 11/25/31 | | | EUR | 163,000 | | | | 133,260 | |
| | | |
0.50% (2) | | | 06/25/44 | | | EUR | 55,000 | | | | 30,666 | |
| | | |
0.75% (2) | | | 05/25/52 | | | EUR | 85,000 | | | | 41,444 | |
| | | |
0.75% (2) | | | 05/25/53 | | | EUR | 53,000 | | | | 25,158 | |
| | | |
1.00% (2) | | | 05/25/27 | | | EUR | 452,000 | | | | 445,424 | |
| |
Hungary Government Bonds | | | | | |
| | | |
3.00% | | | 08/21/30 | | | HUF | 2,250,000 | | | | 4,833 | |
| |
Indonesia Treasury Bonds | | | | | |
| | | |
6.63% | | | 05/15/33 | | | IDR | 1,520,000,000 | | | | 92,339 | |
| |
International Bank for Reconstruction & Development | | | | | |
| | | |
1.75% (2) | | | 03/13/25 | | | NOK | 650,000 | | | | 56,009 | |
| |
Ireland Government Bonds | | | | | |
| | | |
0.55% (2) | | | 04/22/41 | | | EUR | 76,000 | | | | 48,520 | |
| | | |
1.30% (2) | | | 05/15/33 | | | EUR | 65,000 | | | | 57,763 | |
| | | |
1.50% (2) | | | 05/15/50 | | | EUR | 40,000 | | | | 26,280 | |
| | | |
2.00% (2) | | | 02/18/45 | | | EUR | 47,000 | | | | 36,711 | |
| |
Israel Government Bonds — Fixed | | | | | |
| | | |
1.30% | | | 04/30/32 | | | ILS | 116,000 | | | | 22,339 | |
See accompanying Notes to Financial Statements.
51
TCW Global Bond Fund
Schedule of Investments (Continued)
| | | | | | | | | | | | |
| Issues | | Maturity
Date | | | Principal
Amount | | | Value | |
|
| FOREIGN GOVERNMENT BONDS (Continued) | |
| |
Italy Buoni Poliennali Del Tesoro | | | | | |
| | | |
1.10% (2) | | | 04/01/27 | | | EUR | 20,000 | | | $ | 19,326 | |
| | | |
4.40% (2) | | | 05/01/33 | | | EUR | 165,000 | | | | 171,771 | |
| |
Japan Government Thirty Year Bonds | | | | | |
| | | |
0.40% | | | 03/20/50 | | | JPY | 52,750,000 | | | | 244,493 | |
| |
Korea Treasury Bonds | | | | | |
| | | |
1.88% | | | 03/10/51 | | | KRW | 81,510,000 | | | | 38,936 | |
| | | |
2.00% | | | 06/10/31 | | | KRW | 376,090,000 | | | | 237,282 | |
| | | |
2.38% | | | 03/10/27 | | | KRW | 63,350,000 | | | | 44,292 | |
| |
Magyar Export-Import Bank Zrt | | | | | |
| | | |
6.13% (1) | | | 12/04/27 | | | $ | 200,000 | | | | 196,211 | |
| |
Malaysia Government Bonds | | | | | |
| | | |
4.64% | | | 11/07/33 | | | MYR | 562,000 | | | | 123,382 | |
| |
Mexico Bonos | | | | | |
| | | |
7.50% | | | 05/26/33 | | | MXN | 6,100,000 | | | | 282,277 | |
| | | |
8.00% | | | 07/31/53 | | | MXN | 400,000 | | | | 17,825 | |
| |
Netherlands Government Bonds | | | | | |
| | | |
0.50% (2) | | | 07/15/32 | | | EUR | 76,000 | | | | 64,691 | |
| | | |
0.50% (2) | | | 01/15/40 | | | EUR | 46,000 | | | | 31,523 | |
| |
New Zealand Government Bonds | | | | | |
| | | |
1.75% | | | 05/15/41 | | | NZD | 180,000 | | | | 58,941 | |
| | | |
2.00% | | | 05/15/32 | | | NZD | 71,000 | | | | 31,467 | |
| | | |
3.50% (2) | | | 04/14/33 | | | NZD | 499,000 | | | | 246,719 | |
| | | |
4.50% (2) | | | 04/15/27 | | | NZD | 845,000 | | | | 478,777 | |
| |
Norway Government Bonds | | | | | |
| | | |
1.38% (2) | | | 08/19/30 | | | NOK | 1,490,000 | | | | 112,872 | |
| | | |
1.50% (2) | | | 02/19/26 | | | NOK | 2,265,000 | | | | 191,225 | |
| | | |
2.13% (2) | | | 05/18/32 | | | NOK | 497,000 | | | | 38,382 | |
| |
Portugal Obrigacoes do Tesouro OT | | | | | |
| | | |
1.65% (2) | | | 07/16/32 | | | EUR | 95,000 | | | | 86,813 | |
| |
Province of Ontario | | | | | |
| | | |
3.75% | | | 12/02/53 | | | CAD | 29,000 | | | | 17,402 | |
| | | |
4.05% | | | 02/02/32 | | | CAD | 209,000 | | | | 143,278 | |
| |
Republic of Poland Government Bonds | | | | | |
| | | |
1.75% | | | 04/25/32 | | | PLN | 165,000 | | | | 29,197 | |
| |
Republic of South Africa Government Bonds | | | | | |
| | | |
8.88% | | | 02/28/35 | | | ZAR | 570,000 | | | | 24,210 | |
| |
Romania Government Bonds | | | | | |
| | | |
6.70% | | | 02/25/32 | | | RON | 300,000 | | | | 62,449 | |
| |
Singapore Government Bonds | | | | | |
| | | |
1.63% | | | 07/01/31 | | | SGD | 75,000 | | | | 48,376 | |
| |
Spain Government Bonds | | | | | |
| | | |
0.70% (2) | | | 04/30/32 | | | EUR | 24,000 | | | | 19,908 | |
| | | |
0.80% (2) | | | 07/30/27 | | | EUR | 42,000 | | | | 40,514 | |
| | | |
1.00% (2) | | | 07/30/42 | | | EUR | 32,000 | | | | 19,483 | |
| | | |
1.85% (2) | | | 07/30/35 | | | EUR | 98,000 | | | | 83,084 | |
| | | |
1.90% (2) | | | 10/31/52 | | | EUR | 26,000 | | | | 15,882 | |
| |
Sweden Government Bonds | | | | | |
| | | |
0.75% (2) | | | 05/12/28 | | | SEK | 690,000 | | | | 56,059 | |
| | | | | | | | | | | | |
| Issues | | Maturity
Date | | | Principal
Amount | | | Value | |
|
| FOREIGN GOVERNMENT BONDS (Continued) | |
| |
Thailand Government Bonds | | | | | |
| | | |
1.59% | | | 12/17/35 | | | THB | 1,298,000 | | | $ | 29,715 | |
| |
U.K. Gilts | | | | | |
| | | |
0.88% (2) | | | 07/31/33 | | | GBP | 344,000 | | | | 298,452 | |
| | | |
1.25% (2) | | | 10/22/41 | | | GBP | 99,000 | | | | 68,145 | |
| | | |
1.25% (2) | | | 07/31/51 | | | GBP | 80,000 | | | | 43,315 | |
| | | |
1.63% (2) | | | 10/22/28 | | | GBP | 263,000 | | | | 281,517 | |
| | | |
1.75% (2) | | | 09/07/37 | | | GBP | 95,000 | | | | 80,219 | |
| | | |
4.25% (2) | | | 06/07/32 | | | GBP | 80,000 | | | | 96,011 | |
| | | | | | | | | | | | |
| |
Total Foreign Government Bonds | | | | | |
| |
(Cost: $8,308,674) | | | | 7,148,068 | |
| | | | | | | | | | | | |
|
| ASSET-BACKED SECURITIES — 4.4% | |
| |
Dryden 72 CLO Ltd. Series 2019-72A, Class BR | | | | | |
| | | |
7.28% (3 mo. USD Term SOFR + 1.912%) (1),(3) | | | 05/15/32 | | | | 185,000 | | | | 181,202 | |
| |
OCP CLO Ltd. Series 2020-19A, Class AR | | | | | |
| | | |
6.83% (3 mo. USD Term SOFR + 1.412%) (1),(3) | | | 10/20/34 | | | | 100,000 | | | | 98,965 | |
| |
Rockford Tower CLO Ltd. Series 2021-1A, Class B | | | | | |
| | | |
7.33% (3 mo. USD Term SOFR + 1.912%) (1),(3) | | | 07/20/34 | | | | 180,000 | | | | 175,556 | |
| |
Sixth Street CLO XVII Ltd. Series 2021-17A, Class A | | | | | |
| | | |
6.92% (3 mo. USD Term SOFR + 1.502%) (1),(3) | | | 01/20/34 | | | | 150,000 | | | | 149,460 | |
| |
SLM Student Loan Trust Series 2008-5, Class B | | | | | |
| | | |
7.45% (90 day USD SOFR Average + 2.112%) (3) | | | 07/25/73 | | | | 50,000 | | | | 48,740 | |
| |
Student Loan Consolidation Center Student Loan Trust I Series 2002-2, Class B2 | | | | | |
| | | |
1.65% (28 day ARS) (1),(3) | | | 07/01/42 | | | | 50,000 | | | | 46,204 | |
| |
Textainer Marine Containers VII Ltd. Series 2021-2A, Class A | | | | | |
| | | |
2.23% (1) | | | 04/20/46 | | | | 92,000 | | | | 78,452 | |
| | | | | | | | | | | | |
| |
Total Asset-backed Securities | | | | | |
| |
(Cost: $785,584) | | | | 778,579 | |
| | | | | | | | | | | | |
|
COMMERCIAL MORTGAGE-BACKED SECURITIES —
AGENCY — 0.1% | |
| |
Federal National Mortgage Association-Aces Series 2016-M2, Class X3 (I/O) | | | | | |
| | | |
2.04% (8) | | | 04/25/36 | | | | 129,181 | | | | 1,126 | |
| |
Federal National Mortgage Association-Aces Series 2016-M4, Class X2 (I/O) | | | | | |
| | | |
2.67% (8) | | | 01/25/39 | | | | 445,256 | | | | 6,015 | |
| |
Government National Mortgage Association Series 2011-147, Class IO (I/O) | | | | | |
| | | |
0.00% (8) | | | 10/16/44 | | | | 77,755 | | | | 1 | |
See accompanying Notes to Financial Statements.
52
TCW Global Bond Fund
October 31, 2023
| | | | | | | | | | | | |
| Issues | | Maturity
Date | | | Principal
Amount | | | Value | |
|
COMMERCIAL MORTGAGE-BACKED SECURITIES —
AGENCY (Continued) | |
| |
Government National Mortgage Association Series 2012-144, Class IO (I/O) | | | | | |
| | | |
0.33% (8) | | | 01/16/53 | | | $ | 1,462,325 | | | $ | 9,867 | |
| | | | | | | | | | | | |
| |
Total Commercial Mortgage-Backed Securities — Agency | | | | | |
| | | |
(Cost: $43,613) | | | | | | | | | | | 17,009 | |
| | | | | | | | | | | | |
|
COMMERCIAL MORTGAGE-BACKED SECURITIES —
NON-AGENCY — 3.6% | |
| |
BHMS Mortgage Trust Series 2018-ATLS, Class C | | | | | |
| | | |
7.53% (1 mo. USD Term SOFR + 2.197%) (1) | | | 07/15/35 | | | | 100,000 | | | | 97,515 | |
| |
BX Mortgage Trust Series 2021-PAC, Class E | | | | | |
| | | |
7.40% (1 mo. USD Term SOFR + 2.062%) (1) | | | 10/15/36 | | | | 100,000 | | | | 95,655 | |
| |
BX Trust Series 2019-OC11, Class D | | | | | |
| | | |
3.94% (1),(8) | | | 12/09/41 | | | | 60,000 | | | | 48,360 | |
| |
COMM Mortgage Trust Series 2012-CR4, Class XA (I/O) | | | | | |
| | | |
1.14% (8) | | | 10/15/45 | | | | 167,201 | | | | 2 | |
| |
COMM Mortgage Trust Series 2017-PANW, Class D | | | | | |
| | | |
3.93% (1),(8) | | | 10/10/29 | | | | 100,000 | | | | 88,248 | |
| |
DC Office Trust Series 2019-MTC, Class D | | | | | |
| | | |
3.07% (1),(8) | | | 09/15/45 | | | | 165,000 | | | | 95,111 | |
| |
DC Office Trust Series 2019-MTC, Class E | | | | | |
| | | |
3.07% (1),(8) | | | 09/15/45 | | | | 180,000 | | | | 90,125 | |
| |
GS Mortgage Securities Trust Series 2010-C1, Class X (I/O) | | | | | |
| | | |
0.45% (1),(8) | | | 08/10/43 | | | | 961,137 | | | | 2,643 | |
| |
GS Mortgage Securities Trust Series 2014-GC20, Class XA (I/O) | | | | | |
| | | |
1.00% (8) | | | 04/10/47 | | | | 930,453 | | | | 722 | |
| |
JPMBB Commercial Mortgage Securities Trust Series 2014-C19, Class XA (I/O) | | | | | |
| | | |
0.56% (8) | | | 04/15/47 | | | | 1,160,589 | | | | 218 | |
| |
JPMorgan Chase Commercial Mortgage Securities Trust Series 2011-C3, Class XB (I/O) | | | | | |
| | | |
0.39% (1),(8) | | | 02/15/46 | | | | 6,044,098 | | | | 16,226 | |
| |
Taurus U.K. DAC Series 2021-UK4A, Class B | | | | | |
| | | |
6.72% (Sterling Overnight Index Average + 1.500%) (1),(3) | | | 08/17/31 | | | | 93,839 | | | | 110,020 | |
| | | | | | | | | | | | |
| |
Total Commercial Mortgage-Backed Securities — Non-Agency | | | | | |
| |
(Cost: $635,944) | | | | 644,845 | |
| | | | | | | | | | | | |
|
RESIDENTIAL MORTGAGE-BACKED SECURITIES —
AGENCY — 22.5% | |
| |
Federal Home Loan Mortgage Corp., Pool #G08681 | | | | | |
| | | |
3.50% | | | 12/01/45 | | | | 15,800 | | | | 13,528 | |
| |
Federal Home Loan Mortgage Corp., Pool #G08698 | | | | | |
| | | |
3.50% | | | 03/01/46 | | | | 14,761 | | | | 12,653 | |
| | | | | | | | | | | | |
| Issues | | Maturity
Date | | | Principal
Amount | | | Value | |
|
RESIDENTIAL MORTGAGE-BACKED SECURITIES —
AGENCY (Continued) | |
| |
Federal Home Loan Mortgage Corp., Pool #G08716 | | | | | |
| | | |
3.50% | | | 08/01/46 | | | $ | 15,044 | | | $ | 12,846 | |
| |
Federal Home Loan Mortgage Corp., Pool #G08721 | | | | | |
| | | |
3.00% | | | 09/01/46 | | | | 3,064 | | | | 2,524 | |
| |
Federal Home Loan Mortgage Corp., Pool #G08722 | | | | | |
| | | |
3.50% | | | 09/01/46 | | | | 1,555 | | | | 1,328 | |
| |
Federal Home Loan Mortgage Corp., Pool #G08732 | | | | | |
| | | |
3.00% | | | 11/01/46 | | | | 4,327 | | | | 3,561 | |
| |
Federal Home Loan Mortgage Corp., Pool #G08762 | | | | | |
| | | |
4.00% | | | 05/01/47 | | | | 13,641 | | | | 12,088 | |
| |
Federal Home Loan Mortgage Corp., Pool #G08833 | | | | | |
| | | |
5.00% | | | 07/01/48 | | | | 1,851 | | | | 1,741 | |
| |
Federal Home Loan Mortgage Corp., Pool #G18592 | | | | | |
| | | |
3.00% | | | 03/01/31 | | | | 2,395 | | | | 2,242 | |
| |
Federal Home Loan Mortgage Corp., Pool #SD0231 | | | | | |
| | | |
3.00% | | | 01/01/50 | | | | 90,426 | | | | 73,614 | |
| |
Federal Home Loan Mortgage Corp., Pool #SD8189 | | | | | |
| | | |
2.50% | | | 01/01/52 | | | | 44,229 | | | | 33,993 | |
| |
Federal Home Loan Mortgage Corp., Pool #ZT1703 | | | | | |
| | | |
4.00% | | | 01/01/49 | | | | 36,464 | | | | 32,175 | |
| |
Federal Home Loan Mortgage Corp. REMICS Series 3439, Class SC (I/O) (I/F) | | | | | |
| | | |
0.47% (-30 day USD SOFR Average + 5.786%) (3) | | | 04/15/38 | | | | 33,019 | | | | 1,343 | |
| |
Federal National Mortgage Association, Pool #AB3679 | | | | | |
| | | |
3.50% | | | 10/01/41 | | | | 42,447 | | | | 37,300 | |
| |
Federal National Mortgage Association, Pool #AB4045 | | | | | |
| | | |
3.50% | | | 12/01/41 | | | | 59,397 | | | | 51,546 | |
| |
Federal National Mortgage Association, Pool #AT5914 | | | | | |
| | | |
3.50% | | | 06/01/43 | | | | 19,254 | | | | 16,738 | |
| |
Federal National Mortgage Association, Pool #BD7081 | | | | | |
| | | |
4.00% | | | 03/01/47 | | | | 14,723 | | | | 12,997 | |
| |
Federal National Mortgage Association, Pool #BV2994 | | | | | |
| | | |
2.50% | | | 04/01/52 | | | | 91,966 | | | | 70,626 | |
| |
Federal National Mortgage Association, Pool #CA0996 | | | | | |
| | | |
3.50% | | | 01/01/48 | | | | 46,900 | | | | 39,937 | |
| |
Federal National Mortgage Association, Pool #CA2208 | | | | | |
| | | |
4.50% | | | 08/01/48 | | | | 1,343 | | | | 1,224 | |
| |
Federal National Mortgage Association, Pool #CB2610 | | | | | |
| | | |
2.00% | | | 01/01/52 | | | | 67,840 | | | | 50,118 | |
| |
Federal National Mortgage Association, Pool #CB3347 | | | | | |
| | | |
2.00% | | | 01/01/52 | | | | 182,816 | | | | 134,597 | |
| |
Federal National Mortgage Association, Pool #FM2870 | | | | | |
| | | |
3.00% | | | 03/01/50 | | | | 120,001 | | | | 97,690 | |
| |
Federal National Mortgage Association, Pool #MA1527 | | | | | |
| | | |
3.00% | | | 08/01/33 | | | | 10,744 | | | | 9,523 | |
| |
Federal National Mortgage Association, Pool #MA1652 | | | | | |
| | | |
3.50% | | | 11/01/33 | | | | 17,384 | | | | 16,170 | |
See accompanying Notes to Financial Statements.
53
TCW Global Bond Fund
Schedule of Investments (Continued)
| | | | | | | | | | | | |
| Issues | | Maturity
Date | | | Principal
Amount | | | Value | |
|
RESIDENTIAL MORTGAGE-BACKED SECURITIES —
AGENCY (Continued) | |
| |
Federal National Mortgage Association, Pool #MA2705 | | | | | |
| | | |
3.00% | | | 08/01/46 | | | $ | 56,308 | | | $ | 46,378 | |
| |
Federal National Mortgage Association, Pool #MA4152 | | | | | |
| | | |
2.00% | | | 10/01/40 | | | | 66,389 | | | | 52,745 | |
| |
Federal National Mortgage Association, Pool #MA4204 | | | | | |
| | | |
2.00% | | | 12/01/40 | | | | 54,189 | | | | 42,951 | |
| |
Federal National Mortgage Association, Pool #MA4563 | | | | | |
| | | |
2.50% | | | 03/01/52 | | | | 90,423 | | | | 69,452 | |
| |
Federal National Mortgage Association REMICS Series 2007-52, Class LS (I/O) (I/F) | | | | | |
| | | |
0.61% (-30 day USD SOFR Average + 5.936%) (3) | | | 06/25/37 | | | | 34,193 | | | | 1,296 | |
| |
Federal National Mortgage Association REMICS Series 2008-18, Class SM (I/O) (I/F) | | | | | |
| | | |
1.56% (-30 day USD SOFR Average + 6.886%) (3) | | | 03/25/38 | | | | 38,876 | | | | 1,551 | |
| |
Federal National Mortgage Association REMICS Series 2009-115, Class SB (I/O) (I/F) | | | | | |
| | | |
0.81% (-30 day USD SOFR Average + 6.136%) (3) | | | 01/25/40 | | | | 20,890 | | | | 1,206 | |
| |
Federal National Mortgage Association REMICS Series 2010-116, Class SE (I/O) (I/F) | | | | | |
| | | |
1.16% (-30 day USD SOFR Average + 6.486%) (3) | | | 10/25/40 | | | | 39,592 | | | | 3,105 | |
| |
Government National Mortgage Association, Pool #MA3597 | | | | | |
| | | |
3.50% | | | 04/20/46 | | | | 9,530 | | | | 8,269 | |
| |
Government National Mortgage Association, Pool #MA3662 | | | | | |
| | | |
3.00% | | | 05/20/46 | | | | 26,192 | | | | 22,034 | |
| |
Government National Mortgage Association, Pool #MA3663 | | | | | |
| | | |
3.50% | | | 05/20/46 | | | | 1,381 | | | | 1,198 | |
| |
Government National Mortgage Association, Pool #MA3803 | | | | | |
| | | |
3.50% | | | 07/20/46 | | | | 6,408 | | | | 5,556 | |
| |
Government National Mortgage Association, Pool #MA4454 | | | | | |
| | | |
5.00% | | | 05/20/47 | | | | 6,789 | | | | 6,478 | |
| |
Government National Mortgage Association, Pool #MA4900 | | | | | |
| | | |
3.50% | | | 12/20/47 | | | | 29,097 | | | | 25,157 | |
| |
Government National Mortgage Association, Pool #MA5399 | | | | | |
| | | |
4.50% | | | 08/20/48 | | | | 12,067 | | | | 11,049 | |
| |
Government National Mortgage Association REMICS Series 2011-146, Class EI (I/O) (PAC) | | | | | |
| | | |
5.00% | | | 11/16/41 | | | | 32,732 | | | | 5,825 | |
| | | | | | | | | | | | |
| Issues | | Maturity
Date | | | Principal
Amount | | | Value | |
|
RESIDENTIAL MORTGAGE-BACKED SECURITIES —
AGENCY (Continued) | |
| |
Government National Mortgage Association, TBA | | | | | |
| | | |
2.50% (9) | | | 12/01/51 | | | $ | 150,000 | | | $ | 119,230 | |
| | | |
5.00% (9) | | | 05/01/53 | | | | 50,000 | | | | 46,525 | |
| | | |
5.50% (9) | | | 06/01/53 | | | | 50,000 | | | | 47,824 | |
| | | |
4.50% (9) | | | 04/01/53 | | | | 100,000 | | | | 90,331 | |
| |
Uniform Mortgage-Backed Security, TBA | | | | | |
| | | |
3.00% (9) | | | 02/01/52 | | | | 475,000 | | | | 379,722 | |
| | | |
3.50% (9) | | | 04/01/52 | | | | 50,000 | | | | 41,639 | |
| | | |
2.00% (9) | | | 12/01/51 | | | | 175,000 | | | | 128,567 | |
| | | |
2.50% (9) | | | 01/01/52 | | | | 125,000 | | | | 95,825 | |
| | | |
5.00% (9) | | | 04/01/53 | | | | 675,000 | | | | 622,405 | |
| | | |
5.50% (9) | | | 04/01/53 | | | | 600,000 | | | | 569,337 | |
| | | |
4.00% (9) | | | 05/01/52 | | | | 250,000 | | | | 216,025 | |
| | | |
4.50% (9) | | | 04/01/53 | | | | 675,000 | | | | 602,919 | |
| | | | | | | | | | | | |
| |
Total Residential Mortgage-Backed Securities — Agency | | | | | |
| |
(Cost: $4,271,991) | | | | 4,006,701 | |
| | | | | | | | | | | | |
|
RESIDENTIAL MORTGAGE-BACKED SECURITIES —
NON-AGENCY — 7.6% | |
| |
Banc of America Funding Trust Series 2005-C, Class A3 | | | | | |
| | | |
5.75% (1 mo. USD Term SOFR + 0.414%) (3) | | | 05/20/35 | | | | 2,404 | | | | 2,396 | |
| |
BCMSC Trust Series 2000-A, Class A4 | | | | | |
| | | |
8.29% (8) | | | 06/15/30 | | | | 189,525 | | | | 24,779 | |
| |
Bear Stearns ALT-A Trust Series 2004-8, Class M2 | | | | | |
| | | |
7.16% (1 mo. USD Term SOFR + 1.839%) (3) | | | 09/25/34 | | | | 102,093 | | | | 92,551 | |
| |
Bear Stearns ALT-A Trust Series 2005-8, Class 11A1 | | | | | |
| | | |
5.98% (1 mo. USD Term SOFR + 0.654%) (3) | | | 10/25/35 | | | | 23,610 | | | | 20,673 | |
| |
Deephaven Residential Mortgage Trust Series 2021-3, Class A1 | | | | | |
| | | |
1.19% (1),(8) | | | 08/25/66 | | | | 93,295 | | | | 75,208 | |
| |
DSLA Mortgage Loan Trust Series 2004-AR1, Class A1A | | | | | |
| | | |
6.29% (1 mo. USD Term SOFR + 0.954%) (3) | | | 09/19/44 | | | | 59,056 | | | | 53,679 | |
| |
First Horizon Mortgage Pass-Through Trust Series 2005-AR4, Class 2A1 | | | | | |
| | | |
4.96% (8),(10) | | | 10/25/35 | | | | 13,594 | | | | 12,471 | |
| |
GS Mortgage-Backed Securities Corp. Trust Series 2021-PJ5, Class A1 | | | | | |
| | | |
2.00% (1),(8) | | | 10/25/51 | | | | 82,302 | | | | 60,132 | |
| |
GS Mortgage-Backed Securities Corp. Trust Series 2022-PJ2, Class A4 | | | | | |
| | | |
2.50% (1),(8) | | | 06/25/52 | | | | 87,805 | | | | 64,358 | |
| |
HSI Asset Securitization Corp. Trust Series 2006-WMC1, Class A3 | | | | | |
| | | |
5.74% (1 mo. USD Term SOFR + 0.414%) (3) | | | 07/25/36 | | | | 267,912 | | | | 111,219 | |
| |
IndyMac INDX Mortgage Loan Trust Series 2005-AR15, Class A2 | | | | | |
| | | |
3.77% (8) | | | 09/25/35 | | | | 42,817 | | | | 31,924 | |
See accompanying Notes to Financial Statements.
54
TCW Global Bond Fund
October 31, 2023
| | | | | | | | | | | | |
| Issues | | Maturity
Date | | | Principal
Amount | | | Value | |
|
RESIDENTIAL MORTGAGE-BACKED SECURITIES —
NON-AGENCY (Continued) | |
| |
JPMorgan Mortgage Acquisition Trust Series 2006-CH2, Class AF3 | | | | | |
| | | |
5.46% | | | 09/25/29 | | | $ | 164,217 | | | $ | 97,782 | |
| |
JPMorgan Mortgage Trust Series 2005-A6, Class 7A1 | | | | | |
| | | |
5.05% (8) | | | 08/25/35 | | | | 9,728 | | | | 8,000 | |
| |
JPMorgan Mortgage Trust Series 2021-8, Class A3 | | | | | |
| | | |
2.50% (1),(8) | | | 12/25/51 | | | | 101,079 | | | | 74,355 | |
| |
Lehman XS Trust Series 2006-9, Class A1B | | | | | |
| | | |
5.76% (1 mo. USD Term SOFR + 0.434%) (3),(5) | | | 05/25/46 | | | | 7 | | | | — | |
| |
Merrill Lynch Alternative Note Asset Trust Series 2007-A1, Class A2B | | | | | |
| | | |
5.74% (1 mo. USD Term SOFR + 0.414%) (3) | | | 01/25/37 | | | | 276,191 | | | | 84,464 | |
| |
Merrill Lynch Alternative Note Asset Trust Series 2007-A3, Class A2D | | | | | |
| | | |
6.10% (1 mo. USD Term SOFR + 0.774%) (3),(5) | | | 04/25/37 | | | | 1,251,739 | | | | 53,009 | |
| |
MFA Trust Series 2021-RPL1, Class A2 | | | | | |
| | | |
2.07% (1),(8) | | | 07/25/60 | | | | 100,000 | | | | 73,893 | |
| |
Morgan Stanley ABS Capital I, Inc. Trust Series 2006-HE4, Class A4 | | | | | |
| | | |
5.92% (1 mo. USD Term SOFR + 0.594%) (3) | | | 06/25/36 | | | | 230,882 | | | | 118,205 | |
| |
Morgan Stanley ABS Capital I, Inc. Trust Series 2007-HE2, Class A2B | | | | | |
| | | |
5.53% (1 mo. USD Term SOFR + 0.204%) (3) | | | 01/25/37 | | | | 143,889 | | | | 62,662 | |
| |
MortgageIT Trust Series 2005-1, Class 1A1 | | | | | |
| | | |
6.08% (1 mo. USD Term SOFR + 0.754%) (3) | | | 02/25/35 | | | | 11,473 | | | | 10,867 | |
| |
Ownit Mortgage Loan Trust Series 2006-3, Class A2D | | | | | |
| | | |
5.98% (1 mo. USD Term SOFR + 0.654%) (3) | | | 03/25/37 | | | | 48,379 | | | | 45,339 | |
| |
RESIMAC Premier Series 2021-1A, Class A1 | | | | | |
| | | |
6.15% (1 mo. USD Term SOFR + 0.814%) (1),(3) | | | 07/10/52 | | | | 76,202 | | | | 76,068 | |
| |
Structured Adjustable Rate Mortgage Loan Trust Series 2004-18, Class 4A1 | | | | | |
| | | |
6.30% (8) | | | 12/25/34 | | | | 8,824 | | | | 8,577 | |
| |
Structured Asset Mortgage Investments II Trust Series 2005-AR6, Class 2A1 | | | | | |
| | | |
6.06% (1 mo. USD Term SOFR + 0.734%) (3) | | | 09/25/45 | | | | 22,003 | | | | 18,806 | |
| |
Structured Asset Mortgage Investments II Trust Series 2006-AR3, Class 22A1 | | | | | |
| | | |
4.25% (8),(10) | | | 05/25/36 | | | | 123,721 | | | | 66,210 | |
| | | | | | | | | | | | |
| |
Total Residential Mortgage-Backed Securities — Non-Agency | | | | | |
| |
(Cost: $1,933,876) | | | | 1,347,627 | |
| | | | | | | | | | | | |
| | | | | | | | | | | | |
| Issues | | Maturity
Date | | | Principal
Amount | | | Value | |
|
| U.S. TREASURY SECURITIES — 2.9% | |
| |
U.S. Treasury Bonds | | | | | |
| | | |
4.13% | | | 08/15/53 | | | $ | 313,000 | | | $ | 267,842 | |
| |
U.S. Treasury Notes | | | | | |
| | | |
3.88% | | | 08/15/33 | | | | 221,000 | | | | 203,405 | |
| | | |
4.63% | | | 09/30/28 | | | | 22,000 | | | | 21,799 | |
| | | |
4.88% | | | 10/31/28 | | | | 21,000 | | | | 21,047 | |
| | | | | | | | | | | | |
| |
Total U.S. Treasury Securities | | | | | |
| |
(Cost: $557,445) | | | | 514,093 | |
| | | | | | | | | | | | |
| |
Total Fixed Income Securities | | | | | |
| | | |
(Cost: $22,067,928) | | | | | | | | | | | 19,450,310 | |
| | | | | | | | | | | | |
| | | |
| | | | | | | | | | | | |
| | | | | | Shares | | | | |
|
MONEY MARKET INVESTMENTS — 1.5% | |
| | |
State Street Institutional U.S. Government Money Market Fund — Premier Class, 5.30% (11) | | | | 271,442 | | | | 271,442 | |
| | | | | | | | | | | | |
|
Total Money Market Investments | |
| |
(Cost: $271,442) | | | | 271,442 | |
| | | | | | | | | | | | |
|
INVESTMENT COMPANIES — 3.2% | |
| |
TCW Emerging Markets Income Fund — I | | | | | |
| | |
Class (12) | | | | 96,714 | | | | 564,812 | |
| | | | | | | | | | | | |
|
Total Investment Companies | |
| |
(Cost: $736,208) | | | | 564,812 | |
| | | | | | | | | | | | |
|
COMMON STOCK — 0.0% | |
|
TELECOMMUNICATIONS — 0.0% | |
| | |
Intelsat SA (5),(13) | | | | 344 | | | | 8,462 | |
| | | | | | | | | | | | |
|
Total Common Stock | |
| |
(Cost: $31,977) | | | | 8,462 | |
| | | | | | | | | | | | |
|
RIGHTS — 0.0% | |
| | |
Intelsat Jackson Holdings
SA (5),(13) | | | | 35 | | | | — | |
| | |
Intelsat Jackson Holdings
SA (5),(13) | | | | 35 | | | | — | |
| | | | | | | | | | | | |
|
Total Rights | |
| |
(Cost: $—) | | | | — | |
| | | | | | | | | | | | |
| |
PURCHASED OPTIONS (14) (0.0%) | | | | | |
| |
(Cost: $3,063) | | | | 714 | |
| | | | | | | | | | | | |
| | | |
| | | | | | | | | | | | |
| | | | | | Principal
Amount | | | | |
|
SHORT TERM INVESTMENTS — 2.2% | |
|
| U.S. TREASURY SECURITY — 2.2% | |
| | | |
(Cost: $392,527) | | | | | | | | | | | | |
| |
U.S. Treasury Bills | | | | | |
| | | |
5.43% (15) | | | 03/07/24 | | | | 400,000 | | | | 392,511 | |
| | | | | | | | | | | | |
| |
Total Investments (116.2%) | | | | | |
| | | |
(Cost: $23,503,145) | | | | | | | | | | | 20,688,251 | |
| |
Liabilities In Excess Of Other Assets (-16.2%) | | | | (2,886,641 | ) |
| | | | | | | | | | | | |
| | | |
Net Assets (100.0%) | | | | | | | | | | $ | 17,801,610 | |
| | | | | | | | | | | | |
See accompanying Notes to Financial Statements.
55
TCW Global Bond Fund
Schedule of Investments (Continued)
| | | | | | | | | | | | | | | | | | | | | | | | |
| Forward Currency Exchange Contracts | |
| | | | | | |
| Counterparty | | Contracts to
Deliver | | | Units of
Currency | | | Settlement
Date | | | In Exchange for
U.S. Dollars | | | Contracts at
Value | | | Unrealized
Appreciation
(Depreciation) | |
BUY (16) | | | | | | | | | | | | | | | | | | | | | | | | |
Citibank N.A. | | | AUD | | | | 26,000 | | | | 01/12/24 | | | $ | 16,589 | | | $ | 16,501 | | | $ | (88 | ) |
Goldman Sachs & Co. | | | BRL | | | | 381 | | | | 01/12/24 | | | | 72 | | | | 75 | | | | 3 | |
Goldman Sachs & Co. | | | CAD | | | | 18,232 | | | | 01/12/24 | | | | 13,311 | | | | 13,150 | | | | (161 | ) |
Goldman Sachs & Co. | | | CHF | | | | 41,000 | | | | 01/12/24 | | | | 45,263 | | | | 45,420 | | | | 157 | |
Goldman Sachs & Co. | | | CLP | | | | 9,441,000 | | | | 01/12/24 | | | | 10,202 | | | | 10,473 | | | | 271 | |
Goldman Sachs & Co. | | | CNH | | | | 5,762,930 | | | | 01/12/24 | | | | 790,621 | | | | 788,846 | | | | (1,775 | ) |
Citibank N.A. | | | CZK | | | | 322,280 | | | | 01/12/24 | | | | 13,828 | | | | 13,842 | | | | 14 | |
Goldman Sachs & Co. | | | DKK | | | | 250,000 | | | | 01/12/24 | | | | 35,436 | | | | 35,550 | | | | 114 | |
Citibank N.A. | | | EUR | | | | 1,035,324 | | | | 01/12/24 | | | | 1,094,457 | | | | 1,098,095 | | | | 3,638 | |
State Street Bank & Trust Co. | | | EUR | | | | 17,000 | | | | 01/12/24 | | | | 18,174 | | | | 18,031 | | | | (143 | ) |
State Street Bank & Trust Co. | | | JPY | | | | 268,094,000 | | | | 01/12/24 | | | | 1,824,576 | | | | 1,791,391 | | | | (33,185 | ) |
Goldman Sachs & Co. | | | NZD | | | | 36,000 | | | | 01/12/24 | | | | 20,990 | | | | 20,944 | | | | (46 | ) |
Goldman Sachs & Co. | | | PEN | | | | 35,516 | | | | 01/12/24 | | | | 9,211 | | | | 9,234 | | | | 23 | |
Goldman Sachs & Co. | | | PLN | | | | 20,273 | | | | 01/12/24 | | | | 4,636 | | | | 4,799 | | | | 163 | |
Goldman Sachs & Co. | | | SEK | | | | 105,000 | | | | 01/12/24 | | | | 9,548 | | | | 9,432 | | | | (116 | ) |
Citibank N.A. | | | THB | | | | 855,818 | | | | 01/12/24 | | | | 23,265 | | | | 23,965 | | | | 700 | |
| | | | | | | | | | | | | | | | | | | | | | | | |
| | | | | | | | | �� | | | | | $ | 3,930,179 | | | $ | 3,899,748 | | | $ | (30,431 | ) |
| | | | | | | | | | | | | | | | | | | | | | | | |
SELL (17) | | | | | | | | | | | | | | | | | | | | | | | | |
Citibank N.A. | | | AUD | | | | 20,299 | | | | 01/12/24 | | | $ | 12,926 | | | $ | 12,883 | | | $ | 43 | |
Goldman Sachs & Co. | | | CNH | | | | 120,000 | | | | 01/12/24 | | | | 16,475 | | | | 16,426 | | | | 49 | |
Goldman Sachs & Co. | | | COP | | | | 4,853,486 | | | | 01/12/24 | | | | 1,077 | | | | 1,154 | | | | (77 | ) |
State Street Bank & Trust Co. | | | EUR | | | | 43,000 | | | | 01/12/24 | | | | 45,837 | | | | 45,607 | | | | 230 | |
Citibank N.A. | | | EUR | | | | 21,000 | | | | 01/12/24 | | | | 22,279 | | | | 22,273 | | | | 6 | |
Goldman Sachs & Co. | | | GBP | | | | 367,242 | | | | 01/12/24 | | | | 447,650 | | | | 445,897 | | | | 1,753 | |
Goldman Sachs & Co. | | | IDR | | | | 295,369,661 | | | | 01/12/24 | | | | 18,804 | | | | 18,584 | | | | 220 | |
Goldman Sachs & Co. | | | ILS | | | | 13,674 | | | | 01/12/24 | | | | 3,545 | | | | 3,395 | | | | 150 | |
State Street Bank & Trust Co. | | | JPY | | | | 3,343,000 | | | | 01/12/24 | | | | 22,833 | | | | 22,338 | | | | 495 | |
Citibank N.A. | | | JPY | | | | 4,018,000 | | | | 01/12/24 | | | | 27,370 | | | | 26,848 | | | | 522 | |
Goldman Sachs & Co. | | | KRW | | | | 71,794,251 | | | | 01/12/24 | | | | 53,323 | | | | 53,382 | | | | (59 | ) |
Citibank N.A. | | | MXN | | | | 4,706,039 | | | | 01/12/24 | | | | 252,022 | | | | 257,666 | | | | (5,644 | ) |
Goldman Sachs & Co. | | | MYR | | | | 298,804 | | | | 01/12/24 | | | | 63,722 | | | | 63,026 | | | | 696 | |
Citibank N.A. | | | NOK | | | | 4,345,000 | | | | 01/12/24 | | | | 394,894 | | | | 389,722 | | | | 5,172 | |
Goldman Sachs & Co. | | | NZD | | | | 1,396,000 | | | | 01/12/24 | | | | 831,800 | | | | 812,177 | | | | 19,623 | |
Goldman Sachs & Co. | | | RON | | | | 244,539 | | | | 01/12/24 | | | | 51,690 | | | | 51,994 | | | | (304 | ) |
Goldman Sachs & Co. | | | SGD | | | | 14,327 | | | | 01/12/24 | | | | 10,509 | | | | 10,491 | | | | 18 | |
Citibank N.A. | | | ZAR | | | | 552,501 | | | | 01/12/24 | | | | 28,137 | | | | 29,291 | | | | (1,154 | ) |
| | | | | | | | | | | | | | | | | | | | | | | | |
| | | | | | | | | | | | | | $ | 2,304,893 | | | $ | 2,283,154 | | | $ | 21,739 | |
| | | | | | | | | | | | | | | | | | | | | | | | |
See accompanying Notes to Financial Statements.
56
TCW Global Bond Fund
October 31, 2023
| | | | | | | | | | | | | | | | | | |
| Futures Contracts | |
| | | | | |
Number of
Contracts | | Type | | Expiration
Date | | | Notional | | | Market
Value | | | Net Unrealized
Appreciation
(Depreciation) | |
Long Futures | |
| 1 | | 2-Year Canadian Bond Futures | | | 12/18/23 | | | $ | 73,729 | | | $ | 73,524 | | | $ | (205 | ) |
| 25 | | 2-Year U.S. Treasury Note Futures | | | 12/29/23 | | | | 5,083,579 | | | | 5,060,547 | | | | (23,032 | ) |
| 4 | | 5-Year Canadian Bond Futures | | | 12/18/23 | | | | 314,736 | | | | 312,739 | | | | (1,997 | ) |
| 2 | | 5-Year U.S. Treasury Note Futures | | | 12/29/23 | | | | 212,683 | | | | 208,953 | | | | (3,730 | ) |
| 17 | | Euro SCHWATZ Futures | | | 12/7/23 | | | | 1,890,317 | | | | 1,889,889 | | | | (428 | ) |
| 2 | | Euro-Bobl Future | | | 12/7/23 | | | | 247,213 | | | | 245,837 | | | | (1,376 | ) |
| | | | | | | | | | | | | | | | | | |
| | | | | | | | $ | 7,822,257 | | | $ | 7,791,489 | | | $ | (30,768 | ) |
| | | | | | | | | | | | | | | | | | |
Short Futures | |
| 10 | | 10-Year U.S. Treasury Note Futures | | | 12/19/23 | | | | (1,147,561 | ) | | $ | (1,088,281 | ) | | $ | 59,280 | |
| 1 | | Long Gilt Future | | | 12/27/23 | | | | (114,791 | ) | | | (113,045 | ) | | | 1,746 | |
| | | | | | | | | | | | | | | | | | |
| | | | | | | | $ | (1,262,352 | ) | | $ | (1,201,326 | ) | | $ | 61,026 | |
| | | | | | | | | | | | | | | | | | |
| | | | | | | | | | | | | | | | | | | | | | | | | | | | | | |
| Centrally Cleared — Interest Rate Swap Agreements | |
Notional
Amount | | | Expiration
Date | | | Payment
Made by
Fund
Frequency | | Payment Made
by Fund | | Payment Received
by Fund
Frequency | | Payment
Received
by Fund | | Unrealized
Appreciation
(Depreciation) | | | Premium
Paid | | | Value | |
| | GBP | | | | 500,000 | | | | 06/16/25 | | | Annual | | 12-Month Sterling Overnight Index Average | | Annual | | 4.08% | | $ | (9,413 | ) | | | $ — | | | | $ (9,413) | |
| | EUR | | | | 180,000 | (18) | | | 06/16/28 | | | Annual | | 12-Month Euro Short-Term Rate | | Annual | | 2.75% | | | (2,115 | ) | | | — | | | | (2,115) | |
| | | | | | | | | | | | | | | | | | | | | | | | | | | | | | |
| | | | | | | | | | | | | | | | | | | | $ | (11,528 | ) | | | $ — | | | | $ (11,528) | |
| | | | | | | | | | | | | | | | | | | | | | | | | | | | | | |
| | | | | | | | | | | | | | | | | | | | | | | | | | | | | | | | | | | | |
| Purchased Options — OTC | |
| | | | | | | | |
| Description | | Counterparty | | | Exercise
Price | | | Expiration
Date | | | Number of
Contracts | | | Notional
Amount | | | Market
Value | | | Premiums
Paid
(Received)
by Fund | | | Unrealized
Appreciation
(Depreciation) | |
CURRENCY OPTIONS | | | | | | | | | | | | | | | | | | | | | | | | | | | | | | | | | | | | |
USD Put / JPY Call | | | Goldman Sachs & Co. | | | | JPY | | | | 145 | | | | 12/20/23 | | | | 190,000 | | | $ | 190,000 | | | $ | 714 | | | $ | 3,063 | | | $ | (2,349 | ) |
| | | | | | | | | | | | | | | | | | | | | | | | | | | | | | | | | | | | |
| | | | | | | | | | | | | | | | | | | | | | | | | | | | | | | | | | |
| Written Options — OTC | |
| | | | | | | | |
| Description | | Counterparty | | Exercise
Price | | | Expiration
Date | | | Number of
Contracts | | | Notional
Amount | | | Market
Value | | | Premiums
Paid
(Received)
by Fund | | | Unrealized
Appreciation
(Depreciation) | |
CURRENCY OPTIONS | | | | | | | | | | | | | | | | | | | | | | | | | | | | | | | | | | |
USD Put / JPY Call | | Goldman Sachs & Co. | | | JPY | | | | 140 | | | | 12/20/23 | | | | (190,000 | ) | | $ | (190,000 | ) | | $ | (215 | ) | | $ | (1,163 | ) | | $ | 948 | |
| | | | | | | | | | | | | | | | | | | | | | | | | | | | | | | | | | |
See accompanying Notes to Financial Statements.
57
TCW Global Bond Fund
Schedule of Investments (Continued)
Notes to the Schedule of Investments:
| ABS | | Asset-Backed Securities. |
| ACES | | Alternative Credit Enhancement Securities. |
| CLO | | Collateralized Loan Obligation. |
| EETC | | Enhanced Equipment Trust Certificate. |
| I/F | | Inverse Floating rate security whose interest rate moves in the opposite direction of prevailing interest rates. |
| I/O | | Interest Only Security. |
| PAC | | Planned Amortization Class. |
| REIT | | Real Estate Investment Trust. |
| REMIC | | Real Estate Mortgage Investment Conduit. |
| SOFR | | Secured Overnight Financing Rate. |
| CNH | | Chinese Yuan Renminbi. |
| GBP | | British Pound Sterling. |
| (1) | | Security exempt from registration under Rule 144A of the Securities Act of 1933, as amended. These securities may be resold, normally only to qualified institutional buyers. At October 31, 2023, the value of these securities amounted to $3,475,478 or 19.5% of net assets. These securities are determined to be liquid by the Fund’s investment advisor, unless otherwise noted, under procedures established by and under the general supervision of the Company’s Board of Directors. |
| (2) | | Investments issued under Regulation S of the Securities Act of 1933, as amended, may not be offered, sold, or delivered within the United States except under special exemptions. At October 31, 2023, the value of these securities amounted to $5,382,088 or 30.2% of net assets. |
| (3) | | Floating or variable rate security. The interest shown reflects the rate in effect at October 31, 2023. |
| (5) | | For fair value measurement disclosure purposes, security is categorized as Level 3. Security is valued using significant unobservable inputs. |
| (6) | | Restricted security (Note 11). |
| (7) | | Security is not accruing interest. |
| (8) | | Variable rate security. Interest rate disclosed is as of the most recent information available. Certain variable rate securities are not based on a published reference rate and spread but are determined by the issuer or agent and are based on current market conditions. These securities do not indicate a reference rate and spread in their description above. |
See accompanying Notes to Financial Statements.
58
TCW Global Bond Fund
October 31, 2023
| (9) | | Security purchased on a forward commitment with an approximate principal amount. The actual principal amount and maturity date will be determined upon settlement when the security is delivered. |
| (10) | | A portion of the principal balance has been written-off during the period due to defaults in the underlying loans. Cost basis has been adjusted. |
| (11) | | Rate disclosed is the 7-day net yield as of October 31, 2023. |
| (13) | | Non-income producing security. |
| (14) | | See options table for description of purchased options. |
| (15) | | Rate shown represents yield-to-maturity. |
| (16) | | Fund buys foreign currency, sells U.S. Dollar. |
| (17) | | Fund sells foreign currency, buys U.S. Dollar. |
| (18) | | This instrument has a forward starting effective date. See Note 3, Portfolio Investments in the Notes to Financial Statements for further information. |
The summary of the TCW Global Bond Fund transactions in the affiliated fund for the year ended October 31, 2023 is as follows:
| | | | | | | | | | | | | | | | | | | | | | | | | | | | | | | | | | | | |
Name of
Affiliated
Fund | | Value at
October 31,
2022 | | | Purchases
at Cost | | | Proceeds
from Sales | | | Number
of Shares
Held
October 31,
2023 | | | Value at
October 31,
2023 | | | Dividends and
Interest
Income
Received | | | Distributions
Received from
Net Realized
Gain | | | Net Realized
Gain (Loss)
on
Investments | | | Net change in
Unrealized
Gain (Loss)
on
Investments | |
TCW Emerging Markets Income Fund — I Class | |
| | $ | 561,009 | | | $ | 30,995 | | | $ | 45,213 | | | | 96,714 | | | $ | 564,812 | | | $ | 31,262 | | | $ | — | | | $ | (16,515 | ) | | $ | 34,536 | |
| | | | | | | | | | | | | | | | | | | | | | | | | | | | | | | | | | | | |
Total | | | | | | | | | | | | | | | | | | $ | 564,812 | | | $ | 31,262 | | | $ | — | | | $ | (16,515 | ) | | $ | 34,536 | |
| | | | | | | | | | | | | | | | | | | | | | | | | | | | | | | | | | | | |
See accompanying Notes to Financial Statements.
59
TCW Global Bond Fund
Investments by Sector | October 31, 2023 |
| | | | |
| Sector | | Percentage of
Net Assets | |
Foreign Government Bonds | | | 40.2 | % |
Corporate Bonds | | | 27.6 | |
Residential Mortgage-Backed Securities — Agency | | | 22.5 | |
Residential Mortgage-Backed Securities — Non-Agency | | | 7.6 | |
U.S. Treasury Securities | | | 5.1 | |
Asset-Backed Securities | | | 4.4 | |
Commercial Mortgage-Backed Securities — Non-Agency | | | 3.6 | |
Investment Companies | | | 3.2 | |
Money Market Investments | | | 1.5 | |
Municipal Bonds | | | 0.4 | |
Commercial Mortgage-Backed Securities — Agency | | | 0.1 | |
Purchased Option | | | 0.0 | ** |
Common Stock | | | 0.0 | ** |
Rights | | | 0.0 | ** |
Other* | | | (16.2 | ) |
| | | | |
Total | | | 100.0 | % |
| | | | |
| * | Includes futures, swap agreements, pending trades, written options interest receivable, fund share transactions and accrued expenses payable. |
| ** | Amount rounds to less than 0.1%. |
See accompanying Notes to Financial Statements.
60
TCW Global Bond Fund
Investments by Country | October 31, 2023 |
| | | | |
| Country | | Percentage of
Net Assets | |
Australia | | | 1.9 | % |
Bermuda | | | 0.6 | |
Canada | | | 2.6 | |
Cayman Islands | | | 4.1 | |
Chile | | | 1.0 | |
China | | | 4.8 | |
Colombia | | | 0.1 | |
France | | | 5.6 | |
Free Of Tax | | | 1.2 | |
Germany | | | 1.1 | |
Great Britain | | | 7.1 | |
Hungary | | | 1.1 | |
Indonesia | | | 0.5 | |
Ireland | | | 1.9 | |
Israel | | | 0.1 | |
Italy | | | 1.2 | |
Japan | | | 1.4 | |
Kazakhstan | | | 1.1 | |
Luxembourg | | | 0.6 | |
Malaysia | | | 0.7 | |
Mexico | | | 2.8 | |
Netherlands | | | 0.6 | |
New Zealand | | | 4.6 | |
Norway | | | 1.9 | |
Poland | | | 0.2 | |
Portugal | | | 0.5 | |
Romania | | | 0.4 | |
Saudi Arabia | | | 1.9 | |
Singapore | | | 0.3 | |
South Africa | | | 0.1 | |
South Korea | | | 2.9 | |
Spain | | | 1.0 | |
Supranational | | | 1.9 | |
Sweden | | | 0.3 | |
Switzerland | | | 1.3 | |
Thailand | | | 0.2 | |
United States | | | 56.6 | |
| | | | |
Total | | | 116.2 | % |
| | | | |
See accompanying Notes to Financial Statements.
61
TCW Global Bond Fund
Fair Valuation Summary | October 31, 2023 |
The following is a summary of the fair valuations according to the inputs used as of October 31, 2023 in valuing the Fund’s investments:
| | | | | | | | | | | | | | | | |
Description | | Quoted Prices
in Active
Markets for
Identical
Assets
(Level 1) | | | Other
Significant
Observable
Inputs
(Level 2) | | | Significant
Unobservable
Inputs
(Level 3) | | | Total | |
Fixed Income Securities | | | | | | | | | | | | | | | | |
Corporate Bonds | | $ | — | | | $ | 4,920,504 | | | $ | — | | | $ | 4,920,504 | |
Municipal Bonds | | | — | | | | 72,884 | | | | — | | | | 72,884 | |
Foreign Government Bonds | | | — | | | | 7,148,068 | | | | — | | | | 7,148,068 | |
Asset-Backed Securities | | | — | | | | 778,579 | | | | — | | | | 778,579 | |
Commercial Mortgage-Backed Securities — Agency | | | — | | | | 17,009 | | | | — | | | | 17,009 | |
Commercial Mortgage-Backed Securities — Non-Agency | | | — | | | | 644,845 | | | | — | | | | 644,845 | |
Residential Mortgage-Backed Securities — Agency | | | — | | | | 4,006,701 | | | | — | | | | 4,006,701 | |
Residential Mortgage-Backed Securities — Non-Agency | | | — | | | | 1,294,618 | | | | 53,009 | | | | 1,347,627 | |
U.S. Treasury Securities | | | 514,093 | | | | — | | | | — | | | | 514,093 | |
| | | | | | | | | | | | | | | | |
Total Fixed Income Securities | | | 514,093 | | | | 18,883,208 | | | | 53,009 | | | | 19,450,310 | |
| | | | | | | | | | | | | | | | |
Money Market Investments | | | 271,442 | | | | — | | | | — | | | | 271,442 | |
Investment Companies | | | 564,812 | | | | — | | | | — | | | | 564,812 | |
Common Stock | | | — | | | | — | | | | 8,462 | | | | 8,462 | |
Rights | | | — | | | | — | | | | — | | | | — | |
Purchased Options | | | — | | | | 714 | | | | — | | | | 714 | |
Short Term Investments | | | 392,511 | | | | — | | | | — | | | | 392,511 | |
| | | | | | | | | | | | | | | | |
Total Investments | | $ | 1,742,858 | | | $ | 18,883,922 | | | $ | 61,471 | | | $ | 20,688,251 | |
| | | | | | | | | | | | | | | | |
Asset Derivatives | | | | | | | | | | | | | | | | |
Forward Currency Exchange Contracts | | | | | | | | | | | | | | | | |
Foreign Currency Risk | | | — | | | | 34,060 | | | | — | | | | 34,060 | |
Futures Contracts | | | | | | | | | | | | | | | | |
Interest Rate Risk | | | 61,026 | | | | — | | | | — | | | | 61,026 | |
| | | | | | | | | | | | | | | | |
Total | | $ | 1,803,884 | | | $ | 18,917,982 | | | $ | 61,471 | | | $ | 20,783,337 | |
| | | | | | | | | | | | | | | | |
Liability Derivatives | | | | | | | | | | | | | | | | |
Forward Currency Exchange Contracts | | | | | | | | | | | | | | | | |
Foreign Currency Risk | | $ | — | | | $ | (42,752 | ) | | $ | — | | | $ | (42,752 | ) |
Futures Contracts | | | | | | | | | | | | | | | | |
Interest Rate Risk | | | (30,768 | ) | | | — | | | | — | | | | (30,768 | ) |
Swap Agreements | | | | | | | | | | | | | | | | |
Interest Rate Risk | | | — | | | | (11,528 | ) | | | — | | | | (11,528 | ) |
Written Options | | | | | | | | | | | | | | | | |
Foreign Currency Risk | | | — | | | | (215 | ) | | | — | | | | (215 | ) |
| | | | | | | | | | | | | | | | |
Total | | $ | (30,768 | ) | | $ | (54,495 | ) | | $ | — | | | $ | (85,263 | ) |
| | | | | | | | | | | | | | | | |
See accompanying Notes to Financial Statements.
62
TCW High Yield Bond Fund
Schedule of Investments | October 31, 2023 |
| | | | | | | | | | | | |
| Issues | | Maturity
Date | | | Principal
Amount | | | Value | |
|
FIXED INCOME SECURITIES — 91.7% of Net Assets | |
|
| BANK LOANS — 7.8% | |
|
| Airlines — 0.1% | |
| |
American Airlines, Inc. 2021 Term Loan | | | | | |
| | | |
10.43% (3 mo. USD Term SOFR + 4.750%) (1) | | | 04/20/28 | | | $ | 63,000 | | | $ | 63,984 | |
| | | | | | | | | | | | |
|
| Apparel — 0.2% | |
| |
Hanesbrands, Inc. 2023 Term Loan B | | | | | |
| | | |
9.07% (1 mo. USD Term SOFR + 3.750%) (1) | | | 03/08/30 | | | | 89,550 | | | | 88,543 | |
| | | | | | | | | | | | |
|
| Chemicals — 0.3% | |
| |
Chemours Co. 2023 USD Term Loan B | | | | | |
| | | |
8.82% (1 mo. USD Term SOFR + 2.500%) (1) | | | 08/18/28 | | | | 85,000 | | | | 82,875 | |
| |
Iris Holding, Inc. Term Loan | | | | | |
| | | |
10.23% (3 mo. USD Term SOFR + 4.750%) (1) | | | 06/28/28 | | | | 99,990 | | | | 87,637 | |
| | | | | | | | | | | | |
| | | |
| | | | | | | | | | | 170,512 | |
| | | | | | | | | | | | |
|
| Commercial Services — 1.2% | |
| |
GTCR W Merger Sub LLC USD Term Loan B | | | | | |
| | | |
0.00% (2) | | | 09/20/30 | | | | 82,500 | | | | 82,018 | |
| |
Neptune Bidco U.S., Inc. 2022 USD Term Loan B | | | | | |
| | | |
10.51% (3 mo. USD Term SOFR + 5.000%) (1) | | | 04/11/29 | | | | 156,215 | | | | 137,030 | |
| |
Spin Holdco, Inc. 2021 Term Loan | | | | | |
| | | |
9.66% (3 mo. USD Term SOFR + 4.000%) (1) | | | 03/6/28 | | | | 414,375 | | | | 356,456 | |
| |
VT Topco, Inc. 2023 Term Loan B | | | | | |
| | | |
9.66% (3 mo. USD Term SOFR + 4.250%) (1) | | | 08/09/30 | | | | 75,000 | | | | 74,977 | |
| | | | | | | | | | | | |
| | | |
| | | | | | | | | | | 650,481 | |
| | | | | | | | | | | | |
|
| Entertainment — 0.2% | |
| |
Ontario Gaming GTA LP Term Loan B | | | | | |
| | | |
9.64% (3 mo. USD Term SOFR + 4.250%) (1) | | | 07/20/30 | | | | 100,000 | | | | 100,000 | |
| | | | | | | | | | | | |
|
| Food — 0.2% | |
| |
B&G Foods, Inc. 2019 Term Loan B4 | | | | | |
| | | |
7.83% (1 mo. USD Term SOFR + 2.500%) (1) | | | 10/10/26 | | | | 90,000 | | | | 88,232 | |
| | | | | | | | | | | | |
|
| Health Care-Products — 0.0% | |
| |
Auris Luxembourg III SARL 2019 USD Term Loan B2 | | | | | |
| | | |
9.62% (2 mo. USD Term SOFR + 3.750%) (1) | | | 02/27/26 | | | | 15,758 | | | | 15,068 | |
| | | | | | | | | | | | |
|
| Health Care-Services — 0.2% | |
| |
eResearchTechnology, Inc. 2020 1st Lien Term Loan | | | | | |
| | | |
9.94% (1 mo. USD Term SOFR + 4.500%) (1) | | | 02/04/27 | | | | 126,407 | | | | 122,389 | |
| | | | | | | | | | | | |
| | | | | | | | | | | | |
| Issues | | Maturity
Date | | | Principal
Amount | | | Value | |
|
| Internet — 0.3% | |
| |
Magnite, Inc. Term Loan | | | | | |
| | | |
10.44% (3 mo. USD Term SOFR + 5.000%) (1) | | | 04/28/28 | | | $ | 59,198 | | | $ | 59,531 | |
| |
MH Sub I LLC 2023 Term Loan | | | | | |
| | | |
9.57% (1 mo. USD Term SOFR + 4.250%) (1) | | | 05/03/28 | | | | 89,135 | | | | 85,328 | |
| | | | | | | | | | | | |
| | | |
| | | | | | | | | | | 144,859 | |
| | | | | | | | | | | | |
|
| Machinery-Diversified — 1.2% | |
| |
ASP Blade Holdings, Inc. Initial Term Loan | | | | | |
| | | |
9.65% (1 mo. USD Term SOFR + 4.000%) (1) | | | 10/16/28 | | | | 550,776 | | | | 486,234 | |
| |
Titan Acquisition Ltd. 2018 Term Loan B | | | | | |
| | | |
8.73% (3 mo. USD LIBOR + 3.000%) (1) | | | 03/28/25 | | | | 194,486 | | | | 191,889 | |
| | | | | | | | | | | | |
| | | |
| | | | | | | | | | | 678,123 | |
| | | | | | | | | | | | |
|
| Media — 0.2% | |
| |
DirecTV Financing LLC Term Loan | | | | | |
| | | |
10.44% (1 mo. USD Term SOFR + 5.000%) (1) | | | 08/02/27 | | | | 136,940 | | | | 133,493 | |
| | | | | | | | | | | | |
|
| Metal Fabricate & Hardware — 0.2% | |
| |
AZZ, Inc. Term Loan B | | | | | |
| | | |
9.07% (1 mo. USD Term SOFR + 3.750%) (1) | | | 05/13/29 | | | | 100,000 | | | | 100,197 | |
| | | | | | | | | | | | |
|
| Mining — 0.2% | |
| |
Arsenal AIC Parent LLC Term Loan | | | | | |
| | | |
9.88% (3 mo. USD Term SOFR + 4.500%) (1) | | | 08/18/30 | | | | 100,000 | | | | 99,911 | |
| | | | | | | | | | | | |
|
| Packaging & Containers — 1.6% | |
| |
Clydesdale Acquisition Holdings, Inc. Term Loan B | | | | | |
| | | |
9.60% (1 mo. USD Term SOFR + 4.175%) (1) | | | 04/13/29 | | | | 296,250 | | | | 287,302 | |
| |
Plaze, Inc. 2020 Incremental Term Loan | | | | | |
| | | |
9.19% (1 mo. USD Term SOFR + 3.750%) (1) | | | 08/03/26 | | | | 208,565 | | | | 201,695 | |
| |
Proampac PG Borrower LLC 2023 Term Loan | | | | | |
| | | |
9.89% (3 mo. USD Term SOFR + 4.500%) (1) | | | 09/15/28 | | | | 375,000 | | | | 370,549 | |
| | | | | | | | | | | | |
| | | |
| | | | | | | | | | | 859,546 | |
| | | | | | | | | | | | |
|
| Pharmaceuticals — 0.5% | |
| |
Elanco Animal Health, Inc. Term Loan B | | | | | |
| | | |
7.16% (1 mo. USD Term SOFR + 1.750%) (1) | | | 08/01/27 | | | | 258,382 | | | | 252,811 | |
| | | | | | | | | | | | |
|
| Real Estate — 0.3% | |
| |
Cushman & Wakefield U.S. Borrower LLC 2023 Term Loan B | | | | | |
| | | |
9.32% (1 mo. USD Term SOFR + 4.000%) (1) | | | 01/31/30 | | | | 75,000 | | | | 72,187 | |
See accompanying Notes to Financial Statements.
63
TCW High Yield Bond Fund
Schedule of Investments (Continued)
| | | | | | | | | | | | |
| Issues | | Maturity
Date | | | Principal
Amount | | | Value | |
|
| Real Estate (Continued) | |
| |
Greystar Real Estate Partners LLC Term Loan | | | | | |
| | | |
9.15% (3 mo. USD Term SOFR + 3.750%) (1) | | | 08/21/30 | | | $ | 100,000 | | | $ | 100,000 | |
| | | | | | | | | | | | |
| | | |
| | | | | | | | | | | 172,187 | |
| | | | | | | | | | | | |
|
| Software — 0.4% | |
|
CT Technologies Intermediate Holdings, Inc. 2021 Term Loan B | |
| | | |
9.69% (1 mo. USD Term SOFR + 4.250%) (1) | | | 12/16/25 | | | | 141,375 | | | | 133,938 | |
| |
EagleView Technology Corp. 2018 Add On Term Loan B | | | | | |
| | | |
0.00% (2) | | | 08/14/25 | | | | 80,000 | | | | 76,280 | |
| | | | | | | | | | | | |
| | | |
| | | | | | | | | | | 210,218 | |
| | | | | | | | | | | | |
|
| Telecommunications — 0.5% | |
| |
SBA Senior Finance II LLC 2018 Term Loan B | | | | | |
| | | |
7.18% (1 mo. USD Term SOFR + 1.750%) (1) | | | 04/11/25 | | | | 258,031 | | | | 258,198 | |
| | | | | | | | | | | | |
|
Total Bank Loans | |
| |
(Cost: $4,357,508) | | | | 4,208,752 | |
| | | | | | | | | | | | |
|
CORPORATE BONDS — 83.1% | |
|
| Aerospace & Defense — 1.5% | |
| |
TransDigm, Inc. | | | | | |
| | | |
4.63% | | | 01/15/29 | | | | 135,000 | | | | 116,555 | |
| | | |
6.25% (3) | | | 03/15/26 | | | | 418,000 | | | | 409,494 | |
| | | |
6.75% (3) | | | 08/15/28 | | | | 305,000 | | | | 296,838 | |
| | | | | | | | | | | | |
| | | |
| | | | | | | | | | | 822,887 | |
| | | | | | | | | | | | |
|
| Agriculture — 0.5% | |
| |
BAT Capital Corp. (United Kingdom) | | | | | |
| | | |
5.28% | | | 04/02/50 | | | | 401,000 | | | | 285,416 | |
| | | | | | | | | | | | |
|
| Auto Manufacturers — 3.1% | |
| |
Allison Transmission, Inc. | | | | | |
| | | |
3.75% (3) | | | 01/30/31 | | | | 100,000 | | | | 79,539 | |
| |
Ford Motor Credit Co. LLC | | | | | |
| | | |
3.37% | | | 11/17/23 | | | | 1,600,000 | | | | 1,601,600 | |
| | | | | | | | | | | | |
| | | |
| | | | | | | | | | | 1,681,139 | |
| | | | | | | | | | | | |
|
| Banks — 2.8% | |
| |
Bank of America Corp. | | | | | |
| | | |
4.38% (5 yr. CMT + 2.760%) (1),(4) | | | 01/27/27 | | | | 225,000 | | | | 182,486 | |
| |
Bank of New York Mellon Corp. | | | | | |
| | | |
3.75% (5 yr. CMT + 2.630%) (1),(4) | | | 12/20/26 | | | | 285,000 | | | | 219,806 | |
| |
JPMorgan Chase & Co. | | | | | |
| | | |
3.65% (5 yr. CMT + 2.850%) (1),(4) | | | 06/01/26 | | | | 95,000 | | | | 82,648 | |
| |
U.S. Bancorp | | | | | |
| | | |
3.70% (5 yr. CMT + 2.541%) (1),(4) | | | 01/15/27 | | | | 400,000 | | | | 281,744 | |
| | | | | | | | | | | | |
| Issues | | Maturity
Date | | | Principal
Amount | | | Value | |
|
| Banks (Continued) | |
| |
UBS Group AG (Switzerland) | | | | | |
| | | |
6.37% (Secured Overnight Financing Rate + 3.340%) (1),(3) | | | 07/15/26 | | | $ | 85,000 | | | $ | 84,499 | |
| | | |
6.54% (Secured Overnight Financing Rate + 3.920%) (1),(3) | | | 08/12/33 | | | | 405,000 | | | | 389,185 | |
| | | |
9.02% (Secured Overnight Financing Rate + 5.020%) (1),(3) | | | 11/15/33 | | | | 250,000 | | | | 281,211 | |
| | | | | | | | | | | | |
| | | |
| | | | | | | | | | | 1,521,579 | |
| | | | | | | | | | | | |
|
| Beverages — 0.5% | |
| |
Primo Water Holdings, Inc. | | | | | |
| | | |
4.38% (3) | | | 04/30/29 | | | | 300,000 | | | | 253,473 | |
| | | | | | | | | | | | |
|
| Chemicals — 3.0% | |
| |
ASP Unifrax Holdings, Inc. | | | | | |
| | | |
5.25% (3) | | | 09/30/28 | | | | 412,000 | | | | 280,547 | |
| |
Axalta Coating Systems LLC | | | | | |
| | | |
3.38% (3) | | | 02/15/29 | | | | 250,000 | | | | 206,620 | |
| |
Herens Holdco SARL(Luxembourg) | | | | | |
| | | |
4.75% (3) | | | 05/15/28 | | | | 400,000 | | | | 310,588 | |
| |
International Flavors & Fragrances, Inc. | | | | | |
| | | |
2.30% (3) | | | 11/01/30 | | | | 185,000 | | | | 137,462 | |
| |
International Flavors & Fragrances, Inc. | | | | | |
| | | |
5.00% | | | 09/26/48 | | | | 25,000 | | | | 18,013 | |
| |
Olympus Water U.S. Holding Corp. | | | | | |
| | | |
7.13% (3) | | | 10/01/27 | | | | 125,000 | | | | 116,214 | |
| |
SCIH Salt Holdings, Inc. | | | | | |
| | | |
4.88% (3) | | | 05/01/28 | | | | 70,000 | | | | 60,900 | |
| |
SK Invictus Intermediate II SARL | | | | | |
| | | |
5.00% (3) | | | 10/30/29 | | | | 487,000 | | | | 368,176 | |
| |
Valvoline, Inc. | | | | | |
| | | |
3.63% (3) | | | 06/15/31 | | | | 150,000 | | | | 114,215 | |
| | | | | | | | | | | | |
| | | |
| | | | | | | | | | | 1,612,735 | |
| | | | | | | | | | | | |
|
| Commercial Services — 3.5% | |
| |
Adtalem Global Education, Inc. | | | | | |
| | | |
5.50% (3) | | | 03/01/28 | | | | 218,000 | | | | 199,939 | |
| |
Block, Inc. | | | | | |
| | | |
3.50% | | | 06/01/31 | | | | 125,000 | | | | 96,406 | |
| |
Carriage Services, Inc. | | | | | |
| | | |
4.25% (3) | | | 05/15/29 | | | | 277,000 | | | | 226,844 | |
| |
Gartner, Inc. | | | | | |
| | | |
3.75% (3) | | | 10/01/30 | | | | 80,000 | | | | 66,900 | |
| | | |
4.50% (3) | | | 07/01/28 | | | | 296,000 | | | | 266,764 | |
| |
GTCR W-2 Merger Sub LLC | | | | | |
| | | |
7.50% (3) | | | 01/15/31 | | | | 125,000 | | | | 123,399 | |
|
Prime Security Services Borrower LLC/Prime Finance, Inc. | |
| | | |
3.38% (3) | | | 08/31/27 | | | | 100,000 | | | | 88,476 | |
See accompanying Notes to Financial Statements.
64
TCW High Yield Bond Fund
October 31, 2023
| | | | | | | | | | | | |
| Issues | | Maturity
Date | | | Principal
Amount | | | Value | |
|
| Commercial Services (Continued) | |
| |
Upbound Group, Inc. | | | | | |
| | | |
6.38% (3) | | | 02/15/29 | | | $ | 435,000 | | | $ | 376,275 | |
| |
VT Topco, Inc. | | | | | |
| | | |
8.50% (3) | | | 08/15/30 | | | | 178,000 | | | | 173,804 | |
| |
WASH Multifamily Acquisition, Inc. | | | | | |
| | | |
5.75% (3) | | | 04/15/26 | | | | 295,000 | | | | 273,214 | |
| | | | | | | | | | | | |
| | | |
| | | | | | | | | | | 1,892,021 | |
| | | | | | | | | | | | |
|
| Computers — 1.7% | |
| |
Booz Allen Hamilton, Inc. | | | | | |
| | | |
3.88% (3) | | | 09/01/28 | | | | 468,000 | | | | 418,708 | |
| |
NCR Voyix Corp. | | | | | |
| | | |
5.25% (3) | | | 10/01/30 | | | | 316,000 | | | | 262,047 | |
| |
Science Applications International Corp. | | | | | |
| | | |
4.88% (3) | | | 04/01/28 | | | | 275,000 | | | | 247,299 | |
| | | | | | | | | | | | |
| | | |
| | | | | | | | | | | 928,054 | |
| | | | | | | | | | | | |
|
| Diversified Financial Services — 1.8% | |
| |
American Express Co. | | | | | |
| | | |
3.55% (5 yr. CMT + 2.854%) (1),(4) | | | 09/15/26 | | | | 230,000 | | | | 181,412 | |
|
Charles Schwab Corp. | |
| | | |
5.00% (5 yr. CMT + 3.256%) (1),(4) | | | 06/01/27 | | | | 265,000 | | | | 209,957 | |
|
GGAM Finance Ltd. (Ireland) | |
| | | |
8.00% (3) | | | 06/15/28 | | | | 100,000 | | | | 98,619 | |
|
Jane Street Group/JSG Finance, Inc. | |
| | | |
4.50% (3) | | | 11/15/29 | | | | 540,000 | | | | 460,442 | |
| | | | | | | | | | | | |
| | | |
| | | | | | | | | | | 950,430 | |
| | | | | | | | | | | | |
|
| Electric — 0.7% | |
|
FirstEnergy Corp. | |
| | | |
2.65% | | | 03/01/30 | | | | 395,000 | | | | 318,996 | |
| | | |
5.10% | | | 07/15/47 | | | | 96,000 | | | | 79,888 | |
| | | | | | | | | | | | |
| | | |
| | | | | | | | | | | 398,884 | |
| | | | | | | | | | | | |
|
| Electrical Components & Equipment — 0.2% | |
|
Energizer Holdings, Inc. | |
| | | |
4.38% (3) | | | 03/31/29 | | | | 130,000 | | | | 107,250 | |
| | | | | | | | | | | | |
|
| Electronics — 0.1% | |
|
Coherent Corp. | |
| | | |
5.00% (3) | | | 12/15/29 | | | | 65,000 | | | | 55,266 | |
| | | | | | | | | | | | |
|
| Engineering & Construction — 0.3% | |
|
Artera Services LLC | |
| | | |
9.03% (3) | | | 12/04/25 | | | | 195,000 | | | | 176,311 | |
| | | | | | | | | | | | |
|
| Entertainment — 3.7% | |
|
Banijay Entertainment SASU (France) | |
| | | |
8.13% (3) | | | 05/01/29 | | | | 110,000 | | | | 107,344 | |
|
Caesars Resort Collection LLC/CRC Finco, Inc. | |
| | | |
5.75% (3) | | | 07/01/25 | | | | 600,000 | | | | 591,414 | |
| | | | | | | | | | | | |
| Issues | | Maturity
Date | | | Principal
Amount | | | Value | |
|
| Entertainment (Continued) | |
|
CDI Escrow Issuer, Inc. | |
| | | |
5.75% (3) | | | 04/01/30 | | | $ | 157,000 | | | $ | 140,694 | |
|
Churchill Downs, Inc. | |
| | | |
4.75% (3) | | | 01/15/28 | | | | 70,000 | | | | 62,771 | |
|
Everi Holdings, Inc. | |
| | | |
5.00% (3) | | | 07/15/29 | | | | 225,000 | | | | 189,461 | |
|
Live Nation Entertainment, Inc. | |
| | | |
4.75% (3) | | | 10/15/27 | | | | 115,000 | | | | 105,346 | |
|
Ontario Gaming GTA LP (Canada) | |
| | | |
8.00% (3) | | | 08/01/30 | | | | 128,000 | | | | 125,687 | |
|
Penn Entertainment, Inc. | |
| | | |
5.63% (3) | | | 01/15/27 | | | | 65,000 | | | | 59,349 | |
|
WarnerMedia Holdings, Inc. | |
| | | |
5.14% | | | 03/15/52 | | | | 850,000 | | | | 602,352 | |
| | | | | | | | | | | | |
| | | |
| | | | | | | | | | | 1,984,418 | |
| | | | | | | | | | | | |
|
| Environmental Control — 0.4% | |
|
Madison IAQ LLC | |
| | | |
4.13% (3) | | | 06/30/28 | | | | 225,000 | | | | 189,000 | |
| | | | | | | | | | | | |
|
| Food — 4.2% | |
|
JBS USA LUX SA/JBS USA Food Co./JBS USA Finance, Inc. | |
| | | |
3.75% | | | 12/01/31 | | | | 130,000 | | | | 101,205 | |
| | | |
5.75% | | | 04/01/33 | | | | 640,000 | | | | 563,501 | |
|
Nathan’s Famous, Inc. | |
| | | |
6.63% (3) | | | 11/01/25 | | | | 8,000 | | | | 7,960 | |
|
Pilgrim’s Pride Corp. | |
| | | |
3.50% | | | 03/01/32 | | | | 875,000 | | | | 667,109 | |
| | | |
6.25% | | | 07/01/33 | | | | 5,000 | | | | 4,609 | |
|
Post Holdings, Inc. | |
| | | |
5.75% (3) | | | 03/01/27 | | | | 300,000 | | | | 285,750 | |
| |
Simmons Foods, Inc./Simmons Prepared Foods, Inc./Simmons Pet Food, Inc./Simmons Feed | | | | | |
| | | |
4.63% (3) | | | 03/01/29 | | | | 510,000 | | | | 414,722 | |
|
Smithfield Foods, Inc. | |
| | | |
5.20% (3) | | | 04/01/29 | | | | 217,000 | | | | 195,974 | |
| | | | | | | | | | | | |
| | | | | | | | | | | 2,240,830 | |
| | | | | | | | | | | | |
|
| Health Care-Products — 2.5% | |
|
Bausch & Lomb Escrow Corp. | |
| | | |
8.38% (3) | | | 10/01/28 | | | | 405,000 | | | | 402,833 | |
|
Embecta Corp. | |
| | | |
6.75% (3) | | | 02/15/30 | | | | 375,000 | | | | 311,055 | |
|
Hologic, Inc. | |
| | | |
3.25% (3) | | | 02/15/29 | | | | 55,000 | | | | 46,233 | |
|
Teleflex, Inc. | |
| | | |
4.25% (3) | | | 06/01/28 | | | | 687,000 | | | | 607,010 | |
| | | | | | | | | | | | |
| | | |
| | | | | | | | | | | 1,367,131 | |
| | | | | | | | | | | | |
See accompanying Notes to Financial Statements.
65
TCW High Yield Bond Fund
Schedule of Investments (Continued)
| | | | | | | | | | | | |
| Issues | | Maturity
Date | | | Principal
Amount | | | Value | |
|
| Health Care-Services — 8.8% | |
|
Catalent Pharma Solutions, Inc. | |
| | | |
3.50% (3) | | | 04/01/30 | | | $ | 325,000 | | | $ | 255,440 | |
| | | |
5.00% (3) | | | 07/15/27 | | | | 350,000 | | | | 312,786 | |
|
Centene Corp. | |
| | | |
2.45% | | | 07/15/28 | | | | 185,000 | | | | 155,687 | |
| | | |
2.63% | | | 08/01/31 | | | | 250,000 | | | | 188,398 | |
| | | |
3.00% | | | 10/15/30 | | | | 75,000 | | | | 59,422 | |
| | | |
4.25% | | | 12/15/27 | | | | 1,020,000 | | | | 939,634 | |
|
Fortrea Holdings, Inc. | |
| | | |
7.50% (3) | | | 07/01/30 | | | | 50,000 | | | | 48,441 | |
|
HealthEquity, Inc. | |
| | | |
4.50% (3) | | | 10/01/29 | | | | 170,000 | | | | 146,020 | |
|
Heartland Dental LLC/Heartland Dental Finance Corp. | |
| | | |
10.50% (3) | | | 04/30/28 | | | | 75,000 | | | | 72,173 | |
|
IQVIA, Inc. | |
| | | |
5.00% (3) | | | 05/15/27 | | | | 228,000 | | | | 215,109 | |
|
Kedrion SpA (Italy) | |
| | | |
6.50% (3) | | | 09/01/29 | | | | 250,000 | | | | 209,375 | |
|
ModivCare Escrow Issuer, Inc. | |
| | | |
5.00% (3) | | | 10/01/29 | | | | 635,000 | | | | 463,398 | |
|
Molina Healthcare, Inc. | |
| | | |
3.88% (3) | | | 11/15/30 | | | | 250,000 | | | | 204,062 | |
|
Prime Healthcare Services, Inc. | |
| | | |
7.25% (3) | | | 11/01/25 | | | | 270,000 | | | | 247,050 | |
|
Star Parent, Inc. | |
| | | |
9.00% (3) | | | 10/01/30 | | | | 225,000 | | | | 223,740 | |
|
Tenet Healthcare Corp. | |
| | | |
4.25% | | | 06/01/29 | | | | 160,000 | | | | 137,100 | |
| | | |
4.38% | | | 01/15/30 | | | | 65,000 | | | | 55,079 | |
| | | |
4.88% | | | 01/01/26 | | | | 810,000 | | | | 777,940 | |
| | | | | | | | | | | | |
| | | |
| | | | | | | | | | | 4,710,854 | |
| | | | | | | | | | | | |
|
| Household Products/Wares — 0.5% | |
|
Central Garden & Pet Co. | |
| | | |
4.13% | | | 10/15/30 | | | | 240,000 | | | | 196,039 | |
|
Spectrum Brands, Inc. | |
| | | |
5.00% (3) | | | 10/01/29 | | | | 65,000 | | | | 58,961 | |
| | | | | | | | | | | | |
| | | |
| | | | | | | | | | | 255,000 | |
| | | | | | | | | | | | |
|
| Housewares — 0.8% | |
|
Newell Brands, Inc. | |
| | | |
4.88% | | | 06/01/25 | | | | 349,000 | | | | 334,168 | |
| | | |
6.50% | | | 04/01/46 | | | | 145,000 | | | | 101,988 | |
| | | | | | | | | | | | |
| | | |
| | | | | | | | | | | 436,156 | |
| | | | | | | | | | | | |
|
| Insurance — 0.8% | |
|
Acrisure LLC/Acrisure Finance, Inc. | |
| | | |
4.25% (3) | | | 02/15/29 | | | | 335,000 | | | | 275,055 | |
| | | | | | | | | | | | |
| Issues | | Maturity
Date | | | Principal
Amount | | | Value | |
|
| Insurance (Continued) | |
| |
Alliant Holdings Intermediate LLC/Alliant Holdings Co-Issuer | | | | | |
| | | |
4.25% (3) | | | 10/15/27 | | | $ | 165,000 | | | $ | 145,170 | |
| | | | | | | | | | | | |
| | | |
| | | | | | | | | | | 420,225 | |
| | | | | | | | | | | | |
|
| Internet — 1.4% | |
|
Cogent Communications Group, Inc. | |
| | | |
7.00% (3) | | | 06/15/27 | | | | 100,000 | | | | 95,782 | |
|
Gen Digital, Inc. | |
| | | |
6.75% (3) | | | 09/30/27 | | | | 53,000 | | | | 51,681 | |
|
Netflix, Inc. | |
| | | |
4.63% | | | 05/15/29 | | | | 100,000 | | | | 108,057 | |
|
Uber Technologies, Inc. | |
| | | |
7.50% (3) | | | 05/15/25 | | | | 285,000 | | | | 285,647 | |
|
Uber Technologies, Inc. | |
| | | |
8.00% (3) | | | 11/01/26 | | | | 190,000 | | | | 191,815 | |
| | | | | | | | | | | | |
| | | |
| | | | | | | | | | | 732,982 | |
| | | | | | | | | | | | |
|
| Investment Companies — 0.6% | |
|
Icahn Enterprises LP/Icahn Enterprises Finance Corp. | |
| | | |
4.38% | | | 02/01/29 | | | | 250,000 | | | | 194,375 | |
| | | |
5.25% | | | 05/15/27 | | | | 45,000 | | | | 38,644 | |
| | | |
6.25% | | | 05/15/26 | | | | 50,000 | | | | 45,750 | |
| | | |
6.38% | | | 12/15/25 | | | | 50,000 | | | | 47,107 | |
| | | | | | | | | | | | |
| | | |
| | | | | | | | | | | 325,876 | |
| | | | | | | | | | | | |
|
| Iron & Steel — 0.3% | |
|
ATI, Inc. | |
| | | |
5.13% | | | 10/01/31 | | | | 130,000 | | | | 107,900 | |
| | | |
7.25% | | | 08/15/30 | | | | 30,000 | | | | 28,950 | |
| | | | | | | | | | | | |
| | | |
| | | | | | | | | | | 136,850 | |
| | | | | | | | | | | | |
|
| Lodging — 1.1% | |
|
Hilton Domestic Operating Co., Inc. | |
| | | |
3.63% (3) | | | 02/15/32 | | | | 325,000 | | | | 257,201 | |
|
Wyndham Hotels & Resorts, Inc. | |
| | | |
4.38% (3) | | | 08/15/28 | | | | 387,000 | | | | 342,100 | |
| | | | | | | | | | | | |
| | | |
| | | | | | | | | | | 599,301 | |
| | | | | | | | | | | | |
|
| Machinery-Construction & Mining — 0.5% | |
|
BWX Technologies, Inc. | |
| | | |
4.13% (3) | | | 06/30/28 | | | | 330,000 | | | | 292,126 | |
| | | | | | | | | | | | |
|
| Media — 8.3% | |
|
Altice Financing SA (Luxembourg) | |
| | | |
5.75% (3) | | | 08/15/29 | | | | 150,000 | | | | 116,067 | |
|
Cable One, Inc. | |
| | | |
4.00% (3) | | | 11/15/30 | | | | 640,000 | | | | 477,600 | |
|
CCO Holdings LLC/CCO Holdings Capital Corp. | |
| | | |
5.50% (3) | | | 05/01/26 | | | | 1,525,000 | | | | 1,456,375 | |
See accompanying Notes to Financial Statements.
66
TCW High Yield Bond Fund
October 31, 2023
| | | | | | | | | | | | |
| Issues | | Maturity
Date | | | Principal
Amount | | | Value | |
|
| Media (Continued) | |
|
CSC Holdings LLC | |
| | | |
6.50% (3) | | | 02/01/29 | | | $ | 870,000 | | | $ | 689,115 | |
| | | |
7.50% (3) | | | 04/01/28 | | | | 385,000 | | | | 247,154 | |
|
Diamond Sports Group LLC/Diamond Sports Finance Co. | |
| | | |
5.38% (3),(5) | | | 08/15/26 | | | | 452,000 | | | | 5,221 | |
|
DISH DBS Corp. | |
| | | |
5.25% (3) | | | 12/01/26 | | | | 350,000 | | | | 282,984 | |
| | | |
7.38% | | | 07/01/28 | | | | 272,000 | | | | 153,353 | |
| | | |
7.75% | | | 07/01/26 | | | | 30,000 | | | | 20,166 | |
|
DISH Network Corp. | |
| | | |
11.75% (3) | | | 11/15/27 | | | | 115,000 | | | | 114,005 | |
|
Gray Escrow II, Inc. | |
| | | |
5.38% (3) | | | 11/15/31 | | | | 400,000 | | | | 251,384 | |
|
Nexstar Media, Inc. | |
| | | |
4.75% (3) | | | 11/01/28 | | | | 140,000 | | | | 117,943 | |
|
Tele Columbus AG (Germany) | |
| | | |
3.88% (6) | | | 05/02/25 | | | | 100,000 | | | | 58,852 | |
|
VZ Secured Financing BV (Netherlands) | |
| | | |
3.50% (6) | | | 01/15/32 | | | | 190,000 | | | | 153,057 | |
| | | |
5.00% (3) | | | 01/15/32 | | | | 410,000 | | | | 312,449 | |
| | | | | | | | | | | | |
| | | |
| | | | | | | | | | | 4,455,725 | |
| | | | | | | | | | | | |
|
| Miscellaneous Manufacturers — 0.1% | |
|
General Electric Co. | |
| | | |
6.11% (3 mo. USD Term SOFR + 0.742%) (1) | | | 08/15/36 | | | | 52,000 | | | | 46,653 | |
| | | | | | | | | | | | |
|
| Oil & Gas — 0.9% | |
|
SM Energy Co. | |
| | | |
6.50% | | | 07/15/28 | | | | 330,000 | | | | 318,209 | |
|
Transocean Titan Financing Ltd. | |
| | | |
8.38% (3) | | | 02/01/28 | | | | 170,000 | | | | 170,408 | |
| | | | | | | | | | | | |
| | | | | | | | | | | 488,617 | |
| | | | | | | | | | | | |
|
| Oil & Gas Services — 0.4% | |
|
Archrock Partners LP/Archrock Partners Finance Corp. | |
| | | |
6.25% (3) | | | 04/01/28 | | | | 200,000 | | | | 186,750 | |
| | | | | | | | | | | | |
|
| Packaging & Containers — 4.9% | |
|
Ardagh Packaging Finance PLC/Ardagh Holdings USA, Inc. | |
| | | |
5.25% (3) | | | 08/15/27 | | | | 325,000 | | | | 237,250 | |
| | | |
5.25% (3) | | | 08/15/27 | | | | 50,000 | | | | 36,430 | |
|
Ball Corp. | |
| | | |
6.88% | | | 03/15/28 | | | | 600,000 | | | | 598,500 | |
|
Clearwater Paper Corp. | |
| | | |
4.75% (3) | | | 08/15/28 | | | | 364,000 | | | | 321,670 | |
|
Graphic Packaging International LLC | |
| | | |
4.13% | | | 08/15/24 | | | | 725,000 | | | | 710,500 | |
| |
Pactiv Evergreen Group Issuer LLC/Pactiv Evergreen Group Issuer, Inc. | | | | | |
| | | |
4.38% (3) | | | 10/15/28 | | | | 280,000 | | | | 240,450 | |
| | | | | | | | | | | | |
| Issues | | Maturity
Date | | | Principal
Amount | | | Value | |
|
| Packaging & Containers (Continued) | |
|
Sealed Air Corp. | |
| | | |
4.00% (3) | | | 12/01/27 | | | $ | 362,000 | | | $ | 319,918 | |
|
Silgan Holdings, Inc. | |
| | | |
4.13% | | | 02/01/28 | | | | 125,000 | | | | 110,524 | |
|
Trivium Packaging Finance BV (Netherlands) | |
| | | |
5.50% (3) | | | 08/15/26 | | | | 55,000 | | | | 49,944 | |
| | | | | | | | | | | | |
| | | |
| | | | | | | | | | | 2,625,186 | |
| | | | | | | | | | | | |
|
| Pharmaceuticals — 1.5% | |
|
180 Medical, Inc. (United Kingdom) | |
| | | |
3.88% (3) | | | 10/15/29 | | | | 138,000 | | | | 115,230 | |
|
Bausch Health Cos., Inc. (Canada) | |
| | | |
5.75% (3) | | | 08/15/27 | | | | 18,000 | | | | 9,450 | |
|
Grifols SA (Spain) | |
| | | |
4.75% (3) | | | 10/15/28 | | | | 325,000 | | | | 272,594 | |
|
Option Care Health, Inc. | |
| | | |
4.38% (3) | | | 10/31/29 | | | | 50,000 | | | | 41,999 | |
|
Organon & Co./Organon Foreign Debt Co.-Issuer BV | |
| | | |
5.13% (3) | | | 04/30/31 | | | | 65,000 | | | | 50,927 | |
|
Prestige Brands, Inc. | |
| | | |
3.75% (3) | | | 04/01/31 | | | | 215,000 | | | | 170,979 | |
|
Teva Pharmaceutical Finance Netherlands III BV | |
| | | |
8.13% | | | 09/15/31 | | | | 170,000 | | | | 168,553 | |
| | | | | | | | | | | | |
| | | |
| | | | | | | | | | | 829,732 | |
| | | | | | | | | | | | |
|
| Pipelines — 6.7% | |
|
DCP Midstream Operating LP | |
| | | |
5.60% | | | 04/01/44 | | | | 136,000 | | | | 114,912 | |
|
Energy Transfer LP | |
| | | |
6.63% (3 mo. USD LIBOR + 4.155%) (1),(4) | | | 02/15/28 | | | | 897,000 | | | | 696,296 | |
|
Global Partners LP/GLP Finance Corp. | |
| | | |
6.88% | | | 01/15/29 | | | | 540,000 | | | | 477,040 | |
|
NGL Energy Operating LLC/NGL Energy Finance Corp. | |
| | | |
7.50% (3) | | | 02/01/26 | | | | 260,000 | | | | 254,059 | |
|
Rockies Express Pipeline LLC | |
| | | |
4.80% (3) | | | 05/15/30 | | | | 30,000 | | | | 25,305 | |
| | | |
6.88% (3) | | | 04/15/40 | | | | 541,000 | | | | 451,486 | |
|
TransMontaigne Partners LP/TLP Finance Corp. | |
| | | |
6.13% | | | 02/15/26 | | | | 362,000 | | | | 310,415 | |
|
Venture Global Calcasieu Pass LLC | |
| | | |
4.13% (3) | | | 08/15/31 | | | | 600,000 | | | | 485,034 | |
| | | |
6.25% (3) | | | 01/15/30 | | | | 500,000 | | | | 472,365 | |
|
Venture Global LNG, Inc. | |
| | | |
9.50% (3) | | | 02/01/29 | | | | 215,000 | | | | 218,231 | |
| | | |
9.88% (3) | | | 02/01/32 | | | | 110,000 | | | | 111,636 | |
| | | | | | | | | | | | |
| | | |
| | | | | | | | | | | 3,616,779 | |
| | | | | | | | | | | | |
|
| Real Estate — 0.6% | |
|
Cushman & Wakefield U.S. Borrower LLC | |
| | | |
8.88% (3) | | | 09/01/31 | | | | 171,000 | | | | 162,467 | |
See accompanying Notes to Financial Statements.
67
TCW High Yield Bond Fund
Schedule of Investments (Continued)
| | | | | | | | | | | | |
| Issues | | Maturity
Date | | | Principal
Amount | | | Value | |
|
| Real Estate (Continued) | |
|
Greystar Real Estate Partners LLC | |
| | | |
7.75% (3) | | | 09/01/30 | | | $ | 175,000 | | | $ | 172,813 | |
| | | | | | | | | | | | |
| | | |
| | | | | | | | | | | 335,280 | |
| | | | | | | | | | | | |
|
| REIT — 4.0% | |
|
American Assets Trust LP | |
| | | |
3.38% | | | 02/01/31 | | | | 475,000 | | | | 342,418 | |
|
GLP Capital LP/GLP Financing II, Inc. | |
| | | |
5.75% | | | 06/01/28 | | | | 473,000 | | | | 443,894 | |
|
Hudson Pacific Properties LP | |
| | | |
3.25% | | | 01/15/30 | | | | 132,000 | | | | 84,912 | |
| | | |
4.65% | | | 04/01/29 | | | | 80,000 | | | | 57,152 | |
|
VICI Properties LP/VICI Note Co., Inc. | |
| | | |
3.88% (3) | | | 02/15/29 | | | | 34,000 | | | | 28,898 | |
| | | |
4.50% (3) | | | 01/15/28 | | | | 40,000 | | | | 36,235 | |
| | | |
4.63% (3) | | | 06/15/25 | | | | 512,000 | | | | 492,575 | |
| | | |
5.63% (3) | | | 05/01/24 | | | | 106,000 | | | | 105,374 | |
| | | |
5.75% (3) | | | 02/01/27 | | | | 554,000 | | | | 533,120 | |
| | | | | | | | | | | | |
| | | |
| | | | | | | | | | | 2,124,578 | |
| | | | | | | | | | | | |
|
| Retail — 5.0% | |
|
Ferrellgas LP/Ferrellgas Finance Corp. | |
| | | |
5.38% (3) | | | 04/01/26 | | | | 110,000 | | | | 103,295 | |
| | | |
5.88% (3) | | | 04/01/29 | | | | 95,000 | | | | 84,408 | |
| |
Fertitta Entertainment LLC/Fertitta Entertainment Finance Co., Inc. | | | | | |
| | | |
4.63% (3) | | | 01/15/29 | | | | 325,000 | | | | 274,394 | |
| | | |
6.75% (3) | | | 01/15/30 | | | | 90,000 | | | | 71,775 | |
|
FirstCash, Inc. | |
| | | |
5.63% (3) | | | 01/01/30 | | | | 165,000 | | | | 147,132 | |
|
LCM Investments Holdings II LLC | |
| | | |
8.25% (3) | | | 08/01/31 | | | | 200,000 | | | | 190,750 | |
|
Lithia Motors, Inc. | |
| | | |
3.88% (3) | | | 06/01/29 | | | | 95,000 | | | | 79,050 | |
|
Michaels Cos., Inc. | |
| | | |
5.25% (3) | | | 05/01/28 | | | | 480,000 | | | | 348,240 | |
| | | |
7.88% (3) | | | 05/01/29 | | | | 125,000 | | | | 69,832 | |
|
Papa John’s International, Inc. | |
| | | |
3.88% (3) | | | 09/15/29 | | | | 345,000 | | | | 285,977 | |
|
Yum! Brands, Inc. | |
| | | |
3.88% | | | 11/01/23 | | | | 1,000,000 | | | | 1,001,250 | |
| | | | | | | | | | | | |
| | | |
| | | | | | | | | | | 2,656,103 | |
| | | | | | | | | | | | |
|
| Software — 0.6% | |
|
Alteryx, Inc. | |
| | | |
8.75% (3) | | | 03/15/28 | | | | 85,000 | | | | 84,362 | |
|
Open Text Corp. (Canada) | |
| | | |
6.90% (3) | | | 12/01/27 | | | | 85,000 | | | | 84,575 | |
|
ZoomInfo Technologies LLC/ZoomInfo Finance Corp. | |
| | | |
3.88% (3) | | | 02/01/29 | | | | 200,000 | | | | 166,000 | |
| | | | | | | | | | | | |
| | | |
| | | | | | | | | | | 334,937 | |
| | | | | | | | | | | | |
| | | | | | | | | | | | |
| Issues | | Maturity
Date | | | Principal
Amount | | | Value | |
|
| Telecommunications — 4.8% | |
|
Altice France SA | |
| | | |
5.13% (3) | | | 01/15/29 | | | $ | 200,000 | | | $ | 139,230 | |
| | | |
5.50% (3) | | | 10/15/29 | | | | 450,000 | | | | 311,638 | |
| | | |
8.13% (3) | | | 02/01/27 | | | | 250,000 | | | | 213,125 | |
|
CommScope, Inc. | |
| | | |
4.75% (3) | | | 09/01/29 | | | | 365,000 | | | | 252,762 | |
|
Consolidated Communications, Inc. | |
| | | |
6.50% (3) | | | 10/01/28 | | | | 95,000 | | | | 75,240 | |
|
Frontier Communications Holdings LLC | |
| | | |
5.00% (3) | | | 05/01/28 | | | | 362,000 | | | | 314,176 | |
| | | |
8.63% (3) | | | 03/15/31 | | | | 100,000 | | | | 94,146 | |
|
Global Switch Finance BV (United Kingdom) | |
| | | |
1.38% (6) | | | 10/07/30 | | | | 115,000 | | | | 101,469 | |
|
Intelsat Jackson Holdings SA (Luxembourg) | |
| | | |
6.50% (3),(7) | | | 03/15/30 | | | | 120,000 | | | | 105,733 | |
|
Level 3 Financing, Inc. | |
| | | |
10.50% (3) | | | 05/15/30 | | | | 184,000 | | | | 184,442 | |
|
SES GLOBAL Americas Holdings, Inc. (Luxembourg) | |
| | | |
5.30% (3) | | | 03/25/44 | | | | 559,000 | | | | 365,678 | |
|
Zayo Group Holdings, Inc. | |
| | | |
4.00% (3) | | | 03/01/27 | | | | 525,000 | | | | 395,749 | |
| | | | | | | | | | | | |
| | | |
| | | | | | | | | | | 2,553,388 | |
| | | | | | | | | | | | |
|
| Total Corporate Bonds | |
| |
(Cost: $49,754,055) | | | | 44,629,922 | |
| | | | | | | | | | | | |
|
| U.S. TREASURY SECURITIES — 0.8% (Cost: $413,224) | |
|
U.S. Treasury Notes | |
| | | |
4.63% | | | 10/15/26 | | | | 415,000 | | | | 411,904 | |
| | | | | | | | | | | | |
|
Total Fixed Income Securities | |
| |
(Cost: $54,524,787) | | | | 49,250,578 | |
| | | | | | | | | | | | |
| | | |
| | | | | | | | | | | | |
| | | | | | Shares | | | | |
|
COMMON STOCK — 0.0% | |
|
| Electric — 0.0% | |
| | |
Homer City Generation LLC — Series A (8),(9) | | | | 5,610 | | | | — | |
| | | | | | | | | | | | |
|
| Total Common Stock | |
| |
(Cost: $327,224) | | | | — | |
| | | | | | | | | | | | |
|
| WARRANTS — 0.0% | |
|
| Entertainment — 0.0% | |
| | |
Cineworld Group PLC (8),(9) | | | | 42,717 | | | | — | |
| | | | | | | | | | | | |
|
Total Warrants | |
| |
(Cost: $—) | | | | — | |
| | | | | | | | | | | | |
See accompanying Notes to Financial Statements.
68
TCW High Yield Bond Fund
October 31, 2023
| | | | | | | | | | | | |
| Issues | | | | |
Shares | | | Value | |
|
| MONEY MARKET INVESTMENTS — 0.8% | |
| | |
State Street Institutional U.S. Government Money Market Fund — Premier Class, 5.30% (10) | | | | 412,193 | | | $ | 412,193 | |
|
Total Money Market Investments | |
| |
(Cost: $412,193) | | | | 412,193 | |
| | | | | | | | | | | | |
| | | |
| | | | | | | | | | | | |
| | | Maturity
Date | | | Principal
Amount | | | | |
|
SHORT TERM INVESTMENTS — 3.9% | |
|
| U.S. TREASURY SECURITIES — 3.9% | |
|
U.S. Treasury Bills | |
| | | |
5.23% (11) | | | 12/05/23 | | | $ | 560,000 | | | | 557,204 | |
| | | | | | | | | | | | |
| Issues | | Maturity
Date | | | Principal
Amount | | | Value | |
|
| U.S. TREASURY SECURITIES (Continued) | |
| | | |
5.43% (11) | | | 03/07/24 | | | $ | 1,500,000 | | | $ | 1,471,915 | |
| | | |
5.48% (11) | | | 04/04/24 | | | | 65,000 | | | | 63,514 | |
| | | | | | | | | | | | |
|
Total U.S. Treasury Securities | |
| |
(Cost: $2,092,691) | | | | 2,092,633 | |
| | | | | | | | | | | | |
|
Total Short Term Investments | |
| |
(Cost: $2,092,691) | | | | 2,092,633 | |
| | | | | | | | | | | | |
| |
Total Investments (96.4%) | | | | | |
| |
(Cost: $57,356,895) | | | | 51,755,404 | |
| | | | | | | | | | | | |
| |
Excess Of Other Assets Over Liabilities (3.6%) | | | | 1,908,189 | |
| |
Net Assets (100.0%) | | | $ | 53,663,593 | |
| | | | | | | | | | | | |
| | | | | | | | | | | | | | | | | | |
| Futures Contracts | |
| | | | | |
Number of
Contracts | | Type | | Expiration
Date | | | Notional | | | Market Value | | | Net Unrealized
Appreciation
(Depreciation) | |
Long Futures | |
| 30 | | 2-Year U.S. Treasury Note Futures | | | 12/29/23 | | | $ | 6,102,996 | | | $ | 6,072,656 | | | $ | (30,340 | ) |
| 38 | | 5-Year U.S. Treasury Note Futures | | | 12/29/23 | | | | 4,022,405 | | | | 3,970,110 | | | | (52,295 | ) |
| | | | | | | | | | | | | | | | | | |
| | | | | | | | $ | 10,125,401 | | | $ | 10,042,766 | | | $ | (82,635 | ) |
| | | | | | | | | | | | | | | | | | |
Short Futures | |
| 4 | | 10-Year U.S. Treasury Note Futures | | | 12/19/23 | | | | (459,024 | ) | | $ | (435,312 | ) | | $ | 23,712 | |
| 3 | | Euro-Bobl Future | | | 12/7/23 | | | | (370,789 | ) | | | (368,756 | ) | | | 2,033 | |
| 4 | | U.S. Ultra Long Bond Futures | | | 12/19/23 | | | | (509,446 | ) | | | (450,250 | ) | | | 59,196 | |
| | | | | | | | | | | | | | | | | | |
| | | | | | | | $ | (1,339,259 | ) | | $ | (1,254,318 | ) | | $ | 84,941 | |
| | | | | | | | | | | | | | | | | | |
| | | | | | | | | | | | | | | | | | | | | | | | |
| Forward Currency Exchange Contracts | |
| | | | | | |
| Counterparty | | Contracts to
Deliver | | | Units of
Currency | | | Settlement
Date | | | In Exchange for
U.S. Dollars | | | Contracts at
Value | | | Unrealized
Appreciation
(Depreciation) | |
| BUY (12) | | | | | | | | | | | | | | | |
Citibank N.A. | | | EUR | | | | 22,000 | | | | 01/12/24 | | | $ | 23,238 | | | $ | 23,334 | | | $ | 96 | |
| | | | | | | | | | | | | | | | | | | | | | | | |
| SELL (13) | | | | | | | | | | | | | | | |
Citibank N.A. | | | EUR | | | | 422,000 | | | | 01/12/24 | | | | 446,379 | | | | 447,585 | | | | (1,206 | ) |
| | | | | | | | | | | | | | | | | | | | | | | | |
| | | | | | | | | | | | | | $ | 446,379 | | | $ | 447,585 | | | $ | (1,206 | ) |
| | | | | | | | | | | | | | | | | | | | | | | | |
See accompanying Notes to Financial Statements.
69
TCW High Yield Bond Fund
Schedule of Investments (Continued)
Notes to the Schedule of Investments:
| EETC | | Enhanced Equipment Trust Certificate. |
| REIT | | Real Estate Investment Trust. |
| (1) | | Floating or variable rate security. The interest shown reflects the rate in effect at October 31, 2023. |
| (2) | | This position represents an unsettled bank loan at period end. Certain details associated with this purchase are not known prior to the settlement date, including coupon rate, which will be adjusted on settlement date. |
| (3) | | Security exempt from registration under Rule 144A of the Securities Act of 1933, as amended. These securities may be resold, normally only to qualified institutional buyers. At October 31, 2023, the value of these securities amounted to $29,531,856 or 55.0% of net assets. These securities are determined to be liquid by the Fund’s investment advisor, unless otherwise noted, under procedures established by and under the general supervision of the Company’s Board of Directors. |
| (5) | | Security is currently in default due to bankruptcy or failure to make payment of principal or interest of the issuer. Income is not being accrued. |
| (6) | | Investments issued under Regulation S of the Securities Act of 1933, as amended, may not be offered, sold, or delivered within the United States except under special exemptions. At October 31, 2023, the value of these securities amounted to $313,378 or 0.6% of net assets. |
| (7) | | Restricted security (Note 11). |
| (8) | | For fair value measurement disclosure purposes, security is categorized as Level 3. Security is valued using significant unobservable inputs. |
| (9) | | Non-income producing security. |
| (10) | | Rate disclosed is the 7-day net yield as of October 31, 2023. |
| (11) | | Rate shown represents yield-to-maturity. |
| (12) | | Fund buys foreign currency, sells U.S. Dollar. |
| (13) | | Fund sells foreign currency, buys U.S. Dollar. |
See accompanying Notes to Financial Statements.
70
TCW High Yield Bond Fund
Investments by Sector | October 31, 2023 |
| | | | |
| Sector | | Percentage of
Net Assets | |
Corporate Bonds | | | 83.1 | % |
Bank Loans | | | 7.8 | |
U.S. Treasury Securities | | | 4.7 | |
Money Market Investments | | | 0.8 | |
Common Stock | | | 0.0 | ** |
Warrants | | | 0.0 | ** |
Other* | | | 3.6 | |
| | | | |
Total | | | 100.0 | % |
| | | | |
| * | Includes capstock, futures, pending trades, interest receivable and accrued expenses payable. |
| ** | Amount rounds to less than 0.1%. |
See accompanying Notes to Financial Statements.
71
TCW High Yield Bond Fund
Fair Valuation Summary | October 31, 2023 |
The following is a summary of the fair valuations according to the inputs used as of October 31, 2023 in valuing the Fund’s investments:
| | | | | | | | | | | | | | | | |
Description | | Quoted Prices
in Active
Markets for
Identical
Assets
(Level 1) | | | Other
Significant
Observable
Inputs
(Level 2) | | | Significant
Unobservable
Inputs
(Level 3) | | | Total | |
Fixed Income Securities | | | | | | | | | | | | | | | | |
Bank Loans* | | $ | — | | | $ | 4,208,752 | | | $ | — | | | $ | 4,208,752 | |
Corporate Bonds* | | | — | | | | 44,629,922 | | | | — | | | | 44,629,922 | |
U.S. Treasury Securities | | | 411,904 | | | | — | | | | — | | | | 411,904 | |
| | | | | | | | | | | | | | | | |
Total Fixed Income Securities | | | 411,904 | | | | 48,838,674 | | | | — | | | | 49,250,578 | |
| | | | | | | | | | | | | | | | |
Common Stock* | | | — | | | | — | | | | — | | | | — | |
Warrants | | | — | | | | — | | | | — | | | | — | |
Money Market Investments | | | 412,193 | | | | — | | | | — | | | | 412,193 | |
Short-Term Investments | | | 2,092,633 | | | | — | | | | — | | | | 2,092,633 | |
| | | | | | | | | | | | | | | | |
Total Investments | | $ | 2,916,730 | | | $ | 48,838,674 | | | $ | — | | | $ | 51,755,404 | |
| | | | | | | | | | | | | | | | |
Asset Derivatives | | | | | | | | | | | | | | | | |
Forward Currency Exchange Contracts | | | | | | | | | | | | | | | | |
Foreign Currency Risk | | | — | | | | 96 | | | | — | | | | 96 | |
Futures Contracts | | | | | | | | | | | | | | | | |
Interest Rate Risk | | | 84,941 | | | | — | | | | — | | | | 84,941 | |
| | | | | | | | | | | | | | | | |
Total Investments | | $ | 3,001,671 | | | $ | 48,838,770 | | | $ | — | | | $ | 51,840,441 | |
| | | | | | | | | | | | | | | | |
Liability Derivatives | | | | | | | | | | | | | | | | |
Futures Contracts | | | | | | | | | | | | | | | | |
Interest Rate Risk | | $ | (82,635 | ) | | $ | — | | | $ | — | | | $ | (82,635 | ) |
Forward Currency Exchange Contracts | | | | | | | | | | | | | | | | |
Foreign Currency Risk | | | — | | | | (1,206 | ) | | | — | | | | (1,206 | ) |
| | | | | | | | | | | | | | | | |
Total | | $ | (82,635 | ) | | $ | (1,206 | ) | | $ | — | | | $ | (83,841 | ) |
| | | | | | | | | | | | | | | | |
| * | See Schedule of Investments for corresponding industries. |
See accompanying Notes to Financial Statements.
72
TCW Short Term Bond Fund
Schedule of Investments | October 31, 2023 |
| | | | | | | | | | | | |
| Issues | | Maturity
Date | | | Principal
Amount | | | Value | |
|
FIXED INCOME SECURITIES — 106.0% of Net Assets | |
|
COMMERCIAL MORTGAGE-BACKED SECURITIES —
AGENCY — 1.4% | |
| |
Federal Home Loan Mortgage Corp. Multifamily Structured Pass-Through Certificates Series KF68, Class A | | | | | |
| | | |
5.92% (30 day USD SOFR Average + 0.604%) (1) | | | 07/25/26 | | | $ | 45,412 | | | $ | 45,404 | |
| |
Federal Home Loan Mortgage Corp. Multifamily Structured Pass-Through Certificates Series KJ29, Class A1 | | | | | |
| | | |
0.74% | | | 01/25/26 | | | | 13,940 | | | | 13,627 | |
| |
Federal Home Loan Mortgage Corp. Multifamily Structured Pass-Through Certificates Series KJ31, Class A1 | | | | | |
| | | |
0.57% | | | 05/25/26 | | | | 6,242 | | | | 6,095 | |
| |
Federal Home Loan Mortgage Corp. Multifamily Structured Pass-Through Certificates Series KJ34, Class A1 | | | | | |
| | | |
0.68% | | | 06/25/26 | | | | 7,659 | | | | 7,136 | |
| |
Federal Home Loan Mortgage Corp. Multifamily Structured Pass-Through Certificates Series KL05, Class X1HG (I/O) | | | | | |
| | | |
1.22% (2) | | | 12/25/27 | | | | 500,000 | | | | 18,005 | |
| |
Federal Home Loan Mortgage Corp. Multifamily Structured Pass-Through Certificates Series KS06, Class X (I/O) | | | | | |
| | | |
1.04% (2) | | | 08/25/26 | | | | 546,922 | | | | 9,902 | |
| |
Federal Home Loan Mortgage Corp. Multifamily Structured Pass-Through Certificates Series KS07, Class X (I/O) | | | | | |
| | | |
0.61% (2) | | | 09/25/25 | | | | 236,868 | | | | 2,528 | |
| |
Federal National Mortgage Association-Aces Series 2014-M11, Class 1A | | | | | |
| | | |
3.08% (2) | | | 08/25/24 | | | | 14,119 | | | | 13,775 | |
| |
FRESB Mortgage Trust Series 2015-SB3, Class A3 | | | | | |
| | | |
5.98% (30 day USD SOFR Average + 0.664%) (1) | | | 01/25/43 | | | | 1,881 | | | | 1,875 | |
| |
Government National Mortgage Association Series 2008-92, Class E | | | | | |
| | | |
5.56% (2) | | | 03/16/44 | | | | 4,155 | | | | 4,071 | |
| |
Government National Mortgage Association Series 2010-159, Class D | | | | | |
| | | |
4.56% (2) | | | 09/16/44 | | | | 5,806 | | | | 5,634 | |
| |
Government National Mortgage Association Series 2011-165, Class IO (I/O) | | | | | |
| | | |
0.00% (2) | | | 10/16/51 | | | | 208,847 | | | | 2 | |
| | | | | | | | | | | | |
| | |
Total Commercial Mortgage-Backed Securities — Agency | | | | | | | | | |
| | |
(Cost: $164,485) | | | | | | | | 128,054 | |
| | | | | | | | | | | | |
| | | | | | | | | | | | |
| Issues | | Maturity
Date | | | Principal
Amount | | | Value | |
|
COMMERCIAL MORTGAGE-BACKED SECURITIES —
NON-AGENCY — 3.9% | |
| |
BBCMS Trust Series 2015-SRCH, Class XB (I/O) | | | | | |
| | | |
0.19% (2),(3) | | | 08/10/35 | | | $ | 2,000,000 | | | $ | 13,823 | |
| |
Citigroup Commercial Mortgage Trust Series 2014-GC23, Class XB (I/O) | | | | | |
| | | |
0.21% (2) | | | 07/10/47 | | | | 3,784,000 | | | | 5,674 | |
| |
COMM Mortgage Trust Series 2012-CR3, Class XA (I/O) | | | | | |
| | | |
0.88% (2) | | | 10/15/45 | | | | 16,590 | | | | 22 | |
| |
COMM Mortgage Trust Series 2012-CR4, Class XA (I/O) | | | | | |
| | | |
1.14% (2) | | | 10/15/45 | | | | 200,220 | | | | 2 | |
|
COMM Mortgage Trust Series 2014-CR19, Class XA (I/O) | |
| | | |
0.83% (2) | | | 08/10/47 | | | | 67,315 | | | | 315 | |
| |
COMM Mortgage Trust Series 2014-CR20, Class A3 | | | | | |
| | | |
3.33% | | | 11/10/47 | | | | 14,698 | | | | 14,408 | |
| |
COMM Mortgage Trust Series 2016-DC2, Class XA (I/O) | | | | | |
| | | |
0.92% (2) | | | 02/10/49 | | | | 706,974 | | | | 11,042 | |
| |
FS Rialto Issuer LLC Series 2019-FL1, Class A | | | | | |
| | | |
6.65% (1 mo. USD Term SOFR + 1.314%) (1),(3) | | | 12/16/36 | | | | 93,493 | | | | 93,125 | |
| |
JPMBB Commercial Mortgage Securities Trust Series 2014-C18, Class XA (I/O) | | | | | |
| | | |
0.64% (2) | | | 02/15/47 | | | | 750,116 | | | | 29 | |
|
MF1 Ltd. Series 2020-FL4, Class A | |
| | | |
7.15% (1 mo. USD Term SOFR + 1.814%) (1),(3) | | | 11/15/35 | | | | 9,346 | | | | 9,354 | |
| |
SREIT Trust Series 2021-MFP, Class A | | | | | |
| | | |
6.18% (1 mo. USD Term SOFR + 0.845%) (1),(3) | | | 11/15/38 | | | | 100,000 | | | | 97,948 | |
| |
Wells Fargo Commercial Mortgage Trust Series 2015-NXS2, Class XA (I/O) | | | | | |
| | | |
0.59% (2) | | | 07/15/58 | | | | 1,371,922 | | | | 9,957 | |
| |
Westlake Automobile Receivables Trust Series 2022-2A, Class C | | | | | |
| | | |
4.85% (3) | | | 09/15/27 | | | | 50,000 | | | | 48,871 | |
| |
WFRBS Commercial Mortgage Trust Series 2014-C21, Class XA (I/O) | | | | | |
| | | |
0.99% (2) | | | 08/15/47 | | | | 1,384,066 | | | | 5,278 | |
| |
WFRBS Commercial Mortgage Trust Series 2014-C24, Class A3 | | | | | |
| | | |
3.43% | | | 11/15/47 | | | | 37,918 | | | | 37,130 | |
| | | | | | | | | | | | |
| | |
Total Commercial Mortgage-Backed Securities — Non-Agency | | | | | | | | | |
| | |
(Cost: $466,619) | | | | | | | | 346,978 | |
| | | | | | | | | | | | |
|
RESIDENTIAL MORTGAGE-BACKED SECURITIES —
AGENCY — 33.8% | |
| |
Federal Home Loan Mortgage Corp. REMICS Series 3071, Class TF (PAC) | | | | | |
| | | |
5.73% (30 day USD SOFR Average + 0.414%)(1) | | | 04/15/35 | | | | 5,036 | | | | 5,013 | |
See accompanying Notes to Financial Statements.
73
TCW Short Term Bond Fund
Schedule of Investments (Continued)
| | | | | | | | | | | | |
| Issues | | Maturity
Date | | | Principal
Amount | | | Value | |
|
RESIDENTIAL MORTGAGE-BACKED SECURITIES —
AGENCY (Continued) | |
| |
Federal Home Loan Mortgage Corp. REMICS Series 3300, Class FA | | | | | |
| | | |
5.73% (30 day USD SOFR Average + 0.414%)(1) | | | 08/15/35 | | | $ | 14,618 | | | $ | 14,243 | |
| |
Federal Home Loan Mortgage Corp. REMICS Series 3318, Class F | | | | | |
| | | |
5.68% (30 day USD SOFR Average + 0.364%)(1) | | | 05/15/37 | | | | 17,806 | | | | 17,209 | |
| |
Federal Home Loan Mortgage Corp. REMICS Series 4231, Class FD | | | | | |
| | | |
5.78% (30 day USD SOFR Average + 0.464%)(1) | | | 10/15/32 | | | | 17,565 | | | | 17,528 | |
| |
Federal Home Loan Mortgage Corp. STRIPS Series 263, Class F5 | | | | | |
| | | |
5.93% (30 day USD SOFR Average + 0.614%)(1) | | | 06/15/42 | | | | 14,252 | | | | 13,823 | |
| |
Federal National Mortgage Association, Pool #254548 | | | | | |
| | | |
5.50% | | | 12/01/32 | | | | 4,574 | | | | 4,502 | |
| |
Federal National Mortgage Association, Pool #600187 | | | | | |
| | | |
7.00% | | | 07/01/31 | | | | 11,269 | | | | 11,318 | |
| |
Federal National Mortgage Association, Pool #995364 | | | | | |
| | | |
6.00% | | | 10/01/38 | | | | 4,099 | | | | 4,109 | |
| |
Federal National Mortgage Association, Pool #AL0851 | | | | | |
| | | |
6.00% | | | 10/01/40 | | | | 2,897 | | | | 2,950 | |
| |
Federal National Mortgage Association REMICS Series 2003-11, Class FA | | | | | |
| | | |
6.44% (30 day USD SOFR Average + 1.114%)(1) | | | 09/25/32 | | | | 5,728 | | | | 5,786 | |
| |
Federal National Mortgage Association REMICS Series 2006-23, Class FP (PAC) | | | | | |
| | | |
5.74% (30 day USD SOFR Average + 0.414%) (1) | | | 04/25/36 | | | | 8,996 | | | | 8,738 | |
| |
Federal National Mortgage Association REMICS Series 2007-64, Class FA | | | | | |
| | | |
5.91% (30 day USD SOFR Average + 0.584%) (1) | | | 07/25/37 | | | | 12,037 | | | | 11,856 | |
| |
Federal National Mortgage Association REMICS Series 2008-24, Class PF (PAC) | | | | | |
| | | |
6.09% (30 day USD SOFR Average + 0.764%) (1) | | | 02/25/38 | | | | 3,973 | | | | 4,003 | |
| |
Federal National Mortgage Association REMICS Series 2020-10, Class FA | | | | | |
| | | |
5.94% (30 day USD SOFR Average + 0.614%) (1) | | | 03/25/50 | | | | 14,514 | | | | 13,878 | |
| |
Federal National Mortgage Association REMICS Series 2017-10, Class FA | | | | | |
| | | |
5.84% (30 day USD SOFR Average + 0.514%) (1) | | | 03/25/47 | | | | 32,125 | | | | 31,433 | |
| |
Government National Mortgage Association, Pool #80022 | | | | | |
| | | |
2.75% (1 yr. CMT +
1.500%) (1) | | | 12/20/26 | | | | 3,190 | | | | 3,118 | |
| | | | | | | | | | | | |
| Issues | | Maturity
Date | | | Principal
Amount | | | Value | |
|
RESIDENTIAL MORTGAGE-BACKED SECURITIES —
AGENCY (Continued) | |
| |
Government National Mortgage Association, Pool #80636 | | | | | |
| | | |
3.625% (1 yr. CMT +
1.500%) (1) | | | 09/20/32 | | | $ | 2,787 | | | $ | 2,704 | |
| |
Government National Mortgage Association, Pool #80757 | | | | | |
| | | |
3.625% (1 yr. CMT +
1.500%) (1) | | | 10/20/33 | | | | 1,188 | | | | 1,143 | |
| |
Government National Mortgage Association, Pool #80797 | | | | | |
| | | |
3.63% (1 yr. CMT +
1.500%) (1) | | | 01/20/34 | | | | 13,145 | | | | 12,564 | |
| |
Government National Mortgage Association, Pool #80937 | | | | | |
| | | |
3.88% (1 yr. CMT +
1.500%) (1) | | | 06/20/34 | | | | 5,914 | | | | 5,805 | |
| |
Government National Mortgage Association REMICS Series 2023-113, Class FD | | | | | |
| | | |
6.50% (30 day USD SOFR Average + 1.35) (1) | | | 08/20/53 | | | | 49,588 | | | | 48,800 | |
| |
Government National Mortgage Association REMICS Series 2023-116, Class FL | | | | | |
| | | |
6.47% (30 day USD SOFR Average + 1.15) (1) | | | 08/20/53 | | | | 49,755 | | | | 49,330 | |
| |
Government National Mortgage Association, TBA | | | | | |
| | | |
5.00% (4) | | | 05/01/53 | | | | 25,000 | | | | 23,262 | |
| | | |
5.50% (4) | | | 06/01/53 | | | | 75,000 | | | | 71,735 | |
| | | |
4.50% (4) | | | 04/01/53 | | | | 50,000 | | | | 45,165 | |
| |
Uniform Mortgage-Backed Security, TBA | | | | | |
| | | |
4.50% (4) | | | 01/01/38 | | | | 275,000 | | | | 260,842 | |
| | | |
5.00% (4) | | | 02/01/38 | | | | 525,000 | | | | 506,441 | |
| | | |
5.50% (4) | | | 02/01/38 | | | | 525,000 | | | | 514,964 | |
| | | |
6.00% (4) | | | 03/01/38 | | | | 75,000 | | | | 74,733 | |
| | | |
5.00% (4) | | | 04/01/53 | | | | 525,000 | | | | 484,093 | |
| | | |
5.50% (4) | | | 04/01/53 | | | | 400,000 | | | | 379,558 | |
| | | |
4.00% (4) | | | 05/01/52 | | | | 200,000 | | | | 172,820 | |
| | | |
4.50% (4) | | | 04/01/53 | | | | 225,000 | | | | 200,973 | |
| | | | | | | | | | | | |
| | |
Total Residential Mortgage-Backed Securities — Agency | | | | | | | | | |
| | | |
(Cost: $3,022,861) | | | | | | | | | | | 3,024,439 | |
| | | | | | | | | | | | |
|
RESIDENTIAL MORTGAGE-BACKED SECURITIES —
NON-AGENCY — 7.0% | |
| |
ABFC Trust Series 2002-WF2, Class A2 | | | | | |
| | | |
6.56% (1 mo. USD Term SOFR + 1.239%) (1) | | | 05/25/32 | | | | 11,538 | | | | 11,443 | |
| |
BNC Mortgage Loan Trust Series 2006-2, Class A4 | | | | | |
| | | |
5.76% (1 mo. USD Term SOFR + 0.434%) (1) | | | 11/25/36 | | | | 21,254 | | | | 20,135 | |
| |
CIT Mortgage Loan Trust Series 2007-1, Class 1A | | | | | |
| | | |
6.79% (1 mo. USD Term SOFR + 1.464%) (1),(3) | | | 10/25/37 | | | | 3,682 | | | | 3,679 | |
See accompanying Notes to Financial Statements.
74
TCW Short Term Bond Fund
| | | | | | | | | | | | |
| Issues | | Maturity
Date | | | Principal
Amount | | | Value | |
|
RESIDENTIAL MORTGAGE-BACKED SECURITIES —
NON-AGENCY(Continued) | |
| |
Credit Suisse First Boston Mortgage Securities Corp. Series 2002-AR31, Class 6A1 | | | | | |
| | | |
5.25% (2) | | | 11/25/32 | | | $ | 6,912 | | | $ | 6,569 | |
| |
First Franklin Mortgage Loan Trust Series 2004-FF5, Class A3C | | | | | |
| | | |
6.44% (1 mo. USD Term SOFR + 1.114%) (1) | | | 08/25/34 | | | | 7,113 | | | | 6,518 | |
| |
JPMorgan Mortgage Acquisition Trust Series 2007-CH4, Class A5 | | | | | |
| | | |
5.68% (1 mo. USD Term SOFR + 0.354%) (1) | | | 05/25/37 | | | | 33,897 | | | | 33,495 | |
| |
JPMorgan Mortgage Trust Series 2018-8, Class A3 | | | | | |
| | | |
4.00% (2),(3) | | | 01/25/49 | | | | 39,405 | | | | 34,246 | |
| |
Morgan Stanley Capital I, Inc. Trust Series 2006-NC2, Class A2D | | | | | |
| | | |
6.02% (1 mo. USD Term SOFR + 0.694%) (1) | | | 02/25/36 | | | | 21,063 | | | | 20,842 | |
| |
New Century Home Equity Loan Trust Series 2005-1, Class M1 | | | | | |
| | | |
6.11% (1 mo. USD Term SOFR + 0.789%) (1) | | | 03/25/35 | | | | 28,770 | | | | 28,781 | |
| |
New Century Home Equity Loan Trust Series 2005-4, Class M3 | | | | | |
| | | |
6.26% (1 mo. USD Term SOFR + 0.939%) (1) | | | 09/25/35 | | | | 49,934 | | | | 50,504 | |
| |
NovaStar Mortgage Funding Trust Series 2005-1, Class M5 | | | | | |
| | | |
6.52% (1 mo. USD Term SOFR + 1.194%) (1) | | | 06/25/35 | | | | 14,692 | | | | 14,624 | |
| |
Opteum Mortgage Acceptance Corp. Asset-Backed Pass-Through Certificates Series 2005-2, Class M5 | | | | | |
| | | |
6.41% (1 mo. USD Term SOFR + 1.089%) (1) | | | 04/25/35 | | | | 31,706 | | | | 31,511 | |
| |
Ownit Mortgage Loan Trust Series 2006-3, Class A2D | | | | | |
| | | |
5.98% (1 mo. USD Term SOFR + 0.654%) | | | 03/25/37 | | | | 29,995 | | | | 28,110 | |
| |
Park Place Securities, Inc. Asset-Backed Pass-Through Certificates Series 2004-WHQ2, Class M4 | | | | | |
| | | |
7.01% (1 mo. USD Term SOFR + 1.689%) (1) | | | 02/25/35 | | | | 27,108 | | | | 25,992 | |
| |
Preston Ridge Partners Mortgage LLC Series 2021-6, Class A1 | | | | | |
| | | |
1.79% (3) | | | 07/25/26 | | | | 29,413 | | | | 27,503 | |
| |
Residential Accredit Loans, Inc. Trust Series 2002-QS16, Class A2 | | | | | |
| | | |
5.99% (1 mo. USD
Term SOFR + 0.664%) (1),(5) | | | 10/25/17 | | | | 68 | | | | 36 | |
| |
Residential Asset Securities Corporation Trust Series 2005-EMX1, Class M1 | | | | | |
6.08% (1 mo. USD Term SOFR + 0.759%)(1) | | | 03/25/35 | | | | 8,466 | | | | 8,439 | |
| |
Residential Asset Securities Corporation Trust Series 2006-KS3, Class M1 | | | | | |
| | | | | | | | | | | | |
| Issues | | Maturity
Date | | | Principal
Amount | | | Value | |
|
RESIDENTIAL MORTGAGE-BACKED SECURITIES —
NON-AGENCY(Continued) | |
5.93% (1 mo. USD Term SOFR + 0.444%)(1) | | | 04/25/36 | | | $ | 23,184 | | | $ | 22,700 | |
| |
Soundview Home Loan Trust Series 2005-OPT1, Class M2 | | | | | |
6.11% (1 mo. USD Term SOFR + 0.789%)(1) | | | 06/25/35 | | | | 13,352 | | | | 12,945 | |
| |
Structured Asset Investment Loan Trust Series 2005-11, Class A3 | | | | | |
6.04% (1 mo. USD Term SOFR + 0.714%)(1) | | | 01/25/36 | | | | 11,151 | | | | 10,707 | |
| |
Structured Asset Investment Loan Trust Series 2005-HE3, Class M1 | | | | | |
6.16% (1 mo. USD Term SOFR + 0.834%)(1) | | | 09/25/35 | | | | 34,204 | | | | 33,436 | |
| |
VOLT XCIV LLC Series 2021-NPL3, Class A1 | | | | | |
2.24% (3) | | | 02/27/51 | | | | 99,557 | | | | 94,230 | |
| |
Wells Fargo Home Equity Asset-Backed Securities Trust Series 2005-4, Class M3 | | | | | |
6.19% (1 mo. USD Term SOFR + 0.864%)(1) | | | 12/25/35 | | | | 100,000 | | | | 97,420 | |
| | | | | | | | | | | | |
| | |
Total Residential Mortgage-Backed Securities — Non-Agency | | | | | | | | | |
| | | |
(Cost: $635,560) | | | | | | | | | | | 623,865 | |
| | | | | | | | | | | | |
|
CORPORATE BONDS — 19.5% | |
|
| Aerospace & Defense — 0.4% | |
| |
BAE Systems Holdings, Inc. (United Kingdom) | | | | | |
3.85% (3) | | | 12/15/25 | | | | 20,000 | | | | 19,176 | |
| | | |
Boeing Co. 1.43% | | | 02/04/24 | | | | 15,000 | | | | 14,818 | |
| | | | | | | | | | | | |
| | | |
| | | | | | | | | | | 33,994 | |
| | | | | | | | | | | | |
|
| Agriculture — 0.2% | |
| |
Imperial Brands Finance PLC (United Kingdom) | | | | | |
4.25% (3) | | | 07/21/25 | | | | 20,000 | | | | 19,326 | |
| | | | | | | | | | | | |
|
| Banks — 11.7% | |
| | | |
Bank of America Corp. | | | | | | | | | | | | |
1.73% (Secured Overnight Financing Rate + 0.960%)(1) | | | 07/22/27 | | | | 95,000 | | | | 83,868 | |
2.55% (Secured Overnight Financing Rate + 1.050%)(1) | | | 02/04/28 | | | | 45,000 | | | | 39,785 | |
3.42% (3 mo. USD Term SOFR + 1.302%) (1) | | | 12/20/28 | | | | 5,000 | | | | 4,453 | |
| | | |
Citigroup, Inc. | | | | | | | | | | | | |
1.46% (Secured Overnight Financing Rate + 0.770%) (1) | | | 06/09/27 | | | | 90,000 | | | | 79,245 | |
3.52% (3 mo. USD Term SOFR + 1.413%)(1) | | | 10/27/28 | | | | 10,000 | | | | 8,992 | |
| | | |
DNB Bank ASA (Norway) | | | | | | | | | | | | |
0.86% (1 yr. CMT +
0.330%) (1),(3) | | | 09/30/25 | | | | 30,000 | | | | 28,542 | |
See accompanying Notes to Financial Statements.
75
TCW Short Term Bond Fund
Schedule of Investments (Continued)
| | | | | | | | | | | | |
| Issues | | Maturity
Date | | | Principal
Amount | | | Value | |
|
| Banks (Continued) | |
| | | |
Goldman Sachs Group, Inc. | | | | | | | | | | | | |
1.22% | | | 12/06/23 | | | $ | 95,000 | | | $ | 94,579 | |
5.83% (Secured Overnight Financing Rate + 0.486%) (1) | | | 10/21/24 | | | | 10,000 | | | | 9,987 | |
| |
HSBC Holdings PLC (United Kingdom) | | | | | |
1.59% (SOFR + 1.290%) (1) | | | 05/24/27 | | | | 25,000 | | | | 22,026 | |
2.25% (Secured Overnight Financing Rate + 1.100%) (1) | | | 11/22/27 | | | | 75,000 | | | | 65,782 | |
| | | |
JPMorgan Chase & Co. | | | | | | | | | | | | |
0.56% (Secured Overnight Financing Rate + 0.420%) (1) | | | 02/16/25 | | | | 55,000 | | | | 53,950 | |
1.04% (3 mo. USD Term SOFR + 0.695%) (1) | | | 02/04/27 | | | | 85,000 | | | | 75,603 | |
2.07% (Secured Overnight Financing Rate + 1.015%) (1) | | | 06/01/29 | | | | 5,000 | | | | 4,156 | |
| |
Lloyds Banking Group PLC (United Kingdom) | | | | | |
1.63% (1 yr. CMT + 0.850%) (1) | | | 05/11/27 | | | | 30,000 | | | | 26,573 | |
3.57% (3 mo. USD LIBOR + 1.205%)(1) | | | 11/07/28 | | | | 20,000 | | | | 17,768 | |
| | | |
Morgan Stanley | | | | | | | | | | | | |
0.79% (Secured Overnight Financing Rate + 0.525%)(1) | | | 05/30/25 | | | | 75,000 | | | | 72,348 | |
1.51% (SOFR + 0.858%)(1) | | | 07/20/27 | | | | 20,000 | | | | 17,561 | |
| |
PNC Financial Services Group, Inc. | | | | | |
5.58% (Secured Overnight Financing Rate + 1.841%)(1) | | | 06/12/29 | | | | 5,000 | | | | 4,789 | |
6.62% (Secured Overnight Financing Rate + 1.730%)(1) | | | 10/20/27 | | | | 30,000 | | | | 30,089 | |
| |
Santander U.K. Group Holdings PLC (United Kingdom) | | | | | |
1.09% (Secured Overnight Financing Rate + 0.787%) | | | 03/15/25 | | | | 45,000 | | | | 43,947 | |
| | | |
U.S. Bancorp | | | | | | | | | | | | |
4.65% (Secured Overnight Financing Rate + 1.230%) (1) | | | 02/01/29 | | | | 20,000 | | | | 18,472 | |
6.79% (Secured Overnight Financing Rate + 1.880%) (1) | | | 10/26/27 | | | | 45,000 | | | | 45,299 | |
| | | |
UBS Group AG (Switzerland) | | | | | | | | | | | | |
1.31% (Secured Overnight Financing Rate Index + 0.980%) (1),(3) | | | 02/02/27 | | | | 65,000 | | | | 57,688 | |
2.59% (Secured Overnight Financing Rate + 1.560%) (3) | | | 09/11/25 | | | | 10,000 | | | | 9,645 | |
| | | |
3.09% (Secured Overnight Financing Rate + 1.730%) (3) | | | 05/14/32 | | | | 10,000 | | | | 7,710 | |
| |
Wells Fargo & Co. 2.16% | | | | | |
| | | |
(3 mo. USD Term SOFR + 1.012%) (1) | | | 02/11/26 | | | | 80,000 | | | | 75,689 | |
| | | |
2.39% (Secured Overnight Financing Rate + 2.100%) (1) | | | 06/02/28 | | | | 40,000 | | | | 34,878 | |
| | | |
3.53% (Secured Overnight Financing Rate + 1.510%) (1) | | | 03/24/28 | | | | 15,000 | | | | 13,685 | |
| | | | | | | | | | | | |
| | | |
| | | | | | | | | | | 1,047,109 | |
| | | | | | | | | | | | |
| | | | | | | | | | | | |
| Issues | | Maturity
Date | | | Principal
Amount | | | Value | |
|
| Biotechnology — 0.3% | |
| |
Amgen, Inc. | | | | | |
| | | |
5.15% | | | 03/02/28 | | | $ | 30,000 | | | $ | 29,291 | |
| | | | | | | | | | | | |
|
| Chemicals — 0.3% | |
| |
International Flavors & Fragrances, Inc. | | | | | |
| | | |
1.83% (3) | | | 10/15/27 | | | | 30,000 | | | | 24,907 | |
| | | |
3.47% (3) | | | 12/01/50 | | | | 5,000 | | | | 2,790 | |
| | | | | | | | | | | | |
| | | |
| | | | | | | | | | | 27,697 | |
| | | | | | | | | | | | |
|
| Commercial Services — 0.3% | |
| |
Global Payments, Inc. | | | | | |
| | | |
4.45% | | | 06/01/28 | | | | 30,000 | | | | 27,685 | |
| | | | | | | | | | | | |
|
| Diversified Financial Services — 0.5% | |
| |
AerCap Ireland Capital DAC/AerCap Global Aviation Trust (Ireland) | | | | | |
| | | |
4.88% | | | 01/16/24 | | | | 10,000 | | | | 9,970 | |
| |
American Express Co. | | | | | |
| | | |
2.25% | | | 03/04/25 | | | | 20,000 | | | | 19,032 | |
| |
Capital One Financial Corp. | | | | | |
| | | |
1.34% (Secured Overnight Financing Rate + 0.690%) (1) | | | 12/06/24 | | | | 20,000 | | | | 19,749 | |
| | | | | | | | | | | | |
| | | |
| | | | | | | | | | | 48,751 | |
| | | | | | | | | | | | |
|
| Electric — 0.7% | |
| |
American Electric Power Co., Inc. | | | | | |
| | | |
2.03% | | | 03/15/24 | | | | 30,000 | | | | 29,497 | |
| |
Metropolitan Edison Co. | | | | | |
| | | |
4.00% (3) | | | 04/15/25 | | | | 30,000 | | | | 28,826 | |
| | | | | | | | | | | | |
| | | |
| | | | | | | | | | | 58,323 | |
| | | | | | | | | | | | |
|
| Health Care-Products — 0.5% | |
| |
Baxter International, Inc. | | | | | |
| | | |
0.87% | | | 12/01/23 | | | | 25,000 | | | | 24,893 | |
| |
Thermo Fisher Scientific, Inc. | | | | | |
| | | |
1.22% | | | 10/18/24 | | | | 25,000 | | | | 23,893 | |
| | | | | | | | | | | | |
| | | |
| | | | | | | | | | | 48,786 | |
| | | | | | | | | | | | |
|
| Health Care-Services — 0.5% | |
| |
HCA, Inc. | | | | | |
| | | |
5.25% | | | 04/15/25 | | | | 10,000 | | | | 9,862 | |
| | | |
5.25% | | | 06/15/26 | | | | 40,000 | | | | 39,062 | |
| | | | | | | | | | | | |
| | | |
| | | | | | | | | | | 48,924 | |
| | | | | | | | | | | | |
|
| Insurance — 1.0% | |
| |
Athene Global Funding | | | | | |
| | | |
6.04% (Secured Overnight Financing Rate Index + 0.700%) (1),(3) | | | 05/24/24 | | | | 30,000 | | | | 29,879 | |
| |
Guardian Life Global Funding | | | | | |
| | | |
5.74% (3) | | | 10/02/28 | | | | 35,000 | | | | 34,775 | |
| |
Metropolitan Life Global Funding I | | | | | |
| | | |
3.45% (3) | | | 12/18/26 | | | | 30,000 | | | | 28,017 | |
| | | | | | | | | | | | |
| | | |
| | | | | | | | | | | 92,671 | |
| | | | | | | | | | | | |
See accompanying Notes to Financial Statements.
76
TCW Short Term Bond Fund
| | | | | | | | | | | | |
| Issues | | Maturity
Date | | | Principal
Amount | | | Value | |
|
| Miscellaneous Manufacturers — 0.1% | |
| |
General Electric Co. | | | | | |
| | | |
6.01% (3 mo. USD Term SOFR + 0.642%) (1) | | | 05/05/26 | | | $ | 5,000 | | | $ | 4,976 | |
| | | | | | | | | | | | |
|
| Oil & Gas — 0.1% | |
| |
Petroleos Mexicanos | | | | | |
| | | |
6.70% | | | 02/16/32 | | | | 13,000 | | | | 9,594 | |
| | | | | | | | | | | | |
|
| Packaging & Containers — 0.3% | |
| |
Amcor Flexibles North America, Inc. | | | | | |
| | | |
4.00% | | | 05/17/25 | | | | 25,000 | | | | 24,243 | |
| | | | | | | | | | | | |
|
| Pharmaceuticals — 0.7% | |
| |
Bayer U.S. Finance II LLC | | | | | |
| | | |
3.38% (3) | | | 07/15/24 | | | | 10,000 | | | | 9,815 | |
4.25% (3) | | | 12/15/25 | | | | 30,000 | | | | 28,830 | |
| |
Becton Dickinson & Co. | | | | | |
| | | |
3.73% | | | 12/15/24 | | | | 20,000 | | | | 19,513 | |
| | | | | | | | | | | | |
| | | |
| | | | | | | | | | | 58,158 | |
| | | | | | | | | | | | |
|
| REIT — 1.6% | |
| |
American Tower Corp. (REIT) | | | | | |
| | | |
3.60% | | | 01/15/28 | | | | 35,000 | | | | 31,460 | |
| |
Extra Space Storage LP | | | | | |
| | | |
3.88% | | | 12/15/27 | | | | 15,000 | | | | 13,655 | |
| | | |
5.70% | | | 04/01/28 | | | | 15,000 | | | | 14,624 | |
| |
Healthcare Realty Holdings LP (REIT) | | | | | |
| | | |
3.63% | | | 01/15/28 | | | | 15,000 | | | | 13,329 | |
| |
Kilroy Realty LP | | | | | |
| | | |
3.45% | | | 12/15/24 | | | | 40,000 | | | | 38,534 | |
| |
VICI Properties LP/VICI Note Co., Inc. | | | | | |
| | | |
4.63% (3) | | | 06/15/25 | | | | 10,000 | | | | 9,621 | |
| | | |
5.75% (3) | | | 02/01/27 | | | | 20,000 | | | | 19,246 | |
| | | | | | | | | | | | |
| | | |
| | | | | | | | | | | 140,469 | |
| | | | | | | | | | | | |
|
| Savings & Loans — 0.3% | |
| |
Nationwide Building Society (United Kingdom) | | | | | |
| | | |
2.97% (Secured Overnight Financing Rate + 1.290%) (1),(3) | | | 02/16/28 | | | | 25,000 | | | | 22,235 | |
| | | | | | | | | | | | |
|
Total Corporate Bonds | |
| |
(Cost: $1,782,647) | | | | 1,742,232 | |
| | | | | | | | | | | | |
|
MUNICIPAL BONDS — 1.0% | |
| |
City & County of Denver Airport System Revenue, Revenue Bond | | | | | |
| | | |
1.12% | | | 11/15/24 | | | | 10,000 | | | | 9,555 | |
| |
City of Baltimore, General Obligation Unlimited | | | | | |
| | | |
5.00% | | | 10/15/25 | | | | 25,000 | | | | 24,845 | |
| |
Commonwealth of Massachusetts, Revenue Bond | | | | | |
| | | |
4.11% | | | 07/15/31 | | | | 18,835 | | | | 18,140 | |
| |
New York City Transitional Finance Authority Future Tax Secured Revenue | | | | | |
| | | |
2.31% | | | 11/01/26 | | | | 25,000 | | | | 22,836 | |
| | | | | | | | | | | | |
| Issues | | Maturity
Date | | | Principal
Amount | | | Value | |
|
| Savings & Loans (Continued) | |
| |
New York State Dormitory Authority, Revenue Bond | | | | | |
| | | |
5.00% | | | 03/15/24 | | | $ | 15,000 | | | $ | 14,955 | |
| | | | | | | | | | | | |
|
Total Municipal Bonds | |
| |
(Cost: $94,902) | | | | 90,331 | |
| | | | | | | | | | | | |
|
| U.S. TREASURY SECURITIES — 26.6% | |
| |
U.S. Treasury Notes | | | | | |
| | | |
4.63% | | | 10/15/26 | | | | 312,000 | | | | 309,672 | |
| | | |
4.63% | | | 09/30/28 | | | | 8,000 | | | | 7,927 | |
| | | |
4.88% | | | 10/31/28 | | | | 13,000 | | | | 13,029 | |
| | | |
5.00% | | | 10/31/25 | | | | 2,052,000 | | | | 2,049,555 | |
| | | | | | | | | | | | |
| | | |
Total U.S. Treasury Securities | | | | | | | | | | | | |
| |
(Cost: $2,380,083) | | | | 2,380,183 | |
| | | | | | | | | | | | |
|
| ASSET-BACKED SECURITIES — 9.6% | |
| |
AMMC CLO XI Ltd. Series 2012-11A, Class A1R2 | | | | | |
| | | |
6.66% (3 mo. USD Term SOFR + 1.272%) (1),(3) | | | 04/30/31 | | | | 34,778 | | | | 34,603 | |
| |
Apidos CLO XXII Ltd. Series 2015-22A, Class A1R | | | | | |
| | | |
6.74% (3 mo. USD Term SOFR + 1.322%) (1),(3) | | | 04/20/31 | | | | 43,895 | | | | 43,762 | |
| |
Carvana Auto Receivables Trust Series 2022-P3, Class A3 | | | | | |
| | | |
4.61% | | | 11/10/27 | | | | 50,000 | | | | 49,065 | |
| |
CoreVest American Finance Ltd. Series 2019-1, Class XA (I/O) | | | | | |
| | | |
2.24% (2),(3) | | | 03/15/52 | | | | 10,120 | | | | 18 | |
| |
Dryden 58 CLO Ltd. Series 2018-58A, Class A1 | | | | | |
| | | |
6.66% (3 mo. USD Term SOFR + 1.262%) (1),(3) | | | 07/17/31 | | | | 44,313 | | | | 44,090 | |
| |
Exeter Automobile Receivables Trust Series 2021-1A, Class D | | | | | |
| | | |
1.08% | | | 11/16/26 | | | | 40,000 | | | | 38,079 | |
| |
Flatiron CLO 17 Ltd. Series 2017-1A, Class AR | | | | | |
| | | |
6.61% (3 mo. USD Term SOFR + 1.242%) (1),(3) | | | 05/15/30 | | | | 17,064 | | | | 17,003 | |
| |
LCM XXIV Ltd. Series 24A, Class AR | | | | | |
| | | |
6.66% (3 mo. USD Term SOFR + 1.242%) (1),(3) | | | 03/20/30 | | | | 19,173 | | | | 19,087 | |
| |
Madison Park Funding XVII Ltd. Series 2015-17A, Class AR2 | | | | | |
| | | |
6.67% (3 mo. USD Term SOFR + 1.262%) (1),(3) | | | 07/21/30 | | | | 28,721 | | | | 28,579 | |
| |
Magnetite XVIII Ltd. Series 2016-18A, Class AR2 | | | | | |
| | | |
6.51% (3 mo. USD Term SOFR + 1.142%) (1),(3) | | | 11/15/28 | | | | 67,018 | | | | 66,795 | |
| |
Navient Private Education Refi Loan Trust Series 2020-BA, Class A2 | | | | | |
| | | |
2.12% (3) | | | 01/15/69 | | | | 103,582 | | | | 93,676 | |
| |
Navient Private Education Refi Loan Trust Series 2021-BA, Class A | | | | | |
| | | |
0.94% (3) | | | 07/15/69 | | | | 55,163 | | | | 46,890 | |
| |
Navient Private Education Refi Loan Trust Series 2021-CA, Class A | | | | | |
| | | |
1.06% (3) | | | 10/15/69 | | | | 61,360 | | | | 51,989 | |
See accompanying Notes to Financial Statements.
77
TCW Short Term Bond Fund
Schedule of Investments (Continued)
| | | | | | | | | | | | |
| Issues | | Maturity
Date | | | Principal
Amount | | | Value | |
|
| ASSET-BACKED SECURITIES (Continued) | |
| |
Octagon Investment Partners 35 Ltd. Series 2018-1A, Class A1A | | | | | |
| | | |
6.74% (3 mo. USD Term SOFR + 1.322%) (1),(3) | | | 01/20/31 | | | $ | 42,240 | | | $ | 42,118 | |
| |
Palmer Square CLO Ltd. Series 2018-1A, Class A1 | | | | | |
| | | |
6.69% (3 mo. USD Term SOFR + 1.292%) (1),(3) | | | 04/18/31 | | | | 35,110 | | | | 34,967 | |
| |
Rockford Tower CLO Ltd. Series 2018-2A, Class A | | | | | |
| | | |
6.84% (3 mo. USD Term SOFR + 1.422%) (1),(3) | | | 10/20/31 | | | | 45,000 | | | | 44,832 | |
| |
Santander Drive Auto Receivables Trust Series 2022-2, Class C | | | | | |
| | | |
3.76% | | | 07/16/29 | | | | 45,000 | | | | 42,669 | |
| |
SoFi Professional Loan Program LLC Series 2017-F, Class A2FX | | | | | |
| | | |
2.84% (3) | | | 01/25/41 | | | | 42,957 | | | | 41,490 | |
| |
SoFi Professional Loan Program LLC Series 2019-A, Class A2FX | | | | | |
| | | |
3.69% (3) | | | 06/15/48 | | | | 41,635 | | | | 39,983 | |
| |
Tricon American Homes Trust Series 2017-SFR2, Class A | | | | | |
| | | |
2.93% (3) | | | 01/17/36 | | | | 29,938 | | | | 29,695 | |
| |
Tricon American Homes Trust Series 2017-SFR2, Class B | | | | | |
| | | |
3.28% (3) | | | 01/17/36 | | | | 39,000 | | | | 38,702 | |
| |
U.S. Small Business Administration Series 2005-20B, Class 1 | | | | | |
| | | |
4.63% | | | 02/01/25 | | | | 9,624 | | | | 9,455 | |
| | | | | | | | | | | | |
|
Total Asset-backed Securities | |
| |
(Cost: $878,978) | | | | 857,547 | |
| | | | | | | | | | | | |
|
U.S. GOVERNMENT AGENCY OBLIGATIONS — 3.2% | |
| |
Federal Home Loan Banks | | | | | |
| | | |
5.30% | | | 05/22/24 | | | | 70,000 | | | | 69,905 | |
| | | |
5.37% | | | 05/21/24 | | | | 100,000 | | | | 99,766 | |
| |
U.S. International Development Finance Corp. | | | | | |
| | | |
1.49% | | | 08/15/31 | | | | 138,378 | | | | 119,464 | |
| | | | | | | | | | | | |
| |
Total U.S. Government Agency Obligations | | | | | |
| |
(Cost: $309,052) | | | | 289,135 | |
| | | | | | | | | | | | |
| |
Total Fixed Income Securities | | | | | |
| |
(Cost: $9,735,187) | | | | 9,482,764 | |
| | | | | | | | | | | | |
| | | |
| | | | | | | | | | | | |
| | | | | | | | | | | | |
| | | | | | Shares | | | | |
|
MONEY MARKET INVESTMENTS — 7.1% | |
| | |
State Street Institutional U.S. Government Money Market Fund — Premier Class, 5.30% (6) | | | $ | 637,067 | | | $ | 637,067 | |
| | | | | | | | | | | | |
|
Total Money Market Investments | |
| |
(Cost: $637,067) | | | | 637,067 | |
| | | | | | | | | | | | |
| | | |
| | | | | | | | | | | | |
| | | | | | Principal
Amount | | | | |
|
SHORT TERM INVESTMENTS — 20.3% | |
|
| U.S. Treasury Securities — 20.3% | |
|
U.S. Treasury Bills | |
| | | |
5.18% (7) | | | 11/28/23 | | | $ | 241,000 | | | | 240,045 | |
| | | |
5.18% (7) | | | 11/28/23 | | | | 500,000 | | | | 498,018 | |
| | | |
5.38% (7) | | | 02/15/24 | | | | 300,000 | | | | 295,321 | |
| | | |
5.52% (7) | | | 04/11/24 | | | | 250,000 | | | | 244,033 | |
| | | |
5.23% (7) | | | 12/05/23 | | | | 250,000 | | | | 248,752 | |
| | | |
5.49% (7) | | | 04/04/24 | | | | 300,000 | | | | 293,143 | |
| | | | | | | | | | | | |
| | | |
Total U.S. Treasury Securities | | | | | | | | | | | | |
| |
(Cost: $1,819,267) | | | | 1,819,312 | |
| | | | | | | | | | | | |
|
Total Short Term Investments | |
| |
(Cost: $1,819,267) | | | | 1,819,312 | |
| | | | | | | | | | | | |
|
Total Investments (133.4%) | |
| |
(Cost: $12,191,521) | | | | 11,939,143 | |
| | | | | | | | | | | | |
| |
Liabilities In Excess Of Other Assets (-33.4%) | | | | (2,986,682 | ) |
| |
Net Assets (100.0%) | | | $ | 8,952,461 | |
| | | | | | | | | | | | |
See accompanying Notes to Financial Statements.
78
TCW Short Term Bond Fund
October 31, 2023
| | | | | | | | | | | | | | | | | | |
FUTURES CONTRACTS | |
| | | | | |
Number of
Contracts | | Type | | Expiration
Date | | | Notional
Contract
Value | | | Value | | | Net Unrealized
Appreciation
(Depreciation) | |
Long Futures | | | | | | | | | | | | | | | | | | |
| 8 | | 2-Year U.S. Treasury Note Futures | | | 12/29/23 | | | $ | 1,626,815 | | | $ | 1,619,375 | | | $ | (7,440 | ) |
| | | | | | | | | | | | | | | | | | |
Short Futures | | | | | | | | | | | | | | | | | | |
| 5 | | 10-Year U.S. Treasury Note Futures | | | 12/19/23 | | | $ | (573,781 | ) | | $ | (544,141 | ) | | $ | 29,640 | |
| 14 | | 5-Year U.S. Treasury Note Futures | | | 12/29/23 | | | | (1,484,845 | ) | | | (1,462,672 | ) | | | 22,173 | |
| | | | | | | | | | | | | | | | | | |
| | | | | | | | $ | (2,058,626 | ) | | $ | (2,006,813 | ) | | $ | 51,813 | |
| | | | | | | | | | | | | | | | | | |
Notes to the Schedule of Investments:
| ABS | | Asset-Backed Securities. |
| ACES | | Alternative Credit Enhancement Securities. |
| CLO | | Collateralized Loan Obligation. |
| I/O | | Interest Only Security. |
| PAC | | Planned Amortization Class. |
| REIT | | Real Estate Investment Trust. |
| REMIC | | Real Estate Mortgage Investment Conduit. |
| SOFR | | Secured Overnight Financing Rate. |
| STRIPS | | Separate Trading of Registered Interest and Principal Securities. |
| (1) | | Floating or variable rate security. The interest shown reflects the rate in effect at October 31, 2023. |
| (2) | | Variable rate security. Interest rate disclosed is as of the most recent information available. Certain variable rate securities are not based on a published reference rate and spread but are determined by the issuer or agent and are based on current market conditions. These securities do not indicate a reference rate and spread in their description above. |
| (3) | | Security exempt from registration under Rule 144A of the Securities Act of 1933, as amended. These securities may be resold, normally only to qualified institutional buyers. At October 31, 2023, the value of these securities amounted to $1,522,086 or 17.0% of net assets. These securities are determined to be liquid by the Fund’s investment advisor, unless otherwise noted, under procedures established by and under the general supervision of the Company’s Board of Directors. |
| (4) | | Security purchased on a forward commitment with an approximate principal amount. The actual principal amount and maturity date will be determined upon settlement when the security is delivered. |
| (5) | | The maturity date of the security has been extended past the date disclosed. The new maturity date is not known as of October 31, 2023. |
| (6) | | Rate disclosed is the 7-day net yield as of October 31, 2023. |
| (7) | | Rate shown represents yield-to-maturity. |
See accompanying Notes to Financial Statements.
79
TCW Short Term Bond Fund
Investments by Sector | October 31, 2023 |
| | | | |
| Sector | | Percentage of
Net Assets | |
U.S. Treasury Securities | | | 46.9 | % |
Residential Mortgage-Backed Securities — Agency | | | 33.8 | |
Corporate Bonds | | | 19.5 | |
Asset-Backed Securities | | | 9.6 | |
Money Market Investments | | | 7.1 | |
Residential Mortgage-Backed Securities — Non-Agency | | | 7.0 | |
Commercial Mortgage-Backed Securities — Non-Agency | | | 3.9 | |
U.S. Government Agency Obligations | | | 3.2 | |
Commercial Mortgage-Backed Securities — Agency | | | 1.4 | |
Municipal Bonds | | | 1.0 | |
Other* | | | (33.4 | ) |
| | | | |
Total | | | 100.0 | % |
| | | | |
* Includes futures, pending trades, interest receivable and accrued expenses payable.
See accompanying Notes to Financial Statements.
80
TCW Short Term Bond Fund
Fair Valuation Summary | October 31, 2023 |
The following is a summary of the fair valuations according to the inputs used as of October 31, 2023 in valuing the Fund’s investments:
| | | | | | | | | | | | | | | | |
Description | | Quoted Prices
in Active
Markets for
Identical
Assets
(Level 1) | | | Other
Significant
Observable
Inputs
(Level 2) | | | Significant
Unobservable
Inputs
(Level 3) | | | Total | |
Fixed Income Securities | | | | | | | | | | | | | | | | |
Commercial Mortgage-Backed Securities — Agency | | $ | — | | | $ | 128,054 | | | $ | — | | | $ | 128,054 | |
Commercial Mortgage-Backed Securities — Non-Agency | | | — | | | | 346,978 | | | | — | | | | 346,978 | |
Residential Mortgage-Backed Securities — Agency | | | — | | | | 3,024,439 | | | | — | | | | 3,024,439 | |
Residential Mortgage-Backed Securities — Non-Agency | | | — | | | | 623,865 | | | | — | | | | 623,865 | |
Corporate Bonds* | | | — | | | | 1,742,232 | | | | — | | | | 1,742,232 | |
Municipal Bonds | | | — | | | | 90,331 | | | | — | | | | 90,331 | |
U.S. Treasury Securities | | | 2,380,183 | | | | — | | | | — | | | | 2,380,183 | |
Asset-Backed Securities | | | — | | | | 857,547 | | | | — | | | | 857,547 | |
U.S. Government Agency Obligations | | | — | | | | 289,135 | | | | — | | | | 289,135 | |
| | | | | | | | | | | | | | | | |
Total Fixed Income Securities | | | 2,380,183 | | | | 7,102,581 | | | | — | | | | 9,482,764 | |
| | | | | | | | | | | | | | | | |
Money Market Investments | | | 637,067 | | | | — | | | | — | | | | 637,067 | |
Short-Term Investments | | | 1,819,312 | | | | — | | | | — | | | | 1,819,312 | |
| | | | | | | | | | | | | | | | |
Total Investments | | $ | 4,836,562 | | | $ | 7,102,581 | | | $ | — | | | $ | 11,939,143 | |
| | | | | | | | | | | | | | | | |
| | | | | | | | | | | | | | | | |
Asset Derivatives | | | | | | | | | | | | | | | | |
Futures Contracts | | | | | | | | | | | | | | | | |
Interest Rate Risk | | | 51,813 | | | | — | | | | — | | | | 51,813 | |
| | | | | | | | | | | | | | | | |
Total Investments | | $ | 4,888,375 | | | $ | 7,102,581 | | | $ | — | | | $ | 11,990,956 | |
| | | | | | | | | | | | | | | | |
Liability Derivatives | | | | | | | | | | | | | | | | |
Futures Contracts | | | | | | | | | | | | | | | | |
Interest Rate Risk | | $ | (7,440 | ) | | $ | — | | | $ | — | | | $ | (7,440 | ) |
| | | | | | | | | | | | | | | | |
Total | | $ | (7,440 | ) | | $ | — | | | $ | — | | | $ | (7,440 | ) |
| | | | | | | | | | | | | | | | |
| * | See Schedule of Investments for corresponding industries. |
See accompanying Notes to Financial Statements.
81
TCW Total Return Bond Fund
Schedule of Investments
| | | | | | | | | | | | |
| Issues | | Maturity
Date | | | Principal
Amount | | | Value | |
|
FIXED INCOME SECURITIES — 126.8% of Net Assets | |
|
| ASSET-BACKED SECURITIES — 10.5% | |
| |
AGL CLO 13 Ltd. Series 2021-13A, Class B | | | | | |
| | | |
7.33% (3 mo. USD Term SOFR + 1.912%) (1),(2) | | | 10/20/34 | | | $ | 9,000,000 | | | $ | 8,837,073 | |
| |
Allegro CLO XII Ltd. Series 2020-1A, Class A1 | | | | | |
| | | |
6.92% (3 mo. USD Term SOFR + 1.512%) (1),(2) | | | 01/21/32 | | | | 10,000,000 | | | | 9,980,610 | |
| |
AMSR Trust Series 2020-SFR2, Class E2 | | | | | |
| | | |
4.28% (1) | | | 07/17/37 | | | | 7,713,000 | | | | 7,283,907 | |
| |
AMSR Trust Series 2020-SFR3, Class F | | | | | |
| | | |
3.55% (1) | | | 09/17/37 | | | | 2,682,000 | | | | 2,456,640 | |
| |
AMSR Trust Series 2020-SFR3, Class G | | | | | |
| | | |
4.99% (1) | | | 09/17/37 | | | | 11,402,000 | | | | 10,483,335 | |
| |
Apidos CLO XXXVII Ltd. Series 2021-37A, Class B | | | | | |
| | | |
7.27% (3 mo. USD Term SOFR + 1.862%) (1),(2) | | | 10/22/34 | | | | 13,795,000 | | | | 13,550,470 | |
| |
Carvana Auto Receivables Trust Series 2021-N2, Class R | | | | | |
| | | |
0.00% (1),(3) | | | 03/10/28 | | | | 14,800 | | | | 2,220,215 | |
| |
Carvana Auto Receivables Trust Series 2021-N3, Class R | | | | | |
| | | |
0.00% (1),(3) | | | 06/12/28 | | | | 25,650 | | | | 4,149,375 | |
| |
Carvana Auto Receivables Trust Series 2023-P1, Class R | | | | | |
| | | |
0.00% (1),(3) | | | 03/11/30 | | | | 2,950 | | | | 568,595 | |
| |
CIFC Funding Ltd. Series 2022-2A, Class INCB | | | | | |
| | | |
16.85% (1),(4) | | | 04/19/35 | | | | 3,300,000 | | | | 2,549,567 | |
| |
Cologix Data Centers U.S. Issuer LLC Series 2021-1A, Class A2 | | | | | |
| | | |
3.30% (1) | | | 12/26/51 | | | | 6,140,000 | | | | 5,386,290 | |
| |
CoreVest American Finance Ltd. Series 2020-1, Class XA (I/O) | | | | | |
| | | |
2.57% (1),(4) | | | 03/15/50 | | | | 32,628,409 | | | | 1,553,680 | |
| |
CoreVest American Finance Ltd. Series 2020-1, Class XB (I/O) | | | | | |
| | | |
2.06% (1),(4) | | | 03/15/50 | | | | 38,948,500 | | | | 3,733,229 | |
| |
CoreVest American Finance Ltd. Series 2020-4, Class XA (I/O) | | | | | |
| | | |
3.82% (1),(4) | | | 12/15/52 | | | | 43,746,203 | | | | 2,660,228 | |
| |
CoreVest American Finance Ltd. Series 2020-4, Class XB (I/O) | | | | | |
| | | |
2.78% (1),(4) | | | 12/15/52 | | | | 27,500,000 | | | | 2,051,541 | |
| |
CoreVest American Finance Ltd. Series 2021-1, Class XA (I/O) | | | | | |
| | | |
2.91% (1),(4) | | | 04/15/53 | | | | 62,276,322 | | | | 3,313,760 | |
| |
FirstKey Homes Trust Series 2021-SFR3, Class E1 | | | | | |
| | | |
2.99% (1) | | | 12/17/38 | | | | 5,500,000 | | | | 4,800,505 | |
| |
Flexential Issuer Series 2021-1A, Class A2 | | | | | |
| | | |
3.25% (1) | | | 11/27/51 | | | | 7,580,000 | | | | 6,670,668 | |
| |
GCI Funding I LLC Series 2021-1, Class A | | | | | |
| | | |
2.38% (1) | | | 06/18/46 | | | | 21,984,378 | | | | 18,541,923 | |
| | | | | | | | | | | | |
| Issues | | Maturity
Date | | | Principal
Amount | | | Value | |
|
| ASSET-BACKED SECURITIES (Continued) | |
| |
Global SC Finance II SRL Series 2014-1A, Class A2 | | | | | |
| | | |
3.09% (1) | | | 07/17/29 | | | $ | 1,225,193 | | | $ | 1,198,440 | |
| |
HOA Funding LLC Series 2021-1A, Class A2 | | | | | |
| | | |
4.72% (1) | | | 08/20/51 | | | | 12,382,300 | | | | 10,185,357 | |
| |
HPS Loan Management Ltd. Series 10A-16, Class A2RR | | | | | |
| | | |
7.33% (3 mo. USD Term SOFR + 1.912%) (1),(2) | | | 04/20/34 | | | | 20,000,000 | | | | 19,480,240 | |
| |
JGWPT XXX LLC Series 2013-3A, Class A | | | | | |
| | | |
4.08% (1) | | | 01/17/73 | | | | 5,038,459 | | | | 4,349,889 | |
| |
Lucali CLO Ltd. Series 2020-1A, Class A | | | | | |
| | | |
6.87% (3 mo. USD Term SOFR + 1.472%) (1),(2) | | | 01/15/33 | | | | 8,000,000 | | | | 7,973,288 | |
| |
Madison Park Funding XXXVIII Ltd. Series 2021-38A, Class B | | | | | |
| | | |
7.31% (3 mo. USD Term SOFR + 1.912%) (1),(2) | | | 07/17/34 | | | | 10,000,000 | | | | 9,825,900 | |
| |
Neuberger Berman Loan Advisers CLO 36 Ltd. Series 2020-36A, Class A1R | | | | | |
| | | |
6.93% (3 mo. USD Term SOFR + 1.512%) (1),(2) | | | 04/20/33 | | | | 9,750,000 | | | | 9,718,722 | |
| |
OHA Credit Funding 3 Ltd. Series 2019-3A, Class BR | | | | | |
| | | |
7.33% (3 mo. USD Term SOFR + 1.912%) (1),(2) | | | 07/02/35 | | | | 13,000,000 | | | | 12,708,800 | |
| |
OHA Credit Funding 9 Ltd. Series 2021-9A, Class B | | | | | |
| | | |
7.36% (3 mo. USD Term SOFR + 1.962%) (1),(2) | | | 07/19/35 | | | | 17,500,000 | | | | 17,125,500 | |
| |
Park Avenue Institutional Advisers CLO Ltd. Series 2021-1A, Class A1A | | | | | |
| | | |
7.07% (3 mo. USD Term SOFR + 1.652%) (1),(2) | | | 01/20/34 | | | | 11,000,000 | | | | 10,972,412 | |
| |
Progress Residential Trust Series 2019-SFR3, Class E | | | | | |
| | | |
3.37% (1) | | | 09/17/36 | | | | 8,681,000 | | | | 8,384,584 | |
| |
Progress Residential Trust Series 2020-SFR2, Class F | | | | | |
| | | |
6.15% (1) | | | 06/17/37 | | | | 9,332,000 | | | | 9,109,710 | |
| |
Progress Residential Trust Series 2020-SFR3, Class F | | | | | |
| | | |
2.80% (1) | | | 10/17/27 | | | | 3,299,000 | | | | 3,004,167 | |
| |
Progress Residential Trust Series 2021-SFR1, Class H | | | | | |
| | | |
5.00% (1) | | | 04/17/38 | | | | 4,890,000 | | | | 4,333,547 | |
| |
Progress Residential Trust Series 2021-SFR11, Class F | | | | | |
| | | |
4.42% (1) | | | 01/17/39 | | | | 2,874,000 | | | | 2,348,878 | |
| |
Progress Residential Trust Series 2021-SFR2, Class G | | | | | |
| | | |
4.25% (1) | | | 04/19/38 | | | | 8,369,000 | | | | 7,334,494 | |
| |
Progress Residential Trust Series 2021-SFR3, Class G | | | | | |
| | | |
4.25% (1) | | | 05/17/26 | | | | 3,400,000 | | | | 3,010,697 | |
| |
Progress Residential Trust Series 2021-SFR7, Class F | | | | | |
| | | |
3.83% (1) | | | 08/17/40 | | | | 8,970,000 | | | | 7,080,819 | |
| |
Sixth Street CLO XVII Ltd. Series 2021-17A, Class A | | | | | |
| | | |
6.92% (3 mo. USD Term SOFR + 1.502%) (1) | | | 01/20/34 | | | | 8,000,000 | | | | 7,971,176 | |
| | | | | | | | | | | | |
|
Total Asset-backed Securities | |
| |
(Cost: $300,081,517) | | | | 266,908,231 | |
| | | | | | | | | | | | |
See accompanying Notes to Financial Statements.
82
TCW Total Return Bond Fund
October 31, 2023
| | | | | | | | | | | | |
| Issues | | Maturity
Date | | | Principal
Amount | | | Value | |
|
COMMERCIAL MORTGAGE-BACKED SECURITIES —
AGENCY — 0.3% | |
| |
Federal Home Loan Mortgage Corp. Multifamily Structured Pass-Through Certificates Series K038, Class X3 (I/O) | | | | | |
| | | |
2.49% (4) | | | 06/25/42 | | | $ | 78,039,937 | | | $ | 746,491 | |
| |
Federal Home Loan Mortgage Corp. Multifamily Structured Pass-Through Certificates Series K040, Class X3 (I/O) | | | | | |
| | | |
2.03% (4) | | | 11/25/42 | | | | 77,991,835 | | | | 1,316,931 | |
| |
Federal Home Loan Mortgage Corp. Multifamily Structured Pass-Through Certificates Series K042, Class X3 (I/O) | | | | | |
| | | |
1.60% (4) | | | 01/25/43 | | | | 76,625,000 | | | | 1,253,176 | |
| |
Federal Home Loan Mortgage Corp. Multifamily Structured Pass-Through Certificates Series K045, Class X3 (I/O) | | | | | |
| | | |
1.50% (4) | | | 04/25/43 | | | | 126,630,757 | | | | 2,299,212 | |
| |
Federal Home Loan Mortgage Corp. Multifamily Structured Pass-Through Certificates Series K046, Class X3 (I/O) | | | | | |
| | | |
1.51% (4) | | | 04/25/43 | | | | 94,964,072 | | | | 1,907,140 | |
| | | | | | | | | | | | |
| | |
Total Commercial Mortgage-Backed Securities — Agency | | | | | | | | | |
| | |
(Cost: $35,285,763) | | | | | | | | 7,522,950 | |
| | | | | | | | | | | | |
|
COMMERCIAL MORTGAGE-BACKED SECURITIES —
NON-AGENCY — 7.0% | |
| |
1345 Avenue of the Americas & Park Avenue Plaza Trust Series 2005-1, Class A3 | | | | | |
| | | |
5.28% (1) | | | 08/10/35 | | | | 9,834,081 | | | | 9,291,413 | |
| |
Arbor Realty Commercial Real Estate Notes Ltd. Series 2021-FL4, Class AS | | | | | |
| | | |
7.15% (1 mo. USD Term SOFR + 1.814%) (1),(2) | | | 11/15/36 | | | | 11,800,000 | | | | 11,625,076 | |
| |
BDS Ltd. Series 2020-FL5, Class A 6.60% (1 mo. USD Term SOFR + | | | | | |
| | | |
1.264%) (1),(2) | | | 02/16/37 | | | | 2,414,375 | | | | 2,399,615 | |
| |
Benchmark Mortgage Trust Series 2019-B14, Class 225C | | | | | |
| | | |
3.29% (1),(4) | | | 12/15/62 | | | | 8,734,000 | | | | 942,062 | |
| |
Benchmark Mortgage Trust Series 2019-B14, Class 225D | | | | | |
| | | |
3.29% (1),(4) | | | 12/15/62 | | | | 20,303,000 | | | | 1,119,203 | |
| |
BPR Trust Series 2021-WILL, Class A | | | | | |
| | | |
7.20% (1 mo. USD Term SOFR + 1.864%) (1),(2) | | | 06/15/38 | | | | 4,641,431 | | | | 4,498,845 | |
| |
BX Commercial Mortgage Trust Series 2020-VIV4, Class A | | | | | |
| | | |
2.84% (1) | | | 03/09/44 | | | | 15,285,000 | | | | 12,168,754 | |
| | | | | | | | | | | | |
| Issues | | Maturity
Date | | | Principal
Amount | | | Value | |
|
COMMERCIAL MORTGAGE-BACKED SECURITIES —
NON-AGENCY (Continued) | |
| |
CAMB Commercial Mortgage Trust Series 2019-LIFE, Class D | | | | | |
| | | |
7.13% (1 mo. USD Term SOFR + 1.797%) (1),(2) | | | 12/15/37 | | | $ | 14,425,000 | | | $ | 14,250,150 | |
| |
CSMC Trust Series 2021-BPNY, Class A | | | | | |
| | | |
9.16% (1 mo. USD Term SOFR + 3.829%) (1),(2) | | | 08/15/26 | | | | 18,864,000 | | | | 16,692,999 | |
| |
DBGS Mortgage Trust Series 2018-BIOD, Class E | | | | | |
| | | |
7.33% (1 mo. USD Term SOFR + 1.996%) (1),(2) | | | 05/15/35 | | | | 9,137,627 | | | | 8,807,054 | |
| |
European Loan Conduit No. 36 DAC Series 36A, Class E | | | | | |
| | | |
7.15% (3 mo. EUR EURIBOR + 3.350%) (1),(2) | | | 02/17/30 | | | | 8,987,329 | | | | 9,054,434 | |
| |
Grace Trust Series 2020-GRCE, Class A | | | | | |
| | | |
2.35% (1) | | | 12/10/40 | | | | 10,000,000 | | | | 7,457,848 | |
| |
GreenPoint Mortgage Funding Trust Series 2006-AR5, Class A2A2 (5) | | | | | |
| | | |
5.74% (1 mo. USD Term SOFR + 0.414%) (2) | | | 10/25/46 | | | | 28,703 | | | | — | |
| |
Houston Galleria Mall Trust Series 2015-HGLR, Class D | | | | | |
| | | |
3.98% (1) | | | 03/05/37 | | | | 9,500,000 | | | | 8,618,613 | |
| |
JPMorgan Chase Commercial Mortgage Securities Trust Series 2019-OSB, Class A | | | | | |
| | | |
3.40% (1) | | | 06/05/39 | | | | 6,865,000 | | | | 5,776,230 | |
| |
Life Mortgage Trust Series 2021-BMR, Class G | | | | | |
| | | |
8.40% (1 mo. USD Term SOFR + 3.064%) (1),(2) | | | 03/15/38 | | | | 7,863,761 | | | | 7,473,661 | |
| |
MKT Mortgage Trust Series 2020-525M, Class C | | | | | |
| | | |
2.94% (1) | | | 02/12/40 | | | | 4,900,000 | | | | 2,700,547 | |
| |
MKT Mortgage Trust Series 2020-525M, Class D | | | | | |
| | | |
2.94% (1),(4) | | | 02/12/40 | | | | 7,500,000 | | | | 3,631,919 | |
| |
Morgan Stanley Capital I Trust Series 2020-CNP, Class A | | | | | |
| | | |
2.43% (1),(4) | | | 04/05/42 | | | | 18,000,000 | | | | 12,945,578 | |
| |
One Bryant Park Trust Series 2019-OBP, Class A | | | | | |
| | | |
2.52% (1) | | | 09/15/54 | | | | 6,870,000 | | | | 5,392,871 | |
| |
SFAVE Commercial Mortgage Securities Trust Series 2015-5AVE, Class A2A | | | | | |
| | | |
3.66% (1),(4) | | | 01/05/43 | | | | 20,935,000 | | | | 14,240,481 | |
|
SLG Office Trust Series 2021-OVA, Class G | |
| | | |
2.85% (1) | | | 07/15/41 | | | | 16,460,000 | | | | 9,552,928 | |
|
Taurus U.K. DAC Series 2021-UK4X, Class A | |
| | | |
6.17% (Sterling Overnight Index Average + 0.950%) (2),(6) | | | 08/17/31 | | | | 3,847,402 | | | | 4,563,644 | |
See accompanying Notes to Financial Statements.
83
TCW Total Return Bond Fund
Schedule of Investments (Continued)
| | | | | | | | | | | | |
| Issues | | Maturity
Date | | | Principal
Amount | | | Value | |
|
COMMERCIAL MORTGAGE-BACKED SECURITIES —
NON-AGENCY (Continued) | |
| |
Taurus U.K. DAC Series 2021-UK4X, Class C | | | | | |
| | | |
6.97% (Sterling Overnight Index Average + 1.750%) (2),(6) | | | 08/17/31 | | | $ | 1,313,747 | | | $ | 1,525,739 | |
| |
Wells Fargo Commercial Mortgage Trust Series 2016-NXS6, Class XB | | | | | |
| | | |
0.58% (4) | | | 11/15/49 | | | | 106,409,000 | | | | 1,611,798 | |
| | | | | | | | | | | | |
| | |
Total Commercial Mortgage-Backed Securities — Non-Agency | | | | | | | | | |
| | |
(Cost: $236,024,153) | | | | | | | | 176,341,462 | |
| | | | | | | | | | | | |
| |
RESIDENTIAL MORTGAGE-BACKED SECURITIES —
AGENCY — 70.3% | | | | |
| |
Federal Home Loan Mortgage Corp., Pool #A91162 | | | | | |
| | | |
5.00% | | | 02/01/40 | | | | 9,206,182 | | | | 8,864,309 | |
| |
Federal Home Loan Mortgage Corp., Pool #A92195 | | | | | |
| | | |
5.00% | | | 05/01/40 | | | | 2,363,814 | | | | 2,269,647 | |
| |
Federal Home Loan Mortgage Corp., Pool #G01959 | | | | | |
| | | |
5.00% | | | 12/01/35 | | | | 45,336 | | | | 44,047 | |
| |
Federal Home Loan Mortgage Corp., Pool #G06173 | | | | | |
| | | |
4.00% | | | 11/01/40 | | | | 10,748,757 | | | | 9,624,714 | |
| |
Federal Home Loan Mortgage Corp., Pool #G07556 | | | | | |
| | | |
4.00% | | | 11/01/43 | | | | 3,405,021 | | | | 3,035,600 | |
| |
Federal Home Loan Mortgage Corp., Pool #G07786 | | | | | |
| | | |
4.00% | | | 08/01/44 | | | | 11,260,817 | | | | 10,065,068 | |
| |
Federal Home Loan Mortgage Corp., Pool #G07848 | | | | | |
| | | |
3.50% | | | 04/01/44 | | | | 29,971,751 | | | | 25,986,346 | |
| |
Federal Home Loan Mortgage Corp., Pool #G08710 | | | | | |
| | | |
3.00% | | | 06/01/46 | | | | 942,254 | | | | 777,308 | |
| |
Federal Home Loan Mortgage Corp., Pool #G08833 | | | | | |
| | | |
5.00% | | | 07/01/48 | | | | 2,069,497 | | | | 1,946,418 | |
| |
Federal Home Loan Mortgage Corp., Pool #G08840 | | | | | |
| | | |
5.00% | | | 08/01/48 | | | | 360,663 | | | | 339,594 | |
| |
Federal Home Loan Mortgage Corp., Pool #G08843 | | | | | |
| | | |
4.50% | | | 10/01/48 | | | | 3,133,363 | | | | 2,850,982 | |
| |
Federal Home Loan Mortgage Corp., Pool #G08848 | | | | | |
| | | |
4.50% | | | 11/01/48 | | | | 1,476,374 | | | | 1,346,621 | |
| |
Federal Home Loan Mortgage Corp., Pool #G08849 | | | | | |
| | | |
5.00% | | | 11/01/48 | | | | 2,610,826 | | | | 2,452,983 | |
| |
Federal Home Loan Mortgage Corp., Pool #G16085 | | | | | |
| | | |
2.50% | | | 02/01/32 | | | | 2,578,090 | | | | 2,374,752 | |
| |
Federal Home Loan Mortgage Corp., Pool #G16598 | | | | | |
| | | |
2.50% | | | 12/01/31 | | | | 2,368,513 | | | | 2,180,437 | |
| |
Federal Home Loan Mortgage Corp., Pool #G30450 | | | | | |
| | | |
6.00% | | | 01/01/29 | | | | 408,034 | | | | 398,148 | |
| |
Federal Home Loan Mortgage Corp., Pool #G30452 | | | | | |
| | | |
6.00% | | | 10/01/28 | | | | 375,128 | | | | 366,055 | |
| |
Federal Home Loan Mortgage Corp., Pool #G30454 | | | | | |
| | | |
5.00% | | | 05/01/29 | | | | 445,367 | | | | 430,444 | |
| | | | | | | | | | | | |
| Issues | | Maturity
Date | | | Principal
Amount | | | Value | |
| |
RESIDENTIAL MORTGAGE-BACKED SECURITIES —
AGENCY (Continued) | | | | |
| |
Federal Home Loan Mortgage Corp., Pool #G60238 | | | | | |
| | | |
3.50% | | | 10/01/45 | | | $ | 3,176,612 | | | $ | 2,748,006 | |
| |
Federal Home Loan Mortgage Corp., Pool #G60440 | | | | | |
| | | |
3.50% | | | 03/01/46 | | | | 22,553,329 | | | | 19,510,922 | |
| |
Federal Home Loan Mortgage Corp., Pool #G67707 | | | | | |
| | | |
3.50% | | | 01/01/48 | | | | 12,377,888 | | | | 10,663,717 | |
| |
Federal Home Loan Mortgage Corp., Pool #G67709 | | | | | |
| | | |
3.50% | | | 03/01/48 | | | | 6,936,653 | | | | 5,926,716 | |
|
Federal Home Loan Mortgage Corp., Pool #G67717 | |
| | | |
4.00% | | | 11/01/48 | | | | 25,951,755 | | | | 23,041,937 | |
| |
Federal Home Loan Mortgage Corp., Pool #N70081 | | | | | |
| | | |
5.50% | | | 07/01/38 | | | | 1,410,899 | | | | 1,360,736 | |
| |
Federal Home Loan Mortgage Corp., Pool #P51350 | | | | | |
| | | |
5.00% | | | 03/01/36 | | | | 1,296,459 | | | | 1,270,210 | |
| |
Federal Home Loan Mortgage Corp., Pool #QE0312 | | | | | |
| | | |
2.00% | | | 04/01/52 | | | | 11,652,750 | | | | 8,565,893 | |
| |
Federal Home Loan Mortgage Corp., Pool #QG0601 | | | | | |
| | | |
4.50% | | | 04/01/53 | | | | 19,715,259 | | | | 17,625,571 | |
| |
Federal Home Loan Mortgage Corp., Pool #SD7513 | | | | | |
| | | |
3.50% | | | 04/01/50 | | | | 13,684,903 | | | | 11,689,721 | |
| |
Federal Home Loan Mortgage Corp., Pool #SD8147 | | | | | |
| | | |
2.50% | | | 05/01/51 | | | | 14,702,924 | | | | 11,356,254 | |
| |
Federal Home Loan Mortgage Corp., Pool #SD8194 | | | | | |
| | | |
2.50% | | | 02/01/52 | | | | 18,137,396 | | | | 13,952,347 | |
| |
Federal Home Loan Mortgage Corp., Pool #SD8199 | | | | | |
| | | |
2.00% | | | 03/01/52 | | | | 7,394,341 | | | | 5,442,951 | |
| |
Federal Home Loan Mortgage Corp., Pool #ZT1491 | | | | | |
| | | |
3.50% | | | 11/01/48 | | | | 7,621,369 | | | | 6,489,790 | |
| |
Federal Home Loan Mortgage Corp. Reference REMIC Series R002, Class ZA | | | | | |
| | | |
5.50% | | | 06/15/35 | | | | 1,846,513 | | | | 1,829,643 | |
| |
Federal Home Loan Mortgage Corp. REMICS Series 1829, Class ZB | | | | | |
| | | |
6.50% | | | 03/15/26 | | | | 1,142 | | | | 1,143 | |
| |
Federal Home Loan Mortgage Corp. REMICS Series 2367, Class ZK | | | | | |
| | | |
6.00% | | | 10/15/31 | | | | 39,242 | | | | 39,358 | |
| |
Federal Home Loan Mortgage Corp. REMICS Series 2514, Class PZ (PAC) | | | | | |
| | | |
5.50% | | | 10/15/32 | | | | 827,109 | | | | 825,032 | |
| |
Federal Home Loan Mortgage Corp. REMICS Series 2571, Class PZ (PAC) | | | | | |
| | | |
5.50% | | | 02/15/33 | | | | 1,921,724 | | | | 1,900,289 | |
| |
Federal Home Loan Mortgage Corp. REMICS Series 2647, Class OV (P/O) | | | | | |
| | | |
0.00% (7) | | | 07/15/33 | | | | 467,662 | | | | 348,444 | |
| |
Federal Home Loan Mortgage Corp. REMICS Series 2662, Class MT (TAC) | | | | | |
| | | |
4.50% | | | 08/15/33 | | | | 430,237 | | | | 413,008 | |
| |
Federal Home Loan Mortgage Corp. REMICS Series 2700, Class B | | | | | |
| | | |
4.50% | | | 11/15/23 | | | | 737 | | | | 737 | |
See accompanying Notes to Financial Statements.
84
TCW Total Return Bond Fund
October 31, 2023
| | | | | | | | | | | | |
| Issues | | Maturity
Date | | | Principal
Amount | | | Value | |
| |
RESIDENTIAL MORTGAGE-BACKED SECURITIES —
AGENCY (Continued) | | | | |
| |
Federal Home Loan Mortgage Corp. REMICS Series 2903, Class PO (P/O) | | | | | |
| | | |
0.00% (7) | | | 11/15/23 | | | $ | 354 | | | $ | 354 | |
| |
Federal Home Loan Mortgage Corp. REMICS Series 3045, Class HZ | | | | | |
| | | |
4.50% | | | 10/15/35 | | | | 444,551 | | | | 401,063 | |
| |
Federal Home Loan Mortgage Corp. REMICS Series 3063, Class YG (PAC) | | | | | |
| | | |
5.50% | | | 11/15/35 | | | | 8,601,427 | | | | 8,530,629 | |
| |
Federal Home Loan Mortgage Corp. REMICS Series 3114, Class KZ | | | | | |
| | | |
5.00% | | | 02/15/36 | | | | 6,440,312 | | | | 6,246,217 | |
| |
Federal Home Loan Mortgage Corp. REMICS Series 3146, Class GE | | | | | |
| | | |
5.50% | | | 04/15/26 | | | | 674,734 | | | | 671,468 | |
| |
Federal Home Loan Mortgage Corp. REMICS Series 3149, Class OD (P/O) (PAC) | | | | | |
| | | |
0.00% (7) | | | 05/15/36 | | | | 2,134,488 | | | | 1,688,070 | |
| |
Federal Home Loan Mortgage Corp. REMICS Series 3315, Class S (I/O) (I/F) | | | | | |
| | | |
0.98% (-30 day USD SOFR Average + 6.296%) (2) | | | 05/15/37 | | | | 360,301 | | | | 22,096 | |
| |
Federal Home Loan Mortgage Corp. REMICS Series 3376, Class SX (I/O) (I/F) | | | | | |
| | | |
0.61% (-30 day USD SOFR Average + 5.926%) (2) | | | 10/15/37 | | | | 1,305,736 | | | | 52,931 | |
| |
Federal Home Loan Mortgage Corp. REMICS Series 3410, Class IS (I/O) (I/F) | | | | | |
| | | |
0.84% (-30 day USD SOFR Average + 6.156%) (2) | | | 02/15/38 | | | | 1,762,737 | | | | 77,165 | |
| |
Federal Home Loan Mortgage Corp. REMICS Series 3424, Class BI (I/O) (I/F) | | | | | |
| | | |
1.37% (-30 day USD SOFR Average + 6.686%) (2) | | | 04/15/38 | | | | 2,039,965 | | | | 177,279 | |
| |
Federal Home Loan Mortgage Corp. REMICS Series 3519, Class SH (I/O) (I/F) | | | | | |
| | | |
0.07% (-30 day USD SOFR Average + 5.386%) (2) | | | 07/15/37 | | | | 140,889 | | | | 7,306 | |
| |
Federal Home Loan Mortgage Corp. REMICS Series 3531, Class SC (I/O) (I/F) | | | | | |
| | | |
0.87% (-30 day USD SOFR Average + 6.186%) (2) | | | 05/15/39 | | | | 2,671,041 | | | | 47,684 | |
| |
Federal Home Loan Mortgage Corp. REMICS Series 3541, Class SA (I/O) (I/F) | | | | | |
| | | |
1.32% (-30 day USD SOFR Average + 6.636%) (2) | | | 06/15/39 | | | | 1,004,299 | | | | 84,351 | |
| |
Federal Home Loan Mortgage Corp. REMICS Series 3550, Class GS (I/O) (I/F) | | | | | |
| | | | | | | | | | | | |
| Issues | | Maturity
Date | | | Principal
Amount | | | Value | |
| |
RESIDENTIAL MORTGAGE-BACKED SECURITIES —
AGENCY (Continued) | | | | |
| | | |
1.32% (-30 day USD SOFR Average + 6.636%) (2) | | | 07/15/39 | | | $ | 2,451,801 | | | $ | 203,247 | |
| |
Federal Home Loan Mortgage Corp. REMICS Series 3551, Class VZ | | | | | |
| | | |
5.50% | | | 12/15/32 | | | | 957,408 | | | | 950,841 | |
| |
Federal Home Loan Mortgage Corp. REMICS Series 3557, Class KB | | | | | |
| | | |
4.50% | | | 07/15/29 | | | | 1,548,386 | | | | 1,505,770 | |
| |
Federal Home Loan Mortgage Corp. REMICS Series 3557, Class NB | | | | | |
| | | |
4.50% | | | 07/15/29 | | | | 3,557,295 | | | | 3,466,640 | |
| |
Federal Home Loan Mortgage Corp. REMICS Series 3558, Class KB | | | | | |
| | | |
4.00% | | | 08/15/29 | | | | 1,621,907 | | | | 1,568,097 | |
| |
Federal Home Loan Mortgage Corp. REMICS Series 3565, Class XB | | | | | |
| | | |
4.00% | | | 08/15/24 | | | | 424,448 | | | | 420,732 | |
| |
Federal Home Loan Mortgage Corp. REMICS Series 3575, Class D | | | | | |
| | | |
4.50% | | | 03/15/37 | | | | 201,736 | | | | 191,995 | |
| |
Federal Home Loan Mortgage Corp. REMICS Series 3788, Class SB (I/O) (I/F) | | | | | |
| | | |
1.05% (-30 day USD SOFR Average + 6.366%) (2) | | | 01/15/41 | | | | 3,555,130 | | | | 322,284 | |
| |
Federal Home Loan Mortgage Corp. REMICS Series 3885, Class PO (P/O) (PAC) | | | | | |
| | | |
0.00% (7) | | | 11/15/33 | | | | 766,199 | | | | 627,806 | |
| |
Federal Home Loan Mortgage Corp. REMICS Series 3930, Class KE (PAC) | | | | | |
| | | |
4.00% | | | 09/15/41 | | | | 9,779,802 | | | | 8,932,175 | |
| |
Federal Home Loan Mortgage Corp. REMICS Series 4030, Class HS (I/O) (I/F) | | | | | |
| | | |
1.18% (-30 day USD SOFR Average + 6.496%) (2) | | | 04/15/42 | | | | 1,292,314 | | | | 101,794 | |
| |
Federal Home Loan Mortgage Corp. REMICS Series 4604, Class PB (PAC) | | | | | |
| | | |
3.00% | | | 01/15/46 | | | | 2,201,517 | | | | 1,872,458 | |
| |
Federal Home Loan Mortgage Corp. REMICS Series 4648, Class FA | | | | | |
| | | |
5.93% (30 day USD SOFR Average + 0.614%) (2) | | | 01/15/47 | | | | 5,870,292 | | | | 5,642,357 | |
| |
Federal Home Loan Mortgage Corp. REMICS Series 4846, Class PA | | | | | |
| | | |
4.00% | | | 06/15/47 | | | | 503,110 | | | | 491,343 | |
| |
Federal Home Loan Mortgage Corp. REMICS Series 4896, Class DA | | | | | |
| | | |
3.00% | | | 01/15/49 | | | | 1,126,300 | | | | 954,309 | |
| |
Federal Home Loan Mortgage Corp. REMICS Series 4929, Class FB | | | | | |
| | | |
5.89% (30 day USD SOFR Average + 0.564%) (2) | | | 09/25/49 | | | | 12,580,369 | | | | 12,145,277 | |
See accompanying Notes to Financial Statements.
85
TCW Total Return Bond Fund
Schedule of Investments (Continued)
| | | | | | | | | | | | |
| Issues | | Maturity
Date | | | Principal
Amount | | | Value | |
| |
RESIDENTIAL MORTGAGE-BACKED SECURITIES —
AGENCY (Continued) | | | | |
| |
Federal Home Loan Mortgage Corp. REMICS Series 5210, Class LB | | | | | |
| | | |
3.00% | | | 08/25/50 | | | $ | 16,601,979 | | | $ | 11,313,044 | |
| |
Federal Home Loan Mortgage Corp. STRIPS Series 277, Class 30 | | | | | |
| | | |
3.00% | | | 09/15/42 | | | | 8,645,575 | | | | 7,391,142 | |
| |
Federal National Mortgage Association, Pool #257536 | | | | | |
| | | |
5.00% | | | 01/01/29 | | | | 386,474 | | | | 372,658 | |
| |
Federal National Mortgage Association, Pool #310033 | | | | | |
| | | |
6.00% | | | 07/01/47 | | | | 365,795 | | | | 367,089 | |
| |
Federal National Mortgage Association, Pool #555424 | | | | | |
| | | |
5.50% | | | 05/01/33 | | | | 1,180,899 | | | | 1,167,640 | |
| |
Federal National Mortgage Association, Pool #661856 | | | | | |
| | | |
5.87% (1-year RFUCC + 1.623%)(2) | | | 10/01/32 | | | | 17,864 | | | | 17,625 | |
| |
Federal National Mortgage Association, Pool #671133 | | | | | |
| | | |
4.66% (6-month RFUCC + 1.413%) (2) | | | 02/01/33 | | | | 53,503 | | | | 53,261 | |
| |
Federal National Mortgage Association, Pool #687847 | | | | | |
| | | |
4.18% (1-year RFUCC + 1.558%) (2) | | | 02/01/33 | | | | 9,323 | | | | 9,192 | |
| |
Federal National Mortgage Association, Pool #692104 | | | | | |
| | | |
4.79% (6-month RFUCC + 1.413%) (2) | | | 02/01/33 | | | | 293,770 | | | | 292,130 | |
| |
Federal National Mortgage Association, Pool #699866 | | | | | |
| | | |
4.62% (1-year RFUCC + 1.534%) (2) | | | 04/01/33 | | | | 91,428 | | | | 89,868 | |
| |
Federal National Mortgage Association, Pool #704454 | | | | | |
| | | |
5.07% (1-year RFUCC + 1.679%) (2) | | | 05/01/33 | | | | 15,686 | | | | 15,490 | |
| |
Federal National Mortgage Association, Pool #728824 | | | | | |
| | | |
5.87% (1-year RFUCC + 1.620%) (2) | | | 07/01/33 | | | | 42,579 | | | | 41,772 | |
| |
Federal National Mortgage Association, Pool #734384 | | | | | |
| | | |
5.50% | | | 07/01/33 | | | | 156,002 | | | | 153,597 | |
| |
Federal National Mortgage Association, Pool #888593 | | | | | |
| | | |
7.00% | | | 06/01/37 | | | | 145,406 | | | | 151,826 | |
| |
Federal National Mortgage Association, Pool #934103 | | | | | |
| | | |
5.00% | | | 07/01/38 | | | | 127,496 | | | | 117,140 | |
| | | | | | | | | | | | |
| Issues | | Maturity
Date | | | Principal
Amount | | | Value | |
| |
RESIDENTIAL MORTGAGE-BACKED SECURITIES —
AGENCY (Continued) | | | | |
|
Federal National Mortgage Association, Pool #979563 | |
| | | |
5.00% | | | 04/01/28 | | | $ | 171,805 | | | $ | 166,314 | |
|
Federal National Mortgage Association, Pool #995425 | |
| | | |
6.00% | | | 01/01/24 | | | | 597 | | | | 595 | |
|
Federal National Mortgage Association, Pool #995573 | |
| | | |
6.00% | | | 01/01/49 | | | | 948,583 | | | | 929,027 | |
|
Federal National Mortgage Association, Pool #995953 | |
| | | |
6.00% | | | 11/01/28 | | | | 990,418 | | | | 965,107 | |
|
Federal National Mortgage Association, Pool #995954 | |
| | | |
6.00% | | | 03/01/29 | | | | 567,399 | | | | 552,851 | |
|
Federal National Mortgage Association, Pool #AA3303 | |
| | | |
5.50% | | | 06/01/38 | | | | 1,562,101 | | | | 1,545,914 | |
|
Federal National Mortgage Association, Pool #AB6210 | |
| | | |
3.00% | | | 09/01/42 | | | | 17,630,091 | | | | 14,885,075 | |
|
Federal National Mortgage Association, Pool #AE0588 | |
| | | |
6.00% | | | 08/01/37 | | | | 2,800,075 | | | | 2,802,163 | |
|
Federal National Mortgage Association, Pool #AL0851 | |
| | | |
6.00% | | | 10/01/40 | | | | 1,826,578 | | | | 1,860,045 | |
|
Federal National Mortgage Association, Pool #AL1594 | |
| | | |
6.00% | | | 07/01/40 | | | | 1,496,645 | | | | 1,524,067 | |
|
Federal National Mortgage Association, Pool #AL9106 | |
| | | |
4.50% | | | 02/01/46 | | | | 7,038,335 | | | | 6,491,981 | |
|
Federal National Mortgage Association, Pool #AS7241 | |
| | | |
3.50% | | | 05/01/46 | | | | 5,910,763 | | | | 5,059,025 | |
|
Federal National Mortgage Association, Pool #AS9454 | |
| | | |
4.00% | | | 04/01/47 | | | | 706,685 | | | | 623,995 | |
|
Federal National Mortgage Association, Pool #BM5979 | |
| | | |
3.50% | | | 09/01/45 | | | | 5,821,252 | | | | 5,049,441 | |
|
Federal National Mortgage Association, Pool #BN4316 | |
| | | |
4.00% | | | 01/01/49 | | | | 122,048 | | | | 108,306 | |
|
Federal National Mortgage Association, Pool #BN6264 | |
| | | |
4.00% | | | 04/01/49 | | | | 2,303,224 | | | | 2,040,045 | |
|
Federal National Mortgage Association, Pool #BQ6913 | |
| | | |
2.00% | | | 12/01/51 | | | | 20,786,888 | | | | 15,326,128 | |
|
Federal National Mortgage Association, Pool #BQ7056 | |
| | | |
2.00% | | | 01/01/52 | | | | 44,479,551 | | | | 32,752,978 | |
|
Federal National Mortgage Association, Pool #BU7102 | |
| | | |
2.50% | | | 12/01/51 | | | | 10,987,712 | | | | 8,455,248 | |
|
Federal National Mortgage Association, Pool #BV4119 | |
| | | |
2.50% | | | 03/01/52 | | | | 15,665,095 | | | | 12,031,992 | |
|
Federal National Mortgage Association, Pool #BV7761 | |
| | | |
2.50% | | | 03/01/52 | | | | 13,396,556 | | | | 10,323,741 | |
|
Federal National Mortgage Association, Pool #BV8459 | |
| | | |
3.00% | | | 04/01/52 | | | | 18,561,820 | | | | 14,870,995 | |
|
Federal National Mortgage Association, Pool #BV8463 | |
| | | |
2.50% | | | 04/01/52 | | | | 24,522,018 | | | | 18,834,786 | |
|
Federal National Mortgage Association, Pool #BV8464 | |
| | | |
3.00% | | | 04/01/52 | | | | 19,069,399 | | | | 15,276,978 | |
See accompanying Notes to Financial Statements.
86
TCW Total Return Bond Fund
October 31, 2023
| | | | | | | | | | | | |
| Issues | | Maturity
Date | | | Principal
Amount | | | Value | |
| |
RESIDENTIAL MORTGAGE-BACKED SECURITIES —
AGENCY (Continued) | | | | |
|
Federal National Mortgage Association, Pool #BV8515 | |
| | | |
3.00% | | | 05/01/52 | | | $ | 27,729,594 | | | $ | 22,213,051 | |
|
Federal National Mortgage Association, Pool #BW1194 | |
| | | |
4.00% | | | 09/01/52 | | | | 1,552,155 | | | | 1,342,654 | |
|
Federal National Mortgage Association, Pool #BW9886 | |
| | | |
4.50% | | | 10/01/52 | | | | 18,492,890 | | | | 16,528,519 | |
|
Federal National Mortgage Association, Pool #CA1540 | |
| | | |
4.00% | | | 04/01/48 | | | | 11,330,311 | | | | 10,044,515 | |
|
Federal National Mortgage Association, Pool #CA1710 | |
| | | |
4.50% | | | 05/01/48 | | | | 5,181,229 | | | | 4,720,558 | |
|
Federal National Mortgage Association, Pool #CA1711 | |
| | | |
4.50% | | | 05/01/48 | | | | 4,738,097 | | | | 4,316,825 | |
|
Federal National Mortgage Association, Pool #CA2208 | |
| | | |
4.50% | | | 08/01/48 | | | | 4,879,857 | | | | 4,445,981 | |
|
Federal National Mortgage Association, Pool #CB0610 | |
| | | |
2.50% | | | 05/01/51 | | | | 16,453,819 | | | | 12,748,862 | |
|
Federal National Mortgage Association, Pool #CB2852 | |
| | | |
2.00% | | | 11/01/51 | | | | 18,214,590 | | | | 13,429,578 | |
|
Federal National Mortgage Association, Pool #CB3151 | |
| | | |
2.00% | | | 03/01/52 | | | | 41,924,159 | | | | 31,061,303 | |
|
Federal National Mortgage Association, Pool #FM2342 | |
| | | |
3.50% | | | 12/01/46 | | | | 3,530,421 | | | | 3,067,528 | |
|
Federal National Mortgage Association, Pool #FM9515 | |
| | | |
2.50% | | | 11/01/51 | | | | 20,465,607 | | | | 15,714,081 | |
|
Federal National Mortgage Association, Pool #FS0139 | |
| | | |
2.50% | | | 01/01/52 | | | | 27,281,395 | | | | 21,156,217 | |
|
Federal National Mortgage Association, Pool #FS1598 | |
| | | |
2.00% | | | 04/01/52 | | | | 30,464,281 | | | | 22,394,178 | |
|
Federal National Mortgage Association, Pool #MA1561 | |
| | | |
3.00% | | | 09/01/33 | | | | 15,390,788 | | | | 13,642,791 | |
|
Federal National Mortgage Association, Pool #MA1584 | |
| | | |
3.50% | | | 09/01/33 | | | | 9,867,982 | | | | 8,948,661 | |
|
Federal National Mortgage Association, Pool #MA2995 | |
| | | |
4.00% | | | 05/01/47 | | | | 3,033,863 | | | | 2,678,195 | |
|
Federal National Mortgage Association, Pool #MA4152 | |
| | | |
2.00% | | | 10/01/40 | | | | 47,535,327 | | | | 37,766,121 | |
|
Federal National Mortgage Association, Pool #MA4579 | |
| | | |
3.00% | | | 04/01/52 | | | | 34,614,576 | | | | 27,736,933 | |
| |
Federal National Mortgage Association Benchmark REMIC Series 2007-B2, Class ZA | | | | | |
| | | |
5.50% | | | 06/25/37 | | | | 4,715,596 | | | | 4,579,442 | |
| |
Federal National Mortgage Association REMICS Series 1993-202, Class SZ (I/F) (PAC) | | | | | |
| | | |
10.00% (-U.S. (Fed) Prime Rate + 44.286%) (2) | | | 11/25/23 | | | | 55 | | | | 55 | |
| |
Federal National Mortgage Association REMICS Series 1995-21, Class C (P/O) | | | | | |
| | | |
0.00% (7) | | | 05/25/24 | | | | 7,861 | | | | 7,761 | |
| | | | | | | | | | | | |
| Issues | | Maturity
Date | | | Principal
Amount | | | Value | |
| |
RESIDENTIAL MORTGAGE-BACKED SECURITIES —
AGENCY (Continued) | | | | |
| |
Federal National Mortgage Association REMICS Series 2001-40, Class Z | | | | | |
| | | |
6.00% | | | 08/25/31 | | | $ | 46,175 | | | $ | 45,533 | |
| |
Federal National Mortgage Association REMICS Series 2003-117, Class TG (PAC) | | | | | |
| | | |
4.75% | | | 08/25/33 | | | | 79,208 | | | | 77,957 | |
| |
Federal National Mortgage Association REMICS Series 2004-52, Class SW (I/O) (I/F) | | | | | |
| | | |
1.66% (-30 day USD SOFR Average + 6.986%) (2) | | | 07/25/34 | | | | 278,341 | | | | 6,080 | |
| |
Federal National Mortgage Association REMICS Series 2004-65, Class LT | | | | | |
| | | |
4.50% | | | 08/25/24 | | | | 37,531 | | | | 37,185 | |
| |
Federal National Mortgage Association REMICS Series 2004-68, Class LC | | | | | |
| | | |
5.00% | | | 09/25/29 | | | | 530,763 | | | | 521,612 | |
| |
Federal National Mortgage Association REMICS Series 2005-74, Class CP (I/F) (PAC) | | | | | |
| | | |
4.82% (-30 day USD SOFR Average + 24.330%) (2) | | | 05/25/35 | | | | 31,687 | | | | 31,430 | |
| |
Federal National Mortgage Association REMICS Series 2007-103, Class AI (I/O) (I/F) | | | | | |
| | | |
1.06% (-30 day USD SOFR Average + 6.386%) (2) | | | 03/25/37 | | | | 2,344,897 | | | | 117,061 | |
| |
Federal National Mortgage Association REMICS Series 2007-20, Class SI (I/O) (I/F) | | | | | |
| | | |
1.01% (-30 day USD SOFR Average + 6.336%) (2) | | | 03/25/37 | | | | 517,907 | | | | 28,609 | |
| |
Federal National Mortgage Association REMICS Series 2007-21, Class SE (I/O) (I/F) | | | | | |
| | | |
1.00% (-30 day USD SOFR Average + 6.326%) (2) | | | 03/25/37 | | | | 356,531 | | | | 20,617 | |
| |
Federal National Mortgage Association REMICS Series 2007-56, Class SG (I/O) (I/F) | | | | | |
| | | |
0.97% (-30 day USD SOFR Average + 6.296%) (2) | | | 06/25/37 | | | | 484,375 | | | | 12,548 | |
| |
Federal National Mortgage Association REMICS Series 2007-58, Class SV (I/O) (I/F) | | | | | |
| | | |
1.31% (-30 day USD SOFR Average + 6.636%) (2) | | | 06/25/37 | | | | 2,513,960 | | | | 140,569 | |
| |
Federal National Mortgage Association REMICS Series 2007-65, Class S (I/O) (I/F) | | | | | |
| | | |
1.16% (-30 day USD SOFR Average + 6.486%) (2) | | | 07/25/37 | | | | 235,013 | | | | 13,134 | |
See accompanying Notes to Financial Statements.
87
TCW Total Return Bond Fund
Schedule of Investments (Continued)
| | | | | | | | | | | | |
| Issues | | Maturity
Date | | | Principal
Amount | | | Value | |
| |
RESIDENTIAL MORTGAGE-BACKED SECURITIES —
AGENCY (Continued) | | | | |
| |
Federal National Mortgage Association REMICS Series 2007-88, Class FY | | | | | |
| | | |
5.90% (30 day USD SOFR Average + 0.574%) (2) | | | 09/25/37 | | | $ | 292,046 | | | $ | 283,705 | |
| |
Federal National Mortgage Association REMICS Series 2008-1, Class AI (I/O) (I/F) | | | | | |
| | | |
0.81% (-30 day USD SOFR Average + 6.136%) (2) | | | 05/25/37 | | | | 1,947,571 | | | | 70,766 | |
| |
Federal National Mortgage Association REMICS Series 2008-13, Class SB (I/O) (I/F) | | | | | |
| | | |
0.80% (-30 day USD SOFR Average + 6.126%) (2) | | | 03/25/38 | | | | 2,086,926 | | | | 158,547 | |
| |
Federal National Mortgage Association REMICS Series 2008-23, Class SB (I/O) (I/F) | | | | | |
| | | |
1.41% (-30 day USD SOFR Average + 6.736%) (2) | | | 04/25/38 | | | | 2,424,342 | | | | 92,259 | |
| |
Federal National Mortgage Association REMICS Series 2008-35, Class SD (I/O) (I/F) | | | | | |
| | | |
1.01% (-30 day USD SOFR Average + 6.336%) (2) | | | 05/25/38 | | | | 217,328 | | | | 1,740 | |
| |
Federal National Mortgage Association REMICS Series 2008-66, Class SG (I/O) (I/F) | | | | | |
| | | |
0.63% (-30 day USD SOFR Average + 5.956%) (2) | | | 08/25/38 | | | | 4,680,379 | | | | 306,861 | |
| |
Federal National Mortgage Association REMICS Series 2008-68, Class SA (I/O) (I/F) | | | | | |
| | | |
0.53% (-30 day USD SOFR Average + 5.856%) (2) | | | 08/25/38 | | | | 1,401,967 | | | | 37,064 | |
| |
Federal National Mortgage Association REMICS Series 2009-3, Class SH (I/O) (I/F) | | | | | |
| | | |
0.01% (-30 day USD SOFR Average + 5.336%) (2) | | | 06/25/37 | | | | 503,470 | | | | 18,483 | |
| |
Federal National Mortgage Association REMICS Series 2009-47, Class SV (I/O) (I/F) | | | | | |
| | | |
1.31% (-30 day USD SOFR Average + 6.636%) (2) | | | 07/25/39 | | | | 312,208 | | | | 10,147 | |
| |
Federal National Mortgage Association REMICS Series 2009-51, Class SA (I/O) (I/F) | | | | | |
| | | |
1.31% (-30 day USD SOFR Average + 6.636%) (2) | | | 07/25/39 | | | | 1,702,184 | | | | 81,389 | |
| |
Federal National Mortgage Association REMICS Series 2009-6, Class SD (I/O) (I/F) | | | | | |
| | | |
0.11% (-30 day USD SOFR Average + 5.436%) (2) | | | 02/25/39 | | | | 358,769 | | | | 8,659 | |
| | | | | | | | | | | | |
| Issues | | Maturity
Date | | | Principal
Amount | | | Value | |
| |
RESIDENTIAL MORTGAGE-BACKED SECURITIES —
AGENCY (Continued) | | | | |
| |
Federal National Mortgage Association REMICS Series 2009-68, Class KB | | | | | |
| | | |
4.00% | | | 09/25/24 | | | $ | 175,076 | | | $ | 173,572 | |
| |
Federal National Mortgage Association REMICS Series 2009-71, Class LB | | | | | |
| | | |
4.00% | | | 09/25/29 | | | | 3,455,195 | | | | 3,336,409 | |
| |
Federal National Mortgage Association REMICS Series 2009-72, Class AC | | | | | |
| | | |
4.00% | | | 09/25/29 | | | | 4,505,676 | | | | 4,332,279 | |
| |
Federal National Mortgage Association REMICS Series 2009-72, Class JS (I/O) (I/F) | | | | | |
| | | |
1.81% (-30 day USD SOFR Average + 7.136%) (2) | | | 09/25/39 | | | | 264,203 | | | | 22,552 | |
| |
Federal National Mortgage Association REMICS Series 2011-111, Class DB | | | | | |
| | | |
4.00% | | | 11/25/41 | | | | 6,924,187 | | | | 6,254,388 | |
| |
Federal National Mortgage Association REMICS Series 2011-131, Class ST (I/O) | | | | | |
| | | |
1.10% (30 day USD SOFR Average + 6.426%) (2) | | | 12/25/41 | | | | 13,629,579 | | | | 1,225,288 | |
| |
Federal National Mortgage Association REMICS Series 2012-128, Class UY (PAC) | | | | | |
| | | |
2.50% | | | 11/25/42 | | | | 11,738,000 | | | | 9,313,221 | |
| |
Federal National Mortgage Association REMICS Series 2012-133, Class GC (PAC) | | | | | |
| | | |
2.50% | | | 08/25/41 | | | | 3,647,060 | | | | 3,442,762 | |
| |
Federal National Mortgage Association REMICS Series 2012-153, Class PC (PAC) | | | | | |
| | | |
2.00% | | | 05/25/42 | | | | 1,078,258 | | | | 995,137 | |
| |
Federal National Mortgage Association REMICS Series 2013-101, Class BO (P/O) | | | | | |
| | | |
0.00% (7) | | | 10/25/43 | | | | 2,997,439 | | | | 2,115,461 | |
| |
Federal National Mortgage Association REMICS Series 2013-101, Class CO (P/O) | | | | | |
| | | |
0.00% (7) | | | 10/25/43 | | | | 6,492,641 | | | | 4,565,235 | |
| |
Federal National Mortgage Association REMICS Series 2013-95, Class PN (PAC) | | | | | |
| | | |
3.00% | | | 01/25/43 | | | | 16,422,090 | | | | 14,365,362 | |
| |
Federal National Mortgage Association REMICS Series 2016-106, Class EF | | | | | |
| | | |
5.94% (30 day USD SOFR Average + 0.614%) (2) | | | 01/25/47 | | | | 10,501,890 | | | | 10,214,571 | |
| |
Federal National Mortgage Association REMICS Series 2016-63, Class AF | | | | | |
| | | |
5.94% (30 day USD SOFR Average + 0.614%) (2) | | | 09/25/46 | | | | 6,547,679 | | | | 6,285,439 | |
See accompanying Notes to Financial Statements.
88
TCW Total Return Bond Fund
October 31, 2023
| | | | | | | | | | | | |
| Issues | | Maturity
Date | | | Principal
Amount | | | Value | |
| |
RESIDENTIAL MORTGAGE-BACKED SECURITIES —
AGENCY (Continued) | | | | |
| |
Federal National Mortgage Association REMICS Series 2018-25, Class FA | | | | | |
| | | |
5.74% (30 day USD SOFR Average + 0.414%) (2) | | | 04/25/48 | | | $ | 12,735,605 | | | $ | 11,999,689 | |
| |
Federal National Mortgage Association REMICS Series 2018-52, Class PZ (PAC) | | | | | |
| | | |
4.00% | | | 07/25/48 | | | | 1,546,066 | | | | 1,372,666 | |
| |
Federal National Mortgage Association REMICS Series 2018-55, Class PA (PAC) | | | | | |
| | | |
3.50% | | | 01/25/47 | | | | 1,749,311 | | | | 1,667,844 | |
| |
Federal National Mortgage Association REMICS Series 2019-57, Class LT | | | | | |
| | | |
2.50% | | | 10/25/49 | | | | 7,224,983 | | | | 5,775,178 | |
| |
Federal National Mortgage Association REMICS Series 2020-10, Class FA | | | | | |
| | | |
5.94% (30 day USD SOFR Average + 0.614%) (2) | | | 03/25/50 | | | | 5,820,697 | | | | 5,565,412 | |
| |
Federal National Mortgage Association REMICS Series 2020-12, Class FL | | | | | |
| | | |
5.89% (30 day USD SOFR Average + 0.564%) (2) | | | 03/25/50 | | | | 15,020,269 | | | | 14,243,356 | |
| |
Government National Mortgage Association, Pool #80963 | | | | | |
| | | |
2.63% (1 yr. CMT + 1.500%) (2) | | | 07/20/34 | | | | 56,147 | | | | 54,442 | |
| |
Government National Mortgage Association, Pool #MA2374 | | | | | |
| | | |
5.00% | | | 11/20/44 | | | | 188,980 | | | | 180,851 | |
| |
Government National Mortgage Association, Pool #MA2828 | | | | | |
| | | |
4.50% | | | 05/20/45 | | | | 135,479 | | | | 126,082 | |
| |
Government National Mortgage Association, Pool #MA3456 | | | | | |
| | | |
4.50% | | | 02/20/46 | | | | 712,650 | | | | 663,235 | |
| |
Government National Mortgage Association, Pool #MA3521 | | | | | |
| | | |
3.50% | | | 03/20/46 | | | | 17,602,932 | | | | 15,284,934 | |
| |
Government National Mortgage Association, Pool #MA3662 | | | | | |
| | | |
3.00% | | | 05/20/46 | | | | 5,186,394 | | | | 4,362,880 | |
| |
Government National Mortgage Association, Pool #MA3663 | | | | | |
| | | |
3.50% | | | 05/20/46 | | | | 8,431,200 | | | | 7,310,420 | |
| |
Government National Mortgage Association, Pool #MA3665 | | | | | |
| | | |
4.50% | | | 05/20/46 | | | | 1,134,530 | | | | 1,051,404 | |
| |
Government National Mortgage Association, Pool #MA3735 | | | | | |
| | | |
3.00% | | | 06/20/46 | | | | 65,904 | | | | 55,325 | |
| | | | | | | | | | | | |
| Issues | | Maturity
Date | | | Principal
Amount | | | Value | |
| |
RESIDENTIAL MORTGAGE-BACKED SECURITIES —
AGENCY (Continued) | | | | |
| |
Government National Mortgage Association, Pool #MA3739 | | | | | |
| | | |
5.00% | | | 06/20/46 | | | $ | 2,341,275 | | | $ | 2,259,148 | |
| |
Government National Mortgage Association, Pool #MA3876 | | | | | |
| | | |
4.50% | | | 08/20/46 | | | | 72,460 | | | | 67,151 | |
| |
Government National Mortgage Association, Pool #MA3877 | | | | | |
| | | |
5.00% | | | 08/20/46 | | | | 973,971 | | | | 932,455 | |
| |
Government National Mortgage Association, Pool #MA4006 | | | | | |
| | | |
4.50% | | | 10/20/46 | | | | 34,256 | | | | 31,746 | |
| |
Government National Mortgage Association, Pool #MA4007 | | | | | |
| | | |
5.00% | | | 10/20/46 | | | | 1,971,540 | | | | 1,902,387 | |
| |
Government National Mortgage Association, Pool #MA4071 | | | | | |
| | | |
4.50% | | | 11/20/46 | | | | 145,327 | | | | 135,061 | |
| |
Government National Mortgage Association, Pool #MA4129 | | | | | |
| | | |
4.50% | | | 12/20/46 | | | | 52,430 | | | | 48,539 | |
| |
Government National Mortgage Association, Pool #MA4199 | | | | | |
| | | |
5.00% | | | 01/20/47 | | | | 2,117,629 | | | | 2,043,392 | |
| |
Government National Mortgage Association, Pool #MA4264 | | | | | |
| | | |
4.50% | | | 02/20/47 | | | | 5,204,837 | | | | 4,805,863 | |
| |
Government National Mortgage Association, Pool #MA4265 | | | | | |
| | | |
5.00% | | | 02/20/47 | | | | 1,767,209 | | | | 1,696,466 | |
| |
Government National Mortgage Association, Pool #MA4324 | | | | | |
| | | |
5.00% | | | 03/20/47 | | | | 1,954,919 | | | | 1,887,526 | |
| |
Government National Mortgage Association, Pool #MA4385 | | | | | |
| | | |
5.00% | | | 04/20/47 | | | | 395,472 | | | | 378,358 | |
| |
Government National Mortgage Association, Pool #MA4454 | | | | | |
| | | |
5.00% | | | 05/20/47 | | | | 307,097 | | | | 293,040 | |
| |
Government National Mortgage Association, Pool #MA4513 | | | | | |
| | | |
5.00% | | | 06/20/47 | | | | 1,109,569 | | | | 1,051,394 | |
| |
Government National Mortgage Association, Pool #MA4781 | | | | | |
| | | |
5.00% | | | 10/20/47 | | | | 1,240,810 | | | | 1,183,237 | |
| |
Government National Mortgage Association, Pool #MA4836 | | | | | |
| | | |
3.00% | | | 11/20/47 | | | | 6,847,285 | | | | 5,719,394 | |
| |
Government National Mortgage Association, Pool #MA4838 | | | | | |
| | | |
4.00% | | | 11/20/47 | | | | 6,503,771 | | | | 5,799,069 | |
See accompanying Notes to Financial Statements.
89
TCW Total Return Bond Fund
Schedule of Investments (Continued)
| | | | | | | | | | | | |
| Issues | | Maturity
Date | | | Principal
Amount | | | Value | |
| |
RESIDENTIAL MORTGAGE-BACKED SECURITIES —
AGENCY (Continued) | | | | |
| |
Government National Mortgage Association, Pool #MA4900 | | | | | |
| | | |
3.50% | | | 12/20/47 | | | $ | 4,849,563 | | | $ | 4,192,775 | |
| |
Government National Mortgage Association, Pool #MA4901 | | | | | |
| | | |
4.00% | | | 12/20/47 | | | | 447,856 | | | | 399,330 | |
| |
Government National Mortgage Association, Pool #MA5467 | | | | | |
| | | |
4.50% | | | 09/20/48 | | | | 410,156 | | | | 374,592 | |
| |
Government National Mortgage Association, Pool #MA6080 | | | | | |
| | | |
3.00% | | | 08/20/49 | | | | 189,062 | | | | 151,716 | |
| |
Government National Mortgage Association, Pool #MA6209 | | | | | |
| | | |
3.00% | | | 10/20/49 | | | | 2,743,307 | | | | 2,201,412 | |
| |
Government National Mortgage Association, Pool #MA7418 | | | | | |
| | | |
2.50% | | | 06/20/51 | | | | 33,669,785 | | | | 26,879,968 | |
| |
Government National Mortgage Association, Pool #MA7589 | | | | | |
| | | |
2.50% | | | 09/20/51 | | | | 32,313,121 | | | | 25,789,926 | |
| |
Government National Mortgage Association REMICS Series 2011-70, Class BO (P/O) | | | | | |
| | | |
0.00% (7) | | | 05/20/41 | | | | 3,458,239 | | | | 2,459,491 | |
| |
Government National Mortgage Association REMICS Series 2014-57, Class PS | | | | | |
| | | |
0.75% (1 mo. USD Term SOFR + 6.086%) (2) | | | 04/20/44 | | | | 13,071,069 | | | | 1,026,631 | |
| |
Government National Mortgage Association REMICS Series 2015-42, Class ZB | | | | | |
| | | |
3.00% | | | 03/20/45 | | | | 20,633,524 | | | | 17,108,786 | |
| |
Government National Mortgage Association REMICS Series 2015-43, Class DM | | | | | |
| | | |
2.50% | | | 03/20/45 | | | | 17,317,429 | | | | 14,230,490 | |
| |
Government National Mortgage Association REMICS Series 2015-44, Class Z | | | | | |
| | | |
3.00% | | | 03/20/45 | | | | 13,962,888 | | | | 11,041,775 | |
| |
Government National Mortgage Association REMICS Series 2019-90, Class SJ (I/O) | | | | | |
| | | |
0.65% (1 mo. USD Term SOFR + 5.986%) (2) | | | 07/20/49 | | | | 10,057,604 | | | | 746,598 | |
| |
Government National Mortgage Association REMICS Series 2023-113, Class FD | | | | | |
| | | |
6.50% (30 day USD SOFR Average + 1.35) (2) | | | 08/20/53 | | | | 13,909,422 | | | | 13,688,284 | |
| |
Government National Mortgage Association, TBA | | | | | |
| | | |
2.50% (8) | | | 12/01/51 | | | | 46,050,000 | | | | 36,603,611 | |
| | | |
5.00% (8) | | | 05/01/53 | | | | 7,425,000 | | | | 6,908,910 | |
| | | |
5.50% (8) | | | 06/01/53 | | | | 20,625,000 | | | | 19,727,205 | |
| | | | | | | | | | | | |
| Issues | | Maturity
Date | | | Principal
Amount | | | Value | |
| |
RESIDENTIAL MORTGAGE-BACKED SECURITIES —
AGENCY (Continued) | | | | |
| | | |
4.50% (8) | | | 04/01/53 | | | $ | 20,475,000 | | | $ | 18,495,170 | |
| |
Uniform Mortgage-Backed Security, TBA | | | | | |
| | | |
3.00% (8) | | | 02/01/52 | | | | 76,725,000 | | | | 61,335,047 | |
| | | |
3.50% (8) | | | 04/01/52 | | | | 27,950,000 | | | | 23,276,454 | |
| | | |
2.00% (8) | | | 12/01/53 | | | | 107,600,000 | | | | 79,050,534 | |
| | | |
2.50% (8) | | | 01/01/52 | | | | 60,250,000 | | | | 46,187,746 | |
| | | |
5.00% (8) | | | 04/01/53 | | | | 163,500,000 | | | | 150,760,433 | |
| | | |
5.50% (8) | | | 04/01/53 | | | | 142,875,000 | | | | 135,573,327 | |
| | | |
4.00% (8) | | | 05/01/52 | | | | 119,675,000 | | | | 103,411,206 | |
| | | |
4.50% (8) | | | 04/01/53 | | | | 74,725,000 | | | | 66,745,346 | |
| | | | | | | | | | | | |
| |
Total Residential Mortgage-Backed Securities — Agency
| | | | | |
| |
(Cost: $2,003,177,780) | | | | 1,787,412,054 | |
| | | | | | | | | | | | |
|
RESIDENTIAL MORTGAGE-BACKED SECURITIES —
NON-AGENCY — 36.7% | |
| |
ABFC Trust Series 2007-WMC1, Class A2A | | | | | |
| | | |
6.19% (1 mo. USD Term SOFR + 0.864%) (2) | | | 06/25/37 | | | | 9,240,287 | | | | 6,840,065 | |
| |
ACE Securities Corp. Home Equity Loan Trust Series 2007-ASP1, Class A2C | | | | | |
| | | |
5.96% (1 mo. USD Term SOFR + 0.634%) (2) | | | 03/25/37 | | | | 10,742,353 | | | | 4,330,296 | |
| |
ACE Securities Corp. Home Equity Loan Trust Series 2007-ASP1, Class A2D | | | | | |
| | | |
6.20% (1 mo. USD Term SOFR + 0.874%) (2) | | | 03/25/37 | | | | 5,773,901 | | | | 2,327,177 | |
| |
ACE Securities Corp. Home Equity Loan Trust Series 2007-HE1, Class A1 | | | | | |
| | | |
5.74% (1 mo. USD Term SOFR + 0.414%) (2) | | | 01/25/37 | | | | 26,551,944 | | | | 12,919,232 | |
| |
Argent Securities Trust Series 2006-M1, Class A2C | | | | | |
| | | |
5.74% (1 mo. USD Term SOFR + 0.414%) (2) | | | 07/25/36 | | | | 45,312,359 | | | | 11,265,980 | |
| |
Argent Securities Trust Series 2006-W4, Class A2C | | | | | |
| | | |
5.76% (1 mo. USD Term SOFR + 0.434%) (2) | | | 05/25/36 | | | | 16,756,473 | | | | 4,028,536 | |
| |
Argent Securities, Inc. Asset-Backed Pass-Through Certificates Series 2005-W3, Class M2 | | | | | |
| | | |
6.13% (1 mo. USD Term SOFR + 0.804%) (2) | | | 11/25/35 | | | | 29,183,398 | | | | 23,974,030 | |
| |
Banc of America Funding Trust Series 2004-B, Class 3A1 | | | | | |
| | | |
3.62% (4),(9) | | | 12/20/34 | | | | 141,644 | | | | 112,848 | |
See accompanying Notes to Financial Statements.
90
TCW Total Return Bond Fund
October 31, 2023
| | | | | | | | | | | | |
| Issues | | Maturity
Date | | | Principal
Amount | | | Value | |
|
RESIDENTIAL MORTGAGE-BACKED SECURITIES —
NON-AGENCY (Continued) | |
| |
Banc of America Funding Trust Series 2006-3, Class 4A14 | | | | | |
| | | |
6.00% (9) | | | 03/25/36 | | | $ | 243,604 | | | $ | 184,380 | |
| |
Banc of America Funding Trust Series 2006-3, Class 5A3 | | | | | |
| | | |
5.50% (9) | | | 03/25/36 | | | | 1,058,927 | | | | 882,556 | |
| |
Banc of America Funding Trust Series 2006-D, Class 2A1 | | | | | |
| | | |
3.50% (4),(9) | | | 05/20/36 | | | | 45,344 | | | | 38,969 | |
| |
Banc of America Funding Trust Series 2006-D, Class 3A1 | | | | | |
| | | |
4.39% (4),(9) | | | 05/20/36 | | | | 1,323,928 | | | | 1,169,345 | |
| |
Bear Stearns ALT-A Trust Series 2005-2, Class 2A4 | | | | | |
| | | |
3.75% (4) | | | 04/25/35 | | | | 1,075 | | | | 940 | |
| |
Bear Stearns ALT-A Trust Series 2005-4, Class 23A1 | | | | | |
| | | |
4.48% (4) | | | 05/25/35 | | | | 2,023,052 | | | | 1,893,125 | |
| |
Bear Stearns ALT-A Trust Series 2006-4, Class 32A1 | | | | | |
| | | |
4.21% (4),(9) | | | 07/25/36 | | | | 302,405 | | | | 145,708 | |
| |
Bear Stearns ARM Trust Series 2004-12, Class 1A1 | | | | | |
| | | |
4.48% (4) | | | 02/25/35 | | | | 206,319 | | | | 187,203 | |
| |
Bear Stearns ARM Trust Series 2005-10, Class A3 | | | | | |
| | | |
5.44% (4) | | | 10/25/35 | | | | 1,283,636 | | | | 1,195,158 | |
| |
Bear Stearns ARM Trust Series 2006-2, Class 2A1 | | | | | |
| | | |
3.89% (4),(9) | | | 07/25/36 | | | | 662,115 | | | | 543,283 | |
| |
Bear Stearns ARM Trust Series 2007-1, Class 1A1 | | | | | |
| | | |
3.82% (4) | | | 02/25/47 | | | | 6,633,204 | | | | 5,769,884 | |
| |
Bear Stearns ARM Trust Series 2007-1, Class 2A1 | | | | | |
| | | |
4.31% (4),(9) | | | 02/25/47 | | | | 103,860 | | | | 87,613 | |
| |
Bear Stearns Asset-Backed Securities I Trust Series 2005-AC6, Class 1A3 | | | | | |
| | | |
5.50% (4) | | | 09/25/35 | | | | 688,717 | | | | 626,469 | |
| |
Bear Stearns Asset-Backed Securities I Trust Series 2005-AC6, Class 1A4 | | | | | |
| | | |
5.40% (4) | | | 09/25/35 | | | | 1,472,594 | | | | 1,338,005 | |
| |
Bear Stearns Mortgage Funding Trust Series 2006-AR1, Class 2A1 | | | | | |
| | | |
5.88% (1 mo. USD Term SOFR + 0.554%) (2) | | | 08/25/36 | | | | 8,622,167 | | | | 7,496,042 | |
| |
Bear Stearns Mortgage Funding Trust Series 2006-AR3, Class 1A1 | | | | | |
| | | |
5.62% (1 mo. USD Term SOFR + 0.294%) (2) | | | 10/25/36 | | | | 258,607 | | | | 215,354 | |
| |
C-BASS Mortgage Loan Trust Series 2007-CB2, Class A2B | | | | | |
| | | |
3.54% (9) | | | 02/25/37 | | | | 2,281,820 | | | | 1,356,936 | |
| |
C-BASS Mortgage Loan Trust Series 2007-CB2, Class A2C | | | | | |
| | | |
3.54% (9) | | | 02/25/37 | | | | 7,849,020 | | | | 4,544,987 | |
| | | | | | | | | | | | |
| Issues | | Maturity
Date | | | Principal
Amount | | | Value | |
|
RESIDENTIAL MORTGAGE-BACKED SECURITIES —
NON-AGENCY (Continued) | |
| |
C-BASS Trust Series 2006-CB7, Class A4 | | | | | |
| | | |
5.76% (1 mo. USD Term SOFR + 0.434%) (2) | | | 10/25/36 | | | $ | 16,568,625 | | | $ | 10,269,174 | |
| |
C-BASS Trust Series 2006-CB9, Class A4 | | | | | |
| | | |
5.90% (1 mo. USD Term SOFR + 0.574%) (2) | | | 11/25/36 | | | | 11,523,297 | | | | 4,982,491 | |
| |
Chase Mortgage Finance Trust Series 2006-A1, Class 2A1 | | | | | |
| | | |
5.21% (4),(9) | | | 09/25/36 | | | | 321,724 | | | | 277,379 | |
| |
Chase Mortgage Finance Trust Series 2007-A1, Class 8A1 | | | | | |
| | | |
5.62% (4) | | | 02/25/37 | | | | 1,087,514 | | | | 1,030,736 | |
| |
ChaseFlex Trust Series 2005-1, Class 1A5 | | | | | |
| | | |
6.50% | | | 02/25/35 | | | | 2,099,078 | | | | 1,608,713 | |
| |
CHL Mortgage Pass-Through Trust Series 2004-13, Class 1A3 | | | | | |
| | | |
5.50% | | | 08/25/34 | | | | 2,462,280 | | | | 2,227,989 | |
| |
CHL Mortgage Pass-Through Trust Series 2005-9, Class 1A1 | | | | | |
| | | |
6.04% (1 mo. USD Term SOFR + 0.714%) (2) | | | 05/25/35 | | | | 5,562,092 | | | | 4,485,654 | |
| |
CHL Mortgage Pass-Through Trust Series 2005-HYB5, Class 4A1 | | | | | |
| | | |
5.38% (4),(9) | | | 09/20/35 | | | | 9,293 | | | | 7,843 | |
| |
CHL Mortgage Pass-Through Trust Series 2007-HY5, Class 1A1 | | | | | |
| | | |
4.71% (4),(9) | | | 09/25/47 | | | | 3,342 | | | | 2,491 | |
| |
CHL Mortgage Pass-Through Trust Series 2007-HYB1, Class 1A1 | | | | | |
| | | |
3.66% (4),(9) | | | 03/25/37 | | | | 29,760 | | | | 23,210 | |
| | | |
CIM Trust Series 2019-R3, Class A | | | | | | | | | | | | |
| | | |
2.63% (1),(4) | | | 06/25/58 | | | | 10,069,644 | | | | 8,836,649 | |
| | | |
CIM Trust Series 2020-R1, Class A1 | | | | | | | | | | | | |
| | | |
2.85% (1),(4) | | | 10/27/59 | | | | 18,785,022 | | | | 15,280,882 | |
| | | |
CIM Trust Series 2020-R3, Class A1A | | | | | | | | | | | | |
| | | |
4.00% (1),(4) | | | 01/26/60 | | | | 13,039,758 | | | | 11,917,175 | |
| | | |
CIM Trust Series 2020-R6, Class A1A | | | | | | | | | | | | |
| | | |
2.25% (1),(4) | | | 12/25/60 | | | | 11,011,872 | | | | 9,229,809 | |
| | | |
CIM Trust Series 2020-R7, Class A1A | | | | | | | | | | | | |
| | | |
2.25% (1),(4) | | | 12/27/61 | | | | 17,368,882 | | | | 14,578,868 | |
| | | |
CIM Trust Series 2021-NR2, Class A1 | | | | | | | | | | | | |
| | | |
2.57% (1) | | | 07/25/59 | | | | 11,970,531 | | | | 11,563,314 | |
| | | |
CIM Trust Series 2021-NR3, Class A1 | | | | | | | | | | | | |
| | | |
2.57% (1) | | | 06/25/57 | | | | 5,990,458 | | | | 5,685,314 | |
See accompanying Notes to Financial Statements.
91
TCW Total Return Bond Fund
Schedule of Investments (Continued)
| | | | | | | | | | | | |
| Issues | | Maturity
Date | | | Principal
Amount | | | Value | |
|
RESIDENTIAL MORTGAGE-BACKED SECURITIES —
NON-AGENCY (Continued) | |
| | | |
CIM Trust Series 2021-R3, Class A1A | | | | | | | | | | | | |
| | | |
1.95% (1),(4) | | | 06/25/57 | | | $ | 18,670,884 | | | $ | 15,952,385 | |
| | | |
CIM Trust Series 2023-NR1, Class A1 | | | | | | | | | | | | |
| | | |
6.00% (1) | | | 06/25/62 | | | | 13,585,766 | | | | 13,031,208 | |
| |
CIM Trust Series 2023-NR2, Class A1 | | | | | |
| | | |
6.00% (1),(4) | | | 06/25/62 | | | | 8,553,685 | | | | 8,057,442 | |
| |
CIM Trust Series 2023-R1, Class A1A | | | | | |
| | | |
5.40% (1),(4) | | | 04/25/62 | | | | 13,237,784 | | | | 12,241,734 | |
| |
CIM Trust Series 2023-R1, Class A1B | | | | | |
| | | |
5.40% (1),(4) | | | 04/25/62 | | | | 13,400,000 | | | | 10,261,191 | |
| |
Citigroup Mortgage Loan Trust, Inc. Series 2006-AR5, Class 1A1A | | | | | |
| | | |
4.69% (4),(9) | | | 07/25/36 | | | | 1,571,028 | | | | 1,145,455 | |
| |
Citigroup Mortgage Loan Trust, Inc. Series 2007-12, Class 2A1 | | | | | |
| | | |
6.50% (1),(4),(9) | | | 10/25/36 | | | | 2,195,653 | | | | 1,130,923 | |
| |
CitiMortgage Alternative Loan Trust Series 2007-A5, Class 1A6 | | | | | |
| | | |
6.00% (9) | | | 05/25/37 | | | | 7,776,639 | | | | 6,541,925 | |
| |
Conseco Finance Corp. Series 1999-2, Class A7 | | | | | |
| | | |
6.44% | | | 12/01/30 | | | | 854,057 | | | | 852,039 | |
| |
Conseco Finance Securitizations Corp. Series 2000-4, Class A5 | | | | | |
| | | |
7.97% | | | 05/01/32 | | | | 45,277,023 | | | | 8,246,693 | |
| |
Countrywide Alternative Loan Trust Series 2005-84, Class 1A1 | | | | | |
| | | |
4.09% (4),(9) | | | 02/25/36 | | | | 85,011 | | | | 74,586 | |
| |
Countrywide Alternative Loan Trust Series 2005-J1, Class 2A1 | | | | | |
| | | |
5.50% | | | 02/25/25 | | | | 2,079 | | | | 2,067 | |
| |
Countrywide Alternative Loan Trust Series 2007-19, Class 1A34 | | | | | |
| | | |
6.00% | | | 08/25/37 | | | | 11,263,005 | | | | 5,463,571 | |
| |
Credit Suisse First Boston Mortgage Securities Corp. Series 2005-11, Class 1A1 | | | | | |
| | | |
6.50% (9) | | | 12/25/35 | | | | 1,456,554 | | | | 720,438 | |
| |
Credit Suisse First Boston Mortgage Securities Corp. Series 2005-12, Class 1A1 | | | | | |
| | | |
6.50% | | | 01/25/36 | | | | 6,002,942 | | | | 1,381,452 | |
| |
CSMC Mortgage-Backed Trust Series 2006-8, Class 3A1 | | | | | |
| | | |
6.00% | | | 10/25/21 | | | | 756,435 | | | | 301,236 | |
| |
CSMC Mortgage-Backed Trust Series 2006-9, Class 5A1 | | | | | |
| | | |
5.50% (9) | | | 11/25/36 | | | | 64,860 | | | | 1 | |
| |
CSMC Trust Series 2021-RP11, Class PT | | | | | |
| | | |
3.77% (1),(4),(9) | | | 10/25/61 | | | | 13,020,565 | | | | 9,208,394 | |
| | | | | | | | | | | | |
| Issues | | Maturity
Date | | | Principal
Amount | | | Value | |
|
RESIDENTIAL MORTGAGE-BACKED SECURITIES —
NON-AGENCY (Continued) | |
| |
CSMC Trust Series 2022-RPL1, Class PT | | | | | |
| | | |
4.59% (1),(4),(9) | | | 04/25/61 | | | $ | 12,649,016 | | | $ | 9,789,259 | |
| |
CSMCM Trust Series 2021-RP11, Class CERT | | | | | |
| | | |
3.78% (1) | | | 10/27/61 | | | | 551,000 | | | | 393,263 | |
| |
CSMCM Trust Series 2022-RPL1, Class CERT | | | | | |
| | | |
4.23% (1) | | | 04/25/61 | | | | 534,223 | | | | 408,128 | |
| |
Deutsche Alt-A Securities, Inc. Mortgage Loan Trust Series 2005-1, Class 1A3 | | | | | |
| | | |
5.94% (1 mo. USD Term SOFR + 0.614%) (2) | | | 02/25/35 | | | | 3,129,322 | | | | 2,972,107 | |
| |
Deutsche Alt-A Securities, Inc. Mortgage Loan Trust Series 2006-AR6, Class A6 | | | | | |
| | | |
5.82% (1 mo. USD Term SOFR + 0.494%) (2) | | | 02/25/37 | | | | 154,631 | | | | 128,882 | |
| |
DSLA Mortgage Loan Trust Series 2005-AR6, Class 2A1A | | | | | |
| | | |
6.03% (1 mo. USD Term SOFR + 0.694%) (2) | | | 10/19/45 | | | | 1,638,100 | | | | 1,385,430 | |
| |
DSLA Mortgage Loan Trust Series 2006-AR2, Class 2A1A | | | | | |
| | | |
5.65% (1 mo. USD Term SOFR + 0.314%) (2) | | | 10/19/36 | | | | 18,848,034 | | | | 12,520,926 | |
| |
DSLA Mortgage Loan Trust Series 2007-AR1, Class 2A1A | | | | | |
| | | |
5.59% (1 mo. USD Term SOFR + 0.254%) (2) | | | 03/19/37 | | | | 4,005,358 | | | | 3,239,655 | |
| |
Federal Home Loan Mortgage Corp. STACR REMIC Trust Series 2021-DNA7, Class B1 | | | | | |
| | | |
8.97% (30 day USD SOFR Average + 3.650%) (1),(2) | | | 11/25/41 | | | | 14,650,000 | | | | 14,802,707 | |
| |
Federal Home Loan Mortgage Corp. STACR REMIC Trust Series 2022-DNA1, Class M2 | | | | | |
| | | |
7.82% (30 day USD SOFR Average + 2.500%) (1),(2) | | | 01/25/42 | | | | 13,850,000 | | | | 13,611,244 | |
| |
Federal National Mortgage Association Connecticut Avenue Securities Series 2019-R01, Class 2B1 | | | | | |
| | | |
9.79% (30 day USD SOFR Average + 4.464%) (1),(2) | | | 07/25/31 | | | | 4,000,000 | | | | 4,263,262 | |
| |
Federal National Mortgage Association Connecticut Avenue Securities Series 2019-R02, Class 1B1 | | | | | |
| | | |
9.59% (30 day USD SOFR Average + 4.264%) (1),(2) | | | 08/25/31 | | | | 1,919,016 | | | | 2,015,997 | |
| |
Federal National Mortgage Association Connecticut Avenue Securities Series 2019-R06, Class 2B1 | | | | | |
| | | |
9.19% (30 day USD SOFR Average + 3.864%) (1),(2) | | | 09/25/39 | | | | 8,466,969 | | | | 8,627,439 | |
See accompanying Notes to Financial Statements.
92
TCW Total Return Bond Fund
October 31, 2023
| | | | | | | | | | | | |
| Issues | | Maturity
Date | | | Principal
Amount | | | Value | |
|
RESIDENTIAL MORTGAGE-BACKED SECURITIES —
NON-AGENCY (Continued) | |
| |
Federal National Mortgage Association Connecticut Avenue Securities Series 2021-R03, Class 1M2 | | | | | |
| | | |
6.97% (30 day USD SOFR Average + 1.650%) (1),(2) | | | 12/25/41 | | | $ | 14,450,000 | | | $ | 14,227,678 | |
| |
Federal National Mortgage Association Connecticut Avenue Securities Series 2022-R01, Class 1B1 | | | | | |
| | | |
8.47% (30 day USD SOFR Average + 3.150%) (1),(2) | | | 12/25/41 | | | | 4,305,000 | | | | 4,307,866 | |
| |
Fieldstone Mortgage Investment Trust Series 2007-1, Class 2A2 | | | | | |
| | | |
5.97% (1 mo. USD Term SOFR + 0.384%) (2) | | | 04/25/47 | | | | 2,481,345 | | | | 1,728,499 | |
| |
First Franklin Mortgage Loan Trust Series 2006-FF12, Class A1 | | | | | |
| | | |
5.54% (1 mo. USD Term SOFR + 0.219%) (2) | | | 09/25/36 | | | | 4,914,582 | | | | 4,623,739 | |
| |
First Franklin Mortgage Loan Trust Series 2006-FF18, Class A2C | | | | | |
| | | |
5.76% (1 mo. USD Term SOFR + 0.434%) (2) | | | 12/25/37 | | | | 9,287,978 | | | | 7,852,417 | |
| |
First Franklin Mortgage Loan Trust Series 2006-FF9, Class 2A4 | | | | | |
| | | |
5.94% (1 mo. USD Term SOFR + 0.614%) (2) | | | 06/25/36 | | | | 9,068,000 | | | | 7,640,170 | |
| |
First Franklin Mortgage Loan Trust Series 2007-FF1, Class A2C | | | | | |
| | | |
5.72% (1 mo. USD Term SOFR + 0.394%) (2) | | | 01/25/38 | | | | 3,139,554 | | | | 1,582,370 | |
| |
First Franklin Mortgage Loan Trust Series 2007-FF1, Class A2D | | | | | |
| | | |
5.88% (1 mo. USD Term SOFR + 0.554%) (2) | | | 01/25/38 | | | | 15,366,846 | | | | 7,745,058 | |
| |
First Franklin Mortgage Loan Trust Series 2007-FF2, Class A1 | | | | | |
| | | |
5.72% (1 mo. USD Term SOFR + 0.394%) (2) | | | 03/25/37 | | | | 32,277,769 | | | | 16,250,790 | |
| |
First Franklin Mortgage Loan Trust Series 2007-FF2, Class A2C | | | | | |
| | | |
5.74% (1 mo. USD Term SOFR + 0.414%) (2) | | | 03/25/37 | | | | 34,969,541 | | | | 16,851,164 | |
| |
First Horizon Alternative Mortgage Securities Trust Series 2005-AA7, Class 1A1 | | | | | |
| | | |
4.71% (4),(9) | | | 09/25/35 | | | | 1,335,670 | | | | 1,177,492 | |
| |
First Horizon Alternative Mortgage Securities Trust Series 2005-AA7, Class 2A1 | | | | | |
| | | |
6.04% (4),(9) | | | 09/25/35 | | | | 731,648 | | | | 624,197 | |
| |
First Horizon Alternative Mortgage Securities Trust Series 2006-AA7, Class A1 | | | | | |
| | | |
5.17% (4),(9) | | | 01/25/37 | | | | 4,081,484 | | | | 2,991,277 | |
| | | | | | | | | | | | |
| Issues | | Maturity
Date | | | Principal
Amount | | | Value | |
|
RESIDENTIAL MORTGAGE-BACKED SECURITIES —
NON-AGENCY (Continued) | |
| |
GS Mortgage-Backed Securities Trust Series 2022-PJ6, Class A3 | | | | | |
| | | |
2.50% (1),(4) | | | 01/25/53 | | | $ | 5,660,109 | | | $ | 4,134,533 | |
| |
GSAA Trust Series 2005-7, Class AF5 | | | | | |
| | | |
5.11% | | | 05/25/35 | | | | 51,266 | | | | 48,307 | |
| |
GSR Mortgage Loan Trust Series 2004-9, Class 3A1 | | | | | |
| | | |
4.94% (4) | | | 08/25/34 | | | | 1,095,387 | | | | 994,112 | |
| |
GSR Mortgage Loan Trust Series 2006-OA1, Class 2A2 | | | | | |
| | | |
5.96% (1 mo. USD Term SOFR + 0.634%) (2) | | | 08/25/46 | | | | 42,649,434 | | | | 10,691,066 | |
| |
GSR Mortgage Loan Trust Series 2007-3F, Class 3A7 | | | | | |
| | | |
6.00% (9) | | | 05/25/37 | | | | 4,336,148 | | | | 3,028,685 | |
| |
GSR Mortgage Loan Trust Series 2007-AR2, Class 2A1 | | | | | |
| | | |
4.31% (4),(9) | | | 05/25/37 | | | | 1,479,618 | | | | 854,741 | |
| |
HarborView Mortgage Loan Trust Series 2006-1, Class 1A1A | | | | | |
| | | |
5.97% (1 mo. USD Term SOFR + 0.634%) (2) | | | 03/19/36 | | | | 21,457,777 | | | | 12,954,015 | |
| |
HarborView Mortgage Loan Trust Series 2007-3, Class 1A1A | | | | | |
| | | |
5.85% (1 mo. USD Term SOFR + 0.514%) (2) | | | 05/19/47 | | | | 8,995,205 | | | | 7,423,757 | |
| |
HSI Asset Loan Obligation Trust Series 2007-2, Class 2A12 | | | | | |
| | | |
6.00% | | | 09/25/37 | | | | 534,423 | | | | 396,945 | |
| |
HSI Asset Securitization Corp. Trust Series 2006-HE2, Class 1A | | | | | |
| | | |
5.70% (1 mo. USD Term SOFR + 0.374%) (2) | | | 12/25/36 | | | | 34,726,039 | | | | 13,846,310 | |
| |
HSI Asset Securitization Corp. Trust Series 2006-WMC1, Class A3 | | | | | |
| | | |
5.74% (1 mo. USD Term SOFR + 0.414%) | | | 07/25/36 | | | | 23,560,645 | | | | 9,780,792 | |
| |
Impac CMB Trust Series 2005-1, Class 1A1 | | | | | |
| | | |
5.96% (1 mo. USD Term SOFR + 0.634%) (2) | | | 04/25/35 | | | | 352,475 | | | | 325,074 | |
| |
Impac CMB Trust Series 2005-5, Class A2 | | | | | |
| | | |
5.88% (1 mo. USD Term SOFR + 0.334%) (2) | | | 08/25/35 | | | | 1,945,889 | | | | 1,745,190 | |
| |
Impac Secured Assets Trust Series 2006-3, Class A1 | | | | | |
| | | |
5.78% (1 mo. USD Term SOFR + 0.454%) (2),(9) | | | 11/25/36 | | | | 3,300,024 | | | | 2,919,170 | |
| |
IndyMac INDA Mortgage Loan Trust Series 2007-AR7, Class 1A1 | | | | | |
| | | |
3.43% (4) | | | 11/25/37 | | | | 1,526,701 | | | | 1,234,808 | |
| | | |
IndyMac INDX Mortgage Loan Trust Series 2004-AR4, Class 2A | | | | | | | | | | | | |
| | | |
4.82% (4),(9) | | | 08/25/34 | | | | 2,230,255 | | | | 2,056,381 | |
See accompanying Notes to Financial Statements.
93
TCW Total Return Bond Fund
Schedule of Investments (Continued)
| | | | | | | | | | | | |
| Issues | | Maturity
Date | | | Principal
Amount | | | Value | |
|
RESIDENTIAL MORTGAGE-BACKED SECURITIES —
NON-AGENCY (Continued) | |
| |
IndyMac INDX Mortgage Loan Trust Series 2004-AR9, Class 4A | | | | | |
| | | |
5.07% (4) | | | 11/25/34 | | | $ | 151,785 | | | $ | 134,229 | |
| |
IndyMac INDX Mortgage Loan Trust Series 2005-AR23, Class 2A1 | | | | | |
| | | |
4.34% (4) | | | 11/25/35 | | | | 1,533,500 | | | | 1,211,500 | |
| |
IndyMac INDX Mortgage Loan Trust Series 2005-AR23, Class 6A1 | | | | | |
| | | |
3.81% (4) | | | 11/25/35 | | | | 2,204,491 | | | | 1,840,570 | |
| |
IndyMac INDX Mortgage Loan Trust Series 2005-AR25, Class 2A1 | | | | | |
| | | |
3.56% (4) | | | 12/25/35 | | | | 1,193,201 | | | | 1,029,034 | |
| |
IndyMac INDX Mortgage Loan Trust Series 2005-AR7, Class 2A1 | | | | | |
| | | |
3.10% (4) | | | 06/25/35 | | | | 761,012 | | | | 606,591 | |
| |
IndyMac INDX Mortgage Loan Trust Series 2006-AR39, Class A1 | | | | | |
| | | |
5.80% (1 mo. USD Term SOFR + 0.474%)(2) | | | 02/25/37 | | | | 4,171,913 | | | | 3,399,633 | |
| |
IndyMac INDX Mortgage Loan Trust Series 2006-AR6, Class 2A1A | | | | | |
| | | |
5.84% (1 mo. USD Term SOFR + 0.514%) (2),(9) | | | 06/25/46 | | | | 6,607,422 | | | | 5,786,230 | |
| |
IndyMac INDX Mortgage Loan Trust Series 2007-AR11, Class 1A1 | | | | | |
| | | |
3.11% (4) | | | 06/25/37 | | | | 11,337 | | | | 10,073 | |
| |
IndyMac INDX Mortgage Loan Trust Series 2007-AR5, Class 2A1 | | | | | |
| | | |
3.34% (4) | | | 05/25/37 | | | | 8,263,177 | | | | 6,300,581 | |
| | | |
JPMorgan Alternative Loan Trust Series 2006-A2, Class 5A1 | | | | | | | | | | | | |
| | | |
4.04% (4),(9) | | | 05/25/36 | | | | 3,008,496 | | | | 1,701,165 | |
| |
JPMorgan Alternative Loan Trust Series 2006-A4, Class A8 | | | | | |
| | | |
4.04% (4),(9) | | | 09/25/36 | | | | 207,596 | | | | 224,671 | |
| |
JPMorgan Mortgage Acquisition Trust Series 2006-CH2, Class AF4 | | | | | |
| | | |
5.76% | | | 10/25/36 | | | | 3,648,391 | | | | 2,171,511 | |
| |
JPMorgan Mortgage Acquisition Trust Series 2006-WMC4, Class A3 | | | | | |
| | | |
5.56% (1 mo. USD Term SOFR + 0.234%) (2) | | | 12/25/36 | | | | 24,974,462 | | | | 12,323,716 | |
| |
JPMorgan Mortgage Trust Series 2005-A6, Class 7A1 | | | | | |
| | | |
5.05% (4) | | | 08/25/35 | | | | 96,121 | | | | 79,050 | |
| |
JPMorgan Mortgage Trust Series 2006-A2, Class 5A3 | | | | | |
| | | |
5.74% (4) | | | 11/25/33 | | | | 370,293 | | | | 360,690 | |
| |
JPMorgan Mortgage Trust Series 2006-A4, Class 1A4 | | | | | |
| | | |
4.50% (4),(9) | | | 06/25/36 | | | | 185,295 | | | | 133,182 | |
| | | | | | | | | | | | |
| Issues | | Maturity
Date | | | Principal
Amount | | | Value | |
|
RESIDENTIAL MORTGAGE-BACKED SECURITIES —
NON-AGENCY (Continued) | |
| |
JPMorgan Mortgage Trust Series 2006-A7, Class 2A4R | | | | | |
| | | |
3.98% (4),(9) | | | 01/25/37 | | | $ | 7,258 | | | $ | 5,764 | |
| |
JPMorgan Mortgage Trust Series 2006-S2, Class 2A2 | | | | | |
| | | |
5.88% (5) | | | 06/25/21 | | | | 26,633 | | | | — | |
| |
Lehman Mortgage Trust Series 2006-4, Class 4A1 | | | | | |
| | | |
6.00% | | | 08/25/21 | | | | 518,879 | | | | 343,107 | |
| |
Lehman XS Trust Series 2006-10N, Class 1A3A | | | | | |
| | | |
5.86% (1 mo. USD Term SOFR + 0.534%) (2) | | | 07/25/46 | | | | 6,074,089 | | | | 5,397,706 | |
| |
Lehman XS Trust Series 2006-12N, Class A31A | | | | | |
| | | |
5.84% (1 mo. USD Term SOFR + 0.514%) (2) | | | 08/25/46 | | | | 1,843,758 | | | | 1,778,203 | |
| |
Lehman XS Trust Series 2006-9, Class A1B | | | | | |
| | | |
5.76% (1 mo. USD Term SOFR + 0.434%) (2),(5) | | | 05/25/46 | | | | 806 | | | | — | |
| |
Lehman XS Trust Series 2006-GP1, Class A2A | | | | | |
| | | |
5.78% (1 mo. USD Term SOFR + 0.454%) (2),(5) | | | 05/25/46 | | | | 1,531 | | | | — | |
| |
Lehman XS Trust Series 2006-GP4, Class 3A5 | | | | | |
| | | |
5.89% (1 mo. USD Term SOFR + 0.564%) (2) | | | 08/25/46 | | | | 6,869,418 | | | | 6,349,735 | |
| |
Lehman XS Trust Series 2007-4N, Class 1A1 | | | | | |
| | | |
5.70% (1 mo. USD Term SOFR + 0.374%) (2),(5) | | | 03/25/47 | | | | 316 | | | | — | |
| |
LHOME Mortgage Trust Series 2021-RTL3, Class A1 | | | | | |
| | | |
2.36% (1) | | | 09/25/26 | | | | 21,225,000 | | | | 20,903,942 | |
| |
MASTR Alternative Loan Trust Series 2005-4, Class 1A1 | | | | | |
| | | |
6.50% | | | 05/25/35 | | | | 4,075,232 | | | | 3,244,326 | |
| |
MASTR Alternative Loan Trust Series 2006-2, Class 2A1 | | | | | |
| | | |
5.84% (1 mo. USD Term SOFR + 0.514%) (2),(5),(9) | | | 03/25/36 | | | | 65,446 | | | | 7,135 | |
| |
MASTR Asset Securitization Trust Series 2006-3, Class 2A1 | | | | | |
| | | |
5.89% (1 mo. USD Term SOFR + 0.564%) (2) | | | 10/25/36 | | | | 28,197 | | | | 5,423 | |
| |
MASTR Asset-Backed Securities Trust Series 2006-AB1, Class A4 | | | | | |
| | | |
6.22% | | | 02/25/36 | | | | 189,673 | | | | 146,161 | |
| |
MASTR Asset-Backed Securities Trust Series 2006-HE5, Class A3 | | | | | |
| | | |
5.76% (1 mo. USD Term SOFR + 0.434%) (2) | | | 11/25/36 | | | | 13,936,567 | | | | 7,833,163 | |
| |
MASTR Seasoned Securitization Trust Series 2004-1, Class 4A1 | | | | | |
| | | |
6.22% (4) | | | 10/25/32 | | | | 3,232 | | | | 3,080 | |
See accompanying Notes to Financial Statements.
94
TCW Total Return Bond Fund
October 31, 2023
| | | | | | | | | | | | |
| Issues | | Maturity
Date | | | Principal
Amount | | | Value | |
|
RESIDENTIAL MORTGAGE-BACKED SECURITIES —
NON-AGENCY (Continued) | |
| |
Merrill Lynch Alternative Note Asset Trust Series 2007-A1, Class A2C | | | | | |
| | | |
5.90% (1 mo. USD Term SOFR + 0.574%) (2) | | | 01/25/37 | | | $ | 1,484,930 | | | $ | 429,148 | |
| |
Merrill Lynch Alternative Note Asset Trust Series 2007-A1, Class A3 | | | | | |
| | | |
5.76% (1 mo. USD Term SOFR + 0.434%) (2) | | | 01/25/37 | | | | 763,848 | | | | 233,595 | |
| |
Merrill Lynch First Franklin Mortgage Loan Trust Series 2007-1, Class A2B | | | | | |
| | | |
5.78% (1 mo. USD Term SOFR + 0.454%) (2) | | | 04/25/37 | | | | 33,609,800 | | | | 12,954,044 | |
| |
Merrill Lynch First Franklin Mortgage Loan Trust Series 2007-1, Class A2C | | | | | |
| | | |
5.94% (1 mo. USD Term SOFR + 0.614%) (2) | | | 04/25/37 | | | | 18,755,871 | | | | 7,247,677 | |
| |
Merrill Lynch First Franklin Mortgage Loan Trust Series 2007-1, Class A2D | | | | | |
| | | |
6.12% (1 mo. USD Term SOFR + 0.794%) (2) | | | 04/25/37 | | | | 4,788,817 | | | | 1,853,017 | |
| |
Merrill Lynch First Franklin Mortgage Loan Trust Series 2007-2, Class A2C | | | | | |
| | | |
5.92% (1 mo. USD Term SOFR + 0.594%) (2) | | | 05/25/37 | | | | 4,218,448 | | | | 3,248,705 | |
| |
Merrill Lynch First Franklin Mortgage Loan Trust Series 2007-3, Class A2B | | | | | |
| | | |
5.70% (1 mo. USD Term SOFR + 0.374%) (2) | | | 06/25/37 | | | | 1,748,796 | | | | 1,612,585 | |
| |
Merrill Lynch First Franklin Mortgage Loan Trust Series 2007-4, Class 2A3 | | | | | |
| | | |
5.76% (1 mo. USD Term SOFR + 0.434%) (2) | | | 07/25/37 | | | | 23,694,757 | | | | 19,355,595 | |
| |
Merrill Lynch Mortgage-Backed Securities Trust Series 2007-2, Class 1A1 | | | | | |
| | | |
7.86% (1 yr. CMT + 2.400%) (2),(9) | | | 08/25/36 | | | | 481,527 | | | | 411,925 | |
| |
Mid-State Capital Corp. Trust Series 2005-1, Class A | | | | | |
| | | |
5.75% | | | 01/15/40 | | | | 974,541 | | | | 952,881 | |
| |
Morgan Stanley ABS Capital I, Inc. Trust Series 2004-NC8, Class M2 | | | | | |
| | | |
6.40% (1 mo. USD Term SOFR + 1.074%) (2) | | | 09/25/34 | | | | 378,226 | | | | 372,503 | |
| |
Morgan Stanley Home Equity Loan Trust Series 2006-2, Class A4 | | | | | |
| | | |
6.00% (1 mo. USD Term SOFR + 0.674%) (2) | | | 02/25/36 | | | | 390,728 | | | | 381,677 | |
| |
Morgan Stanley Mortgage Loan Trust Series 2007-3XS, Class 2A6 | | | | | |
| | | |
6.26% | | | 01/25/47 | | | | 2,081,703 | | | | 632,775 | |
| |
Morgan Stanley Mortgage Loan Trust Series 2007-7AX, Class 2A1 | | | | | |
| | | |
5.68% (1 mo. USD Term SOFR + 0.354%) (2) | | | 04/25/37 | | | | 2,640,949 | | | | 710,640 | |
| | | | | | | | | | | | |
| Issues | | Maturity
Date | | | Principal
Amount | | | Value | |
|
RESIDENTIAL MORTGAGE-BACKED SECURITIES —
NON-AGENCY (Continued) | |
| |
MortgageIT Trust Series 2005-4, Class A1 | | | | | |
| | | |
6.00% (1 mo. USD Term SOFR + 0.674%) (2) | | | 10/25/35 | | | $ | 499,450 | | | $ | 491,382 | |
| |
New Century Home Equity Loan Trust Series 2006-1, Class A2B | | | | | |
| | | |
5.80% (1 mo. USD Term SOFR + 0.474%) (2) | | | 05/25/36 | | | | 9,639,993 | | | | 9,375,887 | |
| |
Oakwood Mortgage Investors, Inc. Series 1999-E, Class A1 | | | | | |
| | | |
7.61% (4) | | | 03/15/30 | | | | 5,326,945 | | | | 3,039,637 | |
| |
Ownit Mortgage Loan Trust Series 2006-6, Class A2C | | | | | |
| | | |
5.76% (1 mo. USD Term SOFR + 0.434%) (2) | | | 09/25/37 | | | | 14,564,453 | | | | 6,143,152 | |
| |
Preston Ridge Partners Mortgage LLC Series 2021-10, Class A1 | | | | | |
| | | |
2.49% (1) | | | 10/25/26 | | | | 12,907,406 | | | | 12,084,510 | |
| |
Preston Ridge Partners Mortgage LLC Series 2021-9, Class A1 | | | | | |
| | | |
2.36% (1) | | | 10/25/26 | | | | 6,970,826 | | | | 6,506,270 | |
| |
Preston Ridge Partners Mortgage LLC Series 2022-1, Class A1 | | | | | |
| | | |
3.72% (1) | | | 02/25/27 | | | | 12,267,482 | | | | 11,706,292 | |
| |
Preston Ridge Partners Mortgage LLC Series 2022-2, Class A1 | | | | | |
| | | |
5.00% (1) | | | 03/25/27 | | | | 11,792,559 | | | | 11,442,840 | |
| |
PRET LLC Series 2022-RN1, Class A1 | | | | | |
| | | |
3.72% (1) | | | 07/25/51 | | | | 16,020,104 | | | | 15,533,380 | |
| |
Pretium Mortgage Credit Partners LLC Series 2022-RN3, Class A2 | | | | | |
| | | |
6.50% (1),(4) | | | 08/25/52 | | | | 17,115,000 | | | | 15,997,635 | |
| |
PRPM LLC Series 2022-3, Class A1 | | | | | |
| | | |
5.56% (1) | | | 06/25/27 | | | | 15,329,047 | | | | 14,920,352 | |
| |
RAAC Trust Series 2005-SP1, Class 4A1 | | | | | |
| | | |
7.00% | | | 09/25/34 | | | | 754,377 | | | | 575,535 | |
| |
Residential Accredit Loans, Inc. Trust Series 2005-QA13, Class 2A1 | | | | | |
| | | |
4.99% (4),(9) | | | 12/25/35 | | | | 363,829 | | | | 305,945 | |
| |
Residential Accredit Loans, Inc. Trust Series 2005-QA7, Class A21 | | | | | |
| | | |
4.95% (4),(9) | | | 07/25/35 | | | | 919,150 | | | | 844,063 | |
| |
Residential Accredit Loans, Inc. Trust Series 2005-QA8, Class CB21 | | | | | |
| | | |
4.94% (4),(9) | | | 07/25/35 | | | | 2,575,904 | | | | 1,428,554 | |
| |
Residential Accredit Loans, Inc. Trust Series 2006-QA1, Class A21 | | | | | |
| | | |
5.05% (4),(9) | | | 01/25/36 | | | | 9,154 | | | | 6,482 | |
| |
Residential Accredit Loans, Inc. Trust Series 2006-QA10, Class A2 | | | | | |
| | | |
5.80% (1 mo. USD Term SOFR + 0.474%) (2) | | | 12/25/36 | | | | 6,980,266 | | | | 5,892,076 | |
See accompanying Notes to Financial Statements.
95
TCW Total Return Bond Fund
Schedule of Investments (Continued)
| | | | | | | | | | | | |
| Issues | | Maturity
Date | | | Principal
Amount | | | Value | |
|
RESIDENTIAL MORTGAGE-BACKED SECURITIES —
NON-AGENCY (Continued) | |
| |
Residential Accredit Loans, Inc. Trust Series 2006-QA2, Class 1A1 | | | | | |
| | | |
5.69% (1 mo. USD Term SOFR + 0.364%) (2),(9) | | | 02/25/36 | | | $ | 10,780 | | | $ | 7,219 | |
| |
Residential Accredit Loans, Inc. Trust Series 2006-QS10, Class AV (I/O) | | | | | |
| | | |
0.56% (4),(5) | | | 08/25/36 | | | | 17,813,253 | | | | 306,791 | |
| |
Residential Accredit Loans, Inc. Trust Series 2006-QS5, Class A5 | | | | | |
| | | |
6.00% (9) | | | 05/25/36 | | | | 2,063,904 | | | | 1,601,412 | |
| |
Residential Accredit Loans, Inc. Trust Series 2006-QS6, Class 1AV (I/O) | | | | | |
| | | |
0.77% (4),(5) | | | 06/25/36 | | | | 23,888,398 | | | | 496,867 | |
| |
Residential Accredit Loans, Inc. Trust Series 2006-QS7, Class AV (I/O) | | | | | |
| | | |
0.71% (4),(5) | | | 06/25/36 | | | | 4,796,819 | | | | 76,936 | |
| |
Residential Accredit Loans, Inc. Trust Series 2007-QS1, Class 2AV (I/O) | | | | | |
| | | |
0.17% (4),(5) | | | 01/25/37 | | | | 1,253,893 | | | | 6,192 | |
| |
Residential Accredit Loans, Inc. Trust Series 2007-QS2, Class AV (I/O) | | | | | |
| | | |
0.58% (4),(5) | | | 01/25/37 | | | | 8,682,191 | | | | 84,727 | |
| |
Residential Accredit Loans, Inc. Trust Series 2007-QS3, Class AV (I/O) | | | | | |
| | | |
0.36% (4),(5) | | | 02/25/37 | | | | 39,277,914 | | | | 475,408 | |
| |
Residential Accredit Loans, Inc. Trust Series 2007-QS4, Class 3AV (I/O) | | | | | |
| | | |
0.36% (4),(5) | | | 03/25/37 | | | | 4,726,640 | | | | 51,396 | |
| |
Residential Accredit Loans, Inc. Trust Series 2007-QS5, Class AV (I/O) | | | | | |
| | | |
0.10% (4),(5) | | | 03/25/37 | | | | 5,902,278 | | | | 70,845 | |
| |
Residential Accredit Loans, Inc. Trust Series 2007-QS6, Class A45 | | | | | |
| | | |
5.75% (9) | | | 04/25/37 | | | | 1,317,355 | | | | 1,006,786 | |
| |
Residential Accredit Loans, Inc. Trust Series 2007-QS8, Class AV (I/O) | | | | | |
| | | |
0.41% (4),(5) | | | 06/25/37 | | | | 9,673,261 | | | | 141,231 | |
| |
Residential Asset Securitization Trust Series 2007-A3, Class 1A4 | | | | | |
| | | |
5.75% | | | 04/25/37 | | | | 2,280,760 | | | | 1,099,443 | |
| |
RFMSI Trust Series 2005-SA5, Class 2A | | | | | |
| | | |
4.81% (4),(9) | | | 11/25/35 | | | | 7,288 | | | | 5,987 | |
| |
RFMSI Trust Series 2006-S9, Class A3 (PAC) | | | | | |
| | | |
5.75% (9) | | | 09/25/36 | | | | 294,019 | | | | 210,035 | |
| |
RFMSI Trust Series 2007-S2, Class A9 | | | | | |
| | | |
6.00% (9) | | | 02/25/37 | | | | 2,938,704 | | | | 2,062,371 | |
| |
RFMSI Trust Series 2007-SA2, Class 2A2 | | | | | |
| | | |
4.57% (4),(9) | | | 04/25/37 | | | | 8,535 | | | | 6,566 | |
| |
Roc Mortgage Trust Series 2021-RTL1, Class A1 | | | | | |
| | | |
2.49% (1),(4) | | | 08/25/26 | | | | 15,460,326 | | | | 15,285,230 | |
| | | | | | | | | | | | |
| Issues | | Maturity
Date | | | Principal
Amount | | | Value | |
|
RESIDENTIAL MORTGAGE-BACKED SECURITIES —
NON-AGENCY (Continued) | |
| |
Saxon Asset Securities Trust Series 2006-3, Class A3 | | | | | |
| | | |
5.78% (1 mo. USD Term SOFR + 0.454%) (2) | | | 10/25/46 | | | $ | 2,631,854 | | | $ | 2,537,425 | |
| |
Saxon Asset Securities Trust Series 2007-2, Class A2C | | | | | |
| | | |
5.68% (1 mo. USD Term SOFR + 0.354%) (2) | | | 05/25/47 | | | | 10,190,797 | | | | 6,758,672 | |
| |
Saxon Asset Securities Trust Series 2007-2, Class A2D | | | | | |
| | | |
5.74% (1 mo. USD Term SOFR + 0.414%) (2) | | | 05/25/47 | | | | 11,854,358 | | | | 7,865,380 | |
| |
Securitized Asset-Backed Receivables LLC Trust Series 2006-CB1, Class AF2 | | | | | |
| | | |
2.85% | | | 01/25/36 | | | | 2,709,613 | | | | 2,123,536 | |
| |
Securitized Asset-Backed Receivables LLC Trust Series 2006-WM4, Class A1 | | | | | |
| | | |
5.82% (1 mo. USD Term SOFR + 0.494%) (1),(2) | | | 11/25/36 | | | | 26,347,641 | | | | 11,764,940 | |
| |
Securitized Asset-Backed Receivables LLC Trust Series 2007-BR1, Class A2C | | | | | |
| | | |
6.12% (1 mo. USD Term SOFR + 0.794%) (2) | | | 02/25/37 | | | | 7,471,223 | | | | 3,044,168 | |
| |
Securitized Asset-Backed Receivables LLC Trust Series 2007-BR2, Class A1 | | | | | |
| | | |
5.80% (1 mo. USD Term SOFR + 0.474%) (1),(2) | | | 02/25/37 | | | | 19,344,748 | | | | 15,549,732 | |
| |
Securitized Asset-Backed Receivables LLC Trust Series 2007-BR2, Class A2 | | | | | |
| | | |
5.90% (1 mo. USD Term SOFR + 0.574%) (2) | | | 02/25/37 | | | | 25,517,852 | | | | 10,677,649 | |
| |
Securitized Asset-Backed Receivables LLC Trust Series 2007-NC2, Class A2B | | | | | |
| | | |
5.72% (1 mo. USD Term SOFR + 0.394%) (2) | | | 01/25/37 | | | | 11,307,333 | | | | 9,533,080 | |
| |
Sequoia Mortgage Trust Series 2003-8, Class A1 | | | | | |
| | | |
6.09% (1 mo. USD Term SOFR + 0.754%) (2) | | | 01/20/34 | | | | 266,036 | | | | 252,228 | |
| |
SG Mortgage Securities Trust Series 2007-NC1, Class A2 | | | | | |
| | | |
5.68% (1 mo. USD Term SOFR + 0.354%) (1),(2) | | | 12/25/36 | | | | 15,012,409 | | | | 8,711,483 | |
| |
Soundview Home Loan Trust Series 2007-OPT3, Class 2A4 | | | | | |
| | | |
5.69% (1 mo. USD Term SOFR + 0.364%) (2) | | | 08/25/37 | | | | 4,000,000 | | | | 3,408,169 | |
| |
STARM Mortgage Loan Trust Series 2007-1, Class 1A1 | | | | | |
| | | |
4.69% (4) | | | 02/25/37 | | | | 1,336,110 | | | | 626,709 | |
| |
STARM Mortgage Loan Trust Series 2007-2, Class 2A1 | | | | | |
| | | |
4.10% (4) | | | 04/25/37 | | | | 90,962 | | | | 53,213 | |
| |
STARM Mortgage Loan Trust Series 2007-3, Class 1A1 | | | | | |
| | | |
5.03% (4) | | | 06/25/37 | | | | 2,298 | | | | 1,454 | |
See accompanying Notes to Financial Statements.
96
TCW Total Return Bond Fund
October 31, 2023
| | | | | | | | | | | | |
| Issues | | Maturity
Date | | | Principal
Amount | | | Value | |
|
RESIDENTIAL MORTGAGE-BACKED SECURITIES —
NON-AGENCY (Continued) | |
| |
Structured Adjustable Rate Mortgage Loan Trust Series 2004-12, Class 2A | | | | | |
| | | |
5.64% (4) | | | 09/25/34 | | | $ | 393,511 | | | $ | 376,536 | |
| |
Structured Adjustable Rate Mortgage Loan Trust Series 2004-14, Class 2A | | | | | |
| | | |
6.45% (4) | | | 10/25/34 | | | | 828,786 | | | | 801,392 | |
| |
Structured Adjustable Rate Mortgage Loan Trust Series 2006-2, Class 3A1 | | | | | |
| | | |
5.39% (4),(9) | | | 03/25/36 | | | | 6,764,233 | | | | 6,365,042 | |
| |
Structured Adjustable Rate Mortgage Loan Trust Series 2006-2, Class 5A1 | | | | | |
| | | |
4.52% (4),(9) | | | 03/25/36 | | | | 202,982 | | | | 144,875 | |
| |
Structured Adjustable Rate Mortgage Loan Trust Series 2006-4, Class 5A1 | | | | | |
| | | |
4.76% (4),(9) | | | 05/25/36 | | | | 1,219,620 | | | | 872,844 | |
| |
Structured Adjustable Rate Mortgage Loan Trust Series 2006-5, Class 1A1 | | | | | |
| | | |
4.53% (4),(9) | | | 06/25/36 | | | | 1,451,512 | | | | 1,261,323 | |
| |
Structured Asset Mortgage Investments II Trust Series 2007-AR4, Class A5 5. | | | | | |
| | | |
88% (1 mo. USD Term SOFR + 0.554%) (2) | | | 09/25/47 | | | | 12,169,156 | | | | 10,124,537 | |
| |
Towd Point Mortgage Trust Series 2018-2, Class B1 | | | | | |
| | | |
3.63% (1),(4) | | | 03/25/58 | | | | 13,050,000 | | | | 9,750,360 | |
| |
Wachovia Mortgage Loan Trust LLC Series 2006-AMN1, Class A3 | | | | | |
| | | |
1.78% (1 mo. USD Term SOFR + 0.594%) (2) | | | 08/25/36 | | | | 5,478,670 | | | | 1,874,319 | |
| |
WaMu Mortgage Pass-Through Certificates Trust Series 2004-AR14, Class A1 | | | | | |
| | | |
4.19% (4) | | | 01/25/35 | | | | 2,174,220 | | | | 1,940,281 | |
| |
WaMu Mortgage Pass-Through Certificates Trust Series 2005-AR14, Class 2A1 | | | | | |
| | | |
3.98% (4) | | | 12/25/35 | | | | 446,468 | | | | 380,658 | |
| |
WaMu Mortgage Pass-Through Certificates Trust Series 2005-AR18, Class 1A1 | | | | | |
| | | |
4.06% (4) | | | 01/25/36 | | | | 790,342 | | | | 691,061 | |
| |
WaMu Mortgage Pass-Through Certificates Trust Series 2006-AR11, Class 1A | | | | | |
| | | |
5.76% (1 yr. MTA + 0.960%) (2),(9) | | | 09/25/46 | | | | 1,925,013 | | | | 1,481,101 | |
| |
WaMu Mortgage Pass-Through Certificates Trust Series 2006-AR17, Class 1A1A | | | | | |
| | | |
4.35% (1 yr. MTA + 0.810%) (2) | | | 12/25/46 | | | | 1,963,472 | | | | 1,684,086 | |
| |
Washington Mutual Asset-Backed Certificates WMABS Trust Series 2006-HE1, Class 2A4 | | | | | |
| | | |
6.00% (1 mo. USD Term SOFR + 0.674%) (2) | | | 04/25/36 | | | | 463,727 | | | | 461,111 | |
| | | | | | | | | | | | |
| Issues | | Maturity
Date | | | Principal
Amount | | | Value | |
|
RESIDENTIAL MORTGAGE-BACKED SECURITIES —
NON-AGENCY (Continued) | |
| |
Washington Mutual Asset-Backed Certificates WMABS Trust Series 2007-HE2, Class 2A1 | | | | | |
| | | |
5.54% (1 mo. USD Term SOFR + 0.214%) (2) | | | 02/25/37 | | | $ | 15,534,664 | | | $ | 4,531,831 | |
| |
Washington Mutual Mortgage Pass-Through Certificates WMALT Trust Series 2006-1, Class 3A2 | | | | | |
| | | |
5.75% (9) | | | 02/25/36 | | | | 462,293 | | | | 405,646 | |
| |
Washington Mutual Mortgage Pass-Through Certificates WMALT Trust Series 2006-5, Class 1A1 | | | | | |
| | | |
6.00% (1 mo. USD Term SOFR + 0.714%) (2),(9) | | | 07/25/36 | | | | 1,074,780 | | | | 710,058 | |
| |
Washington Mutual Mortgage Pass-Through Certificates WMALT Trust Series 2006-AR10, Class A2A | | | | | |
| | | |
5.78% (1 mo. USD Term SOFR + 0.454%) (2) | | | 12/25/36 | | | | 1,565,316 | | | | 1,247,323 | |
| |
Washington Mutual Mortgage Pass-Through Certificates WMALT Trust Series 2007-OC2, Class A3 | | | | | |
| | | |
6.06% (1 mo. USD Term SOFR + 0.734%) (2) | | | 06/25/37 | | | | 2,360,109 | | | | 2,158,265 | |
| |
Washington Mutual MSC Mortgage Pass-Through Certificates Trust Series 2002-AR1, Class 1A1 | | | | | |
| | | |
4.69% (4) | | | 11/25/30 | | | | 19,916 | | | | 19,640 | |
| |
Wells Fargo Home Equity Asset-Backed Securities Trust Series 2007-1, Class A3 | | | | | |
| | | |
6.08% (1 mo. USD Term SOFR + 0.754%)(2) | | | 03/25/37 | | | | 5,521,000 | | | | 4,689,888 | |
| |
Wells Fargo Mortgage-Backed Securities Trust Series 2006-AR11, Class A6 | | | | | |
| | | |
5.74% (4),(9) | | | 08/25/36 | | | | 877,627 | | | | 790,537 | |
| | | | | | | | | | | | |
| |
Total Residential Mortgage-Backed Securities — Non-Agency | | | | | |
| |
(Cost: $1,001,960,506) | | | | 932,976,378 | |
| | | | | | | | | | | | |
|
| U.S. GOVERNMENT AGENCY OBLIGATIONS — 1.1% | |
| | | |
(Cost: $31,736,191) | | | | | | | | | | | | |
| | | |
Federal National Mortgage Association 1.55% | | | 08/24/35 | | | | 43,500,000 | | | | 28,255,782 | |
|
U.S. TREASURY SECURITIES — 0.9% | |
| | | |
U.S. Treasury Bonds | | | | | | | | | | | | |
| | | |
4.13% | | | 08/15/53 | | | | 2,765,000 | | | | 2,366,081 | |
| | | |
U.S. Treasury Notes | | | | | | | | | | | | |
| | | |
3.88% | | | 08/15/33 | | | | 7,505,000 | | | | 6,907,494 | |
| | | |
4.88% | | | 10/31/28 | | | | 13,600,000 | | | | 13,671,754 | |
| | | | | | | | | | | | |
|
Total U.S. Treasury Securities | |
| |
(Cost: $22,963,003) | | | | 22,945,329 | |
| | | | | | | | | | | | |
|
Total Fixed Income Securities | |
| |
(Cost: $3,631,228,913) | | | | 3,222,362,186 | |
| | | | | | | | | | | | |
See accompanying Notes to Financial Statements.
97
TCW Total Return Bond Fund
Schedule of Investments (Continued)
| | | | | | | | | | | | |
| Issues | | Maturity
Date | | | Shares | | | Value | |
|
| MONEY MARKET INVESTMENTS — 1.8% | |
| | | |
State Street Institutional U.S. Government Money Market Fund — Premier Class, | | | | | | | | | | | | |
| | |
5.30% (10) | | | $ | 46,385,509 | | | $ | 46,385,509 | |
| | | | | | | | | | | | |
| | |
Total Money Market Investments | | | | | | | | | |
| | | |
(Cost: $46,385,509) | | | | | | | | | | | 46,385,509 | |
| | | | | | | | | | | | |
| | | |
| | | | | | | | | | | | |
| | | | | | | | | | | | |
| Issues | | Maturity
Date | | | Principal
Amount | | | Value | |
|
SHORT TERM INVESTMENTS — 1.6% | |
|
| U.S. Treasury Securities — 1.6% | |
| | | |
(Cost: $39,037,720) | | | | | | | | | | | | |
| | | |
U.S. Treasury Bills | | | | | | | | | | | | |
| | | |
5.52% (11) | | | 04/11/24 | | | $ | 40,000,000 | | | $ | 39,045,280 | |
| | | | | | | | | | | | |
| | |
Total Investments (130.2%) | | | | | | | | | |
| | | |
(Cost: $3,716,652,142) | | | | | | | | | | | 3,307,792,975 | |
| |
Liabilities In Excess Of Other Assets (-30.2%) | | | | (766,383,299 | ) |
| | | | | | | | | | | | |
| | | |
Net Assets (100.0%) | | | | | | | | | | $ | 2,541,409,676 | |
| | | | | | | | | | | | |
| | | | | | | | | | | | | | | | | | |
| Futures Contracts | |
| | | | | |
Number of
Contracts | | Type | | Expiration
Date | | | Notional | | | Market Value | | | Net
Unrealized
Appreciation
(Depreciation) | |
Long Futures | | | | | | | | | | | | | |
| 118 | | 10-Year U.S. Treasury Note Futures | | | 12/19/23 | | | $ | 13,243,149 | | | $ | 12,841,719 | | | $ | (401,430 | ) |
| 1,807 | | U.S. Ultra Long Bond Futures | | | 12/19/23 | | | | 226,161,826 | | | | 203,400,438 | | | | (22,761,388 | ) |
| 2,134 | | 2-Year U.S. Treasury Note Futures | | | 12/29/23 | | | | 434,012,797 | | | | 431,968,283 | | | | (2,044,514 | ) |
| 2,536 | | 5-Year U.S. Treasury Note Futures | | | 12/29/23 | | | | 268,323,517 | | | | 264,952,564 | | | | (3,370,953 | ) |
| | | | | | | | | | | | | | | | | | |
| | | | | | | | $ | 941,741,289 | | | $ | 913,163,004 | | | $ | (28,578,285 | ) |
| | | | | | | | | | | | | | | | | | |
| | | | | | | | | | | | | | | | | | | | | | | | |
| Forward Currency Exchange Contracts | |
| | | | | | |
| Counterparty | | Contracts to
Deliver | | | Units of
Currency | | | Settlement
Date | | | In Exchange for
U.S. Dollars | | | Contracts at
Value | | | Unrealized
Appreciation
(Depreciation) | |
| SELL (12) | | | | | | | | | | | | | | | |
Citibank N.A. | | | EUR | | | | 8,569,000 | | | | 01/12/24 | | | $ | 9,064,031 | | | $ | 9,088,524 | | | $ | (24,493 | ) |
Citibank N.A. | | | GBP | | | | 4,987,000 | | | | 01/12/24 | | | | 6,080,749 | | | | 6,055,099 | | | | 25,650 | |
| | | | | | | | | | | | | | | | | | | | | | | | |
| | | | | | | | | | | $ | 15,144,780 | | | $ | 15,143,623 | | | $ | 1,157 | |
| | | | | | | | | | | | | |
See accompanying Notes to Financial Statements.
98
TCW Total Return Bond Fund
October 31, 2023
Notes to the Schedule of Investments:
| ABS | | Asset-Backed Securities. |
| ARM | | Adjustable Rate Mortgage. |
| CLO | | Collateralized Loan Obligation. |
| I/F | | Inverse Floating rate security whose interest rate moves in the opposite direction of prevailing interest rates. |
| I/O | | Interest Only Security. |
| PAC | | Planned Amortization Class. |
| P/O | | Principal Only Security. |
| REMIC | | Real Estate Mortgage Investment Conduit. |
| SOFR | | Secured Overnight Financing Rate. |
| STRIPS | | Separate Trading of Registered Interest and Principal Securities. |
| TAC | | Target Amortization Class. |
| GBP | | British Pound Sterling. |
| (1) | | Security exempt from registration under Rule 144A of the Securities Act of 1933, as amended. These securities may be resold, normally only to qualified institutional buyers. At October 31, 2023, the value of these securities amounted to $829,262,142 or 32.6% of net assets. These securities are determined to be liquid by the Fund’s investment advisor, unless otherwise noted, under procedures established by and under the general supervision of the Company’s Board of Directors. |
| (2) | | Floating or variable rate security. The interest shown reflects the rate in effect at October 31, 2023. |
| (3) | | This security is a residual or equity position that does not have a stated interest rate. This residual or equity position is entitled to recurring distributions which are generally equal to the remaining cash flow of payments made by underlying securities less contractual payments to debtholders and fund expenses. |
| (4) | | Variable rate security. Interest rate disclosed is as of the most recent information available. Certain variable rate securities are not based on a published reference rate and spread but are determined by the issuer or agent and are based on current market conditions. These securities do not indicate a reference rate and spread in their description above. |
| (5) | | For fair value measurement disclosure purposes, security is categorized as Level 3. Security is valued using significant unobservable inputs. |
| (6) | | Investments issued under Regulation S of the Securities Act of 1933, as amended, may not be offered, sold, or delivered within the United States except under special exemptions. At October 31, 2023, the value of these securities amounted to $6,089,383 or 0.2% of net assets. |
| (7) | | Security is not accruing interest. |
| (8) | | Security purchased on a forward commitment with an approximate principal amount. The actual principal amount and maturity date will be determined upon settlement when the security is delivered. |
| (9) | | A portion of the principal balance has been written-off during the period due to defaults in the underlying loans. Cost basis has been adjusted. |
| (10) | | Rate disclosed is the 7-day net yield as of October 31, 2023. |
| (11) | | Rate shown represents yield-to-maturity. |
| (12) | | Fund sells foreign currency, buys U.S. Dollar. |
See accompanying Notes to Financial Statements.
99
TCW Total Return Bond Fund
Investments by Sector | October 31, 2023 |
| | | | |
| Sector | | Percentage of
Net Assets | |
Residential Mortgage-Backed Securities — Agency | | | 70.3 | % |
Residential Mortgage-Backed Securities — Non-Agency | | | 36.7 | |
Asset-Backed Securities | | | 10.5 | |
Commercial Mortgage-Backed Securities — Non-Agency | | | 7.0 | |
U.S. Treasury Securities | | | 2.5 | |
Money Market Investments | | | 1.8 | |
U.S. Government Agency Obligations | | | 1.1 | |
Commercial Mortgage-Backed Securities — Agency | | | 0.3 | |
Other* | | | (30.2 | ) |
| | | | |
Total | | | 100.0 | % |
| | | | |
| * | Includes futures, pending trades, interest receivable and accrued expenses payable. |
See accompanying Notes to Financial Statements.
100
TCW Total Return Bond Fund
Fair Valuation Summary | October 31, 2023 |
The following is a summary of the fair valuations according to the inputs used as of October 31, 2023 in valuing the Fund’s investments:
| | | | | | | | | | | | | | | | |
Description | | Quoted Prices
in Active
Markets for
Identical
Assets
(Level 1) | | | Other
Significant
Observable
Inputs
(Level 2) | | | Significant
Unobservable
Inputs
(Level 3) | | | Total | |
Fixed Income Securities | | | | | | | | | | | | | | | | |
Asset-Backed Securities | | $ | — | | | $ | 266,908,231 | | | $ | — | | | $ | 266,908,231 | |
Commercial Mortgage-Backed Securities — Agency | | | — | | | | 7,522,950 | | | | — | | | | 7,522,950 | |
Commercial Mortgage-Backed Securities — Non-Agency | | | — | | | | 176,341,462 | | | | — | | | | 176,341,462 | |
Residential Mortgage-Backed Securities — Agency | | | — | | | | 1,787,412,054 | | | | — | | | | 1,787,412,054 | |
Residential Mortgage-Backed Securities — Non-Agency | | | — | | | | 931,258,850 | | | | 1,717,528 | | | | 932,976,378 | |
U.S. Government Agency Obligations | | | — | | | | 28,255,782 | | | | — | | | | 28,255,782 | |
U.S. Treasury Securities | | | 22,945,329 | | | | — | | | | — | | | | 22,945,329 | |
| | | | | | | | | | | | | | | | |
Total Fixed Income Securities | | | 22,945,329 | | | | 3,197,699,329 | | | | 1,717,528 | | | | 3,222,362,186 | |
| | | | | | | | | | | | | | | | |
Money Market Investments | | | 46,385,509 | | | | — | | | | — | | | | 46,385,509 | |
Short-Term Investments | | | 39,045,280 | | | | — | | | | — | | | | 39,045,280 | |
| | | | | | | | | | | | | | | | |
Total Investments | | $ | 108,376,118 | | | $ | 3,197,699,329 | | | $ | 1,717,528 | | | $ | 3,307,792,975 | |
| | | | | | | | | | | | | | | | |
Asset Derivatives | | | | | | | | | | | | | | | | |
Forward Currency Exchange Contracts | | | | | | | | | | | | | | | | |
Foreign Currency Risk | | | — | | | | 25,650 | | | | — | | | | 25,650 | |
| | | | | | | | | | | | | | | | |
Total Investments | | $ | 108,376,118 | | | $ | 3,197,724,979 | | | $ | 1,717,528 | | | $ | 3,307,818,625 | |
| | | | | | | | | | | | | | | | |
Liability Derivatives | | | | | | | | | | | | | | | | |
Futures Contracts | | | | | | | | | | | | | | | | |
Interest Rate Risk | | $ | (28,578,285 | ) | | $ | — | | | $ | — | | | $ | (28,578,285 | ) |
Forward Currency Exchange Contracts | | | | | | | | | | | | | | | | |
Foreign Currency Risk | | | — | | | | (24,493 | ) | | | — | | | | (24,493 | ) |
| | | | | | | | | | | | | | | | |
Total | | $ | (28,578,285 | ) | | $ | (24,493 | ) | | $ | — | | | $ | (28,602,778 | ) |
| | | | | | | | | | | | | | | | |
See accompanying Notes to Financial Statements.
101
TCW Funds, Inc.
Statements of Assets and Liabilities | October 31, 2023 |
| | | | | | | | | | | | |
| | | TCW
Core Fixed
Income Fund | | | TCW
Enhanced
Commodity
Strategy Fund (1) | | | TCW
Global Bond
Fund | |
ASSETS | |
Investments, at Value (2) | | $ | 1,290,147,752 | | | $ | 20,153,471 | | | $ | 20,123,439 | |
Investment in Affiliated Issuers, at Value | | | — | | | | — | | | | 564,812 | (3) |
Foreign Currency, at Value | | | 16 | | | | — | | | | 1,661 | (4) |
Receivable for Securities Sold | | | 5,332,026 | | | | 109,385 | | | | 1,952 | |
Receivable for Sale of When-Issued Securities | | | 16,681,665 | | | | — | | | | 47,283 | |
Receivable for Fund Shares Sold | | | 3,531,239 | | | | 39,281 | | | | 71 | |
Interest and Dividends Receivable | | | 5,845,375 | | | | 111,515 | | | | 171,736 | |
Receivable from Investment Advisor | | | 30,495 | | | | 25,875 | | | | 22,509 | |
Unrealized Appreciation on Open Forward Currency Exchange Contracts | | | 4,719 | | | | — | | | | 34,060 | |
Receivable for Daily Variation Margin on Open Financial Futures Contracts | | | — | | | | 855 | | | | — | |
Cash Collateral Held for Brokers | | | 6,034,415 | | | | — | | | | 101,776 | |
Receivable for Daily Variation Margin on Open Centrally Cleared Swap Contracts | | | — | | | | — | | | | 834 | |
Cash Collateral on Deposit | | | — | | | | 2,146,000 | | | | — | |
Prepaid Expenses | | | 28,168 | | | | 13,604 | | | | 3,738 | |
| | | | | | | | | | | | |
Total Assets | | | 1,327,635,870 | | | | 22,599,986 | | | | 21,073,871 | |
| | | | | | | | | | | | |
LIABILITIES | |
Distributions Payable | | | 3,408,883 | | | | — | | | | 57,459 | |
Payable for Securities Purchased | | | 13,590,812 | | | | — | | | | 2,002 | |
Payable for Purchase of When-Issued Securities | | | 271,728,958 | | | | — | | | | 3,039,489 | |
Payable for Fund Shares Redeemed | | | 2,885,868 | | | | 13,477 | | | | — | |
Disbursements in Excess of Available Cash | | | — | | | | — | | | | 135 | |
Accrued Directors’ Fees and Expenses | | | 10,854 | | | | 10,955 | | | | 10,957 | |
Deferred Accrued Directors’ Fees and Expenses | | | 1,310 | | | | 1,310 | | | | 1,310 | |
Accrued Management Fees | | | 360,666 | | | | 9,556 | | | | 7,632 | |
Accrued Distribution Fees | | | 33,789 | | | | 1,278 | | | | 1,715 | |
Interest Payable on Swap Agreements | | | — | | | | 6,999 | | | | — | |
Payable for Daily Variation Margin on Open Financial Futures Contracts | | | 268,792 | | | | — | | | | 3,782 | |
Payable for Daily Variation Margin on Open Centrally Cleared Swap Contracts | | | 17,892 | | | | — | | | | — | |
Options Written, at Value | | | — | | | | — | | | | 215 | (5) |
Open Swap Agreements, at Value | | | — | | | | 272,990 | | | | — | |
Unrealized Depreciation on Open Forward Currency Exchange Contracts | | | 47,364 | | | | — | | | | 42,752 | |
Transfer Agent Fees Payable | | | 141,029 | | | | 12,286 | | | | 4,764 | |
Administration Fee Payable | | | 106,529 | | | | 23,653 | | | | 1,556 | |
Audit Fees Payable | | | 51,534 | | | | 35,445 | | | | 40,312 | |
Accounting Fees Payable | | | 117,541 | | | | 39,873 | | | | 1,797 | |
Custodian Fees Payable | | | 115,159 | | | | 77,663 | | | | 31,863 | |
Legal Fees Payable | | | 13,987 | | | | 617 | | | | 374 | |
Other Accrued Expenses | | | 44,357 | | | | 28,008 | | | | 24,147 | |
| | | | | | | | | | | | |
Total Liabilities | | | 292,945,324 | | | | 534,110 | | | | 3,272,261 | |
| | | | | | | | | | | | |
NET ASSETS | | $ | 1,034,690,546 | | | $ | 22,065,876 | | | $ | 17,801,610 | |
| | | | | | | | | | | | |
NET ASSETS CONSIST OF: | |
Paid-in Capital | | $ | 1,354,149,087 | | | $ | 27,482,240 | | | $ | 22,954,177 | |
Accumulated Earnings (Loss) | | | (319,458,541 | ) | | | (5,416,364 | ) | | | (5,152,567 | ) |
| | | | | | | | | | | | |
NET ASSETS | | $ | 1,034,690,546 | | | $ | 22,065,876 | | | $ | 17,801,610 | |
| | | | | | | | | | | | |
NET ASSETS ATTRIBUTABLE TO: | |
I Class Share | | $ | 689,214,507 | | | $ | 16,039,598 | | | $ | 9,830,181 | |
| | | | | | | | | | | | |
N Class Share | | $ | 152,264,202 | | | $ | 6,026,278 | | | $ | 7,971,429 | |
| | | | | | | | | | | | |
Plan Class Share | | $ | 193,211,837 | | | $ | — | | | $ | — | |
| | | | | | | | | | | | |
CAPITAL SHARES OUTSTANDING: (6) | |
I Class Share | | | 75,943,281 | | | | 2,704,811 | | | | 1,285,206 | |
| | | | | | | | | | | | |
N Class Share | | | 16,819,536 | | | | 1,016,291 | | | | 1,042,359 | |
| | | | | | | | | | | | |
Plan Class Share | | | 21,173,558 | | | | — | | | | — | |
| | | | | | | | | | | | |
NET ASSET VALUE PER SHARE: (7) | |
I Class Share | | $ | 9.08 | | | $ | 5.93 | | | $ | 7.65 | |
| | | | | | | | | | | | |
N Class Share | | $ | 9.05 | | | $ | 5.93 | | | $ | 7.65 | |
| | | | | | | | | | | | |
Plan Class Share | | $ | 9.13 | | | $ | — | | | $ | — | |
| | | | | | | | | | | | |
| (1) | Consolidated Statement of Assets and Liabilities (See Note 2). |
| (2) | The identified cost for the TCW Core Fixed Income Fund, the TCW Enhanced Commodity Strategy Fund and the TCW Global Bond Fund at October 31, 2023 was $1,388,859,114, $20,846,248 and $22,766,937, respectively. |
| (3) | The identified cost for the TCW Global Bond Fund at October 31, 2023 was $736,208. |
| (4) | The identified cost for the TCW Core Fixed Income Fund and the TCW Global Bond Fund at October 31, 2023 was $16 and $1,683, respectively. |
| (5) | Premium received $1,163. |
| (6) | The number of authorized shares, with a par value of $0.001 per share is 4,000,000,000 for each of the I Class, N Class and Plan Class shares. |
| (7) | Represents offering price and redemption price per share. |
See accompanying Notes to Financial Statements.
102
TCW Funds, Inc.
Statements of Assets and Liabilities | October 31, 2023 |
| | | | | | | | | | | | |
| | | TCW
High Yield
Bond Fund | | |
TCW
Short Term
Bond Fund | | | TCW
Total Return
Bond Fund | |
ASSETS | |
Investments, at Value (1) | | $ | 51,755,404 | | | $ | 11,939,143 | | | $ | 3,307,792,975 | |
Cash | | | — | | | | — | | | | 69,271 | |
Receivable for Securities Sold | | | 1,664,749 | | | | 5,693 | | | | 16,571,548 | |
Receivable for Sale of When-Issued Securities | | | — | | | | 1,079,544 | | | | 3,873,539 | |
Receivable for Fund Shares Sold | | | 57,831 | | | | 73,137 | | | | 8,405,844 | |
Interest and Dividends Receivable | | | 723,533 | | | | 29,186 | | | | 8,948,308 | |
Receivable from Investment Advisor | | | 10,143 | | | | 11,038 | | | | — | |
Unrealized Appreciation on Open Forward Currency Exchange Contracts | | | 96 | | | | — | | | | 25,650 | |
Cash Collateral Held for Brokers | | | 130,000 | | | | 68,000 | | | | 23,009,000 | |
Prepaid Expenses | | | 7,956 | | | | 9,383 | | | | 37,455 | |
| | | | | | | | | | | | |
Total Assets | | | 54,349,712 | | | | 13,215,124 | | | | 3,368,733,590 | |
| | | | | | | | | | | | |
LIABILITIES | |
Distributions Payable | | | 280,119 | | | | 32,921 | | | | 14,672,716 | |
Payable for Securities Purchased | | | 210,822 | | | | 422,002 | | | | 23,050,640 | |
Payable for Purchase of When-Issued Securities | | | — | | | | 3,695,880 | | | | 760,596,500 | |
Payable for Fund Shares Redeemed | | | 17,672 | | | | 6 | | | | 26,256,806 | |
Accrued Directors’ Fees and Expenses | | | 10,953 | | | | 10,958 | | | | 10,691 | |
Deferred Accrued Directors’ Fees and Expenses | | | 1,310 | | | | 1,310 | | | | 1,310 | |
Accrued Management Fees | | | 20,716 | | | | 2,592 | | | | 912,964 | |
Accrued Distribution Fees | | | 1,370 | | | | — | | | | 84,856 | |
Payable for Daily Variation Margin on Open Financial Futures Contracts | | | 8,364 | | | | 38 | | | | 85,626 | |
Unrealized Depreciation on Open Forward Currency Exchange Contracts | | | 1,206 | | | | — | | | | 24,493 | |
Transfer Agent Fees Payable | | | 10,731 | | | | 3,467 | | | | 280,788 | |
Administration Fee Payable | | | 5,432 | | | | 1,128 | | | | 278,215 | |
Audit Fees Payable | | | 62,360 | | | | 60,515 | | | | 142,079 | |
Accounting Fees Payable | | | 12,548 | | | | 990 | | | | 319,278 | |
Custodian Fees Payable | | | 23,314 | | | | 12,306 | | | | 251,976 | |
Legal Fees Payable | | | 869 | | | | 269 | | | | 35,463 | |
Other Accrued Expenses | | | 18,333 | | | | 18,281 | | | | 319,513 | |
| | | | | | | | | | | | |
Total Liabilities | | | 686,119 | | | | 4,262,663 | | | | 827,323,914 | |
| | | | | | | | | | | | |
NET ASSETS | | $ | 53,663,593 | | | $ | 8,952,461 | | | $ | 2,541,409,676 | |
| | | | | | | | | | | | |
NET ASSETS CONSIST OF: | |
Paid-in Capital | | $ | 65,275,378 | | | $ | 9,830,534 | | | $ | 3,554,874,403 | |
Accumulated Earnings (Loss) | | | (11,611,785 | ) | | | (878,073 | ) | | | (1,013,464,727 | ) |
| | | | | | | | | | | | |
NET ASSETS | | $ | 53,663,593 | | | $ | 8,952,461 | | | $ | 2,541,409,676 | |
| | | | | | | | | | | | |
NET ASSETS ATTRIBUTABLE TO: | |
I Class Share | | $ | 47,270,319 | | | $ | 8,952,461 | | | $ | 2,149,490,459 | |
| | | | | | | | | | | | |
N Class Share | | $ | 6,393,274 | | | $ | — | | | $ | 389,443,700 | |
| | | | | | | | | | | | |
Plan Class Share | | $ | — | | | $ | — | | | $ | 2,475,517 | |
| | | | | | | | | | | | |
CAPITAL SHARES OUTSTANDING: (2) | |
I Class Share | | | 8,270,362 | | | | 1,098,785 | | | | 290,893,102 | |
| | | | | | | | | | | | |
N Class Share | | | 1,111,506 | | | | — | | | | 51,076,810 | |
| | | | | | | | | | | | |
Plan Class Share | | | — | | | | — | | | | 333,608 | |
| | | | | | | | | | | | |
NET ASSET VALUE PER SHARE: (3) | |
I Class Share | | $ | 5.72 | | | $ | 8.15 | | | $ | 7.39 | |
| | | | | | | | | | | | |
N Class Share | | $ | 5.75 | | | $ | — | | | $ | 7.62 | |
| | | | | | | | | | | | |
Plan Class Share | | $ | — | | | $ | — | | | $ | 7.42 | |
| | | | | | | | | | | | |
| (1) | The identified cost for the TCW High Yield Bond Fund, the TCW Short Term Bond Fund and the TCW Total Return Bond Fund at October 31, 2023 was $57,356,895, $12,191,521 and $3,716,652,142, respectively. |
| (2) | The number of authorized shares, with a par value of $0.001 per share is 4,000,000,000 for each of the I Class, N Class and Plan Class shares. |
| (3) | Represents offering price and redemption price per share. |
See accompanying Notes to Financial Statements.
103
TCW Funds, Inc.
Statements of Operations | Year Ended October 31, 2023 |
| | | | | | | | | | | | |
| | | TCW
Core Fixed
Income Fund | | | TCW
Enhanced
Commodity
Strategy Fund (1) | | | TCW
Global
Bond Fund | |
INVESTMENT INCOME | |
Income: | |
Dividends | | $ | 2,155,941 | | | $ | 152,773 | | | $ | 24,047 | |
Dividends from Investment in Affiliated Issuers | | | — | | | | — | | | | 31,262 | |
Interest | | | 47,864,220 | | | | 1,070,316 | | | | 850,528 | (2) |
| | | | | | | | | | | | |
Total | | | 50,020,161 | | | | 1,223,089 | | | | 905,837 | |
| | | | | | | | | | | | |
Expenses: | | | | | | | | | | | | |
Management Fees | | | 4,771,416 | | | | 178,103 | | | | 87,803 | |
Accounting Services Fees | | | 108,544 | | | | 36,764 | | | | 1,613 | |
Administration Fees | | | 95,446 | | | | 6,608 | | | | 792 | |
Transfer Agent Fees: | | | | | | | | | | | | |
I Class | | | 450,945 | | | | 26,662 | | | | 6,406 | |
N Class | | | 169,903 | | | | 17,251 | | | | 7,434 | |
Plan Class | | | 11,580 | | | | — | | | | — | |
Custodian Fees | | | 105,404 | | | | 70,528 | | | | 26,019 | |
Professional Fees | | | 127,135 | | | | 51,890 | | | | 65,365 | |
Directors’ Fees and Expenses | | | 45,953 | | | | 45,902 | | | | 45,901 | |
Registration Fees: | | | | | | | | | | | | |
I Class | | | 38,365 | | | | 16,885 | | | | 16,409 | |
N Class | | | 18,684 | | | | 18,495 | | | | 16,401 | |
Plan Class | | | 16,259 | | | | — | | | | — | |
Distribution Fees: | | | | | | | | | | | | |
N Class | | | 447,748 | | | | 20,419 | | | | 21,221 | |
Compliance Expense | | | 6,241 | | | | 6,241 | | | | 6,241 | |
Shareholder Reporting Expense | | | 7,902 | | | | 4,145 | | | | 2,750 | |
Other | | | 109,276 | | | | 19,726 | | | | 21,723 | |
| | | | | | | | | | | | |
Total | | | 6,530,801 | | | | 519,619 | | | | 326,078 | |
| | | | | | | | | | | | |
Less Expenses Borne by Investment Advisor: | | | | | | | | | | | | |
I Class | | | (129,517 | ) | | | (195,342 | ) | | | (102,387 | ) |
N Class | | | (301,974 | ) | | | (109,635 | ) | | | (106,360 | ) |
Plan Class | | | (54,687 | ) | | | — | | | | — | |
| | | | | | | | | | | | |
Net Expenses | | | 6,044,623 | | | | 214,642 | | | | 117,331 | |
| | | | | | | | | | | | |
Net Investment Income | | | 43,975,538 | | | | 1,008,447 | | | | 788,506 | |
| | | | | | | | | | | | |
NET REALIZED AND UNREALIZED GAIN (LOSS) ON INVESTMENTS | |
Net Realized Gain (Loss) on: | |
Investments | | | (68,872,588 | ) | | | (401,870 | ) | | | (631,556 | ) (3) |
Investments in Affiliated Issuers | | | — | | | | — | | | | (16,515 | ) |
Foreign Currency | | | (26,295 | ) | | | — | | | | (3,416 | ) |
Forward Currency Exchange Contracts | | | (170,100 | ) | | | — | | | | (229,394 | ) |
Futures Contracts | | | (14,610,781 | ) | | | (8,472 | ) | | | 15,962 | |
Swap Agreements | | | (6,186,544 | ) | | | (1,442,200 | ) | | | (53,554 | ) |
Change in Unrealized Appreciation (Depreciation) on: | | | | | | | | | | | | |
Investments | | | 35,210,318 | | | | 781,384 | | | | 306,219 | |
Foreign Currency | | | (11,117 | ) | | | — | | | | 1,513 | |
Forward Currency Exchange Contracts | | | 5,479 | | | | — | | | | 66,906 | |
Futures Contracts | | | (46,044 | ) | | | (13,898 | ) | | | (40,517 | ) |
Investments in Affiliated Issuers | | | — | | | | — | | | | 34,536 | |
Options Written | | | — | | | | — | | | | 948 | |
Swap Agreements | | | 8,819,549 | | | | (1,011,468 | ) | | | 47,563 | |
| | | | | | | | | | | | |
Net Realized and Unrealized Gain (Loss) on Investments and Foreign Currency Transactions | | | (45,888,123 | ) | | | (2,096,524 | ) | | | (501,305 | ) |
| | | | | | | | | | | | |
INCREASE (DECREASE) IN NET ASSETS RESULTING FROM OPERATIONS | | $ | (1,912,585 | ) | | $ | (1,088,077 | ) | | $ | 287,201 | |
| | | | | | | | | | | | |
| (1) | Consolidated Statement of Operations (See Note 2). |
| (2) | Net of foreign taxes withheld of $1,213 for the TCW Global Bond Fund. |
| (3) | Net of capital gain withholding taxes of $105 for the TCW Global Bond Fund. |
See accompanying Notes to Financial Statements.
104
TCW Funds, Inc.
Statements of Operations | Year Ended October 31, 2023 |
| | | | | | | | | | | | |
| | | TCW
High Yield
Bond Fund | | | TCW
Short Term
Bond Fund | | | TCW
Total Return
Bond Fund | |
INVESTMENT INCOME | |
Income: | |
Dividends | | $ | 83,352 | | | $ | 25,401 | | | $ | 1,497,009 | |
Interest | | | 3,713,825 | | | | 250,257 | | | | 164,917,362 | |
| | | | | | | | | | | | |
Total | | | 3,797,177 | | | | 275,658 | | | | 166,414,371 | |
| | | | | | | | | | | | |
Expenses: | |
Management Fees | | | 262,946 | | | | 28,825 | | | | 11,538,671 | |
Accounting Services Fees | | | 10,899 | | | | 829 | | | | 266,046 | |
Administration Fees | | | 3,830 | | | | 277 | | | | 176,500 | |
Transfer Agent Fees: | |
I Class | | | 42,999 | | | | 11,905 | | | | 1,317,278 | |
N Class | | | 11,316 | | | | — | | | | 285,340 | |
Plan Class | | | — | | | | — | | | | 6,378 | |
Custodian Fees | | | 13,144 | | | | 9,800 | | | | 231,789 | |
Professional Fees | | | 77,143 | | | | 77,309 | | | | 331,307 | |
Directors’ Fees and Expenses | | | 45,903 | | | | 45,900 | | | | 46,036 | |
Registration Fees: | |
I Class | | | 18,249 | | | | 19,702 | | | | 44,285 | |
N Class | | | 16,449 | | | | — | | | | 24,168 | |
Plan Class | | | — | | | | — | | | | 16,163 | |
Distribution Fees: | |
N Class | | | 19,091 | | | | — | | | | 1,163,119 | |
Compliance Expense | | | 6,241 | | | | 6,241 | | | | 6,241 | |
Shareholder Reporting Expense | | | 7,143 | | | | — | | | | 16,599 | |
Other | | | 18,056 | | | | 15,760 | | | | 291,733 | |
| | | | | | | | | | | | |
Total | | | 553,409 | | | | 216,548 | | | | 15,761,653 | |
| | | | | | | | | | | | |
Less Expenses Borne by Investment Advisor: | | | | | | | | | | | | |
I Class | | | (169,338 | ) | | | (180,313 | ) | | | (322,650 | ) |
N Class | | | (43,610 | ) | | | — | | | | (306,014 | ) |
Plan Class | | | — | | | | — | | | | (22,743 | ) |
| | | | | | | | | | | | |
Net Expenses | | | 340,461 | | | | 36,235 | | | | 15,110,246 | |
| | | | | | | | | | | | |
Net Investment Income | | | 3,456,716 | | | | 239,423 | | | | 151,304,125 | |
| | | | | | | | | | | | |
NET REALIZED AND UNREALIZED GAIN (LOSS) ON INVESTMENTS | |
Net Realized Gain (Loss) on: | |
Investments | | | (2,750,258 | ) | | | (233,025 | ) | | | (58,781,694 | ) |
Foreign Currency | | | 881 | | | | — | | | | (58,535 | ) |
Forward Currency Exchange Contracts | | | 74 | | | | — | | | | (74,959 | ) |
Futures Contracts | | | (166,700 | ) | | | 85,952 | | | | (92,263,861 | ) |
Change in Unrealized Appreciation (Depreciation) on: | |
Investments | | | 2,379,992 | | | | 274,899 | | | | (60,226,346 | ) |
Foreign Currency | | | (240 | ) | | | — | | | | (2,718 | ) |
Forward Currency Exchange Contracts | | | (270 | ) | | | — | | | | 35,581 | |
Futures Contracts | | | 12,229 | | | | (51,539 | ) | | | 40,526,269 | |
| | | | | | | | | | | | |
Net Realized and Unrealized Gain (Loss) on Investments and Foreign Currency Transactions | | | (524,292 | ) | | | 76,287 | | | | (170,846,263 | ) |
| | | | | | | | | | | | |
INCREASE (DECREASE) IN NET ASSETS RESULTING FROM OPERATIONS | | $ | 2,932,424 | | | $ | 315,710 | | | $ | (19,542,138 | ) |
| | | | | | | | | | | | |
See accompanying Notes to Financial Statements.
105
TCW Funds, Inc.
Statements of Changes in Net Assets
| | | | | | | | | | | | | | | | |
| | | TCW
Core Fixed Income
Fund | | | TCW
Enhanced Commodity Strategy
Fund (1) | |
| | | Year Ended
October 31,
2023 | | | Year Ended
October 31,
2022 | | | Year Ended
October 31,
2023 | | | Year Ended
October 31,
2022 | |
OPERATIONS | |
Net Investment Income | | $ | 43,975,538 | | | $ | 28,819,936 | | | $ | 1,008,447 | | | $ | 510,695 | |
Net Realized Loss on Investments, Futures Contracts, Swap Contracts and Foreign Currency Transactions | | | (89,866,308 | ) | | | (137,199,165 | ) | | | (1,852,542 | ) | | | (3,089,264 | ) |
Change in Unrealized Appreciation (Depreciation) on Investments, Futures Contracts, Foreign Currency Transactions and Swap Contracts | | | 43,978,185 | | | | (173,407,321 | ) | | | (243,982 | ) | | | (739,894 | ) |
| | | | | | | | | | | | | | | | |
Decrease in Net Assets Resulting from Operations | | | (1,912,585 | ) | | | (281,786,550 | ) | | | (1,088,077 | ) | | | (3,318,463 | ) |
| | | | | | | | | | | | | | | | |
DISTRIBUTIONS TO SHAREHOLDERS | |
Distributions to Shareholders | | | (37,334,973 | ) | | | (23,342,013 | ) | | | (881,140 | ) | | | (1,055,936 | ) |
Return of Capital | | | — | | | | (4,452,370 | ) | | | — | | | | — | |
| | | | | | | | | | | | | | | | |
Total Distributions to Shareholders | | | (37,334,973 | ) | | | (27,794,383 | ) | | | (881,140 | ) | | | (1,055,936 | ) |
| | | | | | | | | | | | | | | | |
NET CAPITAL SHARE TRANSACTIONS | |
I Class | | | (199,744,870 | ) | | | (301,442,390 | ) | | | (12,030,846 | ) | | | 30,246,122 | |
N Class | | | (12,226,897 | ) | | | (12,158,536 | ) | | | (4,625,785 | ) | | | 11,926,112 | |
Plan Class | | | 122,792,145 | | | | 90,797,662 | | | | — | | | | — | |
| | | | | | | | | | | | | | | | |
Increase (Decrease) in Net Assets Resulting from Net Capital Shares Transactions | | | (89,179,622 | ) | | | (222,803,264 | ) | | | (16,656,631 | ) | | | 42,172,234 | |
| | | | | | | | | | | | | | | | |
Increase (Decrease) in Net Assets | | | (128,427,180 | ) | | | (532,384,197 | ) | | | (18,625,848 | ) | | | 37,797,835 | |
NET ASSETS | |
Beginning of year | | | 1,163,117,726 | | | | 1,695,501,923 | | | | 40,691,724 | | | | 2,893,889 | |
| | | | | | | | | | | | | | | | |
End of year | | $ | 1,034,690,546 | | | $ | 1,163,117,726 | | | $ | 22,065,876 | | | $ | 40,691,724 | |
| | | | | | | | | | | | | | | | |
| (1) | Consolidated Statement of Changes in Net Assets (See Note 2). |
See accompanying Notes to Financial Statements.
106
TCW Funds, Inc.
Statements of Changes in Net Assets
| | | | | | | | | | | | | | | | |
| | | TCW
Global Bond
Fund | | | TCW
High Yield Bond
Fund | |
| | | Year Ended
October 31,
2023 | | | Year Ended
October 31,
2022 | | | Year Ended
October 31,
2023 | | | Year Ended
October 31,
2022 | |
OPERATIONS | |
Net Investment Income | | $ | 788,506 | | | $ | 618,614 | | | $ | 3,456,716 | | | $ | 3,656,278 | |
Net Realized Loss on Investments, Futures Contracts, Swap Contracts and Foreign Currency Transactions | | | (918,473 | ) | | | (2,973,985 | ) | | | (2,916,003 | ) | | | (2,858,840 | ) |
Change in Unrealized Appreciation (Depreciation) on Investments, Futures Contracts, Options Written, Foreign Currency Transactions and Swap Contracts | | | 417,168 | | | | (3,038,103 | ) | | | 2,391,711 | | | | (9,465,871 | ) |
| | | | | | | | | | | | | | | | |
Increase (Decrease) in Net Assets Resulting from Operations | | | 287,201 | | | | (5,393,474 | ) | | | 2,932,424 | | | | (8,668,433 | ) |
| | | | | | | | | | | | | | | | |
DISTRIBUTIONS TO SHAREHOLDERS | |
Distributions to Shareholders | | | (482,626 | ) | | | (98,875 | ) | | | (3,588,507 | ) | | | (5,890,701 | ) |
Return of Capital | | | (143,424 | ) | | | (298,881 | ) | | | — | | | | — | |
| | | | | | | | | | | | | | | | |
Total Distributions to Shareholders | | | (626,050 | ) | | | (397,756 | ) | | | (3,588,507 | ) | | | (5,890,701 | ) |
| | | | | | | | | | | | | | | | |
NET CAPITAL SHARE TRANSACTIONS | |
I Class | | | 1,381,823 | | | | (12,356,627 | ) | | | (3,103,885 | ) | | | (32,767,878 | ) |
N Class | | | 378,629 | | | | (546,364 | ) | | | (2,611,642 | ) | | | (3,908,789 | ) |
| | | | | | | | | | | | | | | | |
Increase (Decrease) in Net Assets Resulting from Net Capital Shares Transactions | | | 1,760,452 | | | | (12,902,991 | ) | | | (5,715,527 | ) | | | (36,676,667 | ) |
| | | | | | | | | | | | | | | | |
Increase (Decrease) in Net Assets | | | 1,421,603 | | | | (18,694,221 | ) | | | (6,371,610 | ) | | | (51,235,801 | ) |
NET ASSETS | |
Beginning of year | | | 16,380,007 | | | | 35,074,228 | | | | 60,035,203 | | | | 111,271,004 | |
| | | | | | | | | | | | | | | | |
End of year | | $ | 17,801,610 | | | $ | 16,380,007 | | | $ | 53,663,593 | | | $ | 60,035,203 | |
| | | | | | | | | | | | | | | | |
See accompanying Notes to Financial Statements.
107
TCW Funds, Inc.
Statements of Changes in Net Assets
| | | | | | | | | | | | | | | | |
| | | TCW
Short Term Bond
Fund | | | TCW
Total Return Bond
Fund | |
| | | Year Ended
October 31,
2023 | | | Year Ended
October 31,
2022 | | | Year Ended
October 31,
2023 | | | Year Ended
October 31,
2022 | |
OPERATIONS | |
Net Investment Income | | $ | 239,423 | | | $ | 153,950 | | | $ | 151,304,125 | | | $ | 146,557,170 | |
Net Realized Loss on Investments, Futures Contracts and Foreign Currency Transactions | | | (147,073 | ) | | | (362,997 | ) | | | (151,179,049 | ) | | | (428,291,873 | ) |
Change in Unrealized Appreciation (Depreciation) on Investments, Futures Contracts and Foreign Currency Transactions | | | 223,360 | | | | (201,283 | ) | | | (19,667,214 | ) | | | (571,666,479 | ) |
| | | | | | | | | | | | | | | | |
Increase (Decrease) in Net Assets Resulting from Operations | | | 315,710 | | | | (410,330 | ) | | | (19,542,138 | ) | | | (853,401,182 | ) |
| | | | | | | | | | | | | | | | |
DISTRIBUTIONS TO SHAREHOLDERS | |
Distributions to Shareholders | | | (255,948 | ) | | | (252,893 | ) | | | (162,939,921 | ) | | | (98,490,713 | ) |
Return of Capital | | | — | | | | (80,452 | ) | | | — | | | | — | |
| | | | | | | | | | | | | | | | |
Total Distributions to Shareholders | | | (255,948 | ) | | | (333,345 | ) | | | (162,939,921 | ) | | | (98,490,713 | ) |
| | | | | | | | | | | | | | | | |
NET CAPITAL SHARE TRANSACTIONS | |
I Class | | | 623,198 | | | | (9,048,272 | ) | | | (291,133,572 | ) | | | (873,138,545 | ) |
N Class | | | — | | | | — | | | | (90,384,369 | ) | | | (155,694,602 | ) |
Plan Class | | | — | | | | — | | | | 1,155,401 | | | | 1,217,353 | |
| | | | | | | | | | | | | | | | |
Increase (Decrease) in Net Assets Resulting from Net Capital Shares Transactions | | | 623,198 | | | | (9,048,272 | ) | | | (380,362,540 | ) | | | (1,027,615,794 | ) |
| | | | | | | | | | | | | | | | |
Increase (Decrease) in Net Assets | | | 682,960 | | | | (9,791,947 | ) | | | (562,844,599 | ) | | | (1,979,507,689 | ) |
NET ASSETS | |
Beginning of year | | | 8,269,501 | | | | 18,061,448 | | | | 3,104,254,275 | | | | 5,083,761,964 | |
| | | | | | | | | | | | | | | | |
End of year | | $ | 8,952,461 | | | $ | 8,269,501 | | | $ | 2,541,409,676 | | | $ | 3,104,254,275 | |
| | | | | | | | | | | | | | | | |
See accompanying Notes to Financial Statements.
108
TCW Funds, Inc.
Notes to Financial Statements | October 31, 2023 |
Note 1 — Organization
TCW Funds, Inc. (the “Company”), a Maryland corporation, is an open-end management investment company registered under the Investment Company Act of 1940, as amended (the “1940 Act”), that currently offers 16 no-load mutual funds (each series a “Fund” and collectively the “Funds”). TCW Investment Management Company LLC (the “Advisor”) is the investment advisor to and an affiliate of the Funds and is registered under the Investment Advisers Act of 1940, as amended. Each Fund has its own investment objective and strategies. The following is a brief description of the investment objectives and principal investment strategies for the Funds that are covered in this report:
| | |
TCW Fund | | Investment Objectives and Principal Investment
Strategies |
| Diversified Fixed Income Funds |
| |
| TCW Core Fixed Income Fund | | Seeks to maximize current income and achieve above average total return consistent with prudent investment management over a full market cycle by investing at least 80% of the value of its net assets, plus any borrowings for investment purposes, in debt securities. The Fund may also invest up to 5% of its net assets in below investment grade bonds (commonly known as “junk bonds”). |
| |
| TCW Enhanced Commodity Strategy Fund | | Seeks total return which exceeds that of its commodity benchmark by investing primarily in commodity-linked derivative instruments backed by a portfolio of Fixed Income Instruments. The average duration of the Fixed Income Instruments held by the Fund is not expected to exceed 3 years, under normal market conditions. The Fund may invest up to 5% of its net assets in below investment grade bonds (commonly known as “junk bonds”). The Fund may invest up to 15% of its assets in foreign securities that are denominated in U.S. dollars. The Fund may invest up to 5% of its assets in securities of foreign issuers that are not denominated in U.S. dollars. The Fund may invest up to 5% of its assets in emerging market securities. |
| |
| TCW Global Bond Fund | | Seeks total return by investing at least 80% of the value of its net assets, plus any borrowings for investment purposes, in debt securities. Under normal market conditions, the Fund invests in securities of issuers located in at least three different countries (one of which may be the United States) and invests at least 30% of its net assets in securities of issuers located outside the United States. The Fund does not limit its investments to a particular credit or ratings category and may invest up to 35% of its net assets in below investment grade bonds (commonly known as “junk bonds”). |
109
TCW Funds, Inc.
Notes to Financial Statements (Continued)
Note 1 — Organization (Continued)
| | |
TCW Fund | | Investment Objectives and Principal Investment
Strategies |
| TCW High Yield Bond Fund | | Seeks to maximize income and achieve above average total return consistent with reasonable risk over a full market cycle by investing at least 80% of the value of its net assets, plus any borrowings for investment purposes, in high yield/below investment grade bonds (commonly known as “junk bonds”). The Fund may invest up to 20% of its net assets in equity securities (including common stock and convertible and non-convertible preferred stocks) and bank loans of companies in the high yield universe. |
| |
| TCW Short Term Bond Fund | | Seeks to maximize current income by investing at least 80% of the value of its net assets, plus any borrowings for investment purposes, in a diversified portfolio of debt securities of varying maturities, including bonds, notes and other similar fixed income instruments issued by governmental or private sector issuers. The Fund may invest up to 10% of its net assets in below investment grade bonds (commonly known as “junk bonds”). Under normal market conditions, the portfolio managers seek to construct an investment portfolio with a dollar-weighted average duration of no more than two years. |
| |
| TCW Total Return Bond Fund | | Seeks to maximize current income and achieve above average total return consistent with prudent investment management over a full market cycle by investing at least 80% of the value of its net assets, plus any borrowings for investment purposes, in debt securities. At least 50% of the Fund’s net assets will be invested in securitized obligations guaranteed by the U.S. government or its agencies, instrumentalities or sponsored corporations; privately issued mortgage-backed and asset-backed securities rated at time of investment Aa3 or higher by Moody’s Investors Service, Inc., AA- or higher by S&P Global Ratings or the equivalent by any other nationally recognized statistical organization; other obligations of the U.S. government or its agencies, instrumentalities or sponsored corporations; and money market instruments. Under normal market conditions, the portfolio managers seek to construct an investment portfolio with a weighted average duration of no more than eight years. |
110
TCW Funds, Inc.
October 31, 2023
Note 1 — Organization (Continued)
All of the Funds currently offer two classes of shares: I Class and N Class, except for the TCW Short Term Bond Fund, which only offers I Class shares, and the TCW Core Fixed Income Fund and TCW Total Return Bond Fund, which also offer Plan Class shares. The three classes of a Fund are substantially the same except that the N Class shares are subject to a distribution fee (see Note 7).
Note 2 — Significant Accounting Policies
The following is a summary of significant accounting policies, which are in conformity with accounting principles generally accepted in the United States of America (“GAAP”) and which are consistently followed by the Funds in the preparation of their financial statements. Each Fund is considered an investment company under the Financial Accounting Standards Board (“FASB”) Accounting Standards Codification (“ASC”) No. 946, Financial Services — Investment Companies. Subsequent events, if any, have been evaluated through the date of issuance in the preparation of the financial statements.
Principles of Accounting: The Funds use the accrual method of accounting for financial reporting purposes.
Principles of Consolidation: The TCW Cayman Enhanced Commodity Fund, Ltd. (the “Subsidiary”), a Cayman Islands exempted company, was incorporated as a wholly owned subsidiary acting as an investment vehicle for the TCW Enhanced Commodity Strategy Fund (the “Parent”) in order to effect certain investments for the Parent consistent with the Parent’s investment objectives and policies as specified in its prospectus and statement of additional information. The accompanying financial statements are consolidated and include the accounts of the Subsidiary. The Parent’s investment in the Subsidiary will normally not exceed 25% of the value of the Parent’s total assets tested at the time of making an investment. The net assets of the Subsidiary at October 31, 2023 were $4,421,040 or 20.04% of the Parent’s consolidated net assets. Intercompany balances and transactions have been eliminated in consolidation.
Net Asset Value: The net asset value (“NAV”) per share of each class of a Fund is determined by dividing the Fund’s net assets attributable to each class by the number of shares issued and outstanding of that class on each day the New York Stock Exchange (“NYSE”) is open for trading.
Security Valuations: Securities listed or traded on the NYSE and other stock exchanges were valued at the latest sale price on the exchange. Securities traded on the NASDAQ stock market (“NASDAQ”) were valued during the period using official closing prices as reported by NASDAQ, which may not have been the last sale price. Investments in open-end mutual funds including money market funds were valued based on the NAV per share as reported by the investment companies. All other securities for which over-the-counter (“OTC”) market quotations were readily available, including short-term securities, swap agreements and forward currency exchange contracts, were valued with prices furnished by independent pricing services or by broker-dealers.
Pursuant to Rule 2a-5 under the 1940 Act, the Company’s Board of Directors (the “Board”, and each member thereof, a “Director”) has designated the Advisor as the “valuation designee” with respect to the fair valuation of the Fund’s portfolio securities, subject to oversight by and periodic reporting to the Board. Fair valued securities are those for which market quotations were not readily available, including in circumstances under which it was determined by the Advisor that prices received were not reflective of their market values.
111
TCW Funds, Inc.
Notes to Financial Statements (Continued)
Note 2 — Significant Accounting Policies (Continued)
Fair value is defined as the price that a Fund would receive upon selling an investment in a timely transaction to an independent buyer in the principal or most advantageous market for the investment. In accordance with the authoritative guidance on fair value measurements and disclosures under GAAP, the Funds disclose investments in their financial statements in a three-tier hierarchy. This hierarchy is utilized to establish classification of fair value measurements based on inputs. Inputs that go into fair value measurement refer broadly to the assumptions that market participants would use in pricing the asset or liability, including assumptions about risk. Inputs may be observable or unobservable. Observable inputs are inputs that reflect the assumptions market participants would use in pricing the asset or liability, developed based on market data obtained from sources independent of the reporting entity. Unobservable inputs are inputs that reflect the reporting entity’s own assumptions about the inputs market participants would use in pricing the asset or liability, developed based on the best information available in the circumstances.
The three-tier hierarchy of inputs is summarized in the three broad levels listed below.
| | |
| Level 1 — | | quoted prices in active markets for identical investments. |
| Level 2 — | | other significant observable inputs (including quoted prices for similar investments, interest rates, prepayment speeds, credit risk, etc.). |
| Level 3 — | | significant unobservable inputs (including the Funds’ own assumptions in determining the fair value of investments). |
Changes in valuation techniques may result in transfers in or out of an investment’s assigned Level within the hierarchy. The inputs or methodologies used for valuing investments are not necessarily an indication of the risk associated with investing in those investments and the determination of the significance of a particular input to the fair value measurement in its entirety requires judgment and consideration of factors specific to each security.
The availability of observable inputs can vary from security to security and is affected by a wide variety of factors, including, for example, the type of security, whether the security is new and not yet established in the marketplace, the liquidity of markets, and other characteristics particular to the security. To the extent that valuation is based on models or inputs that are less observable or unobservable in the market, the determination of fair value requires more judgment. Accordingly, the degree of judgment exercised in determining fair value is greatest for instruments categorized as Level 3.
In periods of market dislocation, the observability of prices and inputs may be reduced for many instruments. This condition, as well as changes related to liquidity of investments, could cause a security to be reclassified between Level 1, Level 2, or Level 3.
In certain cases, the inputs used to measure fair value may fall into different levels of the fair value hierarchy. In such cases, for disclosure purposes the level in the fair value hierarchy within which the fair value measurement falls in its entirety is determined based on the lowest level input that is significant to the fair value measurement.
Fair Value Measurements: Descriptions of the valuation techniques applied to the Funds’ major categories of assets and liabilities measured at fair value on a recurring basis are as follows:
Asset-backed securities (“ABS”) and mortgage-backed securities (“MBS”). The fair value of ABS and MBS is estimated based on pricing models that consider the estimated cash flows of each debt tranche of the
112
TCW Funds, Inc.
October 31, 2023
Note 2 — Significant Accounting Policies (Continued)
issuer, establish a benchmark yield, and develop an estimated tranche-specific spread to the benchmark yield based on the unique attributes of the tranche including, but not limited to, the prepayment speed assumptions and attributes of the collateral. To the extent the inputs are observable and timely, the values would be categorized as Level 2 of the fair value hierarchy; otherwise, they would be categorized as Level 3.
Bank loans. The fair value of bank loans is estimated using recently executed transactions, market price quotations, credit/market events, and cross-asset pricing. Inputs are generally observable and are obtained from independent sources. Bank loans are generally categorized as Level 2 of the fair value hierarchy.
Corporate bonds. The fair value of corporate bonds is estimated using recently executed transactions, market price quotations (where observable), bond spreads, or credit default swap spreads adjusted for any basis difference between cash and derivative instruments. Corporate bonds are generally categorized as Level 2 of the fair value hierarchy; in instances where prices, spreads, or any of the other aforementioned key inputs are unobservable, they are categorized as Level 3 of the hierarchy.
Foreign currency contracts. The fair values of foreign currency contracts are derived from indices, reference rates, and other inputs or a combination of these factors. To the extent that these factors can be observed, foreign currency contracts are categorized as Level 2 of the fair value hierarchy.
Futures contracts. Futures contracts are generally valued at the settlement price established at the close of business each day by the exchange on which they are traded. They are categorized as Level 1.
Government and agency securities. Government and agency securities are normally valued using a model that incorporates market observable data such as reported sales of similar securities, broker quotes, yields, bids, offers, quoted market prices, and reference data. Accordingly, government and agency securities are normally categorized as Level 1 or 2 of the fair value hierarchy depending on the liquidity and transparency of the market.
Money market funds. Money market funds are open-end mutual funds that invest in short-term debt securities. To the extent that these funds are valued based upon the reported NAV, they are categorized as Level 1 of the fair value hierarchy.
Municipal bonds. Municipal bonds are fair valued based on pricing models that take into account, among other factors, information received from market makers and broker-dealers, current trades, bid-wanted lists, offerings, market movements, the callability of the bond, state of issuance, benchmark yield curves, and bond insurance. To the extent that these inputs are observable and timely, the fair values of municipal bonds are categorized as Level 2; otherwise, the fair values are categorized as Level 3.
Options and Swaptions contracts. Exchange-listed options contracts are traded on securities exchanges and are fair valued based on quoted prices from the applicable exchange, and to the extent valuation adjustments are not applied, they are categorized as Level 1. If valuation adjustments are applied and such adjustments are observable and timely, the fair values of exchange-listed options contracts would be categorized as Level 2; otherwise the fair values would be categorized as Level 3. Options and swaptions contracts traded over-the-counter (“OTC”) are fair valued based on pricing models and incorporate various inputs such as interest rates, credit spreads, currency exchange rates and volatility measurements for in-the-money, at-the-money, and out-of-the-money contracts based on a given strike price. To the extent that these inputs are observable and timely, the fair values of OTC options and swaptions contracts would be categorized as Level 2; otherwise the fair values would be categorized as Level 3.
113
TCW Funds, Inc.
Notes to Financial Statements (Continued)
Note 2 — Significant Accounting Policies (Continued)
Restricted securities. Restricted securities, including illiquid Rule 144A securities, issued by non-public entities are categorized as Level 3 of the fair value hierarchy because they trade infrequently, and therefore the inputs are unobservable. Any other restricted securities valued similar to publicly traded securities may be categorized as Level 2 or 3 of the fair value hierarchy depending on whether a discount is applied and significant to the fair value.
Short-term investments. Short-term investments are valued using market price quotations, and are categorized as Level 1 or Level 2 of the fair value hierarchy.
Total return swaps. Total return swaps are fair valued using pricing models that take into account, among other factors, index spread curves, nominal values, modified duration values and cash flows. To the extent that these inputs are observable and timely, the fair values of credit default swaps would be categorized as Level 2; otherwise, the fair values would be categorized as Level 3.
Warrants. Warrants are generally valued based on quoted prices from the applicable exchange. To the extent these securities are actively traded, and valuation adjustments are not applied, they are generally categorized as Level 1 of the fair value hierarchy.
The summary of the inputs used as of October 31, 2023 in valuing the Funds’ investments is listed after the Schedule of Investments for each Fund.
Following is a reconciliation of investments in which significant unobservable inputs (Level 3) were used in determining value:
| | | | | | | | | | | | |
TCW Core Fixed Income Fund | | Asset-Backed
Securities | | | Corporate
Bonds | | | Total | |
Balance as of October 31, 2022 | | $ | 3,965,873 | | | $ | 1,160,224 | | | $ | 5,126,097 | |
Accrued Discounts (Premiums) | | | — | | | | — | | | | — | |
Realized Gain (Loss) | | | — | | | | (2,725 | ) | | | (2,725 | ) |
Change in Unrealized Appreciation (Depreciation)* | | | 26,885 | | | | 339,435 | | | | 366,320 | |
Purchases | | | — | | | | — | | | | — | |
Sales | | | (290,057 | ) | | | (1,496,934 | ) | | | (1,786,991 | ) |
Transfers in to Level 3 | | | — | | | | — | | | | — | |
Transfers out of Level 3 | | | — | | | | — | | | | — | |
| | | | | | | | | | | | |
Balance as of October 31, 2023 | | $ | 3,702,701 | | | $ | — | | | $ | 3,702,701 | |
| | | | | | | | | | | | |
| * | The change in unrealized appreciation (depreciation) on securities still held at October 31, 2023 was $26,885 and is included in the related net realized gains (losses) and net change in appreciation (depreciation) in the Statements of Operations. |
| | | | | | | | | | | | |
TCW Global Bond Fund | | Common
Stock | | | Residential
Mortgage-
Backed
Securities—
Non-Agency | | | Total | |
Balance as of October 31, 2022 | | $ | 9,150 | | | $ | 54,941 | | | $ | 64,091 | |
Accrued Discounts (Premiums) | | | — | | | | 27,310 | | | | 27,310 | |
Realized Gain (Loss) | | | (31 | ) | | | 33 | | | | 2 | |
Change in Unrealized Appreciation (Depreciation)* | | | (657 | ) | | | (29,218 | ) | | | (29,875 | ) |
Purchases | | | — | | | | 176 | | | | 176 | |
Sales | | | — | | | | (233 | ) | | | (233 | ) |
Transfers in to Level 3 | | | — | | | | — | | | | — | |
Transfers out of Level 3 | | | — | | | | — | | | | — | |
| | | | | | | | | | | | |
Balance as of October 31, 2023 | | $ | 8,462 | | | $ | 53,009 | | | $ | 61,471 | |
| | | | | | | | | | | | |
| * | The change in unrealized appreciation (depreciation) on securities still held at October 31, 2023 was $(29,875) and is included in the related net realized gains (losses) and net change in appreciation (depreciation) in the Statements of Operations. |
114
TCW Funds, Inc.
October 31, 2023
Note 2 — Significant Accounting Policies (Continued)
| | | | | | | | | | | | |
TCW High Yield Bond Fund | | Corporate
Bonds | | | Warrants | | | Total | |
Balance as of October 31, 2022 | | $ | 180,205 | | | $ | — | | | $ | 180,205 | |
Accrued Discounts (Premiums) | | | — | | | | — | | | | — | |
Realized Gain (Loss) | | | 38,731 | | | | — | | | | 38,731 | |
Change in Unrealized Appreciation (Depreciation)* | | | 13,566 | | | | (2,136 | ) | | | 11,430 | |
Purchases | | | — | | | | — | | | | — | |
Sales | | | (232,502 | ) | | | — | | | | (232,502 | ) |
Transfers in to Level 3 | | | — | | | | 2,136 | | | | 2,136 | |
Transfers out of Level 3 | | | — | | | | — | | | | — | |
| | | | | | | | | | | | |
Balance as of October 31, 2023 | | $ | — | | | $ | — | | | $ | — | |
| | | | | | | | | | | | |
| * | The change in unrealized appreciation (depreciation) on securities still held at October 31, 2023 was $(2,136) and is included in the related net realized gains (losses) and net change in appreciation (depreciation) in the Statements of Operations. |
| | | | | | | | |
TCW Total Return Bond Fund | | Mortgage-
Backed
Securities | | | Total | |
Balance as of October 31, 2022 | | $ | 1,907,386 | | | $ | 1,907,386 | |
Accrued Discounts (Premiums) | | | (191,147 | ) | | | (191,147 | ) |
Realized Gain (Loss) | | | (55,040 | ) | | | (55,040 | ) |
Change in Unrealized Appreciation (Depreciation)* | | | (30,356 | ) | | | (30,356 | ) |
Purchases | | | 146,287 | | | | 146,287 | |
Sales | | | (68,751 | ) | | | (68,751 | ) |
Transfers in to Level 3 | | | 9,149 | | | | 9,149 | |
Transfers out of Level 3 | | | — | | | | — | |
| | | | | | | | |
Balance as of October 31, 2023 | | $ | 1,717,528 | | | $ | 1,717,528 | |
| | | | | | | | |
| * | The change in unrealized appreciation (depreciation) on securities still held at October 31, 2023 was $(30,362) and is included in the related net realized gains (losses) and net change in appreciation (depreciation) in the Statements of Operations. |
Significant unobservable valuation inputs for Level 3 investments as of October 31, 2023 are as follows:
| | | | | | | | | | | | | | |
Description | | Fair Value at
10/31/2023 | | | Valuation
Techniques | | Unobservable
Input | | Price or Price
Range | | Average
Weighted
Price | | Input to
Valuation If
Input
Increases |
| TCW Core Fixed Income Fund |
Asset-backed Securities | | $ | 3,702,701 | | | Broker Quote | | Offered Quote | | $ 87.188 | | $ 87.188 | | Increase |
| |
| TCW Global Bond Fund | | |
Common Stock | | $ | 8,462 | | | Third-party Vendor | | Vendor Prices | | $ 24.600 | | $ 24.600 | | Increase |
Corporate Bonds | | $ | 0 | | | Broker Quote | | Offered Quote | | $ 0 | | $ 0 | | Increase |
Residential Mortgage-Backed Securities — Non-Agency | | $ | 53,009 | | | Third-party Vendor | | Vendor Prices | | $ 4.235 | | $ 4.235 | | Increase |
Rights | | $ | 0 | | | Broker Quote | | Offered Quote | | $ 0 | | $ 0 | | Increase |
|
| TCW High Yield Bond Fund |
Common Stock | | $ | 0 | | | Broker Quote | | Offered Quote | | $ 0 | | $ 0 | | Increase |
Warrants | | $ | 0 | | | Broker Quote | | Offered Quote | | $ 0 | | $ 0 | | Increase |
| | | | | | |
| TCW Total Return Bond Fund | | | | | | | | | | | | | | |
Residential Mortgage-Backed Securities — Non-Agency | | $ | 1,717,528 | | | Third-party Vendor | | Offered Quote | | $ 0.494–10.902 | | $ 1.479 | | Increase |
Security Transactions and Related Investment Income: Security transactions are recorded as of the trade date. Dividend income is recorded on the ex-dividend date. Interest income is recognized on an accrual basis. Realized gains and losses on investments are recorded on the basis of specific identification.
115
TCW Funds, Inc.
Notes to Financial Statements (Continued)
Note 2 — Significant Accounting Policies (Continued)
Allocation of Operating Activity for Multiple Classes: Investment income, common expenses and realized and unrealized gains and losses are allocated among the share classes of the Funds based on the relative net assets of each class. Distribution fees, which are directly attributable to a class of shares, are charged to the operations of that class. All other expenses are charged to each Fund or class as incurred on a specific identification basis. Differences in class-specific fees and expenses will result in differences in net investment income for each class, and in turn differences in dividends paid by each class.
Dividends and Distributions: Dividends and distributions to shareholders are recorded on the ex-dividend date. The TCW Enhanced Commodity Strategy Fund declares and pays, or reinvests, dividends from net investment income quarterly. The other Fixed Income Funds declare and pay, or reinvest, dividends from net investment income monthly. Capital gains realized by a Fund will be distributed at least annually.
Income and capital gain distributions are determined in accordance with income tax regulations which may differ from GAAP. These differences are primarily due to differing treatments for foreign currency transactions, derivative transactions, market discount and premium, losses deferred due to wash sales, excise tax regulations and employing equalization in determining amounts to be distributed to Fund shareholders. Permanent book and tax basis differences relating to shareholder distributions will result in reclassifications between paid-in capital, undistributed net investment income (loss), and/or undistributed accumulated realized gain (loss). Undistributed net investment income or loss may include temporary book and tax basis differences which will reverse in subsequent periods. Any taxable income or capital gain remaining at fiscal year-end is distributed in the following year.
Use of Estimates: The preparation of the accompanying financial statements requires management to make estimates and assumptions that affect the reported amount of assets and liabilities at the date of the financial statements and the reported amounts of income and expenses during the reporting period. Actual results could differ from these estimates.
Foreign Currency Translation: The books and records of each Fund are maintained in U.S. dollars as follows: (1) foreign currency denominated securities and other assets and liabilities stated in foreign currencies are translated using the daily spot rate; and (2) purchases, sales, income and expenses are translated at the rate of exchange prevailing on the respective dates of such transactions. The resultant exchange gains and losses are included in net realized or net unrealized gain (loss) in the Statements of Operations. Pursuant to U.S. federal income tax regulations, certain foreign exchange gains and losses included in realized and unrealized gains and losses are included in, or are a reduction of, ordinary income for federal income tax purposes.
Foreign Taxes: The Funds may be subject to withholding taxes on income and capital gains imposed by certain countries in which they invest. The withholding tax on income is netted against the income accrued or received. Any reclaimable taxes are recorded as income. The withholding tax on realized or unrealized gain is recorded as a liability.
Derivative Instruments: Derivatives are financial instruments which are valued based on the values of one or more indicators, such as a security, asset, currency, interest rate, or index. Derivative transactions can create investment leverage and may be highly volatile. A derivative contract may result in a mark-to-market loss if the value of the contract decreases due to an unfavorable change in the market rates or values of the underlying instrument. It is possible that a derivative transaction will result in a loss greater than the principal amount invested. The Funds may not be able to close out a derivative transaction at a favorable time or price.
116
TCW Funds, Inc.
October 31, 2023
Note 2 — Significant Accounting Policies (Continued)
For the year ended October 31, 2023, the following Funds had derivatives and transactions in derivatives, grouped in the following risk categories:
TCW Core Fixed Income Fund
| | | | | | | | | | | | | | | | | | | | |
| | | Credit Risk | | | Commodity
Risk | | | Foreign
Currency
Risk | | | Interest
Rate
Risk | | | Total | |
Statement of Assets and Liabilities: | | | | | | | | | | | | | | | | | | | | |
Asset Derivatives | |
Swap Agreements (1) | | $ | — | | | $ | — | | | $ | — | | | $ | 1,108,608 | | | $ | 1,108,608 | |
Futures Contracts (2) | | | — | | | | — | | | | — | | | | 955,375 | | | | 955,375 | |
Forward Currency Exchange Contracts | | | — | | | | — | | | | 4,719 | | | | — | | | | 4,719 | |
| | | | | | | | | | | | | | | | | | | | |
Total Value | | $ | — | | | $ | — | | | $ | 4,719 | | | $ | 2,063,983 | | | $ | 2,068,702 | |
| | | | | | | | | | | | | | | | | | | | |
Liability Derivatives | |
Forward Currency Exchange Contracts | | $ | — | | | $ | — | | | $ | (47,364 | ) | | $ | — | | | $ | (47,364 | ) |
Futures Contracts (2) | | | — | | | | — | | | | — | | | | (2,472,978 | ) | | | (2,472,978 | ) |
| | | | | | | | | | | | | | | | | | | | |
Total Value | | $ | — | | | $ | — | | | $ | (47,364 | ) | | $ | (2,472,978 | ) | | $ | (2,520,342 | ) |
| | | | | | | | | | | | | | | | | | | | |
Statement of Operations: | |
Net Realized Gain (Loss) | |
Forward Currency Exchange Contracts | | $ | — | | | $ | — | | | $ | (170,100 | ) | | $ | — | | | $ | (170,100 | ) |
Futures Contracts | | | — | | | | — | | | | — | | | | (14,610,781 | ) | | | (14,610,781 | ) |
Swap Agreements | | | — | | | | — | | | | — | | | | (6,186,544 | ) | | | (6,186,544 | ) |
| | | | | | | | | | | | | | | | | | | | |
Net Realized Gain (Loss) | | $ | — | | | $ | — | | | $ | (170,100 | ) | | $ | (20,797,325 | ) | | $ | (20,967,425 | ) |
| | | | | | | | | | | | | | | | | | | | |
Net Change in Appreciation (Depreciation) | |
Forward Currency Exchange Contracts | | $ | — | | | $ | — | | | $ | 5,479 | | | $ | — | | | $ | 5,479 | |
Futures Contracts | | | — | | | | — | | | | — | | | | (46,044 | ) | | | (46,044 | ) |
Swap Agreements | | | — | | | | — | | | | — | | | | 8,819,549 | | | | 8,819,549 | |
| | | | | | | | | | | | | | | | | | | | |
Net Change in Appreciation (Depreciation) | | $ | — | | | $ | — | | | $ | 5,479 | | | $ | 8,773,505 | | | $ | 8,778,984 | |
| | | | | | | | | | | | | | | | | | | | |
Number of Contracts or Notional Amounts (5) | |
Forward Currency Exchange Contracts | | $ | — | | | $ | — | | | $ | 16,282,577 | | | $ | — | | | $ | 16,282,577 | |
Futures Contracts | | | — | | | | — | | | | — | | | | 2,184 | | | | 2,184 | |
Swap Agreements | | $ | — | | | $ | — | | | $ | — | | | $ | 66,627,417 | | | $ | 66,627,417 | |
TCW Enhanced Commodity Strategy Fund
| | | | | | | | | | | | | | | | | | | | |
| | | Credit Risk | | | Commodity
Risk | | | Foreign
Currency
Risk | | | Interest
Rate
Risk | | | Total | |
Statement of Assets and Liabilities: | | | | | | | | | | | | | | | | | | | | |
Liability Derivatives | |
Swap Agreements | | $ | — | | | $ | (272,990 | ) | | | — | | | $ | — | | | $ | (272,990 | ) |
Futures Contracts (2) | | | — | | | | (13,898 | ) | | | — | | | | — | | | | (13,898 | ) |
| | | | | | | | | | | | | | | | | | | | |
Total Value | | $ | — | | | $ | (286,888 | ) | | $ | — | | | $ | — | | | $ | (286,888 | ) |
| | | | | | | | | | | | | | | | | | | | |
Statement of Operations: | |
Net Realized Gain (Loss) | |
Futures Contracts | | $ | — | | | $ | (8,472 | ) | | $ | — | | | $ | — | | | $ | (8,472 | ) |
Swap Agreements | | | — | | | | (1,442,200 | ) | | | — | | | | — | | | | (1,442,200 | ) |
| | | | | | | | | | | | | | | | | | | | |
Net Realized Gain (Loss) | | $ | — | | | $ | (1,450,672 | ) | | $ | — | | | $ | — | | | $ | (1,450,672 | ) |
| | | | | | | | | | | | | | | | | | | | |
Net Change in Appreciation (Depreciation) | |
Futures Contracts | | $ | — | | | $ | (13,898 | ) | | $ | — | | | $ | — | | | $ | (13,898 | ) |
Swap Agreements | | | — | | | | (1,011,468 | ) | | | — | | | | — | | | | (1,011,468 | ) |
| | | | | | | | | | | | | | | | | | | | |
Net Change in Appreciation (Depreciation) | | $ | — | | | $ | (1,025,366 | ) | | $ | — | | | $ | — | | | $ | (1,025,366 | ) |
| | | | | | | | | | | | | | | | | | | | |
Number of Contracts or Notional Amount (5) | |
Futures Contracts | | | — | | | | 54 | | | | — | | | | — | | | | 54 | |
Swap Agreements | | $ | — | | | $ | 29,404,940 | | | $ | — | | | $ | — | | | $ | 29,404,940 | |
117
TCW Funds, Inc.
Notes to Financial Statements (Continued)
Note 2 — Significant Accounting Policies (Continued)
TCW Global Bond Fund
| | | | | | | | | | | | | | | | | | | | |
| |
| | | Credit Risk | | | Commodity
Risk | | | Foreign
Currency
Risk | | | Interest
Rate
Risk | | | Total | |
Statement of Assets and Liabilities: | | | | | | | | | | | | | | | | | | | | |
Asset Derivatives | |
Investments (3) | | | — | | | | — | | | | 714 | | | | — | | | | 714 | |
Futures Contracts (2) | | | — | | | | — | | | | — | | | | 61,026 | | | | 61,026 | |
Forward Currency Exchange Contracts | | | — | | | | — | | | | 34,060 | | | | — | | | | 34,060 | |
| | | | | | | | | | | | | | | | | | | | |
Total Value | | $ | — | | | $ | — | | | $ | 34,774 | | | $ | 61,026 | | | $ | 95,800 | |
| | | | | | | | | | | | | | | | | | | | |
Liability Derivatives | |
Forward Currency Exchange Contracts | | | — | | | | — | | | | (42,752 | ) | | | — | | | | (42,752 | ) |
Written Options | | | — | | | | — | | | | (215 | ) | | | — | | | | (215 | ) |
Swap Agreements (1) | | | — | | | | — | | | | — | | | | (11,528 | ) | | | (11,528 | ) |
Futures Contracts (2) | | | — | | | | — | | | | — | | | | (30,768 | ) | | | (30,768 | ) |
| | | | | | | | | | | | | | | | | | | | |
Total Value | | $ | — | | | $ | — | | | $ | (42,967 | ) | | $ | (42,296 | ) | | $ | (85,263 | ) |
| | | | | | | | | | | | | | | | | | | | |
Statement of Operations: | |
Net Realized Gain (Loss) | |
Forward Currency Exchange Contracts | | | — | | | | — | | | | (229,394 | ) | | | — | | | | (229,394 | ) |
Futures Contracts | | | — | | | | — | | | | — | | | | 15,962 | | | | 15,962 | |
Swap Agreements | | | — | | | | — | | | | — | | | | (53,554 | ) | | | (53,554 | ) |
| | | | | | | | | | | | | | | | | | | | |
Net Realized Gain (Loss) | | $ | — | | | $ | — | | | $ | (229,394 | ) | | $ | (37,592 | ) | | $ | (266,986 | ) |
| | | | | | | | | | | | | | | | | | | | |
Net Change in Appreciation (Depreciation) | |
Forward Currency Exchange Contracts | | $ | — | | | $ | — | | | $ | 66,906 | | | $ | — | | | $ | 66,906 | |
Futures Contracts | | | — | | | | — | | | | — | | | | (40,517 | ) | | | (40,517 | ) |
Investments (4) | | | — | | | | — | | | | (2,348 | ) | | | — | | | | (2,348 | ) |
Options Written | | | — | | | | — | | | | 948 | | | | — | | | | 948 | |
Swap Agreements | | | — | | | | — | | | | — | | | | 47,563 | | | | 47,563 | |
| | | | | | | | | | | | | | | | | | | | |
Net Change in Appreciation (Depreciation) | | $ | — | | | $ | — | | | $ | 65,506 | | | $ | 7,046 | | | $ | 72,552 | |
| | | | | | | | | | | | | | | | | | | | |
Number of Contracts or Notional Amounts (5) | |
Forward Currency Exchange Contracts | | $ | — | | | $ | — | | | $ | 7,434,079 | | | $ | — | | | $ | 7,434,079 | |
Options Purchased | | $ | — | | | $ | — | | | $ | 190,000 | | | $ | — | | | $ | 190,000 | |
Options Written | | $ | — | | | $ | — | | | $ | 190,000 | | | $ | — | | | $ | 190,000 | |
Futures Contracts | | | — | | | | — | | | | — | | | | 50 | | | | 50 | |
Swap Agreements | | $ | — | | | $ | — | | | $ | — | | | $ | 1,339,278 | | | $ | 1,339,278 | |
118
TCW Funds, Inc.
October 31, 2023
Note 2 — Significant Accounting Policies (Continued)
TCW High Yield Bond Fund
| | | | | | | | | | | | | | | | | | | | |
| | | Credit Risk | | | Commodity
Risk | | | Foreign
Currency
Risk | | | Interest
Rate
Risk | | | Total | |
Statement of Assets and Liabilities: | | | | | | | | | | | | | | | | | | | | |
Asset Derivatives | |
Futures Contracts (2) | | $ | — | | | $ | — | | | $ | — | | | $ | 84,941 | | | $ | 84,941 | |
Forward Currency Exchange Contracts | | | — | | | | — | | | | 96 | | | | — | | | | 96 | |
| | | | | | | | | | | | | | | | | | | | |
Total Value | | $ | — | | | $ | — | | | $ | 96 | | | $ | 84,941 | | | $ | 85,037 | |
| | | | | | | | | | | | | | | | | | | | |
Liability Derivatives | |
Forward Currency Exchange Contracts | | $ | — | | | $ | — | | | $ | (1,206 | ) | | $ | — | | | $ | (1,206 | ) |
Futures Contracts (2) | | | — | | | | — | | | | — | | | | (82,635 | ) | | | (82,635 | ) |
| | | | | | | | | | | | | | | | | | | | |
Total Value | | $ | — | | | $ | — | | | $ | (1,206 | ) | | $ | (82,635 | ) | | $ | (83,841 | ) |
| | | | | | | | | | | | | | | | | | | | |
Statement of Operations: | |
Net Realized Gain (Loss) | |
Forward Currency Exchange Contracts | | $ | — | | | $ | — | | | $ | 74 | | | $ | — | | | $ | 74 | |
Futures Contracts | | | — | | | | — | | | | — | | | | (166,700 | ) | | | (166,700 | ) |
| | | | | | | | | | | | | | | | | | | | |
Net Realized Gain (Loss) | | $ | — | | | $ | — | | | $ | 74 | | | $ | (166,700 | ) | | $ | (166,626 | ) |
| | | | | | | | | | | | | | | | | | | | |
Net Change in Appreciation (Depreciation) | |
Forward Currency Exchange Contracts | | $ | — | | | $ | — | | | $ | (270 | ) | | $ | — | | | $ | (270 | ) |
Futures Contracts | | | — | | | | — | | | | — | | | | 12,229 | | | | 12,229 | |
| | | | | | | | | | | | | | | | | | | | |
Net Change in Appreciation (Depreciation) | | $ | — | | | $ | — | | | $ | (270 | ) | | $ | 12,229 | | | $ | 11,959 | |
| | | | | | | | | | | | | | | | | | | | |
Number of Contracts or Notional Amounts (5) | |
Forward Currency Exchange Contracts | | $ | — | | | $ | — | | | $ | 394,527 | | | $ | — | | | $ | 394,527 | |
Futures Contracts | | | — | | | | — | | | | — | | | | 92 | | | | 92 | |
TCW Short Term Bond Fund
| | | | | | | | | | | | | | | | | | | | |
| | | Credit Risk | | | Commodity
Risk | | | Foreign
Currency
Risk | | | Interest
Rate
Risk | | | Total | |
Statement of Assets and Liabilities: | | | | | | | | | | | | | | | | | | | | |
Asset Derivatives | |
Futures Contracts (2) | | $ | — | | | $ | — | | | $ | — | | | $ | 51,813 | | | $ | 51,813 | |
| | | | | | | | | | | | | | | | | | | | |
Total Value | | $ | — | | | $ | — | | | $ | — | | | $ | 51,813 | | | $ | 51,813 | |
| | | | | | | | | | | | | | | | | | | | |
Liability Derivatives | |
Futures Contracts (2) | | $ | — | | | $ | — | | | $ | — | | | $ | (7,440 | ) | | $ | (7,440 | ) |
| | | | | | | | | | | | | | | | | | | | |
Total Value | | $ | — | | | $ | — | | | $ | — | | | $ | (7,440 | ) | | $ | (7,440 | ) |
| | | | | | | | | | | | | | | | | | | | |
Statement of Operations: | |
Net Realized Gain (Loss) | |
Futures Contracts | | $ | — | | | $ | — | | | $ | — | | | $ | 85,952 | | | $ | 85,952 | |
| | | | | | | | | | | | | | | | | | | | |
Net Realized Gain (Loss) | | $ | — | | | $ | — | | | $ | — | | | $ | 85,952 | | | $ | 85,952 | |
| | | | | | | | | | | | | | | | | | | | |
Net Change in Appreciation (Depreciation) | |
Futures Contracts | | $ | — | | | $ | — | | | $ | — | | | $ | (51,539 | ) | | $ | (51,539 | ) |
| | | | | | | | | | | | | | | | | | | | |
Net Change in Appreciation (Depreciation) | | $ | — | | | $ | — | | | $ | — | | | $ | (51,539 | ) | | $ | (51,539 | ) |
| | | | | | | | | | | | | | | | | | | | |
Number of Contracts (5) | |
Futures Contracts | | | — | | | | — | | | | — | | | | 31 | | | | 31 | |
119
TCW Funds, Inc.
Notes to Financial Statements (Continued)
Note 2 — Significant Accounting Policies (Continued)
TCW Total Return Bond Fund
| | | | | | | | | | | | | | | | | | | | |
| | | Credit Risk | | | Commodity
Risk | | | Foreign
Currency
Risk | | | Interest
Rate
Risk | | | Total | |
Statement of Assets and Liabilities: | | | | | | | | | | | | | | | | | | | | |
Asset Derivatives | |
Forward Currency Exchange Contracts | | $ | — | | | $ | — | | | $ | 25,650 | | | $ | — | | | $ | 25,650 | |
| | | | | | | | | | | | | | | | | | | | |
Total Value | | $ | — | | | $ | — | | | $ | 25,650 | | | $ | — | | | $ | 25,650 | |
| | | | | | | | | | | | | | | | | | | | |
Liability Derivatives | |
Forward Currency Exchange Contracts | | $ | — | | | $ | — | | | $ | (24,493 | ) | | $ | — | | | $ | (24,493 | ) |
Futures Contracts (2) | | | — | | | | — | | | | — | | | | (28,578,285 | ) | | | (28,578,285 | ) |
| | | | | | | | | | | | | | | | | | | | |
Total Value | | $ | — | | | $ | — | | | $ | (24,493 | ) | | $ | (28,578,285 | ) | | $ | (28,602,778 | ) |
| | | | | | | | | | | | | | | | | | | | |
Statement of Operations: | |
Net Realized Gain (Loss) | |
Forward Currency Exchange Contracts | | $ | — | | | $ | — | | | $ | (74,959 | ) | | $ | — | | | $ | (74,959 | ) |
Futures Contracts | | | — | | | | — | | | | — | | | | (92,263,861 | ) | | | (92,263,861 | ) |
| | | | | | | | | | | | | | | | | | | | |
Net Realized Gain (Loss) | | $ | — | | | $ | — | | | $ | (74,959 | ) | | $ | (92,263,861 | ) | | $ | (92,338,820 | ) |
| | | | | | | | | | | | | | | | | | | | |
Net Change in Appreciation (Depreciation) | |
Forward Currency Exchange Contracts | | $ | — | | | $ | — | | | $ | 35,581 | | | $ | — | | | $ | 35,581 | |
Futures Contracts | | | — | | | | — | | | | — | | | | 40,526,269 | | | | 40,526,269 | |
| | | | | | | | | | | | | | | | | | | | |
Net Change in Appreciation (Depreciation) | | $ | — | | | $ | — | | | $ | 35,581 | | | $ | 40,526,269 | | | $ | 40,561,850 | |
| | | | | | | | | | | | | | | | | | | | |
Number of Contracts or Notional Amounts (5) | |
Forward Currency Exchange Contracts | | $ | — | | | $ | — | | | $ | 11,271,292 | | | $ | — | | | $ | 11,271,292 | |
Futures Contracts | | | — | | | | — | | | | — | | | | 6,802 | | | | 6,802 | |
| (1) | Includes cumulative appreciation (depreciation) of swap agreements as reported in the Schedule of Investments. Only variation margin on October 31, 2023 is reported within the Statement of Assets and Liabilities. |
| (2) | Includes cumulative appreciation (depreciation) of futures contracts as reported in the Schedule of Investments. Only variation margin on October 31, 2023 is reported within the Statement of Assets and Liabilities. |
| (3) | Represents purchased options, at value. |
| (4) | Represents change in unrealized appreciation (depreciation) for purchased options during the year. |
| (5) | Amount disclosed represents average number of contracts or notional amounts, which are representative of the volume traded for the year ended October 31, 2023. |
Counterparty Credit Risk: Derivative contracts may be exposed to counterparty risk. Losses can occur if the counterparty does not perform under the contract.
The Funds’ risk of loss from counterparty credit risk on OTC derivatives is generally limited to the aggregate unrealized gain netted against any collateral held by the Funds.
With exchange-traded futures and centrally cleared swaps, there is less counterparty credit risk to the Funds since the exchange or clearinghouse, as counterparty to such instruments, guarantees against a possible default. The clearinghouse stands between the buyer and the seller of the contract; therefore, the credit risk is limited to failure of the clearinghouse. While offset rights may exist under applicable law, the Funds do not have a contractual right of offset against a clearing broker or clearinghouse in the event of a default (including the bankruptcy or insolvency) of the clearing broker or clearinghouse. Additionally, credit risk exists in exchange-traded futures and centrally cleared swaps with respect to initial and variation margin that is held in a clearing broker’s customer accounts. While clearing brokers are required to segregate customer margin from their own assets, in the event that a clearing broker becomes insolvent or goes into bankruptcy and at that time there is a shortfall in the aggregate amount of margin held by the clearing
120
TCW Funds, Inc.
October 31, 2023
Note 2 — Significant Accounting Policies (Continued)
broker for all its clients, typically the shortfall would be allocated on a pro rata basis across all the clearing broker’s customers, potentially resulting in losses to the Funds.
For OTC derivatives, the Funds mitigate their counterparty risk by entering into an International Swaps and Derivatives Association, Inc. Master Agreement (“ISDA Master Agreement”) or similar agreement with each counterparty. An ISDA Master Agreement is a bilateral agreement between the Funds and a counterparty that governs OTC derivatives and typically contains, among other things, collateral posting terms and netting provisions in the event of a default and/or termination event. Under an ISDA Master Agreement, the Funds may, under certain circumstances, offset with the counterparty certain derivative financial instruments’ payables and/or receivables with collateral held and/or posted and create one single net payment. The provisions of the ISDA Master Agreement typically permit a single net payment in the event of default including the bankruptcy or insolvency of the counterparty. However, bankruptcy or insolvency laws of a particular jurisdiction may impose restrictions on or prohibitions against the right of offset in bankruptcy, insolvency or other events. In addition, certain ISDA Master Agreements allow counterparties to OTC derivatives to terminate derivative contracts prior to maturity in the event a Fund’s net assets declines by a stated percentage or a Fund fails to meet the terms of its ISDA Master Agreements, which would cause the Fund to accelerate payment of any net liability owed to the counterparty.
Collateral requirements: For derivatives traded under an ISDA Master Agreement, the collateral requirements are typically calculated by netting the mark-to- market amount for each transaction under such agreement and comparing that amount to the value of any collateral pledged or received by a Fund.
Cash collateral that has been pledged to cover obligations of a Fund is reported separately on the Statement of Assets and Liabilities. Non-cash collateral pledged by a Fund, if any, is noted in the Schedule of Investments. Generally, the amount of collateral due from or to a party has to exceed a minimum transfer amount threshold, typically $250,000 or $500,000, before a transfer is required, which is determined at the close of each business day and the collateral is transferred on the next business day. To the extent amounts due to a Fund from its counterparties are not fully collateralized, contractually or otherwise, the Fund bears the risk of loss from counterparty non-performance. The Funds attempt to mitigate counterparty risk by entering into agreements only with counterparties that the Advisor believes have the financial resources to honor their obligations and by monitoring the financial stability of those counterparties. For financial reporting purposes, the Funds do not offset derivative assets and derivative liabilities that are subject to netting arrangements in the Statement of Assets and Liabilities. The Funds have implemented the disclosure requirements pursuant to FASB Accounting Standards Update (“ASU”) No. 2011-11, Disclosures about Offsetting Assets and Liabilities that requires disclosures to make financial statements that are prepared under GAAP more comparable to those prepared under International Financial Reporting Standards.
Master Agreements and Netting Arrangements. Certain Funds are parties to various agreements, including but not limited to International Swaps and Derivatives Association Agreements and related Credit Support Annex, Master Repurchase Agreements, and Master Securities Forward Transactions Agreements (collectively “Master Agreements”), which govern the terms of certain transactions with select counterparties. These Master Agreements generally include provisions for general obligations, representations, agreements, collateral, and certain events of default or termination. These Master Agreements also include provisions for netting arrangements that help reduce credit and counterparty risk
121
TCW Funds, Inc.
Notes to Financial Statements (Continued)
Note 2 — Significant Accounting Policies (Continued)
associated with relevant transactions (“netting arrangements”). The netting arrangements are generally tied to credit-related events that, if triggered, would cause an event of default or termination giving a Fund or counterparty the right to terminate early and cause settlement, on a net basis, of all transactions under the applicable Master Agreement. In the event of an early termination as a result of an event of default under the Master Agreement, the total value exposure of all transactions will be offset against collateral exchanged to date, which would result in a net receivable or payable that would be due from or to the counterparty. However, bankruptcy or insolvency laws of a particular jurisdiction may impose restrictions on or prohibitions against the right of offset in the event of a bankruptcy or insolvency of the counterparty. Credit-related events include, but are not limited to, bankruptcy, failure to make timely payments, restructuring, obligation acceleration, obligation default, a material decline in net assets, decline in credit rating or repudiation/moratorium. Any election made by a counterparty to early terminate the transactions under a Master Agreement could have a material adverse impact on a Fund’s financial statements. A Fund’s overall exposure to credit risk, subject to netting arrangements can change substantially within a short period, as it is affected by each transaction subject to the arrangement.
Master Agreements can also help limit counterparty risk by specifying collateral posting arrangements at pre-arranged exposure levels. Under the Master Agreements, collateral is routinely transferred if the total net exposure to certain transactions under the relevant Master Agreement with a counterparty in a given Fund exceeds a specified threshold, net of collateral already in place, typically $250,000 or $500,000 depending on the counterparty and the type of Master Agreement. Collateral under the Master Agreements is usually in the form of cash or U.S. Treasury Bills but could include other types of securities. If permitted under the Master Agreement, certain funds may rehypothecate cash collateral received from a counterparty. The value of all derivative transactions outstanding under a Master Agreement is calculated daily to determine the amount of collateral to be received or pledged by the counterparty. Posting of collateral for OTC derivative transactions are covered under tri-party collateral agreements between the Fund, the Fund’s custodian, and each counterparty. Collateral for centrally cleared derivatives transactions are posted with the applicable derivatives clearing organization.
The following table presents TCW Core Fixed Income Fund’s OTC derivative assets by counterparty net of amounts available for offset under an ISDA Master Agreement or similar agreements and net of the related collateral received or pledged by the Fund as of October 31, 2023:
| | | | | | | | | | | | | | | | |
Counterparty | | Gross Derivative
Assets
in the Statetment of
Assets and
Liabilities | | | Collateral
Received (1) | | | Derivative Assets
(Liabilities) Available
for Offset | | | Net Amount
of Derivative
Assets (2) | |
Citibank N.A. Foreign Currency Exchange Contracts | | $ | 4,002 | | | $ | — | | | $ | (4,002 | ) | | $ | — | |
Goldman Sachs & Co. Foreign Currency Exchange Contracts | | | 717 | | | | — | | | | (717 | ) | | | — | |
| | | | | | | | | | | | | | | | |
Total | | $ | 4,719 | | | $ | — | | | $ | (4,719 | ) | | $ | — | |
| | | | | | | | | | | | | | | | |
| (1) | Excess of collateral received for individual counterparty may not be shown for financial reporting purposes. |
| (2) | Represents the net amount receivable from the counterparty in the event of default. |
122
TCW Funds, Inc.
October 31, 2023
Note 2 — Significant Accounting Policies (Continued)
The following table presents TCW Core Fixed Income Fund’s OTC derivative liabilities by counterparty net of amounts available for offset under an ISDA Master Agreement or similar agreements and net of the related collateral received or pledged by the Fund as of October 31, 2023:
| | | | | | | | | | | | | | | | |
Counterparty | | Gross Derivative
Liabilities
in the Statetment of
Assets and
Liabilities | | | Collateral
Pledged (1) | | | Derivative (Assets)
Liabilities Available
for Offset | | | Net Amount
of Derivative
Liabilities (2) | |
Citibank N.A. Foreign Currency Exchange Contracts | | $ | 46,629 | | | $ | (42,627 | ) | | $ | (4,002 | ) | | $ | — | |
Goldman Sachs & Co. Foreign Currency Exchange Contracts | | | 735 | | | | — | | | | (717 | ) | | | 18 | |
| | | | | | | | | | | | | | | | |
Total | | $ | 47,364 | | | $ | (42,627 | ) | | $ | (4,719 | ) | | $ | 18 | |
| | | | | | | | | | | | | | | | |
| (1) | Excess of collateral pledged for individual counterparty may not be shown for financial reporting purposes. |
| (2) | Represents the net amount payable to the counterparty in the event of default. |
The following table presents TCW Enhanced Commodity Strategy Fund’s OTC derivative liabilities by counterparty net of amounts available for offset under an ISDA Master Agreement or similar agreements and net of the related collateral received or pledged by the Fund as of October 31, 2023:
| | | | | | | | | | | | | | | | |
Counterparty | | Gross Derivative
Liabilities
in the Statetment of
Assets and
Liabilities | | | Collateral
Pledged (1) | | | Derivative (Assets)
Liabilities Available
for Offset | | | Net Amount
of Derivative
Liabilities (2) | |
Citigroup Total Return Swaps | | $ | 272,990 | | | $ | (272,990 | ) | | $ | — | | | $ | — | |
| | | | | | | | | | | | | | | | |
Total | | $ | 272,990 | | | $ | (272,990 | ) | | $ | — | | | $ | — | |
| | | | | | | | | | | | | | | | |
| (1) | Excess of collateral pledged for individual counterparty may not be shown for financial reporting purposes. |
| (2) | Represents the net amount payable to the counterparty in the event of default. |
The following table presents TCW Global Bond Fund’s OTC derivative assets by counterparty net of amounts available for offset under an ISDA Master Agreement or similar agreements and net of the related collateral received or pledged by the Fund as of October 31, 2023:
| | | | | | | | | | | | | | | | |
Counterparty | | Gross Derivative
Assets
in the Statetment of
Assets and
Liabilities | | | Collateral
Received (1) | | | Derivative Assets
(Liabilities) Available
for Offset | | | Net Amount
of Derivative
Assets (2) | |
Citibank N.A. Foreign Currency Exchange Contracts | | $ | 10,095 | | | $ | — | | | $ | (6,886 | ) | | $ | 3,209 | |
Goldman Sachs & Co. Foreign Currency Exchange Contracts | | | 23,240 | | | | — | | | | (2,538 | ) | | | 20,702 | |
Goldman Sachs & Co. Purchased Options | | | 714 | | | | — | | | | — | | | | 714 | |
State Street Bank & Trust Co. Foreign Currency Exchange Contracts | | | 725 | | | | — | | | | (725 | ) | | | — | |
| | | | | | | | | | | | | | | | |
Total | | $ | 34,774 | | | $ | — | | | $ | (10,149 | ) | | $ | 24,625 | |
| | | | | | | | | | | | | | | | |
| (1) | Excess of collateral received for individual counterparty may not be shown for financial reporting purposes. |
| (2) | Represents the net amount receivable from the counterparty in the event of default. |
123
TCW Funds, Inc.
Notes to Financial Statements (Continued)
Note 2 — Significant Accounting Policies (Continued)
The following table presents TCW Global Bond Fund’s OTC derivative liabilities by counterparty net of amounts available for offset under an ISDA Master Agreement or similar agreements and net of the related collateral received or pledged by the Fund as of October 31, 2023
| | | | | | | | | | | | | | | | |
Counterparty | | Gross Derivative
Liabilities
in the Statetment of
Assets and
Liabilities | | | Collateral
Received (1) | | | Derivative (Assets)
Liabilities Available
for Offset | | | Net Amount
of Derivative
Assets (2) | |
Citibank N.A. Foreign Currency Exchange Contracts | | $ | 6,886 | | | $ | — | | | $ | (6,886 | ) | | $ | — | |
Goldman Sachs & Co. Foreign Currency Exchange Contracts | | | 2,538 | | | | — | | | | (2,538 | ) | | | — | |
Goldman Sachs & Co. Written Options | | | 215 | | | | — | | | | — | | | | 215 | |
State Street Bank & Trust Co. Foreign Currency Exchange Contracts | | | 33,328 | | | | — | | | | (725 | ) | | | 32,603 | |
| | | | | | | | | | | | | | | | |
Total | | $ | 42,967 | | | $ | — | | | $ | (10,149 | ) | | $ | 32,818 | |
| | | | | | | | | | | | | | | | |
| (1) | Excess of collateral received for individual counterparty may not be shown for financial reporting purposes. |
| (2) | Represents the net amount receivable from the counterparty in the event of default. |
The following table presents TCW High Yield Bond Fund’s OTC derivative assets by counterparty net of amounts available for offset under an ISDA Master Agreement or similar agreements and net of the related collateral received or pledged by the Fund as of October 31, 2023
| | | | | | | | | | | | | | | | |
Counterparty | | Gross Derivative
Assets
in the Statetment of
Assets and
Liabilities | | | Collateral
Received (1) | | | Derivative Assets
(Liabilities) Available
for Offset | | | Net Amount
of Derivative
Assets (2) | |
Citibank N.A. | | | | | | | | | | | | | | | | |
Foreign Currency Exchange Contracts | | $ | 96 | | | $ | — | | | $ | (96 | ) | | $ | — | |
| | | | | | | | | | | | | | | | |
Total | | $ | 96 | | | $ | — | | | $ | (96 | ) | | $ | — | |
| | | | | | | | | | | | | | | | |
| (1) | Excess of collateral received for individual counterparty may not be shown for financial reporting purposes. |
| (2) | Represents the net amount receivable from the counterparty in the event of default. |
The following table presents TCW High Yield Bond Fund’s OTC derivative liabilities by counterparty net of amounts available for offset under an ISDA Master Agreement or similar agreements and net of the related collateral received or pledged by the Fund as of October 31, 2023
| | | | | | | | | | | | | | | | |
Counterparty | | Gross Derivative
Liabilities
in the Statetment of
Assets and
Liabilities | | | Collateral
Pledged (1) | | | Derivative (Assets)
Liabilities Available
for Offset | | | Net Amount
of Derivative
Liabilities (2) | |
Citibank N.A. | | | | | | | | | | | | | | | | |
Foreign Currency Exchange Contracts | | $ | 1,206 | | | $ | (1,110 | ) | | $ | (96 | ) | | $ | — | |
| | | | | | | | | | | | | | | | |
Total | | $ | 1,206 | | | $ | (1,110 | ) | | $ | (96 | ) | | $ | — | |
| | | | | | | | | | | | | | | | |
| (1) | Excess of collateral pledged for individual counterparty may not be shown for financial reporting purposes. |
| (2) | Represents the net amount payable to the counterparty in the event of default. |
124
TCW Funds, Inc.
October 31, 2023
Note 2 — Significant Accounting Policies (Continued)
The following table presents TCW Total Return Bond Fund’s OTC derivative assets by counterparty net of amounts available for offset under an ISDA Master Agreement or similar agreements and net of the related collateral received or pledged by the Fund as of October 31, 2023
| | | | | | | | | | | | | | | | |
Counterparty | | Gross Derivative
Assets
in the Statetment of
Assets and
Liabilities | | | Collateral
Received (1) | | | Derivative Assets
(Liabilities) Available
for Offset | | | Net Amount
of Derivative
Assets (2) | |
Citibank N.A. | | | | | | | | | | | | | | | | |
Foreign Currency Exchange Contracts | | $ | 25,650 | | | $ | — | | | $ | (24,493 | ) | | $ | 1,157 | |
| | | | | | | | | | | | | | | | |
Total | | $ | 25,650 | | | $ | — | | | $ | (24,493 | ) | | $ | 1,157 | |
| | | | | | | | | | | | | | | | |
| (1) | Excess of collateral received for individual counterparty may not be shown for financial reporting purposes. |
| (2) | Represents the net amount receivable from the counterparty in the event of default. |
The following table presents TCW Total Return Bond Fund’s OTC derivative liabilities by counterparty net of amounts available for offset under an ISDA Master Agreement or similar agreements and net of the related collateral received or pledged by the Fund as of October 31, 2023
| | | | | | | | | | | | | | | | |
Counterparty | | Gross Derivative
Liabilities
in the Statetment of
Assets and
Liabilities | | | Collateral
Pledged (1) | | | Derivative (Assets)
Liabilities Available
for Offset | | | Net Amount
of Derivative
Liabilities (2) | |
Citibank N.A. | | | | | | | | | | | | | | | | |
Foreign Currency Exchange Contracts | | $ | 24,493 | | | $ | — | | | $ | (24,493 | ) | | $ | — | |
| | | | | | | | | | | | | | | | |
Total | | $ | 24,493 | | | $ | — | | | $ | (24,493 | ) | | $ | — | |
| | | | | | | | | | | | | | | | |
| (1) | Excess of collateral pledged for individual counterparty may not be shown for financial reporting purposes. |
| (2) | Represents the net amount payable to the counterparty in the event of default. |
Note 3 — Portfolio Investments
Mortgage-Backed Securities: The Funds may invest in MBS which represent interests in pools of mortgages in which payments of both principal and interest on the securities are generally made monthly, in effect “passing through” monthly payments made by borrowers on the residential or commercial mortgage loans which underlie the securities (net of any fees paid to the issuer or guarantor of the securities). Mortgage pass-through securities differ from other forms of debt securities which normally provide for periodic payment of interest in fixed amounts with principal payments at maturity or specified call dates. The Funds may also invest in Collateralized Mortgage Obligations (“CMOs”). CMOs are debt obligations collateralized by residential or commercial mortgage loans or residential or commercial mortgage pass-through securities. Interest and principal are generally paid monthly. CMOs may be collateralized by whole mortgage loans or private mortgage pass-through securities but are more typically collateralized by portfolios of mortgage pass-through securities guaranteed by Ginnie Mae, Freddie Mac or Fannie Mae. The issuer of a series of CMOs may elect to be treated for tax purposes as a Real Estate Mortgage Investment Conduit. CMOs are structured into multiple classes, each bearing a different stated maturity. Monthly payment of principal received from the pool of underlying mortgages, including prepayments, is first returned to investors holding the shortest maturity class. Investors holding the longer maturity classes usually receive principal only after shorter classes have been retired. An investor may be partially protected against a sooner than desired return of principal because of the sequential payments.
125
TCW Funds, Inc.
Notes to Financial Statements (Continued)
Note 3 — Portfolio Investments (Continued)
The Funds may invest in stripped MBS. Stripped MBS are usually structured with two classes that receive different proportions of the interest and principal distributions on a pool of mortgage assets. In certain cases, one class will receive all of the interest (the interest only or “IO” class), while the other class will receive all of the principal (the principal only or “PO” class). The yield to maturity on IOs is sensitive to the rate of principal repayments (including prepayments) on the related underlying mortgage assets, and principal payments may have a material effect on yield to maturity. If the underlying mortgage assets experience greater than anticipated prepayments of principal, a Fund may not fully recoup its initial investment in IOs.
Inflation-Indexed Bonds: The Funds may invest in inflation-indexed bonds, which are fixed income securities whose principal value or coupon is periodically adjusted according to the rate of inflation. Any increase or decrease in the principal amount of an inflation-indexed bond will be included as interest income.
Inflation-indexed securities issued by the U.S. Treasury have maturities of five, ten, twenty, or thirty years, although it is possible that securities with other maturities will be issued in the future. The U.S. Treasury securities pay interest on a semi-annual basis, equal to a fixed percentage of the inflation-adjusted principal amount.
If the periodic adjustment rate measuring inflation falls, the principal value of inflation-indexed bonds will be adjusted downward, and consequently the interest payable on these securities (calculated with respect to a smaller principal amount) will be reduced. Repayment of the original bond principal upon maturity (as adjusted for inflation) is guaranteed in the case of U.S. Treasury inflation-indexed bonds, even during a period of deflation. However, the current market value of the bonds is not guaranteed, and will fluctuate. The Funds may also invest in other inflation- related bonds which may or may not provide a similar guarantee. If a guarantee of principal is not provided, the adjusted principal value of the bond repaid at maturity may be less than the original principal.
The value of inflation-indexed bonds is expected to change in response to changes in real interest rates. Real interest rates in turn are tied to the relationship between nominal interest rates and the rate of inflation. Therefore, if inflation were to rise at a faster rate than nominal interest rates, real interest rates might decline, leading to an increase in value of inflation-indexed bonds. In contrast, if nominal interest rates increased at a faster rate than inflation, real interest rates might rise, leading to a decrease in value of inflation-indexed bonds.
While the values of these securities are expected to be protected from long-term inflationary trends, short-term increases in inflation may lead to declines in values. If interest rates rise due to reasons other than inflation (for example, due to changes in currency exchange rates), investors in these securities may not be protected to the extent that the increase is not reflected in the bond’s inflation measure.
When-Issued, Delayed-Delivery, To Be Announced (“TBA”) and Forward Commitment Transactions: The Funds may enter into when-issued, delayed-delivery, TBA or forward commitment transactions in order to lock in the purchase price of the underlying security or to adjust the interest rate exposure of each Fund’s existing portfolio. In when-issued, delayed-delivery, TBA or forward commitment transactions, a Fund commits to purchase or sell particular securities, with payment and delivery to take place at a future date. Although the Fund does not pay for the securities or start earning interest on them until they are delivered, it immediately assumes the risks of ownership, including the risk of price fluctuation. If a Fund’s
126
TCW Funds, Inc.
October 31, 2023
Note 3 — Portfolio Investments (Continued)
counterparty fails to deliver a security purchased on a when-issued, delayed-delivery, TBA or forward commitment basis, there may be a loss, and the Fund may have missed an opportunity to make an alternative investment.
Prior to settlement of these transactions, the value of the subject securities will fluctuate with market conditions. In addition, because the Fund is not required to pay for when-issued, delayed-delivery, TBA or forward commitment securities until the delivery date, they may result in a form of leverage to the extent the Fund does not set aside liquid assets to cover the commitment. To guard against this deemed leverage, the Fund monitors the obligations under these transactions on a daily basis and ensures that the Fund has sufficient liquid assets to cover them.
Dollar Roll Transactions: The Funds may enter into dollar roll transactions with financial institutions to take advantage of opportunities in the MBS market. A dollar roll transaction involves a simultaneous sale of securities by a Fund with an agreement to repurchase substantially similar securities at an agreed upon price and date, but generally will be collateralized at time of delivery by different pools of mortgages with different prepayment histories than those securities sold. These transactions are accounted for as financing transactions as opposed to sales and purchases. The differential between the sale price and the repurchase price is recorded as deferred income and recognized between the settlement dates of the sale and repurchase. During the period between the sale and repurchase, a Fund will not be entitled to receive interest and principal payments on the securities sold. Dollar roll transactions involve risk that the market value of the security sold by a Fund may decline below the repurchase price of the security and the counterparties may potentially be unable to complete the transaction. There were no such transactions by the Funds for the year ended October 31, 2023.
Repurchase Agreements: The Funds may enter into repurchase agreements under the terms of a Master Repurchase Agreement (“MRA”). In a repurchase agreement, the Funds purchase a security from a counterparty who agrees to repurchase the same security at a mutually agreed upon date and price. The MRA permits each Fund, under certain circumstances including an event of default (such as bankruptcy or insolvency), to offset payables and/or receivables under the MRA with collateral held and/or posted to the counterparty and create one single net payment due to or from each Fund. However, bankruptcy or insolvency laws of a particular jurisdiction may impose restrictions on or prohibitions against such a right of offset in the event of the MRA counterparty’s bankruptcy or insolvency. Pursuant to the terms of the MRA, each Fund receives securities as collateral with a market value in excess of the repurchase price. Upon a bankruptcy or insolvency of the MRA counterparty, the Fund recognizes a liability with respect to such excess collateral to reflect the Fund’s obligation under bankruptcy law to return the excess to the counterparty. There were no repurchase agreements outstanding as of October 31, 2023.
Reverse Repurchase Agreements: The Funds may enter into reverse repurchase agreements. Under a reverse repurchase agreement, a Fund sells portfolio assets subject to an agreement by the Fund to repurchase the same assets at an agreed upon price and date. The Funds may utilize reverse repurchase agreements when it is anticipated that the interest income to be earned from the investment of the proceeds of the transaction is greater than the interest expense of the transaction. During the term of the reverse repurchase agreement, the Funds continue to receive the principal and interest payments on the securities sold. There were no reverse repurchase agreements outstanding during the year ended October 31, 2023.
127
TCW Funds, Inc.
Notes to Financial Statements (Continued)
Note 3 — Portfolio Investments (Continued)
Securities Lending: The Funds may lend their securities to qualified brokers. The loans must be collateralized at all times primarily with cash although the Funds can accept money market instruments or U.S. Government securities with a market value at least equal to the market value of the securities on loan. As with any extensions of credit, the Funds may bear the risk of delay in recovery or even loss of rights in the collateral if the borrowers of the securities fail financially. The Funds earn additional income for lending their securities by investing the cash collateral in short-term investments. The Funds did not lend any securities during the year ended October 31, 2023.
Derivatives:
Forward Currency Exchange Contracts: The Funds enter into forward currency exchange contracts as a hedge against fluctuations in foreign exchange rates. Forward currency exchange contracts are marked-to-market daily and the change in market value is recorded by the Funds as unrealized gains or losses in the Statement of Assets and Liabilities. When a contract is closed or delivery is taken, a Fund records a realized gain or loss equal to the difference between the value of the contract at the time it was opened and the value at the time it was closed. Risks may arise upon entering into these contracts from the potential inability of counterparties to meet the terms of their contracts and from unanticipated movements in the value of the foreign currency relative to the U.S. dollar. The TCW Core Fixed Income Fund, the TCW Global Bond Fund, the TCW Short Term Bond Fund, and the TCW Total Return Bond Fund entered into forward currency exchange contracts during the year ended October 31, 2023 to hedge against the foreign currency exposure within the Funds. Outstanding forward currency exchange contracts at October 31, 2023 are disclosed in the Schedule of Investments.
Futures Contracts: The Funds may enter into futures contracts. A Fund may seek to manage a variety of different risks through the use of futures contracts, such as interest rate risk, equity price risk, and currency risk. A Fund may use index futures to hedge against broad market risks to its portfolio or to gain broad market exposure. Securities index futures contracts are contracts to buy or sell units of a securities index at a specified future date at a price agreed upon when the contract is made, and are settled in cash. Positions in futures may be closed out only on an exchange or board of trade which provides a secondary market for such futures. Because futures contracts are exchange-traded, they typically have minimal exposure to counterparty risk. Parties to a futures contract are not required to post the entire notional amount of the contract, but rather a small percentage of that amount (by way of margin), both at the time they enter into futures transactions, and then on a daily basis if their positions decline in value; as a result, futures contracts are highly leveraged. Such payments are known as variation margin and are recorded by a Fund as unrealized gains or losses. Because futures markets are highly leveraged, they can be extremely volatile, and there can be no assurance that the pricing of a futures contract will correlate precisely with the pricing of the asset or index underlying it or the asset or liability of a Fund that is the subject of the hedge. It may not always be possible for a Fund to enter into a closing transaction with respect to a futures contract it has entered into at a favorable time or price. When a Fund enters into a futures transaction, it is subject to the risk that the value of the futures contract will move in a direction unfavorable to it.
When a Fund uses futures contracts for hedging purposes, it is likely that the Fund will have an asset or liability that will offset any loss (or gain) on the transactions, at least in part. When a futures contract is closed, the Fund records a realized gain or loss equal to the difference between the value of the contract at the time it was opened and the value at the time it was closed. The TCW Core Fixed Income Fund, the TCW Global Bond Fund, the TCW High Yield Bond Fund, the TCW Short Term Bond Fund, and the TCW Total
128
TCW Funds, Inc.
October 31, 2023
Note 3 — Portfolio Investments (Continued)
Return Bond Fund utilized futures during the year ended October 31, 2023 to help manage interest rate duration of those Funds. Futures contracts outstanding at October 31, 2023 are listed on the Schedule of Investments.
Options: The Funds may purchase and sell put and call options on a security or an index of securities to enhance investment performance and/or to protect against changes in market prices. The Funds may also enter into currency options to hedge against or to take advantage of currency fluctuations.
A call option gives the holder the right to purchase, and obligates the writer to sell, a security at the strike price at any time before the expiration date. A put option gives the holder the right to sell, and obligates the writer to buy, a security at the exercise price at any time before the expiration date. A Fund may purchase put options to protect portfolio holdings against a decline in market value of a security or securities held by it. A Fund may also purchase a put option hoping to profit from an anticipated decline in the value of the underlying security. If a Fund holds the security underlying the option, the option premium and any transaction costs will reduce any profit the Fund might have realized had it sold the underlying security instead of buying the put option. A Fund may purchase call options to hedge against an increase in the price of securities that the Fund ultimately wants to buy. A Fund may also purchase a call option as a long directional investment hoping to profit from an anticipated increase in the value of the underlying security. In order for a call option to be profitable, the market price of the underlying security must rise sufficiently above the exercise price to cover the premium and transaction costs. These costs will reduce any profit a Fund might have realized had it bought the underlying security at the time it purchased the call option.
Purchasing foreign currency options gives a Fund the right, but not the obligation, to buy or sell specified amounts of currency at a rate of exchange that may be exercised by a certain date. These currency options may be used as a short or long hedge against possible variations in foreign exchange rates or to gain exposure to foreign currencies.
When a Fund purchases an option, it runs the risk that it will lose its entire investment in the option in a relatively short period of time, unless the Fund exercises the option or enters into a closing sale transaction before the option’s expiration. If the price of the underlying security does not rise (in the case of a call) or fall (in the case of a put) to an extent sufficient to cover the option premium and transaction costs, the Fund will lose part or all of its investment in the option. Premiums paid for purchasing options that expire are treated as realized losses.
Options purchased or sold by a Fund may be traded on a securities or options exchange. Such options typically have minimal exposure to counterparty risk. However, an exchange or market may at times find it necessary to impose restrictions on particular types of options transactions, such as opening transactions. If an underlying security ceases to meet qualifications imposed by an exchange or the Options Clearing Corporation, new series of options on that security will no longer be opened to replace the expiring series, and opening transactions in existing series may be prohibited.
OTC options are options not traded on exchanges or backed by clearinghouses. Rather, they are entered into directly between a Fund and the counterparty to the option. In the case of an OTC option purchased by a Fund, the value of the option to the Fund will depend on the willingness and ability of the option writer to perform its obligations to the Fund. In addition, OTC options may not be transferable and there may be little or no secondary market for them, so they may be considered illiquid. It may not be possible to enter into closing transactions with respect to OTC options or otherwise to terminate such options, and as a result a Fund may be required to remain obligated on an unfavorable OTC option until its expiration.
129
TCW Funds, Inc.
Notes to Financial Statements (Continued)
Note 3 — Portfolio Investments (Continued)
Swap Agreements: The Funds may enter into swap agreements. Swap agreements are typically two-party contracts entered into primarily by institutional investors. In a standard “swap” transaction, two parties agree to exchange the returns (or differentials in rates of return) earned or realized on particular predetermined investments or instruments, which may be adjusted for an interest factor. The gross returns to be exchanged or “swapped” between the parties are generally calculated with respect to a “notional amount” (i.e., the return on or increase in value of a particular dollar amount invested at a particular interest rate or in a “basket” of securities representing a particular index).
In a total return swap, one party typically agrees to pay to the other a short-term interest rate in return for a payment at one or more times in the future based on the increase in the value of an underlying security or other asset, or index of securities or assets; if the underlying security, asset, or index declines in value, the party that pays the short-term interest rate must also pay to its counterparty a payment based on the amount of the decline. A Fund may take either side of such a swap, and so may take a long or short position in the underlying security, asset, or index. A Fund may enter into a total return swap to hedge against an exposure in its portfolio — such as interest rate risk (including to adjust the duration or credit quality of a Fund’s bond portfolio), equity risk, or credit risk — or generally to put cash to work efficiently in the markets in anticipation of, or as a replacement for, cash investments. A Fund may also enter into a total return swap to gain exposure to securities or markets in which it might not be able to invest directly (in so-called market access transactions).
Interest rate swaps are agreements in which one party pays a floating rate of interest on a notional principal amount and receives a fixed rate of interest on the same notional principal amount for a specified period of time. Alternatively, a party may pay a fixed rate and receive a floating rate. In more complex swaps, the notional principal amount may decline (or amortize) over time. A Fund’s maximum risk of loss due to counterparty default is the discounted NAV of the cash flows paid to/received from the counterparty over the interest rate swap’s remaining life.
The Funds may write (sell) and purchase put and call swaptions. Swaption contracts written by the Funds represent an option that gives the purchaser the right, but not the obligation, to enter into a new swap agreement, or to shorten, extend, cancel or modify an existing swap agreement, on a future date on specified terms. See “Swap Agreements” below. Depending on the terms of the particular option agreement, a Fund will generally incur a greater degree of risk when it writes a swaption than it will incur when it purchases a swaption. When a Fund purchases a swaption, it risks losing only the amount of the premium it has paid should it decide to let the option expire unexercised. However, when a Fund writes a swaption, upon exercise of the option the Fund will become obligated according to the terms of the underlying agreement. During the year ended October 31, 2023, none of the Funds held written swaptions.
A Fund may enter into credit default swap transactions as a “buyer” or “seller” of credit protection. In a credit default swap, one party provides what is in effect insurance against a default or other adverse credit event affecting an issuer of debt securities (typically referred to as a “reference entity”). In general, the buyer of credit protection is obligated to pay the protection seller an upfront amount or a periodic stream of payments over the term of the swap. If a “credit event” occurs, the buyer has the right to deliver to the seller bonds (or other obligations of the reference entity with a value up to the full notional value of the swap), and to receive a payment equal to the par value of the bonds or other obligations. Credit events that would trigger a request that the seller make payment are specific to each credit default swap agreement, but generally include bankruptcy, failure to pay, restructuring, obligation acceleration, obligation default, or
130
TCW Funds, Inc.
October 31, 2023
Note 3 — Portfolio Investments (Continued)
repudiation/moratorium. When a Fund buys protection, it may or may not own securities of the reference entity. When a Fund sells protection under a credit default swap, the position may have the effect of creating leverage in the Fund’s portfolio through the Fund’s indirect long exposure to the issuer or securities on which the swap is written. When a Fund sells protection, it may do so either to earn additional income or to create such a “synthetic” long position.
Whenever a Fund enters into a swap agreement, it takes on counterparty risk — the risk that its counterparty will be unable or unwilling to meet its obligations under the swap agreement. A Fund also takes the risk that the market will move against its position in the swap agreement. In the case of a total return swap, the swap will change in value depending on the change in value of the asset or index on which the swap is written. When a Fund enters into any type of swap for hedging purposes, it is likely that the Fund will have an asset or liability that will offset any loss (or gain) on the swap, at least in part. Swap agreements may be non-transferable or otherwise highly illiquid, and a Fund may not be able to terminate or transfer a swap agreement at any particular time or at an acceptable price.
During the term of a swap transaction, changes in the value of the swap are recognized as unrealized gains or losses by marking-to-market to reflect the market value of the swap. When the swap is terminated, a Fund will record a realized gain or loss equal to the difference, if any, between the proceeds from (or cost of) the closing transaction and the Fund’s basis in the agreement. Upfront swap premium payments paid or received by a Fund, if any, are recorded within the value of the open swap agreement on the Fund’s Statement of Assets and Liabilities and represent payments paid or received upon entering into the swap agreement to compensate for differences between stated terms of the swap agreement and prevailing market conditions (credit spreads, currency exchange rates, and other relevant factors). These upfront payments are recorded as realized gains or losses on each Fund’s Statement of Operations upon termination or maturity of the swap agreement.
During the term of a swap transaction, the periodic net payments can be made for a set period of time or may be triggered by a predetermined credit event. The net periodic payments may be based on a fixed or variable interest rate, the change in market value of a specified security, basket of securities or index, or the return generated by a security. These periodic payments received or made by the Funds are recorded as realized gains and losses, respectively. During the year ended October 31, 2023, the TCW Core Fixed Income Fund and the TCW Global Bond Fund entered into interest rate swaps to manage duration, the yield curve or interest rate risk by economically hedging the value of the fixed rate bonds which may decrease when interest rates rise (interest rate risk); the TCW Enhanced Commodity Strategy Fund used total return swap agreements to gain exposure to the commodity market.
Note 4 — Risk Considerations
Market Risk: The Funds’ investments will fluctuate with market conditions, and so will the value of your investment in the Funds. You could lose money on your investment in the Funds or the Funds could underperform other investments.
Liquidity Risk: The Funds’ investments in illiquid securities may reduce the returns of the Funds because they may not be able to sell the illiquid securities at an advantageous time or price. Investments in high-yield securities, foreign securities, derivatives or other securities with substantial market and/or credit risk tend to have the greatest exposure to liquidity risk. Certain investments in private placements and Rule 144A securities may be considered illiquid investments. The Funds may invest in private placements and Rule 144A securities.
131
TCW Funds, Inc.
Notes to Financial Statements (Continued)
Note 4 — Risk Considerations (Continued)
Interest Rate Risk: The values of the Funds’ investments fluctuate in response to movements in interest rates. If rates rise, the values of debt securities generally fall. The longer the average duration of a Fund’s investment portfolio, the greater the change in value.
Mortgage-Backed Securities Risk: Each Fund may invest in mortgage-backed securities. The values of some mortgage-backed securities may expose a Fund to a lower rate of return upon reinvestment of principal. When interest rates rise, the value of mortgage-related securities generally will decline; however, when interest rates are declining, the value of mortgage-related securities with prepayment features may not increase as much as other fixed-income securities. The rate of prepayments on underlying mortgages will affect the price and volatility of a mortgage-related security, and may shorten or extend the effective maturity of the security beyond what was anticipated at the time of purchase. The value of these securities may fluctuate in response to the market’s perception of the creditworthiness of the issuers. Additionally, although mortgages and mortgage-related securities are generally supported by some form of government or private guarantee and/or insurance, there is no assurance that private guarantors or insurers will meet their obligations.
Derivatives Risk: Use of derivatives, which at times is an important part of the Funds’ investment strategies, involves risks different from, or possibly greater than, the risks associated with investing directly in securities and other traditional investments. Investments in derivatives could cause the Funds to lose more than the principal amount invested. Also, suitable derivative transactions may not be available in all circumstances and there can be no assurance that the Funds will achieve their objective through the use of the derivatives.
Credit Risk: The values of any of the Funds’ investments may also decline in response to events affecting the issuer or its credit rating. The lower-rated debt securities in which a Fund may invest are considered speculative and are subject to greater volatility and risk of loss than investment-grade securities, particularly in deteriorating economic conditions. The value of some mortgage-related securities in which the Funds invest also may fall because of unanticipated levels of principal prepayments that can occur when interest rates decline. Certain Funds invest a material portion of their assets in securities of issuers that hold mortgage- and asset-backed securities and direct investments in securities backed by commercial and residential mortgage loans and other financial assets. The value and related income of these securities are sensitive to changes in economic conditions, including delinquencies and/or defaults. Continuing shifts in the market’s perception of credit quality on securities backed by commercial and residential mortgage loans and other financial assets may result in increased volatility of market price and periods of illiquidity that can negatively impact the valuation of certain issuers held by the Funds.
MBS and ABS are characterized and classified in a variety of different ways. These classifications include a view of the securities’ cash flow structure (pass-through, sequential pay, prepayment-protected, interest only, principal only, etc.), the security of the claim on the underlying assets (senior, mezzanine and subordinated), as well as types of underlying collateral (prime conforming loans, prime non-conforming loans, Alt-A loans, subprime loans, commercial loans, etc.). In many cases, the classification incorporates a degree of subjectivity: a particular loan might be categorized as “prime” by the underwriting standards of one mortgage issuer while another might classify the loan as “subprime.” In addition to other functions, the risk associated with an investment in a mortgage loan must take into account the nature of the collateral, the form and the level of credit enhancement, the vintage of the loan, the geography of the loan, the purpose of the loan (refinance versus purchase versus equity takeout), the borrower’s credit quality (e.g., FICO score), and whether the loan is a first trust deed or a second lien.
132
TCW Funds, Inc.
October 31, 2023
Note 4 — Risk Considerations (Continued)
Counterparty Risk: The Funds may be exposed to counterparty risk, the risk that an entity with which the Funds have unsettled or open transactions may not fulfill its obligations.
Commodities Risk: The TCW Enhanced Commodity Strategy Fund has exposure to commodity markets through its investments in total return swap agreements. Therefore, the price of its shares is affected by factors particular to the commodity markets and may decline and fluctuate more than the price of shares of a fund with a broader range of investments. Commodity prices can be extremely volatile and are affected by many factors, including changes in overall market movements, real or perceived inflationary trends, commodity index volatility, changes in interest rates or currency exchange rates, population growth and changing demographics, nationalization, expropriation, or other confiscation, international regulatory, political and economic developments (e.g., regime changes and changes in economic activity levels), and developments affecting a particular industry or commodity, such as drought, floods or other weather conditions, livestock disease, trade embargoes, competition from substitute products, transportation bottlenecks or shortages, fluctuations in supply and demand, and tariffs.
Foreign Currency Risk: The Funds may be exposed to the risk that the value of the Funds’ investments denominated in foreign currencies will decline in value because the foreign currencies have declined in value relative to the U.S. dollar.
Foreign Investing Risk: The Funds may be exposed to the risk that the Funds’ share prices will fluctuate with market conditions, currency exchange rates and the economic and political climates in countries where the Funds invest.
Investment Style Risk: Certain Funds may also be subject to investment style risk. The Advisor’s investment styles may be out of favor at times or may not produce the best results over short or longer time periods and may increase the volatility of a Fund’s share price.
LIBOR Risk: The London Interbank Offered Rate (“LIBOR”) was a leading benchmark or reference rate for various commercial and financial contracts, including corporate and municipal bonds, bank loans, asset-backed and mortgage-related securities, interest rate swaps and other derivatives. In July 2017, the United Kingdom’s Financial Conduct Authority (FCA), which regulates LIBOR, announced the gradual phase out of the LIBOR rate, with nearly all LIBOR rate publications having ceased as of June 30, 2023 (some LIBOR rates continue to be published, but only on a temporary and synthetic basis). Alternatives to LIBOR have been established and others may be developed. The U.S. Federal Reserve, in conjunction with the Alternative Reference Rates Committee, a steering committee comprised of large U.S. financial institutions, has identified the Secured Overnight Financial Rate (SOFR) as the preferred alternative rate to LIBOR. SOFR is a relatively new index calculated by short-term repurchase agreements, backed by Treasury securities. There remains uncertainty surrounding the nature of any replacement rates. The transition to a new reference rate may result in (i) increased volatility or illiquidity in markets for instruments or contracts that previously relied on or still rely on LIBOR, (ii) a reduction in the value of certain instruments or contracts held by a Fund, (iii) reduced effectiveness of related Fund transactions, such as hedging, (iv) additional tax, accounting and regulatory risks, or (v) costs incurred in connection with closing out positions and entering into new trades. Any pricing adjustments to a Fund’s investments resulting from a substitute reference rate may also adversely affect a Fund’s performance and/or NAV. There is no assurance that the composition or characteristics of any such alternative reference rate will be similar to or produce the same value or economic equivalence as LIBOR or that instruments or contracts using an alternative rate will have the same volume or liquidity.
133
TCW Funds, Inc.
Notes to Financial Statements (Continued)
Note 4 — Risk Considerations (Continued)
Bank Loan Risk: There is a risk of investing in corporate loans made by commercial banks and other financial institutions or institutional investors to companies that need capital to grow or restructure, which includes interest rate risk, liquidity risk and prepayment risk. A Fund may also be subject to the credit risk of other financial institutions and the risks associated with insufficient collateral securing a bank loan, limited available public information about a bank loan, delayed settlement, and less protection for holders of bank loans as compared to holders of registered securities. Bank loans are not registered and otherwise may not be treated as securities under the federal securities laws, meaning investors in loans have less protection against improper practices than investors in securities that are registered under or are otherwise subject to the protections of the securities laws.
For more information on risks related to investing in the Funds, please refer to the Funds’ prospectus and the Statement of Additional Information which can be obtained on the Funds’ website (www.tcw.com) or by calling customer service at 800-FUND-TCW (800-386-3829).
Note 5 — Federal Income Taxes
It is the policy of each Fund to comply with the requirements under Subchapter M of the Internal Revenue Code applicable to regulated investment companies and to distribute all of its net taxable income, including any net realized gains on investments, to its shareholders. Therefore, no federal income tax provision is required.
At October 31, 2023, the components of distributable earnings on a tax basis were as follows:
| | | | | | | | | | | | |
| | | Undistributed
Ordinary
Income | | | Undistributed
Long-Term
Gain | | | Total
Distributable
Earnings | |
TCW Core Fixed Income Fund | | $ | 10,087,880 | | | $ | — | | | $ | 10,087,880 | |
TCW Enhanced Commodity Strategy Fund | | | 102,686 | | | | — | | | | 102,686 | |
TCW Global Bond Fund | | | — | | | | — | | | | — | |
TCW High Yield Bond Fund | | | 410,784 | | | | — | | | | 410,784 | |
TCW Short Term Bond Fund | | | 92,917 | | | | — | | | | 92,917 | |
TCW Total Return Bond Fund | | | 39,003,960 | | | | — | | | | 39,003,960 | |
At the end of the previous fiscal year ended October 31, 2022, the components of distributable earnings on a tax basis were as follows:
| | | | | | | | | | | | |
| | | Undistributed
Ordinary
Income | | | Undistributed
Long-Term
Gain | | | Total
Distributable
Earnings | |
TCW Enhanced Commodity Strategy Fund | | $ | 30,589 | | | $ | — | | | $ | 30,589 | |
TCW High Yield Bond Fund | | | 537,060 | | | | — | | | | 537,060 | |
TCW Short Term Bond Fund | | | 26,232,316 | | | | — | | | | 26,232,316 | |
134
TCW Funds, Inc.
October 31, 2023
Note 5 — Federal Income Taxes (Continued)
Permanent differences incurred during the year ended October 31, 2023, resulting from differences in book and tax accounting, have been reclassified at year-end between undistributed net investment income (loss), undistributed (accumulated) net realized gain (loss) and paid-in capital as follows, with no impact to the net asset value per share:
| | | | | | | | | | | | |
| | | Undistributed
Net
Investment
Income
(Loss) | | | Undistributed
(Accumulated)
Net Realized
Gain (Loss) | | | Paid-in
Capital | |
TCW Core Fixed Income Fund | | $ | (6,879,951 | ) | | $ | 6,797,539 | | | $ | 82,412 | |
TCW Enhanced Commodity Strategy Fund | | | (1,268 | ) | | | 1,268 | | | | – | |
TCW Global Bond Fund | | | (264,767 | ) | | | 302,536 | | | | (37,769 | ) |
TCW High Yield Bond Fund | | | 8,478 | | | | (8,478 | ) | | | – | |
TCW Short Term Bond Fund | | | 7,962 | | | | (8,962 | ) | | | 1,000 | |
TCW Total Return Bond Fund | | | 3,599,197 | | | | (3,599,197 | ) | | | – | |
During the year ended October 31, 2023, the tax character of distributions paid was as follows:
| | | | | | | | | | | | | | | | |
| | | Ordinary
Income | | | Long-Term
Capital Gain | | | Return of
Capital | | | Total
Distributions | |
TCW Core Fixed Income Fund | | $ | 37,334,974 | | | $ | — | | | $ | — | | | $ | 37,334,974 | |
TCW Enhanced Commodity Strategy Fund | | | 881,140 | | | | — | | | | — | | | | 881,140 | |
TCW Global Bond Fund | | | 482,626 | | | | — | | | | 143,424 | | | | 626,050 | |
TCW High Yield Bond Fund | | | 3,588,507 | | | | — | | | | — | | | | 3,588,507 | |
TCW Short Term Bond Fund | | | 255,948 | | | | — | | | | — | | | | 255,948 | |
TCW Total Return Bond Fund | | | 162,939,921 | | | | — | | | | — | | | | 162,939,921 | |
During the previous fiscal year ended October 31, 2022, the tax character of distributions paid was as follows:
| | | | | | | | | | | | | | | | |
| | | Ordinary
Income | | | Long-Term
Capital Gain | | | Return of
Capital | | | Total
Distributions | |
TCW Core Fixed Income Fund | | $ | 23,342,013 | | | $ | — | | | $ | 4,452,370 | | | $ | 27,794,383 | |
TCW Enhanced Commodity Strategy Fund | | | 1,055,936 | | | | — | | | | — | | | | 1,055,936 | |
TCW Global Bond Fund | | | 98,875 | | | | — | | | | 298,881 | | | | 397,756 | |
TCW High Yield Bond Fund | | | 5,483,927 | | | | 406,774 | | | | — | | | | 5,890,701 | |
TCW Short Term Bond Fund | | | 252,893 | | | | — | | | | 80,452 | | | | 333,345 | |
TCW Total Return Bond Fund | | | 98,490,713 | | | | — | | | | — | | | | 98,490,713 | |
At October 31, 2023, net unrealized appreciation (depreciation) on investments for federal income tax purposes was as follows:
| | | | | | | | | | | | | | | | |
| | | Unrealized
Appreciation | | | Unrealized
(Depreciation) | | | Net
Unrealized
Appreciation
(Depreciation) | | | Cost of
Investments
for Federal
Income Tax
Purposes | |
TCW Core Fixed Income Fund | | $ | 3,914,001 | | | $ | (111,098,126 | ) | | $ | (107,184,125 | ) | | $ | 1,397,331,877 | |
TCW Enhanced Commodity Strategy Fund | | | 63,655 | | | | (758,463 | ) | | | (694,808 | ) | | | 20,848,279 | |
TCW Global Bond Fund | | | 126,092 | | | | (2,961,798 | ) | | | (2,835,706 | ) | | | 23,523,958 | |
TCW High Yield Bond Fund | | | 131,672 | | | | (5,638,039 | ) | | | (5,506,367 | ) | | | 57,261,771 | |
TCW Short Term Bond Fund | | | 46,923 | | | | (201,111 | ) | | | (154,188 | ) | | | 12,093,331 | |
TCW Total Return Bond Fund | | | 76,755,578 | | | | (427,944,027 | ) | | | (351,188,449 | ) | | | 3,658,981,424 | |
135
TCW Funds, Inc.
Notes to Financial Statements (Continued)
Note 5 — Federal Income Taxes (Continued)
At October 31, 2023, the following Funds had net realized loss carryforwards for federal income tax purposes:
| | | | | | | | | | | | |
| | | No Expiration | |
| | | Short-Term
Capital
Losses | | | Long-Term
Capital
Losses | | | Total | |
TCW Core Fixed Income Fund | | $ | 167,486,537 | | | $ | 51,454,479 | | | $ | 218,941,016 | |
TCW Enhanced Commodity Strategy Fund | | | 273,525 | | | | 235,319 | | | | 508,844 | |
TCW Global Bond Fund | | | 1,222,502 | | | | 1,034,200 | | | | 2,256,702 | |
TCW High Yield Bond Fund | | | 2,738,705 | | | | 3,497,076 | | | | 6,235,781 | |
TCW Short Term Bond Fund | | | 703,223 | | | | 80,659 | | | | 783,882 | |
TCW Total Return Bond Fund | | | 497,984,987 | | | | 188,619,639 | | | | 686,604,626 | |
The Funds did not have any unrecognized tax benefits at October 31, 2023, nor were there any increases or decreases in unrecognized tax benefits for the year ended October 31, 2023. The Funds are subject to examination by the U.S. Federal and state tax authorities for returns filed for the prior three and four fiscal years, respectively.
Note 6 — Fund Management Fees and Other Expenses
The Funds pay to the Advisor, as compensation for services rendered, facilities furnished and expenses borne by it, the following annual management fees as a percentage of daily net assets:
| | | | |
TCW Core Fixed Income Fund | | | 0.40 | % |
TCW Enhanced Commodity Strategy Fund | | | 0.50 | % |
TCW Global Bond Fund | | | 0.50 | % |
TCW High Yield Bond Fund | | | 0.45 | % |
TCW Short Term Bond Fund | | | 0.35 | % |
TCW Total Return Bond Fund | | | 0.40 | % |
136
TCW Funds, Inc.
October 31, 2023
Note 6 — Fund Management Fees and Other Expenses (Continued)
The Advisor limits the operating expenses of the Funds not to exceed the following expense ratios relative to the Funds’ average daily net assets:
| | | | |
TCW Core Fixed Income Fund | | | | |
I Class | | | 0.49 | % (1) |
N Class | | | 0.70 | % (1) |
P Class | | | 0.44 | % (1) |
TCW Enhanced Commodity Strategy Fund | | | | |
I Class | | | 0.70 | % (1) |
N Class | | | 0.75 | % (1) |
TCW Global Bond Fund | | | | |
I Class | | | 0.60 | % (1) |
N Class | | | 0.70 | % (1) |
TCW High Yield Bond Fund | | | | |
I Class | | | 0.55 | % (1) |
N Class | | | 0.80 | % (1) |
TCW Short Term Bond Fund | | | | |
I Class | | | 0.44 | % (1) |
TCW Total Return Bond Fund | | | | |
I Class | | | 0.49 | % (1) |
N Class | | | 0.70 | % (1) |
P Class | | | 0.44 | % (1) |
| (1) | These limitations are based on an agreement between the Advisor and Company. |
Any advisory fee reduced or withheld, or expense reimbursement paid, pursuant to the expense limitation agreement will be reimbursed by the appropriate Fund to the Advisor in the first, second or third fiscal year after the fiscal year of the reduction or reimbursement. The Advisory may not receive reimbursement for previous reductions or reimbursements before payment of a Fund’s operating expenses for the current year, and cannot cause a Fund to exceed the expense limitation in effect for that Fund (i) at the time the fees and expenses would have been incurred or (ii) at the time the Advisor would recoup that reduction or reimbursement. In addition, any recoupment may not exceed any more restrictive limitation to which the Advisor has agreed.
At October 31, 2023, the balance of recoupable expenses with expiration dates for the Funds were as follows:
| | | | |
Fund | | Expires
10/31/2026 | |
TCW Core Fixed Income Fund | | $ | 366,979 | |
TCW Enhanced Commodity Strategy Fund | | | 95,294 | |
TCW Global Bond Fund | | | 61,859 | |
TCW High Yield Bond Fund | | | 97,660 | |
TCW Total Return Bond Fund | | | 491,126 | |
| | | | |
Total | | | 1,112,918 | |
| | | | |
Directors’ Fees: Directors who are not affiliated with the Advisor receive compensation from the Funds which are shown on the Statements of Operations. Directors may elect to defer receipt of their fees in accordance with the terms of a Non-Qualified Deferred Compensation Plan. Deferred compensation is included within directors’ fees and expenses in the Statements of Assets and Liabilities.
137
TCW Funds, Inc.
Notes to Financial Statements (Continued)
Note 7 — Distribution Plan
TCW Funds Distributors LLC (“Distributor”), an affiliate of the Advisor and the Funds, serves as the nonexclusive distributor of each class of the Funds’ shares. The Funds have a distribution plan pursuant to Rule 12b-1 under the 1940 Act with respect to the N Class shares of each Fund. Under the terms of the plan, each Fund compensates the Distributor at a rate equal to 0.25% of the average daily net assets of the Fund attributable to its N Class shares for distribution and related services.
Note 8 — Purchases and Sales of Securities
Investment transactions (excluding short-term investments) for the year ended October 31, 2023 were as follows:
| | | | | | | | | | | | | | | | |
| | | Purchases at
Cost | | | Sales or Maturity
Proceeds | | | U.S. Government
Purchases at Cost | | | U.S. Government
Sales or Maturity
Proceeds | |
TCW Core Fixed Income Fund | | $ | 115,704,974 | | | $ | 234,975,708 | | | $ | 5,626,958,418 | | | $ | 5,690,320,001 | |
TCW Enhanced Commodity Strategy Fund | | | 2,587,322 | | | | 16,886,494 | | | | 380,978 | | | | 1,109,869 | |
TCW Global Bond Fund | | | 8,815,342 | | | | 8,216,722 | | | | 37,228,875 | | | | 35,996,292 | |
TCW High Yield Bond Fund | | | 31,118,817 | | | | 37,370,223 | | | | 1,663,615 | | | | 1,247,756 | |
TCW Short Term Bond Fund | | | 1,975,709 | | | | 2,240,761 | | | | 51,497,413 | | | | 51,512,167 | |
TCW Total Return Bond Fund | | | 99,105,820 | | | | 522,735,598 | | | | 10,733,408,721 | | | | 10,914,261,421 | |
Note 9 — Capital Share Transactions
Transactions in each Fund’s shares were as follows:
| | | | | | | | | | | | | | | | |
| TCW Core Fixed Income Fund | | Year Ended
October 31, 2023 | | | Year Ended
October 31, 2022 | |
| I Class | | Shares | | | Amount | | | Shares | | | Amount | |
Shares Sold | | | 28,990,684 | | | $ | 282,929,164 | | | | 41,973,338 | | | $ | 439,381,120 | |
Shares Issued upon Reinvestment of Dividends | | | 2,768,894 | | | | 26,888,376 | | | | 2,085,134 | | | | 22,123,909 | |
Shares Redeemed | | | (52,807,381 | ) | | | (509,562,410 | ) | | | (74,327,281 | ) | | | (762,947,419 | ) |
| | | | | | | | | | | | | | | | |
Net Decrease | | | (21,047,803 | ) | | $ | (199,744,870 | ) | | | (30,268,809 | ) | | $ | (301,442,390 | ) |
| | | | | | | | | | | | | | | | |
| | | | |
| N Class | | Shares | | | Amount | | | Shares | | | Amount | |
Shares Sold | | | 4,704,564 | | | $ | 46,067,032 | | | | 4,859,021 | | | $ | 52,088,741 | |
Shares Issued upon Reinvestment of Dividends | | | 424,979 | | | | 4,116,606 | | | | 240,584 | | | | 2,540,892 | |
Shares Redeemed | | | (6,490,795 | ) | | | (62,410,535 | ) | | | (6,301,496 | ) | | | (66,788,169 | ) |
| | | | | | | | | | | | | | | | |
Net Decrease | | | (1,361,252 | ) | | $ | (12,226,897 | ) | | | (1,201,891 | ) | | $ | (12,158,536 | ) |
| | | | | | | | | | | | | | | | |
| | | | |
| Plan Class | | Shares | | | Amount | | | Shares | | | Amount | |
Shares Sold | | | 13,818,064 | | | $ | 135,059,962 | | | | 9,236,640 | | | $ | 97,872,378 | |
Shares Issued upon Reinvestment of Dividends | | | 399,058 | | | | 3,876,958 | | | | 85,060 | | | | 872,216 | |
Shares Redeemed | | | (1,666,445 | ) | | | (16,144,775 | ) | | | (773,500 | ) | | | (7,946,932 | ) |
| | | | | | | | | | | | | | | | |
Net Increase | | | 12,550,677 | | | $ | 122,792,145 | | | | 8,548,200 | | | $ | 90,797,662 | |
| | | | |
| | | | | | | | | | | | | | | | |
| TCW Enhanced Commodity Strategy Fund | | Year Ended
October 31, 2023 | | | Year Ended
October 31, 2022 | |
| I Class | | Shares | | | Amount | | | Shares | | | Amount | |
Shares Sold | | | 1,049,472 | | | $ | 6,520,090 | | | | 4,919,117 | | | $ | 34,467,759 | |
Shares Issued upon Reinvestment of Dividends | | | 104,547 | | | | 632,883 | | | | 141,890 | | | | 865,371 | |
Shares Redeemed | | | (3,101,352 | ) | | | (19,183,819 | ) | | | (722,809 | ) | | | (5,087,008 | ) |
| | | | | | | | | | | | | | | | |
Net Increase (Decrease) | | | (1,947,333 | ) | | $ | (12,030,846 | ) | | | 4,338,198 | | | $ | 30,246,122 | |
| | | | | | | | | | | | | | | | |
| | | | |
| N Class | | Shares | | | Amount | | | Shares | | | Amount | |
Shares Sold | | | 327,975 | | | $ | 2,032,850 | | | | 3,032,140 | | | $ | 21,739,302 | |
Shares Issued upon Reinvestment of Dividends | | | 39,750 | | | | 240,597 | | | | 30,109 | | | | 189,179 | |
Shares Redeemed | | | (1,114,734 | ) | | | (6,899,232 | ) | | | (1,443,330 | ) | | | (10,002,369 | ) |
| | | | | | | | | | | | | | | | |
Net Increase (Decrease) | | | (747,009 | ) | | $ | (4,625,785 | ) | | | 1,618,919 | | | $ | 11,926,112 | |
| | | | | | | | | | | | | | | | |
138
TCW Funds, Inc.
October 31, 2023
Note 9 — Capital Share Transactions (Continued)
| | | | | | | | | | | | | | | | |
| | |
| TCW Global Bond Fund | | Year Ended
October 31, 2023 | | | Year Ended
October 31, 2022 | |
| I Class | | Shares | | | Amount | | | Shares | | | Amount | |
Shares Sold | | | 146,270 | | | $ | 1,191,951 | | | | 137,846 | | | $ | 1,244,126 | |
Shares Issued upon Reinvestment of Dividends | | | 37,595 | | | | 307,452 | | | | 27,221 | | | | 256,389 | |
Shares Redeemed | | | (14,400 | ) | | | (117,580 | ) | | | (1,440,495 | ) | | | (13,857,142 | ) |
| | | | | | | | | | | | | | | | |
Net Increase (Decrease) | | | 169,465 | | | $ | 1,381,823 | | | | (1,275,428 | ) | | $ | (12,356,627 | ) |
| | | | | | | | | | | | | | | | |
| | | | |
| N Class | | Shares | | | Amount | | | Shares | | | Amount | |
Shares Sold | | | 69,280 | | | $ | 569,669 | | | | 52,009 | | | $ | 479,155 | |
Shares Issued upon Reinvestment of Dividends | | | 33,676 | | | | 275,386 | | | | 17,714 | | | | 162,796 | |
Shares Redeemed | | | (57,900 | ) | | | (466,426 | ) | | | (128,525 | ) | | | (1,188,315 | ) |
| | | | | | | | | | | | | | | | |
Net Increase (Decrease) | | | 45,056 | | | $ | 378,629 | | | | (58,802 | ) | | $ | (546,364 | ) |
| | | | | | | | | | | | | | | | |
| | |
| TCW High Yield Bond Fund | | Year Ended
October 31, 2023 | | | Year Ended
October 31, 2022 | |
| I Class | | Shares | | | Amount | | | Shares | | | Amount | |
Shares Sold | | | 2,443,292 | | | $ | 14,436,986 | | | | 4,268,413 | | | $ | 27,306,196 | |
Shares Issued upon Reinvestment of Dividends | | | 513,380 | | | | 3,021,019 | | | | 742,643 | | | | 4,814,705 | |
Shares Redeemed | | | (3,478,640 | ) | | | (20,561,890 | ) | | | (10,179,417 | ) | | | (64,888,779 | ) |
| | | | | | | | | | | | | | | | |
Net Decrease | | | (521,968 | ) | | $ | (3,103,885 | ) | | | (5,168,361 | ) | | $ | (32,767,878 | ) |
| | | | | | | | | | | | | | | | |
| | | | |
| N Class | | Shares | | | Amount | | | Shares | | | Amount | |
Shares Sold | | | 297,220 | | | $ | 1,769,166 | | | | 286,375 | | | $ | 1,838,132 | |
Shares Issued upon Reinvestment of Dividends | | | 74,380 | | | | 440,416 | | | | 116,794 | | | | 759,914 | |
Shares Redeemed | | | (809,680 | ) | | | (4,821,224 | ) | | | (1,023,537 | ) | | | (6,506,835 | ) |
| | | | | | | | | | | | | | | | |
Net Decrease | | | (438,080 | ) | | $ | (2,611,642 | ) | | | (620,368 | ) | | $ | (3,908,789 | ) |
| | | | | | | | | | | | | | | | |
| | |
| TCW Short Term Bond Fund | | Year Ended
October 31, 2023 | | | Year Ended
October 31, 2022 | |
| I Class | | Shares | | | Amount | | | Shares | | | Amount | |
Shares Sold | | | 515,161 | | | $ | 4,241,328 | | | | 508,442 | | | $ | 4,271,112 | |
Shares Issued upon Reinvestment of Dividends | | | 27,821 | | | | 228,485 | | | | 38,685 | | | | 326,721 | |
Shares Redeemed | | | (467,308 | ) | | | (3,846,615 | ) | | | (1,624,862 | ) | | | (13,646,105 | ) |
| | | | | | | | | | | | | | | | |
Net Increase (Decrease) | | | 75,674 | | | $ | 623,198 | | | | (1,077,735 | ) | | $ | (9,048,272 | ) |
| | | | | | | | | | | | | | | | |
| | |
| TCW Total Return Bond Fund | | Year Ended
October 31, 2023 | | | Year Ended
October 31, 2022 | |
| I Class | | Shares | | | Amount | | | Shares | | | Amount | |
Shares Sold | | | 117,980,752 | | | $ | 957,348,605 | | | | 113,029,676 | | | $ | 1,040,830,995 | |
Shares Issued upon Reinvestment of Dividends | | | 10,300,195 | | | | 83,844,031 | | | | 6,016,012 | | | | 55,983,910 | |
Shares Redeemed | | | (163,662,241 | ) | | | (1,332,326,208 | ) | | | (213,416,239 | ) | | | (1,969,953,450 | ) |
| | | | | | | | | | | | | | | | |
Net Decrease | | | (35,381,294 | ) | | $ | (291,133,572 | ) | | | (94,370,551 | ) | | $ | (873,138,545 | ) |
| | | | | | | | | | | | | | | | |
| | | | |
| N Class | | Shares | | | Amount | | | Shares | | | Amount | |
Shares Sold | | | 9,841,693 | | | $ | 80,908,674 | | | | 11,733,040 | | | $ | 110,570,624 | |
Shares Issued upon Reinvestment of Dividends | | | 2,719,199 | | | | 22,844,296 | | | | 1,442,633 | | | | 13,819,002 | |
Shares Redeemed | | | (23,227,636 | ) | | | (194,137,339 | ) | | | (29,721,329 | ) | | | (280,084,228 | ) |
| | | | | | | | | | | | | | | | |
Net Decrease | | | (10,666,744 | ) | | $ | (90,384,369 | ) | | | (16,545,656 | ) | | $ | (155,694,602 | ) |
| | | | | | | | | | | | | | | | |
| | | | |
| Plan Class | | Shares | | | Amount | | | Shares | | | Amount | |
Shares Sold | | | 455,426 | | | $ | 3,710,979 | | | | 177,262 | | | $ | 1,617,758 | |
Shares Issued upon Reinvestment of Dividends | | | 9,716 | | | | 80,407 | | | | 1,414 | | | | 12,941 | |
Shares Redeemed | | | (321,785 | ) | | | (2,635,985 | ) | | | (44,422 | ) | | | (413,346 | ) |
| | | | | | | | | | | | | | | | |
Net Increase | | | 143,357 | | | $ | 1,155,401 | | | | 134,254 | | | $ | 1,217,353 | |
| | | | | | | | | | | | | | | | |
139
TCW Funds, Inc.
Notes to Financial Statements (Continued)
Note 10 — Affiliate Ownership
As of October 31, 2023, affiliates of the Funds and Advisor owned 25.09%, and 83.58% of the net assets of the TCW Enhanced Commodity Strategy Fund and the TCW Global Bond Fund, respectively.
Note 11 — Restricted Securities
The Funds are permitted to invest in securities that have legal or contractual restrictions on resale. These securities may be sold privately, but are required to be registered before being sold to the public (exemption rules apply). Private placement securities are generally considered to be restricted except for those securities traded between qualified institutional investors under the provisions of Rule 144A of the Securities Act of 1933, as amended (the “Securities Act”). However, the Company considers 144A securities to be restricted if those securities have been deemed illiquid. Disposal of these securities may involve time-consuming negotiations and expense, and prompt sale at an acceptable price may be difficult. Restricted securities held by the Fund at October 31, 2023 are listed below.
| | | | | | | | | | | | | | |
| TCW Enhanced Commodity Strategy Fund | | | | | | | | | | | |
Issuer Description | | Acquisition
Date | | Acquisition
Cost | | | Aggregate
Value | | | Percentage
of Net Assets | |
LB-UBS Commercial Mortgage Trust Series 2006-C6, Class XCL (I/O), 0.43%, due 09/15/39 | | 7/15/16 | | $ | 543 | | | $ | 1,182 | | | | 0.01 | % |
| | | | | | | | | | | | | | |
| TCW Global Bond Fund | | | | | | | | | | | |
Issuer Description | | Acquisition
Date | | Acquisition
Cost | | | Aggregate
Value | | | Percentage
of Net Assets | |
Intelsat Jackson Holdings S.A, 6.50%, due 03/15/30 | | 1/27/22 | | $ | 11,752 | | | $ | 10,573 | | | | 0.06 | % |
| | | | | | | | | | | | | | |
| TCW High Yield Bond Fund | | | | | | | | | | | |
Issuer Description | | Acquisition
Date | | Acquisition
Cost | | | Aggregate
Value | | | Percentage
of Net Assets | |
Intelsat Jackson Holdings S.A, 6.50%, due 03/15/30 | | 1/27/22 | | $ | 109,019 | | | $ | 105,733 | | | | 0.20 | % |
| | | | | | | | | | | | | | |
Note 12 — Committed Line Of Credit
The Funds have entered into a $100,000,000 committed revolving line of credit agreement with State Street Bank and Trust Company (the “Bank”) for temporary borrowing purposes, renewable annually. The interest rate on borrowing is the higher of the Federal Funds Effective Rate plus 0.10% plus 1.25% or the Overnight Bank Funding Rate plus 0.10% plus 1.25%. There were no borrowings from the line of credit as of or during the year ended October 31, 2023. The Funds pay the Bank a commitment fee equal to 0.25% per annum on any unused portion of the committed line amount. The commitment fees incurred by the Funds are presented in the Statements of Operations. The commitment fees are allocated to each applicable portfolio in proportion to its relative average daily net assets and the interest expenses are charged directly to the applicable portfolio.
Note 13 — Indemnifications
Under the Company’s organizational documents, its Officers and Directors may be indemnified against certain liabilities and expenses arising out of the performance of their duties to the Company. In addition, the Company entered into an agreement with each of the Directors which provides that the Company will indemnify and hold harmless each Director against any expenses actually and reasonably incurred by such Director in any proceeding arising out of or in connection with the Director’s services to the Company, to the fullest extent permitted by the Company’s Articles of Incorporation and By-Laws, the Maryland General Corporation Law, the Securities Act, and the 1940 Act, each as now or hereinafter in force. Additionally, in
140
TCW Funds, Inc.
October 31, 2023
Note 13 — Indemnifications (Continued)
the normal course of business, the Company enters into agreements with service providers that may contain indemnification clauses. The Company’s maximum exposure under these arrangements is unknown as this would involve future claims that may be made against the Company that have not yet occurred. However, based on experience, the Company expects the risk of loss to be remote. The Company has not accrued any liability in connection with such indemnification.
Note 14 — New Accounting Pronouncements
In January 2021, the Financial Accounting Standards Board issued Accounting Standards Update No. 2021-01 (“ASU 2021-01”), “Reference Rate Reform (Topic 848).” ASU 2021-01 is an update of ASU 2020-04, which is in response to concerns about structural risks of interbank offered rates, and particularly the risk of cessation of LIBOR; regulators have undertaken reference rate reform initiatives to identify alternative reference rates that are more observable or transaction based and less susceptible to manipulation. ASU 2020-04 provides optional guidance for a limited period of time to ease the potential burden in accounting for (or recognizing the effects of) reference rate reform on financial reporting. ASU 2020-04 is elective and applies to all entities, subject to meeting certain criteria, that have contracts, hedging relationships, and other transactions that reference LIBOR or another reference rate expected to be discontinued because of reference rate reform. The ASU 2021-01 update clarifies that certain optional expedients and exceptions in Topic 848 for contract modifications and hedge accounting apply to derivatives that are affected by the discounting transition. In December 2022, the FASB issued ASU No. 2022-06, Reference Rate Reform (Topic 848): Deferral of the Sunset Date of Topic 848, which deferred the sunset day of this guidance to December 31, 2024. Management is currently evaluating the implications, if any, of the additional requirements and its impact on the Funds’ financial statements.
In June 2022, the FASB issued ASU No. 2022-03, “Fair Value Measurement of Equity Securities Subject to Contractual Sale Restrictions” (“ASU 2022-03”). ASU 2022-03 (1) clarifies the guidance in ASC 820 on the fair value measurement of an equity security that is subject to a contractual sale restriction and (2) requires specific disclosures related to such an equity security. ASU 2022-03 is effective for fiscal years beginning after December 15, 2023 and interim periods within that fiscal year, with early adoption permitted. We are currently evaluating the impact of the adoption of ASU 2022-03 on our consolidated financial statements.
141
TCW Core Fixed Income Fund
Financial Highlights — I Class
| | | | | | | | | | | | | | | | | | | | |
| |
| | | Year Ended October 31, | |
| | | 2023 | | | 2022 | | | 2021 | | | 2020 | | | 2019 | |
Net Asset Value per Share, Beginning of year | | $ | 9.39 | | | $ | 11.56 | | | $ | 11.98 | | | $ | 11.41 | | | $ | 10.52 | |
| | | | | | | | | | | | | | | | | | | | |
Income (Loss) from Investment Operations: | |
Net Investment Income (1) | | | 0.36 | | | | 0.20 | | | | 0.11 | | | | 0.20 | | | | 0.30 | |
Net Realized and Unrealized Gain (Loss) on Investments | | | (0.36 | ) | | | (2.17 | ) | | | (0.09 | ) | | | 0.61 | | | | 0.89 | |
| | | | | | | | | | | | | | | | | | | | |
Total from Investment Operations | | | — | | | | (1.97 | ) | | | 0.02 | | | | 0.81 | | | | 1.19 | |
| | | | | | | | | | | | | | | | | | | | |
Less Distributions: | |
Distributions from Net Investment Income | | | (0.31 | ) | | | (0.17 | ) | | | (0.14 | ) | | | (0.24 | ) | | | (0.30 | ) |
Distributions from Return of Capital | | | — | | | | (0.03 | ) | | | (0.04 | ) | | | — | | | | — | |
Distributions from Net Realized Gain | | | — | | | | (0.00 | ) (2) | | | (0.26 | ) | | | — | | | | — | |
| | | | | | | | | | | | | | | | | | | | |
Total Distributions | | | (0.31 | ) | | | (0.20 | ) | | | (0.44 | ) | | | (0.24 | ) | | | (0.30 | ) |
| | | | | | | | | | | | | | | | | | | | |
Net Asset Value per Share, End of year | | $ | 9.08 | | | $ | 9.39 | | | $ | 11.56 | | | $ | 11.98 | | | $ | 11.41 | |
| | | | | | | | | | | | | | | | | | | | |
Total Return | | | (0.29 | %) | | | (17.10 | %) | | | 0.19 | % | | | 7.14 | % | | | 11.48 | % |
|
Ratios/Supplemental Data: | |
| | | | | |
Net Assets, End of year (in thousands) | | $ | 689,215 | | | $ | 911,213 | | | $ | 1,471,072 | | | $ | 1,344,787 | | | $ | 946,896 | |
|
Ratio of Expenses to Average Net Assets: | |
| | | | | |
Before Expense Reimbursement | | | 0.50 | % | | | 0.53 | % | | | 0.51 | % | | | 0.51 | % | | | 0.51 | % |
| | | | | |
After Expense Reimbursement | | | 0.49 | % | | | 0.49 | % | | | 0.49 | % | | | 0.49 | % | | | 0.49 | % |
| | | | | |
Ratio of Net Investment Income to Average Net Assets | | | 3.69 | % | | | 1.90 | % | | | 0.94 | % | | | 1.66 | % | | | 2.69 | % |
| | | | | |
Portfolio Turnover Rate | | | 442.34 | % | | | 473.72 | % | | | 469.87 | % | | | 371.22 | % | | | 214.76 | % |
| (1) | Computed using average shares outstanding throughout the period. |
| (2) | Amount rounds to less than $0.01 per share. |
See accompanying Notes to Financial Statements.
142
TCW Core Fixed Income Fund
Financial Highlights — N Class
| | | | | | | | | | | | | | | | | | | | |
| |
| | | Year Ended October 31, | |
| | | 2023 | | | 2022 | | | 2021 | | | 2020 | | | 2019 | |
Net Asset Value per Share, Beginning of year | | $ | 9.38 | | | $ | 11.53 | | | $ | 11.95 | | | $ | 11.38 | | | $ | 10.49 | |
| | | | | | | | | | | | | | | | | | | | |
Income (Loss) from Investment Operations: | |
Net Investment Income (1) | | | 0.35 | | | | 0.19 | | | | 0.09 | | | | 0.18 | | | | 0.27 | |
Net Realized and Unrealized Gain (Loss) on Investments | | | (0.39 | ) | | | (2.16 | ) | | | (0.09 | ) | | | 0.60 | | | | 0.90 | |
| | | | | | | | | | | | | | | | | | | | |
Total from Investment Operations | | | (0.04 | ) | | | (1.97 | ) | | | 0.00 | | | | 0.78 | | | | 1.17 | |
| | | | | | | | | | | | | | | | | | | | |
Less Distributions: | |
Distributions from Net Investment Income | | | (0.29 | ) | | | (0.15 | ) | | | (0.12 | ) | | | (0.21 | ) | | | (0.28 | ) |
Distributions from Net Realized Gain | | | — | | | | (0.00 | ) (2) | | | (0.26 | ) | | | — | | | | — | |
Distributions from Return of Capital | | | — | | | | (0.03 | ) | | | (0.04 | ) | | | — | | | | — | |
| | | | | | | | | | | | | | | | | | | | |
Total Distributions | | | (0.29 | ) | | | (0.18 | ) | | | (0.42 | ) | | | (0.21 | ) | | | (0.28 | ) |
| | | | | | | | | | | | | | | | | | | | |
Net Asset Value per Share, End of year | | $ | 9.05 | | | $ | 9.38 | | | $ | 11.53 | | | $ | 11.95 | | | $ | 11.38 | |
| | | | | | | | | | | | | | | | | | | | |
Total Return | | | (0.56 | %) | | | (17.22 | %) | | | 0.00 | % | | | 6.92 | % | | | 11.27 | % |
|
Ratios/Supplemental Data: | |
| | | | | |
Net Assets, End of year (in thousands) | | $ | 152,264 | | | $ | 170,497 | | | $ | 223,562 | | | $ | 241,938 | | | $ | 240,107 | |
|
Ratio of Expenses to Average Net Assets: | |
| | | | | |
Before Expense Reimbursement | | | 0.80 | % | | | 0.82 | % | | | 0.80 | % | | | 0.80 | % | | | 0.81 | % |
| | | | | |
After Expense Reimbursement | | | 0.64 | % | | | 0.64 | % | | | 0.65 | % | | | 0.67 | % | | | 0.70 | % |
| | | | | |
Ratio of Net Investment Income to Average Net Assets | | | 3.56 | % | | | 1.77 | % | | | 0.78 | % | | | 1.53 | % | | | 2.48 | % |
| | | | | |
Portfolio Turnover Rate | | | 442.34 | % | | | 473.72 | % | | | 469.87 | % | | | 371.22 | % | | | 214.76 | % |
| (1) | Computed using average shares outstanding throughout the period. |
| (2) | Amount rounds to less than $0.01 per share. |
See accompanying Notes to Financial Statements.
143
TCW Core Fixed Income Fund
Financial Highlights — Plan Class
| | | | | | | | | | | | | | | | |
| | | Year Ended October 31, | | | February 28, 2020
(Commencement
of Operations)
through
October 31, 2020 | |
| | | 2023 | | | 2022 | | | 2021 | |
Net Asset Value per Share, Beginning of year | | $ | 9.44 | | | $ | 11.61 | | | $ | 12.06 | | | $ | 11.72 | |
| | | | | | | | | | | | | | | | |
Income (Loss) from Investment Operations: | |
Net Investment Income(1) | | | 0.37 | | | | 0.25 | | | | 0.11 | | | | 0.18 | |
Net Realized and Unrealized Gain (Loss) on Investments | | | (0.37 | ) | | | (2.21 | ) | | | (0.11 | ) | | | 0.29 | |
| | | | | | | | | | | | | | | | |
Total from Investment Operations | | | (0.00 | ) (2) | | | (1.96 | ) | | | 0.00 | | | | 0.47 | |
| | | | | | | | | | | | | | | | |
Less Distributions: | |
Distributions from Net Investment Income | | | (0.31 | ) | | | (0.18 | ) | | | (0.14 | ) | | | (0.13 | ) |
Distributions from Net Realized Gain | | | — | | | | (0.00 | ) (2) | | | (0.26 | ) | | | N/A | |
Return of capital | | | — | | | | (0.03 | ) | | | (0.05 | ) | | | N/A | |
| | | | | | | | | | | | | | | | |
Total distributions | | | (0.31 | ) | | | (0.21 | ) | | | (0.45 | ) | | | (0.13 | ) |
| | | | | | | | | | | | | | | | |
Net Asset Value per Share, End of year | | $ | 9.13 | | | $ | 9.44 | | | $ | 11.61 | | | $ | 12.06 | |
| | | | | | | | | | | | | | | | |
Total Return | | | (0.11 | %) | | | (17.07 | %) | | | (0.01 | %) | | | 3.98 | % (3) |
|
Ratios/Supplemental Data: | |
| | | | |
Net assets, end of year (in thousands) | | $ | 193,212 | | | $ | 81,408 | | | $ | 867 | | | $ | 0.00 | (4) |
|
Ratio of Expenses to Average Net Assets: | |
| | | | |
Before Expense Reimbursement | | | 0.48 | % | | | 0.51 | % | | | 7.54 | % | | | 14,703.31 | % (5) |
| | | | |
After Expense Reimbursement | | | 0.44 | % | | | 0.44 | % | | | 0.44 | % | | | 0.44 | % (5) |
| | | | |
Ratio of Net Investment Income to Average Net Assets | | | 3.83 | % | | | 2.46 | % | | | 0.97 | % | | | 2.20 | % (5) |
| | | | |
Portfolio Turnover Rate | | | 442.34 | % | | | 473.72 | % | | | 469.87 | % | | | 371.22 | % (3) |
| (1) | Computed using average shares outstanding throughout the period. |
| (2) | Amount rounds to less than $0.01 per share. |
| (3) | For the period February 28, 2020 (Commencement of Operations) through October 31, 2020. |
| (4) | Amount Rounds to less than $1,000. |
See accompanying Notes to Financial Statements.
144
TCW Enhanced Commodity Strategy Fund
Financial Highlights — I Class
| | | | | | | | | | | | | | | | | | | | |
| |
| | | Year Ended October 31, | |
| | | 2023 | | | 2022 | | | 2021 | | | 2020 | | | 2019 | |
Net Asset Value per Share, Beginning of year | | $ | 6.34 | | | $ | 6.32 | | | $ | 4.36 | | | $ | 4.84 | | | $ | 5.01 | |
| | | | | | | | | | | | | | | | | | | | |
Income (Loss) from Investment Operations: | |
Net Investment Income (1) | | | 0.21 | | | | 0.12 | | | | 0.05 | | | | 0.10 | | | | 0.17 | |
Net Realized and Unrealized Gain (Loss) on Investments | | | (0.42 | ) | | | 0.28 | | | | 2.02 | | | | (0.41 | ) | | | (0.20 | ) |
| | | | | | | | | | | | | | | | | | | | |
Total from Investment Operations | | | (0.21 | ) | | | 0.40 | | | | 2.07 | | | | (0.31 | ) | | | (0.03 | ) |
| | | | | | | | | | | | | | | | | | | | |
Less Distributions: | |
Distributions from Net Investment Income | | | (0.20 | ) | | | (0.38 | ) | | | (0.09 | ) | | | (0.15 | ) | | | (0.14 | ) |
Distributions from Net Realized Gain | | | — | | | | — | | | | (0.02 | ) | | | (0.02 | ) | | | — | |
| | | | | | | | | | | | | | | | | | | | |
Total Distributions | | | (0.20 | ) | | | (0.38 | ) | | | (0.11 | ) | | | (0.17 | ) | | | (0.14 | ) |
| | | | | | | | | | | | | | | | | | | | |
Net Asset Value per Share, End of year | | $ | 5.93 | | | $ | 6.34 | | | $ | 6.32 | | | $ | 4.36 | | | $ | 4.84 | |
| | | | | | | | | | | | | | | | | | | | |
Total Return | | | (3.32 | %) | | | 6.82 | % | | | 48.18 | % | | | (5.82 | %) | | | (0.96 | %) |
|
Ratios/Supplemental Data: | |
| | | | | |
Net Assets, End of year (in thousands) | | $ | 16,040 | | | $ | 29,511 | | | $ | 1,983 | | | $ | 693 | | | $ | 740 | |
|
Ratio of Expenses to Average Net Assets: | |
| | | | | |
Before Expense Reimbursement | | | 1.59 | % | | | 1.73 | % | | | 15.84 | % | | | 16.92 | % | | | 17.82 | % |
| | | | | |
After Expense Reimbursement | | | 0.70 | % | | | 0.70 | % | | | 0.70 | % | | | 0.70 | % | | | 0.70 | % |
| | | | | |
Ratio of Net Investment Income to Average Net Assets | | | 3.37 | % | | | 1.70 | % | | | 0.84 | % | | | 2.29 | % | | | 3.45 | % |
| | | | | |
Portfolio Turnover Rate | | | 13.65 | % | | | 53.15 | % | | | 32.09 | % | | | 54.50 | % | | | 122.23 | % |
| (1) | Computed using average shares outstanding throughout the period. |
See accompanying Notes to Financial Statements.
145
TCW Enhanced Commodity Strategy Fund
Financial Highlights — N Class
| | | | | | | | | | | | | | | | | | | | |
| |
| | | Year Ended October 31, | |
| | | 2023 | | | 2022 | | | 2021 | | | 2020 | | | 2019 | |
Net Asset Value per Share, Beginning of year | | $ | 6.34 | | | $ | 6.31 | | | $ | 4.35 | | | $ | 4.84 | | | $ | 5.01 | |
| | | | | | | | | | | | | | | | | | | | |
Income (Loss) from Investment Operations: | |
Net Investment Income (1) | | | 0.20 | | | | 0.12 | | | | 0.04 | | | | 0.10 | | | | 0.17 | |
Net Realized and Unrealized Gain (Loss) on Investments | | | (0.41 | ) | | | 0.29 | | | | 2.03 | | | | (0.42 | ) | | | (0.20 | ) |
| | | | | | | | | | | | | | | | | | | | |
Total from Investment Operations | | | (0.21 | ) | | | 0.41 | | | | 2.07 | | | | (0.32 | ) | | | (0.03 | ) |
| | | | | | | | | | | | | | | | | | | | |
Less Distributions: | |
Distributions from Net Investment Income | | | (0.20 | ) | | | (0.38 | ) | | | (0.09 | ) | | | (0.15 | ) | | | (0.14 | ) |
Distributions from Net Realized Gain | | | — | | | | — | | | | (0.02 | ) | | | (0.02 | ) | | | — | |
| | | | | | | | | | | | | | | | | | | | |
Total Distributions | | | (0.20 | ) | | | (0.38 | ) | | | (0.11 | ) | | | (0.17 | ) | | | (0.14 | ) |
| | | | | | | | | | | | | | | | | | | | |
Net Asset Value per Share, End of year | | $ | 5.93 | | | $ | 6.34 | | | $ | 6.31 | | | $ | 4.35 | | | $ | 4.84 | |
| | | | | | | | | | | | | | | | | | | | |
Total Return | | | (3.37 | %) | | | 6.93 | % | | | 48.21 | % | | | (5.90 | %) | | | (1.16 | %) |
|
Ratios/Supplemental Data: | |
| | | | | |
Net Assets, End of year (in thousands) | | $ | 6,026 | | | $ | 11,181 | | | $ | 911 | | | $ | 472 | | | $ | 504 | |
|
Ratio of Expenses to Average Net Assets: | |
| | | | | |
Before Expense Reimbursement | | | 2.09 | % | | | 2.26 | % | | | 16.76 | % | | | 17.60 | % | | | 19.14 | % |
| | | | | |
After Expense Reimbursement | | | 0.75 | % | | | 0.75 | % | | | 0.75 | % | | | 0.75 | % | | | 0.75 | % |
| | | | | |
Ratio of Net Investment Income to Average Net Assets | | | 3.31 | % | | | 1.79 | % | | | 0.82 | % | | | 2.24 | % | | | 3.57 | % |
| | | | | |
Portfolio Turnover Rate | | | 13.65 | % | | | 53.15 | % | | | 32.09 | % | | | 54.50 | % | | | 122.23 | % |
| (1) | Computed using average shares outstanding throughout the period. |
See accompanying Notes to Financial Statements.
146
TCW Global Bond Fund
Financial Highlights — I Class
| | | | | | | | | | | | | | | | | | | | |
| |
| | | Year Ended October 31, | |
| | | 2023 | | | 2022 | | | 2021 | | | 2020 | | | 2019 | |
Net Asset Value per Share, Beginning of year | | $ | 7.75 | | | $ | 10.18 | | | $ | 10.66 | | | $ | 10.26 | | | $ | 9.45 | |
| | | | | | | | | | | | | | | | | | | | |
Income (Loss) from Investment Operations: | |
Net Investment Income (1) | | | 0.36 | | | | 0.24 | | | | 0.20 | | | | 0.25 | | | | 0.24 | |
Net Realized and Unrealized Gain (Loss) on Investments | | | (0.17 | ) | | | (2.50 | ) | | | (0.20 | ) | | | 0.54 | | | | 0.73 | |
| | | | | | | | | | | | | | | | | | | | |
Total from Investment Operations | | | 0.19 | | | | (2.26 | ) | | | — | | | | 0.79 | | | | 0.97 | |
| | | | | | | | | | | | | | | | | | | | |
Less Distributions: | |
Distributions from Net Investment Income | | | (0.22 | ) | | | (0.03 | ) | | | (0.20 | ) | | | (0.15 | ) | | | (0.16 | ) |
Distributions from Return of Capital | | | (0.07 | ) | | | (0.13 | ) | | | (0.06 | ) | | | — | | | | — | |
Distributions from Net Realized Gain | | | — | | | | (0.01 | ) | | | (0.22 | ) | | | (0.24 | ) | | | — | |
| | | | | | | | | | | | | | | | | | | | |
Total Distributions | | | (0.29 | ) | | | (0.17 | ) | | | (0.48 | ) | | | (0.39 | ) | | | (0.16 | ) |
| | | | | | | | | | | | | | | | | | | | |
Net Asset Value per Share, End of year | | $ | 7.65 | | | $ | 7.75 | | | $ | 10.18 | | | $ | 10.66 | | | $ | 10.26 | |
| | | | | | | | | | | | | | | | | | | | |
Total Return | | | 2.22 | % | | | (22.45 | %) | | | (0.18 | %) | | | 7.99 | % | | | 10.42 | % |
|
Ratios/Supplemental Data: | |
| | | | | |
Net Assets, End of year (in thousands) | | $ | 9,830 | | | $ | 8,650 | | | $ | 24,332 | | | $ | 10,822 | | | $ | 9,384 | |
|
Ratio of Expenses to Average Net Assets: | |
| | | | | |
Before Expense Reimbursement | | | 1.66 | % | | | 1.67 | % | | | 1.15 | % | | | 1.66 | % | | | 1.79 | % |
| | | | | |
After Expense Reimbursement | | | 0.60 | % | | | 0.60 | % | | | 0.60 | % | | | 0.60 | % | | | 0.66 | % |
| | | | | |
Ratio of Net Investment Income to Average Net Assets | | | 4.40 | % | | | 2.59 | % | | | 1.87 | % | | | 2.40 | % | | | 2.48 | % |
| | | | | |
Portfolio Turnover Rate | | | 221.66 | % | | | 208.60 | % | | | 245.94 | % | | | 228.14 | % | | | 83.18 | % |
| (1) | Computed using average shares outstanding throughout the period. |
See accompanying Notes to Financial Statements.
147
TCW Global Bond Fund
Financial Highlights — N Class
| | | | | | | | | | | | | | | | | | | | |
| |
| | | Year Ended October 31, | |
| | | 2023 | | | 2022 | | | 2021 | | | 2020 | | | 2019 | |
Net Asset Value per Share, Beginning of year | | $ | 7.75 | | | $ | 10.17 | | | $ | 10.66 | | | $ | 10.26 | | | $ | 9.45 | |
| | | | | | | | | | | | | | | | | | | | |
Income (Loss) from Investment Operations: | |
Net Investment Income (1) | | | 0.35 | | | | 0.26 | | | | 0.19 | | | | 0.24 | | | | 0.24 | |
Net Realized and Unrealized Gain (Loss) on Investments | | | (0.17 | ) | | | (2.52 | ) | | | (0.21 | ) | | | 0.55 | | | | 0.72 | |
| | | | | | | | | | | | | | | | | | | | |
Total from Investment Operations | | | 0.18 | | | | (2.26 | ) | | | (0.02 | ) | | | 0.79 | | | | 0.96 | |
| | | | | | | | | | | | | | | | | | | | |
Less Distributions: | |
Distributions from Net Investment Income | | | (0.22 | ) | | | (0.03 | ) | | | (0.19 | ) | | | (0.15 | ) | | | (0.15 | ) |
Distributions from Net Realized Gain | | | — | | | | (0.01 | ) | | | (0.22 | ) | | | (0.24 | ) | | | — | |
Distributions from Return of Capital | | | (0.06 | ) | | | (0.12 | ) | | | (0.06 | ) | | | — | | | | — | |
| | | | | | | | | | | | | | | | | | | | |
Total Distributions | | | (0.28 | ) | | | (0.16 | ) | | | (0.47 | ) | | | (0.39 | ) | | | (0.15 | ) |
| | | | | | | | | | | | | | | | | | | | |
Net Asset Value per Share, End of year | | $ | 7.65 | | | $ | 7.75 | | | $ | 10.17 | | | $ | 10.66 | | | $ | 10.26 | |
| | | | | | | | | | | | | | | | | | | | |
Total Return | | | 2.12 | % | | | (22.45 | %) | | | (0.38 | %) | | | 7.93 | % | | | 10.32 | % |
|
Ratios/Supplemental Data: | |
| | | | | |
Net Assets, End of year (in thousands) | | $ | 7,971 | | | $ | 7,730 | | | $ | 10,742 | | | $ | 10,972 | | | $ | 8,282 | |
|
Ratio of Expenses to Average Net Assets: | |
| | | | | |
Before Expense Reimbursement | | | 1.95 | % | | | 2.15 | % | | | 1.53 | % | | | 1.94 | % | | | 2.09 | % |
| | | | | |
After Expense Reimbursement | | | 0.70 | % | | | 0.70 | % | | | 0.70 | % | | | 0.70 | % | | | 0.74 | % |
| | | | | |
Ratio of Net Investment Income to Average Net Assets | | | 4.29 | % | | | 2.80 | % | | | 1.77 | % | | | 2.29 | % | | | 2.39 | % |
| | | | | |
Portfolio Turnover Rate | | | 221.66 | % | | | 208.60 | % | | | 245.94 | % | | | 228.14 | % | | | 83.18 | % |
| (1) | Computed using average shares outstanding throughout the period. |
See accompanying Notes to Financial Statements.
148
TCW High Yield Bond Fund
Financial Highlights — I Class
| | | | | | | | | | | | | | | | | | | | |
| |
| | | Year Ended October 31, | |
| | | 2023 | | | 2022 | | | 2021 | | | 2020 | | | 2019 | |
Net Asset Value per Share, Beginning of year | | $ | 5.80 | | | $ | 6.89 | | | $ | 6.66 | | | $ | 6.49 | | | $ | 6.15 | |
| | | | | | | | | | | | | | | | | | | | |
Income (Loss) from Investment Operations: | |
Net Investment Income (1) | | | 0.35 | | | | 0.28 | | | | 0.23 | | | | 0.24 | | | | 0.27 | |
Net Realized and Unrealized Gain (Loss) on Investments | | | (0.06 | ) | | | (0.94 | ) | | | 0.24 | | | | 0.19 | | | | 0.36 | |
| | | | | | | | | | | | | | | | | | | | |
Total from Investment Operations | | | 0.29 | | | | (0.66 | ) | | | 0.47 | | | | 0.43 | | | | 0.63 | |
| | | | | | | | | | | | | | | | | | | | |
Less Distributions: | |
Distributions from Net Investment Income | | | (0.37 | ) | | | (0.30 | ) | | | (0.24 | ) | | | (0.26 | ) | | | (0.29 | ) |
Distributions from Net Realized Gain | | | — | | | | (0.13 | ) | | | — | | | | — | | | | — | |
| | | | | | | | | | | | | | | | | | | | |
Total Distributions | | | (0.37 | ) | | | (0.43 | ) | | | (0.24 | ) | | | (0.26 | ) | | | (0.29 | ) |
| | | | | | | | | | | | | | | | | | | | |
Net Asset Value per Share, End of year | | $ | 5.72 | | | $ | 5.80 | | | $ | 6.89 | | | $ | 6.66 | | | $ | 6.49 | |
| | | | | | | | | | | | | | | | | | | | |
Total Return | | | 4.95 | % | | | (9.97 | %) | | | 7.18 | % | | | 6.88 | % | | | 10.44 | % |
|
Ratios/Supplemental Data: | |
| | | | | |
Net Assets, End of year (in thousands) | | $ | 47,270 | | | $ | 50,992 | | | $ | 96,223 | | | $ | 85,990 | | | $ | 19,563 | |
|
Ratio of Expenses to Average Net Assets: | |
| | | | | |
Before Expense Reimbursement | | | 0.88 | % | | | 0.84 | % | | | 0.76 | % | | | 0.97 | % | | | 1.68 | % |
| | | | | |
After Expense Reimbursement | | | 0.55 | % | | | 0.55 | % | | | 0.55 | % | | | 0.55 | % | | | 0.55 | % |
| | | | | |
Ratio of Net Investment Income to Average Net Assets | | | 5.95 | % | | | 4.46 | % | | | 3.36 | % | | | 3.67 | % | | | 4.18 | % |
| | | | | |
Portfolio Turnover Rate | | | 62.85 | % | | | 94.04 | % | | | 82.13 | % | | | 111.34 | % | | | 121.56 | % |
| (1) | Computed using average shares outstanding throughout the period. |
See accompanying Notes to Financial Statements.
149
TCW High Yield Bond Fund
Financial Highlights — N Class
| | | | | | | | | | | | | | | | | | | | |
| |
| | | Year Ended October 31, | |
| | | 2023 | | | 2022 | | | 2021 | | | 2020 | | | 2019 | |
Net Asset Value per Share, Beginning of year | | $ | 5.84 | | | $ | 6.93 | | | $ | 6.70 | | | $ | 6.54 | | | $ | 6.19 | |
| | | | | | | | | | | | | | | | | | | | |
Income (Loss) from Investment Operations: | |
Net Investment Income (1) | | | 0.34 | | | | 0.27 | | | | 0.22 | | | | 0.23 | | | | 0.25 | |
Net Realized and Unrealized Gain (Loss) on Investments | | | (0.08 | ) | | | (0.94 | ) | | | 0.23 | | | | 0.18 | | | | 0.38 | |
| | | | | | | | | | | | | | | | | | | | |
Total from Investment Operations | | | 0.26 | | | | (0.67 | ) | | | 0.45 | | | | 0.41 | | | | 0.63 | |
| | | | | | | | | | | | | | | | | | | | |
Less Distributions: | |
Distributions from Net Investment Income | | | (0.35 | ) | | | (0.29 | ) | | | (0.22 | ) | | | (0.25 | ) | | | (0.28 | ) |
Distributions from Net Realized Gain | | | — | | | | (0.13 | ) | | | — | | | | — | | | | — | |
| | | | | | | | | | | | | | | | | | | | |
Total Distributions | | | (0.35 | ) | | | (0.42 | ) | | | (0.22 | ) | | | (0.25 | ) | | | (0.28 | ) |
| | | | | | | | | | | | | | | | | | | | |
Net Asset Value per Share, End of year | | $ | 5.75 | | | $ | 5.84 | | | $ | 6.93 | | | $ | 6.70 | | | $ | 6.54 | |
| | | | | | | | | | | | | | | | | | | | |
Total Return | | | 4.51 | % | | | (10.24 | %) | | | 7.05 | % | | | 6.61 | % | | | 10.16 | % |
|
Ratios/Supplemental Data: | |
| | | | | |
Net Assets, End of year (in thousands) | | $ | 6,393 | | | $ | 9,043 | | | $ | 15,048 | | | $ | 17,805 | | | $ | 9,923 | |
|
Ratio of Expenses to Average Net Assets: | |
| | | | | |
Before Expense Reimbursement | | | 1.37 | % | | | 1.27 | % | | | 1.14 | % | | | 1.47 | % | | | 2.05 | % |
| | | | | |
After Expense Reimbursement | | | 0.80 | % | | | 0.80 | % | | | 0.80 | % | | | 0.80 | % | | | 0.80 | % |
| | | | | |
Ratio of Net Investment Income to Average Net Assets | | | 5.67 | % | | | 4.25 | % | | | 3.11 | % | | | 3.46 | % | | | 3.96 | % |
| | | | | |
Portfolio Turnover Rate | | | 62.85 | % | | | 94.04 | % | | | 82.13 | % | | | 111.34 | % | | | 121.56 | % |
| (1) | Computed using average shares outstanding throughout the period. |
See accompanying Notes to Financial Statements.
150
TCW Short Term Bond Fund
Financial Highlights — I Class
| | | | | | | | | | | | | | | | | | | | |
| |
| | | Year Ended October 31, | |
| | | 2023 | | | 2022 | | | 2021 | | | 2020 | | | 2019 | |
Net Asset Value per Share, Beginning of year | | $ | 8.08 | | | $ | 8.60 | | | $ | 8.60 | | | $ | 8.59 | | | $ | 8.54 | |
| | | | | | | | | | | | | | | | | | | | |
Income (Loss) from Investment Operations: | |
Net Investment Income (1) | | | 0.24 | | | | 0.10 | | | | 0.29 | | | | 0.16 | | | | 0.25 | |
Net Realized and Unrealized Gain (Loss) on Investments | | | 0.08 | | | | (0.41 | ) | | | (0.19 | ) | | | (0.01 | ) | | | 0.07 | |
| | | | | | | | | | | | | | | | | | | | |
Total from Investment Operations | | | 0.32 | | | | (0.31 | ) | | | 0.10 | | | | 0.15 | | | | 0.32 | |
| | | | | | | | | | | | | | | | | | | | |
Less Distributions: | |
Distributions from Net Investment Income | | | (0.25 | ) | | | (0.15 | ) | | | (0.10 | ) | | | (0.11 | ) | | | (0.27 | ) |
Distributions from Return of Capital | | | — | | | | (0.06 | ) | | | — | | | | (0.03 | ) | | | — | |
| | | | | | | | | | | | | | | | | | | | |
Total Distributions | | | (0.25 | ) | | | (0.21 | ) | | | (0.10 | ) | | | (0.14 | ) | | | (0.27 | ) |
| | | | | | | | | | | | | | | | | | | | |
Net Asset Value per Share, End of year | | $ | 8.15 | | | $ | 8.08 | | | $ | 8.60 | | | $ | 8.60 | | | $ | 8.59 | |
| | | | | | | | | | | | | | | | | | | | |
Total Return | | | 4.01 | % | | | (3.61 | %) | | | 1.16 | % | | | 1.70 | % | | | 3.83 | % |
|
Ratios/Supplemental Data: | |
| | | | | |
Net Assets, End of year (in thousands) | | $ | 8,952 | | | $ | 8,270 | | | $ | 18,061 | | | $ | 7,698 | | | $ | 5,644 | |
|
Ratio of Expenses to Average Net Assets: | |
| | | | | |
Before Expense Reimbursement | | | 2.63 | % | | | 2.40 | % | | | 2.77 | % | | | 2.77 | % | | | 3.37 | % |
| | | | | |
After Expense Reimbursement | | | 0.44 | % | | | 0.44 | % | | | 0.44 | % | | | 0.44 | % | | | 0.44 | % |
| | | | | |
Ratio of Net Investment Income to Average Net Assets | | | 2.91 | % | | | 1.21 | % | | | 3.35 | % | | | 1.83 | % | | | 2.94 | % |
| | | | | |
Portfolio Turnover Rate | | | 632.23 | % | | | 542.69 | % | | | 369.54 | % | | | 191.22 | % | | | 248.19 | % |
| (1) | Computed using average shares outstanding throughout the period. |
See accompanying Notes to Financial Statements.
151
TCW Total Return Bond Fund
Financial Highlights — I Class
| | | | | | | | | | | | | | | | | | | | |
| |
| | | Year Ended October 31, | |
| | | 2023 | | | 2022 | | | 2021 | | | 2020 | | | 2019 | |
Net Asset Value per Share, Beginning of year | | $ | 7.96 | | | $ | 10.14 | | | $ | 10.46 | | | $ | 10.07 | | | $ | 9.46 | |
| | | | | | | | | | | | | | | | | | | | |
Income (Loss) from Investment Operations: | |
Net Investment Income (1) | | | 0.43 | | | | 0.33 | | | | 0.21 | | | | 0.26 | | | | 0.34 | |
Net Realized and Unrealized Gain (Loss) on Investments | | | (0.53 | ) | | | (2.28 | ) | | | (0.25 | ) | | | 0.44 | | | | 0.68 | |
| | | | | | | | | | | | | | | | | | | | |
Total from Investment Operations | | | (0.10 | ) | | | (1.95 | ) | | | (0.04 | ) | | | 0.70 | | | | 1.02 | |
| | | | | | | | | | | | | | | | | | | | |
Less Distributions: | |
Distributions from Net Investment Income | | | (0.47 | ) | | | (0.23 | ) | | | (0.20 | ) | | | (0.31 | ) | | | (0.41 | ) |
Distributions from Return of Capital | | | — | | | | — | | | | (0.01 | ) | | | — | | | | — | |
Distributions from Net Realized Gain | | | — | | | | — | | | | (0.07 | ) | | | — | | | | — | |
| | | | | | | | | | | | | | | | | | | | |
Total Distributions | | | (0.47 | ) | | | (0.23 | ) | | | (0.28 | ) | | | (0.31 | ) | | | (0.41 | ) |
| | | | | | | | | | | | | | | | | | | | |
Net Asset Value per Share, End of year | | $ | 7.39 | | | $ | 7.96 | | | $ | 10.14 | | | $ | 10.46 | | | $ | 10.07 | |
| | | | | | | | | | | | | | | | | | | | |
Total Return | | | (1.51 | %) | | | (19.58 | %) | | | (0.40 | %) | | | 7.08 | % | | | 10.82 | % |
|
Ratios/Supplemental Data: | |
| | | | | |
Net Assets, End of year (in thousands) | | $ | 2,149,490 | | | $ | 2,595,866 | | | $ | 4,264,583 | | | $ | 5,737,736 | | | $ | 4,898,103 | |
|
Ratio of Expenses to Average Net Assets: | |
| | | | | |
Before Expense Reimbursement | | | 0.50 | % | | | 0.55 | % | | | 0.52 | % | | | 0.55 | % | | | 0.62 | % |
| | | | | |
After Expense Reimbursement | | | 0.49 | % | | | 0.49 | % | | | 0.49 | % | | | 0.49 | % | | | 0.49 | % |
| | | | | |
Ratio of Net Investment Income to Average Net Assets | | | 5.28 | % | | | 3.59 | % | | | 2.07 | % | | | 2.50 | % | | | 3.47 | % |
| | | | | |
Portfolio Turnover Rate | | | 303.12 | % | | | 386.85 | % | | | 493.39 | % | | | 269.04 | % | | | 177.80 | % |
| (1) | Computed using average shares outstanding throughout the period. |
See accompanying Notes to Financial Statements.
152
TCW Total Return Bond Fund
Financial Highlights — N Class
| | | | | | | | | | | | | | | | | | | | |
| |
| | | Year Ended October 31, | |
| | | 2023 | | | 2022 | | | 2021 | | | 2020 | | | 2019 | |
Net Asset Value per Share, Beginning of year | | $ | 8.21 | | | $ | 10.46 | | | $ | 10.78 | | | $ | 10.37 | | | $ | 9.76 | |
| | | | | | | | | | | | | | | | | | | | |
Income (Loss) from Investment Operations: | |
Net Investment Income (1) | | | 0.43 | | | | 0.33 | | | | 0.19 | | | | 0.23 | | | | 0.32 | |
Net Realized and Unrealized Gain (Loss) on Investments | | | (0.56 | ) | | | (2.37 | ) | | | (0.25 | ) | | | 0.47 | | | | 0.69 | |
| | | | | | | | | | | | | | | | | | | | |
Total from Investment Operations | | | (0.13 | ) | | | (2.04 | ) | | | (0.06 | ) | | | 0.70 | | | | 1.01 | |
| | | | | | | | | | | | | | | | | | | | |
Less Distributions: | |
Distributions from Net Investment Income | | | (0.46 | ) | | | (0.21 | ) | | | (0.18 | ) | | | (0.29 | ) | | | (0.40 | ) |
Distributions from Net Realized Gain | | | — | | | | — | | | | (0.07 | ) | | | — | | | | — | |
Distributions from Return of Capital | | | — | | | | — | | | | (0.01 | ) | | | — | | | | — | |
| | | | | �� | | | | | | | | | | | | | | | |
Total Distributions | | | (0.46 | ) | | | (0.21 | ) | | | (0.26 | ) | | | (0.29 | ) | | | (0.40 | ) |
| | | | | | | | | | | | | | | | | | | | |
Net Asset Value per Share, End of year | | $ | 7.62 | | | $ | 8.21 | | | $ | 10.46 | | | $ | 10.78 | | | $ | 10.37 | |
| | | | | | | | | | | | | | | | | | | | |
Total Return | | | (1.75 | %) | | | (19.70 | %) | | | (0.58 | %) | | | 6.86 | % | | | 10.46 | % |
|
Ratios/Supplemental Data: | |
| | | | | |
Net Assets, End of year (in thousands) | | $ | 389,444 | | | $ | 506,866 | | | $ | 818,608 | | | $ | 1,844,170 | | | $ | 963,512 | |
|
Ratio of Expenses to Average Net Assets: | |
| | | | | |
Before Expense Reimbursement | | | 0.77 | % | | | 0.79 | % | | | 0.81 | % | | | 0.79 | % | | | 0.88 | % |
| | | | | |
After Expense Reimbursement | | | 0.70 | % | | | 0.70 | % | | | 0.70 | % | | | 0.73 | % | | | 0.79 | % |
| | | | | |
Ratio of Net Investment Income to Average Net Assets | | | 5.07 | % | | | 3.40 | % | | | 1.83 | % | | | 2.21 | % | | | 3.16 | % |
| | | | | |
Portfolio Turnover Rate | | | 303.12 | % | | | 386.85 | % | | | 493.39 | % | | | 269.04 | % | | | 177.80 | % |
| (1) | Computed using average shares outstanding throughout the period. |
See accompanying Notes to Financial Statements.
153
TCW Total Return Bond Fund
Financial Highlights — Plan Class
| | | | | | | | | | | | | | | | |
| | |
| | | Year Ended October 31, | | | February 28, 2020
(Commencement
of Operations)
through
October 31, 2020 | |
| | | 2023 | | | 2022 | | | 2021 | |
Net Asset Value per Share, Beginning of year | | $ | 8.00 | | | $ | 10.19 | | | $ | 10.50 | | | $ | 10.33 | |
| | | | | | | | | | | | | | | | |
Income (Loss) from Investment Operations: | | | | | |
Net Investment Income (1) | | | 0.44 | | | | 0.36 | | | | 0.22 | | | | 0.20 | |
Net Realized and Unrealized Gain (Loss) on Investments | | | (0.55 | ) | | | (2.31 | ) | | | (0.24 | ) | | | 0.13 | |
| | | | | | | | | | | | | | | | |
Total from Investment Operations | | | (0.11 | ) | | | (1.95 | ) | | | (0.02 | ) | | | 0.33 | |
| | | | | | | | | | | | | | | | |
Less Distributions: | | | | | |
Distributions from Net Investment Income | | | (0.47 | ) | | | (0.24 | ) | | | (0.21 | ) | | | (0.16 | ) |
Distributions from Net Realized Gain | | | — | | | | — | | | | (0.07 | ) | | | N/A | |
Return of capital | | | — | | | | — | | | | (0.01 | ) | | | N/A | |
| | | | | | | | | | | | | | | | |
Total distributions | | | (0.47 | ) | | | (0.24 | ) | | | (0.29 | ) | | | (0.16 | ) |
| | | | | | | | | | | | | | | | |
Net Asset Value per Share, End of year | | $ | 7.42 | | | $ | 8.00 | | | $ | 10.19 | | | $ | 10.50 | |
| | | | | | | | | | | | | | | | |
Total Return | | | (1.68 | %) | | | (19.43 | %) | | | (0.25 | %) | | | 3.22 | % (2) |
| |
Ratios/Supplemental Data: | | | | | |
| | | | |
Net assets, end of year (in thousands) | | $ | 2,476 | | | $ | 1,522 | | | $ | 571 | | | $ | 0 | (3) |
| |
Ratio of Expenses to Average Net Assets: | | | | | |
| | | | |
Before Expense Reimbursement | | | 1.32 | % | | | 2.98 | % | | | 6.69 | % | | | 14,761.71 | % (4) |
| | | | |
After Expense Reimbursement | | | 0.44 | % | | | 0.44 | % | | | 0.44 | % | | | 0.44 | % (4) |
| | | | |
Ratio of Net Investment Income to Average Net Assets | | | 5.31 | % | | | 3.88 | % | | | 2.13 | % | | | 2.84 | % (4) |
| | | | |
Portfolio Turnover Rate | | | 303.12 | % | | | 386.85 | % | | | 493.39 | % | | | 269.04 | % (2) |
| (1) | Computed using average shares outstanding throughout the period. |
| (2) | For the period February 28, 2020 (Commencement of Operations) through October 31, 2020. |
| (3) | Amount Rounds to less than $1,000. |
See accompanying Notes to Financial Statements.
154
TCW Funds, Inc.
Report of Independent Registered Public Accounting Firm
To the Board of Directors and Shareholders of
TCW Funds, Inc.
Opinion on the Financial Statements and Financial Highlights
We have audited the accompanying statements of assets and liabilities of TCW Core Fixed Income Fund, TCW Global Bond Fund, TCW High Yield Bond Fund, TCW Short Term Bond Fund, and TCW Total Return Bond Fund and the consolidated statement of assets and liabilities of TCW Enhanced Commodity Strategy Fund (collectively, the “TCW Fixed Income Funds”) (six of sixteen funds comprising the TCW Funds, Inc.), including the schedules of investments of TCW Core Fixed Income Fund, TCW Global Bond Fund, TCW High Yield Bond Fund, TCW Short Term Bond Fund, and TCW Total Return Bond Fund and the consolidated schedule of investments of TCW Enhanced Commodity Strategy Fund, as of October 31, 2023, and the related statements of operations for TCW Core Fixed Income Fund, TCW Global Bond Fund, TCW High Yield Bond Fund, TCW Short Term Bond Fund, and TCW Total Return Bond Fund and the related consolidated statement of operations for TCW Enhanced Commodity Strategy Fund for the year then ended, the statements of changes in net assets for TCW Core Fixed Income Fund, TCW Global Bond Fund, TCW High Yield Bond Fund, TCW Short Term Bond Fund, and TCW Total Return Bond Fund and the consolidated statements of changes in net assets for TCW Enhanced Commodity Strategy Fund for each of the two years in the period then ended, the financial highlights for TCW Core Fixed Income Fund, TCW Global Bond Fund, TCW High Yield Bond Fund, TCW Short Term Bond Fund, and TCW Total Return Bond Fund and the consolidated financial highlights for TCW Enhanced Commodity Strategy Fund for each of the five years in the period then ended, and the related notes. In our opinion, the financial statements and financial highlights for TCW Core Fixed Income Fund, TCW Global Bond Fund, TCW High Yield Bond Fund, TCW Short Term Bond Fund, and TCW Total Return Bond Fund and the consolidated financial statements and consolidated financial highlights for TCW Enhanced Commodity Strategy Fund present fairly, in all material respects, the financial position of each of the respective TCW Fixed Income Funds as of October 31, 2023, the results of their operations for the year then ended, the changes in their net assets for each of the two years in the period then ended and the financial highlights for each of the five years in the period then ended, in conformity with accounting principles generally accepted in the United States of America.
Basis for Opinion
These financial statements and financial highlights are the responsibility of the TCW Fixed Income Funds’ management. Our responsibility is to express an opinion on the TCW Fixed Income Funds’ financial statements and financial highlights based on our audits. We are a public accounting firm registered with the Public Company Accounting Oversight Board (United States) (PCAOB) and are required to be independent with respect to the TCW Fixed Income Funds in accordance with the U.S. federal securities laws and the applicable rules and regulations of the Securities and Exchange Commission and the PCAOB.
We conducted our audits in accordance with the standards of the PCAOB. Those standards require that we plan and perform the audits to obtain reasonable assurance about whether the financial statements and financial highlights are free of material misstatement, whether due to error or fraud. The TCW Fixed Income Funds are not required to have, nor were we engaged to perform, an audit of their internal control over financial reporting. As part of our audits we are required to obtain an understanding of internal control over financial reporting but not for the purpose of expressing an opinion on the effectiveness of the TCW Fixed Income Funds’ internal control over financial reporting. Accordingly, we express no such opinion.
155
TCW Funds, Inc.
Report of Independent Registered Public Accounting Firm (Continued)
Our audits included performing procedures to assess the risks of material misstatement of the financial statements and financial highlights, whether due to error or fraud, and performing procedures that respond to those risks. Such procedures included examining, on a test basis, evidence regarding the amounts and disclosures in the financial statements and financial highlights. Our audits also included evaluating the accounting principles used and significant estimates made by management, as well as evaluating the overall presentation of the financial statements and financial highlights. Our procedures included confirmation of securities owned as of October 31, 2023, by correspondence with the custodian and brokers; when replies were not received from brokers, we performed other auditing procedures. We believe that our audits provide a reasonable basis for our opinion.

Los Angeles, California
December 20, 2023
We have served as the auditor of one or more TCW/Metropolitan West Funds investment companies since 1990.
156
TCW Funds, Inc.
Shareholder Expenses (Unaudited)
As a shareholder of a Fund, you incur ongoing operational costs of the Fund, including management fees and other fund expenses. The following example is intended to help you understand your ongoing costs (in dollars and cents) of investing in a Fund and to compare these costs with the ongoing costs of investing in other funds.
The example is based on an investment of $1,000 invested at the beginning of the period and held for the entire period from May 1, 2023 to October 31, 2023 (184 days).
Actual Expenses: The first line under each Fund in the table below provides information about the actual account values and actual expenses. You may use the information in this line, together with the amount you invested, to estimate the expenses that you paid over the period. Simply divide your account value by $1,000 (for example, an $8,600 account value divided by $1,000 = 8.6), then multiply the result by the number in the first line for your Fund under the heading entitled “Expenses Paid During Period” to estimate the expenses you paid on your account during this period.
Hypothetical Example for Comparison Purposes: The second line under each Fund in the table below provides information about the hypothetical expenses based on each Fund’s actual expense ratio and an assumed rate of return of 5% per year before expenses, which is not the Fund’s actual return. The hypothetical account value and expenses may not be used to estimate the actual ending account balance or expenses you paid for the period. You may use this information to compare the ongoing costs of investing in your Fund and other funds. To do so, compare this 5% hypothetical example with the 5% hypothetical examples that appear in the shareholder reports of the other funds.
| | | | | | | | | | | | | | | | |
TCW Funds, Inc. | | Beginning
Account Value
May 1, 2023 | | | Ending
Account Value
October 31, 2023 | | | Annualized
Expense Ratio | | | Expenses Paid
During Period
(May 1, 2023 to
October 31, 2023) | |
| TCW Core Fixed Income Fund | | | | | | | | | | | | | | | | |
I Class Shares | | | | | | | | | | | | | | | | |
Actual | | $ | 1,000.00 | | | $ | 926.60 | | | | 0.49 | % | | $ | 2.38 | |
Hypothetical (5% return before expenses) | | | 1,000.00 | | | | 1,022.74 | | | | 0.49 | % | | | 2.50 | |
| | | | |
N Class Shares | | | | | | | | | | | | | | | | |
Actual | | $ | 1,000.00 | | | $ | 924.70 | | | | 0.63 | % | | $ | 3.06 | |
Hypothetical (5% return before expenses) | | | 1,000.00 | | | | 1,022.03 | | | | 0.63 | % | | | 3.21 | |
| | | | |
Plan Class Shares | | | | | | | | | | | | | | | | |
Actual | | $ | 1,000.00 | | | $ | 927.30 | | | | 0.44 | % | | $ | 2.14 | |
Hypothetical (5% return before expenses) | | | 1,000.00 | | | | 1,023.00 | | | | 0.44 | % | | | 2.24 | |
| | | | |
| TCW Enhanced Commodity Strategy Fund | | | | | | | | | | | | | | | | |
I Class Shares | | | | | | | | | | | | | | | | |
Actual | | $ | 1,000.00 | | | $ | 997.00 | | | | 0.70 | % | | $ | 3.52 | |
Hypothetical (5% return before expenses) | | | 1,000.00 | | | | 1,021.68 | | | | 0.70 | % | | | 3.57 | |
| | | | |
N Class Shares | | | | | | | | | | | | | | | | |
Actual | | $ | 1,000.00 | | | $ | 996.80 | | | | 0.75 | % | | $ | 3.77 | |
Hypothetical (5% return before expenses) | | | 1,000.00 | | | | 1,021.42 | | | | 0.75 | % | | | 3.82 | |
157
TCW Funds, Inc.
Shareholder Expenses (Unaudited) (Continued)
| | | | | | | | | | | | | | | | |
TCW Funds, Inc. | | Beginning
Account Value
May 1, 2023 | | | Ending
Account Value
October 31, 2023 | | | Annualized
Expense Ratio | | | Expenses Paid
During Period
(May 1, 2023 to
October 31, 2023) | |
| | | | |
| TCW Global Bond Fund | | | | | | | | | | | | | | | | |
I Class Shares | | | | | | | | | | | | | | | | |
Actual | | $ | 1,000.00 | | | $ | 925.70 | | | | 0.60 | % (1) | | $ | 2.91 | (1) |
Hypothetical (5% return before expenses) | | | 1,000.00 | | | | 1,022.18 | | | | 0.60 | % (1) | | | 3.06 | (1) |
| | | | |
N Class Shares | | | | | | | | | | | | | | | | |
Actual | | $ | 1,000.00 | | | $ | 925.30 | | | | 0.70 | % (1) | | $ | 3.40 | (1) |
Hypothetical (5% return before expenses) | | | 1,000.00 | | | | 1,021.68 | | | | 0.70 | % (1) | | | 3.57 | (1) |
| | | | |
| TCW High Yield Bond Fund | | | | | | | | | | | | | | | | |
I Class Shares | | | | | | | | | | | | | | | | |
Actual | | $ | 1,000.00 | | | $ | 994.70 | | | | 0.55 | % | | $ | 2.77 | |
Hypothetical (5% return before expenses) | | | 1,000.00 | | | | 1,022.43 | | | | 0.55 | % | | | 2.80 | |
| | | | |
N Class Shares | | | | | | | | | | | | | | | | |
Actual | | $ | 1,000.00 | | | $ | 991.90 | | | | 0.80 | % | | $ | 4.02 | |
Hypothetical (5% return before expenses) | | | 1,000.00 | | | | 1,021.17 | | | | 0.80 | % | | | 4.08 | |
| | | | |
| TCW Short Term Bond Fund | | | | | | | | | | | | | | | | |
I Class Shares | | | | | | | | | | | | | | | | |
Actual | | $ | 1,000.00 | | | $ | 1,002.10 | | | | 0.44 | % | | $ | 2.22 | |
Hypothetical (5% return before expenses) | | | 1,000.00 | | | | 1,022.99 | | | | 0.44 | % | | | 2.24 | |
| | | | |
| TCW Total Return Bond Fund | | | | | | | | | | | | | | | | |
I Class Shares | | | | | | | | | | | | | | | | |
Actual | | $ | 1,000.00 | | | $ | 909.90 | | | | 0.49 | % | | $ | 2.36 | |
Hypothetical (5% return before expenses) | | | 1,000.00 | | | | 1,022.74 | | | | 0.49 | % | | | 2.50 | |
| | | | |
N Class Shares | | | | | | | | | | | | | | | | |
Actual | | $ | 1,000.00 | | | $ | 909.20 | | | | 0.70 | % | | $ | 3.37 | |
Hypothetical (5% return before expenses) | | | 1,000.00 | | | | 1,021.68 | | | | 0.70 | % | | | 3.57 | |
| | | | |
Plan Class Shares | | | | | | | | | | | | | | | | |
Actual | | $ | 1,000.00 | | | $ | 909.50 | | | | 0.44 | % | | $ | 2.12 | |
Hypothetical (5% return before expenses) | | | 1,000.00 | | | | 1,023.00 | | | | 0.44 | % | | | 2.24 | |
| (1) | Does not include expenses of the underlying affiliated investments. |
158

Privacy Policy
The TCW Group, Inc. and Subsidiaries
TCW Investment Management Company LLC
TCW Asset Management Company LLC
Metropolitan West Asset Management, LLC
| | |
TCW Funds, Inc. TCW Strategic Income Fund, Inc. Metropolitan West Funds Sepulveda Management LLC | | TCW Direct Lending LLC TCW Direct Lending VII LLC TCW Direct Lending VIII LLC TCW Star Direct Lending LLC |
Effective February 2023
WHAT YOU SHOULD KNOW
At TCW, we recognize the importance of keeping information about you secure and confidential. We do not sell or share your nonpublic personal and financial information with marketers or others outside our affiliated group of companies.
We carefully manage information among our affiliated group of companies to safeguard your privacy and to provide you with consistently excellent service.
We are providing this notice to you to comply with the requirements of Regulation S-P, “Privacy of Consumer Financial information,” issued by the United States Securities and Exchange Commission.
OUR PRIVACY POLICY
We, The TCW Group, Inc. and its subsidiaries, the TCW Funds, Inc., TCW Strategic Income Fund, Inc., the Metropolitan West Funds, Sepulveda Management LLC, TCW Direct Lending LLC, TCW Direct Lending VII LLC, TCW Direct Lending VIII LLC, and TCW Star Direct Lending LLC (collectively, “TCW”) are committed to protecting the nonpublic personal and financial information of our customers and consumers who obtain or seek to obtain financial products or services primarily for personal, family or household purposes. We fulfill our commitment by establishing and implementing policies and systems to protect the security and confidentiality of this information.
In our offices, we limit access to nonpublic personal and financial information about you to those TCW personnel who need to know the information in order to provide products or services to you. We maintain physical, electronic, and procedural safeguards to protect your nonpublic personal and financial information.
CATEGORIES OF INFORMATION WE COLLECT
We may collect the following types of nonpublic personal and financial information about you from the following sources:
| | ◾ | | Your name, address and identifying numbers, and other personal and financial information, from you and from identification cards and papers you submit to us, on applications, subscription agreements or other forms or communications. |
| | ◾ | | Information about your account balances and financial transactions with us, our affiliated entities, or nonaffiliated third parties, from our internal sources, from affiliated entities and from nonaffiliated third parties. |
| | ◾ | | Information about your account balances and financial transactions and other personal and financial information, from consumer credit reporting agencies or other nonaffiliated third parties, to verify information received from you or others. |
159
CATEGORIES OF INFORMATION WE DISCLOSE TO NONAFFILIATED THIRD PARTIES
We may disclose your name, address and account and other identifying numbers, as well as information about your pending or past transactions and other personal financial information, to nonaffiliated third parties, for our everyday business purposes such as necessary to execute, process, service and confirm your securities transactions and mutual fund transactions, to administer and service your account and commingled investment vehicles in which you are invested, to market our products and services through joint marketing arrangements or to respond to court orders and legal investigations.
We may disclose nonpublic personal and financial information concerning you to law enforcement agencies, federal regulatory agencies, self-regulatory organizations or other nonaffiliated third parties, if required or requested to do so by a court order, judicial subpoena or regulatory inquiry.
We do not otherwise disclose your nonpublic personal and financial information to nonaffiliated third parties, except where we believe in good faith that disclosure is required or permitted by law. Because we do not disclose your nonpublic personal and financial information to nonaffiliated third parties, our Customer Privacy Policy does not contain opt-out provisions.
CATEGORIES OF INFORMATION WE DISCLOSE TO OUR AFFILIATED ENTITIES
| | ◾ | | We may disclose your name, address and account and other identifying numbers, account balances, information about your pending or past transactions and other personal financial information to our affiliated entities for any purpose. |
| | ◾ | | We regularly disclose your name, address and account and other identifying numbers, account balances and information about your pending or past transactions to our affiliates to execute, process and confirm securities transactions or mutual fund transactions for you, to administer and service your account and commingled investment vehicles in which you are invested, or to market our products and services to you. |
INFORMATION ABOUT FORMER CUSTOMERS
We do not disclose nonpublic personal and financial information about former customers to nonaffiliated third parties unless required or requested to do so by a court order, judicial subpoena or regulatory inquiry, or otherwise where we believe in good faith that disclosure is required or permitted by law.
QUESTIONS
Should you have any questions about our Customer Privacy Policy, please contact us by email or by regular mail at the address at the end of this policy.
REMINDER ABOUT TCW’S FINANCIAL PRODUCTS
Financial products offered by The TCW Group, Inc. and its subsidiaries, the TCW Funds, Inc., TCW Strategic Income Fund, Inc., the Metropolitan West Funds, Sepulveda Management LLC, TCW Direct Lending LLC, TCW Direct Lending VII LLC, TCW Direct Lending VIII LLC, and TCW Star Direct Lending LLC.
| | ◾ | | Are not guaranteed by a bank; |
| | ◾ | | Are not obligations of The TCW Group, Inc. or of its subsidiaries; |
| | ◾ | | Are not insured by the Federal Deposit Insurance Corporation; and |
| | ◾ | | Are subject to investment risks, including possible loss of the principal amount committed or invested, and earnings thereon. |
| | |
THE TCW GROUP, INC. TCW FUNDS, INC. TCW STRATEGIC INCOME FUND, INC. METROPOLITAN WEST FUNDS SEPULVEDA MANAGEMENT LLC | | TCW DIRECT LENDING LLC TCW DIRECT LENDING VII LLC TCW DIRECT LENDING VIII LLC TCW STAR DIRECT LENDING LLC |
Attention: Privacy Officer | 515 South Flower Street | Los Angeles, CA 90071 | email: privacy@tcw.com
160
TCW Funds, Inc.
Investment Management and Advisory Agreement Disclosure (Unaudited)
Renewal of Investment Advisory and Management Agreement
TCW Funds, Inc. (the “Corporation”) and TCW Investment Management Company LLC (the “Advisor”) are parties to an Investment Advisory and Management Agreement (“Agreement”), pursuant to which the Advisor is responsible for managing the investments of each separate investment series (each, a “Fund” and collectively, the “Funds”) of the Corporation. Unless terminated by either party, the Agreement continues in effect from year to year provided that the continuance is specifically approved at least annually by the vote of the holders of at least a majority of the outstanding shares of the Funds, or by the Board of Directors of the Corporation (the “Board”), and, in either event, by a majority of the Directors who are not “interested persons” of the Corporation, as such term is defined in Section 2(a)(19) of the Investment Company Act of 1940, as amended (the “Independent Directors”), casting votes in person at a meeting called for that purpose.
At an in-person meeting on September 11, 2023, the Board approved the renewal of the Agreement for an additional one-year term from February 6, 2024 through February 5, 2025. The renewal of the Agreement was approved by the Board (including by a majority of the Independent Directors) upon the recommendation of the Independent Directors. The Independent Directors also met by videoconference in a working session on August 30, 2023 to hear presentations by representatives of the Advisor, to ask related questions, to review and discuss materials provided by the Advisor for their consideration, and to meet separately with their independent legal counsel. On September 11, 2023 they also met separately with their independent legal counsel to review and discuss supplemental information that had been requested on their behalf by their independent legal counsel and presented by the Advisor. The information, material facts, and conclusions that formed the basis for the Independent Directors’ recommendation and the Board’s subsequent approval are described below.
1. Information received
Materials reviewed — During the course of each year, the Directors receive a wide variety of materials relating to the services provided by the Advisor, including reports on the Advisor’s investment processes, as well as on each Fund’s investment results, portfolio composition, portfolio trading practices, compliance monitoring, shareholder services, and other information relating to the nature, extent, and quality of services provided by the Advisor to the Funds. In addition, the Board reviewed information furnished to the Independent Directors in response to a detailed request sent to the Advisor on their behalf. The information in the Advisor’s responses included extensive materials regarding each Fund’s investment results, advisory fee comparisons to advisory fees charged by the Advisor to its institutional clients, financial and profitability information regarding the Advisor, descriptions of various services provided to the Funds and to other advisory and sub-advisory clients, descriptions of functions such as compliance monitoring and portfolio trading practices, and information about the personnel providing investment management services to each Fund. The Directors also considered information provided by an independent data provider, Broadridge, comparing the investment performance and the fee and expense levels of each Fund to those of appropriate peer groups of mutual funds selected by Broadridge. After reviewing this information, the Directors requested additional financial, profitability and service information from the Advisor, which the Advisor provided and the Directors considered.
Review process — The Directors’ determinations were made on the basis of each Director’s business judgment after consideration of all the information presented. The Independent Directors were advised by their independent legal counsel throughout the renewal process and received and reviewed advice from their independent legal counsel regarding legal and industry standards applicable to the renewal of the
161
TCW Funds, Inc.
Investment Management and Advisory Agreement Disclosure (Unaudited) (Continued)
Agreement, including a legal memorandum from their independent legal counsel discussing their fiduciary duties related to their approval of the continuation of the Agreement. The Independent Directors also discussed the renewal of the Agreement with the Advisor’s representatives and in private sessions at which no representatives of the Advisor were present. In deciding to recommend the renewal of the Agreement with respect to each Fund, the Independent Directors did not identify any single piece of information or particular factor that, in isolation, was the controlling factor. Each Independent Director may also have weighed factors differently. This summary describes the most important, but not all, of the factors considered by the Board and the Independent Directors.
2. Nature, extent, and quality of services provided by the Advisor
The Board and the Independent Directors considered the depth and quality of the Advisor’s investment management process, including its research and strong analytical capabilities; the experience, capability, and integrity of its senior management and other personnel; the advance planning and transition arrangements put in place with respect to the changes in key portfolio management and other personnel; the overall resources available to the Advisor; and the ability of its organizational structure to address the fluctuations in assets that have been experienced over the past several years. The Board and the Independent Directors considered the Advisor’s continued commitment and ability to attract and retain well-qualified investment professionals, noting in particular the Advisor’s hiring of professionals in various areas over the past several years, including recruiting and hiring a highly qualified President and Chief Executive Officer to replace the outgoing head of The TCW Group, Inc., the parent company of the Advisor (“TCW”), continued upgrading of resources in its middle office and back office operations and other areas, as well as a continuing and extensive program of infrastructure and systems enhancements, including business continuity and cyber security, as well as budgeting for certain future initiatives. The Board and the Independent Directors also considered that the Advisor made available to its investment professionals a variety of resources and systems relating to investment management, compliance, trading, operations, administration, research, portfolio accounting, and legal matters. They noted the substantial additional resources made available by TCW. The Board and the Independent Directors examined and discussed a detailed description of the extensive additional services provided to the Funds to support their operations and compliance, as compared to the much narrower range of services provided to the Advisor’s institutional and sub-advised clients, as well as the Advisor’s oversight and coordination of numerous outside service providers to the Funds. They further noted the high level of regular communication between the Advisor and the Independent Directors. The Advisor explained its responsibility to supervise the activities of the Funds’ various service providers, as well as supporting the Independent Directors and their meetings, regulatory filings, and various operational personnel, and the related costs.
The Board and the Independent Directors concluded that the nature, extent, and quality of the services provided by the Advisor are of a high quality and have benefited and should continue to benefit the Funds and their shareholders.
3. Investment results
The Board and the Independent Directors considered the investment results of each Fund in light of its investment objective(s) and principal investment strategies. They compared each Fund’s total returns with the total returns of other mutual funds in peer group reports prepared by Broadridge with respect to various longer and more recent periods all ended May 31, 2023. The Board and the Independent Directors reviewed information as to peer group selections presented by Broadridge and discussed the methodology for those selections with Broadridge. In reviewing each Fund’s relative performance, the Board and the
162
TCW Funds, Inc.
Independent Directors took into account each Fund’s investment strategies, distinct characteristics, asset size and diversification.
The Board and the Independent Directors noted that most Funds’ performance was satisfactory over the relevant periods. The Board and the Independent Directors noted that the investment performance of the majority of the Funds was generally close to or above the median performance of the applicable peer group during the three-year period emphasized by Broadridge in the supplemental materials. For those Funds that lagged peer group averages, they noted that the Advisor had discussed with the Board the reasons for the underperformance, including the investment climate and prevailing market conditions during relevant periods as well as the Advisor’s discipline in maintaining a consistent investment style. The Board considered in particular the Advisor’s explanations for the performance of the eight Funds that ranked in the fourth or fifth quintile of their peer groups for the prior three-year period. The Board indicated that it would continue to monitor portfolio investment performance on a regular basis and discuss with the Advisor from time to time any instances of long-term underperformance as appropriate. The Board and the Independent Directors noted that the performance of some Funds for periods when they lagged their peer group averages remained satisfactory when assessed on a risk-adjusted basis because performance quintiles do not necessarily reflect the degree of risk employed by peer funds to achieve their returns. The Board also considered the Advisor’s assessment of the Funds’ performance during the recent period of significant market volatility and rising interest rates.
With respect to the fixed income Funds, the Board and the Independent Directors recognized the Advisor’s deliberate strategy to manage risk in light of its critical view of the fixed income securities markets and overall investment market conditions at present and in the near term. For that reason, the Board and the Independent Directors believed that relative performance also should be considered in light of future market conditions expected by the Advisor and positioning of the Funds’ portfolios in light of those expectations. The Board and the Independent Directors noted the Advisor’s view that longer term performance can be more meaningful for active fixed income funds than shorter term performance because fixed income market cycles are generally longer than three years.
For the U.S. fixed income Funds, the Board and the Independent Directors noted the conservative profile of these Funds, certain of which generally experienced less volatility compared to various other funds in the applicable peer group (except for the relative volatility of Total Return Bond Fund and Core Fixed Income Fund, which have greater exposure to mortgage-backed securities). They also noted the Advisor’s conservative posture for these Funds with respect to credit and interest rate risks.
For the Total Return Bond Fund, the Board and the Independent Directors noted that the Fund’s performance was in the second quintile for the ten- and five-year periods, fifth quintile for the three-year period and fourth quintile for the one-year period. The Board and the Independent Directors considered the Advisor’s explanation that underperformance was driven by the Fund’s higher duration and greater exposure to mortgage-backed securities than its peers, which the Advisor believes may position the Fund for outperformance going forward.
For the Core Fixed Income Fund, the Board and the Independent Directors noted that the Fund’s performance was in the third quintile for the ten-year period, second quintile for the five-year period and fourth quintile for the three-and one-year periods. The Board and the Independent Directors considered the Advisor’s explanation that underperformance was driven by the Fund’s higher duration and greater exposure to mortgage-backed securities than its peers, which the Advisor believes may position the Fund for outperformance going forward. The Board and the Independent Directors also considered that despite
163
TCW Funds, Inc.
Investment Management and Advisory Agreement Disclosure (Unaudited) (Continued)
its underperformance relative to its peers for the three-year period, the Fund outperformed its benchmark index for that period.
For the High Yield Bond Fund, the Board and the Independent Directors noted that the Fund’s performance was in the first quintile for the ten- and five-year periods, fourth quintile for the three-year period and second quintile for the one-year period. The Board and the Independent Directors considered the Advisor’s explanation that underperformance for the three-year period was driven by the Fund’s focus on higher-quality bonds than its peers, and further considered the Fund’s outperformance over the other periods reviewed.
For the Enhanced Commodity Strategy Fund, the Board and the Independent Directors noted that the Fund’s performance was in the third quintile for the ten-, three- and one-year periods and the second quintile for the five-year period.
For the Global Bond Fund, the Board and the Independent Directors noted that the Fund’s performance was in the fourth quintile for the ten-, three- and one-year periods and third quintile for the five-year period. The Board and the Independent Directors considered the Advisor’s explanation that underperformance for the three-year period was driven by the Fund’s higher duration as compared to many of its peers, and further considered that the Fund outperformed its benchmark index for the same period.
For the Short Term Bond Fund, the Board and the Independent Directors noted that the Fund’s performance was in the fourth quintile for the ten-year period, third quintile for the five-year period and second quintile for the three- and one-year periods.
With respect to the U.S. equity Funds, the Board and the Independent Directors noted that the performance of certain of the Funds for most of the various periods reviewed ranked in the first, second or third quintiles, while other Funds ranked in the fourth quintile over various periods.
The Select Equities Fund ranked in the third quintile for the ten-, five- and one-year periods and fourth quintile for the three-year period. The Board and the Independent Directors considered the Advisor’s explanation that underperformance for the three-year period was driven in part the Fund’s more modest positions in companies that were key contributors to the competitor funds’ returns. The Board and the Independent Directors also considered the Fund’s stronger performance over the other periods reviewed.
The Relative Value Dividend Appreciation Fund ranked in the third quintile for the ten- and five-year periods and the first quintile for the three- and one-year periods. The Relative Value Large Cap Fund ranked in the third quintile for the ten- and five-year periods and the first quintile for the three- and one-year periods. The Relative Value Mid Cap Fund ranked in the fourth quintile for the ten- and five-year periods, the second quintile for the three-year period and the first quintile for the one-year period.
The New America Premier Equities Fund ranked in the first quintile for the five-, three- and one-year periods.
The Global Real Estate Fund ranked in the first quintile for the five-, three- and one-year periods.
The Artificial Intelligence Equity Fund ranked in the fourth quintile for the five-year period, third quintile for the three-year period and second quintile for the one-year period.
For the asset allocation Fund, the Board and the Independent Directors noted that the Conservative Allocation Fund’s performance was in the first quintile for the ten-, five-, and three- and one-year periods.
164
TCW Funds, Inc.
With respect to the international and emerging markets Funds, the Board and the Independent Directors noted that the performance of a majority of these Funds ranked in the fourth or fifth quintiles over many of the various time periods reviewed. The Emerging Markets Income Fund ranked in the third quintile for the ten-year period, fourth quintile for the five- and three-year periods and fifth quintile for the one-year period. The Emerging Markets Local Currency Income Fund ranked in the fourth quintile for the ten-, five- and one-year periods and fifth quintile for the three-year period. The Emerging Markets Multi-Asset Opportunities Fund ranked in the fifth quintile for the five- and one-year periods and the fourth quintile for the three-year period. The Developing Markets Equity Fund ranked in the fifth quintile for the five-, three- and one-year periods. The Board and the Independent Directors considered the Advisor’s discussion of performance, including that the challenging international and emerging market conditions in recent years, including conditions in Russia and China, weighed on performance for the Funds in line with other funds in the universe. The Board and the Independent Directors further considered that the Advisor had recommended, and the Board had approved, the liquidation of the Emerging Markets Multi-Asset Opportunities Fund and the Developing Markets Equity Fund.
The Board and the Independent Directors concluded that the Advisor was implementing each Fund’s investment objective(s) and that the Advisor’s record in managing the Funds indicated that its continued management should benefit each Fund and its shareholders over the long term.
4. Advisory fees and total expenses
The Board and the Independent Directors compared the management fees (which Broadridge defines to include the advisory fee and the administrative fee) and total expenses of each Fund (each as a percentage of average net assets) with the median management fee and operating expense level of the other mutual funds in the relevant Broadridge peer groups. These comparisons assisted the Board and the Independent Directors by providing a reasonable statistical measure to assess each Fund’s fees relative to its relevant peers. The Board and the Independent Directors observed that each Fund’s management fee, after giving effect to applicable waivers and/or reimbursements, was below or near the median of the peer group funds on a current basis. The Board and the Independent Directors also observed that each Fund’s total expenses, after giving effect to applicable waivers and/or reimbursements, were below or near the median of the peer group funds. The Board and the Independent Directors also noted the contractual expense limitations to which the Advisor has agreed with respect to each Fund and that the Advisor historically has absorbed any expenses in excess of these limits. The Board and the Independent Directors noted that for several Funds, their below-median management fee and total expenses were in part due to substantial waiver and/or reimbursement pursuant to the contractual expense limitations. The Board and the Independent Directors concluded that the competitive fees charged by the Advisor, and competitive expense ratios, should continue to benefit each Fund and its shareholders.
The Board and the Independent Directors also reviewed information regarding the advisory fees charged by the Advisor to its institutional and sub-advisory clients with similar investment mandates. The Board and the Independent Directors concluded that, although the fees paid by those clients generally were lower than advisory fees paid by the Funds, the differences appropriately reflected the more extensive services provided by the Advisor to the Funds and the Advisor’s significantly greater responsibilities and expenses with respect to the Funds, including the additional time spent by portfolio managers for reasons such as managing the more active cash flows from purchases and redemptions by shareholders, the additional risks of managing a pool of assets for public investors, administrative burdens, daily pricing, valuation and liquidity responsibilities, the supervision of vendors and service providers, and the costs of additional
165
TCW Funds, Inc.
Investment Management and Advisory Agreement Disclosure (Unaudited) (Continued)
infrastructure and operational resources and personnel and of complying with and supporting the more comprehensive regulatory and governance regime applicable to mutual funds.
5. The Advisor’s costs, level of profits, and economies of scale
The Board and the Independent Directors reviewed information regarding the Advisor’s costs of providing services to the Funds, as well as the resulting level of profits to the Advisor. They reviewed the Advisor’s stated assumptions and methods of allocating certain costs, such as personnel costs, which constitute the Advisor’s largest operating cost. The Board and the Independent Directors recognized that the Advisor should be entitled to earn a reasonable level of profits for the services that it provides to each Fund. The Board and the Independent Directors also reviewed a comparison of the Advisor’s profitability with respect to the Funds to the profitability of certain unaffiliated publicly traded asset managers, which the Advisor believed supported its view that the Advisor’s profitability was reasonable. Based on their review, the Board and the Independent Directors concluded that they were satisfied that the Advisor’s level of profitability from its relationship with each Fund was not unreasonable or excessive.
The Board and the Independent Directors considered the extent to which potential economies of scale could be realized as the Funds grow and whether the advisory fees reflect those potential economies of scale. They recognized that the advisory fees for the Funds do not have breakpoints, which would otherwise result in lower advisory fee rates as the Funds grow larger. They also recognized the Advisor’s view that the advisory fees compare favorably to peer group fees and expenses and remain competitive even at higher asset levels and that the relatively low advisory fees reflect the potential economies of scale. The Board and the Independent Directors recognized the benefits of the Advisor’s substantial past and ongoing investment in the advisory business, such as successfully recruiting and retaining key professional talent, systems and technology upgrades, added resources dedicated to legal, compliance, risk management and cybersecurity programs, and improvements to the overall firm infrastructure, as well as the financial pressures of competing against much larger firms and passive investment products. The Board and the Independent Directors further noted the Advisor’s past and current subsidies of the operating expenses of newer and smaller Funds and the Advisor’s commitment to maintain reasonable overall operating expenses for each Fund. The Board and the Independent Directors also recognized that the Funds benefit from receiving investment advice from an organization with other types of advisory clients in addition to mutual funds. The Board and the Independent Directors considered the risk borne by the Advisor that the Funds’ net assets and thus the Advisor’s fees might decline in the event of redemptions and that smaller Funds might not grow to become profitable. The Board and the Independent Directors concluded that the Advisor was satisfactorily sharing potential economies of scale with the Funds through low fees and expenses, and through reinvesting in its capabilities for serving the Funds and their shareholders.
6. Ancillary benefits
The Board and the Independent Directors also considered ancillary benefits received or to be received by the Advisor and its affiliates as a result of the relationship of the Advisor with the Funds. The Board and the Independent Directors noted that, in addition to the fees the Advisor receives under the Agreement, the Advisor receives additional benefits in connection with management of the Funds in the form of reports, research and other services from brokers and their affiliates in return for brokerage commissions paid to such brokers. The Board and the Independent Directors concluded that any potential benefits received or to be derived by the Advisor from its relationships with the Funds are reasonably related to the services provided by the Advisor to the Funds.
166
TCW Funds, Inc.
7. Conclusions
Based on their overall review, including their consideration of each of the factors referred to above (and others), the Board and the Independent Directors concluded that the Agreement is fair and reasonable to each Fund and its shareholders, that each Fund’s shareholders received reasonable value in return for the advisory fees and other amounts paid to the Advisor by each Fund, and that the renewal of the Agreement was in the best interests of each Fund and its shareholders.
167
TCW Funds, Inc.
Supplemental Information
Proxy Voting Guidelines
The policies and procedures that the Company uses to determine how to vote proxies are available without charge. The Board has delegated the Company’s proxy voting authority to the Advisor.
Disclosure of Proxy Voting Guidelines
The proxy voting guidelines of the Advisor are available:
| | 1. | By calling 800-FUND-TCW (800-386-3829) to obtain a hard copy; or |
| | 2. | By going to the SEC website at http://www.sec.gov. |
When the Company receives a request for a description of the Advisor’s proxy voting guidelines, it will deliver the description that is disclosed in the Company’s Statement of Additional Information. This information will be sent out via first class mail (or other means designed to ensure equally prompt delivery) within three business days of receiving the request.
The Advisor, on behalf of the Company, prepares and files Form N-PX with the SEC not later than August 31 of each year, which includes the Company’s proxy voting record for the most recent twelve-month period ended June 30 of that year. The Company’s proxy voting record for the most recent twelve-month period ended June 30 is available:
| | 1. | By calling 800-FUND-TCW (800-386-3829) to obtain a hard copy; or |
| | 2. | By going to the SEC website at http://www.sec.gov. |
When the Company receives a request for the Company’s proxy voting record, it will send the information disclosed in the Company’s most recently filed report on Form N-PX via first class mail (or other means designed to ensure equally prompt delivery) within three business days of receiving the request.
The Company also discloses its proxy voting record on its website as soon as is reasonably practicable after its report on Form N-PX is filed with the SEC.
Availability of Quarterly Portfolio Schedule
The Company files a complete schedule of its portfolio holdings with the SEC for the first and third quarters of its fiscal year on Form NPORT-P. Such filings occur no later than 60 days after the end of the Funds’ first and third quarters and are available on the SEC’s website at www.sec.gov.
168
TCW Funds, Inc.
Directors and Officers of the Company
A board of six directors is responsible for overseeing the operations of the Company, which consists of 16 Funds at October 31, 2023. The directors of the Company, and their business addresses and their principal occupation for the last five years are set forth below.
Independent Directors
| | | | | | |
Name, and Year of Birth (1) | | Term of Office and Length of Time Served | | Principal Occupation(s) During Past 5 Years | | Other Directorships held by Director |
| Samuel P. Bell (1936) | | Mr. Bell has served as a director of TCW Funds, Inc. since October 2002. | | Private Investor. | | TCW Strategic Income Fund, Inc. (closed-end fund). |
Patrick C. Haden (1953) Chairman of the Board | | Mr. Haden has served as a director of TCW Funds, Inc. since May 2001. | | President (since 2003), Wilson Ave. Consulting (business consulting firm); Senior Advisor to President (July 2016 – June 2017), University of Southern California. | | Auto Club (affiliate of AAA); Metropolitan West Funds (mutual fund); TCW Strategic Income Fund, Inc. (closed end fund). |
| Peter McMillan (1957) | | Mr. McMillan has served as a director of TCW Funds, Inc. since August 2010. | | Co-founder (since 2019), Pacific Oak Capital Advisors (investment advisory firm); Co-founder, Managing Partner and Chief Investment Officer (since May 2013), Temescal Canyon Partners (investment advisory firm); Co-founder and Executive Vice President (2005 – 2019), KBS Capital Advisors (a manager of real estate investment trusts). | | Pacific Oak Strategic Opportunity REIT (real estate investments); Keppel Pacific Oak U.S. REIT (real estate investments); Pacific Oak Residential Trust (real estate investments); Metropolitan West Funds (mutual fund); TCW DL VII Financing LLC (private fund): TCW Strategic Income Fund, Inc. (closed-end fund). |
| Victoria B. Rogers (1961) | | Ms. Rogers has served as a director of the TCW Funds, Inc. since October 2011. | | President and Chief Executive Officer (since 1996), The Rose Hills Foundation (charitable foundation). | | Norton Simon Museum (art museum); Stanford University (university); Causeway Capital Management Trust (mutual fund); Causeway ETML Trust (mutual fund); The Rose Hills Foundation (charitable foundation); TCW Strategic Income Fund, Inc. (closed-end fund). |
| Andrew Tarica (1959) | | Mr. Tarica has served as a director of the TCW Funds, Inc. since March 2012. | | Director of Fixed Income (since February 2022), Forest Road Securities (broker dealer); Chief Executive Officer (since February 2001), Meadowbrook Capital Management (asset management company); Employee (2003 – January 2022), Cowen Prime Services (broker dealer). | | Metropolitan West Funds (mutual fund); TCW Strategic Income Fund, Inc. (closed-end fund); TCW Direct Lending VII, LLC (business development company); TCW Direct Lending VIII, LLC (business development company); TCW Star Direct Lending, LLC (business development company); TCW ETF Trust (exchange-traded fund). |
| (1) | The address of each Independent Director is c/o Morgan Lewis, & Bockius LLP, Counsel to the Independent Directors of TCW Funds, Inc., 300 South Grand Avenue, Los Angeles, CA 90071. |
169
TCW Funds, Inc.
Directors and Officers of the Company (Continued)
Interested Director
This Director is an “interested person” of the Company as defined in the 1940 Act because he is a director and officer of the Advisor, and shareholder and director of The TCW Group, Inc., the parent company of the Advisor.
| | | | | | |
Name and Year of Birth | | Term of Office and Length of Time Served | | Principal Occupation(s)
During Past 5 Years | | Other Directorships held by Director |
| Marc I. Stern (1944) | | Mr. Stern has served as a director since inception of TCW Funds, Inc. in September 1992. | | Chairman (since January 2016), TCW LLC; Chairman (since February 2013), The TCW Group Inc., the Advisor, TCW Asset Management Company LLC and Metropolitan West Asset Management, LLC. | | N/A |
The officers of the Company who are not directors of the Company are:
| | | | |
| Name and Year of Birth (1) | | Position(s) Held with Company | | Principal Occupation(s) During Past 5 Years (2) |
Kathryn Koch (1980) President and Chief Executive Officer | | Ms. Koch has served as President and Chief Executive Officer of TCW Funds, Inc. since February 2023. | | President and Chief Executive Officer (since February 2023), The TCW Group, Inc., TCW LLC, the Advisor, TCW Asset Management Company LLC, Metropolitan West Asset Management, LLC and TCW Strategic Income Fund, Inc.; President and Principal Executive Officer (since February 2023), Metropolitan West Funds; Chief Investment Officer of Public Equity (2004 – January 2023), Goldman Sachs. |
Lisa Eisen (1963) Tax Officer | | Ms. Eisen has served as Tax Officer of TCW Funds, Inc. since December 2016. | | Tax Officer (since December 2016), Metropolitan West Funds and TCW Strategic Income Fund, Inc.; Managing Director and Director of Tax (since August 2016), TCW LLC. |
Meredith S. Jackson (1959) Senior Vice President, General Counsel and Secretary | | Ms. Jackson has served as Senior Vice President since January 2016 and General Counsel and Secretary of TCW Funds, Inc. since February 2013. | | Executive Vice President, General Counsel and Secretary (since January 2016), TCW LLC; Executive Vice President, General Counsel and Secretary (since February 2013), the Advisor, The TCW Group, Inc., TCW Asset Management Company LLC and Metropolitan West Asset Management, LLC. Senior Vice President, General Counsel and Secretary (since February 2013), TCW Strategic Income Fund, Inc., Vice President and Secretary (since February 2013), Metropolitan West Funds. |
170
TCW Funds, Inc.
| | | | |
| Name and Year of Birth (1) | | Position(s) Held with Company | | Principal Occupation(s) During Past 5 Years (2) |
Gladys Xiques (1973) Chief Compliance Officer and AML Officer | | Ms. Xiques has served as Chief Compliance Officer and AML Officer of TCW Funds, Inc. since January 2021. | | Chief Compliance Officer and AML Officer (since January 2021), TCW Strategic Income Fund, Inc. and Metropolitan West Funds; Managing Director and Global Chief Compliance Officer (since January 2021), TCW LLC, the Advisor, Metropolitan West Asset Management, LLC and TCW Asset Management Company LLC; Global Chief Compliance Officer (since January 2021), The TCW Group, Inc.; Senior Vice President (February 2015 – December 2020), TCW LLC, the Advisor, Metropolitan West Asset Management, LLC and TCW Asset Management Company LLC. |
Richard M. Villa (1964) Treasurer Principal Financial and Accounting Officer | | Mr. Villa has served as Treasurer and Principal Financial and Accounting Officer of TCW Funds, Inc. since February 2014. | | Executive Vice President, Chief Financial Officer and Assistant Secretary (since July 2008), the Advisor, The TCW Group, Inc., TCW Asset Management Company LLC, Metropolitan West Asset Management, LLC, and (since January 2016), TCW LLC; Treasurer and Principal Financial and Accounting Officer (since February 2014), TCW Strategic Income Fund, Inc. and (since February 2021), Metropolitan West Funds. |
| (1) | The address of the Interested Director and each officer is c/o the TCW Group, Inc., 515 South Flower Street, Los Angeles, CA 90071. |
| (2) | Positions with The TCW Group, Inc. and its affiliates may have changed over time. |
In addition, Eric Chan, Managing Director of Fund Operations for the Advisor, TCW Asset Management Company LLC, TCW LLC (since 2009), and Metropolitan West Asset Management, LLC (since November 2006), is Assistant Treasurer of the Company and TCW Strategic Income Fund, Inc. (since 2009) and Metropolitan West Funds (since 2010). Mr. Chan is a Certified Public Accountant. Peter Davidson, Senior Vice President, Associate General Counsel and Assistant Secretary of TCW Asset Management Company LLC, Metropolitan West Asset Management, LLC, TCW LLC, and the Advisor (since July 2022), is Vice President and Assistant Secretary of the Company, TCW Strategic Income Fund, Inc. and Metropolitan West Funds (since September 2022).
The SAI (Statement of Additional Information) has additional information regarding the Board of Directors. A copy is available without charge by calling 1-800-FUND-TCW (1-800-386-3829) to obtain a hard copy or by going to the SEC website at http://www.sec.gov.
171
TCW Funds, Inc.
515 South Flower Street
Los Angeles, California 90071
800 FUND TCW
(800 386 3829)
www.TCW.com
INVESTMENT ADVISOR
TCW Investment Management Company LLC
515 South Flower Street
Los Angeles, California 90071
TRANSFER AGENT
U.S. Bancorp Fund Services, LLC
615 E. Michigan Street
Milwaukee, Wisconsin 53202
INDEPENDENT REGISTERED
PUBLIC ACCOUNTING FIRM
Deloitte & Touche LLP
555 West 5th Street
Los Angeles, California 90013
CUSTODIAN & ADMINISTRATOR
State Street Bank & Trust Company
One Congress Street, Suite 1
Boston, Massachusetts 02114-2016
DISTRIBUTOR
TCW Funds Distributors LLC
515 South Flower Street
Los Angeles, California 90071
DIRECTORS
Patrick C. Haden
Director and Chairman of the Board
Samuel P. Bell
Director
Peter McMillan
Director
Victoria B. Rogers
Director
Marc I. Stern
Director
Andrew Tarica
Director
OFFICERS
Kathryn Koch
President and Chief Executive Officer
Meredith S. Jackson
Senior Vice President,
General Counsel and Secretary
Richard M. Villa
Treasurer and Principal Financial and Accounting Officer
Gladys Xiques
Chief Compliance Officer and Anti-Money Laundering Officer
Lisa Eisen
Tax Officer
Eric W. Chan
Assistant Treasurer
Peter Davidson
Vice President and Assistant Secretary
TCW FAMILY OF FUNDS
EQUITY FUNDS
TCW Artificial Intelligence Equity Fund
TCW Global Real Estate Fund
TCW New America Premier Equities Fund
TCW Relative Value Dividend Appreciation Fund
TCW Relative Value Large Cap Fund
TCW Relative Value Mid Cap Fund
TCW Select Equities Fund
ASSET ALLOCATION FUND
TCW Conservative Allocation Fund
FIXED INCOME FUNDS
TCW Core Fixed Income Fund
TCW Enhanced Commodity Strategy Fund
TCW Global Bond Fund
TCW High Yield Bond Fund
TCW Short Term Bond Fund
TCW Total Return Bond Fund
INTERNATIONAL FUNDS
TCW Emerging Markets Income Fund
TCW Emerging Markets Local Currency Income Fund
FUNDarEQ1022

OCTOBER 31

A N N U A L
R E P O R T
INTERNATIONAL FUNDS
TCW Emerging Markets Income Fund
TCW Emerging Markets Local Currency Income Fund
TCW Funds, Inc.
Table of Contents
|
| |
| The Letter to Shareholders and/or Management Discussions contained in this Annual Report are the opinions of each Fund’s portfolio managers and are not the opinions of TCW Funds, Inc. or its Board of Directors. Various matters discussed in the Letter to Shareholders and/or Management Discussions constitute forward-looking statements within the meaning of the federal securities laws. Actual results and the timing of certain events could differ materially from those projected or contemplated by these forward-looking statements due to a number of factors, including general economic conditions, overall availability of securities for investment by a Fund, the level of volatility in the securities markets and in the share price of a Fund, and other risk factors discussed in the SEC filings of TCW Funds, Inc. The data presented in the Letter to Shareholders and/or Management Discussions represents past performance and cannot be used to predict future results. |
| | |
To Our Valued Shareholders | | |

Dear Valued Investors,
I am pleased to present the 2023 annual report for the TCW Funds, Inc. covering the 12-month period ended October 31, 2023. I would like to express our appreciation for your continued investment in the TCW Funds as well as to welcome new shareholders to our fund family. As of October 31, 2023, the TCW Funds held total net assets of approximately $8.6 billion.
This report contains information and portfolio management discussions of our TCW International Funds.
The International Markets
We are constructive on Emerging Markets (EM) Fixed Income heading into 2024, based upon 1) the outperformance of Emerging Markets growth strategies compared to Developed Markets (DM) growth, 2) improving inflation dynamics in both EM and the U.S., 3) reduced U.S. rates volatility, and 4) attractive valuations, in our view. In addition, technical positioning appears supportive, as investors appear broadly underweight EM Fixed Income.
Global EM economies are forecast to grow between 3.5-4.0% in 2024, suggesting increased outperformance versus the U.S., where growth is forecast to slow from above 2% this year to around 1% next year. The EM growth outlook reflects a combination of persistently strong commodity prices, monetary easing, and a pickup in DM growth outside the U.S. and Japan. As for China, we forecast somewhat slower growth in 2024, but increasing fiscal stimulus raises the likelihood of reaching the 5% target in 2023.
Monetary policy in Emerging Markets remains generally favorable, given disinflation. In Latin America, most central banks are already easing monetary policy or about to start an easing cycle. In the CEE (central and eastern European) region, monetary policy has begun turning with several central banks already in easing mode, while a couple of
CEE central banks (Turkey and Russia) continue to tighten as they cope with high/rising inflation and FX depreciation pressures. As for Asia (outside of China mentioned above), the need to anchor exchange rate expectations and avoid disorderly capital flows, given historically tight to negative spreads between Asian and U.S. rates, has forced most Asian central banks to tighten monetary conditions, and some have increased policy rates.
U.S. rates volatility has started to decline on signs that the Fed hiking cycle may be complete. Declining rates volatility should, in our view, help encourage risk-taking. Further, we anticipate that flows will re-enter Emerging Markets Fixed Income on the back of stability in rates volatility and comfort around a soft landing in global growth.
Valuations remain attractive in Emerging Markets Fixed Income, in our view. Overall yields for EM investment grade sovereigns over 6% are in the 99th percentile versus the past ten years. EM high yield (HY) sovereign spreads, are at post-GFC (Global Financial Crisis) wides versus U.S. HY – this spread differential of ~360 bps represents the 93rd percentile relative to U.S. HY spreads. Absolute yields for high yield sovereigns are in the 95th percentile in the past ten years. Overall yields for EM local currency, an investment grade rated asset class, average approximately 6.5% with opportunities for double-digit yields in select markets. There is also potential for EMFX (emerging market foreign exchange) upside; if and when the end of the Fed hiking cycle is confirmed, downward pressure on the dollar should resume, although a broad-based weakening in the dollar will likely require a stronger growth picture in the rest of the world, particularly Europe and China.
We see the main risks as follows:
| • | | A re-acceleration of inflation that requires the Fed to remain hawkish poses a risk to the market. This could in turn spark further downside in global growth if the Fed |
1
| | |
Letter to Shareholders (Continued) | | |
| | | is forced to hike rates further and EM CBs (Central Banks) pause easing cycles. |
| • | | Geopolitical risk: In our base case, the Middle East conflict will last for at least a few months, but it will remain contained. Visibility is low regarding when and how the fighting ends. The Russia-Ukraine war has become less of a market factor over time, but with the war’s end still unpredictable, the potential to suppress risk appetite in the European and Eurasia region cannot be fully discounted. |
| • | | Elections risk: There are a number of elections in 2024 which pose varying upside or downside risks. Tensions between China and Taiwan, in particular following the latter’s presidential election (January 2024) and the run-up to the U.S. elections (November 2024), will require close monitoring by market participants. |
We truly value our relationship with you and thank you for making the TCW Funds part of your long-term investment plan. If you have any questions or require further information, we invite you to visit our website at www.tcw.com, or call our shareholder services department at 800-386-3829.
We look forward to further correspondence with you through our semi-annual report next year.
Sincerely,

Kathryn Koch
President and Chief Executive Officer
2
TCW Emerging Markets Income Fund
Management Discussions
For the year ended October 31, 2023, the TCW Emerging Markets Income Fund (the “Fund”) returned 8.72%, 8.48% and 8.63% net of fees on its I Class, N Class and P Class shares, respectively. Performance of the Fund’s classes varies because of differing expenses. The Fund’s benchmark, the JPMorgan EMBI Global Diversified Index (“EMBI”), returned 8.36% over the same period.
Outperformance for the one-year period was driven by a combination of an emphasis on high yield relative to investment grade and periods of short-duration positioning in a rising rate environment. Further, exposure to oil & gas and select distressed sovereigns further contributed to relative outperformance. On the other hand, currency hedging for eur-denominated exposure hurt relative performance. However, these euro hedges were held against long eur-denominated bond positions, which in aggregate contributed net positively to performance.
We are constructive on Emerging Markets (EM) Fixed Income heading into 2024, based upon 1) the outperformance of Emerging Markets growth strategies compared to Developed Markets (DM) growth, 2) improving inflation dynamics in both EM and the U.S., 3) reduced U.S. rates volatility, and 4) yields at historically attractive levels (95th-99th percentile). In addition, technical positioning appears supportive, as investors appear broadly underweight EM Fixed Income.
Global EM economies are forecast to grow between 3.5-4.0% in 2024, suggesting increased outperformance versus the U.S., where growth is forecast to slow from above 2% this year to around 1% next year. The EM growth outlook reflects a combination of persistently strong commodity prices, monetary easing, and a pickup in DM growth outside the U.S. and Japan. As for China, we forecast somewhat slower growth in 2024, but increasing fiscal stimulus raises the likelihood of reaching the 5% target in 2023.
Monetary policy in Emerging Markets remains generally favorable, given disinflation. In Latin America, most central banks are already easing monetary policy or about to start an easing cycle. In the CEE region, monetary policy has begun turning with several central banks already in easing mode, while a couple of CEE central banks (Turkey and Russia) continue to tighten as they cope with high/rising inflation and FX depreciation pressures. As for Asia (outside of China mentioned above), the need to anchor exchange rate expectations and avoid disorderly capital flows, given historically tight to negative spreads between Asian and U.S. rates, has forced most Asian central banks to tighten monetary conditions, and some have increased policy rates.
U.S. rates volatility has started to decline on signs that the Fed hiking cycle may be complete. Declining rates volatility should, in our view, help encourage risk-taking. Further, we anticipate that flows will re-enter Emerging Markets fixed income on the back of stability in rates volatility and comfort around a soft landing in global growth.
Valuations remain attractive in Emerging Markets Fixed Income, in our view. Overall yields for EM investment grade sovereigns over 6% are in the 99th percentile versus the past ten years. EM high yield (HY) sovereign spreads, are at post-GFC wides versus U.S. HY – this spread differential of 362 bps represents the 93rd percentile relative to U.S. HY spreads. Absolute yields for high yield sovereigns are in the 95th percentile in the past ten years. We anticipate 2024 returns to be driven by a combination of lower U.S. rates, benefiting investment grade assets and spread tightening in high yield.
3
TCW Emerging Markets Income Fund
Management Discussions (Continued)
We see the main risks as follows:
| • | | A re-acceleration of inflation that requires the Fed to remain hawkish poses a risk to the market. This could in turn spark further downside in global growth if the Fed is forced to hike rates further and EM CBs pause easing cycles. |
| • | | Geopolitical risk: In our base case, the Middle East conflict will last for at least a few months, but it will remain contained. Visibility is low regarding when and how the fighting ends. The Russia-Ukraine war has become less of a market factor over time, but with the war’s end still unpredictable, the potential to suppress risk appetite in the European and Eurasia region cannot be fully discounted. |
| • | | Elections risk: There are a number of elections in 2024 which pose varying upside or downside risks. Tensions between China and Taiwan, in particular following the latter’s presidential election (January 2024) and the run-up to the U.S. elections (November 2024), will require close monitoring by market participants. |
| | | | | | | | | | | | | | | | | | | | | | | | |
| | | Annualized Total Return as of October 31, 2023 (1) | |
| | | 1 Yr Return | | | 3 Yr Return | | | 5 Yr Return | | | 10 Yr Return | | | Inception
to Date | | | Inception Index | |
TCW Emerging Markets Income Fund | | | | | | | | | | | | | | | | | | | | | | | | |
Class I (Inception: 09/01/1996) | | | 8.72 | % | | | (5.11 | %) | | | (0.81 | %) | | | 1.15 | % | | | 7.08 | % (2) | | | 7.13 | % |
Class N (Inception: 03/01/2004 ) | | | 8.48 | % | | | (5.24 | %) | | | (0.95 | %) | | | 0.93 | % | | | 5.13 | % | | | 5.17 | % |
Class P (Inception: 02/28/2020 ) | | | 8.63 | % | | | (5.09 | %) | | | — | | | | — | | | | (4.85 | %) | | | (4.37 | %) |
JPMorgan EMBI Global Diversified Index | | | 8.36 | % | | | (4.99 | %) | | | (0.19 | %) | | | 2.05 | % | | | | | | | | |

4
TCW Emerging Markets Income Fund
Management Discussions (Continued)
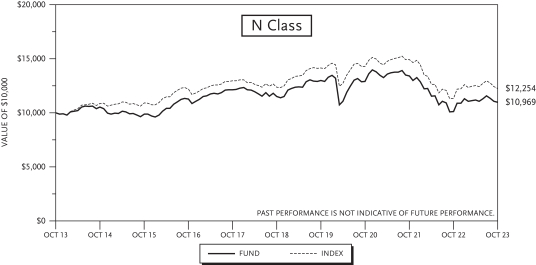
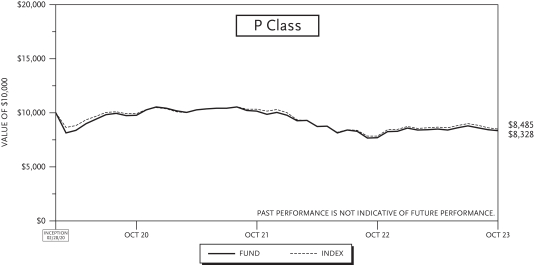
| (1) | The total returns do not reflect taxes that a shareholder would pay on fund distributions or on the redemption of fund shares. |
| (2) | Performance data includes the performance of the predecessor entity for periods before the Fund’s registration became effective. The predecessor entity was not registered under the 1940 Act, and therefore, was not subject to certain investment restrictions that we imposed by the 1940 Act. If the predecessor entity had been registered under the 1940 Act, the predecessor entity’s performance may have been lower. |
5
TCW Emerging Markets Local Currency Income Fund
Management Discussions
For the year ended October 31, 2023, the TCW Emerging Markets Local Currency Income Fund (the “Fund”) returned 11.92% and 11.89% net of fees on its I Class and N Class shares, respectively. Performance of the Fund’s classes varies because of differing expenses. The Fund’s benchmark, the JPMorgan GBI-EM Global Diversified Index (“GBI-EM GD”), returned 13.50% over the same period.
Relative underperformance for the one-year period was driven by a combination of 1) defensive positioning in Central and Eastern Europe earlier in the period and 2) higher beta (i.e. more market-sensitive) local currency exposure during an unexpected period of dollar strength. This was partially offset by underweight positioning in Turkey, Egypt and China.
We are constructive on Emerging Markets (EM) Fixed Income heading into 2024, based upon 1) the outperformance of Emerging Markets growth strategies compared to Developed Markets (DM) growth, 2) improving inflation dynamics in both EM and the U.S., 3) reduced U.S. rates volatility, and 4) attractive valuations, in our view. In addition, technical positioning appears supportive, as investors appear broadly underweight EM Fixed Income.
Global EM economies are forecast to grow between 3.5-4.0% in 2024, suggesting increased outperformance versus the U.S., where growth is forecast to slow from above 2% this year to around 1% next year. The EM growth outlook reflects a combination of persistently strong commodity prices, monetary easing, and a pickup in DM growth outside the U.S. and Japan. As for China, we forecast somewhat slower growth in 2024, but increasing fiscal stimulus raises the likelihood of reaching the 5% target in 2023.
Monetary policy in Emerging Markets remains generally favorable, given disinflation. In Latin America, most central banks are already easing monetary policy or about to start an easing cycle. In the CEE region, monetary policy has begun turning with several central banks already in easing mode, while a couple of CEE central banks (Turkey and Russia) continue to tighten as they cope with high/rising inflation and FX depreciation pressures. As for Asia (outside of China mentioned above), the need to anchor exchange rate expectations and avoid disorderly capital flows, given historically tight to negative spreads between Asian and U.S. rates, has forced most Asian central banks to tighten monetary conditions, and some have increased policy rates.
U.S. rates volatility has started to decline on signs that the Fed hiking cycle may be complete. Declining rates volatility should, in our view, help encourage risk-taking. Further, we anticipate that flows will re-enter Emerging Markets fixed income on the back of stability in rates volatility and comfort around a soft landing in global growth.
Valuations remain attractive in Emerging Markets Local Currency, in our view. The market is differentiated: overall yields – for an investment grade rated asset class – average approximately 6.5%, with a number of markets providing potential for double-digit yields and currency upside. If and when the end of the Fed hiking cycle is confirmed, downward pressure on the dollar should resume, although a broad-based weakening in the dollar will likely require a stronger growth picture in the rest of the world, particularly Europe and China.
We see the main risks as follows:
| • | | A re-acceleration of inflation that requires the Fed to remain hawkish poses a risk to the market. This could in turn spark further downside in global growth if the Fed is forced to hike rates further and EM CBs pause easing cycles. |
6
TCW Emerging Markets Local Currency Income Fund
Management Discussions (Continued)
| • | | Geopolitical risk: In our base case, the Middle East conflict will last for at least a few months, but it will remain contained. Visibility is low regarding when and how the fighting ends. The Russia-Ukraine war has become less of a market factor over time, but with the war’s end still unpredictable, the potential to suppress risk appetite in the European and Eurasia region cannot be fully discounted. |
| • | | Elections risk: There are a number of elections in 2024 which pose varying upside or downside risks. Tensions between China and Taiwan, in particular following the latter’s presidential election (January 2024) and the run-up to the U.S. elections (November 2024), will require close monitoring by market participants. |
| | | | | | | | | | | | | | | | | | | | |
| | | Annualized Total Return as of October 31, 2023 (1) | |
| | | 1 Yr Return | | | 3 Yr Return | | | 5 Yr Return | | | 10 Yr Return | | | Inception
to Date | |
TCW Emerging Markets Local Currency Income Fund | | | | | | | | | | | | | | | | | | | | |
Class I (Inception: 12/15/2010 ) | | | 11.92 | % | | | (3.42 | %) | | | (0.50 | %) | | | (1.34 | %) | | | (0.12 | %) |
Class N (Inception: 12/15/2010 ) | | | 11.89 | % | | | (3.48 | %) | | | (0.56 | %) | | | (1.38 | %) | | | (0.16 | %) |
JPMorgan GBI-EM Global Diversified Index | | | 13.50 | % | | | (3.00 | %) | | | 0.29 | % | | | (1.16 | %) | | | (0.16 | %) |

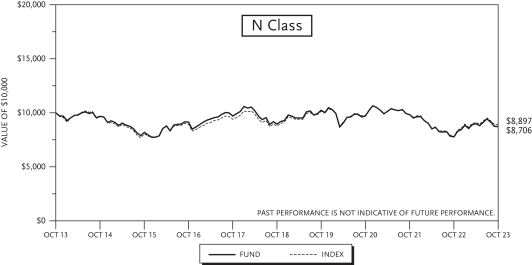
| (1) | The total returns do not reflect taxes that a shareholder would pay on fund distributions or on the redemption of fund shares. |
7
TCW Emerging Markets Income Fund
Schedule of Investments
| | | | | | | | | | | | |
| Issues | | Maturity
Date | | | Principal
Amount | | | Value | |
|
FIXED INCOME SECURITIES —96.7% of Net Assets | |
|
| Angola — 2.2% | |
|
Angola Government International Bonds | |
| | | |
8.00% (1) | | | 11/26/29 | | | $ | 12,298,000 | | | $ | 9,813,804 | |
| | | |
8.25% (2) | | | 05/09/28 | | | | 44,795,000 | | | | 38,037,226 | |
| | | |
8.75% (2) | | | 04/14/32 | | | | 37,935,000 | | | | 29,626,401 | |
| | | | | | | | | | | | |
|
Total Angola | |
| |
(Cost: $82,787,978) | | | | 77,477,431 | |
| | | | | | | | | | | | |
|
| Argentina — 1.3% | |
|
Argentina Republic Government International Bonds | |
| | | |
3.50% | | | 07/09/41 | | | | 81,333,047 | | | | 21,439,392 | |
| | | |
3.63% | | | 07/09/35 | | | | 48,571,035 | | | | 12,021,331 | |
| | | |
4.25% | | | 01/09/38 | | | | 36,873,346 | | | | 11,154,187 | |
| | | | | | | | | | | | |
|
Total Argentina | |
| |
(Cost: $57,814,960) | | | | 44,614,910 | |
| | | | | | | | | | | | |
|
| Azerbaijan — 0.7% | |
|
Republic of Azerbaijan International Bonds | |
| | | |
3.50% (1) | | | 09/01/32 | | | | 11,405,000 | | | | 8,955,776 | |
|
Southern Gas Corridor CJSC | |
| | | |
6.88% (1) | | | 03/24/26 | | | | 14,445,000 | | | | 14,264,236 | |
| | | | | | | | | | | | |
|
Total Azerbaijan | |
| |
(Cost: $24,011,855) | | | | 23,220,012 | |
| | | | | | | | | | | | |
|
| Bahrain — 3.3% | |
|
Bahrain Government International Bonds | |
| | | |
5.63% (1) | | | 05/18/34 | | | | 30,422,000 | | | | 25,060,123 | |
| | | |
6.75% (1) | | | 09/20/29 | | | | 56,114,000 | | | | 54,360,437 | |
| | | |
7.75% (2) | | | 04/18/35 | | | | 38,282,000 | | | | 36,766,033 | |
| | | | | | | | | | | | |
|
Total Bahrain | |
| |
(Cost: $119,242,232) | | | | 116,186,593 | |
| | | | | | | | | | | | |
|
| Brazil — 3.3% | |
|
Acu Petroleo Luxembourg Sarl | |
| | | |
7.50% (2) | | | 07/13/35 | | | | 21,954,898 | | | | 19,827,681 | |
|
Aegea Finance Sarl | |
| | | |
9.00% (2) | | | 01/20/31 | | | | 6,825,000 | | | | 6,842,062 | |
|
Brazil Government International Bonds | |
| | | |
3.88% | | | 06/12/30 | | | | 29,750,000 | | | | 25,640,694 | |
| | | |
6.00% | | | 10/20/33 | | | | 42,100,000 | | | | 39,047,750 | |
|
CSN Resources SA | |
| | | |
4.63% (2) | | | 06/10/31 | | | | 13,360,000 | | | | 10,053,400 | |
| | | |
7.63% (1) | | | 04/17/26 | | | | 5,000,000 | | | | 4,969,248 | |
|
Minerva Luxembourg SA | |
| | | |
8.88% (2) | | | 09/13/33 | | | | 10,000,000 | | | | 9,832,000 | |
| | | | | | | | | | | | |
|
Total Brazil | |
| |
(Cost: $118,393,000) | | | | 116,212,835 | |
| | | | | | | | | | | | |
|
| Chile — 3.5% | |
|
AES Andes SA | |
| | | |
7.13% (5 yr. USD Swap + 4.644%)(2), (3) | | | 03/26/79 | | | | 19,856,000 | | | | 18,796,385 | |
| | | | | | | | | | | | |
| Issues | | Maturity
Date | | | Principal
Amount | | | Value | |
|
| Chile (Continued) | |
|
Chile Government International Bonds | |
| | | |
2.75% | | | 01/31/27 | | | $ | 20,410,000 | | | $ | 18,700,390 | |
| | | |
4.95% | | | 01/05/36 | | | | 35,990,000 | | | | 32,058,092 | |
| | | |
5.33% | | | 01/05/54 | | | | 24,773,952 | | | | 21,090,065 | |
|
Corp. Nacional del Cobre de Chile | |
| | | |
3.00% (1) | | | 09/30/29 | | | | 20,575,000 | | | | 17,124,829 | |
| | | |
5.13% (1) | | | 02/02/33 | | | | 19,500,000 | | | | 17,271,150 | |
| | | | | | | | | | | | |
|
Total Chile | |
| |
(Cost: $133,096,430) | | | | 125,040,911 | |
| | | | | | | | | | | | |
|
China — 0.3% (Cost: $9,756,606) | |
|
MGM China Holdings Ltd. | |
| | | |
4.75% (1) | | | 02/01/27 | | | | 10,800,000 | | | | 9,505,728 | |
| | | | | | | | | | | | |
|
| Colombia — 4.0% | |
|
Colombia Government International Bonds | |
| | | |
7.38% | | | 09/18/37 | | | | 23,425,000 | | | | 21,202,075 | |
| | | |
7.50% | | | 02/02/34 | | | | 41,040,000 | | | | 38,503,242 | |
|
Ecopetrol SA | |
| | | |
8.63% | | | 01/19/29 | | | | 46,245,000 | | | | 46,277,372 | |
| | | |
8.88% | | | 01/13/33 | | | | 17,801,000 | | | | 17,117,442 | |
|
Gran Tierra Energy, Inc. | |
| | | |
9.50% (2) | | | 10/15/29 | | | | 21,226,000 | | | | 18,247,992 | |
| | | | | | | | | | | | |
|
Total Colombia | |
| |
(Cost: $145,665,647) | | | | 141,348,123 | |
| | | | | | | | | | | | |
|
| Dominican Republic — 3.4% | |
|
Dominican Republic International Bonds | |
| | | |
4.50% (2) | | | 01/30/30 | | | | 15,336,000 | | | | 13,023,331 | |
| | | |
4.88% (2) | | | 09/23/32 | | | | 44,169,000 | | | | 35,834,310 | |
| | | |
5.50% (2) | | | 02/22/29 | | | | 42,255,000 | | | | 38,549,236 | |
| | | |
6.00% (1) | | | 07/19/28 | | | | 22,445,000 | | | | 21,300,305 | |
| | | |
6.85% (1) | | | 01/27/45 | | | | 14,850,000 | | | | 12,436,875 | |
| | | | | | | | | | | | |
|
Total Dominican Republic | |
| |
(Cost: $122,753,338) | | | | 121,144,057 | |
| | | | | | | | | | | | |
|
| Ecuador — 1.4% | |
|
Ecuador Government International Bonds | |
| | | |
2.50% (1) | | | 07/31/40 | | | | 37,320,000 | | | | 12,632,820 | |
| | | |
3.50% (2) | | | 07/31/35 | | | | 58,555,699 | | | | 22,426,833 | |
| | | |
6.00% (1) | | | 07/31/30 | | | | 31,022,281 | | | | 15,821,363 | |
| | | | | | | | | | | | |
|
Total Ecuador | |
| |
(Cost: $54,095,355) | | | | 50,881,016 | |
| | | | | | | | | | | | |
|
| Egypt — 2.9% | |
|
Egypt Government International Bonds | |
| | | |
5.88% (1) | | | 02/16/31 | | | | 31,212,000 | | | | 17,282,084 | |
| | | |
7.05% (2) | | | 01/15/32 | | | | 49,321,000 | | | | 27,989,667 | |
| | | |
7.30% (1) | | | 09/30/33 | | | | 51,910,000 | | | | 28,810,050 | |
| | | |
7.50% (1) | | | 02/16/61 | | | | 20,697,000 | | | | 10,296,758 | |
See accompanying Notes to Financial Statements.
8
TCW Emerging Markets Income Fund
October 31, 2023
| | | | | | | | | | | | |
| Issues | | Maturity
Date | | | Principal
Amount | | | Value | |
|
| Egypt (Continued) | |
| | | |
8.50% (1) | | | 01/31/47 | | | $ | 31,961,000 | | | $ | 16,733,182 | |
| | | | | | | | | | | | |
|
Total Egypt | |
| |
(Cost: $115,616,283) | | | | 101,111,741 | |
| | | | | | | | | | | | |
|
| El Salvador — 1.1% | |
|
El Salvador Government International Bonds | |
| | | |
6.38% (1) | | | 01/18/27 | | | | 22,587,000 | | | | 18,580,664 | |
| | | |
7.12% (1) | | | 01/20/50 | | | | 19,754,000 | | | | 12,435,143 | |
| | | |
8.25% (1) | | | 04/10/32 | | | | 11,790,000 | | | | 9,310,706 | |
| | | | | | | | | | | | |
|
Total El Salvador | |
| |
(Cost: $45,884,348) | | | | 40,326,513 | |
| | | | | | | | | | | | |
|
| Gabon — 1.1% | |
|
Gabon Government International Bonds | |
| | | |
6.63% (1) | | | 02/06/31 | | | | 35,663,000 | | | | 25,370,658 | |
| | | |
6.95% (1) | | | 06/16/25 | | | | 15,491,000 | | | | 13,573,214 | |
| | | | | | | | | | | | |
|
Total Gabon | |
| |
(Cost: $44,612,269) | | | | 38,943,872 | |
| | | | | | | | | | | | |
|
| Ghana — 2.1% | |
|
Ghana Government International Bonds | |
| | | |
6.38% (1),(4) | | | 02/11/27 | | | | 39,445,000 | | | | 17,201,965 | |
| | | |
7.63% (1),(4) | | | 05/16/29 | | | | 58,635,000 | | | | 25,506,225 | |
| | | |
7.75% (1),(4) | | | 04/07/29 | | | | 21,562,000 | | | | 9,406,423 | |
| | | |
7.88% (1),(4) | | | 03/26/27 | | | | 3,264,000 | | | | 1,423,430 | |
| | | |
8.13% (1),(4) | | | 03/26/32 | | | | 16,386,000 | | | | 7,011,569 | |
| | | |
8.63% (1),(4) | | | 04/07/34 | | | | 8,146,000 | | | | 3,536,993 | |
| | | |
8.88% (1),(4) | | | 05/07/42 | | | | 21,933,000 | | | | 9,268,886 | |
| | | | | | | | | | | | |
|
Total Ghana | |
| |
(Cost: $73,741,232) | | | | 73,355,491 | |
| | | | | | | | | | | | |
|
| Guatemala — 1.3% | |
|
Guatemala Government Bonds | |
| | | |
3.70% (2) | | | 10/07/33 | | | | 3,800,000 | | | | 2,813,607 | |
| | | |
4.90% (1) | | | 06/01/30 | | | | 11,256,000 | | | | 10,054,985 | |
| | | |
6.60% (2) | | | 06/13/36 | | | | 36,450,000 | | | | 33,894,855 | |
| | | | | | | | | | | | |
|
Total Guatemala | |
| |
(Cost: $49,908,032) | | | | 46,763,447 | |
| | | | | | | | | | | | |
|
| Hungary — 2.7% | |
|
Hungary Government International Bonds | |
| | | |
6.75% (2) | | | 09/25/52 | | | | 20,890,000 | | | | 19,404,721 | |
|
Magyar Export-Import Bank Zrt | |
| | | |
6.13% (2) | | | 12/04/27 | | | | 33,016,000 | | | | 32,390,446 | |
|
MVM Energetika Zrt | |
| | | |
7.50% (1) | | | 06/09/28 | | | | 28,075,000 | | | | 28,125,984 | |
|
OTP Bank Nyrt | |
| | | |
8.75% (5 yr. CMT + 5.060%)(1),(3) | | | 05/15/33 | | | | 15,395,000 | | | | 15,256,045 | |
| | | | | | | | | | | | |
|
Total Hungary | |
| |
(Cost: $96,865,221) | | | | 95,177,196 | |
| | | | | | | | | | | | |
| | | | | | | | | | | | |
| Issues | | Maturity
Date | | | Principal
Amount | | | Value | |
|
| India — 0.6% | |
|
Greenko Power II Ltd. | |
| | | |
4.30% (1) | | | 12/13/28 | | | $ | 8,625,750 | | | $ | 7,261,187 | |
|
India Airport Infra | |
| | | |
6.25% (1) | | | 10/25/25 | | | | 6,216,000 | | | | 6,035,487 | |
|
India Green Power Holdings | |
| | | |
4.00% (1) | | | 02/22/27 | | | | 8,970,000 | | | | 7,714,290 | |
| | | | | | | | | | | | |
|
Total India | |
| |
(Cost: $20,509,575) | | | | 21,010,964 | |
| | | | | | | | | | | | |
|
| Indonesia — 3.7% | |
|
Freeport Indonesia PT | |
| | | |
5.32% (2) | | | 04/14/32 | | | | 32,445,000 | | | | 28,885,784 | |
|
Indonesia Asahan Aluminium PT/Mineral Industri Indonesia Persero PT | |
| | | |
4.75% (2) | | | 05/15/25 | | | | 9,390,000 | | | | 9,192,810 | |
| | | |
5.45% (1) | | | 05/15/30 | | | | 7,825,000 | | | | 7,233,430 | |
| | | |
5.45% (2) | | | 05/15/30 | | | | 55,536,000 | | | | 51,337,478 | |
|
Perusahaan Perseroan Persero PT Perusahaan Listrik Negara | |
| | | |
4.88% (1) | | | 07/17/49 | | | | 25,423,000 | | | | 18,064,186 | |
| | | |
5.25% (1) | | | 05/15/47 | | | | 23,177,000 | | | | 17,774,441 | |
| | | | | | | | | | | | |
|
Total Indonesia | |
| |
(Cost: $144,194,638) | | | | 132,488,129 | |
| | | | | | | | | | | | |
|
Iraq — 0.4% (Cost: $15,722,887) | |
|
Iraq International Bonds | |
| | | |
5.80% (1) | | | 01/15/28 | | | | 16,894,688 | | | | 15,080,198 | |
| | | | | | | | | | | | |
|
| Israel — 1.8% | |
|
Energian Israel Finance Ltd. | |
| | | |
4.88% (1) | | | 03/30/26 | | | | 28,037,112 | | | | 24,777,798 | |
| | | |
5.38% (1) | | | 03/30/28 | | | | 18,223,588 | | | | 14,966,122 | |
|
Leviathan Bond Ltd. | |
| | | |
6.13% (1) | | | 06/30/25 | | | | 8,195,000 | | | | 7,625,447 | |
| | | |
6.75% (1) | | | 06/30/30 | | | | 18,182,000 | | | | 15,474,700 | |
| | | | | | | | | | | | |
|
Total Israel | |
| |
(Cost: $65,103,537) | | | | 62,844,067 | |
| | | | | | | | | | | | |
|
| Jordan — 1.0% | |
|
Jordan Government International Bonds | |
| | | |
7.50% (2) | | | 01/13/29 | | | | 12,500,000 | | | | 11,668,588 | |
| | | |
7.75% (2) | | | 01/15/28 | | | | 25,720,000 | | | | 24,562,600 | |
| | | | | | | | | | | | |
|
Total Jordan | |
| |
(Cost: $37,675,572) | | | | 36,231,188 | |
| | | | | | | | | | | | |
|
| Kazakhstan — 2.5% | |
|
KazMunayGas National Co. JSC | |
| | | |
4.75% (2) | | | 04/19/27 | | | | 80,145,000 | | | | 74,991,676 | |
| | | |
5.38% (1) | | | 04/24/30 | | | | 15,765,000 | | | | 14,152,241 | |
| | | | | | | | | | | | |
|
Total Kazakhstan | |
| |
(Cost: $89,889,027) | | | | 89,143,917 | |
| | | | | | | | | | | | |
See accompanying Notes to Financial Statements.
9
TCW Emerging Markets Income Fund
Schedule of Investments (Continued)
| | | | | | | | | | | | |
| Issues | | Maturity
Date | | | Principal
Amount | | | Value | |
|
| Kenya — 0.9% | |
|
Republic of Kenya Government International Bonds | |
| | | |
6.30% (1) | | | 01/23/34 | | | $ | 19,916,000 | | | $ | 13,619,623 | |
| | | |
6.88% (1) | | | 06/24/24 | | | | 7,098,000 | | | | 6,800,949 | |
| | | |
7.00% (1) | | | 05/22/27 | | | | 12,075,000 | | | | 10,479,711 | |
| | | | | | | | | | | | |
|
Total Kenya | |
| |
(Cost: $31,600,846) | | | | 30,900,283 | |
| | | | | | | | | | | | |
|
| Mexico — 6.7% | |
|
BBVA Bancomer SA | |
| | | |
5.13% (5 yr. CMT + 2.650%)(1),(3) | | | 01/18/33 | | | | 11,061,000 | | | | 9,360,924 | |
|
Cemex SAB de CV | |
| | | |
5.13% (5 yr. CMT + 4.534%)(2),(3),(5) | | | 06/08/26 | | | | 16,993,000 | | | | 15,724,642 | |
|
Mexico Government International Bonds | |
| | | |
3.25% | | | 04/16/30 | | | | 34,780,000 | | | | 29,371,848 | |
| | | |
6.34% | | | 05/04/53 | | | | 26,080,000 | | | | 22,864,913 | |
| | | |
6.35% | | | 02/09/35 | | | | 72,615,000 | | | | 69,598,710 | |
|
Petroleos Mexicanos | |
| | | |
5.35% | | | 02/12/28 | | | | 43,974,000 | | | | 35,522,470 | |
| | | |
6.49% | | | 01/23/27 | | | | 28,511,000 | | | | 25,286,121 | |
| | | |
6.88% | | | 08/04/26 | | | | 31,117,000 | | | | 28,751,016 | |
| | | | | | | | | | | | |
|
Total Mexico | |
| |
(Cost: $248,342,879) | | | | 236,480,644 | |
| | | | | | | | | | | | |
|
| Morocco — 0.8% | |
|
Morocco Government International Bonds | |
| | | |
5.95% (2) | | | 03/08/28 | | | | 14,506,000 | | | | 14,252,145 | |
| | | |
6.50% (2) | | | 09/08/33 | | | | 15,494,000 | | | | 14,897,326 | |
| | | | | | | | | | | | |
|
Total Morocco | |
| |
(Cost: $29,938,501) | | | | 29,149,471 | |
| | | | | | | | | | | | |
|
Mozambique — 0.4% (Cost: $12,162,997) | |
|
Mozambique International Bonds | |
| | | |
9.00% (1) | | | 09/15/31 | | | | 16,380,000 | | | | 12,722,346 | |
| | | | | | | | | | | | |
|
| Nigeria — 2.8% | |
|
Nigeria Government International Bonds | |
| | | |
6.13% (2) | | | 09/28/28 | | | | 43,451,000 | | | | 35,608,181 | |
| | | |
7.38% (1) | | | 09/28/33 | | | | 17,790,000 | | | | 13,431,450 | |
| | | |
7.70% (2) | | | 02/23/38 | | | | 31,954,000 | | | | 22,866,123 | |
| | | |
8.38% (1) | | | 03/24/29 | | | | 31,100,000 | | | | 27,350,895 | |
| | | | | | | | | | | | |
|
Total Nigeria | |
| |
(Cost: $110,449,326) | | | | 99,256,649 | |
| | | | | | | | | | | | |
|
| Oman — 3.2% | |
|
Oman Government International Bonds | |
| | | |
6.00% (1) | | | 08/01/29 | | | | 63,535,000 | | | | 61,867,206 | |
| | | |
6.25% (2) | | | 01/25/31 | | | | 43,875,000 | | | | 42,778,125 | |
| | | | | | | | | | | | |
| Issues | | Maturity
Date | | | Principal
Amount | | | Value | |
|
| Oman (Continued) | |
|
Oryx Funding Ltd. | |
| | | |
5.80% (1) | | | 02/03/31 | | | $ | 11,000,000 | | | $ | 10,164,000 | |
| | | | | | | | | | | | |
|
Total Oman | |
| |
(Cost: $118,481,238) | | | | 114,809,331 | |
| | | | | | | | | | | | |
|
| Pakistan — 1.2% | |
|
Pakistan Government International Bonds | |
| | | |
6.00% (2) | | | 04/08/26 | | | | 43,138,000 | | | | 23,833,745 | |
| | | |
6.88% (1) | | | 12/05/27 | | | | 37,960,000 | | | | 20,187,128 | |
| | | | | | | | | | | | |
|
Total Pakistan | |
| |
(Cost: $60,243,771) | | | | 44,020,873 | |
| | | | | | | | | | | | |
|
| Panama — 2.2% | |
|
Panama Government International Bonds | |
| | | |
3.16% | | | 01/23/30 | | | | 46,328,000 | | | | 37,305,622 | |
| | | |
4.50% | | | 04/16/50 | | | | 32,730,000 | | | | 20,557,713 | |
| | | |
6.40% | | | 02/14/35 | | | | 22,342,000 | | | | 20,393,778 | |
| | | | | | | | | | | | |
|
Total Panama | |
| |
(Cost: $88,654,242) | | | | 78,257,113 | |
| | | | | | | | | | | | |
|
| Paraguay — 0.6% | |
|
Paraguay Government International Bonds | |
| | | |
3.85% (1) | | | 06/28/33 | | | | 9,584,000 | | | | 7,698,348 | |
| | | |
6.10% (1) | | | 08/11/44 | | | | 14,456,000 | | | | 12,162,264 | |
| | | | | | | | | | | | |
|
Total Paraguay | |
| |
(Cost: $21,810,659) | | | | 19,860,612 | |
| | | | | | | | | | | | |
|
| Peru — 2.8% | |
|
Peru Government International Bonds | |
| | | |
2.78% | | | 01/23/31 | | | | 54,625,000 | | | | 43,891,188 | |
| | | |
3.00% | | | 01/15/34 | | | | 73,389,000 | | | | 55,746,033 | |
| | | | | | | | | | | | |
|
Total Peru | |
| |
(Cost: $108,016,150) | | | | 99,637,221 | |
| | | | | | | | | | | | |
|
| Philippines — 2.1% | |
|
Philippines Government International Bonds | |
| | | |
2.95% | | | 05/05/45 | | | | 11,583,000 | | | | 7,145,495 | |
| | | |
3.20% | | | 07/06/46 | | | | 26,324,000 | | | | 16,611,892 | |
| | | |
3.56% | | | 09/29/32 | | | | 37,245,000 | | | | 31,470,735 | |
| | | |
5.00% | | | 07/17/33 | | | | 21,835,000 | | | | 20,640,036 | |
| | | | | | | | | | | | |
|
Total Philippines | |
| |
(Cost: $87,095,610) | | | | 75,868,158 | |
| | | | | | | | | | | | |
|
| Poland — 2.1% | |
|
Bank Gospodarstwa Krajowego | |
| | | |
6.25% (2) | | | 10/31/28 | | | | 17,050,000 | | | | 17,273,781 | |
|
Republic of Poland Government International Bonds | |
| | | |
4.88% | | | 10/04/33 | | | | 20,281,000 | | | | 18,843,665 | |
| | | |
5.50% | | | 11/16/27 | | | | 19,464,000 | | | | 19,602,000 | |
| | | |
5.50% | | | 04/04/53 | | | | 21,978,000 | | | | 19,457,563 | |
| | | | | | | | | | | | |
|
Total Poland | |
| |
(Cost: $78,392,915) | | | | 75,177,009 | |
| | | | | | | | | | | | |
See accompanying Notes to Financial Statements.
10
TCW Emerging Markets Income Fund
October 31, 2023
| | | | | | | | | | | | |
| Issues | | Maturity
Date | | | Principal
Amount | | | Value | |
|
| Qatar — 1.6% | |
|
Qatar Government International Bonds | |
| | | |
3.75% (1) | | | 04/16/30 | | | $ | 18,035,000 | | | $ | 16,509,239 | |
|
QatarEnergy | |
| | | |
3.30% (1) | | | 07/12/51 | | | | 63,545,000 | | | | 38,911,384 | |
| | | | | | | | | | | | |
|
Total Qatar | |
| |
(Cost: $64,624,314) | | | | 55,420,623 | |
| | | | | | | | | | | | |
|
| Romania — 2.6% | |
|
Romania Government International Bonds | |
| | | |
6.00% (2) | | | 05/25/34 | | | | 19,566,000 | | | | 17,913,005 | |
| | | |
6.63% (2) | | | 02/17/28 | | | | 34,674,000 | | | | 34,796,746 | |
| | | |
7.13% (2) | | | 01/17/33 | | | | 21,160,000 | | | | 21,102,191 | |
| | | |
7.63% (2) | | | 01/17/53 | | | | 18,098,000 | | | | 17,851,795 | |
| | | | | | | | | | | | |
|
Total Romania | |
| |
(Cost: $92,622,358) | | | | 91,663,737 | |
| | | | | | | | | | | | |
|
| Saudi Arabia — 4.7% | |
|
Gaci First Investment Co. | |
| | | |
4.75% (1) | | | 02/14/30 | | | | 31,800,000 | | | | 29,882,460 | |
| | | |
4.88% (1) | | | 02/14/35 | | | | 22,326,000 | | | | 19,752,862 | |
| | | |
5.38% (1) | | | 10/13/22 | | | | 23,244,000 | | | | 18,043,155 | |
|
Greensaif Pipelines Bidco Sarl | |
| | | |
6.13% (2) | | | 02/23/38 | | | | 59,760,000 | | | | 55,738,152 | |
|
TMS Issuer Sarl | |
| | | |
5.78% (1) | | | 08/23/32 | | | | 42,300,000 | | | | 41,189,625 | |
| | | | | | | | | | | | |
|
Total Saudi Arabia | |
| |
(Cost: $176,133,157) | | | | 164,606,254 | |
| | | | | | | | | | | | |
|
| South Africa — 2.7% | |
|
Eskom Holdings SOC Ltd. | |
| | | |
6.35% (1) | | | 08/10/28 | | | | 37,890,000 | | | | 34,432,537 | |
| | | |
8.45% (1) | | | 08/10/28 | | | | 31,278,000 | | | | 29,732,867 | |
|
Republic of South Africa Government International Bonds | |
| | | |
5.65% | | | 09/27/47 | | | | 19,400,000 | | | | 12,682,750 | |
| | | |
5.88% | | | 06/22/30 | | | | 9,395,000 | | | | 8,263,043 | |
|
Sasol Financing USA LLC | |
| | | |
8.75% (2) | | | 05/03/29 | | | | 11,210,000 | | | | 10,691,538 | |
| | | | | | | | | | | | |
|
Total South Africa | |
| |
(Cost: $101,860,466) | | | | 95,802,735 | |
| | | | | | | | | | | | |
|
| South Korea — 2.6% | |
|
Hyundai Capital America | |
| | | |
5.50% (2) | | | 03/30/26 | | | | 13,056,000 | | | | 12,848,306 | |
| | | |
5.60% (2) | | | 03/30/28 | | | | 34,424,000 | | | | 33,346,529 | |
| | | |
5.70% (2) | | | 06/26/30 | | | | 10,596,000 | | | | 10,039,341 | |
|
POSCO | |
| | | |
5.75% (2) | | | 01/17/28 | | | | 17,270,000 | | | | 17,021,312 | |
|
SK Hynix, Inc. | |
| | | |
6.38% (2) | | | 01/17/28 | | | | 18,470,000 | | | | 18,309,311 | |
| | | | | | | | | | | | |
|
Total South Korea | |
| |
(Cost: $93,710,483) | | | | 91,564,799 | |
| | | | | | | | | | | | |
| | | | | | | | | | | | |
| Issues | | Maturity
Date | | | Principal
Amount | | | Value | |
|
Sri Lanka — 0.5% (Cost: $30,566,527) | |
|
Sri Lanka Government International Bonds | |
| | | |
6.75% (1),(4) | | | 04/18/28 | | | $ | 36,568,000 | | | $ | 18,349,822 | |
| | | | | | | | | | | | |
|
| Turkey — 4.6% | |
|
Turkiye Government International Bonds | |
| | | |
5.75% | | | 05/11/47 | | | | 32,053,000 | | | | 21,034,781 | |
| | | |
9.13% | | | 07/13/30 | | | | 41,825,000 | | | | 42,004,847 | |
| | | |
9.38% | | | 03/14/29 | | | | 19,925,000 | | | | 20,348,406 | |
| | | |
9.38% | | | 01/19/33 | | | | 28,750,000 | | | | 28,900,219 | |
| | | |
9.88% | | | 01/15/28 | | | | 29,780,000 | | | | 31,269,000 | |
|
Yapi ve Kredi Bankasi AS | |
| | | |
9.25% (2) | | | 10/16/28 | | | | 18,675,000 | | | | 18,812,075 | |
| | | | | | | | | | | | |
|
Total Turkey | |
| |
(Cost: $161,199,755) | | | | 162,369,328 | |
| | | | | | | | | | | | |
|
| Ukraine — 0.9% | |
|
Ukraine Government International Bonds | |
| | | |
7.25% (1),(4) | | | 03/15/35 | | | | 58,686,000 | | | | 14,900,375 | |
| | | |
7.38% (1),(4) | | | 09/25/34 | | | | 8,850,000 | | | | 2,256,750 | |
| | | |
7.75% (1),(4) | | | 09/01/27 | | | | 21,218,000 | | | | 6,110,784 | |
| | | |
7.75% (1),(4) | | | 09/01/28 | | | | 8,550,000 | | | | 2,438,460 | |
| | | |
7.75% (1),(4) | | | 08/01/41 | | | | 14,662,000 | | | | 6,127,250 | |
| | | | | | | | | | | | |
|
Total Ukraine | |
| |
(Cost: $35,706,949) | | | | 31,833,619 | |
| | | | | | | | | | | | |
|
| United Arab Emirates — 2.9% | |
|
Abu Dhabi Government International Bonds | |
| | | |
3.13% (1) | | | 09/30/49 | | | | 30,600,000 | | | | 18,838,125 | |
|
Finance Department Government of Sharjah | |
| | | |
6.50% (2) | | | 11/23/32 | | | | 38,035,000 | | | | 36,930,806 | |
|
Galaxy Pipeline Assets Bidco Ltd. | |
| | | |
2.63% (2) | | | 03/31/36 | | | | 17,206,000 | | | | 13,016,224 | |
| | | |
2.94% (2) | | | 09/30/40 | | | | 23,272,013 | | | | 17,267,833 | |
|
MDGH GMTN RSC Ltd. | |
| | | |
5.08% (1) | | | 05/22/53 | | | | 19,125,000 | | | | 15,984,828 | |
| | | | | | | | | | | | |
|
Total United Arab Emirates | |
| |
(Cost: $115,486,042) | | | | 102,037,816 | |
| | | | | | | | | | | | |
|
| Uruguay — 1.5% | |
|
Uruguay Government International Bonds | |
| | | |
4.38% | | | 01/23/31 | | | | 11,700,000 | | | | 11,070,540 | |
| | | |
5.10% | | | 06/18/50 | | | | 32,250,000 | | | | 27,986,550 | |
| | | |
5.75% | | | 10/28/34 | | | | 15,420,000 | | | | 15,469,132 | |
| | | | | | | | | | | | |
|
Total Uruguay | |
| |
(Cost: $58,932,338) | | | | 54,526,222 | |
| | | | | | | | | | | | |
|
| Venezuela — 0.9% | |
|
Venezuela Government International Bonds | |
| | | |
8.25% (1),(4),(6) | | | 10/13/24 | | | | 60,057,200 | | | | 10,510,010 | |
| | | |
9.25% (4),(6) | | | 09/15/27 | | | | 60,955,000 | | | | 12,038,612 | |
See accompanying Notes to Financial Statements.
11
TCW Emerging Markets Income Fund
Schedule of Investments (Continued)
| | | | | | | | | | | | |
| Issues | | Maturity
Date | | | Principal
Amount | | | Value | |
|
| Venezuela (Continued) | |
| | | |
9.25% (1),(4),(6) | | | 05/07/28 | | | $ | 49,048,000 | | | $ | 9,217,241 | |
| | | | | | | | | | | | |
|
Total Venezuela | |
| |
(Cost: $55,533,009) | | | | 31,765,863 | |
| | | | | | | | | | | | |
|
| Zambia — 0.8% | |
|
First Quantum Minerals Ltd. | |
| | | |
8.63% (2) | | | 06/01/31 | | | | 13,475,000 | | | | 11,453,750 | |
|
Zambia Government International Bonds | |
| | | |
5.38% (1),(4) | | | 09/20/49 | | | | 25,550,000 | | | | 14,152,145 | |
| | | |
8.97% (1),(4) | | | 07/30/27 | | | | 7,198,000 | | | | 4,412,149 | |
| | | | | | | | | | | | |
|
Total Zambia | |
| |
(Cost: $31,573,015) | | | | 30,018,044 | |
| | | | | | | | | | | | |
|
Total Fixed Income Securities | |
| |
(Cost: $3,680,477,569) | | | | 3,424,206,911 | |
| | | | | | | | | | | | |
| | | |
| | | | | | | | | | | | |
| Issues | | | | |
Shares | | | Value | |
|
| MONEY MARKET INVESTMENTS — 1.4% | |
| | | |
State Street Institutional U.S. Government Money Market Fund — Premier Class, 5.30%(7) | | | | | | | 49,108,572 | | | $ | 49,108,572 | |
| | | | | | | | | | | | |
|
Total Money Market Investments | |
| |
(Cost: $49,108,572) | | | | 49,108,572 | |
| | | | | | | | | | | | |
| |
Total Investments (98.1%) | | | | | |
| |
(Cost: $3,729,586,141) | | | | 3,473,315,483 | |
| |
| Excess Of Other Assets Over Liabilities (1.9%) | | | 66,121,048 | |
| | | | | | | | | | | | |
| |
| Total Net Assets (100.0%) | | | $ 3,539,436,531 | |
| | | | | | | | | | | | |
Notes to the Schedule of Investments:
| (1) | | Investments issued under Regulation S of the Securities Act of 1933, as amended, may not be offered, sold, or delivered within the United States except under special exemptions. At October 31, 2023, the value of these securities amounted to $1,216,458,097 or 34.4% of net assets. |
| (2) | | Security exempt from registration under Rule 144A of the Securities Act of 1933, as amended. These securities may be resold, normally only to qualified institutional buyers. At October 31, 2023, the value of these securities amounted to $1,149,368,104 or 32.5% of net assets. These securities are determined to be liquid by the Fund’s investment advisor, unless otherwise noted, under procedures established by and under the general supervision of the Company’s Board of Directors. |
| (3) | | Floating or variable rate security. The interest shown reflects the rate in effect at October 31, 2023. |
| (4) | | Security is currently in default due to bankruptcy or failure to make payment of principal or interest of the issuer. Income is not being accrued. |
| (6) | | For fair value measurement disclosure purposes, security is categorized as Level 3. Security is valued using significant unobservable inputs. |
| (7) | | Rate disclosed is the 7-day net yield as of October 31, 2023. |
See accompanying Notes to Financial Statements.
12
TCW Emerging Markets Income Fund
Investments by Sector | October 31, 2023 |
| | | | |
| Sector | | Percentage of
Net Assets | |
Auto Manufacturers | | | 1.6 | % |
Banks | | | 1.7 | |
Building Materials | | | 0.4 | |
Chemicals | | | 0.3 | |
Electric | | | 4.4 | |
Energy-Alternate Sources | | | 0.4 | |
Engineering & Construction | | | 0.2 | |
Food | | | 0.3 | |
Foreign Government Bonds | | | 64.3 | |
Investment Companies | | | 2.4 | |
Iron & Steel | | | 0.9 | |
Lodging | | | 0.3 | |
Mining | | | 4.0 | |
Oil & Gas | | | 10.2 | |
Pipelines | | | 4.6 | |
Semiconductors | | | 0.5 | |
Water | | | 0.2 | |
Money Market Investments | | | 1.4 | |
| | | | |
Total | | | 98.1 | % |
| | | | |
See accompanying Notes to Financial Statements.
13
TCW Emerging Markets Income Fund
Fair Valuation Summary | October 31, 2023 |
The following is a summary of the fair valuations according to the inputs used as of October 31, 2023 in valuing the Fund’s investments:
| | | | | | | | | | | | | | | | |
Description | | Quoted Prices
in Active
Markets for
Identical
Assets
(Level 1) | | | Other
Significant
Observable
Inputs
(Level 2) | | | Significant
Unobservable
Inputs
(Level 3) | | | Total | |
Fixed Income Securities | | | | | | | | | | | | | | | | |
Auto Manufacturers | | $ | — | | | $ | 56,234,176 | | | $ | — | | | $ | 56,234,176 | |
Banks | | | — | | | | 60,702,825 | | | | — | | | | 60,702,825 | |
Building Materials | | | — | | | | 15,724,642 | | | | — | | | | 15,724,642 | |
Chemicals | | | — | | | | 10,691,537 | | | | — | | | | 10,691,537 | |
Electric | | | — | | | | 157,090,400 | | | | — | | | | 157,090,400 | |
Energy-Alternate Sources | | | — | | | | 14,975,477 | | | | — | | | | 14,975,477 | |
Engineering & Construction | | | — | | | | 6,035,487 | | | | — | | | | 6,035,487 | |
Food | | | — | | | | 9,832,000 | | | | — | | | | 9,832,000 | |
Foreign Government Bonds | | | — | | | | 2,244,885,377 | | | | 31,765,863 | | | | 2,276,651,240 | |
Investment Companies | | | — | | | | 83,663,305 | | | | — | | | | 83,663,305 | |
Iron & Steel | | | — | | | | 32,043,960 | | | | — | | | | 32,043,960 | |
Lodging | | | — | | | | 9,505,728 | | | | — | | | | 9,505,728 | |
Mining | | | — | | | | 142,499,231 | | | | — | | | | 142,499,231 | |
Oil & Gas | | | — | | | | 362,101,779 | | | | — | | | | 362,101,779 | |
Pipelines | | | — | | | | 161,303,750 | | | | — | | | | 161,303,750 | |
Semiconductors | | | — | | | | 18,309,311 | | | | — | | | | 18,309,311 | |
Water | | | — | | | | 6,842,063 | | | | — | | | | 6,842,063 | |
| | | | | | | | | | | | | | | | |
Total Fixed Income Securities | | | — | | | | 3,392,441,048 | | | | 31,765,863 | | | | 3,424,206,911 | |
| | | | | | | | | | | | | | | | |
Money Market Investments | | | 49,108,572 | | | | — | | | | — | | | | 49,108,572 | |
| | | | | | | | | | | | | | | | |
Total Investments | | $ | 49,108,572 | | | $ | 3,392,441,048 | | | $ | 31,765,863 | | | $ | 3,473,315,483 | |
| | | | | | | | | | | | | | | | |
See accompanying Notes to Financial Statements.
14
TCW Emerging Markets Local Currency Income Fund
Schedule of Investments | October 31, 2023 |
| | | | | | | | | | | | | | | | |
Issues | | Maturity
Date | | | | | | Principal
Amount | | | Value | |
|
FIXED INCOME SECURITIES — 95.3% of Net Assets | |
|
| Brazil — 12.8% | |
|
Brazil Notas do Tesouro Nacional Series F | |
| | | | |
10.00% | | | 01/01/25 | | | | BRL | | | | 27,184,000 | | | $ | 5,329,453 | |
| | | | |
10.00% | | | 01/01/27 | | | | BRL | | | | 24,145,000 | | | | 4,637,825 | |
| | | | |
10.00% | | | 01/01/29 | | | | BRL | | | | 27,108,000 | | | | 5,070,214 | |
| | | | |
10.00% | | | 01/01/31 | | | | BRL | | | | 2,262,000 | | | | 413,148 | |
| | | | | | | | | | | | | | | | |
|
Total Brazil | |
| |
(Cost: $15,019,149) | | | | 15,450,640 | |
| | | | | | | | | | | | | | | | |
|
| Chile — 2.1% | |
|
Bonos de la Tesoreria de la Republica en pesos | |
| | | | |
4.70% (1) | | | 09/01/30 | | | | CLP | | | | 1,170,000,000 | | | | 1,165,210 | |
| | | | |
5.00% (1) | | | 10/01/28 | | | | CLP | | | | 370,000,000 | | | | 385,695 | |
| | | | |
5.00% | | | 03/01/35 | | | | CLP | | | | 435,000,000 | | | | 429,971 | |
| | | | |
6.00% (1) | | | 04/01/33 | | | | CLP | | | | 475,000,000 | | | | 512,119 | |
| | | | | | | | | | | | | | | | |
|
Total Chile | |
| |
(Cost: $2,614,597) | | | | 2,492,995 | |
| | | | | | | | | | | | | | | | |
|
| China — 4.9% | |
|
China Government Bonds | |
| | | | |
2.60% | | | 09/01/32 | | | | CNY | | | | 9,500,000 | | | | 1,286,851 | |
| | | | |
2.67% | | | 05/25/33 | | | | CNY | | | | 9,600,000 | | | | 1,301,977 | |
| | | | |
3.27% | | | 11/19/30 | | | | CNY | | | | 22,980,000 | | | | 3,286,973 | |
| | | | | | | | | | | | | | | | |
|
Total China | |
| |
(Cost: $6,061,834) | | | | 5,875,801 | |
| | | | | | | | | | | | | | | | |
|
| Colombia — 3.5% | |
|
Colombia TES Series B | |
| | | | |
6.00% | | | 04/28/28 | | | | COP | | | | 4,960,700,000 | | | | 994,907 | |
| | | | |
6.25% | | | 07/09/36 | | | | COP | | | | 1,628,500,000 | | | | 253,450 | |
| | | | |
7.00% | | | 06/30/32 | | | | COP | | | | 8,974,300,000 | | | | 1,640,664 | |
| | | | |
7.75% | | | 09/18/30 | | | | COP | | | | 6,322,500,000 | | | | 1,286,653 | |
| | | | | | | | | | | | | | | | |
|
Total Colombia | |
| |
(Cost: $4,567,430) | | | | 4,175,674 | |
| | | | | | | | | | | | | | | | |
|
| Czech Republic — 6.2% | |
|
Czech Republic Government Bonds | |
| | | | |
0.25% | | | 02/10/27 | | | | CZK | | | | 19,350,000 | | | | 727,934 | |
| | | | |
0.95% (1) | | | 05/15/30 | | | | CZK | | | | 19,490,000 | | | | 671,165 | |
| | | | |
1.00% (1) | | | 06/26/26 | | | | CZK | | | | 24,560,000 | | | | 965,294 | |
| | | | |
1.25% | | | 02/14/25 | | | | CZK | | | | 28,760,000 | | | | 1,178,648 | |
| | | | |
1.75% | | | 06/23/32 | | | | CZK | | | | 25,090,000 | | | | 864,755 | |
| | | | |
2.00% | | | 10/13/33 | | | | CZK | | | | 24,840,000 | | | | 847,192 | |
| | | | |
2.50% (1) | | | 08/25/28 | | | | CZK | | | | 33,930,000 | | | | 1,337,852 | |
| | | | |
3.50% | | | 05/30/35 | | | | CZK | | | | 10,820,000 | | | | 417,976 | |
| | | | |
5.00% | | | 09/30/30 | | | | CZK | | | | 9,940,000 | | | | 438,966 | |
| | | | | | | | | | | | | | | | |
|
Total Czech Republic | |
| |
(Cost: $7,804,755) | | | | 7,449,782 | |
| | | | | | | | | | | | | | | | |
|
| Hungary — 3.2% | |
|
Hungary Government Bonds | |
| | | | |
1.00% | | | 11/26/25 | | | | HUF | | | | 30,340,000 | | | | 73,310 | |
| | | | | | | | | | | | | | | | |
Issues | | Maturity
Date | | | | | | Principal
Amount | | | Value | |
|
| Hungary (Continued) | |
| | | | |
2.50% | | | 10/24/24 | | | | HUF | | | | 396,830,000 | | | $ | 1,035,642 | |
| | | | |
2.75% | | | 12/22/26 | | | | HUF | | | | 183,000,000 | | | | 435,339 | |
| | | | |
3.00% | | | 10/27/27 | | | | HUF | | | | 139,470,000 | | | | 326,795 | |
| | | | |
3.25% | | | 10/22/31 | | | | HUF | | | | 217,910,000 | | | | 460,291 | |
| | | | |
4.75% | | | 11/24/32 | | | | HUF | | | | 430,070,000 | | | | 979,574 | |
| | | | |
5.50% | | | 06/24/25 | | | | HUF | | | | 196,930,000 | | | | 523,350 | |
| | | | | | | | | | | | | | | | |
|
Total Hungary | |
| |
(Cost: $4,091,836) | | | | 3,834,301 | |
| | | | | | | | | | | | | | | | |
|
| Indonesia — 9.7% | |
|
Indonesia Treasury Bonds | |
| | | | |
6.13% | | | 05/15/28 | | | | IDR | | | | 25,016,000,000 | | | | 1,518,126 | |
| | | | |
6.38% | | | 04/15/32 | | | | IDR | | | | 22,066,000,000 | | | | 1,330,489 | |
| | | | |
7.00% | | | 09/15/30 | | | | IDR | | | | 16,323,000,000 | | | | 1,025,004 | |
| | | | |
7.00% | | | 02/15/33 | | | | IDR | | | | 41,354,000,000 | | | | 2,594,225 | |
| | | | |
7.50% | | | 08/15/32 | | | | IDR | | | | 29,589,000,000 | | | | 1,892,709 | |
| | | | |
7.50% | | | 06/15/35 | | | | IDR | | | | 5,097,000,000 | | | | 328,088 | |
| | | | |
8.38% | | | 09/15/26 | | | | IDR | | | | 9,076,000,000 | | | | 591,554 | |
| | | | |
8.38% | | | 03/15/34 | | | | IDR | | | | 7,341,000,000 | | | | 500,953 | |
| | | | |
9.00% | | | 03/15/29 | | | | IDR | | | | 29,008,000,000 | | | | 1,981,346 | |
| | | | | | | | | | | | | | | | |
|
Total Indonesia | |
| |
(Cost: $12,413,683) | | | | 11,762,494 | |
| | | | | | | | | | | | | | | | |
|
| Malaysia — 9.9% | |
|
Malaysia Government Bonds | |
| | | | |
3.58% | | | 07/15/32 | | | | MYR | | | | 4,361,000 | | | | 880,410 | |
| | | | |
3.73% | | | 06/15/28 | | | | MYR | | | | 11,291,000 | | | | 2,354,521 | |
| | | | |
3.76% | | | 05/22/40 | | | | MYR | | | | 3,750,000 | | | | 726,714 | |
| | | | |
3.88% | | | 03/14/25 | | | | MYR | | | | 9,126,000 | | | | 1,926,727 | |
| | | | |
3.89% | | | 08/15/29 | | | | MYR | | | | 10,965,000 | | | | 2,284,910 | |
| | | | |
4.76% | | | 04/07/37 | | | | MYR | | | | 8,127,000 | | | | 1,794,812 | |
| | | | |
4.89% | | | 06/08/38 | | | | MYR | | | | 5,588,000 | | | | 1,256,324 | |
|
Malaysia Government Investment Issue | |
| | | | |
3.47% | | | 10/15/30 | | | | MYR | | | | 3,583,000 | | | | 723,669 | |
| | | | | | | | | | | | | | | | |
|
Total Malaysia | |
| |
(Cost: $12,654,980) | | | | 11,948,087 | |
| | | | | | | | | | | | | | | | |
|
| Mexico — 10.7% | |
|
Mexico Bonos | |
| | | | |
5.00% | | | 03/06/25 | | | | MXN | | | | 12,762,600 | | | | 654,593 | |
| | | | |
5.75% | | | 03/05/26 | | | | MXN | | | | 32,846,800 | | | | 1,632,401 | |
| | | | |
7.50% | | | 05/26/33 | | | | MXN | | | | 92,058,700 | | | | 4,260,003 | |
| | | | |
7.75% | | | 05/29/31 | | | | MXN | | | | 49,982,000 | | | | 2,411,300 | |
| | | | |
8.50% | | | 05/31/29 | | | | MXN | | | | 19,495,000 | | | | 1,003,947 | |
| | | | |
8.50% | | | 11/18/38 | | | | MXN | | | | 27,800,000 | | | | 1,347,576 | |
| | | | |
10.00% | | | 12/05/24 | | | | MXN | | | | 30,017,700 | | | | 1,641,637 | |
| | | | | | | | | | | | | | | | |
|
Total Mexico | |
| |
(Cost: $13,807,212) | | | | 12,951,457 | |
| | | | | | | | | | | | | | | | |
See accompanying Notes to Financial Statements.
15
TCW Emerging Markets Local Currency Income Fund
Schedule of Investments (Continued)
| | | | | | | | | | | | | | | | |
Issues | | Maturity
Date | | | | | | Principal
Amount | | | Value | |
|
| Peru — 1.9% | |
|
Peru Government Bonds | |
| | | | |
5.40% | | | 08/12/34 | | | | PEN | | | | 2,817,000 | | | $ | 616,084 | |
| | | | |
6.15% | | | 08/12/32 | | | | PEN | | | | 1,481,000 | | | | 353,654 | |
| | | | |
7.30% (1) | | | 08/12/33 | | | | PEN | | | | 2,000,000 | | | | 512,323 | |
|
Peru Government International Bonds | |
| | | | |
6.90% (1) | | | 08/12/37 | | | | PEN | | | | 3,176,000 | | | | 771,455 | |
| | | | | | | | | | | | | | | | |
|
Total Peru | |
| |
(Cost: $2,360,699) | | | | 2,253,516 | |
| | | | | | | | | | | | | | | | |
|
| Poland — 7.5% | |
|
Republic of Poland Government Bonds | |
| | | | |
0.75% | | | 04/25/25 | | | | PLN | | | | 4,317,000 | | | | 961,836 | |
| | | | |
1.25% | | | 10/25/30 | | | | PLN | | | | 9,849,000 | | | | 1,789,012 | |
| | | | |
2.25% | | | 10/25/24 | | | | PLN | | | | 6,929,000 | | | | 1,599,895 | |
| | | | |
2.50% | | | 04/25/24 | | | | PLN | | | | 3,738,000 | | | | 876,320 | |
| | | | |
2.50% | | | 07/25/27 | | | | PLN | | | | 3,942,000 | | | | 853,362 | |
| | | | |
2.75% | | | 10/25/29 | | | | PLN | | | | 4,301,000 | | | | 889,257 | |
| | | | |
3.25% | | | 07/25/25 | | | | PLN | | | | 3,650,000 | | | | 838,911 | |
| | | | |
6.00% | | | 10/25/33 | | | | PLN | | | | 5,372,000 | | | | 1,307,898 | |
| | | | | | | | | | | | | | | | |
|
Total Poland | |
| |
(Cost: $9,095,026) | | | | 9,116,491 | |
| | | | | | | | | | | | | | | | |
|
| Romania — 3.7% | |
|
Romania Government Bonds | |
| | | | |
3.25% | | | 06/24/26 | | | | RON | | | | 3,100,000 | | | | 612,019 | |
| | | | |
4.15% | | | 01/26/28 | | | | RON | | | | 7,230,000 | | | | 1,404,109 | |
| | | | |
4.75% | | | 02/24/25 | | | | RON | | | | 2,275,000 | | | | 475,978 | |
| | | | |
6.70% | | | 02/25/32 | | | | RON | | | | 9,490,000 | | | | 1,975,480 | |
| | | | | | | | | | | | | | | | |
|
Total Romania | |
| |
(Cost: $4,625,773) | | | | 4,467,586 | |
| | | | | | | | | | | | | | | | |
|
| South Africa — 10.0% | |
|
Republic of South Africa Government Bonds | |
| | | | |
6.25% | | | 03/31/36 | | | | ZAR | | | | 39,384,348 | | | | 1,300,108 | |
| | | | |
7.00% | | | 02/28/31 | | | | ZAR | | | | 48,810,519 | | | | 2,060,926 | |
| | | | |
8.00% | | | 01/31/30 | | | | ZAR | | | | 7,193,725 | | | | 337,835 | |
| | | | |
8.25% | | | 03/31/32 | | | | ZAR | | | | 43,756,308 | | | | 1,920,209 | |
| | | | |
8.50% | | | 01/31/37 | | | | ZAR | | | | 37,152,125 | | | | 1,465,299 | |
| | | | |
8.88% | | | 02/28/35 | | | | ZAR | | | | 72,933,498 | | | | 3,097,755 | |
| | | | |
9.00% | | | 01/31/40 | | | | ZAR | | | | 23,763,428 | | | | 942,455 | |
| | | | |
10.50% | | | 12/21/26 | | | | ZAR | | | | 16,160,000 | | | | 889,205 | |
| | | | | | | | | | | | | | | | |
|
Total South Africa | |
| |
(Cost: $14,791,511) | | | | 12,013,792 | |
| | | | | | | | | | | | | | | | |
|
| Supranational — 2.1% | |
|
International Bank for Reconstruction & Development | |
| | | | |
6.85% | | | 04/24/28 | | | | INR | | | | 108,500,000 | | | | 1,281,534 | |
|
International Finance Corp. | |
| | | | |
6.30% | | | 11/25/24 | | | | INR | | | | 108,500,000 | | | | 1,290,525 | |
| | | | | | | | | | | | | | | | |
|
Total Supranational | |
| |
(Cost: $2,588,082) | | | | 2,572,059 | |
| | | | | | | | | | | | | | | | |
| | | | | | | | | | | | | | | | |
Issues | | Maturity
Date | | | | | | Principal
Amount | | | Value | |
|
| Thailand — 7.1% | |
|
Thailand Government Bonds | |
| | | | |
1.59% | | | 12/17/35 | | | | THB | | | | 62,158,000 | | | $ | 1,422,985 | |
| | | | |
1.60% | | | 12/17/29 | | | | THB | | | | 51,440,000 | | | | 1,322,013 | |
| | | | |
2.00% | | | 12/17/31 | | | | THB | | | | 105,704,000 | | | | 2,694,250 | |
| | | | |
2.88% | | | 12/17/28 | | | | THB | | | | 63,122,000 | | | | 1,756,721 | |
| | | | |
3.30% | | | 06/17/38 | | | | THB | | | | 12,905,000 | | | | 346,655 | |
| | | | |
3.35% | | | 06/17/33 | | | | THB | | | | 28,130,000 | | | | 791,698 | |
| | | | |
3.78% | | | 06/25/32 | | | | THB | | | | 9,857,000 | | | | 286,272 | |
| | | | | | | | | | | | | | | | |
|
Total Thailand | |
| |
(Cost: $9,513,230) | | | | 8,620,594 | |
| | | | | | | | | | | | | | | | |
|
Total Fixed Income Securities | |
| |
(Cost: $122,009,797) | | | | 114,985,269 | |
| | | | | | | | | | | | | | | | |
| |
PURCHASED OPTIONS (2) (0.0%) (Cost: $134,108) | | | | 50,115 | |
| | | | | | | | | | | | | | | | |
| | | | |
| | | | | | | | | | | | | | | | |
| | | | | | | | | Shares | | | | |
|
| MONEY MARKET INVESTMENTS — 2.8% | |
| | |
State Street Institutional U.S. Government Money Market Fund — Premier Class, 5.30% (3) | | | | 3,341,844 | | | | 3,341,844 | |
| | | | | | | | | | | | | | | | |
|
Total Money Market Investments | |
| |
(Cost: $3,341,844) | | | | 3,341,844 | |
| | | | | | | | | | | | | | | | |
| |
Total Investments (98.1%) | | | | | |
| |
(Cost: $125,485,749) | | | | 118,377,228 | |
| |
Excess Of Other Assets Over Liabilities (1.9%) | | | | 2,311,546 | |
| | | | | | | | | | | | | | | | |
| |
Total Net Assets (100.0%) | | | $ | 120,688,774 | |
| | | | | | | | | | | | | | | | |
See accompanying Notes to Financial Statements.
16
TCW Emerging Markets Local Currency Income Fund
October 31, 2023
Purchased Options — OTC
| | | | | | | | | | | | | | | | | | | | | | | | | | | | | | |
| | | | | | | | | |
| Description | | Counterparty | | Exercise
Price | | | Expiration
Date | | | Number of
Contracts | | | Notional
Amount | | | Market
Value | | | Premiums
Paid
(Received)
by Fund | | | Unrealized
Appreciation
(Depreciation) | |
USD Call / ZAR Put | | Barclays Capital | | | ZAR 19.3 | | | | 12/15/23 | | | | 3,600,000 | | | $ | 3,600,000 | | | $ | 34,816 | | | $ | 92,161 | | | $ | (57,345 | ) |
USD Call / ZAR Put | | Bank of America | | | ZAR 19.3 | | | | 12/15/23 | | | | 1,582,000 | | | | 1,582,000 | | | | 15,299 | | | | 41,946 | | | | (26,647 | ) |
| | | | | | | | | | | | | | | | | | | | | | | | | | | | | | |
| | | | | | | | | | | | | | | | | | | | $ | 50,115 | | | $ | 134,107 | | | $ | (83,992 | ) |
| | | | | | | | | | | | | | | | | | | | | | | | | | | | | | |
Written Options — OTC
| | | | | | | | | | | | | | | | | | | | | | | | | | | | | | |
| | | | | | | | | |
| Description | | Counterparty | | Exercise
Price | | | Expiration
Date | | | Number of
Contracts | | | Notional
Amount | | | Market
Value | | | Premiums
Paid
(Received)
by Fund | | | Unrealized
Appreciation
(Depreciation) | |
USD Call / ZAR Put | | Bank of America | | | ZAR 20.8 | | | | 12/15/23 | | | | (1,582,000 | ) | | $ | (1,582,000 | ) | | $ | (2,562 | ) | | $ | (13,676 | ) | | $ | 11,114 | |
USD Call / ZAR Put | | Barclays Capital | | | ZAR 20.8 | | | | 12/15/23 | | | | (3,600,000 | ) | | | (3,600,000 | ) | | | (5,832 | ) | | | (31,680 | ) | | | 25,848 | |
| | | | | | | | | | | | | | | | | | | | | | | | | | | | | | |
| | | | | | | | | | | | | | | | | | | | $ | (8,394 | ) | | $ | (45,356 | ) | | $ | 36,962 | |
| | | | | | | | | | | | | | | | | | | | | | | | | | | | | | |
Forward Currency Exchange Contracts
| | | | | | | | | | | | | | | | | | | | | | | | |
| | | | | | |
| Counterparty | | Contracts to
Deliver | | | Units of
Currency | | | Settlement
Date | | | In Exchange for
U.S. Dollars | | | Contracts at
Value | | | Unrealized
Appreciation
(Depreciation) | |
| BUY (4) | | | | | | | | | | | | | | | | | | |
Bank of America | | | CNH | | | | 30,511,701 | | | | 12/12/23 | | | $ | 4,168,892 | | | $ | 4,167,619 | | | $ | (1,273 | ) |
Bank of America | | | PLN | | | | 4,426,436 | | | | 12/07/23 | | | | 1,051,785 | | | | 1,049,793 | | | | (1,992 | ) |
Barclays Capital | | | MYR | | | | 7,600,000 | | | | 01/12/24 | | | | 1,625,842 | | | | 1,603,053 | | | | (22,789 | ) |
BNP Paribas S.A. | | | COP | | | | 2,351,462,140 | | | | 11/15/23 | | | | 568,070 | | | | 566,724 | | | | (1,346 | ) |
BNP Paribas S.A. | | | NGN | | | | 178,734,500 | | | | 11/02/23 | | | | 223,000 | | | | 197,442 | | | | (25,558 | ) |
BNP Paribas S.A. | | | NGN | | | | 386,545,000 | | | | 11/13/23 | | | | 485,000 | | | | 425,968 | | | | (59,032 | ) |
BNP Paribas S.A. | | | NGN | | | | 399,734,744 | | | | 11/15/23 | | | | 499,668 | | | | 440,309 | | | | (59,359 | ) |
Citibank N.A. | | | COP | | | | 3,926,904,900 | | | | 11/15/23 | | | | 958,600 | | | | 946,420 | | | | (12,180 | ) |
Citibank N.A. | | | PLN | | | | 6,654,579 | | | | 12/11/23 | | | | 1,542,236 | | | | 1,577,812 | | | | 35,576 | |
Goldman Sachs & Co. | | | PLN | | | | 6,394,991 | | | | 12/07/23 | | | | 1,518,641 | | | | 1,516,664 | | | | (1,977 | ) |
JPMorgan Chase Bank | | | COP | | | | 7,511,034,749 | | | | 11/15/23 | | | | 1,829,524 | | | | 1,810,227 | | | | (19,297 | ) |
JPMorgan Chase Bank | | | THB | | | | 120,871,363 | | | | 01/12/24 | | | | 3,342,681 | | | | 3,384,722 | | | | 42,041 | |
JPMorgan Chase Bank | | | TRY | | | | 36,520,000 | | | | 09/18/24 | | | | 1,000,000 | | | | 955,875 | | | | (44,125 | ) |
Morgan Stanley & Co. | | | COP | | | | 13,163,919,000 | | | | 03/18/24 | | | | 3,202,900 | | | | 3,084,088 | | | | (118,812 | ) |
Morgan Stanley & Co. | | | TRY | | | | 8,173,307 | | | | 12/11/23 | | | | 284,100 | | | | 280,033 | | | | (4,067 | ) |
Morgan Stanley & Co. | | | TRY | | | | 23,482,500 | | | | 01/12/24 | | | | 775,000 | | | | 782,751 | | | | 7,751 | |
Morgan Stanley & Co. | | | TRY | | | | 23,342,580 | | | | 09/18/24 | | | | 640,400 | | | | 610,969 | | | | (29,431 | ) |
| | | | | | | | | | | | | | | | | | | | | | | | |
| | | | | | | | | | | | | | $ | 23,716,339 | | | $ | 23,400,469 | | | $ | (315,870 | ) |
| | | | | | | | | | | | | | | | | | | | | | | | |
| SELL (5) | | | | | | | | | | | | | | | | | | |
Barclays Capital | | | COP | | | | 4,593,655,000 | | | | 11/15/23 | | | $ | 1,100,000 | | | $ | 1,107,112 | | | $ | (7,112 | ) |
BNP Paribas S.A. | | | EUR | | | | 1,189,572 | | | | 03/18/24 | | | | 1,281,200 | | | | 1,265,577 | | | | 15,623 | |
BNP Paribas S.A. | | | NGN | | | | 178,734,500 | | | | 11/02/23 | | | | 197,333 | | | | 197,442 | | | | (109 | ) |
Citibank N.A. | | | PEN | | | | 5,990,837 | | | | 03/18/24 | | | | 1,601,400 | | | | 1,554,824 | | | | 46,576 | |
Goldman Sachs & Co. | | | CNH | | | | 30,511,701 | | | | 12/12/23 | | | | 4,185,131 | | | | 4,167,618 | | | | 17,513 | |
Goldman Sachs & Co. | | | MYR | | | | 6,815,976 | | | | 01/12/24 | | | | 1,463,913 | | | | 1,437,682 | | | | 26,231 | |
JPMorgan Chase Bank | | | PLN | | | | 10,821,426 | | | | 12/07/23 | | | | 2,458,186 | | | | 2,566,457 | | | | (108,271 | ) |
JPMorgan Chase Bank | | | PLN | | | | 6,654,579 | | | | 12/11/23 | | | | 1,511,511 | | | | 1,577,812 | | | | (66,301 | ) |
Morgan Stanley & Co. | | | MYR | | | | 784,024 | | | | 01/12/24 | | | | 168,372 | | | | 165,373 | | | | 2,999 | |
| | | | | | | | | | | | | | | | | | | | | | | | |
| | | | | | | | | | | | | | $ | 13,967,046 | | | $ | 14,039,897 | | | $ | (72,851 | ) |
| | | | | | | | | | | | | | | | | | | | | | | | |
See accompanying Notes to Financial Statements.
17
TCW Emerging Markets Local Currency Income Fund
Schedule of Investments (Continued)
Notes to the Schedule of Investments:
| CNH | | Chinese Yuan Renminbi. |
| (1) | | Investments issued under Regulation S of the Securities Act of 1933, as amended, may not be offered, sold, or delivered within the United States except under special exemptions. At October 31, 2023, the value of these securities amounted to $6,321,113 or 5.2% of net assets. |
| (2) | | See options table for description of purchased options. |
| (3) | | Rate disclosed is the 7-day net yield as of October 31, 2023. |
| (4) | | Fund buys foreign currency, sells U.S. Dollar. |
| (5) | | Fund sells foreign currency, buys U.S. Dollar. |
See accompanying Notes to Financial Statements.
18
TCW Emerging Markets Local Currency Income Fund
Investments by Sector | October 31, 2023 |
| | | | |
| Sector | | Percentage of
Net Assets | |
Foreign Government Bonds | | | 93.2 | % |
Supranational | | | 2.1 | |
Money Market Investments | | | 2.8 | |
Purchased Options | | | 0.0 | * |
| | | | |
Total | | | 98.1 | % |
| | | | |
| * | Amount rounds to less than 0.1%. |
See accompanying Notes to Financial Statements.
19
TCW Emerging Markets Local Currency Income Fund
Fair Valuation Summary | October 31, 2023 |
| | | | | | | | | | | | | | | | |
The following is a summary of the fair valuations according to the inputs used as of October 31, 2023 in valuing the Fund’s investments: | |
Description | | Quoted Prices
in Active
Markets for
Identical
Assets
(Level 1) | | | Other
Significant
Observable
Inputs
(Level 2) | | | Significant
Unobservable
Inputs
(Level 3) | | | Total | |
Fixed Income Securities | | | | | | | | | | | | | | | | |
Foreign Government Bonds | | $ | — | | | $ | 112,413,210 | | | $ | — | | | $ | 112,413,210 | |
Supranational | | | — | | | | 2,572,059 | | | | — | | | | 2,572,059 | |
| | | | | | | | | | | | | | | | |
Total Fixed Income Securities | | | — | | | | 114,985,269 | | | | — | | | | 114,985,269 | |
| | | | | | | | | | | | | | | | |
Currency Options | | | — | | | | 50,115 | | | | — | | | | 50,115 | |
Money Market Investments | | | 3,341,844 | | | | — | | | | — | | | | 3,341,844 | |
| | | | | | | | | | | | | | | | |
Total Investments | | | 3,341,844 | | | | 115,035,384 | | | | — | | | | 118,377,228 | |
| | | | | | | | | | | | | | | | |
Asset Derivatives | | | | | | | | | | | | | | | | |
Forward Currency Exchange Contracts | | | | | | | | | | | | | | | | |
Foreign Currency Risk | | | — | | | | 194,310 | | | | — | | | | 194,310 | |
| | | | | | | | | | | | | | | | |
Total | | $ | 3,341,844 | | | $ | 115,229,694 | | | $ | — | | | $ | 118,571,538 | |
| | | | | | | | | | | | | | | | |
Liability Derivatives | | | | | | | | | | | | | | | | |
Written Options | | | | | | | | | | | | | | | | |
Foreign Currency Risk | | $ | — | | | $ | (8,394 | ) | | $ | — | | | $ | (8,394 | ) |
Forward Currency Exchange Contracts | | | | | | | | | | | | | | | | |
Foreign Currency Risk | | | — | | | | (583,031 | ) | | | — | | | | (583,031 | ) |
| | | | | | | | | | | | | | | | |
Total | | $ | — | | | $ | (591,425 | ) | | $ | — | | | $ | (591,425 | ) |
| | | | | | | | | | | | | | | | |
See accompanying Notes to Financial Statements.
20
TCW Funds, Inc.
Statements of Assets and Liabilities | October 31, 2023 |
| | | | | | | | |
| | | TCW
Emerging
Markets
Income Fund | | | TCW
Emerging Markets
Local Currency
Income Fund | |
ASSETS | |
Investments, at Value (1) | | $ | 3,473,315,483 | | | $ | 118,377,228 | |
Foreign Currency, at Value (2) | | | 2,952 | | | | 400,021 | |
Receivable for Securities Sold | | | 62,018,449 | | | | — | |
Receivable for Fund Shares Sold | | | 4,068,843 | | | | 126,042 | |
Interest and Dividends Receivable | | | 55,556,230 | | | | 2,453,249 | |
Receivable from Investment Advisor | | | 148,225 | | | | 28,440 | |
Unrealized Appreciation on Open Forward
Foreign Currency Contracts | | | — | | | | 194,310 | |
Cash Collateral Held for Brokers | | | — | | | | 630,000 | |
Prepaid Expenses | | | 73,044 | | | | 28,287 | |
| | | | | | | | |
Total Assets | | | 3,595,183,226 | | | | 122,237,577 | |
| | | | | | | | |
LIABILITIES | |
Distributions Payable | | | 16,240,623 | | | | 612,757 | |
Payable for Securities Purchased | | | 29,101,861 | | | | — | |
Payable for Fund Shares Redeemed | | | 6,136,644 | | | | 77,558 | |
Accrued Capital Gain Withholding Taxes | | | — | | | | 1,681 | |
Accrued Directors’ Fees and Expenses | | | 10,615 | | | | 10,946 | |
Deferred Accrued Directors’ Fees and Expenses | | | 1,310 | | | | 1,310 | |
Accrued Management Fees | | | 2,280,857 | | | | 77,333 | |
Accrued Distribution Fees | | | 94,080 | | | | 3,025 | |
Options Written, at Value | | | — | | | | 8,394 | (3) |
Unrealized Depreciation on Open Forward
Foreign Currency Contracts | | | — | | | | 583,031 | |
Transfer Agent Fees Payable | | | 320,307 | | | | 33,699 | |
Administration Fee Payable | | | 361,273 | | | | 12,904 | |
Audit Fees Payable | | | 47,311 | | | | 27,983 | |
Accounting Fees Payable | | | 425,972 | | | | 14,457 | |
Custodian Fees Payable | | | 363,980 | | | | 51,415 | |
Legal Fees Payable | | | 46,322 | | | | 1,826 | |
Other Accrued Expenses | | | 315,540 | | | | 30,484 | |
| | | | | | | | |
Total Liabilities | | | 55,746,695 | | | | 1,548,803 | |
| | | | | | | | |
NET ASSETS | | $ | 3,539,436,531 | | | $ | 120,688,774 | |
| | | | | | | | |
NET ASSETS CONSIST OF: | |
Paid-in Capital | | $ | 6,204,732,194 | | | $ | 185,097,750 | |
Accumulated Earnings (Loss) | | | (2,665,295,663 | ) | | | (64,408,976 | ) |
| | | | | | | | |
NET ASSETS | | $ | 3,539,436,531 | | | $ | 120,688,774 | |
| | | | | | | | |
See accompanying Notes to Financial Statements.
21
TCW Funds, Inc.
Statements of Assets and Liabilities (Continued) | October 31, 2023 |
| | | | | | | | |
| | | TCW
Emerging
Markets
Income Fund | | | TCW
Emerging Markets
Local Currency
Income Fund | |
NET ASSETS ATTRIBUTABLE TO: | |
I Class Share | | $ | 2,097,431,794 | | | $ | 106,740,088 | |
| | | | | | | | |
N Class Share | | $ | 443,172,788 | | | $ | 13,948,686 | |
| | | | | | | | |
Plan Class Share | | $ | 998,831,949 | | | $ | — | |
| | | | | | | | |
CAPITAL SHARES OUTSTANDING: (4) | |
I Class Share | | | 359,369,158 | | | | 15,188,631 | |
| | | | | | | | |
N Class Share | | | 58,826,034 | | | | 1,989,767 | |
| | | | | | | | |
Plan Class Share | | | 171,287,894 | | | | — | |
| | | | | | | | |
NET ASSET VALUE PER SHARE: (5) | |
I Class Share | | $ | 5.84 | | | $ | 7.03 | |
| | | | | | | | |
N Class Share | | $ | 7.53 | | | $ | 7.01 | |
| | | | | | | | |
Plan Class Share | | $ | 5.83 | | | $ | — | |
| | | | | | | | |
| (1) | The identified cost for the TCW Emerging Markets Income Fund and the TCW Emerging Markets Local Currency Income Fund at October 31, 2023 was $3,729,586,141 and $125,485,749, respectively. |
| (2) | The identified cost for the TCW Emerging Markets Income Fund and the TCW Emerging Markets Local Currency Income Fund at October 31, 2023 was $2,884 and $407,484, respectively. |
| (3) | Premium received $45,356. |
| (4) | The number of authorized shares, with a par value of $0.001 per share is 4,000,000,000 for each of the I Class, N Class and Plan Class shares. |
| (5) | Represents offering price and redemption price per share. |
See accompanying Notes to Financial Statements.
22
TCW Funds, Inc.
Statements of Operations | Year Ended October 31, 2023 |
| | | | | | | | |
| | | TCW
Emerging
Markets
Income Fund | | | TCW
Emerging
Markets
Local Currency
Income Fund | |
INVESTMENT INCOME | |
Income: | |
Dividends | | $ | 4,994,745 | | | $ | 190,550 | |
Interest | | | 290,348,543 | (1) | | | 9,417,558 | (1) |
| | | | | | | | |
Total | | | 295,343,288 | | | | 9,608,108 | |
| | | | | | | | |
Expenses: | |
Management Fees | | | 29,027,797 | | | | 1,068,750 | |
Accounting Services Fees | | | 392,448 | | | | 13,299 | |
Administration Fees | | | 309,182 | | | | 10,277 | |
Transfer Agent Fees: | | | | | | | | |
I Class | | | 1,236,870 | | | | 74,830 | |
N Class | | | 442,442 | | | | 38,694 | |
Plan Class | | | 128,421 | | | | — | |
Custodian Fees | | | 332,368 | | | | 33,973 | |
Professional Fees | | | 209,015 | | | | 45,569 | |
Directors’ Fees and Expenses | | | 46,075 | | | | 45,906 | |
Registration Fees: | | | | | | | | |
I Class | | | 68,217 | | | | 19,820 | |
N Class | | | 25,359 | | | | 21,275 | |
Plan Class | | | 37,301 | | | | — | |
Distribution Fees: | | | | | | | | |
N Class | | | 1,108,487 | | | | 83,443 | |
Compliance Expense | | | 6,241 | | | | 6,241 | |
Shareholder Reporting Expense | | | 16,351 | | | | 4,897 | |
Other | | | 385,738 | | | | 32,574 | |
| | | | | | | | |
Total | | | 33,772,312 | | | | 1,499,548 | |
| | | | | | | | |
Less Expenses Borne by Investment Advisor: | | | | | | | | |
I Class | | | (521,557 | ) | | | (133,882 | ) |
N Class | | | (875,465 | ) | | | (137,727 | ) |
Plan Class | | | (472,486 | ) | | | — | |
| | | | | | | | |
Net Expenses | | | 31,902,804 | | | | 1,227,939 | |
| | | | | | | | |
Net Investment Income | | | 263,440,484 | | | | 8,380,169 | |
| | | | | | | | |
NET REALIZED AND UNREALIZED GAIN (LOSS) ON INVESTMENTS | | | | | | | | |
Net Realized Gain (Loss) on: | |
Investments | | | (341,591,724 | ) (2) | | | (4,216,064 | ) (2) |
Foreign Currency | | | 233,282 | | | | (102,516 | ) |
Forward Currency Exchange Contracts | | | (9,993,171 | ) | | | (985,559 | ) |
Futures Contracts | | | (875 | ) | | | — | |
Options Written | | | 907,681 | | | | 37,154 | |
Swap Agreements | | | (1,192,550 | ) | | | — | |
Change in Unrealized Appreciation (Depreciation) on: | |
Investments | | | 420,273,438 | | | | 14,651,701 | (3) |
Foreign Currency | | | 47,237 | | | | 50,759 | |
Forward Currency Exchange Contracts | | | 92,506 | | | | (444,068 | ) |
Options Written | | | (576,693 | ) | | | 36,962 | |
| | | | | | | | |
Net Realized and Unrealized Gain (Loss) on Investments and
Foreign Currency Transactions | | | 68,199,131 | | | | 9,028,369 | |
| | | | | | | | |
INCREASE IN NET ASSETS RESULTING FROM OPERATIONS | | $ | 331,639,615 | | | $ | 17,408,538 | |
| | | | | | | | |
| (1) | Net of foreign taxes withheld of $75,127 and $84,034 for the TCW Emerging Markets Income Fund and the TCW Emerging Markets Local Currency Income Fund, respectively. |
| (2) | Net of capital gain withholding taxes of $13,928 and $5,004 for the TCW Emerging Markets Income Fund and the TCW Emerging Markets Local Currency Income Fund, respectively. |
| (3) | Net of capital gain withholding taxes of $1,681 for the TCW Emerging Markets Local Currency Income Fund. |
See accompanying Notes to Financial Statements.
23
TCW Funds, Inc.
Statements of Changes in Net Assets
| | | | | | | | | | | | | | | | |
| | | TCW
Emerging Markets Income
Fund | | | TCW
Emerging Markets Local
Currency Income Fund | |
| | | Year Ended
October 31,
2023 | | | Year Ended
October 31,
2022 | | | Year Ended
October 31,
2023 | | | Year Ended
October 31,
2022 | |
OPERATIONS | |
Net Investment Income | | $ | 263,440,484 | | | $ | 263,031,375 | | | $ | 8,380,169 | | | $ | 8,658,590 | |
Net Realized Loss on Investments, Futures Contracts, Options Written, Swap Contracts and Foreign Currency Transactions | | | (351,637,357 | ) | | | (1,236,883,602 | ) | | | (5,266,985 | ) | | | (39,003,843 | ) |
Change in Unrealized Appreciation (Depreciation) on Investments, Options Written and Foreign Currency Transactions | | | 419,836,488 | | | | (547,198,195 | ) | | | 14,295,354 | | | | (12,774,182 | ) |
| | | | | | | | | | | | | | | | |
Increase (Decrease) in Net Assets Resulting from Operations | | | 331,639,615 | | | | (1,521,050,422 | ) | | | 17,408,538 | | | | (43,119,435 | ) |
| | | | | | | | | | | | | | | | |
DISTRIBUTIONS TO SHAREHOLDERS | |
Distributions to Shareholders | | | (208,679,952 | ) | | | (228,258,436 | ) | | | (4,696,848 | ) | | | (2,830,965 | ) |
Return of Capital | | | — | | | | (22,694,796 | ) | | | — | | | | (3,893,084 | ) |
| | | | | | | | | | | | | | | | |
Total Distributions to Shareholders | | | (208,679,952 | ) | | | (250,953,232 | ) | | | (4,696,848 | ) | | | (6,724,049 | ) |
| | | | | | | | | | | | | | | | |
NET CAPITAL SHARE TRANSACTIONS | |
I Class | | | (488,084,644 | ) | | | (1,075,983,840 | ) | | | (2,663,384 | ) | | | (58,769,672 | ) |
N Class | | | 43,962,199 | | | | (289,669 | ) | | | (30,598,395 | ) | | | 10,286,694 | |
Plan Class | | | (66,215,732 | ) | | | (488,386,713 | ) | | | — | | | | — | |
| | | | | | | | | | | | | | | | |
Decrease in Net Assets Resulting from
Net Capital Shares Transactions | | | (510,338,177 | ) | | | (1,564,660,222 | ) | | | (33,261,779 | ) | | | (48,482,978 | ) |
| | | | | | | | | | | | | | | | |
Decrease in Net Assets | | | (387,378,514 | ) | | | (3,336,663,876 | ) | | | (20,550,089 | ) | | | (98,326,462 | ) |
NET ASSETS | |
Beginning of year | | | 3,926,815,045 | | | | 7,263,478,921 | | | | 141,238,863 | | | | 239,565,325 | |
| | | | | | | | | | | | | | | | |
End of year | | $ | 3,539,436,531 | | | $ | 3,926,815,045 | | | $ | 120,688,774 | | | $ | 141,238,863 | |
| | | | | | | | | | | | | | | | |
See accompanying Notes to Financial Statements.
24
TCW Funds, Inc.
Notes to Financial Statements | October 31, 2023 |
Note 1 — Organization
TCW Funds, Inc., a Maryland corporation (the “Company”), is an open-end management investment company registered under the Investment Company Act of 1940, as amended (the “1940 Act”), that currently offers 16 no-load mutual funds (each series, a “Fund” and collectively, the “Funds”). TCW Investment Management Company LLC (the “Advisor”) is the investment advisor to and an affiliate of the Funds and is registered under the Investment Advisers Act of 1940, as amended. Each Fund has its own investment objective and strategies. The following is a brief description of the investment objectives and principal investment strategies for the Funds that are covered in this report:
| | |
TCW Fund | | Investment Objectives and Principal Investment Strategies |
| Diversified Fixed Income Fund | | |
| |
| TCW Emerging Markets Income Fund | | Seeks high total return from current income and capital appreciation by investing at least 80% of the value of its net assets, plus any borrowings for investment purposes, in debt securities issued or guaranteed by companies, financial institutions and government entities in emerging market countries. The Fund generally invests in at least four emerging market countries. |
| Non-Diversified Fixed Income Fund | | |
| |
TCW Emerging Markets Local Currency Income Fund | | Seeks to provide high total return from current income and capital appreciation through investment in debt securities denominated in the local currencies of various emerging market countries; invests at least 80% of the value of its net assets, plus any borrowings for investment purposes, in debt securities issued or guaranteed by non-financial companies, financial institutions and government entities in emerging market countries denominated in the local currencies of an issuer, and in derivative instruments that provide investment exposure to such securities. |
All of the Funds currently offer two classes of shares: I Class and N Class, except for the TCW Emerging Markets Income Fund, which also offers Plan Class shares. The three classes of a Fund are substantially the same except that the Class N shares are subject to a distribution fee (see Note 7).
Note 2 — Significant Accounting Policies
The following is a summary of significant accounting policies, which are in conformity with accounting principles generally accepted in the United States of America (“GAAP”) and which are consistently followed by the Funds in the preparation of their financial statements. Each Fund is considered an investment company under the Financial Accounting Standards Board (“FASB”) Accounting Standards Codification (“ASC”) No. 946, Financial Services — Investment Companies. Subsequent events, if any, have been evaluated through the date of issuance in the preparation of the financial statements.
Principles of Accounting: The Funds use the accrual method of accounting for financial reporting purposes.
Net Asset Value: The net asset value (“NAV”) per share of each class of a Fund is determined by dividing the Fund’s net assets attributable to each class by the number of shares issued and outstanding of that class on each day the New York Stock Exchange (“NYSE”) is open for trading.
25
TCW Funds, Inc.
Notes to Financial Statements (Continued)
Note 2 — Significant Accounting Policies (Continued)
Security Valuations: Securities listed or traded on the NYSE and other stock exchanges were valued at the latest sale price on the exchange. Securities traded on the NASDAQ stock market (“NASDAQ”) were valued during the period using official closing prices as reported by NASDAQ, which may not have been the last sale price. Investments in open-end mutual funds including money market funds were valued based on the NAV per share as reported by the investment companies. All other securities for which over the-counter (“OTC”) market quotations were readily available, including short-term securities, swap agreements and forward currency exchange contracts, were valued with prices furnished by independent pricing services or by broker-dealers.
Pursuant to Rule 2a-5 under the 1940 Act, the Company’s Board of Directors (the “Board”, and each member thereof, a “Director”) has designated the Advisor as the “valuation designee” with respect to the fair valuation of the Fund’s portfolio securities, subject to oversight by and periodic reporting to the Board. Fair valued securities are those for which market quotations were not readily available, including in circumstances under which it was determined by the Advisor that prices received were not reflective of their market values.
The Advisor, as the valuation designee, uses a fair valuation methodology for foreign equity securities (exclusive of certain Latin American and Canadian equity securities). This methodology is designed to address the effect of movements in the U.S. market on the securities traded on foreign exchanges that have been closed for a period of time due to time zone differences. The utilization of the fair value model may result in the adjustment of prices taking into account fluctuations in the U.S. market. The fair value model was utilized each trading day and was not dependent on certain thresholds or triggers.
Fair value is defined as the price that a Fund would receive upon selling an investment in a timely transaction to an independent buyer in the principal or most advantageous market for the investment. In accordance with the authoritative guidance on fair value measurements and disclosures under GAAP, the Funds disclose investments in their financial statements in a three-tier hierarchy. This hierarchy is utilized to establish classification of fair value measurements based on inputs. Inputs that go into fair value measurement refer broadly to the assumptions that market participants would use in pricing the asset or liability, including assumptions about risk. Inputs may be observable or unobservable. Observable inputs are inputs that reflect the assumptions market participants would use in pricing the asset or liability, developed based on market data obtained from sources independent of the reporting entity. Unobservable inputs are inputs that reflect the reporting entity’s own assumptions about the inputs market participants would use in pricing the asset or liability, developed based on the best information available in the circumstances.
The three-tier hierarchy of inputs is summarized in the three broad levels listed below.
| | |
| Level 1 — | | quoted prices in active markets for identical investments. |
| Level 2 — | | other significant observable inputs (including quoted prices for similar investments, interest rates, prepayment speeds, credit risk, etc.). |
| Level 3 — | | significant unobservable inputs (including the Funds’ own assumptions in determining the fair value of investments). |
Changes in valuation techniques may result in transfers in or out of an investment’s assigned Level within the hierarchy. The inputs or methodologies used for valuing investments are not necessarily an indication of the risk associated with investing in those investments and the determination of the significance of a particular input to the fair value measurement in its entirety requires judgment and consideration of factors specific to each security.
26
TCW Funds, Inc.
October 31, 2023
Note 2 — Significant Accounting Policies (Continued)
The availability of observable inputs can vary from security to security and is affected by a wide variety of factors, including, for example, the type of security, whether the security is new and not yet established in the marketplace, the liquidity of markets, and other characteristics particular to the security. To the extent that valuation is based on models or inputs that are less observable or unobservable in the market, the determination of fair value requires more judgment. Accordingly, the degree of judgment exercised in determining fair value is greatest for instruments categorized as Level 3.
In periods of market dislocation, the observability of prices and inputs may be reduced for many instruments. This condition, as well as changes related to liquidity of investments, could cause a security to be reclassified between Level 1, Level 2, or Level 3.
In certain cases, the inputs used to measure fair value may fall into different levels of the fair value hierarchy. In such cases, for disclosure purposes the level in the fair value hierarchy within which the fair value measurement falls in its entirety is determined based on the lowest level input that is significant to the fair value measurement.
Fair Value Measurements: Descriptions of the valuation techniques applied to the Funds’ major categories of assets and liabilities measured at fair value on a recurring basis are as follows:
Corporate bonds. The fair value of corporate bonds is estimated using recently executed transactions, market price quotations (where observable), bond spreads, or credit default swap spreads adjusted for any basis difference between cash and derivative instruments. Corporate bonds are generally categorized as Level 2 of the fair value hierarchy; in instances where prices, spreads, or any of the other aforementioned key inputs are unobservable, they are categorized as Level 3 of the hierarchy.
Credit default swaps. Credit default swaps are fair valued using pricing models that take into account, among other factors, index spread curves, nominal values, modified duration values and cash flows. To the extent that these inputs are observable and timely, the fair values of credit default swaps would be categorized as Level 2; otherwise, the fair values would be categorized as Level 3.
Equity securities. Securities are generally valued based on quoted prices from the applicable exchange. To the extent these securities are actively traded and valuation adjustments are not applied, they are generally categorized as Level 1 of the fair value hierarchy. Restricted securities issued by publicly held companies are generally categorized as Level 2 of the fair value hierarchy; if a discount is applied and significant, they are categorized as Level 3. Restricted securities held in non-public entities are categorized as Level 3 of the fair value hierarchy because they trade infrequently, and therefore the inputs are unobservable. Certain foreign securities that are fair valued using a pricing service that considers the correlation of the trading patterns of the foreign security to the intraday trading in the U.S. markets are categorized as Level 2 of the fair value hierarchy.
Foreign currency contracts. The fair values of foreign currency contracts are derived from indices, reference rates, and other inputs or a combination of these factors. To the extent that these factors can be observed, foreign currency contracts are categorized as Level 2 of the fair value hierarchy.
Futures contracts. Futures contracts are generally valued at the settlement price established at the close of business each day by the exchange on which they are traded. They are categorized as Level 1.
Money market funds. Money market funds are open-end mutual funds that invest in short-term debt securities. To the extent that these funds are valued based upon the reported NAV, they are categorized as Level 1 of the fair value hierarchy.
27
TCW Funds, Inc.
Notes to Financial Statements (Continued)
Note 2 — Significant Accounting Policies (Continued)
Options and Swaptions contracts. Exchange-listed options contracts are traded on securities exchanges and are fair valued based on quoted prices from the applicable exchange, and to the extent valuation adjustments are not applied, they are categorized as Level 1. If valuation adjustments are applied and such adjustments are observable and timely, the fair values of exchange-listed options contracts would be categorized as Level 2; otherwise the fair values would be categorized as Level 3. Options and swaptions contracts traded over-the-counter (“OTC”) are fair valued based on pricing models and incorporate various inputs such as interest rates, credit spreads, currency exchange rates and volatility measurements for in-the-money, at-the-money, and out-of-the-money contracts based on a given strike price. To the extent that these inputs are observable and timely, the fair values of OTC options and swaptions contracts would be categorized as Level 2; otherwise the fair values would be categorized as Level 3.
Restricted securities. Restricted securities, including illiquid Rule 144A securities, issued by non-public entities are categorized as Level 3 of the fair value hierarchy because they trade infrequently, and therefore the inputs are unobservable. Any other restricted securities valued similar to publicly traded securities may be categorized as Level 2 or 3 of the fair value hierarchy depending on whether a discount is applied and significant to the fair value.
Short-term investments. Short-term investments are valued using market price quotations, and are categorized as Level 1 or Level 2 of the fair value hierarchy.
U.S. and foreign government and agency securities. Government and agency securities are normally valued using a model that incorporates market observable data such as reported sales of similar securities, broker quotes, yields, bids, offers, quoted market prices, and reference data. Accordingly, U.S. and foreign government and agency securities are normally categorized as Level 1 or 2 of the fair value hierarchy depending on the liquidity and transparency of the market.
The summary of the inputs used as of October 31, 2023 in valuing the Funds’ investments is listed after the Schedule of Investments for each Fund.
Following is a reconciliation of investments in which significant unobservable inputs (Level 3) were used in determining value:
| | | | | | | | |
TCW EMERGING MARKETS INCOME FUND | | FOREIGN GOVERNMENT
BONDS | | | TOTAL | |
Balance as of October 31, 2022 | | $ | 13,179,666 | | | $ | 13,179,666 | |
Accrued Discounts (Premiums) | | | — | | | | — | |
Realized Gain (Loss) | | | — | | | | — | |
Change in Unrealized Appreciation (Depreciation)* | | | 18,586,197 | | | | 18,586,197 | |
Purchases | | | — | | | | — | |
Sales | | | — | | | | — | |
Transfers in to Level 3 | | | — | | | | — | |
Transfers out of Level 3 | | | — | | | | — | |
| | | | | | | | |
Balance as of October 31, 2023 | | $ | 31,765,863 | | | $ | 31,765,863 | |
| | | | | | | | |
| * | The change in unrealized appreciation (depreciation) on securities still held at October 31, 2023 was $18,586,197 and is included in the related net realized gains (losses) and net change in appreciation (depreciation) in the Statements of Operations. |
28
TCW Funds, Inc.
October 31, 2023
Note 2 — Significant Accounting Policies (Continued)
Significant unobservable valuation inputs for Level 3 investments as of October 31, 2023 are as follows:
| | | | | | | | | | | | | | | | | | |
Description | | Fair Value at
10/31/2023 | | | Valuation Techniques | | Unobservable Input | | Price or Price
Range | | Average
Weighted
Price | | | Input to
Valuation If
Input
Increases | |
TCW Emerging Markets Income Fund | |
Sovereign | | $ | 31,765,863 | | | Third-party Vendor | | Vendor Prices | | $17.500–$19.750 | | $ | 18.679 | | | | Increase | |
Security Transactions and Related Investment Income: Security transactions are recorded as of the trade date. Dividend income is recorded on the ex-dividend date. Interest income is recognized on an accrual basis. Realized gains and losses on investments are recorded on the basis of specific identification.
Allocation of Operating Activity for Multiple Classes: Investment income, common expenses and realized and unrealized gains and losses are allocated among the share classes of the Funds based on the relative net assets of each class. Distribution fees, which are directly attributable to a class of shares, are charged to the operations of that class. All other expenses are charged to each Fund or class as incurred on a specific identification basis. Differences in class- specific fees and expenses will result in differences in net investment income for each class, and in turn differences in dividends paid by each class.
Dividends and Distributions: Dividends and distributions to shareholders are recorded on the ex-dividend date. The TCW Emerging Markets Income Fund and the TCW Emerging Markets Local Currency Income Fund declare and pay, or reinvest, dividends from net investment income monthly. Capital gains realized by a Fund will be distributed at least annually.
Income and capital gain distributions are determined in accordance with income tax regulations which may differ from GAAP. These differences are primarily due to differing treatments for foreign currency transactions, derivative transactions, market discount and premium, losses deferred due to wash sales, excise tax regulations and employing equalization in determining amounts to be distributed to Fund shareholders. Permanent book and tax basis differences relating to shareholder distributions will result in reclassifications between paid-in capital, undistributed net investment income (loss), and/or undistributed accumulated realized gain (loss). Undistributed net investment income or loss may include temporary book and tax basis differences which will reverse in subsequent periods. Any taxable income or capital gain remaining at fiscal year-end is distributed in the following year.
Use of Estimates: The preparation of the accompanying financial statements requires management to make estimates and assumptions that affect the reported amount of assets and liabilities at the date of the financial statements and the reported amounts of income and expenses during the reporting period. Actual results could differ from these estimates.
Foreign Currency Translation: The books and records of each Fund are maintained in U.S. dollars as follows: (1) foreign currency denominated securities and other assets and liabilities stated in foreign currencies are translated using the daily spot rate; and (2) purchases, sales, income and expenses are translated at the rate of exchange prevailing on the respective dates of such transactions. The resultant exchange gains and losses are included in net realized or net unrealized gain (loss) in the Statements of Operations. Pursuant to U.S. federal income tax regulations, certain foreign exchange gains and losses included in realized and unrealized gains and losses are included in, or are a reduction of, ordinary income for federal income tax purposes.
29
TCW Funds, Inc.
Notes to Financial Statements (Continued)
Note 2 — Significant Accounting Policies (Continued)
Foreign Taxes: The Funds may be subject to withholding taxes on income and capital gains imposed by certain countries in which they invest. The withholding tax on income is netted against the income accrued or received. Any reclaimable taxes are recorded as income. The withholding tax on realized or unrealized gain is recorded as a liability.
Derivative Instruments: Derivatives are financial instruments which are valued based on the values of one or more indicators, such as a security, asset, currency, interest rate, or index. Derivative transactions can create investment leverage and may be highly volatile. A derivative contract may result in a mark -to -market loss if the value of the contract decreases due to an unfavorable change in the market rates or values of the underlying instrument. It is possible that a derivative transaction will result in a loss greater than the principal amount invested. The Funds may not be able to close out a derivative transaction at a favorable time or price.
For the year ended October 31, 2023, the following Funds had derivatives and transactions in derivatives, grouped in the following risk categories:
TCW Emerging Markets Income Fund
| | | | | | | | | | | | | | | | | | | | |
| | | Credit Risk | | | Equity Risk | | | Foreign
Currency
Risk | | | Interest
Rate
Risk | | | Total | |
Statement of Operations: | |
Net Realized Gain (Loss) | |
Forward Currency Exchange Contracts | | $ | — | | | $ | — | | | $ | (9,993,171 | ) | | $ | — | | | $ | (9,993,171 | ) |
Investments (2) | | | — | | | | — | | | | (2,366,794 | ) | | | (2,311,334 | ) | | | (4,678,128 | ) |
Futures | | | — | | | | — | | | | — | | | | 875 | | | | 875 | |
Options Written | | | — | | | | — | | | | 907,681 | | | | — | | | | 907,681 | |
Swap Agreements | | | (1,192,550 | ) | | | — | | | | — | | | | — | | | | (1,192,550 | ) |
| | | | | | | | | | | | | | | | | | | | |
Net Realized Gain (Loss) | | $ | (1,192,550 | ) | | $ | — | | | $ | (11,452,284 | ) | | $ | (2,310,459 | ) | | $ | (14,955,293 | ) |
| | | | | | | | | | | | | | | | | | | | |
Net Change in Appreciation (Depreciation) | |
Forward Currency Exchange Contracts | | $ | — | | | $ | — | | | $ | 92,506 | | | $ | — | | | $ | 92,506 | |
Investments (3) | | | — | | | | — | | | | 2,176,733 | | | | 1,217,584 | | | | 3,394,317 | |
Options Written | | | — | | | | — | | | | (576,693 | ) | | | — | | | | (576,693 | ) |
| | | | | | | | | | | | | | | | | | | | |
Net Change in Appreciation (Depreciation) | | $ | — | | | $ | — | | | $ | 1,692,546 | | | $ | 1,217,584 | | | $ | 2,910,130 | |
| | | | | | | | | | | | | | | | | | | | |
Number of Contracts or Notional Amounts (4) | |
Forward Currency Exchange Contracts | | $ | — | | | $ | — | | | $ | 131,999,579 | | | $ | — | | | $ | 131,999,579 | |
Options Purchased | | $ | — | | | $ | — | | | $ | 204,626,667 | | | | 8,750 | | | $ | 204,635,417 | |
Options Written | | $ | — | | | $ | — | | | $ | 248,250,000 | | | $ | — | | | $ | 248,250,000 | |
Swap Agreements | | $ | 91,500,000 | | | $ | — | | | $ | — | | | $ | — | | | $ | 91,500,000 | |
TCW Emerging Markets Local Currency Income Fund
| | | | | | | | | | | | | | | | | | | | |
| | | Credit Risk | | | Equity Risk | | | Foreign
Currency
Risk | | | Interest
Rate
Risk | | | Total | |
Statement of Assets and Liabilities: | |
Asset Derivatives | |
Investments (1) | | $ | — | | | $ | — | | | $ | 50,115 | | | $ | — | | | $ | 50,115 | |
Forward Currency Exchange Contracts | | | — | | | | — | | | | 194,310 | | | | — | | | | 194,310 | |
| | | | | | | | | | | | | | | | | | | | |
Total Value | | $ | — | | | $ | — | | | $ | 244,425 | | | $ | — | | | $ | 244,425 | |
| | | | | | | | | | | | | | | | | | | | |
Liability Derivatives | |
Forward Currency Exchange Contracts | | $ | — | | | $ | — | | | $ | (583,031 | ) | | $ | — | | | $ | (583,031 | ) |
Written Options | | | — | | | | — | | | | (8,394 | ) | | | — | | | | (8,394 | ) |
| | | | | | | | | | | | | | | | | | | | |
Total Value | | $ | — | | | $ | — | | | $ | (591,425 | ) | | $ | — | | | $ | (591,425 | ) |
| | | | | | | | | | | | | | | | | | | | |
30
TCW Funds, Inc.
October 31, 2023
Note 2 — Significant Accounting Policies (Continued)
TCW Emerging Markets Local Currency Income Fund (Continued)
| | | | | | | | | | | | | | | | | | | | |
| | | Credit Risk | | | Equity Risk | | | Foreign
Currency
Risk | | | Interest
Rate
Risk | | | Total | |
Statement of Operations: | |
Net Realized Gain (Loss) | |
Forward Currency Exchange Contracts | | $ | — | | | $ | — | | | $ | (985,559 | ) | | $ | — | | | $ | (985,559 | ) |
Investments (2) | | | — | | | | — | | | | (266,213 | ) | | | — | | | | (266,213 | ) |
Options Written | | | — | | | | — | | | | 37,154 | | | | — | | | | 37,154 | |
| | | | | | | | | | | | | | | | | | | | |
Net Realized Gain (Loss) | | $ | — | | | $ | — | | | $ | (1,214,618 | ) | | $ | — | | | $ | (1,214,618 | ) |
| | | | | | | | | | | | | | | | | | | | |
Net Change in Appreciation (Depreciation) | |
Forward Currency Exchange Contracts | | $ | — | | | $ | — | | | $ | (444,068 | ) | | $ | — | | | $ | (444,068 | ) |
Investments (3) | | | — | | | | — | | | | (83,992 | ) | | | — | | | | (83,992 | ) |
Options Written | | | — | | | | — | | | | 36,962 | | | | — | | | | 36,962 | |
| | | | | | | | | | | | | | | | | | | | |
Net Change in Appreciation (Depreciation) | | $ | — | | | $ | — | | | $ | (491,098 | ) | | $ | — | | | $ | (491,098 | ) |
| | | | | | | | | | | | | | | | | | | | |
Number of Contracts or Notional Amounts (4) | |
Forward Currency Exchange Contracts | | $ | — | | | $ | — | | | $ | 40,163,907 | | | $ | — | | | $ | 40,163,907 | |
Options Purchased | | $ | — | | | $ | — | | | $ | 8,873,625 | | | $ | — | | | $ | 8,873,625 | |
Options Written | | $ | — | | | $ | — | | | $ | 5,182,000 | | | $ | — | | | $ | 5,182,000 | |
| (1) | Represents purchased options, at value. |
| (2) | Represents realized gain (loss) for purchased options. |
| (3) | Represents change in unrealized appreciation (depreciation) for purchased options during the year. |
| (4) | Amount disclosed represents average number of contracts or notional amounts, which are representative of the volume traded for the year ended October 31, 2023. |
Counterparty Credit Risk: Derivative contracts may be exposed to counterparty risk. Losses can occur if the counterparty does not perform under the contract.
The Funds’ risk of loss from counterparty credit risk on OTC derivatives is generally limited to the aggregate unrealized gain netted against any collateral held by the Funds.
With exchange-traded futures and centrally cleared swaps, there is less counterparty credit risk to the Funds since the exchange or clearinghouse, as counterparty to such instruments, guarantees against a possible default. The clearinghouse stands between the buyer and the seller of the contract; therefore, the credit risk is limited to failure of the clearinghouse. While offset rights may exist under applicable law, the Funds do not have a contractual right of offset against a clearing broker or clearinghouse in the event of a default (including the bankruptcy or insolvency) of the clearing broker or clearinghouse. Additionally, credit risk exists in exchange-traded futures and centrally cleared swaps with respect to initial and variation margin that is held in a clearing broker’s customer accounts. While clearing brokers are required to segregate customer margin from their own assets, in the event that a clearing broker becomes insolvent or goes into bankruptcy and at that time there is a shortfall in the aggregate amount of margin held by the clearing broker for all its clients, typically the shortfall would be allocated on a pro rata basis across all the clearing broker’s customers, potentially resulting in losses to the Funds.
For OTC derivatives the Funds mitigate their counterparty risk by entering into an International Swaps and Derivatives Association, Inc. Master Agreement (“ISDA Master Agreement”) or similar agreement with each counterparty. An ISDA Master Agreement is a bilateral agreement between the Funds and a counterparty that governs OTC derivatives and typically contains, among other things, collateral posting terms and netting provisions in the event of a default and/or termination event. Under an ISDA Master Agreement, the Funds may, under certain circumstances, offset with the counterparty certain derivative
31
TCW Funds, Inc.
Notes to Financial Statements (Continued)
Note 2 — Significant Accounting Policies (Continued)
financial instruments’ payables and/or receivables with collateral held and/or posted and create one single net payment. The provisions of the ISDA Master Agreement typically permit a single net payment in the event of default including the bankruptcy or insolvency of the counterparty. However, bankruptcy or insolvency laws of a particular jurisdiction may impose restrictions on or prohibitions against the right of offset in bankruptcy, insolvency or other events. In addition, certain ISDA Master Agreements allow counterparties to OTC derivatives to terminate derivative contracts prior to maturity in the event a Fund’s net assets declines by a stated percentage or a Fund fails to meet the terms of its ISDA Master Agreements, which would cause the Fund to accelerate payment of any net liability owed to the counterparty.
Collateral requirements: For derivatives traded under an ISDA Master Agreement, the collateral requirements are typically calculated by netting the mark-to-market amount for each transaction under such agreement and comparing that amount to the value of any collateral pledged or received by a Fund.
Cash collateral that has been pledged to cover obligations of a Fund is reported separately on the Statement of Assets and Liabilities. Non-cash collateral pledged by a Fund, if any, is noted in the Schedule of Investments. Generally, the amount of collateral due from or to a party has to exceed a minimum transfer amount threshold, typically $250,000 or $500,000, before a transfer is required, which is determined at the close of each business day and the collateral is transferred on the next business day. To the extent amounts due to a Fund from its counterparties are not fully collateralized, contractually or otherwise, the Fund bears the risk of loss from counterparty non-performance. The Funds attempt to mitigate counterparty risk by entering into agreements only with counterparties that the Advisor believes have the financial resources to honor their obligations and by monitoring the financial stability of those counterparties. For financial reporting purposes, the Funds do not offset derivative assets and derivative liabilities that are subject to netting arrangements in the Statement of Assets and Liabilities. The Funds have implemented the disclosure requirements pursuant to FASB Accounting Standards Update (“ASU”) No. 2011-11, Disclosures about Offsetting Assets and Liabilities that requires disclosures to make financial statements that are prepared under GAAP more comparable to those prepared under International Financial Reporting Standards.
Master Agreements and Netting Arrangements. Certain Funds are parties to various agreements, including but not limited to International Swaps and Derivatives Association Agreements and related Credit Support Annex, Master Repurchase Agreements, and Master Securities Forward Transactions Agreements (collectively “Master Agreements”), which govern the terms of certain transactions with select counterparties. These Master Agreements generally include provisions for general obligations, representations, agreements, collateral, and certain events of default or termination. These Master Agreements also include provisions for netting arrangements that help reduce credit and counterparty risk associated with relevant transactions (“netting arrangements”). The netting arrangements are generally tied to credit-related events that, if triggered, would cause an event of default or termination giving a Fund or counterparty the right to terminate early and cause settlement, on a net basis, of all transactions under the applicable Master Agreement. In the event of an early termination as a result of an event of default under the Master Agreement, the total value exposure of all transactions will be offset against collateral exchanged to date, which would result in a net receivable or payable that would be due from or to the counterparty. However, bankruptcy or insolvency laws of a particular jurisdiction may impose restrictions on or prohibitions against the right of offset in the event of a bankruptcy or insolvency of the counterparty.
32
TCW Funds, Inc.
October 31, 2023
Note 2 — Significant Accounting Policies (Continued)
Credit-related events include, but are not limited to, bankruptcy, failure to make timely payments, restructuring, obligation acceleration, obligation default, a material decline in net assets, decline in credit rating or repudiation/moratorium. Any election made by a counterparty to early terminate the transactions under a Master Agreement could have a material adverse impact on a Fund’s financial statements. A Fund’s overall exposure to credit risk, subject to netting arrangements can change substantially within a short period, as it is affected by each transaction subject to the arrangement.
Master Agreements can also help limit counterparty risk by specifying collateral posting arrangements at pre-arranged exposure levels. Under the Master Agreements, collateral is routinely transferred if the total net exposure to certain transactions under the relevant Master Agreement with a counterparty in a given Fund exceeds a specified threshold, net of collateral already in place, typically $250,000 or $500,000 depending on the counterparty and the type of Master Agreement. Collateral under the Master Agreements is usually in the form of cash or U.S. Treasury Bills but could include other types of securities. If permitted under the Master Agreement, certain funds may rehypothecate cash collateral received from a counterparty. The value of all derivative transactions outstanding under a Master Agreement is calculated daily to determine the amount of collateral to be received or pledged by the counterparty. Posting of collateral for OTC derivative transactions are covered under tri-party collateral agreements between the Fund, the Fund’s custodian, and each counterparty. Collateral for centrally cleared derivatives transactions are posted with the applicable derivatives clearing organization.
The following table presents TCW Emerging Markets Local Currency Income Fund’s OTC derivative assets by counterparty net of amounts available for offset under an ISDA Master Agreement or similar agreements and net of the related collateral received or pledged by the Fund as of October 31, 2023:
| | | | | | | | | | | | | | | | |
Counterparty | | Gross Derivative
Assets
in the Statetment of
Assets and
Liabilities | | | Collateral
Received (1) | | | Derivative Assets
(Liabilities) Available
for Offset | | | Net Amount
of Derivative
Assets (2) | |
Bank of America Purchased Options | | $ | 15,299 | | | $ | — | | | $ | — | | | $ | 15,299 | |
Barclays Capital Purchased Options | | | 34,816 | | | | — | | | | — | | | | 34,816 | |
BNP Paribas S.A. Foreign Currency Exchange Contracts | | | 15,623 | | | | — | | | | (15,623 | ) | | | — | |
Citibank N.A. Foreign Currency Exchange Contracts | | | 82,152 | | | | — | | | | (12,180 | ) | | | 69,972 | |
Goldman Sachs & Co. Foreign Currency Exchange Contracts | | | 43,744 | | | | — | | | | (1,977 | ) | | | 41,767 | |
JPMorgan Chase Bank Foreign Currency Exchange Contracts | | | 42,041 | | | | — | | | | (42,041 | ) | | | — | |
Morgan Stanley & Co.. Foreign Currency Exchange Contracts | | | 10,750 | | | | — | | | | (10,750 | ) | | | — | |
| | | | | | | | | | | | | | | | |
Total | | $ | 244,425 | | | $ | — | | | $ | (82,571 | ) | | $ | 161,854 | |
| | | | | | | | | | | | | | | | |
| (1) | Excess of collateral received for individual counterparty may not be shown for financial reporting purposes. |
| (2) | Represents the net amount receivable from the counterparty in the event of default. |
33
TCW Funds, Inc.
Notes to Financial Statements (Continued)
Note 2 — Significant Accounting Policies (Continued)
The following table presents TCW Emerging Markets Local Currency Income Fund’s OTC derivative liabilities by counterparty net of amounts available for offset under an ISDA Master Agreement or similar agreements and net of the related collateral received or pledged by the Fund as of October 31, 2023
| | | | | | | | | | | | | | | | |
Counterparty | | Gross Derivatives
Liabilities
in the Statement of
Assets and
Liabilities | | | Collateral
Received (1) | | | Derivative (Assets)
Liabilities Available
for Offset | | | Net Amount
of Derivative
Liabilities (2) | |
Bank of America Foreign Currency Exchange Contracts | | $ | 3,265 | | | $ | — | | | $ | — | | | $ | 3,265 | |
Bank of America Written Options | | | 2,562 | | | | — | | | | — | | | | 2,562 | |
Barclays Capital Foreign Currency Exchange Contracts | | | 29,901 | | | | — | | | | — | | | | 29,901 | |
Barclays Capital Written Options | | | 5,832 | | | | — | | | | — | | | | 5,832 | |
BNP Paribas S.A. Foreign Currency Exchange Contracts | | | 145,404 | | | | — | | | | (15,623 | ) | | | 129,781 | |
Citibank N.A. Foreign Currency Exchange Contracts | | | 12,180 | | | | — | | | | (12,180 | ) | | | — | |
Goldman Sachs & Co. Foreign Currency Exchange Contracts | | | 1,977 | | | | — | | | | (1,977 | ) | | | — | |
JPMorgan Chase Bank Foreign Currency Exchange Contracts | | | 237,994 | | | | (195,953 | ) | | | (42,041 | ) | | | — | |
Morgan Stanley & Co.. Foreign Currency Exchange Contracts | | | 152,310 | | | | (141,560 | ) | | | (10,750 | ) | | | — | |
| | | | | | | | | | | | | | | | |
Total | | $ | 591,425 | | | $ | (337,513 | ) | | $ | (82,571 | ) | | $ | 171,341 | |
| | | | | | | | | | | | | | | | |
| (1) | Excess of collateral received for individual counterparty may not be shown for financial reporting purposes. |
| (2) | Represents the net amount receivable from the counterparty in the event of default. |
Note 3 — Portfolio Investments
When-Issued, Delayed-Delivery, and Forward Commitment Transactions: The Funds may enter into when-issued, delayed-delivery, or forward commitment transactions in order to lock in the purchase price of the underlying security or to adjust the interest rate exposure of each Fund’s existing portfolio. In when-issued, delayed-delivery, or forward commitment transactions, a Fund commits to purchase or sell particular securities, with payment and delivery to take place at a future date. Although the Fund does not pay for the securities or start earning interest on them until they are delivered, it immediately assumes the risks of ownership, including the risk of price fluctuation. If a Fund’s counterparty fails to deliver a security purchased on a when-issued, delayed-delivery, or forward commitment basis, there may be a loss, and the Fund may have missed an opportunity to make an alternative investment.
Prior to settlement of these transactions, the value of the subject securities will fluctuate with market conditions. In addition, because the Fund is not required to pay for when-issued, delayed-delivery, or forward commitment securities until the delivery date, they may result in a form of leverage to the extent the Fund does not set aside liquid assets to cover the commitment. To guard against this deemed leverage, the Fund monitors the obligations under these transactions on a daily basis and ensures that the Fund has sufficient liquid assets to cover them.
34
TCW Funds, Inc.
October 31, 2023
Note 3 — Portfolio Investments (Continued)
Repurchase Agreements: The Funds may enter into repurchase agreements under the terms of a Master Repurchase Agreement (“MRA”). In a repurchase agreement, the Funds purchase a security from a counterparty who agrees to repurchase the same security at a mutually agreed upon date and price. The MRA permits each Fund, under certain circumstances, including an event of default (such as bankruptcy or insolvency), to offset payables and/or receivables under the MRA with collateral held and/or posted to the counterparty and create one single net payment due to or from each Fund. However, bankruptcy or insolvency laws of a particular jurisdiction may impose restrictions on or prohibitions against such a right of offset in the event of the MRA counterparty’s bankruptcy or insolvency. Pursuant to the terms of the MRA, each Fund receives securities as collateral with a market value in excess of the repurchase price. Upon a bankruptcy or insolvency of the MRA counterparty, the Fund recognizes a liability with respect to such excess collateral to reflect the Fund’s obligation under bankruptcy law to return the excess to the counterparty. There were no repurchase agreements outstanding as of October 31, 2023.
Participation Notes: The Funds may invest in participation notes of equity-linked instruments (collectively, participation notes), through which a counterparty provides exposure to common stock, in the form of an unsecured interest, in markets where direct investment by a Fund is not possible. Participation notes provide the economic benefit of common stock ownership to a Fund, while legal ownership and voting rights are retained by the counterparty. Although participation notes are usually structured with a defined maturity or termination date, early redemption may be possible. Risks associated with participation notes include possible failure of the counterparty to perform in accordance with the terms of the agreement, inability to transfer or liquidate the notes, potential delays or an inability to redeem before maturity under certain market conditions, and limited legal recourse against the issuer of the underlying common stock. None of the Funds held participation notes as of October 31, 2023.
Securities Lending: The Funds may lend their securities to qualified brokers. The loans must be collateralized at all times primarily with cash although the Funds can accept money market instruments or U.S. Government securities with a market value at least equal to the market value of the securities on loan. As with any extensions of credit, the Funds may bear the risk of delay in recovery or even loss of rights in the collateral if the borrowers of the securities fail financially. The Funds earn additional income for lending their securities by investing the cash collateral in short-term investments. The Funds did not lend any securities during the year ended October 31, 2023.
Derivatives:
Forward Currency Exchange Contracts: The Funds enter into forward currency exchange contracts as a hedge against fluctuations in foreign exchange rates. Forward currency exchange contracts are marked-to market daily and the change in market value is recorded by the Funds as unrealized gains or losses in the Statement of Assets and Liabilities. When a contract is closed or delivery is taken, a Fund records a realized gain or loss equal to the difference between the value of the contract at the time it was opened and the value at the time it was closed. Risks may arise upon entering into these contracts from the potential inability of counterparties to meet the terms of their contracts and from unanticipated movements in the value of the foreign currency relative to the U.S. dollar. Outstanding forward currency exchange contracts at October 31, 2023 are disclosed in the Schedule of Investments.
35
TCW Funds, Inc.
Notes to Financial Statements (Continued)
Note 3 — Portfolio Investments (Continued)
Futures Contracts: The Funds may enter into futures contracts. A Fund may seek to manage a variety of different risks through the use of futures contracts, such as interest rate risk, equity price risk, and currency risk. A Fund may use index futures to hedge against broad market risks to its portfolio or to gain broad market exposure. Securities index futures contracts are contracts to buy or sell units of a securities index at a specified future date at a price agreed upon when the contract is made and are settled in cash. Positions in futures may be closed out only on an exchange or board of trade which provides a secondary market for such futures. Because futures contracts are exchange-traded, they typically have minimal exposure to counterparty risk. Parties to a futures contract are not required to post the entire notional amount of the contract, but rather a small percentage of that amount (by way of margin), both at the time they enter into futures transactions, and then on a daily basis if their positions decline in value; as a result, futures contracts are highly leveraged. Such payments are known as variation margin and are recorded by a Fund as unrealized gains or losses. Because futures markets are highly leveraged, they can be extremely volatile, and there can be no assurance that the pricing of a futures contract will correlate precisely with the pricing of the asset or index underlying it or the asset or liability of a Fund that is the subject of the hedge. It may not always be possible for a Fund to enter into a closing transaction with respect to a futures contract it has entered into at a favorable time or price. When a Fund enters into a futures transaction, it is subject to the risk that the value of the futures contract will move in a direction unfavorable to it.
When a Fund uses futures contracts for hedging purposes, it is likely that the Fund will have an asset or liability that will offset any loss (or gain) on the transactions, at least in part. When a futures contract is closed, the Fund records a realized gain or loss equal to the difference between the value of the contract at the time it was opened and the value at the time it was closed. There were no futures contracts outstanding at October 31, 2023.
Options: The Funds may purchase and sell put and call options on a security or an index of securities to enhance investment performance and/or to protect against changes in market prices. The Funds may also enter into currency options to hedge against or to take advantage of currency fluctuations.
A call option gives the holder the right to purchase, and obligates the writer to sell, a security at the strike price at any time before the expiration date. A put option gives the holder the right to sell, and obligates the writer to buy, a security at the exercise price at any time before the expiration date. A Fund may purchase put options to protect portfolio holdings against a decline in market value of a security or securities held by it. A Fund may also purchase a put option hoping to profit from an anticipated decline in the value of the underlying security. If a Fund holds the security underlying the option, the option premium and any transaction costs will reduce any profit the Fund might have realized had it sold the underlying security instead of buying the put option. A Fund may purchase call options to hedge against an increase in the price of securities that the Fund ultimately wants to buy. A Fund may also purchase a call option as a long directional investment hoping to profit from an anticipated increase in the value of the underlying security. In order for a call option to be profitable, the market price of the underlying security must rise sufficiently above the exercise price to cover the premium and transaction costs. These costs will reduce any profit a Fund might have realized had it bought the underlying security at the time it purchased the call option.
Purchasing foreign currency options gives a Fund the right, but not the obligation, to buy or sell specified amounts of currency at a rate of exchange that may be exercised by a certain date. These currency options may be used as a short or long hedge against possible variations in foreign exchange rates or to gain exposure to foreign currencies.
36
TCW Funds, Inc.
October 31, 2023
Note 3 — Portfolio Investments (Continued)
When a Fund purchases an option, it runs the risk that it will lose its entire investment in the option in a relatively short period of time, unless the Fund exercises the option or enters into a closing sale transaction before the option’s expiration. If the price of the underlying security does not rise (in the case of a call) or fall (in the case of a put) to an extent sufficient to cover the option premium and transaction costs, the Fund will lose part or all of its investment in the option. Premiums paid for purchasing options that expire are treated as realized losses.
Options purchased or sold by a Fund may be traded on a securities or options exchange. Such options typically have minimal exposure to counterparty risk. However, an exchange or market may at times find it necessary to impose restrictions on particular types of options transactions, such as opening transactions. If an underlying security ceases to meet qualifications imposed by an exchange or the Options Clearing Corporation, new series of options on that security will no longer be opened to replace the expiring series, and opening transactions in existing series may be prohibited.
OTC options are options not traded on exchanges or backed by clearinghouses. Rather, they are entered into directly between a Fund and the counterparty to the option. In the case of an OTC option purchased by a Fund, the value of the option to the Fund will depend on the willingness and ability of the option writer to perform its obligations to the Fund. In addition, OTC options may not be transferable and there may be little or no secondary market for them, so they may be considered illiquid. It may not be possible to enter into closing transactions with respect to OTC options or otherwise to terminate such options, and as a result a Fund may be required to remain obligated on an unfavorable OTC option until its expiration.
During the year ended October 31, 2023, the TCW Emerging Markets Income Fund and the TCW Emerging Markets Local Currency Income Fund entered into options to hedge the currency exposure of the Funds.
Swap Agreements: The Funds may enter into swap agreements. Swap agreements are typically two-party contracts entered into primarily by institutional investors. In a standard “swap” transaction, two parties agree to exchange the returns (or differentials in rates of return) earned or realized on particular predetermined investments or instruments, which may be adjusted for an interest factor. The gross returns to be exchanged or “swapped” between the parties are generally calculated with respect to a “notional amount” (i.e., the return on or increase in value of a particular dollar amount invested at a particular interest rate or in a “basket” of securities representing a particular index).
In a total return swap, one party typically agrees to pay to the other a short-term interest rate in return for a payment at one or more times in the future based on the increase in the value of an underlying security or other asset, or index of securities or assets; if the underlying security, asset, or index declines in value, the party that pays the short-term interest rate must also pay to its counterparty a payment based on the amount of the decline. A Fund may take either side of such a swap, and so may take a long or short position in the underlying security, asset, or index. A Fund may enter into a total return swap to hedge against an exposure in its portfolio — such as interest rate risk (including to adjust the duration or credit quality of a Fund’s bond portfolio), equity risk, or credit risk — or generally to put cash to work efficiently in the markets in anticipation of, or as a replacement for, cash investments. A Fund may also enter into a total return swap to gain exposure to securities or markets in which it might not be able to invest directly (in so-called market access transactions).
Interest rate swaps are agreements in which one party pays a floating rate of interest on a notional principal amount and receives a fixed rate of interest on the same notional principal amount for a specified period of
37
TCW Funds, Inc.
Notes to Financial Statements (Continued)
Note 3 — Portfolio Investments (Continued)
time. Alternatively, a party may pay a fixed rate and receive a floating rate. In more complex swaps, the notional principal amount may decline (or amortize) over time. A Fund’s maximum risk of loss due to counterparty default is the discounted NAV of the cash flows paid to/received from the counterparty over the interest rate swap’s remaining life.
A Fund may enter into credit default swap transactions as a “buyer” or “seller” of credit protection. In a credit default swap, one party provides what is in effect insurance against a default or other adverse credit event affecting an issuer of debt securities (typically referred to as a “reference entity”). In general, the buyer of credit protection is obligated to pay the protection seller an upfront amount or a periodic stream of payments over the term of the swap. If a “credit event” occurs, the buyer has the right to deliver to the seller bonds or other obligations of the reference entity (with a value up to the full notional value of the swap), and to receive a payment equal to the par value of the bonds or other obligations. Credit events that would trigger a request that the seller make payment are specific to each credit default swap agreement, but generally include bankruptcy, failure to pay, restructuring, obligation acceleration, obligation default, or repudiation/moratorium. When a Fund buys protection, it may or may not own securities of the reference entity. When a Fund sells protection under a credit default swap, the position may have the effect of creating leverage in the Fund’s portfolio through the Fund’s indirect long exposure to the issuer or securities on which the swap is written. When a Fund sells protection, it may do so either to earn additional income or to create such a “synthetic” long position.
Whenever a Fund enters into a swap agreement, it takes on counterparty risk — the risk that its counterparty will be unable or unwilling to meet its obligations under the swap agreement. A Fund also takes the risk that the market will move against its position in the swap agreement. In the case of a total return swap, the swap will change in value depending on the change in value of the asset or index on which the swap is written. When a Fund enters into any type of swap for hedging purposes, it is likely that the Fund will have an asset or liability that will offset any loss (or gain) on the swap, at least in part. Swap agreements may be non-transferable or otherwise highly illiquid, and a Fund may not be able to terminate or transfer a swap agreement at any particular time or at an acceptable price.
During the term of a swap transaction, changes in the value of the swap are recognized as unrealized gains or losses by marking-to-market to reflect the market value of the swap. When the swap is terminated, a Fund will record a realized gain or loss equal to the difference, if any, between the proceeds from (or cost of) the closing transaction and the Fund’s basis in the agreement. Upfront swap premium payments paid or received by a Fund, if any, are recorded within the value of the open swap agreement on the Fund’s Statement of Assets and Liabilities and represent payments paid or received upon entering into the swap agreement to compensate for differences between stated terms of the swap agreement and prevailing market conditions (credit spreads, currency exchange rates, and other relevant factors). These upfront payments are recorded as realized gains or losses on each Fund’s Statement of Operations upon termination or maturity of the swap agreement.
During the term of a swap transaction, the periodic net payments can be made for a set period of time or may be triggered by a predetermined credit event. The net periodic payments may be based on a fixed or variable interest rate, the change in market value of a specified security, basket of securities or index, or the return generated by a security. These periodic payments received or made by the Funds are recorded as realized gains and losses, respectively. During the year ended October 31, 2023, the TCW Emerging Markets Income Fund used credit default swaps to limit certain credit exposure within each Fund.
38
TCW Funds, Inc.
October 31, 2023
Note 4 — Risk Considerations
Market Risk: The Funds’ investments will fluctuate with market conditions, and so will the value of your investment in the Funds. You could lose money on your investment in the Funds or the Funds could underperform other investments.
Liquidity Risk: The Funds’ investments in illiquid securities may reduce the returns of the Funds because they may not be able to sell the illiquid securities at an advantageous time or price. Investments in high-yield securities, foreign securities, derivatives or other securities with substantial market and/or credit risk tend to have the greatest exposure to liquidity risk. Certain investments in private placements and Rule 144A securities may be considered illiquid investments. The Funds may invest in private placements and Rule 144A securities.
Interest Rate Risk: The values of the Funds’ investments fluctuate in response to movements in interest rates. If rates rise, the values of debt securities generally fall. The longer the average duration of a Fund’s investment portfolio, the greater the change in value.
Investment Style Risk: Certain Funds may also be subject to investment style risk. The Advisor’s investment styles may be out of favor at times or may not produce the best results over short or longer time periods and may increase the volatility of a Fund’s share price.
LIBOR Risk: The London Interbank Offered Rate (“LIBOR”) was a leading benchmark or reference rate for various commercial and financial contracts, including corporate and municipal bonds, bank loans, asset-backed and mortgage-related securities, interest rate swaps and other derivatives. In July 2017, the United Kingdom’s Financial Conduct Authority (FCA), which regulates LIBOR, announced the gradual phase out of the LIBOR rate, with nearly all LIBOR rate publications having ceased as of June 30, 2023 (some LIBOR rates continue to be published, but only on a temporary and synthetic basis). Alternatives to LIBOR have been established and others may be developed. The U.S. Federal Reserve, in conjunction with the Alternative Reference Rates Committee, a steering committee comprised of large U.S. financial institutions, has identified the Secured Overnight Financial Rate (SOFR) as the preferred alternative rate to LIBOR. SOFR is a relatively new index calculated by short-term repurchase agreements, backed by Treasury securities. There remains uncertainty surrounding the nature of any replacement rates. The transition to a new reference rate may result in (i) increased volatility or illiquidity in markets for instruments or contracts that previously relied on or still rely on LIBOR, (ii) a reduction in the value of certain instruments or contracts held by a Fund, (iii) reduced effectiveness of related Fund transactions, such as hedging, (iv) additional tax, accounting and regulatory risks, or (v) costs incurred in connection with closing out positions and entering into new trades. Any pricing adjustments to a Fund’s investments resulting from a substitute reference rate may also adversely affect a Fund’s performance and/or NAV. There is no assurance that the composition or characteristics of any such alternative reference rate will be similar to or produce the same value or economic equivalence as LIBOR or that instruments or contracts using an alternative rate will have the same volume or liquidity.
Derivatives Risk: Use of derivatives, which at times is an important part of the Funds’ investment strategies, involves risks different from, or possibly greater than, the risks associated with investing directly in securities and other traditional investments. Investments in derivatives could cause the Funds to lose more than the principal amount invested. Also, suitable derivative transactions may not be available in all circumstances and there can be no assurance that the Funds will achieve their objective through the use of the derivatives.
39
TCW Funds, Inc.
Notes to Financial Statements (Continued)
Note 4 — Risk Considerations (Continued)
Credit Risk: The values of any of the Funds’ investments may also decline in response to events affecting the issuer or its credit rating. The lower rated debt securities in which a Fund may invest are considered speculative and are subject to greater volatility and risk of loss than investment-grade securities, particularly in deteriorating economic conditions.
Counterparty Risk: The Funds may be exposed to counterparty risk, the risk that an entity with which the Funds have unsettled or open transactions may not fulfill its obligations.
Foreign Currency Risk: The Funds may be exposed to the risk that the value of the Funds’ investments denominated in foreign currencies will decline in value because the foreign currencies have declined in value relative to the U.S. dollar.
Foreign and Developing/Emerging Markets Investing Risk: The Funds may be exposed to the risk that the Funds’ share prices will fluctuate with market conditions, currency exchange rates and the economic and political climates in countries where the Funds invest. The Funds are also subject to risks associated with financial, economic and other global market developments and disruptions, including those arising from war, terrorism, market manipulation, government interventions, defaults and shutdowns, and political changes or diplomatic developments, which can all negatively impact the securities markets and cause a Fund to lose value. As one current example, Russia’s recent military incursions in Ukraine have led to sanctions being levied against Russia by the United States, European Union and other countries, which has adversely affected European and global energy and financial markets and thus could affect the value of a Fund’s investments.
China Investing Risk: The risks of investing in companies located or operating in China, including Hong Kong, such as nationalization, expropriation, or confiscation of property; difficulty in obtaining and/or enforcing judgments; alteration or discontinuation of economic reforms; military conflicts; inflation, currency fluctuations and fluctuations in inflation and interest rates that may have negative effects on the economy and securities markets of China; and China’s dependency on the economies of other Asian countries, many of which are developing countries. Health events, such as the recent coronavirus outbreak, may cause uncertainty and volatility in the Chinese economy. Certain securities issued by companies located or operating in China are subject to trading restrictions, quota limitations, and clearing and settlement risks. Significant portions of the Chinese securities markets may become rapidly illiquid, as Chinese issuers have the ability to suspend the trading of their equity securities, or as a result of adverse economic, market or political events, or adverse investor perceptions, whether or not accurate.
For more information on risks related to investing in the Funds, please refer to the Funds’ prospectus and the Statement of Additional Information which can be obtained on the Funds’ website (www.tcw.com) or by calling customer service at 800-FUND-TCW (800-386-3829).
Note 5 — Federal Income Taxes
It is the policy of each Fund to comply with the requirements under Subchapter M of the Internal Revenue Code applicable to regulated investment companies and to distribute all of its net taxable income, including any net realized gains on investments, to its shareholders. Therefore, no federal income tax provision is required.
40
TCW Funds, Inc.
October 31, 2023
Note 5 — Federal Income Taxes (Continued)
At October 31, 2023, the components of distributable earnings on a tax basis were as follows:
| | | | | | | | | | | | |
| | | Undistributed
Ordinary
Income | | | Undistributed
Long-Term
Gain | | | Total
Distributable
Earnings | |
TCW Emerging Markets Income Fund | | $ | 1,802,569 | | | $ | — | | | $ | 1,802,569 | |
TCW Emerging Markets Local Currency Income Fund | | | 1,177,419 | | | | — | | | | 1,177,419 | |
Permanent differences incurred during the year ended October 31, 2023, resulting from differences in book and tax accounting, have been reclassified at year-end between undistributed net investment income (loss), undistributed (accumulated) net realized gain (loss) and paid-in capital as follows, with no impact to the NAV per share:
| | | | | | | | | | | | |
| | | Undistributed
Net Investment
Income (Loss) | | | Undistributed
Accumulated
Net Realized
Gain (Loss) | | | Paid-in
Capital | |
TCW Emerging Markets Income Fund | | $ | (52,963,536 | ) | | $ | 52,963,536 | | | $ | — | |
TCW Emerging Markets Local Currency Income Fund | | | (2,535,638 | ) | | | 2,827,714 | | | | (292,076 | ) |
During the year ended October 31, 2023, the tax character of distributions paid was as follows:
| | | | | | | | | | | | | | | | |
| | | Ordinary
Income | | | Long-Term
Capital Gain | | | Return of
Capital Gain | | | Total
Distributions | |
TCW Emerging Markets Income Fund | | $ | 208,679,952 | | | $ | — | | | $ | — | | | $ | 208,679,952 | |
TCW Emerging Markets Local Currency Income Fund | | | 4,696,848 | | | | — | | | | — | | | | 4,696,848 | |
During the previous fiscal year ended October 31, 2022, the tax character of distributions paid was as follows:
| | | | | | | | | | | | | | | | |
| | | Ordinary
Income | | | Long-Term
Capital Gain | | | Return of
Capital Gain | | | Total
Distributions | |
TCW Emerging Markets Income Fund | | $ | 228,258,436 | | | $ | — | | | $ | 22,694,796 | | | $ | 250,953,232 | |
TCW Emerging Markets Local Currency Income Fund | | | 2,830,965 | | | | — | | | | 3,893,084 | | | | 6,724,049 | |
At October 31, 2023, net unrealized appreciation (depreciation) on investments for federal income tax purposes was as follows :
| | | | | | | | | | | | | | | | |
| | | Unrealized
Appreciation | | | Unrealized
(Depreciation) | | | Net
Unrealized
Appreciation
(Depreciation) | | | Cost of
Investments for
Federal Income
Tax Purposes | |
TCW Emerging Markets Income Fund | | $ | 9,728,055 | | | $ | (285,678,284 | ) | | $ | (275,950,229 | ) | | $ | 3,749,265,712 | |
TCW Emerging Markets Local Currency Income Fund | | | 1,068,591 | | | | (11,001,834 | ) | | | (9,933,243 | ) | | | 128,310,471 | |
At October 31, 2023, following Funds had net realized losses that will be carried forward indefinitely for federal income tax purposes:
| | | | | | | | | | | | |
| | | Short-Term
Capital Losses | | | Long-Term
Capital Losses | | | Total | |
TCW Emerging Markets Income Fund | | $ | 1,404,547,010 | | | $ | 970,359,821 | | | $ | 2,374,906,831 | |
TCW Emerging Markets Local Currency Income Fund | | | 32,156,015 | | | | 22,653,190 | | | | 54,809,205 | |
41
TCW Funds, Inc.
Notes to Financial Statements (Continued)
Note 5 — Federal Income Taxes (Continued)
The Funds did not have any unrecognized tax benefits at October 31, 2023, nor were there any increases or decreases in unrecognized tax benefits for the year ended October 31, 2023. The Funds are subject to examination by the U.S. Federal and state tax authorities for returns filed for the prior three and four fiscal years, respectively.
Note 6 — Fund Management Fees and Other Expenses
The Funds pay to the Advisor, as compensation for services rendered, facilities furnished and expenses borne by it, the following annual management fees as a percentage of daily net assets:
| | | | |
TCW Emerging Markets Income Fund | | | 0.75 | % |
TCW Emerging Markets Local Currency Income Fund | | | 0.75 | % |
The Advisor limits the operating expenses of the Funds not to exceed the following expense ratios relative to the Funds’ average daily net assets:
| | | | |
TCW Emerging Markets Income Fund | | | | |
I Class | | | 0.85 | % (1) |
N Class | | | 0.95 | % (1) |
Plan Class | | | 0.77 | % (1) |
TCW Emerging Markets Local Currency Income Fund | | | | |
I Class | | | 0.85 | % (1) |
N Class | | | 0.90 | % (1) |
| (1) | These limitations are based on an agreement between the Advisor and Company. |
Any advisory fee reduced or withheld, or expense reimbursement paid, pursuant to the Expense Limitation Agreement will be reimbursed by the appropriate Fund to the Advisor in the first, second or third fiscal year after the fiscal year of the reduction or reimbursement. The Advisor may not receive reimbursement for previous reductions or reimbursements before payment of a Fund’s operating expenses for the current year, and cannot cause a Fund to exceed the expense limitation in effect for that Fund (i) at the time the fees and expenses would have been incurred or (ii) at the time the Advisor would recoup that reduction or reimbursement. In addition, any recoupment may not exceed any more restrictive limitation to which the Advisor has agreed.
At October 31, 2023, the balance of recoupable expenses with expiration dates for the Funds were as follows:
| | | | |
Fund | | Expires
10/31/2026 | |
TCW Emerging Markets Income Fund | | $ | 1,030,033 | |
TCW Emerging Markets Local Currency Income Fund | | | 225,798 | |
| | | | |
Total | | | 1,255,831 | |
| | | | |
Directors’ Fees: Directors who are not affiliated with the Advisor receive compensation from the Funds which are shown on the Statements of Operations. Directors may elect to defer receipt of their fees in accordance with the terms of a Non-Qualified Deferred Compensation Plan. Deferred compensation is included within directors’ fees and expenses in the Statements of Assets and Liabilities.
Note 7 — Distribution Plan
TCW Funds Distributors LLC (“Distributor”), an affiliate of the Advisor and the Funds, serves as the nonexclusive distributor of each class of the Funds’ shares. The Funds have a distribution plan pursuant to Rule 12b-1 under the 1940 Act with respect to the N Class shares of each Fund. Under the terms of the plan, each Fund compensates the Distributor at a rate equal to 0.25% of the average daily net assets of the Fund attributable to its N Class shares for distribution and related services.
42
TCW Funds, Inc.
October 31, 2023
Note 8 — Purchases and Sales of Securities
Investment transactions (excluding short-term investments) for the year ended October 31, 2023 were as follows:
| | | | | | | | | | | | | | | | |
| | | Purchases
at Cost | | | Sales or Maturity
Proceeds | | | U.S. Government
Purchases at Cost | | | U.S. Government
Sales or Maturity
Proceeds | |
TCW Emerging Markets Income Fund | | $ | 5,687,353,958 | | | $ | 6,103,963,860 | | | $ | — | | | $ | — | |
TCW Emerging Markets Local Currency Income Fund | | | 167,864,057 | | | | 200,097,555 | | | | — | | | | — | |
Note 9 — Capital Share Transactions
Transactions in each Fund’s shares were as follows:
| | | | | | | | | | | | | | | | |
| TCW Emerging Markets Income Fund | | Year Ended
October 31, 2023 | | | Year Ended
October 31, 2022 | |
| I Class | | Shares | | | Amount | | | Shares | | | Amount | |
Shares Sold | | | 155,379,245 | | | $ | 946,777,138 | | | | 216,629,505 | | | $ | 1,474,180,966 | |
Shares Issued upon Reinvestment of Dividends | | | 16,484,865 | | | | 99,967,408 | | | | 19,244,065 | | | | 132,388,695 | |
Shares Redeemed | | | (253,454,288 | ) | | | (1,534,829,190 | ) | | | (394,714,567 | ) | | | (2,682,553,501 | ) |
| | | | | | | | | | | | | | | | |
Net Decrease | | | (81,590,178 | ) | | $ | (488,084,644 | ) | | | (158,840,997 | ) | | $ | (1,075,983,840 | ) |
| | | | | | | | | | | | | | | | |
| | | | |
| N Class | | Shares | | | Amount | | | Shares | | | Amount | |
Shares Sold | | | 15,090,614 | | | $ | 119,272,021 | | | | 21,222,788 | | | $ | 186,846,363 | |
Shares Issued upon Reinvestment of Dividends | | | 2,938,551 | | | | 23,013,683 | | | | 2,509,111 | | | | 22,043,204 | |
Shares Redeemed | | | (12,491,675 | ) | | | (98,323,505 | ) | | | (24,289,272 | ) | | | (209,179,236 | ) |
| | | | | | | | | | | | | | | | |
Net Increase (Decrease) | | | 5,537,490 | | | $ | 43,962,199 | | | | (557,373 | ) | | $ | (289,669 | ) |
| | | | | | | | | | | | | | | | |
| | | | |
| Plan Class | | Shares | | | Amount | | | Shares | | | Amount | |
Shares Sold | | | 38,757,199 | | | $ | 235,169,525 | | | | 51,708,975 | | | $ | 353,620,135 | |
Shares Issued upon Reinvestment of Dividends | | | 5,624,869 | | | | 34,094,725 | | | | 4,639,507 | | | | 31,452,790 | |
Shares Redeemed | | | (55,895,176 | ) | | | (335,479,982 | ) | | | (127,362,071 | ) | | | (873,459,638 | ) |
| | | | | | | | | | | | | | | | |
Net Decrease | | | (11,513,108 | ) | | $ | (66,215,732 | ) | | | (71,013,589 | ) | | $ | (488,386,713 | ) |
| | | | | | | | | | | | | | | | |
| | |
TCW Emerging Markets Local Currency
Income Fund | | Year Ended
October 31, 2023 | | | Year Ended
October 31, 2022 | |
| I Class | | Shares | | | Amount | | | Shares | | | Amount | |
Shares Sold | | | 3,211,839 | | | $ | 23,179,638 | | | | 4,953,513 | | | $ | 38,450,053 | |
Shares Issued upon Reinvestment of Dividends | | | 471,364 | | | | 3,408,057 | | | | 709,095 | | | | 5,526,890 | |
Shares Redeemed | | | (4,123,910 | ) | | | (29,251,079 | ) | | | (13,661,596 | ) | | | (102,746,615 | ) |
| | | | | | | | | | | | | | | | |
Net Decrease | | | (440,707 | ) | | $ | (2,663,384 | ) | | | (7,998,988 | ) | | $ | (58,769,672 | ) |
| | | | | | | | | | | | | | | | |
| | | | |
| N Class | | Shares | | | Amount | | | Shares | | | Amount | |
Shares Sold | | | 749,949 | | | $ | 5,375,271 | | | | 5,205,699 | | | $ | 37,181,265 | |
Shares Issued upon Reinvestment of Dividends | | | 132,939 | | | | 952,940 | | | | 175,441 | | | | 1,344,419 | |
Shares Redeemed | | | (5,020,848 | ) | | | (36,926,606 | ) | | | (3,936,505 | ) | | | (28,238,990 | ) |
| | | | | | | | | | | | | | | | |
Net Decrease | | | (4,137,960 | ) | | $ | (30,598,395 | ) | | | 1,444,635 | | | $ | 10,286,694 | |
| | | | | | | | | | | | | | | | |
Note 10 — Restricted Securities
The Funds are permitted to invest in securities that have legal or contractual restrictions on resale. These securities may be sold privately, but are required to be registered before being sold to the public (exemption rules apply). Private placement securities are generally considered to be restricted except for those securities traded between qualified institutional investors under the provisions of Rule 144A of the Securities Act of 1933, as amended (the “Securities Act”). However, the Company considers 144A securities
43
TCW Funds, Inc.
Notes to Financial Statements (Continued)
Note 10 — Restricted Securities (Continued)
to be restricted if those securities have been deemed illiquid. Disposal of these securities may involve time-consuming negotiations and expense, and prompt sale at an acceptable price may be difficult. There were no restricted securities held by the Funds at October 31, 2023.
Note 11 — Committed Line of Credit
The Funds have entered into a $100,000,000 committed revolving line of credit agreement with State Street Bank and Trust Company (the “Bank”) for temporary borrowing purposes, renewable annually. The interest rate on borrowing is the higher of the Federal Funds Effective Rate plus 0.10% plus 1.25% or the Overnight Bank Funding Rate plus 0.10% plus 1.25%. There were no borrowings from the line of credit as of or during the year ended October 31, 2023. The Funds pay the Bank a commitment fee equal to 0.25% per annum on any unused portion of the committed line amount. The commitment fees incurred by the Funds are presented in the Statements of Operations. The commitment fees are allocated to each applicable portfolio in proportion to its relative average daily net assets and the interest expenses are charged directly to the applicable portfolio.
Note 12 — Indemnifications
Under the Company’s organizational documents, its Officers and Directors may be indemnified against certain liabilities and expenses arising out of the performance of their duties to the Company. In addition, the Company entered into an agreement with each of the Directors which provides that the Company will indemnify and hold harmless each Director against any expenses actually and reasonably incurred by such Director in any proceeding arising out of or in connection with the Director’s services to the Company, to the fullest extent permitted by the Company’s Articles of Incorporation and By-Laws, the Maryland General Corporation Law, the Securities Act, and the 1940 Act, each as now or hereinafter in force. Additionally, in the normal course of business, the Company enters into agreements with service providers that may contain indemnification clauses. The Company’s maximum exposure under these arrangements is unknown as this would involve future claims that may be made against the Company that have not yet occurred. However, based on experience, the Company expects the risk of loss to be remote. The Company has not accrued any liability in connection with such indemnification.
Note 13 — New Accounting Pronouncements
In January 2021, the Financial Accounting Standards Board issued Accounting Standards Update No. 2021-01 (“ASU 2021-01”), “Reference Rate Reform (Topic 848).” ASU 2021-01 is an update of ASU 2020-04, which is in response to concerns about structural risks of interbank offered rates, and particularly the risk of cessation of LIBOR; regulators have undertaken reference rate reform initiatives to identify alternative reference rates that are more observable or transaction based and less susceptible to manipulation. ASU 2020-04 provides optional guidance for a limited period of time to ease the potential burden in accounting for (or recognizing the effects of) reference rate reform on financial reporting. ASU 2020-04 is elective and applies to all entities, subject to meeting certain criteria, that have contracts, hedging relationships, and other transactions that reference LIBOR or another reference rate expected to be discontinued because of reference rate reform. The ASU 2021-01 update clarifies that certain optional expedients and exceptions in Topic 848 for contract modifications and hedge accounting apply to derivatives that are affected by the discounting transition. In December 2022, the FASB issued ASU No. 2022-06, Reference Rate Reform (Topic 848): Deferral of the Sunset Date of Topic 848, which deferred the sunset day of this guidance to December 31, 2024. Management is currently evaluating the implications, if any, of the additional requirements and its impact on the Funds’ financial statements.
44
TCW Funds, Inc.
October 31, 2023
Note 13 — New Accounting Pronouncements (Continued)
In June 2022, the FASB issued ASU No. 2022-03, “Fair Value Measurement of Equity Securities Subject to Contractual Sale Restrictions” (“ASU 2022-03”). ASU 2022-03 (1) clarifies the guidance in ASC 820 on the fair value measurement of an equity security that is subject to a contractual sale restriction and (2) requires specific disclosures related to such an equity security. ASU 2022-03 is effective for fiscal years beginning after December 15, 2023 and interim periods within that fiscal year, with early adoption permitted. We are currently evaluating the impact of the adoption of ASU 2022-03 on our consolidated financial statements.
45
TCW Emerging Markets Income Fund
Financial Highlights — I Class
| | | | | | | | | | | | | | | | | | | | |
| |
| | | Year Ended October 31, | |
| | | 2023 | | | 2022 | | | 2021 | | | 2020 | | | 2019 | |
Net Asset Value per Share, Beginning of year | | $ | 5.67 | | | $ | 7.87 | | | $ | 7.93 | | | $ | 8.33 | | | $ | 7.77 | |
| | | | | | | | | | | | | | | | | | | | |
Income (Loss) from Investment Operations: | |
Net Investment Income (1) | | | 0.41 | | | | 0.33 | | | | 0.35 | | | | 0.39 | | | | 0.46 | |
Net Realized and Unrealized Gain (Loss) on Investments | | | 0.09 | | | | (2.22 | ) | | | (0.02 | ) | | | (0.46 | ) | | | 0.54 | |
| | | | | | | | | | | | | | | | | | | | |
Total from Investment Operations | | | 0.50 | | | | (1.89 | ) | | | 0.33 | | | | (0.07 | ) | | | 1.00 | |
| | | | | | | | | | | | | | | | | | | | |
Less Distributions: | |
Distributions from Net Investment Income | | | (0.33 | ) | | | (0.28 | ) | | | (0.37 | ) | | | (0.33 | ) | | | (0.44 | ) |
Distributions from Return of Capital | | | — | | | | (0.03 | ) | | | (0.02 | ) | | | — | | | | — | |
| | | | | | | | | | | | | | | | | | | | |
Total Distributions | | | (0.33 | ) | | | (0.31 | ) | | | (0.39 | ) | | | (0.33 | ) | | | (0.44 | ) |
| | | | | | | | | | | | | | | | | | | | |
Net Asset Value per Share, End of year | | $ | 5.84 | | | $ | 5.67 | | | $ | 7.87 | | | $ | 7.93 | | | $ | 8.33 | |
| | | | | | | | | | | | | | | | | | | | |
Total Return | | | 8.72 | % | | | (24.47 | %) | | | 4.04 | % | | | (0.69 | %) | | | 13.13 | % |
|
Ratios/Supplemental Data: | |
| | | | | |
Net Assets, End of year (in thousands) | | $ | 2,097,432 | | | $ | 2,500,689 | | | $ | 4,720,489 | | | $ | 5,877,348 | | | $ | 5,668,552 | |
|
Ratio of Expenses to Average Net Assets: | |
| | | | | |
Before Expense Reimbursement | | | 0.85 | % | | | 0.90 | % | | | 0.85 | % | | | 0.85 | % | | | 0.84 | % |
| | | | | |
After Expense Reimbursement | | | 0.82 | % | | | 0.85 | % | | | N/A | | | | N/A | | | | N/A | |
| | | | | |
Ratio of Net Investment Income to Average Net Assets | | | 6.80 | % | | | 4.79 | % | | | 4.23 | % | | | 4.95 | % | | | 5.62 | % |
| | | | | |
Portfolio Turnover Rate | | | 152.31 | % | | | 119.10 | % | | | 150.31 | % | | | 135.46 | % | | | 136.47 | % |
| (1) | Computed using average shares outstanding throughout the period. |
See accompanying Notes to Financial Statements.
46
TCW Emerging Markets Income Fund
Financial Highlights — N Class
| | | | | | | | | | | | | | | | | | | | |
| |
| | | Year Ended October 31, | |
| | | 2023 | | | 2022 | | | 2021 | | | 2020 | | | 2019 | |
Net Asset Value per Share, Beginning of year | | $ | 7.32 | | | $ | 10.16 | | | $ | 10.23 | | | $ | 10.72 | | | $ | 10.00 | |
| | | | | | | | | | | | | | | | | | | | |
Income (Loss) from Investment Operations: | |
Net Investment Income (1) | | | 0.53 | | | | 0.41 | | | | 0.44 | | | | 0.49 | | | | 0.57 | |
Net Realized and Unrealized Gain (Loss) on Investments | | | 0.10 | | | | (2.86 | ) | | | (0.03 | ) | | | (0.57 | ) | | | 0.69 | |
| | | | | | | | | | | | | | | | | | | | |
Total from Investment Operations | | | 0.63 | | | | (2.45 | ) | | | 0.41 | | | | (0.08 | ) | | | 1.26 | |
| | | | | | | | | | | | | | | | | | | | |
Less Distributions: | |
Distributions from Net Investment Income | | | (0.42 | ) | | | (0.36 | ) | | | (0.46 | ) | | | (0.41 | ) | | | (0.54 | ) |
Distributions from Return of Capital | | | — | | | | (0.03 | ) | | | (0.02 | ) | | | — | | | | — | |
| | | | | | | | | | | | | | | | | | | | |
Total Distributions | | | (0.42 | ) | | | (0.39 | ) | | | (0.48 | ) | | | (0.41 | ) | | | (0.54 | ) |
| | | | | | | | | | | | | | | | | | | | |
Net Asset Value per Share, End of year | | $ | 7.53 | | | $ | 7.32 | | | $ | 10.16 | | | $ | 10.23 | | | $ | 10.72 | |
| | | | | | | | | | | | | | | | | | | | |
Total Return | | | 8.48 | % | | | (24.57 | %) | | | 3.97 | % | | | (0.69 | %) | | | 12.85 | % |
|
Ratios/Supplemental Data: | |
| | | | | |
Net Assets, End of year (in thousands) | | $ | 443,173 | | | $ | 390,155 | | | $ | 546,887 | | | $ | 261,520 | | | $ | 320,492 | |
|
Ratio of Expenses to Average Net Assets: | |
| | | | | |
Before Expense Reimbursement | | | 1.15 | % | | | 1.17 | % | | | 1.13 | % | | | 1.14 | % | | | 1.14 | % |
| | | | | |
After Expense Reimbursement | | | 0.95 | % | | | 0.95 | % | | | 0.95 | % | | | 0.98 | % | | | 1.05 | % |
| | | | | |
Ratio of Net Investment Income to Average Net Assets | | | 6.70 | % | | | 4.72 | % | | | 4.20 | % | | | 4.82 | % | | | 5.41 | % |
| | | | | |
Portfolio Turnover Rate | | | 152.31 | % | | | 119.10 | % | | | 150.31 | % | | | 135.46 | % | | | 136.47 | % |
| (1) | Computed using average shares outstanding throughout the period. |
See accompanying Notes to Financial Statements.
47
TCW Emerging Markets Income Fund
Financial Highlights — Plan Class
| | | | | | | | | | | | | | | | |
| | | Year Ended October 31, | | | March 2, 2020
(Commencement
of Operations)
through
October 31, 2020 | |
| | | 2023 | | | 2022 | | | 2021 | |
Net Asset Value per Share, Beginning of year | | $ | 5.67 | | | $ | 7.86 | | | $ | 7.93 | | | $ | 8.34 | |
| | | | | | | | | | | | | | | | |
Income (Loss) from Investment Operations: | |
Net Investment Income (1) | | | 0.42 | | | | 0.33 | | | | 0.36 | | | | 0.26 | |
Net Realized and Unrealized Gain (Loss) on Investments | | | 0.07 | | | | (2.20 | ) | | | (0.04 | ) | | | (0.48 | ) |
| | | | | | | | | | | | | | | | |
Total from Investment Operations | | | 0.49 | | | | (1.87 | ) | | | 0.32 | | | | (0.22 | ) |
| | | | | | | | | | | | | | | | |
Less Distributions: | |
Distributions from Net Investment Income | | | (0.33 | ) | | | (0.29 | ) | | | (0.37 | ) | | | (0.19 | ) |
Return of capital | | | — | | | | (0.03 | ) | | | (0.02 | ) | | | — | |
| | | | | | | | | | | | | | | | |
Total distributions | | | (0.33 | ) | | | (0.32 | ) | | | (0.39 | ) | | | (0.19 | ) |
| | | | | | | | | | | | | | | | |
Net Asset Value per Share, End of year | | $ | 5.83 | | | $ | 5.67 | | | $ | 7.86 | | | $ | 7.93 | |
| | | | | | | | | | | | | | | | |
Total Return | | | 8.63 | % | | | (24.41 | %) | | | 4.12 | % | | | (2.59 | %) (2) |
|
Ratios/Supplemental Data: | |
| | | | |
Net assets, end of year (in thousands) | | $ | 998,832 | | | $ | 1,035,971 | | | $ | 1,996,103 | | | $ | 489,106 | |
|
Ratio of Expenses to Average Net Assets: | |
| | | | |
Before Expense Reimbursement | | | 0.82 | % | | | 0.81 | % | | | 0.80 | % | | | 0.79 | % (3) |
| | | | |
After Expense Reimbursement | | | 0.77 | % | | | 0.77 | % | | | 0.77 | % | | | 0.77 | % (3) |
| | | | |
Ratio of Net Investment Income to Average Net Assets | | | 6.87 | % | | | 4.86 | % | | | 4.43 | % | | | 4.96 | % (3) |
| | | | |
Portfolio Turnover Rate | | | 152.31 | % | | | 119.10 | % | | | 150.31 | % | | | 135.46 | % (2) |
| (1) | Computed using average shares outstanding throughout the period. |
| (2) | For the period March 2, 2020 (Commencement of Operations) through October 31, 2020. |
See accompanying Notes to Financial Statements.
48
TCW Emerging Markets Local Currency Income Fund
Financial Highlights — I Class
| | | | | | | | | | | | | | | | | | | | |
| |
| | | Year Ended October 31, | |
| | | 2023 | | | 2022 | | | 2021 | | | 2020 | | | 2019 | |
Net Asset Value per Share, Beginning of year | | $ | 6.50 | | | $ | 8.47 | | | $ | 8.57 | | | $ | 9.17 | | | $ | 8.14 | |
| | | | | | | | | | | | | | | | | | | | |
Income (Loss) from Investment Operations: | |
Net Investment Income (1) | | | 0.43 | | | | 0.35 | | | | 0.37 | | | | 0.42 | | | | 0.58 | |
Net Realized and Unrealized Gain (Loss) on Investments | | | 0.35 | | | | (2.06 | ) | | | (0.25 | ) | | | (0.89 | ) | | | 0.57 | |
| | | | | | | | | | | | | | | | | | | | |
Total from Investment Operations | | | 0.78 | | | | (1.71 | ) | | | 0.12 | | | | (0.47 | ) | | | 1.15 | |
| | | | | | | | | | | | | | | | | | | | |
Less Distributions: | |
Distributions from Net Investment Income | | | (0.25 | ) | | | (0.10 | ) | | | (0.22 | ) | | | (0.09 | ) | | | (0.12 | ) |
Distributions from Return of Capital | | | — | | | | (0.16 | ) | | | — | | | | (0.04 | ) | | | — | |
| | | | | | | | | | | | | | | | | | | | |
Total Distributions | | | (0.25 | ) | | | (0.26 | ) | | | (0.22 | ) | | | (0.13 | ) | | | (0.12 | ) |
| | | | | | | | | | | | | | | | | | | | |
Net Asset Value per Share, End of year | | $ | 7.03 | | | $ | 6.50 | | | $ | 8.47 | | | $ | 8.57 | | | $ | 9.17 | |
| | | | | | | | | | | | | | | | | | | | |
Total Return | | | 11.92 | % | | | (20.57 | %) | | | 1.34 | % | | | (5.26 | %) | | | 14.26 | % |
|
Ratios/Supplemental Data: | |
| | | | | |
Net Assets, End of year (in thousands) | | $ | 106,740 | | | $ | 101,530 | | | $ | 200,019 | | | $ | 192,679 | | | $ | 220,968 | |
|
Ratio of Expenses to Average Net Assets: | |
| | | | | |
Before Expense Reimbursement | | | 0.97 | % | | | 1.02 | % | | | 0.96 | % | | | 0.97 | % | | | 1.03 | % |
| | | | | |
After Expense Reimbursement | | | 0.85 | % | | | 0.85 | % | | | 0.85 | % | | | 0.85 | % | | | 0.88 | % |
| | | | | |
Ratio of Net Investment Income to Average Net Assets | | | 5.90 | % | | | 4.65 | % | | | 4.14 | % | | | 4.90 | % | | | 6.66 | % |
| | | | | |
Portfolio Turnover Rate | | | 123.91 | % | | | 122.49 | % | | | 117.18 | % | | | 135.99 | % | | | 127.74 | % |
| (1) | Computed using average shares outstanding throughout the period. |
See accompanying Notes to Financial Statements.
49
TCW Emerging Markets Local Currency Income Fund
Financial Highlights — N Class
| | | | | | | | | | | | | | | | | | | | |
| |
| | | Year Ended October 31, | |
| | | 2023 | | | 2022 | | | 2021 | | | 2020 | | | 2019 | |
Net Asset Value per Share, Beginning of year | | $ | 6.48 | | | $ | 8.44 | | | $ | 8.55 | | | $ | 9.15 | | | $ | 8.13 | |
| | | | | | | | | | | | | | | | | | | | |
Income (Loss) from Investment Operations: | |
Net Investment Income (1) | | | 0.42 | | | | 0.34 | | | | 0.36 | | | | 0.42 | | | | 0.57 | |
Net Realized and Unrealized Gain (Loss) on Investments | | | 0.35 | | | | (2.04 | ) | | | (0.25 | ) | | | (0.89 | ) | | | 0.57 | |
| | | | | | | | | | | | | | | | | | | | |
Total from Investment Operations | | | 0.77 | | | | (1.70 | ) | | | 0.11 | | | | (0.47 | ) | | | 1.14 | |
| | | | | | | | | | | | | | | | | | | | |
Less Distributions: | |
Distributions from Net Investment Income | | | (0.24 | ) | | | (0.10 | ) | | | (0.22 | ) | | | (0.09 | ) | | | (0.12 | ) |
Distributions from Return of Capital | | | — | | | | (0.16 | ) | | | — | | | | (0.04 | ) | | | — | |
| | | | | | | | | | | | | | | | | | | | |
Total Distributions | | | (0.24 | ) | | | (0.26 | ) | | | (0.22 | ) | | | (0.13 | ) | | | (0.12 | ) |
| | | | | | | | | | | | | | | | | | | | |
Net Asset Value per Share, End of year | | $ | 7.01 | | | $ | 6.48 | | | $ | 8.44 | | | $ | 8.55 | | | $ | 9.15 | |
| | | | | | | | | | | | | | | | | | | | |
Total Return | | | 11.89 | % | | | (20.66 | %) | | | 1.30 | % | | | (5.28 | %) | | | 14.14 | % |
|
Ratios/Supplemental Data: | |
| | | | | |
Net Assets, End of year (in thousands) | | $ | 13,949 | | | $ | 39,709 | | | $ | 39,546 | | | $ | 25,329 | | | $ | 28,011 | |
|
Ratio of Expenses to Average Net Assets: | |
| | | | | |
Before Expense Reimbursement | | | 1.31 | % | | | 1.38 | % | | | 1.32 | % | | | 1.35 | % | | | 1.40 | % |
| | | | | |
After Expense Reimbursement | | | 0.90 | % | | | 0.90 | % | | | 0.90 | % | | | 0.90 | % | | | 0.92 | % |
| | | | | |
Ratio of Net Investment Income to Average Net Assets | | | 5.83 | % | | | 4.64 | % | | | 4.05 | % | | | 4.84 | % | | | 6.63 | % |
| | | | | |
Portfolio Turnover Rate | | | 123.91 | % | | | 122.49 | % | | | 117.18 | % | | | 135.99 | % | | | 127.74 | % |
| (1) | Computed using average shares outstanding throughout the period. |
See accompanying Notes to Financial Statements.
50
TCW Funds, Inc.
Report of Independent Registered Public Accounting Firm
To the Board of Directors and Shareholders of
TCW Funds, Inc.
Opinion on the Financial Statements and Financial Highlights
We have audited the accompanying statements of assets and liabilities of TCW Emerging Markets Income Fund and TCW Emerging Markets Local Currency Income Fund (collectively, the “TCW International Funds”) (two of sixteen funds comprising TCW Funds, Inc.), including the schedules of investments, as of October 31, 2023, and the related statements of operations for the year then ended, the statements of changes in net assets for each of the two years in the period then ended, the financial highlights for each of the five years in the period then ended for the TCW International Funds, and the related notes. In our opinion, the financial statements and financial highlights present fairly, in all material respects, the financial position of each of the respective TCW International Funds as of October 31, 2023, the results of their operations for the year then ended, the changes in its net assets for each of the two years in the period then ended, and the financial highlights for each of the five years in the period then ended for the TCW International Funds, in conformity with accounting principles generally accepted in the United States of America.
Basis for Opinion
These financial statements and financial highlights are the responsibility of the TCW International Funds’ management. Our responsibility is to express an opinion on the TCW International Funds’ financial statements and financial highlights based on our audits. We are a public accounting firm registered with the Public Company Accounting Oversight Board (United States) (PCAOB) and are required to be independent with respect to the TCW International Funds in accordance with the U.S. federal securities laws and the applicable rules and regulations of the Securities and Exchange Commission and the PCAOB.
We conducted our audits in accordance with the standards of the PCAOB. Those standards require that we plan and perform the audits to obtain reasonable assurance about whether the financial statements and financial highlights are free of material misstatement, whether due to error or fraud. The TCW International Funds are not required to have, nor were we engaged to perform, an audit of their internal control over financial reporting. As part of our audits we are required to obtain an understanding of internal control over financial reporting but not for the purpose of expressing an opinion on the effectiveness of the TCW International Funds’ internal control over financial reporting. Accordingly, we express no such opinion.
Our audits included performing procedures to assess the risks of material misstatement of the financial statements and financial highlights, whether due to error or fraud, and performing procedures that respond to those risks. Such procedures included examining, on a test basis, evidence regarding the amounts and disclosures in the financial statements and financial highlights. Our audits also included evaluating the accounting principles used and significant estimates made by management, as well as evaluating the overall presentation of the financial statements and financial highlights. Our procedures included confirmation of securities owned as of October 31, 2023, by correspondence with the custodian and brokers; when replies were not received from brokers, we performed other auditing procedures. We believe that our audits provide a reasonable basis for our opinion.

Los Angeles, California
December 20, 2023
We have served as the auditor of one or more TCW/Metropolitan West Funds investment companies since 1990.
51
TCW Funds, Inc.
Shareholder Expenses (Unaudited)
As a shareholder of a Fund, you incur ongoing operational costs of the Fund, including management fees and other fund expenses. The following example is intended to help you understand your ongoing costs (in dollars and cents) of investing in a Fund and to compare these costs with the ongoing costs of investing in other funds.
The example is based on an investment of $1,000 invested at the beginning of the period and held for the entire period from May 1, 2023 to October 31, 2023 (184 days).
Actual Expenses: The first line under each Fund in the table below provides information about the actual account values and actual expenses. You may use the information in this line, together with the amount you invested, to estimate the expenses that you paid over the period. Simply divide your account value by $1,000 (for example, an $8,600 account value divided by $1,000 = 8.6), then multiply the result by the number in the first line for your Fund under the heading entitled “Expenses Paid During Period” to estimate the expenses you paid on your account during this period.
Hypothetical Example for Comparison Purposes: The second line under each Fund in the table below provides information about the hypothetical expenses based on each Fund’s actual expense ratio and an assumed rate of return of 5% per year before expenses, which is not the Fund’s actual return. The hypothetical account value and expenses may not be used to estimate the actual ending account balance or expenses you paid for the period. You may use this information to compare the ongoing costs of investing in your Fund and other funds. To do so, compare this 5% hypothetical example with the 5% hypothetical examples that appear in the shareholder reports of the other funds.
| | | | | | | | | | | | | | | | |
TCW Funds, Inc. | | Beginning
Account Value
May 1, 2023 | | | Ending
Account Value
October 31, 2023 | | | Annualized
Expense Ratio | | | Expenses Paid
During Period
(May 1, 2023 to
October 31, 2023) | |
| TCW Emerging Markets Income Fund | | | | | | | | | | | | | | | | |
I Class Shares | | | | | | | | | | | | | | | | |
Actual | | $ | 1,000.00 | | | $ | 982.40 | | | | 0.80 | % | | $ | 4.00 | |
Hypothetical (5% return before expenses) | | | 1,000.00 | | | | 1,021.17 | | | | 0.80 | % | | | 4.08 | |
| | | | |
N Class Shares | | | | | | | | | | | | | | | | |
Actual | | $ | 1,000.00 | | | $ | 980.50 | | | | 0.95 | % | | $ | 4.74 | |
Hypothetical (5% return before expenses) | | | 1,000.00 | | | | 1,020.42 | | | | 0.95 | % | | | 4.84 | |
| | | | |
Plan Class Shares | | | | | | | | | | | | | | | | |
Actual | | $ | 1,000.00 | | | $ | 981.20 | | | | 0.77 | % | | $ | 3.85 | |
Hypothetical (5% return before expenses) | | | 1,000.00 | | | | 1,021.30 | | | | 0.77 | % | | | 3.92 | |
| | | | |
| TCW Emerging Markets Local Currency Income Fund | | | | | | | | | | | | | | | | |
I Class Shares | | $ | 1,000.00 | | | $ | 969.60 | | | | 0.85 | % | | $ | 4.22 | |
Actual | | | 1,000.00 | | | | 1,020.92 | | | | 0.85 | % | | | 4.33 | |
Hypothetical (5% return before expenses) | | | | | | | | | | | | | | | | |
| | | | |
N Class Shares | | $ | 1,000.00 | | | $ | 969.20 | | | | 0.90 | % | | $ | 4.47 | |
Actual | | | 1,000.00 | | | | 1,020.67 | | | | 0.90 | % | | | 4.58 | |
Hypothetical (5% return before expenses) | | | | | | | | | | | | | | | | |
52

Privacy Policy
The TCW Group, Inc. and Subsidiaries
TCW Investment Management Company LLC
TCW Asset Management Company LLC
Metropolitan West Asset Management, LLC
| | |
TCW Funds, Inc. TCW Strategic Income Fund, Inc. Metropolitan West Funds Sepulveda Management LLC | | TCW Direct Lending LLC TCW Direct Lending VII LLC TCW Direct Lending VIII LLC TCW Star Direct Lending LLC |
Effective February 2023
WHAT YOU SHOULD KNOW
At TCW, we recognize the importance of keeping information about you secure and confidential. We do not sell or share your nonpublic personal and financial information with marketers or others outside our affiliated group of companies.
We carefully manage information among our affiliated group of companies to safeguard your privacy and to provide you with consistently excellent service.
We are providing this notice to you to comply with the requirements of Regulation S-P, “Privacy of Consumer Financial information,” issued by the United States Securities and Exchange Commission.
OUR PRIVACY POLICY
We, The TCW Group, Inc. and its subsidiaries, the TCW Funds, Inc., TCW Strategic Income Fund, Inc., the Metropolitan West Funds, Sepulveda Management LLC, TCW Direct Lending LLC, TCW Direct Lending VII LLC, TCW Direct Lending VIII LLC, and TCW Star Direct Lending LLC (collectively, “TCW”) are committed to protecting the nonpublic personal and financial information of our customers and consumers who obtain or seek to obtain financial products or services primarily for personal, family or household purposes. We fulfill our commitment by establishing and implementing policies and systems to protect the security and confidentiality of this information.
In our offices, we limit access to nonpublic personal and financial information about you to those TCW personnel who need to know the information in order to provide products or services to you. We maintain physical, electronic, and procedural safeguards to protect your nonpublic personal and financial information.
CATEGORIES OF INFORMATION WE COLLECT
We may collect the following types of nonpublic personal and financial information about you from the following sources:
| | ◾ | Your name, address and identifying numbers, and other personal and financial information, from you and from identification cards and papers you submit to us, on applications, subscription agreements or other forms or communications. |
| | ◾ | Information about your account balances and financial transactions with us, our affiliated entities, or nonaffiliated third parties, from our internal sources, from affiliated entities and from nonaffiliated third parties. |
| | ◾ | Information about your account balances and financial transactions and other personal and financial information, from consumer credit reporting agencies or other nonaffiliated third parties, to verify information received from you or others. |
53
CATEGORIES OF INFORMATION WE DISCLOSE TO NONAFFILIATED THIRD PARTIES
We may disclose your name, address and account and other identifying numbers, as well as information about your pending or past transactions and other personal financial information, to nonaffiliated third parties, for our everyday business purposes such as necessary to execute, process, service and confirm your securities transactions and mutual fund transactions, to administer and service your account and commingled investment vehicles in which you are invested, to market our products and services through joint marketing arrangements or to respond to court orders and legal investigations.
We may disclose nonpublic personal and financial information concerning you to law enforcement agencies, federal regulatory agencies, self-regulatory organizations or other nonaffiliated third parties, if required or requested to do so by a court order, judicial subpoena or regulatory inquiry.
We do not otherwise disclose your nonpublic personal and financial information to nonaffiliated third parties, except where we believe in good faith that disclosure is required or permitted by law. Because we do not disclose your nonpublic personal and financial information to nonaffiliated third parties, our Customer Privacy Policy does not contain opt-out provisions.
CATEGORIES OF INFORMATION WE DISCLOSE TO OUR AFFILIATED ENTITIES
| | ◾ | We may disclose your name, address and account and other identifying numbers, account balances, information about your pending or past transactions and other personal financial information to our affiliated entities for any purpose. |
| | ◾ | We regularly disclose your name, address and account and other identifying numbers, account balances and information about your pending or past transactions to our affiliates to execute, process and confirm securities transactions or mutual fund transactions for you, to administer and service your account and commingled investment vehicles in which you are invested, or to market our products and services to you. |
INFORMATION ABOUT FORMER CUSTOMERS
We do not disclose nonpublic personal and financial information about former customers to nonaffiliated third parties unless required or requested to do so by a court order, judicial subpoena or regulatory inquiry, or otherwise where we believe in good faith that disclosure is required or permitted by law.
QUESTIONS
Should you have any questions about our Customer Privacy Policy, please contact us by email or by regular mail at the address at the end of this policy.
REMINDER ABOUT TCW’S FINANCIAL PRODUCTS
Financial products offered by The TCW Group, Inc. and its subsidiaries, the TCW Funds, Inc., TCW Strategic Income Fund, Inc., the Metropolitan West Funds, Sepulveda Management LLC, TCW Direct Lending LLC, TCW Direct Lending VII LLC, TCW Direct Lending VIII LLC, and TCW Star Direct Lending LLC.
| | ◾ | Are not guaranteed by a bank; |
| | ◾ | Are not obligations of The TCW Group, Inc. or of its subsidiaries; |
| | ◾ | Are not insured by the Federal Deposit Insurance Corporation; and |
| | ◾ | Are subject to investment risks, including possible loss of the principal amount committed or invested, and earnings thereon. |
| | |
THE TCW GROUP, INC. TCW FUNDS, INC. TCW STRATEGIC INCOME FUND, INC. METROPOLITAN WEST FUNDS SEPULVEDA MANAGEMENT LLC | | TCW DIRECT LENDING LLC TCW DIRECT LENDING VII LLC TCW DIRECT LENDING VIII LLC TCW STAR DIRECT LENDING LLC |
Attention: Privacy Officer | 515 South Flower Street | Los Angeles, CA 90071 | email: privacy@tcw.com
54
TCW Funds, Inc.
Investment Management and Advisory Agreement Disclosure (Unaudited)
Renewal of Investment Advisory and Management Agreement
TCW Funds, Inc. (the “Corporation”) and TCW Investment Management Company LLC (the “Advisor”) are parties to an Investment Advisory and Management Agreement (“Agreement”), pursuant to which the Advisor is responsible for managing the investments of each separate investment series (each, a “Fund” and collectively, the “Funds”) of the Corporation. Unless terminated by either party, the Agreement continues in effect from year to year provided that the continuance is specifically approved at least annually by the vote of the holders of at least a majority of the outstanding shares of the Funds, or by the Board of Directors of the Corporation (the “Board”), and, in either event, by a majority of the Directors who are not “interested persons” of the Corporation, as such term is defined in Section 2(a)(19) of the Investment Company Act of 1940, as amended (the “Independent Directors”), casting votes in person at a meeting called for that purpose.
At an in-person meeting on September 11, 2023, the Board approved the renewal of the Agreement for an additional one-year term from February 6, 2024 through February 5, 2025. The renewal of the Agreement was approved by the Board (including by a majority of the Independent Directors) upon the recommendation of the Independent Directors. The Independent Directors also met by videoconference in a working session on August 30, 2023 to hear presentations by representatives of the Advisor, to ask related questions, to review and discuss materials provided by the Advisor for their consideration, and to meet separately with their independent legal counsel. On September 11, 2023 they also met separately with their independent legal counsel to review and discuss supplemental information that had been requested on their behalf by their independent legal counsel and presented by the Advisor. The information, material facts, and conclusions that formed the basis for the Independent Directors’ recommendation and the Board’s subsequent approval are described below.
1. Information received
Materials reviewed — During the course of each year, the Directors receive a wide variety of materials relating to the services provided by the Advisor, including reports on the Advisor’s investment processes, as well as on each Fund’s investment results, portfolio composition, portfolio trading practices, compliance monitoring, shareholder services, and other information relating to the nature, extent, and quality of services provided by the Advisor to the Funds. In addition, the Board reviewed information furnished to the Independent Directors in response to a detailed request sent to the Advisor on their behalf. The information in the Advisor’s responses included extensive materials regarding each Fund’s investment results, advisory fee comparisons to advisory fees charged by the Advisor to its institutional clients, financial and profitability information regarding the Advisor, descriptions of various services provided to the Funds and to other advisory and sub-advisory clients, descriptions of functions such as compliance monitoring and portfolio trading practices, and information about the personnel providing investment management services to each Fund. The Directors also considered information provided by an independent data provider, Broadridge, comparing the investment performance and the fee and expense levels of each Fund to those of appropriate peer groups of mutual funds selected by Broadridge. After reviewing this information, the Directors requested additional financial, profitability and service information from the Advisor, which the Advisor provided and the Directors considered.
55
TCW Funds, Inc.
Investment Management and Advisory Agreement Disclosure (Unaudited) (Continued)
Review process — The Directors’ determinations were made on the basis of each Director’s business judgment after consideration of all the information presented. The Independent Directors were advised by their independent legal counsel throughout the renewal process and received and reviewed advice from their independent legal counsel regarding legal and industry standards applicable to the renewal of the Agreement, including a legal memorandum from their independent legal counsel discussing their fiduciary duties related to their approval of the continuation of the Agreement. The Independent Directors also discussed the renewal of the Agreement with the Advisor’s representatives and in private sessions at which no representatives of the Advisor were present. In deciding to recommend the renewal of the Agreement with respect to each Fund, the Independent Directors did not identify any single piece of information or particular factor that, in isolation, was the controlling factor. Each Independent Director may also have weighed factors differently. This summary describes the most important, but not all, of the factors considered by the Board and the Independent Directors.
2. Nature, extent, and quality of services provided by the Advisor
The Board and the Independent Directors considered the depth and quality of the Advisor’s investment management process, including its research and strong analytical capabilities; the experience, capability, and integrity of its senior management and other personnel; the advance planning and transition arrangements put in place with respect to the changes in key portfolio management and other personnel; the overall resources available to the Advisor; and the ability of its organizational structure to address the fluctuations in assets that have been experienced over the past several years. The Board and the Independent Directors considered the Advisor’s continued commitment and ability to attract and retain well-qualified investment professionals, noting in particular the Advisor’s hiring of professionals in various areas over the past several years, including recruiting and hiring a highly qualified President and Chief Executive Officer to replace the outgoing head of The TCW Group, Inc., the parent company of the Advisor (“TCW”), continued upgrading of resources in its middle office and back office operations and other areas, as well as a continuing and extensive program of infrastructure and systems enhancements, including business continuity and cyber security, as well as budgeting for certain future initiatives. The Board and the Independent Directors also considered that the Advisor made available to its investment professionals a variety of resources and systems relating to investment management, compliance, trading, operations, administration, research, portfolio accounting, and legal matters. They noted the substantial additional resources made available by TCW. The Board and the Independent Directors examined and discussed a detailed description of the extensive additional services provided to the Funds to support their operations and compliance, as compared to the much narrower range of services provided to the Advisor’s institutional and sub-advised clients, as well as the Advisor’s oversight and coordination of numerous outside service providers to the Funds. They further noted the high level of regular communication between the Advisor and the Independent Directors. The Advisor explained its responsibility to supervise the activities of the Funds’ various service providers, as well as supporting the Independent Directors and their meetings, regulatory filings, and various operational personnel, and the related costs.
The Board and the Independent Directors concluded that the nature, extent, and quality of the services provided by the Advisor are of a high quality and have benefited and should continue to benefit the Funds and their shareholders.
56
TCW Funds, Inc.
3. Investment results
The Board and the Independent Directors considered the investment results of each Fund in light of its investment objective(s) and principal investment strategies. They compared each Fund’s total returns with the total returns of other mutual funds in peer group reports prepared by Broadridge with respect to various longer and more recent periods all ended May 31, 2023. The Board and the Independent Directors reviewed information as to peer group selections presented by Broadridge and discussed the methodology for those selections with Broadridge. In reviewing each Fund’s relative performance, the Board and the Independent Directors took into account each Fund’s investment strategies, distinct characteristics, asset size and diversification.
The Board and the Independent Directors noted that most Funds’ performance was satisfactory over the relevant periods. The Board and the Independent Directors noted that the investment performance of the majority of the Funds was generally close to or above the median performance of the applicable peer group during the three-year period emphasized by Broadridge in the supplemental materials. For those Funds that lagged peer group averages, they noted that the Advisor had discussed with the Board the reasons for the underperformance, including the investment climate and prevailing market conditions during relevant periods as well as the Advisor’s discipline in maintaining a consistent investment style. The Board considered in particular the Advisor’s explanations for the performance of the eight Funds that ranked in the fourth or fifth quintile of their peer groups for the prior three-year period. The Board indicated that it would continue to monitor portfolio investment performance on a regular basis and discuss with the Advisor from time to time any instances of long-term underperformance as appropriate. The Board and the Independent Directors noted that the performance of some Funds for periods when they lagged their peer group averages remained satisfactory when assessed on a risk-adjusted basis because performance quintiles do not necessarily reflect the degree of risk employed by peer funds to achieve their returns. The Board also considered the Advisor’s assessment of the Funds’ performance during the recent period of significant market volatility and rising interest rates.
With respect to the fixed income Funds, the Board and the Independent Directors recognized the Advisor’s deliberate strategy to manage risk in light of its critical view of the fixed income securities markets and overall investment market conditions at present and in the near term. For that reason, the Board and the Independent Directors believed that relative performance also should be considered in light of future market conditions expected by the Advisor and positioning of the Funds’ portfolios in light of those expectations. The Board and the Independent Directors noted the Advisor’s view that longer term performance can be more meaningful for active fixed income funds than shorter term performance because fixed income market cycles are generally longer than three years.
For the U.S. fixed income Funds, the Board and the Independent Directors noted the conservative profile of these Funds, certain of which generally experienced less volatility compared to various other funds in the applicable peer group (except for the relative volatility of Total Return Bond Fund and Core Fixed Income Fund, which have greater exposure to mortgage-backed securities). They also noted the Advisor’s conservative posture for these Funds with respect to credit and interest rate risks.
For the Total Return Bond Fund, the Board and the Independent Directors noted that the Fund’s performance was in the second quintile for the ten-and five-year periods, fifth quintile for the three-year
57
TCW Funds, Inc.
Investment Management and Advisory Agreement Disclosure (Unaudited) (Continued)
period and fourth quintile for the one-year period. The Board and the Independent Directors considered the Advisor’s explanation that underperformance was driven by the Fund’s higher duration and greater exposure to mortgage-backed securities than its peers, which the Advisor believes may position the Fund for outperformance going forward.
For the Core Fixed Income Fund, the Board and the Independent Directors noted that the Fund’s performance was in the third quintile for the ten-year period, second quintile for the five-year period and fourth quintile for the three- and one-year periods. The Board and the Independent Directors considered the Advisor’s explanation that underperformance was driven by the Fund’s higher duration and greater exposure to mortgage-backed securities than its peers, which the Advisor believes may position the Fund for outperformance going forward. The Board and the Independent Directors also considered that despite its underperformance relative to its peers for the three-year period, the Fund outperformed its benchmark index for that period.
For the High Yield Bond Fund, the Board and the Independent Directors noted that the Fund’s performance was in the first quintile for the ten- and five-year periods, fourth quintile for the three-year period and second quintile for the one-year period. The Board and the Independent Directors considered the Advisor’s explanation that underperformance for the three-year period was driven by the Fund’s focus on higher-quality bonds than its peers, and further considered the Fund’s outperformance over the other periods reviewed.
For the Enhanced Commodity Strategy Fund, the Board and the Independent Directors noted that the Fund’s performance was in the third quintile for the ten-, three- and one-year periods and the second quintile for the five-year period.
For the Global Bond Fund, the Board and the Independent Directors noted that the Fund’s performance was in the fourth quintile for the ten-, three- and one-year periods and third quintile for the five-year period. The Board and the Independent Directors considered the Advisor’s explanation that underperformance for the three-year period was driven by the Fund’s higher duration as compared to many of its peers, and further considered that the Fund outperformed its benchmark index for the same period.
For the Short Term Bond Fund, the Board and the Independent Directors noted that the Fund’s performance was in the fourth quintile for the ten-year period, third quintile for the five-year period and second quintile for the three- and one-year periods.
With respect to the U.S. equity Funds, the Board and the Independent Directors noted that the performance of certain of the Funds for most of the various periods reviewed ranked in the first, second or third quintiles, while other Funds ranked in the fourth quintile over various periods.
The Select Equities Fund ranked in the third quintile for the ten-, five- and one-year periods and fourth quintile for the three-year period. The Board and the Independent Directors considered the Advisor’s explanation that underperformance for the three-year period was driven in part the Fund’s more modest positions in companies that were key contributors to the competitor funds’ returns. The Board and the Independent Directors also considered the Fund’s stronger performance over the other periods reviewed.
58
TCW Funds, Inc.
The Relative Value Dividend Appreciation Fund ranked in the third quintile for the ten- and five-year periods and the first quintile for the three- and one-year periods. The Relative Value Large Cap Fund ranked in the third quintile for the ten- and five-year periods and the first quintile for the three- and one-year periods. The Relative Value Mid Cap Fund ranked in the fourth quintile for the ten- and five-year periods, the second quintile for the three-year period and the first quintile for the one-year period.
The New America Premier Equities Fund ranked in the first quintile for the five-, three- and one-year periods.
The Global Real Estate Fund ranked in the first quintile for the five-, three- and one-year periods.
The Artificial Intelligence Equity Fund ranked in the fourth quintile for the five-year period, third quintile for the three-year period and second quintile for the one-year period.
For the asset allocation Fund, the Board and the Independent Directors noted that the Conservative Allocation Fund’s performance was in the first quintile for the ten-, five-, and three- and one-year periods.
With respect to the international and emerging markets Funds, the Board and the Independent Directors noted that the performance of a majority of these Funds ranked in the fourth or fifth quintiles over many of the various time periods reviewed. The Emerging Markets Income Fund ranked in the third quintile for the ten-year period, fourth quintile for the five- and three-year periods and fifth quintile for the one-year period. The Emerging Markets Local Currency Income Fund ranked in the fourth quintile for the ten-, five- and one-year periods and fifth quintile for the three-year period. The Emerging Markets Multi-Asset Opportunities Fund ranked in the fifth quintile for the five- and one-year periods and the fourth quintile for the three-year period. The Developing Markets Equity Fund ranked in the fifth quintile for the five-, three- and one-year periods. The Board and the Independent Directors considered the Advisor’s discussion of performance, including that the challenging international and emerging market conditions in recent years, including conditions in Russia and China, weighed on performance for the Funds in line with other funds in the universe. The Board and the Independent Directors further considered that the Advisor had recommended, and the Board had approved, the liquidation of the Emerging Markets Multi-Asset Opportunities Fund and the Developing Markets Equity Fund.
The Board and the Independent Directors concluded that the Advisor was implementing each Fund’s investment objective(s) and that the Advisor’s record in managing the Funds indicated that its continued management should benefit each Fund and its shareholders over the long term.
4. Advisory fees and total expenses
The Board and the Independent Directors compared the management fees (which Broadridge defines to include the advisory fee and the administrative fee) and total expenses of each Fund (each as a percentage of average net assets) with the median management fee and operating expense level of the other mutual funds in the relevant Broadridge peer groups. These comparisons assisted the Board and the Independent Directors by providing a reasonable statistical measure to assess each Fund’s fees relative to its relevant peers. The Board and the Independent Directors observed that each Fund’s management fee, after giving effect to applicable waivers and/or reimbursements, was below or near the median of the peer group funds
59
TCW Funds, Inc.
Investment Management and Advisory Agreement Disclosure (Unaudited) (Continued)
on a current basis. The Board and the Independent Directors also observed that each Fund’s total expenses, after giving effect to applicable waivers and/or reimbursements, were below or near the median of the peer group funds. The Board and the Independent Directors also noted the contractual expense limitations to which the Advisor has agreed with respect to each Fund and that the Advisor historically has absorbed any expenses in excess of these limits. The Board and the Independent Directors noted that for several Funds, their below-median management fee and total expenses were in part due to substantial waiver and/or reimbursement pursuant to the contractual expense limitations. The Board and the Independent Directors concluded that the competitive fees charged by the Advisor, and competitive expense ratios, should continue to benefit each Fund and its shareholders.
The Board and the Independent Directors also reviewed information regarding the advisory fees charged by the Advisor to its institutional and sub-advisory clients with similar investment mandates. The Board and the Independent Directors concluded that, although the fees paid by those clients generally were lower than advisory fees paid by the Funds, the differences appropriately reflected the more extensive services provided by the Advisor to the Funds and the Advisor’s significantly greater responsibilities and expenses with respect to the Funds, including the additional time spent by portfolio managers for reasons such as managing the more active cash flows from purchases and redemptions by shareholders, the additional risks of managing a pool of assets for public investors, administrative burdens, daily pricing, valuation and liquidity responsibilities, the supervision of vendors and service providers, and the costs of additional infrastructure and operational resources and personnel and of complying with and supporting the more comprehensive regulatory and governance regime applicable to mutual funds.
5. The Advisor’s costs, level of profits, and economies of scale
The Board and the Independent Directors reviewed information regarding the Advisor’s costs of providing services to the Funds, as well as the resulting level of profits to the Advisor. They reviewed the Advisor’s stated assumptions and methods of allocating certain costs, such as personnel costs, which constitute the Advisor’s largest operating cost. The Board and the Independent Directors recognized that the Advisor should be entitled to earn a reasonable level of profits for the services that it provides to each Fund. The Board and the Independent Directors also reviewed a comparison of the Advisor’s profitability with respect to the Funds to the profitability of certain unaffiliated publicly traded asset managers, which the Advisor believed supported its view that the Advisor’s profitability was reasonable. Based on their review, the Board and the Independent Directors concluded that they were satisfied that the Advisor’s level of profitability from its relationship with each Fund was not unreasonable or excessive.
The Board and the Independent Directors considered the extent to which potential economies of scale could be realized as the Funds grow and whether the advisory fees reflect those potential economies of scale. They recognized that the advisory fees for the Funds do not have breakpoints, which would otherwise result in lower advisory fee rates as the Funds grow larger. They also recognized the Advisor’s view that the advisory fees compare favorably to peer group fees and expenses and remain competitive even at higher asset levels and that the relatively low advisory fees reflect the potential economies of scale. The Board and the Independent Directors recognized the benefits of the Advisor’s substantial past and ongoing investment in the advisory business, such as successfully recruiting and retaining key professional talent, systems and technology upgrades, added resources dedicated to legal, compliance, risk management and cybersecurity programs, and improvements to the overall firm infrastructure, as well as the financial
60
TCW Funds, Inc.
pressures of competing against much larger firms and passive investment products. The Board and the Independent Directors further noted the Advisor’s past and current subsidies of the operating expenses of newer and smaller Funds and the Advisor’s commitment to maintain reasonable overall operating expenses for each Fund. The Board and the Independent Directors also recognized that the Funds benefit from receiving investment advice from an organization with other types of advisory clients in addition to mutual funds. The Board and the Independent Directors considered the risk borne by the Advisor that the Funds’ net assets and thus the Advisor’s fees might decline in the event of redemptions and that smaller Funds might not grow to become profitable. The Board and the Independent Directors concluded that the Advisor was satisfactorily sharing potential economies of scale with the Funds through low fees and expenses, and through reinvesting in its capabilities for serving the Funds and their shareholders.
6. Ancillary benefits
The Board and the Independent Directors also considered ancillary benefits received or to be received by the Advisor and its affiliates as a result of the relationship of the Advisor with the Funds. The Board and the Independent Directors noted that, in addition to the fees the Advisor receives under the Agreement, the Advisor receives additional benefits in connection with management of the Funds in the form of reports, research and other services from brokers and their affiliates in return for brokerage commissions paid to such brokers. The Board and the Independent Directors concluded that any potential benefits received or to be derived by the Advisor from its relationships with the Funds are reasonably related to the services provided by the Advisor to the Funds.
7. Conclusions
Based on their overall review, including their consideration of each of the factors referred to above (and others), the Board and the Independent Directors concluded that the Agreement is fair and reasonable to each Fund and its shareholders, that each Fund’s shareholders received reasonable value in return for the advisory fees and other amounts paid to the Advisor by each Fund, and that the renewal of the Agreement was in the best interests of each Fund and its shareholders.
61
TCW Funds, Inc.
Supplemental Information
Proxy Voting Guidelines
The policies and procedures that the Company uses to determine how to vote proxies are available without charge. The Board has delegated the Company’s proxy voting authority to the Advisor.
Disclosure of Proxy Voting Guidelines
The proxy voting guidelines of the Advisor are available:
| | 1. | By calling 800-FUND-TCW (800-386-3829) to obtain a hard copy; or |
| | 2. | By going to the SEC website at http://www.sec.gov. |
When the Company receives a request for a description of the Advisor’s proxy voting guidelines, it will deliver the description that is disclosed in the Company’s Statement of Additional Information. This information will be sent out via first class mail (or other means designed to ensure equally prompt delivery) within three business days of receiving the request.
The Advisor, on behalf of the Company, prepares and files Form N-PX with the SEC not later than August 31 of each year, which includes the Company’s proxy voting record for the most recent twelve-month period ended June 30 of that year. The Company’s proxy voting record for the most recent twelve-month period ended June 30 is available:
| | 1. | By calling 800-FUND-TCW (800-386-3829) to obtain a hard copy; or |
| | 2. | By going to the SEC website at http://www.sec.gov. |
When the Company receives a request for the Company’s proxy voting record, it will send the information disclosed in the Company’s most recently filed report on Form N-PX via first class mail (or other means designed to ensure equally prompt delivery) within three business days of receiving the request.
The Company also discloses its proxy voting record on its website as soon as is reasonably practicable after its report on Form N-PX is filed with the SEC.
Availability of Quarterly Portfolio Schedule
The Company files a complete schedule of its portfolio holdings with the SEC for the first and third quarters of its fiscal year on Form NPORT-P. Such filings occur no later than 60 days after the end of the Funds’ first and third quarters and are available on the SEC’s website at www.sec.gov.
62
TCW Funds, Inc.
Tax Information Notice (Unaudited)
The following Funds paid foreign taxes during the year ended October 31, 2023 that are available as income tax credits:
| | | | |
Fund | | Foreign Tax Credit | |
TCW Emerging Markets Income Fund | | $ | 89,055 | |
TCW Emerging Markets Local Currency Income Fund | | $ | 89,038 | |
This information is given to meet certain requirements of the Code and should not be used by shareholders for preparing their income tax returns. In February 2024, shareholders will receive Form 1099-DIV which will show the actual distribution received and include their share of qualified dividends during the calendar year of 2023 Shareholders are advised to check with their tax advisors for information on the treatment of these amounts on their individual tax returns.
63
TCW Funds, Inc.
Directors and Officers of the Company
A board of six directors is responsible for overseeing the operations of the Company, which consists of 16 Funds at October 31, 2023. The directors of the Company, and their business addresses and their principal occupation for the last five years are set forth below.
Independent Directors
| | | | | | |
Name, and Year of Birth (1) | | Term of Office and Length of Time Served | | Principal Occupation(s) During Past 5 Years | | Other Directorships held by Director |
| Samuel P. Bell (1936) | | Mr. Bell has served as a director of TCW Funds, Inc. since October 2002. | | Private Investor. | | TCW Strategic Income Fund, Inc. (closed-end fund). |
Patrick C. Haden (1953) Chairman of the Board | | Mr. Haden has served as a director of TCW Funds, Inc. since May 2001. | | President (since 2003), Wilson Ave. Consulting (business consulting firm); Senior Advisor to President (July 2016 – June 2017), University of Southern California. | | Auto Club (affiliate of AAA); Metropolitan West Funds (mutual fund); TCW Strategic Income Fund, Inc. (closed end fund). |
| Peter McMillan (1957) | | Mr. McMillan has served as a director of TCW Funds, Inc. since August 2010. | | Co-founder (since 2019), Pacific Oak Capital Advisors (investment advisory firm); Co-founder, Managing Partner and Chief Investment Officer (since May 2013), Temescal Canyon Partners (investment advisory firm); Co-founder and Executive Vice President (2005 – 2019), KBS Capital Advisors (a manager of real estate investment trusts). | | Pacific Oak Strategic Opportunity REIT (real estate investments); Keppel Pacific Oak U.S. REIT (real estate investments); Pacific Oak Residential Trust (real estate investments); Metropolitan West Funds (mutual fund); TCW DL VII Financing LLC (private fund); TCW Strategic Income Fund, Inc. (closed-end fund). |
| Victoria B. Rogers (1961) | | Ms. Rogers has served as a director of the TCW Funds, Inc. since October 2011. | | President and Chief Executive Officer (since 1996), The Rose Hills Foundation (charitable foundation). | | Norton Simon Museum (art museum); Stanford University (university); Causeway Capital Management Trust (mutual fund); Causeway ETML Trust (mutual fund); The Rose Hills Foundation (charitable foundation); TCW Strategic Income Fund, Inc. (closed-end fund). |
| Andrew Tarica (1959) | | Mr. Tarica has served as a director of the TCW Funds, Inc. since March 2012. | | Director of Fixed Income (since February 2022), Forest Road Securities (broker dealer); Chief Executive Officer (since February 2001), Meadowbrook Capital Management (asset management company); Employee (2003 – January 2022), Cowen Prime Services (broker dealer). | | Metropolitan West Funds (mutual fund); TCW Strategic Income Fund, Inc. (closed-end fund); TCW Direct Lending VII, LLC (business development company); TCW Direct Lending VIII, LLC (business development company); TCW Star Direct Lending, LLC (business development company); TCW ETF Trust (exchange-traded fund). |
| (1) | The address of each Independent Director is c/o Morgan Lewis, & Bockius LLP, Counsel to the Independent Directors of TCW Funds, Inc., 300 South Grand Avenue, Los Angeles, CA 90071. |
64
TCW Funds, Inc.
Interested Director
This Director is an “interested person” of the Company as defined in the 1940 Act because he is a director and officer of the Advisor, and shareholder and director of The TCW Group, Inc., the parent company of the Advisor.
| | | | | | |
Name and Year of Birth | | Term of Office and Length of Time Served | | Principal Occupation(s)
During Past 5 Years | | Other Directorships held by Director |
| Marc I. Stern (1944) | | Mr. Stern has served as a director since inception of TCW Funds, Inc. in September 1992. | | Chairman (since January 2016), TCW LLC; Chairman (since February 2013), The TCW Group Inc., the Advisor, TCW Asset Management Company LLC and Metropolitan West Asset Management, LLC. | | N/A |
The officers of the Company who are not directors of the Company are:
| | | | |
| Name and Year of Birth (1) | | Position(s) Held with Company | | Principal Occupation(s) During Past 5 Years (2) |
Kathryn Koch (1980) President and Chief Executive Officer | | Ms. Koch has served as President and Chief Executive Officer of TCW Funds, Inc. since February 2023. | | President and Chief Executive Officer (since February 2023), The TCW Group, Inc., TCW LLC, the Advisor, TCW Asset Management Company LLC, Metropolitan West Asset Management, LLC and TCW Strategic Income Fund, Inc.; President and Principal Executive Officer (since February 2023), Metropolitan West Funds; Chief Investment Officer of Public Equity (2004 – January 2023), Goldman Sachs. |
Lisa Eisen (1963) Tax Officer | | Ms. Eisen has served as Tax Officer of TCW Funds, Inc. since December 2016. | | Tax Officer (since December 2016), Metropolitan West Funds and TCW Strategic Income Fund, Inc.; Managing Director and Director of Tax (since August 2016), TCW LLC. |
Meredith S. Jackson (1959) Senior Vice President, General Counsel and Secretary | | Ms. Jackson has served as Senior Vice President since January 2016 and General Counsel and Secretary of TCW Funds, Inc. since February 2013. | | Executive Vice President, General Counsel and Secretary (since January 2016), TCW LLC; Executive Vice President, General Counsel and Secretary (since February 2013), the Advisor, The TCW Group, Inc., TCW Asset Management Company LLC and Metropolitan West Asset Management, LLC. Senior Vice President, General Counsel and Secretary (since February 2013), TCW Strategic Income Fund, Inc., Vice President and Secretary (since February 2013), Metropolitan West Funds. |
65
TCW Funds, Inc.
Directors and Officers of the Company (Continued)
| | | | |
| Name and Year of Birth (1) | | Position(s) Held with Company | | Principal Occupation(s) During Past 5 Years (2) |
Gladys Xiques (1973) Chief Compliance Officer and AML Officer | | Ms. Xiques has served as Chief Compliance Officer and AML Officer of TCW Funds, Inc. since January 2021. | | Chief Compliance Officer and AML Officer (since January 2021), TCW Strategic Income Fund, Inc. and Metropolitan West Funds; Managing Director and Global Chief Compliance Officer (since January 2021), TCW LLC, the Advisor, Metropolitan West Asset Management, LLC and TCW Asset Management Company LLC; Global Chief Compliance Officer (since January 2021), The TCW Group, Inc.; Senior Vice President (February 2015 – December 2020), TCW LLC, the Advisor, Metropolitan West Asset Management, LLC and TCW Asset Management Company LLC. |
Richard M. Villa (1964) Treasurer Principal Financial and Accounting Officer | | Mr. Villa has served as Treasurer and Principal Financial and Accounting Officer of TCW Funds, Inc. since February 2014. | | Executive Vice President, Chief Financial Officer and Assistant Secretary (since July 2008), the Advisor, The TCW Group, Inc., TCW Asset Management Company LLC, Metropolitan West Asset Management, LLC, and (since January 2016), TCW LLC; Treasurer and Principal Financial and Accounting Officer (since February 2014), TCW Strategic Income Fund, Inc. and (since February 2021), Metropolitan West Funds. |
| (1) | The address of the Interested Director and each officer is c/o the TCW Group, Inc., 515 South Flower Street, Los Angeles, CA 90071. |
| (2) | Positions with The TCW Group, Inc. and its affiliates may have changed over time. |
In addition, Eric Chan, Managing Director of Fund Operations for the Advisor, TCW Asset Management Company LLC, TCW LLC (since 2009), and Metropolitan West Asset Management, LLC (since November 2006), is Assistant Treasurer of the Company and TCW Strategic Income Fund, Inc. (since 2009) and Metropolitan West Funds (since 2010). Mr. Chan is a Certified Public Accountant. Peter Davidson, Senior Vice President, Associate General Counsel and Assistant Secretary of TCW Asset Management Company LLC, Metropolitan West Asset Management, LLC, TCW LLC, and the Advisor (since July 2022), is Vice President and Assistant Secretary of the Company, TCW Strategic Income Fund, Inc. and Metropolitan West Funds (since September 2022).
The SAI (Statement of Additional Information) has additional information regarding the Board of Directors. A copy is available without charge by calling 1-800-FUND-TCW (1-800-386-3829) to obtain a hard copy or by going to the SEC website at http://www.sec.gov.
66
TCW Funds, Inc.
515 South Flower Street
Los Angeles, California 90071
800 FUND TCW
(800 386 3829)
www.TCW.com
INVESTMENT ADVISOR
TCW Investment Management Company LLC
515 South Flower Street
Los Angeles, California 90071
TRANSFER AGENT
U.S. Bancorp Fund Services, LLC
615 E. Michigan Street
Milwaukee, Wisconsin 53202
INDEPENDENT REGISTERED PUBLIC ACCOUNTING FIRM
Deloitte & Touche LLP
555 West 5th Street
Los Angeles, California 90013
CUSTODIAN & ADMINISTRATOR
State Street Bank & Trust Company
One Congress Street, Suite 1
Boston, Massachusetts 02114-2016
DISTRIBUTOR
TCW Funds Distributors LLC
515 South Flower Street
Los Angeles, California 90071
DIRECTORS
Patrick C. Haden
Director and Chairman of the Board
Samuel P. Bell
Director
Peter McMillan
Director
Victoria B. Rogers
Director
Marc I. Stern
Director
Andrew Tarica
Director
OFFICERS
Kathryn Koch
President and Chief Executive Officer
Meredith S. Jackson
Senior Vice President,
General Counsel and Secretary
Richard M. Villa
Treasurer and Principal Financial and Accounting Officer
Gladys Xiques
Chief Compliance Officer and Anti-Money Laundering Officer
Lisa Eisen
Tax Officer
Eric W. Chan
Assistant Treasurer
Peter Davidson
Vice President and Assistant Secretary
TCW FAMILY OF FUNDS
EQUITY FUNDS
TCW Artificial Intelligence Equity Fund
TCW Global Real Estate Fund
TCW New America Premier Equities Fund
TCW Relative Value Dividend Appreciation Fund
TCW Relative Value Large Cap Fund
TCW Relative Value Mid Cap Fund
TCW Select Equities Fund
ASSET ALLOCATION FUND
TCW Conservative Allocation Fund
FIXED INCOME FUNDS
TCW Core Fixed Income Fund
TCW Enhanced Commodity Strategy Fund
TCW Global Bond Fund
TCW High Yield Bond Fund
TCW Short Term Bond Fund
TCW Total Return Bond Fund
INTERNATIONAL FUNDS
TCW Emerging Markets Income Fund
TCW Emerging Markets Local Currency Income Fund
FUNDarEQ1022
| (a) | The Registrant has adopted a code of ethics that applies to its principal executive officer and principal financial officer or persons performing similar functions. |
| (b) | No disclosures are required by this Item 2(b). |
| (c) | The Registrant has made no material changes to its code of ethics. |
| (d) | The Registrant has not granted any waivers from any provisions of its code of ethics during the period covered by this Form N-CSR. |
| (f) | A copy of the Registrant’s code of ethics is filed as Exhibit 13(a)(1) to this Form N-CSR. |
| Item 3. | Audit Committee Financial Expert. |
| (a)(1) | The Registrant’s Board of Directors (the “Board”) has determined that the Registrant has two members serving on the Registrant’s Audit Committee that possess the attributes identified in Form N-CSR to qualify as an “audit committee financial expert.” |
| (a)(2) | The audit committee financial experts are Samuel P. Bell and Victoria B. Rogers. Each has been deemed to be “independent” as that term is defined in Form N-CSR. |
| Item 4. | Principal Accountant Fees and Services. |
The firm of Deloitte & Touche LLP (“Deloitte”) serves as the independent registered public accounting firm for the Registrant.
For the fiscal years ended October 31, 2023 and October 31, 2022, the aggregate fees billed for professional services rendered by Deloitte for the audit of the Registrant’s annual financial
statements or for services that are normally provided by Deloitte in connection with statutory and regulatory filings or engagements were:
| | |
2023 | | 2022 |
| $522,274 | | $557,289 |
For the fiscal years October 31, 2023 and October 31, 2022, the aggregate fees billed for assurance and related services rendered by Deloitte that are reasonably related to the performance of the audit or review of the Registrant’s financial statements and that are not reported under Audit Fees above were:
For the fiscal years ended October 31, 2023 and October 31, 2022, the aggregate fees billed for tax compliance, tax advice and tax planning by Deloitte were:
| | |
2023 | | 2022 |
| $103,506 | | $112,762 |
For the fiscal years ended October 31, 2023 and October 31, 2022, the aggregate fees billed by Deloitte to the Registrant for all services other than services reported under Audit Fees, Audit-Related Fees, and Tax Fees were:
Fees were for Passive Foreign Investment Company analysis.
| (e)(1) | The Registrant’s Audit Committee approves each specific service the auditor will perform for the Registrant. Accordingly, the Audit Committee has not established pre-approval policies or procedures for services that the auditor may perform for the Registrant. |
| (e)(2) | None of the services described in each of paragraphs (b) through (d) of this Item were approved by the Registrant’s Audit Committee pursuant to paragraph (c)(7)(i)(C) of Rule 2-01 of Regulation S-X. |
| (g) | For the fiscal years ended October 31, 2023 and October 31, 2022, aggregate non-audit fees billed by Deloitte for services rendered to the Registrant were: |
| | |
2023 | | 2022 |
| $112,956 | | $130,560 |
For the twelve month periods ended October 31, 2023 and October 31, 2022, aggregate non-audit fees billed by Deloitte for services rendered to the Registrant’s investment adviser and any entity controlling, controlled by or under common control with the investment adviser that provides ongoing services to the Registrant were $554,743 and $652,316, respectively.
| Item 5. | Audit Committee of Listed Registrants. |
Not applicable.
| (a) | The Schedule of Investments is included as part of the Report to Shareholders filed under Item 1 of this Form N-CSR. |
| Item 7. | Disclosure of Proxy Voting Policies and Procedures for Closed-End Management Investment Companies. |
Not applicable.
| Item 8. | Portfolio Managers of Closed-End Management Investment Companies. |
Not applicable.
| Item 9. | Purchases of Equity Securities by Closed-End Management Investment Company and Affiliated Purchasers. |
Not applicable.
| Item 10. | Submission of Matters to a Vote of Security Holders. |
There have been no material changes to the procedures by which shareholders may recommend nominees to the Registrant’s Board of Directors.
| Item 11. | Controls and Procedures. |
| (a) | The Chief Executive Officer and Principal Financial and Accounting Officer have concluded, as of a date within 90 days of the filing date of this report, that the Registrant’s disclosure controls and procedures (as defined in Rule 30a-3(c) under |
| | the 1940 Act) are effective, as of such date, based on their evaluation of these controls and procedures required by Rule 30a-3(b) under the 1940 Act and 15d-15(b) under the Securities Exchange Act of 1934, as amended. |
| (b) | There were no changes in the Registrant’s internal control over financial reporting (as defined in Rule 30a-3(d) under the 1940 Act) that occurred during the period covered by this report that have materially affected, or are reasonably likely to materially affect, the Registrant’s internal control over financial reporting. |
| Item 12. | Disclosure of Securities Lending Activities for Closed-End Management Investment Companies. |
Not applicable.
SIGNATURES
Pursuant to the requirements of the Securities Exchange Act of 1934, as amended, and the Investment Company Act of 1940, as amended, the Registrant has duly caused this report to be signed on its behalf by the undersigned, thereunto duly authorized.
| | |
| (Registrant) | | TCW Funds, Inc. |
| |
| By (Signature and Title) | | |
| | /s/ Megan McClellan |
| | Megan McClellan |
| | President and Principal Executive Officer |
| |
| Date | | January 4, 2024 |
Pursuant to the requirements of the Securities Exchange Act of 1934, as amended, and the Investment Company Act of 1940, as amended, this report has been signed below by the following persons on behalf of the Registrant and in the capacities and on the dates indicated.
| | |
| By (Signature and Title) | | |
| | /s/ Megan McClellan |
| | Megan McClellan |
| | President and Principal Executive Officer |
| |
| Date | | January 4, 2024 |
| |
| By (Signature and Title) | | |
| | /s/ Richard M. Villa |
| | Richard M. Villa |
| | Treasurer and Principal Financial and Accounting Officer |
| |
| Date | | January 4, 2024 |