UNITED STATES
SECURITIES AND EXCHANGE COMMISSION
Washington, D.C. 20549
FORM N-CSR
CERTIFIED SHAREHOLDER REPORT OF REGISTERED MANAGEMENT INVESTMENT COMPANIES
Investment Company Act file number 811-07288
Franklin Strategic Mortgage Portfolio
(Exact name of registrant as specified in charter)
One Franklin Parkway, San Mateo, CA 94403-1906
(Address of principal executive offices) (Zip code)
Craig S. Tyle, One Franklin Parkway, San Mateo, CA 94403-1906
(Name and address of agent for service)
Registrant's telephone number, including area code:650 312-2000
Date of fiscal year end: 9/30
Date of reporting period: 9/30/16
Item 1. Reports to Stockholders.
| Contents | |
| Annual Report | |
| Franklin Strategic Mortgage Portfolio | 3 |
| Performance Summary | 6 |
| Your Fund’s Expenses | 9 |
| Financial Highlights and Statement of Investments | 10 |
| Financial Statements | 20 |
| Notes to Financial Statements | 24 |
| Report of Independent Registered | |
| Public Accounting Firm | 34 |
| Tax Information | 35 |
| Board Members and Officers | 36 |
| Shareholder Information | 40 |
Visit franklintempleton.com for fund updates, to access your account, or to find helpful financial planning tools.
2 Annual Report
franklintempleton.com
Annual Report
Franklin Strategic Mortgage Portfolio
This annual report for Franklin Strategic Mortgage Portfolio covers the fiscal year ended September 30, 2016.
Your Fund’s Goal and Main Investments
The Fund seeks high total return (a combination of high current income and capital appreciation) relative to the performance of the general mortgage securities market by investing at least 80% of its net assets in a portfolio of mortgage securities. The Fund invests substantially in mortgage securities that are issued or guaranteed by the U.S. government, its agencies or instrumentalities, which include mortgage pass-through securities representing interests in “pools” of mortgage loans issued or guaranteed by the Government National Mortgage Association (Ginnie Mae), Fannie Mae and Freddie Mac.1
Performance Overview
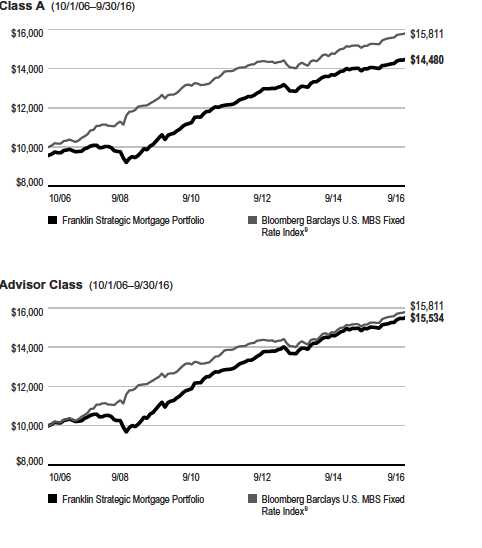
For the year under review, the Fund’s Class A shares delivered a +2.98% cumulative total return. In comparison, the Fund’s primary benchmark, the Bloomberg Barclays U.S. Mortgage-Backed Securities (MBS) Fixed Rate Index, which measures the performance of investment-grade fixed-rate mortgage-backed pass-through securities of Ginnie Mae, Fannie Mae and Freddie Mac, produced a +3.63% total return.2 The Lipper U.S. Mortgage Funds Classification Average, which consists of funds chosen by Lipper that invest primarily in mortgages and securities issued or guaranteed by the U.S. government and certain federal agencies, returned +3.49%.3 The Bloomberg Barclays U.S. Treasury Index, the U.S. Treasury component of the Bloomberg Barclays U.S. Government Index, generated a +4.09% total return.2 You can find the Fund’s long-term performance data in the Performance Summary beginning on page 6.
Performance data represent past performance, which does not guarantee future results. Investment return and principal value
will fluctuate, and you may have a gain or loss when you sell your shares. Current performance may differ from figures shown. For most recent month-end performance, go to franklintempleton.com or call (800) 342-5236.
Economic and Market Overview
The U.S. economy grew modestly during the first three quarters of the 12-month period ended September 30, 2016, despite a general decline in private inventory, nonresidential fixed investments and exports. However, personal consumption expenditures remained strong throughout the period. Manufacturing conditions generally contracted during the first half of the period but generally expanded in the second half. Manufacturing data rebounded in September to enter into expansionary territory, after contracting in August. The services sector, although volatile, continued to grow throughout the period. Growth in the services industry contributed to new
1. Securities owned by the Fund but not shares of the Fund are guaranteed by the U.S. government, its agencies or instrumentalities as to the timely payment of principal and
interest. Although U.S. government-sponsored entities may be chartered or sponsored by acts of Congress, their securities are neither insured nor guaranteed by the U.S.
Treasury. Please refer to the Fund’s prospectus for a detailed discussion regarding various levels of credit support for government agency or instrumentality securities.
2. Source: Morningstar.
3. Source: Lipper, a Thomson Reuters Company. For the 12-month period ended 9/30/16, this category consisted of 121 funds. Lipper calculations do not include sales charges
or subsidization by a fund’s manager. The Fund’s performance relative to the average might have differed if these or other factors had been considered.
The indexes are unmanaged and include reinvestment of any income or distributions. They do not reflect any fees, expenses or sales charges. One cannot invest directly in an
index, and an index is not representative of the Fund’s portfolio.
See www.franklintempletondatasources.com for additional data provider information.
The dollar value, number of shares or principal amount, and names of all portfolio holdings are listed in the Fund’s Statement of Investments (SOI).
The SOI begins on page 14.
franklintempleton.com
Annual Report
3
FRANKLIN STRATEGIC MORTGAGE PORTFOLIO
jobs, and the unemployment rate decreased slightly from 5.1% in September 2015 to 5.0% at period-end.4 Home sales and prices rose amid relatively low mortgage rates. Monthly retail sales grew for most of the review period, and rose to the highest level in April in more than a year, due to a broad-based increase across most retail categories. After declining in August, retail sales rose in September, driven largely by sales in auto and auto components dealers, gasoline stations and grocery stores. Inflation, as measured by the Consumer Price Index (CPI), rose slightly in September due to an increase in shelter and gasoline costs. The CPI reported its strongest monthly reading over the past three years in April as energy prices rose.
After maintaining a near-zero interest rate for seven years to support the U.S. economy’s recovery, the U.S. Federal Reserve (Fed) raised its target range for the federal funds rate to 0.25%–0.50% at its December 2015 meeting and maintained the rate through the period-end. In July, the Fed Chair signaled the possibility of a near-term increase in interest rates citing strengthening labor market conditions and the Fed’s optimism about future economic growth. However, following lower-than-expected job growth in August, the Fed kept interest rates unchanged at its September meeting and lowered its forecast for 2016 U.S. economic growth.
The 10-year Treasury yield, which moves inversely to price, shifted throughout the period. It rose from 2.06% on September 30, 2015, to a period high of 2.36% in November 2015. However, negative interest rates in Japan and Europe, and central banks’ purchases of government bonds, pushed down the Treasury yield. The U.K.’s historic referendum to leave the European Union in June 2016 (also known as the “Brexit”) also boosted safe haven buying by investors. The Treasury yield remained volatile and ended the period at 1.60% after the Fed kept interest rates unchanged.
Investment Strategy
Under normal market conditions, we invest at least 80% of the Fund’s net assets in mortgage securities. The Fund invests substantially in mortgage securities that are issued or guaranteed by the U.S. government, its agencies or instrumentalities, which include mortgage pass-through securities representing interests in “pools” of mortgage loans issued or guaranteed by Ginnie Mae, Fannie Mae and Freddie Mac.1 These securities may be fixed-rate or adjustable-rate mortgage securities (ARMS). Securities issued by different government agencies or instrumentalities have different levels of credit support. We may also invest in other types of mortgage securities that may be issued by private issuers, including, but not limited to, certain ARMS, commercial mortgage-backed securities (CMBS), home equity loan asset-backed securities (HELs), manufactured housing asset-backed securities (MHs), and collateralized mortgage obligations (CMOs), as well as in other mortgage-related asset-backed securities. The Fund also may invest in U.S. Treasury securities. The Fund may invest a small portion of its assets directly in mortgage loans. At least 80% of total net assets, at the time of purchase, are invested in securities rated BBB or higher by Standard & Poor’s (S&P), or Baa by Moody’s Investors Service (Moody’s), independent credit rating agencies. Within these parameters, we rely on our research to help us identify attractive investment opportunities.
| Dividend Distributions* | ||||
| 10/1/15–9/30/16 | ||||
| Dividend per Share (cents) | ||||
| Advisor | ||||
| Month | Class A | Class A1 | Class C | Class |
| October | 1.4991 | 1.7088 | 1.1935 | 1.7006 |
| November | 1.5760 | 1.7769 | 1.2567 | 1.7746 |
| December | 1.9616 | 2.1629 | 1.6295 | 2.1602 |
| January | 1.5199 | 1.7077 | 1.2208 | 1.7058 |
| February | 1.6443 | 1.8471 | 1.3234 | 1.8444 |
| March | 1.4492 | 1.6504 | 1.1288 | 1.6483 |
| April | 1.4067 | 1.5970 | 1.1054 | 1.5949 |
| May | 1.5674 | 1.7632 | 1.2560 | 1.7608 |
| June | 1.5792 | 1.7495 | 1.3077 | 1.7472 |
| July | 1.7318 | 1.9231 | 1.4313 | 1.9205 |
| August | 2.1818 | 2.3995 | 1.8381 | 2.3962 |
| September | 1.8019 | 1.9996 | 1.5023 | 1.9864 |
| Total | 19.9189 | 22.2857 | 16.1935 | 22.2399 |
*The distribution amount is the sum of the dividend payments to shareholders for
the period shown and includes only estimated tax-basis net investment income.
Assumes shares were purchased and held for the entire accrual period. Since
dividends accrue daily, your actual distributions will vary depending on the date you
purchased your shares and any account activity. All Fund distributions will vary
depending upon current market conditions, and past distributions are not indicative
of future trends.
Manager’s Discussion
U.S. economic indicators were generally encouraging during the reporting period. Steady growth in the services sector created new jobs and slightly boosted employment levels. Retail sales grew for most of the period. Low energy prices
4 Annual Report
4. Source: Bureau of Labor Statistics.
franklintempleton.com
FRANKLIN STRATEGIC MORTGAGE PORTFOLIO
pulled inflation lower. In this environment, home sales and prices grew.
High-quality securitized sectors performed well during the period. CMBS lead results and outpaced Treasuries. Ginnie Mae, Freddie Mac and Fannie Mae MBS also delivered strong performance and outperformed Treasuries.
In our analysis, agency MBS valuations remained relatively fully valued during the period, but the Fed’s continued reinvestment of principal proceeds and low supply levels supported the sector. Without the Fed’s support, MBS could be vulnerable to supply shocks until alternative demand sources emerge. We believe that banks, mortgage real estate investment trusts, overseas investors and domestic money managers could become sources of potential demand, but we believe that they would need to increase their allocations to the MBS sector to compensate for the Fed’s reduced presence. As spreads tighten and we approach the termination of the Fed’s reinvestment program, we believe the MBS sector could possibly experience volatility. Although recent lower mortgage rates could potentially increase prepayment speeds, our overall prepayment expectations remained anchored.
The Fund’s exposure to non-agency residential MBS and CMBS were significant contributors to performance. Our shorter duration positioning detracted from performance relative to the benchmark over the period as interest rate movements had a negative impact on the portfolio. The Fund’s underweighted exposure to fixed-rate agency MBS relative to the benchmark detracted from performance, but performance was mitigated by positive security selection within the sector. Allocation to ARMS contributed to returns but security selection within the sector hurt performance.
What is duration?
Duration is a measure of a bond’s price sensitivity to interest rate changes. In general, a portfolio of securities with a lower duration can be expected to be less sensitive to interest rate changes than a portfolio with a higher duration.
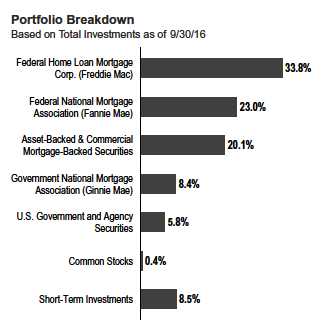
Within the agency MBS sector, we mainly increased our allocation to 3.0% coupon securities and reduced our exposure to 3.5% MBS. The portfolio’s heaviest mortgage allocations were in 3.0%, 3.5% and 4.0% coupon securities. We reduced our exposure to agency MBS, CMBS and residential MBS. At period-end, the portfolio’s heaviest mortgage allocations were in agency MBS and CMBS. Although we selectively reduced holdings, the Fund remained allocated to CMBS, as we believe commercial real estate fundamentals could slowly and steadily improve over the intermediate term.
Thank you for your continued participation in Franklin Strategic Mortgage Portfolio. We look forward to serving your future investment needs.

The foregoing information reflects our analysis, opinions and portfolio holdings as of September 30, 2016, the end of the reporting period. The way we implement our main investment strategies and the resulting portfolio holdings may change depending on factors such as market and economic conditions. These opinions may not be relied upon as investment advice or an offer for a particular security. The information is not a complete analysis of every aspect of any market, country, industry, security or the Fund. Statements of fact are from sources considered reliable, but the investment manager makes no representation or warranty as to their completeness or accuracy. Although historical performance is no guarantee of future results, these insights may help you understand our investment management philosophy.
franklintempleton.com
Annual Report
5
FRANKLIN STRATEGIC MORTGAGE PORTFOLIO
Performance Summary as of September 30, 2016
The performance table and graphs do not reflect any taxes that a shareholder would pay on Fund dividends, capital gain distributions, if any, or any realized gains on the sale of Fund shares. Total return reflects reinvestment of the Fund’s dividends and capital gain distributions, if any, and any unrealized gains or losses.
Performance as of 9/30/161
Cumulative total return excludes sales charges. Average annual total return includes maximum sales charges. Sales charges will vary depending on the size of the investment and the class of share purchased. The maximum is 4.25% and the minimum is 0%. Class A: 4.25% maximum initial sales charge; Advisor Class: no sales charges. For other share classes, visit franklintempleton.com.
| Cumulative | Average Annual | Total Annual | ||||
| Share Class | Total Return2 | Total Return3 | Operating Expenses4 | |||
| A5 | 1.01 | % | ||||
| 1-Year | +2.98 | % | -1.39 | % | ||
| 5-Year | +19.20 | % | +2.67 | % | ||
| 10-Year | +51.20 | % | +3.77 | % | ||
| Advisor6 | 0.76 | % | ||||
| 1-Year | +3.34 | % | +3.34 | % | ||
| 5-Year | +20.72 | % | +3.84 | % | ||
| 10-Year | +55.34 | % | +4.50 | % | ||
| Distribution | 30-Day Standardized Yield8 | |||||
| Share Class | Rate7 | (with waiver) | (without waiver) | |||
| A | 2.19 | % | 1.51 | % | 1.50 | % |
| Advisor | 2.53 | % | 1.83 | % | 1.81 | % |
Performance data represent past performance, which does not guarantee future results. Investment return and principal value will fluctuate, and you may have a gain or loss when you sell your shares. Current performance may differ from figures shown. For most recent month-end performance, go to franklintempleton.com or call (800) 342-5236.
See page 8 for Performance Summary footnotes.
6 Annual Report
franklintempleton.com
FRANKLIN STRATEGIC MORTGAGE PORTFOLIO
PERFORMANCE SUMMARY
Total Return Index Comparison for a Hypothetical $10,000 Investment1
Total return represents the change in value of an investment over the periods shown. It includes any applicable maximum sales charge, Fund expenses, account fees and reinvested distributions. The unmanaged index includes reinvestment of any income or distributions. It differs from the Fund in composition and does not pay management fees or expenses. One cannot invest directly in an index.
See page 8 for Performance Summary footnotes.
franklintempleton.com
Annual Report
7
FRANKLIN STRATEGIC MORTGAGE PORTFOLIO
PERFORMANCE SUMMARY
Each class of shares is available to certain eligible investors and has different annual fees and expenses, as described in the prospectus.
All investments involve risks, including possible loss of principal. The Fund’s share price and yield will be affected by interest rate movements and mortgage
prepayments, especially in relation to mortgage-backed securities. During periods of declining interest rates, principal prepayments tend to increase as
borrowers refinance their mortgages at lower rates; therefore the Fund may be forced to reinvest returned principal at lower interest rates, reducing income.
Moreover, because of pre-payments, mortgage backed securities may be less effective than some other types of debt securities as a means of “locking in”
long-term interest rates and may have less potential for capital appreciation during periods of falling interest rates. Bond prices generally move in the opposite
direction of interest rates. Thus, as prices of bonds in the Fund adjust to a rise in interest rates, the Fund’s share price may decline. Changes in the financial
strength of a bond issuer or in a bond’s credit rating may affect its value. The Fund is actively managed but there is no guarantee that the manager’s investment
decisions will produce the desired results. The Fund’s prospectus also includes a description of the main investment risks.
1. The Fund has a fee waiver associated with any investment it makes in a Franklin Templeton money fund and/or other Franklin Templeton fund, contractually guaranteed
through its current fiscal year-end. Fund investment results reflect the fee waiver; without this waiver, the results would have been lower.
2. Cumulative total return represents the change in value of an investment over the periods indicated.
3. Average annual total return represents the average annual change in value of an investment over the periods indicated. Return for less than one year, ifany,hasnotbeen
annualized.
4. Figures are as stated in the Fund’s current prospectus and may differ from the expense ratios disclosed in the Financial Highlights in this report. In periods of market volatility,
assets may decline significantly, causing total annual Fund operating expenses to become higher than the figures shown.
5. Performance quotations for Class A shares reflect the following methods of calculation: (a) For periods prior to 2/1/12, a restated figure is used based on Class A1
performance and including the Class A Rule 12b-1 fee, and (b) for periods after 2/1/12, actual Class A performance is used, reflecting all charges and fees applicable to that
class. Since 2/1/12 (commencement of sales), the cumulative and average annual total returns of Class A shares were +16.78% and +2.43%.
6. Effective 2/1/12, the Fund began offering Advisor Class shares, which do not have sales charges or a Rule 12b-1 fee. Performance quotations for this class reflect the
following methods of calculation: (a) For periods prior to 2/1/12, a restated figure is used based on the Fund’s oldest share class, Class A1, excluding the effect of its maximum
initial sales charge; and (b) for periods after 2/1/12, actual Advisor Class performance is used, reflecting all charges and fees applicable to that class. Since 2/1/12
(commencement of sales), the cumulative and average annual total returns of Advisor Class shares were +18.14% and +3.64%.
7. Distribution rate is based on an annualization of the sum of distributions per share for the 30 days of September and the maximum offering price (NAV for Advisor Class) on
9/30/16.
8. The Fund’s 30-day standardized yield is calculated over a trailing 30-day period using the yield to maturity on bonds and/or the dividends accrued on stocks. It may not equal
the Fund’s actual income distribution rate, which reflects the Fund’s past dividends paid to shareholders.
9. Source: Morningstar. The Bloomberg Barclays MBS Fixed Rate Index is the FNMA component of the Barclays Fixed Rate MBS Index and includes the mortgage-backed
pass-through securities of the Federal National Mortgage Association.
See www.franklintempletondatasources.com for additional data provider information.
8 Annual Report
franklintempleton.com
FRANKLIN STRATEGIC MORTGAGE PORTFOLIO
Your Fund’s Expenses
As a Fund shareholder, you can incur two types of costs: (1) transaction costs, including sales charges (loads), as applicable, on Fund purchases and redemptions; and (2) ongoing Fund costs, including management fees, distribution and service (12b-1) fees, and other Fund expenses. All mutual funds have ongoing costs, sometimes referred to as operating expenses. The table below shows ongoing costs of investing in the Fund and can help you understand these costs and compare them with those of other mutual funds. The table assumes a $1,000 investment held for the six months indicated.
Actual Fund Expenses
The table below provides information about actual account values and actual expenses in the columns under the heading “Actual.” In these columns the Fund’s actual return, which includes the effect of Fund expenses, is used to calculate the “Ending Account Value” for each class of shares. You can estimate the expenses you paid during the period by following these steps (of course, your account value and expenses will differ from those in this illustration): Divide your account value by $1,000 (if your account had an $8,600 value, then $8,600 ÷ $1,000 = 8.6). Then multiply the result by the number in the row for your class of shares under the headings “Actual” and “Expenses Paid During Period” (if Actual Expenses Paid During Period were $7.50, then 8.6 x $7.50 = $64.50). In this illustration, the actual expenses paid this period are $64.50.
Hypothetical Example for Comparison with Other Funds
Under the heading “Hypothetical” in the table, information is provided about hypothetical account values and hypothetical expenses based on the Fund’s actual expense ratio and an assumed rate of return of 5% per year before expenses, which is not the Fund’s actual return. This information may not be used to estimate the actual ending account balance or expenses you paid for the period, but it can help you compare ongoing costs of investing in the Fund with those of other funds. To do so, compare this 5% hypothetical example for the class of shares you hold with the 5% hypothetical examples that appear in the shareholder reports of other funds.
Please note that expenses shown in the table are meant to highlight ongoing costs and do not reflect any transactional costs. Therefore, information under the heading “Hypothetical” is useful in comparing ongoing costs only, and will not help you compare total costs of owning different funds. In addition, if transactional costs were included, your total costs would have been higher.
| Actual | Hypothetical | |||||||||||
| (actual return after expenses) | (5% annual return before expenses) | |||||||||||
| Expenses | Expenses | Net | ||||||||||
| Beginning | Ending | Paid During | Ending | Paid During | Annualized | |||||||
| Share | Account | Account | Period | Account | Period | Expense | ||||||
| Class | Value 4/1/16 | Value 9/30/16 | 4/1/16–9/30/161,2 | Value 9/30/16 | 4/1/16–9/30/161,2 | Ratio2 | ||||||
| A | $ | 1,000 | $ | 1,019.30 | $ | 5.00 | $ | 1,020.05 | $ | 5.00 | 0.99 | % |
| A1 | $ | 1,000 | $ | 1,021.60 | $ | 3.74 | $ | 1,021.30 | $ | 3.74 | 0.74 | % |
| C | $ | 1,000 | $ | 1,017.40 | $ | 7.01 | $ | 1,018.05 | $ | 7.01 | 1.39 | % |
| Advisor | $ | 1,000 | $ | 1,021.60 | $ | 3.74 | $ | 1,021.30 | $ | 3.74 | 0.74 | % |
1. Expenses are equal to the annualized expense ratio for the six-month period as indicated above–in the far right column–multiplied by the simple average account value
over the period indicated, and then multiplied by 183/366 to reflect the one-half year period.
2. Reflects expenses after fee waivers and expense reimbursements. Does not include acquired fund fees and expenses.
franklintempleton.com
Annual Report
9
FRANKLIN STRATEGIC MORTGAGE PORTFOLIO
| Financial Highlights | |||||||||||||||||
| Year Ended September 30, | |||||||||||||||||
| 2016 | 2015 | 2014 | 2013 | 2012 | a | ||||||||||||
| Class A | |||||||||||||||||
| Per share operating performance | |||||||||||||||||
| (for a share outstanding throughout the year) | |||||||||||||||||
| Net asset value, beginning of year | $ | 9.49 | $ | 9.43 | $ | 9.37 | $ | 9.69 | $ | 9.47 | |||||||
| Income from investment operationsb: | |||||||||||||||||
| Net investment income | 0.144 | 0.185 | 0.249 | 0.229 | 0.172 | ||||||||||||
| Net realized and unrealized gains (losses) | 0.135 | 0.088 | 0.218 | (0.202 | ) | 0.255 | |||||||||||
| Total from investment operations | 0.279 | 0.273 | 0.467 | 0.027 | 0.427 | ||||||||||||
| Less distributions from net investment income | (0.199 | ) | (0.213 | ) | (0.407 | ) | (0.347 | ) | (0.207 | ) | |||||||
| Net asset value, end of year. | $ | 9.57 | $ | 9.49 | $ | 9.43 | $ | 9.37 | $ | 9.69 | |||||||
| Total returnc | 2.98 | % | 2.91 | % | 5.09 | % | 0.28 | % | 4.57 | % | |||||||
| Ratios to average net assetsd | |||||||||||||||||
| Expenses before waiver and payments by affiliates | 1.00 | % | 1.01 | % | 1.06 | % | 0.96 | % | 1.01 | % | |||||||
| Expenses net of waiver and payments by affiliates | 0.99 | %e | 1.01 | %f | 1.06 | %f | 0.96 | % | 1.01 | % | |||||||
| Net investment income | 1.47 | % | 1.84 | % | 2.37 | % | 2.04 | % | 2.07 | % | |||||||
| Supplemental data | |||||||||||||||||
| Net assets, end of year (000’s) | $ | 34,191 | $ | 26,328 | $ | 9,920 | $ | 8,627 | $ | 4,856 | |||||||
| Portfolio turnover rate | 551.77 | % | 614.11 | % | 514.95 | % | 674.91 | % | 594.80 | % | |||||||
| Portfolio turnover rate excluding mortgage dollar rollsg | 185.40 | % | 172.54 | % | 133.55 | % | 252.41 | % | 167.39 | % | |||||||
aFor the period February 1, 2012 (effective date) to September 30, 2012.
bThe amount shown for a share outstanding throughout the period may not correlate with the Statement of Operations for the period due to the timing of sales and
repurchases of the Fund’s shares in relation to income earned and/or fluctuating fair value of the investments of the Fund.
cTotal return does not reflect sales commissions or contingent deferred sales charges, if applicable, and is not annualized for periods less than one year.
dRatios are annualized for periods less than one year.
eBenefit of expense reduction rounds to less than 0.01%.
fBenefit of waiver and payments by affiliates and expense reduction rounds to less than 0.01%.
gSee Note 1(f) regarding mortgage dollar rolls.
10 Annual Report | The accompanying notes are an integral part of these financial statements.
franklintempleton.com
| FRANKLIN STRATEGIC MORTGAGE PORTFOLIO | |||||||||||||||||||
| FINANCIAL HIGHLIGHTS | |||||||||||||||||||
| Year Ended September 30, | |||||||||||||||||||
| 2016 | 2015 | 2014 | 2013 | 2012 | |||||||||||||||
| Class A1 | |||||||||||||||||||
| Per share operating performance | |||||||||||||||||||
| (for a share outstanding throughout the year) | |||||||||||||||||||
| Net asset value, beginning of year | $ | 9.49 | $ | 9.44 | $ | 9.38 | $ | 9.69 | $ | 9.39 | |||||||||
| Income from investment operationsa: | |||||||||||||||||||
| Net investment income | 0.160 | 0.197 | 0.232 | 0.190 | 0.212 | ||||||||||||||
| Net realized and unrealized gains (losses) | 0.153 | 0.090 | 0.259 | (0.129 | ) | 0.436 | |||||||||||||
| Total from investment operations | 0.313 | 0.287 | 0.491 | 0.061 | 0.648 | ||||||||||||||
| Less distributions from net investment income | (0.223 | ) | (0.237 | ) | (0.431 | ) | (0.371 | ) | (0.348 | ) | |||||||||
| Net asset value, end of year. | $ | 9.58 | $ | 9.49 | $ | 9.44 | $ | 9.38 | $ | 9.69 | |||||||||
| Total returnb | 3.34 | % | 3.06 | % | 5.35 | % | 0.64 | % | 7.04 | % | |||||||||
| Ratios to average net assets | |||||||||||||||||||
| Expenses before waiver and payments by affiliates | 0.75 | % | 0.76 | % | 0.81 | % | 0.71 | % | 0.76 | % | |||||||||
| Expenses net of waiver and payments by affiliates | 0.74 | %c | 0.76 | %d | 0.81 | %d | 0.71 | % | 0.76 | % | |||||||||
| Net investment income | 1.72 | % | 2.09 | % | 2.62 | % | 2.29 | % | 2.32 | % | |||||||||
| Supplemental data | |||||||||||||||||||
| Net assets, end of year (000’s) | $ | 53,432 | $ | 59,352 | $ | 64,325 | $ | 75,609 | $ | 109,162 | |||||||||
| Portfolio turnover rate | 551.77 | % | 614.11 | % | 514.95 | % | 674.91 | % | 594.80 | % | |||||||||
| Portfolio turnover rate excluding mortgage dollar rollse | 185.40 | % | 172.54 | % | 133.55 | % | 252.41 | % | 167.39 | % | |||||||||
aThe amount shown for a share outstanding throughout the period may not correlate with the Statement of Operations for the period due to the timing of sales and
repurchases of the Fund’s shares in relation to income earned and/or fluctuating fair value of the investments of the Fund.
bTotal return does not reflect sales commissions or contingent deferred sales charges, if applicable.
cBenefit of expense reduction rounds to less than 0.01%.
dBenefit of waiver and payments by affiliates and expense reduction rounds to less than 0.01%.
eSee Note 1(f) regarding mortgage dollar rolls.
franklintempleton.com
The accompanying notes are an integral part of these financial statements. | Annual Report 11
| FRANKLIN STRATEGIC MORTGAGE PORTFOLIO | |||||||||||||||||
| FINANCIAL HIGHLIGHTS | |||||||||||||||||
| Year Ended September 30, | |||||||||||||||||
| 2016 | 2015 | 2014 | 2013 | 2012 | a | ||||||||||||
| Class C | |||||||||||||||||
| Per share operating performance | |||||||||||||||||
| (for a share outstanding throughout the year) | |||||||||||||||||
| Net asset value, beginning of year | $ | 9.49 | $ | 9.43 | $ | 9.37 | $ | 9.69 | $ | 9.47 | |||||||
| Income from investment operationsb: | |||||||||||||||||
| Net investment income | 0.112 | 0.142 | 0.207 | 0.167 | 0.155 | ||||||||||||
| Net realized and unrealized gains (losses) | 0.130 | 0.093 | 0.223 | (0.178 | ) | 0.247 | |||||||||||
| Total from investment operations | 0.242 | 0.235 | 0.430 | (0.011 | ) | 0.402 | |||||||||||
| Less distributions from net investment income | (0.162 | ) | (0.175 | ) | (0.370 | ) | (0.309 | ) | (0.182 | ) | |||||||
| Net asset value, end of year. | $ | 9.57 | $ | 9.49 | $ | 9.43 | $ | 9.37 | $ | 9.69 | |||||||
| Total returnc | 2.57 | % | 2.51 | % | 4.68 | % | (0.11 | )% | 4.29 | % | |||||||
| Ratios to average net assetsd | |||||||||||||||||
| Expenses before waiver and payments by affiliates | 1.40 | % | 1.41 | % | 1.46 | % | 1.36 | % | 1.41 | % | |||||||
| Expenses net of waiver and payments by affiliates | 1.39 | %e | 1.41 | %f | 1.46 | %f | 1.36 | % | 1.41 | % | |||||||
| Net investment income | 1.07 | % | 1.44 | % | 1.97 | % | 1.64 | % | 1.67 | % | |||||||
| Supplemental data | |||||||||||||||||
| Net assets, end of year (000’s) | $ | 9,468 | $ | 4,067 | $ | 2,409 | $ | 2,137 | $ | 1,540 | |||||||
| Portfolio turnover rate | 551.77 | % | 614.11 | % | 514.95 | % | 674.91 | % | 594.80 | % | |||||||
| Portfolio turnover rate excluding mortgage dollar rollsg | 185.40 | % | 172.54 | % | 133.55 | % | 252.41 | % | 167.39 | % | |||||||
aFor the period February 1, 2012 (effective date) to September 30, 2012.
bThe amount shown for a share outstanding throughout the period may not correlate with the Statement of Operations for the period due to the timing of sales and
repurchases of the Fund’s shares in relation to income earned and/or fluctuating fair value of the investments of the Fund.
cTotal return does not reflect sales commissions or contingent deferred sales charges, if applicable, and is not annualized for periods less than one year.
dRatios are annualized for periods less than one year.
eBenefit of expense reduction rounds to less than 0.01%.
fBenefit of waiver and payments by affiliates and expense reduction rounds to less than 0.01%.
gSee Note 1(f) regarding mortgage dollar rolls.
12 Annual Report | The accompanying notes are an integral part of these financial statements.
franklintempleton.com
| FRANKLIN STRATEGIC MORTGAGE PORTFOLIO | |||||||||||||||||||
| FINANCIAL HIGHLIGHTS | |||||||||||||||||||
| Year Ended September 30, | |||||||||||||||||||
| 2016 | 2015 | 2014 | 2013 | 2012 | a | ||||||||||||||
| Advisor Class | |||||||||||||||||||
| Per share operating performance | |||||||||||||||||||
| (for a share outstanding throughout the year) | |||||||||||||||||||
| Net asset value, beginning of year | $ | 9.48 | $ | 9.43 | $ | 9.37 | $ | 9.69 | $ | 9.47 | |||||||||
| Income from investment operationsb: | |||||||||||||||||||
| Net investment income | 0.146 | 0.199 | 0.371 | 0.252 | 0.149 | ||||||||||||||
| Net realized and unrealized gains (losses) | 0.166 | 0.087 | 0.119 | (0.201 | ) | 0.294 | |||||||||||||
| Total from investment operations | 0.312 | 0.286 | 0.490 | 0.051 | 0.443 | ||||||||||||||
| Less distributions from net investment income | (0.222 | ) | (0.236 | ) | (0.430 | ) | (0.371 | ) | (0.223 | ) | |||||||||
| Net asset value, end of year. | $ | 9.57 | $ | 9.48 | $ | 9.43 | $ | 9.37 | $ | 9.69 | |||||||||
| Total returnc | 3.34 | % | 3.06 | % | 5.35 | % | 0.54 | % | 4.74 | % | |||||||||
| Ratios to average net assetsd | |||||||||||||||||||
| Expenses before waiver and payments by affiliates | 0.75 | % | 0.76 | % | 0.81 | % | 0.71 | % | 0.76 | % | |||||||||
| Expenses net of waiver and payments by affiliates | 0.74 | %e | 0.76 | %f | 0.81 | %f | 0.71 | % | 0.76 | % | |||||||||
| Net investment income | 1.72 | % | 2.09 | % | 2.62 | % | 2.29 | % | 2.32 | % | |||||||||
| Supplemental data | |||||||||||||||||||
| Net assets, end of year (000’s) | $ | 8,264 | $ | 12,651 | $ | 9,049 | $ | 3,007 | $ | 1,281 | |||||||||
| Portfolio turnover rate | 551.77 | % | 614.11 | % | 514.95 | % | 674.91 | % | 594.80 | % | |||||||||
| Portfolio turnover rate excluding mortgage dollar rollsg | 185.40 | % | 172.54 | % | 133.55 | % | 252.41 | % | 167.39 | % | |||||||||
aFor the period February 1, 2012 (effective date) to September 30, 2012.
bThe amount shown for a share outstanding throughout the period may not correlate with the Statement of Operations for the period due to the timing of sales and
repurchases of the Fund’s shares in relation to income earned and/or fluctuating fair value of the investments of the Fund.
cTotal return is not annualized for periods less than one year.
dRatios are annualized for periods less than one year.
eBenefit of expense reduction rounds to less than 0.01%.
fBenefit of waiver and payments by affiliates and expense reduction rounds to less than 0.01%.
gSee Note 1(f) regarding mortgage dollar rolls.
franklintempleton.com
The accompanying notes are an integral part of these financial statements. | Annual Report 13
| FRANKLIN STRATEGIC MORTGAGE PORTFOLIO | ||||
| Statement of Investments, September 30, 2016 | ||||
| Shares | Value | |||
| Common Stocks (Cost $487,757) 0.4% | ||||
| Mortgage REITs 0.4% | ||||
| AGNC Investment Corp | 22,000 | $ | 429,880 | |
| Principal | ||||
| Amount | ||||
| U.S. Government and Agency Securities 6.9% | ||||
| U.S. Treasury Bond, | ||||
| 4.75%, 2/15/37 | $ | 1,725,000 | 2,508,561 | |
| 4.25%, 11/15/40 | 131,000 | 180,841 | ||
| U.S. Treasury Note, | ||||
| 2.00%, 2/28/21 | 510,000 | 529,035 | ||
| 2.00%, 11/30/22 | 2,800,001 | 2,909,922 | ||
| 2.25%, 11/15/25 | 1,050,000 | 1,109,226 | ||
| Total U.S. Government and Agency Securities (Cost $7,079,749) | 7,237,585 | |||
| Asset-Backed Securities and Commercial Mortgage-Backed Securities 23.6% | ||||
| Finance 23.6% | ||||
| a American Home Mortgage Investment Trust, 2005-1, 6A, FRN, 3.229%, 6/25/45 | 185,068 | 184,047 | ||
| a,b American Homes 4 Rent, | ||||
| 2014-SFR1, A, 144A, FRN, 1.531%, 6/17/31 | 182,785 | 182,333 | ||
| 2014-SFR1, C, 144A, FRN, 2.281%, 6/17/31 | 250,000 | 249,560 | ||
| b,c Anthracite Ltd., 2004-HY1A, E, 144A, 7.147%, 6/20/41 | 1,598,000 | 6,712 | ||
| a,b ARCap REIT Inc., 2004-RR3, A2, 144A, FRN, 4.76%, 9/21/45 | 136,614 | 138,465 | ||
| d Banc of America Commercial Mortgage Trust, 2006-4, AJ, 5.695%, 7/10/46 | 144,008 | 142,200 | ||
| a Bear Stearns ALT-A Trust, 2004-13, A2, FRN, 1.405%, 11/25/34 | 148,813 | 142,939 | ||
| Bear Stearns Commercial Mortgage Securities Trust, | ||||
| a 2005-T20, E, FRN, 5.126%, 10/12/42 | 215,000 | 213,306 | ||
| a 2006-PW11, AJ, FRN, 5.436%, 3/11/39. | 350,000 | 336,572 | ||
| 2006-PW13, AJ, 5.611%, 9/11/41 | 49,345 | 49,324 | ||
| a 2007-PW16, AM, FRN, 5.717%, 6/11/40 | 750,000 | 767,977 | ||
| a CD Commercial Mortgage Trust, 2005-CD1, E, FRN, 5.45%, 7/15/44. | 215,000 | 214,778 | ||
| a CD Mortgage Trust, 2006-CD3, AJ, FRN, 5.688%, 10/15/48 | 450,000 | 265,884 | ||
| b Centerline REIT Inc., 2004-RR3, B, 144A, 5.04%, 9/21/45 | 200,000 | 181,718 | ||
| Citigroup Commercial Mortgage Trust, | ||||
| 2006-C5, AJ, 5.482%, 10/15/49 | 288,000 | 269,981 | ||
| a 2007-C6, AM, FRN, 5.711%, 12/10/49 | 200,000 | 203,222 | ||
| a,b Citigroup Mortgage Loan Trust, 2013-A, A, 144A, FRN, 3.00%, 5/25/42 | 80,275 | 80,036 | ||
| a,b Colony American Homes, | ||||
| 2014-1A, A, 144A, FRN, 1.681%, 5/17/31 | 98,779 | 98,890 | ||
| 2014-1A, C, 144A, FRN, 2.381%, 5/17/31 | 250,000 | 250,539 | ||
| 2014-2A, C, 144A, FRN, 2.431%, 7/17/31 | 200,000 | 200,948 | ||
| b Colony MFM Trust, 2014-1, A, 144A, 2.543%, 4/20/50 | 225,657 | 225,126 | ||
| b COMM Mortgage Trust, 2012-9W57, A, 144A, 2.365%, 2/10/29 | 395,000 | 395,861 | ||
| a Commercial Mortgage Trust, | ||||
| 2005-GG5, AJ, FRN, 5.459%, 4/10/37. | 8,088 | 8,082 | ||
| 2006-GG7, AJ, FRN, 5.758%, 7/10/38. | 195,000 | 180,041 | ||
| b 2014-BBG, A, 144A, FRN, 1.325%, 3/15/29 | 550,000 | 544,830 | ||
| a Conseco Finance Securitizations Corp., 2002-2, M1, FRN, 7.424%, 3/01/33 | 450,000 | 503,994 | ||
| Conseco Financial Corp., | ||||
| a 1997-3, A7, FRN, 7.64%, 3/15/28 | 178,305 | 185,796 | ||
| 1998-6, A8, 6.66%, 6/01/30 | 224,794 | 241,423 | ||
| b Core Industrial Trust, 2015-CALW, A, 144A, 3.04%, 2/10/34 | 250,000 | 263,558 | ||
| b CountryPlace Manufactured Housing Contract Trust, 2007-1, A3, 144A, 5.593%, 7/15/37. | 98,047 | 98,342 | ||
14 Annual Report
franklintempleton.com
FRANKLIN STRATEGIC MORTGAGE PORTFOLIO
STATEMENT OF INVESTMENTS
| Principal | ||||
| Amount | Value | |||
| Asset-Backed Securities and Commercial Mortgage-Backed | ||||
| Securities (continued) | ||||
| Finance (continued) | ||||
| CSAIL Commercial Mortgage Trust, 2015-C1, A4, 3.505%, 4/15/50 | $ | 430,000 | $ | 464,286 |
| a,b CSMC, 2009-15R, 3A1, 144A, FRN, 2.965%, 3/26/36 | 75,241 | 74,674 | ||
| a,b CSMC Trust, 2014-OAK1, 1A1, 144A, FRN, 3.00%, 11/25/29 | 201,952 | 207,112 | ||
| a,d CWABS Asset-Backed Certificates Trust, 2004-7, MV3, FRN, 1.575%, 12/25/34 | 68,556 | 68,410 | ||
| a CWABS Inc. Asset-Backed Certificates, 2004-1, M1, FRN, 1.275%, 3/25/34 | 134,345 | 130,365 | ||
| a,b Eleven Madison Trust Mortgage Trust, 2015-11MD, A, 144A, FRN, 3.555%, 9/10/35 | 400,000 | 434,512 | ||
| a Fannie Mae Connecticut Avenue Securities, | ||||
| 2014-C02, 2M1, FRN, 1.475%, 5/25/24 | 83,607 | 83,634 | ||
| 2014-C02, 2M2, FRN, 3.125%, 5/25/24 | 400,000 | 397,900 | ||
| a FHLMC Structured Agency Credit Risk Debt Notes, | ||||
| 2014-DN1, M2, FRN, 2.725%, 2/25/24 | 250,000 | 256,812 | ||
| 2014-DN3, M2, FRN, 2.925%, 8/25/24 | 119,950 | 120,696 | ||
| 2014-DN3, M3, FRN, 4.525%, 8/25/24 | 250,000 | 261,883 | ||
| 2014-DN4, M2, FRN, 2.925%, 10/25/24 | 163,233 | 164,100 | ||
| 2014-DN4, M3, FRN, 5.075%, 10/25/24 | 250,000 | 265,457 | ||
| 2014-HQ1, M2, FRN, 3.025%, 8/25/24 | 250,000 | 254,078 | ||
| 2014-HQ2, M2, FRN, 2.725%, 9/25/24 | 250,000 | 257,893 | ||
| 2014-HQ3, M2, FRN, 3.175%, 10/25/24 | 190,835 | 193,106 | ||
| 2015-DN1, M2, FRN, 2.925%, 1/25/25 | 198,280 | 200,070 | ||
| 2015-DN1, M3, FRN, 4.675%, 1/25/25 | 250,000 | 264,786 | ||
| 2015-DNA1, M2, FRN, 2.375%, 10/25/27 | 250,000 | 254,424 | ||
| 2015-DNA2, M2, FRN, 3.125%, 12/25/27 | 250,000 | 255,330 | ||
| d 2015-DNA3, B, FRN, 9.875%, 4/25/28. | 249,984 | 263,859 | ||
| 2015-HQ1, M1, FRN, 1.575%, 3/25/25 | 30,405 | 30,420 | ||
| 2015-HQ1, M2, FRN, 2.725%, 3/25/25 | 250,000 | 253,402 | ||
| 2015-HQ1, M3, FRN, 4.325%, 3/25/25 | 250,000 | 264,674 | ||
| 2015-HQA1, B, FRN, 9.325%, 3/25/28 | 249,988 | 250,268 | ||
| 2015-HQA1, M2, FRN, 3.175%, 3/25/28 | 250,000 | 255,943 | ||
| 2016-HQ1, M1, FRN, 2.275%, 9/25/28 | 238,873 | 239,993 | ||
| a FNMA, 2007-1, NF, FRN, 0.775%, 2/25/37 | 155,837 | 155,183 | ||
| b G-Force LLC, | ||||
| 2005-RRA, B, 144A, 5.09%, 8/22/36 | 112,627 | 112,391 | ||
| 2005-RRA, C, 144A, 5.20%, 8/22/36 | 300,000 | 290,811 | ||
| d GMAC Commercial Mortgage Securities Inc. Trust, 2005-C1, B, 4.936%, 5/10/43 | 711,268 | 119,828 | ||
| Green Tree Financial Corp., | ||||
| 1996-9, M1, 7.63%, 8/15/27 | 250,792 | 273,440 | ||
| 1997-3, A6, 7.32%, 3/15/28 | 12,574 | 13,067 | ||
| 1997-6, A7, 7.14%, 1/15/29 | 1,650 | 1,652 | ||
| 1998-4, A7, 6.87%, 4/01/30 | 98,582 | 106,183 | ||
| a Greenwich Capital Commercial Funding Corp., 2006-GG7, AM, FRN, 5.758%, 7/10/38 | 87,429 | 87,342 | ||
| a GSAA Home Equity Trust, FRN, 0.895%, 6/25/35 | 119,392 | 114,881 | ||
| a GSAMP Trust, 2005-HE3, M2, FRN, 1.53%, 6/25/35 | 175,202 | 173,230 | ||
| a,b Hilton USA Trust, 2013-HLF, BFL, 144A, FRN, 2.023%, 11/05/30. | 226,679 | 226,685 | ||
| a Home Equity Mortgage Trust, 2004-4, M3, FRN, 1.50%, 12/25/34 | 538,455 | 513,669 | ||
| a,b Invitation Homes Trust, | ||||
| 2014-SFR1, B, 144A, FRN, 2.031%, 6/17/31 | 250,000 | 250,426 | ||
| 2014-SFR2, B, 144A, FRN, 2.131%, 9/17/31 | 200,000 | 200,439 | ||
| 2014-SFR3, C, 144A, FRN, 3.031%, 12/17/31 | 250,000 | 252,236 | ||
| 2015-SFR2, A, 144A, FRN, 1.877%, 6/17/32 | 244,710 | 246,188 | ||
| 2015-SFR2, C, 144A, FRN, 2.527%, 6/17/32 | 200,000 | 200,572 | ||
| 2015-SFR3, C, 144A, FRN, 2.531%, 8/17/32 | 225,000 | 225,671 | ||
franklintempleton.com
Annual Report
15
FRANKLIN STRATEGIC MORTGAGE PORTFOLIO
STATEMENT OF INVESTMENTS
| Principal | ||||
| Amount | Value | |||
| Asset-Backed Securities and Commercial Mortgage-Backed | ||||
| Securities (continued) | ||||
| Finance (continued) | ||||
| JP Morgan Chase Commercial Mortgage Securities Trust, | ||||
| a,b 2003-LN1, H, 144A, FRN, 5.773%, 10/15/37 | $ | 96,036 | $ | 96,239 |
| a 2005-LDP5, E, FRN, 5.735%, 12/15/44 | 300,000 | 298,932 | ||
| a 2005-LPD5, F, FRN, 5.735%, 12/15/44 | 250,000 | 248,508 | ||
| a,d 2006-CB16, B, FRN, 5.672%, 5/12/45 | 240,000 | 100,356 | ||
| 2006-CB17, AM, 5.464%, 12/12/43 | 490,000 | 490,676 | ||
| a,d 2006-LDP7, AJ, FRN, 6.116%, 4/17/45 | 143,000 | 107,519 | ||
| a,b JP Morgan Mortgage Trust, 2013-3, A3, 144A, FRN, 3.434%, 7/25/43 | 272,291 | 280,885 | ||
| a JPMBB Commercial Mortgage Securities Trust, 2014-C24, AS, FRN, 3.914%, 11/15/47. | 250,000 | 271,909 | ||
| a LB-UBS Commercial Mortgage Trust, | ||||
| b,d 2001-C3, E, 144A, FRN, 6.95%, 6/15/36 | 300,000 | 303,189 | ||
| 2006-C1, AJ, FRN, 5.276%, 2/15/41 | 299,851 | 299,809 | ||
| 2006-C4, AJ, FRN, 6.08%, 6/15/38 | 12,622 | 12,651 | ||
| a Lehman XS Trust, 2005-1, 2A2, FRN, 2.023%, 7/25/35 | 98,999 | 95,499 | ||
| b LNR CDO Ltd., | ||||
| a 2002-1A, DFL, 144A, FRN, 1.925%, 7/24/37 | 39,072 | 39,142 | ||
| 2002-1A, DFX, 144A, 6.727%, 7/24/37 | 62,721 | 62,872 | ||
| a,b Mach One ULC, | ||||
| 2004-1A, K, 144A, FRN, 5.45%, 5/28/40 | 125,000 | 125,741 | ||
| 2004-1A, L, 144A, FRN, 5.45%, 5/28/40 | 125,000 | 125,087 | ||
| a Madison Avenue Manufactured Housing Contract Trust, 2002-A, B1, FRN, 3.775%, 3/25/32 | 181,269 | 183,905 | ||
| a Merrill Lynch Mortgage Investors Trust, | ||||
| 2003-A, 1A, FRN, 1.265%, 3/25/28 | 225,195 | 214,758 | ||
| 2004-A1, M1, FRN, 2.828%, 2/25/34. | 222,411 | 178,188 | ||
| a Merrill Lynch Mortgage Trust, 2005-CKI1, D, FRN, 5.346%, 11/12/37 | 112,107 | 109,673 | ||
| a,b Mill City Mortgage Loan Trust, 2016-1, A, 144A, FRN, 2.50%, 4/25/57 | 196,893 | 198,460 | ||
| a Morgan Stanley ABS Capital I Inc. Trust, 2005-WMC, M2, FRN, 1.26%, 1/25/35 | 208,716 | 206,061 | ||
| Morgan Stanley Capital I Trust, | ||||
| b 2005-RR6, B, 144A, 5.306%, 5/24/43 | 260,233 | 256,278 | ||
| a 2006-HQ8, AJ, FRN, 5.422%, 3/12/44 | 139,282 | 139,965 | ||
| a Novastar Home Equity Loan, 2004-4, M4, FRN, 2.175%, 3/25/35 | 341,829 | 340,024 | ||
| Oakwood Mortgage Investors Inc., 1999-A, A3, 6.09%, 4/15/29 | 238,206 | 241,148 | ||
| a,b Progress Residential Trust, 2015-SFR1, A, 144A, FRN, 1.931%, 2/17/32 | 363,391 | 365,158 | ||
| Residential Asset Securities Corp., 2004-KS8, AI6, 4.79%, 9/25/34 | 51,383 | 51,785 | ||
| a Residential Funding Mortgage Securities II, | ||||
| 2002-HI5, M1, FRN, 6.14%, 1/25/28 | 19,203 | 19,133 | ||
| 2003-HI2, M2, FRN, 5.58%, 7/25/28 | 64,799 | 64,898 | ||
| 2004-HI3, A5, FRN, 5.48%, 6/25/34 | 96,030 | 99,818 | ||
| a,b Silver Bay Realty Trust, 2014-1, A, 144A, FRN, 1.531%, 9/17/31 | 188,344 | 187,275 | ||
| a,b Springleaf Mortgage Loan Trust, 2013-1A, M4, 144A, FRN, 4.44%, 6/25/58 | 400,000 | 401,326 | ||
| a,b SWAY Residential 2014-1 Trust, 2014-1, A, 144A, FRN, 1.831%, 1/17/32 | 247,683 | 248,216 | ||
| a,b Tricon American Homes Trust, | ||||
| 2015-SFR1, A, 144A, FRN, 1.781%, 5/17/32 | 248,833 | 248,627 | ||
| 2015-SFR1, C, 144A, FRN, 2.431%, 5/17/32 | 200,000 | 198,497 | ||
| a Wachovia Bank Commercial Mortgage Trust, | ||||
| b 2003-C7, F, 144A, FRN, 6.112%, 10/15/35. | 74,311 | 74,624 | ||
| 2006-C25, C, FRN, 6.01%, 5/15/43. | 400,000 | 399,117 | ||
| a WaMu Mortgage Pass-Through Certificates, | ||||
| 2005-AR8, 1A1A, FRN, 0.815%, 7/25/45 | 156,006 | 149,281 | ||
| 2005-AR19, A1A1, FRN, 0.795%, 12/25/45 | 306,845 | 293,234 | ||
16 Annual Report
franklintempleton.com
FRANKLIN STRATEGIC MORTGAGE PORTFOLIO
STATEMENT OF INVESTMENTS
| Principal | ||||
| Amount | Value | |||
| Asset-Backed Securities and Commercial Mortgage-Backed | ||||
| Securities (continued) | ||||
| Finance (continued) | ||||
| Wells Fargo Mortgage Backed Securities Trust, | ||||
| a 2004-W, A9, FRN, 2.816%, 11/25/34 | $ | 144,603 | $ | 146,761 |
| a 2005-AR9, 2A2, FRN, 3.037%, 10/25/33 | 203,023 | 200,505 | ||
| a 2005-AR10, 2A3, FRN, 2.956%, 6/25/35 | 132,295 | 132,028 | ||
| 2007-3, 3A1, 5.50%, 4/25/22 | 28,204 | 28,929 | ||
| Total Asset-Backed Securities and Commercial Mortgage-Backed Securities | ||||
| (Cost $25,090,713) | 24,895,151 | |||
| Mortgage-Backed Securities 76.8% | ||||
| a Federal Home Loan Mortgage Corp. (FHLMC) Adjustable Rate 3.4% | ||||
| FHLMC, 2.807%, 11/01/37 | 1,309,705 | 1,380,493 | ||
| FHLMC, 3.068%, 6/01/37 | 2,064,331 | 2,189,567 | ||
| 3,570,060 | ||||
| Federal Home Loan Mortgage Corp. (FHLMC) Fixed Rate 36.4% | ||||
| e FHLMC Gold 30 Year, 3.00%, 10/01/46. | 6,300,000 | 6,548,445 | ||
| FHLMC Gold 30 Year, 3.50%, 4/01/46 | 2,196,714 | 2,318,150 | ||
| FHLMC Gold 30 Year, 3.50%, 5/01/46 | 2,221,962 | 2,344,923 | ||
| FHLMC Gold 30 Year, 3.50%, 6/01/46 | 2,362,379 | 2,493,655 | ||
| FHLMC Gold 30 Year, 3.50%, 10/01/46. | 7,030,000 | 7,435,915 | ||
| FHLMC Gold 30 Year, 4.00%, 4/01/46 | 5,454,489 | 5,854,600 | ||
| FHLMC Gold 30 Year, 4.00%, 5/01/46 | 2,742,491 | 2,943,893 | ||
| FHLMC Gold 30 Year, 4.00%, 10/01/46. | 5,500,000 | 5,930,322 | ||
| FHLMC Gold 30 Year, 4.50%, 4/01/40 | 821,288 | 902,992 | ||
| FHLMC Gold 30 Year, 5.00%, 10/01/33 - 2/01/39 | 554,618 | 614,937 | ||
| FHLMC Gold 30 Year, 5.50%, 9/01/33 | 57,551 | 65,505 | ||
| FHLMC Gold 30 Year, 6.00%, 7/01/28 - 11/01/36 | 172,631 | 198,152 | ||
| FHLMC Gold 30 Year, 6.50%, 2/01/19 - 7/01/32 | 108,156 | 123,731 | ||
| FHLMC Gold 30 Year, 7.50%, 10/01/25 - 8/01/32 | 297,779 | 336,038 | ||
| FHLMC Gold 30 Year, 8.00%, 7/01/24 - 5/01/30 | 106,886 | 115,291 | ||
| FHLMC Gold 30 Year, 8.50%, 10/01/17 - 6/01/21 | 16,504 | 16,687 | ||
| FHLMC Gold 30 Year, 9.00%, 9/01/30 | 30,827 | 31,419 | ||
| FHLMC Gold 30 Year, 9.50%, 12/01/19 - 4/01/25 | 37,267 | 37,635 | ||
| FHLMC PC 30 Year, 8.50%, 5/01/17. | 20,824 | 21,021 | ||
| 38,333,311 | ||||
| a Federal National Mortgage Association (FNMA) Adjustable Rate 15.3% | ||||
| FNMA, 1.899% - 2.202%, 1/01/18 - 4/01/37 | 398,663 | 406,579 | ||
| FNMA, 2.272%, 1/01/34 | 661,331 | 683,877 | ||
| FNMA, 2.305% - 2.45%, 1/01/23 - 7/01/34 | 859,826 | 886,571 | ||
| FNMA, 2.45% - 2.516%, 4/01/18 - 8/01/34 | 961,993 | 1,013,781 | ||
| FNMA, 2.527% - 2.578%, 7/01/19 - 11/01/34. | 323,993 | 334,594 | ||
| FNMA, 2.597%, 4/01/41 | 2,533,389 | 2,652,024 | ||
| FNMA, 2.615% - 2.77%, 5/01/22 - 4/01/37 | 955,919 | 983,566 | ||
| FNMA, 2.775% - 2.778%, 8/01/29 - 6/01/31 | 285,344 | 297,755 | ||
| FNMA, 2.801%, 9/01/34 | 1,345,572 | 1,415,823 | ||
| FNMA, 2.82% - 2.825%, 10/01/24 - 9/01/26 | 166,010 | 172,341 | ||
| FNMA, 2.829%, 9/01/39 | 1,286,334 | 1,356,900 | ||
| FNMA, 2.835% - 2.875%, 1/01/22 - 4/01/37 | 847,921 | 891,633 | ||
| FNMA, 2.875% - 2.933%, 10/01/19 - 7/01/38. | 420,465 | 429,488 | ||
| FNMA, 2.941%, 9/01/37 | 1,580,012 | 1,671,556 | ||
franklintempleton.com
Annual Report
17
FRANKLIN STRATEGIC MORTGAGE PORTFOLIO
STATEMENT OF INVESTMENTS
| Principal | ||||
| Amount | Value | |||
| Mortgage-Backed Securities (continued) | ||||
| a Federal National Mortgage Association (FNMA) Adjustable Rate (continued) | ||||
| FNMA, 2.96% - 2.965%, 1/01/22 - 10/01/32 | $ | 174,406 | $ | 178,202 |
| FNMA, 2.987%, 6/01/35 | 2,121,504 | 2,239,178 | ||
| FNMA, 3.00% - 3.75%, 6/01/17 - 6/01/34 | 487,449 | 498,182 | ||
| 16,112,050 | ||||
| Federal National Mortgage Association (FNMA) Fixed Rate 11.8% | ||||
| FNMA 15 Year, 5.00%, 6/01/18 - 7/01/18 | 186,963 | 192,229 | ||
| FNMA 15 Year, 5.50%, 11/01/16 - 2/01/18. | 53,670 | 54,521 | ||
| e FNMA 30 Year, 3.00%, 10/01/46 | 6,885,000 | 7,158,786 | ||
| FNMA 30 Year, 5.00%, 4/01/34 | 164,081 | 182,880 | ||
| FNMA 30 Year, 5.50%, 9/01/33 - 11/01/33. | 897,498 | 1,017,190 | ||
| FNMA 30 Year, 5.50%, 11/01/34 - 11/01/35 | 571,274 | 651,005 | ||
| FNMA 30 Year, 6.00%, 12/01/23 - 10/01/34 | 458,651 | 534,190 | ||
| FNMA 30 Year, 6.00%, 10/01/34 - 5/01/35. | 717,669 | 830,405 | ||
| FNMA 30 Year, 6.00%, 7/01/35 - 8/01/35 | 327,859 | 378,674 | ||
| FNMA 30 Year, 6.50%, 12/01/27 - 8/01/32. | 906,408 | 1,045,675 | ||
| FNMA 30 Year, 7.50%, 8/01/25 - 5/01/32 | 31,386 | 37,631 | ||
| FNMA 30 Year, 8.00%, 1/01/25 - 7/01/31 | 26,992 | 31,342 | ||
| FNMA 30 Year, 8.50%, 11/01/26 - 11/01/28 | 186,751 | 206,071 | ||
| FNMA 30 Year, 9.00%, 12/01/17 - 4/01/25. | 2,142 | 2,427 | ||
| FNMA 30 Year, 9.50%, 11/01/21 - 4/01/30. | 46,608 | 50,096 | ||
| FNMA 30 Year, 10.00%, 11/01/18 - 4/01/21 | 12,398 | 12,828 | ||
| FNMA 30 Year, 10.50%, 5/01/30 | 3,741 | 3,760 | ||
| FNMA PL 30 Year, 10.00%, 9/01/20 | 10,211 | 10,530 | ||
| 12,400,240 | ||||
| Government National Mortgage Association (GNMA) Fixed Rate 9.9% | ||||
| GNMA I SF 30 Year, 6.50%, 1/15/24 - 9/15/32 | 141,894 | 163,771 | ||
| GNMA I SF 30 Year, 7.00%, 5/15/17 - 2/15/32 | 73,613 | 78,460 | ||
| GNMA I SF 30 Year, 7.50%, 10/15/23 - 10/15/29 | 39,823 | 42,940 | ||
| GNMA I SF 30 Year, 8.00%, 1/15/17 - 9/15/27 | 54,791 | 61,231 | ||
| GNMA I SF 30 Year, 8.25%, 2/15/21 - 5/15/21 | 29,934 | 30,061 | ||
| GNMA I SF 30 Year, 8.50%, 3/15/17 - 7/15/24 | 50,038 | 50,940 | ||
| GNMA I SF 30 Year, 9.00%, 8/15/28. | 997 | 1,000 | ||
| GNMA I SF 30 Year, 10.00%, 12/15/18 | 2,277 | 2,290 | ||
| e GNMA II SF 30 Year, 3.00%, 10/01/46 | 4,835,000 | 5,066,174 | ||
| GNMA II SF 30 Year, 3.50%, 3/20/46 | 1,513,928 | 1,610,273 | ||
| GNMA II SF 30 Year, 3.50%, 6/20/46 | 2,202,735 | 2,344,102 | ||
| GNMA II SF 30 Year, 3.50%, 7/20/46 | 585,550 | 623,252 | ||
| GNMA II SF 30 Year, 6.50%, 1/20/26 - 1/20/33 | 211,129 | 252,036 | ||
| GNMA II SF 30 Year, 7.50%, 11/20/22 - 7/20/32 | 128,932 | 151,635 | ||
| GNMA II SF 30 Year, 8.00%, 1/20/17 - 8/20/26 | 2,483 | 2,516 | ||
| GNMA II SF 30 Year, 9.00%, 11/20/19 - 3/20/25 | 1,300 | 1,392 | ||
| GNMA II SF 30 Year, 10.50%, 6/20/20 | 12 | 12 | ||
| 10,482,085 | ||||
| Total Mortgage-Backed Securities (Cost $80,114,950) | 80,897,746 | |||
| Total Investments before Short Term Investments (Cost $112,773,169) | 113,460,362 | |||
18 Annual Report
franklintempleton.com
FRANKLIN STRATEGIC MORTGAGE PORTFOLIO
STATEMENT OF INVESTMENTS
| Shares | Value | ||||
| Short Term Investments 10.0% | |||||
| Money Market Funds (Cost $5,250,982) 5.0% | |||||
| f,g Institutional Fiduciary Trust Money Market Portfolio | 5,250,982 | $ | 5,250,982 | ||
| Principal | |||||
| Amount | |||||
| Repurchase Agreements (Cost $5,277,019) 5.0% | |||||
| h Joint Repurchase Agreement, 0.463%, 10/03/16 (Maturity Value $5,277,223) | |||||
| BNP Paribas Securities Corp. (Maturity Value $2,147,777) | |||||
| Deutsche Bank Securities Inc. (Maturity Value $928,000) | |||||
| HSBC Securities (USA) Inc. (Maturity Value $2,147,777) | |||||
| Merrill Lynch, Pierce, Fenner & Smith Inc. (Maturity Value $53,669) | |||||
| Collateralized by U.S. Government Agency Securities, 1.00% - 5.375%, 3/08/17 - 8/12/21; iU.S. | |||||
| Treasury Bill, 10/06/16 - 8/17/17; U.S. Treasury Bond, 7.50% - 8.875%, 11/15/16 - 2/15/21; and U.S. | |||||
| Treasury Note, 0.338% - 4.625%, 10/31/16 - 6/30/21; (valued at $5,384,111) | $ | 5,277,019 | 5,277,019 | ||
| Total Investments (Cost $123,301,170) 117.7% | 123,988,363 | ||||
| Other Assets, less Liabilities (17.7)% | (18,633,650 | ) | |||
| Net Assets 100.0% | $ | 105,354,713 | |||
aThe coupon rate shown represents the rate at period end.
bSecurity was purchased pursuant to Rule 144A under the Securities Act of 1933 and may be sold in transactions exempt from registration only to qualified institutional buyers
or in a public offering registered under the Securities Act of 1933. These securities have been deemed liquid under guidelines approved by the Fund’s Board of Trustees. At
September 30, 2016, the aggregate value of these securities was $8,850,251, representing 8.4% of net assets.
cSee Note 7 regarding defaulted securities.
dThe bond pays interest and/or principal based upon the issuer’s ability to pay, which may be less than the stated interest rate or principal paydown.
eSecurity purchased on a to-be-announced (TBA) basis. See Note 1(d).
fNon-income producing.
gSee Note 3(f) regarding investments in affiliated management investment companies.
hSee Note 1(c) regarding joint repurchase agreement.
iThe security was issued on a discount basis with no stated coupon rate.
| At September 30, 2016, the Fund had the following financial futures contracts outstanding. See Note 1(e). | ||||||||
| Financial Futures Contracts | ||||||||
| Number of | Notional | Expiration | Unrealized | Unrealized | ||||
| Description | Type | Contracts | Value | Date | Appreciation | Depreciation | ||
| Interest Rate Contracts | ||||||||
| CME Ultra Long Term U.S. Treasury Bond. | Short | 5 | $ | 919,375 | 12/20/16 | $ | 18,424 | $ — |
| Net unrealized appreciation (depreciation) | $ | 18,424 | ||||||
See Abbreviations on page 33.
franklintempleton.com
The accompanying notes are an integral part of these financial statements. | Annual Report 19
FRANKLIN STRATEGIC MORTGAGE PORTFOLIO
Financial Statements
Statement of Assets and Liabilities
September 30, 2016
| Assets: | |||
| Investments in securities: | |||
| Cost - Unaffiliated issuers | $ | 112,773,169 | |
| Cost - Non-controlled affiliates (Note 3f) | 5,250,982 | ||
| Cost - Repurchase agreements | 5,277,019 | ||
| Total cost of investments | $ | 123,301,170 | |
| Value - Unaffiliated issuers | $ | 113,460,362 | |
| Value - Non-controlled affiliates (Note 3f) | 5,250,982 | ||
| Value - Repurchase agreements | 5,277,019 | ||
| Total value of investments | 123,988,363 | ||
| Receivables: | |||
| Investment securities sold | 2,138,077 | ||
| Capital shares sold | 67,883 | ||
| Dividends and interest | 307,386 | ||
| Due from brokers. | 23,000 | ||
| Variation margin | 10,781 | ||
| Other assets | 30 | ||
| Total assets | 126,535,520 | ||
| Liabilities: | |||
| Payables: | |||
| Investment securities purchased | 20,801,517 | ||
| Capital shares redeemed | 218,848 | ||
| Management fees | 33,157 | ||
| Distribution fees | 24,205 | ||
| Transfer agent fees | 21,108 | ||
| Distributions to shareholders | 16,415 | ||
| Accrued expenses and other liabilities | 65,557 | ||
| Total liabilities | 21,180,807 | ||
| Net assets, at value | $ | 105,354,713 | |
| Net assets consist of: | |||
| Paid-in capital | $ | 122,242,530 | |
| Distributions in excess of net investment income | (37,456 | ) | |
| Net unrealized appreciation (depreciation) | 705,648 | ||
| Accumulated net realized gain (loss) | (17,556,009 | ) | |
| Net assets, at value | $ | 105,354,713 |
20 Annual Report | The accompanying notes are an integral part of these financial statements.
franklintempleton.com
FRANKLIN STRATEGIC MORTGAGE PORTFOLIO
FINANCIAL STATEMENTS
| Statement of Assets and Liabilities (continued) | ||
| September 30, 2016 | ||
| Class A: | ||
| Net assets, at value | $ | 34,190,991 |
| Shares outstanding | 3,571,731 | |
| Net asset value per sharea | $ | 9.57 |
| Maximum offering price per share (net asset value per share ÷ 95.75%) | $ | 9.99 |
| Class A1: | ||
| Net assets, at value | $ | 53,431,813 |
| Shares outstanding | 5,578,590 | |
| Net asset value per sharea | $ | 9.58 |
| Maximum offering price per share (net asset value per share ÷ 95.75%) | $ | 10.01 |
| Class C: | ||
| Net assets, at value | $ | 9,468,307 |
| Shares outstanding | 988,976 | |
| Net asset value and maximum offering price per sharea | $ | 9.57 |
| Advisor Class: | ||
| Net assets, at value | $ | 8,263,602 |
| Shares outstanding | 863,914 | |
| Net asset value and maximum offering price per share | $ | 9.57 |
aRedemption price is equal to net asset value less contingent deferred sales charges, if applicable.
franklintempleton.com
The accompanying notes are an integral part of these financial statements. | Annual Report 21
| FRANKLIN STRATEGIC MORTGAGE PORTFOLIO | |||
| FINANCIAL STATEMENTS | |||
| Statement of Operations | |||
| for the year ended September 30, 2016 | |||
| Investment income: | |||
| Dividends | $ | 77,011 | |
| Interest | 2,868,832 | ||
| Paydown gain (loss) | (320,882 | ) | |
| Total investment income | 2,624,961 | ||
| Expenses: | |||
| Management fees (Note 3a) | 426,415 | ||
| Distribution fees: (Note 3c) | |||
| Class A | 77,565 | ||
| Class C | 46,122 | ||
| Transfer agent fees: (Note 3e) | |||
| Class A | 39,224 | ||
| Class A1 | 71,659 | ||
| Class C | 8,956 | ||
| Advisor Class | 15,048 | ||
| Custodian fees (Note 4) | 1,393 | ||
| Reports to shareholders. | 30,945 | ||
| Registration and filing fees | 76,195 | ||
| Professional fees | 60,140 | ||
| Trustees’ fees and expenses | 3,670 | ||
| Other | 63,238 | ||
| Total expenses | 920,570 | ||
| Expense reductions (Note 4) | (36 | ) | |
| Expenses waived/paid by affiliates (Note 3f) | (13,121 | ) | |
| Net expenses | 907,413 | ||
| Net investment income | 1,717,548 | ||
| Realized and unrealized gains (losses): | |||
| Net realized gain (loss) from: | |||
| Investments | 2,217,237 | ||
| Foreign currency transactions | 30,740 | ||
| Futures contracts. | 339,406 | ||
| Net realized gain (loss) | 2,587,383 | ||
| Net change in unrealized appreciation (depreciation) on: | |||
| Investments | (822,562 | ) | |
| Translation of other assets and liabilities | |||
| denominated in foreign currencies | (29,468 | ) | |
| Futures contracts. | (65,700 | ) | |
| Net change in unrealized appreciation (depreciation) | (917,730 | ) | |
| Net realized and unrealized gain (loss) | 1,669,653 | ||
| Net increase (decrease) in net assets resulting from operations | $ | 3,387,201 | |
22 Annual Report | The accompanying notes are an integral part of these financial statements.
franklintempleton.com
| FRANKLIN STRATEGIC MORTGAGE PORTFOLIO | ||||||
| FINANCIAL STATEMENTS | ||||||
| Statements of Changes in Net Assets | ||||||
| Year Ended September 30, | ||||||
| 2016 | 2015 | |||||
| Increase (decrease) in net assets: | ||||||
| Operations: | ||||||
| Net investment income. | $ | 1,717,548 | $ | 1,866,391 | ||
| Net realized gain (loss) | 2,587,383 | 1,457,566 | ||||
| Net change in unrealized appreciation (depreciation) | (917,730 | ) | (645,304 | ) | ||
| Net increase (decrease) in net assets resulting from operations | 3,387,201 | 2,678,653 | ||||
| Distributions to shareholders from: | ||||||
| Net investment income: | ||||||
| Class A | (651,156 | ) | (361,427 | ) | ||
| Class A1. | (1,326,336 | ) | (1,550,020 | ) | ||
| Class C | (121,974 | ) | (57,702 | ) | ||
| Advisor Class | (277,140 | ) | (269,405 | ) | ||
| Total distributions to shareholders. | (2,376,606 | ) | (2,238,554 | ) | ||
| Capital share transactions: (Note 2) | ||||||
| Class A | 7,566,588 | 16,373,968 | ||||
| Class A1. | (6,429,412 | ) | (5,324,027 | ) | ||
| Class C | 5,319,994 | 1,650,264 | ||||
| Advisor Class | (4,510,111 | ) | 3,555,241 | |||
| Total capital share transactions | 1,947,059 | 16,255,446 | ||||
| Net increase (decrease) in net assets | 2,957,654 | 16,695,545 | ||||
| Net assets: | ||||||
| Beginning of year | 102,397,059 | 85,701,514 | ||||
| End of year | $ | 105,354,713 | $ | 102,397,059 | ||
| Undistributed net investment income included in net assets: | ||||||
| End of year | $ | — | $ | 12,660 | ||
| Distributions in excess of net investment income included in net assets: | ||||||
| End of year | $ | (37,456 | ) | $ | — | |
franklintempleton.com
The accompanying notes are an integral part of these financial statements. | Annual Report 23
FRANKLIN STRATEGIC MORTGAGE PORTFOLIO
Notes to Financial Statements
1. Organization and Significant Accounting Policies
Franklin Strategic Mortgage Portfolio (Trust) is registered under the Investment Company Act of 1940 (1940 Act) as an open-end management investment company, consisting of one fund, Franklin Strategic Mortgage Portfolio (Fund) and applies the specialized accounting and reporting guidance in U.S. Generally Accepted Accounting Principles (U.S. GAAP). The Fund offers four classes of shares: Class A, Class A1, Class C and Advisor Class. Each class of shares differs by its initial sales load, contingent deferred sales charges, voting rights on matters affecting a single class, its exchange privilege and fees primarily due to differing arrangements for distribution and transfer agent fees.
The following summarizes the Fund’s significant accounting policies.
a. Financial Instrument Valuation
The Fund’s investments in financial instruments are carried at fair value daily. Fair value is the price that would be received to sell an asset or paid to transfer a liability in an orderly transaction between market participants on the measurement date. The Fund calculates the net asset value (NAV) per share as of 4 p.m. Eastern time each day the New York Stock Exchange (NYSE) is open for trading. Under compliance policies and procedures approved by the Fund’s Board of Trustees (the Board), the Fund’s administrator has responsibility for oversight of valuation, including leading the cross-functional Valuation Committee (VC). The VC provides administration and oversight of the Fund’s valuation policies and procedures, which are approved annually by the Board. Among other things, these procedures allow the Fund to utilize independent pricing services, quotations from securities and financial instrument dealers, and other market sources to determine fair value.
Equity securities and derivative financial instruments listed on an exchange or on the NASDAQ National Market System are valued at the last quoted sale price or the official closing price of the day, respectively. Over-the-counter (OTC) securities are valued within the range of the most recent quoted bid and ask prices. Securities that trade in multiple markets or on multiple exchanges are valued according to the broadest and most representative market. Certain equity securities are valued based upon fundamental characteristics or relationships to similar securities.
Debt securities generally trade in the OTC market rather than on a securities exchange. The Fund’s pricing services use multiple valuation techniques to determine fair value. In instances where sufficient market activity exists, the pricing services may utilize a market-based approach through which quotes from market makers are used to determine fair value. In instances where sufficient market activity may not exist or is limited, the pricing services also utilize proprietary valuation models which may consider market characteristics such as benchmark yield curves, credit spreads, estimated default rates, anticipated market interest rate volatility, coupon rates, anticipated timing of principal repayments, underlying collateral, and other unique security features in order to estimate the relevant cash flows, which are then discounted to calculate the fair value.
Investments in open-end mutual funds are valued at the closing NAV. Investments in repurchase agreements are valued at cost, which approximates fair value.
The Fund has procedures to determine the fair value of financial instruments for which market prices are not reliable or readily available. Under these procedures, the VC convenes on a regular basis to review such financial instruments and considers a number of factors, including significant unobservable valuation inputs, when arriving at fair value. The VC primarily employs a market-based approach which may use related or comparable assets or liabilities, recent transactions, market multiples, book values, and other relevant information for the investment to determine the fair value of the investment. An income-based valuation approach may also be used in which the anticipated future cash flows of the investment are discounted to calculate fair value. Discounts may also be applied due to the nature or duration of any restrictions on the disposition of the investments. Due to the inherent uncertainty of valuations of such investments, the fair values may differ significantly from the values that would have been used had an active market existed. The VC employs various methods for calibrating these valuation approaches including a regular review of key inputs and assumptions, transactional back-testing or disposition analysis, and reviews of any related market activity.
b. Foreign Currency Translation
Portfolio securities and other assets and liabilities denominated in foreign currencies are translated into U.S. dollars based on the exchange rate of such currencies against U.S. dollars on the date of valuation. The Fund may enter into foreign currency exchange contracts to facilitate transactions denominated in a
24 Annual Report
franklintempleton.com
FRANKLIN STRATEGIC MORTGAGE PORTFOLIO
NOTES TO FINANCIAL STATEMENTS
foreign currency. Purchases and sales of securities, income and expense items denominated in foreign currencies are translated into U.S. dollars at the exchange rate in effect on the transaction date. Portfolio securities and assets and liabilities denominated in foreign currencies contain risks that those currencies will decline in value relative to the U.S. dollar. Occasionally, events may impact the availability or reliability of foreign exchange rates used to convert the U.S. dollar equivalent value. If such an event occurs, the foreign exchange rate will be valued at fair value using procedures established and approved by the Board.
The Fund does not separately report the effect of changes in foreign exchange rates from changes in market prices on securities held. Such changes are included in net realized and unrealized gain or loss from investments in the Statement of Operations.
Realized foreign exchange gains or losses arise from sales of foreign currencies, currency gains or losses realized between the trade and settlement dates on securities transactions and the difference between the recorded amounts of dividends, interest, and foreign withholding taxes and the U.S. dollar equivalent of the amounts actually received or paid. Net unrealized foreign exchange gains and losses arise from changes in foreign exchange rates on foreign denominated assets and liabilities other than investments in securities held at the end of the reporting period.
c. Joint Repurchase Agreement
The Fund enters into a joint repurchase agreement whereby its uninvested cash balance is deposited into a joint cash account with other funds managed by the investment manager or an affiliate of the investment manager and is used to invest in one or more repurchase agreements. The value and face amount of the joint repurchase agreement are allocated to the funds based on their pro-rata interest. A repurchase agreement is accounted for as a loan by the Fund to the seller, collateralized by securities which are delivered to the Fund’s custodian. The fair value, including accrued interest, of the initial collateralization is required to be at least 102% of the dollar amount invested by the funds, with the value of the underlying securities marked to market daily to maintain coverage of at least 100%. Repurchase agreements are subject to the terms of Master Repurchase Agreements (MRAs) with approved counterparties (sellers). The MRAs contain various provisions, including but not limited to events of default and maintenance of collateral for repurchase agreements. In the event of default by either the seller or the Fund, certain MRAs may permit the non-defaulting party to net and close-out all transactions, if any, traded under such agreements. The Fund may sell securities it holds as collateral and apply the proceeds towards the repurchase price and any other amounts owed by the seller to the Fund in the event of default by the seller. This could involve costs or delays in addition to a loss on the securities if their value falls below the repurchase price owed by the seller. The joint repurchase agreement held by the Fund at year end, as indicated in the Statement of Investments, had been entered into on September 30, 2016.
d. Securities Purchased on a TBA Basis
The Fund purchases securities on a to-be-announced (TBA) basis, with payment and delivery scheduled for a future date. These transactions are subject to market fluctuations and are subject to the risk that the value at delivery may be more or less than the trade date purchase price. Sufficient assets have been segregated for these securities.
e. Derivative Financial Instruments
The Fund invested in derivative financial instruments in order to manage risk or gain exposure to various other investments or markets. Derivatives are financial contracts based on an underlying or notional amount, require no initial investment or an initial net investment that is smaller than would normally be required to have a similar response to changes in market factors, and require or permit net settlement. Derivatives contain various risks including the potential inability of the counterparty to fulfill their obligations under the terms of the contract, the potential for an illiquid secondary market, and/or the potential for market movements which expose the Fund to gains or losses in excess of the amounts shown in the Statement of Assets and Liabilities. Realized gain and loss and unrealized appreciation and depreciation on these contracts for the period are included in the Statement of Operations.
Collateral requirements differ by type of derivative. Collateral or initial margin requirements are set by the broker or exchange clearing house for exchange traded and centrally cleared derivatives. Initial margin deposited is held at the exchange and can be in the form of cash and/or securities.
The Fund entered into exchange traded financial futures contracts primarily to manage and/or gain exposure to interest rate risk. A futures contract is an agreement between the Fund and a counterparty to buy or sell an asset at a specified price on
franklintempleton.com
Annual Report
25
FRANKLIN STRATEGIC MORTGAGE PORTFOLIO
NOTES TO FINANCIAL STATEMENTS
1. Organization and Significant Accounting
Policies (continued)
e. Derivative Financial Instruments (continued)
a future date. Required initial margins are pledged by the Fund, and the daily change in fair value is accounted for as a variation margin payable or receivable in the Statement of Assets and Liabilities.
The Fund entered into OTC forward exchange contracts primarily to manage and/or gain exposure to certain foreign currencies. A forward exchange contract is an agreement between the Fund and a counterparty to buy or sell a foreign currency at a specific exchange rate on a future date.
See Note 8 regarding other derivative information.
f. Mortgage Dollar Rolls
The Fund enters into mortgage dollar rolls, typically on a TBA basis. Mortgage dollar rolls are agreements between the Fund and a financial institution where the Fund sells (or buys) mortgage-backed securities for delivery on a specified date and simultaneously contracts to repurchase (or sell) substantially similar (same type, coupon, and maturity) securities at a future date and at a predetermined price. Gains or losses are realized on the initial sale, and the difference between the repurchase price and the sale price is recorded as an unrealized gain or loss to the Fund upon entering into the mortgage dollar roll. In addition, the Fund may invest the cash proceeds that are received from the initial sale. During the period between the sale and repurchase, the Fund is not entitled to principal and interest paid on the mortgage backed securities. Transactions in mortgage dollar rolls are accounted for as purchases and sales and may result in an increase to the Fund’s portfolio turnover rate. The risks of mortgage dollar roll transactions include the potential inability of the counterparty to fulfill its obligations.
g. Income and Deferred Taxes
It is the Fund’s policy to qualify as a regulated investment company under the Internal Revenue Code. The Fund intends to distribute to shareholders substantially all of its taxable income and net realized gains to relieve it from federal income and excise taxes. As a result, no provision for U.S. federal income taxes is required.
The Fund may be subject to foreign taxation related to income received, capital gains on the sale of securities and certain foreign currency transactions in the foreign jurisdictions in which it invests. Foreign taxes, if any, are recorded based on the tax regulations and rates that exist in the foreign markets in which the Fund invests. When a capital gain tax is determined to apply, the Fund records an estimated deferred tax liability in an amount that would be payable if the securities were disposed of on the valuation date.
The Fund may recognize an income tax liability related to its uncertain tax positions under U.S. GAAP when the uncertain tax position has a less than 50% probability that it will be sustained upon examination by the tax authorities based on its technical merits. As of September 30, 2016, the Fund has determined that no tax liability is required in its financial statements related to uncertain tax positions for any open tax years (or expected to be taken in future tax years). Open tax years are those that remain subject to examination and are based on each tax jurisdiction’s statute of limitation.
h. Security Transactions, Investment Income, Expenses and Distributions
Security transactions are accounted for on trade date. Realized gains and losses on security transactions are determined on a specific identification basis. Interest income and estimated expenses are accrued daily. Amortization of premium and accretion of discount on debt securities are included in interest income. Paydown gains and losses are recorded separately on the Statement of Operations. Dividend income is recorded on the ex-dividend date. Dividends from net investment income are normally declared daily; these dividends may be reinvested or paid monthly to shareholders. Distributions to shareholders are recorded on the ex-dividend date and are determined according to income tax regulations (tax basis). Distributable earnings determined on a tax basis may differ from earnings recorded in accordance with U.S. GAAP. These differences may be permanent or temporary. Permanent differences are reclassified among capital accounts to reflect their tax character. These reclassifications have no impact on net assets or the results of operations. Temporary differences are not reclassified, as they may reverse in subsequent periods.
Net investment income, not including class specific expenses, is allocated daily to each class of shares based upon the relative value of the settled shares of each class. Realized and unrealized gains and losses are allocated daily to each class of shares based
26 Annual Report
franklintempleton.com
FRANKLIN STRATEGIC MORTGAGE PORTFOLIO
NOTES TO FINANCIAL STATEMENTS
upon the relative proportion of net assets of each class. Differences in per share distributions, by class, are generally due to differences in class specific expenses.
i. Accounting Estimates
The preparation of financial statements in accordance with U.S. GAAP requires management to make estimates and assumptions that affect the reported amounts of assets and liabilities at the date of the financial statements and the amounts of income and expenses during the reporting period. Actual results could differ from those estimates.
j. Guarantees and Indemnifications
Under the Fund’s organizational documents, its officers and trustees are indemnified by the Fund against certain liabilities arising out of the performance of their duties to the Fund.
2. Shares of Beneficial Interest
Additionally, in the normal course of business, the Fund enters into contracts with service providers that contain general indemnification clauses. The Fund’s maximum exposure under these arrangements is unknown as this would involve future claims that may be made against the Fund that have not yet occurred. Currently, the Fund expects the risk of loss to be remote.
At September 30, 2016, there were an unlimited number of shares authorized (without par value). Transactions in the Fund’s shares were as follows:
| Year Ended September 30, | ||||||||||||
| 2016 | 2015 | |||||||||||
| Shares | Amount | Shares | Amount | |||||||||
| Class A Shares: | ||||||||||||
| Shares sold | 2,195,608 | $ | 20,859,418 | 2,392,859 | $ | 22,732,268 | ||||||
| Shares issued in reinvestment of distributions | 63,407 | 602,975 | 33,994 | 323,261 | ||||||||
| Shares redeemed | (1,462,885 | ) | (13,895,805 | ) | (703,047 | ) | (6,681,561 | ) | ||||
| Net increase (decrease) | 796,130 | $ | 7,566,588 | 1,723,806 | $ | 16,373,968 | ||||||
| Class A1 Shares: | ||||||||||||
| Shares sold | 488,676 | $ | 4,639,255 | 571,587 | $ | 5,452,345 | ||||||
| Shares issued in reinvestment of distributions | 132,064 | 1,255,793 | 145,411 | 1,384,046 | ||||||||
| Shares redeemed | (1,296,056 | ) | (12,324,460 | ) | (1,278,192 | ) | (12,160,418 | ) | ||||
| Net increase (decrease) | (675,316 | ) | $ | (6,429,412 | ) | (561,194 | ) | $ | (5,324,027 | ) | ||
| Class C Shares: | ||||||||||||
| Shares sold | 762,910 | $ | 7,244,402 | 264,766 | $ | 2,516,733 | ||||||
| Shares issued in reinvestment of distributions | 11,731 | 111,692 | 5,668 | 53,916 | ||||||||
| Shares redeemed | (214,304 | ) | (2,036,100 | ) | (97,082 | ) | (920,385 | ) | ||||
| Net increase (decrease) | 560,337 | $ | 5,319,994 | 173,352 | $ | 1,650,264 | ||||||
| Advisor Class Shares: | ||||||||||||
| Shares sold | 495,713 | $ | 4,697,342 | 557,886 | $ | 5,299,324 | ||||||
| Shares issued in reinvestment of distributions | 22,802 | 216,556 | 22,277 | 211,818 | ||||||||
| Shares redeemed | (989,438 | ) | (9,424,009 | ) | (205,097 | ) | (1,955,901 | ) | ||||
| Net increase (decrease) | (470,923 | ) | $ | (4,510,111 | ) | 375,066 | $ | 3,555,241 | ||||
franklintempleton.com
Annual Report
27
FRANKLIN STRATEGIC MORTGAGE PORTFOLIO
NOTES TO FINANCIAL STATEMENTS
3. Transactions with Affiliates
Franklin Resources, Inc. is the holding company for various subsidiaries that together are referred to as Franklin Templeton Investments. Certain officers and trustees of the Fund are also officers and/or directors of the following subsidiaries:
| Subsidiary | Affiliation |
| Franklin Advisers, Inc. (Advisers) | Investment manager |
| Franklin Templeton Services, LLC (FT Services) | Administrative manager |
| Franklin Templeton Distributors, Inc. (Distributors) | Principal underwriter |
| Franklin Templeton Investor Services, LLC (Investor Services) | Transfer agent |
a. Management Fees
The Fund pays an investment management fee to Advisers based on the average daily net assets of the Fund as follows:
| Annualized Fee Rate | Net Assets | |
| 0.400 | % | First $250 million |
| 0.380 | % | Over $250 million, up to and including $500 million |
| 0.360 | % | In excess of $500 million |
For the year ended September 30, 2016, the effective investment management fee rate was 0.400% of the Fund’s average daily net assets.
b. Administrative Fees
Under an agreement with Advisers, FT Services provides administrative services to the Fund. The fee is paid by Advisers based on the Fund’s average daily net assets, and is not an additional expense of the Fund.
c. Distribution Fees
The Board has adopted distribution plans for Class A and Class C shares, pursuant to Rule 12b-1 under the 1940 Act. Under the Fund’s Class A reimbursement distribution plan, the Fund reimburses Distributors for costs incurred in connection with the servicing, sale and distribution of the Fund’s shares up to the maximum annual plan rate. Under the Class A reimbursement distribution plan, costs exceeding the maximum for the current plan year cannot be reimbursed in subsequent periods. In addition, under the Fund’s Class C compensation distribution plan, the Fund pays Distributors for costs incurred in connection with the servicing, sale and distribution of the Fund’s shares up to the maximum annual plan rate. The plan year, for purposes of monitoring compliance with the maximum annual plan rate, is February 1 through January 31.
The maximum annual plan rates, based on the average daily net assets, for each class, are as follows:
| Class A | 0.25 | % |
| Class C | 0.65 | % |
28 Annual Report
franklintempleton.com
FRANKLIN STRATEGIC MORTGAGE PORTFOLIO
NOTES TO FINANCIAL STATEMENTS
d. Sales Charges/Underwriting Agreements
Front-end sales charges and contingent deferred sales charges (CDSC) do not represent expenses of the Fund. These charges are deducted from the proceeds of sales of Fund shares prior to investment or from redemption proceeds prior to remittance, as applicable. Distributors has advised the Fund of the following commission transactions related to the sales and redemptions of the Fund’s shares for the year:
| Sales charges retained net of commissions paid to | ||
| unaffiliated brokers/dealers. | $ | 17,213 |
| CDSC retained | $ | 3,548 |
e. Transfer Agent Fees
Each class of shares pays transfer agent fees to Investor Services for its performance of shareholder servicing obligations and reimburses Investor Services for out of pocket expenses incurred, including shareholder servicing fees paid to third parties. These fees are allocated daily based upon their relative proportion of such classes’ aggregate net assets.
For the year ended September 30, 2016, the Fund paid transfer agent fees of $134,887, of which $64,710 was retained by Investor Services.
f. Investments in Affiliated Management Investment Companies
The Fund invests in one or more affiliated management investment companies for purposes other than exercising a controlling influence over the management or policies. Management fees paid by the Fund are waived on assets invested in the affiliated management investment companies, as noted in the Statement of Operations, in an amount not to exceed the management and administrative fees paid directly or indirectly by each affiliate. Prior to October 1, 2013, the waiver was accounted for as a reduction to management fees. During the year ended September 30, 2016, the Fund held investments in affiliated management investment companies as follows:
| % of | |||||||||||
| Affiliated | |||||||||||
| Number of | Number of | Fund Shares | |||||||||
| Shares Held | Shares | Value | Outstanding | ||||||||
| at Beginning | Gross | Gross | Held at End | at End | Investment | Realized | Held at End | ||||
| of Year | Additions | Reductions | of Year | of Year | Income | Gain (Loss) | of Year | ||||
| Non-Controlled Affiliates | |||||||||||
| Institutional Fiduciary Trust Money Market | |||||||||||
| Portfolio | 5,085,478 | 1,382,801 | (1,217,297 | ) | 5,250,982 | $ | 5,250,982 | $– | $– | 0.0 | %a |
| aRounds to less than 0.1%. | |||||||||||
4. Expense Offset Arrangement
The Fund has entered into an arrangement with its custodian whereby credits realized as a result of uninvested cash balances are used to reduce a portion of the Fund’s custodian expenses. During the year ended September 30, 2016, the custodian fees were reduced as noted in the the Statement of Operations.
5. Income Taxes
For tax purposes, capital losses may be carried over to offset future capital gains. Capital loss carryforwards with no expiration, if any, must be fully utilized before those losses with expiration dates.
franklintempleton.com
Annual Report
29
FRANKLIN STRATEGIC MORTGAGE PORTFOLIO
NOTES TO FINANCIAL STATEMENTS
5. Income Taxes (continued)
At September 30, 2016, capital loss carryforwards were as follows:
| Capital loss carryforwards subject to expiration: | ||
| 2017 | $ | 2,449,042 |
| 2018 | 6,929,694 | |
| 2019 | 8,155,073 | |
| Total capital loss carryforwards | $ | 17,533,809 |
During the year ended September 30, 2016, the Fund utilized $1,809,058 of capital loss carryforwards.
On September 30, 2016, the Fund had expired capital loss carryforwards of $741,739, which were reclassified to paid-in capital.
The tax character of distributions paid during the years ended September 30, 2016 and 2015, was as follows:
| 2016 | 2015 | |||
| Distributions paid from ordinary income | $ | 2,376,606 | $ | 2,238,554 |
At September 30, 2016, the cost of investments, net unrealized appreciation (depreciation), and undistributed ordinary income for income tax purposes were as follows:
| Cost of investments | $ | 123,338,469 | |
| Unrealized appreciation | $ | 1,731,266 | |
| Unrealized depreciation | (1,081,372 | ) | |
| Net unrealized appreciation (depreciation) | $ | 649,894 | |
| Distributable earnings - undistributed ordinary income . | $ | 12,486 | |
Differences between income and/or capital gains as determined on a book basis and a tax basis are primarily due to differing treatments of paydown losses and financial futures transactions.
6. Investment Transactions
Purchases and sales of investments (excluding short term securities) for the year ended September 30, 2016, aggregated $673,438,819 and $685,015,617, respectively.
7. Credit Risk and Defaulted Securities
At September 30, 2016, the Fund had 7.2% of its portfolio invested in high yield securities or other securities rated below investment grade and unrated securities, if any. These securities may be more sensitive to economic conditions causing greater price volatility and are potentially subject to a greater risk of loss due to default than higher rated securities.
The Fund held a defaulted security and/or other securities for which the income has been deemed uncollectible. At September 30, 2016, the value of this security represents less than 0.1% of the Fund’s portfolio. The Fund discontinues accruing income on securities for which income has been deemed uncollectible and provides an estimate for losses on interest receivable. The security has been identified in the accompanying Statement of Investments.
30 Annual Report
franklintempleton.com
FRANKLIN STRATEGIC MORTGAGE PORTFOLIO
NOTES TO FINANCIAL STATEMENTS
8. Other Derivative Information
At September 30, 2016, the Fund’s investments in derivative contracts are reflected in the Statement of Assets and Liabilities as follows:
| Asset Derivatives | Liability Derivatives | |||||
| Derivative Contracts | Statement of | Statement of | ||||
| Not Accounted for as | Assets and Liabilities | Assets and Liabilities | ||||
| Hedging Instruments | Location | Fair Value | Location | Fair Value | ||
| Interest rate contracts | Variation margin | $ | 18,424 | a | Variation margin | $- |
aThis amount reflects the cumulative appreciation (depreciation) of futures contracts as reported in the Statement of Investments. Only the variation margin receivable/
payable at year end is separately reported within the Statement of Assets and Liabilities. Prior variation margin movements were recorded to cash upon receipt or payment.
For the year ended September 30, 2016, the effect of derivative contracts in the Fund’s Statement of Operations was as follows:
| Derivative | ||||||||
| Contracts | Net Change in | |||||||
| Not Accounted for | Unrealized | |||||||
| as | Net Realized | Appreciation | ||||||
| Hedging | Statement of | Gain (Loss) for | Statement of | (Depreciation) | ||||
| Instruments | Operations Locations | the Year | Operations Locations | for the Year | ||||
| Net realized gain (loss) from: | Net change in unrealized | |||||||
| appreciation (depreciation) on: | ||||||||
| Interest rate | Futures contracts | $ | 339,406 | Futures contracts | $ | (65,700 | ) | |
| contracts | ||||||||
| Foreign exchange | Foreign currency transactions | 29,468 | a | Translation of other assets and | (29,468 | )a | ||
| contracts | liabilities denominated in foreign currencies | |||||||
| Totals | $ | 368,874 | $ | (95,168 | ) | |||
aForward exchange contracts are included in net realized gain (loss) from foreign currency transactions and net change in unrealized appreciation (depreciation) on
translation of other assets and liabilities denominated in foreign currencies in the Statement of Operations.
For the year ended September 30, 2016, the average month end fair value of derivatives represented less than 0.1% of average month end net assets. The average month end number of open derivatives contracts for the year was 3.
9. Credit Facility
The Fund, together with other U.S. registered and foreign investment funds (collectively, Borrowers), managed by Franklin Templeton Investments, are borrowers in a joint syndicated senior unsecured credit facility totaling $2 billion (Global Credit Facility) which matures on February 10, 2017. This Global Credit Facility provides a source of funds to the Borrowers for temporary and emergency purposes, including the ability to meet future unanticipated or unusually large redemption requests.
Under the terms of the Global Credit Facility, the Fund shall, in addition to interest charged on any borrowings made by the Fund and other costs incurred by the Fund, pay its share of fees and expenses incurred in connection with the implementation and maintenance of the Global Credit Facility, based upon its relative share of the aggregate net assets of all of the Borrowers, including an annual commitment fee of 0.07% based upon the unused portion of the Global Credit Facility. Effective February 12, 2016, the annual commitment fee is 0.15%. These fees are reflected in other expenses in the Statement of Operations. During the year ended September 30, 2016, the Fund did not use the Global Credit Facility.
franklintempleton.com
Annual Report
31
FRANKLIN STRATEGIC MORTGAGE PORTFOLIO
NOTES TO FINANCIAL STATEMENTS
10. Fair Value Measurements
The Fund follows a fair value hierarchy that distinguishes between market data obtained from independent sources (observable inputs) and the Fund’s own market assumptions (unobservable inputs). These inputs are used in determining the value of the Fund’s financial instruments and are summarized in the following fair value hierarchy:
- Level 1 – quoted prices in active markets for identical financial instruments
- Level 2 – other significant observable inputs (including quoted prices for similar financial instruments, interest rates, prepayment speed, credit risk, etc.)
- Level 3 – significant unobservable inputs (including the Fund’s own assumptions in determining the fair value of financial instruments)
The input levels are not necessarily an indication of the risk or liquidity associated with financial instruments at that level.
For movements between the levels within the fair value hierarchy, the Fund has adopted a policy of recognizing the transfers as of the date of the underlying event which caused the movement.
A summary of inputs used as of September 30, 2016, in valuing the Fund’s assets carried at fair value, is as follows:
| Level 1 | Level 2 | Level 3 | Total | |||||
| Assets: | ||||||||
| Investments in Securities: | ||||||||
| Equity Investmentsa | $ | 429,880 | $ | — | $ | — | $ | 429,880 |
| U.S. Government and Agency Securities | — | 7,237,585 | — | 7,237,585 | ||||
| Asset-Backed Securities and Commercial | ||||||||
| Mortgage-Backed Securities. | — | 24,888,439 | 6,712 | 24,895,151 | ||||
| Mortgage-Backed Securities | — | 80,897,746 | — | 80,897,746 | ||||
| Short Term Investments | 5,250,982 | 5,277,019 | — | 10,528,001 | ||||
| Total Investments in Securities | $ | 5,680,862 | $ | 118,300,789 | $ | 6,712 | $ | 123,988,363 |
| Other Financial Instruments: | ||||||||
| Futures Contracts | $ | 18,424 | $ | — | $ | — | $ | 18,424 |
aFor detailed categories, see the accompanying Statement of Investments.
A reconciliation of assets in which Level 3 inputs are used in determining fair value is presented when there are significant Level 3 financial instruments at the end of the year.
11. Subsequent Events
The Fund has evaluated subsequent events through the issuance of the financial statements and determined that no events have occurred that require disclosure.
32 Annual Report
franklintempleton.com
FRANKLIN STRATEGIC MORTGAGE PORTFOLIO
NOTES TO FINANCIAL STATEMENTS
| Abbreviations | |
| Selected Portfolio | |
| CDO | Collateralized Debt Obligation |
| FRN | Floating Rate Note |
| MFM | Multi-Family Mortgage |
| PC | Participation Certificate |
| PL | Project Loan |
| REIT | Real Estate Investment Trust |
| SF | Single Family |
franklintempleton.com
Annual Report
33
FRANKLIN STRATEGIC MORTGAGE PORTFOLIO
Report of Independent Registered Public Accounting Firm
To the Board of Trustees and Shareholders of Franklin Strategic Mortgage Portfolio
In our opinion, the accompanying statement of assets and liabilities, including the statement of investments, and the related statements of operations and of changes in net assets and the financial highlights present fairly, in all material respects, the financial position of Franklin Strategic Mortgage Portfolio (the "Fund") at September 30, 2016, the results of its operations for the year then ended, the changes in its net assets for each of the two years in the period then ended and the financial highlights for the periods presented, in conformity with accounting principles generally accepted in the United States of America. These financial statements and financial highlights (hereafter referred to as "financial statements") are the responsibility of the Fund’s management. Our responsibility is to express an opinion on these financial statements based on our audits. We conducted our audits of these financial statements in accordance with the standards of the Public Company Accounting Oversight Board (United States). Those standards require that we plan and perform the audit to obtain reasonable assurance about whether the financial statements are free of material misstatement. An audit includes examining, on a test basis, evidence supporting the amounts and disclosures in the financial statements, assessing the accounting principles used and significant estimates made by management, and evaluating the overall financial statement presentation. We believe that our audits, which included confirmation of securities at September 30, 2016 by correspondence with the custodian, transfer agent and brokers, provides a reasonable basis for our opinion.
PricewaterhouseCoopers LLP
San Francisco, California
November 16, 2016
34 Annual Report
franklintempleton.com
FRANKLIN STRATEGIC MORTGAGE PORTFOLIO
Tax Information (unaudited)
Under Section 871(k)(1)(C) of the Internal Revenue Code (Code), the Fund hereby reports the maximum amount allowable but no less than $2,250,165 as interest related dividends for purposes of the tax imposed under Section 871(a)(1)(A) of the Code for the fiscal year ended September 30, 2016.
franklintempleton.com
Annual Report
35
FRANKLIN STRATEGIC MORTGAGE PORTFOLIO
Board Members and Officers
The name, year of birth and address of the officers and board members, as well as their affiliations, positions held with the Trust, principal occupations during at least the past five years and number of U.S. registered portfolios overseen in the Franklin Templeton Investments fund complex, are shown below. Generally, each board member serves until that person’s successor is elected and qualified.
| Independent Board Members | ||||
| Number of Portfolios in | ||||
| Name, Year of Birth | Length of | Fund Complex Overseen | Other Directorships Held | |
| and Address | Position | Time Served | by Board Member* | During at Least the Past 5 Years |
| Harris J. Ashton (1932) | Trustee | Since 1992 | 143 | Bar-S Foods (meat packing company) |
| One Franklin Parkway | (1981-2010). | |||
| San Mateo, CA 94403-1906 | ||||
| Principal Occupation During at Least the Past 5 Years: | ||||
| Director of various companies; and formerly, Director, RBC Holdings, Inc. (bank holding company) (until 2002); and President, Chief Executive | ||||
| Officer and Chairman of the Board, General Host Corporation (nursery and craft centers) (until 1998). | ||||
| Mary C. Choksi (1950) | Trustee | Since 2014 | 137 | Avis Budget Group Inc. (car rental) |
| One Franklin Parkway | (2007-present), Omnicom Group Inc. | |||
| San Mateo, CA 94403-1906 | (advertising and marketing | |||
| communications services) | ||||
| (2011-present) and H.J. Heinz | ||||
| Company (processed foods and allied | ||||
| products) (1998-2006). | ||||
| Principal Occupation During at Least the Past 5 Years: | ||||
| Senior Advisor, Strategic Investment Group (investment management group) (2015-present); director of various companies; and formerly, | ||||
| Founding Partner and Senior Managing Director, Strategic Investment Group (1987–2015); Founding Partner and Managing Director, Emerging | ||||
| Markets Management LLC (investment management firm) (1987-2011); and Loan Officer/Senior Loan Officer/Senior Pension Investment | ||||
| Officer, World Bank Group (international financial institution) (1977-1987). | ||||
| Edith E. Holiday (1952) | Trustee | Since 2003 | 143 | Hess Corporation (exploration and |
| One Franklin Parkway | refining of oil and gas) (1993-present), | |||
| San Mateo, CA 94403-1906 | Canadian National Railway (railroad) | |||
| (2001-present), White Mountains | ||||
| Insurance Group, Ltd. (holding | ||||
| company) (2004-present), RTI | ||||
| International Metals, Inc. (manufacture | ||||
| and distribution of titanium) | ||||
| (1999-2015) and H.J. Heinz Company | ||||
| (processed foods and allied products) | ||||
| (1994-2013). | ||||
| Principal Occupation During at Least the Past 5 Years: | ||||
| Director or Trustee of various companies and trusts; and formerly, Assistant to the President of the United States and Secretary of the | ||||
| Cabinet (1990-1993); General Counsel to the United States Treasury Department (1989-1990); and Counselor to the Secretary and Assistant | ||||
| Secretary for Public Affairs and Public Liaison-United States Treasury Department (1988-1989). | ||||
| J. Michael Luttig (1954) | Trustee | Since 2009 | 143 | Boeing Capital Corporation (aircraft |
| One Franklin Parkway | financing) (2006-2013). | |||
| San Mateo, CA 94403-1906 | ||||
| Principal Occupation During at Least the Past 5 Years: | ||||
| Executive Vice President, General Counsel and member of the Executive Council, The Boeing Company (aerospace company) (2006-present); | ||||
| and formerly, Federal Appeals Court Judge, U.S. Court of Appeals for the Fourth Circuit (1991-2006). | ||||
36 Annual Report
franklintempleton.com
FRANKLIN STRATEGIC MORTGAGE PORTFOLIO
| Independent Board Members (continued) | ||||
| Number of Portfolios in | ||||
| Name, Year of Birth | Length of | Fund Complex Overseen | Other Directorships Held | |
| and Address | Position | Time Served | by Board Member* | During at Least the Past 5 Years |
| Larry D. Thompson | Trustee | Since 2007 | 143 | The Southern Company (energy |
| One Franklin Parkway | company) (2014-present; previously | |||
| San Mateo, CA 94403-1906 | 2010-2012), Graham Holdings | |||
| Company (education and media | ||||
| organization) (2011-present) and | ||||
| Cbeyond, Inc. (business | ||||
| communications provider) | ||||
| (2010-2012). | ||||
| Principal Occupation During at Least the Past 5 Years: | ||||
| Director of various companies; John A. Sibley Professor of Corporate and Business Law, University of Georgia School of Law (2015-present; | ||||
| previously 2011-2012); and formerly, Executive Vice President - Government Affairs, General Counsel and Corporate Secretary, PepsiCo, Inc. | ||||
| (consumer products) (2012-2014); Senior Vice President - Government Affairs, General Counsel and Secretary, PepsiCo, Inc. (2004-2011); | ||||
| Senior Fellow of The Brookings Institution (2003-2004); Visiting Professor, University of Georgia School of Law (2004); and Deputy Attorney | ||||
| General, U.S. Department of Justice (2001-2003). | ||||
| John B. Wilson (1959) | Lead | Trustee | 117 | None |
| One Franklin Parkway | Independent | since 2007 | ||
| San Mateo, CA 94403-1906 | Trustee | and Lead | ||
| Independent | ||||
| Trustee | ||||
| since 2008 | ||||
| Principal Occupation During at Least the Past 5 Years: | ||||
| President, Staples Europe (office supplies) (2012-present); President and Founder, Hyannis Port Capital, Inc. (real estate and private equity | ||||
| investing); serves on private and non-profit boards; and formerly, Chief Operating Officer and Executive Vice President, Gap, Inc. (retail) | ||||
| (1996-2000); Chief Financial Officer and Executive Vice President – Finance and Strategy, Staples, Inc. (1992-1996); Senior Vice President – | ||||
| Corporate Planning, Northwest Airlines, Inc. (airlines) (1990-1992); and Vice President and Partner, Bain & Company (consulting firm) | ||||
| (1986-1990). | ||||
| Interested Board Members and Officers | ||||
| Number of Portfolios in | ||||
| Name, Year of Birth | Length of | Fund Complex Overseen | Other Directorships Held | |
| and Address | Position | Time Served | by Board Member* | During at Least the Past 5 Years |
| **Gregory E. Johnson (1961) | Trustee | Since 2007 | 159 | None |
| One Franklin Parkway | ||||
| San Mateo, CA 94403-1906 | ||||
| Principal Occupation During at Least the Past 5 Years: | ||||
| Chairman of the Board, Member - Office of the Chairman, Director, and Chief Executive Officer, Franklin Resources, Inc.; officer and/or director | ||||
| or trustee, as the case may be, of some of the other subsidiaries of Franklin Resources, Inc. and of 44 of the investment companies in Franklin | ||||
| Templeton Investments; Vice Chairman, Investment Company Institute; and formerly, President, Franklin Resources, Inc. (1994-2015). | ||||
| **Rupert H. Johnson, Jr. (1940) | Chairman of | Since 2013 | 143 | None |
| One Franklin Parkway | the Board and | |||
| San Mateo, CA 94403-1906 | Trustee | |||
| Principal Occupation During at Least the Past 5 Years: | ||||
| Vice Chairman, Member - Office of the Chairman and Director, Franklin Resources, Inc.; Director, Franklin Advisers, Inc.; Senior Vice | ||||
| President, Franklin Advisory Services, LLC; and officer and/or director or trustee, as the case may be, of some of the other subsidiaries of | ||||
| Franklin Resources, Inc. and of 43 of the investment companies in Franklin Templeton Investments. | ||||
| Alison E. Baur (1964) | Vice President | Since 2012 | Not Applicable | Not Applicable |
| One Franklin Parkway | ||||
| San Mateo, CA 94403-1906 | ||||
| Principal Occupation During at Least the Past 5 Years: | ||||
| Deputy General Counsel, Franklin Templeton Investments; and officer of some of the other subsidiaries of Franklin Resources, Inc. and of 45 | ||||
| of the investment companies in Franklin Templeton Investments. | ||||
franklintempleton.com
Annual Report
37
FRANKLIN STRATEGIC MORTGAGE PORTFOLIO
| Interested Board Members and Officers (continued) | ||||
| Number of Portfolios in | ||||
| Name, Year of Birth | Length of | Fund Complex Overseen | Other Directorships Held | |
| and Address | Position | Time Served | by Board Member* | During at Least the Past 5 Years |
| Laura F. Fergerson (1962) | Chief Executive Since 2009 | Not Applicable | Not Applicable | |
| One Franklin Parkway | Officer – | |||
| San Mateo, CA 94403-1906 | Finance and | |||
| Administration | ||||
| Principal Occupation During at Least the Past 5 Years: | ||||
| Senior Vice President, Franklin Templeton Services, LLC; Vice President, Franklin Advisers, Inc. and Franklin Templeton Institutional, LLC; and | ||||
| officer of 45 of the investment companies in Franklin Templeton Investments. | ||||
| Gaston Gardey (1967) | Treasurer, | Since 2009 | Not Applicable | Not Applicable |
| One Franklin Parkway | Chief Financial | |||
| San Mateo, CA 94403-1906 | Officer and | |||
| Chief | ||||
| Accounting | ||||
| Officer | ||||
| Principal Occupation During at Least the Past 5 Years: | ||||
| Treasurer, U.S. Fund Administration & Reporting, Franklin Templeton Investments; and officer of 27 of the investment companies in Franklin | ||||
| Templeton Investments. | ||||
| Aliya S. Gordon (1973) | Vice President Since 2009 | Not Applicable | Not Applicable | |
| One Franklin Parkway | ||||
| San Mateo, CA 94403-1906 | ||||
| Principal Occupation During at Least the Past 5 Years: | ||||
| Senior Associate General Counsel, Franklin Templeton Investments; officer of 45 of the investment companies in Franklin Templeton | ||||
| Investments. | ||||
| Steven J. Gray (1955) | Vice President Since 2009 | Not Applicable | Not Applicable | |
| One Franklin Parkway | ||||
| San Mateo, CA 94403-1906 | ||||
| Principal Occupation During at Least the Past 5 Years: | ||||
| Senior Associate General Counsel, Franklin Templeton Investments; Vice President, Franklin Templeton Distributors, Inc. and Franklin | ||||
| Alternative Strategies Advisers, LLC; and officer of 45 of the investment companies in Franklin Templeton Investments. | ||||
| Robert Lim (1948) | Vice President Since May 2016 | Not Applicable | Not Applicable | |
| One Franklin Parkway | – AML | |||
| San Mateo, CA 94403-1906 | Compliance | |||
| Principal Occupation During at Least the Past 5 Years: | ||||
| Vice President, Franklin Templeton Companies, LLC; Chief Compliance Officer, Franklin Templeton Distributors, Inc. and Franklin Templeton | ||||
| Investor Services, LLC; and officer of 45 of the investment companies in Franklin Templeton Investments. | ||||
| Christopher J. Molumphy | President and Since 2010 | Not Applicable | Not Applicable | |
| (1962) | Chief Executive | |||
| One Franklin Parkway | Officer – | |||
| San Mateo, CA 94403-1906 | Investment | |||
| Management | ||||
| Principal Occupation During at Least the Past 5 Years: | ||||
| Director and Executive Vice President, Franklin Advisers, Inc.; Executive Vice President, Franklin Templeton Institutional, LLC; and officer of | ||||
| some of the other subsidiaries of Franklin Resources, Inc. and of 22 of the investment companies in Franklin Templeton Investments. | ||||
| Kimberly H. Novotny (1972) | Vice President Since 2013 | Not Applicable | Not Applicable | |
| 300 S.E. 2nd Street | ||||
| Fort Lauderdale, FL 33301-1923 | ||||
| Principal Occupation During at Least the Past 5 Years: | ||||
| Associate General Counsel, Franklin Templeton Investments; Vice President and Corporate Secretary, Fiduciary Trust International of the | ||||
| South; Vice President, Templeton Investment Counsel, LLC; Assistant Secretary, Franklin Resources, Inc.; and officer of 45 of the investment | ||||
| companies in Franklin Templeton Investments. | ||||
38 Annual Report
franklintempleton.com
FRANKLIN STRATEGIC MORTGAGE PORTFOLIO
| Interested Board Members and Officers (continued) | ||||
| Number of Portfolios in | ||||
| Name, Year of Birth | Length of | Fund Complex Overseen | Other Directorships Held | |
| and Address | Position | Time Served | by Board Member* | During at Least the Past 5 Years |
| Robert C. Rosselot (1960) | Chief | Since 2013 | Not Applicable | Not Applicable |
| 300 S.E. 2nd Street | Compliance | |||
| Fort Lauderdale, FL 33301-1923 | Officer | |||
| Principal Occupation During at Least the Past 5 Years: | ||||
| Director, Global Compliance, Franklin Templeton Investments; Vice President, Franklin Templeton Companies, LLC; officer of 45 of the | ||||
| investment companies in Franklin Templeton Investments; and formerly, Senior Associate General Counsel, Franklin Templeton Investments | ||||
| (2007-2013); and Secretary and Vice President, Templeton Group of Funds (2004-2013). | ||||
| Karen L. Skidmore (1952) | Vice President | Since 2006 | Not Applicable | Not Applicable |
| One Franklin Parkway | and Secretary | |||
| San Mateo, CA 94403-1906 | ||||
| Principal Occupation During at Least the Past 5 Years: | ||||
| Senior Associate General Counsel, Franklin Templeton Investments; and officer of 45 of the investment companies in Franklin Templeton | ||||
| Investments. | ||||
| Navid J. Tofigh (1972) | Vice President | Since 2015 | Not Applicable | Not Applicable |
| One Franklin Parkway | ||||
| San Mateo, CA 94403-1906 | ||||
| Principal Occupation During at Least the Past 5 Years: | ||||
| Associate General Counsel, Franklin Templeton Investments; and officer of 45 of the investment companies in Franklin Templeton Investments. | ||||
| Craig S. Tyle (1960) | Vice President | Since 2005 | Not Applicable | Not Applicable |
| One Franklin Parkway | ||||
| San Mateo, CA 94403-1906 | ||||
| Principal Occupation During at Least the Past 5 Years: | ||||
| General Counsel and Executive Vice President, Franklin Resources, Inc.; and officer of some of the other subsidiaries of Franklin Resources, | ||||
| Inc. and of 45 of the investment companies in Franklin Templeton Investments. | ||||
| Lori A. Weber (1964) | Vice President | Since 2011 | Not Applicable | Not Applicable |
| 300 S.E. 2nd Street | ||||
| Fort Lauderdale, FL 33301-1923 | ||||
| Principal Occupation During at Least the Past 5 Years: | ||||
| Senior Associate General Counsel, Franklin Templeton Investments; Assistant Secretary, Franklin Resources, Inc.; Vice President and | ||||
| Secretary, Templeton Investment Counsel, LLC; and officer of 45 of the investment companies in Franklin Templeton Investments. | ||||
*We base the number of portfolios on each separate series of the U.S. registered investment companies within the Franklin Templeton Investments fund complex. These
portfolios have a common investment manager or affiliated investment managers.
**Gregory E. Johnson is considered to be an interested person of the Fund under the federal securities laws due to his position as an officer and director ofFranklin
Resources, Inc. (Resources), which is the parent company of the Fund’s investment manager and distributor. Rupert H. Johnson, Jr. is considered to be an interested person
of the Fund under the federal securities laws due to his position as officer and director and major shareholder of Resources.
Note 1: Rupert H. Johnson, Jr. is the uncle of Gregory E. Johnson.
Note 2: Officer information is current as of the date of this report. It is possible that after this date, information about officers may change.
Note 3: Effective November 1, 2016, Frank A. Olson ceased to be a trustee of the Trust.
The Sarbanes-Oxley Act of 2002 and Rules adopted by the Securities and Exchange Commission require the Fund to disclose whether the Fund’s Audit
Committee includes at least one member who is an audit committee financial expert within the meaning of such Act and Rules. The Fund’s Board has determined
that there is at least one such financial expert on the Audit Committee and has designated John B. Wilson as its audit committee financial expert. The Board
believes that Mr. Wilson qualifies as such an expert in view of his extensive business background and experience, including service as chief financial officer of
Staples, Inc. from 1992 to 1996. Mr. Wilson has been a Member and Chairman of the Fund’s Audit Committee since 2007. As a result of such background and
experience, the Board believes that Mr. Wilson has acquired an understanding of generally accepted accounting principles and financial statements, the general
application of such principles in connection with the accounting estimates, accruals and reserves, and analyzing and evaluating financial statements that
present a breadth and level of complexity of accounting issues generally comparable to those of the Fund, as well as an understanding of internal controls and
procedures for financial reporting and an understanding of audit committee functions. Mr. Wilson is an independent Board member as that term is defined under
the relevant Securities and Exchange Commission Rules and Releases.
The Statement of Additional Information (SAI) includes additional information about the board members and is available, without charge, upon request.
Shareholders may call (800) DIAL BEN/342-5236 to request the SAI.
franklintempleton.com
Annual Report
39
FRANKLIN STRATEGIC MORTGAGE PORTFOLIO
Shareholder Information
Proxy Voting Policies and Procedures
The Fund’s investment manager has established Proxy Voting Policies and Procedures (Policies) that the Fund uses to determine how to vote proxies relating to portfolio securities. Shareholders may view the Fund’s complete Policies online at franklintempleton.com. Alternatively, shareholders may request copies of the Policies free of charge by calling the Proxy Group collect at (954) 527-7678 or by sending a written request to: Franklin Templeton Companies, LLC, 300 S.E. 2nd Street, Fort Lauderdale, FL 33301, Attention: Proxy Group. Copies of the Fund’s proxy voting records are also made available online at franklintempleton.com and posted on the U.S. Securities and Exchange Commission’s website at sec.gov and reflect the most recent 12-month period ended June 30.
Quarterly Statement of Investments
The Fund files a complete statement of investments with the U.S. Securities and Exchange Commission for the first and third quarters for each fiscal year on Form N-Q. Shareholders may view the filed Form N-Q by visiting the Commission’s website at sec.gov. The filed form may also be viewed and copied at the Commission’s Public Reference Room in Washington, DC. Information regarding the operations of the Public Reference Room may be obtained by calling (800) SEC-0330.
Householding of Reports and Prospectuses
You will receive each Fund’s financial reports every six months as well as an annual updated summary prospectus (prospectus available upon request). To reduce Fund expenses, we try to identify related shareholders in a household and send only one copy of the financial reports and summary prospectus. This process, called “householding,” will continue indefinitely unless you instruct us otherwise. If you prefer not to have these documents householded, please call us at (800) 632-2301. At any time you may view current prospectuses/summary prospectuses and financial reports on our website. If you choose, you may receive these documents through electronic delivery.
40 Annual Report
franklintempleton.com
Item 2. Code of Ethics.
(a) The Registrant has adopted a code of ethics that applies to its principal executive officers and principal financial and accounting officer.
(c) N/A
(d) N/A
(f) Pursuant to Item 12(a)(1), the Registrant is attaching as an exhibit a copy of its code of ethics that applies to its principal executive officers and principal financial and accounting officer.
Item 3. Audit Committee Financial Expert.
(a)(1) The Registrant has an audit committee financial expert serving on its audit committee.
(2) The audit committee financial expert is John B. Wilson and he is "independent" as defined under the relevant Securities and Exchange Commission Rules and Releases.
Item 4. Principal Accountant Fees and Services.
(a) Audit Fees
The aggregate fees paid to the principal accountant for professional services rendered by the principal accountant for the audit of the registrant’s annual financial statements or for services that are normally provided by the principal accountant in connection with statutory and regulatory filings or engagements were $38,561 for the fiscal year ended September 30, 2016 and $48,915 for the fiscal year ended September 30, 2015.
(b) Audit-Related Fees
There were no fees paid to the principal accountant for assurance and related services rendered by the principal accountant to the registrant that are reasonably related to the performance of the audit of the registrant's financial statements and are not reported under paragraph (a) of Item 4.
There were no fees paid to the principal accountant for assurance and related services rendered by the principal accountant to the registrant's investment adviser and any entity controlling, controlled by or under common control with the investment adviser that provides ongoing services to the registrant that are reasonably related to the performance of the audit of their financial statements.
(c) Tax Fees
There were no fees paid to the principal accountant for professional services rendered by the principal accountant to the registrant for tax compliance, tax advice and tax planning.
There were no fees paid to the principal accountant for professional services rendered by the principal accountant to the registrant’s investment adviser and any entity controlling, controlled by or under common control with the investment adviser that provides ongoing services to the registrant for tax compliance, tax advice and tax planning.
(d) All Other Fees
The aggregate fees paid to the principal accountant for products and services rendered by the principal accountant to the registrant not reported in paragraphs (a)-(c) of Item 4 were $0 for the fiscal year ended September 30, 2016 and $40 for the fiscal year ended September 30, 2015. The services for which these fees were paid include review of materials provided to the fund Board in connection with the investment management contract renewal process.
The aggregate fees paid to the principal accountant for products and services rendered by the principal accountant to the registrant’s investment adviser and any entity controlling, controlled by or under common control with the investment adviser that provides ongoing services to the registrant not reported in paragraphs (a)-(c) of Item 4 were $539,168 for the fiscal year ended September 30, 2016 and $387,983 for the fiscal year ended September 30, 2015. The services for which these fees were paid included review of materials provided to the fund Board in connection with the investment management contract renewal process and derivatives assessments, and review of system processes related to fixed income securities.
(e) (1) The registrant’s audit committee is directly responsible for approving the services to be provided by the auditors, including:
(i) pre-approval of all audit and audit related services;
(ii) pre-approval of all non-audit related services to be provided to the Fund by the auditors;
(iii) pre-approval of all non-audit related services to be provided to the registrant by the auditors to the registrant’s investment adviser or to any entity that controls, is controlled by or is under common control with the registrant’s investment adviser and that provides ongoing services to the registrant where the non-audit services relate directly to the operations or financial reporting of the registrant; and
(iv) establishment by the audit committee, if deemed necessary or appropriate, as an alternative to committee pre-approval of services to be provided by the auditors, as required by paragraphs (ii) and (iii) above, of policies and procedures to permit such services to be pre-approved by other means, such as through establishment of guidelines or by action of a designated member or members of the committee; provided the policies and procedures are detailed as to the particular service and the committee is informed of each service and such policies and procedures do not include delegation of audit committee responsibilities, as contemplated under the Securities Exchange Act of 1934, to management; subject, in the case of (ii) through (iv), to any waivers, exceptions or exemptions that may be available under applicable law or rules.
(e) (2) None of the services provided to the registrant described in paragraphs (b)-(d) of Item 4 were approved by the audit committee pursuant to paragraph (c)(7)(i)(C) of Rule 2-01 of regulation S-X.
(f) No disclosures are required by this Item 4(f).
(g) The aggregate non-audit fees paid to the principal accountant for services rendered by the principal accountant to the registrant and the registrant’s investment adviser and any entity controlling, controlled by or under common control with the investment adviser that provides ongoing services to the registrant were $539,168 for the fiscal year ended September 30, 2016 and $388,023 for the fiscal year ended September 30, 2015.
(h) The registrant’s audit committee of the board has considered whether the provision of non-audit services that were rendered to the registrant’s investment adviser (not including any sub-adviser whose role is primarily portfolio management and is subcontracted with or overseen by another investment adviser), and any entity controlling, controlled by, or under common control with the investment adviser that provides ongoing services to the registrant that were not pre-approved pursuant to paragraph (c)(7)(ii) of Rule 2-01 of Regulation S-X is compatible with maintaining the principal accountant’s independence.
Item 5. Audit Committee of Listed Registrants. N/A
Item 6. Schedule of Investments. N/A
Item 7. Disclosure of Proxy Voting Policies and Procedures for Closed-End Management Investment Companies. N/A
Item 8. Portfolio Managers of Closed-End Management Investment Companies. N/A
Item 9. Purchases of Equity Securities by Closed-End Management Investment Company and Affiliated Purchasers. N/A
Item 10. Submission of Matters to a Vote of Security Holders.
There have been no changes to the procedures by which shareholders may recommend nominees to the Registrant's Board of Trustees that would require disclosure herein.
Item 11. Controls and Procedures.
(a) Evaluation of Disclosure Controls and Procedures. The Registrant maintains disclosure controls and procedures that are designed to ensure that information required to be disclosed in the Registrant’s filings under the Securities Exchange Act of 1934 and the Investment Company Act of 1940 is recorded, processed, summarized and reported within the periods specified in the rules and forms of the Securities and Exchange Commission. Such information is accumulated and communicated to the Registrant’s management, including its principal executive officer and principal financial officer, as appropriate, to allow timely decisions regarding required disclosure. The Registrant’s management, including the principal executive officer and the principal financial officer, recognizes that any set of controls and procedures, no matter how well designed and operated, can provide only reasonable assurance of achieving the desired control objectives.
Within 90 days prior to the filing date of this Shareholder Report on Form N-CSR, the Registrant had carried out an evaluation, under the supervision and with the participation of the Registrant’s management, including the Registrant’s principal executive officer and the Registrant’s principal financial officer, of the effectiveness of the design and operation of the Registrant’s disclosure controls and procedures. Based on such evaluation, the Registrant’s principal executive officer and principal financial officer concluded that the Registrant’s disclosure controls and procedures are effective.
(b) Changes in Internal Controls. There have been no changes in the Registrant’s internal controls or in other factors that could materially affect the internal controls over financial reporting subsequent to the date of their evaluation in connection with the preparation of this Shareholder Report on Form N-CSR.
Item 12. Exhibits.
(a) (1) Code of Ethics
(a) (2) Certifications pursuant to Section 302 of the Sarbanes-Oxley Act of 2002 of Laura F. Fergerson, Chief Executive Officer - Finance and Administration, and Gaston Gardey, Chief Financial Officer and Chief Accounting Officer
(b) Certifications pursuant to Section 906 of the Sarbanes-Oxley Act of 2002 of Laura F. Fergerson, Chief Executive Officer - Finance and Administration, and Gaston Gardey, Chief Financial Officer and Chief Accounting Officer
SIGNATURES
Pursuant to the requirements of the Securities Exchange Act of 1934 and the Investment Company Act of 1940, the registrant has duly caused this report to be signed on its behalf by the undersigned, thereunto duly authorized.
FRANKLIN STRATEGIC MORTGAGE PORTFOLIO
By /s/Laura F. Fergerson
Laura F. Fergerson
Chief Executive Officer - Finance and Administration
Date November 25, 2016
Pursuant to the requirements of the Securities Exchange Act of 1934 and the Investment Company Act of 1940, this report has been signed below by the following persons on behalf of the registrant and in the capacities and on the dates indicated.
By /s/Laura F. Fergerson
Laura F. Fergerson
Chief Executive Officer - Finance and Administration
Date November 25, 2016
By /s/Gaston Gardey
Gaston Gardey
Chief Financial Officer and
Chief Accounting Officer
Date November 25, 2016