| Investment Advisor’s Message (continued) |
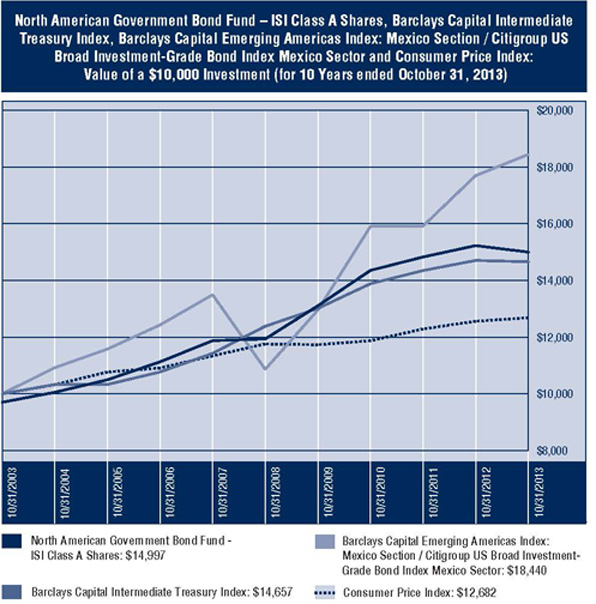
ISI North American Government Bond Fund’s investment objective is to provide a high level of current income, consistent with prudent investment risk, by investing primarily in a portfolio consisting of fixed income securities issued or guaranteed by the governments of the United States, Canada and Mexico. For the reporting period, the ISI Class A Shares produced a one-year total return of -1.51% and a five year average annual total return of +4.68% excluding sales charge. From its inception on January 15, 1993, through October 31, 2013, the ISI Class A Shares have posted a cumulative total return of +199.69%, which translates into an average annual total return of +5.42%. For the reporting period, the ISI Class C Shares produced a one-year total return of -2.23% and a five year average annual total return of +4.02%. From its inception on May 16, 2003, through October 31, 2013, the ISI Class C Shares have posted a cumulative total return of +41.27%, which translates into an average annual total return of +3.36%. From its inception on September 16, 2010 through October 31, 2013, the ISI Class I Shares have posted a cumulative total return of +7.42%, which translates to an average annual total return of +2.32%.
The Fund’s net assets totaled $101.21 million at the end of the reporting period.
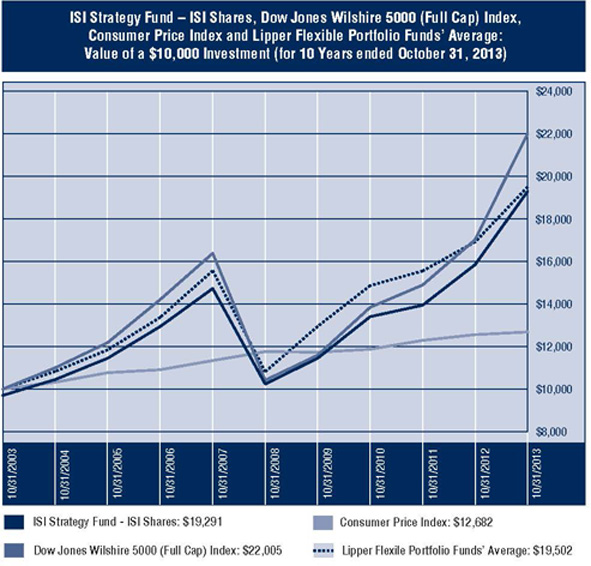
ISI Strategy Fund has an investment objective of maximizing total return through a combination of long-term growth of capital and current income by actively allocating the Fund’s assets between common stocks of U.S. issuers and U.S. Treasury securities. For the reporting period, the Fund produced a one-year total return of +21.72% and a five-year average annual total return of +13.51% excluding sales charge. From its inception on September 16, 1997, through October 31, 2013, the Fund has posted a cumulative total return of +151.08%, which translates into an average annual total return of +5.87%. The Fund’s net assets totaled $85.99 million at the end of the reporting period.
We would like to welcome new investors to the ISI Funds and thank those who have been with us for some time. We appreciate your confidence.
Sincerely,
R. Alan Medaugh
President
November 14, 2013
| Management Discussion & Analysis (Unaudited) |
The Total Return U.S. Treasury Fund
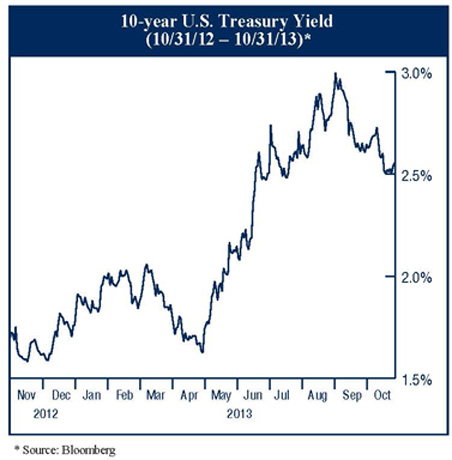
This fiscal year, the Treasury benchmark 10-year bond yield rose by 90 basis points (0.9%). The increase in yields began in early May and peaked in late August closing the year at 2.55%. Political issues were more important than economic issues this year. Growth and inflation have both been subdued but Congressional partisan deadlock brought the country close to both a budget and debt impasse. The situation brought about a short-term fix which means a replay is possible in February and March of next year. The Fund’s active maturity management anticipated the political issues; the portfolio’s duration was reduced from 4.6 years to 4.1 years during the year. At the end of the fiscal year, the Fund had 77.3% of its maturities in the 5-10 year range resulting in a duration less than the whole Treasury bond market (4.1 years for the Fund versus 4.9 years for the Treasury market).
Management Discussion & Analysis (Unaudited) (continued) |
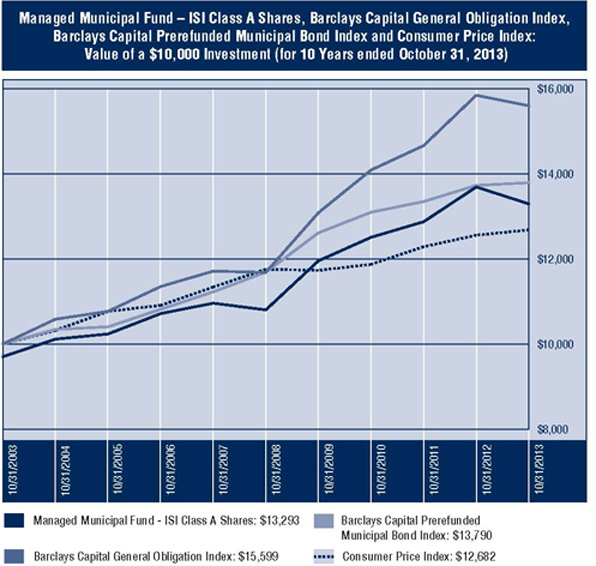
The Managed Municipal Fund
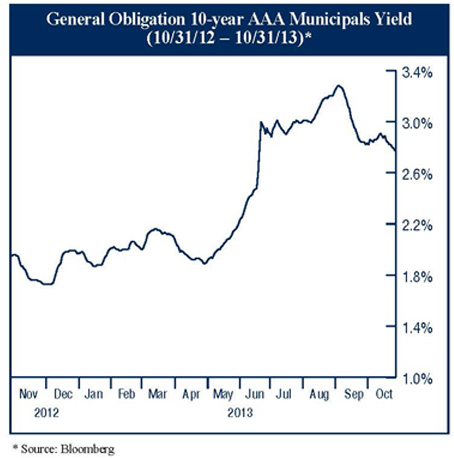
Municipal yields rose on balance during the year especially in the period from May to early September, much as occurred in the Treasury market. The benchmark is AAA 10-year Municipal General Obligation bonds. Rates moved a bit lower from September to October but still rose by 80 basis points (0.8%) during the fiscal year.
Management Discussion & Analysis (Unaudited) (continued) |
To cushion the effects of rising rates, the Fund holds 45.2% of its assets in 0-5 year issues and has held a similar percentage for the fiscal year. The Fund retains a position in longer-term bonds because, unlike the relationship over most of the last 20 years, AAA Municipals now yield more than Treasuries. Please see the table below.
Comparison of AAA Municipal Yields as a Percentage of U.S. Treasury Yields (10/31/2012 and 10/31/2013) |
|
| | |
| 5 Year | 98.25 | 92.70 |
| 10 year | 110.56 | 104.69 |
| 15 year | 121.28 | 119.26 |
| 20 year | 123.32 | 121.59 |
| * Source Bloomberg |
Management Discussion & Analysis (Unaudited) (continued) |
The North American Government Bond Fund
The year saw increasing yields in all three of the Fund’s markets. In the U.S., 10-year rates rose +90 basis points (0.9%), 10-year Canadian Treasury yields rose +64 basis points and 10-year Mexican Treasury yields rose +57 basis points. To blunt the adverse effects of higher rates, the Fund has generally held a duration less than each of the Treasury markets over the fiscal year. Please see the table below.
Duration History (in years) (10/31/2012 - 10/31/2013) |
| | | | |
| | | | | | |
| 10/31/2012 | 5.0 | 5.44 | 3.6 | 6.53 | 2.9 | 6.04 |
| 1/31/2013 | 4.9 | 5.21 | 3.1 | 6.39 | 2.5 | 6.44 |
| 4/30/2013 | 4.7 | 5.30 | 2.8 | 6.49 | 2.6 | 6.50 |
| 7/31/2013 | 4.3 | 5.01 | 2.7 | 6.45 | 2.3 | 6.02 |
| 10/31/2013 | 4.2 | 5.01 | 2.4 | 6.29 | 2.1 | 5.71 |
Management Discussion & Analysis (Unaudited) (continued) |
The Strategy Fund
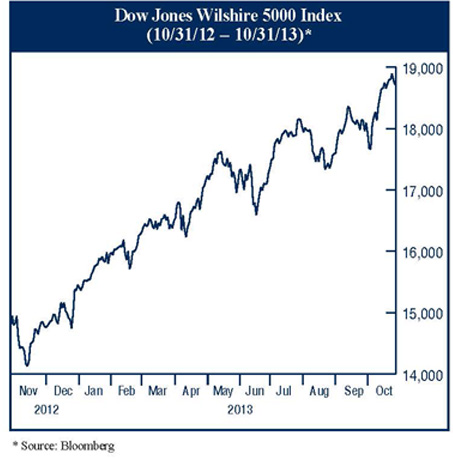
The stock market rallied strongly during the fiscal year. The Fund benefitted from its equity position. Earnings performance and attractive yields were, for the second year, the basic forces behind the stock market rally. U.S. Treasury yields rose during the year (10-year benchmark Treasury was up +90 basis points (0.9%). The Fund’s performance for the fiscal year was up +21.72% excluding sales charge. Stocks lead the way with the Wilshire 5000 up + 29.29%. The U.S. Treasury position had negative returns. For example, the Barclays Capital Treasury Index was down -1.45% for the fiscal year. The political uncertainties in the U.S., Europe and China gave the stock market a “Wall of Worry” to climb, which for the most part it did during the fiscal year. The Treasury market reacted negatively to the political risks. Please see charts below showing the price action of the Wilshire 5000 and the increase in 10-year Treasury yields during the fiscal year.
Management Discussion & Analysis (Unaudited) (continued) |
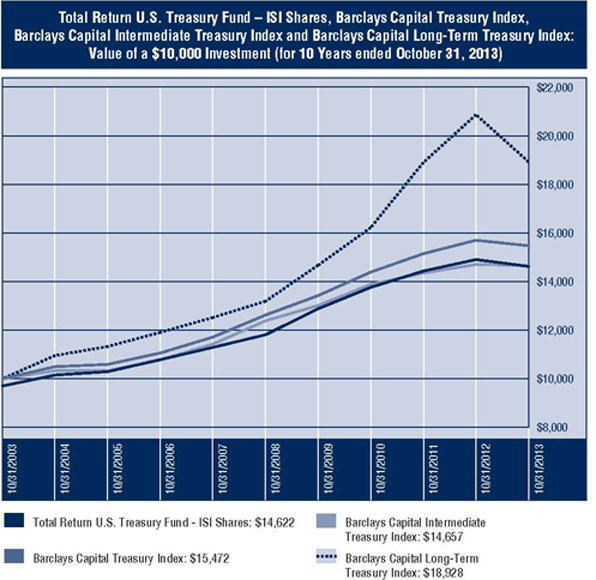
Total Return U.S. Treasury Fund, Inc. – Performance Comparison1 (Unaudited) |
Total Return U.S. Treasury Fund, Inc. – Performance Comparison1 (Unaudited) (continued) |
| | Cumulative Total Returns (With Sales Charge) | Average Annual Total Returns (With Sales Charge) |
Periods Ended October 31, 2013 | 1 Year | 3 Years | 5 Years | 10 Years | Since Inception2 | 1 Year | 3 Years | 5 Years | 10 Years | Since Inception2 |
Total Return US Treasury Fund | | | | | | | | | | |
Barclays Capital Treasury Index3 | | | | | | | | | | |
Barclays Capital Intermediate Treasury Index3 | | | | | | | | | | |
Barclays Capital Long-Term Treasury Index3 | | | | | | | | | | |
| 1 | Past performance is not indicative of future results. Investment return and principal value will fluctuate so that an investor’s shares, when redeemed, may be worth more or less than their original cost. The performance information presented in the graph and table above does not reflect the deduction of taxes that a shareholder would pay on Fund distributions or the redemption of Fund shares. All performance assumes the reinvestment of dividends and capital gain distributions and includes the Fund’s maximum 3.00% sales charge. Distributions of the Fund’s capital gains and any non-US Treasury income may be subject to state and local taxes. Management is not aware of any single index that is truly representative of the Fund since its active maturity management policy allows the manager to adjust the weighted average maturity throughout each US Treasury sector. Currently, the Fund’s weighted average maturity is approximately 4.45 years. |
| 2 | The Fund’s inception date is August 10, 1988. Benchmark returns are for the periods beginning August 31, 1988. |
| 3 | The Barclays Capital Treasury Index is an unmanaged index reflecting the performance of all public Treasury obligations and does not focus on one particular segment of the Treasury market. The Barclays Capital Intermediate Treasury Index is an unmanaged index reflecting the performance of US Treasury securities in the intermediate-term Treasury sector. The Barclays Capital Long-Term Treasury Index is an unmanaged index reflecting the performance of US Treasury securities in the long-term Treasury sector. Benchmark returns do not reflect expenses or sales charges that have been deducted from the Fund’s returns. |
Expense Ratio Information as of: | |
| Gross Expense Ratio | 0.89% |
Managed Municipal Fund, Inc. – Performance Comparison1 (Unaudited) |
Managed Municipal Fund, Inc. – Performance Comparison1 (Unaudited) (continued) |
| | Cumulative Total Returns (With Sales Charge) | Average Annual Total Returns (With Sales Charge) |
Periods Ended October 31, 2013 | 1 Year | 3 Years | 5 Years | 10 Years | Since Inception | 1 Year | 3 Years | 5 Years | 10 Years | Since Inception |
Managed Municipal Fund – ISI Class A Shares2 | | | | | | | | | | |
Managed Municipal Fund – ISI Class I Shares3 | | | | | | | | | | |
Barclays Capital General Obligation Index4 | | | | | | | | | | |
Barclays Capital Prerefunded Municipal Bond Index4 | | | | | | | | | | |
| | | | | | | | | | |
| 1 | Past performance is not indicative of future results. Investment return and principal value will fluctuate so that an investor’s shares, when redeemed, may be worth more or less than their original cost. The performance information presented in the graph and table above does not reflect the deduction of taxes that a shareholder would pay on Fund distributions or the redemption of Fund shares. All performance assumes the reinvestment of dividends and capital gain distributions and includes the sales charge, if applicable. ISI Class A Shares have a maximum 3.00% sales charge. Distributions of the Fund’s income and capital gains may be subject to state and local taxes. |
| 2 | The ISI Class A Shares inception date is February 26, 1990. Benchmark returns are for the periods beginning February 28, 1990. |
| 3 | The ISI Class I Shares inception date is October 7, 2010. Benchmark returns are for the period beginning October 31, 2010. Cumulative and annualized returns for the Barclays Capital General Obligation Index from October 31, 2010 through October 31, 2013 were 10.72% and 3.45%, respectively. Cumulative and annualized returns for the Barclays Capital Prerefunded Municipal Bond Index from October 31, 2010 through October 31, 2013 were 5.30% and 1.74%, respectively. |
| 4 | The Barclays Capital General Obligation Index is an unmanaged index reflecting general municipal bond market performance. The Barclays Capital Prerefunded Municipal Bond Index, an unmanaged index, is a subcomponent of the general Barclays Capital Municipal Bond Index, and contains only bonds from that index that have been prerefunded or escrowed to maturity. Benchmark returns do not reflect expenses or sales charges that have been deducted from the Fund’s returns. |
| 5 | The Consumer Price Index is a widely used measure of inflation. |
Expense Ratio Information as of: | |
| Gross Expense Ratio – Class A | 1.04% |
| Gross Expense Ratio – Class I | 0.79% |
North American Government Bond Fund, Inc. – Performance Comparison1 (Unaudited) |
North American Government Bond Fund, Inc. – Performance Comparison1 (Unaudited) (continued) |
| | Cumulative Total Returns (With Sales Charge) | Average Annual Total Returns (With Sales Charge) |
Periods Ended October 31, 2013 | 1 Year | 3 Years | 5 Years | 10 Years | Since Inception | 1 Year | 3 Years | 5 Years | 10 Years | Since Inception |
North American Government Bond Fund - ISI Class A Shares2 | | | | | | | | | | |
North American Government Bond Fund - ISI Class C Shares3 | | | | | | | | | | |
North American Government Bond Fund - ISI Class I Shares4 | | | | | | | | | | |
Barclays Capital Intermediate Treasury Index5 | | | | | | | | | | |
Barclays Capital Emerging Americas Index: Mexico Section / Citigroup US Broad Investment-Grade Bond Index Mexico Sector / Barclays Capital Global Aggregate Index: Mexico Section6 | | | | | | | | | | |
| | | | | | | | | | |
| 1 | Past performance is not indicative of future results. Investment return and principal value will fluctuate so that an investor’s shares, when redeemed, may be worth more or less than their original cost. The performance information presented in the graph and table above does not reflect the deduction of taxes that a shareholder would pay on Fund distributions or the redemption of Fund shares. All performance assumes the reinvestment of dividends and capital gain distributions and includes sales charges, if applicable. ISI Class A shares have a maximum 3.00% sales charge. ISI Class C Shares have a maximum 1.00% contingent deferred sales charge in the first year, which is eliminated thereafter. |
| 2 | ISI Class A Shares inception date is January 15, 1993. Benchmark returns are for the periods beginning January 31, 1993. |
| 3 | ISI Class C Shares inception date is May 16, 2003. Cumulative and annualized returns for the Barclays Capital Intermediate Treasury Index from May 31, 2003 through October 31, 2013 were 44.88% and 3.62%, respectively. |
| 4 | ISI Class I Shares inception date is September 16, 2010. Benchmark returns are for the periods beginning September 30, 2010. Cumulative and annualized returns for the Barclays Capital Intermediate Treasury Index from September 30, 2010 through October 31, 2013 were 5.94% and 1.89%, respectively. |
| 5 | The Barclays Capital Intermediate Treasury Index is an unmanaged index reflecting the performance of US Treasury securities in the intermediate-term Treasury sector. Benchmark returns do not reflect expenses or sales charges that have been deducted from the Fund’s returns. |
| 6 | Reflects the performance of the Barclays Capital Emerging Americas Index: Mexico Section through October 31, 2004 and the Citigroup US Broad Investment-Grade Bond Index Mexico Sector from that date through October 31, 2006 and the Barclays Capital Global Aggregate Index: Mexico from October 31, 2006 through October 31, 2013. The Barclays Capital Emerging Americas Index: Mexico Section has been discontinued. Barclays Capital Emerging Americas Index: Mexico Section was an unmanaged sub-index of the Barclays Capital Emerging Americas Index reflecting the performance of selected Mexican debt instruments with maturities of one year or more. The Citigroup US Broad Investment-Grade Bond Index Mexico Sector is an unmanaged sub-index of the Citigroup US Broad Investment-Grade Bond Index reflecting the performance of selected Mexican debt instruments with maturities of one year or more. The Barclays Capital Global Aggregate Index: Mexico Section is an unmanaged sub-index of Barclays Capital Global Aggregate Index which provides broad-based measure of global investment-grade fixed income markets. The Mexico Section reflects the US dollar performance of selected Mexican government peso-denominated debt instruments with maturities of one year or more. Benchmark returns do not reflect expenses or sales charges that have been deducted from the Fund’s returns. |
| 7 | The Consumer Price Index is a widely used measure of inflation. |
Expense Ratio Information as of: | |
| Gross Expense Ratio – Class A | 1.25% |
| Gross Expense Ratio – Class C | 1.85% |
| Gross Expense Ratio – Class I | 0.85% |
ISI Strategy Fund, Inc. – Performance Comparison1 (Unaudited) |
ISI Strategy Fund, Inc. – Performance Comparison1 (Unaudited) (continued) |
| | Cumulative Total Returns (With Sales Charge) | Average Annual Total Returns (With Sales Charge) |
| Periods Ended October 31, 2013 | 1 Year | 3 Years | 5 Years | 10 Years | Since Inception2 | 1 Year | 3 Years | 5 Years | 10 Years | Since Inception2 |
| | | | | | | | | | |
DJ Wilshire 5000 (Full Cap) Index3 | | | | | | | | | | |
| | | | | | | | | | |
Lipper Flexible Portfolio Funds’ Average5 | | | | | | | | | | |
| 1 | Past performance is not indicative of future results. Investment return and principal value will fluctuate so that an investor’s shares, when redeemed, may be worth more or less than their original cost. The performance information presented in the graph and table above does not reflect the deduction of taxes that a shareholder would pay on Fund distributions or the redemption of Fund shares. All performance assumes the reinvestment of dividends and capital gain distributions and includes the Fund’s maximum 3.00% sales charge. |
| 2 | The Fund’s inception date is September 16, 1997. Benchmark returns are for the periods beginning September 30, 1997. |
| 3 | The DJ Wilshire 5000 (Full Cap) Index is an unmanaged index that represents the broadest measure of the US equity market. Benchmark returns do not reflect expenses or sales charges that have been deducted from the Fund’s returns. |
| 4 | The Consumer Price Index is a widely used measure of inflation. |
| 5 | Lipper figures represent the average total returns by all mutual funds designated by Lipper as falling into the category indicated. The Lipper Flexible Portfolio Funds’ Average category includes funds that allocate their investments across various asset classes, including domestic common stocks, bonds and money market instruments with a focus on total return. |
Expense Ratio Information as of: | |
| Gross Expense Ratio | 1.08% |
| Shareholder Expense Examples (Unaudited) |
As a shareholder of the Funds, you incur two types of cost: (1) transaction costs, including sales charges (loads); and (2) ongoing costs, including management fees, Rule 12b-1 distribution/shareholder service fees and other Fund expenses. This example is intended to help you understand your ongoing costs (in dollars) of investing in each Fund and to compare these costs with the ongoing costs of investing in other mutual funds.
A mutual fund’s ongoing costs are expressed as a percentage of its average net assets. This figure is known as the expense ratio. The expenses in the tables below are based on an investment of $1,000 made at the beginning of the period (May 1, 2013) shown and held for the entire period (October 31, 2013).
Actual Expenses – “Actual Return” in the following table provides information about actual account values and actual expenses. You may use the information here, together with the amount you invested, to estimate the expenses that you paid over the period. Simply divide your account value by $1,000 (for example, an $8,600 account value divided by $1,000 = 8.6), then multiply the result by the number in the “Expenses Paid During Period” column to estimate the expenses you paid on your account during this period.
Hypothetical Example for Comparison Purposes – “Hypothetical Returns” in the following table provides information about hypothetical account values and hypothetical expenses based on each Fund’s actual expense ratio and an assumed rate of return of 5% per year before expenses, which is not the actual return of each Fund. The hypothetical account values and expenses may not be used to estimate the actual ending account balance or expenses you paid for the period. You may use this information to compare the ongoing cost of investing in a Fund and other funds. To do so, compare this 5% hypothetical example with the 5% hypothetical examples that appear in the shareholder reports of other funds.
Expenses shown in the tables are meant to highlight your ongoing costs only and do not reflect any transactional costs, such as sales charges (loads). Therefore, “Hypothetical Returns” in the table are useful in comparing ongoing costs only, and will not help you determine the relative total costs of owning different funds. If these transactional costs were included, your costs would have been higher.
| Shareholder Expense Examples (Unaudited) (continued) |
Total Return U.S. Treasury Fund, Inc.
| Beginning Account Value May 1, 2013 | Ending Account Value October 31, 2013 | Expenses Paid During Period(1) | |
| Based on Actual Fund Return | $1,000.00 | $974.50 | $4.48 | 0.90% |
| Based on Hypothetical 5% Return | $1,000.00 | $1,020.67 | $4.58 | 0.90% |
Managed Municipal Fund, Inc. – Class A
| Beginning Account Value May 1, 2013 | Ending Account Value October 31, 2013 | Expenses Paid During Period(1) | |
| Based on Actual Fund Return | $1,000.00 | $963.10 | $5.39 | 1.09% |
| Based on Hypothetical 5% Return | $1,000.00 | $1,019.71 | $5.55 | 1.09% |
Managed Municipal Fund, Inc. – Class I
| Beginning Account Value May 1, 2013 | Ending Account Value October 31, 2013 | Expenses Paid During Period(1) | |
| Based on Actual Fund Return | $1,000.00 | $963.50 | $4.11 | 0.83% |
| Based on Hypothetical 5% Return | $1,000.00 | $1,021.02 | $4.23 | 0.83% |
North American Government Bond Fund, Inc. – Class A
| Beginning Account Value May 1, 2013 | Ending Account Value October 31, 2013 | Expenses Paid During Period(1) | |
| Based on Actual Fund Return | $1,000.00 | $966.90 | $6.49 | 1.31% |
| Based on Hypothetical 5% Return | $1,000.00 | $1,018.60 | $6.67 | 1.31% |
North American Government Bond Fund, Inc. – Class C
| Beginning Account Value May 1, 2013 | Ending Account Value October 31, 2013 | Expenses Paid During Period(1) | |
| Based on Actual Fund Return | $1,000.00 | $963.10 | $9.45 | 1.91% |
| Based on Hypothetical 5% Return | $1,000.00 | $1,015.58 | $9.70 | 1.91% |
| (1) | Expenses are equal to each Fund’s annualized expense ratio for the period, multiplied by the average account value over the period, multiplied by 184/365 (to reflect the one-half year period). |
| Shareholder Expense Examples (Unaudited) (continued) |
North American Government Bond Fund, Inc. – Class I
| Beginning Account Value May 1, 2013 | Ending Account Value October 31, 2013 | Expenses Paid During Period(1) | |
| Based on Actual Fund Return | $1,000.00 | $966.00 | $5.45 | 1.10% |
| Based on Hypothetical 5% Return | $1,000.00 | $1,019.66 | $5.60 | 1.10% |
ISI Strategy Fund, Inc.
| Beginning Account Value May 1, 2013 | Ending Account Value October 31, 2013 | Expenses Paid During Period(1) | |
| Based on Actual Fund Return | $1,000.00 | $1,087.70 | $5.63 | 1.07% |
| Based on Hypothetical 5% Return | $1,000.00 | $1,019.81 | $5.45 | 1.07% |
| (1) | Expenses are equal to each Fund’s annualized expense ratio for the period, multiplied by the average account value over the period, multiplied by 184/365 (to reflect the one-half year period). |
| Portfolio Profiles (Unaudited) |
| Portfolio Profiles (as a % of Net Assets) | October 31, 2013 |
| Total Return U.S. Treasury Fund, Inc. | |
| U.S. Treasury Obligations | | | 99.55 | % |
| Other Assets and Liabilities | | | 0.45 | % |
| | | | 100.00 | % |
| | | | | |
| Managed Municipal Fund, Inc. | |
| Aaa Municipal Obligations* | | | 81.22 | % |
| Aa Municipal Obligations* | | | 7.28 | % |
| NR Municipal Obligations* | | | 0.44 | % |
| U.S. Treasury Obligations | | | 10.17 | % |
| Other Assets and Liabilities | | | 0.89 | % |
| | | | 100.00 | % |
| | | | | |
| * Ratings are based on Moody’s Investors Service, Inc. | |
| | | | | |
| North American Government Bond Fund, Inc. | |
| Canadian Securities | | | 19.35 | % |
| Mexican Securities | | | 14.13 | % |
| U.S. Treasury Obligations | | | 65.27 | % |
| Other Assets and Liabilities | | | 1.25 | % |
| | | | 100.00 | % |
| | | | | |
| ISI Strategy Fund, Inc. | |
| Consumer Discretionary | | | 13.03 | % |
| Consumer Staples | | | 8.11 | % |
| Energy | | | 7.81 | % |
| Financials | | | 12.23 | % |
| Health Care | | | 9.99 | % |
| Industrials | | | 9.57 | % |
| Information Technology | | | 13.98 | % |
| Materials | | | 3.13 | % |
| Telecommunication Services | | | 2.26 | % |
| Utilities | | | 2.01 | % |
| U.S. Treasury Obligations | | | 17.91 | % |
| Other Assets and Liabilities | | | (0.03 | )% |
| | | | 100.00 | % |
| Total Return U.S. Treasury Fund, Inc. |
| Schedule of Investments | October 31, 2013 |
| | | | | | | | | | |
| U.S. TREASURY OBLIGATIONS - 99.55% | | | | | | | | |
| U.S. Treasury Notes | | | 0.250% | | 02/28/14 | | $ | 6,690,000 | | | $ | 6,693,787 | |
| U.S. Treasury Notes | | | 0.250% | | 03/31/14 | | | 7,180,000 | | | | 7,184,207 | |
| U.S. Treasury Notes | | | 3.750% | | 11/15/18 | | | 700,000 | | | | 783,016 | |
| U.S. Treasury Notes | | | 1.250% | | 01/31/19 | | | 16,000,000 | | | | 15,887,504 | |
| U.S. Treasury Notes | | | 2.625% | | 08/15/20 | | | 1,680,000 | | | | 1,762,753 | |
| U.S. Treasury Bonds | | | 8.125% | | 08/15/19 | | | 10,000,000 | | | | 13,671,880 | |
| U.S. Treasury Bonds | | | 8.750% | | 08/15/20 | | | 11,000,000 | | | | 15,908,750 | |
| | | | | | | | | | | | | | |
| Total U.S. Treasury Obligations (Cost $59,337,524) | | | $ | 61,891,897 | |
| | | | | | | | | | | | | | |
| Total Investments - 99.55% (Cost $59,337,524)* | | | $ | 61,891,897 | |
| Other Assets in Excess of Liabilities - 0.45% | | | | 281,745 | |
| Net Assets - 100.00% | | | $ | 62,173,642 | |
| |
|
| * | Cost for Federal income tax purposes is $59,337,524 and net unrealized appreciation on a tax basis consists of: |
| Gross Unrealized Appreciation | | $ | 2,668,911 | |
| Gross Unrealized Depreciation | | | (114,538 | ) |
| Net Unrealized Appreciation | | $ | 2,554,373 | |
See Notes to Financial Statements.
| Managed Municipal Fund, Inc. |
| Schedule of Investments | October 31, 2013 |
| | | | | | | | | | | |
| MUNICIPAL BONDS - 88.94% | | | | | | | | | | | |
| General Obligation - 44.73% | | | | | | | | | | | |
| Baltimore County, MD | | | 4.000% | | 08/01/22 | Aaa/AAA | | $ | 1,665,000 | | | $ | 1,846,768 | |
| City of Austin, TX, Series A | | | 3.000% | | 09/01/29 | Aaa/AAA | | | 2,085,000 | | | | 1,826,314 | |
| City of Columbus, OH, Series 1 | | | 4.000% | | 07/01/29 | Aaa/AAA | | | 500,000 | | | | 510,850 | |
| Delaware State, Series A | | | 3.000% | | 08/01/26 | Aaa/AAA | | | 1,500,000 | | | | 1,486,350 | |
| Delaware State, Series B | | | 3.000% | | 07/01/19 | Aaa/AAA | | | 1,400,000 | | | | 1,527,246 | |
| Georgia State, Series A | | | 3.000% | | 07/01/29 | Aaa/AAA | | | 3,000,000 | | | | 2,693,430 | |
| Georgia State, Series B | | | 4.250% | | 04/01/25 | Aaa/AAA | | | 1,120,000 | | | | 1,177,310 | |
| Maryland State, Series B | | | 3.000% | | 03/15/26 | Aaa/AAA | | | 1,750,000 | | | | 1,722,175 | |
| Mecklenburg County, NC | | | 3.500% | | 02/01/26 | Aaa/AAA | | | 2,000,000 | | | | 2,065,100 | |
| Montgomery County, MD, Public Improvements, Series A | | | 3.000% | | 11/01/29 | Aaa/AAA | | | 2,000,000 | | | | 1,793,880 | |
| Oregon State, State Property, ODOT Building, Series K | | | 5.000% | | 05/01/30 | Aa1/AA+ | | | 1,915,000 | | | | 2,101,732 | |
| Prince Georges County, MD, Public Improvements | | | 4.125% | | 07/15/26 | Aaa/AAA | | | 2,000,000 | | | | 2,098,620 | |
| South Carolina State, Coastal Carolina University, Series A | | | 4.000% | | 04/01/28 | Aaa/AA+ | | | 1,000,000 | | | | 1,063,960 | |
| Texas State, Water Financial Assistance, Series C-1 | | | 5.000% | | 08/01/39 | Aaa/AAA | | | 3,515,000 | | | | 3,701,119 | |
Utah State, Series A | | | 3.000% | | 07/01/18 | Aaa/AAA | | | 1,000,000 | | | | 1,086,930 | |
Utah State, Series A | | | 5.000% | | 07/01/23 | Aaa/AAA | | | 2,785,000 | | | | 3,303,205 | |
| Wake County, NC, Series A | | | 3.000% | | 05/01/29 | Aaa/AAA | | | 2,525,000 | | | | 2,298,356 | |
| Washington State, Series F | | | 4.500% | | 07/01/27 | Aa1/AA+ | | | 2,500,000 | | | | 2,614,325 | |
| Washington State, Motor Vehicle Fuel Tax, Series E | | | 4.000% | | 02/01/36 | Aa1/AA+ | | | 2,000,000 | | | | 1,873,600 | |
| Washington, MD, Suburban Sanitation District, Public Improvements | | | 2.000% | | 06/01/24 | Aaa/AAA | | | 2,000,000 | | | | 1,778,300 | |
| Washington, MD, Suburban Sanitation District, Public Improvements | | | 3.000% | | 06/01/26 | Aaa/AAA | | | 2,000,000 | | | | 1,952,060 | |
| | | | | | | | | | | | | $ | 40,521,630 | |
Prerefunded2 Issues - 34.04% | | | | | | | | | | | | | | |
| Alexandria, VA, Capital Improvements, 06/15/14 @ 100 | | | 4.250% | | 06/15/21 | Aaa/AAA | | $ | 3,300,000 | | | $ | 3,384,249 | |
| Fairfax County, VA, Water Authority Water Revenue, 04/01/2017 @ 100 | | | 4.500% | | 04/01/27 | NR/NR | | | 355,000 | | | | 401,178 | |
| Georgia State, Series G, 10/01/16 @ 100 | | | 4.125% | | 10/01/23 | Aaa/AA+ | | | 2,000,000 | | | | 2,171,800 | |
See Notes to Financial Statements.
| Managed Municipal Fund, Inc. |
| Schedule of Investments (continued) | October 31, 2013 |
| | | | | | | | | | | |
| MUNICIPAL BONDS - 88.94% (continued) | | | | | | | | | |
Prerefunded2 Issues - 34.04% (continued) | | | | | | | | | |
| Henrico County, VA, Public Improvements, 07/15/15 @ 100 | | | 4.250% | | 07/15/24 | Aaa/AAA | | $ | 2,830,000 | | | $ | 3,020,035 | |
| Kansas State, Development Finance Authority, Series DW-1, 04/01/17 @ 100 | | | 3.000% | | 04/01/20 | Aaa/AAA | | | 2,865,000 | | | | 2,976,248 | |
| Kansas State, Development Finance Authority, Series DW-1, 04/01/17 @ 100 | | | 3.125% | | 04/01/22 | Aaa/AAA | | | 2,975,000 | | | | 3,218,206 | |
| Maryland State, Capital Improvements, Series A, 02/15/15 @ 100 | | | 4.000% | | 02/15/20 | Aaa/AAA | | | 4,000,000 | | | | 4,193,840 | |
| Mecklenburg County, NC, Public Improvements, Series A, 02/01/14 @ 100 | | | 4.000% | | 02/01/20 | Aaa/AAA | | | 3,000,000 | | | | 3,028,950 | |
Tennessee State, Series A, 05/01/17 @ 100 | | | 5.000% | | 05/01/26 | Aaa/AA+ | | | 500,000 | | | | 574,880 | |
Tennessee State, Series A, 05/01/17 @ 100 | | | 5.000% | | 05/01/27 | Aaa/AA+ | | | 2,075,000 | | | | 2,385,752 | |
Virginia State, Series B, 06/01/16 @ 100 | | | 4.250% | | 06/01/26 | Aaa/AAA | | | 2,500,000 | | | | 2,741,675 | |
Washington, MD, Suburban Sanitation District, Water Supply, 06/01/16 @ 100 | | | 4.250% | | 06/01/26 | Aaa/AAA | | | 2,500,000 | | | | 2,744,950 | |
| | | | | | | | | | | | | $ | 30,841,763 | |
| Revenue Bonds - 10.17% | | | | | | | | | | | | | | |
| Fairfax County, VA, Water Authority Water Revenue | | | 4.500% | | 04/01/27 | Aaa/AAA | | $ | 2,145,000 | | | $ | 2,236,828 | |
| Gwinnett County, GA, Water & Sewerage Authority, Series A | | | 4.000% | | 08/01/28 | Aaa/AAA | | | 2,000,000 | | | | 2,063,160 | |
| Virginia State, Housing Development Authority, Series A | | | 2.500% | | 07/01/26 | Aaa/AAA | | | 2,000,000 | | | | 1,764,640 | |
| Virginia State, Resources Authority Clean Water Revenue | | | 4.500% | | 10/01/28 | Aaa/AAA | | | 3,000,000 | | | | 3,148,020 | |
| | | | | | | | | | | | | $ | 9,212,648 | |
| | | | | | | | | | | | | | | |
| Total Municipal Bonds (Cost $78,719,110) | | | $ | 80,576,041 | |
See Notes to Financial Statements.
| Managed Municipal Fund, Inc. |
| Schedule of Investments (continued) | October 31, 2013 |
| | | | | | | | | | |
| U.S. TREASURY OBLIGATIONS - 10.17% | | | | | | | | |
| U.S. Treasury Notes | | | 0.500% | | 11/15/13 | | $ | 1,750,000 | | | $ | 1,750,273 | |
| U.S. Treasury Notes | | | 0.250% | | 02/28/14 | | | 3,085,000 | | | | 3,086,746 | |
| U.S. Treasury Notes | | | 0.250% | | 03/31/14 | | | 4,380,000 | | | | 4,382,567 | |
| | | | | | | | | | | | | | |
| Total U.S. Treasury Obligations (Cost $9,219,215) | | | $ | 9,219,586 | |
| | | | | | | | | | | | | | |
| Total Investments - 99.11% (Cost $87,938,325)* | | | $ | 89,795,627 | |
| Other Assets in Excess of Liabilities - 0.89% | | | | 803,242 | |
| Net Assets - 100.00% | | | $ | 90,598,869 | |
| |
|
| 1 | Moody's Municipal Bond Ratings: |
| | |
| | | Aaa | Judged to be of the best quality. |
| | | | |
| | | Aa | Judged to be of high quality by all standards. Issues are sometimes denoted with a 1, 2 or 3, which denote a high, medium or low ranking within the rating. |
| | | | |
| | | NR | Bond is not rated by this rating organization. |
| | | | |
| | S&P Municipal Bond Ratings: |
| | |
| | | AAA | Of the highest quality. |
| | | | |
| | | AA | The second strongest capacity of payment of debt services. Those issues determined to possess very strong safety characteristics are denoted with a plus (+) sign. |
| | | | |
| | | NR | Bond is not rated by this rating organization. |
| | | | |
| 2 | Prerefunded: Bonds which are prerefunded are collateralized by U.S. Treasury securities which are held in escrow and are used to pay principal and interest on tax-exempt issues and to retire the bonds in full at the earliest refunding date. |
| | |
| * | Cost for Federal income tax purposes is $87,938,371 and net unrealized appreciation on a tax basis consists of: |
| Gross Unrealized Appreciation | | $ | 3,639,891 | |
| Gross Unrealized Depreciation | | | (1,782,635 | ) |
| Net Unrealized Appreciation | | $ | 1,857,256 | |
See Notes to Financial Statements.
| North American Government Bond Fund, Inc. |
| Schedule of Investments | October 31, 2013 |
| | | | | | | | | | |
| CANADIAN SECURITIES - 19.35% | | | | | | | | | | |
| Canadian Government Bonds | | | 0.750% | | 05/01/14 | | CAD 5,000,000 | | | $ | 4,790,678 | |
| Canadian Government Bonds | | | 2.250% | | 08/01/14 | | | 3,150,000 | | | | 3,049,335 | |
| Canadian Government Bonds | | | 1.000% | | 05/01/15 | | | 3,100,000 | | | | 2,971,350 | |
| Canadian Government Bonds | | | 4.000% | | 06/01/17 | | | 5,075,000 | | | | 5,307,516 | |
| Canadian Government Bonds | | | 3.750% | | 06/01/19 | | | 3,280,000 | | | | 3,461,986 | |
| | | | | | | | | | | | | | |
| Total Canadian Securities (Cost $20,074,246) | | | $ | 19,580,865 | |
| | | | | | | | | | | | | | |
| MEXICAN SECURITIES - 14.13% | | | | | | | | | | | | | |
Mexican Bono2 | | | 8.000% | | 12/19/13 | | MXN 41,091,000 | | | | 3,170,296 | |
Mexican Bono2 | | | 8.000% | | 12/17/15 | | | 54,407,000 | | | | 4,509,210 | |
Mexican Bono2 | | | 7.250% | | 12/15/16 | | | 79,860,000 | | | | 6,626,117 | |
| | | | | | | | | | | | | | |
| Total Mexican Securities (Cost $15,177,945) | | | $ | 14,305,623 | |
| | | | | | | | | | | | | | |
| U.S. TREASURY OBLIGATIONS - 65.27% | | | | | | | | | | |
| U.S. Treasury Notes | | | 0.250% | | 02/28/14 | | $ | 1,955,000 | | | $ | 1,956,106 | |
| U.S. Treasury Notes | | | 0.250% | | 03/31/14 | | | 11,700,000 | | | | 11,706,856 | |
| U.S. Treasury Notes | | | 2.625% | | 08/15/20 | | | 5,010,000 | | | | 5,256,783 | |
| U.S. Treasury Notes | | | 2.000% | | 11/15/21 | | | 5,400,000 | | | | 5,316,467 | |
| U.S. Treasury Bonds | | | 8.750% | | 05/15/17 | | | 11,800,000 | | | | 15,076,341 | |
| U.S. Treasury Bonds | | | 8.875% | | 08/15/17 | | | 7,550,000 | | | | 9,801,727 | |
| U.S. Treasury Bonds | | | 8.125% | | 08/15/19 | | | 3,775,000 | | | | 5,161,135 | |
| U.S. Treasury Bonds | | | 8.500% | | 02/15/20 | | | 6,000,000 | | | | 8,459,766 | |
| U.S. Treasury Bonds | | | 8.750% | | 08/15/20 | | | 2,300,000 | | | | 3,326,375 | |
| | | | | | | | | | | | | | |
| Total U.S. Treasury Obligations (Cost $63,059,357) | | | $ | 66,061,556 | |
| | | | | | | | | | | | | | |
| Total Investments - 98.75% (Cost $98,311,548)* | | | $ | 99,948,044 | |
| Other Assets in Excess of Liabilities - 1.25% | | | | 1,263,185 | |
| Net Assets - 100.00% | | | $ | 101,211,229 | |
See Notes to Financial Statements.
| North American Government Bond Fund, Inc. |
| Schedule of Investments (continued) | October 31, 2013 |
|
| | |
| CAD | Canadian Dollar |
| | |
| MXN | Mexican Peso |
| 1 | Principal Amount is shown in U.S. dollars unless otherwise noted. |
| | |
| 2 | Bonos are fixed rate, local currency-denominated coupon bonds issued by the Mexican government. |
| | |
| * | Cost for Federal income tax purposes is $98,311,639 and net unrealized appreciation on a tax basis consists of: |
| Gross Unrealized Appreciation | | $ | 3,381,800 | |
| Gross Unrealized Depreciation | | | (1,745,395 | ) |
| Net Unrealized Appreciation | | $ | 1,636,405 | |
See Notes to Financial Statements.
| Schedule of Investments | October 31, 2013 |
| | | | | | |
| COMMON STOCKS - 82.12% | | | | |
| Consumer Discretionary - 13.03% | | | | |
| Auto Components - 0.81% | | | | | | |
| Allison Transmission Holdings, Inc. | | | 1,750 | | | $ | 42,612 | |
| American Axle & Manufacturing Holdings, Inc.* | | | 4,370 | | | | 81,326 | |
| Federal-Mogul Corp.* | | | 8,375 | | | | 171,604 | |
| Goodyear Tire & Rubber Co. (The) | | | 7,215 | | | | 151,371 | |
Lear Corp. | | | 3,250 | | | | 251,517 | |
| | | | | | | | 698,430 | |
| Automobiles - 0.57% | | | | | | | | |
Ford Motor Co. | | | 17,115 | | | | 292,838 | |
| General Motors Co.* | | | 3,965 | | | | 146,507 | |
| Winnebago Industries, Inc.* | | | 1,640 | | | | 48,642 | |
| | | | | | | | 487,987 | |
| Diversified Consumer Services - 0.21% | | | | | |
H&R Block, Inc. | | | 1,220 | | | | 34,697 | |
Hillenbrand, Inc. | | | 2,200 | | | | 62,084 | |
Regis Corp. | | | 1,140 | | | | 16,530 | |
| Service Corp. International | | | 2,490 | | | | 44,845 | |
| Weight Watchers International, Inc. | | | 650 | | | | 20,871 | |
| | | | | | | | 179,027 | |
| Hotels, Restaurants & Leisure - 1.96% | | | | | |
| Brinker International, Inc. | | | 900 | | | | 39,978 | |
| Darden Restaurants, Inc. | | | 1,130 | | | | 58,229 | |
Denny's Corp.* | | | 4,730 | | | | 30,036 | |
| Dunkin' Brands Group, Inc. | | | 2,480 | | | | 118,246 | |
| Hyatt Hotels Corp. - Class A* | | | 2,905 | | | | 138,278 | |
| International Game Technology | | | 4,430 | | | | 83,284 | |
| Jack in the Box, Inc.* | | | 1,010 | | | | 41,087 | |
| Marriott International, Inc. - Class A | | | 2,606 | | | | 117,478 | |
McDonald's Corp. | | | 3,022 | | | | 291,683 | |
| MGM Resorts International* | | | 3,878 | | | | 73,837 | |
| Scientific Games Corp. - Class A* | | | 5,300 | | | | 96,884 | |
Wendy's Co. (The) | | | 11,100 | | | | 96,459 | |
| | |
| Hotels, Restaurants & Leisure - 1.96% (continued) | |
| Wyndham Worldwide Corp. | | | 3,355 | | | $ | 222,772 | |
Wynn Resorts Ltd. | | | 1,080 | | | | 179,550 | |
Yum! Brands, Inc. | | | 1,440 | | | | 97,373 | |
| | | | | | | | 1,685,174 | |
| Household Durables - 0.81% | | | | | | | | |
| Beazer Homes USA, Inc.* | | | 1,380 | | | | 25,075 | |
DR Horton, Inc. | | | 4,020 | | | | 76,179 | |
| Harman International Industries, Inc. | | | 600 | | | | 48,612 | |
| Hovnanian Enterprises, Inc. - Class A* | | | 3,630 | | | | 18,368 | |
Jarden Corp.* | | | 6,205 | | | | 343,509 | |
Libbey, Inc.* | | | 1,310 | | | | 27,968 | |
| Newell Rubbermaid, Inc. | | | 5,265 | | | | 156,002 | |
| | | | | | | | 695,713 | |
| Internet & Catalog Retail - 1.05% | | | | | |
Amazon.com, Inc.* | | | 1,280 | | | | 465,959 | |
| Liberty Interactive Corp. - Class A* | | | 12,115 | | | | 326,620 | |
| Liberty Ventures - Series A* | | | 616 | | | | 66,140 | |
| Orbitz Worldwide, Inc.* | | | 5,170 | | | | 47,771 | |
| | | | | | | | 906,490 | |
| Leisure Equipment & Products - 0.24% | |
Brunswick Corp. | | | 1,000 | | | | 45,130 | |
| LeapFrog Enterprises, Inc.* | | | 2,770 | | | | 23,711 | |
Mattel, Inc. | | | 2,220 | | | | 98,502 | |
| Smith & Wesson Holding Corp.* | | | 3,690 | | | | 39,778 | |
| | | | | | | | 207,121 | |
| Media - 4.44% | | | | | | | | |
| Cablevision Systems Corp. - New York Group - Class A | | | 13,878 | | | | 215,803 | |
| Charter Communications, Inc. - Class A* | | | 2,072 | | | | 278,145 | |
| Comcast Corp. - Class A | | | 7,400 | | | | 352,092 | |
DIRECTV* | | | 7,855 | | | | 490,859 | |
| DISH Network Corp. - Class A | | | 4,735 | | | | 228,227 | |
| DreamWorks Animation SKG, Inc. - Class A* | | | 1,620 | | | | 55,469 | |
See Notes to Financial Statements.
| Schedule of Investments (continued) | October 31, 2013 |
| | | | | | |
| COMMON STOCKS - 82.12% (continued) | |
| Consumer Discretionary - 13.03% (continued) | |
| Media - 4.44% (continued) | | | | | | |
| Interpublic Group of Cos., Inc. (The) | | | 7,100 | | | $ | 119,280 | |
| John Wiley & Sons, Inc. - Class A | | | 3,575 | | | | 179,787 | |
| Journal Communications, Inc. - Class A* | | | 2,680 | | | | 22,378 | |
| Lamar Advertising Co. - Class A* | | | 1,140 | | | | 52,109 | |
| Liberty Global PLC - Class A* | | | 3,998 | | | | 313,323 | |
| News Corp. - Class A* | | | 2,468 | | | | 43,437 | |
| Nexstar Broadcasting Group, Inc. - Class A | | | 760 | | | | 33,736 | |
| Omnicom Group, Inc. | | | 2,210 | | | | 150,523 | |
Scholastic Corp. | | | 850 | | | | 24,387 | |
| Thomson Reuters Corp. | | | 3,540 | | | | 132,998 | |
| Time Warner Cable, Inc. | | | 3,730 | | | | 448,159 | |
Time Warner, Inc. | | | 2,655 | | | | 182,505 | |
| Viacom, Inc. - Class B | | | 1,230 | | | | 102,447 | |
| Walt Disney Co. (The) | | | 5,378 | | | | 368,877 | |
| World Wrestling Entertainment, Inc. - Class A | | | 2,040 | | | | 26,418 | |
| | | | | | | | 3,820,959 | |
| Multi-Line Retail - 0.82% | | | | | | | | |
Big Lots, Inc.* | | | 1,130 | | | | 41,087 | |
| Dillard's, Inc. - Class A | | | 760 | | | | 62,305 | |
| Dollar General Corp.* | | | 1,490 | | | | 86,092 | |
Kohl's Corp. | | | 3,950 | | | | 224,360 | |
Nordstrom, Inc. | | | 2,415 | | | | 146,035 | |
Target Corp. | | | 2,266 | | | | 146,814 | |
| | | | | | | | 706,693 | |
| Specialty Retail - 1.68% | | | | | | | | |
AutoNation, Inc.* | | | 1,000 | | | | 48,230 | |
AutoZone, Inc.* | | | 230 | | | | 99,979 | |
Best Buy Co., Inc. | | | 2,260 | | | | 96,728 | |
Chico's FAS, Inc. | | | 2,460 | | | | 42,189 | |
Conn's, Inc.* | | | 990 | | | | 59,836 | |
| | | | | | |
| Specialty Retail - 1.68% (continued) | | | | | |
Express, Inc.* | | | 1,482 | | | $ | 34,397 | |
| GameStop Corp. - Class A | | | 2,240 | | | | 122,797 | |
Gap, Inc. (The) | | | 579 | | | | 21,417 | |
| Home Depot, Inc. (The) | | | 2,257 | | | | 175,798 | |
Lowe's Cos., Inc. | | | 3,525 | | | | 175,474 | |
| Sally Beauty Holdings, Inc.* | | | 2,260 | | | | 59,483 | |
Staples, Inc. | | | 20,650 | | | | 332,878 | |
Systemax, Inc. | | | 1,031 | | | | 9,794 | |
TJX Cos., Inc. | | | 1,240 | | | | 75,379 | |
| Wet Seal, Inc. (The) - Class A* | | | 5,200 | | | | 17,212 | |
Zale Corp.* | | | 2,020 | | | | 31,573 | |
Zumiez, Inc.* | | | 1,370 | | | | 40,607 | |
| | | | | | | | 1,443,771 | |
| Textiles, Apparel & Luxury Goods - 0.44% | |
Carter's, Inc. | | | 1,000 | | | | 69,150 | |
NIKE, Inc. - Class B | | | 2,205 | | | | 167,051 | |
Unifi, Inc.* | | | 1,120 | | | | 27,317 | |
| Wolverine World Wide, Inc. | | | 1,930 | | | | 111,438 | |
| | | | | | | | 374,956 | |
| Consumer Staples - 8.11% | | | | | |
| Beverages - 1.62% | | | | | | | | |
| Coca-Cola Bottling Co. Consolidated | | | 580 | | | | 36,726 | |
| Coca-Cola Co. (The) | | | 13,860 | | | | 548,440 | |
| Coca-Cola Enterprises, Inc. | | | 5,555 | | | | 231,810 | |
| Dr Pepper Snapple Group, Inc. | | | 3,743 | | | | 177,231 | |
PepsiCo, Inc. | | | 4,699 | | | | 395,139 | |
| | | | | | | | 1,389,346 | |
| Food & Staples Retailing - 1.85% | | | | | |
| Costco Wholesale Corp. | | | 1,170 | | | | 138,060 | |
| CVS Caremark Corp. | | | 5,015 | | | | 312,234 | |
Kroger Co. (The) | | | 2,120 | | | | 90,821 | |
Rite Aid Corp.* | | | 12,885 | | | | 68,677 | |
Safeway, Inc. | | | 1,890 | | | | 65,961 | |
Sysco Corp. | | | 3,140 | | | | 101,547 | |
| Wal-Mart Stores, Inc. | | | 10,637 | | | | 816,390 | |
| | | | | | | | 1,593,690 | |
See Notes to Financial Statements.
| Schedule of Investments (continued) | October 31, 2013 |
| | | | | | |
| COMMON STOCKS - 82.12% (continued) | |
| Consumer Staples - 8.11% (continued) | |
| Food Products - 2.07% | | | | | | |
| Boulder Brands, Inc.* | | | 1,680 | | | $ | 27,535 | |
Campbell Soup Co. | | | 1,420 | | | | 60,449 | |
| Chiquita Brands International, Inc.* | | | 2,900 | | | | 30,015 | |
ConAgra Foods, Inc. | | | 10,260 | | | | 326,371 | |
| Darling International, Inc.* | | | 1,480 | | | | 34,440 | |
Dean Foods Co.* | | | 2,225 | | | | 43,388 | |
| Dole Food Co., Inc.* | | | 5,100 | | | | 69,105 | |
General Mills, Inc. | | | 4,091 | | | | 206,268 | |
Hershey Co. (The) | | | 193 | | | | 19,153 | |
Kellogg Co. | | | 2,535 | | | | 160,339 | |
| Kraft Foods Group, Inc. | | | 2,076 | | | | 112,893 | |
| McCormick & Co., Inc. - Non-Voting Shares | | | 1,118 | | | | 77,310 | |
| Mondelez International, Inc. - Class A | | | 11,775 | | | | 396,111 | |
| Pilgrim's Pride Corp.* | | | 3,610 | | | | 51,154 | |
Pinnacle Foods, Inc. | | | 1,490 | | | | 40,364 | |
| TreeHouse Foods, Inc.* | | | 1,390 | | | | 101,831 | |
| WhiteWave Foods Co. - Class A* | | | 1,136 | | | | 22,731 | |
| | | | | | | | 1,779,457 | |
| Household Products - 1.13% | | | | | | | | |
| Colgate-Palmolive Co. | | | 4,025 | | | | 260,538 | |
| Harbinger Group, Inc.* | | | 5,210 | | | | 56,737 | |
| Kimberly-Clark Corp. | | | 250 | | | | 27,000 | |
| Procter & Gamble Co. (The) | | | 7,758 | | | | 626,459 | |
| | | | | | | | 970,734 | |
| Personal Products - 0.33% | | | | | | | | |
Avon Products, Inc. | | | 15,110 | | | | 264,425 | |
| Revlon, Inc. - Class A* | | | 930 | | | | 22,087 | |
| | | | | | | | 286,512 | |
| Tobacco - 1.11% | | | | | | | | |
Altria Group, Inc. | | | 6,297 | | | | 234,438 | |
Lorillard, Inc. | | | 420 | | | | 21,424 | |
| Philip Morris International, Inc. | | | 5,452 | | | | 485,882 | |
| Reynolds American, Inc. | | | 3,141 | | | | 161,353 | |
| | | | | | | | | |
| Tobacco - 1.11% (continued) | | | | | | | | |
Vector Group Ltd. | | | 3,200 | | | $ | 51,744 | |
| | | | | | | | 954,841 | |
| Energy - 7.81% | | | | | | | | |
| Energy Equipment & Services - 1.17% | | | | | |
| Dresser-Rand Group, Inc.* | | | 2,865 | | | | 174,106 | |
Halliburton Co. | | | 5,440 | | | | 288,483 | |
| Newpark Resources, Inc.* | | | 2,390 | | | | 30,473 | |
Schlumberger Ltd. | | | 4,102 | | | | 384,440 | |
| Superior Energy Services, Inc.* | | | 2,930 | | | | 78,612 | |
Unit Corp.* | | | 930 | | | | 47,811 | |
| | | | | | | | 1,003,925 | |
| Oil, Gas & Consumable Fuels - 6.64% | | | | | |
| Anadarko Petroleum Corp. | | | 586 | | | | 55,840 | |
Apache Corp. | | | 4,040 | | | | 358,752 | |
Chevron Corp. | | | 5,871 | | | | 704,285 | |
Cimarex Energy Co. | | | 996 | | | | 104,929 | |
ConocoPhillips | | | 4,705 | | | | 344,876 | |
| CONSOL Energy, Inc. | | | 2,570 | | | | 93,805 | |
| Contango Oil & Gas Co. | | | 850 | | | | 36,423 | |
| Crosstex Energy, Inc. | | | 2,520 | | | | 77,339 | |
Devon Energy Corp. | | | 2,170 | | | | 137,187 | |
Exxon Mobil Corp. | | | 14,363 | | | | 1,287,212 | |
Forest Oil Corp.* | | | 6,480 | | | | 30,715 | |
| Green Plains Renewable Energy, Inc. | | | 1,660 | | | | 26,776 | |
Kinder Morgan, Inc. | | | 4,765 | | | | 168,252 | |
Marathon Oil Corp. | | | 9,980 | | | | 351,895 | |
| Marathon Petroleum Corp. | | | 1,945 | | | | 139,379 | |
Murphy Oil Corp. | | | 7,500 | | | | 452,400 | |
| Newfield Exploration Co.* | | | 3,110 | | | | 94,699 | |
| Occidental Petroleum Corp. | | | 1,040 | | | | 99,923 | |
| Peabody Energy Corp. | | | 6,820 | | | | 132,854 | |
Phillips 66 | | | 7,070 | | | | 455,520 | |
| Southwestern Energy Co.* | | | 3,765 | | | | 140,133 | |
| Spectra Energy Corp. | | | 4,135 | | | | 147,082 | |
Tesoro Corp. | | | 1,080 | | | | 52,801 | |
Valero Energy Corp. | | | 2,420 | | | | 99,631 | |
W&T Offshore, Inc. | | | 2,030 | | | | 38,753 | |
See Notes to Financial Statements.
| Schedule of Investments (continued) | October 31, 2013 |
| | | | | | |
| COMMON STOCKS - 82.12% (continued) | |
| Energy - 7.81% (continued) | | | | |
| Oil, Gas & Consumable Fuels - 6.64% (continued) | |
| Williams Cos., Inc. (The) | | | 2,225 | | | $ | 79,455 | |
| | | | | | | | 5,710,916 | |
| Financials - 12.23% | | | | | | | | |
| Capital Markets - 1.39% | | | | | | | | |
| Bank of New York Mellon Corp. (The) | | | 7,535 | | | | 239,613 | |
BlackRock, Inc. | | | 16 | | | | 4,813 | |
| Charles Schwab Corp. (The) | | | 2,325 | | | | 52,661 | |
| E*TRADE Financial Corp.* | | | 4,080 | | | | 68,993 | |
| Goldman Sachs Group, Inc. (The) | | | 1,000 | | | | 160,860 | |
Invesco Ltd. | | | 951 | | | | 32,096 | |
| Investment Technology Group, Inc.* | | | 2,130 | | | | 34,123 | |
Legg Mason, Inc. | | | 5,040 | | | | 193,889 | |
Morgan Stanley | | | 5,955 | | | | 171,087 | |
| Raymond James Financial, Inc. | | | 1,620 | | | | 73,953 | |
State Street Corp. | | | 2,305 | | | | 161,511 | |
| | | | | | | | 1,193,599 | |
| Commercial Banks - 2.61% | | | | | | | | |
BB&T Corp. | | | 6,065 | | | | 206,028 | |
| Cullen/Frost Bankers, Inc. | | | 2,588 | | | | 183,205 | |
| CVB Financial Corp. | | | 4,920 | | | | 71,537 | |
| Enterprise Financial Services Corp. | | | 1,010 | | | | 18,210 | |
Fifth Third Bancorp | | | 6,745 | | | | 128,357 | |
FirstMerit Corp. | | | 5,455 | | | | 122,519 | |
MB Financial, Inc. | | | 2,160 | | | | 64,152 | |
| Pinnacle Financial Partners, Inc.* | | | 1,760 | | | | 54,560 | |
| PNC Financial Services Group, Inc. (The) | | | 1,200 | | | | 88,236 | |
| Susquehanna Bancshares, Inc. | | | 4,012 | | | | 47,281 | |
| SVB Financial Group* | | | 1,160 | | | | 111,105 | |
Trico Bancshares | | | 900 | | | | 22,761 | |
| Union First Market Bankshares Corp. | | | 1,457 | | | | 35,143 | |
| | |
| Commercial Banks - 2.61% (continued) | |
| United Community Banks, Inc.* | | | 3,040 | | | $ | 47,394 | |
US Bancorp | | | 5,760 | | | | 215,194 | |
| Washington Trust Bancorp, Inc. | | | 700 | | | | 23,023 | |
| Webster Financial Corp. | | | 2,460 | | | | 68,609 | |
Wells Fargo & Co. | | | 17,328 | | | | 739,732 | |
| | | | | | | | 2,247,046 | |
| Consumer Finance - 0.95% | | | | | | | | |
| American Express Co. | | | 4,955 | | | | 405,319 | |
| Capital One Financial Corp. | | | 1,700 | | | | 116,739 | |
DFC Global Corp.* | | | 1,950 | | | | 23,595 | |
| Discover Financial Services | | | 5,165 | | | | 267,960 | |
| | | | | | | | 813,613 | |
| Diversified Financial Services - 2.02% | | | | | |
| Bank of America Corp. | | | 30,281 | | | | 422,723 | |
Citigroup, Inc. | | | 7,175 | | | | 349,996 | |
CME Group, Inc. | | | 550 | | | | 40,815 | |
| JPMorgan Chase & Co. | | | 11,716 | | | | 603,843 | |
MSCI, Inc.* | | | 3,945 | | | | 160,838 | |
| NASDAQ OMX Group, Inc. (The) | | | 4,085 | | | | 144,732 | |
| Resource America, Inc. - Class A | | | 1,110 | | | | 9,579 | |
| | | | | | | | 1,732,526 | |
| Insurance - 4.04% | | | | | | | | |
Aflac, Inc. | | | 2,515 | | | | 163,425 | |
Allstate Corp. (The) | | | 5,285 | | | | 280,422 | |
| American Equity Investment Life Holding Co. | | | 3,890 | | | | 81,068 | |
| American Financial Group, Inc. | | | 1,000 | | | | 56,260 | |
| American International Group, Inc. | | | 6,155 | | | | 317,906 | |
| American National Insurance Co. | | | 240 | | | | 24,257 | |
| Berkshire Hathaway, Inc. - Class B* | | | 6,986 | | | | 803,949 | |
| Brown & Brown, Inc. | | | 3,360 | | | | 107,285 | |
Chubb Corp. (The) | | | 1,150 | | | | 105,892 | |
| Cincinnati Financial Corp. | | | 1,782 | | | | 89,100 | |
See Notes to Financial Statements.
| Schedule of Investments (continued) | October 31, 2013 |
| | | | | | |
| COMMON STOCKS - 82.12% (continued) | |
| Financials - 12.23% (continued) | | | | |
| Insurance - 4.04% (continued) | | | | |
| Employers Holdings, Inc. | | | 1,818 | | | $ | 54,667 | |
| FBL Financial Group, Inc. - Class A | | | 900 | | | | 40,266 | |
| Genworth Financial, Inc. - Class A* | | | 6,240 | | | | 90,667 | |
Loews Corp. | | | 3,025 | | | | 146,138 | |
PartnerRe Ltd. | | | 2,993 | | | | 299,928 | |
| Principal Financial Group, Inc. | | | 5,195 | | | | 246,555 | |
| Progressive Corp. (The) | | | 3,910 | | | | 101,543 | |
| Protective Life Corp. | | | 2,870 | | | | 132,249 | |
RLI Corp. | | | 1,020 | | | | 96,369 | |
Unum Group | | | 7,523 | | | | 238,780 | |
| | | | | | | | 3,476,726 | |
| Real Estate Investment Trusts - 0.58% | | | | | |
| American Tower Corp. | | | 1,640 | | | | 130,134 | |
| FelCor Lodging Trust, Inc.* | | | 6,176 | | | | 41,503 | |
HCP, Inc. | | | 990 | | | | 41,085 | |
iStar Financial, Inc.* | | | 4,770 | | | | 60,245 | |
| NorthStar Realty Finance Corp. | | | 6,300 | | | | 58,779 | |
| Parkway Properties Inc. | | | 1,000 | | | | 18,110 | |
| Potlatch Corp. - REIT | | | 1,410 | | | | 57,570 | |
| Strategic Hotels & Resorts, Inc.* | | | 2,870 | | | | 24,969 | |
Ventas, Inc. | | | 410 | | | | 26,749 | |
Weyerhaeuser Co. | | | 1,310 | | | | 39,824 | |
| | | | | | | | 498,968 | |
| Real Estate Management & Development - 0.36% | |
| CBRE Group, Inc. - Class A* | | | 4,890 | | | | 113,595 | |
| Jones Lang LaSalle, Inc. | | | 2,070 | | | | 197,064 | |
| | | | | | | | 310,659 | |
| Thrifts & Mortgage Finance - 0.28% | | | | | |
| Capitol Federal Financial, Inc. | | | 6,400 | | | | 81,088 | |
| New York Community Bancorp, Inc. | | | 8,790 | | | | 142,486 | |
| Rockville Financial, Inc. | | | 1,590 | | | | 20,908 | |
| | | | | | | | 244,482 | |
| Health Care - 9.99% | | | | | | | | |
| Biotechnology - 1.25% | | | | | | | | |
Amgen, Inc. | | | 3,473 | | | $ | 402,868 | |
Celgene Corp.* | | | 1,020 | | | | 151,460 | |
| Gilead Sciences, Inc.* | | | 3,705 | | | | 263,018 | |
| Halozyme Therapeutics, Inc.* | | | 3,710 | | | | 43,221 | |
InterMune, Inc.* | | | 1,540 | | | | 21,699 | |
| Quintiles Transnational Holdings, Inc.* | | | 1,000 | | | | 41,990 | |
| United Therapeutics Corp.* | | | 900 | | | | 79,668 | |
| Vertex Pharmaceuticals, Inc.* | | | 1,000 | | | | 71,340 | |
| | | | | | | | 1,075,264 | |
| Health Care Equipment & Supplies - 1.16% | |
Accuray, Inc.* | | | 3,210 | | | | 21,668 | |
Alere, Inc.* | | | 3,340 | | | | 112,658 | |
| Baxter International, Inc. | | | 422 | | | | 27,797 | |
| Boston Scientific Corp.* | | | 19,275 | | | | 225,325 | |
| DENTSPLY International, Inc. | | | 1,660 | | | | 78,186 | |
Hologic, Inc.* | | | 12,095 | | | | 270,807 | |
Medtronic, Inc. | | | 2,555 | | | | 146,657 | |
STERIS Corp. | | | 1,388 | | | | 62,724 | |
| West Pharmaceutical Services, Inc. | | | 1,010 | | | | 48,833 | |
| | | | | | | | 994,655 | |
| Health Care Providers & Services - 3.01% | |
| AmerisourceBergen Corp. | | | 2,535 | | | | 165,612 | |
| Community Health Systems, Inc. | | | 2,100 | | | | 91,623 | |
| DaVita HealthCare Partners, Inc.* | | | 3,200 | | | | 179,872 | |
Emeritus Corp.* | | | 190 | | | | 3,640 | |
| ExamWorks Group, Inc.* | | | 1,910 | | | | 49,373 | |
| Express Scripts Holding Co.* | | | 4,181 | | | | 261,396 | |
HCA Holdings, Inc. | | | 5,175 | | | | 243,949 | |
Health Net, Inc.* | | | 1,440 | | | | 43,776 | |
HealthSouth Corp. | | | 2,260 | | | | 79,349 | |
Humana, Inc. | | | 1,840 | | | | 169,556 | |
| Kindred Healthcare, Inc. | | | 3,200 | | | | 44,416 | |
| Laboratory Corp. of America Holdings* | | | 1,605 | | | | 161,944 | |
| LifePoint Hospitals, Inc.* | | | 1,610 | | | | 83,140 | |
See Notes to Financial Statements.
| Schedule of Investments (continued) | October 31, 2013 |
| | | | | | |
| COMMON STOCKS - 82.12% (continued) | |
| Health Care - 9.99% (continued) | | | | |
| Health Care Providers & Services - 3.01% (continued) | |
| Magellan Health Services, Inc.* | | | 1,780 | | | $ | 104,486 | |
McKesson Corp. | | | 1,040 | | | | 162,594 | |
| Quest Diagnostics, Inc. | | | 2,815 | | | | 168,647 | |
| Select Medical Holdings Corp. | | | 8,070 | | | | 68,434 | |
| Team Health Holdings, Inc.* | | | 2,080 | | | | 90,355 | |
| Tenet Healthcare Corp.* | | | 2,943 | | | | 138,880 | |
| UnitedHealth Group, Inc. | | | 1,600 | | | | 109,216 | |
WellPoint, Inc. | | | 2,011 | | | | 170,533 | |
| | | | | | | | 2,590,791 | |
| Health Care Technology - 0.03% | | | | | |
Omnicell, Inc.* | | | 1,270 | | | | 29,299 | |
| | | | | | | | | |
| Life Sciences Tools & Services - 0.14% | | | | | |
| Thermo Fisher Scientific, Inc. | | | 1,220 | | | | 119,291 | |
| | | | | | | | | |
| Pharmaceuticals - 4.40% | | | | | | | | |
Abbott Laboratories | | | 8,881 | | | | 324,601 | |
AbbVie, Inc. | | | 4,431 | | | | 214,682 | |
Allergan, Inc. | | | 811 | | | | 73,485 | |
| Bristol-Myers Squibb Co. | | | 6,038 | | | | 317,116 | |
Eli Lilly & Co. | | | 2,190 | | | | 109,106 | |
| Endo Health Solutions, Inc.* | | | 7,430 | | | | 324,914 | |
| Forest Laboratories, Inc.* | | | 590 | | | | 27,748 | |
Hospira, Inc.* | | | 2,440 | | | | 98,869 | |
Johnson & Johnson | | | 8,720 | | | | 807,559 | |
Merck & Co., Inc. | | | 11,047 | | | | 498,109 | |
Mylan, Inc.* | | | 5,515 | | | | 208,853 | |
| Nektar Therapeutics* | | | 1,820 | | | | 17,308 | |
Pfizer, Inc. | | | 21,855 | | | | 670,511 | |
| Salix Pharmaceuticals Ltd.* | | | 1,210 | | | | 86,817 | |
| | | | | | | | 3,779,678 | |
| Industrials - 9.57% | | | | | | | | |
| Aerospace & Defense - 1.75% | | | | | |
AAR Corp. | | | 1,652 | | | | 48,371 | |
Boeing Co. (The) | | | 1,120 | | | | 146,160 | |
| Curtiss-Wright Corp. | | | 1,736 | | | | 86,418 | |
| | |
| Aerospace & Defense - 1.75% (continued) | |
Exelis, Inc. | | | 4,570 | | | $ | 75,359 | |
GenCorp, Inc.* | | | 3,380 | | | | 56,784 | |
| Honeywell International, Inc. | | | 3,025 | | | | 262,358 | |
| Huntington Ingalls Industries, Inc. | | | 598 | | | | 42,787 | |
| Lockheed Martin Corp. | | | 1,210 | | | | 161,341 | |
Raytheon Co. | | | 1,422 | | | | 117,130 | |
| Spirit Aerosystems Holdings, Inc. - Class A* | | | 8,265 | | | | 220,593 | |
| United Technologies Corp. | | | 2,679 | | | | 284,644 | |
| | | | | | | | 1,501,945 | |
| Air Freight & Logistics - 0.46% | | | | | |
FedEx Corp. | | | 1,050 | | | | 137,550 | |
| United Parcel Service, Inc. - Class B | | | 2,468 | | | | 242,456 | |
UTi Worldwide, Inc. | | | 1,110 | | | | 16,872 | |
| | | | | | | | 396,878 | |
| Airlines - 0.84% | | | | | | | | |
| Alaska Air Group, Inc. | | | 400 | | | | 28,264 | |
Delta Air Lines, Inc. | | | 11,275 | | | | 297,435 | |
| Republic Airways Holdings, Inc.* | | | 2,740 | | | | 32,277 | |
| United Continental Holdings, Inc.* | | | 8,755 | | | | 297,232 | |
| US Airways Group, Inc.* | | | 2,870 | | | | 63,054 | |
| | | | | | | | 718,262 | |
| Building Products - 0.17% | | | | | | | | |
| Builders FirstSource, Inc.* | | | 4,310 | | | | 31,937 | |
Griffon Corp. | | | 3,900 | | | | 48,867 | |
Masco Corp. | | | 1,000 | | | | 21,130 | |
USG Corp.* | | | 1,630 | | | | 44,516 | |
| | | | | | | | 146,450 | |
| Commercial Services & Supplies - 0.38% | |
Iron Mountain, Inc. | | | 2,160 | | | | 57,326 | |
| Republic Services, Inc. | | | 1,130 | | | | 37,821 | |
| United Stationers, Inc. | | | 1,950 | | | | 86,658 | |
| Waste Management, Inc. | | | 3,325 | | | | 144,771 | |
| | | | | | | | 326,576 | |
| Construction & Engineering - 0.39% | | | | | |
| AECOM Technology Corp.* | | | 1,990 | | | | 63,242 | |
KBR, Inc. | | | 4,540 | | | | 156,812 | |
See Notes to Financial Statements.
| Schedule of Investments (continued) | October 31, 2013 |
| | | | | | |
| COMMON STOCKS - 82.12% (continued) | |
| Industrials - 9.57% (continued) | | | | |
| Construction & Engineering - 0.39% (continued) | |
Tutor Perini Corp.* | | | 2,150 | | | $ | 49,343 | |
URS Corp. | | | 1,260 | | | | 68,317 | |
| | | | | | | | 337,714 | |
| Electrical Equipment - 0.47% | | | | | |
| Babcock & Wilcox Co. (The) | | | 2,470 | | | | 79,559 | |
| Emerson Electric Co. | | | 3,965 | | | | 265,536 | |
General Cable Corp. | | | 1,880 | | | | 61,908 | |
| | | | | | | | 407,003 | |
| Industrial Conglomerates - 1.57% | | | | | |
3M Co. | | | 2,118 | | | | 266,550 | |
Danaher Corp. | | | 2,835 | | | | 204,375 | |
General Electric Co. | | | 33,735 | | | | 881,833 | |
| | | | | | | | 1,352,758 | |
| Machinery - 2.03% | | | | | | | | |
| Blount International, Inc.* | | | 2,750 | | | | 33,495 | |
Caterpillar, Inc. | | | 3,074 | | | | 256,249 | |
Deere & Co. | | | 3,172 | | | | 259,596 | |
Graco, Inc. | | | 1,360 | | | | 105,074 | |
| Illinois Tool Works, Inc. | | | 1,011 | | | | 79,657 | |
ITT Corp. | | | 5,315 | | | | 211,165 | |
Joy Global, Inc. | | | 1,710 | | | | 97,042 | |
Meritor, Inc.* | | | 5,660 | | | | 38,884 | |
| Mueller Industries, Inc. | | | 1,870 | | | | 112,742 | |
| Navistar International Corp.* | | | 1,000 | | | | 36,160 | |
Rexnord Corp.* | | | 2,230 | | | | 52,450 | |
SPX Corp. | | | 2,951 | | | | 267,685 | |
| Stanley Black & Decker, Inc. | | | 1,000 | | | | 79,090 | |
Timken Co. (The) | | | 1,000 | | | | 52,810 | |
| Trinity Industries, Inc. | | | 1,230 | | | | 62,275 | |
| | | | | | | | 1,744,374 | |
| Professional Services - 0.48% | | | | | |
| Dun & Bradstreet Corp. (The) | | | 2,020 | | | | 219,756 | |
| Manpowergroup, Inc. | | | 2,000 | | | | 156,200 | |
| Verisk Analytics, Inc. - Class A* | | | 560 | | | | 38,371 | |
| | | | | | | | 414,327 | |
| Road & Rail - 0.63% | | | | | | | | |
Arkansas Best Corp. | | | 1,540 | | | $ | 42,150 | |
| Avis Budget Group, Inc.* | | | 2,031 | | | | 63,631 | |
| Hertz Global Holdings, Inc.* | | | 3,460 | | | | 79,442 | |
Ryder System, Inc. | | | 1,000 | | | | 65,830 | |
Union Pacific Corp. | | | 1,919 | | | | 290,536 | |
| | | | | | | | 541,589 | |
| Trading Companies & Distributors - 0.40% | |
GATX Corp. | | | 1,400 | | | | 72,170 | |
Watsco, Inc. | | | 1,050 | | | | 100,054 | |
| WESCO International, Inc.* | | | 1,980 | | | | 169,211 | |
| | | | | | | | 341,435 | |
| Information Technology - 13.98% | | | | | |
| Communications Equipment - 1.15% | | | | | |
Black Box Corp. | | | 1,010 | | | | 25,291 | |
| Brocade Communications Systems, Inc.* | | | 5,120 | | | | 41,063 | |
Ciena Corp.* | | | 5,460 | | | | 127,054 | |
Cisco Systems, Inc. | | | 13,730 | | | | 308,925 | |
| Comtech Telecommunications Corp. | | | 810 | | | | 24,316 | |
Harris Corp. | | | 1,010 | | | | 62,580 | |
| Juniper Networks, Inc.* | | | 3,580 | | | | 66,731 | |
| Motorola Solutions, Inc. | | | 1,700 | | | | 106,284 | |
NETGEAR, Inc.* | | | 570 | | | | 16,393 | |
QUALCOMM, Inc. | | | 2,975 | | | | 206,673 | |
| | | | | | | | 985,310 | |
| Computers & Peripherals - 2.62% | | | | | |
Apple, Inc. | | | 2,664 | | | | 1,391,540 | |
Diebold, Inc. | | | 3,730 | | | | 111,751 | |
EMC Corp. | | | 2,010 | | | | 48,381 | |
Hewlett-Packard Co. | | | 16,840 | | | | 410,391 | |
| Lexmark International, Inc. - Class A | | | 1,350 | | | | 47,992 | |
NCR Corp.* | | | 3,330 | | | | 121,711 | |
| Silicon Graphics International Corp.* | | | 1,810 | | | | 23,114 | |
| Western Digital Corp. | | | 1,400 | | | | 97,482 | |
| | | | | | | | 2,252,362 | |
See Notes to Financial Statements.
| Schedule of Investments (continued) | October 31, 2013 |
| | | | | | |
| COMMON STOCKS - 82.12% (continued) | |
| Information Technology - 13.98% (continued) | |
| Electronic Equipment, Instruments & Components - 0.73% | |
| Arrow Electronics, Inc.* | | | 1,000 | | | $ | 48,020 | |
Avnet, Inc. | | | 3,470 | | | | 137,759 | |
CTS Corp. | | | 1,403 | | | | 26,124 | |
| Ingram Micro, Inc. - Class A* | | | 3,570 | | | | 82,717 | |
| Insight Enterprises, Inc.* | | | 2,030 | | | | 42,772 | |
Itron, Inc.* | | | 490 | | | | 20,908 | |
Plexus Corp.* | | | 850 | | | | 32,538 | |
ScanSource, Inc.* | | | 1,334 | | | | 51,306 | |
Tech Data Corp.* | | | 2,179 | | | | 113,439 | |
| TTM Technologies, Inc.* | | | 4,010 | | | | 35,087 | |
| Vishay Intertechnology, Inc.* | | | 2,800 | | | | 34,356 | |
| | | | | | | | 625,026 | |
| Internet Software & Services - 1.98% | | | | | |
| Akamai Technologies, Inc.* | | | 1,110 | | | | 49,661 | |
Brightcove, Inc.* | | | 1,770 | | | | 27,028 | |
Digital River, Inc.* | | | 2,030 | | | | 36,215 | |
Earthlink, Inc. | | | 5,930 | | | | 30,006 | |
Equinix, Inc.* | | | 1,000 | | | | 161,480 | |
| Facebook, Inc. - Class A* | | | 3,220 | | | | 161,837 | |
| Google, Inc. - Class A* | | | 986 | | | | 1,016,152 | |
j2 Global, Inc. | | | 1,300 | | | | 71,474 | |
| Monster Worldwide, Inc.* | | | 7,040 | | | | 30,413 | |
VeriSign, Inc.* | | | 390 | | | | 21,169 | |
| Web.com Group, Inc.* | | | 2,430 | | | | 65,489 | |
| WebMD Health Corp.* | | | 1,000 | | | | 35,220 | |
| | | | | | | | 1,706,144 | |
| IT Services - 2.90% | | | | | | | | |
| Automatic Data Processing, Inc. | | | 1,000 | | | | 74,970 | |
| CACI International, Inc. - Class A* | | | 840 | | | | 60,463 | |
Cardtronics, Inc.* | | | 1,530 | | | | 60,053 | |
| Computer Sciences Corp. | | | 3,265 | | | | 160,834 | |
DST Systems, Inc. | | | 740 | | | | 62,730 | |
| Fidelity National Information Services, Inc. | | | 1,790 | | | | 87,262 | |
Fiserv, Inc.* | | | 1,100 | | | | 115,203 | |
| Global Payments, Inc. | | | 4,307 | | | | 256,180 | |
| | | | | | |
| IT Services - 2.90% (continued) | | | | | |
| Heartland Payment Systems, Inc. | | | 1,362 | | | $ | 55,093 | |
iGATE Corp.* | | | 3,650 | | | | 116,216 | |
| International Business Machines Corp. | | | 3,792 | | | | 679,564 | |
| Leidos Holdings, Inc. | | | 4,118 | | | | 193,917 | |
| MoneyGram International, Inc.* | | | 2,560 | | | | 54,042 | |
Unisys Corp.* | | | 2,770 | | | | 72,989 | |
| Vantiv, Inc. - Class A* | | | 1,690 | | | | 46,475 | |
Visa, Inc. - Class A | | | 858 | | | | 168,743 | |
| Western Union Co. (The) | | | 13,464 | | | | 229,157 | |
| | | | | | | | 2,493,891 | |
| Office Electronics - 0.36% | | | | | | | | |
Xerox Corp. | | | 31,265 | | | | 310,774 | |
| | | | | | | | | |
| Semiconductors & Semiconductor Equipment - 1.87% | |
| Applied Micro Circuits Corp.* | | | 3,080 | | | | 35,913 | |
Atmel Corp.* | | | 2,550 | | | | 18,564 | |
| Broadcom Corp. - Class A | | | 5,410 | | | | 144,555 | |
Cree, Inc.* | | | 1,210 | | | | 73,507 | |
Diodes, Inc.* | | | 2,280 | | | | 55,222 | |
First Solar, Inc.* | | | 1,580 | | | | 79,427 | |
Intel Corp. | | | 10,249 | | | | 250,383 | |
| Lam Research Corp.* | | | 4,200 | | | | 227,766 | |
| Marvell Technology Group Ltd. | | | 8,960 | | | | 107,520 | |
| ON Semiconductor Corp.* | | | 19,395 | | | | 136,929 | |
PMC - Sierra, Inc.* | | | 10,760 | | | | 63,161 | |
Rambus, Inc.* | | | 5,260 | | | | 45,972 | |
| Spansion, Inc. - Class A* | | | 1,930 | | | | 23,102 | |
| Texas Instruments, Inc. | | | 7,600 | | | | 319,808 | |
| TriQuint Semiconductor, Inc.* | | | 3,350 | | | | 26,566 | |
| | | | | | | | 1,608,395 | |
| Software - 2.37% | | | | | | | | |
CA, Inc. | | | 3,489 | | | | 110,811 | |
Comverse, Inc.* | | | 1,070 | | | | 33,791 | |
Intuit, Inc. | | | 3,105 | | | | 221,728 | |
Microsoft Corp. | | | 22,087 | | | | 780,775 | |
| Nuance Communications, Inc.* | | | 3,060 | | | | 47,614 | |
Oracle Corp. | | | 16,799 | | | | 562,766 | |
See Notes to Financial Statements.
| Schedule of Investments (continued) | October 31, 2013 |
| | | | | | |
| COMMON STOCKS - 82.12% (continued) | |
| Information Technology - 13.98% (continued) | |
| Software - 2.37% (continued) | | | | |
Pegasystems, Inc. | | | 680 | | | $ | 25,881 | |
| Rally Software Development Corp.* | | | 1,430 | | | | 38,367 | |
Rovi Corp.* | | | 1,000 | | | | 16,760 | |
| Solera Holdings, Inc. | | | 1,170 | | | | 65,777 | |
Symantec Corp. | | | 5,945 | | | | 135,189 | |
| | | | | | | | 2,039,459 | |
| Materials - 3.13% | | | | | | | | |
| Chemicals - 1.42% | | | | | | | | |
Ashland, Inc. | | | 1,150 | | | | 106,432 | |
Cabot Corp. | | | 950 | | | | 44,280 | |
| Cytec Industries, Inc. | | | 1,364 | | | | 113,335 | |
| Dow Chemical Co. (The) | | | 5,544 | | | | 218,822 | |
| EI du Pont de Nemours & Co. | | | 2,645 | | | | 161,874 | |
Ferro Corp.* | | | 4,880 | | | | 62,610 | |
Mosaic Co. (The) | | | 1,865 | | | | 85,510 | |
Olin Corp. | | | 2,788 | | | | 62,758 | |
| OMNOVA Solutions, Inc.* | | | 2,610 | | | | 22,707 | |
Praxair, Inc. | | | 590 | | | | 73,579 | |
| RPM International, Inc. | | | 3,923 | | | | 151,899 | |
W.R. Grace & Co.* | | | 1,281 | | | | 117,416 | |
| | | | | | | | 1,221,222 | |
| Construction Materials - 0.07% | | | | | |
| Vulcan Materials Co. | | | 1,070 | | | | 57,298 | |
| | | | | | | | | |
| Containers & Packaging - 1.18% | | | | | |
Ball Corp. | | | 1,888 | | | | 92,304 | |
| Berry Plastics Group, Inc.* | | | 2,040 | | | | 40,963 | |
| Crown Holdings, Inc.* | | | 7,385 | | | | 321,986 | |
| Myers Industries, Inc. | | | 1,900 | | | | 33,858 | |
| Owens-Illinois, Inc.* | | | 6,260 | | | | 199,006 | |
Sealed Air Corp. | | | 5,575 | | | | 168,254 | |
| Silgan Holdings, Inc. | | | 3,575 | | | | 161,125 | |
| | | | | | | | 1,017,496 | |
| Metals & Mining - 0.42% | | | | | | | | |
Alcoa, Inc. | | | 5,640 | | | | 52,283 | |
| Freeport-McMoRan Copper & Gold, Inc. | | | 2,151 | | | | 79,071 | |
| | | | | | |
| Metals & Mining - 0.42% (continued) | | | | | |
| Newmont Mining Corp. | | | 5,080 | | | $ | 138,481 | |
| Southern Copper Corp. | | | 3,326 | | | | 92,961 | |
| | | | | | | | 362,796 | |
| Paper & Forest Products - 0.04% | | | | | |
Wausau Paper Corp. | | | 2,760 | | | | 32,292 | |
| | | | | | | | | |
| Telecommunication Services - 2.26% | |
| Diversified Telecommunication Services - 1.96% | |
AT&T, Inc. | | | 21,255 | | | | 769,431 | |
CenturyLink, Inc. | | | 4,765 | | | | 161,343 | |
| Cincinnati Bell, Inc.* | | | 12,815 | | | | 36,651 | |
| Consolidated Communications Holdings, Inc. | | | 2,310 | | | | 43,035 | |
| General Communication, Inc. - Class A* | | | 2,420 | | | | 23,014 | |
| Level 3 Communications, Inc.* | | | 2,500 | | | | 76,375 | |
tw telecom, Inc.* | | | 2,410 | | | | 75,963 | |
| Verizon Communications, Inc. | | | 9,940 | | | | 502,070 | |
| | | | | | | | 1,687,882 | |
| Wireless Telecommunication Services - 0.30% | |
| Crown Castle International Corp.* | | | 570 | | | | 43,331 | |
| NTELOS Holdings Corp. | | | 1,340 | | | | 25,514 | |
| SBA Communications Corp. - Class A* | | | 1,580 | | | | 138,203 | |
Sprint Corp.* | | | 7,355 | | | | 49,499 | |
| | | | | | | | 256,547 | |
| Utilities - 2.01% | | | | | | | | |
| Electric Utilities - 0.71% | | | | | | | | |
| American Electric Power Co., Inc. | | | 730 | | | | 34,193 | |
Duke Energy Corp. | | | 1,310 | | | | 93,966 | |
Exelon Corp. | | | 3,920 | | | | 111,877 | |
| NextEra Energy, Inc. | | | 1,100 | | | | 93,225 | |
PPL Corp. | | | 1,823 | | | | 55,839 | |
Southern Co. (The) | | | 3,575 | | | | 146,253 | |
Xcel Energy, Inc. | | | 2,600 | | | | 75,036 | |
| | | | | | | | 610,389 | |
See Notes to Financial Statements.
| Schedule of Investments (continued) | October 31, 2013 |
| | | | | | |
| COMMON STOCKS - 82.12% (continued) | |
| Utilities - 2.01% (continued) | | | | |
| Gas Utilities - 0.29% | | | | | | |
| AGL Resources, Inc. | | | 1,000 | | | $ | 47,860 | |
ONEOK, Inc. | | | 1,700 | | | | 96,050 | |
UGI Corp. | | | 2,480 | | | | 102,597 | |
| | | | | | | | 246,507 | |
| Independent Power Producers & Energy Traders - 0.52% | |
AES Corp. | | | 32,030 | | | | 451,303 | |
| | | | | | | | | |
| Multi-Utilities - 0.41% | | | | | | | | |
| Alliant Energy Corp. | | | 870 | | | | 45,432 | |
| | | | | | |
| Multi-Utilities - 0.41% (continued) | | | | | |
| CenterPoint Energy, Inc. | | | 3,380 | | | $ | 83,148 | |
| Consolidated Edison, Inc. | | | 700 | | | | 40,754 | |
| Dominion Resources, Inc. | | | 2,080 | | | | 132,600 | |
Sempra Energy | | | 310 | | | | 28,253 | |
| Wisconsin Energy Corp. | | | 620 | | | | 26,108 | |
| | | | | | | | 356,295 | |
| Water Utilities - 0.08% | | | | | | | | |
| American Water Works Co., Inc. | | | 1,540 | | | | 66,020 | |
| | | | | | | | | |
| Total Common Stocks (Cost $53,067,075) | | | | | | $ | 70,619,058 | |
| | | | | | | | | | |
| U.S. TREASURY OBLIGATIONS - 17.91% | | | | | | | | | | |
| U.S. Treasury Notes | | | 0.250% | | 03/31/14 | | $ | 5,755,000 | | | $ | 5,758,373 | |
| U.S. Treasury Notes | | | 2.000% | | 01/31/16 | | | 1,000,000 | | | | 1,036,680 | |
| U.S. Treasury Notes | | | 1.000% | | 03/31/17 | | | 2,000,000 | | | | 2,016,406 | |
| U.S. Treasury Notes | | | 2.625% | | 08/15/20 | | | 1,600,000 | | | | 1,678,813 | |
| U.S. Treasury Notes | | | 1.750% | | 05/15/22 | | | 3,500,000 | | | | 3,342,500 | |
| U.S. Treasury Bonds | | | 8.125% | | 08/15/19 | | | 1,150,000 | | | | 1,572,266 | |
| | | | | | | | | | | | | | |
| Total U.S. Treasury Obligations (Cost $15,493,863) | | | $ | 15,405,038 | |
| | | | | | | | | | | | | | |
| Total Investments - 100.03% (Cost $68,560,938)** | | | $ | 86,024,096 | |
| Liabilities in Excess of Other Assets - (0.03)% | | | | (26,214 | ) |
| Net Assets - 100.00% | | | $ | 85,997,882 | |
| |
|
| * | Non-income producing security. |
| | |
| ** | Cost for Federal income tax purposes is $68,637,148 and net unrealized appreciation on a tax basis consists of: |
| Gross Unrealized Appreciation | | $ | 18,173,353 | |
| Gross Unrealized Depreciation | | | (786,405 | ) |
| Net Unrealized Appreciation | | $ | 17,386,948 | |
| | The difference between the federal income tax cost of portfolio investments and the Schedule of Investments cost is due to certain timing differences in the recognition of capital gains and losses under income tax regulations and accounting principles generally accepted in the United States. These timing differences are temporary in nature and are due to the tax deferral of losses on wash sales. |
See Notes to Financial Statements.
| Statements of Assets and Liabilities | October 31, 2013 |
| | Total Return U.S. Treasury Fund, Inc. | | | Managed Municipal Fund, Inc. | |
| ASSETS | | | | | | |
| Investments in securities: | | | | | | |
| At cost | | $ | 59,337,524 | | | $ | 87,938,325 | |
| At value (Note 1) | | $ | 61,891,897 | | | $ | 89,795,627 | |
| Cash | | | 40,669 | | | | 132,924 | |
| Interest receivable | | | 452,682 | | | | 854,727 | |
| Receivable for capital shares sold | | | 576 | | | | 207 | |
| Other assets | | | 11,283 | | | | 26,768 | |
| TOTAL ASSETS | | | 62,397,107 | | | | 90,810,253 | |
| | | | | | | | | |
| LIABILITIES | | | | | | | | |
| Distributions payable | | | 29,857 | | | | 81,566 | |
| Payable for capital shares redeemed | | | 121,796 | | | | 21,951 | |
| Accrued distribution fees (Note 2) | | | 13,251 | | | | 17,649 | |
| Accrued investment advisory fees (Note 2) | | | 12,095 | | | | 30,703 | |
| Accrued transfer agent fees (Note 2) | | | 4,096 | | | | 5,923 | |
| Accrued directors' fees (Note 2) | | | 3,610 | | | | 5,076 | |
| Accrued administration fees (Note 2) | | | 3,342 | | | | 7,323 | |
| Other accrued expenses and liabilities | | | 35,418 | | | | 41,193 | |
| TOTAL LIABILITIES | | | 223,465 | | | | 211,384 | |
| | | | | | | | | |
| NET ASSETS | | $ | 62,173,642 | | | $ | 90,598,869 | |
| | | | | | | | | |
| NET ASSETS CONSIST OF: | | | | | | | | |
| Paid-in capital | | $ | 59,649,127 | | | $ | 88,217,869 | |
| Distributions in excess of net investment income | | | (29,857 | ) | | | (25 | ) |
| Accumulated net realized gains (losses) from security transactions | | | (1 | ) | | | 523,723 | |
| Net unrealized appreciation on investments | | | 2,554,373 | | | | 1,857,302 | |
| Net assets | | $ | 62,173,642 | | | $ | 90,598,869 | |
See Notes to Financial Statements.
| Statements of Assets and Liabilities (continued) | October 31, 2013 |
| | Total Return U.S. Treasury Fund, Inc. | | | Managed Municipal Fund, Inc. | |
| SHARES OF CAPITAL STOCK OUTSTANDING OF $0.001 PAR VALUE | | | | | | |
| ISI Class A Shares (50,000,000 shares authorized) | | | — | | | | 7,890,625 | |
| ISI Class I Shares (5,000,000 shares authorized) | | | — | | | | 683,556 | |
| ISI Shares (115,000,000 shares authorized) | | | 6,331,947 | | | | — | |
| | | | | | | | | |
| NET ASSET VALUE AND REDEMPTION PRICE PER SHARE | | | | | | | | |
| ISI Class A Shares (based on net assets of $83,371,334) | | $ | — | | | $ | 10.57 | |
| ISI Class I Shares (based on net assets of $7,227,535) | | $ | — | | | $ | 10.57 | |
| ISI Shares (based on net assets of $62,173,642) | | $ | 9.82 | | | $ | — | |
| | | | | | | | | |
| MAXIMUM OFFERING PRICE VALUE PER SHARE (100/97) X NET ASSET VALUE PER SHARE | | | | | | | | |
| ISI Class A Shares | | $ | — | | | $ | 10.90 | |
| ISI Shares | | $ | 10.12 | | | $ | — | |
See Notes to Financial Statements.
| Statements of Assets and Liabilities | October 31, 2013 |
| | North American Government Bond Fund, Inc. | | | | |
| ASSETS | | | | | | |
| Investments in securities: | | | | | | |
| At cost | | $ | 98,311,548 | | | $ | 68,560,938 | |
| At value (Note 1) | | $ | 99,948,044 | | | $ | 86,024,096 | |
| Cash | | | 82,169 | | | | 123,952 | |
Cash denominated in foreign currency (Note 1)(a) | | | 879 | | | | — | |
| Dividends and interest receivable, at value | | | 1,480,111 | | | | 124,453 | |
| Receivable for capital shares sold | | | 101,184 | | | | 48,877 | |
| Other assets | | | 53,059 | | | | 29,451 | |
| TOTAL ASSETS | | | 101,665,446 | | | | 86,350,829 | |
| | | | | | | | | |
| LIABILITIES | | | | | | | | |
| Distributions payable | | | 64,326 | | | | — | |
| Payable for capital shares redeemed | | | 203,284 | | | | 278,155 | |
| Accrued distribution fees (Note 2) | | | 38,366 | | | | 17,866 | |
| Accrued investment advisory fees (Note 2) | | | 34,665 | | | | 28,588 | |
| Accrued transfer agent fees (Note 2) | | | 18,659 | | | | 1,155 | |
| Accrued administration fees (Note 2) | | | 15,329 | | | | — | |
| Accrued directors' fees (Note 2) | | | 8,587 | | | | 1,989 | |
| Accrued shareholder servicing fees (Note 2) | | | 3,124 | | | | — | |
| Other accrued expenses and liabilities | | | 67,877 | | | | 25,194 | |
| TOTAL LIABILITIES | | | 454,217 | | | | 352,947 | |
| | | | | | | | | |
| NET ASSETS | | $ | 101,211,229 | | | $ | 85,997,882 | |
| | | | | | | | | |
| NET ASSETS CONSIST OF: | | | | | | | | |
| Paid-in capital | | $ | 99,643,377 | | | $ | 62,993,985 | |
| Undistributed (distributions in excess of) net investment income | | | (64,325 | ) | | | 2,054 | |
| Accumulated net realized gains (losses) from security and foreign currency transactions | | | (92 | ) | | | 5,538,685 | |
| Net unrealized appreciation on investments and foreign currency translation | | | 1,632,269 | | | | 17,463,158 | |
| Net assets | | $ | 101,211,229 | | | $ | 85,997,882 | |
| (a) | For North American Government Bond Fund, Inc., the cost of cash denominated in foreign currency is $885. |
See Notes to Financial Statements.
| Statements of Assets and Liabilities (continued) | October 31, 2013 |
| | North American Government Bond Fund, Inc. | | | | |
| SHARES OF CAPITAL STOCK OUTSTANDING OF $0.001 PAR VALUE | | | | | | |
| ISI Class A Shares (50,000,000 shares authorized) | | | 11,080,588 | | | | — | |
| ISI Class C Shares (5,000,000 shares authorized) | | | 1,934,977 | | | | — | |
| ISI Class I Shares (5,000,000 shares authorized) | | | 283,889 | | | | — | |
| ISI Shares (25,000,000 shares authorized) | | | — | | | | 5,250,355 | |
| | | | | | | | | |
| NET ASSET VALUE AND REDEMPTION PRICE PER SHARE | | | | | | | | |
| ISI Class A Shares (based on net assets of $84,430,395) | | $ | 7.62 | | | $ | — | |
| ISI Class C Shares (based on net assets of $14,615,413)* | | $ | 7.55 | | | $ | — | |
| ISI Class I Shares (based on net assets of $2,165,421) | | $ | 7.63 | | | $ | — | |
| ISI Shares (based on net assets of $85,997,882) | | $ | — | | | $ | 16.38 | |
| | | | | | | | | �� |
| MAXIMUM OFFERING PRICE VALUE PER SHARE (100/97) X NET ASSET VALUE PER SHARE | | | | | | | | |
| ISI Class A Shares | | $ | 7.86 | | | $ | — | |
| ISI Shares | | $ | — | | | $ | 16.89 | |
| * | Contingent deferred sales charge of 1.00% is imposed on the sale of shares if redeemed within the first year of purchase. |
See Notes to Financial Statements.
| Statements of Operations | Year Ended October 31, 2013 |
| | Total Return U.S. Treasury Fund, Inc. | | | Managed Municipal Fund, Inc. | |
| INVESTMENT INCOME | | | | | | |
| Interest | | $ | 1,295,136 | | | $ | 3,453,172 | |
| | | | | | | | | |
| EXPENSES | | | | | | | | |
| Investment advisory fees (Note 2) | | | 160,024 | | | | 425,797 | |
| Distribution fees (Note 2): | | | | | | | | |
| ISI Class A Shares | | | — | | | | 248,501 | |
| ISI Shares | | | 175,747 | | | | — | |
| Transfer agent fees (Note 2): | | | | | | | | |
| ISI Class A Shares | | | — | | | | 59,239 | |
| ISI Class I Shares | | | — | | | | 4,258 | |
| ISI Shares | | | 57,296 | | | | — | |
| Administration fees (Note 2) | | | 52,813 | | | | 83,500 | |
| Professional fees | | | 45,879 | | | | 58,098 | |
| Custody fees | | | 42,394 | | | | 75,645 | |
| Registration fees | | | 30,199 | | | | 55,237 | |
| Compliance consulting fees (Note 2) | | | 16,473 | | | | 25,655 | |
| Directors' fees and expenses | | | 13,712 | | | | 21,394 | |
| Other expenses | | | 28,083 | | | | 33,207 | |
| TOTAL EXPENSES | | | 622,620 | | | | 1,090,531 | |
| | | | | | | | | |
| NET INVESTMENT INCOME | | | 672,516 | | | | 2,362,641 | |
| | | | | | | | | |
| REALIZED AND UNREALIZED GAINS (LOSSES) ON INVESTMENTS | | | | | | | | |
| Net realized gains from security transactions | | | 350,551 | | | | 525,005 | |
| Net change in unrealized appreciation/(depreciation) on investments | | | (2,429,015 | ) | | | (6,288,934 | ) |
| | | | | | | | | |
| NET REALIZED AND UNREALIZED LOSSES ON INVESTMENTS | | | (2,078,464 | ) | | | (5,763,929 | ) |
| | | | | | | | | |
| NET DECREASE IN NET ASSETS RESULTING FROM OPERATIONS | | $ | (1,405,948 | ) | | $ | (3,401,288 | ) |
See Notes to Financial Statements.
| Statements of Operations (continued) | Year Ended October 31, 2013 |
| | North American Government Bond Fund, Inc. | | | | |
| INVESTMENT INCOME | | | | | | |
| Interest | | $ | 3,541,630 | | | $ | 160,356 | |
| Dividends | | | — | | | | 1,307,045 | |
| Foreign taxes withheld | | | — | | | | (518 | ) |
| TOTAL INVESTMENT INCOME | | | 3,541,630 | | | | 1,466,883 | |
| | | | | | | | | |
| EXPENSES | | | | | | | | |
| Investment advisory fees (Note 2) | | | 549,705 | | | | 286,223 | |
| Distribution fees (Note 2): | | | | | | | | |
| ISI Class A Shares | | | 405,769 | | | | — | |
| ISI Class C Shares | | | 120,344 | | | | — | |
| ISI Shares | | | — | | | | 178,888 | |
| Transfer agent fees (Note 2): | | | | | | | | |
| ISI Class A Shares | | | 99,002 | | | | — | |
| ISI Class C Shares | | | 15,738 | | | | — | |
| ISI Class I Shares | | | 17,593 | | | | — | |
| ISI Shares | | | — | | | | 48,278 | |
| Custody fees | | | 116,097 | | | | 75,937 | |
| Administration fees (Note 2) | | | 113,557 | | | | 49,882 | |
| Professional fees | | | 73,314 | | | | 43,244 | |
| Registration fees | | | 44,693 | | | | 34,473 | |
| Shareholder servicing fees (Note 2): | | | | | | | | |
| ISI Class C Shares | | | 40,115 | | | | — | |
| Compliance consulting fees (Note 2) | | | 35,708 | | | | 15,539 | |
| Directors' fees and expenses | | | 30,086 | | | | 12,381 | |
| Other expenses | | | 69,604 | | | | 25,041 | |
| TOTAL EXPENSES | | | 1,731,325 | | | | 769,886 | |
| | | | | | | | | |
| NET INVESTMENT INCOME | | | 1,810,305 | | | | 696,997 | |
| | | | | | | | | |
| REALIZED AND UNREALIZED GAINS (LOSSES) ON INVESTMENTS AND FOREIGN CURRENCIES | | | | | | | | |
| Net realized gains (losses) from: | | | | | | | | |
| Security transactions | | | 1,504,912 | | | | 5,618,548 | |
| Foreign currency transactions | | | (8,938 | ) | | | — | |
| Net change in unrealized appreciation/(depreciation) on: | | | | | | | | |
| Investments | | | (5,253,315 | ) | | | 7,560,061 | |
| Foreign currency translations | | | (3,964 | ) | | | — | |
| | | | | | | | | |
| NET REALIZED AND UNREALIZED GAINS (LOSSES) ON INVESTMENTS AND FOREIGN CURRENCIES | | | (3,761,305 | ) | | | 13,178,609 | |
| | | | | | | | | |
| NET INCREASE (DECREASE) IN NET ASSETS RESULTING FROM OPERATIONS | | $ | (1,951,000 | ) | | $ | 13,875,606 | |
See Notes to Financial Statements.
| Total Return U.S. Treasury Fund, Inc. |
| Statements of Changes in Net Assets | |
| | | | | | |
| FROM OPERATIONS | | | | | | |
| Net investment income | | $ | 672,516 | | | $ | 859,603 | |
| Net realized gains from security transactions | | | 350,551 | | | | 1,922,327 | |
| Net change in net unrealized appreciation/(depreciation) on investments | | | (2,429,015 | ) | | | (75,791 | ) |
| Net increase (decrease) in net assets resulting from operations | | | (1,405,948 | ) | | | 2,706,139 | |
| | | | | | | | | |
| DISTRIBUTIONS TO SHAREHOLDERS | | | | | | | | |
| From net investment income | | | (666,200 | ) | | | (895,776 | ) |
| From net realized gains from security transactions | | | (1,742,186 | ) | | | (1,797,336 | ) |
| From return of capital | | | (246,880 | ) | | | — | |
| Decrease in net assets resulting from distributions to shareholders | | | (2,655,266 | ) | | | (2,693,112 | ) |
| | | | | | | | | |
| FROM CAPITAL SHARE TRANSACTIONS | | | | | | | | |
| Proceeds from shares sold | | | 847,213 | | | | 4,163,812 | |
| Reinvestment of distributions to shareholders | | | 1,918,696 | | | | 1,916,360 | |
| Payments for shares redeemed | | | (14,364,990 | ) | | | (13,753,040 | ) |
| Net decrease in net assets resulting from capital share transactions | | | (11,599,081 | ) | | | (7,672,868 | ) |
| | | | | | | | | |
| TOTAL DECREASE IN NET ASSETS | | | (15,660,295 | ) | | | (7,659,841 | ) |
| | | | | | | | | |
| NET ASSETS | | | | | | | | |
| Beginning of year | | | 77,833,937 | | | | 85,493,778 | |
| End of year | | $ | 62,173,642 | | | $ | 77,833,937 | |
| | | | | | | | | |
| END OF YEAR DISTRIBUTIONS IN EXCESS OF NET INVESTMENT INCOME | | $ | (29,857 | ) | | $ | (36,173 | ) |
| | | | | | | | | |
| CAPITAL SHARE ACTIVITY | | | | | | | | |
| Shares sold | | | 83,453 | | | | 401,210 | |
| Shares reinvested | | | 190,073 | | | | 184,576 | |
| Shares redeemed | | | (1,437,502 | ) | | | (1,328,999 | ) |
| Net decrease in shares outstanding | | | (1,163,976 | ) | | | (743,213 | ) |
| Shares outstanding, beginning of year | | | 7,495,923 | | | | 8,239,136 | |
| Shares outstanding, end of year | | | 6,331,947 | | | | 7,495,923 | |
See Notes to Financial Statements.
| Managed Municipal Fund, Inc. |
| Statements of Changes in Net Assets | |
| | | | | | |
| FROM OPERATIONS | | | | | | |
| Net investment income | | $ | 2,362,641 | | | $ | 2,700,550 | |
| Net realized gains from security transactions | | | 525,005 | | | | 532,929 | |
| Net change in net unrealized appreciation/(depreciation) on investments | | | (6,288,934 | ) | | | 3,536,133 | |
| Net increase (decrease) in net assets resulting from operations | | | (3,401,288 | ) | | | 6,769,612 | |
| | | | | | | | | |
| DISTRIBUTIONS TO SHAREHOLDERS | | | | | | | | |
| From net investment income | | | | | | | | |
| ISI Class A Shares | | | (2,186,601 | ) | | | (2,568,434 | ) |
| ISI Class I Shares | | | (175,691 | ) | | | (133,180 | ) |
| From net realized gains from security transactions | | | | | | | | |
| ISI Class A Shares | | | (464,062 | ) | | | — | |
| ISI Class I Shares | | | (28,892 | ) | | | — | |
| Decrease in net assets resulting from distributions to shareholders | | | (2,855,246 | ) | | | (2,701,614 | ) |
| | | | | | | | | |
| FROM CAPITAL SHARE TRANSACTIONS | | | | | | | | |
| Proceeds from shares sold | | | | | | | | |
| ISI Class A Shares | | | 8,226,840 | | | | 11,734,473 | |
| ISI Class I Shares | | | 2,930,854 | | | | 3,353,402 | |
| Reinvestment of distributions to shareholders | | | | | | | | |
| ISI Class A Shares | | | 1,493,696 | | | | 1,384,337 | |
| ISI Class I Shares | | | 13,566 | | | | 9,090 | |
| Payments for shares redeemed | | | | | | | | |
| ISI Class A Shares | | | (30,559,542 | ) | | | (11,310,110 | ) |
| ISI Class I Shares | | | (1,833,115 | ) | | | (602,433 | ) |
| Net increase (decrease) in net assets resulting from capital share transactions | | | (19,727,701 | ) | | | 4,568,759 | |
| | | | | | | | | |
| TOTAL INCREASE (DECREASE) IN NET ASSETS | | | (25,984,235 | ) | | | 8,636,757 | |
| | | | | | | | | |
| NET ASSETS | | | | | | | | |
| Beginning of year | | | 116,583,104 | | | | 107,946,347 | |
| End of year | | $ | 90,598,869 | | | $ | 116,583,104 | |
| | | | | | | | | |
| END OF YEAR DISTRIBUTIONS IN EXCESS OF NET INVESTMENT INCOME | | $ | (25 | ) | | $ | (374 | ) |
See Notes to Financial Statements.
| Managed Municipal Fund, Inc. |
| Statements of Changes in Net Assets (continued) | |
| | | | | | |
| CAPITAL SHARE ACTIVITY | | | | | | |
| Shares sold | | | | | | |
| ISI Class A Shares | | | 744,950 | | | | 1,053,310 | |
| ISI Class I Shares | | | 270,632 | | | | 302,045 | |
| Shares reinvested | | | | | | | | |
| ISI Class A Shares | | | 137,047 | | | | 124,951 | |
| ISI Class I Shares | | | 1,251 | | | | 819 | |
| Shares redeemed | | | | | | | | |
| ISI Class A Shares | | | (2,833,029 | ) | | | (1,022,082 | ) |
| ISI Class I Shares | | | (171,268 | ) | | | (54,327 | ) |
| | | | | | | | | |
| Net increase (decrease) in shares outstanding | | | | | | | | |
| ISI Class A Shares | | | (1,951,032 | ) | | | 156,179 | |
| ISI Class I Shares | | | 100,615 | | | | 248,537 | |
| | | | | | | | | |
| Shares outstanding, beginning of year | | | | | | | | |
| ISI Class A Shares | | | 9,841,657 | | | | 9,685,478 | |
| ISI Class I Shares | | | 582,941 | | | | 334,404 | |
| Shares outstanding, end of year | | | | | | | | |
| ISI Class A Shares | | | 7,890,625 | | | | 9,841,657 | |
| ISI Class I Shares | | | 683,556 | | | | 582,941 | |
See Notes to Financial Statements.
| North American Government Bond Fund, Inc. |
| Statements of Changes in Net Assets | |
| | | | | | |
| FROM OPERATIONS | | | | | | |
| Net investment income | | $ | 1,810,305 | | | $ | 2,285,298 | |
| Net realized gains from security and foreign currency transactions | | | 1,495,974 | | | | 1,614,684 | |
| Net change in net unrealized appreciation/(depreciation) on investments and foreign currency translations | | | (5,257,279 | ) | | | 505,520 | |
| Net increase (decrease) in net assets resulting from operations | | | (1,951,000 | ) | | | 4,405,502 | |
| | | | | | | | | |
| DISTRIBUTIONS TO SHAREHOLDERS | | | | | | | | |
| From net investment income | | | | | | | | |
| ISI Class A Shares | | | (1,242,273 | ) | | | (1,783,773 | ) |
| ISI Class C Shares | | | (162,289 | ) | | | (185,403 | ) |
| ISI Class I Shares | | | (251,435 | ) | | | (499,263 | ) |
| From net realized gains from security transactions | | | | | | | | |
| ISI Class A Shares | | | (1,184,021 | ) | | | (1,448,786 | ) |
| ISI Class C Shares | | | (154,678 | ) | | | (198,567 | ) |
| ISI Class I Shares | | | (239,645 | ) | | | (223,788 | ) |
| From return of capital | | | | | | | | |
| ISI Class A Shares | | | (28,772 | ) | | | (48,032 | ) |
| ISI Class C Shares | | | (3,759 | ) | | | (6,583 | ) |
| ISI Class I Shares | | | (5,823 | ) | | | (7,419 | ) |
| Decrease in net assets resulting from distributions to shareholders | | | (3,272,695 | ) | | | (4,401,614 | ) |
| | | | | | | | | |
| FROM CAPITAL SHARE TRANSACTIONS | | | | | | | | |
| Proceeds from shares sold | | | | | | | | |
| ISI Class A Shares | | | 17,302,209 | | | | 32,362,310 | |
| ISI Class C Shares | | | 1,255,273 | | | | 2,428,002 | |
| ISI Class I Shares | | | 8,272,561 | | | | 20,486,601 | |
| Reinvestment of distributions to shareholders | | | | | | | | |
| ISI Class A Shares | | | 1,671,239 | | | | 2,274,493 | |
| ISI Class C Shares | | | 191,253 | | | | 257,632 | |
| ISI Class I Shares | | | 138,441 | | | | 165,970 | |
| Payments for shares redeemed | | | | | | | | |
| ISI Class A Shares | | | (46,968,168 | ) | | | (30,466,181 | ) |
| ISI Class C Shares | | | (3,615,208 | ) | | | (2,453,586 | ) |
| ISI Class I Shares | | | (37,524,003 | ) | | | (7,059,022 | ) |
| Net increase (decrease) in net assets resulting from capital share transactions | | | (59,276,403 | ) | | | 17,996,219 | |
| | | | | | | | | |
| TOTAL INCREASE (DECREASE) IN NET ASSETS | | | (64,500,098 | ) | | | 18,000,107 | |
See Notes to Financial Statements.
| North American Government Bond Fund, Inc. |
| Statements of Changes in Net Assets (continued) | |
| | | | | | |
| NET ASSETS | | | | | | |
| Beginning of year | | $ | 165,711,327 | | | $ | 147,711,220 | |
| End of year | | $ | 101,211,229 | | | $ | 165,711,327 | |
| | | | | | | | | |
| END OF YEAR DISTRIBUTIONS IN EXCESS OF NET INVESTMENT INCOME | | $ | (64,325 | ) | | $ | (136,355 | ) |
| | | | | | | | | |
| CAPITAL SHARE ACTIVITY | | | | | | | | |
| Shares sold | | | | | | | | |
| ISI Class A Shares | | | 2,210,246 | | | | 4,075,826 | |
| ISI Class C Shares | | | 161,225 | | | | 307,183 | |
| ISI Class I Shares | | | 1,042,288 | | | | 2,573,607 | |
| Shares reinvested | | | | | | | | |
| ISI Class A Shares | | | 214,513 | | | | 286,337 | |
| ISI Class C Shares | | | 24,757 | | | | 32,648 | |
| ISI Class I Shares | | | 17,489 | | | | 20,817 | |
| Shares redeemed | | | | | | | | |
| ISI Class A Shares | | | (6,042,659 | ) | | | (3,835,415 | ) |
| ISI Class C Shares | | | (466,830 | ) | | | (310,710 | ) |
| ISI Class I Shares | | | (4,755,861 | ) | | | (886,808 | ) |
| | | | | | | | | |
| Net increase (decrease) in shares outstanding | | | | | | | | |
| ISI Class A Shares | | | (3,617,900 | ) | | | 526,748 | |
| ISI Class C Shares | | | (280,848 | ) | | | 29,121 | |
| ISI Class I Shares | | | (3,696,084 | ) | | | 1,707,616 | |
| | | | | | | | | |
| Shares outstanding, beginning of year | | | | | | | | |
| ISI Class A Shares | | | 14,698,488 | | | | 14,171,740 | |
| ISI Class C Shares | | | 2,215,825 | | | | 2,186,704 | |
| ISI Class I Shares | | | 3,979,973 | | | | 2,272,357 | |
| Shares outstanding, end of year | | | | | | | | |
| ISI Class A Shares | | | 11,080,588 | | | | 14,698,488 | |
| ISI Class C Shares | | | 1,934,977 | | | | 2,215,825 | |
| ISI Class I Shares | | | 283,889 | | | | 3,979,973 | |
See Notes to Financial Statements.
| Statements of Changes in Net Assets | |
| | | | | | |
| FROM OPERATIONS | | | | | | |
| Net investment income | | $ | 696,997 | | | $ | 623,465 | |
| Net realized gains from security transactions | | | 5,618,548 | | | | 6,030,040 | |
| Net change in net unrealized appreciation on investments | | | 7,560,061 | | | | 949,090 | |
| Net increase in net assets resulting from operations | | | 13,875,606 | | | | 7,602,595 | |
| | | | | | | | | |
| DISTRIBUTIONS TO SHAREHOLDERS | | | | | | | | |
| From net investment income | | | (686,465 | ) | | | (632,521 | ) |
| From net realized gains from security transactions | | | (2,720,495 | ) | | | — | |
| Decrease in net assets resulting from distributions to shareholders | | | (3,406,960 | ) | | | (632,521 | ) |
| | | | | | | | | |
| FROM CAPITAL SHARE TRANSACTIONS | | | | | | | | |
| Proceeds from shares sold | | | 17,784,145 | | | | 7,133,775 | |
| Reinvestment of distributions to shareholders | | | 3,015,066 | | | | 544,550 | |
| Payments for shares redeemed | | | (8,781,704 | ) | | | (8,397,793 | ) |
| Net increase (decrease) in net assets resulting from capital share transactions | | | 12,017,507 | | | | (719,468 | ) |
| | | | | | | | | |
| TOTAL INCREASE IN NET ASSETS | | | 22,486,153 | | | | 6,250,606 | |
| | | | | | | | | |
| NET ASSETS | | | | | | | | |
| Beginning of year | | | 63,511,729 | | | | 57,261,123 | |
| End of year | | $ | 85,997,882 | | | $ | 63,511,729 | |
| | | | | | | | | |
END OF YEAR UNDISTRIBUTED NET INVESTMENT INCOME | | $ | 2,054 | | | $ | 20,463 | |
| | | | | | | | | |
| CAPITAL SHARE ACTIVITY | | | | | | | | |
| Shares sold | | | 1,152,539 | | | | 515,670 | |
| Shares reinvested | | | 217,792 | | | | 39,842 | |
| Shares redeemed | | | (588,442 | ) | | | (621,759 | ) |
| Net increase (decrease) in shares outstanding | | | 781,889 | | | | (66,247 | ) |
| Shares outstanding, beginning of year | | | 4,468,466 | | | | 4,534,713 | |
| Shares outstanding, end of year | | | 5,250,355 | | | | 4,468,466 | |
See Notes to Financial Statements.
| Total Return U.S. Treasury Fund, Inc. |
| Selected Per Share Data and Ratios for a Share Outstanding Throughout Each Year | |
| | |
| | | | |
| | | | | | | | | | | | | | | |
| Net asset value at beginning of year | | $ | 10.38 | | | $ | 10.38 | | | $ | 10.09 | | | $ | 10.11 | | | $ | 9.59 | |
| | | | | | | | | | | | | | | | | | | | | |
| Income (loss) from investment operations: | | | | | | | | | | | | | | | | | | | | |
Net investment income(a) | | | 0.10 | | | | 0.11 | | | | 0.15 | | | | 0.15 | | | | 0.17 | |
| Net realized and unrealized gains (losses) on investments | | | (0.29 | ) | | | 0.23 | | | | 0.33 | | | | 0.50 | | | | 0.70 | |
| Total from investment operations | | | (0.19 | ) | | | 0.34 | | | | 0.48 | | | | 0.65 | | | | 0.87 | |
| | | | | | | | | | | | | | | | | | | | | |
| Less distributions: | | | | | | | | | | | | | | | | | | | | |
| Distributions from net investment income | | | (0.10 | ) | | | (0.11 | ) | | | (0.15 | ) | | | (0.15 | ) | | | (0.17 | ) |
| Distributions from net realized gains | | | (0.23 | ) | | | (0.23 | ) | | | (0.04 | ) | | | (0.52 | ) | | | (0.18 | ) |
| Return of capital | | | (0.04 | ) | | | — | | | | — | | | | — | | | | — | |
| Total distributions | | | (0.37 | ) | | | (0.34 | ) | | | (0.19 | ) | | | (0.67 | ) | | | (0.35 | ) |
| | | | | | | | | | | | | | | | | | | | | |
| Net asset value at end of year | | $ | 9.82 | | | $ | 10.38 | | | $ | 10.38 | | | $ | 10.09 | | | $ | 10.11 | |
| | | | | | | | | | | | | | | | | | | | | |
TOTAL RETURN(b) | | | (1.89 | )% | | | 3.28 | % | | | 4.87 | % | | | 6.85 | % | | | 9.05 | % |
| | | | | | | | | | | | | | | | | | | | | |
| Net assets at end of year (000's) | | $ | 62,174 | | | $ | 77,834 | | | $ | 85,494 | | | $ | 97,793 | | | $ | 112,295 | |
| | | | | | | | | | | | | | | | | | | | | |
| Ratio of expenses to average net assets | | | 0.89 | % | | | 0.83 | % | | | 0.84 | % | | | 0.82 | % | | | 0.80 | % |
| | | | | | | | | | | | | | | | | | | | | |
| Ratio of net investment income to average net assets | | | 0.96 | % | | | 1.05 | % | | | 1.50 | % | | | 1.49 | % | | | 1.68 | % |
| | | | | | | | | | | | | | | | | | | | | |
| Portfolio turnover rate | | | 0 | % | | | 52 | % | | | 51 | % | | | 44 | % | | | 109 | % |
|
| | |
| (a) | Calculated using the average shares outstanding for the year. |
| | |
| (b) | Total return is a measure of the change in value of an investment in the Fund over the year covered, which assumes any dividends, capital gains distributions or return of capital distributions are reinvested in shares of the Fund. Returns shown do not reflect initial sales charges, the deduction of taxes a shareholder would pay on Fund distributions or the redemption of Fund shares. |
See Notes to Financial Statements.
| Managed Municipal Fund, Inc. - Class A |
| Selected Per Share Data and Ratios for a Share Outstanding Throughout Each Year | |
| | |
| | | | |
| | | | | | | | | | | | | | | |
| Net asset value at beginning of year | | $ | 11.18 | | | $ | 10.77 | | | $ | 10.82 | | | $ | 10.68 | | | $ | 9.96 | |
| | | | | | | | | | | | | | | | | | | | | |
| Income (loss) from investment operations: | | | | | | | | | | | | | | | | | | | | |
Net investment income(a) | | | 0.24 | | | | 0.27 | | | | 0.28 | | | | 0.31 | | | | 0.32 | |
| Net realized and unrealized gains (losses) on investments | | | (0.56 | ) | | | 0.41 | | | | 0.02 | | | | 0.18 | | | | 0.74 | |
| Total from investment operations | | | (0.32 | ) | | | 0.68 | | | | 0.30 | | | | 0.49 | | | | 1.06 | |
| | | | | | | | | | | | | | | | | | | | | |
| Less distributions: | | | | | | | | | | | | | | | | | | | | |
| Distributions from net investment income | | | (0.24 | ) | | | (0.27 | ) | | | (0.28 | ) | | | (0.31 | ) | | | (0.32 | ) |
| Distributions from net realized gains | | | (0.05 | ) | | | — | | | | (0.07 | ) | | | (0.04 | ) | | | (0.02 | ) |
| Total distributions | | | (0.29 | ) | | | (0.27 | ) | | | (0.35 | ) | | | (0.35 | ) | | | (0.34 | ) |
| | | | | | | | | | | | | | | | | | | | | |
| Net asset value at end of year | | $ | 10.57 | | | $ | 11.18 | | | $ | 10.77 | | | $ | 10.82 | | | $ | 10.68 | |
| | | | | | | | | | | | | | | | | | | | | |
TOTAL RETURN(b) | | | (2.90 | )% | | | 6.34 | % | | | 2.93 | % | | | 4.62 | % | | | 10.68 | % |
| | | | | | | | | | | | | | | | | | | | | |
| Net assets at end of year (000's) | | $ | 83,371 | | | $ | 110,060 | | | $ | 104,342 | | | $ | 112,203 | | | $ | 100,923 | |
| | | | | | | | | | | | | | | | | | | | | |
| Ratio of expenses to average net assets | | | 1.04 | % | | | 0.99 | % | | | 1.01 | % | | | 0.97 | % | | | 0.97 | % |
| | | | | | | | | | | | | | | | | | | | | |
| Ratio of net investment income to average net assets | | | 2.20 | % | | | 2.42 | % | | | 2.65 | % | | | 2.89 | % | | | 3.02 | % |
| | | | | | | | | | | | | | | | | | | | | |
| Portfolio turnover rate | | | 13 | % | | | 17 | % | | | 10 | % | | | 22 | % | | | 10 | % |
|
| | |
| (a) | Calculated using the average shares outstanding for the year. |
| | |
| (b) | Total return is a measure of the change in value of an investment in the Fund over the year covered, which assumes any dividends or capital gains distributions are reinvested in shares of the Fund. Returns shown do not reflect initial sales charges, the deduction of taxes a shareholder would pay on Fund distributions or the redemption of Fund shares. |
See Notes to Financial Statements.
| Managed Municipal Fund, Inc. - Class I |
| Selected Per Share Data and Ratios for a Share Outstanding Throughout Each Period | |
| | |
| | | | | | Period Ended October 31, | |
| | | | | | | | | |
| Net asset value at beginning of period | | $ | 11.19 | | | $ | 10.78 | | | $ | 10.82 | | | $ | 10.94 | |
| | | | | | | | | | | | | | | | | |
| Income (loss) from investment operations: | | | | | | | | | | | | | | | | |
Net investment income(b) | | | 0.27 | | | | 0.30 | | | | 0.31 | | | | 0.02 | |
| Net realized and unrealized gains (losses) on investments | | | (0.57 | ) | | | 0.41 | | | | 0.03 | | | | (0.11 | ) |
| Total from investment operations | | | (0.30 | ) | | | 0.71 | | | | 0.34 | | | | (0.09 | ) |
| | | | | | | | | | | | | | | | | |
| Less distributions: | | | | | | | | | | | | | | | | |
| Distributions from net investment income | | | (0.27 | ) | | | (0.30 | ) | | | (0.31 | ) | | | (0.03 | ) |
| Distributions from net realized gains | | | (0.05 | ) | | | — | | | | (0.07 | ) | | | — | |
| Total distributions | | | (0.32 | ) | | | (0.30 | ) | | | (0.38 | ) | | | (0.03 | ) |
| | | | | | | | | | | | | | | | | |
| Net asset value at end of period | | $ | 10.57 | | | $ | 11.19 | | | $ | 10.78 | | | $ | 10.82 | |
| | | | | | | | | | | | | | | | | |
TOTAL RETURN(c) | | | (2.75 | )% | | | 6.60 | % | | | 3.28 | % | | | (0.86 | )%(d) |
| | | | | | | | | | | | | | | | | |
| Net assets at end of period (000's) | | $ | 7,228 | | | $ | 6,523 | | | $ | 3,605 | | | $ | 76 | |
| | | | | | | | | | | | | | | | | |
| Ratio of expenses to average net assets | | | 0.79 | % | | | 0.74 | % | | | 0.76 | % | | | 0.70 | %(e) |
| | | | | | | | | | | | | | | | | |
| Ratio of net investment income to average net assets | | | 2.46 | % | | | 2.66 | % | | | 2.92 | % | | | 2.83 | %(e) |
| | | | | | | | | | | | | | | | | |
| Portfolio turnover rate | | | 13 | % | | | 17 | % | | | 10 | % | | | 22 | %(d) |
| |
|
| (a) | Class I commenced operations on October 7, 2010. |
| | |
| (b) | Calculated using the average shares outstanding for the period. |
| | |
| (c) | Total return is a measure of the change in value of an investment in the Fund over the period covered, which assumes any dividends or capital gains distributions are reinvested in shares of the Fund. Returns shown do not reflect the deduction of taxes a shareholder would pay on Fund distributions or the redemption of Fund shares. |
| | |
| (d) | Not annualized. |
| | |
| (e) | Annualized. |
See Notes to Financial Statements.
| North American Government Bond Fund, Inc. - Class A |
| Selected Per Share Data and Ratios for a Share Outstanding Throughout Each Year | |
| | |
| | | | |
| | | | | | | | | | | | | | | |
| Net asset value at beginning of year | | $ | 7.93 | | | $ | 7.93 | | | $ | 7.89 | | | $ | 7.56 | | | $ | 7.22 | |
| | | | | | | | | | | | | | | | | | | | | |
| Income (loss) from investment operations: | | | | | | | | | | | | | | | | | | | | |
Net investment income(a) | | | 0.10 | | | | 0.11 | | | | 0.14 | | | | 0.14 | | | | 0.14 | |
| Net realized and unrealized gains (losses) on investments and foreign currencies | | | (0.22 | ) | | | 0.10 | | | | 0.12 | | | | 0.56 | | | | 0.56 | |
| Total from investment operations | | | (0.12 | ) | | | 0.21 | | | | 0.26 | | | | 0.70 | | | | 0.70 | |
| | | | | | | | | | | | | | | | | | | | | |
| Less distributions: | | | | | | | | | | | | | | | | | | | | |
| Distributions from net investment income | | | (0.10 | ) | | | (0.12 | ) | | | (0.16 | ) | | | (0.14 | ) | | | (0.08 | ) |
| Distributions from net realized gains | | | (0.09 | ) | | | (0.09 | ) | | | (0.06 | ) | | | (0.23 | ) | | | (0.28 | ) |
| Return of capital | | | (0.00 | )* | | | (0.00 | )* | | | — | | | | — | | | | — | |
| Total distributions | | | (0.19 | ) | | | (0.21 | ) | | | (0.22 | ) | | | (0.37 | ) | | | (0.36 | ) |
| | | | | | | | | | | | | | | | | | | | | |
| Net asset value at end of year | | $ | 7.62 | | | $ | 7.93 | | | $ | 7.93 | | | $ | 7.89 | | | $ | 7.56 | |
| | | | | | | | | | | | | | | | | | | | | |
TOTAL RETURN(b) | | | (1.51 | )% | | | 2.71 | % | | | 3.30 | % | | | 9.53 | % | | | 9.80 | % |
| | | | | | | | | | | | | | | | | | | | | |
| Net assets at end of year (000's) | | $ | 84,430 | | | $ | 116,599 | | | $ | 112,407 | | | $ | 134,383 | | | $ | 132,814 | |
| | | | | | | | | | | | | | | | | | | | | |
| Ratio of expenses to average net assets | | | 1.25 | % | | | 1.18 | % | | | 1.18 | % | | | 1.15 | % | | | 1.13 | % |
| | | | | | | | | | | | | | | | | | | | | |
| Ratio of net investment income to average net assets | | | 1.33 | % | | | 1.40 | % | | | 1.83 | % | | | 1.85 | % | | | 1.87 | % |
| | | | | | | | | | | | | | | | | | | | | |
| Portfolio turnover rate | | | 10 | % | | | 57 | % | | | 46 | % | | | 48 | % | | | 131 | % |
|
| | |
| (a) | Calculated using the average shares outstanding for the year. |
| | |
| (b) | Total return is a measure of the change in value of an investment in the Fund over the year covered, which assumes any dividends, capital gains distributions or return of capital distributions are reinvested in shares of the Fund. Returns shown do not reflect initial sales charges, the deduction of taxes a shareholder would pay on Fund distributions or the redemption of Fund shares. |
| | |
| * | Amount less than $0.005 per share. |
See Notes to Financial Statements.
| North American Government Bond Fund, Inc. - Class C |
| Selected Per Share Data and Ratios for a Share Outstanding Throughout Each Year | |
| | |
| | | | |
| | | | | | | | | | | | | | | |
| Net asset value at beginning of year | | $ | 7.88 | | | $ | 7.89 | | | $ | 7.85 | | | $ | 7.54 | | | $ | 7.21 | |
| | | | | | | | | | | | | | | | | | | | | |
| Income (loss) from investment operations: | | | | | | | | | | | | | | | | | | | | |
Net investment income(a) | | | 0.06 | | | | 0.06 | | | | 0.10 | | | | 0.09 | | | | 0.09 | |
| Net realized and unrealized gains (losses) on investments and foreign currencies | | | (0.23 | ) | | | 0.11 | | | | 0.12 | | | | 0.56 | | | | 0.55 | |
| Total from investment operations | | | (0.17 | ) | | | 0.17 | | | | 0.22 | | | | 0.65 | | | | 0.64 | |
| | | | | | | | | | | | | | | | | | | | | |
| Less distributions: | | | | | | | | | | | | | | | | | | | | |
| Distributions from net investment income | | | (0.07 | ) | | | (0.09 | ) | | | (0.12 | ) | | | (0.11 | ) | | | (0.03 | ) |
| Distributions from net realized gains | | | (0.09 | ) | | | (0.09 | ) | | | (0.06 | ) | | | (0.23 | ) | | | (0.28 | ) |
| Return of capital | | | (0.00 | )* | | | (0.00 | )* | | | — | | | | — | | | | — | |
| Total distributions | | | (0.16 | ) | | | (0.18 | ) | | | (0.18 | ) | | | (0.34 | ) | | | (0.31 | ) |
| | | | | | �� | | | | | | | | | | | | | | | |
| Net asset value at end of year | | $ | 7.55 | | | $ | 7.88 | | | $ | 7.89 | | | $ | 7.85 | | | $ | 7.54 | |
| | | | | | | | | | | | | | | | | | | | | |
TOTAL RETURN(b) | | | (2.23 | )% | | | 2.13 | % | | | 2.84 | % | | | 8.85 | % | | | 8.97 | % |
| | | | | | | | | | | | | | | | | | | | | |
| Net assets at end of year (000's) | | $ | 14,615 | | | $ | 17,451 | | | $ | 17,248 | | | $ | 22,963 | | | $ | 24,659 | |
| | | | | | | | | | | | | | | | | | | | | |
| Ratio of expenses to average net assets | | | 1.85 | % | | | 1.78 | % | | | 1.78 | % | | | 1.78 | % | | | 1.76 | % |
| | | | | | | | | | | | | | | | | | | | | |
| Ratio of net investment income to average net assets | | | 0.73 | % | | | 0.80 | % | | | 1.23 | % | | | 1.23 | % | | | 1.22 | % |
| | | | | | | | | | | | | | | | | | | | | |
| Portfolio turnover rate | | | 10 | % | | | 57 | % | | | 46 | % | | | 48 | % | | | 131 | % |
|
| | |
| (a) | Calculated using the average shares outstanding for the year. |
| | |
| (b) | Total return is a measure of the change in value of an investment in the Fund over the year covered, which assumes any dividends, capital gains distributions or return of capital distributions are reinvested in shares of the Fund. Returns shown do not reflect contingent deferred sales charges, the deduction of taxes a shareholder would pay on Fund distributions or the redemption of Fund shares. |
| | |
| * | Amount less than $0.005 per share. |
See Notes to Financial Statements.
| North American Government Bond Fund, Inc. - Class I |
| Selected Per Share Data and Ratios for a Share Outstanding Throughout Each Period | |
| | |
| | | | | | Period Ended October 31, | |
| | | | | | | | | |
| Net asset value at beginning of period | | $ | 7.96 | | | $ | 7.95 | | | $ | 7.89 | | | $ | 7.80 | |
| | | | | | | | | | | | | | | | | |
| Income (loss) from investment operations: | | | | | | | | | | | | | | | | |
Net investment income(b) | | | 0.13 | | | | 0.14 | | | | 0.18 | | | | 0.02 | |
| Net realized and unrealized gains (losses) on investments and foreign currencies | | | (0.24 | ) | | | 0.11 | | | | 0.12 | | | | 0.12 | |
| Total from investment operations | | | (0.11 | ) | | | 0.25 | | | | 0.30 | | | | 0.14 | |
| | | | | | | | | | | | | | | | | |
| Less distributions: | | | | | | | | | | | | | | | | |
| Distributions from net investment income | | | (0.13 | ) | | | (0.15 | ) | | | (0.18 | ) | | | (0.02 | ) |
| Distributions from net realized gains | | | (0.09 | ) | | | (0.09 | ) | | | (0.06 | ) | | | (0.03 | ) |
| Return of capital | | | (0.00 | )* | | | (0.00 | )* | | | — | | | | — | |
| Total distributions | | | (0.22 | ) | | | (0.24 | ) | | | (0.24 | ) | | | (0.05 | ) |
| | | | | | | | | | | | | | | | | |
| Net asset value at end of period | | $ | 7.63 | | | $ | 7.96 | | | $ | 7.95 | | | $ | 7.89 | |
| | | | | | | | | | | | | | | | | |
TOTAL RETURN(c) | | | (1.46 | )% | | | 3.14 | % | | | 3.88 | % | | | 1.74 | %(d) |
| | | | | | | | | | | | | | | | | |
| Net assets at end of period (000's) | | $ | 2,165 | | | $ | 31,661 | | | $ | 18,056 | | | $ | 197 | |
| | | | | | | | | | | | | | | | | |
| Ratio of expenses to average net assets | | | 0.85 | % | | | 0.78 | % | | | 0.78 | % | | | 0.69 | %(e) |
| | | | | | | | | | | | | | | | | |
| Ratio of net investment income to average net assets | | | 1.69 | % | | | 1.78 | % | | | 2.25 | % | | | 2.25 | %(e) |
| | | | | | | | | | | | | | | | | |
| Portfolio turnover rate | | | 10 | % | | | 57 | % | | | 46 | % | | | 48 | %(d) |
| |
|
| (a) | Class I commenced operations on September 16, 2010. |
| | |
| (b) | Calculated using the average shares outstanding for the period. |
| | |
| (c) | Total return is a measure of the change in value of an investment in the Fund over the period covered, which assumes any dividends, capital gains distributions or return of capital distributions are reinvested in shares of the Fund. Returns shown do not reflect the deduction of taxes a shareholder would pay on Fund distributions or the redemption of Fund shares. |
| | |
| (d) | Not annualized. |
| | |
| (e) | Annualized. |
| | |
| * | Amount less than $0.005 per share. |
See Notes to Financial Statements.
| Selected Per Share Data and Ratios for a Share Outstanding Throughout Each Year | |
| | |
| | | | |
| | | | | | | | | | | | | | | |
| Net asset value at beginning of year | | $ | 14.21 | | | $ | 12.63 | | | $ | 12.28 | | | $ | 10.64 | | | $ | 9.63 | |
| | | | | | | | | | | | | | | | | | | | | |
| Income from investment operations: | | | | | | | | | | | | | | | | | | | | |
Net investment income(a) | | | 0.15 | | | | 0.14 | | | | 0.15 | | | | 0.16 | | | | 0.11 | |
| Net realized and unrealized gains on investments | | | 2.79 | | | | 1.58 | | | | 0.35 | | | | 1.64 | | | | 1.02 | |
| Total from investment operations | | | 2.94 | | | | 1.72 | | | | 0.50 | | | | 1.80 | | | | 1.13 | |
| | | | | | | | | | | | | | | | | | | | | |
| Less distributions: | | | | | | | | | | | | | | | | | | | | |
| Distributions from net investment income | | | (0.15 | ) | | | (0.14 | ) | | | (0.15 | ) | | | (0.16 | ) | | | (0.12 | ) |
| Distributions from net realized gains | | | (0.62 | ) | | | — | | | | — | | | | — | | | | — | |
| Total distributions | | | (0.77 | ) | | | (0.14 | ) | | | (0.15 | ) | | | (0.16 | ) | | | (0.12 | ) |
| | | | | | | | | | | | | | | | | | | | | |
| Net asset value at end of year | | $ | 16.38 | | | $ | 14.21 | | | $ | 12.63 | | | $ | 12.28 | | | $ | 10.64 | |
| | | | | | | | | | | | | | | | | | | | | |
TOTAL RETURN(b) | | | 21.72 | % | | | 13.69 | % | | | 4.03 | % | | | 17.05 | % | | | 11.84 | % |
| | | | | | | | | | | | | | | | | | | | | |
| Net assets at end of year (000's) | | $ | 85,998 | | | $ | 63,512 | | | $ | 57,261 | | | $ | 60,445 | | | $ | 53,731 | |
| | | | | | | | | | | | | | | | | | | | | |
| Ratio of expenses to average net assets | | | 1.08 | % | | | 1.11 | % | | | 1.04 | % | | | 1.06 | % | | | 1.10 | % |
| | | | | | | | | | | | | | | | | | | | �� | |
| Ratio of net investment income to average net assets | | | 0.97 | % | | | 1.03 | % | | | 1.12 | % | | | 1.40 | % | | | 1.19 | % |
| | | | | | | | | | | | | | | | | | | | | |
| Portfolio turnover rate | | | 38 | % | | | 55 | % | | | 50 | % | | | 38 | % | | | 55 | % |
| |
|
| (a) | Calculated using the average shares outstanding for the year. |
| | |
| (b) | Total return is a measure of the change in value of an investment in the Fund over the year covered, which assumes any dividends or capital gains distributions are reinvested in shares of the Fund. Returns shown do not reflect initial sales charges, the deduction of taxes a shareholder would pay on Fund distributions or the redemption of Fund shares. |
See Notes to Financial Statements.
| Notes to Financial Statements | |
October 31, 2013
Note 1 – Organization and Significant Accounting Policies
A. Organization
Total Return U.S. Treasury Fund, Inc. (“Total Return”), Managed Municipal Fund, Inc. (“Managed Municipal”), North American Government Bond Fund, Inc. (“North American”) and ISI Strategy Fund, Inc. (“Strategy”) (each a “Fund” and collectively, the “Funds”) are registered under the Investment Company Act of 1940, as amended, as open-end management investment companies. The Funds are organized as corporations under the laws of the State of Maryland.
Total Return’s investment objectives are to provide a high level of total return with relative stability of principal and, secondarily, high current income. Managed Municipal’s investment objectives are to provide a high level of total return with relative stability of principal and, secondarily, high current income exempt from Federal income tax. North American’s investment objective is to provide a high level of current income, consistent with prudent investment risk. Strategy’s investment objective is to maximize total return through a combination of long-term growth of capital and current income.
Total Return and Strategy each currently offer a single class of shares (ISI Shares) to investors. Managed Municipal offers two classes of shares – ISI Class A Shares and ISI Class I Shares. North American offers three classes of shares – ISI Class A Shares, ISI Class C Shares and ISI Class I Shares. ISI Shares and ISI Class A Shares are subject to a maximum front-end sales charge equal to 3.00%. A contingent deferred sales charge of 1.00% is imposed on the sale of ISI Class C Shares if redeemed within the first year of purchase.
Total Return and Strategy are authorized to issue 115,000,000 and 25,000,000 shares, respectively, of ISI Shares at $0.001 par value. Managed Municipal is authorized to issue 50,000,000 ISI Class A Shares and 5,000,000 ISI Class I Shares at $0.001 par value. North American is authorized to issue 50,000,000 ISI Class A Shares, 5,000,000 ISI Class C Shares and 5,000,000 ISI Class I Shares at $0.001 par value.
B. Valuation of Securities
Exchange traded securities and over-the-counter securities listed on the NASDAQ National Market System for which market quotations are readily available are valued each Fund business day using the last reported sales price or the NASDAQ Official Closing Price (“NOCP”) provided by independent pricing services as of the close of trading on the New York Stock Exchange (normally 4:00p.m. Eastern Time). In the absence of a sale price or NOCP, such securities are valued at the mean of the last bid and the last asked prices. Non-exchange traded securities for which quotations are readily
| Notes to Financial Statements (continued) | |
available are generally valued at the mean between the last bid and the last asked prices. Debt securities may be valued at prices supplied by a Fund’s pricing agent based on broker or dealer supplied valuations or matrix pricing, a method of valuing securities by reference to the value of other securities with similar characteristics such as rating, interest rate, and maturity. Money market instruments that mature in 60 days or less may be valued at amortized cost unless the Fund’s investment advisor believes another valuation is more appropriate.
When valuing securities for which market quotations are not readily available or for which the market quotations that are readily available are considered unreliable, the Funds determine a fair value in good faith under procedures established by and under the general supervision of the Funds’ Boards of Directors (the “Board”). The Funds may use these procedures to establish the fair value of securities when, for example, a significant event occurs between the time the market closes and the calculation of the net asset value per share, and the event is likely to affect the Fund’s net asset value per share. Fair valuation may also be used for securities that are subject to legal or contractual restrictions on resale, securities for which no or limited trading activity has occurred for a period of time, or securities that are otherwise deemed to be illiquid (i.e., securities that cannot be disposed of within seven days at approximately the price at which the security is currently priced by the Funds).
If a fair value is required, the investment advisor, or the sub-advisor in the case of Strategy, determines the value of the security until the Board meets to establish the fair value of the security.
As of October 31, 2013, there were no fair valued securities.
Accounting principles generally accepted in the United States (“GAAP”) establish a single authoritative definition of fair value, set out a frame work for measuring fair value and require additional disclosures about fair value measurements.
Various inputs are used in determining the value of each Fund’s investments. These inputs are summarized in the three broad levels listed below:
Level 1 – quoted prices in active markets for identical securities
Level 2 – other significant observable inputs
Level 3 – significant unobservable inputs
The inputs or methodology used for valuing securities are not necessarily an indication of the risks associated with investing in those securities.
| Notes to Financial Statements (continued) | |
The following is a summary of the inputs used to value each Fund’s investments as of October 31, 2013:
| Total Return | | | | | | | | | | | | |
| | | | | | | | | | | | |
| U.S. Treasury Obligations | | $ | — | | | $ | 61,891,897 | | | $ | — | | | $ | 61,891,897 | |
Total | | $ | — | | | $ | 61,891,897 | | | $ | — | | | $ | 61,891,897 | |
| Managed Municipal | | | | | | | | | | | | | | | | |
| | | | | | | | | | | | |
Municipal Bonds | | $ | — | | | $ | 80,576,041 | | | $ | — | | | $ | 80,576,041 | |
| U.S. Treasury Obligations | | | — | | | | 9,219,586 | | | | — | | | | 9,219,586 | |
Total | | $ | — | | | $ | 89,795,627 | | | $ | — | | | $ | 89,795,627 | |
| North American | | | | | | | | | | | | | | | | |
| | | | | | | | | | | | |
Canadian Securities | | $ | — | | | $ | 19,580,865 | | | $ | — | | | $ | 19,580,865 | |
Mexican Securities | | | — | | | | 14,305,623 | | | | — | | | | 14,305,623 | |
| U.S. Treasury Obligations | | | — | | | | 66,061,556 | | | | — | | | | 66,061,556 | |
Total | | $ | — | | | $ | 99,948,044 | | | $ | — | | | $ | 99,948,044 | |
| Strategy | | | | | | | | | | | | | | | | |
| | | | | | | | | | | | |
Common Stocks | | $ | 70,619,058 | | | $ | — | | | $ | — | | | $ | 70,619,058 | |
| U.S. Treasury Obligations | | | — | | | | 15,405,038 | | | | — | | | | 15,405,038 | |
Total | | $ | 70,619,058 | | | $ | 15,405,038 | | | $ | — | | | $ | 86,024,096 | |
See Strategy’s Schedule of Investments for a listing of the common stocks valued using Level 1 inputs by industry type.
The Funds’ policy is to disclose significant transfers between Levels based on valuations at the end of the reporting period. The Funds may hold securities which are periodically fair valued in accordance with the Funds’ Fair Value Procedures. This may result in movements between Level 1 and Level 2 throughout the year. There were no transfers between Level 1, 2, or 3 as of October 31, 2013, based on the valuation input Levels on October 31, 2012 for the Funds.
| Notes to Financial Statements (continued) | |
C. Securities Transactions and Investment Income
Securities transactions are recorded on trade date. Realized gains and losses are determined by comparing the proceeds of a sale or the cost of a purchase with a specific offsetting transaction. Dividend income is recorded on the ex-dividend date. Interest income, including amortization of premiums and accretion of discounts, is accrued daily. Estimated expenses are also accrued daily. With respect to North American and Managed Municipal, income, gains (losses) and common expenses are allocated to each class based on its respective net assets. Class specific expenses are charged directly to each class.
D. Distributions
Total Return declares distributions daily, and North American declares monthly distributions at fixed rates approved by the Board. These distributions are paid monthly. To the extent that a Fund’s net investment income is less than an approved fixed rate, some of its distributions may be designated as a return of capital. Managed Municipal declares and pays dividends monthly from its net investment income. Strategy declares and pays dividends quarterly from its net investment income. Net realized capital gains, if any, are distributed at least annually. The Funds record dividends and distributions on the ex-dividend date.
E. Federal Income Taxes
Each Fund intends to continue to qualify as a regulated investment company under Subchapter M of the Internal Revenue Code of 1986, as amended, and distribute substantially all of its taxable income to shareholders. Therefore, no provision for Federal Income tax or excise tax is required.
F. Foreign Currency Translation
The Funds maintain their accounting records in U.S. dollars. North American determines the U.S. dollar value of foreign currency-denominated assets, liabilities and transactions by using prevailing exchange rates. In valuing security transactions, the receipt of income and the payment of expenses, North American uses the prevailing exchange rate on the transaction date.
| Notes to Financial Statements (continued) | |
Net realized gains and losses on foreign currency transactions shown on North American’s financial statements result from the sale of foreign currencies, currency gains or losses realized between the trade and settlement dates on securities transactions, and from the difference between the amounts of interest recorded on North American’s books and the U.S. dollar equivalent of the amounts actually received or paid. That portion of realized gains (losses) from security transactions that results from fluctuation in foreign currency exchange rates relating to the sale of foreign securities is not separately disclosed but is included in net realized gains (losses) from security transactions. That portion of unrealized gains and losses on investments that results from fluctuations in foreign currency exchange rates is not separately disclosed but is included in the net change in unrealized appreciation/depreciation on investments.
G. Forward Foreign Currency Contracts
North American may use forward foreign currency contracts to manage foreign exchange rate risk. The Fund may use these contracts to fix the U.S. dollar value of securities transactions for the period between the date of the transaction and the date the security is received or delivered or to hedge the U.S. dollar value of securities that it already owns. The use of forward foreign currency contracts does not eliminate fluctuations in the prices of the underlying securities, but does establish a rate of exchange that can be achieved in the future. North American determines the net U.S. dollar value of the forward foreign currency contracts using prevailing exchange rates.
H. Estimates
In preparing the Funds' financial statements in conformity with GAAP, management makes estimates and assumptions that affect the reported amounts of assets and liabilities and disclosure of contingent assets and liabilities at the date of the financial statements and the reported amounts of revenues and expenses during the year. Actual results may be different.
Note 2 – Fees and Transactions with Affiliates
International Strategy & Investment, Inc. (“ISI”) is the Funds’ investment advisor. As compensation for ISI’s advisory services, Total Return pays ISI an annual fee based on the Fund’s average daily net assets, which is calculated daily and paid monthly at the following annual rates: 0.20% of the first $100 million, 0.18% of the next $100 million, 0.16% of the next $100 million, 0.14% of the next $200 million and 0.12% of the amount over $500 million. In addition, Total Return pays ISI 1.50% of the Fund’s gross interest income. As compensation for ISI’s advisory services, Managed Municipal, North American and Strategy each pay ISI a fee, which is calculated daily and paid monthly, at the annual rate of 0.40% of such Fund’s average daily net assets.
| Notes to Financial Statements (continued) | |
ISI has contractually agreed to reimburse expenses with respect to Class C Shares of North American through March 1, 2015 to the extent necessary to limit the annual ordinary operating expenses of ISI Class C Shares to 1.85% of the average daily net assets attributable to such shares. During the year ended October 31, 2013, no expenses were reimbursed by ISI under the expense limitation agreement.
Los Angeles Capital Management and Equity Research, Inc. is Strategy’s Sub-Advisor and is responsible for managing the common stocks in Strategy’s portfolio. The Sub-Advisor is paid by ISI, not Strategy.
International Strategy & Investment Group LLC (“ISI Group”), an affiliate of ISI, is the distributor for the Funds. Total Return, Managed Municipal (ISI Class A Shares, only) and Strategy each pay ISI Group a distribution/shareholder service fee, pursuant to Rule 12b-1, that is calculated daily and paid monthly at the annual rate of 0.25% of average daily net assets. North American’s ISI Class A Shares and ISI Class C Shares pay ISI Group a distribution/shareholder service fee, pursuant to Rule 12b-1, that is calculated daily and paid monthly at the annual rates of 0.40% and 1.00% (which may include up to 0.25% for shareholder servicing fees for each class) of their average daily net assets, respectively.
During the year ended October 31, 2013, ISI Group earned commissions on sales of ISI Shares of Total Return, Managed Municipal and Strategy of $1,110, $3,057 and $9,667, respectively, and earned commissions of $2,428 on sales of ISI Class A Shares of North American. ISI Group retained $830 of contingent deferred sales charges on redemptions of ISI Class C Shares of North American during the year ended October 31, 2013.
State Street Bank and Trust Company (“State Street”) is the administrator of the Funds. State Street is responsible for providing certain administrative services to the Funds, and assists in managing and supervising all aspects of the general day-to-day business activities and operations of the Funds other than investment advisory activities, including maintaining the books and records of the Funds, and preparing certain reports and other documents required by federal and/or state laws and regulations. For the performance of these services, the Funds pay State Street an annual fee of $300,000. This fee is allocated among the Funds based on the relative net assets of each Fund.
State Street is the fund accountant and fund custodian, and State Street is responsible for safeguarding and controlling the Funds’ cash and securities, handling the delivery of securities and collecting interest and dividends on the Funds’ investments. State Street as fund accounting agent is responsible for maintaining the books and records and calculating the daily net asset value of each Fund. For fund accounting services, the
| Notes to Financial Statements (continued) | |
Funds pay State Street an annual base fee of $180,000. This fee is allocated among the Funds based on the relative net assets for each Fund. For fund custodian services, the Funds pay State Street an annual base fee of 1 (one) basis point on net assets, plus other asset-based fees that vary according to the number of positions and transactions, plus out-of-pocket fees.
State Street also serves as transfer agent for the Funds and is responsible for the issuance, transfer and redemption of shares and the opening, maintenance and servicing of shareholder accounts. For these services State Street receives an annual amount of $130,000, allocated among the Funds based on the relative net assets of each Fund and a monthly fee from each Fund at an annual rate of $20 for each direct account and $15 for certain accounts established through financial intermediaries. In addition, the Funds reimburse State Street for its out-of-pocket expenses including, but not limited to, postage and supplies.
EJV Financial Services, LLC (“EJV”) provides certain compliance services to the Funds. Edward J. Veilleux, Vice President and Chief Compliance Officer (“CCO”) of the Funds, is also a principal of EJV. The Funds pay EJV $18,750 quarterly for providing CCO services. This fee is allocated among the Funds based on the relative net assets of each Fund. In addition, the Funds reimburse EJV for any reasonable out-of-pocket expenses relating to these compliance services.
Effective January 1, 2012 the Funds pay each independent Director an annual fee of $21,000. The Audit Committee Chairman and Chairman of the Board receive an additional annual fee of $2,000 and $4,000, respectively. The Funds also reimburse each of the Directors for out-of-pocket expenses incurred in connection with attending the Board of Directors’ meetings. Certain officers of the Funds are also officers or employees of the above named service providers, and during their terms of office, receive no compensation from the Funds.
Note 3 – Federal Income Tax
The Funds may periodically make reclassifications among certain capital accounts as a result of differences in the characterization and allocation of certain income and capital gain distributions determined annually in accordance with Federal tax regulations, which may differ from GAAP. These book/tax differences may be either temporary or permanent in nature. To the extent they are permanent, they are charged or credited to paid-in-capital, undistributed net investment income or accumulated net realized gains, as appropriate, in the year that the differences arose. The reclassifications have no impact on the net assets or net asset value per share of the Funds.
| Notes to Financial Statements (continued) | |
The Funds determine their net investment income and capital gain distributions in accordance with income tax regulations, which may differ from GAAP.
During the years ended October 31, 2013 and October 31, 2012, the tax character of distributions paid by each of the Funds was as follows:
| | | | | | | |
| | | | | | | | | | | | |
Total Return | | $ | 1,000,452 | * | | $ | 1,646,163 | * | | $ | — | | | $ | — | |
Managed Municipal | | | 20,586 | | | | 21,808 | | | | 2,341,706 | | | | 2,679,806 | |
North American | | | 1,766,138 | * | | | 4,060,711 | * | | | — | | | | — | |
Strategy | | | 703,061 | * | | | 632,521 | | | | — | | | | — | |
| | | | | | | |
| | | | | | | | | | | | |
Total Return | | $ | 1,407,934 | | | $ | 1,046,949 | | | $ | 246,880 | | | $ | — | |
Managed Municipal | | | 492,954 | | | | — | | | | — | | | | — | |
North American | | | 1,468,203 | | | | 278,869 | | | | 38,354 | | | | 62,034 | |
Strategy | | | 2,703,899 | | | | — | | | | — | | | | — | |
| * | A portion of the ordinary income is short-term gains that are taxed as ordinary income for tax purposes. However, these short-term gains may be offset by losses incurred through October 31, 2013 and therefore could be treated as return of capital. |
The Funds recognize the tax benefits or expenses of uncertain tax positions only when the position is “more likely than not” to be sustained assuming examination by tax authorities. Management has reviewed each Fund’s tax positions taken on Federal and state income tax returns for all open tax years (tax years ended October 31, 2010 through October 31, 2013) and concluded that no provision for unrecognized tax benefits or expenses is required in these financial statements.
| Notes to Financial Statements (continued) | |
As of October 31, 2013, the components of distributable earnings (accumulated deficit) on a tax basis were as follows:
| | | | | | | | | | | | | |
| Undistributed ordinary income | | $ | — | | | $ | 33,551 | | | $ | — | | | $ | 905,921 | |
| Undistributed tax-exempt income | | | — | | | | 80,916 | | | | — | | | | — | |
| Accumulated undistributed long-term capital gains (losses) | | | (1 | ) | | | 490,843 | | | | — | | | | 4,708,975 | |
| Capital loss carryforwards | | | — | | | | — | | | | — | | | | — | |
| Net unrealized appreciation (depreciation) | | | 2,554,373 | | | | 1,857,256 | | | | 1,632,178 | | | | 17,386,948 | |
| Other temporary differences | | | (29,857 | ) | | | (81,566 | ) | | | (64,326 | ) | | | 2,053 | |
Total | | $ | 2,524,515 | | | $ | 2,381,000 | | | $ | 1,567,852 | | | $ | 23,003,897 | |
As of October 31, 2013, the Funds recorded the following reclassifications primarily due to foreign exchange gains/losses, REIT adjustments to increase (decrease) the accounts listed below:
| | Undistributed Net Investment Income/(Loss) | | | Accumulated Net Realized Gain/(Loss) | | | | |
| Total Return | | $ | — | | | $ | — | | | $ | — | |
| Managed Municipal | | | — | | | | — | | | | — | |
| North American | | | (82,278 | ) | | | 82,278 | | | | — | |
| Strategy | | | (28,941 | ) | | | 28,941 | | | | — | |
The difference between the federal income tax cost of portfolio investments and the financial statement cost for Strategy is due to certain timing differences in the recognition of capital gains or losses under income tax reporting regulations and GAAP. These “book/tax” differences are temporary in nature and are primarily due to the tax deferral of losses on wash sales.
| Notes to Financial Statements (continued) | |
Note 4 – Investment Transactions
The aggregate cost of purchases and proceeds from sales of investments, other than short-term obligations, for the year ended October 31, 2013 were as follows:
| | | Non-U.S. Government Obligations | | | U.S. Government Obligations | |
| | | | | | | | | | | | |
Total Return | | $ | — | | | $ | — | | | $ | — | | | $ | 7,053,523 | |
Managed Municipal | | | 12,691,932 | | | | 29,067,875 | | | | — | | | | — | |
North American | | | 11,412,510 | | | | 25,043,001 | | | | — | | | | 33,222,501 | |
Strategy | | | 33,483,039 | | | | 23,825,155 | | | | — | | | | 1,040,605 | |
Note 5 – Market and Credit Risk
North American invests in Canadian and Mexican government securities. Investing in Canadian and Mexican government securities may have different risks than investing in U.S. government securities. An investment in Canada or Mexico may be affected by developments unique to those countries. These developments may not affect the U.S. economy or the prices of U.S. government securities in the same manner. In addition, the value of bonds issued by non-U.S. governments may be affected by adverse international political and economic developments that may not impact the value of U.S. government securities.
Note 6 – Contractual Obligations
In the ordinary course of business, the Funds enter into contracts that contain a variety of indemnifications. Each Fund’s maximum exposure under these arrangements is unknown. However, the Funds have not had prior claims or losses pursuant to these indemnification provisions and believe the risk of loss thereunder to be remote.
Note 7 – Subsequent Events
GAAP requires the Funds to recognize in the financial statements the effects of all subsequent events that provide additional evidence about conditions that existed as of the date of the Statements of Assets and Liabilities. For non-recognized subsequent events that must be disclosed to keep the financial statements from being misleading, the Funds are required to disclose the nature of the event as well as an estimate of its financial effect, or a statement that such an estimate cannot be made. Management has evaluated subsequent events through the issuance of these financial statements and has determined no disclosure is necessary other than as noted below.
| Notes to Financial Statements (continued) | |
On November 29, 2013, the Funds paid the following per share net investment income distributions related to the period ended November 29, 2013:
| | Net Investment Income per share November 29, 2013 | |
| Total Return | | $ | 0.0150 | |
| Managed Municipal - Class A | | | 0.0202 | |
| Managed Municipal - Class I | | | 0.0224 | |
| North American - Class A | | | 0.0160 | |
| North American - Class C | | | 0.0130 | |
| North American - Class I | | | 0.0180 | |
| Strategy | | | — | |
| Report of Independent Registered Public Accounting Firm |
To the Board of Directors and
Shareholders of Total Return U.S. Treasury Fund, Inc.,
Managed Municipal Fund, Inc., North American Government Bond Fund, Inc.,
and ISI Strategy Fund, Inc.
We have audited the accompanying statements of assets and liabilities of the Total Return U.S. Treasury Fund, Inc., Managed Municipal Fund, Inc., North American Government Bond Fund, Inc., and ISI Strategy Fund, Inc., (the “Funds”) including the schedules of investments, as of October 31, 2013, and the related statements of operations for the year then ended, the statements of changes in net assets for each of the two years in the period then ended, and the financial highlights for each of the years and periods in the five-year period then ended. These financial statements and financial highlights are the responsibility of the Funds’ management. Our responsibility is to express an opinion on these financial statements and financial highlights based on our audits.
We conducted our audits in accordance with the standards of the Public Company Accounting Oversight Board (United States). Those standards require that we plan and perform the audits to obtain reasonable assurance about whether the financial statements and financial highlights are free of material misstatement. An audit includes examining, on a test basis, evidence supporting the amounts and disclosures in the financial statements. Our procedures included confirmation of securities owned as of October 31, 2013 by correspondence with the custodian. An audit also includes assessing the accounting principles used and significant estimates made by management, as well as evaluating the overall financial statement presentation. We believe that our audits provide a reasonable basis for our opinion.
In our opinion, the financial statements and financial highlights referred to above present fairly, in all material respects, the financial position of the Total Return U.S. Treasury Fund, Inc., Managed Municipal Fund, Inc., North American Government Bond Fund, Inc., and ISI Strategy Fund, Inc., as of October 31, 2013, the results of their operations for the year then ended, the changes in their net assets for each of the two years in the period then ended, and the financial highlights for each of the years and periods in the five-year period then ended, in conformity with accounting principles generally accepted in the United States of America.
| |  |
| | BBD, LLP |
Philadelphia, Pennsylvania
December 23, 2013
| Fund Directors and Officers (Unaudited) |
| | Business Experience During the Past Five Years | Other Directorships Held By Director |
|
W. Murray Jacques (age 77) | since 2002 | President, WMJ Consulting, LLC (real estate investment management company) (1999 to present); formerly, Principal of CM Coastal Development, LLC (real estate development) (2002 to 2006); Member of FLJ Design, LLC (jewelry design) (2005 to present). | None |
Louis E. Levy (age 81) | since 1994 | Retired Partner, KPMG Peat Marwick (retired 1990); Scudder Group of Mutual Funds (retired 2005). | None |
Edward A. Kuczmarski (age 64) | since 2007 | Certified Public Accountant and Partner of Crowe Horwath LLP (accounting firm) (1980 to present). | Board Member of Reich & Tang Funds; Board Member of Brookfield Investment Management Funds. |
|
R. Alan Medaugh* (age 70) President and Director | President since 1991; Director since 2007 | President, International Strategy & Investment Inc. (registered investment advisor) (1991 to present). Director, International Strategy & Investment Group LLC (registered broker-dealer) (1991 to present). | None |
| * | Mr. Medaugh is deemed to be an Interested Director, as defined in the Investment Company Act of 1940, as amended because he serves as the President of ISI Inc. and a Director of ISI Group LLC. |
| Fund Directors and Officers (Unaudited) (continued) |
| | Business Experience During the Past Five Years |
|
Thomas D. Stevens* (age 64) Vice President | since 1997 | Chairman and President, Los Angeles Capital Management and Equity Research, Inc. (registered investment advisor) (March 2002 to present). |
Carrie L. Butler (age 46) Vice President and Secretary | Vice President since 1991; Secretary since 2013 | Managing Director, International Strategy & Investment Inc. (registered investment advisor) (2000 to present). |
Edward J. Veilleux (age 70) Vice President and Chief Compliance Officer | Vice President since 1992; Chief Compliance Officer since 2008 | President, EJV Financial Services, LLC (mutual fund consulting company) (2002 to present); Officer of various investment companies for which EJV Financial Services provides consulting and compliance services. |
Anthony Rose (age 43) Chief Financial Officer, Treasurer and Vice President | Vice President, Chief Financial Officer, and Treasurer since 2013 | CFO, International Strategy & Investment Group, LLC (June 2013 to present); CFO – Equities, Credit Suisse (2008 – 2013). |
Heena Dhruv (age 37) Vice President | Assistant Vice President from 2005-2013; Vice President since 2013 | Managing Director, International Strategy & Investment Inc. (registered investment advisor) (2005 to present); formerly, Associate Managing Director, International Strategy & Investment Inc. (January 2003 to July 2005). |
Theodore J. Boudria, Jr. (age 45) Assistant Treasurer State Street Bank and Trust Company 4 Copley Place, 5th floor Boston, MA 02116 | since 2013 | Vice President, State Street Bank and Trust Company (2011 to present); Senior Vice President, Brown Brothers Harriman & Co. (2009 – 2011); Vice President Brown Brothers Harriman & Co. (2004 – 2009). |
| * | Thomas D. Stevens is an officer of the ISI Strategy Fund, Inc. only. |
| Fund Directors and Officers (Unaudited) (continued) |
| | Business Experience During the Past Five Years |
Executive Officers (Continued) |
Francine Hayes (age 45) Assistant Secretary State Street Bank and Trust Company 4 Copley Place, 5th floor Boston, MA 02116 | since 2012 | Vice President and Managing Counsel, State Street Bank and Trust Company (since 2004). |
Directors and officers of the Funds are also directors and officers of all of the other investment companies in the ISI Fund Complex advised by International Strategy & Investment Inc. (“ISI” or the “Advisor”) or its affiliates. There are currently four funds in the ISI Family of Funds (the “ISI Fund Complex”). Each of the above named persons serves in the capacity noted above for each fund in the ISI Fund Complex.
The Statements of Additional Information for the Funds include additional information about the Directors and are available without charge by calling (800) 955-7175.
| Notice to Shareholders (Unaudited) |
Federal Tax Information
Certain tax information for the Fund is required to be provided to shareholders based on the Fund’s income and distributions for the taxable year ended October 31, 2013. The amounts shown may differ from those elsewhere in this report due to differences between tax and financial reporting requirements. In January 2014, shareholders will receive Form 1099-DIV which will include their share of qualified dividends, and capital gains distributed during the calendar year 2013. Shareholders are advised to check with their tax advisors for information on the treatment of these amounts on their individual income tax returns.
Strategy designated 76.71% of ordinary income dividends as income qualifying for dividends received deduction for the fiscal year ended October 31, 2013.
Strategy designates $1,243,109 of the dividends received by the Fund as qualified dividend income.
Total Return, Managed Municipal, North American, and Strategy designate $1,407,934, $492,954, $1,468,203, and $2,703,899 respectively for long term capital gains, for the fiscal year ended October 31, 2013.
Managed Municipal designates 99.13% of distributions paid from ordinary income as tax exempt income.
Proxy Voting Policies and Procedures
A description of the policies and procedures that Strategy uses to determine how to vote proxies relating to securities held in Strategy’s portfolio is available, without charge and upon request, by calling (800) 955-7175. Information regarding how Strategy voted proxies relating to portfolio securities during the most recent twelve-month period ended June 30 is available, without charge, upon request, by calling (800) 955-7175 or on the SEC’s website at http://www.sec.gov.
Availability of Quarterly Portfolio Schedule
The Funds file their complete schedule of portfolio holdings with the SEC for the first and third quarters of each fiscal year on Form N-Q. Each Fund’s Form N-Q is available on the SEC’s website at http://www.sec.gov or may be reviewed and copied at the SEC’s Public Reference Room in Washington, DC. Information on the operation of the Public Reference Room may be obtained by calling 800-SEC-0330.
| Investment Advisory Agreements and Investment Sub-Advisory Agreement Approvals (Unaudited) |
At a meeting of the Board of Directors of the ISI Funds held on September 26, 2013 (the “Meeting”), the Boards of Directors of the ISI Funds (each a “Board” and together the “Boards”), including those directors who are not “interested”, as such term is defined in the Investment Company Act of 1940, as amended (the “Independent Directors” or “Directors”) voting separately, unanimously approved the continuance of the Investment Advisory Agreements between International Strategy and Investment Inc. (“ISI” or the “Advisor”) and each of the ISI Funds (“Funds”) as well as the Investment Sub-Advisory Agreement (the “Sub-Advisory Agreement” and together with the Investment Advisory Agreements, the “Agreements”) between ISI and Los Angeles Capital Management and Equity Research, Inc. (“Los Angeles Capital” or the “Sub-Advisor”) with respect to ISI Strategy Fund, Inc. (“Strategy”). The Independent Directors had previously met with their counsel in executive session to consider the renewal of the Agreements. In evaluating the Investment Advisory Agreements and the Sub-Advisory Agreement, each Board reviewed materials furnished by ISI and the Board of Directors of Strategy (the “Strategy Board”) reviewed materials furnished by the Sub-Advisor. Specifically, each Board considered: (1) the nature, extent and quality of the services provided by ISI to the Funds and the Sub-Advisor to Strategy, including information on the investment performance of each Fund; (2) the total expense ratio of each Fund compared to its relevant peer group as of July 31, 2013; (3) the investment advisory fee schedule for each Fund; (4) the cost of the services provided and profitability to ISI with respect to its relationship with the Funds and the cost of the services provided and profitability to the Sub-Advisor with respect to its relationship with Strategy ; (5) the extent to which economies of scale would be realized as each Fund grows and whether the advisory fees and sub-advisory fee for Strategy reflect these economies of scale for the benefit of shareholders of each Fund; and (6) other benefits received by ISI from its relationship with the Funds and the Sub-Advisor from its relationship with Strategy. In their deliberations regarding consideration of the renewal of the Agreements, the Boards did not identify any specific information that was all-important or controlling. The Boards attributed different weights to the factors that they should consider in approving the Agreements with particular focus on the factors discussed below.
NATURE, EXTENT AND QUALITY OF SERVICES. In considering the nature, extent and quality of the services provided by the Advisor, the Directors relied on their prior experience as Directors of the ISI Funds as well as on the Meeting materials. The Directors noted that under the Investment Advisory Agreements the Advisor is responsible for, among other things, with respect to each of the ISI Funds: (i) managing the investment operations of the ISI Funds in accordance with their respective investment objectives and policies, applicable legal and regulatory requirements, and the instructions of the Directors; (ii) providing necessary and appropriate reports and information to the Directors; (iii) maintaining all necessary books and records
| Investment Advisory Agreements and Investment Sub-Advisory Agreement Approvals (Unaudited) (continued) |
pertaining to the ISI Funds’ securities transactions; and (iv) furnishing the ISI Funds with the assistance, cooperation, and information necessary for the ISI Funds to meet various legal requirements regarding registration and reporting. In addition, the Directors of Strategy noted that the Sub-Advisory Agreement for Strategy provides that the Sub-Advisor is responsible for: (i) determining which securities shall be represented in the portion of Strategy’s portfolio allocated to Los Angeles Capital and formulating and implementing an investment program; (ii) reporting regularly to the Strategy Board on the portfolio; (iii) taking all actions necessary for the purchase and sale of portfolio securities; and (iv) obtaining and evaluating pertinent economic, statistical and financial data.
In connection with the renewal of the Agreements, the Directors reviewed information provided by ISI which included information on each Fund’s performance and that of its peer group for various time periods ended July 31, 2013, each Fund’s total assets under management, each Fund’s portfolio structure, and a summary of purchase and sales activity for each Fund for the period April 30, 2013 through July 31, 2013. The Boards noted that on a quarterly basis ISI senior management provides each Board with detailed information regarding its investment approach for each Fund, recent economic information and reports, market updates and the Advisor’s general economic outlook.
Each Board then considered the short-term and long-term performance information for its respective Fund as compared to each Fund’s benchmark index and peer group.
| | • | Total Return. The Board reviewed the investment objective of the Fund and the information comparing the Fund’s performance to the returns of relevant indices for selected periods ended July 31, 2013. The Board noted that the Fund returned -3.05% during the one-year period ended July 31, 2013, as compared to the Barclays U.S. Treasury Total Return Index, which returned -2.72%, and that the Fund’s performance was slightly ahead of the CDA/Lipper U.S. Treasury Funds Average, which returned -4.27%, during the same period. The Board discussed the impact of the current bond yield environment on the Fund’s performance and the effect of certain peer funds with longer durations in depressing the calculated average. The Board noted that the Fund’s benchmark index and peer groups, including the Morningstar Intermediate Government Average, do not provide a precise comparison because the Fund’s composition differs from that of its benchmark and peer groups. The Board further noted that although the Fund’s performance was better than average in the Lipper category for the 1, 3, 5, and 10 years and above median for 3, 5, and 10 years in the Morningstar category, the lower returns for Total Return for the quarter ended July 31, 2013 and the year-ended July 31, 2013 are in line with expectations, given the challenges of the current interest rate environment. |
| Investment Advisory Agreements and Investment Sub-Advisory Agreement Approvals (Unaudited) (continued) |
| | • | Managed Municipal. The Board reviewed the investment objective of the Fund and the Fund’s performance for selected periods ended July 31, 2013. The Board noted that the Fund returned -4.16% during the one-year period ended July 31, 2013, as compared to the Barclays AAA High Quality Index, which returned -1.42%, and the CDA/Lipper General and Insured Municipal Debt Funds Average, which returned -2.96%, during the same period. The Board indicated that the Fund’s benchmark index and peer groups, including the Morningstar Municipal National Intermediate Average, do not provide a precise comparison because the Fund’s composition differs from that of its benchmark and peer groups. The Board noted that the Fund’s performance had been held back by the longer duration of securities held by the Fund, specifically as a result of an increase in the long sector of the Fund’s portfolio by 13.7%. The Board also took into consideration the high credit qualities of the portfolio securities held by the Fund, which invests exclusively in high quality municipal securities bonds. The Board discussed the effect of near record redemptions in the municipal funds community and the positive effect this has had on the performance of the lower quality sector, and consequently, the underperformance of the Fund when compared to the performance of the average fund. The Board compared the Fund’s returns against that of its benchmark and peer groups over longer-term periods and concluded that the lower returns for Managed Municipal for the quarter ending July 31, 2013 and the year-ended July 31, 2013 are in line with expectations when taking into consideration the near record rate of redemptions in the municipal funds sector and the impact that large-scale redemptions have had on elevating the performance of lower quality bonds. |
| | • | North American. The Board reviewed the investment objective of the Fund and the Fund’s performance for selected periods ended July 31, 2013. The Board noted that the Fund returned -1.64% during the one-year period ended July 31, 2013, compared to the Fund’s blended benchmark index which returned -1.85%. The Board noted that for the quarterly period ending July 31, 2013, the Fund’s performance, though negative, was still ahead of its blended benchmark index as a result of the Fund’s duration shortening program and the Fund’s slightly higher levels of investment in Mexico and Canada The Board noted that the Fund’s Lipper rank was above average for the 1, 3, 5, and 10 year periods when compared to the CDA/Lipper average and that in the Morningstar category, the Fund’s negative return was slightly ahead of its corporate dominated benchmark. The Board indicated that the Fund’s blended benchmark index and peer groups, including the Morningstar Intermediate Term Bond Average, do not provide a precise comparison because the Fund’s composition differs from that of its blended benchmark index and peer groups. The Board noted in particular that the Fund’s peer groups are limited to U.S. Government securities, whereas the |
| Investment Advisory Agreements and Investment Sub-Advisory Agreement Approvals (Unaudited) (continued) |
| | Fund invests in a much more diverse universe of North American government bonds. The Board also took into consideration the high credit qualities of the portfolio securities held by the Fund. The Board compared the Fund’s returns against that of its blended benchmark index and peer groups over longer-term periods and concluded that the returns for North American for the quarter ended July 31, 2013 and the year-ended July 31, 2013 are in line with expectations, given the challenges of the current interest rate environment. |
| | • | Strategy. The Board reviewed the investment objective of the Fund and the Fund’s performance for selected periods ended July 31, 2013. The Board noted that the Fund returned 20.00% during the one-year period ended July 31, 2013, compared to the blended 80% Wilshire 5000/20% Barclays Treasury Index, which returned 21.18. The Board noted that the Fund’s equity section, when compared with the average large-blend fund in both the Lipper and Morningstar categories, was above median in all timeframes while the Fund’s bond section was close to its benchmark in each period. The Board indicated that the Fund’s blended benchmark index and peer groups, including the Morningstar Large Blend Average, do not provide a precise comparison because the Fund’s composition differs from that of its blended benchmark index and peer groups. The Board took into consideration the high credit qualities of the portfolio securities held by the Fund and the Fund’s exposure to equities. The Board compared the Fund’s returns against its blended benchmark index and peer groups over longer-term periods and concluded that given the current popularity of equity-oriented funds, the Fund’s performance for the year-ended July 31, 2013 was in line with expectations. |
The Board discussed the distinctive nature of the services provided by the Advisor in offering specialized fixed income management for bond portfolios and the experience and expertise appropriate for an investment adviser to such funds. Each Board determined that ISI has demonstrated consistency in its investment approach and that the Advisor provides an extensive array of ancillary services to the Funds in the areas of oversight and administration. The Directors reviewed the background and experience of the Advisor’s key investment professionals, including those individuals responsible for the investment and compliance operations of the ISI Funds. They also considered the resources, operational structures and practices of the Advisor in managing the ISI Funds, in monitoring and securing each Fund’s compliance with its investment objectives and policies and with applicable laws and regulations. The Directors also considered information about the Advisor’s overall investment management business, noting that the Advisor serves as the investment advisor for two primary lines of business: one as the advisor to the ISI Funds and the second as Portfolio Manager or Sub-advisor to a series of funds registered in Japan.
| Investment Advisory Agreements and Investment Sub-Advisory Agreement Approvals (Unaudited) (continued) |
Drawing upon the materials provided and their general knowledge of the business of the Advisor, the Directors of the Funds determined that the Advisor had the experience and resources necessary to manage the ISI Funds. On the basis of this review, the Directors concluded that the nature and extent of the services provided by the Advisor to the ISI Funds were appropriate, had been of uniformly high quality, and could be expected to remain so.
The Strategy Board noted that the Sub-Advisor had presented detailed information about its resources, operational structure and practices in managing the investment process for the equity portion of Strategy and in monitoring and securing Strategy’s compliance with its investment objectives and policies and with applicable laws and regulations. The Strategy Board noted that the Sub-Advisor has demonstrated consistency in its investment approach with respect to the equity portion of Strategy. The Strategy Board also considered the background and experience of the investment management team of Los Angeles Capital and information regarding Los Angeles Capital’s overall investment management business.
Drawing upon the materials provided and their general knowledge of the business of the Los Angeles Capital, the Directors of Strategy determined that the Sub-Advisor had the experience and resources necessary to manage the equity portion of Strategy. On the basis of this review, the Directors of Strategy concluded that the nature and extent of the services provided by the Sub-Advisor to Strategy were appropriate, had been of uniformly high quality, and could be expected to remain so.
INVESTMENT ADVISORY FEE SCHEDULES FOR EACH FUND. Each Board considered the investment advisory fees paid by each Fund to ISI. The Board of Directors of Strategy noted that the sub-advisory fee for Strategy is paid by ISI and not the Fund. Each Board concluded that the fee schedules under the Investment Advisory Agreements provide fair compensation to ISI in light of the nature, extent and quality of the services being provided by ISI to each of the Funds.
COSTS OF SERVICES PROVIDED AND PROFITABILITY. Each Board reviewed the costs associated with ISI’s portfolio management, research and corporate governance and considered the profitability of ISI from the advisory and ancillary services provided to each of the Funds. Each Board was advised by ISI of the methodology it used to assign its costs associated with the portfolio management, research and corporate governance services provided to each of the Funds. The Board of Directors of Strategy was also provided with a report from the Sub-Advisor showing its profitability with respect to its management of Strategy and the methodology used by the Sub-Advisor to prepare its profitability analysis.
| Investment Advisory Agreements and Investment Sub-Advisory Agreement Approvals (Unaudited) (continued) |
Each Board first discussed ISI’s business operations that include the ISI Funds and ISI’s institutional line of business which encompasses portfolio management responsibilities for a series of off-shore funds. Each Board compared the advisory fees from these two businesses noting that the shared costs of these two operations are divided based on the number of personnel assigned or the percentage of revenue. The Board noted that ISI’s revenue for its institutional line of business had been reduced as a result of the closure of the U.S. Treasury based hedge funds and mutual funds managed by ISI due to the compression of yield between the U.S. and Japan.
Having reviewed the fee income statement for each of the ISI Funds; discussed with management the Advisor’s methodology used for allocating the costs that form the basis of ISI’s profitability analysis; and noted that such costs are further allocated among the individual Funds based upon a percentage of revenue, each Board concluded that the Advisor’s methodology for allocating costs was reasonable. The Board noted that the Advisor’s total expenses had decreased while total revenue had increased slightly resulting in a 3% increase in the Advisor’s profit margin for the fiscal year ending June 30, 2013. After additional discussion and analysis each Board concluded that, to the extent that ISI’s relationship with each Fund had been profitable during the period for which information had been provided, the profitability that ISI derived from its relationship with the ISI Funds was vital towards retaining qualified investment professionals and the administrative personnel necessary for the ISI Funds’ portfolio management, compliance and operational processes and that ISI’s profitability was fair and reasonable.
The Directors of Strategy considered the benefits received by the Sub-Advisor from its relationship with Strategy and concluded that the Sub-Advisor’s profitability from its relationship with Strategy (including fall-out benefits) was fair and reasonable.
EXPENSE RATIOS AND ECONOMIES OF SCALE. Each Board discussed economy of scale considerations with respect to whether the ISI Funds would benefit from any economies of scale. The Boards concluded that asset levels of the Funds were not at a point that would make economy of scale considerations relevant at this time.
Each Board reviewed an expense ratio report that compared the actual expense ratio of each Fund to the average expense ratio of comparable managed funds selected by CDA/Lipper. The Boards of Directors of Managed Municipal, North American and Strategy noted that the investment advisory fees for their respective Funds do not contain breakpoints and considered the extent to which economies of scale would be realized as the Funds grow. After additional discussion, the Boards determined that with the exception of North American, the total expense ratio of each Fund was at or near the average of its respective peer group. In reaching this conclusion the Boards relied on upon the following information:
| Investment Advisory Agreements and Investment Sub-Advisory Agreement Approvals (Unaudited) (continued) |
| | • | Total Return. The Board determined that the Fund’s total expense ratio of 0.87% was slightly below the average total expense ratio of 0.89% for comparable managed funds. |
| | • | Managed Municipal. The Board determined that the Fund’s total expense ratio of 1.02% was slightly above the average total expense ratio of 0.99% for comparable managed funds. The Board noted that the total net assets of the Fund were $96 million and substantially below the average total net assets of $147 million for comparable managed funds. |
| | • | North American. The Board determined that the Fund’s total expense ratio of 1.20% was above the average total expense ratio of 1.07% for other government bond funds. The Board noted that the Fund’s expenses were relatively higher than the average of its respective peer group as the cost of custody services for Canadian and Mexican securities is higher than U.S. securities. The Board also noted that the total net assets of the Fund were $112 million and significantly smaller than the average total net assets of $170 million for other government bond funds. The Board concluded that because no other mutual fund shares the Fund’s focus of investing exclusively in a diversified portfolio of North American government bonds, at this time, the total expense ratios of other government bond funds do not provide the appropriate counterpoints for comparative purposes. |
| | • | Strategy. The Board determined that the Fund’s total expense ratio of 1.11% was below the average total expense ratio of 1.15% for comparable managed funds. The Board noted that the total net assets of the Fund were $81 million) and well below the average total net assets of $95 million for comparable managed funds. |
OTHER BENEFITS REVIEWED. Each Board considered the fact that International Strategy & Investment Group LLC (“ISI Group”), an affiliate of ISI, serves as the distributor of each of the Funds. Each Board reviewed the costs and profitability of ISI Group in rendering distribution services to each of the Funds for the year ended June 30, 2013. The Boards noted that ISI Group continued to operate at a loss for the distribution services it provided to the Funds. Each Board also considered other benefits received by ISI in connection with its relationship with the Funds. Each Board compared ISI’s fees charged to each Fund against ISI’s fees charged to its institutional clients. Each Board considered the investment management, compliance and administrative services ISI provided to each of the Funds, including ISI’s supervisory responsibilities with respect to the selection and oversight of the Sub-Advisor for Strategy. Each Board noted the benefits that ISI derives from the shared costs of its two primary lines of business, and that ISI’s profit margins were higher for its mutual fund business year-over-year. The Board of Directors of Strategy considered the benefits received by the Sub-Advisor from its relationship with Strategy and concluded that the Sub-Advisor’s profitability from its relationship with Strategy (including fall-out benefits) was fair and reasonable.
| Privacy Policy (Unaudited) |
ISI Funds Privacy Policy
| What does ISI Funds do with your personal information? |
| Why? | Financial companies choose how they share your personal information. Federal law gives consumers the right to limit some but not all sharing. Federal law also requires us to tell you how we collect, share, and protect your personal information. Please read this notice carefully to understand what we do. |
| What? | The types of personal information we collect and share depend on the product or service you have with us. This information can include: • Social Security number and other information we receive from you on applications or other forms • Information about your transactions with us and our service providers, or others If you decide to close your account(s) or become an inactive customer, we will continue to adhere to the privacy policies and practices described in this notice. |
| How? | All financial companies need to share customers’ personal information to run their everyday business. In the section below, we list the reasons financial companies can share their customers’ personal information; the reasons ISI Funds chooses to share; and whether you can limit this sharing. |
| Reasons We can Share Your Personal Information: | Does ISI Funds Share? | Can You Limit This Sharing? |
For Our Everyday Business Purposes: Such as to process your transactions, maintain your account(s), respond to court orders and legal investigations or report to credit bureaus | Yes | No |
For Our Marketing Purposes: To offer our products and services to you | Yes | No |
| For Joint Marketing with Other Financial Companies | No | — |
For Our Affiliates’ Everyday Business Purposes: Information about your transactions and experiences | Yes | No |
For Our Affiliates’ Everyday Business Purposes: Information about your creditworthiness | No | — |
| For Our Affiliates to Market to You | No | — |
| For Non-Affiliates to Market to You | No | — |
| Questions? | Call 1-800-882-8585 or go to http://www.isigrp.com/main/about_isi_disclosures.html |
| Privacy Policy (Unaudited) (continued) |

| Who We Are: |
| Who is Providing this notice? | International Strategy & Investment Inc. (“ISI Funds”) |
| What We Do: |
| How does ISI Funds protect my personal information? | To protect your personal information from unauthorized access and use, we use security measures that comply with federal law. These measures include computer safeguards and secured files and buildings. We also restrict access to your personal and account information to those persons who need to know it in order to provide services to you. |
| How does ISI Funds collect my personal information? | We collect your personal information, for example, when you: • Open an account • Purchase or sell shares • Exchange shares |
| Why can’t I limit all sharing? | Federal law gives you the right to limit only: • Sharing for affiliates’ everyday business purposes—information about your creditworthiness • Affiliates from using your information to market to you • Sharing for non-affiliates to market to you State laws and individual companies may give you additional rights to limit sharing. |
| Definitions: |
| Affiliates | Companies related by common ownership or control. They can be financial and non-financial companies. The following companies may be considered Affiliates of ISI Funds: • The term “affiliate” means ISI Funds’ investment advisor, distributor and any entity controlling, controlled by and under common control with the investment advisor and/or distributor. |
| Non-Affiliates | Companies not related by common ownership or control. They can be financial and nonfinancial companies. The following companies provide services to ISI Funds, and we may share your personal information as part of their everyday services to ISI Funds: • State Street Bank and Trust Company |
| Joint Marketing | A formal agreement between non-affiliated financial companies that together market financial products or services to you. • ISI Funds does not have any formal or informal agreements with any non-affiliated entity to market products or services to you. |
| Other Important Information: |
| In the event that you hold shares of the Funds through a financial intermediary, including, but not limited to, a broker-dealer, bank or trust company, the privacy policy of your financial intermediary will govern how your non-public personal information will be shared with non-affiliated third parties by that entity. ISI Funds may, at its discretion, change the Privacy Policy at any time. If it makes material changes to the policy, it will provide notice of these changes. |
Effective Date: September 2012
| Questions? | Call 1-800-882-8585 or go to http://www.isigrp.com/main/about_isi_disclosures.html |
THIS PAGE INTENTIONALLY LEFT BLANK.
|
| | Board of Directors |
| | Louis E. Levy Chairman | Edward J. Veilleux Vice President Chief Compliance Officer |
| | W. Murray Jacques Director | Thomas D. Stevens * Vice President |
| | Edward A. Kuczmarski Director | Anthony Rose Vice President Treasurer |
| | Carrie L. Butler Vice President Secretary | Edward S. Hyman Senior Economic Advisor |
| | | *Thomas D. Stevens is an officer for only the ISI Strategy Fund, Inc.. |
| | Investment Advisor |
| | ISI Inc. 666 Fifth Avenue New York, NY 10103 (800) 955-7175 |
| | Shareholder Servicing Agent |
| | State Street Bank & Trust Company One Lincoln Street Boston, MA 02111 |
| | Distributor |
| | ISI Group LLC 666 Fifth Avenue New York, NY 10103 (800) 955-7175 |