UNITED STATES
SECURITIES AND EXCHANGE COMMISSION
Washington, D.C. 20549
FORM N-CSR
Certified Shareholder Report of
Registered Management Investment Companies
Investment Company Act File Number: 811-07338
Capital World Growth and Income Fund
(Exact Name of Registrant as Specified in Charter)
333 South Hope Street
Los Angeles, California 90071
(Address of Principal Executive Offices)
Registrant's telephone number, including area code: (213) 486-9200
Date of fiscal year end: November 30
Date of reporting period: November 30, 2017
Michael W. Stockton
Capital World Growth and Income Fund
333 South Hope Street
Los Angeles, California 90071
(Name and Address of Agent for Service)
ITEM 1 – Reports to Stockholders
 | Capital World Growth
and Income Fund® Annual report
for the year ended
November 30, 2017 |

Global flexibility:
Following opportunity
anywhere.
Capital World Growth and Income Fund seeks to provide you with long-term growth of capital while providing current income.
This fund is one of more than 40 offered by one of the nation’s largest mutual fund families, American Funds, from Capital Group. For more than 85 years, Capital has invested with a long-term focus based on thorough research and attention to risk.
Fund results shown in this report, unless otherwise indicated, are for Class A shares at net asset value. If a sales charge (maximum 5.75%) had been deducted, the results would have been lower. Results are for past periods and are not predictive of results for future periods. Current and future results may be lower or higher than those shown. Share prices and returns will vary, so investors may lose money. Investing for short periods makes losses more likely. For current information and month-end results, visit americanfunds.com.
Here are the average annual total returns on a $1,000 investment with all distributions reinvested for the period ended December 31, 2017 (the most recent calendar quarter-end):
| Class A shares | | 1 year | | 5 years | | 10 years |
| | | | | | | |
| Reflecting 5.75% maximum sales charge | | 17.52% | | 9.71% | | 4.39% |
For other share class results, visit americanfunds.com and americanfundsretirement.com.
The total annual fund operating expense ratio is 0.77% for Class A shares as of the prospectus dated February 1, 2018 (unaudited). The expense ratio is restated to reflect current fees.
Investment results assume all distributions are reinvested and reflect applicable fees and expenses. When applicable, investment results reflect fee waivers, without which results would have been lower. Visit americanfunds.com for more information.
The fund’s 30-day yield for Class A shares as of December 31, 2017, reflecting the 5.75% maximum sales charge and calculated in accordance with the U.S. Securities and Exchange Commission formula, was 1.81%.
Investing outside the United States may be subject to risks, such as currency fluctuations, periods of illiquidity and price volatility. These risks may be heightened in connection with investments in developing countries. Refer to the fund prospectus and the Risk Factors section of this report for more information on these and other risks associated with investing in the fund.
Investments are not FDIC-insured, nor are they deposits of or guaranteed by a bank or any other entity, so they may lose value.
| Contents |
| | |
| 1 | Letter to investors |
| 6 | The value of a long-term perspective |
| 8 | Summary investment portfolio |
| 12 | Financial statements |
| 34 | Board of trustees and other officers |
Fellow investors:
Equity markets rallied during the fiscal year, supported by growing evidence of a synchronized global recovery, accelerating corporate earnings growth and accommodative measures from central banks around the world.
In this constructive environment, Capital World Growth and Income Fund produced a total return of 24.96% for the 12 months ended November 30, 2017. The fund slightly outpaced the 24.64% gain of its primary benchmark, the MSCI ACWI (All Country World Index). By comparison, the Lipper Global Funds Index, a peer group measure, recorded a 23.54% total return. The fund has outpaced these measures over longer time frames, as shown in the table below.
Capital World Growth and Income Fund seeks to provide investors with current income and long-term growth of capital.
The fund paid dividends totaling $1.07 a share for the 12 months, as well as a capital gains distribution of $1.24 paid in December. For the year, investors who reinvested dividends recorded an income return of 2.47%.
A rising global economic tide
Stocks steadily rose throughout the fiscal year as investors were encouraged by improving economic fundamentals, most notably in Europe and some emerging markets. Equity markets were further bolstered by stronger corporate earnings as companies across a number of sectors benefited from an uptick in consumer spending, expanding trade activity and a low interest rate environment. Continued central bank stimulus measures and waning political uncertainty also provided a supportive backdrop. Pivotal elections in the U.S. and Europe served to reshape the political landscape. The election of
Results at a glance
For periods ended November 30, 2017, with all distributions reinvested
| | | Cumulative
total returns | | Average annual total returns |
| | | 1 year | | | 5 years | | 10 years | | Lifetime
(since 3/26/93) |
| | | | | | | | | | |
| Capital World Growth and Income Fund (Class A shares) | | | 24.96 | % | | | 11.12 | % | | | 4.81 | % | | | 10.79 | % |
| MSCI ACWI* | | | 24.64 | | | | 10.94 | | | | 4.37 | | | | 7.57 | |
| Lipper Global Funds Index† | | | 23.54 | | | | 11.67 | | | | 4.70 | | | | 7.71 | |
| | |
| * | Results for the MSCI ACWI reflect dividends gross of withholding taxes through December 31, 2000, and dividends net of withholding taxes thereafter. This index is a free float-adjusted market capitalization-weighted index that is designed to measure results of more than 40 developed and emerging equity markets. It is unmanaged and, therefore, has no expenses. Investors cannot invest directly in an index. Source: MSCI. |
| † | Lipper indexes track the largest mutual funds (no more than 30), represented by one share class per fund, in the corresponding Lipper category. Lipper source: Thomson Reuters Lipper. |
| | |
| Capital World Growth and Income Fund | 1 |
The New Geography of Investing®
Fifty years ago, companies tended to do business solely within their own borders. Globalization, however, has made that less and less true. Where a company is headquartered or where its stock is listed have become less meaningful proxies.
Equity portion breakdown by revenue (%)
| | Region | | Fund | | Index |
| n | United States | | | 35 | % | | | 41 | % |
| n | Canada | | | 3 | | | | 3 | |
| n | Europe | | | 22 | | | | 17 | |
| n | Japan | | | 5 | | | | 7 | |
| n | Asia-Pacific ex. Japan | | | 4 | | | | 4 | |
| n | Emerging markets | | | 31 | | | | 28 | |
| | Total | | | 100 | % | | | 100 | % |
Equity portion breakdown by domicile (%)
| | Region | | Fund | | Index |
| n | United States | | | 37 | % | | | 53 | % |
| n | Canada | | | 3 | | | | 3 | |
| n | Europe | | | 31 | | | | 21 | |
| n | Japan | | | 6 | | | | 8 | |
| n | Asia-Pacific ex. Japan | | | 5 | | | | 4 | |
| n | Emerging markets | | | 18 | | | | 11 | |
| | Total | | | 100 | % | | | 100 | % |
Source: Capital Group (as of November 30, 2017).
Compared with the MSCI ACWI (All Country World Index) as a percent of net assets. All figures include convertible securities.
President Donald Trump in the U.S. and President Emmanuel Macron in France fueled investor hopes for business-friendly government policies, regulatory rollbacks, potentially greater economic development and higher inflation in the years ahead. The market rally continued throughout the period, and several major market indexes reached historic highs.
In Europe, stocks moved higher amid a strengthening economy and a monetary stimulus boost from the European Central Bank (ECB). At their October meeting, ECB officials said the bank will likely continue buying European government bonds through September 2018, but will reduce the amount purchased from the current €60 billion a month to €30 billion a month starting in December. Political disputes continued to make headlines during the fiscal year. Following an uneasy election victory in September for Chancellor Angela Merkel’s conservative party, German leaders failed to form a coalition government. Talks were ongoing at the close of the fiscal year. The euro appreciated against the dollar, giving a further boost to returns for U.S.–based investors. For the 12 months ended November 30, 2017, the MSCI Europe ex U.K. Index gained 33.75%.*
Meanwhile, shortly after the close of the fiscal year Brexit negotiators agreed on terms for the U.K.’s departure from the European Union, opening a path for trade discussions to move forward. The U.K. stock market rose 21.33% in U.S. dollar terms during the period.
In Japan, equities rose 24.32% amid improving economic growth and Prime Minister Shinzo Abe’s success in October’s snap election, a victory that gives him a better opportunity to enact his pro-defense and pro-growth plans. Japan’s economy grew for the seventh consecutive quarter, its longest streak in nearly two decades. Gross domestic product increased an annualized 1.4% in the third quarter as robust export activity offset weak
| * | Unless otherwise noted, country stock returns are based on MSCI indexes, expressed in U.S. dollars and assume the reinvestment of dividends. Results reflect dividends net of withholding taxes. |
| 2 | Capital World Growth and Income Fund |
Where the fund’s assets are invested*
(percent invested by country of domicile)
| | | Capital World Growth
and Income Fund | | MSCI All Country
World Index† |
| | | | | |
| Europe | | | 29.0 | % | | | 21.5 | % |
| United Kingdom | | | 11.0 | | | | 5.7 | |
| Switzerland | | | 4.2 | | | | 2.6 | |
| France | | | 5.9 | | | | 3.5 | |
| Spain | | | 2.7 | | | | 1.1 | |
| Netherlands | | | 1.2 | | | | 1.2 | |
| Germany | | | .9 | | | | 3.2 | |
| Italy | | | .8 | | | | .8 | |
| Denmark | | | .5 | | | | .6 | |
| Other Europe | | | 1.8 | | | | 2.8 | |
| | | | | | | | | |
| The Americas | | | 38.0 | | | | 57.1 | |
| United States | | | 34.1 | | | | 52.6 | |
| Canada | | | 2.3 | | | | 3.1 | |
| Brazil | | | 1.3 | | | | .8 | |
| Other Americas | | | .3 | | | | .6 | |
| | | | | | | | | |
| Asia/Pacific | | | 25.5 | | | | 20.3 | |
| South Korea | | | 6.6 | | | | 1.8 | |
| Japan | | | 5.6 | | | | 8.0 | |
| China | | | 4.2 | | | | 3.5 | |
| Hong Kong | | | 3.5 | | | | 1.1 | |
| India | | | 1.7 | | | | 1.0 | |
| Thailand | | | 1.1 | | | | .3 | |
| Australia | | | 1.0 | | | | 2.2 | |
| Taiwan | | | .9 | | | | 1.3 | |
| Singapore | | | .5 | | | | .4 | |
| Other Asia/Pacific | | | .4 | | | | .7 | |
| | | | | | | | | |
| Other | | | .5 | | | | 1.1 | |
| | | | | | | | | |
| Bonds, notes & other debt instruments, short-term securities & other assets less liabilities | | | 7.0 | | | | — | |
| | | | | | | | | |
| Total | | | 100.0 | % | | | 100.0 | % |
| | |
| * | Percent of net assets by country as of November 30, 2017. |
| † | The MSCI All Country World Index is weighted by market capitalization. |
domestic figures. The country’s exports grew by double digits for a fourth straight month in October, continuing the best year-to-date performance since 2008. Household consumption declined 1.9%, and retail sales fell for the first time in a year. Economists said that the domestic downturn was likely temporary, a sentiment supported by the Consumer Confidence Index, which reached a four-year high.
Emerging markets notched some of the strongest gains of the period for U.S. investors, aided by signs of more robust growth in China, a weaker dollar, improved corporate earnings and rising commodities prices. Chinese stocks rose 44.99%, as second-quarter gross domestic product of 6.9% exceeded expectations. Shares of several technology companies soared on encouraging earnings news. Elsewhere in developing markets, Indian shares advanced 32.19%. Toward the end of the period, government leaders in India unveiled plans aimed at stoking a slowing economy, including a $32 billion capital injection for the country’s state-run banks to help address bad loans and stimulate lending. Brazil and Russia also posted double-digit gains, climbing 19.67% and 15.04%, respectively.
U.S. equity markets, as measured by the Standard & Poor’s 500 Composite Index (a market capitalization-weighted index based on the results of approximately 500 widely held common stocks), gained 22.87%, boosted by record highs on strong corporate earnings and improved economic sentiment. Returns for growth-oriented stocks continued their strong run, with large-cap shares up more than 29% year-to-date. The country’s economic data was mostly positive, as stronger consumer and industrial numbers offset softer durable goods orders.
All sectors rise
All sectors within the MSCI ACWI generated positive returns for the 12-month period. Information technology stocks rallied 43.05%, supported by better-than-expected corporate earnings. Meanwhile, basic materials stocks gained an impressive 26.24% amid accelerating activity in the manufacturing sector and higher demand from China. Cyclical sectors generally outpaced defensive areas of the market. Stocks in the industrials sector rose 24.08% in aggregate on expectations for greater infrastructure spending, higher demand for aircraft and signs of a sustainable upturn in manufacturing worldwide. Meanwhile, energy stocks lagged the overall market with a 5.89% return for the 12 months, but began
| Capital World Growth and Income Fund | 3 |
Largest equity holdings
(as of November 30, 2017)
| Company | | Country of domicile | | Percent of
net assets | | 12-month
return† |
| | | | | | | |
| AbbVie | | United States | | | 2.9 | % | | | 59.41 | % |
| Samsung Electronics | | South Korea | | | 2.8 | | | | 58.80 | |
| Prudential | | United Kingdom | | | 1.6 | | | | 30.21 | |
| Royal Dutch Shell* | | United Kingdom | | | 1.6 | | | | 25.33 | |
| Amgen | | United States | | | 1.5 | | | | 21.93 | |
| Broadcom | | United States | | | 1.3 | | | | 63.02 | |
| Alphabet* | | United States | | | 1.3 | | | | 33.55 | |
| Verizon Communications | | United States | | | 1.2 | | | | 1.98 | |
| Novartis | | Switzerland | | | 1.1 | | | | 24.33 | |
| Amazon | | United States | | | 1.1 | | | | 56.78 | |
| | |
| * | 12-month return for Royal Dutch Shell and Alphabet represents Class A shares only. |
| † | Returns shown are on a share price basis. |
picking up momentum on firmer oil prices toward the end of the period.
Inside the portfolio
The fund’s overall result was supported by solid positive contributions from holdings in every market sector. Information technology stocks generated some of the best returns of the period. Shares of semiconductor and smartphone maker Samsung Electronics, the fund’s second-largest investment, soared 58.80% on healthy profits from its memory chip business as well as plans to pay dividends and retire its U.S. Treasury holdings. Shares of semiconductor maker Broadcom (+63.02%), the fund’s sixth-largest holding, were lifted by demand for Apple’s iPhone 8 and X. The fund also has an investment in Apple, which surged 55.49%, but a relatively light exposure to the company proved to be a drag on returns. Alibaba, China’s largest e-commerce company, climbed 88.34% on robust quarterly earnings reports, underscoring the country’s ongoing shift to a consumer-led economy.
Investments in more economically sensitive areas of the market, most notably industrials and financials, also produced noteworthy gains. Shares of Airbus (+63.14%) and Boeing (+83.85%) advanced amid substantial growth in global air travel and increasing demand for more fuel-efficient airplanes. China now accounts for roughly 20% of Boeing’s aircraft sales. In addition, the company benefited from an increase in U.S. defense spending under the new administration, which should continue over a multiyear period, as well as more foreign military spending from countries in Asia and the Middle East. In the financials sector, U.K.–domiciled insurer Prudential, the fund’s third-largest position, advanced 30.21%. Shares of India’s HDFC Bank rose 43.00%, beating earnings expectations, as the company continued to grow its market share and footprint across India.
Results for holdings in the health care sector were generally favorable. Top holding AbbVie, a U.S. biopharmaceuticals company, soared 59.41% on robust first-quarter revenue from Humira, with sales of the arthritis drug expected to show continued strength over the next few years. Biotech company Amgen (+21.93%), the fund’s fifth-largest holding, and Swiss drug maker Novartis (+24.33%), the fund’s ninth-largest holding, both advanced during the period. However, Teva Pharmaceutical plummeted 60.69%. The Israeli–based maker of generic drugs cut its 2017 profit forecast and slashed its dividend due to weaker prices for its products.
Elsewhere among the fund’s top 10 holdings, shares of Royal Dutch Shell rose after second-quarter revenue and earnings beat forecasts. Online retailer Amazon notched a 56.78% increase, while information technology firm Alphabet finished up a healthy 33.55%. Verizon Communications recorded a modestly positive return, but trailed the broader market.
A number of energy holdings dampened returns. Oil and gas giants Chesapeake, Schlumberger and Noble Energy all registered double-digit losses.
Looking forward
The investment landscape has brightened considerably over the past year with most major economies gaining strength. Recent events indicate that this expansion will likely continue into 2018. Europe appears particularly compelling as the recovery spreads across the continent, and we’re seeing constructive developments in countries that have engaged in fiscal reform over the past few years. The U.S. and Japanese economies continue to strengthen, and central bank policies across the globe remain accommodative. Developing countries are benefiting from a healthy demand for technology-related components and services. As we head into the new fiscal year, it appears that all feet are on the accelerator.
In this generally positive environment however, risks remain. A faster-than-expected rise in inflation or an unforeseen geopolitical event in North Korea or the Middle East could trigger market volatility. Looking ahead, our chief concern is the relatively high level of equity valuations, particularly in the U.S. Much of the good news today is reflected in asset prices. Taking elevated valuations into consideration, it is important to guard against complacency and not to overreact to inevitable bouts of market instability. We maintain a balanced approach to investing, seeking opportunities for both capital appreciation and current income
| 4 | Capital World Growth and Income Fund |
in the form of dividends, while also being mindful of valuation.
Indeed, much of the market leadership during the past 12 months has been concentrated largely on growth-oriented technology and consumer discretionary firms. Given its value orientation and focus on established dividend-paying companies, we are pleased with the fund’s strong return for the fiscal year.
We thank you for your commitment to Capital World Growth and Income Fund.
Cordially,

Mark E. Denning
President

Michael Cohen
Vice President
January 12, 2018
For current information about the fund, visit americanfunds.com.
Why your annual report has a different look
You have probably noticed that this annual report doesn’t look like the glossier reports of the past. After surveying a large, representative sample of our investors, we have decided to make a few key changes to these documents and have adjusted the look and feel of our reports (e.g., paper stock and design standards) to reflect the prevailing industry norm. These changes will reduce costs and the amount of paper we consume.
You also told us that we should be considering ways to deliver the valuable perspective of our investment professionals to you digitally. We are in the process of building our digital investor education content on our website, which will provide a platform for investment professionals to communicate with investors using the channels that you access more often.
If you have not already done so, you can elect to receive your annual reports electronically. Once you do, you will receive an email notification as soon as the documents are available. To learn more, visit americanfunds.com/gopaperless. n
| Capital World Growth and Income Fund | 5 |
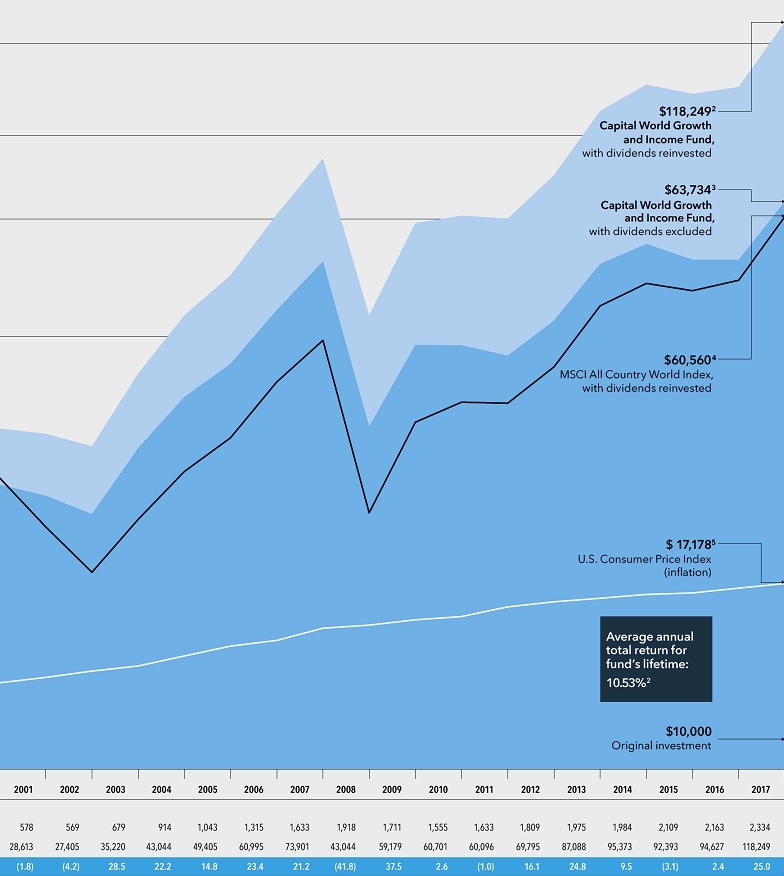
The value of a long-term perspective
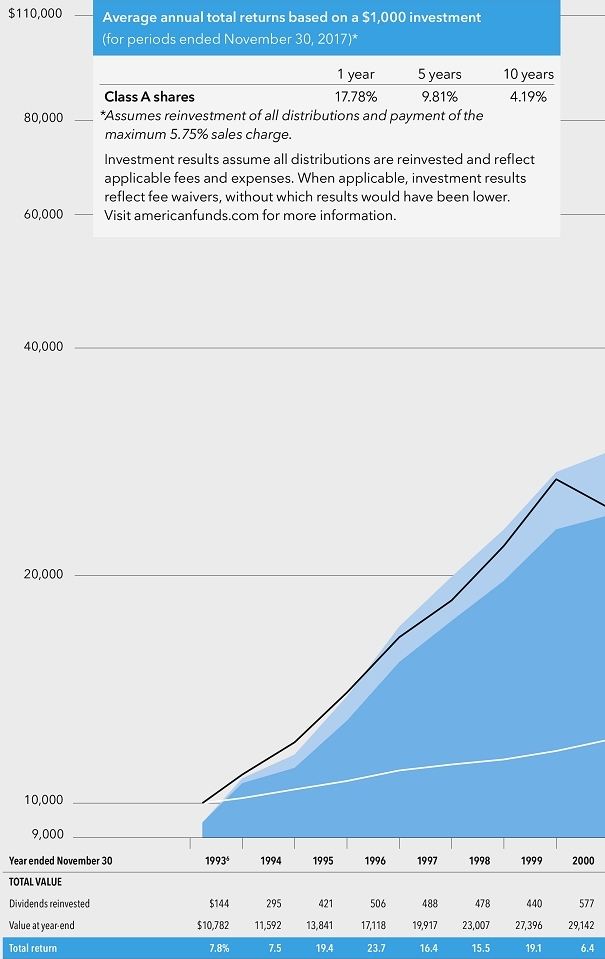
Fund results shown are for Class A shares and reflect deduction of the maximum sales charge of 5.75% on the $10,000 investment.¹ Thus, the net amount invested was $9,425. Results are for past periods and are not predictive of results for future periods. Current and future results may be lower or higher than those shown. Share prices and returns will vary, so investors may lose money. For current information and month-end results, visit americanfunds.com.
The results shown are before taxes on fund distributions and sale of fund shares.
| 1 | As outlined in the prospectus, the sales charge is reduced for accounts (and aggregated investments) of $25,000 or more and is eliminated for purchases of $1 million or more. There is no sales charge on dividends or capital gain distributions that are reinvested in additional shares. |
| 2 | Includes reinvested dividends of $29,273 and reinvested capital gain distributions of $24,602. |
| 3 | Results calculated with capital gains reinvested. |
| 4 | The market index is unmanaged and, therefore, has no expenses. Investors cannot invest directly in an index. Results reflect dividends gross of withholding taxes through December 31, 2000, and dividends net of withholding taxes thereafter. Source: MSCI. |
| 5 | Computed from data supplied by the U.S. Department of Labor, Bureau of Labor Statistics. |
| 6 | For the period March 26 (commencement of operations) through November 30, 1993. |
| | |
| 6 | Capital World Growth and Income Fund |
How a $10,000 investment has grown
While notable for their volatility in recent years, financial markets have tended to reward investors over the long term. As the chart shows, over its lifetime, Capital World Growth and Income Fund has done demonstrably better than its relevant benchmark.
| Capital World Growth and Income Fund | 7 |
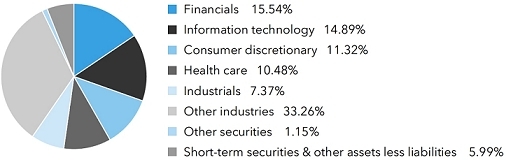
Summary investment portfolio November 30, 2017
| Industry sector diversification | Percent of net assets |
| Country diversification by domicile | | Percent of
net assets |
| United States | | | 34.06 | % |
| Euro zone* | | | 12.72 | |
| United Kingdom | | | 11.01 | |
| South Korea | | | 6.59 | |
| Japan | | | 5.62 | |
| China | | | 4.19 | |
| Switzerland | | | 4.16 | |
| Hong Kong | | | 3.53 | |
| Canada | | | 2.34 | |
| Other countries | | | 8.83 | |
| Bonds, notes & other debt instruments, short-term securities & other assets less liabilities | | | 6.95 | |
| * | Countries using the euro as a common currency; those represented in the fund’s portfolio are Belgium, Finland, France, Germany, Ireland, Italy, the Netherlands, Portugal and Spain. |
| Common stocks 92.86% | | Shares | | | Value
(000) | |
| Financials 15.54% | | | | | | | | |
| Prudential PLC1 | | | 63,174,799 | | | $ | 1,589,417 | |
| HDFC Bank Ltd.1 | | | 28,896,610 | | | | 831,557 | |
| HDFC Bank Ltd. (ADR) | | | 540,900 | | | | 52,521 | |
| Barclays PLC1 | | | 311,082,756 | | | | 811,039 | |
| AIA Group Ltd.1 | | | 93,807,196 | | | | 764,615 | |
| UBS Group AG1 | | | 41,866,000 | | | | 723,649 | |
| KB Financial Group Inc.1 | | | 12,533,647 | | | | 689,567 | |
| Zurich Insurance Group AG1 | | | 2,276,844 | | | | 687,678 | |
| Banco Santander, SA1 | | | 82,008,989 | | | | 551,490 | |
| Other securities | | | | | | | 8,433,291 | |
| | | | | | | | 15,134,824 | |
| | | | | | | | | |
| Information technology 14.89% | | | | | | | | |
| Samsung Electronics Co., Ltd.1 | | | 1,176,233 | | | | 2,763,575 | |
| Broadcom Ltd. | | | 4,709,454 | | | | 1,308,946 | |
| Alphabet Inc., Class A2 | | | 667,380 | | | | 691,519 | |
| Alphabet Inc., Class C2 | | | 521,167 | | | | 532,325 | |
| Intel Corp. | | | 22,521,253 | | | | 1,009,853 | |
| Microsoft Corp. | | | 11,544,700 | | | | 971,717 | |
| Alibaba Group Holding Ltd. (ADR)2 | | | 4,641,680 | | | | 821,949 | |
| Apple Inc. | | | 4,550,081 | | | | 781,931 | |
| Taiwan Semiconductor Manufacturing Co., Ltd.1 | | | 101,805,000 | | | | 766,436 | |
| Micron Technology, Inc.2 | | | 16,133,000 | | | | 683,878 | |
| SK hynix, Inc.1 | | | 9,333,000 | | | | 665,098 | |
| Tencent Holdings Ltd.1 | | | 12,165,600 | | | | 627,977 | |
| Texas Instruments Inc. | | | 5,615,400 | | | | 546,322 | |
| Other securities | | | | | | | 2,331,951 | |
| | | | | | | | 14,503,477 | |
| | | | | | | | | |
| Consumer discretionary 11.32% | | | | | | | | |
| Amazon.com, Inc.2 | | | 928,583 | | | | 1,092,710 | |
| Netflix, Inc.2 | | | 5,431,589 | | | | 1,018,857 | |
| Hyundai Motor Co.1 | | | 6,302,655 | | | | 952,990 | |
| LVMH Moët Hennessy-Louis Vuitton SE1 | | | 2,188,300 | | | | 637,374 | |
| Other securities | | | | | | | 7,326,353 | |
| | | | | | | | 11,028,284 | |
| | | | | | | | | |
| Health care 10.48% | | | | | | | | |
| AbbVie Inc. | | | 29,067,095 | | | | 2,817,182 | |
| Amgen Inc. | | | 8,405,869 | | | | 1,476,575 | |
| Novartis AG1 | | | 12,899,991 | | | | 1,103,760 | |
| Stryker Corp. | | | 4,935,500 | | | | 769,938 | |
| 8 | Capital World Growth and Income Fund |
| | | | Shares | | | | Value
(000) | |
| Takeda Pharmaceutical Co. Ltd.1 | | | 13,691,200 | | | $ | 754,983 | |
| Other securities | | | | | | | 3,282,145 | |
| | | | | | | | 10,204,583 | |
| | | | | | | | | |
| Industrials 7.37% | | | | | | | | |
| Boeing Co. | | | 2,926,000 | | | | 809,917 | |
| Airbus SE, non-registered shares1 | | | 7,599,798 | | | | 789,712 | |
| Lockheed Martin Corp. | | | 2,102,000 | | | | 670,790 | |
| Other securities | | | | | | | 4,912,379 | |
| | | | | | | | 7,182,798 | |
| | | | | | | | | |
| Energy 6.72% | | | | | | | | |
| Royal Dutch Shell PLC, Class B1 | | | 23,112,376 | | | | 749,423 | |
| Royal Dutch Shell PLC, Class A1 | | | 20,687,933 | | | | 660,161 | |
| Royal Dutch Shell PLC, Class A (ADR) | | | 994,252 | | | | 63,751 | |
| Royal Dutch Shell PLC, Class A (EUR denominated)1 | | | 1,035,502 | | | | 33,140 | |
| Royal Dutch Shell PLC, Class B (ADR) | | | 344,800 | | | | 22,736 | |
| TOTAL SA1 | | | 12,498,174 | | | | 705,647 | |
| Canadian Natural Resources, Ltd. | | | 19,592,448 | | | | 664,547 | |
| BP PLC1 | | | 92,302,701 | | | | 611,028 | |
| Other securities | | | | | | | 3,030,369 | |
| | | | | | | | 6,540,802 | |
| | | | | | | | | |
| Consumer staples 6.51% | | | | | | | | |
| Imperial Brands PLC1 | | | 25,620,178 | | | | 1,062,248 | |
| Philip Morris International Inc. | | | 9,673,800 | | | | 993,983 | |
| British American Tobacco PLC1 | | | 8,045,647 | | | | 511,818 | |
| British American Tobacco PLC (ADR) | | | 4,101,483 | | | | 260,977 | |
| Nestlé SA1 | | | 9,003,052 | | | | 770,815 | |
| Other securities | | | | | | | 2,740,108 | |
| | | | | | | | 6,339,949 | |
| | | | | | | | | |
| Utilities 5.05% | | | | | | | | |
| Engie SA1 | | | 45,598,810 | | | | 798,172 | |
| Iberdrola, SA, non-registered shares1 | | | 86,410,727 | | | | 686,692 | |
| Other securities | | | | | | | 3,437,141 | |
| | | | | | | | 4,922,005 | |
| | | | | | | | | |
| Materials 3.72% | | | | | | | | |
| Vale SA, ordinary nominative | | | 54,677,511 | | | | 586,955 | |
| Vale SA, ordinary nominative (ADR) | | | 19,279,317 | | | | 206,289 | |
| Rio Tinto PLC1 | | | 12,640,300 | | | | 599,139 | |
| Other securities | | | | | | | 2,233,702 | |
| | | | | | | | 3,626,085 | |
| | | | | | | | | |
| Telecommunication services 3.71% | | | | | | | | |
| Verizon Communications Inc. | | | 23,727,287 | | | | 1,207,482 | |
| Nippon Telegraph and Telephone Corp.1 | | | 16,481,000 | | | | 864,264 | |
| Other securities | | | | | | | 1,541,867 | |
| | | | | | | | 3,613,613 | |
| | | | | | | | | |
| Real estate 2.65% | | | | | | | | |
| CK Asset Holdings Ltd.1 | | | 77,500,856 | | | | 656,178 | |
| Other securities | | | | | | | 1,928,815 | |
| | | | | | | | 2,584,993 | |
| | | | | | | | | |
| Miscellaneous 4.90% | | | | | | | | |
| Other common stocks in initial period of acquisition | | | | | | | 4,773,028 | |
| | | | | | | | | |
| Total common stocks (cost: $66,154,689,000) | | | | | | | 90,454,441 | |
| | | | | | | | | |
| Convertible stocks 0.19% | | | | | | | | |
| Other 0.11% | | | | | | | | |
| Other securities | | | | | | | 102,781 | |
| Capital World Growth and Income Fund | 9 |
| Convertible stocks (continued) | | Shares | | | Value
(000) | |
| Miscellaneous 0.08% | | | | | | | | |
| Other convertible stocks in initial period of acquisition | | | | | | $ | 76,782 | |
| | | | | | | | | |
| Total convertible stocks (cost: $170,926,000) | | | | | | | 179,563 | |
| | | | | | | | | |
| Bonds, notes & other debt instruments 0.96% | | Principal amount
(000) | | | | | |
| Corporate bonds & notes 0.55% | | | | | | | | |
| Other 0.55% | | | | | | | | |
| Other securities | | | | | | | 539,345 | |
| | | | | | | | | |
| Bonds & notes of governments & government agencies outside the U.S. 0.33% | | | | | | | | |
| Other securities | | | | | | | 318,003 | |
| | | | | | | | | |
| U.S. Treasury bonds & notes 0.08% | | | | | | | | |
| U.S. Treasury 0.08% | | | | | | | | |
| Other securities | | | | | | | 77,564 | |
| | | | | | | | | |
| Total bonds, notes & other debt instruments (cost: $874,742,000) | | | | | | | 934,912 | |
| | | | | | | | | |
| Short-term securities 5.69% | | | | | | | | |
| Federal Home Loan Bank 1.04%–1.24% due 12/1/2017–2/2/2018 | | $ | 763,800 | | | | 762,797 | |
| Microsoft Corp. 1.33% due 2/13/20183 | | | 45,600 | | | | 45,478 | |
| U.S. Treasury Bills 1.01%–1.55% due 1/2/2018–11/8/2018 | | | 586,500 | | | | 584,075 | |
| Other securities | | | | | | | 4,153,959 | |
| | | | | | | | | |
| Total short-term securities (cost: $5,546,579,000) | | | | | | | 5,546,309 | |
| Total investment securities 99.70% (cost: $72,746,936,000) | | | | | | | 97,115,225 | |
| Other assets less liabilities 0.30% | | | | | | | 295,504 | |
| | | | | | | | | |
| Net assets 100.00% | | | | | | $ | 97,410,729 | |
This summary investment portfolio is designed to streamline the report and help investors better focus on the fund’s principal holdings. See the inside back cover for details on how to obtain a complete schedule of portfolio holdings.
As permitted by U.S. Securities and Exchange Commission regulations, “Miscellaneous” securities include holdings in their first year of acquisition that have not previously been publicly disclosed.
“Other securities” includes all issues that are not disclosed separately in the summary investment portfolio. “Other securities” also includes loan participations and assignments, which may be subject to legal or contractual restrictions on resale. The total value of all such loans was $78,003,000, which represented ..08% of the net assets of the fund. “Other securities” also includes a security which was pledged as collateral. The total value of pledged collateral was $3,305,000, which represented less than .01% of the net assets of the fund.
Forward currency contracts
| Contract amount | | | | | | Unrealized
depreciation |
Purchases
(000) | | Sales
(000) | | Counterparty | | Settlement date | | at 11/30/2017
(000) |
| USD185,300 | | GBP140,000 | | JPMorgan Chase | | 12/15/2017 | | | $(4,146 | ) |
| USD48,822 | | GBP36,920 | | Citibank | | 12/18/2017 | | | (1,146 | ) |
| | | | | | | | | | $(5,292 | ) |
| 10 | Capital World Growth and Income Fund |
Investments in affiliates
A company is an affiliate of the fund under the Investment Company Act of 1940 if the fund’s holdings in that company represent 5% or more of the outstanding voting shares. The value of the fund’s affiliated-company holdings is either shown in the summary investment portfolio or included in the value of “Other securities” under the respective industry sectors. Further details on such holdings and related transactions during the year ended November 30, 2017, appear below.
| | | Beginning
shares | | | Additions | | | Reductions | | | Ending
shares | | | Net
realized
loss
(000) | | | Net
unrealized
(depreciation)
appreciation
(000) | | | Dividend
income
(000) | | | Value of
affiliates at
11/30/2017
(000) | |
| Common stocks 1.13% | | | | | | | | | | | | | | | | | | | | | | | | | | |
| Consumer discretionary 0.74% | | | | | | | | | | | | | | | | | | | | | | | | | | |
| ProSiebenSat.1 Media SE1 | | | — | | | | 13,255,754 | | | | — | | | | 13,255,754 | | | $ | — | | | $ | (91,241 | ) | | $ | 12,774 | | | $ | 421,729 | |
| Ocado Group PLC1,2 | | | 39,080,197 | | | | — | | | | — | | | | 39,080,197 | | | | — | | | | 54,563 | | | | — | | | | 186,585 | |
| Greene King PLC1 | | | 16,760,403 | | | | — | | | | 594,750 | | | | 16,165,653 | | | | (2,784 | ) | | | (21,915 | ) | | | 6,981 | | | | 113,852 | |
| | | | | | | | | | | | | | | | | | | | | | | | | | | | | | | | 722,166 | |
| | | | | | | | | | | | | | | | | | | | | | | | | | | | | | | | | |
| Energy 0.00% | | | | | | | | | | | | | | | | | | | | | | | | | | | | | | | | |
| Golar LNG Ltd.4 | | | 5,422,000 | | | | — | | | | 575,000 | | | | 4,847,000 | | | | (20,509 | ) | | | 23,348 | | | | 1,027 | | | | — | |
| | | | | | | | | | | | | | | | | | | | | | | | | | | | | | | | | |
| Telecommunication services 0.39% | | | | | | | | | | | | | | | | | | | | | | | | | | | |
| LG Uplus Corp.1 | | | 3,454,902 | | | | 25,764,440 | | | | 49,900 | | | | 29,169,442 | | | | (39 | ) | | | (17,211 | ) | | | 999 | | | | 373,807 | |
| Total common stocks | | | | | | | | | | | | | | | | | | | | | | | | | | | | | | | 1,095,973 | |
| Total 1.13% | | | | | | | | | | | | | | | | | | $ | (23,332 | ) | | $ | (52,456 | ) | | $ | 21,781 | | | $ | 1,095,973 | |
| 1 | Valued under fair value procedures adopted by authority of the board of trustees. The total value of all such securities, including those in “Miscellaneous” and “Other securities,” was $51,391,316,000, which represented 52.76% of the net assets of the fund. This amount includes $50,440,290,000 related to certain securities trading outside the U.S. whose values were adjusted as a result of significant market movements following the close of local trading. |
| 2 | Security did not produce income during the last 12 months. |
| 3 | Acquired in a transaction exempt from registration under Rule 144A or Section 4(2) of the Securities Act of 1933. May be resold in the U.S. in transactions exempt from registration, normally to qualified institutional buyers. The total value of all such securities, including those in “Other securities,” was $3,617,656,000, which represented 3.71% of the net assets of the fund. |
| 4 | Unaffiliated issuer at 11/30/2017. |
Key to abbreviations and symbol
ADR = American Depositary Receipts
EUR = Euros
GBP = British pounds
USD/$ = U.S. dollars
See Notes to Financial Statements
| Capital World Growth and Income Fund | 11 |
Financial statements
| Statement of assets and liabilities | | | |
| at November 30, 2017 | | (dollars in thousands) |
| | | |
| Assets: | | | | |
| Investment securities, at value: | | | | |
| Unaffiliated issuers (cost: $71,433,190) | | $ | 96,019,252 | | | | | |
| Affiliated issuers (cost: $1,313,746) | | | 1,095,973 | | | $ | 97,115,225 | |
| Cash | | | | | | | 359 | |
| Cash denominated in currencies other than U.S. dollars (cost: $8,817) | | | | | | | 8,815 | |
| Receivables for: | | | | | | | | |
| Sales of investments | | | 474,242 | | | | | |
| Sales of fund’s shares | | | 68,948 | | | | | |
| Dividends and interest | | | 218,936 | | | | | |
| Other | | | 1,224 | | | | 763,350 | |
| | | | | | | | 97,887,749 | |
| | | | | | | | | |
| Liabilities: | | | | | | | | |
| Unrealized depreciation on open forward currency contracts | | | | | | | 5,292 | |
| Payables for: | | | | | | | | |
| Purchases of investments | | | 316,058 | | | | | |
| Repurchases of fund’s shares | | | 76,760 | | | | | |
| Investment advisory services | | | 29,553 | | | | | |
| Services provided by related parties | | | 32,407 | | | | | |
| Trustees’ deferred compensation | | | 1,507 | | | | | |
| Other | | | 15,443 | | | | 471,728 | |
| Net assets at November 30, 2017 | | | | | | $ | 97,410,729 | |
| | | | | | | | | |
| Net assets consist of: | | | | | | | | |
| Capital paid in on shares of beneficial interest | | | | | | $ | 68,396,930 | |
| Undistributed net investment income | | | | | | | 81,836 | |
| Undistributed net realized gain | | | | | | | 4,574,033 | |
| Net unrealized appreciation | | | | | | | 24,357,930 | |
| Net assets at November 30, 2017 | | | | | | $ | 97,410,729 | |
(dollars and shares in thousands, except per-share amounts)
Shares of beneficial interest issued and outstanding (no stated par value) —
unlimited shares authorized (1,838,994 total shares outstanding)
| | | Net assets | | Shares
outstanding | | Net asset
value per share |
| Class A | | $ | 56,785,844 | | | | 1,071,060 | | | $ | 53.02 | |
| Class C | | | 2,675,001 | | | | 51,040 | | | | 52.41 | |
| Class T | | | 11 | | | | — | * | | | 53.03 | |
| Class F-1 | | | 3,820,214 | | | | 72,212 | | | | 52.90 | |
| Class F-2 | | | 7,097,836 | | | | 133,960 | | | | 52.98 | |
| Class F-3 | | | 2,535,504 | | | | 47,813 | | | | 53.03 | |
| Class 529-A | | | 3,415,296 | | | | 64,629 | | | | 52.84 | |
| Class 529-C | | | 758,061 | | | | 14,422 | | | | 52.56 | |
| Class 529-E | | | 138,063 | | | | 2,617 | | | | 52.76 | |
| Class 529-T | | | 11 | | | | — | * | | | 53.02 | |
| Class 529-F-1 | | | 149,416 | | | | 2,825 | | | | 52.90 | |
| Class R-1 | | | 233,589 | | | | 4,451 | | | | 52.48 | |
| Class R-2 | | | 932,190 | | | | 17,810 | | | | 52.34 | |
| Class R-2E | | | 52,915 | | | | 1,002 | | | | 52.80 | |
| Class R-3 | | | 2,113,842 | | | | 40,148 | | | | 52.65 | |
| Class R-4 | | | 2,002,840 | | | | 37,869 | | | | 52.89 | |
| Class R-5E | | | 14,425 | | | | 272 | | | | 52.96 | |
| Class R-5 | | | 1,304,931 | | | | 24,598 | | | | 53.05 | |
| Class R-6 | | | 13,380,740 | | | | 252,266 | | | | 53.04 | |
| | |
| * | Amount less than one thousand. |
See Notes to Financial Statements
| 12 | Capital World Growth and Income Fund |
| Statement of operations | | | | |
| for the year ended November 30, 2017 | | (dollars in thousands) |
| | | | | |
| Investment income: | | | | | | | | |
| Income: | | | | | | | | |
| Dividends (net of non-U.S. taxes of $122,718; also includes $21,781 from affiliates) | | $ | 2,299,598 | | | | | |
| Interest (net of non-U.S. taxes of $398) | | | 107,975 | | | $ | 2,407,573 | |
| Fees and expenses*: | | | | | | | | |
| Investment advisory services | | | 334,039 | | | | | |
| Distribution services | | | 205,949 | | | | | |
| Transfer agent services | | | 93,020 | | | | | |
| Administrative services | | | 23,181 | | | | | |
| Reports to shareholders | | | 3,344 | | | | | |
| Registration statement and prospectus | | | 3,045 | | | | | |
| Trustees’ compensation | | | 773 | | | | | |
| Auditing and legal | | | 1,492 | | | | | |
| Custodian | | | 10,136 | | | | | |
| Other | | | 3,040 | | | | 678,019 | |
| Net investment income | | | | | | | 1,729,554 | |
| | | | | | | | | |
| Net realized gain and unrealized appreciation: | | | | | | | | |
| Net realized gain (loss) on: | | | | | | | | |
| Investments (net of non-U.S. taxes of $2,929): | | | | | | | | |
| Unaffiliated issuers | | | 4,967,472 | | | | | |
| Affiliated issuers | | | (23,332 | ) | | | | |
| Forward currency contracts | | | (10,422 | ) | | | | |
| Currency transactions | | | (30,860 | ) | | | 4,902,858 | |
| Net unrealized appreciation (depreciation) on: | | | | | | | | |
| Investments (net of non-U.S. taxes of $6,232): | | | | | | | | |
| Unaffiliated issuers | | | 13,181,470 | | | | | |
| Affiliated issuers | | | (52,456 | ) | | | | |
| Forward currency contracts | | | (1,376 | ) | | | | |
| Currency translations | | | 4,414 | | | | 13,132,052 | |
| Net realized gain and unrealized appreciation | | | | | | | 18,034,910 | |
| | | | | | | | | |
| Net increase in net assets resulting from operations | | | | | | $ | 19,764,464 | |
| | |
| * | Additional information related to class-specific fees and expenses is included in the Notes to Financial Statements. |
See Notes to Financial Statements
| Capital World Growth and Income Fund | 13 |
Statements of changes in net assets
| | | (dollars in thousands) |
| | | |
| | | Year ended November 30 |
| | | 2017 | | 2016 |
| | | | | |
| Operations: | | | | | | | | |
| Net investment income | | $ | 1,729,554 | | | $ | 1,774,755 | |
| Net realized gain | | | 4,902,858 | | | | 2,420,318 | |
| Net unrealized appreciation (depreciation) | | | 13,132,052 | | | | (2,311,364 | ) |
| Net increase in net assets resulting from operations | | | 19,764,464 | | | | 1,883,709 | |
| | | | | | | | | |
| Dividends and distributions paid to shareholders: | | | | | | | | |
| Dividends from net investment income | | | (1,969,024 | ) | | | (1,920,044 | ) |
| Distributions from net realized gain on investments | | | (2,239,604 | ) | | | (1,318,506 | ) |
| Total dividends and distributions paid to shareholders | | | (4,208,628 | ) | | | (3,238,550 | ) |
| | | | | | | | | |
| Net capital share transactions | | | 805,149 | | | | (1,900,242 | ) |
| | | | | | | | | |
| Total increase (decrease) in net assets | | | 16,360,985 | | | | (3,255,083 | ) |
| | | | | | | | | |
| Net assets: | | | | | | | | |
| Beginning of year | | | 81,049,744 | | | | 84,304,827 | |
| End of year (including undistributed net investment income: $81,836 and $328,176, respectively) | | $ | 97,410,729 | | | $ | 81,049,744 | |
| | | | | | | | | |
See Notes to Financial Statements
| 14 | Capital World Growth and Income Fund |
Notes to financial statements
1. Organization
Capital World Growth and Income Fund (the “fund”) is registered under the Investment Company Act of 1940 as an open-end, diversified management investment company. The fund seeks long-term growth of capital while providing current income.
The fund has 19 share classes consisting of six retail share classes (Classes A, C, T, F-1, F-2 and F-3), five 529 college savings plan share classes (Classes 529-A, 529-C, 529-E, 529-T and 529-F-1) and eight retirement plan share classes (Classes R-1, R-2, R-2E, R-3, R-4, R-5E, R-5 and R-6). The 529 college savings plan share classes can be used to save for college education. The retirement plan share classes are generally offered only through eligible employer-sponsored retirement plans. The fund’s share classes are described further in the following table:
| Share class | | Initial sales
charge | | Contingent deferred sales
charge upon redemption | | Conversion feature | |
| Classes A and 529-A | | Up to 5.75% | | None (except 1% for certain redemptions within one year of purchase without an initial sales charge1) | | None | |
| Class C | | None | | 1% for redemptions within one year of purchase | | Class C converts to Class F-1 after 10 years | |
| Class 529-C | | None | | 1% for redemptions within one year of purchase | | Class 529-C converts to Class 529-A after 10 years2 | |
| Class 529-E | | None | | None | | None | |
| Classes T and 529-T3 | | Up to 2.50% | | None | | None | |
| Classes F-1, F-2, F-3 and 529-F-1 | | None | | None | | None | |
| Classes R-1, R-2, R-2E, R-3, R-4, R-5E, R-5 and R-6 | | None | | None | | None | |
| 1 | 18 months for shares purchased on or after August 14, 2017. |
| 2 | Effective December 1, 2017. |
| 3 | Class T and 529-T shares are not available for purchase. |
Holders of all share classes have equal pro rata rights to the assets, dividends and liquidation proceeds of the fund. Each share class has identical voting rights, except for the exclusive right to vote on matters affecting only its class. Share classes have different fees and expenses (“class-specific fees and expenses”), primarily due to different arrangements for distribution, transfer agent and administrative services. Differences in class-specific fees and expenses will result in differences in net investment income and, therefore, the payment of different per-share dividends by each share class.
2. Significant accounting policies
The fund is an investment company that applies the accounting and reporting guidance issued in Topic 946 by the U.S. Financial Accounting Standards Board. The fund’s financial statements have been prepared to comply with U.S. generally accepted accounting principles (“U.S. GAAP”). These principles require the fund’s investment adviser to make estimates and assumptions that affect reported amounts and disclosures. Actual results could differ from those estimates. Subsequent events, if any, have been evaluated through the date of issuance in the preparation of the financial statements. The fund follows the significant accounting policies described in this section, as well as the valuation policies described in the next section on valuation.
Security transactions and related investment income — Security transactions are recorded by the fund as of the date the trades are executed with brokers. Realized gains and losses from security transactions are determined based on the specific identified cost of the securities. In the event a security is purchased with a delayed payment date, the fund will segregate liquid assets sufficient to meet its payment obligations. Dividend income is recognized on the ex-dividend date and interest income is recognized on an accrual basis. Market discounts, premiums and original issue discounts on fixed-income securities are amortized daily over the expected life of the security.
Class allocations — Income, fees and expenses (other than class-specific fees and expenses) and realized and unrealized gains and losses are allocated daily among the various share classes based on their relative net assets. Class-specific fees and expenses, such as distribution, transfer agent and administrative services, are charged directly to the respective share class.
Dividends and distributions to shareholders — Dividends and distributions to shareholders are recorded on the ex-dividend date.
| Capital World Growth and Income Fund | 15 |
Currency translation — Assets and liabilities, including investment securities, denominated in currencies other than U.S. dollars are translated into U.S. dollars at the exchange rates supplied by one or more pricing vendors on the valuation date. Purchases and sales of investment securities and income and expenses are translated into U.S. dollars at the exchange rates on the dates of such transactions. The effects of changes in exchange rates on investment securities are included with the net realized gain or loss and net unrealized appreciation or depreciation on investments in the fund’s statement of operations. The realized gain or loss and unrealized appreciation or depreciation resulting from all other transactions denominated in currencies other than U.S. dollars are disclosed separately.
3. Valuation
Capital Research and Management Company (“CRMC”), the fund’s investment adviser, values the fund’s investments at fair value as defined by U.S. GAAP. The net asset value of each share class of the fund is generally determined as of approximately 4:00 p.m. New York time each day the New York Stock Exchange is open.
Methods and inputs — The fund’s investment adviser uses the following methods and inputs to establish the fair value of the fund’s assets and liabilities. Use of particular methods and inputs may vary over time based on availability and relevance as market and economic conditions evolve.
Equity securities are generally valued at the official closing price of, or the last reported sale price on, the exchange or market on which such securities are traded, as of the close of business on the day the securities are being valued or, lacking any sales, at the last available bid price. Prices for each security are taken from the principal exchange or market on which the security trades.
Fixed-income securities, including short-term securities, are generally valued at prices obtained from one or more pricing vendors. Vendors value such securities based on one or more of the inputs described in the following table. The table provides examples of inputs that are commonly relevant for valuing particular classes of fixed-income securities in which the fund is authorized to invest. However, these classifications are not exclusive, and any of the inputs may be used to value any other class of fixed-income security.
| Fixed-income class | | Examples of standard inputs |
| All | | Benchmark yields, transactions, bids, offers, quotations from dealers and trading systems, new issues, spreads and other relationships observed in the markets among comparable securities; and proprietary pricing models such as yield measures calculated using factors such as cash flows, financial or collateral performance and other reference data (collectively referred to as “standard inputs”) |
| Corporate bonds & notes; convertible securities | | Standard inputs and underlying equity of the issuer |
| Bonds & notes of governments & government agencies | | Standard inputs and interest rate volatilities |
| Mortgage-backed; asset-backed obligations | | Standard inputs and cash flows, prepayment information, default rates, delinquency and loss assumptions, collateral characteristics, credit enhancements and specific deal information |
When the fund’s investment adviser deems it appropriate to do so (such as when vendor prices are unavailable or deemed to be not representative), fixed-income securities will be valued in good faith at the mean quoted bid and ask prices that are reasonably and timely available (or bid prices, if ask prices are not available) or at prices for securities of comparable maturity, quality and type.
Securities with both fixed-income and equity characteristics, or equity securities traded principally among fixed-income dealers, are generally valued in the manner described for either equity or fixed-income securities, depending on which method is deemed most appropriate by the fund’s investment adviser. Forward currency contracts are valued at the mean of representative quoted bid and ask prices, generally based on prices supplied by one or more pricing vendors.
Securities and other assets for which representative market quotations are not readily available or are considered unreliable by the fund’s investment adviser are fair valued as determined in good faith under fair valuation guidelines adopted by authority of the fund’s board of trustees as further described. The investment adviser follows fair valuation guidelines, consistent with U.S. Securities and Exchange Commission rules and guidance, to consider relevant principles and factors when making fair value determinations. The investment adviser considers relevant indications of value that are reasonably and timely available to it in determining the fair value to be assigned to a particular security, such as the type and cost of the security; contractual or legal restrictions on resale of the security; relevant financial or business developments of the issuer; actively traded similar or related securities; conversion or exchange rights on the security; related corporate actions; significant events occurring after the close of trading in the security; and changes in overall market conditions. In addition, the closing prices of equity securities that trade in markets outside U.S. time zones may be adjusted to reflect significant events
| 16 | Capital World Growth and Income Fund |
that occur after the close of local trading but before the net asset value of each share class of the fund is determined. Fair valuations and valuations of investments that are not actively trading involve judgment and may differ materially from valuations that would have been used had greater market activity occurred.
Processes and structure — The fund’s board of trustees has delegated authority to the fund’s investment adviser to make fair value determinations, subject to board oversight. The investment adviser has established a Joint Fair Valuation Committee (the “Fair Valuation Committee”) to administer, implement and oversee the fair valuation process, and to make fair value decisions. The Fair Valuation Committee regularly reviews its own fair value decisions, as well as decisions made under its standing instructions to the investment adviser’s valuation teams. The Fair Valuation Committee reviews changes in fair value measurements from period to period and may, as deemed appropriate, update the fair valuation guidelines to better reflect the results of back testing and address new or evolving issues. The Fair Valuation Committee reports any changes to the fair valuation guidelines to the board of trustees with supplemental information to support the changes. The fund’s board and audit committee also regularly review reports that describe fair value determinations and methods.
The fund’s investment adviser has also established a Fixed-Income Pricing Review Group to administer and oversee the fixed-income valuation process, including the use of fixed-income pricing vendors. This group regularly reviews pricing vendor information and market data. Pricing decisions, processes and controls over security valuation are also subject to additional internal reviews, including an annual control self-evaluation program facilitated by the investment adviser’s compliance group.
Classifications — The fund’s investment adviser classifies the fund’s assets and liabilities into three levels based on the inputs used to value the assets or liabilities. Level 1 values are based on quoted prices in active markets for identical securities. Level 2 values are based on significant observable market inputs, such as quoted prices for similar securities and quoted prices in inactive markets. Certain securities trading outside the U.S. may transfer between Level 1 and Level 2 due to valuation adjustments resulting from significant market movements following the close of local trading. Level 3 values are based on significant unobservable inputs that reflect the investment adviser’s determination of assumptions that market participants might reasonably use in valuing the securities. The valuation levels are not necessarily an indication of the risk or liquidity associated with the underlying investment. For example, U.S. government securities are reflected as Level 2 because the inputs used to determine fair value may not always be quoted prices in an active market. The following tables present the fund’s valuation levels as of November 30, 2017 (dollars in thousands):
| | | Investment securities |
| | | | Level 1 | | | | Level 2* | | | | Level 3 | | | | Total | |
| Assets: | | | | | | | | | | | | | | | | |
| Common stocks: | | | | | | | | | | | | | | | | |
| Financials | | $ | 3,353,165 | | | $ | 11,781,659 | | | $ | — | | | $ | 15,134,824 | |
| Information technology | | | 8,251,978 | | | | 6,251,499 | | | | — | | | | 14,503,477 | |
| Consumer discretionary | | | 5,121,397 | | | | 5,906,887 | | | | — | | | | 11,028,284 | |
| Health care | | | 7,429,129 | | | | 2,775,454 | | | | — | | | | 10,204,583 | |
| Industrials | | | 3,804,296 | | | | 3,378,502 | | | | — | | | | 7,182,798 | |
| Energy | | | 3,492,199 | | | | 3,048,603 | | | | — | | | | 6,540,802 | |
| Consumer staples | | | 2,116,380 | | | | 4,223,569 | | | | — | | | | 6,339,949 | |
| Utilities | | | 920,468 | | | | 4,001,537 | | | | — | | | | 4,922,005 | |
| Materials | | | 1,130,389 | | | | 2,495,696 | | | | — | | | | 3,626,085 | |
| Telecommunication services | | | 1,403,506 | | | | 2,210,107 | | | | — | | | | 3,613,613 | |
| Real estate | | | 587,764 | | | | 1,997,229 | | | | — | | | | 2,584,993 | |
| Miscellaneous | | | 1,477,527 | | | | 3,295,501 | | | | — | | | | 4,773,028 | |
| Convertible stocks | | | 154,490 | | | | 25,073 | | | | — | | | | 179,563 | |
| Bonds, notes & other debt instruments | | | — | | | | 934,912 | | | | — | | | | 934,912 | |
| Short-term securities | | | — | | | | 5,546,309 | | | | — | | | | 5,546,309 | |
| Total | | $ | 39,242,688 | | | $ | 57,872,537 | | | $ | — | | | $ | 97,115,225 | |
| | | | | | | | | | | | | | | | | |
| | | Other investments† |
| | | | Level 1 | | | | Level 2 | | | | Level 3 | | | | Total | |
| Liabilities: | | | | | | | | | | | | | | | | |
| Unrealized depreciation on open forward currency contracts | | $ | — | | | $ | (5,292 | ) | | $ | — | | | $ | (5,292 | ) |
| * | Securities with a value of $50,440,290,000, which represented 51.78% of the net assets of the fund, were classified as Level 2 due to significant market movements following the close of local trading. |
| † | Forward currency contracts are not included in the investment portfolio. |
| Capital World Growth and Income Fund | 17 |
4. Risk factors
Investing in the fund may involve certain risks including, but not limited to, those described below.
Market conditions — The prices of, and the income generated by, the common stocks and other securities held by the fund may decline —sometimes rapidly or unpredictably — due to various factors, including events or conditions affecting the general economy or particular industries; overall market changes; local, regional or global political, social or economic instability; governmental or governmental agency responses to economic conditions; and currency exchange rate, interest rate and commodity price fluctuations.
Issuer risks — The prices of, and the income generated by, securities held by the fund may decline in response to various factors directly related to the issuers of such securities, including reduced demand for an issuer’s goods or services, poor management performance and strategic initiatives such as mergers, acquisitions or dispositions and the market response to any such initiatives.
Investing outside the U.S. — Securities of issuers domiciled outside the U.S., or with significant operations or revenues outside the U.S., may lose value because of adverse political, social, economic or market developments (including social instability, regional conflicts, terrorism and war) in the countries or regions in which the issuers operate or generate revenue. These securities may also lose value due to changes in foreign currency exchange rates against the U.S. dollar and/or currencies of other countries. Issuers of these securities may be more susceptible to actions of foreign governments, such as the imposition of price controls or punitive taxes, that could adversely impact the value of these securities. Securities markets in certain countries may be more volatile and/or less liquid than those in the U.S. Investments outside the U.S. may also be subject to different accounting practices and different regulatory, legal and reporting standards and practices, and may be more difficult to value, than those in the U.S. In addition, the value of investments outside the U.S. may be reduced by foreign taxes, including foreign withholding taxes on interest and dividends. Further, there may be increased risks of delayed settlement of securities purchased or sold by the fund. The risks of investing outside the U.S. may be heightened in connection with investments in emerging markets.
Investing in emerging markets — Investing in emerging markets may involve risks in addition to and greater than those generally associated with investing in the securities markets of developed countries. For instance, developing countries may have less developed legal and accounting systems than those in developed countries. The governments of these countries may be less stable and more likely to impose capital controls, nationalize a company or industry, place restrictions on foreign ownership and on withdrawing sale proceeds of securities from the country, and/or impose punitive taxes that could adversely affect the prices of securities. In addition, the economies of these countries may be dependent on relatively few industries that are more susceptible to local and global changes. Securities markets in these countries can also be relatively small and have substantially lower trading volumes. As a result, securities issued in these countries may be more volatile and less liquid, and may be more difficult to value, than securities issued in countries with more developed economies and/or markets. Less certainty with respect to security valuations may lead to additional challenges and risks in calculating the fund’s net asset value. Additionally, there may be increased settlement risks for transactions in local securities.
Investing in growth-oriented stocks — Growth-oriented common stocks and other equity-type securities (such as preferred stocks, convertible preferred stocks and convertible bonds) may involve larger price swings and greater potential for loss than other types of investments.
Investing in income-oriented stocks — Income provided by the fund may be reduced by changes in the dividend policies of, and the capital resources available for dividend payments at, the companies in which the fund invests.
Management — The investment adviser to the fund actively manages the fund’s investments. Consequently, the fund is subject to the risk that the methods and analyses employed by the investment adviser in this process may not produce the desired results. This could cause the fund to lose value or its investment results to lag relevant benchmarks or other funds with similar objectives.
5. Certain investment techniques
Loan transactions — The fund has entered into loan transactions in which the fund acquires a loan either through an agent, by assignment from another holder, or as a participation interest in another holder’s portion of a loan. The loan is often administered by a financial institution that acts as agent for the holders of the loan, and the fund may be required to receive approval from the agent and/or borrower prior to the sale of the investment. The loan’s interest rate and maturity date may change based on the terms of the loan, including potential early payments of principal.
Forward currency contracts — The fund has entered into forward currency contracts, which represent agreements to exchange currencies on specific future dates at predetermined rates. The fund’s investment adviser uses forward currency contracts to manage the fund’s exposure to changes in exchange rates. Upon entering into these contracts, risks may arise from the potential inability of counterparties to meet the terms of their contracts and from possible movements in exchange rates.
| 18 | Capital World Growth and Income Fund |
On a daily basis, the fund’s investment adviser values forward currency contracts and records unrealized appreciation or depreciation for open forward currency contracts in the fund’s statement of assets and liabilities. Realized gains or losses are recorded at the time the forward currency contract is closed or offset by another contract with the same broker for the same settlement date and currency.
Closed forward currency contracts that have not reached their settlement date are included in the respective receivables or payables for closed forward currency contracts in the fund’s statement of assets and liabilities. Net realized gains or losses from closed forward currency contracts and net unrealized appreciation or depreciation from open forward currency contracts are recorded in the fund’s statement of operations. The average month-end notional amount of open forward currency contracts while held was $602,535,000.
The following tables present the financial statement impacts resulting from the fund’s use of forward currency contracts as of, or for the year ended, November 30, 2017 (dollars in thousands):
| | | | | Assets | | Liabilities |
| Contracts | | Risk type | | Location on statement of
assets and liabilities | Value | | Location on statement of
assets and liabilities | Value |
| Forward currency | | Currency | | Unrealized appreciation on open forward currency contracts | $ | — | | Unrealized depreciation on open forward currency contracts | $ | 5,292 |
| | | | | | | | | | | |
| | | | | Net realized loss | | Net unrealized depreciation |
| Contracts | | Risk type | | Location on statement of operations | Value | | Location on statement of operations | Value |
| Forward currency | | Currency | | Net realized loss on forward currency contracts | $ | (10,422) | | Net unrealized depreciation on forward currency contracts | $ | (1,376) |
Collateral — The fund participates in a collateral program due to its use of forward currency contracts. The program calls for the fund to either receive or pledge highly liquid assets, such as cash or U.S. Treasury bills, as collateral based on the net gain or loss on unsettled forward currency contracts by counterparty. The purpose of the collateral is to cover potential losses that could occur in the event that either party cannot meet its contractual obligations.
Rights of offset — The fund has entered into enforceable master netting agreements with certain counterparties for forward currency contracts, where on any date amounts payable by each party to the other (in the same currency with respect to the same transaction) may be closed or offset by each party’s payment obligation. If an early termination date occurs under these agreements following an event of default or termination event, all obligations of each party to its counterparty are settled net through a single payment in a single currency (“close-out netting”). For financial reporting purposes, the fund does not offset financial assets and financial liabilities that are subject to these master netting arrangements in the statement of assets and liabilities.
The following table presents the fund’s forward currency contracts by counterparty that are subject to master netting agreements but that are not offset in the fund’s statement of assets and liabilities. The net amount column shows the impact of offsetting on the fund’s statement of assets and liabilities as of November 30, 2017, if close-out netting was exercised (dollars in thousands):
| | | | | | Gross amounts not offset in the | | | | |
| | | Gross amounts | | | statement of assets and liabilities and | | | | |
| | | recognized in the | | | subject to a master netting agreement | | | | |
| | | statement of assets | | | Available | | | Non-cash | | | Cash | | | Net | |
| Counterparty | | and liabilities | | | to offset | | | collateral* | | | collateral | | | amount | |
| Liabilities: | | | | | | | | | | | | | | | | | | | | |
| Citibank | | $ | 1,146 | | | $ | — | | | $ | 719 | | | | — | | | $ | 1,865 | |
| JPMorgan Chase | | | 4,146 | | | | — | | | | 2,580 | | | | — | | | $ | 6,726 | |
| Total | | $ | 5,292 | | | $ | — | | | $ | 3,299 | | | $ | — | | | $ | 8,591 | |
| * | Non-cash collateral is shown on a settlement basis. |
6. Taxation and distributions
Federal income taxation — The fund complies with the requirements under Subchapter M of the Internal Revenue Code applicable to mutual funds and intends to distribute substantially all of its net taxable income and net capital gains each year. The fund is not subject to income taxes to the extent such distributions are made. Therefore, no federal income tax provision is required.
| Capital World Growth and Income Fund | 19 |
As of and during the period ended November 30, 2017, the fund did not have a liability for any unrecognized tax benefits. The fund recognizes interest and penalties, if any, related to unrecognized tax benefits as income tax expense in the statement of operations. During the period, the fund did not incur any significant interest or penalties.
The fund’s tax returns are not subject to examination by federal, state and, if applicable, non-U.S. tax authorities after the expiration of each jurisdiction’s statute of limitations, which is generally three years after the date of filing but can be extended in certain jurisdictions.
Non-U.S. taxation — Dividend and interest income are recorded net of non-U.S. taxes paid. The fund may file withholding tax reclaims in certain jurisdictions to recover a portion of amounts previously withheld. As a result of rulings from European courts, the fund filed for additional reclaims related to prior years. These reclaims are recorded when the amount is known and there are no significant uncertainties on collectability. Gains realized by the fund on the sale of securities in certain countries, if any, may be subject to non-U.S. taxes. If applicable, the fund records an estimated deferred tax liability based on unrealized gains to provide for potential non-U.S. taxes payable upon the sale of these securities.
Distributions — Distributions paid to shareholders are based on net investment income and net realized gains determined on a tax basis, which may differ from net investment income and net realized gains for financial reporting purposes. These differences are due primarily to different treatment for items such as currency gains and losses; short-term capital gains and losses; capital losses related to sales of certain securities within 30 days of purchase; unrealized appreciation of certain investments in securities outside the U.S. and non-U.S. taxes on capital gains. The fiscal year in which amounts are distributed may differ from the year in which the net investment income and net realized gains are recorded by the fund for financial reporting purposes. The fund may also designate a portion of the amount paid to redeeming shareholders as a distribution for tax purposes.
During the year ended November 30, 2017, the fund reclassified $6,827,000 from undistributed net investment income to undistributed net realized gain, $43,000 from undistributed net investment income to capital paid in on shares of beneficial interest and $207,067,000 from undistributed net realized gain to capital paid in on shares of beneficial interest to align financial reporting with tax reporting.
As of November 30, 2017, the tax basis components of distributable earnings, unrealized appreciation (depreciation) and cost of investments were as follows (dollars in thousands):
| Undistributed ordinary income | | $ | 316,169 | |
| Undistributed long-term capital gains | | | 4,606,188 | |
| Gross unrealized appreciation on investments | | | 26,531,057 | |
| Gross unrealized depreciation on investments | | | (2,433,098 | ) |
| Net unrealized appreciation on investments | | | 24,097,959 | |
| Cost of investments | | | 73,011,974 | |
| 20 | Capital World Growth and Income Fund |
Distributions paid were characterized for tax purposes as follows (dollars in thousands):
| | | Year ended November 30, 2017 | | | Year ended November 30, 2016 | |
| Share class | | Ordinary
income | | | Long-term
capital gains | | | Total
dividends and
distributions
paid | | | Ordinary
income | | | Long-term
capital gains | | | Total
dividends and
distributions
paid | |
| Class A | | $ | 1,188,285 | | | $ | 1,387,059 | | | $ | 2,575,344 | | | $ | 1,228,463 | | | $ | 841,069 | | | $ | 2,069,532 | |
| Class B1 | | | 240 | | | | 1,562 | | | | 1,802 | | | | 3,095 | | | | 5,311 | | | | 8,406 | |
| Class C | | | 40,873 | | | | 80,390 | | | | 121,263 | | | | 52,549 | | | | 58,523 | | | | 111,072 | |
| Class T2 | | | — | 3 | | | — | | | | — | 3 | | | | | | | | | | | | |
| Class F-1 | | | 77,749 | | | | 91,483 | | | | 169,232 | | | | 78,808 | | | | 60,077 | | | | 138,885 | |
| Class F-2 | | | 159,998 | | | | 159,723 | | | | 319,721 | | | | 124,210 | | | | 66,264 | | | | 190,474 | |
| Class F-34 | | | 16,016 | | | | — | | | | 16,016 | | | | | | | | | | | | | |
| Class 529-A | | | 67,588 | | | | 79,155 | | | | 146,743 | | | | 65,347 | | | | 45,971 | | | | 111,318 | |
| Class 529-B1 | | | 34 | | | | 220 | | | | 254 | | | | 345 | | | | 587 | | | | 932 | |
| Class 529-C | | | 9,956 | | | | 18,264 | | | | 28,220 | | | | 10,214 | | | | 11,002 | | | | 21,216 | |
| Class 529-E | | | 2,465 | | | | 3,236 | | | | 5,701 | | | | 2,440 | | | | 1,908 | | | | 4,348 | |
| Class 529-T2 | | | — | 3 | | | — | | | | — | 3 | | | | | | | | | | | | |
| Class 529-F-1 | | | 3,118 | | | | 3,215 | | | | 6,333 | | | | 2,780 | | | | 1,763 | | | | 4,543 | |
| Class R-1 | | | 3,398 | | | | 6,189 | | | | 9,587 | | | | 3,872 | | | | 4,003 | | | | 7,875 | |
| Class R-2 | | | 13,868 | | | | 25,406 | | | | 39,274 | | | | 15,985 | | | | 16,608 | | | | 32,593 | |
| Class R-2E | | | 566 | | | | 461 | | | | 1,027 | | | | 147 | | | | 23 | | | | 170 | |
| Class R-3 | | | 38,573 | | | | 52,656 | | | | 91,229 | | | | 42,043 | | | | 34,912 | | | | 76,955 | |
| Class R-4 | | | 40,948 | | | | 48,186 | | | | 89,134 | | | | 43,192 | | | | 31,267 | | | | 74,459 | |
| Class R-5E | | | 254 | | | | 240 | | | | 494 | | | | — | 3 | | | — | 3 | | | — | 3 |
| Class R-5 | | | 29,985 | | | | 30,978 | | | | 60,963 | | | | 33,645 | | | | 21,688 | | | | 55,333 | |
| Class R-6 | | | 275,110 | | | | 251,181 | | | | 526,291 | | | | 212,909 | | | | 117,530 | | | | 330,439 | |
| Total | | $ | 1,969,024 | | | $ | 2,239,604 | | | $ | 4,208,628 | | | $ | 1,920,044 | | | $ | 1,318,506 | | | $ | 3,238,550 | |
| 1 | Class B and 529-B shares were fully liquidated on May 5, 2017. |
| 2 | Class T and 529-T shares began investment operations on April 7, 2017. |
| 3 | Amount less than one thousand. |
| 4 | Class F-3 shares began investment operations on January 27, 2017. |
7. Fees and transactions with related parties
CRMC, the fund’s investment adviser, is the parent company of American Funds Distributors,® Inc. (“AFD”), the principal underwriter of the fund’s shares, and American Funds Service Company® (“AFS”), the fund’s transfer agent. CRMC, AFD and AFS are considered related parties to the fund.
Investment advisory services — The fund has an investment advisory and service agreement with CRMC that provides for monthly fees accrued daily. These fees are based on a series of decreasing annual rates beginning with 0.600% on the first $500 million of daily net assets and decreasing to 0.350% on such assets in excess of $115 billion. For the year ended November 30, 2017, the investment advisory services fee was $334,039,000, which was equivalent to an annualized rate of 0.374% of average daily net assets.
Class-specific fees and expenses — Expenses that are specific to individual share classes are accrued directly to the respective share class. The principal class-specific fees and expenses are further described below:
Distribution services — The fund has plans of distribution for all share classes, except Class F-2, F-3, R-5E, R-5 and R-6 shares. Under the plans, the board of trustees approves certain categories of expenses that are used to finance activities primarily intended to sell fund shares and service existing accounts. The plans provide for payments, based on an annualized percentage of average daily net assets, ranging from 0.30% to 1.00% as noted in this section. In some cases, the board of trustees has limited the amounts that may be paid to less than the maximum allowed by the plans. All share classes with a plan may use up to 0.25% of average daily net assets to pay service fees, or to compensate AFD for paying service fees, to firms that have entered into agreements with AFD to provide
| Capital World Growth and Income Fund | 21 |
certain shareholder services. The remaining amounts available to be paid under each plan are paid to dealers to compensate them for their sales activities.
| Share class | | Currently approved limits | | Plan limits |
| Class A | | | 0.30 | % | | | 0.30 | % |
| Class 529-A | | | 0.30 | | | | 0.50 | |
| Classes C, 529-C and R-1 | | | 1.00 | | | | 1.00 | |
| Class R-2 | | | 0.75 | | | | 1.00 | |
| Class R-2E | | | 0.60 | | | | 0.85 | |
| Classes 529-E and R-3 | | | 0.50 | | | | 0.75 | |
| Classes T, F-1, 529-T, 529-F-1 and R-4 | | | 0.25 | | | | 0.50 | |
For Class A and 529-A shares, distribution-related expenses include the reimbursement of dealer and wholesaler commissions paid by AFD for certain shares sold without a sales charge. These share classes reimburse AFD for amounts billed within the prior 15 months but only to the extent that the overall annual expense limits are not exceeded. As of November 30, 2017, there were no unreimbursed expenses subject to reimbursement for Class A or 529-A shares.
Transfer agent services — The fund has a shareholder services agreement with AFS under which the fund compensates AFS for providing transfer agent services to each of the fund’s share classes. These services include recordkeeping, shareholder communications and transaction processing. In addition, the fund reimburses AFS for amounts paid to third parties for performing transfer agent services on behalf of fund shareholders.
Administrative services — The fund has an administrative services agreement with CRMC under which the fund compensates CRMC for providing administrative services to Class A, C, T, F, 529 and R shares. These services include, but are not limited to, coordinating, monitoring, assisting and overseeing third parties that provide services to fund shareholders. Under the agreement, Class A shares pay an annual fee of 0.01% and Class C, T, F, 529 and R shares pay an annual fee of 0.05% of their respective average daily net assets.
529 plan services — Each 529 share class is subject to service fees to compensate the Virginia College Savings Plan (“Virginia529”) for its oversight and administration of the 529 college savings plan. The quarterly fee is based on a series of decreasing annual rates beginning with 0.10% on the first $20 billion of the net assets invested in the Class 529 shares of the American Funds and decreasing to 0.03% on such assets in excess of $100 billion. The fee for any given calendar quarter is accrued and calculated on the basis of the average net assets of Class 529 shares of the American Funds for the last month of the prior calendar quarter. The fee is included in other expenses in the fund’s statement of operations. Virginia529 is not considered a related party to the fund.
| 22 | Capital World Growth and Income Fund |
For the year ended November 30, 2017, class-specific expenses under the agreements were as follows (dollars in thousands):
| | | Distribution | | | Transfer agent | | | Administrative | | | 529 plan | |
| Share class | | services | | | services | | | services | | | services | |
| Class A | | $130,332 | | | $64,504 | | | $5,379 | | | Not applicable | |
| Class B1 | | 135 | | | 28 | | | Not applicable | | | Not applicable | |
| Class C | | 27,768 | | | 3,472 | | | 1,397 | | | Not applicable | |
| Class T2 | | — | | | — | 3 | | — | 3 | | Not applicable | |
| Class F-1 | | 8,930 | | | 4,736 | | | 1,792 | | | Not applicable | |
| Class F-2 | | Not applicable | | | 6,904 | | | 3,226 | | | Not applicable | |
| Class F-34 | | Not applicable | | | 48 | | | 563 | | | Not applicable | |
| Class 529-A | | 7,042 | | | 3,228 | | | 1,583 | | | $2,153 | |
| Class 529-B1 | | 17 | | | 4 | | | 1 | | | 1 | |
| Class 529-C | | 7,040 | | | 774 | | | 355 | | | 484 | |
| Class 529-E | | 633 | | | 72 | | | 64 | | | 87 | |
| Class 529-T2 | | — | | | — | 3 | | — | 3 | | — | 3 |
| Class 529-F-1 | | — | | | 137 | | | 67 | | | 91 | |
| Class R-1 | | 2,284 | | | 236 | | | 115 | | | Not applicable | |
| Class R-2 | | 6,861 | | | 3,276 | | | 462 | | | Not applicable | |
| Class R-2E | | 218 | | | 70 | | | 18 | | | Not applicable | |
| Class R-3 | | 10,048 | | | 3,025 | | | 1,008 | | | Not applicable | |
| Class R-4 | | 4,641 | | | 1,858 | | | 931 | | | Not applicable | |
| Class R-5E | | Not applicable | | | 15 | | | 5 | | | Not applicable | |
| Class R-5 | | Not applicable | | | 593 | | | 605 | | | Not applicable | |
| Class R-6 | | Not applicable | | | 40 | | | 5,610 | | | Not applicable | |
| Total class-specific expenses | | $205,949 | | | $93,020 | | | $23,181 | | | $2,816 | |
| 1 | Class B and 529-B shares were fully liquidated on May 5, 2017. |
| 2 | Class T and 529-T shares began investment operations on April 7, 2017. |
| 3 | Amount less than one thousand. |
| 4 | Class F-3 shares began investment operations on January 27, 2017. |
Trustees’ deferred compensation — Trustees who are unaffiliated with CRMC may elect to defer the cash payment of part or all of their compensation. These deferred amounts, which remain as liabilities of the fund, are treated as if invested in shares of the fund or other American Funds. These amounts represent general, unsecured liabilities of the fund and vary according to the total returns of the selected funds. Trustees’ compensation of $773,000 in the fund’s statement of operations reflects $537,000 in current fees (either paid in cash or deferred) and a net increase of $236,000 in the value of the deferred amounts.
Affiliated officers and trustees — Officers and certain trustees of the fund are or may be considered to be affiliated with CRMC, AFD and AFS. No affiliated officers or trustees received any compensation directly from the fund.
Security transactions with related funds — The fund may purchase from, or sell securities to, other funds managed by CRMC (or funds managed by certain affiliates of CRMC) under procedures adopted by the fund’s board of trustees. The funds involved in such transactions are considered related by virtue of having a common investment adviser (or affiliated investment advisers), common trustees and/or common officers. When such transactions occur, each transaction is executed at the current market price of the security and no brokerage commissions or fees are paid in accordance with Rule 17a-7 of the 1940 Act.
Interfund lending — Pursuant to an exemptive order issued by the SEC, the fund, along with other CRMC-managed funds (or funds managed by certain affiliates of CRMC), may participate in an interfund lending program. The program provides an alternate credit facility that permits the funds to lend or borrow cash for temporary purposes directly to or from one another, subject to the conditions of the exemptive order. The fund did not lend or borrow cash through the interfund lending program at any time during the year ended November 30, 2017.
| Capital World Growth and Income Fund | 23 |
8. Capital share transactions
Capital share transactions in the fund were as follows (dollars and shares in thousands):
| | | | | | | | | Reinvestments of | | | | | | | | | Net (decrease) | |
| | | Sales1 | | | dividends and distributions | | | Repurchases1 | | | increase | |
| Share class | | Amount | | | Shares | | | Amount | | | Shares | | | Amount | | | Shares | | | Amount | | | Shares | |
| | | | | | | | | | | | | | | | | | | | | | | | | |
| Year ended November 30, 2017 | | | | | | | | | | | | | | | | | | | | | | |
| Class A | | $ | 2,628,362 | | | | 54,577 | | | $ | 2,524,538 | | | | 55,645 | | | $ | (8,168,557 | ) | | | (170,064 | ) | | $ | (3,015,657 | ) | | | (59,842 | ) |
| Class B2 | | | 53 | | | | 1 | | | | 1,789 | | | | 41 | | | | (76,246 | ) | | | (1,666 | ) | | | (74,404 | ) | | | (1,624 | ) |
| Class C | | | 256,113 | | | | 5,351 | | | | 119,475 | | | | 2,690 | | | | (1,120,022 | ) | | | (23,604 | ) | | | (744,434 | ) | | | (15,563 | ) |
| Class T3 | | | 10 | | | | — | 4 | | | — | | | | — | | | | — | | | | — | | | | 10 | | | | — | 4 |
| Class F-1 | | | 804,915 | | | | 16,771 | | | | 164,457 | | | | 3,633 | | | | (1,060,101 | ) | | | (21,994 | ) | | | (90,729 | ) | | | (1,590 | ) |
| Class F-2 | | | 3,353,864 | | | | 69,747 | | | | 305,902 | | | | 6,723 | | | | (3,336,739 | ) | | | (69,128 | ) | | | 323,027 | | | | 7,342 | |
| Class F-35 | | | 2,513,596 | | | | 51,259 | | | | 14,297 | | | | 285 | | | | (188,965 | ) | | | (3,731 | ) | | | 2,338,928 | | | | 47,813 | |
| Class 529-A | | | 249,031 | | | | 5,202 | | | | 146,693 | | | | 3,242 | | | | (390,242 | ) | | | (8,103 | ) | | | 5,482 | | | | 341 | |
| Class 529-B2 | | | 25 | | | | 1 | | | | 254 | | | | 6 | | | | (11,073 | ) | | | (243 | ) | | | (10,794 | ) | | | (236 | ) |
| Class 529-C | | | 55,756 | | | | 1,168 | | | | 28,193 | | | | 632 | | | | (108,029 | ) | | | (2,269 | ) | | | (24,080 | ) | | | (469 | ) |
| Class 529-E | | | 11,860 | | | | 247 | | | | 5,700 | | | | 126 | | | | (19,056 | ) | | | (397 | ) | | | (1,496 | ) | | | (24 | ) |
| Class 529-T3 | | | 10 | | | | — | 4 | | | — | 4 | | | — | 4 | | | — | | | | — | | | | 10 | | | | — | 4 |
| Class 529-F-1 | | | 27,329 | | | | 567 | | | | 6,328 | | | | 139 | | | | (22,865 | ) | | | (472 | ) | | | 10,792 | | | | 234 | |
| Class R-1 | | | 15,092 | | | | 317 | | | | 9,576 | | | | 215 | | | | (53,986 | ) | | | (1,133 | ) | | | (29,318 | ) | | | (601 | ) |
| Class R-2 | | | 149,744 | | | | 3,148 | | | | 39,230 | | | | 883 | | | | (335,416 | ) | | | (7,085 | ) | | | (146,442 | ) | | | (3,054 | ) |
| Class R-2E | | | 35,881 | | | | 753 | | | | 1,027 | | | | 22 | | | | (6,630 | ) | | | (136 | ) | | | 30,278 | | | | 639 | |
| Class R-3 | | | 429,435 | | | | 8,982 | | | | 91,068 | | | | 2,026 | | | | (664,502 | ) | | | (13,926 | ) | | | (143,999 | ) | | | (2,918 | ) |
| Class R-4 | | | 431,764 | | | | 8,942 | | | | 89,098 | | | | 1,969 | | | | (587,924 | ) | | | (12,304 | ) | | | (67,062 | ) | | | (1,393 | ) |
| Class R-5E | | | 4,896 | | | | 99 | | | | 493 | | | | 11 | | | | (1,572 | ) | | | (32 | ) | | | 3,817 | | | | 78 | |
| Class R-5 | | | 294,683 | | | | 6,118 | | | | 60,888 | | | | 1,338 | | | | (378,138 | ) | | | (7,878 | ) | | | (22,567 | ) | | | (422 | ) |
| Class R-6 | | | 3,329,787 | | | | 68,917 | | | | 526,173 | | | | 11,516 | | | | (1,392,173 | ) | | | (28,694 | ) | | | 2,463,787 | | | | 51,739 | |
| Total net increase (decrease) | | $ | 14,592,206 | | | | 302,167 | | | $ | 4,135,179 | | | | 91,142 | | | $ | (17,922,236 | ) | | | (372,859 | ) | | $ | 805,149 | | | | 20,450 | |
| | | | | | | | | | | | | | | | | | | | | | | | | | | | | | | | | |
| Year ended November 30, 2016 | | | | | | | | | | | | | | | | | | | | | | |
| Class A | | $ | 2,528,742 | | | | 58,336 | | | $ | 2,029,083 | | | | 46,895 | | | $ | (7,121,616 | ) | | | (162,735 | ) | | $ | (2,563,791 | ) | | | (57,504 | ) |
| Class B | | | 748 | | | | 17 | | | | 8,342 | | | | 194 | | | | (285,233 | ) | | | (6,621 | ) | | | (276,143 | ) | | | (6,410 | ) |
| Class C | | | 237,940 | | | | 5,546 | | | | 109,049 | | | | 2,547 | | | | (1,086,695 | ) | | | (25,274 | ) | | | (739,706 | ) | | | (17,181 | ) |
| Class F-1 | | | 850,298 | | | | 19,741 | | | | 135,578 | | | | 3,139 | | | | (1,410,352 | ) | | | (32,847 | ) | | | (424,476 | ) | | | (9,967 | ) |
| Class F-2 | | | 2,960,952 | | | | 67,770 | | | | 178,908 | | | | 4,137 | | | | (1,689,935 | ) | | | (38,917 | ) | | | 1,449,925 | | | | 32,990 | |
| Class 529-A | | | 234,685 | | | | 5,414 | | | | 111,298 | | | | 2,580 | | | | (378,113 | ) | | | (8,659 | ) | | | (32,130 | ) | | | (665 | ) |
| Class 529-B | | | 267 | | | | 6 | | | | 931 | | | | 22 | | | | (29,987 | ) | | | (694 | ) | | | (28,789 | ) | | | (666 | ) |
| Class 529-C | | | 59,309 | | | | 1,374 | | | | 21,210 | | | | 494 | | | | (110,955 | ) | | | (2,553 | ) | | | (30,436 | ) | | | (685 | ) |
| Class 529-E | | | 10,023 | | | | 231 | | | | 4,347 | | | | 101 | | | | (17,124 | ) | | | (392 | ) | | | (2,754 | ) | | | (60 | ) |
| Class 529-F-1 | | | 19,301 | | | | 444 | | | | 4,541 | | | | 105 | | | | (19,906 | ) | | | (457 | ) | | | 3,936 | | | | 92 | |
| Class R-1 | | | 16,394 | | | | 383 | | | | 7,863 | | | | 183 | | | | (53,236 | ) | | | (1,230 | ) | | | (28,979 | ) | | | (664 | ) |
| Class R-2 | | | 149,565 | | | | 3,485 | | | | 32,556 | | | | 761 | | | | (303,990 | ) | | | (7,063 | ) | | | (121,869 | ) | | | (2,817 | ) |
| Class R-2E | | | 16,082 | | | | 370 | | | | 170 | | | | 4 | | | | (1,530 | ) | | | (36 | ) | | | 14,722 | | | | 338 | |
| Class R-3 | | | 335,432 | | | | 7,749 | | | | 76,811 | | | | 1,786 | | | | (704,579 | ) | | | (16,318 | ) | | | (292,336 | ) | | | (6,783 | ) |
| Class R-4 | | | 361,234 | | | | 8,307 | | | | 74,442 | | | | 1,724 | | | | (652,596 | ) | | | (15,036 | ) | | | (216,920 | ) | | | (5,005 | ) |
| Class R-5E | | | 8,656 | | | | 194 | | | | — | | | | — | | | | — | | | | — | | | | 8,656 | | | | 194 | |
| Class R-5 | | | 208,737 | | | | 4,797 | | | | 55,314 | | | | 1,279 | | | | (502,726 | ) | | | (11,772 | ) | | | (238,675 | ) | | | (5,696 | ) |
| Class R-6 | | | 2,137,677 | | | | 49,550 | | | | 330,373 | | | | 7,632 | | | | (848,527 | ) | | | (19,554 | ) | | | 1,619,523 | | | | 37,628 | |
| Total net increase (decrease) | | $ | 10,136,042 | | | | 233,714 | | | $ | 3,180,816 | | | | 73,583 | | | $ | (15,217,100 | ) | | | (350,158 | ) | | $ | (1,900,242 | ) | | | (42,861 | ) |
| 1 | Includes exchanges between share classes of the fund. |
| 2 | Class B and 529-B shares were fully liquidated on May 5, 2017. |
| 3 | Class T and 529-T shares began investment operations on April 7, 2017. |
| 4 | Amount less than one thousand. |
| 5 | Class F-3 shares began investment operations on January 27, 2017. |
9. Investment transactions
The fund made purchases and sales of investment securities, excluding short-term securities and U.S. government obligations, if any, of $29,980,374,000 and $33,187,195,000, respectively, during the year ended November 30, 2017.
| 24 | Capital World Growth and Income Fund |
Financial highlights
| | | | | | Income (loss) from | | | | | | | | | | | | | | | | | | | | | | | | | |
| | | | | | investment operations1 | | | Dividends and distributions | | | | | | | | | | | | | | | | |
| | | | | | | | | Net gains | | | | | | | | | | | | | | | | | | | | | | | | | | | | |
| | | | | | | | | (losses) on | | | | | | | | | | | | | | | | | | | | | | | | | | | | |
| | | Net asset | | | | | | securities | | | | | | Dividends | | | | | | Total | | | Net asset | | | | | | | | | Ratio of | | | Ratio of | |
| | | value, | | | Net | | | (both | | | Total from | | | (from net | | | Distributions | | | dividends | | | value, | | | | | | Net assets, | | | expenses to | | | net income | |
| | | beginning | | | investment | | | realized and | | | investment | | | investment | | | (from capital | | | and | | | end | | | Total | | | end of period | | | average | | | to average | |
| Period ended | | of period | | | income2 | | | unrealized) | | | operations | | | income) | | | gains) | | | distributions | | | of period | | | return3 | | | (in millions) | | | net assets | | | net assets2 | |
| Class A: | | | | | | | | | | | | | | | | | | | | | | | | | | | | | | | | | | | | | | | | | | | | | | | | |
| 11/30/2017 | | $ | 44.61 | | | $ | .93 | | | $ | 9.79 | | | $ | 10.72 | | | $ | (1.07 | ) | | $ | (1.24 | ) | | $ | (2.31 | ) | | $ | 53.02 | | | | 24.96 | % | | $ | 56,786 | | | | .77 | % | | | 1.93 | % |
| 11/30/2016 | | | 45.34 | | | | .96 | | | | .06 | | | | 1.02 | | | | (1.04 | ) | | | (.71 | ) | | | (1.75 | ) | | | 44.61 | | | | 2.42 | | | | 50,454 | | | | .79 | | | | 2.20 | |
| 11/30/2015 | | | 47.87 | | | | .90 | | | | (2.38 | ) | | | (1.48 | ) | | | (1.05 | ) | | | — | | | | (1.05 | ) | | | 45.34 | | | | (3.12 | ) | | | 53,886 | | | | .77 | | | | 1.93 | |
| 11/30/2014 | | | 44.68 | | | | 1.20 | | | | 3.00 | | | | 4.20 | | | | (1.01 | ) | | | — | | | | (1.01 | ) | | | 47.87 | | | | 9.52 | | | | 57,559 | | | | .77 | | | | 2.59 | |
| 11/30/2013 | | | 36.75 | | | | .83 | | | | 8.13 | | | | 8.96 | | | | (1.03 | ) | | | — | | | | (1.03 | ) | | | 44.68 | | | | 24.77 | | | | 54,676 | | | | .80 | | | | 2.05 | |
| Class C: | | | | | | | | | | | | | | | | | | | | | | | | | | | | | | | | | | | | | | | | | | | | | | | | |
| 11/30/2017 | | | 44.12 | | | | .55 | | | | 9.66 | | | | 10.21 | | | | (.68 | ) | | | (1.24 | ) | | | (1.92 | ) | | | 52.41 | | | | 23.95 | | | | 2,675 | | | | 1.56 | | | | 1.14 | |
| 11/30/2016 | | | 44.85 | | | | .61 | | | | .05 | | | | .66 | | | | (.68 | ) | | | (.71 | ) | | | (1.39 | ) | | | 44.12 | | | | 1.60 | | | | 2,938 | | | | 1.59 | | | | 1.41 | |
| 11/30/2015 | | | 47.34 | | | | .52 | | | | (2.34 | ) | | | (1.82 | ) | | | (.67 | ) | | | — | | | | (.67 | ) | | | 44.85 | | | | (3.87 | ) | | | 3,757 | | | | 1.57 | | | | 1.13 | |
| 11/30/2014 | | | 44.19 | | | | .83 | | | | 2.96 | | | | 3.79 | | | | (.64 | ) | | | — | | | | (.64 | ) | | | 47.34 | | | | 8.65 | | | | 4,582 | | | | 1.57 | | | | 1.82 | |
| 11/30/2013 | | | 36.36 | | | | .50 | | | | 8.05 | | | | 8.55 | | | | (.72 | ) | | | — | | | | (.72 | ) | | | 44.19 | | | | 23.79 | | | | 4,819 | | | | 1.60 | | | | 1.26 | |
| Class T: | | | | | | | | | | | | | | | | | | | | | | | | | | | | | | | | | | | | | | | | | | | | | | | | |
| 11/30/20174,5 | | | 46.73 | | | | .68 | | | | 6.22 | | | | 6.90 | | | | (.60 | ) | | | — | | | | (.60 | ) | | | 53.03 | | | | 14.86 | 6,7 | | | — | 8 | | | .56 | 7,9 | | | 2.09 | 7,9 |
| Class F-1: | | | | | | | | | | | | | | | | | | | | | | | | | | | | | | | | | | | | | | | | | | | | | | | | |
| 11/30/2017 | | | 44.53 | | | | .90 | | | | 9.76 | | | | 10.66 | | | | (1.05 | ) | | | (1.24 | ) | | | (2.29 | ) | | | 52.90 | | | | 24.86 | | | | 3,820 | | | | .83 | | | | 1.87 | |
| 11/30/2016 | | | 45.25 | | | | .93 | | | | .08 | | | | 1.01 | | | | (1.02 | ) | | | (.71 | ) | | | (1.73 | ) | | | 44.53 | | | | 2.39 | | | | 3,286 | | | | .83 | | | | 2.14 | |
| 11/30/2015 | | | 47.78 | | | | .89 | | | | (2.39 | ) | | | (1.50 | ) | | | (1.03 | ) | | | — | | | | (1.03 | ) | | | 45.25 | | | | (3.17 | ) | | | 3,791 | | | | .81 | | | | 1.90 | |
| 11/30/2014 | | | 44.59 | | | | 1.21 | | | | 2.97 | | | | 4.18 | | | | (.99 | ) | | | — | | | | (.99 | ) | | | 47.78 | | | | 9.48 | | | | 3,861 | | | | .81 | | | | 2.62 | |
| 11/30/2013 | | | 36.68 | | | | .82 | | | | 8.11 | | | | 8.93 | | | | (1.02 | ) | | | — | | | | (1.02 | ) | | | 44.59 | | | | 24.75 | | | | 3,976 | | | | .82 | | | | 2.03 | |
| Class F-2: | | | | | | | | | | | | | | | | | | | | | | | | | | | | | | | | | | | | | | | | | | | | | | | | |
| 11/30/2017 | | | 44.59 | | | | 1.05 | | | | 9.76 | | | | 10.81 | | | | (1.18 | ) | | | (1.24 | ) | | | (2.42 | ) | | | 52.98 | | | | 25.21 | | | | 7,098 | | | | .55 | | | | 2.17 | |
| 11/30/2016 | | | 45.33 | | | | 1.07 | | | | .05 | | | | 1.12 | | | | (1.15 | ) | | | (.71 | ) | | | (1.86 | ) | | | 44.59 | | | | 2.66 | | | | 5,646 | | | | .55 | | | | 2.45 | |
| 11/30/2015 | | | 47.85 | | | | 1.01 | | | | (2.37 | ) | | | (1.36 | ) | | | (1.16 | ) | | | — | | | | (1.16 | ) | | | 45.33 | | | | (2.90 | ) | | | 4,244 | | | | .54 | | | | 2.16 | |
| 11/30/2014 | | | 44.67 | | | | 1.23 | | | | 3.07 | | | | 4.30 | | | | (1.12 | ) | | | — | | | | (1.12 | ) | | | 47.85 | | | | 9.76 | | | | 4,168 | | | | .53 | | | | 2.66 | |
| 11/30/2013 | | | 36.74 | | | | .94 | | | | 8.13 | | | | 9.07 | | | | (1.14 | ) | | | — | | | | (1.14 | ) | | | 44.67 | | | | 25.13 | | | | 2,541 | | | | .54 | | | | 2.31 | |
| Class F-3: | | | | | | | | | | | | | | | | | | | | | | | | | | | | | | | | | | | | | | | | | | | | | | | | |
| 11/30/20174,10 | | | 45.54 | | | | .82 | | | | 7.54 | | | | 8.36 | | | | (.87 | ) | | | — | | | | (.87 | ) | | | 53.03 | | | | 18.53 | 6 | | | 2,536 | | | | .45 | 9 | | | 1.93 | 9 |
| Class 529-A: | | | | | | | | | | | | | | | | | | | | | | | | | | | | | | | | | | | | | | | | | | | | | | | | |
| 11/30/2017 | | | 44.48 | | | | .90 | | | | 9.74 | | | | 10.64 | | | | (1.04 | ) | | | (1.24 | ) | | | (2.28 | ) | | | 52.84 | | | | 24.87 | | | | 3,415 | | | | .84 | | | | 1.86 | |
| 11/30/2016 | | | 45.21 | | | | .92 | | | | .06 | | | | .98 | | | | (1.00 | ) | | | (.71 | ) | | | (1.71 | ) | | | 44.48 | | | | 2.34 | | | | 2,859 | | | | .87 | | | | 2.12 | |
| 11/30/2015 | | | 47.73 | | | | .86 | | | | (2.37 | ) | | | (1.51 | ) | | | (1.01 | ) | | | — | | | | (1.01 | ) | | | 45.21 | | | | (3.19 | ) | | | 2,936 | | | | .86 | | | | 1.84 | |
| 11/30/2014 | | | 44.55 | | | | 1.15 | | | | 3.00 | | | | 4.15 | | | | (.97 | ) | | | — | | | | (.97 | ) | | | 47.73 | | | | 9.43 | | | | 3,104 | | | | .86 | | | | 2.50 | |
| 11/30/2013 | | | 36.65 | | | | .80 | | | | 8.10 | | | | 8.90 | | | | (1.00 | ) | | | — | | | | (1.00 | ) | | | 44.55 | | | | 24.67 | | | | 2,853 | | | | .88 | | | | 1.97 | |
See end of table for footnotes.
| Capital World Growth and Income Fund | 25 |
Financial highlights (continued)
| | | | | | Income (loss) from | | | | | | | | | | | | | | | | | | | | | | | | | |
| | | | | | investment operations1 | | | Dividends and distributions | | | | | | | | | | | | | | | | |
| | | | | | | | | Net gains | | | | | | | | | | | | | | | | | | | | | | | | | | | | |
| | | | | | | | | (losses) on | | | | | | | | | | | | | | | | | | | | | | | | | | | | |
| | | Net asset | | | | | | securities | | | | | | Dividends | | | | | | Total | | | Net asset | | | | | | | | | Ratio of | | | Ratio of | |
| | | value, | | | Net | | | (both | | | Total from | | | (from net | | | Distributions | | | dividends | | | value, | | | | | | Net assets, | | | expenses to | | | net income | |
| | | beginning | | | investment | | | realized and | | | investment | | | investment | | | (from capital | | | and | | | end | | | Total | | | end of period | | | average | | | to average | |
| Period ended | | of period | | | income2 | | | unrealized) | | | operations | | | income) | | | gains) | | | distributions | | | of period | | | return3 | | | (in millions) | | | net assets | | | net assets2 | |
| Class 529-C: | | | | | | | | | | | | | | | | | | | | | | | | | | | | | | | | | | | | | | | | | | | | | | | | |
| 11/30/2017 | | $ | 44.25 | | | $ | .52 | | | $ | 9.70 | | | $ | 10.22 | | | $ | (.67 | ) | | $ | (1.24 | ) | | $ | (1.91 | ) | | $ | 52.56 | | | | 23.90 | % | | $ | 758 | | | | 1.61 | % | | | 1.09 | % |
| 11/30/2016 | | | 44.98 | | | | .58 | | | | .06 | | | | .64 | | | | (.66 | ) | | | (.71 | ) | | | (1.37 | ) | | | 44.25 | | | | 1.55 | | | | 659 | | | | 1.64 | | | | 1.35 | |
| 11/30/2015 | | | 47.49 | | | | .49 | | | | (2.35 | ) | | | (1.86 | ) | | | (.65 | ) | | | — | | | | (.65 | ) | | | 44.98 | | | | (3.95 | ) | | | 701 | | | | 1.64 | | | | 1.07 | |
| 11/30/2014 | | | 44.33 | | | | .79 | | | | 2.99 | | | | 3.78 | | | | (.62 | ) | | | — | | | | (.62 | ) | | | 47.49 | | | | 8.57 | | | | 756 | | | | 1.64 | | | | 1.73 | |
| 11/30/2013 | | | 36.48 | | | | .48 | | | | 8.07 | | | | 8.55 | | | | (.70 | ) | | | — | | | | (.70 | ) | | | 44.33 | | | | 23.69 | | | | 709 | | | | 1.66 | | | | 1.19 | |
| Class 529-E: | | | | | | | | | | | | | | | | | | | | | | | | | | | | | | | | | | | | | | | | | | | | | | | | |
| 11/30/2017 | | | 44.41 | | | | .79 | | | | 9.73 | | | | 10.52 | | | | (.93 | ) | | | (1.24 | ) | | | (2.17 | ) | | | 52.76 | | | | 24.58 | | | | 138 | | | | 1.06 | | | | 1.63 | |
| 11/30/2016 | | | 45.14 | | | | .82 | | | | .07 | | | | .89 | | | | (.91 | ) | | | (.71 | ) | | | (1.62 | ) | | | 44.41 | | | | 2.11 | | | | 117 | | | | 1.09 | | | | 1.90 | |
| 11/30/2015 | | | 47.65 | | | | .75 | | | | (2.36 | ) | | | (1.61 | ) | | | (.90 | ) | | | — | | | | (.90 | ) | | | 45.14 | | | | (3.41 | ) | | | 122 | | | | 1.09 | | | | 1.61 | |
| 11/30/2014 | | | 44.48 | | | | 1.04 | | | | 2.99 | | | | 4.03 | | | | (.86 | ) | | | — | | | | (.86 | ) | | | 47.65 | | | | 9.16 | | | | 130 | | | | 1.09 | | | | 2.27 | |
| 11/30/2013 | | | 36.59 | | | | .70 | | | | 8.10 | | | | 8.80 | | | | (.91 | ) | | | — | | | | (.91 | ) | | | 44.48 | | | | 24.36 | | | | 122 | | | | 1.11 | | | | 1.74 | |
| Class 529-T: | | | | | | | | | | | | | | | | | | | | | | | | | | | | | | | | | | | | | | | | | | | | | | | | |
| 11/30/20174,5 | | | 46.73 | | | | .66 | | | | 6.22 | | | | 6.88 | | | | (.59 | ) | | | — | | | | (.59 | ) | | | 53.02 | | | | 14.81 | 6,7 | | | — | 8 | | | .61 | 7,9 | | | 2.03 | 7,9 |
| Class 529-F-1: | | | | | | | | | | | | | | | | | | | | | | | | | | | | | | | | | | | | | | | | | | | | | | |
| 11/30/2017 | | | 44.52 | | | | 1.01 | | | | 9.75 | | | | 10.76 | | | | (1.14 | ) | | | (1.24 | ) | | | (2.38 | ) | | | 52.90 | | | | 25.14 | | | | 149 | | | | .62 | | | | 2.08 | |
| 11/30/2016 | | | 45.25 | | | | 1.02 | | | | .06 | | | | 1.08 | | | | (1.10 | ) | | | (.71 | ) | | | (1.81 | ) | | | 44.52 | | | | 2.56 | | | | 115 | | | | .64 | | | | 2.34 | |
| 11/30/2015 | | | 47.78 | | | | .96 | | | | (2.37 | ) | | | (1.41 | ) | | | (1.12 | ) | | | — | | | | (1.12 | ) | | | 45.25 | | | | (2.99 | ) | | | 113 | | | | .64 | | | | 2.07 | |
| 11/30/2014 | | | 44.60 | | | | 1.25 | | | | 3.00 | | | | 4.25 | | | | (1.07 | ) | | | — | | | | (1.07 | ) | | | 47.78 | | | | 9.66 | | | | 114 | | | | .64 | | | | 2.71 | |
| 11/30/2013 | | | 36.68 | | | | .89 | | | | 8.12 | | | | 9.01 | | | | (1.09 | ) | | | — | | | | (1.09 | ) | | | 44.60 | | | | 24.98 | | | | 100 | | | | .66 | | | | 2.19 | |
| Class R-1: | | | | | | | | | | | | | | | | | | | | | | | | | | | | | | | | | | | | | | | | | | | | | | | | |
| 11/30/2017 | | | 44.18 | | | | .55 | | | | 9.69 | | | | 10.24 | | | | (.70 | ) | | | (1.24 | ) | | | (1.94 | ) | | | 52.48 | | | | 23.99 | | | | 234 | | | | 1.54 | | | | 1.16 | |
| 11/30/2016 | | | 44.91 | | | | .62 | | | | .07 | | | | .69 | | | | (.71 | ) | | | (.71 | ) | | | (1.42 | ) | | | 44.18 | | | | 1.65 | | | | 223 | | | | 1.55 | | | | 1.44 | |
| 11/30/2015 | | | 47.42 | | | | .54 | | | | (2.36 | ) | | | (1.82 | ) | | | (.69 | ) | | | — | | | | (.69 | ) | | | 44.91 | | | | (3.87 | ) | | | 257 | | | | 1.54 | | | | 1.16 | |
| 11/30/2014 | | | 44.26 | | | | .84 | | | | 2.98 | | | | 3.82 | | | | (.66 | ) | | | — | | | | (.66 | ) | | | 47.42 | | | | 8.69 | | | | 302 | | | | 1.54 | | | | 1.83 | |
| 11/30/2013 | | | 36.42 | | | | .52 | | | | 8.06 | | | | 8.58 | | | | (.74 | ) | | | — | | | | (.74 | ) | | | 44.26 | | | | 23.84 | | | | 302 | | | | 1.55 | | | | 1.30 | |
| |
| Class R-2: | | | | | | | | | | | | | | | | | | | | | | | | | | | | | | | | | | | | | | | | | | | | | | | | |
| 11/30/2017 | | | 44.07 | | | | .55 | | | | 9.66 | | | | 10.21 | | | | (.70 | ) | | | (1.24 | ) | | | (1.94 | ) | | | 52.34 | | | | 23.98 | | | | 932 | | | | 1.54 | | | | 1.16 | |
| 11/30/2016 | | | 44.81 | | | | .62 | | | | .06 | | | | .68 | | | | (.71 | ) | | | (.71 | ) | | | (1.42 | ) | | | 44.07 | | | | 1.63 | | | | 920 | | | | 1.54 | | | | 1.44 | |
| 11/30/2015 | | | 47.31 | | | | .56 | | | | (2.35 | ) | | | (1.79 | ) | | | (.71 | ) | | | — | | | | (.71 | ) | | | 44.81 | | | | (3.82 | ) | | | 1,061 | | | | 1.50 | | | | 1.20 | |
| 11/30/2014 | | | 44.17 | | | | .85 | | | | 2.96 | | | | 3.81 | | | | (.67 | ) | | | — | | | | (.67 | ) | | | 47.31 | | | | 8.69 | | | | 1,244 | | | | 1.52 | | | | 1.86 | |
| 11/30/2013 | | | 36.35 | | | | .54 | | | | 8.04 | | | | 8.58 | | | | (.76 | ) | | | — | | | | (.76 | ) | | | 44.17 | | | | 23.88 | | | | 1,277 | | | | 1.51 | | | | 1.35 | |
| Class R-2E: | | | | | | | | | | | | | | | | | | | | | | | | | | | | | | | | | | | | | | | | | | | | | | | | |
| 11/30/2017 | | | 44.47 | | | | .69 | | | | 9.75 | | | | 10.44 | | | | (.87 | ) | | | (1.24 | ) | | | (2.11 | ) | | | 52.80 | | | | 24.34 | | | | 53 | | | | 1.24 | | | | 1.42 | |
| 11/30/2016 | | | 45.25 | | | | .73 | | | | .10 | | | | .83 | | | | (.90 | ) | | | (.71 | ) | | | (1.61 | ) | | | 44.47 | | | | 1.98 | | | | 16 | | | | 1.23 | | | | 1.68 | |
| 11/30/2015 | | | 47.84 | | | | .72 | | | | (2.39 | ) | | | (1.67 | ) | | | (.92 | ) | | | — | | | | (.92 | ) | | | 45.25 | | | | (3.54 | ) | | | 1 | | | | 1.19 | | | | 1.54 | |
| 11/30/20144,11 | | | 47.71 | | | | .12 | | | | .21 | | | | .33 | | | | (.20 | ) | | | — | | | | (.20 | ) | | | 47.84 | | | | .70 | 6,7 | | | — | 8 | | | .30 | 6,7 | | | .26 | 6,7 |
| |
| 26 | Capital World Growth and Income Fund |
| | | | | | Income (loss) from | | | | | | | | | | | | | | | | | | | | | | | | | |
| | | | | | investment operations1 | | | Dividends and distributions | | | | | | | | | | | | | | | | |
| | | | | | | | | Net gains | | | | | | | | | | | | | | | | | | | | | | | | | | | | |
| | | | | | | | | (losses) on | | | | | | | | | | | | | | | | | | | | | | | | | | | | |
| | | Net asset | | | | | | securities | | | | | | Dividends | | | | | | Total | | | Net asset | | | | | | | | | Ratio of | | | Ratio of | |
| | | value, | | | Net | | | (both | | | Total from | | | (from net | | | Distributions | | | dividends | | | value, | | | | | | Net assets, | | | expenses to | | | net income | |
| | | beginning | | | investment | | | realized and | | | investment | | | investment | | | (from capital | | | and | | | end | | | Total | | | end of period | | | average | | | to average | |
| Period ended | | of period | | | income2 | | | unrealized) | | | operations | | | income) | | | gains) | | | distributions | | | of period | | | return3 | | | (in millions) | | | net assets | | | net assets2 | |
| Class R-3: | | | | | | | | | | | | | | | | | | | | | | | | | | | | | | | | | | | | | | | | | | | | | | | | |
| 11/30/2017 | | $ | 44.32 | | | $ | .77 | | | $ | 9.72 | | | $ | 10.49 | | | $ | (.92 | ) | | $ | (1.24 | ) | | $ | (2.16 | ) | | $ | 52.65 | | | | 24.54 | % | | $ | 2,114 | | | | 1.09 | % | | | 1.60 | % |
| 11/30/2016 | | | 45.05 | | | | .82 | | | | .06 | | | | .88 | | | | (.90 | ) | | | (.71 | ) | | | (1.61 | ) | | | 44.32 | | | | 2.10 | | | | 1,909 | | | | 1.10 | | | | 1.88 | |
| 11/30/2015 | | | 47.57 | | | | .75 | | | | (2.37 | ) | | | (1.62 | ) | | | (.90 | ) | | | — | | | | (.90 | ) | | | 45.05 | | | | (3.43 | ) | | | 2,246 | | | | 1.09 | | | | 1.61 | |
| 11/30/2014 | | | 44.40 | | | | 1.05 | | | | 2.98 | | | | 4.03 | | | | (.86 | ) | | | — | | | | (.86 | ) | | | 47.57 | | | | 9.18 | | | | 2,629 | | | | 1.09 | | | | 2.28 | |
| 11/30/2013 | | | 36.53 | | | | .71 | | | | 8.08 | | | | 8.79 | | | | (.92 | ) | | | — | | | | (.92 | ) | | | 44.40 | | | | 24.41 | | | | 2,651 | | | | 1.09 | | | | 1.76 | |
| Class R-4: | | | | | | | | | | | | | | | | | | | | | | | | | | | | | | | | | | | | | | | | | | | | | | | | |
| 11/30/2017 | | | 44.51 | | | | .92 | | | | 9.76 | | | | 10.68 | | | | (1.06 | ) | | | (1.24 | ) | | | (2.30 | ) | | | 52.89 | | | | 24.93 | | | | 2,003 | | | | .79 | | | | 1.90 | |
| 11/30/2016 | | | 45.24 | | | | .95 | | | | .06 | | | | 1.01 | | | | (1.03 | ) | | | (.71 | ) | | | (1.74 | ) | | | 44.51 | | | | 2.40 | | | | 1,748 | | | | .80 | | | | 2.18 | |
| 11/30/2015 | | | 47.76 | | | | .89 | | | | (2.37 | ) | | | (1.48 | ) | | | (1.04 | ) | | | — | | | | (1.04 | ) | | | 45.24 | | | | (3.13 | ) | | | 2,003 | | | | .79 | | | | 1.91 | |
| 11/30/2014 | | | 44.58 | | | | 1.19 | | | | 2.99 | | | | 4.18 | | | | (1.00 | ) | | | — | | | | (1.00 | ) | | | 47.76 | | | | 9.49 | | | | 2,275 | | | | .79 | | | | 2.59 | |
| 11/30/2013 | | | 36.67 | | | | .83 | | | | 8.11 | | | | 8.94 | | | | (1.03 | ) | | | — | | | | (1.03 | ) | | | 44.58 | | | | 24.78 | | | | 2,380 | | | | .80 | | | | 2.07 | |
| Class R-5E: | | | | | | | | | | | | | | | | | | | | | | | | | | | | | | | | | | | | | | | | | | | | | | | | |
| 11/30/2017 | | | 44.59 | | | | 1.01 | | | | 9.78 | | | | 10.79 | | | | (1.18 | ) | | | (1.24 | ) | | | (2.42 | ) | | | 52.96 | | | | 25.17 | | | | 14 | | | | .58 | | | | 2.09 | |
| 11/30/2016 | | | 45.34 | | | | 1.01 | | | | .06 | | | | 1.07 | | | | (1.11 | ) | | | (.71 | ) | | | (1.82 | ) | | | 44.59 | | | | 2.54 | | | | 9 | | | | .66 | | | | 2.31 | |
| 11/30/20154,12 | | | 45.70 | | | | .02 | | | | (.38 | ) | | | (.36 | ) | | | — | | | | — | | | | — | | | | 45.34 | | | | (.79 | )6 | | | — | 8 | | | .02 | 6 | | | .04 | 6 |
| Class R-5: | | | | | | | | | | | | | | | | | | | | | | | | | | | | | | | | | | | | | | | | | | | | | | | | |
| 11/30/2017 | | | 44.64 | | | | 1.07 | | | | 9.78 | | | | 10.85 | | | | (1.20 | ) | | | (1.24 | ) | | | (2.44 | ) | | | 53.05 | | | | 25.29 | | | | 1,305 | | | | .49 | | | | 2.21 | |
| 11/30/2016 | | | 45.37 | | | | 1.10 | | | | .04 | | | | 1.14 | | | | (1.16 | ) | | | (.71 | ) | | | (1.87 | ) | | | 44.64 | | | | 2.71 | | | | 1,117 | | | | .50 | | | | 2.51 | |
| 11/30/2015 | | | 47.90 | | | | 1.03 | | | | (2.38 | ) | | | (1.35 | ) | | | (1.18 | ) | | | — | | | | (1.18 | ) | | | 45.37 | | | | (2.84 | ) | | | 1,393 | | | | .49 | | | | 2.21 | |
| 11/30/2014 | | | 44.70 | | | | 1.35 | | | | 2.99 | | | | 4.34 | | | | (1.14 | ) | | | — | | | | (1.14 | ) | | | 47.90 | | | | 9.83 | | | | 1,509 | | | | .49 | | | | 2.93 | |
| 11/30/2013 | | | 36.77 | | | | .96 | | | | 8.12 | | | | 9.08 | | | | (1.15 | ) | | | — | | | | (1.15 | ) | | | 44.70 | | | | 25.15 | | | | 1,615 | | | | .49 | | | | 2.37 | |
| Class R-6: | | | | | | | | | | | | | | | | | | �� | | | | | | | | | | | | | | | | | | | | | | | | | | | | | | |
| 11/30/2017 | | | 44.64 | | | | 1.08 | | | | 9.79 | | | | 10.87 | | | | (1.23 | ) | | | (1.24 | ) | | | (2.47 | ) | | | 53.04 | | | | 25.33 | | | | 13,381 | | | | .45 | | | | 2.23 | |
| 11/30/2016 | | | 45.37 | | | | 1.10 | | | | .07 | | | | 1.17 | | | | (1.19 | ) | | | (.71 | ) | | | (1.90 | ) | | | 44.64 | | | | 2.77 | | | | 8,951 | | | | .45 | | | | 2.52 | |
| 11/30/2015 | | | 47.89 | | | | 1.05 | | | | (2.37 | ) | | | (1.32 | ) | | | (1.20 | ) | | | — | | | | (1.20 | ) | | | 45.37 | | | | (2.78 | ) | | | 7,390 | | | | .45 | | | | 2.26 | |
| 11/30/2014 | | | 44.70 | | | | 1.31 | | | | 3.04 | | | | 4.35 | | | | (1.16 | ) | | | — | | | | (1.16 | ) | | | 47.89 | | | | 9.87 | | | | 6,334 | | | | .44 | | | | 2.83 | |
| 11/30/2013 | | | 36.77 | | | | .97 | | | | 8.13 | | | | 9.10 | | | | (1.17 | ) | | | — | | | | (1.17 | ) | | | 44.70 | | | | 25.21 | | | | 4,418 | | | | .45 | | | | 2.38 | |
| | Year ended November 30 |
| | 2017 | 2016 | 2015 | 2014 | 2013 |
| Portfolio turnover rate for all share classes | 35% | 35% | 35% | 36% | 24% |
| 1 | Based on average shares outstanding. |
| 2 | For the year ended November 30, 2014, this column reflects the impact of a corporate action event that resulted in a one-time increase to net investment income. If the corporate action event had not occurred, the Class A net investment income per share and ratio of net income to average net assets would have been lower by $.34 and .73 percentage points, respectively. The impact to the other share classes would have been similar. |
| 3 | Total returns exclude any applicable sales charges, including contingent deferred sales charges. |
| 4 | Based on operations for the period shown and, accordingly, is not representative of a full year. |
| 5 | Class T and 529-T shares began investment operations on April 7, 2017. |
| 7 | All or a significant portion of assets in this class consisted of seed capital invested by CRMC and/or its affiliates. Fees for distribution services are not charged or accrued on these seed capital assets. If such fees were paid by the fund on seed capital assets, fund expenses would have been higher and net income and total return would have been lower. |
| 8 | Amount less than $1 million. |
| 10 | Class F-3 shares began investment operations on January 27, 2017. |
| 11 | Class R-2E shares began investment operations on August 29, 2014. |
| 12 | Class R-5E shares began investment operations on November 20, 2015. |
See Notes to Financial Statements
| Capital World Growth and Income Fund | 27 |
Report of Independent Registered Public Accounting Firm
To the Board of Trustees and Shareholders of Capital World Growth and Income Fund
In our opinion, the accompanying statement of assets and liabilities, including the summary investment portfolio, and the related statements of operations and of changes in net assets and the financial highlights present fairly, in all material respects, the financial position of Capital World Growth and Income Fund (the “Fund”) as of November 30, 2017, the results of its operations for the year then ended, the changes in its net assets for each of the two years in the period then ended and the financial highlights for each of the periods presented, in conformity with accounting principles generally accepted in the United States of America. These financial statements and financial highlights (hereafter referred to as “financial statements”) are the responsibility of the Fund’s management. Our responsibility is to express an opinion on these financial statements based on our audits. We conducted our audits of these financial statements in accordance with the standards of the Public Company Accounting Oversight Board (United States). Those standards require that we plan and perform the audit to obtain reasonable assurance about whether the financial statements are free of material misstatement. An audit includes examining, on a test basis, evidence supporting the amounts and disclosures in the financial statements, assessing the accounting principles used and significant estimates made by management, and evaluating the overall financial statement presentation. We believe that our audits, which included confirmation of securities as of November 30, 2017 by correspondence with the custodian and brokers, provide a reasonable basis for our opinion.
PricewaterhouseCoopers LLP
Los Angeles, California
January 12, 2018
| 28 | Capital World Growth and Income Fund |
As a fund shareholder, you incur two types of costs: (1) transaction costs, such as initial sales charges on purchase payments and contingent deferred sales charges on redemptions (loads), and (2) ongoing costs, including management fees, distribution and service (12b-1) fees, and other expenses. This example is intended to help you understand your ongoing costs (in dollars) of investing in the fund so you can compare these costs with the ongoing costs of investing in other mutual funds. The example is based on an investment of $1,000 invested at the beginning of the period and held for the entire six-month period (June 1, 2017, through November 30, 2017).
Actual expenses:
The first line of each share class in the table on the following page provides information about actual account values and actual expenses. You may use the information in this line, together with the amount you invested, to estimate the expenses that you paid over the period. Simply divide your account value by $1,000 (for example, an $8,600 account value divided by $1,000 = 8.6), then multiply the result by the number in the first line under the heading titled “Expenses paid during period” to estimate the expenses you paid on your account during this period.
Hypothetical example for comparison purposes:
The second line of each share class in the table on the following page provides information about hypothetical account values and hypothetical expenses based on the actual expense ratio for the share class and an assumed rate of return of 5.00% per year before expenses, which is not the actual return of the share class. The hypothetical account values and expenses may not be used to estimate the actual ending account balance or expenses you paid for the period. You may use this information to compare the ongoing costs of investing in the fund and other funds. To do so, compare this 5.00% hypothetical example with the 5.00% hypothetical examples that appear in the shareholder reports of the other funds.
Notes:
Retirement plan participants may be subject to certain fees charged by the plan sponsor, and Class F-1, F-2, F-3 and 529-F-1 shareholders may be subject to fees charged by financial intermediaries, typically ranging from 0.75% to 1.50% of assets annually depending on services offered. You can estimate the impact of these fees by adding the amount of the fees to the total estimated expenses you paid on your account during the period as calculated above. In addition, your ending account value would be lower by the amount of these fees.
Note that the expenses shown in the table on the following page are meant to highlight your ongoing costs only and do not reflect any transactional costs, such as sales charges (loads). Therefore, the second line of each share class in the table is useful in comparing ongoing costs only and will not help you determine the relative total costs of owning different funds. In addition, if these transactional costs were included, your costs would have been higher.
| Capital World Growth and Income Fund | 29 |
| | | Beginning | | | Ending | | | | | | | |
| | | account value | | | account value | | | Expenses paid | | | Annualized | |
| | | 6/1/2017 | | | 11/30/2017 | | | during period* | | | expense ratio | |
| Class A – actual return | | $ | 1,000.00 | | | $ | 1,095.18 | | | $ | 3.99 | | | | .76 | % |
| Class A – assumed 5% return | | | 1,000.00 | | | | 1,021.26 | | | | 3.85 | | | | .76 | |
| Class C – actual return | | | 1,000.00 | | | | 1,090.76 | | | | 8.12 | | | | 1.55 | |
| Class C – assumed 5% return | | | 1,000.00 | | | | 1,017.30 | | | | 7.84 | | | | 1.55 | |
| Class T – actual return | | | 1,000.00 | | | | 1,096.24 | | | | 2.94 | | | | .56 | |
| Class T – assumed 5% return | | | 1,000.00 | | | | 1,022.26 | | | | 2.84 | | | | .56 | |
| Class F-1 – actual return | | | 1,000.00 | | | | 1,094.66 | | | | 4.31 | | | | .82 | |
| Class F-1 – assumed 5% return | | | 1,000.00 | | | | 1,020.96 | | | | 4.15 | | | | .82 | |
| Class F-2 – actual return | | | 1,000.00 | | | | 1,096.21 | | | | 2.89 | | | | .55 | |
| Class F-2 – assumed 5% return | | | 1,000.00 | | | | 1,022.31 | | | | 2.79 | | | | .55 | |
| Class F-3 – actual return | | | 1,000.00 | | | | 1,096.66 | | | | 2.37 | | | | .45 | |
| Class F-3 – assumed 5% return | | | 1,000.00 | | | | 1,022.81 | | | | 2.28 | | | | .45 | |
| Class 529-A – actual return | | | 1,000.00 | | | | 1,094.68 | | | | 4.36 | | | | .83 | |
| Class 529-A – assumed 5% return | | | 1,000.00 | | | | 1,020.91 | | | | 4.20 | | | | .83 | |
| Class 529-C – actual return | | | 1,000.00 | | | | 1,090.36 | | | | 8.38 | | | | 1.60 | |
| Class 529-C – assumed 5% return | | | 1,000.00 | | | | 1,017.05 | | | | 8.09 | | | | 1.60 | |
| Class 529-E – actual return | | | 1,000.00 | | | | 1,093.40 | | | | 5.56 | | | | 1.06 | |
| Class 529-E – assumed 5% return | | | 1,000.00 | | | | 1,019.75 | | | | 5.37 | | | | 1.06 | |
| Class 529-T – actual return | | | 1,000.00 | | | | 1,095.82 | | | | 3.26 | | | | .62 | |
| Class 529-T – assumed 5% return | | | 1,000.00 | | | | 1,021.96 | | | | 3.14 | | | | .62 | |
| Class 529-F-1 – actual return | | | 1,000.00 | | | | 1,095.77 | | | | 3.20 | | | | .61 | |
| Class 529-F-1 – assumed 5% return | | | 1,000.00 | | | | 1,022.01 | | | | 3.09 | | | | .61 | |
| Class R-1 – actual return | | | 1,000.00 | | | | 1,090.90 | | | | 8.07 | | | | 1.54 | |
| Class R-1 – assumed 5% return | | | 1,000.00 | | | | 1,017.35 | | | | 7.79 | | | | 1.54 | |
| Class R-2 – actual return | | | 1,000.00 | | | | 1,090.71 | | | | 8.07 | | | | 1.54 | |
| Class R-2 – assumed 5% return | | | 1,000.00 | | | | 1,017.35 | | | | 7.79 | | | | 1.54 | |
| Class R-2E – actual return | | | 1,000.00 | | | | 1,092.33 | | | | 6.50 | | | | 1.24 | |
| Class R-2E – assumed 5% return | | | 1,000.00 | | | | 1,018.85 | | | | 6.28 | | | | 1.24 | |
| Class R-3 – actual return | | | 1,000.00 | | | | 1,093.28 | | | | 5.72 | | | | 1.09 | |
| Class R-3 – assumed 5% return | | | 1,000.00 | | | | 1,019.60 | | | | 5.52 | | | | 1.09 | |
| Class R-4 – actual return | | | 1,000.00 | | | | 1,094.88 | | | | 4.15 | | | | .79 | |
| Class R-4 – assumed 5% return | | | 1,000.00 | | | | 1,021.11 | | | | 4.00 | | | | .79 | |
| Class R-5E – actual return | | | 1,000.00 | | | | 1,096.06 | | | | 3.00 | | | | .57 | |
| Class R-5E – assumed 5% return | | | 1,000.00 | | | | 1,022.21 | | | | 2.89 | | | | .57 | |
| Class R-5 – actual return | | | 1,000.00 | | | | 1,096.60 | | | | 2.58 | | | | .49 | |
| Class R-5 – assumed 5% return | | | 1,000.00 | | | | 1,022.61 | | | | 2.48 | | | | .49 | |
| Class R-6 – actual return | | | 1,000.00 | | | | 1,096.60 | | | | 2.31 | | | | .44 | |
| Class R-6 – assumed 5% return | | | 1,000.00 | | | | 1,022.86 | | | | 2.23 | | | | .44 | |
| * | The “expenses paid during period” are equal to the “annualized expense ratio,” multiplied by the average account value over the period, multiplied by the number of days in the period, and divided by 365 (to reflect the one-half year period). |
| 30 | Capital World Growth and Income Fund |
We are required to advise you of the federal tax status of certain distributions received by shareholders during the fiscal year. The fund hereby designates the following amounts for the fund’s fiscal year ended November 30, 2017:
| | Foreign taxes | | $ | 0.07 per share | |
| | Foreign source income | | $ | 0.96 per share | |
| | Long-term capital gains | | $ | 2,442,214,000 | |
| | Qualified dividend income | | | 100% | |
| | Corporate dividends received deduction | | $ | 755,211,000 | |
| | U.S. government income that may be exempt from state taxation | | $ | 7,041,000 | |
Individual shareholders should refer to their Form 1099 or other tax information, which will be mailed in January 2018, to determine the calendar year amounts to be included on their 2017 tax returns. Shareholders should consult their tax advisors.
| Capital World Growth and Income Fund | 31 |
Approval of Investment Advisory and Service Agreement
Capital World Growth and Income Fund’s board has approved the fund’s Investment Advisory and Service Agreement (the “agreement”) with Capital Research and Management Company (“CRMC”) for an additional one-year term through October 31, 2018. The board approved the agreement following the recommendation of the fund’s Contracts Committee (the “committee”), which is composed of all of the fund’s independent board members. The board and the committee determined that the fund’s advisory fee structure was fair and reasonable in relation to the services provided, and that approving the agreement was in the best interests of the fund and its shareholders.
In reaching this decision, the board and the committee took into account information furnished to them throughout the year and otherwise provided to them, as well as information prepared specifically in connection with their review of the agreement, and were advised by their independent counsel. They considered the following factors, among others, but did not identify any single issue or particular piece of information that, in isolation, was the controlling factor, and each board and committee member did not necessarily attribute the same weight to each factor.
1. Nature, extent and quality of services
The board and the committee considered the depth and quality of CRMC’s investment management process, including its global research capabilities; the experience, capability and integrity of its senior management and other personnel; the low turnover rates of its key personnel; the overall financial strength and stability of CRMC and the Capital Group organization; and the ongoing evolution of CRMC’s organizational structure designed to maintain and strengthen these qualities. The board and the committee also considered the nature, extent and quality of administrative, compliance and shareholder services provided by CRMC to the fund under the agreement and other agreements, as well as the benefits to fund shareholders from investing in a fund that is part of a large family of funds. The board and the committee concluded that the nature, extent and quality of the services provided by CRMC have benefited and should continue to benefit the fund and its shareholders.
2. Investment results
The board and the committee considered the investment results of the fund in light of its objective of providing long-term growth of capital while providing current income. They compared the fund’s investment results with those of other funds (including funds that currently form the basis of the Lipper index for the category in which the fund is included), and data such as relevant market and fund indexes, over various periods through March 31, 2017. This report, including the letter to shareholders and related disclosures, contains certain information about the fund’s investment results. The board and the committee reviewed the fund’s investment results measured against various indexes, including the MSCI All Country World Index and Lipper Global Funds Index. They noted that the investment results of the fund generally compared favorably to the results of these indexes for the lifetime period, 20-year period, 10-year period and five-year period. The board and the committee concluded that the fund’s investment results have been satisfactory for renewal of the agreement, and that CRMC’s record in managing the fund indicated that its continued management should benefit the fund and its shareholders.
3. Advisory fees and total expenses
The board and the committee compared the advisory fees and total expense levels of the fund to those of other relevant funds. They observed that the fund’s advisory fees and expenses generally compared favorably to those of other similar funds included in the Lipper Global Funds category. The board and the committee also considered the breakpoint discounts in the fund’s advisory fee structure that reduce the level of fees charged by CRMC to the fund as fund assets increase. In addition, they reviewed information regarding the effective advisory fees charged to non-mutual fund clients by CRMC and its affiliates. They noted that, to the extent there were differences between the advisory fees paid by the fund and the advisory fees paid by those clients, the differences appropriately reflected the investment, operational, regulatory and market differences between advising the fund and the other clients. The board and the committee concluded that the fund’s cost structure was fair and reasonable in relation to the services provided, and that the fund’s shareholders receive reasonable value in return for the advisory fees and other amounts paid to CRMC by the fund.
| 32 | Capital World Growth and Income Fund |
4. Ancillary benefits
The board and the committee considered a variety of other benefits that CRMC and its affiliates receive as a result of CRMC’s relationship with the fund and other American Funds, including fees for administrative services provided to certain share classes; fees paid to CRMC’s affiliated transfer agent; sales charges and distribution fees received and retained by the fund’s principal underwriter, an affiliate of CRMC; and possible ancillary benefits to CRMC and its institutional management affiliates in managing other investment vehicles. The board and the committee reviewed CRMC’s portfolio trading practices, noting the benefits CRMC receives from the research obtained with commissions from portfolio transactions made on behalf of the fund. The board and the committee took these ancillary benefits into account in evaluating the reasonableness of the advisory fees and other amounts paid to CRMC by the fund.
5. Adviser financial information
The board and the committee reviewed information regarding CRMC’s costs of providing services to the American Funds, including personnel, systems and resources of investment, compliance, trading, accounting and other administrative operations. They considered CRMC’s costs and related cost allocation methodology as well as its willingness to invest in technology, infrastructure and staff to maintain and expand services and capabilities, respond to industry and regulatory developments, and attract and retain qualified personnel. They noted information regarding the compensation structure for CRMC’s investment professionals. The board and the committee also compared CRMC’s profitability and compensation data to the reported results and data of several large, publicly held investment management companies. The board and the committee noted the competitiveness and cyclicality of both the mutual fund industry and the capital markets, and the importance in that environment of CRMC’s long-term profitability for maintaining its independence, company culture and management continuity. They further considered the breakpoint discounts in the fund’s advisory fee structure. The board and the committee concluded that the fund’s advisory fee structure reflected a reasonable sharing of benefits between CRMC and the fund’s shareholders.
| Capital World Growth and Income Fund | 33 |
Board of trustees and other officers
Independent trustees1
| Name and year of birth | | Year first
elected
a trustee
of the fund2 | | Principal occupation(s) during past five years | | Number of
portfolios in
fund complex
overseen by
trustee3 | | Other directorships4
held by trustee |
Joseph C. Berenato, 1946
Chairman of the Board
(Independent and Non-Executive) | | 2005 | | Former Chairman and CEO, Ducommun Incorporated (aerospace components manufacturer) | | 16 | | None |
| Mary Anne Dolan, 1947 | | 2010 | | Founder and President, MAD Ink (communications company); former Editor-in-Chief, The Los Angeles Herald Examiner (retired 1989) | | 10 | | None |
| John G. Freund, 1953 | | 2016 | | Founder and Managing Director, Skyline Ventures (a venture capital investor in health care companies) | | 6 | | Collegium Pharmaceutical, Inc.; Proteon Therapeutics, Inc.; Tetraphase Pharmaceuticals, Inc. |
| Pedro J. Greer Jr., 1956 | | 2016 | | Physician; Chairman of the Board and Associate Dean, Florida International University | | 3 | | None |
| R. Clark Hooper, 1946 | | 2010 | | Private investor | | 80 | | None |
| Merit E. Janow, 1958 | | 2001 | | Dean and Professor, Columbia University, School of International and Public Affairs | | 79 | | Mastercard Incorporated; Trimble Inc. |
| Leonade D. Jones, 1947 | | 2010 | | Retired; former Treasurer, The Washington Post Company (retired 1996) | | 10 | | None |
| Earl Lewis Jr., PhD, 1955 | | 2017 | | President, The Andrew W. Mellon Foundation; former Executive Vice President, Provost, Emory University | | 3 | | 2U, Inc. |
| Christopher E. Stone, 1956 | | 2009 | | President, Open Society Foundations; former Professor of the Practice of Criminal Justice, John F. Kennedy School of Government, Harvard University | | 6 | | None |
We are deeply saddened by the loss of Dr. Steadman Upham, who passed away on July 30, 2017. Dr. Upham served as an independent trustee on the boards of several American Funds since 2001. His wise counsel and friendship will be missed.
Stefanie Powers retired from the fund on December 31, 2017. The trustees thank Ms. Powers for her wise counsel, outstanding service and dedication to the fund.
Interested trustee5,6
Name, year of birth and
position with fund | | Year first
elected
a trustee
or officer
of the fund2 | | Principal occupation(s) during past five years
and positions held with affiliated entities or
the principal underwriter of the fund | | Number of
portfolios in
fund complex
overseen
by trustee3 | | Other directorships4
held by trustee |
Mark E. Denning, 1957
Vice Chairman of the Board and President | | 1993 | | Director, Capital Research and Management Company; Partner — Capital Research Global Investors, Capital Research Company;7 Partner — Capital Research Global Investors, Capital International, Inc.7 | | 1 | | None |
The fund’s statement of additional information includes further details about fund trustees and is available without charge upon request by calling American Funds Service Company at (800) 421-4225 or by visiting the American Funds website at americanfunds.com. The address for all trustees and officers of the fund is 333 South Hope Street, Los Angeles, CA 90071, Attention: Secretary.
| 34 | Capital World Growth and Income Fund |
Other officers6
Name, year of birth and
position with fund | | Year first
elected
an officer of the fund2 | | Principal occupation(s) during past five years and positions held with affiliated entities
or the principal underwriter of the fund |
Donald H. Rolfe, 1972
Executive Vice President | | 2008 | | Senior Vice President and Senior Counsel — Fund Business Management Group, Capital Research and Management Company |
L. Alfonso Barroso, 1971
Senior Vice President | | 2010 | | Partner — Capital Research Global Investors, Capital Research Company7 |
Michael Cohen, 1961
Senior Vice President | | 2014 | | Director, Capital Research and Management Company;
Partner — Capital International Investors, Capital Bank and Trust Company;7
Partner — Capital International Investors, Capital International Limited;7
Chairman of the Board and Senior Vice President, Capital International Limited7 |
Sung Lee, 1966
Senior Vice President | | 2008 | | Partner — Capital Research Global Investors, Capital International, Inc.7 |
David M. Riley, 1967
Vice President | | 2007 | | Partner — Capital Research Global Investors, Capital Research and Management Company;
Director, The Capital Group Companies, Inc.7 |
Alexander G. Sheynkman, 1963
Vice President | | 2010 | | Partner — Capital Research Global Investors, Capital Research and Management Company |
Michael W. Stockton, 1967
Secretary | | 2013 | | Vice President — Fund Business Management Group, Capital Research and Management Company |
Gregory F. Niland, 1971
Treasurer | | 2016 | | Vice President — Investment Operations, Capital Research and Management Company |
Jennifer L. Butler, 1966
Assistant Secretary | | 2013 | | Assistant Vice President — Fund Business Management Group, Capital Research and Management Company |
Brian C. Janssen, 1972
Assistant Treasurer | | 2016 | | Vice President — Investment Operations, Capital Research and Management Company |
Dori Laskin, 1951
Assistant Treasurer | | 2010 | | Vice President — Investment Operations, Capital Research and Management Company |
| 1 | The term independent trustee refers to a trustee who is not an “interested person” of the fund within the meaning of the Investment Company Act of 1940. |
| 2 | Trustees and officers of the fund serve until their resignation, removal or retirement. |
| 3 | Funds managed by Capital Research and Management Company or its affiliates. |
| 4 | This includes all directorships/trusteeships (other than those in the American Funds or other funds managed by Capital Research and Management Company or its affiliates) that are held by each trustee as a trustee or director of a public company or a registered investment company. |
| 5 | The term interested trustee refers to a trustee who is an “interested person” within the meaning of the Investment Company Act of 1940, on the basis of their affiliation with the fund’s investment adviser, Capital Research and Management Company, or affiliated entities (including the fund’s principal underwriter). |
| 6 | All of the trustees and/or officers listed, with the exception of L. Alfonso Barroso, Michael Cohen and Alexander G. Sheynkman, are officers and/or directors/trustees of one or more of the other funds for which Capital Research and Management Company serves as investment adviser. |
| 7 | Company affiliated with Capital Research and Management Company. |
| Capital World Growth and Income Fund | 35 |
Offices of the fund and of the investment adviser
Capital Research and Management Company
333 South Hope Street
Los Angeles, CA 90071-1406
6455 Irvine Center Drive
Irvine, CA 92618-4518
Transfer agent for shareholder accounts
American Funds Service Company
(Write to the address near you.)
P.O. Box 6007
Indianapolis, IN 46206-6007
P.O. Box 2280
Norfolk, VA 23501-2280
Custodian of assets
JPMorgan Chase Bank
270 Park Avenue
New York, NY 10017-2070
Counsel
O’Melveny & Myers LLP
400 South Hope Street
Los Angeles, CA 90071-2899
Independent registered public accounting firm
PricewaterhouseCoopers LLP
601 South Figueroa Street
Los Angeles, CA 90017-3874
Principal underwriter
American Funds Distributors, Inc.
333 South Hope Street
Los Angeles, CA 90071-1406
| 36 | Capital World Growth and Income Fund |
Investors should carefully consider investment objectives, risks, charges and expenses. This and other important information is contained in the fund prospectus and summary prospectus, which can be obtained from your financial professional and should be read carefully before investing. You may also call American Funds Service Company (AFS) at (800) 421-4225 or visit the American Funds website at americanfunds.com. Fund shares offered through American Funds Distributors, Inc.
“American Funds Proxy Voting Procedures and Principles” — which describes how we vote proxies relating to portfolio securities — is available on the American Funds website or upon request by calling AFS. The fund files its proxy voting record with the U.S. Securities and Exchange Commission (SEC) for the 12 months ended June 30 by August 31. The proxy voting record is available free of charge on the SEC website at sec.gov and on the American Funds website.
A complete November 30, 2017, portfolio of Capital World Growth and Income Fund’s investments is available free of charge by calling AFS or visiting the SEC website (where it is part of Form N-CSR).
Capital World Growth and Income Fund files a complete list of its portfolio holdings with the SEC for the first and third quarters of each fiscal year on Form N-Q. This filing is available free of charge on the SEC website. You may also review or, for a fee, copy this filing at the SEC’s Public Reference Room in Washington, D.C. Additional information regarding the operation of the Public Reference Room may be obtained by calling the SEC’s Office of Investor Education and Advocacy at (800) SEC-0330. Additionally, the list of portfolio holdings is available by calling AFS.
This report is for the information of shareholders of Capital World Growth and Income Fund, but it also may be used as sales literature when preceded or accompanied by the current prospectus or summary prospectus, which gives details about charges, expenses, investment objectives and operating policies of the fund. If used as sales material after March 31, 2018, this report must be accompanied by an American Funds statistical update for the most recently completed calendar quarter.
MSCI has not approved, reviewed or produced this report, makes no express or implied warranties or representations and is not liable whatsoever for any data in the report. You may not redistribute the MSCI data or use it as a basis for other indices or investment products.
The Standard & Poor’s 500 Composite Index (“Index”) is a product of S&P Dow Jones Indices LLC and/or its affiliates and has been licensed for use by Capital Group. Copyright © 2018 S&P Dow Jones Indices LLC, a division of S&P Global, and/or its affiliates. All rights reserved. Redistribution or reproduction in whole or in part are prohibited without written permission of S&P Dow Jones Indices LLC.
American Funds from Capital Group
The Capital AdvantageSM
Since 1931, American Funds, part of Capital Group, has helped investors pursue long-term investment success. Our consistent approach — in combination with The Capital SystemSM — has resulted in a superior long-term track record.
| | Aligned with investor success |
| | We base our decisions on a long-term perspective, which we believe aligns our goals with the interests of our clients. Our portfolio managers average 27 years of investment experience, including 21 years at our company, reflecting a career commitment to our long-term approach.1 |
| | |
| | The Capital System |
| | The Capital System combines individual accountability with teamwork. Funds using The Capital System are divided into portions that are managed independently by investment professionals with diverse backgrounds, ages and investment approaches. An extensive global research effort is the backbone of our system. |
| | |
| | American Funds’ superior long-term track record |
| | Equity funds have beaten their Lipper peer indexes in 93% of 10-year periods and 98% of 20-year periods. Fixed income funds have beaten their Lipper indexes in 80% of 10-year periods and 80% of 20-year periods.2 Fund management fees have been among the lowest in the industry.3 |
| | 1 | Portfolio manager experience as of December 31, 2016. |
| | 2 | Based on Class F-2 share results for rolling periods through December 31, 2016. Periods covered are the shorter of the fund’s lifetime or since the comparable Lipper index inception date (except Capital Income Builder and SMALLCAP World Fund, for which the Lipper average was used). Expenses differ for each share class, so results will vary. Class F-2 shares were first offered on August 1, 2008. Class F-2 share results prior to the date of first sale are hypothetical based on Class A share results without a sales charge, adjusted for typical estimated expenses. Results for certain funds with an inception date after August 1, 2008, also include hypothetical returns because those funds’ Class F-2 shares sold after the funds’ date of first offering. Please see americanfunds.com for more information on specific expense adjustments and the actual dates of first sale. |
| | 3 | On average, our management fees were in the lowest quintile 73% of the time, based on the 20-year period ended December 31, 2016, versus comparable Lipper categories, excluding funds of funds. |

ITEM 2 – Code of Ethics
The Registrant has adopted a Code of Ethics that applies to its Principal Executive Officer and Principal Financial Officer. The Registrant undertakes to provide to any person without charge, upon request, a copy of the Code of Ethics. Such request can be made to American Funds Service Company at 800/421-9225 or to the Secretary of the Registrant, 333 South Hope Street, Los Angeles, California 90071.
ITEM 3 – Audit Committee Financial Expert
The Registrant’s board has determined that Joseph C. Berenato, a member of the Registrant’s audit committee, is an “audit committee financial expert” and "independent," as such terms are defined in this Item. This designation will not increase the designee’s duties, obligations or liability as compared to his or her duties, obligations and liability as a member of the audit committee and of the board, nor will it reduce the responsibility of the other audit committee members. There may be other individuals who, through education or experience, would qualify as "audit committee financial experts" if the board had designated them as such. Most importantly, the board believes each member of the audit committee contributes significantly to the effective oversight of the Registrant’s financial statements and condition.
| ITEM 4 – Principal Accountant Fees and Services | |
| | | |
| Registrant: | |
| a) Audit Fees: |
| | 2016 | $136,000 |
| | 2017 | $145,000 |
| | |
| b) Audit-Related Fees: |
| | 2016 | None |
| | 2017 | None |
| | |
| c) Tax Fees: |
| | 2016 | $9,000 |
| | 2017 | $9,000 |
| | The tax fees consist of professional services relating to the preparation of the Registrant’s tax returns. |
| | |
| d) All Other Fees: |
| | 2016 | None |
| | 2017 | None |
| | |
| | Adviser and affiliates (includes only fees for non-audit services billed to the adviser and affiliates for engagements that relate directly to the operations and financial reporting of the Registrant and were subject to the pre-approval policies described below): |
| a) Audit Fees: |
| | Not Applicable |
| | |
| b) Audit-Related Fees: |
| | 2016 | $17,000 |
| | 2017 | $0 |
| | The audit-related fees consist of assurance and related services relating to the examination of the Registrant’s transfer agent, principal underwriter and investment adviser conducted in accordance with Statement on Standards for Attestation Engagements Number 16 issued by the American Institute of Certified Public Accountants. |
| | |
| c) Tax Fees: |
| | 2016 | $9,000 |
| | 2017 | None |
| | The tax fees consist of consulting services relating to the Registrant’s investments. |
| | | |
| | | |
| d) All Other Fees: |
| | 2016 | $2,000 |
| | 2017 | None |
| | The other fees consist of subscription services related to an accounting research tool. |
| | |
| | | |
| | All audit and permissible non-audit services that the Registrant’s audit committee considers compatible with maintaining the independent registered public accounting firm’s independence are required to be pre-approved by the committee. The pre-approval requirement will extend to all non-audit services provided to the Registrant, the investment adviser, and any entity controlling, controlled by, or under common control with the investment adviser that provides ongoing services to the Registrant, if the engagement relates directly to the operations and financial reporting of the Registrant. The committee will not delegate its responsibility to pre-approve these services to the investment adviser. The committee may delegate to one or more committee members the authority to review and pre-approve audit and permissible non-audit services. Actions taken under any such delegation will be reported to the full committee at its next meeting. The pre-approval requirement is waived with respect to non-audit services if certain conditions are met. The pre-approval requirement was not waived for any of the non-audit services listed above provided to the Registrant, adviser and affiliates. |
| | | |
| | Aggregate non-audit fees paid to the Registrant’s auditors, including fees for all services billed to the Registrant, adviser and affiliates that provide ongoing services to the Registrant, were $39,000 for fiscal year 2016 and $60,000 for fiscal year 2017. The non-audit services represented by these amounts were brought to the attention of the committee and considered to be compatible with maintaining the auditors’ independence. |
ITEM 5 – Audit Committee of Listed Registrants
Not applicable to this Registrant, insofar as the Registrant is not a listed issuer as defined in Rule 10A-3 under the Securities Exchange Act of 1934.
ITEM 6 – Schedule of Investments

Capital World Growth and Income Fund®
Investment portfolio
November 30, 2017
Common stocks 92.86%
Financials 15.54% | Shares | Value
(000) |
| Prudential PLC1 | 63,174,799 | $1,589,417 |
| HDFC Bank Ltd.1 | 28,896,610 | 831,557 |
| HDFC Bank Ltd. (ADR) | 540,900 | 52,521 |
| Barclays PLC1 | 311,082,756 | 811,039 |
| AIA Group Ltd.1 | 93,807,196 | 764,615 |
| UBS Group AG1 | 41,866,000 | 723,649 |
| KB Financial Group Inc.1 | 12,533,647 | 689,567 |
| Zurich Insurance Group AG1 | 2,276,844 | 687,678 |
| Banco Santander, SA1 | 82,008,989 | 551,490 |
| BNP Paribas SA1 | 6,319,530 | 478,708 |
| Kotak Mahindra Bank Ltd.1 | 30,148,585 | 469,250 |
| Société Générale1 | 9,154,561 | 461,434 |
| American International Group, Inc. | 7,602,309 | 455,834 |
| Wells Fargo & Co. | 6,507,300 | 367,467 |
| DBS Group Holdings Ltd1 | 19,353,219 | 352,285 |
| Siam Commercial Bank PCL, foreign registered1 | 74,162,855 | 346,810 |
| Sampo Oyj, Class A1 | 6,109,288 | 323,114 |
| Principal Financial Group, Inc. | 4,430,000 | 313,600 |
| PNC Financial Services Group, Inc. | 2,028,067 | 285,065 |
| JPMorgan Chase & Co. | 2,701,400 | 282,350 |
| Intesa Sanpaolo SpA1 | 83,444,641 | 280,063 |
| HSBC Holdings PLC (HKD denominated)1 | 21,484,000 | 215,743 |
| HSBC Holdings PLC (GBP denominated)1 | 5,190,997 | 51,608 |
| Lloyds Banking Group PLC1 | 299,082,984 | 266,416 |
| Hana Financial Group Inc.1 | 5,820,560 | 253,675 |
| Standard Life Aberdeen PLC1 | 39,549,981 | 230,321 |
| Credit Suisse Group AG1 | 13,056,742 | 221,388 |
| Banco Bilbao Vizcaya Argentaria, SA1 | 24,781,565 | 212,088 |
| Julius Baer Group Ltd.1 | 3,183,351 | 187,205 |
| PICC Property and Casualty Co. Ltd., Class H1 | 89,104,000 | 169,591 |
| ABN AMRO Group NV, depository receipts1 | 5,374,032 | 159,057 |
| CIT Group Inc. | 3,185,000 | 158,740 |
| CME Group Inc., Class A | 991,800 | 148,314 |
| Bank of Montreal | 1,842,961 | 141,806 |
| Royal Bank of Canada | 1,695,000 | 132,497 |
| Itaú Unibanco Holding SA, preferred nominative (ADR) | 10,316,325 | 129,470 |
| Bangkok Bank PCL, nonvoting depository receipt1 | 19,684,500 | 120,257 |
| M&T Bank Corp. | 688,000 | 116,238 |
| East West Bancorp, Inc. | 1,649,000 | 101,479 |
| Fairfax Financial Holdings Ltd., subordinate voting (CAD denominated) | 166,100 | 91,279 |
| BB&T Corp. | 1,822,069 | 90,047 |
| Goldman Sachs Group, Inc. | 325,000 | 80,483 |
| Grupo Financiero Santander México, SAB de CV, Class B (ADR) | 9,750,000 | 79,267 |
| Grupo Financiero Inbursa, SAB de CV | 37,819,423 | 66,810 |
| Bank of Ireland Group PLC1,2 | 7,755,610 | 60,543 |
| Sony Financial Holdings Inc.1 | 2,983,300 | 50,592 |
| Huntington Bancshares Inc. | 3,466,000 | 49,910 |
Capital World Growth and Income Fund — Page 1 of 11
Common stocks
Financials (continued) | Shares | Value
(000) |
| Resona Holdings, Inc.1 | 9,161,600 | $48,796 |
| Citigroup Inc. | 620,000 | 46,810 |
| Discovery Ltd.1 | 3,102,000 | 37,278 |
| Bank Central Asia Tbk PT1 | 24,366,900 | 36,671 |
| Deutsche Börse AG1 | 269,664 | 30,575 |
| Regions Financial Corp. | 1,700,000 | 28,203 |
| Akbank TAS1 | 12,030,000 | 27,628 |
| Invesco Ltd. | 746,300 | 26,994 |
| Janus Henderson Group PLC | 704,740 | 26,266 |
| Housing Development Finance Corp. Ltd.1 | 918,492 | 23,854 |
| Moody’s Corp. | 139,500 | 21,179 |
| Marsh & McLennan Companies, Inc. | 245,600 | 20,613 |
| Aon PLC, Class A | 143,500 | 20,121 |
| Chubb Ltd. | 118,300 | 17,995 |
| Bankia, SA1 | 3,680,052 | 17,697 |
| BM&FBOVESPA SA - Bolsa de Valores, Mercadorias e Futuros, ordinary nominative | 254,470 | 1,807 |
| | | 15,134,824 |
| Information technology 14.89% | | |
| Samsung Electronics Co., Ltd.1 | 1,176,233 | 2,763,575 |
| Broadcom Ltd. | 4,709,454 | 1,308,946 |
| Alphabet Inc., Class A2 | 667,380 | 691,519 |
| Alphabet Inc., Class C2 | 521,167 | 532,325 |
| Intel Corp. | 22,521,253 | 1,009,853 |
| Microsoft Corp. | 11,544,700 | 971,717 |
| Alibaba Group Holding Ltd. (ADR)2 | 4,641,680 | 821,949 |
| Apple Inc. | 4,550,081 | 781,931 |
| Taiwan Semiconductor Manufacturing Co., Ltd.1 | 101,805,000 | 766,436 |
| Micron Technology, Inc.2 | 16,133,000 | 683,878 |
| SK hynix, Inc.1 | 9,333,000 | 665,098 |
| Tencent Holdings Ltd.1 | 12,165,600 | 627,977 |
| Texas Instruments Inc. | 5,615,400 | 546,322 |
| AAC Technologies Holdings Inc.1 | 21,483,000 | 433,395 |
| ASML Holding NV1 | 2,438,193 | 428,692 |
| Accenture PLC, Class A | 2,862,000 | 423,605 |
| Nintendo Co., Ltd.1 | 865,780 | 351,506 |
| Western Union Co. | 10,558,165 | 207,890 |
| Keyence Corp.1 | 148,000 | 86,259 |
| Tableau Software, Inc., Class A2 | 1,139,700 | 80,121 |
| MediaTek Inc.1 | 7,035,000 | 77,358 |
| QUALCOMM Inc. | 865,000 | 57,384 |
| HP Inc. | 2,606,000 | 55,899 |
| Murata Manufacturing Co., Ltd.1 | 376,000 | 51,203 |
| NetApp, Inc. | 866,800 | 48,983 |
| Visa Inc., Class A | 263,400 | 29,656 |
| | | 14,503,477 |
| Consumer discretionary 11.32% | | |
| Amazon.com, Inc.2 | 928,583 | 1,092,710 |
| Netflix, Inc.2 | 5,431,589 | 1,018,857 |
| Hyundai Motor Co.1 | 6,302,655 | 952,990 |
| LVMH Moët Hennessy-Louis Vuitton SE1 | 2,188,300 | 637,374 |
| Home Depot, Inc. | 2,925,000 | 525,974 |
| ProSiebenSat.1 Media SE1,3 | 13,255,754 | 421,729 |
| Sony Corp.1 | 8,361,000 | 389,198 |
Capital World Growth and Income Fund — Page 2 of 11
Common stocks
Consumer discretionary (continued) | Shares | Value
(000) |
| Hyundai Mobis Co., Ltd.1 | 1,536,604 | $385,551 |
| Kering SA1 | 822,421 | 365,078 |
| NIKE, Inc., Class B | 5,934,153 | 358,542 |
| Ctrip.com International, Ltd. (ADR)2 | 7,101,000 | 327,214 |
| ITV PLC1 | 139,157,687 | 301,123 |
| Twenty-First Century Fox, Inc., Class A | 7,720,000 | 246,577 |
| Norwegian Cruise Line Holdings Ltd.2 | 4,362,000 | 236,246 |
| Viacom Inc., Class B | 8,326,688 | 235,812 |
| Intercontinental Hotels Group PLC1 | 3,830,528 | 224,730 |
| Galaxy Entertainment Group Ltd.1 | 29,873,000 | 215,160 |
| Daimler AG1 | 2,363,750 | 195,585 |
| Gree Electric Appliances, Inc. of Zhuhai., Class A1 | 29,682,882 | 191,340 |
| Ocado Group PLC1,2,3 | 39,080,197 | 186,585 |
| McDonald’s Corp. | 1,000,000 | 171,970 |
| Bayerische Motoren Werke AG1 | 1,659,100 | 167,200 |
| Paddy Power Betfair PLC1 | 1,443,997 | 160,960 |
| Shimano Inc.1 | 1,151,200 | 159,367 |
| Six Flags Entertainment Corp. | 2,400,000 | 157,008 |
| MGM Resorts International | 4,512,700 | 153,973 |
| Carnival Corp., units | 2,292,200 | 150,460 |
| Priceline Group Inc.2 | 86,375 | 150,267 |
| Toyota Motor Corp.1 | 2,236,500 | 140,922 |
| Las Vegas Sands Corp. | 1,728,100 | 119,740 |
| Greene King PLC1,3 | 16,165,653 | 113,852 |
| Industria de Diseño Textil, SA1 | 3,123,000 | 110,681 |
| Naspers Ltd., Class N1 | 411,300 | 110,347 |
| Li & Fung Ltd.1 | 209,500,000 | 92,419 |
| Daily Mail and General Trust PLC, Class A, nonvoting1 | 12,000,000 | 86,766 |
| Altice NV, Class A1,2 | 7,107,866 | 56,194 |
| Altice NV, Class B1,2 | 1,294,460 | 10,209 |
| Wynn Macau, Ltd.1 | 22,349,600 | 64,477 |
| Merlin Entertainments PLC1 | 10,090,000 | 48,062 |
| SES SA, Class A (FDR)1 | 2,778,000 | 45,880 |
| Dollar General Corp. | 464,600 | 40,922 |
| Astra International Tbk PT1 | 63,601,100 | 37,543 |
| Wynn Resorts, Ltd. | 215,100 | 34,003 |
| Comcast Corp., Class A | 847,200 | 31,804 |
| Starbucks Corp. | 502,500 | 29,055 |
| YUM! Brands, Inc. | 282,600 | 23,589 |
| DENSO Corp.1 | 409,600 | 23,082 |
| Lowe’s Companies, Inc. | 200,000 | 16,674 |
| Publicis Groupe SA1 | 187,947 | 12,483 |
| | | 11,028,284 |
| Health care 10.48% | | |
| AbbVie Inc. | 29,067,095 | 2,817,182 |
| Amgen Inc. | 8,405,869 | 1,476,575 |
| Novartis AG1 | 12,899,991 | 1,103,760 |
| Stryker Corp. | 4,935,500 | 769,938 |
| Takeda Pharmaceutical Co. Ltd.1 | 13,691,200 | 754,983 |
| Medtronic PLC | 5,794,000 | 475,861 |
| Thermo Fisher Scientific Inc. | 2,224,000 | 428,698 |
| Abbott Laboratories | 6,624,000 | 373,395 |
| Daiichi Sankyo Co., Ltd.1 | 13,307,000 | 321,362 |
| UnitedHealth Group Inc. | 1,362,100 | 310,790 |
Capital World Growth and Income Fund — Page 3 of 11
Common stocks
Health care (continued) | Shares | Value
(000) |
| ConvaTec Group PLC1 | 73,638,046 | $193,551 |
| Gilead Sciences, Inc. | 2,535,520 | 189,606 |
| Teva Pharmaceutical Industries Ltd. (ADR) | 12,748,000 | 188,925 |
| Grifols, SA, Class B, preferred nonvoting, non-registered shares1 | 6,770,000 | 154,070 |
| Incyte Corp.2 | 1,527,000 | 151,158 |
| UCB SA1 | 1,535,000 | 114,432 |
| Illumina, Inc.2 | 355,382 | 81,749 |
| Express Scripts Holding Co.2 | 1,165,000 | 75,935 |
| Roche Holding AG, non-registered shares, nonvoting1 | 211,781 | 53,441 |
| Pfizer Inc. | 1,262,700 | 45,786 |
| GlaxoSmithKline PLC1 | 2,111,000 | 36,526 |
| Eli Lilly and Co. | 353,100 | 29,886 |
| AstraZeneca PLC1 | 411,700 | 26,627 |
| Shanghai Pharmaceutical (Group) Co., Ltd., Class H1 | 6,630,900 | 16,702 |
| Danaher Corp. | 144,600 | 13,645 |
| | | 10,204,583 |
| Industrials 7.37% | | |
| Boeing Co. | 2,926,000 | 809,917 |
| Airbus SE, non-registered shares1 | 7,599,798 | 789,712 |
| Lockheed Martin Corp. | 2,102,000 | 670,790 |
| CSX Corp. | 7,824,226 | 436,201 |
| General Dynamics Corp. | 2,074,000 | 429,650 |
| Komatsu Ltd.1 | 8,823,400 | 275,045 |
| CCR SA, ordinary nominative | 54,858,544 | 265,289 |
| Airports of Thailand PCL, foreign registered1 | 126,536,100 | 241,883 |
| BAE Systems PLC1 | 31,988,000 | 238,932 |
| ASSA ABLOY AB, Class B1 | 11,761,167 | 238,513 |
| International Consolidated Airlines Group, SA (CDI)1 | 28,708,657 | 238,252 |
| General Electric Co. | 12,751,000 | 233,216 |
| Hyundai Heavy Industries Co., Ltd. 1 | 1,642,000 | 225,847 |
| Edenred SA1 | 7,169,000 | 205,156 |
| Ryanair Holdings PLC (ADR)2 | 1,627,235 | 198,425 |
| Emerson Electric Co. | 3,000,000 | 194,460 |
| Union Pacific Corp. | 1,481,940 | 187,465 |
| Groupe Eurotunnel SE1 | 12,940,000 | 172,083 |
| Babcock International Group PLC1 | 17,383,149 | 163,901 |
| Adecco Group AG1 | 2,129,050 | 160,954 |
| J.B. Hunt Transport Services, Inc. | 1,000,000 | 111,140 |
| Fosun International Ltd.1 | 51,485,600 | 107,711 |
| Nielsen Holdings PLC | 1,880,500 | 69,052 |
| C.H. Robinson Worldwide, Inc. | 619,900 | 53,714 |
| Alliance Global Group, Inc.1,2 | 166,723,940 | 51,982 |
| Industries Qatar QSC1 | 1,869,119 | 45,562 |
| Singapore Technologies Engineering Ltd1 | 16,101,000 | 39,095 |
| United Technologies Corp. | 300,000 | 36,435 |
| Waste Connections, Inc. | 474,000 | 32,625 |
| Sydney Airport, units1 | 5,498,154 | 30,957 |
| TransDigm Group Inc. | 104,200 | 29,571 |
| Recruit Holdings Co., Ltd.1 | 1,206,000 | 28,308 |
| Jardine Matheson Holdings Ltd.1 | 429,000 | 26,840 |
| IDEX Corp. | 185,400 | 25,135 |
| Bunzl PLC1 | 828,560 | 23,713 |
| Northrop Grumman Corp. | 69,000 | 21,211 |
| Safran SA1 | 195,275 | 20,818 |
Capital World Growth and Income Fund — Page 4 of 11
Common stocks
Industrials (continued) | Shares | Value
(000) |
| FANUC CORP.1 | 79,900 | $19,994 |
| Capita PLC1 | 2,713,000 | 17,137 |
| Kubota Corp.1 | 849,000 | 16,107 |
| | | 7,182,798 |
| Energy 6.72% | | |
| Royal Dutch Shell PLC, Class B1 | 23,112,376 | 749,423 |
| Royal Dutch Shell PLC, Class A1 | 20,687,933 | 660,161 |
| Royal Dutch Shell PLC, Class A (ADR) | 994,252 | 63,751 |
| Royal Dutch Shell PLC, Class A (EUR denominated)1 | 1,035,502 | 33,140 |
| Royal Dutch Shell PLC, Class B (ADR) | 344,800 | 22,736 |
| TOTAL SA1 | 12,498,174 | 705,647 |
| Canadian Natural Resources, Ltd. | 19,592,448 | 664,547 |
| BP PLC1 | 92,302,701 | 611,028 |
| EOG Resources, Inc. | 4,770,787 | 488,147 |
| Enbridge Inc. (CAD denominated) | 9,612,278 | 362,467 |
| Enbridge Inc.1,4 | 2,351,836 | 81,740 |
| Halliburton Co. | 10,454,100 | 436,772 |
| Suncor Energy Inc. | 8,892,044 | 308,428 |
| TransCanada Corp. | 5,470,212 | 262,370 |
| Noble Energy, Inc. | 8,000,000 | 210,400 |
| Chevron Corp. | 1,742,900 | 207,388 |
| Eni SpA1 | 7,405,300 | 121,632 |
| Eni SpA (ADR) | 253,148 | 8,346 |
| Golar LNG Ltd. | 4,847,000 | 119,769 |
| Kinder Morgan, Inc. | 5,864,000 | 101,037 |
| Oil Search Ltd.1 | 15,996,423 | 85,832 |
| Schlumberger Ltd. | 1,175,600 | 73,886 |
| ConocoPhillips | 974,600 | 49,588 |
| Chesapeake Energy Corp.2 | 9,500,000 | 38,665 |
| Southwestern Energy Co.2 | 5,778,420 | 36,751 |
| Occidental Petroleum Corp. | 281,500 | 19,846 |
| Helmerich & Payne, Inc. | 295,400 | 17,305 |
| | | 6,540,802 |
| Consumer staples 6.51% | | |
| Imperial Brands PLC1 | 25,620,178 | 1,062,248 |
| Philip Morris International Inc. | 9,673,800 | 993,983 |
| British American Tobacco PLC1 | 8,045,647 | 511,818 |
| British American Tobacco PLC (ADR) | 4,101,483 | 260,977 |
| Nestlé SA1 | 9,003,052 | 770,815 |
| Pernod Ricard SA1 | 2,922,493 | 456,016 |
| Altria Group, Inc. | 5,840,200 | 396,141 |
| Treasury Wine Estates Ltd.1 | 28,717,307 | 342,983 |
| Thai Beverage PCL1 | 460,847,400 | 330,174 |
| Kirin Holdings Co., Ltd.1 | 9,898,800 | 232,156 |
| Kellogg Co. | 3,350,000 | 221,636 |
| Associated British Foods PLC1 | 4,805,511 | 190,805 |
| Procter & Gamble Co. | 1,500,000 | 134,985 |
| Japan Tobacco Inc.1 | 2,697,500 | 89,385 |
| Seven & i Holdings Co., Ltd.1 | 2,100,000 | 86,189 |
| Coca-Cola Co. | 1,118,000 | 51,171 |
| Kroger Co. | 1,705,600 | 44,107 |
| Danone SA1 | 465,008 | 39,257 |
| Shoprite Holdings Ltd.1 | 1,498,000 | 24,908 |
Capital World Growth and Income Fund — Page 5 of 11
Common stocks
Consumer staples (continued) | Shares | Value
(000) |
| Diageo PLC1 | 659,200 | $22,775 |
| Unilever PLC1 | 361,500 | 20,413 |
| Carlsberg A/S, Class B1 | 159,035 | 18,863 |
| AMOREPACIFIC Corp.1 | 59,500 | 16,916 |
| Mondelez International, Inc. | 311,600 | 13,380 |
| Reckitt Benckiser Group PLC1 | 89,400 | 7,848 |
| | | 6,339,949 |
| Utilities 5.05% | | |
| Engie SA1 | 45,598,810 | 798,172 |
| Iberdrola, SA, non-registered shares1 | 86,410,727 | 686,692 |
| Dominion Energy, Inc. | 4,732,422 | 398,139 |
| EDP - Energias de Portugal, SA1 | 105,264,653 | 369,064 |
| Orsted AS1 | 5,957,629 | 346,335 |
| CK Infrastructure Holdings Ltd.1 | 38,598,000 | 328,637 |
| China Resources Gas Group Ltd.1 | 68,842,000 | 268,404 |
| Enel SPA1 | 37,469,273 | 243,430 |
| Sempra Energy | 1,900,800 | 229,978 |
| Gas Natural SDG, SA1 | 9,435,000 | 211,005 |
| Power Grid Corp. of India Ltd.1 | 64,038,000 | 205,226 |
| National Grid PLC1 | 13,620,212 | 162,357 |
| SSE PLC1 | 8,208,945 | 152,057 |
| Red Eléctrica de Corporación, SA1 | 4,781,000 | 108,183 |
| Exelon Corp. | 1,689,700 | 70,477 |
| Power Assets Holdings Ltd.1 | 7,669,000 | 65,561 |
| CMS Energy Corp. | 1,200,000 | 59,880 |
| AES Corp. | 5,360,000 | 56,709 |
| Huaneng Power International, Inc., Class H1 | 88,050,000 | 56,414 |
| NextEra Energy, Inc. | 338,905 | 53,561 |
| Duke Energy Corp. | 580,000 | 51,724 |
| | | 4,922,005 |
| Materials 3.72% | | |
| Vale SA, ordinary nominative | 54,677,511 | 586,955 |
| Vale SA, ordinary nominative (ADR) | 19,279,317 | 206,289 |
| Rio Tinto PLC1 | 12,640,300 | 599,139 |
| Asahi Kasei Corp.1 | 37,934,000 | 477,060 |
| Air Liquide SA, non-registered shares1 | 2,248,400 | 281,595 |
| Akzo Nobel NV1 | 3,024,678 | 272,560 |
| Nitto Denko Corp.1 | 2,536,100 | 250,638 |
| Fortescue Metals Group Ltd.1 | 51,826,981 | 181,360 |
| Koninklijke DSM NV1 | 1,135,972 | 106,580 |
| BASF SE1 | 951,000 | 106,409 |
| Potash Corp. of Saskatchewan Inc. | 5,236,800 | 102,903 |
| LafargeHolcim Ltd.1 | 1,244,139 | 68,019 |
| Celanese Corp., Series A | 608,000 | 65,202 |
| AngloGold Ashanti Ltd.1 | 4,611,968 | 48,122 |
| AngloGold Ashanti Ltd. (ADR) | 1,506,280 | 15,741 |
| Monsanto Co. | 403,290 | 47,725 |
| Newcrest Mining Ltd.1 | 2,610,597 | 46,083 |
| Sherwin-Williams Co. | 104,000 | 41,540 |
| Barrick Gold Corp. | 2,931,600 | 40,397 |
| Amcor Ltd.1 | 2,670,315 | 31,247 |
Capital World Growth and Income Fund — Page 6 of 11
Common stocks
Materials (continued) | Shares | Value
(000) |
| Shin-Etsu Chemical Co., Ltd.1 | 255,000 | $26,884 |
| Agrium Inc. | 215,000 | 23,637 |
| | | 3,626,085 |
| Telecommunication services 3.71% | | |
| Verizon Communications Inc. | 23,727,287 | 1,207,482 |
| Nippon Telegraph and Telephone Corp.1 | 16,481,000 | 864,264 |
| LG Uplus Corp.1,3 | 29,169,442 | 373,807 |
| BT Group PLC1 | 80,268,200 | 283,178 |
| América Móvil, SAB de CV, Series L (ADR) | 8,228,300 | 140,704 |
| Singapore Telecommunications Ltd.1 | 47,947,000 | 132,640 |
| Koninklijke KPN NV1 | 26,846,889 | 98,514 |
| Vodafone Group PLC1 | 30,900,200 | 93,713 |
| TDC A/S1 | 12,455,304 | 75,891 |
| Bharti Airtel Ltd.1 | 9,628,099 | 74,053 |
| Telia Co. AB1 | 16,640,800 | 73,053 |
| Bezeq - The Israel Telecommunication Corp. Ltd.1 | 47,540,000 | 71,241 |
| BCE Inc. | 1,156,000 | 55,320 |
| MegaFon PJSC (GDR)1 | 5,544,563 | 53,539 |
| NTT DoCoMo, Inc.1 | 625,100 | 16,214 |
| | | 3,613,613 |
| Real estate 2.65% | | |
| CK Asset Holdings Ltd.1 | 77,500,856 | 656,178 |
| Sun Hung Kai Properties Ltd.1 | 27,967,750 | 459,087 |
| Link REIT1 | 27,985,391 | 249,750 |
| SM Prime Holdings, Inc.1 | 300,819,759 | 217,789 |
| Daito Trust Construction Co., Ltd.1 | 1,186,000 | 217,215 |
| Crown Castle International Corp. REIT | 1,528,426 | 172,712 |
| Sino Land Co. Ltd.1 | 92,610,000 | 168,620 |
| Lamar Advertising Co. REIT, Class A | 2,196,038 | 165,208 |
| American Campus Communities, Inc. REIT | 2,911,279 | 123,380 |
| Fibra Uno Administración, SA de CV REIT | 31,315,000 | 48,934 |
| Iron Mountain Inc. REIT | 775,000 | 31,674 |
| Ayala Land, Inc.1 | 33,410,000 | 28,590 |
| Gaming and Leisure Properties, Inc. REIT | 778,300 | 28,268 |
| American Tower Corp. REIT | 122,200 | 17,588 |
| | | 2,584,993 |
| Miscellaneous 4.90% | | |
| Other common stocks in initial period of acquisition | | 4,773,028 |
| Total common stocks (cost: $66,154,689,000) | | 90,454,441 |
Convertible stocks 0.19%
Energy 0.07% | | |
| Kinder Morgan Inc., Series A, depository share, convertible preferred 2018 | 1,188,200 | 42,347 |
| Southwestern Energy Co., Series B, 6.25% convertible preferred 2018 | 1,592,000 | 23,068 |
| | | 65,415 |
| Real estate 0.04% | | |
| American Tower Corp., Series B, 5.50% depository share, convertible preferred 2018 | 296,200 | 37,366 |
Capital World Growth and Income Fund — Page 7 of 11
Convertible stocks
Miscellaneous 0.08% | Shares | Value
(000) |
| Other convertible stocks in initial period of acquisition | | $76,782 |
| Total convertible stocks (cost: $170,926,000) | | 179,563 |
Bonds, notes & other debt instruments 0.96%
Corporate bonds & notes 0.55%
Energy 0.16% | Principal?amount
(000) | |
| Genel Energy Finance 3 Ltd. 7.50% 20194 | $ 15,000 | 14,100 |
| Kinder Morgan, Inc. 4.30% 2025 | 30,595 | 31,590 |
| Kinder Morgan, Inc. 5.55% 2045 | 13,415 | 14,353 |
| Petróleos Mexicanos 6.875% 2026 | 35,630 | 40,679 |
| Petróleos Mexicanos 5.50% 2044 | 3,647 | 3,411 |
| Petróleos Mexicanos 5.625% 2046 | 5,325 | 5,001 |
| Petróleos Mexicanos 6.75% 2047 | 7,282 | 7,719 |
| TransCanada Corp. 5.875% 2076 | 36,500 | 39,838 |
| | | 156,691 |
| Telecommunication services 0.11% | | |
| CenturyLink, Inc. 7.50% 2024 | 7,016 | 6,858 |
| CenturyLink, Inc., Series T, 5.80% 2022 | 20,048 | 19,246 |
| Frontier Communications Corp. 11.00% 2025 | 9,785 | 7,559 |
| Sprint Corp. 11.50% 2021 | 33,950 | 41,419 |
| T-Mobile US, Inc. 6.375% 2025 | 7,105 | 7,645 |
| T-Mobile US, Inc. 6.50% 2026 | 22,126 | 24,304 |
| | | 107,031 |
| Health care 0.11% | | |
| Teva Pharmaceutical Finance Company BV 3.15% 2026 | 59,700 | 49,888 |
| VPI Escrow Corp. 6.375% 20204 | 54,008 | 54,143 |
| | | 104,031 |
| Consumer staples 0.08% | | |
| Herbalife Ltd., Term Loan, (3-month USD-LIBOR + 5.50%) 6.85% 20235,6,7 | 77,925 | 78,003 |
| Financials 0.08% | | |
| Discover Financial Services 10.25% 2019 | 4,334 | 4,822 |
| HBOS PLC 6.75% 20184 | 36,490 | 37,276 |
| Lloyds Banking Group PLC, junior subordinated 6.657% preference shares (undated)4 | 30,300 | 35,375 |
| | | 77,473 |
| Materials 0.01% | | |
| CRH America, Inc. 8.125% 2018 | 15,540 | 16,116 |
| Total corporate bonds & notes | | 539,345 |
| Bonds & notes of governments & government agencies outside the U.S. 0.33% | | |
| Colombia (Republic of), Series B, 7.50% 2026 | COP80,150,000 | 28,583 |
| India (Republic of) 8.60% 2028 | INR1,220,300 | 20,644 |
| Indonesia (Republic of), Series 68, 8.375% 2034 | IDR530,800,000 | 43,226 |
| Poland (Republic of), Series 0726, 2.50% 2026 | PLN166,200 | 44,463 |
| Portuguese Republic 4.125% 2027 | €25,895 | 36,736 |
| Portuguese Republic 3.875% 2030 | 49,240 | 67,752 |
Capital World Growth and Income Fund — Page 8 of 11
Bonds, notes & other debt instruments
Bonds & notes of governments & government agencies outside the U.S. (continued) | Principal?amount
(000) | Value
(000) |
| Portuguese Republic 4.10% 2045 | €20,155 | $27,861 |
| Turkey (Republic of) 10.70% 2022 | TRY207,000 | 48,738 |
| | | 318,003 |
U.S. Treasury bonds & notes 0.08%
U.S. Treasury 0.08% | | |
| U.S. Treasury 0.75% 20178 | $77,600 | 77,564 |
| Total U.S. Treasury bonds & notes | | 77,564 |
| Total bonds, notes & other debt instruments (cost: $874,742,000) | | 934,912 |
| Short-term securities 5.69% | | |
| ANZ New Zealand (International) Ltd. 1.29% due 12/8/20174 | 50,000 | 49,987 |
| Australia & New Zealand Banking Group, Ltd. 1.20% due 12/4/20174 | 79,200 | 79,189 |
| Bank of Montreal 1.34%–1.50% due 12/13/2017–2/20/2018 | 182,300 | 182,159 |
| Bank of Tokyo-Mitsubishi UFJ, Ltd. 1.33% due 1/12/2018 | 82,200 | 82,064 |
| BNP Paribas, New York Branch 1.16% due 12/5/2017 | 49,200 | 49,192 |
| CAFCO, LLC 1.38% due 12/18/20174 | 50,000 | 49,970 |
| Caisse d’Amortissement de la Dette Sociale 1.36% due 1/4/20184 | 40,000 | 39,952 |
| Canadian Imperial Holdings Inc. 1.37% due 1/24/2018 | 50,000 | 49,898 |
| Chariot Funding, LLC 1.44% due 12/22/20174 | 50,000 | 49,961 |
| Coca-Cola Co. 1.26% due 12/14/20174 | 25,000 | 24,989 |
| CPPIB Capital Inc. 1.30%–1.31% due 1/3/2018–1/5/20184 | 191,100 | 190,866 |
| DBS Bank Ltd. 1.33%–1.47% due 1/5/2018–3/9/20184 | 176,200 | 175,824 |
| Export Development Canada 1.24% due 12/5/2017 | 50,000 | 49,992 |
| Fairway Finance Corp. 1.36% due 1/24/20184 | 70,000 | 69,848 |
| Federal Home Loan Bank 1.04%–1.24% due 12/1/2017–2/2/2018 | 763,800 | 762,797 |
| Kells Funding, LLC 1.40%–1.43% due 1/18/2018–2/13/20184 | 147,600 | 147,201 |
| KfW 1.32% due 1/16/20184 | 93,900 | 93,748 |
| Liberty Street Funding Corp. 1.35%–1.43% due 1/8/2018–2/9/20184 | 214,700 | 214,252 |
| Microsoft Corp. 1.33% due 2/13/20184 | 45,600 | 45,478 |
| Mizuho Bank, Ltd. 1.20%–1.42% due 12/5/2017–2/21/20184 | 286,600 | 286,046 |
| National Australia Bank Ltd. 1.34%–1.42% due 2/6/2018–2/27/20184 | 228,400 | 227,727 |
| Nordea Bank AB 1.25%–1.29% due 12/18/2017–1/23/20184 | 278,800 | 278,417 |
| Old Line Funding, LLC 1.27%–1.36% due 12/6/2017–1/22/20184 | 89,600 | 89,469 |
| Oversea-Chinese Banking Corp. Ltd. 1.38%–1.41% due 2/2/2018–2/9/20184 | 125,000 | 124,661 |
| Royal Bank of Canada 1.33% due 2/7/2018 | 125,000 | 124,668 |
| Sanofi 1.21% due 12/22/20174 | 44,900 | 44,868 |
| Société Générale 1.30% due 12/4/20174 | 16,600 | 16,598 |
| Sumitomo Mitsui Banking Corp. 1.24%–1.27% due 12/6/2017–12/13/20174 | 150,000 | 149,953 |
| Svenska Handelsbanken Inc. 1.29%–1.38% due 12/11/2017–2/12/20184 | 233,700 | 233,311 |
| Swedbank AB 1.45%–1.50% due 3/6/2018–3/21/2018 | 180,000 | 179,262 |
| Thunder Bay Funding, LLC 1.28%–1.68% due 12/6/2017–5/29/20184 | 126,000 | 125,434 |
| Toronto-Dominion Bank 1.28%–1.39% due 12/4/2017–1/31/20184 | 262,600 | 262,238 |
| Total Capital Canada Ltd. 1.32% due 2/5/20184 | 100,000 | 99,750 |
| Toyota Industries Commercial Finance, Inc. 1.25% due 12/7/20174 | 11,400 | 11,398 |
| Toyota Motor Credit Corp. 1.30% due 1/16/2018 | 100,000 | 99,836 |
| U.S. Treasury Bills 1.01%–1.55% due 1/2/2018–11/8/2018 | 586,500 | 584,075 |
Capital World Growth and Income Fund — Page 9 of 11
| Short-term securities | Principal?amount
(000) | Value
(000) |
| United Overseas Bank Limited 1.37%–1.41% due 1/24/2018–2/1/20184 | $74,000 | $73,832 |
| Victory Receivables Corp. 1.28%–1.44% due 12/7/2017–2/7/20184 | 127,700 | 127,399 |
| Total short-term securities (cost: $5,546,579,000) | | 5,546,309 |
| Total investment securities 99.70% (cost: $72,746,936,000) | | 97,115,225 |
| Other assets less liabilities 0.30% | | 295,504 |
| Net assets 100.00% | | $97,410,729 |
As permitted by U.S. Securities and Exchange Commission regulations, “Miscellaneous” securities include holdings in their first year of acquisition that have not previously been publicly disclosed.
Forward currency contracts
| Contract amount | Counterparty | Settlement
date | Unrealized
depreciation
at 11/30/2017
(000) |
Purchases
(000) | Sales
(000) |
| USD185,300 | GBP140,000 | JPMorgan Chase | 12/15/2017 | $(4,146) |
| USD48,822 | GBP36,920 | Citibank | 12/18/2017 | (1,146) |
| | | | | $(5,292) |
The following footnotes apply to either the individual securities noted or one or more of the securities aggregated and listed as a single line item.
| 1 | Valued under fair value procedures adopted by authority of the board of trustees. The total value of all such securities, including those in “Miscellaneous,“ was $51,391,316,000, which represented 52.76% of the net assets of the fund. This amount includes $50,440,290,000 related to certain securities trading outside the U.S. whose values were adjusted as a result of significant market movements following the close of local trading. |
| 2 | Security did not produce income during the last 12 months. |
| 3 | Represents an affiliated company as defined under the Investment Company Act of 1940. |
| 4 | Acquired in a transaction exempt from registration under Rule 144A or Section 4(2) of the Securities Act of 1933. May be resold in the U.S. in transactions exempt from registration, normally to qualified institutional buyers. The total value of all such securities was $3,617,656,000, which represented 3.71% of the net assets of the fund. |
| 5 | Loan participations and assignments; may be subject to legal or contractual restrictions on resale. The total value of all such loans was $78,003,000, which represented .08% of the net assets of the fund. |
| 6 | Principal payments may be made periodically. Therefore, the effective maturity date may be earlier than the stated maturity date. |
| 7 | Coupon rate may change periodically. |
| 8 | A portion of this security was pledged as collateral. The total value of pledged collateral was $3,305,000, which represented less than .01% of the net assets of the fund. |
| | |
| | |
| Key to abbreviations and symbols | |
| | |
| ADR = American Depositary Receipts | HKD = Hong Kong dollars |
| CAD = Canadian dollars | IDR = Indonesian rupiah |
| CDI = CREST Depository Interest | INR = Indian rupees |
| COP = Colombian pesos | LIBOR = London Interbank Offered Rate |
| EUR/€ = Euros | PLN = Polish zloty |
| FDR = Fiduciary Depositary Receipts | TRY = Turkish lira |
| GBP = British pounds | USD/$ = U.S. dollars |
| GDR = Global Depositary Receipts | |
Capital World Growth and Income Fund — Page 10 of 11
Additional financial disclosures are included in the fund’s current shareholder report and should be read in conjunction with this report.
Investments are not FDIC-insured, nor are they deposits of or guaranteed by a bank or any other entity, so they may lose value.
Investors should carefully consider investment objectives, risks, charges and expenses. This and other important information is contained in the fund prospectus and summary prospectus, which can be obtained from your financial professional and should be read carefully before investing. You may also call American Funds Service Company (AFS) at (800) 421-4225 or visit the American Funds website at americanfunds.com. Fund shares offered through American Funds Distributors, Inc.
| MFGEFPX-033-0118O-S60686 | Capital World Growth and Income Fund — Page 11 of 11 |
Report of Independent Registered Public Accounting Firm
To the Board of Trustees and Shareholders of Capital World Growth and Income Fund
In our opinion, the accompanying statement of assets and liabilities, including the summary investment portfolio, and the related statements of operations and of changes in net assets and the financial highlights (included in Item 1 of this Form N-CSR) and the investment portfolio (included in Item 6 of this Form N-CSR) present fairly, in all material respects, the financial position of Capital World Growth and Income Fund (the "Fund") as of November 30, 2017, the results of its operations for the year then ended, the changes in its net assets for each of the two years in the period then ended and the financial highlights for each of the periods presented, in conformity with accounting principles generally accepted in the United States of America. These financial statements, financial highlights, and investment portfolio (hereafter referred to as "financial statements") are the responsibility of the Fund's management. Our responsibility is to express an opinion on these financial statements based on our audits. We conducted our audits of these financial statements in accordance with the standards of the Public Company Accounting Oversight Board (United States). Those standards require that we plan and perform the audit to obtain reasonable assurance about whether the financial statements are free of material misstatement. An audit includes examining, on a test basis, evidence supporting the amounts and disclosures in the financial statements, assessing the accounting principles used and significant estimates made by management, and evaluating the overall financial statement presentation. We believe that our audits, which included confirmation of securities as of November 30, 2017 by correspondence with the custodian and brokers, provide a reasonable basis for our opinion.
PricewaterhouseCoopers LLP
Los Angeles, California
January 12, 2018
ITEM 7 – Disclosure of Proxy Voting Policies and Procedures for Closed-End Management Investment Companies
Not applicable to this Registrant, insofar as the Registrant is not a closed-end management investment company.
ITEM 8 – Portfolio Managers of Closed-End Management Investment Companies
Not applicable to this Registrant, insofar as the Registrant is not a closed-end management investment company.
ITEM 9 – Purchases of Equity Securities by Closed-End Management Investment Company and Affiliated Purchasers
Not applicable to this Registrant, insofar as the Registrant is not a closed-end management investment company.
ITEM 10 – Submission of Matters to a Vote of Security Holders
There have been no material changes to the procedures by which shareholders may recommend nominees to the Registrant’s board of trustees since the Registrant last submitted a proxy statement to its shareholders. The procedures are as follows. The Registrant has a nominating and governance committee comprised solely of persons who are not considered ‘‘interested persons’’ of the Registrant within the meaning of the Investment Company Act of 1940, as amended. The committee periodically reviews such issues as the board’s composition, responsibilities, committees, compensation and other relevant issues, and recommends any appropriate changes to the full board of trustees. While the committee normally is able to identify from its own resources an ample number of qualified candidates, it will consider shareholder suggestions of persons to be considered as nominees to fill future vacancies on the board. Such suggestions must be sent in writing to the nominating and governance committee of the Registrant, c/o the Registrant’s Secretary, and must be accompanied by complete biographical and occupational data on the prospective nominee, along with a written consent of the prospective nominee for consideration of his or her name by the nominating and governance committee.
ITEM 11 – Controls and Procedures
| (a) | The Registrant’s Principal Executive Officer and Principal Financial Officer have concluded, based on their evaluation of the Registrant’s disclosure controls and procedures (as such term is defined in Rule 30a-3 under the Investment Company Act of 1940), that such controls and procedures are adequate and reasonably designed to achieve the purposes described in paragraph (c) of such rule. |
| | |
| (b) | There were no changes in the Registrant’s internal controls over financial reporting (as defined in Rule 30a-3(d) under the Investment Company Act of 1940) that occurred during the Registrant’s second fiscal quarter of the period covered by this report that has materially affected, or is reasonably likely to materially affect, the Registrant’s internal control over financial reporting. |
ITEM 12 – Exhibits
| (a)(1) | The Code of Ethics that is the subject of the disclosure required by Item 2 is attached as an exhibit hereto. |
| | |
| (a)(2) | The certifications required by Rule 30a-2 of the Investment Company Act of 1940 and Sections 302 and 906 of the Sarbanes-Oxley Act of 2002 are attached as exhibits hereto. |
SIGNATURES
Pursuant to the requirements of the Securities Exchange Act of 1934 and the Investment Company Act of 1940, the Registrant has duly caused this report to be signed on its behalf by the undersigned, thereunto duly authorized.
| | CAPITAL WORLD GROWTH AND INCOME FUND |
| | |
| | By /s/ Donald H. Rolfe |
| | Donald H. Rolfe, Executive Vice President and Principal Executive Officer |
| | |
| | Date: January 31, 2017 |
Pursuant to the requirements of the Securities Exchange Act of 1934 and the Investment Company Act of 1940, this report has been signed below by the following persons on behalf of the Registrant and in the capacities and on the dates indicated.
| By /s/ Donald H. Rolfe |
Donald H. Rolfe, Executive Vice President and Principal Executive Officer |
| |
| Date: January 31, 2017 |
| By /s/ Gregory F. Niland |
Gregory F. Niland, Treasurer and Principal Financial Officer |
| |
| Date: January 31, 2017 |