UNITED STATES
SECURITIES AND EXCHANGE COMMISSION
Washington, D.C. 20549
FORM N-CSR
Certified Shareholder Report of
Registered Management Investment Companies
Investment Company Act File Number: 811-07338
Capital World Growth and Income Fund
(Exact Name of Registrant as Specified in Charter)
333 South Hope Street
Los Angeles, California 90071
(Address of Principal Executive Offices)
Registrant's telephone number, including area code: (213) 486-9200
Date of fiscal year end: November 30
Date of reporting period: November 30, 2015
Michael W. Stockton
Capital World Growth and Income Fund
333 South Hope Street
Los Angeles, California 90071
(Name and Address of Agent for Service)
ITEM 1 – Reports to Stockholders

Take a prudent approach
to global investing.
Special feature page 6
 | Capital World Growth
and Income Fund® |
| |
Annual report
for the year ended
November 30, 2015 |
Capital World Growth and Income Fund seeks to provide you with long-term growth of capital while providing current income.
This fund is one of more than 40 offered by one of the nation’s largest mutual fund families, American Funds, from Capital Group. For more than 80 years, Capital has invested with a long-term focus based on thorough research and attention to risk.
Fund results shown in this report, unless otherwise indicated, are for Class A shares at net asset value. If a sales charge (maximum 5.75%) had been deducted, the results would have been lower. Results are for past periods and are not predictive of results for future periods. Current and future results may be lower or higher than those shown. Share prices and returns will vary, so investors may lose money. Investing for short periods makes losses more likely. Investments are not FDIC-insured, nor are they deposits of or guaranteed by a bank or any other entity, so they may lose value. For current information and month-end results, visit americanfunds.com.
Here are the average annual total returns on a $1,000 investment with all distributions reinvested for periods ended December 31, 2015 (the most recent calendar quarter-end):
| Class A shares | 1 year | 5 years | 10 years |
| | | | |
| Reflecting 5.75% maximum sales charge | –7.79% | 5.69% | 5.23% |
For other share class results, visit americanfunds.com and americanfundsretirement.com.
The total annual fund operating expense ratio is 0.77% for Class A shares as of the prospectus dated February 1, 2016 (unaudited).
Investment results assume all distributions are reinvested and reflect applicable fees and expenses. When applicable, investment results reflect fee waivers, without which results would have been lower. Visit americanfunds.com for more information.
The fund’s 30-day yield for Class A shares as of December 31, 2015, reflecting the 5.75% maximum sales charge and calculated in accordance with the U.S. Securities and Exchange Commission formula, was 2.03%.
Investing outside the United States may be subject to risks, such as currency fluctuations, periods of illiquidity and price volatility. These risks may be heightened in connection with investments in developing countries. Refer to the fund prospectus and the Risk Factors section of this report for more information on these and other risks associated with investing in the fund.

Fellow investors:
Global stock markets generated mixed results during Capital World Growth and Income Fund’s fiscal year, as investors focused on uneven and slowing economic growth, sliding commodities prices and the possible impact of interest rate hikes in the U.S. Broad currency weakness took a toll on total returns for dollar-based investors in most non-U.S. markets. Dividend-paying stocks tended to trail the broader market.
For the 12 months ended November 30, 2015, the fund declined 3.12%. This compares to the 2.49% drop registered by the fund’s benchmark, the MSCI ACWI (All Country World Index). The Lipper Global Funds Index, a peer group measure, fell 0.76%. It is worth noting that the fund has consistently outpaced both of these indexes over longer time frames, as shown in the table below.
Capital World Growth and Income Fund seeks to provide investors with current income and long-term growth of capital. The fund paid dividends totaling $1.05 per share for the 12 months, which included a special dividend of 17 cents a share paid in December 2014. This amounted to an income return of 2.21% for those who reinvested dividends.
Currency weakness takes a toll
In a period characterized by heightened turbulence, major developed markets nonetheless generally recorded positive returns in local currency terms. In Europe, stocks advanced on expectations for further central bank stimulus and rising export activity. German exports to the United States jumped more than 20% in the first nine months of 2015 compared to the same period a year earlier. However, these gains were translated into losses for U.S. investors as a result of the sharp decline in the euro against the U.S. dollar. The MSCI EU Index fell 4.77%* in U.S. dollar terms for the 12 months.
Although Japan’s economy fell into recession in the second half of the period, Japanese stocks were up solidly. The economy shrank at an annualized rate of less than 1% in the second and third quarters, but unemployment fell to 3.1% in October, a 20-year low. Toward the end of the period, Prime Minister
| * | Unless otherwise noted, country stock returns are based on MSCI indexes, expressed in U.S. dollars and assume the reinvestment of dividends. Results reflect dividends net of withholding taxes, except the MSCI USA Index, which reflects dividends gross of withholding taxes. |
Results at a glance
For periods ended November 30, 2015, with all distributions reinvested
| | | Cumulative
total returns | | Average annual total returns |
| | | | | | | | | | | | Lifetime |
| | | 1 year | | 5 years | | 10 years | | (since 3/26/93) |
| | | | | | | | | | | | | | | | | |
Capital World Growth and Income Fund
(Class A shares) | | | –3.12 | % | | | 8.77 | % | | | 6.46 | % | | | 10.59 | % |
| MSCI ACWI* | | | –2.49 | | | | 7.99 | | | | 5.20 | | | | 7.05 | |
| Lipper Global Funds Index† | | | –0.76 | | | | 8.06 | | | | 5.34 | | | | 7.26 | |
| * | Results for the MSCI ACWI reflect dividends gross of withholding taxes through December 31, 2000, and dividends net of withholding taxes thereafter. This index is a free float-adjusted market capitalization-weighted index that is designed to measure results of more than 40 developed and emerging equity markets. It is unmanaged and, therefore, has no expenses. Investors cannot invest directly in an index. |
| † | Lipper indexes track the largest mutual funds (no more than 30), represented by one share class per fund, in the corresponding Lipper category. |
| Capital World Growth and Income Fund | 1 |
Largest equity holdings
(as of November 30, 2015)
| Company | | Country of domicile | | Percent of
net assets | | 12-month
return† |
| | | | | | | | | | | |
| Amgen | | United States | | | 3.8 | % | | | –2.55 | % |
| Novartis | | Switzerland | | | 2.6 | | | | –11.88 | |
| Alphabet* | | United States | | | 2.3 | | | | 38.93 | |
| Verizon Communications | | United States | | | 1.7 | | | | –10.16 | |
| Prudential | | United Kingdom | | | 1.6 | | | | –4.23 | |
| Gilead Sciences | | United States | | | 1.5 | | | | 5.62 | |
| Philip Morris International | | United States | | | 1.5 | | | | .53 | |
| Altria Group | | United States | | | 1.4 | | | | 14.60 | |
| UBS Group | | Switzerland | | | 1.3 | | | | 6.64 | |
| Barclays | | United Kingdom | | | 1.2 | | | | –12.33 | |
| * | 12-month return for Alphabet represents Class A shares only. |
| † | Returns shown are on a share price basis. |
Shinzo Abe unveiled new stimulus measures that included boosting the minimum wage annual escalation rate. Japanese shares produced a 7.65% gain for U.S. investors.
U.S. stocks recorded modest gains, with the MSCI USA Index rising 2.73%. In August, stock prices slid as investors focused on slowing growth in China and the prospect of tighter U.S. monetary policy. Stocks bounced back in October, buoyed by news that U.S. gross domestic product rose 2.0% in the third quarter, thanks largely to rising consumer spending. The unemployment rate stood at 5.0% at the end of the fund’s fiscal year, a figure widely regarded as representing full employment. After prolonged anticipation, the Federal Reserve increased its benchmark interest rate in December for the first time in nearly a decade.
Results in emerging markets were decidedly more downbeat, largely due to the impact of China’s economy, lower commodity prices and political tensions in a number of areas. Chinese stocks ended the period 5.53% lower after a currency devaluation in August appeared to raise concerns that the world’s second-largest economy might not be as strong as official figures seemed to indicate. Toward the end of the period, China’s central bank cut interest rates for the fifth time since November 2014 and lowered the level of reserves that banks must hold. In India, stocks plummeted 13.83%. Despite robust economic growth during the third quarter, concerns persisted over whether the government’s ruling party could push through key economic reforms. Shares in Brazil (–45.10%) recorded some of the largest declines for the period, as deteriorating political and economic conditions, including a corruption scandal involving senior government officials, weighed on investor sentiment. Despite strong gains in local currency terms, Russian stocks declined 10.86% in dollar terms. Economic sanctions imposed by the U.S. and Europe, as well as lower oil prices, contributed to a substantially weaker ruble.
Inside the portfolio
Economic and market conditions offer useful perspective when examining the fund’s results, but as we often note in these reports, the fund’s portfolio is carefully constructed one investment at a time following extensive research.
In a volatile period when growth-oriented stocks tended to outpace value-oriented stocks, we believe the fund held up relatively well. Despite its negative return, the fund received positive contributions from holdings in a range of industries and geographies. Netflix soared nearly 150% on a 7-for-1 stock split. Among the fund’s top 10 holdings, Class A shares of Alphabet — which changed its name from Google during the year — gained 38.93% with strong revenue growth complemented by increasing attention to cost control and shareholder returns. Tobacco companies Altria and Philip Morris International were up 14.60% and 0.53%, respectively. The fund’s sixth-largest holding, U.S. biotechnology company Gilead Sciences, saw an increase of 5.62%. Company returns shown are on a share price basis.
However, health care holdings, the second largest sector concentration in the portfolio, collectively detracted from the fund’s overall result. The two largest holdings, Amgen (–2.55%) and Novartis (–11.88%) both slipped, the former amid investor concerns over loss of patent protection for some key therapies. Among the fund’s other top 10 holdings, U.S. telecom Verizon Communications (–10.16%), insurance giant Prudential (–4.23%) and European financial services firm Barclays (–12.33%) all lost ground.
Looking forward
We are mindful of the many challenges currently facing global investors. Chinese growth has meaningfully slowed, helping suppress oil prices. While there are hopeful signs of recovery out of Europe and Japan, economic growth in those regions remains muted. Lower commodities prices, coupled with rising rates in the U.S., could present further
| 2 | Capital World Growth and Income Fund |
difficulties for a number of emerging markets. However, while the Federal Reserve did raise its benchmark interest rate shortly after the close of the fund’s fiscal year, we expect it will proceed prudently with regard to further hikes, given the fragility of the global economy.
Given the strength of the U.S. dollar and the fact that U.S. stocks have outpaced non-U.S. stocks for some time, investors may be questioning the merits of investing globally. We look at these conditions not as a constant but as a dynamic, and note that it is critical to consider a number of factors when making long-term investment decisions, including valuation and future business prospects. Many U.S. companies are commanding high valuations relative to global competitors domiciled in other markets. Our emphasis on individual companies continues to uncover opportunities for patient long-term investors.
We thank you for your commitment to Capital World Growth and Income Fund and look forward to reporting back to you in six months.
Cordially,

Mark E. Denning
President

Michael Cohen
Senior Vice President
January 8, 2016
For current information about the fund, visit americanfunds.com.

Where the fund’s assets are invested*
(percent invested by country of domicile)
| | | Capital World Growth
and Income Fund | | MSCI All Country
World Index† |
| Europe | | | 30.4 | % | | | 23.1 | % |
| United Kingdom | | | 12.1 | | | | 6.8 | |
| Switzerland | | | 5.8 | | | | 3.2 | |
| France | | | 4.0 | | | | 3.4 | |
| Germany | | | 3.2 | | | | 3.2 | |
| Sweden | | | .8 | | | | 1.0 | |
| Spain | | | .7 | | | | 1.2 | |
| Finland | | | .6 | | | | .3 | |
| Other Europe | | | 3.2 | | | | 4.0 | |
| | | | | | | | | |
| The Americas | | | 46.4 | | | | 57.6 | |
| United States | | | 43.1 | | | | 53.5 | |
| Canada | | | 2.2 | | | | 2.9 | |
| Other Americas | | | 1.1 | | | | 1.2 | |
| | | | | | | | | |
| Asia/Pacific | | | 17.6 | | | | 18.2 | |
| Hong Kong | | | 3.8 | | | | 1.0 | |
| Japan | | | 3.4 | | | | 8.0 | |
| China | | | 2.8 | | | | 2.2 | |
| Thailand | | | 1.7 | | | | .2 | |
| India | | | 1.6 | | | | .8 | |
| Other Asia/Pacific | | | 4.3 | | | | 6.0 | |
| | | | | | | | | |
| Other | | | .3 | | | | 1.1 | |
| | | | | | | | | |
| Bonds, notes & other debt instruments, short-term securities & other assets less liabilities | | | 5.3 | | | | — | |
| Total | | | 100.0 | % | | | 100.0 | % |
| * | Percent of net assets by country as of November 30, 2015. |
| † | The MSCI All Country World Index is weighted by market capitalization. |
| Capital World Growth and Income Fund | 3 |
The value of a long-term perspective
Fund results shown are for Class A shares and reflect deduction of the maximum sales charge of 5.75% on the $10,000 investment.¹ Thus, the net amount invested was $9,425. Results are for past periods and are not predictive of results for future periods. Current and future results may be lower or higher than those shown. Share prices and returns will vary, so investors may lose money. For current information and month-end results, visit americanfunds.com.
The results shown are before taxes on fund distributions and sale of fund shares.
| 1 | As outlined in the prospectus, the sales charge is reduced for accounts (and aggregated investments) of $25,000 or more and is eliminated for purchases of $1 million or more. There is no sales charge on dividends or capital gain distributions that are reinvested in additional shares. |
| 2 | Includes reinvested dividends of $24,775 and reinvested capital gain distributions of $20,534. |
| 3 | Results calculated with capital gains reinvested. |
| 4 | The market index is unmanaged and, therefore, has no expenses. Investors cannot invest directly in an index. Results reflect dividends gross of withholding taxes through December 31, 2000, and dividends net of withholding taxes thereafter. |
| 5 | Computed from data supplied by the U.S. Department of Labor, Bureau of Labor Statistics. |
| 6 | For the period March 26, 1993, commencement of operations, through November 30, 1993. |

| 4 | Capital World Growth and Income Fund |
How a $10,000 investment has grown
While notable for their volatility in recent years, financial markets have tended to reward investors over the long term. Active management — bolstered by experience and careful research — can add even more value. As the chart shows, over its lifetime, Capital World Growth and Income Fund has done demonstrably better than its relevant benchmark.

| Capital World Growth and Income Fund | 5 |

| 6 | Capital World Growth and Income Fund |
Take a prudent approach to global investing.
The turbulence in global equity markets this past summer provided a vivid illustration of one of investing’s unshakable truths: Downturns are inevitable. Knowing this, of course, doesn’t make the volatility any less jarring.
Amid news reports of an economic slowdown in China, sliding commodities prices and turmoil in the Middle East, the MSCI ACWI (All Country World Index) slid 11.97%* between August 10 and September 29 of 2015, leaving many to feel uneasy about global investing. Investors in Capital World Growth and Income Fund, however, may find some reassurance in the fund’s distinctly conservative approach.
As a result of this approach, the fund has a history of resilience during down markets. In the past when stock prices have fallen, the fund has tended to outpace the broader market. This, in turn, has helped the fund deliver solid long-term returns and relatively low volatility over its lifetime (see chart on page 9). “The fund was conceived nearly a quarter century ago with downside protection in mind,” says Mark Denning, president of the fund and a portfolio manager since its inception in March 1993. “We believed there was a need for a fund that could provide exposure to global markets while being mindful of the risks associated with global investing. We seek to do this by investing primarily in what we call ‘seasoned’ companies. Some might call them blue chips, but we refer to them as seasoned because they are stable companies that have been around for a long time, and we expect them to be around for decades to come. We also focus on companies that pay dividends. We feel these two things help provide a measure of stability.”
In the following pages we take a closer look at how the fund’s managers account for potential downside risk when selecting investments, and how that approach has helped to lower volatility over extended time periods.
Fund objectives light the way
Capital World Growth and Income Fund has a dual mandate to provide long-term capital appreciation along with current income. As Mark noted, to achieve these objectives, the fund’s managers invest chiefly in well-established companies that often have a track record of paying regular dividends. Because they also tend to be mature businesses, they are able to generate enough free cash flow to support dividend payments, finance share buybacks or invest in expansion.
“We are definitely looking for capital appreciation and businesses that are participating in the growth of the global economy,” says Michael Cohen, senior vice president of the fund and a portfolio manager. “But our focus on income has proved over time to be a stabilizing factor. Dividends can provide a buffer of sorts against market declines because they represent a tangible return whether stock prices are rising or falling.”
| * | Results reflect dividends net of withholding taxes. |
| Capital World Growth and Income Fund | 7 |
When a company consistently pays dividends, it is often an indication of healthy cash flows and strong management, as well as management’s commitment to creating value for their investors. “Because dividends are paid out of earnings, steady and growing dividend payments indicate that company managers are disciplined allocators of capital,” adds Mark.
In addition, dividend payments and dividend growth historically have been a significant component of total return in major developed markets. With modest global growth expected in the near term, dividends could make up an even greater portion of total return than they have in recent years, allowing investors to get paid while they wait for more favorable economic conditions. “Today, in a world largely characterized by slow growth abroad, and in the U.S. where valuations for many growth-oriented companies have risen to unapologetic levels, I believe we are entering a period when we should be thinking about dividend income being the lion’s share of total return,” says portfolio manager James Terrille.
A value orientation
Another hallmark of the fund’s approach is its value orientation. The fund’s managers look to invest in companies whose shares are priced at a discount to what they believe is the intrinsic value of the company.
“Relatively low valuations can help limit the downside of an investment during market declines,” James continues. “I look for companies with attractive valuations, leading market positions and cash flow characteristics that can support the dividend even in a relatively adverse economic environment.” He cites as an example U.S. telecom Verizon Communications. Its shares, which have come under pressure as the company faces price competition from rivals Sprint and T-Mobile, have recently traded at low valuations and offer a dividend yield of around 5%. James believes the company offers significantly more upside than downside for long-term investors.
In accordance with our process, The Capital System,SM each of the fund’s managers makes investment decisions independently, based on fundamental research and their own convictions. Each brings a different perspective and approach. Portfolio manager Alfonso Barroso carefully studies earnings-, cash flow-, dividend-, sales- and asset-based metrics before making investment decisions. “I tend to favor low valuations, but in reality they are only inexpensive if they fail to discount the long-term cash flows and dividends of the business,” he explains. Alfonso gravitates toward established businesses with reasonably predictable and steady earnings and dividend growth. Consider National Grid, a U.K.-based utility that also operates in the northeastern United States. “Their returns are largely regulated, and most of their earnings come from the U.K., which has one of the more attractive regulatory regimes globally for transmission and distribution assets,” notes Alfonso. “This is also a market that needs a lot of new investment over the next five to 10 years, so the company can for the most part reliably grow its asset base, regardless of the economic cycle.”
Valuation is also a key consideration for Mark, who seeks to invest in companies that he believes will get qualitatively better over time and can generate returns through a rising price-to-earnings ratio, increasing earnings and a growing dividend yield. “One of the big risks of investing, particularly in growth companies, is valuation risk,” explains Mark. “If you invest in a growing company today at 25 times earnings, you want to be very sure that the company can continue to grow for the next three to five years. If it doesn’t, the valuation will likely be lower, and you never want to go from growth to ex-growth.”
Mark also looks for earnings visibility over a number of years. “I am less focused on the next twelve months. My real focus is two to four years out, because that is an investment horizon where I believe we at Capital can add value.”
| 8 | Capital World Growth and Income Fund |

How your fund measures up: higher returns, lower volatility
Returns versus volatility (for the period 3/31/93–11/30/15)
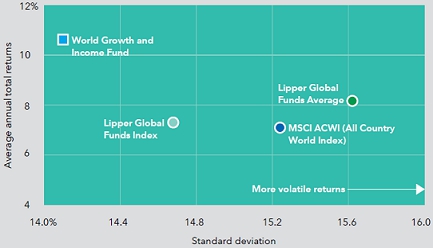 | Over its 22-year lifetime, Capital World Growth and Income Fund has produced solid returns with relatively lower volatility, as measured by standard deviation. Standard deviation is a common measure of volatility reflecting how returns have varied from the mean over time. A lower number signifies lower volatility. |
Source: Standard & Poor’s, MSCI, Lipper. Volatility is calculated at net asset value by Lipper using annualized standard deviation (based on monthly returns). Returns calculated at net asset value, with all distributions reinvested. Results for MSCI ACWI reflect dividends gross of withholding taxes through December 31, 2000, and dividends net of withholding taxes thereafter. Market indexes are unmanaged and, therefore, have no expenses. Investors cannot invest directly in an index. Lipper indexes track the largest mutual funds (no more than 30), represented by one share class per fund, in the corresponding Lipper category. Lipper averages reflect the current composition of all eligible mutual funds (all share classes) within a given category.
Fund results shown are for Class A shares at net asset value. If a sales charge (maximum 5.75%) had been deducted, the results would have been lower. Results are for past periods and are not predictive of results for future periods. Current and future results may be lower or higher than those shown. Share prices and returns will vary, so investors may lose money. For current information and month-end results, visit americanfunds.com.
| Capital World Growth and Income Fund | 9 |

The New Geography of Investing®
Fifty years ago, companies tended to do business solely within their own borders. Globalization, however, has made that less and less true. Where a company is headquartered or where its stock is listed have become less meaningful proxies.
Equity portion breakdown by domicile (%)
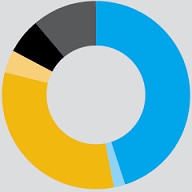
| | Region | | Fund | | Index |
 | United States | | | 45 | % | | | 53 | % |
 | Canada | | | 2 | | | | 3 | |
 | Europe | | | 32 | | | | 23 | |
 | Japan | | | 4 | | | | 8 | |
 | Asia-Pacific ex. Japan | | | 6 | | | | 4 | |
 | Emerging markets | | | 11 | | | | 9 | |
| | Total | | | 100 | % | | | 100 | % |
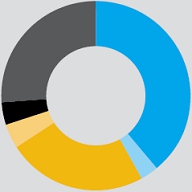
Equity portion breakdown by revenue (%)
| | Region | | Fund | | Index |
| United States | | | 39 | % | | | 40 | % |
| Canada | | | 3 | | | | 3 | |
| Europe | | | 24 | | | | 19 | |
| Japan | | | 4 | | | | 7 | |
| Asia-Pacific ex. Japan | | | 4 | | | | 4 | |
| Emerging markets | | | 26 | | | | 27 | |
| | Total | | | 100 | % | | | 100 | % |
Source: Capital Group (as of November 30, 2015).
Compared with the MSCI ACWI (All Country World Index) as a percent of net assets. All figures include convertible securities.
A focus on balance sheets
When analyzing potential investments, portfolio manager David Riley looks closely at balance sheets and leverage metrics. He avoids companies with aggressive financial engineering that would imprudently take on debt in order to drive expansion. “If you look at my portfolio, you will usually see big positions in companies with recognizable names, strong balance sheets, consistent dividend growth and pricing power, but what you won’t see is aggressive leverage,” he says. David often invests heavily in defensive market sectors, such as consumer staples. Beverage giant Coca-Cola is one example.
David is also attracted to companies that have faced the prospect of bankruptcy in the past and learned from the experience. “When a company’s board and management have been traumatized, I believe future bankruptcy risk is minimal because they are going to be very reluctant to push the envelope,” he notes.
While he tends to have a yield orientation, David is also comfortable investing in higher multiple stocks if he has confidence in a company’s growth trajectory and franchise sustainability. Consider, for example, Netflix. While it has a relatively high valuation, he believes it has a strong
| 10 | Capital World Growth and Income Fund |
long-term growth profile. “If there is a downturn, its shares may decline, but the downside will not be magnified by financial leverage, and there is little risk of bankruptcy,” he adds.
Tracking all potential outcomes
To be sure, the fund’s managers cannot foretell the future, and there is an element of uncertainty in the prospects of even the most solid companies. Therefore, the fund’s managers work closely with investment analysts to determine a range of potential outcomes for an investment and then assign a probability for each. Explains Alfonso, “Often the first question I will ask an analyst presenting an investment idea for the fund is, ‘What is the possible downside?’ This discipline is a cornerstone of my approach as an investor.”
Once James has closely examined a company’s fundamentals, he typically will construct best-, worse- and base-case scenarios. He then uses the range of possibilities to determine the value of the company. “For each case I set a price on the stock, then look at the price of its shares and decide whether it represents good value for our investors,” he says.
For David, avoiding catastrophic loss is as important a part of achieving superior long-term results as is identifying the hot growth companies.
“There is always a ‘probability tree’ of outcomes. I really try to dig into some of the more negative outcome branches and think them through,” he says. “Having lived through 2008 and 2009, which was devastating for our investors as well as for us and so many others, I feel it’s essential to keep in mind how another shock of this kind could impact the fund’s results.”
Weathering the storms
Indeed, the fund has not always avoided the blows of major market declines. The financial crisis of 2007–2009 was widespread, resulting in significant downturns across industries and regions. Triggered by a housing bubble in the U.S., it roiled the global economy. During that period, Capital World Growth and Income Fund’s returns fell precipitously. However, they fell a bit less brutally than those of the market.
Over the fund’s lifetime, there have been four major global market downturns, as measured by the MSCI ACWI. Among these was the bursting of the tech bubble in March 2000. During the two-and-a-half years that followed, the MSCI ACWI lost nearly 50% its value. Some local markets recorded even greater losses. While Capital World Growth and Income Fund did not completely avoid the effects of this correction, its decline of slightly less than 25% was not nearly as severe.
“Over the course of time, Capital World Growth and Income Fund has tended to fare a bit better than the overall market during declines. That was most evident in the wake of the technology collapse, when the fund did exceptionally well relative to the broader market,” observes Mark. “With our value-orientation, long-term approach and focus on seasoned companies, I believe we can continue to offer investors relative stability over longer time frames.”
| Capital World Growth and Income Fund | 11 |
Summary investment portfolio November 30, 2015
| Industry sector diversification | Percent of net assets |

| Country diversification by domicile | | Percent of
net assets |
| United States | | | 43.10 | % |
| United Kingdom | | | 12.10 | |
| Euro zone* | | | 11.47 | |
| Switzerland | | | 5.76 | |
| Hong Kong | | | 3.76 | |
| Japan | | | 3.45 | |
| China | | | 2.81 | |
| Canada | | | 2.16 | |
| Thailand | | | 1.69 | |
| Other countries | | | 8.44 | |
| Bonds, notes & other debt instruments, short-term securities & other assets less liabilities | | | 5.26 | |
| * | Countries using the euro as a common currency; those represented in the fund’s portfolio are Austria, Belgium, Finland, France, Germany, Ireland, Italy, the Netherlands, Portugal and Spain. |
| Common stocks 94.72% | | Shares | | | Value
(000) | |
| Financials 16.90% | | | | | | | | |
| Prudential PLC1 | | | 56,570,800 | | | $ | 1,311,674 | |
| UBS Group AG1 | | | 55,859,786 | | | | 1,070,167 | |
| Barclays PLC1 | | | 289,160,985 | | | | 971,973 | |
| Société Générale1 | | | 16,441,989 | | | | 783,581 | |
| HDFC Bank Ltd.1 | | | 35,060,126 | | | | 674,442 | |
| HDFC Bank Ltd. (ADR) | | | 569,900 | | | | 33,122 | |
| American International Group, Inc. | | | 10,955,800 | | | | 696,570 | |
| AIA Group Ltd.1 | | | 108,436,196 | | | | 647,758 | |
| Link Real Estate Investment Trust1 | | | 99,014,391 | | | | 601,318 | |
| Siam Commercial Bank PCL1 | | | 159,850,831 | | | | 584,795 | |
| Other securities | | | | | | | 6,874,662 | |
| | | | | | | | 14,250,062 | |
| | | | | | | | | |
| Health care 16.03% | | | | | | | | |
| Amgen Inc. | | | 19,828,700 | | | | 3,194,404 | |
| Novartis AG1 | | | 25,513,054 | | | | 2,176,628 | |
| Gilead Sciences, Inc. | | | 12,313,531 | | | | 1,304,742 | |
| Bayer AG1 | | | 4,908,175 | | | | 654,951 | |
| Thermo Fisher Scientific Inc. | | | 4,566,200 | | | | 631,962 | |
| AbbVie Inc. | | | 10,730,829 | | | | 623,998 | |
| Alexion Pharmaceuticals, Inc.2 | | | 3,231,350 | | | | 576,602 | |
| Stryker Corp. | | | 5,516,000 | | | | 532,073 | |
| Takeda Pharmaceutical Co. Ltd.1 | | | 10,383,000 | | | | 505,083 | |
| Medtronic PLC | | | 6,542,000 | | | | 492,874 | |
| UnitedHealth Group Inc. | | | 3,706,200 | | | | 417,726 | |
| Other securities | | | | | | | 2,404,282 | |
| | | | | | | | 13,515,325 | |
| | | | | | | | | |
| Information technology 11.78% | | | | | | | | |
| Alphabet Inc., Class A2 | | | 1,369,829 | | | | 1,044,974 | |
| Alphabet Inc., Class C2 | | | 1,163,017 | | | | 863,656 | |
| Oracle Corp. | | | 24,052,000 | | | | 937,306 | |
| Texas Instruments Inc. | | | 12,417,700 | | | | 721,717 | |
| Intel Corp. | | | 20,590,000 | | | | 715,914 | |
| Samsung Electronics Co., Ltd.1 | | | 386,842 | | | | 428,271 | |
| Other securities | | | | | | | 5,215,164 | |
| | | | | | | | 9,927,002 | |
| 12 | Capital World Growth and Income Fund |
| | | Shares | | | Value
(000) | |
| Consumer discretionary 10.33% | | | | | | | | |
| Netflix, Inc.2 | | | 6,265,283 | | | $ | 772,697 | |
| Kingfisher PLC1,3 | | | 121,513,199 | | | | 646,761 | |
| Toyota Motor Corp.1 | | | 9,673,500 | | | | 600,078 | |
| Amazon.com, Inc.2 | | | 865,500 | | | | 575,384 | |
| Home Depot, Inc. | | | 3,620,000 | | | | 484,646 | |
| Other securities | | | | | | | 5,623,785 | |
| | | | | | | | 8,703,351 | |
| | | | | | | | | |
| Industrials 10.22% | | | | | | | | |
| Lockheed Martin Corp. | | | 3,420,900 | | | | 749,724 | |
| General Dynamics Corp. | | | 3,505,700 | | | | 513,445 | |
| ASSA ABLOY AB, Class B1 | | | 22,416,167 | | | | 476,367 | |
| Union Pacific Corp. | | | 5,634,740 | | | | 473,036 | |
| Boeing Co. | | | 2,668,000 | | | | 388,061 | |
| Other securities | | | | | | | 6,018,059 | |
| | | | | | | | 8,618,692 | |
| | | | | | | | | |
| Consumer staples 7.44% | | | | | | | | |
| Philip Morris International Inc. | | | 14,554,200 | | | | 1,271,892 | |
| Altria Group, Inc. | | | 19,914,700 | | | | 1,147,087 | |
| Imperial Tobacco Group PLC1 | | | 14,318,000 | | | | 773,729 | |
| Coca-Cola Co. | | | 14,357,800 | | | | 611,929 | |
| Nestlé SA1 | | | 7,667,443 | | | | 568,171 | |
| Other securities | | | | | | | 1,897,874 | |
| | | | | | | | 6,270,682 | |
| | | | | | | | | |
| Energy 5.36% | | | | | | | | |
| Royal Dutch Shell PLC, Class A (GBP denominated)1 | | | 13,242,130 | | | | 327,679 | |
| Royal Dutch Shell PLC, Class B1 | | | 11,011,787 | | | | 273,982 | |
| Royal Dutch Shell PLC, Class A (ADR) | | | 904,109 | | | | 44,989 | |
| Royal Dutch Shell PLC, Class A (EUR denominated)1 | | | 1,718,318 | | | | 42,778 | |
| Royal Dutch Shell PLC, Class B (ADR) | | | 344,800 | | | | 17,219 | |
| Canadian Natural Resources, Ltd. | | | 24,362,330 | | | | 589,972 | |
| BP PLC1 | | | 84,555,653 | | | | 490,613 | |
| EOG Resources, Inc. | | | 5,256,000 | | | | 438,508 | |
| Other securities | | | | | | | 2,292,872 | |
| | | | | | | | 4,518,612 | |
| | | | | | | | | |
| Telecommunication services 4.75% | | | | | | | | |
| Verizon Communications Inc. | | | 31,140,053 | | | | 1,415,315 | |
| China Mobile Ltd.1 | | | 38,951,000 | | | | 447,005 | |
| Other securities | | | | | | | 2,145,179 | |
| | | | | | | | 4,007,499 | |
| | | | | | | | | |
| Utilities 4.30% | | | | | | | | |
| SSE PLC1 | | | 27,919,269 | | | | 602,986 | |
| EDP - Energias de Portugal, SA1 | | | 155,000,908 | | | | 516,383 | |
| Dominion Resources, Inc. | | | 5,767,422 | | | | 388,551 | |
| Other securities | | | | | | | 2,118,404 | |
| | | | | | | | 3,626,324 | |
| | | | | | | | | |
| Materials 2.62% | | | | | | | | |
| Other securities | | | | | | | 2,209,008 | |
| | | | | | | | | |
| | | | | | | | | |
| Miscellaneous 4.99% | | | | | | | | |
| Other common stocks in initial period of acquisition | | | | | | | 4,206,014 | |
| | | | | | | | | |
| Total common stocks (cost: $66,303,456,000) | | | | | | | 79,852,571 | |
| | | | | | | | | |
| | | | | | | | | |
| Rights & warrants 0.00% | | | | | | | | |
| Financials 0.00% | | | | | | | | |
| Other securities | | | | | | | 4,116 | |
| | | | | | | | | |
| | | | | | | | | |
| Miscellaneous 0.00% | | | | | | | | |
| Other rights & warrants in initial period of acquisition | | | | | | | 2,167 | |
| | | | | | | | | |
| Total rights & warrants (cost: $0) | | | | | | | 6,283 | |
| Capital World Growth and Income Fund | 13 |
| Convertible stocks 0.02% | | Shares | | | Value
(000) | |
| Financials 0.02% | | | | | | | | |
| Other securities | | | | | | $ | 14,560 | |
| | | | | | | | | |
| Total convertible stocks (cost: $10,438,000) | | | | | | | 14,560 | |
| | | | | | | | | |
| Bonds, notes & other debt instruments 0.97% | | Principal amount
(000) | | | | | |
| U.S. Treasury bonds & notes 0.41% | | | | | | | | |
| U.S. Treasury 0.41% | | | | | | | | |
| Other securities | | | | | | | 343,513 | |
| | | | | | | | | |
| Corporate bonds & notes 0.38% | | | | | | | | |
| Other 0.38% | | | | | | | | |
| Other securities | | | | | | | 318,632 | |
| | | | | | | | | |
| Bonds & notes of governments & government agencies outside the U.S. 0.18% | | | | | | | | |
| Other securities | | | | | | | 158,040 | |
| | | | | | | | | |
| Total bonds, notes & other debt instruments (cost: $835,718,000) | | | | | | | 820,185 | |
| | | | | | | | | |
| Short-term securities 4.22% | | | | | | | | |
| Federal Home Loan Bank 0.10%–0.23% due 12/2/2015–4/8/2016 | | $ | 967,600 | | | | 967,118 | |
| Other securities | | | | | | | 2,587,874 | |
| | | | | | | | | |
| Total short-term securities (cost: $3,555,266,000) | | | | | | | 3,554,992 | |
| Total investment securities 99.93% (cost: $70,704,878,000) | | | | | | | 84,248,591 | |
| Other assets less liabilities 0.07% | | | | | | | 56,236 | |
| | | | | | | | | |
| Net assets 100.00% | | | | | | $ | 84,304,827 | |
This summary investment portfolio is designed to streamline the report and help investors better focus on the fund’s principal holdings. See the inside back cover for details on how to obtain a complete schedule of portfolio holdings.
As permitted by U.S. Securities and Exchange Commission regulations, “Miscellaneous” securities include holdings in their first year of acquisition that have not previously been publicly disclosed.
“Other securities” includes all issues that are not disclosed separately in the summary investment portfolio. Some of these securities (with an aggregate value of $1,795,296,000, which represented 2.13% of the net assets of the fund) were acquired in transactions exempt from registration under Rule 144A or Section 4(2) of the Securities Act of 1933 and may be resold in the U.S. in transactions exempt from registration, normally to qualified institutional buyers. “Other securities” also includes securities which were pledged as collateral. The total value of pledged collateral was $4,445,000, which represented less than .01% of the net assets of the fund.
Forward currency contracts
The fund has entered into forward currency contracts as shown in the following table. The average month-end notional amount of open forward currency contracts while held was $901,687,000.
| | | | | | | Contract amount | | Unrealized
(depreciation)
appreciation | |
| | | Settlement date | | Counterparty | | Receive
(000) | | Deliver
(000) | | at 11/30/2015
(000) | |
| Sales: | | | | | | | | | | | | |
| Australian dollars | | 1/11/2016 | | Bank of America, N.A. | | $28,761 | | A$41,000 | | | $(822 | ) |
| Australian dollars | | 1/25/2016 | | UBS AG | | $6,818 | | A$9,500 | | | (32 | ) |
| British pounds | | 12/14/2015 | | Citibank | | $208,908 | | £138,335 | | | 557 | |
| British pounds | | 1/11/2016 | | Bank of America, N.A. | | $240,696 | | £160,160 | | | (563 | ) |
| British pounds | | 1/11/2016 | | Citibank | | $240,450 | | £160,000 | | | (569 | ) |
| Euros | | 12/14/2015 | | HSBC Bank | | $34,135 | | €31,842 | | | 479 | |
| Euros | | 12/21/2015 | | Bank of America, N.A. | | $91,999 | | €86,346 | | | 706 | |
| 14 | Capital World Growth and Income Fund |
| | | | | | | Contract amount | | Unrealized
(depreciation)
appreciation | |
| | | Settlement date | | Counterparty | | Receive
(000) | | Deliver
(000) | | at 11/30/2015
(000) | |
| Japanese yen | | 12/21/2015 | | HSBC Bank | | $46,732 | | ¥5,770,071 | | | $(179 | ) |
| Singapore dollars | | 2/24/2016 | | Barclays Bank PLC | | $96,838 | | S$137,335 | | | (227 | ) |
| | | | | | | | | | | | $(650 | ) |
Investments in affiliates
A company is an affiliate of the fund under the Investment Company Act of 1940 if the fund’s holdings in that company represent 5% or more of the outstanding voting shares. The value of the fund’s affiliated-company holdings is either shown in the summary investment portfolio or included in the value of “Other securities” under the respective industry sectors. Further details on such holdings and related transactions during the year ended November 30, 2015, appear below.
| | | Beginning
shares | | | Additions | | | Reductions | | | Ending
shares | | | Dividend
income
(000) | | | Value of
affiliates at
11/30/2015
(000) | |
| Kingfisher PLC1 | | | 67,581,398 | | | | 53,931,801 | | | | — | | | | 121,513,199 | | | $ | 17,471 | | | $ | 646,761 | |
| ComfortDelGro Corp. Ltd.1 | | | 124,903,000 | | | | 43,339,000 | | | | 19,752,000 | | | | 148,490,000 | | | | 9,287 | | | | 307,845 | |
| American Campus Communities, Inc. | | | — | | | | 6,763,000 | | | | — | | | | 6,763,000 | | | | 10,376 | | | | 273,225 | |
| Greene King PLC1 | | | — | | | | 16,727,000 | | | | — | | | | 16,727,000 | | | | 5,697 | | | | 214,137 | |
| Golar LNG Ltd. | | | 3,754,495 | | | | 1,425,505 | | | | — | | | | 5,180,000 | | | | 7,521 | | | | 141,673 | |
| | | | | | | | | | | | | | | | | | | $ | 50,352 | | | $ | 1,583,641 | |
The following footnotes apply to either the individual securities noted or one or more of the securities aggregated and listed as a single line item.
| 1 | Valued under fair value procedures adopted by authority of the board of trustees. The total value of all such securities, including those in “Miscellaneous” and “Other securities,” was $40,053,565,000, which represented 47.51% of the net assets of the fund. This amount includes $39,098,194,000 related to certain securities trading outside the U.S. whose values were adjusted as a result of significant market movements following the close of local trading. |
| 2 | Security did not produce income during the last 12 months. |
| 3 | Represents an affiliated company as defined under the Investment Company Act of 1940. |
Key to abbreviations and symbols
ADR = American Depositary Receipts
A$ = Australian dollars
EUR/€ = Euros
GBP/£ = British pounds
¥ = Japanese yen
S$ = Singapore dollars
See Notes to Financial Statements
| Capital World Growth and Income Fund | 15 |
Financial statements
Statement of assets and liabilities
at November 30, 2015
(dollars in thousands)
| Assets: | | | | | | | | |
| Investment securities, at value: | | | | | | | | |
| Unaffiliated issuers (cost: $69,123,168) | | $ | 82,664,950 | | | | | |
| Affiliated issuers (cost: $1,581,710) | | | 1,583,641 | | | $ | 84,248,591 | |
| Cash denominated in currencies other than U.S. dollars (cost: $5,814) | | | | | | | 5,814 | |
| Cash | | | | | | | 58,270 | |
| Unrealized appreciation on open forward currency contracts | | | | | | | 1,742 | |
| Receivables for: | | | | | | | | |
| Sales of investments | | | 50,982 | | | | | |
| Sales of fund’s shares | | | 47,682 | | | | | |
| Dividends and interest | | | 195,597 | | | | | |
| Other | | | 492 | | | | 294,753 | |
| | | | | | | | 84,609,170 | |
| Liabilities: | | | | | | | | |
| Unrealized depreciation on open forward currency contracts | | | | | | | 2,392 | |
| Payables for: | | | | | | | | |
| Purchases of investments | | | 148,600 | | | | | |
| Repurchases of fund’s shares | | | 82,191 | | | | | |
| Investment advisory services | | | 26,135 | | | | | |
| Services provided by related parties | | | 33,579 | | | | | |
| Trustees’ deferred compensation | | | 1,484 | | | | | |
| Other | | | 9,962 | | | | 301,951 | |
| Net assets at November 30, 2015 | | | | | | $ | 84,304,827 | |
| | | | | | | | | |
| Net assets consist of: | | | | | | | | |
| Capital paid in on shares of beneficial interest | | | | | | $ | 69,093,600 | |
| Undistributed net investment income | | | | | | | 367,603 | |
| Undistributed net realized gain | | | | | | | 1,306,382 | |
| Net unrealized appreciation | | | | | | | 13,537,242 | |
| Net assets at November 30, 2015 | | | | | | $ | 84,304,827 | |
(dollars and shares in thousands, except per-share amounts)
Shares of beneficial interest issued and outstanding (no stated par value) —
unlimited shares authorized (1,861,405 total shares outstanding)
| | | | | | Shares | | | Net asset | |
| | | Net assets | | | outstanding | | | value per share | |
| Class A | | $ | 53,886,179 | | | | 1,188,406 | | | $ | 45.34 | |
| Class B | | | 362,611 | | | | 8,034 | | | | 45.13 | |
| Class C | | | 3,757,421 | | | | 83,784 | | | | 44.85 | |
| Class F-1 | | | 3,790,904 | | | | 83,769 | | | | 45.25 | |
| Class F-2 | | | 4,243,764 | | | | 93,628 | | | | 45.33 | |
| Class 529-A | | | 2,936,356 | | | | 64,953 | | | | 45.21 | |
| Class 529-B | | | 40,681 | | | | 902 | | | | 45.11 | |
| Class 529-C | | | 700,617 | | | | 15,576 | | | | 44.98 | |
| Class 529-E | | | 121,918 | | | | 2,701 | | | | 45.14 | |
| Class 529-F-1 | | | 113,104 | | | | 2,499 | | | | 45.25 | |
| Class R-1 | | | 256,711 | | | | 5,716 | | | | 44.91 | |
| Class R-2 | | | 1,061,089 | | | | 23,681 | | | | 44.81 | |
| Class R-2E | | | 1,117 | | | | 25 | | | | 45.25 | |
| Class R-3 | | | 2,245,898 | | | | 49,849 | | | | 45.05 | |
| Class R-4 | | | 2,002,802 | | | | 44,267 | | | | 45.24 | |
| Class R-5E | | | 10 | | | | — | * | | | 45.34 | |
| Class R-5 | | | 1,393,542 | | | | 30,716 | | | | 45.37 | |
| Class R-6 | | | 7,390,103 | | | | 162,899 | | | | 45.37 | |
*Amount less than one thousand.
See Notes to Financial Statements
| 16 | Capital World Growth and Income Fund |
Statement of operations
for the year ended November 30, 2015
(dollars in thousands)
| Investment income: | | | | | | | | |
| Income: | | | | | | | | |
| Dividends (net of non-U.S. taxes of $77,224; also includes $50,352 from affiliates) | | $ | 2,300,306 | | | | | |
| Interest (net of non-U.S. taxes of $639) | | | 63,839 | | | $ | 2,364,145 | |
| Fees and expenses*: | | | | | | | | |
| Investment advisory services | | | 327,182 | | | | | |
| Distribution services | | | 235,792 | | | | | |
| Transfer agent services | | | 97,897 | | | | | |
| Administrative services | | | 21,091 | | | | | |
| Reports to shareholders | | | 3,736 | | | | | |
| Registration statement and prospectus | | | 1,944 | | | | | |
| Trustees’ compensation | | | 427 | | | | | |
| Auditing and legal | | | 3,534 | | | | | |
| Custodian | | | 9,735 | | | | | |
| Other | | | 4,176 | | | | 705,514 | |
| Net investment income | | | | | | | 1,658,631 | |
| | | | | | | | | |
| Net realized gain and unrealized depreciation: | | | | | | | | |
| Net realized gain (loss) on: | | | | | | | | |
| Investments (net of non-U.S. taxes of $93; also includes $17,622 net gain from affiliates) | | | 4,784,568 | | | | | |
| Forward currency contracts | | | 20,276 | | | | | |
| Currency transactions | | | (30,330 | ) | | | 4,774,514 | |
| Net unrealized (depreciation) appreciation on: | | | | | | | | |
| Investments (net of non-U.S. taxes of $3,637) | | | (9,216,909 | ) | | | | |
| Forward currency contracts | | | (4,748 | ) | | | | |
| Currency translations | | | 2,977 | | | | (9,218,680 | ) |
| Net realized gain and unrealized depreciation | | | | | | | (4,444,166 | ) |
| | | | | | | | | |
| Net decrease in net assets resulting from operations | | | | | | $ | (2,785,535 | ) |
* Additional information related to class-specific fees and expenses is included in the Notes to Financial Statements.
Statements of changes in net assets
(dollars in thousands)
| | | | Year ended November 30 | |
| | | | 2015 | | | | 2014 | |
| | | | | | | | | |
| Operations: | | | | | | | | |
| Net investment income | | $ | 1,658,631 | | | $ | 2,197,598 | |
| Net realized gain | | | 4,774,514 | | | | 5,628,114 | |
| Net unrealized depreciation | | | (9,218,680 | ) | | | (6,340 | ) |
| Net (decrease) increase in net assets resulting from operations | | | (2,785,535 | ) | | | 7,819,372 | |
| | | | | | | | | |
| Dividends paid to shareholders from net investment income | | | (1,933,803 | ) | | | (1,842,249 | ) |
| | | | | | | | | |
| Net capital share transactions | | | (401,335 | ) | | | (289,946 | ) |
| | | | | | | | | |
| Total (decrease) increase in net assets | | | (5,120,673 | ) | | | 5,687,177 | |
| | | | | | | | | |
| Net assets: | | | | | | | | |
| Beginning of year | | | 89,425,500 | | | | 83,738,323 | |
| End of year (including undistributed net investment income: $367,603 and $681,687, respectively) | | $ | 84,304,827 | | | $ | 89,425,500 | |
See Notes to Financial Statements
| Capital World Growth and Income Fund | 17 |
Notes to financial statements
1. Organization
Capital World Growth and Income Fund (the “fund”) is registered under the Investment Company Act of 1940 as an open-end, diversified management investment company. The fund seeks long-term growth of capital while providing current income.
The fund has 18 share classes consisting of five retail share classes (Classes A, B and C, as well as two F share classes, F-1 and F-2), five 529 college savings plan share classes (Classes 529-A, 529-B, 529-C, 529-E and 529-F-1) and eight retirement plan share classes (Classes R-1, R-2, R-2E, R-3, R-4, R-5E, R-5 and R-6). The 529 college savings plan share classes can be used to save for college education. The retirement plan share classes are generally offered only through eligible employer-sponsored retirement plans. The fund’s share classes are described further in the following table:
| Share class | | Initial sales
charge | | Contingent deferred sales
charge upon redemption | | Conversion feature | |
| Classes A and 529-A | | Up to 5.75% | | None (except 1% for certain redemptions within one year of purchase without an initial sales charge) | | None | |
| Classes B and 529-B* | | None | | Declines from 5% to 0% for redemptions within six years of purchase | | Classes B and 529-B convert to Classes A and 529-A, respectively, after eight years | |
| Class C | | None | | 1% for redemptions within one year of purchase | | Class C converts to Class F-1 after 10 years | |
| Class 529-C | | None | | 1% for redemptions within one year of purchase | | None | |
| Class 529-E | | None | | None | | None | |
| Classes F-1, F-2 and 529-F-1 | | None | | None | | None | |
| Classes R-1, R-2, R-2E, R-3, R-4, R-5E, R-5 and R-6 | | None | | None | | None | |
* Class B and 529-B shares of the fund are not available for purchase.
On November 20, 2015, the fund made an additional retirement plan share class (Class R-5E) available for sale pursuant to an amendment to its registration statement filed with the U.S. Securities and Exchange Commission. Refer to the fund’s prospectus for more details.
Holders of all share classes have equal pro rata rights to the assets, dividends and liquidation proceeds of the fund. Each share class has identical voting rights, except for the exclusive right to vote on matters affecting only its class. Share classes have different fees and expenses (“class-specific fees and expenses”), primarily due to different arrangements for distribution, transfer agent and administrative services. Differences in class-specific fees and expenses will result in differences in net investment income and, therefore, the payment of different per-share dividends by each share class.
2. Significant accounting policies
The fund is an investment company that applies the accounting and reporting guidance issued in Topic 946 by the U.S. Financial Accounting Standards Board. The fund’s financial statements have been prepared to comply with U.S. generally accepted accounting principles (“U.S. GAAP”). These principles require the fund’s investment adviser to make estimates and assumptions that affect reported amounts and disclosures. Actual results could differ from those estimates. Subsequent events, if any, have been evaluated through the date of issuance in the preparation of the financial statements. The fund follows the significant accounting policies described in this section, as well as the valuation policies described in the next section on valuation.
Security transactions and related investment income — Security transactions are recorded by the fund as of the date the trades are executed with brokers. Realized gains and losses from security transactions are determined based on the specific identified cost of the securities. In the event a security is purchased with a delayed payment date, the fund will segregate liquid assets sufficient to meet its payment obligations. Dividend income is recognized on the ex-dividend date and interest income is recognized on an accrual basis. Market discounts, premiums and original issue discounts on fixed-income securities are amortized daily over the expected life of the security.
| 18 | Capital World Growth and Income Fund |
Class allocations — Income, fees and expenses (other than class-specific fees and expenses) and realized and unrealized gains and losses are allocated daily among the various share classes based on their relative net assets. Class-specific fees and expenses, such as distribution, transfer agent and administrative services, are charged directly to the respective share class.
Dividends and distributions to shareholders — Dividends and distributions to shareholders are recorded on the ex-dividend date.
Currency translation — Assets and liabilities, including investment securities, denominated in currencies other than U.S. dollars are translated into U.S. dollars at the exchange rates supplied by one or more pricing vendors on the valuation date. Purchases and sales of investment securities and income and expenses are translated into U.S. dollars at the exchange rates on the dates of such transactions. The effects of changes in exchange rates on investment securities are included with the net realized gain or loss and net unrealized appreciation or depreciation on investments in the fund’s statement of operations. The realized gain or loss and unrealized appreciation or depreciation resulting from all other transactions denominated in currencies other than U.S. dollars are disclosed separately.
3. Valuation
Capital Research and Management Company (“CRMC”), the fund’s investment adviser, values the fund’s investments at fair value as defined by U.S. GAAP. The net asset value of each share class of the fund is generally determined as of approximately 4:00 p.m. New York time each day the New York Stock Exchange is open.
Methods and inputs — The fund’s investment adviser uses the following methods and inputs to establish the fair value of the fund’s assets and liabilities. Use of particular methods and inputs may vary over time based on availability and relevance as market and economic conditions evolve.
Equity securities are generally valued at the official closing price of, or the last reported sale price on, the exchange or market on which such securities are traded, as of the close of business on the day the securities are being valued or, lacking any sales, at the last available bid price. Prices for each security are taken from the principal exchange or market on which the security trades.
Fixed-income securities, including short-term securities, are generally valued at prices obtained from one or more pricing vendors. Vendors value such securities based on one or more of the inputs described in the following table. The table provides examples of inputs that are commonly relevant for valuing particular classes of fixed-income securities in which the fund is authorized to invest. However, these classifications are not exclusive, and any of the inputs may be used to value any other class of fixed-income security.
| Fixed-income class | | Examples of standard inputs |
| All | | Benchmark yields, transactions, bids, offers, quotations from dealers and trading systems, new issues, spreads and other relationships observed in the markets among comparable securities; and proprietary pricing models such as yield measures calculated using factors such as cash flows, financial or collateral performance and other reference data (collectively referred to as “standard inputs”) |
| Corporate bonds & notes; convertible securities | | Standard inputs and underlying equity of the issuer |
| Bonds & notes of governments & government agencies | | Standard inputs and interest rate volatilities |
| Mortgage-backed; asset-backed obligations | | Standard inputs and cash flows, prepayment information, default rates, delinquency and loss assumptions, collateral characteristics, credit enhancements and specific deal information |
When the fund’s investment adviser deems it appropriate to do so (such as when vendor prices are unavailable or deemed to be not representative), fixed-income securities will be valued in good faith at the mean quoted bid and ask prices that are reasonably and timely available (or bid prices, if ask prices are not available) or at prices for securities of comparable maturity, quality and type.
Securities with both fixed-income and equity characteristics, or equity securities traded principally among fixed-income dealers, are generally valued in the manner described for either equity or fixed-income securities, depending on which method is deemed most appropriate by the fund’s investment adviser. Forward currency contracts are valued at the mean of representative quoted bid and ask prices, generally based on prices supplied by one or more pricing vendors.
Securities and other assets for which representative market quotations are not readily available or are considered unreliable by the fund’s investment adviser are fair valued as determined in good faith under fair valuation guidelines adopted by authority of the fund’s board of trustees as further described. The investment adviser follows fair valuation guidelines, consistent with U.S. Securities and Exchange
| Capital World Growth and Income Fund | 19 |
Commission rules and guidance, to consider relevant principles and factors when making fair value determinations. The investment adviser considers relevant indications of value that are reasonably and timely available to it in determining the fair value to be assigned to a particular security, such as the type and cost of the security; contractual or legal restrictions on resale of the security; relevant financial or business developments of the issuer; actively traded similar or related securities; conversion or exchange rights on the security; related corporate actions; significant events occurring after the close of trading in the security; and changes in overall market conditions. In addition, the closing prices of equity securities that trade in markets outside U.S. time zones may be adjusted to reflect significant events that occur after the close of local trading but before the net asset value of each share class of the fund is determined. Fair valuations and valuations of investments that are not actively trading involve judgment and may differ materially from valuations that would have been used had greater market activity occurred.
Processes and structure — The fund’s board of trustees has delegated authority to the fund’s investment adviser to make fair value determinations, subject to board oversight. The investment adviser has established a Joint Fair Valuation Committee (the “Fair Valuation Committee”) to administer, implement and oversee the fair valuation process, and to make fair value decisions. The Fair Valuation Committee regularly reviews its own fair value decisions, as well as decisions made under its standing instructions to the investment adviser’s valuation teams. The Fair Valuation Committee reviews changes in fair value measurements from period to period and may, as deemed appropriate, update the fair valuation guidelines to better reflect the results of back testing and address new or evolving issues. The Fair Valuation Committee reports any changes to the fair valuation guidelines to the board of trustees with supplemental information to support the changes. The fund’s board and audit committee also regularly review reports that describe fair value determinations and methods.
The fund’s investment adviser has also established a Fixed-Income Pricing Review Group to administer and oversee the fixed-income valuation process, including the use of fixed-income pricing vendors. This group regularly reviews pricing vendor information and market data. Pricing decisions, processes and controls over security valuation are also subject to additional internal reviews, including an annual control self-evaluation program facilitated by the investment adviser’s compliance group.
Classifications — The fund’s investment adviser classifies the fund’s assets and liabilities into three levels based on the inputs used to value the assets or liabilities. Level 1 values are based on quoted prices in active markets for identical securities. Level 2 values are based on significant observable market inputs, such as quoted prices for similar securities and quoted prices in inactive markets. Certain securities trading outside the U.S. may transfer between Level 1 and Level 2 due to valuation adjustments resulting from significant market movements following the close of local trading. Level 3 values are based on significant unobservable inputs that reflect the investment adviser’s determination of assumptions that market participants might reasonably use in valuing the securities. The valuation levels are not necessarily an indication of the risk or liquidity associated with the underlying investment. For example, U.S. government securities are reflected as Level 2 because the inputs used to determine fair value may not always be quoted prices in an active market. The following tables present the fund’s valuation levels as of November 30, 2015 (dollars in thousands):
| | | Investment securities | |
| | | Level 1 | | | Level 2* | | | Level 3 | | | Total | |
| Assets: | | | | | | | | | | | | | | | | |
| Common stocks: | | | | | | | | | | | | | | | | |
| Financials | | $ | 3,565,001 | | | $ | 10,685,061 | | | $ | — | | | $ | 14,250,062 | |
| Health care | | | 9,052,162 | | | | 4,463,163 | | | | — | | | | 13,515,325 | |
| Information technology | | | 7,071,618 | | | | 2,855,384 | | | | — | | | | 9,927,002 | |
| Consumer discretionary | | | 3,276,633 | | | | 5,426,718 | | | | — | | | | 8,703,351 | |
| Industrials | | | 4,552,462 | | | | 4,066,230 | | | | — | | | | 8,618,692 | |
| Consumer staples | | | 3,440,011 | | | | 2,830,671 | | | | — | | | | 6,270,682 | |
| Energy | | | 3,003,442 | | | | 1,515,170 | | | | — | | | | 4,518,612 | |
| Telecommunication services | | | 2,157,404 | | | | 1,850,095 | | | | — | | | | 4,007,499 | |
| Utilities | | | 1,415,612 | | | | 2,210,712 | | | | — | | | | 3,626,324 | |
| Materials | | | 520,626 | | | | 1,688,382 | | | | — | | | | 2,209,008 | |
| Miscellaneous | | | 1,750,318 | | | | 2,455,696 | | | | — | | | | 4,206,014 | |
| Rights & warrants | | | — | | | | 6,283 | | | | — | | | | 6,283 | |
| Convertible stocks | | | 14,560 | | | | — | | | | — | | | | 14,560 | |
| Bonds, notes & other debt instruments | | | — | | | | 820,185 | | | | — | | | | 820,185 | |
| Short-term securities | | | — | | | | 3,554,992 | | | | — | | | | 3,554,992 | |
| Total | | $ | 39,819,849 | | | $ | 44,428,742 | | | $ | — | | | $ | 84,248,591 | |
| 20 | Capital World Growth and Income Fund |
| | | Other investments† | |
| | | Level 1 | | | Level 2 | | | Level 3 | | | Total | |
| Assets: | | | | | | | | | | | | | | | | |
| Unrealized appreciation on open forward currency contracts | | $ | — | | | $ | 1,742 | | | $ | — | | | $ | 1,742 | |
| Liabilities: | | | | | | | | | | | | | | | | |
| Unrealized depreciation on open forward currency contracts | | | — | | | | (2,392 | ) | | | — | | | | (2,392 | ) |
| Total | | $ | — | | | $ | (650 | ) | | $ | — | | | $ | (650 | ) |
| * | Securities with a value of $33,507,602,000, which represented 39.75% of the net assets of the fund, transferred from Level 1 to Level 2 since the prior fiscal year-end, primarily due to significant market movements following the close of local trading. |
| † | Forward currency contracts are not included in the investment portfolio. |
4. Risk factors
Investing in the fund may involve certain risks including, but not limited to, those described below.
Market conditions — The prices of, and the income generated by, the common stocks and other securities held by the fund may decline —sometimes rapidly or unpredictably — due to various factors, including events or conditions affecting the general economy or particular industries; overall market changes; local, regional or global political, social or economic instability; governmental or governmental agency responses to economic conditions; and currency exchange rate, interest rate and commodity price fluctuations.
Issuer risks — The prices of, and the income generated by, securities held by the fund may decline in response to various factors directly related to the issuers of such securities, including reduced demand for an issuer’s goods or services, poor management performance and strategic initiatives such as mergers, acquisitions or dispositions and the market response to any such initiatives.
Investing outside the U.S. — Securities of issuers domiciled outside the U.S., or with significant operations or revenues outside the U.S., may lose value because of adverse political, social, economic or market developments (including social instability, regional conflicts, terrorism and war) in the countries or regions in which the issuers operate or generate revenue. These securities may also lose value due to changes in foreign currency exchange rates against the U.S. dollar and/or currencies of other countries. Issuers of these securities may be more susceptible to actions of foreign governments, such as the imposition of price controls or punitive taxes, that could adversely impact revenues. Securities markets in certain countries may be more volatile and/or less liquid than those in the U.S. Investments outside the U.S. may also be subject to different accounting practices and different regulatory, legal and reporting standards and practices, and may be more difficult to value, than those in the U.S. In addition, the value of investments outside the U.S. may be reduced by foreign taxes, including foreign withholding taxes on interest and dividends. Further, there may be increased risks of delayed settlement of securities purchased or sold by the fund. The risks of investing outside the U.S. may be heightened in connection with investments in emerging markets.
Investing in emerging markets — Investing in emerging markets may involve risks in addition to and greater than those generally associated with investing in the securities markets of developed countries. For instance, developing countries may have less developed legal and accounting systems than those in developed countries. The governments of these countries may be less stable and more likely to impose capital controls, nationalize a company or industry, place restrictions on foreign ownership and on withdrawing sale proceeds of securities from the country, and/or impose punitive taxes that could adversely affect the prices of securities. In addition, the economies of these countries may be dependent on relatively few industries that are more susceptible to local and global changes. Securities markets in these countries can also be relatively small and have substantially lower trading volumes. As a result, securities issued in these countries may be more volatile and less liquid, and may be more difficult to value, than securities issued in countries with more developed economies and/or markets. Less certainty with respect to security valuations may lead to additional challenges and risks in calculating the fund’s net asset value. Additionally, there may be increased settlement risks for transactions in local securities.
Investing in growth-oriented stocks — Growth-oriented common stocks and other equity-type securities (such as preferred stocks, convertible preferred stocks and convertible bonds) may involve larger price swings and greater potential for loss than other types of investments.
Investing in income-oriented stocks — Income provided by the fund may be reduced by changes in the dividend policies of, and the capital resources available for dividend payments at, the companies in which the fund invests.
Management — The investment adviser to the fund actively manages the fund’s investments. Consequently, the fund is subject to the risk that the methods and analyses employed by the investment adviser in this process may not produce the desired results. This could cause the fund to lose value or its investment results to lag relevant benchmarks or other funds with similar objectives.
| Capital World Growth and Income Fund | 21 |
5. Certain investment techniques
Forward currency contracts — The fund has entered into forward currency contracts, which represent agreements to exchange currencies on specific future dates at predetermined rates. The fund’s investment adviser uses forward currency contracts to manage the fund’s exposure to changes in exchange rates. Upon entering into these contracts, risks may arise from the potential inability of counterparties to meet the terms of their contracts and from possible movements in exchange rates.
On a daily basis, the fund’s investment adviser values forward currency contracts and records unrealized appreciation or depreciation for open forward currency contracts in the fund’s statement of assets and liabilities. Realized gains or losses are recorded at the time the forward currency contract is closed or offset by another contract with the same broker for the same settlement date and currency.
Closed forward currency contracts that have not reached their settlement date are included in the respective receivables or payables for closed forward currency contracts in the fund’s statement of assets and liabilities. Net realized gains or losses from closed forward currency contracts and net unrealized appreciation or depreciation from open forward currency contracts are recorded in the fund’s statement of operations.
The following tables present the financial statement impacts resulting from the fund’s use of forward currency contracts as of, or for the year ended, November 30, 2015 (dollars in thousands):
| | | | | Assets | | Liabilities | |
| Contract | | Risk type | | Location on statement of
assets and liabilities | | Value | | Location on statement of
assets and liabilities | | Value | |
| Forward currency | | Currency | | Unrealized appreciation on open forward currency contracts | | $1,742 | | Unrealized depreciation on open forward currency contracts | | $2,392 | |
| | | | | | | | | | | | |
| | | | | Net realized gain | | Net unrealized depreciation | |
| Contract | | Risk type | | Location on statement of
operations | | Value | | Location on statement of
operations | | Value | |
| Forward currency | | Currency | | Net realized gain on forward currency contracts | | $20,276 | | Net unrealized depreciation on forward currency contracts | | $(4,748 | ) |
Collateral — The fund participates in a collateral program due to its use of forward currency contracts. The program calls for the fund to either receive or pledge collateral based on the net gain or loss on unsettled forward currency contracts by counterparty. The purpose of the collateral is to cover potential losses that could occur in the event that either party cannot meet its contractual obligations.
Rights of offset — The fund has entered into enforceable master netting agreements with certain counterparties for forward currency contracts, where on any date amounts payable by each party to the other (in the same currency with respect to the same transaction) may be closed or offset by each party’s payment obligation. If an early termination date occurs under these agreements following an event of default or termination event, all obligations of each party to its counterparty are settled net through a single payment in a single currency (“close-out netting”). For financial reporting purposes, the fund does not offset financial assets and financial liabilities that are subject to these master netting arrangements in the statement of assets and liabilities.
The following table presents the fund’s forward currency contracts by counterparty that are subject to master netting agreements but that are not offset in the fund’s statement of assets and liabilities. The net amount column shows the impact of offsetting on the fund’s statement of assets and liabilities as of November 30, 2015 (dollars in thousands) if close-out netting was exercised:
| | | | | | Gross amounts not offset in the | | | | |
| | | Gross amounts | | | statement of assets and liabilities and | | | | |
| | | recognized in the | | | subject to a master netting agreement | | | | |
| | | statement of assets | | | Available | | | Non-cash | | | Cash | | | Net | |
| Counterparty | | and liabilities | | | to offset | | | collateral* | | | collateral | | | amount | |
| Assets: | | | | | | | | | | | | | | | | | | | | |
| Bank of America, N.A. | | $ | 706 | | | $ | (706 | ) | | $ | — | | | $ | — | | | $ | — | |
| Citibank | | | 557 | | | | (557 | ) | | | — | | | | — | | | | — | |
| HSBC Bank | | | 479 | | | | (179 | ) | | | — | | | | — | | | | 300 | |
| Total | | $ | 1,742 | | | $ | (1,442 | ) | | $ | — | | | $ | — | | | $ | 300 | |
| 22 | Capital World Growth and Income Fund |
| | | | | | Gross amounts not offset in the | | | | |
| | | Gross amounts | | | statement of assets and liabilities and | | | | |
| | | recognized in the | | | subject to a master netting agreement | | | | |
| | | statement of assets | | | Available | | | Non-cash | | | Cash | | | Net | |
| Counterparty | | and liabilities | | | to offset | | | collateral* | | | collateral | | | amount | |
| Liabilities: | | | | | | | | | | | | | | | | | | | | |
| Bank of America, N.A. | | $ | 1,385 | | | $ | (706 | ) | | $ | (679 | ) | | $ | — | | | $ | — | |
| Barclays Bank PLC | | | 227 | | | | — | | | | (227 | ) | | | — | | | | — | |
| Citibank | | | 569 | | | | (557 | ) | | | (12 | ) | | | — | | | | — | |
| HSBC Bank | | | 179 | | | | (179 | ) | | | — | | | | — | | | | — | |
| UBS AG | | | 32 | | | | — | | | | (32 | ) | | | — | | | | — | |
| Total | | $ | 2,392 | | | $ | (1,442 | ) | | $ | (950 | ) | | $ | — | | | $ | — | |
| * | Non-cash collateral is shown on a settlement basis. |
6. Taxation and distributions
Federal income taxation — The fund complies with the requirements under Subchapter M of the Internal Revenue Code applicable to mutual funds and intends to distribute substantially all of its net taxable income and net capital gains each year. The fund is not subject to income taxes to the extent such distributions are made. Therefore, no federal income tax provision is required.
As of and during the period ended November 30, 2015, the fund did not have a liability for any unrecognized tax benefits. The fund recognizes interest and penalties, if any, related to unrecognized tax benefits as income tax expense in the statement of operations. During the period, the fund did not incur any interest or penalties.
The fund is not subject to examination by U.S. federal tax authorities for tax years before 2011, by state tax authorities for tax years before 2010 and by tax authorities outside the U.S. for tax years before 2008.
Non-U.S. taxation — Dividend and interest income are recorded net of non-U.S. taxes paid. The fund may file withholding tax reclaims in certain jurisdictions to recover a portion of amounts previously withheld. As a result of rulings from European courts, the fund filed for additional reclaims related to prior years. These reclaims are recorded when the amount is known and there are no significant uncertainties on collectability. Gains realized by the fund on the sale of securities in certain countries are subject to non-U.S. taxes. The fund records a liability based on unrealized gains to provide for potential non-U.S. taxes payable upon the sale of these securities.
Distributions — Distributions paid to shareholders are based on net investment income and net realized gains determined on a tax basis, which may differ from net investment income and net realized gains for financial reporting purposes. These differences are due primarily to different treatment for items such as currency gains and losses; short-term capital gains and losses; capital losses related to sales of certain securities within 30 days of purchase; unrealized appreciation of certain investments in securities outside the U.S.; and net capital losses. The fiscal year in which amounts are distributed may differ from the year in which the net investment income and net realized gains are recorded by the fund for financial reporting purposes. The fund may also designate a portion of the amount paid to redeeming shareholders as a distribution for tax purposes.
During the year ended November 30, 2015, the fund reclassified $325,000 from undistributed net investment income to capital paid in on shares of beneficial interest, $38,587,000 from undistributed net investment income to undistributed net realized gain and $81,637,000 from undistributed net realized gain to capital paid in on shares of beneficial interest to align financial reporting with tax reporting.
| Capital World Growth and Income Fund | 23 |
As of November 30, 2015, the tax-basis components of distributable earnings, unrealized appreciation (depreciation) and cost of investment securities were as follows (dollars in thousands):
| Undistributed ordinary income | | $ | 678,372 | |
| Undistributed long-term capital gains* | | | 1,316,383 | |
| Gross unrealized appreciation on investment securities | | | 18,340,109 | |
| Gross unrealized depreciation on investment securities | | | (5,116,160 | ) |
| Net unrealized appreciation on investment securities | | | 13,223,949 | |
| Cost of investment securities | | | 71,024,642 | |
| * | Reflects the utilization of capital loss carryforward of $3,412,000,000. |
Tax-basis distributions paid to shareholders from ordinary income were as follows (dollars in thousands):
| | | Year ended November 30 | |
| Share class | | 2015 | | | 2014 | |
| Class A | | $ | 1,256,037 | | | $ | 1,228,992 | |
| Class B | | | 8,171 | | | | 13,909 | |
| Class C | | | 60,980 | | | | 66,490 | |
| Class F-1 | | | 88,206 | | | | 86,543 | |
| Class F-2 | | | 106,158 | | | | 75,715 | |
| Class 529-A | | | 65,889 | | | | 62,744 | |
| Class 529-B | | | 778 | | | | 1,175 | |
| Class 529-C | | | 10,264 | | | | 9,859 | |
| Class 529-E | | | 2,441 | | | | 2,362 | |
| Class 529-F-1 | | | 2,724 | | | | 2,465 | |
| Class R-1 | | | 4,256 | | | | 4,382 | |
| Class R-2 | | | 17,968 | | | | 18,571 | |
| Class R-2E1 | | | 12 | | | | — | 2 |
| Class R-3 | | | 48,083 | | | | 49,375 | |
| Class R-4 | | | 47,836 | | | | 51,045 | |
| Class R-5E3 | | | — | | | | | |
| Class R-5 | | | 37,236 | | | | 38,123 | |
| Class R-6 | | | 176,764 | | | | 130,499 | |
| Total | | $ | 1,933,803 | | | $ | 1,842,249 | |
| 1 | Class R-2E shares were offered beginning August 29, 2014. |
| 2 | Amount less than one thousand. |
| 3 | Class R-5E shares were offered beginning November 20, 2015. |
7. Fees and transactions with related parties
CRMC, the fund’s investment adviser, is the parent company of American Funds Distributors,® Inc. (“AFD”), the principal underwriter of the fund’s shares, and American Funds Service Company® (“AFS”), the fund’s transfer agent. CRMC, AFD and AFS are considered related parties to the fund.
Investment advisory services — The fund has an investment advisory and service agreement with CRMC that provides for monthly fees accrued daily. These fees are based on a series of decreasing annual rates beginning with 0.600% on the first $500 million of daily net assets and decreasing to 0.350% on such assets in excess of $115 billion. For the year ended November 30, 2015, the investment advisory services fee was $327,182,000, which was equivalent to an annualized rate of 0.374% of average daily net assets.
Class-specific fees and expenses — Expenses that are specific to individual share classes are accrued directly to the respective share class. The principal class-specific fees and expenses are further described below:
Distribution services — The fund has plans of distribution for all share classes, except Class F-2, R-5E, R-5 and R-6 shares. Under the plans, the board of trustees approves certain categories of expenses that are used to finance activities primarily intended to sell fund shares and service existing accounts. The plans provide for payments, based on an annualized percentage of average daily net assets, ranging from 0.30% to 1.00% as noted below. In some cases, the board of trustees has limited the amounts that may be paid to less than the maximum allowed by the plans. All share classes with a plan may use up to 0.25% of average daily net assets to pay
| 24 | Capital World Growth and Income Fund |
service fees, or to compensate AFD for paying service fees, to firms that have entered into agreements with AFD to provide certain shareholder services. The remaining amounts available to be paid under each plan are paid to dealers to compensate them for their sales activities.
For Class A and 529-A shares, distribution-related expenses include the reimbursement of dealer and wholesaler commissions paid by AFD for certain shares sold without a sales charge. These share classes reimburse AFD for amounts billed within the prior 15 months but only to the extent that the overall annual expense limit of 0.30% is not exceeded. As of November 30, 2015, there were no unreimbursed expenses subject to reimbursement for Class A or 529-A shares.
| Share class | | Currently approved limits | | Plan limits | |
| Class A | | | 0.30 | % | | | 0.30 | % | |
| Class 529-A | | | 0.30 | | | | 0.50 | | |
| Classes B and 529-B | | | 1.00 | | | | 1.00 | | |
| Classes C, 529-C and R-1 | | | 1.00 | | | | 1.00 | | |
| Class R-2 | | | 0.75 | | | | 1.00 | | |
| Class R-2E | | | 0.60 | | | | 0.85 | | |
| Classes 529-E and R-3 | | | 0.50 | | | | 0.75 | | |
| Classes F-1, 529-F-1 and R-4 | | | 0.25 | | | | 0.50 | | |
Transfer agent services — The fund has a shareholder services agreement with AFS under which the fund compensates AFS for providing transfer agent services to each of the fund’s share classes. These services include recordkeeping, shareholder communications and transaction processing. In addition, the fund reimburses AFS for amounts paid to third parties for performing transfer agent services on behalf of fund shareholders.
Administrative services — The fund has an administrative services agreement with CRMC under which the fund compensates CRMC for providing administrative services to Class A, C, F, 529 and R shares. These services include, but are not limited to, coordinating, monitoring, assisting and overseeing third parties that provide services to fund shareholders. Under the agreement, Class A shares pay an annual fee of 0.01% and Class C, F, 529 and R shares pay an annual fee of 0.05% of their respective average daily net assets.
529 plan services — Each 529 share class is subject to service fees to compensate the Virginia College Savings Plan (“Virginia529”) for its oversight and administration of the 529 college savings plan. The quarterly fee is based on a series of decreasing annual rates beginning with 0.10% on the first $30 billion of the net assets invested in Class 529 shares of the American Funds and decreasing to 0.05% on such assets in excess of $70 billion. The fee for any given calendar quarter is accrued and calculated on the basis of the average net assets of Class 529 shares of the American Funds for the last month of the prior calendar quarter. The fee is included in other expenses in the fund’s statement of operations. Virginia529 is not considered a related party to the fund.
For the year ended November 30, 2015, class-specific expenses under the agreements were as follows (dollars in thousands):
| | | | Distribution | | | Transfer agent | | | Administrative | | | 529 plan |
| | Share class | | services | | | services | | | services | | | services |
| | Class A | | | $134,991 | | | | $69,147 | | | | $5,592 | | | Not applicable |
| | Class B | | | 5,458 | | | | 702 | | | | Not applicable | | | Not applicable |
| | Class C | | | 41,431 | | | | 5,167 | | | | 2,079 | | | Not applicable |
| | Class F-1 | | | 9,818 | | | | 4,505 | | | | 1,970 | | | Not applicable |
| | Class F-2 | | Not applicable | | | | 4,191 | | | | 2,160 | | | Not applicable |
| | Class 529-A | | | 6,705 | | | | 3,120 | | | | 1,518 | | | $2,688 |
| | Class 529-B | | | 564 | | | | 68 | | | | 29 | | | 50 |
| | Class 529-C | | | 7,265 | | | | 797 | | | | 366 | | | 648 |
| | Class 529-E | | | 626 | | | | 74 | | | | 63 | | | 112 |
| | Class 529-F-1 | | | — | | | | 118 | | | | 57 | | | 101 |
| | Class R-1 | | | 2,817 | | | | 278 | | | | 141 | | | Not applicable |
| | Class R-2 | | | 8,581 | | | | 3,562 | | | | 577 | | | Not applicable |
| | Class R-2E | | | 3 | | | | 1 | | | | — | * | | Not applicable |
| | Class R-3 | | | 12,223 | | | | 3,492 | | | | 1,225 | | | Not applicable |
| | Class R-4 | | | 5,310 | | | | 1,973 | | | | 1,064 | | | Not applicable |
| | Class R-5E† | | Not applicable | | | | — | * | | | — | * | | Not applicable |
| | Class R-5 | | Not applicable | | | | 677 | | | | 736 | | | Not applicable |
| | Class R-6 | | Not applicable | | | | 25 | | | | 3,514 | | | Not applicable |
| | Total class-specific expenses | | | $235,792 | | | | $97,897 | | | | $21,091 | | | $3,599 |
| | * | Amount less than one thousand. |
| | † | Class R-5E shares were offered beginning November 20, 2015. |
| Capital World Growth and Income Fund | 25 |
Trustees’ deferred compensation — Trustees who are unaffiliated with CRMC may elect to defer the cash payment of part or all of their compensation. These deferred amounts, which remain as liabilities of the fund, are treated as if invested in shares of the fund or other American Funds. These amounts represent general, unsecured liabilities of the fund and vary according to the total returns of the selected funds. Trustees’ compensation of $427,000 in the fund’s statement of operations includes $400,000 in current fees (either paid in cash or deferred) and a net increase of $27,000 in the value of the deferred amounts.
Affiliated officers and trustees — Officers and certain trustees of the fund are or may be considered to be affiliated with CRMC, AFD and AFS. No affiliated officers or trustees received any compensation directly from the fund.
8. Capital share transactions
Capital share transactions in the fund were as follows (dollars and shares in thousands):
| | | | | | | | | Reinvestments of | | | | | | | | | Net (decrease) | |
| | | Sales1 | | | dividends | | | Repurchases1 | | | increase | |
| Share class | | Amount | | | Shares | | | Amount | | | Shares | | | Amount | | | Shares | | | Amount | | | Shares | |
| | | | | | | | | | | | | | | | | | | | | | | | | | | | | | | | | |
| Year ended November 30, 2015 | | | | | | | | | | | | | | | | | | | | | | | | | |
| | | | | | | | | | | | | | | | | | | | | | | | | | | | | | | | | |
| Class A | | $ | 3,683,750 | | | | 78,792 | | | $ | 1,229,677 | | | | 26,502 | | | $ | (5,558,045 | ) | | | (119,365 | ) | | $ | (644,618 | ) | | | (14,071 | ) |
| Class B | | | 2,982 | | | | 63 | | | | 8,090 | | | | 175 | | | | (402,562 | ) | | | (8,634 | ) | | | (391,490 | ) | | | (8,396 | ) |
| Class C | | | 404,737 | | | | 8,735 | | | | 59,607 | | | | 1,292 | | | | (1,064,595 | ) | | | (23,034 | ) | | | (600,251 | ) | | | (13,007 | ) |
| Class F-1 | | | 1,110,065 | | | | 23,801 | | | | 86,372 | | | | 1,863 | | | | (1,062,607 | ) | | | (22,706 | ) | | | 133,830 | | | | 2,958 | |
| Class F-2 | | | 1,258,019 | | | | 27,018 | | | | 98,045 | | | | 2,116 | | | | (1,042,926 | ) | | | (22,597 | ) | | | 313,138 | | | | 6,537 | |
| Class 529-A | | | 273,799 | | | | 5,879 | | | | 65,878 | | | | 1,423 | | | | (342,576 | ) | | | (7,372 | ) | | | (2,899 | ) | | | (70 | ) |
| Class 529-B | | | 872 | | | | 19 | | | | 778 | | | | 17 | | | | (34,711 | ) | | | (746 | ) | | | (33,061 | ) | | | (710 | ) |
| Class 529-C | | | 72,071 | | | | 1,554 | | | | 10,261 | | | | 222 | | | | (97,725 | ) | | | (2,113 | ) | | | (15,393 | ) | | | (337 | ) |
| Class 529-E | | | 11,626 | | | | 250 | | | | 2,441 | | | | 53 | | | | (15,611 | ) | | | (336 | ) | | | (1,544 | ) | | | (33 | ) |
| Class 529-F-1 | | | 20,149 | | | | 431 | | | | 2,724 | | | | 59 | | | | (17,445 | ) | | | (374 | ) | | | 5,428 | | | | 116 | |
| Class R-1 | | | 27,353 | | | | 592 | | | | 4,250 | | | | 92 | | | | (61,764 | ) | | | (1,344 | ) | | | (30,161 | ) | | | (660 | ) |
| Class R-2 | | | 185,598 | | | | 4,024 | | | | 17,955 | | | | 390 | | | | (323,051 | ) | | | (7,020 | ) | | | (119,498 | ) | | | (2,606 | ) |
| Class R-2E | | | 952 | | | | 20 | | | | 11 | | | | — | 2 | | | (34 | ) | | | — | 2 | | | 929 | | | | 20 | |
| Class R-3 | | | 457,598 | | | | 9,860 | | | | 48,000 | | | | 1,040 | | | | (756,780 | ) | | | (16,330 | ) | | | (251,182 | ) | | | (5,430 | ) |
| Class R-4 | | | 440,878 | | | | 9,429 | | | | 47,814 | | | | 1,033 | | | | (645,012 | ) | | | (13,818 | ) | | | (156,320 | ) | | | (3,356 | ) |
| Class R-5E3 | | | 10 | | | | — | 2 | | | — | | | | — | | | | — | | | | — | | | | 10 | | | | — | 2 |
| Class R-5 | | | 302,691 | | | | 6,483 | | | | 37,220 | | | | 803 | | | | (375,811 | ) | | | (8,077 | ) | | | (35,900 | ) | | | (791 | ) |
| Class R-6 | | | 2,178,487 | | | | 46,869 | | | | 176,733 | | | | 3,812 | | | | (927,573 | ) | | | (20,033 | ) | | | 1,427,647 | | | | 30,648 | |
| Total net increase (decrease) | | $ | 10,431,637 | | | | 223,819 | | | $ | 1,895,856 | | | | 40,892 | | | $ | (12,728,828 | ) | | | (273,899 | ) | | $ | (401,335 | ) | | | (9,188 | ) |
| | | | | | | | | | | | | | | | | | | | | | | | | | | | | | | | | |
| Year ended November 30, 2014 | | | | | | | | | | | | | | | | | | | | | | |
| | | | | | | | | | | | | | | | | | | | | | | |
| Class A | | $ | 3,673,668 | | | | 79,841 | | | $ | 1,203,606 | | | | 26,200 | | | $ | (5,874,971 | ) | | | (127,306 | ) | | $ | (997,697 | ) | | | (21,265 | ) |
| Class B | | | 5,360 | | | | 118 | | | | 13,755 | | | | 301 | | | | (497,276 | ) | | | (10,877 | ) | | | (478,161 | ) | | | (10,458 | ) |
| Class C | | | 383,627 | | | | 8,422 | | | | 64,781 | | | | 1,422 | | | | (1,006,282 | ) | | | (22,091 | ) | | | (557,874 | ) | | | (12,247 | ) |
| Class F-1 | | | 1,013,291 | | | | 22,081 | | | | 85,090 | | | | 1,858 | | | | (1,506,428 | ) | | | (32,292 | ) | | | (408,047 | ) | | | (8,353 | ) |
| Class F-2 | | | 1,781,356 | | | | 38,120 | | | | 68,652 | | | | 1,488 | | | | (432,915 | ) | | | (9,404 | ) | | | 1,417,093 | | | | 30,204 | |
| Class 529-A | | | 284,917 | | | | 6,216 | | | | 62,731 | | | | 1,368 | | | | (303,854 | ) | | | (6,601 | ) | | | 43,794 | | | | 983 | |
| Class 529-B | | | 1,374 | | | | 30 | | | | 1,175 | | | | 26 | | | | (37,151 | ) | | | (813 | ) | | | (34,602 | ) | | | (757 | ) |
| Class 529-C | | | 76,996 | | | | 1,685 | | | | 9,857 | | | | 215 | | | | (91,013 | ) | | | (1,985 | ) | | | (4,160 | ) | | | (85 | ) |
| Class 529-E | | | 12,129 | | | | 264 | | | | 2,362 | | | | 52 | | | | (14,557 | ) | | | (317 | ) | | | (66 | ) | | | (1 | ) |
| Class 529-F-1 | | | 19,359 | | | | 420 | | | | 2,463 | | | | 54 | | | | (15,426 | ) | | | (335 | ) | | | 6,396 | | | | 139 | |
| Class R-1 | | | 28,979 | | | | 635 | | | | 4,369 | | | | 96 | | | | (53,959 | ) | | | (1,181 | ) | | | (20,611 | ) | | | (450 | ) |
| Class R-2 | | | 206,687 | | | | 4,535 | | | | 18,552 | | | | 408 | | | | (344,915 | ) | | | (7,567 | ) | | | (119,676 | ) | | | (2,624 | ) |
| Class R-2E4 | | | 231 | | | | 5 | | | | — | | | | — | | | | — | | | | — | | | | 231 | | | | 5 | |
| Class R-3 | | | 515,284 | | | | 11,231 | | | | 49,310 | | | | 1,080 | | | | (765,034 | ) | | | (16,724 | ) | | | (200,440 | ) | | | (4,413 | ) |
| Class R-4 | | | 447,278 | | | | 9,692 | | | | 51,028 | | | | 1,114 | | | | (764,373 | ) | | | (16,567 | ) | | | (266,067 | ) | | | (5,761 | ) |
| Class R-5 | | | 355,170 | | | | 7,715 | | | | 38,098 | | | | 831 | | | | (610,650 | ) | | | (13,168 | ) | | | (217,382 | ) | | | (4,622 | ) |
| Class R-6 | | | 1,841,973 | | | | 39,800 | | | | 126,096 | | | | 2,738 | | | | (420,746 | ) | | | (9,126 | ) | | | 1,547,323 | | | | 33,412 | |
| Total net increase (decrease) | | $ | 10,647,679 | | | | 230,810 | | | $ | 1,801,925 | | | | 39,251 | | | $ | (12,739,550 | ) | | | (276,354 | ) | | $ | (289,946 | ) | | | (6,293 | ) |
| 1 | Includes exchanges between share classes of the fund. |
| 2 | Amount less than one thousand. |
| 3 | Class R-5E shares were offered beginning November 20, 2015. |
| 4 | Class R-2E shares were offered beginning August 29, 2014. |
| 26 | Capital World Growth and Income Fund |
9. Investment transactions
The fund made purchases and sales of investment securities, excluding short-term securities and U.S. government obligations, if any, of $29,246,302,000 and $28,631,826,000, respectively, during the year ended November 30, 2015.
| Capital World Growth and Income Fund | 27 |
Financial highlights
| | | | | | (Loss) income from | | | | | | | | | | | | | | | | | | | |
| | | | | | investment operations1 | | | | | | | | | | | | | | | | | | | |
| | | Net asset
value,
beginning
of period | | | Net
investment
income2 | | | Net (losses)
gains on
securities (both
realized and
unrealized) | | | Total from
investment
operations | | | Dividends
(from net
investment
income) | | | Net asset
value,
end
of period | | | Total
return3 | | | Net assets,
end of period
(in millions) | | | Ratio of
expenses
to average
net assets | | | Ratio of
net income
to average
net assets2 | |
| Class A: | | | | | | | | | | | | | | | | | | | | | | | | | | | | | | | | | | | | | | | | |
| Year ended 11/30/2015 | | $ | 47.87 | | | $ | .90 | | | $ | (2.38 | ) | | $ | (1.48 | ) | | $ | (1.05 | ) | | $ | 45.34 | | | | (3.12 | )% | | $ | 53,886 | | | | .77 | % | | | 1.93 | % |
| Year ended 11/30/2014 | | | 44.68 | | | | 1.20 | | | | 3.00 | | | | 4.20 | | | | (1.01 | ) | | | 47.87 | | | | 9.52 | | | | 57,559 | | | | .77 | | | | 2.59 | |
| Year ended 11/30/2013 | | | 36.75 | | | | .83 | | | | 8.13 | | | | 8.96 | | | | (1.03 | ) | | | 44.68 | | | | 24.77 | | | | 54,676 | | | | .80 | | | | 2.05 | |
| Year ended 11/30/2012 | | | 32.57 | | | | .87 | | | | 4.28 | | | | 5.15 | | | | (.97 | ) | | | 36.75 | | | | 16.14 | | | | 46,323 | | | | .82 | | | | 2.52 | |
| Year ended 11/30/2011 | | | 33.75 | | | | .94 | | | | (1.22 | ) | | | (.28 | ) | | | (.90 | ) | | | 32.57 | | | | (.99 | ) | | | 45,595 | | | | .79 | | | | 2.67 | |
| Class B: | | | | | | | | | | | | | | | | | | | | | | | | | | | | | | | | | | | | | | | | |
| Year ended 11/30/2015 | | | 47.61 | | | | .54 | | | | (2.36 | ) | | | (1.82 | ) | | | (.66 | ) | | | 45.13 | | | | (3.85 | ) | | | 363 | | | | 1.52 | | | | 1.16 | |
| Year ended 11/30/2014 | | | 44.42 | | | | .90 | | | | 2.93 | | | | 3.83 | | | | (.64 | ) | | | 47.61 | | | | 8.69 | | | | 782 | | | | 1.52 | | | | 1.96 | |
| Year ended 11/30/2013 | | | 36.53 | | | | .53 | | | | 8.08 | | | | 8.61 | | | | (.72 | ) | | | 44.42 | | | | 23.83 | | | | 1,194 | | | | 1.56 | | | | 1.31 | |
| Year ended 11/30/2012 | | | 32.37 | | | | .60 | | | | 4.26 | | | | 4.86 | | | | (.70 | ) | | | 36.53 | | | | 15.27 | | | | 1,433 | | | | 1.57 | | | | 1.76 | |
| Year ended 11/30/2011 | | | 33.53 | | | | .67 | | | | (1.21 | ) | | | (.54 | ) | | | (.62 | ) | | | 32.37 | | | | (1.74 | ) | | | 1,829 | | | | 1.56 | | | | 1.90 | |
| Class C: | | | | | | | | | | | | | | | | | | | | | | | | | | | | | | | | | | | | | | | | |
| Year ended 11/30/2015 | | | 47.34 | | | | .52 | | | | (2.34 | ) | | | (1.82 | ) | | | (.67 | ) | | | 44.85 | | | | (3.87 | ) | | | 3,757 | | | | 1.57 | | | | 1.13 | |
| Year ended 11/30/2014 | | | 44.19 | | | | .83 | | | | 2.96 | | | | 3.79 | | | | (.64 | ) | | | 47.34 | | | | 8.65 | | | | 4,582 | | | | 1.57 | | | | 1.82 | |
| Year ended 11/30/2013 | | | 36.36 | | | | .50 | | | | 8.05 | | | | 8.55 | | | | (.72 | ) | | | 44.19 | | | | 23.79 | | | | 4,819 | | | | 1.60 | | | | 1.26 | |
| Year ended 11/30/2012 | | | 32.23 | | | | .59 | | | | 4.24 | | | | 4.83 | | | | (.70 | ) | | | 36.36 | | | | 15.19 | | | | 4,373 | | | | 1.61 | | | | 1.73 | |
| Year ended 11/30/2011 | | | 33.40 | | | | .65 | | | | (1.21 | ) | | | (.56 | ) | | | (.61 | ) | | | 32.23 | | | | (1.77 | ) | | | 4,683 | | | | 1.58 | | | | 1.87 | |
| Class F-1: | | | | | | | | | | | | | | | | | | | | | | | | | | | | | | | | | | | | | | | | |
| Year ended 11/30/2015 | | | 47.78 | | | | .89 | | | | (2.39 | ) | | | (1.50 | ) | | | (1.03 | ) | | | 45.25 | | | | (3.17 | ) | | | 3,791 | | | | .81 | | | | 1.90 | |
| Year ended 11/30/2014 | | | 44.59 | | | | 1.21 | | | | 2.97 | | | | 4.18 | | | | (.99 | ) | | | 47.78 | | | | 9.48 | | | | 3,861 | | | | .81 | | | | 2.62 | |
| Year ended 11/30/2013 | | | 36.68 | | | | .82 | | | | 8.11 | | | | 8.93 | | | | (1.02 | ) | | | 44.59 | | | | 24.75 | | | | 3,976 | | | | .82 | | | | 2.03 | |
| Year ended 11/30/2012 | | | 32.51 | | | | .87 | | | | 4.28 | | | | 5.15 | | | | (.98 | ) | | | 36.68 | | | | 16.16 | | | | 3,177 | | | | .80 | | | | 2.52 | |
| Year ended 11/30/2011 | | | 33.69 | | | | .93 | | | | (1.22 | ) | | | (.29 | ) | | | (.89 | ) | | | 32.51 | | | | (1.02 | ) | | | 3,299 | | | | .80 | | | | 2.66 | |
| Class F-2: | | | | | | | | | | | | | | | | | | | | | | | | | | | | | | | | | | | | | | | | |
| Year ended 11/30/2015 | | | 47.85 | | | | 1.01 | | | | (2.37 | ) | | | (1.36 | ) | | | (1.16 | ) | | | 45.33 | | | | (2.90 | ) | | | 4,244 | | | | .54 | | | | 2.16 | |
| Year ended 11/30/2014 | | | 44.67 | | | | 1.23 | | | | 3.07 | | | | 4.30 | | | | (1.12 | ) | | | 47.85 | | | | 9.76 | | | | 4,168 | | | | .53 | | | | 2.66 | |
| Year ended 11/30/2013 | | | 36.74 | | | | .94 | | | | 8.13 | | | | 9.07 | | | | (1.14 | ) | | | 44.67 | | | | 25.13 | | | | 2,541 | | | | .54 | | | | 2.31 | |
| Year ended 11/30/2012 | | | 32.56 | | | | .97 | | | | 4.28 | | | | 5.25 | | | | (1.07 | ) | | | 36.74 | | | | 16.43 | | | | 1,857 | | | | .54 | | | | 2.80 | |
| Year ended 11/30/2011 | | | 33.75 | | | | 1.02 | | | | (1.22 | ) | | | (.20 | ) | | | (.99 | ) | | | 32.56 | | | | (.75 | ) | | | 1,401 | | | | .54 | | | | 2.91 | |
| Class 529-A: | | | | | | | | | | | | | | | | | | | | | | | | | | | | | | | | | | | | | | | | |
| Year ended 11/30/2015 | | | 47.73 | | | | .86 | | | | (2.37 | ) | | | (1.51 | ) | | | (1.01 | ) | | | 45.21 | | | | (3.19 | ) | | | 2,936 | | | | .86 | | | | 1.84 | |
| Year ended 11/30/2014 | | | 44.55 | | | | 1.15 | | | | 3.00 | | | | 4.15 | | | | (.97 | ) | | | 47.73 | | | | 9.43 | | | | 3,104 | | | | .86 | | | | 2.50 | |
| Year ended 11/30/2013 | | | 36.65 | | | | .80 | | | | 8.10 | | | | 8.90 | | | | (1.00 | ) | | | 44.55 | | | | 24.67 | | | | 2,853 | | | | .88 | | | | 1.97 | |
| Year ended 11/30/2012 | | | 32.49 | | | | .84 | | | | 4.27 | | | | 5.11 | | | | (.95 | ) | | | 36.65 | | | | 16.04 | | | | 2,299 | | | | .89 | | | | 2.45 | |
| Year ended 11/30/2011 | | | 33.67 | | | | .91 | | | | (1.21 | ) | | | (.30 | ) | | | (.88 | ) | | | 32.49 | | | | (1.06 | ) | | | 2,023 | | | | .85 | | | | 2.61 | |
|
| Class 529-B: | | | | | | | | | | | | | | | | | | | | | | | | | | | | | | | | | | | | | | | | |
| Year ended 11/30/2015 | | | 47.59 | | | | .49 | | | | (2.36 | ) | | | (1.87 | ) | | | (.61 | ) | | | 45.11 | | | | (3.96 | ) | | | 41 | | | | 1.65 | | | | 1.04 | |
| Year ended 11/30/2014 | | | 44.40 | | | | .83 | | | | 2.95 | | | | 3.78 | | | | (.59 | ) | | | 47.59 | | | | 8.57 | | | | 77 | | | | 1.65 | | | | 1.80 | |
| Year ended 11/30/2013 | | | 36.52 | | | | .48 | | | | 8.08 | | | | 8.56 | | | | (.68 | ) | | | 44.40 | | | | 23.69 | | | | 105 | | | | 1.67 | | | | 1.20 | |
| Year ended 11/30/2012 | | | 32.36 | | | | .57 | | | | 4.26 | | | | 4.83 | | | | (.67 | ) | | | 36.52 | | | | 15.11 | | | | 115 | | | | 1.69 | | | | 1.65 | |
| Year ended 11/30/2011 | | | 33.53 | | | | .63 | | | | (1.21 | ) | | | (.58 | ) | | | (.59 | ) | | | 32.36 | | | | (1.84 | ) | | | 134 | | | | 1.65 | | | | 1.80 | |
| 28 | Capital World Growth and Income Fund |
| | | | | | (Loss) income from | | | | | | | | | | | | | | | | | | | |
| | | | | | investment operations1 | | | | | | | | | | | | | | | | | | | |
| | | Net asset
value,
beginning
of period | | | Net
investment
income2 | | | Net (losses)
gains on
securities (both
realized and
unrealized) | | | Total from
investment
operations | | | Dividends
(from net
investment
income) | | | Net asset
value,
end
of period | | | Total
return3 | | | Net assets,
end of period
(in millions) | | | Ratio of
expenses
to average
net assets | | | Ratio of
net income
to average
net assets2 | |
| Class 529-C: | | | | | | | | | | | | | | | | | | | | | | | | | | | | | | | | | | | | | | | | |
| Year ended 11/30/2015 | | $ | 47.49 | | | $ | .49 | | | $ | (2.35 | ) | | $ | (1.86 | ) | | $ | (.65 | ) | | $ | 44.98 | | | | (3.95 | )% | | $ | 701 | | | | 1.64 | % | | | 1.07 | % |
| Year ended 11/30/2014 | | | 44.33 | | | | .79 | | | | 2.99 | | | | 3.78 | | | | (.62 | ) | | | 47.49 | | | | 8.57 | | | | 756 | | | | 1.64 | | | | 1.73 | |
| Year ended 11/30/2013 | | | 36.48 | | | | .48 | | | | 8.07 | | | | 8.55 | | | | (.70 | ) | | | 44.33 | | | | 23.69 | | | | 709 | | | | 1.66 | | | | 1.19 | |
| Year ended 11/30/2012 | | | 32.34 | | | | .57 | | | | 4.25 | | | | 4.82 | | | | (.68 | ) | | | 36.48 | | | | 15.14 | | | | 582 | | | | 1.68 | | | | 1.66 | |
| Year ended 11/30/2011 | | | 33.51 | | | | .63 | | | | (1.20 | ) | | | (.57 | ) | | | (.60 | ) | | | 32.34 | | | | (1.84 | ) | | | 527 | | | | 1.65 | | | | 1.81 | |
| Class 529-E: | | | | | | | | | | | | | | | | | | | | | | | | | | | | | | | | | | | | | | | | |
| Year ended 11/30/2015 | | | 47.65 | | | | .75 | | | | (2.36 | ) | | | (1.61 | ) | | | (.90 | ) | | | 45.14 | | | | (3.41 | ) | | | 122 | | | | 1.09 | | | | 1.61 | |
| Year ended 11/30/2014 | | | 44.48 | | | | 1.04 | | | | 2.99 | | | | 4.03 | | | | (.86 | ) | | | 47.65 | | | | 9.16 | | | | 130 | | | | 1.09 | | | | 2.27 | |
| Year ended 11/30/2013 | | | 36.59 | | | | .70 | | | | 8.10 | | | | 8.80 | | | | (.91 | ) | | | 44.48 | | | | 24.36 | | | | 122 | | | | 1.11 | | | | 1.74 | |
| Year ended 11/30/2012 | | | 32.44 | | | | .76 | | | | 4.26 | | | | 5.02 | | | | (.87 | ) | | | 36.59 | | | | 15.78 | | | | 99 | | | | 1.13 | | | | 2.20 | |
| Year ended 11/30/2011 | | | 33.61 | | | | .82 | | | | (1.21 | ) | | | (.39 | ) | | | (.78 | ) | | | 32.44 | | | | (1.31 | ) | | | 89 | | | | 1.12 | | | | 2.33 | |
| Class 529-F-1: | | | | | | | | | | | | | | | | | | | | | | | | | | | | | | | | | | | | | | | | |
| Year ended 11/30/2015 | | | 47.78 | | | | .96 | | | | (2.37 | ) | | | (1.41 | ) | | | (1.12 | ) | | | 45.25 | | | | (2.99 | ) | | | 113 | | | | .64 | | | | 2.07 | |
| Year ended 11/30/2014 | | | 44.60 | | | | 1.25 | | | | 3.00 | | | | 4.25 | | | | (1.07 | ) | | | 47.78 | | | | 9.66 | | | | 114 | | | | .64 | | | | 2.71 | |
| Year ended 11/30/2013 | | | 36.68 | | | | .89 | | | | 8.12 | | | | 9.01 | | | | (1.09 | ) | | | 44.60 | | | | 24.98 | | | | 100 | | | | .66 | | | | 2.19 | |
| Year ended 11/30/2012 | | | 32.51 | | | | .91 | | | | 4.28 | | | | 5.19 | | | | (1.02 | ) | | | 36.68 | | | | 16.27 | | | | 78 | | | | .67 | | | | 2.65 | |
| Year ended 11/30/2011 | | | 33.70 | | | | .98 | | | | (1.21 | ) | | | (.23 | ) | | | (.96 | ) | | | 32.51 | | | | (.84 | ) | | | 66 | | | | .64 | | | | 2.81 | |
| Class R-1: | | | | | | | | | | | | | | | | | | | | | | | | | | | | | | | | | | | | | | | | |
| Year ended 11/30/2015 | | | 47.42 | | | | .54 | | | | (2.36 | ) | | | (1.82 | ) | | | (.69 | ) | | | 44.91 | | | | (3.87 | ) | | | 257 | | | | 1.54 | | | | 1.16 | |
| Year ended 11/30/2014 | | | 44.26 | | | | .84 | | | | 2.98 | | | | 3.82 | | | | (.66 | ) | | | 47.42 | | | | 8.69 | | | | 302 | | | | 1.54 | | | | 1.83 | |
| Year ended 11/30/2013 | | | 36.42 | | | | .52 | | | | 8.06 | | | | 8.58 | | | | (.74 | ) | | | 44.26 | | | | 23.84 | | | | 302 | | | | 1.55 | | | | 1.30 | |
| Year ended 11/30/2012 | | | 32.29 | | | | .61 | | | | 4.24 | | | | 4.85 | | | | (.72 | ) | | | 36.42 | | | | 15.27 | | | | 276 | | | | 1.56 | | | | 1.79 | |
| Year ended 11/30/2011 | | | 33.46 | | | | .66 | | | | (1.20 | ) | | | (.54 | ) | | | (.63 | ) | | | 32.29 | | | | (1.75 | ) | | | 275 | | | | 1.56 | | | | 1.90 | |
| Class R-2: | | | | | | | | | | | | | | | | | | | | | | | | | | | | | | | | | | | | | | | | |
| Year ended 11/30/2015 | | | 47.31 | | | | .56 | | | | (2.35 | ) | | | (1.79 | ) | | | (.71 | ) | | | 44.81 | | | | (3.82 | ) | | | 1,061 | | | | 1.50 | | | | 1.20 | |
| Year ended 11/30/2014 | | | 44.17 | | | | .85 | | | | 2.96 | | | | 3.81 | | | | (.67 | ) | | | 47.31 | | | | 8.69 | | | | 1,244 | | | | 1.52 | | | | 1.86 | |
| Year ended 11/30/2013 | | | 36.35 | | | | .54 | | | | 8.04 | | | | 8.58 | | | | (.76 | ) | | | 44.17 | | | | 23.88 | | | | 1,277 | | | | 1.51 | | | | 1.35 | |
| Year ended 11/30/2012 | | | 32.22 | | | | .61 | | | | 4.24 | | | | 4.85 | | | | (.72 | ) | | | 36.35 | | | | 15.30 | | | | 1,150 | | | | 1.55 | | | | 1.78 | |
| Year ended 11/30/2011 | | | 33.39 | | | | .66 | | | | (1.20 | ) | | | (.54 | ) | | | (.63 | ) | | | 32.22 | | | | (1.75 | ) | | | 1,124 | | | | 1.56 | | | | 1.90 | |
| Class R-2E: | | | | | | | | | | | | | | | | | | | | | | | | | | | | | | | | | | | | | | | | |
| Year ended 11/30/2015 | | | 47.84 | | | | .72 | | | | (2.39 | ) | | | (1.67 | ) | | | (.92 | ) | | | 45.25 | | | | (3.54 | ) | | | 1 | | | | 1.19 | | | | 1.54 | |
| Period from 8/29/2014 to 11/30/20144,5 | | | 47.71 | | | | .12 | | | | .21 | | | | .33 | | | | (.20 | ) | | | 47.84 | | | | .70 | 6,7 | | | — | 8 | | | .30 | 6,7 | | | .26 | 6,7 |
| Class R-3: | | | | | | | | | | | | | | | | | | | | | | | | | | | | | | | | | | | | | | | | |
| Year ended 11/30/2015 | | | 47.57 | | | | .75 | | | | (2.37 | ) | | | (1.62 | ) | | | (.90 | ) | | | 45.05 | | | | (3.43 | ) | | | 2,246 | | | | 1.09 | | | | 1.61 | |
| Year ended 11/30/2014 | | | 44.40 | | | | 1.05 | | | | 2.98 | | | | 4.03 | | | | (.86 | ) | | | 47.57 | | | | 9.18 | | | | 2,629 | | | | 1.09 | | | | 2.28 | |
| Year ended 11/30/2013 | | | 36.53 | | | | .71 | | | | 8.08 | | | | 8.79 | | | | (.92 | ) | | | 44.40 | | | | 24.41 | | | | 2,651 | | | | 1.09 | | | | 1.76 | |
| Year ended 11/30/2012 | | | 32.38 | | | | .77 | | | | 4.25 | | | | 5.02 | | | | (.87 | ) | | | 36.53 | | | | 15.81 | | | | 2,335 | | | | 1.10 | | | | 2.23 | |
| Year ended 11/30/2011 | | | 33.56 | | | | .82 | | | | (1.21 | ) | | | (.39 | ) | | | (.79 | ) | | | 32.38 | | | | (1.32 | ) | | | 2,159 | | | | 1.10 | | | | 2.36 | |
See page 30 for footnotes.
| Capital World Growth and Income Fund | 29 |
Financial highlights (continued)
| | | | | | (Loss) income from | | | | | | | | | | | | | | | | | | | |
| | | | | | investment operations1 | | | | | | | | | | | | | | | | | | | |
| | | Net asset
value,
beginning
of period | | | Net
investment
income2 | | | Net (losses)
gains on
securities (both
realized and
unrealized) | | | Total from
investment
operations | | | Dividends
(from net
investment
income) | | | Net asset
value,
end
of period | | | Total
return3 | | | Net assets,
end of period
(in millions) | | | Ratio of
expenses
to average
net assets | | | Ratio of
net income
to average
net assets2 | |
| Class R-4: | | | | | | | | | | | | | | | | | | | | | | | | | | | | | | | | | | | | | | | | |
| Year ended 11/30/2015 | | $ | 47.76 | | | $ | .89 | | | $ | (2.37 | ) | | $ | (1.48 | ) | | $ | (1.04 | ) | | $ | 45.24 | | | | (3.13 | )% | | $ | 2,003 | | | | .79 | % | | | 1.91 | % |
| Year ended 11/30/2014 | | | 44.58 | | | | 1.19 | | | | 2.99 | | | | 4.18 | | | | (1.00 | ) | | | 47.76 | | | | 9.49 | | | | 2,275 | | | | .79 | | | | 2.59 | |
| Year ended 11/30/2013 | | | 36.67 | | | | .83 | | | | 8.11 | | | | 8.94 | | | | (1.03 | ) | | | 44.58 | | | | 24.78 | | | | 2,380 | | | | .80 | | | | 2.07 | |
| Year ended 11/30/2012 | | | 32.50 | | | | .87 | | | | 4.28 | | | | 5.15 | | | | (.98 | ) | | | 36.67 | | | | 16.13 | | | | 2,159 | | | | .80 | | | | 2.53 | |
| Year ended 11/30/2011 | | | 33.68 | | | | .93 | | | | (1.22 | ) | | | (.29 | ) | | | (.89 | ) | | | 32.50 | | | | (.98 | ) | | | 1,972 | | | | .80 | | | | 2.66 | |
| Class R-5E: | | | | | | | | | | | | | | | | | | | | | | | | | | | | | | | | | | | | | | | | |
| Period from 11/20/2015 to 11/30/20154,9 | | | 45.70 | | | | .02 | | | | (.38 | ) | | | (.36 | ) | | | — | | | | 45.34 | | | | (.79 | )6 | | | — | 8 | | | .02 | 6 | | | .04 | 6 |
| Class R-5: | | | | | | | | | | | | | | | | | | | | | | | | | | | | | | | | | | | | | | | | |
| Year ended 11/30/2015 | | | 47.90 | | | | 1.03 | | | | (2.38 | ) | | | (1.35 | ) | | | (1.18 | ) | | | 45.37 | | | | (2.84 | ) | | | 1,393 | | | | .49 | | | | 2.21 | |
| Year ended 11/30/2014 | | | 44.70 | | | | 1.35 | | | | 2.99 | | | | 4.34 | | | | (1.14 | ) | | | 47.90 | | | | 9.83 | | | | 1,509 | | | | .49 | | | | 2.93 | |
| Year ended 11/30/2013 | | | 36.77 | | | | .96 | | | | 8.12 | | | | 9.08 | | | | (1.15 | ) | | | 44.70 | | | | 25.15 | | | | 1,615 | | | | .49 | | | | 2.37 | |
| Year ended 11/30/2012 | | | 32.59 | | | | .98 | | | | 4.28 | | | | 5.26 | | | | (1.08 | ) | | | 36.77 | | | | 16.49 | | | | 1,381 | | | | .50 | | | | 2.84 | |
| Year ended 11/30/2011 | | | 33.77 | | | | 1.04 | | | | (1.22 | ) | | | (.18 | ) | | | (1.00 | ) | | | 32.59 | | | | (.71 | ) | | | 1,273 | | | | .50 | | | | 2.95 | |
|
| Class R-6: | | | | | | | | | | | | | | | | | | | | | | | | | | | | | | | | | | | | | | | | |
| Year ended 11/30/2015 | | | 47.89 | | | | 1.05 | | | | (2.37 | ) | | | (1.32 | ) | | | (1.20 | ) | | | 45.37 | | | | (2.78 | ) | | | 7,390 | | | | .45 | | | | 2.26 | |
| Year ended 11/30/2014 | | | 44.70 | | | | 1.31 | | | | 3.04 | | | | 4.35 | | | | (1.16 | ) | | | 47.89 | | | | 9.87 | | | | 6,334 | | | | .44 | | | | 2.83 | |
| Year ended 11/30/2013 | | | 36.77 | | | | .97 | | | | 8.13 | | | | 9.10 | | | | (1.17 | ) | | | 44.70 | | | | 25.21 | | | | 4,418 | | | | .45 | | | | 2.38 | |
| Year ended 11/30/2012 | | | 32.59 | | | | .99 | | | | 4.29 | | | | 5.28 | | | | (1.10 | ) | | | 36.77 | | | | 16.55 | | | | 2,518 | | | | .45 | | | | 2.86 | |
| Year ended 11/30/2011 | | | 33.77 | | | | 1.03 | | | | (1.19 | ) | | | (.16 | ) | | | (1.02 | ) | | | 32.59 | | | | (.65 | ) | | | 1,731 | | | | .45 | | | | 2.97 | |
| | | Year ended November 30 |
| | | 2015 | | 2014 | | 2013 | | 2012 | | 2011 |
| Portfolio turnover rate for all share classes | | 35% | | 36% | | 24% | | 23% | | 27% |
| 1 | Based on average shares outstanding. |
| 2 | For the year ended November 30, 2014, this column reflects the impact of a corporate action event that resulted in a one-time increase to net investment income. If the corporate action event had not occurred, the Class A net investment income per share and ratio of net income to average net assets would have been lower by $.34 and .73 percentage points, respectively. The impact to the other share classes would have been similar. |
| 3 | Total returns exclude any applicable sales charges, including contingent deferred sales charges. |
| 4 | Based on operations for the period shown and, accordingly, is not representative of a full year. |
| 5 | Class R-2E shares were offered beginning August 29, 2014. |
| 6 | Not annualized. |
| 7 | Although the fund has a plan of distribution for Class R-2E shares, fees for distribution services are not paid by the fund on accounts for which a broker-dealer (or other financial intermediary) has not been assigned, including amounts invested in the fund by CRMC and/or its affiliates. If fees for distribution services were charged on these assets, fund expenses would be higher and net income and total return would be lower. |
| 8 | Amount less than $1 million. |
| 9 | Class R-5E shares were offered beginning November 20, 2015. |
See Notes to Financial Statements
| 30 | Capital World Growth and Income Fund |
Report of Independent Registered Public Accounting Firm
To the Board of Trustees and Shareholders of Capital World Growth and Income Fund
In our opinion, the accompanying statement of assets and liabilities, including the summary investment portfolio, and the related statements of operations and of changes in net assets and the financial highlights present fairly, in all material respects, the financial position of Capital World Growth and Income Fund (the “Fund”) at November 30, 2015, the results of its operations for the year then ended, the changes in its net assets for each of the two years in the period then ended and the financial highlights for each of the periods presented, in conformity with accounting principles generally accepted in the United States of America. These financial statements and financial highlights (hereafter referred to as “financial statements”) are the responsibility of the Fund’s management. Our responsibility is to express an opinion on these financial statements based on our audits. We conducted our audits of these financial statements in accordance with the standards of the Public Company Accounting Oversight Board (United States). Those standards require that we plan and perform the audit to obtain reasonable assurance about whether the financial statements are free of material misstatement. An audit includes examining, on a test basis, evidence supporting the amounts and disclosures in the financial statements, assessing the accounting principles used and significant estimates made by management, and evaluating the overall financial statement presentation. We believe that our audits, which included confirmation of securities at November 30, 2015 by correspondence with the custodian and brokers, provide a reasonable basis for our opinion.
PricewaterhouseCoopers, LLP
Los Angeles, California
January 8, 2016
| Capital World Growth and Income Fund | 31 |
As a fund shareholder, you incur two types of costs: (1) transaction costs, such as initial sales charges on purchase payments and contingent deferred sales charges on redemptions (loads), and (2) ongoing costs, including management fees, distribution and service (12b-1) fees, and other expenses. This example is intended to help you understand your ongoing costs (in dollars) of investing in the fund so you can compare these costs with the ongoing costs of investing in other mutual funds. The example is based on an investment of $1,000 invested at the beginning of the period and held for the entire six-month period (June 1, 2015, through November 30, 2015).
Actual expenses:
The first line of each share class in the table on the following page provides information about actual account values and actual expenses. You may use the information in this line, together with the amount you invested, to estimate the expenses that you paid over the period. Simply divide your account value by $1,000 (for example, an $8,600 account value divided by $1,000 = 8.6), then multiply the result by the number in the first line under the heading entitled “Expenses paid during period” to estimate the expenses you paid on your account during this period.
Hypothetical example for comparison purposes:
The second line of each share class in the table on the following page provides information about hypothetical account values and hypothetical expenses based on the actual expense ratio for the share class and an assumed rate of return of 5.00% per year before expenses, which is not the actual return of the share class. The hypothetical account values and expenses may not be used to estimate the actual ending account balance or expenses you paid for the period. You may use this information to compare the ongoing costs of investing in the fund and other funds. To do so, compare this 5.00% hypothetical example with the 5.00% hypothetical examples that appear in the shareholder reports of the other funds.
Notes:
Retirement plan participants may be subject to certain fees charged by the plan sponsor, and Class F-1, F-2 and 529-F-1 shareholders may be subject to fees charged by financial intermediaries, typically ranging from 0.75% to 1.50% of assets annually depending on services offered. You can estimate the impact of these fees by adding the amount of the fees to the total estimated expenses you paid on your account during the period as calculated above. In addition, your ending account value would be lower by the amount of these fees.
Note that the expenses shown in the table on the following page are meant to highlight your ongoing costs only and do not reflect any transactional costs, such as sales charges (loads). Therefore, the second line of each share class in the table is useful in comparing ongoing costs only and will not help you determine the relative total costs of owning different funds. In addition, if these transactional costs were included, your costs would have been higher.
| 32 | Capital World Growth and Income Fund |
| | | Beginning
account value
6/1/2015 | | | Ending
account value
11/30/2015 | | | Expenses paid
during period* | | | Annualized
expense ratio | |
| Class A - actual return | | $ | 1,000.00 | | | $ | 952.00 | | | $ | 3.82 | | | | .78 | % |
| Class A - assumed 5% return | | | 1,000.00 | | | | 1,021.16 | | | | 3.95 | | | | .78 | |
| Class B - actual return | | | 1,000.00 | | | | 948.36 | | | | 7.42 | | | | 1.52 | |
| Class B - assumed 5% return | | | 1,000.00 | | | | 1,017.45 | | | | 7.69 | | | | 1.52 | |
| Class C - actual return | | | 1,000.00 | | | | 948.35 | | | | 7.67 | | | | 1.57 | |
| Class C - assumed 5% return | | | 1,000.00 | | | | 1,017.20 | | | | 7.94 | | | | 1.57 | |
| Class F-1 - actual return | | | 1,000.00 | | | | 951.65 | | | | 4.01 | | | | .82 | |
| Class F-1 - assumed 5% return | | | 1,000.00 | | | | 1,020.96 | | | | 4.15 | | | | .82 | |
| Class F-2 - actual return | | | 1,000.00 | | | | 952.99 | | | | 2.69 | | | | .55 | |
| Class F-2 - assumed 5% return | | | 1,000.00 | | | | 1,022.31 | | | | 2.79 | | | | .55 | |
| Class 529-A - actual return | | | 1,000.00 | | | | 951.63 | | | | 4.26 | | | | .87 | |
| Class 529-A - assumed 5% return | | | 1,000.00 | | | | 1,020.71 | | | | 4.41 | | | | .87 | |
| Class 529-B - actual return | | | 1,000.00 | | | | 947.76 | | | | 8.11 | | | | 1.66 | |
| Class 529-B - assumed 5% return | | | 1,000.00 | | | | 1,016.75 | | | | 8.39 | | | | 1.66 | |
| Class 529-C - actual return | | | 1,000.00 | | | | 947.82 | | | | 8.06 | | | | 1.65 | |
| Class 529-C - assumed 5% return | | | 1,000.00 | | | | 1,016.80 | | | | 8.34 | | | | 1.65 | |
| Class 529-E - actual return | | | 1,000.00 | | | | 950.60 | | | | 5.33 | | | | 1.09 | |
| Class 529-E - assumed 5% return | | | 1,000.00 | | | | 1,019.60 | | | | 5.52 | | | | 1.09 | |
| Class 529-F-1 - actual return | | | 1,000.00 | | | | 952.56 | | | | 3.18 | | | | .65 | |
| Class 529-F-1 - assumed 5% return | | | 1,000.00 | | | | 1,021.81 | | | | 3.29 | | | | .65 | |
| Class R-1 - actual return | | | 1,000.00 | | | | 948.27 | | | | 7.57 | | | | 1.55 | |
| Class R-1 - assumed 5% return | | | 1,000.00 | | | | 1,017.30 | | | | 7.84 | | | | 1.55 | |
| Class R-2 - actual return | | | 1,000.00 | | | | 948.54 | | | | 7.42 | | | | 1.52 | |
| Class R-2 - assumed 5% return | | | 1,000.00 | | | | 1,017.45 | | | | 7.69 | | | | 1.52 | |
| Class R-2E - actual return | | | 1,000.00 | | | | 950.07 | | | | 5.77 | | | | 1.18 | |
| Class R-2E - assumed 5% return | | | 1,000.00 | | | | 1,019.15 | | | | 5.97 | | | | 1.18 | |
| Class R-3 - actual return | | | 1,000.00 | | | | 950.46 | | | | 5.38 | | | | 1.10 | |
| Class R-3 - assumed 5% return | | | 1,000.00 | | | | 1,019.55 | | | | 5.57 | | | | 1.10 | |
| Class R-4 - actual return | | | 1,000.00 | | | | 951.89 | | | | 3.91 | | | | .80 | |
| Class R-4 - assumed 5% return | | | 1,000.00 | | | | 1,021.06 | | | | 4.05 | | | | .80 | |
| Class R-5E - actual return† | | | 1,000.00 | | | | 992.13 | | | | .17 | | | | .62 | |
| Class R-5E - assumed 5% return† | | | 1,000.00 | | | | 1,021.96 | | | | 3.14 | | | | .62 | |
| Class R-5 - actual return | | | 1,000.00 | | | | 953.31 | | | | 2.45 | | | | .50 | |
| Class R-5 - assumed 5% return | | | 1,000.00 | | | | 1,022.56 | | | | 2.54 | | | | .50 | |
| Class R-6 - actual return | | | 1,000.00 | | | | 953.72 | | | | 2.20 | | | | .45 | |
| Class R-6 - assumed 5% return | | | 1,000.00 | | | | 1,022.81 | | | | 2.28 | | | | .45 | |
| * | The “expenses paid during period” are equal to the “annualized expense ratio,” multiplied by the average account value over the period, multiplied by the number of days in the period, and divided by 365 (to reflect the one-half year period). |
| † | The period for the “annualized expense ratio” and “actual return” line is based on the number of days since the initial sale of the share class on November 20, 2015. The “assumed 5% return” line is based on 183 days. |
| Capital World Growth and Income Fund | 33 |
We are required to advise you of the federal tax status of certain distributions received by shareholders during the fiscal year. The fund hereby designates the following amounts for the fund’s fiscal year ended November 30, 2015:
| Foreign taxes | | $ | 0.03 per share |
| Foreign source income | | $ | 0.90 per share |
| Qualified dividend income | | | 100% |
| Corporate dividends received deduction | | $ | 798,928,000 |
| U.S. government income that may be exempt from state taxation | | $ | 2,572,000 |
Individual shareholders should refer to their Form 1099 or other tax information, which will be mailed in January 2016, to determine the calendar year amounts to be included on their 2015 tax returns. Shareholders should consult their tax advisors.
| 34 | Capital World Growth and Income Fund |
Approval of Investment Advisory and Service Agreement
Capital World Growth and Income Fund’s board has approved the fund’s Investment Advisory and Service Agreement (the “agreement”) with Capital Research and Management Company (“CRMC”) for an additional one-year term through October 31, 2016. The board approved the agreement following the recommendation of the fund’s Contracts Committee (the “committee”), which is composed of all of the fund’s independent board members. The board and the committee determined that the fund’s advisory fee structure was fair and reasonable in relation to the services provided, and that approving the agreement was in the best interests of the fund and its shareholders.
In reaching this decision, the board and the committee took into account information furnished to them throughout the year and otherwise provided to them, as well as information prepared specifically in connection with their review of the agreement, and were advised by their independent counsel. They considered the following factors, among others, but did not identify any single issue or particular piece of information that, in isolation, was the controlling factor, and each board and committee member did not necessarily attribute the same weight to each factor.
1. Nature, extent and quality of services
The board and the committee considered the depth and quality of CRMC’s investment management process, including its global research capabilities; the experience, capability and integrity of its senior management and other personnel; the low turnover rates of its key personnel; the overall financial strength and stability of CRMC and the Capital Group organization; and the ongoing evolution of CRMC’s organizational structure designed to maintain and strengthen these qualities. The board and the committee also considered the nature, extent and quality of administrative, compliance and shareholder services provided by CRMC to the fund under the agreement and other agreements, as well as the benefits to fund shareholders from investing in a fund that is part of a large family of funds. The board and the committee concluded that the nature, extent and quality of the services provided by CRMC have benefited and should continue to benefit the fund and its shareholders.
2. Investment results
The board and the committee considered the investment results of the fund in light of its objective of providing long-term growth of capital while providing current income. They compared the fund’s investment results with those of other funds (including funds that form the basis of the Lipper index for the category in which the fund is included), and data such as relevant market and fund indexes, over various periods through March 31, 2015. This report, including the letter to shareholders and related disclosures, contains certain information about the fund’s investment results. The board and the committee reviewed the fund’s investment results measured against various indexes, including the MSCI All Country World Index and the Lipper Global Funds Index. They noted that the investment results of the fund generally compared favorably to those of these indexes for the lifetime and 10-year periods and were mixed for shorter periods. The board and the committee concluded that the fund’s investment results have been satisfactory for renewal of the agreement, and that CRMC’s record in managing the fund indicated that its continued management should benefit the fund and its shareholders.
3. Advisory fees and total expenses
The board and the committee compared the advisory fees and total expense levels of the fund to those of other relevant funds. They observed that the fund’s advisory fees and expenses generally compared favorably to those of other similar funds included in the Lipper Global Funds category. The board and the committee also considered the breakpoint discounts in the fund’s advisory fee structure that reduce the level of fees charged by CRMC to the fund as fund assets increase. In addition, they reviewed information regarding the effective advisory fees charged to non-mutual fund clients by CRMC and its affiliates. They noted that, to the extent there were differences between the advisory fees paid by the fund and the advisory fees paid by those clients, the differences appropriately reflected the investment, operational and regulatory differences between advising the fund and the other clients. The board and the committee concluded that the fund’s cost structure was fair and reasonable in relation to the services provided, and that the fund’s shareholders receive reasonable value in return for the advisory fees and other amounts paid to CRMC by the fund.
| Capital World Growth and Income Fund | 35 |
4. Ancillary benefits
The board and the committee considered a variety of other benefits that CRMC and its affiliates receive as a result of CRMC’s relationship with the fund and the other American Funds, including fees for administrative services provided to certain share classes; fees paid to CRMC’s affiliated transfer agent; sales charges and distribution fees received and retained by the fund’s principal underwriter, an affiliate of CRMC; and possible ancillary benefits to CRMC and its institutional management affiliates in managing other investment vehicles. The board and the committee reviewed CRMC’s portfolio trading practices, noting the benefits CRMC receives from the research obtained with commissions from portfolio transactions made on behalf of the fund. The board and the committee took these ancillary benefits into account in evaluating the reasonableness of the advisory fees and other amounts paid to CRMC by the fund.
5. Adviser financial information
The board and the committee reviewed information regarding CRMC’s costs of providing services to the American Funds, including personnel, systems and resources of investment, compliance, trading, accounting and other administrative operations. They considered CRMC’s costs and related cost allocation methodology as well as its willingness to invest in technology, infrastructure and staff to maintain and expand services and capabilities, respond to industry and regulatory developments, and attract and retain qualified personnel. They noted information regarding the compensation structure for CRMC’s investment professionals. The board and the committee also compared CRMC’s profitability and compensation data to the reported results and data of several large, publicly held investment management companies. The board and the committee noted the competitiveness and cyclicality of both the mutual fund industry and the capital markets, and the importance in that environment of CRMC’s long-term profitability for maintaining its independence, company culture and management continuity. They further considered the breakpoint discounts in the fund’s advisory fee structure. The board and the committee concluded that the fund’s advisory fee structure reflected a reasonable sharing of benefits between CRMC and the fund’s shareholders.
| 36 | Capital World Growth and Income Fund |
Board of trustees and other officers
Independent trustees1
| Name and year of birth | | Year first
elected
a trustee
of the fund2 | | Principal occupation(s) during past five years | | Number of
portfolios in fund
complex overseen
by trustee | | Other directorships3
held by trustee |
| Joseph C. Berenato, 1946 | | 2005 | | Former Chairman and CEO, Ducommun Incorporated (aerospace components manufacturer) | | 15 | | Ducommun Incorporated |
| Robert J. Denison, 1941 | | 2005 | | Chair, First Security Management (private investment) | | 6 | | None |
| Mary Anne Dolan, 1947 | | 2010 | | Founder and President, MAD Ink (communications company) | | 10 | | None |
| R. Clark Hooper, 1946 | | 2010 | | Private investor | | 81 | | The Swiss Helvetia Fund, Inc. |
Merit E. Janow, 1958
Chairman of the Board
(Independent and Non-Executive) | | 2001 | | Dean and Professor, Columbia University, School of International and Public Affairs | | 78 | | MasterCard Incorporated; The NASDAQ Stock Market LLC; Trimble Navigation Limited |
| Leonade D. Jones, 1947 | | 2010 | | Retired; former Treasurer, The Washington Post Company (retired 1996) | | 10 | | None |
| Stefanie Powers, 1942 | | 1993–1996
1997 | | Actor, producer, author, entrepreneur; Co-founder and President of The William Holden Wildlife Foundation; conservation consultant to Land Rover and Jaguar North America; founder of The Jaguar Conservation Trust | | 3 | | None |
| Christopher E. Stone, 1956 | | 2009 | | President, Open Society Foundations; former Professor of the Practice of Criminal Justice, John F. Kennedy School of Government, Harvard University | | 6 | | None |
| Steadman Upham, PhD, 1949 | | 2001 | | President and University Professor, The University of Tulsa | | 78 | | None |
Koichi Itoh retired from the fund on December 31, 2015. The trustees thank Mr. Itoh for his wise counsel and dedication to the fund.
Interested trustee4,5
Name, year of birth and
position with fund | | Year first
elected
a trustee
or officer
of the fund2 | | Principal occupation(s) during past five years
and positions held with affiliated entities or
the principal underwriter of the fund | | Number of
portfolios in fund
complex overseen
by trustee | | Other directorships3
held by trustee |
Mark E. Denning, 1957
Vice Chairman of the Board and President | | 1993 | | Director, Capital Research and Management Company; Partner — Capital Research Global Investors, Capital Research Company;6 Partner — Capital Research Global Investors, Capital International, Inc.6 | | 1 | | None |
The fund’s statement of additional information includes further details about fund trustees and is available without charge upon request by calling American Funds Service Company at (800) 421-4225 or by visiting the American Funds website at americanfunds.com. The address for all trustees and officers of the fund is 333 South Hope Street, Los Angeles, CA 90071, Attention: Secretary.
See page 38 for footnotes.
| Capital World Growth and Income Fund | 37 |
Other officers5
Name, year of birth and
position with fund | | Year first
elected
an officer
of the fund2 | | Principal occupation(s) during past five years and positions held with affiliated entities
or the principal underwriter of the fund |
Donald H. Rolfe, 1972
Executive Vice President | | 2008 | | Vice President and Senior Counsel — Fund Business Management Group, Capital Research and Management Company |
L. Alfonso Barroso, 1971
Senior Vice President | | 2010 | | Partner — Capital Research Global Investors, Capital Research Company6 |
Michael Cohen, 1961
Senior Vice President | | 2014 | | Chairman of the Board and Senior Vice President, Capital International Limited;6
Partner — Capital International Investors, Capital International Limited;6
Partner — Capital International Investors, Capital Bank and Trust Company;6
Director, Capital Research and Management Company |
Sung Lee, 1966
Vice President | | 2008 | | Partner — Capital Research Global Investors, Capital International, Inc.6 |
David M. Riley, 1967
Vice President | | 2007 | | Partner — Capital Research Global Investors, Capital Research and Management Company; Director, The Capital Group Companies, Inc.6 |
Alexander G. Sheynkman, 1963
Vice President | | 2010 | | Partner — Capital Research Global Investors, Capital Research and Management Company |
Michael W. Stockton, 1967
Secretary | | 2013 | | Vice President — Fund Business Management Group, Capital Research and Management Company |
Neal F. Wellons, 1971
Treasurer | | 2008 | | Vice President — Investment Operations, Capital Research and Management Company |
Jennifer L. Butler, 1966
Assistant Secretary | | 2013 | | Assistant Vice President — Fund Business Management Group, Capital Research and Management Company |
Dori Laskin, 1951
Assistant Treasurer | | 2010 | | Vice President — Investment Operations, Capital Research and Management Company |
Jeffrey P. Regal, 1971
Assistant Treasurer | | 2003 | | Vice President — Investment Operations, Capital Research and Management Company |
| 1 | The term independent trustee refers to a trustee who is not an “interested person” of the fund within the meaning of the Investment Company Act of 1940. |
| 2 | Trustees and officers of the fund serve until their resignation, removal or retirement. |
| 3 | This includes all directorships/trusteeships (other than those in the American Funds or other funds managed by Capital Research and Management Company or its affiliates) that are held by each trustee as a trustee or director of a public company or a registered investment company. |
| 4 | The term interested trustee refers to a trustee who is an “interested person” within the meaning of the Investment Company Act of 1940, on the basis of their affiliation with the fund’s investment adviser, Capital Research and Management Company, or affiliated entities (including the fund’s principal underwriter). |
| 5 | All of the directors/trustees and/or officers listed, with the exception of L. Alfonso Barroso, Michael Cohen and Alexander G. Sheynkman, are officers and/or directors/trustees of one or more of the other funds for which Capital Research and Management Company serves as investment adviser. |
| 6 | Company affiliated with Capital Research and Management Company. |
| 38 | Capital World Growth and Income Fund |
This page was intentionally left blank.
| Capital World Growth and Income Fund | 39 |
Offices of the fund and of the investment adviser
Capital Research and Management Company
333 South Hope Street
Los Angeles, CA 90071-1406
6455 Irvine Center Drive
Irvine, CA 92618-4518
Transfer agent for shareholder accounts
American Funds Service Company
(Write to the address near you.)
P.O. Box 6007
Indianapolis, IN 46206-6007
P.O. Box 2280
Norfolk, VA 23501-2280
Custodian of assets
JPMorgan Chase Bank
270 Park Avenue
New York, NY 10017-2070
Counsel
O’Melveny & Myers LLP
400 South Hope Street
Los Angeles, CA 90071-2899
Independent registered public accounting firm
PricewaterhouseCoopers LLP
601 South Figueroa Street
Los Angeles, CA 90017-3874
Principal underwriter
American Funds Distributors, Inc.
333 South Hope Street
Los Angeles, CA 90071-1406
| 40 | Capital World Growth and Income Fund |
Investors should carefully consider investment objectives, risks, charges and expenses. This and other important information is contained in the fund prospectus and summary prospectus, which can be obtained from your financial professional and should be read carefully before investing. You may also call American Funds Service Company (AFS) at (800) 421-4225 or visit the American Funds website at americanfunds.com.
“American Funds Proxy Voting Procedures and Principles” — which describes how we vote proxies relating to portfolio securities — is available on the American Funds website or upon request by calling AFS. The fund files its proxy voting record with the U.S. Securities and Exchange Commission (SEC) for the 12 months ended June 30 by August 31. The proxy voting record is available free of charge on the SEC website at sec.gov and on the American Funds website.
A complete November 30, 2015, portfolio of Capital World Growth and Income Fund’s investments is available free of charge by calling AFS or visiting the SEC website (where it is part of Form N-CSR).
Capital World Growth and Income Fund files a complete list of its portfolio holdings with the SEC for the first and third quarters of each fiscal year on Form N-Q. This filing is available free of charge on the SEC website. You may also review or, for a fee, copy this filing at the SEC’s Public Reference Room in Washington, D.C. Additional information regarding the operation of the Public Reference Room may be obtained by calling the SEC’s Office of Investor Education and Advocacy at (800) SEC-0330. Additionally, the list of portfolio holdings is available by calling AFS.
This report is for the information of shareholders of Capital World Growth and Income Fund, but it also may be used as sales literature when preceded or accompanied by the current prospectus or summary prospectus, which gives details about charges, expenses, investment objectives and operating policies of the fund. If used as sales material after March 31, 2016, this report must be accompanied by an American Funds statistical update for the most recently completed calendar quarter.
The American Funds Advantage
Since 1931, American Funds, part of Capital Group, has helped investors pursue long-term investment success. Our consistent approach — in combination with The Capital SystemSM — has resulted in a superior long-term track record.
| | Aligned with investor success |
| | We base our decisions on a long-term perspective, which we believe aligns our goals with the interests of our clients. Our portfolio managers average 27 years of investment experience, including 22 years at our company, reflecting a career commitment to our long-term approach.1 |
| | |
| | The Capital SystemSM |
| | Our investment process, The Capital System, combines individual accountability with teamwork. Each fund is divided into portions that are managed independently by investment professionals with diverse backgrounds, ages and investment approaches. An extensive global research effort is the backbone of our system. |
| | |
| | Superior long-term track record |
| | Our equity funds have beaten their Lipper peer indexes in 91% of 10-year periods and 96% of 20-year periods. Our fixed-income funds have beaten their Lipper indexes in 54% of 10-year periods and 57% of 20-year periods.2 Our fund management fees have been among the lowest in the industry.3 |
| | 1 | Portfolio manager experience as of December 31, 2014. |
| | 2 | Based on Class A share results for rolling periods through December 31, 2014. Periods covered are the shorter of the fund’s lifetime or since the comparable Lipper index inception date (except SMALLCAP World Fund, for which the Lipper average was used). |
| | 3 | On average, our management fees were in the lowest quintile 70% of the time, based on the 20-year period ended December 31, 2014, versus comparable Lipper categories, excluding funds of funds. |

ITEM 2 – Code of Ethics
The Registrant has adopted a Code of Ethics that applies to its Principal Executive Officer and Principal Financial Officer. The Registrant undertakes to provide to any person without charge, upon request, a copy of the Code of Ethics. Such request can be made to American Funds Service Company at 800/421-9225 or to the Secretary of the Registrant, 333 South Hope Street, Los Angeles, California 90071.
ITEM 3 – Audit Committee Financial Expert
The Registrant’s board has determined that Leonade D. Jones, a member of the Registrant’s audit committee, is an “audit committee financial expert” and "independent," as such terms are defined in this Item. This designation will not increase the designee’s duties, obligations or liability as compared to his or her duties, obligations and liability as a member of the audit committee and of the board, nor will it reduce the responsibility of the other audit committee members. There may be other individuals who, through education or experience, would qualify as "audit committee financial experts" if the board had designated them as such. Most importantly, the board believes each member of the audit committee contributes significantly to the effective oversight of the Registrant’s financial statements and condition.
ITEM 4 – Principal Accountant Fees and Services
| | Registrant: |
| | | a) Audit Fees: |
| | | | 2014 | $129,000 |
| | | | 2015 | $119,000 |
| | | | |
| | | b) Audit-Related Fees: |
| | | | 2014 | None |
| | | | 2015 | None |
| | | | |
| | | c) Tax Fees: |
| | | | 2014 | $8,000 |
| | | | 2015 | $9,000 |
| | | | The tax fees consist of professional services relating to the preparation of the Registrant’s tax returns. |
| | | | |
| | | d) All Other Fees: |
| | | | 2014 | None |
| | | | 2015 | None |
| | | | |
| | Adviser and affiliates (includes only fees for non-audit services billed to the adviser and affiliates for engagements that relate directly to the operations and financial reporting of the Registrant and were subject to the pre-approval policies described below): |
| | | a) Audit Fees: |
| | | | Not Applicable |
| | | | |
| | | b) Audit-Related Fees: |
| | | | 2014 | None |
| | | | 2015 | None |
| | | | |
| | | c) Tax Fees: |
| | | | 2014 | $44,000 |
| | | | 2015 | $29,000 |
| | | | The tax fees consist of consulting services relating to the Registrant’s investments. |
| | | | |
| | | d) All Other Fees: |
| | | | 2014 | None |
| | | | 2015 | $2,000 |
| | | | The other fees consist of subscription services related to an accounting research tool. |
| | | | |
All audit and permissible non-audit services that the Registrant’s audit committee considers compatible with maintaining the independent registered public accounting firm’s independence are required to be pre-approved by the committee. The pre-approval requirement will extend to all non-audit services provided to the Registrant, the investment adviser, and any entity controlling, controlled by, or under common control with the investment adviser that provides ongoing services to the Registrant, if the engagement relates directly to the operations and financial reporting of the Registrant. The committee will not delegate its responsibility to pre-approve these services to the investment adviser. The committee may delegate to one or more committee members the authority to review and pre-approve audit and permissible non-audit services. Actions taken under any such delegation will be reported to the full committee at its next meeting. The pre-approval requirement is waived with respect to non-audit services if certain conditions are met. The pre-approval requirement was not waived for any of the non-audit services listed above provided to the Registrant, adviser and affiliates.
Aggregate non-audit fees paid to the Registrant’s auditors, including fees for all services billed to the Registrant, adviser and affiliates that provide ongoing services to the Registrant, were $52,000 for fiscal year 2014 and $59,000 for fiscal year 2015. The non-audit services represented by these amounts were brought to the attention of the committee and considered to be compatible with maintaining the auditors’ independence.
ITEM 5 – Audit Committee of Listed Registrants
Not applicable to this Registrant, insofar as the Registrant is not a listed issuer as defined in Rule 10A-3 under the Securities Exchange Act of 1934.
ITEM 6 – Schedule of Investments
Capital World Growth and Income Fund®
Investment portfolio
November 30, 2015
Common stocks 94.72%
Financials 16.90% | Shares | Value
(000) |
| Prudential PLC1 | 56,570,800 | $1,311,674 |
| UBS Group AG1 | 55,859,786 | 1,070,167 |
| Barclays PLC1 | 289,160,985 | 971,973 |
| Société Générale1,2 | 16,441,989 | 783,581 |
| HDFC Bank Ltd.1 | 35,060,126 | 674,442 |
| HDFC Bank Ltd. (ADR) | 569,900 | 33,122 |
| American International Group, Inc.2 | 10,955,800 | 696,570 |
| AIA Group Ltd.1 | 108,436,196 | 647,758 |
| Link Real Estate Investment Trust1 | 99,014,391 | 601,318 |
| Siam Commercial Bank PCL1 | 159,850,831 | 584,795 |
| Crown Castle International Corp. | 3,771,792 | 324,035 |
| Wharf (Holdings) Ltd.1 | 52,958,000 | 304,057 |
| China Construction Bank Corp., Class H1 | 436,306,735 | 299,227 |
| Cheung Kong Property Holdings Ltd.1 | 43,026,000 | 279,912 |
| American Campus Communities, Inc.3 | 6,763,000 | 273,225 |
| Agricultural Bank of China Ltd., Class H1 | 705,103,000 | 269,613 |
| Credit Suisse Group AG1,2 | 11,852,084 | 254,272 |
| Lamar Advertising Co., Class A2 | 4,340,000 | 253,499 |
| CIT Group Inc.2 | 5,107,300 | 219,410 |
| Hang Seng Bank Ltd.1 | 11,400,000 | 206,270 |
| Sampo Oyj, Class A1 | 4,140,974 | 204,884 |
| PICC Property and Casualty Co. Ltd., Class H1 | 89,104,000 | 192,819 |
| BB&T Corp. | 4,850,000 | 187,307 |
| State Street Corp. | 2,435,000 | 176,732 |
| Bangkok Bank PCL, nonvoting depository receipt1 | 35,745,900 | 166,934 |
| Bangkok Bank PCL1 | 1,941,600 | 9,257 |
| Lloyds Banking Group PLC1,2 | 140,630,100 | 154,419 |
| Progressive Corp. | 4,995,000 | 153,946 |
| Julius Bär Gruppe AG1,2 | 3,183,351 | 152,008 |
| Ventas, Inc. | 2,790,115 | 148,825 |
| Citigroup Inc. | 2,750,000 | 148,747 |
| Kotak Mahindra Bank Ltd.1 | 14,028,840 | 146,542 |
| BNP Paribas SA1 | 2,413,303 | 142,911 |
| Aberdeen Asset Management PLC1 | 29,615,682 | 142,466 |
| Fairfax Financial Holdings Ltd. (CAD denominated) | 292,400 | 140,386 |
| ING Groep NV, depository receipts1,2 | 9,625,000 | 132,011 |
| BM&FBOVESPA SA - Bolsa de Valores, Mercadorias e Futuros, ordinary nominative | 44,029,700 | 129,392 |
| Deutsche Börse AG1 | 1,415,000 | 121,364 |
| Mitsubishi UFJ Financial Group, Inc.1 | 18,500,000 | 118,911 |
| Wells Fargo & Co. | 2,012,300 | 110,878 |
| CME Group Inc., Class A | 1,104,500 | 107,854 |
| UniCredit SpA1,2 | 17,753,100 | 104,074 |
| Woori Bank1,2 | 12,625,314 | 103,356 |
| HSBC Holdings PLC (GBP denominated)1 | 9,858,953 | 78,561 |
| HSBC Holdings PLC (HKD denominated)1 | 2,739,630 | 21,948 |
| Sino Land Co. Ltd.1 | 66,720,000 | 98,784 |
| Grupo Financiero Santander México, SAB de CV, Class B (ADR)2 | 9,750,000 | 94,477 |
Capital World Growth and Income Fund — Page 1 of 10
Common stocks
Financials (continued) | Shares | Value
(000) |
| Bankia, SA1,2 | 70,000,000 | $87,495 |
| HCP, Inc. | 2,267,000 | 80,547 |
| Sumitomo Mitsui Financial Group, Inc.1 | 2,025,000 | 77,345 |
| ACE Ltd. | 655,500 | 75,284 |
| Fibra Uno Administración, SA de CV | 31,315,000 | 72,742 |
| RSA Insurance Group PLC1 | 9,310,226 | 61,645 |
| KASIKORNBANK PCL, nonvoting depository receipts1 | 7,434,100 | 35,439 |
| KASIKORNBANK PCL1 | 451,000 | 2,136 |
| Goldman Sachs Group, Inc. | 188,600 | 35,838 |
| Care Capital Properties, Inc. | 1,115,278 | 35,299 |
| Public Storage | 145,000 | 34,809 |
| Housing Development Finance Corp. Ltd.1 | 1,898,334 | 34,416 |
| Sumitomo Mitsui Trust Holdings, Inc.1 | 5,136,000 | 19,639 |
| JPMorgan Chase & Co. | 270,000 | 18,004 |
| Bank Rakyat Indonesia (Persero) Tbk PT1 | 12,075,000 | 9,379 |
| Bank of the Philippine Islands1 | 4,100,000 | 7,259 |
| Starwood Property Trust, Inc. | 350,000 | 7,116 |
| Synchrony Financial | 218,565 | 6,957 |
| | | 14,250,062 |
| Health care 16.03% | | |
| Amgen Inc. | 19,828,700 | 3,194,404 |
| Novartis AG1 | 25,513,054 | 2,176,628 |
| Gilead Sciences, Inc. | 12,313,531 | 1,304,742 |
| Bayer AG1 | 4,908,175 | 654,951 |
| Thermo Fisher Scientific Inc. | 4,566,200 | 631,962 |
| AbbVie Inc. | 10,730,829 | 623,998 |
| Alexion Pharmaceuticals, Inc.2 | 3,231,350 | 576,602 |
| Stryker Corp. | 5,516,000 | 532,073 |
| Takeda Pharmaceutical Co. Ltd.1 | 10,383,000 | 505,083 |
| Medtronic PLC | 6,542,000 | 492,874 |
| UnitedHealth Group Inc. | 3,706,200 | 417,726 |
| UCB SA1 | 3,994,742 | 355,929 |
| ResMed Inc. | 5,526,000 | 329,184 |
| GlaxoSmithKline PLC1 | 15,009,182 | 304,939 |
| Aetna Inc. | 2,070,000 | 212,692 |
| St. Jude Medical, Inc. | 2,912,800 | 183,798 |
| Grifols, SA, Class B, preferred nonvoting, non-registered shares1,2 | 4,586,090 | 159,303 |
| Grifols, SA, Class B (ADR)2 | 604,061 | 20,991 |
| Edwards Lifesciences Corp.2 | 1,030,000 | 167,890 |
| Illumina, Inc.2 | 833,977 | 153,368 |
| Incyte Corp.2 | 1,088,800 | 124,385 |
| HOYA Corp.1 | 2,763,000 | 112,124 |
| Teleflex Inc. | 649,000 | 85,473 |
| Fisher & Paykel Healthcare Corp. Ltd.1 | 14,939,600 | 82,581 |
| AstraZeneca PLC1 | 1,014,100 | 68,835 |
| Roche Holding AG, non-registered shares, non-voting1 | 160,055 | 42,790 |
| | | 13,515,325 |
| Information technology 11.78% | | |
| Alphabet Inc., Class A2 | 1,369,829 | 1,044,974 |
| Alphabet Inc., Class C2 | 1,163,017 | 863,656 |
| Oracle Corp. | 24,052,000 | 937,306 |
| Texas Instruments Inc. | 12,417,700 | 721,717 |
| Intel Corp. | 20,590,000 | 715,914 |
Capital World Growth and Income Fund — Page 2 of 10
Common stocks
Information technology (continued) | Shares | Value
(000) |
| Samsung Electronics Co., Ltd.1 | 386,842 | $428,271 |
| Samsung Electronics Co., Ltd., nonvoting preferred1 | 9,700 | 9,166 |
| Nintendo Co., Ltd.1 | 2,510,000 | 385,865 |
| Motorola Solutions, Inc. | 5,181,677 | 371,941 |
| MediaTek Inc.1 | 46,071,000 | 366,620 |
| Accenture PLC, Class A | 3,385,000 | 362,940 |
| Taiwan Semiconductor Manufacturing Co., Ltd.1 | 81,798,000 | 351,214 |
| Baidu, Inc., Class A (ADR)2 | 1,506,100 | 328,285 |
| Tencent Holdings Ltd.1 | 14,299,000 | 283,904 |
| TE Connectivity Ltd. | 3,950,000 | 265,005 |
| Western Union Co. | 11,294,000 | 213,005 |
| Analog Devices, Inc. | 3,300,186 | 203,390 |
| AAC Technologies Holdings Inc.1 | 27,401,000 | 192,121 |
| ASML Holding NV1 | 2,041,280 | 188,426 |
| Avago Technologies Ltd. | 1,352,000 | 176,368 |
| Quanta Computer Inc.1 | 95,292,595 | 149,475 |
| Quanta Computer Inc. (GDR)1 | 434,070 | 3,404 |
| Apple Inc. | 1,150,700 | 136,128 |
| STMicroelectronics NV1 | 17,570,000 | 127,538 |
| Delta Electronics, Inc.1 | 25,330,000 | 122,135 |
| Hewlett Packard Enterprise Co. | 7,870,000 | 116,948 |
| Yahoo! Inc.2 | 3,423,798 | 115,759 |
| Murata Manufacturing Co., Ltd.1 | 742,500 | 115,398 |
| Tableau Software, Inc., Class A | 1,139,700 | 110,585 |
| Automatic Data Processing, Inc. | 1,245,000 | 107,394 |
| Hewlett-Packard Co. | 7,870,000 | 98,690 |
| Tata Consultancy Services Ltd.1 | 2,426,146 | 86,028 |
| Alibaba Group Holding Ltd. (ADR)2 | 747,780 | 62,873 |
| Microsoft Corp. | 1,125,000 | 61,144 |
| Yahoo Japan Corp.1 | 11,111,700 | 45,819 |
| Cisco Systems, Inc. | 1,138,352 | 31,020 |
| NetApp, Inc.2 | 866,800 | 26,576 |
| | | 9,927,002 |
| Consumer discretionary 10.33% | | |
| Netflix, Inc.2 | 6,265,283 | 772,697 |
| Kingfisher PLC1,3 | 121,513,199 | 646,761 |
| Toyota Motor Corp.1 | 9,673,500 | 600,078 |
| Amazon.com, Inc.2 | 865,500 | 575,384 |
| Home Depot, Inc. | 3,620,000 | 484,646 |
| Kering SA1 | 2,100,002 | 361,884 |
| Hyundai Mobis Co., Ltd.1 | 1,638,522 | 354,391 |
| Renault SA1 | 3,420,180 | 344,534 |
| General Motors Co.2 | 9,300,897 | 336,692 |
| ProSiebenSat.1 Media SE1 | 5,455,000 | 286,405 |
| Norwegian Cruise Line Holdings Ltd. | 3,892,000 | 223,556 |
| Greene King PLC1,3 | 16,727,000 | 214,137 |
| MGM Resorts International2 | 9,215,000 | 209,549 |
| Daimler AG1 | 2,236,250 | 200,090 |
| Intercontinental Hotels Group PLC1 | 4,735,901 | 181,533 |
| Ctrip.com International, Ltd. (ADR)2 | 1,628,000 | 174,212 |
| Shimano Inc.1 | 1,151,200 | 171,005 |
| Hyundai Motor Co.1 | 1,291,100 | 163,692 |
| Barratt Developments PLC1,2 | 17,536,032 | 158,730 |
| Bayerische Motoren Werke AG1 | 1,412,100 | 154,083 |
Capital World Growth and Income Fund — Page 3 of 10
Common stocks
Consumer discretionary (continued) | Shares | Value
(000) |
| Whitbread PLC1 | 2,202,208 | $150,846 |
| HUGO BOSS AG1 | 1,714,852 | 148,544 |
| Daily Mail and General Trust PLC, Class A, nonvoting1 | 13,740,000 | 147,961 |
| Li & Fung Ltd.1 | 209,500,000 | 143,994 |
| LVMH Moet Hennessy Vuitton SE1 | 847,800 | 142,055 |
| Ocado Group PLC1,2 | 23,970,000 | 133,574 |
| Johnson Controls, Inc. | 2,656,325 | 122,191 |
| Priceline Group Inc.2 | 89,000 | 111,148 |
| NIKE, Inc., Class B | 800,000 | 105,824 |
| Altice NV, Class A1 | 4,599,000 | 70,514 |
| Altice NV, Class B1 | 1,533,000 | 23,779 |
| Galaxy Entertainment Group Ltd.1,2 | 31,910,000 | 93,542 |
| Merlin Entertainments PLC1 | 14,247,563 | 87,807 |
| WPP PLC1 | 3,683,700 | 85,162 |
| Volkswagen AG, nonvoting preferred1 | 510,000 | 70,841 |
| Sands China Ltd.1 | 20,099,100 | 67,684 |
| RTL Group SA, non-registered shares1 | 770,000 | 67,304 |
| DENSO Corp.1 | 1,306,100 | 62,376 |
| Newell Rubbermaid Inc. | 1,387,900 | 61,984 |
| Melco Crown Entertainment Ltd. (ADR)2 | 3,125,584 | 50,791 |
| MGM China Holdings Ltd.1,2 | 27,670,000 | 36,309 |
| Wynn Resorts, Ltd. | 562,800 | 35,327 |
| Prada SpA1 | 9,130,500 | 32,077 |
| Wynn Macau, Ltd.1,2 | 14,418,000 | 17,896 |
| Carnival Corp., units | 250,000 | 12,632 |
| Fiat Chrysler Automobiles NV1 | 500,000 | 7,130 |
| | | 8,703,351 |
| Industrials 10.22% | | |
| Lockheed Martin Corp. | 3,420,900 | 749,724 |
| General Dynamics Corp. | 3,505,700 | 513,445 |
| ASSA ABLOY AB, Class B1 | 22,416,167 | 476,367 |
| Union Pacific Corp. | 5,634,740 | 473,036 |
| Boeing Co. | 2,668,000 | 388,061 |
| Precision Castparts Corp. | 1,492,261 | 345,518 |
| Norfolk Southern Corp. | 3,477,710 | 330,591 |
| Babcock International Group PLC1 | 20,060,999 | 323,591 |
| ComfortDelGro Corp. Ltd.1,3 | 148,490,000 | 307,845 |
| General Electric Co. | 9,971,941 | 298,560 |
| Nielsen Holdings PLC | 6,308,491 | 294,480 |
| CSX Corp. | 9,485,865 | 269,683 |
| Airbus Group SE, non-registered shares1 | 3,658,870 | 264,257 |
| Randstad Holding NV1 | 4,116,449 | 257,177 |
| Danaher Corp. | 2,500,000 | 240,975 |
| Deutsche Post AG1 | 8,185,000 | 239,272 |
| Edenred SA1 | 11,169,000 | 231,150 |
| Jardine Matheson Holdings Ltd.1 | 4,638,600 | 230,887 |
| Waste Management, Inc. | 4,200,000 | 225,834 |
| Kühne + Nagel International AG1 | 1,655,356 | 223,699 |
| Safran SA1 | 2,215,000 | 163,404 |
| BAE Systems PLC1 | 19,891,500 | 154,736 |
| Emerson Electric Co. | 3,000,000 | 150,000 |
| Adecco SA1,2 | 2,129,050 | 145,397 |
| Ryanair Holdings PLC (ADR)2 | 1,847,235 | 142,052 |
| Capita PLC1 | 7,150,000 | 136,977 |
Capital World Growth and Income Fund — Page 4 of 10
Common stocks
Industrials (continued) | Shares | Value
(000) |
| GEA Group AG, non-registered shares1 | 3,138,000 | $130,154 |
| KONE Oyj, Class B1 | 3,020,000 | 128,602 |
| VINCI SA1 | 1,850,000 | 120,191 |
| Meggitt PLC1 | 19,356,000 | 112,737 |
| Cummins Inc. | 885,000 | 88,827 |
| Bunzl PLC1 | 2,818,462 | 81,502 |
| Andritz AG1 | 1,216,876 | 63,638 |
| CK Hutchison Holdings Ltd.1 | 4,340,000 | 56,817 |
| Industries Qatar QSC1 | 1,869,119 | 51,548 |
| Singapore Technologies Engineering Ltd1 | 24,920,000 | 50,455 |
| Kawasaki Heavy Industries, Ltd.1 | 11,873,000 | 47,218 |
| Siemens AG1 | 356,000 | 36,882 |
| Yamato Holdings Co., Ltd.1 | 1,657,900 | 31,727 |
| United Technologies Corp. | 300,000 | 28,815 |
| Granite Construction Inc. | 314,790 | 12,834 |
| Contax Participações SA, units | 152,400 | 27 |
| | | 8,618,692 |
| Consumer staples 7.44% | | |
| Philip Morris International Inc. | 14,554,200 | 1,271,892 |
| Altria Group, Inc. | 19,914,700 | 1,147,087 |
| Imperial Tobacco Group PLC1 | 14,318,000 | 773,729 |
| Coca-Cola Co. | 14,357,800 | 611,929 |
| Nestlé SA1 | 7,667,443 | 568,171 |
| Thai Beverage PCL1 | 726,018,100 | 352,181 |
| Wal-Mart de México, SAB de CV, Series V | 106,092,946 | 280,811 |
| British American Tobacco PLC1 | 4,057,700 | 236,385 |
| Pernod Ricard SA1 | 1,623,223 | 184,576 |
| Associated British Foods PLC1 | 3,307,511 | 176,522 |
| Treasury Wine Estates Ltd.1 | 31,619,095 | 173,571 |
| Japan Tobacco Inc.1 | 4,148,600 | 148,806 |
| Reckitt Benckiser Group PLC1 | 982,500 | 92,188 |
| Reynolds American Inc. | 1,831,228 | 84,694 |
| Tingyi (Cayman Islands) Holding Corp.1 | 45,498,000 | 65,859 |
| SABMiller PLC1 | 967,000 | 58,683 |
| Procter & Gamble Co. | 495,500 | 37,083 |
| Sprouts Farmers Market, Inc.2 | 270,000 | 6,515 |
| | | 6,270,682 |
| Energy 5.36% | | |
| Royal Dutch Shell PLC, Class A (GBP denominated)1 | 13,242,130 | 327,679 |
| Royal Dutch Shell PLC, Class B1 | 11,011,787 | 273,982 |
| Royal Dutch Shell PLC, Class A (ADR) | 904,109 | 44,989 |
| Royal Dutch Shell PLC, Class A (EUR denominated)1 | 1,718,318 | 42,778 |
| Royal Dutch Shell PLC, Class B (ADR) | 344,800 | 17,219 |
| Canadian Natural Resources, Ltd. | 24,362,330 | 589,972 |
| BP PLC1 | 84,555,653 | 490,613 |
| EOG Resources, Inc. | 5,256,000 | 438,508 |
| Suncor Energy Inc. | 13,424,027 | 370,921 |
| Enbridge Inc. (CAD denominated) | 8,653,013 | 307,321 |
| ConocoPhillips | 5,250,000 | 283,763 |
| Schlumberger Ltd. | 2,500,000 | 192,875 |
| Kinder Morgan, Inc. | 7,524,000 | 177,341 |
| Spectra Energy Corp | 5,970,000 | 156,414 |
| Golar LNG Ltd.3 | 5,180,000 | 141,673 |
Capital World Growth and Income Fund — Page 5 of 10
Common stocks
Energy (continued) | Shares | Value
(000) |
| BG Group PLC1 | 7,265,000 | $112,865 |
| Eni SpA1 | 6,435,300 | 104,312 |
| Eni SpA (ADR) | 253,148 | 8,174 |
| John Wood Group PLC1 | 10,049,664 | 84,533 |
| Surgutneftegas OJSC (ADR) | 10,474,600 | 66,199 |
| Baker Hughes Inc. | 1,085,000 | 58,666 |
| Chesapeake Energy Corp. | 9,500,000 | 50,065 |
| Exxon Mobil Corp. | 610,000 | 49,813 |
| Repsol, SA, non-registered shares1 | 3,325,000 | 43,170 |
| Gazprom PJSC (ADR)1 | 6,870,000 | 28,277 |
| Southwestern Energy Co.2 | 2,423,363 | 21,835 |
| YPF Sociedad Anónima, Class D (ADR) | 1,010,500 | 18,492 |
| Devon Energy Corp. | 200,000 | 9,202 |
| Tullow Oil PLC1,2 | 2,353,209 | 6,961 |
| | | 4,518,612 |
| Telecommunication services 4.75% | | |
| Verizon Communications Inc. | 31,140,053 | 1,415,315 |
| China Mobile Ltd.1 | 38,951,000 | 447,005 |
| AT&T Inc. | 9,230,000 | 310,774 |
| Singapore Telecommunications Ltd.1 | 93,551,810 | 253,608 |
| TeliaSonera AB1 | 41,925,000 | 205,652 |
| CenturyLink, Inc. | 7,563,200 | 203,677 |
| SoftBank Group Corp.1 | 3,589,000 | 190,756 |
| Advanced Info Service PCL1 | 34,125,800 | 189,733 |
| BCE Inc. | 2,345,000 | 100,933 |
| Bezeq - The Israel Telecommunication Corp. Ltd.1 | 43,840,000 | 94,413 |
| Bharti Airtel Ltd.1 | 17,950,000 | 89,956 |
| Intouch Holdings PCL1 | 41,539,500 | 76,413 |
| Intouch Holdings PCL, nonvoting depository receipts1 | 5,695,000 | 10,476 |
| TDC A/S1 | 13,554,744 | 71,085 |
| América Móvil, SAB de CV, Series L (ADR) | 4,306,700 | 69,725 |
| MTN Group Ltd.1 | 5,582,000 | 56,022 |
| LG Uplus Corp.1 | 5,734,902 | 52,806 |
| Idea Cellular Ltd.1 | 24,910,000 | 52,745 |
| KDDI Corp.1 | 1,431,600 | 35,594 |
| Mobile TeleSystems OJSC (ADR) | 4,875,000 | 34,369 |
| TELUS Corp. | 711,492 | 22,611 |
| MegaFon PJSC (GDR)1,2 | 1,109,116 | 16,775 |
| China Unicom (Hong Kong) Ltd.1 | 5,660,000 | 7,056 |
| | | 4,007,499 |
| Utilities 4.30% | | |
| SSE PLC1 | 27,919,269 | 602,986 |
| EDP - Energias de Portugal, SA1 | 155,000,908 | 516,383 |
| Dominion Resources, Inc. | 5,767,422 | 388,551 |
| Iberdrola, SA, non-registered shares1 | 44,808,849 | 313,309 |
| NextEra Energy, Inc. | 2,178,000 | 217,495 |
| Exelon Corp. | 6,185,300 | 168,920 |
| China Resources Gas Group Ltd.1 | 58,310,000 | 163,861 |
| Sempra Energy | 1,620,000 | 160,753 |
| National Grid PLC1 | 11,099,493 | 154,765 |
| CMS Energy Corp. | 4,311,300 | 150,982 |
| Eversource Energy | 2,843,000 | 144,851 |
| Power Grid Corp. of India Ltd.1 | 64,038,000 | 130,982 |
Capital World Growth and Income Fund — Page 6 of 10
Common stocks
Utilities (continued) | Shares | Value
(000) |
| Duke Energy Corp. | 1,878,000 | $127,253 |
| Centrica PLC1 | 34,743,867 | 114,058 |
| PT Perusahaan Gas Negara (Persero) Tbk1 | 524,342,100 | 100,359 |
| Engie SA1 | 3,372,030 | 58,672 |
| Power Assets Holdings Ltd.1 | 6,169,500 | 55,337 |
| AES Corp. | 3,681,100 | 36,774 |
| NRG Energy, Inc. | 1,620,800 | 20,033 |
| | | 3,626,324 |
| Materials 2.62% | | |
| Amcor Ltd.1 | 27,898,007 | 272,295 |
| Rio Tinto PLC1 | 7,304,300 | 242,694 |
| BASF SE1 | 2,615,000 | 216,436 |
| Syngenta AG1 | 582,000 | 214,384 |
| HeidelbergCement AG1 | 2,684,000 | 213,654 |
| Sherwin-Williams Co. | 660,000 | 182,206 |
| Akzo Nobel NV1 | 2,467,000 | 175,304 |
| Koninklijke DSM NV1 | 3,313,600 | 168,436 |
| Vale SA, Class A, preferred nominative | 36,743,500 | 100,952 |
| Vale SA, Class A, preferred nominative (ADR) | 5,444,600 | 14,592 |
| Praxair, Inc. | 1,000,000 | 112,800 |
| Fortescue Metals Group Ltd.1 | 71,453,091 | 100,818 |
| Celanese Corp., Series A | 875,000 | 61,906 |
| Linde AG1 | 309,000 | 53,941 |
| Monsanto Co. | 506,200 | 48,170 |
| Glencore PLC1 | 20,885,000 | 30,420 |
| | | 2,209,008 |
| Miscellaneous 4.99% | | |
| Other common stocks in initial period of acquisition | | 4,206,014 |
| Total common stocks (cost: $66,303,456,000) | | 79,852,571 |
Rights & warrants 0.00%
Financials 0.00% | | |
| Credit Suisse Group AG, rights, expire 20151 | 6,722,084 | 4,116 |
| Miscellaneous 0.00% | | |
| Other rights & warrants in initial period of acquisition | | 2,167 |
| Total rights & warrants (cost: $0) | | 6,283 |
Convertible stocks 0.02%
Financials 0.02% | | |
| Bank of America Corp., Series L, 7.25% convertible preferred | 13,000 | 14,560 |
| Total convertible stocks (cost: $10,438,000) | | 14,560 |
Capital World Growth and Income Fund — Page 7 of 10
Bonds, notes & other debt instruments 0.97%
U.S. Treasury bonds & notes 0.41%
U.S. Treasury 0.41% | Principal amount
(000) | Value
(000) |
| U.S. Treasury 0.375% 20164 | $ 144,000 | $144,056 |
| U.S. Treasury 1.375% 2020 | 5,950 | 5,880 |
| U.S. Treasury 2.875% 2045 | 198,000 | 193,577 |
| Total U.S. Treasury bonds & notes | | 343,513 |
Corporate bonds & notes 0.38%
Materials 0.13% | | |
| ArcelorMittal 10.85% 2019 | 20,000 | 21,300 |
| ArcelorMittal 7.25% 2022 | 24,365 | 21,609 |
| CRH America, Inc. 8.125% 2018 | 15,540 | 17,821 |
| FMG Resources 9.75% 20225 | 49,680 | 48,065 |
| | | 108,795 |
| Financials 0.12% | | |
| Developers Diversified Realty Corp. 7.875% 2020 | 8,075 | 9,735 |
| Discover Financial Services 10.25% 2019 | 4,334 | 5,242 |
| ERP Operating LP 5.125% 2016 | 2,886 | 2,922 |
| ERP Operating LP 5.75% 2017 | 2,055 | 2,184 |
| HBOS PLC 6.75% 20185 | 36,490 | 40,158 |
| Lloyds Banking Group PLC, junior subordinated 6.657% preference shares (undated)5 | 30,300 | 34,125 |
| Simon Property Group, LP 6.125% 2018 | 890 | 992 |
| Simon Property Group, LP 10.35% 2019 | 5,170 | 6,396 |
| | | 101,754 |
| Telecommunication services 0.12% | | |
| América Móvil, SAB de CV 6.45% 2022 | MXN63,350 | 3,664 |
| América Móvil, SAB de CV 8.46% 2036 | 55,000 | 3,219 |
| Numericable Group SA 6.00% 20225 | $21,500 | 21,285 |
| Numericable Group SA 6.25% 20245 | 8,000 | 7,900 |
| Sprint Nextel Corp. 9.125% 2017 | 27,750 | 28,236 |
| Sprint Nextel Corp. 11.50% 2021 | 33,950 | 32,507 |
| | | 96,811 |
| Energy 0.01% | | |
| Genel Energy Finance 3 Ltd. 7.50% 20195 | 15,000 | 11,272 |
| Total corporate bonds & notes | | 318,632 |
| Bonds & notes of governments & government agencies outside the U.S. 0.18% | | |
| Brazil (Federal Republic of) 10.00% 2025 | BRL127,000 | 24,196 |
| Brazil (Federal Republic of) 6.00% 20506 | 114,062 | 25,129 |
| India (Republic of) 8.60% 2028 | INR1,170,000 | 18,333 |
| Indonesia (Republic of) 8.375% 2034 | IDR1,300,000,000 | 90,382 |
| | | 158,040 |
| Total bonds, notes & other debt instruments (cost: $835,718,000) | | 820,185 |
| Short-term securities 4.22% | | |
| Australia & New Zealand Banking Group, Ltd. 0.28%–0.36% due 12/17/2015–3/1/20165 | $166,100 | 166,022 |
| CAFCO, LLC 0.40% due 12/2/2015 | 20,000 | 20,000 |
| Chariot Funding, LLC 0.39%–0.40% due 12/7/2015–12/15/20155 | 93,600 | 93,596 |
| Electricité de France 0.17% due 12/14/20155 | 39,700 | 39,698 |
| Fannie Mae 0.15%–0.26% due 1/4/2016–2/10/2016 | 250,000 | 249,921 |
| Federal Farm Credit Banks 0.21%–0.28% due 1/8/2016–4/26/2016 | 175,000 | 174,810 |
Capital World Growth and Income Fund — Page 8 of 10
| Short-term securities | Principal amount
(000) | Value
(000) |
| Federal Home Loan Bank 0.10%–0.23% due 12/2/2015–4/8/2016 | $967,600 | $967,118 |
| Freddie Mac 0.11%–0.20% due 12/10/2015–2/2/2016 | 246,300 | 246,258 |
| General Electric Co. 0.09% due 12/1/2015 | 50,000 | 50,000 |
| KfW 0.27%–0.28% due 1/14/2016–2/16/20165 | 124,500 | 124,459 |
| Mitsubishi UFJ Trust and Banking Corp. 0.28% due 1/12/20165 | 30,600 | 30,590 |
| Mizuho Funding LLC 0.29%–0.34% due 1/7/2016–2/5/20165 | 201,600 | 201,533 |
| National Australia Bank Ltd. 0.27%–0.38% due 2/17/2016–3/3/20165 | 185,700 | 185,558 |
| Nordea Bank AB 0.24%–0.41% due 1/15/2016–2/23/20165 | 193,200 | 193,093 |
| Province of Ontario 0.14% due 12/4/2015 | 33,400 | 33,400 |
| Reckitt Benckiser Treasury Services PLC 0.32% due 12/4/20155 | 45,000 | 44,999 |
| Sumitomo Mitsui Banking Corp. 0.16% due 12/16/2015–12/18/20155 | 84,700 | 84,693 |
| Svenska Handelsbanken Inc. 0.29%–0.36% due 1/5/2016–2/17/20165 | 155,800 | 155,707 |
| Thunder Bay Funding, LLC 0.26% due 1/7/20165 | 43,600 | 43,587 |
| Toronto-Dominion Holdings USA Inc. 0.26%–0.39% due 12/1/2015–2/8/20165 | 225,000 | 224,959 |
| Toyota Motor Credit Corp. 0.30% due 2/11/2016–2/18/2016 | 156,100 | 155,994 |
| U.S. Treasury Bills 0.14% due 12/17/2015 | 25,000 | 25,000 |
| Victory Receivables Corp. 0.25% due 12/16/20155 | 44,000 | 43,997 |
| Total short-term securities (cost: $3,555,266,000) | | 3,554,992 |
| Total investment securities 99.93% (cost: $70,704,878,000) | | 84,248,591 |
| Other assets less liabilities 0.07% | | 56,236 |
| Net assets 100.00% | | $84,304,827 |
As permitted by U.S. Securities and Exchange Commission regulations, “Miscellaneous” securities include holdings in their first year of acquisition that have not previously been publicly disclosed.
Forward currency contracts
The fund has entered into forward currency contracts as shown in the following table. The average month-end notional amount of open forward currency contracts while held was $901,687,000.
| | Settlement
date | Counterparty | Contract amount | Unrealized
(depreciation)
appreciation
at 11/30/2015
(000) |
Receive
(000) | Deliver
(000) |
| Sales: | | | | | |
| Australian dollars | 1/11/2016 | Bank of America, N.A. | $28,761 | A$41,000 | $(822) |
| Australian dollars | 1/25/2016 | UBS AG | $6,818 | A$9,500 | (32) |
| British pounds | 12/14/2015 | Citibank | $208,908 | £138,335 | 557 |
| British pounds | 1/11/2016 | Bank of America, N.A. | $240,696 | £160,160 | (563) |
| British pounds | 1/11/2016 | Citibank | $240,450 | £160,000 | (569) |
| Euros | 12/14/2015 | HSBC Bank | $34,135 | €31,842 | 479 |
| Euros | 12/21/2015 | Bank of America, N.A. | $91,999 | €86,346 | 706 |
| Japanese yen | 12/21/2015 | HSBC Bank | $46,732 | ¥5,770,071 | (179) |
| Singapore dollars | 2/24/2016 | Barclays Bank PLC | $96,838 | S$137,335 | (227) |
| | | | | | $(650) |
Capital World Growth and Income Fund — Page 9 of 10
| 1 | Valued under fair value procedures adopted by authority of the board of trustees. The total value of all such securities, including those in “Miscellaneous“ and “Other securities,“ was $40,053,564,000, which represented 47.51% of the net assets of the fund. This amount includes $39,098,193,000 related to certain securities trading outside the U.S. whose values were adjusted as a result of significant market movements following the close of local trading. |
| 2 | Security did not produce income during the last 12 months. |
| 3 | Represents an affiliated company as defined under the Investment Company Act of 1940. |
| 4 | A portion of this security was pledged as collateral. The total value of pledged collateral was $4,445,000, which represented .01% of the net assets of the fund. |
| 5 | Acquired in a transaction exempt from registration under Rule 144A or Section 4(2) of the Securities Act of 1933. May be resold in the U.S. in transactions exempt from registration, normally to qualified institutional buyers. The total value of all such securities was $1,795,296,000, which represented 2.13% of the net assets of the fund. |
| 6 | Index-linked bond whose principal amount moves with a government price index. |
| Key to abbreviations and symbols |
| ADR = American Depositary Receipts |
| GDR = Global Depositary Receipts |
| A$ = Australian dollars |
| BRL = Brazilian reais |
| CAD = Canadian dollars |
| EUR/€ = Euros |
| GBP/£ = British pounds |
| HKD = Hong Kong dollars |
| IDR = Indonesian rupiah |
| INR = Indian rupees |
| ¥ = Japanese yen |
| MXN = Mexican pesos |
| S$ = Singapore dollars |
Investments are not FDIC-insured, nor are they deposits of or guaranteed by a bank or any other entity, so they may lose value.
Investors should carefully consider investment objectives, risks, charges and expenses. This and other important information is contained in the fund prospectus and summary prospectus, which can be obtained from your financial professional and should be read carefully before investing. You may also call American Funds Service Company (AFS) at (800) 421-4225 or visit the American Funds website at americanfunds.com.
| MFGEFPX-033-0116O-S49181 | Capital World Growth and Income Fund — Page 10 of 10 |
Report of Independent Registered Public Accounting Firm
To the Board of Trustees and Shareholders of Capital World Growth and Income Fund
In our opinion, the accompanying statement of assets and liabilities, including the summary investment portfolio, and the related statements of operations and of changes in net assets and the financial highlights (included in Item 1 of this Form N-CSR) and the investment portfolio (included in Item 6 of this Form N-CSR) present fairly, in all material respects, the financial position of Capital World Growth and Income Fund (the “Fund”) at November 30, 2015, the results of its operations for the year then ended, the changes in its net assets for each of the two years in the period then ended and the financial highlights for each of the periods presented, in conformity with accounting principles generally accepted in the United States of America. These financial statements, financial highlights, and investment portfolio (hereafter referred to as "financial statements") are the responsibility of the Fund’s management. Our responsibility is to express an opinion on these financial statements based on our audits. We conducted our audits of these financial statements in accordance with the standards of the Public Company Accounting Oversight Board (United States). Those standards require that we plan and perform the audit to obtain reasonable assurance about whether the financial statements are free of material misstatement. An audit includes examining, on a test basis, evidence supporting the amounts and disclosures in the financial statements, assessing the accounting principles used and significant estimates made by management, and evaluating the overall financial statement presentation. We believe that our audits, which included confirmation of securities at November 30, 2015 by correspondence with the custodian and brokers, provide a reasonable basis for our opinion.
PricewaterhouseCoopers LLP
Los Angeles, California
January 8, 2016
ITEM 7 – Disclosure of Proxy Voting Policies and Procedures for Closed-End Management Investment Companies
Not applicable to this Registrant, insofar as the Registrant is not a closed-end management investment company.
ITEM 8 – Portfolio Managers of Closed-End Management Investment Companies
Not applicable to this Registrant, insofar as the Registrant is not a closed-end management investment company.
ITEM 9 – Purchases of Equity Securities by Closed-End Management Investment Company and Affiliated Purchasers
Not applicable to this Registrant, insofar as the Registrant is not a closed-end management investment company.
ITEM 10 – Submission of Matters to a Vote of Security Holders
There have been no material changes to the procedures by which shareholders may recommend nominees to the Registrant’s board of trustees since the Registrant last submitted a proxy statement to its shareholders. The procedures are as follows. The Registrant has a nominating and governance committee comprised solely of persons who are not considered ‘‘interested persons’’ of the Registrant within the meaning of the Investment Company Act of 1940, as amended. The committee periodically reviews such issues as the board’s composition, responsibilities, committees, compensation and other relevant issues, and recommends any appropriate changes to the full board of trustees. While the committee normally is able to identify from its own resources an ample number of qualified candidates, it will consider shareholder suggestions of persons to be considered as nominees to fill future vacancies on the board. Such suggestions must be sent in writing to the nominating and governance committee of the Registrant, c/o the Registrant’s Secretary, and must be accompanied by complete biographical and occupational data on the prospective nominee, along with a written consent of the prospective nominee for consideration of his or her name by the nominating and governance committee.
ITEM 11 – Controls and Procedures
| (a) | The Registrant’s Principal Executive Officer and Principal Financial Officer have concluded, based on their evaluation of the Registrant’s disclosure controls and procedures (as such term is defined in Rule 30a-3 under the Investment Company Act of 1940), that such controls and procedures are adequate and reasonably designed to achieve the purposes described in paragraph (c) of such rule. |
| | |
| (b) | There were no changes in the Registrant’s internal controls over financial reporting (as defined in Rule 30a-3(d) under the Investment Company Act of 1940) that occurred during the Registrant’s second fiscal quarter of the period covered by this report that has materially affected, or is reasonably likely to materially affect, the Registrant’s internal control over financial reporting. |
ITEM 12 – Exhibits
| (a)(1) | The Code of Ethics that is the subject of the disclosure required by Item 2 is attached as an exhibit hereto. |
| | |
| (a)(2) | The certifications required by Rule 30a-2 of the Investment Company Act of 1940 and Sections 302 and 906 of the Sarbanes-Oxley Act of 2002 are attached as exhibits hereto. |
SIGNATURES
Pursuant to the requirements of the Securities Exchange Act of 1934 and the Investment Company Act of 1940, the Registrant has duly caused this report to be signed on its behalf by the undersigned, thereunto duly authorized.
| | CAPITAL WORLD GROWTH AND INCOME FUND |
| | |
| | By /s/ Donald H. Rolfe |
| | Donald H. Rolfe, Executive Vice President and Principal Executive Officer |
| | |
| | Date: January 29, 2016 |
Pursuant to the requirements of the Securities Exchange Act of 1934 and the Investment Company Act of 1940, this report has been signed below by the following persons on behalf of the Registrant and in the capacities and on the dates indicated.
| By /s/ Donald H. Rolfe |
Donald H. Rolfe, Executive Vice President and Principal Executive Officer |
| |
| Date: January 29, 2016 |
| By /s/ Neal F. Wellons |
Neal F. Wellons, Treasurer and Principal Financial Officer |
| |
| Date: January 29, 2016 |
