UNITED STATES
SECURITIES AND EXCHANGE COMMISSION
Washington, D.C. 20549
FORM N-CSR
Certified Shareholder Report of
Registered Management Investment Companies
Investment Company Act File Number: 811-07338
Capital World Growth and Income Fund
(Exact Name of Registrant as Specified in Charter)
333 South Hope Street
Los Angeles, California 90071
(Address of Principal Executive Offices)
Registrant's telephone number, including area code: (213) 486-9200
Date of fiscal year end: November 30
Date of reporting period: November 30, 2016
Michael W. Stockton
Capital World Growth and Income Fund
333 South Hope Street
Los Angeles, California 90071
(Name and Address of Agent for Service)
ITEM 1 – Reports to Stockholders

Global flexibility:
Following opportunity
anywhere.
Special feature page 6
 | | Capital World Growth
and Income Fund®
Annual report
for the year ended
November 30, 2016 |
Capital World Growth and Income Fund seeks to provide you with long-term growth of capital while providing current income.
This fund is one of more than 40 offered by one of the nation’s largest mutual fund families, American Funds, from Capital Group. For 85 years, Capital has invested with a long-term focus based on thorough research and attention to risk.
Fund results shown in this report, unless otherwise indicated, are for Class A shares at net asset value. If a sales charge (maximum 5.75%) had been deducted, the results would have been lower. Results are for past periods and are not predictive of results for future periods. Current and future results may be lower or higher than those shown. Share prices and returns will vary, so investors may lose money. Investing for short periods makes losses more likely. Investments are not FDIC-insured, nor are they deposits of or guaranteed by a bank or any other entity, so they may lose value. For current information and month-end results, visit americanfunds.com.
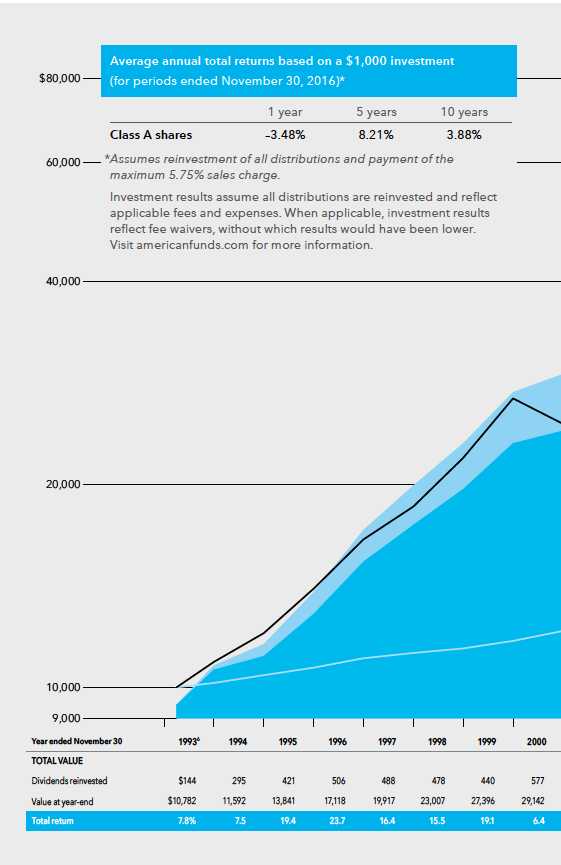
Here are the average annual total returns on a $1,000 investment with all distributions reinvested for periods ended December 31, 2016 (the most recent calendar quarter-end):
| Class A shares | 1 year | 5 years | 10 years |
| | | | |
| Reflecting 5.75% maximum sales charge | 0.36% | 8.72% | 3.78% |
For other share class results, visit americanfunds.com and americanfundsretirement.com.
The total annual fund operating expense ratio is 0.79% for Class A shares as of the prospectus dated February 1, 2017 (unaudited).
Investment results assume all distributions are reinvested and reflect applicable fees and expenses. When applicable, investment results reflect fee waivers, without which results would have been lower. Visit americanfunds.com for more information.
The fund’s 30-day yield for Class A shares as of December 31, 2016, reflecting the 5.75% maximum sales charge and calculated in accordance with the U.S. Securities and Exchange Commission formula, was 2.02%.
Investing outside the United States may be subject to risks, such as currency fluctuations, periods of illiquidity and price volatility. These risks may be heightened in connection with investments in developing countries. Refer to the fund prospectus and the Risk Factors section of this report for more information on these and other risks associated with investing in the fund.

Fellow investors:
Global stock markets produced modest gains during Capital World Growth and Income Fund’s fiscal year, a period characterized by unexpected political developments, aggressive monetary stimulus in markets around the world and improving growth in the United States.
Against this backdrop, the fund generated a total return of 2.42% for the 12 months ended November 30, 2016. This result lagged the 3.68% gain of the fund’s primary benchmark, the MSCI ACWI (All Country World Index). The Lipper Global Funds Index, a peer group measure, recorded a 3.28% total return. It is worth noting that the fund has consistently outpaced both of these indexes over longer time frames, as shown in the table below.
Capital World Growth and Income Fund seeks to provide investors with current income and long-term growth of capital. The fund paid dividends totaling $1.04 per share for the 12 months, as well as capital gains distributions totaling 71 cents paid in December. For the year, investors who reinvested dividends recorded an income return of 2.34%.
The global macroeconomic environment
The fiscal year was characterized by volatile swings from gains to losses, starting with a selloff in the early months after the U.S. Federal Reserve raised interest rates in December 2015 and investors focused on plummeting oil prices and China’s slowing growth. After bouncing back, equities fell sharply in June after U.K. voters surprised markets by choosing to leave the European Union. The declines were short-lived however, as markets rebounded after European economic data remained resilient following the referendum. The British Pound declined sharply against the U.S. dollar. Political uncertainty weighed on European markets throughout the period, as investors considered the impact of the Brexit vote, the election of Donald Trump as U.S. president and a pending Italian referendum on constitutional reform, positioned by Prime Minister Matteo Renzi as an initiative to streamline government. Shortly after the close of the fiscal year, Italian voters rejected the measure. For the 12 months, the MSCI EU Index fell 7.80% in U.S. dollar terms. In the U.K., British exporters were bolstered by the declining pound but U.K. shares ended 7.83% lower for U.S. investors as a result of the currency weakness.
In Japan, equity prices were similarly volatile amid a strengthening yen and persistent deflationary pressures. In the third quarter, Japan’s economy grew at a faster-than-expected 2.2%, supported by higher exports. In October, industrial output climbed for the third consecutive
Results at a glance
For periods ended November 30, 2016, with all distributions reinvested
| | | Cumulative
total returns | | Average annual total returns |
| | | 1 year | | 5 years | | 10 years | | Lifetime
(since 3/26/93) |
| | | | | | | | | |
| Capital World Growth and Income Fund (Class A shares) | | | 2.42 | % | | | 9.50 | % | | | 4.50 | % | | | 10.23 | % |
| MSCI ACWI* | | | 3.68 | | | | 8.85 | | | | 3.57 | | | | 6.90 | |
| Lipper Global Funds Index† | | | 3.28 | | | | 9.24 | | | | 3.74 | | | | 7.08 | |
| * | Results for the MSCI ACWI reflect dividends gross of withholding taxes through December 31, 2000, and dividends net of withholding taxes thereafter. This index is a free float-adjusted market capitalization-weighted index that is designed to measure results of more than 40 developed and emerging equity markets. It is unmanaged and, therefore, has no expenses. Investors cannot invest directly in an index. |
| † | Lipper indexes track the largest mutual funds (no more than 30), represented by one share class per fund, in the corresponding Lipper category. |
| | |
| Capital World Growth and Income Fund | 1 |
Largest equity holdings
(as of November 30, 2016)
| Company | | Country of domicile | | Percent of
net assets | | 12-month
return† |
| Amgen | | United States | | | 2.3 | | | | –10.57 | % |
| AbbVie | | United States | | | 2.1 | | | | 4.56 | % |
| Novartis | | Switzerland | | | 2.1 | | | | –19.34 | % |
| Verizon Communications | | United States | | | 1.6 | | | | 9.79 | % |
| Philip Morris International | | United States | | | 1.5 | | | | 1.02 | % |
| Prudential | | United Kingdom | | | 1.5 | | | | –16.67 | % |
| Imperial Brands | | United Kingdom | | | 1.4 | | | | –20.64 | % |
| Altria | | United States | | | 1.3 | | | | 10.99 | % |
| Royal Dutch Shell* | | United Kingdom | | | 1.3 | | | | 2.89 | % |
| Barclays | | United Kingdom | | | 1.1 | | | | –19.70 | % |
| * | 12-month return for Royal Dutch Shell represents Class A shares only. |
| † | Returns shown are on a share price basis. |
month and household spending was relatively stable, but wage growth remained sluggish and core consumer prices fell for the eighth consecutive month. Japanese shares edged up 1.72% for U.S. investors.
After an uneven start, U.S. equities ended with solid gains, as the U.S. presidential election result brightened prospects for tax cuts, infrastructure spending and an easier regulatory environment. The U.S. economy continued to strengthen throughout the period. Third-quarter GDP was revised up to a 3.5% annualized gain and the unemployment rate fell below 5%. In October, new home construction reached a nine-year high, and durable goods orders and capital expenditures rose.
Results for emerging market stocks were generally upbeat, supported by firmer commodities prices, new stimulus measures in China and stronger growth in the U.S. However, volatility was renewed toward the end of the fiscal year with the prospect of higher interest rates in the U.S. and questions about the future of global trade after the U.S. election. Brazilian equities soared 56.49% on hopes of economic reform under new political leadership. A proposal by President Michel Temer to cap government spending won preliminary support from legislators. Results for stocks in India were essentially flat, weighed down by the government’s surprise move to pull 86% of the country’s currency from circulation as part of an effort to curb tax evasion. Russian equities soared 23.54%, fueled by rising oil prices and prospects for improved relations with the U.S. In Mexico, stocks tumbled 14.27% as the peso slid against the U.S. dollar and investors worried that the prospect for changes in U.S. trade policy could stifle exports.
Inside the portfolio
The fund received some of its strongest contributions from holdings in more economically sensitive areas of the market, most notably the materials and energy sectors. Brazilian mining company Vale (+179.9%) and Fortescue Metals Group (+209.9%) soared on higher commodities prices and, in the case of the former, optimism about political and economic reform in Brazil. Canadian Natural Resources, an independent crude oil and natural gas producer with operations in North America, the North Sea and off the coast of Africa, rose on higher oil prices and progress on cost cutting. Royal Dutch Shell, the fund’s ninth-largest holding, rose 2.9%.
Select holdings in information technology stocks also supported the fund’s overall positive total return. Japanese game maker Nintendo shares advanced 59.6%, as the company pushed into mobile gaming, most notably with its Pokémon Go game. U.S. semiconductor maker Texas Instruments (+27.2%), rose on earnings that beat estimates.
Health care holdings, the second-largest sector concentration in the fund, proved to be a drag on the fund’s overall result. Top-holding Amgen (–10.6%), a U.S. biotech company, and Swiss drug maker Novartis (–19.3%), the fund’s third-largest holding, declined as drug makers came under pressure amid political criticism and greater scrutiny of drug pricing practices. However, No. 2 holding AbbVie (+4.6%), a U.S. biopharmaceuticals company, recorded positive results for the fiscal year. Among the fund’s financial holdings, U.K. insurer Prudential (–16.7%) and British bank Barclays (–19.7%) both declined amid Brexit worries.
Elsewhere among the fund’s top-10 holdings, U.S. telecom company Verizon Communications (+9.8%) and tobacco companies Altria (+11.0%) and Philip Morris International (+1.0%) all advanced, while British tobacco maker Imperial Brands (–20.6%) lost ground.
Looking forward
Given that market leadership during the past 12 months has been largely composed of U.S. growth-oriented companies, we are pleased with the fund’s overall positive result. Largely for valuation reasons, the fund’s managers have been focused on what they believe are top companies in non-U.S. markets. We continue to believe that, over time, attractively valued, profitable businesses will tend to outpace businesses with less attractive valuations.
The global economy remains on a path of slow growth, as a number of challenges remain. We have seen some positive developments in Europe, but markets could experience volatility in the coming
| * | Unless otherwise noted, country stock returns are based on MSCI indexes, expressed in U.S. dollars, and assume the reinvestment of dividends. Results reflect dividends net of withholding taxes. |
| | |
| 2 | Capital World Growth and Income Fund |
months due to Brexit fallout and other political developments. The consequences of Italian voters’ rejection of a constitutional referendum aimed at streamlining the government remain unclear. In addition, several European countries are holding key elections in 2017, including Germany and France. Similarly, in the U.S. questions remain about the future direction of trade policy under President Trump. That said, the economy continues to gain momentum and investors have been encouraged by the prospect of corporate tax reform and infrastructure spending under the new administration. With the U.S. economy improving steadily, we expect the U.S. Federal Reserve to raise rates gradually in the near future. With commodity prices on the rise, and global economic growth finding its footing, the backdrop for emerging markets has also brightened.
We believe that our disciplined dividend orientation can continue to generate value for our investors over the long term, and we remain focused on seeking out what we consider to be superior businesses in markets around the world.
We thank you for your commitment to Capital World Growth and Income Fund and look forward to reporting back to you in six months.
Cordially,

Mark E. Denning
Vice Chairman and President

Michael Cohen
Senior Vice President
January 10, 2017
For current information about the fund, visit americanfunds.com.
Where the fund’s assets are invested*
(percent invested by country of domicile)
| | | Capital World Growth
and Income Fund | | MSCI All Country
World Index† |
| | | | | |
| Europe | | | 28.8 | % | | | 20.7 | % |
| United Kingdom | | | 11.1 | | | | 5.9 | |
| Switzerland | | | 5.3 | | | | 2.8 | |
| France | | | 4.6 | | | | 3.2 | |
| Germany | | | 1.7 | | | | 2.9 | |
| Spain | | | 1.8 | | | | 1.0 | |
| Netherlands | | | .9 | | | | 1.1 | |
| Sweden | | | .6 | | | | .9 | |
| Other Europe | | | 2.8 | | | | 2.9 | |
| | | | | | | | | |
| The Americas | | | 45.6 | | | | 58.6 | |
| United States | | | 40.3 | | | | 54.0 | |
| Canada | | | 4.0 | | | | 3.3 | |
| Brazil | | | .9 | | | | .8 | |
| Other Americas | | | .4 | | | | .5 | |
| | | | | | | | | |
| Asia/Pacific | | | 18.4 | | | | 19.6 | |
| Japan | | | 4.3 | | | | 7.9 | |
| Hong Kong | | | 3.6 | | | | 1.2 | |
| China | | | 2.1 | | | | 2.9 | |
| India | | | 1.8 | | | | .9 | |
| South Korea | | | 1.7 | | | | 1.6 | |
| Thailand | | | 1.6 | | | | .2 | |
| Australia | | | 1.2 | | | | 2.4 | |
| Taiwan | | | 1.1 | | | | 1.3 | |
| Singapore | | | .6 | | | | .4 | |
| Other Asia/Pacific | | | .4 | | | | .8 | |
| | | | | | | | | |
| Other | | | 1.4 | | | | 1.1 | |
| | | | | | | | | |
| Bonds, notes & other debt instruments, short-term securities & other assets less liabilities | | | 5.8 | | | | — | |
| | | | | | | | | |
| Total | | | 100.0 | % | | | 100.0 | % |
| * | Percent of net assets by country as of November 30, 2016. |
| † | The MSCI All Country World Index is weighted by market capitalization. |
| Capital World Growth and Income Fund | 3 |
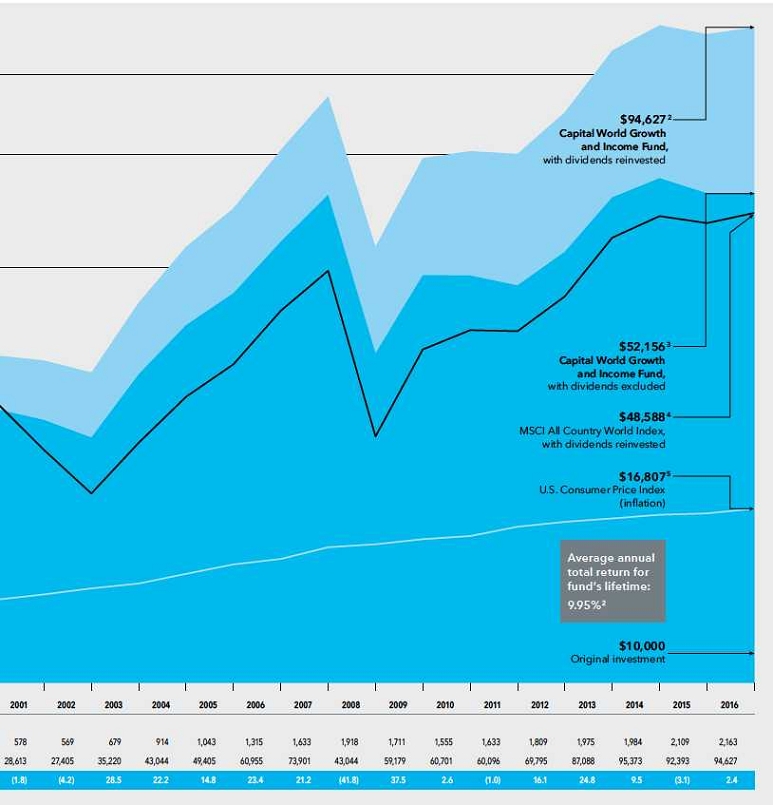
The value of a long-term perspective
Fund results shown are for Class A shares and reflect deduction of the maximum sales charge of 5.75% on the $10,000 investment.1 Thus, the net amount invested was $9,425. Results are for past periods and are not predictive of results for future periods. Current and future results may be lower or higher than those shown. Share prices and returns will vary, so investors may lose money. For current information and month-end results, visit americanfunds.com.
The results shown are before taxes on fund distributions and sale of fund shares.
| 1 | As outlined in the prospectus, the sales charge is reduced for accounts (and aggregated investments) of $25,000 or more and is eliminated for purchases of $1 million or more. There is no sales charge on dividends or capital gain distributions that are reinvested in additional shares. |
| 2 | Includes reinvested dividends of $26,938 and reinvested capital gain distributions of $21,981. |
| 3 | Results calculated with capital gains reinvested. |
| 4 | The market index is unmanaged and, therefore, has no expenses. Investors cannot invest directly in an index. Results reflect dividends gross of withholding taxes through December 31, 2000, and dividends net of withholding taxes thereafter. |
| 5 | Computed from data supplied by the U.S. Department of Labor, Bureau of Labor Statistics. |
| 6 | For the period from March 26, 1993, commencement of fund operations, through November 30, 1993. |
| 4 | Capital World Growth and Income Fund |
How a $10,000 investment has grown
While notable for their volatility in recent years, financial markets have tended to reward investors over the long term. Active management — bolstered by experience and careful research — can add even more value. As the chart shows, over its lifetime, Capital World Growth and Income Fund has done demonstrably better than its relevant benchmark.
| Capital World Growth and Income Fund | 5 |
Global flexibility:
Following opportunity anywhere.
Change these days seems to be picking up speed at a dizzying pace. Technological advancements are altering the way people live and disrupting whole industries. New global companies rise in relatively short order to take a dominant market share from long-established businesses. Global supply chains quickly snap into action to meet the shifting demands of an evolving marketplace.
Whether it’s a shakeup in the euro zone triggered by recent election results, the ascendancy of Donald Trump to the U.S. presidency, or unprecedented steps taken by major central banks around the world to stimulate growth, nearly every week brings news of developments that promise to transform the global investment landscape.
Change, of course, is not new. In the 23 years since Capital World Growth and Income Fund began operations, investors have witnessed the introduction of the euro currency, the formation of the World Trade Organization and the emergence of China as the world’s second-largest economy. Borders have been redrawn, technology has brought the world closer together and investment opportunity has opened up to a degree few could have foreseen back in 1993.
Through all these changes, the fund has proved to be relatively resilient, and over its lifetime it has outpaced its primary benchmark, the MSCI ACWI. One important reason why the fund has adapted well to a rapidly changing environment is its flexible investment approach.
“When we started the fund 23 years ago, we believed very strongly that the fund’s dual growth-and-income objective was relevant for most investors,” explains Mark Denning, the fund’s president and a founding manager. “We anticipated that businesses and economies outside the U.S. would expand at a rapid pace, providing growth and diversification opportunities for our investors. We also believed a focus on established dividend payers around the world could help mitigate some of the risks of global investing. In today’s environment, where we can look to China and other developing markets for opportunity — and we can find some Japanese companies that have higher payout ratios than many U.S. companies — I look at our global growth-and-income approach as more relevant than ever.”
In the following pages, we take a closer look at the fund’s broad flexibility and how it serves the fund’s managers as they seek to achieve the fund’s objectives.
Go where the opportunity is
Perhaps the clearest manifestation of the fund’s flexibility is its ability to invest in companies based in virtually any market in the world. Thanks to the flourishing of global trade and the maturation of many of the world’s developing economies, today there are many more markets — and many more global companies — open to investment than there were two decades ago. As measured by the MSCI ACWI Index, a broad measure of the world’s stock markets, nearly half of the world’s investment opportunities lie outside the United States.
“The fund’s flexibility allows it to take advantage of the best values around the world, in any market and in any industry,” said Mark. “Focusing on companies based on geography would limit us in our choices and potentially restrict us from

| 6 | Capital World Growth and Income Fund |
“The fund’s flexibility allows it to take advantage of the best values around the world, in any market and in any industry.”
Mark Denning, president

| Capital World Growth and Income Fund | 7 |

investing in what we consider to be the most attractively valued companies.”
Primarily for valuation reasons, the fund has been invested largely outside the U.S. At the close of the fiscal year, nearly 60% of the fund’s assets were invested in companies domiciled abroad, including about 29% in Europe. “But there have been periods in the fund’s history when we have deemed U.S. stocks to be much more attractive in terms of relative valuation, and the fund had much higher exposure to U.S.-domiciled companies,” Mark explains.
Focus on companies, not countries
Clearly not all opportunities are equal. Indeed, the fund’s managers do not invest in markets or countries but focus on building the portfolio one investment at a time, selecting individual companies based on their underlying fundamentals and business prospects. In today’s increasingly global market, there are world-class companies domiciled in countries all over the world.
By having the flexibility to cross borders, for example, the fund’s managers can invest in leading innovators in any industry. While U.S. technology companies rank among the world’s most innovative businesses, innovation can be found across regions, nations and economies. Consider that today the latest advancements in screen technology for smart phones are being developed by Samsung Electronics, based in Suwon, South Korea, and a holding in the fund.
“Samsung is widely known for making the Galaxy smartphone, but it also has a division that is leading the development of a display technology called OLED that allows for flexible screens,” says Alfonso Barroso, a fund manager based in London. This technology allows for the construction of wraparound screens that extend from the front, around the side edges to the back of the phone. Ultimately the technology is intended to result in folding screens for devices such as tablets and televisions. “One day you may have a device in your pocket that you will be able to fold out to the size of a phone, and then unfold to the size of a notebook, then fold back down to fit in your pocket,” explains Alfonso.
In 2017, both Samsung and Apple are expected to introduce new models with wraparound screens. As the only company producing the OLED screens in large quantities, Samsung has contracted to supply screens for both its Galaxy S8 and the iPhone 8. “Without the flexibility to invest in Korea, we might miss the opportunity to invest directly in what we believe to be a major technological shift from flat to flexible display,” says Alfonso. “Of course this technology has the potential to put the “wow” factor back into the handset replacement cycle. Because of the fund’s global flexibility we can also invest in Apple and other companies that might benefit by adopting the technology.”
A holistic view
In addition to providing worldwide access to investment opportunity, the fund’s global approach also allows the fund’s managers to think holistically about global industries and individual companies within those industries. “Rather than stitching together a patchwork of investments from the U.S., international and emerging markets, or by style or market cap, or whatever other segmentation you might think of, we can take a truly holistic approach in choosing the best company in terms of growth prospects, earnings, cash flows and general market positioning,” says Michael Cohen, senior vice president of the fund and a portfolio manager. “That is something
| 8 | Capital World Growth and Income Fund |
“The fund does set a yield target, meaning a level of income that the overall portfolio must generate. But there are a variety of paths I can take to meet that target.”
Sung Lee, fund manager
that investments in separate U.S. and international funds might not provide in combination,” he adds.
Consider the global auto industry. Most leading automakers are global businesses operating largely in the same markets. The fund’s managers can look at individual companies in the U.S., Japan, Europe and emerging markets, consider each company’s merits relative to the competition and decide which to invest in. “If your mandate covers only the U.S., for example, and you have a constructive view on autos, you might feel compelled to invest in General Motors in that context,” says Michael. “Within Capital World Growth and Income Fund, we can consider all the major automakers and invest in only the best company. We could also decide to invest in all of them — or none of them.”
Many paths to income
In their pursuit of the fund’s growth and income objectives, the fund’s managers naturally focus on well-established companies with a track record of paying regular dividends. That said, the fund does not have strict guidelines on the types of companies that managers must invest in. “The fund does set a yield target, meaning a level of income that the overall portfolio must generate,” says Sung Lee, a fund manager in Singapore. “But there are a variety of paths I can take to meet that target.”
In putting together a portfolio that offers a reasonable dividend yield, managers can explore a wide spectrum of alternatives, from purely income-focused investments with fairly modest growth to companies with no dividends but very rapid growth, or troubled companies with the potential for a turn-around. While the fund is chiefly
Yearly MSCI Index Performance by Region in U.S. Dollars (Best to Worst)
A flexible approach to investing across regions and economies may help investors capitalize on broader investment themes that transcend narrower investment approaches. Since 2006, emerging market stocks have had the strongest returns for four years, U.S. stocks for three years, and Europe and Japan & developed Pacific for two years each.
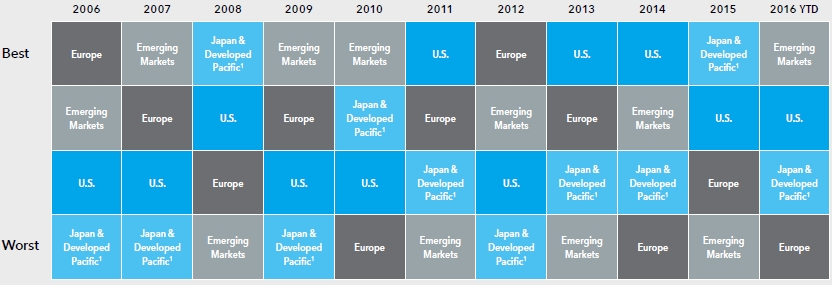
Sources: MSCI, RIMES. As of 12/5/16.
MSCI has not approved, reviewed or produced this report, makes no express or implied warranties or representations and is not liable whatsoever for any data in the report. You may not redistribute the MSCI data or use it as a basis for other indices or investment products.
| Capital World Growth and Income Fund | 9 |

The New Geography of Investing®
Fifty years ago, companies tended to do business solely within their own borders. Globalization, however, has made that less and less true. Where a company is headquartered or where its stock is listed have become less meaningful proxies.
Equity portion breakdown by revenue (%)
| | Region | | Fund | | Index |
 | United States | | | 38 | % | | | 41 | % |
 | Canada | | | 4 | | | | 3 | |
 | Europe | | | 21 | | | | 17 | |
 | Japan | | | 4 | | | | 8 | |
 | Asia-Pacific ex. Japan | | | 5 | | | | 4 | |
 | Emerging markets | | | 28 | | | | 27 | |
| | Total | | | 100 | % | | | 100 | % |
Equity portion breakdown by domicile (%)
| | Region | | Fund | | Index |
| | United States | | | 43 | % | | | 54 | % |
| | Canada | | | 4 | | | | 3 | |
| | Europe | | | 32 | | | | 20 | |
| | Japan | | | 4 | | | | 8 | |
| | Asia-Pacific ex. Japan | | | 6 | | | | 4 | |
| | Emerging markets | | | 11 | | | | 11 | |
| | Total | | | 100 | % | | | 100 | % |
Source: Capital Group (as of November 30, 2016).
Compared with the MSCI ACWI (All Country World Index) as a percent of net assets.
All figures include convertible securities.
focused on global equity markets, managers have the added flexibility of investing in some bonds. “Some of the fund’s managers may choose to invest primarily in companies whose dividend yields are close to the target, but I take another approach,” says Sung, a growth-oriented investor with investments in U.S. online retailer Amazon and streaming video service Netflix. “I am a big believer that Amazon and Netflix are doing things that are really changing people’s lives in a lot of ways.”
Blending multiple perspectives
Another facet of the fund’s flexibility can be found in its system of investment management. Known as The Capital System,SM it combines high-conviction investing and individual accountability with diverse perspectives and teamwork. The fund is divided into portions that are managed independently by nine investment professionals with varied backgrounds and investment approaches. An additional fund segment is managed by a group of analysts. Each manager is able to focus on only those ideas he or she feels are most compelling. As a result, there is broad diversification across the individual portfolios that comprise the fund.
“Under The Capital System, I have the flexibility to hold concentrated positions not only in specific companies but also in specific sectors that I like, and to hold little or nothing in major sectors of the global market,” says Eric Richter, a portfolio manager based in Washington, D.C. “So I can have a portfolio that includes my best ideas, knowing all of us together will produce diversification.”
Because he has spent most of his career as an investor living in the U.S., Eric tends to focus on U.S. companies. “On the other
| 10 | Capital World Growth and Income Fund |
“We will continue to work hard to generate value for our investors by searching in markets all around the world for world-class companies.”
Michael Cohen, senior vice president
hand, Asia is the geographic area where I rely the most heavily on the research organization and other colleagues who have much greater knowledge of specific country and company conditions that often I don’t have a history with,” Eric adds.
At the other end of the spectrum is Harold La, a portfolio manager in Hong Kong who has spent much of his career covering emerging markets (EM) in Asia and tends to have a heavy concentration in EM companies. “I see more EM companies, I am closer to them, so I am more comfortable investing in them,” says Harold.
Because he lives in Hong Kong, Harold has made dozens of visits to China and India to meet with company managements and gain an in-depth understanding of the local political, economic and business climate. “I am probably more comfortable investing in Indian companies, for example, than a U.S. colleague who is far away and might only see them once or twice a year at best. By being on the ground in local markets, I am less affected by news headlines.”
Among the fund’s holdings is HDFC Bank, the second-largest private bank in India. In November, in an effort to crack down on corruption and drive citizens into the formal economy, India’s Prime Minister Narendra Modi announced a demonetization effort that would render much of the country’s currency null and void. HDFC shares, along with other banks, fell sharply on the news. The fund held onto its investment. “I have been covering banks in Asia for 15 years, and HDFC is one of the strongest banks I have encountered,” Harold says.
Global presence, local knowledge
At the heart of the fund’s broad flexibility and multifaceted investment approach is an extensive global research network. The fund’s nine managers are supported by dozens of investment analysts based in local markets all around the world, many of whom have spent years — even decades — covering the same companies and industries. They also develop relationships with politicians, regulators and central bankers. “Our strong presence of locally domiciled analysts and portfolio managers gives us a differentiated depth of knowledge of local markets,” says Alfonso.
The knowledge acquired by both local specialists and the analysts who follow industries globally is widely shared so that the fund’s managers can look at valuations and competitive conditions in a context that a single market investor might not have. “Because we share local research, we can observe developments in one market, identify the trends which other countries or regions are likely to experience, and determine possible outcomes in other markets,” said Sung. “We can identify what we believe the implications are for the stocks in different segments of the value chain, whether it is parts makers or service providers.”
Consider, for example, Netflix, whose streaming video service has disrupted the cable television business in the United States. “Netflix has had a great impact on people’s viewing behavior, and the cable cord-cutting, I think, has started to happen much more quickly than people expected,” says Sung. “We can take that information and look at other markets where a similar service may soon be introduced and use that knowledge to determine how legacy businesses in that market might be impacted.”
Globalization reconsidered
The globalization of the world’s economy and markets over the past 20 years has boosted global trade and expanded opportunities for both businesses and investors. More recently, global trade has slowed, and recent election results around the world suggest, in part, a populist backlash against the impact of globalization. The U.K.’s “Brexit” vote in June to leave the European Union, and the rejection of a constitutional referendum in Italy shortly after the close of the fund’s fiscal year, have raised questions about the future direction of the EU. Similarly, the election of Donald Trump as U.S. president in November has raised some questions about the future direction of U.S. trade policy.
That said, globalization is likely to only accelerate going forward, says Mark. “Once the glass has been smashed, it can be very hard to put things back the way they were,” he says. “Some things are too difficult to reverse. I don’t think we are going to see a major reversal of global supply chains. At the margin, we may see some things come back to certain countries domestically.”
For the investment professionals who manage Capital World Growth and Income Fund, the key to successful global investing will be a continuation along the path they are on: working hard to understand shifting economic and political dynamics, and seeking to make sound judgments about the ability of companies to operate successfully as circumstances evolve. Observes Michael: “We will continue to work hard to generate value for our investors by searching in markets all around the world for world-class companies.” ■
| Capital World Growth and Income Fund | 11 |
Summary investment portfolio November 30, 2016
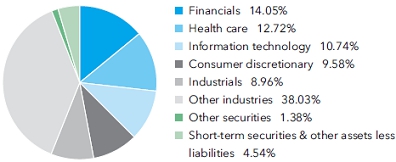
| Industry sector diversification | Percent of net assets |
| Country diversification by domicile | | Percent of
net assets |
| United States | | 40.26 | % |
| Euro zone* | | 11.33 | |
| United Kingdom | | 11.14 | |
| Switzerland | | 5.31 | |
| Japan | | 4.27 | |
| Canada | | 3.98 | |
| Hong Kong | | 3.60 | |
| China | | 2.11 | |
| India | | 1.77 | |
| Other countries | | 10.44 | |
| Bonds, notes & other debt instruments, short-term securities & other assets less liabilities | | 5.79 | |
| * | Countries using the euro as a common currency; those represented in the fund’s portfolio are Austria, Belgium, Finland, France, Germany, Ireland, Italy, the Netherlands, Portugal and Spain. |
| Common stocks 94.08% | | Shares | | | Value
(000) | |
| Financials 14.05% | | | | | | | | |
| Prudential PLC1 | | | 61,356,400 | | | $ | 1,185,481 | |
| Barclays PLC1 | | | 345,242,756 | | | | 931,822 | |
| UBS Group AG1 | | | 55,859,786 | | | | 888,416 | |
| HDFC Bank Ltd.1 | | | 36,585,126 | | | | 734,563 | |
| HDFC Bank Ltd. (ADR) | | | 569,900 | | | | 36,770 | |
| American International Group, Inc. | | | 11,688,800 | | | | 740,252 | |
| Société Générale1 | | | 17,051,989 | | | | 731,253 | |
| AIA Group Ltd.1 | | | 89,997,196 | | | | 548,023 | |
| Siam Commercial Bank PCL1 | | | 132,758,855 | | | | 543,960 | |
| Other securities | | | | | | | 5,042,978 | |
| | | | | | | | 11,383,518 | |
| | | | | | | | | |
| Health care 12.72% | | | | | | | | |
| Amgen Inc. | | | 12,684,841 | | | | 1,827,505 | |
| AbbVie Inc. | | | 28,019,095 | | | | 1,703,561 | |
| Novartis AG1 | | | 24,150,054 | | | | 1,661,950 | |
| Stryker Corp. | | | 6,807,000 | | | | 773,684 | |
| Medtronic PLC | | | 8,179,000 | | | | 597,149 | |
| Teva Pharmaceutical Industries Ltd. (ADR) | | | 15,112,050 | | | | 569,724 | |
| Takeda Pharmaceutical Co. Ltd.1 | | | 12,717,200 | | | | 526,993 | |
| UnitedHealth Group Inc. | | | 3,117,100 | | | | 493,499 | |
| Other securities | | | | | | | 2,156,656 | |
| | | | | | | | 10,310,721 | |
| | | | | | | | | |
| Information technology 10.74% | | | | | | | | |
| Alphabet Inc., Class A2 | | | 636,880 | | | | 494,143 | |
| Alphabet Inc., Class C2 | | | 555,867 | | | | 421,369 | |
| Samsung Electronics Co., Ltd.1 | | | 457,799 | | | | 677,345 | |
| Intel Corp. | | | 19,380,000 | | | | 672,486 | |
| Taiwan Semiconductor Manufacturing Co., Ltd.1 | | | 108,673,000 | | | | 622,677 | |
| Texas Instruments Inc. | | | 8,311,200 | | | | 614,447 | |
| Nintendo Co., Ltd.1 | | | 2,405,832 | | | | 590,427 | |
| Oracle Corp. | | | 13,726,000 | | | | 551,648 | |
| Apple Inc. | | | 4,776,829 | | | | 527,935 | |
| Tencent Holdings Ltd.1 | | | 18,149,500 | | | | 451,903 | |
| Other securities | | | | | | | 3,075,877 | |
| | | | | | | | 8,700,257 | |
| 12 | Capital World Growth and Income Fund |
| | | Shares | | | Value
(000) | |
| Consumer discretionary 9.58% | | | | | | | | |
| Netflix, Inc.2 | | | 7,076,089 | | | $ | 827,902 | |
| Amazon.com, Inc.2 | | | 919,883 | | | | 690,437 | |
| Other securities | | | | | | | 6,248,052 | |
| | | | | | | | 7,766,391 | |
| | | | | | | | | |
| Industrials 8.96% | | | | | | | | |
| Boeing Co. | | | 5,483,000 | | | | 825,520 | |
| Lockheed Martin Corp. | | | 2,884,400 | | | | 765,087 | |
| Union Pacific Corp. | | | 5,383,140 | | | | 545,474 | |
| General Dynamics Corp. | | | 2,919,700 | | | | 511,969 | |
| Abertis Infraestructuras, SA, Class A1 | | | 34,657,935 | | | | 463,010 | |
| Other securities | | | | | | | 4,153,738 | |
| | | | | | | | 7,264,798 | |
| | | | | | | | | |
| Consumer staples 8.44% | | | | | | | | |
| Philip Morris International Inc. | | | 13,653,300 | | | | 1,205,313 | |
| Imperial Brands PLC1 | | | 26,137,100 | | | | 1,120,833 | |
| Altria Group, Inc. | | | 15,989,700 | | | | 1,022,222 | |
| Nestlé SA1 | | | 9,260,052 | | | | 622,984 | |
| Reynolds American Inc. | | | 9,292,528 | | | | 502,726 | |
| Thai Beverage PCL1 | | | 746,930,900 | | | | 455,135 | |
| Other securities | | | | | | | 1,914,927 | |
| | | | | | | | 6,844,140 | |
| | | | | | | | | |
| Energy 7.71% | | | | | | | | |
| Royal Dutch Shell PLC, Class B1 | | | 16,907,953 | | | | 451,172 | |
| Royal Dutch Shell PLC, Class A (GBP denominated)1 | | | 17,697,975 | | | | 450,611 | |
| Royal Dutch Shell PLC, Class A (ADR) | | | 945,123 | | | | 48,296 | |
| Royal Dutch Shell PLC, Class A (EUR denominated)1 | | | 1,784,000 | | | | 45,577 | |
| Royal Dutch Shell PLC, Class B (ADR) | | | 344,800 | | | | 18,678 | |
| Canadian Natural Resources, Ltd. | | | 25,377,830 | | | | 856,381 | |
| Suncor Energy Inc. | | | 22,412,717 | | | | 713,777 | |
| EOG Resources, Inc. | | | 5,541,587 | | | | 568,123 | |
| TOTAL SA1 | | | 11,841,645 | | | | 566,780 | |
| BP PLC1 | | | 84,002,150 | | | | 487,318 | |
| Other securities | | | | | | | 2,039,457 | |
| | | | | | | | 6,246,170 | |
| | | | | | | | | |
| Materials 4.81% | | | | | | | | |
| Vale SA, Class A, preferred nominative | | | 57,362,000 | | | | 433,346 | |
| Vale SA, Class A, preferred nominative (ADR) | | | 15,444,600 | | | | 115,835 | |
| Other securities | | | | | | | 3,346,985 | |
| | | | | | | | 3,896,166 | |
| | | | | | | | | |
| Utilities 4.79% | | | | | | | | |
| SSE PLC1 | | | 38,157,269 | | | | 704,200 | |
| Dominion Resources, Inc. | | | 6,238,422 | | | | 457,214 | |
| Other securities | | | | | | | 2,723,244 | |
| | | | | | | | 3,884,658 | |
| | | | | | | | | |
| Telecommunication services 4.33% | | | | | | | | |
| Verizon Communications Inc. | | | 26,791,053 | | | | 1,336,874 | |
| Other securities | | | | | | | 2,169,498 | |
| | | | | | | | 3,506,372 | |
| | | | | | | | | |
| Real estate 3.14% | | | | | | | | |
| Cheung Kong Property Holdings Ltd.1 | | | 78,990,856 | | | | 539,776 | |
| Other securities | | | | | | | 2,008,023 | |
| | | | | | | | 2,547,799 | |
| | | | | | | | | |
| Miscellaneous 4.81% | | | | | | | | |
| Other common stocks in initial period of acquisition | | | | | | | 3,901,001 | |
| | | | | | | | | |
| Total common stocks (cost: $65,073,701,000) | | | | | | | 76,251,991 | |
| Capital World Growth and Income Fund | 13 |
| Convertible stocks 0.13% | | Shares | | | Value
(000) | |
| Miscellaneous 0.13% | | | | | | | | |
| Other convertible stocks in initial period of acquisition | | | | | | $ | 102,000 | |
| | | | | | | | | |
| Total convertible stocks (cost: $79,932,000) | | | | | | | 102,000 | |
| | | | | | | | | |
| Bonds, notes & other debt instruments 1.25% | Principal amount
(000) | | | | | |
| Corporate bonds & notes 0.91% | | | | | | | | |
| Other 0.91% | | | | | | | | |
| Other securities | | | | | | | 738,446 | |
| | | | | | | | | |
| | | | | | | | | |
| Bonds & notes of governments & government agencies outside the U.S. 0.26% | | | | | | | | |
| Other securities | | | | | | | 211,072 | |
| | | | | | | | | |
| U.S. Treasury bonds & notes 0.08% | | | | | | | | |
| U.S. Treasury 0.08% | | | | | | | | |
| Other securities | | | | | | | 64,594 | |
| | | | | | | | | |
| Total bonds, notes & other debt instruments (cost: $975,592,000) | | | | | | | 1,014,112 | |
| | | | | | | | | |
| Short-term securities 4.48% | | | | | | | | |
| Federal Home Loan Bank 0.31%–0.65% due 12/2/2016–5/23/2017 | | $ | 810,000 | | | | 809,388 | |
| Other securities | | | | | | | 2,822,148 | |
| | | | | | | | | |
| Total short-term securities (cost: $3,631,139,000) | | | | | | | 3,631,536 | |
| Total investment securities 99.94% (cost: $69,760,364,000) | | | | | | | 80,999,639 | |
| Other assets less liabilities 0.06% | | | | | | | 50,105 | |
| | | | | | | | | |
| Net assets 100.00% | | | | | | $ | 81,049,744 | |
This summary investment portfolio is designed to streamline the report and help investors better focus on the fund’s principal holdings. See the inside back cover for details on how to obtain a complete schedule of portfolio holdings.
As permitted by U.S. Securities and Exchange Commission regulations, “Miscellaneous” securities include holdings in their first year of acquisition that have not previously been publicly disclosed.
“Other securities” includes all issues that are not disclosed separately in the summary investment portfolio. Some of these securities (with an aggregate value of $2,020,714,000, which represented 2.49% of the net assets of the fund) were acquired in transactions exempt from registration under Rule 144A or Section 4(2) of the Securities Act of 1933 and may be resold in the U.S. in transactions exempt from registration, normally to qualified institutional buyers. “Other securities” also includes securities which were pledged as collateral. The total value of pledged collateral was $3,705,000, which represented less than .01% of the net assets of the fund.
Forward currency contracts
The fund has entered into forward currency contracts as shown in the following table. The average month-end notional amount of open forward currency contracts while held was $1,431,108,000.
| | | | | | | Contract amount | | Unrealized
(depreciation)
appreciation | |
| | | Settlement date | | Counterparty | | Receive
(000) | | Deliver
(000) | | at 11/30/2016
(000) | |
| Sales: | | | | | | | | | | | | |
| British pounds | | 12/7/2016 | | JPMorgan Chase | | $170,961 | | £140,000 | | | $(4,222 | ) |
| British pounds | | 12/16/2016 | | Citibank | | $101,514 | | £82,718 | | | (2,032 | ) |
| British pounds | | 12/20/2016 | | Bank of America, N.A. | | $29,261 | | £23,465 | | | (117 | ) |
| British pounds | | 1/11/2017 | | Citibank | | $199,978 | | £160,000 | | | (482 | ) |
| British pounds | | 1/19/2017 | | UBS AG | | $156,180 | | £124,850 | | | (266 | ) |
| British pounds | | 1/19/2017 | | JPMorgan Chase | | $153,543 | | £122,746 | | | (268 | ) |
| British pounds | | 1/19/2017 | | Bank of America, N.A. | | $156,177 | | £124,849 | | | (270 | ) |
| British pounds | | 1/19/2017 | | Bank of America, N.A. | | $199,545 | | £160,160 | | | (1,148 | ) |
| Euros | | 12/7/2016 | | JPMorgan Chase | | $41,165 | | €37,790 | | | 1,104 | |
| Euros | | 12/7/2016 | | Citibank | | $32,448 | | €29,788 | | | 870 | |
| Euros | | 12/19/2016 | | HSBC Bank | | $35,259 | | €31,842 | | | 1,475 | |
| 14 | Capital World Growth and Income Fund |
| | | | | | | Contract amount | | Unrealized
(depreciation)
appreciation | |
| | | Settlement date | | Counterparty | | Receive
(000) | | Deliver
(000) | | at 11/30/2016
(000) | |
| Euros | | 12/20/2016 | | Bank of America, N.A. | | $128,048 | | €120,640 | | | $ 43 | |
| Euros | | 12/20/2016 | | HSBC Bank | | $67,384 | | €63,533 | | | (28 | ) |
| Euros | | 1/19/2017 | | Citibank | | $57,979 | | €53,783 | | | 818 | |
| South African rand | | 1/6/2017 | | Barclays Bank PLC | | $15,985 | | ZAR223,100 | | | 260 | |
| South African rand | | 1/6/2017 | | Barclays Bank PLC | | $15,940 | | ZAR223,100 | | | 215 | |
| South African rand | | 1/6/2017 | | Barclays Bank PLC | | $18,165 | | ZAR255,858 | | | 132 | |
| | | | | | | | | | | | $(3,916 | ) |
Investments in affiliates
A company is an affiliate of the fund under the Investment Company Act of 1940 if the fund’s holdings in that company represent 5% or more of the outstanding voting shares. The value of the fund’s affiliated-company holdings is either shown in the summary investment portfolio or included in the value of “Other securities” under the respective industry sectors. Further details on such holdings and related transactions during the year ended November 30, 2016, appear below.
| | | | Beginning
shares | | | | Additions | | | | Reductions | | | | Ending
shares | | | Dividend
income
(000) | | | Value of
affiliates at
11/30/2016
(000) | |
| Greene King PLC1 | | | 16,727,000 | | | | 33,403 | | | | — | | | | 16,760,403 | | | $ | 7,265 | | | $ | 143,858 | |
| Golar LNG Ltd. | | | 5,180,000 | | | | 242,000 | | | | — | | | | 5,422,000 | | | | 3,132 | | | | 132,297 | |
| Ocado Group PLC1,2 | | | 23,970,000 | | | | 15,110,197 | | | | — | | | | 39,080,197 | | | | — | | | | 132,022 | |
| American Campus Communities, Inc.3 | | | 6,763,000 | | | | 518,000 | | | | 4,431,000 | | | | 2,850,000 | | | | 1,165 | | | | — | |
| ComfortDelGro Corp. Ltd.1,3 | | | 148,490,000 | | | | — | | | | 130,792,761 | | | | 17,697,239 | | | | 4,313 | | | | — | |
| Kingfisher PLC1,3 | | | 121,513,199 | | | | 1,018,000 | | | | 90,512,393 | | | | 32,018,806 | | | | 15,793 | | | | — | |
| | | | | | | | | | | | | | | | | | | $ | 31,668 | | | $ | 408,177 | |
| 1 | Valued under fair value procedures adopted by authority of the board of trustees. The total value of all such securities, including those in “Miscellaneous” and “Other securities,” was $37,914,674,000, which represented 46.78% of the net assets of the fund. This amount includes $37,179,723,000 related to certain securities trading outside the U.S. whose values were adjusted as a result of significant market movements following the close of local trading. |
| 2 | Security did not produce income during the last 12 months. |
| 3 | Unaffiliated issuer at 11/30/2016. |
Key to abbreviations and symbols
ADR = American Depositary Receipts
EUR/€ = Euros
GBP/£ = British pounds
ZAR = South African rand
See Notes to Financial Statements
| Capital World Growth and Income Fund | 15 |
Financial statements
| Statement of assets and liabilities | | | | | | | | |
| at November 30, 2016 | (dollars in thousands) |
| | |
| Assets: | | | | | | | | |
| Investment securities, at value: | | | | | | | | |
| Unaffiliated issuers (cost: $69,074,503) | | $ | 80,591,462 | | | | | |
| Affiliated issuers (cost: $685,861) | | | 408,177 | | | $ | 80,999,639 | |
| Cash | | | | | | | 372 | |
| Cash denominated in currencies other than U.S. dollars (cost: $11,859) | | | | | | | 11,863 | |
| Unrealized appreciation on open forward currency contracts | | | | | | | 4,917 | |
| Receivables for: | | | | | | | | |
| Sales of investments | | | 175,595 | | | | | |
| Sales of fund’s shares | | | 73,779 | | | | | |
| Dividends and interest | | | 225,899 | | | | | |
| Other | | | 59 | | | | 475,332 | |
| | | | | | | | 81,492,123 | |
| Liabilities: | | | | | | | | |
| Unrealized depreciation on open forward currency contracts | | | | | | | 8,833 | |
| Payables for: | | | | | | | | |
| Purchases of investments | | | 234,732 | | | | | |
| Repurchases of fund’s shares | | | 123,169 | | | | | |
| Closed forward currency contracts | | | 3,408 | | | | | |
| Investment advisory services | | | 24,862 | | | | | |
| Services provided by related parties | | | 29,524 | | | | | |
| Trustees’ deferred compensation | | | 1,468 | | | | | |
| Other | | | 16,383 | | | | 433,546 | |
| Net assets at November 30, 2016 | | | | | | $ | 81,049,744 | |
| | | | | | | | | |
| Net assets consist of: | | | | | | | | |
| Capital paid in on shares of beneficial interest | | | | | | $ | 67,384,671 | |
| Undistributed net investment income | | | | | | | 328,176 | |
| Undistributed net realized gain | | | | | | | 2,111,019 | |
| Net unrealized appreciation | | | | | | | 11,225,878 | |
| Net assets at November 30, 2016 | | | | | | $ | 81,049,744 | |
(dollars and shares in thousands, except per-share amounts)
Shares of beneficial interest issued and outstanding (no stated par value) —
unlimited shares authorized (1,818,544 total shares outstanding)
| | | Net assets | | | Shares outstanding | | | Net asset
value per share | |
| Class A | | $ | 50,454,104 | | | | 1,130,902 | | | $ | 44.61 | |
| Class B | | | 72,237 | | | | 1,624 | | | | 44.49 | |
| Class C | | | 2,938,354 | | | | 66,603 | | | | 44.12 | |
| Class F-1 | | | 3,286,067 | | | | 73,802 | | | | 44.53 | |
| Class F-2 | | | 5,646,040 | | | | 126,618 | | | | 44.59 | |
| Class 529-A | | | 2,859,340 | | | | 64,288 | | | | 44.48 | |
| Class 529-B | | | 10,508 | | | | 236 | | | | 44.46 | |
| Class 529-C | | | 658,959 | | | | 14,891 | | | | 44.25 | |
| Class 529-E | | | 117,289 | | | | 2,641 | | | | 44.41 | |
| Class 529-F-1 | | | 115,354 | | | | 2,591 | | | | 44.52 | |
| Class R-1 | | | 223,205 | | | | 5,052 | | | | 44.18 | |
| Class R-2 | | | 919,499 | | | | 20,864 | | | | 44.07 | |
| Class R-2E | | | 16,144 | | | | 363 | | | | 44.47 | |
| Class R-3 | | | 1,908,834 | | | | 43,066 | | | | 44.32 | |
| Class R-4 | | | 1,747,709 | | | | 39,262 | | | | 44.51 | |
| Class R-5E | | | 8,666 | | | | 194 | | | | 44.59 | |
| Class R-5 | | | 1,116,877 | | | | 25,020 | | | | 44.64 | |
| Class R-6 | | | 8,950,558 | | | | 200,527 | | | | 44.64 | |
See Notes to Financial Statements
| 16 | Capital World Growth and Income Fund |
| Statement of operations | | | | | | | | |
| for the year ended November 30, 2016 | | (dollars in thousands) |
| | | |
| Investment income: | | | | | | | | |
| Income: | | | | | | | | |
| Dividends (net of non-U.S. taxes of $88,913; also includes $31,668 from affiliates) | | $ | 2,334,901 | | | | | |
| Interest (net of non-U.S. taxes of $1,201) | | | 88,833 | | | $ | 2,423,734 | |
| Fees and expenses*: | | | | | | | | |
| Investment advisory services | | | 304,681 | | | | | |
| Distribution services | | | 202,924 | | | | | |
| Transfer agent services | | | 98,993 | | | | | |
| Administrative services | | | 19,885 | | | | | |
| Reports to shareholders | | | 3,877 | | | | | |
| Registration statement and prospectus | | | 1,973 | | | | | |
| Trustees’ compensation | | | 466 | | | | | |
| Auditing and legal | | | 4,259 | | | | | |
| Custodian | | | 8,642 | | | | | |
| Other | | | 3,279 | | | | 648,979 | |
| Net investment income | | | | | | | 1,774,755 | |
| | | | | | | | | |
| Net realized gain and unrealized depreciation: | | | | | | | | |
| Net realized gain (loss) on: | | | | | | | | |
| Investments (net of non-U.S. taxes of $1,041; also includes $50,060 net gain from affiliates) | | | 2,215,950 | | | | | |
| Forward currency contracts | | | 216,336 | | | | | |
| Currency transactions | | | (11,968 | ) | | | 2,420,318 | |
| Net unrealized depreciation on: | | | | | | | | |
| Investments (net of non-U.S. taxes of $6,232) | | | (2,307,033 | ) | | | | |
| Forward currency contracts | | | (3,266 | ) | | | | |
| Currency translations | | | (1,065 | ) | | | (2,311,364 | ) |
| Net realized gain and unrealized depreciation | | | | | | | 108,954 | |
| Net increase in net assets resulting from operations | | | | | | $ | 1,883,709 | |
| * | Additional information related to class-specific fees and expenses is included in the Notes to Financial Statements. |
| Statements of changes in net assets | | | | | | | | |
| | | (dollars in thousands) |
| | | |
| | | Year ended November 30 | |
| | | 2016 | | | 2015 | |
| Operations: | | | | | | | | |
| Net investment income | | $ | 1,774,755 | | | $ | 1,658,631 | |
| Net realized gain | | | 2,420,318 | | | | 4,774,514 | |
| Net unrealized depreciation | | | (2,311,364 | ) | | | (9,218,680 | ) |
| Net increase (decrease) in net assets resulting from operations | | | 1,883,709 | | | | (2,785,535 | ) |
| | | | | | | | | |
| Dividends and distributions paid to shareholders: | | | | | | | | |
| Dividends from net investment income | | | (1,920,044 | ) | | | (1,933,803 | ) |
| Distributions from net realized gain on investments | | | (1,318,506 | ) | | | — | |
| Total dividends and distributions paid to shareholders | | | (3,238,550 | ) | | | (1,933,803 | ) |
| | | | | | | | | |
| Net capital share transactions | | | (1,900,242 | ) | | | (401,335 | ) |
| | | | | | | | | |
| Total decrease in net assets | | | (3,255,083 | ) | | | (5,120,673 | ) |
| | | | | | | | | |
| Net assets: | | | | | | | | |
| Beginning of year | | | 84,304,827 | | | | 89,425,500 | |
| End of year (including undistributed net investment income: $328,176 and $367,603, respectively) | | $ | 81,049,744 | | | $ | 84,304,827 | |
See Notes to Financial Statements
| Capital World Growth and Income Fund | 17 |
Notes to financial statements
1. Organization
Capital World Growth and Income Fund (the “fund”) is registered under the Investment Company Act of 1940 as an open-end, diversified management investment company. The fund seeks long-term growth of capital while providing current income.
The fund has 18 share classes consisting of five retail share classes (Classes A, B and C, as well as two F share classes, F-1 and F-2), five 529 college savings plan share classes (Classes 529-A, 529-B, 529-C, 529-E and 529-F-1) and eight retirement plan share classes (Classes R-1, R-2, R-2E, R-3, R-4, R-5E, R-5 and R-6). The 529 college savings plan share classes can be used to save for college education. The retirement plan share classes are generally offered only through eligible employer-sponsored retirement plans. The fund’s share classes are described further in the following table:
| Share class | | Initial sales
charge | | Contingent deferred sales
charge upon redemption | | Conversion feature |
| Classes A and 529-A | | Up to 5.75% | | None (except 1% for certain redemptions within one year of purchase without an initial sales charge) | | None |
| Classes B and 529-B* | | None | | Declines from 5% to 0% for redemptions within six years of purchase | | Classes B and 529-B convert to Classes A and 529-A, respectively, after eight years |
| Class C | | None | | 1% for redemptions within one year of purchase | | Class C converts to Class F-1 after 10 years |
| Class 529-C | | None | | 1% for redemptions within one year of purchase | | None |
| Class 529-E | | None | | None | | None |
| Classes F-1, F-2 and 529-F-1 | | None | | None | | None |
| Classes R-1, R-2, R-2E, R-3, R-4, R-5E, R-5 and R-6 | | None | | None | | None |
| * | Class B and 529-B shares of the fund are not available for purchase. |
Holders of all share classes have equal pro rata rights to the assets, dividends and liquidation proceeds of the fund. Each share class has identical voting rights, except for the exclusive right to vote on matters affecting only its class. Share classes have different fees and expenses (“class-specific fees and expenses”), primarily due to different arrangements for distribution, transfer agent and administrative services. Differences in class-specific fees and expenses will result in differences in net investment income and, therefore, the payment of different per-share dividends by each share class.
2. Significant accounting policies
The fund is an investment company that applies the accounting and reporting guidance issued in Topic 946 by the U.S. Financial Accounting Standards Board. The fund’s financial statements have been prepared to comply with U.S. generally accepted accounting principles (“U.S. GAAP”). These principles require the fund’s investment adviser to make estimates and assumptions that affect reported amounts and disclosures. Actual results could differ from those estimates. Subsequent events, if any, have been evaluated through the date of issuance in the preparation of the financial statements. The fund follows the significant accounting policies described in this section, as well as the valuation policies described in the next section on valuation.
Security transactions and related investment income — Security transactions are recorded by the fund as of the date the trades are executed with brokers. Realized gains and losses from security transactions are determined based on the specific identified cost of the securities. In the event a security is purchased with a delayed payment date, the fund will segregate liquid assets sufficient to meet its payment obligations. Dividend income is recognized on the ex-dividend date and interest income is recognized on an accrual basis. Market discounts, premiums and original issue discounts on fixed-income securities are amortized daily over the expected life of the security.
Class allocations — Income, fees and expenses (other than class-specific fees and expenses) and realized and unrealized gains and losses are allocated daily among the various share classes based on their relative net assets. Class-specific fees and expenses, such as distribution, transfer agent and administrative services, are charged directly to the respective share class.
Dividends and distributions to shareholders — Dividends and distributions to shareholders are recorded on the ex-dividend date.
| 18 | Capital World Growth and Income Fund |
Currency translation — Assets and liabilities, including investment securities, denominated in currencies other than U.S. dollars are translated into U.S. dollars at the exchange rates supplied by one or more pricing vendors on the valuation date. Purchases and sales of investment securities and income and expenses are translated into U.S. dollars at the exchange rates on the dates of such transactions. The effects of changes in exchange rates on investment securities are included with the net realized gain or loss and net unrealized appreciation or depreciation on investments in the fund’s statement of operations. The realized gain or loss and unrealized appreciation or depreciation resulting from all other transactions denominated in currencies other than U.S. dollars are disclosed separately.
3. Valuation
Capital Research and Management Company (“CRMC”), the fund’s investment adviser, values the fund’s investments at fair value as defined by U.S. GAAP. The net asset value of each share class of the fund is generally determined as of approximately 4:00 p.m. New York time each day the New York Stock Exchange is open.
Methods and inputs — The fund’s investment adviser uses the following methods and inputs to establish the fair value of the fund’s assets and liabilities. Use of particular methods and inputs may vary over time based on availability and relevance as market and economic conditions evolve.
Equity securities are generally valued at the official closing price of, or the last reported sale price on, the exchange or market on which such securities are traded, as of the close of business on the day the securities are being valued or, lacking any sales, at the last available bid price. Prices for each security are taken from the principal exchange or market on which the security trades.
Fixed-income securities, including short-term securities, are generally valued at prices obtained from one or more pricing vendors. Vendors value such securities based on one or more of the inputs described in the following table. The table provides examples of inputs that are commonly relevant for valuing particular classes of fixed-income securities in which the fund is authorized to invest. However, these classifications are not exclusive, and any of the inputs may be used to value any other class of fixed-income security.
| Fixed-income class | Examples of standard inputs |
| All | Benchmark yields, transactions, bids, offers, quotations from dealers and trading systems, new issues, spreads and other relationships observed in the markets among comparable securities; and proprietary pricing models such as yield measures calculated using factors such as cash flows, financial or collateral performance and other reference data (collectively referred to as “standard inputs”) |
| Corporate bonds & notes; convertible securities | Standard inputs and underlying equity of the issuer |
| Bonds & notes of governments & government agencies | Standard inputs and interest rate volatilities |
| Mortgage-backed; asset-backed obligations | Standard inputs and cash flows, prepayment information, default rates, delinquency and loss assumptions, collateral characteristics, credit enhancements and specific deal information |
When the fund’s investment adviser deems it appropriate to do so (such as when vendor prices are unavailable or deemed to be not representative), fixed-income securities will be valued in good faith at the mean quoted bid and ask prices that are reasonably and timely available (or bid prices, if ask prices are not available) or at prices for securities of comparable maturity, quality and type.
Securities with both fixed-income and equity characteristics, or equity securities traded principally among fixed-income dealers, are generally valued in the manner described for either equity or fixed-income securities, depending on which method is deemed most appropriate by the fund’s investment adviser. Forward currency contracts are valued at the mean of representative quoted bid and ask prices, generally based on prices supplied by one or more pricing vendors.
Securities and other assets for which representative market quotations are not readily available or are considered unreliable by the fund’s investment adviser are fair valued as determined in good faith under fair valuation guidelines adopted by authority of the fund’s board of trustees as further described. The investment adviser follows fair valuation guidelines, consistent with U.S. Securities and Exchange Commission rules and guidance, to consider relevant principles and factors when making fair value determinations. The investment adviser considers relevant indications of value that are reasonably and timely available to it in determining the fair value to be assigned to a particular security, such as the type and cost of the security; contractual or legal restrictions on resale of the security; relevant financial or business developments of the issuer; actively traded similar or related securities; conversion or exchange rights on the security; related corporate actions; significant events occurring after the close of trading in the security; and changes in overall market conditions. In addition, the closing prices of equity securities that trade in markets outside U.S. time zones may be adjusted to reflect significant events
| Capital World Growth and Income Fund | 19 |
that occur after the close of local trading but before the net asset value of each share class of the fund is determined. Fair valuations and valuations of investments that are not actively trading involve judgment and may differ materially from valuations that would have been used had greater market activity occurred.
Processes and structure — The fund’s board of trustees has delegated authority to the fund’s investment adviser to make fair value determinations, subject to board oversight. The investment adviser has established a Joint Fair Valuation Committee (the “Fair Valuation Committee”) to administer, implement and oversee the fair valuation process, and to make fair value decisions. The Fair Valuation Committee regularly reviews its own fair value decisions, as well as decisions made under its standing instructions to the investment adviser’s valuation teams. The Fair Valuation Committee reviews changes in fair value measurements from period to period and may, as deemed appropriate, update the fair valuation guidelines to better reflect the results of back testing and address new or evolving issues. The Fair Valuation Committee reports any changes to the fair valuation guidelines to the board of trustees with supplemental information to support the changes. The fund’s board and audit committee also regularly review reports that describe fair value determinations and methods.
The fund’s investment adviser has also established a Fixed-Income Pricing Review Group to administer and oversee the fixed-income valuation process, including the use of fixed-income pricing vendors. This group regularly reviews pricing vendor information and market data. Pricing decisions, processes and controls over security valuation are also subject to additional internal reviews, including an annual control self-evaluation program facilitated by the investment adviser’s compliance group.
Classifications — The fund’s investment adviser classifies the fund’s assets and liabilities into three levels based on the inputs used to value the assets or liabilities. Level 1 values are based on quoted prices in active markets for identical securities. Level 2 values are based on significant observable market inputs, such as quoted prices for similar securities and quoted prices in inactive markets. Certain securities trading outside the U.S. may transfer between Level 1 and Level 2 due to valuation adjustments resulting from significant market movements following the close of local trading. Level 3 values are based on significant unobservable inputs that reflect the investment adviser’s determination of assumptions that market participants might reasonably use in valuing the securities. The valuation levels are not necessarily an indication of the risk or liquidity associated with the underlying investment. For example, U.S. government securities are reflected as Level 2 because the inputs used to determine fair value may not always be quoted prices in an active market. The following tables present the fund’s valuation levels as of November 30, 2016 (dollars in thousands):
| | | Investment securities | |
| | | Level 1 | | | Level 2* | | | Level 3 | | | Total | |
| Assets: | | | | | | | | | | | | | | | | |
| Common stocks: | | | | | | | | | | | | | | | | |
| Financials | | $ | 2,916,370 | | | $ | 8,467,148 | | | $ | — | | | $ | 11,383,518 | |
| Health care | | | 7,288,415 | | | | 3,022,306 | | | | — | | | | 10,310,721 | |
| Information technology | | | 5,543,702 | | | | 3,156,555 | | | | — | | | | 8,700,257 | |
| Consumer discretionary | | | 3,692,661 | | | | 4,073,730 | | | | — | | | | 7,766,391 | |
| Industrials | | | 4,341,342 | | | | 2,923,456 | | | | — | | | | 7,264,798 | |
| Consumer staples | | | 3,481,426 | | | | 3,362,714 | | | | — | | | | 6,844,140 | |
| Energy | | | 4,058,899 | | | | 2,187,271 | | | | — | | | | 6,246,170 | |
| Materials | | | 1,002,785 | | | | 2,893,381 | | | | — | | | | 3,896,166 | |
| Utilities | | | 1,303,856 | | | | 2,580,802 | | | | — | | | | 3,884,658 | |
| Telecommunication services | | | 1,848,177 | | | | 1,658,195 | | | | — | | | | 3,506,372 | |
| Real estate | | | 1,018,580 | | | | 1,529,219 | | | | — | | | | 2,547,799 | |
| Miscellaneous | | | 1,841,103 | | | | 2,059,898 | | | | — | | | | 3,901,001 | |
| Convertible stocks | | | 102,000 | | | | — | | | | — | | | | 102,000 | |
| Bonds, notes & other debt instruments | | | — | | | | 1,014,112 | | | | — | | | | 1,014,112 | |
| Short-term securities | | | — | | | | 3,631,536 | | | | — | | | | 3,631,536 | |
| Total | | $ | 38,439,316 | | | $ | 42,560,323 | | | $ | — | | | $ | 80,999,639 | |
| 20 | Capital World Growth and Income Fund |
| | | Other investments† | |
| | | Level 1 | | | Level 2 | | | Level 3 | | | Total | |
| Assets: | | | | | | | | | | | | | | | | |
| Unrealized appreciation on open forward currency contracts | | $ | — | | | $ | 4,917 | | | $ | — | | | $ | 4,917 | |
| Liabilities: | | | | | | | | | | | | | | | | |
| Unrealized depreciation on open forward currency contracts | | | — | | | | (8,833 | ) | | | — | | | | (8,833 | ) |
| Total | | $ | — | | | $ | (3,916 | ) | | $ | — | | | $ | (3,916 | ) |
| * | Securities with a value of $37,179,723,000, which represented 45.87% of the net assets of the fund, were classified as Level 2 due to significant market movements following the close of local trading. |
| † | Forward currency contracts are not included in the investment portfolio. |
4. Risk factors
Investing in the fund may involve certain risks including, but not limited to, those described below.
Market conditions — The prices of, and the income generated by, the common stocks and other securities held by the fund may decline – sometimes rapidly or unpredictably – due to various factors, including events or conditions affecting the general economy or particular industries; overall market changes; local, regional or global political, social or economic instability; governmental or governmental agency responses to economic conditions; and currency exchange rate, interest rate and commodity price fluctuations.
Issuer risks — The prices of, and the income generated by, securities held by the fund may decline in response to various factors directly related to the issuers of such securities, including reduced demand for an issuer’s goods or services, poor management performance and strategic initiatives such as mergers, acquisitions or dispositions and the market response to any such initiatives.
Investing outside the U.S. — Securities of issuers domiciled outside the United States, or with significant operations or revenues outside the United States, may lose value because of adverse political, social, economic or market developments (including social instability, regional conflicts, terrorism and war) in the countries or regions in which the issuers operate or generate revenue. These securities may also lose value due to changes in foreign currency exchange rates against the U.S. dollar and/or currencies of other countries. Issuers of these securities may be more susceptible to actions of foreign governments, such as the imposition of price controls or punitive taxes, that could adversely impact the value of these securities. Securities markets in certain countries may be more volatile and/or less liquid than those in the United States. Investments outside the United States may also be subject to different accounting practices and different regulatory, legal and reporting standards and practices, and may be more difficult to value, than those in the United States. In addition, the value of investments outside the United States may be reduced by foreign taxes, including foreign withholding taxes on interest and dividends. Further, there may be increased risks of delayed settlement of securities purchased or sold by the fund. The risks of investing outside the United States may be heightened in connection with investments in emerging markets.
Investing in emerging markets — Investing in emerging markets may involve risks in addition to and greater than those generally associated with investing in the securities markets of developed countries. For instance, developing countries may have less developed legal and accounting systems than those in developed countries. The governments of these countries may be less stable and more likely to impose capital controls, nationalize a company or industry, place restrictions on foreign ownership and on withdrawing sale proceeds of securities from the country, and/or impose punitive taxes that could adversely affect the prices of securities. In addition, the economies of these countries may be dependent on relatively few industries that are more susceptible to local and global changes. Securities markets in these countries can also be relatively small and have substantially lower trading volumes. As a result, securities issued in these countries may be more volatile and less liquid, and may be more difficult to value, than securities issued in countries with more developed economies and/or markets. Less certainty with respect to security valuations may lead to additional challenges and risks in calculating the fund’s net asset value. Additionally, there may be increased settlement risks for transactions in local securities.
Investing in growth-oriented stocks — Growth-oriented common stocks and other equity-type securities (such as preferred stocks, convertible preferred stocks and convertible bonds) may involve larger price swings and greater potential for loss than other types of investments.
Investing in income-oriented stocks — Income provided by the fund may be reduced by changes in the dividend policies of, and the capital resources available for dividend payments at, the companies in which the fund invests.
Management — The investment adviser to the fund actively manages the fund’s investments. Consequently, the fund is subject to the risk that the methods and analyses employed by the investment adviser in this process may not produce the desired results. This could cause the fund to lose value or its investment results to lag relevant benchmarks or other funds with similar objectives.
| Capital World Growth and Income Fund | 21 |
5. Certain investment techniques
Forward currency contracts — The fund has entered into forward currency contracts, which represent agreements to exchange currencies on specific future dates at predetermined rates. The fund’s investment adviser uses forward currency contracts to manage the fund’s exposure to changes in exchange rates. Upon entering into these contracts, risks may arise from the potential inability of counterparties to meet the terms of their contracts and from possible movements in exchange rates.
On a daily basis, the fund’s investment adviser values forward currency contracts and records unrealized appreciation or depreciation for open forward currency contracts in the fund’s statement of assets and liabilities. Realized gains or losses are recorded at the time the forward currency contract is closed or offset by another contract with the same broker for the same settlement date and currency.
Closed forward currency contracts that have not reached their settlement date are included in the respective receivables or payables for closed forward currency contracts in the fund’s statement of assets and liabilities. Net realized gains or losses from closed forward currency contracts and net unrealized appreciation or depreciation from open forward currency contracts are recorded in the fund’s statement of operations.
The following tables present the financial statement impacts resulting from the fund’s use of forward currency contracts as of, or for the year ended, November 30, 2016 (dollars in thousands):
| | | | | Assets | | | Liabilities | |
| Contract | | Risk type | | Location on statement of
assets and liabilities | | Value | | | Location on statement of assets and liabilities | | Value | |
| Forward currency | | Currency | | Unrealized appreciation on open forward currency contracts | | $ | 4,917 | | | Unrealized depreciation on open forward currency contracts | | $ | 8,833 | |
| Forward currency | | Currency | | Receivables for closed forward currency contracts | | | — | | | Payables for closed forward currency contracts | | | 3,408 | |
| | | | | | | $ | 4,917 | | | | | $ | 12,241 | |
| | | | | | | | | | | | | | | |
| | | | | Net realized gain | | | Net unrealized depreciation | |
| Contract | | Risk type | | Location on statement of operations | | Value | | | Location on statement of operations | | Value | |
| Forward currency | | Currency | | Net realized gain on forward currency contracts | | $ | 216,336 | | | Net unrealized depreciation on forward currency contracts | | $ | (3,266 | ) |
Collateral — The fund participates in a collateral program due to its use of forward currency contracts. The program calls for the fund to either receive or pledge collateral based on the net gain or loss on unsettled forward currency contracts by counterparty. The purpose of the collateral is to cover potential losses that could occur in the event that either party cannot meet its contractual obligations.
Rights of offset — The fund has entered into enforceable master netting agreements with certain counterparties for forward currency contracts, where on any date amounts payable by each party to the other (in the same currency with respect to the same transaction) may be closed or offset by each party’s payment obligation. If an early termination date occurs under these agreements following an event of default or termination event, all obligations of each party to its counterparty are settled net through a single payment in a single currency (“close-out netting”). For financial reporting purposes, the fund does not offset financial assets and financial liabilities that are subject to these master netting arrangements in the statement of assets and liabilities.
| 22 | Capital World Growth and Income Fund |
The following table presents the fund’s forward currency contracts by counterparty that are subject to master netting agreements but that are not offset in the fund’s statement of assets and liabilities. The net amount column shows the impact of offsetting on the fund’s statement of assets and liabilities as of November 30, 2016, if close-out netting was exercised (dollars in thousands):
| | | | Gross amounts
recognized in the | | | Gross amounts not offset in the
statement of assets and liabilities and
subject to a master netting agreement | | | | |
| Counterparty | | | statement of assets
and liabilities | | | Available
to offset | | | Non-cash
collateral* | | | Cash
collateral | | | Net
amount | |
| Assets: | | | | | | | | | | | | | | | | | | | | | |
| Bank of America, N.A. | | | $ | 43 | | | $ | (43 | ) | | $ | — | | | $ | — | | | $ | — | |
| Barclays Bank PLC | | | | 607 | | | | — | | | | — | | | | — | | | | 607 | |
| Citibank | | | | 1,688 | | | | (1,688 | ) | | | — | | | | — | | | | — | |
| HSBC Bank | | | | 1,475 | | | | (28 | ) | | | (1,447 | ) | | | — | | | | — | |
| JPMorgan Chase | | | | 1,104 | | | | (1,104 | ) | | | — | | | | — | | | | — | |
| Total | | | $ | 4,917 | | | $ | (2,863 | ) | | $ | (1,447 | ) | | $ | — | | | $ | 607 | |
| Liabilities: | | | | | | | | | | | | | | | | | | | | | |
| Bank of America, N.A. | | | $ | 1,535 | | | $ | (43 | ) | | $ | — | | | $ | — | | | $ | 1,492 | |
| Citibank | | | | 5,922 | | | | (1,688 | ) | | | (2,199 | ) | | | — | | | | 2,035 | |
| HSBC Bank | | | | 28 | | | | (28 | ) | | | — | | | | — | | | | — | |
| JPMorgan Chase | | | | 4,490 | | | | (1,104 | ) | | | (855 | ) | | | — | | | | 2,531 | |
| UBS AG | | | | 266 | | | | — | | | | — | | | | — | | | | 266 | |
| Total | | | $ | 12,241 | | | $ | (2,863 | ) | | $ | (3,054 | ) | | $ | — | | | $ | 6,324 | |
| * | Non-cash collateral is shown on a settlement basis. |
6. Taxation and distributions
Federal income taxation — The fund complies with the requirements under Subchapter M of the Internal Revenue Code applicable to mutual funds and intends to distribute substantially all of its net taxable income and net capital gains each year. The fund is not subject to income taxes to the extent such distributions are made. Therefore, no federal income tax provision is required.
As of and during the period ended November 30, 2016, the fund did not have a liability for any unrecognized tax benefits. The fund recognizes interest and penalties, if any, related to unrecognized tax benefits as income tax expense in the statement of operations. During the period, the fund did not incur any interest or penalties.
The fund is not subject to examination by U.S. federal tax authorities for tax years before 2012, by state tax authorities for tax years before 2011 and by tax authorities outside the U.S. for tax years before 2009.
Non-U.S. taxation — Dividend and interest income are recorded net of non-U.S. taxes paid. The fund may file withholding tax reclaims in certain jurisdictions to recover a portion of amounts previously withheld. As a result of rulings from European courts, the fund filed for additional reclaims related to prior years. These reclaims are recorded when the amount is known and there are no significant uncertainties on collectability. Gains realized by the fund on the sale of securities in certain countries are subject to non-U.S. taxes. The fund records an estimated deferred tax liability based on unrealized gains to provide for potential non-U.S. taxes payable upon the sale of these securities.
Distributions — Distributions paid to shareholders are based on net investment income and net realized gains determined on a tax basis, which may differ from net investment income and net realized gains for financial reporting purposes. These differences are due primarily to different treatment for items such as currency gains and losses; short-term capital gains and losses; capital losses related to sales of certain securities within 30 days of purchase; unrealized appreciation of certain investments in securities outside the U.S.; and cost of investments sold. The fiscal year in which amounts are distributed may differ from the year in which the net investment income and net realized gains are recorded by the fund for financial reporting purposes. The fund may also designate a portion of the amount paid to redeeming shareholders as a distribution for tax purposes.
During the year ended November 30, 2016, the fund reclassified $100,000 from undistributed net investment income to capital paid in on shares of beneficial interest, $105,962,000 from undistributed net realized gain to undistributed net investment income and $191,213,000 from undistributed net realized gain to capital paid in on shares of beneficial interest to align financial reporting with tax reporting.
| Capital World Growth and Income Fund | 23 |
As of November 30, 2016, the tax basis components of distributable earnings, unrealized appreciation (depreciation) and cost of investment securities were as follows (dollars in thousands):
| Undistributed ordinary income | $ | 518,467 | |
| Undistributed long-term capital gains | | 2,164,509 | |
| Gross unrealized appreciation on investment securities | | 15,548,639 | |
| Gross unrealized depreciation on investment securities | | (4,555,648 | ) |
| Net unrealized appreciation on investment securities | | 10,992,991 | |
| Cost of investment securities | | 70,006,648 | |
The tax character of distributions paid to shareholders was as follows (dollars in thousands):
| | | Year ended November 30, 2016 | | | Year ended November 30, 2015 | |
| Share class | | Ordinary
income | | | Long-term
capital gains | | | Total
dividends and
distributions
paid | | | Ordinary
income | | | Long-term
capital gains | | | Total
dividends
paid | |
| Class A | | $ | 1,228,463 | | | $ | 841,069 | | | $ | 2,069,532 | | | $ | 1,256,037 | | | $ | — | | | $ | 1,256,037 | |
| Class B | | | 3,095 | | | | 5,311 | | | | 8,406 | | | | 8,171 | | | | — | | | | 8,171 | |
| Class C | | | 52,549 | | | | 58,523 | | | | 111,072 | | | | 60,980 | | | | — | | | | 60,980 | |
| Class F-1 | | | 78,808 | | | | 60,077 | | | | 138,885 | | | | 88,206 | | | | — | | | | 88,206 | |
| Class F-2 | | | 124,210 | | | | 66,264 | | | | 190,474 | | | | 106,158 | | | | — | | | | 106,158 | |
| Class 529-A | | | 65,347 | | | | 45,971 | | | | 111,318 | | | | 65,889 | | | | — | | | | 65,889 | |
| Class 529-B | | | 345 | | | | 587 | | | | 932 | | | | 778 | | | | — | | | | 778 | |
| Class 529-C | | | 10,214 | | | | 11,002 | | | | 21,216 | | | | 10,264 | | | | — | | | | 10,264 | |
| Class 529-E | | | 2,440 | | | | 1,908 | | | | 4,348 | | | | 2,441 | | | | — | | | | 2,441 | |
| Class 529-F-1 | | | 2,780 | | | | 1,763 | | | | 4,543 | | | | 2,724 | | | | — | | | | 2,724 | |
| Class R-1 | | | 3,872 | | | | 4,003 | | | | 7,875 | | | | 4,256 | | | | — | | | | 4,256 | |
| Class R-2 | | | 15,985 | | | | 16,608 | | | | 32,593 | | | | 17,968 | | | | — | | | | 17,968 | |
| Class R-2E | | | 147 | | | | 23 | | | | 170 | | | | 12 | | | | — | | | | 12 | |
| Class R-3 | | | 42,043 | | | | 34,912 | | | | 76,955 | | | | 48,083 | | | | — | | | | 48,083 | |
| Class R-4 | | | 43,192 | | | | 31,267 | | | | 74,459 | | | | 47,836 | | | | — | | | | 47,836 | |
| Class R-5E* | | | — | † | | | — | † | | | — | † | | | — | | | | — | | | | — | |
| Class R-5 | | | 33,645 | | | | 21,688 | | | | 55,333 | | | | 37,236 | | | | — | | | | 37,236 | |
| Class R-6 | | | 212,909 | | | | 117,530 | | | | 330,439 | | | | 176,764 | | | | — | | | | 176,764 | |
| Total | | $ | 1,920,044 | | | $ | 1,318,506 | | | $ | 3,238,550 | | | $ | 1,933,803 | | | $ | — | | | $ | 1,933,803 | |
| * | Class R-5E shares were offered beginning November 20, 2015. |
| † | Amount less than one thousand. |
7. Fees and transactions with related parties
CRMC, the fund’s investment adviser, is the parent company of American Funds Distributors,® Inc. (“AFD”), the principal underwriter of the fund’s shares, and American Funds Service Company® (“AFS”), the fund’s transfer agent. CRMC, AFD and AFS are considered related parties to the fund.
Investment advisory services — The fund has an investment advisory and service agreement with CRMC that provides for monthly fees accrued daily. These fees are based on a series of decreasing annual rates beginning with 0.600% on the first $500 million of daily net assets and decreasing to 0.350% on such assets in excess of $115 billion. For the year ended November 30, 2016, the investment advisory services fee was $304,681,000, which was equivalent to an annualized rate of 0.376% of average daily net assets.
Class-specific fees and expenses — Expenses that are specific to individual share classes are accrued directly to the respective share class. The principal class-specific fees and expenses are further described below:
Distribution services — The fund has plans of distribution for all share classes, except Class F-2, R-5E, R-5 and R-6 shares. Under the plans, the board of trustees approves certain categories of expenses that are used to finance activities primarily intended to sell fund shares and service existing accounts. The plans provide for payments, based on an annualized percentage of average daily net assets, ranging from 0.30% to 1.00% as noted in this section. In some cases, the board of trustees has limited the amounts that may be paid to less than the maximum allowed by the plans. All share classes with a plan may use up to 0.25% of average daily net assets
| 24 | Capital World Growth and Income Fund |
to pay service fees, or to compensate AFD for paying service fees, to firms that have entered into agreements with AFD to provide certain shareholder services. The remaining amounts available to be paid under each plan are paid to dealers to compensate them for their sales activities.
For Class A and 529-A shares, distribution-related expenses include the reimbursement of dealer and wholesaler commissions paid by AFD for certain shares sold without a sales charge. These share classes reimburse AFD for amounts billed within the prior 15 months but only to the extent that the overall annual expense limit of 0.30% is not exceeded. As of November 30, 2016, there were no unreimbursed expenses subject to reimbursement for Class A or 529-A shares.
| Share class | | Currently approved limits | | Plan limits |
| Class A | | | 0.30 | % | | | 0.30 | % |
| Class 529-A | | | 0.30 | | | | 0.50 | |
| Classes B and 529-B | | | 1.00 | | | | 1.00 | |
| Classes C, 529-C and R-1 | | | 1.00 | | | | 1.00 | |
| Class R-2 | | | 0.75 | | | | 1.00 | |
| Class R-2E | | | 0.60 | | | | 0.85 | |
| Classes 529-E and R-3 | | | 0.50 | | | | 0.75 | |
| Classes F-1, 529-F-1 and R-4 | | | 0.25 | | | | 0.50 | |
Transfer agent services — The fund has a shareholder services agreement with AFS under which the fund compensates AFS for providing transfer agent services to each of the fund’s share classes. These services include recordkeeping, shareholder communications and transaction processing. In addition, the fund reimburses AFS for amounts paid to third parties for performing transfer agent services on behalf of fund shareholders.
Administrative services — The fund has an administrative services agreement with CRMC under which the fund compensates CRMC for providing administrative services to Class A, C, F, 529 and R shares. These services include, but are not limited to, coordinating, monitoring, assisting and overseeing third parties that provide services to fund shareholders. Under the agreement, Class A shares pay an annual fee of 0.01% and Class C, F, 529 and R shares pay an annual fee of 0.05% of their respective average daily net assets.
529 plan services — Each 529 share class is subject to service fees to compensate the Virginia College Savings Plan (“Virginia529”) for its oversight and administration of the 529 college savings plan. From December 1, 2015 to June 30, 2016, the quarterly fee was based on a series of decreasing annual rates beginning with 0.10% on the first $30 billion of the net assets invested in Class 529 shares of the American Funds and decreasing to 0.05% on such assets in excess of $70 billion. Effective July 1, 2016, the quarterly fee was amended to annual rates of 0.10% on the first $20 billion of the net assets invested in the Class 529 shares of the American Funds, 0.05% on such assets between $20 billion and $100 billion, and 0.03% on such assets over $100 billion. The fee for any given calendar quarter is accrued and calculated on the basis of the average net assets of Class 529 shares of the American Funds for the last month of the prior calendar quarter. The fee is included in other expenses in the fund’s statement of operations. Virginia529 is not considered a related party to the fund.
| Capital World Growth and Income Fund | 25 |
For the year ended November 30, 2016, class-specific expenses under the agreements were as follows (dollars in thousands):
| Share class | | Distribution
services | | | Transfer agent
services | | | Administrative
services | | | 529 plan
services | |
| Class A | | | $122,386 | | | | $70,988 | | | | $5,147 | | | | Not applicable | |
| Class B | | | 1,901 | | | | 320 | | | | Not applicable | | | | Not applicable | |
| Class C | | | 32,493 | | | | 4,626 | | | | 1,633 | | | | Not applicable | |
| Class F-1 | | | 8,366 | | | | 4,520 | | | | 1,685 | | | | Not applicable | |
| Class F-2 | | | Not applicable | | | | 4,995 | | | | 2,397 | | | | Not applicable | |
| Class 529-A | | | 6,306 | | | | 3,316 | | | | 1,422 | | | | $2,290 | |
| Class 529-B | | | 229 | | | | 37 | | | | 12 | | | | 20 | |
| Class 529-C | | | 6,600 | | | | 818 | | | | 334 | | | | 538 | |
| Class 529-E | | | 580 | | | | 75 | | | | 59 | | | | 94 | |
| Class 529-F-1 | | | — | | | | 127 | | | | 55 | | | | 89 | |
| Class R-1 | | | 2,339 | | | | 244 | | | | 117 | | | | Not applicable | |
| Class R-2 | | | 7,165 | | | | 3,375 | | | | 481 | | | | Not applicable | |
| Class R-2E | | | 56 | | | | 17 | | | | 5 | | | | Not applicable | |
| Class R-3 | | | 9,989 | | | | 3,066 | | | | 1,002 | | | | Not applicable | |
| Class R-4 | | | 4,514 | | | | 1,830 | | | | 905 | | | | Not applicable | |
| Class R-5E | | | Not applicable | | | | — | * | | | — | * | | | Not applicable | |
| Class R-5 | | | Not applicable | | | | 609 | | | | 609 | | | | Not applicable | |
| Class R-6 | | | Not applicable | | | | 30 | | | | 4,022 | | | | Not applicable | |
| Total class-specific expenses | | | $202,924 | | | | $98,993 | | | | $19,885 | | | | $3,031 | |
| * | Amount less than one thousand. |
Trustees’ deferred compensation — Trustees who are unaffiliated with CRMC may elect to defer the cash payment of part or all of their compensation. These deferred amounts, which remain as liabilities of the fund, are treated as if invested in shares of the fund or other American Funds. These amounts represent general, unsecured liabilities of the fund and vary according to the total returns of the selected funds. Trustees’ compensation of $466,000 in the fund’s statement of operations reflects $426,000 in current fees (either paid in cash or deferred) and a net increase of $40,000 in the value of the deferred amounts.
Affiliated officers and trustees — Officers and certain trustees of the fund are or may be considered to be affiliated with CRMC, AFD and AFS. No affiliated officers or trustees received any compensation directly from the fund.
Security transactions with related funds — The fund may purchase from, or sell securities to, other CRMC-managed funds (or funds managed by certain affiliates of CRMC) under procedures adopted by the fund’s board of trustees. The funds involved in such transactions are considered related by virtue of having a common investment adviser (or affiliated investment advisers), common trustees and/or common officers. When such transactions occur, each transaction is executed at the current market price of the security and no brokerage commissions or fees are paid in accordance with Rule 17a-7 of the 1940 Act.
| 26 | Capital World Growth and Income Fund |
8. Capital share transactions
Capital share transactions in the fund were as follows (dollars and shares in thousands):
| | | Sales1 | | | Reinvestments of
dividends and distributions | | | Repurchases1 | | | Net (decrease)
increase | |
| Share class | | Amount | | | Shares | | | Amount | | | Shares | | | Amount | | | Shares | | | Amount | | | Shares | |
| | | | | | | | | | | | | | | | | | | | | | | | | |
| Year ended November 30, 2016 | | | | | | | | | | | | | | | | | | | | | | | | | |
| | | | | | | | | | | | | | | | | | | | | | | | | | | | | | | | | |
| Class A | | $ | 2,528,742 | | | | 58,336 | | | $ | 2,029,083 | | | | 46,895 | | | $ | (7,121,616 | ) | | | (162,735 | ) | | $ | (2,563,791 | ) | | | (57,504 | ) |
| Class B | | | 748 | | | | 17 | | | | 8,342 | | | | 194 | | | | (285,233 | ) | | | (6,621 | ) | | | (276,143 | ) | | | (6,410 | ) |
| Class C | | | 237,940 | | | | 5,546 | | | | 109,049 | | | | 2,547 | | | | (1,086,695 | ) | | | (25,274 | ) | | | (739,706 | ) | | | (17,181 | ) |
| Class F-1 | | | 850,298 | | | | 19,741 | | | | 135,578 | | | | 3,139 | | | | (1,410,352 | ) | | | (32,847 | ) | | | (424,476 | ) | | | (9,967 | ) |
| Class F-2 | | | 2,960,952 | | | | 67,770 | | | | 178,908 | | | | 4,137 | | | | (1,689,935 | ) | | | (38,917 | ) | | | 1,449,925 | | | | 32,990 | |
| Class 529-A | | | 234,685 | | | | 5,414 | | | | 111,298 | | | | 2,580 | | | | (378,113 | ) | | | (8,659 | ) | | | (32,130 | ) | | | (665 | ) |
| Class 529-B | | | 267 | | | | 6 | | | | 931 | | | | 22 | | | | (29,987 | ) | | | (694 | ) | | | (28,789 | ) | | | (666 | ) |
| Class 529-C | | | 59,309 | | | | 1,374 | | | | 21,210 | | | | 494 | | | | (110,955 | ) | | | (2,553 | ) | | | (30,436 | ) | | | (685 | ) |
| Class 529-E | | | 10,023 | | | | 231 | | | | 4,347 | | | | 101 | | | | (17,124 | ) | | | (392 | ) | | | (2,754 | ) | | | (60 | ) |
| Class 529-F-1 | | | 19,301 | | | | 444 | | | | 4,541 | | | | 105 | | | | (19,906 | ) | | | (457 | ) | | | 3,936 | | | | 92 | |
| Class R-1 | | | 16,394 | | | | 383 | | | | 7,863 | | | | 183 | | | | (53,236 | ) | | | (1,230 | ) | | | (28,979 | ) | | | (664 | ) |
| Class R-2 | | | 149,565 | | | | 3,485 | | | | 32,556 | | | | 761 | | | | (303,990 | ) | | | (7,063 | ) | | | (121,869 | ) | | | (2,817 | ) |
| Class R-2E | | | 16,082 | | | | 370 | | | | 170 | | | | 4 | | | | (1,530 | ) | | | (36 | ) | | | 14,722 | | | | 338 | |
| Class R-3 | | | 335,432 | | | | 7,749 | | | | 76,811 | | | | 1,786 | | | | (704,579 | ) | | | (16,318 | ) | | | (292,336 | ) | | | (6,783 | ) |
| Class R-4 | | | 361,234 | | | | 8,307 | | | | 74,442 | | | | 1,724 | | | | (652,596 | ) | | | (15,036 | ) | | | (216,920 | ) | | | (5,005 | ) |
| Class R-5E | | | 8,656 | | | | 194 | | | | — | | | | — | | | | — | | | | — | | | | 8,656 | | | | 194 | |
| Class R-5 | | | 208,737 | | | | 4,797 | | | | 55,314 | | | | 1,279 | | | | (502,726 | ) | | | (11,772 | ) | | | (238,675 | ) | | | (5,696 | ) |
| Class R-6 | | | 2,137,677 | | | | 49,550 | | | | 330,373 | | | | 7,632 | | | | (848,527 | ) | | | (19,554 | ) | | | 1,619,523 | | | | 37,628 | |
| Total net increase (decrease) | | $ | 10,136,042 | | | | 233,714 | | | $ | 3,180,816 | | | | 73,583 | | | $ | (15,217,100 | ) | | | (350,158 | ) | | $ | (1,900,242 | ) | | | (42,861 | ) |
| | | | | | | | | | | | | | | | | | | | | | | | | | | | | | | | | |
| Year ended November 30, 2015 | | | | | | | | | | | | | | | | | | | | | | | | | |
| Class A | | $ | 3,683,750 | | | | 78,792 | | | $ | 1,229,677 | | | | 26,502 | | | $ | (5,558,045 | ) | | | (119,365 | ) | | $ | (644,618 | ) | | | (14,071 | ) |
| Class B | | | 2,982 | | | | 63 | | | | 8,090 | | | | 175 | | | | (402,562 | ) | | | (8,634 | ) | | | (391,490 | ) | | | (8,396 | ) |
| Class C | | | 404,737 | | | | 8,735 | | | | 59,607 | | | | 1,292 | | | | (1,064,595 | ) | | | (23,034 | ) | | | (600,251 | ) | | | (13,007 | ) |
| Class F-1 | | | 1,110,065 | | | | 23,801 | | | | 86,372 | | | | 1,863 | | | | (1,062,607 | ) | | | (22,706 | ) | | | 133,830 | | | | 2,958 | |
| Class F-2 | | | 1,258,019 | | | | 27,018 | | | | 98,045 | | | | 2,116 | | | | (1,042,926 | ) | | | (22,597 | ) | | | 313,138 | | | | 6,537 | |
| Class 529-A | | | 273,799 | | | | 5,879 | | | | 65,878 | | | | 1,423 | | | | (342,576 | ) | | | (7,372 | ) | | | (2,899 | ) | | | (70 | ) |
| Class 529-B | | | 872 | | | | 19 | | | | 778 | | | | 17 | | | | (34,711 | ) | | | (746 | ) | | | (33,061 | ) | | | (710 | ) |
| Class 529-C | | | 72,071 | | | | 1,554 | | | | 10,261 | | | | 222 | | | | (97,725 | ) | | | (2,113 | ) | | | (15,393 | ) | | | (337 | ) |
| Class 529-E | | | 11,626 | | | | 250 | | | | 2,441 | | | | 53 | | | | (15,611 | ) | | | (336 | ) | | | (1,544 | ) | | | (33 | ) |
| Class 529-F-1 | | | 20,149 | | | | 431 | | | | 2,724 | | | | 59 | | | | (17,445 | ) | | | (374 | ) | | | 5,428 | | | | 116 | |
| Class R-1 | | | 27,353 | | | | 592 | | | | 4,250 | | | | 92 | | | | (61,764 | ) | | | (1,344 | ) | | | (30,161 | ) | | | (660 | ) |
| Class R-2 | | | 185,598 | | | | 4,024 | | | | 17,955 | | | | 390 | | | | (323,051 | ) | | | (7,020 | ) | | | (119,498 | ) | | | (2,606 | ) |
| Class R-2E | | | 952 | | | | 20 | | | | 11 | | | | — | 3 | | | (34 | ) | | | — | 3 | | | 929 | | | | 20 | |
| Class R-3 | | | 457,598 | | | | 9,860 | | | | 48,000 | | | | 1,040 | | | | (756,780 | ) | | | (16,330 | ) | | | (251,182 | ) | | | (5,430 | ) |
| Class R-4 | | | 440,878 | | | | 9,429 | | | | 47,814 | | | | 1,033 | | | | (645,012 | ) | | | (13,818 | ) | | | (156,320 | ) | | | (3,356 | ) |
| Class R-5E2 | | | 10 | | | | — | 3 | | | — | | | | — | | | | — | | | | — | | | | 10 | | | | — | 3 |
| Class R-5 | | | 302,691 | | | | 6,483 | | | | 37,220 | | | | 803 | | | | (375,811 | ) | | | (8,077 | ) | | | (35,900 | ) | | | (791 | ) |
| Class R-6 | | | 2,178,487 | | | | 46,869 | | | | 176,733 | | | | 3,812 | | | | (927,573 | ) | | | (20,033 | ) | | | 1,427,647 | | | | 30,648 | |
| Total net increase (decrease) | | $ | 10,431,637 | | | | 223,819 | | | $ | 1,895,856 | | | | 40,892 | | | $ | (12,728,828 | ) | | | (273,899 | ) | | $ | (401,335 | ) | | | (9,188 | ) |
| 1 | Includes exchanges between share classes of the fund. |
| 2 | Class R-5E shares were offered beginning November 20, 2015. |
| 3 | Amount less than one thousand. |
9. Investment transactions
The fund made purchases and sales of investment securities, excluding short-term securities and U.S. government obligations, if any, of $26,779,937,000 and $29,698,487,000, respectively, during the year ended November 30, 2016.
| Capital World Growth and Income Fund | 27 |
Financial highlights
| | | | | | Income (loss) from
investment operations1 | | | Dividends and distributions | | | | | | | | | | | | | | | | |
| | | Net asset
value,
beginning
of period | | | Net
investment
income2 | | | Net gains
(losses) on
securities (both
realized and
unrealized) | | | Total from
investment
operations | | | Dividends
(from net
investment
income) | | | Distributions
(from capital
gains) | | | Total
dividends
and
distributions | | | Net asset
value,
end
of period | | | Total
return3 | | | Net assets,
end of period
(in millions) | | | Ratio of
expenses to
average
net assets | | | Ratio of
net income
to average
net assets2 | |
| Class A: | | | | | | | | | | | | | | | | | | | | | | | | | | | | | | | | | | | | | | | | | | | | | | | | |
| Year ended 11/30/2016 | | $ | 45.34 | | | $ | .96 | | | $ | .06 | | | $ | 1.02 | | | $ | (1.04 | ) | | $ | (.71 | ) | | $ | (1.75 | ) | | $ | 44.61 | | | | 2.42 | % | | $ | 50,454 | | | | .79 | % | | | 2.20 | % |
| Year ended 11/30/2015 | | | 47.87 | | | | .90 | | | | (2.38 | ) | | | (1.48 | ) | | | (1.05 | ) | | | — | | | | (1.05 | ) | | | 45.34 | | | | (3.12 | ) | | | 53,886 | | | | .77 | | | | 1.93 | |
| Year ended 11/30/2014 | | | 44.68 | | | | 1.20 | | | | 3.00 | | | | 4.20 | | | | (1.01 | ) | | | — | | | | (1.01 | ) | | | 47.87 | | | | 9.52 | | | | 57,559 | | | | .77 | | | | 2.59 | |
| Year ended 11/30/2013 | | | 36.75 | | | | .83 | | | | 8.13 | | | | 8.96 | | | | (1.03 | ) | | | — | | | | (1.03 | ) | | | 44.68 | | | | 24.77 | | | | 54,676 | | | | .80 | | | | 2.05 | |
| Year ended 11/30/2012 | | | 32.57 | | | | .87 | | | | 4.28 | | | | 5.15 | | | | (.97 | ) | | | — | | | | (.97 | ) | | | 36.75 | | | | 16.14 | | | | 46,323 | | | | .82 | | | | 2.52 | |
| Class B: | | | | | | | | | | | | | | | | | | | | | | | | | | | | | | | | | | | | | | | | | | | | | | | | |
| Year ended 11/30/2016 | | | 45.13 | | | | .63 | | | | .06 | | | | .69 | | | | (.62 | ) | | | (.71 | ) | | | (1.33 | ) | | | 44.49 | | | | 1.64 | | | | 72 | | | | 1.56 | | | | 1.46 | |
| Year ended 11/30/2015 | | | 47.61 | | | | .54 | | | | (2.36 | ) | | | (1.82 | ) | | | (.66 | ) | | | — | | | | (.66 | ) | | | 45.13 | | | | (3.85 | ) | | | 363 | | | | 1.52 | | | | 1.16 | |
| Year ended 11/30/2014 | | | 44.42 | | | | .90 | | | | 2.93 | | | | 3.83 | | | | (.64 | ) | | | — | | | | (.64 | ) | | | 47.61 | | | | 8.69 | | | | 782 | | | | 1.52 | | | | 1.96 | |
| Year ended 11/30/2013 | | | 36.53 | | | | .53 | | | | 8.08 | | | | 8.61 | | | | (.72 | ) | | | — | | | | (.72 | ) | | | 44.42 | | | | 23.83 | | | | 1,194 | | | | 1.56 | | | | 1.31 | |
| Year ended 11/30/2012 | | | 32.37 | | | | .60 | | | | 4.26 | | | | 4.86 | | | | (.70 | ) | | | — | | | | (.70 | ) | | | 36.53 | | | | 15.27 | | | | 1,433 | | | | 1.57 | | | | 1.76 | |
| Class C: | | | | | | | | | | | | | | | | | | | | | | | | | | | | | | | | | | | | | | | | | | | | | | | | |
| Year ended 11/30/2016 | | | 44.85 | | | | .61 | | | | .05 | | | | .66 | | | | (.68 | ) | | | (.71 | ) | | | (1.39 | ) | | | 44.12 | | | | 1.60 | | | | 2,938 | | | | 1.59 | | | | 1.41 | |
| Year ended 11/30/2015 | | | 47.34 | | | | .52 | | | | (2.34 | ) | | | (1.82 | ) | | | (.67 | ) | | | — | | | | (.67 | ) | | | 44.85 | | | | (3.87 | ) | | | 3,757 | | | | 1.57 | | | | 1.13 | |
| Year ended 11/30/2014 | | | 44.19 | | | | .83 | | | | 2.96 | | | | 3.79 | | | | (.64 | ) | | | — | | | | (.64 | ) | | | 47.34 | | | | 8.65 | | | | 4,582 | | | | 1.57 | | | | 1.82 | |
| Year ended 11/30/2013 | | | 36.36 | | | | .50 | | | | 8.05 | | | | 8.55 | | | | (.72 | ) | | | — | | | | (.72 | ) | | | 44.19 | | | | 23.79 | | | | 4,819 | | | | 1.60 | | | | 1.26 | |
| Year ended 11/30/2012 | | | 32.23 | | | | .59 | | | | 4.24 | | | | 4.83 | | | | (.70 | ) | | | — | | | | (.70 | ) | | | 36.36 | | | | 15.19 | | | | 4,373 | | | | 1.61 | | | | 1.73 | |
| Class F-1: | | | | | | | | | | | | | | | | | | | | | | | | | | | | | | | | | | | | | | | | | | | | | | | | |
| Year ended 11/30/2016 | | | 45.25 | | | | .93 | | | | .08 | | | | 1.01 | | | | (1.02 | ) | | | (.71 | ) | | | (1.73 | ) | | | 44.53 | | | | 2.39 | | | | 3,286 | | | | .83 | | | | 2.14 | |
| Year ended 11/30/2015 | | | 47.78 | | | | .89 | | | | (2.39 | ) | | | (1.50 | ) | | | (1.03 | ) | | | — | | | | (1.03 | ) | | | 45.25 | | | | (3.17 | ) | | | 3,791 | | | | .81 | | | | 1.90 | |
| Year ended 11/30/2014 | | | 44.59 | | | | 1.21 | | | | 2.97 | | | | 4.18 | | | | (.99 | ) | | | — | | | | (.99 | ) | | | 47.78 | | | | 9.48 | | | | 3,861 | | | | .81 | | | | 2.62 | |
| Year ended 11/30/2013 | | | 36.68 | | | | .82 | | | | 8.11 | | | | 8.93 | | | | (1.02 | ) | | | — | | | | (1.02 | ) | | | 44.59 | | | | 24.75 | | | | 3,976 | | | | .82 | | | | 2.03 | |
| Year ended 11/30/2012 | | | 32.51 | | | | .87 | | | | 4.28 | | | | 5.15 | | | | (.98 | ) | | | — | | | | (.98 | ) | | | 36.68 | | | | 16.16 | | | | 3,177 | | | | .80 | | | | 2.52 | |
| Class F-2: | | | | | | | | | | | | | | | | | | | | | | | | | | | | | | | | | | | | | | | | | | | | | | | | |
| Year ended 11/30/2016 | | | 45.33 | | | | 1.07 | | | | .05 | | | | 1.12 | | | | (1.15 | ) | | | (.71 | ) | | | (1.86 | ) | | | 44.59 | | | | 2.66 | | | | 5,646 | | | | .55 | | | | 2.45 | |
| Year ended 11/30/2015 | | | 47.85 | | | | 1.01 | | | | (2.37 | ) | | | (1.36 | ) | | | (1.16 | ) | | | — | | | | (1.16 | ) | | | 45.33 | | | | (2.90 | ) | | | 4,244 | | | | .54 | | | | 2.16 | |
| Year ended 11/30/2014 | | | 44.67 | | | | 1.23 | | | | 3.07 | | | | 4.30 | | | | (1.12 | ) | | | — | | | | (1.12 | ) | | | 47.85 | | | | 9.76 | | | | 4,168 | | | | .53 | | | | 2.66 | |
| Year ended 11/30/2013 | | | 36.74 | | | | .94 | | | | 8.13 | | | | 9.07 | | | | (1.14 | ) | | | — | | | | (1.14 | ) | | | 44.67 | | | | 25.13 | | | | 2,541 | | | | .54 | | | | 2.31 | |
| Year ended 11/30/2012 | | | 32.56 | | | | .97 | | | | 4.28 | | | | 5.25 | | | | (1.07 | ) | | | — | | | | (1.07 | ) | | | 36.74 | | | | 16.43 | | | | 1,857 | | | | .54 | | | | 2.80 | |
| Class 529-A: | | | | | | | | | | | | | | | | | | | | | | | | | | | | | | | | | | | | | | | | | | | | | | | | |
| Year ended 11/30/2016 | | | 45.21 | | | | .92 | | | | .06 | | | | .98 | | | | (1.00 | ) | | | (.71 | ) | | | (1.71 | ) | | | 44.48 | | | | 2.34 | | | | 2,859 | | | | .87 | | | | 2.12 | |
| Year ended 11/30/2015 | | | 47.73 | | | | .86 | | | | (2.37 | ) | | | (1.51 | ) | | | (1.01 | ) | | | — | | | | (1.01 | ) | | | 45.21 | | | | (3.19 | ) | | | 2,936 | | | | .86 | | | | 1.84 | |
| Year ended 11/30/2014 | | | 44.55 | | | | 1.15 | | | | 3.00 | | | | 4.15 | | | | (.97 | ) | | | — | | | | (.97 | ) | | | 47.73 | | | | 9.43 | | | | 3,104 | | | | .86 | | | | 2.50 | |
| Year ended 11/30/2013 | | | 36.65 | | | | .80 | | | | 8.10 | | | | 8.90 | | | | (1.00 | ) | | | — | | | | (1.00 | ) | | | 44.55 | | | | 24.67 | | | | 2,853 | | | | .88 | | | | 1.97 | |
| Year ended 11/30/2012 | | | 32.49 | | | | .84 | | | | 4.27 | | | | 5.11 | | | | (.95 | ) | | | — | | | | (.95 | ) | | | 36.65 | | | | 16.04 | | | | 2,299 | | | | .89 | | | | 2.45 | |
| Class 529-B: | | | | | | | | | | | | | | | | | | | | | | | | | | | | | | | | | | | | | | | | | | | | | | | | |
| Year ended 11/30/2016 | | | 45.11 | | | | .59 | | | | .05 | | | | .64 | | | | (.58 | ) | | | (.71 | ) | | | (1.29 | ) | | | 44.46 | | | | 1.52 | | | | 11 | | | | 1.67 | | | | 1.36 | |
| Year ended 11/30/2015 | | | 47.59 | | | | .49 | | | | (2.36 | ) | | | (1.87 | ) | | | (.61 | ) | | | — | | | | (.61 | ) | | | 45.11 | | | | (3.96 | ) | | | 41 | | | | 1.65 | | | | 1.04 | |
| Year ended 11/30/2014 | | | 44.40 | | | | .83 | | | | 2.95 | | | | 3.78 | | | | (.59 | ) | | | — | | | | (.59 | ) | | | 47.59 | | | | 8.57 | | | | 77 | | | | 1.65 | | | | 1.80 | |
| Year ended 11/30/2013 | | | 36.52 | | | | .48 | | | | 8.08 | | | | 8.56 | | | | (.68 | ) | | | — | | | | (.68 | ) | | | 44.40 | | | | 23.69 | | | | 105 | | | | 1.67 | | | | 1.20 | |
| Year ended 11/30/2012 | | | 32.36 | | | | .57 | | | | 4.26 | | | | 4.83 | | | | (.67 | ) | | | — | | | | (.67 | ) | | | 36.52 | | | | 15.11 | | | | 115 | | | | 1.69 | | | | 1.65 | |
| 28 | Capital World Growth and Income Fund |
| | | | | | Income (loss) from
investment operations1 | | | Dividends and distributions | | | | | | | | | | | | | | | | |
| | | Net asset
value,
beginning
of period | | | Net
investment
income2 | | | Net gains
(losses) on
securities (both
realized and
unrealized) | | | Total from
investment
operations | | | Dividends
(from net
investment
income) | | | Distributions
(from capital
gains) | | | Total
dividends
and
distributions | | | Net asset
value,
end
of period | | | Total
return3 | | | Net assets,
end of period
(in millions) | | | Ratio of
expenses to
average
net assets | | | Ratio of
net income
to average
net assets2 | |
| Class 529-C: | | | | | | | | | | | | | | | | | | | | | | | | | | | | | | | | | | | | | | | | | | | | | | | | |
| Year ended 11/30/2016 | | $ | 44.98 | | | $ | .58 | | | $ | .06 | | | $ | .64 | | | $ | (.66 | ) | | $ | (.71 | ) | | $ | (1.37 | ) | | $ | 44.25 | | | | 1.55 | % | | $ | 659 | | | | 1.64 | % | | | 1.35 | % |
| Year ended 11/30/2015 | | | 47.49 | | | | .49 | | | | (2.35 | ) | | | (1.86 | ) | | | (.65 | ) | | | — | | | | (.65 | ) | | | 44.98 | | | | (3.95 | ) | | | 701 | | | | 1.64 | | | | 1.07 | |
| Year ended 11/30/2014 | | | 44.33 | | | | .79 | | | | 2.99 | | | | 3.78 | | | | (.62 | ) | | | — | | | | (.62 | ) | | | 47.49 | | | | 8.57 | | | | 756 | | | | 1.64 | | | | 1.73 | |
| Year ended 11/30/2013 | | | 36.48 | | | | .48 | | | | 8.07 | | | | 8.55 | | | | (.70 | ) | | | — | | | | (.70 | ) | | | 44.33 | | | | 23.69 | | | | 709 | | | | 1.66 | | | | 1.19 | |
| Year ended 11/30/2012 | | | 32.34 | | | | .57 | | | | 4.25 | | | | 4.82 | | | | (.68 | ) | | | — | | | | (.68 | ) | | | 36.48 | | | | 15.14 | | | | 582 | | | | 1.68 | | | | 1.66 | |
| Class 529-E: | | | | | | | | | | | | | | | | | | | | | | | | | | | | | | | | | | | | | | | | | | | | | | | | |
| Year ended 11/30/2016 | | | 45.14 | | | | .82 | | | | .07 | | | | .89 | | | | (.91 | ) | | | (.71 | ) | | | (1.62 | ) | | | 44.41 | | | | 2.11 | | | | 117 | | | | 1.09 | | | | 1.90 | |
| Year ended 11/30/2015 | | | 47.65 | | | | .75 | | | | (2.36 | ) | | | (1.61 | ) | | | (.90 | ) | | | — | | | | (.90 | ) | | | 45.14 | | | | (3.41 | ) | | | 122 | | | | 1.09 | | | | 1.61 | |
| Year ended 11/30/2014 | | | 44.48 | | | | 1.04 | | | | 2.99 | | | | 4.03 | | | | (.86 | ) | | | — | | | | (.86 | ) | | | 47.65 | | | | 9.16 | | | | 130 | | | | 1.09 | | | | 2.27 | |
| Year ended 11/30/2013 | | | 36.59 | | | | .70 | | | | 8.10 | | | | 8.80 | | | | (.91 | ) | | | — | | | | (.91 | ) | | | 44.48 | | | | 24.36 | | | | 122 | | | | 1.11 | | | | 1.74 | |
| Year ended 11/30/2012 | | | 32.44 | | | | .76 | | | | 4.26 | | | | 5.02 | | | | (.87 | ) | | | — | | | | (.87 | ) | | | 36.59 | | | | 15.78 | | | | 99 | | | | 1.13 | | | | 2.20 | |
| Class 529-F-1: | | | | | | | | | | | | | | | | | | | | | | | | | | | | | | | | | | | | | | | | | | | | | | | | |
| Year ended 11/30/2016 | | | 45.25 | | | | 1.02 | | | | .06 | | | | 1.08 | | | | (1.10 | ) | | | (.71 | ) | | | (1.81 | ) | | | 44.52 | | | | 2.56 | | | | 115 | | | | .64 | | | | 2.34 | |
| Year ended 11/30/2015 | | | 47.78 | | | | .96 | | | | (2.37 | ) | | | (1.41 | ) | | | (1.12 | ) | | | — | | | | (1.12 | ) | | | 45.25 | | | | (2.99 | ) | | | 113 | | | | .64 | | | | 2.07 | |
| Year ended 11/30/2014 | | | 44.60 | | | | 1.25 | | | | 3.00 | | | | 4.25 | | | | (1.07 | ) | | | — | | | | (1.07 | ) | | | 47.78 | | | | 9.66 | | | | 114 | | | | .64 | | | | 2.71 | |
| Year ended 11/30/2013 | | | 36.68 | | | | .89 | | | | 8.12 | | | | 9.01 | | | | (1.09 | ) | | | — | | | | (1.09 | ) | | | 44.60 | | | | 24.98 | | | | 100 | | | | .66 | | | | 2.19 | |
| Year ended 11/30/2012 | | | 32.51 | | | | .91 | | | | 4.28 | | | | 5.19 | | | | (1.02 | ) | | | — | | | | (1.02 | ) | | | 36.68 | | | | 16.27 | | | | 78 | | | | .67 | | | | 2.65 | |
| Class R-1: | | | | | | | | | | | | | | | | | | | | | | | | | | | | | | | | | | | | | | | | | | | | | | | | |
| Year ended 11/30/2016 | | | 44.91 | | | | .62 | | | | .07 | | | | .69 | | | | (.71 | ) | | | (.71 | ) | | | (1.42 | ) | | | 44.18 | | | | 1.65 | | | | 223 | | | | 1.55 | | | | 1.44 | |
| Year ended 11/30/2015 | | | 47.42 | | | | .54 | | | | (2.36 | ) | | | (1.82 | ) | | | (.69 | ) | | | — | | | | (.69 | ) | | | 44.91 | | | | (3.87 | ) | | | 257 | | | | 1.54 | | | | 1.16 | |
| Year ended 11/30/2014 | | | 44.26 | | | | .84 | | | | 2.98 | | | | 3.82 | | | | (.66 | ) | | | — | | | | (.66 | ) | | | 47.42 | | | | 8.69 | | | | 302 | | | | 1.54 | | | | 1.83 | |
| Year ended 11/30/2013 | | | 36.42 | | | | .52 | | | | 8.06 | | | | 8.58 | | | | (.74 | ) | | | — | | | | (.74 | ) | | | 44.26 | | | | 23.84 | | | | 302 | | | | 1.55 | | | | 1.30 | |
| Year ended 11/30/2012 | | | 32.29 | | | | .61 | | | | 4.24 | | | | 4.85 | | | | (.72 | ) | | | — | | | | (.72 | ) | | | 36.42 | | | | 15.27 | | | | 276 | | | | 1.56 | | | | 1.79 | |
| Class R-2: | | | | | | | | | | | | | | | | | | | | | | | | | | | | | | | | | | | | | | | | | | | | | | | | |
| Year ended 11/30/2016 | | | 44.81 | | | | .62 | | | | .06 | | | | .68 | | | | (.71 | ) | | | (.71 | ) | | | (1.42 | ) | | | 44.07 | | | | 1.63 | | | | 920 | | | | 1.54 | | | | 1.44 | |
| Year ended 11/30/2015 | | | 47.31 | | | | .56 | | | | (2.35 | ) | | | (1.79 | ) | | | (.71 | ) | | | — | | | | (.71 | ) | | | 44.81 | | | | (3.82 | ) | | | 1,061 | | | | 1.50 | | | | 1.20 | |
| Year ended 11/30/2014 | | | 44.17 | | | | .85 | | | | 2.96 | | | | 3.81 | | | | (.67 | ) | | | — | | | | (.67 | ) | | | 47.31 | | | | 8.69 | | | | 1,244 | | | | 1.52 | | | | 1.86 | |
| Year ended 11/30/2013 | | | 36.35 | | | | .54 | | | | 8.04 | | | | 8.58 | | | | (.76 | ) | | | — | | | | (.76 | ) | | | 44.17 | | | | 23.88 | | | | 1,277 | | | | 1.51 | | | | 1.35 | |
| Year ended 11/30/2012 | | | 32.22 | | | | .61 | | | | 4.24 | | | | 4.85 | | | | (.72 | ) | | | — | | | | (.72 | ) | | | 36.35 | | | | 15.30 | | | | 1,150 | | | | 1.55 | | | | 1.78 | |
| Class R-2E: | | | | | | | | | | | | | | | | | | | | | | | | | | | | | | | | | | | | | | | | | | | | | | | | |
| Year ended 11/30/2016 | | | 45.25 | | | | .73 | | | | .10 | | | | .83 | | | | (.90 | ) | | | (.71 | ) | | | (1.61 | ) | | | 44.47 | | | | 1.98 | | | | 16 | | | | 1.23 | | | | 1.68 | |
| Year ended 11/30/2015 | | | 47.84 | | | | .72 | | | | (2.39 | ) | | | (1.67 | ) | | | (.92 | ) | | | — | | | | (.92 | ) | | | 45.25 | | | | (3.54 | ) | | | 1 | | | | 1.19 | | | | 1.54 | |
| Period from 8/29/2014 to 11/30/20144,5 | | | 47.71 | | | | .12 | | | | .21 | | | | .33 | | | | (.20 | ) | | | — | | | | (.20 | ) | | | 47.84 | | | | .70 | 6,7 | | | — | 8 | | | .30 | 6,7 | | | .26 | 6,7 |
| Class R-3: | | | | | | | | | | | | | | | | | | | | | | | | | | | | | | | | | | | | | | | | | | | | | | | | |
| Year ended 11/30/2016 | | | 45.05 | | | | .82 | | | | .06 | | | | .88 | | | | (.90 | ) | | | (.71 | ) | | | (1.61 | ) | | | 44.32 | | | | 2.10 | | | | 1,909 | | | | 1.10 | | | | 1.88 | |
| Year ended 11/30/2015 | | | 47.57 | | | | .75 | | | | (2.37 | ) | | | (1.62 | ) | | | (.90 | ) | | | — | | | | (.90 | ) | | | 45.05 | | | | (3.43 | ) | | | 2,246 | | | | 1.09 | | | | 1.61 | |
| Year ended 11/30/2014 | | | 44.40 | | | | 1.05 | | | | 2.98 | | | | 4.03 | | | | (.86 | ) | | | — | | | | (.86 | ) | | | 47.57 | | | | 9.18 | | | | 2,629 | | | | 1.09 | | | | 2.28 | |
| Year ended 11/30/2013 | | | 36.53 | | | | .71 | | | | 8.08 | | | | 8.79 | | | | (.92 | ) | | | — | | | | (.92 | ) | | | 44.40 | | | | 24.41 | | | | 2,651 | | | | 1.09 | | | | 1.76 | |
| Year ended 11/30/2012 | | | 32.38 | | | | .77 | | | | 4.25 | | | | 5.02 | | | | (.87 | ) | | | — | | | | (.87 | ) | | | 36.53 | | | | 15.81 | | | | 2,335 | | | | 1.10 | | | | 2.23 | |
See page 30 for footnotes.
| Capital World Growth and Income Fund | 29 |
Financial highlights (continued)
| | | | | | Income (loss) from
investment operations1 | | | Dividends and distributions | | | | | | | | | | | | | | | | |
| | | Net asset
value,
beginning
of period | | | Net
investment
income2 | | | Net gains
(losses) on
securities (both
realized and
unrealized) | | | Total from
investment
operations | | | Dividends
(from net
investment
income) | | | Distributions
(from capital
gains) | | | Total
dividends
and
distributions | | | Net asset
value,
end
of period | | | Total
return3 | | | Net assets,
end of period
(in millions) | | | Ratio of
expenses to
average
net assets | | | Ratio of
net income
to average
net assets2 | |
| Class R-4: | | | | | | | | | | | | | | | | | | | | | | | | | | | | | | | | | | | | | | | | | | | | | | | | |
| Year ended 11/30/2016 | | $ | 45.24 | | | $ | .95 | | | $ | .06 | | | $ | 1.01 | | | $ | (1.03 | ) | | $ | (.71 | ) | | $ | (1.74 | ) | | $ | 44.51 | | | | 2.40 | % | | $ | 1,748 | | | | .80 | % | | | 2.18 | % |
| Year ended 11/30/2015 | | | 47.76 | | | | .89 | | | | (2.37 | ) | | | (1.48 | ) | | | (1.04 | ) | | | — | | | | (1.04 | ) | | | 45.24 | | | | (3.13 | ) | | | 2,003 | | | | .79 | | | | 1.91 | |
| Year ended 11/30/2014 | | | 44.58 | | | | 1.19 | | | | 2.99 | | | | 4.18 | | | | (1.00 | ) | | | — | | | | (1.00 | ) | | | 47.76 | | | | 9.49 | | | | 2,275 | | | | .79 | | | | 2.59 | |
| Year ended 11/30/2013 | | | 36.67 | | | | .83 | | | | 8.11 | | | | 8.94 | | | | (1.03 | ) | | | — | | | | (1.03 | ) | | | 44.58 | | | | 24.78 | | | | 2,380 | | | | .80 | | | | 2.07 | |
| Year ended 11/30/2012 | | | 32.50 | | | | .87 | | | | 4.28 | | | | 5.15 | | | | (.98 | ) | | | — | | | | (.98 | ) | | | 36.67 | | | | 16.13 | | | | 2,159 | | | | .80 | | | | 2.53 | |
| Class R-5E: | | | | | | | | | | | | | | | | | | | | | | | | | | | | | | | | | | | | | | | | | | | | | | | | |
| Year ended 11/30/2016 | | | 45.34 | | | | 1.01 | | | | .06 | | | | 1.07 | | | | (1.11 | ) | | | (.71 | ) | | | (1.82 | ) | | | 44.59 | | | | 2.54 | | | | 9 | | | | .66 | | | | 2.31 | |
| Period from 11/20/2015 to 11/30/20154,9 | | | 45.70 | | | | .02 | | | | (.38 | ) | | | (.36 | ) | | | — | | | | — | | | | — | | | | 45.34 | | | | (.79 | )6 | | | — | 8 | | | .02 | 6 | | | .04 | 6 |
| Class R-5: | | | | | | | | | | | | | | | | | | | | | | | | | | | | | | | | | | | | | | | | | | | | | | | | |
| Year ended 11/30/2016 | | | 45.37 | | | | 1.10 | | | | .04 | | | | 1.14 | | | | (1.16 | ) | | | (.71 | ) | | | (1.87 | ) | | | 44.64 | | | | 2.71 | | | | 1,117 | | | | .50 | | | | 2.51 | |
| Year ended 11/30/2015 | | | 47.90 | | | | 1.03 | | | | (2.38 | ) | | | (1.35 | ) | | | (1.18 | ) | | | — | | | | (1.18 | ) | | | 45.37 | | | | (2.84 | ) | | | 1,393 | | | | .49 | | | | 2.21 | |
| Year ended 11/30/2014 | | | 44.70 | | | | 1.35 | | | | 2.99 | | | | 4.34 | | | | (1.14 | ) | | | — | | | | (1.14 | ) | | | 47.90 | | | | 9.83 | | | | 1,509 | | | | .49 | | | | 2.93 | |
| Year ended 11/30/2013 | | | 36.77 | | | | .96 | | | | 8.12 | | | | 9.08 | | | | (1.15 | ) | | | — | | | | (1.15 | ) | | | 44.70 | | | | 25.15 | | | | 1,615 | | | | .49 | | | | 2.37 | |
| Year ended 11/30/2012 | | | 32.59 | | | | .98 | | | | 4.28 | | | | 5.26 | | | | (1.08 | ) | | | — | | | | (1.08 | ) | | | 36.77 | | | | 16.49 | | | | 1,381 | | | | .50 | | | | 2.84 | |
| Class R-6: | | | | | | | | | | | | | | | | | | | | | | | | | | | | | | | | | | | | | | | | | | | | | | | | |
| Year ended 11/30/2016 | | | 45.37 | | | | 1.10 | | | | .07 | | | | 1.17 | | | | (1.19 | ) | | | (.71 | ) | | | (1.90 | ) | | | 44.64 | | | | 2.77 | | | | 8,951 | | | | .45 | | | | 2.52 | |
| Year ended 11/30/2015 | | | 47.89 | | | | 1.05 | | | | (2.37 | ) | | | (1.32 | ) | | | (1.20 | ) | | | — | | | | (1.20 | ) | | | 45.37 | | | | (2.78 | ) | | | 7,390 | | | | .45 | | | | 2.26 | |
| Year ended 11/30/2014 | | | 44.70 | | | | 1.31 | | | | 3.04 | | | | 4.35 | | | | (1.16 | ) | | | — | | | | (1.16 | ) | | | 47.89 | | | | 9.87 | | | | 6,334 | | | | .44 | | | | 2.83 | |
| Year ended 11/30/2013 | | | 36.77 | | | | .97 | | | | 8.13 | | | | 9.10 | | | | (1.17 | ) | | | — | | | | (1.17 | ) | | | 44.70 | | | | 25.21 | | | | 4,418 | | | | .45 | | | | 2.38 | |
| Year ended 11/30/2012 | | | 32.59 | | | | .99 | | | | 4.29 | | | | 5.28 | | | | (1.10 | ) | | | — | | | | (1.10 | ) | | | 36.77 | | | | 16.55 | | | | 2,518 | | | | .45 | | | | 2.86 | |
| | | Year ended November 30 |
| | | 2016 | | 2015 | | 2014 | | 2013 | | 2012 | |
| Portfolio turnover rate for all share classes | | 35% | | 35% | | 36% | | 24% | | 23% | |
| 1 | Based on average shares outstanding. |
| 2 | For the year ended November 30, 2014, this column reflects the impact of a corporate action event that resulted in a one-time increase to net investment income. If the corporate action event had not occurred, the Class A net investment income per share and ratio of net income to average net assets would have been lower by $.34 and .73 percentage points, respectively. The impact to the other share classes would have been similar. |
| 3 | Total returns exclude any applicable sales charges, including contingent deferred sales charges. |
| 4 | Based on operations for the period shown and, accordingly, is not representative of a full year. |
| 5 | Class R-2E shares were offered beginning August 29, 2014. |
| 6 | Not annualized. |
| 7 | All or a significant portion of assets in this class consisted of seed capital invested by CRMC and/or its affiliates. Fees for distribution services are not charged or accrued on these seed capital assets. If such fees were paid by the fund on seed capital assets, fund expenses would have been higher and net income and total return would have been lower. |
| 8 | Amount less than $1 million. |
| 9 | Class R-5E shares were offered beginning November 20, 2015. |
See Notes to Financial Statements
| 30 | Capital World Growth and Income Fund |
Report of Independent Registered Public Accounting Firm
To the Board of Trustees and Shareholders of Capital World Growth and Income Fund
In our opinion, the accompanying statement of assets and liabilities, including the summary investment portfolio, and the related statements of operations and of changes in net assets and the financial highlights present fairly, in all material respects, the financial position of Capital World Growth and Income Fund (the “Fund”) at November 30, 2016, the results of its operations for the year then ended, the changes in its net assets for each of the two years in the period then ended and the financial highlights for each of the periods presented, in conformity with accounting principles generally accepted in the United States of America. These financial statements and financial highlights (hereafter referred to as “financial statements”) are the responsibility of the Fund’s management. Our responsibility is to express an opinion on these financial statements based on our audits. We conducted our audits of these financial statements in accordance with the standards of the Public Company Accounting Oversight Board (United States). Those standards require that we plan and perform the audit to obtain reasonable assurance about whether the financial statements are free of material misstatement. An audit includes examining, on a test basis, evidence supporting the amounts and disclosures in the financial statements, assessing the accounting principles used and significant estimates made by management, and evaluating the overall financial statement presentation. We believe that our audits, which included confirmation of securities at November 30, 2016 by correspondence with the custodian and brokers, provide a reasonable basis for our opinion.
PricewaterhouseCoopers LLP
Los Angeles, California
January 10, 2017
| Capital World Growth and Income Fund | 31 |
As a fund shareholder, you incur two types of costs: (1) transaction costs, such as initial sales charges on purchase payments and contingent deferred sales charges on redemptions (loads), and (2) ongoing costs, including management fees, distribution and service (12b-1) fees, and other expenses. This example is intended to help you understand your ongoing costs (in dollars) of investing in the fund so you can compare these costs with the ongoing costs of investing in other mutual funds. The example is based on an investment of $1,000 invested at the beginning of the period and held for the entire six-month period (June 1, 2016, through November 30, 2016).
Actual expenses:
The first line of each share class in the table on the following page provides information about actual account values and actual expenses. You may use the information in this line, together with the amount you invested, to estimate the expenses that you paid over the period. Simply divide your account value by $1,000 (for example, an $8,600 account value divided by $1,000 = 8.6), then multiply the result by the number in the first line under the heading titled “Expenses paid during period” to estimate the expenses you paid on your account during this period.
Hypothetical example for comparison purposes:
The second line of each share class in the table on the following page provides information about hypothetical account values and hypothetical expenses based on the actual expense ratio for the share class and an assumed rate of return of 5.00% per year before expenses, which is not the actual return of the share class. The hypothetical account values and expenses may not be used to estimate the actual ending account balance or expenses you paid for the period. You may use this information to compare the ongoing costs of investing in the fund and other funds. To do so, compare this 5.00% hypothetical example with the 5.00% hypothetical examples that appear in the shareholder reports of the other funds.
Notes:
Retirement plan participants may be subject to certain fees charged by the plan sponsor, and Class F-1, F-2 and 529-F-1 shareholders may be subject to fees charged by financial intermediaries, typically ranging from 0.75% to 1.50% of assets annually depending on services offered. You can estimate the impact of these fees by adding the amount of the fees to the total estimated expenses you paid on your account during the period as calculated above. In addition, your ending account value would be lower by the amount of these fees.
Note that the expenses shown in the table on the following page are meant to highlight your ongoing costs only and do not reflect any transactional costs, such as sales charges (loads). Therefore, the second line of each share class in the table is useful in comparing ongoing costs only and will not help you determine the relative total costs of owning different funds. In addition, if these transactional costs were included, your costs would have been higher.
| 32 | Capital World Growth and Income Fund |
| | | Beginning
account value
6/1/2016 | | Ending
account value
11/30/2016 | | Expenses paid
during period* | | Annualized
expense ratio | |
| Class A - actual return | | $ | 1,000.00 | | $ | 1,026.70 | | $ | 3.96 | | | .78 | % |
| Class A - assumed 5% return | | | 1,000.00 | | | 1,021.16 | | | 3.95 | | | .78 | |
| Class B - actual return | | | 1,000.00 | | | 1,022.91 | | | 7.86 | | | 1.55 | |
| Class B - assumed 5% return | | | 1,000.00 | | | 1,017.30 | | | 7.84 | | | 1.55 | |
| Class C - actual return | | | 1,000.00 | | | 1,022.79 | | | 7.96 | | | 1.57 | |
| Class C - assumed 5% return | | | 1,000.00 | | | 1,017.20 | | | 7.94 | | | 1.57 | |
| Class F-1 - actual return | | | 1,000.00 | | | 1,026.82 | | | 4.17 | | | .82 | |
| Class F-1 - assumed 5% return | | | 1,000.00 | | | 1,020.96 | | | 4.15 | | | .82 | |
| Class F-2 - actual return | | | 1,000.00 | | | 1,028.02 | | | 2.80 | | | .55 | |
| Class F-2 - assumed 5% return | | | 1,000.00 | | | 1,022.31 | | | 2.79 | | | .55 | |
| Class 529-A - actual return | | | 1,000.00 | | | 1,026.42 | | | 4.32 | | | .85 | |
| Class 529-A - assumed 5% return | | | 1,000.00 | | | 1,020.81 | | | 4.31 | | | .85 | |
| Class 529-B - actual return | | | 1,000.00 | | | 1,022.22 | | | 8.36 | | | 1.65 | |
| Class 529-B - assumed 5% return | | | 1,000.00 | | | 1,016.80 | | | 8.34 | | | 1.65 | |
| Class 529-C - actual return | | | 1,000.00 | | | 1,022.53 | | | 8.21 | | | 1.62 | |
| Class 529-C - assumed 5% return | | | 1,000.00 | | | 1,016.95 | | | 8.19 | | | 1.62 | |
| Class 529-E - actual return | | | 1,000.00 | | | 1,025.29 | | | 5.43 | | | 1.07 | |
| Class 529-E - assumed 5% return | | | 1,000.00 | | | 1,019.70 | | | 5.42 | | | 1.07 | |
| Class 529-F-1 - actual return | | | 1,000.00 | | | 1,027.57 | | | 3.20 | | | .63 | |
| Class 529-F-1 - assumed 5% return | | | 1,000.00 | | | 1,021.91 | | | 3.19 | | | .63 | |
| Class R-1 - actual return | | | 1,000.00 | | | 1,022.81 | | | 7.81 | | | 1.54 | |
| Class R-1 - assumed 5% return | | | 1,000.00 | | | 1,017.35 | | | 7.79 | | | 1.54 | |
| Class R-2 - actual return | | | 1,000.00 | | | 1,022.86 | | | 7.81 | | | 1.54 | |
| Class R-2 - assumed 5% return | | | 1,000.00 | | | 1,017.35 | | | 7.79 | | | 1.54 | |
| Class R-2E - actual return | | | 1,000.00 | | | 1,024.59 | | | 6.24 | | | 1.23 | |
| Class R-2E - assumed 5% return | | | 1,000.00 | | | 1,018.90 | | | 6.23 | | | 1.23 | |
| Class R-3 - actual return | | | 1,000.00 | | | 1,025.03 | | | 5.53 | | | 1.09 | |
| Class R-3 - assumed 5% return | | | 1,000.00 | | | 1,019.60 | | | 5.52 | | | 1.09 | |
| Class R-4 - actual return | | | 1,000.00 | | | 1,026.71 | | | 4.01 | | | .79 | |
| Class R-4 - assumed 5% return | | | 1,000.00 | | | 1,021.11 | | | 4.00 | | | .79 | |
| Class R-5E - actual return | | | 1,000.00 | | | 1,027.35 | | | 3.35 | | | .66 | |
| Class R-5E - assumed 5% return | | | 1,000.00 | | | 1,021.76 | | | 3.35 | | | .66 | |
| Class R-5 - actual return | | | 1,000.00 | | | 1,028.19 | | | 2.49 | | | .49 | |
| Class R-5 - assumed 5% return | | | 1,000.00 | | | 1,022.61 | | | 2.48 | | | .49 | |
| Class R-6 - actual return | | | 1,000.00 | | | 1,028.73 | | | 2.24 | | | .44 | |
| Class R-6 - assumed 5% return | | | 1,000.00 | | | 1,022.86 | | | 2.23 | | | .44 | |
| * | The “expenses paid during period” are equal to the “annualized expense ratio,” multiplied by the average account value over the period, multiplied by the number of days in the period, and divided by 365 (to reflect the one-half year period). |
| Capital World Growth and Income Fund | 33 |
We are required to advise you of the federal tax status of certain distributions received by shareholders during the fiscal year. The fund hereby designates the following amounts for the fund’s fiscal year ended November 30, 2016:
| Foreign taxes | | | $0.06 per share |
| Foreign source income | | | $0.91 per share |
| Long-term capital gains | | | $1,509,719,000 |
| Qualified dividend income | | | 100% |
| Corporate dividends received deduction | | | $863,828,000 |
| U.S. government income that may be exempt from state taxation | | | $10,039,000 |
Individual shareholders should refer to their Form 1099 or other tax information, which will be mailed in January 2017, to determine the calendar year amounts to be included on their 2016 tax returns. Shareholders should consult their tax advisors.
| 34 | Capital World Growth and Income Fund |
Approval of Investment Advisory and Service Agreement
The Capital World Growth and Income Fund’s board has approved the fund’s Investment Advisory and Service Agreement (the “agreement”) with Capital Research and Management Company (“CRMC”) for an additional one-year term through October 31, 2017. The board approved the agreement following the recommendation of the fund’s Contracts Committee (the “committee”), which is composed of all of the fund’s independent board members. The board and the committee determined that the fund’s advisory fee structure was fair and reasonable in relation to the services provided, and that approving the agreement was in the best interests of the fund and its shareholders.
In reaching this decision, the board and the committee took into account information furnished to them throughout the year and otherwise provided to them, as well as information prepared specifically in connection with their review of the agreement, and were advised by their independent counsel. They considered the following factors, among others, but did not identify any single issue or particular piece of information that, in isolation, was the controlling factor, and each board and committee member did not necessarily attribute the same weight to each factor.
1. Nature, extent and quality of services
The board and the committee considered the depth and quality of CRMC’s investment management process, including its global research capabilities; the experience, capability and integrity of its senior management and other personnel; the low turnover rates of its key personnel; the overall financial strength and stability of CRMC and the Capital Group organization; and the ongoing evolution of CRMC’s organizational structure designed to maintain and strengthen these qualities. The board and the committee also considered the nature, extent and quality of administrative, compliance and shareholder services provided by CRMC to the fund under the agreement and other agreements, as well as the benefits to fund shareholders from investing in a fund that is part of a large family of funds. The board and the committee concluded that the nature, extent and quality of the services provided by CRMC have benefited and should continue to benefit the fund and its shareholders.
2. Investment results
The board and the committee considered the investment results of the fund in light of its objective of providing long-term growth of capital while providing current income. They compared the fund’s investment results with those of other funds (including funds that currently form the basis of the Lipper index for the category in which the fund is included), and data such as relevant market and fund indexes, over various periods through March 31, 2016. This report, including the letter to shareholders and related disclosures, contains certain information about the fund’s investment results. The board and the committee reviewed the fund’s investment results measured against various indexes, including the MSCI All Country World Index and the Lipper Global Funds Index. They noted that the investment results of the fund generally compared favorably to those of these indexes for the lifetime period, 20-year period, 10-year period and five-year periods. The board and the committee concluded that the fund’s investment results have been satisfactory for renewal of the agreement and that CRMC’s record in managing the fund indicated that its continued management should benefit the fund and its shareholders.
3. Advisory fees and total expenses
The board and the committee compared the advisory fees and total expense levels of the fund to those of other relevant funds. They observed that the fund’s advisory fees and expenses generally compared favorably to those of other similar funds included in the Lipper Global Funds category. The board and the committee also considered the breakpoint discounts in the fund’s advisory fee structure that reduce the level of fees charged by CRMC to the fund as fund assets increase. In addition, they reviewed information regarding the effective advisory fees charged to non-mutual fund clients by CRMC and its affiliates. They noted that, to the extent there were differences between the advisory fees paid by the fund and the advisory fees paid by those clients, the differences appropriately reflected the investment, operational, regulatory and market differences between advising the fund and the other clients. The board and the committee concluded that the fund’s cost structure was fair and reasonable in relation to the services provided, and that the fund’s shareholders receive reasonable value in return for the advisory fees and other amounts paid to CRMC by the fund.
| Capital World Growth and Income Fund | 35 |
4. Ancillary benefits
The board and the committee considered a variety of other benefits that CRMC and its affiliates receive as a result of CRMC’s relationship with the fund and the other American Funds, including fees for administrative services provided to certain share classes; fees paid to CRMC’s affiliated transfer agent; sales charges and distribution fees received and retained by the fund’s principal underwriter, an affiliate of CRMC; and possible ancillary benefits to CRMC and its institutional management affiliates in managing other investment vehicles. The board and the committee reviewed CRMC’s portfolio trading practices, noting the benefits CRMC receives from the research obtained with commissions from portfolio transactions made on behalf of the fund. The board and the committee took these ancillary benefits into account in evaluating the reasonableness of the advisory fees and other amounts paid to CRMC by the fund.
5. Adviser financial information
The board and the committee reviewed information regarding CRMC’s costs of providing services to the American Funds, including personnel, systems and resources of investment, compliance, trading, accounting and other administrative operations. They considered CRMC’s costs and related cost allocation methodology as well as its willingness to invest in technology, infrastructure and staff to maintain and expand services and capabilities, respond to industry and regulatory developments, and attract and retain qualified personnel. They noted information regarding the compensation structure for CRMC’s investment professionals. The board and the committee also compared CRMC’s profitability and compensation data to the reported results and data of several large, publicly held investment management companies. The board and the committee noted the competitiveness and cyclicality of both the mutual fund industry and the capital markets, and the importance in that environment of CRMC’s long-term profitability for maintaining its independence, company culture and management continuity. They further considered the breakpoint discounts in the fund’s advisory fee structure. The board and the committee concluded that the fund’s advisory fee structure reflected a reasonable sharing of benefits between CRMC and the fund’s shareholders.
| 36 | Capital World Growth and Income Fund |
Board of trustees and other officers
Independent trustees1
| Name and year of birth | | Year first
elected
a trustee
of the fund2 | | Principal occupation(s) during past five years | | Number of
portfolios in fund
complex overseen
by trustee3 | | Other directorships4
held by trustee |
| Joseph C. Berenato, 1946 | | 2005 | | Former Chairman and CEO, Ducommun Incorporated (aerospace components manufacturer) | | 16 | | Ducommun Incorporated |
| Mary Anne Dolan, 1947 | | 2010 | | Founder and President, MAD Ink (communications company) | | 10 | | None |
| John G. Freund, 1953 | | 2016 | | Founder and Managing Director, Skyline Ventures (venture capital investor in health care companies) | | 6 | | Collegium Pharmaceutical, Inc.; Proteon Therapeutics, Inc.; Tetraphase Pharmaceuticals, Inc. |
| Pedro J. Greer, Jr., 1956 | | 2016 | | Physician; Chairman of the Board and Associate Dean, Florida International University | | 3 | | None |
| R. Clark Hooper, 1946 | | 2010 | | Private investor | | 81 | | None |
| Merit E. Janow, 1958 | | 2001 | | Dean and Professor, Columbia University, School of International and Public Affairs | | 80 | | MasterCard Incorporated; Trimble, Inc. |
| Leonade D. Jones, 1947 | | 2010 | | Retired; former Treasurer, The Washington Post Company (retired 1996) | | 10 | | None |
| Earl Lewis, Jr., PhD, 1955 | | 2017 | | President, The Andrew W. Mellon Foundation; former Executive Vice President, Provost Emory University | | 3 | | 2U, Inc. |
| Stefanie Powers, 1942 | | 1993–1996 1997 | | Actor, producer, author, entrepreneur; Co-founder and President of The William Holden Wildlife Foundation; founder of The Jaguar Conservation Trust; former conservation consultant to Land Rover and Jaguar North America | | 3 | | None |
| Christopher E. Stone, 1956 | | 2009 | | President, Open Society Foundations; former Professor of the Practice of Criminal Justice, John F. Kennedy School of Government, Harvard University | | 6 | | None |
Steadman Upham, PhD, 1949
Chairman of the Board (Independent and Non-Executive) | | 2001 | | President Emeritus and University Professor, The University of Tulsa | | 80 | | None |
Robert J. Denison retired from the fund on December 31, 2016. The trustees thank Mr. Denison for his wise counsel and dedication to the fund.
Interested trustee5,6
| Name, year of birth and position with fund | | Year first
elected
a trustee
or officer
of the fund2 | | Principal occupation(s) during past five years
and positions held with affiliated entities or
the principal underwriter of the fund | | Number of
portfolios in fund
complex overseen
by trustee3 | | Other directorships4
held by trustee |
Mark E. Denning, 1957
Vice Chairman of the Board and President | | 1993 | | Director, Capital Research and Management Company; Partner — Capital Research Global Investors, Capital Research Company;7 Partner — Capital Research Global Investors, Capital International, Inc.7 | | 1 | | None |
The fund’s statement of additional information includes further details about fund trustees and is available without charge upon request by calling American Funds Service Company at (800) 421-4225 or by visiting the American Funds website at americanfunds.com. The address for all trustees and officers of the fund is 333 South Hope Street, Los Angeles, CA 90071, Attention: Secretary.
See page 38 for footnotes.
| Capital World Growth and Income Fund | 37 |
Other officers6
Name, year of birth and
position with fund | | Year first
elected
an officer
of the fund2 | | Principal occupation(s) during past five years and positions held with affiliated entities
or the principal underwriter of the fund |
Donald H. Rolfe, 1972
Executive Vice President | | 2008 | | Senior Vice President and Senior Counsel — Fund Business Management Group, Capital Research and Management Company |
L. Alfonso Barroso, 1971
Senior Vice President | | 2010 | | Partner — Capital Research Global Investors, Capital Research Company7 |
Michael Cohen, 1961
Senior Vice President | | 2014 | | Director, Capital Research and Management Company;
Partner — Capital International Investors, Capital Bank and Trust Company;7
Partner — Capital International Investors, Capital International Limited;7
Chairman of the Board and Senior Vice President, Capital International Limited7 |
Sung Lee, 1966
Vice President | | 2008 | | Partner — Capital Research Global Investors, Capital International, Inc.7 |
David M. Riley, 1967
Vice President | | 2007 | | Partner — Capital Research Global Investors, Capital Research and Management Company; Director, The Capital Group Companies, Inc.6 |
Alexander G. Sheynkman, 1963
Vice President | 2010 | | Partner — Capital Research Global Investors, Capital Research and Management Company |
Michael W. Stockton, 1967
Secretary | | 2013 | | Vice President — Fund Business Management Group, Capital Research and Management Company |
Gregory F. Niland, 1971
Treasurer | | 2016 | | Vice President — Investment Operations, Capital Research and Management Company |
Jennifer L. Butler, 1966
Assistant Secretary | | 2013 | | Assistant Vice President — Fund Business Management Group, Capital Research and Management Company |
Brian C. Janssen, 1972
Assistant Treasurer | | 2016 | | Vice President — Investment Operations, Capital Research and Management Company |
Dori Laskin, 1951
Assistant Treasurer | | 2010 | | Vice President — Investment Operations, Capital Research and Management Company |
| 1 | The term independent trustee refers to a trustee who is not an “interested person” of the fund within the meaning of the Investment Company Act of 1940. |
| 2 | Trustees and officers of the fund serve until their resignation, removal or retirement. |
| 3 | Funds managed by Capital Research and Management Company or its affiliates. |
| 4 | This includes all directorships/trusteeships (other than those in the American Funds or other funds managed by Capital Research and Management Company or its affiliates) that are held by each trustee as a trustee or director of a public company or a registered investment company. |
| 5 | The term interested trustee refers to a trustee who is an “interested person” within the meaning of the Investment Company Act of 1940, on the basis of their affiliation with the fund’s investment adviser, Capital Research and Management Company, or affiliated entities (including the fund’s principal underwriter). |
| 6 | All of the trustees and/or officers listed, with the exception of L. Alfonso Barroso, Michael Cohen and Alexander G. Sheynkman, are officers and/or directors/trustees of one or more of the other funds for which Capital Research and Management Company serves as investment adviser. |
| 7 | Company affiliated with Capital Research and Management Company. |
| 38 | Capital World Growth and Income Fund |
This page was intentionally left blank.
| Capital World Growth and Income Fund | 39 |
Offices of the fund and of the investment adviser
Capital Research and Management Company
333 South Hope Street
Los Angeles, CA 90071-1406
6455 Irvine Center Drive
Irvine, CA 92618-4518
Transfer agent for shareholder accounts
American Funds Service Company
(Write to the address near you.)
P.O. Box 6007
Indianapolis, IN 46206-6007
P.O. Box 2280
Norfolk, VA 23501-2280
Custodian of assets
JPMorgan Chase Bank
270 Park Avenue
New York, NY 10017-2070
Counsel
O’Melveny & Myers LLP
400 South Hope Street
Los Angeles, CA 90071-2899
Independent registered public accounting firm
PricewaterhouseCoopers LLP
601 South Figueroa Street
Los Angeles, CA 90017-3874
Principal underwriter
American Funds Distributors, Inc.
333 South Hope Street
Los Angeles, CA 90071-1406
| 40 | Capital World Growth and Income Fund |
Investors should carefully consider investment objectives, risks, charges and expenses. This and other important information is contained in the fund prospectus and summary prospectus, which can be obtained from your financial professional and should be read carefully before investing. You may also call American Funds Service Company (AFS) at (800) 421-4225 or visit the American Funds website at americanfunds.com.
“American Funds Proxy Voting Procedures and Principles” — which describes how we vote proxies relating to portfolio securities — is available on the American Funds website or upon request by calling AFS. The fund files its proxy voting record with the U.S. Securities and Exchange Commission (SEC) for the 12 months ended June 30 by August 31. The proxy voting record is available free of charge on the SEC website at sec.gov and on the American Funds website.
A complete November 30, 2016, portfolio of Capital World Growth and Income Fund’s investments is available free of charge by calling AFS or visiting the SEC website (where it is part of Form N-CSR).
Capital World Growth and Income Fund files a complete list of its portfolio holdings with the SEC for the first and third quarters of each fiscal year on Form N-Q. This filing is available free of charge on the SEC website. You may also review or, for a fee, copy this filing at the SEC’s Public Reference Room in Washington, D.C. Additional information regarding the operation of the Public Reference Room may be obtained by calling the SEC’s Office of Investor Education and Advocacy at (800) SEC-0330. Additionally, the list of portfolio holdings is available by calling AFS.
This report is for the information of shareholders of Capital World Growth and Income Fund, but it also may be used as sales literature when preceded or accompanied by the current prospectus or summary prospectus, which gives details about charges, expenses, investment objectives and operating policies of the fund. If used as sales material after March 31, 2017, this report must be accompanied by an American Funds statistical update for the most recently completed calendar quarter.
American Funds from Capital Group
The Capital AdvantageSM
Since 1931, American Funds, part of Capital Group, has helped investors pursue long-term investment success. Our consistent approach — in combination with The Capital SystemSM — has resulted in a superior long-term track record.
Aligned with investor success
We base our decisions on a long-term perspective, which we believe aligns our goals with the interests of our clients. Our portfolio managers average 27 years of investment experience, including 22 years at our company, reflecting a career commitment to our long-term approach.1
The Capital SystemSM
The Capital System combines individual accountability with teamwork. Funds using The Capital System are divided into portions that are managed independently by investment professionals with diverse backgrounds, ages and investment approaches. An extensive global research effort is the backbone of our system.
American Funds’ superior long-term track record
Equity funds have beaten their Lipper peer indexes in 91% of 10-year periods and 95% of 20-year periods. Fixed income funds have beaten their Lipper indexes in 58% of 10-year periods and 58% of 20-year periods.2 Fund management fees have been among the lowest in the industry.3
| | 1 | Portfolio manager experience as of December 31, 2015. |
| | 2 | Based on Class A share results for rolling periods through December 31, 2015. Periods covered are the shorter of the fund’s lifetime or since the comparable Lipper index inception date (except Capital Income Builder and SMALLCAP World Fund, for which the Lipper average was used). Expenses differ for each share class, so results will vary. |
| | 3 | On average, our management fees were in the lowest quintile 68% of the time, based on the 20-year period ended December 31, 2015, versus comparable Lipper categories, excluding funds of funds. |

ITEM 2 – Code of Ethics
The Registrant has adopted a Code of Ethics that applies to its Principal Executive Officer and Principal Financial Officer. The Registrant undertakes to provide to any person without charge, upon request, a copy of the Code of Ethics. Such request can be made to American Funds Service Company at 800/421-9225 or to the Secretary of the Registrant, 333 South Hope Street, Los Angeles, California 90071.
ITEM 3 – Audit Committee Financial Expert
The Registrant’s board has determined that Leonade D. Jones, a member of the Registrant’s audit committee, is an “audit committee financial expert” and "independent," as such terms are defined in this Item. This designation will not increase the designee’s duties, obligations or liability as compared to his or her duties, obligations and liability as a member of the audit committee and of the board, nor will it reduce the responsibility of the other audit committee members. There may be other individuals who, through education or experience, would qualify as "audit committee financial experts" if the board had designated them as such. Most importantly, the board believes each member of the audit committee contributes significantly to the effective oversight of the Registrant’s financial statements and condition.
| ITEM 4 – Principal Accountant Fees and Services | |
| | | |
| Registrant: | |
| a) Audit Fees: | |
| | 2015 | $119,000 |
| | 2016 | $136,000 |
| | | |
| b) Audit-Related Fees: | |
| | 2015 | None |
| | 2016 | None |
| | | |
| c) Tax Fees: | |
| | 2015 | $9,000 |
| | 2016 | $9,000 |
| | The tax fees consist of professional services relating to the preparation of the Registrant’s tax returns. |
| | | |
| d) All Other Fees: | |
| | 2015 | None |
| | 2016 | None |
| | | |
| | Adviser and affiliates (includes only fees for non-audit services billed to the adviser and affiliates for engagements that relate directly to the operations and financial reporting of the Registrant and were subject to the pre-approval policies described below): |
| a) Audit Fees: | |
| | Not Applicable | |
| | | |
| b) Audit-Related Fees: | |
| | 2015 | None |
| | 2016 | $17,000 |
| | The audit-related fees consist of assurance and related services relating to the examination of the Registrant’s transfer agent, principal underwriter and investment adviser conducted in accordance with Statement on Standards for Attestation Engagements Number 16 issued by the American Institute of Certified Public Accountants. |
| | | |
| c) Tax Fees: | |
| | 2015 | $29,000 |
| | 2016 | $9,000 |
| | The tax fees consist of consulting services relating to the Registrant’s investments. |
| | | |
| | | |
| d) All Other Fees: | |
| | 2015 | $2,000 |
| | 2016 | $2,000 |
| | The other fees consist of subscription services related to an accounting research tool. |
| | | |
| | All audit and permissible non-audit services that the Registrant’s audit committee considers compatible with maintaining the independent registered public accounting firm’s independence are required to be pre-approved by the committee. The pre-approval requirement will extend to all non-audit services provided to the Registrant, the investment adviser, and any entity controlling, controlled by, or under common control with the investment adviser that provides ongoing services to the Registrant, if the engagement relates directly to the operations and financial reporting of the Registrant. The committee will not delegate its responsibility to pre-approve these services to the investment adviser. The committee may delegate to one or more committee members the authority to review and pre-approve audit and permissible non-audit services. Actions taken under any such delegation will be reported to the full committee at its next meeting. The pre-approval requirement is waived with respect to non-audit services if certain conditions are met. The pre-approval requirement was not waived for any of the non-audit services listed above provided to the Registrant, adviser and affiliates. |
| | | |
| | Aggregate non-audit fees paid to the Registrant’s auditors, including fees for all services billed to the Registrant, adviser and affiliates that provide ongoing services to the Registrant, were $59,000 for fiscal year 2015 and $39,000 for fiscal year 2016. The non-audit services represented by these amounts were brought to the attention of the committee and considered to be compatible with maintaining the auditors’ independence. |
ITEM 5 – Audit Committee of Listed Registrants
Not applicable to this Registrant, insofar as the Registrant is not a listed issuer as defined in Rule 10A-3 under the Securities Exchange Act of 1934.
ITEM 6 – Schedule of Investments
Capital World Growth and Income Fund®
Investment portfolio
November 30, 2016
Common stocks 94.08%
Financials 14.05% | Shares | Value
(000) |
| Prudential PLC1 | 61,356,400 | $1,185,481 |
| Barclays PLC1 | 345,242,756 | 931,822 |
| UBS Group AG1 | 55,859,786 | 888,416 |
| HDFC Bank Ltd.1 | 36,585,126 | 734,563 |
| HDFC Bank Ltd. (ADR) | 569,900 | 36,770 |
| American International Group, Inc. | 11,688,800 | 740,252 |
| Société Générale1 | 17,051,989 | 731,253 |
| AIA Group Ltd.1 | 89,997,196 | 548,023 |
| Siam Commercial Bank PCL1 | 132,758,855 | 543,960 |
| Intesa Sanpaolo SpA1 | 141,055,000 | 311,624 |
| Sampo Oyj, Class A1 | 5,349,138 | 236,466 |
| Kotak Mahindra Bank Ltd.1 | 20,831,276 | 230,360 |
| Zurich Insurance Group AG1 | 880,872 | 230,243 |
| Credit Suisse Group AG1 | 17,039,616 | 226,989 |
| Principal Financial Group, Inc. | 3,681,000 | 212,357 |
| CIT Group Inc. | 5,164,600 | 210,974 |
| BNP Paribas SA1 | 3,546,635 | 205,913 |
| DBS Group Holdings Ltd1 | 14,999,500 | 183,173 |
| Wells Fargo & Co. | 3,434,700 | 181,764 |
| Banco Bilbao Vizcaya Argentaria, SA1 | 29,380,127 | 181,413 |
| JPMorgan Chase & Co. | 2,182,000 | 174,931 |
| Aberdeen Asset Management PLC1 | 52,245,682 | 174,586 |
| Fairfax Financial Holdings Ltd. (CAD denominated) | 366,100 | 173,966 |
| Citigroup Inc. | 3,070,000 | 173,117 |
| Bangkok Bank PCL, non-voting depository receipt1 | 38,690,900 | 168,891 |
| PICC Property and Casualty Co. Ltd., Class H1 | 89,104,000 | 149,037 |
| Goldman Sachs Group, Inc. | 650,000 | 142,538 |
| Julius Bär Gruppe AG1 | 3,183,351 | 140,679 |
| Bank of Montreal | 1,982,613 | 130,664 |
| Lloyds Banking Group PLC1 | 179,339,784 | 129,854 |
| Hang Seng Bank Ltd.1 | 6,516,800 | 123,306 |
| Royal Bank of Canada | 1,695,000 | 109,879 |
| BB&T Corp. | 2,357,239 | 106,665 |
| CME Group Inc., Class A | 892,750 | 100,800 |
| Itaú Unibanco Holding SA, preferred nominative (ADR) | 9,631,721 | 99,592 |
| East West Bancorp, Inc. | 2,019,000 | 96,670 |
| Banco Bradesco SA, preferred nominative (ADR) | 10,342,332 | 89,461 |
| HSBC Holdings PLC (GBP denominated)1 | 9,858,953 | 78,355 |
| Grupo Financiero Santander México, SAB de CV, Class B (ADR) | 9,750,000 | 68,347 |
| Progressive Corp. | 1,576,000 | 52,481 |
| Bank Central Asia Tbk PT1 | 36,012,000 | 38,115 |
| Deutsche Börse AG1,2 | 269,664 | 21,779 |
| Henderson Group PLC1 | 7,047,400 | 20,394 |
| Chubb Ltd. | 118,300 | 15,142 |
| ING Groep NV1 | 1,087,455 | 14,756 |
| EXOR SpA1 | 301,857 | 12,662 |
| Standard Chartered PLC (HKD denominated)1,2 | 1,161,275 | 9,155 |
Capital World Growth and Income Fund — Page 1 of 11
Common stocks
Financials (continued) | Shares | Value
(000) |
| Bankia, SA1 | 9,526,340 | $8,474 |
| Bank of the Philippine Islands1 | 4,100,000 | 7,406 |
| | | 11,383,518 |
| Health care 12.72% | | |
| Amgen Inc. | 12,684,841 | 1,827,505 |
| AbbVie Inc. | 28,019,095 | 1,703,561 |
| Novartis AG1 | 24,150,054 | 1,661,950 |
| Stryker Corp. | 6,807,000 | 773,684 |
| Medtronic PLC | 8,179,000 | 597,149 |
| Teva Pharmaceutical Industries Ltd. (ADR) | 15,112,050 | 569,724 |
| Takeda Pharmaceutical Co. Ltd.1 | 12,717,200 | 526,993 |
| UnitedHealth Group Inc. | 3,117,100 | 493,499 |
| UCB SA1 | 4,681,734 | 300,524 |
| Gilead Sciences, Inc. | 3,164,320 | 233,210 |
| Bayer AG1 | 2,452,000 | 230,118 |
| Thermo Fisher Scientific Inc. | 1,622,000 | 227,258 |
| Express Scripts Holding Co.2 | 2,175,000 | 165,039 |
| McKesson Corp. | 986,000 | 141,797 |
| Alexion Pharmaceuticals, Inc.2 | 1,111,025 | 136,201 |
| Illumina, Inc.2 | 918,382 | 122,273 |
| Incyte Corp.2 | 1,088,800 | 111,373 |
| Edwards Lifesciences Corp.2 | 1,320,000 | 109,362 |
| Grifols, SA, Class B, preferred non-voting, non-registered shares1 | 6,770,000 | 106,297 |
| AstraZeneca PLC1 | 1,425,800 | 73,733 |
| Roche Holding AG, non-registered shares, non-voting1 | 300,281 | 66,773 |
| GlaxoSmithKline PLC1 | 2,996,000 | 55,918 |
| Aetna Inc. | 319,300 | 41,777 |
| Eli Lilly and Co. | 353,100 | 23,700 |
| Danaher Corp. | 144,600 | 11,303 |
| | | 10,310,721 |
| Information technology 10.74% | | |
| Alphabet Inc., Class A2 | 636,880 | 494,143 |
| Alphabet Inc., Class C2 | 555,867 | 421,369 |
| Samsung Electronics Co., Ltd.1 | 457,799 | 677,345 |
| Intel Corp. | 19,380,000 | 672,486 |
| Taiwan Semiconductor Manufacturing Co., Ltd.1 | 108,673,000 | 622,677 |
| Texas Instruments Inc. | 8,311,200 | 614,447 |
| Nintendo Co., Ltd.1 | 2,405,832 | 590,427 |
| Oracle Corp. | 13,726,000 | 551,648 |
| Apple Inc. | 4,776,829 | 527,935 |
| Tencent Holdings Ltd.1 | 18,149,500 | 451,903 |
| Broadcom Ltd. | 2,586,000 | 440,887 |
| Alibaba Group Holding Ltd. (ADR)2 | 4,677,180 | 439,748 |
| Accenture PLC, Class A | 3,115,000 | 372,024 |
| Western Union Co. | 11,294,000 | 237,513 |
| ASML Holding NV1 | 2,214,193 | 228,195 |
| Juniper Networks, Inc. | 6,914,948 | 190,438 |
| QUALCOMM Inc. | 2,397,000 | 163,308 |
| International Business Machines Corp. | 900,000 | 145,998 |
| Delta Electronics, Inc.1 | 25,269,126 | 126,715 |
| Keyence Corp.1 | 172,500 | 119,382 |
| Nokia Corp.1 | 22,750,000 | 97,893 |
| Motorola Solutions, Inc. | 1,111,000 | 89,158 |
Capital World Growth and Income Fund — Page 2 of 11
Common stocks
Information technology (continued) | Shares | Value
(000) |
| Tata Consultancy Services Ltd.1 | 2,363,146 | $78,475 |
| Largan Precision Co., Ltd.1 | 556,032 | 63,898 |
| Tableau Software, Inc., Class A2 | 1,139,700 | 51,150 |
| Murata Manufacturing Co., Ltd.1 | 326,000 | 45,028 |
| Microsoft Corp. | 735,200 | 44,303 |
| Hewlett-Packard Co. | 2,606,000 | 40,132 |
| NetApp, Inc. | 866,800 | 31,690 |
| MediaTek Inc.1 | 4,506,000 | 31,234 |
| Automatic Data Processing, Inc. | 159,600 | 15,325 |
| Amadeus IT Holding, SA, Class A, non-registered shares1 | 271,182 | 12,271 |
| Quanta Computer Inc.1 | 5,970,000 | 11,112 |
| | | 8,700,257 |
| Consumer discretionary 9.58% | | |
| Netflix, Inc.2 | 7,076,089 | 827,902 |
| Amazon.com, Inc.2 | 919,883 | 690,437 |
| Hyundai Motor Co.1 | 3,734,890 | 426,491 |
| Kering SA1 | 1,917,979 | 415,804 |
| Toyota Motor Corp.1 | 6,844,500 | 403,058 |
| Home Depot, Inc. | 2,925,000 | 378,495 |
| Priceline Group Inc.2 | 191,400 | 287,804 |
| Publicis Groupe SA1 | 4,236,639 | 274,563 |
| Viacom Inc., Class B | 6,248,488 | 234,193 |
| General Motors Co. | 5,945,000 | 205,281 |
| Hyundai Mobis Co., Ltd.1 | 912,080 | 193,967 |
| Shimano Inc.1 | 1,151,200 | 192,483 |
| MGM Resorts International2 | 6,520,700 | 187,209 |
| LVMH Moet Hennessy Vuitton SE1 | 1,014,800 | 184,285 |
| Intercontinental Hotels Group PLC1 | 4,402,750 | 180,383 |
| Norwegian Cruise Line Holdings Ltd.2 | 4,362,000 | 173,651 |
| Altice NV, Class A1,2 | 4,728,376 | 81,035 |
| Altice NV, Class A1,2 | 3,881,470 | 66,521 |
| Altice NV, Class B1,2 | 1,294,460 | 22,493 |
| Industria de Diseño Textil, SA1 | 4,822,000 | 164,527 |
| Galaxy Entertainment Group Ltd.1 | 31,910,000 | 157,938 |
| Daimler AG1 | 2,363,750 | 157,056 |
| Ctrip.com International, Ltd. (ADR)2 | 3,256,000 | 147,269 |
| Greene King PLC1,3 | 16,760,403 | 143,858 |
| Bayerische Motoren Werke AG1 | 1,659,100 | 141,561 |
| Kingfisher PLC1 | 32,018,806 | 141,231 |
| Six Flags Entertainment Corp. | 2,400,000 | 138,336 |
| Ocado Group PLC1,2,3 | 39,080,197 | 132,022 |
| Daily Mail and General Trust PLC, Class A, non-voting1 | 13,740,000 | 131,132 |
| Carnival Corp., units | 2,292,200 | 117,842 |
| Wyndham Worldwide Corp. | 1,421,000 | 102,298 |
| Li & Fung Ltd.1 | 209,500,000 | 91,700 |
| NIKE, Inc., Class B | 1,600,000 | 80,112 |
| Wynn Resorts, Ltd. | 732,900 | 74,749 |
| Paddy Power Betfair PLC1 | 711,828 | 74,312 |
| DENSO Corp.1 | 1,502,000 | 66,759 |
| Merlin Entertainments PLC1 | 11,420,563 | 62,273 |
| Naspers Ltd., Class N1 | 411,300 | 59,757 |
| HUGO BOSS AG1 | 819,000 | 47,253 |
| Wynn Macau, Ltd.1 | 18,937,600 | 35,017 |
| Comcast Corp., Class A | 423,600 | 29,445 |
Capital World Growth and Income Fund — Page 3 of 11
Common stocks
Consumer discretionary (continued) | Shares | Value
(000) |
| Ferrari NV1 | 479,476 | $26,251 |
| Lowe’s Companies, Inc. | 250,000 | 17,638 |
| | | 7,766,391 |
| Industrials 8.96% | | |
| Boeing Co. | 5,483,000 | 825,520 |
| Lockheed Martin Corp. | 2,884,400 | 765,087 |
| Union Pacific Corp. | 5,383,140 | 545,474 |
| General Dynamics Corp. | 2,919,700 | 511,969 |
| Abertis Infraestructuras, SA, Class A1 | 34,657,935 | 463,010 |
| Airbus Group SE, non-registered shares1 | 6,944,798 | 442,349 |
| Caterpillar Inc. | 4,143,000 | 395,905 |
| General Electric Co. | 10,192,641 | 313,526 |
| CSX Corp. | 8,337,000 | 298,548 |
| Edenred SA1 | 11,912,106 | 250,215 |
| Babcock International Group PLC1 | 18,152,999 | 216,437 |
| ASSA ABLOY AB, Class B1 | 9,135,167 | 172,103 |
| Emerson Electric Co. | 3,000,000 | 169,320 |
| Nielsen Holdings PLC | 3,912,891 | 168,646 |
| BAE Systems PLC1 | 19,891,500 | 149,454 |
| Airports of Thailand PCL1 | 12,946,000 | 145,734 |
| KONE Oyj, Class B1 | 3,020,000 | 133,023 |
| Adecco SA1 | 2,129,050 | 130,881 |
| Ryanair Holdings PLC (ADR)2 | 1,627,235 | 129,918 |
| GEA Group AG, non-registered shares1 | 3,138,000 | 116,740 |
| Meggitt PLC1 | 19,356,000 | 114,407 |
| Norfolk Southern Corp. | 856,100 | 91,140 |
| Capita PLC1 | 13,132,500 | 86,183 |
| Fosun International Ltd.1 | 51,485,600 | 76,195 |
| Singapore Technologies Engineering Ltd1 | 24,920,000 | 58,594 |
| Industries Qatar QSC1 | 1,869,119 | 53,689 |
| Andritz AG1 | 975,746 | 50,342 |
| Fortive Corp. | 906,303 | 49,838 |
| Alliance Global Group, Inc.1 | 170,987,140 | 44,703 |
| CK Hutchison Holdings Ltd.1 | 3,483,000 | 42,361 |
| Jardine Matheson Holdings Ltd.1 | 770,300 | 41,697 |
| Bunzl PLC1 | 1,553,749 | 39,947 |
| United Technologies Corp. | 300,000 | 32,316 |
| ComfortDelGro Corp. Ltd.1 | 17,697,239 | 31,025 |
| Kawasaki Heavy Industries, Ltd.1 | 9,372,000 | 30,271 |
| Waste Management, Inc. | 325,600 | 22,636 |
| Northrop Grumman Corp. | 69,000 | 17,226 |
| FANUC CORP.1 | 79,900 | 13,727 |
| Safran SA1 | 195,275 | 13,405 |
| Deutsche Post AG1 | 223,000 | 6,964 |
| Cummins Inc. | 30,000 | 4,253 |
| Contax Participações SA, ordinary nominative2 | 7,620 | 20 |
| | | 7,264,798 |
| Consumer staples 8.44% | | |
| Philip Morris International Inc. | 13,653,300 | 1,205,313 |
| Imperial Brands PLC1 | 26,137,100 | 1,120,833 |
| Altria Group, Inc. | 15,989,700 | 1,022,222 |
| Nestlé SA1 | 9,260,052 | 622,984 |
| Reynolds American Inc. | 9,292,528 | 502,726 |
Capital World Growth and Income Fund — Page 4 of 11
Common stocks
Consumer staples (continued) | Shares | Value
(000) |
| Thai Beverage PCL1 | 746,930,900 | $455,135 |
| Coca-Cola Co. | 10,591,705 | 427,375 |
| British American Tobacco PLC1 | 5,505,400 | 301,913 |
| Kroger Co. | 9,005,000 | 290,861 |
| Treasury Wine Estates Ltd.1 | 30,507,000 | 243,497 |
| Pernod Ricard SA1 | 1,949,493 | 204,221 |
| Japan Tobacco Inc.1 | 5,757,500 | 200,351 |
| Associated British Foods PLC1 | 4,399,811 | 140,379 |
| Seven & i Holdings Co., Ltd.1 | 1,175,000 | 45,985 |
| ITC Ltd.1 | 4,367,009 | 14,942 |
| ConAgra Foods, Inc. | 400,000 | 14,676 |
| Mondelez International, Inc. | 311,600 | 12,850 |
| Reckitt Benckiser Group PLC1 | 147,700 | 12,474 |
| Sprouts Farmers Market, Inc.2 | 270,000 | 5,403 |
| | | 6,844,140 |
| Energy 7.71% | | |
| Royal Dutch Shell PLC, Class B1 | 16,907,953 | 451,172 |
| Royal Dutch Shell PLC, Class A (GBP denominated)1 | 17,697,975 | 450,611 |
| Royal Dutch Shell PLC, Class A (ADR) | 945,123 | 48,296 |
| Royal Dutch Shell PLC, Class A (EUR denominated)1 | 1,784,000 | 45,577 |
| Royal Dutch Shell PLC, Class B (ADR) | 344,800 | 18,678 |
| Canadian Natural Resources, Ltd. | 25,377,830 | 856,381 |
| Suncor Energy Inc. | 22,412,717 | 713,777 |
| EOG Resources, Inc. | 5,541,587 | 568,123 |
| TOTAL SA1 | 11,841,645 | 566,780 |
| BP PLC1 | 84,002,150 | 487,318 |
| Enbridge Inc. (CAD denominated) | 8,679,278 | 365,056 |
| Halliburton Co. | 5,523,700 | 293,253 |
| Chevron Corp. | 2,127,600 | 237,355 |
| Golar LNG Ltd.3 | 5,422,000 | 132,297 |
| Kinder Morgan, Inc. | 5,864,000 | 130,181 |
| Spectra Energy Corp | 3,000,000 | 122,850 |
| Noble Energy, Inc. | 3,000,000 | 114,480 |
| Eni SpA1 | 7,405,300 | 103,396 |
| Eni SpA (ADR) | 253,148 | 7,065 |
| ConocoPhillips | 2,250,000 | 109,170 |
| Exxon Mobil Corp. | 1,225,200 | 106,960 |
| Schlumberger Ltd. | 1,241,000 | 104,306 |
| Oil Search Ltd.1 | 16,836,423 | 82,417 |
| Chesapeake Energy Corp.2 | 9,500,000 | 66,500 |
| Southwestern Energy Co.2 | 2,525,635 | 28,666 |
| Peyto Exploration & Development Corp. | 1,049,878 | 25,839 |
| Devon Energy Corp. | 200,000 | 9,666 |
| | | 6,246,170 |
| Materials 4.81% | | |
| Vale SA, Class A, preferred nominative | 57,362,000 | 433,346 |
| Vale SA, Class A, preferred nominative (ADR) | 15,444,600 | 115,835 |
| Asahi Kasei Corp.1 | 42,286,000 | 382,019 |
| Fortescue Metals Group Ltd.1 | 78,235,770 | 342,032 |
| HeidelbergCement AG1 | 3,355,000 | 300,670 |
| BHP Billiton PLC1 | 16,246,000 | 268,248 |
| Syngenta AG1 | 688,500 | 262,985 |
| Rio Tinto PLC1 | 6,854,100 | 258,404 |
Capital World Growth and Income Fund — Page 5 of 11
Common stocks
Materials (continued) | Shares | Value
(000) |
| Amcor Ltd.1 | 21,963,209 | $233,377 |
| BASF SE1 | 2,448,000 | 209,653 |
| Koninklijke DSM NV1 | 3,442,572 | 208,055 |
| Nitto Denko Corp.1 | 2,414,300 | 169,764 |
| Potash Corp. of Saskatchewan Inc. | 8,941,878 | 163,010 |
| Agrium Inc. | 1,159,000 | 116,885 |
| Wacker Chemie AG1 | 1,200,000 | 106,012 |
| Celanese Corp., Series A | 875,000 | 69,405 |
| Monsanto Co. | 581,300 | 59,705 |
| Newcrest Mining Ltd.1 | 3,612,500 | 51,286 |
| Akzo Nobel NV1 | 784,978 | 48,763 |
| Sherwin-Williams Co. | 166,000 | 44,599 |
| Sumitomo Metal Mining Co., Ltd.1 | 2,129,000 | 28,950 |
| LANXESS AG1 | 374,777 | 23,163 |
| | | 3,896,166 |
| Utilities 4.79% | | |
| SSE PLC1 | 38,157,269 | 704,200 |
| Dominion Resources, Inc. | 6,238,422 | 457,214 |
| EDP - Energias de Portugal, SA1 | 117,811,072 | 340,499 |
| Iberdrola, SA, non-registered shares1 | 49,449,316 | 297,038 |
| Exelon Corp. | 6,927,900 | 225,226 |
| Sempra Energy | 2,000,800 | 199,680 |
| China Resources Gas Group Ltd.1 | 65,850,000 | 195,196 |
| CMS Energy Corp. | 4,763,300 | 191,580 |
| National Grid PLC1 | 16,614,336 | 189,088 |
| Cheung Kong Infrastructure Holdings Ltd.1 | 21,949,000 | 183,876 |
| Power Grid Corp. of India Ltd.1 | 64,038,000 | 180,182 |
| Engie SA1 | 13,645,030 | 168,116 |
| Power Assets Holdings Ltd.1 | 16,840,000 | 161,161 |
| Red Eléctrica de Corporación, SA1 | 6,182,000 | 109,876 |
| Duke Energy Corp. | 1,326,000 | 97,819 |
| NextEra Energy, Inc. | 734,000 | 83,845 |
| Huaneng Power International, Inc., Class H1 | 82,420,000 | 51,570 |
| AES Corp. | 4,235,100 | 48,492 |
| | | 3,884,658 |
| Telecommunication services 4.33% | | |
| Verizon Communications Inc. | 26,791,053 | 1,336,874 |
| Nippon Telegraph and Telephone Corp.1 | 9,825,000 | 395,355 |
| Telia Co. AB1 | 74,096,800 | 277,775 |
| MTN Group Ltd.1 | 31,177,000 | 251,123 |
| Singapore Telecommunications Ltd.1 | 89,751,810 | 235,900 |
| AT&T Inc. | 4,578,000 | 176,848 |
| Bharti Airtel Ltd.1 | 30,581,712 | 144,805 |
| CenturyLink, Inc. | 5,530,053 | 130,067 |
| América Móvil, SAB de CV, Series L (ADR) | 10,105,500 | 122,378 |
| China Mobile Ltd.1 | 9,865,000 | 107,886 |
| Bezeq - The Israel Telecommunication Corp. Ltd.1 | 47,540,000 | 87,931 |
| BCE Inc. | 1,903,000 | 82,010 |
| TDC A/S1,2 | 12,455,304 | 63,396 |
| MegaFon PJSC (GDR)1 | 4,180,176 | 36,528 |
| LG Uplus Corp.1 | 3,454,902 | 33,833 |
| NTT DoCoMo, Inc.1 | 625,100 | 14,414 |
Capital World Growth and Income Fund — Page 6 of 11
Common stocks
Telecommunication services (continued) | Shares | Value
(000) |
| Intouch Holdings PCL1 | 6,633,800 | $9,249 |
| SFR Group SA, non-registered shares1 | 3 | — |
| | | 3,506,372 |
| Real estate 3.14% | | |
| Cheung Kong Property Holdings Ltd.1 | 78,990,856 | 539,776 |
| Crown Castle International Corp. | 5,410,126 | 451,529 |
| Wharf (Holdings) Ltd.1 | 50,131,000 | 370,884 |
| Sun Hung Kai Properties Ltd.1 | 23,223,750 | 303,344 |
| Lamar Advertising Co., Class A | 3,981,700 | 263,947 |
| Link Real Estate Investment Trust1 | 30,613,391 | 210,520 |
| American Campus Communities, Inc. | 2,850,000 | 134,263 |
| Sino Land Co. Ltd.1 | 66,700,000 | 104,695 |
| Ventas, Inc. | 1,168,115 | 70,578 |
| Fibra Uno Administración, SA de CV | 37,470,000 | 57,855 |
| Public Storage | 145,000 | 30,349 |
| Care Capital Properties, Inc. | 417,750 | 10,059 |
| | | 2,547,799 |
| Miscellaneous 4.81% | | |
| Other common stocks in initial period of acquisition | | 3,901,001 |
| Total common stocks (cost: $65,073,701,000) | | 76,251,991 |
Convertible stocks 0.13%
Miscellaneous 0.13% | | |
| Other convertible stocks in initial period of acquisition | | 102,000 |
| Total convertible stocks (cost: $79,932,000) | | 102,000 |
Bonds, notes & other debt instruments 1.25%
Corporate bonds & notes 0.91%
Telecommunication services 0.41% | Principal amount
(000) | |
| CenturyLink, Inc. 7.50% 2024 | $ 13,683 | 14,093 |
| CenturyLink, Inc., Series T, 5.80% 2022 | 26,647 | 26,414 |
| Frontier Communications Corp. 11.00% 2025 | 71,138 | 71,583 |
| MetroPCS Wireless, Inc. 6.25% 2021 | 15,000 | 15,675 |
| Numericable Group SA 6.00% 20224 | 21,500 | 21,742 |
| Numericable Group SA 6.25% 20244 | 8,000 | 7,940 |
| Sprint Nextel Corp. 9.125% 2017 | 27,750 | 28,244 |
| Sprint Nextel Corp. 7.00% 2020 | 14,475 | 15,054 |
| Sprint Nextel Corp. 11.50% 2021 | 33,950 | 40,740 |
| Sprint Nextel Corp. 7.875% 2023 | 25,000 | 25,875 |
| T-Mobile US, Inc. 6.00% 2024 | 3,825 | 4,026 |
| T-Mobile US, Inc. 6.50% 2024 | 11,400 | 12,209 |
| T-Mobile US, Inc. 6.375% 2025 | 16,205 | 17,360 |
| T-Mobile US, Inc. 6.50% 2026 | 31,401 | 33,991 |
| | | 334,946 |
| Energy 0.25% | | |
| Genel Energy Finance 3 Ltd. 7.50% 20194 | 15,000 | 12,225 |
| Kinder Morgan, Inc. 4.30% 2025 | 30,595 | 30,887 |
| Kinder Morgan, Inc. 5.55% 2045 | 13,415 | 13,402 |
Capital World Growth and Income Fund — Page 7 of 11
Bonds, notes & other debt instruments
Corporate bonds & notes (continued)
Energy (continued) | Principal amount
(000) | Value
(000) |
| Petróleos Mexicanos 6.875% 2026 | $58,480 | $60,468 |
| Petróleos Mexicanos 6.875% 20264 | 30,150 | 31,175 |
| Petróleos Mexicanos 5.50% 2044 | 3,647 | 2,839 |
| Petróleos Mexicanos 5.625% 2046 | 5,325 | 4,159 |
| Petróleos Mexicanos 6.75% 20474 | 7,282 | 6,408 |
| TransCanada Corp. 5.875% 2076 | 36,500 | 37,869 |
| | | 199,432 |
| Materials 0.10% | | |
| ArcelorMittal 10.85% 2019 | 20,000 | 23,600 |
| ArcelorMittal 7.25% 2022 | 24,365 | 27,464 |
| CRH America, Inc. 8.125% 2018 | 15,540 | 17,056 |
| FMG Resources 9.75% 20224 | 11,775 | 13,642 |
| | | 81,762 |
| Financials 0.09% | | |
| Discover Financial Services 10.25% 2019 | 4,334 | 5,031 |
| HBOS PLC 6.75% 20184 | 36,490 | 38,696 |
| Lloyds Banking Group PLC, junior subordinated 6.657% preference shares (undated)4 | 30,300 | 32,497 |
| | | 76,224 |
| Health care 0.05% | | |
| VPI Escrow Corp. 6.75% 20184 | 16,840 | 16,051 |
| VPI Escrow Corp. 6.375% 20204 | 26,925 | 22,886 |
| | | 38,937 |
| Real estate 0.01% | | |
| ERP Operating LP 5.75% 2017 | 905 | 926 |
| Simon Property Group, LP 10.35% 2019 | 5,170 | 6,219 |
| | | 7,145 |
| Total corporate bonds & notes | | 738,446 |
| Bonds & notes of governments & government agencies outside the U.S. 0.26% | | |
| Colombia (Republic of), Series B, 7.50% 2026 | COP207,581,000 | 68,828 |
| India (Republic of) 7.80% 2021 | INR1,000,000 | 15,498 |
| India (Republic of) 8.60% 2028 | 1,220,300 | 20,640 |
| Indonesia (Republic of) 8.25% 2021 | IDR66,000,000 | 4,938 |
| Indonesia (Republic of), Series 68, 8.375% 2034 | 530,800,000 | 39,088 |
| Pakistan (Islamic Republic of) 8.25% 2024 | $6,590 | 7,167 |
| Pakistan (Islamic Republic of) 8.25% 2025 | 9,654 | 10,572 |
| Poland (Republic of), Series 0726, 2.50% 2026 | PLN205,000 | 44,341 |
| | | 211,072 |
U.S. Treasury bonds & notes 0.08%
U.S. Treasury 0.08% | | |
| U.S. Treasury 0.75% 20175 | $64,700 | 64,594 |
| Total U.S. Treasury bonds & notes | | 64,594 |
| Total bonds, notes & other debt instruments (cost: $975,592,000) | | 1,014,112 |
Capital World Growth and Income Fund — Page 8 of 11
| Short-term securities 4.48% | Principal amount
(000) | Value
(000) |
| American Honda Finance Corp. 0.65%–0.68% due 1/18/2017–1/25/2017 | $90,000 | $89,935 |
| ANZ New Zealand (International) Ltd. 0.86% due 2/24/20174 | 50,000 | 49,902 |
| Apple Inc. 0.91% due 5/18/20174 | 25,000 | 24,911 |
| Bank of Montreal 0.63% due 12/6/2016 | 50,000 | 49,997 |
| Bank of Nova Scotia 0.91%–0.98% due 1/9/2017–1/17/20174 | 76,800 | 76,750 |
| Bank of Tokyo-Mitsubishi UFJ, Ltd. 0.65% due 12/14/2016 | 50,000 | 49,989 |
| BNP Paribas, New York Branch 0.83% due 2/8/2017 | 50,000 | 49,928 |
| Canadian Imperial Bank of Commerce 0.80% due 2/22/20174 | 40,000 | 39,936 |
| Ciesco LLC 1.10% due 2/1/20174 | 75,000 | 74,902 |
| Fairway Finance Corp. 0.43%–0.90% due 12/2/2016–12/20/20164 | 65,000 | 64,985 |
| Fannie Mae 0.35%–0.60% due 12/16/2016–1/3/2017 | 90,800 | 90,775 |
| Federal Home Loan Bank 0.31%–0.65% due 12/2/2016–5/23/2017 | 810,000 | 809,388 |
| Freddie Mac 0.39%–0.49% due 3/2/2017–5/3/2017 | 250,000 | 249,492 |
| General Electric Co. 0.36% due 12/1/2016 | 25,800 | 25,800 |
| GlaxoSmithKline Finance PLC 0.63% due 12/12/20164 | 36,000 | 35,995 |
| IBM Corp. 0.52% due 12/5/20164 | 50,000 | 49,998 |
| KfW 0.78% due 2/1/20174 | 90,000 | 89,918 |
| Liberty Street Funding Corp. 0.85% due 2/7/20174 | 50,000 | 49,925 |
| Microsoft Corp. 0.54%–0.78% due 12/1/2016–2/13/20174 | 236,100 | 235,987 |
| Mizuho Bank, Ltd. 0.62%–0.95% due 12/1/2016–12/12/20164 | 183,600 | 183,589 |
| Nestlé Capital Corp. 0.71% due 1/12/20174 | 50,000 | 49,970 |
| Old Line Funding, LLC 0.89%–1.02% due 12/13/2016–1/23/20174 | 137,200 | 137,110 |
| Pfizer Inc. 0.43% due 12/12/20164 | 25,000 | 24,997 |
| Siemens Capital Co. LLC 0.50% due 12/21/20164 | 50,000 | 49,988 |
| Sumitomo Mitsui Banking Corp. 0.95% due 1/18/20174 | 75,000 | 74,937 |
| Svenska Handelsbanken Inc. 1.09% due 4/24/2017 | 24,000 | 24,014 |
| Toronto-Dominion Holdings USA Inc. 1.07%–1.16% due 1/24/2017–3/21/20174 | 87,400 | 87,288 |
| Total Capital Canada Ltd. 0.50%–0.77% due 12/15/2016–2/1/20174 | 174,700 | 174,585 |
| Toyota Credit Canada Corp. 0.83% due 12/7/2016 | 65,000 | 64,996 |
| U.S. Treasury Bills 0.35%–0.43% due 1/19/2017–2/9/2017 | 310,000 | 309,770 |
| Victory Receivables Corp. 0.98%–1.01% due 12/12/2016–12/13/20164 | 100,000 | 99,983 |
| Westpac Banking Corp. 0.91%–0.92% due 1/9/2017–1/23/20174 | 141,900 | 141,796 |
| Total short-term securities (cost: $3,631,139,000) | | 3,631,536 |
| Total investment securities 99.94% (cost: $69,760,364,000) | | 80,999,639 |
| Other assets less liabilities 0.06% | | 50,105 |
| Net assets 100.00% | | $81,049,744 |
As permitted by U.S. Securities and Exchange Commission regulations, “Miscellaneous” securities include holdings in their first year of acquisition that have not previously been publicly disclosed.
Capital World Growth and Income Fund — Page 9 of 11
Forward currency contracts
The fund has entered into forward currency contracts as shown in the following table. The average month-end notional amount of open forward currency contracts while held was $1,431,108,000.
| | Settlement
date | Counterparty | Contract amount | Unrealized
(depreciation)
appreciation
at 11/30/2016
(000) |
Receive
(000) | Deliver
(000) |
| Sales: | | | | | |
| British pounds | 12/7/2016 | JPMorgan Chase | $170,961 | £140,000 | $(4,222) |
| British pounds | 12/16/2016 | Citibank | $101,514 | £82,718 | (2,032) |
| British pounds | 12/20/2016 | Bank of America, N.A. | $29,261 | £23,465 | (117) |
| British pounds | 1/11/2017 | Citibank | $199,978 | £160,000 | (482) |
| British pounds | 1/19/2017 | UBS AG | $156,180 | £124,850 | (266) |
| British pounds | 1/19/2017 | JPMorgan Chase | $153,543 | £122,746 | (268) |
| British pounds | 1/19/2017 | Bank of America, N.A. | $156,177 | £124,849 | (270) |
| British pounds | 1/19/2017 | Bank of America, N.A. | $199,545 | £160,160 | (1,148) |
| Euros | 12/7/2016 | JPMorgan Chase | $41,165 | €37,790 | 1,104 |
| Euros | 12/7/2016 | Citibank | $32,448 | €29,788 | 870 |
| Euros | 12/19/2016 | HSBC Bank | $35,259 | €31,842 | 1,475 |
| Euros | 12/20/2016 | Bank of America, N.A. | $128,048 | €120,640 | 43 |
| Euros | 12/20/2016 | HSBC Bank | $67,384 | €63,533 | (28) |
| Euros | 1/19/2017 | Citibank | $57,979 | €53,783 | 818 |
| South African rand | 1/6/2017 | Barclays Bank PLC | $15,985 | ZAR223,100 | 260 |
| South African rand | 1/6/2017 | Barclays Bank PLC | $15,940 | ZAR223,100 | 215 |
| South African rand | 1/6/2017 | Barclays Bank PLC | $18,165 | ZAR255,858 | 132 |
| | | | | | $(3,916) |
The following footnotes apply to either the individual securities noted or one or more of the securities aggregated and listed as a single line item.
| 1 | Valued under fair value procedures adopted by authority of the board of trustees. The total value of all such securities, including those in “Miscellaneous,“ was $37,914,674,000, which represented 46.78% of the net assets of the fund. This amount includes $37,179,723,000 related to certain securities trading outside the U.S. whose values were adjusted as a result of significant market movements following the close of local trading. |
| 2 | Security did not produce income during the last 12 months. |
| 3 | Represents an affiliated company as defined under the Investment Company Act of 1940. |
| 4 | Acquired in a transaction exempt from registration under Rule 144A or Section 4(2) of the Securities Act of 1933. May be resold in the U.S. in transactions exempt from registration, normally to qualified institutional buyers. The total value of all such securities was $2,020,714,000, which represented 2.49% of the net assets of the fund. |
| 5 | A portion of this security was pledged as collateral. The total value of pledged collateral was $3,705,000, which represented less than .01% of the net assets of the fund. |
| Key to abbreviations and symbols |
| ADR = American Depositary Receipts |
| CAD = Canadian dollars |
| COP = Colombian pesos |
| EUR/€ = Euros |
| GBP/£ = British pounds |
| GDR = Global Depositary Receipts |
| HKD = Hong Kong dollars |
| IDR = Indonesian rupiah |
| INR = Indian rupees |
| PLN = Polish zloty |
| ZAR = South African rand |
Capital World Growth and Income Fund — Page 10 of 11
Investments are not FDIC-insured, nor are they deposits of or guaranteed by a bank or any other entity, so they may lose value.
Investors should carefully consider investment objectives, risks, charges and expenses. This and other important information is contained in the fund prospectus and summary prospectus, which can be obtained from your financial professional and should be read carefully before investing. You may also call American Funds Service Company (AFS) at (800) 421-4225 or visit the American Funds website at americanfunds.com.
| MFGEFPX-033-0117O-S54101 | Capital World Growth and Income Fund — Page 11 of 11 |
Report of Independent Registered Public Accounting Firm
To the Board of Trustees and Shareholders of Capital World Growth and Income Fund
In our opinion, the accompanying statement of assets and liabilities, including the summary investment portfolio, and the related statements of operations and of changes in net assets and the financial highlights (included in Item 1 of this Form N-CSR) and the investment portfolio (included in Item 6 of this Form N-CSR) present fairly, in all material respects, the financial position of Capital World Growth and Income Fund (the “Fund”) at November 30, 2016, the results of its operations for the year then ended, the changes in its net assets for each of the two years in the period then ended and the financial highlights for each of the periods presented, in conformity with accounting principles generally accepted in the United States of America. These financial statements, financial highlights, and investment portfolio (hereafter referred to as "financial statements") are the responsibility of the Fund’s management. Our responsibility is to express an opinion on these financial statements based on our audits. We conducted our audits of these financial statements in accordance with the standards of the Public Company Accounting Oversight Board (United States). Those standards require that we plan and perform the audit to obtain reasonable assurance about whether the financial statements are free of material misstatement. An audit includes examining, on a test basis, evidence supporting the amounts and disclosures in the financial statements, assessing the accounting principles used and significant estimates made by management, and evaluating the overall financial statement presentation. We believe that our audits, which included confirmation of securities at November 30, 2016 by correspondence with the custodian and brokers, provide a reasonable basis for our opinion.
PricewaterhouseCoopers LLP
Los Angeles, California
January 10, 2017
ITEM 7 – Disclosure of Proxy Voting Policies and Procedures for Closed-End Management Investment Companies
Not applicable to this Registrant, insofar as the Registrant is not a closed-end management investment company.
ITEM 8 – Portfolio Managers of Closed-End Management Investment Companies
Not applicable to this Registrant, insofar as the Registrant is not a closed-end management investment company.
ITEM 9 – Purchases of Equity Securities by Closed-End Management Investment Company and Affiliated Purchasers
Not applicable to this Registrant, insofar as the Registrant is not a closed-end management investment company.
ITEM 10 – Submission of Matters to a Vote of Security Holders
There have been no material changes to the procedures by which shareholders may recommend nominees to the Registrant’s board of trustees since the Registrant last submitted a proxy statement to its shareholders. The procedures are as follows. The Registrant has a nominating and governance committee comprised solely of persons who are not considered ‘‘interested persons’’ of the Registrant within the meaning of the Investment Company Act of 1940, as amended. The committee periodically reviews such issues as the board’s composition, responsibilities, committees, compensation and other relevant issues, and recommends any appropriate changes to the full board of trustees. While the committee normally is able to identify from its own resources an ample number of qualified candidates, it will consider shareholder suggestions of persons to be considered as nominees to fill future vacancies on the board. Such suggestions must be sent in writing to the nominating and governance committee of the Registrant, c/o the Registrant’s Secretary, and must be accompanied by complete biographical and occupational data on the prospective nominee, along with a written consent of the prospective nominee for consideration of his or her name by the nominating and governance committee.
ITEM 11 – Controls and Procedures
| (a) | The Registrant’s Principal Executive Officer and Principal Financial Officer have concluded, based on their evaluation of the Registrant’s disclosure controls and procedures (as such term is defined in Rule 30a-3 under the Investment Company Act of 1940), that such controls and procedures are adequate and reasonably designed to achieve the purposes described in paragraph (c) of such rule. |
| | |
| (b) | There were no changes in the Registrant’s internal controls over financial reporting (as defined in Rule 30a-3(d) under the Investment Company Act of 1940) that occurred during the Registrant’s second fiscal quarter of the period covered by this report that has materially affected, or is reasonably likely to materially affect, the Registrant’s internal control over financial reporting. |
ITEM 12 – Exhibits
| (a)(1) | The Code of Ethics that is the subject of the disclosure required by Item 2 is attached as an exhibit hereto. |
| | |
| (a)(2) | The certifications required by Rule 30a-2 of the Investment Company Act of 1940 and Sections 302 and 906 of the Sarbanes-Oxley Act of 2002 are attached as exhibits hereto. |
SIGNATURES
Pursuant to the requirements of the Securities Exchange Act of 1934 and the Investment Company Act of 1940, the Registrant has duly caused this report to be signed on its behalf by the undersigned, thereunto duly authorized.
| | CAPITAL WORLD GROWTH AND INCOME FUND |
| | |
| | By /s/ Donald H. Rolfe |
| | Donald H. Rolfe, Executive Vice President and Principal Executive Officer |
| | |
| | Date: January 31, 2017 |
Pursuant to the requirements of the Securities Exchange Act of 1934 and the Investment Company Act of 1940, this report has been signed below by the following persons on behalf of the Registrant and in the capacities and on the dates indicated.
| By /s/ Donald H. Rolfe |
Donald H. Rolfe, Executive Vice President and Principal Executive Officer |
| |
| Date: January 31, 2017 |
| By /s/ Gregory F. Niland |
Gregory F. Niland, Treasurer and Principal Financial Officer |
| |
| Date: January 31, 2017 |