UNITED STATES
SECURITIES AND EXCHANGE COMMISSION
Washington, D.C. 20549
FORM N-CSR
Certified Shareholder Report of
Registered Management Investment Companies
Investment Company Act File Number: 811-07338
Capital World Growth and Income Fund, Inc.
(Exact Name of Registrant as Specified in Charter)
333 South Hope Street
Los Angeles, California 90071
(Address of Principal Executive Offices)
Registrant's telephone number, including area code: (213) 486-9200
Date of fiscal year end: November 30
Date of reporting period: November 30, 2012
Vincent P. Corti
Capital World Growth and Income Fund, Inc.
333 South Hope Street
Los Angeles, California 90071
(Name and Address of Agent for Service)
Copies to:
Kathryn A. Sanders
O’Melveny & Myers LLP
400 South Hope Street, 10th Floor
Los Angeles, California 90071
(Counsel for the Registrant)
ITEM 1 – Reports to Stockholders
Capital World Growth
and Income Fund®


Special feature
Far and wide: pursuing value in a low-growth world
See page 6
Annual report for the year ended November 30 , 2012
Capital World Growth and Income Fund seeks long-term growth of capital while providing current income. It invests on a global basis in a diversified portfolio consisting primarily of common stocks and other equity securities.
This fund is one of more than 40 offered by American Funds, which is one of the nation’s largest mutual fund families. For more than 80 years, Capital Research and Management Company,SM the American Funds adviser, has invested with a long-term focus based on thorough research and attention to risk.
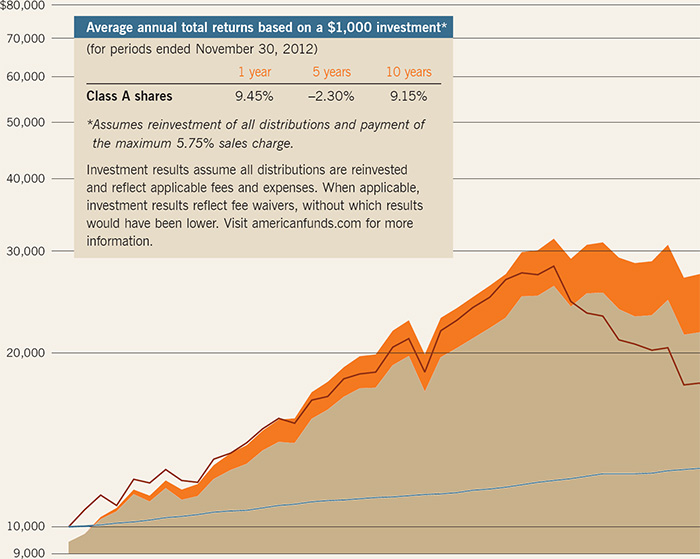
Fund results shown in this report, unless otherwise indicated, are for Class A shares at net asset value. If a sales charge (maximum 5.75%) had been deducted, the results would have been lower. Results are for past periods and are not predictive of results for future periods. Current and future results may be lower or higher than those shown. Share prices and returns will vary, so investors may lose money. Investing for short periods makes losses more likely. Investments are not FDIC-insured, nor are they deposits of or guaranteed by a bank or any other entity, so they may lose value. For current information and month-end results, visit americanfunds.com.
Here are the average annual total returns on a $1,000 investment with all distributions reinvested for periods ended December 31, 2012 (the most recent calendar quarter-end):
| | | | | | | | |
| Class A shares | | 1 year | | 5 years | | 10 years | |
| | | | | | | | |
| Reflecting 5.75% maximum sales charge | | 12.27% | | –1.84% | | 9.58% | |
The total annual fund operating expense ratio is 0.82% for Class A shares as of the prospectus dated February 1, 2013 (unaudited).
Investment results assume all distributions are reinvested and reflect applicable fees and expenses. When applicable, investment results reflect fee waivers, without which results would have been lower. Visit americanfunds.com for more information.
The fund’s 30-day yield for Class A shares as of December 31, 2012, reflecting the 5.75% maximum sales charge and calculated in accordance with the U.S. Securities and Exchange Commission formula, was 2.18%.
Results for other share classes can be found on page 31.
Investing outside the United States may be subject to risks, such as currency fluctuations, periods of illiquidity and price volatility. These risks may be heightened in connection with investments in developing countries. Refer to the fund prospectus and the Risk Factors section of this report for more information on these and other risks associated with investing in the fund.
Fellow investors:
Global equity markets rallied during the second half of Capital World Growth and Income Fund’s fiscal year despite considerable volatility, uncertainty over fiscal problems in Europe and the United States, and a slowdown in China. The fund overcame a sluggish first half to produce a strong return for the full 12 months.
For the year ended November 30, 2012, the fund delivered a gain of 16.1%. That result surpassed the fund’s relevant benchmarks. The unmanaged MSCI All Country World Index, which measures a broad range of developed- and developing-country stock markets, rose 13.3%.* The Lipper Global Funds Index, a measure of the fund’s peer group, recorded a 10.7% return.
The fund’s total return includes the reinvestment of dividends, which totaled 97 cents a share during the fiscal year. These dividends represented an income return of 3.0%. As you can see in the table below, Capital World Growth and Income Fund continues to compare favorably to its peers and benchmarks over longer time frames.
The global investing environment
Most of the world’s stock markets ended the fiscal year substantially higher as investors welcomed additional stimulus measures from major central banks, including in the U.S. and Europe. Later in the period, concerns about moderating growth in China gave way to renewed optimism about the longer term economic outlook for the country.
In Europe, stocks generally rallied during the second half. On a U.S. dollar-adjusted basis, the MSCI All Country Europe Index surged 13.6% and most European countries registered double-digit gains for
| | |
| * | Unless otherwise noted, MSCI indexes are stated in U.S. dollars and their results reflect dividends net of withholding taxes. |
Results at a glance
For periods ended November 30, 2012, with all distributions reinvested
| | | | | | | | | | | | | | |
| | | Total returns | | Average annual total returns | |
| | |
| |
|
|
| | | 1 year | | 5 years | | 10 years | | Lifetime
(since 3/26/93) | |
|
|
|
|
|
|
|
|
|
|
| Capital World Growth and Income Fund (Class A shares) | | 16.14 | % | | –1.14 | % | | 9.80 | % | | 10.71 | % | |
| MSCI All Country World Index† | | 13.33 | | | –1.82 | | | 7.34 | | | 6.73 | | |
| Lipper Global Funds Index | | 10.69 | | | –1.84 | | | 6.83 | | | 6.72 | | |
| | |
| † | The market index is unmanaged and, therefore, has no expenses. Results reflect dividends gross of withholding taxes through December 31, 2000, and dividends net of withholding taxes thereafter. |

| | |
| In this report |
| | |
| | Special feature |
| | |
| 6 | Far and wide: pursuing value in a low-growth world |
| | |
| | Even as global economic growth slows, the fund’s portfolio counselors are finding companies around the world with what they believe are good prospects for sales and profit growth. |
| | |
| | Contents |
| | |
| 1 | Letter to investors |
| | |
| 4 | The value of a long-term perspective |
| | |
| 12 | Summary investment portfolio |
| | |
| 18 | Financial statements |
| | |
| 35 | Board of directors and other officers |
| | |
| Capital World Growth and Income Fund | 1 |
(as of November 30, 2012)
| | | | | | | | | | |
| Company | | Country | | Percent of
net assets | | 12-month
return | |
|
|
|
|
|
|
|
|
| | |
| Novartis | | Switzerland | | 2.99 | % | | 14.68 | % | |
| Philip Morris International | | United States | | 2.51 | | | 17.89 | | |
| BP | | United Kingdom | | 2.00 | | | –4.90 | | |
| Bayer | | Germany | | 1.84 | | | 37.68 | | |
| Altria | | United States | | 1.81 | | | 17.85 | | |
| Amgen | | United States | | 1.67 | | | 53.34 | | |
| Home Depot | | United States | | 1.49 | | | 65.91 | | |
| Microsoft | | United States | | 1.37 | | | 4.07 | | |
| Royal Dutch Shell | | United Kingdom | | 1.09 | | | –4.09 | | |
| National Grid | | United Kingdom | | 1.07 | | | 14.96 | | |
the fiscal year. Among the few markets to sustain declines were fiscally troubled European nations Greece (–2.3%), Spain (–3.4%) and Portugal (–9.7%).
Despite signs of slowing corporate profits and mixed economic data, U.S. stocks rose 16.1%, as measured by Standard & Poor’s 500 Composite Index. Following November’s election, pledges from President Obama and Congressional leaders to work together on a compromise budget appeared to encourage investors. On January 1, following the close of the fund’s fiscal year, the White House and lawmakers agreed to raise taxes on affluent Americans, averting the so-called fiscal cliff. However, scheduled budget cuts were delayed for a few months, so a number of issues remain unresolved going into 2013.
Although growth slowed in China and other developing countries, the developing world continued to experience relatively healthy economic activity. However, results for equities were mixed. China and India’s stock markets rose 20.0% and 18.4%, respectively, but Russia declined 4.3%. While Brazilian equities were positive during the year, a slide in the Brazilian real versus the dollar resulted in a loss of 8.9% for U.S. investors.
Inside the portfolio
While country returns provide a useful backdrop, the investment professionals who manage Capital World Growth and Income Fund do not focus on particular geographies or market sectors. Rather, they build the portfolio one company at a time through careful fundamental research. The fund’s strong result in both absolute and relative terms was supported by a broad diversity of companies, many of which were among the largest holdings in the portfolio.
As you can see in the table above, a number of the fund’s 10 largest holdings produced double-digit gains; these included home improvement retailer Home Depot, biotechnology company Amgen and European pharmaceutical makers Bayer and Novartis (the fund’s top holding). The only holdings in the top 10 to lose ground were oil companies BP and Royal Dutch Shell, partly reflecting a slide in energy prices during the period.
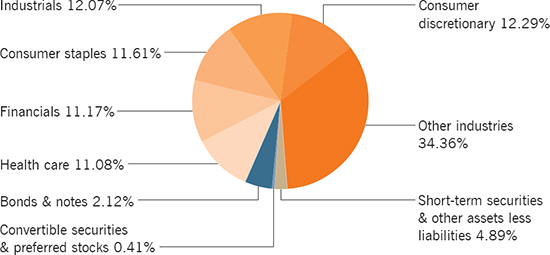
Consumer discretionary companies, which represented the fund’s largest sector weighting, accounted for 12.3% of the portfolio at fiscal year-end. Holdings in this sector contributed some of the strongest returns of the period. In addition to Home Depot, the fund was supported by double-digit gains from U.S. cable operators Comcast (+64.0%) and Time Warner Cable (+56.9%), auto components maker Michelin (+45.7%) and Virgin Media (+58.7%). Several investments in the basic materials and industrials sectors also bolstered results.
Other holdings that dampened returns included HTC Corp. (–44.3%) and French utility GDF SUEZ (–19.9%).
A look ahead
As we look forward, a number of serious fiscal challenges around the world — particularly in the U.S. and Europe — have yet to be fully resolved. Despite some signs of progress in recent months, leaders in the U.S. still must address longer term budget concerns. European leaders, likewise, continue to grapple with the region’s structural problems and also are confronted with a difficult economic outlook.
Despite these challenges, we are encouraged by a number of developments. In a sluggish global economy, corporate profits have been remarkably resilient. In the U.S., we believe a dramatic transformation in U.S. energy supply and a housing market turnaround are leading to greater opportunity, and while Europe’s troubles will not be resolved quickly, we have seen a number of companies in Europe adjust to the changing landscape. We are further encouraged by what we believe are reasonable valuations in several areas.
Growth has clearly slowed in China as the nation’s leaders seek to transition toward a more domestic-focused economy. However, we believe China can continue to be a leading contributor to overall global growth.
And while global economic growth may remain muted, particularly in the world’s indebted developed nations, we believe there will continue to be opportunities to invest in companies experiencing vibrant
| | |
| 2 | Capital World Growth and Income Fund |
profit growth. We invite you to read our feature on page 6, “Far and wide: pursuing value in a low-growth world,” to learn more about how the fund’s portfolio counselors and analysts look for growth in a sluggish economy.
Our focus remains on investing in sound companies that we believe can provide long-term capital appreciation — regardless of where they are domiciled — and that often reward investors with regular dividend payments.
As always, we thank you, our fellow investors, for your continued support of Capital World Growth and Income Fund and we look forward to reporting back to you in six months’ time.
Cordially,

Michael Thawley
Vice Chairman of the Board

Mark E. Denning
President
January 9, 2013
For current information about the fund, visit americanfunds.com.
| | | | | | | | |
| Where the fund’s assets were invested* |
| | | | | | | | |
| | | Capital World Growth
and Income Fund | | MSCI All Country
World Index† | |
|
|
|
|
|
|
| | | | | | | | |
| Europe | | 37.2 | % | | 25.4 | % | |
| United Kingdom | | 11.1 | | | 8.4 | | |
| Switzerland | | 6.2 | | | 3.3 | | |
| France | | 5.1 | | | 3.5 | | |
| Germany | | 4.8 | | | 3.2 | | |
| Sweden | | 3.6 | | | 1.2 | | |
| Belgium | | 1.3 | | | .4 | | |
| Finland | | 1.0 | | | .3 | | |
| Russia | | .8 | | | .7 | | |
| Netherlands | | .8 | | | .9 | | |
| Italy | | .6 | | | .8 | | |
| Other Europe | | 1.9 | | | 2.7 | | |
| The Americas | | 37.8 | | | 53.3 | | |
| United States | | 35.7 | | | 46.3 | | |
| Canada | | 1.0 | | | 4.3 | | |
| Mexico | | .6 | | | .7 | | |
| Brazil | | .5 | | | 1.5 | | |
| Other Americas | | — | | | .5 | | |
| Asia/Pacific | | 17.0 | | | 20.1 | | |
| Hong Kong | | 3.6 | | | 1.2 | | |
| China | | 2.6 | | | 2.3 | | |
| Australia | | 2.2 | | | 3.3 | | |
| Japan | | 2.1 | | | 7.2 | | |
| South Korea | | 1.9 | | | 1.9 | | |
| Singapore | | 1.5 | | | .7 | | |
| Thailand | | 1.1 | | | .3 | | |
| Other Asia/Pacific | | 2.0 | | | 3.2 | | |
| Other | | 1.0 | | | 1.2 | | |
| Bonds & notes, short-term securities & other assets less liabilities | | 7.0 | | | — | | |
| Total | | 100.0 | % | | 100.0 | % | |
| | |
| * | Percent of net assets by country as of November 30, 2012. |
| † | The MSCI All Country World Index is weighted by market capitalization. |
| | |
| Capital World Growth and Income Fund | 3 |
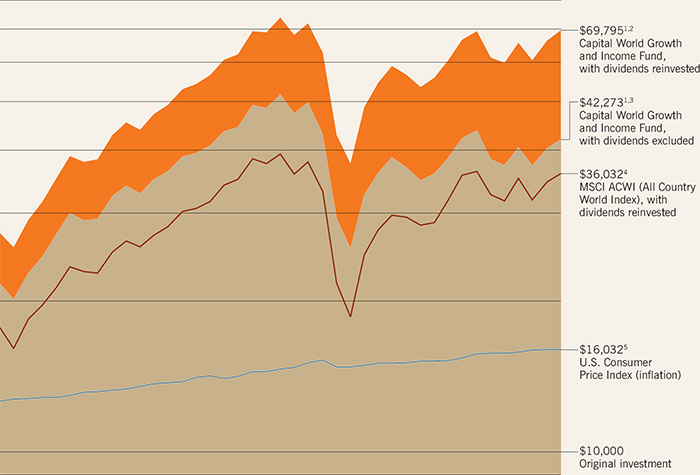
The value of a long-term perspective
How a $10,000 investment has grown since March 26, 1993
| | | | | | | | | | | | | | | | | | | | | | | | | | | | | | | | |
Year ended
November 30 | | 1993 | 6 | 1994 | | 1995 | | 1996 | | 1997 | | 1998 | | 1999 | | 2000 | | 2001 | | 2002 | |
|
|
|
|
|
|
|
|
|
|
|
|
|
|
|
|
|
|
|
|
|
|
| Total value | | | | | | | | | | | | | | | | | | | | | | | | | | | | | | | |
| Dividends reinvested | | $ | 144 | | | 295 | | | 421 | | | 506 | | | 488 | | | 478 | | | 440 | | | 577 | | | 578 | | | 569 | |
| Value at year-end | | $ | 10,782 | | | 11,592 | | | 13,841 | | | 17,118 | | | 19,917 | | | 23,007 | | | 27,396 | | | 29,142 | | | 28,613 | | | 27,405 | |
| WGI total return | | | 7.8 | % | | 7.5 | | | 19.4 | | | 23.7 | | | 16.4 | | | 15.5 | | | 19.1 | | | 6.4 | | | (1.8 | ) | | (4.2 | ) |
| | |
| 1 | As outlined in the prospectus, the sales charge is reduced for accounts (and aggregated investments) of $25,000 or more and is eliminated for purchases of $1 million or more. There is no sales charge on dividends or capital gain distributions that are reinvested in additional shares. |
| 2 | Includes reinvested dividends of $18,706 and reinvested capital gain distributions of $20,534. |
| 3 | Results calculated with capital gains reinvested. |
| | |
| 4 | Capital World Growth and Income Fund |
Fund results shown are for Class A shares and reflect deduction of the maximum sales charge of 5.75% on the $10,000 investment.1 Thus, the net amount invested was $9,425. Results are for past periods and are not predictive of results for future periods. Current and future results may be lower or higher than those shown. Share prices and returns will vary, so investors may lose money. For current information and month-end results, visit americanfunds.com.
| | | | | | | | | | | | | | | | | | | | | | | | | | | | | | | | |
| 2003 | | 2004 | | 2005 | | 2006 | | 2007 | | 2008 | | 2009 | | 2010 | | 2011 | | 2012 | | | |
|
|
|
|
|
|
|
|
|
|
|
|
|
|
|
|
|
|
|
|
|
|
|
|
|
|
|
| | | |
| | | | | | | | | | | | | | | | | | | | | | | | | | | | | | | Average
annual total
return for
fund’s lifetime
10.4%2 | |
| | | | | | | | | | | | | | | | | | | | | | | | | | | | | | | |
| | 679 | | | 914 | | | 1,043 | | | 1,315 | | | 1,633 | | | 1,918 | | | 1,711 | | | 1,555 | | | 1,633 | | | 1,809 | | |
| | 35,220 | | | 43,044 | | | 49,405 | | | 60,955 | | | 73,901 | | | 43,044 | | | 59,179 | | | 60,701 | | | 60,096 | | | 69,795 | | |
| | 28.5 | | | 22.2 | | | 14.8 | | | 23.4 | | | 21.2 | | | (41.8 | ) | | 37.5 | | | 2.6 | | | (1.0 | ) | | 16.1 | ► | |
| | |
| 4 | The market index is unmanaged and, therefore, has no expenses. Results reflect dividends gross of withholding taxes through December 31, 2000, and dividends net of withholding taxes thereafter. |
| 5 | Computed from data supplied by the U.S. Department of Labor, Bureau of Labor Statistics. |
| 6 | For the period March 26, 1993 (when the fund began operations), through November 30, 1993. |
The results shown are before taxes on fund distributions and sale of fund shares.
| | |
| Capital World Growth and Income Fund | 5 |

| | |
| 6 | Capital World Growth and Income Fund |
Far and wide: pursuing value in a low-growth world
Even as global economic growth slows, the portfolio counselors who manage your fund believe they are finding companies around the world with good prospects for sales and profit growth. In the following pages, we look at how these investment professionals seek to build long-term value for investors despite the cloudy horizon.
Economic news has been less than encouraging lately. As leaders in Europe, the United States and other advanced nations wrestled over lingering fiscal troubles, growth in their economies was sluggish. At the same time, the pace of expansion in China, India and Brazil slowed considerably.
Investors may be faced with more of the same in coming years. The International Monetary Fund recently lowered its forecast for 2013 global growth to 3.6%. It expects gross domestic product (GDP) for the world’s developed nations to rise a modest 1.5%. However, the organization predicts a healthier 5.6% growth for the developing world. In fact, many economists expect growth to remain relatively low for a number of years as the developed world reduces its debt, and China and other developing nations seek a balance between exports and domestic demand.
“A look at historical data has shown that economic growth and stock market returns are not related. China has been a great example of that.”
Does this mean investors should expect weak equity returns going forward? Not necessarily, says Mark Denning, president of Capital World Growth and Income Fund and a portfolio counselor. “A look at historical data has shown that economic growth and stock market returns are not related. China has been a great example of that. Its economy has been among the strongest in the world in recent years, yet stock market returns there have been uneven.”
Consider, for example, that in 2011 China’s economy expanded at a 9.2% rate, yet the Chinese stock market, as measured by the MSCI China Index, dropped 18.4%. During the same period, the U.S. economy grew 1.8% while its stock market rose 2.1% as measured by the S&P 500. Why the disconnect? Simply put, prospects for companies are not necessarily tied to the changing fate of the local or regional economy where they are based. Nor are local companies necessarily the best positioned to participate in the growth of their home economies.
“Even in an environment of generally slower growth, there will be some areas of vibrant growth — and there will be companies that are going to do well,” says Michael Thawley, vice chairman of the fund. “Some people might avoid stocks because they are concerned about a particular crisis or discouraging economic data. But there are companies that will adapt to difficult conditions. They will adjust their focus, rethink their strategies and change their product offerings. What we try to do is invest in those companies that can thrive as conditions change.”
Indeed, rather than invest in economies, countries or particular sectors of the market, the investment professionals who manage Capital World Growth and Income Fund build the portfolio one company at a time. Through intensive fundamental research, they seek to identify companies with long-term growth potential. While the fund’s portfolio counselors have broad flexibility, they focus on larger, established companies that often pay dividends. Many of these are companies with global operations that can benefit from growth opportunities around the world. “Periods of intense stress also tend to be periods of restructuring,” says Michael. “This means great opportunity for investors who can recognize companies with the vision, initiative, leadership and other attributes to benefit from new trends.” Here are some examples of where they are looking for growth.
| | |
| Capital World Growth and Income Fund | 7 |
Developing countries: driving future middle-class consumption
The relative proportions of global middle-class consumption are changing dramatically. In the chart below, the width of each band of color for a given year indicates the percentages of consumption for a given region. By 2030, for example, India and China are expected to collectively account for about one-third of the middle class’s consumption of goods and services.
Share of global middle-class consumption
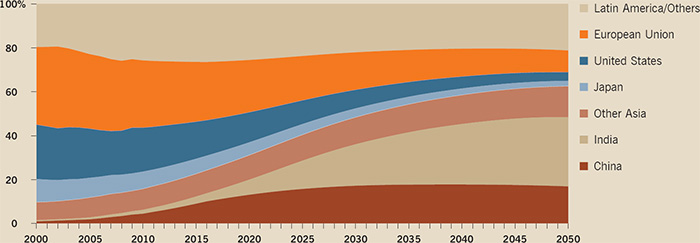
Sources: The New Global Middle Class: A Cross-Over from West to East, 2010, Homi Kharas and Geoffrey Gertz; The Emerging Middle Class in Developing Countries, 2010, Homi Kharas.
“ Even in an environment of generally slower growth, there will be some areas of vibrant growth — and there will be companies that are going to do well.”
A rising consumer class
China and other developing economies have experienced slower growth recently, but many of these areas are expected to continue experiencing growth at a faster rate than the global average. What’s more, millions of people living in developing nations are seeing their standards of living rise substantially.
“Economic cycles will ebb and flow, but this is an undeniable, powerful phenomenon with long-term implication for investors,” says Mark. The McKinsey Global Institute estimates that the global consumer class will grow from 2.4 billion people today to 4.2 billion by 2025, when the world’s population is expected to be about 7.9 billion. As you can see in the chart above, China, India, Latin America and other developing areas are expected to account for a much larger share of global consumption in the coming years.
With their increased spending power, these rising middle-class populations are already driving demand for products ranging from food and beverages and better health care to smartphones, automobiles and various types of luxury goods. “As consumers in these markets see their purchasing power increase, there will be opportunities for growth in a broad range of industries and sectors,” says Mark. “The challenge for investors is to identify companies with strong products, recognizable brands and the flexibility to tap into growth potential around the world, whether they are domiciled in the developing or developed world.”
Developed but developing
In fact, as trade has become increasingly globalized, the country or region where a company is based has become less important. In many cases, multinational companies based in developed markets are in a position to benefit from the rising consumer demand in developing markets.
Consider, for example, industrial conglomerate Jardine Matheson Holdings, a holding in the fund. This Fortune Global 500 company has business interests in property management, automobile distribution, financial services, supermarkets and restaurants. Based in Hong Kong, the company trades on the London and Singapore exchanges, but has significant operations in developing Asian markets including Indonesia and China.
“Jardines is a large, multinational company
| | |
| 8 | Capital World Growth and Income Fund |

whose shares trade in advanced markets, which gives investors the potential benefits of liquidity and transparency,” says Mark. “But much of its growth potential comes from businesses serving consumers in Southeast Asia.” One example: Jardines has a controlling interest in Astra International, the largest automobile distributor in Indonesia. Because of low penetration, the Indonesian auto market has strong potential for growth, Mark says. Despite robust sales in recent months, only 4% of Indonesia’s 240 million residents have a car. “Certainly, Astra will face challenges, including increased competition, but I believe the company can grow its earnings by 10% to 15% over the next few years,” says Amol Gogate, a Hong Kong-based investment analyst who covers the company.
A convergence of trends
Despite the murky economic picture in recent years, a combination of factors has led to an explosion in wireless communication around the world. This has been driven by rising consumer demand in developing markets, but also by the advent of faster LTE (fourth-generation) networks in the U.S. and other advanced markets.
“In places like Africa and other developing areas, basic voice and simple text-type communication is still very much a growth industry,” says portfolio counselor Sung Lee. “And the development of smartphones and the LTE service in places like the U.S. has been a real boon to the service operators. All around the world, with some exceptions, a lot of telecom companies that were thought to be beyond their growth stage have seen very robust revenue growth during a period of general economic malaise.”
What’s more, because wireless service businesses often generate strong cash flows, Sung believes such investments can help the fund meet both of its primary objectives — long-term capital appreciation and current income. Consider, for example, AT&T and Verizon Communications, both among the fund’s top 20 holdings. As of November 30, they paid dividend yields of 5.3% and 4.7%, respectively. “Over the last couple of years, both of these stocks have been strong investments in terms of capital appreciation — and all along they have paid relatively high dividends, providing a measure of stability for investors.”
The demand for mobile data communication has also translated into strong growth in mobile phone sales, a trend that is expected to continue. Global sales of handsets will rise from 649.1 million in 2012 to 1.2 billion in 2016, according to research firm Gartner. As you can see in the chart on page 10, most of that growth is expected to come from the Asia/Pacific region. Also, as sales growth slows in North America and Western Europe, it is expected to pick up pace in Africa and Latin America.
One beneficiary of the rising demand for smartphones has been Samsung
| | |
| Capital World Growth and Income Fund | 9 |
As the income of the global consumer has risen, phone sales have gone into high gear
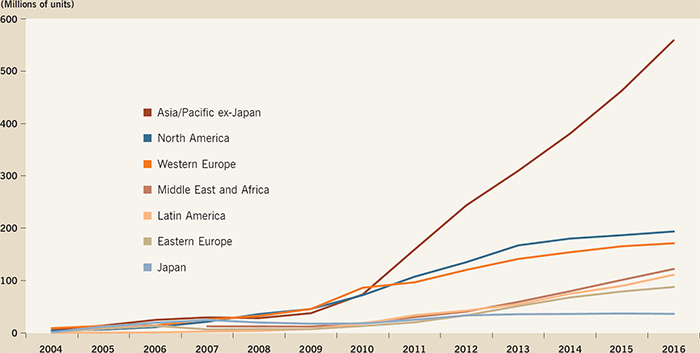
Source: Gartner, Inc.; data from 2012 to 2016 are estimates.
“Samsung has executed incredibly well to emerge as a primary beneficiary of the movement toward smartphones in the past couple of years.”
Electronics, one of the top holdings of the fund. “Samsung has executed incredibly well to emerge as a primary beneficiary of the movement toward smartphones in the past couple of years,” says Sung.
Resistant to economic fluctuations
In his search for growth, portfolio counselor Alfonso Barroso tends to focus on companies with essential products and services that aren’t sensitive to the ups and downs of economic cycles. This includes companies in so-called defensive areas of utilities and businesses focused on health care. “I look for companies that can grow by gaining market share, expanding into new markets and launching new products and services,” says Alfonso, who is based in London.
Swiss pharmaceutical maker Novartis, the fund’s top holding, provides one such example. The company, which has recently introduced medicines to treat multiple sclerosis, leukemia and other types of cancer, also makes a variety of consumer drugs such as Excedrin and Theraflu. With operations in more than 140 countries, including India, China and Russia, Novartis also could benefit from rising consumer demand in developing markets.
“Novartis is attractively valued relative to both the broader market and the pharmaceuticals industry largely because of concerns about patent expirations,” says Alfonso. “But I believe the negative impact of the patent expirations should abate starting in 2013.”
U.S. biotechnology company Amgen, the fund’s sixth-largest holding, has also focused on introducing new medicines and has developed a fairly robust pipeline. Its primary offerings include medicines for anemia, bone diseases, inflammatory conditions and the stimulation of white blood cells in chemotherapy patients. Alfonso believes the medicines that the company is developing have the potential to benefit investors regardless of the health of the macroeconomy.
“Both Amgen and Novartis, in my view, are well-positioned to potentially grow earnings by 5% to 10% a year over the next five years even if global economic growth remains subdued,” says Alfonso. “What’s more, both companies have stable and highly cash flow generative-based businesses that have supported predictable and rising dividend payments.”
Connecting the dots
Looking beneath the broad macroeconomic
| | |
| 10 | Capital World Growth and Income Fund |

picture often reveals that particular industries or areas are picking up momentum while others are stagnating or slowing down. In the U.S., the emerging natural gas boom is impacting various areas of the U.S. economy.
“There are a lot of investment implications for shale gas in the United States, some of which are related to a recovery from low gas prices,” says portfolio counselor Eric Richter, who often looks for growth potential in industries that appear to be coming off a cyclical bottom. “But the best opportunity is not necessarily through a natural gas company.”
In fact, research has led Eric not only to direct investment in a natural gas company but also in companies that stand to benefit indirectly. One example: railroads. As natural gas became more abundant early last year, prices dropped substantially. “Because natural gas and coal can serve as substitutes for one another, the cheaper gas drove down demand for coal,” explains Eric. “This hurt railroads, which generate much of their profits from transporting coal.” More recently, gas prices have begun to recover as manufacturing and other activity in the U.S. pick up momentum. “As natural gas prices recover, it provides an incentive for utilities to use more coal, which in turn can benefit the railroads,” Eric continues. “So, I have looked for opportunities to invest not just in natural gas companies directly, which generally don’t have great yields, but also indirectly through railroads that carry coal and often offer a good dividend yield.”
Flexible and focused
Nearly 20 years ago, Capital World Growth and Income Fund was created to provide investors with a conservative approach to global investing. Our investment professionals have pursued the fund’s growth-and-income objective by remaining flexible and focused on the long term. They have relied on fundamental research to build a portfolio of companies that they believe can endure and thrive in the long run. This approach has served investors over time.
“Truly, despite the economic headwinds and fiscal problems around the world, there is a great deal of opportunity,” says portfolio counselor Jeanne Carroll. “I see potential for growth in both the developed and developing worlds. But it is important to dig in and do the research to find the companies that can best take advantage of economic growth and demographic trends.”
Mark agrees. “Do I think there are individual companies that are going to do well even in troubled areas like Europe? I do. And that connects directly with what we do. We don’t invest in markets. We carefully scrutinize companies, including those that others have stopped looking at, perhaps because they are avoiding troubled countries or regions or sectors. By remaining flexible and looking for opportunity around the world, we have the potential to benefit from growth wherever it arises.” ■
| | |
| Capital World Growth and Income Fund | 11 |
Summary investment portfolio November 30, 2012
The following summary investment portfolio is designed to streamline the report and help investors better focus on the fund’s principal holdings. See the inside back cover for details on how to obtain a complete schedule of portfolio holdings.
Industry sector diversification (percent of net assets)
| | | | | |
| Country diversification | | Percent of
net assets | |
|
|
|
|
| United States | | | 35.7 | % |
|
|
|
|
|
| Euro zone* | | | 14.6 | |
|
|
|
|
|
| United Kingdom | | | 11.1 | |
|
|
|
|
|
| Switzerland | | | 6.2 | |
|
|
|
|
|
| Hong Kong | | | 3.6 | |
|
|
|
|
|
| Sweden | | | 3.6 | |
|
|
|
|
|
| China | | | 2.6 | |
|
|
|
|
|
| Australia | | | 2.2 | |
|
|
|
|
|
| Japan | | | 2.1 | |
|
|
|
|
|
| South Korea | | | 1.9 | |
|
|
|
|
|
| Other countries | | | 9.4 | |
|
|
|
|
|
| Bonds & notes, short-term securities & other assets less liabilities | | | 7.0 | |
|
|
|
|
|
| | |
| * | Countries using the euro as a common currency; those represented in the fund’s portfolio are Austria, Belgium, Finland, France, Germany, Ireland, Italy, the Netherlands, Portugal and Spain. |
| | | | | | | | | | | |
| Common stocks — 92.58% | | Shares | | Value
(000) | | Percent of
net assets | |
| Consumer discretionary — 12.29% | | | | | | | | | | |
| Home Depot, Inc. | | | 16,095,800 | | $ | 1,047,354 | | | 1.49 | % |
| The world’s largest home improvement retailer. | | | | | | | | | | |
|
|
|
|
|
|
|
|
|
|
|
| Comcast Corp., Class A | | | 13,567,900 | | | 504,454 | | | .72 | |
| The largest cable TV provider in the U.S. | | | | | | | | | | |
|
|
|
|
|
|
|
|
|
|
|
| General Motors Co.1 | | | 18,646,450 | | | 482,570 | | | .69 | |
| U.S.-based auto manufacturer of brands such as Buick, Cadillac, Chevrolet and GMC. | | | | | | | | | | |
|
|
|
|
|
|
|
|
|
|
|
| Virgin Media Inc. | | | 11,495,500 | | | 404,297 | | | .58 | |
| United Kingdom-based provider of television, Internet, mobile phone and fixed-line telephone services. | | | | | | | | | | |
|
|
|
|
|
|
|
|
|
|
|
| DIRECTV1 | | | 7,873,000 | | | 391,288 | | | .56 | |
| Digital television services provider in the United States, Latin America and the Caribbean. | | | | | | | | | | |
|
|
|
|
|
|
|
|
|
|
|
| Cie. Générale des Établissements Michelin, Class B | | | 4,000,000 | | | 372,009 | | | .53 | |
| One of the world’s largest tire makers. Its brands include Uniroyal and Goodrich. | | | | | | | | | | |
|
|
|
|
|
|
|
|
|
|
|
| Amazon.com, Inc.1 | | | 1,397,400 | | | 352,215 | | | .50 | |
| Major online retailer of books, CDs, DVDs, toys, apparel, home furnishings and other products. | | | | | | | | | | |
|
|
|
|
|
|
|
|
|
|
|
| Other securities | | | | | | 5,068,558 | | | 7.22 | |
| | | | | |
|
|
|
|
| |
| | | | | | | 8,622,745 | | | 12.29 | |
| | | | | |
|
|
|
|
| |
| | | | | | | | | | | |
| Industrials — 12.07% | | | | | | | | | | |
| ASSA ABLOY AB, Class B | | | 19,660,007 | | | 711,245 | | | 1.01 | |
| Manufactures mechanical, electromagnetic and electronic locks and security systems. | | | | | | | | | | |
|
|
|
|
|
|
|
|
|
|
|
| AB Volvo, Class B | | | 41,589,080 | | | 589,142 | | | .84 | |
| One of Sweden’s major manufacturers of trucks, buses, and marine and aerospace engines. | | | | | | | | | | |
|
|
|
|
|
|
|
|
|
|
|
| KONE Oyj, Class B | | | 6,185,000 | | | 463,329 | | | .66 | |
| Finland-based manufacturer of elevators and escalators, as well as automatic building doors. | | | | | | | | | | |
|
|
|
|
|
|
|
|
|
|
|
| Jardine Matheson Holdings Ltd. | | | 7,748,000 | | | 457,287 | | | .65 | |
| Hong Kong-based diversified trading company operating in numerous industries, including supermarkets, real estate, hotels, restaurants, financial services, construction and mining. | | | | | | | | | | |
|
|
|
|
|
|
|
|
|
|
|
| | |
| 12 | Capital World Growth and Income Fund |
| | | | | | | | | | | |
| Common stocks | | Shares | | Value
(000) | | Percent of
net assets | |
|
|
|
|
|
|
|
|
|
|
|
| United Parcel Service, Inc., Class B | | | 5,200,000 | | $ | 380,172 | | | .54 | % |
| The world’s largest package delivery company and express carrier. | | | | | | | | | | |
|
|
|
|
|
|
|
|
|
|
|
| General Electric Co. | | | 17,500,000 | | | 369,775 | | | .53 | |
| Global operator of infrastructure, technology, energy and finance businesses. | | | | | | | | | | |
|
|
|
|
|
|
|
|
|
|
|
| Other securities | | | | | | 5,499,932 | | | 7.84 | |
| | | | | |
|
|
|
|
| |
| | | | | | | 8,470,882 | | | 12.07 | |
| | | | | |
|
|
|
|
| |
| | | | | | | | | | | |
| Consumer staples — 11.61% | | | | | | | | | | |
| Philip Morris International Inc. | | | 19,606,300 | | | 1,762,214 | | | 2.51 | |
| One of the world’s largest international tobacco companies. | | | | | | | | | | |
|
|
|
|
|
|
|
|
|
|
|
| Altria Group, Inc. | | | 37,619,300 | | | 1,271,909 | | | 1.81 | |
| One of the world’s largest tobacco companies. The group also owns a large interest in the global brewer SABMiller. | | | | | | | | | | |
|
|
|
|
|
|
|
|
|
|
|
| Anheuser-Busch InBev NV | | | 7,924,534 | | | 694,538 | | | .99 | |
| Anheuser-Busch InBev NV, VVPR STRIPS1 | | | 3,247,475 | | | 4 | | | |
| One of the world’s largest brewers. | | | | | | | | | | |
|
|
|
|
|
|
|
|
|
|
|
| Wesfarmers Ltd. | | | 16,071,520 | | | 596,253 | | | .85 | |
| Australia-based retailer that operates home improvement and convenient stores, and has a presence in coal and natural gas production, and insurance. | | | | | | | | | | |
|
|
|
|
|
|
|
|
|
|
|
| Lorillard, Inc. | | | 4,314,988 | | | 522,804 | | | .75 | |
| U.S.-based tobacco company. | | | | | | | | | | |
|
|
|
|
|
|
|
|
|
|
|
| Nestlé SA | | | 7,310,030 | | | 478,422 | | | .68 | |
| Global packaged food and beverage company based in Switzerland. | | | | | | | | | | |
|
|
|
|
|
|
|
|
|
|
|
| Other securities | | | | | | 2,819,435 | | | 4.02 | |
| | | | | |
|
|
|
|
| |
| | | | | | | 8,145,579 | | | 11.61 | |
| | | | | |
|
|
|
|
| |
| | | | | | | | | | | |
| Financials — 11.17% | | | | | | | | | | |
| Société Générale1 | | | 14,946,365 | | | 540,487 | | | .77 | |
| Has retail, corporate and investment banking operations around the world, with particular strength in Europe. | | | | | | | | | | |
|
|
|
|
|
|
|
|
|
|
|
| HSBC Holdings PLC (Hong Kong) | | | 26,720,033 | | | 271,503 | | | .69 | |
| HSBC Holdings PLC (United Kingdom) | | | 20,476,231 | | | 209,204 | | | |
| One of the world’s largest international banking and financial services organizations. | | | | | | | | | | |
|
|
|
|
|
|
|
|
|
|
|
| Industrial and Commercial Bank of China Ltd., Class H | | | 676,073,470 | | | 456,229 | | | .65 | |
| A state-owned commercial bank in China and one of the world’s largest banks. | | | | | | | | | | |
|
|
|
|
|
|
|
|
|
|
|
| Prudential PLC | | | 29,060,000 | | | 421,354 | | | .60 | |
| Major life insurance and pension provider with operations in the U.S., U.K. and Asia-Pacific region. | | | | | | | | | | |
|
|
|
|
|
|
|
|
|
|
|
| AIA Group Ltd. | | | 95,215,796 | | | 370,411 | | | .53 | |
| Life insurance and financial services provider in the Asia-Pacific region. | | | | | | | | | | |
|
|
|
|
|
|
|
|
|
|
|
| Siam Commercial Bank PCL | | | 66,634,100 | | | 352,820 | | | .50 | |
| Commercial bank based in Thailand. | | | | | | | | | | |
|
|
|
|
|
|
|
|
|
|
|
| Other securities | | | | | | 5,214,773 | | | 7.43 | |
| | | | | |
|
|
|
|
| |
| | | | | | | 7,836,781 | | | 11.17 | |
| | | | | |
|
|
|
|
| |
| | | | | | | | | | | |
| Health care — 11.08% | | | | | | | | | | |
| Novartis AG | | | 33,907,063 | | | 2,098,381 | | | 2.99 | |
| One of the world’s largest pharmaceutical companies. | | | | | | | | | | |
|
|
|
|
|
|
|
|
|
|
|
| Bayer AG | | | 14,267,026 | | | 1,290,499 | | | 1.84 | |
| Makes pharmaceuticals and over-the-counter medicines, and develops medical diagnostic equipment. | | | | | | | | | | |
|
|
|
|
|
|
|
|
|
|
|
| Amgen Inc. | | | 13,159,758 | | | 1,168,587 | | | 1.67 | |
| The world’s largest biotechnology company. | | | | | | | | | | |
|
|
|
|
|
|
|
|
|
|
|
| | |
| Capital World Growth and Income Fund | 13 |
| | | | | | | | | | | |
| Common stocks | | Shares | | Value
(000) | | Percent of
net assets | |
| Health care (continued) | | | | | | | | | | |
| Abbott Laboratories | | | 10,999,300 | | $ | 714,954 | | | 1.02 | % |
| Major health care company that develops drugs, drug-delivery systems, diagnostic tools and nutritional supplements. | | | | | | | | | | |
|
|
|
|
|
|
|
|
|
|
|
| Gilead Sciences, Inc.1 | | | 9,430,000 | | | 707,250 | | | 1.01 | |
| Develops drugs to treat infectious diseases and cancer. | | | | | | | | | | |
|
|
|
|
|
|
|
|
|
|
|
| Roche Holding AG | | | 2,014,000 | | | 396,410 | | | .56 | |
| A world leader in pharmaceuticals and diagnostic research. | | | | | | | | | | |
|
|
|
|
|
|
|
|
|
|
|
| Other securities | | | | | | 1,393,786 | | | 1.99 | |
| | | | | |
|
|
|
|
| |
| | | | | | | 7,769,867 | | | 11.08 | |
| | | | | |
|
|
|
|
| |
| | | | | | | | | | | |
| Telecommunication services — 7.39% | | | | | | | | | | |
| AT&T Inc. | | | 20,610,000 | | | 703,419 | | | 1.01 | |
| Global provider of telecommunication services, including local and long-distance, Internet and wireless communications. | | | | | | | | | | |
|
|
|
|
|
|
|
|
|
|
|
| Verizon Communications Inc. | | | 15,119,500 | | | 667,072 | | | .95 | |
| Major broadband and telecommunication services provider. | | | | | | | | | | |
|
|
|
|
|
|
|
|
|
|
|
| SOFTBANK CORP. | | | 13,509,700 | | | 506,399 | | | .72 | |
| Internet and telecommunications conglomerate and distributor of digital media and software. | | | | | | | | | | |
|
|
|
|
|
|
|
|
|
|
|
| TeliaSonera AB | | | 71,210,054 | | | 477,563 | | | .68 | |
| Telecommunications company serving the Nordic and Baltic regions, and mobile communications provider serving northern and eastern Europe and Spain. | | | | | | | | | | |
|
|
|
|
|
|
|
|
|
|
|
| Vodafone Group PLC | | | 179,857,500 | | | 464,368 | | | .66 | |
| One of the leading global operators of mobile telephone services. | | | | | | | | | | |
|
|
|
|
|
|
|
|
|
|
|
| Other securities | | | | | | 2,363,964 | | | 3.37 | |
| | | | | |
|
|
|
|
| |
| | | | | | | 5,182,785 | | | 7.39 | |
| | | | | |
|
|
|
|
| |
| | | | | | | | | | | |
| Information technology — 6.52% | | | | | | | | | | |
| Microsoft Corp. | | | 36,085,019 | | | 960,583 | | | 1.37 | |
| A world leader in software and Internet technologies. Its products include the Windows operating system and Office software. | | | | | | | | | | |
|
|
|
|
|
|
|
|
|
|
|
| Samsung Electronics Co. Ltd. | | | 556,400 | | | 722,444 | | | 1.03 | |
| Korea’s top electronics manufacturer and a global leader in semiconductor production. | | | | | | | | | | |
|
|
|
|
|
|
|
|
|
|
|
| Oracle Corp. | | | 13,337,000 | | | 428,118 | | | .61 | |
| Major supplier of database management software. Also develops business applications and provides consulting and support. | | | | | | | | | | |
|
|
|
|
|
|
|
|
|
|
|
| Other securities | | | | | | 2,463,349 | | | 3.51 | |
| | | | | |
|
|
|
|
| |
| | | | | | | 4,574,494 | | | 6.52 | |
| | | | | |
|
|
|
|
| |
| | | | | | | | | | | |
| Energy — 5.67% | | | | | | | | | | |
| BP PLC | | | 203,283,213 | | | 1,405,679 | | | 2.00 | |
| One of the world’s largest oil companies. | | | | | | | | | | |
|
|
|
|
|
|
|
|
|
|
|
| Royal Dutch Shell PLC, Class B | | | 17,620,746 | | | 608,238 | | | 1.09 | |
| Royal Dutch Shell PLC, Class A (ADR) | | | 1,127,500 | | | 75,509 | | | |
| Royal Dutch Shell PLC, Class A | | | 1,686,000 | | | 56,507 | | | |
| Royal Dutch Shell PLC, Class B (ADR) | | | 344,800 | | | 23,819 | | | |
| A global group of energy and oil companies. | | | | | | | | | | |
|
|
|
|
|
|
|
|
|
|
|
| Other securities | | | | | | 1,809,862 | | | 2.58 | |
| | | | | |
|
|
|
|
| |
| | | | | | | 3,979,614 | | | 5.67 | |
| | | | | |
|
|
|
|
| |
| | |
| 14 | Capital World Growth and Income Fund |
| | | | | | | | | | | |
| Common stocks | | Shares | | Value
(000) | | Percent of
net assets | |
| Utilities — 5.24% | | | | | | | | | | |
| National Grid PLC | | | 66,484,639 | | $ | 750,955 | | | 1.07 | % |
| Operates electricity networks in the U.K. and U.S. | | | | | | | | | | |
|
|
|
|
|
|
|
|
|
|
|
| GDF SUEZ | | | 20,468,329 | | | 460,394 | | | .66 | |
| Major natural gas and electricity company based in France. | | | | | | | | | | |
|
|
|
|
|
|
|
|
|
|
|
| SSE PLC | | | 18,545,336 | | | 423,402 | | | .60 | |
| One of the U.K.’s largest gas and electricity companies. | | | | | | | | | | |
|
|
|
|
|
|
|
|
|
|
|
| PT Perusahaan Gas Negara (Persero) Tbk | | | 831,120,000 | | | 392,017 | | | .56 | |
| Explores for and produces oil and gas in Indonesia. | | | | | | | | | | |
|
|
|
|
|
|
|
|
|
|
|
| Other securities | | | | | | 1,648,930 | | | 2.35 | |
| | | | | |
|
|
|
|
| |
| | | | | | | 3,675,698 | | | 5.24 | |
| | | | | |
|
|
|
|
| |
| | | | | | | | | | | |
| Materials — 4.74% | | | | | | | | | | |
| Dow Chemical Co. | | | 16,047,000 | | | 484,459 | | | .69 | |
| A major producer of plastics, chemicals, herbicides and pesticides. | | | | | | | | | | |
|
|
|
|
|
|
|
|
|
|
|
| BASF SE | | | 4,429,000 | | | 396,873 | | | .57 | |
| The largest chemical company in the world. | | | | | | | | | | |
|
|
|
|
|
|
|
|
|
|
|
| Other securities | | | | | | 2,442,728 | | | 3.48 | |
| | | | | |
|
|
|
|
| |
| | | | | | | 3,324,060 | | | 4.74 | |
| | | | | |
|
|
|
|
| |
| | | | | | | | | | | |
| Miscellaneous — 4.80% | | | | | | | | | | |
| Other common stocks in initial period of acquisition | | | | | | 3,366,079 | | | 4.80 | |
| | | | | |
|
|
|
|
| |
| Total common stocks (cost: $52,120,377,000) | | | | | | 64,948,584 | | | 92.58 | |
| | | | | |
|
|
|
|
| |
| | | | | | | | | | | |
| Preferred stocks — 0.01% | | | | | | | | | | |
| Financials — 0.01% | | | | | | | | | | |
| Other securities | | | | | | 10,271 | | | .01 | |
| | | | | |
|
|
|
|
| |
| Total preferred stocks (cost: $9,150,000) | | | | | | 10,271 | | | .01 | |
| | | | | |
|
|
|
|
| |
| | | | | | | | | | | |
| Convertible securities — 0.40% | | | | | | | | | | |
| Other — 0.40% | | | | | | | | | | |
| Other securities | | | | | | 277,431 | | | .40 | |
| | | | | |
|
|
|
|
| |
| Total convertible securities (cost: $262,002,000) | | | | | | 277,431 | | | .40 | |
| | | | | |
|
|
|
|
| |
| | | | | | | | | | | |
| Bonds & notes — 2.12% | | Principal amount
(000) | | | | | | | |
| | | | | | | | | | | |
| U.S. Treasury bonds & notes — 0.57% | | | | | | | | | | |
| U.S. Treasury 0.25%–1.875% 20142 | | $ | 393,000 | | | 399,162 | | | .57 | |
| | | | | |
|
|
|
|
| |
| | | | | | | | | | | |
| Energy — 0.15% | | | | | | | | | | |
| BP Capital Markets PLC 3.875%–5.25% 2013–2015 | | | 10,655 | | | 11,305 | | | .02 | |
|
|
|
|
|
|
|
|
|
|
|
| Other securities | | | | | | 93,220 | | | .13 | |
| | | | | |
|
|
|
|
| |
| | | | | | | 104,525 | | | .15 | |
| | | | | |
|
|
|
|
| |
| | |
| Capital World Growth and Income Fund | 15 |
| | | | | | | | | | | |
| Bonds & notes | | Principal amount
(000) | | Value
(000) | | Percent of
net assets | |
| Health care — 0.01% | | | | | | | | | | |
| Amgen Inc. 5.375% 2043 | | $ | 9,625 | | $ | 11,396 | | | .01 | % |
| | | | | |
|
|
|
|
| |
| | | | | | | | | | | |
| Other — 1.39% | | | | | | | | | | |
| Other securities | | | | | | 975,094 | | | 1.39 | |
| | | | | |
|
|
|
|
| |
| Total bonds & notes (cost: $1,295,392,000) | | | | | | 1,490,177 | | | 2.12 | |
| | | | | |
|
|
|
|
| |
| | | | | | | | | | | |
| Short-term securities — 4.62% | | | | | | | | | | |
| | | | | | | | | | | |
| U.S. Treasury Bills 0.11%–0.195% due 12/6/2012–7/25/2013 | | | 1,163,800 | | | 1,163,380 | | | 1.66 | |
|
|
|
|
|
|
|
|
|
|
|
| Fannie Mae 0.13%–0.175% due 1/2–4/10/2013 | | | 534,329 | | | 534,186 | | | .76 | |
|
|
|
|
|
|
|
|
|
|
|
| Federal Home Loan Bank 0.124%–0.20% due 12/10/2012–4/17/2013 | | | 381,900 | | | 381,780 | | | .55 | |
|
|
|
|
|
|
|
|
|
|
|
| Other securities | | | | | | 1,160,022 | | | 1.65 | |
| | | | | |
|
|
|
|
| |
| Total short-term securities (cost: $3,238,984,000) | | | | | | 3,239,368 | | | 4.62 | |
| | | | | |
|
|
|
|
| |
| Total investment securities (cost: $56,925,905,000) | | | | | | 69,965,831 | | | 99.73 | |
| Other assets less liabilities | | | | | | 189,643 | | | .27 | |
| | | | | |
|
|
|
|
| |
| Net assets | | | | | $ | 70,155,474 | | | 100.00 | % |
| | | | | |
|
|
|
|
| |
As permitted by U.S. Securities and Exchange Commission regulations, “Miscellaneous” securities include holdings in their first year of acquisition that have not previously been publicly disclosed.
“Other securities” includes all issues that are not disclosed separately in the summary investment portfolio, including securities which were valued under fair value procedures adopted by authority of the board of directors. The total value of all such securities was $110,936,000, which represented .16% of the net assets of the fund. Some of “Other securities” (with an aggregate value of $939,074,000, which represented 1.34% of the net assets of the fund) were acquired in transactions exempt from registration under Rule 144A or section 4(2) of the Securities Act of 1933 and may be resold in the U.S. in transactions exempt from registration, normally to qualified institutional buyers.
The descriptions of the companies shown in the summary investment portfolio, which were obtained from published reports and other sources believed to be reliable, are supplemental and are not covered by the Report of Independent Registered Public Accounting Firm.
Forward currency contracts
The fund has entered into forward currency contracts to sell currencies as shown in the following table. The open forward currency contracts shown are generally indicative of the level of activity over the prior 12-month period.
| | | | | | | | | | | | | | | | | |
| | | | | | | Contract amount | | Unrealized appreciation
(depreciation)
at 11/30/2012
(000) | |
| | | | | | |
| | |
| | | Settlement
date | | Counterparty | | Receive
(000) | | Deliver
(000) | | |
|
|
|
|
|
|
|
|
|
|
|
|
| | | | | | | | | | | | |
| Sales: | | | | | | | | | | | | | | |
| Australian dollars | | 1/8/2013 | | Barclays Bank PLC | | $ | 145,116 | | A$ | 139,000 | | | $ | 509 | | |
| Euros | | 12/10/2012 | | JPMorgan Chase | | $ | 224,322 | | € | 175,000 | | | | (3,295 | ) | |
| Euros | | 12/14/2012 | | UBS AG | | $ | 222,656 | | € | 175,000 | | | | (4,972 | ) | |
| Euros | | 12/18/2012 | | HSBC Bank | | $ | 159,356 | | € | 125,000 | | | | (3,244 | ) | |
| Euros | | 12/19/2012 | | UBS AG | | $ | 49,824 | | € | 39,000 | | | | (908 | ) | |
| Euros | | 12/20/2012 | | Citibank | | $ | 151,721 | | € | 119,000 | | | | (3,077 | ) | |
| | | | | | | | | | | | | |
|
| | |
| | | | | | | | | | | | | | $ | (14,987 | ) | |
| | | | | | | | | | | | | |
|
| | |
| | |
| 16 | Capital World Growth and Income Fund |
Investments in affiliates
A company is considered to be an affiliate of the fund under the Investment Company Act of 1940 if the fund’s holdings in that company represent 5% or more of the outstanding voting shares. The value of the fund’s holdings in affiliated companies is included in “Other securities” under the respective industry sectors in the summary investment portfolio. Further details on these holdings and related transactions during the year ended November 30, 2012, appear below.
| | | | | | | | | | | | | | | | | | | | |
| | | Beginning shares
or principal
amount | | Additions | | Reductions | | Ending shares
or principal
amount | | Dividend
or interest
income
(000) | | Value
of affiliates
at 11/30/2012
(000) | |
|
|
|
|
|
|
|
|
|
|
|
|
|
|
| | | | | | | | | | | | | | |
| ComfortDelGro Corp. Ltd. | | | 135,100,000 | | | — | | | — | | | 135,100,000 | | $ | 6,744 | | $ | 190,375 | |
| Qantas Airways Ltd.1 | | | 125,158,600 | | | — | | | — | | | 125,158,600 | | | — | | | 173,066 | |
| Darty PLC3 | | | 26,593,098 | | | — | | | 2,000,000 | | | 24,593,098 | | | 1,212 | | | — | |
| OPAP SA3 | | | 16,055,910 | | | — | | | 16,055,910 | | | — | | | 5,775 | | | — | |
| Virgin Media Inc.3 | | | 15,757,000 | | | — | | | 4,261,500 | | | 11,495,500 | | | 2,521 | | | — | |
| Virgin Media Inc. 6.50% convertible notes 20163 | | $ | 7,100,000 | | | — | | $ | 3,600,000 | | $ | 3,500,000 | | | 431 | | | — | |
| | | | | | | | | | | | | | |
|
|
|
|
| |
| | | | | | | | | | | | | | | $ | 16,683 | | $ | 363,441 | |
| | | | | | | | | | | | | | |
|
|
|
|
| |
The following footnotes apply to either the individual securities noted or one or more of the securities aggregated and listed as a single line item.
| | |
| 1 | Security did not produce income during the last 12 months. |
| 2 | A portion of this security was pledged as collateral for net losses on unsettled forward currency contracts with certain counterparties. The total value of pledged collateral was $4,444,000, which represented .01% of the net assets of the fund. |
| 3 | Unaffiliated issuer at 11/30/2012. |
| |
| Key to abbreviation and symbols |
| ADR = American Depositary Receipts |
| A$ = Australian dollars |
| € = Euros |
See Notes to Financial Statements
| | |
| Capital World Growth and Income Fund | 17 |
Financial statements
| | | | | | | | | | | |
| Statement of assets and liabilities | | | | | | | | | | |
| at November 30, 2012 | | | | | (dollars in thousands) | |
| | | | | | | | | | | |
| Assets: | | | | | | | | | | |
| Investment securities, at value: | | | | | | | | | | |
| Unaffiliated issuers (cost: $56,504,187) | | | | | $ | 69,602,390 | | | | |
| Affiliated issuers (cost: $421,718) | | | | | | 363,441 | | $ | 69,965,831 | |
| | | | | |
|
| | | | |
| Cash denominated in currencies other than U.S. dollars (cost: $7,464) | | | | | | | | | 7,464 | |
| Cash | | | | | | | | | 54 | |
| Unrealized appreciation on open forward currency contracts | | | | | | | | | 509 | |
| Receivables for: | | | | | | | | | | |
| Sales of investments | | | | | | 243,045 | | | | |
| Sales of fund’s shares | | | | | | 75,930 | | | | |
| Dividends and interest | | | | | | 217,991 | | | 536,966 | |
| | | | | |
|
| |
|
| |
| | | | | | | | | | 70,510,824 | |
| Liabilities: | | | | | | | | | | |
| Unrealized depreciation on open forward currency contracts | | | | | | | | | 15,496 | |
| Payables for: | | | | | | | | | | |
| Purchases of investments | | | | | | 156,763 | | | | |
| Repurchases of fund’s shares | | | | | | 116,109 | | | | |
| Investment advisory services | | | | | | 21,389 | | | | |
| Services provided by related parties | | | | | | 43,436 | | | | |
| Directors’ deferred compensation | | | | | | 1,108 | | | | |
| Other | | | | | | 1,049 | | | 339,854 | |
| | | | | |
|
| |
|
| |
| Net assets at November 30, 2012 | | | | | | | | $ | 70,155,474 | |
| | | | | | | | |
|
| |
| | | | | | | | | | | |
| Net assets consist of: | | | | | | | | | | |
| Capital paid in on shares of capital stock | | | | | | | | $ | 71,095,540 | |
| Undistributed net investment income | | | | | | | | | 624,411 | |
| Accumulated net realized loss | | | | | | | | | (14,587,790 | ) |
| Net unrealized appreciation | | | | | | | | | 13,023,313 | |
| | | | | | | | |
|
| |
| Net assets at November 30, 2012 | | | | | | | | $ | 70,155,474 | |
| | | | | | | | |
|
| |
| | | | | | | | | | | |
| (dollars and shares in thousands, except per-share amounts) | |
| | | | | | | | | | | |
Total authorized capital stock — 4,000,000 shares,
$.01 par value (1,911,925 total shares outstanding) | | | | | | | | | | |
| | | | | | | | | | | |
| | | Net assets | | Shares
outstanding | | Net asset value
per share | |
|
|
|
|
|
|
|
|
| Class A | | $ | 46,323,249 | | | 1,260,556 | | $ | 36.75 | |
| Class B | | | 1,432,804 | | | 39,226 | | | 36.53 | |
| Class C | | | 4,373,176 | | | 120,271 | | | 36.36 | |
| Class F-1 | | | 3,177,453 | | | 86,624 | | | 36.68 | |
| Class F-2 | | | 1,856,614 | | | 50,530 | | | 36.74 | |
| Class 529-A | | | 2,298,584 | | | 62,718 | | | 36.65 | |
| Class 529-B | | | 114,978 | | | 3,148 | | | 36.52 | |
| Class 529-C | | | 582,064 | | | 15,957 | | | 36.48 | |
| Class 529-E | | | 99,115 | | | 2,709 | | | 36.59 | |
| Class 529-F-1 | | | 78,157 | | | 2,131 | | | 36.68 | |
| Class R-1 | | | 276,101 | | | 7,581 | | | 36.42 | |
| Class R-2 | | | 1,149,854 | | | 31,637 | | | 36.35 | |
| Class R-3 | | | 2,335,321 | | | 63,925 | | | 36.53 | |
| Class R-4 | | | 2,158,731 | | | 58,865 | | | 36.67 | |
| Class R-5 | | | 1,381,022 | | | 37,559 | | | 36.77 | |
| Class R-6 | | | 2,518,251 | | | 68,488 | | | 36.77 | |
See Notes to Financial Statements
| | |
| 18 | Capital World Growth and Income Fund |
| | | | | | | | |
| Statement of operations | | | | | | | |
| for the year ended November 30, 2012 | | (dollars in thousands) | |
| | | | | | | | |
| Investment income: | | | | | | | |
| Income: | | | | | | | |
| Dividends (net of non-U.S. taxes of $144,246; also includes $16,252 from affiliates) | | $ | 2,198,517 | | | | |
| Interest (includes $431 from affiliates) | | | 96,357 | | $ | 2,294,874 | |
| | |
|
| | | | |
| | | | | | | | |
| Fees and expenses*: | | | | | | | |
| Investment advisory services | | | 260,673 | | | | |
| Distribution services | | | 217,325 | | | | |
| Transfer agent services | | | 107,382 | | | | |
| Administrative services | | | 14,729 | | | | |
| Reports to shareholders | | | 3,913 | | | | |
| Registration statement and prospectus | | | 922 | | | | |
| Directors’ compensation | | | 585 | | | | |
| Auditing and legal | | | 204 | | | | |
| Custodian | | | 7,821 | | | | |
| State and local taxes | | | 565 | | | | |
| Other | | | 3,400 | | | 617,519 | |
| | |
|
| |
|
| |
| Net investment income | | | | | | 1,677,355 | |
| | | | | | | | |
| Net realized gain and unrealized appreciation on investments, forward currency contracts and currency: | | | | | | | |
| Net realized gain (loss) on: | | | | | | | |
| Investments (net of non-U.S. taxes of $295; also includes $384,211 net loss from affiliates) | | | 235,372 | | | | |
| Forward currency contracts | | | 45,490 | | | | |
| Currency transactions | | | (2,197 | ) | | 278,665 | |
| | |
|
| | | | |
| Net unrealized appreciation (depreciation) on: | | | | | | | |
| Investments | | | 8,279,678 | | | | |
| Forward currency contracts | | | (14,318 | ) | | | |
| Currency translations | | | (2,495 | ) | | 8,262,865 | |
| | |
|
| |
|
| |
| Net realized gain and unrealized appreciation on investments, forward currency contracts and currency | | | | | | 8,541,530 | |
| | | | | |
|
| |
| Net increase in net assets resulting from operations | | | | | $ | 10,218,885 | |
| | | | | |
|
| |
| | | | | | | | |
| *Additional information related to class-specific fees and expenses is included in the Notes to Financial Statements. |
| | | | | | | | |
| Statements of changes in net assets | | | | | | | |
| | | (dollars in thousands) | |
| | | | |
| | | Year ended November 30 | |
| | | 2012 | | 2011 | |
| | |
|
|
| |
| Operations: | | | | | | | |
| Net investment income | | $ | 1,677,355 | | $ | 1,987,803 | |
| Net realized gain on investments, forward currency contracts and currency transactions | | | 278,665 | | | 837,186 | |
| Net unrealized appreciation (depreciation) on investments, forward currency contracts and currency translations | | | 8,262,865 | | | (3,205,256 | ) |
| | |
|
| |
|
| |
| Net increase (decrease) in net assets resulting from operations | | | 10,218,885 | | | (380,267 | ) |
| | |
|
| |
|
| |
| | | | | | | | |
| Dividends paid to shareholders from net investment income | | | (1,889,680 | ) | | (1,908,500 | ) |
| | | | | | | | |
| Net capital share transactions | | | (6,354,159 | ) | | (6,453,000 | ) |
| | |
|
| |
|
| |
| | | | | | | | |
| Total increase (decrease) in net assets | | | 1,975,046 | | | (8,741,767 | ) |
| | | | | | | | |
| Net assets: | | | | | | | |
| Beginning of year | | | 68,180,428 | | | 76,922,195 | |
| | |
|
| |
|
| |
| End of year (including undistributed net investment income: | | | | | | | |
| $624,411 and $642,459, respectively) | | $ | 70,155,474 | | $ | 68,180,428 | |
| | |
|
| |
|
| |
See Notes to Financial Statements
| | |
| Capital World Growth and Income Fund | 19 |
Notes to financial statements
1. Organization
Capital World Growth and Income Fund, Inc. (the “fund”) is registered under the Investment Company Act of 1940 as an open-end, diversified management investment company. The fund seeks long-term growth of capital while providing current income. It invests on a global basis in a diversified portfolio consisting primarily of common stocks and other equity securities. Shareholders approved a proposal to reorganize the fund from a Maryland corporation to a Delaware statutory trust. The reorganization may be completed in 2013; however, the fund reserves the right to delay the implementation.
The fund has 16 share classes consisting of five retail share classes (Classes A, B and C, as well as two F share classes, F-1 and F-2), five 529 college savings plan share classes (Classes 529-A, 529-B, 529-C, 529-E and 529-F-1) and six retirement plan share classes (Classes R-1, R-2, R-3, R-4, R-5 and R-6). The 529 college savings plan share classes can be used to save for college education. The retirement plan share classes are generally offered only through eligible employer-sponsored retirement plans. The fund’s share classes are further described below:
| | | | | | | |
| Share class | | Initial sales charge | | Contingent deferred sales
charge upon redemption | | Conversion feature |
|
|
|
|
|
|
|
| | | | | | | |
| Classes A and 529-A | | Up to 5.75% | | None (except 1% for certain redemptions within one year of purchase without an initial sales charge) | | None |
|
|
|
|
|
|
|
| Classes B and 529-B* | | None | | Declines from 5% to 0% for redemptions within six years of purchase | | Classes B and 529-B convert to Classes A and 529-A, respectively, after eight years |
|
|
|
|
|
|
|
| Class C | | None | | 1% for redemptions
within one year of purchase | | Class C converts to Class F-1
after 10 years |
|
|
|
|
|
|
|
| Class 529-C | | None | | 1% for redemptions
within one year of purchase | | None |
|
|
|
|
|
|
|
| Class 529-E | | None | | None | | None |
|
|
|
|
|
|
|
| Classes F-1, F-2 and 529-F-1 | | None | | None | | None |
|
|
|
|
|
|
|
Classes R-1, R-2, R-3, R-4,
R-5 and R-6 | | None | | None | | None |
|
|
|
|
|
|
|
* Class B and 529-B shares of the fund are not available for purchase.
Holders of all share classes have equal pro rata rights to assets, dividends and liquidation proceeds. Each share class has identical voting rights, except for the exclusive right to vote on matters affecting only its class. Share classes have different fees and expenses (“class-specific fees and expenses”), primarily due to different arrangements for distribution, administrative and shareholder services. Differences in class-specific fees and expenses will result in differences in net investment income and, therefore, the payment of different per-share dividends by each class.
2. Significant accounting policies
The financial statements have been prepared to comply with accounting principles generally accepted in the United States of America. These principles require management to make estimates and assumptions that affect reported amounts and disclosures. Actual results could differ from those estimates. The fund follows the significant accounting policies described below, as well as the valuation policies described in the next section on valuation.
Security transactions and related investment income — Security transactions are recorded by the fund as of the date the trades are executed with brokers. Realized gains and losses from security transactions are determined based on the specific identified cost of the securities. In the event a security is purchased with a delayed payment date, the fund will segregate liquid assets sufficient to meet its payment obligations. Dividend income is recognized on the ex-dividend date and interest income is recognized on an accrual basis. Market discounts, premiums and original issue discounts on fixed-income securities are amortized daily over the expected life of the security.
Class allocations — Income, fees and expenses (other than class-specific fees and expenses) and realized and unrealized gains and losses are allocated daily among the various share classes based on their relative net assets. Class-specific fees and expenses, such as distribution, administrative and shareholder services, are charged directly to the respective share class.
Dividends and distributions to shareholders — Dividends and distributions paid to shareholders are recorded on the ex-dividend date.
Currency translation — Assets and liabilities, including investment securities, denominated in currencies other than U.S. dollars are translated into U.S. dollars at the exchange rates supplied by one or more pricing vendors on the valuation date. Purchases and sales of investment securities and income and expenses are translated into U.S. dollars at the exchange rates on the dates of such transactions. On the
| | |
| 20 | Capital World Growth and Income Fund |
accompanying financial statements, the effects of changes in exchange rates on investment securities are included with the net realized gain or loss and net unrealized appreciation or depreciation on investments. The realized gain or loss and unrealized appreciation or depreciation resulting from all other transactions denominated in currencies other than U.S. dollars are disclosed separately.
3. Valuation
Capital Research and Management Company (“CRMC”), the fund’s investment adviser, values the fund’s investments at fair value as defined by accounting principles generally accepted in the United States of America. The net asset value of each share class of the fund is generally determined as of approximately 4:00 p.m. New York time each day the New York Stock Exchange is open.
Methods and inputs — The fund’s investment adviser uses the following methods and inputs to establish the fair value of the fund’s assets and liabilities. Use of particular methods and inputs may vary over time based on availability and relevance as market and economic conditions evolve.
Equity securities are generally valued at the official closing price of, or the last reported sale price on, the exchange or market on which such securities are traded, as of the close of business on the day the securities are being valued or, lacking any sales, at the last available bid price. Prices for each security are taken from the principal exchange or market on which the security trades.
Fixed-income securities, including short-term securities purchased with more than 60 days left to maturity, are generally valued at prices obtained from one or more pricing vendors. Vendors value such securities based on one or more of the inputs described in the following table. The table provides examples of inputs that are commonly relevant for valuing particular classes of fixed-income securities in which the fund is authorized to invest. However, these classifications are not exclusive, and any of the inputs may be used to value any other class of fixed-income security.
| | | |
| Fixed-income class | | Examples of standard inputs |
|
|
|
| |
| All | | Benchmark yields, transactions, bids, offers, quotations from dealers and trading systems, new issues, spreads and other relationships observed in the markets among comparable securities; and proprietary pricing models such as yield measures calculated using factors such as cash flows, financial or collateral performance and other reference data (collectively referred to as “standard inputs”) |
|
|
|
| Corporate bonds & notes; convertible securities | | Standard inputs and underlying equity of the issuer |
|
|
|
| Bonds & notes of governments & government agencies | | Standard inputs and interest rate volatilities |
|
|
|
| Mortgage-backed; asset-backed obligations | | Standard inputs and cash flows, prepayment information, default rates, delinquency and loss assumptions, collateral characteristics, credit enhancements and specific deal information |
When the fund’s investment adviser deems it appropriate to do so (such as when vendor prices are unavailable or not deemed to be representative), fixed-income securities will be valued in good faith at the mean quoted bid and ask prices that are reasonably and timely available (or bid prices, if ask prices are not available) or at prices for securities of comparable maturity, quality and type.
Securities with both fixed-income and equity characteristics, or equity securities traded principally among fixed-income dealers, are generally valued in the manner described above for either equity or fixed-income securities, depending on which method is deemed most appropriate by the fund’s investment adviser. Short-term securities purchased within 60 days to maturity are valued at amortized cost, which approximates fair value. The value of short-term securities originally purchased with maturities greater than 60 days is determined based on an amortized value to par when they reach 60 days. Forward currency contracts are valued at the mean of representative quoted bid and ask prices, generally based on prices supplied by one or more pricing vendors.
Securities and other assets for which representative market quotations are not readily available or are considered unreliable by the fund’s investment adviser are fair valued as determined in good faith under fair value guidelines adopted by authority of the fund’s board of directors as further described below. The investment adviser follows fair valuation guidelines, consistent with U.S. Securities and Exchange Commission rules and guidance, to consider relevant principles and factors when making fair value determinations. The investment adviser considers relevant indications of value that are reasonably and timely available to it in determining the fair value to be assigned to a particular security, such as the type and cost of the security; contractual or legal restrictions on resale of the security; relevant financial or business developments of the issuer; actively traded similar or related securities; conversion or exchange rights on the security; related corporate actions; significant events occuring after the close of trading in the security; and changes in overall market conditions. In addition, the closing prices of equity securities that trade in markets outside U.S. time zones may be adjusted to reflect significant events that occur after the close of local trading but before the net asset value of each share class of the fund is determined. Fair valuations and valuations of investments that are not actively trading involve judgment and may differ materially from valuations that would have been used had greater market activity occurred.
| | |
| Capital World Growth and Income Fund | 21 |
Processes and structure — The fund’s board of directors has delegated authority to the fund’s investment adviser to make fair value determinations, subject to board oversight. The investment adviser has established a Joint Fair Valuation Committee (the “Fair Valuation Committee”) to administer, implement and oversee the fair valuation process, and to make fair value decisions. The Fair Valuation Committee regularly reviews its own fair value decisions, as well as decisions made under its standing instructions to the investment adviser’s valuation teams. The Fair Valuation Committee reviews changes in fair value measurements from period to period and may, as deemed appropriate, update the fair valuation guidelines to better reflect the results of back testing and address new or evolving issues. The Fair Valuation Committee reports any changes to the fair valuation guidelines to the board of directors with supplemental information to support the changes. The fund’s board and audit committee also regularly review reports that describe fair value determinations and methods.
The fund’s investment adviser has also established a Fixed-Income Pricing Review Group to administer and oversee the fixed-income valuation process, including the use of fixed-income pricing vendors. This group regularly reviews pricing vendor information and market data. Pricing decisions, processes and controls over security valuation are also subject to additional internal reviews, including an annual control self-evaluation program facilitated by the investment adviser’s compliance group.
Classifications — The fund’s investment adviser classifies the fund’s assets and liabilities into three levels based on the inputs used to value the assets or liabilities. Level 1 values are based on quoted prices in active markets for identical securities. Level 2 values are based on significant observable market inputs, such as quoted prices for similar securities and quoted prices in inactive markets. Certain securities trading outside the U.S. may transfer between Level 1 and Level 2 due to valuation adjustments resulting from significant market movements following the close of local trading. Level 3 values are based on significant unobservable inputs that reflect the investment adviser’s determination of assumptions that market participants might reasonably use in valuing the securities. The valuation levels are not necessarily an indication of the risk or liquidity associated with the underlying investment. For example, U.S. government securities are reflected as Level 2 because the inputs used to determine fair value may not always be quoted prices in an active market. The following tables present the fund’s valuation levels as of November 30, 2012 (dollars in thousands):
| | | | | | | | | | | | | | |
| | | Investment securities | |
| | |
| |
| | | Level 1* | | Level 2 | | Level 3 | | Total | |
|
|
|
|
|
|
|
|
| |
| |
| Assets: | | | | | | | | | | | | | |
| Common stocks: | | | | | | | | | | | | | |
| Consumer discretionary | | $ | 8,622,745 | | $ | — | | $ | — | | $ | 8,622,745 | |
| Industrials | | | 8,470,882 | | | — | | | — | | | 8,470,882 | |
| Consumer staples | | | 8,145,579 | | | — | | | — | | | 8,145,579 | |
| Financials | | | 7,836,781 | | | — | | | — | | | 7,836,781 | |
| Health care | | | 7,769,867 | | | — | | | — | | | 7,769,867 | |
| Telecommunication services | | | 5,182,785 | | | — | | | — | | | 5,182,785 | |
| Information technology | | | 4,475,852 | | | 98,642 | | | — | | | 4,574,494 | |
| Energy | | | 3,979,614 | | | — | | | — | | | 3,979,614 | |
| Utilities | | | 3,675,698 | | | — | | | — | | | 3,675,698 | |
| Materials | | | 3,324,060 | | | — | | | — | | | 3,324,060 | |
| Miscellaneous | | | 3,366,079 | | | — | | | — | | | 3,366,079 | |
| Preferred stocks | | | — | | | 10,271 | | | — | | | 10,271 | |
| Convertible securities | | | 77,546 | | | 199,885 | | | — | | | 277,431 | |
| Bonds & notes | | | — | | | 1,490,177 | | | — | | | 1,490,177 | |
| Short-term securities | | | — | | | 3,239,368 | | | — | | | 3,239,368 | |
| | |
|
| |
|
| |
|
| |
|
| |
| Total | | $ | 64,927,488 | | $ | 5,038,343 | | $ | — | | $ | 69,965,831 | |
| | |
|
| |
|
| |
|
| |
|
| |
| | | | | | | | | | | | | | |
| | | Other investments† | |
| | |
| |
| | | Level 1 | | Level 2 | | Level 3 | | Total | |
|
|
|
|
|
|
|
|
|
|
| Assets: | | | | | | | | | | | | | |
| Unrealized appreciation on open forward currency contracts | | $ | — | | $ | 509 | | $ | — | | $ | 509 | |
| Liabilities: | | | | | | | | | | | | | |
| Unrealized depreciation on open forward currency contracts | | | — | | | (15,496 | ) | | — | | | (15,496 | ) |
| | |
|
| |
|
| |
|
| |
|
| |
| Total | | $ | — | | $ | (14,987 | ) | $ | — | | $ | (14,987 | ) |
| | |
|
| |
|
| |
|
| |
|
| |
| | |
| * | Securities with a market value of $34,826,288,000, which represented 49.64% of the net assets of the fund, transferred from Level 2 to Level 1 since the prior fiscal year-end, primarily due to a lack of significant market movements following the close of local trading. |
| † | Forward currency contracts are not included in the investment portfolio. |
| | |
| 22 | Capital World Growth and Income Fund |
4. Risk factors
Investing in the fund may involve certain risks including, but not limited to, those described below.
Market conditions — The prices of, and the income generated by, the common stocks and other securities held by the fund may decline due to market conditions and other factors, including those directly involving the issuers of securities held by the fund.
Investing outside the U.S. — Securities of issuers domiciled outside the U.S., or with significant operations outside the U.S., may lose value because of adverse political, social, economic or market developments in the countries or regions in which the issuer operates. These securities may also lose value due to changes in foreign currency exchange rates against the U.S. dollar and/or currencies of other countries. Securities markets in certain countries may be more volatile and/or less liquid than those in the U.S. Investments outside the U.S. may also be subject to different settlement and accounting practices and different regulatory, legal and reporting standards, and may be more difficult to value, than those in the U.S. The risks of investing outside the U.S. may be heightened in connection with investments in emerging markets.
Investing in emerging markets — Investing in emerging markets may involve risks in addition to and greater than those generally associated with investing in developed countries. For instance, developing countries may have less developed legal and accounting systems than those in developed countries. The governments of these countries may be less stable and more likely to impose capital controls, nationalize a company or industry, place restrictions on foreign ownership and on withdrawing sale proceeds of securities from the country, and/or impose punitive taxes that could adversely affect the prices of securities. In addition, the economies of these countries may be dependent on relatively few industries that are more susceptible to local and global changes. Securities markets in these countries can also be relatively small and have substantially lower trading volumes. As a result, securities issued in these countries may be more volatile and less liquid, and may be more difficult to value, than securities issued in countries with more developed economies and/or markets. Additionally, there may be increased settlement risks for transactions in local securities.
Investing in growth-oriented stocks — Growth-oriented stocks may involve larger price swings and greater potential for loss than other types of investments.
Investing in income-oriented stocks — Income provided by the fund may be reduced by changes in the dividend policies of, and the capital resources available at, the companies in which the fund invests.
Management — The investment adviser to the fund actively manages the fund’s investments. Consequently, the fund is subject to the risk that the methods and analyses employed by the investment adviser in this process may not produce the desired results. This could cause the fund to lose value or its investment results to lag relevant benchmarks or other funds with similar objectives.
5. Certain investment techniques
Forward currency contracts — The fund has entered into forward currency contracts, which represent agreements to exchange currencies on specific future dates at predetermined rates. The fund’s investment adviser uses forward currency contracts to manage the fund’s exposure to changes in exchange rates. Upon entering into these contracts, risks may arise from the potential inability of counterparties to meet the terms of their contracts and from possible movements in exchange rates.
On a daily basis, the fund’s investment adviser values forward currency contracts based on the applicable exchange rates and records unrealized appreciation or depreciation for open forward currency contracts in the fund’s statement of assets and liabilities. Realized gains or losses are recorded at the time the forward currency contract is closed or offset by another contract with the same broker for the same settlement date and currency. Closed forward currency contracts that have not reached their settlement date are included in the respective receivables or payables for closed forward currency contracts in the fund’s statement of assets and liabilities. Net realized gains or losses from closed forward currency contracts and net unrealized appreciation or depreciation from open forward currency contracts are recorded in the fund’s statement of operations.
Collateral — To reduce the risk to counterparties of forward currency contracts, the fund has entered into a collateral program with certain counterparties. The program calls for the fund to either receive or pledge collateral based on the net unrealized gain or loss on unsettled forward currency contracts by counterparty. The purpose of the collateral is to cover potential losses that could occur in the event that either party can not meet its contractual obligations.
6. Taxation and distributions
Federal income taxation — The fund complies with the requirements under Subchapter M of the Internal Revenue Code applicable to mutual funds and intends to distribute substantially all of its net taxable income and net capital gains each year. The fund is not subject to income taxes to the extent such distributions are made. Therefore, no federal income tax provision is required.
As of and during the period ended November 30, 2012, the fund did not have a liability for any unrecognized tax benefits. The fund recognizes interest and penalties, if any, related to unrecognized tax benefits as income tax expense in the statement of operations. During the period, the fund did not incur any interest or penalties.
| | |
| Capital World Growth and Income Fund | 23 |
The fund is not subject to examination by U.S. federal tax authorities for tax years before 2008, by state tax authorities for tax years before 2007 and by tax authorities outside the U.S. for tax years before 2005.
Non-U.S. taxation — Dividend and interest income are recorded net of non-U.S. taxes paid. Gains realized by the fund on the sale of securities in certain countries are subject to non-U.S. taxes. The fund records a liability based on unrealized gains to provide for potential non-U.S. taxes payable upon the sale of these securities.
Distributions — Distributions paid to shareholders are based on net investment income and net realized gains determined on a tax basis, which may differ from net investment income and net realized gains for financial reporting purposes. These differences are due primarily to different treatment for items such as currency gains and losses; short-term capital gains and losses; capital losses related to sales of certain securities within 30 days of purchase; unrealized appreciation of certain investments in securities outside the U.S.; cost of investments sold; and net capital losses. The fiscal year in which amounts are distributed may differ from the year in which the net investment income and net realized gains are recorded by the fund for financial reporting purposes.
During the year ended November 30, 2012, the fund reclassified $194,351,000 from accumulated net realized loss to undistributed net investment income and $74,000 from undistributed net investment income to capital paid in on shares of capital stock to align financial reporting with tax reporting.
Under the Regulated Investment Company Modernization Act of 2010 (the “Act”), net capital losses recognized after November 30, 2011, may be carried forward indefinitely, and their character is retained as short-term and/or long-term losses. Previously, net capital losses were carried forward for eight years and treated as short-term losses. As a transition rule, the Act requires that post-enactment net capital losses be used before pre-enactment net capital losses.
As of November 30, 2012, the tax basis components of distributable earnings, unrealized appreciation (depreciation) and cost of investment securities were as follows:
| | | | | | | | |
| | | | | | (dollars in thousands) | |
|
|
|
|
|
|
|
| | | | | | | |
| Undistributed ordinary income | | | | | $ | 857,091 | |
| Capital loss carryforward*: | | | | | | | |
| No expiration | | $ | (66,897 | ) | | | |
| Expiring 2016 | | | (1,291,317 | ) | | | |
| Expiring 2017 | | | (13,178,426 | ) | | (14,536,640 | ) |
| | |
|
| | | | |
|
|
|
|
|
|
|
|
| Gross unrealized appreciation on investment securities | | | | | | 16,273,107 | |
| Gross unrealized depreciation on investment securities | | | | | | (3,536,824 | ) |
| Net unrealized appreciation on investment securities | | | | | | 12,736,283 | |
|
|
|
|
|
|
|
|
| Cost of investment securities | | | | | | 57,229,548 | |
|
|
|
|
|
|
|
|
| | |
| * | The capital loss carryforward will be used to offset any capital gains realized by the fund in future years through the expiration dates. The fund will not make distributions from capital gains while a capital loss carryforward remains. |
Tax-basis distributions paid to shareholders from ordinary income were as follows (dollars in thousands):
| | | | | | | | |
| | | Year ended November 30 | |
| | |
| |
| Share class | | 2012 | | 2011 | |
|
|
|
|
|
|
| |
| Class A | | $ | 1,295,073 | | $ | 1,340,861 | |
| Class B | | | 33,659 | | | 40,785 | |
| Class C | | | 93,351 | | | 99,005 | |
| Class F-1 | | | 95,614 | | | 97,133 | |
| Class F-2 | | | 44,923 | | | 44,057 | |
| Class 529-A | | | 59,493 | | | 53,362 | |
| Class 529-B | | | 2,434 | | | 2,679 | |
| Class 529-C | | | 11,059 | | | 9,646 | |
| Class 529-E | | | 2,364 | | | 2,092 | |
| Class 529-F-1 | | | 2,111 | | | 1,770 | |
| Class R-1 | | | 6,013 | | | 5,238 | |
| Class R-2 | | | 24,066 | | | 22,987 | |
| Class R-3 | | | 57,429 | | | 53,891 | |
| Class R-4 | | | 57,655 | | | 54,813 | |
| Class R-5 | | | 41,232 | | | 40,150 | |
| Class R-6 | | | 63,204 | | | 40,031 | |
| | |
|
| |
|
| |
| Total | | $ | 1,889,680 | | $ | 1,908,500 | |
| | |
|
| |
|
| |
| | |
| 24 | Capital World Growth and Income Fund |
7. Fees and transactions with related parties
CRMC, the fund’s investment adviser, is the parent company of American Funds Distributors,® Inc. (“AFD”), the principal underwriter of the fund’s shares, and American Funds Service Company® (“AFS”), the fund’s transfer agent.
Investment advisory services — The fund has an investment advisory and service agreement with CRMC that provides for monthly fees accrued daily. These fees are based on a series of decreasing annual rates beginning with 0.600% on the first $500 million of daily net assets and decreasing to 0.350% on such assets in excess of $115 billion. For the year ended November 30, 2012, the investment advisory services fee was $260,673,000, which was equivalent to an annualized rate of 0.379% of average daily net assets.
Class-specific fees and expenses — Expenses that are specific to individual share classes are accrued directly to the respective share class. The principal class-specific fees and expenses are described below:
| | |
| | Distribution services — The fund has plans of distribution for all share classes, except Class F-2, R-5 and R-6 shares. Under the plans, the board of directors approves certain categories of expenses that are used to finance activities primarily intended to sell fund shares and service existing accounts. The plans provide for payments, based on an annualized percentage of average daily net assets, ranging from 0.30% to 1.00% as noted below. In some cases, the board of directors has limited the amounts that may be paid to less than the maximum allowed by the plans. All share classes with a plan may use up to 0.25% of average daily net assets to pay service fees, or to compensate AFD for paying service fees, to firms that have entered into agreements with AFD to provide certain shareholder services. The remaining amounts available to be paid under each plan are paid to dealers to compensate them for their sales activities. |
| | |
| | For Class A and 529-A shares, distribution-related expenses include the reimbursement of dealer and wholesaler commissions paid by AFD for certain shares sold without a sales charge. These share classes reimburse AFD for amounts billed within the prior 15 months but only to the extent that the overall annual expense limit of 0.30% is not exceeded. As of November 30, 2012, there were no unreimbursed expenses subject to reimbursement for Class A or 529-A shares. |
| | | | | | | | | |
| | Share class | | Currently approved limits | | Plan limits | |
| |
|
|
|
|
|
|
|
|
| | | | | | | | | |
| | Class A | | 0.30 | % | | 0.30 | % | |
| | Class 529-A | | 0.30 | | | 0.50 | | |
| | Classes B and 529-B | | 1.00 | | | 1.00 | | |
| | Classes C, 529-C and R-1 | | 1.00 | | | 1.00 | | |
| | Class R-2 | | 0.75 | | | 1.00 | | |
| | Classes 529-E and R-3 | | 0.50 | | | 0.75 | | |
| | Classes F-1, 529-F-1 and R-4 | | 0.25 | | | 0.50 | | |
| | |
| | Transfer agent services — The fund has a shareholder services agreement with AFS under which the fund compensates AFS for providing transfer agent services to each of the fund’s share classes. These services include recordkeeping, shareholder communications and transaction processing. In addition, the fund reimburses AFS for amounts paid to third parties for performing transfer agent services on behalf of fund shareholders. |
| | |
| | During the period December 1, 2011, through December 31, 2011, only Class A and B shares were subject to the shareholder services agreement with AFS. During this period, AFS and other third parties were compensated for providing transfer agent services to Class C, F, 529 and R shares through the fees paid by the fund to CRMC under the fund’s administrative services agreement with CRMC as described in the administrative services section below; CRMC paid for any transfer agent services expenses in excess of 0.10% of the respective average daily net assets of each of such share classes. |
| | |
| | Effective January 1, 2012, the shareholder services agreement with AFS was modified to include Class C, F, 529 and R shares and payment for transfer agent services for such classes under the administrative services agreement terminated. Under this structure, transfer agent services expenses for some classes may exceed 0.10% of average daily net assets, resulting in an increase in expenses paid by some share classes. |
| | |
| | For the year ended November 30, 2012, the total transfer agent services fee paid under these agreements was $107,382,000, of which $105,786,000 was paid by the fund to AFS and $1,596,000 was paid by the fund to CRMC through its administrative services agreement with the fund. Amounts paid to CRMC by the fund were then paid by CRMC to AFS and other third parties. |
| | |
| | Administrative services — The fund has an administrative services agreement with CRMC under which the fund compensates CRMC for providing administrative services to Class A, C, F, 529 and R shares. These services include, but are not limited to, coordinating, monitoring, assisting and overseeing third parties that provide services to fund shareholders. |
| | |
| Capital World Growth and Income Fund | 25 |
| | |
| | During the period December 1, 2011, through December 31, 2011, the agreement applied only to Class C, F, 529 and R shares. The agreement also required CRMC to arrange for the provision of transfer agent services for such share classes, which paid CRMC annual fees up to 0.15% (0.10% for Class R-5 and 0.05% for Class R-6) of their respective average daily net assets. During this period, up to 0.05% of these fees were used to compensate CRMC for performing administrative services; all other amounts paid under this agreement were used to compensate AFS and other third parties for transfer agent services. |
| | |
| | Effective January 1, 2012, the administrative services agreement with CRMC was modified to include Class A shares. Under the revised agreement, Class A shares pay an annual fee of 0.01% and Class C, F, 529 and R shares pay an annual fee of 0.05% of their respective average daily net assets to CRMC for administrative services. Fees for transfer agent services are no longer included as part of the administrative services fee paid by the fund to CRMC. |
| | |
| | For the year ended November 30, 2012, total fees paid to CRMC for performing administrative services were $14,729,000. |
| | |
| | 529 plan services — Each 529 share class is subject to service fees to compensate the Commonwealth of Virginia for the maintenance of the 529 college savings plan. The quarterly fee is based on a series of decreasing annual rates beginning with 0.10% on the first $30 billion of the net assets invested in Class 529 shares of the American Funds and decreasing to 0.06% on such assets between $120 billion and $150 billion. The fee for any given calendar quarter is accrued and calculated on the basis of the average net assets of Class 529 shares of the American Funds for the last month of the prior calendar quarter. The fee is included in other expenses on the accompanying financial statements. The Commonwealth of Virginia is not considered a related party. |
| | |
| | Class-specific expenses under the agreements described above for the year ended November 30, 2012, were as follows (dollars in thousands): |
| | | | | | | | | | | | | | | |
| | Share class | | Distribution
services | | Transfer agent
services | | Administrative
services | | 529 plan
services | |
| |
|
|
|
|
|
|
|
|
|
|
| | | | | | | | | | | |
| | Class A | | | $108,636 | | | $ 77,776 | | | $ 4,203 | | Not applicable | |
| | Class B | | | 16,082 | | | 2,783 | | Not applicable | | Not applicable | |
| | Class C | | | 44,872 | | | 7,579 | | | 2,122 | | Not applicable | |
| | Class F-1 | | | 8,324 | | | 3,577 | | | 1,628 | | Not applicable | |
| | Class F-2 | | Not applicable | | | 1,279 | | | 731 | | Not applicable | |
| | Class 529-A | | | 4,617 | | | 2,762 | | | 1,052 | | | $2,154 | |
| | Class 529-B | | | 1,228 | | | 180 | | | 60 | | | 123 | |
| | Class 529-C | | | 5,527 | | | 766 | | | 270 | | | 553 | |
| | Class 529-E | | | 469 | | | 78 | | | 46 | | | 93 | |
| | Class 529-F-1 | | | — | | | 91 | | | 35 | | | 71 | |
| | Class R-1 | | | 2,826 | | | 301 | | | 144 | | Not applicable | |
| | Class R-2 | | | 8,439 | | | 4,075 | | | 574 | | Not applicable | |
| | Class R-3 | | | 11,240 | | | 3,461 | | | 1,147 | | Not applicable | |
| | Class R-4 | | | 5,065 | | | 2,009 | | | 1,032 | | Not applicable | |
| | Class R-5 | | Not applicable | | | 651 | | | 661 | | Not applicable | |
| | Class R-6 | | Not applicable | | | 14 | | | 1,024 | | Not applicable | |
| | | | |
| | |
| | |
| | |
| |
| | Total class-specific expenses | | | $217,325 | | | $107,382 | | | $14,729 | | | $2,994 | |
| | | | |
| | |
| | |
| | |
| |
Directors’ deferred compensation — Directors who are unaffiliated with CRMC may elect to defer the cash payment of part or all of their compensation. These deferred amounts, which remain as liabilities of the fund, are treated as if invested in shares of the fund or other American Funds. These amounts represent general, unsecured liabilities of the fund and vary according to the total returns of the selected funds. Directors’ compensation of $585,000, shown on the accompanying financial statements, includes $471,000 in current fees (either paid in cash or deferred) and a net increase of $114,000 in the value of the deferred amounts.
Affiliated officers and directors — Officers and certain directors of the fund are or may be considered to be affiliated with CRMC, AFS and AFD. No affiliated officers or directors received any compensation directly from the fund.
| | |
| 26 | Capital World Growth and Income Fund |
8. Capital share transactions
Capital share transactions in the fund were as follows (dollars and shares in thousands):
| | | | | | | | | | | | | | | | | | | | | | | | | | |
| | | Sales* | | Reinvestments of
dividends | | Repurchases* | | Net (decrease) increase | |
| | |
| |
| |
| |
| |
| Share class | | Amount | | Shares | | Amount | | Shares | | Amount | | Shares | | Amount | | Shares | |
|
|
|
|
|
|
|
|
|
|
|
|
|
|
|
|
| |
| | | | | | | | | | | | | | | | | | | | | | | | | | |
| Year ended November 30, 2012 | | | | | | | | | | | | | | | | | | | |
| | | | | | | | | | | | | | | | | | | | | | | | | | |
| Class A | | $ | 2,626,636 | | | 76,391 | | $ | 1,262,109 | | | 37,759 | | $ | (8,702,758 | ) | | (253,570 | ) | $ | (4,814,013 | ) | | (139,420 | ) |
| Class B | | | 9,241 | | | 270 | | | 33,137 | | | 1,005 | | | (632,184 | ) | | (18,561 | ) | | (589,806 | ) | | (17,286 | ) |
| Class C | | | 229,803 | | | 6,736 | | | 90,255 | | | 2,747 | | | (1,171,467 | ) | | (34,497 | ) | | (851,409 | ) | | (25,014 | ) |
| Class F-1 | | | 966,663 | | | 28,595 | | | 93,738 | | | 2,809 | | | (1,581,212 | ) | | (46,262 | ) | | (520,811 | ) | | (14,858 | ) |
| Class F-2 | | | 727,890 | | | 20,760 | | | 38,704 | | | 1,157 | | | (495,180 | ) | | (14,407 | ) | | 271,414 | | | 7,510 | |
| Class 529-A | | | 256,259 | | | 7,491 | | | 59,473 | | | 1,783 | | | (303,115 | ) | | (8,839 | ) | | 12,617 | | | 435 | |
| Class 529-B | | | 2,045 | | | 59 | | | 2,433 | | | 74 | | | (38,180 | ) | | (1,123 | ) | | (33,702 | ) | | (990 | ) |
| Class 529-C | | | 74,097 | | | 2,174 | | | 11,055 | | | 335 | | | (97,169 | ) | | (2,855 | ) | | (12,017 | ) | | (346 | ) |
| Class 529-E | | | 12,233 | | | 358 | | | 2,362 | | | 71 | | | (16,051 | ) | | (471 | ) | | (1,456 | ) | | (42 | ) |
| Class 529-F-1 | | | 16,246 | | | 473 | | | 2,110 | | | 63 | | | (15,169 | ) | | (443 | ) | | 3,187 | | | 93 | |
| Class R-1 | | | 30,699 | | | 903 | | | 5,992 | | | 182 | | | (69,691 | ) | | (2,030 | ) | | (33,000 | ) | | (945 | ) |
| Class R-2 | | | 238,510 | | | 6,997 | | | 24,035 | | | 730 | | | (373,175 | ) | | (10,976 | ) | | (110,630 | ) | | (3,249 | ) |
| Class R-3 | | | 518,783 | | | 15,146 | | | 57,318 | | | 1,726 | | | (673,549 | ) | | (19,624 | ) | | (97,448 | ) | | (2,752 | ) |
| Class R-4 | | | 479,903 | | | 13,902 | | | 57,635 | | | 1,726 | | | (595,861 | ) | | (17,419 | ) | | (58,323 | ) | | (1,791 | ) |
| Class R-5 | | | 301,418 | | | 8,702 | | | 41,168 | | | 1,229 | | | (394,640 | ) | | (11,440 | ) | | (52,054 | ) | | (1,509 | ) |
| Class R-6 | | | 738,967 | | | 21,376 | | | 57,556 | | | 1,712 | | | (263,231 | ) | | (7,702 | ) | | 533,292 | | | 15,386 | |
| | |
|
| |
|
| |
|
| |
|
| |
|
| |
|
| |
|
| |
|
| |
| Total net increase (decrease) | | $ | 7,229,393 | | | 210,333 | | $ | 1,839,080 | | | 55,108 | | $ | (15,422,632 | ) | | (450,219 | ) | $ | (6,354,159 | ) | | (184,778 | ) |
| | |
|
| |
|
| |
|
| |
|
| |
|
| |
|
| |
|
| |
|
| |
| | | | | | | | | | | | | | | | | | | | | | | | | | |
| Year ended November 30, 2011 | | | | | | | | | | | | | | | | |
| | | | | | | | | | | | | | | | | | | | | | | | | | |
| Class A | | $ | 3,731,263 | | | 105,624 | | $ | 1,298,014 | | | 37,014 | | $ | (10,080,108 | ) | | (288,090 | ) | $ | (5,050,831 | ) | | (145,452 | ) |
| Class B | | | 27,094 | | | 768 | | | 39,855 | | | 1,137 | | | (650,444 | ) | | (18,736 | ) | | (583,495 | ) | | (16,831 | ) |
| Class C | | | 368,672 | | | 10,513 | | | 94,784 | | | 2,715 | | | (1,415,495 | ) | | (40,867 | ) | | (952,039 | ) | | (27,639 | ) |
| Class F-1 | | | 755,450 | | | 21,487 | | | 91,386 | | | 2,611 | | | (1,263,249 | ) | | (36,215 | ) | | (416,413 | ) | | (12,117 | ) |
| Class F-2 | | | 505,685 | | | 14,269 | | | 36,670 | | | 1,048 | | | (547,202 | ) | | (15,680 | ) | | (4,847 | ) | | (363 | ) |
| Class 529-A | | | 317,733 | | | 9,049 | | | 53,346 | | | 1,525 | | | (239,957 | ) | | (6,877 | ) | | 131,122 | | | 3,697 | |
| Class 529-B | | | 3,553 | | | 101 | | | 2,679 | | | 76 | | | (35,665 | ) | | (1,025 | ) | | (29,433 | ) | | (848 | ) |
| Class 529-C | | | 90,796 | | | 2,597 | | | 9,643 | | | 276 | | | (78,585 | ) | | (2,265 | ) | | 21,854 | | | 608 | |
| Class 529-E | | | 14,564 | | | 415 | | | 2,092 | | | 60 | | | (10,923 | ) | | (314 | ) | | 5,733 | | | 161 | |
| Class 529-F-1 | | | 18,633 | | | 532 | | | 1,770 | | | 51 | | | (10,449 | ) | | (297 | ) | | 9,954 | | | 286 | |
| Class R-1 | | | 60,237 | | | 1,727 | | | 5,191 | | | 148 | | | (47,902 | ) | | (1,375 | ) | | 17,526 | | | 500 | |
| Class R-2 | | | 292,234 | | | 8,381 | | | 22,951 | | | 658 | | | (414,012 | ) | | (11,861 | ) | | (98,827 | ) | | (2,822 | ) |
| Class R-3 | | | 575,962 | | | 16,411 | | | 53,757 | | | 1,539 | | | (702,642 | ) | | (20,122 | ) | | (72,923 | ) | | (2,172 | ) |
| Class R-4 | | | 545,123 | | | 15,505 | | | 54,784 | | | 1,566 | | | (617,735 | ) | | (17,634 | ) | | (17,828 | ) | | (563 | ) |
| Class R-5 | | | 334,435 | | | 9,533 | | | 40,062 | | | 1,144 | | | (427,170 | ) | | (12,193 | ) | | (52,673 | ) | | (1,516 | ) |
| Class R-6 | | | 714,337 | | | 20,910 | | | 39,935 | | | 1,144 | | | (114,152 | ) | | (3,252 | ) | | 640,120 | | | 18,802 | |
| | |
|
| |
|
| |
|
| |
|
| |
|
| |
|
| |
|
| |
|
| |
| Total net increase (decrease) | | $ | 8,355,771 | | | 237,822 | | $ | 1,846,919 | | | 52,712 | | $ | (16,655,690 | ) | | (476,803 | ) | $ | (6,453,000 | ) | | (186,269 | ) |
| | |
|
| |
|
| |
|
| |
|
| |
|
| |
|
| |
|
| |
|
| |
* Includes exchanges between share classes of the fund.
9. Investment transactions
The fund made purchases and sales of investment securities, excluding short-term securities and U.S. government obligations, if any, of $14,259,278,000 and $19,962,058,000, respectively, during the year ended November 30, 2012.
| | |
| Capital World Growth and Income Fund | 27 |
Financial highlights
| | | | | | | | | | | | | | | | | | | | | | | | | | | | | | | | | | | | | | | | | |
| | | | | Income (loss) from
investment operations1 | | Dividends and distributions | | | | | | | | | | | | | |
| | | | |
| |
| | | | | | | | | | | | | |
| | | | | | | | | | | | | | | | | | | | |
| | | Net asset
value,
beginning
of period | | Net
investment
income | | Net gains
(losses) on
securities
(both
realized and
unrealized) | | Total from
investment
operations | | Dividends
(from net
investment
income) | | Distributions
(from capital
gains) | | Total
dividends
and
distributions | | Net asset
value, end
of period | | Total
return2,3 | | Net assets,
end of period
(in millions) | | Ratio of
expenses to
average net
assets before
reimbursements/
waivers | | Ratio of
expenses to
average net
assets after
reimbursements/
waivers3 | | Ratio of
net income
to average
net assets3 | |
|
|
|
|
|
|
|
|
|
|
|
|
|
|
|
|
|
|
|
|
|
|
|
|
|
|
|
|
|
|
|
|
|
|
|
|
|
|
|
|
|
| | | | | | | | | | | | | | | | | | | | | | | | | | | | | | | | | | | | | | | | | |
| Class A: | | | | | | | | | | | | | | | | | | | | | | | | | | | | | | | | | | | | | | | | |
| Year ended 11/30/2012 | | $ | 32.57 | | $ | .87 | | $ | 4.28 | | $ | 5.15 | | $ | (.97 | ) | $ | — | | $ | (.97 | ) | $ | 36.75 | | | 16.14 | % | $ | 46,323 | | | .82 | % | | .82 | % | | 2.52 | % |
| Year ended 11/30/2011 | | | 33.75 | | | .94 | | | (1.22 | ) | | (.28 | ) | | (.90 | ) | | — | | | (.90 | ) | | 32.57 | | | (.99 | ) | | 45,595 | | | .79 | | | .79 | | | 2.67 | |
| Year ended 11/30/2010 | | | 33.80 | | | .86 | | | (.03 | ) | | .83 | | | (.88 | ) | | — | | | (.88 | ) | | 33.75 | | | 2.57 | | | 52,156 | | | .79 | | | .79 | | | 2.59 | |
| Year ended 11/30/2009 | | | 25.50 | | | .78 | | | 8.52 | | | 9.30 | | | (1.00 | ) | | — | | | (1.00 | ) | | 33.80 | | | 37.48 | | | 56,058 | | | .83 | | | .83 | | | 2.80 | |
| Year ended 11/30/2008 | | | 48.56 | | | 1.27 | | | (19.81 | ) | | (18.54 | ) | | (1.18 | ) | | (3.34 | ) | | (4.52 | ) | | 25.50 | | | (41.75 | ) | | 46,011 | | | .75 | | | .71 | | | 3.28 | |
|
|
|
|
|
|
|
|
|
|
|
|
|
|
|
|
|
|
|
|
|
|
|
|
|
|
|
|
|
|
|
|
|
|
|
|
|
|
|
|
|
| Class B: | | | | | | | | | | | | | | | | | | | | | | | | | | | | | | | | | | | | | | | | |
| Year ended 11/30/2012 | | | 32.37 | | | .60 | | | 4.26 | | | 4.86 | | | (.70 | ) | | — | | | (.70 | ) | | 36.53 | | | 15.27 | | | 1,433 | | | 1.57 | | | 1.57 | | | 1.76 | |
| Year ended 11/30/2011 | | | 33.53 | | | .67 | | | (1.21 | ) | | (.54 | ) | | (.62 | ) | | — | | | (.62 | ) | | 32.37 | | | (1.74 | ) | | 1,829 | | | 1.56 | | | 1.56 | | | 1.90 | |
| Year ended 11/30/2010 | | | 33.58 | | | .60 | | | (.03 | ) | | .57 | | | (.62 | ) | | — | | | (.62 | ) | | 33.53 | | | 1.80 | | | 2,459 | | | 1.56 | | | 1.56 | | | 1.82 | |
| Year ended 11/30/2009 | | | 25.34 | | | .57 | | | 8.46 | | | 9.03 | | | (.79 | ) | | — | | | (.79 | ) | | 33.58 | | | 36.43 | | | 2,999 | | | 1.61 | | | 1.61 | | | 2.04 | |
| Year ended 11/30/2008 | | | 48.27 | | | .96 | | | (19.69 | ) | | (18.73 | ) | | (.86 | ) | | (3.34 | ) | | (4.20 | ) | | 25.34 | | | (42.21 | ) | | 2,598 | | | 1.52 | | | 1.48 | | | 2.51 | |
|
|
|
|
|
|
|
|
|
|
|
|
|
|
|
|
|
|
|
|
|
|
|
|
|
|
|
|
|
|
|
|
|
|
|
|
|
|
|
|
|
| Class C: | | | | | | | | | | | | | | | | | | | | | | | | | | | | | | | | | | | | | | | | |
| Year ended 11/30/2012 | | | 32.23 | | | .59 | | | 4.24 | | | 4.83 | | | (.70 | ) | | — | | | (.70 | ) | | 36.36 | | | 15.19 | | | 4,373 | | | 1.61 | | | 1.61 | | | 1.73 | |
| Year ended 11/30/2011 | | | 33.40 | | | .65 | | | (1.21 | ) | | (.56 | ) | | (.61 | ) | | — | | | (.61 | ) | | 32.23 | | | (1.77 | ) | | 4,683 | | | 1.58 | | | 1.58 | | | 1.87 | |
| Year ended 11/30/2010 | | | 33.45 | | | .59 | | | (.02 | ) | | .57 | | | (.62 | ) | | — | | | (.62 | ) | | 33.40 | | | 1.78 | | | 5,775 | | | 1.59 | | | 1.59 | | | 1.80 | |
| Year ended 11/30/2009 | | | 25.25 | | | .56 | | | 8.43 | | | 8.99 | | | (.79 | ) | | — | | | (.79 | ) | | 33.45 | | | 36.42 | | | 6,428 | | | 1.61 | | | 1.61 | | | 2.01 | |
| Year ended 11/30/2008 | | | 48.11 | | | .95 | | | (19.63 | ) | | (18.68 | ) | | (.84 | ) | | (3.34 | ) | | (4.18 | ) | | 25.25 | | | (42.23 | ) | | 5,405 | | | 1.56 | | | 1.52 | | | 2.47 | |
|
|
|
|
|
|
|
|
|
|
|
|
|
|
|
|
|
|
|
|
|
|
|
|
|
|
|
|
|
|
|
|
|
|
|
|
|
|
|
|
|
| Class F-1: | | | | | | | | | | | | | | | | | | | | | | | | | | | | | | | | | | | | | | | | |
| Year ended 11/30/2012 | | | 32.51 | | | .87 | | | 4.28 | | | 5.15 | | | (.98 | ) | | — | | | (.98 | ) | | 36.68 | | | 16.16 | | | 3,177 | | | .80 | | | .80 | | | 2.52 | |
| Year ended 11/30/2011 | | | 33.69 | | | .93 | | | (1.22 | ) | | (.29 | ) | | (.89 | ) | | — | | | (.89 | ) | | 32.51 | | | (1.02 | ) | | 3,299 | | | .80 | | | .80 | | | 2.66 | |
| Year ended 11/30/2010 | | | 33.74 | | | .86 | | | (.03 | ) | | .83 | | | (.88 | ) | | — | | | (.88 | ) | | 33.69 | | | 2.58 | | | 3,827 | | | .80 | | | .80 | | | 2.60 | |
| Year ended 11/30/2009 | | | 25.46 | | | .79 | | | 8.50 | | | 9.29 | | | (1.01 | ) | | — | | | (1.01 | ) | | 33.74 | | | 37.49 | | | 4,152 | | | .82 | | | .81 | | | 2.83 | |
| Year ended 11/30/2008 | | | 48.48 | | | 1.27 | | | (19.78 | ) | | (18.51 | ) | | (1.17 | ) | | (3.34 | ) | | (4.51 | ) | | 25.46 | | | (41.76 | ) | | 3,677 | | | .76 | | | .72 | | | 3.30 | |
|
|
|
|
|
|
|
|
|
|
|
|
|
|
|
|
|
|
|
|
|
|
|
|
|
|
|
|
|
|
|
|
|
|
|
|
|
|
|
|
|
| Class F-2: | | | | | | | | | | | | | | | | | | | | | | | | | | | | | | | | | | | | | | | | |
| Year ended 11/30/2012 | | | 32.56 | | | .97 | | | 4.28 | | | 5.25 | | | (1.07 | ) | | — | | | (1.07 | ) | | 36.74 | | | 16.43 | | | 1,857 | | | .54 | | | .54 | | | 2.80 | |
| Year ended 11/30/2011 | | | 33.75 | | | 1.02 | | | (1.22 | ) | | (.20 | ) | | (.99 | ) | | — | | | (.99 | ) | | 32.56 | | | (.75 | ) | | 1,401 | | | .54 | | | .54 | | | 2.91 | |
| Year ended 11/30/2010 | | | 33.79 | | | .94 | | | (.02 | ) | | .92 | | | (.96 | ) | | — | | | (.96 | ) | | 33.75 | | | 2.86 | | | 1,464 | | | .54 | | | .54 | | | 2.84 | |
| Year ended 11/30/2009 | | | 25.51 | | | .72 | | | 8.64 | | | 9.36 | | | (1.08 | ) | | — | | | (1.08 | ) | | 33.79 | | | 37.80 | | | 1,165 | | | .58 | | | .58 | | | 2.42 | |
| Period from 8/1/2008 to 11/30/20084 | | | 38.34 | | | .23 | | | (12.79 | ) | | (12.56 | ) | | (.27 | ) | | — | | | (.27 | ) | | 25.51 | | | (32.95 | ) | | 127 | | | .18 | | | .17 | | | .83 | |
|
|
|
|
|
|
|
|
|
|
|
�� |
|
|
|
|
|
|
|
|
|
|
|
|
|
|
|
|
|
|
|
|
|
|
|
|
|
|
|
|
|
| Class 529-A: | | | | | | | | | | | | | | | | | | | | | | | | | | | | | | | | | | | | | | | | |
| Year ended 11/30/2012 | | | 32.49 | | | .84 | | | 4.27 | | | 5.11 | | | (.95 | ) | | — | | | (.95 | ) | | 36.65 | | | 16.04 | | | 2,299 | | | .89 | | | .89 | | | 2.45 | |
| Year ended 11/30/2011 | | | 33.67 | | | .91 | | | (1.21 | ) | | (.30 | ) | | (.88 | ) | | — | | | (.88 | ) | | 32.49 | | | (1.06 | ) | | 2,023 | | | .85 | | | .85 | | | 2.61 | |
| Year ended 11/30/2010 | | | 33.72 | | | .84 | | | (.02 | ) | | .82 | | | (.87 | ) | | — | | | (.87 | ) | | 33.67 | | | 2.54 | | | 1,972 | | | .84 | | | .84 | | | 2.54 | |
| Year ended 11/30/2009 | | | 25.45 | | | .77 | | | 8.49 | | | 9.26 | | | (.99 | ) | | — | | | (.99 | ) | | 33.72 | | | 37.41 | | | 1,796 | | | .87 | | | .86 | | | 2.75 | |
| Year ended 11/30/2008 | | | 48.46 | | | 1.24 | | | (19.76 | ) | | (18.52 | ) | | (1.15 | ) | | (3.34 | ) | | (4.49 | ) | | 25.45 | | | (41.77 | ) | | 1,235 | | | .80 | | | .77 | | | 3.23 | |
|
|
|
|
|
|
|
|
|
|
|
|
|
|
|
|
|
|
|
|
|
|
|
|
|
|
|
|
|
|
|
|
|
|
|
|
|
|
|
|
|
| Class 529-B: | | | | | | | | | | | | | | | | | | | | | | | | | | | | | | | | | | | | | | | | |
| Year ended 11/30/2012 | | | 32.36 | | | .57 | | | 4.26 | | | 4.83 | | | (.67 | ) | | — | | | (.67 | ) | | 36.52 | | | 15.11 | | | 115 | | | 1.69 | | | 1.69 | | | 1.65 | |
| Year ended 11/30/2011 | | | 33.53 | | | .63 | | | (1.21 | ) | | (.58 | ) | | (.59 | ) | | — | | | (.59 | ) | | 32.36 | | | (1.84 | ) | | 134 | | | 1.65 | | | 1.65 | | | 1.80 | |
| Year ended 11/30/2010 | | | 33.58 | | | .57 | | | (.02 | ) | | .55 | | | (.60 | ) | | — | | | (.60 | ) | | 33.53 | | | 1.72 | | | 167 | | | 1.65 | | | 1.65 | | | 1.74 | |
| Year ended 11/30/2009 | | | 25.35 | | | .54 | | | 8.46 | | | 9.00 | | | (.77 | ) | | — | | | (.77 | ) | | 33.58 | | | 36.29 | | | 188 | | | 1.70 | | | 1.69 | | | 1.95 | |
| Year ended 11/30/2008 | | | 48.28 | | | .92 | | | (19.70 | ) | | (18.78 | ) | | (.81 | ) | | (3.34 | ) | | (4.15 | ) | | 25.35 | | | (42.26 | ) | | 140 | | | 1.62 | | | 1.58 | | | 2.41 | |
|
|
|
|
|
|
|
|
|
|
|
|
|
|
|
|
|
|
|
|
|
|
|
|
|
|
|
|
|
|
|
|
|
|
|
|
|
|
|
|
|
| Class 529-C: | | | | | | | | | | | | | | | | | | | | | | | | | | | | | | | | | | | | | | | | |
| Year ended 11/30/2012 | | | 32.34 | | | .57 | | | 4.25 | | | 4.82 | | | (.68 | ) | | — | | | (.68 | ) | | 36.48 | | | 15.14 | | | 582 | | | 1.68 | | | 1.68 | | | 1.66 | |
| Year ended 11/30/2011 | | | 33.51 | | | .63 | | | (1.20 | ) | | (.57 | ) | | (.60 | ) | | — | | | (.60 | ) | | 32.34 | | | (1.84 | ) | | 527 | | | 1.65 | | | 1.65 | | | 1.81 | |
| Year ended 11/30/2010 | | | 33.57 | | | .58 | | | (.03 | ) | | .55 | | | (.61 | ) | | — | | | (.61 | ) | | 33.51 | | | 1.71 | | | 526 | | | 1.64 | | | 1.64 | | | 1.75 | |
| Year ended 11/30/2009 | | | 25.34 | | | .54 | | | 8.47 | | | 9.01 | | | (.78 | ) | | — | | | (.78 | ) | | 33.57 | | | 36.32 | | | 491 | | | 1.69 | | | 1.68 | | | 1.93 | |
| Year ended 11/30/2008 | | | 48.27 | | | .92 | | | (19.69 | ) | | (18.77 | ) | | (.82 | ) | | (3.34 | ) | | (4.16 | ) | | 25.34 | | | (42.27 | ) | | 342 | | | 1.61 | | | 1.58 | | | 2.42 | |
|
|
|
|
|
|
|
|
|
|
|
|
|
|
|
|
|
|
|
|
|
|
|
|
|
|
|
|
|
|
|
|
|
|
|
|
|
|
|
|
|
| Class 529-E: | | | | | | | | | | | | | | | | | | | | | | | | | | | | | | | | | | | | | | | | |
| Year ended 11/30/2012 | | | 32.44 | | | .76 | | | 4.26 | | | 5.02 | | | (.87 | ) | | — | | | (.87 | ) | | 36.59 | | | 15.78 | | | 99 | | | 1.13 | | | 1.13 | | | 2.20 | |
| Year ended 11/30/2011 | | | 33.61 | | | .82 | | | (1.21 | ) | | (.39 | ) | | (.78 | ) | | — | | | (.78 | ) | | 32.44 | | | (1.31 | ) | | 89 | | | 1.12 | | | 1.12 | | | 2.33 | |
| Year ended 11/30/2010 | | | 33.67 | | | .74 | | | (.03 | ) | | .71 | | | (.77 | ) | | — | | | (.77 | ) | | 33.61 | | | 2.21 | | | 87 | | | 1.13 | | | 1.13 | | | 2.25 | |
| Year ended 11/30/2009 | | | 25.41 | | | .68 | | | 8.49 | | | 9.17 | | | (.91 | ) | | — | | | (.91 | ) | | 33.67 | | | 37.03 | | | 80 | | | 1.18 | | | 1.17 | | | 2.43 | |
| Year ended 11/30/2008 | | | 48.40 | | | 1.12 | | | (19.74 | ) | | (18.62 | ) | | (1.03 | ) | | (3.34 | ) | | (4.37 | ) | | 25.41 | | | (41.97 | ) | | 55 | | | 1.11 | | | 1.07 | | | 2.92 | |
| | |
| 28 | Capital World Growth and Income Fund |
| | | | | | | | | | | | | | | | | | | | | | | | | | | | | | | | | | | | | | | | | |
| | | | | Income (loss) from
investment operations1 | | Dividends and distributions | | | | | | | | | | | | | |
| | | | |
| |
| | | | | | | | | | | | | |
| | | | | | | | | | | | | | | | | | | | |
| | | Net asset
value,
beginning
of period | | Net
investment
income | | Net gains
(losses) on
securities
(both
realized and
unrealized) | | Total from
investment
operations | | Dividends
(from net
investment
income) | | Distributions
(from capital
gains) | | Total
dividends
and
distributions | | Net asset
value, end
of period | | Total
return3 | | Net assets,
end of period
(in millions) | | Ratio of
expenses to
average net
assets before
reimbursements/
waivers | | Ratio of
expenses to
average net
assets after
reimbursements/
waivers3 | | Ratio of
net income
to average
net assets3 | |
|
|
|
|
|
|
|
|
|
|
|
|
|
|
|
|
|
|
|
|
|
|
|
|
|
|
|
|
| | | | | | | | | | | | | | | | | | | | | | | | | | | | |
| Class 529-F-1: | | | | | | | | | | | | | | | | | | | | | | | | | | | | | | | | | | | | | | | | |
| Year ended 11/30/2012 | | $ | 32.51 | | $ | .91 | | $ | 4.28 | | $ | 5.19 | | $ | (1.02 | ) | $ | — | | $ | (1.02 | ) | $ | 36.68 | | | 16.27 | % | $ | 78 | | | .67 | % | | .67 | % | | 2.65 | % |
| Year ended 11/30/2011 | | | 33.70 | | | .98 | | | (1.21 | ) | | (.23 | ) | | (.96 | ) | | — | | | (.96 | ) | | 32.51 | | | (.84 | ) | | 66 | | | .64 | | | .64 | | | 2.81 | |
| Year ended 11/30/2010 | | | 33.75 | | | .91 | | | (.02 | ) | | .89 | | | (.94 | ) | | — | | | (.94 | ) | | 33.70 | | | 2.74 | | | 59 | | | .63 | | | .63 | | | 2.75 | |
| Year ended 11/30/2009 | | | 25.47 | | | .82 | | | 8.50 | | | 9.32 | | | (1.04 | ) | | — | | | (1.04 | ) | | 33.75 | | | 37.68 | | | 49 | | | .68 | | | .67 | | | 2.93 | |
| Year ended 11/30/2008 | | | 48.50 | | | 1.31 | | | (19.76 | ) | | (18.45 | ) | | (1.24 | ) | | (3.34 | ) | | (4.58 | ) | | 25.47 | | | (41.66 | ) | | 31 | | | .61 | | | .57 | | | 3.44 | |
|
|
|
|
|
|
|
|
|
|
|
|
|
|
|
|
|
|
|
|
|
|
|
|
|
|
|
|
|
|
|
|
|
|
|
|
|
|
|
|
|
| Class R-1: | | | | | | | | | | | | | | | | | | | | | | | | | | | | | | | | | | | | | | | | |
| Year ended 11/30/2012 | | | 32.29 | | | .61 | | | 4.24 | | | 4.85 | | | (.72 | ) | | — | | | (.72 | ) | | 36.42 | | | 15.27 | | | 276 | | | 1.56 | | | 1.56 | | | 1.79 | |
| Year ended 11/30/2011 | | | 33.46 | | | .66 | | | (1.20 | ) | | (.54 | ) | | (.63 | ) | | — | | | (.63 | ) | | 32.29 | | | (1.75 | ) | | 275 | | | 1.56 | | | 1.56 | | | 1.90 | |
| Year ended 11/30/2010 | | | 33.52 | | | .60 | | | (.02 | ) | | .58 | | | (.64 | ) | | — | | | (.64 | ) | | 33.46 | | | 1.80 | | | 269 | | | 1.56 | | | 1.56 | | | 1.84 | |
| Year ended 11/30/2009 | | | 25.31 | | | .57 | | | 8.45 | | | 9.02 | | | (.81 | ) | | — | | | (.81 | ) | | 33.52 | | | 36.45 | | | 217 | | | 1.58 | | | 1.58 | | | 2.02 | |
| Year ended 11/30/2008 | | | 48.22 | | | .96 | | | (19.67 | ) | | (18.71 | ) | | (.86 | ) | | (3.34 | ) | | (4.20 | ) | | 25.31 | | | (42.21 | ) | | 124 | | | 1.52 | | | 1.48 | | | 2.54 | |
|
|
|
|
|
|
|
|
|
|
|
|
|
|
|
|
|
|
|
|
|
|
|
|
|
|
|
|
|
|
|
|
|
|
|
|
|
|
|
|
|
| Class R-2: | | | | | | | | | | | | | | | | | | | | | | | | | | | | | | | | | | | | | | | | |
| Year ended 11/30/2012 | | | 32.22 | | | .61 | | | 4.24 | | | 4.85 | | | (.72 | ) | | — | | | (.72 | ) | | 36.35 | | | 15.30 | | | 1,150 | | | 1.55 | | | 1.55 | | | 1.78 | |
| Year ended 11/30/2011 | | | 33.39 | | | .66 | | | (1.20 | ) | | (.54 | ) | | (.63 | ) | | — | | | (.63 | ) | | 32.22 | | | (1.75 | ) | | 1,124 | | | 1.56 | | | 1.56 | | | 1.90 | |
| Year ended 11/30/2010 | | | 33.45 | | | .59 | | | (.03 | ) | | .56 | | | (.62 | ) | | — | | | (.62 | ) | | 33.39 | | | 1.77 | | | 1,259 | | | 1.57 | | | 1.57 | | | 1.81 | |
| Year ended 11/30/2009 | | | 25.25 | | | .55 | | | 8.43 | | | 8.98 | | | (.78 | ) | | — | | | (.78 | ) | | 33.45 | | | 36.34 | | | 1,270 | | | 1.66 | | | 1.66 | | | 1.95 | |
| Year ended 11/30/2008 | | | 48.11 | | | .93 | | | (19.62 | ) | | (18.69 | ) | | (.83 | ) | | (3.34 | ) | | (4.17 | ) | | 25.25 | | | (42.24 | ) | | 836 | | | 1.59 | | | 1.55 | | | 2.45 | |
|
|
|
|
|
|
|
|
|
|
|
|
|
|
|
|
|
|
|
|
|
|
|
|
|
|
|
|
|
|
|
|
|
|
|
|
|
|
|
|
|
| Class R-3: | | | | | | | | | | | | | | | | | | | | | | | | | | | | | | | | | | | | | | | | |
| Year ended 11/30/2012 | | | 32.38 | | | .77 | | | 4.25 | | | 5.02 | | | (.87 | ) | | — | | | (.87 | ) | | 36.53 | | | 15.81 | | | 2,335 | | | 1.10 | | | 1.10 | | | 2.23 | |
| Year ended 11/30/2011 | | | 33.56 | | | .82 | | | (1.21 | ) | | (.39 | ) | | (.79 | ) | | — | | | (.79 | ) | | 32.38 | | | (1.32 | ) | | 2,159 | | | 1.10 | | | 1.10 | | | 2.36 | |
| Year ended 11/30/2010 | | | 33.61 | | | .75 | | | (.02 | ) | | .73 | | | (.78 | ) | | — | | | (.78 | ) | | 33.56 | | | 2.27 | | | 2,311 | | | 1.10 | | | 1.10 | | | 2.29 | |
| Year ended 11/30/2009 | | | 25.37 | | | .69 | | | 8.48 | | | 9.17 | | | (.93 | ) | | — | | | (.93 | ) | | 33.61 | | | 37.07 | | | 2,208 | | | 1.13 | | | 1.13 | | | 2.47 | |
| Year ended 11/30/2008 | | | 48.32 | | | 1.12 | | | (19.70 | ) | | (18.58 | ) | | (1.03 | ) | | (3.34 | ) | | (4.37 | ) | | 25.37 | | | (41.95 | ) | | 1,397 | | | 1.09 | | | 1.05 | | | 2.95 | |
|
|
|
|
|
|
|
|
|
|
|
|
|
|
|
|
|
|
|
|
|
|
|
|
|
|
|
|
|
|
|
|
|
|
|
|
|
|
|
|
|
| Class R-4: | | | | | | | | | | | | | | | | | | | | | | | | | | | | | | | | | | | | | | | | |
| Year ended 11/30/2012 | | | 32.50 | | | .87 | | | 4.28 | | | 5.15 | | | (.98 | ) | | — | | | (.98 | ) | | 36.67 | | | 16.13 | | | 2,159 | | | .80 | | | .80 | | | 2.53 | |
| Year ended 11/30/2011 | | | 33.68 | | | .93 | | | (1.22 | ) | | (.29 | ) | | (.89 | ) | | — | | | (.89 | ) | | 32.50 | | | (.98 | ) | | 1,972 | | | .80 | | | .80 | | | 2.66 | |
| Year ended 11/30/2010 | | | 33.73 | | | .85 | | | (.02 | ) | | .83 | | | (.88 | ) | | — | | | (.88 | ) | | 33.68 | | | 2.56 | | | 2,062 | | | .81 | | | .81 | | | 2.58 | |
| Year ended 11/30/2009 | | | 25.46 | | | .78 | | | 8.50 | | | 9.28 | | | (1.01 | ) | | — | | | (1.01 | ) | | 33.73 | | | 37.46 | | | 1,840 | | | .83 | | | .83 | | | 2.76 | |
| Year ended 11/30/2008 | | | 48.48 | | | 1.23 | | | (19.75 | ) | | (18.52 | ) | | (1.16 | ) | | (3.34 | ) | | (4.50 | ) | | 25.46 | | | (41.77 | ) | | 1,159 | | | .79 | | | .76 | | | 3.25 | |
|
|
|
|
|
|
|
|
|
|
|
|
|
|
|
|
|
|
|
|
|
|
|
|
|
|
|
|
|
|
|
|
|
|
|
|
|
|
|
|
|
| Class R-5: | | | | | | | | | | | | | | | | | | | | | | | | | | | | | | | | | | | | | | | | |
| Year ended 11/30/2012 | | | 32.59 | | | .98 | | | 4.28 | | | 5.26 | | | (1.08 | ) | | — | | | (1.08 | ) | | 36.77 | | | 16.49 | | | 1,381 | | | .50 | | | .50 | | | 2.84 | |
| Year ended 11/30/2011 | | | 33.77 | | | 1.04 | | | (1.22 | ) | | (.18 | ) | | (1.00 | ) | | — | | | (1.00 | ) | | 32.59 | | | (.71 | ) | | 1,273 | | | .50 | | | .50 | | | 2.95 | |
| Year ended 11/30/2010 | | | 33.81 | | | .95 | | | (.02 | ) | | .93 | | | (.97 | ) | | — | | | (.97 | ) | | 33.77 | | | 2.89 | | | 1,371 | | | .50 | | | .50 | | | 2.85 | |
| Year ended 11/30/2009 | | | 25.51 | | | .88 | | | 8.51 | | | 9.39 | | | (1.09 | ) | | — | | | (1.09 | ) | | 33.81 | | | 37.89 | | | 1,598 | | | .53 | | | .53 | | | 3.18 | |
| Year ended 11/30/2008 | | | 48.58 | | | 1.35 | | | (19.80 | ) | | (18.45 | ) | | (1.28 | ) | | (3.34 | ) | | (4.62 | ) | | 25.51 | | | (41.61 | ) | | 1,399 | | | .50 | | | .46 | | | 3.54 | |
|
|
|
|
|
|
|
|
|
|
|
|
|
|
|
|
|
|
|
|
|
|
|
|
|
|
|
|
|
|
|
|
|
|
|
|
|
|
|
|
|
| Class R-6: | | | | | | | | | | | | | | | | | | | | | | | | | | | | | | | | | | | | | | | | |
| Year ended 11/30/2012 | | | 32.59 | | | .99 | | | 4.29 | | | 5.28 | | | (1.10 | ) | | — | | | (1.10 | ) | | 36.77 | | | 16.55 | | | 2,518 | | | .45 | | | .45 | | | 2.86 | |
| Year ended 11/30/2011 | | | 33.77 | | | 1.03 | | | (1.19 | ) | | (.16 | ) | | (1.02 | ) | | — | | | (1.02 | ) | | 32.59 | | | (.65 | ) | | 1,731 | | | .45 | | | .45 | | | 2.97 | |
| Year ended 11/30/2010 | | | 33.82 | | | .98 | | | (.04 | ) | | .94 | | | (.99 | ) | | — | | | (.99 | ) | | 33.77 | | | 2.92 | | | 1,158 | | | .46 | | | .46 | | | 2.97 | |
| Period from 5/1/2009 to 11/30/20094 | | | 26.05 | | | .51 | | | 7.85 | | | 8.36 | | | (.59 | ) | | — | | | (.59 | ) | | 33.82 | | | 32.50 | | | 517 | | | .49 | 5 | | .49 | 5 | | 2.84 | 5 |
| | | | | | | | | | | | | | | | | |
| | | Year ended November 30 | |
| | �� |
| |
| | | | 2012 | | | 2011 | | | 2010 | | | 2009 | | | 2008 | |
|
|
|
|
|
|
|
|
|
|
|
|
|
|
|
|
|
| Portfolio turnover rate for all share classes | | | 23 | % | | 27 | % | | 25 | % | | 44 | % | | 37 | % |
| | |
| 1 | Based on average shares outstanding. |
| 2 | Total returns exclude any applicable sales charges, including contingent deferred sales charges. |
| 3 | This column reflects the impact, if any, of certain reimbursements/waivers from CRMC. During some of the periods shown, CRMC reduced fees for investment advisory services. In addition, during some of the periods shown, CRMC paid a portion of the fund’s transfer agent fees for certain retirement plan share classes. |
| 4 | Based on operations for the period shown and, accordingly, is not representative of a full year. |
| 5 | Annualized. |
See Notes to Financial Statements
| | |
| Capital World Growth and Income Fund | 29 |
Report of Independent Registered Public Accounting Firm
To the Board of Directors and Shareholders of Capital World Growth and Income Fund, Inc.
In our opinion, the accompanying statement of assets and liabilities, including the summary investment portfolio, and the related statements of operations and of changes in net assets and the financial highlights present fairly, in all material respects, the financial position of Capital World Growth and Income Fund, Inc. (the “Fund”) at November 30, 2012, the results of its operations for the year then ended, the changes in its net assets for each of the two years in the period then ended and the financial highlights for each of the periods presented, in conformity with accounting principles generally accepted in the United States of America. These financial statements and financial highlights (hereafter referred to as “financial statements”) are the responsibility of the Fund’s management. Our responsibility is to express an opinion on these financial statements based on our audits. We conducted our audits of these financial statements in accordance with the standards of the Public Company Accounting Oversight Board (United States). Those standards require that we plan and perform the audit to obtain reasonable assurance about whether the financial statements are free of material misstatement. An audit includes examining, on a test basis, evidence supporting the amounts and disclosures in the financial statements, assessing the accounting principles used and significant estimates made by management, and evaluating the overall financial statement presentation. We believe that our audits, which included confirmation of securities at November 30, 2012 by correspondence with the custodian and brokers, provide a reasonable basis for our opinion.
PricewaterhouseCoopers LLP
Los Angeles, California
January 9, 2013
| | |
| 30 | Capital World Growth and Income Fund |
| | |
| Other share class results | unaudited |
Classes B, C, F and 529
Fund results shown are for past periods and are not predictive of results for future periods. Current and future results may be lower or higher than those shown. Share prices and returns will vary, so investors may lose money. For current information and month-end results, visit americanfunds.com.
Average annual total returns for periods ended December 31, 2012 (the most recent calendar quarter-end):
| | | | | | | | | | | |
| | | 1 year | | 5 years | | 10 years/
Life of class1 | |
| | |
|
|
|
|
|
|
| Class B shares2 | | | | | | | | | | |
| Reflecting applicable contingent deferred sales charge (CDSC), maximum of 5%, payable only if shares are sold within six years of purchase | | | 13.19 | % | | –1.79 | % | | 9.55 | % |
| Not reflecting CDSC | | | 18.19 | | | –1.43 | | | 9.55 | |
| | | | | | | | | | | |
| Class C shares | | | | | | | | | | |
Reflecting CDSC, maximum of 1%, payable only if shares are sold within
one year of purchase | | | 17.17 | | | –1.46 | | | 9.34 | |
| Not reflecting CDSC | | | 18.17 | | | –1.46 | | | 9.34 | |
| | | | | | | | | | | |
| Class F-1 shares3 | | | | | | | | | | |
| Not reflecting annual asset-based fee charged by sponsoring firm | | | 19.14 | | | –0.67 | | | 10.21 | |
| | | | | | | | | | | |
| Class F-2 shares3 — first sold 8/1/08 | | | | | | | | | | |
| Not reflecting annual asset-based fee charged by sponsoring firm | | | 19.44 | | | — | | | 2.60 | |
| | | | | | | | | | | |
| Class 529-A shares4 | | | | | | | | | | |
| Reflecting 5.75% maximum sales charge | | | 12.20 | | | –1.89 | | | 9.51 | |
| Not reflecting maximum sales charge | | | 19.03 | | | –0.73 | | | 10.16 | |
| | | | | | | | | | | |
| Class 529-B shares2,4 | | | | | | | | | | |
Reflecting applicable CDSC, maximum of 5%, payable only if shares
are sold within six years of purchase | | | 13.06 | | | –1.88 | | | 9.42 | |
| Not reflecting CDSC | | | 18.06 | | | –1.53 | | | 9.42 | |
| | | | | | | | | | | |
| Class 529-C shares4 | | | | | | | | | | |
Reflecting CDSC, maximum of 1%, payable only if shares are sold within
one year of purchase | | | 17.07 | | | –1.52 | | | 9.26 | |
| Not reflecting CDSC | | | 18.07 | | | –1.52 | | | 9.26 | |
| | | | | | | | | | | |
| Class 529-E shares3,4 | | | 18.73 | | | –1.01 | | | 9.83 | |
| | | | | | | | | | | |
| Class 529-F-1 shares3,4 | | | | | | | | | | |
| Not reflecting annual asset-based fee charged by sponsoring firm | | | 19.27 | | | –0.52 | | | 10.31 | |
| | |
| 1 | Applicable to Class F-2 shares only. All other share classes reflect 10-year results. |
| 2 | These shares are not available for purchase. |
| 3 | These shares are sold without any initial or contingent deferred sales charge. |
| 4 | Results shown do not reflect the $10 account setup fee and an annual $10 account maintenance fee. |
Investment results assume all distributions are reinvested and reflect applicable fees and expenses. When applicable, investment results reflect fee waivers, without which results would have been lower. Visit americanfunds.com for more information.
For information regarding the differences among the various share classes, refer to the fund prospectus.
| | |
| Capital World Growth and Income Fund | 31 |
| |
| As a shareholder of the fund, you incur two types of costs: (1) transaction costs, such as initial sales charges on purchase payments and contingent deferred sales charges on redemptions (loads), and (2) ongoing costs, including management fees, distribution and service (12b-1) fees, and other expenses. This example is intended to help you understand your ongoing costs (in dollars) of investing in the fund so you can compare these costs with the ongoing costs of investing in other mutual funds. The example is based on an investment of $1,000 invested at the beginning of the period and held for the entire six-month period (June 1, 2012, through November 30, 2012). |
| |
| Actual expenses: |
| The first line of each share class in the table on the next page provides information about actual account values and actual expenses. You may use the information in this line, together with the amount you invested, to estimate the expenses that you paid over the period. Simply divide your account value by $1,000 (for example, an $8,600 account value divided by $1,000 = 8.6), then multiply the result by the number in the first line under the heading entitled “Expenses paid during period” to estimate the expenses you paid on your account during this period. |
| |
| Hypothetical example for comparison purposes: |
| The second line of each share class in the table on the next page provides information about hypothetical account values and hypothetical expenses based on the actual expense ratio for the share class and an assumed rate of return of 5.00% per year before expenses, which is not the actual return of the share class. The hypothetical account values and expenses may not be used to estimate the actual ending account balance or expenses you paid for the period. You may use this information to compare the ongoing costs of investing in the fund and other funds. To do so, compare this 5.00% hypothetical example with the 5.00% hypothetical examples that appear in the shareholder reports of the other funds. |
| |
| Notes: |
| There are some account fees that are charged to certain types of accounts, such as individual retirement accounts and 529 college savings plan accounts (generally, a $10 fee is charged to set up the account and an additional $10 fee is charged to the account annually), that would increase the amount of expenses paid on your account. In addition, retirement plan participants may be subject to certain fees charged by the plan sponsor, and Class F-1, F-2 and 529-F-1 shareholders may be subject to fees charged by financial intermediaries, typically ranging from 0.75% to 1.50% of assets annually depending on services offered. You can estimate the impact of these fees by adding the amount of the fees to the total estimated expenses you paid on your account during the period as calculated above. In addition, your ending account value would be lower by the amount of these fees. |
| |
| Note that the expenses shown in the table are meant to highlight your ongoing costs only and do not reflect any transactional costs, such as sales charges (loads). Therefore, the second line of each share class in the table is useful in comparing ongoing costs only and will not help you determine the relative total costs of owning different funds. In addition, if these transactional costs were included, your costs would have been higher. |
| | |
| 32 | Capital World Growth and Income Fund |
| | | | | | | | | | | | | | |
| | | Beginning
account value
6/1/2012 | | Ending
account value
11/30/2012 | | Expenses paid
during period* | | Annualized
expense ratio | |
|
|
|
|
|
|
|
|
|
|
| |
| Class A — actual return | | $ | 1,000.00 | | $ | 1,148.36 | | $ | 4.35 | | | .81 | % |
| Class A — assumed 5% return | | | 1,000.00 | | | 1,020.95 | | | 4.09 | | | .81 | |
|
|
|
|
|
|
|
|
|
|
|
|
|
|
| Class B — actual return | | | 1,000.00 | | | 1,144.23 | | | 8.36 | | | 1.56 | |
| Class B — assumed 5% return | | | 1,000.00 | | | 1,017.20 | | | 7.87 | | | 1.56 | |
|
|
|
|
|
|
|
|
|
|
|
|
|
|
| Class C — actual return | | | 1,000.00 | | | 1,143.81 | | | 8.63 | | | 1.61 | |
| Class C — assumed 5% return | | | 1,000.00 | | | 1,016.95 | | | 8.12 | | | 1.61 | |
|
|
|
|
|
|
|
|
|
|
|
|
|
|
| Class F-1 — actual return | | | 1,000.00 | | | 1,148.12 | | | 4.35 | | | .81 | |
| Class F-1 — assumed 5% return | | | 1,000.00 | | | 1,020.95 | | | 4.09 | | | .81 | |
|
|
|
|
|
|
|
|
|
|
|
|
|
|
| Class F-2 — actual return | | | 1,000.00 | | | 1,149.74 | | | 2.90 | | | .54 | |
| Class F-2 — assumed 5% return | | | 1,000.00 | | | 1,022.30 | | | 2.73 | | | .54 | |
|
|
|
|
|
|
|
|
|
|
|
|
|
|
| Class 529-A — actual return | | | 1,000.00 | | | 1,147.69 | | | 4.78 | | | .89 | |
| Class 529-A — assumed 5% return | | | 1,000.00 | | | 1,020.55 | | | 4.50 | | | .89 | |
|
|
|
|
|
|
|
|
|
|
|
|
|
|
| Class 529-B — actual return | | | 1,000.00 | | | 1,143.22 | | | 9.06 | | | 1.69 | |
| Class 529-B — assumed 5% return | | | 1,000.00 | | | 1,016.55 | | | 8.52 | | | 1.69 | |
|
|
|
|
|
|
|
|
|
|
|
|
|
|
| Class 529-C — actual return | | | 1,000.00 | | | 1,143.28 | | | 9.00 | | | 1.68 | |
| Class 529-C — assumed 5% return | | | 1,000.00 | | | 1,016.60 | | | 8.47 | | | 1.68 | |
|
|
|
|
|
|
|
|
|
|
|
|
|
|
| Class 529-E — actual return | | | 1,000.00 | | | 1,146.60 | | | 6.06 | | | 1.13 | |
| Class 529-E — assumed 5% return | | | 1,000.00 | | | 1,019.35 | | | 5.70 | | | 1.13 | |
|
|
|
|
|
|
|
|
|
|
|
|
|
|
| Class 529-F-1 — actual return | | | 1,000.00 | | | 1,149.15 | | | 3.60 | | | .67 | |
| Class 529-F-1 — assumed 5% return | | | 1,000.00 | | | 1,021.65 | | | 3.39 | | | .67 | |
|
|
|
|
|
|
|
|
|
|
|
|
|
|
| Class R-1 — actual return | | | 1,000.00 | | | 1,143.88 | | | 8.36 | | | 1.56 | |
| Class R-1 — assumed 5% return | | | 1,000.00 | | | 1,017.20 | | | 7.87 | | | 1.56 | |
|
|
|
|
|
|
|
|
|
|
|
|
|
|
| Class R-2 — actual return | | | 1,000.00 | | | 1,144.26 | | | 8.31 | | | 1.55 | |
| Class R-2 — assumed 5% return | | | 1,000.00 | | | 1,017.25 | | | 7.82 | | | 1.55 | |
|
|
|
|
|
|
|
|
|
|
|
|
|
|
| Class R-3 — actual return | | | 1,000.00 | | | 1,146.68 | | | 5.90 | | | 1.10 | |
| Class R-3 — assumed 5% return | | | 1,000.00 | | | 1,019.50 | | | 5.55 | | | 1.10 | |
|
|
|
|
|
|
|
|
|
|
|
|
|
|
| Class R-4 — actual return | | | 1,000.00 | | | 1,148.14 | | | 4.30 | | | .80 | |
| Class R-4 — assumed 5% return | | | 1,000.00 | | | 1,021.00 | | | 4.04 | | | .80 | |
|
|
|
|
|
|
|
|
|
|
|
|
|
|
| Class R-5 — actual return | | | 1,000.00 | | | 1,150.13 | | | 2.69 | | | .50 | |
| Class R-5 — assumed 5% return | | | 1,000.00 | | | 1,022.50 | | | 2.53 | | | .50 | |
|
�� |
|
|
|
|
|
|
|
|
|
|
|
|
| Class R-6 — actual return | | | 1,000.00 | | | 1,150.42 | | | 2.42 | | | .45 | |
| Class R-6 — assumed 5% return | | | 1,000.00 | | | 1,022.75 | | | 2.28 | | | .45 | |
|
|
|
|
|
|
|
|
|
|
|
|
|
|
| | |
| * | The “expenses paid during period” are equal to the “annualized expense ratio,” multiplied by the average account value over the period, multiplied by the number of days in the period, and divided by 366 (to reflect the one-half year period). |
We are required to advise you of the federal tax status of certain distributions received by shareholders during the fiscal year. The fund hereby designates the following amounts for the fund’s fiscal year ended November 30, 2012:
| | | | | |
| Foreign taxes | | $ | 0.08 per share | |
|
|
|
|
|
| Foreign source income | | $ | 0.90 per share | |
|
|
|
|
|
| Qualified dividend income | | | 100 | % |
|
|
|
|
|
| Corporate dividends received deduction | | $ | 721,833,000 | |
|
|
|
|
|
| U.S. government income that may be exempt from state taxation | | $ | 4,459,000 | |
|
|
|
|
|
Individual shareholders should refer to their Form 1099 or other tax information, which will be mailed in January 2013, to determine the calendar year amounts to be included on their 2012 tax returns. Shareholders should consult their tax advisers.
| | |
| Capital World Growth and Income Fund | 33 |
Approval of Investment Advisory and Service Agreement
The fund’s board has approved the fund’s Investment Advisory and Service Agreement (the “agreement”) with Capital Research and Management Company (“CRMC”) for an additional one-year term through October 31, 2013. The board approved the agreement following the recommendation of the fund’s Contracts Committee (the “committee”), which is composed of all of the fund’s independent board members. The board and the committee determined that the fund’s advisory fee structure was fair and reasonable in relation to the services provided and that approving the agreement was in the best interests of the fund and its shareholders.
In reaching this decision, the board and the committee took into account information furnished to them throughout the year, as well as information prepared specifically in connection with their review of the agreement, and were advised by their independent counsel. They considered the factors discussed below, among others, but did not identify any single issue or particular piece of information that, in isolation, was the controlling factor.
| |
| 1. Nature, extent and quality of services |
| The board and the committee considered the depth and quality of CRMC’s investment management process, including its global research capabilities; the experience, capability and integrity of its senior management and other personnel; the low turnover rates of its key personnel; the overall financial strength and stability of its organization; and the ongoing evolution of CRMC’s organizational structure designed to maintain and strengthen these qualities. The board and the committee also considered the nature, extent and quality of administrative, compliance and shareholder services provided by CRMC to the fund under the agreement and other agreements, as well as the benefits to fund shareholders from investing in a fund that is part of a large family of funds. The board and the committee concluded that the nature, extent and quality of the services provided by CRMC have benefited and should continue to benefit the fund and its shareholders. |
| |
| 2. Investment results |
| The board and the committee considered the investment results of the fund in light of its objective of providing long-term growth of capital while providing current income. They compared the fund’s total returns with those of other relevant funds (including the other funds that are the basis of the Lipper index for the category in which the fund is included) and market data such as relevant market indices, in each case as available at the time of the related board and committee meetings. This report, including the letter to shareholders and related disclosures, contains certain information about the fund’s investment results. The board and the committee concluded that the fund’s long-term results have been satisfactory and that CRMC’s record in managing the fund indicated that its continued management should benefit the fund and its shareholders. |
| |
| 3. Advisory fees and total expenses |
| The board and the committee compared the advisory fees and total expense levels of the fund to those of other relevant funds. They observed that the fund’s advisory fees and expenses remain significantly below those of most other relevant funds. The board and the committee also noted the breakpoint discounts in the fund’s advisory fee structure that reduce the level of fees charged by CRMC to the fund as fund assets increase. In addition, they reviewed information regarding the advisory fees paid by clients of an affiliate of CRMC. They noted that, to the extent there were differences between the advisory fees paid by the fund and the advisory fees paid by those clients, the differences appropriately reflected the investment, operational and regulatory differences between advising the fund and the other clients. The board and the committee concluded that the fund’s cost structure was fair and reasonable in relation to the services provided, and that the shareholders receive reasonable value in return for the advisory fees and other amounts paid to CRMC by the fund. |
| |
| 4. Ancillary benefits |
| The board and the committee considered a variety of other benefits received by CRMC and its affiliates as a result of CRMC’s relationship with the fund and the other American Funds, including fees for administrative services provided to certain share classes; fees paid to CRMC’s affiliated transfer agent; sales charges and distribution fees received and retained by the fund’s principal underwriter, an affiliate of CRMC; and possible ancillary benefits to CRMC’s institutional management affiliates. The board and the committee reviewed CRMC’s portfolio trading practices, noting that while CRMC receives the benefit of research provided by broker-dealers executing portfolio transactions on behalf of the fund, it does not obtain third-party research or other services in return for allocating brokerage to such broker-dealers. The board and the committee took these ancillary benefits into account in evaluating the reasonableness of the advisory fees and other amounts paid to CRMC by the fund. |
| |
| 5. Adviser financial information |
| The board and the committee reviewed information regarding CRMC’s costs of providing services to the American Funds, including personnel, systems and resources of investment, compliance, trading, accounting and other administrative operations. They considered CRMC’s costs and willingness to invest in technology, infrastructure and staff to maintain and expand services and capabilities, respond to industry and regulatory developments, and attract and retain qualified personnel. They noted information regarding the compensation structure for CRMC’s investment professionals. The board and the committee also compared CRMC’s profitability to the reported results of several large, publicly held investment management companies. The board and the committee noted the competitiveness and cyclicality of both the mutual fund industry and the capital markets, and the importance in that environment of CRMC’s long-term profitability for maintaining its independence, company culture and management continuity. They further considered the breakpoint discounts in the fund’s advisory fee structure. The board and the committee concluded that the fund’s advisory fee structure reflected a reasonable sharing of benefits between CRMC and the fund’s shareholders. |
| | |
| 34 | Capital World Growth and Income Fund |
| |
| Board of directors and other officers |
| | | | | | | | | |
| “Independent” directors1 | | | | | | | | |
| Name and age | | Year first
elected
a director
of the fund2 | | Principal occupation(s) during past five years | | Number of
portfolios in fund
complex3 overseen
by director | | Other directorships4
held by director |
|
|
|
|
|
|
|
|
|
| Joseph C. Berenato, 66 | | 2005 | | Former Chairman and CEO, Ducommun Incorporated (aerospace components manufacturer) | | 6 | | Ducommun Incorporated |
|
|
|
|
|
|
|
|
|
| Robert J. Denison, 71 | | 2005 | | Chair, First Security Management (private investment) | | 6 | | None |
|
|
|
|
|
|
|
|
|
| Mary Anne Dolan, 65 | | 2010 | | Founder and President, MAD Ink (communications company) | | 10 | | None |
|
|
|
|
|
|
|
|
|
| R. Clark Hooper, 66 | | 2010 | | Private investor | | 67 | | JPMorgan Value Opportunities Fund, Inc.; The Swiss Helvetia Fund, Inc. |
|
|
|
|
|
|
|
|
|
| Koichi Itoh, 72 | | 2005 | | Chairman of the Board, Itoh Building Co., Ltd. (building management) | | 6 | | None |
|
|
|
|
|
|
|
|
|
Merit E. Janow, 54
Chairman of the Board
(Independent and Non-Executive) | | 2001 | | Professor, Columbia University, School of International and Public Affairs; former Member, World Trade Organization Appellate Body | | 64 | | The NASDAQ Stock Market LLC; Trimble Navigation Limited |
|
|
|
|
|
|
|
|
|
| Leonade D. Jones, 65 | | 2010 | | Retired; former Treasurer, The Washington Post Company | | 9 | | None |
|
|
|
|
|
|
|
|
|
| Gail L. Neale, 77 | | 1993 | | President, The Lovejoy Consulting Group, Inc. (a pro bono consulting group advising nonprofit organizations) | | 2 | | None |
|
|
|
|
|
|
|
|
|
| Robert J. O’Neill, Ph.D., 76 | | 1993 | | Member of the Board of Directors, The Lowy Institute for International Policy Studies, Sydney, Australia; Fellow of the Australian Institute of International Affairs; former Chairman of Directors, Forty Seven Friends Pty Ltd (a not-for-profit supporting a local art and craft center in Australia); former Chairman, Academic Advisory Committee, United States Studies Centre, University of Sydney; former Planning Director and acting CEO, United States Studies Centre, University of Sydney; former Deputy Chairman of the Council and Chairman of the International Advisory Panel, Graduate School of Government, University of Sydney | | 3 | | None |
|
|
|
|
|
|
|
|
|
| Stefanie Powers, 70 | | 1993–1996
1997 | | Actor, producer, author, entrepreneur; Co-founder and President of The William Holden Wildlife Foundation; conservation consultant to Land Rover and Jaguar North America; founder of The Jaguar Conservation Trust | | 3 | | None |
|
|
|
|
|
|
|
|
|
| Christopher E. Stone, 56 | | 2009 | | President, Open Society Foundations; former Professor of the Practice of Criminal Justice, John F. Kennedy School of Government, Harvard University | | 6 | | None |
|
|
|
|
|
|
|
|
|
| Steadman Upham, Ph.D., 63 | | 2001 | | President and University Professor, The University of Tulsa | | 64 | | None |
|
|
|
|
|
|
|
|
|
| | | | | | | | | |
| “Interested” directors5,6 | | | | | | | | |
| | | | | | | | | |
Name, age and
position with fund | | Year first
elected
a director
or officer
of the fund2 | | Principal occupation(s) during past five years
and positions held with affiliated entities or
the principal underwriter of the fund | | Number of
portfolios in fund
complex3 overseen
by director | | Other directorships4
held by director |
|
|
|
|
|
|
|
|
|
Michael J. Thawley, 62
Vice Chairman of the Board | | 2007 | | Senior Vice President, Capital Research and Management Company; Senior Vice President and International Advisor, Capital Strategy Research, Inc.;7 former Australian Ambassador to the United States | | 2 | | None |
|
|
|
|
|
|
|
|
|
Mark E. Denning, 55
President | | 1993 | | Senior Vice President — Capital Research Global Investors, Capital Research Company;7 Director, Capital Research and Management Company | | 1 | | None |
|
|
|
|
|
|
|
|
|
The fund’s statement of additional information includes further details about fund directors and is available without charge upon request by calling American Funds Service Company at 800/421-4225 or by visiting the American Funds website at americanfunds.com. The address for all directors and officers of the fund is 333 South Hope Street, Los Angeles, CA 90071, Attention: Secretary.
See page 36 for footnotes.
| | | |
| | Capital World Growth and Income Fund | 35 |
| | | | | |
| Other officers6 | | | | |
| | | | | |
Name, age and
position with fund | | Year first
elected
an officer
of the fund2 | | Principal occupation(s) during past five years and positions held with affiliated entities or the principal underwriter of the fund |
|
|
|
|
|
Stephen E. Bepler, 70
Senior Vice President | | 1993 | | Senior Vice President — Capital Research Global Investors, Capital Research Company7 |
|
|
|
|
|
L. Alfonso Barroso, 41
Vice President | | 2010 | | Senior Vice President — Capital Research Global Investors, Capital Research Company7 |
|
|
|
|
|
Jeanne K. Carroll, 64
Vice President | | 2001 | | Senior Vice President — Capital Research Global Investors, Capital Research Company7 |
|
|
|
|
|
Sung Lee, 46
Vice President | | 2008 | | Senior Vice President — Capital Research Global Investors, Capital Research Company7 |
|
|
|
|
|
Jesper Lyckeus, 45
Vice President | | 2008 | | Senior Vice President — Capital Research Global Investors, Capital Research Company7 |
|
|
|
|
|
David M. Riley, 45
Vice President | | 2007 | | Senior Vice President — Capital Research Global Investors, Capital Research and Management Company |
|
|
|
|
|
Donald H. Rolfe, 40
Vice President | | 2008 | | Chief Compliance Officer, Capital Research Company;7 Chief Compliance Officer, Capital Research and Management Company; Vice President and Senior Counsel — Fund Business Management Group, Capital Research and Management Company |
|
|
|
|
|
Alexander G. Sheynkman, 49
Vice President | | 2010 | | Senior Vice President — Capital Research Global Investors, Capital Research Company7 |
|
|
|
|
|
Vincent P. Corti, 56
Secretary | | 1993 | | Vice President — Fund Business Management Group, Capital Research and Management Company |
|
|
|
|
|
Neal F. Wellons, 41
Treasurer | | 2008 | | Vice President — Fund Business Management Group, Capital Research and Management Company |
|
|
|
|
|
Dori Laskin, 61
Assistant Treasurer | | 2010 | | Vice President — Fund Business Management Group, Capital Research and Management Company |
|
|
|
|
|
Jeffrey P. Regal, 41
Assistant Treasurer | | 2003 | | Vice President — Fund Business Management Group, Capital Research and Management Company |
|
|
|
|
|
| | |
| 1 | The term “independent” director refers to a director who is not an “interested person” of the fund within the meaning of the Investment Company Act of 1940. |
| 2 | Directors and officers of the fund serve until their resignation, removal or retirement. |
| 3 | Capital Research and Management Company manages the American Funds. Capital Research and Management Company also manages American Funds Insurance Series,® which is composed of 19 funds and serves as the underlying investment vehicle for certain variable insurance contracts; American Funds Target Date Retirement Series,® which is composed of 10 funds and is available through tax-deferred retirement plans and IRAs; American Funds Portfolio Series,SM which is composed of eight funds; and American Funds College Target Date Series,SM which is composed of seven funds. |
| 4 | This includes all directorships (other than those in the American Funds or other funds managed by Capital Research and Management Company) that are held by each director as a director or a trustee of a public company or a registered investment company. |
| 5 | “Interested persons” within the meaning of the Investment Company Act of 1940, on the basis of their affiliation with the fund’s investment adviser, Capital Research and Management Company, or affiliated entities (including the fund’s principal underwriter). |
| 6 | All of the officers listed, with the exception of Jeanne K. Carroll, are officers and/or directors/trustees of one or more of the other funds for which Capital Research and Management Company serves as investment adviser. |
| 7 | Company affiliated with Capital Research and Management Company. |
| | |
| 36 | Capital World Growth and Income Fund |
| |
| Offices of the fund and of the investment adviser |
Capital Research and Management Company
333 South Hope Street
Los Angeles, CA 90071-1406 |
| |
6455 Irvine Center Drive
Irvine, CA 92618 |
| |
| Custodian of assets |
JPMorgan Chase Bank
270 Park Avenue
New York, NY 10017-2070 |
| |
| Transfer agent for shareholder accounts |
American Funds Service Company
(Write to the address near you.) |
| |
| P.O. Box 6007 |
| Indianapolis, IN 46206-6007 |
| |
| P.O. Box 2280 |
| Norfolk, VA 23501-2280 |
| |
| Counsel |
O’Melveny & Myers LLP
400 South Hope Street
Los Angeles, CA 90071-2899 |
| |
| Independent registered public accounting firm |
PricewaterhouseCoopers LLP
350 South Grand Avenue
Los Angeles, CA 90071-2889 |
| |
| Principal underwriter |
American Funds Distributors, Inc.
333 South Hope Street
Los Angeles, CA 90071-1406 |
Investors should carefully consider investment objectives, risks, charges and expenses. This and other important information is contained in the fund prospectus and summary prospectus, which can be obtained from your financial professional and should be read carefully before investing. You may also call American Funds Service Company (AFS) at 800/421-4225 or visit the American Funds website at americanfunds.com.
“American Funds Proxy Voting Procedures and Principles” — which describes how we vote proxies relating to portfolio securities — is available on the American Funds website or upon request by calling AFS. The fund files its proxy voting record with the U.S. Securities and Exchange Commission (SEC) for the 12 months ended June 30 by August 31. The proxy voting record is available free of charge on the SEC website at sec.gov and on the American Funds website.
A complete November 30, 2012, portfolio of Capital World Growth and Income Fund’s investments is available free of charge by calling AFS or visiting the SEC website (where it is part of Form N-CSR).
Capital World Growth and Income Fund files a complete list of its portfolio holdings with the SEC for the first and third quarters of each fiscal year on Form N-Q. This filing is available free of charge on the SEC website. You may also review or, for a fee, copy this filing at the SEC’s Public Reference Room in Washington, D.C. Additional information regarding the operation of the Public Reference Room may be obtained by calling the SEC’s Office of Investor Education and Advocacy at 800/SEC-0330. Additionally, the list of portfolio holdings is available by calling AFS.
This report is for the information of shareholders of Capital World Growth and Income Fund, but it also may be used as sales literature when preceded or accompanied by the current prospectus or summary prospectus, which gives details about charges, expenses, investment objectives and operating policies of the fund. If used as sales material after March 31, 2013, this report must be accompanied by an American Funds statistical update for the most recently completed calendar quarter.
| | |
 | The right choice for the long term® |
The American Funds difference
Since 1931, American Funds has helped investors pursue long-term investment success. Our consistent approach — in combination with a proven system — has resulted in a superior long-term track record.
| | | |
 | Consistent approach |
| We base our decisions on a long-term perspective because we believe it is the best way to achieve superior long-term investment results. Our portfolio counselors average 25 years of investment experience, including 21 years at our company, reflecting a career commitment to our long-term approach.1 |
| | |
 | Proven system |
| Our system combines individual accountability with teamwork. Each fund is divided into portions that are managed by investment professionals with varied backgrounds, ages and investment styles. An extensive global research effort is the backbone of our system. |
| | |
 | Superior long-term track record |
| Our equity funds have beaten their Lipper peer indexes in 91% of 10-year periods and 96% of 20-year periods. Our fixed-income funds have beaten their Lipper indexes in 60% of 10-year periods and 67% of 20-year periods.2 Our fund management fees have been among the lowest in the industry.3 |
| | |
| | 1 | As of 12/31/11. |
| | 2 | Based on Class A share results for periods through 12/31/11. Periods covered are the shorter of the fund’s lifetime or since the comparable Lipper index inception date. |
| | 3 | Based on management fees for the 20-year period ended 12/31/11 versus comparable Lipper categories, excluding funds of funds. |
| | |
| | American Funds span a range of investment objectives |
| |
|
| ■ | Growth funds |
| | AMCAP Fund®
EuroPacific Growth Fund® |
| | The Growth Fund of America®
The New Economy Fund®
New Perspective Fund®
New World Fund®
SMALLCAP World Fund® |
| |
|
| ■ | Growth-and-income funds |
| | American Mutual Fund® |
| | Capital World Growth and Income Fund®
Fundamental InvestorsSM |
| | International Growth and Income FundSM
The Investment Company of America®
Washington Mutual Investors FundSM |
| |
|
| ■ | Equity-income funds |
| | Capital Income Builder®
The Income Fund of America® |
| |
|
| ■ | Balanced funds |
| | American Balanced Fund® |
| | American Funds Global Balanced FundSM |
| |
|
| ■ | Bond funds |
| | American Funds Mortgage Fund®
American High-Income Trust®
The Bond Fund of America®
Capital World Bond Fund®
Intermediate Bond Fund of America®
Short-Term Bond Fund of America®
U.S. Government Securities Fund® |
| |
|
| ■ | Tax-exempt bond funds |
| | American Funds Short-Term Tax-Exempt Bond Fund®
American High-Income Municipal Bond Fund®
Limited Term Tax-Exempt Bond Fund of America®
The Tax-Exempt Bond Fund of America®
State-specific tax-exempt funds
American Funds Tax-Exempt Fund of New York®
The Tax-Exempt Fund of California®
The Tax-Exempt Fund of Maryland®
The Tax-Exempt Fund of Virginia® |
| |
|
| ■ | Money market fund |
| | American Funds Money Market Fund® |
| |
|
| ■ | American Funds Portfolio SeriesSM
American Funds Global Growth PortfolioSM
American Funds Growth PortfolioSM
American Funds Growth and Income PortfolioSM
American Funds Balanced PortfolioSM |
| | American Funds Income PortfolioSM |
| | American Funds Tax-Advantaged Income PortfolioSM
American Funds Preservation PortfolioSM |
| | American Funds Tax-Exempt Preservation PortfolioSM |
| |
|
| ■ | American Funds Target Date Retirement Series® |
| |
|
| ■ | American Funds College Target Date SeriesSM |

| | | | | |
|
| The Capital Group Companies |
| American Funds | Capital Research and Management | Capital International | Capital Guardian | Capital Bank and Trust |
ITEM 2 – Code of Ethics
The Registrant has adopted a Code of Ethics that applies to its Principal Executive Officer and Principal Financial Officer. The Registrant undertakes to provide to any person without charge, upon request, a copy of the Code of Ethics. Such request can be made to American Funds Service Company at 800/421-0180 or to the Secretary of the Registrant, 333 South Hope Street, Los Angeles, California 90071.
ITEM 3 – Audit Committee Financial Expert
The Registrant’s board has determined that Joseph C. Berenato, a member of the Registrant’s audit committee, is an “audit committee financial expert” and "independent," as such terms are defined in this Item. This designation will not increase the designee’s duties, obligations or liability as compared to his or her duties, obligations and liability as a member of the audit committee and of the board, nor will it reduce the responsibility of the other audit committee members. There may be other individuals who, through education or experience, would qualify as "audit committee financial experts" if the board had designated them as such. Most importantly, the board believes each member of the audit committee contributes significantly to the effective oversight of the Registrant’s financial statements and condition.
ITEM 4 – Principal Accountant Fees and Services
| | Registrant: |
| | | a) Audit Fees: |
| | | | 2011 | $108,000 |
| | | | 2012 | $107,000 |
| | | | |
| | | b) Audit-Related Fees: |
| | | | 2011 | None |
| | | | 2012 | None |
| | | | |
| | | c) Tax Fees: |
| | | | 2011 | $8,000 |
| | | | 2012 | None |
| | | | The tax fees consist of professional services relating to the preparation of the Registrant’s tax returns. |
| | | | |
| | | d) All Other Fees: |
| | | | 2011 | None |
| | | | 2012 | None |
| | | | |
| | Adviser and affiliates (includes only fees for non-audit services billed to the adviser and affiliates for engagements that relate directly to the operations and financial reporting of the Registrant and were subject to the pre-approval policies described below): |
| | | a) Audit Fees: |
| | | | Not Applicable |
| | | | |
| | | b) Audit-Related Fees: |
| | | | 2011 | None |
| | | | 2012 | None |
| | | | |
| | | c) Tax Fees: |
| | | | 2011 | $19,000 |
| | | | 2012 | $1,000 |
| | | | The tax fees consist of consulting services relating to the Registrant’s investments. |
| | | | |
| | | d) All Other Fees: |
| | | | 2011 | $2,000 |
| | | | 2012 | $2,000 |
| | | | The other fees consist of subscription services related to an accounting research tool. |
All audit and permissible non-audit services that the Registrant’s audit committee considers compatible with maintaining the independent registered public accounting firm’s independence are required to be pre-approved by the committee. The pre-approval requirement will extend to all non-audit services provided to the Registrant, the investment adviser, and any entity controlling, controlled by, or under common control with the investment adviser that provides ongoing services to the Registrant, if the engagement relates directly to the operations and financial reporting of the Registrant. The committee will not delegate its responsibility to pre-approve these services to the investment adviser. The committee may delegate to one or more committee members the authority to review and pre-approve audit and permissible non-audit services. Actions taken under any such delegation will be reported to the full committee at its next meeting. The pre-approval requirement is waived with respect to non-audit services if certain conditions are met. The pre-approval requirement was not waived for any of the non-audit services listed above provided to the Registrant, adviser and affiliates.
Aggregate non-audit fees paid to the Registrant’s auditors, including fees for all services billed to the Registrant, adviser and affiliates that provide ongoing services to the Registrant, were $29,000 for fiscal year 2011 and $2,000 for fiscal year 2012. The non-audit services represented by these amounts were brought to the attention of the committee and considered to be compatible with maintaining the auditors’ independence.
ITEM 5 – Audit Committee of Listed Registrants
Not applicable to this Registrant, insofar as the Registrant is not a listed issuer as defined in Rule 10A-3 under the Securities Exchange Act of 1934.
ITEM 6 – Schedule of Investments

Capital World Growth and Income Fund®
Investment portfolio
November 30, 2012
| Common stocks — 92.58% | Shares | Value (000) |
| | | |
| CONSUMER DISCRETIONARY — 12.29% | | |
| Home Depot, Inc. | 16,095,800 | $1,047,354 |
| Comcast Corp., Class A | 13,567,900 | 504,454 |
| General Motors Co.1 | 18,646,450 | 482,570 |
| Virgin Media Inc. | 11,495,500 | 404,297 |
| DIRECTV1 | 7,873,000 | 391,288 |
| Cie. Générale des Établissements Michelin, Class B | 4,000,000 | 372,009 |
| Bayerische Motoren Werke AG | 2,463,100 | 218,439 |
| Bayerische Motoren Werke AG, nonvoting preferred | 2,500,652 | 152,204 |
| Amazon.com, Inc.1 | 1,397,400 | 352,215 |
| SJM Holdings Ltd. | 146,350,000 | 345,188 |
| Kingfisher PLC | 65,948,999 | 293,735 |
| Renault SA | 5,369,361 | 268,536 |
| News Corp., Class A | 10,240,458 | 252,325 |
| Time Warner Cable Inc. | 2,600,000 | 246,714 |
| British Sky Broadcasting Group PLC | 17,747,000 | 215,809 |
| Whitbread PLC | 5,314,096 | 204,250 |
| Daimler AG | 3,942,000 | 194,715 |
| Hyundai Motor Co. | 876,000 | 182,424 |
| H & M Hennes & Mauritz AB, Class B | 5,607,300 | 181,956 |
| adidas AG | 2,031,300 | 178,639 |
| Li & Fung Ltd. | 99,818,000 | 164,341 |
| WPP PLC | 11,106,000 | 152,312 |
| Marks and Spencer Group PLC | 23,618,187 | 147,803 |
| Magna International Inc. | 2,791,300 | 129,600 |
| Intercontinental Hotels Group PLC | 4,626,561 | 123,640 |
| Ford Motor Co. | 10,568,000 | 121,004 |
| Honda Motor Co., Ltd. | 3,617,000 | 119,872 |
| Daily Mail and General Trust PLC, Class A, nonvoting | 13,430,392 | 113,397 |
| McDonald’s Corp. | 1,300,000 | 113,152 |
| Wynn Macau, Ltd. | 38,400,000 | 109,747 |
| Swatch Group Ltd, non-registered shares | 222,400 | 107,420 |
| YUM! Brands, Inc. | 1,590,000 | 106,657 |
| NIKE, Inc., Class B | 1,000,000 | 97,480 |
| Cie. Financière Richemont SA, Class A, non-registered shares | 1,190,000 | 91,751 |
| Johnson Controls, Inc. | 2,772,325 | 76,350 |
| William Hill PLC | 13,067,600 | 70,597 |
| Nordstrom, Inc. | 1,000,000 | 54,090 |
| Reed Elsevier PLC | 4,703,000 | 48,412 |
| SES SA, Class A (FDR) | 1,515,000 | 42,855 |
| Darden Restaurants, Inc. | 791,700 | 41,865 |
| Aristocrat Leisure Ltd. | 8,517,734 | 28,978 |
| D.R. Horton, Inc. | 1,400,000 | 27,244 |
| Darty PLC | 24,593,098 | 18,814 |
| Stella International Holdings Ltd. | 6,238,500 | 16,067 |
| Dixons Retail PLC1 | 23,103,600 | 10,176 |
| | | 8,622,745 |
| | | |
| | | |
| INDUSTRIALS — 12.07% | | |
| ASSA ABLOY AB, Class B | 19,660,007 | 711,245 |
| AB Volvo, Class B | 41,589,080 | 589,142 |
| KONE Oyj, Class B | 6,185,000 | 463,329 |
| Jardine Matheson Holdings Ltd. | 7,748,000 | 457,287 |
| United Parcel Service, Inc., Class B | 5,200,000 | 380,172 |
| General Electric Co. | 17,500,000 | 369,775 |
| Schneider Electric SA | 4,897,623 | 344,213 |
| Atlas Copco AB, Class A | 9,000,000 | 231,853 |
| Atlas Copco AB, Class B | 4,669,084 | 107,721 |
| VINCI SA | 7,335,500 | 323,651 |
| Lockheed Martin Corp. | 3,305,000 | 308,356 |
| PACCAR Inc | 5,720,000 | 251,337 |
| United Technologies Corp. | 2,950,000 | 236,325 |
| Singapore Technologies Engineering Ltd | 76,260,000 | 229,292 |
| Hutchison Port Holdings Trust | 293,882,000 | 227,759 |
| Union Pacific Corp. | 1,844,700 | 226,492 |
| CSX Corp. | 11,068,865 | 218,721 |
| Komatsu Ltd. | 9,500,000 | 212,853 |
| Emerson Electric Co. | 3,960,000 | 198,911 |
| ComfortDelGro Corp. Ltd.2 | 135,100,000 | 190,375 |
| Bureau Veritas SA | 1,596,369 | 177,117 |
| Qantas Airways Ltd.1,2 | 125,158,600 | 173,066 |
| Ryanair Holdings PLC (ADR) | 4,900,000 | 168,707 |
| General Dynamics Corp. | 2,435,000 | 161,928 |
| Siemens AG | 1,387,000 | 143,046 |
| Kühne + Nagel International AG | 1,174,050 | 141,388 |
| Waste Management, Inc. | 4,200,000 | 136,794 |
| Danaher Corp. | 2,500,000 | 134,925 |
| Masco Corp. | 6,700,000 | 113,632 |
| Southwest Airlines Co. | 11,233,300 | 107,053 |
| Eaton Corp. | 2,000,000 | 104,320 |
| Republic Services, Inc. | 3,000,000 | 85,410 |
| SGS SA | 36,826 | 82,617 |
| Hutchison Whampoa Ltd. | 7,480,000 | 76,921 |
| BAE Systems PLC | 13,675,000 | 71,709 |
| United Continental Holdings, Inc.1 | 3,000,000 | 60,660 |
| Geberit AG | 240,000 | 50,709 |
| Capita PLC | 3,745,000 | 45,750 |
| Norfolk Southern Corp. | 712,000 | 42,991 |
| Aggreko PLC | 1,185,000 | 42,376 |
| Legrand SA | 1,040,000 | 42,119 |
| FedEx Corp. | 302,001 | 27,038 |
| Contax Participações SA, ordinary nominative | 152,400 | 1,797 |
| | | 8,470,882 |
| | | |
| | | |
| CONSUMER STAPLES — 11.61% | | |
| Philip Morris International Inc. | 19,606,300 | 1,762,214 |
| Altria Group, Inc. | 37,619,300 | 1,271,909 |
| Anheuser-Busch InBev NV | 7,924,534 | 694,538 |
| Anheuser-Busch InBev NV, VVPR STRIPS1 | 3,247,475 | 4 |
| Wesfarmers Ltd. | 16,071,520 | 596,253 |
| Lorillard, Inc. | 4,314,988 | 522,804 |
| Nestlé SA | 7,310,030 | 478,422 |
| Pernod Ricard SA | 2,673,562 | 302,716 |
| British American Tobacco PLC | 5,352,000 | 280,736 |
| Kraft Foods Group, Inc.1 | 5,772,166 | 261,017 |
| Diageo PLC | 8,470,500 | 252,014 |
| Tingyi (Cayman Islands) Holding Corp. | 86,020,000 | 251,394 |
| Mondelez International, Inc. | 9,569,103 | 247,744 |
| Coca-Cola Co. | 4,338,800 | 164,527 |
| SABMiller PLC | 3,580,000 | 162,177 |
| Reynolds American Inc. | 3,425,000 | 149,741 |
| Danone SA | 2,070,123 | 131,317 |
| Colgate-Palmolive Co. | 1,175,000 | 127,488 |
| Imperial Tobacco Group PLC | 2,955,000 | 118,217 |
| Cia. de Bebidas das Américas — AmBev, preferred nominative (ADR) | 2,815,700 | 117,161 |
| L’Oréal SA, non-registered shares | 637,100 | 86,462 |
| ConAgra Foods, Inc. | 2,700,000 | 80,622 |
| Koninklijke Ahold NV | 3,400,597 | 43,147 |
| Treasury Wine Estates Ltd. | 7,212,137 | 37,859 |
| Molson Coors Brewing Co., Class B | 122,900 | 5,096 |
| | | 8,145,579 |
| | | |
| | | |
| FINANCIALS — 11.17% | | |
| Société Générale1 | 14,946,365 | 540,487 |
| HSBC Holdings PLC (Hong Kong) | 26,720,033 | 271,503 |
| HSBC Holdings PLC (United Kingdom) | 20,476,231 | 209,204 |
| Industrial and Commercial Bank of China Ltd., Class H | 676,073,470 | 456,229 |
| Prudential PLC | 29,060,000 | 421,354 |
| AIA Group Ltd. | 95,215,796 | 370,411 |
| Siam Commercial Bank PCL | 66,634,100 | 352,820 |
| China Construction Bank Corp., Class H | 440,805,735 | 337,848 |
| Wells Fargo & Co. | 10,000,000 | 330,100 |
| Link Real Estate Investment Trust | 55,340,000 | 300,256 |
| Westfield Group | 26,688,000 | 290,214 |
| Bank of China Ltd., Class H | 626,129,000 | 264,179 |
| Agricultural Bank of China, Class H | 599,521,000 | 263,009 |
| Citigroup Inc. | 7,415,000 | 256,337 |
| UBS AG | 16,035,786 | 250,911 |
| JPMorgan Chase & Co. | 5,864,000 | 240,893 |
| BNP Paribas SA | 4,035,063 | 225,367 |
| Credit Suisse Group AG | 9,010,650 | 213,331 |
| Barclays PLC | 53,795,000 | 212,022 |
| Woori Finance Holdings Co., Ltd. | 20,047,350 | 187,912 |
| Toronto-Dominion Bank | 1,870,000 | 156,211 |
| Willis Group Holdings PLC | 4,286,445 | 150,368 |
| Banco Santander, SA1 | 17,676,345 | 135,957 |
| Sampo Oyj, Class A | 4,225,974 | 134,929 |
| Deutsche Börse AG | 2,049,600 | 115,447 |
| Hang Seng Bank Ltd. | 7,000,000 | 106,939 |
| UniCredit SpA1 | 21,829,006 | 101,635 |
| Samsung Card Co., Ltd. | 2,855,000 | 95,839 |
| Weyerhaeuser Co.1 | 3,359,686 | 92,593 |
| CapitaMall Trust | 47,611,000 | 80,742 |
| Kimco Realty Corp. | 4,132,329 | 79,589 |
| Canadian Imperial Bank of Commerce (CIBC) | 889,318 | 71,801 |
| Itaú Unibanco Holding SA, preferred nominative (ADR) | 4,636,610 | 70,245 |
| KB Financial Group Inc. | 1,870,000 | 61,565 |
| Ping An Insurance (Group) Co. of China, Ltd., Class H | 7,865,000 | 59,519 |
| Sun Hung Kai Properties Ltd. | 3,678,000 | 53,816 |
| Starwood Property Trust, Inc. | 2,250,000 | 51,435 |
| Sberbank of Russia (GDR)3 | 2,865,801 | 33,759 |
| Sberbank of Russia (ADR) | 1,263,000 | 14,941 |
| BB&T Corp. | 1,400,000 | 39,438 |
| Ascendas Real Estate Investment Trust | 18,995,000 | 37,349 |
| State Street Corp. | 761,105 | 33,823 |
| Banco Santander (Brasil) SA, units | 2,794,815 | 18,965 |
| Banco Santander (Brasil) SA, units (ADR) | 1,304,339 | 8,726 |
| Old Republic International Corp. | 2,500,000 | 26,225 |
| CapitaCommercial Trust | 7,940,000 | 10,538 |
| | | 7,836,781 |
| | | |
| | | |
| HEALTH CARE — 11.08% | | |
| Novartis AG | 33,907,063 | 2,098,381 |
| Bayer AG | 14,267,026 | 1,290,499 |
| Amgen Inc. | 13,159,758 | 1,168,587 |
| Abbott Laboratories | 10,999,300 | 714,954 |
| Gilead Sciences, Inc.1 | 9,430,000 | 707,250 |
| Roche Holding AG | 2,014,000 | 396,410 |
| Teva Pharmaceutical Industries Ltd. (ADR) | 6,125,000 | 247,144 |
| Zimmer Holdings, Inc. | 3,230,000 | 213,083 |
| UCB SA | 3,510,000 | 199,236 |
| GlaxoSmithKline PLC | 8,236,100 | 176,094 |
| St. Jude Medical, Inc. | 4,735,000 | 162,316 |
| Edwards Lifesciences Corp.1 | 1,030,000 | 89,373 |
| Stryker Corp. | 1,468,000 | 79,507 |
| Sonic Healthcare Ltd. | 4,875,000 | 68,377 |
| Boston Scientific Corp.1 | 10,000,000 | 55,400 |
| Orion Oyj, Class B | 2,024,201 | 54,205 |
| Fisher & Paykel Healthcare Corp. Ltd. | 23,339,600 | 49,051 |
| | | 7,769,867 |
| | | |
| | | |
| TELECOMMUNICATION SERVICES — 7.39% | | |
| AT&T Inc. | 20,610,000 | 703,419 |
| Verizon Communications Inc. | 15,119,500 | 667,072 |
| SOFTBANK CORP. | 13,509,700 | 506,399 |
| TeliaSonera AB | 71,210,054 | 477,563 |
| Vodafone Group PLC | 179,857,500 | 464,368 |
| Sprint Nextel Corp., Series 11 | 60,792,200 | 348,339 |
| América Móvil, SAB de CV, Series L (ADR) | 13,075,198 | 308,444 |
| Singapore Telecommunications Ltd. | 107,213,810 | 290,740 |
| OJSC Mobile TeleSystems (ADR) | 14,649,480 | 255,340 |
| CenturyLink, Inc. | 5,400,600 | 209,759 |
| MTN Group Ltd. | 10,292,000 | 189,427 |
| Türk Telekomünikasyon AS, Class D | 39,150,000 | 146,359 |
| Turkcell Iletisim Hizmetleri AS1 | 22,121,626 | 133,088 |
| Advanced Info Service PCL | 15,801,800 | 113,275 |
| Philippine Long Distance Telephone Co. (ADR) | 877,673 | 54,609 |
| Philippine Long Distance Telephone Co. | 693,790 | 43,877 |
| Millicom International Cellular SA (SDR) | 950,000 | 81,530 |
| Perusahaan Perseroan (Persero) PT Telekomunikasi Indonesia Tbk, Class B | 54,204,000 | 50,851 |
| KT Corp. (ADR) | 2,523,000 | 43,421 |
| OJSC MegaFon (GDR)1,3 | 2,000,000 | 42,100 |
| Telefónica Czech Republic, AS | 1,744,998 | 31,105 |
| BCE Inc. | 512,500 | 21,700 |
| | | 5,182,785 |
| | | |
| | | |
| INFORMATION TECHNOLOGY — 6.52% | | |
| Microsoft Corp. | 36,085,019 | 960,583 |
| Samsung Electronics Co. Ltd. | 556,400 | 722,444 |
| Oracle Corp. | 13,337,000 | 428,118 |
| Automatic Data Processing, Inc. | 6,040,000 | 342,830 |
| Google Inc., Class A1 | 320,129 | 223,568 |
| Delta Electronics, Inc. | 59,003,873 | 211,207 |
| Accenture PLC, Class A | 2,825,000 | 191,874 |
| HOYA Corp. | 9,103,000 | 174,805 |
| Maxim Integrated Products, Inc. | 5,723,000 | 167,054 |
| Amadeus IT Holding, SA, Class A, non-registered shares | 5,815,000 | 135,751 |
| Quanta Computer Inc. | 50,388,595 | 126,604 |
| Analog Devices, Inc. | 2,970,186 | 120,590 |
| Telefonaktiebolaget LM Ericsson, Class B | 11,877,220 | 110,679 |
| Compal Electronics, Inc.4 | 142,989,106 | 98,642 |
| Intel Corp. | 5,000,000 | 97,850 |
| HTC Corp. | 9,707,000 | 88,871 |
| Siliconware Precision Industries Co., Ltd. | 66,700,000 | 72,201 |
| Murata Manufacturing Co., Ltd. | 1,274,000 | 72,173 |
| Nintendo Co., Ltd. | 552,300 | 66,194 |
| Yahoo! Inc.1 | 3,423,798 | 64,265 |
| Nokia Corp. | 10,971,000 | 36,384 |
| Nokia Corp. (ADR) | 4,169,800 | 13,593 |
| NetEase, Inc. (ADR)1 | 1,099,270 | 48,214 |
| | | 4,574,494 |
| | | |
| | | |
| ENERGY — 5.67% | | |
| BP PLC | 203,283,213 | 1,405,679 |
| Royal Dutch Shell PLC, Class B | 17,620,746 | 608,238 |
| Royal Dutch Shell PLC, Class A (ADR) | 1,127,500 | 75,509 |
| Royal Dutch Shell PLC, Class A | 1,686,000 | 56,507 |
| Royal Dutch Shell PLC, Class B (ADR) | 344,800 | 23,819 |
| Eni SpA | 13,745,000 | 324,987 |
| OJSC Gazprom (ADR) | 27,399,000 | 243,577 |
| EOG Resources, Inc. | 1,680,000 | 197,602 |
| Apache Corp. | 2,422,036 | 186,715 |
| Chevron Corp. | 1,295,000 | 136,868 |
| Occidental Petroleum Corp. | 1,443,000 | 108,528 |
| Husky Energy Inc. | 3,456,000 | 96,998 |
| Canadian Natural Resources, Ltd. | 3,325,000 | 95,698 |
| ConocoPhillips | 1,650,000 | 93,951 |
| Woodside Petroleum Ltd. | 2,215,164 | 78,137 |
| Devon Energy Corp. | 1,500,000 | 77,505 |
| Seadrill Ltd. | 1,860,019 | 71,584 |
| Schlumberger Ltd. | 700,000 | 50,134 |
| China National Offshore Oil Corp. | 13,276,900 | 28,403 |
| EnCana Corp. | 880,000 | 19,175 |
| | | 3,979,614 |
| | | |
| | | |
| UTILITIES — 5.24% | | |
| National Grid PLC | 66,484,639 | 750,955 |
| GDF SUEZ | 20,468,329 | 460,394 |
| SSE PLC | 18,545,336 | 423,402 |
| PT Perusahaan Gas Negara (Persero) Tbk | 831,120,000 | 392,017 |
| Power Assets Holdings Ltd. | 31,001,500 | 272,806 |
| CEZ, a s | 7,629,000 | 253,505 |
| RWE AG | 5,726,000 | 238,786 |
| Dominion Resources, Inc. | 4,456,422 | 227,768 |
| FirstEnergy Corp. | 4,495,000 | 190,858 |
| Public Service Enterprise Group Inc. | 5,000,000 | 150,450 |
| Exelon Corp. | 3,000,000 | 90,660 |
| E.ON AG | 4,200,000 | 75,653 |
| PG&E Corp. | 1,401,000 | 57,371 |
| Cia. Energética de Minas Gerais — CEMIG, preferred nominative (ADR) | 3,961,987 | 48,495 |
| Power Grid Corp. of India Ltd. | 10,378,641 | 22,496 |
| LIGHT SA, ordinary nominative | 1,810,600 | 20,082 |
| | | 3,675,698 |
| | | |
| | | |
| MATERIALS — 4.74% | | |
| Dow Chemical Co. | 16,047,000 | 484,459 |
| BASF SE | 4,429,000 | 396,873 |
| Syngenta AG | 723,500 | 290,040 |
| Amcor Ltd. | 30,684,007 | 252,972 |
| Israel Chemicals Ltd. | 20,435,000 | 251,742 |
| Akzo Nobel NV | 4,238,000 | 242,186 |
| Praxair, Inc. | 1,763,120 | 189,024 |
| ArcelorMittal | 11,679,654 | 177,495 |
| Koninklijke DSM NV | 3,054,000 | 175,895 |
| Linde AG | 959,000 | 165,819 |
| CRH PLC | 6,497,177 | 118,721 |
| Nitto Denko Corp. | 2,201,800 | 114,717 |
| Holcim Ltd | 1,240,908 | 85,030 |
| Sherwin-Williams Co. | 500,000 | 76,260 |
| Vicat S.A. | 1,025,000 | 55,509 |
| Formosa Plastics Corp. | 20,000,000 | 52,661 |
| Ube Industries, Ltd. | 25,200,000 | 52,274 |
| K+S AG | 1,068,000 | 48,253 |
| voestalpine AG | 1,397,000 | 45,104 |
| Rautaruukki Oyj | 3,396,570 | 24,892 |
| Usinas Siderúrgicas de Minas Gerais SA — USIMINAS, Class A, preferred nominative | 4,125,500 | 24,134 |
| | | 3,324,060 |
| | | |
| | | |
| MISCELLANEOUS — 4.80% | | |
| Other common stocks in initial period of acquisition | | 3,366,079 |
| | | |
| | | |
| Total common stocks (cost: $52,120,377,000) | | 64,948,584 |
| | | |
| | | |
| | | |
| Preferred stocks — 0.01% | | |
| | | |
| FINANCIALS — 0.01% | | |
| Citigroup Inc. 7.875% preferred | 366,000 | 10,271 |
| | | |
| Total preferred stocks (cost: $9,150,000) | | 10,271 |
| | | |
| | | |
| | Shares or | |
| Convertible securities — 0.40% | principal amount | |
| | | |
| FINANCIALS — 0.12% | | |
| Credit Suisse Group AG 4.00% convertible notes 2013 | CHF41,013,000 | 59,858 |
| Bank of America Corp., Series L, 7.25% convertible preferred | 13,000 | 14,469 |
| National Financial Partners Corp. 4.00% convertible notes 2017 | $7,000,000 | 10,163 |
| | | 84,490 |
| | | |
| | | |
| CONSUMER DISCRETIONARY — 0.10% | | |
| General Motors Co., Series B, 4.75% convertible preferred 2013 | 1,558,603 | 63,077 |
| Virgin Media Inc. 6.50% convertible notes 2016 | $3,500,000 | 6,987 |
| | | 70,064 |
| | | |
| | | |
| INDUSTRIALS — 0.10% | | |
| United Continental Holdings, Inc. 6.00% convertible notes 2029 | $15,000,000 | 36,328 |
| United Continental Holdings, Inc. 4.50% convertible debentures 2015 | $4,700,000 | 6,286 |
| United Continental Holdings, Inc. 6.00% convertible preferred 2030 | 397,000 | 13,244 |
| JetBlue Airways Corp., Series B, 6.75% convertible notes 2039 | $3,925,000 | 5,220 |
| JetBlue Airways Corp., Series A, convertible notes 5.50% 2038 | $3,250,000 | 4,111 |
| JetBlue Airways Corp., Series B, convertible notes 5.50% 2038 | $3,240,000 | 4,324 |
| | | 69,513 |
| | | |
| | | |
| TELECOMMUNICATION SERVICES — 0.06% | | |
| Clearwire Corp. 8.25% convertible notes 20403 | $44,385,000 | 42,832 |
| | | |
| | | |
| CONSUMER STAPLES — 0.02% | | |
| Alliance One International, Inc. 5.50% convertible notes 2014 | $11,000,000 | 10,532 |
| | | |
| | | |
| Total convertible securities (cost: $262,002,000) | | 277,431 |
| | | |
| | | |
| | Principal amount | Value |
| Bonds & notes — 2.12% | (000) | (000) |
| | | |
| FINANCIALS — 0.64% | | |
| Prologis, Inc. 6.25% 2017 | $ 4,620 | $ 5,332 |
| Prologis, Inc. 6.625% 2018 | 13,907 | 16,628 |
| Prologis, Inc. 6.625% 2019 | 1,600 | 1,920 |
| Prologis, Inc. 7.375% 2019 | 21,933 | 27,271 |
| Prologis, Inc. 6.875% 2020 | 20,380 | 24,777 |
| Mizuho Capital Investment (USD) 2 Ltd, junior subordinated 14.95% (undated)3,5 | 60,000 | 71,608 |
| HBOS PLC 6.75% 20183 | 36,490 | 38,953 |
| Lloyds Banking Group PLC, junior subordinated 6.657% preference shares (undated)3,5 | 30,300 | 25,679 |
| JPMorgan Chase & Co., Series I, junior subordinated 7.90% (undated)5 | 41,090 | 46,585 |
| Westfield Group 6.75% 20193 | 18,040 | 22,350 |
| Westfield Group 4.625% 20213 | 19,975 | 22,328 |
| Developers Diversified Realty Corp. 5.50% 2015 | 3,744 | 4,070 |
| Developers Diversified Realty Corp. 9.625% 2016 | 3,650 | 4,511 |
| Developers Diversified Realty Corp. 7.50% 2017 | 10,210 | 12,297 |
| Developers Diversified Realty Corp. 7.875% 2020 | 8,075 | 10,425 |
| Simon Property Group, LP 5.25% 2016 | 3,540 | 4,066 |
| Simon Property Group, LP 6.10% 2016 | 860 | 1,000 |
| Simon Property Group, LP 5.875% 2017 | 165 | 196 |
| Simon Property Group, LP 6.125% 2018 | 890 | 1,096 |
| Simon Property Group, LP 10.35% 2019 | 11,635 | 16,817 |
| ERP Operating LP 5.125% 2016 | 2,886 | 3,226 |
| ERP Operating LP 5.75% 2017 | 2,055 | 2,438 |
| ERP Operating LP 4.625% 2021 | 13,215 | 14,926 |
| Regions Financial Corp. 5.20% 2015 | 15,295 | 16,155 |
| Regions Bank, junior subordinated 7.50% 2018 | 2,475 | 2,976 |
| HVB Funding Trust I, junior subordinated 8.741% 20313 | 9,650 | 8,540 |
| HVB Funding Trust III, junior subordinated 9.00% 20313 | 3,171 | 2,838 |
| AXA SA 8.60% 2030 | 8,000 | 9,967 |
| Standard Chartered Bank 6.40% 20173 | 8,451 | 9,875 |
| Barclays Bank PLC, Series RCI, junior subordinated 14.00% (undated)5 | £4,520 | 9,721 |
| Discover Financial Services 6.45% 2017 | $ 3,057 | 3,594 |
| Discover Financial Services 10.25% 2019 | 4,334 | 5,672 |
| Capital One Capital III 7.686% 20665 | 165 | 166 |
| | | 448,003 |
| | | |
| | | |
| U.S. TREASURY BONDS & NOTES — 0.57% | | |
| U.S. Treasury 0.25% 2014 | 92,000 | 92,030 |
| U.S. Treasury 1.875% 20146 | 301,000 | 307,132 |
| | | 399,162 |
| | | |
| | | |
| TELECOMMUNICATION SERVICES — 0.36% | | |
| Sprint Nextel Corp. 9.125% 2017 | 35,000 | 41,300 |
| Sprint Nextel Corp. 11.50% 2021 | 55,550 | 74,784 |
| MTS International Funding Ltd. 8.625% 20203 | 29,865 | 37,376 |
| MTS International Funding Ltd. 8.625% 2020 | 24,093 | 30,152 |
| América Móvil, SAB de CV 6.45% 20224 | MXN155,000 | 12,294 |
| América Móvil, SAB de CV 8.46% 2036 | 341,400 | 28,244 |
| Clearwire Communications and Clearwire Finance, Inc., Series A, 12.00% 20153 | $2,500 | 2,650 |
| Clearwire Communications and Clearwire Finance, Inc. 12.00% 20173 | 22,500 | 24,863 |
| | | 251,663 |
| | | |
| | | |
| BONDS & NOTES OF GOVERNMENTS OUTSIDE THE U.S. — 0.20% | | |
| United Mexican States Government, Series M30, 10.00% 20365 | MXN738,400 | 80,825 |
| Polish Government, Series 1021, 5.75% 2021 | PLN172,900 | 62,462 |
| | | 143,287 |
| | | |
| | | |
| ENERGY — 0.15% | | |
| Gazprom OJSC 8.146% 2018 | $ 4,415 | 5,445 |
| Gazprom OJSC, Series 9, 6.51% 2022 | 30,710 | 36,547 |
| Gazprom OJSC, Series 2, 8.625% 2034 | 1,015 | 1,461 |
| Gazprom OJSC 7.288% 2037 | 38,175 | 49,219 |
| Gazprom OJSC 7.288% 20373 | 365 | 470 |
| BP Capital Markets PLC 5.25% 2013 | 3,335 | 3,481 |
| BP Capital Markets PLC 3.875% 2015 | 7,320 | 7,824 |
| Petroplus Finance Ltd. 6.75% 20143,7 | 375 | 78 |
| | | 104,525 |
| | | |
| | | |
| MATERIALS — 0.11% | | |
| ArcelorMittal 4.25% 20155 | 8,000 | 8,084 |
| ArcelorMittal 10.35% 20195 | 20,000 | 23,686 |
| ArcelorMittal 6.75% 20225 | 22,839 | 23,804 |
| CRH America, Inc. 6.00% 2016 | 1,260 | 1,419 |
| CRH America, Inc. 8.125% 2018 | 15,540 | 18,922 |
| | | 75,915 |
| | | |
| | | |
| FEDERAL AGENCY BONDS & NOTES — 0.04% | | |
| Federal Farm Credit Banks, Consolidated Systemwide Designated Bonds, 0.22% 2013 | 29,000 | 29,005 |
| | | |
| | | |
| CONSUMER DISCRETIONARY — 0.03% | | |
| Marks and Spencer Group PLC 6.25% 20173 | 100 | 112 |
| Marks and Spencer Group PLC 7.125% 20373 | 15,550 | 17,518 |
| | | 17,630 |
| | | |
| | | |
| HEALTH CARE — 0.01% | | |
| Amgen Inc. 5.375% 2043 | 9,625 | 11,396 |
| | | |
| | | |
| CONSUMER STAPLES — 0.01% | | |
| British American Tobacco International Finance PLC 8.125% 20133 | 9,000 | 9,591 |
| | | |
| | | |
| Total bonds & notes (cost: $1,295,392,000) | | 1,490,177 |
| | | |
| | | |
| | | |
| Short-term securities — 4.62% | | |
| | | |
| U.S. Treasury Bills 0.11%–0.195% due 12/6/2012–7/25/2013 | 1,163,800 | 1,163,380 |
| Fannie Mae 0.13%–0.175% due 1/2–4/10/2013 | 534,329 | 534,186 |
| Federal Home Loan Bank 0.124%–0.20% due 12/10/2012–4/17/2013 | 381,900 | 381,780 |
| Freddie Mac 0.15%–0.19% due 1/22–4/26/2013 | 237,700 | 237,604 |
| Federal Farm Credit Banks 0.18%–0.21% due 12/28/2012–8/2/2013 | 192,700 | 192,591 |
| Thunder Bay Funding, LLC 0.14% due 12/6/20123 | 60,004 | 60,003 |
| Old Line Funding, LLC 0.18% due 12/3/20123 | 30,000 | 30,000 |
| Bank of Nova Scotia 0.17%–0.175% due 12/17/2012–1/25/2013 | 85,900 | 85,885 |
| Toronto-Dominion Holdings USA Inc. 0.19% due 12/18/20123 | 85,200 | 85,191 |
| Commonwealth Bank of Australia 0.19%–0.20% due 12/7/2012–1/8/20133 | 80,000 | 79,991 |
| Siemens Capital Co. LLC 0.15% due 12/14/20123 | 75,000 | 74,992 |
| Victory Receivables Corp. 0.19% due 1/3/20133 | 50,000 | 49,991 |
| Bank of Tokyo-Mitsubishi UFJ, Ltd. 0.17% due 12/5/2012 | 11,600 | 11,600 |
| International Bank for Reconstruction and Development 0.14% due 1/14/2013 | 56,800 | 56,792 |
| GlaxoSmithKline Finance PLC 0.13% due 12/4/20123 | 55,400 | 55,399 |
| Province of Ontario 0.14% due 12/19/2012 | 50,000 | 49,996 |
| Straight-A Funding LLC 0.15%–0.18% due 12/10/2012–1/2/20133 | 50,000 | 49,995 |
| Svenska Handelsbanken Inc. 0.21% due 1/4/20133 | 40,000 | 39,992 |
| | | |
| Total short-term securities (cost: $3,238,984,000) | | 3,239,368 |
| | | |
| | | |
| Total investment securities (cost: $56,925,905,000) | | 69,965,831 |
| Other assets less liabilities | | 189,643 |
| | | |
| Net assets | | $70,155,474 |
As permitted by U.S. Securities and Exchange Commission regulations, “Miscellaneous” securities include holdings in their first year of acquisition that have not previously been publicly disclosed.
1Security did not produce income during the last 12 months.
2Represents an affiliated company as defined under the Investment Company Act of 1940.
3Acquired in a transaction exempt from registration under Rule 144A or section 4(2) of the Securities Act of 1933. May be resold in the U.S. in transactions exempt from registration, normally to qualified institutional buyers. The total value of all such securities was $939,074,000, which represented 1.34% of the net assets of the fund.
4Valued under fair value procedures adopted by authority of the board of directors. The total value of all such securities was $110,936,000, which represented .16% of the net assets of the fund.
5Coupon rate may change periodically.
6A portion of this security was pledged as collateral for net losses on unsettled forward currency contracts with certain counterparties. The total value of pledged collateral was $4,444,000, which represented .01% of the net assets of the fund.
7Scheduled interest and/or principal payment was not received.
Key to abbreviations and symbol
ADR = American Depositary Receipts
FDR = Fiduciary Depositary Receipts
GDR = Global Depositary Receipts
SDR = Swedish Depositary Receipts
£ = British pounds
MXN = Mexican pesos
PLN = Polish zloty
Investments are not FDIC-insured, nor are they deposits of or guaranteed by a bank or any other entity, so they may lose value.
Investors should carefully consider investment objectives, risks, charges and expenses. This and other important information is contained in the fund prospectus and summary prospectus, which can be obtained from your financial professional and should be read carefully before investing. You may also call American Funds Service Company (AFS) at 800/421-4225 or visit the American Funds website at americanfunds.com.
MFGEFPX-033-0113O-S32833
Report of Independent Registered Public Accounting Firm
To the Board of Directors and Shareholders of Capital World Growth and Income Fund, Inc.
We have audited, in accordance with standards of the Public Company Accounting Oversight Board (United States), the financial statements of Capital World Growth and Income Fund, Inc. (the “Fund”) as of November 30, 2012, and for the year then ended and have issued our unqualified report thereon dated January 9, 2013 (which report and financial statements are included in Item 1 of this Certified Shareholder Report on Form N-CSR). Our audit included an audit of the Fund’s investment portfolio (the “Portfolio”) as of November 30, 2012 appearing in Item 6 of this Form N-CSR. The Portfolio is the responsibility of the Fund’s management. Our responsibility is to express an opinion on the Portfolio based on our audit.
In our opinion, the Portfolio referred to above, when read in conjunction with the financial statements of the Fund referred to above, presents fairly, in all material respects, the information set forth therein.
PricewaterhouseCoopers LLP
January 9, 2013
ITEM 7 – Disclosure of Proxy Voting Policies and Procedures for Closed-End Management Investment Companies
Not applicable to this Registrant, insofar as the Registrant is not a closed-end management investment company.
ITEM 8 – Portfolio Managers of Closed-End Management Investment Companies
Not applicable to this Registrant, insofar as the Registrant is not a closed-end management investment company.
ITEM 9 – Purchases of Equity Securities by Closed-End Management Investment Company and Affiliated Purchasers
Not applicable to this Registrant, insofar as the Registrant is not a closed-end management investment company.
ITEM 10 – Submission of Matters to a Vote of Security Holders
There have been no material changes to the procedures by which shareholders may recommend nominees to the Registrant’s board of directors since the Registrant last submitted a proxy statement to its shareholders. The procedures are as follows. The Registrant has a nominating and governance committee comprised solely of persons who are not considered ‘‘interested persons’’ of the Registrant within the meaning of the Investment Company Act of 1940, as amended. The committee periodically reviews such issues as the board’s composition, responsibilities, committees, compensation and other relevant issues, and recommends any appropriate changes to the full board of directors. While the committee normally is able to identify from its own resources an ample number of qualified candidates, it will consider shareholder suggestions of persons to be considered as nominees to fill future vacancies on the board. Such suggestions must be sent in writing to the nominating and governance committee of the Registrant, c/o the Registrant’s Secretary, and must be accompanied by complete biographical and occupational data on the prospective nominee, along with a written consent of the prospective nominee for consideration of his or her name by the nominating and governance committee.
ITEM 11 – Controls and Procedures
| (a) | The Registrant’s Principal Executive Officer and Principal Financial Officer have concluded, based on their evaluation of the Registrant’s disclosure controls and procedures (as such term is defined in Rule 30a-3 under the Investment Company Act of 1940), that such controls and procedures are adequate and reasonably designed to achieve the purposes described in paragraph (c) of such rule. |
| | |
| (b) | There were no changes in the Registrant’s internal controls over financial reporting (as defined in Rule 30a-3(d) under the Investment Company Act of 1940) that occurred during the Registrant’s second fiscal quarter of the period covered by this report that has materially affected, or is reasonably likely to materially affect, the Registrant’s internal control over financial reporting. |
ITEM 12 – Exhibits
| (a)(1) | The Code of Ethics that is the subject of the disclosure required by Item 2 is attached as an exhibit hereto. |
| | |
| (a)(2) | The certifications required by Rule 30a-2 of the Investment Company Act of 1940 and Sections 302 and 906 of the Sarbanes-Oxley Act of 2002 are attached as exhibits hereto. |
SIGNATURES
Pursuant to the requirements of the Securities Exchange Act of 1934 and the Investment Company Act of 1940, the Registrant has duly caused this report to be signed on its behalf by the undersigned, thereunto duly authorized.
| | CAPITAL WORLD GROWTH AND INCOME FUND, INC. |
| | |
| | By /s/ Michael J. Thawley |
| | Michael J. Thawley, Vice Chairman and Principal Executive Officer |
| | |
| | Date: January 31, 2013 |
Pursuant to the requirements of the Securities Exchange Act of 1934 and the Investment Company Act of 1940, this report has been signed below by the following persons on behalf of the Registrant and in the capacities and on the dates indicated.
| By /s/ Michael J. Thawley |
Michael J. Thawley, Vice Chairman and Principal Executive Officer |
| |
| Date: January 31, 2013 |
| By /s/ Neal F. Wellons |
Neal F. Wellons, Treasurer and Principal Financial Officer |
| |
| Date: January 31, 2013 |