Item 1: Report to Shareholders| Dividend Growth Fund | June 30, 2005 |
The views and opinions in this report were current as of June 30, 2005. They are not guarantees of performance or investment results and should not be taken as investment advice. Investment decisions reflect a variety of factors, and the managers reserve the right to change their views about individual stocks, sectors, and the markets at any time. As a result, the views expressed should not be relied upon as a forecast of the fund’s future investment intent. The report is certified under the Sarbanes-Oxley Act of 2002, which requires mutual funds and other public companies to affirm that, to the best of their knowledge, the information in their financial reports is fairly and accurately stated in all material respects.
REPORTS ON THE WEB
Sign up for our E-mail Program, and you can begin to receive updated fund reports and prospectuses online rather than through the mail. Log in to your account at troweprice.com for more information.
Fellow Shareholders
Market performance in the first half of 2005 was uninspiring. Stocks generally declined, as modest second-quarter gains were not enough to offset first-quarter losses. Continued geopolitical uncertainty and concerns about the impact of high energy prices on the pace of economic growth kept a lid on market returns. Large-cap shares held up slightly better than small-caps, but mid-cap stocks decisively outperformed both segments. Value stocks outperformed their growth counterparts across all market capitalizations. In the large-cap universe, energy stocks and utilities produced vigorous gains and far surpassed other sectors. Health care was also modestly higher. The materials and consumer discretionary sectors fared worst, but stocks in the telecommunication services, information technology, industrials, and financial sectors also struggled.
Underneath the market’s weakness, there is good news for the investors in this fund. Corporate balance sheets are generally in excellent shape, and the trend of cash-rich companies returning cash to shareholders via stock buybacks and dividends continued into 2005. According to Business Week, 381 companies in the S&P 500 spent $82 billion repurchasing their own shares in the first quarter of 2005, up 91% from a year ago. More important to us, dividend payments from the S&P 500 companies rose 16% in the first quarter compared to the year-ago period.
Your fund returned -0.96% during the six months ended June 30, narrowly trailing the S&P 500 Stock Index and somewhat more behind its Lipper peer group, as shown in the table. Returns for the 12 months were better, reflecting the stronger market environment in the second half of 2004. For the year, fund results outpaced the S&P 500 but lagged our Lipper benchmark.
| PERFORMANCE COMPARISON |
| | |
| Periods Ended 6/30/05 | 6 Months | 12 Months |
| Dividend Growth Fund | -0.96% | 7.85% |
| S&P 500 Stock Index | -0.81 | 6.32 |
| Lipper Multi-Cap Core | | |
| Funds Index | 0.46 | 8.51 |
PERFORMANCE REVIEW
Top contributors for the first half of the year generally fell into the energy, aerospace and defense, industrials, and health care areas. Those gains were offset by holdings in consumer discretionary and financials. After declining early on, the price of oil rebounded to record levels of over $60 a barrel in June. Although inventories have risen around the globe and demand slightly moderated, concerns about the adequacy of global surplus capacity and limited refining capacity reemerged. This price strength provided a tailwind for energy stocks, and as oil companies spend at higher levels, demand for equipment and services is increasing. Diamond Offshore Drilling and ExxonMobil, the fund’s largest position, were our top two contributors during the first half. (Please refer to the financial statements in this report for a complete listing of the fund’s holdings and the amount each represents in the portfolio.)
Aerospace and defense, an area we have been committed to for some time, provided good results driven by increased defense spending. Our top contributors in this segment included Lockheed Martin, the nation’s largest defense contractor, and Rockwell Collins, which benefited from robust growth in its defense segment as well as a rebound in its commercial aerospace markets.
Health care companies reversed their recent underperformance, buoyed by strength in service providers and to some extent pharmaceutical companies. Several factors worked in favor of the services industry, including moderating cost trends and consolidation. Hospital operator HCA was among our top contributors, aided by stabilizing patient volumes and improvement in the company’s level of bad debts. The legislative and regulatory environment has improved for pharmaceutical companies. Eli Lilly fended off a patent challenge in a U.S. District Court this past April, a major victory since the pharmaceutical giants depend on patents to protect their products from generic competition. In addition, an FDA advisory panel said that Celebrex could still be marketed and recommended allowing Vioxx back on the market, countering some of the safety concerns we noted in the December letter. Although the worst appears to be over for most of the large pharmaceutical companies, they offer little in the way of growth given the well-documented holes in the drug pipeline. Their primary attraction now lies in their historically low valuations and above-average yields. Our top-conviction pharmaceutical holding is Wyeth, whose growth prospects we believe are above the industry average.
The consumer discretionary sector trailed as high energy costs cut into consumers’ purchasing power. Several retailers, including Family Dollar Stores and Home Depot, along with consumer product companies such as Estee Lauder, had a lackluster start to the year. We remain committed to each of these investments because we see their businesses as long-term winners. Interestingly, multiline retailer Target and pharmacy operator Walgreen performed well for us in the first half, bucking the trend felt by most other consumer-oriented businesses. Media stocks continued to suffer due to weak advertising markets and the shift in market share from “old media” (newspapers/TV/Radio) to new media (the Internet). Time Warner, Viacom, and Tribune are feeling pressure, but in our opinion represent very good value.
Financials remain the fund’s largest sector exposure, and except for real estate, every industry within the sector was either flat or down. Uncertainties over inflation and interest rates and a weak environment for brokerage and investment banking were largely responsible for the subpar performance. Vornado Realty Trust, a real estate investment trust (REIT) that owns office property and shopping centers in the New York City area and elsewhere on the East Coast, was a good contributor. Major bank holdings Citigroup and State Street were flat, despite good underlying company results. Insurers American International Group and Marsh & McLennan detracted modestly as they continue to work through their respective regulatory issues. Mortgage thrifts remained troubled, and exposure to Fannie Mae and Freddie Mac hampered results. Fannie Mae announced it would cut its dividend in half to try to boost its capital cushion amid an accounting crisis. In addition, discussion on Capitol Hill about regulatory reform for the government-sponsored entities weighed on the stock. Freddie Mac was also under pressure from potential reforms. Among other changes, the chairman of the House Banking Committee is seeking stronger capital requirements. Passage of a reform package should reduce some of the political risk inherent in the current stock prices. Additionally, new management teams are working to improve systems and controls, and progress is being made toward timely financial reporting. Freddie Mac should have current financial statements in the next few months, and Fannie Mae should follow in the next year. The government-sponsored entities remain at the heart of the U.S. housing industry and Congress will likely strengthen the current mortgage system that has worked for so many years.
PORTFOLIO CHANGES
With technology shares again looking attractive, much of our buying in the first half was focused on the sector. We found good value in some of the larger-cap semiconductor companies, including Intel and Analog Devices, both new positions. The semiconductor industry suffered through an inventory correction in the first half of the year, which weakened stock prices and provided an opportunity for us to increase exposure at attractive prices. Inventories are now largely in balance, and capacity utilization is improving, and this is being reflected in the companies’ margin structure and performance. To make room for Intel and Analog Devices, we eliminated Intersil, a mid-cap semiconductor company, and Molex, a connector company. In each case, we believe the risk-reward trade-off in our new holdings is superior. In communications equipment, we initiated a position in the world’s largest cell phone maker, Nokia. We are familiar with Nokia since we previously owned it. We’ve now returned to it based on its attractive valuation, new product flow, and management’s aggressive new focus on returning the company’s significant excess cash to shareholders via dividends and share repurchases. Within IT service companies, we focused on transaction processors such as First Data and Paychex, because we like their less-cyclical business models that yield recurring revenue. In addition, companies like these tend to perform well when the economy slows and their relative growth looks especially attractive.
| SECTOR DIVERSIFICATION |
| | | |
| | Percent of | Percent of |
| Net Assets | Net Assets |
| | 12/31/04 | 6/30/05 |
| Financials | 22.9% | 21.7% |
| Industrials and Business Services | 14.4 | 15.0 |
| Consumer Discretionary | 15.4 | 14.5 |
| Information Technology | 10.5 | 11.7 |
| Energy | 8.0 | 8.6 |
| Health Care | 7.9 | 7.8 |
| Consumer Staples | 7.9 | 7.5 |
| Telecommunication Services | 5.7 | 5.6 |
| Utilities | 1.6 | 2.4 |
| Materials | 3.2 | 1.7 |
| Others and Reserves | 2.5 | 3.5 |
| Total | 100.0% | 100.0% |
| Historical weightings reflect current industry/sector classifications. |
We also added to our industrials holdings. We initiated a position in Teleflex, a mid-cap industrial conglomerate. It is another old favorite in which we have made successful investments in the past. Teleflex’s units serve the automotive, medical, marine, industrial, and aerospace markets. The company’s management recognized that some of its diverse businesses could not be justified financially, and it is now restructuring, including divesting segments that are not up to par. We see tremendous value in the company based on the free cash flow it generates, and though it has already moved somewhat higher, we think it still has room for significant appreciation.
We took some money off the table in energy and continued to reduce our exposure in materials. In general, we see signs of slowing demand in nearly all commodities as weakness spreads beyond the U.S. to include Japan and the European Union. There is mounting evidence that we may have seen the peak in the global steel cycle. In general, many commodity stocks are now fairly valued, in our opinion. We eliminated Dow Chemical and steel maker Nucor, and significantly reduced our positions in fertilizer maker Potash Corp./Saskatchewan and Diamond Offshore Drilling—all positions that have done well for us.
OUTLOOK
We are optimistic as we head into the back half of the year. The economy appears sound, inflation is in check, and interest rates remain low by historical standards, providing stimulus for continued steady growth. Valuations, particularly among larger-cap stocks, are reasonable, and corporate fundamentals generally healthy. We believe the fund is well positioned in companies that offer an attractive combination of earnings and dividend growth.
Respectfully submitted,

Thomas J. Huber
President of the fund and chairman of its Investment Advisory Committee
July 19, 2005
The committee chairman has day-to-day responsibility for managing the portfolio and works with committee members in developing and executing the fund’s investment program.
RISKS OF STOCK INVESTING
As with all stock and bond mutual funds, a fund’s share price can fall because of weakness in the stock or bond markets, a particular industry, or specific holdings. Stock markets can decline for many reasons, including adverse political or economic developments, changes in investor psychology, or heavy institutional selling. The prospects for an industry or company may deteriorate because of a variety of factors, including disappointing earnings or changes in the competitive environment. In addition, the investment manager’s assessment of companies held in a fund may prove incorrect, resulting in losses or poor performance even in rising markets. Funds investing in stocks with a dividend orientation may have somewhat lower potential for price appreciation than those concentrating on rapidly growing firms. Also, a company may reduce or eliminate its dividend.
GLOSSARY
Dividend yield: The annual dividend of a stock divided by the stock’s price.
Beta: A measure of the market risk of a stock showing how responsive it is to a given market index, such as the S&P 500 Stock Index. By definition, the beta of the benchmark index is 1.00. A fund with a 1.10 beta is expected to perform 10% better than the index in up markets and 10% worse in down markets. Usually, higher betas represent riskier investments.
Lipper indexes: Fund benchmarks that consist of a small number (10 to 30) of the largest mutual funds in a particular category as tracked by Lipper Inc.
Price/earnings ratio (P/E): A valuation measure calculated by dividing the price of a stock by its current or projected earnings per share. This ratio gives investors an idea of how much they are paying for current or future earnings power.
Risk/reward: The relationship between the degree of risk associated with an investment and its return potential. Typically, the higher the potential return of an investment, the greater the risk.
Standard & Poor’s Stock Ratings: A computerized scoring system based on per share earnings and dividend records of the most recent 10 years and measured against a matrix derived from the scores of a large and representative sample of stocks.
S&P 500 Stock Index: An unmanaged index that tracks the stocks of 500 primarily large-capitalization U.S. companies.
| PORTFOLIO HIGHLIGHTS |
| |
| TWENTY-FIVE LARGEST HOLDINGS | |
| | Percent of |
| | Net Assets |
| | 6/30/05 |
| |
| ExxonMobil | 2.4% |
| Citigroup | 2.4 |
| GE | 1.9 |
| Target | 1.7 |
| State Street | 1.6 |
| Microsoft | 1.5 |
| Vodafone | 1.4 |
| Home Depot | 1.4 |
| Total | 1.4 |
| First Data | 1.3 |
| U.S. Bancorp | 1.3 |
| Sprint | 1.3 |
| Time Warner | 1.3 |
| Roper Industries | 1.3 |
| NiSource | 1.3 |
| Wyeth | 1.3 |
| Carnival | 1.2 |
| Altria Group | 1.2 |
| St. Paul Companies | 1.2 |
| Wells Fargo | 1.2 |
| Diamond Offshore Drilling | 1.2 |
| Pfizer | 1.2 |
| Union Pacific | 1.2 |
| BP | 1.2 |
| Viacom | 1.2 |
| Total | 35.6% |
| |
| Note: Table excludes investments in the T. Rowe Price Reserve Investment Fund. | |
| MAJOR PORTFOLIO CHANGES | |
| Listed in descending order of size | |
| |
| 6 Months Ended 6/30/05 | |
| |
| Largest Purchases | Largest Sales |
| |
| Teleflex | New York Times ** |
| Analog Devices * | Nucor ** |
| Nokia * | Dow Chemical ** |
| Tribune * | Molex ** |
| Intel * | Potash Corp./Saskatchewan |
| John Nuveen * | Hewlett-Packard ** |
| Sigma Aldrich * | Intersil Holding ** |
| AGL Resources * | SLM Corporation ** |
| Time Warner | Newell Rubbermaid ** |
| First Data | Diamond Offshore Drilling |
| |
| * | Position added | |
| ** | Position eliminated | |
This chart shows the value of a hypothetical $10,000 investment in the fund over the past 10 fiscal year periods or since inception (for funds lacking 10-year records). The result is compared with benchmarks, which may include a broad-based market index and a peer group average or index. Market indexes do not include expenses, which are deducted from fund returns as well as mutual fund averages and indexes.
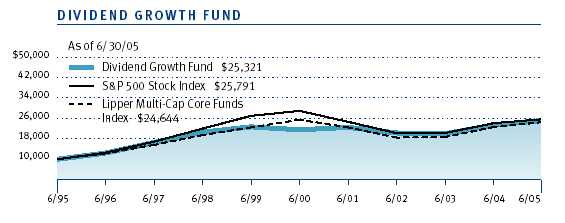
| AVERAGE ANNUAL COMPOUND TOTAL RETURN |
This table shows how the fund and its benchmarks would have performed if their actual (or cumulative) returns for the periods shown had been earned at a constant rate.
| Periods Ended 6/30/05 | 1 Year | 5 Years | 10 Years |
| |
| Dividend Growth Fund | 7.85% | 3.20% | 9.74% |
| |
| S&P 500 Stock Index | 6.32 | -2.37 | 9.94 |
| |
| Lipper Multi-Cap Core | | | |
| Funds Index | 8.51 | -0.77 | 9.44 |
| |
| Current performance may be higher or lower than the quoted past performance, which can- |
| not guarantee future results. Share price, principal value, and return will vary, and you may |
| have a gain or loss when you sell your shares. For the most recent month-end performance |
| information, please visit our Web site (troweprice.com) or contact a T. Rowe Price represen- |
| tative at 1-800-225-5132. | | | |
| Average annual total return figures include changes in principal value, reinvested dividends, and capital |
| gain distributions. Returns do not reflect taxes that the shareholder may pay on fund distributions or the |
| redemption of fund shares. When assessing performance, investors should consider both short- and long- |
| term returns. | | | |
As a mutual fund shareholder, you may incur two types of costs: (1) transaction costs such as redemption fees or sales loads and (2) ongoing costs, including management fees, distribution and service (12b-1) fees, and other fund expenses. The following example is intended to help you understand your ongoing costs (in dollars) of investing in the fund and to compare these costs with the ongoing costs of investing in other mutual funds. The example is based on an investment of $1,000 invested at the beginning of the most recent six-month period and held for the entire period.
Actual Expenses
The first line of the following table (“Actual”) provides information about actual account values and actual expenses. You may use the information in this line, together with your account balance, to estimate the expenses that you paid over the period. Simply divide your account value by $1,000 (for example, an $8,600 account value divided by $1,000 = 8.6), then multiply the result by the number in the first line under the heading “Expenses Paid During Period” to estimate the expenses you paid on your account during this period.
Hypothetical Example for Comparison Purposes
The information on the second line of the table (“Hypothetical”) is based on hypothetical account values and expenses derived from the fund’s actual expense ratio and an assumed 5% per year rate of return before expenses (not the fund’s actual return). You may compare the ongoing costs of investing in the fund with other funds by contrasting this 5% hypothetical example and the 5% hypothetical examples that appear in the shareholder reports of the other funds. The hypothetical account values and expenses may not be used to estimate the actual ending account balance or expenses you paid for the period.
Note: T. Rowe Price charges an annual small-account maintenance fee of $10, generally for accounts with less than $2,000 ($500 for UGMA/UTMA). The fee is waived for any investor whose T. Rowe Price mutual fund accounts total $25,000 or more, accounts employing automatic investing, and IRAs and other retirement plan accounts that utilize a prototype plan sponsored by T. Rowe Price (although a separate custodial or administrative fee may apply to such accounts). This fee is not included in the accompanying table. If you are subject to the fee, keep it in mind when you are estimating the ongoing expenses of investing in the fund and when comparing the expenses of this fund with other funds.
You should also be aware that the expenses shown in the table highlight only your ongoing costs and do not reflect any transaction costs, such as redemption fees or sales loads. Therefore, the second line of the table is useful in comparing ongoing costs only and will not help you determine the relative total costs of owning different funds. To the extent a fund charges transaction costs, however, the total cost of owning that fund is higher.
| T. ROWE PRICE DIVIDEND GROWTH FUND |
| |
| | Beginning | Ending | Expenses Paid |
| | Account Value | Account Value | During Period* |
| | 1/1/05 | 6/30/05 | 1/1/05 to 6/30/05 |
| Actual | $1,000.00 | $990.40 | $3.75 |
| Hypothetical (assumes 5% | | | |
| return before expenses) | $1,000.00 | $1,021.03 | $3.81 |
| * Expenses are equal to the fund’s annualized expense ratio for the six-month period (0.76%), multiplied |
| by the average account value over the period, multiplied by the number of days in the most recent fiscal |
| half year (181) divided by the days in the year (365) to reflect the half-year period. |
Unaudited
| FINANCIAL HIGHLIGHTS | For a share outstanding throughout each period |
| | 6 Months | | Year | | | | | | | | |
| | | Ended | | Ended | | | | | | | | |
| | | 6/30/05** | | 12/31/04 | 12/31/03 | 12/31/02 | 12/31/01 | 12/31/00 |
| NET ASSET VALUE | | | | | | | | | | | | |
| Beginning of period | $ | 22.92 | $ | 20.72 | $ | 16.76 | $ | 20.79 | $ | 21.88 | $ | 20.21 |
|
|
| |
| Investment activities | | | | | | | | | | | | |
| Net investment | | | | | | | | | | | | |
| income (loss) | | 0.11 | | 0.26 | | 0.22 | | 0.20 | | 0.27 | | 0.30 |
| Net realized and | | | | | | | | | | | | |
| unrealized gain (loss) | | (0.33) | | 2.19 | | 3.97 | | (4.03) | | (1.08) | | 1.71 |
|
|
| Total from | | | | | | | | | | | | |
| investment activities | | (0.22) | | 2.45 | | 4.19 | | (3.83) | | (0.81) | | 2.01 |
|
|
| |
| Distributions | | | | | | | | | | | | |
| Net investment income | | (0.11) | | (0.25) | | (0.23) | | (0.20) | | (0.28) | | (0.29) |
| Net realized gain | | – | | – | | – | | – | | – | | (0.05) |
|
|
| Total distributions | | (0.11) | | (0.25) | | (0.23) | | (0.20) | | (0.28) | | (0.34) |
|
|
| |
| NET ASSET VALUE | | | | | | | | | | | | |
| End of period | $ | 22.59 | $ | 22.92 | $ | 20.72 | $ | 16.76 | $ | 20.79 | $ | 21.88 |
|
|
| |
| |
| Ratios/Supplemental Data | | | | | | | | | | |
| Total return^ | | (0.96)% | | 11.90% | | 25.17% | (18.47)% | | (3.64)% | | 10.06% |
| Ratio of total expenses to | | | | | | | | | | | | |
| average net assets | | 0.76%† | | 0.78% | | 0.83% | | 0.83% | | 0.82% | | 0.81% |
| Ratio of net investment | | | | | | | | | | | | |
| income (loss) to average | | | | | | | | | | | | |
| net assets | | 1.03%† | | 1.21%+ | | 1.25% | | 1.08% | | 1.31% | | 1.43% |
| Portfolio turnover rate | | 19.7%† | | 16.5% | | 17.5% | | 20.4% | | 34.9% | | 35.7% |
| Net assets, end of period | | | | | | | | | | | | |
| (in millions) | $ | 765 | $ | 754 | $ | 695 | $ | 531 | $ | 692 | $ | 751 |
| ^ | Total return reflects the rate that an investor would have earned on an investment in the fund during each period, |
| | assuming reinvestment of all distributions. |
| † | Annualized |
| ** Per share amounts calculated using average shares outstanding method. |
| + | Includes the effect of a one-time special dividend (0.18% of average net assets) that is not expected to recur. |
The accompanying notes are an integral part of these financial statements.
Unaudited
| PORTFOLIO OF INVESTMENTS (1) | Shares | Value |
| (Cost and value in $ 000s) | | |
| COMMON STOCKS 96.5% | | |
| |
| CONSUMER DISCRETIONARY 14.5% | | |
| Hotels, Restaurants & Leisure 1.7% | | |
| Carnival | 175,000 | 9,546 |
| International Game Technology | 125,000 | 3,519 |
| | | 13,065 |
| Leisure Equipment & Products 0.7% | | |
| Mattel | 300,000 | 5,490 |
| | | 5,490 |
| Media 7.4% | | |
| Clear Channel Communications | 150,000 | 4,640 |
| Disney | 180,000 | 4,532 |
| EchoStar Communications, Class A | 100,000 | 3,015 |
| McGraw-Hill | 180,000 | 7,965 |
| Meredith | 100,000 | 4,906 |
| Omnicom | 100,000 | 7,986 |
| Time Warner * | 600,000 | 10,026 |
| Tribune | 125,000 | 4,398 |
| Viacom, Class B | 275,000 | 8,805 |
| | | 56,273 |
| Multiline Retail 2.6% | | |
| Family Dollar Stores | 270,000 | 7,047 |
| Target | 232,500 | 12,650 |
| | | 19,697 |
| Specialty Retail 2.1% | | |
| Home Depot | 275,000 | 10,698 |
| Ross Stores | 200,000 | 5,782 |
| | | 16,480 |
| Total Consumer Discretionary | | 111,005 |
| |
| CONSUMER STAPLES 7.5% | | |
| Beverages 1.0% | | |
| PepsiCo | 135,000 | 7,281 |
| | | 7,281 |
| Food & Staples Retailing 2.2% | | |
| Sysco | 125,000 | 4,524 |
| Wal-Mart | 85,000 | 4,097 |
| Walgreen | 177,500 | 8,163 |
| | | 16,784 |
| Food Products 2.1% | | |
| General Mills | 147,500 | 6,901 |
| McCormick | 160,000 | 5,229 |
| Unilever (GBP) | 400,000 | 3,847 |
| | | 15,977 |
| Household Products 0.3% | | |
| Colgate-Palmolive | 50,000 | 2,496 |
| | | 2,496 |
| Personal Products 0.7% | | |
| Estee Lauder, Class A | 140,000 | 5,478 |
| | | 5,478 |
| Tobacco 1.2% | | |
| Altria Group | 147,500 | 9,537 |
| | | 9,537 |
| Total Consumer Staples | | 57,553 |
| |
| ENERGY 8.6% | | |
| Energy Equipment & Services 2.3% | | |
| Baker Hughes | 170,000 | 8,697 |
| Diamond Offshore Drilling | 172,500 | 9,217 |
| | | 17,914 |
| Oil, Gas & Consumable Fuels 6.3% | | |
| Amerada Hess | 12,500 | 1,331 |
| BP ADR | 145,000 | 9,045 |
| Chevron | 150,000 | 8,388 |
| ExxonMobil | 325,000 | 18,678 |
| Total ADR | 90,000 | 10,516 |
| | | 47,958 |
| Total Energy | | 65,872 |
| FINANCIALS 21.7% | | |
| Capital Markets 5.1% | | |
| Bank of New York | 170,000 | 4,893 |
| John Nuveen | 125,000 | 4,702 |
| Mellon Financial | 245,000 | 7,029 |
| Morgan Stanley | 115,000 | 6,034 |
| State Street | 250,000 | 12,062 |
| Waddell & Reed Financial, Class A | 235,000 | 4,348 |
| | | 39,068 |
| Commercial Banks 2.8% | | |
| Fifth Third Bancorp | 60,000 | 2,473 |
| U.S. Bancorp | 345,000 | 10,074 |
| Wells Fargo | 150,000 | 9,237 |
| | | 21,784 |
| Consumer Finance 1.2% | | |
| American Express | 165,000 | 8,783 |
| | | 8,783 |
| Diversified Financial Services 3.0% | | |
| Citigroup | 400,000 | 18,492 |
| Principal Financial Group | 100,000 | 4,190 |
| | | 22,682 |
| Insurance 6.0% | | |
| American International Group | 117,500 | 6,827 |
| Genworth Financial, Class A | 200,000 | 6,046 |
| Hartford Financial Services | 80,000 | 5,982 |
| Marsh & McLennan | 270,000 | 7,479 |
| Prudential | 27,500 | 1,806 |
| St. Paul Companies | 235,000 | 9,290 |
| XL Capital | 115,000 | 8,558 |
| | | 45,988 |
| Real Estate 1.9% | | |
| Archstone-Smith Trust, REIT | 145,000 | 5,600 |
| Cousins Properties, REIT | 135,000 | 3,993 |
| Vornado Realty Trust, REIT | 65,000 | 5,226 |
| | | 14,819 |
| Thrifts & Mortgage Finance 1.7% | | |
| Fannie Mae | 90,000 | 5,256 |
| Freddie Mac | 72,500 | 4,729 |
| Radian | 67,500 | 3,187 |
| | | 13,172 |
| Total Financials | | 166,296 |
| |
| HEALTH CARE 7.8% | | |
| Biotechnology 0.5% | | |
| MedImmune * | 150,000 | 4,008 |
| | | 4,008 |
| Health Care Equipment & Supplies 1.1% | | |
| Dentsply International | 70,000 | 3,780 |
| Medtronic | 90,000 | 4,661 |
| | | 8,441 |
| Health Care Providers & Services 1.0% | | |
| Cardinal Health | 30,000 | 1,727 |
| HCA | 110,000 | 6,234 |
| | | 7,961 |
| Pharmaceuticals 5.2% | | |
| Abbott Laboratories | 110,000 | 5,391 |
| Bristol Myers Squibb | 155,000 | 3,872 |
| Eli Lilly | 47,500 | 2,646 |
| Johnson & Johnson | 135,000 | 8,775 |
| Pfizer | 330,000 | 9,102 |
| Wyeth | 220,000 | 9,790 |
| | | 39,576 |
| Total Health Care | | 59,986 |
| |
| INDUSTRIALS & BUSINESS SERVICES 15.0% | | |
| Aerospace & Defense 3.5% | | |
| General Dynamics | 40,000 | 4,382 |
| Honeywell International | 170,000 | 6,227 |
| Lockheed Martin | 130,000 | 8,433 |
| Rockwell Collins | 165,000 | 7,867 |
| | | 26,909 |
| Air Freight & Logistics 1.6% | | |
| C.H. Robinson Worldwide | 50,000 | 2,910 |
| Expeditors International of Washington | 55,000 | 2,739 |
| UPS, Class B | 100,000 | 6,916 |
| | | 12,565 |
| Building Products 0.7% | | |
| Masco | 155,000 | 4,923 |
| | | 4,923 |
| Commercial Services & Supplies 1.4% | | |
| ARAMARK, Class B | 130,000 | 3,432 |
| Waste Management | 250,000 | 7,085 |
| | | 10,517 |
| Industrial Conglomerates 5.4% | | |
| GE | 420,000 | 14,553 |
| Roper Industries | 140,000 | 9,992 |
| Teleflex | 135,000 | 8,015 |
| Tyco International | 300,000 | 8,760 |
| | | 41,320 |
| Machinery 1.2% | | |
| Danaher | 95,000 | 4,972 |
| Pall | 140,000 | 4,251 |
| | | 9,223 |
| Road & Rail 1.2% | | |
| Union Pacific | 140,000 | 9,072 |
| | | 9,072 |
| Total Industrials & Business Services | | 114,529 |
| |
| INFORMATION TECHNOLOGY 11.7% | | |
| Communications Equipment 1.3% | | |
| Cisco Systems * | 200,000 | 3,822 |
| Nokia ADR | 365,000 | 6,074 |
| | | 9,896 |
| Computers & Peripherals 1.4% | | |
| Dell * | 150,000 | 5,926 |
| Diebold | 115,000 | 5,188 |
| | | 11,114 |
| Electronic Equipment & Instruments 0.4% | | |
| Jabil Circuit * | 100,000 | 3,073 |
| | | 3,073 |
| IT Services 3.6% | | |
| Automatic Data Processing | 155,000 | 6,505 |
| Certegy | 160,000 | 6,115 |
| First Data | 255,000 | 10,236 |
| Paychex | 135,000 | 4,393 |
| | | 27,249 |
| Semiconductor & Semiconductor Equipment 3.0% | | |
| Analog Devices | 165,000 | 6,156 |
| Intel | 215,000 | 5,603 |
| Linear Technology | 135,000 | 4,953 |
| Texas Instruments | 175,000 | 4,912 |
| Xilinx | 55,000 | 1,403 |
| | | 23,027 |
| Software 2.0% | | |
| Jack Henry & Associates | 175,000 | 3,204 |
| Microsoft | 475,000 | 11,799 |
| | | 15,003 |
| Total Information Technology | | 89,362 |
| |
| MATERIALS 1.7% | | |
| Chemicals 1.0% | | |
| Potash Corp./Saskatchewan | 37,000 | 3,536 |
| Sigma Aldrich | 70,000 | 3,923 |
| | | 7,459 |
| Paper & Forest Products 0.7% | | |
| International Paper | 175,000 | 5,287 |
| | | 5,287 |
| Total Materials | | 12,746 |
| TELECOMMUNICATION SERVICES 5.6% | | |
| Diversified Telecommunication Services 4.2% | | |
| Alltel | 100,000 | 6,228 |
| Sprint | 400,000 | 10,036 |
| Telus (Non-voting shares) | 225,000 | 7,652 |
| Verizon Communications | 225,000 | 7,774 |
| | | 31,690 |
| Wireless Telecommunication Services 1.4% | | |
| Vodafone ADR | 450,000 | 10,944 |
| | | 10,944 |
| Total Telecommunication Services | | 42,634 |
| |
| UTILITIES 2.4% | | |
| Electric Utilities 0.5% | | |
| Pinnacle West Capital | 90,000 | 4,001 |
| | | 4,001 |
| Gas Utilities 1.9% | | |
| AGL Resources | 105,000 | 4,058 |
| NiSource | 400,000 | 9,892 |
| | | 13,950 |
| Total Utilities | | 17,951 |
| Total Common Stocks (Cost $551,157) | | 737,934 |
| SHORT-TERM INVESTMENTS 3.9% | | |
| | | |
| Money Market Fund 3.9% | | |
| T. Rowe Price Reserve Investment Fund, 3.14% #† | 30,080,527 | 30,080 |
| Total Short-Term Investments (Cost $30,080) | | 30,080 |
| | | |
| Total Investments in Securities | | |
| 100.4% of Net Assets (Cost $581,237) | | $ 768,014 |
| (1) | Denominated in U.S. dollars unless other- |
| | wise noted |
| # | Seven-day yield |
| * | Non-income producing |
| † | Affiliated company – See Note 4 |
| ADR | American Depository Receipts |
| GBP | British pound |
| REIT | Real Estate Investment Trust |
The accompanying notes are an integral part of these financial statements.
Unaudited
| STATEMENT OF ASSETS AND LIABILITIES |
| (In thousands except shares and per share amounts) | | |
| Assets | | |
| Investments in securities, at value | | |
| Affiliated companies (cost $30,080) | $ | 30,080 |
| Non-affiliated companies (cost $551,157) | | 737,934 |
|
|
| Total investments in securities | | 768,014 |
| Dividends receivable | | 1,060 |
| Receivable for investment securities sold | | 1,346 |
| Receivable for shares sold | | 337 |
| Other assets | | 1 |
|
|
| Total assets | | 770,758 |
|
|
| |
| Liabilities | | |
| Investment management fees payable | | 325 |
| Payable for investment securities purchased | | 592 |
| Payable for shares redeemed | | 4,476 |
| Due to affiliates | | 119 |
| Other liabilities | | 187 |
|
|
| Total liabilities | | 5,699 |
|
|
| |
| NET ASSETS | $ | 765,059 |
|
|
| Net Assets Consist of: | | |
| Undistributed net investment income (loss) | $ | 385 |
| Undistributed net realized gain (loss) | | 11,640 |
| Net unrealized gain (loss) | | 186,777 |
| Paid-in-capital applicable to 33,866,441 shares of | | |
| $0.0001 par value capital stock outstanding; | | |
| 1,000,000,000 shares authorized | | 566,257 |
|
|
| |
| NET ASSETS | $ | 765,059 |
|
|
| |
| NET ASSET VALUE PER SHARE | $ | 22.59 |
|
|
The accompanying notes are an integral part of these financial statements.
Unaudited
| STATEMENT OF OPERATIONS |
| ($ 000s) | | |
| | | 6 Months |
| | | Ended |
| | | 6/30/05 |
| Investment Income (Loss) | | |
| Income | | |
| Dividend | $ | 6,660 |
| Securities lending | | 11 |
|
|
| Total income | | 6,671 |
|
|
| Expenses | | |
| Investment management | | 1,912 |
| Shareholder servicing | | 782 |
| Custody and accounting | | 68 |
| Prospectus and shareholder reports | | 45 |
| Registration | | 11 |
| Proxy and annual meeting | | 9 |
| Legal and audit | | 7 |
| Directors | | 4 |
| Miscellaneous | | 1 |
|
|
| Total expenses | | 2,839 |
|
|
| Net investment income (loss) | | 3,832 |
|
|
| |
| Realized and Unrealized Gain (Loss) | | |
| Net realized gain (loss) | | |
| Securities | | 11,649 |
| Foreign currency transactions | | (3) |
|
|
| Net realized gain (loss) | | 11,646 |
|
|
| Change in net unrealized gain (loss) on securities | | (22,426) |
|
|
| Net realized and unrealized gain (loss) | | (10,780) |
|
|
| |
| INCREASE (DECREASE) IN NET | | |
| ASSETS FROM OPERATIONS | $ | (6,948) |
|
|
The accompanying notes are an integral part of these financial statements.
Unaudited
| STATEMENT OF CHANGES IN NET ASSETS |
| ($ 000s) | | | | |
| | | 6 Months | | Year |
| | | Ended | | Ended |
| | | 6/30/05 | | 12/31/04 |
| |
| Increase (Decrease) in Net Assets | | | | |
| Operations | | | | |
| Net investment income (loss) | $ | 3,832 | $ | 8,555 |
| Net realized gain (loss) | | 11,646 | | 20,549 |
| Change in net unrealized gain (loss) | | (22,426) | | 51,147 |
|
|
| Increase (decrease) in net assets from operations | | (6,948) | | 80,251 |
|
|
| |
| Distributions to shareholders | | | | |
| Net investment income | | (3,716) | | (8,286) |
|
|
| |
| Capital share transactions * | | | | |
| Shares sold | | 77,031 | | 108,886 |
| Distributions reinvested | | 3,450 | | 7,772 |
| Shares redeemed | | (58,533) | | (129,907) |
|
|
| Increase (decrease) in net assets from capital | | | | |
| share transactions | | 21,948 | | (13,249) |
|
|
| |
| Net Assets | | | | |
| Increase (decrease) during period | | 11,284 | | 58,716 |
| Beginning of period | | 753,775 | | 695,059 |
|
|
| |
| End of period | $ | 765,059 | $ | 753,775 |
|
|
| (Including undistributed net investment income of | | | | |
| $385 at 6/30/05 and $269 at 12/31/04) | | | | |
| |
| *Share information | | | | |
| Shares sold | | 3,421 | | 5,139 |
| Distributions reinvested | | 153 | | 358 |
| Shares redeemed | | (2,600) | | (6,147) |
|
|
| Increase (decrease) in shares outstanding | | 974 | | (650) |
The accompanying notes are an integral part of these financial statements.
Unaudited
| NOTES TO FINANCIAL STATEMENTS |
NOTE 1 - SIGNIFICANT ACCOUNTING POLICIES
T. Rowe Price Dividend Growth Fund, Inc. (the fund) is registered under the Investment Company Act of 1940 (the 1940 Act) as a diversified, open-end management investment company. The fund commenced operations on December 30, 1992. The fund seeks to provide increasing dividend income over time, long-term growth of capital, and a reasonable level of current income through investments primarily in dividend-paying stocks.
The accompanying financial statements were prepared in accordance with accounting principles generally accepted in the United States of America, which require the use of estimates made by fund management. Fund management believes that estimates and security valuations are appropriate; however actual results may differ from those estimates, and the security valuations reflected in the financial statements may differ from the value the fund receives upon sale of the securities.
Valuation The fund values its investments and computes its net asset value per share at the close of the New York Stock Exchange (NYSE), normally 4 p.m. ET, each day that the NYSE is open for business. Equity securities listed or regularly traded on a securities exchange or in the over-the-counter market are valued at the last quoted sale price or, for certain markets, the official closing price at the time the valuations are made, except for OTC Bulletin Board securities, which are valued at the mean of the latest bid and asked prices. A security that is listed or traded on more than one exchange is valued at the quotation on the exchange determined to be the primary market for such security. Listed securities not traded on a particular day are valued at the mean of the latest bid and asked prices for domestic securities and the last quoted sale price for international securities.
Investments in mutual funds are valued at the mutual fund’s closing net asset value per share on the day of valuation.
Other investments, including restricted securities, and those for which the above valuation procedures are inappropriate or are deemed not to reflect fair value are stated at fair value as determined in good faith by the T. Rowe Price Valuation Committee, established by the fund’s Board of Directors.
Most foreign markets close before the close of trading on the NYSE. If the fund determines that developments between the close of a foreign market and the close of the NYSE will, in its judgment, materially affect the value of some or all of its portfolio securities, which in turn will affect the fund’s share price, the fund will adjust the previous closing prices to reflect the fair value of the securities as of the close of the NYSE, as determined in good faith by the T. Rowe Price Valuation Committee, established by the fund’s Board of Directors. A fund may also fair value securities in other situations, such as when a particular foreign market is closed but the fund is open. In deciding whether to make fair value adjustments, the fund reviews a variety of factors, including developments in foreign markets, the performance of U.S. securities markets, and the performance of instruments trading in U. S. markets that represent foreign securities and baskets of foreign securities. The fund uses outside pricing services to provide it with closing market prices and information used for adjusting those prices. The fund cannot predict when and how often it will use closing prices and when it will adjust those prices to reflect fair value. As a means of evaluating its fair value process, the fund routinely compares closing market prices, the next day’s opening prices in the same markets, and adjusted prices.
Currency Translation Assets, including investments, and liabilities denominated in foreign currencies are translated into U.S. dollar values each day at the prevailing exchange rate, using the mean of the bid and asked prices of such currencies against U.S. dollars as quoted by a major bank. Purchases and sales of securities, income, and expenses are translated into U.S. dollars at the prevailing exchange rate on the date of the transaction. The effect of changes in foreign currency exchange rates on realized and unrealized security gains and losses is reflected as a component of security gains and losses.
Rebates and Credits Subject to best execution, the fund may direct certain security trades to brokers who have agreed to rebate a portion of the related brokerage commission to the fund in cash. Commission rebates are included in realized gain on securities in the accompanying financial statements and totaled $13,000 for the six months ended June 30, 2005. Additionally, the fund earns credits on temporarily uninvested cash balances at the custodian that reduce the fund’s custody charges. Custody expense in the accompanying financial statements is presented before reduction for credits.
Investment Transactions, Investment Income, and Distributions Income and expenses are recorded on the accrual basis. Dividends received from mutual fund investments are reflected as dividend income; capital gain distributions are reflected as realized gain/loss. Dividend income and capital gain distributions are recorded on the ex-dividend date. Investment transactions are accounted for on the trade date. Realized gains and losses are reported on the identified cost basis.
Distributions to shareholders are recorded on the ex-dividend date. Income distributions are declared and paid on a quarterly basis. Capital gain distributions, if any, are declared and paid by the fund, typically on an annual basis.
NOTE 2 - INVESTMENT TRANSACTIONS
Consistent with its investment objective, the fund engages in the following practices to manage exposure to certain risks or enhance performance. The investment objective, policies, program, and risk factors of the fund are described more fully in the fund’s prospectus and Statement of Additional Information.
Securities Lending The fund lends its securities to approved brokers to earn additional income. It receives as collateral cash and U.S. government securities valued at 102% to 105% of the value of the securities on loan. Cash collateral is invested in a money market pooled trust managed by the fund’s lending agent in accordance with investment guidelines approved by fund management. Collateral is maintained over the life of the loan in an amount not less than the value of loaned securities, as determined at the close of fund business each day; any additional collateral required due to changes in security values is delivered to the fund the next business day. Although risk is mitigated by the collateral, the fund could experience a delay in recovering its securities and a possible loss of income or value if the borrower fails to return the securities. Securities lending revenue recognized by the fund consists of earnings on invested collateral and borrowing fees, net of any rebates to the borrower and compensation to the lending agent. At June 30, 2005, there were no securities on loan.
Other Purchases and sales of portfolio securities, other than short-term securities, aggregated $86,135,000 and $71,717,000, respectively, for the six months ended June 30, 2005.
NOTE 3 - FEDERAL INCOME TAXES
No provision for federal income taxes is required since the fund intends to continue to qualify as a regulated investment company under Subchapter M of the Internal Revenue Code and distribute to shareholders all of its taxable income and gains. Federal income tax regulations differ from generally accepted accounting principles; therefore, distributions determined in accordance with tax regulations may differ in amount or character from net investment income and realized gains for financial reporting purposes. Financial reporting records are adjusted for permanent book/tax differences to reflect tax character. Financial records are not adjusted for temporary differences. The amount and character of tax-basis distributions and composition of net assets are finalized at fiscal year-end; accordingly, tax-basis balances have not been determined as of June 30, 2005.
At June 30, 2005, the cost of investments for federal income tax purposes was $581,237,000. Net unrealized gain aggregated $186,777,000 at period-end, of which $207,098,000 related to appreciated investments and $20,321,000 related to depreciated investments.
NOTE 4 - RELATED PARTY TRANSACTIONS
The fund is managed by T. Rowe Price Associates, Inc. (the manager or Price Associates), a wholly owned subsidiary of T. Rowe Price Group, Inc. The investment management agreement between the fund and the manager provides for an annual investment management fee, which is computed daily and paid monthly. The fee consists of an individual fund fee, equal to 0.20% of the fund’s average daily net assets, and a group fee. The group fee rate is calculated based on the combined net assets of certain mutual funds sponsored by Price Associates (the group) applied to a graduated fee schedule, with rates ranging from 0.48% for the first $1 billion of assets to 0.29% for assets in excess of $160 billion. Prior to May 1, 2005, the maximum group fee rate in the graduated fee schedule had been 0.295% for assets in excess of $120 billion. The fund’s group fee is determined by applying the group fee rate to the fund’s average daily net assets. At June 30, 2005, the effective annual group fee ra te was 0.31%.
In addition, the fund has entered into service agreements with Price Associates and two wholly owned subsidiaries of Price Associates (collectively, Price). Price Associates computes the daily share price and maintains the financial records of the fund. T. Rowe Price Services, Inc., provides shareholder and administrative services in its capacity as the fund’s transfer and dividend disbursing agent. T. Rowe Price Retirement Plan Services, Inc., provides subaccounting and recordkeeping services for certain retirement accounts invested in the fund. For the six months ended June 30, 2005, expenses incurred pursuant to these service agreements were $32,000 for Price Associates, $384,000 for T. Rowe Price Services, Inc., and $213,000 for T. Rowe Price Retirement Plan Services, Inc. The total amount payable at period end pursuant to these service agreements is reflected as due to affiliates in the accompanying financial statements.
The fund may invest in the T. Rowe Price Reserve Investment Fund and the T. Rowe Price Government Reserve Investment Fund (collectively, the Reserve Funds), open-end management investment companies managed by Price Associates and affiliates of the fund. The Reserve Funds are offered as cash management options to mutual funds, trusts, and other accounts managed by Price Associates and/or its affiliates, and are not available for direct purchase by members of the public. The Reserve Funds pay no investment management fees. During the six months ended June 30, 2005, dividend income from the Reserve Funds totaled $347,000, and the value of shares of the Reserve Funds held at June 30, 2005 and December 31, 2004 was $30,080,000 and $16,012,000, respectively.
As of June 30, 2005, T. Rowe Price Group, Inc. and/or its wholly owned subsidiaries owned 316,237 shares of the fund, representing less than 1% of the fund’s net assets.
| INFORMATION ON PROXY VOTING POLICIES, PROCEDURES, AND RECORDS |
A description of the policies and procedures used by T. Rowe Price funds and portfolios to determine how to vote proxies relating to portfolio securities is available in each fund’s Statement of Additional Information, which you may request by calling 1-800-225-5132 or by accessing the SEC’s Web site, www.sec.gov. The description of our proxy voting policies and procedures is also available on our Web site, www.troweprice.com. To access it, click on the words “Company Info” at the top of our homepage for individual investors. Then, in the window that appears, click on the “Proxy Voting Policy” navigation button in the top left corner.
Each fund’s most recent annual proxy voting record is available on our Web site and through the SEC’s Web site. To access it through our Web site, follow the directions above, then click on the words “Proxy Voting Record” at the bottom of the Proxy Voting Policy page.
| HOW TO OBTAIN QUARTERLY PORTFOLIO HOLDINGS |
The fund files a complete schedule of portfolio holdings with the Securities and Exchange Commission for the first and third quarters of each fiscal year on Form N-Q. The fund’s Form N-Q is available electronically on the SEC’s Web site (www.sec.gov); hard copies may be reviewed and copied at the SEC’s Public Reference Room, 450 Fifth St. N.W., Washington, DC 20549. For more information on the Public Reference Room, call 1-800-SEC-0330.
| APPROVAL OF INVESTMENT MANAGEMENT AGREEMENT |
On March 2, 2005, the fund’s Board of Directors unanimously approved the investment advisory contract (“Contract”) between the fund and its investment manager, T. Rowe Price Associates, Inc. (“Manager”). The Board considered a variety of factors in connection with its review of the Contract, also taking into account information provided by the Manager during the course of the year, as discussed below:
Services Provided by the Manager
The Board considered the nature, quality, and extent of the services provided to the fund by the Manager. These services included, but were not limited to, management of the fund’s portfolio and a variety of activities related to portfolio management. The Board also reviewed the background and experience of the Manager’s senior management team and investment personnel involved in the management of the fund. The Board concluded that it was satisfied with the nature, quality, and extent of the services provided by the Manager.
Investment Performance of the Fund
The Board reviewed the fund’s average annual total return over the 1-, 3-, 5-, and 10-year periods as well as the fund’s year-by-year returns and compared these returns to previously agreed upon comparable performance measures and market data, including those supplied by Lipper and Morningstar, which are independent providers of mutual fund data. On the basis of this evaluation and the Board’s ongoing review of investment results, the Board concluded that the fund’s performance was satisfactory.
Costs, Benefits, Profits, and Economies of Scale
The Board reviewed detailed information regarding the revenues received by the Manager under the Contract and other benefits that the Manager (and its affiliates) may have realized from its relationship with the fund, including research received under “soft dollar” agreements. The Board also received information on the estimated costs incurred and profits realized by the Manager and its affiliates from advising T. Rowe Price mutual funds, as well as estimates of the gross profits realized from managing the fund in particular. The Board concluded that the Manager’s profits were reasonable in light of the services provided to the fund. The Board also considered whether the fund or other funds benefit under the fee levels set forth in the Contract from any economies of scale realized by the Manager. Under the Contract, the fund pays a fee to the Manager composed of two components—a group fee rate based on the aggregate assets of certain T. Rowe Price mutual funds (including the fund) that declines at certain asset levels and an individual fund fee rate that is assessed on the assets of the fund. The Board concluded that an additional breakpoint should be added to the group fee component of the fees paid by the fund under the Contract at a level of $160 billion. The Board further concluded that, with this change, the advisory fee structure for the fund continued to provide for a reasonable sharing of benefits from any economies of scale with the fund’s investors.
Fees
The Board reviewed the fund’s management fee rate, operating expenses, and total expense ratio and compared them to fees and expenses of other comparable funds based on information and data supplied by Lipper. The information provided to the Board indicated that the fund’s management fee rate was above the median for certain groups of comparable funds but below the median for other groups of comparable funds. The information also indicated that the fund’s expense ratio was generally below the median for comparable funds. The Board also reviewed the fee schedules for comparable privately managed accounts of the Manager and its affiliates. Management informed the Board that the Manager’s responsibilities for privately managed accounts are more limited than its responsibilities for the fund and other T. Rowe Price mutual funds that it or its affiliates advise. On the basis of the information provided, the Board concluded that the fees paid by the fund under the Contract were reasonable.
Approval of the Contract
As noted, the Board approved the continuation of the Contract as amended to add an additional breakpoint to the group fee rate. No single factor was considered in isolation or to be determinative to the decision. Rather, the Board concluded, in light of a weighting and balancing of all factors considered, that it was in the best interests of the fund to approve the continuation of the Contract, including the fees to be charged for services thereunder.
Item 2. Code of Ethics.
A code of ethics, as defined in Item 2 of Form N-CSR, applicable to its principal executive officer, principal financial officer, principal accounting officer or controller, or persons performing similar functions is filed as an exhibit to the registrant’s annual Form N-CSR. No substantive amendments were approved or waivers were granted to this code of ethics during the registrant’s most recent fiscal half-year.
Item 3. Audit Committee Financial Expert.
Disclosure required in registrant’s annual Form N-CSR.
Item 4. Principal Accountant Fees and Services.
Disclosure required in registrant’s annual Form N-CSR.
Item 5. Audit Committee of Listed Registrants.
Not applicable.
Item 6. Schedule of Investments.
Not applicable. The complete schedule of investments is included in Item 1 of this Form N-CSR.
Item 7. Disclosure of Proxy Voting Policies and Procedures for Closed-End Management Investment Companies.
Not applicable.
Item 8. Portfolio Managers of Closed-End Management Investment Companies.
Not applicable.
Item 9. Purchases of Equity Securities by Closed-End Management Investment Company and Affiliated Purchasers.
Not applicable.
Item 10. Submission of Matters to a Vote of Security Holders.
Not applicable.
Item 11. Controls and Procedures.
(a) The registrant’s principal executive officer and principal financial officer have evaluated the registrant’s disclosure controls and procedures within 90 days of this filing and have concluded that the registrant’s disclosure controls and procedures were effective, as of that date, in ensuring that information required to be disclosed by the registrant in this Form N-CSR was recorded, processed, summarized, and reported timely.
(b) The registrant’s principal executive officer and principal financial officer are aware of no change in the registrant’s internal control over financial reporting that occurred during the registrant’s second
fiscal quarter covered by this report that has materially affected, or is reasonably likely to materially affect, the registrant’s internal control over financial reporting.
Item 12. Exhibits.
(a)(1) The registrant’s code of ethics pursuant to Item 2 of Form N-CSR is filed with the registrant’s annual Form N-CSR.
(2) Separate certifications by the registrant's principal executive officer and principal financial officer, pursuant to Section 302 of the Sarbanes-Oxley Act of 2002 and required by Rule 30a-2(a) under the Investment Company Act of 1940, are attached.
(3) Written solicitation to repurchase securities issued by closed-end companies: not applicable.
(b) A certification by the registrant's principal executive officer and principal financial officer, pursuant to Section 906 of the Sarbanes-Oxley Act of 2002 and required by Rule 30a-2(b) under the Investment Company Act of 1940, is attached.
| |
SIGNATURES |
| |
| | Pursuant to the requirements of the Securities Exchange Act of 1934 and the Investment |
| Company Act of 1940, the registrant has duly caused this report to be signed on its behalf by the |
| undersigned, thereunto duly authorized. |
| |
| T. Rowe Price Dividend Growth Fund, Inc. |
| |
| By | /s/ James S. Riepe |
| | James S. Riepe |
| | Principal Executive Officer |
| |
| Date | August 18, 2005 |
| |
| |
| | Pursuant to the requirements of the Securities Exchange Act of 1934 and the Investment |
| Company Act of 1940, this report has been signed below by the following persons on behalf of |
| the registrant and in the capacities and on the dates indicated. |
| |
| |
| By | /s/ James S. Riepe |
| | James S. Riepe |
| | Principal Executive Officer |
| |
| Date | August 18, 2005 |
| |
| |
| |
| By | /s/ Joseph A. Carrier |
| | Joseph A. Carrier |
| | Principal Financial Officer |
| |
| Date | August 18, 2005 |