| UNITED STATES |
| SECURITIES AND EXCHANGE COMMISSION |
| Washington, D.C. 20549 |
| |
FORM N-CSR |
| |
CERTIFIED SHAREHOLDER REPORT OF REGISTERED |
MANAGEMENT INVESTMENT COMPANIES |
| |
| |
| |
| Investment Company Act File Number: 811-7055 |
|
| |
| T. Rowe Price Dividend Growth Fund, Inc. |
|
| (Exact name of registrant as specified in charter) |
| |
| 100 East Pratt Street, Baltimore, MD 21202 |
|
| (Address of principal executive offices) |
| |
| David Oestreicher |
| 100 East Pratt Street, Baltimore, MD 21202 |
|
| (Name and address of agent for service) |
| |
| |
| Registrant’s telephone number, including area code: (410) 345-2000 |
| |
| |
| Date of fiscal year end: December 31 |
| |
| |
| Date of reporting period: June 30, 2008 |
Item 1: Report to Shareholders| Dividend Growth Fund | June 30, 2008 |
The views and opinions in this report were current as of June 30, 2008. They are not guarantees of performance or investment results and should not be taken as investment advice. Investment decisions reflect a variety of factors, and the managers reserve the right to change their views about individual stocks, sectors, and the markets at any time. As a result, the views expressed should not be relied upon as a forecast of the fund’s future investment intent. The report is certified under the Sarbanes-Oxley Act, which requires mutual funds and other public companies to affirm that, to the best of their knowledge, the information in their financial reports is fairly and accurately stated in all material respects.
REPORTS ON THE WEB
Sign up for our E-mail Program, and you can begin to receive updated fund reports and prospectuses online rather than through the mail. Log in to your account at troweprice.com for more information.
Manager’s Letter
Fellow Shareholders
The first half of 2008 was difficult for investors. Markets declined as repercussions from the housing crisis spread to a point where confidence in the U.S. financial system—which is obviously critical to properly functioning markets—came into question. A large and well-established brokerage firm, Bear Stearns, was a casualty in the upheaval. To make matters worse, evidence of inflation, primarily in the form of soaring energy and food costs, placed further pressure on a burdened consumer. Financial stocks bore the brunt of investors’ wrath, though few market sectors were unscathed.
HIGHLIGHTS
• Large-cap stocks fell during a turbulent first half of the year as financial companies continued to suffer from the collapse of the subprime lending market and investors worried about the slowing U.S. economy.
• The Dividend Growth Fund lost ground but outpaced the broad market as measured by the S&P 500 Stock Index, aided by stock selection in information technology and financials.
• The fund’s best contributors came from the energy and materials sectors while financial stocks were key detractors.
• The market sell-off has been painful, but it is creating opportunities for the kind of high-quality, consistent-growth companies we favor.
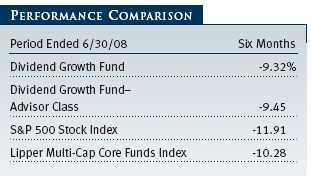
The fund lost ground in this challenging environment but outpaced the S&P 500 Stock Index and its Lipper peer group. Information technology and financials provided the greatest boost to the fund’s performance relative to the S&P 500, due almost entirely to stock selection. Energy provided the fund’s best absolute contributions, but both stock selection and our lighter exposure to this strong-performing sector hampered relative results.
Six months ago, we noted a slowdown in companies initiating or adding to their dividends, reversing a trend that began following the May 2003 tax cuts on dividends and capital gains. Not surprisingly, given the current economic and market environment, this trend continued in the first half of the year. A number of hard-hit financial companies slashed or suspended dividends, for example. Among S&P 500 companies, there have been nearly five times the number of dividend cuts in the first half of the year than in the same period in 2007. At the end of 2007, about 97% of financial companies in the S&P 500 paid dividends—the most of any sector. But of the 16 dividend cuts so far this year, 14 have been financial firms, and three more in the sector have suspended their dividends. Given that a significant number of financial institutions need to raise capital, we anticipate more dividend reductions/suspensions in the financial sector. Even so, dividends added about one percentage point to S&P 500 total returns in the first six months of 2008. However, non-dividend-paying companies outperformed dividend payers.
ENVIRONMENT
U.S. stocks declined amid sluggish economic growth in the first half of 2008. As lending dried up in the wake of the subprime mortgage debacle, the residential real estate market has slowed to a crawl, home prices have fallen, and homeowners have lost a key source of cash that had bolstered consumer spending. To make matters worse, surging food and particularly energy costs also weighed on investor sentiment and contributed to weaker consumer spending and corporate profit growth in some sectors.
Rising energy prices at the same time the economy is faltering creates understandable stress. In our opinion, energy prices will dictate the near-term direction of the market because they will largely determine whether the world economy falters. Record prices for a barrel of oil obviously affect the consumer at the gas pump and through home heating bills. But energy is also an important factor in the cost of producing goods—whether to farmers growing crops or to Ford or GM manufacturing automobiles. This additional cost is either passed on to the consumer or “eaten” by the producer in the form of lower profit levels. Either way, someone must pay—and the cost to the economy is real.
A big question is where energy is headed. Our thought is that in the short term we are headed for a correction. Something has to give—rising energy prices in the face of weakening global economies are not sustainable. Demand is down since people in the U.S. are actively trying to use less energy. Emerging markets economies—a key source of incremental demand for oil—are still healthy but slowing. It seems to us that the stars are aligned for a correction, which would be a near-term relief to the equity markets.
In the large-cap universe, the financials sector suffered a severe decline. Various banks, brokerages, and insurers reported steep losses, wrote down the values of mortgage assets, or were forced to raise capital. A year ago, financials was the largest sector of the S&P 500 Index, encompassing nearly 21% of the index’s capitalization; at midyear 2008, financials are the third-largest sector after energy and information technology and account for just over 14% of the benchmark. The financial system needs to be fully cleansed of its excesses built up in the last several years. The process has begun, as banks and other financial companies recognize losses and repair their balance sheets. The bottoming of the housing market is a critical part of this process because it will positively impact both the financial system and consumers.
Telecommunication services stocks also fell sharply, while information technology, health care, consumer discretionary, and industrials and business services shares generally performed in line with the broad market. Utilities and consumer staples companies declined but held up better than other segments. There was little shelter from the storm in the equity markets. Only energy and materials posted gains.
PERFORMANCE REVIEW
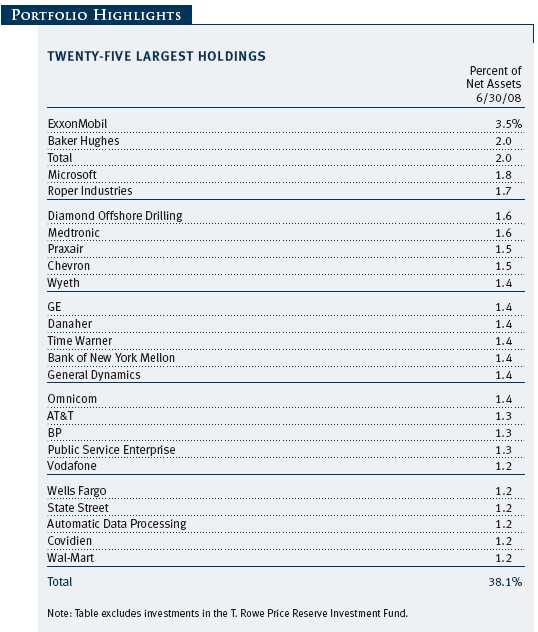
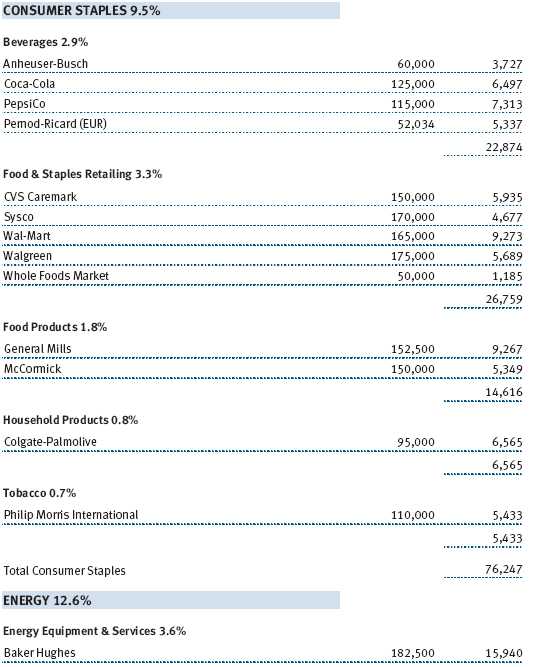
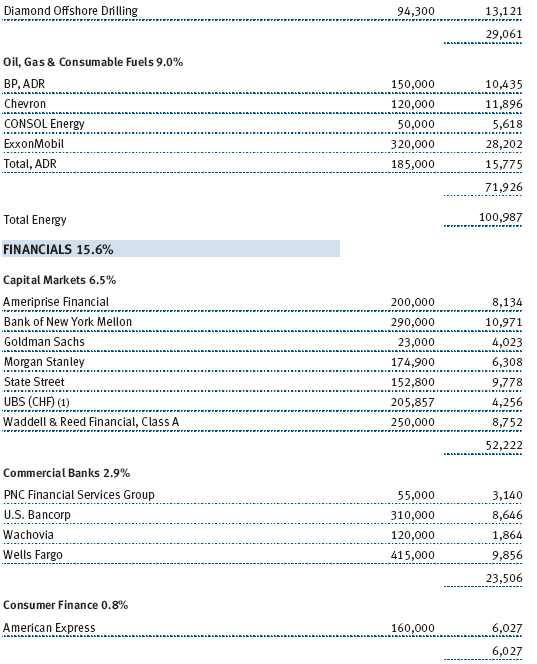
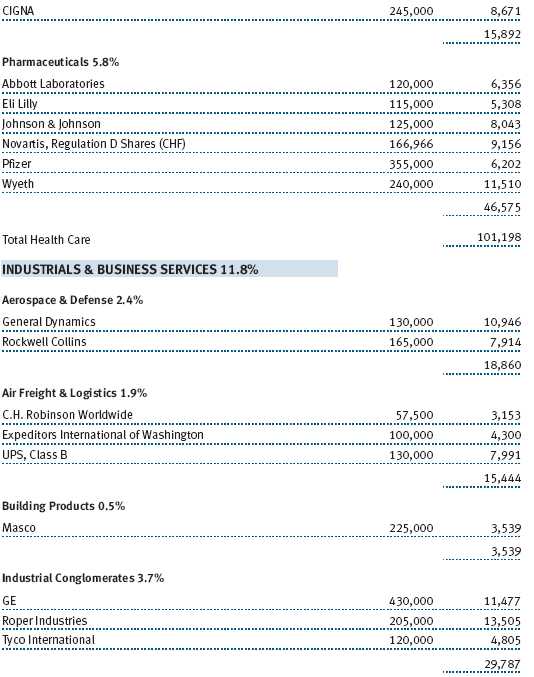
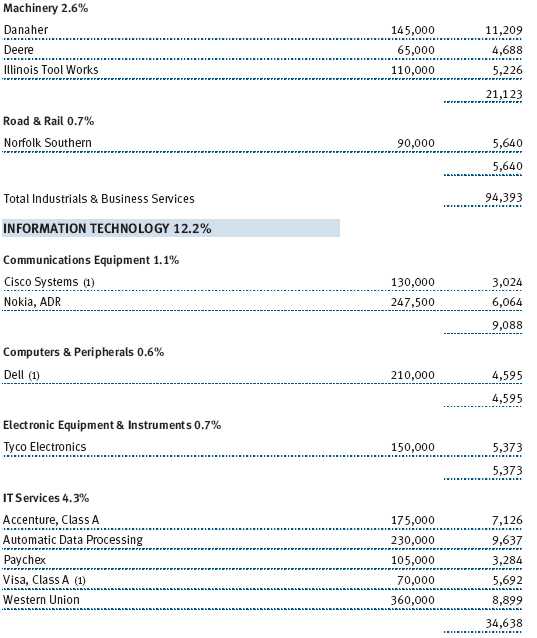
In this tough environment, only two sectors generated positive returns for the fund: energy and materials. Consol Energy, an Illinois Basin coal producer, continued to benefit from the surge in exports as developing nations search for a cheaper alternative to oil and natural gas. While we reduced our position into the strength, we will look to rebuild it on weakness as Consol remains one of the best-positioned coal companies in the world because of its location, its high energy content reserves, and the resource diversification provided by its 81.5% ownership in CNX Gas Corp. Oil service companies such as Baker Hughes are benefiting from demand to find and develop new sources. Even energy had its losers, though: Major oil companies BP and ExxonMobil declined due to refinery issues and poor earnings guidance. (Please see the portfolio of investments for a complete listing of holdings and the amount each represents in the portfolio.)
In materials, chemical stocks did well, led by Potash Corporation of Saskatchewan. It’s the world’s largest fertilizer producer and enjoyed strong profits from growing demand, largely from farmers who require fertilizer to maximize the yields on their crops and capitalize on record crop prices. Praxair, an industrial gas company, continued its solid performance driven by high energy/commodity prices, strong industrial production growth in emerging Asian and South American markets, and the continued upward trajectory of commodity producers’ capital expenditures. As a result, the company’s backlog continues to grow.
Information technology provided several strong contributors. We initiated a position in IT services firm Visa during the first half of the year, and it was the fund’s top contributor. The world’s largest retail electronic payments network reported strong revenue growth despite a sluggish environment for consumer spending; the company’s solid global growth helped offset poor performance in the U.S. Another key contributor was Accenture, which we added in the second half last year. The stock sold off on fears that economic weakness would harm its business as in past slowdowns. We are comfortable owning Accenture due to its attractive valuation (13 times 2009 earnings estimates) and because the company gets more of its revenue from outsourcing (versus consulting) than in the past. We believe this business is more durable (less discretionary) than the traditional consulting business. In fact, the company’s most recent earnings report showed higher sales across all business segments, and it raised its earnings guidance for the next period. Our semiconductor holdings also did well, led by Xilinx, Applied Materials, and Linear Technology. Nokia, the number-one maker of cellular phones in the world and our top contributor last year, fell sharply in the first half on concerns about global growth and particularly a slowdown in emerging markets, where Nokia holds strong market share.
Some of our consumer staples stocks were solid contributors, including Wal-Mart and Anheuser-Busch. Wal-Mart bucked the trend of poor-performing retailers and actually was a very good stock (up 20% in the first half). The company is the largest food retailer in the country and prides itself on offering goods at the lowest available price. As a result, traffic increased in its stores as the economy softened. Anheuser-Busch was a different story. We bought it in the high $40’s in April 2008 because we thought it was an undervalued asset. Apparently we were not alone. The St. Louis-based brewer of Budweiser, Michelob, and other brands recently agreed to a takeover offer from Belgium beverage company InBev for $70 a share.
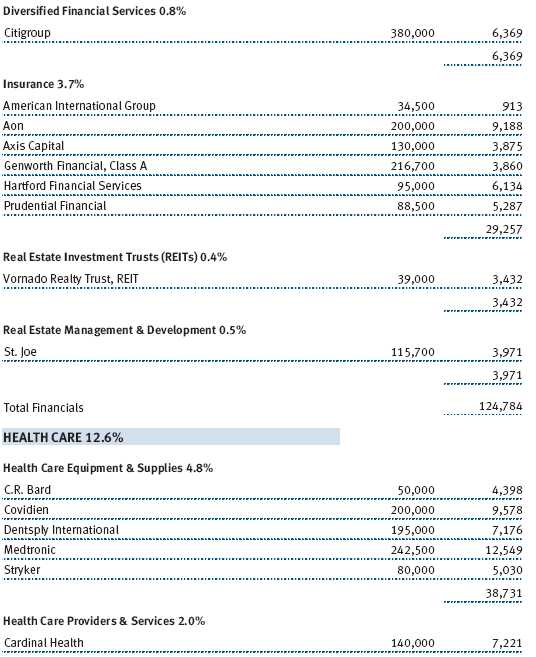
Our financials held up better than those in the index, but they were by far the largest absolute detractors. All were affected to some degree by the housing crisis, subprime mortgage debacle, and the resulting credit crisis. State Street, a top absolute detractor, has generated strong earnings results but was hurt by credit-related investments both on and off its balance sheet. Although near-term performance may prove difficult, we believe the long-term outlook remains intact. Morgan Stanley fell sharply with other brokers after it had to raise large amounts of capital during the period. The company was stuck with various loans (mortgage and other) that proved to be heavily impaired and needed to be written down to fair value. Ameriprise Financial reported an increase in quarterly profit but missed expectations. Other key detractors in the sector included Citigroup, Bank of New York Mellon, and Wells Fargo. Insurers including Prudential and American International Group also suffered due to concerns of holdings on their balance sheets.

PORTFOLIO CHANGES
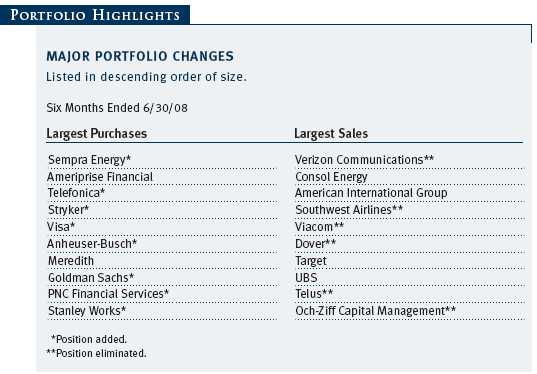
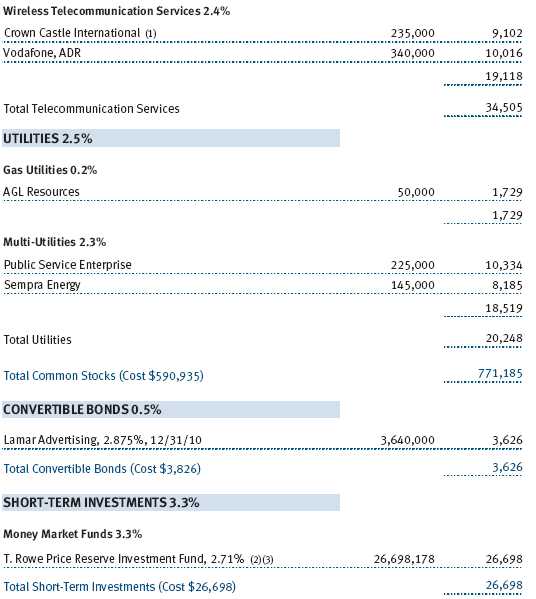
As always, we make changes to the portfolio based upon new opportunities presented. We wrote about Anheuser-Busch earlier, an investment that paid off more quickly than anticipated. One of our other new holdings is Sempra Energy. Sempra has several different sources of income, including regulated utilities in southern California (40% of income), a pipelines and storage business, a liquefied natural gas (LNG) business to import natural gas into the U.S., and a nonregulated power generation business. The company has a good opportunity to invest in and grow its utility, LNG, and pipeline businesses, which should drive double-digit growth in earnings, cash flow, and the dividend. Sempra recently traded at 12 times 2009 earnings estimates and represents good value, in our view.
Stryker is best known for its orthopedics business, where it enjoys roughly 20% global market share in the implants used in hip and knee replacements. Strong demographic trends of an aging population staying active later in life, as well as a relative insulation from the broader economy, make this an attractive business. Outside of orthopedics, Stryker generates approximately 40% of corporate revenues selling tools and equipment to hospitals through the company’s MedSurg division. This business provides steady growth and diversification and is generally not exposed to many of the risks inherent in other health care businesses, such as FDA actions, product recalls, and lengthy and expensive approval processes. We expect Stryker to grow earnings at approximately 20% annually for the foreseeable future. The stock’s valuation recently approached historic lows of 19 times forward earnings, and we are optimistic that as the strength and stability of the business becomes better appreciated, this will, in retrospect, appear to have been an excellent buying opportunity.
Telefonica, the principal operator in Spain in both fixed and mobile telephony (40% of the company), also has significant European mobile exposure (about 20% of the company) and Latin American exposure in both fixed and mobile (40% of the company). Despite an economic slowdown in Spain, the company is growing revenue and operating cash through its dominance of broadband in a benign competitive market. It is taking share in European mobile and showing explosive growth in Mexico and Brazil. In summary, the businesses are doing well, generating over 20% earnings and free cash flow growth per year, yet the valuation of eight times earnings and seven times free cash flow for 2009 is a significant discount to the sector and the market. Management owns considerable stock (the CEO alone owns a stake worth more than $150 million) and is committed to returning capital to shareholders through dividends and stock buybacks (8% in 2008). Telefonica has the attributes of good growth, cheap valuation, and good capital return.
We added two new financials in the sell-off. PNC Financial Services, a diversified regional bank based in Pittsburgh, was a new purchase in the first half. In addition to traditional banking services, it also has an investment services operation and owns 34% of publicly owned BlackRock, one of the top asset managers in the country. The latter two businesses generate fee income, which is more predictable and stable than traditional bank lending. PNC also has a history of solid loan underwriting. The stock seems to be a good value to us (11 times 2009 earnings), particularly when adjusting for the value of its BlackRock stake. In addition, PNC offers a 4.6% yield and a dividend that has demonstrated consistent growth.
We initiated a position in Goldman Sachs as part of our decision to slowly add to the beaten-down financials sector. Goldman is a rare company among its financial peers in that it is a clear market share gainer and beneficiary from the woes that have plagued the vast majority of its competitors. We expect Goldman to use its excess capital and distressed investing expertise to generate investment opportunities that benefit the firm, its clients, and shareholders for years beyond the end of the current credit malaise.
We sold positions either because stocks reached our target or something changed in the fundamentals of the business to alter the investment thesis. We sold Verizon Communications in the first half of the year. While the stock did not look particularly expensive, we are concerned that the company wouldn’t show the same defensiveness it has in past economic cycles. This is no longer a purely fixed-line telephone company—today wireless, DSL, and even TV are significant businesses and, in our opinion, more susceptible to suffering in a soft economy. The other reason for a sale was that we think Telefonica, outlined above, offers better growth at a better valuation.
Concern over continued dislocation in the airline industry combined with higher fuel prices caused us to move on from Southwest Airlines. Should fuel prices fall, our other travel-related holdings—such as Carnival and Marriot—will benefit, and we feel they are better businesses than the airlines.
Consumer weakness also caused us to eliminate Viacom and reduce our weight in a longtime favorite, retailer Target. Target is approaching a price where we are considering rebuilding the position. A loss of confidence in the management teams at AIG and UBS drove significant sales in both companies, much of which we put into PNC and Goldman Sachs. We sold a good bit of coal company Consol as discussed earlier. This was done after the stock performed very well.
OUTLOOK
At some point, we will see a recovery from this tough market environment, although no one can say when this will occur. The kind of market turmoil we’ve experienced over the past year is painful, but it also creates long-term opportunities. Although investor sentiment remains poor, valuations seem generally reasonable. In fact, outside of financials, earnings growth for the balance of market constituents is holding up reasonably well. Certainly energy and commodity companies are doing well, but industrial, health care, and consumer nondurables are holding up too. The markets will ultimately stabilize. The volatility we are seeing now is due to uncertainty over the depth of the housing crisis and its impact on the financial system and the economy in general. A correction in oil prices, which we think is a good possibility, would go a long way toward providing near-term relief to the markets.
Dividends should continue to regain their relative importance, helping our strategy, which emphasizes attractively priced companies that can grow their dividends and earnings over time. There is good value in the market in certain areas and yields we have not seen in a long time. We will continue to work to identify those companies that we believe will provide shareholders favorable risk-adjusted returns.
Respectfully submitted,

Thomas J. Huber
President of the fund and chairman of its Investment Advisory Committee
July 18, 2008
The committee chairman has day-to-day responsibility for managing the portfolio and works with committee members in developing and executing the fund’s investment program.
RISKS OF STOCK INVESTING
As with all stock and bond mutual funds, a fund’s share price can fall because of weakness in the stock or bond markets, a particular industry, or specific holdings. Stock markets can decline for many reasons, including adverse political or economic developments, changes in investor psychology, or heavy institutional selling. The prospects for an industry or company may deteriorate because of a variety of factors, including disappointing earnings or changes in the competitive environment. In addition, the investment manager’s assessment of companies held in a fund may prove incorrect, resulting in losses or poor performance even in rising markets. Funds investing in stocks with a dividend orientation may have somewhat lower potential for price appreciation than those concentrating on rapidly growing firms. Also, a company may reduce or eliminate its dividend.
GLOSSARY
Dividend yield: The annual dividend of a stock divided by the stock’s price.
Beta: A measure of the market risk of a stock showing how responsive it is to a given market index, such as the S&P 500 Stock Index. By definition, the beta of the benchmark index is 1.00. A fund with a 1.10 beta is expected to perform 10% better than the index in up markets and 10% worse in down markets. Usually, higher betas represent riskier investments.
Free cash flow: The excess cash a company generates from its operations that can be taken out of the business for the benefit of shareholders, such as dividends, share repurchases, investments, and acquisitions.
Lipper indexes: Fund benchmarks that consist of a small number (10 to 30) of the largest mutual funds in a particular category as tracked by Lipper Inc.
Price/earnings ratio (P/E): A valuation measure calculated by dividing the price of a stock by its current or projected earnings per share. This ratio gives investors an idea of how much they are paying for current or future earnings power.
Risk/reward: The relationship between the degree of risk associated with an investment and its return potential. Typically, the higher the potential return of an investment, the greater the risk.
S&P 500 Stock Index: An unmanaged index that tracks the stocks of 500 primarily large-capitalization U.S. companies.
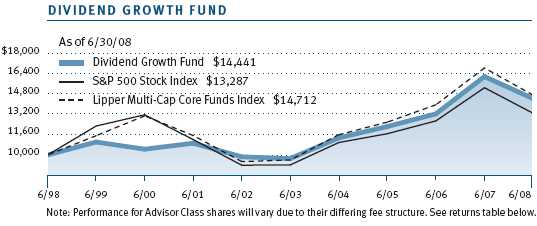
Performance and Expenses
This chart shows the value of a hypothetical $10,000 investment in the fund over the past 10 fiscal year periods or since inception (for funds lacking 10-year records). The result is compared with benchmarks, which may include a broad-based market index and a peer group average or index. Market indexes do not include expenses, which are deducted from fund returns as well as mutual fund averages and indexes.
| AVERAGE ANNUAL COMPOUND TOTAL RETURN |
This table shows how the fund would have performed each year if its actual (or cumulative) returns for the periods shown had been earned at a constant rate.

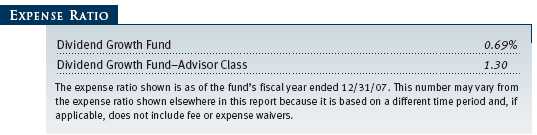
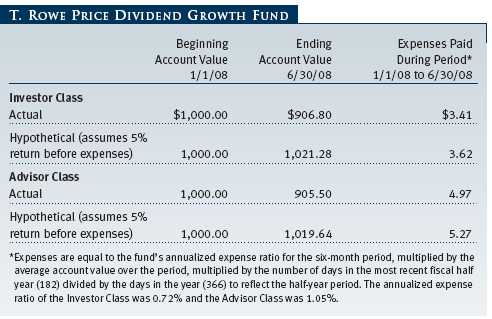
As a mutual fund shareholder, you may incur two types of costs: (1) transaction costs, such as redemption fees or sales loads, and (2) ongoing costs, including management fees, distribution and service (12b-1) fees, and other fund expenses. The following example is intended to help you understand your ongoing costs (in dollars) of investing in the fund and to compare these costs with the ongoing costs of investing in other mutual funds. The example is based on an investment of $1,000 invested at the beginning of the most recent six-month period and held for the entire period.
Please note that the fund has two share classes: The original share class (“investor class”) charges no distribution and service (12b-1) fee, and the Advisor Class shares are offered only through unaffiliated brokers and other financial intermediaries and charge a 0.25% 12b-1 fee. Each share class is presented separately in the table.
Actual Expenses
The first line of the following table (“Actual”) provides information about actual account values and expenses based on the fund’s actual returns. You may use the information in this line, together with your account balance, to estimate the expenses that you paid over the period. Simply divide your account value by $1,000 (for example, an $8,600 account value divided by $1,000 = 8.6), then multiply the result by the number in the first line under the heading “Expenses Paid During Period” to estimate the expenses you paid on your account during this period.
Hypothetical Example for Comparison Purposes
The information on the second line of the table (“Hypothetical”) is based on hypothetical account values and expenses derived from the fund’s actual expense ratio and an assumed 5% per year rate of return before expenses (not the fund’s actual return). You may compare the ongoing costs of investing in the fund with other funds by contrasting this 5% hypothetical example and the 5% hypothetical examples that appear in the shareholder reports of the other funds. The hypothetical account values and expenses may not be used to estimate the actual ending account balance or expenses you paid for the period.
Note: T. Rowe Price charges an annual small-account maintenance fee of $10, generally for accounts with less than $2,000 ($500 for UGMA/UTMA). The fee is waived for any investor whose T. Rowe Price mutual fund accounts total $25,000 or more, accounts employing automatic investing, and IRAs and other retirement plan accounts that utilize a prototype plan sponsored by T. Rowe Price (although a separate custodial or administrative fee may apply to such accounts). This fee is not included in the accompanying table. If you are subject to the fee, keep it in mind when you are estimating the ongoing expenses of investing in the fund and when comparing the expenses of this fund with other funds.
You should also be aware that the expenses shown in the table highlight only your ongoing costs and do not reflect any transaction costs, such as redemption fees or sales loads. Therefore, the second line of the table is useful in comparing ongoing costs only and will not help you determine the relative total costs of owning different funds. To the extent a fund charges transaction costs, however, the total cost of owning that fund is higher.
Unaudited
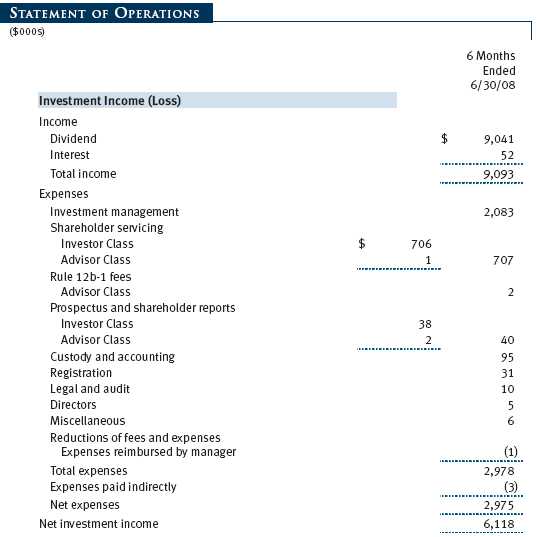
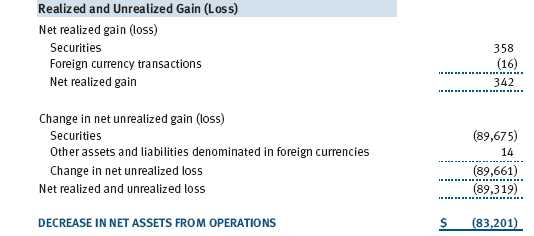
The accompanying notes are an integral part of these financial statements.
Unaudited
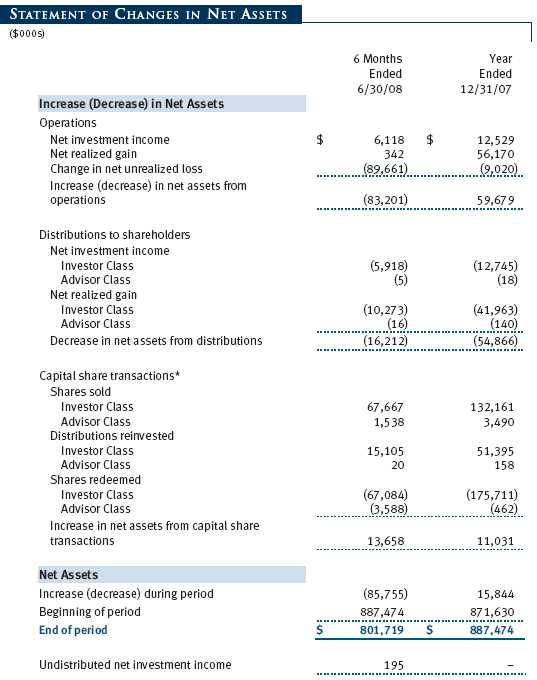
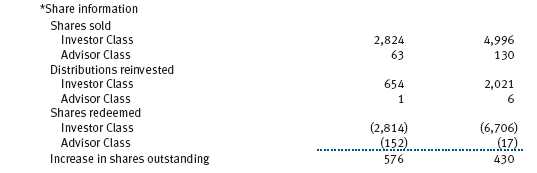
The accompanying notes are an integral part of these financial statements.
Unaudited


The accompanying notes are an integral part of these financial statements.
Unaudited

The accompanying notes are an integral part of these financial statements.
Unaudited
The accompanying notes are an integral part of these financial statements.
Unaudited
The accompanying notes are an integral part of these financial statements.
Unaudited
| NOTES TO FINANCIAL STATEMENTS |
T. Rowe Price Dividend Growth Fund, Inc. (the fund), is registered under the Investment Company Act of 1940 (the 1940 Act) as a diversified, open-end management investment company. The fund seeks to provide increasing dividend income over time, long-term growth of capital, and a reasonable level of current income through investments primarily in dividend-paying stocks. The fund has two classes of shares: the Dividend Growth Fund original share class, referred to in this report as the Investor Class, offered since December 30, 1992, and Dividend Growth Fund – Advisor Class (Advisor Class), offered since December 29, 2005. Advisor Class shares are sold only through unaffiliated brokers and other unaffiliated financial intermediaries that are compensated by the class for distribution, shareholder servicing, and/or certain administrative services under a Board-approved Rule 12b-1 plan. Each class has exclusive voting rights on matters related solely to that class, separate voting rights on matters that relate to both classes, and, in all other respects, the same rights and obligations as the other class.
NOTE 1 - SIGNIFICANT ACCOUNTING POLICIES
Basis of Preparation The accompanying financial statements were prepared in accordance with accounting principles generally accepted in the United States of America, which require the use of estimates made by fund management. Fund management believes that estimates and security valuations are appropriate; however, actual results may differ from those estimates, and the security valuations reflected in the financial statements may differ from the value the fund ultimately realizes upon sale of the securities.
Investment Transactions, Investment Income, and Distributions Income and expenses are recorded on the accrual basis. Premiums and discounts on debt securities are amortized for financial reporting purposes. Dividends received from mutual fund investments are reflected as dividend income; capital gain distributions are reflected as realized gain/loss. Dividend income and capital gain distributions are recorded on the ex-dividend date. Income tax-related interest and penalties, if incurred, would be recorded as income tax expense. Investment transactions are accounted for on the trade date. Realized gains and losses are reported on the identified cost basis. Distributions to shareholders are recorded on the ex-dividend date. Income distributions are declared and paid by each class on a quarterly basis. Capital gain distributions, if any, are declared and paid by the fund, typically on an annual basis.
Currency Translation Assets, including investments, and liabilities denominated in foreign currencies are translated into U.S. dollar values each day at the prevailing exchange rate, using the mean of the bid and asked prices of such currencies against U.S. dollars as quoted by a major bank. Purchases and sales of securities, income, and expenses are translated into U.S. dollars at the prevailing exchange rate on the date of the transaction. The effect of changes in foreign currency exchange rates on realized and unrealized security gains and losses is reflected as a component of security gains and losses.
Class Accounting The Advisor Class pays distribution, shareholder servicing, and/or certain administrative expenses in the form of Rule 12b-1 fees, in an amount not exceeding 0.25% of the class’s average daily net assets. Shareholder servicing, prospectus, and shareholder report expenses incurred by each class are charged directly to the class to which they relate. Expenses common to both classes, investment income, and realized and unrealized gains and losses are allocated to the classes based upon the relative daily net assets of each class.
Rebates and Credits Subject to best execution, the fund may direct certain security trades to brokers who have agreed to rebate a portion of the related brokerage commission to the fund in cash. Commission rebates are reflected as realized gain on securities in the accompanying financial statements and totaled $10,000 for the six months ended June 30, 2008. Additionally, the fund earns credits on temporarily uninvested cash balances at the custodian that reduce the fund’s custody charges. Custody expense in the accompanying financial statements is presented before reduction for credits, which are reflected as expenses paid indirectly.
New Accounting Pronouncements On January 1, 2008, the fund adopted Statement of Financial Accounting Standards No. 157 (FAS 157), Fair Value Measurements. FAS 157 defines fair value, establishes the framework for measuring fair value, and expands the disclosures of fair value measurements in the financial statements. Adoption of FAS 157 did not have a material impact on the fund’s net assets or results of operations.
In March 2008, the Financial Accounting Standards Board issued Statement of Financial Accounting Standards No. 161, Disclosures about Derivative Instruments and Hedging Activities (“FAS 161”), which is effective for fiscal years and interim periods beginning after November 15, 2008. FAS 161 requires enhanced disclosures about derivative and hedging activities, including how such activities are accounted for and their effect on financial position, performance and cash flows. Management is currently evaluating the impact the adoption of FAS 161 will have on the fund’s financial statements and related disclosures.
NOTE 2 - VALUATION
The fund’s investments are reported at fair value as defined under FAS 157. The fund values its investments and computes its net asset value per share at the close of the New York Stock Exchange (NYSE), normally 4 p.m. ET, each day that the NYSE is open for business.
Valuation Methods Equity securities listed or regularly traded on a securities exchange or in the over-the-counter (OTC) market are valued at the last quoted sale price or, for certain markets, the official closing price at the time the valuations are made, except for OTC Bulletin Board securities, which are valued at the mean of the latest bid and asked prices. A security that is listed or traded on more than one exchange is valued at the quotation on the exchange determined to be the primary market for such security. Listed securities not traded on a particular day are valued at the mean of the latest bid and asked prices for domestic securities and the last quoted sale price for international securities.
Debt securities are generally traded in the OTC market. Securities with remaining maturities of one year or more at the time of acquisition are valued at prices furnished by dealers who make markets in such securities or by an independent pricing service, which considers the yield or price of bonds of comparable quality, coupon, maturity, and type, as well as prices quoted by dealers who make markets in such securities. Securities with remaining maturities of less than one year at the time of acquisition generally use amortized cost in local currency to approximate fair value. However, if amortized cost is deemed not to reflect fair value or the fund holds a significant amount of such securities with remaining maturities of more than 60 days, the securities are valued at prices furnished by dealers who make markets in such securities or by an independent pricing service.
Investments in mutual funds are valued at the mutual fund’s closing net asset value per share on the day of valuation.
Other investments, including restricted securities, and those for which the above valuation procedures are inappropriate or are deemed not to reflect fair value are stated at fair value as determined in good faith by the T. Rowe Price Valuation Committee, established by the fund’s Board of Directors.
For valuation purposes, the last quoted prices of non-U.S. equity securities may be adjusted under the circumstances described below. If the fund determines that developments between the close of a foreign market and the close of the NYSE will, in its judgment, materially affect the value of some or all of its portfolio securities, the fund will adjust the previous closing prices to reflect what it believes to be the fair value of the securities as of the close of the NYSE. In deciding whether it is necessary to adjust closing prices to reflect fair value, the fund reviews a variety of factors, including developments in foreign markets, the performance of U.S. securities markets, and the performance of instruments trading in U.S. markets that represent foreign securities and baskets of foreign securities. A fund may also fair value securities in other situations, such as when a particular foreign market is closed but the fund is open. The fund uses outside pricing services to provide it with closing prices and information to evaluate and/or adjust those prices. The fund cannot predict how often it will use closing prices and how often it will determine it necessary to adjust those prices to reflect fair value. As a means of evaluating its security valuation process, the fund routinely compares closing prices, the next day’s opening prices in the same markets, and adjusted prices.
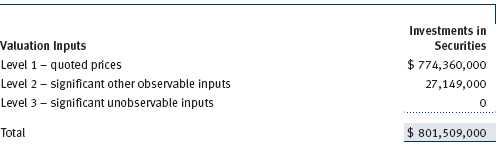
Valuation Inputs Various inputs are used to determine the value of the fund’s investments. These inputs are summarized in the three broad levels listed below:
Level 1 – quoted prices in active markets for identical securities
Level 2 – observable inputs other than Level 1 quoted prices (including, but not limited to, quoted prices for similar securities, interest rates, prepayment speeds, credit risk)
Level 3 – unobservable inputs
Observable inputs are those based on market data obtained from sources independent of the fund, and unobservable inputs reflect the fund’s own assumptions based on the best information available. The input levels are not necessarily an indication of the risk or liquidity associated with investments at that level. For example, non-U.S. equity securities actively traded in foreign markets generally are reflected in Level 2 despite the availability of closing prices, because the fund evaluates and determines whether those closing prices reflect fair value at the close of the NYSE or require adjustment, as described above. The following table summarizes the fund’s investments, based on the inputs used to determine their values on June 30, 2008:
NOTE 3 - INVESTMENT TRANSACTIONS
Purchases and sales of portfolio securities, other than short-term securities, aggregated $103,287,000 and $94,793,000, respectively, for the six months ended June 30, 2008.
NOTE 4 - FEDERAL INCOME TAXES
No provision for federal income taxes is required since the fund intends to continue to qualify as a regulated investment company under Subchapter M of the Internal Revenue Code and distribute to shareholders all of its taxable income and gains. Distributions are determined in accordance with Federal income tax regulations, which differ from generally accepted accounting principles, and, therefore, may differ in amount or character from net investment income and realized gains for financial reporting purposes. Financial reporting records are adjusted for permanent book/tax differences to reflect tax character but are not adjusted for temporary differences. The amount and character of tax-basis distributions and composition of net assets are finalized at fiscal year-end; accordingly, tax-basis balances have not been determined as of June 30, 2008.
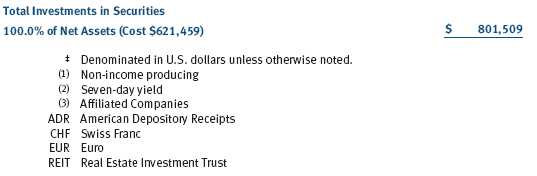
At June 30, 2008, the cost of investments for federal income tax purposes was $621,459,000. Net unrealized gain aggregated $180,073,000 at period-end, of which $214,486,000 related to appreciated investments and $34,413,000 related to depreciated investments.
NOTE 5 - RELATED PARTY TRANSACTIONS
The fund is managed by T. Rowe Price Associates, Inc. (the manager or Price Associates), a wholly owned subsidiary of T. Rowe Price Group, Inc. The investment management agreement between the fund and the manager provides for an annual investment management fee, which is computed daily and paid monthly. The fee consists of an individual fund fee, equal to 0.20% of the fund’s average daily net assets, and a group fee. The group fee rate is calculated based on the combined net assets of certain mutual funds sponsored by Price Associates (the group) applied to a graduated fee schedule, with rates ranging from 0.48% for the first $1 billion of assets to 0.285% for assets in excess of $220 billion. The fund’s group fee is determined by applying the group fee rate to the fund’s average daily net assets. At June 30, 2008, the effective annual group fee rate was 0.30%.
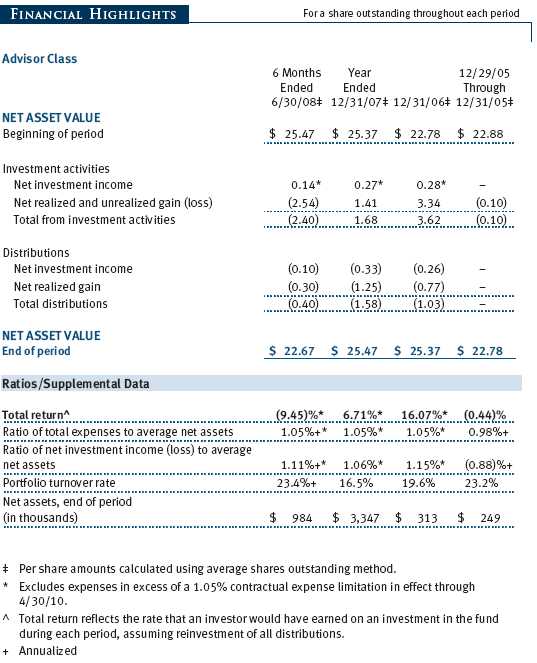
The Advisor Class is also subject to a contractual expense limitation through April 30, 2010. During the limitation period, the manager is required to waive its management fee and/or reimburse expenses, excluding interest, taxes, brokerage commissions, and extraordinary expenses, that would otherwise cause the class’s ratio of annualized total expenses to average net assets (expense ratio) to exceed its expense limitation of 1.05%. The class is required to repay the manager for expenses previously reimbursed and management fees waived to the extent the class’s net assets have grown or expenses have declined sufficiently to allow repayment without causing the class’s expense ratio to exceed its expense limitation. However, no repayment will be made more than three years after the date of any reimbursement or waiver or later than April 30, 2012. Pursuant to this agreement, expenses in the amount of $1,000 were reimbursed by the manager during the six months ended June 30, 2008. Including these amounts, expenses previously reimbursed by the manager in the amount of $7,000 remain subject to repayment at June 30, 2008.
In addition, the fund has entered into service agreements with Price Associates and two wholly owned subsidiaries of Price Associates (collectively, Price). Price Associates computes the daily share prices and provides certain other administrative services to the fund. T. Rowe Price Services, Inc., provides shareholder and administrative services in its capacity as the fund’s transfer and dividend disbursing agent. T. Rowe Price Retirement Plan Services, Inc., provides subaccounting and recordkeeping services for certain retirement accounts invested in the Investor Class. For the six months ended June 30, 2008, expenses incurred pursuant to these service agreements were $60,000 for Price Associates, $440,000 for T. Rowe Price Services, Inc., and $130,000 for T. Rowe Price Retirement Plan Services, Inc. The total amount payable at period-end pursuant to these service agreements is reflected as Due to Affiliates in the accompanying financial statements.
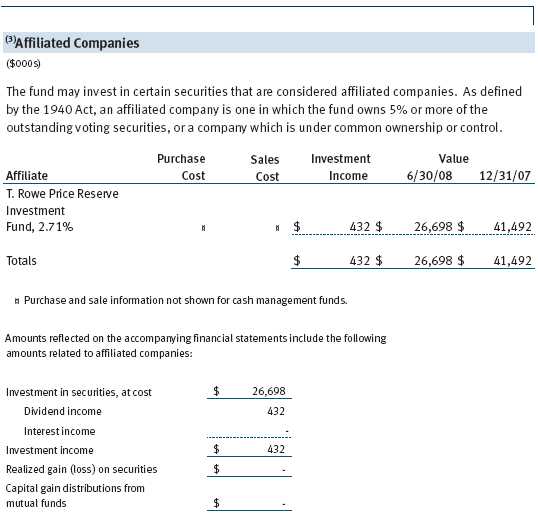
The fund may invest in the T. Rowe Price Reserve Investment Fund and the T. Rowe Price Government Reserve Investment Fund (collectively, the T. Rowe Price Reserve Investment Funds), open-end management investment companies managed by Price Associates and considered affiliates of the fund. The T. Rowe Price Reserve Investment Funds are offered as cash management options to mutual funds, trusts, and other accounts managed by Price Associates and/or its affiliates and are not available for direct purchase by members of the public. The T. Rowe Price Reserve Investment Funds pay no investment management fees.
As of June 30, 2008, T. Rowe Price Group, Inc., and/or its wholly owned subsidiaries owned 356,457 shares of the Investor Class, representing 1% of the fund’s net assets.
| INFORMATION ON PROXY VOTING POLICIES, PROCEDURES, AND RECORDS |
A description of the policies and procedures used by T. Rowe Price funds and portfolios to determine how to vote proxies relating to portfolio securities is available in each fund’s Statement of Additional Information, which you may request by calling 1-800-225-5132 or by accessing the SEC’s Web site, www.sec.gov. The description of our proxy voting policies and procedures is also available on our Web site, www.troweprice.com. To access it, click on the words “Company Info” at the top of our homepage for individual investors. Then, in the window that appears, click on the “Proxy Voting Policy” navigation button in the top left corner.
Each fund’s most recent annual proxy voting record is available on our Web site and through the SEC’s Web site. To access it through our Web site, follow the directions above, then click on the words “Proxy Voting Record” at the bottom of the Proxy Voting Policy page.
| HOW TO OBTAIN QUARTERLY PORTFOLIO HOLDINGS |
The fund files a complete schedule of portfolio holdings with the Securities and Exchange Commission for the first and third quarters of each fiscal year on Form N-Q. The fund’s Form N-Q is available electronically on the SEC’s Web site (www.sec.gov); hard copies may be reviewed and copied at the SEC’s Public Reference Room, 450 Fifth St. N.W., Washington, DC 20549. For more information on the Public Reference Room, call 1-800-SEC-0330.
| APPROVAL OF INVESTMENT MANAGEMENT AGREEMENT |
On March 4, 2008, the fund’s Board of Directors (Board) unanimously approved the investment advisory contract (Contract) between the fund and its investment manager, T. Rowe Price Associates, Inc. (Manager). The Board considered a variety of factors in connection with its review of the Contract, also taking into account information provided by the Manager during the course of the year, as discussed below:
Services Provided by the Manager
The Board considered the nature, quality, and extent of the services provided to the fund by the Manager. These services included, but were not limited to, management of the fund’s portfolio and a variety of related activities, as well as financial and administrative services, reporting, and communications. The Board also reviewed the background and experience of the Manager’s senior management team and investment personnel involved in the management of the fund. The Board concluded that it was satisfied with the nature, quality, and extent of the services provided by the Manager.
Investment Performance of the Fund
The Board reviewed the fund’s average annual total returns over the 1-, 3-, 5-, and 10-year periods as well as the fund’s year-by-year returns and compared these returns with previously agreed upon comparable performance measures and market data, including those supplied by Lipper and Morningstar, which are independent providers of mutual fund data. On the basis of this evaluation and the Board’s ongoing review of investment results, the Board concluded that the fund’s performance was satisfactory.
Costs, Benefits, Profits, and Economies of Scale
The Board reviewed detailed information regarding the revenues received by the Manager under the Contract and other benefits that the Manager (and its affiliates) may have realized from its relationship with the fund, including research received under “soft dollar” agreements. The Board noted that soft dollars were not used to pay for third-party, non-broker research. The Board also received information on the estimated costs incurred and profits realized by the Manager and its affiliates from advising T. Rowe Price mutual funds, as well as estimates of the gross profits realized from managing the fund in particular. The Board concluded that the Manager’s profits were reasonable in light of the services provided to the fund. The Board also considered whether the fund or other funds benefit under the fee levels set forth in the Contract from any economies of scale realized by the Manager. Under the Contract, the fund pays a fee to the Manager composed of two components—a group fee rate based on the aggregate assets of certain T. Rowe Price mutual funds (including the fund) that declines at certain asset levels and an individual fund fee rate that is assessed on the assets of the fund. The Board concluded that the advisory fee structure for the fund continued to provide for a reasonable sharing of benefits from any economies of scale with the fund’s investors.
Fees
The Board reviewed the fund’s management fee rate, operating expenses, and total expense ratio for the Investor Class and Advisor Class and compared them with fees and expenses of other comparable funds based on information and data supplied by Lipper. The information provided to the Board indicated that the fund’s management fee rate was above the median for certain groups of comparable funds but at or below the median for other groups of comparable funds. The information also indicated that the fund’s expense ratio for the Investor Class was above the median for certain groups of comparable funds but below the median for other groups of comparable funds, and that the fund’s expense ratio for the Advisor Class was at or below the median for comparable funds. The Board also reviewed the fee schedules for comparable privately managed accounts of the Manager and its affiliates. Management informed the Board that the Manager’s responsibilities for privately managed accounts are more limited than its responsibilities for the fund and other T. Rowe Price mutual funds that it or its affiliates advise. On the basis of the information provided, the Board concluded that the fees paid by the fund under the Contract were reasonable.
Approval of the Contract
As noted, the Board approved the continuation of the Contract. No single factor was considered in isolation or to be determinative to the decision. Rather, the Board concluded, in light of a weighting and balancing of all factors considered, that it was in the best interests of the fund to approve the continuation of the Contract, including the fees to be charged for services thereunder.
Item 2. Code of Ethics.
A code of ethics, as defined in Item 2 of Form N-CSR, applicable to its principal executive officer, principal financial officer, principal accounting officer or controller, or persons performing similar functions is filed as an exhibit to the registrant’s annual Form N-CSR. No substantive amendments were approved or waivers were granted to this code of ethics during the registrant’s most recent fiscal half-year.
Item 3. Audit Committee Financial Expert.
Disclosure required in registrant’s annual Form N-CSR.
Item 4. Principal Accountant Fees and Services.
Disclosure required in registrant’s annual Form N-CSR.
Item 5. Audit Committee of Listed Registrants.
Not applicable.
Item 6. Investments.
(a) Not applicable. The complete schedule of investments is included in Item 1 of this Form N-CSR.
(b) Not applicable.
Item 7. Disclosure of Proxy Voting Policies and Procedures for Closed-End Management Investment Companies.
Not applicable.
Item 8. Portfolio Managers of Closed-End Management Investment Companies.
Not applicable.
Item 9. Purchases of Equity Securities by Closed-End Management Investment Company and Affiliated Purchasers.
Not applicable.
Item 10. Submission of Matters to a Vote of Security Holders.
Not applicable.
Item 11. Controls and Procedures.
(a) The registrant’s principal executive officer and principal financial officer have evaluated the registrant’s disclosure controls and procedures within 90 days of this filing and have concluded that the registrant’s disclosure controls and procedures were effective, as of that date, in ensuring that information required to be disclosed by the registrant in this Form N-CSR was recorded, processed, summarized, and reported timely.
(b) The registrant’s principal executive officer and principal financial officer are aware of no change in the registrant’s internal control over financial reporting that occurred during the registrant’s second fiscal quarter covered by this report that has materially affected, or is reasonably likely to materially affect, the registrant’s internal control over financial reporting.
Item 12. Exhibits.
(a)(1) The registrant’s code of ethics pursuant to Item 2 of Form N-CSR is filed with the registrant’s annual Form N-CSR.
(2) Separate certifications by the registrant's principal executive officer and principal financial officer, pursuant to Section 302 of the Sarbanes-Oxley Act of 2002 and required by Rule 30a-2(a) under the Investment Company Act of 1940, are attached.
(3) Written solicitation to repurchase securities issued by closed-end companies: not applicable.
(b) A certification by the registrant's principal executive officer and principal financial officer, pursuant to Section 906 of the Sarbanes-Oxley Act of 2002 and required by Rule 30a-2(b) under the Investment Company Act of 1940, is attached.
| | |
SIGNATURES |
| |
| | Pursuant to the requirements of the Securities Exchange Act of 1934 and the Investment |
| Company Act of 1940, the registrant has duly caused this report to be signed on its behalf by the |
| undersigned, thereunto duly authorized. |
| |
| T. Rowe Price Dividend Growth Fund, Inc. |
| |
| |
| |
| By | /s/ Edward C. Bernard |
| | Edward C. Bernard |
| | Principal Executive Officer |
| |
| Date | August 20, 2008 |
| |
| |
| |
| | Pursuant to the requirements of the Securities Exchange Act of 1934 and the Investment |
| Company Act of 1940, this report has been signed below by the following persons on behalf of |
| the registrant and in the capacities and on the dates indicated. |
| |
| |
| By | /s/ Edward C. Bernard |
| | Edward C. Bernard |
| | Principal Executive Officer |
| |
| Date | August 20, 2008 |
| |
| |
| |
| By | /s/ Gregory K. Hinkle |
| | Gregory K. Hinkle |
| | Principal Financial Officer |
| |
| Date | August 20, 2008 |