Item 1: Report to Shareholders| Dividend Growth Fund | June 30, 2007 |
The views and opinions in this report were current as of June 30, 2007. They are not guarantees of performance or investment results and should not be taken as investment advice. Investment decisions reflect a variety of factors, and the managers reserve the right to change their views about individual stocks, sectors, and the markets at any time. As a result, the views expressed should not be relied upon as a forecast of the fund’s future investment intent. The report is certified under the Sarbanes-Oxley Act, which requires mutual funds and other public companies to affirm that, to the best of their knowledge, the information in their financial reports is fairly and accurately stated in all material respects.
REPORTS ON THE WEB
Sign up for our E-mail Program, and you can begin to receive updated fund reports and prospectuses online rather than through the mail. Log in to your account at troweprice.com for more information.
Manager’s Letter
Fellow Shareholders
U.S. stocks generated strong returns in the first half of 2007, with several major equity indexes, including the S&P 500, reaching new all-time highs. Shares were boosted by better-than-expected first-quarter earnings, especially among multinational firms, the Federal Reserve’s steady monetary policy, and an economic pickup in the second quarter. A dramatic rise in merger and acquisition (M&A) activity also had a significant impact on the market and the portfolio as private-equity buyers and others helped bid up stock prices. Although many of the deals involved small-and mid-cap companies, several of the fund’s holdings were subject to takeovers, aiding results.
HIGHLIGHTS
• U.S. stocks posted strong gains, aided by better-than-expected earnings, an improved economy, and continued corporate deal making.
• The Dividend Growth Fund outpaced the broad market as measured by the S&P 500 Stock Index during the first half of 2007.
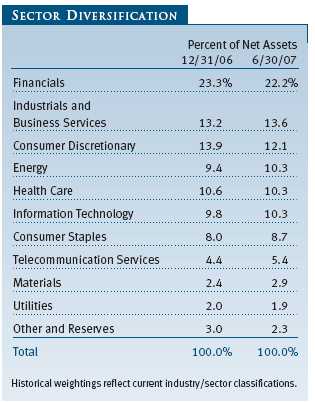
• All market sectors contributed positively to fund performance, led by energy, information technology, and industrials and business services.
• Given the stock market’s run, valuations look fair and our bias is to be more defensive going forward. We will continue to look for investment opportunities that provide an attractive risk-adjusted return potential.
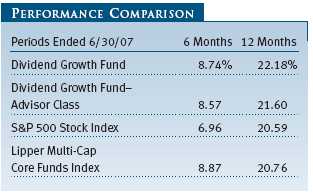
Your fund benefited from the favorable environment in the first half of the year, outpacing the large-cap S&P 500 Stock Index. Results narrowly lagged the fund’s Lipper index of similar funds. For the 12-month period, the fund outperformed both the broad market index and our Lipper peer group. (Performance for the Advisor Class was slightly lower due to its differing fee structure.) All sectors contributed positively to performance in the first half of the year, led by energy, information technology, and industrials and business services.
In addition, the fund benefited from the M&A and leveraged buyout (LBO) frenzy as several of our companies were or are in the process of being acquired. In total, the fund had nine companies taken out through merger, LBO, or private-equity purchase over the course of the last year. This activity is being driven by low financing costs as well as the tremendous amount of liquidity in the market. While some deals are being done at attractive prices to the buyer, many appear to us, at least on the surface, to be uneconomic and driven primarily by low interest rates. How long the party lasts is unclear, but the current shake-up in the fixed-income markets is likely signaling a slowdown in deal making.
Of importance to the fund’s strategy, the number of S&P 500 companies paying a dividend rose to 392. Companies that increased their dividends outnumbered those that cut them by more than seven to one. Dividends accounted for nearly a full percentage point of S&P 500 total return during the first half of the year.
ENVIRONMENT
Global economic growth remained on an upward trajectory in the first six months of 2007, led by strength in Europe and emerging markets. Indeed, global growth has been driven to a great extent by developing countries, which now account for almost 30% of global GDP and are growing at about 6% per year, according to ISI Group. Because they represent much of the world’s work force, emerging markets help keep labor costs down. At the same time, developing countries are major consumers of raw materials, which has kept commodity prices high. In contrast, first-quarter U.S. economic activity weakened considerably but improved in the second quarter. For its part, the Federal Reserve held the fed funds target rate steady, as it has since June 2006. The generally positive global economic conditions provided a favorable backdrop for corporate profits, which continued to grow at a healthy rate in most regions of the world.
In the large-cap universe, economically sensitive energy and materials stocks fared best, surging as the economy strengthened and some commodity prices firmed in the last few months. Speculation about industry consolidation also lifted metals and mining stocks. Telecommunication services stocks did very well, aided by a major private-equity buyout offer. Shares of financial companies lagged, falling amid concerns about their exposure to the subprime mortgage market and a second-quarter spike in longer-term interest rates. Consumer discretionary and consumer staples stocks trailed as well, as high gasoline prices weighed on spending trends.
PERFORMANCE REVIEW
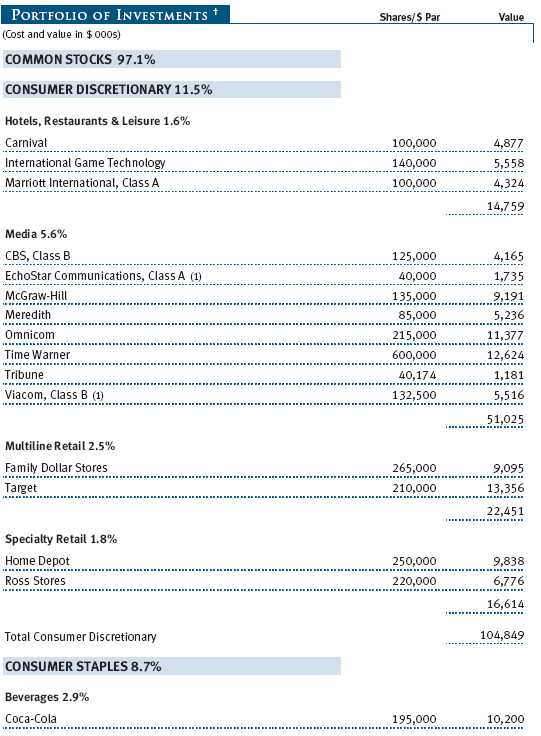
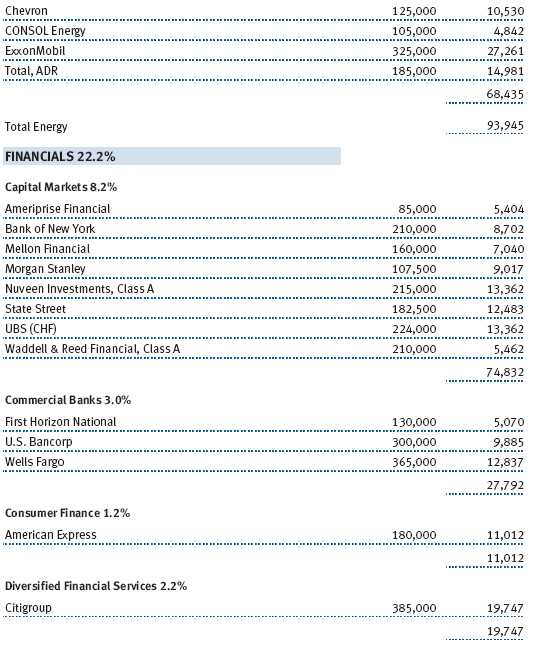
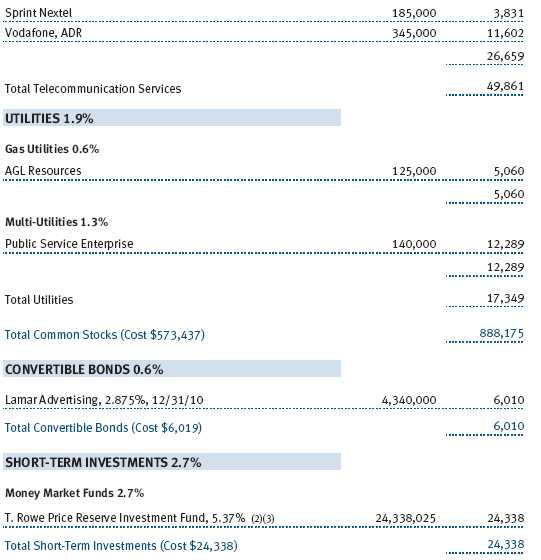
Our holdings in the energy sector benefited from the strong global economic environment as well as geopolitical turmoil that kept energy prices elevated. Our top contributor in the first half was Public Service Enterprise Group (PEG), a utility that we highlighted in our year-end letter as a new addition to the portfolio. It is unusual to be rewarded so quickly in a new investment, but we will not complain. Factors that drove the stock to artificially low levels, including a broken merger agreement, were quickly rectified by the market. Several other top-10 contributors included integrated oil producers ExxonMobil and Total and energy service companies Diamond Offshore Drilling and Baker Hughes. Diamond Offshore rebounded strongly from share price weakness in the second half of 2006 as the daily rental rates it receives for its rigs continued to expand. (Please see the portfolio of investments for a complete listing of holdings and the amount each represents in the portfolio.)
In information technology, Nokia was a terrific performer. Nokia is the number-one maker of cellular phones in the world and holds leading positions in large emerging growth markets such as China and India. Strong growth, helped by a troubled competitor in Motorola and an impressive lineup of new products, generated share-price gains of more than 40%. Several of our semiconductor holdings, including Linear Technology, Analog Devices, and Xilinx, had good first-half performance. While fundamentals improved modestly, much of the gains were driven by an increased focus by management teams to return some of the excess cash these companies generate back to shareholders. For example, Linear Technology is expected to repurchase 26% of its outstanding shares in 2007. We remain optimistic that such actions, combined with an improvement in business conditions for these companies, will continue to drive good returns.
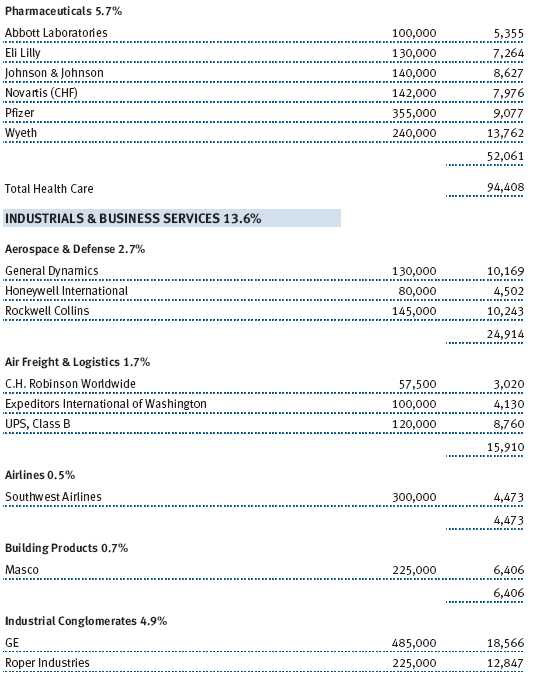
Industrials and business services, one of our longtime favored sectors, continued to perform well. Business strength is largely being driven by growth outside the U.S.—companies exposed to anything “infrastructure related” in developing markets have been handsomely rewarded. Honeywell International, with its commercial aerospace business, is an example, and it was also helped by good results in its building solution business (which is not exposed to the weak residential market) and good capital allocation. Deere benefited from U.S. policy mandating increased use of ethanol, the grain alcohol usually made from corn, to power motor vehicles. Deere also received investor attention as a beneficiary of rising global living standards—Deere’s equipment would play an integral role in improving food quality. Illinois Tool Works, a diversified industrial company, advanced as fears subsided that its relatively modest exposure to domestic housing and auto would not derail its fundamental performance. Within business services, First Data was a standout on the strength of its acquisition by a private-equity group for a healthy premium.
Disappointing performance was centered largely on stocks tied to domestic real estate, especially banks. While we do not have large exposure to the pure retail banking sector, holdings such as First Horizon National, Citigroup, and U.S. Bancorp fell modestly. Mortgages and consumer credit in general have been growth drivers for many financial services companies over the years, and fears of stalling growth as well as the prospect of increased credit costs weighed on the group.
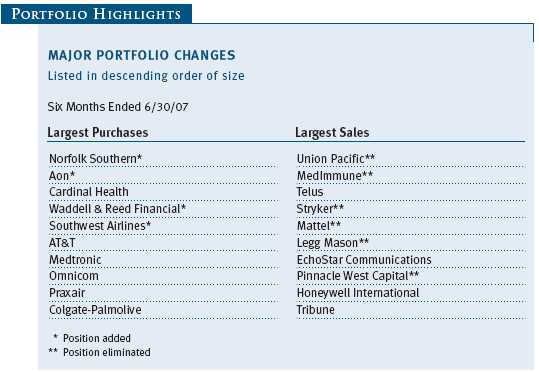
PORTFOLIO CHANGES
As always there were several changes to the portfolio since our last report. Norfolk Southern was a new addition, funded by a swap out of Union Pacific. We felt the risk/reward trade-off at Norfolk Southern was more favorable. We think it is a very well-managed railroad that can continue to drive productivity, and it is the cheapest railroad on free cash flow yield. This strong free cash flow generation allows Norfolk to increase dividends and buy back stock. With a yield of just 1.6%, we expect Norfolk to continue to raise its dividend as well as repurchase 3% to 4% of the stock annually.
Aon is a collection of three solid franchises: the second-largest global insurance broker, a management consulting operation, and an insurance underwriter. We think Aon now has a good management team committed to improving the expense structure, selling non-core assets and buying back stock (about $1 billion per year, or nearly 8.5% of the company). We purchased the stock following an earnings miss at what we considered an inexpensive price that offered attractive expected returns—a company selling at 11.4 times estimated 2008 earnings per share (EPS) that should grow 10% to 13% over the next few years. We continue to believe the prospective margin improvement, reasonable top-line growth, and aggressive capital management create an attractive risk/reward profile for the stock.
We added significantly to Cardinal Health, which competes in the pharmaceutical distribution (which accounts for about 60% of profits), medication delivery systems, and medical products manufacturing and distribution industries. At current levels, the stock is trading at 14.8 times our calendar-year 2008 EPS estimates and 12.8 times our 2009 estimates, which we think is very attractive given Cardinal’s mid-teens growth outlook, its lack of sensitivity to the economic cycle, strong balance sheet, and shareholder-friendly capital strategy. Cardinal is repurchasing $3.7 billion of stock in fiscal-year 2007 and expects to buy back another $1.4 billion (about 5% of market cap) in 2008. Management also plans to continue to steadily increase its dividend payout ratio from 14% to more than 20%, resulting in a dividend growth rate that exceeds an already attractive earnings growth rate. The stock currently yields 0.7%.
We have successfully owned Waddell & Reed Financial in the past, and it has found its way into the portfolio again. The Kansas City-based asset manager has gone through management, regulatory, and performance turmoil over the past several years but appears to be on its way to a full recovery thanks to the steady leadership of new CEO Hank Herrmann. Mr. Herrmann, a former analyst and portfolio manager at Waddell & Reed, has successfully maintained the company’s well-performing investment culture, rebuilt relationships with the proprietary advisors, and overseen the firm’s expansion into the non-proprietary sales channel. With just under $50 billion in assets under management, the firm is large enough to support a strong investment team yet small enough to grow significantly. We think the company is poised for a reacceleration of asset inflows, benefits from a strong balance sheet, and has an attractive valuation. At the time of purchase, Waddell & Reed traded at 15.5 times our 2007 EPS projections and 13.5 times 2008 EPS—a more than 20% discount to its peers. In addition, the stock carries a 2.5% yield. There is scarcity value in the franchise, and we believe the stock’s downside is protected by both the strong balance sheet and the potential to sell the company.
One of the fund’s largest purchases over the past year was Southwest Airlines. From time to time we have looked at the airline business and concluded it was too tough an industry to make attractive returns. Changes in industry structure and Southwest’s ever-improving position caused us to reevaluate. Although Southwest is already a household name, it continues to gain market share in a domestic airline industry riddled with troubled competitors. While the company is now the number-one U.S. carrier based on passenger enplanements—carrying almost 100 million people per year—it continues to grow at an attractive rate. It also has by far the best balance sheet in the business and an unparalleled fuel-hedging program, at a time when fuel prices are at record levels. We expect the company to start to capitalize on its leading domestic position in passenger traffic in numerous ways beyond ticket sales. Management believes that over th e next few years ancillary revenue and revenue-enhancing initiatives can generate upward of $1 billion in incremental annual revenue. We have also recently seen the company aggressively step up its efforts to optimize its pristine balance sheet through aggressive share repurchases, which we find encouraging and expect to continue. Given this combination of positive attributes, as well as our expectation of solid earnings growth, we believe the timing is right to own Southwest.
Our large sales in the first half of the year were almost exclusively due to good performance. Stryker, Mattel, Pinnacle West Capital, and Telus were all good stocks for the portfolio, and we felt the proceeds would be better used elsewhere. MedImmune, our lone biotech holding, was acquired by AstraZeneca for a significant premium. Union Pacific and Legg Mason were swapped into what we consider better ideas, including Norfolk Southern and Waddell & Reed.
OUTLOOK
Given the stock market’s run in the first half of the year and its continued climb as we write this letter, valuations look fair to us. Strength in commodity and industrial shares are being bolstered by expectations of continued global growth as well as heightened M&A activity. The “easy” money has been made in many cases, and our bias is to be more defensive going forward. We will continue to look for investment opportunities that provide an attractive risk-adjusted return potential.
Respectfully submitted,

Thomas J. Huber
President of the fund and chairman of its Investment Advisory Committee
July 25, 2007
The committee chairman has day-to-day responsibility for managing the portfolio and works with committee members in developing and executing the fund’s investment program.
SUPPLEMENT TO PROSPECTUS DATED MAY 1, 2007
ERRATUM
Effective May 1, 2007, the fund’s operating policy that sets forth the percentage of the fund’s “total bond assets” that may be invested in noninvestment-grade securities is hereby corrected to remove the word “bond” and refer to “total assets” instead.
RISKS OF STOCK INVESTING
As with all stock and bond mutual funds, a fund’s share price can fall because of weakness in the stock or bond markets, a particular industry, or specific holdings. Stock markets can decline for many reasons, including adverse political or economic developments, changes in investor psychology, or heavy institutional selling. The prospects for an industry or company may deteriorate because of a variety of factors, including disappointing earnings or changes in the competitive environment. In addition, the investment manager’s assessment of companies held in a fund may prove incorrect, resulting in losses or poor performance even in rising markets. Funds investing in stocks with a dividend orientation may have somewhat lower potential for price appreciation than those concentrating on rapidly growing firms. Also, a company may reduce or eliminate its dividend.
GLOSSARY
Dividend yield: The annual dividend of a stock divided by the stock’s price.
Beta: A measure of the market risk of a stock showing how responsive it is to a given market index, such as the S&P 500 Stock Index. By definition, the beta of the benchmark index is 1.00. A fund with a 1.10 beta is expected to perform 10% better than the index in up markets and 10% worse in down markets. Usually, higher betas represent riskier investments.
Free cash flow: The excess cash a company generates from its operations that can be taken out of the business for the benefit of shareholders, such as dividends, share repurchases, investments, and acquisitions.
Lipper indexes: Fund benchmarks that consist of a small number (10 to 30) of the largest mutual funds in a particular category as tracked by Lipper Inc.
Price/earnings ratio (P/E): A valuation measure calculated by dividing the price of a stock by its current or projected earnings per share. This ratio gives investors an idea of how much they are paying for current or future earnings power.
Risk/reward: The relationship between the degree of risk associated with an investment and its return potential. Typically, the higher the potential return of an investment, the greater the risk.
S&P 500 Stock Index: An unmanaged index that tracks the stocks of 500 primarily large-capitalization U.S. companies.

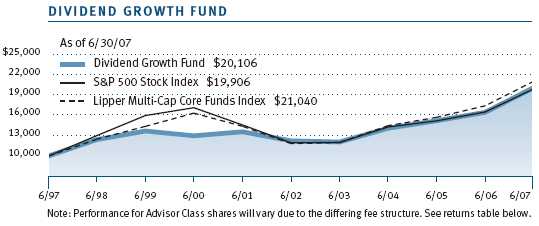
Performance and Expenses
This chart shows the value of a hypothetical $10,000 investment in the fund over the past 10 fiscal year periods or since inception (for funds lacking 10-year records). The result is compared with benchmarks, which may include a broad-based market index and a peer group average or index. Market indexes do not include expenses, which are deducted from fund returns as well as mutual fund averages and indexes.
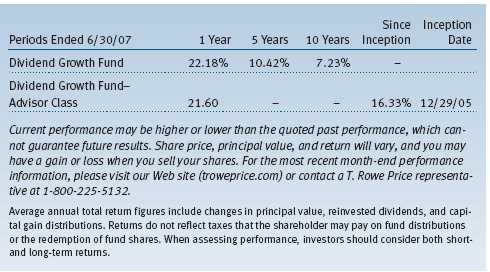
| AVERAGE ANNUAL COMPOUND TOTAL RETURN |
This table shows how the fund would have performed each year if its actual (or cumulative) returns for the periods shown had been earned at a constant rate.

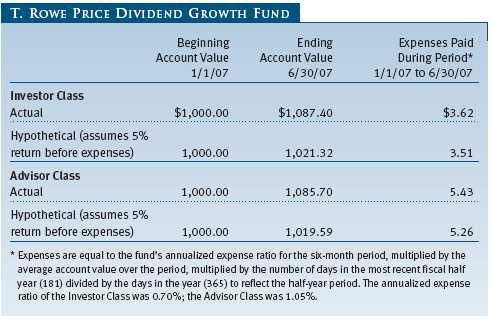
As a mutual fund shareholder, you may incur two types of costs: (1) transaction costs, such as redemption fees or sales loads, and (2) ongoing costs, including management fees, distribution and service (12b-1) fees, and other fund expenses. The following example is intended to help you understand your ongoing costs (in dollars) of investing in the fund and to compare these costs with the ongoing costs of investing in other mutual funds. The example is based on an investment of $1,000 invested at the beginning of the most recent six-month period and held for the entire period.
Please note that the fund has two share classes: The original share class (“investor class”) charges no distribution and service (12b-1) fee. Advisor Class shares are offered only through unaffiliated brokers and other financial intermediaries and charge a 0.25% 12b-1 fee. Each share class is presented separately in the table.
Actual Expenses
The first line of the following table (“Actual”) provides information about actual account values and expenses based on the fund’s actual returns. You may use the information in this line, together with your account balance, to estimate the expenses that you paid over the period. Simply divide your account value by $1,000 (for example, an $8,600 account value divided by $1,000 = 8.6), then multiply the result by the number in the first line under the heading “Expenses Paid During Period” to estimate the expenses you paid on your account during this period.
Hypothetical Example for Comparison Purposes
The information on the second line of the table (“Hypothetical”) is based on hypothetical account values and expenses derived from the fund’s actual expense ratio and an assumed 5% per year rate of return before expenses (not the fund’s actual return). You may compare the ongoing costs of investing in the fund with other funds by contrasting this 5% hypothetical example and the 5% hypothetical examples that appear in the shareholder reports of the other funds. The hypothetical account values and expenses may not be used to estimate the actual ending account balance or expenses you paid for the period.
Note: T. Rowe Price charges an annual small-account maintenance fee of $10, generally for accounts with less than $2,000 ($500 for UGMA/UTMA). The fee is waived for any investor whose T. Rowe Price mutual fund accounts total $25,000 or more, accounts employing automatic investing, and IRAs and other retirement plan accounts that utilize a prototype plan sponsored by T. Rowe Price (although a separate custodial or administrative fee may apply to such accounts). This fee is not included in the accompanying table. If you are subject to the fee, keep it in mind when you are estimating the ongoing expenses of investing in the fund and when comparing the expenses of this fund with other funds.
You should also be aware that the expenses shown in the table highlight only your ongoing costs and do not reflect any transaction costs, such as redemption fees or sales loads. Therefore, the second line of the table is useful in comparing ongoing costs only and will not help you determine the relative total costs of owning different funds. To the extent a fund charges transaction costs, however, the total cost of owning that fund is higher.
Unaudited
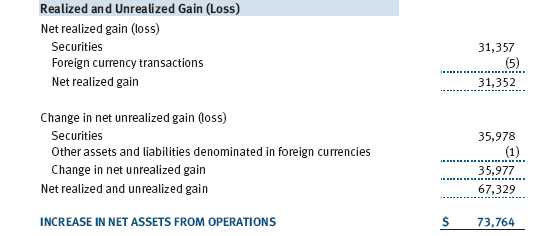
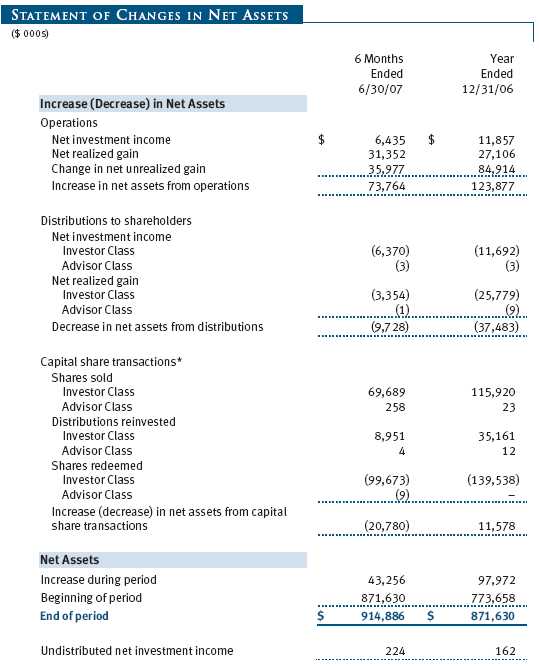
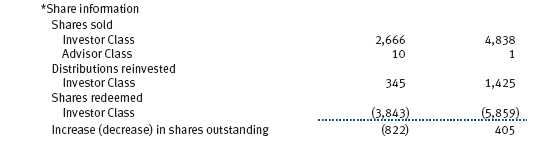
The accompanying notes are an integral part of these financial statements.
Unaudited
The accompanying notes are an integral part of these financial statements.
Unaudited


The accompanying notes are an integral part of these financial statements.
Unaudited
The accompanying notes are an integral part of these financial statements.
Unaudited
The accompanying notes are an integral part of these financial statements.
Unaudited
The accompanying notes are an integral part of these financial statements.
Unaudited
| NOTES TO FINANCIAL STATEMENTS |
NOTE 1 - SIGNIFICANT ACCOUNTING POLICIES
T. Rowe Price Dividend Growth Fund, Inc. (the fund), is registered under the Investment Company Act of 1940 (the 1940 Act) as a diversified, open-end management investment company. The fund seeks to provide increasing dividend income over time, long-term growth of capital, and a reasonable level of current income through investments primarily in dividend-paying stocks. The fund has two classes of shares: the Dividend Growth Fund original share class, referred to in this report as the Investor Class, offered since December 30, 1992, and Dividend Growth Fund—Advisor Class (Advisor Class), offered since December 29, 2005. Advisor Class shares are sold only through unaffiliated brokers and other unaffiliated financial intermediaries that are compensated by the class for distribution, shareholder servicing, and/or certain administrative services under a Board-approved Rule 12b-1 plan. Each class has exclusive voting rights on matters related solely to that class, separate voting rights on m atters that relate to both classes, and, in all other respects, the same rights and obligations as the other class.
The accompanying financial statements were prepared in accordance with accounting principles generally accepted in the United States of America, which require the use of estimates made by fund management. Fund management believes that estimates and security valuations are appropriate; however, actual results may differ from those estimates, and the security valuations reflected in the financial statements may differ from the value the fund ultimately realizes upon sale of the securities.
Valuation The fund values its investments and computes its net asset value per share at the close of the New York Stock Exchange (NYSE), normally 4 p.m. ET, each day that the NYSE is open for business. Equity securities listed or regularly traded on a securities exchange or in the over-the-counter (OTC) market are valued at the last quoted sale price or, for certain markets, the official closing price at the time the valuations are made, except for OTC Bulletin Board securities, which are valued at the mean of the latest bid and asked prices. A security that is listed or traded on more than one exchange is valued at the quotation on the exchange determined to be the primary market for such security. Listed securities not traded on a particular day are valued at the mean of the latest bid and asked prices for domestic securities and the last quoted sale price for international securities.
Debt securities are generally traded in the over-the-counter market. Securities with original maturities of one year or more are valued at prices furnished by dealers who make markets in such securities or by an independent pricing service, which considers yield or price of bonds of comparable quality, coupon, maturity, and type, as well as prices quoted by dealers who make markets in such securities. Securities with original maturities of less than one year are valued at amortized cost in local currency, which approximates fair value when combined with accrued interest.
Investments in mutual funds are valued at the mutual fund’s closing net asset value per share on the day of valuation.
Other investments, including restricted securities, and those for which the above valuation procedures are inappropriate or are deemed not to reflect fair value are stated at fair value as determined in good faith by the T. Rowe Price Valuation Committee, established by the fund’s Board of Directors.
Most foreign markets close before the close of trading on the NYSE. If the fund determines that developments between the close of a foreign market and the close of the NYSE will, in its judgment, materially affect the value of some or all of its portfolio securities, which in turn will affect the fund’s share price, the fund will adjust the previous closing prices to reflect the fair value of the securities as of the close of the NYSE, as determined in good faith by the T. Rowe Price Valuation Committee, established by the fund’s Board of Directors. A fund may also fair value securities in other situations, such as when a particular foreign market is closed but the fund is open. In deciding whether to make fair value adjustments, the fund reviews a variety of factors, including developments in foreign markets, the performance of U.S. securities markets, and the performance of instruments trading in U.S. markets that represent foreign securities and baskets of foreign securities. The fund uses outside pricing services to provide it with closing market prices and information used for adjusting those prices. The fund cannot predict when and how often it will use closing prices and when it will adjust those prices to reflect fair value. As a means of evaluating its fair value process, the fund routinely compares closing market prices, the next day’s opening prices in the same markets, and adjusted prices.
Currency Translation Assets, including investments, and liabilities denominated in foreign currencies are translated into U.S. dollar values each day at the prevailing exchange rate, using the mean of the bid and asked prices of such currencies against U.S. dollars as quoted by a major bank. Purchases and sales of securities, income, and expenses are translated into U.S. dollars at the prevailing exchange rate on the date of the transaction. The effect of changes in foreign currency exchange rates on realized and unrealized security gains and losses is reflected as a component of security gains and losses.
Class Accounting The Advisor Class pays distribution, shareholder servicing, and/or certain administrative expenses in the form of Rule 12b-1 fees, in an amount not exceeding 0.25% of the class’s average daily net assets. Shareholder servicing, prospectus, and shareholder report expenses incurred by each class are charged directly to the class to which they relate. Expenses common to both classes, investment income, and realized and unrealized gains and losses are allocated to the classes based upon the relative daily net assets of each class.
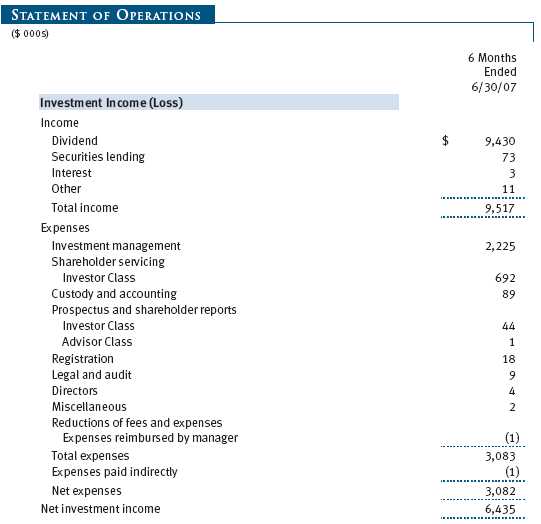
Rebates and Credits Subject to best execution, the fund may direct certain security trades to brokers who have agreed to rebate a portion of the related brokerage commission to the fund in cash. Commission rebates are reflected as realized gain on securities in the accompanying financial statements and totaled $6,000 for the six months ended June 30, 2007. Additionally, the fund earns credits on temporarily uninvested cash balances at the custodian that reduce the fund’s custody charges. Custody expense in the accompanying financial statements is presented before reduction for credits, which are reflected as expenses paid indirectly.
Investment Transactions, Investment Income, and Distributions Income and expenses are recorded on the accrual basis. Premiums and discounts on debt securities are amortized for financial reporting purposes. Dividends received from mutual fund investments are reflected as dividend income; capital gain distributions are reflected as realized gain/loss. Dividend income and capital gain distributions are recorded on the ex-dividend date. Any income tax-related interest and penalties would be classified as income tax expense. Investment transactions are accounted for on the trade date. Realized gains and losses are reported on the identified cost basis. Distributions to shareholders are recorded on the ex-dividend date. Income distributions are declared and paid by each class on a quarterly basis. Capital gain distributions, if any, are declared and paid by the fund, typically on an annual basis.
New Accounting Pronouncements Effective June 29, 2007, the fund adopted Financial Accounting Standards Board (“FASB”) Interpretation No. 48 (“FIN 48”), Accounting for Uncertainty in Income Taxes, a clarification of FASB Statement No. 109, Accounting for Income Taxes. FIN 48 establishes financial accounting and disclosure requirements for recognition and measurement of tax positions taken or expected to be taken on an income tax return. The adoption of FIN 48 had no impact on the fund’s net assets or results of operations.
In September 2006, the FASB released the Statement of Financial Accounting Standard No. 157 (“FAS 157”), Fair Value Measurements. FAS 157 clarifies the definition of fair value and establishes the framework for measuring fair value, as well as proper disclosure of this methodology in the financial statements. It will be effective for the fund’s fiscal year beginning January 1, 2008. Management is evaluating the effects of FAS 157; however, it is not expected to have a material impact on the fund’s net assets or results of operations.
NOTE 2 - INVESTMENT TRANSACTIONS
Consistent with its investment objective, the fund engages in the following practices to manage exposure to certain risks or to enhance performance. The investment objective, policies, program, and risk factors of the fund are described more fully in the fund’s prospectus and Statement of Additional Information.
Securities Lending The fund lends its securities to approved brokers to earn additional income. It receives as collateral cash and U.S. government securities valued at 102% to 105% of the value of the securities on loan. Cash collateral is invested in a money market pooled trust managed by the fund’s lending agent in accordance with investment guidelines approved by fund management. Collateral is maintained over the life of the loan in an amount not less than the value of loaned securities, as determined at the close of fund business each day; any additional collateral required due to changes in security values is delivered to the fund the next business day. Although risk is mitigated by the collateral, the fund could experience a delay in recovering its securities and a possible loss of income or value if the borrower fails to return the securities. Securities lending revenue recognized by the fund consists of earnings on invested collateral and borrowing fees, net of any rebates to the borrower and compensation to the lending agent. At June 30, 2007, there were no securities on loan.
Other Purchases and sales of portfolio securities, other than short-term securities, aggregated $79,358,000 and $97,374,000, respectively, for the six months ended June 30, 2007.
NOTE 3 - FEDERAL INCOME TAXES
No provision for federal income taxes is required since the fund intends to continue to qualify as a regulated investment company under Subchapter M of the Internal Revenue Code and distribute to shareholders all of its taxable income and gains. Federal income tax regulations differ from generally accepted accounting principles; therefore, distributions determined in accordance with tax regulations may differ in amount or character from net investment income and realized gains for financial reporting purposes. Financial reporting records are adjusted for permanent book/tax differences to reflect tax character. Financial records are not adjusted for temporary differences. The amount and character of tax-basis distributions and composition of net assets are finalized at fiscal year-end; accordingly, tax-basis balances have not been determined as of June 30, 2007.
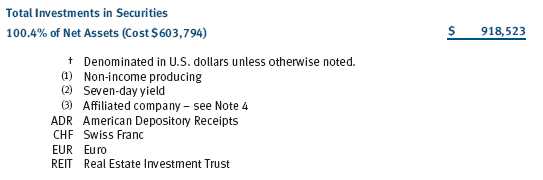
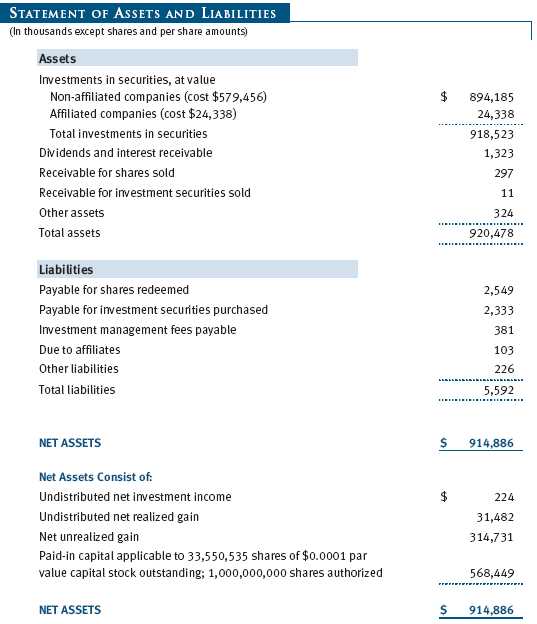
At June 30, 2007, the cost of investments for federal income tax purposes was $603,794,000. Net unrealized gain aggregated $314,731,000 at period-end, of which $316,761,000 related to appreciated investments and $2,030,000 related to depreciated investments.
NOTE 4 - RELATED PARTY TRANSACTIONS
The fund is managed by T. Rowe Price Associates, Inc. (the manager or Price Associates), a wholly owned subsidiary of T. Rowe Price Group, Inc. The investment management agreement between the fund and the manager provides for an annual investment management fee, which is computed daily and paid monthly. The fee consists of an individual fund fee, equal to 0.20% of the fund’s average daily net assets, and a group fee. The group fee rate is calculated based on the combined net assets of certain mutual funds sponsored by Price Associates (the group) applied to a graduated fee schedule, with rates ranging from 0.48% for the first $1 billion of assets to 0.285% for assets in excess of $220 billion. The fund’s group fee is determined by applying the group fee rate to the fund’s average daily net assets. At June 30, 2007, the effective annual group fee rate was 0.30%.
The Advisor Class is also subject to a contractual expense limitation through April 30, 2008. During the limitation period, the manager is required to waive its management fee and/or reimburse expenses, excluding interest, taxes, brokerage commissions, and extraordinary expenses, that would otherwise cause the class’s ratio of annualized total expenses to average net assets (expense ratio) to exceed its expense limitation of 1.05% . The class is required to repay the manager for expenses previously reimbursed and management fees waived to the extent the class’s net assets have grown or expenses have declined sufficiently to allow repayment without causing the class’s expense ratio to exceed its expense limitation. However, no repayment will be made more than three years after the date of any reimbursement or waiver or later than April 30, 2010. Pursuant to this agreement, expenses in the amount of $1,000 were reimbursed by the manager during the six months ended June 30, 2 007. Including these amounts, expenses previously reimbursed by the manager in the amount of $4,000 remain subject to repayment at June 30, 2007.
In addition, the fund has entered into service agreements with Price Associates and two wholly owned subsidiaries of Price Associates (collectively, Price). Price Associates computes the daily share prices and provides certain other administrative services to the fund. T. Rowe Price Services, Inc., provides shareholder and administrative services in its capacity as the fund’s transfer and dividend disbursing agent. T. Rowe Price Retirement Plan Services, Inc., provides subaccounting and recordkeeping services for certain retirement accounts invested in the Investor Class. For the six months ended June 30, 2007, expenses incurred pursuant to these service agreements were $55,000 for Price Associates, $400,000 for T. Rowe Price Services, Inc., and $151,000 for T. Rowe Price Retirement Plan Services, Inc. The total amount payable at period-end pursuant to these service agreements is reflected as Due to Affiliates in the accompanying financial statements.
The fund may invest in the T. Rowe Price Reserve Investment Fund and the T. Rowe Price Government Reserve Investment Fund (collectively, the T. Rowe Price Reserve Investment Funds), open-end management investment companies managed by Price Associates and affiliates of the fund. The T. Rowe Price Reserve Investment Funds are offered as cash management options to mutual funds, trusts, and other accounts managed by Price Associates and/or its affiliates, and are not available for direct purchase by members of the public. The T. Rowe Price Reserve Investment Funds pay no investment management fees. During the six months ended June 30, 2007, dividend income from the T. Rowe Price Reserve Investment Funds totaled $558,000, and the value of shares of the T. Rowe Price Reserve Investment Funds held at June 30, 2007, and December 31, 2006, was $24,338,000 and $23,742,000, respectively.
As of June 30, 2007, T. Rowe Price Group, Inc., and/or its wholly owned subsidiaries owned 336,573 shares of the Investor Class, and 11,507 shares of the Advisor Class, aggregating 1% of the fund’s net assets.
| INFORMATION ON PROXY VOTING POLICIES, PROCEDURES, AND RECORDS |
A description of the policies and procedures used by T. Rowe Price funds and portfolios to determine how to vote proxies relating to portfolio securities is available in each fund’s Statement of Additional Information, which you may request by calling 1-800-225-5132 or by accessing the SEC’s Web site, www.sec.gov. The description of our proxy voting policies and procedures is also available on our Web site, www.troweprice.com. To access it, click on the words “Company Info” at the top of our homepage for individual investors. Then, in the window that appears, click on the “Proxy Voting Policy” navigation button in the top left corner.
Each fund’s most recent annual proxy voting record is available on our Web site and through the SEC’s Web site. To access it through our Web site, follow the directions above, then click on the words “Proxy Voting Record” at the bottom of the Proxy Voting Policy page.
| HOW TO OBTAIN QUARTERLY PORTFOLIO HOLDINGS |
The fund files a complete schedule of portfolio holdings with the Securities and Exchange Commission for the first and third quarters of each fiscal year on Form N-Q. The fund’s Form N-Q is available electronically on the SEC’s Web site (www.sec.gov); hard copies may be reviewed and copied at the SEC’s Public Reference Room, 450 Fifth St. N.W., Washington, DC 20549. For more information on the Public Reference Room, call 1-800-SEC-0330.
| APPROVAL OF INVESTMENT MANAGEMENT AGREEMENT |
On March 7, 2007, the fund’s Board of Directors (Board) unanimously approved the investment advisory contract (Contract) between the fund and its investment manager, T. Rowe Price Associates, Inc. (Manager). The Board considered a variety of factors in connection with its review of the Contract, also taking into account information provided by the Manager during the course of the year, as discussed below:
Services Provided by the Manager
The Board considered the nature, quality, and extent of the services provided to the fund by the Manager. These services included, but were not limited to, management of the fund’s portfolio and a variety of related activities, as well as financial and administrative services, reporting, and communications. The Board also reviewed the background and experience of the Manager’s senior management team and investment personnel involved in the management of the fund. The Board concluded that it was satisfied with the nature, quality, and extent of the services provided by the Manager.
Investment Performance of the Fund
The Board reviewed the fund’s average annual total return over the 1-, 3-, 5-, and 10-year periods as well as the fund’s year-by-year returns and compared these returns with previously agreed upon comparable performance measures and market data, including those supplied by Lipper and Morningstar, which are independent providers of mutual fund data. On the basis of this evaluation and the Board’s ongoing review of investment results, the Board concluded that the fund’s performance was satisfactory.
Costs, Benefits, Profits, and Economies of Scale
The Board reviewed detailed information regarding the revenues received by the Manager under the Contract and other benefits that the Manager (and its affiliates) may have realized from its relationship with the fund, including research received under “soft dollar” agreements. The Board noted that soft dollars were not used to pay for third-party, non-broker research. The Board also received information on the estimated costs incurred and profits realized by the Manager and its affiliates from advising T. Rowe Price mutual funds, as well as estimates of the gross profits realized from managing the fund in particular. The Board concluded that the Manager’s profits were reasonable in light of the services provided to the fund. The Board also considered whether the fund or other funds benefit under the fee levels set forth in the Contract from any economies of scale realized by the Manager. Under the Contract, the fund pays a fee to the Manager composed of two components—a group fee rate based on the aggregate assets of certain T. Rowe Price mutual funds (including the fund) that declines at certain asset levels and an individual fund fee rate that is assessed on the assets of the fund. The Board concluded that the advisory fee structure for the fund continued to provide for a reasonable sharing of benefits from any economies of scale with the fund’s investors.
Fees
The Board reviewed the fund’s management fee rate, operating expenses, and total expense ratio and compared them with fees and expenses of other comparable funds based on information and data supplied by Lipper. The information provided to the Board indicated that the fund’s management fee rate (for both classes) was at or below the median for comparable funds. The information also indicated that the fund’s expense ratio (for both classes) was generally below the median for comparable funds. The Board also reviewed the fee schedules for comparable privately managed accounts of the Manager and its affiliates. Management informed the Board that the Manager’s responsibilities for privately managed accounts are more limited than its responsibilities for the fund and other T. Rowe Price mutual funds that it or its affiliates advise. On the basis of the information provided, the Board concluded that the fees paid by the fund under the Contract were reasonable.
Approval of the Contract
As noted, the Board approved the continuation of the Contract. No single factor was considered in isolation or to be determinative to the decision. Rather, the Board concluded, in light of a weighting and balancing of all factors considered, that it was in the best interests of the fund to approve the continuation of the Contract, including the fees to be charged for services thereunder.
Item 2. Code of Ethics.
A code of ethics, as defined in Item 2 of Form N-CSR, applicable to its principal executive officer, principal financial officer, principal accounting officer or controller, or persons performing similar functions is filed as an exhibit to the registrant’s annual Form N-CSR. No substantive amendments were approved or waivers were granted to this code of ethics during the registrant’s most recent fiscal half-year.
Item 3. Audit Committee Financial Expert.
Disclosure required in registrant’s annual Form N-CSR.
Item 4. Principal Accountant Fees and Services.
Disclosure required in registrant’s annual Form N-CSR.
Item 5. Audit Committee of Listed Registrants.
Not applicable.
Item 6. Schedule of Investments.
Not applicable. The complete schedule of investments is included in Item 1 of this Form N-CSR.
Item 7. Disclosure of Proxy Voting Policies and Procedures for Closed-End Management Investment Companies.
Not applicable.
Item 8. Portfolio Managers of Closed-End Management Investment Companies.
Not applicable.
Item 9. Purchases of Equity Securities by Closed-End Management Investment Company and Affiliated Purchasers.
Not applicable.
Item 10. Submission of Matters to a Vote of Security Holders.
Not applicable.
Item 11. Controls and Procedures.
(a) The registrant’s principal executive officer and principal financial officer have evaluated the registrant’s disclosure controls and procedures within 90 days of this filing and have concluded that the registrant’s disclosure controls and procedures were effective, as of that date, in ensuring that information required to be disclosed by the registrant in this Form N-CSR was recorded, processed, summarized, and reported timely.
(b) The registrant’s principal executive officer and principal financial officer are aware of no change in the registrant’s internal control over financial reporting that occurred during the registrant’s second fiscal quarter covered by this report that has materially affected, or is reasonably likely to materially affect, the registrant’s internal control over financial reporting.
Item 12. Exhibits.(a)(1) The registrant’s code of ethics pursuant to Item 2 of Form N-CSR is filed with the registrant’s annual Form N-CSR.
(2) Separate certifications by the registrant's principal executive officer and principal financial officer, pursuant to Section 302 of the Sarbanes-Oxley Act of 2002 and required by Rule 30a-2(a) under the Investment Company Act of 1940, are attached.
(3) Written solicitation to repurchase securities issued by closed-end companies: not applicable.
(b) A certification by the registrant's principal executive officer and principal financial officer, pursuant to Section 906 of the Sarbanes-Oxley Act of 2002 and required by Rule 30a-2(b) under the Investment Company Act of 1940, is attached.
| |
| | |
SIGNATURES |
| |
| | Pursuant to the requirements of the Securities Exchange Act of 1934 and the Investment |
| Company Act of 1940, the registrant has duly caused this report to be signed on its behalf by the |
| undersigned, thereunto duly authorized. |
| |
| T. Rowe Price Dividend Growth Fund, Inc. |
| |
| |
| By | /s/ Edward C. Bernard |
| | Edward C. Bernard |
| | Principal Executive Officer |
| |
| Date | August 17, 2007 |
| |
| |
| |
| | Pursuant to the requirements of the Securities Exchange Act of 1934 and the Investment |
| Company Act of 1940, this report has been signed below by the following persons on behalf of |
| the registrant and in the capacities and on the dates indicated. |
| |
| |
| By | /s/ Edward C. Bernard |
| | Edward C. Bernard |
| | Principal Executive Officer |
| |
| Date | August 17, 2007 |
| |
| |
| |
| By | /s/ Joseph A. Carrier |
| | Joseph A. Carrier |
| | Principal Financial Officer |
| |
| Date | August 17, 2007 |