| UNITED STATES |
| SECURITIES AND EXCHANGE COMMISSION |
| Washington, D.C. 20549 |
| |
FORM N-CSR |
| |
CERTIFIED SHAREHOLDER REPORT OF REGISTERED |
MANAGEMENT INVESTMENT COMPANIES |
| |
| |
| |
| Investment Company Act File Number: 811-7055 |
|
| |
| T. Rowe Price Dividend Growth Fund, Inc. |
|
| (Exact name of registrant as specified in charter) |
| |
| 100 East Pratt Street, Baltimore, MD 21202 |
|
| (Address of principal executive offices) |
| |
| David Oestreicher |
| 100 East Pratt Street, Baltimore, MD 21202 |
|
| (Name and address of agent for service) |
| |
| |
| Registrant’s telephone number, including area code: (410) 345-2000 |
| |
| |
| Date of fiscal year end: December 31 |
| |
| |
| Date of reporting period: June 30, 2009 |
Item 1: Report to Shareholders| Dividend Growth Fund | June 30, 2009 |
The views and opinions in this report were current as of June 30, 2009. They are not guarantees of performance or investment results and should not be taken as investment advice. Investment decisions reflect a variety of factors, and the managers reserve the right to change their views about individual stocks, sectors, and the markets at any time. As a result, the views expressed should not be relied upon as a forecast of the fund’s future investment intent. The report is certified under the Sarbanes-Oxley Act, which requires mutual funds and other public companies to affirm that, to the best of their knowledge, the information in their financial reports is fairly and accurately stated in all material respects.
REPORTS ON THE WEB
Sign up for our E-mail Program, and you can begin to receive updated fund reports and prospectuses online rather than through the mail. Log in to your account at troweprice.com for more information.
Manager’s Letter
Fellow Shareholders
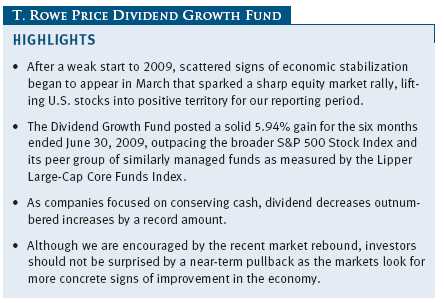
Although the U.S. and global economies remain mired in an economic downturn of historic proportions, scattered signs of stabilization began to appear over the last six months. For U.S. stocks, weakness at the end of 2008 stretched into the first two months of 2009 as the S&P 500 Index lost approximately 25% from the start of the year through early March. Early signs that the economy may have reached a bottom spurred a sharp rally beginning in March, although investor optimism receded and markets gave back some gains in the closing weeks of June as tepid economic data indicated a more subdued, long-term recovery. However, the rally was enough to lift most major indices into positive territory for the reporting period. Dividend reductions and eliminations increased as more companies focused on cash conservation in this uncertain economic environment.
The Dividend Growth Fund posted a solid 5.94% gain for the six months ended June 30, 2009, outpacing the broader S&P 500 Stock Index and its peer group of similarly managed funds as measured by the Lipper Large-Cap Core Funds Index. Returns for the fund’s Advisor Class differed slightly due to its different fee structure.

While the returns of the past six months have been encouraging, we understand that they do not completely make up for the losses suffered during the worst of the market downturn in 2008 and early 2009. Rest assured, we will continue to rely on our exhaustive analysis and disciplined approach to identify those companies that are best positioned to provide a sustainable combination of current income and long-term capital appreciation for our shareholders.
THE DIVIDEND ENVIRONMENT
In the second quarter of 2009, only 233 of the 7,000 publicly owned companies that report dividend information to Standard & Poor’s increased their dividend payment—the lowest number since S&P started keeping dividend records in 1955. Although payout reductions or eliminations traditionally have been seen as a sign of weakness, even healthy companies with strong cash flows began to rein in payments as dividend decreases and eliminations reached their highest level in over 50 years. Among S&P 500 stocks, non-dividend-paying stocks substantially outpaced dividend payers for the first six months of the year. However, dividend yields were relatively attractive, with an S&P 500 indicated yield of 2.35% at the end of our reporting period.

Dividend-paying stocks have endured a difficult period over the last year. However, we believe there are some positive elements to their story. Historically, dividends have accounted for a large portion of investor returns. For example, investors in the S&P 500 would have earned approximately 11% from dividends during the current decade, helping to lessen the negative impact of a weak period for equities. Dividends also serve as a simple measure of a company’s financial health since they are a reflection of its cash flow. Those firms that cut their dividends historically have underperformed the market over the near term, while those who sustain or increase their dividends have tended to outperform. In the current uncertain market, we believe that high-quality, dividend-paying stocks offer the potential not only for consistent income, but also for solid capital appreciation.
MARKET ENVIRONMENT
The U.S. economy is in one of the deepest and longest downturns since the Great Depression. Gross domestic product contracted markedly and unemployment exceeded 9% by the end of our reporting period, with further increases likely over the coming months.
Scattered signs of economic stabilization began to emerge in March as credit markets improved, housing price declines began to moderate, and consumer confidence increased. However, economic news throughout June was mixed. On the positive side, the Conference Board’s index of leading economic indicators surged for the second straight month, and consumer confidence was stronger than expected early in the month. However, weakness in manufacturing and industrial production began to appear later in the month, and a cautious retail outlook, coupled with an unexpected increase in jobless claims, took some of the wind out of the recovery argument.
U.S. stocks began our reporting period on a sour note as the weakness of 2008’s historic equity market downturn carried over into the first two months of 2009. However, equities rallied sharply from their March lows, sparked by oversold valuations and early signs that the economy is in the process of bottoming and that government measures to stabilize the financial markets may be starting to bear fruit. With an improving backdrop for the economy and markets, investors regained some measure of confidence and appetite for risk before tepid economic news dampened their optimism in June. Nevertheless, growth stocks significantly outperformed value stocks across all market capitalizations. Additionally, the best-performing S&P 500 sectors were information technology, materials, and consumer discretionary—traditionally seen as the market’s “riskier,” more economically sensitive sectors. At the same time, the traditional market safe havens turned in weaker performance as health care, utilities, and consumer staples were either flat or negative for the period. Viewed as the impetus and epicenter of the recent downturn, financials sector shares lost ground despite an extraordinary rebound over the last three months of the reporting period.
PERFORMANCE REVIEW
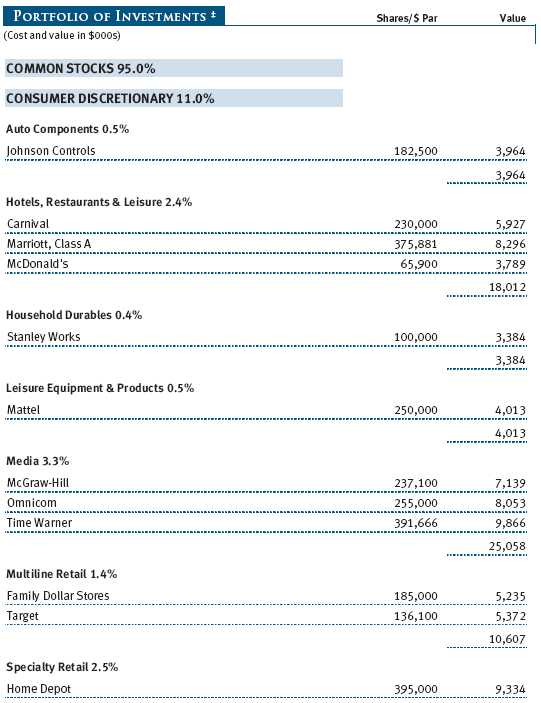
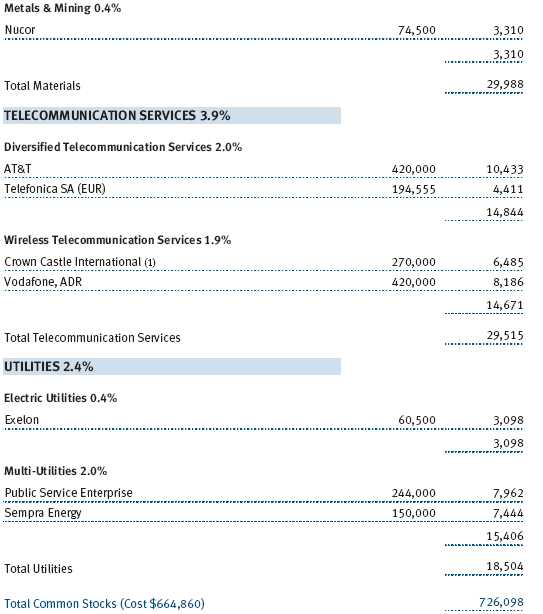
All sectors contributed positively to the fund’s absolute performance for the period, with the exception of our industrials and business services holdings. The consumer discretionary sector was the largest contributor to fund returns as the pace of the economic downturn slowed and investors focused on expectations for increased consumer spending. Our media holdings were particularly strong, led by advertising firm Omnicom, which benefited from increased advertising spending in print, on television, and online as the global economy improves and companies look to increase their budgets. Specialty retailer Ross Stores was also a strong performer. Ross is a good example of the type of company we currently own in the consumer sector: one that provides customers a good product at a good value, preserving its relevance even in tough economic times. (Please see the portfolio of investments for a complete listing of holdings and the amount each represents in the portfolio.)

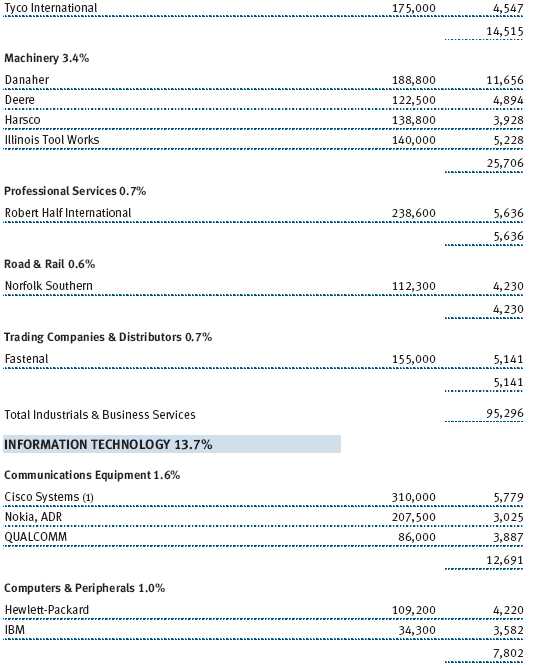
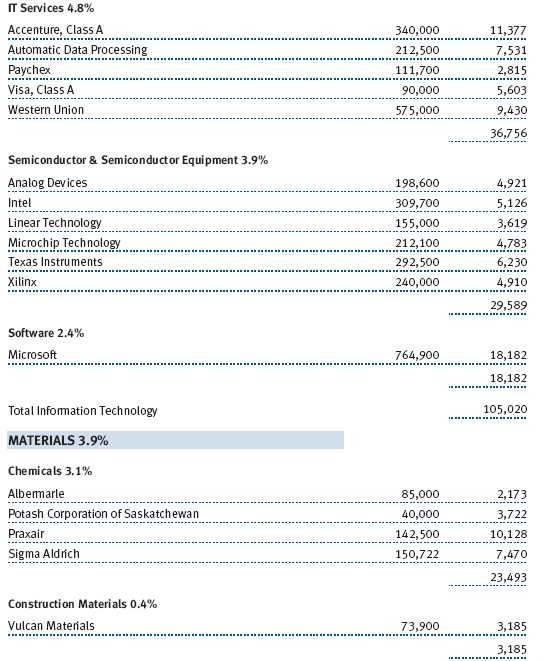
Often at the leading edge of market recoveries, the information technology sector posted strong returns in anticipation of increased consumer spending and business capital expenditures. Microsoft rallied strongly in April after the company reported earnings that were in line with analyst estimates and affirmed plans to cut costs. With its vast resources, software market dominance, and exceptional business model, we believe Microsoft compares very favorably with the broader market. Our semiconductor holdings also aided results, particularly Texas Instruments and Analog Devices, while electronic equipment supplier Tyco Electronics weighed on returns.
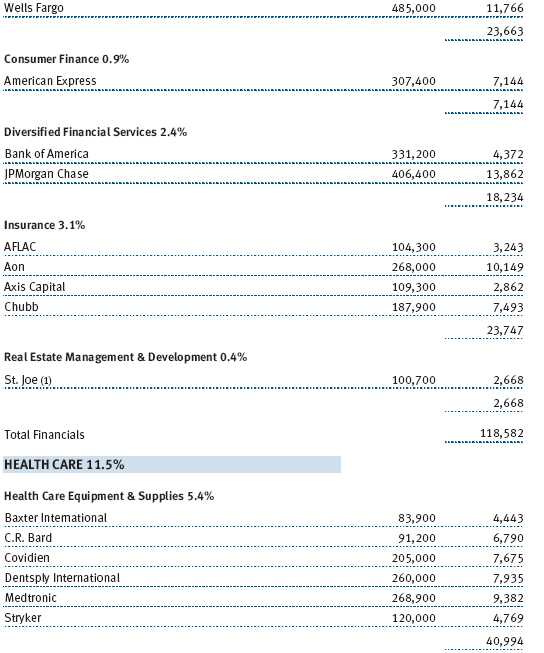
The fund’s financials sector holdings also performed well. Financial stocks were boosted midway through the period by early signs of economic recovery, better-than-feared results from the federal government’s bank “stress tests,” and news that the Treasury Department would allow several large banks to repay some of the money received last fall as part of the Troubled Asset Relief Program (TARP). American Express benefited from effective cost control, beat first-quarter earnings estimates, and provided clear but sober guidance for the rest of the year. Recent fund acquisition Goldman Sachs also boosted performance. Goldman is a rare company among its financial peers in that it is a clear market share gainer and beneficiary from the woes that have plagued the vast majority of its competitors. We expect Goldman to use its excess capital and distressed investing expertise to generate investment opportunities that benefit the firm, its clients, and shareholders for years beyond the end of the current downturn.
Dividend cuts or eliminations have been most prevalent in the financials sector, which is historically one of the fund’s larger exposures. Rather than abandon the sector, we decided to remain invested but with a focus on those companies that we believe are taking market share and will emerge stronger. This includes companies such as JPMorgan Chase, Wells Fargo, and Goldman Sachs. While many banks have indicated a strong desire to reinstate dividend payments, the timing is unclear as the their TARP funds, others have not. Until they have fully repaid any government funds and the regulatory environment is clarified, it is unlikely that dividends will be reinstated.
The fund’s exposure to the industrials and business services sector weighed on returns, although strong stock selection compared with the benchmark helped. Industrial conglomerate General Electric (GE) suffered early in the period as the economic downturn accelerated and corporate capital expenditures ground to a virtual halt. The firm’s sizable financial services exposure further exacerbated the share price weakness as the financials sector plummeted, and we eliminated the position during the period. A position in Danaher helped offset some of the damage from GE. Danaher is a highly diversified industrial manufacturer whose end markets benefit from strong growth and low cyclicality. The company’s management has also successfully executed acquisitions that have benefited earnings.
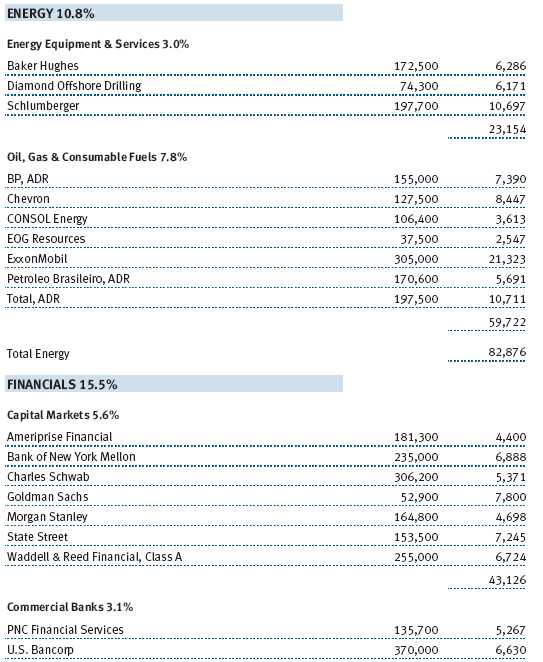
Other significant detractors from fund performance included energy holding ExxonMobil and consumer staples holding Wal-Mart Stores. Weak energy pricing took a toll on shares of ExxonMobil early in the period, but with superior assets, disciplined management, and a strong record of returning cash to shareholders, we believe Exxon continues to offer a compelling investment opportunity. Shares in the world’s biggest retailer, Wal-Mart, fell as investors had concerns about the company’s ability to sustain sales and profit growth once the recession ends and consumers begin buying from higher-price point competitors.
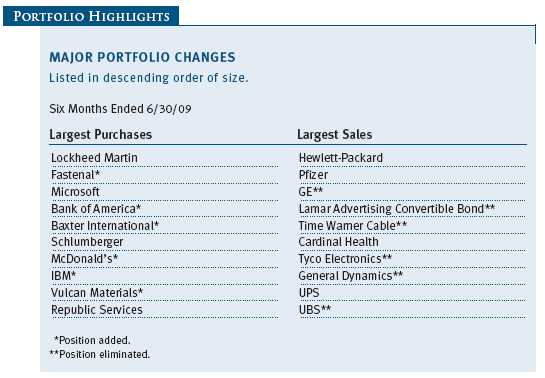
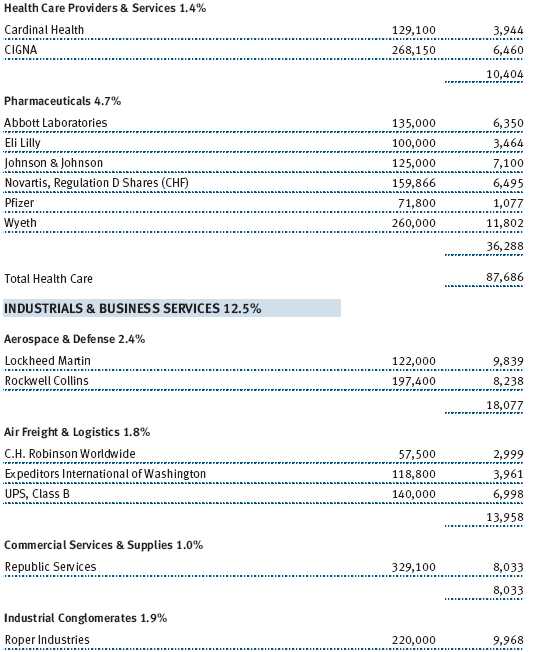
The fund established several new positions over the first half of the year. We purchased shares in Bank of America as a deteriorating credit outlook and concerns regarding its capital sufficiency pushed the valuation to attractive levels. With most purchases, but especially those in the financials sector, we are buying based upon “normalized” earnings (post-recession). In this light, Bank of America looks attractively priced as it is trading at just 4.5 times our 2012 estimate. We believe the company will be a good performer over the next 12 to 18 months as the market begins to recognize the company’s earnings power. Baxter International is a diversified global health care company, operating primarily in bioscience, medical delivery solutions, and dialysis-related products. With strong growth in its bioscience segment, we believe the company should deliver consistent, long-term growth. IBM is a dominant global technology player deriving over 60% of revenues from outside the U.S. We are attracted to IBM’s significant recurring revenue base, which makes it less cyclical. In addition, we believe it is attractively priced for a company generating strong earnings-per-share growth and terrific cash flow. Declines in construction activity and expenses associated with a recent acquisition pressured shares of Vulcan Materials, providing an attractive entry point. As the leading U.S. producer of aggregates used in concrete and asphalt, the company has a solid business model, operates in an industry with high barriers to entry, and should benefit substantially from increased infrastructure spending.
Time Warner Cable was among the positions that we eliminated during the past six months. Time Warner Cable was spun off from its parent company Time Warner in March 2009. We eliminated the position and swapped into shares of the parent company. We reduced our holdings in computer giant Hewlett-Packard, instead favoring IBM at current prices. We also trimmed our position in pharmaceutical manufacturer Pfizer as its pending purchase of Wyeth, another fund holding, increased the fund’s combined position size to uncomfortable levels.
OUTLOOK
Companies in our portfolio have largely done an admirable job negotiating the current economic downturn. Most have aggressively attacked their cost structure in an effort to offset declining revenue and protect profitability. The good news is that many companies will have significant earnings leverage when the revenue environment improves. However, a smooth ride is anything but certain. Despite the much-hyped “green shoots” pointing to recovery, our economy still faces significant headwinds. Weakness in housing, unemployment, automobiles, and other areas gives cause for concern, as do the long-term implications of the massive government stimulus programs. The question of how we are to pay for the huge deficits looms large, and tax increases are already being proposed. Amid all the questions, one thing is certain: Our nation’s indebtedness will continue to increase, raising the likelihood of a weaker dollar and higher inflation down the road.
We currently favor stocks that stand to benefit the most from a gradual market rebound and are selectively adding companies with solid fundamentals and strong competitive positions. In addition, we believe it is prudent to favor companies with global exposure that are not overly reliant on the U.S. for growth. We have become more positive on financial stocks as we believe the sector is beginning to show signs of stabilization and good value. Already one of our largest exposures, the information technology sector has above-average growth prospects. It seems likely that there is pent-up demand for IT products since most companies pared their budgets substantially over the past year. Despite the difficult short-term outlook for energy prices, we believe prices should trend significantly higher over time based on increased demand from a gradually improving global economy.
Although we are cautiously optimistic that the worst of the global economic and market downturn is behind us, our optimism is tempered with concerns about the depth and sustainability of the current rebound and a belief that markets may have gotten ahead of the recovery. Investors should not be surprised by a near-term pullback as the markets look for more concrete signs of improvement in the real economy. In this uncertain economic environment, we continue to rely on our exhaustive analysis and disciplined approach to identify those companies that are best positioned to provide a sustainable combination of current income and long-term capital appreciation for our shareholders.
Respectfully submitted,

Thomas J. Huber
President of the fund and chairman of its Investment Advisory Committee
July 21, 2009
The committee chairman has day-to-day responsibility for managing the portfolio and works with committee members in developing and executing the fund’s investment program.
RISKS OF STOCK INVESTING
As with all stock and bond mutual funds, a fund’s share price can fall because of weakness in the stock or bond markets, a particular industry, or specific holdings. Stock markets can decline for many reasons, including adverse political or economic developments, changes in investor psychology, or heavy institutional selling. The prospects for an industry or company may deteriorate because of a variety of factors, including disappointing earnings or changes in the competitive environment. In addition, the investment manager’s assessment of companies held in a fund may prove incorrect, resulting in losses or poor performance even in rising markets. Funds investing in stocks with a dividend orientation may have somewhat lower potential for price appreciation than those concentrating on rapidly growing firms. Also, a company may reduce or eliminate its dividend.
GLOSSARY
Beta: A measure of the market risk of a stock showing how responsive it is to a given market index, such as the S&P 500 Stock Index. By definition, the beta of the benchmark index is 1.00. A fund with a 1.10 beta is expected to perform 10% better than the index in up markets and 10% worse in down markets. Usually, higher betas represent riskier investments.
Dividend yield: The annual dividend of a stock divided by the stock’s price.
Free cash flow: The excess cash a company generates from its operations that can be taken out of the business for the benefit of shareholders, such as dividends, share repurchases, investments, and acquisitions.
Lipper indexes: Fund benchmarks that consist of a small number (10 to 30) of the largest mutual funds in a particular category as tracked by Lipper Inc.
Price/earnings (P/E) ratio: A valuation measure calculated by dividing the price of a stock by its current or projected earnings per share. This ratio gives investors an idea of how much they are paying for current or future earnings power.
Risk/reward: The relationship between the degree of risk associated with an investment and its return potential. Typically, the higher the potential return of an investment, the greater the risk.
S&P 500 Stock Index: An unmanaged index that tracks the stocks of 500 primarily large-capitalization U.S. companies.

Performance and Expenses
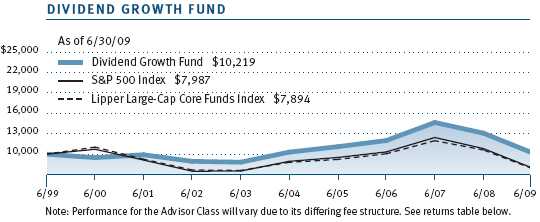
This chart shows the value of a hypothetical $10,000 investment in the fund over the past 10 fiscal year periods or since inception (for funds lacking 10-year records). The result is compared with benchmarks, which may include a broad-based market index and a peer group average or index. Market indexes do not include expenses, which are deducted from fund returns as well as mutual fund averages and indexes.
| AVERAGE ANNUAL COMPOUND TOTAL RETURN |
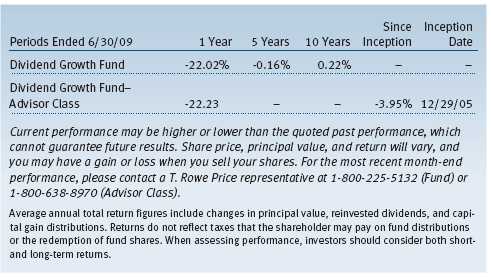
This table shows how the fund would have performed each year if its actual (or cumulative) returns for the periods shown had been earned at a constant rate.
As a mutual fund shareholder, you may incur two types of costs: (1) transaction costs, such as redemption fees or sales loads, and (2) ongoing costs, including management fees, distribution and service (12b-1) fees, and other fund expenses. The following example is intended to help you understand your ongoing costs (in dollars) of investing in the fund and to compare these costs with the ongoing costs of investing in other mutual funds. The example is based on an investment of $1,000 invested at the beginning of the most recent six-month period and held for the entire period.
Please note that the fund has two share classes: The original share class (“investor class”) charges no distribution and service (12b-1) fee, and the Advisor Class shares are offered only through unaffiliated brokers and other financial intermediaries and charge a 0.25% 12b-1 fee. Each share class is presented separately in the table.
Actual Expenses
The first line of the following table (“Actual”) provides information about actual account values and expenses based on the fund’s actual returns. You may use the information in this line, together with your account balance, to estimate the expenses that you paid over the period. Simply divide your account value by $1,000 (for example, an $8,600 account value divided by $1,000 = 8.6), then multiply the result by the number in the first line under the heading “Expenses Paid During Period” to estimate the expenses you paid on your account during this period.
Hypothetical Example for Comparison Purposes
The information on the second line of the table (“Hypothetical”) is based on hypothetical account values and expenses derived from the fund’s actual expense ratio and an assumed 5% per year rate of return before expenses (not the fund’s actual return). You may compare the ongoing costs of investing in the fund with other funds by contrasting this 5% hypothetical example and the 5% hypothetical examples that appear in the shareholder reports of the other funds. The hypothetical account values and expenses may not be used to estimate the actual ending account balance or expenses you paid for the period.
Note: T. Rowe Price charges an annual small-account maintenance fee of $10, generally for accounts with less than $2,000 ($500 for UGMA/UTMA). The fee is waived for any investor whose T. Rowe Price mutual fund accounts total $25,000 or more, accounts employing automatic investing, and IRAs and other retirement plan accounts that utilize a prototype plan sponsored by T. Rowe Price (although a separate custodial or administrative fee may apply to such accounts). This fee is not included in the accompanying table. If you are subject to the fee, keep it in mind when you are estimating the ongoing expenses of investing in the fund and when comparing the expenses of this fund with other funds.
You should also be aware that the expenses shown in the table highlight only your ongoing costs and do not reflect any transaction costs, such as redemption fees or sales loads. Therefore, the second line of the table is useful in comparing ongoing costs only and will not help you determine the relative total costs of owning different funds. To the extent a fund charges transaction costs, however, the total cost of owning that fund is higher.

Unaudited

The accompanying notes are an integral part of these financial statements.
Unaudited
The accompanying notes are an integral part of these financial statements.
Unaudited

The accompanying notes are an integral part of these financial statements.
Unaudited
The accompanying notes are an integral part of these financial statements.
Unaudited

The accompanying notes are an integral part of these financial statements.
Unaudited
The accompanying notes are an integral part of these financial statements.
Unaudited
| NOTES TO FINANCIAL STATEMENTS |
T. Rowe Price Dividend Growth Fund, Inc. (the fund), is registered under the Investment Company Act of 1940 (the 1940 Act) as a diversified, open-end management investment company. The fund seeks to provide increasing dividend income over time, long-term growth of capital, and a reasonable level of current income through investments primarily in dividend-paying stocks. The fund has two classes of shares: the Dividend Growth Fund original share class, referred to in this report as the Investor Class, offered since December 30, 1992, and Dividend Growth Fund—Advisor Class (Advisor Class), offered since December 29, 2005. Advisor Class shares are sold only through unaffiliated brokers and other unaffiliated financial intermediaries that are compensated by the class for distribution, shareholder servicing, and/or certain administrative services under a Board-approved Rule 12b-1 plan. Each class has exclusive voting rights on matters related solely to that class, separate voting rights on matters that relate to both classes, and, in all other respects, the same rights and obligations as the other class.
NOTE 1 - SIGNIFICANT ACCOUNTING POLICIES
Basis of Preparation The accompanying financial statements were prepared in accordance with accounting principles generally accepted in the United States of America, which require the use of estimates made by fund management. Fund management believes that estimates and security valuations are appropriate; however, actual results may differ from those estimates, and the security valuations reflected in the financial statements may differ from the value the fund ultimately realizes upon sale of the securities. Further, fund management believes no events have occurred between June 30, 2009 and August 20, 2009, the date of issuance of the financial statements, that require adjustment of, or disclosure in, the accompanying financial statements.
Investment Transactions, Investment Income, and Distributions Income and expenses are recorded on the accrual basis. Premiums and discounts on debt securities are amortized for financial reporting purposes. Dividends received from mutual fund investments are reflected as dividend income; capital gain distributions are reflected as realized gain/loss. Dividend income and capital gain distributions are recorded on the ex-dividend date. Income tax-related interest and penalties, if incurred, would be recorded as income tax expense. Investment transactions are accounted for on the trade date. Realized gains and losses are reported on the identified cost basis. Distributions to shareholders are recorded on the ex-dividend date. Income distributions are declared and paid by each class on a quarterly basis. Capital gain distributions, if any, are declared and paid by the fund, typically on an annual basis.
Currency Translation Assets, including investments, and liabilities denominated in foreign currencies are translated into U.S. dollar values each day at the prevailing exchange rate, using the mean of the bid and asked prices of such currencies against U.S. dollars as quoted by a major bank. Purchases and sales of securities, income, and expenses are translated into U.S. dollars at the prevailing exchange rate on the date of the transaction. The effect of changes in foreign currency exchange rates on realized and unrealized security gains and losses is reflected as a component of security gains and losses.
Class Accounting The Advisor Class pays distribution, shareholder servicing, and/or certain administrative expenses in the form of Rule 12b-1 fees, in an amount not exceeding 0.25% of the class’s average daily net assets. Shareholder servicing, prospectus, and shareholder report expenses incurred by each class are charged directly to the class to which they relate. Expenses common to both classes, investment income, and realized and unrealized gains and losses are allocated to the classes based upon the relative daily net assets of each class.
Rebates and Credits Subject to best execution, the fund may direct certain security trades to brokers who have agreed to rebate a portion of the related brokerage commission to the fund in cash. Commission rebates are reflected as realized gain on securities in the accompanying financial statements and totaled $4,000 for the six months ended June 30, 2009. Additionally, the fund earns credits on temporarily uninvested cash balances held at the custodian which reduce the fund’s custody charges. Custody expense in the accompanying financial statements is presented before reduction for credits.
New Accounting Pronouncement On January 1, 2009, the fund adopted Statement of Financial Accounting Standards No. 161 (FAS 161), Disclosures about Derivative Instruments and Hedging Activities. FAS 161 requires enhanced disclosures about derivative and hedging activities, including how such activities are accounted for and their effect on financial position, performance and cash flows. Adoption of FAS 161 had no impact on the fund’s net assets or results of operations.
NOTE 2 - VALUATION
The fund’s investments are reported at fair value as defined under Statement of Financial Accounting Standards No. 157 (FAS 157), Fair Value Measurements. The fund values its investments and computes its net asset value per share at the close of the New York Stock Exchange (NYSE), normally 4 p.m. ET, each day that the NYSE is open for business.
Valuation Methods Equity securities listed or regularly traded on a securities exchange or in the over-the-counter (OTC) market are valued at the last quoted sale price or, for certain markets, the official closing price at the time the valuations are made, except for OTC Bulletin Board securities, which are valued at the mean of the latest bid and asked prices. A security that is listed or traded on more than one exchange is valued at the quotation on the exchange determined to be the primary market for such security. Listed securities not traded on a particular day are valued at the mean of the latest bid and asked prices for domestic securities and the last quoted sale price for international securities.
Debt securities are generally traded in the OTC market. Securities with remaining maturities of one year or more at the time of acquisition are valued at prices furnished by dealers who make markets in such securities or by an independent pricing service, which considers the yield or price of bonds of comparable quality, coupon, maturity, and type, as well as prices quoted by dealers who make markets in such securities. Securities with remaining maturities of less than one year at the time of acquisition generally use amortized cost in local currency to approximate fair value. However, if amortized cost is deemed not to reflect fair value or the fund holds a significant amount of such securities with remaining maturities of more than 60 days, the securities are valued at prices furnished by dealers who make markets in such securities or by an independent pricing service.
Investments in mutual funds are valued at the mutual fund’s closing net asset value per share on the day of valuation.
Other investments, including restricted securities, and those for which the above valuation procedures are inappropriate or are deemed not to reflect fair value are stated at fair value as determined in good faith by the T. Rowe Price Valuation Committee, established by the fund’s Board of Directors.
For valuation purposes, the last quoted prices of non-U.S. equity securities may be adjusted under the circumstances described below. If the fund determines that developments between the close of a foreign market and the close of the NYSE will, in its judgment, materially affect the value of some or all of its portfolio securities, the fund will adjust the previous closing prices to reflect what it believes to be the fair value of the securities as of the close of the NYSE. In deciding whether it is necessary to adjust closing prices to reflect fair value, the fund reviews a variety of factors, including developments in foreign markets, the performance of U.S. securities markets, and the performance of instruments trading in U.S. markets that represent foreign securities and baskets of foreign securities. A fund may also fair value securities in other situations, such as when a particular foreign market is closed but the fund is open. The fund uses outside pricing services to provide it with closing prices and information to evaluate and/or adjust those prices. The fund cannot predict how often it will use closing prices and how often it will determine it necessary to adjust those prices to reflect fair value. As a means of evaluating its security valuation process, the fund routinely compares closing prices, the next day’s opening prices in the same markets, and adjusted prices.
Valuation Inputs Various inputs are used to determine the value of the fund’s investments. These inputs are summarized in the three broad levels listed below:
Level 1 – quoted prices in active markets for identical securities
Level 2 – observable inputs other than Level 1 quoted prices (including, but not limited to, quoted prices for similar securities, interest rates, prepayment speeds, credit risk)
Level 3 – unobservable inputs
Observable inputs are those based on market data obtained from sources independent of the fund, and unobservable inputs reflect the fund’s own assumptions based on the best information available. The input levels are not necessarily an indication of the risk or liquidity associated with investments at that level. For example, non-U.S. equity securities actively traded in foreign markets generally are reflected in Level 2 despite the availability of closing prices because the fund evaluates and determines whether those closing prices reflect fair value at the close of the NYSE or require adjustment, as described above. The following table summarizes the fund’s investments, based on the inputs used to determine their values on June 30, 2009:

NOTE 3 - OTHER INVESTMENT TRANSACTIONS
Consistent with its investment objective, the fund engages in the following practices to manage exposure to certain risks or to enhance performance. The investment objective, policies, program, and risk factors of the fund are described more fully in the fund’s prospectus and Statement of Additional Information.
Securities Lending The fund lends its securities to approved brokers to earn additional income. It receives as collateral cash and U.S. government securities valued at 102% to 105% of the value of the securities on loan. Cash collateral is invested by the fund’s lending agent(s) in accordance with investment guidelines approved by fund management. Although risk is mitigated by the collateral, the fund could experience a delay in recovering its securities and a possible loss of income or value if the borrower fails to return the securities or if collateral investments decline in value. Securities lending revenue recognized by the fund consists of earnings on invested collateral and borrowing fees, net of any rebates to the borrower and compensation to the lending agent. At June 30, 2009, there were no securities on loan.
Other Purchases and sales of portfolio securities other than short-term securities aggregated $120,023,000 and $57,908,000, respectively, for the six months ended June 30, 2009.
NOTE 4 - FEDERAL INCOME TAXES
No provision for federal income taxes is required since the fund intends to continue to qualify as a regulated investment company under Subchapter M of the Internal Revenue Code and distribute to shareholders all of its taxable income and gains. Distributions are determined in accordance with Federal income tax regulations, which differ from generally accepted accounting principles, and, therefore, may differ in amount or character from net investment income and realized gains for financial reporting purposes. Financial reporting records are adjusted for permanent book/tax differences to reflect tax character but are not adjusted for temporary differences. The amount and character of tax-basis distributions and composition of net assets are finalized at fiscal year-end; accordingly, tax-basis balances have not been determined as of June 30, 2009.
In accordance with federal tax regulations, the fund deferred recognition of certain capital loss amounts previously recognized in the prior fiscal year for financial reporting purposes until the current fiscal period for tax purposes. Such deferrals amounted to $8,894,000 and related to net capital losses realized between November 1 and the fund’s fiscal year-end date. The fund intends to retain realized gains to the extent of available capital loss carryforwards. As of December 31, 2008, the fund had $18,589,000 of unused capital loss carryforwards, all of which expire in fiscal 2016.
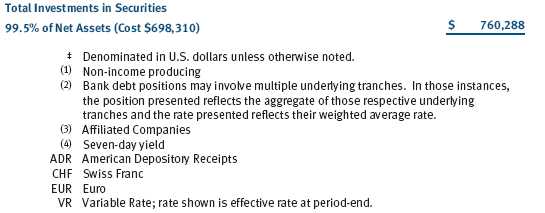
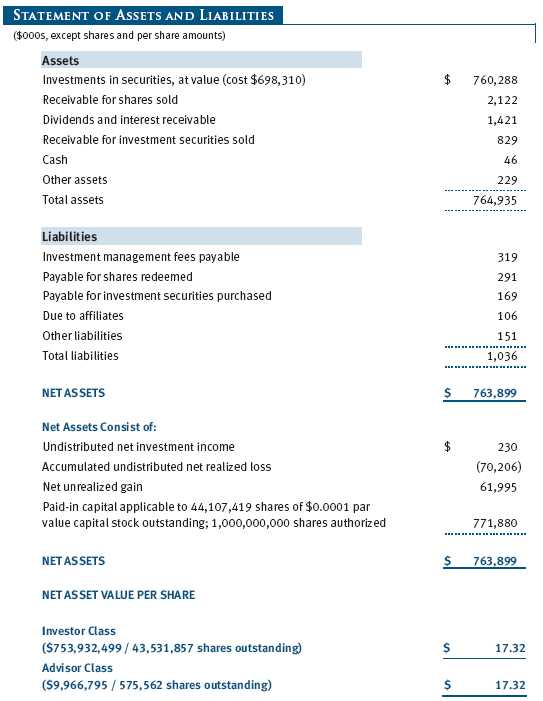
At June 30, 2009, the cost of investments for federal income tax purposes was $698,310,000. Net unrealized gain aggregated $61,995,000 at period-end, of which $118,187,000 related to appreciated investments and $56,192,000 related to depreciated investments.
NOTE 5 - RELATED PARTY TRANSACTIONS
The fund is managed by T. Rowe Price Associates, Inc. (the manager or Price Associates), a wholly owned subsidiary of T. Rowe Price Group, Inc. The investment management agreement between the fund and the manager provides for an annual investment management fee, which is computed daily and paid monthly. The fee consists of an individual fund fee, equal to 0.20% of the fund’s average daily net assets, and a group fee. The group fee rate is calculated based on the combined net assets of certain mutual funds sponsored by Price Associates (the group) applied to a graduated fee schedule, with rates ranging from 0.48% for the first $1 billion of assets to 0.285% for assets in excess of $220 billion. The fund’s group fee is determined by applying the group fee rate to the fund’s average daily net assets. At June 30, 2009, the effective annual group fee rate was 0.31%.
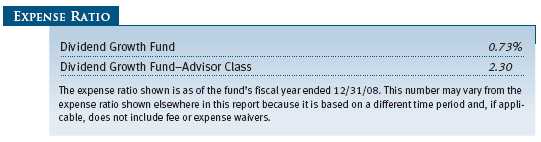
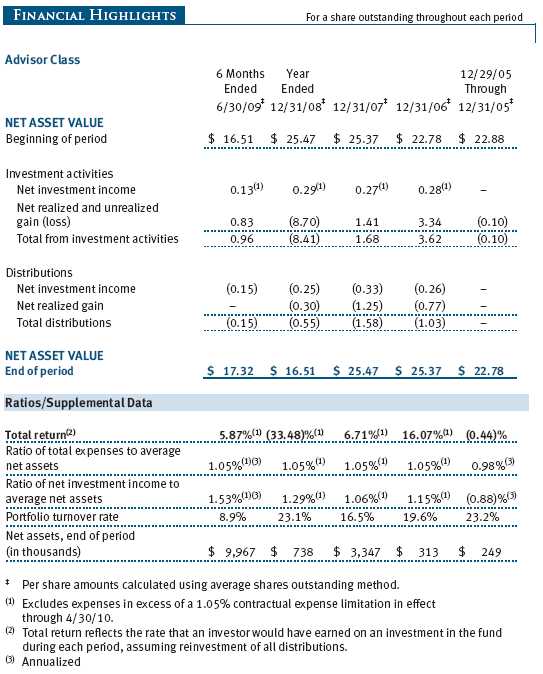
The Advisor Class is also subject to a contractual expense limitation through April 30, 2010. During the limitation period, the manager is required to waive its management fee and/or reimburse expenses, excluding interest, taxes, brokerage commissions, and extraordinary expenses, that would otherwise cause the class’s ratio of annualized total expenses to average net assets (expense ratio) to exceed its expense limitation of 1.05%. The class is required to repay the manager for expenses previously reimbursed and management fees waived to the extent the class’s net assets have grown or expenses have declined sufficiently to allow repayment without causing the class’s expense ratio to exceed its expense limitation. However, no repayment will be made more than three years after the date of any reimbursement or waiver or later than April 30, 2012. Pursuant to this agreement, expenses previously reimbursed by the manager in the amount of $9,000 remain subject to repayment at June 30, 2009.
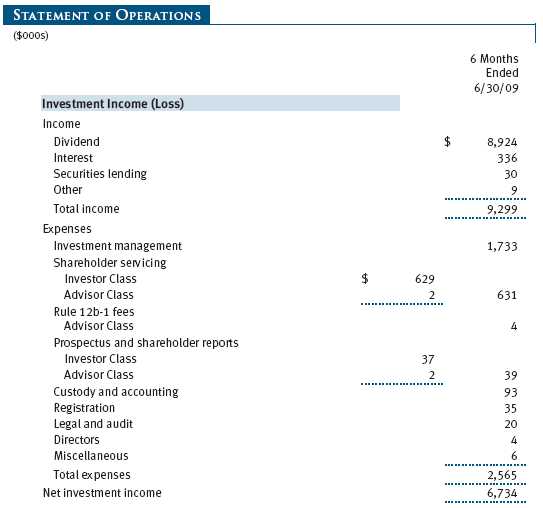
In addition, the fund has entered into service agreements with Price Associates and two wholly owned subsidiaries of Price Associates (collectively, Price). Price Associates computes the daily share prices and provides certain other administrative services to the fund. T. Rowe Price Services, Inc., provides shareholder and administrative services in its capacity as the fund’s transfer and dividend disbursing agent. T. Rowe Price Retirement Plan Services, Inc., provides subaccounting and recordkeeping services for certain retirement accounts invested in the Investor Class. For the six months ended June 30, 2009, expenses incurred pursuant to these service agreements were $54,000 for Price Associates, $332,000 for T. Rowe Price Services, Inc., and $102,000 for T. Rowe Price Retirement Plan Services, Inc. The total amount payable at period-end pursuant to these service agreements is reflected as Due to Affiliates in the accompanying financial statements.
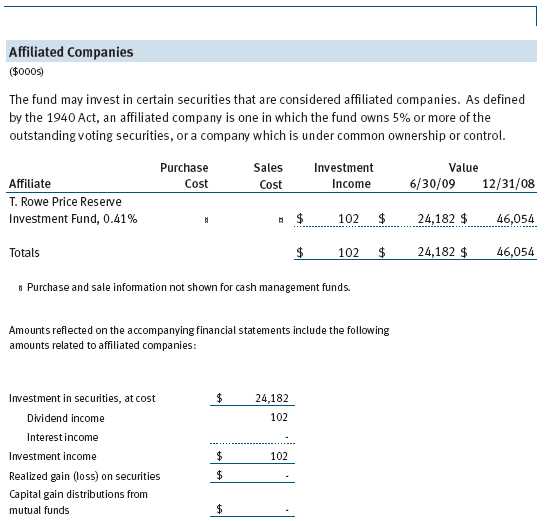
The fund may invest in the T. Rowe Price Reserve Investment Fund and the T. Rowe Price Government Reserve Investment Fund (collectively, the T. Rowe Price Reserve Investment Funds), open-end management investment companies managed by Price Associates and considered affiliates of the fund. The T. Rowe Price Reserve Investment Funds are offered as cash management options to mutual funds, trusts, and other accounts managed by Price Associates and/or its affiliates and are not available for direct purchase by members of the public. The T. Rowe Price Reserve Investment Funds pay no investment management fees.
| INFORMATION ON PROXY VOTING POLICIES, PROCEDURES, AND RECORDS |
A description of the policies and procedures used by T. Rowe Price funds and portfolios to determine how to vote proxies relating to portfolio securities is available in each fund’s Statement of Additional Information, which you may request by calling 1-800-225-5132 or by accessing the SEC’s Web site, www.sec.gov. The description of our proxy voting policies and procedures is also available on our Web site, www.troweprice.com. To access it, click on the words “Our Company” at the top of our corporate homepage. Then, when the next page appears, click on the words “Proxy Voting Policies” on the left side of the page.
Each fund’s most recent annual proxy voting record is available on our Web site and through the SEC’s Web site. To access it through our Web site, follow the directions above, then click on the words “Proxy Voting Records” on the right side of the Proxy Voting Policies page.
| HOW TO OBTAIN QUARTERLY PORTFOLIO HOLDINGS |
The fund files a complete schedule of portfolio holdings with the Securities and Exchange Commission for the first and third quarters of each fiscal year on Form N-Q. The fund’s Form N-Q is available electronically on the SEC’s Web site (www.sec.gov); hard copies may be reviewed and copied at the SEC’s Public Reference Room, 450 Fifth St. N.W., Washington, DC 20549. For more information on the Public Reference Room, call 1-800-SEC-0330.
| APPROVAL OF INVESTMENT MANAGEMENT AGREEMENT |
On March 10, 2009, the fund’s Board of Directors (Board) unanimously approved the investment advisory contract (Contract) between the fund and its investment manager, T. Rowe Price Associates, Inc. (Manager). The Board considered a variety of factors in connection with its review of the Contract, also taking into account information provided by the Manager during the course of the year, as discussed below:
Services Provided by the Manager
The Board considered the nature, quality, and extent of the services provided to the fund by the Manager. These services included, but were not limited to, management of the fund’s portfolio and a variety of related activities, as well as financial and administrative services, reporting, and communications. The Board also reviewed the background and experience of the Manager’s senior management team and investment personnel involved in the management of the fund. The Board concluded that it was satisfied with the nature, quality, and extent of the services provided by the Manager.
Investment Performance of the Fund
The Board reviewed the fund’s average annual total returns over the 1-, 3-, 5-, and 10-year periods as well as the fund’s year-by-year returns and compared these returns with previously agreed upon comparable performance measures and market data, including those supplied by Lipper and Morningstar, which are independent providers of mutual fund data. On the basis of this evaluation and the Board’s ongoing review of investment results, and factoring in the severity of the market turmoil in 2008, the Board concluded that the fund’s performance was satisfactory.
Costs, Benefits, Profits, and Economies of Scale
The Board reviewed detailed information regarding the revenues received by the Manager under the Contract and other benefits that the Manager (and its affiliates) may have realized from its relationship with the fund, including research received under “soft dollar” agreements. The Board noted that soft dollars were not used to pay for third-party, non-broker research during 2008. The Board also received information on the estimated costs incurred and profits realized by the Manager and its affiliates from advising T. Rowe Price mutual funds, as well as estimates of the gross profits realized from managing the fund in particular. The Board concluded that the Manager’s profits were reasonable in light of the services provided to the fund. The Board also considered whether the fund or other funds benefit under the fee levels set forth in the Contract from any economies of scale realized by the Manager. Under the Contract, the fund pays a fee to the Manager composed of two components—a group fee rate based on the aggregate assets of certain T. Rowe Price mutual funds (including the fund) that declines at certain asset levels and an individual fund fee rate that is assessed on the assets of the fund. The Board concluded that the advisory fee structure for the fund continued to provide for a reasonable sharing of benefits from any economies of scale with the fund’s investors.
Fees
The Board reviewed the fund’s management fee rate, operating expenses, and total expense ratio (for the Investor Class and Advisor Class) and compared them with fees and expenses of other comparable funds based on information and data supplied by Lipper. The information provided to the Board indicated that the fund’s management fee rate for the Investor Class was at or below the median for comparable funds, and the management fee rate for the Advisor Class (after including expense reimbursements by the Manager) was below the median for comparable funds. The information also indicated that the expense ratio for both classes was below the median for comparable funds. The Board also reviewed the fee schedules for comparable privately managed accounts of the Manager and its affiliates. Management informed the Board that the Manager’s responsibilities for privately managed accounts are more limited than its responsibilities for the fund and other T. Rowe Price mutual funds that it or its affiliates advise. On the basis of the information provided, the Board concluded that the fees paid by the fund under the Contract were reasonable.
Approval of the Contract
As noted, the Board approved the continuation of the Contract. No single factor was considered in isolation or to be determinative to the decision. Rather, the Board concluded, in light of a weighting and balancing of all factors considered, that it was in the best interests of the fund to approve the continuation of the Contract, including the fees to be charged for services thereunder.
Item 2. Code of Ethics.
A code of ethics, as defined in Item 2 of Form N-CSR, applicable to its principal executive officer, principal financial officer, principal accounting officer or controller, or persons performing similar functions is filed as an exhibit to the registrant’s annual Form N-CSR. No substantive amendments were approved or waivers were granted to this code of ethics during the registrant’s most recent fiscal half-year.
Item 3. Audit Committee Financial Expert.
Disclosure required in registrant’s annual Form N-CSR.
Item 4. Principal Accountant Fees and Services.
Disclosure required in registrant’s annual Form N-CSR.
Item 5. Audit Committee of Listed Registrants.
Not applicable.
Item 6. Investments.
(a) Not applicable. The complete schedule of investments is included in Item 1 of this Form N-CSR.
(b) Not applicable.
Item 7. Disclosure of Proxy Voting Policies and Procedures for Closed-End Management Investment Companies.
Not applicable.
Item 8. Portfolio Managers of Closed-End Management Investment Companies.
Not applicable.
Item 9. Purchases of Equity Securities by Closed-End Management Investment Company and Affiliated Purchasers.
Not applicable.
Item 10. Submission of Matters to a Vote of Security Holders.
Not applicable.
Item 11. Controls and Procedures.
(a) The registrant’s principal executive officer and principal financial officer have evaluated the registrant’s disclosure controls and procedures within 90 days of this filing and have concluded that the registrant’s disclosure controls and procedures were effective, as of that date, in ensuring that information required to be disclosed by the registrant in this Form N-CSR was recorded, processed, summarized, and reported timely.
(b) The registrant’s principal executive officer and principal financial officer are aware of no change in the registrant’s internal control over financial reporting that occurred during the registrant’s second fiscal quarter covered by this report that has materially affected, or is reasonably likely to materially affect, the registrant’s internal control over financial reporting.
Item 12. Exhibits.
(a)(1) The registrant’s code of ethics pursuant to Item 2 of Form N-CSR is filed with the registrant’s annual Form N-CSR.
(2) Separate certifications by the registrant's principal executive officer and principal financial officer, pursuant to Section 302 of the Sarbanes-Oxley Act of 2002 and required by Rule 30a-2(a) under the Investment Company Act of 1940, are attached.
(3) Written solicitation to repurchase securities issued by closed-end companies: not applicable.
(b) A certification by the registrant's principal executive officer and principal financial officer, pursuant to Section 906 of the Sarbanes-Oxley Act of 2002 and required by Rule 30a-2(b) under the Investment Company Act of 1940, is attached.
| | |
SIGNATURES |
| |
| | Pursuant to the requirements of the Securities Exchange Act of 1934 and the Investment |
| Company Act of 1940, the registrant has duly caused this report to be signed on its behalf by the |
| undersigned, thereunto duly authorized. |
| |
| T. Rowe Price Dividend Growth Fund, Inc. |
| |
| |
| |
| By | /s/ Edward C. Bernard |
| | Edward C. Bernard |
| | Principal Executive Officer |
| |
| Date | August 20, 2009 |
| |
| |
| |
| | Pursuant to the requirements of the Securities Exchange Act of 1934 and the Investment |
| Company Act of 1940, this report has been signed below by the following persons on behalf of |
| the registrant and in the capacities and on the dates indicated. |
| |
| |
| By | /s/ Edward C. Bernard |
| | Edward C. Bernard |
| | Principal Executive Officer |
| |
| Date | August 20, 2009 |
| |
| |
| |
| By | /s/ Gregory K. Hinkle |
| | Gregory K. Hinkle |
| | Principal Financial Officer |
| |
| Date | August 20, 2009 |