Item 1: Report to Shareholders| Dividend Growth Fund | December 31, 2005 |
The views and opinions in this report were current as of December 31, 2005. They are not guarantees of performance or investment results and should not be taken as investment advice. Investment decisions reflect a variety of factors, and the managers reserve the right to change their views about individual stocks, sectors, and the markets at any time. As a result, the views expressed should not be relied upon as a forecast of the fund’s future investment intent. The report is certified under the Sarbanes-Oxley Act of 2002, which requires mutual funds and other public companies to affirm that, to the best of their knowledge, the information in their financial reports is fairly and accurately stated in all material respects.
REPORTS ON THE WEB
Sign up for our E-mail Program, and you can begin to receive updated fund reports and prospectuses online rather than through the mail. Log in to your account at troweprice.com for more information.
Fellow Shareholders
U.S. stocks generated positive returns for the third consecutive year in 2005, but gains were more modest than in the prior two years. Equities generally sagged through April as investors worried about inflation and rising short-term interest rates. Despite soaring energy costs, most major indexes gradually worked their way higher as the year progressed—supported by firm economic and corporate earnings growth and merger activity—and finished near their highest levels of the year amid hopes that the Federal Reserve would soon stop raising short-term rates. Mid-cap stocks decisively outperformed their larger and smaller counterparts, and value stocks generally outperformed growth for the full year, but the relative performance of growth stocks improved notably in the second half of the year.
In the large-cap universe, many sectors produced modest gains, but energy stocks far surpassed other segments, helped by rising oil prices in the wake of Hurricane Katrina, which severely disrupted energy production along the Gulf Coast. On the downside, concerns that elevated energy costs would sap consumer spending weighed on consumer discretionary stocks. Telecommunication services shares also declined due to weak fundamentals and heightened competition.
Dividends continued to make a comeback in the past year. According to Standard & Poor’s, U.S. companies in the S&P 500 Stock Index paid a record $202 billion in dividends in 2005; some 300 companies increased their dividends, while only nine cut them. Perhaps the clearest evidence of dividends’ renewed importance can be seen in the S&P 500’s performance for the year: the index returned just 3% on share price gains but nearly 5% when dividends are included. With payout ratios at only 33% compared with a long-term average of 50%, there appears to be room on the upside for higher payouts ahead.

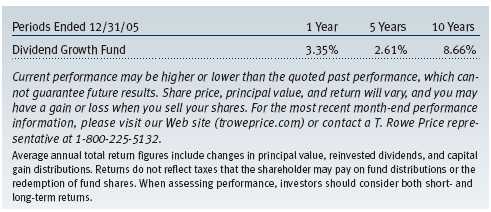
Your fund posted moderate gains for both the 6- and 12-month periods ended December 31, 2005, trailing the S&P 500 index and its Lipper peer group for both periods, as shown in the table. Relative to the S&P 500, the fund’s performance was hurt by an overweight in consumer discretionary stocks (primarily media) and poor stock selection in sectors that did well overall, including utilities and energy. The fund also suffered from a large-cap focus during a period when small- and mid-caps did better and from a quality bias, as low-quality stocks in the S&P 500 outperformed higher-quality stocks. We find the best opportunities now in quality large-cap companies. While we naturally have a quality bias in our stock selection process, we pressed it as the year progressed, given 1) the valuation disparity between the groups and 2) the belief that the economic cycle has peaked. These are typically the conditions under which high quality outperforms. While we were early, we remain comfortable that this strategy will bear fruit.
PERFORMANCE REVIEW
Fund performance in the second half of 2005 was again led by more cyclical sectors, including financials, industrials, and energy. Financials made a particularly strong move, driven primarily by the prospect of the end of the Federal Reserve’s interest rate hikes. The Fed raised the short-term fed funds rate in four quarter-point increments over the last six months, for a total of 13 quarter-point rate increases since mid-2004. The year ended with growing expectations that the Fed was nearing the end of its rate-tightening program.
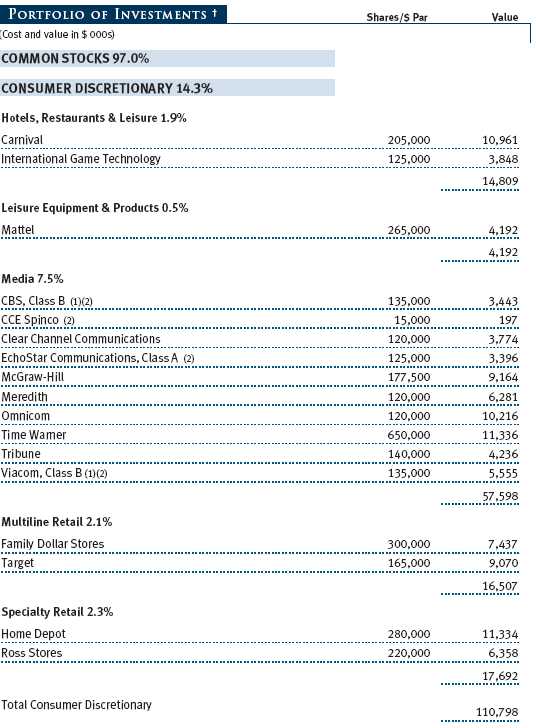
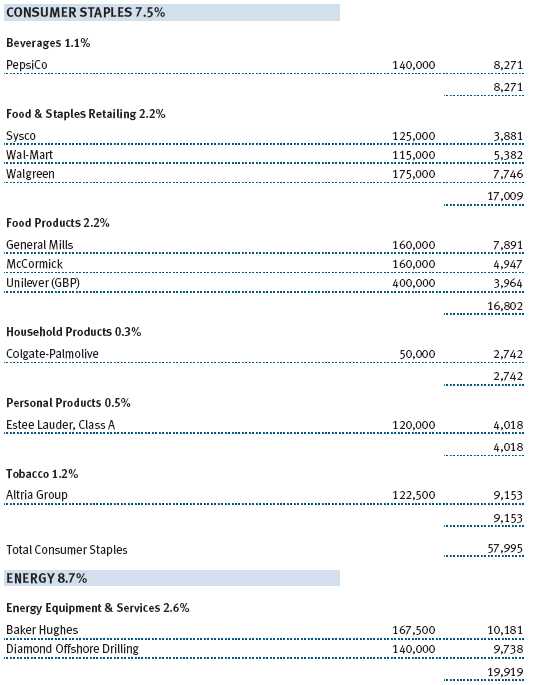
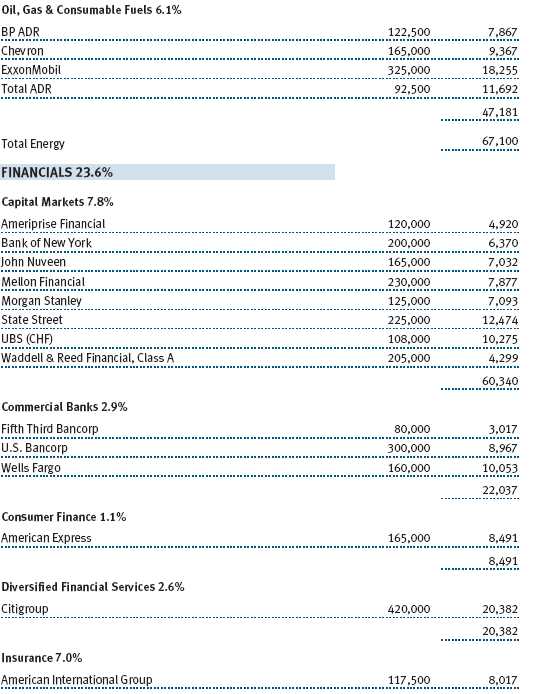
It is not unusual for financial stocks to respond positively to such a scenario. The solid performance was broad-based across financial stocks, though the fund benefited most from capital markets holdings, including State Street, Mellon Financial, and UBS. State Street finally saw a positive turn in its business, and the stock responded accordingly. Mellon’s favorable performance was partially due to some activist shareholders who, in light of the company’s recent history of poor execution, called for management to take steps to improve shareholder value. Since Mellon’s upturn had less to do with its business prospects than outside pressure, we took the opportunity to trim some of our holding and will continue to do so on further strength in the share price. UBS, a new addition to the portfolio, is a Swiss global financial services firm with strong positions in private banking, investment banking, and asset management. The company is well capitalized and well managed and trades at just 11 times forward earnings. In addition to its 3% yield, the company returns 4% to shareholders via share repurchase, for a 7% effective yield. The company benefited from general strength in financial stocks as well as recognition of the value of its private wealth division, which accounts for half of its overall business. (Please see the portfolio of investments for a complete listing of the fund’s holdings and the amount each represents in the portfolio.)
Insurance stocks also rebounded sharply, aided by the interest rate environment and the prospect for improved pricing power following the losses the industry took on a difficult hurricane season. Marsh & McLennan, St. Paul Companies, AIG, and Hartford Financial Services all rebounded strongly in the back half of the year. Interestingly, many of these companies were among the worst performers in 2004 following the New York attorney general’s investigation into the prevalence of contingent commissions in the industry.
Hurricane Katrina, which resulted in the temporary closure of domestic refining capacity, caused oil prices to spike further from already elevated levels. Prices for a barrel of oil briefly flirted with $70 before retreating to the $60 range. While much of the refining capacity in the Gulf Coast region is now in restart mode, it will likely be the second quarter of 2006 before it is all operational. Oil-related stocks responded in kind, especially oil services stocks Diamond Offshore and Baker Hughes, which were solid contributors in the second half of the year. Large integrated oil companies such as Total also contributed positively. Oil services stocks are arguably the biggest beneficiaries of higher oil prices—higher prices make it economical for the exploration companies to look and drill for oil, increasing the demand for their services.
Other strong performers in the last six months included Union Pacific and Altria Group. Union Pacific benefited from strong pricing power in its underlying railroad business. High fuel prices make rail even more attractive relative to trucking as a method of shipping goods, and railroad capacity is tight, creating a strong pricing environment for the entire industry. In addition, we continue to hold Union Pacific because it has additional opportunities to accelerate earnings per share growth as it works to alleviate congestion in its network. Altria (formerly Philip Morris) rose as the roadmap for a company breakup became clearer after the Illinois Supreme Court tossed out a lawsuit over “light” cigarettes. Altria also owns Kraft Foods, among other units, and a primary roadblock for Altria to move ahead with shareholder-friendly actions has been a difficult legal environment, which now appears to be ebbing. One more significant lawsuit, known as the “Engle” case in Florida, remains in the company’s path.
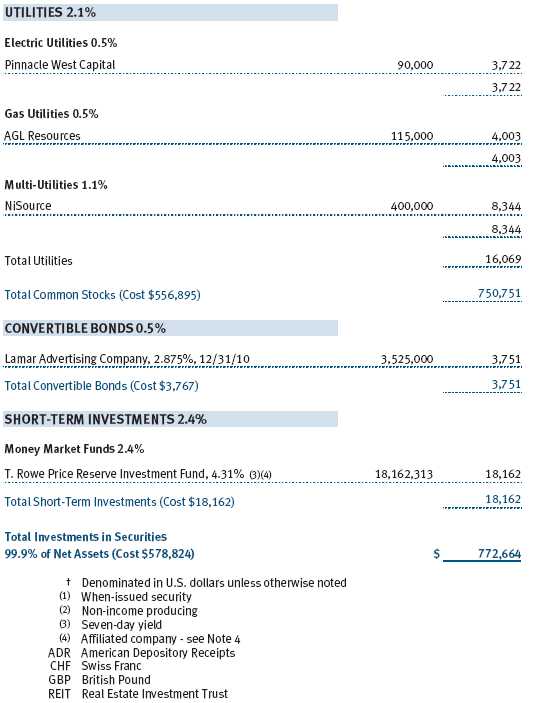
Defensive sectors, including utilities, telecom services, and health care, were among the fund’s largest second-half detractors, led by NiSource, an Indiana-based utility. NiSource underperformed in 2005 as investors feared that high natural gas prices would result in demand destruction for the gas distribution companies. We believe these concerns are overdone and expect NiSource to outperform as demand for natural gas remains firm. Telecom services suffered from sector rotation as investors shed defensive holdings in search of higher growth. This caused holdings such as Vodafone and Verizon to underperform, though we remain holders of both stocks. We favor Vodafone, the world’s largest wireless operator, in particular. Weakness in the company’s Japanese and select European markets pressured results in the back half of 2005. We are sticking with the stock at current valuation levels. The stock trades at 11 times forward earnings and yields 3.3%.

Although we had cut our pharmaceutical holdings substantially in 2004, companies such as Pfizer still hurt performance. The difficulties facing the industry are well publicized, including government scrutiny of drug pricing, litigation concerns, patent expirations, and soft new product pipelines. Pfizer is not immune to the problems, though the company received a major boost when its Lipitor patent was upheld in a challenge by a generic pharmaceutical manufacturer. Critically, this decision provided Pfizer with exclusivity on its largest product until 2011. We rebuilt the position on the heels of the decision (we were amazed the stock’s response was relatively muted), believing that the company is poised once again to be a good investment. Pfizer is cutting overhead, aggressively defending its intellectual property, continuing to invest in its pipeline, and returning money to shareholders. A recent 25% increase brought its yield to nearly 4%, and management is buying back 4% of the company annually via share repurchase, giving shareholders an effective 8% return before any capital appreciation.
PORTFOLIO CHANGES
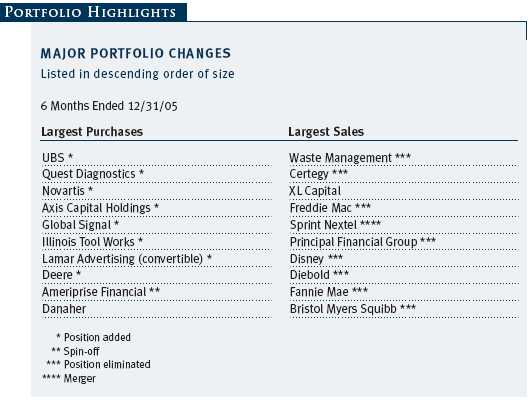
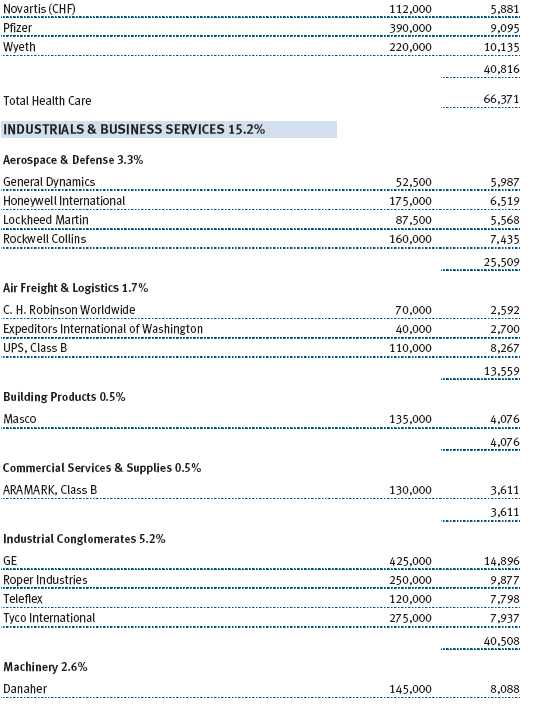
Financials, industrials, and health care accounted for some of our largest purchases in the second half of 2005. In financials, new positions included UBS, mentioned earlier as a key contributor, and Axis Capital, a Bermuda-based reinsurer that began operations after the September 11, 2001, terrorist attacks. As a relatively new company, Axis does not face the legacy issues such as asbestos and other environmental problems that burden many industry participants. The company operates in a diverse set of geographic markets and business lines, which allows management to deploy capital opportunistically. Importantly, management has also shown a commitment to return excess capital to shareholders. A clean balance sheet, strong return-on-equity prospects, and an inexpensive valuation (seven times 2006 earnings estimates) make this company an attractive investment.
In health care we initiated a position in Novartis, a Swiss pharmaceutical company. We think Novartis is capable of growing earnings in the low teens over the next several years, using modest assumptions for the launch of two new drugs to treat high blood pressure and Type II diabetes. We see good value with the stock at 17 times forward earnings estimates. Quest Diagnostics is the largest provider of clinical laboratory testing services in the U.S. and controls approximately 13% of the $40 billion industry. Following years of consolidation, the market structure has evolved into an attractive oligopoly. Management has demonstrated strong operational execution and a desire to return capital to shareholders via dividends and share repurchase. Industry growth is healthy at 5% to 6%, though Quest should be capable of double-digit earnings per share growth through market share gains and effective use of free cash flow (share repurchase or acquisitions). The stock currently trades at 17 times 2006 estimates.
Illinois Tool Works was a new addition in materials. Illinois Tool is a diversified industrial company serving numerous end markets. The company has performed well over the years by running extremely efficient operations and making smart acquisitions to help fuel growth. Concern over two of the company’s end markets (housing and autos) knocked the stock to a level of 14 times 2006 earnings and provided an attractive risk/reward opportunity for investors. Illinois Tool has a long history of consistent dividend growth.
Our sales were driven by companies reaching our price targets or due to a fundamental change in outlook; in some cases we simply discovered a better idea. Waste Management fell into the last bucket—we sold the stock and put the proceeds into Illinois Tool Works. We eliminated Fannie Mae and Freddie Mac as issues mounted surrounding management oversight, accounting, and other controls. With many other financials also inexpensive at the time (particularly insurance stocks), we took the opportunity to move the money into areas of greater conviction. Certegy, Principal Financial, Prudential, and Disney were all successful investments, and we found the risk/reward equation to be better in other areas now, so we eliminated them. Additionally, we reduced our exposure to telecom service stocks including Sprint Nextel and Alltel. Both companies had performed well in a tough environment and warranted a reduction in position size.
OUTLOOK
Despite the devastation caused by the hurricanes, we are generally encouraged by the overall health of the economy. The end of interest rate hikes should be positive for the market. Some concerns remain, however. Although fuel costs have moderated from their highs following the hurricane season, price stability is important for maintaining strong consumer confidence and demand. The ongoing geopolitical instability and the ever present possibility of terrorist acts continue to weigh on the markets, as well. Nevertheless, valuations, particularly among large-cap stocks, remain reasonable and fundamentals generally sound. As always, we will seek companies offering a combination of earnings and dividend growth whose prices reflect attractive valuations.
Respectfully submitted,

Thomas J. Huber
President of the fund and chairman of its Investment Advisory Committee
January 19, 2006
The committee chairman has day-to-day responsibility for managing the portfolio and works with committee members in developing and executing the fund’s investment program.
RISKS OF STOCK INVESTING
As with all stock and bond mutual funds, a fund’s share price can fall because of weakness in the stock or bond markets, a particular industry, or specific holdings. Stock markets can decline for many reasons, including adverse political or economic developments, changes in investor psychology, or heavy institutional selling. The prospects for an industry or company may deteriorate because of a variety of factors, including disappointing earnings or changes in the competitive environment. In addition, the investment manager’s assessment of companies held in a fund may prove incorrect, resulting in losses or poor performance even in rising markets. Funds investing in stocks with a dividend orientation may have somewhat lower potential for price appreciation than those concentrating on rapidly growing firms. Also, a company may reduce or eliminate its dividend.
GLOSSARY
Dividend yield: The annual dividend of a stock divided by the stock’s price.
Beta: A measure of the market risk of a stock showing how responsive it is to a given market index, such as the S&P 500 Stock Index. By definition, the beta of the benchmark index is 1.00. A fund with a 1.10 beta is expected to perform 10% better than the index in up markets and 10% worse in down markets. Usually, higher betas represent riskier investments.
Lipper indexes: Fund benchmarks that consist of a small number (10 to 30) of the largest mutual funds in a particular category as tracked by Lipper Inc.
Price/earnings ratio (P/E): A valuation measure calculated by dividing the price of a stock by its current or projected earnings per share. This ratio gives investors an idea of how much they are paying for current or future earnings power.
Risk/reward: The relationship between the degree of risk associated with an investment and its return potential. Typically, the higher the potential return of an investment, the greater the risk.
Standard & Poor’s Stock Ratings: A computerized scoring system based on per share earnings and dividend records of the most recent 10 years and measured against a matrix derived from the scores of a large and representative sample of stocks.
S&P 500 Stock Index: An unmanaged index that tracks the stocks of 500 primarily large-capitalization U.S. companies.

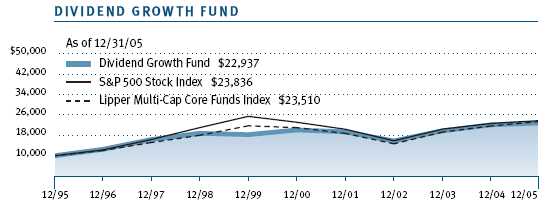
This chart shows the value of a hypothetical $10,000 investment in the fund over the past 10 fiscal year periods or since inception (for funds lacking 10-year records). The result is compared with benchmarks, which may include a broad-based market index and a peer group average or index. Market indexes do not include expenses, which are deducted from fund returns as well as mutual fund averages and indexes.
| AVERAGE ANNUAL COMPOUND TOTAL RETURN |
This table shows how the fund would have performed each year if its actual (or cumulative) returns for the periods shown had been earned at a constant rate.
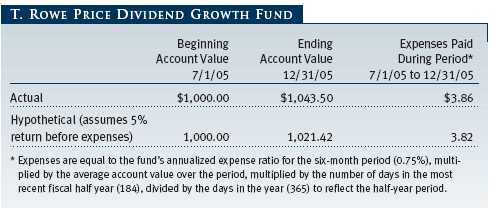
As a mutual fund shareholder, you may incur two types of costs: (1) transaction costs such as redemption fees or sales loads and (2) ongoing costs, including management fees, distribution and service (12b-1) fees, and other fund expenses. The following example is intended to help you understand your ongoing costs (in dollars) of investing in the fund and to compare these costs with the ongoing costs of investing in other mutual funds. The example is based on an investment of $1,000 invested at the beginning of the most recent six-month period and held for the entire period.
Actual Expenses
The first line of the following table (“Actual”) provides information about actual account values and actual expenses. You may use the information in this line, together with your account balance, to estimate the expenses that you paid over the period. Simply divide your account value by $1,000 (for example, an $8,600 account value divided by $1,000 = 8.6), then multiply the result by the number in the first line under the heading “Expenses Paid During Period” to estimate the expenses you paid on your account during this period.
Hypothetical Example for Comparison Purposes
The information on the second line of the table (“Hypothetical”) is based on hypothetical account values and expenses derived from the fund’s actual expense ratio and an assumed 5% per year rate of return before expenses (not the fund’s actual return). You may compare the ongoing costs of investing in the fund with other funds by contrasting this 5% hypothetical example and the 5% hypothetical examples that appear in the shareholder reports of the other funds. The hypothetical account values and expenses may not be used to estimate the actual ending account balance or expenses you paid for the period.
Note: T. Rowe Price charges an annual small-account maintenance fee of $10, generally for accounts with less than $2,000 ($500 for UGMA/UTMA). The fee is waived for any investor whose T. Rowe Price mutual fund accounts total $25,000 or more, accounts employing automatic investing, and IRAs and other retirement plan accounts that utilize a prototype plan sponsored by T. Rowe Price (although a separate custodial or administrative fee may apply to such accounts). This fee is not included in the accompanying table. If you are subject to the fee, keep it in mind when you are estimating the ongoing expenses of investing in the fund and when comparing the expenses of this fund with other funds.
You should also be aware that the expenses shown in the table highlight only your ongoing costs and do not reflect any transaction costs, such as redemption fees or sales loads. Therefore, the second line of the table is useful in comparing ongoing costs only and will not help you determine the relative total costs of owning different funds. To the extent a fund charges transaction costs, however, the total cost of owning that fund is higher.
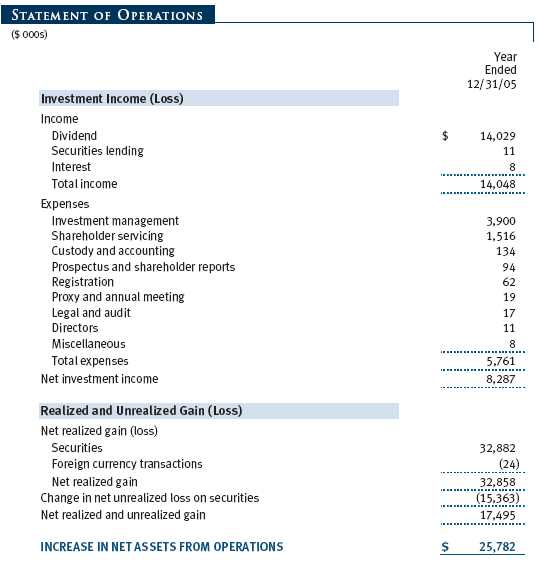
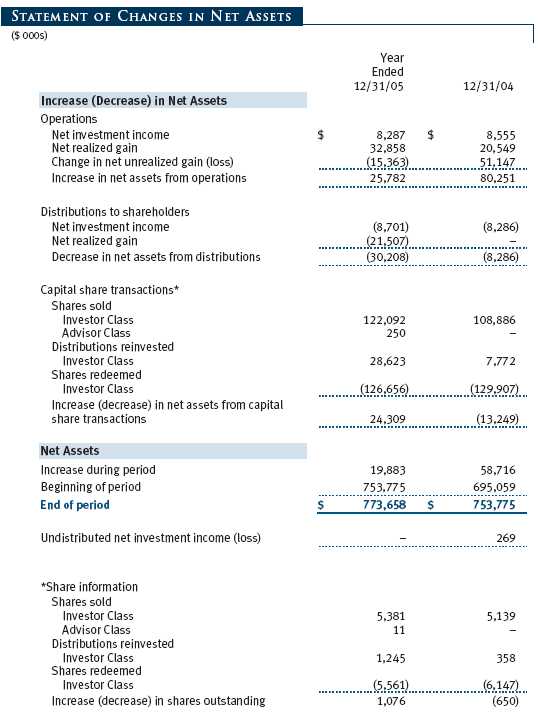
The accompanying notes are an integral part of these financial statements.


The accompanying notes are an integral part of these financial statements.
The accompanying notes are an integral part of these financial statements.
The accompanying notes are an integral part of these financial statements.
The accompanying notes are an integral part of these financial statements.
| NOTES TO FINANCIAL STATEMENTS |
NOTE 1 - SIGNIFICANT ACCOUNTING POLICIES
T. Rowe Price Dividend Growth Fund, Inc. (the fund) is registered under the Investment Company Act of 1940 (the 1940 Act) as a diversified, open-end management investment company. The fund seeks to provide increasing dividend income over time, long-term growth of capital, and a reasonable level of current income through investments primarily in dividend-paying stocks. The fund has two classes of shares: the Dividend Growth Fund original share class, referred to in this report as the Investor Class, offered since December 30, 1992, and Dividend Growth Fund—Advisor Class (Advisor Class), offered since December 29, 2005. Advisor Class shares are sold only through unaffiliated brokers and other unaffiliated financial intermediaries that are compensated by the class for distribution, shareholder servicing, and/or certain administrative services under a Board-approved Rule 12b-1 plan. Each class has exclusive voting rights on matters related solely to that class, separate voting rights on matters that relate to both classes, and, in all other respects, the same rights and obligations as the other class.
The accompanying financial statements were prepared in accordance with accounting principles generally accepted in the United States of America, which require the use of estimates made by fund management. Fund management believes that estimates and security valuations are appropriate; however actual results may differ from those estimates, and the security valuations reflected in the financial statements may differ from the value the fund ultimately realizes upon sale of the securities.
Valuation The fund values its investments and computes its net asset value per share at the close of the New York Stock Exchange (NYSE), normally 4 p.m. ET, each day that the NYSE is open for business. Equity securities listed or regularly traded on a securities exchange or in the over-the-counter market are valued at the last quoted sale price or, for certain markets, the official closing price at the time the valuations are made, except for OTC Bulletin Board securities, which are valued at the mean of the latest bid and asked prices. A security that is listed or traded on more than one exchange is valued at the quotation on the exchange determined to be the primary market for such security. Listed securities not traded on a particular day are valued at the mean of the latest bid and asked prices for domestic securities and the last quoted sale price for international securities.
Debt securities are generally traded in the over-the-counter market. Securities with original maturities of one year or more are valued at prices furnished by dealers who make markets in such securities or by an independent pricing service, which considers yield or price of bonds of comparable quality, coupon, maturity, and type, as well as prices quoted by dealers who make markets in such securities. Securities with original maturities of less than one year are valued at amortized cost in local currency, which approximates fair value when combined with accrued interest.
Investments in mutual funds are valued at the mutual fund’s closing net asset value per share on the day of valuation.
Other investments, including restricted securities, and those for which the above valuation procedures are inappropriate or are deemed not to reflect fair value are stated at fair value as determined in good faith by the T. Rowe Price Valuation Committee, established by the fund’s Board of Directors.
Most foreign markets close before the close of trading on the NYSE. If the fund determines that developments between the close of a foreign market and the close of the NYSE will, in its judgment, materially affect the value of some or all of its portfolio securities, which in turn will affect the fund’s share price, the fund will adjust the previous closing prices to reflect the fair value of the securities as of the close of the NYSE, as determined in good faith by the T. Rowe Price Valuation Committee, established by the fund’s Board of Directors. A fund may also fair value securities in other situations, such as when a particular foreign market is closed but the fund is open. In deciding whether to make fair value adjustments, the fund reviews a variety of factors, including developments in foreign markets, the performance of U.S. securities markets, and the performance of instruments trading in U. S. markets that represent foreign securities and baskets of foreign securities. The fund uses outside pricing services to provide it with closing market prices and information used for adjusting those prices. The fund cannot predict when and how often it will use closing prices and when it will adjust those prices to reflect fair value. As a means of evaluating its fair value process, the fund routinely compares closing market prices, the next day’s opening prices in the same markets, and adjusted prices.
Currency Translation Assets, including investments, and liabilities denominated in foreign currencies are translated into U.S. dollar values each day at the prevailing exchange rate, using the mean of the bid and asked prices of such currencies against U.S. dollars as quoted by a major bank. Purchases and sales of securities, income, and expenses are translated into U.S. dollars at the prevailing exchange rate on the date of the transaction. The effect of changes in foreign currency exchange rates on realized and unrealized security gains and losses is reflected as a component of security gains and losses.
Class Accounting The Advisor Class pays distribution, shareholder servicing, and/or certain administrative expenses in the form of Rule 12b-1 fees, in an amount not exceeding 0.25% of the class’s average daily net assets; no such fees were incurred during the period ended December 31, 2005. Shareholder servicing, prospectus, and shareholder report expenses incurred by each class are charged directly to the class to which they relate. Expenses common to both classes, investment income, and realized and unrealized gains and losses are allocated to the classes based upon the relative daily net assets of each class.
Rebates and Credits Subject to best execution, the fund may direct certain security trades to brokers who have agreed to rebate a portion of the related brokerage commission to the fund in cash. Commission rebates are reflected as realized gain on securities in the accompanying financial statements and totaled $23,000 for the year ended December 31, 2005. Additionally, the fund earns credits on temporarily uninvested cash balances at the custodian that reduce the fund’s custody charges. Custody expense in the accompanying financial statements is presented before reduction for credits.
Investment Transactions, Investment Income, and Distributions Income and expenses are recorded on the accrual basis. Premiums and discounts on debt securities are amortized for financial reporting purposes. Dividends received from mutual fund investments are reflected as dividend income; capital gain distributions are reflected as realized gain/loss. Dividend income and capital gain distributions are recorded on the ex-dividend date. Investment transactions are accounted for on the trade date. Realized gains and losses are reported on the identified cost basis. Distributions to shareholders are recorded on the ex-dividend date. Income distributions are declared and paid by each class on a quarterly basis. Capital gain distributions, if any, are declared and paid by the fund, typically on an annual basis.
NOTE 2 - INVESTMENT TRANSACTIONS
Consistent with its investment objective, the fund engages in the following practices to manage exposure to certain risks or enhance performance. The investment objective, policies, program, and risk factors of the fund are described more fully in the fund’s prospectus and Statement of Additional Information.
Securities Lending The fund lends its securities to approved brokers to earn additional income. It receives as collateral cash and U.S. government securities valued at 102% to 105% of the value of the securities on loan. Cash collateral is invested in a money market pooled trust managed by the fund’s lending agent in accordance with investment guidelines approved by fund management. Collateral is maintained over the life of the loan in an amount not less than the value of loaned securities, as determined at the close of fund business each day; any additional collateral required due to changes in security values is delivered to the fund the next business day. Although risk is mitigated by the collateral, the fund could experience a delay in recovering its securities and a possible loss of income or value if the borrower fails to return the securities. Securities lending revenue recognized by the fund consists of earnings on invested collateral and borrowing fees, net of any rebates to the borrower and compensation to the lending agent. At December 31, 2005, there were no securities on loan.
Other Purchases and sales of portfolio securities, other than short-term securities, aggregated $174,104,000 and $171,394,000, respectively, for the year ended December 31, 2005.
NOTE 3 - FEDERAL INCOME TAXES
No provision for federal income taxes is required since the fund intends to continue to qualify as a regulated investment company under Subchapter M of the Internal Revenue Code and distribute to shareholders all of its taxable income and gains. Federal income tax regulations differ from generally accepted accounting principles; therefore, distributions determined in accordance with tax regulations may differ significantly in amount or character from net investment income and realized gains for financial reporting purposes. Financial reporting records are adjusted for permanent book/tax differences to reflect tax character. Financial records are not adjusted for temporary differences.
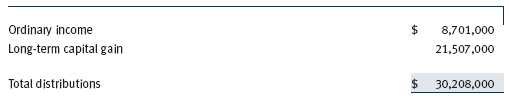
Distributions during the year ended December 31, 2005 were characterized as follows for tax purposes:
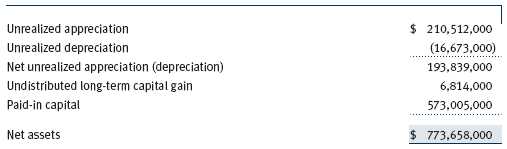
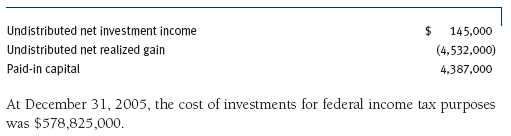
At December 31, 2005, the tax-basis components of net assets were as follows:
For the year ended December 31, 2005, the fund recorded the following permanent reclassifications to reflect tax character. Reclassifications to paid-in capital relate primarily to a tax practice that treats a portion of the proceeds from each redemption of capital shares as a distribution of taxable net investment income and/or realized capital gain. Results of operations and net assets were not affected by these reclassifications.
NOTE 4 - RELATED PARTY TRANSACTIONS
The fund is managed by T. Rowe Price Associates, Inc. (the manager or Price Associates), a wholly owned subsidiary of T. Rowe Price Group, Inc. The investment management agreement between the fund and the manager provides for an annual investment management fee, which is computed daily and paid monthly. The fee consists of an individual fund fee, equal to 0.20% of the fund’s average daily net assets, and a group fee. The group fee rate is calculated based on the combined net assets of certain mutual funds sponsored by Price Associates (the group) applied to a graduated fee schedule, with rates ranging from 0.48% for the first $1 billion of assets to 0.29% for assets in excess of $160 billion. Prior to May 1, 2005, the maximum group fee rate in the graduated fee schedule had been 0.295% for assets in excess of $120 billion. The fund’s group fee is determined by applying the group fee rate to the fund’s average daily net assets. At December 31, 2005, the effective annual group fee rate was 0.31%.
The Advisor Class is also subject to a contractual expense limitation through April 30, 2008. During the limitation period, the manager is required to waive its management fee and reimburse the class for any expenses, excluding interest, taxes, brokerage commissions, and extraordinary expenses, that would otherwise cause the class’s ratio of total expenses to average net assets (expense ratio) to exceed its expense limitation of 1.05%. The class is required to repay the manager for expenses previously reimbursed and management fees waived to the extent the class’s net assets have grown or expenses have declined sufficiently to allow repayment without causing the class’s expense ratio to exceed it expense limitation. However, no repayment will be made more than three years after the date of any reimbursement or waiver or later than April 30, 2010. Pursuant to this agreement, at December 31, 2005, there were no amounts subject to repayment. For the year ended December 31, 2005, t he Advisor Class operated below its expense limitation.
In addition, the fund has entered into service agreements with Price Associates and two wholly owned subsidiaries of Price Associates (collectively, Price). Price Associates computes the daily share prices and maintains the financial records of the fund. T. Rowe Price Services, Inc., provides shareholder and administrative services in its capacity as the fund’s transfer and dividend disbursing agent. T. Rowe Price Retirement Plan Services, Inc., provides subaccounting and record-keeping services for certain retirement accounts invested in the Investor Class. For the year ended December 31, 2005, expenses incurred pursuant to these service agreements were $64,000 for Price Associates, $770,000 for T. Rowe Price Services, Inc., and $390,000 for T. Rowe Price Retirement Plan Services, Inc. The total amount payable at period end pursuant to these service agreements is reflected as Due to Affiliates in the accompanying financial statements.
The fund may invest in the T. Rowe Price Reserve Investment Fund and the T. Rowe Price Government Reserve Investment Fund (collectively, the T. Rowe Price Reserve Funds), open-end management investment companies managed by Price Associates and affiliates of the fund. The T. Rowe Price Reserve Funds are offered as cash management options to mutual funds, trusts, and other accounts managed by Price Associates and/or its affiliates, and are not available for direct purchase by members of the public. The T. Rowe Price Reserve Funds pay no investment management fees. During the year ended December 31, 2005, dividend income from the T. Rowe Price Reserve Funds totaled $731,000, and the value of shares of the T. Rowe Price Reserve Funds held at December 31, 2005 and December 31, 2004 was $18,162,000 and $16,012,000, respectively.
As of December 31, 2005, T. Rowe Price Group, Inc. and/or its wholly owned subsidiaries owned 325,147 shares of the Investor class and 10,927 shares of the Advisor, aggregating less than 1% of the fund’s net assets.
| REPORT OF INDEPENDENT REGISTERED PUBLIC ACCOUNTING FIRM |
To the Board of Directors and Shareholders of T. Rowe Price Dividend Growth Fund, Inc.
In our opinion, the accompanying statement of assets and liabilities, including the portfolio of investments, and the related statements of operations and of changes in net assets and the financial highlights present fairly, in all material respects, the financial position of T. Rowe Price Dividend Growth Fund, Inc. (the “Fund”) at December 31, 2005, the results of its operations for the year then ended, the changes in its net assets for each of the two years in the period then ended and the financial highlights for each of the five years in the period then ended, in conformity with accounting principles generally accepted in the United States of America. These financial statements and financial highlights (hereafter referred to as “financial statements”) are the responsibility of the Fund’s management; our responsibility is to express an opinion on these financial statements based on our audits. We conducted our audits of these financial statements in accordance with the standards of the Public Company Accounting Oversight Board (United States). Those standards require that we plan and perform the audit to obtain reasonable assurance about whether the financial statements are free of material misstatement. An audit includes examining, on a test basis, evidence supporting the amounts and disclosures in the financial statements, assessing the accounting principles used and significant estimates made by management, and evaluating the overall financial statement presentation. We believe that our audits, which included confirmation of securities at December 31, 2005 by correspondence with the custodian and by agreement to the underlying ownership records for T. Rowe Price Reserve Investment Fund, provide a reasonable basis for our opinion.
PricewaterhouseCoopers LLP
Baltimore, Maryland
February 13, 2006
| TAX INFORMATION (UNAUDITED) FOR THE TAX YEAR ENDED 12/31/05 |
We are providing this information as required by the Internal Revenue Code. The amounts shown may differ from those elsewhere in this report because of differences between tax and financial reporting requirements.
The fund’s distributions to shareholders included:
• $462,000 from short-term capital gains,
• $25,578,000 from long-term capital gains, subject to the 15% rate gains category.
For taxable non-corporate shareholders, $8,749,000 of the fund’s income represents qualified dividend income subject to the 15% rate category.
For corporate shareholders, $8,749,000 of the fund’s income qualifies for the dividends-received deduction.
| INFORMATION ON PROXY VOTING POLICIES, PROCEDURES, AND RECORDS |
A description of the policies and procedures used by T. Rowe Price funds and portfolios to determine how to vote proxies relating to portfolio securities is available in each fund’s Statement of Additional Information, which you may request by calling 1-800-225-5132 or by accessing the SEC’s Web site, www.sec.gov. The description of our proxy voting policies and procedures is also available on our Web site, www.troweprice.com. To access it, click on the words “Company Info” at the top of our homepage for individual investors. Then, in the window that appears, click on the “Proxy Voting Policy” navigation button in the top left corner.
Each fund’s most recent annual proxy voting record is available on our Web site and through the SEC’s Web site. To access it through our Web site, follow the directions above, then click on the words “Proxy Voting Record” at the bottom of the Proxy Voting Policy page.
| HOW TO OBTAIN QUARTERLY PORTFOLIO HOLDINGS |
The fund files a complete schedule of portfolio holdings with the Securities and Exchange Commission for the first and third quarters of each fiscal year on Form N-Q. The fund’s Form N-Q is available electronically on the SEC’s Web site (www.sec.gov); hard copies may be reviewed and copied at the SEC’s Public Reference Room, 450 Fifth St. N.W., Washington, DC 20549. For more information on the Public Reference Room, call 1-800-SEC-0330.
| ABOUT THE FUND’S DIRECTORS AND OFFICERS |
Your fund is governed by a Board of Directors that meets regularly to review investments, performance, compliance matters, advisory fees, expenses, and other business affairs, and is responsible for protecting the interests of shareholders. The majority of the fund’s directors are independent of T. Rowe Price Associates, Inc. (T. Rowe Price); “inside” directors are officers of T. Rowe Price. The Board of Directors elects the fund’s officers, who are listed in the final table. The business address of each director and officer is 100 East Pratt Street, Baltimore, MD 21202. The Statement of Additional Information includes additional information about the fund directors and is available without charge by calling a T. Rowe Price representative at 1-800-225-5132.
| Independent Directors | |
| |
| Name | |
| (Year of Birth) | |
| Year Elected * | |
| [Number of T. Rowe Price | Principal Occupation(s) During Past 5 Years and Directorships of |
| Portfolios Overseen] | Other Public Companies |
| |
| Jeremiah E. Casey ** | Director, National Life Insurance (2001 to 8/05); Director, The Rouse |
| (1940) | Company, real estate developers (1990 to 2004) |
| 2005 | |
| [59] | |
| |
| Anthony W. Deering | Chairman, Exeter Capital, LLC, a private investment firm (2004 to pres- |
| (1945) | ent); Director, Chairman of the Board, and Chief Executive Officer, The |
| 2001 | Rouse Company, real estate developers (1997 to 2004); Director, |
| [113] | Mercantile Bank (4/03 to present) |
| |
| Donald W. Dick, Jr. | Principal, EuroCapital Advisors, LLC, an acquisition and management |
| (1943) | advisory firm; Chairman, President, and Chief Executive Officer, The |
| 1992 | Haven Group, a custom manufacturer of modular homes (1/04 to |
| [113] | present) |
| |
| David K. Fagin | Chairman and President, Nye Corporation (6/88 to present); Director, |
| (1938) | Canyon Resources Corp. and Golden Star Resources Ltd. (5/00 to |
| 1992 | present) and Pacific Rim Mining Corp. (2/02 to present) |
| [113] | |
| |
| Karen N. Horn | Managing Director and President, Global Private Client Services, Marsh |
| (1943) | Inc. (1999 to 2003); Managing Director and Head of International |
| 2003 | Private Banking, Bankers Trust (1996 to 1999); Director, Eli Lilly and |
| [113] | Company and Georgia Pacific |
| F. Pierce Linaweaver | President, F. Pierce Linaweaver & Associates, Inc., consulting environ- |
| (1934) | mental and civil engineers |
| 2001 | |
| [113] | |
| |
| Theo C. Rodgers *** | President, A&R Development Corporation |
| (1941) | |
| 2005 | |
| [97] | |
| |
| John G. Schreiber | Owner/President, Centaur Capital Partners, Inc., a real estate invest- |
| (1946) | ment company; Partner, Blackstone Real Estate Advisors, L.P.; |
| 2001 | Director, AMLI Residential Properties Trust |
| [113] | |
| |
| * Each independent director serves until retirement, resignation, or election of a successor. |
| ** Elected effective October 19, 2005. |
| *** Elected effective April 1, 2005. |
| Inside Directors | |
| |
| Name | |
| (Year of Birth) | |
| Year Elected * | |
| [Number of T. Rowe Price | Principal Occupation(s) During Past 5 Years and Directorships of |
| Portfolios Overseen] | Other Public Companies |
| |
| James A.C. Kennedy, CFA | Director and Vice President, T. Rowe Price and T. Rowe Price Group, |
| (1953) | Inc.; Director, T. Rowe Price Global Asset Management Limited, |
| 1997 | T. Rowe Price Global Investment Services Limited, and T. Rowe Price |
| [45] | International, Inc. |
| |
| James S. Riepe | Director and Vice President, T. Rowe Price; Vice Chairman of the Board, |
| (1943) | Director, and Vice President, T. Rowe Price Group, Inc.; Chairman of the |
| 1992 | Board and Director, T. Rowe Price Global Asset Management Limited, |
| [113] | T. Rowe Price Global Investment Services Limited, T. Rowe Price |
| | Investment Services, Inc., T. Rowe Price Retirement Plan Services, Inc., |
| | and T. Rowe Price Services, Inc.; Chairman of the Board, Director, |
| | President, and Trust Officer, T. Rowe Price Trust Company; Director, |
| | T. Rowe Price International, Inc.; Chairman of the Board, all funds |
| * Each inside director serves until retirement, resignation, or election of a successor. |
| Officers | |
| |
| Name (Year of Birth) | |
| Title and Fund(s) Served | Principal Occupation(s) |
| |
| P. Robert Bartolo, CPA (1972) | Vice President, T. Rowe Price and T. Rowe Price |
| Vice President, Dividend Growth Fund | Group, Inc.; formerly intern, T. Rowe Price (to |
| | 2001) |
| |
| Joseph A. Carrier, CPA (1960) | Vice President, T. Rowe Price, T. Rowe Price |
| Treasurer, Dividend Growth Fund | Group, Inc., T. Rowe Price Investment Services, |
| | Inc., and T. Rowe Price Trust Company |
| |
| Roger L. Fiery III, CPA (1959) | Vice President, T. Rowe Price, T. Rowe Price |
| Vice President, Dividend Growth Fund | Group, Inc., T. Rowe Price International, Inc., |
| | and T. Rowe Price Trust Company |
| |
| John R. Gilner (1961) | Chief Compliance Officer and Vice President, |
| Chief Compliance Officer, Dividend Growth Fund | T. Rowe Price; Vice President, T. Rowe Price |
| | Group, Inc., and T. Rowe Price Investment |
| | Services, Inc. |
| |
| David R. Giroux, CFA (1975) | Vice President, T. Rowe Price and T. Rowe Price |
| Vice President, Dividend Growth Fund | Group, Inc. |
| |
| Gregory S. Golczewski (1966) | Vice President, T. Rowe Price and T. Rowe Price |
| Vice President, Dividend Growth Fund | Trust Company |
| |
| Michael W. Holton (1968) | Vice President, T. Rowe Price and T. Rowe Price |
| Vice President, Dividend Growth Fund | Group, Inc. |
| |
| Henry H. Hopkins (1942) | Director and Vice President, T. Rowe Price |
| Vice President, Dividend Growth Fund | Investment Services, Inc., T. Rowe Price Services, |
| | Inc., and T. Rowe Price Trust Company; Vice |
| | President, T. Rowe Price, T. Rowe Price Group, Inc., |
| | T. Rowe Price International, Inc., and |
| | T. Rowe Price Retirement Plan Services, Inc. |
| |
| Thomas J. Huber, CFA (1966) | Vice President, T. Rowe Price and T. Rowe Price |
| President, Dividend Growth Fund | Group, Inc. |
| |
| David M. Lee, CFA (1962) | Vice President, T. Rowe Price and T. Rowe Price |
| Vice President, Dividend Growth Fund | Group, Inc. |
| |
| Patricia B. Lippert (1953) | Assistant Vice President, T. Rowe Price and |
| Secretary, Dividend Growth Fund | T. Rowe Price Investment Services, Inc. |
| Jason Nogueira, CFA (1974) | Employee, T. Rowe Price; formerly Healthcare |
| Vice President, Dividend Growth Fund | Equity Analyst, Putnam Investments (to 2004); |
| | student, Harvard Business School (to 2003); |
| | Financial Analyst, J.W. Child Associates (to |
| | 2001) |
| |
| Timothy E. Parker (1974) | Vice President, T. Rowe Price and T. Rowe Price |
| Vice President, Dividend Growth Fund | Group, Inc.; Student, Darden Graduate School, |
| | University of Virginia (to 2001) |
| |
| Donald J. Peters (1959) | Vice President, T. Rowe Price and T. Rowe Price |
| Vice President, Dividend Growth Fund | Group, Inc. |
| |
| Karen M. Regan (1967) | Vice President, T. Rowe Price |
| Vice President, Dividend Growth Fund | |
| |
| William J. Stromberg, CFA (1960) | Vice President, T. Rowe Price, T. Rowe Price |
| Vice President, Dividend Growth Fund | Group, Inc., and T. Rowe Price Trust Company |
| |
| Julie L. Waples (1970) | Vice President, T. Rowe Price |
| Vice President, Dividend Growth Fund | |
| |
| Unless otherwise noted, officers have been employees of T. Rowe Price or T. Rowe Price International for at |
| least five years. | |
Item 2. Code of Ethics.The registrant has adopted a code of ethics, as defined in Item 2 of Form N-CSR, applicable to its principal executive officer, principal financial officer, principal accounting officer or controller, or persons performing similar functions. A copy of this code of ethics is filed as an exhibit to this Form N-CSR. No substantive amendments were approved or waivers were granted to this code of ethics during the period covered by this report.
Item 3. Audit Committee Financial Expert.
The registrant’s Board of Directors/Trustees has determined that Mr. Donald W. Dick Jr. qualifies as an audit committee financial expert, as defined in Item 3 of Form N-CSR. Mr. Dick is considered independent for purposes of Item 3 of Form N-CSR.
Item 4. Principal Accountant Fees and Services.
(a) – (d) Aggregate fees billed to the registrant for the last two fiscal years for professional services rendered by the registrant’s principal accountant were as follows:
| | 2005 | 2004 |
| Audit Fees | $8,016 | $7,530 |
| Audit-Related Fees | 515 | 1,050 |
| Tax Fees | 2,277 | 2,042 |
| All Other Fees | 394 | - |
Audit fees include amounts related to the audit of the registrant’s annual financial statements and services normally provided by the accountant in connection with statutory and regulatory filings. Audit-related fees include amounts reasonably related to the performance of the audit of the registrant’s financial statements and specifically include the issuance of a report on internal controls. Tax fees include amounts related to services for tax compliance, tax planning, and tax advice. The nature of these services specifically includes the review of distribution calculations and the preparation of Federal, state, and excise tax returns. All other fees include the registrant’s pro-rata share of amounts for agreed-upon procedures in conjunction with service contract approvals by the registrant’s Board of Directors/Trustees.
(e)(1) The registrant’s audit committee has adopted a policy whereby audit and non-audit services performed by the registrant’s principal accountant for the registrant, its investment adviser, and any entity controlling, controlled by, or under common control with the investment adviser that provides ongoing services to the registrant require pre-approval in advance at regularly scheduled audit committee meetings. If such a service is required between regularly scheduled audit committee meetings, pre-approval may be authorized by one audit committee member with ratification at the next scheduled audit committee meeting. Waiver of pre-approval for audit or non-audit services requiring fees of a de minimis amount is not permitted.
(2) No services included in (b) – (d) above were approved pursuant to paragraph (c)(7)(i)(C) of Rule 2-01 of Regulation S-X.
(f) Less than 50 percent of the hours expended on the principal accountant’s engagement to audit the registrant’s financial statements for the most recent fiscal year were attributed to work performed by persons other than the principal accountant’s full-time, permanent employees.
(g) The aggregate fees billed for the most recent fiscal year and the preceding fiscal year by the registrant’s principal accountant for non-audit services rendered to the registrant, its investment adviser, and any entity controlling, controlled by, or under common control with the investment adviser that provides ongoing services to the registrant were $1,008,000 and $903,000, respectively, and were less than the aggregate fees billed for those same periods by the registrant’s principal accountant for audit services rendered to the T. Rowe Price Funds.
(h) All non-audit services rendered in (g) above were pre-approved by the registrant’s audit committee. Accordingly, these services were considered by the registrant’s audit committee in maintaining the principal accountant’s independence.Item 5. Audit Committee of Listed Registrants.
Not applicable.
Item 6. Schedule of Investments.
Not applicable. The complete schedule of investments is included in Item 1 of this Form N-CSR.
Item 7. Disclosure of Proxy Voting Policies and Procedures for Closed-End Management Investment Companies.
Not applicable.
Item 8. Portfolio Managers of Closed-End Management Investment Companies.
Not applicable.
Item 9. Purchases of Equity Securities by Closed-End Management Investment Company and Affiliated Purchasers.
Not applicable.
Item 10. Submission of Matters to a Vote of Security Holders.
Not applicable.
Item 11. Controls and Procedures.
(a) The registrant’s principal executive officer and principal financial officer have evaluated the registrant’s disclosure controls and procedures within 90 days of this filing and have concluded that the registrant’s disclosure controls and procedures were effective, as of that date, in ensuring that information required to be disclosed by the registrant in this Form N-CSR was recorded, processed, summarized, and reported timely.
(b) The registrant’s principal executive officer and principal financial officer are aware of no change in the registrant’s internal control over financial reporting that occurred during the registrant’s second fiscal quarter covered by this report that has materially affected, or is reasonably likely to materially affect, the registrant’s internal control over financial reporting.
Item 12. Exhibits.
(a)(1) The registrant’s code of ethics pursuant to Item 2 of Form N-CSR is attached.
(2) Separate certifications by the registrant's principal executive officer and principal financial officer, pursuant to Section 302 of the Sarbanes-Oxley Act of 2002 and required by Rule 30a-2(a) under the Investment Company Act of 1940, are attached.
(3) Written solicitation to repurchase securities issued by closed-end companies: not applicable.
(b) A certification by the registrant's principal executive officer and principal financial officer, pursuant to Section 906 of the Sarbanes-Oxley Act of 2002 and required by Rule 30a-2(b) under the Investment Company Act of 1940, is attached.
SIGNATURES |
| |
| |
| | Pursuant to the requirements of the Securities Exchange Act of 1934 and the Investment |
| Company Act of 1940, the registrant has duly caused this report to be signed on its behalf by the |
| undersigned, thereunto duly authorized. |
| |
| T. Rowe Price Dividend Growth Fund, Inc. |
| |
| |
| By | /s/ James S. Riepe |
| | James S. Riepe |
| | Principal Executive Officer |
| |
| Date | February 21, 2006 |
| |
| |
| | Pursuant to the requirements of the Securities Exchange Act of 1934 and the Investment |
| Company Act of 1940, this report has been signed below by the following persons on behalf of |
| the registrant and in the capacities and on the dates indicated. |
| |
| |
| By | /s/ James S. Riepe |
| | James S. Riepe |
| | Principal Executive Officer |
| |
| Date | February 21, 2006 |
| |
| |
| |
| By | /s/ Joseph A. Carrier |
| | Joseph A. Carrier |
| | Principal Financial Officer |
| |
| Date | February 21, 2006 |