| UNITED STATES |
| SECURITIES AND EXCHANGE COMMISSION |
| Washington, D.C. 20549 |
| |
FORM N-CSR |
| |
CERTIFIED SHAREHOLDER REPORT OF REGISTERED |
MANAGEMENT INVESTMENT COMPANIES |
| |
| |
| |
| Investment Company Act File Number: 811-7055 |
|
| |
| T. Rowe Price Dividend Growth Fund, Inc. |
|
| (Exact name of registrant as specified in charter) |
| |
| 100 East Pratt Street, Baltimore, MD 21202 |
|
| (Address of principal executive offices) |
| |
| David Oestreicher |
| 100 East Pratt Street, Baltimore, MD 21202 |
|
| (Name and address of agent for service) |
| |
| |
| Registrant’s telephone number, including area code: (410) 345-2000 |
| |
| |
| Date of fiscal year end: December 31 |
| |
| |
| Date of reporting period: December 31, 2008 |
Item 1: Report to Shareholders| Dividend Growth Fund | December 31, 2008 |
The views and opinions in this report were current as of December 31, 2008. They are not guarantees of performance or investment results and should not be taken as investment advice. Investment decisions reflect a variety of factors, and the managers reserve the right to change their views about individual stocks, sectors, and the markets at any time. As a result, the views expressed should not be relied upon as a forecast of the fund’s future investment intent. The report is certified under the Sarbanes-Oxley Act, which requires mutual funds and other public companies to affirm that, to the best of their knowledge, the information in their financial reports is fairly and accurately stated in all material respects.
REPORTS ON THE WEB
Sign up for our E-mail Program, and you can begin to receive updated fund reports and prospectuses online rather than through the mail. Log in to your account at troweprice.com for more information.
Manager’s Letter
Fellow Shareholders
The past 12 months have been extraordinarily challenging even for the most experienced investors. Problems that began in the U.S. subprime mortgage market spread throughout the financial world, causing even the most venerable of financial houses to close, seek government assistance, or find partners to stay viable. The economy clearly has lurched into what may be a long and painful recession, and financial markets have experienced extreme volatility as investors sought to escape from all but the safest of assets. Over the final three months of 2008, stock dividend reductions and eliminations outnumbered new or increased payouts on a quarterly basis for the first time since 1958, while yields became increasingly attractive. Payers outpaced nonpayers for the 12-month period.
HIGHLIGHTS
• Equity markets posted steep losses for the 6- and 12-month periods ended December 31, 2008, as weakness that began in the U.S. financial system eventually boiled over and scorched the global economy.
• The Dividend Growth Fund was caught in the maelstrom and fell sharply, but still managed to outperform the broader equity markets and its Lipper peer group.
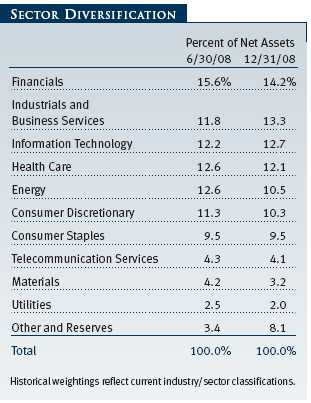
• The fund’s utilities, materials, and consumer staples holdings fared best, while our financials and industrials and business services names suffered.
• Although we recognize that the financial markets remain uncertain, the broad equity sell-off has resulted in attractive opportunities across many market sectors.

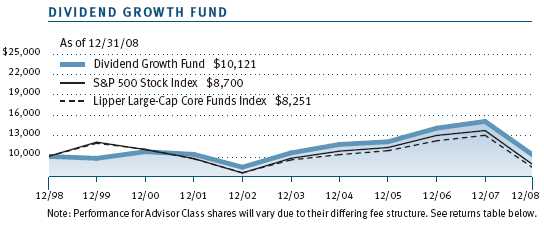
The Dividend Growth Fund declined sharply over the 6- and 12-month periods ended December 31, 2008, but outpaced both the broader S&P 500 Index and its peer group as measured by the Lipper Large-Cap Core Funds Index. (Please note that the Lipper Large-Cap Core Funds Index replaced the Lipper Multi-Cap Core Funds Index as the fund’s preferred peer group index during the period.) The performance of the fund’s Advisor Class differed slightly due to its separate fee structure.
As fellow shareholders, we understand the profound impact these losses have on the individuals and families that have chosen T. Rowe Price to help manage their assets. Although the fund’s performance over the past year outpaced both its benchmark and its average peer, we take little comfort in this fact as the losses were still substantial. In this uncertain environment, however, we remain focused on identifying high-quality companies that we believe are best positioned to provide a sustainable combination of current income and long-term capital appreciation for our shareholders.
MARKET ENVIRONMENT
The last half of 2008 saw an extraordinary sell-off in global financial markets. The fourth quarter was particularly brutal for U.S. equities, capping off a dismal year that will go down in history as the third-worst year for stocks in more than a century. Problems that initially started in the housing sector cascaded through the U.S. financial system and eventually infected the global economy. Growth stalled and many economies sank into recession. Unemployment rates in the U.S. surpassed 7% by the year’s end and are likely to climb higher in the months to come. The slowdown contributed to an extraordinary drop in the price of oil, which fell from $140 to $40 per barrel in a few short months. The banking industry was at the center of the storm, finally facing the music after years of extending easy credit to businesses and consumers. Steep declines in the housing market resulted in increased foreclosures. Credit cards and commercial loans saw dramatic increases in payment delinquencies. The result was a banking industry under severe stress, capital ratios devastated by write-offs, and an extreme contraction in the availability of credit to individuals and corporations.
In a disturbing sign that the problems were spreading, mortgage giants Fannie Mae and Freddie Mac were placed under conservatorship in September. Ironically, the Treasury took this drastic step shortly after the quasi-governmental entities had assured investors that they were on sound financial footing—a clear sign that events were moving quickly. As the crisis cascaded across markets and throughout the economy, several financial houses teetered into bankruptcy while others were forced to seek government assistance or private sector partners to stay afloat. In any event, the survivors hoarded cash and reduced lending activity to a trickle, causing global credit markets to seize.
Beginning in September, fiscal and monetary policymakers around the world implemented unprecedented bailout packages. These coordinated efforts have poured hundreds of billions of dollars into frozen credit markets and economic stimulus packages. In the U.S., the Treasury and the Fed have tried several different approaches to encourage banks to resume lending to consumers and businesses. While the most prominent of these was the $700 billion Troubled Asset Relief Program (TARP), the government has committed hundreds of billions of additional dollars through other measures as well. The Fed also has guided short-term interest rates to virtually 0%, and many central banks around the world have followed suit.
Equity markets were pummeled in this challenging environment. U.S. stocks plunged deep into bear market territory as the worsening credit crisis cascaded through capital markets and the global economy lurched into recession. Concerted policy actions failed to prevent a massive equity sell-off as risk-averse investors fled stocks en masse in an attempt to find relative safety and liquidity. Although stock dividend reductions or eliminations traditionally have been seen as signs of weakness, even firms with relatively strong financial positions began to rein in payments in an effort to conserve cash. In a market where lending virtually stopped and investors were hoarding cash, reducing or eliminating dividends was one of the few options available as firms sought to solidify their cash positions to ride out the storm. In one positive aspect to an otherwise dismal year, dividend yields became increasingly attractive, with an average yield of 3.73% as of December 31, 2008. As measured by Standard and Poor’s Index Services, dividend-paying stocks in the S&P 500 Index outperformed non-dividend payers by approximately six percentage points for the year.
PERFORMANCE REVIEW
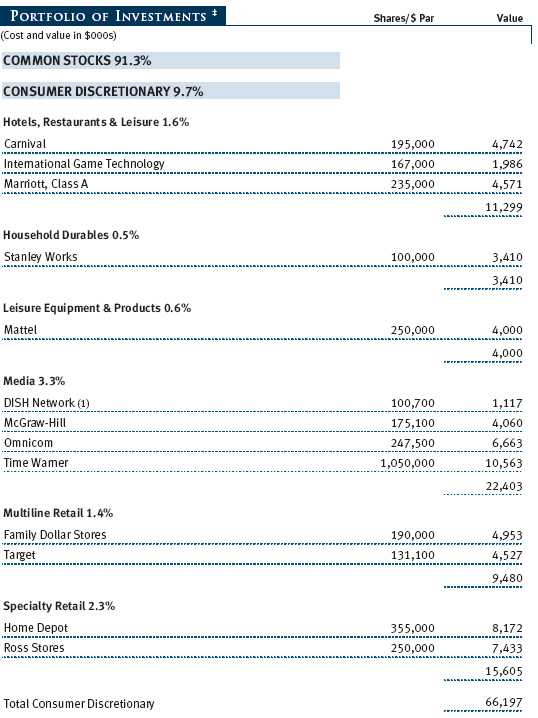
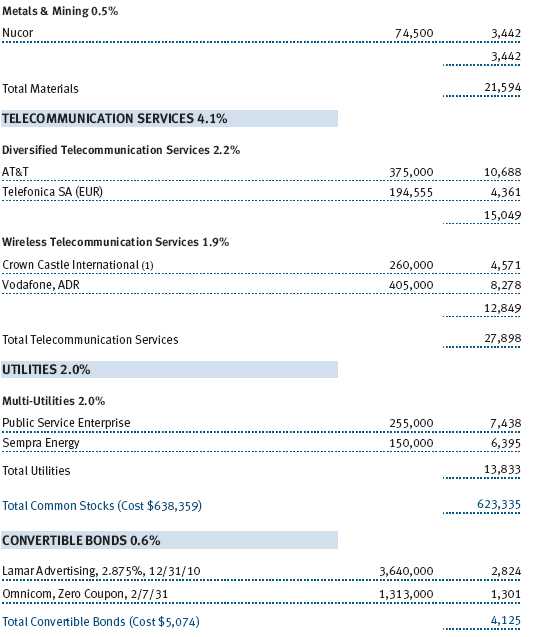
Under these extremely difficult conditions, there were few places to hide and no sector provided positive returns for the fund. Our holdings in the traditionally defensive utilities sector fared best as investors sought cover wherever they could find it, although the sector still detracted from results. A small position in natural gas distributor AGL Resources was our strongest performer in the sector behind a solid management team, strong free cash flow, attractive yields, and reasonable valuations. Our materials sector holdings also were among our better performers and were led by steel producer Nucor, a new position in the fund, whose flexible cost structure and pristine balance sheet make it one of the more attractive companies to own through a down cycle. (Please see the portfolio of investments for a complete listing of holdings and the amount each represents in the portfolio.)
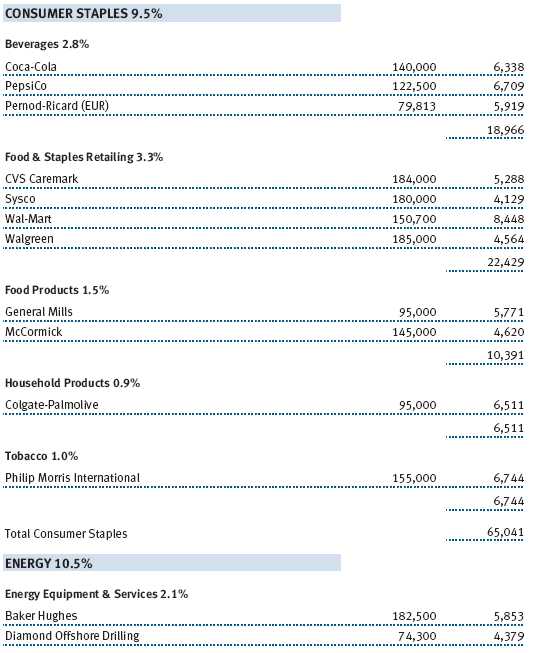
Although our consumer staples holdings generally detracted from performance, there were some bright spots. Anheuser-Busch was the fund’s largest positive contributor for the year. After a brief period of wrangling back and forth, the St. Louis-based beverage giant eventually accepted a buyout offer from InBev, an international brewing conglomerate based in Leuven, Belgium. Wal-Mart was another bright spot in our portfolio as increasingly cash-strapped consumers chose to spend their dollars at discount retailers. Wal-Mart is the low-cost operator in the U.S. retail market and should continue to win market share over time. Discount specialty retailers Ross and Family Dollar also helped performance as household budgets were squeezed by the deteriorating economy.
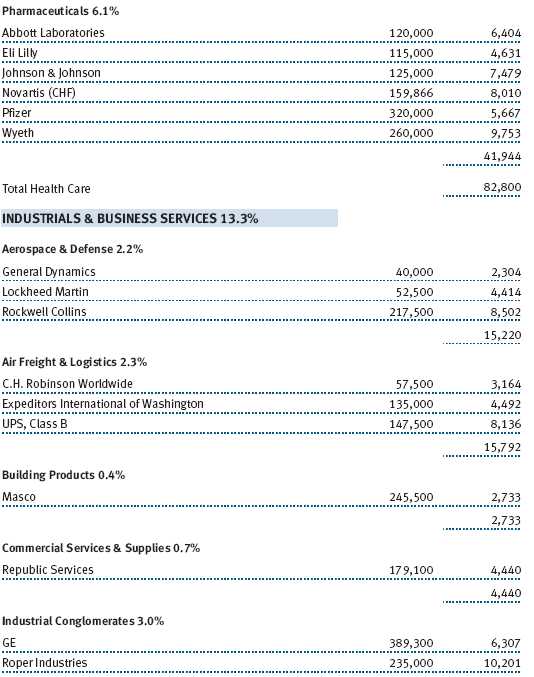
After a very strong start to the year, the energy sector tumbled due to rapidly decreasing demand expectations as global economic growth ground to a halt. Highly exposed to economically sensitive worldwide drilling activity, our oilfield services holdings in Baker Hughes and Diamond Offshore Drilling were among the weakest performers for the year. The larger, integrated oil companies fared better under the prevailing economic and market conditions, benefiting shares in our ExxonMobil and Chevron positions.
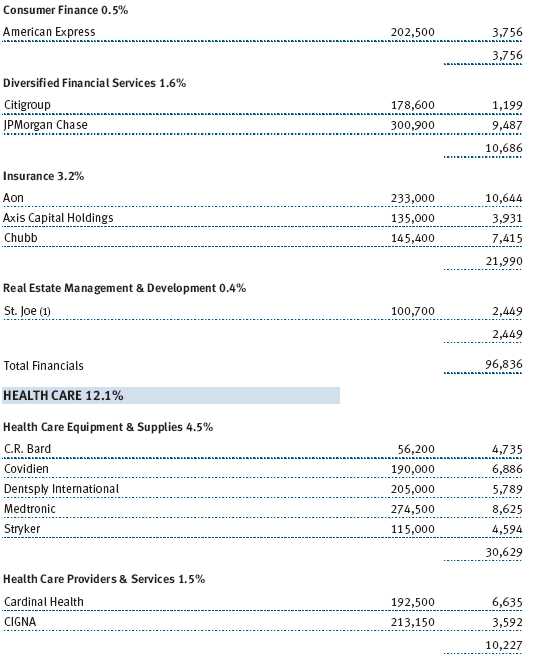
The fund’s exposure to the financials sector and the industrials and business services sector was the biggest drag on performance. As the sector where the current troubles began, financial stocks were among the first to fall—and fell furthest—plummeting nearly 57% for the year. We could not avoid the widespread carnage and our holdings suffered, particularly among our insurance and capital markets names. Diversified financial services giant Wells Fargo fared relatively well for the fund in this beaten down sector. Through the firm’s acquisition of troubled Wachovia—in which the fund briefly held a small position during the period—Wells Fargo should increase its scale in noncore businesses, such as investment banking, and expand its geographic footprint into previously untapped retail and commercial markets on the East Coast and in the South. We expect management to continue to build on its industry-leading retail and commercial lending sales culture while integrating Wachovia’s best-in-class service culture, building a formidable competitor and a perennial market share gainer in the U.S. banking industry.
Industrials and business services stocks suffered as the economy slowed and corporate capital expenditures ground to a virtual halt. For years, global communications and aviation electronics firm Rockwell Collins thrived as its core markets grew and the company delivered impressive financial results. Unfortunately, share valuations fell in 2008 as demand for Rockwell Collins’ products deteriorated due to slower spending among the firm’s customers in the private and government sectors alike. Among our stronger performers in this sector was Republic Services, a waste collection and disposal firm operating in an industry that is less affected by economic downturns. Professional staffing firm Robert Half International also helped fund performance as a solid management team was able to control expenses and squeeze efficiencies even in this challenging environment.
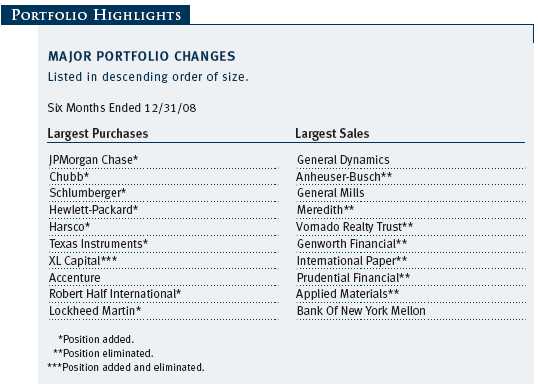
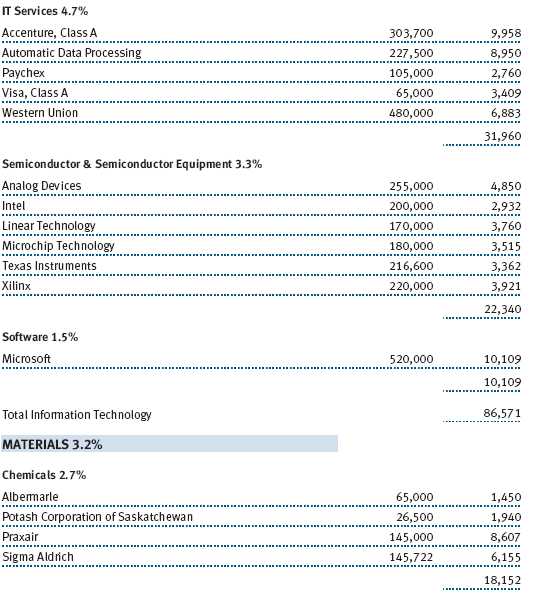
The fund established several new positions over the year. We took advantage of oversold valuations to purchase shares in property and casualty insurer Chubb. This is one of the sector’s best-run firms with a strong market position, solid financial strength, and a clean investment portfolio. We expect the company to benefit from the ongoing dislocation at its major competitors, and as capacity leaves the market, it should be in position to gain market share. While we expect increased policy payouts to gradually emerge over the next few years in select areas, we believe the company has a strong enough balance sheet to absorb those losses comfortably and still outperform. Schlumberger is a leader in the global oil services industry, which is facing a difficult year ahead as the fall in the prices of oil and gas has left its customers with no choice other than to reduce capital spending. However, the valuation of Schlumberger looks quite compelling when considering that the multi-year outlook for oil and gas capital spending appears robust once the global economy begins to stabilize. Texas Instruments is an undervalued semiconductor company that has a strong footprint in the subsectors of analog and microcontrollers—areas with low capital intensity and high gross margins. The firm holds over $2.7 billion in cash with no debt, which should allow shareholder-friendly actions like share buybacks or acquisitions of smaller, distressed competitors.
OUTLOOK
The global economy is clearly in the midst of a deep, painful, and prolonged recession, and will likely remain so throughout most of 2009. However, we believe it will eventually recover. Although currently not an issue, we expect inflationary pressures to increase over time as massive government efforts to increase liquidity and a gradual economic recovery eventually take hold.
We currently favor stocks that stand to benefit the most from a market rebound and are selectively adding companies with solid fundamentals and strong competitive positions. One of our themes is focused on the oversold energy sector as we believe oil prices should trend significantly higher over time based on increased demand from a gradually improving global economy. We also see selective opportunities within financials. With massive capacity being removed through bankruptcy and consolidation, the firms that ultimately survive should take increased market share and be some of the biggest winners when markets recover. We are also looking closely at quality information technology names with solid balance sheets selling at compelling valuations. Finally, we are being cautious in the consumer discretionary space as we believe the deleveraging of household balance sheets is just beginning. However, we are looking closely at companies that offer value to customers, are well capitalized, and self funding. In most cases, these companies make or sell products that meet consumers’ needs, rather than their wants—a positive attribute in this recessionary climate.
Through this period of extreme volatility and heightened uncertainty, we have relied on the disciplined investment philosophy and process that have been the hallmark of our firm since its founding over 70 years ago. Although we will continue to be risk aware, we intend to balance this awareness against the need to move quickly and efficiently as attractive investment opportunities present themselves. We believe that periods of severe market volatility and dislocation have historically proven to be good times to invest in high-quality companies. We remain firm in our belief that this time will be no different.
Respectfully submitted,

Thomas J. Huber
President of the fund and chairman of its Investment Advisory Committee
January 22, 2009
The committee chairman has day-to-day responsibility for managing the portfolio and works with committee members in developing and executing the fund’s investment program.
RISKS OF STOCK INVESTING
As with all stock and bond mutual funds, a fund’s share price can fall because of weakness in the stock or bond markets, a particular industry, or specific holdings. Stock markets can decline for many reasons, including adverse political or economic developments, changes in investor psychology, or heavy institutional selling. The prospects for an industry or company may deteriorate because of a variety of factors, including disappointing earnings or changes in the competitive environment. In addition, the investment manager’s assessment of companies held in a fund may prove incorrect, resulting in losses or poor performance even in rising markets. Funds investing in stocks with a dividend orientation may have somewhat lower potential for price appreciation than those concentrating on rapidly growing firms. Also, a company may reduce or eliminate its dividend.
GLOSSARY
Dividend yield: The annual dividend of a stock divided by the stock’s price.
Free cash flow: The excess cash a company generates from its operations that can be taken out of the business for the benefit of shareholders, such as dividends, share repurchases, investments, and acquisitions.
Lipper indexes: Fund benchmarks that consist of a small number (10 to 30) of the largest mutual funds in a particular category as tracked by Lipper Inc.
Price/earnings ratio (P/E): A valuation measure calculated by dividing the price of a stock by its current or projected earnings per share. This ratio gives investors an idea of how much they are paying for current or future earnings power.
S&P 500 Index: An unmanaged index that tracks the stocks of 500 primarily large-capitalization U.S. companies.

Performance and Expenses
This chart shows the value of a hypothetical $10,000 investment in the fund over the past 10 fiscal year periods or since inception (for funds lacking 10-year records). The result is compared with benchmarks, which may include a broad-based market index and a peer group average or index. Market indexes do not include expenses, which are deducted from fund returns as well as mutual fund averages and indexes.
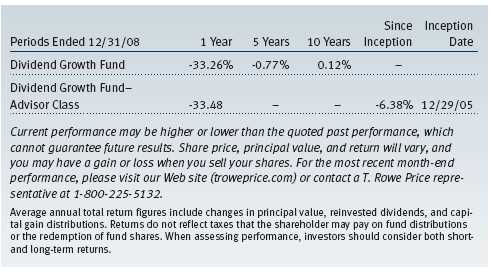
| AVERAGE ANNUAL COMPOUND TOTAL RETURN |
This table shows how the fund would have performed each year if its actual (or cumulative) returns for the periods shown had been earned at a constant rate.

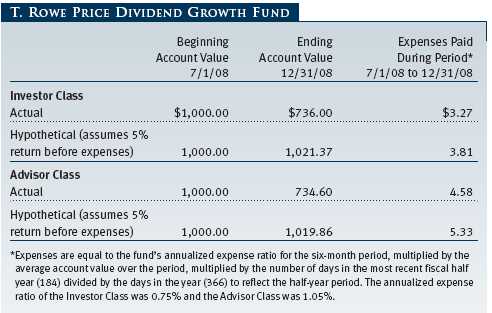
As a mutual fund shareholder, you may incur two types of costs: (1) transaction costs, such as redemption fees or sales loads, and (2) ongoing costs, including management fees, distribution and service (12b-1) fees, and other fund expenses. The following example is intended to help you understand your ongoing costs (in dollars) of investing in the fund and to compare these costs with the ongoing costs of investing in other mutual funds. The example is based on an investment of $1,000 invested at the beginning of the most recent six-month period and held for the entire period.
Please note that the fund has two share classes: The original share class (“investor class”) charges no distribution and service (12b-1) fee, and the Advisor Class shares are offered only through unaffiliated brokers and other financial intermediaries and charge a 0.25% 12b-1 fee. Each share class is presented separately in the table.
Actual Expenses
The first line of the following table (“Actual”) provides information about actual account values and expenses based on the fund’s actual returns. You may use the information in this line, together with your account balance, to estimate the expenses that you paid over the period. Simply divide your account value by $1,000 (for example, an $8,600 account value divided by $1,000 = 8.6), then multiply the result by the number in the first line under the heading “Expenses Paid During Period” to estimate the expenses you paid on your account during this period.
Hypothetical Example for Comparison Purposes
The information on the second line of the table (“Hypothetical”) is based on hypothetical account values and expenses derived from the fund’s actual expense ratio and an assumed 5% per year rate of return before expenses (not the fund’s actual return). You may compare the ongoing costs of investing in the fund with other funds by contrasting this 5% hypothetical example and the 5% hypothetical examples that appear in the shareholder reports of the other funds. The hypothetical account values and expenses may not be used to estimate the actual ending account balance or expenses you paid for the period.
Note: T. Rowe Price charges an annual small-account maintenance fee of $10, generally for accounts with less than $2,000 ($500 for UGMA/UTMA). The fee is waived for any investor whose T. Rowe Price mutual fund accounts total $25,000 or more, accounts employing automatic investing, and IRAs and other retirement plan accounts that utilize a prototype plan sponsored by T. Rowe Price (although a separate custodial or administrative fee may apply to such accounts). This fee is not included in the accompanying table. If you are subject to the fee, keep it in mind when you are estimating the ongoing expenses of investing in the fund and when comparing the expenses of this fund with other funds.
You should also be aware that the expenses shown in the table highlight only your ongoing costs and do not reflect any transaction costs, such as redemption fees or sales loads. Therefore, the second line of the table is useful in comparing ongoing costs only and will not help you determine the relative total costs of owning different funds. To the extent a fund charges transaction costs, however, the total cost of owning that fund is higher.
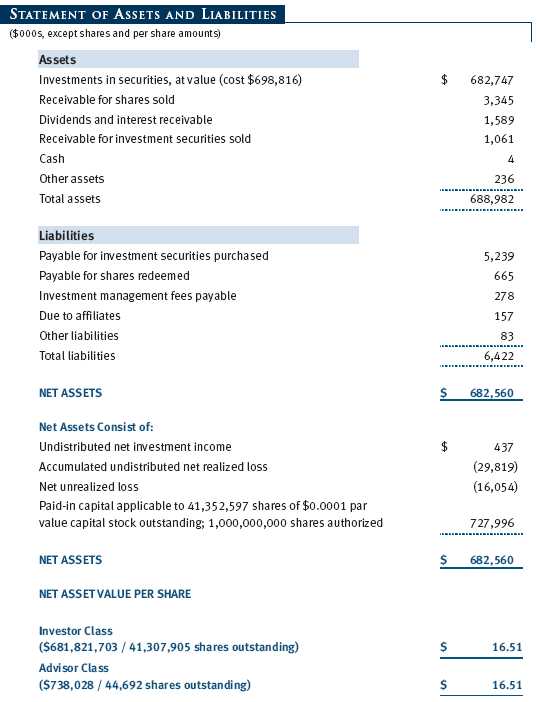
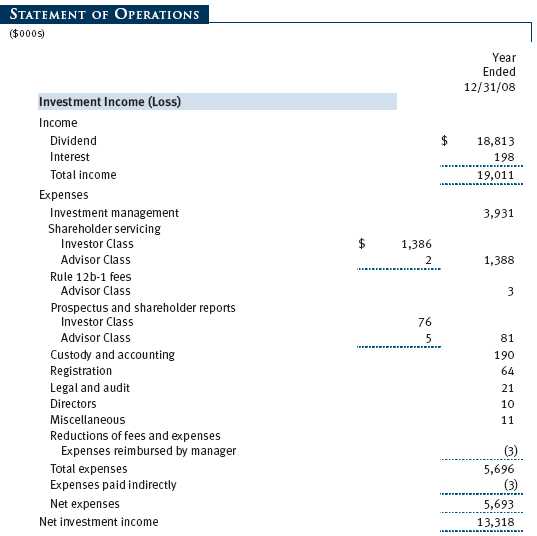
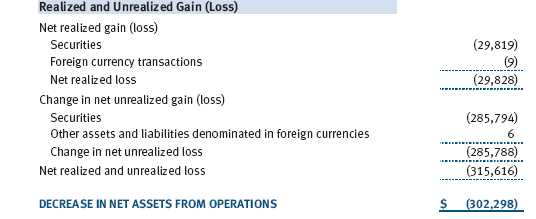
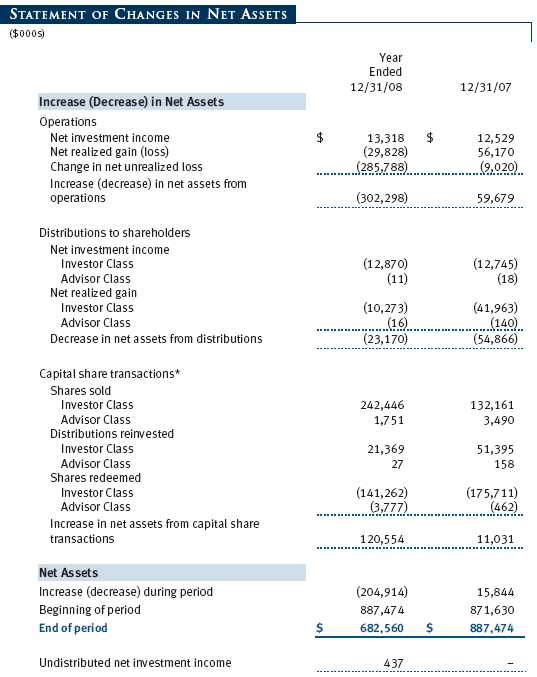
The accompanying notes are an integral part of these financial statements.
The accompanying notes are an integral part of these financial statements.


The accompanying notes are an integral part of these financial statements.
The accompanying notes are an integral part of these financial statements.
The accompanying notes are an integral part of these financial statements.
The accompanying notes are an integral part of these financial statements.
| NOTES TO FINANCIAL STATEMENTS |
T. Rowe Price Dividend Growth Fund, Inc. (the fund), is registered under the Investment Company Act of 1940 (the 1940 Act) as a diversified, open-end management investment company. The fund seeks to provide increasing dividend income over time, long-term growth of capital, and a reasonable level of current income through investments primarily in dividend-paying stocks. The fund has two classes of shares: the Dividend Growth Fund original share class, referred to in this report as the Investor Class, offered since December 30, 1992, and Dividend Growth Fund—Advisor Class (Advisor Class), offered since December 29, 2005. Advisor Class shares are sold only through unaffiliated brokers and other unaffiliated financial intermediaries that are compensated by the class for distribution, shareholder servicing, and/or certain administrative services under a Board-approved Rule 12b-1 plan. Each class has exclusive voting rights on matters related solely to that class, separate voting rights on matters that relate to both classes, and, in all other respects, the same rights and obligations as the other class.
NOTE 1 - SIGNIFICANT ACCOUNTING POLICIES
Basis of Preparation The accompanying financial statements were prepared in accordance with accounting principles generally accepted in the United States of America, which require the use of estimates made by fund management. Fund management believes that estimates and security valuations are appropriate; however, actual results may differ from those estimates, and the security valuations reflected in the financial statements may differ from the value the fund ultimately realizes upon sale of the securities.
Investment Transactions, Investment Income, and Distributions Income and expenses are recorded on the accrual basis. Premiums and discounts on debt securities are amortized for financial reporting purposes. Dividends received from mutual fund investments are reflected as dividend income; capital gain distributions are reflected as realized gain/loss. Dividend income and capital gain distributions are recorded on the ex-dividend date. Income tax-related interest and penalties, if incurred, would be recorded as income tax expense. Investment transactions are accounted for on the trade date. Realized gains and losses are reported on the identified cost basis. Distributions to shareholders are recorded on the ex-dividend date. Income distributions are declared and paid by each class on a quarterly basis. Capital gain distributions, if any, are declared and paid by the fund, typically on an annual basis.
Currency Translation Assets, including investments, and liabilities denominated in foreign currencies are translated into U.S. dollar values each day at the prevailing exchange rate, using the mean of the bid and asked prices of such currencies against U.S. dollars as quoted by a major bank. Purchases and sales of securities, income, and expenses are translated into U.S. dollars at the prevailing exchange rate on the date of the transaction. The effect of changes in foreign currency exchange rates on realized and unrealized security gains and losses is reflected as a component of security gains and losses.
Class Accounting The Advisor Class pays distribution, shareholder servicing, and/or certain administrative expenses in the form of Rule 12b-1 fees, in an amount not exceeding 0.25% of the class’s average daily net assets. Shareholder servicing, prospectus, and shareholder report expenses incurred by each class are charged directly to the class to which they relate. Expenses common to both classes, investment income, and realized and unrealized gains and losses are allocated to the classes based upon the relative daily net assets of each class.
Rebates and Credits Subject to best execution, the fund may direct certain security trades to brokers who have agreed to rebate a portion of the related brokerage commission to the fund in cash. Commission rebates are reflected as realized gain on securities in the accompanying financial statements and totaled $18,000 for the year ended December 31, 2008. Additionally, the fund earns credits on temporarily uninvested cash balances at the custodian that reduce the fund’s custody charges. Custody expense in the accompanying financial statements is presented before reduction for credits, which are reflected as expenses paid indirectly.
New Accounting Pronouncements On January 1, 2008, the fund adopted Statement of Financial Accounting Standards No. 157 (FAS 157), Fair Value Measurements. FAS 157 defines fair value, establishes the framework for measuring fair value, and expands the disclosures of fair value measurements in the financial statements. Adoption of FAS 157 did not have a material impact on the fund’s net assets or results of operations.
In March 2008, the Financial Accounting Standards Board issued Statement of Financial Accounting Standards No. 161 (FAS 161), Disclosures about Derivative Instruments and Hedging Activities, which is effective for fiscal years and interim periods beginning after November 15, 2008. FAS 161 requires enhanced disclosures about derivative and hedging activities, including how such activities are accounted for and their effect on financial position, performance and cash flows. Management is currently evaluating the impact the adoption of FAS 161 will have on the fund’s financial statements and related disclosures.
NOTE 2 - VALUATION
The fund’s investments are reported at fair value as defined under FAS 157. The fund values its investments and computes its net asset value per share at the close of the New York Stock Exchange (NYSE), normally 4 p.m. ET, each day that the NYSE is open for business.
Equity securities listed or regularly traded on a securities exchange or in the over-the-counter (OTC) market are valued at the last quoted sale price or, for certain markets, the official closing price at the time the valuations are made, except for OTC Bulletin Board securities, which are valued at the mean of the latest bid and asked prices. A security that is listed or traded on more than one exchange is valued at the quotation on the exchange determined to be the primary market for such security. Listed securities not traded on a particular day are valued at the mean of the latest bid and asked prices for domestic securities and the last quoted sale price for international securities.
Debt securities are generally traded in the OTC market. Securities with remaining maturities of one year or more at the time of acquisition are valued at prices furnished by dealers who make markets in such securities or by an independent pricing service, which considers the yield or price of bonds of comparable quality, coupon, maturity, and type, as well as prices quoted by dealers who make markets in such securities. Securities with remaining maturities of less than one year at the time of acquisition generally use amortized cost in local currency to approximate fair value. However, if amortized cost is deemed not to reflect fair value or the fund holds a significant amount of such securities with remaining maturities of more than 60 days, the securities are valued at prices furnished by dealers who make markets in such securities or by an independent pricing service.
Investments in mutual funds are valued at the mutual fund’s closing net asset value per share on the day of valuation.
Other investments, including restricted securities, and those for which the above valuation procedures are inappropriate or are deemed not to reflect fair value are stated at fair value as determined in good faith by the T. Rowe Price Valuation Committee, established by the fund’s Board of Directors.
For valuation purposes, the last quoted prices of non-U.S. equity securities may be adjusted under the circumstances described below. If the fund determines that developments between the close of a foreign market and the close of the NYSE will, in its judgment, materially affect the value of some or all of its portfolio securities, the fund will adjust the previous closing prices to reflect what it believes to be the fair value of the securities as of the close of the NYSE. In deciding whether it is necessary to adjust closing prices to reflect fair value, the fund reviews a variety of factors, including developments in foreign markets, the performance of U.S. securities markets, and the performance of instruments trading in U.S. markets that represent foreign securities and baskets of foreign securities. A fund may also fair value securities in other situations, such as when a particular foreign market is closed but the fund is open. The fund uses outside pricing services to provide it with closing prices and information to evaluate and/or adjust those prices. The fund cannot predict how often it will use closing prices and how often it will determine it necessary to adjust those prices to reflect fair value. As a means of evaluating its security valuation process, the fund routinely compares closing prices, the next day’s opening prices in the same markets, and adjusted prices.
Valuation Inputs Various inputs are used to determine the value of the fund’s investments. These inputs are summarized in the three broad levels listed below:
Level 1 – quoted prices in active markets for identical securities
Level 2 – observable inputs other than Level 1 quoted prices (including, but not limited to, quoted prices for similar securities, interest rates, prepayment speeds, credit risk)
Level 3 – unobservable inputs
Observable inputs are those based on market data obtained from sources independent of the fund, and unobservable inputs reflect the fund’s own assumptions based on the best information available. The input levels are not necessarily an indication of the risk or liquidity associated with investments at that level. For example, non-U.S. equity securities actively traded in foreign markets generally are reflected in Level 2 despite the availability of closing prices, because the fund evaluates and determines whether those closing prices reflect fair value at the close of the NYSE or require adjustment, as described above. The following table summarizes the fund’s investments, based on the inputs used to determine their values on December 31, 2008:

NOTE 3 - INVESTMENT TRANSACTIONS
Consistent with its investment objective, the fund engages in the following practices to manage exposure to certain risks or to enhance performance. The investment objective, policies, program, and risk factors of the fund are described more fully in the fund’s prospectus and Statement of Additional Information.
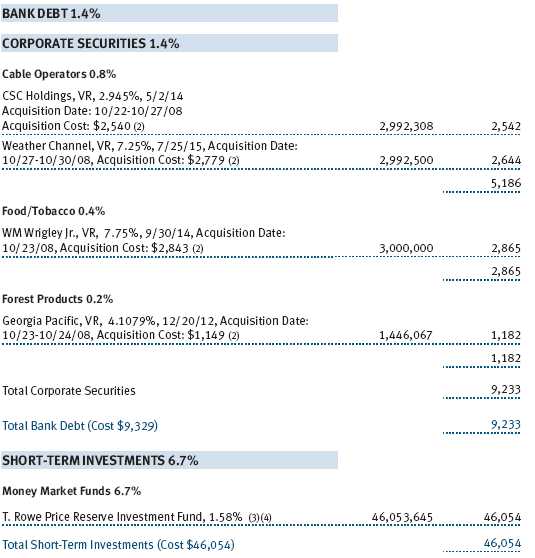
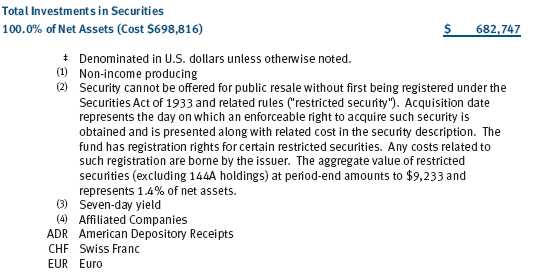
Restricted Securities The fund may invest in securities that are subject to legal or contractual restrictions on resale. Prompt sale of such securities at an acceptable price may be difficult and may involve substantial delays and additional costs.
Other Purchases and sales of portfolio securities, other than short-term securities aggregated $271,189,000 and $174,488,000, respectively, for the year ended December 31, 2008.
NOTE 4 - FEDERAL INCOME TAXES
No provision for federal income taxes is required since the fund intends to continue to qualify as a regulated investment company under Subchapter M of the Internal Revenue Code and distribute to shareholders all of its taxable income and gains. Distributions are determined in accordance with Federal income tax regulations, which differ from generally accepted accounting principles, and, therefore, may differ significantly in amount or character from net investment income and realized gains for financial reporting purposes. Financial reporting records are adjusted for permanent book/tax differences to reflect tax character but are not adjusted for temporary differences.
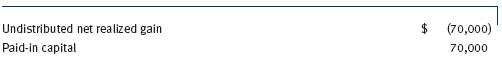
Reclassifications to paid-in capital relate primarily to a tax practice that treats a portion of the proceeds from each redemption of capital shares as a distribution of taxable net investment income and/or realized capital gain. For the year ended December 31, 2008, the following reclassifications, which had no impact on results of operations or net assets, were recorded to reflect tax character:
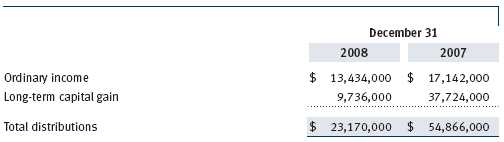
Distributions during the years ended December 31, 2008 and December 31, 2007 were characterized for tax purposes as follows:
At December 31, 2008, the tax-basis cost of investments and components of net assets were as follows:

The difference between book-basis and tax-basis net unrealized appreciation (depreciation) is attributable to the deferral of losses from wash sales for tax purposes. The fund intends to retain realized gains to the extent of available capital loss carryforwards. As of December 31, 2008 all unused capital loss carryforwards expire in fiscal 2016. Pursuant to federal income tax regulations applicable to investment companies, recognition of capital losses on certain transactions is deferred until the subsequent tax year. Consequently, realized losses reflected in the accompanying financial statements include net capital losses realized between November 1 and the fund’s fiscal year-end that have not been recognized for tax purposes (Post-October loss deferrals).
NOTE 5 - RELATED PARTY TRANSACTIONS
The fund is managed by T. Rowe Price Associates, Inc. (the manager or Price Associates), a wholly owned subsidiary of T. Rowe Price Group, Inc. The investment management agreement between the fund and the manager provides for an annual investment management fee, which is computed daily and paid monthly. The fee consists of an individual fund fee, equal to 0.20% of the fund’s average daily net assets, and a group fee. The group fee rate is calculated based on the combined net assets of certain mutual funds sponsored by Price Associates (the group) applied to a graduated fee schedule, with rates ranging from 0.48% for the first $1 billion of assets to 0.285% for assets in excess of $220 billion. The fund’s group fee is determined by applying the group fee rate to the fund’s average daily net assets. At December 31, 2008, the effective annual group fee rate was 0.31%.
The Advisor Class is also subject to a contractual expense limitation through April 30, 2010. During the limitation period, the manager is required to waive its management fee and/or reimburse expenses, excluding interest, taxes, brokerage commissions, and extraordinary expenses, that would otherwise cause the class’s ratio of annualized total expenses to average net assets (expense ratio) to exceed its expense limitation of 1.05%. The class is required to repay the manager for expenses previously reimbursed and management fees waived to the extent the class’s net assets have grown or expenses have declined sufficiently to allow repayment without causing the class’s expense ratio to exceed its expense limitation. However, no repayment will be made more than three years after the date of any reimbursement or waiver or later than April 30, 2012. Pursuant to this agreement, expenses in the amount of $3,000 were reimbursed by the manager during the year ended December 31, 2008. Including these amounts, expenses previously reimbursed by the manager in the amount of $9,000 remain subject to repayment at December 31, 2008.
In addition, the fund has entered into service agreements with Price Associates and two wholly owned subsidiaries of Price Associates (collectively, Price). Price Associates computes the daily share prices and provides certain other administrative services to the fund. T. Rowe Price Services, Inc., provides shareholder and administrative services in its capacity as the fund’s transfer and dividend disbursing agent. T. Rowe Price Retirement Plan Services, Inc., provides subaccounting and recordkeeping services for certain retirement accounts invested in the Investor Class. For the year ended December 31, 2008, expenses incurred pursuant to these service agreements were $120,000 for Price Associates, $848,000 for T. Rowe Price Services, Inc., and $237,000 for T. Rowe Price Retirement Plan Services, Inc. The total amount payable at period-end pursuant to these service agreements is reflected as Due to Affiliates in the accompanying financial statements.
The fund may invest in the T. Rowe Price Reserve Investment Fund and the T. Rowe Price Government Reserve Investment Fund (collectively, the T. Rowe Price Reserve Investment Funds), open-end management investment companies managed by Price Associates and considered affiliates of the fund. The T. Rowe Price Reserve Investment Funds are offered as cash management options to mutual funds, trusts, and other accounts managed by Price Associates and/or its affiliates and are not available for direct purchase by members of the public. The T. Rowe Price Reserve Investment Funds pay no investment management fees.
As of December 31, 2008, T. Rowe Price Group, Inc., and/or its wholly owned subsidiaries owned 470,851 shares of the investor class, representing 1% of the fund’s net assets.
| REPORT OF INDEPENDENT REGISTERED PUBLIC ACCOUNTING FIRM |
To the Board of Directors and Shareholders of T. Rowe Price Dividend Growth Fund, Inc.
In our opinion, the accompanying statement of assets and liabilities, including the schedule of investments, and the related statements of operations and of changes in net assets and the financial highlights present fairly, in all material respects, the financial position of T. Rowe Price Dividend Growth Fund, Inc. (the “Fund”) at December 31, 2008, the results of its operations for the year then ended, the changes in its net assets for each of the two years in the period then ended and the financial highlights for each of the fiscal periods presented, in conformity with accounting principles generally accepted in the United States of America. These financial statements and financial highlights (hereafter referred to as “financial statements”) are the responsibility of the Fund’s management; our responsibility is to express an opinion on these financial statements based on our audits. We conducted our audits of these financial statements in accordance with the standards of the Public Company Accounting Oversight Board (United States). Those standards require that we plan and perform the audit to obtain reasonable assurance about whether the financial statements are free of material misstatement. An audit includes examining, on a test basis, evidence supporting the amounts and disclosures in the financial statements, assessing the accounting principles used and significant estimates made by management, and evaluating the overall financial statement presentation. We believe that our audits, which included confirmation of securities at December 31, 2008 by correspondence with the custodian and confirmation of the underlying fund by correspondence with the transfer agent, provide a reasonable basis for our opinion.
PricewaterhouseCoopers LLP
Baltimore, Maryland
February 12, 2009
| TAX INFORMATION (UNAUDITED) FOR THE TAX YEAR ENDED 12/31/08 |
We are providing this information as required by the Internal Revenue Code. The amounts shown may differ from those elsewhere in this report because of differences between tax and financial reporting requirements.
The fund’s distributions to shareholders included:
• $624,000 from short-term capital gains,
• $9,736,000 from long-term capital gains, of which all was subject to the 15% rate gains category.
For taxable non-corporate shareholders, $13,308,000 of the fund’s income represents qualified dividend income subject to the 15% rate category.
For corporate shareholders, $13,308,000 of the fund’s income qualifies for the dividends-received deduction.
| INFORMATION ON PROXY VOTING POLICIES, PROCEDURES, AND RECORDS |
A description of the policies and procedures used by T. Rowe Price funds and portfolios to determine how to vote proxies relating to portfolio securities is available in each fund’s Statement of Additional Information, which you may request by calling 1-800-225-5132 or by accessing the SEC’s Web site, www.sec.gov. The description of our proxy voting policies and procedures is also available on our Web site, www.troweprice.com. To access it, click on the words “Our Company” at the top of our corporate homepage. Then, when the next page appears, click on the words “Proxy Voting Policies” on the left side of the page.
Each fund’s most recent annual proxy voting record is available on our Web site and through the SEC’s Web site. To access it through our Web site, follow the directions above, then click on the words “Proxy Voting Records” on the right side of the Proxy Voting Policies page.
| HOW TO OBTAIN QUARTERLY PORTFOLIO HOLDINGS |
The fund files a complete schedule of portfolio holdings with the Securities and Exchange Commission for the first and third quarters of each fiscal year on Form N-Q. The fund’s Form N-Q is available electronically on the SEC’s Web site (www.sec.gov); hard copies may be reviewed and copied at the SEC’s Public Reference Room, 450 Fifth St. N.W., Washington, DC 20549. For more information on the Public Reference Room, call 1-800-SEC-0330.
| ABOUT THE FUND’S DIRECTORS AND OFFICERS |
Your fund is governed by a Board of Directors (Board) that meets regularly to review a wide variety of matters affecting the fund, including performance, investment programs, compliance matters, advisory fees and expenses, service providers, and other business affairs. The Board elects the fund’s officers, who are listed in the final table. At least 75% of Board members are independent of T. Rowe Price Associates, Inc. (T. Rowe Price), and T. Rowe Price International, Inc. (T. Rowe Price International); “inside” or “interested” directors are employees or officers of T. Rowe Price. The business address of each director and officer is 100 East Pratt Street, Baltimore, Maryland 21202. The Statement of Additional Information includes additional information about the directors and is available without charge by calling a T. Rowe Price representative at 1-800-225-5132.
| Independent Directors | |
| |
| Name | |
| (Year of Birth) | Principal Occupation(s) During Past Five Years and Directorships of |
| Year Elected* | Other Public Companies |
| |
| Jeremiah E. Casey | Director, National Life Insurance (2001 to 2005); Director, The Rouse |
| (1940) | Company, real estate developers (1990 to 2004) |
| 2005 | |
| |
| Anthony W. Deering | Chairman, Exeter Capital, LLC, a private investment firm (2004 to |
| (1945) | present); Director, Under Armour (8/08 to present); Director, Vornado |
| 2001 | Real Estate Investment Trust (3/04 to present); Director, Mercantile |
| | Bankshares (2002 to 2007); Member, Advisory Board, Deutsche Bank |
| | North America (2004 to present); Director, Chairman of the Board, |
| | and Chief Executive Officer, The Rouse Company, real estate develop- |
| | ers (1997 to 2004) |
| |
| Donald W. Dick, Jr. | Principal, EuroCapital Advisors, LLC, an acquisition and management |
| (1943) | advisory firm (10/95 to present); Chairman, The Haven Group, a cus- |
| 1992 | tom manufacturer of modular homes (1/04 to present) |
| |
| David K. Fagin | Chairman and President, Nye Corporation (6/88 to present); Director, |
| (1938) | Golden Star Resources Ltd. (5/92 to present); Director, Pacific Rim |
| 1992 | Mining Corp. (2/02 to present); Director, B.C. Corporation (3/08 to |
| | present); Chairman, Canyon Resources Corp. (8/07 to 3/08); Director, |
| | Atna Resources Ltd. (3/08 to present) |
| |
| Karen N. Horn | Director, Eli Lilly and Company (1987 to present); Director, Simon |
| (1943) | Property Group (2004 to present); Director, Federal National Mortgage |
| 2003 | Association (9/06 to present); Director, Norfolk Southern (2/08 to |
| | present); Director, Georgia Pacific (5/04 to 12/05); Managing |
| | Director and President, Global Private Client Services, Marsh Inc. |
| | (1999 to 2003) |
| Theo C. Rodgers | President, A&R Development Corporation (1977 to present) |
| (1941) | |
| 2005 | |
| |
| John G. Schreiber | Owner/President, Centaur Capital Partners, Inc., a real estate invest- |
| (1946) | ment company (1991 to present); Partner, Blackstone Real Estate |
| 2001 | Advisors, L.P. (10/92 to present) |
| |
| *Each independent director oversees 126 T. Rowe Price portfolios (except for Mr. Fagin, who oversees |
| 125 T. Rowe Price portfolios) and serves until retirement, resignation, or election of a successor. |
| Inside Directors | |
| |
| Name | |
| (Year of Birth) | |
| Year Elected* | |
| [Number of T. Rowe Price | Principal Occupation(s) During Past Five Years and Directorships of |
| Portfolios Overseen] | Other Public Companies |
| |
| Edward C. Bernard | Director and Vice President, T. Rowe Price; Vice Chairman of the Board, |
| (1956) | Director, and Vice President, T. Rowe Price Group, Inc.; Chairman of |
| 2006 | the Board, Director, and President, T. Rowe Price Investment Services, |
| [126] | Inc.; Chairman of the Board and Director, T. Rowe Price Global Asset |
| | Management Limited, T. Rowe Price Global Investment Services |
| | Limited, T. Rowe Price Retirement Plan Services, Inc., T. Rowe Price |
| | Savings Bank, and T. Rowe Price Services, Inc.; Director, T. Rowe Price |
| | International, Inc.; Chief Executive Officer, Chairman of the Board, |
| | Director, and President, T. Rowe Price Trust Company; Chairman of |
| | the Board, all funds |
| |
| Brian C. Rogers, CFA, CIC | Chief Investment Officer, Director, and Vice President, T. Rowe Price; |
| (1955) | Chairman of the Board, Chief Investment Officer, Director, and Vice |
| 2006 | President, T. Rowe Price Group, Inc.; Vice President, T. Rowe Price |
| [71] | Trust Company |
| |
| *Each inside director serves until retirement, resignation, or election of a successor. |
| Officers | |
| |
| Name (Year of Birth) | |
| Title and Fund(s) Served | Principal Occupation(s) |
| |
| Peter J. Bates, CFA (1974) | Vice President, T. Rowe Price and T. Rowe Price |
| Vice President, Dividend Growth Fund | Group, Inc.; formerly intern, T. Rowe Price (to |
| | 2004); Vice President of Finance, Rent-A-Center, |
| | Inc. (to 2003) |
| |
| Roger L. Fiery III, CPA (1959) | Vice President, T. Rowe Price, T. Rowe Price |
| Vice President, Dividend Growth Fund | Group, Inc., T. Rowe Price International, Inc., |
| | and T. Rowe Price Trust Company |
| |
| John R. Gilner (1961) | Chief Compliance Officer and Vice President, |
| Chief Compliance Officer, Dividend | T. Rowe Price; Vice President, T. Rowe Price |
| Growth Fund | Group, Inc., and T. Rowe Price Investment |
| | Services, Inc. |
| |
| Gregory S. Golczewski (1966) | Vice President, T. Rowe Price and T. Rowe Price |
| Vice President, Dividend Growth Fund | Trust Company |
| |
| Gregory K. Hinkle, CPA (1958) | Vice President, T. Rowe Price, T. Rowe Price |
| Treasurer, Dividend Growth Fund | Group, Inc., T. Rowe Price Investment Services, |
| | Inc., and T. Rowe Price Trust Company; formerly |
| | Partner, PricewaterhouseCoopers LLP (to 2007) |
| |
| Thomas J. Huber, CFA (1966) | Vice President, T. Rowe Price, T. Rowe Price |
| President, Dividend Growth Fund | Group, Inc., and T. Rowe Price Trust Company |
| |
| David M. Lee, CFA (1962) | Vice President, T. Rowe Price and T. Rowe Price |
| Vice President, Dividend Growth Fund | Group, Inc. |
| |
| Patricia B. Lippert (1953) | Assistant Vice President, T. Rowe Price and |
| Secretary, Dividend Growth Fund | T. Rowe Price Investment Services, Inc. |
| |
| Daniel Martino, CFA (1974) | Vice President, T. Rowe Price and T. Rowe Price |
| Vice President, Dividend Growth Fund | Group, Inc.; formerly Research Analyst and |
| | Co-portfolio Manager, Taurus Asset Management |
| | and ONEX (to 2006) |
| |
| Jason Nogueira, CFA (1974) | Vice President, T. Rowe Price and T. Rowe Price |
| Vice President, Dividend Growth Fund | Group, Inc.; formerly Healthcare Equity Analyst, |
| | Putnam Investments (to 2004); student, |
| | Harvard Business School (to 2003) |
| David Oestreicher (1967) | Director and Vice President, T. Rowe Price |
| Vice President, Dividend Growth Fund | Investment Services, Inc., T. Rowe Price Trust |
| | Company, and T. Rowe Price Services, Inc.; Vice |
| | President, T. Rowe Price, T. Rowe Price Global |
| | Asset Management Limited, T. Rowe Price Global |
| | Investment Services Limited, T. Rowe Price |
| | Group, Inc., T. Rowe Price International, Inc., |
| | and T. Rowe Price Retirement Plan Services, Inc. |
| |
| Timothy E. Parker, CFA (1974) | Vice President, T. Rowe Price and T. Rowe Price |
| Vice President, Dividend Growth Fund | Group, Inc. |
| |
| Robert T. Quinn, Jr. (1972) | Vice President, T. Rowe Price and T. Rowe Price |
| Vice President, Dividend Growth Fund | Group, Inc.; formerly Director of Investment |
| | Banking, UBS Investment Bank (to 2004) |
| |
| William J. Stromberg, CFA (1960) | Vice President, T. Rowe Price, T. Rowe Price |
| Vice President, Dividend Growth Fund | Group, Inc., and T. Rowe Price Trust Company |
| |
| Eric L. Veiel, CFA (1972) | Vice President, T. Rowe Price and T. Rowe Price |
| Vice President, Dividend Growth Fund | Group, Inc.; formerly Senior Equity Analyst, |
| | Wachovia Securities (to 2005) |
| |
| Julie L. Waples (1970) | Vice President, T. Rowe Price |
| Vice President, Dividend Growth Fund | |
| |
| Unless otherwise noted, officers have been employees of T. Rowe Price or T. Rowe Price International |
| for at least five years. | |
Item 2. Code of Ethics.
The registrant has adopted a code of ethics, as defined in Item 2 of Form N-CSR, applicable to its principal executive officer, principal financial officer, principal accounting officer or controller, or persons performing similar functions. A copy of this code of ethics is filed as an exhibit to this Form N-CSR. No substantive amendments were approved or waivers were granted to this code of ethics during the period covered by this report.
Item 3. Audit Committee Financial Expert.
The registrant’s Board of Directors/Trustees has determined that Ms. Karen N. Horn qualifies as an audit committee financial expert, as defined in Item 3 of Form N-CSR. Ms. Horn is considered independent for purposes of Item 3 of Form N-CSR.
Item 4. Principal Accountant Fees and Services.
(a) – (d) Aggregate fees billed to the registrant for the last two fiscal years for professional services rendered by the registrant’s principal accountant were as follows:
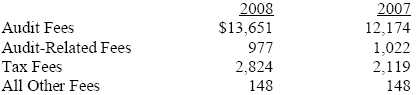
Audit fees include amounts related to the audit of the registrant’s annual financial statements and services normally provided by the accountant in connection with statutory and regulatory filings. Audit-related fees include amounts reasonably related to the performance of the audit of the registrant’s financial statements and specifically include the issuance of a report on internal controls and, if applicable, agreed-upon procedures related to fund acquisitions. Tax fees include amounts related to services for tax compliance, tax planning, and tax advice. The nature of these services specifically includes the review of distribution calculations and the preparation of Federal, state, and excise tax returns. All other fees include the registrant’s pro-rata share of amounts for agreed-upon procedures in conjunction with service contract approvals by the registrant’s Board of Directors/Trustees.
(e)(1) The registrant’s audit committee has adopted a policy whereby audit and non-audit services performed by the registrant’s principal accountant for the registrant, its investment adviser, and any entity controlling, controlled by, or under common control with the investment adviser that provides ongoing services to the registrant require pre-approval in advance at regularly scheduled audit committee meetings. If such a service is required between regularly scheduled audit committee meetings, pre-approval may be authorized by one audit committee member with ratification at the next scheduled audit committee meeting. Waiver of pre-approval for audit or non-audit services requiring fees of a de minimis amount is not permitted.
(2) No services included in (b) – (d) above were approved pursuant to paragraph (c)(7)(i)(C) of Rule 2-01 of Regulation S-X.
(f) Less than 50 percent of the hours expended on the principal accountant’s engagement to audit the registrant’s financial statements for the most recent fiscal year were attributed to work performed by persons other than the principal accountant’s full-time, permanent employees.
(g) The aggregate fees billed for the most recent fiscal year and the preceding fiscal year by the registrant’s principal accountant for non-audit services rendered to the registrant, its investment adviser, and any entity controlling, controlled by, or under common control with the investment adviser that provides ongoing services to the registrant were $1,922,000 and $1,486,000, respectively.
(h) All non-audit services rendered in (g) above were pre-approved by the registrant’s audit committee. Accordingly, these services were considered by the registrant’s audit committee in maintaining the principal accountant’s independence.
Item 5. Audit Committee of Listed Registrants.
Not applicable.
Item 6. Investments.
(a) Not applicable. The complete schedule of investments is included in Item 1 of this Form N-CSR.
(b) Not applicable.
Item 7. Disclosure of Proxy Voting Policies and Procedures for Closed-End Management Investment Companies.
Not applicable.
Item 8. Portfolio Managers of Closed-End Management Investment Companies.
Not applicable.
Item 9. Purchases of Equity Securities by Closed-End Management Investment Company and Affiliated Purchasers.
Not applicable.
Item 10. Submission of Matters to a Vote of Security Holders.
Not applicable.
Item 11. Controls and Procedures.
(a) The registrant’s principal executive officer and principal financial officer have evaluated the registrant’s disclosure controls and procedures within 90 days of this filing and have concluded that the registrant’s disclosure controls and procedures were effective, as of that date, in ensuring that information required to be disclosed by the registrant in this Form N-CSR was recorded, processed, summarized, and reported timely.
(b) The registrant’s principal executive officer and principal financial officer are aware of no change in the registrant’s internal control over financial reporting that occurred during the registrant’s second fiscal quarter covered by this report that has materially affected, or is reasonably likely to materially affect, the registrant’s internal control over financial reporting.
Item 12. Exhibits.
(a)(1) The registrant’s code of ethics pursuant to Item 2 of Form N-CSR is attached.
(2) Separate certifications by the registrant's principal executive officer and principal financial officer, pursuant to Section 302 of the Sarbanes-Oxley Act of 2002 and required by Rule 30a-2(a) under the Investment Company Act of 1940, are attached.
(3) Written solicitation to repurchase securities issued by closed-end companies: not applicable.
(b) A certification by the registrant's principal executive officer and principal financial officer, pursuant to Section 906 of the Sarbanes-Oxley Act of 2002 and required by Rule 30a-2(b) under the Investment Company Act of 1940, is attached.
| | |
SIGNATURES |
| |
| | Pursuant to the requirements of the Securities Exchange Act of 1934 and the Investment |
| Company Act of 1940, the registrant has duly caused this report to be signed on its behalf by the |
| undersigned, thereunto duly authorized. |
| |
| T. Rowe Price Dividend Growth Fund, Inc. |
| |
| |
| |
| By | /s/ Edward C. Bernard |
| | Edward C. Bernard |
| | Principal Executive Officer |
| |
| Date | February 19, 2009 |
| |
| |
| |
| | Pursuant to the requirements of the Securities Exchange Act of 1934 and the Investment |
| Company Act of 1940, this report has been signed below by the following persons on behalf of |
| the registrant and in the capacities and on the dates indicated. |
| |
| |
| By | /s/ Edward C. Bernard |
| | Edward C. Bernard |
| | Principal Executive Officer |
| |
| Date | February 19, 2009 |
| |
| |
| |
| By | /s/ Gregory K. Hinkle |
| | Gregory K. Hinkle |
| | Principal Financial Officer |
| |
| Date | February 19, 2009 |