UNITED STATES
SECURITIES AND EXCHANGE COMMISSION
Washington, D.C. 20549
FORM N-CSR
CERTIFIED SHAREHOLDER REPORT OF REGISTERED
MANAGEMENT INVESTMENT COMPANIES
Investment Company Act file number | 811-7440 |
|
DIMENSIONAL EMERGING MARKETS VALUE FUND INC. |
(Exact name of registrant as specified in charter) |
|
1299 Ocean Avenue, Santa Monica, CA | | 90401 |
(Address of principal executive offices) | | (Zip code) |
|
Catherine L. Newell, Esquire, Vice President and Secretary
Dimensional Emerging Markets Value Fund Inc.,
1299 Ocean Avenue, Santa Monica, CA 90401 |
(Name and address of agent for service) |
|
Registrant’s telephone number, including area code: | 310-395-8005 | |
|
Date of fiscal year end: | November 30 | |
|
Date of reporting period: | November 30, 2007 | |
| | | | | | | | | |
ITEM 1. REPORTS TO STOCKHOLDERS.
DFA INVESTMENT DIMENSIONS GROUP INC.
Emerging Markets Value Portfolio
DIMENSIONAL EMERGING MARKETS
VALUE FUND INC.
Annual Report
Year Ended November 30, 2007
Dimensional Investing
Dimensional Fund Advisors strives to deliver the performance of capital markets and add value through portfolio design and trading. The firm departs from the rules and rigidity of traditional indexing and avoids the cost-generating activity of stock picking and market timing. Instead, we focus on the dimensions of capital markets that reward investors and we deliver them as intelligently and effectively as possible.
A look through our annual report gives you a sense of our strategy line. As daunting as this variety may seem, all the strategies are easily understood if you look at the simple dimensions that drive returns. Financial science has documented that, over the long term, small cap stocks outperform large cap stocks, and value stocks outperform growth stocks. These returns seem to be compensation for risk. In fixed income, risk is well described by bond maturity and credit quality. Dimensional's vehicles deliberately target specific risk and return tradeoffs. They are diversified and painstakingly designed to work together in your total investment plan.
Dimensional's Investment Strategies
$151 Billion in Assets Under Management Worldwide as of November 30, 2007.
Core Equity
US Core Equity
International Core Equity
Emerging Markets Core Equity
US Vector Equity
Value
US Small Cap Value
US Targeted Value
US Large Cap Value
International Small Cap Value
International Value
Emerging Markets Value
Small Cap
US Micro Cap
US Small Cap
International Small Cap
Emerging Markets Small Cap
Tax-Managed
US Small Cap
US Targeted Value
US Equity
US Marketwide Value
International Value
Fixed Income
One-Year
Two-Year Global
Five-Year Government
Five-Year Global
Intermediate Government
Inflation-Protected Securities
Short-Term Municipal
Real Estate
Real Estate Securities (US)
International Real Estate Securities
Dimensional strives to offer investors reliable access to the return dimensions that are available across all markets, both domestic and international. From single-country small cap strategies launched early in its history, the firm has evolved into a provider of globally diversified investment solutions across size and price ranges in developed and emerging markets. Our goal is to consistently target the returns in these markets by structuring broadly diversified strategies across forty approved countries. Our lineup of strategies encompasses most major global asset classes, including real estate and fixed income.
The work is never complete, however, and Dimensional will continue to research solutions to address your future needs. We invite you to explore our website, www.dimensional.com, to learn more about the concepts and strategies of Dimensional investing.

Dimensional Fund Advisors is an investment advisor registered with the Securities and Exchange Commission. Consider the investment objectives, risks, and charges and expenses of the Dimensional funds carefully before investing. For these and other information about the Dimensional funds, please read the prospectus carefully before investing. Prospectuses are available by calling Dimensional Fund Advisors collect at (310) 395-8005; on the Internet at www.dimensional.com; or, by mail, DFA Securities Inc., c/o Dimensional Fund Advisors, 1299 Ocean Avenue, Santa Monica, CA 90401. Dimensional funds are distributed by DFA Securities Inc.
[THIS PAGE INTENTIONALLY LEFT BLANK]
ANNUAL REPORT
Table of Contents
| | | Page | |
| Dimensional Investing | |
|
| Definitions of Abbreviations and Footnotes | | | 1 | | |
|
| DFA Investment Dimensions Group Inc. — Emerging Markets Value Portfolio | |
|
| Performance Chart | | | 2 | | |
|
| Management's Discussion and Analysis (including Dimensional Emerging Markets Value Fund Inc.) | | | 3 | | |
|
| Disclosure of Fund Expenses | | | 5 | | |
|
| Disclosure of Portfolio Holdings | | | 6 | | |
|
| Statement of Assets and Liabilities | | | 7 | | |
|
| Statement of Operations | | | 8 | | |
|
| Statements of Changes in Net Assets | | | 9 | | |
|
| Financial Highlights | | | 10 | | |
|
| Notes to Financial Statements | | | 11 | | |
|
| Report of Independent Registered Public Accounting Firm | | | 15 | | |
|
| Dimensional Emerging Markets Value Fund Inc. | |
|
| Performance Chart | | | 16 | | |
|
| Disclosure of Fund Expenses | | | 17 | | |
|
| Disclosure of Portfolio Holdings | | | 18 | | |
|
| Summary Schedule of Portfolio Holdings | | | 19 | | |
|
| Statement of Assets and Liabilities | | | 23 | | |
|
| Statement of Operations | | �� | 24 | | |
|
| Statements of Changes in Net Assets | | | 25 | | |
|
| Financial Highlights | | | 26 | | |
|
| Notes to Financial Statements | | | 27 | | |
|
| Report of Independent Registered Public Accounting Firm | | | 33 | | |
|
| Fund Management | | | 34 | | |
|
| Voting Proxies on Fund Portfolio Securities | | | 42 | | |
|
| Notice to Shareholders | | | 43 | | |
|
| This report is submitted for the information of the Fund's shareholders. It is not authorized for distribution to prospective investors unless preceded or accompanied by an effective prospectus. | |
|
i
[THIS PAGE INTENTIONALLY LEFT BLANK]
DFA INVESTMENT DIMENSIONS GROUP INC.
DIMENSIONAL EMERGING MARKETS VALUE FUND INC.
DEFINITIONS OF ABBREVIATIONS AND FOOTNOTES
Statement of Assets and Liabilities/Summary Schedule of Portfolio Holdings
Investment Abbreviations
ADR American Depositary Receipt
FHLMC Federal Home Loan Mortgage Corporation
FNMA Federal National Mortgage Association
Investment Footnotes
† See Note B to Financial Statements.
†† Securities have been fair valued. See Note B to Financial Statements.
** Calculated as a percentage of total net assets. Percentages shown parenthetically next to the category headings have been calculated as a percentage of total investments. "Other Securities" are those securities that are not among the top 50 holdings of the fund or do not represent more than 1.0% of the net assets of the fund. Some of the individual securities within this category may include Total or Partial Securities on Loan and/or Non-Income Producing Securities.
* Non-Income Producing Securities.
# Total or Partial Securities on Loan.
@ Security purchased with cash proceeds from Securities on Loan.
(r) The adjustable rate shown is effective as of November 30, 2007.
Financial Highlights
(A) Computed using average shares outstanding.
(B) Represents the combined ratios for the respective portfolio and its respective pro-rata share of its Master Fund Series.
All Statements and Schedules
— Amounts designated as — are either zero or rounded to zero.
SEC Securities and Exchange Commission
1
DFA INVESTMENT DIMENSIONS GROUP INC.
PERFORMANCE CHART
2
DFA INVESTMENT DIMENSIONS GROUP INC.
MANAGEMENT'S DISCUSSION AND ANALYSIS
International Equity Market Review Year Ended November 30, 2007
International equity markets had broadly positive returns for the year under review. When expressed in local currencies, prices rose strongly in all of the largest country constituents of the MSCI EAFE Index with the exception of Japan and Italy. Net returns were improved by appreciation of most of the relevant non-U.S. currencies relative to the U.S. dollar. Overall, currency exchange rate changes added to returns for U.S. dollar-based investors: total return for the MSCI EAFE Index (net dividends) was 9.28% in local currency and 17.30% in U.S. dollars.
% Total Returns for Year Ended November 30, 2007
| Ten Largest Foreign Developed Markets | | Local
Currency
Return | | U.S. Dollar
Return | |
| Japan | | | –1.99 | % | | | 2.19 | % | |
| United Kingdom | | | 9.24 | % | | | 14.19 | % | |
| France | | | 7.38 | % | | | 18.91 | % | |
| Hong Kong | | | 49.96 | % | | | 49.82 | % | |
| Germany | | | 25.05 | % | | | 38.47 | % | |
| Canada | | | 9.64 | % | | | 25.26 | % | |
| Australia | | | 22.71 | % | | | 37.47 | % | |
| Switzerland | | | 5.10 | % | | | 11.52 | % | |
| Spain | | | 17.64 | % | | | 30.27 | % | |
| Italy | | | –0.83 | % | | | 9.82 | % | |
Net returns unless otherwise noted.
Source: MSCI data copyright MSCI 2007, all rights reserved.
Large company value stocks and small cap stocks were the poorest-performing asset classes in international markets, while large company growth stocks had the best relative results.
% Total Returns for Year Ended November 30, 2007 (U.S. dollars)
| MSCI EAFE Small Cap Index (net dividends) | | | 8.60 | % | |
| MSCI EAFE Value Index (net dividends) | | | 12.30 | % | |
| MSCI EAFE Index (net dividends) | | | 17.30 | % | |
| MSCI EAFE Growth Index (net dividends) | | | 22.32 | % | |
Returns in emerging markets were higher, on average, than in developed country markets, although results varied widely among individual countries. For the year under review, total returns in U.S. dollars were 45.15% for the MSCI Emerging Markets Index (net dividends), and 17.30% for the MSCI EAFE Index (net dividends).
% Total Returns for Year Ended November 30, 2007
| Country | | Total
Returns
(USD) | |
| Argentina | | | 6.39 | % | |
| Brazil | | | 88.78 | % | |
| Chile | | | 30.39 | % | |
| China | | | 99.34 | % | |
| Czech Republic | | | 54.22 | % | |
| Hungary | | | 28.10 | % | |
| India | | | 65.99 | % | |
| Indonesia | | | 60.42 | % | |
| Israel | | | 31.62 | % | |
| Malaysia | | | 43.39 | % | |
| Mexico | | | 20.11 | % | |
| Philippines | | | 47.91 | % | |
| Poland | | | 31.53 | % | |
| South Africa | | | 32.00 | % | |
| South Korea | | | 33.47 | % | |
| Taiwan | | | 11.36 | % | |
| Thailand | | | 28.91 | % | |
| Turkey | | | 78.37 | % | |
Net returns unless otherwise noted. Source: MSCI data copyright MSCI 2007, all rights reserved.
3
Master-Feeder Structure
The portfolio described below, called a "Feeder Fund", does not buy individual securities directly; instead, the portfolio invests in a corresponding fund called a "Master Fund". The Master Fund, in turn, purchases stocks, bonds, and/or other securities.
Emerging Markets Value Portfolio
The Emerging Markets Value Portfolio (the "Portfolio") seeks to capture the returns of value stocks in selected emerging markets by purchasing shares of the Dimensional Emerging Markets Value Fund Inc., (the "Master Fund") which invests in such stocks. The investment strategy employs a disciplined, quantitative approach, emphasizing broad diversification and consistent exposure to emerging markets value stocks, but does not attempt to track closely a specific equity index. As of November 30, 2007, the Master Fund held approximately 1,800 stocks in 18 countries. The portfolio's target country weights are capped at a ceiling set by the manager to limit single-country risk exposure. Throughout the year ended November 30, 2007, the Master Fund was essentially fully invested in equities throughout the year: cash equivalents averaged less than 1% of the Master Fund's assets.
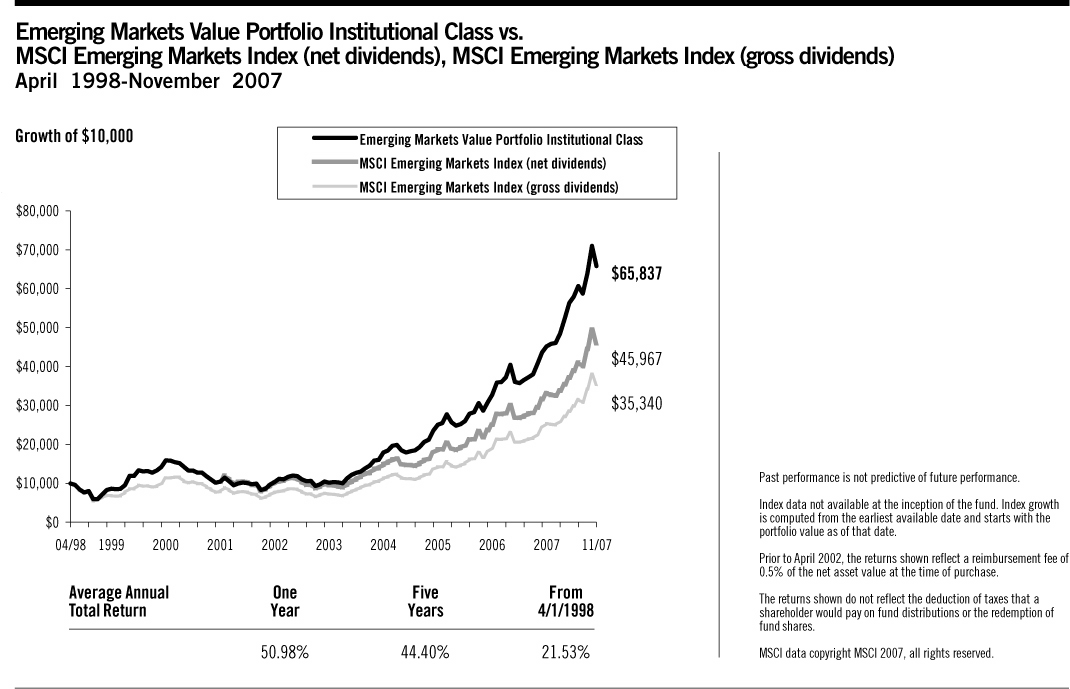
As a result of the Master Fund's diversified investment approach, performance was determined principally by broad structural trends in emerging country stock markets, rather than the behavior of a limited number of stocks. For the year ended November 30, 2007, emerging markets value stocks outperformed developed country stocks, emerging markets growth stocks, and core emerging markets strategies. Total returns were 17.30% for the MSCI EAFE Index (net dividends), 45.56% for the MSCI Emerging Markets Index (gross dividends), 45.15% for the MSCI Emerging Markets Index (net dividends), and 50.98% for the Emerging Markets Value Portfolio. Relative to the MSCI Emerging Markets Index (net dividends), the outperformance of the Portfolio was due primarily to greater exposure to stocks with strong value characteristics as measured by book-to-market ratio. Value stocks, which outperformed growth stocks and the Index, comprised approximately 66% of the Portfolio compared to approximately 22% of the the Index. Composition differences also contributed to the Portfolio's outperformance as it did not invest in some of the countries that underperformed the MSCI Emerging Markets Index. The MSCI Emerging Markets Index (net dividends) does not have 10 years of performance. The Portfolio intends to include the MSCI Emerging Markets Index (gross dividends) until the MSCI Emerging Markets Index (net dividends) has at least ten years of data to report.
Dimensional Emerging Markets Value Fund Inc.
Dimensional Emerging Markets Value Fund Inc., (the "Fund") seeks to capture the returns of value stocks in selected emerging markets by purchasing shares of the which invests in such stocks. The investment strategy employs a disciplined, quantitative approach, emphasizing broad diversification and consistent exposure to emerging markets value stocks, but does not attempt to track closely a specific equity index. As of November 30, 2007, the Fund held approximately 1,800 stocks in 18 countries. The Fund's target country weights are capped at a ceiling set by the manager to limit single-country risk exposure. Throughout the year ended November 30, 2007, the Fund was essentially fully invested in equities throughout the year: cash equivalents averaged less than 1% of the Fund's assets.
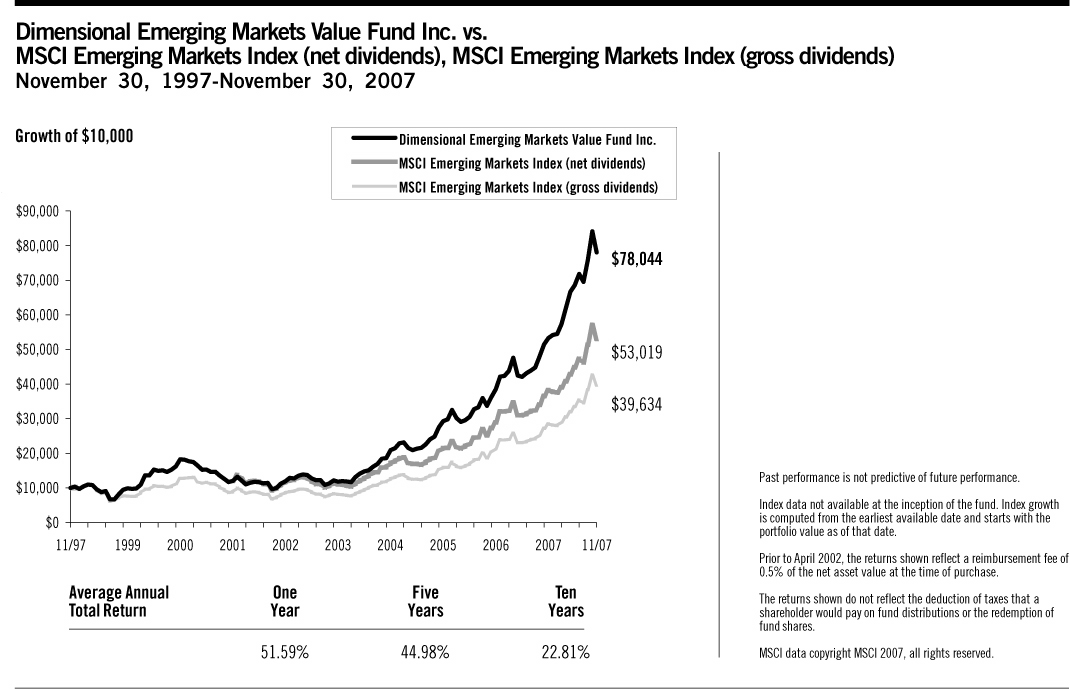
As a result of the Fund's diversified investment approach, performance was determined principally by broad structural trends in emerging country stock markets, rather than the behavior of a limited number of stocks. For the year ended November 30, 2007, emerging markets value stocks outperformed developed country stocks, emerging markets growth stocks, and core emerging markets strategies. Total returns were 17.30% for the MSCI EAFE Index (net dividends), 45.56% for the MSCI Emerging Markets Index (gross dividends), 45.15% for the MSCI Emerging Markets Index (net dividends), and 51.59% for the Dimensional Emerging Markets Value Fund. Relative to the MSCI Emerging Markets Index (net dividends), the outperformance of the Fund was due primarily to greater exposure to stocks with strong value characteristics as measured by book-to-market ratio. Value stocks, which outperformed growth stocks and the Index, comprised approximately 66% of the Fund compared to approximately 22% of the Index. Composition differences also contributed to the Fund's outperformance as it did not invest in seven of the countries that underperformed the MSCI Emerging Markets Index. The MSCI Emerging Markets Index (net dividends) does not have 10 years of performance. The Fund intends to include the MSCI Emerging Markets Index (gross dividends) until the MSCI Emerging Markets Index (net dividends) has at least ten years of data to report.
4
DFA INVESTMENT DIMENSIONS GROUP INC.
EMERGING MARKETS VALUE PORTFOLIO
DISCLOSURE OF FUND EXPENSES
(Unaudited)
The following Expense Table is shown so that you can understand the impact of fees on your investment. All mutual funds have operating expenses. As a shareholder of the fund, you incur ongoing costs, which include costs for portfolio management, administrative services, and shareholder reports, among others. Operating expenses, legal and audit services, which are deducted from a fund's gross income, directly reduce the investment return of the fund. A fund's expenses are expressed as a percentage of its average net assets. This figure is known as the expense ratio. The following examples are intended to help you understand the ongoing costs, in dollars, of investing in the fund and to compare these costs with those of other mutual funds. The examples are based on an investment of $1,000 made at the beginning of the period shown and held for the entire period.
The Expense Table below illustrates your fund's costs in two ways.
Actual Fund Return
This section helps you to estimate the actual expenses after fee waivers that you paid over the period. The "Ending Account Value" shown is derived from the fund's actual return and "Expenses Paid During Period" reflect the dollar amount that would have been paid by an investor who started with $1,000 in the fund. You may use the information here, together with the amount you invested, to estimate the expenses that you paid over the period.
To do so, simply divide your account value by $1,000 (for example, a $7,500 account value divided by $1,000 = 7.5), then multiply the result by the number given for your fund under the heading "Expenses Paid During Period."
Hypothetical Example for Comparison Purposes
This section is intended to help you compare your fund's costs with those of other mutual funds. The hypothetical "Ending Account Value" and "Expenses Paid During Period" are derived from the fund's actual expense ratio and an assumed 5% annual return before expenses. In this case, because the return used is not the fund's actual return, the results do not apply to your investment. The example is useful in making comparisons because the SEC requires all mutual funds to calculate expenses based on a 5% annual return. You can assess your fund's cost by comparing this hypothetical example with the hypothetical examples that appear in shareholder reports of other funds.
Please note that the expenses shown in the table are meant to highlight and help you compare ongoing costs only and do not reflect any transactional costs, if applicable. The "Annualized Expense Ratio" represents the actual expenses for the six-month period indicated.
Six Months Ended November 30, 2007
EXPENSE TABLE
| | | Beginning
Account
Value
06/01/07 | | Ending
Account
Value
11/30/07 | | Annualized
Expense
Ratio* | | Expenses
Paid
During
Period* | |
| Actual Fund Return | | $ | 1,000.00 | | | $ | 1,168.90 | | | | 0.60 | % | | $ | 3.25 | | |
| Hypothetical 5% Annual Return | | $ | 1,000.00 | | | $ | 1,022.07 | | | | 0.60 | % | | $ | 3.03 | | |
* Expenses are equal to the fund's annualized expense ratio for the six-month period, multiplied by the average account value over the period, multiplied by the number of days in the most recent six-month period (183), then divided by the number of days in the year (365) to reflect the six-month period. The Portfolio is a Feeder Fund. The expenses shown reflect the direct expenses of the Feeder Fund and the indirect payment of the Feeder Fund's portion of the expenses of its Master Fund.
5
DFA INVESTMENT DIMENSIONS GROUP INC.
EMERGING MARKETS VALUE PORTFOLIO
DISCLOSURE OF PORTFOLIO HOLDINGS
(Unaudited)
The SEC has adopted the requirement that all Funds file a complete Schedule of Investments with the SEC for their first and third fiscal quarters on Form N-Q. For DFA Investment Dimensions Group Inc., this would be for the fiscal quarters ending February 28 (February 29 during leap year) and August 31. The Form N-Q filing must be made within 60 days of the end of the quarter. DFA Investment Dimensions Group Inc. filed its most recent Form N-Q with the SEC on October 30, 2007. It is available upon request, without charge, by calling collect: (310) 395-8005 or by mailing a request to Dimensional Fund Advisors LP, 1299 Ocean Avenue, Santa Monica, California 90401, or by visiting the SEC's website at http://www.sec.gov, or they may be reviewed and copied at the SEC's Public Reference Room in Washington, D.C. (call 1-800-732-0330 for information on the operation of the Public Reference Room).
PORTFOLIO HOLDINGS
The SEC adopted a requirement that all Funds present their categories of portfolio holdings in a table, chart or graph format in their annual and semi-annual shareholder reports, whether or not a Schedule of Investments is utilized. The following table, which presents portfolio holdings as a percent of total investments before short-term investments and collateral for loaned securities, is provided in compliance with such requirement.
The categories of industry classification for the Affiliated Investment Company is represented in the Disclosure of Portfolio Holdings, which is included elsewhere within the report. Refer to the Summary Schedule of Portfolio Holdings for the underlying Master Fund's holdings which reflects the investments by country.
| Affiliated Investment Company | | | 100.0 | % | |
6
DFA INVESTMENT DIMENSIONS GROUP INC.
EMERGING MARKETS VALUE PORTFOLIO
STATEMENT OF ASSETS AND LIABILITIES
NOVEMBER 30, 2007
(Amounts in thousands, except share and per share amounts)
| ASSETS: | |
Investment in Dimensional Emerging Markets Value Fund Inc. (Affiliated Investment Company)
(112,898,031 Shares) at Value† | | $ | 7,488,526 | | |
| Receivable for Fund Shares Sold | | | 13,458 | | |
| Prepaid Expenses and Other Assets | | | 43 | | |
| Total Assets | | | 7,502,027 | | |
| LIABILITIES: | |
| Payables: | |
| Affiliated Investment Company Shares Purchased | | | 9,758 | | |
| Fund Shares Redeemed | | | 3,700 | | |
| Due to Advisor | | | 2,522 | | |
| Accrued Expenses and Other Liabilities | | | 245 | | |
| Total Liabilities | | | 16,225 | | |
| NET ASSETS | | $ | 7,485,802 | | |
| SHARES OUTSTANDING, $0.01 PAR VALUE (1) | | | 163,265,493 | | |
| NET ASSET VALUE, OFFERING AND REDEMPTION PRICE PER SHARE | | $ | 45.85 | | |
| Investment at Cost | | $ | 3,766,692 | | |
| NET ASSETS CONSIST OF: | |
| Paid-In Capital | | $ | 3,621,779 | | |
| Undistributed Net Investment Income (Distributions in Excess of Net Investment Income) | | | 22,447 | | |
| Accumulated Net Realized Gain (Loss) | | | 119,742 | | |
| Net Unrealized Appreciation (Depreciation) | | | 3,721,834 | | |
| NET ASSETS | | $ | 7,485,802 | | |
| (1) NUMBER OF SHARES AUTHORIZED | | | 400,000,000 | | |
See accompanying Notes to Financial Statements.
7
DFA INVESTMENT DIMENSIONS GROUP INC.
EMERGING MARKETS VALUE PORTFOLIO
STATEMENT OF OPERATIONS
FOR THE YEAR ENDED NOVEMBER 30, 2007
(Amounts in thousands)
| Investment Income | |
| Income Distributions Received from Affiliated Investment Company | | $ | 144,074 | | |
| Expenses | |
| Administrative Services Fees | | | 23,907 | | |
| Accounting & Transfer Agent Fees | | | 93 | | |
| Shareholders' Reports | | | 129 | | |
| Filing Fees | | | 90 | | |
| Directors'/Trustees' Fees & Expenses | | | 53 | | |
| Legal Fees | | | 52 | | |
| Audit Fees | | | 15 | | |
| Other | | | 13 | | |
| Total Expenses | | | 24,352 | | |
| Net Investment Income (Loss) | | | 119,722 | | |
| Realized and Unrealized Gain (Loss) | |
| Capital Gain Distributions Received from Affiliated Investment Company | | | 170,231 | | |
| Net Realized Gain (Loss) on Affiliated Investment Company Shares Sold | | | (6,781 | ) | |
| Change in Unrealized Appreciation (Depreciation) of Affiliated Investment Company Shares | | | 2,124,572 | | |
| Net Realized and Unrealized Gain (Loss) | | | 2,288,022 | | |
| Net Increase (Decrease) in Net Assets Resulting from Operations | | $ | 2,407,744 | | |
See accompanying Notes to Financial Statements.
8
DFA INVESTMENT DIMENSIONS GROUP INC.
EMERGING MARKETS VALUE PORTFOLIO
STATEMENTS OF CHANGES IN NET ASSETS
(Amounts in thousands)
| | | Year
Ended
Nov. 30,
2007 | | Year
Ended
Nov. 30,
2006 | |
| Increase (Decrease) in Net Assets | |
| Operations: | |
| Net Investment Income (Loss) | | $ | 119,722 | | | $ | 65,857 | | |
| Capital Gain Distributions Received from Affiliated Investment Company | | | 170,231 | | | | 50,497 | | |
| Net Realized Gain (Loss) on Affiliated Investment Company Shares Sold | | | (6,781 | ) | | | (13,463 | ) | |
| Change in Unrealized Appreciation (Depreciation) of | |
| Affiliated Investment Company Shares | | | 2,124,572 | | | | 926,855 | | |
| Net Increase (Decrease) in Net Assets Resulting from Operations | | | 2,407,744 | | | | 1,029,746 | | |
| Distributions From: | |
| Net Investment Income | | | (96,479 | ) | | | (64,380 | ) | |
| Net Short-Term Gains | | | (8,058 | ) | | | (4,774 | ) | |
| Net Long-Term Gains | | | (44,751 | ) | | | (18,035 | ) | |
| Total Distributions | | | (149,288 | ) | | | (87,189 | ) | |
| Capital Share Transactions (1): | |
| Shares Issued | | | 1,777,388 | | | | 1,640,064 | | |
| Shares Issued in Lieu of Cash Distributions | | | 124,212 | | | | 68,287 | | |
| Shares Redeemed | | | (957,950 | ) | | | (444,692 | ) | |
| Net Increase (Decrease) from Capital Share Transactions | | | 943,650 | | | | 1,263,659 | | |
| Total Increase (Decrease) in Net Assets | | | 3,202,106 | | | | 2,206,216 | | |
| Net Assets | |
| Beginning of Period | | | 4,283,696 | | | | 2,077,480 | | |
| End of Period | | $ | 7,485,802 | | | $ | 4,283,696 | | |
| (1) Shares Issued and Redeemed: | |
| Shares Issued | | | 46,560 | | | | 60,346 | | |
| Shares Issued in Lieu of Cash Distributions | | | 3,560 | | | | 2,776 | | |
| Shares Redeemed | | | (23,900 | ) | | | (16,972 | ) | |
| | | | 26,220 | | | | 46,150 | | |
Undistributed Net Investment Income
(Distributions in Excess of Net Investment Income) | | $ | 22,447 | | | $ | 4,576 | | |
See accompanying Notes to Financial Statements.
9
DFA INVESTMENT DIMENSIONS GROUP INC.
EMERGING MARKETS VALUE PORTFOLIO
FINANCIAL HIGHLIGHTS
(for a share outstanding throughout each period)
| | | Year
Ended
Nov. 30,
2007 | | Year
Ended
Nov. 30,
2006 | | Year
Ended
Nov. 30,
2005 | | Year
Ended
Nov. 30,
2004 | | Year
Ended
Nov. 30,
2003 | |
Net Asset Value, Beginning of
Period | | $ | 31.26 | | | $ | 22.86 | | | $ | 17.93 | | | $ | 12.53 | | | $ | 8.42 | | |
| Income from Investment Operations | |
| Net Investment Income (Loss) | | | 0.78 | (A) | | | 0.60 | (A) | | | 0.50 | | | | 0.21 | | | | 0.19 | | |
Net Gains (Losses) (Realized
and Unrealized) | | | 14.82 | | | | 8.65 | | | | 4.96 | | | | 5.54 | | | | 4.13 | | |
Total from Investment
Operations | | | 15.60 | | | | 9.25 | | | | 5.46 | | | | 5.75 | | | | 4.32 | | |
| Less Distributions | |
| Net Investment Income | | | (0.63 | ) | | | (0.60 | ) | | | (0.44 | ) | | | (0.35 | ) | | | (0.14 | ) | |
| Net Realized Gains | | | (0.38 | ) | | | (0.25 | ) | | | (0.09 | ) | | | — | | | | (0.07 | ) | |
| Total Distributions | | | (1.01 | ) | | | (0.85 | ) | | | (0.53 | ) | | | (0.35 | ) | | | (0.21 | ) | |
| Net Asset Value, End of Period | | $ | 45.85 | | | $ | 31.26 | | | $ | 22.86 | | | $ | 17.93 | | | $ | 12.53 | | |
| Total Return | | | 50.98 | % | | | 41.55 | % | | | 31.06 | % | | | 46.76 | % | | | 52.59 | % | |
Net Assets, End of Period
(thousands) | | $ | 7,485,802 | | | $ | 4,283,696 | | | $ | 2,077,480 | | | $ | 895,313 | | | $ | 403,035 | | |
Ratio of Expenses to Average
Net Assets (B) | | | 0.60 | % | | | 0.63 | % | | | 0.70 | % | | | 0.77 | % | | | 0.86 | % | |
Ratio of Net Investment Income to
Average Net Assets | | | 2.00 | % | | | 2.22 | % | | | 2.45 | % | | | 1.37 | % | | | 2.41 | % | |
See page 1 for the Definitions of Abbreviations and Footnotes.
See accompanying Notes to Financial Statements.
10
DFA INVESTMENT DIMENSIONS GROUP INC.
EMERGING MARKETS VALUE PORTFOLIO
NOTES TO FINANCIAL STATEMENTS
A. Organization:
DFA Investment Dimensions Group Inc. (the "Group") is an open-end management investment company whose shares are offered, without a sales charge, generally to institutional investors and clients of registered investment advisors. The Group offers forty-nine operational portfolios, one of which, the Emerging Markets Value Portfolio (the "Portfolio") is included in this report. The remaining forty-eight portfolios are presented in separate reports.
The Portfolio primarily invests all of its assets in the Dimensional Emerging Markets Value Fund Inc. (the "Fund"). At November 30, 2007, the Portfolio owned 91% of the outstanding shares of the Fund. The financial statements of the Fund are included elsewhere in this report and should be read in conjunction with the financial statements of the Portfolio.
Effective October 10, 2007, the Fund established two new classes of shares of the Portfolio contained in this report, which new classes are designated as Class R1 shares and Class R2 shares. In conjunction with the creation of these two additional classes of shares, the original class of shares of the Portfolio of the Fund contained in this report was renamed the "Institutional Class shares" effective October 10, 2007. The designation of the original class of shares as "Institutional Class shares" did not change the fees, expenses, rights or preferences of the shares. The Class R1 and Class R2 shares had not commenced operations as of November 30, 2007.
B. Significant Accounting Policies:
The following significant accounting policies are in conformity with accounting principles generally accepted in the United States of America. Such policies are consistently followed by the Group in preparation of its financial statements. The preparation of financial statements in accordance with accounting principles generally accepted in the United States of America requires management to make estimates and assumptions that affect the reported amounts of assets and liabilities and disclosure of contingent assets and liabilities at the date of the financial statements and the reported amounts of increases and decreases in net assets from operations during the reporting period. Actual results could differ from those estimates and those differences could be material.
1. Security Valuation: The shares of the Fund held by the Portfolio are valued at its respective daily net asset value.
2. Deferred Compensation Plan: Each eligible Director of the Group may elect participation in the Deferred Compensation Plan (the "Plan"). Under the Plan, effective January 1, 2002, such Directors may defer payment of all or a portion of their total fees earned as a Director. These deferred amounts may be treated as though such amounts had been invested in shares of the following funds: U.S. Large Cap Value Portfolio; U.S. Core Equity 1 Portfolio; U.S. Core Equity 2 Portfolio; U.S. Vector Equity Portfolio; U.S. Micro Cap Portfolio; DFA International Value Portfolio; International Core Equity Portfolio; Emerging Markets Portfolio; Emerging Markets Core Equity Portfolio; and/or DFA Two-Year Global Fixed Income Portfolio. Contributions made under the Plan and the change in unrealized appreciation (depreciation) and income, are included in Directors'/Trustees' Fees and Expenses. At November 30, 2007, the total liability for deferred compensation to Directors is included in Accrued Expenses and Other Liabilities in the amount of $116 (in thousands).
Each Director has the option to receive their distribution of proceeds in one of the following methods upon one year's notice: lump sum; annual installments over a period of agreed upon years; or semi-annual installments over a period of agreed upon years. As of November 30, 2007, none of the Directors have requested distribution of proceeds.
3. Other: Security transactions are accounted for as of the trade date. Costs used in determining realized gains and losses on the sale of affiliated investment company shares are on the basis of identified cost. Dividend income and distributions to shareholders are recorded on the ex-dividend date. Distributions received from the investment in
11
affiliated investment company that represent a return of capital or capital gain are recorded as a reduction of cost of investments or as a realized gain, respectively. Expenses directly attributable to the Portfolio are directly charged. Common expenses of the Group are allocated using methods approved by the Board of Directors/Trustees, generally based on average net assets.
C. Investment Advisor:
Dimensional Fund Advisors LP ("Dimensional" or the "Advisor") provides administrative services to the Portfolio, including supervision of services provided by others, providing information to the shareholders and the Board of Directors/Trustees, and other administrative services. The Advisor provides investment advisory services to the Fund. For the year ended November 30, 2007, the Portfolio's administrative services fees were accrued daily and paid monthly to the Advisor based on an effective annual rate of 0.40% of average daily net assets.
Fees Paid to Officers and Directors/Trustees:
Certain Officers and Directors/Trustees of the Advisor are also Officers and Directors/Trustees of the Group; however, such Officers and Directors/Trustees (with the exception of the Chief Compliance Officer ("CCO")) receive no compensation from the Group. For the year ended November 30, 2007, the total related amounts paid by the Group to the CCO were $157 (in thousands). The total related amount paid by the Portfolio is included in Other Expenses on the Statement of Operations.
D. Federal Income Taxes:
The Portfolio has qualified and intends to continue to qualify as a regulated investment company under Subchapter M of the Internal Revenue Code for federal income tax purposes and to distribute substantially all of its taxable income and net capital gains to shareholders. Accordingly, no provision has been made for federal income taxes.
Distributions from net investment income and net realized capital gains are determined in accordance with U.S. federal income tax regulations, which may differ from those amounts determined under accounting principles generally accepted in the United States of America. These book/tax differences are either temporary or permanent in nature. To the extent these differences are permanent, they are charged or credited to paid-in capital, undistributed net investment income or accumulated net realized gains, as appropriate, in the period that the differences arise. Accordingly, the following permanent differences as of November 30, 2007, primarily attributable to the utilization of accumulated earnings and profits distributed to shareholders on redemptions of shares as part of the dividends paid deduction for income tax purposes, were reclassified to the following accounts. These reclassifications had no effect on net assets or net asset value pe r share (amounts in thousands):
Increase
(Decrease)
Paid-In Capital | | Increase
(Decrease)
Undistributed
Net Investment
Income | | Increase
(Decrease)
Accumulated
Net Realized
Gains/(Losses) | |
| $ | 12,762 | | | $ | (5,372 | ) | | $ | (7,390 | ) | |
12
The tax character of dividends and distributions declared and paid during the years ended November 30, 2006 and November 30, 2007 were as follows (amounts in thousands):
| | | Net Investment
Income and
Short-Term
Capital Gains | | Long-Term
Capital Gains | | Total | |
| | 2006 | | | $ | 70,897 | | | $ | 19,141 | | | $ | 90,038 | | |
| | 2007 | | | | 110,158 | | | | 51,893 | | | | 162,051 | | |
At November 30, 2007, the following net investment income and short-term capital gains and long-term capital gains distributions designated for federal income tax purposes are due to the utilization of accumulated earnings and profits distributed to shareholders upon redemption of shares (amounts in thousands):
Net Investment
Income
and Short-Term
Capital Gains | | Long-Term
Capital Gains | | Total | |
| $ | 5,621 | | | $ | 7,142 | | | $ | 12,763 | | |
At November 30, 2007, the components of distributable earnings/(accumulated losses) were as follows (amounts in thousands):
Undistributed
Net Investment
Income and
Short-Term
Capital Gains | | Undistributed
Long-Term
Capital Gains | | Total Net
Distributable
Earnings/
(Accumulated
Losses) | |
| $ | 24,042 | | | $ | 155,651 | | | $ | 179,693 | | |
For federal income tax purposes, the Portfolio measures its capital loss carryforwards annually at November 30, its fiscal year end. Capital loss carryforwards may be carried forward and applied against future capital gains. As of November 30, 2007, the Portfolio had no capital loss carryforwards available to offset future realized capital gains.
At November 30, 2007, the total cost and aggregate gross unrealized appreciation and (depreciation) of securities for federal income tax purposes were different from amounts reported for financial reporting purposes (amounts in thousands):
Federal
Tax Cost | | Unrealized
Appreciation | | Unrealized
(Depreciation) | | Net
Unrealized
Appreciation
(Depreciation) | |
| $ | 3,804,079 | | | $ | 3,721,834 | | | $ | (37,387 | ) | | $ | 3,684,447 | | |
E. Line of Credit:
The Portfolio, together with other Dimensional-advised portfolios, has entered into a $250 million unsecured discretionary line of credit effective June 26, 2007 with an affiliate of its domestic custodian bank. Each portfolio is permitted to borrow, subject to its investment limitations, up to a maximum of $250 million, as long as total borrowings under the line of credit do not exceed $250 million in the aggregate. Borrowings under the line of credit are charged interest at the then current Federal Funds Rate plus 1%. Each portfolio is individually, and not jointly, liable for its particular advances under the line of credit. There is no commitment fee on the unused portion of the line of credit. The agreement for the discretionary line of credit may be terminated by either party at any time. The line of credit is scheduled to expire on June 24, 2008. There were no borrowings by the Portfolio under this line of credit during the year ended November 30, 2007.
The Portfolio, together with other Dimensional-advised portfolios, has also entered into an additional $500 million unsecured line of credit effective January 22, 2007 with its international custodian bank. Each portfolio is permitted to borrow, subject to its investment limitations, up to a maximum of $500 million, as long as total borrowings
13
under the line of credit do not exceed $500 million in the aggregate. Each portfolio is individually, and not jointly, liable for its particular advances under the line of credit. Borrowings under the line of credit are charged interest at rates agreed to by the parties at the time of borrowing. There is no commitment fee on the unused portion of the line of credit. The agreement for the line of credit expires on January 21, 2008. There were no borrowings by the Portfolio under this line credit during the year ended November 30, 2007.
F. Indemnitees; Contractual Obligations:
Under the Group's organizational documents, its officers and directors are indemnified against certain liability arising out of the performance of their duties to the Group.
In the normal course of business, the Group enters into contracts that contain a variety of representations and warranties which provide general indemnification. The Group's maximum exposure under these arrangements is unknown as this would involve future claims that may be made against the Group and/or its affiliates that have not yet occurred. However, based on experience, the Group expects the risk of loss to be remote.
G. Recently Issued Accounting Standards and Interpretation:
On September 20, 2006, Statement of Financial Accounting Standards No. 157, Fair Value Measurements ("FAS 157"), was issued and is effective for fiscal years beginning after November 15, 2007. FAS 157 defines fair value, establishes a framework for measuring fair value and expands disclosures about fair value measurements. Management is currently evaluating the implications of FAS 157. At this time, its impact on the Portfolio's financial statements has not been determined.
On July 13, 2006, the Financial Accounting Standards Board ("FASB") released FASB Interpretation No. 48 ("FIN 48") "Accounting for Uncertainty in Income Taxes." FIN 48 provides guidance for how uncertain tax positions should be recognized, measured, presented and disclosed in the financial statements. FIN 48 requires the evaluation of tax positions taken in the course of preparing the Portfolio's tax returns to determine whether the tax positions are "more-likely-than-not" of being sustained by the applicable tax authority. Tax benefits of positions not deemed to meet the "more-likely-than-not" threshold would be booked as a tax expense in the current year and recognized as: a liability for unrecognized tax benefits; a reduction of an income tax refund receivable; a reduction of deferred tax asset; an increase in deferred tax liability; or a combination thereof. FIN 48 is effective six months following the fiscal year ending November 30, 200 7. At this time, management is evaluating the implication of FIN 48 and does not believe it will have a material impact, if any, on the funds financial statements.
H. Other:
At November 30, 2007, one shareholder held approximately 19% of the outstanding shares of the Portfolio. The shareholder is an omnibus account, which typically holds shares for the benefit of several other underlying investors.
14
REPORT OF INDEPENDENT REGISTERED PUBLIC ACCOUNTING FIRM
To the Shareholders and Board of Directors of
Dimensional Emerging Markets Value Fund Inc.:
In our opinion, the accompanying statement of assets and liabilities, including the summary schedule of portfolio holdings, and the related statements of operations and of changes in net assets and the financial highlights present fairly, in all material respects, the financial position of Dimensional Emerging Markets Value Fund Inc. (the "Fund") at November 30, 2007, the results of its operations for the year then ended, the changes in its net assets for each of the two years in the period then ended and the financial highlights for each of the five years in the period then ended, in conformity with accounting principles generally accepted in the United States of America. These financial statements and financial highlights (hereafter referred to as "financial statements") are the responsibility of the Fund's management; our responsibility is to express an opinion on these financial statements based on our audits. We conducted our audits of these financial statements in accordance with the standards of the Public Company Accounting Oversight Board (United States). Those standards require that we plan and perform the audit to obtain reasonable assurance about whether the financial statements are free of material misstatement. An audit includes examining, on a test basis, evidence supporting the amounts and disclosures in the financial statements, assessing the accounting principles used and significant estimates made by management, and evaluating the overall financial statement presentation. We believe that our audits, which included confirmation of securities at November 30, 2007 by correspondence with the custodian, provide a reasonable basis for our opinion.
PricewaterhouseCoopers LLP
Philadelphia, Pennsylvania
January 22, 2008
15
DIMENSIONAL EMERGING MARKETS VALUE FUND INC.
PERFORMANCE CHART
16
DIMENSIONAL EMERGING MARKETS VALUE FUND INC.
DISCLOSURE OF FUND EXPENSES
(Unaudited)
The following Expense Table is shown so that you can understand the impact of fees on your investment. All mutual funds have operating expenses. As a shareholder of the fund, you incur ongoing costs, which include costs for portfolio management, administrative services, and shareholder reports, among others. Operating expenses, legal and audit services, which are deducted from a fund's gross income, directly reduce the investment return of the fund. A fund's expenses are expressed as a percentage of its average net assets. This figure is known as the expense ratio. The following examples are intended to help you understand the ongoing costs, in dollars, of investing in the fund and to compare these costs with those of other mutual funds. The examples are based on an investment of $1,000 made at the beginning of the period shown and held for the entire period.
The Expense Table below illustrates your fund's costs in two ways.
Actual Fund Return
This section helps you to estimate the actual expenses after fee waivers that you paid over the period. The "Ending Account Value" shown is derived from the fund's actual return and "Expenses Paid During Period" reflect the dollar amount that would have been paid by an investor who started with $1,000 in the fund. You may use the information here, together with the amount you invested, to estimate the expenses that you paid over the period.
To do so, simply divide your account value by $1,000 (for example, a $7,500 account value divided by $1,000 = 7.5), then multiply the result by the number given for your fund under the heading "Expenses Paid During Period."
Hypothetical Example for Comparison Purposes
This section is intended to help you compare your fund's costs with those of other mutual funds. The hypothetical "Ending Account Value" and "Expenses Paid During Period" are derived from the fund's actual expense ratio and an assumed 5% annual return before expenses. In this case, because the return used is not the fund's actual return, the results do not apply to your investment. The example is useful in making comparisons because the SEC requires all mutual funds to calculate expenses based on a 5% annual return. You can assess your fund's cost by comparing this hypothetical example with the hypothetical examples that appear in shareholder reports of other funds.
Please note that the expenses shown in the table are meant to highlight and help you compare ongoing costs only and do not reflect any transactional costs, if applicable. The "Annualized Expense Ratio" represents the actual expenses for the six-month period indicated.
Six Months Ended November 30, 2007
EXPENSE TABLE
| | | Beginning
Account
Value
06/01/07 | | Ending
Account
Value
11/30/07 | | Annualized
Expense
Ratio* | | Expenses
Paid
During
Period* | |
| Actual Fund Return | | $ | 1,000.00 | | | $ | 1,171.20 | | | | 0.19 | % | | $ | 1.04 | | |
| Hypothetical 5% Annual Return | | $ | 1,000.00 | | | $ | 1,024.11 | | | | 0.19 | % | | $ | 0.97 | | |
* Expenses are equal to the fund's annualized expense ratio for the six-month period, multiplied by the average account value over the period, multiplied by the number of days in the most recent six-month period (183), then divided by the number of days in the year (365) to reflect the six-month period.
17
DIMENSIONAL EMERGING MARKETS VALUE FUND INC.
DISCLOSURE OF PORTFOLIO HOLDINGS
(Unaudited)
The SEC has adopted the requirement that all Funds file a complete Schedule of Investments with the SEC for their first and third fiscal quarters on Form N-Q. For Dimensional Emerging Markets Value Fund Inc., this would be for the fiscal quarters ending February 28 (February 29 during leap year) and August 31. The Form N-Q filing must be made within 60 days of the end of the quarter. Dimensional Emerging Markets Value Fund Inc. filed its most recent Form N-Q with the SEC on October 30, 2007. It is available upon request without charge, by calling collect: (310) 395-8005 or by mailing a request to Dimensional Fund Advisors LP, 1299 Ocean Avenue, Santa Monica, California 90401, or by visiting the SEC's website at http://www.sec.gov, or they may be reviewed and copied at the SEC's Public Reference Room in Washington, D.C. (call 1-800-732-0330 for information on the operation of the Public Reference Room).
The SEC has also amended certain regulations to permit a fund to include in its reports to shareholders a "Summary Schedule of Portfolio Holdings" in lieu of a full Schedule of Investments. The Summary Schedule of Portfolio Holdings reports the fund's 50 largest holdings in unaffiliated issuers and any investments that exceed one percent of the fund's net assets at the end of the reporting period. The amendments also require that the Summary Schedule of Portfolio Holdings identify each category of investments that are held.
The fund is required to file a complete Schedule of Investments with the SEC on Form N-CSR within ten days after mailing the annual and semi-annual reports to shareholders. It will be available upon request, without charge, by calling collect: (310) 395-8005 or by mailing a request to Dimensional Fund Advisors LP, 1299 Ocean Avenue, Santa Monica, California 90401, or by visiting the SEC's website at http://www.sec.gov, or they may be reviewed and copied at the SEC's Public Reference Room in Washington, D.C. (call 1-800-732-0330 for information on the operation of the Public Reference Room).
PORTFOLIO HOLDINGS
The SEC adopted a requirement that all Funds present their categories of portfolio holdings in a table, chart or graph format in their annual and semi-annual shareholder reports, whether or not a Schedule of Investments is utilized. The following table, which presents portfolio holdings as a percent of total investments before short-term investments and collateral for loaned securities, is provided in compliance with such requirement. The categories shown below represent broad industry sectors. Each industry sector consists of one or more specific industry classifications.
Consumer
Discretionary | | Consumer
Staples | | Energy | | Financials | | Health
Care | | Industrials | | Information
Technology | | Materials | | Telecommunication
Services | | Utilities | | Other | | Total | |
| | 8.9 | % | | | 5.3 | % | | | 12.1 | % | | | 19.0 | % | | | 1.0 | % | | | 14.3 | % | | | 5.7 | % | | | 27.7 | % | | | 3.3 | % | | | 2.0 | % | | | 0.7 | % | | | 100.0 | % | |
18
DIMENSIONAL EMERGING MARKETS VALUE FUND INC.
SUMMARY SCHEDULE OF PORTFOLIO HOLDINGS
November 30, 2007
| | | Shares | | Value†† | | Percentage
of Net Assets** | |
| ARGENTINA — (0.2%) | |
| COMMON STOCKS — (0.2%) | |
| Other Securities | | | | | | $ | 19,325,718 | | | | 0.2 | % | |
| BRAZIL — (9.3%) | |
| COMMON STOCKS — (1.0%) | |
| Companhia Siderurgica Nacional SA | | | 931,400 | | | | 70,918,782 | | | | 0.9 | % | |
| Other Securities | | | | | | | 20,063,254 | | | | 0.2 | % | |
| TOTAL COMMON STOCKS | | | | | | | 90,982,036 | | | | 1.1 | % | |
| PREFERRED STOCKS — (8.3%) | |
| Gerdau SA | | | 1,222,542 | | | | 34,711,546 | | | | 0.4 | % | |
| Gerdau SA Sponsored ADR | | | 1,259,570 | | | | 35,406,513 | | | | 0.4 | % | |
| Investimentos Itau SA | | | 5,990,063 | | | | 43,437,730 | | | | 0.5 | % | |
| Klabin SA | | | 8,361,300 | | | | 33,021,701 | | | | 0.4 | % | |
| Metalurgica Gerdau SA | | | 2,366,200 | | | | 92,103,216 | | | | 1.1 | % | |
| Suzano Papel e Celullose SA | | | 2,299,139 | | | | 38,346,771 | | | | 0.5 | % | |
| Usinas Siderurgicas de Minas Gerais SA Series A | | | 3,180,037 | | | | 161,245,835 | | | | 2.0 | % | |
| Votorantim Celulose e Papel SA Sponsored ADR | | | 1,181,000 | | | | 39,232,820 | | | | 0.5 | % | |
| Other Securities | | | | | | | 261,109,060 | | | | 3.2 | % | |
| TOTAL PREFERRED STOCKS | | | | | | | 738,615,192 | | | | 9.0 | % | |
| TOTAL — BRAZIL | | | | | | | 829,597,228 | | | | 10.1 | % | |
| CHILE — (2.6%) | |
| COMMON STOCKS — (2.5%) | |
| Enersis SA Sponsored ADR | | | 4,542,672 | | | | 79,360,480 | | | | 1.0 | % | |
| Other Securities | | | | | | | 141,556,005 | | | | 1.7 | % | |
| TOTAL COMMON STOCKS | | | | | | | 220,916,485 | | | | 2.7 | % | |
| PREFERRED STOCKS — (0.1%) | |
| Other Securities | | | | | | | 9,507,652 | | | | 0.1 | % | |
| TOTAL — CHILE | | | | | | | 230,424,137 | | | | 2.8 | % | |
| CHINA — (4.3%) | |
| COMMON STOCKS — (4.3%) | |
| Other Securities | | | | | | | 384,656,688 | | | | 4.7 | % | |
| RIGHTS/WARRANTS — (0.0%) | |
| Other Securities | | | | | | | 86,006 | | | | 0.0 | % | |
| TOTAL — CHINA | | | | | | | 384,742,694 | | | | 4.7 | % | |
| CZECH REPUBLIC — (0.6%) | |
| COMMON STOCKS — (0.6%) | |
| Telefonica 02 Czech Republic A.S. | | | 1,166,446 | | | | 35,508,341 | | | | 0.4 | % | |
| Other Securities | | | | | | | 17,656,460 | | | | 0.3 | % | |
| TOTAL — CZECH REPUBLIC | | | | | | | 53,164,801 | | | | 0.7 | % | |
| HUNGARY — (2.2%) | |
| COMMON STOCKS — (2.2%) | |
| # MOL Hungarian Oil & Gas NYRT | | | 1,046,802 | | | | 149,966,504 | | | | 1.8 | % | |
| Other Securities | | | | | | | 44,050,142 | | | | 0.6 | % | |
| TOTAL — HUNGARY | | | | | | | 194,016,646 | | | | 2.4 | % | |
19
DIMENSIONAL EMERGING MARKETS VALUE FUND INC.
CONTINUED
| | | Shares | | Value†† | | Percentage
of Net Assets** | |
| INDIA — (14.2%) | |
| COMMON STOCKS — (14.1%) | |
| ICICI Bank Sponsored ADR | | | 949,468 | | | $ | 57,452,309 | | | | 0.7 | % | |
| Jindal Steel & Power, Ltd. | | | 113,229 | | | | 38,721,090 | | | | 0.5 | % | |
| Reliance Communications, Ltd. | | | 4,291,822 | | | | 73,160,060 | | | | 0.9 | % | |
| Reliance Industries, Ltd. | | | 6,049,665 | | | | 437,208,625 | | | | 5.3 | % | |
| Sterlite Industries (India), Ltd. Series A | | | 2,076,364 | | | | 54,637,045 | | | | 0.7 | % | |
| Tata Steel, Ltd. | | | 1,904,649 | | | | 39,769,534 | | | | 0.5 | % | |
| Other Securities | | | | | | | 554,255,958 | | | | 6.7 | % | |
| TOTAL COMMON STOCKS | | | | | | | 1,255,204,621 | | | | 15.3 | % | |
| PREFERRED STOCKS — (0.0%) | |
| Other Securities | | | | | | | 196,892 | | | | 0.0 | % | |
| RIGHTS/WARRANTS — (0.1%) | |
| Other Securities | | | | | | | 6,671,706 | | | | 0.1 | % | |
| TOTAL — INDIA | | | | | | | 1,262,073,219 | | | | 15.4 | % | |
| INDONESIA — (3.1%) | |
| COMMON STOCKS — (3.1%) | |
| PT Astra International Tbk | | | 13,431,500 | | | | 36,042,674 | | | | 0.5 | % | |
| PT International Nickel Indonesia Tbk | | | 6,872,000 | | | | 69,366,479 | | | | 0.9 | % | |
| PT Semen Gresik Tbk | | | 67,590,910 | | | | 43,174,378 | | | | 0.5 | % | |
| Other Securities | | | | | | | 126,427,217 | | | | 1.5 | % | |
| TOTAL COMMON STOCKS | | | | | | | 275,010,748 | | | | 3.4 | % | |
| RIGHTS/WARRANTS — (0.0%) | |
| Other Securities | | | | | | | 392,105 | | | | 0.0 | % | |
| TOTAL — INDONESIA | | | | | | | 275,402,853 | | | | 3.4 | % | |
| ISRAEL — (2.8%) | |
| COMMON STOCKS — (2.8%) | |
| Bank Hapoalim B.M. | | | 14,182,489 | | | | 71,646,517 | | | | 0.9 | % | |
| Bank Leumi Le-Israel | | | 13,378,631 | | | | 62,555,027 | | | | 0.8 | % | |
| Other Securities | | | | | | | 112,807,691 | | | | 1.3 | % | |
| TOTAL — ISRAEL | | | | | | | 247,009,235 | | | | 3.0 | % | |
| MALAYSIA — (4.6%) | |
| COMMON STOCKS — (4.6%) | |
| * Sime Darby Berhad | | | 10,193,905 | | | | 33,328,269 | | | | 0.4 | % | |
| Other Securities | | | | | | | 378,413,901 | | | | 4.6 | % | |
| TOTAL COMMON STOCKS | | | | | | | 411,742,170 | | | | 5.0 | % | |
| PREFERRED STOCKS — (0.0%) | |
| Other Securities | | | | | | | 204,111 | | | | 0.0 | % | |
| RIGHTS/WARRANTS — (0.0%) | |
| Other Securities | | | | | | | 764,951 | | | | 0.0 | % | |
| TOTAL — MALAYSIA | | | | | | | 412,711,232 | | | | 5.0 | % | |
20
DIMENSIONAL EMERGING MARKETS VALUE FUND INC.
CONTINUED
| | | Shares | | Value†† | | Percentage
of Net Assets** | |
| MEXICO — (6.8%) | |
| COMMON STOCKS — (6.8%) | |
| # Alfa S.A.B. de C.V. Series A | | | 6,037,464 | | | $ | 39,299,559 | | | | 0.5 | % | |
| Cemex S.A.B. de C.V. Sponsored ADR | | | 7,347,625 | | | | 210,215,551 | | | | 2.6 | % | |
| Fomento Economico Mexicano S.A.B. de C.V. Sponsored ADR | | | 1,149,795 | | | | 37,253,358 | | | | 0.5 | % | |
| # Grupo Carso S.A.B. de C.V. Series A-1 | | | 13,173,051 | | | | 46,255,132 | | | | 0.6 | % | |
| # Organizacion Soriana S.A.B. de C.V. Series B | | | 15,749,100 | | | | 43,431,852 | | | | 0.5 | % | |
| Other Securities | | | | | | | 232,121,085 | | | | 2.7 | % | |
| TOTAL — MEXICO | | | | | | | 608,576,537 | | | | 7.4 | % | |
| PHILIPPINES — (0.8%) | |
| COMMON STOCKS — (0.8%) | |
| Other Securities | | | | | | | 72,996,995 | | | | 0.9 | % | |
| POLAND — (3.1%) | |
| COMMON STOCKS — (3.1%) | |
| * Polski Koncern Naftowy Orlen SA | | | 5,310,008 | | | | 112,539,161 | | | | 1.4 | % | |
| Other Securities | | | | | | | 159,870,530 | | | | 1.9 | % | |
| TOTAL COMMON STOCKS | | | | | | | 272,409,691 | | | | 3.3 | % | |
| RIGHTS/WARRANTS — (0.0%) | |
| Other Securities | | | | | | | 45,378 | | | | 0.0 | % | |
| TOTAL — POLAND | | | | | | | 272,455,069 | | | | 3.3 | % | |
| SOUTH AFRICA — (10.2%) | |
| COMMON STOCKS — (10.2%) | |
| ABSA Group, Ltd. | | | 2,353,362 | | | | 44,110,454 | | | | 0.5 | % | |
| African Rainbow Minerals, Ltd. | | | 1,435,149 | | | | 31,360,143 | | | | 0.4 | % | |
| ArcelorMittal South Africa, Ltd. | | | 2,658,860 | | | | 54,126,598 | | | | 0.7 | % | |
| Barloworld, Ltd. | | | 2,119,859 | | | | 35,413,690 | | | | 0.4 | % | |
| Gold Fields, Ltd. Sponsored ADR | | | 4,882,535 | | | | 80,317,701 | | | | 1.0 | % | |
| *# Harmony Gold Mining Co., Ltd. | | | 3,183,494 | | | | 33,732,934 | | | | 0.4 | % | |
| Nedbank Group, Ltd. | | | 2,262,249 | | | | 44,906,567 | | | | 0.5 | % | |
| Sanlam, Ltd. | | | 28,259,449 | | | | 96,992,464 | | | | 1.2 | % | |
| Sasol, Ltd. Sponsored ADR | | | 1,309,923 | | | | 66,203,508 | | | | 0.8 | % | |
| Other Securities | | | | | | | 421,866,952 | | | | 5.2 | % | |
| TOTAL COMMON STOCKS | | | | | | | 909,031,011 | | | | 11.1 | % | |
| RIGHTS/WARRANTS — (0.0%) | |
| Other Securities | | | | | | | 42,548 | | | | 0.0 | % | |
| TOTAL — SOUTH AFRICA | | | | | | | 909,073,559 | | | | 11.1 | % | |
| SOUTH KOREA — (11.4%) | |
| COMMON STOCKS — (11.4%) | |
| # Hyundai Motor Co., Ltd. | | | 764,050 | | | | 57,697,508 | | | | 0.7 | % | |
| LG Corp. | | | 381,163 | | | | 32,582,793 | | | | 0.4 | % | |
| LG Electronics, Inc. | | | 466,520 | | | | 48,709,697 | | | | 0.6 | % | |
| # POSCO ADR | | | 1,060,011 | | | | 167,343,937 | | | | 2.1 | % | |
| # Samsung Corp. | | | 632,820 | | | | 44,598,002 | | | | 0.6 | % | |
| * Sk Energy Co., Ltd. | | | 317,698 | | | | 65,357,185 | | | | 0.8 | % | |
| Other Securities | | | | | | | 601,021,579 | | | | 7.2 | % | |
| TOTAL — SOUTH KOREA | | | | | | | 1,017,310,701 | | | | 12.4 | % | |
21
DIMENSIONAL EMERGING MARKETS VALUE FUND INC.
CONTINUED
| | | Shares | | Value†† | | Percentage
of Net Assets** | |
| TAIWAN — (9.8%) | |
| COMMON STOCKS — (9.8%) | |
| Chi Mei Optoelectronic Corp. | | | 28,881,840 | | | $ | 39,033,138 | | | | 0.5 | % | |
| Mega Financial Holding Co., Ltd. | | | 69,497,000 | | | | 43,007,449 | | | | 0.5 | % | |
| United Microelectronics Corp. | | | 84,774,374 | | | | 50,714,321 | | | | 0.6 | % | |
| Other Securities | | | | | | | 742,990,774 | | | | 9.1 | % | |
| TOTAL — TAIWAN | | | | | | | 875,745,682 | | | | 10.7 | % | |
| THAILAND — (2.5%) | |
| COMMON STOCKS — (2.5%) | |
| Other Securities | | | | | | | 218,487,192 | | | | 2.7 | % | |
| RIGHTS/WARRANTS — (0.0%) | |
| Other Securities | | | | | | | 253,663 | | | | 0.0 | % | |
| TOTAL — THAILAND | | | | | | | 218,740,855 | | | | 2.7 | % | |
| TURKEY — (3.2%) | |
| COMMON STOCKS — (3.2%) | |
| Eregli Demir ve Celik Fabrikalari Turk A.S. | | | 4,647,576 | | | | 38,192,276 | | | | 0.5 | % | |
| Turkiye Garanti Bankasi A.S. | | | 4,310,290 | | | | 37,541,819 | | | | 0.5 | % | |
| Other Securities | | | | | | | 207,959,782 | | | | 2.5 | % | |
| TOTAL — TURKEY | | | | | | | 283,693,877 | | | | 3.5 | % | |
| | | Face
Amount | | Value† | | | |
| | | (000) | | | | | |
| SECURITIES LENDING COLLATERAL — (8.3%) | |
@ Repurchase Agreement, Deutsche Bank Securities 4.63%, 12/03/07 (Collateralized
by $116,699,233 FHLMC, rates ranging from 5.000% to 6.500%, maturities ranging
from 11/01/36 to 10/01/37 & FNMA, rates ranging from 4.153%(r) to 5.500%,
maturities ranging from 08/01/13 to 02/01/36, valued at $101,562,724) to be
repurchased at $99,609,716 | | $ | 99,571 | | | | 99,571,298 | | | | 1.2 | % | |
@ Repurchase Agreement, HSBC Securities, Inc. 4.63%, 12/03/07 (Collateralized
by $122,455,360 FHLMC, rates ranging from 6.000% to 6.500%, maturities ranging
from 12/01/32 to 11/01/37 & FNMA, rates ranging from 5.000% to 8.000%, maturities
ranging from 02/01/24 to 11/01/37, valued at $102,003,207) to be repurchased at
$100,038,583 | | | 100,000 | | | | 100,000,000 | | | | 1.2 | % | |
@ Repurchase Agreement, Merrill Lynch 4.63%, 12/03/07 (Collateralized by $691,693,391
FHLMC, rates ranging from 5.000% to 7.000%, maturities ranging from 01/01/24 to
10/01/36 & FNMA, rates ranging from 4.500% to 6.500%, maturities ranging from
05/01/18 to 11/01/37, valued at $546,185,122) to be repurchased at $535,680,003 | | | 535,473 | | | | 535,473,400 | | | | 6.6 | % | |
| TOTAL SECURITIES LENDING COLLATERAL | | | | | | | 735,044,698 | | | | 9.0 | % | |
TOTAL INVESTMENTS — (100.0%)
(Cost $5,271,689,547) | | | | | | $ | 8,902,105,736 | | | | 108.7 | % | |
| | | | | | | | | | | | | | |
See accompanying Notes to Financial Statements.
22
DIMENSIONAL EMERGING MARKETS VALUE FUND INC.
STATEMENT OF ASSETS AND LIABILITIES
NOVEMBER 30, 2007
(Amounts in thousands, except share and per share amounts)
| ASSETS: | |
| Investments at Value (including $669,888 of securities on loan) | | $ | 8,167,061 | | |
| Collateral Received from Securities on Loan at Value | | | 735,045 | | |
| Foreign Currencies at Value | | | 3,567 | | |
| Receivables: | |
| Investment Securities Sold | | | 35,403 | | |
| Dividends and Interest | | | 9,830 | | |
| Fund Shares Sold | | | 9,758 | | |
| Securities Lending Income | | | 1,170 | | |
| Prepaid Expenses and Other Assets | | | 3 | | |
| Total Assets | | | 8,961,837 | | |
| LIABILITIES: | |
| Payables: | |
| Upon Return of Securities Loaned | | | 735,045 | | |
| Investment Securities Purchased | | | 455 | | |
| Due to Advisor | | | 697 | | |
| Loan Payable | | | 24,081 | | |
| Deferred Thailand Capital Gains Tax | | | 11,982 | | |
| Accrued Expenses and Other Liabilities | | | 867 | | |
| Total Liabilities | | | 773,127 | | |
| NET ASSETS | | $ | 8,188,710 | | |
| SHARES OUTSTANDING, $0.01 PAR VALUE (1) | | | 123,446,288 | | |
| NET ASSET VALUE, OFFERING AND REDEMPTION PRICE PER SHARE | | $ | 66.33 | | |
| Investments at Cost | | $ | 4,536,645 | | |
| Collateral Received from Securities on Loan at Cost | | $ | 735,045 | | |
| Foreign Currencies at Cost | | $ | 3,477 | | |
| NET ASSETS CONSIST OF: | |
| Paid-In Capital | | $ | 3,908,238 | | |
| Undistributed Net Investment Income (Distributions in Excess of Net Investment Income) | | | 6,305 | | |
| Accumulated Net Realized Gain (Loss) | | | 655,565 | | |
| Deferred Thailand Capital Gains Tax | | | (11,982 | ) | |
| Net Unrealized Foreign Exchange Gain (Loss) | | | 78 | | |
| Net Unrealized Appreciation (Depeciation) | | | 3,630,506 | | |
| NET ASSETS | | $ | 8,188,710 | | |
| (1) NUMBER OF SHARES AUTHORIZED | | | Unlimited | | |
See accompanying Notes to Financial Statements.
23
DIMENSIONAL EMERGING MARKETS VALUE FUND INC.
STATEMENT OF OPERATIONS
FOR THE YEAR ENDED NOVEMBER 30, 2007
(Amounts in thousands)
| Investment Income | |
| Dividends (Net of Foreign Taxes Withheld of $16,545) | | $ | 169,359 | | |
| Interest | | | 1,103 | | |
| Income from Securities Lending | | | 9,140 | | |
| Total Investment Income | | | 179,602 | | |
| Expenses | |
| Investment Advisory Services Fees | | | 6,669 | | |
| Accounting & Transfer Agent Fees | | | 668 | | |
| Custodian Fees | | | 5,190 | | |
| Shareholders' Reports | | | 31 | | |
| Directors'/Trustees' Fees & Expenses | | | 92 | | |
| Legal Fees | | | 43 | | |
| Audit Fees | | | 79 | | |
| Other | | | 127 | | |
| Total Expenses | | | 12,899 | | |
| Net Investment Income (Loss) | | | 166,703 | | |
| Realized and Unrealized Gain (Loss) | |
| Net Realized Gain (Loss) on: | |
| Investment Securities Sold | | | 659,828 | | |
| Foreign Currency Transactions | | | (2,063 | ) | |
| Change in Unrealized Appreciation (Depreciation) of: | |
| Investment Securities and Foreign Currency | | | 1,892,737 | | |
| Translation of Foreign Currency Denominated Amounts | | | (230 | ) | |
| Deferred Thailand Capital Gains Tax | | | (3,211 | ) | |
| Net Realized and Unrealized Gain (Loss) | | | 2,547,061 | | |
| Net Increase (Decrease) in Net Assets Resulting from Operations | | $ | 2,713,764 | | |
See accompanying Notes to Financial Statements.
24
DIMENSIONAL EMERGING MARKETS VALUE FUND INC.
STATEMENTS OF CHANGES IN NET ASSETS
(Amounts in thousands)
| | | Year
Ended
Nov. 30,
2007 | | Year
Ended
Nov. 30,
2006 | |
| Increase (Decrease) in Net Assets | |
| Operations: | |
| Net Investment Income (Loss) | | $ | 166,703 | | | $ | 87,319 | | |
| Net Realized Gain (Loss) on: | |
| Investment Securities Sold | | | 659,828 | | | | 191,697 | | |
| Foreign Currency Transactions | | | (2,063 | ) | | | (2,472 | ) | |
| Change in Unrealized Appreciation (Depreciation) of: | |
| Investment Securities and Foreign Currency | | | 1,892,737 | | | | 926,842 | | |
| Translation of Foreign Currency Denominated Amounts | | | (230 | ) | | | 281 | | |
| Deferred Thailand Capital Gains Tax | | | (3,211 | ) | | | (4,652 | ) | |
| Net Increase (Decrease) in Net Assets Resulting from Operations | | | 2,713,764 | | | | 1,199,015 | | |
| Distributions From: | |
| Net Investment Income | | | (160,170 | ) | | | (89,423 | ) | |
| Net Short-Term Gains | | | (7,987 | ) | | | (5,458 | ) | |
| Net Long-Term Gains | | | (183,896 | ) | | | (53,393 | ) | |
| Total Distributions | | | (352,053 | ) | | | (148,274 | ) | |
| Capital Share Transactions (1): | |
| Shares Issued | | | 1,088,699 | | | | 1,397,138 | | |
| Shares Issued in Lieu of Cash Distributions | | | 338,352 | | | | 129,459 | | |
| Shares Redeemed | | | (437,964 | ) | | | (156,490 | ) | |
| Net Increase (Decrease) from Capital Share Transactions | | | 989,087 | | | | 1,370,107 | | |
| Total Increase (Decrease) in Net Assets | | | 3,350,798 | | | | 2,420,848 | | |
| Net Assets | |
| Beginning of Period | | | 4,837,912 | | | | 2,417,064 | | |
| End of Period | | $ | 8,188,710 | | | $ | 4,837,912 | | |
| (1) Shares Issued and Redeemed: | |
| Shares Issued | | | 20,030 | | | | 34,302 | | |
| Shares Issued in Lieu of Cash Distributions | | | 6,805 | | | | 3,503 | | |
| Shares Redeemed | | | (7,211 | ) | | | (4,043 | ) | |
| | | | 19,624 | | | | 33,762 | | |
Undistributed Net Investment Income
(Distributions in Excess of Net Investment Income) | | $ | 6,305 | | | $ | 3,675 | | |
See accompanying Notes to Financial Statements.
25
DIMENSIONAL EMERGING MARKETS VALUE FUND INC.
FINANCIAL HIGHLIGHTS
(for a share outstanding throughout each period)
| | | Year
Ended
Nov. 30,
2007 | | Year
Ended
Nov. 30,
2006 | | Year
Ended
Nov. 30,
2005 | | Year
Ended
Nov. 30,
2004 | | Year
Ended
Nov. 30,
2003 | |
Net Asset Value, Beginning of
Period | | $ | 46.60 | | | $ | 34.50 | | | $ | 27.57 | | | $ | 19.25 | | | $ | 12.81 | | |
| Income from Investment Operations | |
| Net Investment Income (Loss) | | | 1.41 | (A) | | | 1.03 | (A) | | | 0.99 | (A) | | | 0.52 | | | | 0.33 | | |
Net Gains (Losses) on Securities
(Realized and Unrealized) | | | 21.49 | | | | 12.95 | | | | 7.42 | | | | 8.42 | | | | 6.45 | | |
Total from Investment
Operations | | | 22.90 | | | | 13.98 | | | | 8.41 | | | | 8.94 | | | | 6.78 | | |
| Less Distributions | |
| Net Investment Income | | | (1.34 | ) | | | (1.04 | ) | | | (0.88 | ) | | | (0.41 | ) | | | (0.34 | ) | |
| Net Realized Gains | | | (1.83 | ) | | | (0.84 | ) | | | (0.60 | ) | | | (0.21 | ) | | | — | | |
| Total Distributions | | | (3.17 | ) | | | (1.88 | ) | | | (1.48 | ) | | | (0.62 | ) | | | (0.34 | ) | |
| Net Asset Value, End of Period | | $ | 66.33 | | | $ | 46.60 | | | $ | 34.50 | | | $ | 27.57 | | | $ | 19.25 | | |
| Total Return | | | 51.59 | % | | | 42.14 | % | | | 31.60 | % | | | 47.38 | % | | | 53.30 | % | |
Net Assets, End of Period
(thousands) | | $ | 8,188,710 | | | $ | 4,837,912 | | | $ | 2,417,064 | | | $ | 1,172,950 | | | $ | 617,723 | | |
Ratio of Expenses to Average
Net Assets | | | 0.19 | % | | | 0.22 | % | | | 0.29 | % | | | 0.34 | % | | | 0.42 | % | |
Ratio of Net Investment Income
to Average Net Assets | | | 2.50 | % | | | 2.57 | % | | | 3.23 | % | | | 2.33 | % | | | 2.39 | % | |
| Portfolio Turnover Rate | | | 14 | % | | | 9 | % | | | 7 | % | | | 8 | % | | | 10 | % | |
See page 1 for the Definitions of Abbreviations and Footnotes.
See accompanying Notes to Financial Statements.
26
DIMENSIONAL EMERGING MARKETS VALUE FUND INC.
NOTES TO FINANCIAL STATEMENTS
A. Organization:
Dimensional Emerging Markets Value Fund Inc. (the "Fund") was organized as a closed-end management investment company registered under the Investment Company Act of 1940, as amended. Effective November 21, 1997, the Fund was reorganized as an open-end management investment company.
B. Significant Accounting Policies:
The following significant accounting policies are in conformity with accounting principles generally accepted in the United States of America. Such policies are consistently followed by the Fund in preparation of its financial statements. The preparation of financial statements in accordance with accounting principles generally accepted in the United States of America requires management to make estimates and assumptions that affect the reported amounts of assets and liabilities and disclosure of contingent assets and liabilities at the date of the financial statements and the reported amounts of increases and decreases in net assets from operations during the reporting period. Actual results could differ from those estimates and those differences could be material.
1. Security Valuation: Securities held by the Fund (including over-the-counter securities) are valued at the last quoted sale price of the day. Securities held by the Fund that are listed on Nasdaq are valued at the Nasdaq Official Closing Price ("NOCP"). If there is no last reported sale price or NOCP for the day, the Fund values the securities at the mean of the most recent quoted bid and asked prices. Price information on listed securities is taken from the exchange where the security is primarily traded. Generally, securities issued by open-end investment companies are valued using their respective net asset values or public offering prices, as appropriate, for purchase orders placed at the close of the NYSE.
Securities for which no market quotations are readily available (including restricted securities), or for which market quotations have become unreliable, are valued in good faith at fair value in accordance with procedures adopted by the Board of Directors/Trustees. Fair value pricing may also be used if events that have a significant effect on the value of an investment (as determined in the discretion of the Investment Committee of the Advisor) occur before the net asset value is calculated. When fair value pricing is used, the prices of securities used by the Fund may differ from the quoted or published prices for the same securities on their primary markets or exchanges.
The Fund will also fair value price in the circumstances described below. Generally, trading in foreign securities markets is completed each day at various times prior to the close of the New York Stock Exchange (NYSE). For example, trading in the Japanese securities markets is completed each day at the close of the Tokyo Stock Exchange (normally, 7:00 a.m. PT), which is fourteen hours prior to the close of the NYSE (normally, 1:00 p.m. PT) and the time that the net asset value of the Fund is computed. Due to the time differences between the closings of the relevant foreign securities exchanges and the time the Fund prices its shares at the close of the NYSE, the Fund will fair value its foreign investments when it is determined that the market quotations for the foreign investments are either unreliable or not readily available. The fair value prices will attempt to reflect the impact of the U.S. financial markets' perceptions and trading a ctivities on the Fund's foreign investments since the last closing prices of the foreign investments were calculated on their primary foreign securities markets or exchanges. For these purposes, the Board of Directors/Trustees of the Fund has determined that movements in relevant indices or other appropriate market indicators, after the close of the Tokyo Stock Exchange or the London Stock Exchange, demonstrate that market quotations may be unreliable, and may trigger fair value pricing. Consequently, fair valuation of portfolio securities may occur on a daily basis. The fair value pricing by the Fund utilizes data furnished by an independent pricing service (and that data draws upon, among other information, the market values of foreign investments). The fair value prices of portfolio securities generally will be used when it is determined that the use of such prices will have a material impact on the net asset value of the Fund. When the Fund uses fair value pricing, the values assigned to the Fund's forei gn investments may not be the quoted or published prices of the investments on their primary markets or exchanges.
27
2. Foreign Currency Translation: Securities and other assets and liabilities of the Fund whose values are initially expressed in foreign currencies are translated to U.S. dollars using the mean between the most recently quoted bid and asked prices for the U.S. dollar as quoted by generally recognized reliable sources. Dividend and interest income and certain expenses are translated to U.S. dollars at the rate of exchange on their respective accrual dates. Receivables and payables denominated in foreign currencies are marked to market based on daily exchange rates and exchange gains or losses are realized upon ultimate receipt or disbursement.
The Fund does not isolate the effect of fluctuations in foreign exchange rates from the effect of fluctuations in the market prices of securities held whether realized or unrealized.
Realized gains or losses on foreign currency transactions represent net foreign exchange gains or losses from the disposition of foreign currencies, currency gains or losses realized between the trade and settlement dates on securities transactions, and the difference between amounts of interest, dividends and foreign withholding taxes recorded on the Fund's books and the U.S. dollar equivalent amounts actually received or paid.
3. Deferred Compensation Plan: Each eligible Director of the Fund may elect participation in the Deferred Compensation Plan (the "Plan"). Under the Plan, effective January 1, 2002, such Directors may defer payment of all or a portion of their total fees earned as a Director. These deferred amounts may be treated as though such amounts had been invested in shares of the following funds: U.S. Large Cap Value Portfolio; U.S. Core Equity 1 Portfolio; U.S. Core Equity 2 Portfolio; U.S. Vector Equity Portfolio; U.S. Micro Cap Portfolio; DFA International Value Portfolio; International Core Equity Portfolio; Emerging Markets Portfolio; Emerging Markets Core Equity Portfolio; and/or DFA Two-Year Global Fixed Income Portfolio. Contributions made under the Plan and the change in unrealized a ppreciation (depreciation) and income, are included in Directors'/Trustees' Fees and Expenses. At November 30, 2007, the total liability for deferred compensation to Directors is included in Accrued Expenses and Other Liabilities in the amount of $130 (in thousands).
Each Director has the option to receive their distribution of proceeds in one of the following methods upon one year's notice: lump sum; annual installments over a period of agreed upon years; or semi-annual installments over a period of agreed upon years. As of November 30, 2007, none of the Directors have requested distribution of proceeds.
4. Other: Security transactions are accounted for as of the trade date. Costs used in determining realized gains and losses on the sale of investment securities are on the basis of identified cost. Dividend income and distributions to shareholders are recorded on the ex-dividend date. Distributions received on securities that represent a return of capital or capital gain are recorded as a reduction of cost of investments or as a realized gain, respectively. The Fund estimates the character of distributions received that may be considered return of capital distributions. Interest income is recorded on the accrual basis. Expenses directly attributable to a Portfolio are directly charged. Common expenses of the Fund or Portfolios are allocated using methods approved by the Board of Di rectors/Trustees, generally based on average net assets.
The Fund may be subject to taxes imposed by countries in which it invests, with respect to its investment in issuers existing or operating in such countries. Such taxes are generally based on income earned or repatriated and capital gains realized on the sale of such investments. The Fund accrues such taxes when the related income or capital gains are earned or throughout the holding period. Some countries require governmental approval for the repatriation of investment income, capital or the proceeds of sales earned by foreign investors. In addition, if there is a deterioration in a country's balance of payments or for other reasons, a country may impose temporary restrictions on foreign capital remittances abroad.
The Fund's investments in Chile are subject to governmental taxes on investment income. Such taxes are due when currencies are repatriated from the country. The Fund accrues for taxes on income as the income is earned.
The Fund's investments in Thailand are subject to a 15% governmental capital gains tax. Such taxes are due upon sale of individual securities. The Fund accrues for taxes on the capital gains throughout the holding period of the underlying securities. The Fund is also subject to a 10% governmental capital gains tax on short-term capital gains for investments in India. Such taxes are due upon sale of individual securities. The taxes for the capital gains are accrued when the capital gains are earned.
28
C. Investment Advisor:
Dimensional Fund Advisors LP ("Dimensional" or the "Advisor") provides investment advisory services to the Fund. For the year ended November 30, 2007, the Fund's advisory services fees were accrued daily and paid monthly to the Advisor based on an effective annual rate of 0.10% of average daily net assets.
Fees Paid to Officers and Directors/Trustees:
Certain Officers and Directors/Trustees of the Advisor are also Officers and Directors/Trustees of the Fund; however, such Officers and Directors/Trustees (with the exception of the Chief Compliance Officer ("CCO")) receive no compensation from the Fund. For the year ended November 30, 2007, the total related amounts paid by the Fund to the CCO were $10 (in thousands). The total related amounts paid by the Fund are included in Other Expenses on the Statement of Operations.
D. Purchases and Sales of Securities:
For the year ended November 30, 2007, the Fund made the following purchases and sales of investment securities, other than short-term securities and U.S. government securities (amounts in thousands):
| Purchases | | $ | 1,711,807 | | |
| Sales | | | 919,628 | | |
There were no purchases or sales of long-term U.S. government securities.
E. Federal Income Taxes:
The Fund has qualified and intends to continue to qualify as a regulated investment company under Subchapter M of the Internal Revenue Code for federal income tax purposes and to distribute substantially all of its taxable income and net capital gains to shareholders. Accordingly, no provision has been made for federal income taxes.
Distributions from net investment income and net realized capital gains are determined in accordance with U.S. federal income tax regulations, which may differ from these amounts determined under accounting principles generally accepted in the United States of America. These book/tax differences are either temporary or permanent in nature. To the extent these differences are permanent, they are charged or credited to paid-in capital, undistributed net investment income or accumulated net realized gains, as appropriate, in the period that the differences arise. Accordingly, the following permanent differences as of November 30, 2007, primarily attributable to net realized gains on securities considered to be "passive foreign investment companies" were reclassified to the following accounts. These reclassifications had no effect on net assets or net asset value per share (amounts in thousands):
Increase
(Decrease)
Undistributed
Net Investment
Income | | Increase
(Decrease)
Accumulated
Net Realized
Gains/(Losses) | |
| $ | (1,431 | ) | | $ | 1,431 | | |
The tax character of dividends and distributions declared and paid during the years ended November 30, 2006 and November 30, 2007 were as follows (amounts in thousands):
| | | Net Investment
Income and
Short-Term
Gains | | Long-Term
Capital Gains | | Total | |
| | 2006 | | | $ | 94,881 | | | $ | 53,393 | | | $ | 148,274 | | |
| | 2007 | | | | 168,157 | | | | 183,896 | | | | 352,053 | | |
29
At November 30, 2007, the components of distributable earnings/(accumulated losses) were as follows (amounts in thousands):
Undistributed
Net Investment
Income and
Short-Term
Capital Gains | | Undistributed
Net Realized
Capital Gains | | Total Net
Distributable
Earnings/
(Accumulated
Losses) | |
| $ | 21,416 | | | $ | 644,373 | | | $ | 665,789 | | |
For federal income tax purposes, the Fund measures its capital loss carryforwards annually at November 30, its fiscal year end. Capital loss carryforwards may be carried forward and applied against future capital gains. As of November 30, 2007, the Fund had no capital loss carryforwards available to offset future realized capital gains.
Some of the Fund's investments are in securities considered to be "passive foreign investment companies" for which any unrealized appreciation (depreciation) (mark to market) and/or realized gains are required to be included in distributable net investment income for tax purposes. At November 30, 2007, the Fund had cumulative unrealized appreciation (depreciation) (mark to market) and realized gains on the sale of passive foreign investment companies (in thousands), of $2,435 and $3,563, respectively, which are included in distributable net investment income for federal income tax purposes, accordingly, such gains have been reclassified from accumulated net realized gains to accumulated net investment income.
At November 30, 2007, the total cost and aggregate gross unrealized appreciation and (depreciation) of securities for federal income tax purposes were different from amounts reported for financial reporting purposes (amounts in thousands):
Federal
Tax Cost | | Unrealized
Appreciation | | Unrealized
(Depreciation) | | Net
Unrealized
Appreciation
(Depreciation) | |
| $ | 5,275,478 | | | $ | 3,801,749 | | | $ | (175,121 | ) | | $ | 3,626,628 | | |
F. Financial Instruments:
In accordance with the Fund's investment objectives and policies, the Fund may invest in certain financial instruments that have off-balance sheet risk in excess of the amounts recognized in the financial statements and concentrations of credit and market risk. These instruments and their significant corresponding risks are described below:
1. Repurchase Agreements: The Fund may purchase money market instruments from financial institutions, such as banks and non-bank dealers, subject to the counterparty's agreement to repurchase them at an agreed upon date and price. The counterparty will be required on a daily basis to maintain the value of the collateral subject to the agreement at not less than the repurchase price (including accrued interest). The agreements are conditioned upon the collateral being deposited under the Federal Reserve book-entry system or with the Fund's custodian or a third party sub-custodian. In the event of default or bankruptcy by the other party to the agreement, retention of the collateral may be subject to legal proceedings. All open repurchase agreements were entered into on November 30, 2007.
2. Foreign Market Risks: Investments in foreign markets may involve certain considerations and risks not typically associated with investments in the United States, including the possibility of future political and economic developments and the level of foreign governmental supervision and regulation of foreign securities markets. These markets are generally smaller, less liquid and more volatile than the major securities markets in the United States. Consequently, acquisition and disposition of securities by the Fund may be inhibited.
30
G. Line of Credit:
The Fund, together with other Dimensional-advised portfolios, has entered into a $250 million unsecured discretionary line of credit effective June 26, 2007 with an affiliate of its domestic custodian bank. Each portfolio is permitted to borrow, subject to its investment limitations, up to a maximum of $250 million, as long as total borrowings under the line of credit do not exceed $250 million in the aggregate. Borrowings under the line of credit are charged interest at the then current Federal Funds Rate plus 1%. Each portfolio is individually, and not jointly, liable for its particular advances under the line of credit. There is no commitment fee on the unused portion of the line of credit. The agreement for the discretionary line of credit may be terminated by either party at any time. The line of credit is scheduled to expire on June 24, 2008. There were no borrowings by the Fund under this line of credit during the year ended November 30, 2007.
The Fund, together with other Dimensional-advised portfolios, has also entered into an additional $500 million unsecured line of credit effective January 22, 2007 with its international custodian bank. Each portfolio is permitted to borrow, subject to its investment limitations, up to a maximum of $500 million, as long as total borrowings under the line of credit do not exceed $500 million in the aggregate. Each portfolio is individually, and not jointly, liable for its particular advances under the line of credit. Borrowings under the line of credit are charged interest at rates agreed to by the parties at the time of borrowing. There is no commitment fee on the unused portion of the line of credit. The agreement for the line of credit expires on January 21, 2008.
For the year ended November 30, 2007, borrowings by the Portfolio under this line of credit were as follows (amounts in thousands, except percentage and days):
Weighted
Average
Interest Rate | | Weighted
Average
Loan Balance | | Number of
Days
Outstanding | | Interest
Expense
Incurred | | Maximum Amount
Borrowed During
the Period | |
| | 5.48 | % | | $ | 9,825 | | | | 15 | | | $ | 22 | | | $ | 24,081 | | |
At November 30, 2007 the Portfolio had a loan outstanding in the amount of $24,081 (amount in thousands).
H. Securities Lending:
As of November 30, 2007, the Fund had securities on loan to brokers/dealers, for which the Fund held cash collateral. The Fund invests the cash collateral, as described below, and records a liability for the return of the collateral, during the period the securities are on loan. Loans of securities are required at all times to be secured by collateral equal to at least (i) 100% of the current market value of the loaned securities with respect to securities of the U.S. government or its agencies, (ii) 102% of the current market value of the loaned securities with respect to U.S. securities, and (iii) 105% of the current market value of the loaned securities with respect to foreign securities. However, in the event of default or bankruptcy by the other party to the agreement, realization and/or retention of the collateral may be subject to legal proceedings. In the event that the borrower fails to return loaned securities, and cash collateral being maintained by the borrower is insufficient to cover the value of loaned securities and provided such collateral insufficiency is not the result of investment losses, the lending agent has agreed to pay the amount of the shortfall to the Fund or, at the option of the lending agent, to replace the securities.
Subject to the Fund's investment policy, the cash collateral received by the Fund from securities on loan is invested in securities of the U.S. government or its agencies, repurchase agreements collateralized by securities of the U.S. government or its agencies, and registered and unregistered money market funds. Agencies include both agency debentures and agency mortgage backed securities. In addition, the Fund will be able to terminate the loan at any time and will receive reasonable interest on the loan, as well as amounts equal to any dividends, interest or other distributions on the loaned securities. However, dividend income received from loaned securities may not be eligible to be taxed at qualified dividend income rates.
I. Indemnitees; Contractual Obligations:
Under the Fund's organizational documents, its officers and directors are indemnified against certain liability arising out of the performance of their duties to the Fund.
31
In the normal course of business, the Fund enters into contracts that contain a variety of representations and warranties which provide general indemnification. The Fund's maximum exposure under these arrangements is unknown as this would involve future claims that may be made against the Fund and/or its affiliates that have not yet occurred. However, based on experience, the Fund expects the risk of loss to be remote.
J. Recently Issued Accounting Standards and Interpretation:
On September 20, 2006, Statement of Financial Accounting Standards No. 157, Fair Value Measurements ("FAS 157"), was issued and is effective for fiscal years beginning after November 15, 2007. FAS 157 defines fair value, establishes a framework for measuring fair value and expands disclosures about fair value measurements. Management is currently evaluating the implications of FAS 157. At this time, its impact on the Fund's financial statements has not been determined.
On July 13, 2006, the Financial Accounting Standards Board ("FASB") released FASB Interpretation No. 48 ("FIN 48") "Accounting for Uncertainty in Income Taxes." FIN 48 provides guidance for how uncertain tax positions should be recognized, measured, presented and disclosed in the financial statements. FIN 48 requires the evaluation of tax positions taken in the course of preparing the Fund's tax returns to determine whether the tax positions are "more-likely-than-not" of being sustained by the applicable tax authority. Tax benefits of positions not deemed to meet the "more-likely-than-not" threshold would be booked as a tax expense in the current year and recognized as: a liability for unrecognized tax benefits; a reduction of an income tax refund receivable; a reduction of deferred tax asset; an increase in deferred tax liability; or a combination thereof. FIN 48 is effective six months following the fiscal year ending November 30, 2007. At this time, management is evaluating the implication of FIN 48 and does not believe it will have a material impact, if any, on the funds financial statements.
32
REPORT OF INDEPENDENT REGISTERED PUBLIC ACCOUNTING FIRM
To the Shareholders of Emerging Markets Value Portfolio and
Board of Directors of DFA Investment Dimensions Group Inc.:
In our opinion, the accompanying statement of assets and liabilities, and the related statements of operations and of changes in net assets and the financial highlights present fairly, in all material respects, the financial position of The Emerging Markets Value Portfolio (one of the portfolios constituting DFA Investment Dimensions Group Inc., hereafter referred to as the "Portfolio") at November 30, 2007, the results of its operations for the year then ended, the changes in its net assets for each of the two years in the period then ended and the financial highlights for each of the five years in the period then ended, in conformity with accounting principles generally accepted in the United States of America. These financial statements and financial highlights (hereafter referred to as "financial statements") are the responsibility of the Portfolios' management; our responsibility is to express an opinion on these financial statements ba sed on our audits. We conducted our audits of these financial statements in accordance with the standards of the Public Company Accounting Oversight Board (United States). Those standards require that we plan and perform the audit to obtain reasonable assurance about whether the financial statements are free of material misstatement. An audit includes examining, on a test basis, evidence supporting the amounts and disclosures in the financial statements, assessing the accounting principles used and significant estimates made by management, and evaluating the overall financial statement presentation. We believe that our audits, which included confirmation of securities at November 30, 2007 by correspondence with the transfer agent of the investee fund, provide a reasonable basis for our opinion.
PricewaterhouseCoopers LLP
Philadelphia, Pennsylvania
January 22, 2008
33
FUND MANAGEMENT
Trustees/Directors
Each Board of Trustees/Directors of The DFA Investment Trust Company Inc. ("DFAITC"), DFA Investment Dimensions Group Inc. ("DFAIDG"), Dimensional Investment Group Inc. ("DIG") and Dimensional Emerging Markets Value Fund Inc. ("DEM") (each, the "Fund" and collectively, the "Funds") is responsible for establishing the Funds' policies and for overseeing the management of the Funds. The Trustees/Directors of the Funds, including all of the disinterested Directors, have adopted written procedures to monitor potential conflicts of interest that might develop between portfolios of the Funds (the "Feeder Portfolios") that invest in certain series of DFAITC or DEM (the "Master Funds").
Each Board has two standing committees, an Audit Committee and a Portfolio Performance and Service Review Committee (the "Performance Committee"). The Audit Committee is comprised of George M. Constantinides, Roger G. Ibbotson and Abbie J. Smith. Each member of the Audit Committee is a disinterested Director. The Audit Committee oversees the Fund's accounting and financial reporting policies and practices, the Fund's internal controls, the Fund's financial statements and the independent audits thereof and performs other oversight functions as requested by the Board. The Audit Committee recommends the appointment of each Fund's independent registered certified public accounting firm and also acts as a liaison between the Fund's independent registered certified public accounting firm and the full Board. There were four Audit Committee meetings held during the fiscal year ended November 30, 2007.
Each Board's Performance Committee is comprised of Messrs. Constantinides and Ibbotson, Ms. Smith, John P. Gould, Myron S. Scholes and Robert C. Merton. Each member of the Fund's Performance Committee is a disinterested Director. The Performance Committee regularly reviews and monitors the investment performance of the Fund's series and reviews the performance of the Fund's service providers. There were six Performance Committee meetings held during the fiscal year ended November 30, 2007.
Certain biographical information for each disinterested Trustee/Director and each interested Trustee/Director of the Funds is set forth in the tables below, including a description of each Trustee/Director's experience as a Trustee/Director of the Funds and as a director or trustee of other funds, as well as other recent professional experience.
The statements of additional information (together, "SAI") of the Funds include additional information about each Trustee/Director. You may obtain copies of the SAI and prospectus of each Fund advised by Dimensional Fund Advisors LP by calling collect (310) 395-8005 or by mailing a request to Dimensional Fund Advisors LP, 1299 Ocean Avenue, Santa Monica, California 90401. Prospectuses are also available at www.dimensional.com.
Name, Position
with the Fund,
Address and Age | | Term of Office1 and
Length of Service | | Portfolios within the
DFA Fund Complex2
Overseen | | Principal Occupation(s) During Past 5 Years and
Other Directorships of Public Companies Held | |
| | | Disinterested Trustees/Directors | |
|
George M. Constantinides
Director of DFAIDG, DIG and DEM.
Trustee of DFAITC.
Graduate School of Business, University of Chicago
5807 S. Woodlawn Avenue Chicago, IL 60637
Age: 59 | | DFAITC - since 1993
DFAIDG - since 1983
DIG - since 1993
DEM - since 1993 | | 86 portfolios in 4 investment companies | | Leo Melamed Professor of Finance, Graduate School of Business, University of Chicago. | |
|
34
Name, Position
with the Fund,
Address and Age | | Term of Office1 and
Length of Service | | Portfolios within the
DFA Fund Complex2
Overseen | | Principal Occupation(s) During Past 5 Years and
Other Directorships of Public Companies Held | |
John P. Gould
Director of DFAIDG, DIG and DEM.
Trustee of DFAITC.
Graduate School of Business, University of Chicago
5807 S. Woodlawn Avenue
Chicago, IL 60637
Age: 68 | | DFAITC - since 1993
DFAIDG - since 1986
DIG - since 1993
DEM - since 1993 | | 86 portfolios in 4 investment companies | | Steven G. Rothmeier Distinguished Service Professor of Economics, Graduate School of Business, University of Chicago (since 1965). Member of the Boards of Milwaukee Mutual Insurance Company (since 1997) and UNext.com (1999-2006). Formerly, Senior Vice-President, Lexecon Inc. (economics, law, strategy and finance consulting) (1994-2004). Formerly, President, Cardean University (division of UNext.com) (1999-2001). Trustee, Harbor Fund (registered investment company) (14 Portfolios). | |
|
Roger G. Ibbotson
Director of DFAIDG, DIG and DEM.
Trustee of DFAITC.
Yale School of Management
P.O. Box 208200
New Haven, CT 06520-8200
Age: 64 | | DFAITC - since 1993
DFAIDG - since 1981
DIG - since 1993
DEM - since 1993 | | 86 portfolios in 4 investment companies | | Professor in Practice of Finance, Yale School of Management (since 1984). Director, BIRR Portfolio Analysis, Inc. (software products) (since 1990). Chairman, CIO and Partner, Zebra Capital Management, LLC (hedge fund manager) (since 2001).
Consultant to Morningstar, Inc. (since 2006). Formerly, Chairman, Ibottson Associates, Inc., Chicago, IL (software data publishing and consulting) (1977-2006). | |
|
Robert C. Merton
Director of DFAIDG, DIG and DEM.
Trustee of DFAITC.
Harvard Business School
353 Baker Library
Soldiers Field
Boston, MA 02163
Age: 63 | | DFAITC - since 2003
DFAIDG - since 2003
DIG - since 2003
DEM - since 2003 | | 86 portfolios in 4 investment companies | | John and Natty McArthur University Professor, Graduate School of Business Administration, Harvard University (since 1998). George Fisher Baker Professor of Business Administration, Graduate School of Business Administration, Harvard University (1988-1998), Co-founder, Chief Science Officer, Integrated Finance Limited (since 2002). Director, MF Risk, Inc. (risk management software) (since 2001). Director, Peninsula Banking Group (bank) (since 2003). Director, Community First Financial Group (bank holding company) (since 2003). Advisory Board Member, Alpha Simplex Group (hedge fund) (since 2001). Member Competitive Markets Advisory Council, Chicago Mercantile Exchange (futures trading exchange) (since 2004). Formerly, Advisory Board Member, NuServe (insurance software) (2001-2003). Director, Vical Incorporated (biopharmaceutical product development) (since 2002). | |
|
Myron S. Scholes
Director of DFAIDG, DIG and DEM.
Trustee of DFAITC.
Oak Hill Capital Management, Inc.
1100 King Street
Building 4
Rye Brook, NY 10573
Age: 66 | | DFAITC - since 1993
DFAIDG - since 1981
DIG - since 1993
DEM - since 1993 | | 86 portfolios in 4 investment companies | | Frank E. Buck Professor Emeritus of Finance, Stanford University (since 1981). Chairman, Platinum Grove Asset Management (hedge fund) (formerly, Oak Hill Platinum Partners) (since 1999). Managing Partner, Oak Hill Capital Management (private equity firm). Chairman, Oak Hill Platinum Partners (hedge fund) (since 2004). Director, Chicago Mercantile Exchange (since 2001). Director, American Century Fund Complex (registered investment companies) (37 Portfolios) (since 1981); and Director, Chicago Mercantile Exchange Holdings Inc. (since 2000). | |
|
Abbie J. Smith
Director of DFAIDG, DIG and DEM.
Trustee of DFAITC.
Graduate School of Business
University of Chicago
5807 S. Woodlawn Avenue
Chicago, IL 60637
Age: 54 | | DFAITC - since 2000
DFAIDG - since 2000
DIG - since 2000
DEM - since 2000 | | 86 portfolios in 4 investment companies | | Boris and Irene Stern Professor of Accounting, Graduate School of Business, University of Chicago (since 1980), Formerly, Marvin Bower Fellow, Harvard Business School (9/01 to 8/02). Director, HNI Corporation (formerly known as HON Industries Inc.) (office furniture) (since 2000) and Director, Ryder System Inc. (transportation) (since 2003). | |
|
35
Name, Position
with the Fund,
Address and Age | | Term of Office1 and
Length of Service | | Portfolios within the
DFA Fund Complex2
Overseen | | Principal Occupation(s) During Past 5 Years and
Other Directorships of Public Companies Held | |
| | | Interested Trustees/Directors* | |
|
David G. Booth
Chairman, Director, Chief Executive Officer and President of DFAIDG, DIG and DEM. Chairman, Trustee, Chief Executive Officer, Chief Investment Officer and President of DFAITC.
1299 Ocean Avenue
Santa Monica, CA 90401
Age: 60 | | DFAITC - since 1993
DFAIDG - since 1981
DIG - since 1992
DEM - since 1993 | | 86 portfolios in 4 investment companies | | Chairman, Director/Trustee, Presdient, Chief Executive Officer and formerly Chief Investment Officer of the following companies: Dimensional Holdings Inc., Dimensional Fund Advisors LP, DFA Securities Inc., Dimensional Fund Advisors Canada Inc., DFAIDG, DIG, DEM and DFAITC. Director of Dimensional Fund Advisors Ltd, and formerly Chief Investment Officer. Director, President and formerly Chief Investment Officer of DFA Australia Ltd. Formerly, Director of Dimensional Funds PLC. Chairman, Director, Chief Executive Officer and formerly Chief Investment Officer of Dimensional Fund Advisors Canada Inc. (All Chief Investment Officer positions held starting 1/03 through 3/07 except for Dimensional Fund Advisors Canada Inc., which was from 6/03 through 3/07, and Dimensional Holdings Inc., which was from 10/06 through 3/07.)
Limited Partner, Oak Hill Partners, Director, Universit y of Chicago Business School. Formerly, Director, SA Funds (registered investment company). Formerly Director, Assante Corporation (investment management) (until 2002). | |
|
Rex A. Sinquefield
The Show Me Institute
7777 Bonhomme Ave.,
Suite 2150 St. Louis, MO 63105
Age: 63 | | DFAITC - since 1993
DFAIDG - since 1981
DIG - since 1992
DEM - since 1993 | | 86 portfolios in 4 investment companies | | Director/Trustee (and prior to 2006 Chairman, and prior to 2003, Chief Investment Officer) of Dimensional Fund Advisors LP, DFA Securities Inc., DFAIDG, DIG, DEM and DFAITC. Director of Dimensional Holdings Inc. Director and formerly President of Dimensional Fund Advisors Ltd, Director (and prior to 1/1/2003, Chief Investment Officer) of DFA Australia Ltd. Director of Dimensional Funds PLC and Dimensional Fund Advisors Canada Inc.
Trustee, St. Louis University (since 2003). Life Trustee and Member of Investment Committee, DePaul University. Director, The German St. Vincent Orphan Home. Member of Investment Committee, Archdiocese of St. Louis. Trustee and Member of Investment Committee, St. Louis Art Institute (since 2005). President and Director, The Show Me Institute (since 2006). Trustee, St. Louis Symphony Orchestra (since 2005). Trustee, Missouri Botanical Garden (si nce 2005). | |
|
1 Each Trustee/Director holds office for an indefinite term until his or her successor is elected and qualified.
2 Each Trustee/Director is a director or trustee of each of the four registered investment companies within the DFA Fund Complex, which includes the Funds.
* Interested Directors are described as such because they are deemed to be "interested persons," as that term is defined under the Investment Company Act of 1940, as amended, due to their positions with Dimensional Fund Advisors LP.
36
Officers
The name, age, information regarding positions with the Funds and the principal occupation for each officer of the Funds are set forth below. Each officer listed below holds the same office (except as otherwise noted) in the following entities: Dimensional Fund Advisors LP (prior to November 3, 2006, Dimensional Fund Advisors Inc.) ("Dimensional"), DFA Securities Inc., DFAIDG, DIG, DFAITC and DEM (collectively, the "DFA Entities"). The address of each officer is: Dimensional Fund Advisors LP, 1299 Ocean Avenue, Santa Monica, California 90401, unless otherwise indicated.
Name, Position with the Fund
and Age | | Term of Office1
and Length of
Service | | Principal Occupation(s) During Past 5 Years | |
| | | Officers | |
|
M. Akbar Ali
Vice President
Age: 36 | | Since 2005 | | Vice President of all the DFA Entities. Portfolio Manager of Dimensional (since August 2002). Formerly, Graduate Student at the University of California, Los Angeles (August 2000 to June 2002); Senior Technology Office at JPMorgan Chase & Co. (February 1997 to June 2000). | |
|
Darryl Avery
Vice President
Age: 41 | | Since 2005 | | Vice President of all the DFA Entities. From June 2002 to January 2005, institutional client service representative of Dimensional. Formerly, institutional client service and marketing representative for Metropolitan West Asset Management (February 2001 to February 2002); institutional client service and marketing representative for Payden & Rygel (June 1990 to January 2001). | |
|
Arthur H. Barlow
Vice President
Age: 52 | | Since 1993 | | Vice President of all the DFA Entities. Formerly, Vice President of DFA Australia Limited and Dimensional Fund Advisors Ltd. | |
|
Scott A. Bosworth
Vice President
Age: 38 | | Since 2007 | | Vice President of all the DFA Entities. Regional Director of Dimensional (since November 1997). | |
|
Valerie A. Brown
Vice President and Assistant Secretary
Age: 40 | | Since 2001 | | Vice President and Assistant Secretary of all the DFA Entities, DFA Australia Limited, Dimensional Fund Advisors Ltd., and since June 2003, Dimensional Fund Advisors Canada Inc. Since March 2000, legal counsel for Dimensional. | |
|
David P. Butler
Vice President
Age: 42 | | Since 2007 | | Vice President of all the DFA Entities. Director of US Financial Services of Dimensional (since January 2005). Formerly, Regional Director of Dimensional Fund Advisors LP (January 1995 to January 2005). | |
|
Patrick Carter
Vice President
Age: 45 | | Since 2007 | | Vice President of all the DFA Entities. Regional Director of Dimensional (since March 2006). Formerly, Director of Merrill Lynch Retirement Group (December 1998 to March 2006). | |
|
Stephen A. Clark
Vice President
Age: 35 | | Since 2004 | | Vice President of all the DFA Entities, April 2001 to April 2004, Portfolio Manager of Dimensional. Formerly, Graduate Student at the University of Chicago (September 2000 to March 2001). | |
|
Robert P. Cornell
Vice President
Age: 58 | | Since 2007 | | Vice President of all the DFA Entities. Regional Director of Financial Services Group of Dimensional (since August 1993). | |
|
Christopher S. Crossan
Vice President and Chief Compliance Officer
Age: 41 | | Since 2004 | | Vice President and Chief Compliance Officer of all the DFA Entities. Formerly, Senior Compliance Officer, INVESCO Institutional, Inc. and its affiliates (August 2000 to January 2004). | |
|
James L. Davis
Vice President
Age: 50 | | Since 1999 | | Vice President of all the DFA Entities. Formerly, Vice President of DFA Australia Limited and Dimensional Fund Advisors Ltd. | |
|
Robert T. Deere
Vice President
Age: 50 | | Since 1994 | | Vice President of all the DFA Entities and DFA Australia Limited. | |
|
37
Name, Position with the Fund
and Age | | Term of Office1
and Length of
Service | | Principal Occupation(s) During Past 5 Years | |
Robert W. Dintzner
Vice President
Age: 37 | | Since 2001 | | Vice President of all the DFA Entities. Prior to April 2001, marketing supervisor and marketing coordinator for Dimensional. | |
|
Kenneth Elmgren
Vice President
Age: 53 | | Since 2007 | | Vice President of all the DFA Entities. Formerly, Managing Principal of Beverly Capital (May 2004 to September 2006); Principal of Wydown Capital (September 2001 to May 2004). | |
|
Richard A. Eustice
Vice President and Assistant Secretary
Age: 42 | | Since 1998 | | Vice President and Assistant Secretary of all the DFA Entities and DFA Australia Limited. Formerly, Vice President of Dimensional Fund Advisors Ltd. | |
|
Eugene F. Fama, Jr.
Vice President
Age: 46 | | Since 1993 | | Vice President of all the DFA Entities. Formerly, Vice President of DFA Australia Limited and Dimensional Fund Advisors Ltd. | |
|
Gretchen A. Flicker
Vice President
Age: 36 | | Since 2004 | | Vice President of all the DFA Entities. Prior to April 2004, institutional client service representative of Dimensional. | |
|
Glenn S. Freed
Vice President
Age: 46 | | Since 2001 | | Vice President of all the DFA Entities, Formerly, Professor and Associate Dean of the Leventhal School of Accounting (September 1998 to August 2001) and Academic Director Master of Business Taxation Program (June 1996 to August 2001) at the University of Southern California Marshall School of Business. | |
|
Mark R. Gochnour
Vice President
Age: 39 | | Since 2007 | | Vice President of all the DFA Entities. Regional Director of Dimensional. | |
|
Henry F. Gray
Vice President
Age: 40 | | Since 2000 | | Vice President of all the DFA Entities. Prior to July 2000, Portfolio Manager of Dimensional. Formerly, Vice President of DFA Australia Limited. | |
|
John T. Gray
Vice President
Age: 32 | | Since 2007 | | Vice President of all the DFA Entities. Formerly, Regional Director of Dimensional (January 2005 to February 2007); Client Services Coordinator of Dimensional (December 1999 to December 2002). | |
|
Darla Hastings
Vice President
Age: 52 | | Since 2007 | | Vice President of all the DFA Entities. Chief Marketing Officer of Dimensional. Formerly, Senior Vice President, Customer Experience for Benchmark Assisted Living (May 2005 to April 2006); Executive Vice President and Chief Marketing Officer of State Street Corporation (September 2001 to October 2005). | |
|
Joel H. Hefner
Vice President
Age: 39 | | Since 2007 | | Vice President of all the DFA Entities. Regional Director of Dimensional (since June 1998). | |
|
Julie Henderson
Vice President and Fund Controller
Age: 33 | | Since 2005 | | Vice President and Fund Controller of all the DFA Entities. Formerly, Senior Manager at PricewaterhouseCoopers LLP (July 1996 to April 2005). | |
|
Kevin Hight
Vice President
Age: 40 | | Since 2005 | | Vice President of all the DFA Entities. Formerly, Regional Director of Dimensional (since March 2003 to March 2005). Formerly, Vice President and Portfolio Manager for Payden & Rygel (July 1999 to February 2003). | |
|
Christine W. Ho
Vice President
Age: 40 | | Since 2004 | | Vice President of all the DFA Entities. Prior to April 2004, Assistant Controller of Dimensional. | |
|
Jeff J. Jeon
Vice President
Age: 34 | | Since 2004 | | Vice President of all the DFA Entities. Prior to April 2004, counsel of Dimensional. Formerly, an Associate at Gibson, Dunn & Crutcher LLP (September 1997 to August 2001). | |
|
38
Name, Position with the Fund
and Age | | Term of Office1
and Length of
Service | | Principal Occupation(s) During Past 5 Years | |
Patrick Keating
Vice President
Age: 52 | | Since 2003 | | Vice President of all the DFA Entities and Dimensional Fund Advisors Canada Inc. Formerly, Director, President and Chief Executive Officer, Assante Asset Management, Inc. (October 2000 to December 2002); Director, Assante Capital Management (October 2000 to December 2002); President and Chief Executive Officer, Assante Capital Management (October 2000 to April 2001); Executive Vice President, Assante Corporation (May 2001 to December 2002); Director, Assante Asset Management Ltd. (September 1997 to December 2002); President and Chief Executive Officer, Assante Asset Management Ltd. (September 1998 to May 2001). | |
|
Joseph F. Kolerich
Vice President
Age: 35 | | Since 2004 | | Vice President of all the DFA Entities. From April 2001 to April 2004, Portfolio Manager for Dimensional, Formerly, a trader at Lincoln Capital Fixed Income Management (formerly Lincoln Capital Management Company). | |
|
Michael F. Lane
Vice President
Age: 40 | | Since 2004 | | Vice President of all the DFA Entities. Formerly, Vice President of Advisor Services at TIAA-CREF (July 2001 to September 2004); AEGON, President, Advisor Resources (September 1994 to June 2001). | |
|
Kristina M. LaRusso
Vice President
Age: 31 | | Since 2006 | | Vice President of all DFA Entities. Formerly, Operations Supervisor of Dimensional (March 2003 to December 2006); Operations Coordinator of Dimensional (March 1998 to March 2003.) | |
|
Inmoo Lee
Vice President
Age: 41 | | Since 2007 | | Vice President of all the DFA Entities. Associate Professor Department of Finance and Accounting, Business School, National University of Singapore (July 2004 to present); Associate Professor, College of Business Administration, Korea University (September 2001 to May 2006). | |
|
Juliet Lee
Vice President
Age: 36 | | Since 2005 | | Vice President of all the DFA Entities. Human Resources Manager of Dimensional (since January 2004). Formerly, Assistant Vice President for Metropolitan West Asset Management LLC (February 2001 to December 2003) and Director of Human Resources for Icebox, LLC (March 2000 to February 2001). | |
|
David R. Martin
Vice President, Chief Financial Officer and Treasurer
Age: 50 | | Since 2007 | | Vice President, Chief Financial Officer and Treasurer of all the DFA Entities. Formerly, Executive Vice President and Chief Financial Officer of Janus Capital Group Inc. (June 2005 to March 2007); Senior Vice President of Finance at Charles Schwab & Co., Inc. (March 1999 to May 2005). | |
|
Heather H. Mathews
Vice President
Age: 37 | | Since 2004 | | Vice President of all the DFA Entities. Prior to April 2004, Portfolio Manager for Dimensional Fund Advisors Inc. Formerly, Graduate Student at Harvard University (August 1998 to June 2000). | |
|
David M. New
Vice President
Age: 47 | | Since 2003 | | Vice President of all the DFA Entities. Formerly, Client Service Manager of Dimensional. Formerly, Director of Research, Wurts and Associates (investment consulting firm) (December 2000 to June 2002). | |
|
Catherine L. Newell
Vice President and Secretary
Age: 43 | | Vice President since 1997 and Secretary since 2000 | | Vice President and Secretary of all the DFA Entities. Vice President and Assistant Secretary of DFA Australia Limited (since February 2002, April 1997 and May 2002, respectively). Vice President and Secretary of Dimensional Fund Advisors Canada Inc. (since June 2003). Director, Dimensional Funds plc (since January 2002). Formerly, Assistant Secretary of all DFA Entities and Dimensional Fund Advisors Ltd. | |
|
Gerard K. O'Reilly
Vice President
Age: 30 | | Since 2007 | | Vice President of all the DFA Entities. Formerly, Research Associate of Dimensional Fund Advisors LP (2004 to 2006); Research Assistant in PhD program, Aeronautics Department California Institute of Technology (1998 to 2004). | |
|
Carmen Palafox
Vice President
Age: 32 | | Since 2006 | | Vice President of all the DFA Entities. Operations Manager of Dimensional Fund Advisors LP (since May 1996). | |
|
39
Name, Position with the Fund
and Age | | Term of Office1
and Length of
Service | | Principal Occupation(s) During Past 5 Years | |
Sonya Park
Vice President
Age: 35 | | Since 2005 | | Vice President of all the DFA Entities. From February 2002 to January 2005, institutional client service representative of Dimensional. Formerly, Associate Director at Watson Pharmaceuticals Inc. (January 2001 to February 2002); Graduate student at New York University (February 2000 to December 2000). | |
|
David A. Plecha
Vice President
Age: 46 | | Since 1993 | | Vice President of all the DFA Entities, DFA Australia Limited and Dimensional Fund Advisors Ltd.. | |
|
Eduardo A. Repetto
Vice President and Chief Investment Officer
Age: 40 | | Since 2002 | | Chief Investment Officer (beginning March 2007) and Vice President of all the DFA Entities. Formerly, Research Associate for Dimensional (June 2000 to April 2002). Formerly, Research Scientist (August 1998 to June 2000), California Institute of Technology. | |
|
L. Jacobo Rodriguez
Vice President
Age: 36 | | Since 2005 | | Vice President of all the DFA Entities. From August 2004 to July 2005, institutional client service representative of Dimensional. Formerly, Financial Services Analyst, Cato Institute (September 2001 to June 2004); Book Review Editor, Cato Journal, Cato Institute (May 1996 to June 2004); and Assistant Director, Project on Global Economic Liberty, Cato Institute (January 1996 to August 2001). | |
|
David E. Schneider
Vice President
Age: 61 | | Since 2001 | | Vice President of all the DFA Entities. Currently, Director of Institutional Services. Prior to 2001, Regional Director of Dimensional. | |
|
Ted R. Simpson
Vice President
Age: 38 | | Since 2007 | | Vice President of all the DFA Entities. Regional Director of Dimensional (since December 2002). Formerly, contract employee with Dimensional (April 2002 to December 2002). | |
|
Bryce D. Skaff
Vice President
Age: 32 | | Since 2007 | | Vice President of all the DFA Entities. Formerly, Regional Director of Dimensional (December 1999 to January 2007). | |
|
Grady M. Smith
Vice President
Age: 51 | | Since 2004 | | Vice President of all the DFA Entities. Prior to April 2004, Portfolio Manager of Dimensional. Formerly, Principal of William M. Mercer, Incorporated (July 1995 to June 2001). | |
|
Carl G. Snyder
Vice President
Age: 44 | | Since 2000 | | Vice President of all the DFA Entities. Prior to July 2000, Portfolio Manager of Dimensional. Formerly, Vice President of DFA Australia Limited. | |
|
Lawrence R. Spieth
Vice President
Age: 60 | | Since 2004 | | Vice President of all the DFA Entities. Prior to April 2004, institutional client service representative of Dimensional. | |
|
Bradley G. Steiman
Vice President
Age: 34 | | Since 2004 | | Vice President of all the DFA Entities and Director and Vice President of Dimensional Fund Advisors Canada Inc. Prior to April 2002, Regional Director of Dimensional. Formerly, Vice President and General Manager of Assante Global Advisors (July 2000 to April 2002); Vice President of Assante Asset Management Inc. (March 2000 to July 2000); and Private Client Manager at Loring Ward Investment Counsel Ltd. (June 1997 to February 2002). | |
|
Karen E. Umland
Vice President
Age: 41 | | Since 1997 | | Vice President of all the DFA Entities, DFA Australia Limited, Dimensional Fund Advisors Ltd., and since June 2003, Dimensional Fund Advisors Canada Inc. | |
|
Carol W. Wardlaw
Vice President
Age: 49 | | Since 2004 | | Vice President of all the DFA Entities. Prior to April 2004, Regional Director of Dimensional. | |
|
Weston J. Wellington
Vice President
Age: 56 | | Since 1997 | | Vice President of all the DFA Entities. Formerly, Vice President of DFA Australia Limited. | |
|
40
Name, Position with the Fund
and Age | | Term of Office1
and Length of
Service | | Principal Occupation(s) During Past 5 Years | |
Daniel M. Wheeler
Vice President
Age: 62 | | Since 2001 | | Vice President of all the DFA Entities. Prior to 2001, Director of Financial Advisors Services of Dimensional. Director of Dimensional Fund Advisors Ltd. (since October 2003) and President of Dimensional Fund Advisors Canada Inc. (since June 2003). | |
|
Ryan Wiley
Vice President
Age: 30 | | Since 2007 | | Vice President of all the DFA Entities. Senior Trader of Dimensional. Formerly, Portfolio Manager (2006 to 2007); Trader (2001 to 2006); and Trading Assistant of Dimensional (1999 to 2001). | |
|
Paul E. Wise
Vice President
Age: 52 | | Since 2005 | | Vice President of all the DFA Entities. Chief Technology Officer for Dimensional (since 2004). Formerly, Principal of Turnbuckle Management Group (January 2002 to August 2004); Vice President of Information Technology of AIM Management Group (March 1997 to January 2002). | |
|
1 Each officer holds office for an indefinite term at the pleasure of the Boards of Trustee/Directors and until his or her successor is elected and qualified.
41
VOTING PROXIES ON FUND PORTFOLIO SECURITIES
A description of the policies and procedures that the Fund uses in voting proxies relating to securities held in the portfolio is available without charge, upon request, by calling collect: (310) 395-8005. Information regarding how the Advisor votes these proxies is available from the EDGAR database on the SEC's website at http://www.sec.gov and from the Advisor's website at http://www.dimensional.com and reflects the twelve-month period beginning July 1st and ending June 30th.
42
NOTICE TO SHAREHOLDERS
(Unaudited)
For shareholders that do not have a November 30, 2007 tax year end, this notice is for informational purposes only. For shareholders with a November 30, 2007 tax year end, please consult your tax advisor as to the pertinence of this notice. For the fiscal year December 1, 2006 to November 30, 2007, each portfolio is designating the following items with regard to distributions paid during the year.
| DFA Investment Dimensions Group Inc. | | Net
Investment
Income
Distributions | | Short-Term
Capital Gain
Distributions | | Long-Term
Capital Gain
Distributions | | Total
Distributions | | Qualifying
Dividend
Income(1) | | Foreign
Tax
Credit(2) | | Qualifying
Interest
Income(3) | | Qualifying
Short-Term
Capital Gain(4) | |
| Emerging Markets Value Portfolio | | | 67.22 | % | | | 0.75 | % | | | 32.03 | % | | | 100.00 | % | | | 8.14 | % | | | — | | | | 0.55 | % | | | 1.10 | % | |
| Dimensional Emerging Markets Value Fund Inc. | |
Dimensional Emerging Markets
Value Fund Inc. | | | 45.50 | % | | | 2.27 | % | | | 52.23 | % | | | 100.00 | % | | | 6.83 | % | | | 9.83 | % | | | 0.52 | % | | | 4.32 | % | |
(1) The percentage in this column represents the amount of "Qualifying Dividend Income" as created by the Jobs and Growth Tax Relief Reconciliation Act of 2003 and is reflected as a percentage of ordinary income distributions (the total of net investment income and short-term capital gain distributions). It is the intention of each of the aforementioned funds to designate the maximum amount permitted by law.
(2) Foreign Tax Credit represent dividends which qualify for the foreign tax credit pass through and is reflected as a percentage of investment company taxable income (the total of net investment income and short-term capital gain distributions).
(3) The percentage in this column represents the amount of "Qualifying Interest Income" as created by The American Jobs Creation Act of 2004. The information is reflected as a percentage of ordinary income distributions (the total of net investment income and short-term capital gain distributions).
(4) The percentage in this column represents the amount of "Qualifying Short-Term Capital Gain" as created by The American Jobs Creation Act of 2004. The information is reflected as a percentage of ordinary income distributions (the total of net investment income and short-term capital gain distributions).
43
[THIS PAGE INTENTIONALLY LEFT BLANK]

DFA113007-005A
ITEM 2. CODE OF ETHICS.
The Registrant has adopted, as of the end of the period covered by this Form N-CSR (the “Report”), a code of ethics that applies to the Registrant’s principal executive officer and principal financial officer (the “Code of Business Ethics”). The Registrant has not made any substantive amendments to the Code of Business Ethics during the period covered by this Report. The Registrant also has not granted any waiver from any provisions of the Code of Business Ethics during the period covered by this Report. A copy of the Code of Business Ethics is filed as an exhibit to this Report.
ITEM 3. AUDIT COMMITTEE FINANCIAL EXPERT.
The Registrant’s Board of Directors has determined that Abbie J. Smith possesses the technical attributes to qualify as an “audit committee financial expert” serving on the Registrant’s Audit Committee and has designated Ms. Smith as the “audit committee financial expert.” Ms. Smith
earned a Ph.D. in Accounting, and has taught Accounting at the graduate level since 1980. Ms. Smith’s education and career have provided her with an understanding of generally accepted accounting principles and financial statements; the ability to assess the general application of such principles in connection with the accounting for estimates, accruals and reserves; and experience preparing, analyzing and evaluating financial statements that present a breadth and level of complexity of issues that can reasonably be expected to be raised by the Registrant’s financial statements. In addition, Ms. Smith has served on the boards of directors and audit committees of entities other than the Registrant. Ms. Smith is independent under the standards set forth in Item 3 of Form N-CSR.
ITEM 4. PRINCIPAL ACCOUNTANT FEES AND SERVICES.
(a) Audit Fees
Fiscal Year Ended November 30, 2007: $19,533
Fiscal Year Ended November 30, 2006: $29,631
(b) Audit-Related Fees
Fees for Registrant Fiscal Year Ended November 30, 2007: $1,215
Fiscal Year Ended November 30, 2006: $2,940
For fiscal years ended November 30, 2007 and November 30, 2006, Audited-Related Fees included fees for services related to limited procedures performed in connection with the production of the Registrant’s semi-annual financial statements.
Audit-Related Fees required to be approved pursuant to paragraph (c)(7)(ii) of Rule 2-01 of Regulation S-X
Fiscal Year Ended November 30, 2007: $145,000
Fiscal Year Ended November 30, 2006: $150,000
For the fiscal years ended November 30, 2007 and November 30, 2006, Audit-Related Fees required to be approved pursuant to paragraph (c)(7)(ii) of Rule 2-01 of Regulation S-X included fees for services rendered in connection with the issuance of a Type II SAS 70 over controls at the Registrant’s investment adviser.
(c) Tax Fees
Fees for Registrant Fiscal Year Ended November 30, 2007: $10,953
Fiscal Year Ended November 30, 2006: $ 6,536
Tax Fees included, for the fiscal years ended November 30, 2007 and November 30, 2006, fees for tax services in connection with the Registrant’s excise tax calculations, limited review of the Registrant’s applicable tax returns and capital gains tax services in India.
There were no Tax Fees required to be approved pursuant to paragraph (c)(7)(ii) of Rule 2-01 of Regulation S-X during the fiscal years indicated above.
(d) All Other Fees
Fees for Registrant Fiscal Year Ended November 30, 2007: $0
Fiscal Year Ended November 30, 2006: $0
There were no “All Other Fees” required to be approved pursuant to paragraph (c)(7)(ii) of Rule 2-01 of Regulation S-X during the fiscal years indicated above.
(e)(1) Audit Committee’s Pre-Approval Policies and Procedures
Pre-Approval Policies and Procedures
as adopted by the
Audit Committees
of
DFA Investment Dimensions Group Inc.
Dimensional Emerging Markets Value Fund Inc.
Dimensional Investment Group Inc.
The DFA Investment Trust Company
(together, the “Funds”)
The Sarbanes-Oxley Act of 2002 (the “Act”) and the rules (the “Rules”) adopted by the U.S. Securities and Exchange Commission (the “SEC”) require that the Funds’ Audit Committees (together, the “Committee”) pre-approve all audit services and non-audit services provided to the Funds by their independent registered public accounting firm (the “Auditor”). The Act and the Rules also require that the Committee pre-approve all non-audit services provided by the Auditor to Dimensional Fund Advisors, Inc. (“Dimensional”), the Funds’ investment advisor, and to affiliates of Dimensional that provide ongoing services to the Funds (with Dimensional, together the “Service Affiliates”) if the services directly impact the Funds’ operations and financial reporting.
The following policies and procedures govern the ways in which the Committee will pre-approve audit and various types of non-audit services that the Auditor provides to the Funds and to Service Affiliates. These policies and procedures do not apply in the case of audit services that the Auditor provides to Service Affiliates, nor do they apply to services that an audit firm other than the Auditor provides to such entities.
These policies and procedures comply with the requirements for pre-approval, but also provide a mechanism by which management of the Funds may request and secure pre-approval of audit and non-audit services in an orderly manner with minimal disruption to normal business operations. Pre-approval of non-audit services may be achieved through a combination of the procedures described in Sections C and D below.
A. General
1. The Committee must pre-approve all audit services and non-audit services that the Auditor provides to the Funds.
2. The Committee must pre-approve any engagement of the Auditor to provide non-audit services to any Service Affiliate during the period of the
Auditor’s engagement to provide audit services to the Funds, if the non-audit services to the Service Affiliate directly impact the Funds’ operations and financial reporting.
B. Pre-Approval of Audit Services to the Funds
1. The Committee shall approve the engagement of an independent registered public accounting firm to certify the Funds’ financial statements for each fiscal year (the “Engagement”). The approval of the Engagement shall not be delegated to a Designated Member (as that term is defined in Section D below). In approving the Engagement, the Committee shall obtain, review and consider sufficient information concerning the proposed Auditor to enable the Committee to make a reasonable evaluation of the Auditor’s qualifications and independence. The Committee also shall consider the Auditor’s proposed fees for the Engagement, in light of the scope and nature of the audit services that the Funds will receive.
2. The Committee shall report to the Boards of Directors/Trustees of the Funds (together, the “Board”) regarding its approval of the Engagement and of the proposed fees for the Engagement, and the basis for such approval.
3. Unless otherwise in accordance with applicable law, the Engagement, in any event, shall require that the Auditor be selected by the vote, cast in person, of a majority of the members of the Board who are not “interested persons” of the Funds (as that term is defined in Section 2(a)(19) of the Investment Company Act of 1940) (the “Independent Directors”).
C. Pre-Approval of Non-Audit Services to the Funds and to Service Affiliates—by Types of Services
1. The Committee may pre-approve types of non-audit services to the Funds and their Service Affiliates pursuant to this Section C.
2. Annually, at such time as the Committee considers the Engagement of the Auditor, management of the Funds, in consultation with the Auditor, shall provide to the Committee, for its consideration and action, the following: (a) a list of those types of non-audit services, if any, that the Funds may request from the Auditor during the fiscal year; and (b) a list of those types of non-audit services directly impacting the Funds’ operations and financial reporting that Service Affiliates may request from the Auditor during the fiscal year.
3. The lists submitted to the Committee shall describe the types of non-audit services in reasonable detail and shall include an estimated budget (or budgeted range) of fees, where possible, and such other information as the Committee may request.
4. The Committee’s pre-approval of the types of non-audit services submitted pursuant to this Section C shall constitute authorization for management of the Funds to utilize the Auditor for the types of non-audit services so pre-approved, if needed or desired during the fiscal year.
5. A list of the types of non-audit services pre-approved by the Committee pursuant to this Section C will be distributed to management of the Service Affiliates and the appropriate partners of the Auditor. Periodically, the Auditor will discuss with the Committee those non-audit services that have been or are being provided pursuant to this Section C.
D. Pre-Approval of Non-Audit Services to the Funds and to Service Affiliates—Project-by-Project Basis
1. The Committee also may pre-approve non-audit services on a project-by-project basis pursuant to this Section D.
2. Management of the Funds, in consultation with the Auditor, may submit either to the Committee or to the Designated Member, as provided in this Section D, for their consideration and action, a pre-approval request identifying one or more non-audit service projects. The request so submitted shall describe the project(s) in reasonable detail and shall include an estimated budget (or budgeted range) of fees and such other information as the Committee or the Designated Member, as appropriate, shall request.
3. The Committee, from time to time, shall designate one or more of its members who are Independent Directors (each a “Designated Member”) to consider, on the Committee’s behalf, any non-audit services, whether to the Funds or to any Service Affiliate, that have not been pre-approved by the Committee. The Designated Member also shall review, on the Committee’s behalf, any proposed material change in the nature or extent of any non-audit services previously approved. The Funds’ management, in consultation with the Auditor, shall explain why such non-audit services or material change in non-audit services are necessary and appropriate and the anticipated costs thereof.
4. The Designated Member will review the requested non-audit services or proposed material change in such services and will either:
(a) pre-approve, pre-approve subject to conditions, or disapprove any such requested services, or any proposed material change in services, whether to the Funds or to a Service Affiliate; or
(b) refer such matter to the Committee for its consideration and action.
In considering any requested non-audit services or proposed material change in such services, the Designated Member’s authority shall be
limited to approving non-audit services or proposed material changes that do not exceed $10,000 in value.
5. The Designated Member’s pre-approval (or pre-approval subject to conditions) of the requested non-audit services or proposed material change in services pursuant to this Section D shall constitute authorization for the management of the Funds or the Service Affiliate, as the case may be, to utilize the Auditor for the non-audit services so pre-approved. Any action by the Designated Member in approving a requested non-audit service shall be presented for ratification by the Committee not later than at its next scheduled meeting. If the Designated Member does not approve the Auditor providing the requested non-audit service, the matter may be presented to the full Committee for its consideration and action.
E. Amendment; Annual Review
1. The Committee may amend these procedures from time to time.
2. These procedures shall be reviewed annually by the Committee.
F. Recordkeeping
1. The Funds shall maintain a written record of all decisions made by the Committee or by a Designated Member pursuant to these procedures, together with appropriate supporting materials.
2. In connection with the approval of any non-audit service pursuant to the de minimis exception provided in the Rules, a record shall be made indicating that each of the conditions for this exception, as set forth in the Rules, has been satisfied.
3. A copy of these Procedures (and of any amendments to these Procedures) shall be maintained and preserved permanently in an easily accessible place. The written records referred to in paragraphs 1 and 2 of this Section F shall be maintained and preserved for six years from the end of the fiscal year in which the actions recorded were taken, for at least the first two years in an easily accessible location.
(e)(2) The fees disclosed in Items 4(b), 4(c) or 4(d) were approved by the Registrant’s Audit Committee but not pursuant to paragraph (c)(7)(i)(C) of Rule 2-01 of Regulation S-X.
(f) The percentage of hours expended on the principal accountant’s engagement to audit the Registrant’s financial statements for the fiscal year ended November 30, 2007 that were attributed to work performed by persons other than the principal accountant’s full time, permanent employees was not greater than 50%.
(g) Aggregate Non-Audit Fees
Fiscal Year Ended November 30, 2007: $375,500
Fiscal Year Ended November 30, 2006: $379,458
(h) The Registrant’s Audit Committee has considered whether the provision of non-audit services that were rendered to the Registrant’s investment adviser, and any entity controlling, controlled by, or under common control with the investment adviser that provides ongoing services to the Registrant, that were not pre-approved pursuant to paragraph (c)(7)(ii) of Rule 2-01 of Regulation S-X is compatible with maintaining the principal accountant’s independence.
ITEM 5. AUDIT COMMITTEE OF LISTED REGISTRANTS.
This item is not applicable to the Registrant because it is not a listed issuer.
ITEM 6. SCHEDULE OF INVESTMENTS.
The Registrant’s schedule of investments is provided below.
DIMENSIONAL EMERGING MARKETS VALUE FUND INC.
DEFINITIONS OF ABBREVIATIONS AND FOOTNOTES
Schedule of Investments
Investment Abbreviations
ADR | | American Depositary Receipt |
GDR | | Global Depositary Receipt |
FHLMC | | Federal Home Loan Mortgage Corporation |
FNMA | | Federal National Mortgage Association |
Investment Footnotes
† | | See Note B to Financial Statements. |
†† | | Securities have been fair valued. See Note B to Financial Statements |
* | | Non-Income Producing Securities. |
# | | Total or Partial Securities on Loan. |
@ | | Security purchased with cash proceeds from Securities on Loan. |
(r) | | The adjustable rate shown is effective as of November 30, 2007. |
– | | Amounts designated as - are either zero or rounded to zero. |
DIMENSIONAL EMERGING MARKETS VALUE FUND INC.
SCHEDULE OF INVESTMENTS
November 30, 2007
| | | | Shares | | Value †† | |
| | | | | | | |
ARGENTINA — (0.2%) | | | | | |
COMMON STOCKS — (0.2%) | | | | | |
| | Acindar Industria Argentina de Aceros SA Series B | | 659,405 | | $ | 1,140,384 | |
* | | Alpargatas S.A.I.C. | | 6,363 | | 9,973 | |
* | | Banco Suquia SA | | 327,868 | | 50,572 | |
| | BBVA Banco Frances SA | | 130,508 | | 361,937 | |
* | | Capex SA Series A | | 131,575 | | 983,990 | |
* | | Celulosa Argentina SA Series B | | 14,412 | | 23,578 | |
* | | Central Puerto SA Series B | | 125,000 | | 229,420 | |
| | Cresud SA Comercial Industrial Financiera y Agropecuaria | | 461,252 | | 858,062 | |
| | Dycasa SA Series B | | 55,000 | | 76,951 | |
* | | Endesa Costanera SA Series B | | 261,000 | | 361,915 | |
* | | IRSA Inversiones y Representaciones SA | | 1,186,421 | | 1,774,541 | |
* | | Juan Minetti SA | | 769,693 | | 611,594 | |
| | Ledesma S.A.A.I. | | 885,405 | | 1,241,539 | |
* | | MetroGas SA Series B | | 176,000 | | 78,973 | |
* | | Molinos Rio de la Plata SA Series B | | 502,274 | | 1,799,884 | |
* | | Petrobras Energia Participacio | | 518,520 | | 573,588 | |
* | | Polledo SA Industria Constructora y FinancierA | | 50,000 | | 8,803 | |
| | Siderar S.A.I.C. Series A | | 494,314 | | 4,004,812 | |
| | Solvay Indupa S.A.I.C. | | 1,229,322 | | 1,497,781 | |
| | Tenaris SA | | 140,000 | | 3,226,058 | |
* | | Transportadora de Gas del Sur SA Series B | | 364,679 | | 411,363 | |
| | | | | | | |
TOTAL — ARGENTINA | | | | 19,325,718 | |
| | | | | | | |
BRAZIL — (9.3%) | | | | | |
COMMON STOCKS — (1.0%) | | | | | |
| | Companhia Siderurgica Nacional SA | | 931,400 | | 70,918,782 | |
* | | Eleva Alimentos SA | | 12,500 | | 172,017 | |
| | Eternit SA | | 829,920 | | 2,953,584 | |
| | Industrias Romi SA | | 82,800 | | 1,015,659 | |
| | Perdigao SA ADR | | 321,626 | | 15,354,425 | |
* | | Plascar Participacoes Industriais SA | | 110,117 | | 567,569 | |
TOTAL COMMON STOCKS | | | | 90,982,036 | |
| | | | | | | |
PREFERRED STOCKS — (8.3%) | | | | | |
| | Aracruz Celulose SA Sponsored ADR | | 112,740 | | 8,638,139 | |
| | ArcelorMittal Inox Brasil SA | | 413,076 | | 19,777,047 | |
| | Braskem SA Preferred A | | 1,479,200 | | 12,995,705 | |
| | Braskem SA Special Preferred A Sponsored ADR | | 506,100 | | 9,033,885 | |
| | Centrais Electricas de Santa Catarina SA | | 259,400 | | 6,062,844 | |
| | Companhia Brasileira de Distribuicao Grupo Pao de Acucar | | 293,080 | | 4,881,669 | |
| | Companhia Brasileira de Distribuicao Grupo Pao de Acucar Sponsored ADR | | 25,500 | | 842,010 | |
| | Companhia Brasileira de Petroleo Ipiranga SA | | 1,040,800 | | 15,965,861 | |
| | Companhia de Tecidos Norte de Minas | | 529,350 | | 3,014,818 | |
| | | | | | | | |
1
| | Companhia Vale do Rio Doce Series B | | 239,144 | | — | |
| | Confab Industrial SA | | 1,954,890 | | 6,379,264 | |
| | Distribuidora de Produtos de Petroleo Ipiranga SA | | 16,000 | | 374,854 | |
| | Duratex SA | | 805,100 | | 20,074,731 | |
| | Forjas Taurus SA | | 591,500 | | 3,949,492 | |
| | Gerdau SA | | 1,222,542 | | 34,711,546 | |
| | Gerdau SA Sponsored ADR | | 1,259,570 | | 35,406,513 | |
| | Globex Utilidades SA | | 34,076 | | 760,328 | |
* | | Inepar Industria e Construcoes SA | | 7,896 | | 169,134 | |
| | Investimentos Itau SA | | 5,990,063 | | 43,437,730 | |
| | Klabin SA | | 8,361,300 | | 33,021,701 | |
| | Magnesita SA Series A | | 140,483,000 | | 3,487,194 | |
| | Mahle-Metal Leve SA Industria e Comercio | | 4,000 | | 71,401 | |
| | Marcopolo SA | | 1,454,700 | | 6,248,223 | |
| | Metalurgica Gerdau SA | | 2,366,200 | | 92,103,216 | |
| | Refinaria Petroleo Ipiranga SA | | 12,600 | | 346,154 | |
| | Sadia SA | | 3,082,282 | | 19,016,031 | |
# | | Sadia SA ADR | | 375,020 | | 22,951,224 | |
* | | Santista Textil SA | | 29,600 | | 426,490 | |
| | Sao Paulo Alpargatas SA | | 37,800 | | 2,867,419 | |
| | Suzano Papel e Celullose SA | | 2,299,139 | | 38,346,771 | |
| | Suzano Petroquimica SA | | 1,016,323 | | 5,708,915 | |
* | | Telemar Norte Leste SA | | 631,500 | | 23,319,741 | |
| | Ultrapar Participacoes SA | | 26,800 | | 943,315 | |
| | Ultrapar Participacoes SA Sponsored ADR | | 128,400 | | 4,560,768 | |
| | Uniao de Industrias Petroquimicas SA Series B | | 5,879,158 | | 7,149,308 | |
| | Unibanco-Uniao de Bancos Brasileiros SA GDR | | 201,400 | | 30,153,608 | |
| | Usinas Siderurgicas de Minas Gerais SA Series A | | 3,180,037 | | 161,245,835 | |
| | Votorantim Celulose e Papel SA | | 629,975 | | 20,662,983 | |
| | Votorantim Celulose e Papel SA Sponsored ADR | | 1,181,000 | | 39,232,820 | |
| | Whirlpool SA | | 127,100 | | 276,505 | |
TOTAL PREFERRED STOCKS | | | | 738,615,192 | |
| | | | | | | |
TOTAL — BRAZIL | | | | 829,597,228 | |
| | | | | | | |
CHILE — (2.6%) | | | | | |
COMMON STOCKS — (2.5%) | | | | | |
| | Banco de Credito e Inversiones SA Series A | | 81,935 | | 2,477,726 | |
| | Banmedica SA | | 275,445 | | 359,312 | |
| | Cap SA | | 199,310 | | 5,908,983 | |
| | Cementos Bio-Bio SA | | 665,307 | | 1,645,022 | |
| | Compania Cervecerias Unidas SA | | 143,000 | | 1,034,450 | |
| | Compania Cervecerias Unidas SA ADR | | 4,000 | | 142,600 | |
| | Compania de Consumidores de Gas Santiago SA | | 124,667 | | 616,005 | |
| | Compania de Telecomunicaciones de Chile SA Series A | | 2,486,405 | | 4,962,490 | |
| | Compania de Telecomunicaciones de Chile SA Series B | | 372,166 | | 816,492 | |
* | | Compania SudAmericana de Vapores SA | | 7,770,771 | | 17,662,588 | |
| | Compania Telecomunicaciones de Chile SA Sponsored ADR | | 1,712,478 | | 13,888,197 | |
| | CorpBanca SA | | 1,044,617,607 | | 7,329,563 | |
* | | Corpbanca SA ADR | | 30,058 | | 1,042,712 | |
| | Cristalerias de Chile SA | | 264,624 | | 3,138,196 | |
| | CTI SA (Cia Tecno Industrial) | | 4,900,000 | | 242,119 | |
| | Distribucion y Servicio D&S SA ADR | | 11,500 | | 381,685 | |
| | Empresa Nacional de Electricidad SA | | 2,694,503 | | 3,626,222 | |
| | Empresa Nacional de Telecomunicaciones SA | | 116,880 | | 1,790,335 | |
2
| | Empresas CMPC SA | | 729,964 | | 26,833,878 | |
| | Empresas Copec SA | | 1,119,488 | | 19,831,942 | |
| | Empresas Iansa SA | | 24,637,401 | | 1,898,631 | |
| | Enersis SA | | 31,903,095 | | 10,978,019 | |
| | Enersis SA Sponsored ADR | | 4,542,672 | | 79,360,480 | |
| | Industrias Forestales SA | | 3,436,382 | | 930,496 | |
| | Inversiones Frimetal SA | | 4,900,000 | | — | |
* | | Madeco SA | | 38,949,259 | | 4,889,154 | |
* | | Madeco SA Sponsored ADR | | 209,822 | | 2,486,391 | |
| | Masisa SA | | 9,423,699 | | 1,862,575 | |
| | Minera Valparaiso SA | | 7,500 | | 239,786 | |
| | Parque Arauco SA | | 2,474,668 | | 2,934,679 | |
| | Soquimic Comercial SA | | 198,000 | | 99,597 | |
| | Vina de Concha y Toro SA | | 287,212 | | 625,060 | |
* | | Vina San Pedro SA | | 79,756,271 | | 748,616 | |
| | Watt’s SA | | 163,489 | | 132,484 | |
TOTAL COMMON STOCKS | | | | 220,916,485 | |
| | | | | | | |
PREFERRED STOCKS — (0.1%) | | | | | |
| | Sociedad Quimica y Minera de Chile SA Series A | | 43,364 | | 1,037,068 | |
| | Sociedad Quimica y Minera de Chile SA Series B | | 481,533 | | 8,470,584 | |
TOTAL PREFERRED STOCKS | | | | 9,507,652 | |
| | | | | | | |
TOTAL — CHILE | | | | 230,424,137 | |
| | | | | | | |
CHINA — (4.3%) | | | | | |
COMMON STOCKS — (4.3%) | | | | | |
| | AMVIG Holdings, Ltd. | | 1,698,000 | | 2,400,947 | |
* # | | AviChina Industry and Technology Co., Ltd. | | 4,952,000 | | 1,347,182 | |
* # | | Bank of China, Ltd. | | 46,340,000 | | 24,234,213 | |
* # | | Baoye Group Co., Ltd. | | 1,070,000 | | 1,177,663 | |
* # | | Beijing Capital Land, Ltd. | | 8,428,000 | | 6,371,273 | |
| | Beijing Enterprises Holdings, Ltd. | | 200,000 | | 1,009,762 | |
* # | | Brilliance China Automotive Holdings, Ltd. | | 21,082,000 | | 4,453,756 | |
| | Catic Shenzhen Holdings, Ltd. | | 856,000 | | 653,435 | |
| | Chaoda Modern Agriculture | | 13,592,650 | | 12,777,358 | |
* # | | China Aerospace International Holdings, Ltd. | | 9,642,600 | | 1,709,270 | |
* # | | China Foods, Ltd. | | 6,944,000 | | 5,188,509 | |
| | China Green Holdings, Ltd. | | 1,644,000 | | 1,724,422 | |
* # | | China Haidian Holdings, Ltd. | | 6,156,000 | | 655,399 | |
* | | China Pharmaceutical Group, Ltd. | | 4,424,000 | | 1,753,255 | |
# | | China Rare Earth Holdings, Ltd. | | 5,216,700 | | 1,338,635 | |
| | China Resources Enterprise, Ltd. | | 2,508,000 | | 10,599,857 | |
* # | | China Shipping Container Lines Co., Ltd. | | 22,155,150 | | 20,224,097 | |
| | China Travel International Investment Hong Kong, Ltd. | | 25,074,000 | | 16,878,808 | |
| | China Unicom, Ltd. | | 2,392,000 | | 5,572,647 | |
| | China Unicom, Ltd. ADR | | 1,197,012 | | 27,662,947 | |
* # | | Chongqing Iron and Steel Co., Ltd. | | 2,072,000 | | 1,054,897 | |
| | Citic Pacific, Ltd. | | 4,065,000 | | 23,020,354 | |
# | | CNPC (Hong Kong), Ltd. | | 16,180,000 | | 11,234,557 | |
| | Comba Telecom Systems Holdings, Ltd. | | 3,146,000 | | 906,815 | |
| | COSCO Pacific, Ltd. | | 7,644,000 | | 21,386,237 | |
* # | | Dalian Port (PDA) Co., Ltd. | | 3,542,000 | | 2,670,101 | |
| | Denway Motors, Ltd. | | 33,564,000 | | 21,966,575 | |
3
| | Digital China Holdings, Ltd. | | 1,170,000 | | 799,098 | |
* | | Dongfeng Motor Corp. | | 19,844,000 | | 15,421,222 | |
# | | Dynasty Fine Wines Group, Ltd. | | 3,672,000 | | 1,503,339 | |
* # | | Enerchina Holdings, Ltd. | | 6,493,500 | | 320,901 | |
* | | First Tractor Co., Ltd. | | 1,318,000 | | 851,811 | |
* # | | Founder Holdings, Ltd. | | 3,334,000 | | 254,556 | |
# | | Geely Automobile Holdings, Ltd. | | 8,460,000 | | 1,127,579 | |
| | Global Bio-Chem Technology Group Co., Ltd. | | 10,394,000 | | 2,836,293 | |
* | | Great Wall Motor Co., Ltd. | | 1,600,500 | | 2,456,616 | |
* # | | Great Wall Technology Co., Ltd. | | 1,836,000 | | 591,607 | |
* # | | Guangshen Railway Co., Ltd. Sponsored ADR | | 221,911 | | 8,141,915 | |
* | | Guangzhou Pharmaceutical Co., Ltd. | | 1,230,000 | | 1,106,855 | |
| | Hainan Meilan International Airport Co., Ltd. | | 936,000 | | 1,326,936 | |
# | | HKC (Holdings), Ltd. | | 17,444,000 | | 5,572,088 | |
* | | Jingwei Textile Machinery Co., Ltd. | | 552,000 | | 248,797 | |
# | | Lianhua Supermarket Holdings Co., Ltd. | | 751,000 | | 1,098,240 | |
* # | | Lingbao Gold Co., Ltd. | | 1,176,000 | | 722,434 | |
* # | | Maanshan Iron and Steel Co., Ltd. | | 11,526,000 | | 8,289,180 | |
| | Minmetals Resources, Ltd. | | 6,384,000 | | 4,356,634 | |
# | | Neo-China Group (Holdings), Ltd. | | 986,000 | | 931,019 | |
| | PetroChina Co., Ltd. ADR | | 35,300 | | 6,768,422 | |
* | | Qingling Motors Co., Ltd. | | 4,848,000 | | 1,070,868 | |
* # | | Semiconductor Manufacturing International Corp | | 39,682,000 | | 3,769,800 | |
* | | Semiconductor Manufacturing International Corp. ADR | | 907,264 | | 4,354,867 | |
* # | | Shanghai Electric Group Co., Ltd. | | 14,012,000 | | 11,166,477 | |
| | Shanghai Industrial Holdings, Ltd. | | 3,780,000 | | 18,260,306 | |
* # | | Shanghai Prime Machinery Co., Ltd. | | 3,004,000 | | 1,109,855 | |
# | | Shenzhen International Holdings, Ltd. | | 43,502,500 | | 6,332,475 | |
| | Shenzhen Investment, Ltd. | | 5,164,000 | | 3,972,339 | |
* | | Shenzhou International Group | | 828,000 | | 372,910 | |
| | SinoCom Software Group, Ltd. | | 270,000 | | 50,772 | |
# | | Sinolink Worldwide Holdings, Ltd. | | 12,742,000 | | 3,138,888 | |
| | Sinopec Kantons Holdings, Ltd. | | 3,122,800 | | 774,398 | |
* | | Sinopec Shanghai Petrochemical Co., Ltd. Sponsored ADR | | 9,500 | | 598,120 | |
* # | | Sinopec Yizheng Chemical Fibre Co., Ltd. | | 2,188,000 | | 840,622 | |
# | | Sinotrans, Ltd. | | 10,382,000 | | 5,098,876 | |
# | | Skyworth Digital Holdings, Ltd. | | 11,417,100 | | 1,710,546 | |
# | | SRE Group, Ltd. | | 9,500,053 | | 3,089,435 | |
| | Stone Group Holdings, Ltd. | | 7,440,000 | | 791,840 | |
* # | | TCL Communication Technology Holdings, Ltd. | | 13,656,000 | | 456,052 | |
* # | | TCL Multimedia Technology Holdings, Ltd. | | 29,622,400 | | 1,797,142 | |
* # | | Tianjin Capital Environmental Protection | | 734,000 | | 393,594 | |
| | TPV Technology, Ltd. | | 10,662,000 | | 6,758,449 | |
* # | | Travelsky Technology, Ltd. | | 4,162,000 | | 4,471,390 | |
* # | | Weiqiao Textile Co., Ltd. | | 3,499,000 | | 5,188,158 | |
* # | | Xiamen International Port Co., Ltd. | | 3,878,000 | | 1,052,298 | |
* # | | Xiwang Sugar Holdings Co., Ltd. | | 2,675,952 | | 931,842 | |
* | | Zhejiang Glass Co., Ltd. | | 1,132,000 | | 1,264,543 | |
* # | | ZTE Corp. | | 238,000 | | 1,141,313 | |
TOTAL COMMON STOCKS | | | | 384,656,688 | |
| | | | | | | |
RIGHTS/WARRANTS — (0.0%) | | | | | |
* | | HKC (Holdings), Ltd. Warrants 11/30/09 | | 1,674,100 | | 86,006 | |
| | | | | | | |
TOTAL — CHINA | | | | 384,742,694 | |
4
CZECH REPUBLIC — (0.6%) | | | | | |
COMMON STOCKS — (0.6%) | | | | | |
| | CEZ A.S. | | 74,076 | | 5,493,591 | |
| | Telefonica 02 Czech Republic A.S. | | 1,166,446 | | 35,508,341 | |
* | | Unipetrol A.S. | | 673,738 | | 12,162,869 | |
| | | | | | | |
TOTAL — CZECH REPUBLIC | | | | 53,164,801 | |
| | | | | | | |
HUNGARY — (2.2%) | | | | | |
COMMON STOCKS — (2.2%) | | | | | |
* | | Danubius Hotel & Spa NYRT | | 138,417 | | 7,239,777 | |
# | | Egis Gyogyszergyar NYRT | | 115,885 | | 13,117,760 | |
* | | Fotex NYRT | | 999,439 | | 5,045,146 | |
# | | MOL Hungarian Oil & Gas NYRT | | 1,046,802 | | 149,966,504 | |
* | | Pannonplast NYRT | | 550,140 | | 4,659,376 | |
* | | RABA Automotive Holding NYRT | | 255,327 | | 2,833,665 | |
* | | Synergon Information Systems | | 89,037 | | 871,504 | |
* | | Tiszai Vegyi Kombinat NYRT | | 237,913 | | 10,246,398 | |
| | Zwack Unicum NYRT | | 387 | | 36,516 | |
| | | | | | | |
TOTAL — HUNGARY | | | | 194,016,646 | |
| | | | | | | |
INDIA — (14.2%) | | | | | |
COMMON STOCKS — (14.1%) | | | | | |
* | | Abhishek Industries, Ltd. | | 92,524 | | 51,971 | |
| | Adani Enterprises, Ltd. | | 867,101 | | 17,496,333 | |
| | Aditya Birla Nuvo, Ltd. | | 159,991 | | 6,354,968 | |
| | Adlabs Films, Ltd. | | 86,755 | | 2,113,458 | |
* | | Aftek, Ltd. | | 866,625 | | 1,520,066 | |
* | | Agro Tech Foods, Ltd. | | 136,705 | | 654,842 | |
| | Alembic, Ltd. | | 619,600 | | 1,386,881 | |
| | Alok Industries, Ltd. | | 736,832 | | 1,404,002 | |
| | Ambuja Cements, Ltd. | | 3,753,732 | | 14,160,503 | |
| | Amtek Auto, Ltd. | | 314,027 | | 3,580,741 | |
| | Apollo Hospitals Enterprise, Ltd. | | 138,288 | | 1,696,974 | |
| | Apollo Tyres, Ltd. | | 1,751,970 | | 1,846,619 | |
* | | Arvind Mills, Ltd. | | 1,330,891 | | 2,521,385 | |
| | Ashok Leyland, Ltd. | | 6,035,668 | | 6,849,511 | |
| | Aurobindo Pharma, Ltd. | | 215,126 | | 2,713,381 | |
* | | Avaya GlobalConnect, Ltd. | | 21,933 | | 136,222 | |
| | Axis Bank, Ltd. | | 1,253,001 | | 29,441,628 | |
| | Aztecsoft, Ltd. | | 154,842 | | 194,646 | |
| | Bajaj Auto Finance, Ltd. | | 89,482 | | 747,228 | |
| | Bajaj Auto, Ltd. | | 66,284 | | 4,537,539 | |
| | Bajaj Hindusthan, Ltd. | | 378,146 | | 2,048,185 | |
| | Balaji Telefilms, Ltd. | | 204,578 | | 1,781,955 | |
| | Ballarpur Industries, Ltd. | | 886,062 | | 3,421,979 | |
| | Balmer Lawrie & Co., Ltd. | | 48,430 | | 735,443 | |
| | Balrampur Chini Mills, Ltd. | | 203,381 | | 526,207 | |
| | Bank of Maharashtra, Ltd. | | 410,000 | | 797,487 | |
| | Bank of Rajasthan, Ltd. | | 439,521 | | 1,803,436 | |
| | BASF India, Ltd. | | 99,750 | | 639,295 | |
* | | Bata India, Ltd. | | 98,732 | | 563,731 | |
5
| | BEML, Ltd. | | 104,405 | | 4,378,338 | |
| | Bharat Forge, Ltd. | | 160,000 | | 1,273,197 | |
| | Bharati Shipyard, Ltd. | | 30,210 | | 545,492 | |
| | Bhushan Steel & Strips, Ltd. | | 146,706 | | 5,002,265 | |
| | Biocon, Ltd. | | 197,567 | | 2,856,413 | |
| | Blue Star Infotech, Ltd. | | 12,900 | | 26,746 | |
| | BOC India, Ltd. | | 300,919 | | 1,112,418 | |
| | Bombay Dyeing & Manufacturing Co., Ltd. | | 63,829 | | 1,172,690 | |
| | Ceat, Ltd. | | 136,470 | | 677,823 | |
| | Century Enka, Ltd. | | 133,495 | | 562,133 | |
| | Century Textiles & Industries, Ltd. | | 205,357 | | 5,772,244 | |
| | Chambal Fertilizers & Chemicals, Ltd. | | 2,270,380 | | 3,584,120 | |
| | Cholamandalam DBS Finance, Ltd. | | 477 | | 2,485 | |
| | City Union Bank, Ltd. | | 83,910 | | 500,307 | |
| | Clariant Chemicals (India), Ltd. | | 2,398 | | 16,857 | |
| | Coromandel Fertilisers, Ltd. | | 136,536 | | 402,657 | |
| | Cranes Software International, Ltd. | | 313,759 | | 967,904 | |
| | Cummins India, Ltd. | | 50,000 | | 534,225 | |
* | | Dabur Pharma, Ltd. | | 55,164 | | 100,041 | |
| | Dalmia Cement (Bharat), Ltd. | | 28,800 | | 356,298 | |
| | DCM Shriram Consolidated, Ltd. | | 210,988 | | 375,701 | |
| | Deepak Fertilizers & Petrochemicals Corp., Ltd. | | 386,267 | | 1,401,562 | |
| | Dhampur Sugar Mills, Ltd. | | 91,465 | | 149,467 | |
* | | Dish TV India, Ltd. | | 1,147,399 | | 2,387,809 | |
| | D-Link (India), Ltd. | | 118,369 | | 276,926 | |
| | Dr. Reddy’s Laboratories, Ltd. | | 617,398 | | 9,865,092 | |
| | E.I.D. - Parry (India), Ltd. | | 357,212 | | 1,443,423 | |
| | Eicher Motors, Ltd. | | 28,098 | | 306,666 | |
| | EIH, Ltd. | | 881,287 | | 3,627,500 | |
| | Elder Pharmaceuticals, Ltd. | | 97,715 | | 994,196 | |
| | Electrosteel Casings, Ltd. | | 513,690 | | 1,087,495 | |
| | Elgi Equipments, Ltd. | | 174,405 | | 320,241 | |
* | | Escorts, Ltd. | | 388,991 | | 1,497,994 | |
| | Essel Propack, Ltd. | | 442,637 | | 656,711 | |
* | | Eveready Industries (India), Ltd. | | 351,390 | | 661,773 | |
| | Everest Industries, Ltd. | | 23,275 | | 61,010 | |
| | Exide Industries, Ltd. | | 1,078,610 | | 1,947,807 | |
| | FDC, Ltd. | | 179,858 | | 139,477 | |
| | Federal Bank, Ltd. | | 510,924 | | 4,087,493 | |
| | Finolex Cables, Ltd. | | 537,055 | | 1,235,278 | |
| | Finolex Industries, Ltd. | | 695,629 | | 1,481,941 | |
| | Gammon India, Ltd. | | 111,404 | | 1,567,286 | |
| | Garden Silk Mills, Ltd. | | 52,000 | | 100,767 | |
| | Geometric, Ltd. | | 73,022 | | 133,142 | |
| | GlaxoSmithKline Consumer Healthcare, Ltd. | | 5,598 | | 101,514 | |
* | | Goetze (India), Ltd. | | 9,785 | | 34,425 | |
| | Graphite India, Ltd. | | 44,000 | | 97,156 | |
| | Great Eastern Shipping Co., Ltd. | | 825,643 | | 10,310,412 | |
| | Great Offshore, Ltd. | | 136,410 | | 3,145,704 | |
| | GTL, Ltd. | | 697,870 | | 4,424,018 | |
| | Gujarat Alkalies & Chemicals, Ltd. | | 471,803 | | 2,407,651 | |
| | Gujarat Fluorochemicals, Ltd. | | 50,745 | | 887,615 | |
| | Gujarat Narmada Valley Fertilizers Co., Ltd. | | 647,256 | | 2,776,664 | |
| | Gujarat State Fertilizers & Chemicals, Ltd. | | 473,389 | | 3,161,690 | |
| | H.E.G., Ltd. | | 129,459 | | 1,396,437 | |
6
| | HCL Infosystems, Ltd. | | 174,000 | | 1,012,727 | |
| | HCL Technologies, Ltd. | | 349,200 | | 2,825,461 | |
| | HDFC Bank, Ltd. | | 241,906 | | 10,560,294 | |
* | | Himachal Futuristic Communications, Ltd. | | 504,605 | | 353,401 | |
| | Himatsingka Seide, Ltd. | | 137,216 | | 345,754 | |
| | Hinduja Ventures, Ltd. | | 65,909 | | 953,652 | |
| | Hindustan Construction Co., Ltd. | | 1,093,222 | | 5,573,732 | |
* | | Hindustan Motors, Ltd. | | 769,723 | | 802,331 | |
| | Hindustan Sanitaryware & Industries, Ltd. | | 24,608 | | 43,113 | |
| | Hotel Leelaventure, Ltd. | | 1,602,335 | | 2,638,633 | |
| | HTMT Global Solutions, Ltd. | | 65,909 | | 809,717 | |
| | ICI India, Ltd. | | 47,767 | | 691,194 | |
| | ICICI Bank Sponsored ADR | | 949,468 | | 57,452,309 | |
| | iGate Global Solutions, Ltd. | | 20,446 | | 205,744 | |
| | India Cements, Ltd. | | 1,297,654 | | 9,711,560 | |
| | India Glycols, Ltd. | | 115,658 | | 1,228,790 | |
| | Indiabulls Financial Services, Ltd. | | 6,234 | | 115,852 | |
| | Indian Hotels Co., Ltd. | | 2,942,890 | | 9,976,660 | |
| | Indian Oil Corp., Ltd. | | 8,798 | | 120,728 | |
| | Indo Rama Synthetics (India), Ltd. | | 202,314 | | 266,037 | |
* | | Indoco Remedies, Ltd. | | 500 | | 3,755 | |
| | IndusInd Bank, Ltd. | | 1,816,067 | | 5,465,870 | |
| | Industrial Development Bank of India, Ltd. | | 3,178,422 | | 13,059,216 | |
| | Ipca Laboratories, Ltd. | | 94,786 | | 1,437,954 | |
| | IVRCL Infrastructures & Projects, Ltd. | | 34,169 | | 402,030 | |
| | J.B. Chemicals & Pharmaceuticals, Ltd. | | 377,474 | | 614,247 | |
| | Jammu & Kashmir Bank, Ltd. | | 222,503 | | 4,126,878 | |
| | JBF Industries, Ltd. | | 35,983 | | 144,281 | |
| | Jet Airways (India), Ltd. | | 244,572 | | 5,153,132 | |
| | Jindal Poly Films, Ltd. | | 21,594 | | 131,523 | |
| | Jindal Saw, Ltd. | | 162,712 | | 3,500,679 | |
| | Jindal Stainless, Ltd. | | 774,612 | | 4,289,208 | |
| | Jindal Steel & Power, Ltd. | | 113,229 | | 38,721,090 | |
| | JK Tyre and Industries, Ltd. | | 119,005 | | 385,185 | |
| | JSW Steel, Ltd. | | 1,091,845 | | 27,769,806 | |
| | Jubilant Organosys, Ltd. | | 138,688 | | 1,058,252 | |
| | Karnataka Bank, Ltd. | | 256,552 | | 1,366,011 | |
| | Karur Vysya Bank, Ltd. | | 87,485 | | 754,348 | |
| | Kesoram Industries, Ltd. | | 204,223 | | 2,878,770 | |
# | | Kingway Brewery Holdings, Ltd. | | 3,814,000 | | 839,079 | |
| | Kirloskar Oil Engines, Ltd. | | 458,360 | | 1,833,194 | |
| | Kohinoor Foods, Ltd. | | 95,364 | | 150,651 | |
| | Lanxess ABS, Ltd. | | 32,052 | | 159,019 | |
| | LIC Housing Finance, Ltd. | | 423,699 | | 3,671,930 | |
| | Maharashtra Scooters, Ltd. | | 13,612 | | 111,016 | |
| | Mahindra & Mahindra, Ltd. | | 556,166 | | 10,312,376 | |
| | Maruti Suzuki India, Ltd. | | 544,780 | | 13,917,420 | |
| | Mastek, Ltd. | | 83,250 | | 590,876 | |
* | | Matrix Laboratories, Ltd. | | 490,684 | | 2,714,458 | |
* | | Megasoft, Ltd. | | 60,998 | | 192,954 | |
| | Mercator Lines, Ltd. | | 153,434 | | 485,029 | |
| | Merck, Ltd. | | 29,241 | | 285,469 | |
| | MIRC Electronics, Ltd. | | 229,924 | | 166,278 | |
| | Mirza International, Ltd. | | 5,000 | | 2,786 | |
| | Monnet Ispat, Ltd. | | 25,865 | | 264,482 | |
7
| | Monsanto India, Ltd. | | 1,217 | | 45,894 | |
| | Moser Baer (India), Ltd. | | 872,302 | | 6,012,650 | |
| | Mphasis, Ltd. | | 292,087 | | 2,097,295 | |
| | MRF, Ltd. | | 17,453 | | 3,103,906 | |
| | Mukand, Ltd. | | 379,410 | | 813,207 | |
| | Mukta Arts, Ltd. | | 30,300 | | 127,953 | |
| | Nagarjuna Construction Co., Ltd. | | 574,251 | | 4,581,937 | |
* | | Nagarjuna Fertilizers & Chemicals, Ltd. | | 2,946,847 | | 5,323,389 | |
* | | Nahar Capital & Financial Services, Ltd. | | 51,549 | | — | |
| | Nahar Spinning Mills, Ltd. | | 51,549 | | 100,747 | |
| | Natco Pharma, Ltd. | | 110,241 | | 371,803 | |
| | Navneet Publications (India), Ltd. | | 118,740 | | 319,558 | |
* | | Netflier Finco, Ltd. | | 39,668 | | 37,406 | |
| | NIIT Technologies, Ltd. | | 190,440 | | 1,075,937 | |
| | NIIT, Ltd. | | 149,557 | | 545,960 | |
| | Nirma, Ltd. | | 280,992 | | 1,688,432 | |
| | NOCIL, Ltd. | | 1,279,177 | | 1,406,080 | |
| | OCL India, Ltd. | | 82,078 | | 657,291 | |
| | Omax Autos, Ltd. | | 64,810 | | 110,827 | |
| | Orchid Chemicals & Pharmaceuticals, Ltd. | | 445,419 | | 2,902,335 | |
| | Patni Computer Systems, Ltd. | | 315,650 | | 2,498,328 | |
| | Petronet LNG, Ltd. | | 1,859,989 | | 4,879,957 | |
| | Polaris Software Lab, Ltd. | | 396,842 | | 1,099,078 | |
| | Prism Cements, Ltd. | | 358,139 | | 548,382 | |
| | PSL, Ltd. | | 62,792 | | 792,334 | |
| | PTC India, Ltd. | | 64,837 | | 242,812 | |
* | | Punjab Tractors, Ltd. | | 72,971 | | 370,020 | |
| | Rain Calcining, Ltd. | | 752,792 | | 1,054,556 | |
| | Rallis India, Ltd. | | 15,926 | | 174,561 | |
| | Raymond, Ltd. | | 288,315 | | 3,064,162 | |
| | REI Agro, Ltd. | | 195,681 | | 3,714,852 | |
| | Reliance Capital, Ltd. | | 339,307 | | 20,177,168 | |
| | Reliance Communications, Ltd. | | 4,291,822 | | 73,160,060 | |
| | Reliance Industries, Ltd. | | 6,049,665 | | 437,208,625 | |
* | | Reliance Natural Resources, Ltd. | | 5,311,927 | | 22,520,023 | |
| | Rico Auto Industries, Ltd. | | 160,452 | | 171,523 | |
| | Rolta India, Ltd. | | 321,636 | | 5,947,434 | |
| | Ruchi Soya Industries, Ltd. | | 941,355 | | 2,466,326 | |
* | | SEAMEC, Ltd. | | 51,335 | | 271,676 | |
| | Sesa GOA, Ltd. | | 8,700 | | 758,318 | |
| | Shasun Chemicals & Drugs, Ltd. | | 94,986 | | 164,576 | |
| | Shriram Transport Finance Co., Ltd. | | 105,855 | | 861,249 | |
* | | Sical Logistics, Ltd. | | 3,414 | | 20,432 | |
| | SKF India, Ltd. | | 10,201 | | 113,334 | |
| | Sona Koyo Steering Systems, Ltd. | | 59,284 | | 96,071 | |
| | Sonata Software, Ltd. | | 457,576 | | 496,853 | |
| | South India Bank, Ltd. | | 219,375 | | 979,672 | |
| | SREI Infrastructure Finance, Ltd. | | 692,456 | | 3,229,537 | |
| | SRF, Ltd. | | 266,306 | | 1,068,953 | |
| | Sterlite Industries (India), Ltd. Series A | | 2,076,364 | | 54,637,045 | |
| | Sterlite Technologies, Ltd. | | 274,890 | | 2,031,831 | |
| | Strides Arcolab, Ltd. | | 126,300 | | 839,454 | |
| | Subros, Ltd. | | 73,890 | | 84,774 | |
| | Sundram Fastners, Ltd. | | 38,520 | | 48,842 | |
| | Supreme Petrochem, Ltd. | | 101,631 | | 72,734 | |
8
* | | Swaraj Engines, Ltd. | | 14,132 | | 59,743 | |
| | Syndicate Bank | | 1,271,548 | | 3,266,478 | |
| | Tata Chemicals, Ltd. | | 1,092,020 | | 8,649,864 | |
| | Tata Investment Corp., Ltd. | | 57,960 | | 994,307 | |
| | Tata Metaliks, Ltd. | | 26,681 | | 104,432 | |
| | Tata Motors, Ltd. | | 405,012 | | 7,539,425 | |
| | Tata Steel, Ltd. | | 1,904,649 | | 39,769,534 | |
| | Tata Tea, Ltd. | | 166,270 | | 3,195,499 | |
* | | Tele Data Informatics, Ltd. | | 534,517 | | 890,300 | |
* | | Teledata Marine Solutions, Ltd. | | 267,258 | | — | |
* | | Teledata Technology Solution | | 267,258 | | — | |
| | Trent, Ltd. | | 14,497 | | 191,944 | |
| | Tube Investments of India, Ltd. | | 486,775 | | 837,448 | |
| | TVS Motor Co., Ltd. | | 1,082,101 | | 1,774,660 | |
| | Ucal Fuel Systems, Ltd. | | 24,245 | | 56,919 | |
| | Unichem Laboratories, Ltd. | | 64,206 | | 301,259 | |
| | United Phosphorus, Ltd. | | 176,000 | | 1,534,272 | |
| | Usha Martin, Ltd. | | 1,017,075 | | 3,328,750 | |
* | | Uttam Galva Steels, Ltd. | | 305,386 | | 412,629 | |
| | Vardhman Textiles, Ltd. | | 88,383 | | 321,332 | |
| | Varun Shipping Co. | | 549,032 | | 1,028,386 | |
| | Videocon Industries, Ltd. | | 35,767 | | 369,409 | |
| | Videsh Sanchar Nigam, Ltd. | | 929,481 | | 14,749,415 | |
| | Videsh Sanchar Nigam, Ltd. ADR | | 37,900 | | 1,254,869 | |
* | | Welspun India, Ltd. | | 37,142 | | 84,040 | |
| | Welspun-Gujarat Stahl Rohren, Ltd. | | 787,428 | | 8,349,456 | |
* | | Wire & Wireless India, Ltd. | | 997,738 | | 1,766,671 | |
| | Wockhardt, Ltd. | | 103,639 | | 1,010,898 | |
| | Wyeth, Ltd. | | 6,540 | | 79,752 | |
| | Zee Entertainment Enterprises, Ltd. | | 1,995,477 | | 14,406,848 | |
* | | Zee News, Ltd. | | 902,155 | | 1,511,762 | |
| | Zensar Technologies, Ltd. | | 68,072 | | 288,494 | |
| | Zuari Industries, Ltd. | | 127,958 | | 1,119,414 | |
TOTAL COMMON STOCKS | | | | 1,255,204,621 | |
| | | | | | | |
PREFERRED STOCKS — (0.0%) | | | | | |
* | | Ispat Industries, Ltd. | | 1,463,759 | | 196,892 | |
| | | | | | | |
RIGHTS/WARRANTS — (0.1%) | | | | | |
* | | Cholamandalam DBS Finance, Ltd. Warrants 10/29/07 | | 130 | | 203 | |
* | | Federal Bank, Ltd. Rights 01/15/08 | | 510,924 | | 840,043 | |
* | | Tata Steel, Ltd. Preferred Rights 12/21/07 | | 1,714,184 | | 813,291 | |
* | | Tata Steel, Ltd. Rights 12/21/07 | | 380,929 | | 5,018,169 | |
TOTAL RIGHTS/WARRANTS | | | | 6,671,706 | |
| | | | | | | |
TOTAL — INDIA | | | | 1,262,073,219 | |
| | | | | | | |
INDONESIA — (3.1%) | | | | | |
COMMON STOCKS — (3.1%) | | | | | |
* | | PT Agis Tbk | | 2,012,000 | | 66,511 | |
* | | PT Apac Citra Centretex Tbk | | 774,000 | | 9,086 | |
| | PT Apexindo Pratama Tbk | | 3,576,500 | | 875,896 | |
* | | PT Asahimas Flat Glass Tbk | | 5,333,500 | | 1,732,591 | |
9
| | PT Astra Graphia Tbk | | 18,779,000 | | 1,129,311 | |
| | PT Astra International Tbk | | 13,431,500 | | 36,042,674 | |
* | | PT Bakrie & Brothers Tbk | | 200,594,500 | | 6,376,194 | |
* | | PT Bakrieland Development Tbk | | 83,941,750 | | 5,529,744 | |
| | PT Bank Niaga Tbk | | 59,850,500 | | 5,461,465 | |
* | | PT Bank Pan Indonesia Tbk | | 141,853,326 | | 10,051,221 | |
| | PT Berlian Laju Tanker Tbk | | 54,456,800 | | 12,569,508 | |
* | | PT Bhakti Investama Tbk | | 57,861,675 | | 6,653,717 | |
* | | PT Budi Acid Jaya Tbk | | 19,230,000 | | 641,728 | |
| | PT Charoen Pokphand Indonesia Tbk | | 32,617,666 | | 3,127,788 | |
* | | PT Ciputra Surya Tbk | | 17,718,000 | | 1,467,504 | |
* | | PT Clipan Finance Indonesia Tbk | | 12,461,000 | | 460,253 | |
* | | PT Davomas Adabi Tbk | | 142,035,000 | | 3,426,713 | |
* | | PT Dynaplast Tbk | | 3,040,000 | | 247,551 | |
| | PT Enseval Putera Megatrading Tbk | | 11,535,000 | | 973,076 | |
* | | PT Ever Shine Textile Tbk | | 19,347,215 | | 180,670 | |
* | | PT Great River International Tbk | | 1,788,000 | | — | |
| | PT Gudang Garam Tbk | | 2,045,500 | | 1,837,815 | |
* | | PT Hero Supermarket Tbk | | 220,000 | | 112,700 | |
* | | PT Holcim Indonesia Tbk | | 12,501,000 | | 2,221,665 | |
| | PT Indofood Sukses Makmur Tbk | | 25,723,500 | | 6,968,122 | |
| | PT Indo-Rama Synthetics Tbk | | 7,901,320 | | 531,219 | |
| | PT International Nickel Indonesia Tbk | | 6,872,000 | | 69,366,479 | |
| | PT Jaya Real Property Tbk | | 25,947,500 | | 4,067,875 | |
* | | PT Kawasan Industry Jababeka Tbk | | 104,408,000 | | 2,187,379 | |
| | PT Lautan Luas Tbk | | 2,102,000 | | 99,140 | |
| | PT Lippo Karawaci Tbk | | 30,656,000 | | 5,490,439 | |
| | PT Matahari Putra Prima Tbk | | 29,674,400 | | 2,058,858 | |
| | PT Mayorah Indah Tbk | | 8,807,572 | | 1,640,685 | |
| | PT Medco Energi International Tbk | | 31,249,000 | | 18,108,260 | |
| | PT Mitra Adiperkasa Tbk | | 3,033,000 | | 227,950 | |
* | | PT Modern Photo Tbk | | 1,266,500 | | 87,858 | |
* | | PT Panasia Indosyntec Tbk | | 403,200 | | 17,212 | |
* | | PT Panin Insurance Tbk | | 30,688,500 | | 1,117,887 | |
* | | PT Panin Life Tbk | | 38,423,500 | | 800,637 | |
| | PT Petrosea Tbk | | 76,000 | | 50,153 | |
* | | PT Polychem Indonesia Tbk | | 14,413,500 | | 286,470 | |
| | PT Ramayana Lestari Sentosa Tbk | | 650,000 | | 59,887 | |
| | PT Samudera Indonesia Tbk | | 415,500 | | 263,280 | |
| | PT Selamat Semp Tbk | | 10,624,000 | | 419,518 | |
| | PT Semen Gresik Tbk | | 67,590,910 | | 43,174,378 | |
| | PT Sinar Mas Agro Resources & Technology Tbk | | 8,192,900 | | 5,255,638 | |
| | PT Summarecon Agung Tbk | | 3,675,000 | | 426,529 | |
* | | PT Sunson Textile Manufacturer Tbk | | 6,012,000 | | 256,649 | |
* | | PT Suparma Tbk | | 3,995,345 | | 117,517 | |
* | | PT Surya Dumai Industri Tbk | | 5,145,000 | | 197,673 | |
| | PT Surya Toto Indonesia Tbk | | 46,400 | | 39,616 | |
* | | PT Suryainti Permata Tbk | | 4,344,500 | | 904,405 | |
| | PT Tempo Scan Pacific Tbk | | 64,660,000 | | 5,249,016 | |
| | PT Tigaraksa Satria Tbk | | 718,200 | | 32,576 | |
| | PT Trias Sentosa Tbk | | 29,527,200 | | 567,297 | |
| | PT Trimegah Sec Tbk | | 34,298,000 | | 1,229,810 | |
| | PT Tunas Ridean Tbk | | 10,810,000 | | 1,487,420 | |
* | | PT Ultrajaya Milk Industry & Trading Co. Tbk | | 13,717,500 | | 919,514 | |
* | | PT Unggul Indah Cahaya Tbk | | 371,435 | | 108,021 | |
TOTAL COMMON STOCKS | | | | 275,010,748 | |
10
RIGHTS/WARRANTS — (0.0%) | | | | | |
* | | PT Bakrieland Development Tbk Warrants 04/30/10 | | 7,865,025 | | 302,178 | |
* | | PT Budi Acid Jaya Tbk Warrants 01/11/12 | | 2,136,666 | | 42,186 | |
* | | PT Matahari Putra Prima Tbk Warrants 01/12/10 | | 5,451,425 | | 41,017 | |
* | | PT Summarecon Agung Tbk Rights 06/21/10 | | 262,500 | | 6,724 | |
TOTAL RIGHTS/WARRANTS | | | | 392,105 | |
| | | | | | | |
TOTAL — INDONESIA | | | | 275,402,853 | |
| | | | | | | |
ISRAEL — (2.8%) | | | | | |
COMMON STOCKS — (2.8%) | | | | | |
* | | Afcon Industries, Ltd. | | 1,451 | | 11,871 | |
* | | Africa Israel Industries, Ltd. | | 7,006 | | 704,407 | |
* | | Alvarion, Ltd. | | 4,828 | | 47,701 | |
* | | American Israeli Paper Mills, Ltd. | | 23,254 | | 1,368,109 | |
| | Ashtrom Properties, Ltd. | | 171,400 | | 191,765 | |
| | Azorim Investment Development & Construction Co., Ltd. | | 299,403 | | 4,596,253 | |
| | Bank Hapoalim B.M. | | 14,182,489 | | 71,646,517 | |
| | Bank Leumi Le-Israel | | 13,378,631 | | 62,555,027 | |
| | Bank of Jerusalem, Ltd. | | 71,150 | | 118,774 | |
| | Baran Group, Ltd. | | 90,555 | | 1,782,220 | |
| | Blue Square Chain Investments and Properties, Ltd. | | 33,400 | | 311,620 | |
| | Clal Industries, Ltd. | | 773,796 | | 4,627,621 | |
* | | Delta-Galil Industries, Ltd. | | 131,707 | | 913,836 | |
| | Dexia Isreal, Ltd. | | 1,050 | | 105,974 | |
| | Discount Investment Corp. | | 283,611 | | 9,334,666 | |
| | Elbit Medical Imaging, Ltd. | | 168,210 | | 9,513,137 | |
* | | Electra (Israel), Ltd. | | 13,319 | | 2,211,960 | |
* | | Elron Electronic Industries, Ltd. | | 274,956 | | 3,204,010 | |
* | | Feuchtwanger Investments, Ltd. | | 10,500 | | 33 | |
* | | First International Bank of Israel, Ltd. (6123804) | | 752,360 | | 1,992,414 | |
* | | First International Bank of Israel, Ltd. (6123815) | | 294,660 | | 4,020,283 | |
* | | Formula Systems, Ltd. | | 91,685 | | 1,260,643 | |
* | | Formula Vision Technologies, Ltd. | | 1 | | — | |
* | | Granite Hacarmel Investments, Ltd. | | 142,500 | | 349,290 | |
* | | GTC Real Estate NV | | 3,052 | | 62,619 | |
| | IDB Development Corp., Ltd. Series A | | 299,281 | | 11,468,428 | |
| | Industrial Building Corp., Ltd. | | 937,191 | | 2,642,559 | |
| | Israel Cold Storage & Supply Co., Ltd. | | 7,000 | | 71,613 | |
| | Israel Petrochemical Enterprises, Ltd. | | 197,712 | | 2,414,611 | |
* | | Israel Salt Industries, Ltd. | | 158,462 | | 1,136,797 | |
* | | Israel Steel Mills, Ltd. | | 97,000 | | 987 | |
* | | Jerusalem Oil Exploration, Ltd. | | 27,096 | | 568,537 | |
* | | Kardan Israel, Ltd. | | 2,237 | | 10,577 | |
* | | Knafaim Arkia Holdings, Ltd. | | 117,857 | | 1,176,514 | |
| | Koor Industries, Ltd. | | 149,180 | | 11,443,937 | |
| | Leader Holding & Investments, Ltd. | | 197,439 | | 527,144 | |
* | | Liberty Properties, Ltd. | | 3,457 | | 45,563 | |
* | | Makhteshim-Agan Industries, Ltd. | | 227,355 | | 1,938,884 | |
* | | Mer Industries, Ltd. | | 19,959 | | 99,618 | |
| | Merhav-Ceramic & Building Materials Center, Ltd. | | 36,232 | | 73,336 | |
* | | Metalink, Ltd. | | 21,794 | | 110,812 | |
11
* | | Middle East Tube Co., Ltd. | | 18,000 | | 46,199 | |
* | | Miloumor, Ltd. | | 97,997 | | 299,378 | |
* | | Minrav Holdings, Ltd. | | 2,000 | | 143,018 | |
| | Mivtach Shamir Holdings, Ltd. | | 10,944 | | 304,471 | |
* | | Naphtha Israel Petroleum Corp. | | 407,900 | | 260,666 | |
* | | OCIF Investments and Development, Ltd. | | 14,180 | | 470,511 | |
* | | Orckit Communications, Ltd. | | 109,096 | | 760,064 | |
* | | Property and Building Corp., Ltd. | | 15,803 | | 2,206,345 | |
* | | Retalix, Ltd. | | 71,662 | | 1,259,946 | |
* | | Scailex Corp., Ltd. | | 423,455 | | 4,329,600 | |
| | Suny Electronic Inc., Ltd. | | 90,241 | | 301,568 | |
| | Super-Sol, Ltd. Series B | | 793,301 | | 3,051,601 | |
* | | Team Computer & Systems, Ltd. | | 6,937 | | 233,694 | |
* | | The Israel Land Development Co., Ltd. | | 182,187 | | 1,575,242 | |
* | | Tower Semiconductor, Ltd. | | 578,773 | | 902,609 | |
* # | | TTI Team Telecom International, Ltd. ADR | | 18,170 | | 45,062 | |
| | Union Bank of Israel, Ltd. | | 499,194 | | 2,565,336 | |
| | United Mizrahi Bank, Ltd. | | 1,696,011 | | 12,972,568 | |
| | Urdan Industries, Ltd. | | 526,698 | | 463,072 | |
| | Ytong Industries, Ltd. | | 173,581 | | 157,618 | |
| | | | | | | |
TOTAL — ISRAEL | | | | 247,009,235 | |
| | | | | | | |
MALAYSIA — (4.6%) | | | | | |
COMMON STOCKS — (4.6%) | | | | | |
| | A&M Realty Berhad | | 854,200 | | 248,569 | |
* | | Advanced Synergy Capital Berhad | | 153,500 | | 20,228 | |
| | Affin Holdings Berhad | | 9,805,900 | | 7,575,053 | |
| | Alliance Financial Group Berhad | | 5,187,100 | | 4,606,947 | |
* | | Al-’Aqar KPJ REIT | | 109,921 | | 32,181 | |
| | Aluminum Co. of Malaysia Berhad | | 250,000 | | 91,512 | |
* | | AMBD Berhad | | 2,782,700 | | 291,572 | |
| | AmInvestment Group Berhad | | 994,468 | | 1,093,004 | |
| | AMMB Holdings Berhad | | 19,012,144 | | 22,771,806 | |
| | Ancom Berhad | | 413,437 | | 133,106 | |
| | Ann Joo Resources Berhad | | 2,253,000 | | 1,715,273 | |
| | APM Automotive Holdings Berhad | | 1,024,700 | | 709,933 | |
| | Apollo Food Holdings Berhad | | 198,400 | | 176,734 | |
| | Asas Dunia Berhad | | 524,700 | | 168,287 | |
| | Asia Pacific Land Berhad | | 5,644,300 | | 879,006 | |
| | Asiatic Development Berhad | | 2,835,900 | | 6,281,106 | |
| | Bandar Raya Developments Berhad | | 3,669,100 | | 3,524,309 | |
| | Batu Kawan Berhad | | 2,309,250 | | 6,944,838 | |
| | Berjaya Corp. Berhad | | 15,708,680 | | 5,202,383 | |
* | | Berjaya Corp. Berhad ICULS | | 36,680,990 | | 6,432,392 | |
| | Berjaya Land Berhad | | 4,523,000 | | 6,648,160 | |
| | Bernas Padiberas Nasional Berhad | | 4,807,300 | | 3,084,911 | |
* | | Bimb Holdings Berhad | | 1,544,700 | | 640,103 | |
| | Bina Darulaman Berhad | | 118,000 | | 38,221 | |
* | | Binaik Equity Berhad | | 149,800 | | 41,191 | |
| | Bolton Properties Berhad | | 1,277,400 | | 419,646 | |
| | Boustead Holdings Berhad | | 3,343,400 | | 6,161,206 | |
| | Boustead Properties Berhad | | 343,700 | | 501,503 | |
| | Cahya Mata Sarawak Berhad | | 1,401,400 | | 977,950 | |
| | Chemical Co. of Malaysia Berhad | | 311,000 | | 258,265 | |
12
| | Chin Teck Plantations Berhad | | 296,600 | | 555,269 | |
| | Choo Bee Metal Industries Berhad | | 339,700 | | 207,394 | |
* | | Country Heights Holdings Berhad | | 174,000 | | 55,483 | |
| | Cycle & Carriage Bintang Berhad | | 249,800 | | 193,002 | |
* | | Damansara Realty Berhad | | 2,955,600 | | 287,634 | |
* | | Datuk Keramik Holdings Berhad | | 127,000 | | — | |
| | Dijaya Corp. Berhad | | 612,100 | | 247,239 | |
| | DNP Holdings Berhad | | 1,431,800 | | 793,708 | |
| | DRB-Hicom Berhad | | 7,715,700 | | 3,802,341 | |
| | Eastern & Oriental Berhad (6468754) | | 1,863,766 | | 1,317,899 | |
| | Eastern & Oriental Berhad (B19ZLW1) | | 283,149 | | 170,840 | |
| | Eastern Pacific Industrial Corp. Berhad | | 497,700 | | 361,308 | |
| | ECM Libra Avenue Berhad | | 6,220,730 | | 1,642,743 | |
| | Edaran Otomobil Nasional Berhad | | 1,591,900 | | 978,812 | |
| | EON Capital Berhad | | 1,459,607 | | 2,978,266 | |
* | | Equine Capital Berhad | | 690,000 | | 398,089 | |
| | Esso Malaysia Berhad | | 905,500 | | 642,035 | |
| | Far East Holdings Berhad | | 388,800 | | 689,814 | |
| | Focal Aims Holdings Berhad | | 424,000 | | 46,244 | |
* | | Fountain View Development Berhad | | 2,573,200 | | 168,258 | |
| | Gamuda Berhad | | 12,943,800 | | 16,924,800 | |
| | General Corp. Berhad | | 1,681,400 | | 573,545 | |
| | Globetronics Technology Berhad | | 360,000 | | 28,340 | |
| | Glomac Berhad | | 1,609,100 | | 630,755 | |
| | Gold IS Berhad | | 1,598,600 | | 1,121,118 | |
* | | Golden Plus Holdings Berhad | | 201,000 | | 101,652 | |
| | Gopeng Berhad | | 273,900 | | 71,901 | |
| | Grand United Holdings Berhad | | 1,387,700 | | 319,389 | |
* | | Gula Perak Berhad | | 50 | | 2 | |
| | GuocoLand (Malaysia) Berhad | | 486,000 | | 477,152 | |
| | Hap Seng Consolidated Berhad | | 1,779,200 | | 1,754,261 | |
| | Hong Leong Financial Group Berhad | | 1,249,437 | | 2,198,092 | |
| | Hong Leong Industries Berhad | | 1,225,800 | | 1,544,623 | |
| | Hume Industries (Malaysia) Berhad | | 537,667 | | 573,367 | |
| | Hunza Properties Berhad | | 1,033,300 | | 851,612 | |
| | Hwang-DBS (Malaysia) Berhad | | 908,700 | | 619,992 | |
| | IGB Corp. Berhad | | 11,062,600 | | 7,590,709 | |
| | IJM Corp. Berhad | | 5,666,500 | | 14,000,151 | |
| | IJM Plantations Berhad | | 204,400 | | 182,139 | |
* | | Insas Berhad | | 3,779,000 | | 678,380 | |
| | Integrated Logistics Berhad | | 1,222,800 | | 437,739 | |
| | IOI Corp. Berhad | | 1,852,500 | | 3,738,794 | |
| | IOI Properties Berhad | | 13,600 | | 55,452 | |
* | | Jaks Resources Berhad | | 3,438,000 | | 1,240,312 | |
| | Jaya Tiasa Holdings Berhad | | 1,185,135 | | 1,246,224 | |
| | Jerneh Asia Berhad | | 425,120 | | 209,372 | |
| | K & N Kenanga Holdings Berhad | | 2,209,100 | | 648,541 | |
* | | Karambunai Corp. Berhad | | 6,839,800 | | 276,131 | |
| | Keck Seng (Malaysia) Berhad | | 1,663,400 | | 2,305,475 | |
| | Kian Joo Can Factory Berhad | | 3,566,680 | | 1,572,090 | |
* | | KIG Glass Industrial Berhad | | 260,000 | | 2,318 | |
| | Kim Hin Industry Berhad | | 453,800 | | 181,150 | |
| | Kim Loong Resources Berhad | | 232,000 | | 191,576 | |
| | KLCC Property Holdings Berhad | | 5,492,000 | | 5,873,952 | |
| | Knusford Berhad | | 153,300 | | 70,097 | |
13
| | KPJ Healthcare Berhad | | 1,570,300 | | 1,597,627 | |
| | KrisAssets Holdings Berhad | | 250,377 | | 205,991 | |
| | KSL Holdings Berhad | | 189,461 | | 86,930 | |
| | Kuala Lumpur Kepong Berhad | | 2,100,050 | | 9,891,205 | |
* | | Kub Malaysia Berhad | | 6,829,000 | | 1,646,448 | |
| | Kuchai Development Berhad | | 345,600 | | 108,111 | |
| | Kulim Malaysia Berhad | | 2,050,825 | | 4,700,222 | |
* | | Kumpulan Europlus Berhad | | 1,702,900 | | 295,220 | |
| | Kumpulan Fima Berhad | | 585,100 | | 113,553 | |
* | | Kumpulan Hartanah Selangor Berhad | | 520,000 | | 136,591 | |
| | Kwantas Corp. Berhad | | 123,000 | | 283,698 | |
* | | Land & General Berhad | | 14,757,000 | | 2,081,164 | |
| | Landmarks Berhad | | 1,497,200 | | 1,342,739 | |
* | | LBS Bina Group Berhad | | 1,607,000 | | 276,915 | |
| | Leader Universal Holdings Berhad | | 6,643,033 | | 2,040,946 | |
| | Leong Hup Holdings Berhad | | 1,469,800 | | 578,023 | |
* | | Lien Hoe Corp. Berhad | | 1,997,150 | | 152,418 | |
* | | Lion Corp Berhad | | 1,520,200 | | 356,972 | |
* | | Lion Diversified Holdings Berhad | | 1,682,500 | | 965,286 | |
| | Lion Industries Corp. Berhad | | 4,734,381 | | 3,064,373 | |
| | MAA Holdings Berhad | | 888,700 | | 517,314 | |
| | Malaysia Building Society Berhad | | 419,000 | | 157,949 | |
* | | Malaysian Airlines System Berhad | | 387,065 | | 566,428 | |
| | Malaysian Bulk Carriers Berhad | | 2,530,525 | | 3,417,597 | |
| | Malaysian Mosaics Berhad | | 354,240 | | 136,392 | |
* | | Malaysian Resources Corp. Berhad | | 5,532,500 | | 4,053,756 | |
| | Marco Holdings Berhad | | 1,710,000 | | 75,981 | |
| | MBM Resources Berhad | | 487,533 | | 460,506 | |
* | | Measat Global Berhad | | 377,500 | | 185,447 | |
| | Mega First Corp. Berhad | | 1,101,700 | | 462,485 | |
| | Melewar Industrial Group Berhad | | 1,294,300 | | 494,094 | |
| | Merge Housing Berhad | | 58,952 | | 10,189 | |
| | Metro Kajang Holdings Berhad | | 535,333 | | 224,893 | |
* | | Metroplex Berhad | | 817,000 | | — | |
| | Mieco Chipboard Berhad | | 873,900 | | 213,664 | |
| | MISC Berhad | | 15,000 | | 43,577 | |
| | MK Land Holdings Berhad | | 6,778,500 | | 1,280,035 | |
| | MMC Corp. Berhad | | 4,108,100 | | 10,629,757 | |
| | MNRB Holdings Berhad | | 1,150,800 | | 1,708,922 | |
| | MTD ACPI Engineering Berhad | | 2,287,200 | | 1,345,052 | |
| | MTD Infraperdana Berhad | | 6,166,300 | | 1,264,323 | |
| | Muda Holdings Berhad | | 706,000 | | 73,570 | |
| | Muhibbah Engineering Berhad | | 978,000 | | 1,002,940 | |
* | | MUI Properties Berhad | | 1,314,000 | | 86,031 | |
* | | Mulpha International Berhad | | 11,817,500 | | 5,219,407 | |
| | Multi-Purpose Holdings Berhad | | 1,974,000 | | 1,212,980 | |
| | MWE Holdings Berhad | | 458,000 | | 133,357 | |
* | | Naluri Berhad | | 3,491,300 | | 736,485 | |
* | | Narra Industries Berhad | | 154,200 | | 31,579 | |
| | NCB Holdings Berhad | | 2,381,700 | | 2,084,958 | |
| | Negri Sembilan Oil Palms Berhad | | 167,600 | | 199,888 | |
| | New Straits Times Press (Malaysia) Berhad | | 1,751,100 | | 1,065,725 | |
| | NV Multi Corp. Berhad | | 671,800 | | 138,612 | |
| | Nylex (Malaysia) Berhad | | 328,550 | | 147,185 | |
| | OKS Property Holdings Berhad | | 373,356 | | 106,193 | |
14
| | Oriental Holdings Berhad | | 3,021,116 | | 5,940,084 | |
| | Oriental Interest Berhad | | 170,000 | | 70,703 | |
| | OSK Holdings Berhad | | 5,309,618 | | 3,891,187 | |
| | OSK Ventures Interantional Berhad | | 66,000 | | 35,238 | |
| | P.I.E. Industrial Berhad | | 323,600 | | 469,905 | |
| | Pacific & Orient Berhad | | 275,494 | | 122,191 | |
| | Pacificmas Berhad | | 305,000 | | 299,421 | |
* | | Pan Malaysia Cement Works Berhad | | 1,271,800 | | 91,329 | |
| | Panasonic Manufacturing Malaysia Berhad | | 339,180 | | 1,130,331 | |
* | | Paracorp Berhad | | 252,000 | | 749 | |
| | Paramount Corp. Berhad | | 203,900 | | 143,685 | |
* | | Parkson Holdings Berhad | | 2,519,790 | | 6,583,449 | |
| | PBA Holdings Berhad | | 1,502,500 | | 544,059 | |
| | Pelikan International Corp. Berhad | | 148,680 | | 185,769 | |
* | | Permaju Industries Berhad | | 1,714,300 | | 316,816 | |
| | Petronas Dagangan Berhad | | 970,900 | | 2,492,678 | |
| | PJ Development Holdings Berhad | | 2,768,800 | | 685,381 | |
| | PK Resources Berhad | | 5,300 | | 1,145 | |
* | | Pos Malaysia & Services Holdings Berhad | | 3,633,817 | | 2,919,591 | |
| | PPB Group Berhad | | 6,909,466 | | 20,532,378 | |
* | | Prime Utilities Berhad | | 46,000 | | 5,000 | |
* | | Promet Berhad | | 140,000 | | — | |
| | Protasco Berhad | | 282,200 | | 83,740 | |
* | | Proton Holdings Berhad | | 3,652,500 | | 3,909,369 | |
* | | Pulai Springs Berhad | | 159,800 | | 54,858 | |
* | | Ramunia Holdings Berhad | | 1,817,000 | | 554,657 | |
* | | Ranhill Berhad | | 4,323,500 | | 3,102,494 | |
* | | RB Land Holdings Berhad | | 742,900 | | 570,110 | |
| | RHB Capital Berhad | | 3,940,800 | | 6,803,845 | |
* | | Salcon Berhad | | 574,000 | | 193,505 | |
* | | Sapura Resources Berhad | | 286,800 | | 32,544 | |
| | Sarawak Energy Berhad | | 4,681,000 | | 3,326,672 | |
| | Sarawak Oil Palms Berhad | | 150,700 | | 271,742 | |
| | Scientex Inc. Berhad | | 632,400 | | 244,494 | |
| | Selangor Dredging Berhad | | 1,312,700 | | 383,317 | |
| | Shangri-La Hotels (Malaysia) Berhad | | 738,000 | | 532,550 | |
| | Shell Refining Co. Federation of Malaysia Berhad | | 164,900 | | 539,872 | |
| | SHL Consolidated Berhad | | 1,008,700 | | 605,174 | |
* | | Silverstone Corp. Berhad | | 8,690 | | 168 | |
* | | Sime Darby Berhad | | 10,193,905 | | 33,328,269 | |
| | Southern Acids (Malaysia) Berhad | | 44,000 | | 21,241 | |
| | Southern Steel Berhad | | 865,300 | | 440,114 | |
| | Store Corp. Berhad | | 124,630 | | 126,232 | |
* | | Subur Tiasa Holdings Berhad | | 438,600 | | 455,378 | |
| | Sunrise Berhad | | 1,479,600 | | 1,510,440 | |
* | | Sunway City Berhad | | 2,358,700 | | 3,459,876 | |
* | | Sunway Holdings, Inc. Berhad | | 4,443,600 | | 2,423,403 | |
| | Suria Capital Holdings Berhad | | 590,800 | | 520,397 | |
| | TA Enterprise Berhad | | 10,119,100 | | 3,680,732 | |
| | Tahp Group Berhad | | 27,000 | | 31,466 | |
* | | Talam Corp. Berhad | | 5,944,350 | | 465,944 | |
* | | Tamco Corp. Holdings Berhad | | 219,500 | | 59,353 | |
| | Tan Chong Motor Holdings Berhad | | 5,338,300 | | 3,675,431 | |
| | TDM Berhad | | 1,059,200 | | 486,084 | |
| | Tekala Corp. Berhad | | 337,700 | | 94,114 | |
15
| | TH Group Berhad | | 1,975,800 | | 459,433 | |
* | | Time Dotcom Berhad | | 8,911,700 | | 2,052,225 | |
| | Tiong Nam Transport Holdings Berhad | | 171,500 | | 48,829 | |
| | Tradewinds (Malaysia) Berhad | | 844,200 | | 1,123,027 | |
* | | Tradewinds Corp. Berhad | | 6,902,600 | | 2,839,631 | |
| | Tradewinds Plantation Berhad | | 779,600 | | 914,465 | |
| | TSR Capital Berhad | | 157,900 | | 93,427 | |
| | UAC Berhad | | 77,398 | | 98,897 | |
| | UEM World Berhad | | 4,772,400 | | 5,341,806 | |
| | UMW Holdings Berhad | | 2,113,843 | | 9,444,080 | |
| | Unico-Desa Plantations Berhad | | 6,691,328 | | 2,058,990 | |
| | Unisem (M) Berhad | | 4,666,700 | | 2,311,475 | |
| | United Malacca Rubber Estates Berhad | | 450,100 | | 898,928 | |
| | United Plantations Berhad | | 771,600 | | 2,953,620 | |
* | | Utama Banking Group Berhad | | 1,811,200 | | 1,069,434 | |
| | Utusan Melayu (Malaysia) Berhad | | 449,500 | | 149,660 | |
| | VS Industry Berhad | | 1,156,680 | | 1,249,793 | |
| | Warisan TC Holdings Berhad | | 109,850 | | 59,476 | |
| | WTK Holdings Berhad | | 2,262,250 | | 1,522,387 | |
| | Yeo Hiap Seng (Malaysia) Berhad | | 355,320 | | 186,733 | |
| | YTL Corp. Berhad | | 5,993,600 | | 14,177,319 | |
| | Yu Neh Huat Berhad | | 2,169,400 | | 1,554,758 | |
| | Zelan Berhad | | 1,017,000 | | 1,776,424 | |
TOTAL COMMON STOCKS | | | | 411,742,170 | |
| | | | | | | |
PREFERRED STOCKS — (0.0%) | | | | | |
* | | Malayan United Industries Berhad A1 | | 1,526,067 | | 108,859 | |
* | | Malayan United Industries Berhad A2 | | 1,526,067 | | 95,252 | |
TOTAL PREFERRED STOCKS | | | | 204,111 | |
| | | | | | | |
RIGHTS/WARRANTS — (0.0%) | | | | | |
* | | Bandar Raya Developments Berhad Warrants 09/26/12 | | 1,607,495 | | 673,672 | |
* | | Jerneh Asia Berhad Warrants 07/26/12 | | 159,420 | | 23,218 | |
* | | Mieco Chipboard Berhad Warrants 04/21/09 | | 76,000 | | 4,066 | |
* | | OSK Holdings Berhad Warrants 04/05/09 | | 93,339 | | 6,936 | |
* | | Salcon Berhad Warrants 05/17/14 | | 143,500 | | 29,003 | |
* | | Sarawak Oil Palms Berhad Warrants 01/19/10 | | 23,250 | | 28,056 | |
TOTAL RIGHTS/WARRANTS | | | | 764,951 | |
| | | | | | | |
TOTAL — MALAYSIA | | | | 412,711,232 | |
| | | | | | | |
MEXICO — (6.8%) | | | | | |
COMMON STOCKS — (6.8%) | | | | | |
# | | Alfa S.A.B. de C.V. Series A | | 6,037,464 | | 39,299,559 | |
| | Cemex S.A.B. de C.V. Sponsored ADR | | 7,347,625 | | 210,215,551 | |
* | | Cintra S.A. de C.V. | | 85,000 | | 20,963 | |
| | Coca-Cola Femsa S.A.B. de C.V. Sponsored ADR | | 195,000 | | 8,839,350 | |
| | Consorcio ARA S.A.B. de C.V. | | 856,400 | | 820,479 | |
* | | Consorcio Hogar S.A.B. de C.V. Series B | | 707,031 | | 405,129 | |
# | | Controladora Comercial Mexicana S.A.B. de C.V. Series B | | 7,880,200 | | 21,644,812 | |
* | | Corporacion Interamericana de Entramiento S.A.B. de C.V. Series B | | 1,666,486 | | 4,583,505 | |
| | Corporacion Mexicana de Restaurantes S.A.B. de C.V. Series B | | 3,689 | | 2,638 | |
| | Corporativo Fragua S.A.B. de C.V. Series B | | 70 | | 419 | |
16
* | | Desc S.A. de C.V. Series B | | 2,052,467 | | 1,975,788 | |
* | | Dine S.A.B. de C.V. | | 1,848,267 | | 1,863,941 | |
| | El Puerto de Liverpool S.A.B. de C.V. Series 1 | | 20,000 | | 111,850 | |
| | El Puerto de Liverpool S.A.B. de C.V. Series C1 | | 328,600 | | 1,810,576 | |
| | Embotelladora Arca S.A.B. de C.V., Mexico | | 458,003 | | 1,532,625 | |
* | | Empaques Ponderosa S.A. de C.V. Series B | | 90,000 | | 7,426 | |
* # | | Empresas ICA S.A.B. de C.V. | | 2,356,372 | | 13,944,883 | |
* | | Empresas ICA S.A.B. de C.V. Sponsored ADR | | 321,828 | | 7,604,796 | |
# | | Fomento Economico Mexicano S.A.B. de C.V. Series B & D | | 1,464,000 | | 4,724,529 | |
| | Fomento Economico Mexicano S.A.B. de C.V. Sponsored ADR | | 1,149,795 | | 37,253,358 | |
| | Gruma S.A.B. de C.V. ADR | | 62,716 | | 795,239 | |
| | Gruma S.A.B. de C.V. Series B | | 3,347,050 | | 10,497,601 | |
| | Grupo Aeroportuario del Pacifico S.A. de C.V. ADR | | 291,300 | | 13,379,409 | |
| | Grupo Aeroportuario del Sureste S.A.B. de C.V. | | 739,200 | | 4,269,503 | |
| | Grupo Aeroportuario del Sureste S.A.B. de C.V. ADR | | 154,633 | | 8,979,538 | |
# | | Grupo Carso S.A.B. de C.V. Series A-1 | | 13,173,051 | | 46,255,132 | |
| | Grupo Cementos de Chihuahua S.A.B. de C.V. | | 2,821,092 | | 15,000,993 | |
| | Grupo Continental S.A.B. de C.V. | | 1,444,500 | | 3,067,121 | |
# | | Grupo Financiero Inbursa S.A. de C.V. Series O | | 11,472,615 | | 28,598,708 | |
* | | Grupo Gigante S.A.B. de C.V. Series B | | 324,076 | | 808,147 | |
| | Grupo Herdez S.A.B. de C.V. | | 319,000 | | 444,538 | |
| | Grupo Industrial Maseca S.A.B. de C.V. Series B | | 2,771,700 | | 2,718,972 | |
| | Grupo Industrial Saltillo S.A.B. de C.V. | | 1,306,869 | | 2,252,499 | |
* | | Grupo Iusacell S.A.B. de C.V. | | 143,500 | | 1,881,320 | |
* | | Grupo Mexicano de Desarrollo S.A.B. de C.V. | | 41,400 | | 143,776 | |
| | Grupo Mexico S.A.B. de C.V. Series B | | 283,519 | | 1,985,868 | |
| | Grupo Nutrisa S.A. de C.V. | | 428 | | 439 | |
| | Grupo Posadas S.A. de C.V. Series L | | 356,000 | | 554,848 | |
* | | Grupo Qumma S.A. de C.V. Series B | | 5,301 | | 87 | |
* | | Impulsora Del Desarrollo Y El Empleo en America Latina, S.A. de C.V. | | 6,727,615 | | 8,887,915 | |
| | Industrias Bachoco S.A.B. de C.V. Series B | | 823,600 | | 2,004,729 | |
* | | Industrias CH S.A.B. de C.V. Series B | | 4,673,952 | | 17,311,727 | |
# | | Industrias Penoles S.A.B. de C.V. | | 1,277,400 | | 30,609,584 | |
# | | Organizacion Soriana S.A.B. de C.V. Series B | | 15,749,100 | | 43,431,852 | |
* | | Sanluis Corporacion S.A. de C.V. Series A | | 2,400 | | 1,052 | |
* | | Sanluis Corporacion S.A. de C.V. Series C & Series B | | 3,376 | | 3,213 | |
* | | Savia S.A. de C.V. | | 3,457,285 | | 253,571 | |
# | | Vitro S.A.B. de C.V. | | 3,272,886 | | 5,971,160 | |
| | Vitro S.A.B. de C.V. Sponsored ADR | | 330,736 | | 1,805,819 | |
| | | | | | | |
TOTAL — MEXICO | | | | 608,576,537 | |
| | | | | | | |
PHILIPPINES — (0.8%) | | | | | |
COMMON STOCKS — (0.8%) | | | | | |
| | A. Soriano Corp. | | 20,195,000 | | 1,577,085 | |
| | Alaska Milk Corp. | | 7,953,000 | | 895,536 | |
* | | Alsons Consolidated Resources, Inc. | | 16,904,000 | | 286,382 | |
* | | Bacnotan Consolidated Industries, Inc. | | 2,341,817 | | 743,517 | |
| | Banco de Oro- EPCI, Inc. | | 5,115,420 | | 6,768,412 | |
* | | Belle Corp. | | 31,340,000 | | 831,669 | |
| | Cebu Holdings, Inc. | | 7,763,250 | | 676,157 | |
* | | Digital Telecommunications Phils., Inc. | | 105,753,000 | | 3,205,682 | |
| | DMCI Holdings, Inc. | | 5,354,000 | | 1,240,659 | |
* | | Empire East Land Holdings, Inc. | | 24,860,000 | | 429,668 | |
* | | Export & Industry Bank, Inc. | | 14,950 | | 138 | |
17
| | Filinvest Development Corp. | | 6,763,500 | | 1,030,086 | |
* | | Filinvest Land, Inc. | | 237,350,156 | | 8,329,308 | |
* | | Filipina Water Bottling Corp. | | 5,471,786 | | — | |
| | First Philippines Holdings Corp. | | 2,011,100 | | 3,050,858 | |
* | | House of Investments, Inc. | | 700,000 | | 31,360 | |
| | Megaworld Properties & Holdings, Inc. | | 82,784,600 | | 7,729,972 | |
| | Metro Bank & Trust Co. | | 7,428,220 | | 9,499,009 | |
* | | Mondragon International Philippines, Inc. | | 2,464,000 | | 7,201 | |
| | Petron Corp. | | 22,111,000 | | 2,975,737 | |
* | | Philippine National Bank | | 3,619,900 | | 3,801,680 | |
* | | Philippine National Construction Corp. | | 398,900 | | 54,088 | |
* | | Philippine Realty & Holdings Corp. | | 20,930,000 | | 215,386 | |
| | Philippine Savings Bank | | 1,232,313 | | 1,768,830 | |
* | | Prime Media Holdings, Inc. | | 409,000 | | 5,546 | |
* | | Prime Orion Philippines, Inc. | | 14,400,000 | | 161,189 | |
* | | RFM Corp. | | 4,976,400 | | 81,126 | |
| | Rizal Commercial Banking Corp. | | 1,165,699 | | 667,511 | |
| | Robinson’s Land Corp. Series B | | 8,084,500 | | 3,485,192 | |
| | Security Bank Corp. | | 2,136,110 | | 3,529,166 | |
| | Semirara Mining Corp. | | 161,700 | | 175,996 | |
| | Shang Properties, Inc. | | 614,285 | | 31,975 | |
| | SM Development Corp. | | 26,395,680 | | 2,373,200 | |
* | | Solid Group, Inc. | | 19,668,000 | | 361,199 | |
| | Union Bank of the Philippines | | 821,942 | | 840,692 | |
| | Universal Robina Corp. | | 18,561,345 | | 6,135,783 | |
| | | | | | | |
TOTAL — PHILIPPINES | | | | 72,996,995 | |
| | | | | | | |
POLAND — (3.1%) | | | | | |
COMMON STOCKS — (3.1%) | | | | | |
| | Agora SA | | 476,224 | | 10,926,808 | |
* | | Amica Wronki SA | | 174,355 | | 1,292,417 | |
| | Asseco Poland SA | | 25,223 | | 775,298 | |
| | Bank Millennium SA | | 5,515,278 | | 28,656,496 | |
| | Bank Przemyslowo Handlowy BPH SA | | 12,570 | | 4,777,390 | |
* | | Boryszew SA | | 252,799 | | 1,171,304 | |
* | | Budimex SA | | 127,217 | | 3,902,984 | |
| | Debica SA | | 110,153 | | 3,987,124 | |
* | | Echo Investment SA | | 105,725 | | 3,197,383 | |
| | Elektrobudowa SA | | 31,135 | | 2,290,952 | |
| | Fabryki Mebli Forte SA | | 70,159 | | 174,853 | |
* | | Farmacol SA | | 3,304 | | 52,037 | |
* | | Ferrum SA | | 4,233 | | 16,606 | |
| | Grupa Kety SA | | 85,385 | | 5,572,187 | |
| | Grupa Lotos SA | | 839,119 | | 15,924,412 | |
| | Impexmetal SA | | 6,026,700 | | 19,715,379 | |
| | Kredyt Bank SA | | 317,313 | | 2,890,217 | |
* | | Kroscienskie Huty Szkla Krosno SA | | 63,425 | | 103,892 | |
* | | Lentex SA | | 158,570 | | 2,052,774 | |
* | | MNI SA | | 287,468 | | 478,606 | |
* | | Mostostal Export SA | | 879,352 | | 1,776,516 | |
* | | Mostostal Warszawa SA | | 365,317 | | 8,423,205 | |
* | | Mostostal Zabrze Holding SA | | 350,940 | | 1,162,283 | |
* | | Netia Holdings SA | | 3,274,477 | | 5,438,143 | |
* | | Opoczno SA | | 8,902 | | 176,405 | |
18
| | Orbis SA | | 668,253 | | 16,348,899 | |
* | | Polski Koncern Miesny Duda SA | | 157,279 | | 457,666 | |
* | | Polski Koncern Naftowy Orlen SA | | 5,310,008 | | 112,539,161 | |
* | | Praterm SA | | 1,500 | | 29,449 | |
| | Prokom Software SA | | 186,227 | | 9,896,197 | |
* | | Raciborska Fabryka Kotlow SA | | 1,167,888 | | 5,141,985 | |
* | | Stalexport SA | | 460,000 | | 574,168 | |
| | Ster-Projekt SA | | 153,711 | | 397,248 | |
| | Sygnity SA | | 22,007 | | 285,356 | |
* | | Synthos SA | | 2,644,222 | | 1,729,669 | |
| | Zelmer SA | | 3,000 | | 74,222 | |
TOTAL COMMON STOCKS | | | | 272,409,691 | |
| | | | | | | |
RIGHTS/WARRANTS — (0.0%) | | | | | |
* | | Elektrobudowa Rights 12/31/07 | | 31,135 | | — | |
* | | Kroscienski Huty Szkla Krosno SA Rights | | 63,425 | | 45,378 | |
TOTAL RIGHTS/WARRANTS | | | | 45,378 | |
| | | | | | | |
TOTAL — POLAND | | | | 272,455,069 | |
| | | | | | | |
SOUTH AFRICA — (10.2%) | | | | | |
COMMON STOCKS — (10.2%) | | | | | |
| | ABSA Group, Ltd. | | 2,353,362 | | 44,110,454 | |
| | Advtech, Ltd. | | 620,958 | | 444,469 | |
| | Aeci, Ltd. | | 1,334,024 | | 16,118,953 | |
| | Afgri, Ltd. | | 2,326,794 | | 2,431,076 | |
| | African Rainbow Minerals, Ltd. | | 1,435,149 | | 31,360,143 | |
* | | AG Industries, Ltd. | | 1,340,058 | | 711,980 | |
| | Allied Electronics Corp., Ltd. | | 415,073 | | 2,771,574 | |
| | Amalgamated Appliance Holdings, Ltd. | | 1,148,822 | | 536,886 | |
| | ArcelorMittal South Africa, Ltd. | | 2,658,860 | | 54,126,598 | |
| | Argent Industrial, Ltd. | | 870,357 | | 2,417,788 | |
| | AST Group, Ltd. | | 968,701 | | 159,719 | |
# | | Aveng, Ltd. | | 1,866,020 | | 15,802,661 | |
| | AVI, Ltd. | | 3,009,957 | | 9,014,447 | |
| | Barloworld, Ltd. | | 2,119,859 | | 35,413,690 | |
| | Bell Equipment, Ltd. | | 452,449 | | 3,316,915 | |
| | Business Connexion Group | | 465,381 | | 381,319 | |
| | Bytes Technology Group, Ltd. | | 314,654 | | 832,789 | |
| | Capitec Bank Holdings, Ltd. | | 143,752 | | 1,007,632 | |
* | | Caxton & CTP Publishers & Printers, Ltd. | | 2,159,854 | | 5,514,205 | |
| | City Lodge Hotels, Ltd. | | 21,170 | | 263,608 | |
* | | Corpgro, Ltd. | | 579,166 | | — | |
| | Data Tec, Ltd. | | 1,770,481 | | 9,349,115 | |
| | Datacentrix Holdings, Ltd. | | 603,757 | | 416,079 | |
* | | Delta Electrical Industries, Ltd. | | 234,340 | | 453,590 | |
| | Dimension Data Holdings P.L.C. | | 3,977,377 | | 5,004,468 | |
| | Distell Group, Ltd. | | 680,989 | | 6,168,228 | |
| | Dorbyl, Ltd. | | 184,041 | | 293,495 | |
* | | Durban Roodeport Deep, Ltd. | | 308,824 | | 259,122 | |
| | Ellerine Holdings, Ltd. | | 1,366,437 | | 16,296,522 | |
* | | Enaleni Pharmaceuticals, Ltd. | | 1,094,764 | | 635,842 | |
| | Enviroserv Holdings, Ltd. | | 259,484 | | 542,557 | |
| | Exxaro Resources, Ltd. | | 80,503 | | 1,231,467 | |
19
| | Gold Fields, Ltd. | | 183,112 | | 3,048,219 | |
| | Gold Fields, Ltd. Sponsored ADR | | 4,882,535 | | 80,317,701 | |
| | Gold Reef Resorts, Ltd. | | 344,218 | | 1,700,650 | |
| | Grindrod, Ltd. | | 1,298,695 | | 4,683,105 | |
| | Group Five, Ltd. | | 258,794 | | 2,149,347 | |
* # | | Harmony Gold Mining Co., Ltd. | | 3,183,494 | | 33,732,934 | |
* | | Harmony Gold Mining Co., Ltd. Sponsored ADR | | 425,220 | | 4,439,297 | |
| | Highveld Steel & Vanadilum Corp., Ltd. | | 268,788 | | 4,348,775 | |
| | Hudaco Industries, Ltd. | | 158,266 | | 1,977,163 | |
# | | Hulamin, Ltd. | | 757,380 | | 2,378,097 | |
| | Iliad Africa, Ltd. | | 76,658 | | 173,877 | |
| | Illovo Sugar, Ltd. | | 497,655 | | 1,806,616 | |
| | Imperial Holdings, Ltd. | | 829,977 | | 12,577,556 | |
# | | Investec, Ltd. | | 1,642,445 | | 17,455,855 | |
* | | JCI, Ltd. | | 4,289,448 | | — | |
| | JD Group, Ltd. | | 1,116,746 | | 8,876,252 | |
| | Johnic Communications, Ltd. | | 391,810 | | 5,730,812 | |
| | Kap International Holdings, Ltd. | | 968,903 | | 465,943 | |
| | Lewis Group, Ltd. | | 930,772 | | 6,557,833 | |
# | | Liberty Group, Ltd. | | 1,566,347 | | 20,532,170 | |
* | | M Cubed Holdings, Ltd. | | 1,850,526 | | 54,387 | |
# | | Medi-Clinic Corp., Ltd. | | 1,277,088 | | 4,327,746 | |
* | | Merafe Resources, Ltd. | | 13,982,084 | | 4,282,621 | |
| | Metair Investments, Ltd. | | 956,461 | | 1,986,564 | |
* | | Metorex, Ltd. | | 610,501 | | 2,022,493 | |
| | Metropolitan Holdings, Ltd. | | 7,756,480 | | 17,113,948 | |
| | Murray & Roberts Holdings, Ltd. | | 1,479,104 | | 20,979,505 | |
| | Mustek, Ltd. | | 482,271 | | 501,588 | |
| | Mvelaphanda Group, Ltd. | | 3,564,018 | | 5,285,110 | |
| | Nampak, Ltd. | | 4,793,106 | | 15,568,661 | |
| | Nedbank Group, Ltd. | | 2,262,249 | | 44,906,567 | |
| | New Clicks Holdings, Ltd. | | 2,981,064 | | 7,163,191 | |
| | Northam Platinum, Ltd. | | 830,061 | | 5,429,656 | |
| | Nu-World Holdings, Ltd. | | 158,299 | | 603,281 | |
| | Oceana Group, Ltd. | | 482,566 | | 1,692,983 | |
| | Omnia Holdings, Ltd. | | 387,795 | | 4,050,022 | |
* | | Palabora Mining Co., Ltd. | | 69,265 | | 990,719 | |
| | Peregrine Holdings, Ltd. | | 665,741 | | 1,993,982 | |
| | Pretoria Portland Cement Co., Ltd. | | 3,933,398 | | 26,224,757 | |
* | | Product Co. | | 130,947 | | — | |
| | PSG Group, Ltd. | | 598,535 | | 2,418,216 | |
* | | Randgold & Exploration Co., Ltd. | | 256,811 | | — | |
| | Redefine Income Fund, Ltd. | | 83,325 | | 98,127 | |
| | Sanlam, Ltd. | | 28,259,449 | | 96,992,464 | |
| | Sappi, Ltd. | | 1,311,653 | | 18,047,632 | |
| | Sappi, Ltd. Sponsored ADR | | 602,200 | | 8,195,942 | |
| | Sasol, Ltd. Sponsored ADR | | 1,309,923 | | 66,203,508 | |
| | Spur Corp., Ltd. | | 153,378 | | 236,251 | |
# | | Steinhoff International Holdings, Ltd. | | 9,195,876 | | 25,817,730 | |
| | Sun International, Ltd. | | 160,150 | | 3,355,788 | |
| | Super Group, Ltd. | | 1,558,474 | | 2,685,975 | |
| | Telkom South Africa, Ltd. | | 1,022,486 | | 21,952,691 | |
| | Telkom South Africa, Ltd. Sponsored ADR | | 3,800 | | 326,762 | |
* | | Tiger Automotive, Ltd. | | 467,278 | | 1,144,352 | |
| | Tiger Wheels, Ltd. | | 575,610 | | — | |
20
| | Tongaat-Hulett | | 723,298 | | 9,930,772 | |
| | Trans Hex Group, Ltd. | | 509,906 | | 753,824 | |
| | Trencor, Ltd. | | 1,038,148 | | 4,269,962 | |
| | UCS Group, Ltd. | | 1,309,466 | | 806,576 | |
* | | Value Group, Ltd. | | 874,662 | | 277,065 | |
TOTAL COMMON STOCKS | | | | 909,031,011 | |
| | | | | | | |
RIGHTS/WARRANTS — (0.0%) | | | | | |
* | | Medi-Clinic Corp., Ltd. Rights 12/07/07 | | 643,422 | | 42,548 | |
| | | | | | | |
TOTAL — SOUTH AFRICA | | | | 909,073,559 | |
| | | | | | | |
SOUTH KOREA — (11.4%) | | | | | |
COMMON STOCKS — (11.4%) | | | | | |
# | | Aekyung Petrochemical Co., Ltd. | | 19,060 | | 844,324 | |
* # | | Anam Electronics Co., Ltd. | | 24,280 | | 297,514 | |
# | | Asia Cement Manufacturing Co., Ltd. | | 10,728 | | 732,427 | |
# | | Asia Paper Manufacturing Co., Ltd. | | 34,410 | | 563,294 | |
# | | AUK Corp. | | 40,090 | | 132,367 | |
* # | | BNG Steel Co., Ltd | | 30,250 | | 442,017 | |
# | | Bohae Brewery Co., Ltd. | | 8,830 | | 262,774 | |
| | Boo Kook Securities Co., Ltd. | | 27,705 | | 972,405 | |
# | | Boryung Pharmaceutical Co., Ltd. | | 10,573 | | 527,503 | |
| | BYC Co., Ltd. | | 810 | | 186,480 | |
| | Byuck San Corp. | | 10,472 | | 115,709 | |
# | | Byuck San Engineering and Construction Co., Ltd. | | 87,860 | | 576,481 | |
# | | Cambridge Members Co., Ltd. | | 8,070 | | 210,399 | |
| | Cheil Industrial, Inc. | | 95,804 | | 5,453,104 | |
* # | | Cho Kwang Leather Co., Ltd. | | 13,660 | | 115,494 | |
| | Cho Kwang Paint Co., Ltd. | | 24,260 | | 75,307 | |
| | Choil Aluminum Manufacturing Co., Ltd. | | 13,190 | | 145,885 | |
| | Chon Bang Co., Ltd. | | 2,520 | | 128,825 | |
# | | Chosun Refractories Co., Ltd. | | 8,170 | | 846,479 | |
# | | Chungho Comnet Co., Ltd. | | 17,450 | | 467,080 | |
* | | CJ Cheiljedang Corp. | | 505 | | 154,600 | |
| | CJ Corp. | | 861 | | 72,426 | |
* # | | Comtec Systems Co., Ltd. | | 75,460 | | 116,822 | |
* # | | Cosmochemical Co., Ltd. | | 47,640 | | 270,635 | |
# | | Crown Confectionery Co., Ltd. | | 1,670 | | 179,698 | |
# | | Dae Chang Industrial Co., Ltd. | | 25,740 | | 175,677 | |
# | | Dae Dong Industrial Co., Ltd. | | 17,320 | | 376,750 | |
# | | Dae Hyun Co., Ltd. | | 192,600 | | 166,709 | |
* # | | Dae Sang Corp. | | 110,202 | | 1,543,158 | |
# | | Dae Won Kang Up Co., Ltd. | | 21,320 | | 535,139 | |
* # | | Dae Young Packaging Co., Ltd. | | 388,976 | | 192,804 | |
# | | Daeduck Electronics Co., Ltd. | | 157,570 | | 990,860 | |
# | | Daeduck Industries Co., Ltd. | | 54,840 | | 471,256 | |
| | Daegu Bank Co., Ltd. | | 135,722 | | 2,144,251 | |
# | | Daehan Flour Mills Co., Ltd. | | 5,955 | | 1,224,189 | |
* # | | Daehan Pulp Co., Ltd. | | 15,051 | | 100,341 | |
# | | Daehan Synthetic Fiber Co., Ltd. | | 5,193 | | 852,726 | |
# | | Daekyo Co., Ltd. | | 24,460 | | 2,349,945 | |
# | | Daelim Industrial Co., Ltd. | | 96,827 | | 17,128,551 | |
| | Daelim Trading Co., Ltd. | | 31,734 | | 181,722 | |
21
# | | Daesang Farmsco Co., Ltd. | | 42,230 | | 85,796 | |
# | | Daesang Holdings Co., Ltd. | | 33,096 | | 217,547 | |
# | | Daesung Industrial Co., Ltd. | | 8,895 | | 1,968,219 | |
* # | | Daewon Cable Co., Ltd. | | 13,570 | | 210,340 | |
# | | Daewon Pharmaceutical Co., Ltd. | | 19,590 | | 241,064 | |
* # | | Daewoo Electronic Components Co., Ltd. | | 18,176 | | 104,571 | |
# | | Daewoo Motor Sales Corp. | | 93,860 | | 4,518,635 | |
| | Daewoong Co., Ltd. | | 14,890 | | 599,358 | |
| | Dahaam E-Tec Co., Ltd. | | 5,985 | | 207,352 | |
# | | Daishin Securities Co., Ltd. | | 201,051 | | 6,713,642 | |
# | | Daiyang Metal Co., Ltd. | | 77,290 | | 578,723 | |
# | | Daou Technology, Inc. | | 98,850 | | 1,229,554 | |
| | DC Chemical Co., Ltd. | | 1,370 | | 417,163 | |
* # | | DI Corp. | | 101,890 | | 252,040 | |
| | Digital Power Communications Co., Ltd. | | 113,840 | | 185,652 | |
| | Dong Ah Tire Industrial Co., Ltd. | | 51,594 | | 448,359 | |
* | | Dong Hai Pulp Co., Ltd. | | 14,310 | | 37,051 | |
| | Dong IL Rubber Belt Co., Ltd. | | 37,288 | | 123,728 | |
# | | Dong Wha Pharmaceutical Industries Co., Ltd. | | 10,828 | | 717,277 | |
* # | | Dong Won Co., Ltd. | | 14,220 | | 260,674 | |
| | Dongbang Agro Co., Ltd. | | 53,610 | | 390,599 | |
# | | Dongbang Transport Logistics Co., Ltd. | | 10,350 | | 380,948 | |
# | | Dongbu Corp. | | 73,520 | | 1,959,576 | |
# | | Dongbu HiTek Co., Ltd. | | 98,304 | | 1,140,668 | |
# | | Dongbu Securities Co., Ltd. | | 76,045 | | 973,061 | |
# | | Dongbu Steel Co., Ltd. | | 92,198 | | 1,673,440 | |
| | Dong-Il Corp. | | 6,072 | | 525,234 | |
| | Dongkook Industrial Co., Ltd. | | 16,200 | | 38,831 | |
| | Dongkuk Steel Mill Co., Ltd. | | 176,412 | | 9,366,669 | |
# | | Dongsu Industrial Co., Ltd. | | 27,140 | | 535,957 | |
| | Dongsung Chemical Co., Ltd. | | 9,530 | | 143,995 | |
# | | Dongsung Pharmaceutical Co., Ltd. | | 18,510 | | 235,692 | |
# | | Dongwon F&B Co., Ltd. | | 8,706 | | 511,266 | |
| | Dongwon Industries Co., Ltd. | | 7,116 | | 541,574 | |
# | | Dongyang Engineering & Construction Corp. | | 6,597 | | 311,239 | |
| | Dongyang Express Bus Corp. | | 3,729 | | 125,856 | |
# | | Dongyang Mechatronics Corp. | | 46,028 | | 393,922 | |
| | Doosan Heavy Industries & Construction Co., Ltd. | | 1,479 | | 226,032 | |
* # | | DPI Co., Ltd. | | 22,738 | | 248,014 | |
| | Duck Yang Industry Co., Ltd. | | 4,000 | | 50,048 | |
# | | Ducsung Co., Ltd. | | 45,260 | | 154,636 | |
* # | | Eagon Industrial Co., Ltd. | | 17,070 | | 348,090 | |
* | | En Paper Manufacturing Co., Ltd. | | 46,660 | | 159,532 | |
| | Enex Co., Ltd. | | 5,960 | | 90,909 | |
# | | e-Starco Co., Ltd. | | 170,050 | | 124,380 | |
# | | F&F Co., Ltd. | | 62,660 | | 327,553 | |
# | | Feelux Co., Ltd. | | 95,500 | | 179,643 | |
* # | | First Fire & Marine Insurance Co., Ltd. | | 28,830 | | 279,846 | |
# | | Fursys, Inc. | | 24,120 | | 605,011 | |
# | | Gaon Cable Co., Ltd. | | 12,730 | | 634,714 | |
# | | Global & Yuasa Battery Co., Ltd. | | 44,940 | | 296,088 | |
| | Green Cross Corp. | | 10,540 | | 1,103,363 | |
| | GS Holdings Corp. | | 285,000 | | 19,301,981 | |
# | | Hae In Co., Ltd. | | 55,050 | | 286,517 | |
# | | Halla Engineering & Construction Corp. | | 38,260 | | 1,191,063 | |
22
# | | Han All Pharmaceutical Co., Ltd. | | 79,410 | | 466,831 | |
# | | Han Kuk Carbon Co., Ltd. | | 25,070 | | 178,191 | |
# | | Han Yang Securities Co., Ltd. | | 41,750 | | 731,882 | |
| | Hana Financial Group, Inc. | | 88,972 | | 4,199,941 | |
| | Handok Pharmaceuticals Co., Ltd. | | 18,150 | | 381,497 | |
# | | Handsome Corp. | | 114,000 | | 1,508,090 | |
# | | Hanil Cement Manufacturing Co., Ltd. | | 25,603 | | 2,766,653 | |
# | | Hanil Construction Co., Ltd. | | 38,025 | | 619,419 | |
# | | Hanil E-Wha Co., Ltd. | | 135,210 | | 377,431 | |
| | Hanil Iron & Steel Co., Ltd. | | 1,815 | | 55,938 | |
* | | Hanjin Heavy Industries and Construction Co., Ltd. | | 114,787 | | 9,607,640 | |
# | | Hanjin Heavy Industry Co., Ltd. | | 44,690 | | 2,053,324 | |
# | | Hanjin Shipping Co., Ltd. | | 250,060 | | 11,779,399 | |
# | | Hanjin Transportation Co., Ltd. | | 38,000 | | 1,821,115 | |
| | Hankook Cosmetics Co., Ltd. | | 110,860 | | 442,590 | |
| | Hankook Shell Oil Co., Ltd. | | 1,880 | | 194,356 | |
# | | Hankook Tire Manufacturing Co., Ltd. | | 335,120 | | 5,953,470 | |
| | Hankuk Electric Glass Co., Ltd. | | 23,010 | | 894,529 | |
| | Hankuk Glass Industries, Inc. | | 29,050 | | 1,224,630 | |
# | | Hankuk Paper Manufacturing Co., Ltd. | | 14,500 | | 656,723 | |
| | Hansae Co., Ltd. | | 43,890 | | 217,878 | |
# | | Hanshin Construction Co., Ltd. | | 19,880 | | 647,701 | |
# | | Hansol Chemical Co., Ltd. | | 35,837 | | 349,359 | |
* # | | Hansol Paper Co., Ltd. | | 158,874 | | 3,114,767 | |
# | | Hanssem Co., Ltd. | | 49,690 | | 325,334 | |
* # | | Hansung Enterprise Co., Ltd. | | 9,410 | | 68,089 | |
| | Hanwha Chemical Corp. | | 267,600 | | 6,400,101 | |
# | | Hanwha Securities Co., Ltd. | | 122,490 | | 2,683,435 | |
| | Hanwha Timeworld Co., Ltd. | | 9,000 | | 150,644 | |
* # | | Heavy Industries | | 59,460 | | 418,580 | |
| | Heung-A Shipping Co., Ltd. | | 63,680 | | 217,102 | |
| | Honam Petrochemical Corp. | | 60,759 | | 7,989,007 | |
| | Hotel Shilla Co., Ltd. | | 67,520 | | 1,850,786 | |
* | | HS R&A Co., Ltd. | | 12,680 | | 164,452 | |
# | | Huchems Fine Chemical Corp. | | 38,970 | | 927,244 | |
* # | | Huneed Technologies | | 9,003 | | 90,251 | |
# | | Husteel Co., Ltd. | | 22,160 | | 436,716 | |
# | | Hwa Sung Industrial Co., Ltd. | | 44,200 | | 710,987 | |
* # | | Hwacheon Machine Tool Co., Ltd. | | 2,050 | | 116,279 | |
| | Hwacheon Machinery Works Co., Ltd. | | 4,490 | | 86,427 | |
# | | Hwashin Co., Ltd. | | 59,700 | | 213,711 | |
# | | Hyosung T & C Co., Ltd. | | 124,047 | | 8,168,477 | |
# | | Hyundai Cement Co., Ltd. | | 17,245 | | 752,580 | |
# | | Hyundai Department Store H & S Co., Ltd. | | 15,752 | | 1,888,173 | |
# | | Hyundai DSF Co., Ltd. | | 27,180 | | 410,914 | |
# | | Hyundai Elevator Co., Ltd. | | 10,770 | | 1,531,506 | |
# | | Hyundai Hysco | | 270,550 | | 3,179,205 | |
# | | Hyundai Merchant Marine Co., Ltd. | | 139,351 | | 6,318,722 | |
| | Hyundai Mobis | | 3,297 | | 309,717 | |
# | | Hyundai Motor Co., Ltd. | | 764,050 | | 57,697,508 | |
* | | Hyundai Pharmaceutical Ind. Co., Ltd. | | 10,470 | | 439,794 | |
# | | Hyundai Securities Co., Ltd. | | 472,919 | | 9,049,767 | |
# | | Hyundai Steel Co. | | 238,900 | | 20,225,794 | |
# | | Il Dong Pharmaceutical Co., Ltd. | | 20,084 | | 970,466 | |
| | Il Sung Construction Co., Ltd. | | 7,660 | | 109,907 | |
23
# | | Iljin Diamond Co., Ltd. | | 11,368 | | 184,394 | |
* | | Iljin Display Co., Ltd. | | 14,591 | | 212,304 | |
| | Ilshin Spinning Co., Ltd. | | 5,070 | | 414,135 | |
# | | Ilsung Pharmaceutical Co., Ltd. | | 9,060 | | 1,210,412 | |
# | | InziControls Co., Ltd. | | 27,640 | | 153,123 | |
# | | ISU Chemical Co., Ltd. | | 19,790 | | 246,011 | |
# | | IsuPetasys Co., Ltd. | | 116,640 | | 172,172 | |
# | | Jahwa Electronics Co., Ltd. | | 69,130 | �� | 446,099 | |
# | | Jeil Mutual Savings Bank | | 40,900 | | 346,728 | |
| | Jeil Pharmaceutical Co. | | 29,220 | | 359,590 | |
# | | Jeonbuk Bank, Ltd. | | 164,370 | | 1,488,604 | |
* | | Jinro, Ltd. | | 57 | | 19,883 | |
# | | Joongang Construction Co., Ltd. | | 20,550 | | 352,790 | |
# | | K.C. Tech Co., Ltd. | | 79,845 | | 477,556 | |
| | KCC Corp. | | 29,050 | | 16,925,888 | |
* # | | KCTC | | 6,030 | | 190,626 | |
# | | Keangnam Enterprises, Ltd. | | 53,580 | | 2,539,281 | |
* # | | KEC Corp. | | 116,249 | | 180,310 | |
* # | | KEC Holdings Co., Ltd. | | 38,749 | | 96,294 | |
# | | Keyang Electric Machinery Co., Ltd. | | 187,450 | | 562,358 | |
# | | KG Chemical Corp. | | 36,983 | | 318,909 | |
* # | | Kia Motors Corp. | | 931,590 | | 10,303,411 | |
# | | KISWIRE, Ltd. | | 38,524 | | 2,051,796 | |
# | | Kodenshi Korea Corp. | | 64,590 | | 216,121 | |
* # | | Kolon Industries, Inc. | | 60,719 | | 2,521,328 | |
# | | Korea Cast Iron Pipe Co., Ltd. | | 44,688 | | 241,795 | |
* # | | Korea Circuit Co., Ltd. | | 57,220 | | 245,887 | |
# | | Korea Development Co., Ltd. | | 40,490 | | 1,103,394 | |
# | | Korea Development Leasing Corp. | | 9,522 | | 432,575 | |
# | | Korea Electric Terminal Co., Ltd. | | 42,160 | | 871,373 | |
| | Korea Exchange Bank | | 482,380 | | 7,583,442 | |
# | | Korea Export Packing Industries Co., Ltd. | | 5,420 | | 72,017 | |
| | Korea Fine Chemical Co., Ltd. | | 5,946 | | 580,521 | |
# | | Korea Flange Co., Ltd. | | 18,630 | | 312,335 | |
# | | Korea Investment Holdings Co., Ltd. | | 167,096 | | 13,253,986 | |
# | | Korea Iron & Steel Co., Ltd. | | 38,530 | | 3,303,202 | |
# | | Korea Kolmar Co., Ltd. | | 20,300 | | 86,133 | |
# | | Korea Komho Petrochemical Co., Ltd. | | 48,369 | | 3,647,893 | |
| | Korea Line Corp. | | 1,718 | | 404,142 | |
# | | Korea Mutual Savings Bank | | 18,280 | | 525,406 | |
# | | Korea Petrochemical Industry Co., Ltd. | | 17,160 | | 1,150,777 | |
# | | Korea Polyol Co., Ltd. | | 9,632 | | 602,008 | |
# | | Korea Zinc Co., Ltd. | | 35,825 | | 5,274,822 | |
| | Korean Air Co., Ltd. | | 205,694 | | 17,383,294 | |
# | | Korean Air Terminal Service Co., Ltd. | | 10,970 | | 643,694 | |
# | | Korean French Banking Corp. | | 159,610 | | 269,472 | |
* # | | KP Chemical Corp. | | 304,576 | | 2,298,577 | |
# | | KPC Holdings Corp. | | 7,249 | | 442,999 | |
| | KT Freetel, Ltd. | | 458,000 | | 15,944,331 | |
* # | | KTB Network, Ltd. | | 163,610 | | 2,060,198 | |
# | | Kukdo Chemical Co., Ltd. | | 15,960 | | 460,561 | |
* | | Kukdong Corp. | | 32,500 | | 47,669 | |
| | Kukje Pharm Ind. Co., Ltd. | | 30,180 | | 122,498 | |
# | | Kumho Electronics Co., Ltd. | | 3,930 | | 139,544 | |
# | | Kumho Industrial Co., Ltd. | | 74,975 | | 5,484,114 | |
24
# | | Kumho Tire Co., Inc. | | 216,000 | | 3,202,100 | |
# | | Kumkang Industrial Co., Ltd. | | 11,170 | | 172,610 | |
| | Kunsul Chemical Industrial Co., Ltd. | | 22,480 | | 465,633 | |
# | | Kwang Dong Pharmaceutical Co., Ltd. | | 243,890 | | 1,065,607 | |
* | | Kwang Myung Electric Engineering Co., Ltd. | | 102,680 | | 151,659 | |
# | | Kyeryong Construction Industrial Co., Ltd. | | 26,510 | | 1,171,405 | |
# | | Kyobo Securities Co., Ltd. | | 67,440 | | 1,195,891 | |
| | Kyung Dong Navien Co., Ltd. | | 3,450 | | 86,199 | |
* # | | Kyungbang Co., Ltd. | | 1,856 | | 384,738 | |
| | Lee Ku Industrial Co., Ltd. | | 60,490 | | 99,363 | |
# | | LG Chemical, Ltd. | | 199,708 | | 21,382,826 | |
| | LG Corp. | | 381,163 | | 32,582,793 | |
| | LG Dacom Corp. | | 63,060 | | 1,699,254 | |
| | LG Electronics, Inc. | | 466,520 | | 48,709,697 | |
# | | LG Fashion Corp. | | 50,470 | | 1,761,008 | |
# | | LG International Corp. | | 82,553 | | 1,874,831 | |
* # | | LG Phillips LCD Co., Ltd. | | 444,000 | | 25,091,644 | |
# | | Lotte Chilsung Beverage Co., Ltd. | | 1,420 | | 1,594,603 | |
# | | Lotte Confectionary Co., Ltd. | | 3,625 | | 5,610,982 | |
# | | Lotte Sam Kang Co., Ltd. | | 4,440 | | 1,113,469 | |
# | | LS Cable, Ltd. | | 67,340 | | 7,757,255 | |
* | | Maniker Co., Ltd. | | 247,030 | | 239,014 | |
# | | Meritz Securities Co., Ltd. | | 163,668 | | 1,604,116 | |
| | Mi Chang Oil Industrial Co., Ltd. | | 3,650 | | 138,116 | |
# | | MonAmi Co., Ltd. | | 9,490 | | 125,802 | |
# | | Moorim Paper Co., Ltd. | | 57,710 | | 741,875 | |
| | Motonic Corp. | | 640 | | 56,210 | |
# | | Namhae Chemical Corp. | | 70,640 | | 1,117,656 | |
* # | | Namkwang Engineering & Construction Co., Ltd. | | 29,601 | | 427,512 | |
* | | Namsun Aluminum Co., Ltd. | | 14,470 | | 142,396 | |
# | | Namyang Dairy Products Co., Ltd. | | 1,985 | | 1,979,913 | |
* # | | Nasan Co., Ltd. | | 16,090 | | 375,659 | |
| | Nexen Corp. | | 5,680 | | 188,890 | |
# | | Nexen Tire Corp. | | 4,820 | | 199,038 | |
| | NH Investment & Securities Co., Ltd. | | 54,071 | | 713,009 | |
# | | Nong Shim Holdings Co., Ltd. | | 7,060 | | 599,546 | |
# | | Noroo Paint Co., Ltd. | | 37,899 | | 176,887 | |
# | | Ottogi Corp. | | 10,309 | | 1,753,496 | |
# | | Pacific Pharmaceutical Co., Ltd. | | 3,840 | | 179,403 | |
# | | Pang Rim Co., Ltd. | | 15,040 | | 402,259 | |
* | | Pantech & Curitel Communications, Inc. | | 2,834 | | — | |
* | | Pantech Co., Ltd. | | 10,374 | | — | |
# | | PaperCorea, Inc. | | 19,552 | | 152,667 | |
# | | Pohang Coated Steel Co., Ltd. | | 15,650 | | 408,107 | |
# | | Poong Lim Industrial Co., Ltd. | | 74,350 | | 851,384 | |
# | | Poong San Corp. | | 123,590 | | 2,707,892 | |
| | POSCO | | 420 | | 267,064 | |
# | | POSCO ADR | | 1,060,011 | | 167,343,937 | |
# | | Pulmuone Co., Ltd. | | 15,710 | | 931,028 | |
| | Pum Yang Construction Co., Ltd. | | 21,917 | | 356,645 | |
| | Pusan Bank | | 431,650 | | 6,767,323 | |
# | | Pusan City Gas Co., Ltd. | | 37,100 | | 1,074,679 | |
* # | | Pyung Hwa Holdings Co., Ltd. | | 42,576 | | 123,466 | |
# | | Pyung Hwa Industrial Co., Ltd. | | 42,488 | | 192,013 | |
# | | S&T Corp. | | 24,601 | | 991,317 | |
25
# | | S&T Dynamics Co., Ltd. | | 138,204 | | 1,801,045 | |
* # | | Saehan Industries, Inc. | | 162,470 | | 1,748,112 | |
* # | | Saehan Media Corp. | | 116,770 | | 181,151 | |
# | | Sam Kwang Glass Industrial Co., Ltd. | | 15,850 | | 710,416 | |
| | Sam Whan Camus Co., Ltd. | | 9,400 | | 115,487 | |
# | | Sam Yung Trading Co., Ltd. | | 13,840 | | 91,534 | |
# | | Sambu Construction Co., Ltd. | | 23,868 | | 1,339,100 | |
* # | | Samho International Co., Ltd. | | 12,120 | | 309,948 | |
| | Samhwa Crown and Closure Co., Ltd. | | 3,100 | | 96,255 | |
| | Samhwa Paints Industrial Co., Ltd. | | 48,610 | | 184,375 | |
* # | | Samick Musical Instruments Co., Ltd. | | 621,710 | | 534,135 | |
| | Samsung Climate Control Co., Ltd. | | 11,990 | | 112,279 | |
# | | Samsung Corp. | | 632,820 | | 44,598,002 | |
# | | Samsung Electro-Mechanics Co., Ltd. | | 99,520 | | 5,238,850 | |
# | | Samsung Fine Chemicals Co., Ltd. | | 89,080 | | 4,468,787 | |
# | | Samsung SDI Co., Ltd. | | 166,550 | | 11,489,047 | |
# | | Samwhan Corp. | | 40,500 | | 1,327,809 | |
# | | Samyang Corp. | | 29,585 | | 1,794,540 | |
# | | Samyang Genex Co., Ltd. | | 9,472 | | 835,894 | |
| | Samyang Tongsang Co., Ltd. | | 8,060 | | 299,608 | |
* | | Samyoung Chemical Co., Ltd. | | 2,820 | | 30,358 | |
# | | Samyoung Electronics Co., Ltd. | | 56,300 | | 612,540 | |
* | | SAVEZONE I&C Corp. | | 166,200 | | 523,185 | |
* | | SC Engineering Co., Ltd. | | 34,640 | | 167,706 | |
# | | Seah Besteel Corp. | | 31,400 | | 547,167 | |
# | | SEAH Holdings Corp. | | 10,789 | | 1,277,793 | |
# | | SEAH Steel Corp. | | 14,125 | | 697,306 | |
# | | Sebang Co., Ltd. | | 80,550 | | 1,180,355 | |
# | | Sejong Industrial Co., Ltd. | | 101,600 | | 546,900 | |
| | Sempio Foods Co. | | 16,170 | | 343,541 | |
# | | Seondo Electric Co., Ltd. | | 35,800 | | 97,116 | |
# | | Seoul Securities Co., Ltd. | | 683,569 | | 1,394,738 | |
* | | SGWICUS Corp. | | 20,530 | | 67,513 | |
* | | SH Chemical Co., Ltd. | | 44,940 | | 392,421 | |
# | | Shin Heung Securities Co., Ltd. | | 39,843 | | 532,708 | |
* | | Shin Poong Paper Manufacturing Co., Ltd. | | 14,470 | | 214,662 | |
# | | Shin Young Securities Co., Ltd. | | 26,040 | | 2,082,097 | |
| | Shin Young Wacoal, Inc. | | 273 | | 44,019 | |
| | Shinhan Financial Group Co., Ltd. | | 91,506 | | 4,972,958 | |
| | Shinpoong Pharmaceutical Co., Ltd. | | 13,200 | | 363,402 | |
# | | Shinsegae Engineering & Construction Co., Ltd. | | 3,980 | | 158,462 | |
| | Shinsung Engineering & Construction Co., Ltd. | | 38,300 | | 300,416 | |
# | | Shinsung Engineering Co., Ltd. | | 108,470 | | 513,546 | |
* # | | Shinsung Tongsang Co., Ltd. | | 34,250 | | 168,829 | |
* # | | Silla Trading Co., Ltd. | | 18,890 | | 183,470 | |
# | | Sindo Ricoh Co., Ltd. | | 27,650 | | 2,035,863 | |
# | | SJM Co., Ltd. | | 60,580 | | 389,546 | |
| | SK Co., Ltd. | | 129,764 | | 30,452,838 | |
* | | Sk Energy Co., Ltd. | | 317,698 | | 65,357,185 | |
# | | SK Gas Co., Ltd. | | 24,760 | | 2,044,032 | |
# | | SKC Co., Ltd. | | 74,250 | | 2,431,697 | |
| | SL Corp. | | 33,210 | | 277,530 | |
| | Songwon Industrial Co., Ltd. | | 45,480 | | 200,455 | |
# | | Soosan Heavy Industries Co., Ltd. | | 90,730 | | 155,879 | |
* # | | Ssangyong Cement Industry Co., Ltd. | | 244,156 | | 4,169,639 | |
26
* # | | Ssangyong Motor Co. | | 390,550 | | 2,389,876 | |
# | | Suheung Capsule Co., Ltd. | | 52,170 | | 315,209 | |
| | Sung Bo Chemicals Co., Ltd. | | 4,130 | | 177,966 | |
# | | Sung Chang Enterprise Co., Ltd. | | 20,760 | | 506,793 | |
* # | | Sung Shin Cement Co., Ltd. | | 60,720 | | 961,758 | |
# | | Sungjee Construction Co., Ltd. | | 28,480 | | 686,578 | |
* # | | Sungwon Corp. | | 69,880 | | 838,676 | |
# | | Sunjin Co., Ltd. | | 7,650 | | 220,187 | |
# | | Sunkyong Securities Co., Ltd. | | 384,280 | | 1,277,444 | |
# | | Tae Kwang Industrial Co., Ltd. | | 2,881 | | 4,343,594 | |
# | | Tae Kyung Industrial Co., Ltd. | | 92,200 | | 469,837 | |
# | | Taegu Department Store Co., Ltd. | | 52,221 | | 847,419 | |
# | | Taeyoung Engineering & Construction | | 242,600 | | 3,068,826 | |
# | | Tai Han Electric Wire Co., Ltd. | | 146,747 | | 9,915,228 | |
| | Tai Lim Packaging Industries Co., Ltd. | | 13,420 | | 166,460 | |
* | | Taihan Textile Co., Ltd. | | 836 | | 48,115 | |
# | | Telcoware Co., Ltd. | | 36,000 | | 313,323 | |
* # | | The Will-Bes & Co., Ltd. | | 44,310 | | 186,582 | |
* | | Tong Kook Corp. | | 607 | | 1,030 | |
# | | Tong Yang Moolsan Co., Ltd. | | 12,890 | | 126,602 | |
* # | | TRYBRANDS, Inc. | | 75,800 | | 427,032 | |
# | | TS Corp. | | 11,001 | | 593,072 | |
# | | Unid Co., Ltd. | | 32,400 | | 1,259,491 | |
* # | | Unimo Technology Co., Ltd. | | 46,890 | | 87,629 | |
# | | Union Steel Manufacturing Co., Ltd. | | 29,697 | | 755,813 | |
| | Wiscom Co., Ltd. | | 32,980 | | 147,860 | |
# | | Woori Financial Co., Ltd. | | 53,950 | | 903,608 | |
# | | Woori Investment & Securities Co., Ltd. | | 333,310 | | 8,756,162 | |
| | WooSung Feed Co., Ltd. | | 101,890 | | 234,004 | |
| | YESCO Co., Ltd. | | 16,050 | | 666,261 | |
# | | Yoosung Enterprise Co., Ltd. | | 106,520 | | 472,321 | |
# | | Youlchon Chemical Co., Ltd. | | 82,970 | | 679,641 | |
* | | Young Poong Mining & Construction Corp. | | 18,030 | | 1,077 | |
| | Youngbo Chemical Co., Ltd. | | 33,000 | | 92,158 | |
# | | Youngone Corp. | | 178,660 | | 1,843,126 | |
# | | Youngpoong Corp. | | 4,220 | | 2,690,123 | |
# | | YuHwa Securities Co., Ltd. | | 26,020 | | 562,685 | |
* # | | Yuyang Telecom Co., Ltd. | | 11,200 | | 142,777 | |
* | | Zinus, Inc. | | 9,330 | | 7,596 | |
| | | | | | | |
TOTAL — SOUTH KOREA | | | | 1,017,310,701 | |
| | | | | | | |
TAIWAN — (9.8%) | | | | | |
COMMON STOCKS — (9.8%) | | | | | |
* | | A.G.V. Products Corp. | | 2,006,000 | | 673,360 | |
* | | Abocom Systems, Inc. | | 442,000 | | 219,205 | |
* | | Acbel Polytech, Inc. | | 2,524,040 | | 1,452,745 | |
* | | Accton Technology Corp. | | 2,528,000 | | 1,358,202 | |
| | Allis Electric Co., Ltd. | | 749,320 | | 246,830 | |
| | Ampoc Far East Co., Ltd. | | 727,200 | | 296,047 | |
| | Amtran Technology Co., Ltd. | | 1,790,361 | | 2,350,328 | |
* | | Apex Science & Engineering Corp. | | 496,000 | | 110,362 | |
* | | Arima Computer Corp. | | 5,278,000 | | 1,069,534 | |
| | Asia Cement Corp. | | 10,885,365 | | 15,947,933 | |
| | Asia Chemical Corp. | | 1,582,000 | | 883,905 | |
27
| | Asia Polymer Corp. | | 1,445,489 | | 1,027,888 | |
* | | Asia Vital Components Co., Ltd. | | 1,133,322 | | 796,207 | |
| | AU Optronics Corp. | | 3,785,317 | | 7,427,849 | |
| | Audix Co., Ltd. | | 346,000 | | 278,831 | |
| | Aurora Corp. | | 548,403 | | 513,980 | |
| | Aurora Systems Corp. | | 281,000 | | 180,428 | |
| | Avision, Inc. | | 1,144,982 | | 666,313 | |
| | Bank of Kaohsiung Co., Ltd. | | 3,532,622 | | 1,879,372 | |
* | | Behavior Tech Computer Corp. | | 1,580,791 | | 440,374 | |
* | | Bes Engineering Corp. | | 9,541,443 | | 2,504,409 | |
| | Biostar Microtech International Corp. | | 458,265 | | 309,359 | |
| | C Sun Manufacturing, Ltd. | | 181,736 | | 107,049 | |
* | | Carnival Industrial Corp. | | 2,482,000 | | 558,972 | |
| | Cathay Chemical Works, Inc. | | 857,000 | | 306,719 | |
| | Cathay Real Estate Development Co., Ltd. | | 6,249,421 | | 3,078,537 | |
| | Central Reinsurance Co., Ltd. | | 1,591,744 | | 811,003 | |
| | Chain Qui Development Co., Ltd. | | 272,173 | | 364,196 | |
| | Champion Building Materials Co., Ltd. | | 1,326,538 | | 555,088 | |
| | Chang Hwa Commercial Bank | | 33,184,459 | | 19,641,936 | |
* | | Chang-Ho Fibre Corp. | | 192,000 | | 87,345 | |
| | Charoen Pokphand Enterprises Co., Ltd. | | 787,000 | | 351,120 | |
| | Cheng Loong Corp. | | 7,053,480 | | 2,408,503 | |
| | Chenming Mold Industrial Corp. | | 762,348 | | 272,538 | |
| | Chi Mei Optoelectronic Corp. | | 28,881,840 | | 39,033,138 | |
* | | Chia Her Industrial Co., Ltd. | | 2,263,340 | | 197,539 | |
* | | Chia Hsin Cement Corp. | | 3,768,000 | | 3,216,852 | |
* | | Chia Hsin Food & Synthetic Fiber Co., Ltd. | | 514,966 | | 61,134 | |
* | | Chien Shing Stainless Steel Co., Ltd. | | 1,934,000 | | 538,659 | |
* | | Chien Tai Cement Co., Ltd. | | 238 | | 9 | |
| | China Airlines | | 17,623,952 | | 7,755,155 | |
| | China Chemical & Pharmaceutical Co. | | 1,877,264 | | 1,004,717 | |
| | China Development Financial Holding Corp. | | 73,969,056 | | 29,404,536 | |
| | China Electric Manufacturing Co., Ltd. | | 2,317,200 | | 1,033,930 | |
* | | China General Plastics Corp. | | 2,402,000 | | 693,664 | |
| | China Glaze Co., Ltd. | | 875,945 | | 298,780 | |
* | | China Man-Made Fiber Co., Ltd. | | 7,318,813 | | 2,848,567 | |
| | China Motor Co., Ltd. | | 6,106,749 | | 4,756,974 | |
* | | China Petrochemical Development Corp. | | 12,493,000 | | 5,488,435 | |
* | | China Rebar Co., Ltd. | | 439,188 | | 61,531 | |
| | China Steel Structure Co., Ltd. | | 498,219 | | 283,211 | |
| | China Synthetic Rubber Corp. | | 2,189,890 | | 2,579,044 | |
* | | China United Trust & Investment Corp. | | 493,999 | | — | |
* | | China Wire & Cable Co., Ltd. | | 1,362,000 | | 302,227 | |
* | | Chinatrust Financial Holdings Co., Ltd. | | 25,190,809 | | 18,366,519 | |
| | Ching Feng Home Fashions Industries Co., Ltd. | | 391,190 | | 224,497 | |
| | Chin-Poon Industrial Co., Ltd. | | 1,908,451 | | 1,736,501 | |
| | Chun Yu Works & Co., Ltd. | | 1,800,000 | | 530,910 | |
| | Chun Yuan Steel Industrial Co., Ltd. | | 3,002,026 | | 1,164,770 | |
| | Chung Hsin Electric & Machinery Co., Ltd. | | 1,362,000 | | 1,171,288 | |
| | Chung Hwa Pulp Corp. | | 2,777,419 | | 1,989,951 | |
* | | Chung Shing Textile Co., Ltd. | | 600 | | 9 | |
* | | Chungwa Picture Tubes Co., Ltd. | | 46,117,045 | | 17,595,595 | |
* | | Clevo Co. | | 2,445,029 | | 3,374,734 | |
* | | CMC Magnetics Corp. | | 23,164,000 | | 8,611,671 | |
| | Collins Co., Ltd. | | 2,258,319 | | 842,139 | |
28
| | Compal Electronics, Inc. | | 2,278,232 | | 2,651,446 | |
| | Compeq Manufacturing Co., Ltd. | | 7,890,000 | | 3,050,077 | |
* | | Compex International Co. Ltd. | | 46,400 | | 288 | |
| | Continental Engineering Corp. | | 5,068,848 | | 2,841,012 | |
* | | Cosmos Bank Taiwan | | 8,886,000 | | 586,671 | |
| | CTCI Corp. | | 2,762,786 | | 2,085,606 | |
| | CX Technology Co., Ltd. | | 82,728 | | 49,404 | |
| | Cyntec Co., Ltd. | | 42,655 | | 61,996 | |
| | Da-Cin Construction Co., Ltd. | | 1,684,579 | | 746,239 | |
* | | Delpha Construction Co., Ltd. | | 1,684,044 | | 372,343 | |
* | | Der Pao Construction Co., Ltd. | | 1,139,000 | | 28,950 | |
| | Diamond Flower Electric Instrument Co., Ltd. | | 67,916 | | 180,182 | |
* | | E.Sun Financial Holding Co., Ltd. | | 12,690,000 | | 6,769,038 | |
| | Eastern Media International | | 8,164,235 | | 3,008,818 | |
| | Eclat Textile Co., Ltd. | | 301,813 | | 161,424 | |
| | Edom Technology Co., Ltd. | | 740,800 | | 460,915 | |
| | Elan Microelectronics Corp. | | 1,495,361 | | 2,991,866 | |
| | Elite Material Co., Ltd. | | 108,739 | | 44,458 | |
| | Elite Semiconductor Memory Technology, Inc. | | 770,009 | | 1,737,808 | |
* | | Elitegroup Computer Systems Co., Ltd. | | 7,355,975 | | 3,694,617 | |
| | Enlight Corp. | | 1,891,549 | | 561,156 | |
* | | EnTie Commercial Bank | | 2,083,474 | | 528,027 | |
| | Eten Information Systems, Ltd. | | 842,009 | | 1,222,641 | |
* | | Eva Airways Corp. | | 16,403,783 | | 6,581,314 | |
* | | Ever Fortune Industrial Co., Ltd. | | 409,000 | | 4,184 | |
| | Everest Textile Co., Ltd. | | 2,977,002 | | 831,599 | |
| | Evergreen International Storage & Transport Corp. | | 5,977,000 | | 3,103,926 | |
| | Evergreen Marine Corp., Ltd. | | 11,512,527 | | 9,973,326 | |
| | Everlight Chemical Industrial Corp. | | 1,816,950 | | 1,283,654 | |
* | | Everspring Industry Co., Ltd. | | 1,293,180 | | 364,923 | |
| | Evertop Wire Cable Corp. | | 790,372 | | 204,764 | |
| | Excel Cell Electronics Co., Ltd. | | 565,000 | | 311,907 | |
| | Far East Textile, Ltd. | | 17,787,541 | | 21,609,094 | |
| | Far Eastern Department Stores, Ltd. | | 5,509,225 | | 6,622,679 | |
* | | Far Eastern International Bank | | 10,989,236 | | 3,790,789 | |
| | Federal Corp. | | 2,762,286 | | 1,651,689 | |
| | Feng Hsin Iron & Steel Co., Ltd. | | 333,000 | | 505,946 | |
* | | FIC Global, Inc. | | 122,255 | | 33,750 | |
| | First Copper Technology Co., Ltd. | | 2,024,750 | | 807,261 | |
| | First Financial Holding Co., Ltd. | | 10,676,506 | | 8,080,348 | |
| | First Hotel | | 495,322 | | 438,930 | |
* | | First Steamship Co., Ltd. | | 728,000 | | 1,402,628 | |
| | Formosa Taffeta Co., Ltd. | | 6,473,511 | | 6,735,389 | |
| | Formosan Rubber Group, Inc. | | 2,419,000 | | 1,299,382 | |
| | Formosan Union Chemical Corp. | | 223,848 | | 86,906 | |
| | Fortune Electric Co., Ltd. | | 945,000 | | 1,334,619 | |
* | | Fu I Industrial Co., Ltd. | | 290,400 | | 98,434 | |
| | Fubon Financial Holding Co., Ltd. | | 27,533,000 | | 24,192,260 | |
| | Fwuson Industry Co., Ltd. | | 1,474,000 | | 478,293 | |
* | | G.T.M. Corp. | | 543,000 | | 311,997 | |
* | | Giga Storage Corp. | | 2,039,898 | | 565,476 | |
| | Giga-Byte Technology Co., Ltd. | | 4,964,287 | | 3,270,596 | |
| | Gold Circuit Electronics, Ltd. | | 1,421,805 | | 1,337,458 | |
| | Goldsun Development & Construction Co., Ltd. | | 7,993,038 | | 3,987,756 | |
| | Good Will Instrument Co., Ltd. | | 365,400 | | 264,218 | |
29
| | Gordon Auto Body Parts Co., Ltd. | | 1,034,830 | | 421,985 | |
* | | Grand Pacific Petrochemical Corp. | | 3,594,000 | | 1,353,245 | |
| | Grape King, Inc. | | 516,000 | | 324,300 | |
| | Great China Metal Industry Co., Ltd. | | 1,577,000 | | 756,546 | |
| | Great Wall Enterprise Co., Ltd. | | 1,960,398 | | 1,837,206 | |
| | Hanpin Co., Ltd. | | 1,008,000 | | 724,764 | |
* | | Helix Technology, Inc. | | 29,585 | | 8,666 | |
| | Hey Song Corp. | | 3,012,000 | | 1,230,478 | |
* | | Hitron Technologies, Inc. | | 619,000 | | 198,334 | |
* | | Ho Tung Holding Corp. | | 3,279,628 | | 985,579 | |
* | | Hocheng Corp. | | 2,354,000 | | 802,769 | |
* | | Hold-Key Electric Wire & Cable Co., Ltd. | | 1,059,420 | | 387,590 | |
* | | Hong Ho Precision Textile Co., Ltd. | | 93,889 | | 20,166 | |
| | Hong Tai Electric Industrial Co., Ltd. | | 1,613,000 | | 1,234,050 | |
| | Hong Yi Fiber Industry Co., Ltd. | | 573,000 | | 168,441 | |
| | Hsin Kuang Steel Co., Ltd. | | 1,000,099 | | 1,043,016 | |
| | Hsing Ta Cement Co., Ltd. | | 1,937,980 | | 664,226 | |
| | Hua Eng Wire & Cable Co., Ltd. | | 3,555,035 | | 1,281,558 | |
| | Hua Nan Financial Holding Co., Ltd. | | 86,428 | | 58,141 | |
* | | Hualon Corp. | | 257,040 | | 8,605 | |
| | Hung Ching Development & Construction Co., Ltd. | | 1,828,468 | | 819,756 | |
| | Hung Poo Construction Corp. | | 1,378,650 | | 1,135,651 | |
| | Hung Sheng Construction Co., Ltd. | | 3,201,000 | | 2,326,236 | |
* | | Hwa Fong Rubber Co., Ltd. | | 296,000 | | 77,825 | |
| | Inventec Corp. | | 10,683,697 | | 6,012,598 | |
* | | Jean Co., Ltd. | | 190,000 | | 76,295 | |
| | Jui Li Enterprise Co., Ltd. | | 692,000 | | 234,488 | |
| | Jung Shing Wire Co., Ltd. | | 126,670 | | 36,561 | |
| | K Laser Technology, Inc. | | 680,000 | | 631,196 | |
| | Kang Na Hsiung Co., Ltd. | | 1,395,127 | | 818,015 | |
* | | Kao Hsing Chang Iron & Steel Corp. | | 2,196,000 | | 611,793 | |
| | Kaulin Manufacturing Co., Ltd. | | 820,050 | | 722,682 | |
| | Kee Tai Properties Co., Ltd. | | 865,095 | | 511,909 | |
* | | Kenda Rubber Industrial Co., Ltd. | | 1,868,505 | | 1,306,488 | |
| | King Yuan Electronics Co., Ltd. | | 7,067,699 | | 3,844,480 | |
| | Kingdom Construction Co., Ltd. | | 3,149,000 | | 1,315,734 | |
* | | King’s Town Bank | | 4,624,012 | | 1,452,625 | |
| | Kinpo Electronics, Inc. | | 9,219,368 | | 3,189,400 | |
| | Knowledge-Yield-Excellence Systems Corp. | | 421,461 | | 735,486 | |
| | Kung Long Batteries Industrial Co., Ltd. | | 173,000 | | 194,938 | |
* | | Kuoyang Construction Co., Ltd. | | 641,029 | | 349,752 | |
* | | Kwong Fong Industries Corp. | | 3,432,000 | | 926,236 | |
| | Lan Fa Textile Co., Ltd. | | 2,082,930 | | 795,485 | |
* | | Lead Data Co., Ltd. | | 2,222,140 | | 779,212 | |
* | | Leadtek Research, Inc. | | 706,645 | | 383,308 | |
* | | Lealea Enterprise Co., Ltd. | | 4,440,000 | | 1,081,516 | |
| | Lee Chang Yung Chemical Industry Corp. | | 927,387 | | 966,129 | |
| | Lee Chi Enterprises Co., Ltd. | | 845,900 | | 296,061 | |
| | Lelon Co., Ltd. | | 919,118 | | 361,302 | |
* | | Leofoo Development Co., Ltd. | | 1,940,000 | | 932,835 | |
| | Les Enphants Co., Ltd. | | 157,740 | | 109,200 | |
* | | Li Peng Enterprise Co., Ltd. | | 3,835,300 | | 1,003,788 | |
| | Lian Hwa Foods Corp. | | 157,000 | | 53,950 | |
* | | Lien Chang Electronic Enterprise Co., Ltd. | | 623,000 | | 230,249 | |
| | Lien Hwa Industrial Corp. | | 3,951,884 | | 2,061,654 | |
30
| | Lingsen Precision Industries, Ltd. | | 1,884,295 | | 871,251 | |
| | Lite-On Technology Corp. | | 104,189 | | 181,943 | |
| | Long Bon Development Co., Ltd. | | 2,355,943 | | 1,344,647 | |
| | Long Chen Paper Co., Ltd. | | 2,964,713 | | 1,152,664 | |
| | Lucky Cement Corp. | | 2,332,000 | | 658,878 | |
| | Macronix International Co., Ltd. | | 19,524,255 | | 9,922,826 | |
| | Mayer Steel Pipe Corp. | | 788,740 | | 753,094 | |
| | Maywufa Co., Ltd. | | 192,264 | | 108,007 | |
| | Mega Financial Holding Co., Ltd. | | 69,497,000 | | 43,007,449 | |
* | | Megamedia Corp. | | 782 | | 6 | |
| | Meiloon Co., Ltd. | | 567,834 | | 460,278 | |
| | Mercuries & Associates, Ltd. | | 2,495,980 | | 1,606,980 | |
* | | Mercuries Data Co., Ltd. | | 1,131,800 | | 230,272 | |
| | Merida Industry Co., Ltd. | | 447,260 | | 891,587 | |
| | Microelectronics Technology, Inc. | | 1,938,000 | | 1,232,220 | |
| | Micro-Star International Co., Ltd. | | 6,109,528 | | 5,426,807 | |
* | | Microtek International, Inc. | | 819,062 | | 140,485 | |
| | Mitac Technology Corp. | | 1,501,065 | | 1,261,490 | |
| | Mobiletron Electronics Co., Ltd. | | 90,000 | | 88,990 | |
| | Mospec Seminconductor Corp. | | 404,000 | | 452,300 | |
* | | Mustek Systems, Inc. | | 1,637,514 | | 398,728 | |
* | | Namchow Chemical Industrial Co., Ltd. | | 845,057 | | 243,520 | |
| | Nankang Rubber Tire Co., Ltd. | | 214,570 | | 271,544 | |
| | Nantex Industry Co., Ltd. | | 1,326,795 | | 1,215,479 | |
| | Nanya Technology Co., Ltd. | | 18,587,706 | | 9,991,021 | |
* | | New Asia Construction & Development Co., Ltd. | | 1,011,542 | | 213,638 | |
| | Nien Hsing Textile Co., Ltd. | | 3,437,000 | | 2,137,849 | |
| | Ocean Plastics Co., Ltd. | | 1,135,776 | | 725,067 | |
* | | Optimax Technology Corp. | | 3,246,000 | | 1,421,451 | |
* | | Opto Tech Corp. | | 885,609 | | 852,480 | |
* | | Orient Semiconductor Electronics, Ltd. | | 648,713 | | 177,155 | |
| | Oriental Union Chemical Corp. | | 3,890,280 | | 4,416,833 | |
* | | Pacific Construction Co., Ltd. | | 4,079,256 | | 471,101 | |
* | | Pacific Electric Wire & Cable Corp. | | 1,873,020 | | 30,189 | |
| | Pan Jit International, Inc. | | 913,155 | | 918,802 | |
| | Phihong Technology Co., Ltd. | | 1,510,447 | | 1,180,720 | |
* | | Picvue Electronics, Ltd. | | 241,600 | | — | |
* | | Potrans Electrical Corp. | | 1,139,000 | | 153,928 | |
| | Prince Housing & Development Corp. | | 3,240,036 | | 1,671,851 | |
* | | Procomp Informatics, Ltd. | | 391,440 | | — | |
* | | Prodisc Technology, Inc. | | 6,185,157 | | 1,100,424 | |
| | Promise Technology, Inc. | | 646,126 | | 325,446 | |
* | | Qisda Corp. | | 8,765,400 | | 9,208,297 | |
* | | Quintain Steel Co., Ltd. | | 2,785,000 | | 578,614 | |
| | Radium Life Tech Corp. | | 791,114 | | 589,753 | |
* | | Ralec Electronic Corp. | | 286,018 | | 333,078 | |
| | Realtek Semiconductor Corp. | | 789,500 | | 2,908,286 | |
* | | Rectron, Ltd. | | 877,300 | | 118,833 | |
* | | Reward Wool Industry Corp. | | 965,000 | | 286,261 | |
* | | Rexon Industrial Corp., Ltd. | | 1,026,820 | | 266,049 | |
* | | Ritek Corp. | | 19,807,518 | | 4,903,824 | |
| | Ruentex Development Co., Ltd. | | 2,897,000 | | 2,384,644 | |
| | Ruentex Industries, Ltd. | | 2,485,000 | | 1,963,431 | |
* | | Sainfoin Technology Corp. | | 835,498 | | — | |
* | | Sampo Corp. | | 5,406,684 | | 1,060,698 | |
31
| | San Fang Chemical Industry Co., Ltd. | | 207,280 | | 177,042 | |
| | Sanyang Industrial Co., Ltd. | | 4,477,000 | | 3,289,904 | |
| | Sanyo Electric Co., Ltd. | | 971,000 | | 1,113,619 | |
| | Senao International Co., Ltd. | | 149,474 | | 181,486 | |
| | Shan-Loong Transportation Co., Ltd. | | 133,286 | | 66,712 | |
| | Sheng Yu Steel Co., Ltd. | | 1,553,000 | | 1,406,874 | |
| | Shihlin Electric & Engineering Corp. | | 1,643,000 | | 1,659,982 | |
| | Shinkong Co., Ltd. | | 2,078,488 | | 1,155,156 | |
* | | Shinkong Synthetic Fibers Co., Ltd. | | 7,613,342 | | 2,557,523 | |
* | | Shuttle, Inc. | | 1,190,223 | | 412,016 | |
| | Sigurd Microelectronics Corp. | | 220,000 | | 134,180 | |
| | Silicon Integrated Systems Corp. | | 8,371,485 | | 3,377,032 | |
| | Sincere Navigation Corp. | | 458,462 | | 868,997 | |
| | Sinkang Industries Co., Ltd. | | 565,669 | | 344,105 | |
| | Sinkong Spinning Co., Ltd. | | 943,311 | | 556,614 | |
| | Sinon Corp. | | 2,114,700 | | 631,910 | |
| | SinoPac Holdings Co., Ltd. | | 52,035,809 | | 21,500,303 | |
* | | Sintek Photronics Corp. | | 5,083,182 | | 1,426,135 | |
| | Siward Crystal Technology Co., Ltd. | | 654,405 | | 423,015 | |
* | | Solomon Technology Corp. | | 1,916,000 | | 1,259,842 | |
| | South East Soda Manufacturing Co., Ltd. | | 763,500 | | 529,722 | |
| | Southeast Cement Co., Ltd. | | 3,235,700 | | 1,138,470 | |
* | | Space Shuttle Hi-Tech Co., Ltd. | | 533,271 | | 201,098 | |
| | Standard Chemical & Pharmaceutical Co., Ltd. | | 577,000 | | 489,263 | |
| | Standard Foods Taiwan, Ltd. | | 1,647,000 | | 794,741 | |
| | Stark Technology, Inc. | | 1,292,000 | | 638,398 | |
| | Sunonwealth Electric Machine Industry Co., Ltd. | | 1,186,705 | | 650,665 | |
| | Synnex Technology International Corp. | | 1,533,945 | | 4,069,540 | |
* | | Syscom Computer Engineering Co. | | 446,000 | | 145,113 | |
| | Sysware Systex Corp. | | 920,890 | | 987,211 | |
* | | T JOIN Transportation Co. | | 2,598,000 | | 1,150,741 | |
| | Ta Chen Stainless Pipe Co., Ltd. | | 1,188,864 | | 1,415,190 | |
* | | Ta Chong Bank, Ltd. | | 12,806,906 | | 4,224,695 | |
| | Ta Ya Electric Wire & Cable Co., Ltd. | | 3,476,213 | | 1,085,673 | |
| | Ta Yih Industrial Co., Ltd. | | 192,000 | | 139,905 | |
| | Tah Hsin Industrial Corp. | | 1,348,000 | | 899,961 | |
* | | Tai Roun Products Co., Ltd. | | 379,000 | | 105,846 | |
| | Ta-I Technology Co., Ltd. | | 831,508 | | 652,437 | |
* | | Taichung Commercial Bank | | 7,343,961 | | 3,052,630 | |
| | Tainan Spinning Co., Ltd. | | 8,733,000 | | 3,852,050 | |
* | | Taishin Financial Holdings Co., Ltd. | | 50,636,000 | | 21,747,075 | |
* | | Taisun Enterprise Co., Ltd. | | 1,931,721 | | 546,364 | |
* | | Taita Chemical Co., Ltd. | | 1,723,690 | | 562,084 | |
* | | Taiwan Business Bank | | 33,344,549 | | 10,351,954 | |
| | Taiwan Cement Corp. | | 12,184,958 | | 17,942,835 | |
| | Taiwan Cooperative Bank | | 17,725,959 | | 13,206,876 | |
| | Taiwan Fire & Marine Insurance Co., Ltd. | | 1,914,320 | | 1,653,957 | |
* | | Taiwan Flourescent Lamp Co., Ltd. | | 756,000 | | 69,831 | |
| | Taiwan Fu Hsing Industrial Co., Ltd. | | 115,000 | | 75,143 | |
| | Taiwan Glass Industrial Corp. | | 5,433,094 | | 5,697,454 | |
| | Taiwan Hon Chuan Enterprise Co., Ltd. | | 1,067,777 | | 812,455 | |
| | Taiwan Kai Yih Industrial Co., Ltd. | | 657,510 | | 307,135 | |
* | | Taiwan Kolin Co., Ltd. | | 5,797,000 | | 2,001,263 | |
| | Taiwan Line Tek Electronic Co., Ltd. | | 431,019 | | 250,902 | |
| | Taiwan Mask Corp. | | 1,940,000 | | 1,077,355 | |
32
* | | Taiwan Navigation Co., Ltd. | | 684,898 | | 1,413,847 | |
| | Taiwan Polypropylene Co., Ltd. | | 1,756,680 | | 1,250,172 | |
* | | Taiwan Pulp & Paper Corp. | | 2,218,000 | | 764,827 | |
* | | Taiwan Sakura Corp. | | 1,612,397 | | 565,624 | |
| | Taiwan Sogo Shinkong Security Co., Ltd. | | 604,123 | | 597,683 | |
| | Taiwan Styrene Monomer Corp. | | 3,576,560 | | 1,598,072 | |
* | | Taiwan Tea Corp. | | 4,944,381 | | 2,275,868 | |
| | Taiyen Biotech Co., Ltd. | | 1,562,000 | | 1,143,693 | |
* | | Tatung Co., Ltd. | | 22,351,000 | | 11,371,793 | |
* | | Teapo Electronic Corp. | | 2,021,670 | | 428,977 | |
| | Teco Electric & Machinery Co., Ltd. | | 13,456,834 | | 7,170,415 | |
| | Tecom, Ltd. | | 1,440,753 | | 924,564 | |
| | Test-Rite International Co., Ltd. | | 1,318,753 | | 793,473 | |
| | Tex-Ray Industrial Co., Ltd. | | 724,000 | | 298,039 | |
| | The Ambassador Hotel | | 605,000 | | 535,578 | |
* | | The Chinese Bank | | 8,296,000 | | — | |
| | The First Insurance Co., Ltd. | | 1,886,446 | | 942,406 | |
| | Thye Ming Industrial Co., Ltd. | | 164,000 | | 326,717 | |
| | Ton Yi Industrial Corp. | | 6,794,810 | | 2,887,920 | |
| | Tong Yang Industry Co., Ltd. | | 434,660 | | 389,266 | |
* | | Tong-Hwa Synthetic Fiber Co., Ltd. | | 634,000 | | 72,626 | |
* | | Tsann Kuen Enterprise Co., Ltd. | | 1,037,000 | | 1,415,827 | |
| | TSRC Corp. | | 1,874,400 | | 2,542,745 | |
* | | Tung Ho Spinning, Weaving & Dyeing Co., Ltd. | | 599,000 | | 117,342 | |
| | Tung Ho Steel Enterprise Corp. | | 2,688,555 | | 4,074,980 | |
* | | Twinhead International Corp. | | 1,446,017 | | 192,229 | |
| | TYC Brother Industrial Co., Ltd. | | 623,241 | | 419,630 | |
* | | Tycoons Group Enterprise Co., Ltd. | | 2,840,000 | | 573,960 | |
| | Tze Shin International Co., Ltd. | | 890,400 | | 524,019 | |
* | | Union Bank of Taiwan | | 8,732,577 | | 1,995,255 | |
* | | Union Insurance Co., Ltd. | | 189,469 | | 79,463 | |
| | Unitech Electronics Co., Ltd. | | 1,280,174 | | 585,133 | |
| | Unitech Printed Circuit Board Corp. | | 1,898,348 | | 1,953,932 | |
| | United Integration Service Co., Ltd. | | 930,000 | | 784,473 | |
| | United Microelectronics Corp. | | 84,774,374 | | 50,714,321 | |
* | | Universal Cement Corp. | | 3,146,585 | | 1,392,434 | |
| | Universal Microelectronics Co., Ltd. | | 729,010 | | 465,690 | |
| | Universal Scientific Industrial Co., Ltd. | | 3,874,816 | | 2,301,650 | |
| | Universal, Inc. | | 622,000 | | 242,723 | |
| | UPC Technology Corp. | | 4,093,498 | | 2,289,211 | |
| | USI Corp. | | 4,010,000 | | 2,168,929 | |
* | | U-TECH Media Corp. | | 1,265,799 | | 418,537 | |
* | | Ve Wong Corp. | | 725,000 | | 456,814 | |
* | | Visual Photonics Epitacy Co., Ltd. | | 86,000 | | 141,832 | |
| | Walsin Lihwa Corp. | | 18,018,412 | | 7,907,959 | |
| | Walsin Technology Corp., Ltd. | | 3,477,513 | | 3,017,612 | |
| | Wan Hwa Enterprise Co., Ltd. | | 1,187,827 | | 581,066 | |
| | Waterland Financial Holdings | | 12,628,620 | | 3,905,556 | |
* | | Wei Chih Steel Industrial Co., Ltd. | | 1,615,898 | | 430,298 | |
* | | Wei Chuan Food Corp. | | 1,007,000 | | 578,707 | |
| | Weltrend Semiconductor, Inc. | | 898,160 | | 1,046,977 | |
| | Winbond Electronics Corp. | | 29,524,000 | | 8,464,152 | |
| | Wintek Corp. | | 7,268,000 | | 9,722,046 | |
| | WPG Holdings Co., Ltd. | | 1,006,464 | | 1,208,329 | |
* | | Wus Printed Circuit Co., Ltd. | | 3,003,928 | | 916,899 | |
33
* | | Ya Hsin Industrial Co., Ltd. | | 1,936,000 | | 357,652 | |
| | Yageo Corp. | | 19,773,840 | | 7,437,584 | |
| | Yang Ming Marine Transport Corp. | | 8,308,906 | | 6,515,835 | |
| | Yeung Cyang Industrial Co., Ltd. | | 593,154 | | 685,077 | |
* | | Yi Jinn Industrial Co., Ltd. | | 1,966,000 | | 320,151 | |
| | Yieh Phui Enterprise Co., Ltd. | | 7,957,927 | | 3,075,289 | |
| | Yosun Industrial Corp. | | 1,309,981 | | 1,066,872 | |
* | | Yuanta Financial Holding Co., Ltd. | | 9,699,422 | | 6,503,242 | |
| | Yuen Foong Yu Paper Manufacturing Co., Ltd. | | 9,442,057 | | 3,634,827 | |
| | Yulon Motor Co., Ltd. | | 6,333,184 | | 6,438,591 | |
| | Yung Chi Paint & Varnish Manufacturing Co., Ltd. | | 55,000 | | 76,033 | |
| | Yung Shin Pharmaceutical Industrial Co., Ltd. | | 551,400 | | 588,416 | |
| | Yung Tay Engineering Co., Ltd. | | 2,407,000 | | 1,878,579 | |
| | Zig Sheng Industrial Co., Ltd. | | 3,215,450 | | 767,469 | |
| | | | | | | |
TOTAL — TAIWAN | | | | 875,745,682 | |
| | | | | | | |
THAILAND — (2.5%) | | | | | |
COMMON STOCKS — (2.5%) | | | | | |
| | Aapico Hitech PCL, Ltd. (Foreign) NVDR | | 539,800 | | 165,859 | |
* | | Adkinson Securities PCL (Foreign) | | 26,881,000 | | 722,704 | |
* | | Advance Agro PCL (Foreign) | | 1,859,030 | | 2,073,370 | |
| | Aromatics (Thailand) PCL (Foreign) | | 3,289,900 | | 6,269,253 | |
# | | Asia Plus Securities PCL (Foreign) | | 7,008,500 | | 811,679 | |
| | Ayudhya Insurance PCL | | 228,500 | | 139,743 | |
| | Bangkok Bank PCL (Foreign) | | 5,539,200 | | 18,819,942 | |
# | | Bangkok Bank PCL (Foreign) NVDR | | 3,612,100 | | 12,272,443 | |
| | Bangkok Expressway PCL (Foreign) | | 5,353,500 | | 3,606,169 | |
| | Bangkok First Investment & Trust PCL (Foreign) | | 1,295,500 | | 248,785 | |
| | Bangkok Insurance PCL (Foreign) | | 87,880 | | 737,364 | |
* | | Bangkok Land PCL (Foreign) | | 39,735,803 | | 903,954 | |
* | | Bangkok Land PCL (Foreign) NVDR | | 38,933,300 | | 885,697 | |
# | | Bank of Ayudhya PCL (Foreign) NVDR | | 16,377,100 | | 13,305,865 | |
| | Banpu PCL (Foreign) | | 895,800 | | 11,962,526 | |
| | Big C Supercenter PCL (Foreign) | | 1,274,800 | | 1,647,758 | |
# | | Cal-Comp Electronics (Thailand) PCL (Foreign) | | 15,304,200 | | 3,142,453 | |
# | | Capital Nomura Securities PCL (Foreign) | | 370,100 | | 399,103 | |
| | Capital Nomura Securities PCL (Foreign) NVDR | | 108,300 | | 116,787 | |
| | Central Plaza Hotel PCL (Foreign) | | 5,422,500 | | 881,121 | |
| | Charoen Pokphand Foods PCL (Foreign) | | 44,618,740 | | 6,011,122 | |
| | Charoong Thai Wire & Cable PCL (Foreign) | | 724,900 | | 156,342 | |
| | Delta Electronics (Thailand) PCL (Foreign) | | 4,909,500 | | 3,162,039 | |
| | Eastern Water Resources Development & Management PCL (Foreign) | | 9,535,200 | | 1,380,382 | |
| | Erawan Group PCL (Foreign) | | 3,812,400 | | 450,538 | |
| | GMM Grammy PCL (Foreign) | | 338,100 | | 106,882 | |
* | | Golden Land Property PCL (Foreign) | | 232,500 | | 51,518 | |
* | | Golden Land Property PCL (Foreign) NVDR | | 570,000 | | 126,302 | |
| | Hana Microelectronics PCL (Foreign) | | 935,000 | | 596,676 | |
| | Hermraj Land & Development PCL (Foreign) | | 58,054,500 | | 2,435,553 | |
| | ICC International PCL (Foreign) | | 2,755,000 | | 3,245,605 | |
* | | Italian-Thai Development PCL | | 7,760,200 | | 1,811,229 | |
* # | | Italian-Thai Development PCL (Foreign) NVDR | | 4,900,000 | | 1,179,851 | |
| | Jasmine International PCL (Foreign) | | 54,242,600 | | 641,023 | |
| | Kang Yong Electric PCL (Foreign) | | 236,200 | | 324,494 | |
| | Kasikornbank PCL (Foreign) | | 1,530,000 | | 3,887,436 | |
34
| | KGI Securities One PCL (Foreign) | | 14,256,100 | | 1,204,593 | |
| | Kiatnakin Bank PCL (Foreign) NVDR | | 116,800 | | 95,759 | |
| | Kiatnakin Finance PCL (Foreign) | | 3,036,300 | | 2,489,322 | |
* | | Krung Thai Bank PCL | | 9,801,600 | | 2,929,040 | |
| | Krung Thai Bank PCL (Foreign) | | 40,093,900 | | 11,963,908 | |
| | Krungthai Card PCL (Foreign) | | 1,326,700 | | 1,195,490 | |
| | Laguna Resorts & Hotels PCL (Foreign) | | 1,364,500 | | 1,773,779 | |
| | Lalin Property PCL (Foreign) | | 4,561,600 | | 450,129 | |
# | | Loxley PCL (Foreign) | | 17,739,300 | | 1,268,310 | |
* | | Magnecomp Precision Technology (Foreign) | | 15,950,000 | | 1,253,475 | |
| | MBK Development PCL (Foreign) | | 903,400 | | 1,788,250 | |
| | MK Real Estate Development PCL (Foreign) | | 5,772,100 | | 399,046 | |
* | | M-Link Asia Corp. PCL (Foreign) | | 2,984,609 | | 100,523 | |
| | Modernform Group PCL (Foreign) | | 46,000 | | 54,362 | |
| | Muramoto Electronic (Thailand) PCL (Foreign) | | 134,300 | | 777,688 | |
* | | Nakornthai Strip Mill PCL (Foreign) | | 126,273,000 | | 969,968 | |
| | Noble Development PCL (Foreign) | | 2,425,600 | | 326,782 | |
* | | Pacific Assets PCL (Foreign) | | 1,034,500 | | 133,257 | |
| | Padaeng Industry PCL (Foreign) NVDR | | 1,600,800 | | 1,678,954 | |
| | Polyplex PCL (Foreign) | | 5,424,000 | | 961,489 | |
| | Power Line Engineering PCL (Foreign) | | 4,061,300 | | 605,940 | |
| | Pranda Jewelry PCL (Foreign) | | 610,000 | | 163,099 | |
* | | Property Perfect PCL (Foreign) | | 3,707,900 | | 422,852 | |
| | PTT Chemical PCL (Foreign) | | 4,915,610 | | 17,427,379 | |
| | Quality Houses PCL (Foreign) | | 47,936,200 | | 3,144,054 | |
| | Regional Container Lines PCL (Foreign) | | 6,950,000 | | 5,954,650 | |
| | Rojana Industrial Park PCL (Foreign) | | 222,600 | | 109,171 | |
| | Saha Pathana Inter-Holding PCL (Foreign) | | 3,316,000 | | 1,959,377 | |
| | Saha Pathanapibul PCL (Foreign) | | 1,367,000 | | 755,238 | |
| | Saha-Union PCL (Foreign) | | 3,025,300 | | 1,635,660 | |
| | Sahaviriya Steel Industries PCL (Foreign) | | 76,350,800 | | 1,985,042 | |
# | | Sansiri PCL (Foreign) | | 10,262,900 | | 1,061,235 | |
| | SC Asset Corp. PCL (Foreign) | | 1,345,200 | | 387,494 | |
| | Seamico Securities PCL (Foreign) | | 5,788,600 | | 567,786 | |
* # | | Shinawatra Satellite PCL (Foreign) | | 11,230,400 | | 3,351,120 | |
| | Siam Commercial Bank PCL (Foreign) | | 4,716,800 | | 11,984,483 | |
| | Siam Industrial Credit PCL (Foreign) | | 1,840,950 | | 180,573 | |
# | | Siam Makro PCL (Foreign) | | 331,200 | | 944,259 | |
* # | | Sino-Thai Engineering & Construction PCL (Foreign) | | 8,745,300 | | 1,304,787 | |
| | Sri Trang Agro Industry PCL (Foreign) | | 1,240,631 | | 469,165 | |
| | Supalai PCL (Foreign) | | 10,329,366 | | 1,074,211 | |
| | SVOA PCL (Foreign) | | 4,744,000 | | 189,213 | |
| | Tata Steel (Thailand) PCL (Foreign) | | 12,239,300 | | 636,418 | |
| | Thai Plastic & Chemicals PCL (Foreign) | | 3,839,200 | | 2,189,130 | |
| | Thai Rayon PCL (Foreign) | | 165,000 | | 375,360 | |
* | | Thai Rung Union Car PCL (Foreign) | | 5,386,250 | | 429,659 | |
| | Thai Union Frozen Products PCL (Foreign) NVDR | | 587,600 | | 395,813 | |
| | Thai Wacoal PCL (Foreign) | | 93,300 | | 92,342 | |
* | | Thai-German Ceramic Industry PCL (Foreign) | | 5,130,300 | | 121,257 | |
| | Thanachart Capital PCL (Foreign) | | 12,543,100 | | 5,336,307 | |
# | | Thoresen Thai Agencies PCL (Foreign) | | 2,366,200 | | 3,600,245 | |
| | Tipco Asphalt PCL (Foreign) | | 157,500 | | 118,657 | |
| | Tipco Asphalt PCL (Foreign) | | 246,356 | | 185,600 | |
| | Tisco Bank PCL (Foreign) NVDR | | 246,000 | | 196,233 | |
* # | | TMB Bank PCL (Foreign) | | 70,353,200 | | 3,013,875 | |
35
* | | Total Access Communication PLC ADR | | 1,264,380 | | 1,289,668 | |
# | | TPI Polene PCL (Foreign) | | 13,440,324 | | 5,281,226 | |
* | | Tuntex (Thailand) PCL (Foreign) | | 1,987,600 | | 112,747 | |
* | | Tycoons Worldwide Group PCL (Foreign) | | 1,243,300 | | 222,231 | |
| | Univentures PCL (Foreign) | | 3,481,400 | | 302,395 | |
# | | Vanachai Group PCL (Foreign) | | 9,076,500 | | 1,115,540 | |
| | Vibhavadi Medical Center PCL (Foreign) | | 1,307,800 | | 115,914 | |
| | Vinythai PCL (Foreign) | | 5,213,817 | | 1,186,096 | |
TOTAL COMMON STOCKS | | | | 218,487,192 | |
| | | | | | | |
RIGHTS/WARRANTS — (0.0%) | | | | | |
* | | Bangkok Land PCL (Foreign) Warrants 01/07/10 | | 3,987,330 | | 14,136 | |
* | | Cal-Comp Electronics (Thailand) PCL (Foreign) Warrants 04/18/09 | | 2,192,300 | | 145,085 | |
* | | Erawan Group PCL (Foreign) Warrants 12/17/07 | | 953,100 | | 25,624 | |
* | | SVI PCL (Foreign) Warrants 12/06/10 | | 799,000 | | 17,468 | |
* | | TMB Bank PCL (Foreign) Rights 12/20/07 | | 34,761,516 | | 51,350 | |
TOTAL RIGHTS/WARRANTS | | | | 253,663 | |
| | | | | | | |
TOTAL — THAILAND | | | | 218,740,855 | |
| | | | | | | |
TURKEY — (3.2%) | | | | | |
COMMON STOCKS — (3.2%) | | | | | |
| | Adana Cimento Sanayi Ticaret A.S. | | 591,987 | | 389,659 | |
| | Akbank T.A.S. | | 4,025,298 | | 28,907,410 | |
* | | Akenerji Elektrik Uretim A.S. | | 216,113 | | 1,896,043 | |
| | Aksa Akrilik Kimya Sanayii A.S. | | 741,264 | | 1,720,985 | |
| | Aksigorta A.S. | | 1,550,206 | | 9,560,286 | |
| | Alarko Carrier Sanayii ve Ticaret A.S. | | 23,199 | | 281,781 | |
| | Alarko Holding A.S. | | 815,561 | | 2,640,626 | |
| | Alkim Alkali Kimya A.S. | | 45,205 | | 246,627 | |
* | | Alternatifbank A.S. | | 1 | | 1 | |
* | | Altinyildiz mensucat ve Konfeksiyon Fabrikalari A.S. | | 134,077 | | 687,109 | |
| | Anadolu Anonim Turk Sigorta Sirketi A.S. | | 1,645,071 | | 2,819,866 | |
| | Anadolu Cam Sanayii A.S. | | 1,302,498 | | 2,699,515 | |
| | Anadolu Isuzu Otomotiv Sanayi ve Ticaret A.S. | | 59,275 | | 416,353 | |
| | Arcelik A.S | | 92,828 | | 637,863 | |
* | | Ayen Enerji A.S. | | 600,828 | | 1,433,311 | |
| | Aygaz A.S. | | 1,199,987 | | 5,010,297 | |
| | Bagfas Bandirma Gubre Fabrikalari A.S. | | 13,996 | | 700,055 | |
* | | Banvit Bandirma Vitaminli Yem Sanayii Ticaret A.S. | | 267,434 | | 968,665 | |
| | Bati Anabolu Cimento A.S. | | 255,022 | | 2,264,196 | |
| | Bati Soeke Cimento Sanayi A.S. | | 183,843 | | 470,075 | |
* | | Beko Elektronik A.S. | | 283,333 | | 494,610 | |
| | Bolu Cimento Sanayii A.S. | | 618,428 | | 1,240,967 | |
| | Borusan Mannesmann Boru Sanayi ve Ticaret A.S. | | 98,343 | | 906,572 | |
| | Bossa Ticaret ve Sanayi Isletmeleri Ticaret A.S. | | 576,288 | | 777,189 | |
| | Brisa Bridgestone Sabanci Lastik San ve Ticaret A.S. | | 9,261 | | 581,727 | |
* | | Cemtas Celik Makina Sanayi ve Ticaret A.S. | | 454,263 | | 697,759 | |
| | Cimsa Cimento Sanayi ve Ticaret A.S. | | 486,117 | | 3,647,435 | |
* | | Dentas Ambalaj ve Kagit Sanayi A.S. | | 1 | | — | |
* | | Dogan Gazetecilik A.S. | | 96,299 | | 299,427 | |
* | | Dogan Sirketler Grubu Holding A.S. | | 7,632,833 | | 14,701,059 | |
| | Dogus Otomotiv Servis ve Ticaret A.S. | | 426,889 | | 2,810,471 | |
* | | Eczacibasi Ilac Sanayi ve Ticaret A.S. | | 813,261 | | 3,602,322 | |
36
* | | Eczacibasi Yapi Gerecleri Sanayi ve Ticaret A.S. | | 362,756 | | 1,077,288 | |
* | | EGE Seramik Sanayi ve Ticaret A.S. | | 41,683 | | 74,318 | |
| | Enka Insaat ve Sanayi A.S. | | 32,525 | | 521,509 | |
| | Eregli Demir ve Celik Fabrikalari Turk A.S. | | 4,647,576 | | 38,192,276 | |
* | | Fortis Bank A.S. | | 1 | | 1 | |
* | | Gentas Clenel Metal Sanayi ve Ticaret A.S. | | 188,745 | | 243,813 | |
* | | Goldas Kuyumculuk Sanayi A.S. | | 630,228 | | 1,482,274 | |
| | Goltas Goller Bolgesi Cimento Sanayi ve Ticaret A.S. | | 24,412 | | 1,408,217 | |
* | | Goodyear Lastikleri T.A.S. | | 50,050 | | 635,227 | |
* | | GSD Holding A.S. | | 2,261,921 | | 2,976,053 | |
* | | Gunes Sigorta A.S. | | 578,342 | | 955,217 | |
| | Hektas Ticaret T.A.S. | | 380,059 | | 387,527 | |
* | | Ihlas Ev Aletleri Imalat Sanayi ve Ticaret A.S. | | 52,706 | | 137,857 | |
* | | Ihlas Holding A.S. | | 2,743,806 | | 2,511,903 | |
* | | Izmir Demir Celik Sanayii A.S. | | 575,981 | | 1,208,516 | |
* | | Kardemir Karabuk Demir Sanayi ve Ticaret A.S. | | 1,501,750 | | 2,200,452 | |
| | Karton Sanayi ve Ticaret A.S. | | 5,771 | | 293,459 | |
* | | Klimasan Klima Sanayi ve Ticaret A.S. | | 43,605 | | 228,585 | |
* | | Koc Holding A.S. Series B | | 3,802,822 | | 19,082,256 | |
| | Konya Cimento Sanayii A.S. | | 3,926 | | 180,879 | |
* | | Kordsa Global Endustriyel Iplik ve Kord Bezi Sanayi ve Ticaret A.S. | | 625,784 | | 2,067,608 | |
| | Mardin Cimento Sanayii ve Ticaret A.S. | | 180,922 | | 1,044,913 | |
* | | Marmari Marti Otel Isletmeleri A.S. | | 869,614 | | 868,797 | |
| | Marshall Boya ve Vernik Sanayii A.S. | | 27,295 | | 359,574 | |
* | | Medya Holdings A.S. | | 33,508 | | — | |
* | | Menderes Tekstil Sanayi ve Ticaret A.S. | | 1,340,476 | | 710,754 | |
* | | Multu Aku ve Malzemeleri Sanayi A.S. | | 257,022 | | 541,287 | |
* | | Net Turizm Ticaret ve Sanayi A.S. | | 1,033,536 | | 1,043,557 | |
| | Nortel Networks Netas Telekomuenikasyon A.S. | | 34,377 | | 851,706 | |
| | Otobus Karoseri Sanayi A.S. | | 57,850 | | 939,811 | |
* | | Parsan Makina Parcalari Sanayii A.S. | | 247,602 | | 586,027 | |
| | Pinar Entegre Et ve Un Sanayi A.S. | | 248,306 | | 919,126 | |
| | Pinar Sut Mamulleri Sanayii A.S. | | 183,609 | | 1,220,616 | |
* | | Raks Elektronik Sanayi ve Ticaret A.S. | | 5,859 | | 3,911 | |
* | | Sabah Yayincilik A.S. | | 31,938 | | 102,547 | |
* | | Sanko Pazarlama Ithalat Ihracat A.S. | | 123,651 | | 389,270 | |
| | Sarkuysan Elektrolitik Bakir Sanayi ve Ticaret A.S. | | 354,689 | | 986,793 | |
* | | Sasa Dupont Sabanci Polyester Sanayi A.S. | | 1,346,358 | | 789,538 | |
* | | Tat Konserve Sanayii A.S. | | 176,814 | | 426,977 | |
* | | Tekstil Bankasi A.S. | | 379,143 | | 609,385 | |
| | Tire Kutsan Oluklu Mukavva Kutu ve Kagit Sanayii A.S. | | 156,597 | | 937,802 | |
| | Tofas Turk Otomobil Fabrikasi A.S. | | 760,313 | | 3,652,872 | |
| | Trakya Cam Sanayii A.S. | | 2,543,706 | | 6,070,380 | |
| | Tupras-Turkiye Petrol Rafinerileri A.S. | | 158,906 | | 4,089,713 | |
* | | Turk Demir Dokum Fabrikalari A.S. | | 125,038 | | 997,359 | |
| | Turk Sise ve Cam Fabrikalari A.S. | | 5,077,954 | | 9,784,617 | |
| | Turkiye Garanti Bankasi A.S. | | 4,310,290 | | 37,541,819 | |
| | Turkiye Is Bankasi A.S. | | 3,125,538 | | 20,019,995 | |
| | Ulker Biskuvi Sanayi A.S. | | 229,705 | | 924,129 | |
| | USAS Ucak Servisi A.S. | | 134,650 | | 276,138 | |
* | | Uzel Makina Sanayii A.S. | | 250,039 | | 439,747 | |
* | | Vestel Elektronik Sanayi ve Ticaret A.S. | | 791,801 | | 2,112,387 | |
| | Yapi Kredi Finansal Kiralama A.S. | | 45,196 | | 136,208 | |
* | | Yapi ve Kredi Bankasi A.S. | | 3,551,131 | | 13,101,138 | |
* | | Zorlu Enerji Elektrik Uretim A.S. | | 462,156 | | 1,839,488 | |
| | | | | | | |
TOTAL — TURKEY | | | | 283,693,877 | |
37
| | | | Face
Amount | | Value † | |
| | | | (000) | | | |
SECURITIES LENDING COLLATERAL — (8.3%) | | | | | |
@ | | Repurchase Agreement, Deutsche Bank Securities 4.63%, 12/03/07 (Collateralized by $116,699,233 FHLMC, rates ranging from 5.000% to 6.500%, maturities ranging from 11/01/36 to 10/01/37 & FNMA, rates ranging from 4.153%(r) to 5.500%, maturities ranging from 08/01/13 to 02/01/36, valued at $101,562,724 ) to be repurchased at $99,609,716 | | $ | 99,571 | | 99,571,298 | |
@ | | Repurchase Agreement, HSBC Securities, Inc. 4.63%, 12/03/07 (Collateralized by $122,455,360 FHLMC, rates ranging from 6.000% to 6.500%, maturities ranging from 12/01/32 to 11/01/37 & FNMA, rates ranging from 5.000% to 8.000%, maturities ranging from 02/01/24 to 11/01/37, valued at $102,003,207 ) to be repurchased at $100,038,583 | | 100,000 | | 100,000,000 | |
@ | | Repurchase Agreement, Merrill Lynch 4.63%, 12/03/07 (Collateralized by $691,693,391 FHLMC, rates ranging from 5.000% to 7.000%, maturities ranging from 01/01/24 to 10/01/36 & FNMA, rates ranging from 4.500% to 6.500%, maturities ranging from 05/01/18 to 11/01/37, valued at $546,185,122 ) to be repurchased at $535,680,003 | | 535,473 | | 535,473,400 | |
TOTAL SECURITIES LENDING COLLATERAL | | | | 735,044,698 | |
| | | | | | | |
TOTAL INVESTMENTS - (100.0%)
(Cost $5,271,689,547) | | | | $ | 8,902,105,736 | |
| | | | | | | | | |
See accompanying Notes to Financial Statements.
38
Report of Independent Registered Public Accounting Firm
To the Board of Directors and Shareholders of
Dimensional Emerging Markets Value Fund Inc.
We have audited, in accordance with the standards of the Public Company Accounting Oversight Board (United States), the financial statements of Dimensional Emerging Markets Value Fund Inc. (the “Fund”) as of November 30, 2007, and for the year then ended and have issued our unqualified report thereon dated January 22, 2008 (which report and financial statements are included in Item 1 of this Certified Shareholder Report on Form N-CSR). Our audit included an audit of the Fund’s investment portfolio (the “Portfolio”) as of November 30, 2007 appearing in Item 6 of this Form N-CSR. This Portfolio is the responsibility of the Fund’s management. Our responsibility is to express an opinion on this Portfolio based on our audit. In our opinion, the Portfolio referred to above, when read in conjunction with the financial statements of the Fund referred to above, presents fairly, in all material respects, the information set forth therein.
PricewaterhouseCoopers LLP
Philadelphia, Pennsylvania
January 22, 2008
ITEM 7. DISCLOSURE OF PROXY VOTING POLICIES AND PROCEDURES FOR CLOSED-END MANAGEMENT INVESTMENT COMPANIES.
This item is not applicable to the Registrant, which is an open-end management investment company.
ITEM 8. PORTFOLIO MANAGERS OF CLOSED-END MANAGEMENT INVESTMENT COMPANIES.
This item is not applicable to the Registrant, which is an open-end management investment company.
ITEM 9. PURCHASES OF EQUITY SECURITIES BY CLOSED-END MANAGEMENT INVESTMENT COMPANY AND AFFILIATED PURCHASERS
This item is not applicable to the Registrant, which is an open-end management investment company.
ITEM 10. SUBMISSION OF MATTERS TO A VOTE OF SECURITY HOLDERS.
None.
ITEM 11. CONTROLS AND PROCEDURES.
(a) Based on their evaluation of the Registrant’s disclosure controls and procedures as of a date within 90 days of the filing date of this Report, the Registrant’s Principal Executive Officer and Principal Financial Officer believe that the disclosure controls and procedures (as defined in Rule 30a-3(c) under the
Investment Company Act of 1940, as amended) are effectively designed to ensure that information required to be disclosed by the Registrant in the Report is recorded, processed, summarized and reported by the filing date, including ensuring that information required to be disclosed in the Report is accumulated and communicated to the Registrant’s officers that are making certifications in the Report, as appropriate, to allow timely decisions regarding required disclosure. The Registrant’s management, including the Principal Executive Officer and the Principal Financial Officer, recognizes that any set of controls and procedures, no matter how well designed and operated, can provide only reasonable assurance of achieving the desired control objectives.
(b) There were no changes in the Registrant’s internal control over financial reporting (as defined in Rule 30a-3(d) under the Investment Company Act of 1940, as amended) that occurred during the second fiscal quarter of the period covered by this Report that have materially affected, or are reasonably likely to materially affect, the Registrant’s internal control over financial reporting.
ITEM 12. EXHIBITS.
(a)(1) Code of Ethics is filed herewith.
(a)(2) Certifications pursuant to Section 302 of the Sarbanes-Oxley Act of 2002 are filed herewith.
(a)(3) This item is not applicable.
(b) Certifications pursuant to Section 906 of the Sarbanes-Oxley Act of 2002 are filed herewith.
SIGNATURES
Pursuant to the requirements of the Securities Exchange Act of 1934 and the Investment Company Act of 1940, the Registrant has duly caused this Report to be signed on its behalf by the undersigned, thereunto duly authorized.
Dimensional Emerging Markets Value Fund Inc.
By: | /s/ David G. Booth | |
| David G. Booth |
| Chairman, Director, President and |
| Chief Executive Officer |
| |
Date: | January 30, 2008 |
| | | |
Pursuant to the requirements of the Securities Exchange Act of 1934 and the Investment Company Act of 1940, this Report has been signed below by the following persons on behalf of the Registrant and in the capacities and on the dates indicated.
By: | /s/ David G. Booth | |
| David G. Booth |
| Principal Executive Officer |
| Dimensional Emerging Markets Value Fund Inc. |
| |
Date: | January 30, 2008 |
| |
| |
By: | /s/ David R. Martin | |
| David R. Martin |
| Principal Financial Officer |
| Dimensional Emerging Markets Value Fund Inc. |
| |
Date: | January 30, 2008 |
| | | |