UNITED STATES
SECURITIES AND EXCHANGE COMMISSION
Washington, D.C. 20549
FORM N-CSR
CERTIFIED SHAREHOLDER REPORT OF REGISTERED
MANAGEMENT INVESTMENT COMPANIES
Investment Company Act file number 811-7440
DIMENSIONAL EMERGING MARKETS VALUE FUND
(Exact name of registrant as specified in charter)
6300 Bee Cave Road, Building One, Austin, TX 78746
(Address of principal executive offices) (Zip code)
Catherine L. Newell, Esquire, Vice President and Secretary
Dimensional Emerging Markets Value Fund,
6300 Bee Cave Road, Building One, Austin, TX 78746
(Name and address of agent for service)
Registrant’s telephone number, including area code: 512-306-7400
Date of fiscal year end: October 31
Date of reporting period: October 31, 2009
| ITEM 1. | REPORTS TO STOCKHOLDERS. |

Dimensional Fund Advisors
6300 Bee Cave Road, Building One
Austin, TX 78746
December 2009
Dear Fellow Shareholder,
After sinking to ten-year lows, stock prices around the world rebounded sharply in March 2009 and posted steady gains in the seven months between March and September. March and April were among the best-return months in the life of Dimensional’s equity Funds.
The unexpected turns in the financial markets this year offered some valuable lessons. We were reminded that stock prices are unpredictable. We saw once again the benefits of staying disciplined in the market as it inevitably moves up and down. And I believe these markets showed very clearly why diversification is so important to long-term investment success.
Although diversification can’t prevent losses, it can help investors avoid the extreme outcomes that can result from concentrating investments in individual stocks or market segments. We believe that successful investing is about both increasing wealth and being able to sleep well at night. Investors who understand how markets work and have a realistic understanding of their own tolerance for risk are most likely to have a good overall experience.
More than $10 billion in net long-term assets flowed into Dimensional’s Funds during the first 10 months of 2009, a reflection of the trust our shareholders around the world have placed in us. We are grateful for that trust and want you to know that we take our responsibility as the steward of your investments in Dimensional’s Funds very seriously. We hope to have the opportunity to continue serving your needs for many years to come.
|
Sincerely, |
|

|
|
David G. Booth |
Chairman and Chief Executive Officer |
[THIS PAGE INTENTIONALLY LEFT BLANK]
ANNUAL REPORT
Table of Contents
This report is submitted for the information of the Fund’s shareholders. It is not authorized for distribution to prospective investors unless preceded or accompanied by an effective prospectus.
i
[THIS PAGE INTENTIONALLY LEFT BLANK]
DFA INVESTMENT DIMENSIONS GROUP INC.
DIMENSIONAL EMERGING MARKETS VALUE FUND
DEFINITIONS OF ABBREVIATIONS AND FOOTNOTES
Statement of Assets and Liabilities/Summary Schedule of Portfolio Holdings
| | |
Investment Abbreviations |
ADR | | American Depositary Receipt |
FNMA | | Federal National Mortgage Association |
|
Investment Footnotes |
† | | See Note B to Financial Statements. |
†† | | Securities have generally been fair valued. See Note B to Financial Statements. |
** | | Calculated as a percentage of total net assets. Percentages shown parenthetically next to the category headings have been calculated as a percentage of total investments. “Other Securities” are those securities that are not among the top 50 holdings of the fund or do not represent more than 1.0% of the net assets of the fund. Some of the individual securities within this category may include Total or Partial Securities on Loan and/or Non-Income Producing Securities. |
* | | Non-Income Producing Securities. |
# | | Total or Partial Securities on Loan. |
@ | | Security purchased with cash proceeds from Securities on Loan. |
§ | | Affiliated Fund. |
|
Financial Highlights |
| |
(A) | | Computed using average shares outstanding. |
(B) | | Annualized |
(C) | | Non-Annualized |
(D) | | Represents the combined ratios for the respective portfolio and its respective pro-rata share of its Master Fund Series. |
(E) | | Because of commencement of operations and related preliminary transaction costs, these ratios are not necessarily indicative of future ratios. |
|
All Statements and Schedules |
| |
— | | Amounts designated as — are either zero or rounded to zero. |
SEC | | Securities and Exchange Commission |
(a) | | Commencement of Operations. |
1
DFA INVESTMENT DIMENSIONS GROUP INC.
PERFORMANCE CHARTS
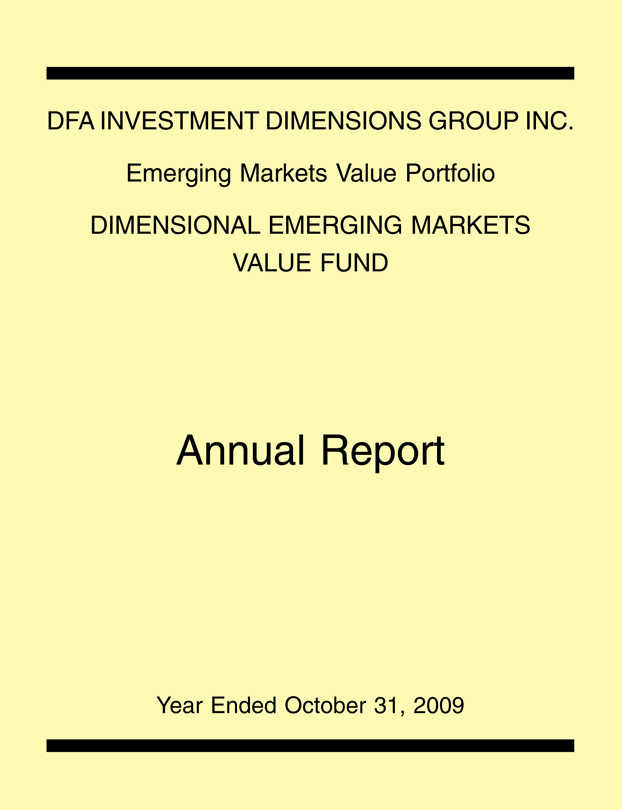
Emerging Markets Value Portfolio Institutional Class vs.
MSCI Emerging Markets Index (net dividends)
October 31, 1999-October 31, 2009
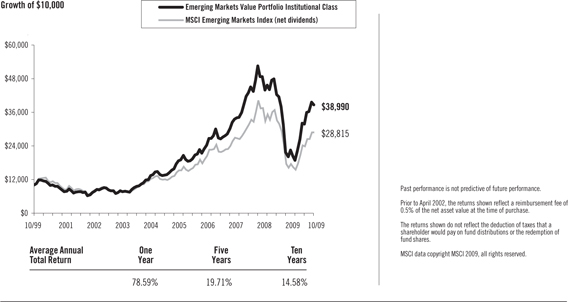
Emerging Markets Value Portfolio Class R2 vs.
MSCI Emerging Markets Index (net dividends)
January 29, 2008-October 31, 2009
2
DFA INVESTMENT DIMENSIONS GROUP INC.
MANAGEMENT’S DISCUSSION AND ANALYSIS
| | |
| International Equity Market Review | | 12 Months Ended October 31, 2009 |
The one-year period ending October 31, 2009, was characterized by unprecedented volatility in non-US developed markets. Non-US developed markets lost 18.87% from November 2008 through February 2009, as measured by the MSCI World ex USA Index (net dividends). From March through October 2009 these same markets gained 57.56%. In April 2009, the Index had its largest-ever monthly gain (12.90%) since October 1990.
From November 2008 through February 2009, developed markets returns were negative across all asset classes. The US dollar rallied against most currencies, reversing a general trend of depreciation dating back to 2006. From March through October 2009 the market reversed course, with small cap and value stocks strongly outperforming large cap and growth stocks. The US dollar depreciated against most major currencies. The rally drove strong positive returns for the 12-month period, with small cap stocks significantly outperforming large cap stocks and value stocks outperforming growth stocks, as measured by the MSCI indexes.
12 Months Ended October 31, 2009
| | | | |
Ten Largest Foreign Developed Markets by Market Cap (BB) | | Local
Currency
Return | | U.S. Dollar
Return |
Japan ($2,432) | | 6.03% | | 15.20% |
United Kingdom ($2,328) | | 23.19% | | 25.68% |
France ($1,106) | | 10.09% | | 28.10% |
Canada ($1,060) | | 17.46% | | 32.58% |
Australia ($912) | | 21.91% | | 66.97% |
Germany ($843) | | 6.37% | | 23.77% |
Switzerland ($821) | | 5.78% | | 20.63% |
Spain ($488) | | 33.27% | | 55.06% |
Italy ($388) | | 7.57% | | 25.17% |
Netherlands ($277) | | 20.17% | | 39.83% |
Country market capitalizations (in parentheses) are in USD billions. Source: Returns are of MSCI indices net of foreign withholding taxes on dividends. Country market capitalizations are based on country carve-outs of the MSCI All-Country World Investable Market Index. MSCI data copyright MSCI 2009, all rights reserved.
Small company stocks were the best-performing asset class in international markets, while growth stocks had the worst relative results.
12 Months Ended October 31, 2009
| | |
| | | U.S. Dollar
Return |
MSCI World ex USA Small Cap Index | | 50.01% |
MSCI World ex USA Value Index | | 31.71% |
MSCI World ex USA Index | | 27.83% |
MSCI World ex USA Growth Index | | 24.03% |
Source: MSCI indices are net of foreign withholding taxes on dividends, copyright MSCI 2009, all rights reserved.
Gains in emerging markets were better, on average, than in developed markets, although results varied widely among the individual emerging markets countries. For the 12 month period, returns in U.S. dollars were 64.13% for the MSCI Emerging Markets Index (net dividends) and 27.83% for the MSCI World ex USA Index (net dividends).
3
12 Months Ended October 31, 2009
| | |
Country | | U.S. Dollar
Return |
Argentina | | 53.21% |
Brazil | | 91.55% |
Chile | | 61.68% |
China | | 82.16% |
Czech Republic | | 26.83% |
Hungary | | 63.54% |
India | | 77.12% |
Indonesia | | 127.39% |
Israel | | 31.43% |
Malaysia | | 56.99% |
Mexico | | 39.79% |
Philippines | | 50.71% |
Poland | | 23.09% |
South Africa | | 61.69% |
South Korea | | 56.17% |
Taiwan | | 48.86% |
Thailand | | 78.58% |
Turkey | | 68.21% |
Source: Returns are of MSCI indices net of foreign withholding taxes on dividends, copyright MSCI 2009, all rights reserved.
Master-Feeder Structure
The Emerging Markets Value Portfolio described below, called a “Feeder Fund,” does not buy individual securities directly; instead, the Portfolio invests in a corresponding fund called a “Master Fund“. The Master Fund, in turn, purchases stocks and/or other securities.
Emerging Markets Value Portfolio
The Emerging Markets Value Portfolio seeks to capture the returns of value stocks in selected emerging markets by purchasing shares of the Dimensional Emerging Markets Value Fund, which invests in such stocks. The investment strategy employs a disciplined, quantitative approach, emphasizing broad diversification and consistent exposure to emerging markets value stocks, but does not attempt to track closely a specific equity index. As of October 31, 2009, the Master Fund held 1,944 stocks across 18 emerging markets countries and was mostly invested in equities throughout the year: the average non-equitized cash level for the period was less than 1% of the Master Fund’s assets. The Master Fund’s target country weights are capped at a ceiling set by the manager in order to limit single-country risk exposure.
As a result of the Master Fund’s diversified investment approach, performance was generally determined by broad structural trends in emerging country stock markets, rather than the behavior of a limited number of stocks. For the 12 months ended October 31, 2009, total returns were 78.59% for the Institutional Class share of the Portfolio, 78.29% for the Class R2 shares of the Portfolio and 64.13% for the MSCI Emerging Markets Index (net dividends). The Master Fund targets large and small cap value stocks while the Index primarily targets large cap stocks. The Master Fund’s greater allocation than the Index to value stocks added approximately 11.9% to relative performance. The Master Fund’s greater allocation to small cap stocks added approximately 3.3% to the relative performance.
4
Dimensional Emerging Markets Value Fund
The Dimensional Emerging Markets Value Fund seeks to capture the returns of value stocks in selected emerging markets. The investment strategy employs a disciplined, quantitative approach, emphasizing broad diversification and consistent exposure to emerging markets value stocks, but does not attempt to closely track a specific equity index. As of October 31, 2009, the Fund held 1,944 stocks in 18 emerging markets countries and was mostly invested in equities throughout the year: the average non-equitized cash level for the period was less than 1% of the Fund’s assets. The Fund’s target country weights are capped at a ceiling set by the manager in order to limit single-country risk exposure.
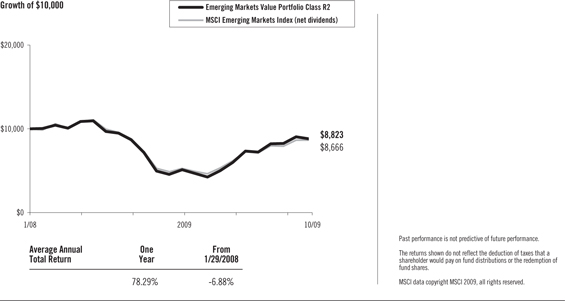
As a result of the Fund’s diversified investment approach, performance was generally determined by broad structural trends in emerging country stock markets, rather than the behavior of a limited number of stocks. For the 12 months ended October 31, 2009, total returns were 79.39% for the Fund and 64.13% for the MSCI Emerging Markets Index (net dividends). The Fund targets large and small cap value stocks while the Index primarily targets large cap stocks. The Fund’s greater allocation than the Index to value stocks added approximately 11.9% to relative performance. The Fund’s greater allocation to small cap stocks added approximately 3.3% to the relative performance.
5
DFA INVESTMENT DIMENSIONS GROUP INC.
EMERGING MARKETS VALUE PORTFOLIO
DISCLOSURE OF FUND EXPENSES
(Unaudited)
The following Expense Table is shown so that you can understand the impact of fees on your investment. All mutual funds have operating expenses. As a shareholder of the fund, you incur ongoing costs, which include costs for portfolio management, administrative services, and shareholder reports, among others. Operating expenses, legal and audit services, which are deducted from a fund’s gross income, directly reduce the investment return of the fund. A fund’s expenses are expressed as a percentage of its average net assets. This figure is known as the expense ratio. The following examples are intended to help you understand the ongoing costs, in dollars, of investing in the fund and to compare these costs with those of other mutual funds. The examples are based on an investment of $1,000 made at the beginning of the period shown and held for the entire period.
The Expense Table below illustrates your fund’s costs in two ways.
Actual Fund Return
This section helps you to estimate the actual expenses after fee waivers that you paid over the period. The “Ending Account Value” shown is derived from the fund’s actual return and “Expenses Paid During Period” reflect the dollar amount that would have been paid by an investor who started with $1,000 in the fund. You may use the information here, together with the amount you invested, to estimate the expenses that you paid over the period.
To do so, simply divide your account value by $1,000 (for example, a $7,500 account value divided by $1,000 = 7.5), then multiply the result by the number given for your fund under the heading “Expenses Paid During Period.”
Hypothetical Example for Comparison Purposes
This section is intended to help you compare your fund’s costs with those of other mutual funds. The hypothetical “Ending Account Value” and “Expenses Paid During Period” are derived from the fund’s actual expense ratio and an assumed 5% annual return before expenses. In this case, because the return used is not the fund’s actual return, the results do not apply to your investment. The example is useful in making comparisons because the SEC requires all mutual funds to calculate expenses based on a 5% annual return. You can assess your fund’s costs by comparing this hypothetical example with the hypothetical examples that appear in shareholder reports of other funds.
Please note that the expenses shown in the table are meant to highlight and help you compare ongoing costs only and do not reflect any transactional costs, if applicable. The “Annualized Expense Ratio” represents the actual expenses for the six-month period indicated.
| | | | | | | | |
| EXPENSE TABLE | | Six Months Ended October 31, 2009 |
| | | | |
| | | Beginning
Account
Value
05/01/09 | | Ending
Account
Value
10/31/09 | | Annualized
Expense
Ratio* | | Expenses
Paid
During
Period* |
Actual Fund Return | | | | | | | | |
Class R2 Shares | | $1,000.00 | | $1,471.60 | | 0.90% | | $5.61 |
Institutional Class Shares | | $1,000.00 | | $1,474.10 | | 0.62% | | $3.87 |
Hypothetical 5% Annual Return | | | | | | | | |
Class R2 Shares | | $1,000.00 | | $1,020.67 | | 0.90% | | $4.58 |
Institutional Class Shares | | $1,000.00 | | $1,022.08 | | 0.62% | | $3.16 |
| * | Expenses are equal to the fund’s annualized expense ratio for the six-month period, multiplied by the average account value over the period, multiplied by the number of days in the most recent six-month period (184), then divided by the number of days in the year (365) to reflect the six-month period. The Portfolio is a Feeder Fund. The expenses shown reflect the direct expenses of the Feeder Fund and the indirect payment of the Feeder Fund’s portion of the expenses of its Master Fund. | |
6
DFA INVESTMENT DIMENSIONS GROUP INC.
EMERGING MARKETS VALUE PORTFOLIO
DISCLOSURE OF PORTFOLIO HOLDINGS
(Unaudited)
The SEC requires that all Funds file a complete Schedule of Investments with the SEC for their first and third fiscal quarters on Form N-Q. For DFA Investment Dimensions Group Inc., this would be for the fiscal quarters ending January 31 and July 31. The Form N-Q filing must be made within 60 days of the end of the quarter. DFA Investment Dimensions Group Inc. filed its most recent Form N-Q with the SEC on September 29, 2009. It is available upon request, without charge, by calling collect: (512) 306-7400 or by mailing a request to Dimensional Fund Advisors LP, 6300 Bee Cave Road, Building One, Austin, Texas 78746, or by visiting the SEC’s website at http://www.sec.gov, or they may be reviewed and copied at the SEC’s Public Reference Room in Washington, D.C. (call 1-800-732-0330 for information on the operation of the Public Reference Room).
PORTFOLIO HOLDINGS
The SEC requires that all Funds present their categories of portfolio holdings in a table, chart or graph format in their annual and semi-annual shareholder reports, whether or not a Schedule of Investments is utilized. The following table, which presents portfolio holdings as a percent of total investments before short-term investments and collateral for loaned securities, is provided in compliance with such requirement.
The categories of industry classification for the Affiliated Investment Company is represented in the Disclosure of Portfolio Holdings, which is included elsewhere within the report. Refer to the Summary Schedule of Portfolio Holdings for the underlying Master Fund’s holdings which reflects the investments by country.
| | | |
Affiliated Investment Company | | 100.0 | % |
7
DFA INVESTMENT DIMENSIONS GROUP INC.
EMERGING MARKETS VALUE PORTFOLIO
STATEMENT OF ASSETS AND LIABILITIES
OCTOBER 31, 2009
(Amounts in thousands, except share and per share amounts)
| | | |
ASSETS: | | | |
Investment in Dimensional Emerging Markets Value Fund (Affiliated Investment Company) at Value† | | $ | 7,409,209 |
Receivables: | | | |
Investment Securities Sold | | | 16,385 |
Fund Shares Sold | | | 9,155 |
Prepaid Expenses and Other Assets | | | 49 |
| | | |
Total Assets | | | 7,434,798 |
| | | |
LIABILITIES: | | | |
Payables: | | | |
Affiliated Investment Company Shares Purchased | | | 4,044 |
Fund Shares Redeemed | | | 21,496 |
Due to Advisor | | | 2,594 |
Accrued Expenses and Other Liabilities | | | 316 |
| | | |
Total Liabilities | | | 28,450 |
| | | |
NET ASSETS | | $ | 7,406,348 |
| | | |
NET ASSET VALUE, OFFERING AND REDEMPTION PRICE PER SHARE: | | | |
Class R2 Shares - based on net assets of $5,082 and shares outstanding of 2,034,960 | | $ | 2.50 |
| | | |
NUMBER OF SHARES AUTHORIZED | | | 100,000,000 |
| | | |
Institutional Class Shares - based on net assets of $7,401,266 and shares outstanding of 256,115,623 | | $ | 28.90 |
| | | |
NUMBER OF SHARES AUTHORIZED | | | 1,500,000,000 |
| | | |
Investments in Affiliated Investment Company at Cost | | $ | 5,504,485 |
| | | |
NET ASSETS CONSIST OF: | | | |
Paid-In Capital | | $ | 5,930,966 |
Undistributed Net Investment Income (Distributions in Excess of Net Investment Income) | | | 12,574 |
Accumulated Net Realized Gain (Loss) | | | 182,234 |
Net Unrealized Appreciation (Depreciation) | | | 1,280,574 |
| | | |
NET ASSETS | | $ | 7,406,348 |
| | | |
See accompanying Notes to Financial Statements.
8
DFA INVESTMENT DIMENSIONS GROUP INC.
EMERGING MARKETS VALUE PORTFOLIO
STATEMENT OF OPERATIONS
FOR THE YEAR ENDED OCTOBER 31, 2009
(Amounts in thousands)
| | | | |
Investment Income | | | | |
Dividends | | $ | 109,045 | |
Interest | | | 277 | |
Income from Securities Lending | | | 11,962 | |
Expenses Allocated from Affiliated Investment Company | | | (10,541 | ) |
| | | | |
Total Investment Income | | | 110,743 | |
| | | | |
Expenses | | | | |
Administrative Services Fees | | | 20,346 | |
Accounting & Transfer Agent Fees | | | 109 | |
Filing Fees | | | 208 | |
Shareholder Servicing Fees — Class R2 Shares | | | 9 | |
Shareholders’ Reports | | | 125 | |
Directors’/Trustees’ Fees & Expenses | | | 87 | |
Professional Fees | | | 70 | |
Other | | | 57 | |
| | | | |
Total Expenses | | | 21,011 | |
| | | | |
Net Investment Income (Loss) | | | 89,732 | |
| | | | |
Realized and Unrealized Gain (Loss) | | | | |
Net Realized Gain (Loss) on Investment Securities Sold | | | 76,523 | |
Change in Unrealized Appreciation (Depreciation) of Investment Securities and Foreign Currency | | | 2,867,814 | |
| | | | |
Net Realized and Unrealized Gain (Loss) | | | 2,944,337 | |
| | | | |
Net Increase (Decrease) in Net Assets Resulting from Operations | | $ | 3,034,069 | |
| | | | |
See accompanying Notes to Financial Statements.
9
DFA INVESTMENT DIMENSIONS GROUP INC.
EMERGING MARKETS VALUE PORTFOLIO
STATEMENTS OF CHANGES IN NET ASSETS
(Amounts in thousands)
| | | | | | | | | | | | |
| | | Year
Ended
Oct. 31,
2009 | | | Period
Dec. 1, 2007
to
Oct. 31, 2008 | | | Year
Ended
Nov. 30,
2007 | |
Increase (Decrease) in Net Assets | | | | | | | | | | | | |
Operations: | | | | | | | | | | | | |
Net Investment Income (Loss) | | $ | 89,732 | | | $ | 179,045 | | | $ | 119,722 | |
Net Realized Gain (Loss) on Investment Securities Sold | | | 76,523 | | | | 603,223 | † | | | 170,231 | † |
Change in Unrealized Appreciation (Depreciation) of Investment Securities and Foreign Currency | | | 2,867,814 | | | | (5,398,482 | )† | | | 2,117,791 | † |
| | | | | | | | | | | | |
Net Increase (Decrease) in Net Assets Resulting from Operations | | | 3,034,069 | | | | (4,616,214 | ) | | | 2,407,744 | |
| | | | | | | | | | | | |
Distributions From: | | | | | | | | | | | | |
Net Investment Income: | | | | | | | | | | | | |
Class R2 Shares | | | (427 | ) | | | (115 | ) | | | — | |
Institutional Class Shares | | | (77,134 | ) | | | (181,885 | ) | | | (96,479 | ) |
Net Short-Term Gains: | | | | | | | | | | | | |
Class R2 Shares | | | (76 | ) | | | — | | | | — | |
Institutional Class Shares | | | (36,974 | ) | | | (13,134 | ) | | | (8,058 | ) |
Net Long-Term Gains: | | | | | | | | | | | | |
Class R2 Shares | | | (1,070 | ) | | | — | | | | — | |
Institutional Class Shares | | | (517,440 | ) | | | (155,738 | ) | | | (44,751 | ) |
| | | | | | | | | | | | |
Total Distributions | | | (633,121 | ) | | | (350,872 | ) | | | (149,288 | ) |
| | | | | | | | | | | | |
Capital Share Transactions: | | | | | | | | | | | | |
Shares Issued | | | 1,980,752 | | | | 2,280,870 | | | | 1,777,388 | |
Shares Issued in Lieu of Cash Distributions | | | 576,478 | | | | 306,474 | | | | 124,212 | |
Shares Redeemed | | | (1,289,209 | ) | | | (1,368,681 | ) | | | (957,950 | ) |
| | | | | | | | | | | | |
Net Increase (Decrease) from Capital Share Transactions | | | 1,268,021 | | | | 1,218,663 | | | | 943,650 | |
| | | | | | | | | | | | |
Total Increase (Decrease) in Net Assets | | | 3,668,969 | | | | (3,748,423 | ) | | | 3,202,106 | |
Net Assets | | | | | | | | | | | | |
Beginning of Period | | | 3,737,379 | | | | 7,485,802 | | | | 4,283,696 | |
| | | | | | | | | | | | |
End of Period | | $ | 7,406,348 | | | $ | 3,737,379 | | | $ | 7,485,802 | |
| | | | | | | | | | | | |
Undistributed Net Investment Income (Distributions in Excess of Net Investment Income) | | $ | 12,574 | | | $ | 6,472 | | | $ | 22,447 | |
| † | See Note A in the Notes to Financial Statements. |
See accompanying Notes to Financial Statements.
10
DFA INVESTMENT DIMENSIONS GROUP INC.
EMERGING MARKETS VALUE PORTFOLIO
FINANCIAL HIGHLIGHTS
(for a share outstanding throughout the period)
| | | | | | | | |
| | | Class R2 Shares | |
| | | Year
Ended
Oct. 31,
2009 | | | Period
Jan. 29, 2008(a)
to Oct. 31, 2008 | |
Net Asset Value, Beginning of Period | | $ | 4.56 | | | $ | 10.00 | |
| | | | | | | | |
| | |
Income from Investment Operations | | | | | | | | |
Net Investment Income (Loss) | | | 0.03 | (A) | | | 0.21 | (A) |
Net Gains (Losses) on Securities
(Realized and Unrealized) | | | 1.14 | | | | (4.93 | ) |
| | | | | | | | |
Total from Investment Operations | | | 1.17 | | | | (4.72 | ) |
| | |
| | |
Less Distributions | | | | | | | | |
Net Investment Income | | | (0.32 | ) | | | (0.72 | ) |
Net Realized Gains | | | (2.91 | ) | | | — | |
| | | | | | | | |
Total Distributions | | | (3.23 | ) | | | (0.72 | ) |
| | |
Net Asset Value, End of Period | | $ | 2.50 | | | $ | 4.56 | |
| | |
Total Return | | | 78.29 | % | | | (50.51 | )%(C) |
| | |
Net Assets, End of Period (thousands) | | | $5,082 | | | $ | 1,799 | |
Ratio of Expenses to Average Net Assets (D) | | | 0.90 | % | | | 0.92 | %(B)(E) |
Ratio of Net Investment Income to Average Net Assets | | | 1.39 | % | | | 3.35 | %(B)(E) |
| | |
See page 1 for the Definitions of Abbreviations and Footnotes.
See accompanying Notes to Financial Statements.
11
DFA INVESTMENT DIMENSIONS GROUP INC.
EMERGING MARKETS VALUE PORTFOLIO
FINANCIAL HIGHLIGHTS
(for a share outstanding throughout each period)
| | | | | | | | | | | | | | | | | | | | | | | | |
| | | Institutional Class Shares | |
| | | Year Ended
Oct. 31, 2009 | | | Period
Dec. 1, 2007
to Oct. 31, 2008 | | | Year Ended
Nov. 30,
2007 | | | Year Ended
Nov. 30,
2006 | | | Year Ended
Nov. 30,
2005 | | | Year
Ended
Nov. 30,
2004 | |
Net Asset Value, Beginning of Period | | $ | 19.36 | | | $ | 45.85 | | | $ | 31.26 | | | $ | 22.86 | | | $ | 17.93 | | | $ | 12.53 | |
| | | | | | | | | | | | | | | | | | | | | | | | |
| | | | | | |
Income from Investment Operations | | | | | | | | | | | | | | | | | | | | | | | | |
Net Investment Income (Loss) | | | 0.38 | (A) | | | 0.98 | (A) | | | 0.78 | (A) | | | 0.60 | (A) | | | 0.50 | | | | 0.21 | |
Net Gains (Losses) on Securities
(Realized and Unrealized) | | | 12.41 | | | | (25.48 | ) | | | 14.82 | | | | 8.65 | | | | 4.96 | | | | 5.54 | |
| | | | | | | | | | | | | | | | | | | | | | | | |
Total from Investment Operations | | | 12.79 | | | | (24.50 | ) | | | 15.60 | | | | 9.25 | | | | 5.46 | | | | 5.75 | |
| | |
| | | | | | |
Less Distributions | | | | | | | | | | | | | | | | | | | | | | | | |
Net Investment Income | | | (0.34 | ) | | | (1.00 | ) | | | (0.63 | ) | | | (0.60 | ) | | | (0.44 | ) | | | (0.35 | ) |
Net Realized Gains | | | (2.91 | ) | | | (0.99 | ) | | | (0.38 | ) | | | (0.25 | ) | | | (0.09 | ) | | | — | |
| | | | | | | | | | | | | | | | | | | | | | | | |
Total Distributions | | | (3.25 | ) | | | (1.99 | ) | | | (1.01 | ) | | | (0.85 | ) | | | (0.53 | ) | | | (0.35 | ) |
| | |
Net Asset Value, End of Period | | $ | 28.90 | | | $ | 19.36 | | | $ | 45.85 | | | $ | 31.26 | | | $ | 22.86 | | | $ | 17.93 | |
| | |
| | |
Total Return | | | 78.59 | % | | | (55.65 | )%(C) | | | 50.98 | % | | | 41.55 | % | | | 31.06 | % | | | 46.76 | % |
| | |
Net Assets, End of Period (thousands) | | $ | 7,401,266 | | | $ | 3,735,580 | | | $ | 7,485,802 | | | $ | 4,283,696 | | | $ | 2,077,480 | | | $ | 895,313 | |
Ratio of Expenses to Average Net Assets (D) | | | 0.62 | % | | | 0.60 | %(B) | | | 0.60 | % | | | 0.63 | % | | | 0.70 | % | | | 0.77 | % |
Ratio of Net Investment
Income to Average Net Assets | | | 1.76 | % | | | 2.82 | %(B) | | | 2.00 | % | | | 2.22 | % | | | 2.45 | % | | | 1.37 | % |
| | |
See page 1 for the Definitions of Abbreviations and Footnotes.
See accompanying Notes to Financial Statements.
12
DFA INVESTMENT DIMENSIONS GROUP INC.
EMERGING MARKETS VALUE PORTFOLIO
NOTES TO FINANCIAL STATEMENTS
A. Organization:
DFA Investment Dimensions Group Inc. (the “Group”) is an open-end management investment company whose shares are offered, without a sales charge, generally to institutional investors and clients of registered investment advisors. The Group offers fifty-seven operational portfolios, one of which, the Emerging Markets Value Portfolio (the “Portfolio”) is included in this report. The remaining fifty-six portfolios are presented in separate reports.
The Portfolio primarily invests all of its assets in the Dimensional Emerging Markets Value Fund (the “Fund”, formerly, the Dimensional Emerging Markets Value Fund Inc.). At October 31, 2009, the Portfolio owned 93% of the Fund. The financial statements of the Fund are included elsewhere in this report and should be read in conjunction with the financial statements of the Portfolio.
Effective November 1, 2009, Dimensional Emerging Markets Value Fund (“DEM II”), a master fund in a master-feeder structure, elected with the consent of its Holder(s) to change its U.S. federal income tax classification from that of an association taxable as a corporation to a partnership pursuant to Treasury Regulation §301.7701-3. The change in capital structure and retroactive reclassification of the statement of changes in net assets and financial highlights for the Fund is a result of the treatment of a partnership for book purposes. DEM II and the Portfolio will maintain their books and records and present their financial statements in accordance with generally accepted accounting principles for investment partnerships.
On January 29, 2008, Class R2 shares commenced operations. As of October 31, 2009, Class R1 has 100,000,000 authorized shares and has not commenced operations.
At a regular meeting of the Board of Directors/Trustees (the “Board”) on September 16, 2008, the Board voted to change the fiscal and tax year ends of the Portfolio from November 30 to October 31.
B. Significant Accounting Policies:
The following significant accounting policies are in conformity with accounting principles generally accepted in the United States of America. Such policies are consistently followed by the Group in preparation of its financial statements. The preparation of financial statements in accordance with accounting principles generally accepted in the United States of America requires management to make estimates and assumptions that affect the reported amounts of assets and liabilities and disclosure of contingent assets and liabilities at the date of the financial statements and the reported amounts of increases and decreases in net assets from operations during the reporting period. Actual results could differ from those estimates and those differences could be material.
1. Security Valuation: The Portfolio’s investment reflects its proportionate interest in the net assets of the Fund.
The Portfolio utilizes a fair value hierarchy which prioritizes the inputs to valuation techniques used to measure fair value into three broad levels described below:
• Level 1 – quoted prices in active markets for identical securities
• Level 2 – other significant observable inputs (including quoted prices for similar securities, interest rates, prepayment speeds, credit risk, etc.)
• Level 3 – significant unobservable inputs (including the Portfolio’s own assumptions in determining the fair value of investments)
The inputs or methodology used for valuing securities are not necessarily an indication of the risk associated with investing in those securities. A summary of the inputs used to value the Portfolio’s net assets as of October 31, 2009 is listed below (in thousands).
13
| | | | | | | | | | |
| | | Valuation Inputs |
| | | Investments in
Securities
(Market Value) |
| | | Level 1 | | Level 2 | | Level 3 | | Total |
Emerging Markets Value Portfolio | | $ | 7,409,209 | | — | | — | | $ | 7,409,209 |
2. Deferred Compensation Plan: Each eligible Director of the Group may elect participation in the Deferred Compensation Plan (the “Plan”). Under the Plan, effective January 1, 2002, such Directors may defer payment of all or a portion of their total fees earned as a Director. These deferred amounts may be treated as though such amounts had been invested in shares of the following funds: U.S. Large Cap Value Portfolio; U.S. Core Equity 1 Portfolio; U.S. Core Equity 2 Portfolio; U.S. Vector Equity Portfolio; U.S. Micro Cap Portfolio; DFA International Value Portfolio; International Core Equity Portfolio; Emerging Markets Portfolio; Emerging Markets Core Equity Portfolio; and/or DFA Two-Year Global Fixed Income Portfolio. Contributions made under the Plan and the change in unrealized appreciation (depreciation) and income, are included in Directors’/Trustees’ Fees & Expenses. At October 31, 2009, the total liability for deferred compensation to Directors is included in Accrued Expenses and Other Liabilities on the Statement of Assets and Liabilities in the amount of $145 (in thousands).
Each Director has the option to receive their distribution of proceeds in one of the following methods upon one year’s notice: lump sum; annual installments over a period of agreed upon years; or semi-annual installments over a period of agreed upon years. As of October 31, 2009, none of the Directors have requested distribution of proceeds.
3. Other: The portfolio recognizes its pro-rata share, on a daily basis, of net investment income and realized and unrealized gains and losses of investment securities and foreign currency from the Fund, which is treated as a partnership for federal income tax purposes. Dividend income and distributions to shareholders are recorded on the ex-dividend date. Distributions received on securities that represent a return of capital or capital gain are recorded as a reduction of cost of investments or as a realized gain, respectively. The Portfolio estimates the character of distributions received that may be considered return of capital distributions. Expenses directly attributable to the Portfolio are directly charged. Common expenses of the Fund are allocated using methods approved by the Board of Directors/Trustees, generally based on average net assets.
C. Investment Advisor:
Dimensional Fund Advisors LP (“Dimensional” or the “Advisor”) provides administrative services to the Portfolio, including supervision of services provided by others, providing information to the shareholders and the Board of Directors/Trustees, and other administrative services. The Advisor provides investment advisory services to the Fund. For the year ended October 31, 2009, the Portfolio’s administrative services fees were accrued daily and paid monthly to the Advisor based on an effective annual rate of 0.40% of average daily net assets.
Pursuant to the Expense Assumption Agreement for the Class R2 Shares of the Emerging Markets Value Portfolio, the Advisor has contractually agreed to assume the Portfolio’s direct expenses (excluding management fees and custodian fees) to the extent necessary to limit the expenses of the Class R2 Shares of the Portfolio to 0.96% of its average net assets on an annualized basis. At any time that the annualized expenses of the Portfolio are less than 0.96% of its average net assets on an annualized basis, the Advisor retains the right to recover any fees previously waived and/or expenses previously assumed to the extent that such recovery will not cause the annualized expenses to exceed 0.96% of its average net assets on an annualized basis. The Portfolio is not obligated to reimburse the Advisor for fees previously waived or expenses previously assumed by the Advisor more than thirty-six months before the date of such recovery. The Expense Assumption Agreement will remain in effect until March 1, 2010, and shall continue in effect from year to year thereafter, unless terminated by the Group or the Advisor. At October 31, 2009, there were no fees subject to future recovery by the Advisor.
14
Fees Paid to Officers and Directors/Trustees:
Certain Officers and Directors/Trustees of the Advisor are also Officers and Directors/Trustees of the Group; however, such Officers and Directors/Trustees (with the exception of the Chief Compliance Officer (“CCO”)) receive no compensation from the Group. For the year ended October 31, 2009, the total related amounts paid by the Group to the CCO were $197 (in thousands). The total related amount paid by the Portfolio is included in Other Expenses on the Statement of Operations.
D. Federal Income Taxes:
The Portfolio has qualified and intends to continue to qualify as a regulated investment company under Subchapter M of the Internal Revenue Code for federal income tax purposes and to distribute substantially all of its taxable income and net capital gains to shareholders. Accordingly, no provision has been made for federal income taxes.
Distributions from net investment income and net realized capital gains are determined in accordance with U.S. federal income tax regulations, which may differ from those amounts determined under accounting principles generally accepted in the United States of America. These book/tax differences are either temporary or permanent in nature. To the extent these differences are permanent, they are charged or credited to paid-in capital, undistributed net investment income or accumulated net realized gains, as appropriate, in the period that the differences arise. Accordingly, the following permanent differences as of October 31, 2009, primarily attributable to the utilization of accumulated earnings and profits distributed to shareholders on redemptions of shares as part of the dividends paid deduction for income tax purposes, were reclassified to the following accounts. These reclassifications had no effect on net assets or net asset value per share (amounts in thousands):
| | | | |
Increase
(Decrease)
Paid-In Capital | | Increase
(Decrease)
Undistributed
Net Investment Income | | Increase
(Decrease)
Accumulated
Net Realized
Gains (Losses) |
$(76,651) | | $(6,069) | | $82,720 |
The tax character of dividends and distributions declared and paid during the year ended November 30, 2007, the period December 1, 2007 to October 31,2008 and the year ended October 31, 2009 were as follows (amounts in thousands):
| | | | | | | | | |
| | | Net Investment
Income and
Short-Term
Capital Gains | | Long-Term
Capital Gains | | Total |
2007 | | | $110,158 | | $ | 51,893 | | $ | 162,051 |
2008 | | | 210,872 | | | 193,750 | | | 404,622 |
2009 | | | 114,611 | | | 518,510 | | | 633,121 |
At October 31, 2009, the following net investment income and short-term capital gains and long-term capital gains distributions designated for federal income tax purposes are due to the utilization of accumulated earnings and profits distributed to shareholders upon redemption of shares (amounts in thousands):
| | | | |
Net Investment
Income and
Short-Term
Capital Gains | | Long-Term
Capital Gains | | Total |
$11,386 | | $8,867 | | $20,253 |
15
At October 31, 2009, the components of distributable earnings/(accumulated losses) were as follows (amounts in thousands):
| | | | |
Undistributed
Net Investment
Income and
Short-Term
Capital Gains | | Undistributed
Long-Term
Capital Gains | | Total Net
Distributable
Earnings
(Accumulated
Losses) |
$78,548 | | $116,405 | | $194,953 |
For federal income tax purposes, the Portfolio measures its capital loss carryforwards annually at October 31, 2009, its fiscal year end. Capital loss carryforwards may be carried forward and applied against future capital gains. As of October 31, 2009, the Portfolio had no capital loss carryforwards available to offset future realized capital gains.
At October 31, 2009, the total cost and aggregate gross unrealized appreciation and (depreciation) of securities for federal income tax purposes were different from amounts reported for financial reporting purposes (amounts in thousands):
| | | | | | |
Federal
Tax Cost | | Unrealized
Appreciation | | Unrealized
(Depreciation) | | Net
Unrealized
Appreciation
(Depreciation) |
$6,117,186 | | $2,018,873 | | $(726,850) | | $1,292,023 |
Accounting for Uncertainty in Income Taxes sets forth a minimum threshold for financial statement recognition of the benefit of a tax position taken or expected to be taken in a tax return. Management has analyzed each Portfolios’ tax positions and has concluded that no provision for income tax is required in any Portfolios’ financial statements. No Portfolio is aware of any tax positions for which it is reasonably possible that the total amounts of unrecognized tax benefits will significantly change in the next twelve months. Each of the Portfolios’ federal tax returns for the prior three fiscal years remains subject to examination by the Internal Revenue Service.
E. Capital Share Transactions:
The capital share transactions by class were as follows (amounts in thousands):
| | | | | | | | | | | | | | | | | | | | | |
| | | Year
Ended
Oct. 31, 2009 | | | Period
Dec. 1, 2007
to
Oct. 31, 2008* | | | Year
Ended
Nov. 30, 2007 | |
| | | Amount | | | Shares | | | Amount | | | Shares | | | Amount | | | Shares | |
Class R2 Shares* | | | | | | | | | | | | | | | | | | | | | |
Shares Issued | | $ | 2,967 | | | 1,723 | | | $ | 2,856 | | | 408 | | | | N/A | | | N/A | |
Shares Issued in Lieu of Cash Distributions | | | 1,574 | | | 942 | | | | 115 | | | 14 | | | | N/A | | | N/A | |
Shares Redeemed | | | (2,169 | ) | | (1,024 | ) | | | (175 | ) | | (28 | ) | | | N/A | | | N/A | |
| | | | | | | | | | | | | | | | | | | | | |
Net Increase (Decrease) — Class R2 Shares | | $ | 2,372 | | | 1,641 | | | $ | 2,796 | | | 394 | | | | N/A | | | N/A | |
| | | | | | | | | | | | | | | | | | | | | |
Institutional Class Shares | | | | | | | | | | | | | | | | | | | | | |
Shares Issued | | $ | 1,977,785 | | | 91,360 | | | $ | 2,278,014 | | | 60,725 | | | $ | 1,777,388 | | | 46,560 | |
Shares Issued in Lieu of Cash Distributions | | | 574,904 | | | 34,181 | | | | 306,359 | | | 7,710 | | | | 124,212 | | | 3,560 | |
Shares Redeemed | | | (1,287,040 | ) | | (62,335 | ) | | | (1,368,506 | ) | | (38,791 | ) | | | (957,950 | ) | | (23,900 | ) |
| | | | | | | | | | | | | | | | | | | | | |
Net Increase (Decrease) — Institutional Class Shares | | $ | 1,265,649 | | | 63,206 | | | $ | 1,215,867 | | | 29,644 | | | $ | 943,650 | | | 26,220 | |
| | | | | | | | | | | | | | | | | | | | | |
| *Class | R2 Shares commenced operations on January 29, 2008. |
16
F. Line of Credit:
The Portfolio, together with other Dimensional-advised portfolios, has entered into an amended and restated $250 million unsecured discretionary line of credit effective July 8, 2009 with an affiliate of its domestic custodian bank. Each portfolio is permitted to borrow, subject to its investment limitations, up to a maximum of $250 million, as long as total borrowings under the line of credit do not exceed $250 million in the aggregate. Borrowings under the line of credit are charged interest at the then current Federal Funds Rate plus 1%. Each portfolio is individually, and not jointly, liable for its particular advances under the line of credit. There is no commitment fee on the unused portion of the line of credit. The agreement for the discretionary line of credit may be terminated by either party at any time. The line of credit is scheduled to expire on June 22, 2010. There were no borrowings by the Portfolio under this line of credit during the year ended October 31, 2009.
The Portfolio, together with other Dimensional-advised portfolios, has also entered into an additional $500 million unsecured line of credit effective January 15, 2009 with its international custodian bank. Each portfolio is permitted to borrow, subject to its investment limitations, up to a maximum of $500 million, as long as total borrowings under the line of credit do not exceed $500 million in the aggregate. Each portfolio is individually, and not jointly, liable for its particular advances under the line of credit. Borrowings under the line of credit are charged interest at rates agreed to by the parties at the time of borrowing. There is no commitment fee on the unused portion of the line of credit. The agreement for the line of credit expires on January 15, 2010. There were no borrowings by the Portfolio under this line credit during the year ended October 31, 2009.
G. Shareholder Servicing Fees:
The Class R2 Shares pay a shareholder servicing fee in the amount of 0.25% of their annual average net assets to compensate service agents that provide shareholder servicing, record keeping, account maintenance and other services to investors in the Emerging Markets Value Portfolio Class R2 Shares.
H. Indemnitees; Contractual Obligations:
Under the Group’s organizational documents, its officers and directors are indemnified against certain liabilities arising out of the performance of their duties to the Group.
In the normal course of business, the Group enters into contracts that contain a variety of representations and warranties which provide general indemnification. The Group’s maximum exposure under these arrangements is unknown as this would involve future claims that may be made against the Group and/or its affiliates that have not yet occurred. However, based on experience, the Group expects the risk of loss to be remote.
I. Other:
At October 31, 2009, three shareholders held approximately 97% of the outstanding shares of Class R2 Shares and two shareholder held 28% of the outstanding shares of the Institutional Class Shares of the Portfolio. One or more of the shareholders of the Institutional Class Shares is an omnibus account, which typically holds shares for the benefit of several other underlying investors.
J. Subsequent Event Note:
Effective November 1, 2009, Dimensional Emerging Markets Value Fund (“DEM II”), a master fund in a master-feeder structure with one RIC feeder (the Emerging Markets Value Portfolio) and other direct client investors, made a “Check-the-Box” election for federal income tax purposes pursuant to Treasury Regulation §301.7701-3, to change their federal entity classifications from a corporation taxable as a regulated investment company to a partnership. DEM II and the Portfolio will maintain their books and records and present their financial statements in accordance with generally accepted accounting principals for investment partnerships. As a result of this election, the master fund is deemed to have distributed all of its assets and liabilities on October 31, 2009 to its shareholders in liquidation of the master fund. Since the master fund has a shareholder owning 80% or more of the fund’s shares, and also has shareholders owning less than 80%, the transaction creates a non-taxable transaction, pursuant to Internal Revenue
17
Code §332, for those owning more than 80%, and a taxable transaction, pursuant to Internal Revenue Code §331, for those shareholders owning less than 80%. Immediately after the deemed liquidation, the shareholders contributed all of the distributed assets and liabilities to a newly formed partnership. The final tax year end of the master fund was October 31, 2009.
For federal income tax purposes, pursuant to Code §336(a), the master fund recognizes gain or loss relative to the investment of the less than 80% shareholders as if the master’s investment securities were sold to those shareholders and, pursuant to Code §331, each of those shareholders recognizes gain or loss as if it liquidated its investment in the master. Pursuant to Code §334(a), each of these shareholders will take a fair market value basis in the securities deemed received by them and a new holding period for those securities commences on the deemed liquidation date. In regards to the shareholder owning 80% or more of the master fund, pursuant to Code §332(a), the shareholder will not recognize any gain or loss on the deemed liquidation. However, pursuant to Code §332(c), a portion of the deemed distribution, which otherwise would have been tax-free as discussed above, since it is utilized by the master fund to satisfy its dividends paid deduction for the tax year, must be recognized and treated as a dividend by the 80% or greater shareholder. Pursuant to Code §334(b)(1) and §1223, the 80% or greater shareholder’s basis and holding period in the securities received in liquidation is the same as it was in the possession of the master.
The master fund had book/tax differences upon its deemed liquidation. The following summary of permanent differences occurred as of the respective effective “Check the Box” election date.
| | | | | | |
Increase
(Decrease)
Paid-in Capital | | Unrealized
Appreciation
(Depreciation)
Investment
Securities | | Increase
(Decrease)
Undistributed
Net Investment
Income | | Increase
(Decrease)
Accumulated
Net Realized
Gains (Losses) |
$1,370,229,576 | | $(1,383,011,838) | | $1,404,500 | | $11,377,762 |
As a result of the transaction, the Dimensional Emerging Markets Value Fund recognized a $104,402,506 and ($16,523) capital gain and currency loss respectively, for the tax year ended October 31, 2009.
The Emerging Markets Value Portfolio which was impacted by the “Check the Box” election also had a permanent book/tax difference resulting from the transaction. For financial statement purposes, this adjustment did not result in any changes to the Portfolio’s net assets or net asset value per share. The following summary of permanent differences occurred as of the effective “Check the Box” election date.
| | | | |
Increase
(Decrease)
Paid-in Capital | | Unrealized
Appreciation
(Depreciation)
Investment
Securities | | Increase
(Decrease)
Accumulated
Net Realized
Gains (Losses) |
$(154,596,409) | | $(82,593,386) | | $237,189,795 |
For financial reporting purposes, this transaction had no impact on the net assets of the respective funds.
K. Subsequent Event Evaluations:
Management has evaluated the impact of all subsequent events on the Portfolios through December 23, 2009, the date the financial statements were available for issuance, and has determined that there are no subsequent events requiring recognition or disclosure in the financial statements.
18
REPORT OF INDEPENDENT REGISTERED PUBLIC ACCOUNTING FIRM
To the Shareholders of Emerging Markets Value Portfolio and
Board of Directors of DFA Investment Dimensions Group Inc.:
In our opinion, the accompanying statement of assets and liabilities, and the related statements of operations and of changes in net assets and the financial highlights present fairly, in all material respects, the financial position of Emerging Markets Value Portfolio (one of the portfolios constituting DFA Investment Dimensions Group Inc., hereafter referred to as the “Portfolio”) at October 31, 2009, the results of its operations for the year then ended, the changes in its net assets and the financial highlights for each of the periods indicated, in conformity with accounting principles generally accepted in the United States of America. These financial statements and financial highlights (hereafter referred to as “financial statements”) are the responsibility of the Portfolio’s management; our responsibility is to express an opinion on these financial statements based on our audits. We conducted our audits of these financial statements in accordance with the standards of the Public Company Accounting Oversight Board (United States). Those standards require that we plan and perform the audit to obtain reasonable assurance about whether the financial statements are free of material misstatement. An audit includes examining, on a test basis, evidence supporting the amounts and disclosures in the financial statements, assessing the accounting principles used and significant estimates made by management, and evaluating the overall financial statement presentation. We believe that our audits, which included confirmation of securities at October 31, 2009 by correspondence with the transfer agent of the investee fund, provide a reasonable basis for our opinion.
PricewaterhouseCoopers LLP
Philadelphia, Pennsylvania
December 23, 2009
19
RESULTS OF THE SHAREHOLDER MEETING
On June 2, 2009 and July 8, 2009, DFA Investment Dimensions Group Inc. (“DFAIDG”) held a Special Joint Meeting of Shareholders for the purpose of voting on several proposals affecting DFAIDG and the Portfolio, including, among other items, the election of Directors, the amendment of certain fundamental investment limitations, and the elimination of certain fundamental investment limitations. The shareholders of the Portfolio approved each of the applicable proposals for DFAIDG and the Portfolio presented at the Meeting. Listed below are the voting results from the Meeting. Please note that not all Proposals presented at the Meeting were voted on by the Portfolio. Additionally, the Proposal numbers reflected below correlate to the Proposal numbers presented for vote at the Meeting.
DFAIDG
| | | | | | | | | | | | | | | | | | | | |
| | | | | Shares Voted | | Percent of Outstanding Shares Voted |
| | | | | For | | % | | Against | | % | | Abstain/WithHold | | % | | For | | Against | | Abstain / WithHold |
Proposal 1: Election of Directors for DFAIDG* | | | | | | | | | | | | | | | | | | |
| 1a | | David G. Booth | | 5,100,343,281 | | 93.94% | | — | | 0.00% | | 328,971,623 | | 6.06% | | 81.55% | | 0.00% | | 5.26% |
| 1b | | George M. Constantinides | | 5,105,280,301 | | 94.03% | | — | | 0.00% | | 324,034,602 | | 5.97% | | 81.63% | | 0.00% | | 5.18% |
| 1c | | John P. Gould | | 5,100,584,112 | | 93.95% | | — | | 0.00% | | 328,730,791 | | 6.05% | | 81.55% | | 0.00% | | 5.26% |
| 1d | | Roger G. Ibbotson | | 5,105,426,112 | | 94.03% | | — | | 0.00% | | 323,888,792 | | 5.97% | | 81.63% | | 0.00% | | 5.18% |
| 1e | | Robert C. Merton | | 5,107,268,900 | | 94.07% | | — | | 0.00% | | 322,046,003 | | 5.93% | | 81.66% | | 0.00% | | 5.15% |
| 1f | | Myron S. Scholes | | 5,104,997,961 | | 94.03% | | — | | 0.00% | | 324,316,942 | | 5.97% | | 81.62% | | 0.00% | | 5.19% |
| 1g | | Eduardo A. Repetto | | 5,094,783,848 | | 93.84% | | — | | 0.00% | | 334,531,055 | | 6.16% | | 81.46% | | 0.00% | | 5.35% |
| 1h | | Abbie J. Smith | | 5,100,861,923 | | 93.95% | | — | | 0.00% | | 328,452,981 | | 6.05% | | 81.55% | | 0.00% | | 5.25% |
| | | |
| | | | | Shares Voted | | Percent of Outstanding Shares Voted |
| | | | | For | | % | | Against | | % | | Abstain/WithHold | | % | | For | | Against | | Abstain / WithHold |
Proposal 2: To approve Articles of Amendment and Restatement for DFAIDG* | | 3,385,698,613 | | 93.83% | | 43,557,844 | | 1.21% | | 179,189,489 | | 4.97% | | 54.13% | | 0.70% | | 4.97% |
* Results are for all Portfolios within DFAIDG
Emerging Markets Value Portfolio
| | | | | | | | | | | | | | | | | | | | | | | | |
| | | | | Shares Voted | | Percent of Outstanding Shares Voted |
| | | | | For | | % | | Against | | % | | Abstain/WithHold | | % | | NonVote | | % | | For | | Against | | Abstain / WithHold |
Proposals: | | | | | | | | | | | | | | | | | | | | | | |
5 | | To approve amendments to certain fundamental investment restrictions |
5a | | Borrowing Money | | 132,322,989 | | 75.20% | | 7,586,186 | | 4.31% | | 843,802 | | 0.48% | | 35,211,160 | | 20.01% | | 50.10% | | 2.87% | | 0.32% |
5b | | Making Loans | | 132,110,921 | | 75.08% | | 7,737,859 | | 4.40% | | 904,198 | | 0.51% | | 35,211,160 | | 20.01% | | 50.02% | | 2.93% | | 0.34% |
5c | | Investments in Real Estate | | 130,422,103 | | 74.12% | | 9,486,023 | | 5.39% | | 844,852 | | 0.48% | | 35,211,160 | | 20.01% | | 49.38% | | 3.59% | | 0.32% |
5d | | Investments in Commodities | | 132,227,173 | | 75.14% | | 7,682,935 | | 4.37% | | 842,869 | | 0.48% | | 35,211,160 | | 20.01% | | 50.07% | | 2.91% | | 0.32% |
5e | | Diversification of Investments | | 132,295,453 | | 75.18% | | 7,607,042 | | 4.32% | | 850,482 | | 0.48% | | 35,211,160 | | 20.01% | | 50.09% | | 2.88% | | 0.32% |
6 | | To approve the elimination of certain fundamental investment restrictions |
6b | | Purchasing Securities on Margin | | 131,696,395 | | 74.84% | | 8,154,685 | | 4.63% | | 901,898 | | 0.51% | | 35,211,160 | | 20.01% | | 49.87% | | 3.09% | | 0.34% |
6d | | Investing for the Purpose of Exercising Control | | 132,128,548 | | 75.09% | | 7,767,248 | | 4.41% | | 857,181 | | 0.49% | | 35,211,160 | | 20.01% | | 50.03% | | 2.94% | | 0.32% |
6e | | Investing in Other Investment Companies | | 131,992,254 | | 75.01% | | 7,915,625 | | 4.50% | | 845,099 | | 0.48% | | 35,211,160 | | 20.01% | | 49.98% | | 3.00% | | 0.32% |
6h | | Investing in Securities of Unseasoned Issuers | | 132,041,608 | | 75.04% | | 7,866,456 | | 4.47% | | 844,913 | | 0.48% | | 35,211,160 | | 20.01% | | 50.00% | | 2.98% | | 0.32% |
8 | | Approval of Investment Advisory Agreement between Dimensional Fund Advisors LP and the Company | | 135,285,853 | | 76.88% | | 620,557 | | 0.35% | | 4,846,568 | | 2.75% | | 35,211,160 | | 20.01% | | 51.22% | | 0.23% | | 1.84% |
20
DIMENSIONAL EMERGING MARKETS VALUE FUND
PERFORMANCE CHART
Dimensional Emerging Markets Value Fund vs.
MSCI Emerging Markets Index (net dividends)
October 31, 1999-October 31, 2009
21
DIMENSIONAL EMERGING MARKETS VALUE FUND
DISCLOSURE OF FUND EXPENSES
(Unaudited)
The following Expense Table is shown so that you can understand the impact of fees on your investment. All mutual funds have operating expenses. As a shareholder of the fund, you incur ongoing costs, which include costs for portfolio management, administrative services, and shareholder reports, among others. Operating expenses, legal and audit services, which are deducted from a fund’s gross income, directly reduce the investment return of the fund. A fund’s expenses are expressed as a percentage of its average net assets. This figure is known as the expense ratio. The following examples are intended to help you understand the ongoing costs, in dollars, of investing in the fund and to compare these costs with those of other mutual funds. The examples are based on an investment of $1,000 made at the beginning of the period shown and held for the entire period.
The Expense Table below illustrates your fund’s costs in two ways.
Actual Fund Return
This section helps you to estimate the actual expenses after fee waivers that you paid over the period. The “Ending Account Value” shown is derived from the fund’s actual return and “Expenses Paid During Period” reflect the dollar amount that would have been paid by an investor who started with $1,000 in the fund. You may use the information here, together with the amount you invested, to estimate the expenses that you paid over the period.
To do so, simply divide your account value by $1,000 (for example, a $7,500 account value divided by $1,000 = 7.5), then multiply the result by the number given for your fund under the heading “Expenses Paid During Period.”
Hypothetical Example for Comparison Purposes
This section is intended to help you compare your fund’s costs with those of other mutual funds. The hypothetical “Ending Account Value” and “Expenses Paid During Period” are derived from the fund’s actual expense ratio and an assumed 5% annual return before expenses. In this case, because the return used is not the fund’s actual return, the results do not apply to your investment. The example is useful in making comparisons because the SEC requires all mutual funds to calculate expenses based on a 5% annual return. You can assess your fund’s costs by comparing this hypothetical example with the hypothetical examples that appear in shareholder reports of other funds.
Please note that the expenses shown in the table are meant to highlight and help you compare ongoing costs only and do not reflect any transactional costs, if applicable. The “Annualized Expense Ratio” represents the actual expenses for the six-month period indicated.
Six Months Ended October 31, 2009
EXPENSE TABLE
| | | | | | | | | | |
| | | | |
| | | Beginning
Account
Value
05/01/09 | | Ending
Account
Value
10/31/09 | | Annualized
Expense
Ratio* | | Expenses
Paid
During
Period* |
Actual Fund Return | | $ | 1,000.00 | | $ | 1,477.20 | | 0.22% | | $1.37 |
Hypothetical 5% Annual Return | | $ | 1,000.00 | | $ | 1,024.10 | | 0.22% | | $1.12 |
| * | Expenses are equal to the fund’s annualized expense ratio for the six-month period, multiplied by the average account value over the period, multiplied by the number of days in the most recent six-month period (184), then divided by the number of days in the year (365) to reflect the six-month period. |
22
DIMENSIONAL EMERGING MARKETS VALUE FUND
DISCLOSURE OF PORTFOLIO HOLDINGS
(Unaudited)
The SEC requires that all Funds file a complete Schedule of Investments with the SEC for their first and third fiscal quarters on Form N-Q. For Dimensional Emerging Markets Value Fund, this would be for the fiscal quarters ending January 31 and July 31. The Form N-Q filing must be made within 60 days of the end of the quarter. Dimensional Emerging Markets Value Fund filed its most recent Form N-Q with the SEC on September 29, 2009. It is available upon request without charge, by calling collect: (512) 306-7400 or by mailing a request to Dimensional Fund Advisors LP, 6300 Bee Cave Road, Building One, Austin, Texas 78746, or by visiting the SEC’s website at http://www.sec.gov, or they may be reviewed and copied at the SEC’s Public Reference Room in Washington, D.C. (call 1-800-732-0330 for information on the operation of the Public Reference Room).
SEC regulations permit a fund to include in its reports to shareholders a “Summary Schedule of Portfolio Holdings” in lieu of a full Schedule of Investments. The Summary Schedule of Portfolio Holdings reports the fund’s 50 largest holdings in unaffiliated issuers and any investments that exceed one percent of the fund’s net assets at the end of the reporting period. The amendments also require that the Summary Schedule of Portfolio Holdings identify each category of investments that are held.
The fund is required to file a complete Schedule of Investments with the SEC on Form N-CSR within ten days after mailing the annual and semi-annual reports to shareholders. It will be available upon request, without charge, by calling collect: (512) 306-7400 or by mailing a request to Dimensional Fund Advisors LP, 6300 Bee Cave Road, Building One, Austin, Texas 78746, or by visiting the SEC’s website at http://www.sec.gov, or they may be reviewed and copied at the SEC’s Public Reference Room in Washington, D.C. (call 1-800-732-0330 for information on the operation of the Public Reference Room).
PORTFOLIO HOLDINGS
The SEC requires that all Funds present their categories of portfolio holdings in a table, chart or graph format in their annual and semi-annual shareholder reports, whether or not a Schedule of Investments is utilized. The following table, which presents portfolio holdings as a percent of total investments before short-term investments and collateral for loaned securities, is provided in compliance with such requirement. The categories shown below represent broad industry sectors. Each industry sector consists of one or more specific industry classifications.
| | | |
| Dimensional Emerging Markets Value Fund | |
Consumer Discretionary | | 10.8 | % |
Consumer Staples | | 6.4 | % |
Energy | | 7.8 | % |
Financials | | 29.7 | % |
Health Care | | 1.3 | % |
Industrials | | 11.6 | % |
Information Technology | | 7.1 | % |
Materials | | 21.6 | % |
Other | | 0.1 | % |
Real Estate Investment Trusts | | — | |
Telecommunication Services | | 2.0 | % |
Utilities | | 1.6 | % |
| | | |
| | 100.0 | % |
23
DIMENSIONAL EMERGING MARKETS VALUE FUND
SUMMARY SCHEDULE OF PORTFOLIO HOLDINGS
October 31, 2009
| | | | | | | | |
| | | Shares | | Value†† | | Percentage
of Net Assets** | |
COMMON STOCKS — (85.6%) | | | | | | | | |
BRAZIL — (5.5%) | | | | | | | | |
BM&F Bovespa SA | | 13,089,600 | | $ | 84,336,376 | | 1.1 | % |
Other Securities | | | | | 399,678,193 | | 5.0 | % |
| | | | | | | | |
TOTAL BRAZIL | | | | | 484,014,569 | | 6.1 | % |
| | | | | | | | |
| | | |
CHILE — (2.4%) | | | | | | | | |
Empresas CMPC SA | | 1,375,219 | | | 49,245,765 | | 0.6 | % |
Enersis SA Sponsored ADR | | 2,873,037 | | | 50,795,294 | | 0.6 | % |
Other Securities | | | | | 107,796,717 | | 1.4 | % |
| | | | | | | | |
TOTAL CHILE | | | | | 207,837,776 | | 2.6 | % |
| | | | | | | | |
| | | |
CHINA — (12.0%) | | | | | | | | |
Bank of China, Ltd. | | 180,881,000 | | | 104,011,089 | | 1.3 | % |
Beijing Enterprises Holdings, Ltd. | | 5,599,500 | | | 33,375,390 | | 0.4 | % |
China Construction Bank Corp. | | 41,385,000 | | | 35,679,319 | | 0.5 | % |
#China Unicom Hong Kong, Ltd. ADR | | 3,936,592 | | | 49,797,889 | | 0.6 | % |
CNPC Hong Kong, Ltd. | | 40,880,000 | | | 42,741,026 | | 0.5 | % |
Denway Motors, Ltd. | | 57,266,000 | | | 27,411,466 | | 0.4 | % |
Dongfeng Motor Corp. | | 28,888,000 | | | 34,382,337 | | 0.4 | % |
Shanghai Industrial Holdings, Ltd. | | 7,759,000 | | | 36,449,823 | | 0.5 | % |
Other Securities | | | | | 687,073,216 | | 8.6 | % |
| | | | | | | | |
| | | |
TOTAL CHINA | | | | | 1,050,921,555 | | 13.2 | % |
| | | | | | | | |
| | | |
CZECH REPUBLIC — (0.4%) | | | | | | | | |
Other Securities | | | | | 32,531,377 | | 0.4 | % |
| | | | | | | | |
| | | |
HUNGARY — (2.2%) | | | | | | | | |
#*MOLHungarian Oil & Gas NYRT | | 818,138 | | | 68,350,657 | | 0.8 | % |
#*OTPBank NYRT | | 3,901,786 | | | 109,716,230 | | 1.4 | % |
Other Securities | | | | | 16,594,742 | | 0.2 | % |
| | | | | | | | |
TOTAL HUNGARY | | | | | 194,661,629 | | 2.4 | % |
| | | | | | | | |
| | | |
INDIA — (10.7%) | | | | | | | | |
ICICI Bank, Ltd. Sponsored ADR | | 3,310,395 | | | 104,111,923 | | 1.3 | % |
*Reliance Industries, Ltd. | | 4,193,665 | | | 169,675,160 | | 2.1 | % |
Other Securities | | | | | 666,095,691 | | 8.4 | % |
| | | | | | | | |
TOTAL INDIA | | | | | 939,882,774 | | 11.8 | % |
| | | | | | | | |
| | | |
INDONESIA — (2.7%) | | | | | | | | |
PT Astra International Tbk | | 9,546,400 | | | 30,713,599 | | 0.4 | % |
PT Bumi Resources Tbk | | 158,328,500 | | | 38,115,617 | | 0.5 | % |
Other Securities | | | | | 163,519,727 | | 2.0 | % |
| | | | | | | | |
TOTAL INDONESIA | | | | | 232,348,943 | | 2.9 | % |
| | | | | | | | |
| | | |
ISRAEL — (2.6%) | | | | | | | | |
*Bank Hapoalim B.M. | | 13,175,469 | | | 48,100,324 | | 0.6 | % |
*Bank Leumi Le-Israel B.M. | | 12,465,728 | | | 48,684,714 | | 0.6 | % |
Other Securities | | | | | 133,709,213 | | 1.7 | % |
| | | | | | | | |
TOTAL ISRAEL | | | | | 230,494,251 | | 2.9 | % |
| | | | | | | | |
| | | |
MALAYSIA — (3.6%) | | | | | | | | |
AMMB Holdings Berhad | | 21,831,262 | | | 30,016,248 | | 0.4 | % |
PPB Group Berhad | | 6,759,566 | | | 29,850,799 | | 0.4 | % |
Other Securities | | | | | 257,290,043 | | 3.2 | % |
| | | | | | | | |
TOTAL MALAYSIA | | | | | 317,157,090 | | 4.0 | % |
| | | | | | | | |
24
DIMENSIONAL EMERGING MARKETS VALUE FUND
CONTINUED
| | | | | | | |
| | | Shares | | Value†† | | Percentage
of Net Assets** |
MEXICO — (6.3%) | | | | | | | |
*Cemex S.A.B. de C.V. Sponsored ADR | | 9,390,579 | | $ | 97,474,207 | | 1.2% |
#Fomento Economico Mexicano S.A.B. de C.V. Sponsored ADR | | 1,402,758 | | | 60,753,449 | | 0.8% |
#Grupo Carso S.A.B. de C.V. Series A-1 | | 10,578,093 | | | 31,244,580 | | 0.4% |
#*Grupo Financiero Banorte S.A.B. de C.V. | | 9,775,260 | | | 31,242,334 | | 0.4% |
*Grupo Mexico S.A.B. de C.V. Series B | | 37,630,484 | | | 75,239,593 | | 0.9% |
#*Organizacion Soriana S.A.B. de C.V. Series B | | 14,451,500 | | | 31,970,335 | | 0.4% |
Other Securities | | | | | 224,409,268 | | 2.8% |
| | | | | | | |
TOTAL MEXICO | | | | | 552,333,766 | | 6.9% |
| | | | | | | |
| | | |
PHILIPPINES — (0.7%) | | | | | | | |
Other Securities | | | | | 59,406,031 | | 0.7% |
| | | | | | | |
| | | |
POLAND — (2.1%) | | | | | | | |
KGHM Polska Miedz SA | | 1,076,971 | | | 36,251,556 | | 0.5% |
*Polski Koncern Naftowy Orlen SA | | 5,310,008 | | | 55,270,438 | | 0.7% |
Other Securities | | | | | 89,333,418 | | 1.1% |
| | | | | | | |
TOTAL POLAND | | | | | 180,855,412 | | 2.3% |
| | | | | | | |
| | | |
RUSSIA — (0.8%) | | | | | | | |
*Gazprom OAO Sponsored ADR | | 2,755,161 | | | 66,074,426 | | 0.8% |
Other Securities | | | | | 2,469,848 | | 0.1% |
| | | | | | | |
TOTAL RUSSIA | | | | | 68,544,274 | | 0.9% |
| | | | | | | |
| | | |
SOUTH AFRICA — (8.7%) | | | | | | | |
#ABSA Group, Ltd. | | 2,880,669 | | | 46,348,396 | | 0.6% |
#Gold Fields, Ltd. Sponsored ADR | | 5,353,350 | | | 68,255,212 | | 0.9% |
Harmony Gold Mining Co., Ltd. | | 2,923,251 | | | 29,227,650 | | 0.4% |
#Nedbank Group, Ltd. | | 2,693,900 | | | 41,601,279 | | 0.5% |
Sanlam, Ltd. | | 28,700,406 | | | 78,760,640 | | 1.0% |
Steinhoff International Holdings, Ltd. | | 11,472,572 | | | 27,724,247 | | 0.3% |
Other Securities | | | | | 469,775,616 | | 5.9% |
| | | | | | | |
TOTAL SOUTH AFRICA | | | | | 761,693,040 | | 9.6% |
| | | | | | | |
| | | |
SOUTH KOREA — (10.3%) | | | | | | | |
Hana Financial Group, Inc. | | 1,078,133 | | | 31,974,873 | | 0.4% |
Hyundai Motor Co., Ltd. | | 895,824 | | | 81,255,253 | | 1.0% |
#*KB Financial Group, Inc. ADR | | 1,770,753 | | | 84,004,522 | | 1.1% |
#POSCO ADR | | 1,041,585 | | | 106,366,660 | | 1.4% |
#Shinhan Financial Group Co., Ltd. ADR | | 663,280 | | | 50,177,132 | | 0.6% |
Other Securities | | | | | 552,386,684 | | 6.9% |
| | | | | | | |
TOTAL SOUTH KOREA | | | | | 906,165,124 | | 11.4% |
| | | | | | | |
| | | |
TAIWAN — (10.6%) | | | | | | | |
#AU Optronics Corp. Sponsored ADR | | 5,821,675 | | | 51,405,388 | | 0.7% |
Chinatrust Financial Holdings Co., Ltd. | | 53,481,946 | | | 32,125,168 | | 0.4% |
*Fubon Financial Holding Co., Ltd. | | 29,313,000 | | | 32,526,620 | | 0.4% |
Mega Financial Holding Co., Ltd. | | 69,737,000 | | | 38,835,040 | | 0.5% |
*United Microelectronics Corp. | | 106,490,069 | | | 51,191,211 | | 0.6% |
Other Securities | | | | | 721,886,417 | | 9.1% |
| | | | | | | |
TOTAL TAIWAN | | | | | 927,969,844 | | 11.7% |
| | | | | | | |
| | | |
THAILAND — (1.8%) | | | | | | | |
Other Securities | | | | | 161,733,191 | | 2.0% |
| | | | | | | |
| | | |
TURKEY — (2.2%) | | | | | | | |
Other Securities | | | | | 190,785,580 | | 2.4% |
| | | | | | | |
TOTAL COMMON STOCKS | | | | | 7,499,336,226 | | 94.2% |
| | | | | | | |
25
DIMENSIONAL EMERGING MARKETS VALUE FUND
CONTINUED
| | | | | | | |
| | | Shares | | Value†† | | Percentage
of Net Assets** |
PREFERRED STOCKS — (5.3%) | | | | | | | |
BRAZIL — (5.3%) | | | | | | | |
Gerdau SA | | 2,445,084 | | $ | 36,851,147 | | 0.5% |
#Gerdau SA Sponsored ADR | | 4,348,258 | | | 65,658,696 | | 0.8% |
Metalurgica Gerdau SA | | 4,022,600 | | | 73,870,975 | | 0.9% |
Usinas Siderurgicas de Minas Gerais SA Series A | | 3,546,355 | | | 92,604,638 | | 1.2% |
Other Securities | | | | | 192,949,483 | | 2.4% |
| | | | | | | |
TOTAL BRAZIL | | | | | 461,934,939 | | 5.8% |
| | | | | | | |
| | | |
CHILE — (0.0%) | | | | | | | |
Other Securities | | | | | 1,719,902 | | 0.0% |
| | | | | | | |
| | | |
INDIA — (0.0%) | | | | | | | |
Other Securities | | | | | 97,463 | | 0.0% |
| | | | | | | |
| | | |
MALAYSIA — (0.0%) | | | | | | | |
Other Securities | | | | | 178,880 | | 0.0% |
| | | | | | | |
| | | |
TOTAL PREFERRED STOCKS | | | | | 463,931,184 | | 5.8% |
| | | | | | | |
| | | |
RIGHTS/WARRANTS — (0.0%) | | | | | | | |
BRAZIL — (0.0%) | | | | | | | |
Other Securities | | | | | 144,019 | | 0.0% |
| | | | | | | |
| | | |
CHINA — (0.0%) | | | | | | | |
Other Securities | | | | | 202,026 | | 0.0% |
| | | | | | | |
| | | |
MALAYSIA — (0.0%) | | | | | | | |
Other Securities | | | | | 38,923 | | 0.0% |
| | | | | | | |
| | | |
PHILIPPINES — (0.0%) | | | | | | | |
Other Securities | | | | | 379,437 | | 0.0% |
| | | | | | | |
| | | |
SOUTH KOREA — (0.0%) | | | | | | | |
Other Securities | | | | | 178 | | 0.0% |
| | | | | | | |
| | | |
TAIWAN — (0.0%) | | | | | | | |
Other Securities | | | | | 68,030 | | 0.0% |
| | | | | | | |
| | | |
THAILAND — (0.0%) | | | | | | | |
Other Securities | | | | | 80,775 | | 0.0% |
| | | | | | | |
| | | |
TOTAL RIGHTS/WARRANTS | | | | | 913,388 | | 0.0% |
| | | | | | | |
| | | Face
Amount | | Value† | | |
| | | (000) | | | | |
TEMPORARY CASH INVESTMENTS — (0.0%) | | | | | | | |
Repurchase Agreement, PNC Capital Markets, Inc. 0.19%, 11/02/09 (Collateralized by $1,245,000 FNMA 5.00%, 06/01/35, valued at $766,237) to be repurchased at $753,012 | | $753 | | | 753,000 | | 0.0% |
| | | | | | | |
26
DIMENSIONAL EMERGING MARKETS VALUE FUND
CONTINUED
| | | | | | | |
| | | Shares/
Face
Amount | | Value† | | Percentage
of Net Assets** |
| | | (000) | | | | |
SECURITIES LENDING COLLATERAL — (9.1%) | | | | | | | |
§@DFA Short Term Investment Fund LP | | 792,322,880 | | $ | 792,322,880 | | 10.0% |
@Repurchase Agreement, Deutsche Bank Securities 0.07%, 11/02/09 (Collateralized by various corporate obligations, ranging in par value from $4,247,617 to $16,429,280, rates ranging from 5.000% to 7.000%, maturities ranging from 03/01/37 to 10/01/39, valued at $584,280) to be repurchased at $572,827 | | $573 | | | 572,824 | | 0.0% |
| | | | | | | |
TOTAL SECURITIES LENDING COLLATERAL | | | | | 792,895,704 | | 10.0% |
| | | | | | | |
TOTAL INVESTMENTS — (100.0%)
(Cost $7,369,005,537) | | | | $ | 8,757,829,502 | | 110.0% |
| | | | | | | |
Summary of inputs used to value the Fund’s net assets as of October 31, 2009 is as follows (See Security Valuation Note):
| | | | | | | | | | | |
| | | Valuation Inputs |
| |
| | | Investment in Securities (Market Value) |
| | | Level 1 | | Level 2 | | Level 3 | | Total |
Common Stocks | | | | | | | | | | | |
Brazil | | $ | 484,014,569 | | | — | | — | | $ | 484,014,569 |
Chile | | | 207,837,776 | | | — | | — | | | 207,837,776 |
China | | | 104,254,493 | | $ | 946,667,062 | | — | | | 1,050,921,555 |
Czech Republic | | | — | | | 32,531,377 | | — | | | 32,531,377 |
Hungary | | | — | | | 194,661,629 | | — | | | 194,661,629 |
India | | | 116,902,770 | | | 822,980,004 | | — | | | 939,882,774 |
Indonesia | | | 4,151,498 | | | 228,197,445 | | — | | | 232,348,943 |
Israel | | | 18,804,680 | | | 211,689,571 | | — | | | 230,494,251 |
Malaysia | | | 445,014 | | | 316,712,076 | | — | | | 317,157,090 |
Mexico | | | 549,997,197 | | | 2,336,569 | | — | | | 552,333,766 |
Philippines | | | 1,729,383 | | | 57,676,648 | | — | | | 59,406,031 |
Poland | | | — | | | 180,855,412 | | — | | | 180,855,412 |
Russia | | | 754,724 | | | 67,789,550 | | — | | | 68,544,274 |
South Africa | | | 106,113,394 | | | 655,579,646 | | — | | | 761,693,040 |
South Korea | | | 252,962,556 | | | 653,202,568 | | — | | | 906,165,124 |
Taiwan | | | 51,416,015 | | | 876,553,829 | | — | | | 927,969,844 |
Thailand | | | 161,733,191 | | | — | | — | | | 161,733,191 |
Turkey | | | — | | | 190,785,580 | | — | | | 190,785,580 |
Preferred Stocks | | | | | | | | | | | |
Brazil | | | 461,934,939 | | | — | | — | | | 461,934,939 |
Chile | | | 1,719,902 | | | — | | — | | | 1,719,902 |
India | | | — | | | 97,463 | | — | | | 97,463 |
Malaysia | | | 178,880 | | | — | | — | | | 178,880 |
Rights/Warrants | | | | | | | | | | | |
Brazil | | | 144,019 | | | — | | — | | | 144,019 |
China | | | 202,026 | | | — | | — | | | 202,026 |
Malaysia | | | 38,923 | | | — | | — | | | 38,923 |
Philippines | | | — | | | 379,437 | | — | | | 379,437 |
27
DIMENSIONAL EMERGING MARKETS VALUE FUND
CONTINUED
| | | | | | | | | | | |
| | | Valuation Inputs |
| |
| | | Investment in Securities (Market Value) |
| | | Level 1 | | Level 2 | | Level 3 | | Total |
South Korea | | | — | | $ | 178 | | — | | $ | 178 |
Taiwan | | | — | | | 68,030 | | — | | | 68,030 |
Thailand | | $ | 80,775 | | | — | | — | | | 80,775 |
Temporary Cash Investments | | | — | | | 753,000 | | — | | | 753,000 |
Securities Lending Collateral | | | — | | | 792,895,704 | | — | | | 792,895,704 |
| | | | | | | | | | | |
TOTAL | | $ | 2,525,416,724 | | $ | 6,232,412,778 | | — | | $ | 8,757,829,502 |
| | | | | | | | | | | |
See accompanying Notes to Financial Statements.
28
DIMENSIONAL EMERGING MARKETS VALUE FUND
STATEMENT OF ASSETS AND LIABILITIES
OCTOBER 31, 2009
(Amounts in thousands, except share and per share amounts)
| | | |
ASSETS: | | | |
Investments at Value (including $712,563 of securities on loan) | | $ | 7,964,181 |
Temporary Cash Investments at Value & Cost | | | 753 |
Collateral Received from Securities on Loan at Value & Cost | | | 792,896 |
Foreign Currencies at Value | | | 12,142 |
Cash | | | 390 |
Receivables: | | | |
Investment Securities Sold | | | 782 |
Dividends, Interest and Taxes Reclaims | | | 6,454 |
Fund Shares Sold | | | 4,046 |
Securities Lending Income | | | 914 |
Prepaid Expenses and Other Assets | | | 17 |
| | | |
Total Assets | | | 8,782,575 |
| | | |
LIABILITIES: | | | |
Payables: | | | |
Upon Return of Securities Loaned | | | 792,896 |
Investment Securities Purchased | | | 460 |
Fund Shares Redeemed | | | 16,387 |
Due to Advisor | | | 698 |
Deferred Thailand Capital Gains Tax | | | 6,036 |
Accrued Expenses and Other Liabilities | | | 973 |
| | | |
Total Liabilities | | | 817,450 |
| | | |
NET ASSETS | | $ | 7,965,125 |
| | | |
Investments at Cost | | $ | 6,575,357 |
| | | |
Foreign Currencies at Cost | | $ | 12,115 |
| | | |
See accompanying Notes to Financial Statements.
29
DIMENSIONAL EMERGING MARKETS VALUE FUND
STATEMENT OF OPERATIONS
FOR THE YEAR ENDED OCTOBER 31, 2009
(Amounts in thousands)
| | | | |
Investment Income | | | | |
Dividends (Net of Foreign Taxes Withheld of $10,259) | | $ | 117,415 | |
Interest | | | 300 | |
Income from Securities Lending | | | 12,936 | |
| | | | |
Total Investment Income | | | 130,651 | |
| | | | |
Expenses | | | | |
Investment Advisory Services Fees | | | 5,493 | |
Accounting & Transfer Agent Fees | | | 595 | |
Custodian Fees | | | 4,068 | |
Shareholders’ Reports | | | 35 | |
Directors’/Trustees’ Fees & Expenses | | | 94 | |
Professional Fees | | | 427 | |
Other | | | 670 | |
| | | | |
Total Expenses | | | 11,382 | |
| | | | |
Net Investment Income (Loss) | | | 119,269 | |
| | | | |
Realized and Unrealized Gain (Loss) | | | | |
Net Realized Gain (Loss) on: | | | | |
Investment Securities Sold | | | 346,115 | |
Futures | | | (3,835 | ) |
Foreign Currency Transactions | | | (2,499 | ) |
In-Kind Redemptions | | | 25,938 | * |
Change in Unrealized Appreciation (Depreciation) of: | | | | |
Investment Securities and Foreign Currency | | | 2,817,363 | |
Futures | | | (30 | ) |
Translation of Foreign Currency Denominated Amounts | | | 449 | |
Change in Deferred Thailand Capital Gains Tax | | | (3,804 | ) |
| | | | |
Net Realized and Unrealized Gain (Loss) | | | 3,179,697 | |
| | | | |
Net Increase (Decrease) in Net Assets Resulting from Operations | | $ | 3,298,966 | |
| | | | |
| * | See Note J in the Notes to Financial Statements. |
See accompanying Notes to Financial Statements.
30
DIMENSIONAL EMERGING MARKETS VALUE FUND
STATEMENTS OF CHANGES IN NET ASSETS
(Amounts in thousands)
| | | | | | | | | | | | |
| | | Year
Ended
Oct. 31,
2009 | | | Period
Dec. 1, 2007
to
Oct. 31, 2008 | | | Year
Ended
Nov. 30,
2007 | |
Increase (Decrease) in Net Assets | | | | | | | | | | | | |
Operations: | | | | | | | | | | | | |
Net Investment Income (Loss) | | $ | 119,269 | | | $ | 220,293 | | | $ | 166,703 | |
Net Realized Gain (Loss) on: | | | | | | | | | | | | |
Investment Securities Sold | | | 346,115 | | | | (165,343 | ) | | | 659,828 | |
Futures | | | (3,835 | ) | | | — | | | | — | |
Foreign Currency Transactions | | | (2,499 | ) | | | (3,212 | ) | | | (2,063 | ) |
In-Kind Redemptions | | | 25,938 | * | | | 18,537 | * | | | — | |
Change in Unrealized Appreciation (Depreciation) of: | | | | | | | | | | | | |
Investment Securities and Foreign Currency | | | 2,817,363 | | | | (5,059,018 | ) | | | 1,892,737 | |
Futures | | | (30 | ) | | | 30 | | | | — | |
Translation of Foreign Currency Denominated Amounts | | | 449 | | | | (330 | ) | | | (230 | ) |
Change in Deferred Thailand Capital Gains Tax | | | (3,804 | ) | | | 9,750 | | | | (3,211 | ) |
| | | | | | | | | | | | |
Net Increase (Decrease) in Net Assets Resulting from Operations | | | 3,298,966 | | | | (4,979,293 | ) | | | 2,713,764 | |
| | | | | | | | | | | | |
Transactions in Interest: | | | | | | | | | | | | |
Contributions | | | 1,430,899 | | | | 1,427,915 | † | | | 1,088,699 | † |
Withdrawals | | | (813,144 | )* | | | (588,928 | )*† | | | (451,665 | )† |
| | | | | | | | | | | | |
Net Increase (Decrease) from Transactions in Interest | | | 617,755 | | | | 838,987 | | | | 637,034 | |
| | | | | | | | | | | | |
Total Increase (Decrease) in Net Assets | | | 3,916,721 | | | | (4,140,306 | ) | | | 3,350,798 | |
Net Assets | | | | | | | | | | | | |
Beginning of Period | | | 4,048,404 | | | | 8,188,710 | | | | 4,837,912 | |
| | | | | | | | | | | | |
End of Period | | $ | 7,965,125 | | | $ | 4,048,404 | | | $ | 8,188,710 | |
| | | | | | | | | | | | |
| * | See Note J in the Notes to Financial Statements. |
| † | See Note A in the Notes to Financial Statements. |
See accompanying Notes to Financial Statements.
31
DIMENSIONAL EMERGING MARKETS VALUE FUND†
FINANCIAL HIGHLIGHTS
(for a share outstanding throughout each period)
| | | | | | | | | | | | | | | | | | | | | | | | |
| | | Year
Ended
Oct. 31,
2009 | | | Period
Dec. 1, 2007
to
Oct. 31, 2008 | | | Year
Ended
Nov. 30,
2007 | | | Year
Ended
Nov. 30,
2006 | | | Year
Ended
Nov. 30,
2005 | | | Year
Ended
Nov. 30,
2004 | |
Total Return | | | 79.39 | % | | | (55.47 | )%(C) | | | 51.59 | % | | | 42.14% | | | | 31.60 | % | | | 47.38 | % |
Net Assets, End of Period (thousands) | | $ | 7,965,125 | | | $ | 4,048,404 | | | $ | 8,188,710 | | | $ | 4,837,912 | | | $ | 2,417,064 | | | $ | 1,172,950 | |
Ratio of Expenses to Average Net Assets | | | 0.21 | % | | | 0.19 | %(B) | | | 0.19 | % | | | 0.22 | % | | | 0.29 | % | | | 0.34 | % |
Ratio of Net Investment Income to Average Net Assets | | | 2.17 | % | | | 3.19 | %(B) | | | 2.50 | % | | | 2.57 | % | | | 3.23 | % | | | 2.33 | % |
Portfolio Turnover Rate | | | 20 | % | | | 14 | %(C) | | | 14 | % | | | 9 | % | | | 7 | % | | | 8 | % |
See page 1 for the Definitions of Abbreviations and Footnotes.
| † | See Note A in the Notes to Financial Statements. |
See accompanying Notes to Financial Statements.
32
DIMENSIONAL EMERGING MARKETS VALUE FUND
NOTES TO FINANCIAL STATEMENTS
A. Organization:
Dimensional Emerging Markets Value Fund Inc. (“DEM I”) was organized as a closed-end management investment company registered under the Investment Company Act of 1940, as amended. Effective November 21, 1997, DEM I was reorganized as an open-end management investment company. On October 27, 2009, the Board of Directors and shareholders of DEM I approved an Agreement and Plan of Reorganization that provided for the reorganization of DEM I from a Maryland corporation to a Delaware statutory trust. Effective October 30, 2009, DEM I transferred all of its assets and liabilities to Dimensional Emerging Markets Value Fund (“DEM II” or the “Fund”), a Delaware statutory trust, in a tax-free exchange under IRC §368(a)(1)(F).
Effective November 1, 2009, Dimensional Emerging Markets Value Fund (“DEM II”), a master fund in a master-feeder structure, elected with the consent of its Holder(s) to change its U.S. federal income tax classification from that of an association taxable as a corporation to a partnership pursuant to Treasury Regulation §301.7701-3. The change in capital structure and retroactive reclassification of the statement of changes in net assets and financial highlights for the Fund is a result of the treatment of a partnership for book purposes. DEM II and the Portfolio will maintain their books and records and present their financial statements in accordance with generally accepted accounting principles for investment partnerships.
At a regular meeting of the Board of Directors/Trustees (the “Board”) on September 16, 2008, the Board voted to change the fiscal and tax year ends of the Fund from November 30 to October 31.
B. Significant Accounting Policies:
The following significant accounting policies are in conformity with accounting principles generally accepted in the United States of America. Such policies are consistently followed by the Fund in preparation of its financial statements. The preparation of financial statements in accordance with accounting principles generally accepted in the United States of America requires management to make estimates and assumptions that affect the reported amounts of assets and liabilities and disclosure of contingent assets and liabilities at the date of the financial statements and the reported amounts of increases and decreases in net assets from operations during the reporting period. Actual results could differ from those estimates and those differences could be material.
1. Security Valuation: Securities held by the Fund (including over-the-counter securities) are valued at the last quoted sale price of the day. Securities held by the Fund that are listed on Nasdaq are valued at the Nasdaq Official Closing Price (“NOCP”). If there is no last reported sale price or NOCP for the day, the Fund values the securities at the mean of the most recent quoted bid and asked prices. Price information on listed securities is taken from the exchange where the security is primarily traded. Generally, securities issued by open-end investment companies are valued using their respective net asset values or public offering prices, as appropriate, for purchase orders placed at the close of the New York Stock Exchange (NYSE).
Securities for which no market quotations are readily available (including restricted securities), or for which market quotations have become unreliable, are valued in good faith at fair value in accordance with procedures adopted by the Board of Directors/Trustees. Fair value pricing may also be used if events that have a significant effect on the value of an investment (as determined in the discretion of the Investment Committee of the Advisor) occur before the net asset value is calculated. When fair value pricing is used, the prices of securities used by the Fund may differ from the quoted or published prices for the same securities on their primary markets or exchanges.
The Fund will also fair value price in the circumstances described below. Generally, trading in foreign securities markets is completed each day at various times prior to the close of the NYSE. For example, trading in the Japanese securities markets is completed each day at the close of the Tokyo Stock Exchange (normally, 11:00 p.m. PT), which is fourteen hours prior to the close of the NYSE (normally, 1:00 p.m. PT) and the time that the net asset value
33
of the Fund is computed. Due to the time differences between the closings of the relevant foreign securities exchanges and the time the Fund prices its shares at the close of the NYSE, the Fund will fair value its foreign investments when it is determined that the market quotations for the foreign investments are either unreliable or not readily available. The fair value prices will attempt to reflect the impact of the U.S. financial markets’ perceptions and trading activities on the Fund’s foreign investments since the last closing prices of the foreign investments were calculated on their primary foreign securities markets or exchanges. For these purposes, the Board of Directors/Trustees of the Fund has determined that movements in relevant indices or other appropriate market indicators, after the close of the Tokyo Stock Exchange or the London Stock Exchange, demonstrate that market quotations may be unreliable. Fair valuation of portfolio securities may occur on a daily basis. The fair value pricing by the Fund utilizes data furnished by an independent pricing service (and that data draws upon, among other information, the market values of foreign investments). When the Fund uses fair value pricing, the values assigned to the Fund’s foreign investments may not be the quoted or published prices of the investments on their primary markets or exchanges.
Futures contracts held by the Fund are valued using the settlement price established each day on the exchange on which they are traded.
The Fund utilizes a fair value hierarchy which prioritizes the inputs to valuation techniques used to measure fair value into three broad levels described below:
• Level 1 – quoted prices in active markets for identical securities
• Level 2 – other significant observable inputs (including quoted prices for similar securities, interest rates, prepayment speeds, credit risk, etc.)
• Level 3 – significant unobservable inputs (including the Fund’s own assumptions in determining the fair value of investments)
A summary of the inputs used to value the Fund’s net assets by each major security type, industry and/or country is disclosed at the end of the Summary Schedule of Portfolio Holdings. The inputs or methodology used for valuing securities are not necessarily an indication of the risk associated with investing in those securities.
2. Foreign Currency Translation: Securities and other assets and liabilities of the Fund whose values are initially expressed in foreign currencies are translated to U.S. dollars using the mean between the most recently quoted bid and asked prices for the U.S. dollar as quoted by generally recognized reliable sources. Dividend and interest income and certain expenses are translated to U.S. dollars at the rate of exchange on their respective accrual dates. Receivables and payables denominated in foreign currencies are marked to market based on daily exchange rates and exchange gains or losses are realized upon ultimate receipt or disbursement.
The Fund does not isolate the effect of fluctuations in foreign exchange rates from the effect of fluctuations in the market prices of securities held whether realized or unrealized.
Realized gains or losses on foreign currency transactions represent net foreign exchange gains or losses from the disposition of foreign currencies, currency gains or losses realized between the trade and settlement dates on securities transactions, and the difference between amounts of interest, dividends and foreign withholding taxes recorded on the Fund’s books and the U.S. dollar equivalent amounts actually received or paid.
3. Deferred Compensation Plan: Each eligible Director of the Fund may elect participation in the Deferred Compensation Plan (the “Plan”). Under the Plan, effective January 1, 2002, such Directors may defer payment of all or a portion of their total fees earned as a Director. These deferred amounts may be treated as though such amounts had been invested in shares of the following funds: U.S. Large Cap Value Portfolio; U.S. Core Equity 1 Portfolio; U.S. Core Equity 2 Portfolio; U.S. Vector Equity Portfolio; U.S. Micro Cap Portfolio; DFA International Value Portfolio; International Core Equity Portfolio; Emerging Markets Portfolio; Emerging Markets Core Equity Portfolio; and/or DFA Two-Year Global Fixed Income Portfolio. Contributions made under the Plan and the change in unrealized appreciation (depreciation) and income, are included in Other Expenses for the year ended October 31, 2009 and are included in Directors’/Trustees’ Fees & Expenses for the period ended October 31, 2008. At October 31, 2009, the total liability for deferred compensation to Directors is included in Accrued Expenses and Other Liabilities on the Statement of Assets and Liabilities in the amount of $157 (in thousands).
34
Each Director has the option to receive their distribution of proceeds in one of the following methods upon one year’s notice: lump sum; annual installments over a period of agreed upon years; or semi-annual installments over a period of agreed upon years. As of October 31, 2009, none of the Directors have requested distribution of proceeds.
4. Other: Security transactions are accounted for as of the trade date. Costs used in determining realized gains and losses on the sale of investment securities are on the basis of identified cost. Dividend income and distributions to shareholders are recorded on the ex-dividend date. Distributions received on securities that represent a return of capital or capital gain are recorded as a reduction of cost of investments or as a realized gain, respectively. The Fund estimates the character of distributions received that may be considered return of capital distributions. Interest income is recorded on the accrual basis. Expenses directly attributable to the Fund are directly charged.
The Fund may be subject to taxes imposed by countries in which it invests, with respect to its investment in issuers existing or operating in such countries. Such taxes are generally based on income earned or repatriated and capital gains realized on the sale of such investments. The Fund accrues such taxes when the related income or capital gains are earned or throughout the holding period. Some countries require governmental approval for the repatriation of investment income, capital or the proceeds of sales earned by foreign investors. In addition, if there is a deterioration in a country’s balance of payments or for other reasons, a country may impose temporary restrictions on foreign capital remittances abroad.
The Fund’s investments in Chile are subject to governmental taxes on investment income. Such taxes are due when currencies are repatriated from the country. The Fund accrues for taxes on income as the income is earned.
The Fund’s investments in Thailand are subject to a 15% governmental capital gains tax. Such taxes are due upon sale of individual securities. The Fund accrues for taxes on the capital gains throughout the holding period based on the unrealized gain of the underlying securities. The Fund is also subject to a 15% governmental capital gains tax on short-term capital gains for investments in India. Such taxes are due upon sale of individual securities. The taxes for the capital gains are accrued when the capital gains are earned.
C. Investment Advisor:
Dimensional Fund Advisors LP (“Dimensional” or the “Advisor”) provides investment advisory services to the Fund. For the year ended October 31, 2009, the Fund’s advisory services fees were accrued daily and paid monthly to the Advisor based on an effective annual rate of 0.10% of average daily net assets.
Fees Paid to Officers and Directors/Trustees:
Certain Officers and Directors/Trustees of the Advisor are also Officers and Directors/Trustees of the Fund; however, such Officers and Directors/Trustees (with the exception of the Chief Compliance Officer (“CCO”)) receive no compensation from the Fund. For the year ended October 31, 2009, the total related amounts paid by the Fund to the CCO were $13 (in thousands). The total related amounts paid by the Fund are included in Other Expenses on the Statement of Operations.
D. Purchases and Sales of Securities:
For the year ended October 31, 2009, the Fund made the following purchases and sales of investment securities, other than short-term securities and U.S. government securities (amounts in thousands):
| | | |
Purchases | | $ | 1,947,348 |
Sales | | | 1,101,052 |
There were no purchases or sales of long-term U.S. government securities.
E. Federal Income Taxes:
No provision for federal income taxes is required since the Series’ are treated as partnerships for Federal income tax purposes. Any net investment income and realized and unrealized gains and losses have been deemed to have been “passed down” to their respective partners.
35
Some of the Fund’s investments are in securities considered to be “passive foreign investment companies” for which any unrealized appreciation (depreciation) (mark to market) and/or realized gains are required to be included in distributable net investment income for tax purposes. At October 31, 2009, the Fund had cumulative unrealized appreciation (depreciation) (mark to market) of $1,247 (in thousands) to be included in distributable net investment income for federal tax purposes. For the year ended October 31, 2009, realized gains on the sale of passive foreign investment companies totaling $428 (in thousands) have been reclassified from accumulated net realized gains to accumulated net investment income for federal tax purposes.
At October 31, 2009, the total cost and aggregate gross unrealized appreciation and (depreciation) of securities for federal income tax purposes were different from amounts reported for financial reporting purposes (amounts in thousands):
| | | | | | |
Federal Tax Cost | | Unrealized Appreciation | | Unrealized (Depreciation) | | Net Unrealized Appreciation (Depreciation) |
$7,381,311 | | $2,170,132 | | $(793,613) | | $1,376,519 |
Accounting for Uncertainty in Income Taxes sets forth a minimum threshold for financial statement recognition of the benefit of a tax position taken or expected to be taken on a tax return. Management has analyzed the Fund’s tax position and has concluded that no provision for income tax is required in the Fund’s financial statements. The Fund is not aware of any tax position for which it is reasonably possible that the total amounts of unrecognized tax benefits will significantly change in the next twelve months. The Fund federal tax returns for the prior three fiscal years remain subject to examination by the Internal Revenue Service.
F. Financial Instruments:
In accordance with the Fund’s investment objectives and policies, the Fund may invest in certain financial instruments that have off-balance sheet risk in excess of the amounts recognized in the financial statements and concentrations of credit and market risk. These instruments and their significant corresponding risks are described below:
1. Repurchase Agreements: The Fund may purchase certain U.S. Government securities subject to the counterparty’s agreement to repurchase them at an agreed upon date and price. The counterparty will be required on a daily basis to maintain the value of the collateral subject to the agreement at not less than the repurchase price (including accrued interest). The agreements are conditioned upon the collateral being deposited under the Federal Reserve book-entry system or with the Fund’s custodian or a third party sub-custodian. In the event of default or bankruptcy by the other party to the agreement, retention of the collateral may be subject to legal proceedings. All open repurchase agreements were entered into on October 30, 2009.
2. Foreign Market Risks: Investments in foreign markets may involve certain considerations and risks not typically associated with investments in the United States, including the possibility of future political and economic developments and the level of foreign governmental supervision and regulation of foreign securities markets. These markets are generally smaller, less liquid and more volatile than the major securities markets in the United States. Consequently, acquisition and disposition of securities by the Fund may be inhibited.
Derivative Financial Instruments:
Disclosures on derivative instruments and hedging activities are intended to improve financial reporting for derivative instruments by enabling investors to understand how and why a fund uses derivatives, how derivatives are accounted for and how derivative instruments affect a fund’s results of operations and financial position. Summarized below are the specific types of derivative instruments used by the Fund.
3. Futures Contracts: The Fund may enter into futures contracts to gain market exposure on uninvested cash pending investment in securities or to maintain liquidity to pay redemptions. Upon entering into a futures contract, the Fund deposits cash or pledges U.S. Government securities to a broker, equal to the minimum “initial
36
margin” requirements of the exchange on which the contract is traded. Subsequent payments are received from or paid to the broker each day, based on the daily fluctuation in the market value of the contract. These receipts or payments are known as “variation margin” and are recorded daily by the Fund as unrealized gains or losses until the contracts are closed. When the contracts are closed, the Fund records a realized gain or loss, which is presented in the Statement of Operations as a net realized gain or loss on futures, equal to the difference between the value of the contract at the time it was opened and the value at the time it was closed.
Risks may arise upon entering into futures contracts from potential imperfect price correlations between the futures contracts and the underlying securities, from the possibility of an illiquid secondary market for these instruments and from the possibility that the Fund could lose more than the initial margin requirements. The Fund entering into stock index futures are subject to equity price risk from those futures contracts. Counterparty credit risk related to exchange-traded futures is minimal because the exchange’s clearinghouse, as counterparty to all exchange-traded futures, guarantees the futures against default.
Additional disclosure on derivative instruments is required showing a summary by primary risk exposure of the derivatives instruments’ (i) location in the balance sheet and fair value at period end and (ii) the location in the Statement of Operations and the realized and change in unrealized gain or loss over the reporting period. The following is a summary of the Fund’s derivative instrument holdings for the year ended October 31, 2009.
At October 31, 2009, the Fund had no outstanding futures contracts.
The following is a summary of the location of realized and change in unrealized gains and losses on the Fund’s Statement of Operations for the Fund’s derivative instrument holdings through the year ended October 31, 2009:
| | |
Derivative Type | | Location of Gain (Loss) on Derivatives Recognized in Income |
Equity contracts | | Net Realized Gain (Loss) on: Futures Change in Unrealized Appreciation (Depreciation) of: Futures |
The following is a summary of the realized and change in unrealized gains and losses from the Fund’s derivative instrument holdings categorized by primary risk exposure through the year ended October 31, 2009 (amounts in thousands):
| | |
| | | Realized Gain (Loss) on Derivatives Recognized in Income |
| | | Equity Contracts |
Dimensional Emerging Markets Value Fund* | | $(3,835) |
| | |
| | | Change in Unrealized Appreciation (Depreciation) on Derivatives Recognized in Income |
| | | Equity Contracts |
Dimensional Emerging Markets Value Fund* | | $(30) |
| * | As of October 31, 2009, there were no futures contracts outstanding. During the year ended October 31, 2009, the Fund had limited activity in these transactions. |
G. Line of Credit:
The Fund, together with other Dimensional-advised portfolios, has entered into an amended and restated $250 million unsecured discretionary line of credit effective July 8, 2009 with an affiliate of its domestic custodian bank. Each portfolio is permitted to borrow, subject to its investment limitations, up to a maximum of $250 million, as long as total borrowings under the line of credit do not exceed $250 million in the aggregate. Borrowings under the line of credit are charged interest at the then current Federal Funds Rate plus 1%. Each portfolio is individually, and not
37
jointly, liable for its particular advances under the line of credit. There is no commitment fee on the unused portion of the line of credit. The agreement for the discretionary line of credit may be terminated by either party at any time. The line of credit is scheduled to expire on June 22, 2010. There were no borrowings by the Fund under this line of credit during the year ended October 31, 2009.
The Fund, together with other Dimensional-advised portfolios, has also entered into an additional $500 million unsecured line of credit effective January 15, 2009 with its international custodian bank. Each portfolio is permitted to borrow, subject to its investment limitations, up to a maximum of $500 million, as long as total borrowings under the line of credit do not exceed $500 million in the aggregate. Each portfolio is individually, and not jointly, liable for its particular advances under the line of credit. Borrowings under the line of credit are charged interest at rates agreed to by the parties at the time of borrowing. There is no commitment fee on the unused portion of the line of credit. The agreement for the line of credit expires on January 15, 2010.
For the year ended October 31, 2009, borrowings by the Fund under this line of credit were as follows (amounts in thousands, except percentage and days):
| | | | | | | | |
Weighted Average Interest Rate | | Weighted Average Loan Balance | | Number of Days Outstanding | | Interest Expense Incurred | | Maximum Amount Borrowed During the Period |
0.94% | | $6,366 | | 40 | | $7 | | $44,805 |
There were no outstanding borrowings by the Fund under this line of credit as of October 31, 2009.
H. Securities Lending:
As of October 31, 2009, the Fund had securities on loan to brokers/dealers, for which the Fund held cash collateral. The Fund invests the cash collateral, as described below, and records a liability for the return of the collateral, during the period the securities are on loan. Loans of securities are required at all times to be secured by collateral equal to at least (i) 100% of the current market value of the loaned securities with respect to securities of the U.S. government or its agencies, (ii) 102% of the current market value of the loaned securities with respect to U.S. securities, and (iii) 105% of the current market value of the loaned securities with respect to foreign securities. However, daily market fluctuations could cause the Fund’s collateral to be lower or higher than the expected thresholds. If this were to occur, the collateral would be adjusted the next business day to ensure adequate collateralization. In the event of default or bankruptcy by the other party to the agreement, realization and/or retention of the collateral may be subject to legal proceedings. If the borrower fails to return loaned securities, and cash collateral being maintained by the borrower is insufficient to cover the value of loaned securities and provided such collateral insufficiency is not the result of investment losses, the lending agent has agreed to pay the amount of the shortfall to the Fund or, at the option of the lending agent, to replace the securities.
Subject to the Fund’s investment policy, the cash collateral received by the Fund from securities on loan is invested in securities of the U.S. government or its agencies, repurchase agreements collateralized by securities of the U.S. government or its agencies or shares of the DFA Short Term Investment Fund LP. Agencies include both agency debentures and agency mortgage backed securities. In addition, the Fund will be able to terminate the loan at any time and will receive reasonable interest on the loan, as well as amounts equal to any dividends, interest or other distributions on the loaned securities. However, dividend income received from loaned securities may not be eligible to be taxed at qualified dividend income rates.
I. Indemnitees; Contractual Obligations:
Under the Fund’s organizational documents, its officers and directors are indemnified against certain liabilities arising out of the performance of their duties to the Fund.
In the normal course of business, the Fund enters into contracts that contain a variety of representations and warranties which provide general indemnification. The Fund’s maximum exposure under these arrangements is unknown as this would involve future claims that may be made against the Fund and/or its affiliates that have not yet occurred. However, based on experience, the Fund expects the risk of loss to be remote.
38
J. In-Kind Redemptions:
In accordance with guidelines described in the Fund’s prospectus, the Fund may distribute portfolio securities rather than cash as payment for a redemption of Fund shares (in-kind redemption). For financial reporting purposes, the Fund recognizes a gain on in-kind redemptions to the extent the value of the distributed securities on the date of redemption exceeds the cost of those securities. Gains and losses realized on in-kind redemptions are not recognized for tax purposes and are reclassified from undistributed realized gain (loss) to paid-in capital. During the period ended October 31, 2008 and the year ended October 31, 2009, the Fund realized $18,537 and $25,938 (in thousands) of net gain respectively.
K. Subsequent Event Note:
Effective November 1, 2009, Dimensional Emerging Markets Value Fund (“DEM II”), a master fund in a master-feeder structure with one RIC feeder and other direct client investors has made a “Check-the-Box” election for federal income tax purposes pursuant to Treasury Regulation §301.7701-3, to change their federal entity classifications from a corporation taxable as a regulated investment company to a partnership. DEM II and the Portfolio will maintain their books and records and present their financial statements in accordance with generally accepted accounting principals for investment partnerships. As a result of this election, the master fund is deemed to have distributed all of its assets and liabilities on October 31, 2009 to its shareholders in liquidation of the master fund. Since the master fund has a shareholder owning 80% or more of the fund’s shares, and also has shareholders owning less than 80%, the transaction creates a non-taxable transaction, pursuant to Internal Revenue Code §332, for those owning more than 80%, and a taxable transaction, pursuant to Internal Revenue Code §331, for those shareholders owning less than 80%. Immediately after the deemed liquidation, the shareholders contributed all of the distributed assets and liabilities to a newly formed partnership. The final tax year end of the Master Fund was October 31, 2009.
For federal income tax purposes, pursuant to Code §336(a), the master fund recognizes gain or loss relative to the investment of the less than 80% shareholders as if the master’s investment securities were sold to those shareholders and, pursuant to Code §331, each of those shareholders recognizes gain or loss as if it liquidated its investment in the master. Pursuant to Code §334(a), each of these shareholders will take a fair market value basis in the securities deemed received by them and a new holding period for those securities commences on the deemed liquidation date. In regards to the shareholder owning 80% or more of the master fund, pursuant to Code §332(a), the shareholder will not recognize any gain or loss on the deemed liquidation. However, pursuant to Code §332(c), a portion of the deemed distribution, which otherwise would have been tax-free as discussed above, since it is utilized by the master fund to satisfy its dividends paid deduction for the tax year, must be recognized and treated as a dividend by the 80% or greater shareholder. Pursuant to Code §334(b)(1) and §1223, the 80% or greater shareholder’s basis and holding period in the securities received in liquidation is the same as it was in the possession of the master.
The master fund had book/tax differences upon its deemed liquidation. The following summary of permanent differences occurred as of the respective effective “Check the Box” election date.
| | | | | | |
Increase (Decrease) Paid-in Capital | | Unrealized
Appreciation
(Depreciation)
Investment
Securities | | Increase
(Decrease)
Undistributed
Net Investment
Income | | Increase
(Decrease)
Accumulated
Net Realized
Gains (Losses) |
| $1,370,229,576 | | $(1,383,011,838) | | $1,404,500 | | $11,377,762 |
As a result of the transaction, the Dimensional Emerging Markets Value Fund recognized a $104,402,506 and ($16,523) capital gain and currency loss respectively, for tax year ended October 31, 2009.
The Emerging Markets Value Portfolio which was impacted by the “Check the Box” election also had a permanent book/tax difference resulting from the transaction. For financial statement purposes, this adjustment did not result in any changes to the Portfolio’s net assets or net asset value per share. The following summary of permanent differences occurred as of the effective “Check the Box” election date.
39
| | | | |
Increase
(Decrease)
Paid-in Capital | | Unrealized
Appreciation
(Depreciation)
Investment
Securities | | Increase
(Decrease)
Accumulated
Net Realized
Gains (Losses) |
| $(154,596,409) | | $(82,593,386) | | $237,189,795 |
For financial reporting purposes, this transaction had no impact on the net assets of the respective funds.
L. Subsequent Event Evaluations:
Management has evaluated the impact of all subsequent events on the Fund through December 23, 2009, the date the financial statements were available for issuance, and has determined that there are no further subsequent events requiring recognition or disclosure in the financial statements.
40
REPORT OF INDEPENDENT REGISTERED PUBLIC ACCOUNTING FIRM
To the Shareholders and Board of Directors of Dimensional Emerging Markets Value Fund (formerly known as the Dimensional Emerging Markets Value Fund Inc.):
In our opinion, the accompanying statement of assets and liabilities, including the summary schedule of portfolio holdings, and the related statements of operations and of changes in net assets and the financial highlights present fairly, in all material respects, the financial position of Dimensional Emerging Markets Value Fund (the “Fund”) at October 31, 2009, the results of its operations for the year then ended, the changes in its net assets and the financial highlights for each of the periods indicated, in conformity with accounting principles generally accepted in the United States of America. These financial statements and financial highlights (hereafter referred to as “financial statements”) are the responsibility of the Fund’s management; our responsibility is to express an opinion on these financial statements based on our audits. We conducted our audits of these financial statements in accordance with the standards of the Public Company Accounting Oversight Board (United States). Those standards require that we plan and perform the audit to obtain reasonable assurance about whether the financial statements are free of material misstatement. An audit includes examining, on a test basis, evidence supporting the amounts and disclosures in the financial statements, assessing the accounting principles used and significant estimates made by management, and evaluating the overall financial statement presentation. We believe that our audits, which included confirmation of securities at October 31, 2009 by correspondence with the custodian, broker and the transfer agent of the investee fund, provide a reasonable basis for our opinion.
PricewaterhouseCoopers LLP
Philadelphia, Pennsylvania
December 23, 2009
41
RESULTS OF THE SHAREHOLDER MEETING
On June 2, 2009, Dimensional Emerging Markets Value Fund (“DEM”) held a Special Joint Meeting of Shareholders for the purpose of voting on several proposals affecting DEM, including, among other items, the election of Directors, the amendment of certain fundamental investment limitations, and the elimination of certain fundamental investment limitations. The shareholders of DEM approved each of the applicable proposals for DEM presented at the Meeting. Listed below are the voting results from the Meeting. Please note that not all Proposals presented at the Meeting were voted on by DEM. Additionally, the Proposal numbers reflected below correlate to the Proposal numbers presented for vote at the Meeting.
DEM
| | | | | | | | | | | | | | | | | | | | | | | | |
| | | | | Shares Voted | | Percent of Outstanding Shares Voted |
| | | | | For | | % | | Against | | % | | Abstain/
WithHold | | % | | NonVote | | % | | For | | Against | | Abstain /
WithHold |
Proposal 1: Election of Directors for DEM | | | | | | | | | | |
| | | | | | | | | | | | |
| 1a | | David G. Booth | | 154,719,678 | | 98.58% | | — | | 0.00% | | 2,230,350 | | 1.42% | | 28,919,699 | | 18.41% | | 98.51% | | 0.00% | | 1.42% |
| 1b | | George M. Constantinides | | 154,719,678 | | 98.58% | | — | | 0.00% | | 2,230,350 | | 1.42% | | 28,919,699 | | 18.41% | | 98.51% | | 0.00% | | 1.42% |
| 1c | | John P. Gould | | 154,719,678 | | 98.58% | | — | | 0.00% | | 2,230,350 | | 1.42% | | 28,919,699 | | 18.41% | | 98.51% | | 0.00% | | 1.42% |
| 1d | | Roger G. Ibbotson | | 154,719,678 | | 98.58% | | — | | 0.00% | | 2,230,350 | | 1.42% | | 28,919,699 | | 18.41% | | 98.51% | | 0.00% | | 1.42% |
| 1e | | Robert C. Merton | | 154,719,678 | | 98.58% | | — | | 0.00% | | 2,230,350 | | 1.42% | | 28,919,699 | | 18.41% | | 98.51% | | 0.00% | | 1.42% |
| 1f | | Myron S. Scholes | | 154,719,678 | | 98.58% | | — | | 0.00% | | 2,230,350 | | 1.42% | | 28,919,699 | | 18.41% | | 98.51% | | 0.00% | | 1.42% |
| 1g | | Eduardo A. Repetto | | 154,719,678 | | 98.58% | | — | | 0.00% | | 2,230,350 | | 1.42% | | 28,919,699 | | 18.41% | | 98.51% | | 0.00% | | 1.42% |
| 1h | | Abbie J. Smith | | 154,719,678 | | 98.58% | | — | | 0.00% | | 2,230,350 | | 1.42% | | 28,919,699 | | 18.41% | | 98.51% | | 0.00% | | 1.42% |
| | | | | | | | | | | | | | | | | | | | | | | | |
| | | | | Shares Voted | | Percent of Outstanding Shares Voted |
| | | | | For | | % | | Against | | % | | Abstain/
WithHold | | % | | NonVote | | % | | For | | Against | | Abstain /
WithHold |
Proposals: | | | | | | | | | | | | | | | | | | |
| | | | | | | | | | | | |
| 3 | | Approval of an Agreement and Plan of Reorganization for DEM | | 123,882,784 | | 78.93% | | 248,809 | | 0.16% | | 3,898,735 | | 2.48% | | 28,919,699 | | 18.43% | | 78.87% | | 0.16% | | 2.48% |
| 5 | | To approve amendments to certain fundamental investment restrictions | | | | | | | | | | |
| 5a | | Borrowing Money | | 121,580,801 | | 77.46% | | 5,835,274 | | 3.72% | | 614,254 | | 0.39% | | 28,919,699 | | 18.43% | | 77.41% | | 3.72% | | 0.39% |
| 5b | | Making Loans | | 121,527,084 | | 77.43% | | 5,840,456 | | 3.72% | | 662,790 | | 0.42% | | 28,919,699 | | 18.43% | | 77.37% | | 3.72% | | 0.42% |
| 5c | | Investments in Real Estate | | 120,018,448 | | 76.47% | | 7,397,704 | | 4.71% | | 614,177 | | 0.39% | | 28,919,699 | | 18.43% | | 76.41% | | 4.71% | | 0.39% |
| 5d | | Investments in Commodities | | 121,499,862 | | 77.41% | | 5,916,917 | | 3.77% | | 613,551 | | 0.39% | | 28,919,699 | | 18.43% | | 77.36% | | 3.77% | | 0.39% |
| 5e | | Diversification of Investments | | 121,586,004 | | 77.47% | | 5,823,213 | | 3.71% | | 621,112 | | 0.40% | | 28,919,699 | | 18.43% | | 77.41% | | 3.71% | | 0.40% |
| 6 | | To approve the elimination of certain fundamental investment restrictions | | | | | | | | | | |
| 6b | | Purchasing Securities on Margin | | 121,252,352 | | 77.26% | | 6,115,035 | | 3.90% | | 662,941 | | 0.42% | | 28,919,699 | | 18.43% | | 77.20% | | 3.89% | | 0.42% |
| 6d | | Investing for the Purpose of | | | | | | | | | | | | | | | | | | | | | | |
| | Exercising Control | | 121,536,300 | | 77.44% | | 5,869,804 | | 3.74% | | 624,225 | | 0.40% | | 28,919,699 | | 18.43% | | 77.38% | | 3.74% | | 0.40% |
| 7a | | Proposed Sub-Advisory Agreement among Dimensional Fund Advisors LP, DFA Australia Limited, and the Company | | 123,729,214 | | 78.83% | | 405,576 | | 0.26% | | 3,895,539 | | 2.48% | | 28,919,699 | | 18.43% | | 78.78% | | 0.26% | | 2.48% |
| 7b | | Proposed Sub-Advisory Agreement among Dimensional Fund Advisors LP, Dimensional Fund Advisors Ltd., and the Company | | 123,730,642 | | 78.83% | | 404,185 | | 0.26% | | 3,895,502 | | 2.48% | | 28,919,699 | | 18.43% | | 78.78% | | 0.26% | | 2.48% |
42
FUND MANAGEMENT
Trustees/Directors
Each Board of Trustees/Directors of The DFA Investment Trust Company Inc. (“DFAITC”), DFA Investment Dimensions Group Inc. (“DFAIDG”), Dimensional Investment Group Inc. (“DIG”) and Dimensional Emerging Markets Value Fund (“DEM”) (each, the “Fund” and collectively, the “Funds”) is responsible for establishing the Funds’ policies and for overseeing the management of the Funds. The Trustees/Directors of the Funds, including all of the disinterested Directors, have adopted written procedures to monitor potential conflicts of interest that might develop between portfolios of the Funds (the “Feeder Portfolios”) that invest in certain series of DFAITC or DEM (the “Master Funds”).
Each Board has two standing committees, an Audit Committee and a Portfolio Performance and Service Review Committee (the “Performance Committee”). The Audit Committee is comprised of George M. Constantinides, Roger G. Ibbotson and Abbie J. Smith. Each member of the Audit Committee is a disinterested Director. The Audit Committee oversees the Fund’s accounting and financial reporting policies and practices, the Fund’s internal controls, the Fund’s financial statements and the independent audits thereof and performs other oversight functions as requested by the Board. The Audit Committee recommends the appointment of each Fund’s independent registered certified public accounting firm and also acts as a liaison between the Fund’s independent registered certified public accounting firm and the full Board. There were two Audit Committee meetings held during the fiscal year ended October 31, 2009.
Each Board’s Performance Committee is comprised of Messrs. Constantinides and Ibbotson, Ms. Smith, John P. Gould, Myron S. Scholes and Robert C. Merton. Each member of the Fund’s Performance Committee is a disinterested Director. The Performance Committee regularly reviews and monitors the investment performance of the Fund’s series and reviews the performance of the Fund’s service providers. There were six Performance Committee meetings held during the fiscal year ended October 31, 2009.
Certain biographical information for each disinterested Trustee/Director and each interested Trustee/Director of the Funds is set forth in the tables below, including a description of each Trustee/Director’s experience as a Trustee/Director of the Funds and as a director or trustee of other funds, as well as other recent professional experience.
The statements of additional information (together, “SAI”) of the Funds include additional information about each Trustee/Director. You may obtain copies of the SAI and prospectus of each Fund advised by Dimensional Fund Advisors LP by calling collect (512) 306-7400 or by mailing a request to Dimensional Fund Advisors LP, 6300 Bee Cave Road, Building One, Austin, Texas 78746. Prospectuses are also available at www.dimensional.com.
| | | | | | |
Name, Position with the Fund, Address and Age | | Term of Office1 and Length of Service | | Portfolios within the DFA Fund Complex2 Overseen | | Principal Occupation(s) During Past 5 Years and Other Directorships of Public Companies Held |
| Disinterested Trustees/Directors |
George M. Constantinides Director of DFAIDG, DIG and DEM. Trustee of DFAITC. The University of Chicago
Booth School of Business 5807 S. Woodlawn Avenue Chicago, IL 60637 Age: 62 | | DFAITC - since 1993 DFAIDG - since 1983 DIG - since 1993 DEM - since 1993 | | 87 portfolios in 4 investment companies | | Leo Melamed Professor of Finance, The University of Chicago Booth School of Business. |
John P. Gould Director of DFAIDG, DIG and DEM. Trustee of DFAITC. The University of Chicago Booth School of Business 5807 S. Woodlawn Avenue Chicago, IL 60637 Age: 70 | | DFAITC - since 1993 DFAIDG - since 1986 DIG - since 1993 DEM - since 1993 | | 87 portfolios in 4 investment companies | | Steven G. Rothmeier Distinguished Service Professor of Economics, The University of Chicago Booth School of Business (since 1965). Member of the Boards of Milwaukee Mutual Insurance Company (since 1997). Member and Chair, Competitive Markets Advisory Committee, Chicago Mercantile Exchange (futures trading exchange) (since 2004). Formerly, Director of UNext, Inc. (1999-2006). Formerly, Senior Vice-President, Lexecon Inc. (economics, law, strategy and finance consulting) (1994-2004). Trustee, Harbor Fund (registered investment company) (27 Portfolios) (since 1994). |
43
| | | | | | |
Name, Position with the Fund, Address and Age | | Term of Office1 and Length of Service | | Portfolios within the DFA Fund Complex2 Overseen | | Principal Occupation(s) During Past 5 Years and Other Directorships of Public Companies Held |
Roger G. Ibbotson Director of DFAIDG, DIG and DEM. Trustee of DFAITC. Yale School of Management 135 Prospect Street New Haven, CT 06520-8200 Age: 66 | | DFAITC - since 1993 DFAIDG - since 1981 DIG - since 1993 DEM - since 1993 | | 87 portfolios in 4 investment companies | | Professor in Practice of Finance, Yale School of Management (since 1984). Director, BIRR Portfolio Analysis, Inc. (software products) (since 1990). Chairman, CIO and Partner, Zebra Capital Management, LLC (hedge fund manager) (since 2001). Formerly, Chairman, Ibbotson Associates, Inc., Chicago, IL (software data publishing and consulting) (1977-2006). |
Robert C. Merton Director of DFAIDG, DIG and DEM. Trustee of DFAITC. Harvard Business School 353 Baker Library Soldiers Field Boston, MA 02163 Age: 65 | | DFAITC - since 2003 DFAIDG - since 2003 DIG - since 2003 DEM - since 2003 | | 87 portfolios in 4 investment companies | | John and Natty McArthur University Professor, Graduate School of Business Administration, Harvard University (since 1998). Director, MF Risk, Inc. (risk management software) (since 2001). Director, Peninsula Banking Group (bank) (since 2003). Director, Community First Financial Group (bank holding company) (since 2003). Member Competitive Markets Advisory Council, Chicago Mercantile Exchange (futures trading exchange) (since 2004). Chairman and Director, Daedalus Software (medical software) (since 2008). Formerly, Advisory Board Member, Alpha Simplex Group (hedge fund) (2001-2007). Formerly, Chief Science Officer and Director, Trinsum Group, a successor to Integrated Finance Limited (2002-2008). Director, Vical Incorporated (biopharmaceutical product development) (since 2002). |
Myron S. Scholes Director of DFAIDG, DIG and DEM. Trustee of DFAITC. Platinum Grove Asset Management, L.P. Reckson Executive Park 1100 King Street Building 4 Rye Brook, NY 10573 Age: 68 | | DFAITC - since 1993 DFAIDG - since 1981 DIG - since 1993 DEM - since 1993 | | 87 portfolios in 4 investment companies | | Frank E. Buck Professor Emeritus of Finance, Stanford University (since 1981). Chairman, Platinum Grove Asset Management, L.P. (hedge fund) (formerly, Oak Hill Platinum Partners) (since 1999). Formerly, Managing Partner, Oak Hill Capital Management (private equity firm) (until 2004). Formerly, Director, Chicago Mercantile Exchange (2001-2008). Director, American Century Fund Complex (registered investment companies) (37 Portfolios) (since 1981). |
Abbie J. Smith Director of DFAIDG, DIG and DEM. Trustee of DFAITC. The University of Chicago Booth School of Business 5807 S. Woodlawn Avenue Chicago, IL 60637 Age: 56 | | DFAITC - since 2000 DFAIDG - since 2000 DIG - since 2000 DEM - since 2000 | | 87 portfolios in 4 investment companies | | Boris and Irene Stern Professor of Accounting, The University of Chicago Booth School of Business (since 1980), and Co-Director Investment Research, Fundamental Investment Advisors (hedge fund) (since 2008). Director, HNI Corporation (formerly known as HON Industries Inc.) (office furniture) (since 2000). Director, Ryder System Inc. (transportation, logistics and supply-chain management) (since 2003). Director/ Trustee, UBS Funds (fund complex) (5 portfolios) (since 2008). |
44
| | | | | | |
Name, Position with the Fund, Address and Age | | Term of Office1 and Length of Service | | Portfolios within the DFA Fund Complex2
Overseen | | Principal Occupation(s) During Past 5 Years and Other
Directorships of Public Companies Held |
| Interested Trustees/Directors* |
| David G. Booth Chairman, Director, Chief Executive Officer and President of DFAIDG, DIG and DEM. Chairman, Trustee, Chief Executive Officer, Chief Investment Officer and President of DFAITC. 6300 Bee Cave Road, Building One Austin, Texas 78746 Age: 62 | | DFAITC - since 1993 DFAIDG - since 1981 DIG - since 1992 DEM - since 1993 | | 87 portfolios in 4 investment companies | | Chairman, Director/Trustee, President, Chief Executive Officer and formerly Chief Investment Officer of the following companies: Dimensional Holdings Inc., Dimensional Fund Advisors LP, Dimensional Fund Advisors Canada ULC, DFAIDG, DIG, DEM and DFAITC. President and Chief Executive Officer of DFA Securities LLC. Director of Dimensional Fund Advisors Ltd, and formerly Chief Investment Officer. Director and formerly, President and Chief Investment Officer of DFA Australia Ltd. Formerly, Director of Dimensional Funds PLC and Dimensional Fund II PLC. Chairman, Director and Chief Executive Officer of Dimensional Fund Advisors Canada ULC (All Chief Investment Officer positions held starting 1/03 through 3/07 except Dimensional Holdings Inc., which was from 10/06 through 3/07.) Limited Partner, Oak Hill Partners (since 2001) and VSC Investors, LLC (since 2007). Trustee, The University of Chicago Booth School of Business. Formerly, Director, SA Funds (registered investment company). Formerly Director, Assante Corporation (investment management) (until 2002). |
Eduardo A. Repetto Director, Chief Investment Officer and Vice President of DFAIDG, DIG and DEM. Trustee, Chief Investment Officer and Vice President of DFAITC 6300 Bee Cave Road, Building One Austin, TX 78746 Age: 42 | | DFAITC - since 2009 DFAIDG - since 2009 DIG - since 2009 DEM - since 2009 | | 87 portfolios in 4 investment companies | | Director/Trustee (beginning June 2009), Chief Investment Officer (beginning March 2007) and Vice President of DFAIDG, DIG, DEM and DFAITC. Chief Investment Officer (beginning March 2007) and Vice President of all the DFA Entities, DFA Australia Limited and Dimensional Fund Advisors Canada ULC. |
| 1 | Each Trustee/Director holds office for an indefinite term until his or her successor is elected and qualified. |
| 2 | Each Trustee/Director is a director or trustee of each of the four registered investment companies within the DFA Fund Complex, which includes the Funds. |
| * | Interested Trustees/Directors are described as such because they are deemed to be “interested persons,” as that term is defined under the Investment Company Act of 1940, as amended, due to their positions with Dimensional Fund Advisors LP. |
45
Officers
The name, age, information regarding positions with the Funds and the principal occupation for each officer of the Funds are set forth below. Each officer listed below holds the same office (except as otherwise noted) in the following entities: Dimensional Fund Advisors LP (prior to November 3, 2006, Dimensional Fund Advisors Inc.) (“Dimensional”), DFA Securities Inc., DFAIDG, DIG, DFAITC and DEM (collectively, the “DFA Entities”). The address of each officer is: Dimensional Fund Advisors LP, 6300 Bee Cave Road, Building One, Austin, Texas 78746, unless otherwise indicated.
| | | | |
Name, Position with the Fund and Age | | Term of Office1 and
Length of
Service | | Principal Occupation(s) During Past 5 Years |
| Officers |
April A. Aandal Vice President and Chief Learning Officer Age: 46 | | Since 2008 | | Vice President of all the DFA Entities. Chief Learning Officer of Dimensional (since September 2008). Formerly, Regional Director of Dimensional (2004-2008); Vice President of Professional Development at Assante Asset Management (June 2002-January 2005). |
Darryl D. Avery Vice President Age: 43 | | Since 2005 | | Vice President of all the DFA Entities. From June 2002 to January 2005, institutional client service representative of Dimensional. |
Arthur H. Barlow Vice President Age: 53 | | Since 1993 | | Vice President of all the DFA Entities. Formerly, Vice President of DFA Australia Limited and Dimensional Fund Advisors Ltd. |
Scott A. Bosworth Vice President Age: 40 | | Since 2007 | | Vice President of all the DFA Entities. Regional Director of Dimensional (since November 1997). |
Valerie A. Brown Vice President and Assistant Secretary Age: 42 | | Since 2001 | | Vice President and Assistant Secretary of all the DFA Entities, DFA Australia Limited, Dimensional Fund Advisors Ltd., and since June 2003, Dimensional Fund Advisors Canada ULC. |
David P. Butler Vice President Age: 45 | | Since 2007 | | Vice President of all the DFA Entities. Director of Global Financial Services of Dimensional (since 2008). Formerly, Regional Director of Dimensional Fund Advisors LP (January 1995 to January 2005). |
Patrick Carter Vice President Age: 47 | | Since 2007 | | Vice President of all the DFA Entities. Regional Director of Dimensional (since March 2006). Formerly, Director of Merrill Lynch Retirement Group (December 1998 to March 2006). |
Joseph H. Chi Vice President Age: 43 | | Since 2009 | | Vice President of all the DFA Entities. Portfolio Manager for Dimensional Fund Advisors LP (since October 2005). Prior to October 2005, Corporate Counsel at Hewitt Associates (July 2002-August 2005). |
Stephen A. Clark Vice President Age: 37 | | Since 2004 | | Vice President of all the DFA Entities. Formerly, Portfolio Manager of Dimensional (April 2001-April 2004). |
Robert P. Cornell Vice President Age: 60 | | Since 2007 | | Vice President of all the DFA Entities. Regional Director of Financial Services Group of Dimensional (since August 1993). |
Christopher S. Crossan Vice President and Chief Compliance Officer Age: 43 | | Since 2004 | | Vice President and Chief Compliance Officer of all the DFA Entities. |
James L. Davis Vice President Age: 52 | | Since 1999 | | Vice President of all the DFA Entities. Formerly, Vice President of DFA Australia Limited and Dimensional Fund Advisors Ltd. |
Robert T. Deere Vice President Age: 52 | | Since 1994 | | Vice President of all the DFA Entities and DFA Australia Limited. |
Robert W. Dintzner Vice President Age: 39 | | Since 2001 | | Vice President of all the DFA Entities. |
46
| | | | |
Name, Position with the Fund
and Age | | Term of Office1
and Length of
Service | | Principal Occupation(s) During Past 5 Years |
Kenneth Elmgren Vice President Age: 55 | | Since 2007 | | Vice President of all the DFA Entities. Formerly, Managing Principal of Beverly Capital (May 2004 to September 2006). |
Richard A. Eustice Vice President and Assistant Secretary Age: 44 | | Since 1998 | | Vice President and Assistant Secretary of all the DFA Entities and DFA Australia Limited. Chief Operating Officer of Dimensional Fund Advisors Ltd. (since July 2008). Formerly, Vice President of Dimensional Fund Advisors Ltd. |
Eugene F. Fama, Jr. Vice President Age: 48 | | Since 1993 | | Vice President of all the DFA Entities. Formerly, Vice President of DFA Australia Limited and Dimensional Fund Advisors Ltd. |
Gretchen A. Flicker Vice President Age: 38 | | Since 2004 | | Vice President of all the DFA Entities. Prior to April 2004, institutional client service representative of Dimensional. |
Jed S. Fogdall Vice President Age: 35 | | Since 2008 | | Vice President of all the DFA Entities. Portfolio Manager for Dimensional (since September 2004). Prior to September 2004, Staff Engineer at the Boeing Company (1997-2004). |
Glenn S. Freed Vice President Age: 47 | | Since 2001 | | Vice President of all the DFA Entities. |
Jeremy P. Freeman Vice President Age: 38 | | Since 2009 | | Vice President of all the DFA Entities. Senior Technology Manager for Dimensional Fund Advisors LP (since June 2006). Formerly, Principal at AIM Investments/Amvescap PLC (now Invesco) (June 1998-June 2006). |
Mark R. Gochnour Vice President Age: 42 | | Since 2007 | | Vice President of all the DFA Entities. Regional Director of Dimensional. |
Henry F. Gray Vice President Age: 42 | | Since 2000 | | Vice President of all the DFA Entities. Prior to July 2000, Portfolio Manager of Dimensional. Formerly, Vice President of DFA Australia Limited. |
John T. Gray Vice President Age: 35 | | Since 2007 | | Vice President of all the DFA Entities. Formerly, Regional Director of Dimensional (January 2005 to February 2007). |
Darla Hastings Vice President Age: 54 | | Since 2007 | | Vice President of all the DFA Entities. Chief Marketing Officer of Dimensional. Formerly, Senior Vice President, Customer Experience for Benchmark Assisted Living (May 2005 to April 2006); Executive Vice President and Chief Marketing Officer of State Street Corporation (September 2001 to October 2005). |
Joel H. Hefner Vice President Age: 41 | | Since 2007 | | Vice President of all the DFA Entities. Regional Director of Dimensional (since June 1998). |
Julie Henderson Vice President and Fund Controller Age: 35 | | Since 2005 | | Vice President and Fund Controller of all the DFA Entities. Formerly, Senior Manager at PricewaterhouseCoopers LLP (July 1996 to April 2005). |
Kevin Hight Vice President Age: 41 | | Since 2005 | | Vice President of all the DFA Entities. Formerly, Regional Director of Dimensional (since March 2003 to March 2005). |
Christine W. Ho Vice President Age: 41 | | Since 2004 | | Vice President of all the DFA Entities. Prior to April 2004, Assistant Controller of Dimensional. |
Jeff J. Jeon Vice President Age: 35 | | Since 2004 | | Vice President of all the DFA Entities. Counsel of Dimensional (since September 2001). |
Patrick M. Keating Vice President Age: 54 | | Since 2003 | | Vice President of all the DFA Entities and Chief Operating Officer of Dimensional. Director, Vice President and Chief Privacy Officer of Dimensional Fund Advisors Canada ULC. Director of DFA Australia Limited. |
47
| | | | |
Name, Position with the Fund
and Age | | Term of Office1
and Length of
Service | | Principal Occupation(s) During Past 5 Years |
Joseph F. Kolerich Vice President Age: 37 | | Since 2004 | | Vice President of all the DFA Entities. Portfolio Manager for Dimensional (since April 2001). |
Michael F. Lane Vice President Age: 42 | | Since 2004 | | Vice President of all the DFA Entities. Formerly, Vice President of Advisor Services at TIAA-CREF (July 2001 to September 2004). |
Kristina M. LaRusso Vice President Age: 34 | | Since 2006 | | Vice President of all DFA Entities. Formerly, Operations Supervisor of Dimensional (March 2003 to December 2006). |
Inmoo Lee Vice President Age: 43 | | Since 2007 | | Vice President of all the DFA Entities. Associate Professor Department of Finance and Accounting, Business School, National University of Singapore (July 2004 to present); Associate Professor, College of Business Administration, Korea University (September 2001 to May 2006). |
Juliet Lee Vice President Age: 38 | | Since 2005 | | Vice President of all the DFA Entities. Human Resources Manager of Dimensional (since January 2004). |
Aaron M. Marcus Vice President & Head of Global Human Resources Age: 39 | | Since 2008 | | Vice President and Head of Global Human Resources of Dimensional. Formerly, Global Head of Recruiting and Vice President of Goldman Sachs & Co. (June 2006 to January 2008); Global Co-Head of HR of the Equities & FICC Division, and Vice President of Goldman Sachs & Co. (May 2005 to May 2006); Head of Americas Campus Recruiting and Vice President of Goldman Sachs & Co. (April 2003 to May 2005). |
David R. Martin Vice President, Chief Financial Officer
and Treasurer Age: 52 | | Since 2007 | | Vice President, Chief Financial Officer and Treasurer of all the DFA Entities. Director, Vice President, Chief Financial Officer and Treasurer of Dimensional Fund Advisors Ltd. and DFA Australia Limited. Chief Financial Officer, Treasurer, and Vice President of Dimensional Fund Advisors Canada ULC. Director of Dimensional Funds PLC and Dimensional Funds II PLC. Formerly, Executive Vice President and Chief Financial Officer of Janus Capital Group Inc. (June 2005 to March 2007); Senior Vice President of Finance at Charles Schwab & Co., Inc. (March 1999 to May 2005). |
Catherine L. Newell Vice President and Secretary Age: 45 | | Vice President since 1997 and Secretary since 2000 | | Vice President and Secretary of all the DFA Entities. Director, Vice President and Secretary of DFA Australia Limited and Dimensional Fund Advisors Ltd. (since February 2002, April 1997 and May 2002, respectively). Vice President and Secretary of Dimensional Fund Advisors Canada ULC (since June 2003). Director, Dimensional Funds PLC and Dimensional Funds II PLC (since 2002 and 2006, respectively). Formerly, Assistant Secretary of all DFA Entities, DFA Australia Limited and Dimensional Fund Advisors Ltd. |
Christian Newton Vice President Age: 34 | | Since 2009 | | Vice President of all DFA Entities. Web Services Manager for Dimensional Fund Advisors LP (Since January 2008). Formerly Design Manager (2005-2008) and Web Developer (2002-2005) of Dimensional Fund Advisors LP. |
Gerard K. O’Reilly Vice President Age: 32 | | Since 2007 | | Vice President of all the DFA Entities. Formerly, Research Associate of Dimensional Fund Advisors LP (2004 to 2006); Research Assistant in PhD program, Aeronautics Department California Institute of Technology (1998 to 2004). |
Daniel C. Ong Vice President Age: 35 | | Since 2009 | | Vice President of all the DFA Entities. Portfolio Manager for Dimensional Fund Advisors LP (since July 2005). Prior to 2005, Graduate Student at the University of Chicago Booth School of Business (2003-2005). |
Carmen Palafox Vice President Age: 35 | | Since 2006 | | Vice President of all the DFA Entities. Operations Manager of Dimensional Fund Advisors LP (since May 1996). |
Sonya Park Vice President Age: 37 | | Since 2005 | | Vice President of all the DFA Entities. From February 2002 to January 2005, institutional client service representative of Dimensional. |
48
| | | | |
Name, Position with the Fund and Age | | Term of Office1 and Length of Service | | Principal Occupation(s) During Past 5 Years |
David A. Plecha Vice President Age: 48 | | Since 1993 | | Vice President of all the DFA Entities, DFA Australia Limited and Dimensional Fund Advisors Ltd |
Ted Randall Vice President Age: 36 | | Since 2008 | | Vice President of all the DFA Entities. Formerly, Research Associate of Dimensional (2006-2008). Systems Developer of Dimensional (2001-2006). |
L. Jacobo Rodriguez Vice President Age: 38 | | Since 2005 | | Vice President of all the DFA Entities. From August 2004 to July 2005, institutional client service representative of Dimensional. Formerly, Financial Services Analyst, Cato Institute (September 2001 to June 2004); Book Review Editor, Cato Journal, Cato Institute (May 1996 to June 2004). |
David E. Schneider Vice President Age: 63 | | Since 2001 | | Vice President of all the DFA Entities. Currently, Director of Institutional Services. |
Bruce A. Simmons Vice President Age: 44 | | Since 2009 | | Vice President of all the DFA Entities. Investment Operations Manager for Dimensional Fund Advisors LP (since May 2007). Formerly, Vice President Client and Fund Reporting at Mellon Financial (September 2005-May 2007); Vice President Business Development at CUADPRO Marketing (July 2003-September 2005). |
Ted R. Simpson Vice President Age: 41 | | Since 2007 | | Vice President of all the DFA Entities. Regional Director of Dimensional (since December 2002). |
Bryce D. Skaff Vice President Age: 34 | | Since 2007 | | Vice President of all the DFA Entities. Formerly, Regional Director of Dimensional (December 1999 to January 2007). |
Grady M. Smith Vice President Age: 53 | | Since 2004 | | Vice President of all the DFA Entities. Prior to April 2004, Portfolio Manager of Dimensional. |
Carl G. Snyder Vice President Age: 46 | | Since 2000 | | Vice President of all the DFA Entities. Formerly, Vice President of DFA Australia Limited. |
Lawrence R. Spieth Vice President Age: 61 | | Since 2004 | | Vice President of all the DFA Entities. Prior to April 2004, Regional Director of Dimensional. |
Bradley G. Steiman Vice President Age: 36 | | Since 2004 | | Vice President of all the DFA Entities and Director and Vice President of Dimensional Fund Advisors Canada ULC. |
Robert C. Trotter Vice President Age: 51 | | Since 2009 | | Vice President of all the DFA Entities. Senior Manager Technology for Dimensional Fund Advisors LP (since March 2007). Formerly, Director of Technology at AMVESCAP (2002-2007). |
Karen E. Umland Vice President Age: 43 | | Since 1997 | | Vice President of all the DFA Entities, DFA Australia Limited, Dimensional Fund Advisors Ltd., and Dimensional Fund Advisors Canada ULC. |
Sunil Wahal Vice President Age: 42 | | Since 2009 | | Vice President of all the DFA Entities. Formerly, Research Associate for Dimensional Fund Advisors LP (July 2008-January 2009); Consultant to Dimensional Fund Advisors LP (September 2005-July 2008); Jack D. Furst Professor of Finance at Arizona State University, WP Carey School of Business (July 2005-July 2008); Associate Professor of Finance at Goizueta Business School, Emory University (1997-2005). |
Brian J. Walsh Vice President Age: 39 | | Since 2009 | | Vice President of all the DFA Entities. Portfolio Manager for Dimensional Fund Advisors LP (since 2004). Formerly, Trader for Dimensional Fund Advisors LP (1997-2004). |
Carol W. Wardlaw Vice President Age: 51 | | Since 2004 | | Vice President of all the DFA Entities. Prior to April 2004, Regional Director of Dimensional. |
49
| | | | |
Name, Position with the Fund
and Age | | Term of Office1
and Length of
Service | | Principal Occupation(s) During Past 5 Years |
Weston J. Wellington Vice President Age: 58 | | Since 1997 | | Vice President of all the DFA Entities. Formerly, Vice President of DFA Australia Limited. |
Daniel M. Wheeler Vice President Age: 64 | | Since 2001 | | Vice President of all the DFA Entities. Prior to 2001 and currently, Director of Financial Advisors Services of Dimensional. Director of Dimensional Fund Advisors Ltd. (since October 2003) and President of Dimensional Fund Advisors Canada ULC (since June 2003). |
Ryan Wiley Vice President Age: 33 | | Since 2007 | | Vice President of all the DFA Entities. Senior Trader of Dimensional. Formerly, Portfolio Manager (2006 to 2007); Trader (2001 to 2006). |
Paul E. Wise Vice President Age: 54 | | Since 2005 | | Vice President of all the DFA Entities. Chief Technology Officer for Dimensional (since 2004). Formerly, Principal of Turnbuckle Management Group (January 2002 to August 2004). |
| 1 | Each officer holds office for an indefinite term at the pleasure of the Boards of Trustees/Directors and until his or her successor is elected and qualified. |
50
VOTING PROXIES ON FUND PORTFOLIO SECURITIES
A description of the policies and procedures that the Fund uses in voting proxies relating to securities held in the portfolio is available without charge, upon request, by calling collect: (512) 306-7400. Information regarding how the Advisor votes these proxies is available from the EDGAR database on the SEC’s website at http://www.sec.gov and from the Advisor’s website at http://www.dimensional.com and reflects the twelve-month period beginning July 1st and ending June 30th.
51
NOTICE TO SHAREHOLDERS
(Unaudited)
For shareholders that do not have an October 31, 2009 tax year end, this notice is for informational purposes only. For shareholders with an October 31, 2009 tax year end, please consult your tax advisor as to the pertinence of this notice. For the fiscal year November 1, 2008 to October 31, 2009, each Portfolio is designating the following items with regard to distributions paid during the fiscal year. All designations are based on financial information available as of the date of this annual report and, accordingly are subject to change. For each item, it is the intention of the Portfolio to designate the maximum amount permitted under the Internal Revenue Code and the regulations thereunder.
| | | | | | | | | | | | | | | | | | | | |
DFA Investment
Dimensions Group Inc. | | Net
Investment
Income
Distributions | | Short-Term
Capital Gain
Distributions | | Long-Term
Capital Gain
Distributions | | Total
Distributions | | Qualifying
For Corporate
Dividends
Received
Distributions(1) | | Qualifying
Dividend
Income(2) | | Foreign
Tax
Credit(3) | | Foreign
Source
Income(4) | | Qualifying
Interest
Income(5) | | Qualifying
Short-Term
Capital
Gain(6) |
Emerging Markets Value Portfolio | | 13% | | 6% | | 81% | | 100% | | 100% | | 100% | | — | | — | | 100% | | 100% |
| | | | | | | | | | |
Dimensional Emerging Markets Value Fund | | | | | | | | | | | | | | | | | | | | |
Dimensional Emerging Markets Value Fund | | 39% | | — | | 61% | | 100% | | 100% | | 100% | | 5% | | 106% | | 100% | | 100% |
| (1) | Qualifying dividends represent dividends which qualify for the corporate dividends received deduction and is reflected as a percentage of ordinary income distributions (the total of short-term capital gain and net investment income distributions). |
| (2) | The percentage in this column represents the amount of “Qualifying Dividend Income” as created by the Jobs and Growth Tax Relief Reconciliation Act of 2003 and is reflected as a percentage of ordinary income distributions (the total of net investment income and short-term capital gain distributions). Please note that these percentages are designated only, refer to your 1099 for actual qualified dividend income. |
| (3) | “Foreign Tax Credit” represents dividends which qualify for the foreign tax credit pass through and is reflected as a percentage of investment company taxable income (the total of net investment income and short-term capital gain distributions). |
| (4) | “Foreign Source Income” represents the portion of dividends derived from foreign sources, and is reflected as a percentage of ordinary income (i.e. the sum of short-term capital gain and net investment income) distributions made during the period. |
| (5) | The percentage in this column represents the amount of “Qualifying Interest Income” as created by The American Jobs Creation Act of 2004. The information is reflected as a percentage of ordinary income distributions (the total of short-term capital gain and net investment income distributions). |
| (6) | The percentage in this column represents the amount of “Qualifying Short-Term Capital Gain” as created by The American Jobs Creation Act of 2004. The information is reflected as a percentage of ordinary income distributions (the total of short-term capital gain and net investment income distributions). |
52

The Registrant has adopted, as of the end of the period covered by this Form N-CSR (the “Report”), a code of ethics that applies to the Registrant’s principal executive officer and principal financial officer (the “Code of Business Ethics”). The Registrant has not made any substantive amendments to the Code of Business Ethics during the period covered by this Report. The Registrant also has not granted any waiver from any provisions of the Code of Business Ethics during the period covered by this Report. A copy of the Code of Business Ethics is filed as an exhibit to this Report.
| ITEM 3. | AUDIT COMMITTEE FINANCIAL EXPERT. |
The Registrant’s Board of Trustees has determined that Abbie J. Smith possesses the technical attributes to qualify as an “audit committee financial expert” serving on the Registrant’s Audit Committee and has designated Ms. Smith as the “audit committee financial expert.” Ms. Smith
earned a Ph.D. in Accounting, and has taught Accounting at the graduate level since 1980. Ms. Smith’s education and career have provided her with an understanding of generally accepted accounting principles and financial statements; the ability to assess the general application of such principles in connection with the accounting for estimates, accruals and reserves; and experience preparing, analyzing and evaluating financial statements that present a breadth and level of complexity of issues that can reasonably be expected to be raised by the Registrant’s financial statements. In addition, Ms. Smith has served on the boards of directors and audit committees of entities other than the Registrant. Ms. Smith is independent under the standards set forth in Item 3 of Form N-CSR.
| ITEM 4. | PRINCIPAL ACCOUNTANT FEES AND SERVICES. |
| | |
(a) | | Audit Fees |
| | Fiscal Year Ended October 31, 2009: $21,565 |
| | Fiscal Year Ended October 31, 2008: $20,333 |
| | | | | | | | |
(b) | | Audit-Related Fees | | | | | | |
| | Fees for Registrant | | Fiscal Year Ended October 31, 2009: $1,172 | | |
| | | | Fiscal Year Ended October 31, 2008: $1,215 | | |
For fiscal years ended October 31, 2009 and October 31, 2008, Audited-Related Fees included fees for services related to limited procedures performed in connection with the production of the Registrant’s semi-annual financial statements.
Audit-Related Fees required to be approved pursuant to paragraph (c)(7)(ii) of Rule 2-01 of Regulation S-X
| | | | | | | | |
| | | | Fiscal Year Ended October 31, 2009: $158,695 | | |
| | | | Fiscal Year Ended October 31, 2008: $165,000 | | |
For the fiscal years ended October 31, 2009 and October 31, 2008, Audit-Related Fees required to be approved pursuant to paragraph (c)(7)(ii) of Rule 2-01 of Regulation S-X included fees for services rendered in connection with the issuance of a Type II SAS 70 over controls at the Registrant’s investment adviser.
| | | | | | | | |
(c) | | Tax Fees | | | | | | |
| | Fees for Registrant | | Fiscal Year Ended October 31, 2009: $16,557 | | |
| | | | Fiscal Year Ended October 31, 2008: $18,027 | | |
Tax Fees included, for the fiscal years ended October 31, 2009 and October 31, 2008, fees for tax services in connection with the Registrant’s excise tax calculations, limited review of the Registrant’s applicable tax returns and capital gains tax services in India.
There were no Tax Fees required to be approved pursuant to paragraph (c)(7)(ii) of Rule 2-01 of Regulation S-X during the fiscal years indicated above.
| | | | | | | | |
(d) | | All Other Fees | | | | | | |
| | Fees for Registrant | | Fiscal Year Ended October 31, 2009: $0 | | |
| | | | | | | | |
| | | | Fiscal Year Ended October 31, 2008: $0 | | |
There were no “All Other Fees” required to be approved pursuant to paragraph (c)(7)(ii) of Rule 2-01 of Regulation S-X during the fiscal years indicated above.
(e)(1) Audit Committee’s Pre-Approval Policies and Procedures
Pre-Approval Policies and Procedures
as adopted by the
Audit Committees
of
DFA Investment Dimensions Group Inc.
Dimensional Emerging Markets Value Fund
Dimensional Investment Group Inc.
The DFA Investment Trust Company
(together, the “Funds”)
The Sarbanes-Oxley Act of 2002 (the “Act”) and the rules (the “Rules”) adopted by the U.S. Securities and Exchange Commission (the “SEC”) require that the Funds’ Audit Committees (together, the “Committee”) pre-approve all audit services and non-audit services provided to the Funds by their independent registered public accounting firm (the “Auditor”). The Act and the Rules also require that the Committee pre-approve all non-audit services provided by the Auditor to Dimensional Fund Advisors LP (“Dimensional”), the Funds’ investment advisor, and to affiliates of Dimensional that provide ongoing services to the Funds (with Dimensional, together the “Service Affiliates”) if the services directly impact the Funds’ operations and financial reporting.
The following policies and procedures govern the ways in which the Committee will pre-approve audit and various types of non-audit services that the Auditor provides to the Funds and to Service Affiliates. These policies and procedures do not apply in the case of audit services that the Auditor provides to Service Affiliates, nor do they apply to services that an audit firm other than the Auditor provides to such entities.
These policies and procedures comply with the requirements for pre-approval, but also provide a mechanism by which management of the Funds may request and secure pre-approval of audit and non-audit services in an orderly manner with minimal disruption to normal business operations. Pre-approval of non-audit services may be achieved through a combination of the procedures described in Sections C and D below.
| | 1. | The Committee must pre-approve all audit services and non-audit services that the Auditor provides to the Funds. |
| | 2. | The Committee must pre-approve any engagement of the Auditor to provide non-audit services to any Service Affiliate during the period of the Auditor’s engagement to provide audit services to the Funds, if the non- |
| | audit services to the Service Affiliate directly impact the Funds’ operations and financial reporting. |
| | B. | Pre-Approval of Audit Services to the Funds |
| | 1. | The Committee shall approve the engagement of an independent registered public accounting firm to certify the Funds’ financial statements for each fiscal year (the “Engagement”). The approval of the Engagement shall not be delegated to a Designated Member (as that term is defined in Section D below). In approving the Engagement, the Committee shall obtain, review and consider sufficient information concerning the proposed Auditor to enable the Committee to make a reasonable evaluation of the Auditor’s qualifications and independence. The Committee also shall consider the Auditor’s proposed fees for the Engagement, in light of the scope and nature of the audit services that the Funds will receive. |
| | 2. | The Committee shall report to the Boards of Directors/Trustees of the Funds (together, the “Board”) regarding its approval of the Engagement and of the proposed fees for the Engagement, and the basis for such approval. |
| | 3. | Unless otherwise in accordance with applicable law, the Engagement, in any event, shall require that the Auditor be selected by the vote, cast in person, of a majority of the members of the Board who are not “interested persons” of the Funds (as that term is defined in Section 2(a)(19) of the Investment Company Act of 1940) (the “Independent Directors”). |
| | C. | Pre-Approval of Non-Audit Services to the Funds and to Service Affiliates—by Types of Services |
| | 1. | The Committee may pre-approve types of non-audit services to the Funds and their Service Affiliates pursuant to this Section C. |
| | 2. | Annually, at such time as the Committee considers the Engagement of the Auditor, management of the Funds, in consultation with the Auditor, shall provide to the Committee, for its consideration and action, the following: (a) a list of those types of non-audit services, if any, that the Funds may request from the Auditor during the fiscal year; and (b) a list of those types of non-audit services directly impacting the Funds’ operations and financial reporting that Service Affiliates may request from the Auditor during the fiscal year. |
| | 3. | The lists submitted to the Committee shall describe the types of non-audit services in reasonable detail and shall include an estimated budget (or budgeted range) of fees, where possible, and such other information as the Committee may request. |
| | 4. | The Committee’s pre-approval of the types of non-audit services submitted pursuant to this Section C shall constitute authorization for management of the Funds to utilize the Auditor for the types of non-audit services so pre-approved, if needed or desired during the fiscal year. |
| | 5. | A list of the types of non-audit services pre-approved by the Committee pursuant to this Section C will be distributed to management of the Service Affiliates and the appropriate partners of the Auditor. Periodically, the Auditor will discuss with the Committee those non-audit services that have been or are being provided pursuant to this Section C. |
| | D. | Pre-Approval of Non-Audit Services to the Funds and to Service Affiliates—Project-by-Project Basis |
| | 1. | The Committee also may pre-approve non-audit services on a project-by-project basis pursuant to this Section D. |
| | 2. | Management of the Funds, in consultation with the Auditor, may submit either to the Committee or to the Designated Member, as provided in this Section D, for their consideration and action, a pre-approval request identifying one or more non-audit service projects. The request so submitted shall describe the project(s) in reasonable detail and shall include an estimated budget (or budgeted range) of fees and such other information as the Committee or the Designated Member, as appropriate, shall request. |
| | 3. | The Committee, from time to time, shall designate one or more of its members who are Independent Directors (each a “Designated Member”) to consider, on the Committee’s behalf, any non-audit services, whether to the Funds or to any Service Affiliate, that have not been pre-approved by the Committee. The Designated Member also shall review, on the Committee’s behalf, any proposed material change in the nature or extent of any non-audit services previously approved. The Funds’ management, in consultation with the Auditor, shall explain why such non-audit services or material change in non-audit services are necessary and appropriate and the anticipated costs thereof. |
| | 4. | The Designated Member will review the requested non-audit services or proposed material change in such services and will either: |
| | (a) | pre-approve, pre-approve subject to conditions, or disapprove any such requested services, or any proposed material change in services, whether to the Funds or to a Service Affiliate; or |
| | (b) | refer such matter to the Committee for its consideration and action. |
| | | In considering any requested non-audit services or proposed material change in such services, the Designated Member’s authority shall be |
| | limited to approving non-audit services or proposed material changes that do not exceed $10,000 in value. |
| | 5. | The Designated Member’s pre-approval (or pre-approval subject to conditions) of the requested non-audit services or proposed material change in services pursuant to this Section D shall constitute authorization for the management of the Funds or the Service Affiliate, as the case may be, to utilize the Auditor for the non-audit services so pre-approved. Any action by the Designated Member in approving a requested non-audit service shall be presented for ratification by the Committee not later than at its next scheduled meeting. If the Designated Member does not approve the Auditor providing the requested non-audit service, the matter may be presented to the full Committee for its consideration and action. |
| | E. | Amendment; Annual Review |
| | 1. | The Committee may amend these procedures from time to time. |
| | 2. | These procedures shall be reviewed annually by the Committee. |
| | 1. | The Funds shall maintain a written record of all decisions made by the Committee or by a Designated Member pursuant to these procedures, together with appropriate supporting materials. |
| | 2. | In connection with the approval of any non-audit service pursuant to the de minimis exception provided in the Rules, a record shall be made indicating that each of the conditions for this exception, as set forth in the Rules, has been satisfied. |
| | 3. | A copy of these Procedures (and of any amendments to these Procedures) shall be maintained and preserved permanently in an easily accessible place. The written records referred to in paragraphs 1 and 2 of this Section F shall be maintained and preserved for six years from the end of the fiscal year in which the actions recorded were taken, for at least the first two years in an easily accessible location. |
| | |
| (e)(2) | | The fees disclosed in Items 4(b), 4(c) or 4(d) were approved by the Registrant’s Audit Committee but not pursuant to paragraph (c)(7)(i)(C) of Rule 2-01 of Regulation S-X. |
| |
(f) | | The percentage of hours expended on the principal accountant’s engagement to audit the Registrant’s financial statements for the fiscal year ended October 31, 2009 that were attributed to work performed by persons other than the principal accountant’s full time, permanent employees was not greater than 50%. |
| |
(g) | | Aggregate Non-Audit Fees |
Fiscal Year Ended October 31, 2009: $530,954
Fiscal Year Ended October 31, 2008: $634,991
| | |
| (h) | | The Registrant’s Audit Committee has considered whether the provision of non-audit services that were rendered to the Registrant’s investment adviser, and any entity controlling, controlled by, or under common control with the investment adviser that provides ongoing services to the Registrant, that were not pre-approved pursuant to paragraph (c)(7)(ii) of Rule 2-01 of Regulation S-X is compatible with maintaining the principal accountant’s independence. |
| ITEM 5. | AUDIT COMMITTEE OF LISTED REGISTRANTS. |
This item is not applicable to the Registrant because it is not a listed issuer.
| (a) | The Registrant’s schedule of investments is provided below. |
DIMENSIONAL EMERGING MARKETS VALUE FUND
DEFINITIONS OF ABBREVIATIONS AND FOOTNOTES
Schedules of Investments
Investment Abbreviations
| | |
| ADR | | American Depositary Receipt |
| |
| FNMA | | Federal National Mortgage Association |
Investment Footnotes
| | |
| † | | See Note B to Financial Statements. |
| |
| †† | | Securities have generally been fair valued. See Note B to Financial Statements. |
| |
| * | | Non-Income Producing Securities. |
| |
| # | | Total or Partial Securities on Loan. |
| |
| @ | | Security purchased with cash proceeds from Securities on Loan. |
| |
| § | | Affiliated Fund. |
| |
| — | | Amounts designated as — are either zero or rounded to zero. |
1
DIMENSIONAL EMERGING MARKETS VALUE FUND
SCHEDULE OF INVESTMENTS
October 31, 2009
| | | | | |
| | | Shares | | Value†† |
COMMON STOCKS — (85.6%) | | | | | |
BRAZIL — (5.5%) | | | | | |
*Acucar Guarani SA | | 1,508,100 | | $ | 3,929,484 |
*Agra Empreendimentos Imobiliarios SA | | 2,572,015 | | | 6,906,012 |
Banco ABC Brasil SA | | 647,946 | | | 3,656,099 |
Banco Alfa de Investimento SA | | 98,700 | | | 458,314 |
*Banco Cruzeiro do Sul SA | | 10,000 | | | 58,015 |
Banco Daycoval SA | | 540,450 | | | 2,807,174 |
Banco do Estado do Rio Grande do Sul SA | | 1,011,980 | | | 6,434,024 |
Banco Industrial e Comercial SA | | 1,292,200 | | | 8,120,262 |
Banco Panamericano SA | | 1,106,800 | | | 4,146,730 |
Banco Pine SA | | 285,300 | | | 1,672,996 |
Banco Sofisa SA | | 715,300 | | | 2,249,524 |
Bematech SA | | 391,800 | | | 1,846,015 |
BM&F Bovespa SA | | 13,089,600 | | | 84,336,376 |
*BR Malls Participacoes SA | | 449,200 | | | 4,816,864 |
Brasil Brokers Participacoes SA | | 4,600 | | | 15,929 |
*Brasil Ecodiesel Industria e Comercio de Biocombustiveis e Oleos Vegetais SA | | 2,988,700 | | | 1,730,514 |
*BRF - Brasil Foods SA | | 131,400 | | | 3,167,883 |
*BRF - Brasil Foods SA ADR | | 106,991 | | | 5,175,157 |
Brookfield Incorporacoes SA | | 2,757,400 | | | 10,456,081 |
Camargo Correa Desenvolvimento Imobiliario SA | | 631,700 | | | 1,990,199 |
*Cia Providencia Industria e Comercio SA | | 229,050 | | | 734,635 |
Cia Vale do Rio Doce | | 290,000 | | | 7,392,100 |
*Construtora Tenda SA | | 1,079,700 | | | 3,217,771 |
*Cosan SA Industria e Comercio | | 1,937,900 | | | 20,516,482 |
*CR2 Empreendimentos Imobiliarios SA | | 57,300 | | | 219,559 |
Cremer SA | | 354,225 | | | 2,815,140 |
*Duratex SA | | 2,716,944 | | | 18,816,256 |
*Empresa Brasileira de Aeronautica SA ADR | | 1,195,061 | | | 24,199,985 |
Eternit SA | | 630,320 | | | 2,755,145 |
Even Construtora e Incorporadora SA | | 1,219,620 | | | 4,278,640 |
EZ Tec Empreendimentos e Participacoes SA | | 878,300 | | | 3,470,123 |
*Ferbasa-Ferro Ligas da Bahia SA | | 385,565 | | | 2,554,237 |
*Fertilizantes Heringer SA | | 120,200 | | | 682,334 |
Financeira Alfa SA | | 36,400 | | | 72,321 |
Gafisa SA | | 1,549,100 | | | 22,951,584 |
#Gafisa SA ADR | | 168,277 | | | 5,012,972 |
*General Shopping Brasil SA | | 300,930 | | | 1,216,293 |
Gerdau SA | | 1,869,600 | | | 21,385,354 |
Globex Utilidades SA | | 45,131 | | | 206,236 |
#Gol Linhas Aereas Inteligentes SA Sponsored ADR | | 96,429 | | | 990,326 |
Grendene SA | | 1,152,945 | | | 5,163,906 |
Guararapes Confeccoes SA | | 24,900 | | | 596,492 |
*Helbor Empreendimentos SA | | 25,100 | | | 156,733 |
*IdeiasNet SA | | 1,004,700 | | | 2,994,252 |
Iguatemi Empresa de Shopping Centers SA | | 358,760 | | | 5,305,233 |
Industrias Romi SA | | 626,500 | | | 4,427,750 |
*Inpar SA | | 1,245,250 | | | 2,650,822 |
#Itau Unibanco Holding SA ADR | | 808,861 | | | 15,481,596 |
JBS SA | | 3,909,700 | | | 21,572,595 |
JHSF Participacoes SA | | 1,733,800 | | | 3,484,135 |
*Kepler Weber SA | | 6,222,700 | | | 1,165,697 |
*Klabin Segall SA | | 420,300 | | | 1,133,302 |
Kroton Educacional SA | | 191,332 | | | 2,039,745 |
*Log-in Logistica Intermodal SA | | 751,000 | | | 3,546,957 |
M Dias Branco SA | | 167,100 | | | 3,602,667 |
*Magnesita Refratarios SA | | 1,148,796 | | | 8,412,505 |
*Magnesita Refratarios SA | | 193,510 | | | 1,439,022 |
*Marfrig Alimentos SA | | 458,500 | | | 5,244,536 |
2
DIMENSIONAL EMERGING MARKETS VALUE FUND
CONTINUED
| | | | | |
| | | Shares | | Value†† |
BRAZIL — (Continued) | | | | | |
*Medial Saude SA | | 542,500 | | $ | 4,434,605 |
*Metalfrio Solutions SA | | 100,200 | | | 580,177 |
*Minerva SA | | 438,400 | | | 1,537,984 |
MPX Energia SA | | 386,000 | | | 5,212,841 |
Multiplan Empreendimentos Imobiliarios SA | | 132,900 | | | 2,012,059 |
Obrascon Huarte Lain Brasil SA | | 271,800 | | | 4,320,163 |
Parana Banco SA | | 83,700 | | | 446,628 |
*Paranapanema SA | | 761,267 | | | 2,912,659 |
PDG Realty SA Empreendimentos e Participacoes | | 1,302,400 | | | 10,868,120 |
*Plascar Participacoes Industriais SA | | 1,198,400 | | | 1,421,807 |
Porto Seguro SA | | 327,900 | | | 3,460,298 |
*Profarma Distribuidora de Produtos Farmaceuticos SA | | 45,825 | | | 415,432 |
Rodobens Negocios Imobiliarios SA | | 181,150 | | | 1,891,092 |
Rossi Residencial SA | | 1,678,700 | | | 11,082,698 |
Sao Carlos Empreendimentos e Participacoes SA | | 80,800 | | | 756,812 |
*Sao Martinho SA | | 409,050 | | | 4,017,124 |
*SLC Agricola SA | | 17,000 | | | 123,524 |
*Springs Global Participacoes SA | | 71,600 | | | 204,444 |
Sul America SA | | 467,095 | | | 10,977,369 |
*TRISUL SA | | 59,000 | | | 168,801 |
Universo Online SA | | 479,100 | | | 2,814,876 |
Usinas Siderurgicas de Minas Gerais SA | | 1,025,500 | | | 25,206,715 |
*Votorantim Celulose e Papel SA | | 238,670 | | | 3,269,251 |
| | | | | |
TOTAL BRAZIL | | | | | 484,014,569 |
| | | | | |
CHILE — (2.4%) | | | | | |
*Almendral SA | | 1,120,749 | | | 108,180 |
Banco de Credito e Inversiones SA Series A | | 128,959 | | | 3,738,463 |
CAP SA | | 35,611 | | | 927,113 |
Cementos Bio-Bio SA | | 665,307 | | | 1,403,416 |
*Centros Comerciales Sudamericanos SA | | 3,680,515 | | | 11,436,319 |
Cintac SA | | 153,487 | | | 66,777 |
Compania Cervecerias Unidas SA | | 143,000 | | | 1,007,531 |
Compania de Consumidores de Gas Santiago SA | | 155,648 | | | 697,697 |
Compania General de Electricidad SA | | 883,589 | | | 5,566,636 |
*Compania SudAmericana de Vapores SA | | 9,901,043 | | | 8,127,638 |
CorpBanca SA | | 1,149,930,134 | | | 7,796,871 |
CorpBanca SA ADR | | 400 | | | 13,280 |
Cristalerias de Chile SA | | 264,624 | | | 3,000,351 |
Embotelladora Andina SA Series A ADR | | 42,895 | | | 643,425 |
Empresa Nacional de Electricidad SA | | 33,756 | | | 52,116 |
Empresa Nacional de Telecomunicaciones SA | | 38,909 | | | 517,392 |
Empresas CMPC SA | | 1,375,219 | | | 49,245,765 |
Empresas Copec SA | | 2,027,911 | | | 27,293,822 |
*Empresas Iansa SA | | 22,761,793 | | | 1,650,493 |
Enersis SA | | 31,903,095 | | | 11,339,584 |
Enersis SA Sponsored ADR | | 2,873,037 | | | 50,795,294 |
Industrias Forestales SA | | 3,436,382 | | | 809,017 |
*Inversiones Aguas Metropolitanas SA | | 2,043,020 | | | 2,414,146 |
Inversiones Frimetal SA | | 2,440,814 | | | 14,849 |
Madeco SA | | 49,034,820 | | | 3,186,178 |
Masisa SA | | 36,430,742 | | | 5,404,059 |
Minera Valparaiso SA | | 7,500 | | | 226,010 |
Parque Arauco SA | | 2,401,968 | | | 2,488,601 |
*Ripley Corp. SA | | 1,898,893 | | | 1,440,255 |
*Salfacorp SA | | 472,731 | | | 820,012 |
Sociedad Quimica y Minera de Chile SA Series B | | 102,357 | | | 3,757,299 |
*Socovesa SA | | 1,912,357 | | | 702,056 |
Soquimic Comercial SA | | 198,000 | | | 83,906 |
Vina Concha Y Toro SA Sponsored ADR | | 7,386 | | | 314,644 |
Vina San Pedro Tarapaca SA | | 86,964,000 | | | 646,968 |
3
DIMENSIONAL EMERGING MARKETS VALUE FUND
CONTINUED
| | | | | |
| | | Shares | | Value†† |
CHILE — (Continued) | | | | | |
Watt’s SA | | 163,489 | | $ | 101,613 |
| | | | | |
TOTAL CHILE | | | | | 207,837,776 |
| | | | | |
CHINA — (12.0%) | | | | | |
Agile Property Holdings, Ltd. | | 9,004,000 | | | 11,501,761 |
*Aluminum Corp. of China, Ltd. | | 28,000 | | | 30,502 |
#*Aluminum Corp. of China, Ltd. ADR | | 287,695 | | | 7,825,304 |
AMVIG Holdings, Ltd. | | 3,391,100 | | | 1,476,885 |
#Angang Steel Co., Ltd. | | 6,255,640 | | | 11,562,590 |
*Anton Oilfield Services Group | | 3,614,000 | | | 377,727 |
#*Asia Cement China Holdings Corp. | | 2,343,000 | | | 1,479,648 |
Bank of China, Ltd. | | 180,881,000 | | | 104,011,089 |
Bank of Communications Co., Ltd. | | 4,991,000 | | | 5,973,952 |
Baoye Group Co., Ltd. | | 1,326,000 | | | 1,020,322 |
#*Beijing Capital International Airport Co., Ltd. | | 11,296,000 | | | 7,596,437 |
Beijing Capital Land, Ltd. | | 5,876,000 | | | 2,463,992 |
Beijing Enterprises Holdings, Ltd. | | 5,599,500 | | | 33,375,390 |
#Beijing North Star Co., Ltd. | | 4,538,000 | | | 1,675,420 |
#Bosideng International Holdings, Ltd. | | 12,174,000 | | | 2,158,837 |
#*Brilliance China Automotive Holdings, Ltd. | | 13,708,000 | | | 2,519,780 |
#*BYD Electronic International Co., Ltd. | | 4,256,000 | | | 3,962,358 |
*Casil Energine International (Holdings), Ltd. | | 4,052,000 | | | 476,288 |
#*Catic Shenzhen Holdings, Ltd. | | 2,458,000 | | | 702,589 |
*Central China Real Estate, Ltd. | | 3,020,000 | | | 819,703 |
#Chaoda Modern Agriculture (Holdings), Ltd. | | 30,559,412 | | | 23,611,625 |
#*China Aerospace International Holdings, Ltd. | | 8,570,000 | | | 1,521,204 |
China Agri-Industries Holdings, Ltd. | | 8,878,000 | | | 8,504,235 |
#*China Aoyuan Property Group, Ltd. | | 7,628,000 | | | 1,437,186 |
China BlueChemical, Ltd. | | 8,096,878 | | | 4,297,629 |
China Citic Bank | | 26,638,000 | | | 19,872,597 |
China Coal Energy Co. | | 2,704,000 | | | 3,741,607 |
*China Communications Services Corp., Ltd. | | 10,345,382 | | | 5,377,903 |
China Construction Bank Corp. | | 41,385,000 | | | 35,679,319 |
China COSCO Holdings Co., Ltd. | | 1,981,500 | | | 2,439,727 |
China Everbright, Ltd. | | 7,443,600 | | | 17,585,039 |
China Foods, Ltd. | | 13,581,200 | | | 9,955,791 |
#*China Grand Forestry Green Resources Group, Ltd. | | 25,060,000 | | | 985,472 |
#China Green (Holdings), Ltd. | | 3,996,800 | | | 3,506,272 |
China Haidian Holdings, Ltd. | | 11,853,000 | | | 1,177,308 |
#China Huiyuan Juice Group, Ltd. | | 2,354,000 | | | 1,525,246 |
China Merchants Holdings (International) Co., Ltd. | | 2,197,167 | | | 7,021,337 |
*China Mining Resources Group, Ltd. | | 20,710,000 | | | 752,827 |
China Mobile, Ltd. | | 4,500 | | | 42,185 |
*China Molybdenum Co., Ltd. | | 1,686,000 | | | 1,386,572 |
#*China Nickel Resources Holding Co., Ltd. | | 3,018,000 | | | 539,558 |
*China Oil & Gas Group, Ltd. | | 3,680,000 | | | 373,209 |
China Oilfield Services, Ltd. | | 264,000 | | | 285,256 |
China Petroleum and Chemical Corp. (Sinopec) | | 46,000 | | | 38,896 |
#China Petroleum and Chemical Corp. (Sinopec) ADR | | 128,120 | | | 10,808,203 |
#China Pharmaceutical Group, Ltd. | | 12,982,000 | | | 7,287,800 |
#*China Properties Group, Ltd. | | 3,630,000 | | | 1,105,855 |
*China Railway Construction Corp., Ltd. | | 2,842,500 | | | 3,760,594 |
#China Rare Earth Holdings, Ltd. | | 14,431,000 | | | 3,122,132 |
China Resources Enterprise, Ltd. | | 6,590,000 | | | 22,112,860 |
China Resources Land, Ltd. | | 3,636,000 | | | 8,767,969 |
*China Resources Microelectronics, Ltd. | | 17,050,000 | | | 446,710 |
China Shineway Pharmaceutical Group, Ltd. | | 160,000 | | | 225,148 |
#*China Shipping Container Lines Co., Ltd. | | 32,569,700 | | | 11,655,941 |
#China Shipping Development Co., Ltd. | | 894,000 | | | 1,263,796 |
China Starch Holdings, Ltd. | | 1,315,000 | | | 127,419 |
China Travel International Investment Hong Kong, Ltd. | | 21,415,000 | | | 4,371,548 |
4
DIMENSIONAL EMERGING MARKETS VALUE FUND
CONTINUED
| | | | | |
| | | Shares | | Value†† |
CHINA — (Continued) | | | | | |
China Unicom Hong Kong, Ltd. | | 2,354,000 | | $ | 2,987,211 |
#China Unicom Hong Kong, Ltd. ADR | | 3,936,592 | | | 49,797,889 |
China Wireless Technologies, Ltd. | | 1,300,000 | | | 218,764 |
*China Zenith Chemical Group, Ltd. | | 13,420,000 | | | 319,743 |
Chongqing Iron and Steel Co., Ltd. | | 2,686,000 | | | 985,150 |
*Chongqing Machinery & Electric Co., Ltd. | | 4,172,000 | | | 740,029 |
*CIMC Enric Holdings, Ltd. | | 132,000 | | | 65,369 |
CITIC Pacific, Ltd. | | 5,812,000 | | | 14,941,162 |
#*CITIC Resources Holdings, Ltd. | | 14,486,000 | | | 4,052,987 |
*Clear Media, Ltd. | | 555,000 | | | 246,015 |
CNPC Hong Kong, Ltd. | | 40,880,000 | | | 42,741,026 |
*Coastal Greenland, Ltd. | | 4,978,000 | | | 408,641 |
Comba Telecom Systems Holdings, Ltd. | | 1,671,735 | | | 1,709,006 |
#COSCO International Holdings, Ltd. | | 3,118,000 | | | 1,315,124 |
COSCO Pacific, Ltd. | | 16,806,000 | | | 23,257,719 |
Coslight Technology International Group, Ltd. | | 264,000 | | | 526,576 |
#Country Garden Holdings Co. | | 19,151,000 | | | 7,342,881 |
Dachan Food Asia, Ltd. | | 847,000 | | | 152,812 |
#Dalian Port (PDA) Co., Ltd. | | 13,298,000 | | | 4,826,560 |
Denway Motors, Ltd. | | 57,266,000 | | | 27,411,466 |
Digital China Holdings, Ltd. | | 1,927,000 | | | 1,973,845 |
Dongfeng Motor Corp. | | 28,888,000 | | | 34,382,337 |
*Dongyue Group | | 448,000 | | | 45,921 |
#Dynasty Fine Wines Group, Ltd. | | 9,454,600 | | | 2,447,059 |
First Tractor Co., Ltd. | | 968,000 | | | 395,822 |
#Fosun International, Ltd. | | 8,032,000 | | | 5,450,543 |
Franshion Properties China, Ltd. | | 18,304,000 | | | 5,094,856 |
#*FU JI Food & Catering Services | | 1,275,000 | | | 1,250,290 |
*Fufeng Group, Ltd. | | 2,090,000 | | | 1,071,230 |
*Fushan International Energy Group, Ltd. | | 1,880,000 | | | 1,443,132 |
#Geely Automobile Holdings, Ltd. | | 41,421,900 | | | 14,977,182 |
#Global Bio-Chem Technology Group Co., Ltd. | | 24,527,400 | | | 6,001,247 |
*Goldbond Group Holdings, Ltd. | | 530,000 | | | 33,933 |
Goldlion Holdings, Ltd. | | 655,000 | | | 166,595 |
*GOME Electrical Appliances Holdings, Ltd. | | 1,721,040 | | | 504,144 |
Great Wall Motor Co., Ltd. | | 3,555,000 | | | 3,992,805 |
Great Wall Technology Co., Ltd. | | 1,178,000 | | | 370,403 |
#Greentown China Holdings, Ltd. | | 3,766,000 | | | 5,445,428 |
#Guangshen Railway Co., Ltd. Sponsored ADR | | 417,917 | | | 8,379,236 |
Guangzhou Investment Co., Ltd. | | 23,938,000 | | | 6,384,641 |
Guangzhou Pharmaceutical Co., Ltd. | | 3,912,000 | | | 1,877,314 |
Guangzhou R&F Properties Co., Ltd. | | 975,200 | | | 1,827,358 |
#Hainan Meilan International Airport Co., Ltd. | | 1,891,000 | | | 1,516,523 |
Haitian International Holdings, Ltd. | | 724,000 | | | 321,206 |
#Harbin Power Equipment Co., Ltd. | | 6,500,000 | | | 6,038,107 |
Hengdeli Holdings, Ltd. | | 814,000 | | | 265,044 |
*Hidili Industry International Development, Ltd. | | 4,722,000 | | | 4,844,072 |
#HKC (Holdings), Ltd. | | 15,023,800 | | | 1,178,752 |
#*Honghua Group, Ltd. | | 7,280,000 | | | 1,506,462 |
#Hopson Development Holdings, Ltd. | | 4,790,000 | | | 8,334,276 |
*Hua Han Bio-Pharmaceutical Holdings, Ltd. | | 796,000 | | | 141,207 |
#*Hunan Non-Ferrous Metal Corp., Ltd. | | 8,706,000 | | | 2,658,091 |
*Industrial & Commercial Bank of China, Ltd. | | 19,791,000 | | | 15,746,016 |
#Intime Department Store Group Co., Ltd. | | 2,341,000 | | | 1,638,915 |
#Ju Teng International Holdings, Ltd. | | 4,064,000 | | | 3,218,112 |
*Kai Yuan Holdings, Ltd. | | 9,600,000 | | | 392,197 |
*Kasen International Holdings, Ltd. | | 172,000 | | | 42,909 |
Kingboard Chemical Holdings, Ltd. | | 1,918,500 | | | 7,721,790 |
#Kingboard Laminates Holdings, Ltd. | | 2,197,000 | | | 1,528,117 |
*Kingway Brewery Holdings, Ltd. | | 426,000 | | | 70,974 |
KWG Property Holding, Ltd. | | 7,797,000 | | | 5,583,362 |
5
DIMENSIONAL EMERGING MARKETS VALUE FUND
CONTINUED
| | | | | |
| | | Shares | | Value†† |
CHINA — (Continued) | | | | | |
*Lai Fung Holdings, Ltd. | | 9,071,000 | | $ | 301,535 |
Lenovo Group, Ltd. | | 12,376,000 | | | 6,978,287 |
Lianhua Supermarket Holdings Co., Ltd. | | 1,352,000 | | | 2,902,955 |
#*Lingbao Gold Co., Ltd. | | 1,520,000 | | | 554,612 |
#Lonking Holdings, Ltd. | | 3,010,000 | | | 1,733,744 |
#*Maanshan Iron & Steel Co., Ltd. | | 23,102,000 | | | 13,907,116 |
*Media China Corp., Ltd. | | 19,100,000 | | | 140,734 |
*Min Xin Holdings, Ltd. | | 668,000 | | | 293,779 |
*Mingyuan Medicare Development Co., Ltd. | | 4,861,900 | | | 606,358 |
*Minmetals Resources, Ltd. | | 3,732,000 | | | 988,297 |
Minth Group, Ltd. | | 2,270,000 | | | 2,357,325 |
*Nan Hai Corp., Ltd. | | 18,400,000 | | | 260,942 |
*Nanjing Panda Electronics Co., Ltd. | | 70,000 | | | 18,488 |
#*Neo-China Land Group (Holdings), Ltd. | | 9,446,000 | | | 6,203,729 |
NetDragon Websoft, Inc. | | 1,191,000 | | | 735,475 |
#*New World China Land, Ltd. | | 5,693,600 | | | 2,269,377 |
#Nine Dragons Paper Holdings, Ltd. | | 15,852,000 | | | 22,586,912 |
#*Oriental Ginza Holdings, Ltd. | | 804,000 | | | 291,764 |
#PetroChina Co., Ltd. ADR | | 32,000 | | | 3,841,280 |
#*PICC Property & Casualty Co., Ltd. | | 5,992,000 | | | 4,421,028 |
#Poly Hong Kong Investment, Ltd. | | 6,160,000 | | | 7,048,405 |
Qin Jia Yuan Media Services Co., Ltd. | | 2,093,450 | | | 444,517 |
Qingling Motors Co., Ltd. | | 12,306,000 | | | 2,586,039 |
Qunxing Paper Holdings Co., Ltd. | | 1,301,000 | | | 523,394 |
*Regent Manner International, Ltd. | | 1,106,000 | | | 384,354 |
*Scud Group, Ltd. | | 752,000 | | | 90,815 |
*Semiconductor Manufacturing International Corp. | | 48,688,000 | | | 2,409,450 |
#*Semiconductor Manufacturing International Corp. ADR | | 892,564 | | | 2,160,005 |
*Shandong Chenming Paper Holdings, Ltd. | | 1,687,500 | | | 1,180,733 |
Shandong Molong Petroleum Machinery Co., Ltd. | | 2,204,000 | | | 306,905 |
#Shanghai Forte Land Co., Ltd. | | 5,026,000 | | | 1,531,235 |
Shanghai Industrial Holdings, Ltd. | | 7,759,000 | | | 36,449,823 |
Shanghai Jin Jiang International Hotels Group Co., Ltd. | | 5,406,000 | | | 1,650,201 |
Shanghai Prime Machinery Co., Ltd. | | 3,728,000 | | | 668,180 |
*Shanghai Zendai Property, Ltd. | | 11,010,000 | | | 456,494 |
Shenzhen International Holdings, Ltd. | | 39,207,500 | | | 2,741,529 |
Shenzhen Investment, Ltd. | | 12,964,000 | | | 5,122,564 |
Shenzhou International Group | | 1,192,000 | | | 1,271,155 |
#Shimao Property Holdings, Ltd. | | 13,759,500 | | | 25,594,065 |
#Shougang Concord International Enterprises Co., Ltd. | | 18,544,000 | | | 3,192,986 |
#Shui On Land, Ltd. | | 18,442,338 | | | 11,178,618 |
Sichuan Xinhua Winshare Chainstore Co., Ltd. | | 2,235,000 | | | 913,728 |
#Sino Biopharmaceutical, Ltd. | | 1,958,666 | | | 679,554 |
#*Sino Union Petroleum & Chemical International, Ltd. | | 10,440,000 | | | 889,608 |
SinoCom Software Group, Ltd. | | 1,602,000 | | | 178,245 |
#Sinofert Holdings, Ltd. | | 12,038,000 | | | 5,942,464 |
#Sinolink Worldwide Holdings, Ltd. | | 9,384,000 | | | 1,800,137 |
#Sino-Ocean Land Holdings, Ltd. | | 15,008,239 | | | 14,576,566 |
Sinopec Kantons Holdings, Ltd. | | 9,174,300 | | | 3,277,096 |
*Sinopec Shanghai Petrochemical Co., Ltd. Sponsored ADR | | 142,846 | | | 5,622,419 |
Sinotrans, Ltd. | | 26,720,000 | | | 7,003,430 |
#*Sinotruk Hong Kong, Ltd. | | 2,666,500 | | | 3,170,615 |
#Skyworth Digital Holdings, Ltd. | | 6,596,000 | | | 3,712,874 |
#*Soho China, Ltd. | | 13,865,000 | | | 7,450,604 |
*Solargiga Energy Holdings, Ltd. | | 46,000 | | | 10,644 |
SPG Land Holdings, Ltd. | | 1,723,000 | | | 972,926 |
#*SRE Group, Ltd. | | 15,566,000 | | | 1,773,453 |
#*TCL Multimedia Technology Holdings, Ltd. | | 2,484,200 | | | 1,945,655 |
#Tian An China Investments Co., Ltd. | | 7,396,000 | | | 4,521,953 |
*Tiangong International Co., Ltd. | | 237,000 | | | 82,906 |
Tianjin Capital Environmental Protection Group Co., Ltd. | | 782,000 | | | 219,660 |
6
DIMENSIONAL EMERGING MARKETS VALUE FUND
CONTINUED
| | | | | |
| | | Shares | | Value†† |
CHINA — (Continued) | | | | | |
#*Tianjin Port Development Holdings, Ltd. | | 3,092,000 | | $ | 1,147,028 |
*Tomson Group, Ltd. | | 1,510,000 | | | 682,272 |
TPV Technology, Ltd. | | 6,112,000 | | | 3,955,966 |
#Travelsky Technology, Ltd. | | 8,035,000 | | | 6,856,948 |
*United Energy Group, Ltd. | | 704,000 | | | 37,026 |
#Vinda International Holdings, Ltd. | | 1,240,000 | | | 796,432 |
#Weiqiao Textile Co., Ltd. | | 1,990,500 | | | 1,388,822 |
Wuyi International Pharmaceutical Co., Ltd. | | 1,207,500 | | | 117,444 |
Xiamen International Port Co., Ltd. | | 4,892,000 | | | 908,618 |
Xingda International Holdings, Ltd. | | 2,936,000 | | | 1,461,314 |
#Xinjiang Xinxin Mining Industry Co., Ltd. | | 3,876,000 | | | 2,058,050 |
#*Xiwang Sugar Holdings Co., Ltd. | | 683,736 | | | 159,959 |
#Yanzhou Coal Mining Co., Ltd. Sponsored ADR | | 577,900 | | | 8,841,870 |
*Yip’s Chemical Holdings, Ltd. | | 376,000 | | | 260,740 |
*Zhejiang Glass Co., Ltd. | | 437,000 | | | 114,932 |
Zhong An Real Estate, Ltd. | | 2,563,000 | | | 972,261 |
| | | | | |
TOTAL CHINA | | | | | 1,050,921,555 |
| | | | | |
CZECH REPUBLIC — (0.4%) | | | | | |
*Central European Media Enterprises, Ltd. | | 68,500 | | | 1,727,859 |
Komercni Banka A.S. | | 30,022 | | | 5,887,338 |
Pegas Nonwovens SA | | 102,342 | | | 2,404,107 |
Telefonica 02 Czech Republic A.S. | | 559,120 | | | 13,173,477 |
*Unipetrol A.S. | | 1,250,841 | | | 9,338,596 |
| | | | | |
TOTAL CZECH REPUBLIC | | | | | 32,531,377 |
| | | | | |
HUNGARY — (2.2%) | | | | | |
*Danubius Hotel & Spa NYRT | | 136,180 | | | 2,509,491 |
Egis Gyogyszergyar NYRT | | 57,430 | | | 6,054,336 |
*FHB Mortgage Bank NYRT | | 5,300 | | | 34,804 |
*Fotex Holding SE Co., Ltd. | | 913,849 | | | 2,034,017 |
#*MOL Hungarian Oil & Gas NYRT | | 818,138 | | | 68,350,657 |
#*OTP Bank NYRT | | 3,901,786 | | | 109,716,230 |
*Pannonplast NYRT | | 520,975 | | | 2,150,578 |
Tisza Chemical Group NYRT | | 237,913 | | | 3,811,516 |
| | | | | |
TOTAL HUNGARY | | | | | 194,661,629 |
| | | | | |
INDIA — (10.7%) | | | | | |
*3i Infotech, Ltd. | | 422,692 | | | 735,261 |
*ACC, Ltd. | | 8,174 | | | 128,695 |
Adani Enterprises, Ltd. | | 10,670 | | | 160,959 |
Aditya Birla Nuvo, Ltd. | | 321,897 | | | 5,348,122 |
Agro Tech Foods, Ltd. | | 67,700 | | | 349,570 |
Alembic, Ltd. | | 619,600 | | | 585,733 |
Allahabad Bank, Ltd. | | 1,091,889 | | | 2,744,771 |
Alok Industries, Ltd. | | 5,246,255 | | | 2,121,774 |
Ambuja Cements, Ltd. | | 5,354,209 | | | 10,029,802 |
Amtek Auto, Ltd. | | 716,113 | | | 2,623,167 |
*Anant Raj Industries, Ltd. | | 15,014 | | | 41,121 |
Andhra Bank | | 1,052,102 | | | 2,489,072 |
Apollo Hospitals Enterprise, Ltd. | | 214,765 | | | 2,417,346 |
Apollo Tyres, Ltd. | | 1,676,970 | | | 1,689,817 |
*Arvind Mills, Ltd. | | 1,526,154 | | | 1,091,670 |
*Ashapura Minechem, Ltd. | | 36,874 | | | 28,451 |
Ashok Leyland, Ltd. | | 6,240,668 | | | 5,939,778 |
*Asian Hotels, Ltd. | | 2,100 | | | 18,720 |
Aurobindo Pharma, Ltd. | | 308,107 | | | 4,861,840 |
Avaya GlobalConnect, Ltd. | | 5,325 | | | 17,743 |
Axis Bank, Ltd. | | 1,200,257 | | | 22,860,893 |
Bajaj Auto Finance, Ltd. | | 90,482 | | | 484,594 |
7
DIMENSIONAL EMERGING MARKETS VALUE FUND
CONTINUED
| | | | | |
| | | Shares | | Value†† |
INDIA — (Continued) | | | | | |
Bajaj Finserv, Ltd. | | 66,284 | | $ | 429,805 |
Bajaj Hindusthan, Ltd. | | 838,582 | | | 3,460,397 |
Bajaj Holdings & Investment, Ltd. | | 299,410 | | | 3,074,279 |
Ballarpur Industries, Ltd. | | 2,658,186 | | | 1,238,022 |
Balmer Lawrie & Co., Ltd. | | 48,430 | | | 487,425 |
Balrampur Chini Mills, Ltd. | | 1,820,136 | | | 5,701,237 |
*Bank of India, Ltd. | | 30,000 | | | 210,223 |
Bank of Maharashtra, Ltd. | | 933,918 | | | 848,155 |
Bank of Rajasthan, Ltd. | | 527,425 | | | 874,993 |
Bata India, Ltd. | | 43,586 | | | 155,314 |
BEML, Ltd. | | 133,202 | | | 2,610,897 |
Bengal & Assam Co., Ltd. | | 9,237 | | | 27,535 |
Bharat Forge, Ltd. | �� | 904,484 | | | 4,734,304 |
Bharati Shipyard, Ltd. | | 30,210 | | | 99,967 |
Bhushan Steel & Strips, Ltd. | | 189,156 | | | 4,597,071 |
Biocon, Ltd. | | 558,142 | | | 2,900,960 |
Birla Corp., Ltd. | | 75,445 | | | 475,150 |
Blue Star Infotech, Ltd. | | 10,194 | | | 18,886 |
Bombay Dyeing & Manufacturing Co., Ltd. | | 6,132 | | | 49,419 |
Bombay Rayon Fashions, Ltd. | | 252,000 | | | 992,058 |
Cadila Healthcare, Ltd. | | 19,500 | | | 232,176 |
*Cairn India, Ltd. | | 2,477,483 | | | 13,723,045 |
*Canara Bank, Ltd. | | 48,691 | | | 349,673 |
Century Enka, Ltd. | | 54,052 | | | 212,348 |
Century Textiles & Industries, Ltd. | | 345,830 | | | 3,215,759 |
Chambal Fertilizers & Chemicals, Ltd. | | 1,344,619 | | | 1,337,570 |
City Union Bank, Ltd. | | 839,100 | | | 476,436 |
Clariant Chemicals (India), Ltd. | | 2,398 | | | 18,851 |
Coromandel International, Ltd. | | 136,536 | | | 612,780 |
Cranes Software International, Ltd. | | 313,759 | | | 255,143 |
Cummins India, Ltd. | | 50,000 | | | 395,149 |
Dalmia Cement (Bharat), Ltd. | | 28,800 | | | 87,383 |
DCM Shriram Consolidated, Ltd. | | 210,988 | | | 227,098 |
Deepak Fertilizers & Petrochemicals Corp., Ltd. | | 386,267 | | | 711,955 |
*Dishman Pharmaceuticals & Chemicals, Ltd. | | 106,182 | | | 523,779 |
DLF, Ltd. | | 89,326 | | | 694,195 |
Dr. Reddy’s Laboratories, Ltd. | | 617,398 | | | 13,192,091 |
E.I.D. - Parry (India), Ltd. | | 357,212 | | | 2,316,109 |
Edelweiss Capital, Ltd. | | 42,687 | | | 418,380 |
Eicher Motors, Ltd. | | 23,810 | | | 250,280 |
EIH, Ltd. | | 881,287 | | | 2,283,707 |
Elder Pharmaceuticals, Ltd. | | 97,715 | | | 551,311 |
Electrosteel Casings, Ltd. | | 513,690 | | | 439,999 |
Elgi Equipments, Ltd. | | 47,790 | | | 72,448 |
*Escorts, Ltd. | | 388,991 | | | 864,340 |
Essel Propack, Ltd. | | 442,637 | | | 392,125 |
Everest Industries, Ltd. | | 9,843 | | | 25,146 |
FAG Bearings (India), Ltd. | | 500 | | | 5,094 |
FDC, Ltd. | | 179,858 | | | 216,184 |
Federal Bank, Ltd. | | 1,334,943 | | | 6,716,193 |
Financial Technologies (India), Ltd. | | 87,301 | | | 2,163,145 |
Finolex Cables, Ltd. | | 537,055 | | | 578,772 |
Finolex Industries, Ltd. | | 695,629 | | | 700,407 |
*Firstsource Solutions, Ltd. | | 462,206 | | | 332,739 |
*Fortis Healthcare, Ltd. | | 659,766 | | | 1,412,753 |
GAIL India, Ltd. | | 700,109 | | | 5,144,797 |
*Gammon India, Ltd. | | 377,404 | | | 1,818,505 |
Geodesic, Ltd. | | 288,760 | | | 679,552 |
Gitanjali Gems, Ltd. | | 513,757 | | | 1,242,339 |
GlaxoSmithKline Consumer Healthcare, Ltd. | | 109 | | | 2,790 |
Godfrey Phillips India, Ltd. | | 784 | | | 28,919 |
8
DIMENSIONAL EMERGING MARKETS VALUE FUND
CONTINUED
| | | | | |
| | | Shares | | Value†† |
INDIA — (Continued) | | | | | |
Godrej Industries, Ltd. | | 106,644 | | $ | 399,757 |
*Goetze (India), Ltd. | | 9,195 | | | 22,691 |
Graphite India, Ltd. | | 89,000 | | | 117,933 |
Great Eastern Shipping Co., Ltd. | | 645,773 | | | 3,256,543 |
Great Offshore, Ltd. | | 162,012 | | | 1,760,616 |
*GTL Infrastructure, Ltd. | | 691,128 | | | 439,806 |
GTL, Ltd. | | 525,227 | | | 3,704,349 |
Gujarat Alkalies & Chemicals, Ltd. | | 421,803 | | | 1,017,717 |
Gujarat Fluorochemicals, Ltd. | | 101,490 | | | 295,571 |
Gujarat Narmada Valley Fertilizers Co., Ltd. | | 647,256 | | | 1,264,482 |
Gujarat State Fertilizers & Chemicals, Ltd. | | 445,889 | | | 1,671,866 |
*Gujarat State Petronet, Ltd. | | 605,003 | | | 1,031,666 |
H.E.G., Ltd. | | 129,459 | | | 699,709 |
HCL Infosystems, Ltd. | | 496,002 | | | 1,604,786 |
HCL Technologies, Ltd. | | 1,246,145 | | | 7,980,522 |
HDFC Bank, Ltd. | | 188,976 | | | 6,438,069 |
Hexaware Technologies, Ltd. | | 1,162,865 | | | 1,875,833 |
Hindalco Industries, Ltd. | | 6,208,588 | | | 15,877,505 |
Hinduja Global Solutions, Ltd. | | 65,909 | | | 725,006 |
Hinduja Ventures, Ltd. | | 65,909 | | | 420,539 |
Hindustan Construction Co., Ltd. | | 803,483 | | | 2,115,384 |
Hotel Leelaventure, Ltd. | | 1,357,335 | | | 973,665 |
*Housing Development & Infrastructure, Ltd. | | 1,047,863 | | | 6,943,901 |
ICI India, Ltd. | | 47,767 | | | 581,622 |
ICICI Bank, Ltd. Sponsored ADR | | 3,310,395 | | | 104,111,923 |
ICSA (India), Ltd. | | 290,435 | | | 1,096,681 |
IDBI Bank, Ltd. | | 2,354,413 | | | 5,643,301 |
India Cements, Ltd. | | 2,016,703 | | | 4,681,611 |
India Infoline, Ltd. | | 1,395,726 | | | 3,763,033 |
Indiabulls Financial Services, Ltd. | | 1,556,730 | | | 5,457,098 |
*Indiabulls Real Estate, Ltd. | | 2,924,244 | | | 15,278,584 |
Indiabulls Securities, Ltd. | | 6,234 | | | 6,022 |
Indian Hotels Co., Ltd. | | 3,531,468 | | | 5,486,119 |
Indian Oil Corp., Ltd. | | 17,596 | | | 117,100 |
Indian Overseas Bank | | 995,564 | | | 2,120,541 |
*Indo Rama Synthetics (India), Ltd. | | 202,314 | | | 132,436 |
IndusInd Bank, Ltd. | | 1,771,067 | | | 4,340,303 |
INEIS ABS India, Ltd. | | 28,114 | | | 97,210 |
*Infotech Enterprises, Ltd. | | 10,576 | | | 53,122 |
Infrastructure Development Finance Co., Ltd. | | 5,874,988 | | | 18,129,843 |
ING Vysya Bank, Ltd. | | 190,329 | | | 1,136,997 |
Ipca Laboratories, Ltd. | | 94,786 | | | 1,815,838 |
IVRCL Infrastructures & Projects, Ltd. | | 1,432,050 | | | 10,430,086 |
J.B. Chemicals & Pharmaceuticals, Ltd. | | 377,474 | | | 377,835 |
Jammu & Kashmir Bank, Ltd. | | 233,400 | | | 2,772,958 |
JBF Industries, Ltd. | | 35,983 | | | 65,995 |
*Jet Airways (India), Ltd. | | 244,572 | | | 1,942,729 |
Jindal Poly Films, Ltd. | | 21,594 | | | 133,980 |
Jindal Saw, Ltd. | | 233,794 | | | 3,414,962 |
JK Tyre and Industries, Ltd. | | 158,673 | | | 494,910 |
*JSL, Ltd. | | 726,612 | | | 1,513,346 |
JSW Steel, Ltd. | | 1,091,845 | | | 17,301,667 |
Jubilant Organosys, Ltd. | | 235,268 | | | 1,161,649 |
*Kalpataru Power Transmission, Ltd. | | 1,000 | | | 19,574 |
Karnataka Bank, Ltd. | | 466,505 | | | 1,280,787 |
Karur Vysya Bank, Ltd. | | 135,412 | | | 1,115,303 |
Kesoram Industries, Ltd. | | 204,223 | | | 1,458,313 |
Kirloskar Oil Engines, Ltd. | | 458,360 | | | 1,218,254 |
Kotak Mahindra Bank, Ltd. | | 74,000 | | | 1,106,062 |
KS Oils, Ltd. | | 1,831,255 | | | 2,461,956 |
Lakshmi Machine Works, Ltd. | | 3,835 | | | 109,115 |
9
DIMENSIONAL EMERGING MARKETS VALUE FUND
CONTINUED
| | | | | |
| | | Shares | | Value†† |
INDIA — (Continued) | | | | | |
*Landmark Property Development Co., Ltd. | | 246,234 | | $ | 26,420 |
LIC Housing Finance, Ltd. | | 518,887 | | | 8,112,246 |
*Madras Cements, Ltd. | | 16,539 | | | 37,425 |
Mahanagar Telephone Nigam, Ltd. ADR | | 7,294 | | | 21,226 |
Maharashtra Scooters, Ltd. | | 4,450 | | | 16,634 |
Maharashtra Seamless, Ltd. | | 70,749 | | | 488,761 |
*Mahindra & Mahindra Financial Services, Ltd. | | 5,034 | | | 26,610 |
Mahindra & Mahindra, Ltd. | | 1,184,703 | | | 22,923,861 |
Mahindra Lifespace Developers, Ltd. | | 92,412 | | | 625,343 |
Maruti Suzuki India, Ltd. | | 532,739 | | | 15,740,701 |
Mastek, Ltd. | | 83,250 | | | 514,909 |
*MAX India, Ltd. | | 3,100 | | | 11,604 |
McLeod Russel India, Ltd. | | 637,181 | | | 2,753,197 |
Mercator Lines, Ltd. | | 1,524,731 | | | 1,537,689 |
Merck, Ltd. | | 29,241 | | | 322,705 |
Monnet Ispat, Ltd. | | 85,565 | | | 671,811 |
Monsanto India, Ltd. | | 252 | | | 8,042 |
Moser Baer (India), Ltd. | | 1,516,872 | | | 2,406,261 |
MRF, Ltd. | | 17,453 | | | 1,945,670 |
*Mukand, Ltd. | | 324,653 | | | 314,753 |
Nagarjuna Construction Co., Ltd. | | 1,407,751 | | | 4,352,359 |
*Nagarjuna Fertilizers & Chemicals, Ltd. | | 1,310,174 | | | 752,510 |
Nahar Capital & Financial Services, Ltd. | | 50,449 | | | 51,814 |
Nahar Spinning Mills, Ltd. | | 33,942 | | | 40,949 |
National Aluminium Co., Ltd. | | 32,056 | | | 243,388 |
Navneet Publications (India), Ltd. | | 296,850 | | | 242,368 |
NIIT Technologies, Ltd. | | 342,060 | | | 977,740 |
NIIT, Ltd. | | 1,018,749 | | | 1,278,874 |
Nirma, Ltd. | | 374,728 | | | 1,390,932 |
NOCIL, Ltd. | | 981,740 | | | 469,990 |
OCL India, Ltd. | | 82,078 | | | 189,059 |
*Oracle Financial Services Software, Ltd. | | 400 | | | 17,873 |
Orchid Chemicals & Pharmaceuticals, Ltd. | | 445,419 | | | 1,438,144 |
Orient Paper & Industries, Ltd. | | 53,000 | | | 48,142 |
Oriental Bank of Commerce | | 377,448 | | | 1,908,476 |
*Panacea Biotec, Ltd. | | 54,056 | | | 169,475 |
*Parsvnath Developers, Ltd. | | 365,608 | | | 806,161 |
Patel Engineering, Ltd. | | 17,847 | | | 169,840 |
Patni Computer Systems, Ltd. | | 690,149 | | | 6,460,881 |
Patni Computer Systems, Ltd. ADR | | 55,441 | | | 1,067,239 |
Petronet LNG, Ltd. | | 2,943,666 | | | 4,008,987 |
Polaris Software Lab, Ltd. | | 396,842 | | | 1,306,593 |
Power Finance Corp., Ltd. | | 129,000 | | | 600,694 |
Prism Cements, Ltd. | | 358,139 | | | 301,516 |
PSL, Ltd. | | 62,792 | | | 184,489 |
PTC India, Ltd. | | 1,726,945 | | | 3,686,813 |
Punj Lloyd, Ltd. | | 1,229,016 | | | 5,217,930 |
Rain Commodities, Ltd. | | 215,083 | | | 675,750 |
Rallis India, Ltd. | | 8,213 | | | 155,313 |
*Ranbaxy Laboratories, Ltd. | | 996,377 | | | 8,207,098 |
*Raymond, Ltd. | | 340,181 | | | 1,303,985 |
REI Agro, Ltd. | | 1,058,470 | | | 999,277 |
Rei Six Ten Retail, Ltd. | | 439,400 | | | 1,362,909 |
Reliance Capital, Ltd. | | 923,214 | | | 14,437,643 |
Reliance Communications, Ltd. | | 5,398,403 | | | 19,909,440 |
*Reliance Industries, Ltd. | | 4,193,665 | | | 169,675,160 |
*Reliance Media World, Ltd. | | 20,606 | | | 4,431 |
*Reliance MediaWorks, Ltd. | | 2,940 | | | 15,570 |
*Reliance Power, Ltd. | | 3,070,011 | | | 8,961,783 |
Rolta India, Ltd. | | 1,217,326 | | | 4,421,891 |
Ruchi Soya Industries, Ltd. | | 1,172,211 | | | 1,957,613 |
10
DIMENSIONAL EMERGING MARKETS VALUE FUND
CONTINUED
| | | | | |
| | | Shares | | Value†† |
INDIA — (Continued) | | | | | |
*S.Kumars Nationwide, Ltd. | | 1,242,979 | | $ | 1,095,745 |
*SEAMEC, Ltd. | | 51,335 | | | 219,267 |
Shriram Transport Finance Co., Ltd. | | 151,058 | | | 1,253,027 |
SKF India, Ltd. | | 15,701 | | | 89,474 |
*Sona Koyo Steering Systems, Ltd. | | 118,568 | | | 39,033 |
South India Bank, Ltd. | | 600,569 | | | 1,668,852 |
SREI Infrastructure Finance, Ltd. | | 818,844 | | | 1,228,409 |
SRF, Ltd. | | 266,306 | | | 1,036,654 |
State Bank of India, Ltd. | | 431,410 | | | 19,905,095 |
#Sterlite Industries (India), Ltd. ADR | | 720,522 | | | 11,362,632 |
Sterlite Industries (India), Ltd. Series A | | 1,436,564 | | | 23,230,515 |
Sterlite Technologies, Ltd. | | 274,890 | | | 1,612,904 |
*Strides Arcolab, Ltd. | | 126,300 | | | 417,794 |
Sundram Fastners, Ltd. | | 38,520 | | | 38,129 |
*Suzlon Energy, Ltd. | | 3,384,835 | | | 4,731,835 |
Syndicate Bank | | 1,422,728 | | | 2,594,753 |
Tanla Solutions, Ltd. | | 617,458 | | | 769,668 |
Tata Chemicals, Ltd. | | 763,975 | | | 4,227,110 |
#Tata Communications, Ltd. ADR | | 20,500 | | | 312,215 |
Tata Investment Corp., Ltd. | | 57,960 | | | 535,026 |
*Tata Metaliks, Ltd. | | 4,758 | | | 9,646 |
Tata Motors, Ltd. | | 1,420,249 | | | 16,745,773 |
Tata Steel, Ltd. | | 2,571,275 | | | 25,415,812 |
Tata Tea, Ltd. | | 270,866 | | | 4,918,099 |
*Teledata Marine Solutions | | 267,258 | | | 194,902 |
Trent, Ltd. | | 14,497 | | | 205,196 |
Triveni Engineering & Industries, Ltd. | | 240,000 | | | 516,309 |
Tube Investments of India, Ltd. | | 642,055 | | | 805,050 |
TVS Motor Co., Ltd. | | 1,082,101 | | | 1,230,668 |
*Ucal Fuel Systems, Ltd. | | 22,332 | | | 26,361 |
Unichem Laboratories, Ltd. | | 79,600 | | | 428,362 |
Union Bank of India, Ltd. | | 752,656 | | | 4,151,534 |
Unitech, Ltd. | | 236,181 | | | 404,671 |
United Phosphorus, Ltd. | | 530,310 | | | 1,608,254 |
Usha Martin, Ltd. | | 1,017,075 | | | 1,348,860 |
*Uttam Galva Steels, Ltd. | | 305,386 | | | 747,578 |
Vardhman Textiles, Ltd. | | 93,334 | | | 299,213 |
Varun Shipping Co., Ltd. | | 549,032 | | | 617,950 |
Videocon Industries, Ltd. | | 782,287 | | | 3,651,226 |
Videsh Sanchar Nigam, Ltd. | | 727,705 | | | 5,957,168 |
Welspun-Gujarat Stahl Rohren, Ltd. | | 824,452 | | | 4,425,282 |
*Wire & Wireless India, Ltd. | | 908,763 | | | 314,074 |
*Wockhardt, Ltd. | | 318,515 | | | 1,142,653 |
*Yes Bank, Ltd. | | 407,120 | | | 2,013,357 |
Zee Entertainment Enterprises, Ltd. | | 1,849,519 | | | 8,970,581 |
Zee News, Ltd. | �� | 502,733 | | | 547,471 |
Zuari Industries, Ltd. | | 127,958 | | | 1,086,288 |
Zydus Wellness, Ltd. | | 3,357 | | | 12,090 |
| | | | | |
TOTAL INDIA | | | | | 939,882,774 |
| | | | | |
INDONESIA — (2.7%) | | | | | |
*PT Agis Tbk | | 2,012,000 | | | 19,483 |
PT Asahimas Flat Glass Tbk | | 5,333,500 | | | 999,970 |
PT Astra International Tbk | | 9,546,400 | | | 30,713,599 |
*PT Bakrie & Brothers Tbk | | 683,539,250 | | | 6,940,306 |
*PT Bakrieland Development Tbk | | 343,219,020 | | | 9,637,792 |
*PT Bank Bukopin Tbk | | 13,923,000 | | | 551,708 |
PT Bank Danamon Indonesia Tbk | | 1,687,803 | | | 787,370 |
*PT Bank Negara Indonesia Persero Tbk | | 5,000,000 | | | 948,403 |
*PT Bank Pan Indonesia Tbk | | 121,357,326 | | | 9,743,166 |
PT Berlian Laju Tanker Tbk | | 69,965,733 | | | 5,112,550 |
11
DIMENSIONAL EMERGING MARKETS VALUE FUND
CONTINUED
| | | | | |
| | | Shares | | Value†† |
INDONESIA — (Continued) | | | | | |
PT Bhakti Investama Tbk | | 60,568,175 | | $ | 1,205,071 |
PT Budi Acid Jaya Tbk | | 14,289,000 | | | 354,962 |
PT Bumi Resources Tbk | | 158,328,500 | | | 38,115,617 |
*PT Central Proteinaprima Tbk | | 178,071,500 | | | 1,225,821 |
*PT Charoen Pokphand Indonesia Tbk | | 31,047,166 | | | 6,475,350 |
*PT Ciputra Development Tbk | | 34,150,000 | | | 2,207,522 |
*PT Ciputra Surya Tbk | | 17,718,000 | | | 1,037,762 |
PT Clipan Finance Indonesia Tbk | | 3,636,000 | | | 73,375 |
*PT Davomas Adabi Tbk | | 139,739,500 | | | 1,068,166 |
*PT Dynaplast Tbk | | 3,040,000 | | | 254,660 |
*PT Energi Mega Persada Tbk | | 118,163,282 | | | 3,416,983 |
*PT Ever Shine Textile Tbk | | 19,347,215 | | | 127,631 |
*PT Gajah Tunggal Tbk | | 225,000 | | | 9,504 |
*PT Global Mediacom Tbk | | 96,453,500 | | | 2,183,762 |
*PT Great River International Tbk | | 1,788,000 | | | — |
PT Gudang Garam Tbk | | 6,628,500 | | | 9,750,750 |
*PT Hero Supermarket Tbk | | 220,000 | | | 92,147 |
*PT Indah Kiat Pulp and Paper Corp. Tbk | | 26,474,000 | | | 4,898,798 |
PT Indofood Sukses Makmur Tbk | | 69,331,500 | | | 21,911,451 |
*PT International Nickel Indonesia Tbk | | 35,816,500 | | | 14,842,705 |
PT Jaya Real Property Tbk | | 25,528,000 | | | 1,884,528 |
PT Kalbe Farma Tbk | | 30,353,500 | | | 3,806,789 |
*PT Kawasan Industry Jababeka Tbk | | 187,435,000 | | | 2,271,298 |
PT Lautan Luas Tbk | | 2,102,000 | | | 168,773 |
*PT Lippo Karawaci Tbk | | 123,916,750 | | | 8,382,244 |
*PT Matahari Putra Prima Tbk | | 35,296,900 | | | 3,255,686 |
PT Mayorah Indah Tbk | | 8,807,572 | | | 2,701,677 |
PT Medco Energi International Tbk | | 28,604,500 | | | 7,994,507 |
*PT Mitra Rajasa Tbk | | 4,697,000 | | | 182,531 |
*PT Panasia Indosyntec Tbk | | 403,200 | | | 9,922 |
*PT Panin Insurance Tbk | | 30,688,500 | | | 709,556 |
*PT Panin Life Tbk | | 183,439,000 | | | 2,364,639 |
*PT Perusahaan Perkebunan London Sumatra Indonesia Tbk | | 1,811,000 | | | 1,443,972 |
PT Ramayana Lestari Sentosa Tbk | | 8,312,500 | | | 482,346 |
*PT Sampoerna Agro Tbk | | 1,385,000 | | | 327,224 |
PT Samudera Indonesia Tbk | | 415,500 | | | 176,100 |
PT Selamat Semp Tbk | | 10,624,000 | | | 767,598 |
PT Semen Gresik Tbk | | 6,156,910 | | | 4,351,112 |
PT Sinar Mas Agro Resources & Technology Tbk | | 8,067,900 | | | 2,615,120 |
PT Summarecon Agung Tbk | | 60,663,000 | | | 3,614,750 |
*PT Sunson Textile Manufacturer Tbk | | 6,012,000 | | | 157,382 |
*PT Surya Dumai Industri Tbk | | 5,145,000 | | | — |
PT Surya Toto Indonesia Tbk | | 46,400 | | | 38,869 |
*PT Suryainti Permata Tbk | | 17,378,000 | | | 189,516 |
PT Tigaraksa Satria Tbk | | 165,200 | | | 5,449 |
PT Timah Tbk | | 23,462,500 | | | 4,685,562 |
PT Trimegah Sec Tbk | | 34,298,000 | | | 646,454 |
*PT Truba Alam Manunggal Engineering Tbk | | 129,244,500 | | | 1,686,037 |
PT Tunas Ridean Tbk | | 11,363,500 | | | 1,788,655 |
PT Ultrajaya Milk Industry & Trading Co. Tbk | | 13,717,500 | | | 847,469 |
PT Unggul Indah Cahaya Tbk | | 371,435 | | | 86,539 |
PT United Tractors Tbk | | 166 | | | 255 |
| | | | | |
TOTAL INDONESIA | | | | | 232,348,943 |
| | | | | |
ISRAEL — (2.6%) | | | | | |
*Africa-Israel Investments, Ltd. | | 224,292 | | | 2,837,068 |
*Alvarion, Ltd. | | 745,931 | | | 2,998,462 |
Ashtrom Properties, Ltd. | | 135,999 | | | 163,286 |
*AudioCodes, Ltd. | | 23,091 | | | 63,928 |
*Azorim Investment Development & Construction Co., Ltd. | | 279,440 | | | 1,793,458 |
*Bank Hapoalim B.M. | | 13,175,469 | | | 48,100,324 |
12
DIMENSIONAL EMERGING MARKETS VALUE FUND
CONTINUED
| | | | | |
| | | Shares | | Value†† |
ISRAEL — (Continued) | | | | | |
*Bank Leumi Le-Israel B.M. | | 12,465,728 | | $ | 48,684,714 |
*Bank of Jerusalem, Ltd. | | 70,475 | | | 119,458 |
*Baran Group, Ltd. | | 97,587 | | | 488,873 |
*Blue Square-Israel, Ltd. | | 61,675 | | | 624,696 |
*Clal Industries, Ltd. | | 882,983 | | | 4,504,621 |
*Clal Insurance Enterprise Holdings, Ltd. | | 262,245 | | | 5,551,684 |
*Delta-Galil Industries, Ltd. | | — | | | 2 |
*Direct Insurance - I.D.I. Insurance Co., Ltd. | | 32,904 | | | 62,781 |
Discount Investment Corp. | | 279,027 | | | 6,556,475 |
*Elbit Medical Imaging, Ltd. | | 141,338 | | | 3,498,454 |
Electra (Israel), Ltd. | | 15,789 | | | 1,453,489 |
*Electra Real Estate, Ltd. | | 72,416 | | | 709,312 |
*Elron Electronic Industries, Ltd. | | 274,219 | | | 1,927,498 |
*Feuchtwanger Investments, Ltd. | | 10,500 | | | 34 |
*First International Bank of Israel, Ltd. (6123804) | | 570,205 | | | 1,607,079 |
*First International Bank of Israel, Ltd. (6123815) | | 289,898 | | | 4,199,950 |
Formula Systems, Ltd. | | 81,043 | | | 868,612 |
*Formula Vision Technologies, Ltd. | | — | | | — |
*Frutarom Industries, Ltd. | | 160,013 | | | 1,294,882 |
*Granite Hacarmel Investments, Ltd. | | 142,500 | | | 303,558 |
*Hadera Paper, Ltd. | | 28,949 | | | 1,844,682 |
*Harel Insurance Investments & Finances, Ltd. | | 106,397 | | | 5,036,305 |
Industrial Building Corp., Ltd. | | 794,392 | | | 1,392,732 |
*Israel Cold Storage & Supply Co., Ltd. | | 7,000 | | | 52,647 |
*Israel Discount Bank, Ltd. | | 1,168,099 | | | 2,229,814 |
*Israel Petrochemical Enterprises, Ltd. | | 79,721 | | | 250,304 |
*Israel Steel Mills, Ltd. | | 97,000 | | | 1,008 |
Ituran Location & Control, Ltd. | | 47,663 | | | 585,478 |
*Jerusalem Oil Exploration, Ltd. | | 33,870 | | | 527,361 |
*Kardan Israel, Ltd. | | 2,237 | | | 5,030 |
*Knafaim Arkia Holdings, Ltd. | | 110,791 | | | 479,275 |
Koor Industries, Ltd. | | 115,691 | | | 3,317,051 |
Liberty Properties, Ltd. | | 3,457 | | | 41,443 |
*Magal Security Systems, Ltd. | | 18,398 | | | 73,506 |
Makhteshim-Agan Industries, Ltd. | | 660,126 | | | 3,085,366 |
*Mellanox Technologies, Ltd. | | 10,882 | | | 191,407 |
*Menorah Mivtachim Holdings, Ltd. | | 235,237 | | | 2,697,007 |
Merhav-Ceramic & Building Materials Center, Ltd. | | 32,832 | | | 67,182 |
*Migdal Insurance & Financial Holdings, Ltd. | | 3,224,814 | | | 5,054,345 |
*Miloumor, Ltd. | | 97,997 | | | 6,788 |
*Minrav Holdings, Ltd. | | 2,000 | | | 121,745 |
*Mivtach Shamir Holdings, Ltd. | | 42,661 | | | 1,279,158 |
*Mizrahi Tefahot Bank, Ltd. | | 1,714,491 | | | 13,934,063 |
*Naphtha Israel Petroleum Corp. | | 146,351 | | | 525,317 |
*NICE Systems, Ltd. Sponsored ADR | | 243,089 | | | 7,528,466 |
*OCIF Investments and Development, Ltd. | | 4,309 | | | 28,181 |
*Oil Refineries, Ltd. | | 11,090,509 | | | 6,091,212 |
Ormat Industries, Ltd. | | 1,037,976 | | | 9,048,469 |
*Phoenix Holdings, Ltd. (The) | | 238,984 | | | 602,981 |
*RADVision, Ltd. | | 63,955 | | | 361,892 |
*Retalix, Ltd. | | 235,506 | | | 2,582,802 |
*Scailex Corp., Ltd. | | 416,611 | | | 7,491,610 |
Super-Sol, Ltd. Series B | | 476,874 | | | 2,256,772 |
*Team Computer & Systems, Ltd. | | 2,615 | | | 38,868 |
Teva Pharmaceutical Industries, Ltd. Sponsored ADR | | 221,228 | | | 11,167,589 |
*Union Bank of Israel, Ltd. | | 456,178 | | | 2,083,697 |
| | | | | |
TOTAL ISRAEL | | | | | 230,494,251 |
| | | | | |
MALAYSIA — (3.6%) | | | | | |
*A&M Realty Berhad | | 720,700 | | | 148,360 |
Affin Holdings Berhad | | 9,611,900 | | | 5,711,310 |
13
DIMENSIONAL EMERGING MARKETS VALUE FUND
CONTINUED
| | | | | |
| | | Shares | | Value†† |
MALAYSIA — (Continued) | | | | | |
*Airasia Berhad | | 2,630,000 | | $ | 1,034,101 |
Al-’Aqar KPJ REIT Berhad | | 69 | | | 20 |
Alliance Financial Group Berhad | | 10,967,000 | | | 7,836,060 |
*AMBD Berhad | | 927,567 | | | 131,551 |
AMMB Holdings Berhad | | 21,831,262 | | | 30,016,248 |
*Ann Joo Resources Berhad | | 2,857,200 | | | 2,168,583 |
APM Automotive Holdings Berhad | | 1,024,700 | | | 701,739 |
Apollo Food Holdings Berhad | | 109,000 | | | 96,503 |
*Asas Dunia Berhad | | 350,000 | | | 62,010 |
*Asia Pacific Land Berhad | | 5,644,300 | | | 469,309 |
*Axiata Group Berhad | | 74,850 | | | 63,745 |
Bandar Raya Developments Berhad | | 4,072,000 | | | 2,107,535 |
Batu Kawan Berhad | | 2,242,250 | | | 6,502,311 |
Berjaya Corp. Berhad | | 16,866,380 | | | 5,778,274 |
*Berjaya Land Berhad | | 3,305,000 | | | 4,025,377 |
Bernas Padiberas Nasional Berhad | | 4,690,300 | | | 2,797,425 |
Bimb Holdings Berhad | | 2,170,800 | | | 709,298 |
Bina Darulaman Berhad | | 60,800 | | | 17,219 |
Bolton Properties Berhad | | 1,277,400 | | | 246,047 |
Boustead Holdings Berhad | | 4,738,580 | | | 4,719,030 |
Cahya Mata Sarawak Berhad | | 1,545,200 | | | 757,230 |
Chemical Co. of Malaysia Berhad | | 311,000 | | | 236,426 |
Chin Teck Plantations Berhad | | 304,700 | | | 640,435 |
*Country Heights Holdings Berhad | | 37,300 | | | 7,323 |
Cycle & Carriage Bintang Berhad | | 249,800 | | | 255,138 |
*Datuk Keramik Holdings Berhad | | 127,000 | | | — |
Dijaya Corp. Berhad | | 612,100 | | | 249,351 |
DNP Holdings Berhad | | 1,861,100 | | | 800,218 |
DRB-Hicom Berhad | | 9,932,000 | | | 3,146,181 |
*Eastern & Oriental Berhad | | 5,187,915 | | | 1,615,135 |
Eastern Pacific Industrial Corp. Berhad | | 497,700 | | | 219,529 |
ECM Libra Avenue Berhad | | 7,043,530 | | | 1,321,641 |
EON Capital Berhad | | 3,277,207 | | | 5,352,587 |
Esso Malaysia Berhad | | 954,100 | | | 731,990 |
Far East Holdings Berhad | | 388,800 | | | 721,817 |
*Fountain View Development Berhad | | 2,573,200 | | | 165,891 |
Gamuda Berhad | | 500,000 | | | 456,522 |
General Corp. Berhad | | 1,681,400 | | | 516,973 |
Genting Plantations Berhad | | 1,918,900 | | | 3,430,658 |
Glomac Berhad | | 1,609,100 | | | 585,769 |
*Gold Is Berhad | | 2,412,900 | | | 852,881 |
*Gula Perak Berhad | | 50 | | | 1 |
GuocoLand (Malaysia) Berhad | | 486,000 | | | 163,185 |
Hap Seng Consolidated Berhad | | 2,582,300 | | | 1,841,591 |
Hap Seng Plantations Holdings Berhad | | 1,676,300 | | | 1,102,302 |
Hong Leong Financial Group Berhad | | 1,876,137 | | | 3,394,234 |
Hong Leong Industries Berhad | | 1,225,800 | | | 1,506,693 |
Hume Industries (Malaysia) Berhad | | 565,767 | | | 562,743 |
Hunza Properties Berhad | | 1,033,300 | | | 435,570 |
Hwang-DBS (Malaysia) Berhad | | 908,700 | | | 416,704 |
*IGB Corp. Berhad | | 10,599,200 | | | 6,020,120 |
IJM Corp. Berhad | | 14,826,280 | | | 20,680,268 |
*IJM Land Berhad | | 3,898,100 | | | 2,661,821 |
*Insas Berhad | | 3,779,000 | | | 597,404 |
*Jaks Resources Berhad | | 3,438,000 | | | 751,953 |
Jaya Tiasa Holdings Berhad | | 1,192,135 | | | 856,636 |
Jerneh Asia Berhad | | 425,120 | | | 153,526 |
*K & N Kenanga Holdings Berhad | | 2,209,100 | | | 391,718 |
*Karambunai Corp. Berhad | | 6,839,800 | | | 137,384 |
Keck Seng (Malaysia) Berhad | | 1,663,400 | | | 1,947,318 |
Kian Joo Can Factory Berhad | | 3,566,680 | | | 1,238,571 |
14
DIMENSIONAL EMERGING MARKETS VALUE FUND
CONTINUED
| | | | | |
| | | Shares | | Value†† |
MALAYSIA — (Continued) | | | | | |
*KIG Glass Industrial Berhad | | 260,000 | | $ | 2,286 |
Kim Loong Resources Berhad | | 324,800 | | | 178,116 |
Kinsteel Berhad | | 6,960,700 | | | 1,875,803 |
KLCC Property Holdings Berhad | | 6,330,700 | | | 6,047,583 |
KNM Group Berhad | | 10,061,700 | | | 2,283,500 |
*Knusford Berhad | | 139,300 | | | 64,364 |
KPJ Healthcare Berhad | | 1,570,300 | | | 2,037,895 |
KrisAssets Holdings Berhad | | 250,377 | | | 219,641 |
KSL Holdings Berhad | | 189,466 | | | 71,264 |
Kub Malaysia Berhad | | 5,214,000 | | | 741,971 |
Kulim Malaysia Berhad | | 2,761,625 | | | 5,938,712 |
*Kumpulan Hartanah Selangor Berhad | | 520,000 | | | 72,641 |
Kwantas Corp. Berhad | | 246,000 | | | 143,111 |
*Landmarks Berhad | | 4,118,808 | | | 1,603,631 |
Leader Universal Holdings Berhad | | 5,383,033 | | | 1,235,775 |
*Lion Corp Berhad | | 7,984,307 | | | 898,542 |
Lion Diversified Holdings Berhad | | 5,448,100 | | | 761,439 |
Lion Industries Corp. Berhad | | 7,130,681 | | | 2,915,821 |
*MAA Holdings Berhad | | 888,700 | | | 187,731 |
*Malaysia Airports Holdings Berhad | | 104,900 | | | 114,008 |
Malaysia Building Society Berhad | | 419,000 | | | 109,919 |
*Malaysian Airlines System Berhad | | 170,067 | | | 153,967 |
Malaysian Bulk Carriers Berhad | | 1,300,025 | | | 1,182,158 |
Malaysian Mosaics Berhad | | 293,040 | | | 95,393 |
*Malaysian Resources Corp. Berhad | | 950,600 | | | 375,601 |
MBM Resources Berhad | | 487,533 | | | 346,543 |
*Measat Global Berhad | | 2,643,100 | | | 1,284,418 |
Mega First Corp. Berhad | | 1,101,700 | | | 372,998 |
Merge Housing Berhad | | 58,952 | | | 8,119 |
Metro Kajang Holdings Berhad | | 535,333 | | | 227,931 |
*Metroplex Berhad | | 817,000 | | | — |
MISC Berhad | | 275,200 | | | 715,444 |
*MK Land Holdings Berhad | | 10,344,500 | | | 1,162,624 |
MMC Corp. Berhad | | 10,879,779 | | | 7,884,841 |
MNRB Holdings Berhad | | 1,150,800 | | | 1,045,043 |
MTD ACPI Engineering Berhad | | 74,200 | | | 14,285 |
Muhibbah Engineering Berhad | | 4,845,400 | | | 1,636,437 |
*MUI Properties Berhad | | 670,000 | | | 28,342 |
*Mulpha International Berhad | | 16,773,100 | | | 2,298,739 |
MWE Holdings Berhad | | 270,000 | | | 63,340 |
Naim Holdings Berhad | | 1,083,600 | | | 976,289 |
NCB Holdings Berhad | | 2,447,800 | | | 2,187,659 |
Negri Sembilan Oil Palms Berhad | | 167,600 | | | 199,583 |
New Straits Times Press Berhad | | 1,751,100 | | | 1,013,404 |
NV Multi Corp. Berhad | | 165,700 | | | 30,991 |
Oriental Holdings Berhad | | 3,044,816 | | | 4,935,709 |
Oriental Interest Berhad | | 165,000 | | | 62,434 |
OSK Holdings Berhad | | 5,239,718 | | | 2,283,804 |
*OSK Ventures International Berhad | | 793,897 | | | 151,047 |
P.I.E. Industrial Berhad | | 323,600 | | | 404,268 |
*Pacific & Orient Berhad | | 283,365 | | | 85,282 |
Panasonic Manufacturing Malaysia Berhad | | 383,380 | | | 1,396,745 |
*Paracorp Berhad | | 252,000 | | | 738 |
Paramount Corp. Berhad | | 203,900 | | | 150,136 |
PBA Holdings Berhad | | 1,502,500 | | | 410,446 |
Pelikan International Corp. Berhad | | 2,742,880 | | | 1,080,943 |
*Permaju Industries Berhad | | 1,703,300 | | | 188,276 |
Petronas Dagangan Berhad | | 460,000 | | | 1,196,641 |
PJ Development Holdings Berhad | | 2,768,800 | | | 543,972 |
POS Malaysia Berhad | | 3,533,817 | | | 2,386,988 |
PPB Group Berhad | | 6,759,566 | | | 29,850,799 |
15
DIMENSIONAL EMERGING MARKETS VALUE FUND
CONTINUED
| | | | | |
| | | Shares | | Value†† |
MALAYSIA — (Continued) | | | | | |
*Prime Utilities Berhad | | 39,000 | | $ | 1,029 |
Protasco Berhad | | 282,200 | | | 77,407 |
Proton Holdings Berhad | | 3,684,300 | | | 4,057,509 |
*Pulai Springs Berhad | | 159,800 | | | 33,482 |
*Ramunia Holdings Berhad | | 2,434,736 | | | 277,497 |
Ranhill Berhad | | 3,026,600 | | | 790,812 |
RHB Capital Berhad | | 5,354,700 | | | 8,400,553 |
Salcon Berhad | | 574,000 | | | 85,371 |
Sarawak Energy Berhad | | 5,649,100 | | | 4,275,869 |
Sarawak Oil Palms Berhad | | 391,820 | | | 314,318 |
Scientex, Inc. Berhad | | 645,048 | | | 259,054 |
Scomi Group Berhad | | 13,422,000 | | | 2,204,322 |
Selangor Dredging Berhad | | 1,312,700 | | | 210,911 |
Shangri-La Hotels (Malaysia) Berhad | | 738,000 | | | 397,917 |
Shell Refining Co. Federation of Malaysia Berhad | | 217,100 | | | 679,971 |
SHL Consolidated Berhad | | 1,008,700 | | | 396,090 |
Southern Steel Berhad | | 1,500,500 | | | 842,618 |
Subur Tiasa Holdings Berhad | | 460,530 | | | 260,844 |
*Sunrise Berhad | | 4,272,034 | | | 2,663,202 |
Sunway City Berhad | | 3,565,000 | | | 3,201,801 |
Sunway Holdings Berhad | | 4,115,900 | | | 1,647,689 |
Supermax Corp. Berhad | | 461,000 | | | 486,143 |
Suria Capital Holdings Berhad | | 590,800 | | | 240,121 |
Ta Ann Holdings Berhad | | 193,300 | | | 260,564 |
TA Enterprise Berhad | | 14,109,800 | | | 3,152,661 |
*TA Global Berhad | | 8,465,880 | | | 1,230,126 |
*TA Global Berhad Ordinary Shares | | 8,465,880 | | | 1,230,126 |
Tahp Group Berhad | | 27,000 | | | 24,429 |
*Talam Corp. Berhad | | 17,833,050 | | | 462,927 |
*Tamco Corp. Holdings Berhad | | 71 | | | 1 |
Tan Chong Motor Holdings Berhad | | 5,244,500 | | | 3,451,652 |
TDM Berhad | | 1,059,200 | | | 474,421 |
*Tebrau Teguh Berhad | | 5,320,066 | | | 1,094,779 |
*Time Dotcom Berhad | | 16,781,400 | | | 1,984,240 |
Tiong Nam Transport Holdings Berhad | | 141,500 | | | 29,019 |
*Titan Chemicals Corp. Berhad | | 3,578,100 | | | 1,204,598 |
Tradewinds (Malaysia) Berhad | | 879,400 | | | 707,148 |
Tradewinds Corp. Berhad | | 5,413,100 | | | 937,853 |
UAC Berhad | | 77,398 | | | 71,169 |
UMW Holdings Berhad | | 2,726,886 | | | 5,022,140 |
Unico-Desa Plantations Berhad | | 4,120,228 | | | 962,831 |
Unisem (M) Berhad | | 4,515,600 | | | 1,950,271 |
United Malacca Rubber Estates Berhad | | 577,100 | | | 1,348,251 |
United Plantations Berhad | | 678,200 | | | 2,634,296 |
VS Industry Berhad | | 1,337,193 | | | 478,255 |
WCT Berhad | | 1,235,300 | | | 940,908 |
WTK Holdings Berhad | | 4,386,550 | | | 1,478,714 |
Yeo Hiap Seng (Malaysia) Berhad | | 355,320 | | | 145,550 |
YTL Cement Berhad | | 11,100 | | | 13,396 |
YTL Corp. Berhad | | 5,705,472 | | | 12,132,974 |
*Yu Neh Huat Berhad | | 4,969,262 | | | 2,445,096 |
Zelan Berhad | | 4,989,300 | | | 1,282,543 |
| | | | | |
TOTAL MALAYSIA | | | | | 317,157,090 |
| | | | | |
MEXICO — (6.3%) | | | | | |
#Alfa S.A.B. de C.V. Series A | | 3,560,217 | | | 18,435,069 |
#*Alsea de Mexico S.A.B. de C.V. | | 2,618,100 | | | 1,762,750 |
#*Axtel S.A.B. de C.V. | | 5,440,940 | | | 4,030,097 |
*Bolsa Mexicana de Valores S.A. de C.V. | | 711,800 | | | 792,461 |
*Carso Infraestructura y Construccion S.A.B. de CV | | 57,500 | | | 32,226 |
*Cemex S.A.B. de C.V. Sponsored ADR | | 9,390,579 | | | 97,474,207 |
16
DIMENSIONAL EMERGING MARKETS VALUE FUND
CONTINUED
| | | | | |
| | | Shares | | Value†† |
MEXICO — (Continued) | | | | | |
Coca-Cola Femsa S.A.B. de C.V. Sponsored ADR | | 266,807 | | $ | 14,391,570 |
#*Consorcio ARA S.A.B. de C.V. | | 10,348,200 | | | 6,489,300 |
#*Corporacion GEO S.A.B. de C.V. Series B | | 5,771,482 | | | 15,189,548 |
*Corporacion Interamericana de Entramiento S.A.B. de C.V. Series B | | 1,639,586 | | | 815,214 |
*Corporacion Mexicana de Restaurantes S.A.B. de C.V. Series B | | 3,689 | | | 819 |
Corporativo Fragua S.A.B. de C.V. Series B | | 70 | | | 517 |
#*Desarrolladora Homex S.A.B. de C.V. | | 1,653,700 | | | 9,837,973 |
#*Desarrolladora Homex S.A.B. de C.V. ADR | | 89,700 | | | 3,189,732 |
*Dine S.A.B. de C.V. | | 1,028,367 | | | 455,624 |
El Puerto de Liverpool S.A.B. de C.V. Series 1 | | 20,000 | | | 85,960 |
El Puerto de Liverpool S.A.B. de C.V. Series C1 | | 328,600 | | | 1,368,778 |
Embotelladora Arca S.A.B. de C.V. | | 1,199,000 | | | 3,014,810 |
*Empaques Ponderosa S.A. de C.V. Series B | | 90,000 | | | 6,135 |
#*Empresas ICA S.A.B. de C.V. | | 2,318,272 | | | 5,084,704 |
#*Empresas ICA S.A.B. de C.V. Sponsored ADR | | 1,118,155 | | | 9,750,312 |
Fomento Economico Mexicano S.A.B. de C.V. Series B & D | | 1,440,300 | | | 6,234,073 |
#Fomento Economico Mexicano S.A.B. de C.V. Sponsored ADR | | 1,402,758 | | | 60,753,449 |
*GMD Resorts S.A.B. de C.V. | | 41,400 | | | 10,159 |
*Gruma S.A.B. de C.V. ADR | | 4,702 | | | 33,572 |
#Grupo Aeroportuario del Centro Norte, S.A.B. de C.V. | | 613,500 | | | 882,817 |
#*Grupo Aeroportuario del Centro Norte, S.A.B. de C.V. ADR | | 31,318 | | | 363,602 |
#Grupo Aeroportuario del Pacifico S.A.B. de C.V. ADR | | 584,789 | | | 14,906,272 |
#Grupo Aeroportuario del Sureste S.A.B. de C.V. | | 727,300 | | | 2,960,702 |
#Grupo Aeroportuario del Sureste S.A.B. de C.V. ADR | | 220,143 | | | 8,957,619 |
#Grupo Carso S.A.B. de C.V. Series A-1 | | 10,578,093 | | | 31,244,580 |
*Grupo Cementos de Chihuahua S.A.B. de C.V. | | 2,799,892 | | | 8,357,000 |
#*Grupo FAMSA S.A.B. de C.V. | | 1,918,478 | | | 3,285,187 |
#*Grupo Financiero Banorte S.A.B. de C.V. | | 9,775,260 | | | 31,242,334 |
#Grupo Financiero Inbursa S.A.B. de C.V. Series O | | 8,260,033 | | | 23,271,664 |
Grupo Gigante S.A.B. de C.V. Series B | | 324,076 | | | 333,924 |
Grupo Herdez S.A.B. de C.V. | | 319,000 | | | 390,181 |
Grupo Industrial Maseca S.A.B. de C.V. Series B | | 2,726,900 | | | 1,856,657 |
*Grupo Industrial Saltillo S.A.B. de C.V. | | 1,341,869 | | | 264,232 |
#*Grupo Iusacell S.A.B. de C.V. | | 210,260 | | | 716,592 |
*Grupo Kuo S.A.B. de C.V. Series B | | 2,038,967 | | | 1,306,421 |
*Grupo Mexicano de Desarrollo S.A.B. de C.V. | | 43,400 | | | 21,365 |
*Grupo Mexico S.A.B. de C.V. Series B | | 37,630,484 | | | 75,239,593 |
*Grupo Nutrisa S.A. de C.V. | | 428 | | | 908 |
*Grupo Posadas S.A. de C.V. Series L | | 356,000 | | | 355,899 |
*Grupo Qumma S.A. de C.V. Series B | | 5,301 | | | 72 |
*Grupo Simec, S.A. de C.V. | | 1,253,200 | | | 3,069,468 |
#*Grupo Simec, S.A. de C.V. Sponsored ADR | | 8,200 | | | 59,860 |
#Grupo Televisa S.A. de C.V. Sponsored ADR | | 326,100 | | | 6,313,296 |
#Industrias Bachoco S.A.B. de C.V. Series B | | 810,300 | | | 1,552,634 |
#*Industrias CH S.A.B. de C.V. Series B | | 2,810,192 | | | 8,555,881 |
Industrias Penoles S.A.B. de C.V. | | 887,455 | | | 16,205,568 |
#*Organizacion Soriana S.A.B. de C.V. Series B | | 14,451,500 | | | 31,970,335 |
Qualitas Compania de Seguros S.A. de C.V. | | 2,041,400 | | | 927,646 |
#*SARE Holding S.A. de C.V. | | 3,301,100 | | | 1,197,559 |
*Savia S.A. de C.V. | | 3,457,285 | | | 209,473 |
Telmex Internacional S.A.B. de C.V. ADR | | 392,831 | | | 5,287,505 |
#*Urbi Desarrollos Urbanos S.A.B. de C.V. | | 5,559,050 | | | 10,656,030 |
#*Vitro S.A.B. de C.V. | | 2,429,986 | | | 1,131,831 |
| | | | | |
TOTAL MEXICO | | | | | 552,333,766 |
| | | | | |
PHILIPPINES — (0.7%) | | | | | |
A. Soriano Corp. | | 20,195,000 | | | 924,669 |
Alaska Milk Corp. | | 7,953,000 | | | 1,006,060 |
*Alsons Consolidated Resources, Inc. | | 16,904,000 | | | 315,963 |
Bacnotan Consolidated Industries, Inc. | | 2,551,998 | | | 493,762 |
Banco de Oro Unibank, Inc. | | 7,364,320 | | | 5,345,443 |
17
DIMENSIONAL EMERGING MARKETS VALUE FUND
CONTINUED
| | | | | |
| | | Shares | | Value†† |
PHILIPPINES — (Continued) | | | | | |
*Belle Corp. | | 29,212,000 | | $ | 853,438 |
*Benpres Holdings Corp. | | 25,704,000 | | | 1,881,844 |
Cebu Holdings, Inc. | | 7,720,250 | | | 305,588 |
China Banking Corp. | | 8,796 | | | 66,531 |
*Digital Telecommunications Phils., Inc. | | 84,763,000 | | | 2,470,551 |
DMCI Holdings, Inc. | | 14,082,280 | | | 2,838,020 |
*Empire East Land Holdings, Inc. | | 37,000,000 | | | 342,873 |
*Export & Industry Bank, Inc. | | 14,950 | | | 82 |
Filinvest Land, Inc. | | 168,982,031 | | | 3,181,152 |
*Filipina Water Bottling Corp. | | 5,471,786 | | | — |
*First Philippines Holdings Corp. | | 3,810,100 | | | 3,729,710 |
International Container Terminal Services, Inc. | | 270,000 | | | 114,323 |
Macroasia Corp. | | 1,663,000 | | | 98,324 |
Megaworld Corp. | | 176,933,600 | | | 5,562,773 |
Metro Bank & Trust Co. | | 8,451,855 | | | 7,149,479 |
*Mondragon International Philippines, Inc. | | 2,464,000 | | | 6,469 |
*Philippine National Bank | | 3,866,918 | | | 1,874,060 |
*Philippine National Construction Corp. | | 398,900 | | | 41,050 |
*Philippine Realty & Holdings Corp. | | 5,860,000 | | | 66,908 |
Philippine Savings Bank | | 1,232,313 | | | 1,294,039 |
*Philippine Townships, Inc. | | 226,200 | | | 22,565 |
*Prime Media Holdings, Inc. | | 409,000 | | | 18,554 |
*Prime Orion Philippines, Inc. | | 12,310,000 | | | 100,827 |
Rizal Commercial Banking Corp. | | 4,481,648 | | | 1,535,019 |
Robinson’s Land Corp. Series B | | 17,781,700 | | | 4,515,235 |
Security Bank Corp. | | 2,387,410 | | | 2,782,091 |
Shang Properties, Inc. | | 614,285 | | | 22,289 |
SM Development Corp. | | 28,566,248 | | | 2,445,597 |
*Solid Group, Inc. | | 10,648,000 | | | 156,354 |
Union Bank of the Philippines | | 2,476,894 | | | 1,779,819 |
Universal Robina Corp. | | 16,573,345 | | | 4,322,349 |
*Vista Land & Lifescapes, Inc. | | 42,637,868 | | | 1,742,221 |
| | | | | |
TOTAL PHILIPPINES | | | | | 59,406,031 |
| | | | | |
POLAND — (2.1%) | | | | | |
*Agora SA | | 559,848 | | | 3,673,715 |
Asseco Poland SA | | 483,351 | | | 9,711,550 |
*Bank Handlowy w Warszawie SA | | 83,949 | | | 1,841,028 |
*Bank Millennium SA | | 5,515,278 | | | 9,051,944 |
*Bank Przemyslowo Handlowy BPH SA | | 72,355 | | | 1,725,893 |
*Bioton SA | | 31,475,429 | | | 2,475,774 |
*Boryszew SA | | 328,915 | | | 664,264 |
*Ciech SA | | 172,748 | | | 2,310,340 |
Debica SA | | 111,346 | | | 2,384,375 |
Dom Development SA | | 46,421 | | | 706,352 |
*Echo Investment SA | | 2,406,970 | | | 3,451,942 |
Emperia Holding SA | | 16,989 | | | 383,130 |
*Farmacol SA | | 5,526 | | | 78,907 |
*Getin Holdings SA | | 1,681,394 | | | 4,785,244 |
*Grupa Kety SA | | 126,858 | | | 4,603,973 |
*Grupa Lotos SA | | 839,119 | | | 7,627,181 |
*Impexmetal SA | | 5,899,609 | | | 5,051,208 |
*ING Bank Slaski SA | | 4,428 | | | 993,651 |
KGHM Polska Miedz SA | | 1,076,971 | | | 36,251,556 |
*Koelner SA | | 133,110 | | | 574,532 |
*Kredyt Bank SA | | 619,815 | | | 2,598,474 |
*LC Corp. SA | | 1,310,803 | | | 736,544 |
*Mostostal Warszawa SA | | 11,583 | | | 264,841 |
*Netia Holdings SA | | 3,441,202 | | | 5,008,910 |
*Orbis SA | | 541,449 | | | 8,560,220 |
*Pfleiderer Grajewo SA | | 55,572 | | | 293,937 |
18
DIMENSIONAL EMERGING MARKETS VALUE FUND
CONTINUED
| | | | | |
| | | Shares | | Value†† |
POLAND — (Continued) | | | | | |
*Pol-Aqua SA | | 12,548 | | $ | 90,386 |
*Polnord SA | | 129,030 | | | 1,532,233 |
*Polski Koncern Naftowy Orlen SA | | 5,310,008 | | | 55,270,438 |
*Przedsiebiorstwo Eksportu Inzyn Importu Kopex SA | | 343,200 | | | 3,053,633 |
*Stalexport SA | | 989,216 | | | 531,757 |
*Sygnity SA | | 117,524 | | | 481,986 |
*Synthos SA | | 9,098,514 | | | 3,733,718 |
*Zaklady Azotowe Pulawy SA | | 9,383 | | | 244,710 |
*Zaklady Azotowe w Tarnowie-Moscicach SA | | 18,179 | | | 107,066 |
| | | | | |
TOTAL POLAND | | | | | 180,855,412 |
| | | | | |
RUSSIA — (0.8%) | | | | | |
*Gazprom OAO Sponsored ADR | | 2,755,161 | | | 66,074,426 |
*Lukoil OAO Sponsored ADR | | 1,050 | | | 60,912 |
*Magnitogorsk Iron & Steel Works Sponsored GDR | | 26,021 | | | 245,831 |
*RusHydro Sponsored ADR | | 212,001 | | | 754,724 |
*Surgutneftegaz Sponsored ADR | | 159,577 | | | 1,408,381 |
| | | | | |
TOTAL RUSSIA | | | | | 68,544,274 |
| | | | | |
SOUTH AFRICA — (8.7%) | | | | | |
#ABSA Group, Ltd. | | 2,880,669 | | | 46,348,396 |
Adcorp Holdings, Ltd. | | 152,955 | | | 523,383 |
Advtech, Ltd. | | 1,358,456 | | | 885,682 |
Aeci, Ltd. | | 1,635,500 | | | 12,929,211 |
Afgri, Ltd. | | 3,987,067 | | | 3,035,358 |
African Bank Investments, Ltd. | | 3,883,766 | | | 14,996,381 |
African Oxygen, Ltd. | | 634,706 | | | 1,865,573 |
African Rainbow Minerals, Ltd. | | 1,156,023 | | | 22,382,845 |
Allied Electronics Corp., Ltd. | | 540,180 | | | 2,018,499 |
Allied Technologies, Ltd. | | 188,005 | | | 1,848,164 |
ArcelorMittal South Africa, Ltd. | | 1,842,527 | | | 24,795,618 |
Argent Industrial, Ltd. | | 1,272,940 | | | 1,469,947 |
*Argility, Ltd. | | 130,947 | | | — |
*Aspen Pharmacare Holdings, Ltd. | | 11,850 | | | 99,870 |
AST Group, Ltd. | | 1,842,229 | | | 211,975 |
Astral Foods, Ltd. | | 129,757 | | | 1,661,749 |
Aveng, Ltd. | | 3,370,436 | | | 17,874,972 |
AVI, Ltd. | | 4,441,928 | | | 11,876,811 |
Avusa, Ltd. | | 418,251 | | | 1,176,122 |
Barloworld, Ltd. | | 2,477,983 | | | 15,449,985 |
*Basil Read Holdings, Ltd. | | 27,917 | | | 60,196 |
*Bell Equipment, Ltd. | | 411,045 | | | 574,754 |
Bidvest Group, Ltd. | | 224,591 | | | 3,516,860 |
*Brait SA | | 50,528 | | | 119,527 |
*Business Connexion Group | | 517,653 | | | 313,645 |
Capitec Bank Holdings, Ltd. | | 178,685 | | | 1,462,234 |
Cashbuild, Ltd. | | 50,784 | | | 453,034 |
Caxton & CTP Publishers & Printers, Ltd. | | 3,015,054 | | | 5,330,287 |
*Cipla Medpro South Africa, Ltd. | | 3,239,574 | | | 1,992,410 |
Clicks Group, Ltd. | | 124,567 | | | 393,935 |
*Corpgro, Ltd. | | 579,166 | | | — |
#Data Tec, Ltd. | | 2,446,932 | | | 8,931,155 |
Datacentrix Holdings, Ltd. | | 959,663 | | | 525,465 |
Delta EMD, Ltd. | | 234,340 | | | 283,375 |
Dimension Data Holdings P.L.C. | | 3,977,377 | | | 4,624,424 |
Discovery Holdings, Ltd. | | 136,687 | | | 535,243 |
Distell Group, Ltd. | | 544,476 | | | 4,451,421 |
*Distribution & Warehousing Network, Ltd. | | 216,722 | | | 196,655 |
#Durban Roodeport Deep, Ltd. | | 1,462,175 | | | 878,774 |
*ElementOne, Ltd. | | 391,810 | | | 574,096 |
*Eqstra Holdings, Ltd. | | 1,033,730 | | | 996,635 |
19
DIMENSIONAL EMERGING MARKETS VALUE FUND
CONTINUED
| | | | | |
| | | Shares | | Value†† |
SOUTH AFRICA — (Continued) | | | | | |
Exxaro Resources, Ltd. | | 62,093 | | $ | 693,612 |
Famous Brands, Ltd. | | 178,254 | | | 541,366 |
FirstRand, Ltd. | | 4,812,380 | | | 10,760,149 |
Foschini, Ltd. | | 281,329 | | | 2,221,614 |
Freeworld Coatings, Ltd. | | 2,147,977 | | | 2,403,991 |
Gold Fields, Ltd. | | 487,041 | | | 6,238,991 |
#Gold Fields, Ltd. Sponsored ADR | | 5,353,350 | | | 68,255,212 |
Gold Reef Resorts, Ltd. | | 484,124 | | | 1,212,606 |
Grindrod, Ltd. | | 2,258,194 | | | 5,179,756 |
Group Five, Ltd. | | 465,209 | | | 2,385,585 |
Harmony Gold Mining Co., Ltd. | | 2,923,251 | | | 29,227,650 |
#Harmony Gold Mining Co., Ltd. Sponsored ADR | | 867,204 | | | 8,637,352 |
*Highveld Steel & Vanadilum Corp., Ltd. | | 239,296 | | | 1,983,965 |
Hudaco Industries, Ltd. | | 162,006 | | | 1,193,215 |
Hulamin, Ltd. | | 882,088 | | | 1,567,886 |
Iliad Africa, Ltd. | | 90,323 | | | 100,361 |
Illovo Sugar, Ltd. | | 1,516,761 | | | 6,875,257 |
Impala Platinum Holdings, Ltd. | | 300,321 | | | 6,526,566 |
Imperial Holdings, Ltd. | | 1,765,005 | | | 18,166,554 |
Investec, Ltd. | | 2,346,934 | | | 17,366,684 |
*JCI, Ltd. | | 4,289,448 | | | — |
JD Group, Ltd. | | 994,362 | | | 5,489,557 |
JSE, Ltd. | | 53,811 | | | 417,475 |
Lewis Group, Ltd. | | 1,114,663 | | | 7,783,783 |
Liberty Holdings, Ltd. | | 1,449,071 | | | 12,528,589 |
*M Cubed Holdings, Ltd. | | 1,850,526 | | | 47,389 |
Medi-Clinic Corp., Ltd. | | 2,442,886 | | | 7,508,013 |
*Merafe Resources, Ltd. | | 15,286,220 | | | 2,732,347 |
*Metair Investments, Ltd. | | 1,650,332 | | | 1,196,812 |
*Metorex, Ltd. | | 2,192,281 | | | 879,051 |
Metropolitan Holdings, Ltd. | | 8,819,158 | | | 15,142,072 |
Mondi, Ltd. | | 1,011,580 | | | 5,696,197 |
Mr. Price Group, Ltd. | | 4,456 | | | 20,533 |
MTN Group, Ltd. | | 103,682 | | | 1,543,746 |
Murray & Roberts Holdings, Ltd. | | 1,742,505 | | | 12,116,233 |
*Mvelaphanda Group, Ltd. | | 4,125,843 | | | 3,738,019 |
Nampak, Ltd. | | 5,935,508 | | | 12,955,873 |
Naspers, Ltd. Series N | | 429,956 | | | 15,512,477 |
#Nedbank Group, Ltd. | | 2,693,900 | | | 41,601,279 |
Network Healthcare Holdings, Ltd. | | 103,755 | | | 153,394 |
#Northam Platinum, Ltd. | | 903,973 | | | 4,224,462 |
Omnia Holdings, Ltd. | | 555,232 | | | 4,116,124 |
Palabora Mining Co., Ltd. | | 192,276 | | | 2,525,644 |
Peregrine Holdings, Ltd. | | 1,366,171 | | | 1,612,513 |
Pretoria Portland Cement Co., Ltd. | | 219,579 | | | 933,707 |
PSG Group, Ltd. | | 1,149,881 | | | 3,228,575 |
*Randgold & Exploration Co., Ltd. | | 256,811 | | | — |
Raubex Group, Ltd. | | 45,871 | | | 145,411 |
Redefine Income Fund, Ltd. | | 32,990 | | | 30,323 |
Reunert, Ltd. | | 651,562 | | | 4,589,453 |
Sanlam, Ltd. | | 28,700,406 | | | 78,760,640 |
Santam, Ltd. | | 18,334 | | | 236,111 |
Sappi, Ltd. | | 3,309,676 | | | 12,230,091 |
#Sappi, Ltd. Sponsored ADR | | 763,341 | | | 2,770,928 |
#Sasol, Ltd. Sponsored ADR | | 704,259 | | | 26,332,244 |
*Sentula Mining, Ltd. | | 159,688 | | | 74,141 |
*Simmer & Jack Mines, Ltd. | | 1,049,068 | | | 268,918 |
Spar Group, Ltd. (The) | | 48,068 | | | 420,121 |
Spur Corp., Ltd. | | 385,679 | | | 517,332 |
Standard Bank Group, Ltd. | | 1,122,093 | | | 14,068,301 |
*Stefanutti Stocks Holdings, Ltd. | | 17,627 | | | 22,509 |
20
DIMENSIONAL EMERGING MARKETS VALUE FUND
CONTINUED
| | | | | |
| | | Shares | | Value†† |
SOUTH AFRICA — (Continued) | | | | | |
Steinhoff International Holdings, Ltd. | | 11,472,572 | | $ | 27,724,247 |
*Sun International, Ltd. | | 22,116 | | | 258,812 |
Telkom South Africa, Ltd. | | 944,704 | | | 5,292,979 |
Telkom South Africa, Ltd. Sponsored ADR | | 5,288 | | | 117,658 |
Tongaat-Hulett, Ltd. | | 266,171 | | | 3,423,943 |
*Trans Hex Group, Ltd. | | 34,840 | | | 17,582 |
Trencor, Ltd. | | 1,468,675 | | | 4,738,510 |
UCS Group, Ltd. | | 1,547,424 | | | 342,631 |
Value Group, Ltd. | | 976,777 | | | 453,662 |
Woolworths Holdings, Ltd. | | 2,641,256 | | | 5,905,613 |
*Zeder Investments, Ltd. | | 193,652 | | | 43,978 |
| | | | | |
TOTAL SOUTH AFRICA | | | | | 761,693,040 |
| | | | | |
SOUTH KOREA — (10.3%) | | | | | |
#Aekyung Petrochemical Co., Ltd. | | 19,060 | | | 271,274 |
#Asia Cement Manufacturing Co., Ltd. | | 28,888 | | | 1,390,469 |
#*Asia Paper Manufacturing Co., Ltd. | | 34,410 | | | 285,174 |
*Asiana Airlines, Inc. | | 523,420 | | | 1,586,903 |
*Basic House Co., Ltd. (The) | | 82,060 | | | 411,202 |
Bing Grae Co., Ltd. | | 29,190 | | | 1,094,524 |
#*BNG Steel Co., Ltd. | | 41,370 | | | 269,179 |
Boo Kook Securities Co., Ltd. | | 27,705 | | | 549,688 |
#Boryung Pharmaceutical Co., Ltd. | | 14,218 | | | 497,724 |
Busan Bank | | 917,340 | | | 10,401,750 |
BYC Co., Ltd. | | 810 | | | 84,797 |
Byuck San Corp. | | 10,472 | | | 74,445 |
#*Byuck San Engineering and Construction Co., Ltd. | | 87,860 | | | 199,941 |
Cheil Industrial, Inc. | | 107,574 | | | 4,013,345 |
#*Chin Hung International, Inc. | | 789,560 | | | 597,705 |
#*Chong Kun Dang Pharmaceutical Corp. | | 18,010 | | | 329,905 |
#Choongwae Pharmaceutical Corp. | | 41,657 | | | 712,963 |
#Chosun Refractories Co., Ltd. | | 10,390 | | | 549,022 |
#Chungho Comnet Co., Ltd. | | 24,590 | | | 217,049 |
#CJ Cheiljedang Corp. | | 44,507 | | | 7,526,469 |
#CJ Corp. | | 92,912 | | | 3,715,508 |
#*Cosmochemical Co., Ltd. | | 47,640 | | | 297,405 |
Crown Confectionery Co., Ltd. | | 3,342 | | | 184,216 |
#Dae Dong Industrial Co., Ltd. | | 17,320 | | | 332,119 |
#*Dae Sang Corp. | | 135,732 | | | 948,336 |
Dae Won Kang Up Co., Ltd. | | 255,760 | | | 347,772 |
Daeduck Electronics Co., Ltd. | | 227,450 | | | 974,101 |
#Daeduck Industries Co., Ltd. | | 77,750 | | | 657,545 |
Daegu Bank Co., Ltd. | | 748,092 | | | 9,925,643 |
#Daegu Department Store Co., Ltd. | | 52,221 | | | 535,157 |
#Daehan Flour Mills Co., Ltd. | | 7,560 | | | 855,288 |
#*Daehan Steel Co., Ltd. | | 57,220 | | | 626,064 |
Daehan Synthetic Fiber Co., Ltd. | | 5,193 | | | 290,238 |
Daekyo Co., Ltd. | | 346,480 | | | 1,395,208 |
Daelim Industrial Co., Ltd. | | 171,614 | | | 10,890,924 |
Daelim Trading Co., Ltd. | | 31,734 | | | 114,869 |
Daesang Holdings Co., Ltd. | | 109,156 | | | 317,599 |
#Daesung Industrial Co., Ltd. | | 8,895 | | | 562,270 |
#Daewoo Engineering & Construction Co., Ltd. | | 951,350 | | | 9,691,869 |
#*Daewoo Motor Sales Corp. | | 245,067 | | | 2,033,948 |
Daewoong Co., Ltd. | | 17,680 | | | 328,490 |
Dahaam E-Tec Co., Ltd. | | 9,515 | | | 227,366 |
Daishin Securities Co., Ltd. | | 261,351 | | | 3,275,144 |
#*Daiyang Metal Co., Ltd. | | 77,290 | | | 106,750 |
#Daou Technology, Inc. | | 152,520 | | | 945,056 |
Digital Power Communications Co., Ltd. | | 113,840 | | | 136,622 |
Dong Ah Tire Industrial Co., Ltd. | | 69,104 | | | 479,764 |
21
DIMENSIONAL EMERGING MARKETS VALUE FUND
CONTINUED
| | | | | |
| | | Shares | | Value†† |
SOUTH KOREA — (Continued) | | | | | |
*Dong Hai Pulp Co., Ltd. | | 6,457 | | $ | 33,453 |
Dongbang Agro Co., Ltd. | | 53,610 | | | 285,655 |
#Dongbu Corp. | | 73,520 | | | 466,075 |
#*Dongbu HiTek Co., Ltd. | | 113,424 | | | 586,661 |
#*Dongbu Securities Co., Ltd. | | 142,296 | | | 710,394 |
#Dongbu Steel Co., Ltd. | | 149,594 | | | 948,776 |
Dong-Il Corp. | | 6,378 | | | 247,874 |
#*Dongil Industries Co., Ltd. | | 9,175 | | | 421,361 |
#Dongkuk Steel Mill Co., Ltd. | | 242,562 | | | 5,151,182 |
Dongwha Pharm Co., Ltd. | | 134,990 | | | 796,886 |
Dongwon F&B Co., Ltd. | | 12,686 | | | 461,929 |
#*Dongwon Systems Corp. | | 154,020 | | | 179,013 |
Dongyang Engineering & Construction Corp. | | 9,995 | | | 136,537 |
Dongyang Express Bus Corp. | | 3,729 | | | 85,981 |
#Dongyang Mechatronics Corp. | | 151,347 | | | 480,269 |
#*Doosan Construction & Engineering Co., Ltd. | | 176,150 | | | 1,078,504 |
DPI Co., Ltd. | | 22,738 | | | 112,927 |
#*Eagon Industrial Co., Ltd. | | 23,940 | | | 252,073 |
e-Starco Co., Ltd. | | 170,050 | | | 138,475 |
*First Fire & Marine Insurance Co., Ltd. | | 28,830 | | | 164,447 |
#Fursys, Inc. | | 33,450 | | | 744,638 |
Gaon Cable Co., Ltd. | | 13,480 | | | 355,611 |
GIIR, Inc. | | 3,170 | | | 29,060 |
#Global & Yuasa Battery Co., Ltd. | | 40,870 | | | 691,804 |
*Golden Bridge Investment & Securities Co., Ltd. | | 21,530 | | | 36,916 |
Green Cross Holdings Corp. | | 10,540 | | | 743,491 |
*GS Engineering & Construction Corp. | | 10,320 | | | 904,983 |
GS Holdings Corp. | | 320,680 | | | 7,943,333 |
*Gwangju Shinsegae Co., Ltd. | | 2,707 | | | 286,498 |
Halla Climate Control Corp. | | 219,060 | | | 2,129,711 |
#Halla Engineering & Construction Corp. | | 38,260 | | | 869,596 |
#Han Kuk Carbon Co., Ltd. | | 25,070 | | | 128,567 |
#Han Yang Securities Co., Ltd. | | 66,910 | | | 581,901 |
Hana Financial Group, Inc. | | 1,078,133 | | | 31,974,873 |
Handok Pharmaceuticals Co., Ltd. | | 18,150 | | | 233,065 |
#Handsome Corp. | | 110,990 | | | 1,339,075 |
Hanil Cement Manufacturing Co., Ltd. | | 29,473 | | | 1,851,525 |
#Hanil Construction Co., Ltd. | | 38,025 | | | 152,426 |
#Hanil E-Wha Co., Ltd. | | 163,890 | | | 508,306 |
#Hanjin Heavy Industries & Construction Co., Ltd. | | 203,224 | | | 3,631,219 |
#Hanjin Heavy Industries & Construction Holdings Co., Ltd. | | 91,460 | | | 904,248 |
#Hanjin Shipping Co., Ltd. | | 375,590 | | | 5,104,606 |
#Hanjin Transportation Co., Ltd. | | 50,240 | | | 1,399,605 |
Hankook Cosmetics Co., Ltd. | | 110,860 | | | 250,395 |
Hankook Tire Manufacturing Co., Ltd. | | 492,550 | | | 9,414,805 |
Hankuk Electric Glass Co., Ltd. | | 1,230 | | | 29,726 |
Hankuk Glass Industries, Inc. | | 29,050 | | | 519,784 |
Hankuk Paper Manufacturing Co., Ltd. | | 17,900 | | | 635,984 |
Hanshin Construction Co., Ltd. | | 24,880 | | | 388,919 |
#Hansol Chemical Co., Ltd. | | 42,777 | | | 389,966 |
*Hansol Paper Co., Ltd. | | 209,734 | | | 1,842,664 |
#Hanssem Co., Ltd. | | 60,410 | | | 507,215 |
#Hanwha Chemical Corp. | | 504,522 | | | 4,690,900 |
#Hanwha Securities Co., Ltd. | | 249,195 | | | 1,652,854 |
Hanwha Timeworld Co., Ltd. | | 9,000 | | | 105,428 |
Heung-A Shipping Co., Ltd. | | 106,352 | | | 59,433 |
#*Hite Holdings Co., Ltd. | | 86,500 | | | 2,232,573 |
*HMC Investment Securities Co., Ltd. | | 96,061 | | | 1,476,569 |
Honam Petrochemical Corp. | | 88,378 | | | 6,061,880 |
#Hotel Shilla Co., Ltd. | | 67,520 | | | 991,824 |
*Huneed Technologies | | 9,003 | | | 62,295 |
22
DIMENSIONAL EMERGING MARKETS VALUE FUND
CONTINUED
| | | | | |
| | | Shares | | Value†† |
SOUTH KOREA — (Continued) | | | | | |
#Husteel Co., Ltd. | | 25,630 | | $ | 325,313 |
#Hwa Sung Industrial Co., Ltd. | | 44,200 | | | 190,253 |
Hwacheon Machine Tool Co., Ltd. | | 2,050 | | | 53,164 |
#Hwashin Co., Ltd. | | 59,700 | | | 169,009 |
*Hynix Semiconductor, Inc. | | 142,778 | | | 2,119,759 |
#Hyosung T & C Co., Ltd. | | 140,707 | | | 7,733,436 |
#*Hyundai Cement Co., Ltd. | | 28,905 | | | 392,933 |
#Hyundai DSF Co., Ltd. | | 38,700 | | | 261,734 |
#Hyundai Elevator Co., Ltd. | | 22,090 | | | 1,053,352 |
#Hyundai H & S Co., Ltd. | | 22,361 | | | 1,587,456 |
#Hyundai Hysco | | 270,550 | | | 3,422,505 |
#Hyundai Merchant Marine Co., Ltd. | | 332,911 | | | 6,824,699 |
#Hyundai Mipo Dockyard Co., Ltd. | | 70,716 | | | 5,825,885 |
Hyundai Motor Co., Ltd. | | 895,824 | | | 81,255,253 |
Hyundai Pharmaceutical Ind. Co., Ltd. | | 104,700 | | | 211,702 |
Hyundai Securities Co., Ltd. | | 755,949 | | | 8,582,807 |
#Hyundai Steel Co. | | 238,900 | | | 15,176,391 |
#Il Dong Pharmaceutical Co., Ltd. | | 23,534 | | | 628,881 |
#*Iljin Holdings Co., Ltd. | | 96,174 | | | 247,860 |
Ilshin Spinning Co., Ltd. | | 5,070 | | | 249,426 |
#Ilsung Pharmaceutical Co., Ltd. | | 9,060 | | | 467,881 |
*Industrial Bank of Korea, Ltd. | | 1,012,400 | | | 12,264,887 |
InziControls Co., Ltd. | | 27,640 | | | 74,967 |
IS Dongseo Co., Ltd. | | 45,400 | | | 292,660 |
#ISU Chemical Co., Ltd. | | 40,930 | | | 483,368 |
#IsuPetasys Co., Ltd. | | 116,640 | | | 159,325 |
#Jahwa Electronics Co., Ltd. | | 69,130 | | | 442,463 |
Jeil Pharmaceutical Co. | | 38,380 | | | 307,206 |
#Jeonbuk Bank, Ltd. | | 269,132 | | | 1,621,295 |
Jinheung Mutual Savings Bank Co., Ltd. | | 144,160 | | | 517,256 |
*Jinro, Ltd. | | 57 | | | 2,102 |
#K.C. Tech Co., Ltd. | | 122,257 | | | 491,472 |
#*KB Financial Group, Inc. ADR | | 1,770,753 | | | 84,004,522 |
KCC Corp. | | 30,892 | | | 8,905,409 |
#*Keangnam Enterprises, Ltd. | | 57,890 | | | 532,490 |
#Keyang Electric Machinery Co., Ltd. | | 187,450 | | | 375,019 |
#KG Chemical Corp. | | 38,323 | | | 335,591 |
#*Kia Motors Corp. | | 1,211,070 | | | 17,988,676 |
#*KIC, Ltd. | | 50,040 | | | 296,262 |
#KISCO Corp. | | 29,571 | | | 1,158,424 |
KISWIRE, Ltd. | | 50,083 | | | 1,623,751 |
#Kodenshi Korea Corp. | | 64,590 | | | 179,965 |
#Kolon Engineering & Construction Co., Ltd. | | 101,960 | | | 542,328 |
#Kolon Industries, Inc. | | 70,909 | | | 2,030,598 |
#Korea Cast Iron Pipe Co., Ltd. | | 63,778 | | | 208,442 |
#*Korea Development Co., Ltd. | | 84,420 | | | 381,749 |
Korea Development Leasing Corp. | | 14,092 | | | 378,625 |
Korea Electric Terminal Co., Ltd. | | 42,160 | | | 721,112 |
Korea Exchange Bank | | 1,422,740 | | | 16,168,117 |
*Korea Express Co., Ltd. | | 44,750 | | | 2,457,076 |
#*Korea Flange Co., Ltd. | | 18,630 | | | 161,784 |
Korea Investment Holdings Co., Ltd. | | 238,116 | | | 6,350,449 |
#Korea Iron & Steel Co., Ltd. | | 9,993 | | | 668,032 |
#Korea Kolmar Co., Ltd. | | 20,300 | | | 56,014 |
#Korea Komho Petrochemical Co., Ltd. | | 69,229 | | | 1,341,501 |
#Korea Line Corp. | | 35,553 | | | 1,444,710 |
*Korea Mutual Savings Bank | | 19,600 | | | 233,078 |
#*Korea Petrochemical Industry Co., Ltd. | | 25,400 | | | 825,247 |
#Korea Zinc Co., Ltd. | | 35,825 | | | 5,536,978 |
*Korean Air Co., Ltd. | | 221,834 | | | 8,441,870 |
#Korean Air Terminal Service Co., Ltd. | | 10,970 | | | 290,793 |
23
DIMENSIONAL EMERGING MARKETS VALUE FUND
CONTINUED
| | | | | |
| | | Shares | | Value†† |
SOUTH KOREA — (Continued) | | | | | |
*Korean French Banking Corp. | | 358,946 | | $ | 239,165 |
*KP Chemical Corp. | | 304,576 | | | 1,758,479 |
KPX Chemical Co., Ltd. | | 10,134 | | | 404,544 |
KPX Fine Chemical Co., Ltd. | | 1,359 | | | 57,394 |
KPX Holdings Corp. | | 7,249 | | | 391,667 |
#*KTB Securities Co., Ltd. | | 336,060 | | | 1,205,746 |
#Kukdo Chemical Co., Ltd. | | 21,360 | | | 477,168 |
Kumho Electronics Co., Ltd. | | 5,226 | | | 220,743 |
#Kumho Industrial Co., Ltd. | | 175,325 | | | 1,472,570 |
Kumho Investment Bank | | 637,880 | | | 569,547 |
#*Kumho Tire Co., Inc. | | 286,360 | | | 1,191,382 |
#Kunsul Chemical Industrial Co., Ltd. | | 22,480 | | | 261,372 |
#Kwang Dong Pharmaceutical Co., Ltd. | | 278,920 | | | 668,302 |
#Kyeryong Construction Industrial Co., Ltd. | | 32,010 | | | 596,310 |
#Kyobo Securities Co., Ltd. | | 67,440 | | | 554,123 |
Kyung Dong Navien Co., Ltd. | | 3,860 | | | 125,680 |
Kyung Nong Corp. | | 60,670 | | | 218,980 |
#*Kyungbang Co., Ltd. | | 4,806 | | | 554,794 |
*Kyung-in Synthetic Corp. | | 125,280 | | | 272,194 |
LG Corp. | | 737 | | | 41,753 |
LG Dacom Corp. | | 268,150 | | | 4,234,721 |
#*LG Display Co., Ltd. ADR | | 1,043,037 | | | 12,412,140 |
#LG Fashion Corp. | | 50,470 | | | 1,140,999 |
#LG International Corp. | | 82,553 | | | 2,019,918 |
LG Phillips LCD Co., Ltd. | | 444,000 | | | 10,624,693 |
*LG Telecom, Ltd. | | 842,310 | | | 6,310,784 |
*Livart Furniture Co., Ltd. | | 14,170 | | | 90,896 |
Lotte Chilsung Beverage Co., Ltd. | | 4,465 | | | 3,054,821 |
#Lotte Confectionary Co., Ltd. | | 4,663 | | | 4,689,310 |
#Lotte Midopa Co., Ltd. | | 84,420 | | | 826,830 |
#Lotte Sam Kang Co., Ltd. | | 5,689 | | | 1,008,048 |
#Lotte Shopping Co., Ltd. | | 52,813 | | | 14,916,034 |
#Meritz Securities Co., Ltd. | | 1,085,155 | | | 1,083,253 |
Mi Chang Oil Industrial Co., Ltd. | | 3,650 | | | 134,606 |
Moorim Paper Co., Ltd. | | 57,710 | | | 484,613 |
Motonic Corp. | | 6,400 | | | 47,672 |
#*Namkwang Engineering & Construction Co., Ltd. | | 39,006 | | | 288,457 |
Namyang Dairy Products Co., Ltd. | | 3,166 | | | 1,441,934 |
#Nexen Corp. | | 6,410 | | | 206,695 |
NH Investment & Securities Co., Ltd. | | 176,431 | | | 1,441,383 |
#Nong Shim Co., Ltd. | | 15,130 | | | 3,067,102 |
Nong Shim Holdings Co., Ltd. | | 13,419 | | | 789,167 |
Noroo Paint Co., Ltd. | | 37,899 | | | 103,239 |
*ON*Media Corp. | | 378,990 | | | 1,068,223 |
Ottogi Corp. | | 10,309 | | | 1,265,369 |
Pacific Corp. | | 20,943 | | | 2,561,883 |
Pacific Pharmaceutical Co., Ltd. | | 3,840 | | | 99,309 |
*Pang Rim Co., Ltd. | | 15,040 | | | 187,707 |
*PaperCorea, Inc. | | 19,552 | | | 129,219 |
#Pohang Coated Steel Co., Ltd. | | 17,630 | | | 384,429 |
#*Poong Lim Industrial Co., Ltd. | | 74,350 | | | 158,649 |
#*Poongsan Corp. | | 104,030 | | | 2,159,003 |
#*Poongsan Holdings Corp. | | 29,678 | | | 522,732 |
POSCO | | 420 | | | 174,060 |
#POSCO ADR | | 1,041,585 | | | 106,366,660 |
#Pulmuone Co., Ltd. | | 6,125 | | | 274,108 |
Pum Yang Construction Co., Ltd. | | 21,917 | | | 140,049 |
Pusan City Gas Co., Ltd. | | 65,770 | | | 1,239,814 |
#*S&T Daewoo Co., Ltd. | | 34,580 | | | 746,651 |
#S&T Dynamics Co., Ltd. | | 138,204 | | | 1,702,058 |
#S&T Holdings Co, Ltd. | | 52,273 | | | 616,010 |
24
DIMENSIONAL EMERGING MARKETS VALUE FUND
CONTINUED
| | | | | |
| | | Shares | | Value†† |
SOUTH KOREA — (Continued) | | | | | |
#Sam Kwang Glass Industrial Co., Ltd. | | 19,870 | | $ | 643,085 |
Sam Yung Trading Co., Ltd. | | 13,840 | | | 59,397 |
#Sambu Construction Co., Ltd. | | 26,614 | | | 533,596 |
#*Samho International Co., Ltd. | | 12,120 | | | 39,768 |
*Samhwa Asset Co. | | 1,350 | | | 18,898 |
Samhwa Crown and Closure Co., Ltd. | | 1,749 | | | 32,086 |
Samhwa Paints Industrial Co., Ltd. | | 48,610 | | | 164,849 |
#*Samick Musical Instruments Co., Ltd. | | 621,710 | | | 502,796 |
Samsung Corp. | | 569,540 | | | 23,180,705 |
Samsung Fine Chemicals Co., Ltd. | | 89,080 | | | 3,529,893 |
#Samsung SDI Co., Ltd. | | 187,935 | | | 21,455,164 |
#Samwhan Corp. | | 40,500 | | | 403,381 |
#Samyang Corp. | | 36,876 | | | 1,191,955 |
Samyang Genex Co., Ltd. | | 12,242 | | | 596,702 |
Samyang Tongsang Co., Ltd. | | 8,060 | | | 190,079 |
#Samyoung Electronics Co., Ltd. | | 73,630 | | | 686,699 |
SC Engineering Co., Ltd. | | 34,640 | | | 145,756 |
#Seah Besteel Corp. | | 100,300 | | | 1,216,248 |
SeAH Holdings Corp. | | 12,561 | | | 620,461 |
#SeAH Steel Corp. | | 17,133 | | | 487,587 |
#Sebang Co., Ltd. | | 80,550 | | | 919,593 |
#Sejong Industrial Co., Ltd. | | 101,600 | | | 506,505 |
#*Seoul Securities Co., Ltd. | | 3,040,139 | | | 2,572,122 |
#*SH Chemical Co., Ltd. | | 528,345 | | | 220,318 |
#Shin Won Corp. | | 234,730 | | | 317,488 |
Shin Young Securities Co., Ltd. | | 29,240 | | | 866,811 |
Shin Young Wacoal, Inc. | | 273 | | | 21,433 |
#Shinhan Engineering & Construction Co., Ltd. | | 23,320 | | | 293,382 |
*Shinhan Financial Group Co., Ltd. | | 81,216 | | | 3,081,412 |
#Shinhan Financial Group Co., Ltd. ADR | | 663,280 | | | 50,177,132 |
Shinpoong Pharmaceutical Co., Ltd. | | 13,200 | | | 237,694 |
Shinsegae Engineering & Construction Co., Ltd. | | 8,470 | | | 94,506 |
#Shinsung Holdings Co., Ltd. | | 79,589 | | | 268,466 |
*Shinsung Tongsang Co., Ltd. | | 34,250 | | | 176,428 |
#Silla Trading Co., Ltd. | | 24,300 | | | 304,234 |
#Sindo Ricoh Co., Ltd. | | 32,751 | | | 1,647,964 |
SJM Co., Ltd. | | 60,580 | | | 275,422 |
SK Co., Ltd. | | 182,809 | | | 14,501,864 |
#SK Energy Co., Ltd. | | 233,120 | | | 21,411,699 |
#SK Gas Co., Ltd. | | 30,216 | | | 1,301,618 |
*SK Networks Co., Ltd. | | 286,430 | | | 2,707,333 |
#SKC Co., Ltd. | | 143,710 | | | 2,198,021 |
SL Corp. | | 37,480 | | | 166,904 |
#*Ssangyong Cement Industry Co., Ltd. | | 193,556 | | | 1,376,859 |
#*STX Corp. | | 96,020 | | | 1,322,464 |
*STX Engine Co., Ltd. | | 112,030 | | | 1,635,869 |
#*STX Offshore & Shipbuilding Co., Ltd. | | 282,490 | | | 3,015,111 |
#*STX Pan Ocean Co., Ltd. | | 634,500 | | | 5,781,703 |
Suheung Capsule Co., Ltd. | | 52,170 | | | 332,812 |
Sung Bo Chemicals Co., Ltd. | | 4,130 | | | 119,419 |
#*Sung Shin Cement Co., Ltd. | | 69,040 | | | 417,483 |
*Sungchang Enterprise Holdings, Ltd. | | 10,160 | | | 167,304 |
#*Sungwon Corp. | | 69,880 | | | 229,881 |
*Sunjin Co., Ltd. | | 7,650 | | | 198,867 |
#Tae Kwang Industrial Co., Ltd. | | 3,447 | | | 2,170,481 |
#Tae Kyung Industrial Co., Ltd. | | 92,200 | | | 399,470 |
#Taeyoung Engineering & Construction | | 275,480 | | | 1,138,879 |
#Tai Han Electric Wire Co., Ltd. | | 146,747 | | | 2,345,088 |
Tai Lim Packaging Industries Co., Ltd. | | 134,200 | | | 89,363 |
*Tec & Co. | | 42,717 | | | 137,301 |
Telcoware Co., Ltd. | | 36,000 | | | 209,103 |
25
DIMENSIONAL EMERGING MARKETS VALUE FUND
CONTINUED
| | | | | |
| | | Shares | | Value†† |
SOUTH KOREA — (Continued) | | | | | |
*Tong Kook Corp. | | 607 | | $ | 802 |
Tong Yang Securities, Inc. | | 300,000 | | | 2,748,611 |
#TS Corp. | | 11,001 | | | 440,733 |
#Unid Co., Ltd. | | 32,400 | | | 838,573 |
Union Steel Manufacturing Co., Ltd. | | 38,857 | | | 708,385 |
Wiscom Co., Ltd. | | 32,980 | | | 112,242 |
#*Woongjin.Com Co., Ltd. | | 219,380 | | | 1,970,875 |
#Woori Financial Co., Ltd. | | 59,070 | | | 465,714 |
Woori Investment & Securities Co., Ltd. | | 528,120 | | | 6,639,036 |
YESCO Co., Ltd. | | 18,780 | | | 410,853 |
Yoosung Enterprise Co., Ltd. | | 106,520 | | | 214,874 |
#Youlchon Chemical Co., Ltd. | | 82,970 | | | 652,333 |
*Young Poong Mining & Construction Corp. | | 18,030 | | | 839 |
#Youngone Corp. | | 42,442 | | | 871,321 |
Youngpoong Corp. | | 4,601 | | | 2,240,890 |
Yuhwa Securities Co., Ltd. | | 28,680 | | | 362,198 |
*Zinus, Inc. | | 1,866 | | | 5,919 |
| | | | | |
TOTAL SOUTH KOREA | | | | | 906,165,124 |
| | | | | |
TAIWAN — (10.6%) | | | | | |
*A.G.V. Products Corp. | | 3,043,429 | | | 1,136,676 |
*Abocom Systems, Inc. | | 340,752 | | | 113,659 |
Acbel Polytech, Inc. | | 2,866,220 | | | 1,958,911 |
Accton Technology Corp. | | 5,114,000 | | | 1,905,222 |
*Action Electronics Co., Ltd. | | 1,443,000 | | | 514,675 |
Ambassador Hotel (The) | | 274,000 | | | 277,793 |
Amtran Technology Co., Ltd. | | 3,385,693 | | | 3,217,786 |
*Apex Science & Engineering Corp. | | 148,000 | | | 68,579 |
*Arima Communication Corp. | | 2,339,000 | | | 850,664 |
*Arima Optoelectronics Corp. | | 1,045,000 | | | 371,354 |
Asia Cement Corp. | | 11,500,327 | | | 12,075,111 |
*Asia Chemical Corp. | | 1,756,000 | | | 534,756 |
*Asia Optical Co, Inc. | | 1,337,000 | | | 2,157,736 |
Asia Polymer Corp. | | 1,632,489 | | | 1,179,320 |
Asia Vital Components Co., Ltd. | | 1,642,307 | | | 1,704,285 |
Asustek Computer, Inc. | | 8,385,422 | | | 15,401,129 |
AU Optronics Corp. | | 4,093,812 | | | 3,630,202 |
#AU Optronics Corp. Sponsored ADR | | 5,821,675 | | | 51,405,388 |
Audix Co., Ltd. | | 1,079,164 | | | 653,546 |
Aurora Corp. | | 28,676 | | | 29,887 |
Aurora Systems Corp. | | 383,281 | | | 199,986 |
Avision, Inc. | | 1,507,555 | | | 686,474 |
*Bank of Kaohsiung Co., Ltd. | | 3,947,926 | | | 1,191,659 |
*Behavior Tech Computer Corp. | | 884,716 | | | 102,962 |
Bes Engineering Corp. | | 10,945,443 | | | 3,034,430 |
*Biostar Microtech International Corp. | | 77,595 | | | 56,716 |
C Sun Manufacturing, Ltd. | | 224,838 | | | 98,909 |
*Cameo Communications, Inc. | | 1,521,000 | | | 820,484 |
*Carnival Industrial Corp. | | 2,726,000 | | | 548,125 |
Cathay Chemical Works, Inc. | | 857,000 | | | 292,140 |
*Cathay Real Estate Development Co., Ltd. | | 7,900,421 | | | 3,128,231 |
*Central Reinsurance Co., Ltd. | | 2,457,781 | | | 958,432 |
Chain Qui Development Co., Ltd. | | 272,173 | | | 196,373 |
Champion Building Materials Co., Ltd. | | 2,472,041 | | | 991,812 |
Chang Hwa Commercial Bank | | 40,500,459 | | | 17,621,616 |
*Chang-Ho Fibre Corp. | | 192,000 | | | 64,106 |
Charoen Pokphand Enterprises Co., Ltd. | | 1,223,000 | | | 584,444 |
*Cheng Loong Corp. | | 8,527,480 | | | 2,782,240 |
Cheng Uei Precision Industry Co., Ltd. | | 235,620 | | | 447,634 |
Chenming Mold Industrial Corp. | | 798,040 | | | 221,296 |
*Chi Mei Optoelectronic Corp. | | 39,881,932 | | | 19,896,487 |
26
DIMENSIONAL EMERGING MARKETS VALUE FUND
CONTINUED
| | | | | |
| | | Shares | | Value†† |
TAIWAN — (Continued) | | | | | |
*Chia Hsin Cement Corp. | | 4,419,594 | | $ | 2,235,625 |
*Chia Hsin Food & Synthetic Fiber Co., Ltd. | | 514,966 | | | — |
*Chien Shing Stainless Steel Co., Ltd. | | 2,280,000 | | | 404,729 |
Chilisin Electronics Corp. | | 321,300 | | | 157,480 |
*China Airlines, Ltd. | | 3,478,866 | | | 1,081,340 |
China Chemical & Pharmaceutical Co. | | 480,264 | | | 332,214 |
*China Development Financial Holding Corp. | | 81,400,032 | | | 21,204,829 |
China Electric Manufacturing Co., Ltd. | | 2,450,200 | | | 1,703,681 |
*China General Plastics Corp. | | 3,008,000 | | | 1,068,009 |
*China Glaze Co., Ltd. | | 717,000 | | | 402,783 |
China Man-Made Fiber Co., Ltd. | | 10,273,813 | | | 1,879,006 |
*China Metal Products Co., Ltd. | | 479,400 | | | 558,295 |
*China Motor Co., Ltd. | | 6,039,749 | | | 4,142,921 |
*China Petrochemical Development Corp. | | 13,620,580 | | | 4,873,926 |
*China Rebar Co., Ltd. | | 439,188 | | | — |
China Steel Structure Co., Ltd. | | 885,219 | | | 623,749 |
China Synthetic Rubber Corp. | | 2,189,890 | | | 2,270,375 |
*China United Trust & Investment Corp. | | 493,999 | | | — |
*China Wire & Cable Co., Ltd. | | 2,472,000 | | | 692,271 |
Chinatrust Financial Holdings Co., Ltd. | | 53,481,946 | | | 32,125,168 |
Chin-Poon Industrial Co., Ltd. | | 3,141,815 | | | 2,323,110 |
Chun Yu Works & Co., Ltd. | | 2,079,000 | | | 554,121 |
Chun Yuan Steel Industrial Co., Ltd. | | 3,664,191 | | | 1,213,514 |
Chung Hsin Electric & Machinery Co., Ltd. | | 2,451,000 | | | 1,469,629 |
Chung Hwa Pulp Corp. | | 4,631,419 | | | 1,905,918 |
*Chung Shing Textile Co., Ltd. | | 600 | | | 9 |
*Chungwa Picture Tubes Co., Ltd. | | 81,289,045 | | | 8,339,189 |
*Clevo Co. | | 46,934 | | | 58,575 |
*CMC Magnetics Corp. | | 24,639,000 | | | 5,410,830 |
Collins Co., Ltd. | | 1,769,823 | | | 462,197 |
Compal Electronics, Inc. | | 2,428,705 | | | 3,036,378 |
*Compeq Manufacturing Co., Ltd. | | 8,639,000 | | | 2,229,203 |
*Compex International Co., Ltd. | | 46,400 | | | 285 |
Continental Engineering Corp. | | 5,097,848 | | | 1,912,235 |
*Cosmos Bank Taiwan | | 2,048,199 | | | 225,637 |
Da-Cin Construction Co., Ltd. | | 756,579 | | | 474,688 |
*Delpha Construction Co., Ltd. | | 1,642,528 | | | 569,634 |
Depo Auto Parts Industrial Co., Ltd. | | 50,000 | | | 108,396 |
*Der Pao Construction Co., Ltd. | | 1,139,000 | | | 28,718 |
Diamond Flower Electric Instrument Co., Ltd. | | 69,281 | | | 80,233 |
D-Link Corp. | | 1,911,780 | | | 1,781,390 |
*E.Sun Financial Holding Co., Ltd. | | 15,969,578 | | | 6,216,301 |
*Eastern Media International Corp. | | 8,183,399 | | | 1,715,138 |
Eclat Textile Co., Ltd. | | 952,204 | | | 557,940 |
*Edom Technology Co., Ltd. | | 129,800 | | | 55,042 |
Elan Microelectronics Corp. | | 255 | | | 345 |
Elite Material Co., Ltd. | | 102,237 | | | 70,088 |
Elitegroup Computer Systems Co., Ltd. | | 6,985,066 | | | 2,651,368 |
*Enlight Corp. | | 1,184,549 | | | 73,331 |
*EnTie Commercial Bank | | 693,232 | | | 193,482 |
*Eva Airways Corp. | | 11,743,944 | | | 4,405,190 |
*Ever Fortune Industrial Co., Ltd. | | 409,000 | | | 4,150 |
*Everest Textile Co., Ltd. | | 3,474,002 | | | 667,875 |
*Evergreen International Storage & Transport Corp. | | 2,962,000 | | | 2,397,216 |
*Evergreen Marine Corp., Ltd. | | 10,174,527 | | | 5,138,833 |
Everlight Chemical Industrial Corp. | | 30,950 | | | 22,204 |
*Everspring Industry Co., Ltd. | | 582,180 | | | 141,820 |
Far Eastern Department Stores, Ltd. | | 5,120,064 | | | 5,259,849 |
*Far Eastern International Bank | | 10,556,514 | | | 3,572,778 |
*Federal Corp. | | 3,092,876 | | | 2,315,495 |
*FIC Global, Inc. | | 102,255 | | | 10,627 |
27
DIMENSIONAL EMERGING MARKETS VALUE FUND
CONTINUED
| | | | | |
| | | Shares | | Value†† |
TAIWAN — (Continued) | | | | | |
*First Copper Technology Co., Ltd. | | 2,596,750 | | $ | 885,352 |
First Financial Holding Co., Ltd. | | 46,440,361 | | | 26,828,184 |
First Hotel | | 599,339 | | | 437,810 |
*First Insurance Co., Ltd. (The) | | 2,140,064 | | | 766,175 |
First Steamship Co., Ltd. | | 802,717 | | | 1,014,581 |
Formosa Chemicals & Fiber Co., Ltd. | | 3,318,660 | | | 6,184,378 |
Formosa Taffeta Co., Ltd. | | 7,804,511 | | | 5,290,833 |
Formosan Rubber Group, Inc. | | 4,450,000 | | | 3,321,205 |
Formosan Union Chemical Corp. | | 592,078 | | | 226,364 |
*Fu I Industrial Co., Ltd. | | 290,400 | | | 75,038 |
*Fubon Financial Holding Co., Ltd. | | 29,313,000 | | | 32,526,620 |
*Fwuson Industry Co., Ltd. | | 1,737,220 | | | 629,186 |
G Shank Enterprise Co., Ltd. | | 250,880 | | | 171,967 |
*G.T.M. Corp. | | 763,000 | | | 473,283 |
Getac Technology Corp. | | 1,836,065 | | | 1,633,567 |
*Giantplus Technology Co., Ltd. | | 1,590,000 | | | 883,963 |
*Giga Storage Corp. | | 1,223,939 | | | 862,646 |
Giga-Byte Technology Co., Ltd. | | 5,303,287 | | | 4,498,218 |
*Gintech Energy Corp. | | 1,585,134 | | | 2,344,072 |
*Gold Circuit Electronics, Ltd. | | 3,710,549 | | | 1,315,970 |
Goldsun Development & Construction Co., Ltd. | | 8,560,543 | | | 3,872,739 |
Good Will Instrument Co., Ltd. | | 383,670 | | | 218,705 |
*Grand Pacific Petrochemical Corp. | | 3,861,000 | | | 1,945,223 |
Grape King, Inc. | | 68,000 | | | 65,846 |
Great China Metal Industry Co., Ltd. | | 1,577,000 | | | 942,370 |
Great Wall Enterprise Co., Ltd. | | 1,807,393 | | | 1,871,403 |
*Hannstar Board Corp. | | 958,000 | | | 856,943 |
*HannStar Display Corp. | | 37,182,000 | | | 7,010,610 |
*Helix Technology, Inc. | | 29,585 | | | — |
Hey Song Corp. | | 3,873,000 | | | 2,030,093 |
Hitron Technologies, Inc. | | 540,335 | | | 271,006 |
*Ho Tung Holding Corp. | | 4,274,468 | | | 1,937,720 |
*Hocheng Corp. | | 2,671,300 | | | 826,846 |
*Hold-Key Electric Wire & Cable Co., Ltd. | | 1,689,548 | | | 1,108,791 |
*Holystone Enterprise Co., Ltd. | | 778,000 | | | 840,926 |
Hong Tai Electric Industrial Co., Ltd. | | 2,166,000 | | | 862,540 |
Hsin Kuang Steel Co., Ltd. | | 1,584,124 | | | 1,246,730 |
Hsing Ta Cement Co., Ltd. | | 2,071,980 | | | 632,663 |
*Hua Eng Wire & Cable Co., Ltd. | | 4,644,035 | | | 1,475,279 |
Hua Nan Financial Holding Co., Ltd. | | 7,657,258 | | | 4,449,023 |
*Hualon Corp. | | 257,040 | | | 8,536 |
Hung Ching Development & Construction Co., Ltd. | | 1,838,468 | | | 909,318 |
Hung Poo Construction Corp. | | 436 | | | 629 |
Hung Sheng Construction Co., Ltd. | | 3,953,000 | | | 1,705,186 |
*Hwa Fong Rubber Co., Ltd. | | 1,948,960 | | | 782,154 |
*Ichia Technologies, Inc. | | 3,181,260 | | | 1,663,727 |
*Inernational Semiconductor Technology, Ltd. | | 2,788,000 | | | 891,612 |
Innolux Display Corp. | | 11,558,140 | | | 15,223,340 |
*Inotera Memories, Inc. | | 2,906,000 | | | 1,716,974 |
Inventec Corp. | | 14,551,859 | | | 8,049,998 |
*Jean Co., Ltd. | | 38,864 | | | 21,841 |
Johnson Health Tech Co., Ltd. | | 120,220 | | | 124,169 |
*Jui Li Enterprise Co., Ltd. | | 712,760 | | | 188,960 |
K Laser Technology, Inc. | | 843,601 | | | 451,446 |
Kang Na Hsiung Co., Ltd. | | 1,409,078 | | | 958,050 |
*Kao Hsing Chang Iron & Steel Corp. | | 2,196,000 | | | 389,126 |
Kaulin Manufacturing Co., Ltd. | | 1,259,656 | | | 566,488 |
Kee Tai Properties Co., Ltd. | | 1,740,236 | | | 870,249 |
Kenda Rubber Industrial Co., Ltd. | | 63,924 | | | 75,504 |
King Yuan Electronics Co., Ltd. | | 10,624,862 | | | 4,100,865 |
Kingdom Construction Co., Ltd. | | 2,867,000 | | | 2,146,417 |
28
DIMENSIONAL EMERGING MARKETS VALUE FUND
CONTINUED
| | | | | |
| | | Shares | | Value†† |
TAIWAN — (Continued) | | | | | |
*King’s Town Bank | | 5,689,012 | | $ | 1,354,602 |
*Kinko Optical Co., Ltd. | | 172,000 | | | 90,823 |
*Kinpo Electronics, Inc. | | 11,607,375 | | | 3,042,448 |
*Kuoyang Construction Co., Ltd. | | 641,029 | | | 307,290 |
*Kwong Fong Industries Corp. | | 4,296,000 | | | 1,037,274 |
*L&K Engineering Co., Ltd. | | 216,000 | | | 184,242 |
*Lan Fa Textile Co., Ltd. | | 2,409,703 | | | 652,705 |
*Lead Data Co., Ltd. | | 2,033,458 | | | 383,662 |
*Lealea Enterprise Co., Ltd. | | 5,585,000 | | | 1,152,183 |
Lee Chang Yung Chemical Industry Corp. | | 2,306,714 | | | 2,558,282 |
Lee Chi Enterprises Co., Ltd. | | 1,564,900 | | | 528,582 |
*Leofoo Development Co., Ltd. | | 1,777,000 | | | 934,321 |
Les Enphants Co., Ltd. | | 63,908 | | | 63,571 |
*Li Peng Enterprise Co., Ltd. | | 4,587,712 | | | 1,866,854 |
Lian Hwa Foods Corp. | | 157,000 | | | 60,381 |
*Lien Chang Electronic Enterprise Co., Ltd. | | 623,000 | | | 285,713 |
Lien Hwa Industrial Corp. | | 4,294,640 | | | 1,966,484 |
Lingsen Precision Industries, Ltd. | | 2,580,481 | | | 893,454 |
Lite-On Technology Corp. | | 10,539,645 | | | 13,881,361 |
*Long Bon International Co., Ltd. | | 2,839,301 | | | 995,013 |
*Long Chen Paper Co., Ltd. | | 3,677,741 | | | 1,172,756 |
*Lucky Cement Corp. | | 2,877,000 | | | 710,898 |
Macronix International Co., Ltd. | | 25,770,028 | | | 13,062,710 |
*Masterlink Securities Corp. | | 5,882,000 | | | 2,286,753 |
*Mayer Steel Pipe Corp. | | 953,364 | | | 542,804 |
Maywufa Co., Ltd. | | 192,264 | | | 98,415 |
Mega Financial Holding Co., Ltd. | | 69,737,000 | | | 38,835,040 |
*Megamedia Corp. | | 782 | | | 6 |
Meiloon Co., Ltd. | | 973,352 | | | 357,765 |
*Mercuries & Associates, Ltd. | | 3,533,829 | | | 1,485,623 |
*Mercuries Data Co., Ltd. | | 649,800 | | | 148,324 |
Merry Electronics Co., Ltd. | | 648,000 | | | 1,081,549 |
Microelectronics Technology, Inc. | | 3,002,123 | | | 1,267,284 |
Micro-Star International Co., Ltd. | | 6,989,985 | | | 4,179,619 |
Mitac International Corp. | | 7,817,000 | | | 3,656,001 |
*Mobiletron Electronics Co., Ltd. | | 90,000 | | | 66,821 |
*Mustek Systems, Inc. | | 462,074 | | | 85,623 |
*Namchow Chemical Industrial Co., Ltd. | | 1,186,057 | | | 742,936 |
Nantex Industry Co., Ltd. | | 1,576,232 | | | 997,934 |
*New Asia Construction & Development Co., Ltd. | | 1,011,542 | | | 216,648 |
Nien Hsing Textile Co., Ltd. | | 3,910,000 | | | 1,973,227 |
*Ocean Plastics Co., Ltd. | | 79,776 | | | 54,083 |
*Optimax Technology Corp. | | 3,466,000 | | | 192,400 |
*Orient Semiconductor Electronics, Ltd. | | 372,276 | | | 63,947 |
Oriental Union Chemical Corp. | | 3,567,225 | | | 2,452,186 |
*Pacific Construction Co., Ltd. | | 4,079,256 | | | 508,786 |
Pan Jit International, Inc. | | 2,473,818 | | | 1,670,959 |
Phihong Technology Co., Ltd. | | 2,254,661 | | | 1,927,167 |
*Phoenix Precision Technology Corp. | | 3,222,000 | | | 2,172,095 |
*Picvue Electronics, Ltd. | | 241,600 | | | — |
*Plotech Co., Ltd. | | 572,000 | | | 342,060 |
*Potrans Electrical Corp. | | 1,139,000 | | | 152,693 |
Pou Chen Corp. | | 8,326,500 | | | 5,708,831 |
*President Securities Corp. | | 634,000 | | | 371,022 |
*Prince Housing & Development Corp. | | 4,151,737 | | | 1,801,008 |
*Procomp Informatics, Ltd. | | 391,440 | | | — |
*Prodisc Technology, Inc. | | 6,185,157 | | | 130,694 |
*Promate Electronic Co., Ltd. | | 272,000 | | | 171,356 |
Promise Technology, Inc. | | 691,002 | | | 488,798 |
*Qisda Corp. | | 8,957,952 | | | 4,968,665 |
*Quintain Steel Co., Ltd. | | 2,435,250 | | | 569,769 |
29
DIMENSIONAL EMERGING MARKETS VALUE FUND
CONTINUED
| | | | | |
| | | Shares | | Value†† |
TAIWAN — (Continued) | | | | | |
*Radiant Opto-Electronics Corp. | | 2,639,000 | | $ | 2,936,281 |
*Radium Life Tech Corp. | | 1,550,788 | | | 1,145,909 |
Ralec Electronic Corp. | | 383,163 | | | 477,965 |
*Rechi Precision Co., Ltd. | | 629,000 | | | 198,088 |
*Ritek Corp. | | 21,314,518 | | | 5,078,681 |
*Sainfoin Technology Corp. | | 835,498 | | | — |
*Sampo Corp. | | 7,195,684 | | | 1,131,399 |
San Fang Chemical Industry Co., Ltd. | | 71,938 | | | 84,586 |
*Sanyang Industrial Co., Ltd. | | 6,088,268 | | | 2,440,733 |
Sanyo Electric Co., Ltd. | | 368,000 | | | 368,670 |
Sheng Yu Steel Co., Ltd. | | 1,716,000 | | | 1,176,192 |
Shihlin Electric & Engineering Corp. | | 2,263,000 | | | 2,720,902 |
*Shin Kong Financial Holding Co., Ltd. | | 14,428,507 | | | 5,870,356 |
*Shinkong Co., Ltd. | | 2,182,412 | | | 1,112,192 |
Shinkong Synthetic Fibers Co., Ltd. | | 10,443,342 | | | 2,577,876 |
*Shuttle, Inc. | | 223 | | | 158 |
Sigurd Microelectronics Corp. | | 2,269,608 | | | 1,135,677 |
*Silicon Integrated Systems Corp. | | 9,117,485 | | | 4,317,230 |
*Sinbon Electronics Co., Ltd. | | 1,284,000 | | | 777,257 |
Sincere Navigation Corp. | | 538,692 | | | 598,832 |
*Sinkang Industries Co., Ltd. | | 806,669 | | | 350,688 |
Sinon Corp. | | 3,047,877 | | | 1,207,037 |
*SinoPac Holdings Co., Ltd. | | 60,339,809 | | | 22,284,339 |
*Sintek Photronics Corp. | | 360,745 | | | 186,988 |
Siward Crystal Technology Co., Ltd. | | 933,875 | | | 377,742 |
Solomon Technology Corp. | | 1,316,950 | | | 544,396 |
South East Soda Manufacturing Co., Ltd. | | 927,500 | | | 810,280 |
*Southeast Cement Co., Ltd. | | 3,208,700 | | | 1,090,706 |
SPI Electronic Co., Ltd. | | 272,500 | | | 287,236 |
Spirox Corp. | | 362,662 | | | 209,549 |
Springsoft, Inc. | | 1,312,000 | | | 1,149,234 |
Standard Chemical & Pharmaceutical Co., Ltd. | | 155,310 | | | 129,939 |
Standard Foods Taiwan, Ltd. | | 586,250 | | | 640,908 |
Stark Technology, Inc. | | 827,200 | | | 470,102 |
Sunonwealth Electric Machine Industry Co., Ltd. | | 1,674,421 | | | 1,003,436 |
*Sunplus Technology Co., Ltd. | | 4,538,620 | | | 3,762,885 |
*Sweeten Construction Co., Ltd. | | 234,000 | | | 127,671 |
Sysware Systex Corp. | | 828,801 | | | 1,030,302 |
T JOIN Transportation Co., Ltd. | | 3,278,000 | | | 2,038,146 |
*Ta Chen Stainless Pipe Co., Ltd. | | 1,498,864 | | | 1,026,929 |
*Ta Chong Bank, Ltd. | | 14,283,906 | | | 2,806,401 |
*Ta Ya Electric Wire & Cable Co., Ltd. | | 5,127,732 | | | 1,179,998 |
Ta Yih Industrial Co., Ltd. | | 192,000 | | | 174,337 |
Tah Hsin Industrial Corp. | | 1,452,000 | | | 1,009,152 |
Ta-I Technology Co., Ltd. | | 1,330,195 | | | 943,152 |
Taichung Commercial Bank | | 9,743,754 | | | 2,413,124 |
Tainan Enterprises Co., Ltd. | | 421,850 | | | 297,328 |
*Tainan Spinning Co., Ltd. | | 10,204,000 | | | 3,766,151 |
*Taishin Financial Holdings Co., Ltd. | | 46,043,000 | | | 18,018,886 |
*Taisun Enterprise Co., Ltd. | | 1,931,721 | | | 741,879 |
*Taita Chemical Co., Ltd. | | 2,126,400 | | | 874,452 |
*Taiwan Business Bank | | 28,343,549 | | | 6,920,761 |
Taiwan Cement Corp. | | 12,306,807 | | | 12,626,116 |
*Taiwan Cogeneration Corp. | | 2,134,000 | | | 1,035,986 |
Taiwan Cooperative Bank | | 32,873,902 | | | 19,396,848 |
*Taiwan Flourescent Lamp Co., Ltd. | | 756,000 | | | 69,270 |
Taiwan Fu Hsing Industrial Co., Ltd. | | 399,000 | | | 217,379 |
Taiwan Glass Industrial Corp. | | 8,054,803 | | | 6,192,220 |
Taiwan Hon Chuan Enterprise Co., Ltd. | | 811,159 | | | 1,307,972 |
*Taiwan International Securities Corp. | | 1,232,000 | | | 303,131 |
Taiwan Kai Yih Industrial Co., Ltd. | | 1,033,060 | | | 610,504 |
30
DIMENSIONAL EMERGING MARKETS VALUE FUND
CONTINUED
| | | | | |
| | | Shares | | Value†† |
TAIWAN — (Continued) | | | | | |
*Taiwan Kolin Co., Ltd. | | 5,797,000 | | $ | — |
Taiwan Mask Corp. | | 2,615,000 | | | 896,600 |
Taiwan Paiho Co., Ltd. | | 1,440,000 | | | 890,566 |
*Taiwan Pulp & Paper Corp. | | 2,425,000 | | | 709,097 |
Taiwan Sakura Corp. | | 1,660,869 | | | 692,042 |
Taiwan Sogo Shinkong Security Co., Ltd. | | 1,021,205 | | | 657,462 |
*Taiwan Styrene Monomer Corp. | | 4,013,856 | | | 1,671,415 |
*Taiwan Tea Corp. | | 1,987,273 | | | 1,129,937 |
*Taiyen Biotech Co., Ltd. | | 1,776,000 | | | 1,036,383 |
*Tatung Co., Ltd. | | 35,836,000 | | | 7,892,635 |
*Teapo Electronic Corp. | | 2,496,670 | | | 311,940 |
Teco Electric & Machinery Co., Ltd. | | 15,963,834 | | | 6,355,204 |
*Tecom, Ltd. | | 805,753 | | | 302,785 |
Test-Rite International Co., Ltd. | | 1,552,332 | | | 701,695 |
Ton Yi Industrial Corp. | | 7,349,810 | | | 2,560,817 |
Tong Yang Industry Co., Ltd. | | 876,261 | | | 1,236,346 |
*Tong-Tai Machine & Tool Co., Ltd. | | 118,000 | | | 85,036 |
*Topco Scientific Co., Ltd. | | 1,172,000 | | | 1,130,587 |
Tsann Kuen Enterprise Co., Ltd. | | 459,100 | | | 378,313 |
TSRC Corp. | | 531,400 | | | 619,000 |
Tung Ho Steel Enterprise Corp. | | 2,878,769 | | | 2,736,395 |
TYC Brother Industrial Co., Ltd. | | 1,596,048 | | | 968,124 |
*Tycoons Group Enterprise Co., Ltd. | | 3,989,000 | | | 601,169 |
*Tze Shin International Co., Ltd. | | 981,665 | | | 370,528 |
*Unimicron Technology Corp. | | 2,976,000 | | | 3,395,564 |
*Union Bank of Taiwan | | 9,425,577 | | | 1,669,836 |
Unitech Electronics Co., Ltd. | | 1,249,739 | | | 637,815 |
*Unitech Printed Circuit Board Corp. | | 3,176,265 | | | 1,042,852 |
United Integration Service Co., Ltd. | | 1,578,000 | | | 814,301 |
*United Microelectronics Corp. | | 106,490,069 | | | 51,191,211 |
*Universal Cement Corp. | | 4,398,551 | | | 2,085,224 |
*Universal Microelectronics Co., Ltd. | | 747,491 | | | 291,885 |
Universal Scientific Industrial Co., Ltd. | | 7,245,366 | | | 3,574,592 |
Universal, Inc. | | 106,660 | | | 97,356 |
UPC Technology Corp. | | 5,203,437 | | | 2,507,917 |
*USI Corp. | | 5,122,000 | | | 2,410,964 |
*U-TECH Media Corp. | | 1,566,799 | | | 551,763 |
Ve Wong Corp. | | 1,167,600 | | | 881,614 |
*Waffer Technology Co., Ltd. | | 1,131,000 | | | 372,638 |
*Walsin Lihwa Corp. | | 23,434,412 | | | 7,594,165 |
*Walsin Technology Corp., Ltd. | | 4,207,876 | | | 1,628,588 |
*Wan Hai Lines Co., Ltd. | | 1,631,000 | | | 750,360 |
Wan Hwa Enterprise Co., Ltd. | | 872,919 | | | 372,542 |
*Waterland Financial Holdings | | 19,429,080 | | | 5,910,695 |
*Wei Chih Steel Industrial Co., Ltd. | | 1,615,898 | | | 373,275 |
*Weikeng Industrial Co., Ltd. | | 1,344,000 | | | 747,932 |
*Winbond Electronics Corp. | | 29,524,000 | | | 5,452,730 |
*Wintek Corp. | | 8,764,000 | | | 5,836,183 |
Wistron NeWeb Corp. | | 649,950 | | | 859,510 |
WPG Holdings Co., Ltd. | | 79,151 | | | 108,288 |
*WT Microelectronics Co., Ltd. | | 1,542,000 | | | 1,044,985 |
*Wus Printed Circuit Co., Ltd. | | 3,176,928 | | | 1,003,564 |
Yageo Corp. | | 26,995,840 | | | 7,440,309 |
Yang Ming Marine Transport Corp. | | 11,471,615 | | | 4,052,292 |
Yeung Cyang Industrial Co., Ltd. | | 951,667 | | | 724,688 |
Yieh Phui Enterprise Co., Ltd. | | 9,876,179 | | | 3,203,941 |
Yosun Industrial Corp. | | 2,450,044 | | | 2,201,864 |
Yuanta Financial Holding Co., Ltd. | | 8,303,422 | | | 5,479,663 |
*Yuen Foong Yu Paper Manufacturing Co., Ltd. | | 10,035,018 | | | 3,592,793 |
Yulon Motor Co., Ltd. | | 11,058,572 | | | 12,369,209 |
*Yulon Nissan Motor Co., Ltd. | | 348,000 | | | 676,399 |
31
DIMENSIONAL EMERGING MARKETS VALUE FUND
CONTINUED
| | | | | |
| | | Shares | | Value†† |
TAIWAN — (Continued) | | | | | |
Yung Chi Paint & Varnish Manufacturing Co., Ltd. | | 65,687 | | $ | 82,848 |
Yung Shin Pharmaceutical Industrial Co., Ltd. | | 255,400 | | | 273,155 |
Yung Tay Engineering Co., Ltd. | | 3,315,000 | | | 2,461,952 |
*Zenitron Corp. | | 1,400,000 | | | 849,642 |
*Zig Sheng Industrial Co., Ltd. | | 4,011,378 | | | 1,541,888 |
Zippy Technology Corp. | | 122,000 | | | 57,084 |
Zyxel Communication Corp. | | 4,187,000 | | | 2,882,594 |
| | | | | |
TOTAL TAIWAN | | | | | 927,969,844 |
| | | | | |
THAILAND — (1.8%) | | | | | |
*Aapico Hitech PCL (Foreign) | | 539,800 | | | 130,004 |
*ACL Bank PCL (Foreign) | | 5,139,500 | | | 1,676,007 |
Asia Plus Securities PCL (Foreign) | | 7,008,500 | | | 377,421 |
Asian Property Development PCL (Foreign) | | 1,911,600 | | | 320,268 |
Ayudhya Insurance PCL (Foreign) | | 228,500 | | | 101,859 |
Bangchak Petroleum PCL (Foreign) | | 4,344,700 | | | 1,793,773 |
Bangkok Bank PCL (Foreign) | | 4,453,800 | | | 15,123,599 |
Bangkok Bank PCL (Foreign) NVDR | | 4,490,900 | | | 15,048,042 |
Bangkok Expressway PCL (Foreign) | | 3,883,500 | | | 2,137,813 |
Bangkok First Investment & Trust PCL (Foreign) | | 521,300 | | | 63,008 |
Bangkok Insurance PCL (Foreign) | | 87,880 | | | 623,113 |
*Bangkok Land PCL (Foreign) | | 78,669,103 | | | 1,388,624 |
Bank of Ayudhya PCL (Foreign) | | 16,269,800 | | | 8,761,598 |
Cal-Comp Electronics (Thailand) PCL (Foreign) | | 15,897,600 | | | 1,655,158 |
Capital Nomura Securities PCL (Foreign) | | 478,400 | | | 357,816 |
Capital Nomura Securities PCL (Foreign) NVDR | | 45,000 | | | 33,657 |
Central Plaza Hotel PCL (Foreign) | | 6,525,000 | | | 819,895 |
Charoen Pokphand Foods PCL (Foreign) | | 35,010,340 | | | 10,107,697 |
Delta Electronics (Thailand) PCL (Foreign) | | 4,830,100 | | | 2,499,947 |
Eastern Water Resources Development & Management PCL (Foreign) | | 9,535,200 | | | 1,078,326 |
Erawan Group PCL (Foreign) | | 4,288,950 | | | 310,524 |
*G J Steel PCL (Foreign) | | 208,666,400 | | | 1,435,850 |
Hana Microelectronics PCL (Foreign) | | 1,555,000 | | | 865,310 |
Hermraj Land & Development PCL (Foreign) | | 64,383,100 | | | 1,540,957 |
ICC International PCL (Foreign) | | 2,710,500 | | | 3,345,045 |
IRPC PCL (Foreign) | | 52,340,500 | | | 6,013,090 |
*Italian-Thai Development PCL (Foreign) NVDR | | 17,827,500 | | | 1,696,079 |
Jasmine International PCL (Foreign) | | 6,917,600 | | | 97,271 |
Kasikornbank PCL (Foreign) | | 1,505,300 | | | 3,692,883 |
Kasikornbank PCL (Foreign) NVDR | | 164,500 | | | 382,644 |
Kiatnakin Finance PCL (Foreign) | | 2,815,900 | | | 2,127,194 |
Krung Thai Bank PCL (Foreign) | | 36,862,700 | | | 9,705,064 |
Laguna Resorts & Hotels PCL (Foreign) | | 1,342,400 | | | 1,536,180 |
*Loxley PCL (Foreign) | | 3,313,700 | | | 247,846 |
MBK Development PCL (Foreign) | | 888,800 | | | 1,781,589 |
Padaeng Industry PCL (Foreign) NVDR | | 1,600,800 | | | 866,851 |
Polyplex PCL (Foreign) | | 5,424,000 | | | 933,074 |
Precious Shipping PCL (Foreign) | | 3,543,300 | | | 1,961,138 |
PTT Aromatics & Refining PCL (Foreign) | | 5,015,216 | | | 3,195,934 |
PTT Chemical PCL (Foreign) | | 3,909,810 | | | 7,310,789 |
Quality Houses PCL (Foreign) | | 24,250,600 | | | 1,813,807 |
*Regional Container Lines PCL (Foreign) | | 5,884,700 | | | 1,919,020 |
Rojana Industrial Park PCL (Foreign) | | 547,500 | | | 168,714 |
Saha Pathana Inter-Holding PCL (Foreign) | | 3,262,400 | | | 1,703,183 |
Saha Pathanapibul PCL (Foreign) | | 1,594,833 | | | 897,019 |
Saha-Union PCL (Foreign) | | 2,976,400 | | | 1,602,848 |
*Sahaviriya Steel Industries PCL (Foreign) | | 68,900,700 | | | 2,576,690 |
Sansiri PCL (Foreign) | | 9,982,900 | | | 1,206,609 |
Serm Suk PCL (Foreign) NVDR | | 39,000 | | | 17,735 |
*Shinawatra Satellite PCL (Foreign) | | 5,868,900 | | | 1,343,219 |
Siam City Bank PCL (Foreign) | | 5,850,600 | | | 4,148,369 |
32
DIMENSIONAL EMERGING MARKETS VALUE FUND
CONTINUED
| | | | | |
| | | Shares | | Value†† |
THAILAND — (Continued) | | | | | |
Siam Commercial Bank PCL (Foreign) | | 3,845,300 | | $ | 8,887,043 |
Siam Makro PCL (Foreign) | | 145,300 | | | 346,677 |
Supalai PCL (Foreign) | | 8,329,366 | | | 1,395,496 |
*Tata Steel (Thailand) PCL (Foreign) | | 27,838,200 | | | 1,765,654 |
Thai Oil PCL (Foreign) | | 2,300,000 | | | 2,838,444 |
Thai Plastic & Chemicals PCL (Foreign) | | 3,787,100 | | | 2,062,086 |
Thai Rayon PCL (Foreign) | | 165,000 | | | 175,243 |
Thai Stanley Electric (Thailand) PCL (Foreign) | | 125,400 | | | 393,927 |
Thai Union Frozen Products PCL (Foreign) | | 1,173,600 | | | 974,343 |
Thai Wacoal PCL (Foreign) | | 93,300 | | | 108,862 |
Thanachart Capital PCL (Foreign) | | 6,228,800 | | | 3,671,125 |
Thoresen Thai Agencies PCL (Foreign) | | 2,560,800 | | | 2,049,406 |
Ticon Industrial Connection PCL (Foreign) | | 105,200 | | | 30,687 |
Tisco Financial Group PCL (Foreign) | | 1,041,700 | | | 673,170 |
Total Access Communication PCL (Foreign) ADR | | 1,264,380 | | | 1,473,003 |
*TPI Polene PCL (Foreign) | | 9,987,124 | | | 2,868,404 |
*Tycoons Worldwide Group PCL (Foreign) | | 1,243,300 | | | 219,461 |
Univentures PCL (Foreign) | | 3,481,400 | | | 233,308 |
Vinythai PCL (Foreign) | | 5,239,317 | | | 1,026,702 |
| | | | | |
TOTAL THAILAND | | | | | 161,733,191 |
| | | | | |
TURKEY — (2.2%) | | | | | |
Adana Cimento Sanayi Ticaret A.S. | | 425,899 | | | 171,692 |
Akbank T.A.S. | | 762 | | | 4,114 |
Akcansa Cimento Sanayi ve Ticaret A.S. | | 317,432 | | | 1,257,107 |
Akenerji Elektrik Uretim A.S. | | 201,755 | | | 1,810,545 |
*Aksa Akrilik Kimya Sanayii A.S. | | 1,424,767 | | | 1,534,312 |
Aksigorta A.S. | | 1,324,168 | | | 3,999,118 |
Alarko Holding A.S. | | 1,013,092 | | | 2,552,018 |
*Alternatifbank A.S. | | 1 | | | 1 |
*Altinyildiz mensucat ve Konfeksiyon Fabrikalari A.S. | | 1 | | | 2 |
Anadolu Anonim Turk Sigorta Sirketi A.S. | | 2,512,298 | | | 2,073,674 |
*Anadolu Cam Sanayii A.S. | | 1,486,817 | | | 1,720,074 |
*Anadolu Isuzu Otomotiv Sanayi ve Ticaret A.S. | | 1 | | | 4 |
*Arcelik A.S. | | 1,552,149 | | | 5,068,775 |
*Aselsan Elektronik Sanayi Ve Ticaret A.S. | | 207,619 | | | 839,698 |
*Asya Katilim Bankasi A.S. | | 123,911 | | | 256,289 |
Ayen Enerji A.S. | | 415,323 | | | 723,220 |
Aygaz A.S. | | 1,118,602 | | | 3,962,327 |
Bagfas Bandirma Gubre Fabrikalari A.S. | | 5,431 | | | 289,646 |
*Banvit Bandirma Vitaminli Yem Sanayii Ticaret A.S. | | 1 | | | 2 |
*Bati Anabolu Cimento A.S. | | 280,524 | | | 1,113,829 |
Bolu Cimento Sanayii A.S. | | 706,424 | | | 824,032 |
*Borusan Mannesmann Boru Sanayi A.S. | | 14,873 | | | 112,707 |
Cemtas Celik Makina Sanayi ve Ticaret A.S. | | 1 | | | — |
Cimsa Cimento Sanayi ve Ticaret A.S. | | 518,069 | | | 2,238,420 |
*Dentas Ambalaj ve Kagit Sanayi A.S. | | — | | | — |
*Deva Holding A.S. | | 35,166 | | | 81,176 |
*Dogan Gazetecilik A.S. | | 515,628 | | | 1,005,498 |
*Dogan Sirketler Grubu Holding A.S. | | 9,540,148 | | | 6,276,452 |
*Dogan Yayin Holding A.S. | | 2,311,143 | | | 1,607,493 |
*Dogus Otomotiv Servis ve Ticaret A.S. | | 315,057 | | | 973,285 |
EIS Eczacibasi Ilac ve Sinai ve Finansal Yatirimlar Sanayi ve Ticaret A.S. | | 1,801,852 | | | 1,862,190 |
Enka Insaat ve Sanayi A.S. | | 7,552 | | | 30,475 |
*Eregli Demir ve Celik Fabrikalari Turk A.S. | | 7,385,534 | | | 20,049,104 |
*Fortis Bank A.S. | | 1 | | | 1 |
*Gentas Clenel Metal Sanayi ve Ticaret A.S. | | 1 | | | — |
*Global Yatirim Holding A.S. | | 2,295,251 | | | 1,226,530 |
*Goldas Kuyumculuk Sanayi A.S. | | 552,019 | | | 343,581 |
Goltas Goller Bolgesi Cimento Sanayi ve Ticaret A.S. | | 24,412 | | | 614,069 |
Goodyear Lastikleri T.A.S. | | 124,529 | | | 950,650 |
33
DIMENSIONAL EMERGING MARKETS VALUE FUND
CONTINUED
| | | | | |
| | | Shares | | Value†† |
TURKEY — (Continued) | | | | | |
*GSD Holding A.S. | | 2,497,284 | | $ | 1,545,344 |
*Gubre Fabrikalari Ticaret A.S. | | 1 | | | 4 |
*Gunes Sigorta A.S. | | 439,694 | | | 567,982 |
*Hektas Ticaret T.A.S. | | 1 | | | — |
*Hurriyet Gazetecilik ve Matbaacilik A.S. | | 2,245,783 | | | 2,394,347 |
*Ihlas Ev Aletleri Imalat Sanayi ve Ticaret A.S. | | — | | | — |
*Ihlas Holding A.S. | | 3,918,431 | | | 1,322,098 |
*Izmir Demir Celik Sanayii A.S. | | 796,660 | | | 1,210,679 |
*Kardemir Karabuk Demir Sanayi ve Ticaret A.S. | | 2,360,622 | | | 1,283,663 |
Karton Sanayi ve Ticaret A.S. | | 9,078 | | | 452,503 |
*Koc Holding A.S. Series B | | 5,412,771 | | | 13,788,787 |
Konya Cimento Sanayii A.S. | | 6,740 | | | 245,840 |
*Kordsa Global Endustriyel Iplik ve Kord Bezi Sanayi ve Ticaret A.S. | | 1,257,505 | | | 1,985,032 |
Mardin Cimento Sanayii ve Ticaret A.S. | | — | | | 1 |
*Marmari Marti Otel Isletmeleri A.S. | | — | | | — |
Marshall Boya ve Vernik Sanayii A.S. | | 27,296 | | | 195,856 |
*Medya Holdings A.S. | | 33,508 | | | — |
*Menderes Tekstil Sanayi ve Ticaret A.S. | | 1 | | | — |
*Net Holding A.S. | | 1,239,663 | | | 490,262 |
*Net Turizm Ticaret ve Sanayi A.S. | | 1,033,537 | | | 817,274 |
Nortel Networks Netas Telekomuenikasyon A.S. | | 67,409 | | | 1,982,710 |
*Petkim Petrokimya Holding A.S. | | 904,477 | | | 4,360,322 |
Pinar Entegre Et ve Un Sanayi A.S. | | 231,479 | | | 578,571 |
Pinar Sut Mamulleri Sanayii A.S. | | 178,141 | | | 762,010 |
*Raks Elektronik Sanayi ve Ticaret A.S. | | 5,859 | | | 3,079 |
*Sabah Yayincilik A.S. | | 31,938 | | | 80,735 |
*Sarkuysan Elektrolitik Bakir Sanayi ve Ticaret A.S. | | 649,929 | | | 1,147,083 |
*Sekerbank T.A.S. | | 1,552,724 | | | 2,580,277 |
*Tat Konserve Sanayii A.S. | | — | | | — |
*Tekfen Holding A.S. | | 1,437,073 | | | 4,114,867 |
*Tekstil Bankasi A.S. | | 1,116,413 | | | 771,354 |
*Tire Kutsan Oluklu Mukavva Kutu Ve Kagit Sanayii A.S. | | 1 | | | 1 |
Tofas Turk Otomobil Fabrikasi A.S. | | 1,022,227 | | | 2,568,199 |
*Trakya Cam Sanayii A.S. | | 2,301,706 | | | 2,706,422 |
Tupras-Turkiye Petrol Rafinerileri A.S. | | 10,701 | | | 183,800 |
Turcas Petrol A.S. | | 436,200 | | | 1,333,527 |
*Turk Ekonomi Bankasi A.S. | | 2,246,859 | | | 3,306,824 |
*Turk Hava Yollari A.S. | | 2,610,500 | | | 7,287,914 |
*Turk Sise ve Cam Fabrikalari A.S. | | 4,183,331 | | | 4,390,176 |
Turkiye Garanti Bankasi A.S. | | 2,940,615 | | | 10,678,969 |
Turkiye Is Bankasi A.S. | | 3,368,436 | | | 12,757,357 |
*Turkiye Sinai Kalkinma Bankasi A.S. | | 2,955,458 | | | 2,895,048 |
*Turkiye Vakiflar Bankasi T.A.O. | | 7,707,611 | | | 18,691,556 |
Ulker Biskuvi Sanayi A.S. | | 1,028,681 | | | 2,406,236 |
*Uzel Makina Sanayii A.S. | | 275,043 | | | 142,713 |
*Vestel Beyaz Esya Sanayi ve Ticaret A.S. | | 447,837 | | | 965,629 |
*Vestel Elektronik Sanayi ve Ticaret A.S. | | 1,086,476 | | | 1,693,715 |
*Yapi ve Kredi Bankasi A.S. | | 4,204,966 | | | 8,645,569 |
*Zorlu Enerji Elektrik Uretim A.S. | | 983,418 | | | 1,879,135 |
| | | | | |
TOTAL TURKEY | | | | | 190,785,580 |
| | | | | |
TOTAL COMMON STOCKS | | | | | 7,499,336,226 |
| | | | | |
PREFERRED STOCKS — (5.3%) | | | | | |
BRAZIL — (5.3%) | | | | | |
#*Aracruz Celulose SA Sponsored ADR | | 643,665 | | | 11,985,042 |
Banco Alfa de Investimento SA | | 61,726 | | | 247,381 |
#Banco Bradesco SA Sponsored ADR | | 348,766 | | | 6,870,690 |
*Braskem SA Preferred A | | 1,479,200 | | | 9,740,418 |
#*Braskem SA Preferred A Sponsored ADR | | 306,860 | | | 4,026,003 |
Companhia Brasileira de Distribuicao Grupo Pao de Acucar | | 302,821 | | | 9,139,982 |
#Companhia Brasileira de Distribuicao Grupo Pao de Acucar Sponsored ADR | | 12,781 | | | 773,123 |
34
DIMENSIONAL EMERGING MARKETS VALUE FUND
CONTINUED
| | | | | |
| | | Shares | | Value†† |
BRAZIL — (Continued) | | | | | |
Companhia de Tecidos Norte de Minas | | 890,475 | | $ | 2,941,964 |
Confab Industrial SA | | 3,302,112 | | | 9,709,889 |
Forjas Taurus SA | | 659,791 | | | 2,599,313 |
Gerdau SA | | 2,445,084 | | | 36,851,147 |
#Gerdau SA Sponsored ADR | | 4,348,258 | | | 65,658,696 |
*Gol Linhas Aereas Inteligentes SA | | 694,900 | | | 7,100,477 |
*Inepar Industria e Construcoes SA | | 7,896 | | | 183,370 |
Investimentos Itau SA | | 4,019,175 | | | 22,975,187 |
Klabin SA | | 5,296,604 | | | 12,628,143 |
Mahle-Metal Leve SA Industria e Comercio | | 4,000 | | | 48,706 |
Marcopolo SA | | 1,886,030 | | | 6,488,046 |
Metalurgica Gerdau SA | | 4,022,600 | | | 73,870,975 |
Randon e Participacoes SA | | 616,500 | | | 4,658,047 |
Sao Paulo Alpargatas SA | | 43,700 | | | 1,984,311 |
Saraiva SA Livreiros Editores | | 21,000 | | | 350,477 |
*Suzano Papel e Celullose SA | | 1,964,839 | | | 17,076,343 |
Telemar Norte Leste SA | | 549,500 | | | 17,293,529 |
Ultrapar Participacoes SA | | 170,741 | | | 7,477,673 |
#Ultrapar Participacoes SA Sponsored ADR | | 305,961 | | | 13,486,761 |
Uniao de Industrias Petroquimicas SA Series B | | 7,370,473 | | | 4,435,003 |
Usinas Siderurgicas de Minas Gerais SA Series A | | 3,546,355 | | | 92,604,638 |
Vale SA Series B | | 239,144 | | | — |
#*Votorantim Celulose e Papel SA Sponsored ADR | | 1,352,316 | | | 18,580,828 |
Whirlpool SA | | 72,600 | | | 148,777 |
| | | | | |
TOTAL BRAZIL | | | | | 461,934,939 |
| | | | | |
CHILE — (0.0%) | | | | | |
Sociedad Quimica y Minera de Chile SA Series A | | 42,776 | | | 1,719,902 |
| | | | | |
INDIA — (0.0%) | | | | | |
*Ispat Industries, Ltd. | | 1,463,759 | | | 97,463 |
| | | | | |
MALAYSIA — (0.0%) | | | | | |
*Malayan United Industries Berhad A1 | | 1,526,067 | | | 98,384 |
*Malayan United Industries Berhad A2 | | 1,526,067 | | | 80,496 |
| | | | | |
TOTAL MALAYSIA | | | | | 178,880 |
| | | | | |
TOTAL PREFERRED STOCKS | | | | | 463,931,184 |
| | | | | |
RIGHTS/WARRANTS — (0.0%) | | | | | |
BRAZIL — (0.0%) | | | | | |
*Eternit SA Rights 11/24/09 | | 157,580 | | | 144,019 |
| | | | | |
CHINA — (0.0%) | | | | | |
#*New World China Land, Ltd. Rights 11/11/09 | | 2,846,800 | | | 202,026 |
| | | | | |
MALAYSIA — (0.0%) | | | | | |
*Jerneh Asia Berhad Warrants 07/26/12 | | 159,420 | | | 9,343 |
*OSK Holdings Berhad Warrants 09/30/12 | | 93,339 | | | 2,188 |
*Sarawak Oil Palms Berhad Warrants 01/19/11 | | 53,568 | | | 27,392 |
| | | | | |
TOTAL MALAYSIA | | | | | 38,923 |
| | | | | |
PHILIPPINES — (0.0%) | | | | | |
*Security Bank Corp. Rights 11/11/09 | | 645,246 | | | 379,437 |
| | | | | |
SOUTH KOREA — (0.0%) | | | | | |
*Pumyang Construction Co., Ltd. Rights 12/02/09 | | 9,287 | | | 178 |
| | | | | |
TAIWAN — (0.0%) | | | | | |
*Shin Kong Financial Holding Co., Ltd. Rights 12/07/09 | | 737,515 | | | 68,030 |
| | | | | |
THAILAND — (0.0%) | | | | | |
*Bangkok Land PCL (Foreign) Warrants 01/07/10 | | 15,090,426 | | | 72,235 |
35
DIMENSIONAL EMERGING MARKETS VALUE FUND
CONTINUED
| | | | | | |
| | | Shares | | Value†† |
THAILAND — (Continued) | | | | | | |
*Bangkok Land PCL (Foriegn) Warrants 05/02/13 | | | 3,987,333 | | $ | 1,193 |
*Rojana Industrial Park PCL (Foreign) Warrants 11/30/14 | | | 30,866 | | | 5,679 |
*Sansiri PCL (Foreign) Warrants | | | 4,991,450 | | | — |
*Ticon Industrial Connection PCL (Foreign) Warrants 05/20/11 | | | 17,533 | | | 1,668 |
| | | | | | |
TOTAL THAILAND | | | | | | 80,775 |
| | | | | | |
TOTAL RIGHTS/WARRANTS | | | | | | 913,388 |
| | | | | | |
| | |
| | | Face
Amount | | Value† |
| | | (000) | | |
TEMPORARY CASH INVESTMENTS — (0.0%) | | | | | | |
Repurchase Agreement, PNC Capital Markets, Inc. 0.19%, 11/02/09 (Collateralized by $1,245,000 FNMA 5.00%, 06/01/35, valued at $766,237) to be repurchased at $753,012 | | $ | 753 | | | 753,000 |
| | |
| | | Shares/
Face
Amount | | |
| | | (000) | | |
SECURITIES LENDING COLLATERAL — (9.1%) | | | | | | |
§@DFA Short Term Investment Fund LP | | | 792,322,880 | | | 792,322,880 |
@Repurchase Agreement, Deutsche Bank Securities 0.07%, 11/02/09 (Collateralized byvarious corporate obligations, ranging in par value from $4,247,617 to $16,429,280, rates ranging from 5.000% to 7.000%, maturities ranging from 03/01/37 to 10/01/39, valued at $584,280) to be repurchased at $572,827 | | $ | 573 | | | 572,824 |
| | | | | | |
TOTAL SECURITIES LENDING COLLATERAL | | | | | | 792,895,704 |
| | | | | | |
TOTAL INVESTMENTS — (100.0%)
(Cost $7,369,005,537) | | | | | $ | 8,757,829,502 |
| | | | | | |
See accompanying Notes to Financial Statements.
36
Report of Independent Registered Public Accounting Firm
To the Board of Directors and Shareholders of Dimensional Emerging Markets Value Fund
(formerly known as the Dimensional Emerging Markets Value Fund Inc.)
We have audited, in accordance with the standards of the Public Company Accounting Oversight Board (United States), the financial statements of Dimensional Emerging Markets Value Fund (hereafter referred to as the “Fund”) as of October 31, 2009, and for the year then ended and have issued our unqualified report thereon dated December 23, 2009 (which report and financial statements are included in Item 1 of this Certified Shareholder Report on Form N-CSR). Our audit included an audit of the Fund’s investment portfolio (the “Portfolio”) as of October 31, 2009 appearing in Item 6 of this Form N-CSR. This Portfolio is the responsibility of the Fund’s management. Our responsibility is to express an opinion on this Portfolio based on our audit. In our opinion, the Portfolio referred to above, when read in conjunction with the financial statements of the Fund referred to above, presents fairly, in all material respects, the information set forth therein.
PricewaterhouseCoopers LLP
Philadelphia, Pennsylvania
December 23, 2009
| ITEM 7. | DISCLOSURE OF PROXY VOTING POLICIES AND PROCEDURES FOR CLOSED-END MANAGEMENT INVESTMENT COMPANIES. |
This item is not applicable to the Registrant, which is an open-end management investment company.
| ITEM 8. | PORTFOLIO MANAGERS OF CLOSED-END MANAGEMENT INVESTMENT COMPANIES. |
This item is not applicable to the Registrant, which is an open-end management investment company.
| ITEM 9. | PURCHASES OF EQUITY SECURITIES BY CLOSED-END MANAGEMENT INVESTMENT COMPANY AND AFFILIATED PURCHASERS |
This item is not applicable to the Registrant, which is an open-end management investment company.
| ITEM 10. | SUBMISSION OF MATTERS TO A VOTE OF SECURITY HOLDERS. |
None.
| ITEM 11. | CONTROLS AND PROCEDURES. |
| | (a) | Based on their evaluation of the Registrant’s disclosure controls and procedures as of a date within 90 days of the filing date of this Report, the Registrant’s Principal Executive Officer and Principal Financial Officer believe that the |
| | | disclosure controls and procedures (as defined in Rule 30a-3(c) under the Investment Company Act of 1940, as amended) are effectively designed to ensure that information required to be disclosed by the Registrant in the Report is recorded, processed, summarized and reported by the filing date, including ensuring that information required to be disclosed in the Report is accumulated and communicated to the Registrant’s officers that are making certifications in the Report, as appropriate, to allow timely decisions regarding required disclosure. The Registrant’s management, including the Principal Executive Officer and the Principal Financial Officer, recognizes that any set of controls and procedures, no matter how well designed and operated, can provide only reasonable assurance of achieving the desired control objectives. |
| | (b) | There were no changes in the Registrant’s internal control over financial reporting (as defined in Rule 30a-3(d) under the Investment Company Act of 1940, as amended) that occurred during the second fiscal quarter of the period covered by this Report that have materially affected, or are reasonably likely to materially affect, the Registrant’s internal control over financial reporting. |
| | |
(a)(1) | | Code of Ethics is filed herewith. |
| |
(a)(2) | | Certifications pursuant to Section 302 of the Sarbanes-Oxley Act of 2002 are filed herewith. |
| |
(a)(3) | | This item is not applicable. |
| |
(b) | | Certifications pursuant to Section 906 of the Sarbanes-Oxley Act of 2002 are filed herewith. |
.
SIGNATURES
Pursuant to the requirements of the Securities Exchange Act of 1934 and the Investment Company Act of 1940, the Registrant has duly caused this Report to be signed on its behalf by the undersigned, thereunto duly authorized.
| | |
| Dimensional Emerging Markets Value Fund |
| |
| By: | | /s/ DAVID G. BOOTH |
| | David G. Booth |
| | Chairman, Trustee, President and |
| | Chief Executive Officer |
|
| Date: January 4, 2010 |
Pursuant to the requirements of the Securities Exchange Act of 1934 and the Investment Company Act of 1940, this Report has been signed below by the following persons on behalf of the Registrant and in the capacities and on the dates indicated.
| | |
| By: | | /s/ DAVID G. BOOTH |
| | David G. Booth |
| | Principal Executive Officer |
| | Dimensional Emerging Markets Value Fund |
|
| Date: January 4, 2010 |
| | |
| By: | | /s/ DAVID R. MARTIN |
| | David R. Martin |
| | Principal Financial Officer |
| | Dimensional Emerging Markets Value Fund |
|
| Date: January 4, 2010 |