UNITED STATES
SECURITIES AND EXCHANGE COMMISSION
Washington, D.C. 20549
FORM N-CSR
CERTIFIED SHAREHOLDER REPORT OF REGISTERED
MANAGEMENT INVESTMENT COMPANIES
Investment Company Act file number 811-7440
DIMENSIONAL EMERGING MARKETS VALUE FUND
(Exact name of registrant as specified in charter)
6300 Bee Cave Road, Building One, Austin, TX 78746
(Address of principal executive offices) (Zip code)
Catherine L. Newell, Esquire, Vice President and Secretary
Dimensional Emerging Markets Value Fund,
6300 Bee Cave Road, Building One, Austin, TX 78746
(Name and address of agent for service)
Registrant’s telephone number, including area code: 512-306-7400
Date of fiscal year end: October 31
Date of reporting period: October 31, 2010
| ITEM 1. | REPORTS TO STOCKHOLDERS. |

ANNUAL REPORT
year ended: October 31, 2010
DFA INVESTMENT DIMENSIONS GROUP INC.
DIMENSIONAL INVESTMENT GROUP INC.
THE DFA INVESTMENT TRUST COMPANY
DIMENSIONAL EMERGING MARKETS VALUE FUND

Dimensional Fund Advisors
6300 Bee Cave Road, Building One
Austin, TX 78746
November 2010
Dear Fellow Shareholder,
In 2011, Dimensional celebrates its thirtieth anniversary. Our growth — from a start-up business working out of my Brooklyn apartment to a global investment firm with offices in six countries — has been greater than we could ever have predicted. We take a lot of pride in what we have been able to accomplish.
The Dimensional business model, at its most basic, is about ideas and the implementation of those ideas. We’ve built Dimensional on a set of ideas that have revolutionized finance over the last fifty years. We work closely with academics like Gene Fama, Ken French, and Robert Merton who have been at the forefront in developing the field of modern finance. This great partnership with leading thinkers has carried us over the last thirty years. It is the principle of comparative advantage at its best. The thinkers work on developing the ideas, and we find the best ways to implement those ideas for our clients.
Working together with academics and our clients, we have helped change the world. It’s great to know that it is still possible to do well by doing good.
Sincerely,

David G. Booth
Chairman and Co-Chief Executive Officer
[THIS PAGE INTENTIONALLY LEFT BLANK]
ANNUAL REPORT
Table of Contents
i
Table of Contents
Continued
ii
Table of Contents
Continued
This report is submitted for the information of the Fund’s shareholders. It is not authorized for distribution to prospective investors unless preceded or accompanied by an effective prospectus.
iii
[THIS PAGE INTENTIONALLY LEFT BLANK]
DFA INVESTMENT DIMENSIONS GROUP INC.
DIMENSIONAL INVESTMENT GROUP INC.
THE DFA INVESTMENT TRUST COMPANY
DIMENSIONAL EMERGING MARKETS VALUE FUND
DEFINITIONS OF ABBREVIATIONS AND FOOTNOTES
Schedules of Investments/Summary Schedules of Portfolio Holdings
| | | | |
Investment Abbreviations |
| | ADR | | American Depositary Receipt |
| | FHLMC | | Federal Home Loan Mortgage Corporation |
| | FNMA | | Federal National Mortgage Association |
| | GDR | | Global Depositary Receipt |
| | P.L.C. | | Public Limited Company |
| | REIT | | Real Estate Investment Trust |
| | SPDR | | Standard & Poor’s Depository Receipts |
|
Investment Footnotes |
| | † | | See Note B to Financial Statements. |
| | †† | | Securities have generally been fair valued. See Note B to Financial Statements. |
| | ** | | Calculated as a percentage of total net assets. Percentages shown parenthetically next to the category headings have been calculated as a percentage of total investments. “Other Securities” are those securities that are not among the top 50 holdings of the Fund or do not represent more than 1.0% of the net assets of the Fund. Some of the individual securities within this category may include Total or Partial Securities on Loan and/or Non-Income Producing Securities. |
| | * | | Non-Income Producing Securities. |
| | # | | Total or Partial Securities on Loan. |
| | ^ | | Denominated in local currency or the Euro, unless otherwise noted. |
| | @ | | Security purchased with cash proceeds from Securities on Loan. |
| | (r) | | The adjustable rate shown is effective as of October 31, 2010. |
| | (y) | | The rate shown is the effective yield. |
| | (g) | | Face Amount denominated in British Pounds. |
| | (e) | | Face Amount denominated in Euro. |
| | (u) | | Face Amount denominated in United States Dollars. |
| | v | | Security segregated as collateral for the Open Futures Contracts. |
| | § | | Affiliated Fund. |
| | ## | | Par amount of collateral is a part of a pooled collateral facility. Value is indicative of the value allocated to this Fund/Portfolio/Series as a part of this facility. |
|
| Financial Highlights |
| | (A) | | Computed using average shares outstanding. |
| | (B) | | Annualized |
| | (C) | | Non-Annualized |
| | (D) | | Represents the combined ratios for the respective portfolio and its respective pro-rata share of its |
| | | | Master Funds. |
| | (E) | | Because of commencement of operations and related preliminary transaction costs, these ratios |
| | | | are not necessarily indicative of future ratios. |
1
DEFINITIONS OF ABBREVIATIONS AND FOOTNOTES
CONTINUED
| | |
| All Statements, Schedules and Notes to Financial Statements |
— | | Amounts designated as — are either zero or rounded to zero. |
RIC | | Registered Investment Company |
SEC | | Securities and Exchange Commission |
(a) | | Commencement of Operations. |
2
DFA INVESTMENT DIMENSIONS GROUP INC.
PERFORMANCE CHARTS
3
DFA INVESTMENT DIMENSIONS GROUP INC.
PERFORMANCE CHARTS
4
DFA INVESTMENT DIMENSIONS GROUP INC.
PERFORMANCE CHARTS
5
DFA INVESTMENT DIMENSIONS GROUP INC.
PERFORMANCE CHARTS
6
DFA INVESTMENT DIMENSIONS GROUP INC.
PERFORMANCE CHARTS
7
DFA INVESTMENT DIMENSIONS GROUP INC.
PERFORMANCE CHARTS
8
DFA INVESTMENT DIMENSIONS GROUP INC.
PERFORMANCE CHARTS
9
DFA INVESTMENT DIMENSIONS GROUP INC.
PERFORMANCE CHARTS
10
DFA INVESTMENT DIMENSIONS GROUP INC.
PERFORMANCE CHARTS
11
DFA INVESTMENT DIMENSIONS GROUP INC.
PERFORMANCE CHARTS
12
DFA INVESTMENT DIMENSIONS GROUP INC.
MANAGEMENT’S DISCUSSION AND ANALYSIS
| | |
| U.S. Equity Market Review | | 12 Months Ended October 31, 2010 |
The year ending October 31, 2010, was a relatively volatile period for U.S. equities. Broad market returns were positive, with the Russell 3000® Index returning 18.34%. Stocks represented by the Russell Midcap® Index outperformed those within both the Russell 2000® Index (small caps) and the Russell 1000® Index (large caps). Meanwhile, stocks represented by the Russell 1000® Growth Index outperformed those represented by the Russell 1000® Value Index.
While market returns were positive through April 2010, stocks retreated in May and June, marking new lows for the fiscal year in early July. Then in September, stocks began a sharp rise which continued through October. Over the course of the fiscal year, the small company premium within the Russell 3000® Index was positive, while the value premium was negative as investors’ risk tolerance shifted, and general economic conditions evolved.
Among the most important factors explaining differences in the behavior of diversified equity portfolios are the company size and company value/growth characteristics of the portfolio’s holdings. Size is measured by market capitalization, and value classification is a function of stock price relative to one or more fundamental characteristics. Compared to other stocks, value stocks often have lower market value relative to their earnings, dividends, and book value.
For the 12 months ended October 31, 2010, the total return of the Russell Microcap® Index was 25.08%, the Russell 2000® Index was 26.57%, the CRSP 6-10 Index was 28.76%, and the MSCI US Small Cap 1750 Index was 28.35%. Large cap growth stocks outperformed large cap value stocks, as measured by the Russell 1000® Growth Index and Russell 1000® Value Index. Small cap growth stocks outperformed small cap value stocks as measured by the Russell 2000® Growth Index and Russell 2000® Value Index.
Total Return for 12 Months Ended October 31, 2010
| | | | |
Russell 2000® Index (small cap companies) | | | 26.57 | % |
Russell Midcap® Index (mid cap companies) | | | 27.73 | % |
Russell 1000® Index (large cap companies) | | | 17.65 | % |
Russell 3000® Value Index | | | 16.41 | % |
Russell 3000® Growth Index | | | 20.32 | % |
Further dividing the large, mid, and small cap market segments by value and growth characteristics shows more detail in the performance differences over the period.
Total Return for 12 Months Ended October 31, 2010
| | | | |
Russell 1000® Value Index (large cap value companies) | | | 15.72 | % |
Russell 1000® Growth Index (large cap growth companies) | | | 19.66 | % |
Russell Midcap® Value Index (mid cap value companies) | | | 27.50 | % |
Russell Midcap® Growth Index (mid cap growth companies) | | | 28.03 | % |
Russell 2500® Value Index (small/mid cap value companies) | | | 26.89 | % |
Russell 2500® Growth Index (small/mid cap growth companies) | | | 28.76 | % |
Russell 2000® Value Index (small cap value companies) | | | 24.43 | % |
Russell 2000® Growth Index (small cap growth companies) | | | 28.66 | % |
Source: Russell data copyright © Russell Investment Group 1995-2010, all rights reserved.
Differences in returns for the various Dimensional U.S. equity funds over the 12 months ended October 31, 2010 were attributable primarily to differences in value/growth and size characteristics as well as the exclusion of REIT securities from most Dimensional portfolios, except for the DFA Real Estate Securities Portfolio and the U.S.
13
Large Company Portfolio. Moreover, the portfolio construction approach used by Dimensional Fund Advisors (the “Advisor”) generally resulted in portfolios with greater emphasis on value or small company characteristics relative to widely used index benchmarks.
Master-Feeder Structure
Certain portfolios described below, called “Feeder Funds,” do not buy individual securities directly; instead, these portfolios invest in corresponding funds called “Master Funds.” Master Funds, in turn, purchase stocks and/or other securities.
Domestic Equity Portfolios’ Performance Overview
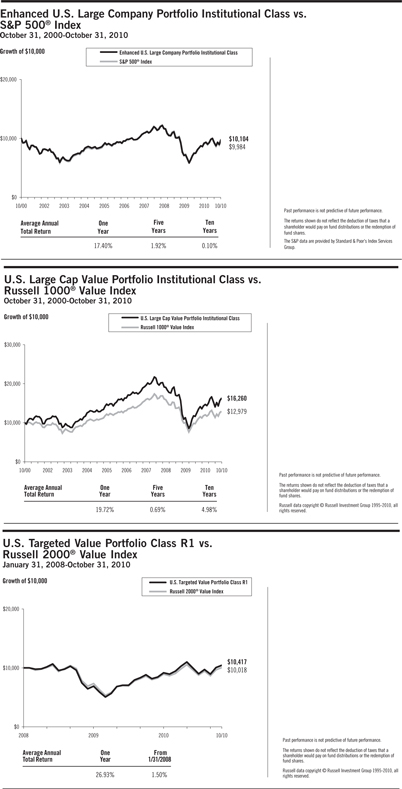
Enhanced U.S. Large Company Portfolio
The Enhanced U.S. Large Company Portfolio seeks to outperform the S&P 500® Index by using an “enhanced cash” strategy. This strategy combines investment in high-grade, short-term fixed income instruments with an overlay of S&P 500® Index futures contracts, swaps, and/or ETFs. For the 12 months ended October 31, 2010, approximately 97% of the overlay instruments consisted of S&P 500® Index futures contracts. ETFs completed the equity exposure for the last month of the fiscal year. The behavior of S&P 500® Index futures contracts and ETFs linked to the S&P 500® Index is determined principally by the performance of the S&P 500® Index.
For the 12 months ended October 31, 2010, the total return was 17.40% for the Portfolio and 16.52% for the S&P 500® Index. Relative to the Index, the Portfolio’s outperformance was primarily due to the fixed income component of the Portfolio exceeding the interest rate embedded in the Portfolio’s S&P 500® futures contracts. The Portfolio’s concentration in government agency and corporate fixed income securities with maturities between one and two years had the most significant contribution to the outperformance. As interest rates declined during the period, these securities generated a positive return, adding to the positive return of the S&P 500® Index.
U.S. Large Cap Value Portfolio
The U.S. Large Cap Value Portfolio seeks to capture the returns of U.S. large company value stocks by purchasing shares of a Master Fund that invests in such stocks. The investment strategy employs a disciplined, quantitative approach, emphasizing broad diversification and consistent exposure to large cap value stocks, but does not attempt to closely track a specific equity index. As of October 31, 2010, the Master Fund held 211 stocks and was mostly invested in equities throughout the year: the average cash level for the period was less than 1% of the Master Fund’s assets.
For the 12 months ended October 31, 2010, total returns were 19.72% for the Portfolio and 15.72% for the Russell 1000® Value Index. Relative to the Index, the Master Fund’s higher concentration in securities with the most prominent value characteristics and composition differences among the Master Fund’s value stocks added approximately 4.2% to the relative performance. Differences in allocation and composition between the Master Fund and the Index across the market capitalization segments contributed to the outperformance, particularly the Master Fund’s smaller allocation to the largest stocks and the composition of those stocks which added approximately 2.9% to the relative performance. The Master Fund’s exclusion of REITs had a negative impact of approximately 0.7%relative to the Index as REITs was the best-performing sector over the period.
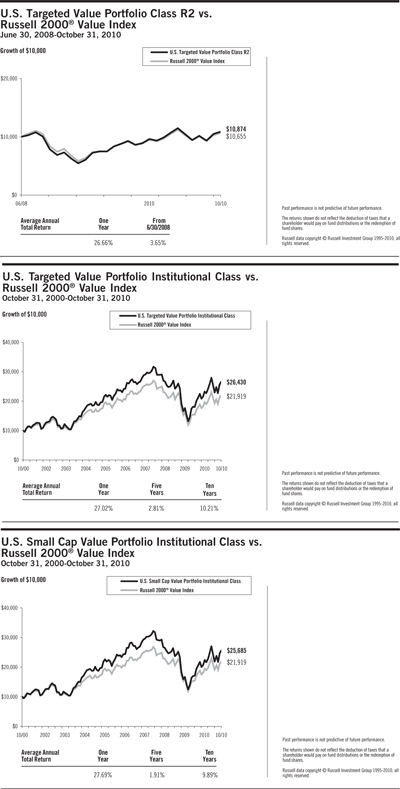
U.S. Targeted Value Portfolio
The U.S. Targeted Value Portfolio seeks to capture the returns of U.S. small and mid capitalization value stocks. The investment strategy employed by the U.S. Targeted Value Portfolio is a disciplined, quantitative approach, emphasizing broad diversification and consistent exposure to small and mid cap value stocks, but does not attempt to closely track a specific equity index. As of October 31, 2010, the Portfolio held 1,526 stocks, and was mostly invested in equities throughout the year: the average cash level for the period was less than 1% of the Portfolio��s assets.
14
As a result of the Portfolio’s diversified investment approach, performance was determined principally by broad structural trends in the U.S. equity market, rather than the behavior of a limited number of stocks. For the 12 months ended October 31, 2010, total returns were 27.02% for the Portfolio’s Institutional class shares, 26.93% for the Portfolio’s Class R1 shares, 26.66% for the Portfolio’s Class R2 shares, and 24.43% for the Russell 2000® Value Index. Relative to the Index, the Portfolio’s higher concentration in securities with the most prominent value characteristics contributed to outperformance. The Portfolio’s deep value stocks (52% of the Portfolio compared to 43% of the Index) added approximately 0.8% relative to the Index. Differences in sector composition between the Portfolio and Index also contributed to the performance of the Portfolio over the Index.
U.S. Small Cap Value Portfolio
The U.S. Small Cap Value Portfolio seeks to capture the returns of U.S. small company value stocks. The investment strategy employs a disciplined, quantitative approach, emphasizing broad diversification and consistent exposure to small company and value stocks. The portfolio does not attempt to closely track a specific index. As of October 31, 2010, the Portfolio held 1,529 stocks and was mostly invested in equities throughout the year: the average cash level for the period was less than 1% of the Portfolio’s assets.
As a result of the Portfolio’s diversified investment approach, performance was determined principally by broad structural trends in the U.S. equity market, rather than the behavior of a limited number of stocks. For the 12 months ended October 31, 2010, total returns were 27.69% for the Portfolio and 24.43% for the Russell 2000® Value Index. Relative to the Index, the Portfolio’s higher concentration in securities with the most prominent value characteristics added approximately 2.5% relative to the Index. The smallest stocks added approximately 1.5% to the Portfolio’s relative performance.
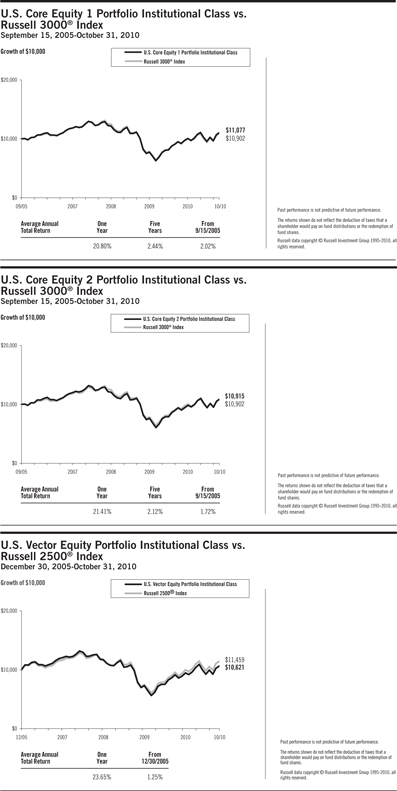
U.S. Core Equity 1 Portfolio
The U.S. Core Equity 1 Portfolio seeks to capture the returns of the total U.S. market universe, with increased exposure to smaller company stocks and those stocks with value characteristics as measured by book-to-market ratio. The investment strategy employs a disciplined, quantitative approach, emphasizing wide diversification and comprehensive exposure to U.S. stocks, but does not attempt to closely track a specific equity index. As of October 31, 2010, the Portfolio held 3,333 stocks and was mostly invested in equities throughout the year: the average cash level for the period was less than 1% of the Portfolio’s assets.
As a result of the Portfolio’s diversified investment approach, performance was determined principally by broad structural trends in the U.S. equity market, rather than the behavior of a limited number of stocks. For the 12 months ended October 31, 2010, total returns were 20.80% for the Portfolio and 18.34% for the Russell 3000® Index. In general, U.S. large cap stocks significantly underperformed U.S. mid cap and small cap stocks over the period. The Portfolio’s lower allocation than the Index to large cap stocks and its greater allocation to mid cap and small cap stocks were the primary sources of the Portfolio’s relative outperformance.
U.S. Core Equity 2 Portfolio
The U.S. Core Equity 2 Portfolio seeks to capture the returns of the total U.S. market universe with greater exposure to smaller company stocks and those stocks with value characteristics as measured by book-to-market ratio than the U.S. Core Equity 1 Portfolio. The investment strategy employs a disciplined, quantitative approach, emphasizing wide diversification and comprehensive exposure to U.S. stocks, but does not attempt to closely track a specific equity index. As of October 31, 2010, the Portfolio held 3,452 stocks and was mostly invested in equities throughout the year: the average cash level for the period was less than 1% of the Portfolio’s assets.
As a result of the Portfolio’s diversified investment approach, performance was determined principally by broad structural trends in the U.S. equity market, rather than the behavior of a limited number of stocks. For the 12 months ended October 31, 2010, total returns were 21.41% for the Portfolio and 18.34% for the Russell 3000® Index. In general, U.S. large cap stocks significantly underperformed U.S. mid cap and small cap stocks over the period. The Portfolio’s lower allocation than the Index to large cap stocks and its greater allocation to mid cap and small cap stocks were the primary sources of the Portfolio’s relative outperformance.
15
U.S. Vector Equity Portfolio
The U.S. Vector Equity Portfolio seeks to capture the returns of a broadly diversified basket of U.S. stocks with stronger exposure to smaller company stocks and those stocks with value characteristics as measured by book-to-market ratio than the U.S. Core Equity 2 Portfolio. The investment strategy employs a disciplined, quantitative approach, emphasizing broad diversification, but does not attempt to closely track a specific equity index. As of October 31, 2010, the Portfolio held 3,226 stocks and essentially was mostly invested in equities throughout the year: the average cash level for the period was less than 1% of the Portfolio’s assets.
As a result of the Portfolio’s diversified investment approach, performance was determined principally by broad structural trends in the U.S. equity market, rather than the behavior of a limited number of stocks. For the 12 months ended October 31, 2010, total returns were 23.65% for the Portfolio and 27.75% for the Russell 2500® Index. In general, U.S. large cap stocks significantly underperformed U.S. mid cap and small cap stocks over the period. The Portfolio’s allocation to large cap stocks was 22% on average, and these stocks were not represented in the Index. The Portfolio’s allocation to large cap stocks was the primary source of the Portfolio’s relative underperformance.
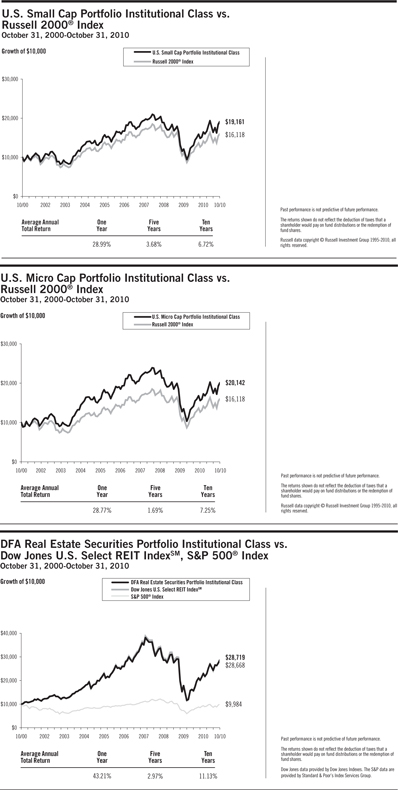
U.S. Small Cap Portfolio
The U.S. Small Cap Portfolio seeks to capture the returns of U.S. small company stocks. The investment strategy employs a disciplined, quantitative approach, emphasizing broad diversification and consistent exposure to small company stocks, but does not attempt to closely track a specific equity index. As of October 31, 2010, the Portfolio held 2,685 stocks and was mostly invested in equities throughout the year: the average cash level for the period was less than 1% of the Portfolio’s assets.
As a result of the Portfolio’s diversified investment approach, performance was determined principally by broad structural trends in the U.S. equity market, rather than the behavior of a limited number of stocks. For the 12 months ended October 31, 2010, total returns were 28.99% for the Portfolio and 26.57% for the Russell 2000® Index. Relative to the Index, the Portfolio’s outperformance was primarily due to differences in Portfolio composition, which added approximately 2.3% to relative performance. The smallest stocks added approximately 1.0% to the Portfolio’s relative performance.
U.S. Micro Cap Portfolio
The U.S. Micro Cap Portfolio seeks to capture the returns of very small U.S. company stocks. The investment strategy employs a disciplined, quantitative approach, emphasizing broad diversification and consistent exposure to very small company stocks, but does not attempt to closely track a specific equity index. As of October 31, 2010, the Portfolio held 2,300 stocks and was mostly invested in equities throughout the year: the average cash level for the period was less than 1% of the Portfolio’s assets.
As a result of the Portfolio’s diversified investment approach, performance was determined principally by broad structural trends in the U.S. equity market, rather than the behavior of a limited number of stocks. For the 12 months ended October 31, 2010, total returns were 28.77% for the Portfolio and 26.57% for the Russell 2000® Index. The Portfolio’s allocation to micro cap stocks, on average 41% more than the Index, and the composition of those stocks added approximately 2.0% to the Portfolio’s outperformance.
DFA Real Estate Securities Portfolio
The DFA Real Estate Securities Portfolio is designed to capture the returns of a broadly diversified portfolio of real estate securities (e.g., REITs), but does not attempt to closely track a specific index. As of October 31, 2010, the Portfolio held 106 REITs and was mostly invested in equities throughout the year: the average cash level for the period was less than 1% of the Portfolio’s assets.
As a result of the Portfolio’s diversified investment approach, performance was determined principally by broad structural trends in the U.S. real estate securities market, rather than the behavior of a limited number of stocks. For the 12 months ended October 31, 2010, total returns were 43.21% for the Portfolio, 42.63% for the Dow Jones U.S. Select REIT Index, and 16.52% for the S&P 500® Index. The Portfolio’s greater diversification than the Dow
16
Jones U.S. Select REIT Index, including a slightly greater allocation to the smallest REITs, contributed to the outperformance. The smallest REITs generally outperformed the broader Index.
| | |
| International Equity Market Review | | 12 Months Ended October 31, 2010 |
The one-year period ending October 31, 2010 was characterized by relatively high levels of volatility in non-US developed markets. Broad market returns were positive, with stocks represented by the MSCI World ex USA Index (net dividends) returning 9.61%.
While market returns were positive in November and December of 2009, high volatility over the next five months — punctuated by an 11% drop in May — took developed non-US stocks to their lows for the fiscal year. In June, stocks began a sharp rise which continued through the remainder of the fiscal year as global economic data generally improved. As measured by the MSCI indices, growth stocks outperformed their value counterparts, while small cap stocks outperformed large caps.
12 Months Ended October 31, 2010
| | | | |
| | | U.S. Dollar
Return | |
MSCI World ex USA Index | | | 9.61% | |
MSCI World ex USA Small Cap Index | | | 17.23% | |
MSCI World ex USA Value Index | | | 6.38% | |
MSCI World ex USA Growth Index | | | 12.87% | |
The performance of the US dollar (USD) was mixed against other major developed markets currencies during the period. While the USD rose slightly against the euro and British pound, it fell against most other G10 currencies, and in particular, against the Japanese yen.
12 Months Ended October 31, 2010
| | | | | | | | |
| Ten Largest Foreign Developed Markets by Market Cap | | Local
Currency
Return | | | U.S. Dollar
Return | |
United Kingdom | | | 16.07% | | | | 12.58% | |
Japan | | | -6.76% | | | | 4.78% | |
Canada | | | 15.83% | | | | 22.62% | |
France | | | 11.80% | | | | 5.31% | |
Australia | | | 3.70% | | | | 12.50% | |
Germany | | | 20.61% | | | | 13.61% | |
Switzerland | | | 5.53% | | | | 9.90% | |
Spain | | | -2.96% | | | | -8.59% | |
Sweden | | | 17.82% | | | | 23.94% | |
Italy | | | 0.69% | | | | -5.14% | |
Source: Returns are of MSCI standard indices net of foreign withholding taxes on dividends. Copyright MSCI 2010, all rights reserved.
Gains in emerging markets were higher on average than in developed markets, although results varied widely among the individual emerging markets countries. For the one-year period ended October 31, 2010, returns in US dollars were 23.56% for the MSCI Emerging Markets Index (net dividends) versus 9.61% for the MSCI World ex USA Index (net dividends). As measured by the MSCI indices, emerging markets growth stocks outperformed their value counterparts, while emerging markets small cap stocks outperformed large caps.
17
| | |
| 12 Months Ended October 31, 2010 | | U.S. Dollar
Return |
MSCI Emerging Markets Index | | 23.56% |
MSCI Emerging Markets Small Cap Index | | 37.02% |
MSCI Emerging Markets Value Index | | 21.96% |
MSCI Emerging Markets Growth Index | | 25.17% |
The US dollar (USD) generally depreciated against most major emerging markets currencies during the period, increasing most local country returns when denominated in USD
| | | | |
| 12 Months Ended October 31, 2010 | | | | |
| Ten Largest Emerging Markets by Market Cap | | Local
Currency
Return | | U.S. Dollar
Return |
China | | 11.14% | | 11.11% |
Brazil | | 11.67% | | 14.86% |
South Korea | | 18.52% | | 24.52% |
Taiwan | | 13.20% | | 20.23% |
India | | 27.64% | | 34.93% |
South Africa | | 18.71% | | 33.55% |
Russia | | 19.19% | | 13.38% |
Mexico | | 25.55% | | 33.87% |
Malaysia | | 23.94% | | 35.93% |
Indonesia | | 41.78% | | 51.50% |
Source: Returns are of MSCI indices net of foreign withholding taxes on dividends. Copyright MSCI 2010, all rights reserved.
Global REIT Market Review
The publicly-traded global REIT market experienced significant levels of volatility during the one-year period ended October 31, 2010. While the market rose from mid-February through late April 2010, it gave back most of those gains in May and early June. The market turned sharply higher in July and rose throughout much of September and October, finshing the period at its highs for the fiscal year.
Over the course of the peirod, there was a wide degree of dispersion in country-level returns within the S&P Global REIT Index. A number of countries, including Canada, the U.S., Hong Kong, Singapore, and South Africa, returned over 40%. On the other hand, REITs in continental Europe and the UK significantly underperformed, as there were persistent concerns over financial conditions in the region. On a sector basis, residential and specialized REITs broadly outperformed the index, while industrial and diversified REITs were relative underperformers.
| | |
| 12 Months Ended October 31, 2010 | | |
| | | U.S. Dollar
Return |
S&P Global ex U.S. REIT Index (net dividends) | | 16.43% |
S&P Global REIT Index (net dividends) | | 28.81% |
Source: Standard Poor’s. Copyright S&P, 2010. All rights reserved.
18
Master-Feeder Structure
Certain portfolios described below, called “Feeder Funds,” do not buy individual securities directly; instead, these portfolios invest in corresponding funds called “Master Funds.” The Master Funds, in turn, purchase stocks and/or other securities.
International Equity Portfolios’ Performance Overview
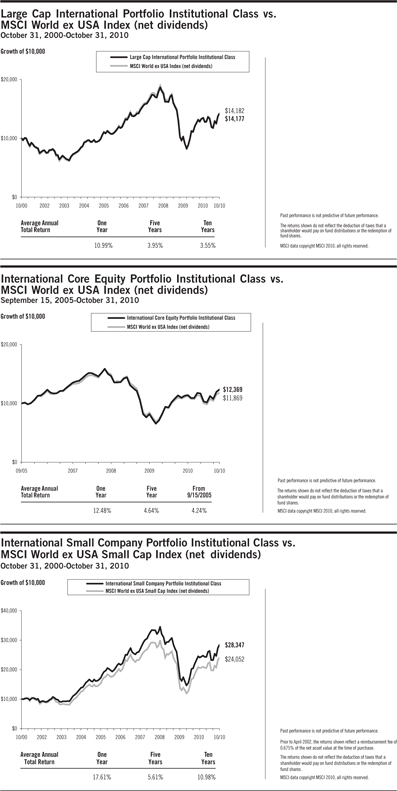
Large Cap International Portfolio
The Large Cap International Portfolio seeks to capture the returns of a broadly diversified basket of international large company stocks. The investment strategy employs a disciplined, quantitative approach, emphasizing broad diversification, but does not attempt to track a specific equity index. As of October 31, 2010, the Portfolio held 1,283 stocks in 23 developed country markets. In general, the Portfolio was fully invested in equities throughout the year. The average cash level for the period was less than 1% of the Portfolio’s assets.
As a result of the Portfolio’s diversified investment approach, performance was determined principally by broad structural trends in the international equity markets, rather than by the behavior of a limited number of stocks. For the 12 months ended October 31, 2010, total returns were 10.99% for the Portfolio and 9.61% for the MSCI World ex USA Index (net dividends). The majority of the Portfolio’s relative outperformance was attributable to differences in the valuation timing and methodology between the Portfolio and the Index. The Portfolio prices foreign exchange rates at the closing of the U.S. markets, while the Index uses rates at 4 pm London time. The Portfolio utilizes fair value pricing to price portfolio securities at the closing of the U.S. markets, while the Index uses local market closing prices.
International Core Equity Portfolio
The International Core Equity Portfolio seeks to capture the returns of a broadly diversified basket of international stocks, with increased exposure to smaller company stocks and those with value characteristics as measured by book-to-market ratio. The investment strategy employs a disciplined, quantitative approach, emphasizing broad diversification, but does not attempt to track a specific equity index. As of October 31, 2010, the Portfolio held 5,176 stocks in 23 developed country markets. In general, the Portfolio was fully invested in equities throughout the year. The average cash level for the period was less than 1% of the Portfolio’s assets.
As a result of the Portfolio’s diversified investment approach, performance was determined principally by broad structural trends in the international equity markets, rather than by the behavior of a limited number of stocks. For the 12 months ended October 31, 2010, total returns were 12.48% for the Portfolio and 9.61% for the MSCI World ex USA Index (net dividends). In general, international large cap stocks underperformed international mid cap and small cap stocks over the period. The Portfolio’s lower allocation than the Index to large cap stocks and its greater allocation to mid cap and small cap stocks were the primary sources of the Portfolio’s relative outperformance.
International Small Company Portfolio
The International Small Company Portfolio seeks to capture the returns of international small company stocks by purchasing shares of five Master Funds that invest individually in Canada, the United Kingdom, Continental Europe (including Israel and excluding the U.K.), Japan, and Asia Pacific. The investment strategy employs a disciplined, quantitative approach, emphasizing broad diversification and consistent exposure to small company stocks, but does not attempt to track a specific equity index. As of October 31, 2010, the Master Funds collectively held 4,615 stocks in 23 developed country markets. In general, the Portfolio was fully invested in the Master Funds throughout the year. The combined average cash level for the period was less than 1% of the Portfolio’s assets.
Each of the Master Funds has a diversified investment approach. As a result, the Portfolio’s performance was determined principally by broad structural trends in international equity markets, rather than the behavior of a limited number of stocks. Over the period, international small company stocks outperformed international large company stocks. For the 12 months ended October 31, 2010, total returns were 17.61% for the Portfolio and 17.23%
19
for the MSCI World ex USA Small Cap Index (net dividends). The Portfolio and the Index held a number of securities in common but at different weights due to different methods for defining size and the Portfolio’s exclusion rules. For the one-year period ended October 31, 2010, overall differences generally offset each other with the end result that the Portfolio slightly outperformed the Index.
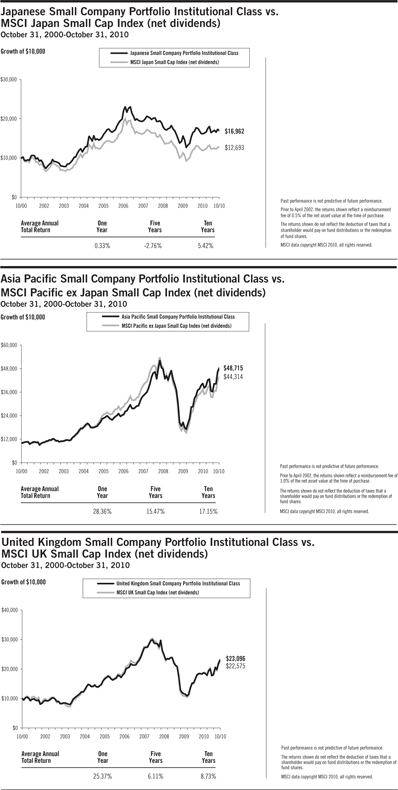
Japanese Small Company Portfolio
The Japanese Small Company Portfolio seeks to capture the returns of Japanese small company stocks by purchasing shares of a Master Fund that invests in such securities. The investment strategy employs a disciplined, quantitative approach, emphasizing broad diversification and consistent exposure to small company stocks, but does not attempt to track a specific equity index. As of October 31, 2010, the Master Fund held 1,333 stocks. In general, the Master Fund was fully invested in equities throughout the year. The average cash level for the period was less than 1% of the Master Fund’s assets.
As a result of the Master Fund’s diversified investment approach, performance was determined principally by broad structural trends in the Japanese equity market, rather than the behavior of a limited number of stocks. For the 12 months ended October 31, 2010, total returns were 0.33% for the Portfolio and 1.12% for the MSCI Japan Small Cap Index (net dividends). Relative to the Index, the Portfolio’s underperformance was primarily due to its exclusion of REITs, as REITs were the best performing sector.
Asia Pacific Small Company Portfolio
The Asia Pacific Small Company Portfolio seeks to capture the returns of small company stocks in developed Asia Pacific markets, excluding Japan, by purchasing shares of a Master Fund that invests in such securities. The investments strategy employs a disciplined, quantitative approach, emphasizing broad diversification and consistent exposure to small company stocks, but does not attempt to track a specific equity index. As of October 31, 2010, the Master Fund held 1,093 stocks, and assets were allocated mainly among four countries: Australia, Hong Kong, New Zealand, and Singapore. Country allocations generally reflect the approximate weights of individual securities within a universe of Asia Pacific small company stocks constructed by the Advisor. In general, the Master Fund was fully invested in equities during the period. The average cash level for period was less than 1% of the Master Fund’s assets.
As a result of the Master Fund’s diversified investment approach, performance was determined principally by broad structural trends in Asia Pacific equity markets rather than the behavior of a limited number of stocks. For the 12 months ended October 31, 2010, total returns were 28.36% for the Portfolio and 25.77% for the MSCI Pacific ex Japan Small Cap Index (net dividends). The Portfolio’s relative outperformance was primarily attributable to differences in the valuation timing and methodology between the Master Fund and the Index. The Master Fund prices foreign exchange rates at the closing of the U.S. markets while the Index uses rates at 4 pm London time. The Master Fund utilizes fair value pricing to price portfolio securities at the closing of the U.S. markets while the Index uses local market closing prices.
United Kingdom Small Company Portfolio
The United Kingdom Small Company Portfolio seeks to capture the returns of U.K. small company stocks by purchasing shares of a Master Fund that invests in such securities. The investment strategy employs a disciplined, quantitative approach, emphasizing broad diversification and consistent exposure to small company stocks, but does not attempt to track a specific equity index. As of October 31, 2010, the Master Fund held 375 stocks. In general, the Master Fund was fully invested in equities throughout the year. The average cash level for the period was less than 1% of the Master Fund’s assets.
As a result of the Master Fund’s diversified investment approach, performance was determined principally by broad structural trends in the U.K. equity market, rather than the behavior of a limited number of stocks. Over the period, U.K. small company stocks outperformed U.K. large company stocks. For the 12 months ended October 31, 2010, total returns were 25.37% for the Portfolio and 21.61% for the MSCI UK Small Cap Index (net dividends). The Master Fund holds a large number of stocks, and in most cases, no single stock will explain a significant amount of the performance difference relative to the Index. However, during the 12-month period ended
20
October 31, 2010, the Master Fund held two stocks that had a significant positive impact on relative performance. One stock was held at a higher weight than in the Index and the other stock was not present in the Index.
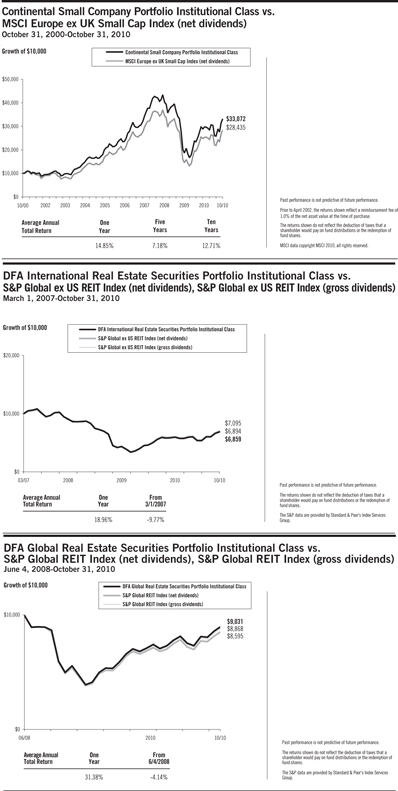
Continental Small Company Portfolio
The Continental Small Company Portfolio seeks to capture the returns of small company stocks in developed markets of Europe (excluding the U.K.) and Israel, by purchasing shares of a Master Fund that invests in such securities. The investment strategy employs a disciplined, quantitative approach, emphasizing broad diversification and consistent exposure to small company stocks, but does not attempt to track a specific equity index. As of October 31, 2010, the Master Fund held 1,405 stocks in 15 developed continental European countries and Israel. Country allocations generally reflect the approximate weights of individual securities within a universe of continental European and Israeli small company stocks constructed by the Advisor. In general, the Master Fund was fully invested in equities throughout the year. The average cash level for period was less than 1% of the Master Fund’s assets.
As a result of the Master Fund’s diversified investment approach, performance was determined principally by broad structural trends in the continental European (excluding the U.K.) and Israeli equity markets, rather than the behavior of a limited number of stocks. For the 12 months ended October 31, 2010, total returns were 14.85% for the Portfolio and 15.17% for the MSCI Europe ex UK Small Cap Index (net dividends). The Master Fund and the Index held a number of securities in common but at different weights due to different methods for defining size and the Master Fund’s exclusion rules. For the one-year period ended October 31, 2010, overall differences generally offset each other with the end result that the Portfolio slightly underperformed the Index.
DFA International Real Estate Securities Portfolio
The DFA International Real Estate Securities Portfolio is designed to capture the returns of a broadly diversified portfolio of real estate securities in international markets, but does not attempt to track a specific index. As of October 31, 2010, the Portfolio held 194 stocks in 19 developed and emerging market countries. In general, the Portfolio was fully invested in equities throughout the year. The average cash level for the period was less than 1% of the Portfolio’s assets.
As a result of the Portfolio’s diversified approach, performance was determined principally by structural trends in international real estate securities markets, rather than the behavior of a limited number of stocks. For the 12 months ended October 31, 2010, total returns were 18.96% for the Portfolio, 17.60% for the S&P Global ex US REIT Index (gross dividends), and 16.43% for the S&P Global ex US REIT Index (net dividends). Relative to the Index (net dividends) the vast majority of the Portfolio’s relative outperformance was attributable to differences between the Index’s assumed withholding tax rates and the Portfolio’s actual withholding tax rates and to differences in the valuation timing and methodology between the Portfolio and the Index. The Portfolio prices foreign exchange rates at the closing of the U.S. markets while the Index uses rates at 4 pm London time. The Portfolio utilizes fair value pricing to price portfolio securities at the closing of the U.S. markets while the Index uses local market closing prices.
DFA Global Real Estate Securities Portfolio
The DFA Global Real Estate Securities Portfolio, a fund of funds, is designed to capture the returns of a broadly diversified portfolio of real estate securities in U.S. and international markets, but does not attempt to track a specific index. As of October 31, 2010, the Portfolio invested in the DFA International Real Estate Securities Portfolio and the DFA Real Estate Securities Portfolio. As of October 31, 2010, the Portfolio held 299 stocks, through its underlying funds, in 20 developed and emerging markets countries. In general, the Portfolio was fully invested in equities throughout the year. The average cash level for the period was less than 1% of the Portfolio’s assets.
As a result of the Portfolio’s diversified approach, performance was principally determined by structural trends in global real estate securities markets, rather than the behavior of a limited number of stocks. For the 12 months ended October 31, 2010, total returns were 31.38% for the Portfolio, 30.27% for the S&P Global REIT Index (gross dividends), and 28.81% for the S&P Global REIT Index (net dividends). Relative to the Index (net dividends), most of the Portfolio’s relative outperformance was attributable to differences between the Index’s assumed withholding
21
tax rates and the Portfolio’s actual withholding tax rates and, with respect to the Portfolio’s holdings of the DFA International Real Estate Securities Portfolio, to differences in the timing of the pricing of securities and foreign exchange rates between this portfolio and the Index. The DFA International Real Estate Securities Portfolio prices foreign exchange rates at the closing of the U.S. markets while the Index uses rates at 4 pm London time. The DFA International Real Estate Securities Portfolio utilizes fair value pricing to price its securities at the closing of the U.S. markets while the Index uses local market closing prices.
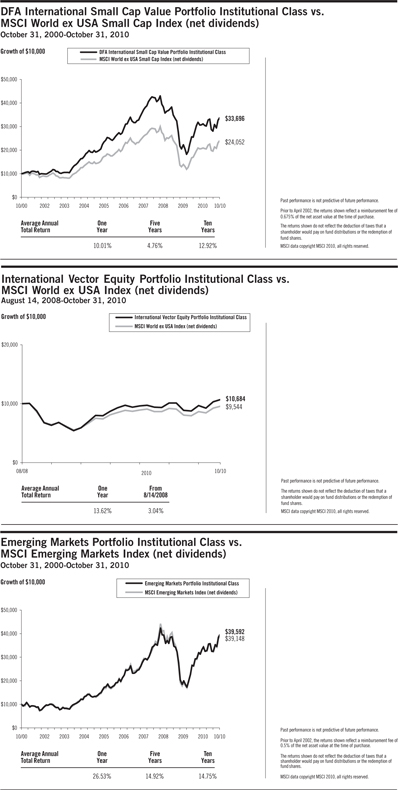
DFA International Small Cap Value Portfolio
The DFA International Small Cap Value Portfolio seeks to capture the returns of international small company value stocks. The investment strategy employs a disciplined, quantitative approach, emphasizing broad diversification and consistent exposure to small company value stocks, but does not attempt to track a specific equity index. As of October 31, 2010, the Portfolio held 2,160 stocks in 23 developed countries. In general, the Portfolio was fully invested in equities throughout the year. The average cash level for the period was less than 1% of the Portfolio’s assets.
As a result of the Portfolio’s diversified investment approach, performance was determined principally by broad structural trends in international equity markets, rather than the behavior of a limited number of stocks. Over the period, international small stocks outperformed international large cap stocks and international value stocks underperformed international growth stocks. For the 12 months ended October 31, 2010, total returns were 10.01% for the Portfolio and 17.23% for the MSCI World ex USA Small Cap Index (net dividends). The primary reason for the Portfolio’s relative underperformance was its significantly greater allocation than the Index to value stocks, which underperformed, and its corresponding lower allocation to growth stocks, which outperformed.
International Vector Equity Portfolio
The International Vector Equity Portfolio seeks to capture the returns of a broadly diversified basket of international stocks, with increased exposure to smaller company stocks and those with value characteristics, as measured by book-to-market ratio, than the International Core Equity Portfolio. The investment strategy employs a disciplined, quantitative approach, emphasizing broad diversification, but does not attempt to track a specific equity index. As of October 31, 2010, the Portfolio held 3,820 stocks in 23 developed country markets. In general, the Portfolio was fully invested in equities throughout the year. The average cash level for the period was less than 1% of the Portfolio’s assets.
As a result of the Portfolio’s diversified investment approach, performance was determined principally by broad structural trends in the international equity markets, rather than by the behavior of a limited number of stocks. For the 12 months ended October 31, 2010, total returns were 13.62% for the Portfolio and 9.61% for the MSCI World ex USA Index (net dividends). In general, international large cap stocks underperformed international mid cap and small cap stocks over the period. The Portfolio’s lower allocation than the Index to large cap stocks and its greater allocation to mid cap and small cap stocks were the primary sources of the Portfolio’s relative outperformance.
Emerging Markets Portfolio
The Emerging Markets Portfolio seeks to capture the returns of large cap stocks in selected emerging markets countries by purchasing shares of a Master Fund investing in such securities. The investment strategy employs a disciplined quantitative approach, emphasizing broad diversification and consistent exposure to large cap emerging markets stocks, but does not attempt to track a specific equity index. As of October 31, 2010, the Master Fund held 712 stocks in 20 emerging markets countries. In general, the Master Fund was fully invested in equities throughout the year. The average cash level for the period was less than 1% of the Master Fund’s assets. The Master Fund’s target country weights were capped at 15% upon purchase by the manager to limit single-country risk exposure.
As a result of the Master Fund’s diversified approach, performance was generally determined by broad structural trends in emerging markets countries, rather than the behavior of a limited number of stocks. For the 12 months ended October 31, 2010, total returns were 26.53% for the Portfolio and 23.56% for the MSCI Emerging Markets Index (net dividends). The Portfolio’s relative outperformance was primarily due to differences in country
22
weight allocations between the Master Fund and the Index. Country weight differences were primarily driven by capping of individual countries to limit single country risk exposure. To a lesser extent, an additional component of the Portfolio’s outperformance was due to differences in valuation timing and methodology between the Master Fund and the Index. The Master Fund prices foreign exchange rates at the closing of the U.S. markets while the Index uses rates at 4 pm London time. The Master Fund utilizes fair value pricing to price portfolio securities at the closing of the U.S. markets while the Index uses local market closing prices.
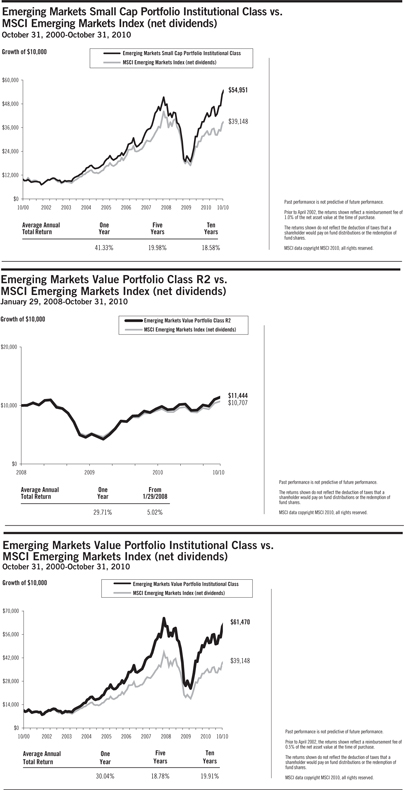
Emerging Markets Small Cap Portfolio
The Emerging Markets Small Cap Portfolio seeks to capture the returns of small company stocks in selected emerging markets by purchasing shares of a Master Fund investing in such securities. The Master Fund’s investment strategy employs a disciplined quantitative approach, emphasizing broad diversification and consistent exposure to small company stocks in selected emerging markets, but does not attempt to track a specific equity index. As of October 31, 2010, the Master Fund held 2,691 stocks across 15 emerging markets countries. In general, the Master Fund was fully invested in equities throughout the year. The average cash level for the period was less than 1% of the Master Fund’s assets. The Master Fund’s target country weights were capped at 15% upon purchase by the manager to limit single-country risk exposure.
As a result of the Master Fund’s diversified approach, performance was generally determined by structural trends in emerging markets countries, rather than the behavior of a limited number of stocks. For the 12 months ended October 31, 2010, total returns were 41.33% for the Portfolio and 23.56% for the MSCI Emerging Markets Index (net dividends). The Portfolio’s outperformance was primarily due to emerging markets small cap stocks outperforming their large cap counterparts during the period. The Master Fund holds primarily small cap stocks whereas the Index generally holds large cap and mid cap stocks. To a lesser extent, an additional component of the Portfolio’s outperformance was due to differences in valuation timing and methodology between the Master Fund and the Index. The Master Fund prices foreign exchange rates at the closing of the U.S. markets while the Index uses rates at 4 pm London time. The Master Fund utilizes fair value pricing to price portfolio securities at the closing of the U.S. markets while the Index uses local market closing prices.
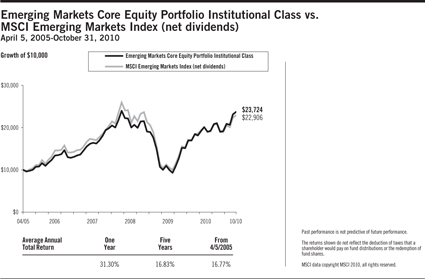
Emerging Markets Value Portfolio
The Emerging Markets Value Portfolio seeks to capture the returns of large and small cap value stocks as measured by book to market ratio in selected emerging markets countries by purchasing shares of the Dimensional Emerging Markets Value Fund (the “Master Fund”), which invests in such securities. The investment strategy employs a disciplined, quantitative approach, emphasizing broad diversification and consistent exposure to emerging markets value stocks, but does not attempt to track a specific equity index. As of October 31, 2010, the Master Fund held 2,016 stocks across 17 emerging markets countries. In general, the Portfolio was fully invested in equities throughout the year. The average cash level for the period was less than 1% of the Portfolio’s assets. The Master Fund’s target country weights were capped at 15% at purchase by the manager to limit single-country risk exposure.
As a result of the Master Fund’s diversified investment approach, performance was generally determined by broad structural trends in emerging markets countries, rather than the behavior of a limited number of stocks. For the 12 months ended October 31, 2010, total returns were 30.04% for the Portfolio’s Institutional Class shares, 29.71% for the Portfolio’s Class R2 shares and 23.56% for the MSCI Emerging Markets Index (net dividends). The Master Fund targets large and small cap value stocks while the Index primarily targets large and mid cap stocks. The Portfolio’s relative outperformance was primarily due to its higher allocation than the Index to small cap value stocks, which outperformed, and a corresponding lower allocation than the Index to large cap stocks which underperformed. To a lesser extent, an additional component of the Portfolio’s outperformance was due to differences in valuation timing and methodology between the Master Fund and the Index. The Master Fund prices foreign exchange rates at the closing of the U.S. markets while the Index uses rates at 4 pm London time. The Master Fund utilizes fair value pricing to price portfolio securities at the closing of the U.S. markets while the Index uses local market closing prices.
23
Emerging Markets Core Equity Portfolio
The Emerging Markets Core Equity Portfolio seeks to capture the returns of a broad universe of emerging markets stocks with increased exposure to smaller company stocks and those stocks with value characteristics as measured by book-to-market ratio. The investment strategy employs a disciplined quantitative approach, emphasizing broad diversification and consistent exposure to selected emerging markets countries, but does not attempt to track a specific equity index. As of October 31, 2010, the Portfolio held 3,174 stocks across 20 emerging markets countries. In general, the Portfolio was fully invested in equities throughout the year. The average cash level for the period was less than 1% of the Portfolio’s assets. The Portfolio’s target country weights were capped at 15% upon purchase by the manager to limit single-country risk exposure.
As a result of the Portfolio’s diversified approach, performance was generally determined by structural trends in emerging markets countries, rather than the behavior of a limited number of stocks. For the 12 months ended October 31, 2010, total returns were 31.30% for the Portfolio and 23.56% for the MSCI Emerging Markets Index (net dividends). In general, emerging markets large cap stocks significantly underperformed emerging markets mid cap and small cap stocks over the period. The Portfolio’s lower allocation than the Index to large cap stocks and its greater allocation to mid cap and small cap stocks had a positive impact on the Portfolio’s relative performance. Composition differences in the Portfolio’s holdings relative to the Index, in particular within regions and sectors, also had a positive impact on the relative performance. To a lesser extent, an additional component of the Portfolio’s outperformance was due to differences in valuation timing and methodology between the Portfolio and the Index. The Portfolio prices foreign exchange rates at the closing of the U.S. markets while the Index uses rates at 4 pm London time. The Portfolio utilizes fair value pricing to price portfolio securities at the closing of the U.S. markets while the Index uses local market closing prices.
24
DFA INVESTMENT DIMENSIONS GROUP INC.
DISCLOSURE OF FUND EXPENSES
(Unaudited)
The following Expense Tables are shown so that you can understand the impact of fees on your investment. All mutual funds have operating expenses. As a shareholder of the fund, you incur ongoing costs, which include costs for portfolio management, administrative services, and shareholder reports, among others. Operating expenses, legal and audit services, which are deducted from a fund’s gross income, directly reduce the investment return of the fund. A fund’s expenses are expressed as a percentage of its average net assets.This figure is known as the expense ratio. The following examples are intended to help you understand the ongoing costs, in dollars, of investing in the fund and to compare these costs with those of other mutual funds. The examples are based on an investment of $1,000 made at the beginning of the period shown and held for the entire period.
The Expense Tables below illustrate your fund’s costs in two ways.
Actual Fund Return
This section helps you to estimate the actual expenses after fee waivers that you paid over the period. The “Ending Account Value” shown is derived from the fund’s actual return and “Expenses Paid During Period” reflect the dollar amount that would have been paid by an investor who started with $1,000 in the fund.You may use the information here, together with the amount you invested, to estimate the expenses that you paid over the period.
To do so, simply divide your account value by $1,000 (for example, a $7,500 account value divided by $1,000 = 7.5), then multiply the result by the number given for your fund under the heading “Expenses Paid During Period.”
Hypothetical Example for Comparison Purposes
This section is intended to help you compare your fund’s costs with those of other mutual funds. The hypothetical “Ending Account Value” and “Expenses Paid During Period” are derived from the fund’s actual expense ratio and an assumed 5% annual return before expenses. In this case, because the return used is not the fund’s actual return, the results do not apply to your investment. The example is useful in making comparisons because the SEC requires all mutual funds to calculate expenses based on a 5% annual return. You can assess your fund’s costs by comparing this hypothetical example with the hypothetical examples that appear in shareholder reports of other funds.
Please note that the expenses shown in the tables are meant to highlight and help you compare ongoing costs only and do not reflect any transactional costs, if applicable. The “Annualized Expense Ratio” represents the actual expenses for the six-month period indicated.
Six Months Ended October 31, 2010
EXPENSE TABLES
| | | | | | | | | | | | | | | | |
| | | Beginning
Account
Value
05/01/10 | | | Ending
Account
Value
10/31/10 | | | Annualized
Expense
Ratio* | | | Expenses
Paid
During
Period* | |
| Enhanced U.S. Large Company Portfolio | | | | | | | | | | | | |
Actual Fund Return | | | | | | | | | | | | | | | | |
Institutional Class Shares | | | $1,000.00 | | | | $1,011.60 | | | | 0.25% | | | | $1.27 | |
Hypothetical 5% Annual Return | | | | | | | | | | | | | | | | |
Institutional Class Shares | | | $1,000.00 | | | | $1,023.95 | | | | 0.25% | | | | $1.28 | |
25
DISCLOSURE OF FUND EXPENSES
CONTINUED
| | | | | | | | | | | | | | | | |
| | | Beginning
Account
Value
05/01/10 | | | Ending
Account
Value
10/31/10 | | | Annualized
Expense
Ratio* | | | Expenses
Paid
During
Period* | |
U.S. Large Cap Value Portfolio** | | | | | | | | | | | | | | | | |
Actual Fund Return | | | | | | | | | | | | | | | | |
Institutional Class Shares | | $ | 1,000.00 | | | $ | 974.10 | | | | 0.27% | | | | $1.34 | |
Hypothetical 5% Annual Return | | | | | | | | | | | | | | | | |
Institutional Class Shares | | $ | 1,000.00 | | | $ | 1,023.84 | | | | 0.27% | | | | $1.38 | |
| | | | |
| U.S. Targeted Value Portfolio | | | | | | | | | | | | |
Actual Fund Return | | | | | | | | | | | | | | | | |
Class R1 Shares | | $ | 1,000.00 | | | $ | 949.40 | | | | 0.48% | | | | $2.36 | |
Class R2 Shares | | $ | 1,000.00 | | | $ | 949.50 | | | | 0.63% | | | | $3.10 | |
Institutional Class Shares | | $ | 1,000.00 | | | $ | 950.40 | | | | 0.38% | | | | $1.87 | |
Hypothetical 5% Annual Return | | | | | | | | | | | | | | | | |
Class R1 Shares | | $ | 1,000.00 | | | $ | 1,022.79 | | | | 0.48% | | | | $2.45 | |
Class R2 Shares | | $ | 1,000.00 | | | $ | 1,022.03 | | | | 0.63% | | | | $3.21 | |
Institutional Class Shares | | $ | 1,000.00 | | | $ | 1,023.29 | | | | 0.38% | | | | $1.94 | |
| | | | |
| U.S. Small Cap Value Portfolio | | | | | | | | | | | | |
Actual Fund Return | | | | | | | | | | | | | | | | |
Institutional Class Shares | | $ | 1,000.00 | | | $ | 948.50 | | | | 0.51% | | | | $2.50 | |
Hypothetical 5% Annual Return | | | | | | | | | | | | | | | | |
Institutional Class Shares | | $ | 1,000.00 | | | $ | 1,022.63 | | | | 0.51% | | | | $2.60 | |
| | | | |
| U.S. Core Equity 1 Portfolio | | | | | | | | | | | | |
Actual Fund Return | | | | | | | | | | | | | | | | |
Institutional Class Shares | | $ | 1,000.00 | | | $ | 999.90 | | | | 0.19% | | | | $0.96 | |
Hypothetical 5% Annual Return | | | | | | | | | | | | | | | | |
Institutional Class Shares | | $ | 1,000.00 | | | $ | 1,024.25 | | | | 0.19% | | | | $0.97 | |
| | | | |
| U.S. Core Equity 2 Portfolio | | | | | | | | | | | | |
Actual Fund Return | | | | | | | | | | | | | | | | |
Institutional Class Shares | | $ | 1,000.00 | | | $ | 990.60 | | | | 0.22% | | | | $1.10 | |
Hypothetical 5% Annual Return | | | | | | | | | | | | | | | | |
Institutional Class Shares | | $ | 1,000.00 | | | $ | 1,024.10 | | | | 0.22% | | | | $1.12 | |
| | | | |
| U.S. Vector Equity Portfolio | | | | | | | | | | | | |
Actual Fund Return | | | | | | | | | | | | | | | | |
Institutional Class Shares | | $ | 1,000.00 | | | $ | 976.80 | | | | 0.32% | | | | $1.59 | |
Hypothetical 5% Annual Return | | | | | | | | | | | | | | | | |
Institutional Class Shares | | $ | 1,000.00 | | | $ | 1,023.59 | | | | 0.32% | | | | $1.63 | |
| | | | |
| U.S. Small Cap Portfolio | | | | | | | | | | | | |
Actual Fund Return | | | | | | | | | | | | | | | | |
Institutional Class Shares | | $ | 1,000.00 | | | $ | 988.50 | | | | 0.37% | | | | $1.85 | |
Hypothetical 5% Annual Return | | | | | | | | | | | | | | | | |
Institutional Class Shares | | $ | 1,000.00 | | | $ | 1,023.34 | | | | 0.37% | | | | $1.89 | |
26
DISCLOSURE OF FUND EXPENSES
CONTINUED
| | | | | | | | | | | | | | | | |
| | | Beginning
Account
Value
05/01/10 | | | Ending
Account
Value
10/31/10 | | | Annualized
Expense
Ratio* | | | Expenses
Paid
During
Period* | |
| U.S. Micro Cap Portfolio | | | | | | | | | | | | |
Actual Fund Return | | | | | | | | | | | | | | | | |
Institutional Class Shares | | | $1,000.00 | | | �� | $990.90 | | | | 0.51% | | | | $2.56 | |
Hypothetical 5% Annual Return | | | | | | | | | | | | | | | | |
Institutional Class Shares | | | $1,000.00 | | | | $1,022.63 | | | | 0.51% | | | | $2.60 | |
| | | | |
| DFA Real Estate Securities Portfolio | | | | | | | | | | | | |
Actual Fund Return | | | | | | | | | | | | | | | | |
Institutional Class Shares | | | $1,000.00 | | | | $1,063.50 | | | | 0.32% | | | | $1.66 | |
Hypothetical 5% Annual Return | | | | | | | | | | | | | | | | |
Institutional Class Shares | | | $1,000.00 | | | | $1,023.59 | | | | 0.32% | | | | $1.63 | |
| | | | |
| Large Cap International Portfolio | | | | | | | | | | | | |
Actual Fund Return | | | | | | | | | | | | | | | | |
Institutional Class Shares | | | $1,000.00 | | | | $1,062.80 | | | | 0.30% | | | | $1.56 | |
Hypothetical 5% Annual Return | | | | | | | | | | | | | | | | |
Institutional Class Shares | | | $1,000.00 | | | | $1,023.69 | | | | 0.30% | | | | $1.53 | |
| | | | |
| International Core Equity Portfolio | | | | | | | | | | | | |
Actual Fund Return | | | | | | | | | | | | | | | | |
Institutional Class Shares | | | $1,000.00 | | | | $1,056.10 | | | | 0.40% | | | | $2.07 | |
Hypothetical 5% Annual Return | | | | | | | | | | | | | | | | |
Institutional Class Shares | | | $1,000.00 | | | | $1,023.19 | | | | 0.40% | | | | $2.04 | |
| | | | |
| International Small Company Portfolio*** | | | | | | | | | | | | |
Actual Fund Return | | | | | | | | | | | | | | | | |
Institutional Class Shares | | | $1,000.00 | | | | $1,074.50 | | | | 0.56% | | | | $2.93 | |
Hypothetical 5% Annual Return | | | | | | | | | | | | | | | | |
Institutional Class Shares | | | $1,000.00 | | | | $1,022.38 | | | | 0.56% | | | | $2.85 | |
| | | | |
| Japanese Small Company Portfolio** | | | | | | | | | | | | |
Actual Fund Return | | | | | | | | | | | | | | | | |
Institutional Class Shares | | | $1,000.00 | | | | $940.40 | | | | 0.57% | | | | $2.79 | |
Hypothetical 5% Annual Return | | | | | | | | | | | | | | | | |
Institutional Class Shares | | | $1,000.00 | | | | $1,022.33 | | | | 0.57% | | | | $2.91 | |
| | | | |
| Asia Pacific Small Company Portfolio** | | | | | | | | | | | | |
Actual Fund Return | | | | | | | | | | | | | | | | |
Institutional Class Shares | | | $1,000.00 | | | | $1,133.00 | | | | 0.64% | | | | $3.44 | |
Hypothetical 5% Annual Return | | | | | | | | | | | | | | | | |
Institutional Class Shares | | | $1,000.00 | | | | $1,021.98 | | | | 0.64% | | | | $3.26 | |
27
DISCLOSURE OF FUND EXPENSES
CONTINUED
| | | | | | | | | | | | | | | | |
| | | Beginning
Account
Value
05/01/10 | | | Ending
Account
Value
10/31/10 | | | Annualized
Expense
Ratio* | | | Expenses
Paid
During
Period* | |
| United Kingdom Small Company Portfolio** | | | | | | | | | | | | |
Actual Fund Return | | | | | | | | | | | | | | | | |
Institutional Class Shares | | $ | 1,000.00 | | | $ | 1,148.60 | | | | 0.60% | | | $ | 3.25 | |
Hypothetical 5% Annual Return | | | | | | | | | | | | | | | | |
Institutional Class Shares | | $ | 1,000.00 | | | $ | 1,022.18 | | | | 0.60% | | | $ | 3.06 | |
| | | | |
| Continental Small Company Portfolio** | | | | | | | | | | | | |
Actual Fund Return | | | | | | | | | | | | | | | | |
Institutional Class Shares | | $ | 1,000.00 | | | $ | 1,093.40 | | | | 0.59% | | | $ | 3.11 | |
Hypothetical 5% Annual Return | | | | | | | | | | | | | | | | |
Institutional Class Shares | | $ | 1,000.00 | | | $ | 1,022.23 | | | | 0.59% | | | $ | 3.01 | |
| | | | |
| DFA International Real Estate Securities Portfolio | | | | | | | | | | | | |
Actual Fund Return | | | | | | | | | | | | | | | | |
Institutional Class Shares | | $ | 1,000.00 | | | $ | 1,148.20 | | | | 0.41% | | | $ | 2.22 | |
Hypothetical 5% Annual Return | | | | | | | | | | | | | | | | |
Institutional Class Shares | | $ | 1,000.00 | | | $ | 1,023.14 | | | | 0.41% | | | $ | 2.09 | |
| | | | |
| DFA Global Real Estate Securities Portfolio*** | | | | | | | | | | | | |
Actual Fund Return | | | | | | | | | | | | | | | | |
Institutional Class Shares | | $ | 1,000.00 | | | $ | 1,101.10 | | | | 0.41% | | | $ | 2.17 | |
Hypothetical 5% Annual Return | | | | | | | | | | | | | | | | |
Institutional Class Shares | | $ | 1,000.00 | | | $ | 1,023.14 | | | | 0.41% | | | $ | 2.09 | |
| | | | |
| DFA International Small Cap Value Portfolio | | | | | | | | | | | | |
Actual Fund Return | | | | | | | | | | | | | | | | |
Institutional Class Shares | | $ | 1,000.00 | | | $ | 1,017.50 | | | | 0.70% | | | $ | 3.56 | |
Hypothetical 5% Annual Return | | | | | | | | | | | | | | | | |
Institutional Class Shares | | $ | 1,000.00 | | | $ | 1,021.68 | | | | 0.70% | | | $ | 3.57 | |
| | | | |
| International Vector Equity Portfolio | | | | | | | | | | | | |
Actual Fund Return | | | | | | | | | | | | | | | | |
Institutional Class Shares | | $ | 1,000.00 | | | $ | 1,055.80 | | | | 0.55% | | | $ | 2.85 | |
Hypothetical 5% Annual Return | | | | | | | | | | | | | | | | |
Institutional Class Shares | | $ | 1,000.00 | | | $ | 1,022.43 | | | | 0.55% | | | $ | 2.80 | |
| | | | |
| Emerging Markets Portfolio** | | | | | | | | | | | | |
Actual Fund Return | | | | | | | | | | | | | | | | |
Institutional Class Shares | | $ | 1,000.00 | | | $ | 1,106.30 | | | | 0.61% | | | $ | 3.24 | |
Hypothetical 5% Annual Return | | | | | | | | | | | | | | | | |
Institutional Class Shares | | $ | 1,000.00 | | | $ | 1,022.13 | | | | 0.61% | | | $ | 3.11 | |
| | | | |
| Emerging Markets Small Cap Portfolio** | | | | | | | | | | | | |
Actual Fund Return | | | | | | | | | | | | | | | | |
Institutional Class Shares | | $ | 1,000.00 | | | $ | 1,180.80 | | | | 0.79% | | | $ | 4.34 | |
Hypothetical 5% Annual Return | | | | | | | | | | | | | | | | |
Institutional Class Shares | | $ | 1,000.00 | | | $ | 1,021.22 | | | | 0.79% | | | $ | 4.02 | |
28
DISCLOSURE OF FUND EXPENSES
CONTINUED
| | | | | | | | | | | | | | | | |
| | | Beginning
Account
Value
05/01/10 | | | Ending
Account
Value
10/31/10 | | | Annualized
Expense
Ratio* | | | Expenses
Paid
During
Period* | |
| Emerging Markets Value Portfolio** | | | | | | | | | | | | |
Actual Fund Return | | | | | | | | | | | | | | | | |
Class R2 Shares | | $ | 1,000.00 | | | $ | 1,116.90 | | | | 0.87% | | | $ | 4.64 | |
Institutional Class Shares | | $ | 1,000.00 | | | $ | 1,119.30 | | | | 0.62% | | | $ | 3.31 | |
Hypothetical 5% Annual Return | | | | | | | | | | | | | | | | |
Class R2 Shares | | $ | 1,000.00 | | | $ | 1,020.82 | | | | 0.87% | | | $ | 4.43 | |
Institutional Class Shares | | $ | 1,000.00 | | | $ | 1,022.08 | | | | 0.62% | | | $ | 3.16 | |
| | | | |
| Emerging Markets Core Equity Portfolio | | | | | | | | | | | | |
Actual Fund Return | | | | | | | | | | | | | | | | |
Institutional Class Shares | | $ | 1,000.00 | | | $ | 1,129.20 | | | | 0.67% | | | $ | 3.60 | |
Hypothetical 5% Annual Return | | | | | | | | | | | | | | | | |
Institutional Class Shares | | $ | 1,000.00 | | | $ | 1,021.83 | | | | 0.67% | | | $ | 3.41 | |
| | * | Expenses are equal to the fund’s annualized expense ratio for the six-month period, multiplied by the average account value over the period, multiplied by the number of days in the most recent six-month period (184), then divided by the number of days in the year (365) to reflect the six-month period. |
| | ** | The Portfolio is a Feeder Fund. The expenses shown reflect the direct expenses of the Feeder Fund and the indirect payment of the Feeder Fund’s portion of the expenses of its Master Fund (Affiliated Investment Company). |
| | *** | The Portfolio is a Fund of Funds. The expenses shown reflect the direct expenses of the Fund of Funds and the indirect payment of the Fund of Funds’ portion of the expenses of its Master Funds (Affiliated Investment Companies). |
29
DFA INVESTMENT DIMENSIONS GROUP INC.
DISCLOSURE OF PORTFOLIO HOLDINGS
(Unaudited)
The SEC requires that all Funds file a complete Schedule of Investments with the SEC for their first and third fiscal quarters on Form N-Q. For DFA Investment Dimensions Group Inc., this would be for the fiscal quarters ending January 31 and July 31. The Form N-Q filing must be made within 60 days of the end of the quarter. DFA Investment Dimensions Group Inc. filed its most recent Form N-Q with the SEC on September 29, 2010. It is available upon request, without charge, by calling collect: (512) 306-7400 or by mailing a request to Dimensional Fund Advisors LP, 6300 Bee Cave Road, Building One, Austin, Texas 78746, or by visiting the SEC’s website at http://www.sec.gov, or they may be reviewed and copied at the SEC’s Public Reference Room in Washington, D.C. (call 1-800-732-0330 for information on the operation of the Public Reference Room).
SEC regulations permit a fund to include in its reports to shareholders a “Summary Schedule of Portfolio Holdings” in lieu of a full Schedule of Investments. The Summary Schedule of Portfolio Holdings reports the fund’s 50 largest holdings in unaffiliated issuers and any investments that exceed one percent of the fund’s net assets at the end of the reporting period. The amendments also require that the Summary Schedule of Portfolio Holdings identify each category of investments that are held.
The fund is required to file a complete Schedule of Investments with the SEC on Form N-CSR within ten days after mailing the annual and semi-annual reports to shareholders. It will be available upon request, without charge, by calling collect: (512) 306-7400 or by mailing a request to Dimensional Fund Advisors LP, 6300 Bee Cave Road, Building One, Austin, Texas 78746, or by visiting the SEC’s website at http://www.sec.gov, or they may be reviewed and copied at the SEC’s Public Reference Room in Washington, D.C. (call 1-800-732-0330 for information on the operation of the Public Reference Room).
PORTFOLIO HOLDINGS
The SEC requires that all Funds present their categories of portfolio holdings in a table, chart or graph format in their annual and semi-annual shareholder reports, whether or not a Schedule of Investments is utilized. The following table, which presents portfolio holdings as a percent of total investments before short-term investments and collateral for loaned securities, is provided in compliance with such requirement. The categories shown below represent broad industry sectors. Each industry sector consists of one or more specific industry classifications.
The categories of industry classification for the Affiliated Investment Companies are represented in the Disclosure of Portfolio Holdings, which are included elsewhere within the report. Refer to the Schedule of Investments/Summary Schedule of Portfolio Holdings for each of the underlying Master Funds’ holdings which reflect the investments by category or country.
FEEDER FUNDS
| | |
| | | Affiliated Investment Companies |
U.S. Large Cap Value Portfolio | | 100.0% |
Japanese Small Company Portfolio | | 100.0% |
Asia Pacific Small Company Portfolio | | 100.0% |
United Kingdom Small Company Portfolio | | 100.0% |
Continental Small Company Portfolio | | 100.0% |
Emerging Markets Portfolio | | 100.0% |
Emerging Markets Small Cap Portfolio | | 100.0% |
Emerging Markets Value Portfolio | | 100.0% |
| |
| FUND OF FUNDS | | |
| |
International Small Company Portfolio | | 100.0% |
DFA Global Real Estate Securities Portfolio | | 100.0% |
30
DISCLOSURE OF PORTFOLIO HOLDINGS
CONTINUED
FIXED INCOME PORTFOLIO
| | |
| Enhanced U.S. Large Company Portfolio |
Corporate | | 19.7% |
Government | | 12.7% |
Foreign Corporate | | 24.0% |
Foreign Government | | 38.0% |
Supranational | | 5.6% |
| | |
| | 100.0% |
DOMESTIC AND INTERNATIONAL EQUITY PORTFOLIOS
| | | | | | | | | | |
| U.S. Targeted Value Portfolio | | U.S. Small Cap Value Portfolio | | U.S. Core Equity 1 Portfolio |
Consumer Discretionary | | 16.8% | | Consumer Discretionary | | 18.2% | | Consumer Discretionary | | 13.8% |
Consumer Staples | | 3.8% | | Consumer Staples | | 2.8% | | Consumer Staples | | 8.4% |
Energy | | 9.4% | | Energy | | 9.5% | | Energy | | 9.6% |
Financials | | 24.4% | | Financials | | 22.5% | | Financials | | 15.9% |
Health Care | | 7.3% | | Health Care | | 6.2% | | Health Care | | 10.8% |
Industrials | | 15.8% | | Industrials | | 19.1% | | Industrials | | 12.9% |
Information Technology | | 13.8% | | Information Technology | | 14.3% | | Information Technology | | 17.1% |
Materials | | 7.2% | | Materials | | 7.0% | | Materials | | 5.1% |
Real Estate Investment Trusts | | — | | Other | | — | | Other | | — |
Telecommunication Services | | 1.1% | | Real Estate Investment Trusts | | — | | Telecommunication Services | | 2.8% |
Utilities | | 0.4% | | Telecommunication Services | | 0.3% | | Utilities | | 3.6% |
| | | | | | | | | | |
| | 100.0% | | Utilities | | 0.1% | | | | 100.0% |
| | | | | | | | | | |
| | | | | | 100.0% | | | | |
| | |
| U.S. Core Equity 2 Portfolio | | U.S. Vector Equity Portfolio | | U.S. Small Cap Portfolio |
Consumer Discretionary | | 14.8% | | Consumer Discretionary | | 15.7% | | Consumer Discretionary | | 17.0% |
Consumer Staples | | 6.8% | | Consumer Staples | | 4.9% | | Consumer Staples | | 3.5% |
Energy | | 10.1% | | Energy | | 9.9% | | Energy | | 5.6% |
Financials | | 18.8% | | Financials | | 24.3% | | Financials | | 13.5% |
Health Care | | 10.0% | | Health Care | | 8.4% | | Health Care | | 11.5% |
Industrials | | 13.9% | | Industrials | | 13.9% | | Industrials | | 18.2% |
Information Technology | | 14.5% | | Information Technology | | 13.2% | | Information Technology | | 21.3% |
Materials | | 5.4% | | Materials | | 5.8% | | Materials | | 5.5% |
Other | | — | | Other | | — | | Other | | — |
Telecommunication Services | | 3.2% | | Telecommunication Services | | 2.5% | | Telecommunication Services | | 1.2% |
Utilities | | 2.5% | | Utilities | | 1.4% | | Utilities | | 2.7% |
| | | | | | | | | | |
| | 100.0% | | | | 100.0% | | | | 100.0% |
| | |
| U.S. Micro Cap Portfolio | | DFA Real Estate Securities Portfolio | | Large Cap International Portfolio |
Consumer Discretionary | | 16.0% | | Real Estate Investment Trusts | | 100.0% | | Consumer Discretionary | | 9.8% |
| | | | | | | | | | |
Consumer Staples | | 4.9% | | | | 100.0% | | Consumer Staples | | 9.6% |
Energy | | 3.7% | | | | | | Energy | | 9.2% |
Financials | | 13.8% | | | | | | Financials | | 23.8% |
Health Care | | 13.0% | | | | | | Health Care | | 7.8% |
Industrials | | 18.4% | | | | | | Industrials | | 12.0% |
Information Technology | | 22.5% | | | | | | Information Technology | | 4.9% |
Materials | | 4.6% | | | | | | Materials | | 12.0% |
Other | | — | | | | | | Other | | 0.1% |
Telecommunication Services | | 1.3% | | | | | | Telecommunication Services | | 5.7% |
Utilities | | 1.8% | | | | | | Utilities | | 5.1% |
| | | | | | | | | | |
| | 100.0% | | | | | | | | 100.0% |
31
DISCLOSURE OF PORTFOLIO HOLDINGS
CONTINUED
| | | | | | | | | | | | | | | | |
| International Core Equity Portfolio | | | DFA International Real Estate Securities Portfolio | | | DFA International Small Cap Value Portfolio | |
Consumer Discretionary | | | 13.8% | | | Financials | | | 0.1% | | | Consumer Discretionary | | | 19.5% | |
Consumer Staples | | | 6.6% | | | Other | | | 0.1% | | | Consumer Staples | | | 6.1% | |
Energy | | | 8.1% | | | Real Estate Investment Trusts | | | 99.8% | | | Energy | | | 5.4% | |
| | | | | | | | | | | | | | | | |
Financials | | | 24.9% | | | | | | 100.0% | | | Financials | | | 18.9% | |
Health Care | | | 4.5% | | | | | | | | | Health Care | | | 2.0% | |
Industrials | | | 16.7% | | | | | | | | | Industrials | | | 22.7% | |
Information Technology | | | 5.5% | | | | | | | | | Information Technology | | | 4.9% | |
Materials | | | 13.7% | | | | | | | | | Materials | | | 19.7% | |
Other | | | — | | | | | | | | | Other | | | — | |
Real Estate Investment Trusts | | | — | | | | | | | | | Real Estate Investment Trusts | | | 0.1% | |
Telecommunication Services | | | 3.3% | | | | | | | | | Telecommunication Services | | | 0.4% | |
Utilities | | | 2.9% | | | | | | | | | Utilities | | | 0.3% | |
| | | | | | | | | | | | | | | | |
| | | 100.0% | | | | | | | | | | | | 100.0% | |
| | | | | | | | | | |
| International Vector Equity Portfolio | | | Emerging Markets Core Equity Portfolio | |
Consumer Discretionary | | | 15.7% | | | Consumer Discretionary | | | 10.1% | |
Consumer Staples | | | 5.5% | | | Consumer Staples | | | 7.2% | |
Energy | | | 6.8% | | | Energy | | | 11.0% | |
Financials | | | 23.8% | | | Financials | | | 23.7% | |
Health Care | | | 3.8% | | | Health Care | | | 2.0% | |
Industrials | | | 18.6% | | | Industrials | | | 11.5% | |
Information Technology | | | 6.3% | | | Information Technology | | | 10.1% | |
Materials | | | 15.8% | | | Materials | | | 15.9% | |
Other | | | — | | | Other | | | — | |
Real Estate Investment Trusts | | | — | | | Real Estate Investment Trusts | | | — | |
Telecommunication Services | | | 2.1% | | | Telecommunication Services | | | 5.1% | |
Utilities | | | 1.6% | | | Utilities | | | 3.4% | |
| | | | | | | | | | |
| | | 100.0% | | | | | | 100.0% | |
32
ENHANCED U.S. LARGE COMPANY PORTFOLIO
SCHEDULE OF INVESTMENTS
October 31, 2010
| | | | | | | | |
| | | Face
Amount^ | | | Value† | |
| | | (000) | | | | |
BONDS — (74.2%) | | | | | | | | |
AUSTRALIA — (1.9%) | | | | | | | | |
Australia & New Zealand Banking Group, Ltd. | | | | | | | | |
(u) 5.500%, 05/24/11 | | | 1,000 | | | $ | 1,023,110 | |
Commonwealth Bank of Australia | | | | | | | | |
(u) 4.750%, 01/27/11 | | | 434 | | | | 437,977 | |
Macquarie Bank, Ltd. | | | | | | | | |
(u) 2.600%, 01/20/12 | | | 1,449 | | | | 1,484,027 | |
| | | | | | | | |
TOTAL AUSTRALIA | | | | | | | 2,945,114 | |
| | | | | | | | |
| | |
AUSTRIA — (2.8%) | | | | | | | | |
Asfinag | | | | | | | | |
2.000%, 10/22/12 | | | 2,050 | | | | 2,100,793 | |
Oesterreichische Volksbanken AG | | | | | | | | |
(e) 3.000%, 02/09/12 | | | 1,600 | | | | 2,267,874 | |
| | | | | | | | |
TOTAL AUSTRIA | | | | | | | 4,368,667 | |
| | | | | | | | |
CANADA — (17.3%) | | | | | | | | |
Alberta Capital Finance Authority | | | | | | | | |
5.850%, 06/01/12 | | | 2,000 | | | | 2,095,382 | |
Bank of Nova Scotia Floating Rate Note | | | | | | | | |
(r)(u)0.543%, 03/05/12 | | | 4,000 | | | | 4,010,484 | |
British Columbia, Province of Canada | | | | | | | | |
5.750%, 01/09/12 | | | 4,000 | | | | 4,124,993 | |
Canada Mortgage & Housing Corp. | | | | | | | | |
5.500%, 06/01/12 | | | 3,700 | | | | 3,855,161 | |
Canadian Government Bond | | | | | | | | |
1.250%, 12/01/11 | | | 2,300 | | | | 2,255,845 | |
1.500%, 06/01/12 | | | 1,000 | | | | 982,930 | |
Ontario, Province of Canada | | | | | | | | |
4.400%, 12/02/11 | | | 4,200 | | | | 4,253,699 | |
Royal Bank of Canada | | | | | | | | |
(u) 5.650%, 07/20/11 | | | 1,300 | | | | 1,344,442 | |
(e) 5.750%, 07/25/11 | | | 2,000 | | | | 2,865,665 | |
Royal Bank of Canada Floating Rate Note | | | | | | | | |
(r)(u)0.356%, 01/27/12 | | | 100 | | | | 100,000 | |
Toronto-Dominion Bank (The) | | | | | | | | |
(g) 6.875%, 06/24/11 | | | 650 | | | | 1,075,645 | |
| | | | | | | | |
TOTAL CANADA | | | | | | | 26,964,246 | |
| | | | | | | | |
| | | | | | | | |
| | | Face
Amount^ | | | Value† | |
| | | (000) | | | | |
DENMARK — (4.5%) | | | | | | | | |
Denmark Government International Bond | | | | | | | | |
(u) 1.875%, 03/16/12 | | | 3,000 | | | $ | 3,058,500 | |
FIH Erhvervsbank A.S. | | | | | | | | |
(u) 2.450%, 08/17/12 | | | 3,800 | | | | 3,906,993 | |
| | | | | | | | |
TOTAL DENMARK | | | | | | | 6,965,493 | |
| | | | | | | | |
| | |
FINLAND — (0.3%) | | | | | | | | |
Nordea Bank Finland P.L.C. Floating Rate Note | | | | | | | | |
(r)(u)0.686%, 02/01/12 | | | 500 | | | | 499,876 | |
| | | | | | | | |
| | |
FRANCE — (6.9%) | | | | | | | | |
Agence Francaise de Developpement | | | | | | | | |
(u) 2.250%, 05/22/12 | | | 2,500 | | | | 2,547,205 | |
Caisse d’Amortissement de la Dette Sociale | | | | | | | | |
(u) 2.250%, 07/06/12 | | | 3,500 | | | | 3,579,384 | |
(u) 5.375%, 07/17/12 | | | 500 | | | | 539,548 | |
Societe Financement de l’Economie Francaise | | | | | | | | |
(e) 3.500%, 11/24/11 | | | 1,800 | | | | 2,574,762 | |
(u) 2.250%, 06/11/12 | | | 1,500 | | | | 1,543,832 | |
| | | | | | | | |
TOTAL FRANCE | | | | | | | 10,784,731 | |
| | | | | | | | |
| | |
GERMANY — (7.1%) | | | | | | | | |
IKB Deutsche Industriebank AG | | | | | | | | |
(e) 2.875%, 01/27/12 | | | 1,500 | | | | 2,129,562 | |
Kreditanstalt fuer Wiederaufbau | | | | | | | | |
(g) 4.375%, 03/07/11 | | | 600 | | | | 974,055 | |
(u) 2.250%, 04/16/12 | | | 2,500 | | | | 2,566,265 | |
Landeskreditbank Baden-Wuerttemberg Foerderbank | | | | | | | | |
(u) 2.000%, 10/01/12 | | | 1,500 | | | | 1,533,922 | |
Landwirtschaftliche Rentenbank | | | | | | | | |
(g) 5.250%, 01/18/12 | | | 2,315 | | | | 3,901,240 | |
| | | | | | | | |
TOTAL GERMANY | | | | | | | 11,105,044 | |
| | | | | | | | |
| | |
JAPAN — (3.3%) | | | | | | | | |
Development Bank of Japan | | | | | | | | |
(e) 5.625%, 08/02/11 | | | 1,500 | | | | 2,153,846 | |
Japan Finance Corp. | | | | | | | | |
(u) 2.000%, 06/24/11 | | | 1,000 | | | | 1,009,718 | |
33
ENHANCED U.S. LARGE COMPANY PORTFOLIO
CONTINUED
| | | | | | | | |
| | | Face
Amount^ | | | Value† | |
| | | (000) | | | | |
JAPAN — (Continued) | | | | | | | | |
(u) 1.500%, 07/06/12 | | | 2,000 | | | $ | 2,024,040 | |
| | | | | | | | |
TOTAL JAPAN | | | | | | | 5,187,604 | |
| | | | | | | | |
NETHERLANDS — (6.2%) | | | | | | | | |
Bank Nederlandse Gemeenten | | | | | | | | |
(u) 2.250%, 01/17/12 | | | 3,000 | | | | 3,054,792 | |
(g) 5.750%, 03/07/12 | | | 521 | | | | 885,007 | |
Nederlandse Waterschapsbank NV | | | | | | | | |
(u) 2.875%, 06/16/11 | | | 4,000 | | | | 4,058,576 | |
Rabobank Nederland NV | | | | | | | | |
(g) 5.000%, 04/11/11 | | | 1,000 | | | | 1,626,510 | |
| | | | | | | | |
TOTAL NETHERLANDS | | | | | | | 9,624,885 | |
| | | | | | | | |
NORWAY — (2.6%) | | | | | | | | |
Kommunalbanken AS | | | | | | | | |
(u) 3.250%, 06/15/11 | | | 4,000 | | | | 4,066,264 | |
| | | | | | | | |
SPAIN — (0.6%) | | | | | | | | |
Instituto de Credito Oficial | | | | | | | | |
(u) 1.875%, 04/15/11 | | | 1,000 | | | | 1,000,548 | |
| | | | | | | | |
SUPRANATIONAL | | | | | | | | |
ORGANIZATION | | | | | | | | |
OBLIGATIONS — (4.2%) | | | | | | | | |
Eurofima | | | | | | | | |
(u) 5.125%, 08/02/12 | | | 1,000 | | | | 1,073,269 | |
European Investment Bank | | | | | | | | |
(u) 3.250%, 10/14/11 | | | 800 | | | | 821,726 | |
(u) 4.625%, 03/21/12 | | | 3,100 | | | | 3,276,582 | |
European Union | | | | | | | | |
(e) 3.250%, 12/09/11 | | | 1,000 | | | | 1,430,396 | |
| | | | | | | | |
TOTAL SUPRANATIONAL | | | | | | | | |
ORGANIZATION | | | | | | | | |
OBLIGATIONS | | | | | | | 6,601,973 | |
| | | | | | | | |
SWEDEN — (2.4%) | | | | | | | | |
Kommuninvest I Sverige | | | | | | | | |
(u) 5.375%, 06/15/11 | | | 1,000 | | | | 1,032,186 | |
(u) 5.375%, 07/03/12 | | | 2,600 | | | | 2,798,871 | |
| | | | | | | | |
TOTAL SWEDEN | | | | | | | 3,831,057 | |
| | | | | | | | |
UNITED KINGDOM — (5.0%) | | | | | | | | |
Bank of Scotland P.L.C. | | | | | | | | |
4.625%, 11/04/11 | | | 1,800 | | | | 2,985,498 | |
| | | | | | | | |
| | | Face
Amount^ | | | Value† | |
| | | (000) | | | | |
UNITED KINGDOM — (Continued) | | | | | | | | |
Barclays Bank P.L.C. Floating Rate Note | | | | | | | | |
(r)(u)0.556%, 01/14/11 | | | 1,000 | | | $ | 999,993 | |
Clydesdale Bank P.L.C. | | | | | | | | |
3.375%, 12/09/11 | | | 800 | | | | 1,316,652 | |
Royal Bank of Scotland P.L.C. (The) | | | | | | | | |
4.125%, 11/14/11 | | | 1,500 | | | | 2,480,442 | |
| | | | | | | | |
TOTAL UNITED KINGDOM | | | | | | | 7,782,585 | |
| | | | | | | | |
UNITED STATES — (9.1%) | | | | | | | | |
Berkshire Hathaway, Inc. Floating Rate Note | | | | | | | | |
(r) 0.591%, 02/10/12 | | $ | 4,000 | | | | 3,998,452 | |
General Electric Capital Corp. | | | | | | | | |
6.000%, 06/15/12 | | | 800 | | | | 862,818 | |
General Electric Capital Corp. Floating Rate Note | | | | | | | | |
(r) 0.916%, 02/01/11 | | | 2,000 | | | | 2,002,492 | |
(r) 0.373%, 06/06/11 | | | 1,000 | | | | 1,000,498 | |
JPMorgan Chase & Co. | | | | | | | | |
(g) 3.750%, 12/12/11 | | | 1,000 | | | | 1,649,592 | |
5.375%, 10/01/12 | | | 800 | | | | 865,527 | |
JPMorgan Chase & Co. Floating Rate Note | | | | | | | | |
(r) 1.043%, 06/13/11 | | | 1,800 | | | | 1,808,266 | |
Toyota Motor Credit Corp. Floating Rate Note | | | | | | | | |
(r) 0.390%, 10/04/11 | | | 2,000 | | | | 1,999,980 | |
| | | | | | | | |
TOTAL UNITED STATES | | | | | | | 14,187,625 | |
| | | | | | | | |
TOTAL BONDS | | | | | | | 115,915,712 | |
| | | | | | | | |
AGENCY OBLIGATIONS — (14.4%) | | | | | | | | |
Federal Home Loan Bank | | | | | | | | |
3.625%, 09/16/11 | | | 1,200 | | | | 1,236,064 | |
1.125%, 05/18/12 | | | 2,000 | | | | 2,023,700 | |
Federal Home Loan Bank Discount Note | | | | | | | | |
(y) v 0.136%, 12/08/10 | | | 4,000 | | | | 3,999,508 | |
Federal Home Loan Mortgage Corporation | | | | | | | | |
1.125%, 07/27/12 | | | 2,000 | | | | 2,026,348 | |
5.500%, 08/20/12 | | | 1,000 | | | | 1,091,639 | |
Federal Home Loan Mortgage Corporation Discount Notes | | | | | | | | |
(y) v 0.180%, 12/08/10 | | | 5,000 | | | | 4,999,385 | |
(y) v 0.185%, 12/14/10 | | | 5,000 | | | | 4,999,285 | |
34
ENHANCED U.S. LARGE COMPANY PORTFOLIO
CONTINUED
| | | | | | | | | | | | | | | | | | |
| | | Face
Amount | | | Value† | | | | | Shares | | | Value† | |
| | | (000) | | | | | | | TEMPORARY CASH INVESTMENTS — (0.5%) | | | | | | | | |
Federal National Mortgage Association | | | | | | | | | | BlackRock Liquidity Funds
Tempcash Portfolio - Institutional Shares | | | 734,050 | | | $ | 734,050 | |
| | | | | | | | | | | | | | | | | | |
4.375%, 09/15/12 | | | $2,000 | | | $ | 2,147,702 | | | | | | | | | | | |
| | | | | | | | | | | | | | | | | | |
TOTAL AGENCY OBLIGATIONS | | | | | | | 22,523,631 | | | TOTAL INVESTMENTS — (100.0%)
(Cost $154,182,471) | | | | | | $ | 156,198,640 | |
| | | | | | | | | | | | | | | | | | |
| | | | | |
COMMERCIAL PAPER — (7.6%) | | | | | | | | | | | | | | | | | | |
Eksportfinans ASA | | | | | | | | | | | | | | | | | | |
0.280%, 11/05/10 | | | 1,000 | | | | 999,969 | | | | | | | | | | | |
National Rural Utilities | | | | | | | | | | | | | | | | | | |
0.260%, 12/16/10 | | | 2,000 | | | | 1,999,288 | | | | | | | | | | | |
Paccar Financial Corp. | | | | | | | | | | | | | | | | | | |
0.260%, 12/10/10 | | | 3,700 | | | | 3,698,817 | | | | | | | | | | | |
Statoilhydro ASA | | | | | | | | | | | | | | | | | | |
0.190%, 11/01/10 | | | 4,500 | | | | 4,500,000 | | | | | | | | | | | |
United Technologies Corp. | | | | | | | | | | | | | | | | | | |
0.170%, 11/01/10 | | | 600 | | | | 600,000 | | | | | | | | | | | |
| | | | | | | | | | | | | | | | | | |
TOTAL COMMERCIAL PAPER | | | | | | | 11,798,074 | | | | | | | | | | | |
| | | | | | | | | | | | | | | | | | |
| | | Shares | | | | | | | | | | | | |
EXCHANGE-TRADED FUND — (3.3%) | | | | | | | | | | | | | | | | | | |
UNITED STATES — (3.3%)
SPDR Trust Series I | | | 44,100 | | | | 5,227,173 | | | | | | | | | | | |
| | | | | | | | | | | | | | | | | | |
Summary of inputs used to value the Portfolio’s investments as of October 31, 2010 is as follows (See Security Valuation Note):
| | | | | | | | | | | | | | |
| | | Valuation Inputs | |
| |
| | | Investment in Securities (Market Value) | |
| | | Level 1 | | | Level 2 | | | Level 3 | | Total | |
Bonds | | | — | | | $ | 115,915,712 | | | — | | $ | 115,915,712 | |
Agency Obligations | | | — | | | | 22,523,631 | | | — | | | 22,523,631 | |
Commercial Paper | | | — | | | | 11,798,074 | | | — | | | 11,798,074 | |
Exchange-Traded Fund | | $ | 5,227,173 | | | | — | | | — | | | 5,227,173 | |
Temporary Cash Investments | | | 734,050 | | | | — | | | — | | | 734,050 | |
Forward Currency Contracts** | | | — | | | | (173,351 | ) | | — | | | (173,351 | ) |
Futures Contracts** | | | 10,406,650 | | | | — | | | — | | | 10,406,650 | |
| | | | | | | | | | | | | | |
TOTAL | | $ | 16,367,873 | | | $ | 150,064,066 | | | — | | $ | 166,431,939 | |
| | | | | | | | | | | | | | |
| ** | Not reflected in the Schedule of Investments, valued at the unrealized appreciation/(depreciation) on the investment. |
See accompanying Notes to Financial Statements.
35
U.S. LARGE CAP VALUE PORTFOLIO
SCHEDULE OF INVESTMENTS
October 31, 2010
| | | | |
| | | Value† | |
AFFILIATED INVESTMENT COMPANY — (100.0%) | | | | |
Investment in The U.S. Large Cap Value Series of
The DFA Investment Trust Company | | $ | 6,922,104,537 | |
| | | | |
| |
TOTAL INVESTMENTS IN AFFILIATED INVESTMENT COMPANY
(Cost $5,483,228,182) | | $ | 6,922,104,537 | |
| | | | |
Summary of inputs used to value the Portfolio’s investments as of October 31, 2010 is as follows (See Security Valuation Note):
| | | | | | | | | | | | |
| | | Valuation Inputs | |
| |
| | | Investment in Securities (Market Value) | |
| | | Level 1 | | | Level 2 | | Level 3 | | Total | |
Affiliated Investment Company | | $ | 6,922,104,537 | | | — | | — | | $ | 6,922,104,537 | |
See accompanying Notes to Financial Statements.
36
U.S. TARGETED VALUE PORTFOLIO
SUMMARY SCHEDULE OF PORTFOLIO HOLDINGS
October 31, 2010
| | | | | | | | | | | | | | | | | | |
| | | Shares | | | | | | Value† | | | Percentage
of Net Assets** |
COMMON STOCKS — (87.6%) | | | | | | | | | | | | | | | | | | |
Consumer Discretionary — (14.8%) | | | | | | | | | | | | | | | | | | |
#*Gaylord Entertainment Co. | | | 204,517 | | | | | | | $ | 6,818,597 | | | | | | | 0.3% |
Jarden Corp. | | | 207,642 | | | | | | | | 6,657,003 | | | | | | | 0.3% |
*Liberty Media Corp. Capital Class A | | | 166,331 | | | | | | | | 9,570,686 | | | | | | | 0.4% |
#*Mohawk Industries, Inc. | | | 141,554 | | | | | | | | 8,116,706 | | | | | | | 0.3% |
#Rent-A-Center, Inc. | | | 265,181 | | | | | | | | 6,666,650 | | | | | | | 0.3% |
#*Saks, Inc. | | | 755,984 | | | | | | | | 8,421,662 | | | | | | | 0.4% |
#*Whirlpool Corp. | | | 88,830 | | | | | | | | 6,735,979 | | | | | | | 0.3% |
Other Securities | | | | | | | | | | | 327,148,537 | | | | | | | 14.4% |
| | | | | | | | | | | | | | | | | | |
Total Consumer Discretionary | | | | | | | | | | | 380,135,820 | | | | | | | 16.7% |
| | | | | | | | | | | | | | | | | | |
| | | | | |
Consumer Staples — (3.3%) | | | | | | | | | | | | | | | | | | |
*Constellation Brands, Inc. Class A | | | 389,483 | | | | | | | | 7,684,500 | | | | | | | 0.4% |
*Ralcorp Holdings, Inc. | | | 107,711 | | | | | | | | 6,684,545 | | | | | | | 0.3% |
#*Smithfield Foods, Inc. | | | 419,475 | | | | | | | | 7,026,206 | | | | | | | 0.3% |
Other Securities | | | | | | | | | | | 64,080,090 | | | | | | | 2.8% |
| | | | | | | | | | | | | | | | | | |
Total Consumer Staples | | | | | | | | | | | 85,475,341 | | | | | | | 3.8% |
| | | | | | | | | | | | | | | | | | |
| | | | | |
Energy — (8.2%) | | | | | | | | | | | | | | | | | | |
*Complete Production Services, Inc. | | | 332,185 | | | | | | | | 7,783,095 | | | | | | | 0.3% |
#*Exterran Holdings, Inc. | | | 284,147 | | | | | | | | 7,151,980 | | | | | | | 0.3% |
Pioneer Natural Resources Co. | | | 149,975 | | | | | | | | 10,468,255 | | | | | | | 0.5% |
*Plains Exploration & Production Co. | | | 265,602 | | | | | | | | 7,402,328 | | | | | | | 0.3% |
*Rowan Cos., Inc. | | | 228,373 | | | | | | | | 7,513,472 | | | | | | | 0.3% |
*Sunoco, Inc. | | | 212,272 | | | | | | | | 7,953,832 | | | | | | | 0.4% |
*Whiting Petroleum Corp. | | | 72,600 | | | | | | | | 7,291,944 | | | | | | | 0.3% |
Other Securities | | | | | | | | | | | 156,464,802 | | | | | | | 6.9% |
| | | | | | | | | | | | | | | | | | |
Total Energy | | | | | | | | | | | 212,029,708 | | | | | | | 9.3% |
| | | | | | | | | | | | | | | | | | |
| | | | | |
Financials — (21.4%) | | | | | | | | | | | | | | | | | | |
*American Capital, Ltd. | | | 1,070,676 | | | | | | | | 7,473,318 | | | | | | | 0.3% |
American Financial Group, Inc. | | | 248,114 | | | | | | | | 7,587,326 | | | | | | | 0.3% |
*Assurant, Inc. | | | 266,924 | | | | | | | | 10,554,175 | | | | | | | 0.5% |
Axis Capital Holdings, Ltd. | | | 226,295 | | | | | | | | 7,696,293 | | | | | | | 0.4% |
#*CNO Financial Group, Inc. | | | 1,229,638 | | | | | | | | 6,689,231 | | | | | | | 0.3% |
Huntington Bancshares, Inc. | | | 1,239,796 | | | | | | | | 7,029,643 | | | | | | | 0.3% |
#*MGIC Investment Corp. | | | 790,073 | | | | | | | | 6,968,444 | | | | | | | 0.3% |
*NASDAQ OMX Group, Inc. (The) | | | 336,903 | | | | | | | | 7,081,701 | | | | | | | 0.3% |
NewAlliance Bancshares, Inc. | | | 537,373 | | | | | | | | 6,926,738 | | | | | | | 0.3% |
#*Old Republic International Corp. | | | 572,695 | | | | | | | | 7,559,574 | | | | | | | 0.3% |
Reinsurance Group of America, Inc. | | | 153,401 | | | | | | | | 7,680,788 | | | | | | | 0.3% |
Transatlantic Holdings, Inc. | | | 140,003 | | | | | | | | 7,364,158 | | | | | | | 0.3% |
Validus Holdings, Ltd. | | | 239,615 | | | | | | | | 6,795,481 | | | | | | | 0.3% |
Webster Financial Corp. | | | 409,887 | | | | | | | | 7,017,265 | | | | | | | 0.3% |
Other Securities | | | | | | | | | | | 446,116,765 | | | | | | | 19.7% |
| | | | | | | | | | | | | | | | | | |
Total Financials | | | | | | | | | | | 550,540,900 | | | | | | | 24.2% |
| | | | | | | | | | | | | | | | | | |
| | | | | |
Health Care — (6.4%) | | | | | | | | | | | | | | | | | | |
*Coventry Health Care, Inc. | | | 317,536 | | | | | | | | 7,436,693 | | | | | | | 0.3% |
*HealthSpring, Inc. | | | 272,795 | | | | | | | | 7,962,886 | | | | | | | 0.3% |
*Hologic, Inc. | | | 465,750 | | | | | | | | 7,461,315 | | | | | | | 0.3% |
*King Pharmaceuticals, Inc. | | | 596,470 | | | | | | | | 8,434,086 | | | | | | | 0.4% |
Other Securities | | | | | | | | | | | 133,194,710 | | | | | | | 5.9% |
| | | | | | | | | | | | | | | | | | |
Total Health Care | | | | | | | | | | | 164,489,690 | | | | | | | 7.2% |
| | | | | | | | | | | | | | | | | | |
| | | | | |
Industrials — (13.8%) | | | | | | | | | | | | | | | | | | |
*Amerco, Inc. | | | 85,436 | | | | | | | | 7,033,092 | | | | | | | 0.3% |
37
U.S. TARGETED VALUE PORTFOLIO
CONTINUED
| | | | | | | | | | | | | | | | | | |
| | | Shares | | | | | | Value† | | | Percentage
of Net Assets** |
Industrials — (Continued) | | | | | | | | | | | | | | | | | | |
#*Avis Budget Group, Inc. | | | 578,582 | | | | | | | $ | 6,717,337 | | | | | | | 0.3% |
*Esterline Technologies Corp. | | | 120,884 | | | | | | | | 7,306,229 | | | | | | | 0.3% |
*Owens Corning, Inc. | | | 282,473 | | | | | | | | 7,638,070 | | | | | | | 0.3% |
#Triumph Group, Inc. | | | 80,276 | | | | | | | | 6,710,271 | | | | | | | 0.3% |
Other Securities | | | | | | | | | | | 321,395,397 | | | | | | | 14.2% |
| | | | | | | | | | | | | | | | | | |
Total Industrials | | | | | | | | | | | 356,800,396 | | | | | | | 15.7% |
| | | | | | | | | | | | | | | | | | |
| | | | | |
Information Technology — (12.1%) | | | | | | | | | | | | | | | | | | |
*Arrow Electronics, Inc. | | | 242,217 | | | | | | | | 7,172,045 | | | | | | | 0.3% |
*CACI International, Inc. | | | 144,521 | | | | | | | | 7,243,393 | | | | | | | 0.4% |
*IAC/InterActiveCorp | | | 329,849 | | | | | | | | 9,202,787 | | | | | | | 0.4% |
*Ingram Micro, Inc. | | | 396,212 | | | | | | | | 6,997,104 | | | | | | | 0.3% |
*International Rectifier Corp. | | | 300,671 | | | | | | | | 6,984,587 | | | | | | | 0.3% |
*Tech Data Corp. | | | 261,278 | | | | | | | | 11,232,341 | | | | | | | 0.5% |
Other Securities | | | | | | | | | | | 263,545,511 | | | | | | | 11.6% |
| | | | | | | | | | | | | | | | | | |
Total Information Technology | | | | | | | | | | | 312,377,768 | | | | | | | 13.8% |
| | | | | | | | | | | | | | | | | | |
| | | | | |
Materials — (6.4%) | | | | | | | | | | | | | | | | | | |
#*Century Aluminum Co. | | | 556,132 | | | | | | | | 7,518,905 | | | | | | | 0.3% |
*Coeur d’Alene Mines Corp. | | | 329,341 | | | | | | | | 6,787,718 | | | | | | | 0.3% |
#Domtar Corp. | | | 107,587 | | | | | | | | 8,538,104 | | | | | | | 0.4% |
*MeadWestavco Corp. | | | 376,177 | | | | | | | | 9,679,034 | | | | | | | 0.4% |
Other Securities | | | | | | | | | | | 131,444,297 | | | | | | | 5.8% |
| | | | | | | | | | | | | | | | | | |
Total Materials | | | | | | | | | | | 163,968,058 | | | | | | | 7.2% |
| | | | | | | | | | | | | | | | | | |
| | | | | |
Real Estate Investment Trusts — (0.0%) | | | | | | | | | | | | | | | | | | |
Other Securities | | | | | | | | | | | 1,365 | | | | | | | 0.0% |
| | | | | | | | | | | | | | | | | | |
| | | | | |
Telecommunication Services — (0.9%) | | | | | | | | | | | | | | | | | | |
Other Securities | | | | | | | | | | | 24,205,757 | | | | | | | 1.1% |
| | | | | | | | | | | | | | | | | | |
| | | | | |
Utilities — (0.3%) | | | | | | | | | | | | | | | | | | |
Other Securities | | | | | | | | | | | 8,749,744 | | | | | | | 0.4% |
| | | | | | | | | | | | | | | | | | |
TOTAL COMMON STOCKS | | | | | | | | | | | 2,258,774,547 | | | | | | | 99.4% |
| | | | | | | | | | | | | | | | | | |
RIGHTS/WARRANTS — (0.0%) | | | | | | | | | | | | | | | | | | |
Other Securities | | | | | | | | | | | 24,271 | | | | | | | 0.0% |
| | | | | | | | | | | | | | | | | | |
| | | | | |
TEMPORARY CASH INVESTMENTS — (0.3%) | | | | | | | | | | | | | | | | | | |
BlackRock Liquidity Funds Tempcash Portfolio - Institutional
Shares | | | 8,755,190 | | | | | | | | 8,755,190 | | | | | | | 0.4% |
| | | | | | | | | | | | | | | | | | |
| | | | | |
| | | Shares/ Face Amount | | | | | | | | | | | | |
| | | (000) | | | | | | | | | | | | |
SECURITIES LENDING COLLATERAL — (12.1%) | | | | | | | | | | | | | | | | | | |
§@DFA Short Term Investment Fund | | | 309,281,722 | | | | | | | | 309,281,722 | | | | | | | 13.6% |
@Repurchase Agreement, Deutsche Bank Securities, Inc. 0.23%,
11/01/10 (Collateralized by $1,449,407 FNMA 3.500%,
10/01/20, valued at $1,516,373) to be repurchased at
$1,472,234 | | | $1,472 | | | | | | | | 1,472,206 | | | | | | | 0.1% |
| | | | | | | | | | | | | | | | | | |
TOTAL SECURITIES LENDING COLLATERAL | | | | | | | | | | | 310,753,928 | | | | | | | 13.7% |
| | | | | | | | | | | | | | | | | | |
38
U.S. TARGETED VALUE PORTFOLIO
CONTINUED
| | | | | | | | | | | | | | | | | | |
| | | | | | | | | Value† | | | | | | Percentage
of Net Assets** |
TOTAL INVESTMENTS — (100.0%)
(Cost $2,378,682,378) | | | | | | | | | | $ | 2,578,307,936 | | | | | | | 113.5% |
| | | | | | | | | | | | | | | | | | |
Summary of inputs used to value the Portfolio’s investments as of October 31, 2010 is as follows (See Security Valuation Note):
| | | | | | | | | | | | | | | | | | | | | | | | |
| | | Valuation Inputs | |
| |
| | | Investment in Securities (Market Value) | |
| | | Level 1 | | | Level 2 | | | Level 3 | | | Total | |
Common Stocks | | | | | | | | | | | | | | | | | | | | | | | | |
Consumer Discretionary | | $ | 380,135,820 | | | | — | | | | | | | | — | | | | | | | $ | 380,135,820 | |
Consumer Staples | | | 85,475,341 | | | | — | | | | | | | | — | | | | | | | | 85,475,341 | |
Energy | | | 212,029,708 | | | | — | | | | | | | | — | | | | | | | | 212,029,708 | |
Financials | | | 550,540,900 | | | | — | | | | | | | | — | | | | | | | | 550,540,900 | |
Health Care | | | 164,489,690 | | | | — | | | | | | | | — | | | | | | | | 164,489,690 | |
Industrials | | | 356,800,396 | | | | — | | | | | | | | — | | | | | | | | 356,800,396 | |
Information Technology | | | 312,377,768 | | | | — | | | | | | | | — | | | | | | | | 312,377,768 | |
Materials | | | 163,968,058 | | | | — | | | | | | | | — | | | | | | | | 163,968,058 | |
Real Estate Investment Trusts | | | 1,365 | | | | — | | | | | | | | — | | | | | | | | 1,365 | |
Telecommunication Services | | | 24,205,757 | | | | — | | | | | | | | — | | | | | | | | 24,205,757 | |
Utilities | | | 8,749,744 | | | | — | | | | | | | | — | | | | | | | | 8,749,744 | |
Rights/Warrants | | | 3,280 | | | $ | 20,991 | | | | | | | | — | | | | | | | | 24,271 | |
Temporary Cash Investments | | | 8,755,190 | | | | — | | | | | | | | — | | | | | | | | 8,755,190 | |
Securities Lending Collateral | | | — | | | | 310,753,928 | | | | | | | | — | | | | | | | | 310,753,928 | |
| | | | | | | | | | | | | | | | | | | | | | | | |
| | | | | | |
TOTAL | | $ | 2,267,533,017 | | | $ | 310,774,919 | | | | | | | | — | | | | | | | $ | 2,578,307,936 | |
| | | | | | | | | | | | | | | | | | | | | | | | |
See accompanying Notes to Financial Statements.
39
U.S. SMALL CAP VALUE PORTFOLIO
SUMMARY SCHEDULE OF PORTFOLIO HOLDINGS
October 31, 2010
| | | | | | | | | | | | | | | | | | |
| | | Shares | | | | | | Value† | | | Percentage
of Net Assets** |
COMMON STOCKS — (83.3%) | | | | | | | | | | | | | | | | | | |
Consumer Discretionary — (15.1%) | | | | | | | | | | | | | | | | | | |
#American Greetings Corp. Class A | | | 1,790,470 | | | | | | | $ | 34,681,404 | | | | | | | 0.5% |
#*Cabela’s, Inc. | | | 1,668,902 | | | | | | | | 30,941,443 | | | | | | | 0.5% |
#Dillard’s, Inc. | | | 1,637,833 | | | | | | | | 41,781,120 | | | | | | | 0.6% |
#*Gaylord Entertainment Co. | | | 1,237,351 | | | | | | | | 41,253,282 | | | | | | | 0.6% |
#Regis Corp. | | | 1,509,892 | | | | | | | | 30,877,291 | | | | | | | 0.5% |
#Rent-A-Center, Inc. | | | 1,421,975 | | | | | | | | 35,748,452 | | | | | | | 0.6% |
#*Saks, Inc. | | | 3,665,122 | | | | | | | | 40,829,459 | | | | | | | 0.6% |
#Scholastic Corp. | | | 1,528,917 | | | | | | | | 45,026,606 | | | | | | | 0.7% |
Other Securities | | | | | | | | | | | 883,267,605 | | | | | | | 13.5% |
| | | | | | | | | | | | | | | | | | |
Total Consumer Discretionary | | | | | | | | | | | 1,184,406,662 | | | | | | | 18.1% |
| | | | | | | | | | | | | | | | | | |
| | | | | |
Consumer Staples — (2.3%) | | | | | | | | | | | | | | | | | | |
#*Hain Celestial Group, Inc. | | | 1,311,686 | | | | | | | | 32,437,995 | | | | | | | 0.5% |
Other Securities | | | | | | | | | | | 150,451,307 | | | | | | | 2.3% |
| | | | | | | | | | | | | | | | | | |
Total Consumer Staples | | | | | | | | | | | 182,889,302 | | | | | | | 2.8% |
| | | | | | | | | | | | | | | | | | |
| | | | | |
Energy — (7.9%) | | | | | | | | | | | | | | | | | | |
#*Bill Barrett Corp. | | | 771,988 | | | | | | | | 29,142,547 | | | | | | | 0.4% |
*Bristow Group, Inc. | | | 988,619 | | | | | | | | 38,338,645 | | | | | | | 0.6% |
*Complete Production Services, Inc. | | | 1,866,574 | | | | | | | | 43,733,829 | | | | | | | 0.7% |
#*Exterran Holdings, Inc. | | | 1,695,768 | | | | | | | | 42,682,481 | | | | | | | 0.6% |
#*Helix Energy Solutions Group, Inc. | | | 2,356,839 | | | | | | | | 29,908,287 | | | | | | | 0.5% |
*SEACOR Holdings, Inc. | | | 362,962 | | | | | | | | 34,390,650 | | | | | | | 0.5% |
Other Securities | | | | | | | | | | | 399,425,547 | | | | | | | 6.1% |
| | | | | | | | | | | | | | | | | | |
Total Energy | | | | | | | | | | | 617,621,986 | | | | | | | 9.4% |
| | | | | | | | | | | | | | | | | | |
| | | | | |
Financials — (18.7%) | | | | | | | | | | | | | | | | | | |
#*American Capital, Ltd. | | | 5,159,435 | | | | | | | | 36,012,856 | | | | | | | 0.5% |
#Argo Group International Holdings, Ltd. | | | 904,866 | | | | | | | | 31,389,802 | | | | | | | 0.5% |
#*CNO Financial Group, Inc. | | | 6,668,947 | | | | | | | | 36,279,072 | | | | | | | 0.6% |
#Delphi Financial Group, Inc. Class A | | | 1,223,115 | | | | | | | | 33,109,723 | | | | | | | 0.5% |
Infinity Property & Casualty Corp. | | | 561,746 | | | | | | | | 29,070,356 | | | | | | | 0.4% |
#*MBIA, Inc. | | | 3,747,338 | | | | | | | | 42,007,659 | | | | | | | 0.6% |
#Montpelier Re Holdings, Ltd. | | | 1,843,926 | | | | | | | | 33,780,724 | | | | | | | 0.5% |
#NewAlliance Bancshares, Inc. | | | 3,319,504 | | | | | | | | 42,788,407 | | | | | | | 0.7% |
#*PHH Corp. | | | 1,726,823 | | | | | | | | 33,275,879 | | | | | | | 0.5% |
Provident Financial Services, Inc. | | | 2,445,306 | | | | | | | | 30,908,668 | | | | | | | 0.5% |
Selective Insurance Group, Inc. | | | 1,870,559 | | | | | | | | 31,649,858 | | | | | | | 0.5% |
Unitrin, Inc. | | | 1,271,106 | | | | | | | | 30,887,876 | | | | | | | 0.5% |
#Webster Financial Corp. | | | 1,883,421 | | | | | | | | 32,244,168 | | | | | | | 0.5% |
Other Securities | | | | | | | | | | | 1,023,500,270 | | | | | | | 15.6% |
| | | | | | | | | | | | | | | | | | |
Total Financials | | | | | | | | | | | 1,466,905,318 | | | | | | | 22.4% |
| | | | | | | | | | | | | | | | | | |
| | | | | |
Health Care — (5.2%) | | | | | | | | | | | | | | | | | | |
#Cooper Cos., Inc. | | | 785,704 | | | | | | | | 38,766,635 | | | | | | | 0.6% |
#*LifePoint Hospitals, Inc. | | | 1,678,385 | | | | | | | | 56,930,819 | | | | | | | 0.9% |
#*Viropharma, Inc. | | | 1,764,650 | | | | | | | | 28,869,674 | | | | | | | 0.4% |
Other Securities | | | | | | | | | | | 282,285,388 | | | | | | | 4.3% |
| | | | | | | | | | | | | | | | | | |
Total Health Care | | | | | | | | | | | 406,852,516 | | | | | | | 6.2% |
| | | | | | | | | | | | | | | | | | |
| | | | | |
Industrials — (15.9%) | | | | | | | | | | | | | | | | | | |
#*Alaska Air Group, Inc. | | | 578,278 | | | | | | | | 30,533,078 | | | | | | | 0.5% |
#Alexander & Baldwin, Inc. | | | 1,120,063 | | | | | | | | 38,563,769 | | | | | | | 0.6% |
#Applied Industrial Technologies, Inc. | | | 1,145,140 | | | | | | | | 34,823,707 | | | | | | | 0.5% |
#*Avis Budget Group, Inc. | | | 2,674,250 | | | | | | | | 31,048,042 | | | | | | | 0.5% |
*Esterline Technologies Corp. | | | 1,023,870 | | | | | | | | 61,882,703 | | | | | | | 1.0% |
40
U.S. SMALL CAP VALUE PORTFOLIO
CONTINUED
| | | | | | | | | | | | | | | | | | |
| | | Shares | | | | | | Value† | | | Percentage
of Net Assets** |
Industrials — (Continued) | | | | | | | | | | | | | | | | | | |
#GATX Corp. | | | 1,408,389 | | | | | | | $ | 44,589,596 | | | | | | | 0.7% |
Seaboard Corp. | | | 18,999 | | | | | | | | 35,225,096 | | | | | | | 0.5% |
#Trinity Industries, Inc. | | | 1,827,519 | | | | | | | | 41,539,507 | | | | | | | 0.6% |
#Triumph Group, Inc. | | | 370,549 | | | | | | | | 30,974,191 | | | | | | | 0.5% |
Other Securities | | | | | | | | | | | 893,979,601 | | | | | | | 13.6% |
| | | | | | | | | | | | | | | | | | |
Total Industrials | | | | | | | | | | | 1,243,159,290 | | | | | | | 19.0% |
| | | | | | | | | | | | | | | | | | |
| | | | | |
Information Technology — (12.0%) | | | | | | | | | | | | | | | | | | |
#*Benchmark Electronics, Inc. | | | 2,751,881 | | | | | | | | 45,213,405 | | | | | | | 0.7% |
*Coherent, Inc. | | | 922,025 | | | | | | | | 38,688,169 | | | | | | | 0.6% |
#*Convergys Corp. | | | 2,539,149 | | | | | | | | 28,743,167 | | | | | | | 0.4% |
*Fairchild Semiconductor International, Inc. | | | 3,188,035 | | | | | | | | 35,929,154 | | | | | | | 0.5% |
*MKS Instruments, Inc. | | | 1,795,829 | | | | | | | | 37,083,869 | | | | | | | 0.6% |
*Skyworks Solutions, Inc. | | | 1,385,062 | | | | | | | | 31,731,770 | | | | | | | 0.5% |
#*Vishay Intertechnology, Inc. | | | 3,162,160 | | | | | | | | 35,732,408 | | | | | | | 0.5% |
Other Securities | | | | | | | | | | | 681,581,848 | | | | | | | 10.4% |
| | | | | | | | | | | | | | | | | | |
Total Information Technology | | | | | | | | | | | 934,703,790 | | | | | | | 14.2% |
| | | | | | | | | | | | | | | | | | |
| | | | | |
Materials — (5.9%) | | | | | | | | | | | | | | | | | | |
#*Coeur d’Alene Mines Corp. | | | 1,885,714 | | | | | | | | 38,864,566 | | | | | | | 0.6% |
#*PolyOne Corp. | | | 2,698,136 | | | | | | | | 34,859,917 | | | | | | | 0.5% |
#Westlake Chemical Corp. | | | 1,654,024 | | | | | | | | 52,862,607 | | | | | | | 0.8% |
Other Securities | | | | | | | | | | | 332,640,018 | | | | | | | 5.1% |
| | | | | | | | | | | | | | | | | | |
Total Materials | | | | | | | | | | | 459,227,108 | | | | | | | 7.0% |
| | | | | | | | | | | | | | | | | | |
Other — (0.0%) | | | | | | | | | | | | | | | | | | |
Other Securities | | | | | | | | | | | 6,633 | | | | | | | 0.0% |
| | | | | | | | | | | | | | | | | | |
Real Estate Investment Trusts — (0.0%) | | | | | | | | | | | | | | | | | | |
Other Securities | | | | | | | | | | | 3,209 | | | | | | | 0.0% |
| | | | | | | | | | | | | | | | | | |
Telecommunication Services — (0.2%) | | | | | | | | | | | | | | | | | | |
Other Securities | | | | | | | | | | | 17,633,165 | | | | | | | 0.3% |
| | | | | | | | | | | | | | | | | | |
Utilities — (0.1%) | | | | | | | | | | | | | | | | | | |
Other Securities | | | | | | | | | | | 8,839,028 | | | | | | | 0.1% |
| | | | | | | | | | | | | | | | | | |
TOTAL COMMON STOCKS | | | | | | | | | | | 6,522,248,007 | | | | | | | 99.5% |
| | | | | | | | | | | | | | | | | | |
RIGHTS/WARRANTS — (0.1%) | | | | | | | | | | | | | | | | | | |
Other Securities | | | | | | | | | | | 3,401,796 | | | | | | | 0.0% |
| | | | | | | | | | | | | | | | | | |
| | | | | |
TEMPORARY CASH INVESTMENTS — (0.3%) | | | | | | | | | | | | | | | | | | |
BlackRock Liquidity Funds Tempcash Portfolio - Institutional
Shares | | | 25,558,555 | | | | | | | | 25,558,555 | | | | | | | 0.4% |
| | | | | | | | | | | | | | | | | | |
| | | | | |
| | | Shares/ Face Amount | | | | | | | | | | | | |
| | | (000) | | | | | | | | | | | | |
SECURITIES LENDING COLLATERAL — (16.3%) | | | | | | | | | | | | | | | | | | |
§@DFA Short Term Investment Fund | | | 1,268,888,448 | | | | | | | | 1,268,888,448 | | | | | | | 19.4% |
41
U.S. SMALL CAP VALUE PORTFOLIO
CONTINUED
| | | | | | | | | | | | | | | | | | |
| | | Shares/
Face
Amount | | | | | | Value† | | | | | | Percentage
of Net Assets** |
| | | (000) | | | | | | | | | | | | |
@Repurchase Agreement, Deutsche Bank Securities, Inc. 0.23%,
11/01/10 (Collateralized by $7,611,177 FNMA 3.500%,
10/01/20, valued at $7,962,830) to be repurchased at $7,731,051 | | | $7,731 | | | | | | | $ | 7,730,903 | | | | | | | 0.1% |
| | | | | | | | | | | | | | | | | | |
TOTAL SECURITIES LENDING COLLATERAL | | | | | | | | | | | 1,276,619,351 | | | | | | | 19.5% |
| | | | | | | | | | | | | | | | | | |
| | | | | |
TOTAL INVESTMENTS — (100.0%)
(Cost $7,677,469,004) | | | | | | | | | | $ | 7,827,827,709 | | | | | | | 119.4% |
| | | | | | | | | | | | | | | | | | |
Summary of inputs used to value the Portfolio’s investments as of October 31, 2010 is as follows (See Security Valuation Note):
| | | | | | | | | | | | | | | | | | | | | | | | |
| | | Valuation Inputs | |
| |
| | | Investment in Securities (Market Value) | |
| | | Level 1 | | | Level 2 | | | Level 3 | | | Total | |
Common Stocks | | | | | | | | | | | | | | | | | | | | | | | | |
Consumer Discretionary | | $ | 1,184,406,662 | | | | — | | | | | | | | — | | | | | | | $ | 1,184,406,662 | |
Consumer Staples | | | 182,889,302 | | | | — | | | | | | | | — | | | | | | | | 182,889,302 | |
Energy | | | 617,621,986 | | | | — | | | | | | | | — | | | | | | | | 617,621,986 | |
Financials | | | 1,466,905,318 | | | | — | | | | | | | | — | | | | | | | | 1,466,905,318 | |
Health Care | | | 406,115,618 | | | $ | 736,898 | | | | | | | | — | | | | | | | | 406,852,516 | |
Industrials | | | 1,243,159,290 | | | | — | | | | | | | | — | | | | | | | | 1,243,159,290 | |
Information Technology | | | 934,703,790 | | | | — | | | | | | | | — | | | | | | | | 934,703,790 | |
Materials | | | 459,227,108 | | | | — | | | | | | | | — | | | | | | | | 459,227,108 | |
Other | | | — | | | | 6,633 | | | | | | | | — | | | | | | | | 6,633 | |
Real Estate Investment Trusts | | | 3,209 | | | | — | | | | | | | | — | | | | | | | | 3,209 | |
Telecommunication Services | | | 17,633,165 | | | | — | | | | | | | | — | | | | | | | | 17,633,165 | |
Utilities | | | 8,839,028 | | | | — | | | | | | | | — | | | | | | | | 8,839,028 | |
Rights/Warrants | | | 27,367 | | | | 3,374,429 | | | | | | | | — | | | | | | | | 3,401,796 | |
Temporary Cash Investments | | | 25,558,555 | | | | — | | | | | | | | — | | | | | | | | 25,558,555 | |
Securities Lending Collateral | | | — | | | | 1,276,619,351 | | | | | | | | — | | | | | | | | 1,276,619,351 | |
| | | | | | | | | | | | | | | | | | | | | | | | |
TOTAL | | $ | 6,547,090,398 | | | $ | 1,280,737,311 | | | | | | | | — | | | | | | | $ | 7,827,827,709 | |
| | | | | | | | | | | | | | | | | | | | | | | | |
See accompanying Notes to Financial Statements.
42
U.S. CORE EQUITY 1 PORTFOLIO
SUMMARY SCHEDULE OF PORTFOLIO HOLDINGS
October 31, 2010
| | | | | | | | | | | | | | | | | | |
| | | Shares | | | | | | Value† | | | Percentage
of Net Assets** |
COMMON STOCKS — (90.3%) | | | | | | | | | | | | | | | | | | |
Consumer Discretionary — (12.5%) | | | | | | | | | | | | | | | | | | |
*Amazon.com, Inc. | | | 55,780 | | | | | | | $ | 9,211,509 | | | | | | | 0.3% |
*Comcast Corp. Class A | | | 417,209 | | | | | | | | 8,586,161 | | | | | | | 0.3% |
*DIRECTV Class A | | | 220,510 | | | | | | | | 9,583,365 | | | | | | | 0.3% |
#*Las Vegas Sands Corp. | | | 176,285 | | | | | | | | 8,087,956 | | | | | | | 0.3% |
*McDonald’s Corp. | | | 138,676 | | | | | | | | 10,784,833 | | | | | | | 0.4% |
*Time Warner, Inc. | | | 220,816 | | | | | | | | 7,178,728 | | | | | | | 0.3% |
Walt Disney Co. (The) | | | 356,203 | | | | | | | | 12,862,490 | | | | | | | 0.4% |
Other Securities | | | | | | | | | | | 333,494,859 | | | | | | | 11.5% |
| | | | | | | | | | | | | | | | | | |
Total Consumer Discretionary | | | | | | | | | | | 399,789,901 | | | | | | | 13.8% |
| | | | | | | | | | | | | | | | | | |
| | | | | |
Consumer Staples — (7.6%) | | | | | | | | | | | | | | | | | | |
Coca-Cola Co. (The) | | | 279,300 | | | | | | | | 17,126,676 | | | | | | | 0.6% |
*CVS Caremark Corp. | | | 273,950 | | | | | | | | 8,251,374 | | | | | | | 0.3% |
Kraft Foods, Inc. | | | 328,406 | | | | | | | | 10,597,662 | | | | | | | 0.4% |
*PepsiCo, Inc. | | | 223,192 | | | | | | | | 14,574,438 | | | | | | | 0.5% |
Philip Morris International, Inc. | | | 255,696 | | | | | | | | 14,958,216 | | | | | | | 0.5% |
*Procter & Gamble Co. (The) | | | 373,178 | | | | | | | | 23,722,925 | | | | | | | 0.8% |
*Wal-Mart Stores, Inc. | | | 499,081 | | | | | | | | 27,035,218 | | | | | | | 0.9% |
Other Securities | | | | | | | | | | | 126,341,381 | | | | | | | 4.4% |
| | | | | | | | | | | | | | | | | | |
Total Consumer Staples | | | | | | | | | | | 242,607,890 | | | | | | | 8.4% |
| | | | | | | | | | | | | | | | | | |
| | | | | |
Energy — (8.6%) | | | | | | | | | | | | | | | | | | |
*Apache Corp. | | | 67,655 | | | | | | | | 6,834,508 | | | | | | | 0.3% |
*Chevron Corp. | | | 383,192 | | | | | | | | 31,655,491 | | | | | | | 1.1% |
*ConocoPhillips | | | 284,161 | | | | | | | | 16,879,163 | | | | | | | 0.6% |
*Exxon Mobil Corp. | | | 580,228 | | | | | | | | 38,567,755 | | | | | | | 1.3% |
Occidental Petroleum Corp. | | | 108,874 | | | | | | | | 8,560,763 | | | | | | | 0.3% |
*Schlumberger, Ltd. | | | 204,389 | | | | | | | | 14,284,747 | | | | | | | 0.5% |
Other Securities | | | | | | | | | | | 159,468,862 | | | | | | | 5.5% |
| | | | | | | | | | | | | | | | | | |
Total Energy | | | | | | | | | | | 276,251,289 | | | | | | | 9.6% |
| | | | | | | | | | | | | | | | | | |
| | | | | |
Financials — (14.4%) | | | | | | | | | | | | | | | | | | |
*American Express Co. | | | 170,473 | | | | | | | | 7,067,811 | | | | | | | 0.3% |
*Bank of America Corp. | | | 1,763,982 | | | | | | | | 20,179,954 | | | | | | | 0.7% |
*Berkshire Hathaway, Inc. | | | 103,135 | | | | | | | | 8,205,421 | | | | | | | 0.3% |
*Citigroup, Inc. | | | 3,746,359 | | | | | | | | 15,622,317 | | | | | | | 0.5% |
*Goldman Sachs Group, Inc. (The) | | | 94,871 | | | | | | | | 15,269,487 | | | | | | | 0.5% |
*JPMorgan Chase & Co. | | | 800,949 | | | | | | | | 30,139,711 | | | | | | | 1.0% |
U.S. Bancorp | | | 332,743 | | | | | | | | 8,045,726 | | | | | | | 0.3% |
*Wells Fargo & Co. | | | 948,438 | | | | | | | | 24,735,263 | | | | | | | 0.9% |
Other Securities | | | | | | | | | | | 331,025,321 | | | | | | | 11.4% |
| | | | | | | | | | | | | | | | | | |
Total Financials | | | | | | | | | | | 460,291,011 | | | | | | | 15.9% |
| | | | | | | | | | | | | | | | | | |
| | | | | |
Health Care — (9.7%) | | | | | | | | | | | | | | | | | | |
*Abbott Laboratories | | | 193,928 | | | | | | | | 9,952,385 | | | | | | | 0.3% |
*Amgen, Inc. | | | 134,636 | | | | | | | | 7,699,833 | | | | | | | 0.3% |
*Johnson & Johnson | | | 341,549 | | | | | | | | 21,746,425 | | | | | | | 0.8% |
Merck & Co., Inc. | | | 447,113 | | | | | | | | 16,221,260 | | | | | | | 0.6% |
*Pfizer, Inc. | | | 1,354,471 | | | | | | | | 23,567,795 | | | | | | | 0.8% |
UnitedHealth Group, Inc. | | | 220,401 | | | | | | | | 7,945,456 | | | | | | | 0.3% |
Other Securities | | | | | | | | | | | 224,074,770 | | | | | | | 7.7% |
| | | | | | | | | | | | | | | | | | |
Total Health Care | | | | | | | | | | | 311,207,924 | | | | | | | 10.8% |
| | | | | | | | | | | | | | | | | | |
| | | | | |
Industrials — (11.6%) | | | | | | | | | | | | | | | | | | |
*3M Co. | | | 90,402 | | | | | | | | 7,613,656 | | | | | | | 0.3% |
General Electric Co. | | | 2,071,642 | | | | | | | | 33,187,705 | | | | | | | 1.1% |
43
U.S. CORE EQUITY 1 PORTFOLIO
CONTINUED
| | | | | | | | | | | | | | | | | | |
| | | Shares | | | | | | Value† | | | Percentage
of Net Assets** |
Industrials — (Continued) | | | | | | | | | | | | | | | | | | |
*Union Pacific Corp. | | | 97,021 | | | | | | | $ | 8,506,801 | | | | | | | 0.3% |
*United Parcel Service, Inc. | | | 106,196 | | | | | | | | 7,151,239 | | | | | | | 0.2% |
*United Technologies Corp. | | | 110,065 | | | | | | | | 8,229,560 | | | | | | | 0.3% |
Other Securities | | | | | | | | | | | 306,633,204 | | | | | | | 10.6% |
| | | | | | | | | | | | | | | | | | |
Total Industrials | | | | | | | | | | | 371,322,165 | | | | | | | 12.8% |
| | | | | | | | | | | | | | | | | | |
| | | | | |
Information Technology — (15.4%) | | | | | | | | | | | | | | | | | | |
*Apple, Inc. | | | 115,795 | | | | | | | | 34,839,242 | | | | | | | 1.2% |
*Cisco Sytems, Inc. | | | 718,867 | | | | | | | | 16,411,734 | | | | | | | 0.6% |
*Google, Inc. | | | 30,334 | | | | | | | | 18,594,439 | | | | | | | 0.6% |
Hewlett-Packard Co. | | | 291,252 | | | | | | | | 12,250,059 | | | | | | | 0.4% |
*Intel Corp. | | | 835,086 | | | | | | | | 16,760,176 | | | | | | | 0.6% |
*International Business Machines Corp. | | | 179,066 | | | | | | | | 25,713,878 | | | | | | | 0.9% |
*Microsoft Corp. | | | 1,056,293 | | | | | | | | 28,139,646 | | | | | | | 1.0% |
*Oracle Corp. | | | 595,998 | | | | | | | | 17,522,341 | | | | | | | 0.6% |
*QUALCOMM, Inc. | | | 206,260 | | | | | | | | 9,308,514 | | | | | | | 0.3% |
Other Securities | | | | | | | | | | | 313,542,834 | | | | | | | 10.8% |
| | | | | | | | | | | | | | | | | | |
Total Information Technology | | | | | | | | | | | 493,082,863 | | | | | | | 17.0% |
| | | | | | | | | | | | | | | | | | |
| | | | | |
Materials — (4.6%) | | | | | | | | | | | | | | | | | | |
Other Securities | | | | | | | | | | | 148,561,083 | | | | | | | 5.1% |
| | | | | | | | | | | | | | | | | | |
| | | | | |
Other — (0.0%) | | | | | | | | | | | | | | | | | | |
Other Securities | | | | | | | | | | | — | | | | | | | 0.0% |
| | | | | | | | | | | | | | | | | | |
| | | | | |
Telecommunication Services — (2.6%) | | | | | | | | | | | | | | | | | | |
*AT&T, Inc. | | | 1,184,233 | | | | | | | | 33,750,640 | | | | | | | 1.2% |
*Verizon Communications, Inc. | | | 551,929 | | | | | | | | 17,921,135 | | | | | | | 0.6% |
Other Securities | | | | | | | | | | | 30,177,431 | | | | | | | 1.0% |
| | | | | | | | | | | | | | | | | | |
Total Telecommunication Services | | | | | | | | | | | 81,849,206 | | | | | | | 2.8% |
| | | | | | | | | | | | | | | | | | |
| | | | | |
Utilities — (3.3%) | | | | | | | | | | | | | | | | | | |
Other Securities | | | | | | | | | | | 104,762,133 | | | | | | | 3.6% |
| | | | | | | | | | | | | | | | | | |
TOTAL COMMON STOCKS | | | | | | | | | | | 2,889,725,465 | | | | | | | 99.8% |
| | | | | | | | | | | | | | | | | | |
RIGHTS/WARRANTS — (0.0%) | | | | | | | | | | | | | | | | | | |
Other Securities | | | | | | | | | | | 117,771 | | | | | | | 0.0% |
| | | | | | | | | | | | | | | | | | |
| | | | | |
TEMPORARY CASH INVESTMENTS — (0.4%) | | | | | | | | | | | | | | | | | | |
BlackRock Liquidity Funds Tempcash Portfolio - Institutional
Shares | | | 12,290,881 | | | | | | | | 12,290,881 | | | | | | | 0.4% |
| | | | | | | | | | | | | | | | | | |
| | | | | |
| | | Shares/
Face
Amount | | | | | | | | | | | | |
| | | (000) | | | | | | | | | | | | |
SECURITIES LENDING COLLATERAL — (9.3%) | | | | | | | | | | | | | | | | | | |
§@DFA Short Term Investment Fund | | | 297,544,923 | | | | | | | | 297,544,923 | | | | | | | 10.3% |
@Repurchase Agreement, Deutsche Bank Securities, Inc. 0.23%,
11/01/10 (Collateralized by $1,394,404 FNMA 3.500%,
10/01/20, valued at $1,458,829) to be repurchased at
$1,416,365 | | | $1,416 | | | | | | | | 1,416,338 | | | | | | | 0.0% |
| | | | | | | | | | | | | | | | | | |
TOTAL SECURITIES LENDING COLLATERAL | | | | | | | | | | | 298,961,261 | | | | | | | 10.3% |
| | | | | | | | | | | | | | | | | | |
TOTAL INVESTMENTS — (100.0%)
(Cost $3,023,843,096) | | | | | | | | | | $ | 3,201,095,378 | | | | | | | 110.5% |
| | | | | | | | | | | | | | | | | | |
44
U.S. CORE EQUITY 1 PORTFOLIO
CONTINUED
Summary of inputs used to value the Portfolio’s investments as of October 31, 2010 is as follows (See Security Valuation Note):
| | | | | | | | | | | | | | | | | | | | | | | | |
| | | Valuation Inputs | |
| |
| | | Investment in Securities (Market Value) | |
| | | Level 1 | | | Level 2 | | | Level 3 | | | Total | |
Common Stocks | | | | | | | | | | | | | | | | | | | | | | | | |
Consumer Discretionary | | $ | 399,789,901 | | | | — | | | | | | | | — | | | | | | | $ | 399,789,901 | |
Consumer Staples | | | 242,607,890 | | | | — | | | | | | | | — | | | | | | | | 242,607,890 | |
Energy | | | 276,251,289 | | | | — | | | | | | | | — | | | | | | | | 276,251,289 | |
Financials | | | 460,291,011 | | | | — | | | | | | | | — | | | | | | | | 460,291,011 | |
Health Care | | | 311,181,347 | | | $ | 26,577 | | | | | | | | — | | | | | | | | 311,207,924 | |
Industrials | | | 371,322,165 | | | | — | | | | | | | | — | | | | | | | | 371,322,165 | |
Information Technology | | | 493,082,863 | | | | — | | | | | | | | — | | | | | | | | 493,082,863 | |
Materials | | | 148,561,083 | | | | — | | | | | | | | — | | | | | | | | 148,561,083 | |
Other | | | — | | | | — | | | | | | | | — | | | | | | | | — | |
Telecommunication Services | | | 81,849,206 | | | | — | | | | | | | | — | | | | | | | | 81,849,206 | |
Utilities | | | 104,762,133 | | | | — | | | | | | | | — | | | | | | | | 104,762,133 | |
Rights/Warrants | | | 77,961 | | | | 39,810 | | | | | | | | — | | | | | | | | 117,771 | |
Temporary Cash Investments | | | 12,290,881 | | | | — | | | | | | | | — | | | | | | | | 12,290,881 | |
Securities Lending Collateral | | | — | | | | 298,961,261 | | | | | | | | — | | | | | | | | 298,961,261 | |
| | | | | | | | | | | | | | | | | | | | | | | | |
TOTAL | | $ | 2,902,067,730 | | | $ | 299,027,648 | | | | | | | | — | | | | | | | $ | 3,201,095,378 | |
| | | | | | | | | | | | | | | | | | | | | | | | |
See accompanying Notes to Financial Statements.
45
U.S. CORE EQUITY 2 PORTFOLIO
SUMMARY SCHEDULE OF PORTFOLIO HOLDINGS
October 31, 2010
| | | | | | | | | | | | | | | | | | |
| | | Shares | | | | | | Value† | | | Percentage
of Net Assets** |
COMMON STOCKS — (89.6%) | | | | | | | | | | | | | | | | | | |
Consumer Discretionary — (13.3%) | | | | | | | | | | | | | | | | | | |
*Carnival Corp. | | | 264,200 | | | | | | | $ | 11,405,514 | | | | | | | 0.2% |
*Comcast Corp. Class A | | | 904,003 | | | | | | | | 18,604,382 | | | | | | | 0.4% |
#*Las Vegas Sands Corp. | | | 255,567 | | | | | | | | 11,725,414 | | | | | | | 0.2% |
*Lowe’s Cos., Inc. | | | 606,612 | | | | | | | | 12,939,034 | | | | | | | 0.3% |
*Time Warner, Inc. | | | 505,637 | | | | | | | | 16,438,259 | | | | | | | 0.3% |
Walt Disney Co. (The) | | | 796,924 | | | | | | | | 28,776,926 | | | | | | | 0.6% |
Other Securities | | | | | | | | | | | 639,482,590 | | | | | | | 12.8% |
| | | | | | | | | | | | | | | | | | |
Total Consumer Discretionary | | | | | | | | | | | 739,372,119 | | | | | | | 14.8% |
| | | | | | | | | | | | | | | | | | |
| | | | | |
Consumer Staples — (6.1%) | | | | | | | | | | | | | | | | | | |
*CVS Caremark Corp. | | | 598,385 | | | | | | | | 18,023,356 | | | | | | | 0.3% |
Kraft Foods, Inc. | | | 727,689 | | | | | | | | 23,482,524 | | | | | | | 0.5% |
*PepsiCo, Inc. | | | 187,890 | | | | | | | | 12,269,217 | | | | | | | 0.2% |
*Procter & Gamble Co. (The) | | | 601,231 | | | | | | | | 38,220,255 | | | | | | | 0.8% |
*Wal-Mart Stores, Inc. | | | 488,942 | | | | | | | | 26,485,988 | | | | | | | 0.5% |
Other Securities | | | | | | | | | | | 218,107,947 | | | | | | | 4.4% |
| | | | | | | | | | | | | | | | | | |
Total Consumer Staples | | | | | | | | | | | 336,589,287 | | | | | | | 6.7% |
| | | | | | | | | | | | | | | | | | |
| | | | | |
Energy — (9.0%) | | | | | | | | | | | | | | | | | | |
*Anadarko Petroleum Corp. | | | 217,215 | | | | | | | | 13,373,928 | | | | | | | 0.3% |
*Apache Corp. | | | 148,901 | | | | | | | | 15,041,979 | | | | | | | 0.3% |
*Chevron Corp. | | | 812,565 | | | | | | | | 67,125,995 | | | | | | | 1.4% |
*ConocoPhillips | | | 621,821 | | | | | | | | 36,936,167 | | | | | | | 0.7% |
Devon Energy Corp. | | | 175,348 | | | | | | | | 11,401,127 | | | | | | | 0.2% |
*Exxon Mobil Corp. | | | 696,027 | | | | | | | | 46,264,915 | | | | | | | 0.9% |
Occidental Petroleum Corp. | | | 169,128 | | | | | | | | 13,298,535 | | | | | | | 0.3% |
*Schlumberger, Ltd. | | | 239,531 | | | | | | | | 16,740,822 | | | | | | | 0.3% |
Other Securities | | | | | | | | | | | 280,941,549 | | | | | | | 5.6% |
| | | | | | | | | | | | | | | | | | |
Total Energy | | | | | | | | | | | 501,125,017 | | | | | | | 10.0% |
| | | | | | | | | | | | | | | | | | |
| | | | | |
Financials — (16.9%) | | | | | | | | | | | | | | | | | | |
*Bank of America Corp. | | | 4,072,969 | | | | | | | | 46,594,765 | | | | | | | 0.9% |
*Bank of New York Mellon Corp. (The) | | | 500,557 | | | | | | | | 12,543,958 | | | | | | | 0.3% |
*Citigroup, Inc. | | | 4,374,919 | | | | | | | | 18,243,412 | | | | | | | 0.4% |
*Goldman Sachs Group, Inc. (The) | | | 206,417 | | | | | | | | 33,222,816 | | | | | | | 0.7% |
*JPMorgan Chase & Co. | | | 1,758,487 | | | | | | | | 66,171,866 | | | | | | | 1.3% |
*MetLife, Inc. | | | 377,097 | | | | | | | | 15,208,322 | | | | | | | 0.3% |
*Morgan Stanley | | | 560,059 | | | | | | | | 13,928,667 | | | | | | | 0.3% |
*PNC Financial Services Group, Inc. | | | 230,384 | | | | | | | | 12,417,698 | | | | | | | 0.2% |
Travelers Cos., Inc. (The) | | | 240,418 | | | | | | | | 13,271,074 | | | | | | | 0.3% |
U.S. Bancorp | | | 650,207 | | | | | | | | 15,722,005 | | | | | | | 0.3% |
*Wells Fargo & Co. | | | 2,251,097 | | | | | | | | 58,708,610 | | | | | | | 1.2% |
Other Securities | | | | | | | | | | | 630,477,892 | | | | | | | 12.6% |
| | | | | | | | | | | | | | | | | | |
Total Financials | | | | | | | | | | | 936,511,085 | | | | | | | 18.8% |
| | | | | | | | | | | | | | | | | | |
| | | | | |
Health Care — (8.9%) | | | | | | | | | | | | | | | | | | |
*Johnson & Johnson | | | 312,579 | | | | | | | | 19,901,905 | | | | | | | 0.4% |
Merck & Co., Inc. | | | 518,887 | | | | | | | | 18,825,220 | | | | | | | 0.4% |
*Pfizer, Inc. | | | 2,383,245 | | | | | | | | 41,468,463 | | | | | | | 0.8% |
UnitedHealth Group, Inc. | | | 491,713 | | | | | | | | 17,726,254 | | | | | | | 0.3% |
*WellPoint, Inc. | | | 211,328 | | | | | | | | 11,483,564 | | | | | | | 0.2% |
Other Securities | | | | | | | | | | | 387,121,797 | | | | | | | 7.8% |
| | | | | | | | | | | | | | | | | | |
Total Health Care | | | | | | | | | | | 496,527,203 | | | | | | | 9.9% |
| | | | | | | | | | | | | | | | | | |
| | | | | |
Industrials — (12.5%) | | | | | | | | | | | | | | | | | | |
FedEx Corp. | | | 133,279 | | | | | | | | 11,691,234 | | | | | | | 0.3% |
46
U.S. CORE EQUITY 2 PORTFOLIO
CONTINUED
| | | | | | | | | | | | | | | | | | |
| | | Shares | | | | | | Value† | | | Percentage
of Net Assets** |
Industrials — (Continued) | | | | | | | | | | | | | | | | | | |
General Electric Co. | | | 4,451,556 | | | | | | | $ | 71,313,927 | | | | | | | 1.4% |
*Union Pacific Corp. | | | 215,752 | | | | | | | | 18,917,135 | | | | | | | 0.4% |
Other Securities | | | | | | | | | | | 590,031,866 | | | | | | | 11.8% |
| | | | | | | | | | | | | | | | | | |
Total Industrials | | | | | | | | | | | 691,954,162 | | | | | | | 13.9% |
| | | | | | | | | | | | | | | | | | |
| | | | | |
Information Technology — (13.0%) | | | | | | | | | | | | | | | | | | |
*Apple, Inc. | | | 73,982 | | | | | | | | 22,258,964 | | | | | | | 0.4% |
*Cisco Sytems, Inc. | | | 644,418 | | | | | | | | 14,712,063 | | | | | | | 0.3% |
*Corning, Inc. | | | 657,240 | | | | | | | | 12,014,347 | | | | | | | 0.2% |
*Google, Inc. | | | 21,286 | | | | | | | | 13,048,105 | | | | | | | 0.3% |
Hewlett-Packard Co. | | | 462,271 | | | | | | | | 19,443,118 | | | | | | | 0.4% |
*Intel Corp. | | | 1,078,333 | | | | | | | | 21,642,143 | | | | | | | 0.4% |
*International Business Machines Corp. | | | 92,663 | | | | | | | | 13,306,407 | | | | | | | 0.3% |
*Microsoft Corp. | | | 730,054 | | | | | | | | 19,448,639 | | | | | | | 0.4% |
*Oracle Corp. | | | 457,669 | | | | | | | | 13,455,469 | | | | | | | 0.3% |
Other Securities | | | | | | | | | | | 574,882,008 | | | | | | | 11.5% |
| | | | | | | | | | | | | | | | | | |
Total Information Technology | | | | | | | | | | | 724,211,263 | | | | | | | 14.5% |
| | | | | | | | | | | | | | | | | | |
| | | | | |
Materials — (4.8%) | | | | | | | | | | | | | | | | | | |
Dow Chemical Co. (The) | | | 440,886 | | | | | | | | 13,592,515 | | | | | | | 0.3% |
Other Securities | | | | | | | | | | | 253,873,693 | | | | | | | 5.1% |
| | | | | | | | | | | | | | | | | | |
Total Materials | | | | | | | | | | | 267,466,208 | | | | | | | 5.4% |
| | | | | | | | | | | | | | | | | | |
| | | | | |
Other — (0.0%) | | | | | | | | | | | | | | | | | | |
Other Securities | | | | | | | | | | | — | | | | | | | 0.0% |
| | | | | | | | | | | | | | | | | | |
| | | | | |
Telecommunication Services — (2.9%) | | | | | | | | | | | | | | | | | | |
*AT&T, Inc. | | | 2,480,137 | | | | | | | | 70,683,904 | | | | | | | 1.4% |
*Verizon Communications, Inc. | | | 1,203,470 | | | | | | | | 39,076,671 | | | | | | | 0.8% |
Other Securities | | | | | | | | | | | 50,508,774 | | | | | | | 1.0% |
| | | | | | | | | | | | | | | | | | |
Total Telecommunication Services | | | | | | | | | | | 160,269,349 | | | | | | | 3.2% |
| | | | | | | | | | | | | | | | | | |
| | | | | |
Utilities — (2.2%) | | | | | | | | | | | | | | | | | | |
Other Securities | | | | | | | | | | | 123,441,800 | | | | | | | 2.5% |
| | | | | | | | | | | | | | | | | | |
TOTAL COMMON STOCKS | | | | | | | | | | | 4,977,467,493 | | | | | | | 99.7% |
| | | | | | | | | | | | | | | | | | |
RIGHTS/WARRANTS — (0.0%) | | | | | | | | | | | | | | | | | | |
Other Securities | | | | | | | | | | | 286,332 | | | | | | | 0.0% |
| | | | | | | | | | | | | | | | | | |
| | | | | |
TEMPORARY CASH INVESTMENTS — (0.4%) | | | | | | | | | | | | | | | | | | |
BlackRock Liquidity Funds Tempcash Portfolio - Institutional
Shares | | | 22,248,086 | | | | | | | | 22,248,086 | | | | | | | 0.5% |
| | | | | | | | | | | | | | | | | | |
| | | | | |
| | | Shares/ Face Amount | | | | | | | | | | | | |
| | | (000) | | | | | | | | | | | | |
SECURITIES LENDING COLLATERAL — (10.0%) | | | | | | | | | | | | | | | | | | |
§@DFA Short Term Investment Fund | | | 555,577,546 | | | | | | | | 555,577,546 | | | | | | | 11.1% |
@Repurchase Agreement, Deutsche Bank Securities, Inc. 0.23%,
11/01/10 (Collateralized by $2,603,638 FNMA 3.500%,
10/01/20, valued at $2,723,932) to be repurchased at
$2,644,645 | | | $2,645 | | | | | | | | 2,644,594 | | | | | | | 0.1% |
| | | | | | | | | | | | | | | | | | |
TOTAL SECURITIES LENDING COLLATERAL | | | | | | | | | | | 558,222,140 | | | | | | | 11.2% |
| | | | | | | | | | | | | | | | | | |
47
U.S. CORE EQUITY 2 PORTFOLIO
CONTINUED
| | | | | | | | | | | | | | | | | | |
| | | | | | | | | Value† | | | | | | Percentage
of Net Assets** |
TOTAL INVESTMENTS — (100.0%)
(Cost $5,452,268,054) | | | | | | | | | | $ | 5,558,224,051 | | | | | | | 111.4% |
| | | | | | | | | | | | | | | | | | |
Summary of inputs used to value the Portfolio’s investments as of October 31, 2010 is as follows (See Security Valuation Note):
| | | | | | | | | | | | | | | | | | | | | | | | |
| | | Valuation Inputs | |
| |
| | | Investment in Securities (Market Value) | |
| | | Level 1 | | | Level 2 | | | Level 3 | | | Total | |
Common Stocks | | | | | | | | | | | | | | | | | | | | | | | | |
Consumer Discretionary | | $ | 739,372,119 | | | | — | | | | | | | | — | | | | | | | $ | 739,372,119 | |
Consumer Staples | | | 336,589,287 | | | | — | | | | | | | | — | | | | | | | | 336,589,287 | |
Energy | | | 501,125,017 | | | | — | | | | | | | | — | | | | | | | | 501,125,017 | |
Financials | | | 936,511,085 | | | | — | | | | | | | | — | | | | | | | | 936,511,085 | |
Health Care | | | 496,455,584 | | | $ | 71,619 | | | | | | | | — | | | | | | | | 496,527,203 | |
Industrials | | | 691,954,162 | | | | — | | | | | | | | — | | | | | | | | 691,954,162 | |
Information Technology | | | 724,211,263 | | | | — | | | | | | | | — | | | | | | | | 724,211,263 | |
Materials | | | 267,466,208 | | | | — | | | | | | | | — | | | | | | | | 267,466,208 | |
Other | | | — | | | | — | | | | | | | | — | | | | | | | | — | |
Telecommunication Services | | | 160,269,349 | | | | — | | | | | | | | — | | | | | | | | 160,269,349 | |
Utilities | | | 123,441,800 | | | | — | | | | | | | | — | | | | | | | | 123,441,800 | |
Rights/Warrants | | | 93,586 | | | | 192,746 | | | | | | | | — | | | | | | | | 286,332 | |
Temporary Cash Investments | | | 22,248,086 | | | | — | | | | | | | | — | | | | | | | | 22,248,086 | |
Securities Lending Collateral | | | — | | | | 558,222,140 | | | | | | | | — | | | | | | | | 558,222,140 | |
| | | | | | | | | | | | | | | | | | | | | | | | |
TOTAL | | $ | 4,999,737,546 | | | $ | 558,486,505 | | | | | | | | — | | | | | | | $ | 5,558,224,051 | |
| | | | | | | | | | | | | | | | | | | | | | | | |
See accompanying Notes to Financial Statements.
48
U.S. VECTOR EQUITY PORTFOLIO
SUMMARY SCHEDULE OF PORTFOLIO HOLDINGS
October 31, 2010
| | | | | | | | | | | | | | | | | | |
| | | Shares | | | | | | Value† | | | Percentage
of Net Assets** |
COMMON STOCKS — (88.9%) | | | | | | | | | | | | | | | | | | |
Consumer Discretionary — (13.9%) | | | | | | | | | | | | | | | | | | |
CBS Corp. Class B | | | 210,809 | | | | | | | $ | 3,568,996 | | | | | | | 0.2% |
*Comcast Corp. Class A | | | 298,194 | | | | | | | | 6,136,833 | | | | | | | 0.4% |
*Liberty Media Corp. Capital Class A | | | 92,738 | | | | | | | | 5,336,145 | | | | | | | 0.3% |
*Liberty Media Corp. Interactive Class A | | | 272,051 | | | | | | | | 4,015,473 | | | | | | | 0.3% |
#*Royal Caribbean Cruises, Ltd. | | | 98,862 | | | | | | | | 3,909,003 | | | | | | | 0.3% |
*Time Warner Cable, Inc. | | | 58,725 | | | | | | | | 3,398,416 | | | | | | | 0.2% |
*Time Warner, Inc. | | | 198,927 | | | | | | | | 6,467,117 | | | | | | | 0.4% |
*TRW Automotive Holdings Corp. | | | 67,909 | | | | | | | | 3,102,762 | | | | | | | 0.2% |
Walt Disney Co. (The) | | | 123,724 | | | | | | | | 4,467,674 | | | | | | | 0.3% |
Other Securities | | | | | | | | | | | 202,995,940 | | | | | | | 13.0% |
| | | | | | | | | | | | | | | | | | |
Total Consumer Discretionary | | | | | | | | | | | 243,398,359 | | | | | | | 15.6% |
| | | | | | | | | | | | | | | | | | |
| | | | | |
Consumer Staples — (4.4%) | | | | | | | | | | | | | | | | | | |
*CVS Caremark Corp. | | | 122,606 | | | | | | | | 3,692,893 | | | | | | | 0.2% |
Kraft Foods, Inc. | | | 126,206 | | | | | | | | 4,072,668 | | | | | | | 0.3% |
*Procter & Gamble Co. (The) | | | 88,050 | | | | | | | | 5,597,338 | | | | | | | 0.4% |
Other Securities | | | | | | | | | | | 62,874,305 | | | | | | | 4.0% |
| | | | | | | | | | | | | | | | | | |
Total Consumer Staples | | | | | | | | | | | 76,237,204 | | | | | | | 4.9% |
| | | | | | | | | | | | | | | | | | |
| | | | | |
Energy — (8.8%) | | | | | | | | | | | | | | | | | | |
*Anadarko Petroleum Corp. | | | 62,467 | | | | | | | | 3,846,093 | | | | | | | 0.2% |
*Chevron Corp. | | | 90,436 | | | | | | | | 7,470,918 | | | | | | | 0.5% |
*ConocoPhillips | | | 197,546 | | | | | | | | 11,734,232 | | | | | | | 0.8% |
*Exxon Mobil Corp. | | | 160,805 | | | | | | | | 10,688,708 | | | | | | | 0.7% |
*Marathon Oil Corp. | | | 94,908 | | | | | | | | 3,375,878 | | | | | | | 0.2% |
Pioneer Natural Resources Co. | | | 54,700 | | | | | | | | 3,818,060 | | | | | | | 0.2% |
Other Securities | | | | | | | | | | | 112,156,169 | | | | | | | 7.2% |
| | | | | | | | | | | | | | | | | | |
Total Energy | | | | | | | | | | | 153,090,058 | | | | | | | 9.8% |
| | | | | | | | | | | | | | | | | | |
| | | | | |
Financials — (21.5%) | | | | | | | | | | | | | | | | | | |
American Financial Group, Inc. | | | 129,237 | | | | | | | | 3,952,067 | | | | | | | 0.3% |
*Bank of America Corp. | | | 1,228,804 | | | | | | | | 14,057,518 | | | | | | | 0.9% |
*Bank of New York Mellon Corp. (The) | | | 140,071 | | | | | | | | 3,510,179 | | | | | | | 0.2% |
*Citigroup, Inc. | | | 1,106,727 | | | | | | | | 4,615,052 | | | | | | | 0.3% |
#*CNA Financial Corp. | | | 129,608 | | | | | | | | 3,592,734 | | | | | | | 0.2% |
Fifth Third Bancorp | | | 366,564 | | | | | | | | 4,604,044 | | | | | | | 0.3% |
*Goldman Sachs Group, Inc. (The) | | | 33,688 | | | | | | | | 5,422,084 | | | | | | | 0.4% |
*JPMorgan Chase & Co. | | | 539,281 | | | | | | | | 20,293,144 | | | | | | | 1.3% |
*KeyCorp | | | 405,203 | | | | | | | | 3,318,613 | | | | | | | 0.2% |
*Lincoln National Corp. | | | 151,070 | | | | | | | | 3,698,194 | | | | | | | 0.2% |
#*M&T Bank Corp. | | | 50,301 | | | | | | | | 3,760,000 | | | | | | | 0.2% |
*MetLife, Inc. | | | 106,708 | | | | | | | | 4,303,534 | | | | | | | 0.3% |
*Morgan Stanley | | | 152,390 | | | | | | | | 3,789,939 | | | | | | | 0.3% |
NYSE Euronext, Inc. | | | 116,858 | | | | | | | | 3,580,529 | | | | | | | 0.2% |
#*Principal Financial Group, Inc. | | | 146,833 | | | | | | | | 3,940,998 | | | | | | | 0.3% |
Regions Financial Corp. | | | 574,455 | | | | | | | | 3,619,066 | | | | | | | 0.2% |
Travelers Cos., Inc. (The) | | | 73,100 | | | | | | | | 4,035,120 | | | | | | | 0.3% |
*Unum Group | | | 203,475 | | | | | | | | 4,561,910 | | | | | | | 0.3% |
*Wells Fargo & Co. | | | 359,913 | | | | | | | | 9,386,531 | | | | | | | 0.6% |
Other Securities | | | | | | | | | | | 268,550,262 | | | | | | | 17.2% |
| | | | | | | | | | | | | | | | | | |
Total Financials | | | | | | | | | | | 376,591,518 | | | | | | | 24.2% |
| | | | | | | | | | | | | | | | | | |
| | | | | |
Health Care — (7.5%) | | | | | | | | | | | | | | | | | | |
*King Pharmaceuticals, Inc. | | | 239,100 | | | | | | | | 3,380,874 | | | | | | | 0.2% |
*Pfizer, Inc. | | | 368,206 | | | | | | | | 6,406,784 | | | | | | | 0.4% |
*WellPoint, Inc. | | | 62,400 | | | | | | | | 3,390,816 | | | | | | | 0.2% |
49
U.S. VECTOR EQUITY PORTFOLIO
CONTINUED
| | | | | | | | | | | | | | | | | | |
| | | Shares | | | | | | Value† | | | Percentage
of Net Assets** |
Health Care — (Continued) | | | | | | | | | | | | | | | | | | |
Other Securities | | | | | | | | | | $ | 117,901,388 | | | | | | | 7.6% |
| | | | | | | | | | | | | | | | | | |
Total Health Care | | | | | | | | | | | 131,079,862 | | | | | | | 8.4% |
| | | | | | | | | | | | | | | | | | |
| | | | | |
Industrials — (12.4%) | | | | | | | | | | | | | | | | | | |
General Electric Co. | | | 601,020 | | | | | | | | 9,628,340 | | | | | | | 0.6% |
Timken Co. | | | 88,398 | | | | | | | | 3,661,445 | | | | | | | 0.3% |
*Union Pacific Corp. | | | 38,880 | | | | | | | | 3,408,998 | | | | | | | 0.2% |
Other Securities | | | | | | | | | | | 199,891,678 | | | | | | | 12.8% |
| | | | | | | | | | | | | | | | | | |
Total Industrials | | | | | | | | | | | 216,590,461 | | | | | | | 13.9% |
| | | | | | | | | | | | | | | | | | |
| | | | | |
Information Technology — (11.8%) | | | | | | | | | | | | | | | | | | |
*IAC/InterActiveCorp. | | | 143,788 | | | | | | | | 4,011,685 | | | | | | | 0.3% |
*Intel Corp. | | | 176,424 | | | | | | | | 3,540,830 | | | | | | | 0.2% |
*Sandisk Corp. | | | 90,011 | | | | | | | | 3,382,613 | | | | | | | 0.2% |
Other Securities | | | | | | | | | | | 194,533,354 | | | | | | | 12.5% |
| | | | | | | | | | | | | | | | | | |
Total Information Technology | | | | | | | | | | | 205,468,482 | | | | | | | 13.2% |
| | | | | | | | | | | | | | | | | | |
| | | | | |
Materials — (5.1%) | | | | | | | | | | | | | | | | | | |
*International Paper Co. | | | 129,026 | | | | | | | | 3,261,777 | | | | | | | 0.2% |
*MeadWestavco Corp. | | | 151,161 | | | | | | | | 3,889,373 | | | | | | | 0.2% |
Other Securities | | | | | | | | | | | 82,127,578 | | | | | | | 5.3% |
| | | | | | | | | | | | | | | | | | |
Total Materials | | | | | | | | | | | 89,278,728 | | | | | | | 5.7% |
| | | | | | | | | | | | | | | | | | |
| | | | | |
Other — (0.0%) | | | | | | | | | | | | | | | | | | |
Other Securities | | | | | | | | | | | — | | | | | | | 0.0% |
| | | | | | | | | | | | | | | | | | |
Telecommunication Services — (2.2%) | | | | | | | | | | | | | | | | | | |
*AT&T, Inc. | | | 631,080 | | | | | | | | 17,985,780 | | | | | | | 1.1% |
*Verizon Communications, Inc. | | | 194,288 | | | | | | | | 6,308,531 | | | | | | | 0.4% |
Other Securities | | | | | | | | | | | 15,124,874 | | | | | | | 1.0% |
| | | | | | | | | | | | | | | | | | |
Total Telecommunication Services | | | | | | | | | | | 39,419,185 | | | | | | | 2.5% |
| | | | | | | | | | | | | | | | | | |
| | | | | |
Utilities — (1.3%) | | | | | | | | | | | | | | | | | | |
Other Securities | | | | | | | | | | | 22,328,035 | | | | | | | 1.5% |
| | | | | | | | | | | | | | | | | | |
TOTAL COMMON STOCKS | | | | | | | | | | | 1,553,481,892 | | | | | | | 99.7% |
| | | | | | | | | | | | | | | | | | |
| | | | | |
RIGHTS/WARRANTS — (0.0%) | | | | | | | | | | | | | | | | | | |
Other Securities | | | | | | | | | | | 140,705 | | | | | | | 0.0% |
| | | | | | | | | | | | | | | | | | |
| | | | | |
TEMPORARY CASH INVESTMENTS — (0.3%) | | | | | | | | | | | | | | | | | | |
BlackRock Liquidity Funds Tempcash Portfolio - Institutional
Shares | | | 5,593,179 | | | | | | | | 5,593,179 | | | | | | | 0.3% |
| | | | | | | | | | | | | | | | | | |
| | | Shares/ Face
Amount | | | | | | | | | | | | |
| | | (000) | | | | | | | | | | | | |
SECURITIES LENDING COLLATERAL — (10.8%) | | | | | | | | | | | | | | | | | | |
§@DFA Short Term Investment Fund | | | 187,245,739 | | | | | | | | 187,245,739 | | | | | | | 12.0% |
@Repurchase Agreement, Deutsche Bank Securities, Inc. 0.23%,
11/01/10 (Collateralized by $877,502 FNMA 3.500%, 10/01/20,
valued at $918,045) to be repurchased at $891,322 | | | $891 | | | | | | | | 891,305 | | | | | | | 0.1% |
| | | | | | | | | | | | | | | | | | |
TOTAL SECURITIES LENDING COLLATERAL | | | | | | | | | | | 188,137,044 | | | | | | | 12.1% |
| | | | | | | | | | | | | | | | | | |
| | | | | |
TOTAL INVESTMENTS — (100.0%) | | | | | | | | | | | | | | | | | | |
(Cost $1,718,900,258) | | | | | | | | | | $ | 1,747,352,820 | | | | | | | 112.1% |
| | | | | | | | | | | | | | | | | | |
50
U.S. VECTOR EQUITY PORTFOLIO
CONTINUED
Summary of inputs used to value the Portfolio’s investments as of October 31, 2010 is as follows (See Security Valuation Note):
| | | | | | | | | | | | | | | | | | | | | | | | |
| | | Valuation Inputs | |
| |
| | | Investment in Securities (Market Value) | |
| | | Level 1 | | | Level 2 | | | Level 3 | | | Total | |
Common Stocks | | | | | | | | | | | | | | | | | | | | | | | | |
Consumer Discretionary | | $ | 243,398,359 | | | | — | | | | | | | | — | | | | | | | $ | 243,398,359 | |
Consumer Staples | | | 76,237,204 | | | | — | | | | | | | | — | | | | | | | | 76,237,204 | |
Energy | | | 153,090,058 | | | | — | | | | | | | | — | | | | | | | | 153,090,058 | |
Financials | | | 376,591,518 | | | | — | | | | | | | | — | | | | | | | | 376,591,518 | |
Health Care | | | 131,055,850 | | | $ | 24,012 | | | | | | | | — | | | | | | | | 131,079,862 | |
Industrials | | | 216,590,461 | | | | — | | | | | | | | — | | | | | | | | 216,590,461 | |
Information Technology | | | 205,468,482 | | | | — | | | | | | | | — | | | | | | | | 205,468,482 | |
Materials | | | 89,278,728 | | | | — | | | | | | | | — | | | | | | | | 89,278,728 | |
Other | | | — | | | | — | | | | | | | | — | | | | | | | | — | |
Telecommunication Services | | | 39,419,185 | | | | — | | | | | | | | — | | | | | | | | 39,419,185 | |
Utilities | | | 22,328,035 | | | | — | | | | | | | | — | | | | | | | | 22,328,035 | |
Rights/Warrants | | | 25,439 | | | | 115,266 | | | | | | | | — | | | | | | | | 140,705 | |
Temporary Cash Investments | | | 5,593,179 | | | | — | | | | | | | | — | | | | | | | | 5,593,179 | |
Securities Lending Collateral | | | — | | | | 188,137,044 | | | | | | | | — | | | | | | | | 188,137,044 | |
| | | | | | | | | | | | | | | | | | | | | | | | |
TOTAL | | $ | 1,559,076,498 | | | $ | 188,276,322 | | | | | | | | — | | | | | | | $ | 1,747,352,820 | |
| | | | | | | | | | | | | | | | | | | | | | | | |
See accompanying Notes to Financial Statements.
51
U.S. SMALL CAP PORTFOLIO
SUMMARY SCHEDULE OF PORTFOLIO HOLDINGS
October 31, 2010
| | | | | | | | | | | | | | | | | | |
| | | Shares | | | | | | Value† | | | Percentage
of Net Assets** |
COMMON STOCKS — (79.5%) | | | | | | | | | | | | | | | | | | |
Consumer Discretionary — (13.6%) | | | | | | | | | | | | | | | | | | |
#*Cheesecake Factory, Inc. | | | 184,932 | | | | | | | $ | 5,385,220 | | | | | | | 0.1% |
#*Coinstar, Inc. | | | 104,716 | | | | | | | | 6,029,547 | | | | | | | 0.2% |
*Dana Holding Corp. | | | 407,323 | | | | | | | | 5,763,620 | | | | | | | 0.2% |
*Deckers Outdoor Corp. | | | 107,700 | | | | | | | | 6,257,370 | | | | | | | 0.2% |
#*Gymboree Corp. | | | 85,748 | | | | | | | | 5,578,765 | | | | | | | 0.2% |
#*Pier 1 Imports, Inc. | | | 682,993 | | | | | | | | 5,928,379 | | | | | | | 0.2% |
#Polaris Industries, Inc. | | | 124,600 | | | | | | | | 8,857,814 | | | | | | | 0.3% |
#*Sally Beauty Holdings, Inc. | | | 492,283 | | | | | | | | 5,991,084 | | | | | | | 0.2% |
#*Tenneco, Inc. | | | 167,225 | | | | | | | | 5,454,880 | | | | | | | 0.1% |
*Ulta Salon Cosmetics & Fragrance, Inc. | | | 169,958 | | | | | | | | 5,216,011 | | | | | | | 0.1% |
*WABCO Holdings, Inc. | | | 140,934 | | | | | | | | 6,542,156 | | | | | | | 0.2% |
Other Securities | | | | | | | | | | | 508,486,043 | | | | | | | 15.0% |
| | | | | | | | | | | | | | | | | | |
Total Consumer Discretionary | | | | | | | | | | | 575,490,889 | | | | | | | 17.0% |
| | | | | | | | | | | | | | | | | | |
| | | | | |
Consumer Staples — (2.8%) | | | | | | | | | | | | | | | | | | |
#Casey’s General Stores, Inc. | | | 137,677 | | | | | | | | 5,708,088 | | | | | | | 0.2% |
#Nu Skin Enterprises, Inc. Class A | | | 180,500 | | | | | | | | 5,523,300 | | | | | | | 0.1% |
Other Securities | | | | | | | | | | | 107,336,334 | | | | | | | 3.2% |
| | | | | | | | | | | | | | | | | | |
Total Consumer Staples | | | | | | | | | | | 118,567,722 | | | | | | | 3.5% |
| | | | | | | | | | | | | | | | | | |
| | | | | |
Energy — (4.5%) | | | | | | | | | | | | | | | | | | |
#CARBO Ceramics, Inc. | | | 66,655 | | | | | | | | 5,583,689 | | | | | | | 0.2% |
*Complete Production Services, Inc. | | | 233,321 | | | | | | | | 5,466,711 | | | | | | | 0.1% |
#*Mariner Energy, Inc. | | | 254,423 | | | | | | | | 6,340,221 | | | | | | | 0.2% |
#RPC, Inc. | | | 277,500 | | | | | | | | 6,107,775 | | | | | | | 0.2% |
Other Securities | | | | | | | | | | | 166,187,732 | | | | | | | 4.9% |
| | | | | | | | | | | | | | | | | | |
Total Energy | | | | | | | | | | | 189,686,128 | | | | | | | 5.6% |
| | | | | | | | | | | | | | | | | | |
| | | | | |
Financials — (10.7%) | | | | | | | | | | | | | | | | | | |
*American Capital, Ltd. | | | 882,842 | | | | | | | | 6,162,237 | | | | | | | 0.2% |
CapitalSource, Inc. | | | 871,013 | | | | | | | | 5,321,889 | | | | | | | 0.1% |
*Investors Bancorp, Inc. | | | 464,275 | | | | | | | | 5,571,300 | | | | | | | 0.2% |
#*MBIA, Inc. | | | 553,569 | | | | | | | | 6,205,508 | | | | | | | 0.2% |
Other Securities | | | | | | | | | | | 431,333,815 | | | | | | | 12.7% |
| | | | | | | | | | | | | | | | | | |
Total Financials | | | | | | | | | | | 454,594,749 | | | | | | | 13.4% |
| | | | | | | | | | | | | | | | | | |
| | | | | |
Health Care — (9.1%) | | | | | | | | | | | | | | | | | | |
#*AMERIGROUP Corp. | | | 133,000 | | | | | | | | 5,550,090 | | | | | | | 0.2% |
*HealthSpring, Inc. | | | 182,857 | | | | | | | | 5,337,596 | | | | | | | 0.2% |
#Hill-Rom Holdings, Inc. | | | 144,017 | | | | | | | | 5,580,659 | | | | | | | 0.2% |
*HMS Holdings Corp. | | | 87,139 | | | | | | | | 5,237,925 | | | | | | | 0.1% |
#*Incyte Corp. | | | 315,283 | | | | | | | | 5,252,615 | | | | | | | 0.1% |
Other Securities | | | | | | | | | | | 360,579,098 | | | | | | | 10.6% |
| | | | | | | | | | | | | | | | | | |
Total Health Care | | | | | | | | | | | 387,537,983 | | | | | | | 11.4% |
| | | | | | | | | | | | | | | | | | |
| | | | | |
Industrials — (14.5%) | | | | | | | | | | | | | | | | | | |
*Alaska Air Group, Inc. | | | 111,907 | | | | | | | | 5,908,690 | | | | | | | 0.2% |
#Con-way, Inc. | | | 161,251 | | | | | | | | 5,322,896 | | | | | | | 0.2% |
*Esterline Technologies Corp. | | | 87,108 | | | | | | | | 5,264,808 | | | | | | | 0.1% |
#*GEO Group, Inc. (The) | | | 205,915 | | | | | | | | 5,281,720 | | | | | | | 0.1% |
#*JetBlue Airways Corp. | | | 758,521 | | | | | | | | 5,294,477 | | | | | | | 0.2% |
#*US Airways Group, Inc. | | | 468,000 | | | | | | | | 5,517,720 | | | | | | | 0.2% |
UTi Worldwide, Inc. | | | 293,686 | | | | | | | | 5,644,645 | | | | | | | 0.2% |
Other Securities | | | | | | | | | | | 577,964,125 | | | | | | | 17.0% |
| | | | | | | | | | | | | | | | | | |
Total Industrials | | | | | | | | | | | 616,199,081 | | | | | | | 18.2% |
| | | | | | | | | | | | | | | | | | |
52
U.S. SMALL CAP PORTFOLIO
CONTINUED
| | | | | | | | | | | | | | | | | | |
| | | Shares | | | | | | Value† | | | Percentage
of Net Assets** |
Information Technology — (16.9%) | | | | | | | | | | | | | | | | | | |
*Acme Packet, Inc. | | | 161,675 | | | | | | | $ | 6,394,246 | | | | | | | 0.2% |
#Adtran, Inc. | | | 210,232 | | | | | | | | 6,784,187 | | | | | | | 0.2% |
#*Aruba Networks, Inc. | | | 263,829 | | | | | | | | 5,780,493 | | | | | | | 0.2% |
*Hypercom Corp. | | | 918,056 | | | | | | | | 5,471,614 | | | | | | | 0.2% |
*International Rectifier Corp. | | | 225,033 | | | | | | | | 5,227,517 | | | | | | | 0.2% |
*Loral Space & Communications, Inc. | | | 128,378 | | | | | | | | 7,141,668 | | | | | | | 0.2% |
#Plantronics, Inc. | | | 144,900 | | | | | | | | 5,199,012 | | | | | | | 0.1% |
*Quest Software, Inc. | | | 296,730 | | | | | | | | 7,765,424 | | | | | | | 0.2% |
*RF Micro Devices, Inc. | | | 1,055,523 | | | | | | | | 7,694,763 | | | | | | | 0.2% |
*Riverbed Technology, Inc. | | | 146,971 | | | | | | | | 8,456,711 | | | | | | | 0.2% |
#Syntel, Inc. | | | 108,782 | | | | | | | | 5,315,089 | | | | | | | 0.2% |
*TIBCO Software, Inc. | | | 474,473 | | | | | | | | 9,119,371 | | | | | | | 0.3% |
#*VeriFone Systems, Inc. | | | 226,455 | | | | | | | | 7,660,973 | | | | | | | 0.2% |
*Zebra Technologies Corp. Class A | | | 150,051 | | | | | | | | 5,368,825 | | | | | | | 0.2% |
Other Securities | | | | | | | | | | | 624,265,806 | | | | | | | 18.4% |
| | | | | | | | | | | | | | | | | | |
Total Information Technology | | | | | | | | | | | 717,645,699 | | | | | | | 21.2% |
| | | | | | | | | | | | | | | | | | |
| | | | | |
Materials — (4.4%) | | | | | | | | | | | | | | | | | | |
*Allied Nevada Gold Corp. | | | 215,616 | | | | | | | | 5,321,403 | | | | | | | 0.2% |
*Coeur d’Alene Mines Corp. | | | 254,520 | | | | | | | | 5,245,657 | | | | | | | 0.1% |
Other Securities | | | | | | | | | | | 174,977,855 | | | | | | | 5.2% |
| | | | | | | | | | | | | | | | | | |
Total Materials | | | | | | | | | | | 185,544,915 | | | | | | | 5.5% |
| | | | | | | | | | | | | | | | | | |
| | | | | |
Other — (0.0%) | | | | | | | | | | | | | | | | | | |
Other Securities | | | | | | | | | | | 454 | | | | | | | 0.0% |
| | | | | | | | | | | | | | | | | | |
| | | | | |
Telecommunication Services — (0.9%) | | | | | | | | | | | | | | | | | | |
*Syniverse Holdings, Inc. | | | 208,017 | | | | | | | | 6,342,438 | | | | | | | 0.2% |
Other Securities | | | | | | | | | | | 32,767,726 | | | | | | | 0.9% |
| | | | | | | | | | | | | | | | | | |
Total Telecommunication Services | | | | | | | | | | | 39,110,164 | | | | | | | 1.1% |
| | | | | | | | | | | | | | | | | | |
| | | | | |
Utilities — (2.1%) | | | | | | | | | | | | | | | | | | |
Other Securities | | | | | | | | | | | 89,996,539 | | | | | | | 2.6% |
| | | | | | | | | | | | | | | | | | |
TOTAL COMMON STOCKS | | | | | | | | | | | 3,374,374,323 | | | | | | | 99.5% |
| | | | | | | | | | | | | | | | | | |
| | | | | |
RIGHTS/WARRANTS — (0.0%) | | | | | | | | | | | | | | | | | | |
Other Securities | | | | | | | | | | | 919,321 | | | | | | | 0.0% |
| | | | | | | | | | | | | | | | | | |
| | | | | |
TEMPORARY CASH INVESTMENTS — (0.5%) | | | | | | | | | | | | | | | | | | |
BlackRock Liquidity Funds Tempcash Portfolio - Institutional
Shares | | | 22,578,102 | | | | | | | | 22,578,102 | | | | | | | 0.7% |
| | | | | | | | | | | | | | | | | | |
| | | | | |
| | | Shares/ Face Amount | | | | | | | | | | | | |
| | | (000) | | | | | | | | | | | | |
SECURITIES LENDING COLLATERAL — (20.0%) | | | | | | | | | | | | | | | | | | |
§@DFA Short Term Investment Fund | | | 842,198,656 | | | | | | | | 842,198,656 | | | | | | | 24.8% |
@Repurchase Agreement, Deutsche Bank Securities, Inc. 0.23%, 11/01/10 (Collateralized by $3,946,848 FNMA 3.500%, 10/01/20, valued at $4,129,201) to be repurchased at $4,009,010 | | | $4,009 | | | | | | | | 4,008,933 | | | | | | | 0.1% |
| | | | | | | | | | | | | | | | | | |
TOTAL SECURITIES LENDING COLLATERAL | | | | | | | | | | | 846,207,589 | | | | | | | 24.9% |
| | | | | | | | | | | | | | | | | | |
53
U.S. SMALL CAP PORTFOLIO
CONTINUED
| | | | | | | | | | |
| | | Value† | | | Percentage
of Net Assets** |
TOTAL INVESTMENTS — (100.0%)
(Cost $3,762,762,465) | | $ | 4,244,079,335 | | | | | | | 125.1% |
| | | | | | | | | | |
Summary of inputs used to value the Portfolio’s investments as of October 31, 2010 is as follows (See Security Valuation Note):
| | | | | | | | | | | | | | | | | | | | | | | | |
| | | Valuation Inputs | |
| |
| | | Investment in Securities (Market Value) | |
| | | Level 1 | | | Level 2 | | | Level 3 | | | Total | |
Common Stocks | | | | | | | | | | | | | | | | | | | | | | | | |
Consumer Discretionary | | $ | 575,490,889 | | | | — | | | | | | | | — | | | | | | | $ | 575,490,889 | |
Consumer Staples | | | 118,567,722 | | | | — | | | | | | | | — | | | | | | | | 118,567,722 | |
Energy | | | 189,686,128 | | | | — | | | | | | | | — | | | | | | | | 189,686,128 | |
Financials | | | 454,594,749 | | | | — | | | | | | | | — | | | | | | | | 454,594,749 | |
Health Care | | | 387,389,840 | | | $ | 148,143 | | | | | | | | — | | | | | | | | 387,537,983 | |
Industrials | | | 616,199,081 | | | | — | | | | | | | | — | | | | | | | | 616,199,081 | |
Information Technology | | | 717,645,699 | | | | — | | | | | | | | — | | | | | | | | 717,645,699 | |
Materials | | | 185,544,915 | | | | — | | | | | | | | — | | | | | | | | 185,544,915 | |
Other | | | — | | | | 454 | | | | | | | | — | | | | | | | | 454 | |
Telecommunication Services | | | 39,110,164 | | | | — | | | | | | | | — | | | | | | | | 39,110,164 | |
Utilities | | | 89,996,539 | | | | — | | | | | | | | — | | | | | | | | 89,996,539 | |
Rights/Warrants | | | 34,946 | | | | 884,375 | | | | | | | | — | | | | | | | | 919,321 | |
Temporary Cash Investments | | | 22,578,102 | | | | — | | | | | | | | — | | | | | | | | 22,578,102 | |
Securities Lending Collateral | | | — | | | | 846,207,589 | | | | | | | | — | | | | | | | | 846,207,589 | |
| | | | | | | | | | | | | | | | | | | | | | | | |
TOTAL | | $ | 3,396,838,774 | | | $ | 847,240,561 | | | | | | | | — | | | | | | | $ | 4,244,079,335 | |
| | | | | | | | | | | | | | | | | | | | | | | | |
See accompanying Notes to Financial Statements.
54
U.S. MICRO CAP PORTFOLIO
SUMMARY SCHEDULE OF PORTFOLIO HOLDINGS
October 31, 2010
| | | | | | | | | | | | | | | | | | |
| | | Shares | | | | | | Value† | | | Percentage
of Net Assets** |
COMMON STOCKS — (87.4%) | | | | | | | | | | | | | | | | | | |
Consumer Discretionary — (14.0%) | | | | | | | | | | | | | | | | | | |
#*BJ’s Restaurants, Inc. | | | 218,820 | | | | | | | $ | 7,253,883 | | | | | | | 0.2% |
#*Buffalo Wild Wings, Inc. | | | 149,089 | | | | | | | | 7,011,656 | | | | | | | 0.2% |
Cato Corp. Class A | | | 251,022 | | | | | | | | 6,639,532 | | | | | | | 0.2% |
#Monro Muffler Brake, Inc. | | | 180,713 | | | | | | | | 8,627,239 | | | | | | | 0.3% |
#*Pier 1 Imports, Inc. | | | 759,929 | | | | | | | | 6,596,184 | | | | | | | 0.2% |
*Pinnacle Entertainment, Inc. | | | 540,950 | | | | | | | | 6,924,160 | | | | | | | 0.2% |
#*Steven Madden, Ltd. | | | 269,303 | | | | | | | | 11,391,517 | | | | | | | 0.4% |
*Valassis Communications, Inc. | | | 353,966 | | | | | | | | 11,680,878 | | | | | | | 0.4% |
Other Securities | | | | | | | | | | | 441,743,230 | | | | | | | 13.9% |
| | | | | | | | | | | | | | | | | | |
Total Consumer Discretionary | | | | | | | | | | | 507,868,279 | | | | | | | 16.0% |
| | | | | | | | | | | | | | | | | | |
| | | | | |
Consumer Staples — (4.2%) | | | | | | | | | | | | | | | | | | |
Andersons, Inc. (The) | | | 164,550 | | | | | | | | 6,478,334 | | | | | | | 0.2% |
J & J Snack Foods Corp. | | | 180,997 | | | | | | | | 7,759,341 | | | | | | | 0.2% |
PriceSmart, Inc. | | | 296,100 | | | | | | | | 8,684,613 | | | | | | | 0.3% |
#*USANA Health Sciences, Inc. | | | 155,615 | | | | | | | | 6,834,611 | | | | | | | 0.2% |
Other Securities | | | | | | | | | | | 123,784,622 | | | | | | | 3.9% |
| | | | | | | | | | | | | | | | | | |
Total Consumer Staples | | | | | | | | | | | 153,541,521 | | | | | | | 4.8% |
| | | | | | | | | | | | | | | | | | |
| | | | | |
Energy — (3.2%) | | | | | | | | | | | | | | | | | | |
*Clayton Williams Energy, Inc. | | | 110,880 | | | | | | | | 6,621,754 | | | | | | | 0.2% |
Other Securities | | | | | | | | | | | 110,929,112 | | | | | | | 3.5% |
| | | | | | | | | | | | | | | | | | |
Total Energy | | | | | | | | | | | 117,550,866 | | | | | | | 3.7% |
| | | | | | | | | | | | | | | | | | |
| | | | | |
Financials — (12.1%) | | | | | | | | | | | | | | | | | | |
#FBL Financial Group, Inc. Class A | | | 289,468 | | | | | | | | 7,572,483 | | | | | | | 0.2% |
*First Cash Financial Services, Inc. | | | 294,883 | | | | | | | | 8,572,249 | | | | | | | 0.3% |
Horace Mann Educators Corp. | | | 424,387 | | | | | | | | 7,931,793 | | | | | | | 0.3% |
Infinity Property & Casualty Corp. | | | 144,873 | | | | | | | | 7,497,178 | | | | | | | 0.2% |
#*Portfolio Recovery Associates, Inc. | | | 97,409 | | | | | | | | 6,531,273 | | | | | | | 0.2% |
#*World Acceptance Corp. | | | 156,911 | | | | | | | | 6,770,710 | | | | | | | 0.2% |
Other Securities | | | | | | | | | | | 392,306,020 | | | | | | | 12.4% |
| | | | | | | | | | | | | | | | | | |
Total Financials | | | | | | | | | | | 437,181,706 | | | | | | | 13.8% |
| | | | | | | | | | | | | | | | | | |
| | | | | |
Health Care — (11.4%) | | | | | | | | | | | | | | | | | | |
Invacare Corp. | | | 248,109 | | | | | | | | 6,698,943 | | | | | | | 0.2% |
*Neogen Corp. | | | 203,656 | | | | | | | | 6,806,184 | | | | | | | 0.2% |
*NxStage Medical, Inc. | | | 335,606 | | | | | | | | 6,765,817 | | | | | | | 0.2% |
Other Securities | | | | | | | | | | | 390,859,989 | | | | | | | 12.3% |
| | | | | | | | | | | | | | | | | | |
Total Health Care | | | | | | | | | | | 411,130,933 | | | | | | | 12.9% |
| | | | | | | | | | | | | | | | | | |
| | | | | |
Industrials — (16.1%) | | | | | | | | | | | | | | | | | | |
*Acacia Technologies Group | | | 355,785 | | | | | | | | 9,470,997 | | | | | | | 0.3% |
American Science & Engineering, Inc. | | | 87,246 | | | | | | | | 7,184,708 | | | | | | | 0.2% |
#Badger Meter, Inc. | | | 155,222 | | | | | | | | 6,446,370 | | | | | | | 0.2% |
*GeoEye, Inc. | | | 145,416 | | | | | | | | 6,437,566 | | | | | | | 0.2% |
#Raven Industries, Inc. | | | 178,996 | | | | | | | | 7,360,316 | | | | | | | 0.2% |
Tredegar Industries, Inc. | | | 334,848 | | | | | | | | 6,459,218 | | | | | | | 0.2% |
#*United Rentals, Inc. | | | 353,280 | | | | | | | | 6,638,131 | | | | | | | 0.2% |
Other Securities | | | | | | | | | | | 532,880,622 | | | | | | | 16.8% |
| | | | | | | | | | | | | | | | | | |
Total Industrials | | | | | | | | | | | 582,877,928 | | | | | | | 18.3% |
| | | | | | | | | | | | | | | | | | |
| | | | | |
Information Technology — (19.7%) | | | | | | | | | | | | | | | | | | |
*Acme Packet, Inc. | | | 171,574 | | | | | | | | 6,785,752 | | | | | | | 0.2% |
*Cabot Microelectronics Corp. | | | 230,045 | | | | | | | | 8,886,638 | | | | | | | 0.3% |
#*DTS, Inc. | | | 171,283 | | | | | | | | 6,817,063 | | | | | | | 0.2% |
55
U.S. MICRO CAP PORTFOLIO
CONTINUED
| | | | | | | | | | | | | | | | | | |
| | | Shares | | | | | | Value† | | | Percentage
of Net Assets** |
Information Technology — (Continued) | | | | | | | | | | | | | | | | | | |
*Forrester Research, Inc. | | | 223,549 | | | | | | | $ | 7,392,765 | | | | | | | 0.2% |
iGATE Corp. | | | 521,424 | | | | | | | | 10,657,907 | | | | | | | 0.3% |
#*IPG Photonics Corp. | | | 458,850 | | | | | | | | 10,324,125 | | | | | | | 0.3% |
#*L-1 Identity Solutions, Inc. | | | 785,607 | | | | | | | | 9,262,307 | | | | | | | 0.3% |
#*Littlefuse, Inc. | | | 200,242 | | | | | | | | 8,496,268 | | | | | | | 0.3% |
#*Loral Space & Communications, Inc. | | | 161,771 | | | | | | | | 8,999,321 | | | | | | | 0.3% |
*Manhattan Associates, Inc. | | | 238,948 | | | | | | | | 7,354,819 | | | | | | | 0.2% |
*NetScout Systems, Inc. | | | 317,575 | | | | | | | | 7,453,485 | | | | | | | 0.2% |
*RightNow Technologies, Inc. | | | 299,706 | | | | | | | | 7,828,321 | | | | | | | 0.3% |
*ScanSource, Inc. | | | 236,107 | | | | | | | | 7,069,044 | | | | | | | 0.2% |
#*STEC, Inc. | | | 446,325 | | | | | | | | 6,962,670 | | | | | | | 0.2% |
#*Tyler Technologies, Inc. | | | 364,519 | | | | | | | | 7,439,833 | | | | | | | 0.2% |
#*Ultimate Software Group, Inc. | | | 215,449 | | | | | | | | 8,915,280 | | | | | | | 0.3% |
#*Universal Display Corp. | | | 307,402 | | | | | | | | 7,697,346 | | | | | | | 0.3% |
Other Securities | | | | | | | | | | | 574,946,376 | | | | | | | 18.1% |
| | | | | | | | | | | | | | | | | | |
Total Information Technology | | | | | | | | | | | 713,289,320 | | | | | | | 22.4% |
| | | | | | | | | | | | | | | | | | |
| | | | | |
Materials — (4.0%) | | | | | | | | | | | | | | | | | | |
#AMCOL International Corp. | | | 263,102 | | | | | | | | 7,298,449 | | | | | | | 0.2% |
Arch Chemicals, Inc. | | | 218,955 | | | | | | | | 7,775,092 | | | | | | | 0.3% |
Balchem Corp. | | | 235,675 | | | | | | | | 7,202,228 | | | | | | | 0.2% |
Other Securities | | | | | | | | | | | 121,780,006 | | | | | | | 3.8% |
| | | | | | | | | | | | | | | | | | |
Total Materials | | | | | | | | | | | 144,055,775 | | | | | | | 4.5% |
| | | | | | | | | | | | | | | | | | |
| | | | | |
Other — (0.0%) | | | | | | | | | | | | | | | | | | |
Other Securities | | | | | | | | | | | 2,444 | | | | | | | 0.0% |
| | | | | | | | | | | | | | | | | | |
| | | | | |
Telecommunication Services — (1.1%) | | | | | | | | | | | | | | | | | | |
Other Securities | | | | | | | | | | | 39,764,550 | | | | | | | 1.3% |
| | | | | | | | | | | | | | | | | | |
| | | | | |
Utilities — (1.6%) | | | | | | | | | | | | | | | | | | |
MGE Energy, Inc. | | | 196,967 | | | | | | | | 7,987,012 | | | | | | | 0.3% |
Other Securities | | | | | | | | | | | 49,028,252 | | | | | | | 1.5% |
| | | | | | | | | | | | | | | | | | |
Total Utilities | | | | | | | | | | | 57,015,264 | | | | | | | 1.8% |
| | | | | | | | | | | | | | | | | | |
TOTAL COMMON STOCKS | | | | | | | | | | | 3,164,278,586 | | | | | | | 99.5% |
| | | | | | | | | | | | | | | | | | |
RIGHTS/WARRANTS — (0.0%) | | | | | | | | | | | | | | | | | | |
Other Securities | | | | | | | | | | | 601,947 | | | | | | | 0.0% |
| | | | | | | | | | | | | | | | | | |
| | | | | |
TEMPORARY CASH INVESTMENTS — (0.4%) | | | | | | | | | | | | | | | | | | |
BlackRock Liquidity Funds Tempcash Portfolio - Institutional
Shares | | | 14,738,317 | | | | | | | | 14,738,317 | | | | | | | 0.5% |
| | | | | | | | | | | | | | | | | | |
| | | | | |
| | | Shares/ Face Amount | | | | | | | | | | | | |
| | | (000) | | | | | | | | | | | | |
SECURITIES LENDING COLLATERAL — (12.2%) | | | | | | | | | | | | | | | | | | |
§@DFA Short Term Investment Fund | | | 438,511,577 | | | | | | | | 438,511,577 | | | | | | | 13.8% |
@Repurchase Agreement, Deutsche Bank Securities, Inc. 0.23%,
11/01/10 (Collateralized by $2,055,024 FNMA 3.500%,
10/01/20, valued at $2,149,971) to be repurchased at
$2,087,390 | | | $2,087 | | | | | | | | 2,087,350 | | | | | | | 0.1% |
| | | | | | | | | | | | | | | | | | |
TOTAL SECURITIES LENDING COLLATERAL | | | | | | | | | | | 440,598,927 | | | | | | | 13.9% |
| | | | | | | | | | | | | | | | | | |
56
U.S. MICRO CAP PORTFOLIO
CONTINUED
| | | | | | | | | | | | | | | | | | |
| | | | | | | | | Value† | | | Percentage
of Net Assets** |
TOTAL INVESTMENTS — (100.0%)
(Cost $3,315,884,886) | | | | | | | | | | $ | 3,620,217,777 | | | | | | | 113.9% |
| | | | | | | | | | | | | | | | | | |
Summary of inputs used to value the Portfolio’s investments as of October 31, 2010 is as follows (See Security Valuation Note):
| | | | | | | | | | | | | | | | | | | | | | | | |
| | | Valuation Inputs | |
| |
| | | Investment in Securities (Market Value) | |
| | | Level 1 | | | Level 2 | | | Level 3 | | | Total | |
Common Stocks | | | | | | | | | | | | | | | | | | | | | | | | |
Consumer Discretionary | | $ | 507,868,279 | | | | — | | | | | | | | — | | | | | | | $ | 507,868,279 | |
Consumer Staples | | | 153,541,521 | | | | — | | | | | | | | — | | | | | | | | 153,541,521 | |
Energy | | | 117,550,866 | | | | — | | | | | | | | — | | | | | | | | 117,550,866 | |
Financials | | | 437,181,706 | | | | — | | | | | | | | — | | | | | | | | 437,181,706 | |
Health Care | | | 410,905,037 | | | $ | 225,896 | | | | | | | | — | | | | | | | | 411,130,933 | |
Industrials | | | 582,877,928 | | | | — | | | | | | | | — | | | | | | | | 582,877,928 | |
Information Technology | | | 713,289,320 | | | | — | | | | | | | | — | | | | | | | | 713,289,320 | |
Materials | | | 144,055,775 | | | | — | | | | | | | | — | | | | | | | | 144,055,775 | |
Other | | | — | | | | 2,444 | | | | | | | | — | | | | | | | | 2,444 | |
Telecommunication Services | | | 39,764,550 | | | | — | | | | | | | | — | | | | | | | | 39,764,550 | |
Utilities | | | 57,015,264 | | | | — | | | | | | | | — | | | | | | | | 57,015,264 | |
Rights/Warrants | | | 4,633 | | | | 597,314 | | | | | | | | — | | | | | | | | 601,947 | |
Temporary Cash Investments | | | 14,738,317 | | | | — | | | | | | | | — | | | | | | | | 14,738,317 | |
Securities Lending Collateral | | | — | | | | 440,598,927 | | | | | | | | — | | | | | | | | 440,598,927 | |
| | | | | | | | | | | | | | | | | | | | | | | | |
TOTAL | | $ | 3,178,793,196 | | | $ | 441,424,581 | | | | | | | | — | | | | | | | $ | 3,620,217,777 | |
| | | | | | | | | | | | | | | | | | | | | | | | |
See accompanying Notes to Financial Statements.
57
DFA REAL ESTATE SECURITIES PORTFOLIO
SUMMARY SCHEDULE OF PORTFOLIO HOLDINGS
October 31, 2010
| | | | | | | | | | | | | | | | | | |
| | | Shares | | | | | | Value† | | | Percentage
of Net Assets** |
COMMON STOCKS — (79.8%) | | | | | | | | | | | | | | | | | | |
Health Care — (0.0%) | | | | | | | | | | | | | | | | | | |
Other Securities | | | | | | | | | | $ | 61,722 | | | | | | | 0.0% |
| | | | | | | | | | | | | | | | | | |
Real Estate Investment Trusts — (79.8%) | | | | | | | | | | | | | | | | | | |
#Alexander’s, Inc. | | | 52,368 | | | | | | | | 19,681,989 | | | | | | | 0.7% |
#Alexandria Real Estate Equities, Inc. | | | 430,728 | | | | | | | | 31,649,893 | | | | | | | 1.2% |
#AMB Property Corp. | | | 1,426,481 | | | | | | | | 40,212,499 | | | | | | | 1.5% |
#American Campus Communites, Inc. | | | 508,865 | | | | | | | | 16,095,400 | | | | | | | 0.6% |
*Apartment Investment & Management Co. Class A | | | 1,095,380 | | | | | | | | 25,533,308 | | | | | | | 0.9% |
#AvalonBay Communities, Inc. | | | 778,009 | | | | | | | | 82,710,137 | | | | | | | 3.1% |
#BioMed Realty Trust, Inc. | | | 1,011,329 | | | | | | | | 18,557,887 | | | | | | | 0.7% |
#Boston Properties, Inc. | | | 1,306,800 | | | | | | | | 112,633,092 | | | | | | | 4.2% |
#BRE Properties, Inc. Class A | | | 551,733 | | | | | | | | 23,685,898 | | | | | | | 0.9% |
#Camden Property Trust | | | 619,003 | | | | | | | | 30,696,359 | | | | | | | 1.1% |
#CBL & Associates Properties, Inc. | | | 1,297,756 | | | | | | | | 20,348,814 | | | | | | | 0.8% |
#Corporate Office Properties Trust | | | 553,900 | | | | | | | | 19,657,911 | | | | | | | 0.7% |
#Developers Diversified Realty Corp. | | | 1,945,090 | | | | | | | | 25,091,661 | | | | | | | 0.9% |
#Digital Realty Trust, Inc. | | | 747,547 | | | | | | | | 44,650,982 | | | | | | | 1.7% |
#Douglas Emmett, Inc. | | | 1,098,938 | | | | | | | | 19,714,948 | | | | | | | 0.7% |
Duke Realty Corp. | | | 2,141,360 | | | | | | | | 26,702,759 | | | | | | | 1.0% |
#Entertainment Properties Trust | | | 398,314 | | | | | | | | 18,414,056 | | | | | | | 0.7% |
Equity Lifestyle Properties, Inc. | | | 286,964 | | | | | | | | 16,333,991 | | | | | | | 0.6% |
#Equity Residential | | | 2,648,356 | | | | | | | | 128,789,552 | | | | | | | 4.8% |
#Essex Property Trust, Inc. | | | 276,971 | | | | | | | | 31,286,644 | | | | | | | 1.2% |
#Federal Realty Investment Trust | | | 576,715 | | | | | | | | 47,279,096 | | | | | | | 1.8% |
#*HCP, Inc. | | | 2,801,005 | | | | | | | | 100,864,190 | | | | | | | 3.8% |
#*Health Care REIT, Inc. | | | 1,166,673 | | | | | | | | 59,616,990 | | | | | | | 2.2% |
#Highwood Properties, Inc. | | | 672,970 | | | | | | | | 22,295,496 | | | | | | | 0.8% |
#Home Properties, Inc. | | | 335,680 | | | | | | | | 18,277,776 | | | | | | | 0.7% |
#Hospitality Properties Trust | | | 1,160,767 | | | | | | | | 26,477,095 | | | | | | | 1.0% |
#Host Marriott Corp. | | | 6,147,086 | | | | | | | | 97,677,197 | | | | | | | 3.6% |
#*Kimco Realty Corp. | | | 3,798,124 | | | | | | | | 65,441,677 | | | | | | | 2.4% |
#Lasalle Hotel Properties | | | 623,626 | | | | | | | | 14,773,700 | | | | | | | 0.5% |
#Liberty Property Trust | | | 1,060,279 | | | | | | | | 35,476,935 | | | | | | | 1.3% |
Macerich Co. (The) | | | 1,044,035 | | | | | | | | 46,574,401 | | | | | | | 1.7% |
Mack-Cali Realty Corp. | | | 742,584 | | | | | | | | 24,935,971 | | | | | | | 0.9% |
Mid-America Apartment Communities, Inc. | | | 279,319 | | | | | | | | 17,046,839 | | | | | | | 0.6% |
#National Retail Properties, Inc. | | | 783,449 | | | | | | | | 21,231,468 | | | | | | | 0.8% |
Nationwide Health Properties, Inc. | | | 1,102,624 | | | | | | | | 45,020,138 | | | | | | | 1.7% |
Omega Healthcare Investors, Inc. | | | 836,312 | | | | | | | | 19,235,176 | | | | | | | 0.7% |
#*ProLogis | | | 4,462,298 | | | | | | | | 60,910,368 | | | | | | | 2.3% |
#Public Storage REIT | | | 1,438,672 | | | | | | | | 142,745,036 | | | | | | | 5.3% |
#Realty Income Corp. | | | 982,058 | | | | | | | | 33,664,948 | | | | | | | 1.3% |
#Regency Centers Corp. | | | 768,887 | | | | | | | | 32,431,654 | | | | | | | 1.2% |
Senior Housing Properties Trust | | | 1,197,532 | | | | | | | | 28,609,039 | | | | | | | 1.1% |
#*Simon Property Group, Inc. | | | 2,740,392 | | | | | | | | 263,132,440 | | | | | | | 9.8% |
#SL Green Realty Corp. | | | 732,883 | | | | | | | | 48,165,071 | | | | | | | 1.8% |
#Tanger Factory Outlet Centers, Inc. | | | 380,398 | | | | | | | | 18,228,672 | | | | | | | 0.7% |
#Taubman Centers, Inc. | | | 513,047 | | | | | | | | 23,815,642 | | | | | | | 0.9% |
UDR, Inc. | | | 1,491,932 | | | | | | | | 33,538,631 | | | | | | | 1.2% |
#Ventas, Inc. | | | 1,474,528 | | | | | | | | 78,975,720 | | | | | | | 2.9% |
#*Vornado Realty Trust | | | 1,636,540 | | | | | | | | 143,017,231 | | | | | | | 5.3% |
#Washington REIT | | | 570,992 | | | | | | | | 18,288,874 | | | | | | | 0.7% |
#Weingarten Realty Investors | | | 1,129,891 | | | | | | | | 27,264,270 | | | | | | | 1.0% |
Other Securities | | | | | | | | | | | 317,354,761 | | | | | | | 11.8% |
| | | | | | | | | | | | | | | | | | |
Total Real Estate Investment Trusts | | | | | | | | | | | 2,684,814,282 | | | | | | | 99.8% |
| | | | | | | | | | | | | | | | | | |
TOTAL COMMON STOCKS | | | | | | | | | | | 2,684,876,004 | | | | | | | 99.8% |
| | | | | | | | | | | | | | | | | | |
58
DFA REAL ESTATE SECURITIES PORTFOLIO
CONTINUED
| | | | | | | | | | | | | | | | | | |
| | | Shares | | | | | | Value† | | | Percentage
of Net Assets** |
TEMPORARY CASH INVESTMENTS — (0.1%) | | | | | | | | | | | | | | | | | | |
BlackRock Liquidity Funds Tempcash Portfolio - Institutional
Shares | | | 2,684,740 | | | | | | | | $2,684,740 | | | | | | | 0.1% |
| | | | | | | | | | | | | | | | | | |
| | | | | |
| |
| Shares/
Face Amount |
| | | | | | | | | | | | | | |
| | | (000) | | | | | | | | | | | | |
SECURITIES LENDING COLLATERAL — (20.1%) | | | | | | | | | | | | | | | | | | |
§@DFA Short Term Investment Fund | | | 673,752,172 | | | | | | | | 673,752,172 | | | | | | | 25.1% |
@ Repurchase Agreement, Deutsche Bank Securities, Inc. 0.23%,
11/01/10 (Collateralized by $3,157,447 FNMA 3.500%,
10/01/20, valued at $3,303,328) to be repurchased at
$3,207,175 | | | $3,207 | | | | | | | | 3,207,114 | | | | | | | 0.1% |
| | | | | | | | | | | | | | | | | | |
TOTAL SECURITIES LENDING COLLATERAL | | | | | | | | | | | 676,959,286 | | | | | | | 25.2% |
| | | | | | | | | | | | | | | | | | |
TOTAL INVESTMENTS — (100.0%)
(Cost $2,919,766,520) | | | | | | | | | | $ | 3,364,520,030 | | | | | | | 125.1% |
| | | | | | | | | | | | | | | | | | |
Summary of inputs used to value the Portfolio’s investments as of October 31, 2010 is as follows (See Security Valuation Note):
| | | | | | | | | | | | | | | | | | | | | | | | |
| | | Valuation Inputs | |
| |
| | | Investment in Securities (Market Value) | |
| | | Level 1 | | | Level 2 | | | Level 3 | | | Total | |
Common Stocks | | | | | | | | | | | | | | | | | | | | | | | | |
Health Care | | $ | 61,722 | | | | — | | | | | | | | — | | | | | | | $ | 61,722 | |
Real Estate Investment Trusts | | | 2,684,814,282 | | | | — | | | | | | | | — | | | | | | | | 2,684,814,282 | |
Temporary Cash Investments | | | 2,684,740 | | | | — | | | | | | | | — | | | | | | | | 2,684,740 | |
Securities Lending Collateral | | | — | | | $ | 676,959,286 | | | | | | | | — | | | | | | | | 676,959,286 | |
| | | | | | | | | | | | | | | | | | | | | | | | |
TOTAL | | $ | 2,687,560,744 | | | $ | 676,959,286 | | | | | | | | — | | | | | | | $ | 3,364,520,030 | |
| | | | | | | | | | | | | | | | | | | | | | | | |
See accompanying Notes to Financial Statements.
59
LARGE CAP INTERNATIONAL PORTFOLIO
SUMMARY SCHEDULE OF PORTFOLIO HOLDINGS
October 31, 2010
| | | | | | | | | | | | | | | | | | |
| | | Shares | | | | | | Value†† | | | Percentage
of Net Assets** |
COMMON STOCKS — (84.8%) | | | | | | | | | | | | | | | | | | |
AUSTRALIA — (6.4%) | | | | | | | | | | | | | | | | | | |
Australia & New Zealand Banking Group, Ltd. | | | 360,926 | | | | | | | $ | 8,805,393 | | | | | | | 0.5% |
BHP Billiton, Ltd. | | | 297,885 | | | | | | | | 12,308,952 | | | | | | | 0.8% |
#BHP Billiton, Ltd. Sponsored ADR | | | 85,300 | | | | | | | | 7,044,927 | | | | | | | 0.4% |
Commonwealth Bank of Australia NL | | | 209,218 | | | | | | | | 10,057,768 | | | | | | | 0.6% |
National Australia Bank, Ltd. | | | 299,123 | | | | | | | | 7,486,542 | | | | | | | 0.5% |
Rio Tinto, Ltd. | | | 85,083 | | | | | | | | 6,924,239 | | | | | | | 0.4% |
#Westpac Banking Corp. | | | 311,382 | | | | | | | | 6,933,514 | | | | | | | 0.4% |
Other Securities | | | | | | | | | | | 62,373,700 | | | | | | | 3.9% |
| | | | | | | | | | | | | | | | | | |
TOTAL AUSTRALIA | | | | | | | | | | | 121,935,035 | | | | | | | 7.5% |
| | | | | | | | | | | | | | | | | | |
| | | | | |
AUSTRIA — (0.2%) | | | | | | | | | | | | | | | | | | |
Other Securities | | | | | | | | | | | 4,496,574 | | | | | | | 0.3% |
| | | | | | | | | | | | | | | | | | |
| | | | | |
BELGIUM — (0.7%) | | | | | | | | | | | | | | | | | | |
Other Securities | | | | | | | | | | | 13,763,735 | | | | | | | 0.9% |
| | | | | | | | | | | | | | | | | | |
| | | | | |
CANADA — (8.2%) | | | | | | | | | | | | | | | | | | |
Bank of Nova Scotia | | | 143,627 | | | | | | | | 7,698,880 | | | | | | | 0.5% |
Barrick Gold Corp. | | | 134,300 | | | | | | | | 6,468,101 | | | | | | | 0.4% |
#Royal Bank of Canada | | | 197,437 | | | | | | | | 10,529,070 | | | | | | | 0.7% |
#Suncor Energy, Inc. | | | 218,807 | | | | | | | | 7,011,092 | | | | | | | 0.4% |
#Toronto Dominion Bank | | | 123,084 | | | | | | | | 8,864,124 | | | | | | | 0.5% |
Other Securities | | | | | | | | | | | 114,226,471 | | | | | | | 7.1% |
| | | | | | | | | | | | | | | | | | |
TOTAL CANADA | | | | | | | | | | | 154,797,738 | | | | | | | 9.6% |
| | | | | | | | | | | | | | | | | | |
| | | | | |
DENMARK — (0.9%) | | | | | | | | | | | | | | | | | | |
Other Securities | | | | | | | | | | | 16,628,023 | | | | | | | 1.0% |
| | | | | | | | | | | | | | | | | | |
FINLAND — (0.8%) | | | | | | | | | | | | | | | | | | |
Other Securities | | | | | | | | | | | 15,956,153 | | | | | | | 1.0% |
| | | | | | | | | | | | | | | | | | |
| | | | | |
FRANCE — (7.7%) | | | | | | | | | | | | | | | | | | |
BNP Paribas SA | | | 132,074 | | | | | | | | 9,660,674 | | | | | | | 0.6% |
GDF Suez SA | | | 171,224 | | | | | | | | 6,841,628 | | | | | | | 0.4% |
Sanofi-Aventis SA | | | 94,781 | | | | | | | | 6,640,547 | | | | | | | 0.4% |
Total SA | | | 162,315 | | | | | | | | 8,835,490 | | | | | | | 0.6% |
#Total SA Sponsored ADR | | | 137,800 | | | | | | | | 7,507,344 | | | | | | | 0.5% |
Other Securities | | | | | | | | | | | 105,832,214 | | | | | | | 6.5% |
| | | | | | | | | | | | | | | | | | |
TOTAL FRANCE | | | | | | | | | | | 145,317,897 | | | | | | | 9.0% |
| | | | | | | | | | | | | | | | | | |
| | | | | |
GERMANY — (6.1%) | | | | | | | | | | | | | | | | | | |
BASF SE | | | 116,835 | | | | | | | | 8,524,536 | | | | | | | 0.5% |
*Daimler AG | | | 128,352 | | | | | | | | 8,481,943 | | | | | | | 0.5% |
Deutsche Bank AG | | | 125,817 | | | | | | | | 7,282,288 | | | | | | | 0.5% |
E.ON AG | | | 200,538 | | | | | | | | 6,288,090 | | | | | | | 0.4% |
#Siemens AG Sponsored ADR | | | 67,650 | | | | | | | | 7,733,072 | | | | | | | 0.5% |
Other Securities | | | | | | | | | | | 77,748,453 | | | | | | | 4.8% |
| | | | | | | | | | | | | | | | | | |
TOTAL GERMANY | | | | | | | | | | | 116,058,382 | | | | | | | 7.2% |
| | | | | | | | | | | | | | | | | | |
| | | | | |
GREECE — (0.2%) | | | | | | | | | | | | | | | | | | |
Other Securities | | | | | | | | | | | 3,758,613 | | | | | | | 0.2% |
| | | | | | | | | | | | | | | | | | |
| | | | | |
HONG KONG — (2.0%) | | | | | | | | | | | | | | | | | | |
Other Securities | | | | | | | | | | | 37,457,138 | | | | | | | 2.3% |
| | | | | | | | | | | | | | | | | | |
| | | | | |
IRELAND — (0.2%) | | | | | | | | | | | | | | | | | | |
Other Securities | | | | | | | | | | | 2,934,464 | | | | | | | 0.2% |
| | | | | | | | | | | | | | | | | | |
60
LARGE CAP INTERNATIONAL PORTFOLIO
CONTINUED
| | | | | | | | | | | | | | | | | | |
| | | Shares | | | | | | Value†† | | | Percentage
of Net Assets** |
ISRAEL — (0.6%) | | | | | | | | | | | | | | | | | | |
Teva Pharmaceutical Industries, Ltd. Sponsored ADR | | | 126,954 | | | | | | | $ | 6,588,913 | | | | | | | 0.4% |
Other Securities | | | | | | | | | | | 4,281,818 | | | | | | | 0.3% |
| | | | | | | | | | | | | | | | | | |
TOTAL ISRAEL | | | | | | | | | | | 10,870,731 | | | | | | | 0.7% |
| | | | | | | | | | | | | | | | | | |
| | | | | |
ITALY — (2.2%) | | | | | | | | | | | | | | | | | | |
Other Securities | | | | | | | | | | | 42,464,095 | | | | | | | 2.6% |
| | | | | | | | | | | | | | | | | | |
| | | | | |
JAPAN — (16.7%) | | | | | | | | | | | | | | | | | | |
Mitsubishi UFJ Financial Group, Inc. ADR | | | 1,455,897 | | | | | | | | 6,784,480 | | | | | | | 0.4% |
Toyota Motor Corp. | | | 228,700 | | | | | | | | 8,100,615 | | | | | | | 0.5% |
Other Securities | | | | | | | | | | | 301,828,055 | | | | | | | 18.7% |
| | | | | | | | | | | | | | | | | | |
TOTAL JAPAN | | | | | | | | | | | 316,713,150 | | | | | | | 19.6% |
| | | | | | | | | | | | | | | | | | |
| | | | | |
NETHERLANDS — (2.3%) | | | | | | | | | | | | | | | | | | |
Unilever NV | | | 218,517 | | | | | | | | 6,489,351 | | | | | | | 0.4% |
Other Securities | | | | | | | | | | | 37,175,256 | | | | | | | 2.3% |
| | | | | | | | | | | | | | | | | | |
TOTAL NETHERLANDS | | | | | | | | | | | 43,664,607 | | | | | | | 2.7% |
| | | | | | | | | | | | | | | | | | |
| | | | | |
NEW ZEALAND — (0.1%) | | | | | | | | | | | | | | | | | | |
Other Securities | | | | | | | | | | | 1,490,718 | | | | | | | 0.1% |
| | | | | | | | | | | | | | | | | | |
| | | | | |
NORWAY — (0.9%) | | | | | | | | | | | | | | | | | | |
Other Securities | | | | | | | | | | | 16,306,929 | | | | | | | 1.0% |
| | | | | | | | | | | | | | | | | | |
| | | | | |
PORTUGAL — (0.2%) | | | | | | | | | | | | | | | | | | |
Other Securities | | | | | | | | | | | 4,251,531 | | | | | | | 0.3% |
| | | | | | | | | | | | | | | | | | |
| | | | | |
SINGAPORE — (1.3%) | | | | | | | | | | | | | | | | | | |
Other Securities | | | | | | | | | | | 24,228,772 | | | | | | | 1.5% |
| | | | | | | | | | | | | | | | | | |
| | | | | |
SPAIN — (3.0%) | | | | | | | | | | | | | | | | | | |
#Banco Bilbao Vizcaya Argentaria SA Sponsored ADR | | | 491,102 | | | | | | | | 6,457,991 | | | | | | | 0.4% |
#Banco Santander SA Sponsored ADR | | | 853,568 | | | | | | | | 10,934,206 | | | | | | | 0.7% |
#Telefonica SA Sponsored ADR | | | 135,963 | | | | | | | | 11,032,038 | | | | | | | 0.7% |
Other Securities | | | | | | | | | | | 28,301,195 | | | | | | | 1.7% |
| | | | | | | | | | | | | | | | | | |
TOTAL SPAIN | | | | | | | | | | | 56,725,430 | | | | | | | 3.5% |
| | | | | | | | | | | | | | | | | | |
| | | | | |
SWEDEN — (2.2%) | | | | | | | | | | | | | | | | | | |
Other Securities | | | | | | | | | | | 42,437,882 | | | | | | | 2.6% |
| | | | | | | | | | | | | | | | | | |
| | | | | |
SWITZERLAND — (5.9%) | | | | | | | | | | | | | | | | | | |
Nestle SA | | | 471,890 | | | | | | | | 25,847,536 | | | | | | | 1.6% |
Novartis AG | | | 151,030 | | | | | | | | 8,751,091 | | | | | | | 0.5% |
#*Novartis AG ADR | | | 141,600 | | | | | | | | 8,205,720 | | | | | | | 0.5% |
#Roche Holding AG Genusschein | | | 97,207 | | | | | | | | 14,275,254 | | | | | | | 0.9% |
#*UBS AG | | | 478,710 | | | | | | | | 8,132,107 | | | | | | | 0.5% |
Other Securities | | | | | | | | | | | 46,782,377 | | | | | | | 2.9% |
| | | | | | | | | | | | | | | | | | |
TOTAL SWITZERLAND | | | | | | | | | | | 111,994,085 | | | | | | | 6.9% |
| | | | | | | | | | | | | | | | | | |
| | | | | |
UNITED KINGDOM — (16.0%) | | | | | | | | | | | | | | | | | | |
Anglo American P.L.C. | | | 186,195 | | | | | | | | 8,675,422 | | | | | | | 0.5% |
AstraZeneca P.L.C. | | | 123,555 | | | | | | | | 6,215,085 | | | | | | | 0.4% |
BG Group P.L.C. | | | 348,779 | | | | | | | | 6,789,416 | | | | | | | 0.4% |
BHP Billiton P.L.C. ADR | | | 89,700 | | | | | | | | 6,350,760 | | | | | | | 0.4% |
#*BP P.L.C. Sponsored ADR | | | 196,119 | | | | | | | | 8,007,539 | | | | | | | 0.5% |
British American Tobacco P.L.C. | | | 232,362 | | | | | | | | 8,852,178 | | | | | | | 0.5% |
GlaxoSmithKline P.L.C. | | | 478,323 | | | | | | | | 9,340,518 | | | | | | | 0.6% |
HSBC Holdings P.L.C. | | | 1,180,768 | | | | | | | | 12,289,079 | | | | | | | 0.8% |
#HSBC Holdings P.L.C. Sponsored ADR | | | 234,056 | | | | | | | | 12,196,658 | | | | | | | 0.7% |
Rio Tinto P.L.C. | | | 140,777 | | | | | | | | 9,143,554 | | | | | | | 0.6% |
61
LARGE CAP INTERNATIONAL PORTFOLIO
CONTINUED
| | | | | | | | | | | | | | | | | | |
| | | Shares | | | | | | Value†† | | | Percentage
of Net Assets** |
UNITED KINGDOM — (Continued) | | | | | | | | | | | | | | | | | | |
#Royal Dutch Shell P.L.C. ADR | | | 344,141 | | | | | | | $ | 22,135,149 | | | | | | | 1.4% |
Royal Dutch Shell P.L.C. Series B | | | 195,121 | | | | | | | | 6,244,225 | | | | | | | 0.4% |
Standard Chartered P.L.C. | | | 259,989 | | | | | | | | 7,520,185 | | | | | | | 0.5% |
Tesco P.L.C. | | | 1,059,552 | | | | | | | | 7,251,211 | | | | | | | 0.4% |
Vodafone Group P.L.C. | | | 3,189,133 | | | | | | | | 8,717,874 | | | | | | | 0.5% |
Vodafone Group P.L.C. Sponsored ADR | | | 384,600 | | | | | | | | 10,580,346 | | | | | | | 0.7% |
Other Securities | | | | | | | | | | | 152,293,978 | | | | | | | 9.4% |
| | | | | | | | | | | | | | | | | | |
TOTAL UNITED KINGDOM | | | | | | | | | | | 302,603,177 | | | | | | | 18.7% |
| | | | | | | | | | | | | | | | | | |
TOTAL COMMON STOCKS | | | | | | | | | | | 1,606,854,859 | | | | | | | 99.4% |
| | | | | | | | | | | | | | | | | | |
PREFERRED STOCKS — (0.1%) | | | | | | | | | | | | | | | | | | |
GERMANY — (0.0%) | | | | | | | | | | | | | | | | | | |
Other Securities | | | | | | | | | | | 1,067,033 | | | | | | | 0.1% |
| | | | | | | | | | | | | | | | | | |
| | | | | |
RIGHTS/WARRANTS — (0.0%) | | | | | | | | | | | | | | | | | | |
AUSTRIA — (0.0%) | | | | | | | | | | | | | | | | | | |
Other Securities | | | | | | | | | | | 33 | | | | | | | 0.0% |
| | | | | | | | | | | | | | | | | | |
| | | | | |
BELGIUM — (0.0%) | | | | | | | | | | | | | | | | | | |
Other Securities | | | | | | | | | | | 4 | | | | | | | 0.0% |
| | | | | | | | | | | | | | | | | | |
| | | | | |
UNITED KINGDOM — (0.0%) | | | | | | | | | | | | | | | | | | |
Other Securities | | | | | | | | | | | 940,877 | | | | | | | 0.1% |
| | | | | | | | | | | | | | | | | | |
TOTAL RIGHTS/WARRANTS | | | | | | | | | | | 940,914 | | | | | | | 0.1% |
| | | | | | | | | | | | | | | | | | |
| | | | | |
| | | Face Amount | | | | | | Value† | | | | | | |
| | | (000) | | | | | | | | | | | | |
TEMPORARY CASH INVESTMENTS — (0.0%) | | | | | | | | | | | | | | | | | | |
Repurchase Agreement, PNC Capital Markets, Inc. 0.19%,
11/01/10 (Collateralized by $585,000 FHLMC 5.00%, 10/15/19,
valued at $661,781) to be repurchased at $647,010 | | | $647 | | | | | | | | 647,000 | | | | | | | 0.0% |
| | | | | | | | | | | | | | | | | | |
| | | | | |
| | | Shares/ Face Amount | | | | | | | | | | | | |
| | | (000) | | | | | | | | | | | | |
SECURITIES LENDING COLLATERAL — (15.1%) | | | | | | | | | | | | | | | | | | |
§@DFA Short Term Investment Fund | | | 282,774,040 | | | | | | | | 282,774,040 | | | | | | | 17.5% |
@Repurchase Agreement, Deutsche Bank Securities, Inc. 0.22%,
11/01/10 (Collateralized by $42,295,271 FNMA 7.000%,
08/01/38, valued at $2,553,855)## to be repurchased at
$2,503,825 | | $ | 2,504 | | | | | | | | 2,503,779 | | | | | | | 0.1% |
| | | | | | | | | | | | | | | | | | |
TOTAL SECURITIES LENDING COLLATERAL | | | | | | | | | | | 285,277,819 | | | | | | | 17.6% |
| | | | | | | | | | | | | | | | | | |
| | | | | |
TOTAL INVESTMENTS — (100.0%)
(Cost $1,669,476,129) | | | | | | | | | | $ | 1,894,787,625 | | | | | | | 117.2% |
| | | | | | | | | | | | | | | | | | |
62
LARGE CAP INTERNATIONAL PORTFOLIO
CONTINUED
Summary of inputs used to value the Portfolio’s investments as of October 31, 2010 is as follows (See Security Valuation Note):
| | | | | | | | | | | | | | | | | | | | | | | | |
| | | Valuation Inputs | |
| |
| | | Investment in Securities (Market Value) | |
| | | Level 1 | | | Level 2 | | | Level 3 | | | Total | |
Common Stocks | | | | | | | | | | | | | | | | | | | | | | | | |
Australia | | $ | 9,171,654 | | | $ | 112,763,381 | | | | | | | | — | | | | | | | $ | 121,935,035 | |
Austria | | | 73,080 | | | | 4,423,494 | | | | | | | | — | | | | | | | | 4,496,574 | |
Belgium | | | 2,138,712 | | | | 11,625,023 | | | | | | | | — | | | | | | | | 13,763,735 | |
Canada | | | 154,797,738 | | | | — | | | | | | | | — | | | | | | | | 154,797,738 | |
Denmark | | | 2,780,449 | | | | 13,847,574 | | | | | | | | — | | | | | | | | 16,628,023 | |
Finland | | | 2,660,444 | | | | 13,295,709 | | | | | | | | — | | | | | | | | 15,956,153 | |
France | | | 16,049,842 | | | | 129,268,055 | | | | | | | | — | | | | | | | | 145,317,897 | |
Germany | | | 27,409,378 | | | | 88,649,004 | | | | | | | | — | | | | | | | | 116,058,382 | |
Greece | | | 398,221 | | | | 3,360,392 | | | | | | | | — | | | | | | | | 3,758,613 | |
Hong Kong | | | 618 | | | | 37,456,520 | | | | | | | | — | | | | | | | | 37,457,138 | |
Ireland | | | 1,196,219 | | | | 1,738,245 | | | | | | | | — | | | | | | | | 2,934,464 | |
Israel | | | 6,854,316 | | | | 4,016,415 | | | | | | | | — | | | | | | | | 10,870,731 | |
Italy | | | 5,849,445 | | | | 36,614,650 | | | | | | | | — | | | | | | | | 42,464,095 | |
Japan | | | 34,598,078 | | | | 282,115,072 | | | | | | | | — | | | | | | | | 316,713,150 | |
Netherlands | | | 4,592,088 | | | | 39,072,519 | | | | | | | | — | | | | | | | | 43,664,607 | |
New Zealand | | | — | | | | 1,490,718 | | | | | | | | — | | | | | | | | 1,490,718 | |
Norway | | | 1,065,326 | | | | 15,241,603 | | | | | | | | — | | | | | | | | 16,306,929 | |
Portugal | | | 292,320 | | | | 3,959,211 | | | | | | | | — | | | | | | | | 4,251,531 | |
Singapore | | | 29,038 | | | | 24,199,734 | | | | | | | | — | | | | | | | | 24,228,772 | |
Spain | | | 30,603,438 | | | | 26,121,992 | | | | | | | | — | | | | | | | | 56,725,430 | |
Sweden | | | 702,015 | | | | 41,735,867 | | | | | | | | — | | | | | | | | 42,437,882 | |
Switzerland | | | 16,303,487 | | | | 95,690,598 | | | | | | | | — | | | | | | | | 111,994,085 | |
United Kingdom | | | 95,595,475 | | | | 207,007,702 | | | | | | | | — | | | | | | | | 302,603,177 | |
Preferred Stocks | | | | | | | | | | | | | | | | | | | | | | | | |
Germany | | | — | | | | 1,067,033 | | | | | | | | — | | | | | | | | 1,067,033 | |
Rights/Warrants | | | | | | | | | | | | | | | | | | | | | | | | |
Austria | | | — | | | | 33 | | | | | | | | — | | | | | | | | 33 | |
Belgium | | | 4 | | | | — | | | | | | | | — | | | | | | | | 4 | |
United Kingdom | | | — | | | | 940,877 | | | | | | | | — | | | | | | | | 940,877 | |
Temporary Cash Investments | | | — | | | | 647,000 | | | | | | | | — | | | | | | | | 647,000 | |
Securities Lending Collateral | | | — | | | | 285,277,819 | | | | | | | | — | | | | | | | | 285,277,819 | |
| | | | | | | | | | | | | | | | | | | | | | | | |
TOTAL | | $ | 413,161,385 | | | $ | 1,481,626,240 | | | | | | | | — | | | | | | | $ | 1,894,787,625 | |
| | | | | | | | | | | | | | | | | | | | | | | | |
See accompanying Notes to Financial Statements.
63
INTERNATIONAL CORE EQUITY PORTFOLIO
SUMMARY SCHEDULE OF PORTFOLIO HOLDINGS
October 31, 2010
| | | | | | | | | | | | | | | | | | |
| | | Shares | | | | | | Value†† | | | Percentage
of Net Assets** |
COMMON STOCKS — (85.2%) | | | | | | | | | | | | | | | | | | |
AUSTRALIA — (5.8%) | | | | | | | | | | | | | | | | | | |
Australia & New Zealand Banking Group, Ltd. | | | 658,301 | | | | | | | $ | 16,060,353 | | | | | | | 0.3% |
Commonwealth Bank of Australia NL | | | 254,892 | | | | | | | | 12,253,461 | | | | | | | 0.3% |
National Australia Bank, Ltd. | | | 526,770 | | | | | | | | 13,184,161 | | | | | | | 0.3% |
Wesfarmers, Ltd. | | | 361,256 | | | | | | | | 11,754,042 | | | | | | | 0.2% |
Other Securities | | | | | | | | | | | 278,536,710 | | | | | | | 5.7% |
| | | | | | | | | | | | | | | | | | |
TOTAL AUSTRALIA | | | | | | | | | | | 331,788,727 | | | | | | | 6.8% |
| | | | | | | | | | | | | | | | | | |
| | | | | |
AUSTRIA — (0.5%) | | | | | | | | | | | | | | | | | | |
Other Securities | | | | | | | | | | | 28,018,523 | | | | | | | 0.6% |
| | | | | | | | | | | | | | | | | | |
| | | | | |
BELGIUM — (1.0%) | | | | | | | | | | | | | | | | | | |
Other Securities | | | | | | | | | | | 54,855,611 | | | | | | | 1.1% |
| | | | | | | | | | | | | | | | | | |
| | | | | |
CANADA — (8.9%) | | | | | | | | | | | | | | | | | | |
#Bank of Montreal | | | 202,373 | | | | | | | | 11,951,099 | | | | | | | 0.2% |
Suncor Energy, Inc. | | | 402,417 | | | | | | | | 12,894,389 | | | | | | | 0.3% |
Teck Resources, Ltd. Class B | | | 337,587 | | | | | | | | 15,093,604 | | | | | | | 0.3% |
#Toronto Dominion Bank | | | 235,160 | | | | | | | | 16,935,486 | | | | | | | 0.4% |
Other Securities | | | | | | | | | | | 447,414,758 | | | | | | | 9.2% |
| | | | | | | | | | | | | | | | | | |
TOTAL CANADA | | | | | | | | | | | 504,289,336 | | | | | | | 10.4% |
| | | | | | | | | | | | | | | | | | |
| | | | | |
DENMARK — (0.8%) | | | | | | | | | | | | | | | | | | |
Other Securities | | | | | | | | | | | 48,333,458 | | | | | | | 1.0% |
| | | | | | | | | | | | | | | | | | |
| | | | | |
FINLAND — (1.4%) | | | | | | | | | | | | | | | | | | |
Other Securities | | | | | | | | | | | 81,547,312 | | | | | | | 1.7% |
| | | | | | | | | | | | | | | | | | |
| | | | | |
FRANCE — (7.2%) | | | | | | | | | | | | | | | | | | |
BNP Paribas SA | | | 331,407 | | | | | | | | 24,241,068 | | | | | | | 0.5% |
GDF Suez SA | | | 425,977 | | | | | | | | 17,020,838 | | | | | | | 0.3% |
*Sanofi-Aventis SA ADR | | | 530,172 | | | | | | | | 18,614,339 | | | | | | | 0.4% |
Schneider Electric SA | | | 88,768 | | | | | | | | 12,612,315 | | | | | | | 0.3% |
Societe Generale Paris SA | | | 219,316 | | | | | | | | 13,151,265 | | | | | | | 0.3% |
#Total SA Sponsored ADR | | | 338,384 | | | | | | | | 18,435,160 | | | | | | | 0.4% |
Vivendi SA | | | 419,021 | | | | | | | | 11,973,602 | | | | | | | 0.2% |
Other Securities | | | | | | | | | | | 290,774,088 | | | | | | | 6.0% |
| | | | | | | | | | | | | | | | | | |
TOTAL FRANCE | | | | | | | | | | | 406,822,675 | | | | | | | 8.4% |
| | | | | | | | | | | | | | | | | | |
| | | | | |
GERMANY — (5.4%) | | | | | | | | | | | | | | | | | | |
#Allianz SE Sponsored ADR | | | 984,886 | | | | | | | | 12,340,622 | | | | | | | 0.2% |
*Daimler AG | | | 266,387 | | | | | | | | 17,603,773 | | | | | | | 0.4% |
Deutsche Bank AG | | | 242,074 | | | | | | | | 13,944,899 | | | | | | | 0.3% |
Munchener Rueckversicherungs-Gesellschaft AG | | | 80,131 | | | | | | | | 12,524,534 | | | | | | | 0.2% |
#Siemens AG Sponsored ADR | | | 125,474 | | | | | | | | 14,342,933 | | | | | | | 0.3% |
Other Securities | | | | | | | | | | | 236,474,016 | | | | | | | 4.9% |
| | | | | | | | | | | | | | | | | | |
TOTAL GERMANY | | | | | | | | | | | 307,230,777 | | | | | | | 6.3% |
| | | | | | | | | | | | | | | | | | |
| | | | | |
GREECE — (0.5%) | | | | | | | | | | | | | | | | | | |
Other Securities | | | | | | | | | | | 29,400,700 | | | | | | | 0.6% |
| | | | | | | | | | | | | | | | | | |
| | | | | |
HONG KONG — (2.2%) | | | | | | | | | | | | | | | | | | |
Other Securities | | | | | | | | | | | 123,798,216 | | | | | | | 2.5% |
| | | | | | | | | | | | | | | | | | |
| | | | | |
IRELAND — (0.5%) | | | | | | | | | | | | | | | | | | |
Other Securities | | | | | | | | | | | 27,024,342 | | | | | | | 0.5% |
| | | | | | | | | | | | | | | | | | |
| | | | | |
ISRAEL — (0.8%) | | | | | | | | | | | | | | | | | | |
Teva Pharmaceutical Industries, Ltd. Sponsored ADR | | | 368,163 | | | | | | | | 19,107,660 | | | | | | | 0.4% |
64
INTERNATIONAL CORE EQUITY PORTFOLIO
CONTINUED
| | | | | | | | | | | | | | | | | | |
| | | Shares | | | | | | Value†† | | | Percentage
of Net Assets** |
ISRAEL — (Continued) | | | | | | | | | | | | | | | | | | |
Other Securities | | | | | | | | | | $ | 25,886,858 | | | | | | | 0.5% |
| | | | | | | | | | | | | | | | | | |
TOTAL ISRAEL | | | | | | | | | | | 44,994,518 | | | | | | | 0.9% |
| | | | | | | | | | | | | | | | | | |
| | | | | |
ITALY — (2.3%) | | | | | | | | | | | | | | | | | | |
UniCredit SpA | | | 5,518,028 | | | | | | | | 14,385,868 | | | | | | | 0.3% |
Other Securities | | | | | | | | | | | 115,484,360 | | | | | | | 2.4% |
| | | | | | | | | | | | | | | | | | |
TOTAL ITALY | | | | | | | | | | | 129,870,228 | | | | | | | 2.7% |
| | | | | | | | | | | | | | | | | | |
| | | | | |
JAPAN — (16.2%) | | | | | | | | | | | | | | | | | | |
#Honda Motor Co., Ltd. Sponsored ADR | | | 409,732 | | | | | | | | 14,762,644 | | | | | | | 0.3% |
Mitsubishi UFJ Financial Group, Inc. | | | 2,706,300 | | | | | | | | 12,559,949 | | | | | | | 0.3% |
Sumitomo Mitsui Financial Group, Inc. | | | 484,058 | | | | | | | | 14,448,040 | | | | | | | 0.3% |
#*Toyota Motor Corp. Sponsored ADR | | | 312,041 | | | | | | | | 22,098,744 | | | | | | | 0.4% |
Other Securities | | | | | | | | | | | 853,802,115 | | | | | | | 17.5% |
| | | | | | | | | | | | | | | | | | |
TOTAL JAPAN | | | | | | | | | | | 917,671,492 | | | | | | | 18.8% |
| | | | | | | | | | | | | | | | | | |
| | | | | |
NETHERLANDS — (2.3%) | | | | | | | | | | | | | | | | | | |
#*ING Groep NV Sponsored ADR | | | 1,565,969 | | | | | | | | 16,881,146 | | | | | | | 0.3% |
Other Securities | | | | | | | | | | | 114,912,653 | | | | | | | 2.4% |
| | | | | | | | | | | | | | | | | | |
TOTAL NETHERLANDS | | | | | | | | | | | 131,793,799 | | | | | | | 2.7% |
| | | | | | | | | | | | | | | | | | |
| | | | | |
NEW ZEALAND — (0.2%) | | | | | | | | | | | | | | | | | | |
Other Securities | | | | | | | | | | | 12,018,251 | | | | | | | 0.2% |
| | | | | | | | | | | | | | | | | | |
| | | | | |
NORWAY — (1.0%) | | | | | | | | | | | | | | | | | | |
Other Securities | | | | | | | | | | | 54,269,344 | | | | | | | 1.1% |
| | | | | | | | | | | | | | | | | | |
| | | | | |
PORTUGAL — (0.3%) | | | | | | | | | | | | | | | | | | |
Other Securities | | | | | | | | | | | 19,359,124 | | | | | | | 0.4% |
| | | | | | | | | | | | | | | | | | |
| | | | | |
SINGAPORE — (1.4%) | | | | | | | | | | | | | | | | | | |
Other Securities | | | | | | | | | | | 81,994,738 | | | | | | | 1.7% |
| | | | | | | | | | | | | | | | | | |
| | | | | |
SPAIN — (2.1%) | | | | | | | | | | | | | | | | | | |
#Banco Santander SA Sponsored ADR | | | 2,151,591 | | | | | | | | 27,561,881 | | | | | | | 0.6% |
Other Securities | | | | | | | | | | | 92,402,501 | | | | | | | 1.9% |
| | | | | | | | | | | | | | | | | | |
TOTAL SPAIN | | | | | | | | | | | 119,964,382 | | | | | | | 2.5% |
| | | | | | | | | | | | | | | | | | |
| | | | | |
SWEDEN — (2.4%) | | | | | | | | | | | | | | | | | | |
#Nordea Bank AB | | | 1,048,729 | | | | | | | | 11,547,196 | | | | | | | 0.2% |
Other Securities | | | | | | | | | | | 123,522,700 | | | | | | | 2.6% |
| | | | | | | | | | | | | | | | | | |
TOTAL SWEDEN | | | | | | | | | | | 135,069,896 | | | | | | | 2.8% |
| | | | | | | | | | | | | | | | | | |
| | | | | |
SWITZERLAND — (5.4%) | | | | | | | | | | | | | | | | | | |
Compagnie Financiere Richemont SA Series A | | | 232,579 | | | | | | | | 11,600,624 | | | | | | | 0.2% |
#Credit Suisse Group AG Sponsored ADR | | | 405,680 | | | | | | | | 16,835,720 | | | | | | | 0.3% |
#Holcim, Ltd. AG | | | 196,366 | | | | | | | | 12,232,874 | | | | | | | 0.3% |
Nestle SA | | | 546,164 | | | | | | | | 29,915,857 | | | | | | | 0.6% |
#*Novartis AG ADR | | | 478,626 | | | | | | | | 27,736,377 | | | | | | | 0.6% |
#Roche Holding AG Genusschein | | | 82,873 | | | | | | | | 12,170,246 | | | | | | | 0.3% |
#*UBS AG | | | 838,389 | | | | | | | | 14,242,170 | | | | | | | 0.3% |
Zurich Financial Services AG | | | 80,500 | | | | | | | | 19,699,753 | | | | | | | 0.4% |
Other Securities | | | | | | | | | | | 165,107,010 | | | | | | | 3.4% |
| | | | | | | | | | | | | | | | | | |
TOTAL SWITZERLAND | | | | | | | | | | | 309,540,631 | | | | | | | 6.4% |
| | | | | | | | | | | | | | | | | | |
| | | | | |
UNITED KINGDOM — (16.6%) | | | | | | | | | | | | | | | | | | |
Anglo American P.L.C. | | | 536,326 | | | | | | | | 24,989,149 | | | | | | | 0.5% |
Barclays P.L.C. Sponsored ADR | | | 1,016,357 | | | | | | | | 17,938,701 | | | | | | | 0.4% |
BG Group P.L.C. | | | 598,458 | | | | | | | | 11,649,727 | | | | | | | 0.2% |
65
INTERNATIONAL CORE EQUITY PORTFOLIO
CONTINUED
| | | | | | | | | | | | | | | | | | |
| | | Shares | | | | | | Value†† | | | Percentage
of Net Assets** |
UNITED KINGDOM — (Continued) | | | | | | | | | | | | | | | | | | |
*BP P.L.C. Sponsored ADR | | | 717,376 | | | | | | | $ | 29,290,462 | | | | | | | 0.6% |
#HSBC Holdings P.L.C. Sponsored ADR | | | 1,196,015 | | | | | | | | 62,324,342 | | | | | | | 1.3% |
*Lloyds Banking Group P.L.C. | | | 11,686,370 | | | | | | | | 12,844,830 | | | | | | | 0.3% |
#Rio Tinto P.L.C. Sponsored ADR | | | 182,907 | | | | | | | | 11,910,904 | | | | | | | 0.2% |
#Royal Dutch Shell P.L.C. ADR | | | 1,054,306 | | | | | | | | 67,812,962 | | | | | | | 1.4% |
SABmiller P.L.C. | | | 396,880 | | | | | | | | 12,876,248 | | | | | | | 0.3% |
Standard Chartered P.L.C. | | | 837,301 | | | | | | | | 24,218,941 | | | | | | | 0.5% |
Tesco P.L.C. | | | 1,793,199 | | | | | | | | 12,272,040 | | | | | | | 0.3% |
Vodafone Group P.L.C. Sponsored ADR | | | 1,797,431 | | | | | | | | 49,447,327 | | | | | | | 1.0% |
Xstrata P.L.C. | | | 782,713 | | | | | | | | 15,163,801 | | | | | | | 0.3% |
Other Securities | | | | | | | | | | | 589,678,026 | | | | | | | 12.1% |
| | | | | | | | | | | | | | | | | | |
TOTAL UNITED KINGDOM | | | | | | | | | | | 942,417,460 | | | | | | | 19.4% |
| | | | | | | | | | | | | | | | | | |
TOTAL COMMON STOCKS | | | | | | | | | | | 4,842,073,540 | | | | | | | 99.5% |
| | | | | | | | | | | | | | | | | | |
PREFERRED STOCKS — (0.0%) | | | | | | | | | | | | | | | | | | |
AUSTRALIA — (0.0%) | | | | | | | | | | | | | | | | | | |
Other Securities | | | | | | | | | | | 139,214 | | | | | | | 0.0% |
| | | | | | | | | | | | | | | | | | |
| | | | | |
GERMANY — (0.0%) | | | | | | | | | | | | | | | | | | |
Other Securities | | | | | | | | | | | 1,135,420 | | | | | | | 0.0% |
| | | | | | | | | | | | | | | | | | |
TOTAL PREFERRED STOCKS | | | | | | | | | | | 1,274,634 | | | | | | | 0.0% |
| | | | | | | | | | | | | | | | | | |
RIGHTS/WARRANTS — (0.1%) | | | | | | | | | | | | | | | | | | |
AUSTRALIA — (0.0%) | | | | | | | | | | | | | | | | | | |
Other Securities | | | | | | | | | | | 15,632 | | | | | | | 0.0% |
| | | | | | | | | | | | | | | | | | |
| | | | | |
AUSTRIA — (0.0%) | | | | | | | | | | | | | | | | | | |
Other Securities | | | | | | | | | | | 898 | | | | | | | 0.0% |
| | | | | | | | | | | | | | | | | | |
| | | | | |
BELGIUM — (0.0%) | | | | | | | | | | | | | | | | | | |
Other Securities | | | | | | | | | | | 1,473 | | | | | | | 0.0% |
| | | | | | | | | | | | | | | | | | |
| | | | | |
FRANCE — (0.0%) | | | | | | | | | | | | | | | | | | |
Other Securities | | | | | | | | | | | 46,795 | | | | | | | 0.0% |
| | | | | | | | | | | | | | | | | | |
| | | | | |
HONG KONG — (0.0%) | | | | | | | | | | | | | | | | | | |
Other Securities | | | | | | | | | | | 5,177 | | | | | | | 0.0% |
| | | | | | | | | | | | | | | | | | |
| | | | | |
ITALY — (0.0%) | | | | | | | | | | | | | | | | | | |
Other Securities | | | | | | | | | | | 840 | | | | | | | 0.0% |
| | | | | | | | | | | | | | | | | | |
| | | | | |
JAPAN — (0.0%) | | | | | | | | | | | | | | | | | | |
Other Securities | | | | | | | | | | | — | | | | | | | 0.0% |
| | | | | | | | | | | | | | | | | | |
| | | | | |
UNITED KINGDOM — (0.1%) | | | | | | | | | | | | | | | | | | |
Other Securities | | | | | | | | | | | 3,034,512 | | | | | | | 0.0% |
| | | | | | | | | | | | | | | | | | |
TOTAL RIGHTS/WARRANTS | | | | | | | | | | | 3,105,327 | | | | | | | 0.0% |
| | | | | | | | | | | | | | | | | | |
| | | Face
Amount | | | | | | Value† | | | | | | |
| | | (000) | | | | | | | | | | | | |
TEMPORARY CASH INVESTMENTS — (0.1%) | | | | | | | | | | | | | | | | | | |
Repurchase Agreement, PNC Capital Markets, Inc. 0.19%,
11/01/10 (Collateralized by $7,960,000 FNMA 4.00%, 09/01/24,
valued at $6,961,597) to be repurchased at $8,115,128 | | | $8,115 | | | | | | | | 8,115,000 | | | | | | | 0.2% |
| | | | | | | | | | | | | | | | | | |
66
INTERNATIONAL CORE EQUITY PORTFOLIO
CONTINUED
| | | | | | | | | | | | | | | | | | |
| | | Shares/ Face Amount | | | | | | Value† | | | Percentage
of Net Assets** |
| | | (000) | | | | | | | | | | | | |
SECURITIES LENDING COLLATERAL — (14.6%) | | | | | | | | | | | | | | | | | | |
§@DFA Short Term Investment Fund | | | 826,241,868 | | | | | | | $ | 826,241,868 | | | | | | | 17.0% |
@Repurchase Agreement, Deutsche Bank Securities, Inc. 0.22%,
11/01/10 (Collateralized by $42,295,271 FNMA 7.000%,
08/01/38, valued at $1,118,211)## to be repurchased at
$1,096,305 | | | $1,096 | | | | | | | | 1,096,285 | | | | | | | 0.0% |
| | | | | | | | | | | | | | | | | | |
TOTAL SECURITIES LENDING COLLATERAL | | | | | | | | | | | 827,338,153 | | | | | | | 17.0% |
| | | | | | | | | | | | | | | | | | |
TOTAL INVESTMENTS — (100.0%)
(Cost $5,623,297,840) | | | | | | | | | | $ | 5,681,906,654 | | | | | | | 116.7% |
| | | | | | | | | | | | | | | | | | |
67
INTERNATIONAL CORE EQUITY PORTFOLIO
CONTINUED
Summary of inputs used to value the Portfolio’s investments as of October 31, 2010 is as follows (See Security Valuation Note):
| | | | | | | | | | | | | | | | | | | | | | | | |
| | | Valuation Inputs | |
| |
| | | Investment in Securities (Market Value) | |
| | | Level 1 | | | Level 2 | | | Level 3 | | | Total | |
Common Stocks | | | | | | | | | | | | | | | | | | | | | | | | |
Australia | | $ | 18,468,595 | | | $ | 313,320,132 | | | | | | | | — | | | | | | | $ | 331,788,727 | |
Austria | | | 127,890 | | | | 27,890,633 | | | | | | | | — | | | | | | | | 28,018,523 | |
Belgium | | | 4,617,807 | | | | 50,237,804 | | | | | | | | — | | | | | | | | 54,855,611 | |
Canada | | | 504,288,895 | | | | 441 | | | | | | | | — | | | | | | | | 504,289,336 | |
Denmark | | | 2,551,243 | | | | 45,782,215 | | | | | | | | — | | | | | | | | 48,333,458 | |
Finland | | | 4,563,466 | | | | 76,983,846 | | | | | | | | — | | | | | | | | 81,547,312 | |
France | | | 70,510,547 | | | | 336,312,128 | | | | | | | | — | | | | | | | | 406,822,675 | |
Germany | | | 57,823,579 | | | | 249,407,198 | | | | | | | | — | | | | | | | | 307,230,777 | |
Greece | | | 4,045,382 | | | | 25,355,318 | | | | | | | | — | | | | | | | | 29,400,700 | |
Hong Kong | | | 327,879 | | | | 123,470,337 | | | | | | | | — | | | | | | | | 123,798,216 | |
Ireland | | | 8,312,670 | | | | 18,711,672 | | | | | | | | — | | | | | | | | 27,024,342 | |
Israel | | | 21,329,299 | | | | 23,665,219 | | | | | | | | — | | | | | | | | 44,994,518 | |
Italy | | | 12,637,748 | | | | 117,232,480 | | | | | | | | — | | | | | | | | 129,870,228 | |
Japan | | | 86,703,729 | | | | 830,967,763 | | | | | | | | — | | | | | | | | 917,671,492 | |
Netherlands | | | 33,232,058 | | | | 98,561,741 | | | | | | | | — | | | | | | | | 131,793,799 | |
New Zealand | | | 410,057 | | | | 11,608,194 | | | | | | | | — | | | | | | | | 12,018,251 | |
Norway | | | 1,750,068 | | | | 52,519,276 | | | | | | | | — | | | | | | | | 54,269,344 | |
Portugal | | | 496,048 | | | | 18,863,076 | | | | | | | | — | | | | | | | | 19,359,124 | |
Singapore | | | 116,087 | | | | 81,878,651 | | | | | | | | — | | | | | | | | 81,994,738 | |
Spain | | | 52,072,357 | | | | 67,892,025 | | | | | | | | — | | | | | | | | 119,964,382 | |
Sweden | | | 7,918,313 | | | | 127,151,583 | | | | | | | | — | | | | | | | | 135,069,896 | |
Switzerland | | | 61,287,130 | | | | 248,253,501 | | | | | | | | — | | | | | | | | 309,540,631 | |
United Kingdom | | | 315,699,339 | | | | 626,718,121 | | | | | | | | — | | | | | | | | 942,417,460 | |
Preferred Stocks | | | | | | | | | | | | | | | | | | | | | | | | |
Australia | | | — | | | | 139,214 | | | | | | | | — | | | | | | | | 139,214 | |
Germany | | | — | | | | 1,135,420 | | | | | | | | — | | | | | | | | 1,135,420 | |
Rights/Warrants | | | | | | | | | | | | | | | | | | | | | | | | |
Australia | | | — | | | | 15,632 | | | | | | | | — | | | | | | | | 15,632 | |
Austria | | | — | | | | 898 | | | | | | | | — | | | | | | | | 898 | |
Belgium | | | 844 | | | | 629 | | | | | | | | — | | | | | | | | 1,473 | |
France | | | 46,795 | | | | — | | | | | | | | — | | | | | | | | 46,795 | |
Hong Kong | | | 2,941 | | | | 2,236 | | | | | | | | — | | | | | | | | 5,177 | |
Italy | | | 840 | | | | — | | | | | | | | — | | | | | | | | 840 | |
Japan | | | — | | | | — | | | | | | | | — | | | | | | | | — | |
United Kingdom | | | — | | | | 3,034,512 | | | | | | | | — | | | | | | | | 3,034,512 | |
Temporary Cash Investments | | | — | | | | 8,115,000 | | | | | | | | — | | | | | | | | 8,115,000 | |
Securities Lending Collateral | | | — | | | | 827,338,153 | | | | | | | | — | | | | | | | | 827,338,153 | |
| | | | | | | | | | | | | | | | | | | | | | | | |
TOTAL | | $ | 1,269,341,606 | | | $ | 4,412,565,048 | | | | | | | | — | | | | | | | $ | 5,681,906,654 | |
| | | | | | | | | | | | | | | | | | | | | | | | |
See accompanying Notes to Financial Statements.
68
INTERNATIONAL SMALL COMPANY PORTFOLIO
SCHEDULE OF INVESTMENTS
October 31, 2010
| | | | | | | | |
| | | | | | Value† | |
AFFILIATED INVESTMENT COMPANIES — (99.6%) | | | | | | | | |
Investment in The Continental Small Company Series of
The DFA Investment Trust Company | | | | | | $ | 1,944,334,558 | |
Investment in The Japanese Small Company Series of
The DFA Investment Trust Company | | | | | | | 1,096,614,585 | |
Investment in The United Kingdom Small Company Series of
The DFA Investment Trust Company | | | | | | | 1,002,935,645 | |
Investment in The Asia Pacific Small Company Series of
The DFA Investment Trust Company | | | | | | | 803,584,662 | |
Investment in The Canadian Small Company Series of
The DFA Investment Trust Company | | | | | | | 663,721,245 | |
| | | | | | | | |
TOTAL INVESTMENTS IN AFFILIATED INVESTMENT COMPANIES
(Cost $4,975,116,425) | | | | | | $ | 5,511,190,695 | |
| | | | | | | | |
| | |
| | | Face
Amount (000) | | | | |
TEMPORARY CASH INVESTMENTS — (0.4%) | | | | | | | | |
Repurchase Agreement, PNC Capital Markets, Inc. 0.19%, 05/03/10
(Collateralized by $28,530,000 FHLMC 5.228%(r), 09/01/38, valued at $17,602,432) to be repurchased at $17,342,275
(Cost $17,342,000) | | $ | 17,342 | | | | 17,342,000 | |
| | | | | | | | |
TOTAL INVESTMENTS - (100.0%) (Cost $4,992,458,425) | | | | | | $ | 5,528,532,695 | |
| | | | | | | | |
Summary of inputs used to value the Portfolio’s investments as of October 31, 2010 is as follows (See Security Valuation Note):
| | | | | | | | | | | | | | | | | | | | | | | | |
| | | Valuation Inputs | |
| |
| | | Investment in Securities (Market Value) | |
| | | Level 1 | | | Level 2 | | | Level 3 | | | Total | |
Affiliated Investment Companies | | $ | 5,511,190,695 | | | | — | | | | | | | | — | | | | | | | $ | 5,511,190,695 | |
Temporary Cash Investments | | | — | | | $ | 17,342,000 | | | | | | | | — | | | | | | | | 17,342,000 | |
| | | | | | | | | | | | | | | | | | | | | | | | |
TOTAL | | $ | 5,511,190,695 | | | $ | 17,342,000 | | | | | | | | — | | | | | | | $ | 5,528,532,695 | |
| | | | | | | | | | | | | | | | | | | | | | | | |
See accompanying Notes to Financial Statements.
69
JAPANESE SMALL COMPANY PORTFOLIO
SCHEDULES OF INVESTMENTS
October 31, 2010
| | | | |
| | | Value† | |
AFFILIATED INVESTMENT COMPANY — (100.0%) | | | | |
Investment in The Japanese Small Company Series of The DFA Investment Trust Company | | $ | 114,984,213 | |
| | | | |
TOTAL INVESTMENTS IN AFFILIATED INVESTMENT COMPANY
(Cost $190,942,562) | | $ | 114,984,213 | |
| | | | |
Summary of inputs used to value the Portfolio’s investments as of October 31, 2010 is as follows (See Security Valuation Note):
| | | | | | | | | | | | | | | | |
| | | Valuation Inputs | |
| |
| | | Investment in Securities (Market Value) | |
| | | Level 1 | | | Level 2 | | | Level 3 | | | Total | |
Affiliated Investment Company | | $ | 114,984,213 | | | | — | | | | — | | | $ | 114,984,213 | |
|
| ASIA PACIFIC SMALL COMPANY PORTFOLIO | |
| | | | | | | | | | Value† | |
AFFILIATED INVESTMENT COMPANY — (100.0%) | | | | | | | | | | | | | | | | |
Investment in The Asia Pacific Small Company Series of
The DFA Investment Trust Company | | | | | | | | | | | | | | $ | 131,556,739 | |
| | | | | | | | | | | | | | | | |
TOTAL INVESTMENTS IN AFFILIATED INVESTMENT COMPANY
(Cost $104,540,094) | | | | | | | | | | | | | | $ | 131,556,739 | |
| | | | | | | | | | | | | | | | |
Summary of inputs used to value the Portfolio’s investments as of October 31, 2010 is as follows (See Security Valuation Note):
| | | | | | | | | | | | |
| | | Valuation Inputs | |
| |
| | | Investment in Securities (Market Value) | |
| | | Level 1 | | | Level 2 | | Level 3 | | Total | |
Affiliated Investment Company | | $ | 131,556,739 | | | — | | — | | $ | 131,556,739 | |
See accompanying Notes to Financial Statements.
70
UNITED KINGDOM SMALL COMPANY PORTFOLIO
SCHEDULES OF INVESTMENTS
October 31, 2010
| | | | |
| | | Value† | |
AFFILIATED INVESTMENT COMPANY — (100.0%) | | | | |
Investment in The United Kingdom Small Company Series of
The DFA Investment Trust Company | | $ | 33,757,708 | |
| | | | |
TOTAL INVESTMENTS IN AFFILIATED INVESTMENT COMPANY
(Cost $30,218,530) | | $ | 33,757,708 | |
| | | | |
Summary of inputs used to value the Portfolio’s investments as of October 31, 2010 is as follows (See Security Valuation Note):
| | | | | | | | | | | | | | | | |
| | | Valuation Inputs | |
| |
| | | Investment in Securities (Market Value) | |
| | | Level 1 | | | Level 2 | | | Level 3 | | | Total | |
Affiliated Investment Company | | $ | 33,757,708 | | | | — | | | | — | | | $ | 33,757,708 | |
|
CONTINENTAL SMALL COMPANY PORTFOLIO | |
| | | | | | | Value† | |
AFFILIATED INVESTMENT COMPANY — (100.0%) | | | | | | | | | | | | | | | | |
Investment in The Continental Small Company Series of
The DFA Investment Trust Company | | | | | | | | | | | | | | $ | 128,155,853 | |
| | | | | | | | | | | | | | | | |
TOTAL INVESTMENTS IN AFFILIATED INVESTMENT COMPANY
(Cost $110,310,890) | | | | | | | | | | | | | | $ | 128,155,853 | |
| | | | | | | | | | | | | | | | |
Summary of inputs used to value the Portfolio’s investments as of October 31, 2010 is as follows (See Security Valuation Note):
| | | | | | | | | | | | | | | | |
| | | Valuation Inputs | |
| |
| | | Investment in Securities (Market Value) | |
| | | Level 1 | | | Level 2 | | | Level 3 | | | Total | |
Affiliated Investment Company | | $ | 128,155,853 | | | | — | | | | — | | | $ | 128,155,853 | |
See accompanying Notes to Financial Statements.
71
DFA INTERNATIONAL REAL ESTATE SECURITIES PORTFOLIO
SUMMARY SCHEDULE OF PORTFOLIO HOLDINGS
October 31, 2010
| | | | | | | | | | | | | | | | | | |
| | | Shares | | | | | | Value†† | | | Percentage
of Net Assets** |
COMMON STOCKS — (86.6%) | | | | | | | | | | | | | | | | | | |
AUSTRALIA — (22.0%) | | | | | | | | | | | | | | | | | | |
#CFS Retail Property Trust | | | 9,068,093 | | | | | | | $ | 16,510,449 | | | | | | | 1.7% |
Charter Hall Office REIT | | | 2,136,057 | | | | | | | | 5,517,519 | | | | | | | 0.6% |
Commonwealth Property Office Fund | | | 8,415,742 | | | | | | | | 7,555,179 | | | | | | | 0.8% |
Dexus Property Group | | | 21,863,944 | | | | | | | | 17,806,813 | | | | | | | 1.9% |
Goodman Group | | | 27,826,009 | | | | | | | | 17,211,712 | | | | | | | 1.8% |
GPT Group | | | 7,702,861 | | | | | | | | 21,099,581 | | | | | | | 2.2% |
#ING Industrial Fund | | | 9,728,673 | | | | | | | | 5,018,049 | | | | | | | 0.5% |
ING Office Fund | | | 11,534,168 | | | | | | | | 6,971,007 | | | | | | | 0.7% |
Stockland Trust Group | | | 10,758,372 | | | | | | | | 39,840,205 | | | | | | | 4.2% |
Westfield Group | | | 7,148,259 | | | | | | | | 86,939,642 | | | | | | | 9.1% |
Other Securities | | | | | | | | | | | 17,668,358 | | | | | | | 1.8% |
| | | | | | | | | | | | | | | | | | |
TOTAL AUSTRALIA | | | | | | | | | | | 242,138,514 | | | | | | | 25.3% |
| | | | | | | | | | | | | | | | | | |
| | | | | |
BELGIUM — (1.6%) | | | | | | | | | | | | | | | | | | |
Befimmo SCA | | | 58,642 | | | | | | | | 5,414,539 | | | | | | | 0.6% |
Cofinimmo SA | | | 47,839 | | | | | | | | 6,831,601 | | | | | | | 0.7% |
Other Securities | | | | | | | | | | | 5,191,078 | | | | | | | 0.5% |
| | | | | | | | | | | | | | | | | | |
TOTAL BELGIUM | | | | | | | | | | | 17,437,218 | | | | | | | 1.8% |
| | | | | | | | | | | | | | | | | | |
| | | | | |
CANADA — (5.8%) | | | | | | | | | | | | | | | | | | |
#Calloway REIT | | | 213,154 | | | | | | | | 5,015,880 | | | | | | | 0.5% |
#H&R REIT | | | 543,046 | | | | | | | | 10,872,634 | | | | | | | 1.1% |
#Riocan REIT | | | 542,522 | | | | | | | | 12,261,135 | | | | | | | 1.3% |
Other Securities | | | | | | | | | | | 35,330,934 | | | | | | | 3.7% |
| | | | | | | | | | | | | | | | | | |
TOTAL CANADA | | | | | | | | | | | 63,480,583 | | | | | | | 6.6% |
| | | | | | | | | | | | | | | | | | |
| | | | | |
CHINA — (0.1%) | | | | | | | | | | | | | | | | | | |
Other Securities | | | | | | | | | | | 1,377,525 | | | | | | | 0.1% |
| | | | | | | | | | | | | | | | | | |
| | | | | |
FRANCE — (13.5%) | | | | | | | | | | | | | | | | | | |
Fonciere des Regions SA | | | 121,620 | | | | | | | | 13,903,274 | | | | | | | 1.5% |
Gecina SA | | | 90,375 | | | | | | | | 10,974,471 | | | | | | | 1.1% |
Icade SA | | | 99,280 | | | | | | | | 10,912,165 | | | | | | | 1.1% |
#Klepierre SA | | | 458,791 | | | | | | | | 17,860,133 | | | | | | | 1.9% |
Societe Immobiliere de Location pour l’Industrie et le Commerce SA | | | 60,258 | | | | | | | | 8,100,236 | | | | | | | 0.8% |
#Unibail-Rodamco SE | | | 365,876 | | | | | | | | 76,339,148 | | | | | | | 8.0% |
Other Securities | | | | | | | | | | | 9,953,484 | | | | | | | 1.0% |
| | | | | | | | | | | | | | | | | | |
TOTAL FRANCE | | | | | | | | | | | 148,042,911 | | | | | | | 15.4% |
| | | | | | | | | | | | | | | | | | |
| | | | | |
GERMANY — (0.1%) | | | | | | | | | | | | | | | | | | |
Other Securities | | | | | | | | | | | 1,684,703 | | | | | | | 0.2% |
| | | | | | | | | | | | | | | | | | |
| | | | | |
GREECE — (0.0%) | | | | | | | | | | | | | | | | | | |
Other Securities | | | | | | | | | | | 319,801 | | | | | | | 0.0% |
| | | | | | | | | | | | | | | | | | |
| | | | | |
HONG KONG — (3.5%) | | | | | | | | | | | | | | | | | | |
#Champion REIT | | | 11,091,713 | | | | | | | | 6,111,723 | | | | | | | 0.6% |
Link REIT (The) | | | 9,330,639 | | | | | | | | 28,858,709 | | | | | | | 3.0% |
Other Securities | | | | | | | | | | | 3,284,204 | | | | | | | 0.4% |
| | | | | | | | | | | | | | | | | | |
TOTAL HONG KONG | | | | | | | | | | | 38,254,636 | | | | | | | 4.0% |
| | | | | | | | | | | | | | | | | | |
| | | | | |
ISRAEL — (0.0%) | | | | | | | | | | | | | | | | | | |
Other Securities | | | | | | | | | | | 51,978 | | | | | | | 0.0% |
| | | | | | | | | | | | | | | | | | |
| | | | | |
ITALY — (0.1%) | | | | | | | | | | | | | | | | | | |
Other Securities | | | | | | | | | | | 1,675,459 | | | | | | | 0.2% |
| | | | | | | | | | | | | | | | | | |
72
DFA INTERNATIONAL REAL ESTATE SECURITIES PORTFOLIO
CONTINUED
| | | | | | | | | | | | | | | | | | |
| | | Shares | | | | | | Value†† | | | Percentage
of Net Assets** |
JAPAN — (13.5%) | | | | | | | | | | | | | | | | | | |
*Advance Residence Investment Corp. | | | 3,475 | | | | | | | $ | 6,050,779 | | | | | | | 0.6% |
#Frontier Real Estate Investment Corp. | | | 687 | | | | | | | | 5,516,125 | | | | | | | 0.6% |
#Japan Logistics Fund, Inc. | | | 623 | | | | | | | | 5,137,974 | | | | | | | 0.5% |
Japan Prime Realty Investment Corp. | | | 2,867 | | | | | | | | 7,126,250 | | | | | | | 0.7% |
Japan Real Estate Investment Corp. | | | 2,121 | | | | | | | | 20,418,676 | | | | | | | 2.1% |
Japan Retail Fund Investment. | | | 7,063 | | | | | | | | 11,000,592 | | | | | | | 1.2% |
MORI TRUST Sogo REIT, Inc. | | | 691 | | | | | | | | 6,278,269 | | | | | | | 0.7% |
Nippon Building Fund, Inc. | | | 2,294 | | | | | | | | 22,478,003 | | | | | | | 2.3% |
#Nomura Real Estate Office Fund, Inc. | | | 1,239 | | | | | | | | 7,619,808 | | | | | | | 0.8% |
#Orix Jreit, Inc. | | | 1,093 | | | | | | | | 5,859,987 | | | | | | | 0.6% |
#United Urban Investment Corp. | | | 831 | | | | | | | | 5,704,687 | | | | | | | 0.6% |
Other Securities | | | | | | | | | | | 44,927,437 | | | | | | | 4.7% |
| | | | | | | | | | | | | | | | | | |
TOTAL JAPAN | | | | | | | | | | | 148,118,587 | | | | | | | 15.4% |
| | | | | | | | | | | | | | | | | | |
| | | | | |
MALAYSIA — (0.1%) | | | | | | | | | | | | | | | | | | |
Other Securities | | | | | | | | | | | 793,555 | | | | | | | 0.1% |
| | | | | | | | | | | | | | | | | | |
| | | | | |
NETHERLANDS — (4.0%) | | | | | | | | | | | | | | | | | | |
Corio NV | | | 257,999 | | | | | | | | 18,964,014 | | | | | | | 2.0% |
Eurocommercial Properties NV | | | 119,557 | | | | | | | | 5,918,125 | | | | | | | 0.6% |
#VastNed Retail NV | | | 71,341 | | | | | | | | 4,961,794 | | | | | | | 0.5% |
#Wereldhave NV | | | 92,108 | | | | | | | | 9,365,795 | | | | | | | 1.0% |
Other Securities | | | | | | | | | | | 4,446,002 | | | | | | | 0.5% |
| | | | | | | | | | | | | | | | | | |
TOTAL NETHERLANDS | | | | | | | | | | | 43,655,730 | | | | | | | 4.6% |
| | | | | | | | | | | | | | | | | | |
| | | | | |
NEW ZEALAND — (0.8%) | | | | | | | | | | | | | | | | | | |
Other Securities | | | | | | | | | | | 8,728,043 | | | | | | | 0.9% |
| | | | | | | | | | | | | | | | | | |
| | | | | |
SINGAPORE — (6.3%) | | | | | | | | | | | | | | | | | | |
Ascendas REIT. | | | 6,725,000 | | | | | | | | 10,734,352 | | | | | | | 1.1% |
#CapitaCommercial Trust | | | 8,787,000 | | | | | | | | 10,158,166 | | | | | | | 1.1% |
#CapitaMall Trust | | | 10,001,300 | | | | | | | | 15,363,198 | | | | | | | 1.6% |
#Suntec REIT | | | 7,290,000 | | | | | | | | 8,792,663 | | | | | | | 0.9% |
Other Securities | | | | | | | | | | | 24,544,530 | | | | | | | 2.6% |
| | | | | | | | | | | | | | | | | | |
TOTAL SINGAPORE | | | | | | | | | | | 69,592,909 | | | | | | | 7.3% |
| | | | | | | | | | | | | | | | | | |
| | | | | |
SOUTH AFRICA — (1.3%) | | | | | | | | | | | | | | | | | | |
Other Securities | | | | | | | | | | | 13,875,612 | | | | | | | 1.4% |
| | | | | | | | | | | | | | | | | | |
| | | | | |
TAIWAN — (0.4%) | | | | | | | | | | | | | | | | | | |
Other Securities | | | | | | | | | | | 4,645,246 | | | | | | | 0.5% |
| | | | | | | | | | | | | | | | | | |
| | | | | |
TURKEY — (0.3%) | | | | | | | | | | | | | | | | | | |
Other Securities | | | | | | | | | | | 2,956,031 | | | | | | | 0.3% |
| | | | | | | | | | | | | | | | | | |
| | | | | |
UNITED KINGDOM — (13.2%) | | | | | | | | | | | | | | | | | | |
British Land Co. P.L.C. | | | 3,773,213 | | | | | | | | 30,806,108 | | | | | | | 3.2% |
Capital Shopping Centres Group P.L.C. | | | 1,978,248 | | | | | | | | 12,181,127 | | | | | | | 1.3% |
Derwent London P.L.C. | | | 479,350 | | | | | | | | 11,679,469 | | | | | | | 1.2% |
Great Portland Estates P.L.C. | | | 1,224,821 | | | | | | | | 6,782,842 | | | | | | | 0.7% |
Hammerson P.L.C. | | | 3,060,087 | | | | | | | | 20,559,473 | | | | | | | 2.1% |
Land Securities Group P.L.C. | | | 3,320,415 | | | | | | | | 36,005,853 | | | | | | | 3.8% |
Segro P.L.C. | | | 2,944,062 | | | | | | | | 13,987,374 | | | | | | | 1.5% |
Shaftesbury P.L.C. | | | 948,497 | | | | | | | | 6,778,986 | | | | | | | 0.7% |
Other Securities | | | | | | | | | | | 6,477,735 | | | | | | | 0.7% |
| | | | | | | | | | | | | | | | | | |
TOTAL UNITED KINGDOM | | | | | | | | | | | 145,258,967 | | | | | | | 15.2% |
| | | | | | | | | | | | | | | | | | |
TOTAL COMMON STOCKS | | | | | | | | | | | 952,088,008 | | | | | | | 99.3% |
| | | | | | | | | | | | | | | | | | |
73
DFA INTERNATIONAL REAL ESTATE SECURITIES PORTFOLIO
CONTINUED
| | | | | | | | | | | | | | | | | | |
| | | Shares | | | | | | Value†† | | | Percentage
of Net Assets** |
RIGHTS/WARRANTS — (0.0%) | | | | | | | | | | | | | | | | | | |
FRANCE — (0.0%) | | | | | | | | | | | | | | | | | | |
Other Securities | | | | | | | | | | $ | 124,732 | | | | | | | 0.0% |
| | | | | | | | | | | | | | | | | | |
| | | | | |
SINGAPORE — (0.0%) | | | | | | | | | | | | | | | | | | |
Other Securities | | | | | | | | | | | 1,362 | | | | | | | 0.0% |
| | | | | | | | | | | | | | | | | | |
TOTAL RIGHTS/WARRANTS | | | | | | | | | | | 126,094 | | | | | | | 0.0% |
| | | | | | | | | | | | | | | | | | |
| | | | | |
| | | Face Amount | | | | | | Value† | | | | | | |
| | | (000) | | | | | | | | | | | | |
TEMPORARY CASH INVESTMENTS — (0.1%) | | | | | | | | | | | | | | | | | | |
Repurchase Agreement, PNC Capital Markets, Inc. 0.19%,
11/01/10 (Collateralized by $1,510,000 FNMA 3.126%(r),
09/01/40, valued at $1,551,730) to be repurchased at
$1,525,024 | | $ | 1,525 | | | | | | | | 1,525,000 | | | | | | | 0.2% |
| | | | | | | | | | | | | | | | | | |
| | | | | |
| | | Shares/ Face Amount | | | | | | | | | | | | |
| | | (000) | | | | | | | | | | | | |
SECURITIES LENDING COLLATERAL — (13.3%) | | | | | | | | | | | | | | | | | | |
§@DFA Short Term Investment Fund | | | 143,463,273 | | | | | | | | 143,463,273 | | | | | | | 14.9% |
@Repurchase Agreement, Deutsche Bank Securities, Inc. 0.22%,
11/01/10 (Collateralized by $42,295,271 FNMA 7.000%,
08/01/38, valued at $2,677,816)## to be repurchased at
$2,625,358 | | $ | 2,625 | | | | | | | | 2,625,310 | | | | | | | 0.3% |
| | | | | | | | | | | | | | | | | | |
TOTAL SECURITIES LENDING COLLATERAL | | | | | | | | | | | 146,088,583 | | | | | | | 15.2% |
| | | | | | | | | | | | | | | | | | |
TOTAL INVESTMENTS — (100.0%)
(Cost $1,169,055,781) | | | | | | | | | | $ | 1,099,827,685 | | | | | | | 114.7% |
| | | | | | | | | | | | | | | | | | |
74
DFA REAL ESTATE SECURITIES PORTFOLIO
CONTINUED
Summary of inputs used to value the Portfolio’s investments as of October 31, 2010 is as follows (See Security Valuation Note):
| | | | | | | | | | | | | | | | | | | | | | | | |
| | | Valuation Inputs | |
| |
| | | Investment in Securities (Market Value) | |
| | | Level 1 | | | Level 2 | | | | | | Level 3 | | | | | | Total | |
Common Stocks | | | | | | | | | | | | | | | | | | | | | | | | |
Australia | | | — | | | $ | 242,138,514 | | | | | | | | — | | | | | | | $ | 242,138,514 | |
Belgium | | | — | | | | 17,437,218 | | | | | | | | — | | | | | | | | 17,437,218 | |
Canada | | $ | 63,480,583 | | | | — | | | | | | | | — | | | | | | | | 63,480,583 | |
China | | | — | | | | 1,377,525 | | | | | | | | — | | | | | | | | 1,377,525 | |
France | | | — | | | | 148,042,911 | | | | | | | | — | | | | | | | | 148,042,911 | |
Germany | | | — | | | | 1,684,703 | | | | | | | | — | | | | | | | | 1,684,703 | |
Greece | | | — | | | | 319,801 | | | | | | | | — | | | | | | | | 319,801 | |
Hong Kong | | | — | | | | 38,254,636 | | | | | | | | — | | | | | | | | 38,254,636 | |
Israel | | | — | | | | 51,978 | | | | | | | | — | | | | | | | | 51,978 | |
Italy | | | 695,942 | | | | 979,517 | | | | | | | | — | | | | | | | | 1,675,459 | |
Japan | | | — | | | | 148,118,587 | | | | | | | | — | | | | | | | | 148,118,587 | |
Malaysia | | | — | | | | 793,555 | | | | | | | | — | | | | | | | | 793,555 | |
Netherlands | | | — | | | | 43,655,730 | | | | | | | | — | | | | | | | | 43,655,730 | |
New Zealand | | | — | | | | 8,728,043 | | | | | | | | — | | | | | | | | 8,728,043 | |
Singapore | | | — | | | | 69,592,909 | | | | | | | | — | | | | | | | | 69,592,909 | |
South Africa | | | — | | | | 13,875,612 | | | | | | | | — | | | | | | | | 13,875,612 | |
Taiwan | | | — | | | | 4,645,246 | | | | | | | | — | | | | | | | | 4,645,246 | |
Turkey | | | — | | | | 2,956,031 | | | | | | | | — | | | | | | | | 2,956,031 | |
United Kingdom | | | — | | | | 145,258,967 | | | | | | | | — | | | | | | | | 145,258,967 | |
Rights/Warrants | | | | | | | | | | | | | | | | | | | | | | | | |
France | | | 124,732 | | | | — | | | | | | | | — | | | | | | | | 124,732 | |
Singapore | | | — | | | | 1,362 | | | | | | | | — | | | | | | | | 1,362 | |
Temporary Cash Investments | | | — | | | | 1,525,000 | | | | | | | | — | | | | | | | | 1,525,000 | |
Securities Lending Collateral | | | — | | | | 146,088,583 | | | | | | | | — | | | | | | | | 146,088,583 | |
| | | | | | | | | | | | | | | | | | | | | | | | |
TOTAL | | $ | 64,301,257 | | | $ | 1,035,526,428 | | | | | | | | — | | | | | | | $ | 1,099,827,685 | |
| | | | | | | | | | | | | | | | | | | | | | | | |
See accompanying Notes to Financial Statements.
75
DFA GLOBAL REAL ESTATE SECURITIES PORTFOLIO
SCHEDULE OF INVESTMENTS
October 31, 2010
| | | | | | | | |
| | | Shares | | | Value† | |
AFFILIATED INVESTMENT COMPANIES — (99.8%) | | | | | | | | |
Investment in DFA Real Estate Securities Portfolio of
DFA Investment Dimensions Group Inc. | | | 18,191,391 | | | $ | 386,385,137 | |
Investment in DFA International Real Estate Securities Portfolio of
DFA Investment Dimensions Group Inc. | | | 55,153,690 | | | | 307,757,588 | |
| | | | | | | | |
TOTAL INVESTMENTS IN AFFILIATED INVESTMENT COMPANIES
(Cost $527,734,376) | | | | | | | 694,142,725 | |
| | | | | | | | |
| | |
TEMPORARY CASH INVESTMENTS — (0.2%) | | | | | | | | |
BlackRock Liquidity Funds Tempcash
Portfolio-Institutional Shares
(Cost $1,430,973) | | | 1,430,973 | | | | 1,430,973 | |
| | | | | | | | |
TOTAL INVESTMENTS - (100.0%) (Cost $529,165,349) | | | | | | $ | 695,573,698 | |
| | | | | | | | |
Summary of inputs used to value the Portfolio’s investments as of October 31, 2010 is as follows (See Security Valuation Note):
| | | | | | | | | | | | |
| | | Valuation Inputs | |
| |
| | | Investment in Securities (Market Value) | |
| | | Level 1 | | | Level 2 | | Level 3 | | Total | |
Affiliated Investment Companies | | $ | 694,142,725 | | | — | | — | | $ | 694,142,725 | |
Temporary Cash Investments | | | 1,430,973 | | | — | | — | | | 1,430,973 | |
| | | | | | | | | | | | |
TOTAL | | $ | 695,573,698 | | | — | | — | | $ | 695,573,698 | |
| | | | | | | | | | | | |
See accompanying Notes to Financial Statements.
76
DFA INTERNATIONAL SMALL CAP VALUE PORTFOLIO
SUMMARY SCHEDULE OF PORTFOLIO HOLDINGS
October 31, 2010
| | | | | | | | | | | | | | | | | | |
| | | Shares | | | | | | Value†† | | | Percentage
of Net Assets** |
COMMON STOCKS — (93.1%) | | | | | | | | | | | | | | | | | | |
AUSTRALIA — (7.1%) | | | | | | | | | | | | | | | | | | |
Goodman Fielder, Ltd. | | | 21,749,231 | | | | | | | $ | 31,620,678 | | | | | | | 0.4% |
*Iluka Resources, Ltd. | | | 5,927,758 | | | | | | | | 39,234,095 | | | | | | | 0.5% |
*Pacific Brands, Ltd. | | | 29,002,108 | | | | | | | | 30,887,469 | | | | | | | 0.4% |
#Primary Health Care, Ltd. | | | 9,763,542 | | | | | | | | 29,876,421 | | | | | | | 0.4% |
Other Securities | | | | | | | | | | | 450,069,866 | | | | | | | 5.9% |
| | | | | | | | | | | | | | | | | | |
TOTAL AUSTRALIA | | | | | | | | | | | 581,688,529 | | | | | | | 7.6% |
| | | | | | | | | | | | | | | | | | |
| | | | | |
AUSTRIA — (1.0%) | | | | | | | | | | | | | | | | | | |
#*Wienerberger AG | | | 2,001,544 | | | | | | | | 33,732,051 | | | | | | | 0.4% |
Other Securities | | | | | | | | | | | 49,779,914 | | | | | | | 0.7% |
| | | | | | | | | | | | | | | | | | |
TOTAL AUSTRIA | | | | | | | | | | | 83,511,965 | | | | | | | 1.1% |
| | | | | | | | | | | | | | | | | | |
| | | | | |
BELGIUM — (1.3%) | | | | | | | | | | | | | | | | | | |
Other Securities | | | | | | | | | | | 106,109,504 | | | | | | | 1.4% |
| | | | | | | | | | | | | | | | | | |
| | | | | |
CANADA — (11.4%) | | | | | | | | | | | | | | | | | | |
#*Canfor Corp | | | 2,774,490 | | | | | | | | 26,197,018 | | | | | | | 0.3% |
*Celestica, Inc. | | | 4,081,842 | | | | | | | | 34,378,883 | | | | | | | 0.5% |
Dorel Industries, Inc. Class B | | | 842,000 | | | | | | | | 28,383,136 | | | | | | | 0.4% |
#Groupe Aeroplan, Inc. | | | 3,847,565 | | | | | | | | 46,778,906 | | | | | | | 0.6% |
#HudBay Minerals, Inc. | | | 2,339,093 | �� | | | | | | | 36,924,598 | | | | | | | 0.5% |
#Laurentian Bank of Canada. | | | 707,853 | | | | | | | | 30,711,340 | | | | | | | 0.4% |
*Lundin Mining Corp. | | | 7,418,026 | | | | | | | | 46,985,438 | | | | | | | 0.6% |
*New Gold, Inc. | | | 6,635,020 | | | | | | | | 49,116,973 | | | | | | | 0.6% |
*RONA, Inc. | | | 3,264,600 | | | | | | | | 41,611,727 | | | | | | | 0.6% |
Sherritt International Corp. | | | 6,254,073 | | | | | | | | 48,627,119 | | | | | | | 0.6% |
West Fraser Timber Co., Ltd. | | | 682,254 | | | | | | | | 29,634,133 | | | | | | | 0.4% |
Other Securities | | | | | | | | | | | 515,779,701 | | | | | | | 6.7% |
| | | | | | | | | | | | | | | | | | |
TOTAL CANADA | | | | | | | | | | | 935,128,972 | | | | | | | 12.2% |
| | | | | | | | | | | | | | | | | | |
| | | | | |
DENMARK — (0.7%) | | | | | | | | | | | | | | | | | | |
Other Securities | | | | | | | | | | | 61,300,446 | | | | | | | 0.8% |
| | | | | | | | | | | | | | | | | | |
| | | | | |
FINLAND — (3.1%) | | | | | | | | | | | | | | | | | | |
Kemira Oyj | | | 1,784,173 | | | | | | | | 26,265,376 | | | | | | | 0.3% |
#Outokumpu Oyj | | | 2,864,481 | | | | | | | | 51,456,040 | | | | | | | 0.7% |
Pohjola Bank P.L.C. | | | 3,363,010 | | | | | | | | 42,547,353 | | | | | | | 0.5% |
#*Rautaruukki Oyj Series K | | | 1,412,365 | | | | | | | | 28,067,599 | | | | | | | 0.4% |
Other Securities | | | | | | | | | | | 104,107,750 | | | | | | | 1.4% |
| | | | | | | | | | | | | | | | | | |
TOTAL FINLAND | | | | | | | | | | | 252,444,118 | | | | | | | 3.3% |
| | | | | | | | | | | | | | | | | | |
| | | | | |
FRANCE — (5.8%) | | | | | | | | | | | | | | | | | | |
Arkema SA | | | 1,028,400 | | | | | | | | 66,453,775 | | | | | | | 0.9% |
Havas SA | | | 7,563,593 | | | | | | | | 39,852,335 | | | | | | | 0.5% |
#Nexans SA | | | 593,945 | | | | | | | | 42,364,142 | | | | | | | 0.6% |
*Valeo SA | | | 736,226 | | | | | | | | 39,796,267 | | | | | | | 0.5% |
Other Securities | | | | | | | | | | | 282,353,969 | | | | | | | 3.7% |
| | | | | | | | | | | | | | | | | | |
TOTAL FRANCE | | | | | | | | | | | 470,820,488 | | | | | | | 6.2% |
| | | | | | | | | | | | | | | | | | |
| | | | | |
GERMANY — (6.0%) | | | | | | | | | | | | | | | | | | |
Aurubis AG | | | 1,055,010 | | | | | | | | 54,393,284 | | | | | | | 0.7% |
Bilfinger Berger SE | | | 956,696 | | | | | | | | 70,128,204 | | | | | | | 0.9% |
Lanxess AG | | | 681,153 | | | | | | | | 47,342,930 | | | | | | | 0.6% |
#*TUI AG | | | 2,408,454 | | | | | | | | 28,152,149 | | | | | | | 0.4% |
Other Securities | | | | | | | | | | | 287,480,223 | | | | | | | 3.8% |
| | | | | | | | | | | | | | | | | | |
TOTAL GERMANY | | | | | | | | | | | 487,496,790 | | | | | | | 6.4% |
| | | | | | | | | | | | | | | | | | |
77
DFA INTERNATIONAL SMALL CAP VALUE PORTFOLIO
CONTINUED
| | | | | | | | | | | | | | | | | | |
| | | Shares | | | | | | Value†† | | | Percentage
of Net Assets** |
GREECE — (0.4%) | | | | | | | | | | | | | | | | | | |
Other Securities | | | | | | | | | | $ | 35,042,512 | | | | | | | 0.5% |
| | | | | | | | | | | | | | | | | | |
| | | | | |
HONG KONG — (2.9%) | | | | | | | | | | | | | | | | | | |
Other Securities | | | | | | | | | | | 237,589,109 | | | | | | | 3.1% |
| | | | | | | | | | | | | | | | | | |
| | | | | |
IRELAND — (0.3%) | | | | | | | | | | | | | | | | | | |
Other Securities | | | | | | | | | | | 26,035,515 | | | | | | | 0.3% |
| | | | | | | | | | | | | | | | | | |
| | | | | |
ISRAEL — (0.7%) | | | | | | | | | | | | | | | | | | |
Other Securities | | | | | | | | | | | 55,767,818 | | | | | | | 0.7% |
| | | | | | | | | | | | | | | | | | |
| | | | | |
ITALY — (3.2%) | | | | | | | | | | | | | | | | | | |
Banca Popolare di Milano Scarl | | | 10,151,010 | | | | | | | | 47,461,321 | | | | | | | 0.6% |
Pirelli & Co. SpA | | | 4,750,256 | | | | | | | | 40,586,921 | | | | | | | 0.5% |
Other Securities | | | | | | | | | | | 175,521,662 | | | | | | | 2.3% |
| | | | | | | | | | | | | | | | | | |
TOTAL ITALY | | | | | | | | | | | 263,569,904 | | | | | | | 3.4% |
| | | | | | | | | | | | | | | | | | |
| | | | | |
JAPAN — (19.1%) | | | | | | | | | | | | | | | | | | |
Other Securities | | | | | | | | | | | 1,561,389,142 | | | | | | | 20.4% |
| | | | | | | | | | | | | | | | | | |
| | | | | |
MALAYSIA — (0.0%) | | | | | | | | | | | | | | | | | | |
Other Securities | | | | | | | | | | | 3,723 | | | | | | | 0.0% |
| | | | | | | | | | | | | | | | | | |
| | | | | |
NETHERLANDS — (1.8%) | | | | | | | | | | | | | | | | | | |
Nutreco NV | | | 569,367 | | | | | | | | 41,477,758 | | | | | | | 0.5% |
Other Securities | | | | | | | | | | | 107,765,123 | | | | | | | 1.4% |
| | | | | | | | | | | | | | | | | | |
TOTAL NETHERLANDS | | | | | | | | | | | 149,242,881 | | | | | | | 1.9% |
| | | | | | | | | | | | | | | | | | |
| | | | | |
NEW ZEALAND — (0.4%) | | | | | | | | | | | | | | | | | | |
Other Securities | | | | | | | | | | | 35,928,179 | | | | | | | 0.5% |
| | | | | | | | | | | | | | | | | | |
| | | | | |
NORWAY — (1.4%) | | | | | | | | | | | | | | | | | | |
Other Securities | | | | | | | | | | | 117,059,231 | | | | | | | 1.5% |
| | | | | | | | | | | | | | | | | | |
| | | | | |
PORTUGAL — (0.2%) | | | | | | | | | | | | | | | | | | |
Other Securities | | | | | | | | | | | 17,650,663 | | | | | | | 0.2% |
| | | | | | | | | | | | | | | | | | |
| | | | | |
SINGAPORE — (1.6%) | | | | | | | | | | | | | | | | | | |
Other Securities | | | | | | | | | | | 127,268,578 | | | | | | | 1.7% |
| | | | | | | | | | | | | | | | | | |
| | | | | |
SPAIN — (1.5%) | | | | | | | | | | | | | | | | | | |
Other Securities | | | | | | | | | | | 121,612,657 | | | | | | | 1.6% |
| | | | | | | | | | | | | | | | | | |
| | | | | |
SWEDEN — (2.9%) | | | | | | | | | | | | | | | | | | |
Boliden AB | | | 2,189,573 | | | | | | | | 37,177,537 | | | | | | | 0.5% |
Holmen AB | | | 932,809 | | | | | | | | 29,611,539 | | | | | | | 0.4% |
Trelleborg AB Series B | | | 6,681,684 | | | | | | | | 62,971,965 | | | | | | | 0.8% |
Other Securities | | | | | | | | | | | 110,052,817 | | | | | | | 1.4% |
| | | | | | | | | | | | | | | | | | |
TOTAL SWEDEN | | | | | | | | | | | 239,813,858 | | | | | | | 3.1% |
| | | | | | | | | | | | | | | | | | |
| | | | | |
SWITZERLAND — (4.5%) | | | | | | | | | | | | | | | | | | |
*Clariant AG | | | 3,580,483 | | | | | | | | 60,553,635 | | | | | | | 0.8% |
Helvetia Holding AG | | | 102,377 | | | | | | | | 36,060,333 | | | | | | | 0.5% |
Other Securities | | | | | | | | | | | 271,158,203 | | | | | | | 3.5% |
| | | | | | | | | | | | | | | | | | |
TOTAL SWITZERLAND | | | | | | | | | | | 367,772,171 | | | | | | | 4.8% |
| | | | | | | | | | | | | | | | | | |
| | | | | |
UNITED KINGDOM — (15.8%) | | | | | | | | | | | | | | | | | | |
Amlin P.L.C. | | | 9,708,370 | | | | | | | | 63,229,380 | | | | | | | 0.8% |
Bellway P.L.C. | | | 3,481,205 | | | | | | | | 29,776,033 | | | | | | | 0.4% |
#Brit Insurance Holdings NV | | | 2,890,998 | | | | | | | | 48,387,798 | | | | | | | 0.6% |
Catlin Group, Ltd. P.L.C. | | | 8,513,512 | | | | | | | | 47,537,231 | | | | | | | 0.6% |
78
DFA INTERNATIONAL SMALL CAP VALUE PORTFOLIO
CONTINUED
| | | | | | | | | | | | | | | | | | |
| | | Shares | | | | | | Value†† | | | Percentage
of Net Assets** |
UNITED KINGDOM — (Continued) | | | | | | | | | | | | | | | | | | |
Close Brothers Group P.L.C. | | | 2,135,186 | | | | | | | $ | 26,393,212 | | | | | | | 0.3% |
*Cookson Group P.L.C. | | | 4,321,345 | | | | | | | | 35,675,598 | | | | | | | 0.5% |
DS Smith P.L.C. | | | 12,895,987 | | | | | | | | 34,788,033 | | | | | | | 0.5% |
Greene King P.L.C. | | | 5,373,011 | | | | | | | | 36,009,996 | | | | | | | 0.5% |
Hiscox, Ltd. P.L.C. | | | 10,648,017 | | | | | | | | 60,438,649 | | | | | | | 0.8% |
Meggitt P.L.C. | | | 12,845,857 | | | | | | | | 67,909,910 | | | | | | | 0.9% |
Millennium & Copthorne Hotels P.L.C. | | | 5,091,746 | | | | | | | | 44,464,042 | | | | | | | 0.6% |
Mondi P.L.C. | | | 7,958,099 | | | | | | | | 66,262,747 | | | | | | | 0.9% |
*Persimmon P.L.C. | | | 6,948,776 | | | | | | | | 37,958,536 | | | | | | | 0.5% |
*Travis Perkins P.L.C. | | | 3,926,630 | | | | | | | | 52,047,102 | | | | | | | 0.7% |
Other Securities | | | | | | | | | | | 639,331,768 | | | | | | | 8.3% |
| | | | | | | | | | | | | | | | | | |
TOTAL UNITED KINGDOM | | | | | | | | | | | 1,290,210,035 | | | | | | | 16.9% |
| | | | | | | | | | | | | | | | | | |
TOTAL COMMON STOCKS | | | | | | | | | | | 7,624,456,788 | | | | | | | 99.6% |
| | | | | | | | | | | | | | | | | | |
PREFERRED STOCKS — (0.1%) | | | | | | | | | | | | | | | | | | |
AUSTRALIA — (0.1%) | | | | | | | | | | | | | | | | | | |
Other Securities | | | | | | | | | | | 3,335,033 | | | | | | | 0.0% |
| | | | | | | | | | | | | | | | | | |
RIGHTS/WARRANTS — (0.0%) | | | | | | | | | | | | | | | | | | |
AUSTRALIA — (0.0%) | | | | | | | | | | | | | | | | | | |
Other Securities | | | | | | | | | | | — | | | | | | | 0.0% |
| | | | | | | | | | | | | | | | | | |
| | | | | |
BELGIUM — (0.0%) | | | | | | | | | | | | | | | | | | |
Other Securities | | | | | | | | | | | 13,021 | | | | | | | 0.0% |
| | | | | | | | | | | | | | | | | | |
| | | | | |
CANADA — (0.0%) | | | | | | | | | | | | | | | | | | |
Other Securities | | | | | | | | | | | 74,589 | | | | | | | 0.0% |
| | | | | | | | | | | | | | | | | | |
| | | | | |
FRANCE — (0.0%) | | | | | | | | | | | | | | | | | | |
Other Securities | | | | | | | | | | | 95,171 | | | | | | | 0.0% |
| | | | | | | | | | | | | | | | | | |
| | | | | |
HONG KONG — (0.0%) | | | | | | | | | | | | | | | | | | |
Other Securities | | | | | | | | | | | 95,934 | | | | | | | 0.0% |
| | | | | | | | | | | | | | | | | | |
| | | | | |
ITALY — (0.0%) | | | | | | | | | | | | | | | | | | |
Other Securities | | | | | | | | | | | 33,143 | | | | | | | 0.0% |
| | | | | | | | | | | | | | | | | | |
| | | | | |
SWEDEN — (0.0%) | | | | | | | | | | | | | | | | | | |
Other Securities | | | | | | | | | | | 11,863 | | | | | | | 0.0% |
| | | | | | | | | | | | | | | | | | |
| | | | | |
UNITED KINGDOM — (0.0%) | | | | | | | | | | | | | | | | | | |
Other Securities | | | | | | | | | | | 6,330 | | | | | | | 0.0% |
| | | | | | | | | | | | | | | | | | |
TOTAL RIGHTS/WARRANTS | | | | | | | | | | | 330,051 | | | | | | | 0.0% |
| | | | | | | | | | | | | | | | | | |
| | | | | |
| | | Face
Amount | | | | | | Value† | | | | | | |
| | | (000) | | | | | | | | | | | | |
TEMPORARY CASH INVESTMENTS — (0.1%) | | | | | | | | | | | | | | | | | | |
Repurchase Agreement, PNC Capital Markets, Inc. 0.19%, 11/01/10 (Collateralized by $18,270,000 FHLMC 5.228%(r), 09/01/38, valued at $11,272,220) to be repurchased at $11,103,176 | | $ | 11,103 | | | | | | | | 11,103,000 | | | | | | | 0.2% |
79
DFA INTERNATIONAL SMALL CAP VALUE PORTFOLIO
CONTINUED
| | | | | | | | | | | | | | | | | | |
| | | Shares/ Face Amount | | | | | | Value† | | | Percentage
of Net Assets** |
| | | (000) | | | | | | | | | | | | |
SECURITIES LENDING COLLATERAL — (6.7%) | | | | | | | | | | | | | | | | | | |
§@DFA Short Term Investment Fund | | | 548,700,317 | | | | | | | | $ 548,700,317 | | | | | | | 7.2% |
@Repurchase Agreement, Deutsche Bank Securities, Inc. 0.22%, 11/01/10 (Collateralized by
$42,295,271 FNMA 7.000%, 08/01/38, valued at $340,786)## to be repurchased at $334,110 | | | $334 | | | | | | | | 334,104 | | | | | | | 0.0% |
| | | | | | | | | | | | | | | | | | |
TOTAL SECURITIES LENDING COLLATERAL | | | | | | | | | | | 549,034,421 | | | | | | | 7.2% |
| | | | | | | | | | | | | | | | | | |
TOTAL INVESTMENTS — (100.0%)
(Cost $8,437,522,566) | | | | | | | | | | | $8,188,259,293 | | | | | | | 107.0% |
| | | | | | | | | | | | | | | | | | |
80
DFA INTERNATIONAL SMALL CAP VALUE PORTFOLIO
CONTINUED
Summary of inputs used to value the Portfolio’s investments as of October 31, 2010 is as follows (See Security Valuation Note):
| | | | | | | | | | | | | | | | | | |
| | | Valuation Inputs | |
| |
| | | Investment in Securities (Market Value) | |
| | | Level 1 | | | Level 2 | | | Level 3 | | Total | |
Common Stocks | | | | | | | | | | | | | | | | | | |
Australia | | $ | 217,235 | | | $ | 581,471,294 | | | | | — | | | | $ | 581,688,529 | |
Austria | | | 20,334 | | | | 83,491,631 | | | | | — | | | | | 83,511,965 | |
Belgium | | | — | | | | 106,109,504 | | | | | — | | | | | 106,109,504 | |
Canada | | | 935,128,972 | | | | — | | | | | — | | | | | 935,128,972 | |
Denmark | | | 160,955 | | | | 61,139,491 | | | | | — | | | | | 61,300,446 | |
Finland | | | — | | | | 252,444,118 | | | | | — | | | | | 252,444,118 | |
France | | | — | | | | 470,820,488 | | | | | — | | | | | 470,820,488 | |
Germany | | | 627 | | | | 487,496,163 | | | | | — | | | | | 487,496,790 | |
Greece | | | 554,551 | | | | 34,487,961 | | | | | — | | | | | 35,042,512 | |
Hong Kong | | | 20,590 | | | | 237,568,519 | | | | | — | | | | | 237,589,109 | |
Ireland | | | — | | | | 26,035,515 | | | | | — | | | | | 26,035,515 | |
Israel | | | — | | | | 55,767,818 | | | | | — | | | | | 55,767,818 | |
Italy | | | — | | | | 263,569,904 | | | | | — | | | | | 263,569,904 | |
Japan | | | 1,831,746 | | | | 1,559,557,396 | | | | | — | | | | | 1,561,389,142 | |
Malaysia | | | — | | | | 3,723 | | | | | — | | | | | 3,723 | |
Netherlands | | | 32,423 | | | | 149,210,458 | | | | | — | | | | | 149,242,881 | |
New Zealand | | | — | | | | 35,928,179 | | | | | — | | | | | 35,928,179 | |
Norway | | | — | | | | 117,059,231 | | | | | — | | | | | 117,059,231 | |
Portugal | | | — | | | | 17,650,663 | | | | | — | | | | | 17,650,663 | |
Singapore | | | 572,460 | | | | 126,696,118 | | | | | — | | | | | 127,268,578 | |
Spain | | | — | | | | 121,612,657 | | | | | — | | | | | 121,612,657 | |
Sweden | | | — | | | | 239,813,858 | | | | | — | | | | | 239,813,858 | |
Switzerland | | | — | | | | 367,772,171 | | | | | — | | | | | 367,772,171 | |
United Kingdom | | | 258,534 | | | | 1,289,951,501 | | | | | — | | | | | 1,290,210,035 | |
Preferred Stocks | | | | | | | | | | | | | | | | | | |
Australia | | | — | | | | 3,335,033 | | | | | — | | | | | 3,335,033 | |
Rights/Warrants | | | | | | | | | | | | | | | | | | |
Australia | | | — | | | | — | | | | | — | | | | | — | |
Belgium | | | 13,021 | | | | — | | | | | — | | | | | 13,021 | |
Canada | | | 74,589 | | | | — | | | | | — | | | | | 74,589 | |
France | | | 95,171 | | | | — | | | | | — | | | | | 95,171 | |
Hong Kong | | | 26,486 | | | | 69,448 | | | | | — | | | | | 95,934 | |
Italy | | | 33,143 | | | | — | | | | | — | | | | | 33,143 | |
Sweden | | | — | | | | 11,863 | | | | | — | | | | | 11,863 | |
United Kingdom | | | — | | | | 6,330 | | | | | — | | | | | 6,330 | |
Temporary Cash Investments | | | — | | | | 11,103,000 | | | | | — | | | | | 11,103,000 | |
Securities Lending Collateral | | | — | | | | 549,034,421 | | | | | — | | | | | 549,034,421 | |
| | | | | | | | | | | | | | | | | | |
TOTAL | | $ | 939,040,837 | | | $ | 7,249,218,456 | | | | | — | | | | $ | 8,188,259,293 | |
| | | | | | | | | | | | | | | | | | |
See accompanying Notes to Financial Statements.
81
INTERNATIONAL VECTOR EQUITY PORTFOLIO
SUMMARY SCHEDULE OF PORTFOLIO HOLDINGS
October 31, 2010
| | | | | | | | | | | | | | |
| | | Shares | | | | | Value†† | | | Percentage
of Net Assets** |
COMMON STOCKS — (88.4%) | | | | | | | | | | | | | | |
AUSTRALIA — (6.2%) | | | | | | | | | | | | | | |
Australia & New Zealand Banking Group, Ltd. | | | 30,566 | | | | | | $ 745,709 | | | | | 0.2% |
Other Securities | | | | | | | | | 24,653,960 | | | | | 6.8% |
| | | | | | | | | | | | | | |
TOTAL AUSTRALIA | | | | | | | | | 25,399,669 | | | | | 7.0% |
| | | | | | | | | | | | | | |
| | | | | |
AUSTRIA — (0.7%) | | | | | | | | | | | | | | |
Voestalpine AG | | | 16,154 | | | | | | 641,468 | | | | | 0.2% |
Other Securities | | | | | | | | | 2,166,676 | | | | | 0.6% |
| | | | | | | | | | | | | | |
TOTAL AUSTRIA | | | | | | | | | 2,808,144 | | | | | 0.8% |
| | | | | | | | | | | | | | |
| | | | | |
BELGIUM — (1.3%) | | | | | | | | | | | | | | |
#Solvay SA | | | 5,891 | | | | | | 624,272 | | | | | 0.2% |
Other Securities | | | | | | | | | 4,530,190 | | | | | 1.2% |
| | | | | | | | | | | | | | |
TOTAL BELGIUM | | | | | | | | | 5,154,462 | | | | | 1.4% |
| | | | | | | | | | | | | | |
| | | | | |
CANADA — (9.8%) | | | | | | | | | | | | | | |
#Bank of Montreal | | | 11,300 | | | | | | 667,319 | | | | | 0.2% |
Magna International, Inc. | | | 9,280 | | | | | | 839,285 | | | | | 0.2% |
Suncor Energy, Inc. | | | 29,572 | | | | | | 947,557 | | | | | 0.3% |
Talisman Energy, Inc. | | | 45,748 | | | | | | 829,376 | | | | | 0.2% |
Teck Resources, Ltd. Class B | | | 33,100 | | | | | | 1,479,910 | | | | | 0.4% |
#Toronto Dominion Bank | | | 11,000 | | | | | | 792,185 | | | | | 0.2% |
Other Securities | | | | | | | | | 34,410,396 | | | | | 9.5% |
| | | | | | | | | | | | | | |
TOTAL CANADA | | | | | | | | | 39,966,028 | | | | | 11.0% |
| | | | | | | | | | | | | | |
| | | | | |
DENMARK — (1.0%) | | | | | | | | | | | | | | |
Other Securities | | | | | | | | | 4,003,151 | | | | | 1.1% |
| | | | | | | | | | | | | | |
| | | | | |
FINLAND — (1.8%) | | | | | | | | | | | | | | |
UPM-Kymmene Oyj | | | 49,028 | | | | | | 814,623 | | | | | 0.2% |
Other Securities | | | | | | | | | 6,665,924 | | | | | 1.9% |
| | | | | | | | | | | | | | |
TOTAL FINLAND | | | | | | | | | 7,480,547 | | | | | 2.1% |
| | | | | | | | | | | | | | |
| | | | | |
FRANCE — (6.3%) | | | | | | | | | | | | | | |
BNP Paribas SA | | | 15,171 | | | | | | 1,109,697 | | | | | 0.3% |
Cie de Saint-Gobain SA | | | 16,388 | | | | | | 769,950 | | | | | 0.2% |
Cie Generale des Establissements Michelin SA Series B | | | 8,962 | | | | | | 716,085 | | | | | 0.2% |
Other Securities | | | | | | | | | 23,191,532 | | | | | 6.4% |
| | | | | | | | | | | | | | |
TOTAL FRANCE | | | | | | | | | 25,787,264 | | | | | 7.1% |
| | | | | | | | | | | | | | |
| | | | | |
GERMANY — (5.1%) | | | | | | | | | | | | | | |
*Daimler AG | | | 10,656 | | | | | | 704,185 | | | | | 0.2% |
Deutsche Bank AG | | | 30,792 | | | | | | 1,782,241 | | | | | 0.5% |
*Infineon Technologies AG ADR | | | 88,444 | | | | | | 694,285 | | | | | 0.2% |
Other Securities | | | | | | | | | 17,776,015 | | | | | 4.9% |
| | | | | | | | | | | | | | |
TOTAL GERMANY | | | | | | | | | 20,956,726 | | | | | 5.8% |
| | | | | | | | | | | | | | |
| | | | | |
GREECE — (0.7%) | | | | | | | | | | | | | | |
Other Securities | | | | | | | | | 2,843,748 | | | | | 0.8% |
| | | | | | | | | | | | | | |
| | | | | |
HONG KONG — (2.6%) | | | | | | | | | | | | | | |
Other Securities | | | | | | | | | 10,745,239 | | | | | 3.0% |
| | | | | | | | | | | | | | |
| | | | | |
IRELAND — (0.7%) | | | | | | | | | | | | | | |
Other Securities | | | | | | | | | 2,979,585 | | | | | 0.8% |
| | | | | | | | | | | | | | |
82
INTERNATIONAL VECTOR EQUITY PORTFOLIO
CONTINUED
| | | | | | | | | | | | | | | | | | |
| | | Shares | | | | | | Value†† | | | Percentage
of Net Assets** |
ISRAEL — (0.7%) | | | | | | | | | | | | | | | | | | |
Teva Pharmaceutical Industries, Ltd. Sponsored ADR | | | 12,719 | | | | | | | | $ 660,116 | | | | | | | 0.2% |
Other Securities | | | | | | | | | | | 2,380,647 | | | | | | | 0.6% |
| | | | | | | | | | | | | | | | | | |
TOTAL ISRAEL | | | | | | | | | | | 3,040,763 | | | | | | | 0.8% |
| | | | | | | | | | | | | | | | | | |
| | | | | |
ITALY — (2.6%) | | | | | | | | | | | | | | | | | | |
Other Securities | | | | | | | | | | | 10,439,114 | | | | | | | 2.9% |
| | | | | | | | | | | | | | | | | | |
| | | | | |
JAPAN — (17.2%) | | | | | | | | | | | | | | | | | | |
Mitsubishi UFJ Financial Group, Inc. | | | 208,200 | | | | | | | | 966,257 | | | | | | | 0.3% |
Sumitomo Mitsui Financial Group, Inc. | | | 23,700 | | | | | | | | 707,392 | | | | | | | 0.2% |
Other Securities | | | | | | | | | | | 68,388,609 | | | | | | | 18.8% |
| | | | | | | | | | | | | | | | | | |
TOTAL JAPAN | | | | | | | | | | | 70,062,258 | | | | | | | 19.3% |
| | | | | | | | | | | | | | | | | | |
| | | | | |
NETHERLANDS — (2.4%) | | | | | | | | | | | | | | | | | | |
*ING Groep NV Sponsored ADR | | | 72,426 | | | | | | | | 780,752 | | | | | | | 0.2% |
Koninklijke DSM NV | | | 11,964 | | | | | | | | 640,295 | | | | | | | 0.2% |
Other Securities | | | | | | | | | | | 8,172,724 | | | | | | | 2.2% |
| | | | | | | | | | | | | | | | | | |
TOTAL NETHERLANDS | | | | | | | | | | | 9,593,771 | | | | | | | 2.6% |
| | | | | | | | | | | | | | | | | | |
| | | | | |
NEW ZEALAND — (0.3%) | | | | | | | | | | | | | | | | | | |
Other Securities | | | | | | | | | | | 1,110,892 | | | | | | | 0.3% |
| | | | | | | | | | | | | | | | | | |
| | | | | |
NORWAY — (1.2%) | | | | | | | | | | | | | | | | | | |
DnB NOR ASA Series A | | | 46,946 | | | | | | | | 644,868 | | | | | | | 0.2% |
Other Securities | | | | | | | | | | | 4,315,127 | | | | | | | 1.2% |
| | | | | | | | | | | | | | | | | | |
TOTAL NORWAY | | | | | | | | | | | 4,959,995 | | | | | | | 1.4% |
| | | | | | | | | | | | | | | | | | |
| | | | | |
PORTUGAL — (0.4%) | | | | | | | | | | | | | | | | | | |
Other Securities | | | | | | | | | | | 1,608,017 | | | | | | | 0.4% |
| | | | | | | | | | | | | | | | | | |
| | | | | |
SINGAPORE — (1.6%) | | | | | | | | | | | | | | | | | | |
Other Securities | | | | | | | | | | | 6,461,864 | | | | | | | 1.8% |
| | | | | | | | | | | | | | | | | | |
| | | | | |
SPAIN — (1.9%) | | | | | | | | | | | | | | | | | | |
Banco Santander SA | | | 59,423 | | | | | | | | 762,730 | | | | | | | 0.2% |
Banco Santander SA Sponsored ADR | | | 49,963 | | | | | | | | 640,026 | | | | | | | 0.2% |
Other Securities | | | | | | | | | | | 6,145,779 | | | | | | | 1.7% |
| | | | | | | | | | | | | | | | | | |
TOTAL SPAIN | | | | | | | | | | | 7,548,535 | | | | | | | 2.1% |
| | | | | | | | | | | | | | | | | | |
| | | | | |
SWEDEN — (2.6%) | | | | | | | | | | | | | | | | | | |
Other Securities | | | | | | | | | | | 10,623,539 | | | | | | | 2.9% |
| | | | | | | | | | | | | | | | | | |
| | | | | |
SWITZERLAND — (5.3%) | | | | | | | | | | | | | | | | | | |
Holcim, Ltd. AG | | | 21,970 | | | | | | | | 1,368,650 | | | | | | | 0.4% |
#*Novartis AG ADR | | | 11,400 | | | | | | | | 660,630 | | | | | | | 0.2% |
Swatch Group AG | | | 2,379 | | | | | | | | 909,333 | | | | | | | 0.2% |
Swiss Reinsurance Co., Ltd. AG | | | 23,898 | | | | | | | | 1,148,230 | | | | | | | 0.3% |
#*UBS AG | | | 52,017 | | | | | | | | 883,641 | | | | | | | 0.2% |
Zurich Financial Services AG | | | 7,781 | | | | | | | | 1,904,146 | | | | | | | 0.5% |
Other Securities | | | | | | | | | | | 14,748,072 | | | | | | | 4.1% |
| | | | | | | | | | | | | | | | | | |
TOTAL SWITZERLAND | | | | | | | | | | | 21,622,702 | | | | | | | 5.9% |
| | | | | | | | | | | | | | | | | | |
| | | | | |
UNITED KINGDOM — (16.0%) | | | | | | | | | | | | | | | | | | |
Anglo American P.L.C. | | | 48,414 | | | | | | | | 2,255,764 | | | | | | | 0.6% |
Aviva P.L.C. | | | 128,562 | | | | | | | | 819,885 | | | | | | | 0.2% |
*BP P.L.C. Sponsored ADR | | | 18,084 | | | | | | | | 738,370 | | | | | | | 0.2% |
#HSBC Holdings P.L.C. Sponsored ADR | | | 51,029 | | | | | | | | 2,659,121 | | | | | | | 0.7% |
International Power P.L.C. | | | 155,255 | | | | | | | | 1,035,900 | | | | | | | 0.3% |
Kingfisher P.L.C. | | | 232,192 | | | | | | | | 884,562 | | | | | | | 0.3% |
Legal & General Group P.L.C. | | | 594,171 | | | | | | | | 955,252 | | | | | | | 0.3% |
83
INTERNATIONAL VECTOR EQUITY PORTFOLIO
CONTINUED
| | | | | | | | | | | | | | | | | | |
| | | Shares | | | | | | Value†† | | | Percentage
of Net Assets** |
UNITED KINGDOM — (Continued) | | | | | | | | | | | | | | | | | | |
*Lloyds Banking Group P.L.C. | | | 637,217 | | | | | | | | $ 700,384 | | | | | | | 0.2% |
Man Group P.L.C. | | | 175,697 | | | | | | | | 734,349 | | | | | | | 0.2% |
Old Mutual P.L.C. | | | 499,092 | | | | | | | | 1,039,401 | | | | | | | 0.3% |
Prudential P.L.C. | | | 68,348 | | | | | | | | 691,277 | | | | | | | 0.2% |
Resolution, Ltd. P.L.C. | | | 153,392 | | | | | | | | 643,070 | | | | | | | 0.2% |
#Royal Dutch Shell P.L.C. ADR | | | 45,916 | | | | | | | | 2,953,317 | | | | | | | 0.8% |
RSA Insurance Group P.L.C. | | | 351,201 | | | | | | | | 736,810 | | | | | | | 0.2% |
Standard Chartered P.L.C. | | | 26,966 | | | | | | | | 779,992 | | | | | | | 0.2% |
Standard Life P.L.C. | | | 228,627 | | | | | | | | 831,141 | | | | | | | 0.2% |
Vodafone Group P.L.C. Sponsored ADR | | | 83,315 | | | | | | | | 2,291,996 | | | | | | | 0.6% |
Weir Group P.L.C. (The) | | | 33,007 | | | | | | | | 823,815 | | | | | | | 0.2% |
*Wolseley P.L.C. | | | 25,895 | | | | | | | | 688,798 | | | | | | | 0.2% |
Xstrata P.L.C. | | | 77,287 | | | | | | | | 1,497,311 | | | | | | | 0.4% |
Other Securities | | | | | | | | | | | 41,309,890 | | | | | | | 11.4% |
| | | | | | | | | | | | | | | | | | |
TOTAL UNITED KINGDOM | | | | | | | | | | | 65,070,405 | | | | | | | 17.9% |
| | | | | | | | | | | | | | | | | | |
TOTAL COMMON STOCKS | | | | | | | | | | | 360,266,418 | | | | | | | 99.2% |
| | | | | | | | | | | | | | | | | | |
PREFERRED STOCKS — (0.0%) | | | | | | | | | | | | | | | | | | |
AUSTRALIA — (0.0%) | | | | | | | | | | | | | | | | | | |
Other Securities | | | | | | | | | | | 56,296 | | | | | | | 0.0% |
| | | | | | | | | | | | | | | | | | |
| | | | | |
GERMANY — (0.0%) | | | | | | | | | | | | | | | | | | |
Other Securities | | | | | | | | | | | 37,465 | | | | | | | 0.0% |
| | | | | | | | | | | | | | | | | | |
TOTAL PREFERRED STOCKS | | | | | | | | | | | 93,761 | | | | | | | 0.0% |
| | | | | | | | | | | | | | | | | | |
RIGHTS/WARRANTS — (0.0%) | | | | | | | | | | | | | | | | | | |
AUSTRIA — (0.0%) | | | | | | | | | | | | | | | | | | |
Other Securities | | | | | | | | | | | 37 | | | | | | | 0.0% |
| | | | | | | | | | | | | | | | | | |
| | | | | |
BELGIUM — (0.0%) | | | | | | | | | | | | | | | | | | |
Other Securities | | | | | | | | | | | 96 | | | | | | | 0.0% |
| | | | | | | | | | | | | | | | | | |
| | | | | |
FRANCE — (0.0%) | | | | | | | | | | | | | | | | | | |
Other Securities | | | | | | | | | | | 2,560 | | | | | | | 0.0% |
| | | | | | | | | | | | | | | | | | |
| | | | | |
HONG KONG — (0.0%) | | | | | | | | | | | | | | | | | | |
Other Securities | | | | | | | | | | | 385 | | | | | | | 0.0% |
| | | | | | | | | | | | | | | | | | |
| | | | | |
UNITED KINGDOM — (0.0%) | | | | | | | | | | | | | | | | | | |
Other Securities | | | | | | | | | | | 97,627 | | | | | | | 0.0% |
| | | | | | | | | | | | | | | | | | |
TOTAL RIGHTS/WARRANTS | | | | | | | | | | | 100,705 | | | | | | | 0.0% |
| | | | | | | | | | | | | | | | | | |
| | | | | |
| | | Face
Amount | | | | | | Value† | | | | | | |
| | | (000) | | | | | | | | | | | | |
TEMPORARY CASH INVESTMENTS — (0.4%) | | | | | | | | | | | | | | | | | | |
Repurchase Agreement, PNC Capital Markets, Inc. 0.19%, 11/01/10 (Collateralized by $3,315,000 FNMA 5.50%, 12/01/38,valued at $1,706,018) to be repurchased at $1,680,027 | | | $1,680 | | | | | | | | 1,680,000 | | | | | | | 0.5% |
| | | | | | | | | | | | | | | | | | |
| | | | | |
| | | Shares/
Face
Amount | | | | | | | | | | | | |
| | | (000) | | | | | | | | | | | | |
SECURITIES LENDING COLLATERAL — (11.2%) | | | | | | | | | | | | | | | | | | |
§@DFA Short Term Investment Fund | | | 43,488,771 | | | | | | | | 43,488,771 | | | | | | | 12.0% |
84
INTERNATIONAL VECTOR EQUITY PORTFOLIO
CONTINUED
| | | | | | | | | | | | | | | | | | |
| | | Shares/
Face
Amount | | | | | | Value† | | | Percentage
of Net Assets** |
| | | (000) | | | | | | | | | |
@Repurchase Agreement, Deutsche Bank Securities, Inc. 0.22%,
11/01/10 (Collateralized by $42,295,271 FNMA 7.000%,
08/01/38, valued at $1,977,158)## to be repurchased at $1,938,426 | | $ | 1,938 | | | | | | | $ | 1,938,390 | | | | | | | 0.5% |
| | | | | | | | | | | | | | | | | | |
TOTAL SECURITIES LENDING COLLATERAL | | | | | | | | | | | 45,427,161 | | | | | | | 12.5% |
| | | | | | | | | | | | | | | | | | |
TOTAL INVESTMENTS — (100.0%)
(Cost $324,244,978) | | | | | | | | | | $ | 407,568,045 | | | | | | | 112.2% |
| | | | | | | | | | | | | | | | | | |
85
INTERNATIONAL VECTOR EQUITY PORTFOLIO
CONTINUED
Summary of inputs used to value the Portfolio’s investments as of October 31, 2010 is as follows (See Security Valuation Note):
| | | | | | | | | | | | | | | | | | | | | | | | |
| | | Valuation Inputs | |
| |
| | | Investment in Securities (Market Value) | |
| | | Level 1 | | | Level 2 | | | Level 3 | | | Total | |
Common Stocks | | | | | | | | | | | | | | | | | | | | | | | | |
Australia | | $ | 273,652 | | | $ | 25,126,017 | | | | | | | | — | | | | | | | $ | 25,399,669 | |
Austria | | | — | | | | 2,808,144 | | | | | | | | — | | | | | | | | 2,808,144 | |
Belgium | | | 239,564 | | | | 4,914,898 | | | | | | | | — | | | | | | | | 5,154,462 | |
Canada | | | 39,966,028 | | | | — | | | | | | | | — | | | | | | | | 39,966,028 | |
Denmark | | | 12,282 | | | | 3,990,869 | | | | | | | | — | | | | | | | | 4,003,151 | |
Finland | | | — | | | | 7,480,547 | | | | | | | | — | | | | | | | | 7,480,547 | |
France | | | 1,218,150 | | | | 24,569,114 | | | | | | | | — | | | | | | | | 25,787,264 | |
Germany | | | 3,060,978 | | | | 17,895,748 | | | | | | | | — | | | | | | | | 20,956,726 | |
Greece | | | 152,318 | | | | 2,691,430 | | | | | | | | — | | | | | | | | 2,843,748 | |
Hong Kong | | | 1,420 | | | | 10,743,819 | | | | | | | | — | | | | | | | | 10,745,239 | |
Ireland | | | 530,832 | | | | 2,448,753 | | | | | | | | — | | | | | | | | 2,979,585 | |
Israel | | | 779,642 | | | | 2,261,121 | | | | | | | | — | | | | | | | | 3,040,763 | |
Italy | | | 605,447 | | | | 9,833,667 | | | | | | | | — | | | | | | | | 10,439,114 | |
Japan | | | 2,598,099 | | | | 67,464,159 | | | | | | | | — | | | | | | | | 70,062,258 | |
Netherlands | | | 2,363,999 | | | | 7,229,772 | | | | | | | | — | | | | | | | | 9,593,771 | |
New Zealand | | | — | | | | 1,110,892 | | | | | | | | — | | | | | | | | 1,110,892 | |
Norway | | | 45,968 | | | | 4,914,027 | | | | | | | | — | | | | | | | | 4,959,995 | |
Portugal | | | 14,409 | | | | 1,593,608 | | | | | | | | — | | | | | | | | 1,608,017 | |
Singapore | | | 1,168 | | | | 6,460,696 | | | | | | | | — | | | | | | | | 6,461,864 | |
Spain | | | 1,393,120 | | | | 6,155,415 | | | | | | | | — | | | | | | | | 7,548,535 | |
Sweden | | | 196,721 | | | | 10,426,818 | | | | | | | | — | | | | | | | | 10,623,539 | |
Switzerland | | | 1,785,783 | | | | 19,836,919 | | | | | | | | — | | | | | | | | 21,622,702 | |
United Kingdom | | | 9,794,457 | | | | 55,275,948 | | | | | | | | — | | | | | | | | 65,070,405 | |
Preferred Stocks | | | | | | | | | | | | | | | | | | | | | | | | |
Australia | | | — | | | | 56,296 | | | | | | | | — | | | | | | | | 56,296 | |
Germany | | | — | | | | 37,465 | | | | | | | | — | | | | | | | | 37,465 | |
Rights/Warrants | | | | | | | | | | | | | | | | | | | | | | | | |
Austria | | | — | | | | 37 | | | | | | | | — | | | | | | | | 37 | |
Belgium | | | 96 | | | | — | | | | | | | | — | | | | | | | | 96 | |
France | | | 2,560 | | | | — | | | | | | | | — | | | | | | | | 2,560 | |
Hong Kong | | | 385 | | | | — | | | | | | | | — | | | | | | | | 385 | |
United Kingdom | | | — | | | | 97,627 | | | | | | | | — | | | | | | | | 97,627 | |
Temporary Cash Investments | | | — | | | | 1,680,000 | | | | | | | | — | | | | | | | | 1,680,000 | |
Securities Lending Collateral | | | — | | | | 45,427,161 | | | | | | | | — | | | | | | | | 45,427,161 | |
| | | | | | | | | | | | | | | | | | | | | | | | |
TOTAL | | $ | 65,037,078 | | | $ | 342,530,967 | | | | | | | | — | | | | | | | $ | 407,568,045 | |
| | | | | | | | | | | | | | | | | | | | | | | | |
See accompanying Notes to Financial Statements.
86
EMERGING MARKETS PORTFOLIO
SCHEDULES OF INVESTMENTS
October 31, 2010
| | | | |
| | | Value† | |
AFFILIATED INVESTMENT COMPANY — (100.0%) | | | | |
Investment in The Emerging Markets Series of
The DFA Investment Trust Company | | $ | 2,373,379,206 | |
| | | | |
TOTAL INVESTMENTS IN AFFILIATED INVESTMENT COMPANY
(Cost $1,100,696,084) | | $ | 2,373,379,206 | |
| | | | |
Summary of inputs used to value the Portfolio’s investments as of October 31, 2010 is as follows (See Security Valuation Note):
| | | | | | | | | | | | |
| | | Valuation Inputs | |
| |
| | | Investment in Securities (Market Value) | |
| | | Level 1 | | | Level 2 | | Level 3 | | Total | |
Affiliated Investment Company | | $ | 2,373,379,206 | | | — | | — | | $ | 2,373,379,206 | |
EMERGING MARKETS SMALL CAP PORTFOLIO
| | | | |
| | | Value† | |
AFFILIATED INVESTMENT COMPANY — (100.0%) | | | | |
Investment in The Emerging Markets Small Cap Series of
The DFA Investment Trust Company | | $ | 1,833,749,476 | |
| | | | |
TOTAL INVESTMENTS IN AFFILIATED INVESTMENT COMPANY
(Cost $1,180,635,586) | | $ | 1,833,749,476 | |
| | | | |
Summary of inputs used to value the Portfolio’s investments as of October 31, 2010 is as follows (See Security Valuation Note):
| | | | | | | | | | | | |
| | | Valuation Inputs | |
| |
| | | Investment in Securities (Market Value) | |
| | | Level 1 | | | Level 2 | | Level 3 | | Total | |
Affiliated Investment Company | | $ | 1,833,749,476 | | | — | | — | | $ | 1,833,749,476 | |
See accompanying Notes to Financial Statements.
87
EMERGING MARKETS VALUE PORTFOLIO
SCHEDULE OF INVESTMENTS
October 31, 2010
| | | | |
| | | Value† | |
AFFILIATED INVESTMENT COMPANY — (100.0%) | | | | |
Investment in Dimensional Emerging Markets Value Fund | | $ | 11,586,667,027 | |
| | | | |
TOTAL INVESTMENTS IN AFFILIATED INVESTMENT COMPANY
(Cost $8,440,891,497) | | $ | 11,586,667,027 | |
| | | | |
Summary of inputs used to value the Portfolio’s investments as of October 31, 2010 is as follows (See Security Valuation Note):
| | | | | | | | | | | | |
| | | Valuation Inputs | |
| |
| | | Investment in Securities (Market Value) | |
| | | Level 1 | | | Level 2 | | Level 3 | | Total | |
Affiliated Investment Company | | $ | 11,586,667,027 | | | — | | — | | $ | 11,586,667,027 | |
See accompanying Notes to Financial Statements.
88
EMERGING MARKETS CORE EQUITY PORTFOLIO
SUMMARY SCHEDULE OF PORTFOLIO HOLDINGS
October 31, 2010
| | | | | | | | | | | | | | | | | | |
| | | Shares | | | | | | Value†† | | | Percentage
of Net Assets** |
COMMON STOCKS — (86.2%) | | | | | | | | | | | | | | | | | | |
BRAZIL — (6.4%) | | | | | | | | | | | | | | | | | | |
Banco Santander Brasil SA ADR | | | 918,363 | | | | | | | | $13,224,427 | | | | | | | 0.3% |
BM&F Bovespa SA | | | 2,153,883 | | | | | | | | 17,962,748 | | | | | | | 0.4% |
#BRF - Brasil Foods SA ADR | | | 665,421 | | | | | | | | 9,735,109 | | | | | | | 0.2% |
Petroleo Brasileiro SA ADR | | | 1,167,237 | | | | | | | | 39,826,126 | | | | | | | 1.0% |
#Vale SA Sponsored ADR | | | 819,190 | | | | | | | | 26,328,767 | | | | | | | 0.6% |
Other Securities | | | | | | | | | | | 182,987,573 | | | | | | | 4.4% |
| | | | | | | | | | | | | | | | | | |
TOTAL BRAZIL | | | | | | | | | | | 290,064,750 | | | | | | | 6.9% |
| | | | | | | | | | | | | | | | | | |
| | | | | |
CHILE — (2.4%) | | | | | | | | | | | | | | | | | | |
Centros Comerciales Sudamericanos SA | | | 1,366,292 | | | | | | | | 10,644,592 | | | | | | | 0.3% |
Empresas CMPC SA | | | 183,412 | | | | | | | | 9,861,465 | | | | | | | 0.2% |
Other Securities | | | | | | | | | | | 86,503,695 | | | | | | | 2.1% |
| | | | | | | | | | | | | | | | | | |
TOTAL CHILE | | | | | | | | | | | 107,009,752 | | | | | | | 2.6% |
| | | | | | | | | | | | | | | | | | |
| | | | | |
CHINA — (12.1%) | | | | | | | | | | | | | | | | | | |
Bank of China, Ltd. | | | 37,195,418 | | | | | | | | 22,388,909 | | | | | | | 0.5% |
China Construction Bank Corp. | | | 27,843,000 | | | | | | | | 26,618,005 | | | | | | | 0.6% |
#China Life Insurance Co., Ltd. ADR | | | 198,056 | | | | | | | | 13,026,143 | | | | | | | 0.3% |
#China Mobile, Ltd. Sponsored ADR | | | 745,451 | | | | | | | | 38,293,818 | | | | | | | 0.9% |
China Petroleum & Chemical Corp. ADR | | | 102,615 | | | | | | | | 9,780,236 | | | | | | | 0.2% |
#CNOOC, Ltd. ADR | | | 116,476 | | | | | | | | 24,334,166 | | | | | | | 0.6% |
Industrial & Commercial Bank of China, Ltd. Series H | | | 33,449,200 | | | | | | | | 27,023,394 | | | | | | | 0.7% |
#PetroChina Co., Ltd. ADR | | | 129,733 | | | | | | | | 15,950,672 | | | | | | | 0.4% |
Other Securities | | | | | | | | | | | 370,240,242 | | | | | | | 8.9% |
| | | | | | | | | | | | | | | | | | |
TOTAL CHINA | | | | | | | | | | | 547,655,585 | | | | | | | 13.1% |
| | | | | | | | | | | | | | | | | | |
| | | | | |
COLOMBIA — (0.2%) | | | | | | | | | | | | | | | | | | |
Other Securities | | | | | | | | | | | 8,434,133 | | | | | | | 0.2% |
| | | | | | | | | | | | | | | | | | |
| | | | | |
CZECH REPUBLIC — (0.4%) | | | | | | | | | | | | | | | | | | |
Other Securities | | | | | | | | | | | 19,724,216 | | | | | | | 0.5% |
| | | | | | | | | | | | | | | | | | |
| | | | | |
EGYPT — (0.1%) | | | | | | | | | | | | | | | | | | |
Other Securities | | | | | | | | | | | 4,479,656 | | | | | | | 0.1% |
| | | | | | | | | | | | | | | | | | |
| | | | | |
HUNGARY — (0.7%) | | | | | | | | | | | | | | | | | | |
#*OTP Bank P.L.C. | | | 488,536 | | | | | | | | 14,508,520 | | | | | | | 0.4% |
Other Securities | | | | | | | | | | | 17,612,863 | | | | | | | 0.4% |
| | | | | | | | | | | | | | | | | | |
TOTAL HUNGARY | | | | | | | | | | | 32,121,383 | | | | | | | 0.8% |
| | | | | | | | | | | | | | | | | | |
| | | | | |
INDIA — (11.0%) | | | | | | | | | | | | | | | | | | |
HDFC Bank, Ltd. | | | 216,913 | | | | | | | | 11,147,177 | | | | | | | 0.3% |
ICICI Bank, Ltd. Sponsored ADR | | | 396,338 | | | | | | | | 20,839,452 | | | | | | | 0.5% |
Infosys Technologies, Ltd. | | | 225,217 | | | | | | | | 15,092,410 | | | | | | | 0.4% |
Reliance Industries, Ltd. | | | 1,381,092 | | | | | | | | 34,093,896 | | | | | | | 0.8% |
Other Securities | | | | | | | | | | | 415,977,732 | | | | | | | 9.9% |
| | | | | | | | | | | | | | | | | | |
TOTAL INDIA | | | | | | | | | | | 497,150,667 | | | | | | | 11.9% |
| | | | | | | | | | | | | | | | | | |
| | | | | |
INDONESIA — (3.2%) | | | | | | | | | | | | | | | | | | |
PT Astra International Tbk | | | 2,085,000 | | | | | | | | 13,349,452 | | | | | | | 0.3% |
Other Securities | | | | | | | | | | | 131,381,222 | | | | | | | 3.2% |
| | | | | | | | | | | | | | | | | | |
TOTAL INDONESIA | | | | | | | | | | | 144,730,674 | | | | | | | 3.5% |
| | | | | | | | | | | | | | | | | | |
| | | | | |
ISRAEL — (0.0%) | | | | | | | | | | | | | | | | | | |
Other Securities | | | | | | | | | | | 451,529 | | | | | | | 0.0% |
| | | | | | | | | | | | | | | | | | |
89
EMERGING MARKETS CORE EQUITY PORTFOLIO
CONTINUED
| | | | | | | | | | | | | | | | | | |
| | | Shares | | | | | | Value†† | | | Percentage
of Net Assets** |
MALAYSIA — (3.5%) | | | | | | | | | | | | | | | | | | |
Other Securities | | | | | | | | | | $ | 160,164,505 | | | | | | | 3.8% |
| | | | | | | | | | | | | | | | | | |
| | | | | |
MEXICO — (4.4%) | | | | | | | | | | | | | | | | | | |
America Movil S.A.B. de C.V. Series L ADR | | | 443,009 | | | | | | | | 25,366,695 | | | | | | | 0.6% |
*Cemex S.A.B. de C.V. Sponsored ADR | | | 1,460,470 | | | | | | | | 12,808,322 | | | | | | | 0.3% |
Fomento Economico Mexicano S.A.B. de C.V. Sponsored ADR | | | 269,936 | | | | | | | | 14,822,186 | | | | | | | 0.3% |
#Grupo Financiero Banorte S.A.B. de C.V. | | | 2,596,307 | | | | | | | | 11,108,106 | | | | | | | 0.3% |
Grupo Mexico S.A.B. de C.V. Series B | | | 5,000,219 | | | | | | | | 16,473,025 | | | | | | | 0.4% |
Other Securities | | | | | | | | | | | 116,225,000 | | | | | | | 2.8% |
| | | | | | | | | | | | | | | | | | |
TOTAL MEXICO | | | | | | | | | | | 196,803,334 | | | | | | | 4.7% |
| | | | | | | | | | | | | | | | | | |
| | | | | |
PERU — (0.3%) | | | | | | | | | | | | | | | | | | |
Other Securities | | | | | | | | | | | 11,197,916 | | | | | | | 0.3% |
| | | | | | | | | | | | | | | | | | |
| | | | | |
PHILIPPINES — (0.9%) | | | | | | | | | | | | | | | | | | |
Other Securities | | | | | | | | | | | 42,776,109 | | | | | | | 1.0% |
| | | | | | | | | | | | | | | | | | |
| | | | | |
POLAND — (1.6%) | | | | | | | | | | | | | | | | | | |
Other Securities | | | | | | | | | | | 71,732,721 | | | | | | | 1.7% |
| | | | | | | | | | | | | | | | | | |
| | | | | |
RUSSIA — (3.4%) | | | | | | | | | | | | | | | | | | |
Gazprom OAO Sponsored ADR | | | 2,814,175 | | | | | | | | 61,616,486 | | | | | | | 1.5% |
Lukoil OAO Sponsored ADR | | | 502,859 | | | | | | | | 28,041,883 | | | | | | | 0.6% |
Other Securities | | | | | | | | | | | 62,371,774 | | | | | | | 1.5% |
| | | | | | | | | | | | | | | | | | |
TOTAL RUSSIA | | | | | | | | | | | 152,030,143 | | | | | | | 3.6% |
| | | | | | | | | | | | | | | | | | |
| | | | | |
SOUTH AFRICA — (7.9%) | | | | | | | | | | | | | | | | | | |
ABSA Group, Ltd. | | | 502,633 | | | | | | | | 9,737,407 | | | | | | | 0.2% |
Gold Fields, Ltd. Sponsored ADR | | | 915,915 | | | | | | | | 14,443,980 | | | | | | | 0.4% |
Impala Platinum Holdings, Ltd. | | | 418,209 | | | | | | | | 11,806,933 | | | | | | | 0.3% |
MTN Group, Ltd. | | | 1,101,689 | | | | | | | | 19,509,715 | | | | | | | 0.5% |
Naspers, Ltd. Series N | | | 378,717 | | | | | | | | 19,718,764 | | | | | | | 0.5% |
Sanlam, Ltd. | | | 3,530,404 | | | | | | | | 13,218,358 | | | | | | | 0.3% |
#Sasol, Ltd. Sponsored ADR | | | 502,813 | | | | | | | | 22,752,288 | | | | | | | 0.5% |
Standard Bank Group, Ltd. | | | 1,234,704 | | | | | | | | 18,160,831 | | | | | | | 0.4% |
Other Securities | | | | | | | | | | | 228,620,168 | | | | | | | 5.5% |
| | | | | | | | | | | | | | | | | | |
TOTAL SOUTH AFRICA | | | | | | | | | | | 357,968,444 | | | | | | | 8.6% |
| | | | | | | | | | | | | | | | | | |
| | | | | |
SOUTH KOREA — (12.0%) | | | | | | | | | | | | | | | | | | |
Hyundai Motor Co., Ltd. | | | 127,347 | | | | | | | | 19,278,402 | | | | | | | 0.5% |
#KB Financial Group, Inc. ADR | | | 254,734 | | | | | | | | 11,437,557 | | | | | | | 0.3% |
POSCO ADR. | | | 193,830 | | | | | | | | 20,146,690 | | | | | | | 0.5% |
Samsung Corp. | | | 176,799 | | | | | | | | 10,382,957 | | | | | | | 0.2% |
Samsung Electronics Co., Ltd. | | | 95,497 | | | | | | | | 63,355,186 | | | | | | | 1.5% |
Shinhan Financial Group Co., Ltd. ADR | | | 135,631 | | | | | | | | 10,548,023 | | | | | | | 0.2% |
Other Securities | | | | | | | | | | | 408,815,501 | | | | | | | 9.8% |
| | | | | | | | | | | | | | | | | | |
TOTAL SOUTH KOREA | | | | | | | | | | | 543,964,316 | | | | | | | 13.0% |
| | | | | | | | | | | | | | | | | | |
| | | | | |
TAIWAN — (11.2%) | | | | | | | | | | | | | | | | | | |
Hon Hai Precision Industry Co., Ltd. | | | 4,008,352 | | | | | | | | 15,159,736 | | | | | | | 0.3% |
Taiwan Semiconductor Manufacturing Co., Ltd. | | | 10,155,652 | | | | | | | | 20,893,350 | | | | | | | 0.5% |
Other Securities | | | | | | | | | | | 471,558,810 | | | | | | | 11.3% |
| | | | | | | | | | | | | | | | | | |
TOTAL TAIWAN | | | | | | | | | | | 507,611,896 | | | | | | | 12.1% |
| | | | | | | | | | | | | | | | | | |
| | | | | |
THAILAND — (2.3%) | | | | | | | | | | | | | | | | | | |
PTT PCL (Foreign) | | | 1,028,800 | | | | | | | | 10,397,812 | | | | | | | 0.3% |
Other Securities | | | | | | | | | | | 93,386,196 | | | | | | | 2.2% |
| | | | | | | | | | | | | | | | | | |
TOTAL THAILAND | | | | | | | | | | | 103,784,008 | | | | | | | 2.5% |
| | | | | | | | | | | | | | | | | | |
90
EMERGING MARKETS CORE EQUITY PORTFOLIO
CONTINUED
| | | | | | | | | | | | | | | | | | |
| | | Shares | | | | | | Value†† | | | Percentage
of Net Assets** |
TURKEY — (2.2%) | | | | | | | | | | | | | | | | | | |
Turkiye Garanti Bankasi A.S. | | | 1,790,492 | | | | | | | | $10,808,272 | | | | | | | 0.2% |
Other Securities | | | | | | | | | | | 90,363,767 | | | | | | | 2.2% |
| | | | | | | | | | | | | | | | | | |
TOTAL TURKEY | | | | | | | | | | | 101,172,039 | | | | | | | 2.4% |
| | | | | | | | | | | | | | | | | | |
TOTAL COMMON STOCKS | | | | | | | | | | | 3,901,027,776 | | | | | | | 93.3% |
| | | | | | | | | | | | | | | | | | |
PREFERRED STOCKS — (5.7%) | | | | | | | | | | | | | | | | | | |
BRAZIL — (5.7%) | | | | | | | | | | | | | | | | | | |
#Banco Bradesco SA Sponsored ADR | | | 1,220,938 | | | | | | | | 25,395,510 | | | | | | | 0.6% |
Itau Unibanco Holding SA ADR | | | 1,648,537 | | | | | | | | 40,488,069 | | | | | | | 1.0% |
#Petroleo Brasileiro SA ADR | | | 1,463,774 | | | | | | | | 45,655,111 | | | | | | | 1.1% |
Vale SA Sponsored ADR | | | 1,025,386 | | | | | | | | 29,459,340 | | | | | | | 0.7% |
Other Securities | | | | | | | | | | | 115,944,555 | | | | | | | 2.8% |
| | | | | | | | | | | | | | | | | | |
TOTAL BRAZIL | | | | | | | | | | | 256,942,585 | | | | | | | 6.2% |
| | | | | | | | | | | | | | | | | | |
| | | | | |
CHILE — (0.0%) | | | | | | | | | | | | | | | | | | |
Other Securities | | | | | | | | | | | 540,597 | | | | | | | 0.0% |
| | | | | | | | | | | | | | | | | | |
| | | | | |
INDIA — (0.0%) | | | | | | | | | | | | | | | | | | |
Other Securities | | | | | | | | | | | 5,805 | | | | | | | 0.0% |
| | | | | | | | | | | | | | | | | | |
TOTAL PREFERRED STOCKS | | | | | | | | | | | 257,488,987 | | | | | | | 6.2% |
| | | | | | | | | | | | | | | | | | |
RIGHTS/WARRANTS — (0.0%) | | | | | | | | | | | | | | | | | | |
CHINA — (0.0%) | | | | | | | | | | | | | | | | | | |
Other Securities | | | | | | | | | | | 38,787 | | | | | | | 0.0% |
| | | | | | | | | | | | | | | | | | |
| | | | | |
INDIA — (0.0%) | | | | | | | | | | | | | | | | | | |
Other Securities | | | | | | | | | | | 42,214 | | | | | | | 0.0% |
| | | | | | | | | | | | | | | | | | |
| | | | | |
INDONESIA — (0.0%) | | | | | | | | | | | | | | | | | | |
Other Securities | | | | | | | | | | | 18,219 | | | | | | | 0.0% |
| | | | | | | | | | | | | | | | | | |
| | | | | |
MALAYSIA — (0.0%) | | | | | | | | | | | | | | | | | | |
Other Securities | | | | | | | | | | | 22,737 | | | | | | | 0.0% |
| | | | | | | | | | | | | | | | | | |
| | | | | |
POLAND — (0.0%) | | | | | | | | | | | | | | | | | | |
Other Securities | | | | | | | | | | | 517,999 | | | | | | | 0.0% |
| | | | | | | | | | | | | | | | | | |
| | | | | |
SOUTH KOREA — (0.0%) | | | | | | | | | | | | | | | | | | |
Other Securities | | | | | | | | | | | 58,005 | | | | | | | 0.0% |
| | | | | | | | | | | | | | | | | | |
| | | | | |
TAIWAN — (0.0%) | | | | | | | | | | | | | | | | | | |
Other Securities | | | | | | | | | | | 21,799 | | | | | | | 0.0% |
| | | | | | | | | | | | | | | | | | |
| | | | | |
THAILAND — (0.0%) | | | | | | | | | | | | | | | | | | |
Other Securities | | | | | | | | | | | 97,237 | | | | | | | 0.0% |
| | | | | | | | | | | | | | | | | | |
TOTAL RIGHTS/WARRANTS | | | | | | | | | | | 816,997 | | | | | | | 0.0% |
| | | | | | | | | | | | | | | | | | |
| | | | | |
| | | Face Amount | | | | | | Value† | | | | | | |
| | | (000) | | | | | | | | | | | | |
TEMPORARY CASH INVESTMENTS — (0.1%) | | | | | | | | | | | | | | | | | | |
Repurchase Agreement, PNC Capital Markets, Inc. 0.19%,
11/01/10 (Collateralized by $6,825,000 FHLMC 4.00%,
12/15/38, valued at $6,358,143) to be repurchased at
$6,026,095 | | | $6,026 | | | | | | | | 6,026,000 | | | | | | | 0.1% |
| | | | | | | | | | | | | | | | | | |
91
EMERGING MARKETS CORE EQUITY PORTFOLIO
CONTINUED
| | | | | | | | | | | | |
| | | Shares/ Face Amount | | | | Value† | | | Percentage
of Net Assets** |
| | | (000) | | | | | | | | | |
SECURITIES LENDING COLLATERAL — (8.0%) | | | | | | | | | | | | |
§@DFA Short Term Investment Fund | | 362,593,120 | | | | $ | 362,593,120 | | | | | 8.7% |
@Repurchase Agreement, Deutsche Bank Securities, Inc. 0.22%,
11/01/10 (Collateralized by $42,295,271 FNMA 7.000%, 08/01/38, valued at $680,387)## to be repurchased at
$ 667,058 | | $667 | | | | | 667,046 | | | | | 0.0% |
| | | | | | | | | | | | |
TOTAL SECURITIES LENDING COLLATERAL | | | | | | | 363,260,166 | | | | | 8.7% |
| | | | | | | | | | | | |
TOTAL INVESTMENTS — (100.0%)
(Cost $3,290,561,843) | | | | | | $ | 4,528,619,926 | | | | | 108.3% |
| | | | | | | | | | | | |
92
EMERGING MARKETS CORE EQUITY PORTFOLIO
CONTINUED
Summary of inputs used to value the Portfolio’s investments as of October 31, 2010 is as follows (See Security Valuation Note):
| | | | | | | | | | | | | | | | | | |
| | | Valuation Inputs | |
| |
| | | Investment in Securities (Market Value) | |
| | | Level 1 | | | Level 2 | | | Level 3 | | Total | |
Common Stocks | | | | | | | | | | | | | | | | | | |
Brazil | | $ | 290,064,750 | | | | — | | | | | — | | | | $ | 290,064,750 | |
Chile | | | 107,009,752 | | | | — | | | | | — | | | | | 107,009,752 | |
China | | | 137,356,364 | | | $ | 410,299,221 | | | | | — | | | | | 547,655,585 | |
Colombia | | | 8,434,133 | | | | — | | | | | — | | | | | 8,434,133 | |
Czech Republic | | | — | | | | 19,724,216 | | | | | — | | | | | 19,724,216 | |
Egypt | | | — | | | | 4,479,656 | | | | | — | | | | | 4,479,656 | |
Hungary | | | 558,547 | | | | 31,562,836 | | | | | — | | | | | 32,121,383 | |
India | | | 27,343,056 | | | | 469,807,611 | | | | | — | | | | | 497,150,667 | |
Indonesia | | | 6,783,178 | | | | 137,947,496 | | | | | — | | | | | 144,730,674 | |
Israel | | | — | | | | 451,529 | | | | | — | | | | | 451,529 | |
Malaysia | | | 56,173 | | | | 160,108,332 | | | | | — | | | | | 160,164,505 | |
Mexico | | | 196,803,334 | | | | — | | | | | — | | | | | 196,803,334 | |
Peru | | | 11,197,916 | | | | — | | | | | — | | | | | 11,197,916 | |
Philippines | | | 2,379,579 | | | | 40,396,530 | | | | | — | | | | | 42,776,109 | |
Poland | | | 256,913 | | | | 71,475,808 | | | | | — | | | | | 71,732,721 | |
Russia | | | 581,620 | | | | 151,448,523 | | | | | — | | | | | 152,030,143 | |
South Africa | | | 55,689,292 | | | | 302,279,152 | | | | | — | | | | | 357,968,444 | |
South Korea | | | 56,220,619 | | | | 487,743,697 | | | | | — | | | | | 543,964,316 | |
Taiwan | | | 17,073,872 | | | | 490,538,024 | | | | | — | | | | | 507,611,896 | |
Thailand | | | 101,362,580 | | | | 2,421,428 | | | | | — | | | | | 103,784,008 | |
Turkey | | | 756,431 | | | | 100,415,608 | | | | | — | | | | | 101,172,039 | |
Preferred Stocks | | | | | | | | | | | | | | | | | | |
Brazil | | | 256,942,585 | | | | — | | | | | — | | | | | 256,942,585 | |
Chile | | | 540,597 | | | | — | | | | | — | | | | | 540,597 | |
India | | | — | | | | 5,805 | | | | | — | | | | | 5,805 | |
Rights/Warrants | | | | | | | | | | | | | | | | | | |
China | | | 37,032 | | | | 1,755 | | | | | — | | | | | 38,787 | |
India | | | — | | | | 42,214 | | | | | — | | | | | 42,214 | |
Indonesia | | | — | | | | 18,219 | | | | | — | | | | | 18,219 | |
Malaysia | | | 12,532 | | | | 10,205 | | | | | — | | | | | 22,737 | |
Poland | | | — | | | | 517,999 | | | | | — | | | | | 517,999 | |
South Korea | | | — | | | | 58,005 | | | | | — | | | | | 58,005 | |
Taiwan | | | — | | | | 21,799 | | | | | — | | | | | 21,799 | |
Thailand | | | 60,908 | | | | 36,329 | | | | | — | | | | | 97,237 | |
Temporary Cash Investments | | | — | | | | 6,026,000 | | | | | — | | | | | 6,026,000 | |
Securities Lending Collateral | | | — | | | | 363,260,166 | | | | | — | | | | | 363,260,166 | |
| | | | | | | | | | | | | | | | | | |
TOTAL | | $ | 1,277,521,763 | | | $ | 3,251,098,163 | | | | | — | | | | $ | 4,528,619,926 | |
| | | | | | | | | | | | | | | | | | |
See accompanying Notes to Financial Statements.
93
DFA INVESTMENT DIMENSIONS GROUP INC.
STATEMENTS OF ASSETS AND LIABILITIES
OCTOBER 31, 2010
(Amounts in thousands, except share and per share amounts)
| | | | | | | | | | | | | | | | |
| | | Enhanced
U.S. Large
Company
Portfolio | | | U.S.
Large Cap
Value
Portfolio | | | U.S.
Targeted
Value Portfolio | | | U.S.
Small Cap
Value
Portfolio | |
ASSETS: | | | | | | | | | | | | | | | | |
Investments in Affiliated Investment Companies at Value | | | — | | | $ | 6,922,105 | | | | — | | | | — | |
Investments at Value (including $0, $0, $295,134 and $1,201,408 of
securities on loan, respectively) | | $ | 155,465 | | | | — | | | $ | 2,258,799 | | | $ | 6,525,650 | |
Temporary Cash Investments at Value & Cost | | | 734 | | | | — | | | | 8,755 | | | | 25,559 | |
Collateral Received from Securities on Loan at Value & Cost | | | — | | | | — | | | | 310,754 | | | | 1,276,619 | |
Receivables: | | | | | | | | | | | | | | | | |
Investment Securities/Affiliated Investment Companies Sold | | | — | | | | 4,496 | | | | 3,850 | | | | 18,067 | |
Dividends and Interest | | | 1,752 | | | | — | | | | 474 | | | | 1,245 | |
Securities Lending Income | | | — | | | | — | | | | 204 | | | | 642 | |
Fund Shares Sold | | | 63 | | | | 4,142 | | | | 6,212 | | | | 1,917 | |
Futures Margin Variation | | | 52 | | | | — | | | | — | | | | — | |
Unrealized Gain on Forward Currency Contracts | | | 124 | | | | — | | | | — | | | | — | |
Prepaid Expenses and Other Assets | | | 22 | | | | 72 | | | | 52 | | | | 25 | |
| | | | | | | | | | | | | | | | |
Total Assets | | | 158,212 | | | | 6,930,815 | | | | 2,589,100 | | | | 7,849,724 | |
| | | | | | | | | | | | | | | | |
LIABILITIES: | | | | | | | | | | | | | | | | |
Payables: | | | | | | | | | | | | | | | | |
Upon Return of Securities Loaned | | | — | | | | — | | | | 310,754 | | | | 1,276,619 | |
Investment Securities/Affiliated Investment Companies Purchased | | | — | | | | — | | | | 5,168 | | | | 11,245 | |
Fund Shares Redeemed | | | 146 | | | | 8,638 | | | | 1,105 | | | | 3,486 | |
Due to Advisor | | | 26 | | | | 853 | | | | 653 | | | | 2,711 | |
Unrealized Loss on Forward Currency Contracts | | | 297 | | | | — | | | | — | | | | — | |
Accrued Expenses and Other Liabilities | | | 13 | | | | 288 | | | | 155 | | | | 386 | |
| | | | | | | | | | | | | | | | |
Total Liabilities | | | 482 | | | | 9,779 | | | | 317,835 | | | | 1,294,447 | |
| | | | | | | | | | | | | | | | |
NET ASSETS | | $ | 157,730 | | | $ | 6,921,036 | | | $ | 2,271,265 | | | $ | 6,555,277 | |
| | | | | | | | | | | | | | | | |
NET ASSET VALUE, OFFERING AND REDEMPTION PRICE PER
SHARE: | | | | | | | | | | | | | | | | |
Class R1 Shares — based on net assets of $0; $0; $41,316 and $0 and
shares outstanding of 0; 0; 2,800,466 and 0, respectively (Note P) | | | N/A | | | | N/A | | | $ | 14.75 | | | | N/A | |
| | | | | | | | | | | | | | | | |
NUMBER OF SHARES AUTHORIZED | | | 100,000,000 | * | | | 100,000,000 | * | | | 100,000,000 | | | | N/A | |
| | | | | | | | | | | | | | | | |
Class R2 Shares — based on net assets of $0; $0; $5,967 and $0 and
shares outstanding of 0; 0; 404,133 and 0, respectively (Note P) | | | N/A | | | | N/A | | | $ | 14.76 | | | | N/A | |
| | | | | | | | | | | | | | | | |
NUMBER OF SHARES AUTHORIZED | | | 100,000,000 | * | | | 100,000,000 | * | | | 100,000,000 | | | | N/A | |
| | | | | | | | | | | | | | | | |
Institutional Class Shares — based on net assets of $157,730;
$6,921,036; $2,223,982 and $6,555,277 and shares outstanding of
20,953,464; 372,437,851; 150,641,311 and 291,485,206, respectively | | $ | 7.53 | | | $ | 18.58 | | | $ | 14.76 | | | $ | 22.49 | |
| | | | | | �� | | | | | | | | | | |
NUMBER OF SHARES AUTHORIZED | | | 300,000,000 | | | | 2,000,000,000 | | | | 700,000,000 | | | | 1,700,000,000 | |
| | | | | | | | | | | | | | | | |
Investments in Affiliated Investment Companies at Cost | | $ | — | | | $ | 5,483,229 | | | $ | — | | | $ | — | |
| | | | | | | | | | | | | | | | |
Investments at Cost | | $ | 153,449 | | | $ | — | | | $ | 2,059,173 | | | $ | 6,375,292 | |
| | | | | | | | | | | | | | | | |
NET ASSETS CONSIST OF: | | | | | | | | | | | | | | | | |
Paid-In Capital | | $ | 238,773 | | | $ | 7,407,853 | | | $ | 2,065,507 | | | $ | 6,523,353 | |
Undistributed Net Investment Income (Distributions in Excess of Net
Investment Income) | | | 228 | | | | 17,386 | | | | 2,297 | | | | 3,668 | |
Accumulated Net Realized Gain (Loss) | | | (93,562 | ) | | | (1,943,079 | ) | | | 3,835 | | | | (122,102 | ) |
Net Unrealized Foreign Exchange Gain (Loss) | | | (132 | ) | | | — | | | | — | | | | — | |
Net Unrealized Appreciation (Depreciation) | | | 12,423 | | | | 1,438,876 | | | | 199,626 | | | | 150,358 | |
| | | | | | | | | | | | | | | | |
NET ASSETS | | $ | 157,730 | | | $ | 6,921,036 | | | $ | 2,271,265 | | | $ | 6,555,277 | |
| | | | | | | | | | | | | | | | |
| * | Share class has not yet commenced operations. See Organization note in Notes to Financial Statements. |
See accompanying Notes to Financial Statements.
94
DFA INVESTMENT DIMENSIONS GROUP INC.
STATEMENTS OF ASSETS AND LIABILITIES
OCTOBER 31, 2010
(Amounts in thousands, except share and per share amounts)
| | | | | | | | | | | | | | | | |
| | | U.S.
Core
Equity 1
Portfolio | | | U.S.
Core
Equity 2
Portfolio | | | U.S.
Vector
Equity
Portfolio | | | U.S.
Small
Cap
Portfolio | |
ASSETS: | | | | | | | | | | | | | | | | |
Investments at Value (including $288,084, $536,938, $180,481
and $805,181 of securities on loan, respectively) | | $ | 2,889,843 | | | $ | 4,977,754 | | | $ | 1,553,623 | | | $ | 3,375,294 | |
Temporary Cash Investments at Value & Cost | | | 12,291 | | | | 22,248 | | | | 5,593 | | | | 22,578 | |
Collateral Received from Securities on Loan at Value & Cost | | | 298,961 | | | | 558,222 | | | | 188,137 | | | | 846,208 | |
Receivables: | | | | | | | | | | | | | | | | |
Investment Securities Sold | | | 265 | | | | 639 | | | | 264 | | | | 6,460 | |
Dividends and Interest | | | 2,416 | | | | 4,177 | | | | 1,003 | | | | 859 | |
Securities Lending Income | | | 135 | | | | 302 | | | | 128 | | | | 662 | |
Fund Shares Sold | | | 2,213 | | | | 2,367 | | | | 931 | | | | 3,489 | |
Prepaid Expenses and Other Assets | | | 65 | | | | 49 | | | | 27 | | | | 38 | |
| | | | | | | | | | | | | | | | |
Total Assets | | | 3,206,189 | | | | 5,565,758 | | | | 1,749,706 | | | | 4,255,588 | |
| | | | | | | | | | | | | | | | |
LIABILITIES: | | | | | | | | | | | | | | | | |
Payables: | | | | | | | | | | | | | | | | |
Upon Return of Securities Loaned | | | 298,961 | | | | 558,222 | | | | 188,137 | | | | 846,208 | |
Investment Securities Purchased | | | 8,208 | | | | 14,301 | | | | 1,864 | | | | 15,343 | |
Fund Shares Redeemed | | | 1,036 | | | | 1,764 | | | | 805 | | | | 1,421 | |
Due to Advisor | | | 405 | | | | 819 | | | | 384 | | | | 966 | |
Accrued Expenses and Other Liabilities | | | 170 | | | | 285 | | | | 93 | | | | 193 | |
| | | | | | | | | | | | | | | | |
Total Liabilities | | | 308,780 | | | | 575,391 | | | | 191,283 | | | | 864,131 | |
| | | | | | | | | | | | | | | | |
NET ASSETS | | $ | 2,897,409 | | | $ | 4,990,367 | | | $ | 1,558,423 | | | $ | 3,391,457 | |
| | | | | | | | | | | | | | | | |
NET ASSET VALUE, OFFERING AND REDEMPTION PRICE
PER SHARE: | | | | | | | | | | | | | | | | |
Institutional Class Shares — based on net assets of
$2,897,409; $4,990,367; $1,558,423 and $3,391,457 and
shares outstanding of 284,538,758; 496,287,178; 158,721,130
and 177,971,909, respectively | | $ | 10.18 | | | $ | 10.06 | | | $ | 9.82 | | | $ | 19.06 | |
| | | | | | | | | | | | | | | | |
NUMBER OF SHARES AUTHORIZED | | | 1,500,000,000 | | | | 2,300,000,000 | | | | 1,000,000,000 | | | | 1,000,000,000 | |
| | | | | | | | | | | | | | | | |
Investments at Cost | | $ | 2,712,591 | | | $ | 4,871,798 | | | $ | 1,525,171 | | | $ | 2,893,977 | |
| | | | | | | | | | | | | | | | |
NET ASSETS CONSIST OF: | | | | | | | | | | | | | | | | |
Paid-In Capital | | $ | 2,795,667 | | | $ | 4,959,513 | | | $ | 1,610,975 | | | $ | 3,138,857 | |
Undistributed Net Investment Income (Distributions in Excess of
Net Investment Income) | | | 6,193 | | | | 11,980 | | | | 2,968 | | | | 4,657 | |
Accumulated Net Realized Gain (Loss) | | | (81,703 | ) | | | (87,082 | ) | | | (83,972 | ) | | | (233,374 | ) |
Net Unrealized Appreciation (Depreciation) | | | 177,252 | | | | 105,956 | | | | 28,452 | | | | 481,317 | |
| | | | | | | | | | | | | | | | |
NET ASSETS | | $ | 2,897,409 | | | $ | 4,990,367 | | | $ | 1,558,423 | | | $ | 3,391,457 | |
| | | | | | | | | | | | | | | | |
See accompanying Notes to Financial Statements.
95
DFA INVESTMENT DIMENSIONS GROUP INC.
STATEMENTS OF ASSETS AND LIABILITIES
OCTOBER 31, 2010
(Amounts in thousands, except share and per share amounts)
| | | | | | | | | | | | | | | | |
| | | U.S.
Micro
Cap
Portfolio | | | DFA
Real Estate
Securities
Portfolio | | | Large
Cap
International
Portfolio | | | International
Core
Equity
Portfolio | |
ASSETS: | | | | | | | | | | | | | | | | |
Investments at Value (including $412,876, $654,562,
$272,601 and $784,857 of securities on loan,
respectively) | | $ | 3,164,881 | | | $ | 2,684,876 | | | $ | 1,608,863 | | | $ | 4,846,454 | |
Temporary Cash Investments at Value & Cost | | | 14,738 | | | | 2,685 | | | | 647 | | | | 8,115 | |
Collateral Received from Securities on Loan at Value &
Cost | | | 440,599 | | | | 676,959 | | | | 285,278 | | | | 827,338 | |
Foreign Currencies at Value | | | — | | | | — | | | | 4,221 | | | | 13,240 | |
Cash | | | — | | | | — | | | | 15 | | | | 20 | |
Receivables: | | | | | | | | | | | | | | | | |
Investment Securities Sold | | | 7,035 | | | | — | | | | — | | | | 690 | |
Dividends, Interest and Tax Reclaims | | | 1,079 | | | | 2,582 | | | | 4,261 | | | | 11,398 | |
Securities Lending Income | | | 571 | | | | 96 | | | | 98 | | | | 477 | |
Fund Shares Sold | | | 5,090 | | | | 1,843 | | | | 1,010 | | | | 2,702 | |
Unrealized Gain on Foreign Currency Contracts | | | — | | | | — | | | | — | | | | 8 | |
Prepaid Expenses and Other Assets | | | 18 | | | | 30 | | | | 17 | | | | 66 | |
| | | | | | | | | | | | | | | | |
Total Assets | | | 3,634,011 | | | | 3,369,071 | | | | 1,904,410 | | | | 5,710,508 | |
| | | | | | | | | | | | | | | | |
LIABILITIES: | | | | | | | | | | | | | | | | |
Payables: | | | | | | | | | | | | | | | | |
Upon Return of Securities Loaned | | | 440,599 | | | | 676,959 | | | | 285,278 | | | | 827,338 | |
Investment Securities Purchased | | | 11,393 | | | | — | | | | 717 | | | | 11,867 | |
Fund Shares Redeemed | | | 2,228 | | | | 1,740 | | | | 1,254 | | | | 2,442 | |
Due to Advisor | | | 1,308 | | | | 669 | | | | 335 | | | | 1,410 | |
Accrued Expenses and Other Liabilities | | | 197 | | | | 151 | | | | 140 | | | | 462 | |
| | | | | | | | | | | | | | | | |
Total Liabilities | | | 455,725 | | | | 679,519 | | | | 287,724 | | | | 843,519 | |
| | | | | | | | | | | | | | | | |
NET ASSETS | | $ | 3,178,286 | | | $ | 2,689,552 | | | $ | 1,616,686 | | | $ | 4,866,989 | |
| | | | | | | | | | | | | | | | |
NET ASSET VALUE, OFFERING AND REDEMPTION
PRICE PER SHARE: | | | | | | | | | | | | | | | | |
Institutional Class Shares — based on net assets of
$3,178,286; $2,689,552; $1,616,686 and $4,866,989
and shares outstanding of 259,346,866; 126,653,593;
83,236,180 and 451,523,175, respectively | | $ | 12.25 | | | $ | 21.24 | | | $ | 19.42 | | | $ | 10.78 | |
| | | | | | | | | | | | | | | | |
NUMBER OF SHARES AUTHORIZED | | | 1,500,000,000 | | | | 700,000,000 | | | | 500,000,000 | | | | 2,000,000,000 | |
| | | | | | | | | | | | | | | | |
Investments at Cost | | $ | 2,860,548 | | | $ | 2,240,122 | | | $ | 1,383,551 | | | $ | 4,787,845 | |
| | | | | | | | | | | | | | | | |
Foreign Currencies at Cost | | $ | — | | | $ | — | | | $ | 4,170 | | | $ | 12,916 | |
| | | | | | | | | | | | | | | | |
NET ASSETS CONSIST OF: | | | | | | | | | | | | | | | | |
Paid-In Capital | | $ | 3,144,547 | | | $ | 2,477,550 | | | $ | 1,574,776 | | | $ | 4,871,191 | |
Undistributed Net Investment Income (Distributions in
Excess of Net Investment Income) | | | 3,227 | | | | 12,994 | | | | 3,984 | | | | 16,165 | |
Accumulated Net Realized Gain (Loss) | | | (273,821 | ) | | | (245,746 | ) | | | (187,612 | ) | | | (79,675 | ) |
Net Unrealized Foreign Exchange Gain (Loss) | | | — | | | | — | | | | 175 | | | | 375 | |
Net Unrealized Appreciation (Depreciation) | | | 304,333 | | | | 444,754 | | | | 225,363 | | | | 58,933 | |
| | | | | | | | | | | | | | | | |
NET ASSETS | | $ | 3,178,286 | | | $ | 2,689,552 | | | $ | 1,616,686 | | | $ | 4,866,989 | |
| | | | | | | | | | | | | | | | |
See accompanying Notes to Financial Statements.
96
DFA INVESTMENT DIMENSIONS GROUP INC.
STATEMENTS OF ASSETS AND LIABILITIES
OCTOBER 31, 2010
(Amounts in thousands, except share and per share amounts)
| | | | | | | | | | | | | | | | |
| | | International
Small
Company
Portfolio | | | Japanese
Small
Company
Portfolio | | | Asia
Pacific
Small
Company
Portfolio | | | United
Kingdom
Small
Company
Portfolio | |
ASSETS: | | | | | | | | | | | | | | | | |
Investments in Affiliated Investment Companies at Value | | $ | 5,511,191 | | | $ | 114,984 | | | $ | 131,557 | | | $ | 33,758 | |
Temporary Cash Investments at Value & Cost | | | 17,342 | | | | — | | | | — | | | | — | |
Cash | | | 16 | | | | — | | | | — | | | | — | |
Receivables: | | | | | | | | | | | | | | | | |
Affiliated Investment Companies Sold | | | — | | | | — | | | | 40 | | | | — | |
Fund Shares Sold | | | 1,932 | | | | 11 | | | | 70 | | | | 13 | |
Prepaid Expenses and Other Assets | | | 35 | | | | 8 | | | | 13 | | | | 9 | |
| | | | | | | | | | | | | | | | |
Total Assets | | | 5,530,516 | | | | 115,003 | | | | 131,680 | | | | 33,780 | |
| | | | | | | | | | | | | | | | |
LIABILITIES: | | | | | | | | | | | | | | | | |
Payables: | | | | | | | | | | | | | | | | |
Affiliated Investment Companies Purchased | | | — | | | | 10 | | | | — | | | | 13 | |
Fund Shares Redeemed | | | 16,878 | | | | 1 | | | | 110 | | | | — | |
Due to Advisor | | | 1,813 | | | | 39 | | | | 43 | | | | 11 | |
Accrued Expenses and Other Liabilities | | | 231 | | | | 20 | | | | 16 | | | | 5 | |
| | | | | | | | | | | | | | | | |
Total Liabilities | | | 18,922 | | | | 70 | | | | 169 | | | | 29 | |
| | | | | | | | | | | | | | | | |
NET ASSETS | | $ | 5,511,594 | | | $ | 114,933 | | | $ | 131,511 | | | $ | 33,751 | |
| | | | | | | | | | | | | | | | |
NET ASSET VALUE, OFFERING AND REDEMPTION PRICE PER SHARE: | | | | | | | | | | | | | | | | |
Institutional Class Shares — based on net assets
of $5,511,594; $114,933; $131,511 and $33,751
and shares outstanding of 341,572,645;
8,132,907; 5,129,238 and 1,392,436,
respectively | | $ | 16.14 | | | $ | 14.13 | | | $ | 25.64 | | | $ | 24.24 | |
| | | | | | | | | | | | | | | | |
NUMBER OF SHARES AUTHORIZED | | | 1,500,000,000 | | | | 100,000,000 | | | | 100,000,000 | | | | 100,000,000 | |
| | | | | | | | | | | | | | | | |
Investments in Affiliated Investment Companies at
Cost | | $ | 4,975,116 | | | $ | 190,942 | | | $ | 104,540 | | | $ | 30,219 | |
| | | | | | | | | | | | | | | | |
NET ASSETS CONSIST OF: | | | | | | | | | | | | | | | | |
Paid-In Capital | | $ | 5,026,522 | | | $ | 279,223 | | | $ | 137,845 | | | $ | 33,057 | |
Undistributed Net Investment Income (Distributions
in Excess of Net Investment Income) | | | 31,973 | | | | 631 | | | | 652 | | | | 203 | |
Accumulated Net Realized Gain (Loss) | | | (83,425 | ) | | | (89,010 | ) | | | (34,001 | ) | | | (3,052 | ) |
Net Unrealized Foreign Exchange Gain (Loss) | | | 449 | | | | 47 | | | | (2 | ) | | | 4 | |
Net Unrealized Appreciation (Depreciation) | | | 536,075 | | | | (75,958 | ) | | | 27,017 | | | | 3,539 | |
| | | | | | | | | | | | | | | | |
NET ASSETS | | $ | 5,511,594 | | | $ | 114,933 | | | $ | 131,511 | | | $ | 33,751 | |
| | | | | | | | | | | | | | | | |
See accompanying Notes to Financial Statements.
97
DFA INVESTMENT DIMENSIONS GROUP INC.
STATEMENTS OF ASSETS AND LIABILITIES
OCTOBER 31, 2010
(Amounts in thousands, except share and per share amounts)
| | | | | | | | | | | | | | | | |
| | | Continental
Small
Company
Portfolio | | | DFA
International
Real Estate
Securities
Portfolio | | | DFA
Global
Real Estate
Securities
Portfolio | | | DFA
International
Small Cap
Value
Portfolio | |
ASSETS: | | | | | | | | | | | | | | | | |
Investments in Affiliated Investment Companies at Value | | $ | 128,156 | | | | — | | | $ | 694,143 | | | | — | |
Investments at Value (including $0, $138,661, $0 and $508,683
of securities on loan, respectively) | | | — | | | $ | 952,214 | | | | — | | | $ | 7,628,122 | |
Temporary Cash Investments at Value & Cost | | | — | | | | 1,525 | | | | 1,431 | | | | 11,103 | |
Collateral Received from Securities on Loan at Value & Cost | | | — | | | | 146,089 | | | | — | | | | 549,034 | |
Foreign Currencies at Value | | | — | | | | 3,788 | | | | — | | | | 16,792 | |
Cash | | | — | | | | 15 | | | | — | | | | 16 | |
Receivables: | | | | | | | | | | | | | | | | |
Investment Securities/Affiliated Investment Companies Sold | | | — | | | | — | | | | — | | | | 17,087 | |
Dividends, Interest and Tax Reclaims | | | — | | | | 3,388 | | | | — | | | | 19,111 | |
Securities Lending Income | | | — | | | | 88 | | | | — | | | | 635 | |
Fund Shares Sold | | | 16 | | | | 430 | | | | 1,164 | | | | 3,276 | |
Unrealized Gain on Foreign Currency Contracts | | | — | | | | 5 | | | | — | | | | 42 | |
Prepaid Expenses and Other Assets | | | 9 | | | | 26 | | | | 15 | | | | 56 | |
| | | | | | | | | | | | | | | | |
Total Assets | | | 128,181 | | | | 1,107,568 | | | | 696,753 | | | | 8,245,274 | |
| | | | | | | | | | | | | | | | |
LIABILITIES: | | | | | | | | | | | | | | | | |
Payables: | | | | | | | | | | | | | | | | |
Upon Return of Securities Loaned | | | — | | | | 146,089 | | | | — | | | | 549,034 | |
Investment Securities/Affiliated Investment Companies
Purchased | | | 13 | | | | 2,005 | | | | 766 | | | | 27,388 | |
Fund Shares Redeemed | | | 3 | | | | 557 | | | | 478 | | | | 8,748 | |
Due to Advisor | | | 42 | | | | 277 | | | | 20 | | | | 4,173 | |
Accrued Expenses and Other Liabilities | | | 17 | | | | 86 | | | | 28 | | | | 613 | |
| | | | | | | | | | | | | | | | |
Total Liabilities | | | 75 | | | | 149,014 | | | | 1,292 | | | | 589,956 | |
| | | | | | | | | | | | | | | | |
NET ASSETS | | $ | 128,106 | | | $ | 958,554 | | | $ | 695,461 | | | $ | 7,655,318 | |
| | | | | | | | | | | | | | | | |
NET ASSET VALUE, OFFERING AND REDEMPTION PRICE
PER SHARE: | | | | | | | | | | | | | | | | |
Institutional Cass Shares — based on net assets of $128,106;
$958,554; $695,461 and $7,655,318 and shares outstanding
of 7,564,918; 171,633,295; 83,958,133 and 473,841,038,
respectively | | $ | 16.93 | | | $ | 5.58 | | | $ | 8.28 | | | $ | 16.16 | |
| | | | | | | | | | | | | | | | |
NUMBER OF SHARES AUTHORIZED | | | 100,000,000 | | | | 700,000,000 | | | | 500,000,000 | | | | 2,300,000,000 | |
| | | | | | | | | | | | | | | | |
Investments in Affiliated Investment Companies at Cost | | $ | 110,311 | | | $ | — | | | $ | 527,735 | | | $ | — | |
| | | | | | | | | | | | | | | | |
Investments at Cost | | $ | — | | | $ | 1,021,442 | | | $ | — | | | $ | 7,877,385 | |
| | | | | | | | | | | | | | | | |
Foreign Currencies at Cost | | $ | — | | | $ | 3,749 | | | $ | — | | | $ | 16,694 | |
| | | | | | | | | | | | | | | | |
NET ASSETS CONSIST OF: | | | | | | | | | | | | | | | | |
Paid-In Capital | | $ | 139,133 | | | $ | 1,133,390 | | | $ | 547,469 | | | $ | 7,728,221 | |
Undistributed Net Investment Income (Distributions in Excess of
Net Investment Income) | | | 597 | | | | (2,542 | ) | | | 5,011 | | | | 37,940 | |
Accumulated Net Realized Gain (Loss) | | | (29,516 | ) | | | (103,196 | ) | | | (23,427 | ) | | | 137,636 | |
Net Unrealized Foreign Exchange Gain (Loss) | | | 47 | | | | 91 | | | | — | | | | 686 | |
Net Unrealized Appreciation (Depreciation) | | | 17,845 | | | | (69,189 | ) | | | 166,408 | | | | (249,165 | ) |
| | | | | | | | | | | | | | | | |
NET ASSETS | | $ | 128,106 | | | $ | 958,554 | | | $ | 695,461 | | | $ | 7,655,318 | |
| | | | | | | | | | | | | | | | |
See accompanying Notes to Financial Statements.
98
DFA INVESTMENT DIMENSIONS GROUP INC.
STATEMENTS OF ASSETS AND LIABILITIES
OCTOBER 31, 2010
(Amounts in thousands, except share and per share amounts)
| | | | | | | | | | | | |
| | | International
Vector
Equity
Portfolio | | | Emerging
Markets
Portfolio | | | Emerging
Markets
Small Cap
Portfolio | |
ASSETS: | | | | | | | | | | | | |
Investments in Affiliated Investment Companies at Value | | | — | | | $ | 2,373,379 | | | $ | 1,833,749 | |
Investments at Value (including $42,181, $0 and $0 of securities on
loan, respectively) | | $ | 360,461 | | | | — | | | | — | |
Temporary Cash Investments at Value & Cost | | | 1,680 | | | | — | | | | — | |
Collateral Received from Securities on Loan at Value & Cost | | | 45,427 | | | | — | | | | — | |
Foreign Currencies at Value | | | 944 | | | | — | | | | — | |
Cash | | | 15 | | | | — | | | | — | |
Receivables: | | | | | | | | | | | | |
Investment Securities/Affiliated Investment Companies Sold | | | 12 | | | | 24,164 | | | | — | |
Dividends, Interest and Tax Reclaims | | | 853 | | | | — | | | | — | |
Securities Lending Income | | | 40 | | | | — | | | | — | |
Fund Shares Sold | | | 160 | | | | 2,872 | | | | 558 | |
Unrealized Gain on Foreign Currency Contracts | | | 2 | | | | — | | | | — | |
Prepaid Expenses and Other Assets | | | 14 | | | | 14 | | | | 29 | |
| | | | | | | | | | | | |
Total Assets | | | 409,608 | | | | 2,400,429 | | | | 1,834,336 | |
| | | | | | | | | | | | |
LIABILITIES: | | | | | | | | | | | | |
Payables: | | | | | | | | | | | | |
Upon Return of Securities Loaned | | | 45,427 | | | | — | | | | — | |
Investment Securities/Affiliated Investment Companies Purchased | | | 847 | | | | — | | | | 161 | |
Fund Shares Redeemed | | | 37 | | | | 27,036 | | | | 397 | |
Due to Advisor | | | 135 | | | | 791 | | | | 676 | |
Accrued Expenses and Other Liabilities | | | 39 | | | | 104 | | | | 64 | |
| | | | | | | | | | | | |
Total Liabilities | | | 46,485 | | | | 27,931 | | | | 1,298 | |
| | | | | | | | | | | | |
NET ASSETS | | $ | 363,123 | | | $ | 2,372,498 | | | $ | 1,833,038 | |
| | | | | | | | | | | | |
NET ASSET VALUE, OFFERING AND REDEMPTION PRICE PER
SHARE: | | | | | | | | | | | | |
Institutional Class Shares — based on net assets of $363,123;
$2,372,498 and $1,833,038 and shares outstanding of 35,328,976;
76,790,382 and 75,563,919, respectively | | $ | 10.28 | | | $ | 30.90 | | | $ | 24.26 | |
| | | | | | | | | | | | |
NUMBER OF SHARES AUTHORIZED | | | 500,000,000 | | | | 500,000,000 | | | | 500,000,000 | |
| | | | | | | | | | | | |
Investments in Affiliated Investment Companies at Cost | | $ | — | | | $ | 1,100,696 | | | $ | 1,180,635 | |
| | | | | | | | | | | | |
Investments at Cost | | $ | 277,138 | | | $ | — | | | $ | — | |
| | | | | | | | | | | | |
Foreign Currencies at Cost | | $ | 936 | | | $ | — | | | $ | — | |
| | | | | | | | | | | | |
NET ASSETS CONSIST OF: | | | | | | | | | | | | |
Paid-In Capital | | $ | 276,696 | | | $ | 964,564 | | | $ | 1,122,358 | |
Undistributed Net Investment Income (Distributions in Excess of Net
Investment Income) | | | 1,086 | | | | 3,270 | | | | 3,213 | |
Accumulated Net Realized Gain (Loss) | | | 1,979 | | | | 136,138 | | | | 57,883 | |
Deferred Thailand Capital Gains Tax | | | — | | | | (4,215 | ) | | | (3,533 | ) |
Net Unrealized Foreign Exchange Gain (Loss) | | | 31 | | | | 58 | | | | 3 | |
Net Unrealized Appreciation (Depreciation) | | | 83,331 | | | | 1,272,683 | | | | 653,114 | |
| | | | | | | | | | | | |
NET ASSETS | | $ | 363,123 | | | $ | 2,372,498 | | | $ | 1,833,038 | |
| | | | | | | | | | | | |
See accompanying Notes to Financial Statements.
99
DFA INVESTMENT DIMENSIONS GROUP INC.
STATEMENTS OF ASSETS AND LIABILITIES
OCTOBER 31, 2010
(Amounts in thousands, except share and per share amounts)
| | | | | | | | |
| | | Emerging
Markets
Value
Portfolio | | | Emerging
Markets
Core Equity
Portfolio | |
ASSETS: | | | | | | | | |
Investments in Affiliated Investment Companies at Value | | $ | 11,586,667 | | | | — | |
Investments at Value (including $0 and $339,827 of securities on loan, respectively) | | | — | | | $ | 4,159,334 | |
Temporary Cash Investments at Value & Cost | | | — | | | | 6,026 | |
Collateral Received from Securities on Loan at Value & Cost | | | — | | | | 363,260 | |
Foreign Currencies at Value | | | — | | | | 2,119 | |
Cash | | | — | | | | 49 | |
Receivables: | | | | | | | | |
Investment Securities/Affiliated Investment Companies Sold | | | — | | | | 269 | |
Dividends, Interest and Tax Reclaims | | | — | | | | 3,921 | |
Securities Lending Income | | | — | | | | 423 | |
Fund Shares Sold | | | 16,023 | | | | 25,659 | |
Unrealized Gain on Foreign Currency Contracts | | | — | | | | 1 | |
Prepaid Expenses and Other Assets | | | 90 | | | | 225 | |
| | | | | | | | |
Total Assets | | | 11,602,780 | | | | 4,561,286 | |
| | | | | | | | |
LIABILITIES: | | | | | | | | |
Payables: | | | | | | | | |
Upon Return of Securities Loaned | | | — | | | | 363,260 | |
Investment Securities/Affiliated Investment Companies Purchased | | | 13,173 | | | | 5,425 | |
Fund Shares Redeemed | | | 2,850 | | | | 4,185 | |
Due to Advisor | | | 3,793 | | | | 1,886 | |
Deferred Thailand Capital Gains Tax | | | — | | | | 5,966 | |
Accrued Expenses and Other Liabilities | | | 426 | | | | 682 | |
| | | | | | | | |
Total Liabilities | | | 20,242 | | | | 381,404 | |
| | | | | | | | |
NET ASSETS | | $ | 11,582,538 | | | $ | 4,179,882 | |
| | | | | | | | |
NET ASSET VALUE, OFFERING AND REDEMPTION PRICE PER SHARE: | | | | | | | | |
Class R2 Shares — based on net assets of $39,668 and $0 and shares outstanding of
20,471,843 and 0, respectively | | $ | 1.94 | | | | N/A | |
| | | | | | | | |
NUMBER OF SHARES AUTHORIZED | | | 100,000,000 | | | | 100,000,000 | * |
| | | | | | | | |
Institutional Class Shares — based on net assets of $11,542,870 and $4,179,882 and
shares outstanding of 318,275,914 and 196,180,731, respectively | | $ | 36.27 | | | $ | 21.31 | |
| | | | | | | | |
NUMBER OF SHARES AUTHORIZED | | | 1,500,000,000 | | | | 1,000,000,000 | |
| | | | | | | | |
Investments in Affiliated Investment Companies at Cost | | $ | 8,440,891 | | | $ | — | |
| | | | | | | | |
Investments at Cost | | $ | — | | | $ | 2,921,276 | |
| | | | | | | | |
Foreign Currencies at Cost | | $ | — | | | $ | 2,071 | |
| | | | | | | | |
NET ASSETS CONSIST OF: | | | | | | | | |
Paid-In Capital | | $ | 7,903,300 | | | $ | 2,994,109 | |
Undistributed Net Investment Income (Distributions in Excess of Net Investment Income) | | | 12,814 | | | | 8,563 | |
Accumulated Net Realized Gain (Loss) | | | 536,606 | | | | (54,988 | ) |
Deferred Thailand Capital Gains Tax | | | (16,079 | ) | | | (5,965 | ) |
Net Unrealized Foreign Exchange Gain (Loss) | | | 121 | | | | 57 | |
Net Unrealized Appreciation (Depreciation) | | | 3,145,776 | | | | 1,238,106 | |
| | | | | | | | |
NET ASSETS | | $ | 11,582,538 | | | $ | 4,179,882 | |
| | | | | | | | |
| * | Share class has not yet commenced operations. See Organization note in Notes to Financial Statements. |
See accompanying Notes to Financial Statements.
100
DFA INVESTMENT DIMENSIONS GROUP INC.
STATEMENTS OF OPERATIONS
FOR THE YEAR ENDED OCTOBER 31, 2010
(Amounts in thousands)
| | | | | | | | | | | | | | | | |
| | | Enhanced
U.S. Large
Company
Portfolio | | | U.S.
Large Cap
Value
Portfolio* | | | U.S.
Targeted
Value
Portfolio | | | U.S.
Small Cap
Value
Portfolio | |
Investment Income | | | | | | | | | | | | | | | | |
Dividends | | $ | 97 | | | $ | 135,162 | | | $ | 19,385 | | | $ | 52,897 | |
Interest | | | 1,867 | | | | 33 | | | | 17 | | | | 34 | |
Income from Securities Lending | | | — | | | | 3,106 | | | | 2,001 | | | | 6,907 | |
Expenses Allocated from Affiliated Investment
Company | | | — | | | | (7,489 | ) | | | — | | | | — | |
| | | | | | | | | | | | | | | | |
Total Investment Income | | | 1,964 | | | | 130,812 | | | | 21,403 | | | | 59,838 | |
| | | | | | | | | | | | | | | | |
Expenses | | | | | | | | | | | | | | | | |
Investment Advisory Services Fees | | | 79 | | | | — | | | | 1,995 | | | | 12,631 | |
Administrative Services Fees | | | 238 | | | | 9,730 | | | | 4,988 | | | | 18,946 | |
Accounting & Transfer Agent Fees | | | 39 | | | | 102 | | | | 242 | | | | 721 | |
S&P 500® Fees | | | 8 | | | | — | | | | — | | | | — | |
Shareholder Servicing Fees — | | | | | | | | | | | | | | | | |
Class R1 Shares | | | — | | | | — | | | | 37 | | | | — | |
Class R2 Shares | | | — | | | | — | | | | 11 | | | | — | |
Custodian Fees | | | 15 | | | | — | | | | 56 | | | | 115 | |
Filing Fees | | | 24 | | | | 130 | | | | 118 | | | | 52 | |
Shareholders’ Reports | | | 3 | | | | 167 | | | | 96 | | | | 98 | |
Directors’/Trustees’ Fees & Expenses | | | 1 | | | | 61 | | | | 19 | | | | 60 | |
Professional Fees | | | 5 | | | | 120 | | | | 61 | | | | 202 | |
Other | | | 5 | | | | 57 | | | | 37 | | | | 128 | |
| | | | | | | | | | | | | | | | |
Total Expenses | | | 417 | | | | 10,367 | | | | 7,660 | | | | 32,953 | |
| | | | | | | | | | | | | | | | |
Net Investment Income (Loss) | | | 1,547 | | | | 120,445 | | | | 13,743 | | | | 26,885 | |
| | | | | | | | | | | | | | | | |
Realized and Unrealized Gain (Loss) | | | | | | | | | | | | | | | | |
Net Realized Gain (Loss) on: | | | | | | | | | | | | | | | | |
Investment Securities Sold | | | 1,013 | | | | 498,315 | | | | 87,567 | | | | 464,145 | |
Futures | | | 15,127 | | | | — | | | | (256 | ) | | | — | |
Foreign Currency Transactions | | | (51 | ) | | | — | | | | — | | | | — | |
In-Kind Redemptions | | | — | | | | — | | | | — | | | | 56,505 | |
Change in Unrealized Appreciation
(Depreciation) of: | | | | | | | | | | | | | | | | |
Investment Securities | | | 143 | | | | 533,400 | | | | 298,035 | | | | 929,717 | |
Futures | | | 8,702 | | | | — | | | | — | | | | — | |
Translation of Foreign Currency Denominated
Amounts | | | (171 | ) | | | — | | | | — | | | | — | |
| | | | | | | | | | | | | | | | |
Net Realized and Unrealized Gain (Loss) | | | 24,763 | | | | 1,031,715 | | | | 385,346 | | | | 1,450,367 | |
| | | | | | | | | | | | | | | | |
Net Increase (Decrease) in Net Assets Resulting
from Operations | | $ | 26,310 | | | $ | 1,152,160 | | | $ | 399,089 | | | $ | 1,477,252 | |
| | | | | | | | | | | | | | | | |
| * | Investment Income and Realized and Unrealized Gain (Loss) were allocated from each Portfolio’s Master Fund (Affiliated Investment Companies). |
See accompanying Notes to Financial Statements.
101
DFA INVESTMENT DIMENSIONS GROUP INC.
STATEMENTS OF OPERATIONS
FOR THE YEAR ENDED OCTOBER 31, 2010
(Amounts in thousands)
| | | | | | | | | | | | | | | | |
| | | U.S.
Core
Equity 1
Portfolio | | | U.S.
Core
Equity 2
Portfolio | | | U.S.
Vector
Equity
Portfolio | | | U.S.
Small
Cap
Portfolio | |
Investment Income | | | | | | | | | | | | | | | | |
Dividends | | $ | 40,649 | | | $ | 72,293 | | | $ | 19,119 | | | $ | 27,384 | |
Interest | | | 18 | | | | 26 | | | | 8 | | | | 25 | |
Income from Securities Lending | | | 1,290 | | | | 2,935 | | | | 1,374 | | | | 6,255 | |
| | | | | | | | | | | | | | | | |
Total Investment Income | | | 41,957 | | | | 75,254 | | | | 20,501 | | | | 33,664 | |
| | | | | | | | | | | | | | | | |
Expenses | | | | | | | | | | | | | | | | |
Investment Advisory Services Fees | | | 4,117 | | | | 8,868 | | | | 4,200 | | | | 889 | |
Administrative Services Fees | | | — | | | | — | | | | — | | | | 9,485 | |
Accounting & Transfer Agent Fees | | | 286 | | | | 508 | | | | 174 | | | | 348 | |
Custodian Fees | | | 61 | | | | 80 | | | | 43 | | | | 79 | |
Filing Fees | | | 139 | | | | 198 | | | | 66 | | | | 62 | |
Shareholders’ Reports | | | 45 | | | | 92 | | | | 40 | | | | 63 | |
Directors’/Trustees’ Fees & Expenses | | | 23 | | | | 43 | | | | 14 | | | | 28 | |
Professional Fees | | | 89 | | | | 140 | | | | 44 | | | | 109 | |
Other | | | 35 | | | | 60 | | | | 24 | | | | 52 | |
| | | | | | | | | | | | | | | | |
Total Expenses | | | 4,795 | | | | 9,989 | | | | 4,605 | | | | 11,115 | |
| | | | | | | | | | | | | | | | |
Net Investment Income (Loss) | | | 37,162 | | | | 65,265 | | | | 15,896 | | | | 22,549 | |
| | | | | | | | | | | | | | | | |
Realized and Unrealized Gain (Loss) | | | | | | | | | | | | | | | | |
Net Realized Gain (Loss) on: | | | | | | | | | | | | | | | | |
Investment Securities Sold | | | 848 | | | | 9,966 | | | | 11,302 | | | | 186,403 | |
Change in Unrealized Appreciation
(Depreciation) of: | | | | | | | | | | | | | | | | |
Investment Securities | | | 406,078 | | | | 767,061 | | | | 260,530 | | | | 519,280 | |
| | | | | | | | | | | | | | | | |
Net Realized and Unrealized Gain (Loss) | | | 406,926 | | | | 777,027 | | | | 271,832 | | | | 705,683 | |
| | | | | | | | | | | | | | | | |
Net Increase (Decrease) in Net Assets Resulting
from Operations | | $ | 444,088 | | | $ | 842,292 | | | $ | 287,728 | | | $ | 728,232 | |
| | | | | | | | | | | | | | | | |
See accompanying Notes to Financial Statements.
102
DFA INVESTMENT DIMENSIONS GROUP INC.
STATEMENTS OF OPERATIONS
FOR THE YEAR ENDED OCTOBER 31, 2010
(Amounts in thousands)
| | | | | | | | | | | | | | | | |
| | | U.S.
Micro
Cap
Portfolio | | | DFA
Real Estate
Securities
Portfolio | | | Large Cap
International
Portfolio | | | International
Core Equity
Portfolio | |
Investment Income | | | | | | | | | | | | | | | | |
Dividends (Net of Foreign Taxes Withheld of $0,
$0, $3,664 and $9,018, respectively) | | $ | 27,428 | | | $ | 81,322 | | | $ | 40,753 | | | $ | 105,858 | |
Interest | | | 10 | | | | 25 | | | | 10 | | | | 43 | |
Income from Securities Lending | | | 6,623 | | | | 2,224 | | | | 1,961 | | | | 7,037 | |
| | | | | | | | | | | | | | | | |
Total Investment Income | | | 34,061 | | | | 83,571 | | | | 42,724 | | | | 112,938 | |
| | | | | | | | | | | | | | | | |
Expenses | | | | | | | | | | | | | | | | |
Investment Advisory Services Fees | | | 3,089 | | | | 7,245 | | | | 3,622 | | | | 14,583 | |
Administrative Services Fees | | | 12,357 | | | | — | | | | — | | | | — | |
Accounting & Transfer Agent Fees | | | 364 | | | | 287 | | | | 186 | | | | 484 | |
Custodian Fees | | | 63 | | | | 27 | | | | 284 | | | | 1,021 | |
Filing Fees | | | 41 | | | | 72 | | | | 49 | | | | 192 | |
Shareholders’ Reports | | | 46 | | | | 90 | | | | 62 | | | | 108 | |
Directors’/Trustees’ Fees & Expenses | | | 29 | | | | 23 | | | | 14 | | | | 41 | |
Professional Fees | | | 101 | | | | 77 | | | | 68 | | | | 173 | |
Other | | | 60 | | | | 49 | | | | 41 | | | | 117 | |
| | | | | | | | | | | | | | | | |
Total Expenses | | | 16,150 | | | | 7,870 | | | | 4,326 | | | | 16,719 | |
| | | | | | | | | | | | | | | | |
Net Investment Income (Loss) | | | 17,911 | | | | 75,701 | | | | 38,398 | | | | 96,219 | |
| | | | | | | | | | | | | | | | |
Realized and Unrealized Gain (Loss) | | | | | | | | | | | | | | | | |
Capital Gain Distributions Received from
Investment Securities | | | — | | | | 3,056 | | | | — | | | | — | |
Net Realized Gain (Loss) on: | | | | | | | | | | | | | | | | |
Investment Securities Sold | | | 246,080 | | | | (57,195 | ) | | | (16,990 | ) | | | 19,341 | |
Foreign Currency Transactions | | | — | | | | — | | | | 383 | | | | 299 | |
Change in Unrealized Appreciation (Depreciation) of: | | | | | | | | | | | | | | | | |
Investment Securities and Foreign Currency | | | 507,946 | | | | 825,263 | | | | 134,897 | | | | 410,019 | |
Translation of Foreign Currency Denominated
Amounts | | | — | | | | — | | | | 134 | | | | 333 | |
| | | | | | | | | | | | | | | | |
Net Realized and Unrealized Gain (Loss) | | | 754,026 | | | | 771,124 | | | | 118,424 | | | | 429,992 | |
| | | | | | | | | | | | | | | | |
Net Increase (Decrease) in Net Assets Resulting
from Operations | | $ | 771,937 | | | $ | 846,825 | | | $ | 156,822 | | | $ | 526,211 | |
| | | | | | | | | | | | | | | | |
See accompanying Notes to Financial Statements.
103
DFA INVESTMENT DIMENSIONS GROUP INC.
STATEMENTS OF OPERATIONS
FOR THE YEAR ENDED OCTOBER 31, 2010
(Amounts in thousands)
| | | | | | | | | | | | | | | | |
| | | International
Small
Company
Portfolio* | | | Japanese
Small
Company
Portfolio* | | | Asia Pacific
Small
Company
Portfolio* | | | United
Kingdom
Small
Company
Portfolio* | |
Investment Income | | | | | | | | | | | | | | | | |
Net Investment Income Received from
Affiliated Investment Companies: | | | | | | | | | | | | | | | | |
Dividends (Net of Foreign Taxes Withheld of $8,231, $161,
$88 and $2, respectively) | | $ | 106,298 | | | $ | 2,145 | | | $ | 3,863 | | | $ | 861 | |
Interest | | | 29 | | | | 1 | | | | 1 | | | | — | |
Income from Securities Lending | | | 10,238 | | | | 238 | | | | 301 | | | | 6 | |
Expenses Allocated from Affiliated Investment Company | | | (6,818 | ) | | | (159 | ) | | | (186 | ) | | | (37 | ) |
| | | | | | | | | | | | | | | | |
Total Net Investment Income Received from
Affiliated Investment Companies | | | 109,747 | | | | 2,225 | | | | 3,979 | | | | 830 | |
| | | | | | | | | | | | | | | | |
Fund Investment Income | | | | | | | | | | | | | | | | |
Interest | | | 15 | | | | — | | | | — | | | | — | |
| | | | | | | | | | | | | | | | |
Total Fund Investment Income | | | 15 | | | | — | | | | — | | | | — | |
| | | | | | | | | | | | | | | | |
Fund Expenses | | | | | | | | | | | | | | | | |
Administrative Services Fees | | | 18,673 | | | | 455 | | | | 441 | | | | 116 | |
Accounting & Transfer Agent Fees | | | 77 | | | | 15 | | | | 15 | | | | 14 | |
Filing Fees | | | 87 | | | | 16 | | | | 19 | | | | 15 | |
Shareholders’ Reports | | | 120 | | | | 2 | | | | 3 | | | | — | |
Directors’/Trustees’ Fees & Expenses | | | 44 | | | | 1 | | | | 1 | | | | — | |
Professional Fees | | | 89 | | | | 2 | | | | 2 | | | | 2 | |
Other | | | 42 | | | | 4 | | | | 5 | | | | 3 | |
| | | | | | | | | | | | | | | | |
Total Expenses | | | 19,132 | | | | 495 | | | | 486 | | | | 150 | |
Fees Waived, Expenses Reimbursed, and/or Previously
Waived Fees Recovered by Advisor (Note C) | | | — | | | | — | | | | 25 | | | | (13 | ) |
| | | | | | | | | | | | | | | | |
Net Expenses | | | 19,132 | | | | 495 | | | | 511 | | | | 137 | |
| | | | | | | | | | | | | | | | |
Net Investment Income (Loss) | | | 90,630 | | | | 1,730 | | | | 3,468 | | | | 693 | |
| | | | | | | | | | | | | | | | |
Realized and Unrealized Gain (Loss) | | | | | | | | | | | | | | | | |
Net Realized Gain (Loss) on: | | | | | | | | | | | | | | | | |
Investment Securities Sold | | | 157,743 | | | | (12,297 | ) | | | 5,129 | | | | 86 | |
Foreign Currency Transactions | | | 1,622 | | | | 76 | | | | (4 | ) | | | 3 | |
Change in Unrealized Appreciation (Depreciation) of: | | | | | | | | | | | | | | | | |
Investment Securities and Foreign Currency | | | 551,254 | | | | 10,741 | | | | 19,235 | | | | 6,121 | |
Translation of Foreign Currency Denominated Amounts | | | 210 | | | | 31 | | | | (12 | ) | | | (1 | ) |
| | | | | | | | | | | | | | | | |
Net Realized and Unrealized Gain (Loss) | | | 710,829 | | | | (1,449 | ) | | | 24,348 | | | | 6,209 | |
| | | | | | | | | | | | | | | | |
Net Increase (Decrease) in Net Assets Resulting from
Operations | | $ | 801,459 | | | $ | 281 | | | $ | 27,816 | | | $ | 6,902 | |
| | | | | | | | | | | | | | | | |
| * | Investment Income and Realized and Unrealized Gain (Loss) were allocated from each Portfolio’s Master Fund (Affiliated Investment Companies). |
See accompanying Notes to Financial Statements.
104
DFA INVESTMENT DIMENSIONS GROUP INC.
STATEMENTS OF OPERATIONS
FOR THE YEAR ENDED OCTOBER 31, 2010
(Amounts in thousands)
| | | | | | | | | | | | | | | | |
| | | Continental
Small
Company
Portfolio* | | | DFA
International
Real Estate
Securities
Portfolio | | | DFA Global
Real Estate
Securities
Portfolio | | | DFA
International
Small Cap
Value
Portfolio | |
Investment Income | | | | | | | | | | | | | | | | |
Net Investment Income Received from Affiliated Investment Companies: | | | | | | | | | | | | | | | | |
Dividends (Net of Foreign Taxes Withheld of $366, $0, $0 and $0, respectively) | | $ | 2,317 | | | | — | | | | — | | | | — | |
Income Distributions Received from Affiliated Investment Company | | | — | | | | — | | | $ | 31,329 | | | | — | |
Interest | | | 1 | | | | — | | | | — | | | | — | |
Income from Securities Lending | | | 337 | | | | — | | | | — | | | | — | |
Expenses Allocated from Affiliated Investment Company | | | (169 | ) | | | — | | | | — | | | | — | |
| | | | | | | | | | | | | | | | |
Total Net Investment Income Received from Affiliated Investment Companies | | | 2,486 | | | | — | | | | 31,329 | | | | — | |
| | | | | | | | | | | | | | | | |
Fund Investment Income | | | | | | | | | | | | | | | | |
Dividends (Net of Foreign Taxes Withheld of $0, $3,606, $0 and $12,529, respectively) | | | — | | | $ | 53,433 | | | | — | | | $ | 149,762 | |
Interest | | | — | | | | 6 | | | | 2 | | | | 35 | |
Income from Securities Lending | | | — | | | | 1,278 | | | | — | | | | 10,942 | |
| | | | | | | | | | | | | | | | |
Total Fund Investment Income | | | — | | | | 54,717 | | | | 2 | | | | 160,739 | |
| | | | | | | | | | | | | | | | |
Fund Expenses | | | | | | | | | | | | | | | | |
Investment Advisory Services Fees | | | — | | | | 2,803 | | | | — | | | | 46,090 | |
Administrative Services Fees | | | 448 | | | | — | | | | 1,945 | | | | — | |
Accounting & Transfer Agent Fees | | | 15 | | | | 114 | | | | 19 | | | | 811 | |
Custodian Fees | | | — | | | | 172 | | | | — | | | | 1,727 | |
Filing Fees | | | 18 | | | | 49 | | | | 34 | | | | 108 | |
Shareholders’ Reports | | | 2 | | | | 43 | | | | 21 | | | | 180 | |
Directors’/Trustees’ Fees & Expenses | | | 1 | | | | 8 | | | | 6 | | | | 69 | |
Professional Fees | | | 2 | | | | 47 | | | | 15 | | | | 303 | |
Other | | | 4 | | | | 28 | | | | 13 | | | | 195 | |
| | | | | | | | | | | | | | | | |
Total Expenses | | | 490 | | | | 3,264 | | | | 2,053 | | | | 49,483 | |
Fees Waived, Expenses Reimbursed, and/or Previously
Waived Fees Recovered by Advisor (Note C) | | | — | | | | — | | | | (1,786 | ) | | | — | |
| | | | | | | | | | | | | | | | |
Net Expenses | | | 490 | | | | 3,264 | | | | 267 | | | | 49,483 | |
| | | | | | | | | | | | | | | | |
Net Investment Income (Loss) | | | 1,996 | | | | 51,453 | | | | 31,064 | | | | 111,256 | |
| | | | | | | | | | | | | | | | |
Realized and Unrealized Gain (Loss) | | | | | | | | | | | | | | | | |
Net Realized Gain (Loss) on: | | | | | | | | | | | | | | | | |
Investment Securities Sold | | | (5,002 | ) | | | (52,532 | ) | | | (16,221 | ) | | | 198,099 | |
Foreign Currency Transactions | | | 51 | | | | 253 | | | | — | | | | 2,837 | |
Change in Unrealized Appreciation (Depreciation) of: | | | | | | | | | | | | | | | | |
Investment Securities and Foreign Currency | | | 19,653 | | | | 149,959 | | | | 134,183 | | | | 395,701 | |
Translation of Foreign Currency Denominated Amounts | | | 1 | | | | (8 | ) | | | — | | | | 688 | |
| | | | | | | | | | | | | | | | |
Net Realized and Unrealized Gain (Loss) | | | 14,703 | | | | 97,672 | | | | 117,962 | | | | 597,325 | |
| | | | | | | | | | | | | | | | |
Net Increase (Decrease) in Net Assets Resulting from Operations | | $ | 16,699 | | | $ | 149,125 | | | $ | 149,026 | | | $ | 708,581 | |
| | | | | | | | | | | | | | | | |
| * | Investment Income and Realized and Unrealized Gain (Loss) were allocated from each Portfolio’s Master Fund (Affiliated Investment Companies). |
See accompanying Notes to Financial Statements.
105
DFA INVESTMENT DIMENSIONS GROUP INC.
STATEMENTS OF OPERATIONS
FOR THE YEAR ENDED OCTOBER 31, 2010
(Amounts in thousands)
| | | | | | | | | | | | |
| | | International
Vector
Equity
Portfolio | | | Emerging
Markets
Portfolio* | | | Emerging
Markets
Small Cap
Portfolio* | |
Investment Income | | | | | | | | | | | | |
Dividends (Net of Foreign Taxes Withheld of $594, $5,788 and $3,222, respectively) | | $ | 6,936 | | | $ | 47,729 | | | $ | 31,732 | |
Interest | | | 3 | | | | 8 | | | | 9 | |
Income from Securities Lending | | | 526 | | | | 1,913 | | | | 2,482 | |
Expenses Allocated from Affiliated Investment Companies. | | | — | | | | (3,955 | ) | | | (4,366 | ) |
| | | | | | | | | | | | |
Total Investment Income | | | 7,465 | | | | 45,695 | | | | 29,857 | |
| | | | | | | | | | | | |
Expenses | | | | | | | | | | | | |
Investment Advisory Services Fees | | | 1,369 | | | | — | | | | — | |
Administrative Services Fees | | | — | | | | 8,397 | | | | 6,212 | |
Accounting & Transfer Agent Fees | | | 58 | | | | 43 | | | | 32 | |
Custodian Fees | | | 136 | | | | — | | | | — | |
Filing Fees | | | 24 | | | | 46 | | | | 48 | |
Shareholders’ Reports | | | 10 | | | | 82 | | | | 35 | |
Directors’/Trustees’ Fees & Expenses | | | 3 | | | | 20 | | | | 13 | |
Professional Fees | | | 12 | | | | 42 | | | | 26 | |
Other | | | 12 | | | | 20 | | | | 12 | |
| | | | | | | | | | | | |
Total Expenses | | | 1,624 | | | | 8,650 | | | | 6,378 | |
| | | | | | | | | | | | |
Fees Waived, Expenses Reimbursed, and/or Previously
Waived Fees Recovered by Advisor (Note C) | | | 28 | | | | — | | | | — | |
| | | | | | | | | | | | |
Net Expenses | | | 1,652 | | | | 8,650 | | | | 6,378 | |
| | | | | | | | | | | | |
Net Investment Income (Loss) | | | 5,813 | | | | 37,045 | | | | 23,479 | |
| | | | | | | | | | | | |
Realized and Unrealized Gain (Loss) | | | | | | | | | | | | |
Net Realized Gain (Loss) on: | | | | | | | | | | | | |
Investment Securities Sold | | | 5,866 | | | | 148,805 | | | | 97,897 | |
Foreign Currency Transactions | | | 77 | | | | 506 | | | | 76 | ** |
Change in Unrealized Appreciation (Depreciation) of: | | | | | | | | | | | | |
Investment Securities and Foreign Currency | | | 28,748 | | | | 317,270 | | | | 373,644 | |
Translation of Foreign Currency Denominated Amounts | | | 27 | | | | (6 | ) | | | (72 | ) |
Change in Deferred Thailand Capital Gains Tax | | | — | | | | (2,143 | ) | | | (2,963 | ) |
| | | | | | | | | | | | |
Net Realized and Unrealized Gain (Loss) | | | 34,718 | | | | 464,432 | | | | 468,582 | |
| | | | | | | | | | | | |
Net Increase (Decrease) in Net Assets Resulting from Operations | | $ | 40,531 | | | $ | 501,477 | | | $ | 492,061 | |
| | | | | | | | | | | | |
| * | Investment Income and Realized and Unrealized Gain (Loss) were allocated from each Portfolio’s respective Master Fund (Affiliated Investment Companies). |
| ** | Net of foreign capital gain taxes withheld of $179. |
See accompanying Notes to Financial Statements.
106
DFA INVESTMENT DIMENSIONS GROUP INC.
STATEMENTS OF OPERATIONS
FOR THE YEAR ENDED OCTOBER 31, 2010
(Amounts in thousands)
| | | | | | | | |
| | | Emerging
Markets
Value
Portfolio* | | | Emerging
Markets
Core Equity
Portfolio | |
Investment Income | | | | | | | | |
Dividends (Net of Foreign Taxes Withheld of $20,141 and $8,240, respectively) | | $ | 171,616 | | | $ | 68,581 | |
Interest | | | 72 | | | | 20 | |
Income from Securities Lending | | | 8,393 | | | | 3,539 | |
Expenses Allocated from Affiliated Investment Companies | | | (17,283 | ) | | | — | |
| | | | | | | | |
Total Investment Income | | | 162,798 | | | | 72,140 | |
| | | | | | | | |
Expenses | | | | | | | | |
Investment Advisory Services Fees | | | — | | | | 17,369 | |
Administrative Services Fees | | | 35,877 | | | | — | |
Accounting & Transfer Agent Fees | | | 136 | | | | 372 | |
Shareholder Servicing Fees — Class R2 Shares | | | 69 | | | | — | |
Custodian Fees | | | — | | | | 2,452 | |
Filing Fees | | | 237 | | | | 122 | |
Shareholders’ Reports | | | 231 | | | | 115 | |
Directors’/Trustees’ Fees & Expenses | | | 88 | | | | 30 | |
Professional Fees | | | 159 | | | | 161 | |
Other | | | 68 | | | | 76 | |
| | | | | | | | |
Total Expenses | | | 36,865 | | | | 20,697 | |
| | | | | | | | |
Net Investment Income (Loss) | | | 125,933 | | | | 51,443 | |
| | | | | | | | |
Realized and Unrealized Gain (Loss) | | | | | | | | |
Net Realized Gain (Loss) on: | | | | | | | | |
Investment Securities Sold | | | 577,480 | | | | 35,721 | |
Foreign Currency Transactions** | | | (3,090 | ) | | | (776 | ) |
Change in Unrealized Appreciation (Depreciation) of: | | | | | | | | |
Investment Securities and Foreign Currency | | | 1,724,116 | | | | 789,087 | |
Translation of Foreign Currency Denominated Amounts | | | 2 | | | | (19 | ) |
Change in Deferred Thailand Capital Gains Tax | | | (9,879 | ) | | | (4,133 | ) |
| | | | | | | | |
Net Realized and Unrealized Gain (Loss) | | | 2,288,629 | | | | 819,880 | |
| | | | | | | | |
Net Increase (Decrease) in Net Assets Resulting from Operations | | $ | 2,414,562 | | | $ | 871,323 | |
| | | | | | | | |
| * Investment | Income and Realized and Unrealized Gain (Loss) were allocated from the Portfolio’s Master Fund (Affiliated Investment Company). |
| ** | Net of foreign capital gain taxes withheld of $1,720 and $982, respectively. |
See accompanying Notes to Financial Statements.
107
DFA INVESTMENT DIMENSIONS GROUP INC.
STATEMENTS OF CHANGES IN NET ASSETS
(Amounts in thousands)
| | | | | | | | | | | | | | | | | | | | | | | | |
| | | Enhanced
U.S. Large Company
Portfolio | | | U.S. Large
Cap Value
Portfolio | | | U.S. Targeted
Value Portfolio | |
| | | Year
Ended
Oct. 31,
2010 | | | Year
Ended
Oct. 31,
2009 | | | Year
Ended
Oct. 31,
2010 | | | Year
Ended
Oct. 31,
2009 | | | Year
Ended
Oct. 31,
2010 | | | Year
Ended
Oct. 31,
2009 | |
Increase (Decrease) in Net Assets | | | | | | | | | | | | | | | | | | | | | | | | |
Operations: | | | | | | | | | | | | | | | | | | | | | | | | |
Net Investment Income (Loss) | | $ | 1,547 | | | $ | 1,409 | | | $ | 120,445 | | | $ | 113,440 | | | $ | 13,743 | | | $ | 13,400 | |
Net Realized Gain (Loss) on: | | | | | | | | | | | | | | | | | | | | | | | | |
Investment Securities Sold | | | 1,013 | | | | (24,217 | ) | | | 498,315 | | | | (2,244,299 | ) | | | 87,567 | | | | (80,571 | ) |
Futures | | | 15,127 | | | | 25,750 | | | | — | | | | — | | | | (256 | ) | | | (823 | ) |
Foreign Currency Transactions | | | (51 | ) | | | (1,379 | ) | | | — | | | | — | | | | — | | | | — | |
Change in Unrealized Appreciation (Depreciation) of: | | | | | | | | | | | | | | | | | | | | | | | | |
Investment Securities | | | 143 | | | | 2,720 | | | | 533,400 | | | | 2,728,048 | | | | 298,035 | | | | 244,441 | |
Futures | | | 8,702 | | | | 1,705 | | | | — | | | | — | | | | — | | | | (3 | ) |
Translation of Foreign Currency Denominated Amounts | | | (171 | ) | | | 39 | | | | — | | | | — | | | | — | | | | — | |
| | | | | | | | | | | | | | | | | | | | | | | | |
Net Increase (Decrease) in Net Assets Resulting from Operations | | | 26,310 | | | | 6,027 | | | | 1,152,160 | | | | 597,189 | | | | 399,089 | | | | 176,444 | |
| | | | | | | | | | | | | | | | | | | | | | | | |
Distributions From: | | | | | | | | | | | | | | | | | | | | | | | | |
Net Investment Income: | | | | | | | | | | | | | | | | | | | | | | | | |
Class R1 Shares | | | — | | | | — | | | | — | | | | — | | | | (312 | ) | | | (424 | ) |
Class R2 Shares | | | — | | | | — | | | | — | | | | — | | | | (29 | ) | | | (27 | ) |
Institutional Class Shares | | | (1,589 | ) | | | (17,802 | ) | | | (116,599 | ) | | | (123,996 | ) | | | (12,213 | ) | | | (13,728 | ) |
Net Short-Term Gains: | | | | | | | | | | | | | | | | | | | | | | | | |
Institutional Class Shares | | | — | | | | (1,762 | ) | | | — | | | | (6,242 | ) | | | — | | | | — | |
| | | | | | | | | | | | | | | | | | | | | | | | |
Total Distributions | | | (1,589 | ) | | | (19,564 | ) | | | (116,599 | ) | | | (130,238 | ) | | | (12,554 | ) | | | (14,179 | ) |
| | | | | | | | | | | | | | | | | | | | | | | | |
Capital Share Transactions (1): | | | | | | | | | | | | | | | | | | | | | | | | |
Shares Issued | | | 15,684 | | | | 58,709 | * | | | 1,304,022 | | | | 1,807,041 | | | | 911,104 | | | | 850,582 | |
Shares Issued in Lieu of Cash Distributions | | | 1,525 | | | | 18,404 | | | | 108,979 | | | | 117,409 | | | | 11,528 | | | | 13,641 | |
Shares Redeemed | | | (49,431 | ) | | | (98,676 | ) | | | (1,391,178 | ) | | | (1,858,197 | ) | | | (521,662 | ) | | | (425,490 | ) |
| | | | | | | | | | | | | | | | | | | | | | | | |
Net Increase (Decrease) from Capital Share Transactions | | | (32,222 | ) | | | (21,563 | ) | | | 21,823 | | | | 66,253 | | | | 400,970 | | | | 438,733 | |
| | | | | | | | | | | | | | | | | | | | | | | | |
Total Increase (Decrease) in Net Assets | | | (7,501 | ) | | | (35,100 | ) | | | 1,057,384 | | | | 533,204 | | | | 787,505 | | | | 600,998 | |
Net Assets | | | | | | | | | | | | | | | | | | | | | | | | |
Beginning of Period | | | 165,231 | | | | 200,331 | | | | 5,863,652 | | | | 5,330,448 | | | | 1,483,760 | | | | 882,762 | |
| | | | | | | | | | | | | | | | | | | | | | | | |
End of Period | | $ | 157,730 | | | $ | 165,231 | | | $ | 6,921,036 | | | $ | 5,863,652 | | | $ | 2,271,265 | | | $ | 1,483,760 | |
| | | | | | | | | | | | | | | | | | | | | | | | |
(1) Shares Issued and Redeemed: | | | | | | | | | | | | | | | | | | | | | | | | |
Shares Issued | | | 2,221 | | | | 9,053 | | | | 74,182 | | | | 140,615 | | | | 65,207 | | | | 88,462 | |
Shares Issued in Lieu of Cash Distributions | | | 224 | | | | 3,392 | | | | 6,369 | | | | 10,018 | | | | 900 | | | | 1,442 | |
Shares Redeemed | | | (6,983 | ) | | | (17,904 | ) | | | (79,010 | ) | | | (145,245 | ) | | | (38,952 | ) | | | (44,353 | ) |
Shares Reduced by Reverse Stock Split (Note P) | | | — | | | | — | | | | — | | | | — | | | | (1,473 | ) | | | — | |
| | | | | | | | | | | | | | | | | | | | | | | | |
Net Increase (Decrease) from Shares Issued and Redeemed | | | (4,538 | ) | | | (5,459 | ) | | | 1,541 | | | | 5,388 | | | | 25,682 | | | | 45,551 | |
| | | | | | | | | | | | | | | | | | | | | | | | |
Undistributed Net Investment Income (Distributions in Excess of Net Investment Income) | | $ | 228 | | | $ | 285 | | | $ | 17,386 | | | $ | 13,540 | | | $ | 2,297 | | | $ | 1,308 | |
| * Includes | $7,414 in capital contributions related to the liquidation of The Enhanced U.S. Large Company Series. See Organization note within the Notes to Financial Statements. |
See accompanying Notes to Financial Statements.
108
DFA INVESTMENT DIMENSIONS GROUP INC.
STATEMENTS OF CHANGES IN NET ASSETS
(Amounts in thousands)
| | | | | | | | | | | | | | | | | | | | | | | | |
| | | U.S. Small
Cap Value Portfolio | | | U.S. Core
Equity 1 Portfolio | | | U.S. Core
Equity 2 Portfolio | |
| | | Year
Ended
Oct. 31,
2010 | | | Year
Ended
Oct. 31,
2009 | | | Year
Ended
Oct. 31,
2010 | | | Year
Ended
Oct. 31,
2009 | | | Year
Ended
Oct. 31,
2010 | | | Year
Ended
Oct. 31,
2009 | |
Increase (Decrease) in Net Assets | | | | | | | | | | | | | | | | | | | | | | | | |
Operations: | | | | | | | | | | | | | | | | | | | | | | | | |
Net Investment Income (Loss) | | $ | 26,885 | | | $ | 16,559 | | | $ | 37,162 | | | $ | 31,729 | | | $ | 65,265 | | | $ | 55,180 | |
Net Realized Gain (Loss) on: | | | | | | | | | | | | | | | | | | | | | | | | |
Investment Securities Sold/Affiliated Investment Company Shares Sold | | | 464,145 | | | | (373,304 | ) | | | 848 | | | | (60,672 | ) | | | 9,966 | | | | (38,804 | ) |
Futures | | | — | | | | 570 | | | | — | | | | 683 | | | | — | | | | 3,212 | |
In-Kind Redemptions | | | 56,505 | * | | | — | | | | — | | | | — | | | | — | | | | — | |
Change in Unrealized Appreciation (Depreciation) of: | | | | | | | | | | | | | | | | | | | | | | | | |
Investment Securities/Affiliated Investment Company Shares | | | 929,717 | | | | 602,920 | | | | 406,078 | | | | 253,827 | | | | 767,061 | | | | 375,912 | |
Futures | | | — | | | | — | | | | — | | | | (2 | ) | | | — | | | | (1 | ) |
| | | | | | | | | | | | | | | | | | | | | | | | |
Net Increase (Decrease) in Net Assets Resulting from Operations | | | 1,477,252 | | | | 246,745 | | | | 444,088 | | | | 225,565 | | | | 842,292 | | | | 395,499 | |
| | | | | | | | | | | | | | | | | | | | | | | | |
Distributions From: | | | | | | | | | | | | | | | | | | | | | | | | |
Net Investment Income: | | | | | | | | | | | | | | | | | | | | | | | | |
Institutional Class Shares | | | (25,747 | ) | | | (69,882 | ) | | | (31,326 | ) | | | (31,598 | ) | | | (53,941 | ) | | | (55,009 | ) |
| | | | | | | | | | | | | | | | | | | | | | | | |
Total Distributions | | | (25,747 | ) | | | (69,882 | ) | | | (31,326 | ) | | | (31,598 | ) | | | (53,941 | ) | | | (55,009 | ) |
| | | | | | | | | | | | | | | | | | | | | | | | |
Capital Share Transactions (1): | | | | | | | | | | | | | | | | | | | | | | | | |
Shares Issued | | | 1,005,684 | | | | 1,293,768 | ** | | | 935,366 | | | | 1,158,480 | | | | 1,032,528 | | | | 1,847,067 | |
Shares Issued in Lieu of Cash Distributions | | | 24,638 | | | | 67,125 | | | | 28,011 | | | | 30,660 | | | | 52,914 | | | | 54,122 | |
Shares Redeemed | | | (1,596,209 | )* | | | (1,372,042 | ) | | | (468,313 | ) | | | (714,086 | ) | | | (687,751 | ) | | | (938,382 | ) |
| | | | | | | | | | | | | | | | | | | | | | | | |
Net Increase (Decrease) from Capital Share Transactions | | | (565,887 | ) | | | (11,149 | ) | | | 495,064 | | | | 475,054 | | | | 397,691 | | | | 962,807 | |
| | | | | | | | | | | | | | | | | | | | | | | | |
Total Increase (Decrease) in Net Assets | | | 885,618 | | | | 165,714 | | | | 907,826 | | | | 669,021 | | | | 1,186,042 | | | | 1,303,297 | |
Net Assets | | | | | | | | | | | | | | | | | | | | | | | | |
Beginning of Period | | | 5,669,659 | | | | 5,503,945 | | | | 1,989,583 | | | | 1,320,562 | | | | 3,804,325 | | | | 2,501,028 | |
| | | | | | | | | | | | | | | | | | | | | | | | |
End of Period | | $ | 6,555,277 | | | $ | 5,669,659 | | | $ | 2,897,409 | | | $ | 1,989,583 | | | $ | 4,990,367 | | | $ | 3,804,325 | |
| | | | | | | | | | | | | | | | | | | | | | | | |
(1) Shares Issued and Redeemed: | | | | | | | | | | | | | | | | | | | | | | | | |
Shares Issued | | | 48,187 | | | | 72,979 | | | | 97,948 | | | | 160,998 | | | | 110,280 | | | | 258,455 | |
Shares Issued in Lieu of Cash Distributions | | | 1,272 | | | | 4,580 | | | | 3,032 | | | | 4,155 | | | | 5,795 | | | | 7,485 | |
Shares Redeemed | | | (78,455 | ) | | | (94,264 | ) | | | (49,368 | ) | | | (101,230 | ) | | | (73,302 | ) | | | (135,979 | ) |
| | | | | | | | | | | | | | | | | | | | | | | | |
Net Increase (Decrease) from Shares Issued and Redeemed | | | (28,996 | ) | | | (16,705 | ) | | | 51,612 | | | | 63,923 | | | | 42,773 | | | | 129,961 | |
| | | | | | | | | | | | | | | | | | | | | | | | |
Undistributed Net Investment Income (Distributions in Excess of Net Investment Income) | | $ | 3,668 | | | $ | 2,918 | | | $ | 6,193 | | | $ | 373 | | | $ | 11,980 | | | $ | 698 | |
| * See | Note M in the Notes to Financial Statements. |
| ** Includes | $28,400 in capital contributions related to the liquidation of The U.S. Small Cap Value Series. See Organization note within the Notes to Financial Statements. |
See accompanying Notes to Financial Statements.
109
DFA INVESTMENT DIMENSIONS GROUP INC.
STATEMENTS OF CHANGES IN NET ASSETS
(Amounts in thousands)
| | | | | | | | | | | | | | | | | | | | | | | | |
| | | U.S. Vector
Equity Portfolio | | | U.S. Small
Cap Portfolio | | | U.S. Micro
Cap Portfolio | |
| | | Year
Ended
Oct. 31,
2010 | | | Year
Ended
Oct. 31,
2009 | | | Year
Ended
Oct. 31,
2010 | | | Year
Ended
Oct. 31,
2009 | | | Year
Ended
Oct. 31,
2010 | | | Year
Ended
Oct. 31,
2009 | |
Increase (Decrease) in Net Assets | | | | | | | | | | | | | | | | | | | | | | | | |
Operations: | | | | | | | | | | | | | | | | | | | | | | | | |
Net Investment Income (Loss) | | $ | 15,896 | | | $ | 14,733 | | | $ | 22,549 | | | $ | 10,818 | | | $ | 17,911 | | | $ | 10,509 | |
Net Realized Gain (Loss) on: | | | | | | | | | | | | | | | | | | | | | | | | |
Investment Securities Sold/Affiliated Investment Company Shares Sold | | | 11,302 | | | | (80,019 | ) | | | 186,403 | | | | (68,079 | ) | | | 246,080 | | | | (190,350 | ) |
Futures | | | — | | | | 407 | | | | — | | | | — | | | | — | | | | — | |
Change in Unrealized Appreciation (Depreciation) of: | | | | | | | | | | | | | | | | | | | | | | | | |
Investment Securities/Affiliated Investment Company Shares | | | 260,530 | | | | 173,818 | | | | 519,280 | | | | 284,014 | | | | 507,946 | | | | 168,490 | |
| | | | | | | | | | | | | | | | | | | | | | | | |
Net Increase (Decrease) in Net Assets Resulting from Operations | | | 287,728 | | | | 108,939 | | | | 728,232 | | | | 226,753 | | | | 771,937 | | | | (11,351 | ) |
| | | | | | | | | | | | | | | | | | | | | | | | |
Distributions From: | | | | | | | | | | | | | | | | | | | | | | | | |
Net Investment Income: | | | | | | | | | | | | | | | | | | | | | | | | |
Institutional Class Shares | | | (14,799 | ) | | | (16,454 | ) | | | (21,528 | ) | | | (26,412 | ) | | | (17,526 | ) | | | (57,816 | ) |
| | | | | | | | | | | | | | | | | | | | | | | | |
Total Distributions | | | (14,799 | ) | | | (16,454 | ) | | | (21,528 | ) | | | (26,412 | ) | | | (17,526 | ) | | | (57,816 | ) |
| | | | | | | | | | | | | | | | | | | | | | | | |
Capital Share Transactions (1): | | | | | | | | | | | | | | | | | | | | | | | | |
Shares Issued | | | 375,571 | | | | 508,175 | | | | 754,050 | | | | 877,915 | * | | | 291,712 | | | | 588,720 | ** |
Shares Issued in Lieu of Cash Distributions | | | 14,588 | | | | 16,189 | | | | 20,104 | | | | 24,690 | | | | 16,858 | | | | 56,003 | |
Shares Redeemed | | | (282,779 | ) | | | (289,358 | ) | | | (611,402 | ) | | | (647,794 | ) | | | (703,060 | ) | | | (681,416 | ) |
| | | | | | | | | | | | | | | | | | | | | | | | |
Net Increase (Decrease) from Capital Share Transactions | | | 107,380 | | | | 235,006 | | | | 162,752 | | | | 254,811 | | | | (394,490 | ) | | | (36,693 | ) |
| | | | | | | | | | | | | | | | | | | | | | | | |
Total Increase (Decrease) in Net Assets | | | 380,309 | | | | 327,491 | | | | 869,456 | | | | 455,152 | | | | 359,921 | | | | (105,860 | ) |
Net Assets | | | | | | | | | | | | | | | | | | | | | | | | |
Beginning of Period | | | 1,178,114 | | | | 850,623 | | | | 2,522,001 | | | | 2,066,849 | | | | 2,818,365 | | | | 2,924,225 | |
| | | | | | | | | | | | | | | | | | | | | | | | |
End of Period | | $ | 1,558,423 | | | $ | 1,178,114 | | | $ | 3,391,457 | | | $ | 2,522,001 | | | $ | 3,178,286 | | | $ | 2,818,365 | |
| | | | | | | | | | | | | | | | | | | | | | | | |
(1) Shares Issued and Redeemed: | | | | | | | | | | | | | | | | | | | | | | | | |
Shares Issued | | | 41,113 | | | | 74,700 | | | | 42,652 | | | | 67,035 | | | | 26,534 | | | | 53,716 | |
Shares Issued in Lieu of Cash Distributions | | | 1,659 | | | | 2,427 | | | | 1,220 | | | | 2,058 | | | | 1,594 | | | | 6,981 | |
Shares Redeemed | | | (30,825 | ) | | | (44,108 | ) | | | (35,288 | ) | | | (54,475 | ) | | | (63,240 | ) | | | (84,421 | ) |
| | | | | | | | | | | | | | | | | | | | | | | | |
Net Increase (Decrease) from Shares Issued and Redeemed | | | 11,947 | | | | 33,019 | | | | 8,584 | | | | 14,618 | | | | (35,112 | ) | | | (23,724 | ) |
| | | | | | | | | | | | | | | | | | | | | | | | |
Undistributed Net Investment Income (Distributions in Excess of Net Investment Income) | | $ | 2,968 | | | $ | 1,895 | | | $ | 4,657 | | | $ | 3,780 | | | $ | 3,227 | | | $ | 3,100 | |
| * Includes | $8,355 in capital contributions related to the liquidation of The U.S. Small Cap Series. See Organization note within the Notes to Financial Statements. |
| ** Includes | $11,529 in capital contributions related to the liquidation of The U.S. Micro Cap Series. See Organization note within the Notes to Financial Statements. |
See accompanying Notes to Financial Statements.
110
DFA INVESTMENT DIMENSIONS GROUP INC.
STATEMENTS OF CHANGES IN NET ASSETS
(Amounts in thousands)
| | | | | | | | | | | | | | | | | | | | | | | | |
| | | DFA Real Estate
Securities
Portfolio | | | Large Cap
International
Portfolio | | | International
Core Equity
Portfolio | |
| | | Year
Ended
Oct. 31,
2010 | | | Year
Ended
Oct. 31,
2009 | | | Year
Ended
Oct. 31,
2010 | | | Year
Ended
Oct. 31,
2009 | | | Year
Ended
Oct. 31,
2010 | | | Year
Ended
Oct. 31,
2009 | |
Increase (Decrease) in Net Assets | | | | | | | | | | | | | | | | | | | | | | | | |
Operations: | | | | | | | | | | | | | | | | | | | | | | | | |
Net Investment Income (Loss) | | $ | 75,701 | | | $ | 69,730 | | | $ | 38,398 | | | $ | 36,172 | | | $ | 96,219 | | | $ | 77,941 | |
Capital Gain Distributions Received from Investment Securities | | | 3,056 | | | | 16,169 | | | | — | | | | — | | | | — | | | | — | |
Net Realized Gain (Loss) on: | | | | | | | | | | | | | | | | | | | | | | | | |
Investment Securities Sold | | | (57,195 | ) | | | (106,626 | ) | | | (16,990 | ) | | | (150,602 | ) | | | 19,341 | | | | (83,575 | ) |
Futures | | | — | | | | (1,065 | ) | | | — | | | | 919 | | | | — | | | | (2,556 | ) |
Foreign Currency Transactions | | | — | | | | — | | | | 383 | | | | 951 | | | | 299 | | | | 1,319 | |
Change in Unrealized Appreciation (Depreciation) of: | | | | | | | | | | | | | | | | | | | | | | | | |
Investment Securities and Foreign Currency | | | 825,263 | | | | 92,786 | | | | 134,897 | | | | 374,243 | | | | 410,019 | | | | 928,934 | |
Futures | | | — | | | | (10 | ) | | | — | | | | — | | | | — | | | | (15 | ) |
Translation of Foreign Currency Denominated Amounts | | | — | | | | — | | | | 134 | | | | (64 | ) | | | 333 | | | | (108 | ) |
| | | | | | | | | | | | | | | | | | | | | | | | |
Net Increase (Decrease) in Net Assets Resulting from Operations | | | 846,825 | | | | 70,984 | | | | 156,822 | | | | 261,619 | | | | 526,211 | | | | 921,940 | |
| | | | | | | | | | | | | | | | | | | | | | | | |
Distributions From: | | | | | | | | | | | | | | | | | | | | | | | | |
Net Investment Income: | | | | | | | | | | | | | | | | | | | | | | | | |
Institutional Class Shares | | | (70,908 | ) | | | (95,934 | ) | | | (40,390 | ) | | | (32,286 | ) | | | (83,173 | ) | | | (77,469 | ) |
| | | | | | | | | | | | | | | | | | | | | | | | |
Total Distributions | | | (70,908 | ) | | | (95,934 | ) | | | (40,390 | ) | | | (32,286 | ) | | | (83,173 | ) | | | (77,469 | ) |
| | | | | | | | | | | | | | | | | | | | | | | | |
Capital Share Transactions (1): | | | | | | | | | | | | | | | | | | | | | | | | |
Shares Issued | | | 469,431 | | | | 760,871 | | | | 380,265 | | | | 380,682 | | | | 1,275,823 | | | | 1,709,907 | |
Shares Issued in Lieu of Cash Distributions | | | 68,782 | | | | 93,552 | | | | 39,047 | | | | 31,081 | | | | 79,558 | | | | 75,441 | |
Shares Redeemed | | | (643,137 | ) | | | (557,875 | ) | | | (283,409 | ) | | | (483,605 | ) | | | (631,272 | ) | | | (911,026 | ) |
| | | | | | | | | | | | | | | | | | | | | | | | |
Net Increase (Decrease) from Capital Share Transactions | | | (104,924 | ) | | | 296,548 | | | | 135,903 | | | | (71,842 | ) | | | 724,109 | | | | 874,322 | |
| | | | | | | | | | | | | | | | | | | | | | | | |
Total Increase (Decrease) in Net Assets | | | 670,993 | | | | 271,598 | | | | 252,335 | | | | 157,491 | | | | 1,167,147 | | | | 1,718,793 | |
Net Assets | | | | | | | | | | | | | | | | | | | | | | | | |
Beginning of Period | | | 2,018,559 | | | | 1,746,961 | | | | 1,364,351 | | | | 1,206,860 | | | | 3,699,842 | | | | 1,981,049 | |
| | | | | | | | | | | | | | | | | | | | | | | | |
End of Period | | $ | 2,689,552 | | | $ | 2,018,559 | | | $ | 1,616,686 | | | $ | 1,364,351 | | | $ | 4,866,989 | | | $ | 3,699,842 | |
| | | | | | | | | | | | | | | | | | | | | | | | |
(1) Shares Issued and Redeemed: | | | | | | | | | | | | | | | | | | | | | | | | |
Shares Issued | | | 25,336 | | | | 61,585 | | | | 20,917 | | | | 26,226 | | | | 128,031 | | | | 227,407 | |
Shares Issued in Lieu of Cash Distributions | | | 3,862 | | | | 7,388 | | | | 2,285 | | | | 2,085 | | | | 8,624 | | | | 9,039 | |
Shares Redeemed | | | (34,560 | ) | | | (45,050 | ) | | | (15,664 | ) | | | (34,086 | ) | | | (63,215 | ) | | | (123,941 | ) |
| | | | | | | | | | | | | | | | | | | | | | | | |
Net Increase (Decrease) from Shares Issued and
Redeemed | | | (5,362 | ) | | | 23,923 | | | | 7,538 | | | | (5,775 | ) | | | 73,440 | | | | 112,505 | |
| | | | | | | | | | | | | | | | | | | | | | | | |
Undistributed Net Investment Income (Distributions in Excess of Net Investment Income) | | $ | 12,994 | | | $ | 8,197 | | | $ | 3,984 | | | $ | 5,593 | | | $ | 16,165 | | | $ | 2,148 | |
See accompanying Notes to Financial Statements.
111
DFA INVESTMENT DIMENSIONS GROUP INC.
STATEMENTS OF CHANGES IN NET ASSETS
(Amounts in thousands)
| | | | | | | | | | | | | | | | | | | | | | | | |
| | | International
Small Company
Portfolio | | | Japanese
Small Company
Portfolio | | | Asia Pacific
Small Company
Portfolio | |
| | | Year
Ended
Oct. 31,
2010 | | | Year
Ended
Oct. 31,
2009 | | | Year
Ended
Oct. 31,
2010 | | | Year
Ended
Oct. 31,
2009 | | | Year
Ended
Oct. 31,
2010 | | | Year
Ended
Oct. 31,
2009 | |
Increase (Decrease) in Net Assets | | | | | | | | | | | | | | | | | | | | | | | | |
Operations: | | | | | | | | | | | | | | | | | | | | | | | | |
Net Investment Income (Loss) | | $ | 90,630 | | | $ | 83,540 | | | $ | 1,730 | | | $ | 1,879 | | | $ | 3,468 | | | $ | 2,525 | |
Net Realized Gain (Loss) on: | | | | | | | | | | | | | | | | | | | | | | | | |
Investment Securities Sold | | | 157,743 | | | | (110,040 | ) | | | (12,297 | ) | | | (14,110 | ) | | | 5,129 | | | | (8,877 | ) |
Futures | | | — | | | | 592 | | | | — | | | | 43 | | | | — | | | | (89 | ) |
Foreign Currency Transactions | | | 1,622 | | | | 1,180 | | | | 76 | | | | 250 | | | | (4 | ) | | | 23 | |
Change in Unrealized Appreciation (Depreciation) of: | | | | | | | | | | | | | | | | | | | | | | | | |
Investment Securities and Foreign Currency | | | 551,254 | | | | 1,280,471 | | | | 10,741 | | | | 37,328 | | | | 19,235 | | | | 52,469 | |
Futures | | | — | | | | 1 | | | | — | | | | — | | | | — | | | | — | |
Translation of Foreign Currency Denominated Amounts | | | 210 | | | | (297 | ) | | | 31 | | | | (61 | ) | | | (12 | ) | | | 29 | |
| | | | | | | | | | | | | | | | | | | | | | | | |
Net Increase (Decrease) in Net Assets Resulting from
Operations | | | 801,459 | | | | 1,255,447 | | | | 281 | | | | 25,329 | | | | 27,816 | | | | 46,080 | |
| | | | | | | | | | | | | | | | | | | | | | | | |
Distributions From: | | | | | | | | | | | | | | | | | | | | | | | | |
Net Investment Income: | | | | | | | | | | | | | | | | | | | | | | | | |
Institutional Class Shares | | | (84,604 | ) | | | (81,118 | ) | | | (1,845 | ) | | | (2,426 | ) | | | (3,162 | ) | | | (2,724 | ) |
| | | | | | | | | | | | | | | | | | | | | | | | |
Total Distributions | | | (84,604 | ) | | | (81,118 | ) | | | (1,845 | ) | | | (2,426 | ) | | | (3,162 | ) | | | (2,724 | ) |
| | | | | | | | | | | | | | | | | | | | | | | | |
Capital Share Transactions (1): | | | | | | | | | | | | | | | | | | | | | | | | |
Shares Issued | | | 1,099,327 | | | | 890,444 | | | | 11,290 | | | | 18,298 | | | | 28,331 | | | | 18,265 | |
Shares Issued in Lieu of Cash Distributions | | | 80,737 | | | | 77,147 | | | | 1,609 | | | | 2,219 | | | | 2,788 | | | | 2,398 | |
Shares Redeemed | | | (655,189 | ) | | | (956,429 | ) | | | (10,460 | ) | | | (62,735 | ) | | | (26,115 | ) | | | (26,210 | ) |
| | | | | | | | | | | | | | | | | | | | | | | | |
Net Increase (Decrease) from Capital Share Transactions | | | 524,875 | | | | 11,162 | | | | 2,439 | | | | (42,218 | ) | | | 5,004 | | | | (5,547 | ) |
| | | | | | | | | | | | | | | | | | | | | | | | |
Total Increase (Decrease) in Net Assets | | | 1,241,730 | | | | 1,185,491 | | | | 875 | | | | (19,315 | ) | | | 29,658 | | | | 37,809 | |
Net Assets | | | | | | | | | | | | | | | | | | | | | | | | |
Beginning of Period | | | 4,269,864 | | | | 3,084,373 | | | | 114,058 | | | | 133,373 | | | | 101,853 | | | | 64,044 | |
| | | | | | | | | | | | | | | | | | | | | | | | |
End of Period | | $ | 5,511,594 | | | $ | 4,269,864 | | | $ | 114,933 | | | $ | 114,058 | | | $ | 131,511 | | | $ | 101,853 | |
| | | | | | | | | | | | | | | | | | | | | | | | |
(1) Shares Issued and Redeemed: | | | | | | | | | | | | | | | | | | | | | | | | |
Shares Issued | | | 75,592 | | | | 81,822 | | | | 793 | | | | 1,589 | | | | 1,254 | | | | 1,318 | |
Shares Issued in Lieu of Cash Distributions | | | 5,955 | | | | 6,961 | | | | 116 | | | | 174 | | | | 135 | | | | 196 | |
Shares Redeemed | | | (45,123 | ) | | | (89,990 | ) | | | (742 | ) | | | (4,937 | ) | | | (1,206 | ) | | | (2,055 | ) |
| | | | | | | | | | | | | | | | | | | | | | | | |
Net Increase (Decrease) from Shares Issued and
Redeemed | | | 36,424 | | | | (1,207 | ) | | | 167 | | | | (3,174 | ) | | | 183 | | | | (541 | ) |
| | | | | | | | | | | | | | | | | | | | | | | | |
Undistributed Net Investment Income (Distributions in Excess
of Net Investment Income) | | $ | 31,973 | | | $ | 13,949 | | | $ | 631 | | | $ | 665 | | | $ | 652 | | | $ | 246 | |
See accompanying Notes to Financial Statements.
112
DFA INVESTMENT DIMENSIONS GROUP INC.
STATEMENTS OF CHANGES IN NET ASSETS
(Amounts in thousands)
| | | | | | | | | | | | | | | | | | | | | | | | |
| | | United Kingdom
Small Company
Portfolio | | | Continental
Small Company
Portfolio | | | DFA International
Real Estate Securities
Portfolio | |
| | | Year
Ended
Oct. 31,
2010 | | | Year
Ended
Oct. 31,
2009 | | | Year
Ended
Oct. 31,
2010 | | | Year
Ended
Oct. 31,
2009 | | | Year
Ended
Oct. 31,
2010 | | | Year
Ended
Oct. 31,
2009 | |
Increase (Decrease) in Net Assets | | | | | | | | | | | | | | | | | | | | | | | | |
Operations: | | | | | | | | | | | | | | | | | | | | | | | | |
Net Investment Income (Loss) | | $ | 693 | | | $ | 861 | | | $ | 1,996 | | | $ | 2,168 | | | $ | 51,453 | | | $ | 32,101 | |
Net Realized Gain (Loss) on: | | | | | | | | | | | | | | | | | | | | | | | | |
Investment Securities Sold | | | 86 | | | | (2,247 | ) | | | (5,002 | ) | | | (7,421 | ) | | | (52,532 | ) | | | (36,531 | ) |
Futures | | | — | | | | 26 | | | | — | | | | (137 | ) | | | — | | | | 234 | |
Foreign Currency Transactions | | | 3 | | | | (10 | ) | | | 51 | | | | (49 | ) | | | 253 | | | | 185 | |
Change in Unrealized Appreciation (Depreciation) of: | | | | | | | | | | | | | | | | | | | | | | | | |
Investment Securities and Foreign Currency | | | 6,121 | | | | 9,569 | | | | 19,653 | | | | 37,449 | | | | 149,959 | | | | 170,229 | |
Futures | | | — | | | | — | | | | — | | | | (1 | ) | | | — | | | | — | |
Translation of Foreign Currency Denominated Amounts | | | (1 | ) | | | (6 | ) | | | 1 | | | | 24 | | | | (8 | ) | | | 209 | |
| | | | | | | | | | | | | | | | | | | | | | | | |
Net Increase (Decrease) in Net Assets Resulting from
Operations | | | 6,902 | | | | 8,193 | | | | 16,699 | | | | 32,033 | | | | 149,125 | | | | 166,427 | |
| | | | | | | | | | | | | | | | | | | | | | | | |
Distributions From: | | | | | | | | | | | | | | | | | | | | | | | | |
Net Investment Income: | | | | | | | | | | | | | | | | | | | | | | | | |
Institutional Class Shares | | | (694 | ) | | | (658 | ) | | | (1,863 | ) | | | (2,087 | ) | | | (78,863 | ) | | | (11,227 | ) |
| | | | | | | | | | | | | | | | | | | | | | | | |
Total Distributions | | | (694 | ) | | | (658 | ) | | | (1,863 | ) | | | (2,087 | ) | | | (78,863 | ) | | | (11,227 | ) |
| | | | | | | | | | | | | | | | | | | | | | | | |
Capital Share Transactions (1): | | | | | | | | | | | | | | | | | | | | | | | | |
Shares Issued | | | 2,343 | | | | 4,137 | | | | 15,385 | | | | 14,850 | | | | 236,837 | | | | 331,853 | |
Shares Issued in Lieu of Cash Distributions | | | 537 | | | | 556 | | | | 1,577 | | | | 1,874 | | | | 78,275 | | | | 11,113 | |
Shares Redeemed | | | (3,200 | ) | | | (10,248 | ) | | | (14,618 | ) | | | (29,732 | ) | | | (169,149 | ) | | | (150,317 | ) |
| | | | | | | | | | | | | | | | | | | | | | | | |
Net Increase (Decrease) from Capital Share Transactions | | | (320 | ) | | | (5,555 | ) | | | 2,344 | | | | (13,008 | ) | | | 145,963 | | | | 192,649 | |
| | | | | | | | | | | | | | | | | | | | | | | | |
Total Increase (Decrease) in Net Assets | | | 5,888 | | | | 1,980 | | | | 17,180 | | | | 16,938 | | | | 216,225 | | | | 347,849 | |
Net Assets | | | | | | | | | | | | | | | | | | | | | | | | |
Beginning of Period | | | 27,863 | | | | 25,883 | | | | 110,926 | | | | 93,988 | | | | 742,329 | | | | 394,480 | |
| | | | | | | | | | | | | | | | | | | | | | | | |
End of Period | | $ | 33,751 | | | $ | 27,863 | | | $ | 128,106 | | | $ | 110,926 | | | $ | 958,554 | | | $ | 742,329 | |
| | | | | | | | | | | | | | | | | | | | | | | | |
(1) Shares Issued and Redeemed: | | | | | | | | | | | | | | | | | | | | | | | | |
Shares Issued | | | 115 | | | | 288 | | | | 1,040 | | | | 1,344 | | | | 48,350 | | | | 82,981 | |
Shares Issued in Lieu of Cash Distributions | | | 27 | | | | 36 | | | | 118 | | | | 148 | | | | 16,761 | | | | 3,104 | |
Shares Redeemed | | | (155 | ) | | | (733 | ) | | | (978 | ) | | | (2,868 | ) | | | (35,159 | ) | | | (38,756 | ) |
| | | | | | | | | | | | | | | | | | | | | | | | |
Net Increase (Decrease) from Shares Issued and
Redeemed | | | (13 | ) | | | (409 | ) | | | 180 | | | | (1,376 | ) | | | 29,952 | | | | 47,329 | |
| | | | | | | | | | | | | | | | | | | | | | | | |
Undistributed Net Investment Income (Distributions in Excess
of Net Investment Income) | | $ | 203 | | | $ | 171 | | | $ | 597 | | | $ | (12 | ) | | $ | (2,542 | ) | | $ | 24,078 | |
See accompanying Notes to Financial Statements.
113
DFA INVESTMENT DIMENSIONS GROUP INC.
STATEMENTS OF CHANGES IN NET ASSETS
(Amounts in thousands)
| | | | | | | | | | | | | | | | | | | | | | | | |
| | | DFA Global
Real Estate Securities
Portfolio | | | DFA International
Small Cap Value
Portfolio | | | International
Vector Equity
Portfolio | |
| | | Year
Ended
Oct. 31,
2010 | | | Year
Ended
Oct. 31,
2009 | | | Year
Ended
Oct. 31,
2010 | | | Year
Ended
Oct. 31,
2009 | | | Year
Ended
Oct. 31,
2010 | | | Year
Ended
Oct. 31,
2009 | |
Increase (Decrease) in Net Assets | | | | | | | | | | | | | | | | | | | | | | | | |
Operations: | | | | | | | | | | | | | | | | | | | | | | | | |
Net Investment Income (Loss) | | $ | 31,064 | | | $ | 7,504 | | | $ | 111,256 | | | $ | 118,909 | | | $ | 5,813 | | | $ | 4,181 | |
Net Realized Gain (Loss) on: | | | | | | | | | | | | | | | | | | | | | | | | |
Investment Securities Sold | | | (16,221 | ) | | | (6,921 | ) | | | 198,099 | | | | (20,925 | ) | | | 5,866 | | | | (3,551 | ) |
Futures | | | — | | | | — | | | | — | | | | (9,031 | ) | | | — | | | | (232 | ) |
Foreign Currency Transactions | | | — | | | | — | | | | 2,837 | | | | (2,189 | ) | | | 77 | | | | (23 | ) |
Change in Unrealized Appreciation (Depreciation) of: | | | | | | | | | | | | | | | | | | | | | | | | |
Investment Securities and Foreign Currency | | | 134,183 | | | | 66,893 | | | | 395,701 | | | | 1,907,503 | | | | 28,748 | | | | 71,485 | |
Futures | | | — | | | | — | | | | — | | | | (28 | ) | | | — | | | | (1 | ) |
Translation of Foreign Currency Denominated Amounts | | | — | | | | — | | | | 688 | | | | (469 | ) | | | 27 | | | | (11 | ) |
| | | | | | | | | | | | | | | | | | | | | | | | |
Net Increase (Decrease) in Net Assets Resulting from
Operations | | | 149,026 | | | | 67,476 | | | | 708,581 | | | | 1,993,770 | | | | 40,531 | | | | 71,848 | |
| | | | | | | | | | | | | | | | | | | | | | | | |
Distributions From: | | | | | | | | | | | | | | | | | | | | | | | | |
Net Investment Income: | | | | | | | | | | | | | | | | | | | | | | | | |
Institutional Class Shares | | | (30,870 | ) | | | (2,346 | ) | | | (101,689 | ) | | | (105,935 | ) | | | (5,380 | ) | | | (3,671 | ) |
Net Short-Term Gains: | | | | | | | | | | | | | | | | | | | | | | | | |
Institutional Class Shares | | | — | | | | (24 | ) | | | — | | | | — | | | | — | | | | — | |
Net Long-Term Gains: | | | | | | | | | | | | | | | | | | | | | | | | |
Institutional Class Shares | | | — | | | | — | | | | — | | | | (25,433 | ) | | | — | | | | — | |
| | | | | | | | | | | | | | | | | | | | | | | | |
Total Distributions | | | (30,870 | ) | | | (2,370 | ) | | | (101,689 | ) | | | (131,368 | ) | | | (5,380 | ) | | | (3,671 | ) |
| | | | | | | | | | | | | | | | | | | | | | | | |
Capital Share Transactions (1): | | | | | | | | | | | | | | | | | | | | | | | | |
Shares Issued | | | 291,090 | | | | 345,457 | | | | 1,457,097 | | | | 1,516,998 | | | | 109,333 | | | | 203,871 | |
Shares Issued in Lieu of Cash Distributions | | | 30,424 | | | | 2,351 | | | | 94,455 | | | | 123,396 | | | | 5,137 | | | | 3,533 | |
Shares Redeemed | | | (176,711 | ) | | | (71,084 | ) | | | (1,363,083 | ) | | | (1,442,587 | ) | | | (49,042 | ) | | | (79,811 | ) |
| | | | | | | | | | | | | | | | | | | | | | | | |
Net Increase (Decrease) from Capital Share
Transactions | | | 144,803 | | | | 276,724 | | | | 188,469 | | | | 197,807 | | | | 65,428 | | | | 127,593 | |
| | | | | | | | | | | | | | | | | | | | | | | | |
Total Increase (Decrease) in Net Assets | | | 262,959 | | | | 341,830 | | | | 795,361 | | | | 2,060,209 | | | | 100,579 | | | | 195,770 | |
Net Assets | | | | | | | | | | | | | | | | | | | | | | | | |
Beginning of Period | | | 432,502 | | | | 90,672 | | | | 6,859,957 | | | | 4,799,748 | | | | 262,544 | | | | 66,774 | |
| | | | | | | | | | | | | | | | | | | | | | | | |
End of Period | | $ | 695,461 | | | $ | 432,502 | | | $ | 7,655,318 | | | $ | 6,859,957 | | | $ | 363,123 | | | $ | 262,544 | |
| | | | | | | | | | | | | | | | | | | | | | | | |
(1) Shares Issued and Redeemed: | | | | | | | | | | | | | | | | | | | | | | | | |
Shares Issued | | | 40,187 | | | | 62,358 | | | | 96,841 | | | | 132,410 | | | | 11,526 | | | | 30,203 | |
Shares Issued in Lieu of Cash Distributions | | | 4,617 | | | | 445 | | | | 6,841 | | | | 10,640 | | | | 590 | | | | 455 | |
Shares Redeemed | | | (24,880 | ) | | | (13,777 | ) | | | (89,769 | ) | | | (126,703 | ) | | | (5,261 | ) | | | (12,091 | ) |
| | | | | | | | | | | | | | | | | | | | | | | | |
Net Increase (Decrease) from Shares Issued and
Redeemed | | | 19,924 | | | | 49,026 | | | | 13,913 | | | | 16,347 | | | | 6,855 | | | | 18,567 | |
| | | | | | | | | | | | | | | | | | | | | | | | |
Undistributed Net Investment Income (Distributions in
Excess of Net Investment Income) | | $ | 5,011 | | | $ | 4,918 | | | $ | 37,940 | | | $ | 10,232 | | | $ | 1,086 | | | $ | 715 | |
See accompanying Notes to Financial Statements.
114
DFA INVESTMENT DIMENSIONS GROUP INC.
STATEMENTS OF CHANGES IN NET ASSETS
(Amounts in thousands)
| | | | | | | | | | | | | | | | |
| | | Emerging Markets
Portfolio | | | Emerging Markets
Small Cap
Portfolio | |
| | | Year
Ended
Oct. 31,
2010 | | | Year
Ended
Oct. 31,
2009 | | | Year
Ended
Oct. 31,
2010 | | | Year
Ended
Oct. 31,
2009 | |
Increase (Decrease) in Net Assets | | | | | | | | | | | | | | | | |
Operations: | | | | | | | | | | | | | | | | |
Net Investment Income (Loss) | | $ | 37,045 | | | $ | 33,922 | | | $ | 23,479 | | | $ | 15,885 | |
Net Realized Gain (Loss) on: | | | | | | | | | | | | | | | | |
Investment Securities Sold | | | 148,805 | | | | 37,268 | | | | 97,897 | | | | (15,114 | ) |
Futures | | | — | | | | (2,712 | ) | | | — | | | | (630 | ) |
Foreign Currency Transactions | | | 506 | | | | (28 | ) | | | 76 | * | | | (178 | ) |
In-Kind Redemptions | | | — | | | | 17,805 | | | | — | | | | — | |
Change in Unrealized Appreciation (Depreciation) of: | | | | | | | | | | | | | | | | |
Investment Securities and Foreign Currency | | | 317,270 | | | | 592,684 | | | | 373,644 | | | | 522,143 | |
Futures | | | — | | | | (30 | ) | | | — | | | | (9 | ) |
Translation of Foreign Currency Denominated
Amounts | | | (6 | ) | | | 196 | | | | (72 | ) | | | 168 | |
Change in Deferred Thailand Capital Gains Tax | | | (2,143 | ) | | | (1,264 | ) | | | (2,963 | ) | | | (785 | ) |
| | | | | | | | | | | | | | | | |
Net Increase (Decrease) in Net Assets Resulting
from Operations | | | 501,477 | | | | 677,841 | | | | 492,061 | | | | 521,480 | |
| | | | | | | | | | | | | | | | |
Distributions From: | | | | | | | | | | | | | | | | |
Net Investment Income: | | | | | | | | | | | | | | | | |
Institutional Class Shares | | | (34,414 | ) | | | (33,127 | ) | | | (22,294 | ) | | | (16,832 | ) |
Net Short-Term Gains: | | | | | | | | | | | | | | | | |
Institutional Class Shares | | | (2,485 | ) | | | — | | | | — | | | | — | |
Net Long-Term Gains: | | | | | | | | | | | | | | | | |
Institutional Class Shares | | | (29,814 | ) | | | (20,948 | ) | | | — | | | | — | |
| | | | | | | | | | | | | | | | |
Total Distributions | | | (66,713 | ) | | | (54,075 | ) | | | (22,294 | ) | | | (16,832 | ) |
| | | | | | | | | | | | | | | | |
Capital Share Transactions (1): | | | | | | | | | | | | | | | | |
Shares Issued | | | 464,965 | | | | 448,802 | | | | 468,984 | | | | 278,046 | |
Shares Issued in Lieu of Cash Distributions | | | 60,045 | | | | 48,701 | | | | 18,296 | | | | 15,192 | |
Shares Redeemed | | | (553,564 | ) | | | (663,241 | ) | | | (257,967 | ) | | | (211,257 | ) |
| | | | | | | | | | | | | | | | |
Net Increase (Decrease) from Capital Share
Transactions | | | (28,554 | ) | | | (165,738 | ) | | | 229,313 | | | | 81,981 | |
| | | | | | | | | | | | | | | | |
Total Increase (Decrease) in Net Assets | | | 406,210 | | | | 458,028 | | | | 699,080 | | | | 586,629 | |
Net Assets | | | | | | | | | | | | | | | | |
Beginning of Period | | | 1,966,288 | | | | 1,508,260 | | | | 1,133,958 | | | | 547,329 | |
| | | | | | | | | | | | | | | | |
End of Period | | $ | 2,372,498 | | | $ | 1,966,288 | | | $ | 1,833,038 | | | $ | 1,133,958 | |
| | | | | | | | | | | | | | | | |
(1) Shares Issued and Redeemed: | | | | | | | | | | | | | | | | |
Shares Issued | | | 16,688 | | | | 23,617 | | | | 22,700 | | | | 23,468 | |
Shares Issued in Lieu of Cash Distributions | | | 2,260 | | | | 2,705 | | | | 933 | | | | 1,244 | |
Shares Redeemed | | | (20,100 | ) | | | (36,851 | ) | | | (13,059 | ) | | | (18,390 | ) |
| | | | | | | | | | | | | | | | |
Net Increase (Decrease) from Shares Issued and
Redeemed | | | (1,152 | ) | | | (10,529 | ) | | | 10,574 | | | | 6,322 | |
| | | | | | | | | | | | | | | | |
Undistributed Net Investment Income (Distributions in
Excess of Net Investment Income) | | $ | 3,270 | | | $ | 3,281 | | | $ | 3,213 | | | $ | 2,323 | |
| * | Net of foreign capital gain taxes withheld of $179. |
See accompanying Notes to Financial Statements.
115
DFA INVESTMENT DIMENSIONS GROUP INC.
STATEMENTS OF CHANGES IN NET ASSETS
(Amounts in thousands)
| | | | | | | | | | | | | | | | | | | | |
| | | Emerging Markets
Value Portfolio | | | | | | Emerging Markets
Core Equity
Portfolio | |
| | | Year
Ended
Oct. 31,
2010 | | | Year
Ended
Oct. 31,
2009 | | | | | | Year
Ended
Oct. 31,
2010 | | | Year
Ended
Oct. 31,
2009 | |
Increase (Decrease) in Net Assets | | | | | | | | | | | | | | | | | | | | |
Operations: | | | | | | | | | | | | | | | | | | | | |
Net Investment Income (Loss) | | $ | 125,933 | | | $ | 89,732 | | | | | | | $ | 51,443 | | | $ | 36,040 | |
Net Realized Gain (Loss) on: | | | | | | | | | | | | | | | | | | | | |
Investment Securities Sold | | | 577,480 | | | | 76,523 | | | | | | | | 35,721 | | | | (25,567 | ) |
Futures | | | — | | | | — | | | | | | | | — | | | | (873 | ) |
Foreign Currency Transactions | | | (3,090 | )* | | | — | | | | | | | | (776 | )* | | | (297 | ) |
Change in Unrealized Appreciation (Depreciation) of: | | | | | | | | | | | | | | | | | | | | |
Investment Securities and Foreign Currency | | | 1,724,116 | | | | 2,867,814 | | | | | | | | 789,087 | | | | 981,322 | |
Futures | | | — | | | | — | | | | | | | | — | | | | (4 | ) |
Translation of Foreign Currency Denominated
Amounts | | | 2 | | | | — | | | | | | | | (19 | ) | | | 33 | |
Deferred Thailand Capital Gains Tax | | | (9,879 | ) | | | — | | | | | | | | (4,133 | ) | | | (1,800 | ) |
| | | | | | | | | | | | | | | | | | | | |
Net Increase (Decrease) in Net Assets Resulting
from Operations | | | 2,414,562 | | | | 3,034,069 | | | | | | | | 871,323 | | | | 988,854 | |
| | | | | | | | | | | | | | | | | | | | |
Distributions From: | | | | | | | | | | | | | | | | | | | | |
Net Investment Income: | | | | | | | | | | | | | | | | | | | | |
Class R2 Shares | | | (5,375 | ) | | | (427 | ) | | | | | | | — | | | | — | |
Institutional Class Shares | | | (109,197 | ) | | | (77,134 | ) | | | | | | | (48,768 | ) | | | (29,028 | ) |
Net Short-Term Gains: | | | | | | | | | | | | | | | | | | | | |
Class R2 Shares | | | (513 | ) | | | (76 | ) | | | | | | | — | | | | — | |
Institutional Class Shares | | | (65,356 | ) | | | (36,974 | ) | | | | | | | — | | | | — | |
Net Long-Term Gains: | | | | | | | | | | | | | | | | | | | | |
Class R2 Shares | | | (909 | ) | | | (1,070 | ) | | | | | | | — | | | | — | |
Institutional Class Shares | | | (115,729 | ) | | | (517,440 | ) | | | | | | | — | | | | — | |
| | | | | | | | | | | | | | | | | | | | |
Total Distributions | | | (297,079 | ) | | | (633,121 | ) | | | | | | | (48,768 | ) | | | (29,028 | ) |
| | | | | | | | | | | | | | | | | | | | |
Capital Share Transactions (1): | | | | | | | | | | | | | | | | | | | | |
Shares Issued | | | 3,348,220 | | | | 1,980,752 | | | | | | | | 1,458,158 | | | | 935,028 | |
Shares Issued in Lieu of Cash Distributions | | | 272,770 | | | | 576,478 | | | | | | | | 43,732 | | | | 27,561 | |
Shares Redeemed | | | (1,562,283 | ) | | | (1,289,209 | ) | | | | | | | (599,598 | ) | | | (622,906 | ) |
| | | | | | | | | | | | | | | | | | | | |
Net Increase (Decrease) from Capital Share
Transactions | | | 2,058,707 | | | | 1,268,021 | | | | | | | | 902,292 | | | | 339,683 | |
| | | | | | | | | | | | | | | | | | | | |
Total Increase (Decrease) in Net Assets | | | 4,176,190 | | | | 3,668,969 | | | | | | | | 1,724,847 | | | | 1,299,509 | |
Net Assets | | | | | | | | | | | | | | | | | | | | |
Beginning of Period | | | 7,406,348 | | | | 3,737,379 | | | | | | | | 2,455,035 | | | | 1,155,526 | |
| | | | | | | | | | | | | | | | | | | | |
End of Period | | $ | 11,582,538 | | | $ | 7,406,348 | | | | | | | $ | 4,179,882 | | | $ | 2,455,035 | |
| | | | | | | | | | | | | | | | | | | | |
(1) Shares Issued and Redeemed: | | | | | | | | | | | | | | | | | | | | |
Shares Issued | | | 121,548 | | | | 93,083 | | | | | | | | 77,138 | | | | 84,048 | |
Shares Issued in Lieu of Cash Distributions | | | 12,712 | | | | 35,123 | | | | | | | | 2,449 | | | | 2,073 | |
Shares Redeemed | | | (53,662 | ) | | | (63,359 | ) | | | | | | | (32,331 | ) | | | (54,153 | ) |
| | | | | | | | | | | | | | | | | | | | |
Net Increase (Decrease) from Shares Issued and
Redeemed | | | 80,598 | | | | 64,847 | | | | | | | | 47,256 | | | | 31,968 | |
| | | | | | | | | | | | | | | | | | | | |
Undistributed Net Investment Income (Distributions in
Excess of Net Investment Income) | | $ | 12,814 | | | $ | 12,574 | | | | | | | $ | 8,563 | | | $ | 6,664 | |
| * | Net of foreign capital gain taxes withheld of $1,720 and $982, respectively. |
See accompanying Notes to Financial Statements.
116
DFA INVESTMENT DIMENSIONS GROUP INC.
FINANCIAL HIGHLIGHTS
(for a share outstanding throughout each period)
| | | | | | | | | | | | | | | | | | | | | | | | | | | | | | | | | | | | | | | | | | | | | | | | |
| | | Enhanced U.S. Large Company Portfolio | | | U.S. Large Cap Value Portfolio | |
| | | Year Ended
Oct. 31,
2010 | | | Year Ended
Oct. 31,
2009 | | | Period
Dec. 1,
2007 to
Oct. 31,
2008 | | | Year Ended
Nov. 30,
2007 | | | Year Ended
Nov. 30,
2006 | | | Year Ended
Nov. 30,
2005 | | | Year Ended
Oct. 31, 2010 | | | Year
Ended
Oct. 31,
2009 | | | Period
Dec. 1,
2007 to
Oct. 31,
2008 | | | Year
Ended
Nov. 30,
2007 | | | Year Ended Nov. 30, 2006 | | | Year
Ended
Nov. 30,
2005 | |
Net Asset Value, Beginning of Period | | $ | 6.48 | | | $ | 6.47 | | | $ | 10.91 | | | $ | 10.95 | | | $ | 9.82 | | | $ | 9.35 | | | $ | 15.81 | | | $ | 14.58 | | | $ | 24.44 | | | $ | 25.40 | | | $ | 21.93 | | | $ | 19.37 | |
| | | | | | | | | | | | | | | | | | | | | | | | | | | | | | | | | | | | | | | | | | | | | | | | |
Income From Investment Operations | | | | | | | | | | | | | | | | | | | | | | | | | | | | | | | | | | | | | | | | | | | | | | | | |
Net Investment Income (Loss) | | | 0.07 | (A) | | | 0.05 | (A) | | | 0.39 | (A) | | | 0.30 | (A) | | | 0.12 | (A) | | | 0.29 | | | | 0.33 | (A) | | | 0.31 | (A) | | | 0.36 | (A) | | | 0.33 | (A) | | | 0.38 | (A) | | | 0.30 | |
Net Gains (Losses) on Securities (Realized and Unrealized) | | | 1.05 | | | | 0.61 | | | | (3.74 | ) | | | 0.45 | | | | 1.19 | | | | 0.37 | | | | 2.76 | | | | 1.28 | | | | (8.83 | ) | | | (0.43 | ) | | | 3.50 | | | | 2.49 | |
| | | | | | | | | | | | | | | | | | | | | | | | | | | | | | | | | | | | | | | | | | | | | | | | |
Total From Investment Operations | | | 1.12 | | | | 0.66 | | | | (3.35 | ) | | | 0.75 | | | | 1.31 | | | | 0.66 | | | | 3.09 | | | | 1.59 | | | | (8.47 | ) | | | (0.10 | ) | | | 3.88 | | | | 2.79 | |
Less Distributions | | | | | | | | | | | | | | | | | | | | | | | | | | | | | | | | | | | | | | | | | | | | | | | | |
Net Investment Income | | | (0.07 | ) | | | (0.59 | ) | | | (0.36 | ) | | | (0.36 | ) | | | (0.18 | ) | | | (0.19 | ) | | | (0.32 | ) | | | (0.34 | ) | | | (0.35 | ) | | | (0.32 | ) | | | (0.35 | ) | | | (0.23 | ) |
Net Realized Gains | | | — | | | | (0.06 | ) | | | (0.73 | ) | | | (0.43 | ) | | | — | | | | — | | | | — | | | | (0.02 | ) | | | (1.04 | ) | | | (0.54 | ) | | | (0.06 | ) | | | — | |
| | | | | | | | | | | | | | | | | | | | | | | | | | | | | | | | | | | | | | | | | | | | | | | | |
Total Distributions | | | (0.07 | ) | | | (0.65 | ) | | | (1.09 | ) | | | (0.79 | ) | | | (0.18 | ) | | | (0.19 | ) | | | (0.32 | ) | | | (0.36 | ) | | | (1.39 | ) | | | (0.86 | ) | | | (0.41 | ) | | | (0.23 | ) |
Net Asset Value, End of Period | | $ | 7.53 | | | $ | 6.48 | | | $ | 6.47 | | | $ | 10.91 | | | $ | 10.95 | | | $ | 9.82 | | | $ | 18.58 | | | $ | 15.81 | | | $ | 14.58 | | | $ | 24.44 | | | $ | 25.40 | | | $ | 21.93 | |
| | | | | | | | | | | | | | | | | | | | | | | | | | | | | | | | | | | | | | | | | | | | | | | | | |
Total Return | | | 17.40 | % | | | 12.23 | % | | | (33.89 | )%(C) | | | 7.13 | % | | | 13.52 | % | | | 7.08 | % | | | 19.72 | % | | | 11.76 | % | | | (36.63 | )%(C) | | | (0.49 | )% | | | 17.97 | % | | | 14.49 | % |
Net Assets, End of Period (thousands) | | $ | 157,730 | | | $ | 165,231 | | | $ | 200,331 | | | $ | 337,050 | | | $ | 347,216 | | | $ | 313,543 | | | $ | 6,921,036 | | | $ | 5,863,652 | | | $ | 5,330,448 | | | $ | 7,535,552 | | | $ | 6,410,086 | | | $ | 4,046,083 | |
Ratio of Expenses to Average Net Assets | | | 0.26 | % | | | 0.29 | %** | | | 0.25 | %(B)(D) | | | 0.25 | %(D) | | | 0.26 | %(D) | | | 0.34 | %(D) | | | 0.28 | % | | | 0.30 | %(D) | | | 0.28 | %(B)(D) | | | 0.27 | %(D) | | | 0.28 | %(D) | | | 0.30 | %(D) |
Ratio of Net Investment Income to Average Net Assets | | | 0.98 | % | | | 0.86 | % | | | 4.74 | %(B) | | | 2.67 | % | | | 1.19 | % | | | 3.11 | % | | | 1.86 | % | | | 2.26 | % | | | 1.86 | %(B) | | | 1.28 | % | | | 1.64 | % | | | 1.48 | % |
Portfolio Turnover Rate | | | 78 | % | | | 46 | %* | | | N/A | | | | N/A | | | | N/A | | | | N/A | | | | N/A | | | | N/A | | | | N/A | | | | N/A | | | | N/A | | | | N/A | |
| * | For the period February 28, 2009 through October 31, 2009. Effective February 28, 2009, Enhanced U.S. Large Company Portfolio invests directly in securities rather than through the Series. |
| ** | Represents the combined ratios for the respective portfolio and for the period November 1, 2008 through February 27, 2009, its respective pro-rata share of its Master Fund Series. |
See page 1 & 2 for the Definitions of Abbreviations and Footnotes.
See accompanying Notes to Financial Statements.
117
DFA INVESTMENT DIMENSIONS GROUP INC.
FINANCIAL HIGHLIGHTS
(for a share outstanding throughout each period)
| | | | | | | | | | | | | | | | | | | | | | | | | | | | | | | | | | | | | | | | | | | | | | | | | | | | | | | | | | | | | | | | |
| | | U.S. Targeted Value Portfolio- Class R1 Shares† | | | | | | | | | U.S. Targeted Value Portfolio- Class R2 Shares† | | | | | | | | | U.S. Targeted Value Portfolio- Institutional Class Shares | |
| | | Year
Ended
Oct. 31,
2010 | | | Year
Ended
Oct. 31,
2009 | | | Period
Jan. 31,
2008(a)
to Oct. 31,
2008 | | | | | | | | | Year
Ended
Oct. 31,
2010 | | | Year
Ended
Oct. 31,
2009 | | | Period
June 30,
2008(a)
to Oct. 31,
2008 | | | | | | | | | Year
Ended
Oct. 31,
2010 | | | Year
Ended
Oct. 31,
2009 | | | Period
Dec. 1,
2007 to
Oct. 31,
2008 | | | Year
Ended
Nov. 30,
2007 | | | Year
Ended
Nov. 30,
2006 | | | Year
Ended
Nov. 30,
2005 | |
Net Asset Value, Beginning of Period | | $ | 11.73 | | | $ | 10.92 | | | $ | 14.69 | | | | | | | | | | | $ | 11.74 | | | $ | 10.91 | | | $ | 13.94 | | | | | | | | | | | $ | 11.70 | | | $ | 10.84 | | | $ | 15.89 | | | $ | 18.69 | | | $ | 17.33 | | | $ | 17.09 | |
| | | | | | | | | | | | | | | | | | | | | | | | | | | | | | | | | | | | | | | | | | | | | | | | | | | | | | | | | | | | | | | | |
Income From Investment Operations | | | | | | | | | | | | | | | | | | | | | | | | | | | | | | | | | | | | | | | | | | | | | | | | | | | | | | | | | | | | | | | | |
Net Investment Income (Loss) | | | 0.07 | (A) | | | 0.12 | (A) | | | 0.13 | (A) | | | | | | | | | | | 0.05 | (A) | | | 0.10 | (A) | | | 0.05 | (A) | | | | | | | | | | | 0.09 | (A) | | | 0.12 | (A) | | | 0.18 | (A) | | | 0.20 | (A) | | | 0.21 | (A) | | | 0.32 | |
Net Gains (Losses) on Securities (Realized and Unrealized) | | | 3.07 | | | | 0.87 | | | | (3.76 | ) | | | | | | | | | | | 3.07 | | | | 0.88 | | | | (3.02 | ) | | | | | | | | | | | 3.06 | | | | 0.88 | | | | (4.68 | ) | | | (1.32 | ) | | | 2.84 | | | | 1.59 | |
| | | | | | | | | | | | | | | | | | | | | | | | | | | | | | | | | | | | | | | | | | | | | | | | | | | | | | | | | | | | | | | | |
Total From Investment
Operations | | | 3.14 | | | | 0.99 | | | | (3.63 | ) | | | | | | | | | | | 3.12 | | | | 0.98 | | | | (2.97 | ) | | | | | | | | | | | 3.15 | | | | 1.00 | | | | (4.50 | ) | | | (1.12 | ) | | | 3.05 | | | | 1.91 | |
Less Distributions | | | | | | | | | | | | | | | | | | | | | | | | | | | | | | | | | | | | | | | | | | | | | | | | | | | | | | | | | | | | | | | | |
Net Investment Income | | | (0.12 | ) | | | (0.18 | ) | | | (0.14 | ) | | | | | | | | | | | (0.10 | ) | | | (0.15 | ) | | | (0.06 | ) | | | | | | | | | | | (0.09 | ) | | | (0.14 | ) | | | (0.15 | ) | | | (0.20 | ) | | | (0.25 | ) | | | (0.23 | ) |
Net Realized Gains | | | — | | | | — | | | | — | | | | | | | | | | | | — | | | | — | | | | — | | | | | | | | | | | | — | | | | — | | | | (0.40 | ) | | | (1.48 | ) | | | (1.44 | ) | | | (1.44 | ) |
| | | | | | | | | | | | | | | | | | | | | | | | | | | | | | | | | | | | | | | | | | | | | | | | | | | | | | | | | | | | | | | | |
Total Distributions | | | (0.12 | ) | | | (0.18 | ) | | | (0.14 | ) | | | | | | | | | | | (0.10 | ) | | | (0.15 | ) | | | (0.06 | ) | | | | | | | | | | | (0.09 | ) | | | (0.14 | ) | | | (0.55 | ) | | | (1.68 | ) | | | (1.69 | ) | | | (1.67 | ) |
Net Asset Value, End of Period | | $ | 14.75 | | | $ | 11.73 | | | $ | 10.92 | | | | | | | | | | | $ | 14.76 | | | $ | 11.74 | | | $ | 10.91 | | | | | | | | | | | $ | 14.76 | | | $ | 11.70 | | | $ | 10.84 | | | $ | 15.89 | | | $ | 18.69 | | | $ | 17.33 | |
| | | | | | | | | | | | | | | | | | | | | | | | | | | | | | | | | | | | | | | | | | | | | | | | | | | | | | | | | | | | | | | | | |
Total Return | | | 26.93 | % | | | 9.36 | % | | | (24.96 | )%(C) | | | | | | | | | | | 26.66 | % | | | 9.23 | % | | | (21.40 | )%(C) | | | | | | | | | | | 27.02 | % | | | 9.47 | % | | | (29.27 | )%(C) | | | (6.59 | )% | | | 19.48 | % | | | 12.17 | % |
Net Assets, End of Period
(thousands) | | $ | 41,316 | | | $ | 31,393 | | | $ | 25,599 | | | | | | | | | | | $ | 5,967 | | | $ | 2,930 | | | $ | 1,715 | | | | | | | | | | | $ | 2,223,982 | | | $ | 1,449,437 | | | $ | 855,448 | | | $ | 554,805 | | | $ | 215,338 | | | $ | 172,595 | |
Ratio of Expenses to Average Net
Assets | | | 0.49 | % | | | 0.52 | % | | | 0.50 | %(B)(E) | | | | | | | | | | | 0.64 | % | | | 0.67 | % | | | 0.66 | %(B)(E) | | | | | | | | | | | 0.38 | % | | | 0.41 | % | | | 0.40 | %(B) | | | 0.41 | %(D)** | | | 0.46 | %(D) | | | 0.47 | %(D) |
Ratio of Net Investment Income to
Average Net Assets | | | 0.59 | % | | | 1.12 | % | | | 1.24 | %(B)(E) | | | | | | | | | | | 0.44 | % | | | 0.91 | % | | | 1.35 | %(B)(E) | | | | | | | | | | | 0.69 | % | | | 1.19 | % | | | 1.39 | %(B) | | | 1.12 | % | | | 1.19 | % | | | 1.91 | % |
Portfolio Turnover Rate | | | 20 | % | | | 17 | % | | | 20 | %(C) | | | | | | | | | | | 20 | % | | | 17 | % | | | 20 | %(C) | | | | | | | | | | | 20 | % | | | 17 | % | | | 20 | %(C) | | | 9 | %(C)* | | | N/A | | | | N/A | |
| * | For the period March 30, 2007 through November 30, 2007. Effective March 30, 2007, U.S. Targeted Value Portfolio invests directly in securities rather than through the Series. |
| ** Represents | the combined ratios for the respective portfolio and for the period December 1, 2006 through March 29, 2007, its respective pro-rata share of its Master Fund Series. |
| † All | per share amounts and net assets values have been adjusted as a result of the reverse stock split on November 19, 2010. (Note P) |
See page 1 & 2 for the Definitions of Abbreviations and Footnotes.
See accompanying Notes to Financial Statements.
118
DFA INVESTMENT DIMENSIONS GROUP INC.
FINANCIAL HIGHLIGHTS
(for a share outstanding throughout each period)
| | | | | | | | | | | | | | | | | | | | | | | | |
| | | U.S. Small Cap Value Portfolio | |
| | | Year
Ended Oct. 31,
2010 | | | Year
Ended Oct. 31,
2009 | | | Period
Dec. 1,
2007 to
Oct. 31,
2008 | | | Year
Ended
Nov. 30,
2007 | | | Year
Ended
Nov. 30,
2006 | | | Year
Ended
Nov. 30,
2005 | |
Net Asset Value, Beginning of Period | | $ | 17.69 | | | $ | 16.32 | | | $ | 26.49 | | | $ | 31.59 | | | $ | 28.74 | | | $ | 27.71 | |
| | | | | | | | | | | | | | | | | | | | | | | | |
Income From Investment Operations | | | | | | | | | | | | | | | | | | | | | | | | |
Net Investment Income (Loss) | | | 0.09 | (A) | | | 0.04 | (A) | | | 0.18 | (A) | | | 0.30 | (A) | | | 0.28 | (A) | | | 0.29 | |
Net Gains (Losses) on Securities (Realized and Unrealized) | | | 4.79 | | | | 1.54 | | | | (7.86 | ) | | | (2.72 | ) | | | 5.06 | | | | 2.66 | |
| | | | | | | | | | | | | | | | | | | | | | | | |
Total From Investment Operations | | | 4.88 | | | | 1.58 | | | | (7.68 | ) | | | (2.42 | ) | | | 5.34 | | | | 2.95 | |
Less Distributions | | | | | | | | | | | | | | | | | | | | | | | | |
Net Investment Income | | | (0.08 | ) | | | (0.21 | ) | | | (0.22 | ) | | | (0.28 | ) | | | (0.23 | ) | | | (0.26 | ) |
Net Realized Gains | | | — | | | | — | | | | (2.27 | ) | | | (2.40 | ) | | | (2.26 | ) | | | (1.66 | ) |
| | | | | | | | | | | | | | | | | | | | | | | | |
Total Distributions | | | (0.08 | ) | | | (0.21 | ) | | | (2.49 | ) | | | (2.68 | ) | | | (2.49 | ) | | | (1.92 | ) |
Net Asset Value, End of Period | | $ | 22.49 | | | $ | 17.69 | | | $ | 16.32 | | | $ | 26.49 | | | $ | 31.59 | | | $ | 28.74 | |
| | | | | | | | | | | | | | | | | | | | | | | | | |
Total Return | | | 27.69 | % | | | 9.97 | % | | | (31.80 | )%(C) | | | (8.41 | )% | | | 20.29 | % | | | 11.32 | % |
Net Assets, End of Period (thousands) | | $ | 6,555,277 | | | $ | 5,669,659 | | | $ | 5,503,945 | | | $ | 8,802,846 | | | $ | 8,738,278 | | | $ | 6,924,234 | |
Ratio of Expenses to Average Net Assets | | | 0.52 | % | | | 0.54 | %** | | | 0.52 | %(B)(D) | | | 0.52 | %(D) | | | 0.53 | %(D) | | | 0.55 | %(D) |
Ratio of Net Investment Income to Average Net Assets | | | 0.43 | % | | | 0.27 | % | | | 0.86 | %(B) | | | 0.98 | % | | | 0.94 | % | | | 1.04 | % |
Portfolio Turnover Rate | | | 19 | % | | | 21 | %* | | | N/A | | | | N/A | | | | N/A | | | | N/A | |
| * | For the period February 28, 2009 through October 31, 2009. Effective February 28, 2009, U.S. Small Cap Value Portfolio invests directly in securities rather than through the Series. |
| ** | Represents the combined ratios for the respective portfolio and for the period November 1, 2008 through February 27, 2009, its respective pro-rata share of its Master Fund Series. |
See page 1 & 2 for the Definitions of Abbreviations and Footnotes.
See accompanying Notes to Financial Statements.
119
DFA INVESTMENT DIMENSIONS GROUP INC.
FINANCIAL HIGHLIGHTS
(for a share outstanding throughout each period)
| | | | | | | | | | | | | | | | | | | | | | | | | | | | | | | | | | | | | | | | | | | | | | | | |
| | | U.S. Core Equity 1 Portfolio | | | U.S. Core Equity 2 Portfolio | |
| | | Year
Ended Oct. 31,
2010 | | | Year
Ended Oct. 31,
2009 | | | Period
Dec. 1,
2007 to
Oct. 31,
2008 | | | Year
Ended
Nov. 30,
2007 | | | Year
Ended
Nov. 30,
2006 | | | Period
Sept. 15,
2005(a)
to Nov. 30,
2005 | | | Year
Ended Oct. 31,
2010 | | | Year
Ended Oct. 31,
2009 | | | Period
Dec. 1,
2007 to
Oct. 31,
2008 | | | Year
Ended
Nov. 30,
2007 | | | Year
Ended
Nov. 30,
2006 | | | Period
Sept. 15,
2005(a)
to Nov. 30,
2005 | |
Net Asset Value, Beginning of Period | | $ | 8.54 | | | $ | 7.81 | | | $ | 11.83 | | | $ | 11.50 | | | $ | 10.22 | | | $ | 10.00 | | | $ | 8.39 | | | $ | 7.73 | | | $ | 11.77 | | | $ | 11.65 | | | $ | 10.24 | | | $ | 10.00 | |
| | | | | | | | | | | | | | | | | | | | | | | | | | | | | | | | | | | | | | | | | | | | | | | | |
Income From Investment Operations | | | | | | | | | | | | | | | | | | | | | | | | | | | | | | | | | | | | | | | | | | | | | | | | |
Net Investment Income (Loss) | | | 0.15 | (A) | | | 0.15 | (A) | | | 0.17 | (A) | | | 0.19 | (A) | | | 0.17 | (A) | | | 0.03 | | | | 0.14 | (A) | | | 0.14 | (A) | | | 0.17 | (A) | | | 0.19 | (A) | | | 0.17 | (A) | | | 0.03 | |
Net Gains (Losses) on Securities
(Realized and Unrealized) | | | 1.61 | | | | 0.73 | | | | (4.03 | ) | | | 0.35 | | | | 1.28 | | | | 0.19 | | | | 1.64 | | | | 0.66 | | | | (4.04 | ) | | | 0.13 | | | | 1.40 | | | | 0.21 | |
| | | | | | | | | | | | | | | | | | | | | | | | | | | | | | | | | | | | | | | | | | | | | | | | |
Total From Investment
Operations | | | 1.76 | | | | 0.88 | | | | (3.86 | ) | | | 0.54 | | | | 1.45 | | | | 0.22 | | | | 1.78 | | | | 0.80 | | | | (3.87 | ) | | | 0.32 | | | | 1.57 | | | | 0.24 | |
Less Distributions | | | | | | | | | | | | | | | | | | | | | | | | | | | | | | | | | | | | | | | | | | | | | | | | |
Net Investment Income | | | (0.12 | ) | | | (0.15 | ) | | | (0.16 | ) | | | (0.18 | ) | | | (0.17 | ) | | | — | | | | (0.11 | ) | | | (0.14 | ) | | | (0.17 | ) | | | (0.17 | ) | | | (0.16 | ) | | | — | |
Net Realized Gains | | | — | | | | — | | | | — | | | | (0.03 | ) | | | — | | | | — | | | | — | | | | — | | | | — | | | | (0.03 | ) | | | — | | | | — | |
| | | | | | | | | | | | | | | | | | | | | | | | | | | | | | | | | | | | | | | | | | | | | | | | |
Total Distributions | | | (0.12 | ) | | | (0.15 | ) | | | (0.16 | ) | | | (0.21 | ) | | | (0.17 | ) | | | — | | | | (0.11 | ) | | | (0.14 | ) | | | (0.17 | ) | | | (0.20 | ) | | | (0.16 | ) | | | — | |
Net Asset Value, End of Period | | $ | 10.18 | | | $ | 8.54 | | | $ | 7.81 | | | $ | 11.83 | | | $ | 11.50 | | | $ | 10.22 | | | $ | 10.06 | | | $ | 8.39 | | | $ | 7.73 | | | $ | 11.77 | | | $ | 11.65 | | | $ | 10.24 | |
| | | | | | | | | | | | | | | | | | | | | | | | | | | | | | | | | | | | | | | | | | | | | | | | | |
Total Return | | | 20.80 | % | | | 11.64 | % | | | (32.85 | )%(C) | | | 4.68 | % | | | 14.35 | % | | | 2.20 | %(C) | | | 21.41 | % | | | 10.66 | % | | | (33.16 | )%(C) | | | 2.78 | % | | | 15.50 | % | | | 2.40 | %(C) |
Net Assets, End of Period
(thousands) | | $ | 2,897,409 | | | $ | 1,989,583 | | | $ | 1,320,562 | | | $ | 1,210,031 | | | $ | 652,270 | | | $ | 123,591 | | | $ | 4,990,367 | | | $ | 3,804,325 | | | $ | 2,501,028 | | | $ | 2,939,420 | | | $ | 1,216,310 | | | $ | 182,078 | |
Ratio of Expenses to Average Net
Assets | | | 0.20 | % | | | 0.22 | % | | | 0.20 | %(B) | | | 0.20 | % | | | 0.23 | % | | | 0.23 | %(B)(E) | | | 0.23 | % | | | 0.24 | % | | | 0.23 | %(B) | | | 0.23 | % | | | 0.26 | % | | | 0.26 | %(B)(E) |
Ratio of Expenses to Average Net
Assets (Excluding Waivers and
Assumption of Expenses and/or
Recovery of Previously Waived
Fees) | | | 0.20 | % | | | 0.22 | % | | | 0.20 | %(B) | | | 0.20 | % | | | 0.23 | % | | | 0.37 | %(B)(E) | | | 0.23 | % | | | 0.24 | % | | | 0.23 | %(B) | | | 0.23 | % | | | 0.26 | % | | | 0.38 | %(B)(E) |
Ratio of Net Investment Income to
Average Net Assets | | | 1.53 | % | | | 2.02 | % | | | 1.78 | %(B) | | | 1.53 | % | | | 1.52 | % | | | 1.85 | %(B)(E) | | | 1.47 | % | | | 1.89 | % | | | 1.77 | %(B) | | | 1.55 | % | | | 1.55 | % | | | 1.92 | %(B)(E) |
Portfolio Turnover Rate | | | 4 | % | | | 7 | % | | | 5 | %(C) | | | 10 | % | | | 6 | % | | | 0 | %(C) | | | 7 | % | | | 4 | % | | | 8 | %(C) | | | 7 | % | | | 5 | % | | | 0 | %(C) |
See page 1 & 2 for the Definitions of Abbreviations and Footnotes.
See accompanying Notes to Financial Statements.
120
DFA INVESTMENT DIMENSIONS GROUP INC.
FINANCIAL HIGHLIGHTS
(for a share outstanding throughout each period)
| | | | | | | | | | | | | | | | | | | | |
| | | U.S. Vector Equity Portfolio | |
| | | Year Ended Oct. 31, 2010 | | | Year Ended Oct. 31, 2009 | | | Period
Dec. 1,
2007 to
Oct. 31,
2008 | | | Year Ended Nov. 30,
2007 | | | Period Dec. 30, 2005(a) to Nov. 30, 2006 | |
Net Asset Value, Beginning of Period | | $ | 8.03 | | | $ | 7.48 | | | $ | 11.38 | | | $ | 11.79 | | | $ | 10.00 | |
| | | | | | | | | | | | | | | | | | | | |
Income From Investment Operations | | | | | | | | | | | | | | | | | | | | |
Net Investment Income (Loss)(A) | | | 0.10 | | | | 0.11 | | | | 0.15 | | | | 0.16 | | | | 0.13 | |
Net Gains (Losses) on Securities (Realized and Unrealized) | | | 1.79 | | | | 0.57 | | | | (3.89 | ) | | | (0.25 | ) | | | 1.73 | |
| | | | | | | | | | | | | | | | | | | | |
Total From Investment Operations | | | 1.89 | | | | 0.68 | | | | (3.74 | ) | | | (0.09 | ) | | | 1.86 | |
Less Distributions | | | | | | | | | | | | | | | | | | | | |
Net Investment Income | | | (0.10 | ) | | | (0.13 | ) | | | (0.16 | ) | | | (0.14 | ) | | | (0.07 | ) |
Net Realized Gains | | | — | | | | — | | | | — | | | | (0.18 | ) | | | — | |
| | | | | | | | | | | | | | | | | | | | |
Total Distributions | | | (0.10 | ) | | | (0.13 | ) | | | (0.16 | ) | | | (0.32 | ) | | | (0.07 | ) |
Net Asset Value, End of Period | | $ | 9.82 | | | $ | 8.03 | | | $ | 7.48 | | | $ | 11.38 | | | $ | 11.79 | |
| | | | | | | | | | | | | | | | | | | | | |
Total Return | | | 23.65 | % | | | 9.47 | % | | | (33.29 | )%(C) | | | (0.87 | )% | | | 18.65 | %(C) |
Net Assets, End of Period (thousands) | | $ | 1,558,423 | | | $ | 1,178,114 | | | $ | 850,623 | | | $ | 959,742 | | | $ | 403,312 | |
Ratio of Expenses to Average Net Assets | | | 0.33 | % | | | 0.35 | % | | | 0.34 | %(B) | | | 0.34 | % | | | 0.36 | %(B)(E) |
Ratio of Expenses to Average Net Assets (Excluding Waivers and Assumption of Expenses and/or Recovery of Previously Waived Fees) | | | 0.33 | % | | | 0.35 | % | | | 0.34 | %(B) | | | 0.33 | % | | | 0.39 | %(B)(E) |
Ratio of Net Investment Income to Average Net Assets | | | 1.13 | % | | | 1.60 | % | | | 1.66 | %(B) | | | 1.29 | % | | | 1.24 | %(B)(E) |
Portfolio Turnover Rate | | | 11 | % | | | 11 | % | | | 11 | %(C) | | | 14 | % | | | 24 | %(C) |
See page 1 & 2 for the Definitions of Abbreviations and Footnotes.
See accompanying Notes to Financial Statements.
121
DFA INVESTMENT DIMENSIONS GROUP INC.
FINANCIAL HIGHLIGHTS
(for a share outstanding throughout each period)
| | | | | | | | | | | | | | | | | | | | | | | | | | | | | | | | | | | | | | | | | | | | | | | | |
| | | U.S. Small Cap Portfolio | | | U.S. Micro Cap Portfolio | |
| | | Year
Ended
Oct. 31,
2010 | | | Year
Ended
Oct. 31,
2009 | | | Period
Dec. 1,
2007 to
Oct. 31,
2008 | | | Year
Ended
Nov. 30,
2007 | | | Year
Ended
Nov. 30,
2006 | | | Year
Ended
Nov. 30,
2005 | | | Year
Ended Oct.
31, 2010 | | | Year
Ended Oct.
31, 2009 | | | Period
Dec. 1,
2007 to
Oct. 31,
2008 | | | Year
Ended
Nov. 30,
2007 | | | Year
Ended
Nov. 30,
2006 | | | Year
Ended
Nov. 30,
2005 | |
Net Asset Value, Beginning of Period | | $ | 14.89 | | | $ | 13.35 | | | $ | 20.64 | | | $ | 22.46 | | | $ | 20.75 | | | $ | 19.13 | | | $ | 9.57 | | | $ | 9.19 | | | $ | 14.80 | | | $ | 16.83 | | | $ | 15.91 | | | $ | 15.06 | |
| | | | | | | | | | | | | | | | | | | | | | | | | | | | | | | | | | | | | | | | | | | | | | | | |
Income From Investment Operations | | | | | | | | | | | | | | | | | | | | | | | | | | | | | | | | | | | | | | | | | | | | | | | | |
Net Investment Income (Loss) | | | 0.13 | (A) | | | 0.06 | (A) | | | 0.14 | (A) | | | 0.21 | (A) | | | 0.17 | (A) | | | 0.15 | | | | 0.06 | (A) | | | 0.03 | (A) | | | 0.10 | (A) | | | 0.14 | (A) | | | 0.10 | (A) | | | 0.07 | |
Net Gains (Losses) on Securities (Realized and Unrealized) | | | 4.17 | | | | 1.65 | | | | (6.08 | ) | | | (0.66 | ) | | | 2.84 | | | | 1.75 | | | | 2.68 | | | | 0.54 | | | | (4.32 | ) | | | (0.69 | ) | | | 2.04 | | | | 1.43 | |
| | | | | | | | | | | | | | | | | | | | | | | | | | | | | | | | | | | | | | | | | | | | | | | | |
Total From
Investment Operations | | | 4.30 | | | | 1.71 | | | | (5.94 | ) | | | (0.45 | ) | | | 3.01 | | | | 1.90 | | | | 2.74 | | | | 0.57 | | | | (4.22 | ) | | | (0.55 | ) | | | 2.14 | | | | 1.50 | |
Less Distributions | | | | | | | | | | | | | | | | | | | | | | | | | | | | | | | | | | | | | | | | | | | | | | | | |
Net Investment Income | | | (0.13 | ) | | | (0.17 | ) | | | (0.17 | ) | | | (0.21 | ) | | | (0.13 | ) | | | (0.13 | ) | | | (0.06 | ) | | | (0.19 | ) | | | (0.13 | ) | | | (0.13 | ) | | | (0.08 | ) | | | (0.06 | ) |
Net Realized Gains | | | — | | | | — | | | | (1.18 | ) | | | (1.16 | ) | | | (1.17 | ) | | | (0.15 | ) | | | — | | | | — | | | | (1.26 | ) | | | (1.35 | ) | | | (1.14 | ) | | | (0.59 | ) |
| | | | | | | | | | | | | | | | | | | | | | | | | | | | | | | | | | | | | | | | | | | | | | | | |
Total
Distributions | | | (0.13 | ) | | | (0.17 | ) | | | (1.35 | ) | | | (1.37 | ) | | | (1.30 | ) | | | (0.28 | ) | | | (0.06 | ) | | | (0.19 | ) | | | (1.39 | ) | | | (1.48 | ) | | | (1.22 | ) | | | (0.65 | ) |
Net Asset Value, End of Period | | $ | 19.06 | | | $ | 14.89 | | | $ | 13.35 | | | $ | 20.64 | | | $ | 22.46 | | | $ | 20.75 | | | $ | 12.25 | | | $ | 9.57 | | | $ | 9.19 | | | $ | 14.80 | | | $ | 16.83 | | | $ | 15.91 | |
| | | | | | | | | | | | | | | | | | | | | | | | | | | | | | | | | | | | | | | | | | | | | | | | | |
Total Return | | | 28.99 | % | | | 13.08 | % | | | (30.67 | )%(C) | | | (2.17 | )% | | | 15.49 | % | | | 10.04 | % | | | 28.77 | % | | | 6.61 | % | | | (31.33 | )%(C) | | | (3.63 | )% | | | 14.52 | % | | | 10.33 | % |
Net Assets, End of Period (thousands) | | $ | 3,391,457 | | | $ | 2,522,001 | | | $ | 2,066,849 | | | $ | 3,285,093 | | | $ | 3,297,199 | | | $ | 2,641,670 | | | $ | 3,178,286 | | | $ | 2,818,365 | | | $ | 2,924,225 | | | $ | 4,700,371 | | | $ | 4,824,003 | | | $ | 3,949,511 | |
Ratio of Expenses to Average Net Assets | | | 0.37 | % | | | 0.40 | %** | | | 0.38 | %(B)(D) | | | 0.38 | %(D) | | | 0.38 | %(D) | | | 0.40 | %(D) | | | 0.52 | % | | | 0.54 | %** | | | 0.53 | %(B)(D) | | | 0.52 | %(D) | | | 0.53 | %(D) | | | 0.55 | %(D) |
Ratio of Net Investment Income to Average Net Assets | | | 0.76 | % | | | 0.50 | % | | | 0.86 | %(B) | | | 0.95 | % | | | 0.82 | % | | | 0.78 | % | | | 0.58 | % | | | 0.38 | % | | | 0.91 | %(B) | | | 0.89 | % | | | 0.64 | % | | | 0.48 | % |
Portfolio Turnover Rate | | | 19 | % | | | 17 | %* | | | N/A | | | | N/A | | | | N/A | | | | N/A | | | | 9 | % | | | 12 | %* | | | N/A | | | | N/A | | | | N/A | | | | N/A | |
| * | For the period February 28, 2009 through October 31, 2009. Effective February 28, 2009, the Portfolios invest directly in securities rather than through the Series. |
| ** | Represents the combined ratios for the respective portfolio and for the period November 1, 2008 through February 27, 2009, its respective pro-rata share of its Master Fund Series. |
See page 1 & 2 for the Definitions of Abbreviations and Footnotes.
See accompanying Notes to Financial Statements.
122
DFA INVESTMENT DIMENSIONS GROUP INC.
FINANCIAL HIGHLIGHTS
(for a share outstanding throughout each period)
| | | | | | | | | | | | | | | | | | | | | | | | | | | | | | | | | | | | | | | | | | | | | | | | |
| | | DFA Real Estate Securities Portfolio | | | Large Cap International Portfolio | |
| | | Year
Ended
Oct. 31,
2010 | | | Year
Ended
Oct. 31,
2009 | | | Period
Dec. 1,
2007 to
Oct. 31,
2008 | | | Year
Ended
Nov. 30,
2007 | | | Year
Ended
Nov. 30,
2006 | | | Year
Ended
Nov. 30,
2005 | | | Year
Ended
Oct. 31,
2010 | | | Year
Ended
Oct. 31,
2009 | | | Period
Dec. 1,
2007 to
Oct. 31,
2008 | | | Year
Ended
Nov. 30,
2007 | | | Year
Ended
Nov. 30,
2006 | | | Year
Ended
Nov. 30,
2005 | |
Net Asset Value, Beginning of Period | | $ | 15.29 | | | $ | 16.16 | | | $ | 27.20 | | | $ | 33.80 | | | $ | 25.75 | | | $ | 23.02 | | | $ | 18.02 | | | $ | 14.81 | | | $ | 27.18 | | | $ | 23.60 | | | $ | 19.00 | | | $ | 17.31 | |
| | | | | | | | | | | | | | | | | | | | | | | | | | | | | | | | | | | | | | | | | | | | | | | | |
Income From Investment Operations | | | | | | | | | | | | | | | | | | | | | | | | | | | | | | | | | | | | | | | | | | | | | | | | |
Net Investment Income (Loss) | | | 0.58 | (A) | | | 0.58 | (A) | | | 0.64 | (A) | | | 0.62 | (A) | | | 0.64 | (A) | | | 0.82 | | | | 0.48 | (A) | | | 0.48 | (A) | | | 0.68 | (A) | | | 0.68 | (A) | | | 0.55 | (A) | | | 0.44 | |
Net Gains (Losses) on Securities (Realized and Unrealized) | | | 5.92 | | | | (0.62 | ) | | | (9.28 | ) | | | (5.64 | ) | | | 8.84 | | | | 3.33 | | | | 1.43 | | | | 3.16 | | | | (12.06 | ) | | | 3.57 | | | | 4.68 | | | | 1.72 | |
| | | | | | | | | | | | | | | | | | | | | | | | | | | | | | | | | | | | | | | | | | | | | | | | |
Total From Investment Operations | | | 6.50 | | | | (0.04 | ) | | | (8.64 | ) | | | (5.02 | ) | | | 9.48 | | | | 4.15 | | | | 1.91 | | | | 3.64 | | | | (11.38 | ) | | | 4.25 | | | | 5.23 | | | | 2.16 | |
Less Distributions | | | | | | | | | | | | | | | | | | | | | | | | | | | | | | | | | | | | | | | | | | | | | | | | |
Net Investment Income | | | (0.55 | ) | | | (0.83 | ) | | | (0.30 | ) | | | (0.70 | ) | | | (1.02 | ) | | | (0.86 | ) | | | (0.51 | ) | | | (0.43 | ) | | | (0.64 | ) | | | (0.67 | ) | | | (0.63 | ) | | | (0.47 | ) |
Net Realized Gains. | | | — | | | | — | | | | (2.10 | ) | | | (0.88 | ) | | | (0.41 | ) | | | (0.56 | ) | | | — | | | | — | | | | (0.35 | ) | | | — | | | | — | | | | — | |
| | | | | | | | | | | | | | | | | | | | | | | | | | | | | | | | | | | | | | | | | | | | | | | | |
Total Distributions | | | (0.55 | ) | | | (0.83 | ) | | | (2.40 | ) | | | (1.58 | ) | | | (1.43 | ) | | | (1.42 | ) | | | (0.51 | ) | | | (0.43 | ) | | | (0.99 | ) | | | (0.67 | ) | | | (0.63 | ) | | | (0.47 | ) |
Net Asset Value, End of Period | | $ | 21.24 | | | $ | 15.29 | | | $ | 16.16 | | | $ | 27.20 | | | $ | 33.80 | | | $ | 25.75 | | | $ | 19.42 | | | $ | 18.02 | | | $ | 14.81 | | | $ | 27.18 | | | $ | 23.60 | | | $ | 19.00 | |
| | | | | | | | | | | | | | | | | | | | | | | | | | | | | | | | | | | | | | | | | | | | | | | | | |
Total Return | | | 43.21 | % | | | 0.98 | % | | | (34.46 | )%(C) | | | (15.45 | )% | | | 38.23 | % | | | 18.81 | % | | | 10.99 | % | | | 25.20 | % | | | (43.14 | )%(C) | | | 18.18 | % | | | 28.00 | % | | | 12.73 | % |
Net Assets, End of Period (thousands) | | $ | 2,689,552 | | | $ | 2,018,559 | | | $ | 1,746,961 | | | $ | 2,671,457 | | | $ | 2,837,026 | | | $ | 1,836,650 | | | $ | 1,616,686 | | | $ | 1,364,351 | | | $ | 1,206,860 | | | $ | 2,224,180 | | | $ | 1,673,239 | | | $ | 1,125,455 | |
Ratio of Expenses to Average Net Assets | | | 0.33 | % | | | 0.36 | % | | | 0.33 | %(B) | | | 0.33 | % | | | 0.33 | % | | | 0.37 | % | | | 0.30 | % | | | 0.32 | % | | | 0.29 | %(B) | | | 0.29 | % | | | 0.29 | % | | | 0.37 | % |
Ratio of Net Investment Income to Average Net Assets | | | 3.13 | % | | | 4.54 | % | | | 3.01 | %(B) | | | 1.99 | % | | | 2.25 | % | | | 3.11 | % | | | 2.65 | % | | | 3.14 | % | | | 3.18 | %(B) | | | 2.62 | % | | | 2.56 | % | | | 2.41 | % |
Portfolio Turnover Rate | | | 2 | % | | | 2 | % | | | 13 | %(C) | | | 17 | % | | | 10 | % | | | 3 | % | | | 7 | % | | | 12 | % | | | 12 | %(C) | | | 5 | % | | | 4 | % | | | 4 | % |
See page 1 & 2 for the Definitions of Abbreviations and Footnotes.
See accompanying Notes to Financial Statements.
123
DFA INVESTMENT DIMENSIONS GROUP INC.
FINANCIAL HIGHLIGHTS
(for a share outstanding throughout each period)
| | | | | | | | | | | | | | | | | | | | | | | | |
| | | International Core Equity Portfolio | |
| | | Year
Ended
Oct. 31,
2010 | | | Year
Ended
Oct. 31,
2009 | | | Period
Dec. 1,
2007 to
Oct. 31,
2008 | | | Year
Ended
Nov. 30,
2007 | | | Year
Ended
Nov. 30,
2006 | | | Period
Sept. 15,
2005(a) to Nov. 30,
2005 | |
Net Asset Value, Beginning of Period | | $ | 9.79 | | | $ | 7.46 | | | $ | 14.35 | | | $ | 12.82 | | | $ | 10.07 | | | $ | 10.00 | |
| | | | | | | | | | | | | | | | | | | | | | | | |
Income From Investment Operations | | | | | | | | | | | | | | | | | | | | | | | | |
Net Investment Income (Loss)(A) | | | 0.23 | | | | 0.23 | | | | 0.37 | | | | 0.35 | | | | 0.28 | | | | 0.04 | |
Net Gains (Losses) on Securities (Realized and Unrealized) | | | 0.96 | | | | 2.32 | | | | (6.76 | ) | | | 1.54 | | | | 2.71 | | | | 0.03 | |
| | | | | | | | | | | | | | | | | | | | | | | | |
Total From Investment Operations | | | 1.19 | | | | 2.55 | | | | (6.39 | ) | | | 1.89 | | | | 2.99 | | | | 0.07 | |
Less Distributions | | | | | | | | | | | | | | | | | | | | | | | | |
Net Investment Income | | | (0.20 | ) | | | (0.22 | ) | | | (0.35 | ) | | | (0.32 | ) | | | (0.24 | ) | | | — | |
Net Realized Gains | | | — | | | | — | | | | (0.15 | ) | | | (0.04 | ) | | | — | | | | — | |
| | | | | | | | | | | | | | | | | | | | | | | | |
Total Distributions | | | (0.20 | ) | | | (0.22 | ) | | | (0.50 | ) | | | (0.36 | ) | | | (0.24 | ) | | | — | |
Net Asset Value, End of Period | | $ | 10.78 | | | $ | 9.79 | | | $ | 7.46 | | | $ | 14.35 | | | $ | 12.82 | | | $ | 10.07 | |
| | | | | | | | | | | | | | | | | | | | | | | | | |
Total Return | | | 12.48 | % | | | 34.81 | % | | | (45.76 | )%(C) | | | 14.83 | % | | | 30.06 | % | | | 0.70 | %(C) |
Net Assets, End of Period (thousands) | | $ | 4,866,989 | | | $ | 3,699,842 | | | $ | 1,981,049 | | | $ | 2,342,187 | | | $ | 851,077 | | | $ | 121,249 | |
Ratio of Expenses to Average Net Assets | | | 0.40 | % | | | 0.41 | % | | | 0.41 | %(B) | | | 0.41 | % | | | 0.48 | % | | | 0.49 | %(B)(E) |
Ratio of Expenses to Average Net Assets (Excluding Waivers and Assumption of Expenses and/or Recovery of Previously Waived Fees) | | | 0.40 | % | | | 0.41 | % | | | 0.41 | %(B) | | | 0.41 | % | | | 0.46 | % | | | 0.90 | %(B)(E) |
Ratio of Net Investment Income to Average Net Assets | | | 2.31 | % | | | 2.84 | % | | | 3.39 | %(B) | | | 2.49 | % | | | 2.35 | % | | | 1.89 | %(B)(E) |
Portfolio Turnover Rate | | | 2 | % | | | 5 | % | | | 4 | %(C) | | | 4 | % | | | 2 | % | | | 0 | %(C) |
See page 1 & 2 for the Definitions of Abbreviations and Footnotes.
See accompanying Notes to Financial Statements.
124
DFA INVESTMENT DIMENSIONS GROUP INC.
FINANCIAL HIGHLIGHTS
(for a share outstanding throughout each period)
| | | | | | | | | | | | | | | | | | | | | | | | | | | | | | | | | | | | | | | | | | | | | | | | |
| | | International Small Company Portfolio | | | Japanese Small Company Portfolio | |
| | | Year
Ended
Oct. 31,
2010 | | | Year
Ended
Oct. 31,
2009 | | | Period
Dec. 1,
2007 to
Oct. 31,
2008 | | | Year
Ended
Nov. 30,
2007 | | | Year
Ended
Nov. 30,
2006 | | | Year
Ended
Nov. 30,
2005 | | | Year
Ended
Oct. 31,
2010 | | | Year
Ended
Oct. 31,
2009 | | | Period
Dec. 1,
2007 to
Oct. 31,
2008 | | | Year
Ended
Nov. 30,
2007 | | | Year
Ended
Nov. 30,
2006 | | | Year
Ended
Nov. 30,
2005 | |
Net Asset Value, Beginning of Period | | $ | 13.99 | | | $ | 10.07 | | | $ | 20.80 | | | $ | 19.43 | | | $ | 16.19 | | | $ | 14.12 | | | $ | 14.32 | | | $ | 11.97 | | | $ | 16.75 | | | $ | 17.23 | | | $ | 17.97 | | | $ | 13.99 | |
| | | | | | | | | | | | | | | | | | | | | | | | | | | | | | | | | | | | | | | | | | | | | | | | |
Income From Investment Operations | | | | | | | | | | | | | | | | | | | | | | | | | | | | | | | | | | | | | | | | | | | | | | | | |
Net Investment Income (Loss)(A) | | | 0.28 | | | | 0.28 | | | | 0.44 | | | | 0.43 | | | | 0.36 | | | | 0.31 | | | | 0.22 | | | | 0.22 | | | | 0.29 | | | | 0.27 | | | | 0.22 | | | | 0.16 | |
Net Gains (Losses) on Securities (Realized and Unrealized) | | | 2.13 | | | | 3.91 | | | | (9.55 | ) | | | 2.07 | | | | 4.02 | | | | 2.38 | | | | (0.18 | ) | | | 2.39 | | | | (4.78 | ) | | | (0.52 | ) | | | (0.73 | ) | | | 4.00 | |
| | | | | | | | | | | | | | | | | | | | | | | | | | | | | | | | | | | | | | | | | | | | | | | | |
Total From Investment Operations | | | 2.41 | | | | 4.19 | | | | (9.11 | ) | | | 2.50 | | | | 4.38 | | | | 2.69 | | | | 0.04 | | | | 2.61 | | | | (4.49 | ) | | | (0.25 | ) | | | (0.51 | ) | | | 4.16 | |
Less Distributions | | | | | | | | | | | | | | | | | | | | | | | | | | | | | | | | | | | | | | | | | | | | | | | | |
Net Investment Income | | | (0.26 | ) | | | (0.27 | ) | | | (0.45 | ) | | | (0.46 | ) | | | (0.36 | ) | | | (0.29 | ) | | | (0.23 | ) | | | (0.26 | ) | | | (0.29 | ) | | | (0.23 | ) | | | (0.23 | ) | | | (0.18 | ) |
Net Realized Gains | | | — | | | | — | | | | (1.17 | ) | | | (0.67 | ) | | | (0.78 | ) | | | (0.33 | ) | | | — | | | | — | | | | — | | | | — | | | | — | | | | — | |
| | | | | | | | | | | | | | | | | | | | | | | | | | | | | | | | | | | | | | | | | | | | | | | | |
Total Distributions | | | (0.26 | ) | | | (0.27 | ) | | | (1.62 | ) | | | (1.13 | ) | | | (1.14 | ) | | | (0.62 | ) | | | (0.23 | ) | | | (0.26 | ) | | | (0.29 | ) | | | (0.23 | ) | | | (0.23 | ) | | | (0.18 | ) |
Net Asset Value, End of Period | | $ | 16.14 | | | $ | 13.99 | | | $ | 10.07 | | | $ | 20.80 | | | $ | 19.43 | | | $ | 16.19 | | | $ | 14.13 | | | $ | 14.32 | | | $ | 11.97 | | | $ | 16.75 | | | $ | 17.23 | | | $ | 17.97 | |
| | | | | | | | | | | | | | | | | | | | | | | | | | | | | | | | | | | | | | | | | | | | | | | | | |
Total Return | | | 17.61 | % | | | 42.34 | % | | | (47.13 | )%(C) | | | 13.29 | % | | | 28.51 | % | | | 19.74 | % | | | 0.33 | % | | | 22.08 | % | | | (27.16 | )%(C) | | | (1.51 | )% | | | (2.94 | )% | | | 30.13 | % |
Net Assets, End of Period (thousands) | | $ | 5,511,594 | | | $ | 4,269,864 | | | $ | 3,084,373 | | | $ | 5,597,209 | | | $ | 4,546,071 | | | $ | 2,725,231 | | | $ | 114,933 | | | $ | 114,058 | | | $ | 133,373 | | | $ | 199,080 | | | $ | 168,957 | | | $ | 169,995 | |
Ratio of Expenses to Average Net Assets (D) | | | 0.56 | % | | | 0.57 | % | | | 0.55 | %(B) | | | 0.55 | % | | | 0.56 | % | | | 0.64 | % | | | 0.57 | % | | | 0.59 | % | | | 0.58 | %(B) | | | 0.56 | % | | | 0.61 | % | | | 0.68 | % |
Ratio of Expenses to Average Net Assets (Excluding Waivers and Assumption of Expenses and/or Recovery of Previously Waived Fees) (D) | | | 0.56 | % | | | 0.57 | % | | | 0.55 | %(B) | | | 0.55 | % | | | 0.56 | % | | | 0.64 | % | | | 0.57 | % | | | 0.59 | % | | | 0.58 | %(B) | | | 0.56 | % | | | 0.58 | % | | | 0.68 | % |
Ratio of Net Investment Income to Average Net Assets | | | 1.94 | % | | | 2.48 | % | | | 2.90 | %(B) | | | 2.03 | % | | | 2.04 | % | | | 2.05 | % | | | 1.52 | % | | | 1.68 | % | | | 2.18 | %(B) | | | 1.51 | % | | | 1.19 | % | | | 1.03 | % |
See page 1 & 2 for the Definitions of Abbreviations and Footnotes.
See accompanying Notes to Financial Statements.
125
DFA INVESTMENT DIMENSIONS GROUP INC.
FINANCIAL HIGHLIGHTS
(for a share outstanding throughout each period)
| | | | | | | | | | | | | | | | | | | | | | | | | | | | | | | | | | | | | | | | | | | | | | | | |
| | | Asia Pacific Small Company Portfolio | | | United Kingdom Small Company Portfolio | |
| | | Year Ended Oct. 31,
2010 | | | Year Ended Oct. 31,
2009 | | | Period
Dec. 1,
2007 to
Oct. 31,
2008 | | | Year Ended Nov. 30,
2007 | | | Year
Ended
Nov. 30,
2006 | | | Year
Ended
Nov. 30,
2005 | | | Year
Ended
Oct. 31,
2010 | | | Year
Ended
Oct. 31,
2009 | | | Period
Dec. 1,
2007 to
Oct. 31,
2008 | | | Year
Ended
Nov. 30,
2007 | | | Year
Ended
Nov. 30,
2006 | | | Year
Ended
Nov. 30,
2005 | |
Net Asset Value, Beginning of Period | | $ | 20.59 | | | $ | 11.67 | | | $ | 28.73 | | | $ | 20.26 | | | $ | 15.28 | | | $ | 14.54 | | | $ | 19.83 | | | $ | 14.27 | | | $ | 31.29 | | | $ | 32.97 | | | $ | 24.65 | | | $ | 23.47 | |
| | | | | | | | | | | | | | | | | | | | | | | | | | | | | | | | | | | | | | | | | | | | | | | | |
Income From Investment Operations | | | | | | | | | | | | | | | | | | | | | | | | | | | | | | | | | | | | | | | | | | | | | | | | |
Net Investment Income (Loss) | | | 0.69 | (A) | | | 0.50 | (A) | | | 0.83 | (A) | | | 0.79 | (A) | | | 0.64 | (A) | | | 0.70 | | | | 0.50 | (A) | | | 0.55 | (A) | | | 0.77 | (A) | | | 0.78 | (A) | | | 0.61 | (A) | | | 0.64 | (A) |
Net Gains (Losses) on Securities (Realized and Unrealized) | | | 4.99 | | | | 8.95 | | | | (17.04 | ) | | | 8.43 | | | | 4.92 | | | | 0.54 | | | | 4.41 | | | | 5.44 | | | | (15.84 | ) | | | (0.08 | ) | | | 9.61 | | | | 2.15 | |
| | | | | | | | | | | | | | | | | | | | | | | | | | | | | | | | | | | | | | | | | | | | | | | | |
Total From Investment Operations | | | 5.68 | | | | 9.45 | | | | (16.21 | ) | | | 9.22 | | | | 5.56 | | | | 1.24 | | | | 4.91 | | | | 5.99 | | | | (15.07 | ) | | | 0.70 | | | | 10.22 | | | | 2.79 | |
Less Distributions | | | | | | | | | | | | | | | | | | | | | | | | | | | | | | | | | | | | | | | | | | | | | | | | |
Net Investment Income | | | (0.63 | ) | | | (0.53 | ) | | | (0.85 | ) | | | (0.75 | ) | | | (0.58 | ) | | | (0.50 | ) | | | (0.50 | ) | | | (0.43 | ) | | | (0.72 | ) | | | (1.03 | ) | | | (0.68 | ) | | | (0.59 | ) |
Net Realized Gains | | | — | | | | — | | | | — | | | | — | | | | — | | | | — | | | | — | | | | — | | | | (1.22 | ) | | | (1.35 | ) | | | (1.22 | ) | | | (1.02 | ) |
Return of Capital | | | — | | | | — | | | | — | | | | — | | | | — | | | | — | | | | — | | | | — | | | | (0.01 | ) | | | — | | | | — | | | | — | |
| | | | | | | | | | | | | | | | | | | | | | | | | | | | | | | | | | | | | | | | | | | | | | | | |
Total Distributions | | | (0.63 | ) | | | (0.53 | ) | | | (0.85 | ) | | | (0.75 | ) | | | (0.58 | ) | | | (0.50 | ) | | | (0.50 | ) | | | (0.43 | ) | | | (1.95 | ) | | | (2.38 | ) | | | (1.90 | ) | | | (1.61 | ) |
Net Asset Value, End of Period | | $ | 25.64 | | | $ | 20.59 | | | $ | 11.67 | | | $ | 28.73 | | | $ | 20.26 | | | $ | 15.28 | | | $ | 24.24 | | | $ | 19.83 | | | $ | 14.27 | | | $ | 31.29 | | | $ | 32.97 | | | $ | 24.65 | |
| | | | | | | | | | | | | | | | | | | | | | | | | | | | | | | | | | | | | | | | | | | | | | | | | |
Total Return | | | 28.36 | % | | | 84.11 | % | | | (57.94 | )%(C) | | | 46.55 | % | | | 37.52 | % | | | 8.81 | % | | | 25.37 | % | | | 42.81 | % | | | (50.97 | )%(C) | | | 1.94 | % | | | 44.15 | % | | | 12.35 | % |
Net Assets, End of Period (thousands) | | $ | 131,511 | | | $ | 101,853 | | | $ | 64,044 | | | $ | 146,307 | | | $ | 71,537 | | | $ | 38,927 | | | $ | 33,751 | | | $ | 27,863 | | | $ | 25,883 | | | $ | 37,139 | | | $ | 31,808 | | | $ | 20,578 | |
Ratio of Expenses to Average Net Assets(D) | | | 0.63 | % | | | 0.65 | % | | | 0.62 | %(B) | | | 0.62 | % | | | 0.64 | % | | | 0.74 | % | | | 0.60 | % | | | 0.61 | % | | | 0.59 | %(B) | | | 0.59 | % | | | 0.60 | % | | | 0.70 | % |
Ratio of Expenses to Average Net Assets (Excluding Waivers and Assumption of Expenses and/or Recovery of Previously Waived Expenses)(D) | | | 0.61 | % | | | 0.65 | % | | | 0.61 | %(B) | | | 0.59 | % | | | 0.64 | % | | | 0.86 | % | | | 0.64 | % | | | 0.70 | % | | | 0.65 | %(B) | | | 0.62 | % | | | 0.67 | % | | | 0.89 | % |
Ratio of Net Investment Income to Average Net Assets | | | 3.14 | % | | | 3.53 | % | | | 3.85 | %(B) | | | 3.13 | % | | | 3.68 | % | | | 3.89 | % | | | 2.39 | % | | | 3.62 | % | | | 3.41 | %(B) | | | 2.28 | % | | | 2.20 | % | | | 2.70 | % |
See page 1 & 2 for the Definitions of Abbreviations and Footnotes.
See accompanying Notes to Financial Statements.
126
DFA INVESTMENT DIMENSIONS GROUP INC.
FINANCIAL HIGHLIGHTS
(for a share outstanding throughout each period)
| | | | | | | | | | | | | | | | | | | | | | | | | | | | | | | | | | | | | | | | |
| | | Continental Small Company Portfolio | | | DFA International Real Estate Securities Portfolio | |
| | | Year
Ended
Oct. 31,
2010 | | | Year
Ended
Oct. 31,
2009 | | | Period
Dec. 1,
2007 to
Oct. 31,
2008 | | | Year
Ended
Nov. 30,
2007 | | | Year
Ended
Nov. 30,
2006 | | | Year
Ended
Nov. 30,
2005 | | | Year
Ended
Oct. 31,
2010 | | | Year
Ended
Oct. 31,
2009 | | | Period
Dec. 1,
2007 to
Oct. 31,
2008 | | | Period
March 1, 2007(a) to Nov. 30, 2007 | |
Net Asset Value, Beginning of Period | | $ | 15.02 | | | $ | 10.73 | | | $ | 22.95 | | | $ | 20.47 | | | $ | 15.78 | | | $ | 14.12 | | | $ | 5.24 | | | $ | 4.18 | | | $ | 9.35 | | | $ | 10.00 | |
| | | | | | | | | | | | | | | | | | | | | | | | | | | | | | | | | | | | | | | | |
Income From Investment Operations | | | | | | | | | | | | | | | | | | | | | | | | | | | | | | | | | | | | | | | | |
Net Investment Income (Loss) | | | 0.27 | (A) | | | 0.28 | (A) | | | 0.52 | (A) | | | 0.40 | (A) | | | 0.31 | (A) | | | 0.21 | | | | 0.31 | (A) | | | 0.26 | (A) | | | 0.34 | (A) | | | 0.23 | (A) |
Net Gains (Losses) on Securities (Realized and Unrealized) | | | 1.89 | | | | 4.29 | | | | (11.32 | ) | | | 3.00 | | | | 6.28 | | | | 2.28 | | | | 0.58 | | | | 0.91 | | | | (5.08 | ) | | | (0.76 | ) |
| | | | | | | | | | | | | | | | | | | | | | | | | | | | | | | | | | | | | | | | |
Total From Investment Operations | | | 2.16 | | | | 4.57 | | | | (10.80 | ) | | | 3.40 | | | | 6.59 | | | | 2.49 | | | | 0.89 | | | | 1.17 | | | | (4.74 | ) | | | (0.53 | ) |
Less Distributions | | | | | | | | | | | | | | | | | | | | | | | | | | | | | | | | | | | | | | | | |
Net Investment Income | | | (0.25 | ) | | | (0.28 | ) | | | (0.45 | ) | | | (0.38 | ) | | | (0.34 | ) | | | (0.30 | ) | | | (0.55 | ) | | | (0.11 | ) | | | (0.43 | ) | | | (0.12 | ) |
Net Realized Gains | | | — | | | | — | | | | (0.96 | ) | | | (0.54 | ) | | | (1.56 | ) | | | (0.53 | ) | | | — | | | | — | | | | — | | | | — | |
Return of Capital | | | — | | | | — | | | | (0.01 | ) | | | — | | | | — | | | | — | | | | — | | | | — | | | | — | | | | — | |
| | | | | | | | | | | | | | | | | | | | | | | | | | | | | | | | | | | | | | | | |
Total Distributions | | | (0.25 | ) | | | (0.28 | ) | | | (1.42 | ) | | | (0.92 | ) | | | (1.90 | ) | | | (0.83 | ) | | | (0.55 | ) | | | (0.11 | ) | | | (0.43 | ) | | | (0.12 | ) |
Net Asset Value, End of Period | | $ | 16.93 | | | $ | 15.02 | | | $ | 10.73 | | | $ | 22.95 | | | $ | 20.47 | | | $ | 15.78 | | | $ | 5.58 | | | $ | 5.24 | | | $ | 4.18 | | | $ | 9.35 | |
| | | | | | | | | | | | | | | | | | | | | | | | | | | | | | | | | | | | | | | | | |
Total Return | | | 14.85 | % | | | 43.12 | % | | | (49.89 | )%(C) | | | 16.99 | % | | | 46.33 | % | | | 18.42 | % | | | 18.96 | % | | | 29.25 | % | | | (52.85 | )%(C) | | | (5.38 | )%(C) |
Net Assets, End of Period (thousands) | | $ | 128,106 | | | $ | 110,926 | | | $ | 93,988 | | | $ | 170,909 | | | $ | 90,261 | | | $ | 52,061 | | | $ | 958,554 | | | $ | 742,329 | | | $ | 394,480 | | | $ | 336,840 | |
Ratio of Expenses to Average Net Assets | | | 0.59 | %(D) | | | 0.62 | %(D) | | | 0.59 | %(B)(D) | | | 0.61 | %(D) | | | 0.62 | %(D) | | | 0.71 | %(D) | | | 0.41 | % | | | 0.43 | % | | | 0.44 | %(B) | | | 0.48 | %(B)(E) |
Ratio of Expenses to Average Net Assets (Excluding Waivers and Assumption of Expenses and/or Recovery of Previously Waived Fees) | | | 0.59 | %(D) | | | 0.61 | %(D) | | | 0.59 | %(B)(D) | | | 0.57 | %(D) | | | 0.61 | %(D) | | | 0.78 | %(D) | | | 0.41 | % | | | 0.43 | % | | | 0.44 | %(B) | | | 0.48 | %(B)(E) |
Ratio of Net Investment Income (Loss) to Average Net Assets | | | 1.78 | %(D) | | | 2.39 | % | | | 3.04 | %(B) | | | 1.70 | % | | | 1.78 | % | | | 1.77 | % | | | 6.42 | % | | | 6.40 | % | | | 5.20 | %(B) | | | 3.50 | %(B)(E) |
Portfolio Turnover Rate | | | N/A | | | | N/A | | | | N/A | | | | N/A | | | | N/A | | | | N/A | | | | 6 | % | | | 5 | % | | | 1 | %(C) | | | 2 | %(C) |
See page 1 & 2 for the Definitions of Abbreviations and Footnotes.
See accompanying Notes to Financial Statements.
127
DFA INVESTMENT DIMENSIONS GROUP INC.
FINANCIAL HIGHLIGHTS
(for a share outstanding throughout each period)
| | | | | | | | | | | | | | | | | | | | | | | | | | | | | | | | | | | | |
| | | DFA Global Real
Estate Securities
Portfolio | | | DFA International Small Cap Value Portfolio | |
| | | Year
Ended
Oct. 31,
2010 | | | Year
Ended
Oct. 31,
2009 | | | Period
June 4,
2008(a) to
Oct. 31,
2008 | | | Year Ended Oct. 31, 2010 | | | Year Ended Oct. 31, 2009 | | | Period Dec. 1, 2007 to Oct. 31, 2008 | | | Year Ended Nov. 30,
2007 | | | Year Ended Nov. 30, 2006 | | | Year Ended Nov. 30, 2005 | |
Net Asset Value, Beginning of Period | | $ | 6.75 | | | $ | 6.04 | | | $ | 10.00 | | | $ | 14.92 | | | $ | 10.82 | | | $ | 22.05 | | | $ | 21.71 | | | $ | 17.57 | | | $ | 15.16 | |
| | | | | | | | | | | | | | | | | | | | | | | | | | | | | | | | | | | | |
Income From Investment Operations | | | | | | | | | | | | | | | | | | | | | | | | | | | | | | | | | | | | |
Net Investment Income (Loss)(A) | | | 0.40 | | | | 0.19 | | | | — | | | | 0.24 | | | | 0.26 | | | | 0.52 | | | | 0.46 | | | | 0.36 | | | | 0.40 | |
Net Gains (Losses) on Securities (Realized and Unrealized) | | | 1.60 | | | | 0.62 | | | | (3.96 | ) | | | 1.22 | | | | 4.14 | | | | (9.60 | ) | | | 1.66 | | | | 4.95 | | | | 2.77 | |
| | | | | | | | | | | | | | | | | | | | | | | | | | | | | | | | | | | | |
Total From Investment Operations | | | 2.00 | | | | 0.81 | | | | (3.96 | ) | | | 1.46 | | | | 4.40 | | | | (9.08 | ) | | | 2.12 | | | | 5.31 | | | | 3.17 | |
Less Distributions | | | | | | | | | | | | | | | | | | | | | | | | | | | | | | | | | | | | |
Net Investment Income | | | (0.47 | ) | | | (0.10 | ) | | | — | | | | (0.22 | ) | | | (0.24 | ) | | | (0.58 | ) | | | (0.53 | ) | | | (0.38 | ) | | | (0.36 | ) |
Net Realized Gains | | | — | | | | — | | | | — | | | | — | | | | (0.06 | ) | | | (1.57 | ) | | | (1.25 | ) | | | (0.79 | ) | | | (0.40 | ) |
| | | | | | | | | | | | | | | | | | | | | | | | | | | | | | | | | | | | |
Total Distributions | | | (0.47 | ) | | | (0.10 | ) | | | — | | | | (0.22 | ) | | | (0.30 | ) | | | (2.15 | ) | | | (1.78 | ) | | | (1.17 | ) | | | (0.76 | ) |
Net Asset Value, End of Period | | $ | 8.28 | | | $ | 6.75 | | | $ | 6.04 | | | $ | 16.16 | | | $ | 14.92 | | | $ | 10.82 | | | $ | 22.05 | | | $ | 21.71 | | | $ | 17.57 | |
| | | | | | | | | | | | | | | | | | | | | | | | | | | | | | | | | | | | | |
Total Return | | | 31.38 | % | | | 13.81 | % | | | (39.60 | )%(C) | | | 10.01 | % | | | 41.42 | % | | | (45.17 | )%(C) | | | 10.25 | % | | | 31.73 | % | | | 21.75 | % |
Net Assets, End of Period (thousands) | | $ | 695,461 | | | $ | 432,502 | | | $ | 90,672 | | | $ | 7,655,318 | | | $ | 6,859,957 | | | $ | 4,799,748 | | | $ | 8,180,859 | | | $ | 6,733,067 | | | $ | 4,128,428 | |
Ratio of Expenses to Average Net Assets | | | 0.41 | %(D) | | | 0.47 | %(D) | | | 0.54 | %(B)(D)(E) | | | 0.70 | % | | | 0.71 | % | | | 0.69 | %(B) | | | 0.69 | % | | | 0.70 | % | | | 0.75 | % |
Ratio of Expenses to Average Net Assets (Excluding Waivers and Assumption of Expenses and/or Recovery of Previously Waived Fees) | | | 0.73 | %(D) | | | 0.79 | %(D) | | | 0.86 | %(B)(D)(E) | | | 0.70 | % | | | 0.71 | % | | | 0.69 | %(B) | | | 0.69 | % | | | 0.70 | % | | | 0.75 | % |
Ratio of Net Investment Income to Average Net Assets | | | 5.59 | % | | | 3.40 | % | | | (0.04 | )%(B)(E) | | | 1.57 | % | | | 2.19 | % | | | 3.22 | %(B) | | | 2.03 | % | | | 1.85 | % | | | 2.44 | % |
Portfolio Turnover Rate | | | N/A | | | | N/A | | | | N/A | | | | 18 | % | | | 22 | % | | | 16 | %(C) | | | 18 | % | | | 14 | % | | | 13 | % |
See page 1 & 2 for the Definitions of Abbreviations and Footnotes.
See accompanying Notes to Financial Statements.
128
DFA INVESTMENT DIMENSIONS GROUP INC.
FINANCIAL HIGHLIGHTS
(for a share outstanding throughout each period)
| | | | | | | | | | | | | | | | | | | | | | | | | | | | | | | | | | | | |
| | | International
Vector Equity
Portfolio | | | Emerging Markets Portfolio | |
| | | Year
Ended
Oct. 31,
2010 | | | Year
Ended
Oct. 31,
2009 | | | Period
August 14,
2008(a) to
Oct. 31,
2008 | | | Year
Ended
Oct. 31,
2010 | | | Year
Ended Oct. 31,
2009 | | | Period
Dec. 1,
2007 to
Oct. 31,
2008 | | | Year
Ended
Nov. 30,
2007 | | | Year
Ended
Nov. 30,
2006 | | | Year
Ended
Nov. 30,
2005 | |
Net Asset Value, Beginning of Period | | $ | 9.22 | | | $ | 6.74 | | | $ | 10.00 | | | $ | 25.23 | | | $ | 17.05 | | | $ | 35.23 | | | $ | 25.40 | | | $ | 19.89 | | | $ | 15.61 | |
| | | | | | | | | | | | | | | | | | | | | | | | | | | | | | | | | | | | |
Income From Investment Operations | | | | | | | | | | | | | | | | | | | | | | | | | | | | | | | | | | | | |
Net Investment Income (Loss) (A) | | | 0.18 | | | | 0.17 | | | | 0.06 | | | | 0.48 | | | | 0.42 | | | | 0.70 | | | | 0.64 | | | | 0.48 | | | | 0.58 | |
Net Gains (Losses) on Securities (Realized and Unrealized) | | | 1.05 | | | | 2.46 | | | | (3.32 | ) | | | 6.07 | | | | 8.42 | | | | (16.85 | ) | | | 9.88 | | | | 5.61 | | | | 4.13 | |
| | | | | | | | | | | | | | | | | | | | | | | | | | | | | | | | | | | | |
Total From Investment Operations | | | 1.23 | | | | 2.63 | | | | (3.26 | ) | | | 6.55 | | | | 8.84 | | | | (16.15 | ) | | | 10.52 | | | | 6.09 | | | | 4.71 | |
Less Distributions | | | | | | | | | | | | | | | | | | | | | | | | | | | | | | | | | | | | |
Net Investment Income | | | (0.17 | ) | | | (0.15 | ) | | | — | | | | (0.46 | ) | | | (0.41 | ) | | | (0.69 | ) | | | (0.53 | ) | | | (0.58 | ) | | | (0.43 | ) |
Net Realized Gains | | | — | | | | — | | | | — | | | | (0.42 | ) | | | (0.25 | ) | | | (1.34 | ) | | | (0.16 | ) | | | — | | | | — | |
| | | | | | | | | | | | | | | | | | | | | | | | | | | | | | | | | | | | |
Total Distributions | | | (0.17 | ) | | | (0.15 | ) | | | — | | | | (0.88 | ) | | | (0.66 | ) | | | (2.03 | ) | | | (0.69 | ) | | | (0.58 | ) | | | (0.43 | ) |
Net Asset Value, End of Period | | $ | 10.28 | | | $ | 9.22 | | | $ | 6.74 | | | $ | 30.90 | | | $ | 25.23 | | | $ | 17.05 | | | $ | 35.23 | | | $ | 25.40 | | | $ | 19.89 | |
| | | | | | | | | | | | | | | | | | | | | | | | | | | | | | | | | | | | | |
Total Return | | | 13.62 | % | | | 39.52 | % | | | (32.60 | )%(C) | | | 26.53 | % | | | 53.39 | % | | | (48.37 | )%(C) | | | 42.08 | % | | | 31.31 | % | | | 30.65 | % |
Net Assets, End of Period (thousands) | | $ | 363,123 | | | $ | 262,544 | | | $ | 66,774 | | | $ | 2,372,498 | | | $ | 1,966,288 | | | $ | 1,508,260 | | | $ | 3,388,442 | | | $ | 2,344,990 | | | $ | 1,805,186 | |
Ratio of Expenses to Average Net Assets | | | 0.54 | % | | | 0.60 | % | | | 0.60 | %(B)(E) | | | 0.60 | %(D) | | | 0.62 | %(D) | | | 0.60 | %(B)(D) | | | 0.60 | %(D) | | | 0.61 | %(D) | | | 0.69 | %(D) |
Ratio of Expenses to Average Net Assets (Excluding Waivers and Assumption of Expenses and/or Recovery of Previously Waived Fees) | | | 0.53 | % | | | 0.59 | % | | | 1.15 | %(B)(E) | | | 0.60 | %(D) | | | 0.62 | %(D) | | | 0.60 | %(B)(D) | | | 0.60 | %(D) | | | 0.61 | %(D) | | | 0.69 | %(D) |
Ratio of Net Investment Income to Average Net Assets | | | 1.91 | % | | | 2.31 | % | | | 3.01 | %(B)(E) | | | 1.76 | % | | | 2.15 | % | | | 2.59 | %(B) | | | 2.12 | % | | | 2.13 | % | | | 3.28 | % |
Portfolio Turnover Rate | | | 5 | % | | | 8 | % | | | 0 | %(C) | | | N/A | | | | N/A | | | | N/A | | | | N/A | | | | N/A | | | | N/A | |
See page 1 & 2 for the Definitions of Abbreviations and Footnotes.
See accompanying Notes to Financial Statements.
129
DFA INVESTMENT DIMENSIONS GROUP INC.
FINANCIAL HIGHLIGHTS
(for a share outstanding throughout each period)
| | | | | | | | | | | | | | | | | | | | | | | | |
| | | Emerging Markets Small Cap Portfolio | |
| | | Year
Ended Oct. 31,
2010 | | | Year
Ended Oct. 31,
2009 | | | Period
Dec. 1,
2007 to
Oct. 31,
2008 | | | Year
Ended
Nov. 30,
2007 | | | Year
Ended
Nov. 30,
2006 | | | Year
Ended
Nov. 30,
2005 | |
Net Asset Value, Beginning of Period | | $ | 17.45 | | | $ | 9.33 | | | $ | 23.74 | | | $ | 17.96 | | | $ | 13.37 | | | $ | 11.44 | |
| | | | | | | | | | | | | | | | | | | | | | | | |
Income From Investment Operations | | | | | | | | | | | | | | | | | | | | | | | | |
Net Investment Income (Loss)(A) | | | 0.34 | | | | 0.26 | | | | 0.44 | | | | 0.31 | | | | 0.30 | | | | 0.27 | |
Net Gains (Losses) on Securities (Realized and Unrealized) | | | 6.79 | | | | 8.14 | | | | (12.95 | ) | | | 6.86 | | | | 4.86 | | | | 2.37 | |
| | | | | | | | | | | | | | | | | | | | | | | | |
Total From Investment Operations | | | 7.13 | | | | 8.40 | | | | (12.51 | ) | | | 7.17 | | | | 5.16 | | | | 2.64 | |
Less Distributions | | | | | | | | | | | | | | | | | | | | | | | | |
Net Investment Income | | | (0.32 | ) | | | (0.28 | ) | | | (0.41 | ) | | | (0.26 | ) | | | (0.26 | ) | | | (0.22 | ) |
Net Realized Gains | | | — | | | | — | | | | (1.49 | ) | | | (1.13 | ) | | | (0.31 | ) | | | (0.49 | ) |
| | | | | | | | | | | | | | | | | | | | | | | | |
Total Distributions | | | (0.32 | ) | | | (0.28 | ) | | | (1.90 | ) | | | (1.39 | ) | | | (0.57 | ) | | | (0.71 | ) |
Net Asset Value, End of Period | | $ | 24.26 | | | $ | 17.45 | | | $ | 9.33 | | | $ | 23.74 | | | $ | 17.96 | | | $ | 13.37 | |
| | | | | | | | | | | | | | | | | | | | | | | | | |
Total Return | | | 41.33 | % | | | 91.35 | % | | | (57.00 | )%(C) | | | 42.58 | % | | | 39.95 | % | | | 24.27 | % |
Net Assets, End of Period (thousands) | | $ | 1,833,038 | | | $ | 1,133,958 | | | $ | 547,329 | | | $ | 1,458,152 | | | $ | 838,948 | | | $ | 482,378 | |
Ratio of Expenses to Average Net Assets(D) | | | 0.78 | % | | | 0.80 | % | | | 0.77 | %(B) | | | 0.78 | % | | | 0.81 | % | | | 0.97 | % |
Ratio of Net Investment Income to Average Net Assets | | | 1.70 | % | | | 2.05 | % | | | 2.61 | %(B) | | | 1.48 | % | | | 1.92 | % | | | 2.21 | % |
See page 1 & 2 for the Definitions of Abbreviations and Footnotes.
See accompanying Notes to Financial Statements.
130
DFA INVESTMENT DIMENSIONS GROUP INC.
FINANCIAL HIGHLIGHTS
(for a share outstanding throughout each period)
| | | | | | | | | | | | | | | | | | | | | | | | | | | | | | | | | | | | |
| | | Emerging Markets Value Portfolio-Class R2 Shares | | | Emerging Markets Value Portfolio-Institutional Class Shares | |
| | | Year
Ended
Oct. 31,
2010 | | | Year Ended
Oct. 31,
2009 | | | Period
Jan. 29, 2008(a) to Oct. 31, 2008 | | | Year Ended Oct. 31, 2010 | | | Year Ended Oct. 31,
2009 | | | Period Dec. 1, 2007
to Oct. 31, 2008 | | | Year Ended Nov. 30,
2007 | | | Year Ended Nov. 30,
2006 | | | Year Ended Nov. 30,
2005 | |
Net Asset Value, Beginning of Period | | $ | 2.50 | | | $ | 4.56 | | | $ | 10.00 | | | $ | 28.90 | | | $ | 19.36 | | | $ | 45.85 | | | $ | 31.26 | | | $ | 22.86 | | | $ | 17.93 | |
| | | | | | | | | | | | | | | | | | | | | | | | | | | | | | | | | | | | |
Income from Investment Operations | | | | | | | | | | | | | | | | | | | | | | | | | | | | | | | | | | | | |
Net Investment Income (Loss) | | | 0.03 | (A) | | | 0.03 | (A) | | | 0.21 | (A) | | | 0.45 | (A) | | | 0.38 | (A) | | | 0.98 | (A) | | | 0.78 | (A) | | | 0.60 | (A) | | | 0.50 | |
Net Gains (Losses) on Securities (Realized and Unrealized) | | | 0.49 | | | | 1.14 | | | | (4.93 | ) | | | 8.01 | | | | 12.41 | | | | (25.48 | ) | | | 14.82 | | | | 8.65 | | | | 4.96 | |
| | | | | | | | | | | | | | | | | | | | | | | | | | | | | | | | | | | | |
Total from Investment Operations | | | 0.52 | | | | 1.17 | | | | (4.72 | ) | | | 8.46 | | | | 12.79 | | | | (24.50 | ) | | | 15.60 | | | | 9.25 | | | | 5.46 | |
Less Distributions | | | | | | | | | | | | | | | | | | | | | | | | | | | | | | | | | | | | |
Net Investment Income | | | (0.38 | ) | | | (0.32 | ) | | | (0.72 | ) | | | (0.39 | ) | | | (0.34 | ) | | | (1.00 | ) | | | (0.63 | ) | | | (0.60 | ) | | | (0.44 | ) |
Net Realized Gains | | | (0.70 | ) | | | (2.91 | ) | | | — | | | | (0.70 | ) | | | (2.91 | ) | | | (0.99 | ) | | | (0.38 | ) | | | (0.25 | ) | | | (0.09 | ) |
| | | | | | | | | | | | | | | | | | | | | | | | | | | | | | | | | | | | |
Total Distributions | | | (1.08 | ) | | | (3.23 | ) | | | (0.72 | ) | | | (1.09 | ) | | | (3.25 | ) | | | (1.99 | ) | | | (1.01 | ) | | | (0.85 | ) | | | (0.53 | ) |
Net Asset Value, End of Period | | $ | 1.94 | | | $ | 2.50 | | | $ | 4.56 | | | $ | 36.27 | | | $ | 28.90 | | | $ | 19.36 | | | $ | 45.85 | | | $ | 31.26 | | | $ | 22.86 | |
| | | | | | | | | | | | | | | | | | | | | | | | | | | | | | | | | | | | | |
Total Return | | | 29.71 | % | | | 78.29 | % | | | (50.51 | )%(C) | | | 30.04 | % | | | 78.59 | % | | | (55.65 | )%(C) | | | 50.98 | % | | | 41.55 | % | | | 31.06 | % |
Net Assets, End of Period (thousands) | | $ | 39,668 | | | $ | 5,082 | | | $ | 1,799 | | | $ | 11,542,870 | | | $ | 7,401,266 | | | $ | 3,735,580 | | | $ | 7,485,802 | | | $ | 4,283,696 | | | $ | 2,077,480 | |
Ratio of Expenses to Average Net Assets (D) | | | 0.86 | % | | | 0.90 | % | | | 0.92 | %(B)(E) | | | 0.60 | % | | | 0.62 | % | | | 0.60 | %(B) | | | 0.60 | % | | | 0.63 | % | | | 0.70 | % |
Ratio of Net Investment Income to Average Net Assets | | | 1.39 | % | | | 1.39 | % | | | 3.35 | %(B)(E) | | | 1.40 | % | | | 1.76 | % | | | 2.82 | %(B) | | | 2.00 | % | | | 2.22 | % | | | 2.45 | % |
See page 1 & 2 for the Definitions of Abbreviations and Footnotes.
See accompanying Notes to Financial Statements.
131
DFA INVESTMENT DIMENSIONS GROUP INC.
FINANCIAL HIGHLIGHTS
(for a share outstanding throughout each period)
| | | | | | | | | | | | | | | | | | | | | | | | |
| | | Emerging Markets Core Equity Portfolio | |
| | | Year Ended Oct. 31, 2010 | | | Year Ended Oct. 31, 2009 | | | Period Dec. 1, 2007 to Oct. 31, 2008 | | | Year Ended Nov. 30,
2007 | | | Year Ended Nov. 30,
2006 | | | Period
April 5,
2005(a) to Nov. 30,
2005 | |
Net Asset Value, Beginning of Period | | $ | 16.49 | | | $ | 9.88 | | | $ | 21.20 | | | $ | 15.13 | | | $ | 11.54 | | | $ | 10.00 | |
| | | | | | | | | | | | | | | | | | | | | | | | |
Income From Investment Operations | | | | | | | | | | | | | | | | | | | | | | | | |
Net Investment Income (Loss) | | | 0.30 | (A) | | | 0.25 | (A) | | | 0.43 | (A) | | | 0.35 | (A) | | | 0.27 | (A) | | | 0.10 | |
Net Gains (Losses) on Securities (Realized and Unrealized) | | | 4.81 | | | | 6.56 | | | | (11.27 | ) | | | 6.10 | | | | 3.54 | | | | 1.51 | |
| | | | | | | | | | | | | | | | | | | | | | | | |
Total From Investment Operations | | | 5.11 | | | | 6.81 | | | | (10.84 | ) | | | 6.45 | | | | 3.81 | | | | 1.61 | |
Less Distributions | | | | | | | | | | | | | | | | | | | | | | | | |
Net Investment Income | | | (0.29 | ) | | | (0.20 | ) | | | (0.40 | ) | | | (0.32 | ) | | | (0.22 | ) | | | (0.07 | ) |
Net Realized Gains | | | — | | | | — | | | | (0.08 | ) | | | (0.06 | ) | | | — | | | | — | |
| | | | | | | | | | | | | | | | | | | | | | | | |
Total Distributions | | | (0.29 | ) | | | (0.20 | ) | | | (0.48 | ) | | | (0.38 | ) | | | (0.22 | ) | | | (0.07 | ) |
Net Asset Value, End of Period | | $ | 21.31 | | | $ | 16.49 | | | $ | 9.88 | | | $ | 21.20 | | | $ | 15.13 | | | $ | 11.54 | |
| | | | | | | | | | | | | | | | | | | | | | | | | |
Total Return | | | 31.30 | % | | | 69.47 | % | | | (51.93 | )%(C) | | | 43.20 | % | | | 33.39 | % | | | 16.12 | %(C) |
Net Assets, End of Period (thousands) | | $ | 4,179,882 | | | $ | 2,455,035 | | | $ | 1,155,526 | | | $ | 1,829,466 | | | $ | 822,136 | | | $ | 218,563 | |
Ratio of Expenses to Average Net Assets | | | 0.65 | % | | | 0.67 | % | | | 0.65 | %(B) | | | 0.65 | % | | | 0.74 | % | | | 1.00 | %(B)(E) |
Ratio of Expenses to Average Net Assets (Excluding Waivers and Assumption of Expenses and/or Recovery of Previously Waived Fees) | | | 0.65 | % | | | 0.67 | % | | | 0.65 | %(B) | | | 0.65 | % | | | 0.72 | % | | | 1.09 | %(B)(E) |
Ratio of Net Investment Income to Average Net Assets | | | 1.63 | % | | | 2.03 | % | | | 2.62 | %(B) | | | 1.87 | % | | | 2.02 | % | | | 1.79 | %(B)(E) |
Portfolio Turnover Rate | | | 4 | % | | | 6 | % | | | 3 | %(C) | | | 2 | % | | | 6 | % | | | 2 | %(C) |
See page 1 & 2 for the Definitions of Abbreviations and Footnotes.
See accompanying Notes to Financial Statements.
132
DFA INVESTMENT DIMENSIONS GROUP INC.
NOTES TO FINANCIAL STATEMENTS
A. Organization:
DFA Investment Dimensions Group Inc. (the “Fund”) is an open-end management investment company registered under the Investment Company Act of 1940, whose shares are generally offered to institutional investors, retirement plans and clients of registered investment advisors.The Fund consists of fifty-eight operational portfolios, of which twenty-five (the “Portfolios”) are included in this report and the remaining thirty-three are presented in separate reports.
Of the Portfolios, eight invest in one or more series of The DFA Investment Trust Company, one invests in the Dimensional Emerging Markets Value Fund, and the DFA Global Real Estate Securities Portfolio invests in two portfolios of the DFA Investment Dimensions Group Inc.
| | | | | | |
Feeder Funds | | Master Funds | | Percentage
Ownership
at 10/31/10 | |
U.S. Large Cap Value Portfolio | | The U.S. Large Cap Value Series | | | 79 | % |
Japanese Small Company Portfolio | | The Japanese Small Company Series | | | 9 | % |
Asia Pacific Small Company Portfolio | | The Asia Pacific Small Company Series | | | 14 | % |
United Kingdom Small Company Portfolio | | The United Kingdom Small Company Series | | | 3 | % |
Continental Small Company Portfolio | | The Continental Small Company Series | | | 6 | % |
Emerging Markets Portfolio | | The Emerging Markets Series | | | 94 | % |
Emerging Markets Small Cap Portfolio | | The Emerging Markets Small Cap Series | | | 97 | % |
Emerging Markets Value Portfolio | | Dimensional Emerging Markets Value Fund | | | 97 | % |
| | |
Fund of Funds | | | | | |
International Small Company Portfolio | | The Japanese Small Company Series | | | 91 | % |
| | The Asia Pacific Small Company Series | | | 86 | % |
| | The United Kingdom Small Company Series | | | 97 | % |
| | The Continental Small Company Series | | | 94 | % |
| | The Canadian Small Company Series | | | 100 | % |
DFA Global Real Estate Securities Portfolio | | DFA Real Estate Securities Portfolio | | | 14 | % |
| | DFA International Real Estate Securities Portfolio | | | 32 | % |
Each feeder fund and fund of funds (collectively, “Feeder Funds) invests primarily in a corresponding master fund(s) (“Master Fund”) as indicated. International Small Company Portfolio and DFA Global Real Estate Securities Portfolio also invest in short-term temporary cash investments.
The financial statements of the Master Funds are included elsewhere in this report and should be read in conjunction with the financial statements of the Feeder Funds.
Prior to March 30, 2007, U.S.Targeted Value Portfolio invested substantially all of its assets in shares of The U.S. Targeted Value Series. At the close of business on March 29, 2007, U.S. Targeted Value Portfolio received its pro-rata share of cash and securities from The U.S. Targeted Value Series in a complete liquidation of its interest in the Series. Effective March 30, 2007, U.S. Targeted Value Portfolio invests directly in securities rather than through the Series and maintains the same investment objective.
133
On January 29, 2008, Class R2 shares of Emerging Markets Value Portfolio commenced operations. On January 31, 2008, Class R1 Shares and on June 30, 2008, Class R2 Shares of U.S. Targeted Value Portfolio commenced operations. The Class R1 Shares and Class R2 Shares of each Portfolio of the Fund (except U.S. Small Cap Value Portfolio, U.S. Micro Cap Portfolio, Japanese Small Company Portfolio, Asia Pacific Small Company Portfolio, United Kingdom Small Company Portfolio, Continental Small Company Portfolio, DFA Global Real Estate Securities Portfolio, DFA International Small Cap Value Portfolio, International Vector Equity Portfolio and Emerging Markets Small Cap Portfolio), contained in this report, had not commenced operations as of October 31, 2010. Class R1 and Class R2 Shares of each Portfolio have 100,000,000 authorized shares.
Effective December 31, 2008, The U.S. Large Cap Value Series, a master fund in a RIC/RIC master-feeder structure, elected with the consent of its respective Holder(s) to change its U.S. federal income tax classification from that of an association taxable as a corporation to a partnership pursuant to Treasury Regulation §301.7701-3. The change in capital structure and retroactive reclassification of the statement of changes in net assets and financial highlights for the respective funds is a result of the treatment of a partnership for book purposes. The Series/Portfolio will maintain its books and records and present its financial statements in accordance with generally accepted accounting principles for investment partnerships.
Effective February 28, 2009, Enhanced U.S. Large Company Portfolio, U.S. Small Cap Value Portfolio, U.S. Small Cap Portfolio and U.S. Micro Cap Portfolio invest directly in securities rather than through a Master Fund. See Federal Income Taxes note for more information regarding these transactions.
Effective November 1, 2009, Dimensional Emerging Markets Value Fund (“DEM II”), a master fund in a master-feeder structure, elected with the consent of its Holder(s) to change its U.S. federal income tax classification from that of an association taxable as a corporation to a partnership pursuant to Treasury Regulation §301.7701-3. The change in capital structure and retroactive reclassification of the statement of changes in net assets and financial highlights for DEM II is a result of the treatment of a partnership for book purposes. DEM II and the Portfolio will maintain their books and records and present their financial statements in accordance with generally accepted accounting principles for investment partnerships.
At a regular meeting of the Board of Directors/Trustees (the “Board”) on September 16, 2008, the Board voted to change the fiscal and tax year ends of the Portfolios from November 30 to October 31.
B. Significant Accounting Policies:
The following significant accounting policies are in conformity with accounting principles generally accepted in the United States of America. Such policies are consistently followed by the Fund in preparation of its financial statements. The preparation of financial statements in accordance with accounting principles generally accepted in the United States of America requires management to make estimates and assumptions that affect the reported amounts of assets and liabilities and disclosure of contingent assets and liabilities at the date of the financial statements and the reported amounts of increases and decreases in net assets from operations during the reporting period. Actual results could differ from those estimates and those differences could be material.
1. Security Valuation: The Portfolios utilize a fair value hierarchy which prioritizes the inputs to valuation techniques used to measure fair value into three broad levels described below:
— Level 1 – quoted prices in active markets for identical securities
— Level 2 – other significant observable inputs (including quoted prices for similar securities, interest rates, prepayment speeds, credit risk, etc.)
— Level 3 – significant unobservable inputs (including the Portfolios’ own assumptions in determining the fair value of investments)
Securities held by Enhanced U.S. Large Company Portfolio, U.S. Targeted Value Portfolio, U.S. Small Cap Value Portfolio, U.S. Core Equity 1 Portfolio, U.S. Core Equity 2 Portfolio, U.S. Vector Equity Portfolio, U.S. Small Cap Portfolio, U.S. Micro Cap Portfolio and DFA Real Estate Securities Portfolio (the “Domestic Equity Portfolios”) and Large Cap International Portfolio, International Core Equity Portfolio, DFA International Real Estate Securities
134
Portfolio, DFA International Small Cap Value Portfolio, International Vector Equity Portfolio and Emerging Markets Core Equity Portfolio (the “International Equity Portfolios”), including over-the-counter securities, are valued at the last quoted sale price of the day. Securities held by the Domestic Equity Portfolios and the International Equity Portfolios that are listed on Nasdaq are valued at the Nasdaq Official Closing Price (“NOCP”). If there is no last reported sale price or NOCP for the day, the Domestic Equity Portfolios and International Equity Portfolios value the securities at the mean of the most recent quoted bid and asked prices. Price information on listed securities is taken from the exchange where the security is primarily traded. Generally, securities issued by open-end investment companies are valued using their respective net asset values or public offering prices, as appropriate, for purchase orders placed at the close of the New York Stock Exchange (NYSE). These securities are generally categorized as Level 1 in the hierarchy.
Securities for which no market quotations are readily available (including restricted securities), or for which market quotations have become unreliable, are valued in good faith at fair value in accordance with procedures adopted by the Board of Directors/Trustees. These securities are generally categorized as Level 2 in the hierarchy. Fair value pricing may also be used if events that have a significant effect on the value of an investment (as determined in the discretion of the Investment Committee of the Advisor) occur before the net asset value is calculated. When fair value pricing is used, the prices of securities used by the Domestic Equity Portfolios and International Equity Portfolios may differ from the quoted or published prices for the same securities on their primary markets or exchanges.
The International Equity Portfolios will also apply a fair value price in the circumstances described below. Generally, trading in foreign securities markets is completed each day at various times prior to the close of the NYSE. For example, trading in the Japanese securities markets is completed each day at the close of the Tokyo Stock Exchange (normally, 11:00 p.m. PT), which is fourteen hours prior to the close of the NYSE (normally, 1:00 p.m. PT) and the time that the net asset values of the International Equity Portfolios are computed. Due to the time differences between the closings of the relevant foreign securities exchanges and the time the International Equity Portfolios price their shares at the close of the NYSE, the International Equity Portfolios will fair value their foreign investments when it is determined that the market quotations for the foreign investments are either unreliable or not readily available. The fair value prices will attempt to reflect the impact of the U.S. financial markets’ perceptions and trading activities on the International Equity Portfolios’ foreign investments since the last closing prices of the foreign investments were calculated on their primary foreign securities markets or exchanges. For these purposes, the Board of Directors/Trustees of the Fund have determined that movements in relevant indices or other appropriate market indicators, after the close of the Tokyo Stock Exchange or the London Stock Exchange, demonstrate that market quotations may be unreliable. Fair valuation of portfolio securities may occur on a daily basis. The fair value pricing by the International Equity Portfolios utilizes data furnished by an independent pricing service (and that data draws upon, among other information, the market values of foreign investments). When an International Equity Portfolio uses fair value pricing, the values assigned to the International Equity Portfolio’s foreign investments may not be the quoted or published prices of the investments on their primary markets or exchanges. Certain foreign equity securities that are fair value adjusted through an independent pricing service which considers statistically relevant trading patterns may periodically move from input valuation Level 2 to input valuation Level 1 when not meeting the fair value adjustment trigger requirements.
Debt Securities held by Enhanced U.S. Large Company Portfolio, (the “Fixed Income Portfolio”), are valued on the basis of prices provided by one or more pricing services or other reasonably reliable sources including broker/dealers that typically handle the purchase and sale of such securities. Securities which are traded over-the-counter and on a stock exchange generally will be valued according to the broadest and most representative market, and it is expected that for bonds and other fixed income securities, this ordinarily will be the over-the-counter market. Securities for which quotations are not readily available (including restricted securities), or for which market quotations have become unreliable, are valued in good faith at fair value in accordance with procedures adopted by the Board of Directors/Trustees. These valuations are classified as Level 2 in the hierarchy.
Listed derivatives, such as futures, that are actively traded are valued based on quoted prices from the exchange and are categorized as Level 1 in the hierarchy. Over the counter derivative contracts, which include forward currency contracts, do not require material subjectivity as pricing inputs are observed from actively quoted markets and are categorized as Level 2 in the hierarchy.
135
Master Fund shares held by International Small Company Portfolio and DFA Global Real Estate Securities Portfolio are valued at their respective daily net asset value. The Feeder Funds’ investments reflect proportionate interest in the net assets of their corresponding Master Fund. These valuations are classified as Level 1 in the hierarchy.
A summary of inputs used to value the Portfolios’ investments by each major security type, industry and/or country is disclosed at the end of the Summary Schedule of Portfolio Holdings/Schedule of Investments. The inputs or methodology used for valuing securities are not necessarily an indication of the risk associated with investing in those securities.
The Portfolios did not have any significant transfers between Level 1 and Level 2 during the year ended October 31, 2010.
2. Foreign Currency Translation: Securities and other assets and liabilities of Enhanced U.S. Large Company Portfolio and the International Equity Portfolios whose values are initially expressed in foreign currencies are translated to U.S. dollars using the mean between the most recently quoted bid and asked prices for the U.S. dollar as quoted by generally recognized reliable sources. Dividend and interest income and certain expenses are translated to U.S. dollars at the rate of exchange on their respective accrual dates. Receivables and payables denominated in foreign currencies are marked to market daily based on daily exchange rates and exchange gains or losses are realized upon ultimate receipt or disbursement. Enhanced U.S. Large Company Portfolio also enters into forward currency contracts solely for the purpose of hedging against fluctuations in currency exchange rates. These contracts are marked to market daily based on daily forward exchange rates.
The International Equity Portfolios do not isolate the effect of fluctuation in foreign exchange rates from the effect of fluctuations in the market prices of securities whether realized or unrealized. However, Enhanced U.S. Large Company Portfolio does isolate the effect of fluctuations in foreign currency rates when determining the realized gain or loss upon the sale or maturity of foreign currency denominated debt obligations pursuant to U.S. Federal income tax regulations; such amounts are categorized as foreign exchange gain or loss for both financial reporting and income tax reporting purposes.
Realized gains or losses on foreign currency transactions represent net foreign exchange gains or losses from the disposition of foreign currencies, currency gains or losses realized between the trade and settlement dates on securities transactions, and the difference between amounts of interest, dividends and foreign withholding taxes recorded on the books of the International Equity Portfolios and Enhanced U.S. Large Company Portfolio and the U.S. dollar equivalent amounts actually received or paid.
3. Deferred Compensation Plan: Each eligible Director of the Fund may elect participation in the Deferred Compensation Plan (the “Plan”). Under the Plan, effective January 1, 2002, such Directors may defer payment of all or a portion of their total fees earned as a Director. These deferred amounts may be treated as though such amounts had been invested in shares of the following funds: U.S. Large Cap Value Portfolio; U.S. Core Equity 1 Portfolio; U.S. Core Equity 2 Portfolio; U.S. Vector Equity Portfolio; U.S. Micro Cap Portfolio; DFA International Value Portfolio; International Core Equity Portfolio; Emerging Markets Portfolio; Emerging Markets Core Equity Portfolio; and/or DFA Two-Year Global Fixed Income Portfolio. Contributions made under the Plan and the change in unrealized appreciation (depreciation) and income are included in Directors’/Trustees’ Fees & Expenses or Other Expenses.
Each Director has the option to receive their distribution of proceeds in one of the following methods: lump sum; annual installments over a period of agreed upon years; or quarterly installments over a period of agreed upon years. Each Director shall have the right in a notice of election to defer compensation (the “Notice”) to elect to defer the receipt of the Director’s deferred compensation until a date specified by such Director in the Notice, which date may not be sooner than the earlier of: (i) the first business day of January following the year in which such Director ceases to be a member of the Board of the Fund; and (ii) five years following the effective date of the Director’s first deferral election. If a Director who elects to defer fees fails to designate in the Notice a time or date as of which payment of the Director’s deferred fee account shall commence, payment of such amount shall commence as of the first business day of January following the year in which the Director ceases to be a member of the Board of the
136
Fund (unless the Director files an amended Notice selecting a different distribution date). Robert C. Merton resigned from the Board of the Fund on December 1, 2009 and received a lump sum payment of the proceeds of his deferred fee account on January 4, 2010 in the amount of $241,764. As of October 31, 2010, no other Directors have requested or received a distribution of proceeds of a deferred fee account.
4. Other: Security transactions are accounted for as of the trade date. Costs used in determining realized gains and losses on the sale of investment securities/affiliated investment companies are on the basis of identified cost. Dividend income and distributions to shareholders are recorded on the ex-dividend date. Distributions received on securities that represent a return of capital or capital gain are recorded as a reduction of cost of investments or as a realized gain, respectively. The Portfolios estimate the character of distributions received that may be considered return of capital distributions. Interest income is recorded on an accrual basis. Discount and premium on debt securities purchased are amortized over the lives of the respective securities utilizing the effective interest method. Expenses directly attributable to a Portfolio are directly charged. Common expenses of the Fund or Portfolios are allocated using methods approved by the Board of Directors/Trustees, generally based on average net assets.
Class R1 Shares, Class R2 Shares and Institutional Class Shares have equal rights to assets and earnings of the Portfolio. Income, gains and losses, and common expenses of the Portfolio are allocated to each class of shares based on its relative net assets. Each class will bear its own class-specific expenses, if any.
U.S. Large Cap Value Portfolio, International Small Company Portfolio, Japanese Small Company Portfolio, Asia Pacific Small Company Portfolio, United Kingdom Small Company Portfolio, Continental Small Company Portfolio, Emerging Markets Portfolio, Emerging Markets Small Cap Portfolio and Emerging Markets Value Portfolio each recognize their pro-rata share of net investment income and realized and unrealized gains/losses on a daily basis, from their respective Master Funds, which are treated as partnerships for federal income tax purposes.
The Portfolios may be subject to taxes imposed by countries in which they invest, with respect to their investments in issuers existing or operating in such countries. Such taxes are generally based on income earned or repatriated and capital gains realized on the sale of such investments. The Portfolios accrue such taxes when the related income or capital gains are earned or throughout the holding period. Some countries require governmental approval for the repatriation of investment income, capital or the proceeds of sales earned by foreign investors. In addition, if there is a deterioration in a country’s balance of payments or for other reasons, a country may impose temporary restrictions on foreign capital remittances abroad.
Emerging Markets Core Equity Portfolio’s investments in Thailand and the investments in Thailand held by the Master Funds of Emerging Markets Portfolio, Emerging Markets Small Cap Portfolio and Emerging Markets Value Portfolio are subject to a 15% governmental capital gains tax. Such taxes are due upon sale of individual securities. Emerging Markets Core Equity Portfolio and the Master Funds of Emerging Markets Portfolio, Emerging Markets Small Cap Portfolio and Emerging Markets Value Portfolio each accrues for taxes on the capital gains throughout the holding period based on the unrealized gain of the underlying securities. These funds are also subject to a 15% governmental capital gains tax on short-term capital gains for investments in India. Such taxes are due upon sale of individual securities. The taxes for the capital gains are accrued when the capital gains are earned.
C. Investment Advisor and Administrator:
Dimensional Fund Advisors LP (“Dimensional” or the “Advisor”) provides investment advisory services to all Portfolios. The Advisor receives no additional compensation for the investment advisory services it provides to the Feeder Funds. The Advisor provides administrative services to the Feeder Funds, including supervision of services provided by others, providing information to shareholders and the Board of Directors/Trustees, and other administrative services.
For the year ended October 31, 2010, the Portfolios’ investment advisory services fees were accrued daily and paid monthly to the Advisor based on the following effective annual rates of average daily net assets:
| | | | |
Enhanced U.S. Large Company Portfolio* | | | 0.05 | % |
U.S. Targeted Value Portfolio* | | | 0.10 | % |
137
| | | | |
U.S. Small Cap Value Portfolio* | | | 0.20 | % |
U.S. Core Equity 1 Portfolio | | | 0.17 | % |
U.S. Core Equity 2 Portfolio | | | 0.20 | % |
U.S. Vector Equity Portfolio | | | 0.30 | % |
U.S. Small Cap Portfolio* | | | 0.03 | % |
U.S. Micro Cap Portfolio* | | | 0.10 | % |
DFA Real Estate Securities Portfolio | | | 0.30 | % |
Large Cap International Portfolio | | | 0.25 | % |
International Core Equity Portfolio | | | 0.35 | % |
DFA International Real Estate Securities Portfolio | | | 0.35 | % |
DFA Global Real Estate Securities Portfolio | | | 0.35 | % |
DFA International Small Cap Value Portfolio | | | 0.65 | % |
International Vector Equity Portfolio | | | 0.45 | % |
Emerging Markets Core Equity Portfolio | | | 0.55 | % |
For the year ended October 31, 2010, the Feeder Funds’ and Enhanced U.S. Large Company Portfolio, U.S. Targeted Value Portfolio, U.S. Small Cap Value Portfolio, U.S. Small Cap Portfolio and U.S. Micro Cap Portfolio administrative services fees were accrued daily and paid monthly to the Advisor based on the following effective annual rates of average daily net assets:
| | | | |
Enhanced U.S. Large Company Portfolio* | | | 0.15 | % |
U.S. Large Cap Value Portfolio | | | 0.15 | % |
U.S. Targeted Value Portfolio* | | | 0.25 | % |
U.S. Small Cap Value Portfolio* | | | 0.30 | % |
U.S. Small Cap Portfolio* | | | 0.32 | % |
U.S. Micro Cap Portfolio* | | | 0.40 | % |
International Small Company Portfolio | | | 0.40 | % |
Japanese Small Company Portfolio | | | 0.40 | % |
Asia Pacific Small Company Portfolio | | | 0.40 | % |
United Kingdom Small Company Portfolio | | | 0.40 | % |
Continental Small Company Portfolio | | | 0.40 | % |
Emerging Markets Portfolio | | | 0.40 | % |
Emerging Markets Small Cap Portfolio | | | 0.45 | % |
Emerging Markets Value Portfolio | | | 0.40 | % |
* Effective March 30, 2007, U.S. Targeted Value Portfolio, and on February 28, 2009, Enhanced U.S. Large Company Portfolio, U.S. Small Cap Value Portfolio, U.S. Small Cap Portfolio and U.S. Micro Cap Portfolio no longer invest substantially all of their assets in their respective Series. Instead, the Portfolios’ assets are managed directly in accordance with the Portfolios’ investment objective and strategies, pursuant to an investment management agreement between the Fund, on behalf of the Portfolios, and Dimensional, which previously was the manager of the Series’ assets. The investment advisory fee paid by the Portfolios are identical to the advisory fee that was charged to the Series.
Pursuant to a Fee Waiver and Expense Assumption Agreement, the Advisor has contractually agreed to waive certain fees, including administration/advisory fees, and in certain instances, assume certain expenses of the Portfolios, as described in the notes below. The Fee Waiver and Expense Assumption Agreement for the Portfolios below will remain in effect through March 1, 2011, and shall continue in effect from year to year thereafter unless terminated by the Fund or the Advisor. For the year ended October 31, 2010, the Portfolios had expense limits based on a percentage of average net assets on an annualized basis, and the Advisor recovered previously waived fees and/or expenses assumed as listed below (amounts in thousands). Previously waived fees subject to future recovery by the Advisor are also reflected below (amounts in thousands). The Portfolios are not obligated to reimburse the
138
Advisor for fees previously waived or expenses previously assumed by the Advisor more than thirty-six months before the date of recovery.
| | | | | | | | |
Institutional Class Shares | | Expense
Limits | | | Recovery
of Previously
Waived Fees/
Expenses Assumed | | Previously
Waived Fees/
Expenses Assumed
Subject to Future
Recovery |
U.S. Targeted Value Portfolio (1) | | | 0.50% | | | — | | — |
U.S. Core Equity 1 Portfolio (2) | | | 0.23% | | | — | | — |
U.S. Core Equity 2 Portfolio (2) | | | 0.26% | | | — | | — |
U.S. Vector Equity Portfolio (2) | | | 0.36% | | | — | | — |
International Core Equity Portfolio (2) | | | 0.49% | | | — | | — |
International Small Company Portfolio (3) | | | 0.45% | | | — | | — |
Japanese Small Company Portfolio (3) | | | 0.47% | | | — | | — |
Asia Pacific Small Company Portfolio (3) | | | 0.47% | | | $25 | | — |
United Kingdom Small Company Portfolio (3) | | | 0.47% | | | — | | $ 56 |
Continental Small Company Portfolio (3) | | | 0.47% | | | — | | — |
DFA International Real Estate Securities Portfolio (2) | | | 0.65% | | | — | | — |
DFA Global Real Estate Securities Portfolio (4) | | | 0.55% | | | — | | 2,580 |
International Vector Equity Portfolio (2) | | | 0.60% | | | 28 | | — |
Emerging Markets Core Equity Portfolio (2) | | | 0.85% | | | — | | — |
| | | |
Class R1 Shares | | | | | | | |
U.S. Targeted Value Portfolio (5) | | | 0.62% | | | — | | — |
| | | |
Class R2 Shares | | | | | | | |
U.S. Targeted Value Portfolio (6) | | | 0.77% | | | — | | — |
Emerging Markets Value Portfolio (7) | | | 0.96% | | | — | | — |
(1) The Advisor has contractually agreed to waive its administration fee and advisory fee and to assume the Portfolio’s direct and indirect expenses (excluding the expenses the Portfolio incurs indirectly through investment in other investment companies) (“Portfolios Expenses”) to the extent necessary to limit the Portfolio Expenses of the Portfolio to the rate listed above as a percentage of average net assets on an annualized basis. At any time that the annualized expenses of the Portfolio are less than the rate listed above for the Portfolio, the Advisor retains the right to recover any fees previously waived and/or expenses previously assumed to the extent that such recovery will not cause the Portfolio’s annualized expenses to exceed the applicable percentage of average net assets on an annualized basis, as listed above.
(2) The Advisor has contractually agreed to waive all or a portion of its advisory fee and assume each Portfolio’s ordinary operating expenses (excluding the expenses a Portfolio incurs indirectly through investment in other investment companies) (“Portfolio Expenses”) to the extent necessary to limit the Portfolio Expenses of each Portfolio to the rates listed above as a percentage of average net assets on an annualized basis. At any time that the annualized Portfolio Expenses of a Portfolio are less than the rates listed above for such Portfolio, the Advisor retains the right to recover any fees previously waived and/or expenses previously assumed to the extent that such recovery will not cause the Portfolio’s annualized Portfolio Expenses to exceed the applicable percentage of average net assets on an annualized basis, as listed above.
(3) The Advisor has contractually agreed to waive its administration fee and to assume each Portfolio’s other direct expenses (for International Small Company, not including expenses incurred through its investment in other investment companies) to the extent necessary to limit the direct expenses of each Portfolio to the rates listed above as a percentage of average net assets on an annualized basis. The Fee Waiver and Expense Assumption Agreement does not include the indirect expenses each Portfolio bears as a shareholder of its Master Funds. At any time that the direct expenses of a Portfolio are less than the rates listed above as a percentage of average net assets on an annualized basis, the Advisor retains the right to recover any fees previously waived and/or expenses
139
previously assumed to the extent that such recovery will not cause the Portfolio’s direct expenses to exceed the applicable percentage of average net assets on an annualized basis, as listed above.
(4) The Advisor has contractually agreed to waive all or a portion of its advisory fee and to assume the expenses of the Portfolio (including the expenses that the Portfolio bears as a shareholder of other investment companies managed by the Advisor but excluding the expenses that the Portfolio incurs indirectly through its investment in unaffiliated investment companies) (“Portfolio Expenses”) to the extent necessary to limit the Portfolio Expenses of the Portfolio to the rate listed above as a percentage of average net assets on an annualized basis. At any time that the annualized Portfolio Expenses of the Portfolio are less than the rate listed above as a percentage of average net assets on an annualized basis, the Advisor retains the right to recover any fees previously waived and/or expenses previously assumed to the extent that such recovery will not cause the Portfolio’s annualized Portfolio Expenses to exceed the applicable percentage of average net assets on an annualized basis, as listed above. The Advisor has voluntarily agreed to waive all or a portion of its advisory fee to the extent necessary to limit the total advisory fees paid by the Portfolio to the Advisor directly and indirectly (the proportionate share of the advisory fees paid by the Portfolio through its investment in other funds managed by the Advisor) to 0.35% of the Portfolio’s average net assets on an annualized basis.
(5) The Advisor has contractually agreed to waive its administration fee and to assume the Portfolio’s direct and indirect expenses (excluding the expenses the Portfolio incurs indirectly through investment in other investment companies) (“Portfolio Expenses”) to the extent necessary to limit the Portfolio Expenses of the Class R1 Shares to the rate listed above as a percentage of average net assets on an annualized basis. At any time that the Class R1 Shares’ annualized expenses are less than the rate listed above as a percentage of average net assets on an annualized basis, the Advisor retains the right to recover any fees previously waived and/or expenses previously assumed to the extent that such recovery will not cause the Portfolio’s annualized expenses to exceed the applicable percentage of average net assets on an annualized basis, as listed above.
(6) The Advisor has contractually agreed to waive its administration fee and to assume the Portfolio’s direct and indirect expenses (excluding the expenses the Portfolio incurs indirectly through investment in other investment companies) (“Portfolio Expenses”) to the extent necessary to limit the Portfolio Expenses of the Class R2 Shares to the rate listed above as a percentage of average net assets on an annualized basis. At any time that the Class R2 Shares’ annualized expenses are less than the rate listed above as a percentage of average net assets on an annualized basis, the Advisor retains the right to recover any fees previously waived and/or expenses previously assumed to the extent that such recovery will not cause the Portfolio’s annualized expenses to exceed the applicable percentage of average net assets on an annualized basis, as listed above.
(7) The Advisor has contractually agreed to assume the Portfolio’s direct expenses (excluding administration fees and custodian fees) to the extent necessary to limit the expenses of the Class R2 shares to the rate listed above as a percentage of average net assets on an annualized basis. At any time that the annualized expenses of the Portfolio are less than the rate listed above, the Advisor retains the right to recover any fees previously waived and/or expenses previously assumed to the extent that such recovery will not cause the Portfolio’s annualized expenses to exceed the applicable percentage of average net assets, as listed above.
Fees Paid to Officers and Directors/Trustees:
Certain Officers and Directors/Trustees of the Advisor are also Officers and Directors/Trustees of the Fund; however, such Officers and Directors/Trustees (with the exception of the Chief Compliance Officer (“CCO”)) receive no compensation from the Fund. For the year ended October 31, 2010, the total related amounts paid by the Fund to the CCO were $211 (in thousands). The total related amounts paid by each of the Portfolios are included in Other Expenses on the Statement of Operations.
140
D. Deferred Compensation:
At October 31, 2010, the total liability for deferred compensation to Directors/Trustees is included in Accrued Expenses and Other Liabilities on the Statement of Assets and Liabilities as follows (amounts in thousands):
| | | | |
Enhanced U.S. Large Company Portfolio | | $ | 5 | |
U.S. Large Cap Value Portfolio | | | 168 | |
U.S. Targeted Value Portfolio | | | 40 | |
U.S. Small Cap Value Portfolio | | | 165 | |
U.S. Core Equity 1 Portfolio | | | 54 | |
U.S. Core Equity 2 Portfolio | | | 100 | |
U.S. Vector Equity Portfolio | | | 32 | |
U.S. Small Cap Portfolio | | | 71 | |
U.S. Micro Cap Portfolio | | | 84 | |
DFA Real Estate Securities Portfolio | | | 53 | |
Large Cap International Portfolio | | | 38 | |
International Core Equity Portfolio | | | 94 | |
International Small Company Portfolio | | | 113 | |
Japanese Small Company Portfolio | | | 4 | |
Asia Pacific Small Company Portfolio | | | 2 | |
United Kingdom Small Company Portfolio | | | 1 | |
Continental Small Company Portfolio | | | 3 | |
DFA International Real Estate Securities Portfolio | | | 17 | |
DFA Global Real Estate Securities Portfolio | | | 8 | |
DFA International Small Cap Value Portfolio | | | 181 | |
International Vector Equity Portfolio | | | 6 | |
Emerging Markets Portfolio | | | 53 | |
Emerging Markets Small Cap Portfolio | | | 27 | |
Emerging Markets Value Portfolio | | | 179 | |
Emerging Markets Core Equity Portfolio | | | 62 | |
E. Purchases and Sales of Securities:
For the year ended October 31, 2010, the Portfolios made the following purchases and sales of investment securities, other than short-term securities (amounts in thousands):
| | | | | | | | | | | | | | | | |
| | | U.S. Government
Securities | | | Other Investment
Securities | |
| | | Purchases | | | Sales | | | Purchases | | | Sales | |
Enhanced U.S. Large Company Portfolio | | $ | 23,295 | | | $ | 15,906 | | | $ | 96,586 | | | $ | 85,229 | |
U.S. Targeted Value Portfolio | | | — | | | | — | | | | 743,256 | | | | 385,651 | |
U.S. Small Cap Value Portfolio | | | — | | | | — | | | | 1,179,085 | | | | 1,604,481 | |
U.S. Core Equity 1 Portfolio | | | — | | | | — | | | | 500,472 | | | | 104,767 | |
U.S. Core Equity 2 Portfolio | | | — | | | | — | | | | 679,494 | | | | 291,591 | |
U.S. Vector Equity Portfolio | | | — | | | | — | | | | 249,878 | | | | 147,332 | |
U.S. Small Cap Portfolio | | | — | | | | — | | | | 721,110 | | | | 569,730 | |
U.S. Micro Cap Portfolio | | | — | | | | — | | | | 272,933 | | | | 670,280 | |
DFA Real Estate Securities Portfolio | | | — | | | | — | | | | 55,110 | | | | 134,927 | |
Large Cap International Portfolio | | | — | | | | — | | | | 226,664 | | | | 94,622 | |
International Core Equity Portfolio | | | — | | | | — | | | | 816,395 | | | | 79,373 | |
DFA International Real Estate Securities Portfolio | | | — | | | | — | | | | 157,052 | | | | 46,998 | |
DFA International Small Cap Value Portfolio | | | — | | | | — | | | | 1,459,275 | | | | 1,247,603 | |
International Vector Equity Portfolio | | | — | | | | — | | | | 80,705 | | | | 16,080 | |
Emerging Markets Core Equity Portfolio | | | — | | | | — | | | | 1,018,104 | | | | 135,723 | |
141
F. Federal Income Taxes:
Each Portfolio has qualified and intends to continue to qualify as a regulated investment company under Subchapter M of the Internal Revenue Code for federal income tax purposes and to distribute substantially all of its taxable income and net capital gains to its shareholders. Accordingly, no provision has been made for federal income taxes.
Distributions from net investment income and net realized capital gains are determined in accordance with U.S. federal income tax regulations, which may differ from those amounts determined under accounting principles generally accepted in the United States of America. These book/tax differences are either temporary or permanent in nature. To the extent these differences are permanent, they are charged or credited to paid-in capital, undistributed net investment income or accumulated net realized gains, as appropriate, in the period that the differences arise. Accordingly, the following permanent differences as of October 31, 2010, primarily attributable to net realized gains on securities considered to be “passive foreign investment companies”, non-deductible offering costs, foreign bond bifurcation, the utilization of accumulated earnings and profits distributed to shareholders on redemptions of shares as part of the dividends paid deduction for income tax purposes and distribution redesignations, were reclassified to the following accounts. These reclassifications had no effect on net assets or net asset value per share (amounts in thousands):
| | | | | | | | | | | | |
| | | Increase
(Decrease)
Paid-In Capital | | | Increase
(Decrease)
Undistributed
Net Investment
Income | | | Increase
(Decrease)
Accumulated
Net Realized
Gains (Losses) | |
Enhanced U.S. Large Company Portfolio | | | — | | | $ | (15 | ) | | $ | 15 | |
U.S. Large Cap Value Portfolio | | | — | | | | — | | | | — | |
U.S. Targeted Value Portfolio | | $ | 30 | | | | (200 | ) | | | 170 | |
U.S. Small Cap Value Portfolio | | | 55,514 | | | | (388 | ) | | | (55,126 | ) |
U.S. Core Equity 1 Portfolio | | | — | | | | (16 | ) | | | 16 | |
U.S. Core Equity 2 Portfolio | | | — | | | | (42 | ) | | | 42 | |
U.S. Vector Equity Portfolio | | | — | | | | (24 | ) | | | 24 | |
U.S. Small Cap Portfolio | | | (104 | ) | | | (144 | ) | | | 248 | |
U.S. Micro Cap Portfolio | | | — | | | | (258 | ) | | | 258 | |
DFA Real Estate Securities Portfolio | | | — | | | | 4 | | | | (4 | ) |
Large Cap International Portfolio | | | — | | | | 383 | | | | (383 | ) |
International Core Equity Portfolio | | | (13 | ) | | | 971 | | | | (958 | ) |
International Small Company Portfolio | | | (8,877 | ) | | | 11,998 | | | | (3,121 | ) |
Japanese Small Company Portfolio | | | (4,574 | ) | | | 81 | | | | 4,493 | |
Asia Pacific Small Company Portfolio | | | (259 | ) | | | 100 | | | | 159 | |
United Kingdom Small Company Portfolio | | | (74 | ) | | | 33 | | | | 41 | |
Continental Small Company Portfolio | | | (195 | ) | | | 476 | | | | (281 | ) |
DFA International Real Estate Securities Portfolio | | | 136 | | | | 790 | | | | (926 | ) |
DFA Global Real Estate Securities Portfolio | | | 101 | | | | (101 | ) | | | — | |
DFA International Small Cap Value Portfolio | | | 13,148 | | | | 16,536 | | | | (29,684 | ) |
International Vector Equity Portfolio | | | 207 | | | | (62 | ) | | | (145 | ) |
Emerging Markets Portfolio | | | 15,558 | | | | (2,642 | ) | | | (12,916 | ) |
Emerging Markets Small Cap Portfolio | | | 2,294 | | | | (295 | ) | | | (1,999 | ) |
Emerging Markets Value Portfolio | | | 48,632 | | | | (11,121 | ) | | | (37,511 | ) |
Emerging Markets Core Equity Portfolio | | | — | | | | (776 | ) | | | 776 | |
142
The tax character of dividends and distributions declared and paid during the year ended October 31, 2009 and the year ended October 31, 2010 were as follows (amounts in thousands):
| | | | | | | | | | | | |
| | | Net Investment Income and Short-Term Capital Gains | | | Long-Term Capital Gains | | | Total | |
| | | |
Enhanced U.S. Large Company Portfolio | | | | | | | | | | | | |
2009 | | $ | 19,564 | | | | — | | | $ | 19,564 | |
2010 | | | 1,589 | | | | — | | | | 1,589 | |
| | | |
U.S. Large Cap Value Portfolio | | | | | | | | | | | | |
2009 | | | 130,238 | | | | — | | | | 130,238 | |
2010 | | | 116,599 | | | | — | | | | 116,599 | |
| | | |
U.S. Targeted Value Portfolio | | | | | | | | | | | | |
2009 | | | 14,179 | | | | — | | | | 14,179 | |
2010 | | | 12,576 | | | $ | 7 | | | | 12,583 | |
| | | |
U.S. Small Cap Value Portfolio | | | | | | | | | | | | |
2009 | | | 69,882 | | | | — | | | | 69,882 | |
2010 | | | 25,747 | | | | — | | | | 25,747 | |
| | | |
U.S. Core Equity 1 Portfolio | | | | | | | | | | | | |
2009 | | | 31,598 | | | | — | | | | 31,598 | |
2010 | | | 31,326 | | | | — | | | | 31,326 | |
| | | |
U.S. Core Equity 2 Portfolio | | | | | | | | | | | | |
2009 | | | 55,009 | | | | — | | | | 55,009 | |
2010 | | | 53,941 | | | | — | | | | 53,941 | |
| | | |
U.S. Vector Equity Portfolio | | | | | | | | | | | | |
2009 | | | 16,454 | | | | — | | | | 16,454 | |
2010 | | | 14,799 | | | | — | | | | 14,799 | |
| | | |
U.S. Small Cap Portfolio | | | | | | | | | | | | |
2009 | | | 26,412 | | | | — | | | | 26,412 | |
2010 | | | 21,528 | | | | — | | | | 21,528 | |
| | | |
U.S. Micro Cap Portfolio | | | | | | | | | | | | |
2009 | | | 57,816 | | | | — | | | | 57,816 | |
2010 | | | 17,526 | | | | — | | | | 17,526 | |
| | | |
DFA Real Estate Securities Portfolio | | | | | | | | | | | | |
2009 | | | 95,934 | | | | — | | | | 95,934 | |
2010 | | | 70,908 | | | | — | | | | 70,908 | |
| | | |
Large Cap International Portfolio | | | | | | | | | | | | |
2009 | | | 32,286 | | | | — | | | | 32,286 | |
2010 | | | 40,390 | | | | — | | | | 40,390 | |
| | | |
International Core Equity Portfolio | | | | | | | | | | | | |
2009 | | | 77,469 | | | | — | | | | 77,469 | |
2010 | | | 83,173 | | | | — | | | | 83,173 | |
143
| | | | | | | | | | | | |
| | | Net Investment Income and Short-Term Capital Gains | | | Long-Term Capital Gains | | | Total | |
| | | |
International Small Company Portfolio | | | | | | | | | | | | |
2009 | | $ | 81,118 | | | | — | | | $ | 81,118 | |
2010 | | | 84,604 | | | | — | | | | 84,604 | |
| | | |
Japanese Small Company Portfolio | | | | | | | | | | | | |
2009 | | | 2,426 | | | | — | | | | 2,426 | |
2010 | | | 1,845 | | | | — | | | | 1,845 | |
| | | |
Asia Pacific Small Company Portfolio | | | | | | | | | | | | |
2009 | | | 2,724 | | | | — | | | | 2,724 | |
2010 | | | 3,162 | | | | — | | | | 3,162 | |
| | | |
United Kingdom Small Company Portfolio | | | | | | | | | | | | |
2009 | | | 658 | | | | — | | | | 658 | |
2010 | | | 694 | | | | — | | | | 694 | |
| | | |
Continental Small Company Portfolio | | | | | | | | | | | | |
2009 | | | 2,087 | | | | — | | | | 2,087 | |
2010 | | | 1,863 | | | | — | | | | 1,863 | |
| | | |
DFA International Real Estate Securities Portfolio | | | | | | | | | | | | |
2009 | | | 11,227 | | | | — | | | | 11,227 | |
2010 | | | 79,025 | | | | — | | | | 79,025 | |
| | | |
DFA Global Real Estate Securities Portfolio | | | | | | | | | | | | |
2009 | | | 2,370 | | | | — | | | | 2,370 | |
2010 | | | 30,971 | | | | — | | | | 30,971 | |
| | | |
DFA International Small Cap Value Portfolio | | | | | | | | | | | | |
2009 | | | 108,717 | | | $ | 25,188 | | | | 133,905 | |
2010 | | | 108,095 | | | | 6,990 | | | | 115,085 | |
| | | |
International Vector Equity Portfolio | | | | | | | | | | | | |
2009 | | | 3,671 | | | | — | | | | 3,671 | |
2010 | | | 5,534 | | | | 54 | | | | 5,588 | |
| | | |
Emerging Markets Portfolio | | | | | | | | | | | | |
2009 | | | 36,673 | | | | 23,932 | | | | 60,605 | |
2010 | | | 40,081 | | | | 42,220 | | | | 82,301 | |
| | | |
Emerging Markets Small Cap Portfolio | | | | | | | | | | | | |
2009 | | | 16,832 | | | | — | | | | 16,832 | |
2010 | | | 22,951 | | | | 1,637 | | | | 24,588 | |
| | | |
Emerging Markets Value Portfolio | | | | | | | | | | | | |
2009 | | | 114,611 | | | | 518,510 | | | | 633,121 | |
2010 | | | 190,697 | | | | 142,234 | | | | 332,931 | |
144
| | | | | | | | | | | | |
| | | Net Investment Income and Short-Term Capital Gains | | | Long-Term Capital Gains | | | Total | |
| | | |
Emerging Markets Core Equity Portfolio | | | | | | | | | | | | |
2009 | | $ | 29,028 | | | | — | | | $ | 29,028 | |
2010 | | | 48,768 | | | | — | | | | 48,768 | |
At October 31, 2010, the following net investment income and short-term capital gains and long-term capital gains distributions designated for federal income tax purposes are due to the utilization of accumulated earnings and profits distributed to shareholders upon redemption of shares (amounts in thousands):
| | | | | | | | | | | | |
| | | Net Investment Income and Short-Term Capital Gains | | | Long-Term
Capital Gains | | | Total | |
U.S. Targeted Value Portfolio | | $ | 22 | | | $ | 7 | | | $ | 29 | |
DFA International Real Estate Securities Portfolio | | | 162 | | | | — | | | | 162 | |
DFA Global Real Estate Securities Portfolio | | | 101 | | | | — | | | | 101 | |
DFA International Small Cap Value Portfolio | | | 6,406 | | | | 6,990 | | | | 13,396 | |
International Vector Equity Portfolio | | | 154 | | | | 54 | | | | 208 | |
Emerging Markets Portfolio | | | 3,182 | | | | 12,406 | | | | 15,588 | |
Emerging Markets Small Cap Portfolio | | | 657 | | | | 1,637 | | | | 2,294 | |
Emerging Markets Value Portfolio | | | 10,256 | | | | 25,596 | | | | 35,852 | |
At October 31, 2010, the components of distributable earnings (accumulated losses) were as follows (amounts in thousands):
| | | | | | | | | | | | | | | | |
| | | Undistributed
Net Investment
Income and
Short-Term
Capital Gains | | | Undistributed
Long-Term
Capital Gains | | | Capital Loss
Carryforward | | | Total Net Distributable Earnings (Accumulated Losses) | |
Enhanced U.S. Large Company Portfolio | | $ | 60 | | | | — | | | $ | (83,155 | ) | | $ | (83,095 | ) |
U.S. Large Cap Value Portfolio | | | 17,615 | | | | — | | | | (1,943,065 | ) | | | (1,925,450 | ) |
U.S. Targeted Value Portfolio | | | 2,337 | | | $ | 4,739 | | | | — | | | | 7,076 | |
U.S. Small Cap Value Portfolio | | | 3,841 | | | | — | | | | (111,515 | ) | | | (107,674 | ) |
U.S. Core Equity 1 Portfolio | | | 6,246 | | | | — | | | | (81,149 | ) | | | (74,903 | ) |
U.S. Core Equity 2 Portfolio | | | 12,077 | | | | — | | | | (84,843 | ) | | | (72,766 | ) |
U.S. Vector Equity Portfolio | | | 2,999 | | | | — | | | | (83,542 | ) | | | (80,543 | ) |
U.S. Small Cap Portfolio | | | 4,727 | | | | — | | | | (202,569 | ) | | | (197,842 | ) |
U.S. Micro Cap Portfolio | | | 3,313 | | | | — | | | | (269,190 | ) | | | (265,877 | ) |
DFA Real Estate Securities Portfolio | | | 13,051 | | | | — | | | | (190,348 | ) | | | (177,297 | ) |
Large Cap International Portfolio | | | 6,285 | | | | — | | | | (168,708 | ) | | | (162,423 | ) |
International Core Equity Portfolio | | | 23,835 | | | | — | | | | (79,551 | ) | | | (55,716 | ) |
International Small Company Portfolio | | | 62,669 | | | | — | | | | (75,782 | ) | | | (13,113 | ) |
Japanese Small Company Portfolio | | | 746 | | | | — | | | | (86,440 | ) | | | (85,694 | ) |
Asia Pacific Small Company Portfolio | | | 4,232 | | | | — | | | | (33,364 | ) | | | (29,132 | ) |
United Kingdom Small Company Portfolio | | | 216 | | | | — | | | | (2,879 | ) | | | (2,663 | ) |
Continental Small Company Portfolio | | | 655 | | | | — | | | | (29,435 | ) | | | (28,780 | ) |
145
| | | | | | | | | | | | | | | | |
| | | Undistributed
Net Investment
Income and
Short-Term
Capital Gains | | | Undistributed
Long-Term
Capital Gains | | | Capital Loss
Carryforward | | | Total Net
Distributable
Earnings
(Accumulated
Losses) | |
DFA International Real Estate Securities Portfolio | | $ | 99,500 | | | | — | | | $ | (86,757 | ) | | $ | 12,743 | |
DFA Global Real Estate Securities Portfolio | | | 5,020 | | | | — | | | | (2,755 | ) | | | 2,265 | |
DFA International Small Cap Value Portfolio | | | 52,524 | | | $ | 138,419 | | | | — | | | | 190,943 | |
International Vector Equity Portfolio | | | 2,022 | | | | 2,417 | | | | — | | | | 4,439 | |
Emerging Markets Portfolio | | | 3,780 | | | | 136,068 | | | | — | | | | 139,848 | |
Emerging Markets Small Cap Portfolio | | | 3,840 | | | | 58,346 | | | | — | | | | 62,186 | |
Emerging Markets Value Portfolio | | | 82,579 | | | | 479,238 | | | | — | | | | 561,817 | |
Emerging Markets Core Equity Portfolio | | | 9,681 | | | | — | | | | (53,657 | ) | | | (43,976 | ) |
For federal income tax purposes, the Fund measures its capital loss carryforwards annually at October 31, its fiscal year end. Capital loss carryforwards may be carried forward and applied against future capital gains. As of October 31, 2010, the following Portfolios had capital loss carryforwards available to offset future realized capital gains through the indicated expiration dates (amounts in thousands):
| | | | | | | | | | | | | | | | | | | | | | | | | | | | | | | | | | | | |
| | | 2011 | | | 2012 | | | 2013 | | | 2014 | | | 2015 | | | 2016 | | | 2017 | | | 2018 | | | Total | |
Enhanced U.S. Large Company Portfolio | | | — | | | | — | | | | — | | | | — | | | | — | | | $ | 83,155 | | | | — | | | | — | | | $ | 83,155 | |
U.S. Large Cap Value Portfolio | | | — | | | | — | | | | — | | | | — | | | | — | | | | — | | | $ | 1,943,065 | | | | — | | | | 1,943,065 | |
U.S. Small Cap Value Portfolio | | | — | | | | — | | | | — | | | | — | | | | — | | | | — | | | | 111,515 | | | | — | | | | 111,515 | |
U.S. Core Equity 1 Portfolio | | | — | | | | — | | | | — | | | | — | | | $ | 2,284 | | | | 18,644 | | | | 60,221 | | | | — | | | | 81,149 | |
U.S. Core Equity 2 Portfolio | | | — | | | | — | | | | — | | | | — | | | | 5,654 | | | | 42,181 | | | | 37,008 | | | | — | | | | 84,843 | |
U.S. Vector Equity Portfolio | | | — | | | | — | | | | — | | | | — | | | | — | | | | 3,326 | | | | 80,216 | | | | — | | | | 83,542 | |
U.S. Small Cap Portfolio | | | — | | | | — | | | | — | | | | — | | | | — | | | | 202,067 | | | | 502 | | | | — | | | | 202,569 | |
U.S. Micro Cap Portfolio | | | — | | | | — | | | | — | | | | — | | | | — | | | | 207,930 | | | | 61,260 | | | | — | | | | 269,190 | |
DFA Real Estate Securities Portfolio | | | — | | | | — | | | | — | | | | — | | | | — | | | | 82,044 | | | | 62,969 | | | $ | 45,335 | | | | 190,348 | |
Large Cap International Portfolio | | | — | | | | — | | | | — | | | | — | | | | — | | | | 19,004 | | | | 135,393 | | | | 14,311 | | | | 168,708 | |
International Core Equity Portfolio | | | — | | | | — | | | | — | | | | — | | | | — | | | | — | | | | 79,551 | | | | — | | | | 79,551 | |
International Small Company Portfolio | | | — | | | | — | | | | — | | | | — | | | | — | | | | — | | | | 75,782 | | | | — | | | | 75,782 | |
Japanese Small Company Portfolio | | $ | 19,912 | | | $ | 3,801 | | | $ | 3,055 | | | $ | 2,451 | | | | 8,004 | | | | 23,057 | | | | 13,952 | | | | 12,208 | | | | 86,440 | |
Asia Pacific Small Company Portfolio | | | 501 | | | | 1,151 | | | | 907 | | | | 864 | | | | — | | | | 21,680 | | | | 8,261 | | | | — | | | | 33,364 | |
United Kingdom Small Company Portfolio | | | — | | | | — | | | | — | | | | — | | | | — | | | | 892 | | | | 1,987 | | | | — | | | | 2,879 | |
Continental Small Company Portfolio | | | — | | | | — | | | | — | | | | — | | | | — | | | | 16,959 | | | | 7,224 | | | | 5,252 | | | | 29,435 | |
DFA International Real Estate Securities | | | | | | | | | | | | | | | | | | | | | | | | | | | | | | | | | | | | |
Portfolio. | | | — | | | | — | | | | — | | | | — | | | | 46 | | | | 13,446 | | | | 34,576 | | | | 38,689 | | | | 86,757 | |
DFA Global Real Estate Securities Portfolio | | | — | | | | — | | | | — | | | | — | | | | — | | | | — | | | | — | | | | 2,755 | | | | 2,755 | |
Emerging Markets Core Equity Portfolio | | | — | | | | — | | | | — | | | | — | | | | — | | | | 27,213 | | | | 26,444 | | | | — | | | | 53,657 | |
During the year ended October 31, 2010, the following Portfolios utilized capital loss carryforwards to offset realized capital gains for federal income tax purposes (amounts in thousands):
| | | | |
Enhanced U.S. Large Company Portfolio | | $ | 24,806 | |
U.S. Large Cap Value Portfolio | | | 498,328 | |
U.S. Targeted Value Portfolio | | | 82,599 | |
U.S. Small Cap Value Portfolio | | | 462,423 | |
U.S. Core Equity 1 Portfolio | | | 981 | |
U.S. Core Equity 2 Portfolio | | | 9,909 | |
U.S. Vector Equity Portfolio | | | 11,136 | |
U.S. Small Cap Portfolio | | | 178,052 | |
U.S. Micro Cap Portfolio | | | 245,602 | |
International Core Equity Portfolio | | | 18,702 | |
International Small Company Portfolio | | | 155,578 | |
146
| | | | |
Asia Pacific Small Company Portfolio | | $ | 5,335 | |
United Kingdom Small Company Portfolio | | | 129 | |
DFA International Small Cap Value Portfolio | | | 32,601 | |
International Vector Equity Portfolio | | | 3,383 | |
Emerging Markets Small Cap Portfolio | | | 37,102 | |
Emerging Markets Core Equity Portfolio | | | 35,738 | |
For the year ended October 31, 2010, Japanese Small Company Portfolio had capital loss carryforward expirations of $4,453 (in thousands).
Some of the Portfolios’ investments and investments held by the Master Funds are in securities considered to be “passive foreign investment companies” for which any unrealized appreciation (depreciation) (mark to market) and/or realized gains are required to be included in distributable net investment income for federal income tax purposes. At October 31, 2010, the following Portfolios had cumulative unrealized appreciation (depreciation) (mark to market) to be included in distributable net investment income for federal tax purposes. For the year ended October 31, 2010, realized gains on the sale of passive foreign investment companies have been reclassified from accumulated net realized gains to accumulated net investment income for federal tax purposes. Amounts listed below are in thousands.
| | | | | | | | |
| | | Mark to Market | | | Realized Gains | |
Large Cap International Portfolio | | $ | 1,994 | | | | — | |
International Core Equity Portfolio | | | 6,636 | | | $ | 660 | |
International Small Company Portfolio | | | 30,541 | | | | 9,481 | |
Japanese Small Company Portfolio | | | 109 | | | | 3 | |
Asia Pacific Small Company Portfolio | | | 3,577 | | | | 44 | |
United Kingdom Small Company Portfolio | | | 12 | | | | — | |
Continental Small Company Portfolio | | | 54 | | | | 425 | |
DFA International Real Estate Securities Portfolio | | | 102,024 | | | | 688 | |
DFA International Small Cap Value Portfolio | | | 14,397 | | | | 19,367 | |
International Vector Equity Portfolio | | | 929 | | | | 15 | |
Emerging Markets Portfolio | | | 434 | | | | — | |
Emerging Markets Small Cap Portfolio | | | 590 | | | | 285 | |
Emerging Markets Value Portfolio | | | 292 | | | | 4 | |
Emerging Markets Core Equity Portfolio | | | 1,040 | | | | — | |
At October 31, 2010, the total cost and aggregate gross unrealized appreciation and (depreciation) of securities for federal income tax purposes were different from amounts reported for financial reporting purposes (amounts in thousands):
| | | | | | | | | | | | | | | | |
| | | Federal Tax Cost | | | Unrealized
Appreciation | | | Unrealized
(Depreciation) | | | Net
Unrealized
Appreciation
(Depreciation) | |
Enhanced U.S. Large Company Portfolio | | $ | 154,182 | | | $ | 2,047 | | | $ | (30 | ) | | $ | 2,017 | |
U.S. Large Cap Value Portfolio | | | 5,483,240 | | | | 1,526,241 | | | | (87,376 | ) | | | 1,438,865 | |
U.S. Targeted Value Portfolio | | | 2,379,587 | | | | 397,362 | | | | (198,641 | ) | | | 198,721 | |
U.S. Small Cap Value Portfolio | | | 7,688,064 | | | | 1,414,262 | | | | (1,274,498 | ) | | | 139,764 | |
U.S. Core Equity 1 Portfolio | | | 3,024,394 | | | | 436,878 | | | | (260,177 | ) | | | 176,701 | |
U.S. Core Equity 2 Portfolio | | | 5,454,505 | | | | 762,296 | | | | (658,577 | ) | | | 103,719 | |
U.S. Vector Equity Portfolio | | | 1,719,330 | | | | 256,530 | | | | (228,507 | ) | | | 28,023 | |
U.S. Small Cap Portfolio | | | 3,793,567 | | | | 894,348 | | | | (443,835 | ) | | | 450,513 | |
U.S. Micro Cap Portfolio | | | 3,320,517 | | | | 990,714 | | | | (691,013 | ) | | | 299,701 | |
147
| | | | | | | | | | | | | | | | |
| | | Federal Tax Cost | | | Unrealized
Appreciation | | | Unrealized
(Depreciation) | | | Net
Unrealized
Appreciation
(Depreciation) | |
DFA Real Estate Securities Portfolio | | $ | 2,975,169 | | | $ | 665,318 | | | $ | (275,967 | ) | | $ | 389,351 | |
Large Cap International Portfolio | | | 1,690,644 | | | | 393,842 | | | | (189,698 | ) | | | 204,144 | |
International Core Equity Portfolio | | | 5,630,995 | | | | 726,505 | | | | (675,593 | ) | | | 50,912 | |
International Small Company Portfolio | | | 5,030,684 | | | | 1,197,767 | | | | (699,918 | ) | | | 497,849 | |
Japanese Small Company Portfolio | | | 193,623 | | | | 60,393 | | | | (139,032 | ) | | | (78,639 | ) |
Asia Pacific Small Company Portfolio | | | 108,755 | | | | 77,859 | | | | (55,057 | ) | | | 22,802 | |
United Kingdom Small Company Portfolio | | | 30,403 | | | | 25,800 | | | | (22,445 | ) | | | 3,355 | |
Continental Small Company Portfolio | | | 110,447 | | | | 79,018 | | | | (61,309 | ) | | | 17,709 | |
DFA International Real Estate Securities | | | | | | | | | | | | | | | | |
Portfolio | | | 1,287,520 | | | | 65,211 | | | | (252,903 | ) | | | (187,692 | ) |
DFA Global Real Estate Securities Portfolio | | | 549,837 | | | | 166,409 | | | | (20,672 | ) | | | 145,737 | |
DFA International Small Cap Value Portfolio | | | 8,452,705 | | | | 1,452,205 | | | | (1,716,651 | ) | | | (264,446 | ) |
International Vector Equity Portfolio | | | 325,612 | | | | 98,796 | | | | (16,840 | ) | | | 81,956 | |
Emerging Markets Portfolio | | | 1,101,083 | | | | 1,351,410 | | | | (79,114 | ) | | | 1,272,296 | |
Emerging Markets Small Cap Portfolio | | | 1,181,698 | | | | 706,692 | | | | (54,641 | ) | | | 652,051 | |
Emerging Markets Value Portfolio | | | 8,453,063 | | | | 3,270,128 | | | | (136,524 | ) | | | 3,133,604 | |
Emerging Markets Core Equity Portfolio | | | 3,292,932 | | | | 1,365,544 | | | | (129,856 | ) | | | 1,235,688 | |
Accounting for Uncertainty in Income Taxes sets forth a minimum threshold for financial statement recognition of the benefit of a tax position taken or expected to be taken in a tax return. Management has analyzed each Portfolio’s tax postions and has concluded that no provision for income tax is required in any Portfolios’ financial statements. No Portfolio is aware of any tax positions for which it is reasonably possible that the total amounts of unrecognized tax benefits will significantly change in the next twelve months. Each of the Portfolios’ federal tax returns for the prior three fiscal years remains subject to examination by the Internal Revenue Service.
On October 22, 2008, The U.S. Micro Cap Series and The U.S. Small Cap Value Series and on October 25, 2008 The U.S. Small Cap Series, each a master fund in a RIC/RIC master-feeder structure, each with a RIC feeder (“the Portfolios”), having 100% investment in their respective master fund, have each made a “Check-the-box” election for federal income tax purposes pursuant to Treasury Regulation § 301.7701-3, to change their federal entity classifications from a corporation taxable as a regulated investment company to a disregarded entity. As a result of this election for tax purposes, each master fund is deemed to have liquidated and distributed all of its assets and liabilities to its owners, the respective portfolios (the RIC feeders), with the respective portfolios deemed the surviving entities. The final tax year end of the Master Funds was October 21, 2008 for The U.S. Micro Cap Series and The U.S. Small Cap Value Series and October 24, 2008 for The U.S. Small Cap Series. For Federal income tax purposes, pursuant to Code §337(a), each of the master funds recognizes no gain or loss and, pursuant to Code §332(a), each of the Portfolios recognizes no gain or loss on the deemed liquidation. However, pursuant to IRC §332 (c), each of the aforementioned Portfolios has recognized the master fund’s deemed dividend, which was distributed as part of the deemed liquidating distribution, as taxable income. Pursuant to IRC Code §334(b)(1) and §1223, each of the Portfolios will maintain each respective master fund’s holding period and tax basis in the assets deemed transferred to the respective Portfolio.
Effective December 31, 2008, The U.S. Large Cap Value Series, a master fund in a RIC/RIC master-feeder structure with four RIC feeders and other direct client investor(s), made a “Check-the-box” election for federal income tax purposes pursuant to Treasury Regulation §301.7701-3, to change its federal entity classification from a corporation taxable as a regulated investment company to a partnership. As a result of this election, the master fund is deemed to have distributed all of its assets and liabilities, in a taxable transaction, to its shareholders in liquidation of the master fund. Immediately thereafter, the shareholders contributed all of the distributed assets and liabilities to a
148
newly formed partnership. The final tax year end of The U.S. Large Cap Value Series was December 30, 2008. For Federal income tax purposes, pursuant to IRC Code §336(a), the master fund recognized a loss as if the master’s investment securities were sold to its shareholders and, pursuant to IRC Code §331, each of the Portfolios recognized a gain as if it liquidated its investment in the master. For tax purposes, pursuant to IRC Code §334(a), each of the Portfolios took a fair market value basis in the securities deemed received by them and a new holding period for those securities commenced on the deemed liquidation date. As a result of the transaction, The U.S. Large Cap Value Series recognized a ($2,303,664,484) capital loss for tax year ended December 30, 2008.
On November 1, 2008, The Enhanced U.S. Large Company Series, a master fund in a RIC/RIC master-feeder structure and Enhanced U.S. Large Company Portfolio (“the Portfolio”), having 100% investment in its respective master fund, made a “Check-the-box” election for federal income tax purposes pursuant to Treasury Regulation §301.7701-3, to change the Series’ federal entity classification from a corporation taxable as a regulated investment company to a disregarded entity. As a result of this election for tax purposes, the master fund is deemed to have liquidated and distributed all of its assets and liabilities to its owner, the Portfolio, with the Portfolio deemed the surviving entity. The final tax year end of the Master Fund was October 31, 2008. For Federal income tax purposes, pursuant to Code §337(a), the Master Fund did not recognize any gain or loss and, pursuant to Code §332(a), the Portfolio did not recognize any gain or loss on the deemed liquidation. However, pursuant to IRC §332(c), the Portfolio has recognized the Master Fund’s deemed dividend, which was distributed as part of the deemed liquidating distribution, as taxable income. Pursuant to IRC Code §334(b)(1) and §1223, the Portfolio will maintain its respective master fund’s holding period and tax basis in the assets deemed transferred to the respective Portfolio.
Effective November 1, 2009, Dimensional Emerging Markets Value Fund (“DEM II”), a master fund in a master-feeder structure with one RIC feeder (Emerging Markets Value Portfolio) and other direct client investors, made a “Check-the-Box” election for federal income tax purposes pursuant to Treasury Regulation §301.7701-3, to change their federal entity classifications from a corporation taxable as a regulated investment company to a partnership. DEM II and the Portfolio will maintain their books and records and present their financial statements in accordance with generally accepted accounting principals for investment partnerships. As a result of this election, the master fund is deemed to have distributed all of its assets and liabilities on October 31, 2009 to its shareholders in liquidation of the master fund. Since the master fund has a shareholder owning 80% or more of the fund’s shares, and also has shareholders owning less than 80%, the transaction creates a non-taxable transaction, pursuant to Internal Revenue Code §332, for those owning more than 80%, and a taxable transaction, pursuant to Internal Revenue Code §331, for those shareholders owning less than 80%. Immediately after the deemed liquidation, the shareholders contributed all of the distributed assets and liabilities to a newly formed partnership. The final tax year end of the master fund was October 31, 2009.
For federal income tax purposes, pursuant to Code §336(a), the master fund recognizes gain or loss relative to the investment of the less than 80% shareholders as if the master’s investment securities were sold to those shareholders and, pursuant to Code §331, each of those shareholders recognizes gain or loss as if it liquidated its investment in the master. Pursuant to Code §334(a), each of these shareholders will take a fair market value basis in the securities deemed received by them and a new holding period for those securities commences on the deemed liquidation date. In regards to the shareholder owning 80% or more of the master fund, pursuant to Code §332(a), the shareholder will not recognize any gain or loss on the deemed liquidation. However, pursuant to Code §332(c), a portion of the deemed distribution, which otherwise would have been tax-free as discussed above, since it is utilized by the master fund to satisfy its dividends paid deduction for the tax year, must be recognized and treated as a dividend by the 80% or greater shareholder. Pursuant to Code §334(b)(1) and §1223, the 80% or greater shareholder’s basis and holding period in the securities received in liquidation is the same as it was in the possession of the master. As a result of the transaction, Dimensional Emerging Markets Value Fund recognized a $104,402,506 and ($16,523) capital gain and currency loss respectively, for the tax year ended October 31, 2009.
Certain prior year balances have been reclassified to conform with current year presentation. Such reclassifications impacted the paid-in capital, undistributed net investment income/distributions in excess of net investment income and accumulated net realized gain/loss components of net assets on the statements of assets and liabilities of International Small Company Portfolio and Emerging Markets Value Portfolio. These reclassifications had no impact on net assets, net asset value, the financial highlights or total return.
149
G. Capital Share Transactions:
The capital share transactions by class were as follows (amounts in thousands):
| | | | | | | | | | | | | | | | |
| | | Year
Ended
Oct. 31, 2010 | | | Year
Ended
Oct. 31, 2009 | |
| | | Amount | | | Shares | | | Amount | | | Shares | |
| | | | |
U.S. Targeted Value Portfolio | | | | | | | | | | | | | | | | |
| | | | |
Class R1 Shares | | | | | | | | | | | | | | | | |
Shares Issued | | $ | 7,401 | | | | 778 | | | $ | 7,979 | | | | 1,266 | |
Shares Issued in Lieu of Cash Distributions | | | 312 | | | | 35 | | | | 423 | | | | 64 | |
Shares Redeemed | | | (5,936 | ) | | | (632 | ) | | | (5,207 | ) | | | (844 | ) |
Shares Reduced by Reverse Stock Split (Note P) | | | — | | | | (1,314 | ) | | | — | | | | — | |
| | | | | | | | | | | | | | | | |
Net Increase (Decrease) — Class R1 Shares | | $ | 1,777 | | | | (1,133 | ) | | $ | 3,195 | | | | 486 | |
| | | | | | | | | | | | | | | | |
| | | | |
Class R2 Shares | | | | | | | | | | | | | | | | |
Shares Issued | | $ | 5,859 | | | | 572 | | | $ | 1,638 | | | | 210 | |
Shares Issued in Lieu of Cash Distributions | | | 29 | | | | 3 | | | | 27 | | | | 4 | |
Shares Redeemed | | | (3,559 | ) | | | (360 | ) | | | (626 | ) | | | (85 | ) |
Shares Reduced by Reverse Stock Split (Note P) | | | — | | | | (159 | ) | | | — | | | | — | |
| | | | | | | | | | | | | | | | |
Net Increase (Decrease) — Class R2 Shares | | $ | 2,329 | | | | 56 | | | $ | 1,039 | | | | 129 | |
| | | | | | | | | | | | | | | | |
| | | | |
Institutional Class Shares | | | | | | | | | | | | | | | | |
Shares Issued | | $ | 897,844 | | | | 63,857 | | | $ | 840,965 | | | | 86,986 | |
Shares Issued in Lieu of Cash Distributions | | | 11,187 | | | | 862 | | | | 13,191 | | | | 1,374 | |
Shares Redeemed | | | (512,167 | ) | | | (37,960 | ) | | | (419,657 | ) | | | (43,424 | ) |
| | | | | | | | | | | | | | | | |
Net Increase (Decrease) — Institutional Class Shares | | $ | 396,864 | | | | 26,759 | | | $ | 434,499 | | | | 44,936 | |
| | | | | | | | | | | | | | | | |
| | | | |
Emerging Markets Value Portfolio | | | | | | | | | | | | | | | | |
| | | | |
Class R2 Shares | | | | | | | | | | | | | | | | |
Shares Issued | | $ | 34,637 | | | | 18,214 | | | $ | 2,967 | | | | 1,723 | |
Shares Issued in Lieu of Cash Distributions | | | 6,798 | | | | 3,947 | | | | 1,574 | | | | 942 | |
Shares Redeemed | | | (6,985 | ) | | | (3,724 | ) | | | (2,169 | ) | | | (1,024 | ) |
| | | | | | | | | | | | | | | | |
Net Increase (Decrease) — Class R2 Shares | | $ | 34,450 | | | | 18,437 | | | $ | 2,372 | | | | 1,641 | |
| | | | | | | | | | | | | | | | |
| | | | |
Institutional Class Shares | | | | | | | | | | | | | | | | |
Shares Issued | | $ | 3,313,583 | | | | 103,334 | | | $ | 1,977,785 | | | | 91,360 | |
Shares Issued in Lieu of Cash Distributions | | | 265,972 | | | | 8,765 | | | | 574,904 | | | | 34,181 | |
Shares Redeemed | | | (1,555,298 | ) | | | (49,938 | ) | | | (1,287,040 | ) | | | (62,335 | ) |
| | | | | | | | | | | | | | | | |
Net Increase (Decrease) — Institutional Class Shares | | $ | 2,024,257 | | | | 62,161 | | | $ | 1,265,649 | | | | 63,206 | |
| | | | | | | | | | | | | | | | |
150
H. Financial Instruments:
In accordance with the Portfolios’ investment objectives and policies, the Portfolios may invest, either directly or indirectly through their investment in a corresponding Master Fund, in certain financial instruments that have off-balance sheet risk in excess of the amounts recognized in the financial statements and concentrations of credit and market risk. These instruments and their significant corresponding risks are described below:
1. Repurchase Agreements: The Portfolios may purchase certain U.S. Government securities subject to the counterparty’s agreement to repurchase them at an agreed upon date and price. The counterparty will be required on a daily basis to maintain the value of the collateral subject to the agreement at not less than the repurchase price (including accrued interest). Due to a clerical error at the repurchase trading agent from October 29, 2010 through November 1, 2010, the collateral held by International Core Equity Portfolio was less than the repurchase price. On November 2, 2010, additional collateral was posted and the repurchase agreement was fully collateralized. The agreements are conditioned upon the collateral being deposited under the Federal Reserve book-entry system with the Fund’s custodian or a third party sub-custodian. In the event of default or bankruptcy by the other party to the agreement, retention of the collateral may be subject to legal proceedings. All open repurchase agreements were entered into on October 29, 2010.
2. Foreign Market Risks: Investments in foreign markets may involve certain considerations and risks not typically associated with investments in U.S. companies, including the possibility of future political and economic developments and the level of foreign governmental supervision and regulation of foreign securities markets. These markets are generally smaller, less liquid and more volatile than the major securities markets in the United States of America. Consequently, acquisition and disposition of international securities held by the Portfolios may be inhibited.
Derivative Financial Instruments:
Disclosures on derivative instruments and hedging activities are intended to improve financial reporting for derivative instruments by enabling investors to understand how and why a Portfolio uses derivatives, how derivatives are accounted for and how derivative instruments affect a Portfolio’s results of operations and financial position. Summarized below are the specific types of derivative instruments used by the Portfolios.
3. Forward Currency Contracts: Enhanced U.S. Large Company Portfolio may enter into forward currency contracts to hedge against adverse changes in the relationship of the U.S. dollar to foreign currencies (foreign exchange rate risk). The decision to hedge a Portfolio’s currency exposure with respect to a foreign market will be based primarily on the Portfolio’s existing exposure to a given foreign currency. Each contract is valued daily and the change in value is recorded by the Portfolio as an unrealized gain or loss, which is presented in the Statements of Operations as the change in unrealized appreciation or depreciation of translation of foreign currency denominated amounts. When the contract is closed or offset with the same counterparty, the Portfolio records a realized gain or loss equal to the change in the value of the contract when it was opened and the value at the time it was closed or offset. This is presented in the Statements of Operations as a net realized gain or loss on foreign currency transactions. At October 31, 2010, Enhanced U.S. Large Company Portfolio had entered into the following contracts and the net unrealized foreign exchange gain/(loss) is reflected in the accompanying financial statements (amounts in thousands):
Enhanced U.S. Large Company Portfolio*
| | | | | | | | | | | | |
Settlement Date | | Currency
Amount | | Currency Sold | | Contract
Amount | | Value at
October 31, 2010 | | Unrealized
Foreign
Exchange
Gain (Loss) | |
11/12/10 | | 18,272 | | Canadian Dollar | | $ 18,034 | | $ 17,910 | | $ | 124 | |
11/12/10 | | 10,847 | | Pound Sterling | | 17,167 | | 17,378 | | | (211 | ) |
11/12/10 | | 9,870 | | Euro | | 13,648 | | 13,734 | | | (86 | ) |
| | | | | | | | | | | | |
| | | | | | $ 48,849 | | $ 49,022 | | $ | (173 | ) |
| | | | | | | | | | | | |
* During the year ended October 31, 2010, the Portfolio’s average cost of forward currency contracts was $(41,128) (in thousands).
151
Risks may arise upon entering into these contracts from the potential inability of counterparties to meet the terms of their contracts and from unanticipated movements in the value of foreign currency relative to the U.S. dollar.
4. Futures Contracts: Certain Portfolios may enter into futures contracts to gain market exposure on uninvested cash pending investment in securities or to maintain liquidity to pay redemptions. Additionally, Enhanced U.S. Large Company Portfolio uses stock index futures to hedge against changes in equity securities’ prices in the normal course of pursuing its investment objectives. Upon entering into a futures contract, the Portfolio deposits cash or pledges U.S. Government securities to a broker, equal to the minimum “initial margin” requirements of the exchange on which the contract is traded. Subsequent payments are received from or paid to the broker each day, based on the daily fluctuation in the market value of the contract. These receipts or payments are known as “variation margin” and are recorded daily by the Portfolio as unrealized gains or losses until the contracts are closed. When the contracts are closed, the Portfolio records a realized gain or loss, which is presented in the Statement of Operations as a net realized gain or loss on futures, equal to the difference between the value of the contract at the time it was opened and the value at the time it was closed.
Risks may arise upon entering into futures contracts from potential imperfect price correlations between the futures contracts and the underlying securities, from the possibility of an illiquid secondary market for these instruments and from the possibility that the Portfolio could lose more than the initial margin requirements. The Portfolios entering into stock index futures are subject to equity price risk from those futures contracts. Counterparty credit risk related to exchange-traded futures is minimal because the exchange’s clearinghouse, as counterparty to all exchange-traded futures, guarantees the futures against default.
At October 31, 2010, the following Portfolio had outstanding futures contracts (dollar amounts in thousands):
| | | | | | | | | | |
| | | Description | | Expiration
Date | | Number of
Contracts* | | Contract
Value | | Unrealized
Gain (Loss) |
Enhanced U.S. Large Company Portfolio | | S&P 500 Index® | | 12/17/2010 | | 515 | | $151,886 | | $10,407 |
Securities have been segregated as collateral for open futures contracts.
*During the year ended October 31, 2010 the Portfolio’s average notional value of outstanding futures contracts was $153,224 (in thousands).
Additional disclosure on derivative instruments is required showing a summary by primary risk exposure of the derivatives instruments’ (i) location in the balance sheet and fair value at period end and (ii) the location in the Statements of Operations and the realized and change in unrealized gain or loss over the reporting period. The following is a summary of the Portfolios’ derivative instrument holdings for the year ended October 31, 2010.
The following is a summary of the location of derivatives on the Portfolios’ Statements of Assets and Liabilities as of October 31, 2010:
| | | | |
| | | Location on the Statements of Assets and Liabilities |
Derivative Type | | Asset Derivatives | | Liability Derivatives |
Foreign exchange contracts | | Unrealized Gain on | | Unrealized Loss on Forward |
| | Forward Currency Contracts | | Currency Contracts |
| | |
Equity contracts | | Receivables: Futures | | |
| | Margin Variation | | |
152
The following is a summary of the Portfolios’ derivative instrument holdings categorized by primary risk exposure as of October 31, 2010 (amounts in thousands):
| | | | | | |
| | | | | Asset Derivatives Value |
| | | Total Value at
October 31, 2010 | | Foreign
Exchange
Contracts | | Equity
Contracts |
Enhanced U.S. Large Company Portfolio | | $10,531 | | $124 | | $10,407* |
| | |
| | | | | Liability Derivatives Value |
| | | Total Value at October 31, 2010 | | Foreign
Exchange
Contracts | | Equity
Contracts |
Enhanced U.S. Large Company Portfolio | | $297 | | $297 | | — |
| * | Includes cumulative appreciation (depreciation) of futures contracts. Only current day’s margin variation is reported within the Statement of Assets and Liabilities. |
The following is a summary of the location on the Portfolios’ Statements of Operations of realized and change in unrealized gains and losses from the Portfolio’s derivative instrument holdings through the year ended October 31, 2010 (amounts in thousands):
| | |
Derivative Type | | Location of Gain (Loss) on Derivatives Recognized in Income |
Foreign exchange contracts | | Net Realized Gain (Loss) on: Foreign Currency Transactions Change in Unrealized Appreciation (Depreciation) of: Translation of Foreign Currency Denominated Amounts |
| |
Equity contracts | | Net Realized Gain (Loss) on: Futures Change in Unrealized Appreciation (Depreciation) of: Futures |
The following is a summary of the realized and change in unrealized gains and losses from the Portfolios’ derivative instrument holdings categorized by primary risk exposure through the year ended October 31, 2010 (amounts in thousands):
| | | | | | | | | | | | |
| | | Realized Gain (Loss)
on Derivatives
Recognized in Income | |
| | | | | | Foreign | | | | |
| | | | | | Exchange | | | Equity | |
| | | Total | | | Contracts | | | Contracts | |
Enhanced U.S. Large Company Portfolio | | $ | 15,133 | | | $ | 6 | | | $ | 15,127 | |
U.S. Targeted Value Portfolio* | | | (256 | ) | | | — | | | | (256 | ) |
| |
| | | Change in Unrealized
Appreciation (Depreciation) on
Derivatives Recognized in Income | |
| | | Total | | | Foreign
Exchange
Contracts | | | Equity
Contracts | |
Enhanced U.S. Large Company Portfolio | | $ | 8,490 | | | $ | (212 | ) | | $ | 8,702 | |
*As of October 31, 2010, there were no futures contracts outstanding. During the year ended October 31, 2010, the Portfolio had limited activity in futures contracts.
153
I. Line of Credit:
The Fund, together with other Dimensional-advised portfolios, has entered into an amended and restated $250 million unsecured discretionary line of credit effective July 8, 2009 with an affiliate of its domestic custodian bank. Each portfolio is permitted to borrow, subject to its investment limitations, up to a maximum of $250 million, as long as total borrowings under the line of credit do not exceed $250 million in the aggregate. Borrowings under the line of credit are charged interest at rates agreed to by the parties at the time of borrowing. Each portfolio is individually, and not jointly, liable for its particular advances under the line of credit. There is no commitment fee on the unused portion of the line of credit. The agreement for the discretionary line of credit may be terminated by either party at any time. The line of credit is scheduled to expire on June 21, 2011.
For the year ended October 31, 2010, borrowings by the Portfolios under this line of credit were as follows (amounts in thousands, except percentages and days):
| | | | | | | | | | | | | | | | | | | | |
| | | Weighted
Average
Interest Rate | | | Weighted
Average
Loan Balance | | | Number of
Days
Outstanding | | | Interest
Expense
Incurred | | | Maximum Amount
Borrowed During
the Period | |
U.S. Targeted Value Portfolio | | | 1.87 | % | | $ | 6,228 | | | | 26 | | | $ | 8 | | | $ | 18,056 | |
U.S. Small Cap Value Portfolio | | | 1.93 | % | | | 8,960 | | | | 68 | | | | 33 | | | | 30,918 | |
U.S. Vector Equity Portfolio | | | 1.98 | % | | | 966 | | | | 6 | | | | — | | | | 2,221 | |
U.S. Small Cap Portfolio | | | 1.99 | % | | | 10,715 | | | | 10 | | | | 6 | | | | 20,785 | |
U.S. Micro Cap Portfolio | | | 1.98 | % | | | 3,162 | | | | 50 | | | | 9 | | | | 15,352 | |
DFA Real Estate Securities Portfolio | | | 1.95 | % | | | 2,869 | | | | 114 | | | | 18 | | | | 11,404 | |
DFA Global Real Estate Securities Portfolio | | | 1.92 | % | | | 2,567 | | | | 47 | | | | 6 | | | | 17,848 | |
There were no outstanding borrowings by the Portfolios under this line of credit as of October 31, 2010.
The Fund, together with other Dimensional-advised portfolios, has also entered into an additional $500 million unsecured line of credit effective January 15, 2010 with its international custodian bank. Each portfolio is permitted to borrow, subject to its investment limitations, up to a maximum of $500 million, as long as total borrowings under the line of credit do not exceed $500 million in the aggregate. Each portfolio is individually, and not jointly, liable for its particular advances under the line of credit. Borrowings under the line of credit are charged interest at rates agreed to by the parties at the time of borrowing. There is no commitment fee on the unused portion of the line of credit. The agreement for the line of credit expires on January 15, 2011.
For the year ended October 31, 2010, borrowings by the Portfolios under this line of credit were as follows (amounts in thousands, except percentages and days):
| | | | | | | | | | | | | | | | | | | | |
| | | Weighted
Average
Interest Rate | | | Weighted
Average
Loan Balance | | | Number of
Days
Outstanding | | | Interest
Expense
Incurred | | | Maximum Amount
Borrowed During
the Period | |
U.S. Small Cap Value Portfolio | | | 0.90 | % | | $ | 903 | | | | 3 | | | | — | | | $ | 903 | |
U.S. Core Equity 1 Portfolio | | | 0.94 | % | | | 7,563 | | | | 2 | | | | — | | | | 8,197 | |
U.S. Micro Cap Portfolio | | | 0.96 | % | | | 21 | | | | 1 | | | | — | | | | 21 | |
DFA Real Estate Securities Portfolio | | | 0.95 | % | | | 266 | | | | 4 | | | | — | | | | 271 | |
Large Cap International Portfolio | | | 0.92 | % | | | 2,433 | | | | 14 | | | $ | 1 | | | | 6,118 | |
International Small Company Portfolio | | | 0.90 | % | | | 5,222 | | | | 15 | | | | 2 | | | | 12,990 | |
DFA International Real Estate | | | | | | | | | | | | | | | | | | | | |
Securities Portfolio | | | 0.89 | % | | | 6,293 | | | | 33 | | | | 5 | | | | 22,677 | |
DFA International Small Cap Value Portfolio | | | 0.90 | % | | | 7,963 | | | | 46 | | | | 9 | | | | 31,973 | |
International Vector Equity Portfolio | | | 0.95 | % | | | 1,512 | | | | 16 | | | | 1 | | | | 4,313 | |
Emerging Markets Core Equity Portfolio | | | 0.93 | % | | | 3,739 | | | | 17 | | | | 2 | | | | 15,531 | |
There were no outstanding borrowings by the Portfolios under this line of credit as of October 31, 2010.
154
J. Securities Lending:
As of October 31, 2010, some of the Portfolios had securities on loan to brokers/dealers, for which each Portfolio received cash collateral. Each Portfolio invests the cash collateral, as described below, and records a liability for the return of the collateral, during the period the securities are on loan. Loans of securities are expected at all times to be secured by collateral equal to at least (i) 100% of the current market value of the loaned securities with respect to securities of the U.S. government or its agencies, (ii) 102% of the current market value of the loaned securities with respect to U.S. securities, and (iii) 105% of the current market value of the loaned securities with respect to foreign securities. However, daily market fluctuations could cause the Portfolios’ collateral to be lower or higher than the expected thresholds. If this were to occur, the collateral would be adjusted the next business day to ensure adequate collateralization. In the event of default or bankruptcy by the other party to the agreement, realization and/or retention of the collateral may be subject to legal proceedings. If the borrower fails to return loaned securities, and cash collateral being maintained by the borrower is insufficient to cover the value of loaned securities and provided such collateral insufficiency is not the result of investment losses, the lending agent has agreed to pay the amount of the shortfall to the Portfolio or, at the option of the lending agent, to replace the securities.
Subject to their stated investment policies, each Portfolio will generally invest the cash collateral received for the loaned securities in The DFA Short Term Investment Fund (the “Money Market Series”), an affiliated registered money market fund advised by the Advisor for which the Advisor receives a management fee of 0.05% of the average daily net assets of the Money Market Series. Each Portfolio also may invest the cash collateral received for the loaned securities in securities of the U.S. government or its agencies, repuchase agreements collateralized by securities of the U.S. government or its agencies, and affiliated and unaffiliated registered and unregistered money market funds. For purposes of this paragraph, agencies include both agency debentures and agency mortgage-backed securities. In addition, each Portfolio will be able to terminate the loan at any time and will receive reasonable interest on the loan, as well as amounts equal to any dividends, interest or other distributions on the loaned securities. However, dividend income received from loaned securities may not be eligible to be taxed at qualified dividend income rates.
K. Shareholder Servicing Fees:
The Class R1 Shares pay a shareholder servicing fee in the amount of 0.10% and Class R2 Shares pay a shareholder servicing fee in the amount of 0.25% of their annual average net assets to compensate service agents that provide shareholder servicing, record keeping, account maintenance and other services to investors in U.S. Targeted Value Portfolio Class R1 and Class R2 Shares and Emerging Markets Value Portfolio Class R2 Shares.
L. Indemnitees; Contractual Obligations:
Under the Fund’s organizational documents, its officers and directors are indemnified against certain liabilities arising out of the performance of their duties to the Fund.
In the normal course of business, the Fund enters into contracts that contain a variety of representations and warranties which provide general indemnification. The Fund’s maximum exposure under these arrangements is unknown as this would involve future claims that may be made against the Fund and/or its affiliates that have not yet occurred. However, based on experience, the Fund expects the risk of loss to be remote.
M. In-Kind Redemptions:
In accordance with guidelines described in the Portfolios’ prospectus, the fund may distribute portfolio securities rather than cash as payment for a redemption of fund shares (in-kind redemption). For financial reporting purposes, the fund recognizes a gain on in-kind redemptions to the extent the value of the distributed securities on the date of redemption exceeds the cost of those securities. Gains and losses realized on in-kind redemptions are not recognized for tax purposes and are reclassified from undistributed realized gain (loss) to paid-in capital.
During the year ended October 31, 2010, U.S. Small Cap Value Portfolio realized net gains of in-kind redemptions in the amount of $56,505 (amount in thousands).
155
N. Recently Issued Accounting Standards:
In January 2010, the Financial Accounting Standards Board (“FASB”) issued Accounting Standards Update (“ASU”) No. 2010-06 “Improving Disclosures about Fair Value Measurements.” ASU No. 2010-06 amends FASB Accounting Standards Codification Topic 820, Fair Value Measurements and Disclosures, to require additional disclosures in the roll forward of activity in Level 3 fair value measurements effective for interim and annual reporting periods beginning after December 15, 2010. Management is currently evaluating the impact ASU No. 2010-06 will have on its financial statement disclosures.
O. Other:
At October 31, 2010, the following number of shareholders held the following approximate percentages of outstanding shares of the Portfolios. One or more of the shareholders may be omnibus accounts, which typically hold shares for the benefit of several other underlying investors.
| | | | |
| | | Number of
Shareholders | | Approximate
Percentage
of Outstanding
Shares |
Enhanced U.S. Large Company Portfolio — Institutional Class Shares | | 3 | | 83% |
U.S. Large Cap Value Portfolio — Institutional Class Shares | | 3 | | 79% |
U.S. Targeted Value Portfolio — Class R1 Shares | | 1 | | 95% |
U.S. Targeted Value Portfolio — Class R2 Shares | | 2 | | 86% |
U.S. Targeted Value Portfolio — Institutional Class Shares | | 2 | | 59% |
U.S. Small Cap Value Portfolio — Institutional Class Shares | | 2 | | 53% |
U.S. Core Equity 1 Portfolio — Institutional Class Shares | | 3 | | 65% |
U.S. Core Equity 2 Portfolio — Institutional Class Shares | | 3 | | 67% |
U.S. Vector Equity Portfolio — Institutional Class Shares | | 4 | | 89% |
U.S. Small Cap Portfolio — Institutional Class Shares | | 3 | | 53% |
U.S. Micro Cap Portfolio — Institutional Class Shares | | 2 | | 58% |
DFA Real Estate Securities Portfolio — Institutional Class Shares | | 3 | | 74% |
Large Cap International Portfolio — Institutional Class Shares | | 2 | | 73% |
International Core Equity Portfolio — Institutional Class Shares | | 3 | | 70% |
International Small Company Portfolio — Institutional Class Shares | | 2 | | 50% |
Japanese Small Company Portfolio — Institutional Class Shares | | 3 | | 68% |
Asia Pacific Small Company Portfolio — Institutional Class Shares | | 3 | | 81% |
United Kingdom Small Company Portfolio — Institutional Class Shares | | 2 | | 89% |
Continental Small Company Portfolio — Institutional Class Shares | | 4 | | 84% |
DFA International Real Estate Securities Portfolio — Institutional Class Shares | | 3 | | 84% |
DFA Global Real Estate Securities Portfolio — Institutional Class Shares | | 2 | | 87% |
DFA International Small Cap Value Portfolio — Institutional Class Shares | | 2 | | 47% |
International Vector Equity Portfolio — Institutional Class Shares | | 3 | | 87% |
Emerging Markets Portfolio — Institutional Class Shares | | 3 | | 66% |
Emerging Markets Small Cap Portfolio — Institutional Class Shares | | 1 | | 29% |
Emerging Markets Value Portfolio — Class R2 Shares | | 1 | | 81% |
Emerging Markets Value Portfolio — Institutional Class Shares | | 2 | | 27% |
Emerging Markets Core Equity Portfolio — Institutional Class Shares | | 2 | | 60% |
The Portfolios are subject to claims and suits that arise from time to time in the ordinary course of business (for example, in The Tribune Company Bankruptcy, certain creditors have filed an action against all shareholders of The Tribune Company who tendered shares when the Tribune Company went private in 2007 in a leveraged buy out transaction, seeking the return of all proceeds received by the shareholders). Although management currently believes
156
that resolving claims against us, individually or in aggregate, will not have a material adverse impact on our financial position, our results of operations, or our cash flows, these matters are subject to inherent uncertainties and management’s view of these matters may change in the future.
P. Subsequent Event Evaluations:
Management has evaluated the impact of all subsequent events on the Portfolios and has determined that the following subsequent event requires recognition or disclosure in the financial statements.
On October 29, 2010, the Board of Directors/Trustees adopted a Plan of Recapitalization of U.S. Targeted Value Portfolio’s Class R1 and Class R2 Shares. On November 19, 2010, a reverse stock split was executed whereby each shareholder of Class R1 Shares received one share for every 1.469 shares held and each shareholder of Class R2 Shares received one share for every 1.394 shares held. The purpose of the reverse split was to reduce the number of Class R1 Shares and Class R2 Shares, thereby increasing the net asset value of each Class R1 Share and Class R2 Share outstanding in order to more closely align the net asset values with the net asset value of U.S. Targeted Value Portfolio’s Institutional Class Shares. The per share data in the financial highlights, capital share activity in the statements of changes in net assets and the outstanding shares and net asset value as of October 31, 2010 in the statement of assets and liabilities have been retroactively restated to reflect the reverse stock splits for the respective Class R1 Shares and Class R2 Shares.
The Board of Directors/Trustees of DFA Investment Dimensions Group Inc. authorized the conversion of the Class R2 Shares of Emerging Markets Value Portfolio to the Class R2A Shares, a new class of shares. The Class R2 Shares of Emerging Markets Value Portfolio ceased to be offered and available for purchase upon the close of business on December 3, 2010. Following the conversion, shareholders and investors purchase and redeem class R2A Shares of the Portfolio.
A class action complaint (the “Complaint”) has been filed in the bankruptcy case of the Tribune Company (the “Tribune”) in the United States Bankruptcy Court for the District of Delaware. The Complaint is against The U.S. Large Cap Value Series and all other Tribune shareholders as a group, which includes hundreds of mutual funds, institutional investors and others who sold shares of Tribune in 2007 when the Tribune became private in a leveraged buyout transaction (the “LBO Transaction”). The U.S. Large Cap Value Series, and all shareholders who participated in the LBO Transaction, received cash in the amount of $34 per share. The Complaint alleges that this transfer violated the rights of creditors and that the cash paid to shareholders in connection with the LBO Transaction should be paid back to the Tribune’s bankruptcy estate and used to pay creditors.
Litigation counsel to The U.S. Large Cap Value Series does not believe that it is possible, at this early stage in the proceedings, to predict with any reasonable certainty the probable outcome of the lawsuit or quantify the potential ultimate exposure to The U.S. Large Cap Value Series. However, even if the plaintiff in the lawsuit were to obtain the recovery it seeks, the amount would be less than 1% of The U.S. Large Cap Value Series’ net asset value at this time. The U.S. Large Cap Value Series’ litigation counsel does not believe at this time that recovery of the full amount the plaintiff seeks is a likely outcome.
Since The U.S. Large Cap Value Series cannot predict with reasonable specificity what the actual outcome of the lawsuit may be or what the size of The U.S. Large Cap Value Series might be at the time the outcome of the lawsuit may be determined, no deduction from the net asset value of The U.S. Large Cap Value Series will be made at this time. Therefore, at this time, those buying or redeeming shares of The U.S. Large Cap Value Series will pay or receive, as the case may be, a price based on net asset value of The U.S. Large Cap Value Series, with no deduction relating to the lawsuit. The attorneys’ fees and costs relating to the lawsuit will be taken as expenses by The U.S. Large Cap Value Series as incurred and in a manner similar to any other expense incurred by The U.S. Large Cap Value Series.
157
REPORT OF INDEPENDENT REGISTERED PUBLIC ACCOUNTING FIRM
To the Shareholders of the Portfolios, as defined, and
Board of Directors of DFA Investment Dimensions Group Inc.:
In our opinion, the accompanying statements of assets and liabilities, including the schedules of investments/ summary schedules of portfolio holdings, and the related statements of operations and of changes in net assets and the financial highlights present fairly, in all material respects, the financial position of Enhanced U.S. Large Company Portfolio, U.S. Large Cap Value Portfolio, U.S. Targeted Value Portfolio, U.S. Small Cap Value Portfolio, U.S. Core Equity 1 Portfolio, U.S. Core Equity 2 Portfolio, U.S. Vector Equity Portfolio, U.S. Small Cap Portfolio, U.S. Micro Cap Portfolio, DFA Real Estate Securities Portfolio, Large Cap International Portfolio, International Core Equity Portfolio, International Small Company Portfolio, Japanese Small Company Portfolio, Asia Pacific Small Company Portfolio, United Kingdom Small Company Portfolio, Continental Small Company Portfolio, DFA International Real Estate Securities Portfolio, DFA Global Real Estate Securities Portfolio, DFA International Small Cap Value Portfolio, International Vector Equity Portfolio, Emerging Markets Portfolio, Emerging Markets Small Cap Portfolio, Emerging Markets Value Portfolio and Emerging Markets Core Equity Portfolio (constituting portfolios within DFA Investment Dimensions Group Inc., hereafter referred to as the “Portfolios”) at October 31, 2010, the results of each of their operations, the changes in each of their net assets and the financial highlights for each of the periods indicated, in conformity with accounting principles generally accepted in the United States of America. These financial statements and financial highlights (hereafter referred to as “financial statements”) are the responsibility of the Portfolios’ management; our responsibility is to express an opinion on these financial statements based on our audits. We conducted our audits of these financial statements in accordance with the standards of the Public Company Accounting Oversight Board (United States). Those standards require that we plan and perform the audit to obtain reasonable assurance about whether the financial statements are free of material misstatement. An audit includes examining, on a test basis, evidence supporting the amounts and disclosures in the financial statements, assessing the accounting principles used and significant estimates made by management, and evaluating the overall financial statement presentation. We believe that our audits, which included confirmation of securities at October 31, 2010 by correspondence with the custodians, brokers, and the transfer agents of the investee funds, provide a reasonable basis for our opinion.
PricewaterhouseCoopers LLP
Philadelphia, Pennsylvania
December 22, 2010
158
DIMENSIONAL INVESTMENT GROUP INC.
PERFORMANCE CHARTS
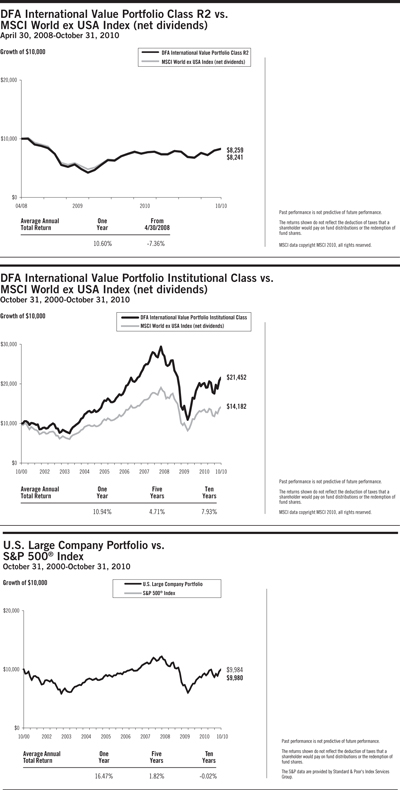
159
DIMENSIONAL INVESTMENT GROUP INC.
MANAGEMENT’S DISCUSSION AND ANALYSIS
| | | | |
| International Equity Market Review | | | 12 Months Ended October 31, 2010 | |
The one-year period ending October 31, 2010, was characterized by relatively high levels of volatility in non-US developed markets. Broad market returns were positive, with stocks represented by the MSCI World ex USA Index (net dividends) returning 9.61%.
While market returns were positive in November and December of 2009, high volatility over the next five months — punctuated by an 11% drop in May — took developed non-US stocks to their lows for the fiscal year. In June, stocks began a sharp rise which continued through the remainder of the fiscal year as global economic data generally improved. As measured by the MSCI indices, growth stocks outperformed their value counterparts, while small cap stocks outperformed large caps.
| | | | |
| 12 Months Ended October 31, 2010 | | | |
| |
| | | U.S. Dollar
Return | |
MSCI World ex USA Index | | | 9.61% | |
MSCI World ex USA Small Cap Index | | | 17.23% | |
MSCI World ex USA Value Index | | | 6.38% | |
MSCI World ex USA Growth Index | | | 12.87% | |
The performance of the US dollar (USD) was mixed against other major developed markets currencies during the period. While the USD rose slightly against the euro and British pound, it fell against most other G10 currencies, and in particular against the Japanese yen.
| | | | | | | | |
| 12 Months Ended October 31, 2010 | | | | | | |
| | |
| Ten Largest Foreign Developed Markets by Market Cap | | Local
Currency
Return | | | U.S. Dollar
Return | |
United Kingdom | | | 16.07% | | | | 12.58% | |
Japan | | | -6.76% | | | | 4.78% | |
Canada | | | 15.83% | | | | 22.62% | |
France | | | 11.80% | | | | 5.31% | |
Australia | | | 3.70% | | | | 12.50% | |
Germany | | | 20.61% | | | | 13.61% | |
Switzerland | | | 5.53% | | | | 9.90% | |
Spain | | | -2.96% | | | | -8.59% | |
Sweden | | | 17.82% | | | | 23.94% | |
Italy | | | 0.69% | | | | -5.14% | |
Source: Returns are of MSCI standard indices net of foreign withholding taxes on dividends. Copyright MSCI 2010, all rights reserved.
Gains in emerging markets were higher on average than in developed markets, although results varied widely among the individual emerging markets countries. For the one-year period ended October 31, 2010, returns in US dollars were 23.56% for the MSCI Emerging Markets Index (net dividends) versus 9.61% for the MSCI World ex USA Index (net dividends). As measured by the MSCI indices, emerging markets growth stocks outperformed their value counterparts, while emerging markets small cap stocks outperformed large caps.
160
| | | | |
| 12 Months Ended October 31, 2010 | | | |
| | | U.S. Dollar
Return | |
MSCI Emerging Markets Index | | | 23.56% | |
MSCI Emerging Markets Small Cap Index | | | 37.02% | |
MSCI Emerging Markets Value Index | | | 21.96% | |
MSCI Emerging Markets Growth Index | | | 25.17% | |
The US dollar (USD) generally depreciated against most major emerging markets currencies during the period, increasing most local country returns when denominated in USD.
| | | | | | | | |
| 12 Months Ended October 31, 2010 | | | | | | |
| Ten Largest Emerging Markets by Market Cap | | Local
Currency
Return | | | U.S. Dollar
Return | |
China | | | 11.14% | | | | 11.11% | |
Brazil | | | 11.67% | | | | 14.86% | |
South Korea | | | 18.52% | | | | 24.52% | |
Taiwan | | | 13.20% | | | | 20.23% | |
India | | | 27.64% | | | | 34.93% | |
South Africa | | | 18.71% | | | | 33.55% | |
Russia | | | 19.19% | | | | 13.38% | |
Mexico | | | 25.55% | | | | 33.87% | |
Malaysia | | | 23.94% | | | | 35.93% | |
Indonesia | | | 41.78% | | | | 51.50% | |
Source: Returns are of MSCI standard indices net of foreign withholding taxes on dividends. Copyright MSCI 2010, all rights reserved.
Master-Feeder Structure
The Portfolio described below, called a “Feeder Fund”, does not buy individual securities directly; instead, the Portfolio invests in a corresponding fund called a “Master Fund”. The Master Fund, in turn, purchases stocks and/or other securities.
International Equity Portfolio Performance Overview
DFA International Value Portfolio
The DFA International Value Portfolio seeks to capture the returns of international large company value stocks by purchasing shares of a Master Fund that invests in such stocks. The investment strategy employs a disciplined, quantitative approach, emphasizing broad diversification and consistent exposure to large cap value stocks, but does not attempt to track a specific equity index. As of October 31, 2010, the Master Fund held 528 stocks in 23 developed countries. In general, the Master Fund was fully invested in equities throughout the year. The average cash level for the period was less than 1% of the Master Fund’s assets.
For the 12 months ended October 31, 2010, total returns were 10.94% for the Portfolio’s Institutional Class shares, 10.60% for the Portfolio’s Class R2 shares, and 9.61% for the MSCI World ex USA Index (net dividends). The MSCI Standard benchmarks indicate that on the whole, growth stocks outperformed value stocks in international developed markets during the period. However, stocks in the deeper value segment of the market outperformed growth stocks on average. The Master Fund’s greater allocation than the Index to these deeper value stocks contributed to relative performance. An additional component of the Portfolio’s outperformance is due to differences in valuation timing and methodology between the Master Fund and the Index. The Master Fund prices
161
foreign exchange rates at the closing of the U.S. markets while the Index uses rates at 4 pm London time. The Master Fund utilizes fair value pricing to price portfolio securities at the closing of the U.S. markets while the Index uses local market closing prices.
| | | | |
| U.S. Equity Market Review | | | 12 Months Ended October 31, 2010 | |
The year ending October 31, 2010, was a relatively volatile period for U.S. equities. Broad market returns were positive, with the Russell 3000® Index returning 18.34%. Stocks represented by the Russell Midcap® Index outperformed those within both the Russell 2000® Index (small caps) and the Russell 1000® Index (large caps). Meanwhile, stocks represented by the Russell 1000® Growth Index outperformed those represented by the Rus-sell 1000® Value Index.
While market returns were positive through April 2010, stocks retreated in May and June, marking new lows for the fiscal year in early July. Then in September, stocks began a sharp rise which continued through October. Over the course of the fiscal year, the small company premium within the Russell 3000® Index was positive, while the value premium was negative as investors’ risk tolerance shifted, and general economic conditions evolved.
Among the most important factors explaining differences in the behavior of diversified equity portfolios are the company size and company value/growth characteristics of the portfolio’s holdings. Size is measured by market capitalization, and value classification is a function of stock price relative to one or more fundamental characteristics. Compared to other stocks, value stocks often have lower market value relative to their earnings, dividends, and book value.
For the 12 months ended October 31, 2010, the total return of the Russell Microcap® Index was 25.08%, the Russell 2000® Index was 26.57%, the CRSP 6-10 Index was 28.76%, and the MSCI US Small Cap 1750 Index was 28.35%. Large cap growth stocks outperformed large cap value stocks, as measured by the Russell 1000® Growth Index and Russell 1000® Value Index. Small cap growth stocks outperformed small cap value stocks as measured by the Russell 2000® Growth Index and Russell 2000® Value Index.
12 Months Ended October 31, 2010
| | | | |
| | | U.S. Dollar
Return | |
Russell 2000® Index (small cap companies) | | | 26.57% | |
Russell Midcap® Index (mid cap companies) | | | 27.73% | |
Russell 1000® Index (large cap companies) | | | 17.65% | |
Russell 3000® Value Index | | | 16.41% | |
Russell 3000® Growth Index | | | 20.32% | |
Further dividing the large, mid, and small cap market segments by value and growth characteristics shows more detail in the performance differences over the period.
Total Return for 12 Months Ended October 31, 2010
| | | | |
Russell 1000® Value Index (large cap value companies) | | | 15.72% | |
Russell 1000® Growth Index (large cap growth companies) | | | 19.66% | |
Russell Midcap® Value Index (mid cap value companies) | | | 27.50% | |
Russell Midcap® Growth Index (mid cap growth companies) | | | 28.03% | |
Russell 2500® Value Index (small/mid cap value companies) | | | 26.89% | |
Russell 2500® Growth Index (small/mid cap growth companies) | | | 28.76% | |
Russell 2000® Value Index (small cap value companies) | | | 24.43% | |
Russell 2000® Growth Index (small cap growth companies) | | | 28.66% | |
Source: Russell data copyright © Russell Investment Group 1995-2010, all rights reserved.
162
Differences in returns for the various Dimensional U.S. equity funds over the 12 months ended October 31, 2010 were attributable primarily to differences in value/growth and size characteristics as well as the exclusion of REIT securities from most Dimensional portfolios, except for the DFA Real Estate Securities Portfolio and the U.S. Large Company Portfolio. Moreover, the portfolio construction approach used by Dimensional Fund Advisors (the “Advisor”) generally resulted in portfolios with greater emphasis on value or small company characteristics relative to widely used index benchmarks.
Domestic Equity Series’ Performance Overview
U. S. Large Company Portfolio
U.S. Large Company Portfolio seeks to approximate the returns of the S&P 500 Index® by investing in S&P 500® Index stocks in approximately the same proportions as they are represented in the Index. The Portfolio was mostly invested in equities throughout the year. The average cash level for the period was less than 1% of the Portfolio’s assets.
For the 12 months ended October 31, 2010, the total return was 16.47% for the Portfolio and 16.52% for the S&P 500® Index. Relative to the Index, no single security in the Portfolio added or detracted more than 0.01% in performance. The Portfolio’s underperformance was primarily attributable to fees and expenses assessed to the Portfolio but not the Index.
163
DIMENSIONAL INVESTMENT GROUP INC.
DISCLOSURE OF FUND EXPENSES
(Unaudited)
The following Expense Tables are shown so that you can understand the impact of fees on your investment. All mutual funds have operating expenses. As a shareholder of the fund, you incur ongoing costs, which include costs for portfolio management, administrative services, and shareholder reports, among others. Operating expenses, legal and audit services, which are deducted from a fund’s gross income, directly reduce the investment return of the fund. A fund’s expenses are expressed as a percentage of its average net assets. This figure is known as the expense ratio. The following examples are intended to help you understand the ongoing costs, in dollars, of investing in the fund and to compare these costs with those of other mutual funds. The examples are based on an investment of $1,000 made at the beginning of the period shown and held for the entire period.
The Expense Tables below illustrate your fund’s costs in two ways.
Actual Fund Return
This section helps you to estimate the actual expenses after fee waivers that you paid over the period. The “Ending Account Value” shown is derived from the fund’s actual return and “Expenses Paid During Period” reflect the dollar amount that would have been paid by an investor who started with $1,000 in the fund.You may use the information here, together with the amount you invested, to estimate the expenses that you paid over the period.
To do so, simply divide your account value by $1,000 (for example, a $7,500 account value divided by $1,000 = 7.5), then multiply the result by the number given for your fund under the heading “Expenses Paid During Period.”
Hypothetical Example for Comparison Purposes
This section is intended to help you compare your fund’s costs with those of other mutual funds. The hypothetical “Ending Account Value” and “Expenses Paid During Period” are derived from the fund’s actual expense ratio and an assumed 5% annual return before expenses. In this case, because the return used is not the fund’s actual return, the results do not apply to your investment. The example is useful in making comparisons because the SEC requires all mutual funds to calculate expenses based on a 5% annual return. You can assess your fund’s costs by comparing this hypothetical example with the hypothetical examples that appear in shareholder reports of other funds.
Please note that the expenses shown in the tables are meant to highlight and help you compare ongoing costs only and do not reflect any transactional costs, if applicable. The “Annualized Expense Ratio” represents the actual expenses for the six-month period indicated.
Six Months Ended October 31, 2010
EXPENSE TABLES
| | | | | | | | | | | | | | | | |
| | | Beginning
Account
Value
05/01/10 | | | Ending
Account
Value
10/31/10 | | | Annualized
Expense
Ratio* | | | Expenses
Paid
During
Period* | |
| DFA International Value Portfolio** | | | | | | | | | | | | |
Actual Fund Return | | | | | | | | | | | | | | | | |
Class R2 Shares | | $ | 1,000.00 | | | $ | 1,061.40 | | | | 0.72% | | | | $3.74 | |
Institutional Class Shares | | $ | 1,000.00 | | | $ | 1,062.70 | | | | 0.45% | | | | $2.34 | |
Hypothetical 5% Annual Return | | | | | | | | | | | | | | | | |
Class R2 Shares | | $ | 1,000.00 | | | $ | 1,021.58 | | | | 0.72% | | | | $3.67 | |
Institutional Class Shares | | $ | 1,000.00 | | | $ | 1,022.94 | | | | 0.45% | | | | $2.29 | |
164
DISCLOSURE OF FUND EXPENSES
CONTINUED
| | | | | | | | | | | | |
| | | Beginning
Account
Value
05/01/10 | | | Ending
Account
Value
10/31/10 | | | Annualized
Expense
Ratio* | | Expenses
Paid
During
Period* |
| U.S. Large Company Portfolio*** | | | | | | | | | | |
Actual Fund Return | | $ | 1,000.00 | | | $ | 1,006.90 | | | 0.10% | | $0.51 |
Hypothetical 5% Annual Return | | $ | 1,000.00 | | | $ | 1,024.70 | | | 0.10% | | $0.51 |
| * | Expenses are equal to the fund’s annualized expense ratio for the six-month period, multiplied by the average account value over the period, multiplied by the number of days in the most recent six-month period (184), then divided by the number of days in the year (365) to reflect the six-month period. |
| ** | The Portfolio is a Feeder Fund. The expenses shown reflect the direct expenses of the Feeder Fund and the indirect payment of the Feeder Fund’s portion of the expenses of its Master Fund (Affiliated Investment Company). |
| *** | Effective September 10, 2010, the Portfolio invests directly in securities rather than through The U.S. Large Company Series. The expenses shown reflect the direct expenses of the Portfolio and the indirect payments of the Portfolio’s portion of the expenses, for the period May 1, 2010 through September 9, 2010 of The U.S. Large Company Series (Affiliated Investment Company). |
165
DIMENSIONAL INVESTMENT GROUP INC.
DISCLOSURE OF PORTFOLIO HOLDINGS
(Unaudited)
The SEC requires that all Funds file a complete Schedule of Investments with the SEC for their first and third fiscal quarters on Form N-Q. For Dimensional Investment Group Inc., this would be for the fiscal quarters ending January 31 and July 31. The Form N-Q filing must be made within 60 days of the end of the quarter. Dimensional Investment Group Inc. filed its most recent Form N-Q with the SEC on September 29, 2010. It is available upon request, without charge, by calling collect: (512) 306-7400 or by mailing a request to Dimensional Fund Advisors LP, 6300 Bee Cave Road, Building One, Austin, Texas 78746, or by visiting the SEC’s website at http://www.sec.gov, or they may be reviewed and copied at the SEC’s Public Reference Room in Washington, D.C. (call 1-800-732-0330 for information on the operation of the Public Reference Room).
SEC regulations permit a fund to include in its reports to shareholders a “Summary Schedule of Portfolio Holdings” in lieu of a full Schedule of Investments. The Summary Schedule of Portfolio Holdings reports the fund’s 50 largest holdings in unaffiliated issuers and any investments that exceed one percent of the fund’s net assets at the end of the reporting period. The amendments also require that the Summary Schedule of Portfolio Holdings identify each category of investments that are held.
The fund is required to file a complete Schedule of Investments with the SEC on Form N-CSR within ten days after mailing the annual and semi-annual reports to shareholders. It will be available upon request, without charge, by calling collect: (512) 306-7400 or by mailing a request to Dimensional Fund Advisors LP, 6300 Bee Cave Road, Building One, Austin, Texas 78746, or by visiting the SEC’s website at http://www.sec.gov, or they may be reviewed and copied at the SEC’s Public Reference Room in Washington, D.C. (call 1-800-732-0330 for information on the operation of the Public Reference Room).
PORTFOLIO HOLDINGS
The SEC requires that all Funds present their categories of portfolio holdings in a table, chart or graph format in their annual and semi-annual shareholder reports, whether or not a Schedule of Investments is utilized. The following table, which presents portfolio holdings as a percent of total investments before short-term investments and collateral for loaned securities, is provided in compliance with such requirement.
The categories of industry classification for the Affiliated Investment Company is represented in the Disclosure of Portfolio Holdings, which is included elsewhere within the report. Refer to the Summary Schedule of Portfolio Holdings for the underlying Master Fund’s holdings which reflects the investments by country.
FEEDER FUND
| | |
| | | Affiliated Investment Companies |
DFA International Value Portfolio | | 100.0% |
DOMESTIC EQUITY PORTFOLIO
| | | | |
| U.S. Large Company Portfolio | |
Consumer Discretionary | | | 10.6% | |
Consumer Staples | | | 11.1% | |
Energy | | | 11.1% | |
Financials | | | 14.0% | |
Health Care | | | 11.5% | |
Industrials | | | 10.7% | |
Information Technology | | | 19.3% | |
Materials | | | 3.7% | |
Real Estate Investment Trusts | | | 1.3% | |
Telecommunication Services | | | 3.1% | |
Utilities | | | 3.6% | |
| | | | |
| | | 100.0% | |
166
DFA INTERNATIONAL VALUE PORTFOLIO
SCHEDULE OF INVESTMENTS
October 31, 2010
| | | | |
| | | Value† | |
AFFILIATED INVESTMENT COMPANY — (100.0%) | | | | |
| |
Investment in The DFA International Value Series of | | | | |
The DFA Investment Trust Company | | $ | 5,163,849,756 | |
| | | | |
| |
TOTAL INVESTMENTS IN AFFILIATED INVESTMENT COMPANY (Cost $4,006,520,351) | | $ | 5,163,849,756 | |
| | | | |
Summary of inputs used to value the Portfolio’s investments as of October 31, 2010 is as follows (See Security Valuation Note):
| | | | | | | | | | | | | | | | |
| | | Valuation Inputs | |
| |
| | | Investment in Securities (Market Value) | |
| | | Level 1 | | | Level 2 | | | Level 3 | | | Total | |
Affiliated Investment Company | | $ | 5,163,849,756 | | | | — | | | | — | | | $ | 5,163,849,756 | |
See accompanying Notes to Financial Statements.
167
U.S. LARGE COMPANY PORTFOLIO
SUMMARY SCHEDULE OF PORTFOLIO HOLDINGS
October 31, 2010
| | | | | | | | | | | | | | | | | | |
| | | Shares | | | | | | Value† | | | Percentage
of Net Assets** |
COMMON STOCKS — (90.2%) | | | | | | | | | | | | | | | | | | |
Consumer Discretionary — (9.6%) | | | | | | | | | | | | | | | | | | |
*Amazon.com, Inc. | | | 120,886 | | | | | | | $ | 19,963,114 | | | | | | | 0.5% |
*Comcast Corp. Class A. | | | 959,002 | | | | | | | | 19,736,261 | | | | | | | 0.5% |
#*Ford Motor Co. | | | 1,175,210 | | | | | | | | 16,605,717 | | | | | | | 0.5% |
#*Home Depot, Inc. | | | 569,030 | | | | | | | | 17,571,646 | | | | | | | 0.5% |
*McDonald’s Corp. | | | 363,682 | | | | | | | | 28,283,549 | | | | | | | 0.8% |
Walt Disney Co. (The) | | | 653,534 | | | | | | | | 23,599,113 | | | | | | | 0.6% |
Other Securities | | | | | | | | | | | 263,105,250 | | | | | | | 7.1% |
| | | | | | | | | | | | | | | | | | |
Total Consumer Discretionary | | | | | | | | | | | 388,864,650 | | | | | | | 10.5% |
| | | | | | | | | | | | | | | | | | |
| | | | | |
Consumer Staples — (10.1%) | | | | | | | | | | | | | | | | | | |
Altria Group, Inc. | | | 712,088 | | | | | | | | 18,101,277 | | | | | | | 0.5% |
Coca-Cola Co. (The) | | | 789,139 | | | | | | | | 48,390,003 | | | | | | | 1.3% |
Kraft Foods, Inc. | | | 595,941 | | | | | | | | 19,231,016 | | | | | | | 0.5% |
*PepsiCo, Inc. | | | 543,619 | | | | | | | | 35,498,321 | | | | | | | 0.9% |
Philip Morris International, Inc. | | | 626,288 | | | | | | | | 36,637,848 | | | | | | | 1.0% |
*Procter & Gamble Co. (The) | | | 969,903 | | | | | | | | 61,656,734 | | | | | | | 1.7% |
*Wal-Mart Stores, Inc. | | | 683,431 | | | | | | | | 37,021,457 | | | | | | | 1.0% |
Other Securities | | | | | | | | | | | 152,042,306 | | | | | | | 4.1% |
| | | | | | | | | | | | | | | | | | |
Total Consumer Staples | | | | | | | | | | | 408,578,962 | | | | | | | 11.0% |
| | | | | | | | | | | | | | | | | | |
| | | | | |
Energy — (10.0%) | | | | | | | | | | | | | | | | | | |
*Chevron Corp. | | | 687,017 | | | | | | | | 56,754,474 | | | | | | | 1.5% |
*ConocoPhillips | | | 506,863 | | | | | | | | 30,107,662 | | | | | | | 0.8% |
*Exxon Mobil Corp. | | | 1,739,862 | | | | | | | | 115,648,627 | | | | | | | 3.1% |
Occidental Petroleum Corp. | | | 277,542 | | | | | | | | 21,823,127 | | | | | | | 0.6% |
*Schlumberger, Ltd. | | | 466,881 | | | | | | | | 32,630,313 | | | | | | | 0.9% |
Other Securities | | | | | | | | | | | 149,025,047 | | | | | | | 4.0% |
| | | | | | | | | | | | | | | | | | |
Total Energy | | | | | | | | | | | 405,989,250 | | | | | | | 10.9% |
| | | | | | | | | | | | | | | | | | |
| | | | | |
Financials — (12.6%) | | | | | | | | | | | | | | | | | | |
*Bank of America Corp. | | | 3,428,552 | | | | | | | | 39,222,635 | | | | | | | 1.1% |
*Berkshire Hathaway, Inc. | | | 591,097 | | | | | | | | 47,027,677 | | | | | | | 1.3% |
*Citigroup, Inc. | | | 8,712,164 | | | | | | | | 36,329,724 | | | | | | | 1.0% |
*Goldman Sachs Group, Inc. (The) | | | 176,184 | | | | | | | | 28,356,815 | | | | | | | 0.8% |
*JPMorgan Chase & Co. | | | 1,354,892 | | | | | | | | 50,984,586 | | | | | | | 1.4% |
U.S. BanCorp. | | | 655,091 | | | | | | | | 15,840,100 | | | | | | | 0.4% |
*Wells Fargo & Co. | | | 1,788,254 | | | | | | | | 46,637,664 | | | | | | | 1.2% |
Other Securities | | | | | | | | | | | 247,090,213 | | | | | | | 6.6% |
| | | | | | | | | | | | | | | | | | |
Total Financials | | | | | | | | | | | 511,489,414 | | | | | | | 13.8% |
| | | | | | | | | | | | | | | | | | |
| | | | | |
Health Care — (10.3%) | | | | | | | | | | | | | | | | | | |
*Abbott Laboratories | | | 527,592 | | | | | | | | 27,076,021 | | | | | | | 0.8% |
*Amgen, Inc. | | | 327,508 | | | | | | | | 18,730,183 | | | | | | | 0.5% |
Bristol-Myers Squibb Co. | | | 585,958 | | | | | | | | 15,762,270 | | | | | | | 0.4% |
*Johnson & Johnson | | | 941,189 | | | | | | | | 59,925,504 | | | | | | | 1.6% |
Merck & Co., Inc. | | | 1,051,605 | | | | | | | | 38,152,229 | | | | | | | 1.0% |
*Pfizer, Inc. | | | 2,746,669 | | | | | | | | 47,792,041 | | | | | | | 1.3% |
Other Securities | | | | | | | | | | | 212,476,738 | | | | | | | 5.7% |
| | | | | | | | | | | | | | | | | | |
Total Health Care | | | | | | | | | | | 419,914,986 | | | | | | | 11.3% |
| | | | | | | | | | | | | | | | | | |
| | | | | |
Industrials — (9.6%) | | | | | | | | | | | | | | | | | | |
*3M Co. | | | 243,676 | | | | | | | | 20,522,393 | | | | | | | 0.5% |
*Boeing Co. (The) | | | 250,013 | | | | | | | | 17,660,918 | | | | | | | 0.5% |
#*Caterpillar, Inc. | | | 215,430 | | | | | | | | 16,932,798 | | | | | | | 0.5% |
General Electric Co. | | | 3,653,176 | | | | | | | | 58,523,880 | | | | | | | 1.6% |
*Union Pacific Corp. | | | 170,017 | | | | | | | | 14,907,091 | | | | | | | 0.4% |
168
U.S. LARGE COMPANY PORTFOLIO
CONTINUED
| | | | | | | | | | | | | | | | | | |
| | | Shares | | | | | | Value† | | | Percentage
of Net Assets** |
Industrials — (Continued) | | | | | | | | | | | | | | | | | | |
*United Parcel Service, Inc. | | | 338,519 | | | | | | | $ | 22,795,869 | | | | | | | 0.6% |
*United Technologies Corp. | | | 317,461 | | | | | | | | 23,736,559 | | | | | | | 0.6% |
Other Securities | | | | | | | | | | | 215,689,335 | | | | | | | 5.8% |
| | | | | | | | | | | | | | | | | | |
Total Industrials | | | | | | | | | | | 390,768,843 | | | | | | | 10.5% |
| | | | | | | | | | | | | | | | | | |
| | | | | |
Information Technology — (17.4%) | | | | | | | | | | | | | | | | | | |
*Apple, Inc. | | | 312,163 | | | | | | | | 93,920,482 | | | | | | | 2.5% |
*Cisco Sytems, Inc. | | | 1,951,493 | | | | | | | | 44,552,585 | | | | | | | 1.2% |
*Google, Inc. | | | 84,943 | | | | | | | | 52,069,210 | | | | | | | 1.4% |
Hewlett-Packard Co. | | | 774,884 | | | | | | | | 32,591,621 | | | | | | | 0.9% |
*Intel Corp. | | | 1,902,579 | | | | | | | | 38,184,761 | | | | | | | 1.0% |
*International Business Machines Corp. | | | 430,976 | | | | | | | | 61,888,154 | | | | | | | 1.7% |
*Microsoft Corp. | | | 2,602,083 | | | | | | | | 69,319,491 | | | | | | | 1.9% |
*Oracle Corp. | | | 1,322,445 | | | | | | | | 38,879,883 | | | | | | | 1.0% |
*QUALCOMM, Inc. | | | 548,493 | | | | | | | | 24,753,489 | | | | | | | 0.7% |
Other Securities | | | | | | | | | | | 251,183,243 | | | | | | | 6.7% |
| | | | | | | | | | | | | | | | | | |
Total Information Technology | | | | | | | | | | | 707,342,919 | | | | | | | 19.0% |
| | | | | | | | | | | | | | | | | | |
| | | | | |
Materials — (3.4%) | | | | | | | | | | | | | | | | | | |
*Freeport-McMoRan Copper & Gold, Inc. Class B | | | 160,746 | | | | | | | | 15,219,431 | | | | | | | 0.4% |
Other Securities | | | | | | | | | | | 120,929,347 | | | | | | | 3.3% |
| | | | | | | | | | | | | | | | | | |
Total Materials | | | | | | | | | | | 136,148,778 | | | | | | | 3.7% |
| | | | | | | | | | | | | | | | | | |
| | | | | |
Real Estate Investment Trusts — (1.2%) | | | | | | | | | | | | | | | | | | |
Other Securities | | | | | | | | | | | 49,213,837 | | | | | | | 1.3% |
| | | | | | | | | | | | | | | | | | |
| | | | | |
Telecommunication Services — (2.8%) | | | | | | | | | | | | | | | | | | |
*AT&T, Inc. | | | 2,019,098 | | | | | | | | 57,544,293 | | | | | | | 1.6% |
*Verizon Communications, Inc. | | | 965,894 | | | | | | | | 31,362,578 | | | | | | | 0.8% |
Other Securities | | | | | | | | | | | 25,458,180 | | | | | | | 0.7% |
| | | | | | | | | | | | | | | | | | |
Total Telecommunication Services | | | | | | | | | | | 114,365,051 | | | | | | | 3.1% |
| | | | | | | | | | | | | | | | | | |
| | | | | |
Utilities — (3.2%) | | | | | | | | | | | | | | | | | | |
Other Securities | | | | | | | | | | | 131,922,829 | | | | | | | 3.6% |
| | | | | | | | | | | | | | | | | | |
TOTAL COMMON STOCKS | | | | | | | | | | | 3,664,599,519 | | | | | | | 98.7% |
| | | | | | | | | | | | | | | | | | |
| | | | | |
TEMPORARY CASH INVESTMENTS — (1.0%) | | | | | | | | | | | | | | | | | | |
BlackRock Liquidity Funds Tempcash Portfolio - Institutional Shares | | | 41,853,441 | | | | | | | | 41,853,441 | | | | | | | 1.1% |
| | | | | | | | | | | | | | | | | | |
| | | | | |
SECURITIES LENDING COLLATERAL — (8.8%) | | | | | | | | | | | | | | | | | | |
§@DFA Short Term Investment Fund | | | 355,223,607 | | | | | | | | 355,223,607 | | | | | | | 9.6% |
| | | | | | | | | | | | | | | | | | |
| | | | | |
TOTAL INVESTMENTS — (100.0%) | | | | | | | | | | | | | | | | | | |
(Cost $3,163,040,809) | | | | | | | | | | $ | 4,061,676,567 | | | | | | | 109.4% |
| | | | | | | | | | | | | | | | | | |
169
U.S. LARGE COMPANY PORTFOLIO
CONTINUED
Summary of inputs used to value the Portfolio’s investments as of October 31, 2010 is as follows (See Security Valuation Note):
| | | | | | | | | | | | | | | | | | | | | | | | | | | | | | | | |
| | | Valuation Inputs | |
| |
| | | Investment in Securities (Market Value) | |
| | | Level 1 | | | Level 2 | | | | | | | | | Level 3 | | | | | | | | | Total | |
Common Stocks | | | | | | | | | | | | | | | | | | | | | | | | | | | | | | | | |
Consumer Discretionary | | $ | 388,864,650 | | | | — | | | | | | | | | | | | — | | | | | | | | | | | $ | 388,864,650 | |
Consumer Staples | | | 408,578,962 | | | | — | | | | | | | | | | | | — | | | | | | | | | | | | 408,578,962 | |
Energy | | | 405,989,250 | | | | — | | | | | | | | | | | | — | | | | | | | | | | | | 405,989,250 | |
Financials | | | 511,489,414 | | | | — | | | | | | | | | | | | — | | | | | | | | | | | | 511,489,414 | |
Health Care | | | 419,914,986 | | | | — | | | | | | | | | | | | — | | | | | | | | | | | | 419,914,986 | |
Industrials | | | 390,768,843 | | | | — | | | | | | | | | | | | — | | | | | | | | | | | | 390,768,843 | |
Information Technology | | | 707,342,919 | | | | — | | | | | | | | | | | | — | | | | | | | | | | | | 707,342,919 | |
Materials | | | 136,148,778 | | | | — | | | | | | | | | | | | — | | | | | | | | | | | | 136,148,778 | |
Real Estate Investment Trusts | | | 49,213,837 | | | | — | | | | | | | | | | | | — | | | | | | | | | | | | 49,213,837 | |
Telecommunication Services | | | 114,365,051 | | | | — | | | | | | | | | | | | — | | | | | | | | | | | | 114,365,051 | |
Utilities | | | 131,922,829 | | | | — | | | | | | | | | | | | — | | | | | | | | | | | | 131,922,829 | |
Temporary Cash Investments | | | 41,853,441 | | | | — | | | | | | | | | | | | — | | | | | | | | | | | | 41,853,441 | |
Securities Lending Collateral | | | — | | | $ | 355,223,607 | | | | | | | | | | | | — | | | | | | | | | | | | 355,223,607 | |
Futures Contracts** | | | 1,447,110 | | | | — | | | | | | | | | | | | — | | | | | | | | | | | | 1,447,110 | |
| | | | | | | | | | | | | | | | | | | | | | | | | | | | | | | | |
TOTAL | | $ | 3,707,900,070 | | | $ | 355,223,607 | | | | | | | | | | | | — | | | | | | | | | | | $ | 4,063,123,677 | |
| | | | | | | | | | | | | | | | | | | | | | | | | | | | | | | | |
** Not reflected in the Summary Schedule of Portfolio Holdings, valued at the unrealized appreciation/(depreciation) on the investment.
See accompanying Notes to Financial Statements.
170
DIMENSIONAL INVESTMENT GROUP INC.
STATEMENTS OF ASSETS AND LIABILITIES
October 31, 2010
(Amounts in thousands, except share and per share amounts)
| | | | | | | | |
| | | DFA
International
Value
Portfolio | | | U.S. Large
Company
Portfolio | |
ASSETS: | | | | | | | | |
Investments in Affiliated Investment Company at Value | | $ | 5,163,850 | | | | — | |
Investments at Value (including $0 and $343,476 of securities on loan, respectively) | | | — | | | $ | 3,664,600 | |
Temporary Cash Investments at Value & Cost | | | — | | | | 41,853 | |
Collateral Received from Securities on Loan at Value & Cost | | | — | | | | 355,224 | |
Cash | | | — | | | | 4,410 | |
Receivables: | | | | | | | | |
Dividends and Interest | | | — | | | | 4,220 | |
Securities Lending Income | | | — | | | | 29 | |
Fund Shares Sold | | | 4,559 | | | | 1,411 | |
Futures Margin Variation | | | — | | | | 5 | |
Prepaid Expenses and Other Assets | | | 55 | | | | 58 | |
| | | | | | | | |
Total Assets | | | 5,168,464 | | | | 4,071,810 | |
| | | | | | | | |
LIABILITIES: | | | | | | | | |
Payables: | | | | | | | | |
Upon Return of Securities Loaned | | | — | | | | 355,224 | |
Affiliated Investment Company Purchased | | | 817 | | | | — | |
Fund Shares Redeemed | | | 3,742 | | | | 2,703 | |
Due to Advisor | | | 857 | | | | 188 | |
Accrued Expenses and Other Liabilities | | | 239 | | | | 722 | |
| | | | | | | | |
Total Liabilities | | | 5,655 | | | | 358,837 | |
| | | | | | | | |
NET ASSETS | | $ | 5,162,809 | | | $ | 3,712,973 | |
| | | | | | | | |
NET ASSET VALUE, OFFERING AND REDEMPTION PRICE PER SHARE: | | | | | | | | |
Class R2 Shares — based on net assets of $4,952 and $0 and shares outstanding of 277,960 and 0, respectively (Note O) | | $ | 17.82 | | | | N/A | |
| | | | | | | | |
NUMBER OF SHARES AUTHORIZED | | | 100,000,000 | | | | N/A | |
| | | | | | | | |
Institutional Class Shares — based on net assets of $5,157,857 and $3,712,973 and shares outstanding of 289,683,614 and 397,379,701, respectively | | $ | 17.81 | | | $ | 9.34 | |
| | | | | | | | |
NUMBER OF SHARES AUTHORIZED | | | 1,500,000,000 | | | | 900,000,000 | |
| | | | | | | | |
Investment in Affiliated Investment Company at Cost | | $ | 4,006,520 | | | $ | — | |
| | | | | | | | |
Investments at Cost | | $ | — | | | $ | 2,765,964 | |
| | | | | | | | |
NET ASSETS CONSIST OF: | | | | | | | | |
Paid-In Capital | | $ | 5,083,325 | | | $ | 3,444,337 | |
Undistributed Net Investment Income (Distributions in Excess of Net Investment Income) | | | 14,433 | | | | 9,631 | |
Accumulated Net Realized Gain (Loss) | | | (1,092,801 | ) | | | (641,077 | ) |
Net Unrealized Foreign Exchange Gain (Loss) | | | 522 | | | | — | |
Net Unrealized Appreciation (Depreciation) | | | 1,157,330 | | | | 900,082 | |
| | | | | �� | | | |
NET ASSETS | | $ | 5,162,809 | | | $ | 3,712,973 | |
| | | | | | | | |
See accompanying Notes to Financial Statements.
171
DIMENSIONAL INVESTMENT GROUP INC.
STATEMENTS OF OPERATIONS
FOR THE YEAR ENDED OCTOBER 31, 2010
(Amounts in thousands)
| | | | | | | | |
| | | DFA
International
Value
Portfolio* | | | U.S. Large
Company
Portfolio** | |
Investment Income | | | | | | | | |
Dividends (Net of Foreign Taxes Withheld of $11,175 and $0,
respectively) | | $ | 123,700 | | | $ | 44,967 | |
Interest | | | 27 | | | | 25 | |
Income from Securities Lending | | | 6,128 | | | | 296 | |
Expenses Allocated from Affiliated Investment Company | | | (11,008 | ) | | | (730 | ) |
| | | | | | | | |
Total Investment Income | | | 118,847 | | | | 44,558 | |
| | | | | | | | |
Expenses | | | | | | | | |
Investment Advisory Services Fees | | | — | | | | 127 | |
Administrative Services Fees | | | 9,323 | | | | 1,076 | |
Accounting & Transfer Agent Fees | | | 79 | | | | 91 | |
Shareholder Servicing Fees — Class R2 Shares | | | 11 | | | | — | |
S&P 500® Fees | | | — | | | | 17 | |
Custodian Fees | | | — | | | | 10 | |
Filing Fees | | | 147 | | | | 241 | |
Shareholders’ Reports | | | 115 | | | | 71 | |
Directors’/Trustees’ Fees & Expenses | | | 45 | | | | 16 | |
Professional Fees | | | 104 | | | | 86 | |
Other | | | 43 | | | | 15 | |
| | | | | | | | |
Total Expenses | | | 9,867 | | | | 1,750 | |
| | | | | | | | |
Fees Waived, Expenses Reimbursed, and/or Previously Waived Fees
Recovered by Advisor (Note C) | | | — | | | | (317 | ) |
| | | | | | | | |
Net Expenses | | | 9,867 | | | | 1,433 | |
| | | | | | | | |
Net Investment Income (Loss) | | | 108,980 | | | | 43,125 | |
| | | | | | | | |
Realized and Unrealized Gain (Loss) | | | | | | | | |
Capital Gain Distributions Received from Investment Securities | | | — | | | | 81 | |
Net Realized Gain (Loss) on: | | | | | | | | |
Investment Securities Sold | | | 255,538 | | | | (88,214 | ) |
Futures | | | — | | | | 76 | |
Foreign Currency Transactions | | | (99 | ) | | | — | |
Change in Unrealized Appreciation (Depreciation) of: | | | | | | | | |
Investment Securities and Foreign Currency | | | 138,488 | | | | 688,388 | |
Futures | | | — | | | | (3,735 | ) |
Translation of Foreign Currency Denominated Amounts | | | 342 | | | | — | |
| | | | | | | | |
Net Realized and Unrealized Gain (Loss) | | | 394,269 | | | | 596,596 | |
| | | | | | | | |
Net Increase (Decrease) in Net Assets Resulting from Operations | | $ | 503,249 | | | $ | 639,721 | |
| | | | | | | | |
| * | Investment Income and Realized and Unrealized Gain (Loss) were allocated from the Portfolio’s Master Fund (Affiliated Investment Company). |
| ** | For the period November 1, 2009 through September 9, 2010, Investment Income and Realized and Unrealized Gain (Loss) were allocated from the Portfolio’s Master Fund (Affiliated Investment Company). |
See accompanying Notes to Financial Statements.
172
DIMENSIONAL INVESTMENT GROUP INC.
STATEMENTS OF CHANGES IN NET ASSETS
(Amounts in thousands)
| | | | | | | | | | | | | | | | | | | | |
| | | DFA International
Value Portfolio | | | | | | U.S. Large
Company Portfolio | |
| | | Year
Ended
Oct. 31,
2010 | | | Year
Ended
Oct. 31,
2009 | | | | | | Year
Ended
Oct. 31,
2010 | | | Year
Ended
Oct. 31,
2009 | |
Increase (Decrease) in Net Assets | | | | | | | | | | | | | | | | | | | | |
Operations: | | | | | | | | | | | | | | | | | | | | |
Net Investment Income (Loss) | | $ | 108,980 | | | $ | 106,511 | | | | | | | $ | 43,125 | | | $ | 17,245 | |
Capital Gain Distributions Received from Investment
Securities | | | — | | | | — | | | | | | | | 81 | | | | — | |
Net Realized Gain (Loss) on: | | | | | | | | | | | | | | | | | | | | |
Investment Securities Sold | | | 255,538 | | | | 45,432 | | | | | | | | (88,214 | ) | | | (37,974 | ) |
Futures | | | — | | | | (824 | ) | | | | | | | 76 | | | | 12,592 | |
Foreign Currency Transactions | | | (99 | ) | | | 2,711 | | | | | | | | — | | | | — | |
Change in Unrealized Appreciation (Depreciation) of: | | | | | | | | | | | | | | | | | | | | |
Investment Securities and Foreign Currency | | | 138,488 | | | | 988,043 | | | | | | | | 688,388 | | | | 73,084 | |
Futures | | | — | | | | — | | | | | | | | (3,735 | ) | | | 1,948 | |
Translation of Foreign Currency Denominated Amounts | | | 342 | | | | 172 | | | | | | | | — | | | | — | |
| | | | | | | | | | | | | | | | | | | | |
Net Increase (Decrease) in Net Assets Resulting from
Operations | | | 503,249 | | | | 1,142,045 | | | | | | | | 639,721 | | | | 66,895 | |
| | | | | | | | | | | | | | | | | | | | |
Distributions From: | | | | | | | | | | | | | | | | | | | | |
Net Investment Income: | | | | | | | | | | | | | | | | | | | | |
Class R2 Shares | | | (249 | ) | | | (208 | ) | | | | | | | — | | | | — | |
Institutional Class Shares | | | (107,160 | ) | | | (105,492 | ) | | | | | | | (35,473 | ) | | | (18,243 | ) |
| | | | | | | | | | | | | | | | | | | | |
Total Distributions | | | (107,409 | ) | | | (105,700 | ) | | | | | | | (35,473 | ) | | | (18,243 | ) |
| | | | | | | | | | | | | | | | | | | | |
Capital Share Transactions (1): | | | | | | | | | | | | | | | | | | | | |
Shares Issued | | | 1,032,364 | | | | 1,077,621 | | | | | | | | 3,071,799 | | | | 156,796 | |
Shares Issued in Lieu of Cash Distributions | | | 101,479 | | | | 98,218 | | | | | | | | 30,048 | | | | 17,318 | |
Shares Redeemed | | | (808,163 | ) | | | (1,124,340 | ) | | | | | | | (778,811 | ) | | | (166,295 | ) |
| | | | | | | | | | | | | | | | | | | | |
Net Increase (Decrease) from Capital Share
Transactions | | | 325,680 | | | | 51,499 | | | | | | | | 2,323,036 | | | | 7,819 | |
| | | | | | | | | | | | | | | | | | | | |
Total Increase (Decrease) in Net Assets | | | 721,520 | | | | 1,087,844 | | | | | | | | 2,927,284 | | | | 56,471 | |
Net Assets | | | | | | | | | | | | | | | | | | | | |
Beginning of Period | | | 4,441,289 | | | | 3,353,445 | | | | | | | | 785,689 | | | | 729,218 | |
| | | | | | | | | | | | | | | | | | | | |
End of Period | | $ | 5,162,809 | | | $ | 4,441,289 | | | | | | | $ | 3,712,973 | | | $ | 785,689 | |
| | | | | | | | | | | | | | | | | | | | |
(1) Shares Issued and Redeemed: | | | | | | | | | | | | | | | | | | | | |
Shares Issued | | | 62,742 | | | | 85,208 | | | | | | | | 350,368 | | | | 22,124 | |
Shares Issued in Lieu of Cash Distributions | | | 6,675 | | | | 7,223 | | | | | | | | 3,492 | | | | 2,474 | |
Shares Redeemed | | | (49,142 | ) | | | (90,150 | ) | | | | | | | (52,726 | ) | | | (24,057 | ) |
Shares Reduced by Reverse Stock Split (Note O) | | | (453 | ) | | | — | | | | | | | | — | | | | — | |
| | | | | | | | | | | | | | | | | | | | |
Net Increase (Decrease) from Shares Issued and
Redeemed | | | 19,822 | | | | 2,281 | | | | | | | | 301,134 | | | | 541 | |
| | | | | | | | | | | | | | | | | | | | |
Undistributed Net Investment Income (Distributions in
Excess of Net Investment Income) | | $ | 14,433 | | | $ | 12,961 | | | | | | | $ | 9,631 | | | $ | 2,126 | |
See accompanying Notes to Financial Statements.
173
DIMENSIONAL INVESTMENT GROUP INC.
FINANCIAL HIGHLIGHTS
(for a share outstanding throughout each period)
| | | | | | | | | | | | | | | | | | | | | | | | | | | | | | | | | | | | |
| | | DFA International Value Portfolio-
Class R2 Shares† | | | DFA International Value Portfolio-
Institutional Class Shares | |
| | | Year
Ended
Oct. 31,
2010 | | | Year
Ended
Oct. 31,
2009 | | | Period April 30,
2008(a) to Oct. 31, 2008 | | | Year
Ended Oct. 31,
2010 | | | Year
Ended Oct. 31,
2009 | | | Period
Dec. 1,
2007 to
Oct. 31,
2008 | | | Year
Ended
Nov. 30,
2007 | | | Year
Ended
Nov. 30,
2006 | | | Year
Ended
Nov. 30,
2005 | |
Net Asset Value, Beginning of Period | | $ | 17.13 | | | $ | 13.58 | | | $ | 26.31 | | | $ | 16.46 | | | $ | 12.54 | | | $ | 25.51 | | | $ | 22.71 | | | $ | 17.67 | | | $ | 15.73 | |
| | | | | | | | | | | | | | | | | | | | | | | | | | | | | | | | | | | | |
Income from Investment Operations | | | | | | | | | | | | | | | | | | | | | | | | | | | | | | | | | | | | |
Net Investment Income (Loss) | | | 0.37 | (A) | | | 0.42 | (A) | | | 0.66 | (A) | | | 0.39 | (A) | | | 0.40 | (A) | | | 0.74 | (A) | | | 0.72 | (A) | | | 0.66 | (A) | | | 0.48 | |
Net Gains (Losses) on Securities (Realized and Unrealized) | | | 1.29 | | | | 4.10 | | | | (11.73 | ) | | | 1.34 | | | | 3.92 | | | | (12.44 | ) | | | 3.09 | | | | 5.37 | | | | 1.89 | |
| | | | | | | | | | | | | | | | | | | | | | | | | | | | | | | | | | | | |
Total from Investment Operations | | | 1.66 | | | | 4.52 | | | | (11.07 | ) | | | 1.73 | | | | 4.32 | | | | (11.70 | ) | | | 3.81 | | | | 6.03 | | | | 2.37 | |
Less Distributions | | | | | | | | | | | | | | | | | | | | | | | | | | | | | | | | | | | | |
Net Investment Income | | | (0.97 | ) | | | (0.97 | ) | | | (1.66 | ) | | | (0.38 | ) | | | (0.40 | ) | | | (0.78 | ) | | | (0.63 | ) | | | (0.65 | ) | | | (0.42 | ) |
Net Realized Gains | | | — | | | | — | | | | — | | | | — | | | | — | | | | (0.49 | ) | | | (0.38 | ) | | | (0.34 | ) | | | (0.01 | ) |
| | | | | | | | | | | | | | | | | | | | | | | | | | | | | | | | | | | | |
Total Distributions | | | (0.97 | ) | | | (0.97 | ) | | | (1.66 | ) | | | (0.38 | ) | | | (0.40 | ) | | | (1.27 | ) | | | (1.01 | ) | | | (0.99 | ) | | | (0.43 | ) |
Net Asset Value, End of Period | | $ | 17.82 | | | $ | 17.13 | | | $ | 13.58 | | | $ | 17.81 | | | $ | 16.46 | | | $ | 12.54 | | | $ | 25.51 | | | $ | 22.71 | | | $ | 17.67 | |
| | | | | | | | | | | | | | | | | | | | | | | | | | | | | | | | | | | | | |
Total Return | | | 10.60 | % | | | 34.86 | % | | | (44.63 | )%(C) | | | 10.94 | % | | | 35.11 | % | | | (47.96 | )%(C) | | | 17.09 | % | | | 35.39 | % | | | 15.40 | % |
Net Assets, End of Period (thousands) | | $ | 4,952 | | | $ | 3,443 | | | $ | 3,372 | | | $ | 5,157,857 | | | $ | 4,437,846 | | | $ | 3,350,073 | | | $ | 6,262,069 | | | $ | 4,456,059 | | | $ | 2,518,457 | |
Ratio of Expenses to Average Net Assets (D) | | | 0.72 | % | | | 0.74 | % | | | 0.73 | %(B)(E) | | | 0.45 | % | | | 0.46 | % | | | 0.44 | %(B) | | | 0.44 | % | | | 0.44 | % | | | 0.48 | % |
Ratio of Net Investment Income to Average Net Assets | | | 2.11 | % | | | 2.96 | % | | | 7.47 | %(B)(E) | | | 2.34 | % | | | 3.00 | % | | | 3.86 | %(B) | | | 2.89 | % | | | 3.25 | % | | | 2.86 | % |
†All per share amounts and net assets values have been adjusted as a result of the reverse stock split on November 19, 2010. (Note O)
See page 1 & 2 for the Definitions of Abbreviations and Footnotes.
See accompanying Notes to Financial Statements.
174
DIMENSIONAL INVESTMENT GROUP INC.
FINANCIAL HIGHLIGHTS
(for a share outstanding throughout each period)
| | | | | | | | | | | | | | | | | | | | | | | | |
| | | U.S. Large Company Portfolio | |
| | | | | | |
| | | Year Ended Oct. 31, 2010 | | | Year Ended Oct. 31,
2009 | | | Period
Dec. 1, 2007
to Oct. 31, 2008 | | | Year Ended Nov. 30,
2007 | | | Year Ended Nov. 30,
2006 | | | Year Ended Nov. 30,
2005 | |
Net Asset Value, Beginning of Period | | $ | 8.16 | | | $ | 7.62 | | | $ | 11.63 | | | $ | 11.00 | | | $ | 9.82 | | | $ | 9.23 | |
| | | | | | | | | | | | | | | | | | | | | | | | |
Income from Investment Operations | | | | | | | | | | | | | | | | | | | | | | | | |
Net Investment Income (Loss) | | | 0.18 | (A) | | | 0.18 | (A) | | | 0.20 | (A) | | | 0.22 | (A) | | | 0.19 | (A) | | | 0.17 | |
Net Gains (Losses) on Securities (Realized and Unrealized) | | | 1.15 | | | | 0.55 | | | | (3.99 | ) | | | 0.62 | | | | 1.18 | | | | 0.61 | |
| | | | | | | | | | | | | | | | | | | | | | | | |
Total from Investment Operations | | | 1.33 | | | | 0.73 | | | | (3.79 | ) | | | 0.84 | | | | 1.37 | | | | 0.78 | |
Less Distributions | | | | | | | | | | | | | | | | | | | | | | | | |
Net Investment Income | | | (0.15 | ) | | | (0.19 | ) | | | (0.22 | ) | | | (0.21 | ) | | | (0.19 | ) | | | (0.19 | ) |
| | | | | | | | | | | | | | | | | | | | | | | | |
Total Distributions | | | (0.15 | ) | | | (0.19 | ) | | | (0.22 | ) | | | (0.21 | ) | | | (0.19 | ) | | | (0.19 | ) |
Net Asset Value, End of Period | | $ | 9.34 | | | $ | 8.16 | | | $ | 7.62 | | | $ | 11.63 | | | $ | 11.00 | | | $ | 9.82 | |
| | | | | | | | | | | | | | | | | | | | | | | | | |
Total Return | | | 16.47 | % | | | 10.07 | % | | | (33.10 | )%(C) | | | 7.71 | % | | | 14.11 | % | | | 8.50 | % |
| | | | | | |
Net Assets, End of Period (thousands) | | $ | 3,712,973 | | | $ | 785,689 | | | $ | 729,218 | | | $ | 1,002,142 | | | $ | 877,405 | | | $ | 692,595 | |
Ratio of Expenses to Average Net Assets | | | 0.10 | %** | | | 0.10 | %(D) | | | 0.10 | %(B)(D) | | | 0.10 | %(D) | | | 0.10 | %(D) | | | 0.10 | %(D) |
Ratio of Expenses to Average Net Assets (Excluding Waivers and Assumption of Expenses and/or Recovery of Previously Waived Fees) | | | 0.11 | %** | | | 0.13 | %(D) | | | 0.11 | %(B)(D) | | | 0.11 | %(D) | | | 0.11 | %(D) | | | 0.14 | %(D) |
Ratio of Net Investment Income to Average Net Assets | | | 1.99 | % | | | 2.53 | % | | | 2.10 | %(B) | | | 1.90 | % | | | 1.90 | % | | | 1.82 | % |
Portfolio Turnover Rate | | | 1 | %* | | | N/A | | | | N/A | | | | N/A | | | | N/A | | | | N/A | |
* For the period September 10, 2010 through October 31, 2010. Effective September 10, 2010, the Portfolio directly invests in securities rather than through The U.S. Large Company Series.
** Represents the combined ratios for the portfolio and for the period November 1, 2009 through September 9, 2010, its respective pro-rata share of The U.S. Large Company Series.
See Page 1 & 2 for the Definitions of Abbreviations and Footnotes.
See accompanying Notes to Financial Statements.
175
DIMENSIONAL INVESTMENT GROUP INC.
NOTES TO FINANCIAL STATEMENTS
A. Organization:
Dimensional Investment Group Inc. (the “Fund”) is an open-end management investment company registered under the Investment Company Act of 1940, whose shares are generally offered to institutional investors, retirement plans and clients of registered investment advisors. The Fund consists of fifteen portfolios, of which DFA International Value Portfolio and U.S. Large Company Portfolio (the “Portfolios”) are presented in this section of the report. The remaining portfolios are presented in separate reports.
DFA International Value Portfolio (the “Feeder Fund”) primarily invests its assets in The DFA International Value Series (the “Series”), a corresponding series of The DFA Investment Trust Company. At October 31, 2010, DFA International Value Portfolio owned 75% of the Series. The financial statements of the Series are included elsewhere in this report and should be read in conjunction with the financial statements of the Portfolio.
Class R2 shares of DFA International Value Portfolio commenced operations on April 30, 2008. As of October 31, 2010, Class R1 shares of DFA International Value Portfolio had 100,000,000 authorized shares and had not commenced operations.
On November 1, 2008, The DFAInternational Value Series, a master fund in a RIC/RIC master-feeder structure, elected with the consent of its respective Holder(s) to change its U.S. federal income tax classification from that of an association taxable as a corporation to a partnership pursuant to Treasury Regulation § 301.7701-3. The change in capital structure and retroactive reclassification of the statement of changes in net assets and financial highlights for the respective funds is a result of the treatment of a partnership for book purposes. The Series/Portfolio will maintain its books and records and present its financial statements in accordance with generally accepted accounting principles for investment partnerships.
On March 1, 2010, the Board of Directors of DFA Investment Dimensions Group Inc. and of Dimensional Investment Group Inc. approved an Agreement and Plan of Reorganization (the “Plan”) which provided that (i) U.S. Large Company Institutional Index Portfolio (the “Acquiring Fund”), a portfolio of Dimensional Investment Group Inc. would acquire substantially all of the assets of U.S. Large Company Portfolio (the “Target Fund”), a portfolio of DFA Investment Dimensions Group Inc. in exchange solely for shares of capital stock of the Acquiring Fund; (ii) the shares of the Acquiring Fund would be distributed to the shareholders of the Target Fund according to their respective interests in the Target Fund; and (iii) the Target Fund would be liquidated and dissolved (the “Reorganization”). In conjunction with completing the Reorganization, the Acquiring Fund would change its name to “U.S. Large Company Portfolio.” The Reorganization took place on May 7, 2010 and the Acquiring Fund changed its name to U.S. Large Company Portfolio effective May 8, 2010.
The purpose of the transaction was to lower fees for the shareholders of the Target Fund and create operating efficiencies from economies of scale.
The Reorganization was accomplished by a tax-free exchange of the following shares on May 7, 2010:
| | | | | | | | |
Target Fund | | Shares | | Acquiring Fund | | Shares | | Value
(in thousands) |
U.S. Large Company Portfolio | | 83,482,168 | | U.S. Large Company Institutional Index Portfolio | | 311,973,980 | | $2,731,987 |
176
The net assets, including net unrealized appreciation (depreciation) of the Target Fund, immediately before the acquisition were as follows (in thousands):
| | | | | | | | |
Target Fund | | Net Assets | | Unrealized Appreciation
(Depreciation) | | Acquiring Fund | | Net Assets |
U.S. Large Company Portfolio | | $2,731,987 | | $315,984 | | U.S. Large Company Institutional Index Portfolio | | $870,696 |
Assuming the acquisition had been completed on November 1, 2009, U.S. Large Company Portfolio’s result of operations for the year ended October 31, 2010 would have been as follows (in thousands):
| | | | |
Net Investment Income | | $ | 71,681 | (a) |
Net Realized and Unrealized Gain (Loss) on Investments | | | 501,073 | (b) |
| | | | |
Net Increase in Net Assets Resulting from Operations | | $ | 572,754 | |
| | | | |
| | (a) | $43,125 as reported in the Statement of Operations, plus $27,799 Net Investment Income from U.S. Large Company Portfolio pre-merger, plus $757 of pro-forma eliminated expenses. |
| | (b) | $596,596 as reported in the Statement of Operations, less $95,523 Net Realized and Unrealized Gain (Loss) on Investments from U.S. Large Company Portfolio pre-merger. |
Because both U.S. Large Company Portfolio and U.S. Large Company Institutional Index Portfolio sold and redeemed shares throughout the period, it is not practicable to provide pro-forma information on a per-share basis.
Prior to September 10, 2010, U.S. Large Company Portfolio invested substantially all of its assets in shares of The U.S. Large Company Series. At the close of business on September 9, 2010, U.S. Large Company Portfolio received its pro-rata share of cash and securities from The U.S. Large Company Series in a complete liquidation of its interest in the Series. Effective September 10, 2010, U.S. Large Company Portfolio invests directly in securities rather than through the Series and maintains the same investment objective.
At a regular meeting of the Board of Directors/Trustees (the “Board”) on September 16, 2008, the Board voted to change the fiscal and tax year ends of the Portfolios from November 30 to October 31.
B. Significant Accounting Policies:
The following significant accounting policies are in conformity with accounting principles generally accepted in the United States of America. Such policies are consistently followed by the Fund in preparation of its financial statements. The preparation of financial statements in accordance with accounting principles generally accepted in the United States of America requires management to make estimates and assumptions that affect the reported amounts of assets and liabilities and disclosure of contingent assets and liabilities at the date of the financial statements and the reported amounts of increases and decreases in net assets from operations during the reporting period. Actual results could differ from those estimates and those differences could be material.
1. Security Valuation: The Portfolios utilize a fair value heirarchy which prioritizes the inputs to valuation techniques used to measure fair value into three broad levels described below:
— Level 1 – quoted prices in active markets for identical securities
— Level 2 – other significant observable inputs (including quoted prices for similar securities, interest rates, prepayment speeds, credit risk, etc.)
— Level 3 – significant unobservable inputs (including the Portfolio’s own assumptions in determining the fair value of investments)
The DFA International Value Portfolio’s investment reflects its proportionate interest in the net assets of the Series. These valuations are classified as Level 1 in the hierarchy.
177
Securities held by U.S. Large Company Portfolio, including over-the-counter securities, are valued at the last quoted sale price of the day. Securities held by U.S. Large Company Portfolio that are listed on Nasdaq are valued at the Nasdaq Official Closing Price (“NOCP”). If there is no last reported sale price or NOCP for the day, U.S. Large Company Portfolio values the securities at the mean of the most recent quoted bid and asked prices. Price information on listed securities is taken from the exchange where the security is primarily traded. Generally, securities issued by open-end investment companies are valued using their respective net asset values or public offering prices, as appropriate, for purchase orders placed at the close of the New York Stock Exchange (NYSE). These securities are generally categorized as Level 1 in the hierarchy.
Securities for which no market quotations are readily available (including restricted securities), or for which market quotations have become unreliable, are valued in good faith at fair value in accordance with procedures adopted by the Board of Directors/Trustees. These securities are generally categorized as Level 2 in the hierarchy. Fair value pricing may also be used if events that have a significant effect on the value of an investment (as determined in the discretion of the Investment Committee of the Advisor) occur before the net asset value is calculated. When fair value pricing is used, the prices of securities used by the Portfolio may differ from the quoted or published prices for the same securities on their primary markets or exchanges.
Futures contracts held by the U.S. Large Company Portfolio are valued using the settlement price established each day on the exchange on which they are traded. These valuations are generally categorized as Level 1 in the hierarchy.
A summary of the inputs used to value the Portfolios’ investments by each major security type, industry and/or country is disclosed at the end of the Schedules of Investments. The inputs or methodology used for valuing securities are not necessarily an indication of the risk associated with investing in those securities.
The Portfolios did not have any significant transfers between Level 1 and Level 2 during the year ended October 31, 2010.
2. Deferred Compensation Plan: Each eligible Director of the Fund may elect participation in the Deferred Compensation Plan (the “Plan”). Under the Plan, effective January 1, 2002, such Directors may defer payment of all or a portion of their total fees earned as a Director. These deferred amounts may be treated as though such amounts had been invested in shares of the following funds: U.S. Large Cap Value Portfolio; U.S. Core Equity 1 Portfolio; U.S. Core Equity 2 Portfolio; U.S. Vector Equity Portfolio; U.S. Micro Cap Portfolio; DFA International Value Portfolio; International Core Equity Portfolio; Emerging Markets Portfolio; Emerging Markets Core Equity Portfolio; and/or DFA Two-Year Global Fixed Income Portfolio. Contributions made under the Plan and the change in unrealized appreciation (depreciation) and income are included in Directors’/Trustees’ Fees & Expenses.
Each Director has the option to receive their distribution of proceeds in one of the following methods: lump sum; annual installments over a period of agreed upon years; or quarterly installments over a period of agreed upon years. Each Director shall have the right in a notice of election to defer compensation (the “Notice”) to elect to defer the receipt of the Director’s deferred compensation until a date specified by such Director in the Notice, which date may not be sooner than the earlier of: (i) the first business day of January following the year in which such Director ceases to be a member of the Board of the Fund; and (ii) five years following the effective date of the Director’s first deferral election. If a Director who elects to defer fees fails to designate in the Notice a time or date as of which payment of the Director’s deferred fee account shall commence, payment of such amount shall commence as of the first business day of January following the year in which the Director ceases to be a member of the Board of the Fund (unless the Director files an amended Notice selecting a different distribution date). Robert C. Merton resigned from the Board of the Fund on December 1, 2009 and received a lump sum payment of the proceeds of his deferred fee account on January 4, 2010 in the amount of $241,764. As of October 31, 2010, no other Directors have requested or received a distribution of proceeds of a deferred fee account.
3. Other: The Feeder Fund recognizes its pro-rata share, on a daily basis, of net investment income and realized and unrealized gains and losses of investment securities from the Series, which is treated as a partnership for federal income tax purposes. Dividend income and distributions to shareholders are recorded on the ex-dividend date. Distributions received on securities that represent a return of capital or capital gain are recorded as a reduction
178
of cost of investments or as a realized gain, respectively. The Feeder Fund estimates the character of distributions received that may be considered return of capital distributions. Expenses directly attributable to the Feeder Fund are directly charged. Common expenses of the Fund are allocated using methods approved by the Board of Directors/Trustees, generally based on average net assets.
Class R2 Shares and Institutional Class Shares have equal rights to assets and earnings of the Feeder Fund. Income, gains and losses, and common expenses of the Feeder Fund are allocated to each class of shares based on its relative net assets. Each class will bear its own class-specific expenses, if any.
C. Investment Advisor:
Dimensional Fund Advisors LP (“Dimensional” or the “Advisor”) provides administrative services to the Portfolios, including supervision of services provided by others, providing information to the shareholders and to the Board of Directors/Trustees, and other administrative services. The Advisor provides investment advisory services to the Portfolios and the Series. The Advisor receives no additional compensation for the investment advisory services it provides to the Feeder Fund. For the year ended October 31, 2010, the Portfolios’ administrative services fees were accrued daily and paid monthly to the Advisor based on the following effective annual rates of average daily net assets:
| | | | |
DFA International Value Portfolio | | | 0.20 | % |
U.S. Large Company Portfolio* | | | 0.05 | % |
For the year ended October 31, 2010, the Portfolio’s investment advisory fees were accrued daily and paid monthly to the Advisor based on the following effective annual rates of average daily net assets:
| | | | |
U.S. Large Company Portfolio* | | | 0.025 | % |
*Effective September 10, 2010, U.S. Large Company Portfolio no longer invests substantially all of its assets in The U.S. Large Company Series. Instead, U.S. Large Company Portfolio’s assets are managed directly in accordance with its investment objective and strategies, pursuant to an investment management agreement between the Fund, on behalf of U.S. Large Company Portfolio, and Dimensional, which previously was the manager of The U.S. Large Company Series’ assets. The investment advisory fee paid by U.S. Large Company Portfolio is identical to the advisory fee that was charged to The U.S. Large Company Series.
Pursuant to a Fee Waiver and Expense Assumption Agreement, the Advisor has contractually agreed to waive certain fees, including administration/advisory fees, and in certain instances, assume certain expenses of the Portfolios, as described in the notes below. The Fee Waiver and Expense Assumption Agreement for the Portfolios below will remain in effect through March 1, 2011, and shall continue in effect from year to year thereafter unless terminated by the Fund or the Advisor. For the year ended October 31, 2010, the Portfolios had expense limits based on a percentage of average net assets on an annualized basis, and the Advisor recovered previously waived fees and/or expenses assumed as listed below (amounts in thousands). The Portfolios are not obligated to reimburse the Advisor for fees previously waived or expenses previously assumed by the Advisor more than thirty-six months before the date of recovery.
| | | | | | | | | | | | |
| | | Expense
Limits | | | Recovery
of Previously
Waived Fees/
Expenses Assumed | | | Previously
Waived Fees/
Expenses Assumed
Subject to Future
Recovery | |
DFA International Value Portfolio — Class R2 Shares (1) | | | 0.79 | % | | | — | | | | — | |
U.S. Large Company Portfolio (2) | | | 0.10 | % | | | — | | | $ | 642 | |
(1) The Advisor has contractually agreed to assume the Portfolio’s direct expenses (excluding management fees and custodian fees) to the extent necessary to limit the expenses of the Class R2 shares of the Portfolio to the rate listed above as a percentage of average net assets on an annualized basis. At any time that the annualized expenses of the Portfolio are less than the rate listed above for the Portfolio, the Advisor retains the right to recover
179
any fees previously waived and/or expenses previously assumed to the extent that such recovery will not cause the Portfolio’s Class R2 shares’ annualized expenses to exceed the applicable percentage of average net assets as listed above.
(2) The Advisor has contractually agreed to waive its administration fee and advisory fee and to assume the Portfolio’s direct and indirect expenses (including the expenses the Portfolio has incurred as a shareholder of The U.S. Large Company Series) necessary to reduce the Portfolio’s expenses to the extent that its total direct and indirect expenses exceed the rate listed above as a percentage of average net assets on an annualized basis. At any time that the annualized expenses of the Portfolio are less than the rate listed above for the Portfolio, the Advisor retains the right to recover any fees previously waived and/or expenses previously assumed to the extent that such recovery will not cause the Portfolio’s annualized expenses to exceed the applicable percentage of average net assets on an annualized basis, as listed above.
Fees Paid to Officers and Directors/Trustees:
Certain Officers and Directors/Trustees of the Advisor are also Officers and Directors/Trustees of the Fund; however, such Officers and Directors/Trustees (with the exception of the Chief Compliance Officer (“CCO”)) receive no compensation from the Fund. For the year ended October 31, 2010, the total related amounts paid by the Fund to the CCO were $29 (in thousands). The total related amounts paid by the Portfolio are included in Other Expenses on the Statement of Operations.
D. Deferred Compensation:
At October 31, 2010, the total liability for deferred compensation to Directors/Trustees is included in Accrued Expenses and Other Liabilities on the Statement of Assets and Liabilities as follow (amounts in thousands):
| | | | |
DFA International Value Portfolio | | $ | 119 | |
U.S. Large Company Portfolio | | | 194 | |
E. Purchases and Sales of Securities:
For the period September 10, 2010 through October 31, 2010, during which the U.S. Large Company Portfolio invested directly in securities, the Portfolio made the following purchases and sales of investment securities, other than short-term securities and U.S. government securities (amounts in thousands):
| | | | |
Purchases | | $ | 25,631 | |
Sales | | | 78,269 | |
There were no purchases or sales of long-term U.S. government securities.
F. Federal Income Taxes:
Each Portfolio has qualified and intends to continue to qualify as a regulated investment company under Subchapter M of the Internal Revenue Code for federal income tax purposes and to distribute substantially all of its taxable income and net capital gains to its shareholders. Accordingly, no provision has been made for federal income taxes.
Distributions from net investment income and from net realized capital gains are determined in accordance with U.S. federal income tax regulations, which may differ from those amounts determined under accounting principles generally accepted in the United States of America. These book/tax differences are either temporary or permanent in nature. To the extent these differences are permanent, they are charged or credited to paid-in capital, undistributed net investment income, accumulated net realized gains or unrealized appreciation, as appropriate, in the period that the differences arise. Accordingly, the following permanent differences as of October 31, 2010, primarily attributable to distribution of assets and liabilities by a partnership in complete liquidation and the expiration of capital loss carryforwards, were reclassified to the following accounts. These reclassifications had no effect on net assets or net asset value per share (amounts in thousands):
180
| | | | | | | | | | | | |
| | | Increase
(Decrease)
Paid-In-Capital | | | Increase
(Decrease)
Undistributed
Net Investment
Income | | | Increase
(Decrease)
Accumulated
Net Realized
Gains (Losses) | |
DFA International Value Portfolio | | | — | | | $ | (99 | ) | | $ | 99 | |
U.S. Large Company Portfolio | | $ | 453,344 | | | | (147 | ) | | | (453,197 | ) |
The tax character of dividends and distributions declared and paid during the years ended October 31, 2009 and October 31, 2010 were as follows (amounts in thousands):
| | | | | | | | | | | | |
| | | Net Investment
Income and
Short-Term
Capital Gains | | | Long-Term
Capital Gains | | | Total | |
DFA International Value Portfolio | | | | | | | | | | | | |
2009 | | $ | 105,700 | | | | — | | | $ | 105,700 | |
2010 | | | 107,409 | | | | — | | | | 107,409 | |
U.S. Large Company Portfolio | | | | | | | | | | | | |
2009 | | | 18,243 | | | | — | | | | 18,243 | |
2010 | | | 35,473 | | | | — | | | | 35,473 | |
At October 31, 2010, the components of distributable earnings (accumulated losses) were as follows (amounts in thousands):
| | | | | | | | | | | | | | |
| | | Undistributed
Net Investment
Income and
Short-Term
Capital Gains | | | Undistributed
Long-Term
Capital Gains | | Capital Loss
Caryforward | | | Total Net
Distributable
Earnings
(Accumulated
Losses) | |
DFA International Value Portfolio | | $ | 14,594 | | | — | | $ | (1,092,654 | ) | | $ | (1,078,060 | ) |
U.S. Large Company Portfolio | | | 9,826 | | | — | | | (386,326 | ) | | | (376,500 | ) |
For federal income tax purposes, the Fund measures its capital loss carryforwards annually at October 31, its fiscal year end. Capital loss carryforwards may be carried forward and applied against future capital gains. As of October 31, 2010, the Portfolios had capital loss carryforwards available to offset future realized capital gains through the indicated expiration date (amounts in thousands):
| | | | | | | | | | | | | | | | | | | | | | | | | | | | | | | | | | | | |
| | | Expires on October 31, | | | | |
| | | 2011 | | | 2012 | | | 2013 | | | 2014 | | | 2015 | | | 2016 | | | 2017 | | | 2018 | | | Total | |
DFA International Value Portfolio | | | — | | | | — | | | | — | | | | — | | | | — | | | $ | 1,092,654 | | | | — | | | | — | | | $ | 1,092,654 | |
U.S. Large Company Portfolio | | $ | 13,997 | | | $ | 5,486 | | | $ | 10,569 | | | $ | 1,944 | | | $ | 86,015 | | | | 100,024 | | | $ | 87,500 | | | $ | 80,791 | | | | 386,326 | |
For the year ended October 31, 2010, DFA International Value Portfolio had utilized capital loss carryforwards to offset realized capital gains for federal income tax purposes of $255,554 (in thousands).
For the year ended October 31, 2010, U.S. Large Company Portfolio had capital loss carryforward expirations of $42,619 (in thousands).
181
At October 31, 2010, the total cost and aggregate gross unrealized appreciation and (depreciation) of securities for federal income tax purposes were different from amounts reported for financial reporting purposes (amounts in thousands):
| | | | | | | | | | | | | | | | |
| | | Federal
Tax Cost | | | Unrealized
Appreciation | | | Unrealized
(Depreciation) | | | Net
Unrealized
Appreciation
(Depreciation) | |
DFA International Value Portfolio | | $ | 4,006,671 | | | $ | 1,245,128 | | | $ | (87,949 | ) | | $ | 1,157,179 | |
U.S. Large Company Portfolio | | | 3,416,346 | | | | 1,192,587 | | | | (547,256 | ) | | | 645,331 | |
Accounting for Uncertainty in Income Taxes sets forth a minimum threshold for financial statement recognition of the benefit of a tax position taken or expected to be taken in a tax return. Management has analyzed the Portfolios’ tax postions and has concluded that no provision for income tax is required in the Portfolios’ financial statements. The Portfolios are not aware of any tax positions for which it is reasonably possible that the total amounts of unrecognized tax benefits will significantly change in the next twelve months. The Portfolios’ federal tax returns for the prior three fiscal years remains subject to examination by the Internal Revenue Service.
On November 1, 2008, The DFA International Value Series, a master fund in a RIC/RIC master-feeder structure with five RIC feeders and other direct client investor(s), made a “Check-the-box” election for federal income tax purposes pursuant to Treasury Regulation §301.7701-3, to change its federal entity classification from a corporation taxable as a regulated investment company to a partnership. As a result of this election, the master fund is deemed to have distributed all of its assets and liabilities, in a taxable transaction, to its shareholders in liquidation of the master fund. Immediately thereafter, the shareholders contributed all of the distributed assets and liabilities to a newly formed partnership. The final tax year end of The DFA International Value Series was October 31, 2008. For Federal income tax purposes, pursuant to Internal Revenue Code §336(a), the master fund recognizes gain or loss as if the master’s investment securities were sold to its shareholders and, pursuant to IRC Code §331, each of the Portfolios recognizes gain or loss as if it liquidated its investment in the master. As a result of the transaction, The DFA International Value Series recognized a ($2,309,440,866) and ($718,733) capital and currency loss respectively for tax year ended October 31, 2008. For tax purposes, pursuant to IRC Code §334(a), each of the Portfolios will take a fair market value basis in the securities deemed received by them and a new holding period for those securities commences on the deemed liquidation date.
Certain prior year balances have been reclassified to conform with current year presentations. Such reclassfications impacted the paid-in-capital, undistributed net investment income/distributions in excess of net investment income and accumulated net realized gain/loss components of net assets on the statement of assets and liabilities of U.S. Large Company Portfolio. These reclassifications had no impact on net assets, net asset value, the financial highlights or total return.
G. Capital Share Transactions:
The capital share transactions by class were as follows (amounts in thousands):
| | | | | | | | | | | | | | | | |
| | | Year
Ended
Oct. 31, 2010 | | | Year
Ended
Oct. 31, 2009 | |
| | | Amount | | | Shares | | | Amount | | | Shares | |
| DFA International Value Portfolio | | | | | | | | | | | | |
Class R2 Shares | | | | | | | | | | | | | | | | |
Shares Issued | | $ | 2,443 | | | | 375 | | | $ | 1,393 | | | | 263 | |
Shares Issued in Lieu of Cash Distributions | | | 249 | | | | 43 | | | | 207 | | | | 38 | |
Shares Redeemed | | | (1,361 | ) | | | (215 | ) | | | (2,329 | ) | | | (425 | ) |
Shares Reduced by Reverse Stock Split (Note O) | | | — | | | | (453 | ) | | | — | | | | — | |
| | | | | | | | | | | | | | | | |
Net Increase (Decrease) — Class R2 Shares | | $ | 1,331 | | | | (250 | ) | | $ | (729 | ) | | | (124 | ) |
| | | | | | | | | | | | | | | | |
182
| | | | | | | | | | | | | | | | |
| | | Year
Ended
Oct. 31, 2010 | | | Year
Ended
Oct. 31, 2009 | |
| | | Amount | | | Shares | | | Amount | | | Shares | |
Institutional Class Shares | | | | | | | | | | | | | | | | |
Shares Issued | | $ | 1,029,921 | | | | 62,367 | | | $ | 1,076,228 | | | | 84,945 | |
Shares Issued in Lieu of Cash Distributions | | | 101,230 | | | | 6,632 | | | | 98,011 | | | | 7,185 | |
Shares Redeemed | | | (806,802 | ) | | | (48,927 | ) | | | (1,122,011 | ) | | | (89,725 | ) |
| | | | | | | | | | | | | | | | |
Net Increase (Decrease) — Institutional Class Shares | | $ | 324,349 | | | | 20,072 | | | $ | 52,228 | | | | 2,405 | |
| | | | | | | | | | | | | | | | |
H. Financial Instruments:
In accordance with U.S. Large Company Portfolio investment objectives and policies, U.S. Large Company Portfolio may invest in certain financial instruments that have off-balance sheet risk in excess of the amounts recognized in the financial statements and concentrations of credit and market risk. These instruments and their significant corresponding risks are described below:
1. Repurchase Agreements: U.S. Large Company Portfolio may purchase certain U.S. Government securities subject to the counterparty’s agreement to repurchase them at an agreed upon date and price. The counterparty will be required on a daily basis to maintain the value of the collateral subject to the agreement at not less than the repurchase price (including accrued interest). The agreements are conditioned upon the collateral being deposited under the Federal Reserve book-entry system with the Trust’s custodian or a third party sub-custodian. In the event of default or bankruptcy by the other party to the agreement, retention of the collateral may be subject to legal proceedings. All open repurchase agreements were entered into on October 29, 2010.
Derivative Financial Instruments:
Disclosures on derivative instruments and hedging activities are intended to improve financial reporting for derivative instruments by enabling investors to understand how and why a fund uses derivatives, how derivatives are accounted for and how derivative instruments affect a fund’s results of operations and financial position. Summarized below are the specific types of derivative instruments used by the Series.
2. Futures Contracts: U.S. Large Company Portfolio may enter into futures contracts to gain market exposure on uninvested cash pending investment in securities or to maintain liquidity to pay redemptions. Upon entering into a futures contract, U.S. Large Company Portfolio deposits cash or pledges U.S. Government securities to a broker, equal to the minimum “initial margin” requirements of the exchange on which the contract is traded. Subsequent payments are received from or paid to the broker each day, based on the daily fluctuation in the market value of the contract. These receipts or payments are known as “variation margin” and are recorded daily by U.S. Large Company Portfolio as unrealized gains or losses until the contracts are closed. When the contracts are closed, U.S. Large Company Portfolio record a realized gain or loss, which is presented in the Statements of Operations as a net realized gain or loss on futures, equal to the difference between the value of the contract at the time it was opened and the value at the time it was closed.
Risks may arise upon entering into futures contracts from potential imperfect price correlations between the futures contracts and the underlying securities, from the possibility of an illiquid secondary market for these instruments and from the possibility that U.S. Large Company Portfolio could lose more than the initial margin requirements. Portfolios entering into stock index futures are subject to equity price risk from those futures contracts. Counterparty credit risk related to exchange-traded futures is minimal because the exchange’s clearinghouse, as counterparty to all exchange-traded futures, guarantees the futures against default.
183
At October 31, 2010, U.S. Large Company Portfolio had outstanding futues contracts (dollar amounts in thousands):
| | | | | | | | | | | | |
| | | Description | | Expiration
Date | | Number of
Contracts* | | Contract
Value | | Unrealized
Gain (Loss) | | Approximate
Cash
Collateral |
U.S. Large Company Portfolio | | S&P 500 ®Index | | 12/17/2010 | | 163 | | $48,073 | | $1,447 | | $4,410 |
| | * | During the year ended October 31, 2010, U.S. Large Company Portfolio’s average notional value of outstanding futures contracts was $39,922 (in thousands). |
Additional disclosure on derivative instruments is required showing a summary by primary risk exposure of the derivatives instruments’ (i) location in the balance sheet and fair value at period end and (ii) the location in the Statements of Operations and the realized and change in unrealized gain or loss over the reporting period. The following is a summary of U.S. Large Company Portfolio’s derivative instrument holdings for the year ended October 31, 2010.
The following is a summary of U.S. Large Company Portfolio’s location and value of derivative instrument holdings on U.S. Large Compnay Portfolio’s Statements of Assets and Liabilities categorized by primary risk exposure as of October 31, 2010 (amounts in thousands):
| | | | | | |
| | | | | Asset Derivatives Value | |
| | | Location on the Statements
of Assets and
Liabilities | | Equity
Contracts | |
U.S. Large Company Portfolio | | Receivables: Futures
Margin Variation | | | $1,447* | |
| | * | Includes cumulative appreciation (depreciation) of futures contracts. Only current day’s margin variation is reported within the Statement of Assets and Liabilities. |
The following is a summary of the location of realized and change in unrealized gains and losses on U.S. Large Company Portfolio’s Statement of Operations for U.S. Large Company Portfolio’s derivative instrument holdings through the year ended October 31, 2010:
| | |
Derivative Type | | Location of Gain (Loss) on Derivatives Recognized in Income |
Equity contracts | | Net Realized Gain (Loss) on: Futures Change in Unrealized Appreciation (Depreciation) of: Futures |
The following is a summary of the realized and change in unrealized gains and losses from U.S. Large Company Portfolio’s direct investment in derivative instrument holdings categorized by primary risk exposure for the period September 10, 2010 through October 31, 2010 (amounts in thousands):
| | |
| | | Realized Gain (Loss)
on Derivatives
Recognized in Income |
| |
| | | Equity
Contracts |
U.S. Large Company Portfolio | | $1,012 |
| |
| | | Change in Unrealized
Appreciation (Depreciation) on
Derivatives Recognized in Income |
| |
| | | Equity
Contracts |
U.S. Large Company Portfolio | | $1,447 |
184
I. Line of Credit:
The Fund, together with other Dimensional-advised portfolios, has entered into an amended and restated $250 million unsecured discretionary line of credit effective July 8, 2009 with an affiliate of its domestic custodian bank. Each portfolio is permitted to borrow, subject to its investment limitations, up to a maximum of $250 million, as long as total borrowings under the line of credit do not exceed $250 million in the aggregate. Borrowings under the line of credit are charged interest at rates agreed upon by the parties at the time of borrowings. Each portfolio is individually, and not jointly, liable for its particular advances under the line of credit. There is no commitment fee on the unused portion of the line of credit. The agreement for the discretionary line of credit may be terminated by either party at any time. The line of credit is scheduled to expire on June 21, 2011. There were no borrowings by the Portfolios under this line of credit during the year ended October 31, 2010.
The Fund, together with other Dimensional-advised portfolios, has also entered into an additional $500 million unsecured line of credit effective January 15, 2010 with its international custodian bank. Each portfolio is permitted to borrow, subject to its investment limitations, up to a maximum of $500 million, as long as total borrowings under the line of credit do not exceed $500 million in the aggregate. Each portfolio is individually, and not jointly, liable for its particular advances under the line of credit. Borrowings under the line of credit are charged interest at rates agreed to by the parties at the time of borrowing. There is no commitment fee on the unused portion of the line of credit. The agreement of the line of credit expires on January 15, 2011. There were no borrowings by the Portfolios under this line of credit during the year ended October 31, 2010.
J. Securities Lending:
As of October 31, 2010, U.S. Large Company Portfolio had securities on loan to brokers/dealers, for which the Portfolio receives cash collateral. The Portfolio invests its cash collateral, as described below, and records a liability for the return of the collateral, during the period the securities are on loan. Loans of securities are expected at all times to be secured by collateral equal to at least (i) 100% of the current market value of the loaned securities with respect to securities of the U.S. government or its agencies, (ii) 102% of the current market value of the loaned securities with respect to U.S. securities, and (iii) 105% of the current market value of the loaned securities with respect to foreign securities. However, daily market fluctuations could cause the Portfolio’s collateral to be lower or higher than the expected thresholds. If this were to occur, the collateral would be adjusted the next business day to ensure adequate collateralization. In the event of default or bankruptcy by the other party to the agreement, realization and/or retention of the collateral may be subject to legal proceedings. If the borrower fails to return loaned securities, and cash collateral being maintained by the borrower is insufficient to cover the value of loaned securities and provided such collateral insufficiency is not the result of investment losses, the lending agent has agreed to pay the amount of the shortfall to the Portfolio or, at the option of the lending agent, to replace the securities.
Subject to its stated investment policies, the Portfolio will generally invest its cash collateral received for the loaned securities in The DFA Short Term Investment Fund (the “Money Market Series”), an affiliated registered money market fund advised by the Advisor for which the Advisor receives a management fee of 0.05% of the average daily net assets of the Money Market Series. The Portfolio also may invest the cash collateral received for the loaned securities in securities of the U.S. government or its agencies, repurchase agreements collateralized by securities of the U.S. government or its agencies, and affiliated and unaffiliated registered and unregistered money market funds. For purposes of this paragraph, agencies include both agency debentures and agency mortgage-backed securities. In addition, the Portfolio will be able to terminate the loan at any time and will receive reasonable interest on the loan, as well as amounts equal to any dividends, interest or other distributions on the loaned securities. However, dividend income received from loaned securities may not be eligible to be taxed at qualified dividend income rates.
185
K. Shareholder Servicing Fees:
The Class R2 Shares pay a shareholder servicing fee in the amount of 0.25% of their annual average net assets to compensate service agents that provide shareholder servicing, record keeping, account maintenance and other services to investors in the DFA International Value Portfolio Class R2 Shares.
L. Indemnitees; Contractual Obligations:
Under the Fund’s organizational documents, its officers and directors are indemnified against certain liabilities arising out of the performance of their duties to the Fund.
In the normal course of business, the Fund enters into contracts that contain a variety of representations and warranties which provide general indemnification. The Fund’s maximum exposure under these arrangements is unknown as this would involve future claims that may be made against the Fund and/or its affiliates that have not yet occurred. However, based on experience, the Fund expects the risk of loss to be remote.
M. Recently Issued Accounting Standards:
In January 2010, the Financial Accounting Standards Board (“FASB”) issued Accounting Standards Update (“ASU”) No. 2010-06 “Improving Disclosures about Fair Value Measurements.” ASU No. 2010-06 amends FASB Accounting Standards Codification Topic 820, Fair Value Measurements and Disclosures, to require additional disclosures in the roll forward of activity in Level 3 fair value measurements effective for interim and annual reporting periods beginning after December 15, 2010. Management is currently evaluating the impact ASU No. 2010-06 will have on its financial statement disclosures.
N. Other:
At October 31, 2010, the following number of shareholders held the following approximate percentages of outstanding shares of the Portfolios. One or more of the shareholders is an omnibus account, which typically holds shares for the benefit of several other underlying investors.
| | | | |
| | | Number of
Shareholders | | Approximate
Percentage
of Oustanding
Shares |
DFA International Value Portfolio — Class R2 Shares | | 3 | | 84% |
DFA International Value Portfolio — Institutional Class Shares | | 2 | | 47% |
U.S. Large Company Portfolio | | 2 | | 66% |
The Portfolios are subject to claims and suits that arise from time to time in the ordinary course of business (for example, in The Tribune Company Bankruptcy, certain creditors have filed an action against all shareholders of The Tribune Company who tendered shares when the Tribune Company went private in 2007 in a leveraged buy out transaction, seeking the return of all proceeds received by the shareholders). Although management currently believes that resolving claims against us, individually or in aggregate, will not have a material adverse impact on our financial position, our results of operations, or our cash flows, these matters are subject to inherent uncertainties and management’s view of these matters may change in the future.
O. Subsequent Event Evaluations:
Management has evaluated the impact of all subsequent events on the Portfolios and has determined that the following subsequent event requires recognition or disclosure in the financial statements.
186
On October 29, 2010, the Board of Directors/Trustees adopted a Plan of Recapitalization of DFA International Value Portfolio’s Class R2 Shares. On November 19, 2010, a reverse stock split was executed whereby each shareholder of Class R2 Shares received one share for every 2.631 shares held. The purpose of the reverse split was to reduce the number of Class R2 Shares, thereby increasing the net asset value of each Class R2 Share outstanding in order to more closely align the net asset value with the net asset value of DFA International Value Portfolio’s Institutional Class Shares. The per share data in the financial highlights, capital share activity in the statements of changes in net assets and the outstanding shares and net asset value as of October 31, 2010 in the statement of assets and liabilities have been retroactively restated to reflect the reverse stock splits for the respective Class R2 Shares.
187
REPORT OF INDEPENDENT REGISTERED PUBLIC ACCOUNTING FIRM
To the Shareholders of the Portfolios, as defined, and
Board of Directors of Dimensional Investment Group Inc.:
In our opinion, the accompanying statements of assets and liabilities, including the schedule of investments/ summary schedule of portfolio holdings, and the related statements of operations and of changes in net assets and the financial highlights present fairly, in all material respects, the financial position of DFA International Value Portfolio and U.S. Large Company Portfolio (constituting portfolios within Dimensional Investment Group Inc., hereafter referred to as the “Portfolios”) at October 31, 2010, the results of each of their operations for the year then ended, the changes in each of their net assets and the financial highlights for each of the periods indicated, in conformity with accounting principles generally accepted in the United States of America. These financial statements and financial highlights (hereafter referred to as “financial statements”) are the responsibility of the Portfolios’ management; our responsibility is to express an opinion on these financial statements based on our audits. We conducted our audits of these financial statements in accordance with the standards of the Public Company Accounting Oversight Board (United States). Those standards require that we plan and perform the audit to obtain reasonable assurance about whether the financial statements are free of material misstatement. An audit includes examining, on a test basis, evidence supporting the amounts and disclosures in the financial statements, assessing the accounting principles used and significant estimates made by management, and evaluating the overall financial statement presentation. We believe that our audits, which included confirmation of securities at October 31, 2010 by correspondence with the custodian, brokers, and the transfer agent of the investee fund, provide a reasonable basis for our opinion.
PricewaterhouseCoopers LLP
Philadelphia, Pennsylvania
December 22, 2010
188
THE DFA INVESTMENT TRUST COMPANY
PERFORMANCE CHARTS
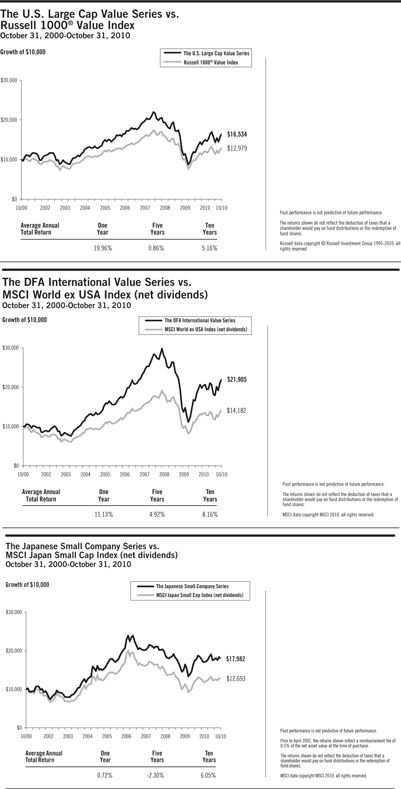
189
THE DFA INVESTMENT TRUST COMPANY
PERFORMANCE CHARTS
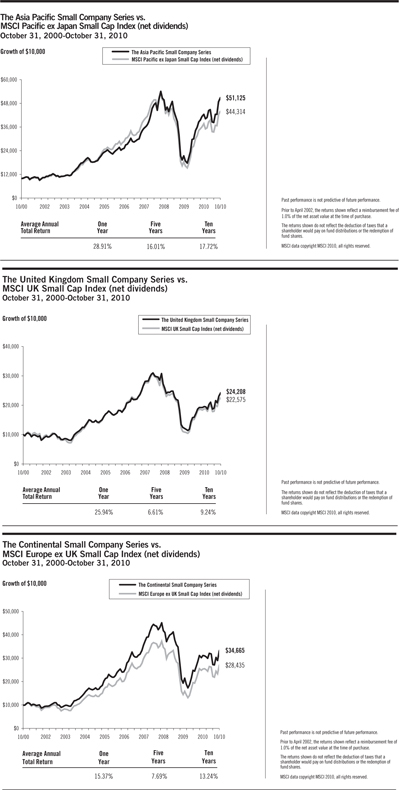
190
THE DFA INVESTMENT TRUST COMPANY
PERFORMANCE CHARTS
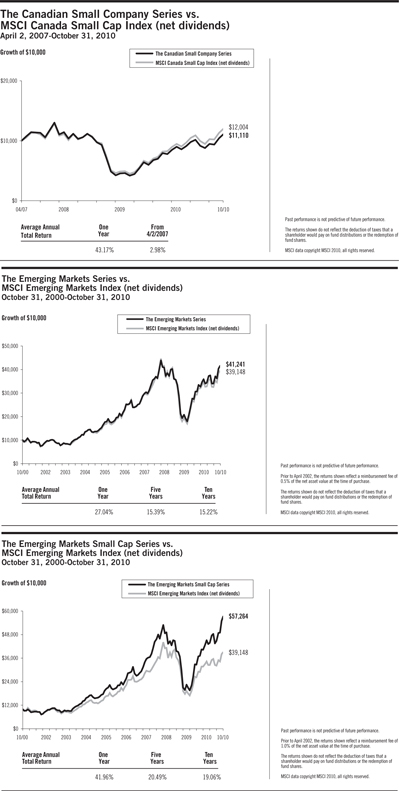
191
THE DFA INVESTMENT TRUST COMPANY
MANAGEMENT’S DISCUSSION AND ANALYSIS
| | |
| U.S. Equity Market Review | | 12 Months Ended October 31, 2010 |
The year ending October 31, 2010, was a relatively volatile period for U.S. equities. Broad market returns were positive, with the Russell 3000® Index returning 18.34%. Stocks represented by the Russell Midcap® Index outperformed those within both the Russell 2000® Index (small caps) and the Russell 1000® Index (large caps). Meanwhile, stocks represented by the Russell 1000® Growth Index outperformed those represented by the Russell 1000® Value Index.
While market returns were positive through April 2010, stocks retreated in May and June, marking new lows for the fiscal year in early July. Then in September, stocks began a sharp rise which continued through October. Over the course of the fiscal year, the small company premium within the Russell 3000® Index was positive, while the value premium was negative as investors’ risk tolerance shifted, and general economic conditions evolved.
Among the most important factors explaining differences in the behavior of diversified equity portfolios are the company size and company value/growth characteristics of the portfolio’s holdings. Size is measured by market capitalization, and value classification is a function of stock price relative to one or more fundamental characteristics. Compared to other stocks, value stocks often have lower market value relative to their earnings, dividends, and book value.
For the 12 months ended October 31, 2010, the total return of the Russell Microcap® Index was 25.08%, the Russell 2000® Index was 26.57%, the CRSP 6-10 Index was 28.76%, and the MSCI US Small Cap 1750 Index was 28.35%. Large cap growth stocks outperformed large cap value stocks, as measured by the Russell 1000® Growth Index and Russell 1000® Value Index. Small cap growth stocks outperformed small cap value stocks as measured by the Russell 2000® Growth Index and Russell 2000® Value Index.
Total Return for 12 Months Ended October 31, 2010
| | | | |
Russell 2000® Index (small cap companies) | | | 26.57 | % |
Russell Midcap® Index (mid cap companies) | | | 27.73 | % |
Russell 1000® Index (large cap companies) | | | 17.65 | % |
Russell 3000® Value Index | | | 16.41 | % |
Russell 3000® Growth Index | | | 20.32 | % |
Further dividing the large, mid, and small cap market segments by value and growth characteristics shows more detail in the performance differences over the period.
Total Return for 12 Months Ended October 31, 2010
| | | | |
Russell 1000® Value Index (large cap value companies) | | | 15.72 | % |
Russell 1000® Growth Index (large cap growth companies) | | | 19.66 | % |
Russell Midcap® Value Index (mid cap value companies) | | | 27.50 | % |
Russell Midcap® Growth Index (mid cap growth companies) | | | 28.03 | % |
Russell 2500® Value Index (small/mid cap value companies) | | | 26.89 | % |
Russell 2500® Growth Index (small/mid cap growth companies) | | | 28.76 | % |
Russell 2000® Value Index (small cap value companies) | | | 24.43 | % |
Russell 2000® Growth Index (small cap growth companies) | | | 28.66 | % |
Source: Russell data copyright © Russell Investment Group 1995-2010, all rights reserved.
Differences in returns for the various Dimensional U.S. equity funds over the 12 months ended October 31, 2010 were attributable primarily to differences in value/growth and size characteristics as well as the exclusion of REIT securities from most Dimensional portfolios, except for the DFA Real Estate Securities Portfolio and the
192
U.S. Large Company Portfolio. Moreover, the portfolio construction approach used by Dimensional Fund Advisors (the “Advisor”) generally resulted in portfolios with greater emphasis on value or small company characteristics relative to widely used index benchmarks.
Domestic Equity Series’ Performance Overview
The U.S. Large Cap Value Series
The U.S. Large Cap Value Series seeks to capture the returns of U.S. large company value stocks. The investment strategy employs a disciplined, quantitative approach, emphasizing broad diversification and consistent exposure to large cap value stocks, but does not attempt to closely track a specific equity index. As of October 31, 2010, the Series held 211 stocks and was mostly invested in equities throughout the year: the average cash level for the period was less than 1% of the Series’ assets.
For the 12 months ended October 31, 2010, total returns were 19.96% for the Series and 15.72% for the Russell 1000® Value Index. Relative to the Index, the Series’ higher concentration in securities with the most prominent value characteristics and composition differences among the Series’ value stocks added approximately 4.2% to the relative performance. Differences in allocation and composition between the Series and the Index across the market capitalization segments contributed to the outperformance, particularly the Series’ smaller allocation to the largest stocks and the composition of those stocks which added approximately 2.9% to the relative performance. The Series’ exclusion of REITs had a negative impact of approximately 0.7% relative to the Index as REITs was the best-performing sector over the period.
| | |
| International Equity Market Review | | 12 Months Ended October 31, 2010 |
The one-year period ending October 31, 2010, was characterized by relatively high levels of volatility in non-US developed markets. Broad market returns were positive, with stocks represented by the MSCI World ex USA Index (net dividends) returning 9.61%.
While market returns were positive in November and December of 2009, high volatility over the next five months — punctuated by an 11% drop in May — took developed non-US stocks to their lows for the fiscal year. In June, stocks began a sharp rise which continued through the remainder of the fiscal year as global economic data generally improved. As measured by the MSCI indices, growth stocks outperformed their value counterparts, while small cap stocks outperformed large caps.
| | | | |
| 12 Months Ended October 31, 2010 | | | |
| | | U.S. Dollar
Return | |
MSCI World ex USA Index | | | 9.61% | |
MSCI World ex USA Small Cap Index | | | 17.23% | |
MSCI World ex USA Growth Index | | | 6.38% | |
MSCI World ex USA Value Index | | | 12.87% | |
The performance of the US dollar (USD) was mixed against other major developed markets currencies during the period. While the USD rose slightly against the euro and British pound, it fell against most other G10 currencies, and in particular against the Japanese yen.
| | | | | | | | |
| 12 Months Ended October 31, 2010 | | | | | | |
| Ten Largest Foreign Developed Markets by Market Cap | | Local
Currency
Return | | | U.S. Dollar
Return | |
United Kingdom | | | 16.07% | | | | 12.58% | |
Japan | | | -6.76% | | | | 4.78% | |
Canada | | | 15.83% | | | | 22.62% | |
193
12 Months Ended October 31, 2010
| | | | | | | | |
| Ten Largest Foreign Developed Markets by Market Cap | | Local
Currency
Return | | | U.S. Dollar
Return | |
France | | | 11.80% | | | | 5.31% | |
Australia | | | 3.70% | | | | 12.50% | |
Germany | | | 20.61% | | | | 13.61% | |
Switzerland | | | 5.53% | | | | 9.90% | |
Spain | | | -2.96% | | | | -8.59% | |
Sweden | | | 17.82% | | | | 23.94% | |
Italy | | | 0.69% | | | | -5.14% | |
Source: Returns are of MSCI standard indices net of foreign withholding taxes on dividends. Copyright MSCI 2010, all rights reserved.
Gains in emerging markets were higher on average than in developed markets, although results varied widely among the individual emerging markets countries. For the one-year period ended October 31, 2010, returns in US dollars were 23.56% for the MSCI Emerging Markets Index (net dividends) versus 9.61% for the MSCI World ex USA Index (net dividends). As measured by the MSCI indices, emerging markets growth stocks outperformed their value counterparts, while emerging markets small cap stocks outperformed large caps.
12 Months Ended October 31, 2010
| | | | |
| | | U.S. Dollar
Return | |
MSCI Emerging Markets Index | | | 23.56% | |
MSCI Emerging Markets Small Cap Index | | | 37.02% | |
MSCI Emerging Markets Value Index | | | 21.96% | |
MSCI Emerging Markets Growth Index | | | 25.17% | |
The US dollar (USD) generally depreciated against most major emerging markets currencies during the period, increasing most local country returns when denominated in USD.
12 Months Ended October 31, 2010
| | | | |
| Ten Largest Emerging Markets by Market Cap | | Local
Currency
Return | | U.S. Dollar
Return |
China | | 11.14% | | 11.11% |
Brazil | | 11.67% | | 14.86% |
South Korea | | 18.52% | | 24.52% |
Taiwan | | 13.20% | | 20.23% |
India | | 27.64% | | 34.93% |
South Africa | | 18.71% | | 33.55% |
Russia | | 19.19% | | 13.38% |
Mexico | | 25.55% | | 33.87% |
Malaysia | | 23.94% | | 35.93% |
Indonesia | | 41.78% | | 51.50% |
Source: Returns are of MSCI indices net of foreign withholding taxes on dividends. Copyright MSCI 2010, all rights reserved.
194
International Equity Series’ Performance Overview
The DFA International Value Series
The DFA International Value Series seeks to capture the returns of international large company value stocks. The investment strategy employs a disciplined, quantitative approach, emphasizing broad diversification and consistent exposure to large cap value stocks, but does not attempt to track any specific equity index. As of October 31, 2010, the Series held 528 stocks in 23 developed countries. In general the portfolio was fully invested in equities throughout the year. The average cash level for the period was less than 1% of the Series’ assets.
For the 12 months ended October 31, 2010, total returns were 11.13% for the Series and 9.61% for the MSCI World ex USA Index (net dividends). The MSCI Standard benchmarks indicate that on the whole, growth stocks outperformed value stocks in international developed markets during the period. However, stocks in the deeper value segment of the market outperformed growth stocks on average. The Series’ greater allocation than the Index to these deeper value stocks contributed to relative performance. An additional component of the Series’ outperformance was due to differences in valuation timing and methodology between the Portfolio and the Index. The Series prices foreign exchange rates at the closing of U.S. markets, while the Index uses rates at 4 pm London time. The Portfolio utilizes fair value pricing to price portfolio securities at the closing of the U.S. markets, while the Index uses local market closing prices.
The Japanese Small Company Series
The Japanese Small Company Series seeks to capture the returns of Japanese small company stocks. The investment strategy employs a disciplined, quantitative approach, emphasizing broad diversification and consistent exposure to small company stocks, but does not attempt to track a specific equity index. As of October 31, 2010, the Series held 1,333 stocks. In general, the Series was fully invested in equities throughout the year. The average cash level for the period was less than 1% of the Series’ assets.
As a result of the Series’ diversified investment approach, performance was determined principally by broad structural trends in the Japanese equity market, rather than the behavior of a limited number of stocks For the 12 months ended October 31, 2010, total returns were 0.72% for the Series and 1.12% for the MSCI Japan Small Cap Index (net dividends). Relative to the Index, the Series’ underperformance was primarily due to its exclusion of REITs, as REITs were the best performing sector over the period. To a lesser extent, compositional differences among the market capitalization segments further detracted from the Series’ relative performance.
The Asia Pacific Small Company Series
The Asia Pacific Small Company Series seeks to capture the returns of small company stocks in developed Asia Pacific markets, excluding Japan. The investments strategy employs a disciplined, quantitative approach, emphasizing broad diversification and consistent exposure to small company stocks, but does not attempt to track a specific equity index. As of October 31, 2010, the Series held 1,093 stocks, and assets were allocated mainly among four countries: Australia, Hong Kong, New Zealand, and Singapore. Country allocations generally reflect the approximate weights of individual securities within a universe of Asia Pacific small company stocks constructed by the Advisor. In general, the Series was fully invested in equities throughout the year. The average cash level for the period was less than 1% of the Series’ assets.
As a result of the Series’ diversified investment approach, performance was determined principally by broad structural trends in Asia Pacific equity markets rather than the behavior of a limited number of stocks. For the 12 months ended October 31, 2010, total returns were 28.91% for the Series and 25.77% for the MSCI Pacific ex Japan Small Cap Index (net dividends). The Series’ relative outperformance was primarily attributable to differences in the valuation timing and methodology between the Series and the Index. The Series prices foreign exchange rates at the closing of the U.S. markets while the Index uses rates at 4 pm London time. The Series utilizes fair value pricing to price portfolio securities at the closing of the U.S. markets while the Index uses local market closing prices.
195
The United Kingdom Small Company Series
The United Kingdom Small Company Series seeks to capture the returns of U.K. small company stocks. The investment strategy employs a disciplined, quantitative approach, emphasizing broad diversification and consistent exposure to small company stocks, but does not attempt to track a specific equity index. As of October 31, 2010, the Series held 375 stocks. In general, the Series was fully invested in equities throughout the year. The average cash level for the period was less than 1% of the Series’ assets.
As a result of the Series’ diversified investment approach, performance was determined principally by broad structural trends in the U.K. equity market, rather than the behavior of a limited number of stocks. Over the period, U.K. small company stocks outperformed U.K. large company stocks. For the 12 months ended October 31, 2010, total returns were 25.94% for the Series and 21.61% for the MSCI UK Small Cap Index (net dividends). The Series holds a large number of stocks, and in most cases, no single stock will explain a significant amount of the performance difference relative to the Index. However, during the 12-month period ended October 31, 2010, the Portfolio held two stocks that had a significant positive impact on relative performance. One stock was held at a higher weight than in the Index and the other stock was not present in the Index as it was considered too large for the Index.
The Continental Small Company Series
The Continental Small Company Series seeks to capture the returns of small company stocks in developed markets of Europe (excluding the U.K.) and Israel, by purchasing shares in such securities. The investment strategy employs a disciplined, quantitative approach, emphasizing broad diversification and consistent exposure to small company stocks, but does not attempt to track a specific equity index. As of October 31, 2010, the Series held 1,405 stocks in 15 developed continental European countries and Israel. Country allocations generally reflect the approximate weights of individual securities within a universe of continental European and Israeli small company stocks constructed by the Advisor. In general, the Series was fully invested in equities throughout the year. The average cash level for period was less than 1% of the Series’ assets.
As a result of the Series’ diversified investment approach, performance was determined principally by broad structural trends in the continental European (excluding the U.K.) and Israeli equity markets, rather than the behavior of a limited number of stocks. For the 12 months ended October 31, 2010, total returns were 15.37% for the Series and 15.17% for the MSCI Europe ex UK Small Cap Index (net dividends). The Series and the Index held a number of securities in common but in different weights due to different methods for defining size and the Series’ exclusion rules. For the one-year period ended October 31, 2010, overall differences generally offset each other with the end result that the Series slightly outperformed the Index.
The Canadian Small Company Series
The Canadian Small Company Series seeks to capture the returns of Canadian small company stocks. The investment strategy employs a disciplined, quantitative approach, emphasizing broad diversification and consistent exposure to small company stocks, but does not attempt to track a specific equity index. As of October 31, 2010, the Series held 410 stocks. In general, the Series was fully invested in equities throughout the year. The average cash level for the period was less than 1% of the Series’ assets.
As a result of the Series’ diversified investment approach, performance was determined principally by broad structural trends in the Canadian equity market, rather than the behavior of a limited number of stocks. Over the period, within the Canadian small company universe, the smallest stocks underperformed larger stocks. For the 12 months ended October 31, 2010, total returns were 43.17% for the Series and 46.20% for the MSCI Canada Small Cap Index (net dividends). The Series holds a large number of stocks and in most cases no single stock will explain a significant amount of the performance difference. However, during the 12-month period ended October 31, 2010, the Index held two securities that significantly outperformed and were excluded from the Series, accounting for the majority of the Series’ relative underperformance. These two securities were considered too large to be eligible for the Series.
196
The Emerging Markets Series
The Emerging Markets Series seeks to capture the returns of large cap stocks in selected emerging markets countries. The investment strategy employs a disciplined quantitative approach, emphasizing broad diversification and consistent exposure to large cap emerging markets stocks, but does not attempt to track a specific equity index. As of October 31, 2010, the Series held 712 stocks in 20 emerging markets countries. In general, the Series was fully invested in equities throughout the year. The average cash level for the period was less than 1% of the Series’ assets. The Series’ target country weights were capped at 15% upon purchase by the manager to limit single-country risk exposure.
As a result of the Series’ diversified approach, performance was generally determined by broad structural trends in emerging markets countries, rather than the behavior of a limited number of stocks. For the 12 months ended October 31, 2010, total returns were 27.04% for the Series and 23.56% for the MSCI Emerging Markets Index (net dividends). The Series’ relative outperformance was primarily due to differences in country weight allocations between the Series and the Index. Country weight differences were primarily driven by capping of individual countries to limit single-country risk exposure. To a lesser extent, an additional component of the Series’ outperformance was due to differences in valuation timing and methodology between the Series and the Index. The Series prices foreign exchange rates at the closing of the U.S. markets while the Index uses rates at 4 pm London time. The Series utilizes fair value pricing to price portfolio securities at the closing of the U.S. markets while the Index uses local market closing prices.
The Emerging Markets Small Cap Series
The Emerging Markets Small Cap Series seeks to capture the returns of small company stocks in selected emerging markets. The investment strategy employs a disciplined quantitative approach, emphasizing broad diversification and consistent exposure to small company stocks in selected emerging markets, but does not attempt to track a specific equity index. As of October 31, 2010, the Series held 2,691 stocks in 15 emerging markets countries. In general, the Series was fully invested in equities throughout the year: the average cash level for the period was less than 1% of the Series’ assets. The Series’ target country weights were capped at 15% upon purchase by the manager to limit single-country risk exposure.
As a result of the Series’ diversified approach, performance was principally determined by structural trends in emerging markets countries, rather than the behavior of a limited number of stocks. For the 12 months ended October 31, 2010, total returns were 41.96% for the Series and 23.56% for the MSCI Emerging Markets Index (net dividends). The Series��� outperformance was primarily due to emerging markets small cap stocks significantly outperforming their large cap counterparts during the period. The Series holds primarily small cap stocks whereas the Index holds primarily large cap and mid cap stocks. To a lesser extent, an additional component of the Series’ outperformance was due to differences in valuation timing and methodology between the Series and the Index. The Series prices foreign exchange rates at the closing of the U.S. markets while the Index uses rates at 4 pm London time. The Series utilizes fair value pricing to price portfolio securities at the closing of the U.S. markets while the Index uses local market closing prices.
197
THE DFA INVESTMENT TRUST COMPANY
DISCLOSURE OF FUND EXPENSES
(Unaudited)
The following Expense Tables are shown so that you can understand the impact of fees on your investment. All mutual funds have operating expenses. As a shareholder of the fund, you incur ongoing costs, which include costs for portfolio management, administrative services, and shareholder reports, among others. Operating expenses, legal and audit services, which are deducted from a fund’s gross income, directly reduce the investment return of the fund. A fund’s expenses are expressed as a percentage of its average net assets. This figure is known as the expense ratio. The following examples are intended to help you understand the ongoing costs, in dollars, of investing in the fund and to compare these costs with those of other mutual funds. The examples are based on an investment of $1,000 made at the beginning of the period shown and held for the entire period.
The Expense Tables below illustrate your fund’s costs in two ways.
Actual Fund Return
This section helps you to estimate the actual expenses after fee waivers that you paid over the period. The “Ending Account Value” shown is derived from the fund’s actual return and “Expenses Paid During Period” reflect the dollar amount that would have been paid by an investor who started with $1,000 in the fund. You may use the information here, together with the amount you invested, to estimate the expenses that you paid over the period.
To do so, simply divide your account value by $1,000 (for example, a $7,500 account value divided by $1,000 = 7.5), then multiply the result by the number given for your fund under the heading “Expenses Paid During Period.”
Hypothetical Example for Comparison Purposes
This section is intended to help you compare your fund’s costs with those of other mutual funds. The hypothetical “Ending Account Value” and “Expenses Paid During Period” are derived from the fund’s actual expense ratio and an assumed 5% annual return before expenses. In this case, because the return used is not the fund’s actual return, the results do not apply to your investment. The example is useful in making comparisons because the SEC requires all mutual funds to calculate expenses based on a 5% annual return. You can assess your fund’s costs by comparing this hypothetical example with the hypothetical examples that appear in shareholder reports of other funds.
Please note that the expenses shown in the tables are meant to highlight and help you compare ongoing costs only and do not reflect any transactional costs, if applicable. The “Annualized Expense Ratio” represents the actual expenses for the six-month period indicated.
Six Months Ended October 31, 2010
EXPENSE TABLES
| | | | | | | | | | | | | | | | |
| | | Beginning
Account
Value
05/01/10 | | | Ending
Account
Value
10/31/10 | | | Annualized
Expense
Ratio* | | | Expenses
Paid
During
Period* | |
| The U.S. Large Cap Value Series | | | | | | | | | | | | |
Actual Fund Return | | $ | 1,000.00 | | | $ | 975.20 | | | | 0.11% | | | $ | 0.55 | |
Hypothetical 5% Annual Return | | $ | 1,000.00 | | | $ | 1,024.65 | | | | 0.11% | | | $ | 0.56 | |
| | | | |
| The DFA International Value Series | | | | | | | | | | | | |
Actual Fund Return | | $ | 1,000.00 | | | $ | 1,063.80 | | | | 0.24% | | | $ | 1.25 | |
Hypothetical 5% Annual Return | | $ | 1,000.00 | | | $ | 1,024.00 | | | | 0.24% | | | $ | 1.22 | |
198
DISCLOSURE OF FUND EXPENSES
CONTINUED
| | | | | | | | | | | | | | | | |
| | | Beginning
Account
Value
05/01/10 | | | Ending
Account
Value
10/31/10 | | | Annualized
Expense
Ratio* | | | Expenses
Paid
During
Period* | |
The Japanese Small Company Series | | | | | | | | | | | | | | | | |
Actual Fund Return | | $ | 1,000.00 | | | $ | 942.00 | | | | 0.14% | | | $ | 0.69 | |
Hypothetical 5% Annual Return | | $ | 1,000.00 | | | $ | 1,024.50 | | | | 0.14% | | | $ | 0.71 | |
| | | | |
The Asia Pacific Small Company Series | | | | | | | | | | | | | | | | |
Actual Fund Return | | $ | 1,000.00 | | | $ | 1,135.30 | | | | 0.18% | | | $ | 0.97 | |
Hypothetical 5% Annual Return | | $ | 1,000.00 | | | $ | 1,024.30 | | | | 0.18% | | | $ | 0.92 | |
| | | | |
The United Kingdom Small Company Series | | | | | | | | | | | | | | | | |
Actual Fund Return | | $ | 1,000.00 | | | $ | 1,151.00 | | | | 0.13% | | | $ | 0.70 | |
Hypothetical 5% Annual Return | | $ | 1,000.00 | | | $ | 1,024.55 | | | | 0.13% | | | $ | 0.66 | |
| | | | |
The Continental Small Company Series | | | | | | | | | | | | | | | | |
Actual Fund Return | | $ | 1,000.00 | | | $ | 1,096.20 | | | | 0.17% | | | $ | 0.90 | |
Hypothetical 5% Annual Return | | $ | 1,000.00 | | | $ | 1,024.35 | | | | 0.17% | | | $ | 0.87 | |
| | | | |
The Canadian Small Company Series | | | | | | | | | | | | | | | | |
Actual Fund Return | | $ | 1,000.00 | | | $ | 1,097.80 | | | | 0.15% | | | $ | 0.79 | |
Hypothetical 5% Annual Return | | $ | 1,000.00 | | | $ | 1,024.45 | | | | 0.15% | | | $ | 0.77 | |
| | | | |
The Emerging Markets Series | | | | | | | | | | | | | | | | |
Actual Fund Return | | $ | 1,000.00 | | | $ | 1,108.50 | | | | 0.20% | | | $ | 1.06 | |
Hypothetical 5% Annual Return | | $ | 1,000.00 | | | $ | 1,024.20 | | | | 0.20% | | | $ | 1.02 | |
| | | | |
The Emerging Markets Small Cap Series | | | | | | | | | | | | | | | | |
Actual Fund Return | | $ | 1,000.00 | | | $ | 1,183.00 | | | | 0.33% | | | $ | 1.82 | |
Hypothetical 5% Annual Return | | $ | 1,000.00 | | | $ | 1,023.54 | | | | 0.33% | | | $ | 1.68 | |
| * | Expenses are equal to the fund’s annualized expense ratio for the six-month period, multiplied by the average account value over the period, multiplied by the number of days in the most recent six-month period (184), then divided by the number of days in the year (365) to reflect the six-month period. |
199
DFA INVESTMENT TRUST COMPANY
DISCLOSURE OF PORTFOLIO HOLDINGS
(Unaudited)
The SEC requires that all Funds file a complete Schedule of Investments with the SEC for their first and third fiscal quarters on Form N-Q. For The DFA Investment Trust Company, this would be for the fiscal quarters ending January 31 and July 31. The Form N-Q filing must be made within 60 days of the end of the quarter. The DFA Investment Trust Company filed its most recent Form N-Q with the SEC on September 29, 2010. It is available upon request, without charge, by calling collect: (512) 306-7400 or by mailing a request to Dimensional Fund Advisors LP, 6300 Bee Cave Road, Building One, Austin, Texas 78746, or by visiting the SEC’s website at http://www.sec.gov, or they may be reviewed and copied at the SEC’s Public Reference Room in Washington, D.C. (call 1-800-732-0330 for information on the operation of the Public Reference Room).
SEC regulations permit a fund to include in its reports to shareholders a “Summary Schedule of Portfolio Holdings” in lieu of a full Schedule of Investments. The Summary Schedule of Portfolio Holdings reports the fund’s 50 largest holdings in unaffiliated issuers and any investments that exceed one percent of the fund’s net assets at the end of the reporting period. The amendments also require that the Summary Schedule of Portfolio Holdings identify each category of investments that are held.
The fund is required to file a complete Schedule of Investments with the SEC on Form N-CSR within ten days after mailing the annual and semi-annual reports to shareholders. It will be available upon request, without charge, by calling collect: (512) 306-7400 or by mailing a request to Dimensional Fund Advisors LP, 6300 Bee Cave Road, Building One, Austin, Texas 78746, or by visiting the SEC’s website at http://www.sec.gov, or they may be reviewed and copied at the SEC’s Public Reference Room in Washington, D.C. (call 1-800-732-0330 for information on the operation of the Public Reference Room).
PORTFOLIO HOLDINGS
The SEC requires that all Funds present their categories of portfolio holdings in a table, chart or graph format in their annual and semi-annual shareholder reports, whether or not a Schedule of Investments is utilized. The following table, which presents portfolio holdings as a percent of total investments before short-term investments and collateral for loaned securities, is provided in compliance with such requirement. The categories shown below represent broad industry sectors. Each industry sector consists of one or more specific industry classifications.
DOMESTIC AND INTERNATIONAL EQUITY PORTFOLIOS
| | | | | | | | | | | | | | | | |
| The U.S. Large Cap Value Series | | | The DFA International Value Series | | | The Japanese Small Company Series | |
Consumer Discretionary | | | 18.2% | | | Consumer Discretionary | | | 15.8% | | | Consumer Discretionary | | | 23.7% | |
Consumer Staples | | | 7.8% | | | Consumer Staples | | | 6.0% | | | Consumer Staples | | | 9.8% | |
Energy | | | 15.5% | | | Energy | | | 10.1% | | | Energy | | | 1.1% | |
Financials | | | 21.4% | | | Financials | | | 31.6% | | | Financials | | | 10.4% | |
Health Care | | | 8.9% | | | Health Care | | | 1.2% | | | Health Care | | | 4.5% | |
Industrials | | | 14.1% | | | Industrials | | | 10.2% | | | Industrials | | | 25.9% | |
Information Technology | | | 3.3% | | | Information Technology | | | 3.6% | | | Information Technology | | | 11.2% | |
Materials | | | 3.4% | | | Materials | | | 11.7% | | | Materials | | | 12.7% | |
Telecommunication Services | | | 6.2% | | | Other | | | — | | | Real Estate Investment Trusts | | | — | |
Utilities | | | 1.2% | | | Telecommunication Services | | | 7.6% | | | Telecommunication Services | | | — | |
| | | | | | Utilities | | | 2.2% | | | Utilities | | | 0.7% | |
| | | | | | | | | | | | | | | | |
| | | 100.0% | | | | | | 100.0% | | | | | | 100.0% | |
200
DISCLOSURE OF PORTFOLIO HOLDINGS
CONTINUED
| | | | | | | | | | | | | | | | |
| The Asia Pacific Small Company Series | | | The United Kingdom Small Company Series | | | The Continental Small Company Series | |
Consumer Discretionary | | | 23.3% | | | Consumer Discretionary | | | 21.6% | | | Consumer Discretionary | | | 15.3% | |
Consumer Staples | | | 4.8% | | | Consumer Staples | | | 4.4% | | | Consumer Staples | | | 7.0% | |
Energy | | | 6.1% | | | Energy | | | 5.0% | | | Energy | | | 5.3% | |
Financials | | | 12.6% | | | Financials | | | 13.5% | | | Financials | | | 16.6% | |
Health Care | | | 4.8% | | | Health Care | | | 3.1% | | | Health Care | | | 8.5% | |
Industrials | | | 21.5% | | | Industrials | | | 30.8% | | | Industrials | | | 25.2% | |
Information Technology | | | 4.4% | | | Information Technology | | | 11.1% | | | Information Technology | | | 10.0% | |
Materials | | | 17.0% | | | Materials | | | 5.6% | | | Materials | | | 8.7% | |
Other | | | — | | | Other | | | — | | | Other | | | — | |
Real Estate Investment Trusts | | | 0.1% | | | Telecommunication Services | | | 2.1% | | | Real Estate Investment Trusts | | | — | |
Telecommunication Services | | | 1.8% | | | Utilities | | | 2.8% | | | Telecommunication Services | | | 1.2% | |
Utilities | | | 3.6% | | | | | | | | | Utilities | | | 2.2% | |
| | | | | | | | | | | | | | | | |
| | | 100.0% | | | | | | 100.0% | | | | | | 100.0% | |
| | | |
| The Canadian Small Company Series | | | The Emerging Markets Series | | | | | The Emerging Markets Small Cap Series | |
Consumer Discretionary | | | 10.5% | | | Consumer Discretionary | | | 6.9% | | | Consumer Discretionary | | | 19.3% | |
Consumer Staples | | | 2.6% | | | Consumer Staples | | | 9.3% | | | Consumer Staples | | | 10.5% | |
Energy | | | 17.9% | | | Energy | | | 14.2% | | | Energy | | | 1.8% | |
Financials | | | 6.8% | | | Financials | | | 21.4% | | | Financials | | | 17.0% | |
Health Care | | | 4.5% | | | Health Care | | | 1.0% | | | Health Care | | | 4.9% | |
Industrials | | | 9.6% | | | Industrials | | | 6.7% | | | Industrials | | | 17.0% | |
Information Technology | | | 5.6% | | | Information Technology | | | 13.6% | | | Information Technology | | | 8.7% | |
Materials | | | 41.3% | | | Materials | | | 13.6% | | | Materials | | | 15.9% | |
Telecommunication Services | | | 0.3% | | | Other | | | — | | | Other | | | 0.1% | |
Utilities | | | 0.9% | | | Real Estate Investment Trusts | | | — | | | Real Estate Investment Trusts | | | — | |
| | | | | | Telecommunication Services | | | 9.9% | | | Telecommunication Services | | | 0.9% | |
| | | | | | | | | | | | | | | | |
| | | 100.0% | | | Utilities | | | 3.4% | | | Utilities | | | 3.9% | |
| | | | | | | | | | | | | | | | |
| | | | | | | | | 100.0% | | | | | | 100.0% | |
201
THE U.S. LARGE CAP VALUE SERIES
SUMMARY SCHEDULE OF PORTFOLIO HOLDINGS
October 31, 2010
| | | | | | | | | | | | | | | | | | | | |
| | | Shares | | | | | | Value† | | | Percentage
of Net Assets** | |
COMMON STOCKS — (90.0%) | | | | | | | | | | | | | | | | | | | | |
Consumer Discretionary — (16.4%) | | | | | | | | | | | | | | | | | | | | |
#*Carnival Corp. | | | 2,792,987 | | | | | | | $ | 120,573,249 | | | | | | | | 1.4% | |
CBS Corp. Class B | | | 3,870,469 | | | | | | | | 65,527,040 | | | | | | | | 0.7% | |
#*Comcast Corp. Class A | | | 11,535,742 | | | | | | | | 237,405,570 | | | | | | | | 2.7% | |
Comcast Corp. Special Class A | | | 3,843,964 | | | | | | | | 74,303,824 | | | | | | | | 0.8% | |
#*Liberty Media Corp. Interactive Class A | | | 3,585,265 | | | | | | | | 52,918,511 | | | | | | | | 0.6% | |
#*News Corp. Class A | | | 8,601,307 | | | | | | | | 124,374,899 | | | | | | | | 1.4% | |
#News Corp. Class B | | | 3,247,295 | | | | | | | | 52,216,504 | | | | | | | | 0.6% | |
*Time Warner Cable, Inc. | | | 2,004,056 | | | | | | | | 115,974,721 | | | | | | | | 1.3% | |
*Time Warner, Inc. | | | 6,251,359 | | | | | | | | 203,231,681 | | | | | | | | 2.3% | |
#Walt Disney Co. (The) | | | 3,195,385 | | | | | | | | 115,385,352 | | | | | | | | 1.3% | |
Other Securities | | | | | | | | | | | 436,691,700 | | | | | | | | 5.0% | |
| | | | | | | | | | | | | | | | | | | | |
Total Consumer Discretionary | | | | | | | | | | | 1,598,603,051 | | | | | | | | 18.1% | |
| | | | | | | | | | | | | | | | | | | | |
| | | | | |
Consumer Staples — (7.0%) | | | | | | | | | | | | | | | | | | | | |
*Archer-Daniels-Midland Co. | | | 2,712,432 | | | | | | | | 90,378,234 | | | | | | | | 1.0% | |
#*CVS Caremark Corp. | | | 6,345,280 | | | | | | | | 191,119,834 | | | | | | | | 2.2% | |
#Kraft Foods, Inc. | | | 5,204,766 | | | | | | | | 167,957,799 | | | | | | | | 1.9% | |
Other Securities | | | | | | | | | | | 236,916,702 | | | | | | | | 2.7% | |
| | | | | | | | | | | | | | | | | | | | |
Total Consumer Staples | | | | | | | | | | | 686,372,569 | | | | | | | | 7.8% | |
| | | | | | | | | | | | | | | | | | | | |
| | | | | |
Energy — (14.0%) | | | | | | | | | | | | | | | | | | | | |
#*Anadarko Petroleum Corp. | | | 2,760,568 | | | | | | | | 169,968,172 | | | | | | | | 1.9% | |
#Chesapeake Energy Corp. | | | 3,103,882 | | | | | | | | 67,354,239 | | | | | | | | 0.8% | |
*Chevron Corp. | | | 999,295 | | | | | | | | 82,551,760 | | | | | | | | 0.9% | |
#*ConocoPhillips | | | 5,935,876 | | | | | | | | 352,591,034 | | | | | | | | 4.0% | |
Hess Corp. | | | 1,348,669 | | | | | | | | 85,006,607 | | | | | | | | 1.0% | |
*Marathon Oil Corp. | | | 3,475,819 | | | | | | | | 123,634,882 | | | | | | | | 1.4% | |
National-Oilwell, Inc. | | | 1,945,893 | | | | | | | | 104,611,208 | | | | | | | | 1.2% | |
*Valero Energy Corp. | | | 2,637,648 | | | | | | | | 47,345,782 | | | | | | | | 0.5% | |
Other Securities | | | | | | | | | | | 333,750,889 | | | | | | | | 3.8% | |
| | | | | | | | | | | | | | | | | | | | |
Total Energy | | | | | | | | | | | 1,366,814,573 | | | | | | | | 15.5% | |
| | | | | | | | | | | | | | | | | | | | |
| | | | | |
Financials — (19.2%) | | | | | | | | | | | | | | | | | | | | |
*Bank of America Corp. | | | 19,776,300 | | | | | | | | 226,240,872 | | | | | | | | 2.6% | |
#*Capital One Financial Corp. | | | 2,303,387 | | | | | | | | 85,847,234 | | | | | | | | 1.0% | |
*Citigroup, Inc. | | | 66,697,025 | | | | | | | | 278,126,594 | | | | | | | | 3.1% | |
CME Group, Inc. | | | 293,931 | | | | | | | | 85,137,114 | | | | | | | | 1.0% | |
#*Hartford Financial Services Group, Inc. | | | 1,998,882 | | | | | | | | 47,933,190 | | | | | | | | 0.5% | |
*Loews Corp. | | | 2,592,160 | | | | | | | | 102,338,477 | | | | | | | | 1.2% | |
#*MetLife, Inc. | | | 4,397,300 | | | | | | | | 177,343,109 | | | | | | | | 2.0% | |
*Morgan Stanley | | | 2,707,152 | | | | | | | | 67,326,870 | | | | | | | | 0.8% | |
#*Prudential Financial, Inc. | | | 2,043,858 | | | | | | | | 107,466,054 | | | | | | | | 1.2% | |
#*SunTrust Banks, Inc. | | | 2,311,090 | | | | | | | | 57,823,472 | | | | | | | | 0.7% | |
#Travelers Cos., Inc. (The) | | | 1,196,594 | | | | | | | | 66,051,989 | | | | | | | | 0.7% | |
Other Securities | | | | | | | | | | | 576,347,243 | | | | | | | | 6.5% | |
| | | | | | | | | | | | | | | | | | | | |
Total Financials | | | | | | | | | | | 1,877,982,218 | | | | | | | | 21.3% | |
| | | | | | | | | | | | | | | | | | | | |
| | | | | |
Health Care — (8.0%) | | | | | | | | | | | | | | | | | | | | |
*Aetna, Inc. | | | 1,935,699 | | | | | | | | 57,799,972 | | | | | | | | 0.7% | |
*Pfizer, Inc. | | | 10,541,551 | | | | | | | | 183,422,987 | | | | | | | | 2.1% | |
*Thermo Fisher Scientific, Inc. | | | 1,915,352 | | | | | | | | 98,487,400 | | | | | | | | 1.1% | |
#UnitedHealth Group, Inc. | | | 2,647,609 | | | | | | | | 95,446,304 | | | | | | | | 1.1% | |
*WellPoint, Inc. | | | 2,580,122 | | | | | | | | 140,203,829 | | | | | | | | 1.6% | |
Other Securities | | | | | | | | | | | 205,647,709 | | | | | | | | 2.3% | |
| | | | | | | | | | | | | | | | | | | | |
Total Health Care | | | | | | | | | | | 781,008,201 | | | | | | | | 8.9% | |
| | | | | | | | | | | | | | | | | | | | |
202
THE U.S. LARGE CAP VALUE SERIES
CONTINUED
| | | | | | | | | | | | | | | | | | | | |
| | | Shares | | | | | | Value† | | | Percentage
of Net Assets** | |
| | | | | |
Industrials — (12.7%) | | | | | | | | | | | | | | | | | | | | |
*CSX Corp. | | | 2,287,204 | | | | | | | $ | 140,548,686 | | | | | | | | 1.6% | |
General Electric Co. | | | 19,264,818 | | | | | | | | 308,622,384 | | | | | | | | 3.5% | |
*Norfolk Southern Corp. | | | 2,186,220 | | | | | | | | 134,430,668 | | | | | | | | 1.5% | |
#*Northrop Grumman Corp. | | | 1,926,678 | | | | | | | | 121,785,316 | | | | | | | | 1.4% | |
*Southwest Airlines Co. | | | 4,316,432 | | | | | | | | 59,394,104 | | | | | | | | 0.7% | |
*Union Pacific Corp. | | | 2,835,808 | | | | | | | | 248,643,645 | | | | | | | | 2.8% | |
Other Securities | | | | | | | | | | | 224,330,398 | | | | | | | | 2.5% | |
| | | | | | | | | | | | | | | | | | | | |
Total Industrials | | | | | | | | | | | 1,237,755,201 | | | | | | | | 14.0% | |
| | | | | | | | | | | | | | | | | | | | |
| | | | | |
Information Technology — (2.9%) | | | | | | | | | | | | | | | | | | | | |
Other Securities | | | | | | | | | | | 287,523,914 | | | | | | | | 3.3% | |
| | | | | | | | | | | | | | | | | | | | |
| | | | | |
Materials — (3.1%) | | | | | | | | | | | | | | | | | | | | |
#*Alcoa, Inc. | | | 5,082,514 | | | | | | | | 66,733,409 | | | | | | | | 0.7% | |
*International Paper Co. | | | 2,298,491 | | | | | | | | 58,105,852 | | | | | | | | 0.7% | |
Other Securities | | | | | | | | | | | 178,601,082 | | | | | | | | 2.0% | |
| | | | | | | | | | | | | | | | | | | | |
Total Materials | | | | | | | | | | | 303,440,343 | | | | | | | | 3.4% | |
| | | | | | | | | | | | | | | | | | | | |
| | | | | |
Telecommunication Services — (5.6%) | | | | | | | | | | | | | | | | | | | | |
*AT&T, Inc. | | | 11,515,790 | | | | | | | | 328,200,015 | | | | | | | | 3.7% | |
#*CenturyLink, Inc. | | | 1,178,012 | | | | | | | | 48,746,137 | | | | | | | | 0.6% | |
*Sprint Nextel Corp. | | | 13,734,331 | | | | | | | | 56,585,444 | | | | | | | | 0.6% | |
*Verizon Communications, Inc. | | | 2,096,010 | | | | | | | | 68,057,445 | | | | | | | | 0.8% | |
Other Securities | | | | | | | | | | | 43,693,274 | | | | | | | | 0.5% | |
| | | | | | | | | | | | | | | | | | | | |
Total Telecommunication Services | | | | | | | | | | | 545,282,315 | | | | | | | | 6.2% | |
| | | | | | | | | | | | | | | | | | | | |
| | | | | |
Utilities — (1.1%) | | | | | | | | | | | | | | | | | | | | |
*Public Service Enterprise Group, Inc. | | | 1,668,763 | | | | | | | | 53,984,483 | | | | | | | | 0.6% | |
Other Securities | | | | | | | | | | | 51,447,310 | | | | | | | | 0.6% | |
| | | | | | | | | | | | | | | | | | | | |
Total Utilities | | | | | | | | | | | 105,431,793 | | | | | | | | 1.2% | |
| | | | | | | | | | | | | | | | | | | | |
TOTAL COMMON STOCKS | | | | | | | | | | | 8,790,214,178 | | | | | | | | 99.7% | |
| | | | | | | | | | | | | | | | | | | | |
| | | | | |
TEMPORARY CASH INVESTMENTS — (0.3%) | | | | | | | | | | | | | | | | | | | | |
BlackRock Liquidity Funds Tempcash Portfolio - Institutional
Shares | | | 32,140,674 | | | | | | | | 32,140,674 | | | | | | | | 0.3% | |
| | | | | | | | | | | | | | | | | | | | |
| | | | | |
| | | Shares/
Face
Amount | | | | | | | | | | | | | |
| | | (000) | | | | | | | | | | | | | |
SECURITIES LENDING COLLATERAL — (9.7%) | | | | | | | | | | | | | | | | | | | | |
§@DFA Short Term Investment Fund | | | 936,367,625 | | | | | | | | 936,367,625 | | | | | | | | 10.6% | |
@Repurchase Agreement, Deutsche Bank Securities, Inc. 0.23%, 11/01/10 (Collateralized by $4,388,158 FNMA 3.500%, 10/01/20, valued at $4,590,901) to be repurchased at $4,457,270 | | $ | 4,457 | | | | | | | | 4,457,185 | | | | | | | | 0.1% | |
| | | | | | | | | | | | | | | | | | | | |
TOTAL SECURITIES LENDING COLLATERAL | | | | | | | | | | | 940,824,810 | | | | | | | | 10.7% | |
| | | | | | | | | | | | | | | | | | | | |
TOTAL INVESTMENTS — (100.0%) | | | | | | | | | | | | | | | | | | | | |
(Cost $7,923,085,138) | | | | | | | | | | $ | 9,763,179,662 | | | | | | | | 110.7% | |
| | | | | | | | | | | | | | | | | | | | |
203
THE U.S. LARGE CAP VALUE SERIES
CONTINUED
Summary of inputs used to value the Series’ investments as of October 31, 2010 is as follows (See Security Valuation Note):
| | | | | | | | | | | | | | | | |
| | | Valuation Inputs | |
| |
| | | Investment in Securities (Market Value) | |
| | | Level 1 | | | Level 2 | | | Level 3 | | | Total | |
Common Stocks | | | | | | | | | | | | | | | | |
Consumer Discretionary | | $ | 1,598,603,051 | | | | — | | | | — | | | $ | 1,598,603,051 | |
Consumer Staples | | | 686,372,569 | | | | — | | | | — | | | | 686,372,569 | |
Energy | | | 1,366,814,573 | | | | — | | | | — | | | | 1,366,814,573 | |
Financials | | | 1,877,982,218 | | | | — | | | | — | | | | 1,877,982,218 | |
Health Care | | | 781,008,201 | | | | — | | | | — | | | | 781,008,201 | |
Industrials | | | 1,237,755,201 | | | | — | | | | — | | | | 1,237,755,201 | |
Information Technology | | | 287,523,914 | | | | — | | | | — | | | | 287,523,914 | |
Materials | | | 303,440,343 | | | | — | | | | — | | | | 303,440,343 | |
Telecommunication Services | | | 545,282,315 | | | | — | | | | — | | | | 545,282,315 | |
Utilities | | | 105,431,793 | | | | — | | | | — | | | | 105,431,793 | |
Temporary Cash Investments | | | 32,140,674 | | | | — | | | | — | | | | 32,140,674 | |
Securities Lending Collateral | | | — | | | $ | 940,824,810 | | | | — | | | | 940,824,810 | |
| | | | | | | | | | | | | | | | |
TOTAL | | $ | 8,822,354,852 | | | $ | 940,824,810 | | | | — | | | $ | 9,763,179,662 | |
| | | | | | | | | | | | | | | | |
See accompanying Notes to Financial Statements.
204
THE DFA INTERNATIONAL VALUE SERIES
SUMMARY SCHEDULE OF PORTFOLIO HOLDINGS
October 31, 2010
| | | | | | | | | | | | | | | | | | | | |
| | | Shares | | | | | | Value†† | | | Percentage
of Net Assets** | |
COMMON STOCKS — (85.2%) | | | | | | | | | | | | | | | | | | | | |
AUSTRALIA — (5.0%) | | | | | | | | | | | | | | | | | | | | |
Australia & New Zealand Banking Group, Ltd. | | | 2,206,006 | | | | | | | $ | 53,819,204 | | | | | | | | 0.8% | |
#National Australia Bank, Ltd. | | | 2,107,947 | | | | | | | | 52,758,343 | | | | | | | | 0.8% | |
Wesfarmers, Ltd. | | | 2,331,991 | | | | | | | | 75,875,057 | | | | | | | | 1.1% | |
Other Securities | | | | | | | | | | | 224,889,210 | | | | | | | | 3.2% | |
| | | | | | | | | | | | | | | | | | | | |
TOTAL AUSTRALIA | | | | | | | | | | | 407,341,814 | | | | | | | | 5.9% | |
| | | | | | | | | | | | | | | | | | | | |
| | | | | |
AUSTRIA — (0.4%) | | | | | | | | | | | | | | | | | | | | |
Other Securities | | | | | | | | | | | 29,957,894 | | | | | | | | 0.4% | |
| | | | | | | | | | | | | | | | | | | | |
| | | | | |
BELGIUM — (0.6%) | | | | | | | | | | | | | | | | | | | | |
Other Securities | | | | | | | | | | | 46,661,837 | | | | | | | | 0.7% | |
| | | | | | | | | | | | | | | | | | | | |
| | | | | |
CANADA — (9.6%) | | | | | | | | | | | | | | | | | | | | |
#Encana Corp. | | | 2,051,015 | | | | | | | | 57,936,800 | | | | | | | | 0.9% | |
#Sun Life Financial, Inc. | | | 1,367,335 | | | | | | | | 38,691,331 | | | | | | | | 0.6% | |
#Suncor Energy, Inc. | | | 2,191,586 | | | | | | | | 70,223,581 | | | | | | | | 1.0% | |
#Talisman Energy, Inc. | | | 2,353,184 | | | | | | | | 42,661,410 | | | | | | | | 0.6% | |
Teck Resources, Ltd. Class B | | | 1,418,230 | | | | | | | | 63,409,440 | | | | | | | | 0.9% | |
#Thomson Reuters Corp. | | | 1,832,184 | | | | | | | | 69,971,141 | | | | | | | | 1.0% | |
#TransCanada Corp. | | | 1,941,948 | | | | | | | | 71,725,837 | | | | | | | | 1.0% | |
Other Securities | | | | | | | | | | | 358,917,190 | | | | | | | | 5.2% | |
| | | | | | | | | | | | | | | | | | | | |
TOTAL CANADA | | | | | | | | | | | 773,536,730 | | | | | | | | 11.2% | |
| | | | | | | | | | | | | | | | | | | | |
| | | | | |
DENMARK — (1.3%) | | | | | | | | | | | | | | | | | | | | |
Other Securities | | | | | | | | | | | 108,243,005 | | | | | | | | 1.6% | |
| | | | | | | | | | | | | | | | | | | | |
| | | | | |
FINLAND — (0.8%) | | | | | | | | | | | | | | | | | | | | |
Other Securities | | | | | | | | | | | 61,678,555 | | | | | | | | 0.9% | |
| | | | | | | | | | | | | | | | | | | | |
| | | | | |
FRANCE — (7.0%) | | | | | | | | | | | | | | | | | | | | |
AXA SA | | | 2,818,397 | | | | | | | | 51,399,167 | | | | | | | | 0.8% | |
BNP Paribas SA | | | 607,569 | | | | | | | | 44,441,191 | | | | | | | | 0.6% | |
Cie de Saint-Gobain SA | | | 875,747 | | | | | | | | 41,144,800 | | | | | | | | 0.6% | |
GDF Suez SA | | | 1,019,150 | | | | | | | | 40,722,357 | | | | | | | | 0.6% | |
Societe Generale Paris SA | | | 1,074,333 | | | | | | | | 64,422,284 | | | | | | | | 0.9% | |
Vivendi SA | | | 2,798,643 | | | | | | | | 79,971,735 | | | | | | | | 1.2% | |
Other Securities | | | | | | | | | | | 244,435,064 | | | | | | | | 3.5% | |
| | | | | | | | | | | | | | | | | | | | |
TOTAL FRANCE | | | | | | | | | | | 566,536,598 | | | | | | | | 8.2% | |
| | | | | | | | | | | | | | | | | | | | |
| | | | | |
GERMANY — (7.9%) | | | | | | | | | | | | | | | | | | | | |
Allianz SE. | | | 481,474 | | | | | | | | 60,300,624 | | | | | | | | 0.9% | |
Bayerische Motoren Werke AG | | | 915,762 | | | | | | | | 65,634,885 | | | | | | | | 1.0% | |
*Daimler AG | | | 2,088,586 | | | | | | | | 138,020,977 | | | | | | | | 2.0% | |
Deutsche Bank AG | | | 987,090 | | | | | | | | 56,862,241 | | | | | | | | 0.8% | |
Deutsche Telekom AG | | | 2,852,483 | | | | | | | | 41,282,568 | | | | | | | | 0.6% | |
#Deutsche Telekom AG Sponsored ADR | | | 3,099,741 | | | | | | | | 44,667,268 | | | | | | | | 0.6% | |
Munchener Rueckversicherungs-Gesellschaft AG | | | 412,644 | | | | | | | | 64,496,557 | | | | | | | | 0.9% | |
Other Securities | | | | | | | | | | | 169,733,757 | | | | | | | | 2.5% | |
| | | | | | | | | | | | | | | | | | | | |
TOTAL GERMANY | | | | | | | | | | | 640,998,877 | | | | | | | | 9.3% | |
| | | | | | | | | | | | | | | | | | | | |
| | | | | |
GREECE — (0.1%) | | | | | | | | | | | | | | | | | | | | |
Other Securities | | | | | | | | | | | 8,298,682 | | | | | | | | 0.1% | |
| | | | | | | | | | | | | | | | | | | | |
| | | | | |
HONG KONG — (1.5%) | | | | | | | | | | | | | | | | | | | | |
Hutchison Whampoa, Ltd. | | | 5,621,000 | | | | | | | | 55,586,897 | | | | | | | | 0.8% | |
Other Securities | | | | | | | | | | | 65,265,505 | | | | | | | | 0.9% | |
| | | | | | | | | | | | | | | | | | | | |
TOTAL HONG KONG | | | | | | | | | | | 120,852,402 | | | | | | | | 1.7% | |
| | | | | | | | | | | | | | | | | | | | |
205
THE DFA INTERNATIONAL VALUE SERIES
CONTINUED
| | | | | | | | | | | | | | | | | | | | |
| | | Shares | | | | | | Value†† | | | Percentage
of Net Assets** | |
IRELAND — (0.1%) | | | | | | | | | | | | | | | | | | | | |
Other Securities | | | | | | | | | | $ | 4,941,532 | | | | | | | | 0.1% | |
| | | | | | | | | | | | | | | | | | | | |
| | | | | |
ISRAEL — (0.4%) | | | | | | | | | | | | | | | | | | | | |
Other Securities | | | | | | | | | | | 29,466,537 | | | | | | | | 0.4% | |
| | | | | | | | | | | | | | | | | | | | |
| | | | | |
ITALY — (1.8%) | | | | | | | | | | | | | | | | | | | | |
Intesa Sanpaolo SpA | | | 10,656,633 | | | | | | | | 37,481,113 | | | | | | | | 0.5% | |
#UniCredit SpA | | | 15,858,749 | | | | | | | | 41,344,820 | | | | | | | | 0.6% | |
Other Securities | | | | | | | | | | | 69,762,927 | | | | | | | | 1.0% | |
| | | | | | | | | | | | | | | | | | | | |
TOTAL ITALY | | | | | | | | | | | 148,588,860 | | | | | | | | 2.1% | |
| | | | | | | | | | | | | | | | | | | | |
| | | | | |
JAPAN — (17.3%) | | | | | | | | | | | | | | | | | | | | |
FUJIFILM Holdings Corp. | | | 1,327,000 | | | | | | | | 44,270,853 | | | | | | | | 0.6% | |
#Nissan Motor Co., Ltd. | | | 4,831,600 | | | | | | | | 42,464,027 | | | | | | | | 0.6% | |
#Sony Corp. Sponsored ADR | | | 1,801,665 | | | | | | | | 60,968,344 | | | | | | | | 0.9% | |
#Sumitomo Corp. | | | 3,241,900 | | | | | | | | 41,045,075 | | | | | | | | 0.6% | |
Other Securities | | | | | | | | | | | 1,210,511,398 | | | | | | | | 17.5% | |
| | | | | | | | | | | | | | | | | | | | |
TOTAL JAPAN | | | | | | | | | | | 1,399,259,697 | | | | | | | | 20.2% | |
| | | | | | | | | | | | | | | | | | | | |
| | | | | |
MALAYSIA — (0.0%) | | | | | | | | | | | | | | | | | | | | |
Other Securities | | | | | | | | | | | — | | | | | | | | 0.0% | |
| | | | | | | | | | | | | | | | | | | | |
| | | | | |
NETHERLANDS — (3.3%) | | | | | | | | | | | | | | | | | | | | |
#ArcelorMittal NV | | | 2,446,831 | | | | | | | | 79,175,937 | | | | | | | | 1.2% | |
*ING Groep NV | | | 3,356,113 | | | | | | | | 35,906,230 | | | | | | | | 0.5% | |
Koninklijke Philips Electronics NV | | | 2,087,065 | | | | | | | | 63,660,707 | | | | | | | | 0.9% | |
Other Securities | | | | | | | | | | | 84,238,184 | | | | | | | | 1.2% | |
| | | | | | | | | | | | | | | | | | | | |
TOTAL NETHERLANDS | | | | | | | | | | | 262,981,058 | | | | | | | | 3.8% | |
| | | | | | | | | | | | | | | | | | | | |
| | | | | |
NEW ZEALAND — (0.1%) | | | | | | | | | | | | | | | | | | | | |
Other Securities | | | | | | | | | | | 4,293,061 | | | | | | | | 0.1% | |
| | | | | | | | | | | | | | | | | | | | |
| | | | | |
NORWAY — (1.0%) | | | | | | | | | | | | | | | | | | | | |
Other Securities | | | | | | | | | | | 84,129,497 | | | | | | | | 1.2% | |
| | | | | | | | | | | | | | | | | | | | |
| | | | | |
PORTUGAL — (0.1%) | | | | | | | | | | | | | | | | | | | | |
Other Securities | | | | | | | | | | | 8,195,419 | | | | | | | | 0.1% | |
| | | | | | | | | | | | | | | | | | | | |
| | | | | |
SINGAPORE — (1.4%) | | | | | | | | | | | | | | | | | | | | |
Other Securities | | | | | | | | | | | 109,763,918 | | | | | | | | 1.6% | |
| | | | | | | | | | | | | | | | | | | | |
| | | | | |
SPAIN — (2.1%) | | | | | | | | | | | | | | | | | | | | |
#Repsol YPF SA Sponsored ADR | | | 1,432,181 | | | | | | | | 39,657,092 | | | | | | | | 0.6% | |
Other Securities | | | | | | | | | | | 130,802,294 | | | | | | | | 1.9% | |
| | | | | | | | | | | | | | | | | | | | |
TOTAL SPAIN | | | | | | | | | | | 170,459,386 | | | | | | | | 2.5% | |
| | | | | | | | | | | | | | | | | | | | |
| | | | | |
SWEDEN — (2.6%) | | | | | | | | | | | | | | | | | | | | |
#Nordea Bank AB | | | 5,498,608 | | | | | | | | 60,543,289 | | | | | | | | 0.9% | |
Other Securities | | | | | | | | | | | 150,105,334 | | | | | | | | 2.1% | |
| | | | | | | | | | | | | | | | | | | | |
TOTAL SWEDEN | | | | | | | | | | | 210,648,623 | | | | | | | | 3.0% | |
| | | | | | | | | | | | | | | | | | | | |
| | | | | |
SWITZERLAND — (5.7%) | | | | | | | | | | | | | | | | | | | | |
Compagnie Financiere Richemont SA Series A | | | 897,817 | | | | | | | | 44,781,503 | | | | | | | | 0.6% | |
Credit Suisse Group AG | | | 1,085,706 | | | | | | | | 44,946,721 | | | | | | | | 0.7% | |
#Holcim, Ltd. AG | | | 739,477 | | | | | | | | 46,066,677 | | | | | | | | 0.7% | |
Swiss Reinsurance Co., Ltd. AG | | | 931,611 | | | | | | | | 44,761,229 | | | | | | | | 0.6% | |
#*UBS AG | | | 3,710,052 | | | | | | | | 63,024,671 | | | | | | | | 0.9% | |
Zurich Financial Services AG | | | 322,634 | | | | | | | | 78,954,165 | | | | | | | | 1.1% | |
Other Securities | | | | | | | | | | | 141,879,887 | | | | | | | | 2.1% | |
| | | | | | | | | | | | | | | | | | | | |
TOTAL SWITZERLAND | | | | | | | | | | | 464,414,853 | | | | | | | | 6.7% | |
| | | | | | | | | | | | | | | | | | | | |
206
THE DFA INTERNATIONAL VALUE SERIES
CONTINUED
| | | | | | | | | | | | | | | | | | | | |
| | | Shares | | | | | | Value†† | | | Percentage of Net Assets** | |
UNITED KINGDOM — (15.1%) | | | | | | | | | | | | | | | | | | | | |
Aviva P.L.C. | | | 7,396,866 | | | | | | | $ | 47,172,407 | | | | | | | | 0.7% | |
#Barclays P.L.C. Sponsored ADR | | | 4,180,831 | | | | | | | | 73,791,667 | | | | | | | | 1.1% | |
International Power P.L.C. | | | 6,483,180 | | | | | | | | 43,257,401 | | | | | | | | 0.6% | |
Kingfisher P.L.C. | | | 10,285,817 | | | | | | | | 39,184,977 | | | | | | | | 0.6% | |
#Royal Dutch Shell P.L.C. ADR | | | 3,170,896 | | | | | | | | 203,952,031 | | | | | | | | 2.9% | |
Vodafone Group P.L.C. | | | 34,976,333 | | | | | | | | 95,611,963 | | | | | | | | 1.4% | |
#Vodafone Group P.L.C. Sponsored ADR | | | 8,066,329 | | | | | | | | 221,904,711 | | | | | | | | 3.2% | |
William Morrison Supermarkets P.L.C. | | | 8,127,143 | | | | | | | | 38,248,483 | | | | | | | | 0.5% | |
Xstrata P.L.C. | | | 3,843,909 | | | | | | | | 74,469,535 | | | | | | | | 1.1% | |
Other Securities | | | | | | | | | | | 384,330,100 | | | | | | | | 5.6% | |
| | | | | | | | | | | | | | | | | | | | |
TOTAL UNITED KINGDOM | | | | | | | | | | | 1,221,923,275 | | | | | | | | 17.7% | |
| | | | | | | | | | | | | | | | | | | | |
TOTAL COMMON STOCKS | | | | | | | | | | | 6,883,172,110 | | | | | | | | 99.5% | |
| | | | | | | | | | | | | | | | | | | | |
| | | | | |
| | | Face Amount | | | | | | Value† | | | | | | | |
| | | (000) | | | | | | | | | | | | | |
TEMPORARY CASH INVESTMENTS — (0.2%) | | | | | | | | | | | | | | | | | | | | |
Repurchase Agreement, PNC Capital Markets, Inc. 0.19%, 11/01/10 (Collateralized by $21,850,000 FHLMC 4.00%, 12/15/38, valued at $20,355,375) to be repurchased at $19,298,306 | | $ | 19,298 | | | | | | | | 19,298,000 | | | | | | | | 0.3% | |
| | | | | |
| | | Shares/
Face
Amount | | | | | | | | | | | | | |
| | | (000) | | | | | | | | | | | | | |
SECURITIES LENDING COLLATERAL — (14.6%) | | | | | | | | | | | | | | | | | | | | |
§@DFA Short Term Investment Fund | | | 1,175,802,100 | | | | | | | | 1,175,802,100 | | | | | | | | 17.0% | |
@Repurchase Agreement, Deutsche Bank Securities, Inc. 0.22%, 11/01/10 (Collateralized by $42,295,271 FNMA 7.000%, 08/01/38, valued at $3,305,966)## to be repurchased at $3,241,202 | | $ | 3,241 | | | | | | | | 3,241,143 | | | | | | | | 0.0% | |
| | | | | | | | | | | | | | | | | | | | |
TOTAL SECURITIES LENDING COLLATERAL | | | | | | | | | | | 1,179,043,243 | | | | | | | | 17.0% | |
| | | | | | | | | | | | | | | | | | | | |
TOTAL INVESTMENTS — (100.0%) | | | | | | | | | | | | | | | | | | | | |
(Cost $6,502,731,182) | | | | | | | | | | $ | 8,081,513,353 | | | | | | | | 116.8% | |
| | | | | | | | | | | | | | | | | | | | |
207
THE DFA INTERNATIONAL VALUE SERIES
CONTINUED
Summary of inputs used to value the Series’ investments as of October 31, 2010 is as follows (See Security Valuation Note):
| | | | | | | | | | | | | | | | |
| | | Valuation Inputs | |
| |
| | | Investment in Securities (Market Value) | |
| | | Level 1 | | | Level 2 | | | Level 3 | | | Total | |
Common Stocks | | | | | | | | | | | | | | | | |
Australia | | $ | 5,383,963 | | | $ | 401,957,851 | | | | — | | | $ | 407,341,814 | |
Austria | | | — | | | | 29,957,894 | | | | — | | | | 29,957,894 | |
Belgium | | | 3,727,334 | | | | 42,934,503 | | | | — | | | | 46,661,837 | |
Canada | | | 773,536,730 | | | | — | | | | — | | | | 773,536,730 | |
Denmark | | | — | | | | 108,243,005 | | | | — | | | | 108,243,005 | |
Finland | | | 2,054,844 | | | | 59,623,711 | | | | — | | | | 61,678,555 | |
France | | | 11,057,872 | | | | 555,478,726 | | | | — | | | | 566,536,598 | |
Germany | | | 104,531,048 | | | | 536,467,829 | | | | — | | | | 640,998,877 | |
Greece | | | 1,399,460 | | | | 6,899,222 | | | | — | | | | 8,298,682 | |
Hong Kong | | | — | | | | 120,852,402 | | | | — | | | | 120,852,402 | |
Ireland | | | 4,941,532 | | | | — | | | | — | | | | 4,941,532 | |
Israel | | | 3,608,246 | | | | 25,858,291 | | | | — | | | | 29,466,537 | |
Italy | | | 28,604,870 | | | | 119,983,990 | | | | — | | | | 148,588,860 | |
Japan | | | 134,121,326 | | | | 1,265,138,371 | | | | — | | | | 1,399,259,697 | |
Malaysia | | | — | | | | — | | | | — | | | | — | |
Netherlands | | | 17,912,213 | | | | 245,068,845 | | | | — | | | | 262,981,058 | |
New Zealand | | | — | | | | 4,293,061 | | | | — | | | | 4,293,061 | |
Norway | | | 367,187 | | | | 83,762,310 | | | | — | | | | 84,129,497 | |
Portugal | | | — | | | | 8,195,419 | | | | — | | | | 8,195,419 | |
Singapore | | | — | | | | 109,763,918 | | | | — | | | | 109,763,918 | |
Spain | | | 55,573,325 | | | | 114,886,061 | | | | — | | | | 170,459,386 | |
Sweden | | | 10,464,260 | | | | 200,184,363 | | | | — | | | | 210,648,623 | |
Switzerland | | | 50,892,561 | | | | 413,522,292 | | | | — | | | | 464,414,853 | |
United Kingdom | | | 579,019,350 | | | | 642,903,925 | | | | — | | | | 1,221,923,275 | |
Temporary Cash Investments | | | — | | | | 19,298,000 | | | | — | | | | 19,298,000 | |
Securities Lending Collateral | | | — | | | | 1,179,043,243 | | | | — | | | | 1,179,043,243 | |
| | | | | | | | | | | | | | | | |
TOTAL | | $ | 1,787,196,121 | | | $ | 6,294,317,232 | | | | — | | | $ | 8,081,513,353 | |
| | | | | | | | | | | | | | | | |
See accompanying Notes to Financial Statements.
208
THE JAPANESE SMALL COMPANY SERIES
SUMMARY SCHEDULE OF PORTFOLIO HOLDINGS
October 31, 2010
| | | | | | | | | | | | | | | | | | | | |
| | | Shares | | | | | | Value†† | | | Percentage
of Net Assets** | |
COMMON STOCKS — (87.6%) | | | | | | | | | | | | | | | | | | | | |
Consumer Discretionary — (20.8%) | | | | | | | | | | | | | | | | | | | | |
Aoyama Trading Co., Ltd. | | | 191,400 | | | | | | | $ | 3,117,117 | | | | | | | | 0.3% | |
Exedy Corp. | | | 119,000 | | | | | | | | 3,713,418 | | | | | | | | 0.3% | |
#*Haseko Corp. | | | 3,508,000 | | | | | | | | 3,009,187 | | | | | | | | 0.3% | |
Kayaba Industry Co., Ltd. | | | 660,000 | | | | | | | | 3,870,694 | | | | | | | | 0.3% | |
K’s Holdings Corp. | | | 156,927 | | | | | | | | 3,899,809 | | | | | | | | 0.3% | |
#Nifco, Inc. | | | 162,700 | | | | | | | | 4,093,473 | | | | | | | | 0.3% | |
Sanrio Co., Ltd. | | | 181,700 | | | | | | | | 3,871,427 | | | | | | | | 0.3% | |
Shimachu Co., Ltd. | | | 145,700 | | | | | | | | 2,985,858 | | | | | | | | 0.2% | |
Toyobo Co., Ltd. | | | 2,084,000 | | | | | | | | 3,473,499 | | | | | | | | 0.3% | |
Other Securities | | | | | | | | | | | 252,875,512 | | | | | | | | 20.9% | |
| | | | | | | | | | | | | | | | | | | | |
Total Consumer Discretionary | | | | | | | | | | | 284,909,994 | | | | | | | | 23.5% | |
| | | | | | | | | | | | | | | | | | | | |
| | | | | |
Consumer Staples — (8.6%) | | | | | | | | | | | | | | | | | | | | |
#Megmilk Snow Brand Co., Ltd. | | | 178,400 | | | | | | | | 3,151,536 | | | | | | | | 0.2% | |
Morinaga Milk Industry Co., Ltd. | | | 843,000 | | | | | | | | 3,439,085 | | | | | | | | 0.3% | |
Other Securities | | | | | | | | | | | 111,091,940 | | | | | | | | 9.2% | |
| | | | | | | | | | | | | | | | | | | | |
Total Consumer Staples | | | | | | | | | | | 117,682,561 | | | | | | | | 9.7% | |
| | | | | | | | | | | | | | | | | | | | |
| | | | | |
Energy — (0.9%) | | | | | | | | | | | | | | | | | | | | |
Other Securities | | | | | | | | | | | 12,896,930 | | | | | | | | 1.1% | |
| | | | | | | | | | | | | | | | | | | | |
| | | | | |
Financials — (9.1%) | | | | | | | | | | | | | | | | | | | | |
Bank of Okinawa, Ltd. (The) | | | 88,100 | | | | | | | | 3,389,540 | | | | | | | | 0.3% | |
Century Tokyo Leasing Corp. | | | 260,590 | | | | | | | | 3,759,430 | | | | | | | | 0.3% | |
Hokkoku Bank, Ltd. (The) | | | 714,000 | | | | | | | | 2,874,405 | | | | | | | | 0.2% | |
Hyakugo Bank, Ltd. (The) | | | 656,609 | | | | | | | | 2,764,094 | | | | | | | | 0.2% | |
Kiyo Holdings, Inc. | | | 2,168,900 | | | | | | | | 2,917,101 | | | | | | | | 0.2% | |
Musashino Bank, Ltd. | | | 105,600 | | | | | | | | 3,066,201 | | | | | | | | 0.3% | |
Tokai Tokyo Financial Holdings, Inc. | | | 898,000 | | | | | | | | 3,120,888 | | | | | | | | 0.3% | |
Tokyo Tatemono Co., Ltd. | | | 908,000 | | | | | | | | 3,658,692 | | | | | | | | 0.3% | |
Other Securities | | | | | | | | | | | 99,413,439 | | | | | | | | 8.2% | |
| | | | | | | | | | | | | | | | | | | | |
Total Financials | | | | | | | | | | | 124,963,790 | | | | | | | | 10.3% | |
| | | | | | | | | | | | | | | | | | | | |
| | | | | |
Health Care — (3.9%) | | | | | | | | | | | | | | | | | | | | |
Kaken Pharmaceutical Co., Ltd. | | | 335,000 | | | | | | | | 3,670,535 | | | | | | | | 0.3% | |
#KYORIN Holdings, Inc. | | | 178,000 | | | | | | | | 2,764,121 | | | | | | | | 0.2% | |
Nihon Kohden Corp. | | | 151,200 | | | | | | | | 2,874,009 | | | | | | | | 0.3% | |
Nippon Shinyaku Co., Ltd. | | | 229,000 | | | | | | | | 3,248,584 | | | | | | | | 0.3% | |
Nipro Corp. | | | 180,100 | | | | | | | | 3,671,774 | | | | | | | | 0.3% | |
#Sawai Pharmaceutical Co., Ltd. | | | 41,500 | | | | | | | | 3,627,965 | | | | | | | | 0.3% | |
Other Securities | | | | | | | | | | | 34,031,234 | | | | | | | | 2.8% | |
| | | | | | | | | | | | | | | | | | | | |
Total Health Care | | | | | | | | | | | 53,888,222 | | | | | | | | 4.5% | |
| | | | | | | | | | | | | | | | | | | | |
| | | | | |
Industrials — (22.7%) | | | | | | | | | | | | | | | | | | | | |
#Asahi Diamond Industrial Co., Ltd. | | | 228,000 | | | | | | | | 4,025,736 | | | | | | | | 0.3% | |
*Duskin Co., Ltd. | | | 184,400 | | | | | | | | 3,241,457 | | | | | | | | 0.3% | |
#Hitachi Zosen Corp. | | | 2,175,500 | | | | | | | | 3,134,938 | | | | | | | | 0.3% | |
#Miura Co., Ltd. | | | 131,300 | | | | | | | | 2,967,570 | | | | | | | | 0.2% | |
*Sankyu, Inc. | | | 717,000 | | | | | | | | 3,006,844 | | | | | | | | 0.3% | |
Takara Standard Co., Ltd. | | | 483,000 | | | | | | | | 2,970,009 | | | | | | | | 0.2% | |
Other Securities | | | | | | | | | | | 291,980,548 | | | | | | | | 24.1% | |
| | | | | | | | | | | | | | | | | | | | |
Total Industrials | | | | | | | | | | | 311,327,102 | | | | | | | | 25.7% | |
| | | | | | | | | | | | | | | | | | | | |
| | | | | |
Information Technology — (9.8%) | | | | | | | | | | | | | | | | | | | | |
#Anritsu Corp. | | | 435,000 | | | | | | | | 2,805,777 | | | | | | | | 0.2% | |
*Dainippon Screen Manufacturing Co., Ltd. | | | 731,000 | | | | | | | | 4,159,684 | | | | | | | | 0.4% | |
209
THE JAPANESE SMALL COMPANY SERIES
CONTINUED
| | | | | | | | | | | | | | | | | | | | |
| | | Shares | | | | | | Value†† | | | Percentage
of Net Assets** | |
Information Technology — (Continued) | | | | | | | | | | | | | | | | | | | | |
Horiba, Ltd. | | | 120,500 | | | | | | | $ | 2,959,345 | | | | | | | | 0.3% | |
IT Holdings Corp. | | | 262,401 | | | | | | | | 2,897,221 | | | | | | | | 0.2% | |
#Kakaku.com, Inc. | | | 573 | | | | | | | | 2,765,044 | | | | | | | | 0.2% | |
Nichicon Corp. | | | 258,800 | | | | | | | | 2,877,646 | | | | | | | | 0.2% | |
Ryosan Co., Ltd. | | | 122,000 | | | | | | | | 3,004,852 | | | | | | | | 0.3% | |
Other Securities | | | | | | | | | | | 112,666,126 | | | | | | | | 9.3% | |
| | | | | | | | | | | | | | | | | | | | |
Total Information Technology | | | | | | | | | | | 134,135,695 | | | | | | | | 11.1% | |
| | | | | | | | | | | | | | | | | | | | |
| | | | | |
Materials — (11.2%) | | | | | | | | | | | | | | | | | | | | |
Adeka Corp. | | | 331,700 | | | | | | | | 3,535,829 | | | | | | | | 0.3% | |
FP Corp. | | | 58,500 | | | | | | | | 3,229,497 | | | | | | | | 0.3% | |
#Kureha Corp. | | | 545,500 | | | | | | | | 3,096,346 | | | | | | | | 0.3% | |
Nihon Parkerizing Co., Ltd. | | | 230,000 | | | | | | | | 3,013,274 | | | | | | | | 0.2% | |
Nippon Denko Co., Ltd. | | | 372,000 | | | | | | | | 2,756,092 | | | | | | | | 0.2% | |
Nippon Paint Co., Ltd. | | | 691,200 | | | | | | | | 5,107,460 | | | | | | | | 0.4% | |
#NOF Corp. | | | 673,000 | | | | | | | | 3,103,136 | | | | | | | | 0.3% | |
#Pacific Metals Co., Ltd. | | | 341,000 | | | | | | | | 2,835,502 | | | | | | | | 0.2% | |
#*Taiheiyo Cement Corp. | | | 2,740,000 | | | | | | | | 2,957,582 | | | | | | | | 0.2% | |
Toagosei Co., Ltd. | | | 897,000 | | | | | | | | 3,933,092 | | | | | | | | 0.3% | |
Tokai Carbon Co., Ltd. | | | 556,000 | | | | | | | | 3,278,348 | | | | | | | | 0.3% | |
Other Securities | | | | | | | | | | | 116,125,372 | | | | | | | | 9.6% | |
| | | | | | | | | | | | | | | | | | | | |
Total Materials | | | | | | | | | | | 152,971,530 | | | | | | | | 12.6% | |
| | | | | | | | | | | | | | | | | | | | |
| | | | | |
Real Estate Investment Trusts — (0.0%) | | | | | | | | | | | | | | | | | | | | |
Other Securities | | | | | | | | | | | 25,319 | | | | | | | | 0.0% | |
| | | | | | | | | | | | | | | | | | | | |
| | | | | |
Telecommunication Services — (0.0%) | | | | | | | | | | | | | | | | | | | | |
Other Securities | | | | | | | | | | | 481,027 | | | | | | | | 0.0% | |
| | | | | | | | | | | | | | | | | | | | |
| | | | | |
Utilities — (0.6%) | | | | | | | | | | | | | | | | | | | | |
#Saibu Gas Co., Ltd. | | | 1,268,000 | | | | | | | | 3,614,327 | | | | | | | | 0.3% | |
Other Securities | | | | | | | | | | | 5,093,434 | | | | | | | | 0.4% | |
| | | | | | | | | | | | | | | | | | | | |
Total Utilities | | | | | | | | | | | 8,707,761 | | | | | | | | 0.7% | |
| | | | | | | | | | | | | | | | | | | | |
TOTAL COMMON STOCKS | | | | | | | | | | | 1,201,989,931 | | | | | | | | 99.2% | |
| | | | | | | | | | | | | | | | | | | | |
RIGHTS/WARRANTS — (0.0%) | | | | | | | | | | | | | | | | | | | | |
Other Securities | | | | | | | | | | | — | | | | | | | | 0.0% | |
TOTAL RIGHTS/WARRANTS | | | | | | | | | | | — | | | | | | | | 0.0% | |
| | | | | | | | | | | | | | | | | | | | |
| | | | | |
| | | Face Amount | | | | | | Value† | | | | | | | |
| | | (000) | | | | | | | | | | | | | |
TEMPORARY CASH INVESTMENTS — (0.2%) | | | | | | | | | | | | | | | | | | | | |
Repurchase Agreement, PNC Capital Markets, Inc. 0.19%,
11/01/10 (Collateralized by $4,900,000 FNMA 5.50%, 12/01/38,valued at $2,521,716) to be
repurchased at $2,483,039 | | $ | 2,483 | | | | | | | | 2,483,000 | | | | | | | | 0.2% | |
| | | | | | | | | | | | | | | | | | | | |
| | | | | |
| | | Shares/
Face
Amount | | | | | | | | | | | | | |
| | | (000) | | | | | | | | | | | | | |
SECURITIES LENDING COLLATERAL — (12.2%) | | | | | | | | | | | | | | | | | | | | |
§@DFA Short Term Investment Fund | | | 165,468,050 | | | | | | | | 165,468,050 | | | | | | | | 13.7% | |
210
THE JAPANESE SMALL COMPANY SERIES
CONTINUED
| | | | | | | | | | | | | | | | | | | | |
| | | Shares/
Face
Amount | | | | | | Value† | | | Percentage
of Net Assets** | |
| | | (000) | | | | | | | | | | | | | |
@Repurchase Agreement, Deutsche Bank Securities, Inc. 0.22%,
11/01/10 (Collateralized by $42,295,271 FNMA 7.000%,
08/01/38, valued at $2,795,227)## to be repurchased at
$2,740,469 | | $ | 2,740 | | | | | | | $ | 2,740,419 | | | | | | | | 0.2% | |
| | | | | | | | | | | | | | | | | | | | |
TOTAL SECURITIES LENDING COLLATERAL | | | | | | | | | | | 168,208,469 | | | | | | | | 13.9% | |
| | | | | | | | | | | | | | | | | | | | |
| | | | | |
TOTAL INVESTMENTS — (100.0%) | | | | | | | | | | | | | | | | | | | | |
(Cost $1,588,187,054) | | | | | | | | | | $ | 1,372,681,400 | | | | | | | | 113.3% | |
| | | | | | | | | | | | | | | | | | | | |
Summary of inputs used to value the Series’ investments as of October 31, 2010 is as follows (See Security Valuation Note):
| | | | | | | | | | | | | | | | |
| | | Valuation Inputs | |
| |
| | | Investment in Securities (Market Value) | |
| | | Level 1 | | | Level 2 | | | Level 3 | | | Total | |
Common Stocks | | | | | | | | | | | | | | | | |
Consumer Discretionary | | $ | 65,037 | | | $ | 284,844,957 | | | | — | | | $ | 284,909,994 | |
Consumer Staples | | | — | | | | 117,682,561 | | | | — | | | | 117,682,561 | |
Energy | | | — | | | | 12,896,930 | | | | — | | | | 12,896,930 | |
Financials | | | — | | | | 124,963,790 | | | | — | | | | 124,963,790 | |
Health Care | | | — | | | | 53,888,222 | | | | — | | | | 53,888,222 | |
Industrials | | | 1,805,746 | | | | 309,521,356 | | | | — | | | | 311,327,102 | |
Information Technology | | | — | | | | 134,135,695 | | | | — | | | | 134,135,695 | |
Materials | | | 79,110 | | | | 152,892,420 | | | | — | | | | 152,971,530 | |
Real Estate Investment Trusts | | | — | | | | 25,319 | | | | — | | | | 25,319 | |
Telecommunication Services | | | — | | | | 481,027 | | | | — | | | | 481,027 | |
Utilities | | | — | | | | 8,707,761 | | | | — | | | | 8,707,761 | |
Rights/Warrants | | | — | | | | — | | | | — | | | | — | |
Temporary Cash Investments | | | — | | | | 2,483,000 | | | | — | | | | 2,483,000 | |
Securities Lending Collateral | | | — | | | | 168,208,469 | | | | — | | | | 168,208,469 | |
| | | | | | | | | | | | | | | | |
TOTAL | | $ | 1,949,893 | | | $ | 1,370,731,507 | | | | — | | | $ | 1,372,681,400 | |
| | | | | | | | | | | | | | | | |
See accompanying Notes to Financial Statements.
211
THE ASIA PACIFIC SMALL COMPANY SERIES
SUMMARY SCHEDULE OF PORTFOLIO HOLDINGS
October 31, 2010
| | | | | | | | | | | | | | | | | | | | |
| | | Shares | | | | | | Value†† | | | Percentage
of Net Assets** | |
COMMON STOCKS — (86.2%) | | | | | | | | | | | | | | | | | | | | |
AUSTRALIA — (51.7%) | | | | | | | | | | | | | | | | | | | | |
Adelaide Brighton, Ltd. | | | 1,781,776 | | | | | | | $ | 6,244,398 | | | | | | | | 0.7 | % |
*Andean Resources, Ltd. | | | 1,464,837 | | | | | | | | 9,136,669 | | | | | | | | 1.0 | % |
Ansell, Ltd. | | | 473,632 | | | | | | | | 6,295,905 | | | | | | | | 0.7 | % |
APA Group, Ltd. | | | 1,702,846 | | | | | | | | 6,518,392 | | | | | | | | 0.7 | % |
Australian Infrastructure Fund NL | | | 3,018,033 | | | | | | | | 5,854,222 | | | | | | | | 0.6 | % |
Australian Pharmaceutical Industries, Ltd. | | | 8,248,388 | | | | | | | | 4,170,326 | | | | | | | | 0.5 | % |
*AWB, Ltd. | | | 3,807,619 | | | | | | | | 5,542,901 | | | | | | | | 0.6 | % |
Boart Longyear Group | | | 1,686,718 | | | | | | | | 5,985,737 | | | | | | | | 0.6 | % |
Bradken, Ltd. | | | 589,828 | | | | | | | | 4,743,303 | | | | | | | | 0.5 | % |
#Campbell Brothers, Ltd. | | | 290,863 | | | | | | | | 10,019,193 | | | | | | | | 1.1 | % |
Challenger Financial Services Group, Ltd. | | | 1,750,037 | | | | | | | | 7,893,293 | | | | | | | | 0.8 | % |
#ConnectEast Group, Ltd. | | | 13,951,937 | | | | | | | | 5,936,849 | | | | | | | | 0.6 | % |
Consolidated Media Holdings, Ltd. | | | 1,225,674 | | | | | | | | 4,026,953 | | | | | | | | 0.4 | % |
#David Jones, Ltd. | | | 1,447,885 | | | | | | | | 6,744,051 | | | | | | | | 0.7 | % |
DUET Group, Ltd. | | | 3,300,250 | | | | | | | | 5,624,843 | | | | | | | | 0.6 | % |
#Flight Centre, Ltd. | | | 192,954 | | | | | | | | 4,317,514 | | | | | | | | 0.5 | % |
Goodman Fielder, Ltd. | | | 4,757,757 | | | | | | | | 6,917,187 | | | | | | | | 0.7 | % |
Graincorp, Ltd Series A | | | 634,518 | | | | | | | | 4,678,450 | | | | | | | | 0.5 | % |
#GUD Holdings, Ltd. | | | 387,740 | | | | | | | | 3,972,190 | | | | | | | | 0.4 | % |
*Iluka Resources, Ltd. | | | 1,472,781 | | | | | | | | 9,747,906 | | | | | | | | 1.0 | % |
#IOOF Holdings, Ltd. | | | 950,183 | | | | | | | | 6,692,291 | | | | | | | | 0.7 | % |
#JB Hi-Fi, Ltd. | | | 379,557 | | | | | | | | 7,396,694 | | | | | | | | 0.8 | % |
#*Karoon Gas Australia, Ltd. | | | 667,086 | | | | | | | | 6,155,517 | | | | | | | | 0.7 | % |
#Kingsgate Consolidated, Ltd. | | | 409,970 | | | | | | | | 4,028,563 | | | | | | | | 0.4 | % |
*Lynas Corp., Ltd. | | | 6,385,207 | | | | | | | | 9,202,825 | | | | | | | | 1.0 | % |
Monadelphous Group, Ltd. | | | 302,955 | | | | | | | | 4,963,891 | | | | | | | | 0.5 | % |
*Mount Gibson Iron, Ltd. | | | 2,962,399 | | | | | | | | 5,885,580 | | | | | | | | 0.6 | % |
Navitas, Ltd. | | | 1,205,167 | | | | | | | | 4,521,704 | | | | | | | | 0.5 | % |
*Pacific Brands, Ltd. | | | 4,412,120 | | | | | | | | 4,698,942 | | | | | | | | 0.5 | % |
*PanAust, Ltd. | | | 8,757,197 | | | | | | | | 6,425,678 | | | | | | | | 0.7 | % |
#Perpetual Trustees Australia, Ltd. | | | 145,492 | | | | | | | | 5,401,823 | | | | | | | | 0.6 | % |
#*Perseus Mining, Ltd. | | | 1,377,405 | | | | | | | | 4,047,188 | | | | | | | | 0.4 | % |
Primary Health Care, Ltd. | | | 1,717,450 | | | | | | | | 5,255,394 | | | | | | | | 0.6 | % |
#Reece Australia, Ltd. | | | 238,457 | | | | | | | | 5,205,510 | | | | | | | | 0.6 | % |
*Riversdale Mining, Ltd. | | | 816,637 | | | | | | | | 8,595,557 | | | | | | | | 0.9 | % |
#SAI Global, Ltd. | | | 992,324 | | | | | | | | 4,250,991 | | | | | | | | 0.5 | % |
#Seek, Ltd. | | | 666,916 | | | | | | | | 4,729,187 | | | | | | | | 0.5 | % |
*Seven Group Holdings, Ltd. | | | 723,898 | | | | | | | | 5,239,495 | | | | | | | | 0.6 | % |
Spark Infrastructure Group, Ltd. | | | 4,454,005 | | | | | | | | 4,887,344 | | | | | | | | 0.5 | % |
*St. Barbara, Ltd. | | | 9,348,675 | | | | | | | | 3,822,176 | | | | | | | | 0.4 | % |
Super Cheap Auto Group, Ltd. | | | 832,879 | | | | | | | | 5,437,284 | | | | | | | | 0.6 | % |
#*Ten Network Holdings, Ltd. | | | 3,318,272 | | | | | | | | 4,685,349 | | | | | | | | 0.5 | % |
Transfield Services, Ltd. | | | 1,322,886 | | | | | | | | 4,492,942 | | | | | | | | 0.5 | % |
UGL, Ltd. | | | 332,576 | | | | | | | | 4,807,541 | | | | | | | | 0.5 | % |
#West Australian Newspapers Holdings, Ltd. | | | 756,808 | | | | | | | | 5,306,719 | | | | | | | | 0.6 | % |
Other Securities | | | | | | | | | | | 294,878,501 | | | | | | | | 31.5 | % |
| | | | | | | | | | | | | | | | | | | | |
TOTAL AUSTRALIA | | | | | | | | | | | 555,384,968 | | | | | | | | 59.4 | % |
| | | | | | | | | | | | | | | | | | | | |
| | | | | |
HONG KONG — (19.2%) | | | | | | | | | | | | | | | | | | | | |
Giordano International, Ltd. | | | 6,824,000 | | | | | | | | 4,100,503 | | | | | | | | 0.5 | % |
Pacific Basin Shipping, Ltd. | | | 6,240,000 | | | | | | | | 4,568,892 | | | | | | | | 0.5 | % |
#Techtronic Industries Co., Ltd. | | | 4,614,000 | | | | | | | | 4,679,234 | | | | | | | | 0.5 | % |
Other Securities | | | | | | | | | | | 192,854,699 | | | | | | | | 20.6 | % |
| | | | | | | | | | | | | | | | | | | | |
TOTAL HONG KONG | | | | | | | | | | | 206,203,328 | | | | | | | | 22.1 | % |
| | | | | | | | | | | | | | | | | | | | |
| | | | | |
MALAYSIA — (0.0%) | | | | | | | | | | | | | | | | | | | | |
Other Securities | | | | | | | | | | | 4,146 | | | | | | | | 0.0 | % |
| | | | | | | | | | | | | | | | | | | | |
212
THE ASIA PACIFIC SMALL COMPANY SERIES
CONTINUED
| | | | | | | | | | | | | | | | | | | | |
| | | Shares | | | | | | Value†† | | | Percentage
of Net Assets** | |
NEW ZEALAND — (5.0%) | | | | | | | | | | | | | | | | | | | | |
Fisher & Paykel Healthcare Corp., Ltd. | | | 2,402,700 | | | | | | | $ | 5,939,087 | | | | | | | | 0.6% | |
Sky City Entertainment Group, Ltd. | | | 2,560,206 | | | | | | | | 5,904,284 | | | | | | | | 0.6% | |
Other Securities | | | | | | | | | | | 41,495,909 | | | | | | | | 4.5% | |
| | | | | | | | | | | | | | | | | | | | |
TOTAL NEW ZEALAND | | | | | | | | | | | 53,339,280 | | | | | | | | 5.7% | |
| | | | | | | | | | | | | | | | | | | | |
| | | | | |
SINGAPORE — (10.3%) | | | | | | | | | | | | | | | | | | | | |
Other Securities | | | | | | | | | | | 110,662,728 | | | | | | | | 11.8% | |
| | | | | | | | | | | | | | | | | | | | |
TOTAL COMMON STOCKS | | | | | | | | | | | 925,594,450 | | | | | | | | 99.0% | |
| | | | | | | | | | | | | | | | | | | | |
PREFERRED STOCKS — (0.1%) | | | | | | | | | | | | | | | | | | | | |
AUSTRALIA — (0.1%) | | | | | | | | | | | | | | | | | | | | |
Other Securities | | | | | | | | | | | 780,533 | | | | | | | | 0.1% | |
| | | | | | | | | | | | | | | | | | | | |
RIGHTS/WARRANTS — (0.0%) | | | | | | | | | | | | | | | | | | | | |
AUSTRALIA — (0.0%) | | | | | | | | | | | | | | | | | | | | |
Other Securities | | | | | | | | | | | 20,891 | | | | | | | | 0.0% | |
| | | | | | | | | | | | | | | | | | | | |
| | | | | |
HONG KONG — (0.0%) | | | | | | | | | | | | | | | | | | | | |
Other Securities | | | | | | | | | | | 15,765 | | | | | | | | 0.0% | |
| | | | | | | | | | | | | | | | | | | | |
| | | | | |
SINGAPORE — (0.0%) | | | | | | | | | | | | | | | | | | | | |
Other Securities | | | | | | | | | | | 182,728 | | | | | | | | 0.0% | |
| | | | | | | | | | | | | | | | | | | | |
TOTAL RIGHTS/WARRANTS | | | | | | | | | | | 219,384 | | | | | | | | 0.0% | |
| | | | | | | | | | | | | | | | | | | | |
| | | Face Amount | | | | | | Value† | | | | | | | |
| | | (000) | | | | | | | | | | | | | |
TEMPORARY CASH INVESTMENTS — (0.0%) | | | | | | | | | | | | | | | | | | | | |
Repurchase Agreement, PNC Capital Markets, Inc. 0.19%, 11/01/10 (Collateralized by $80,000 FNMA 3.126%(r), 09/01/40,valued at $82,211) to be repurchased at $77,001 | | $ | 77 | | | | | | | | 77,000 | | | | | | | | 0.0% | |
| | | | | | | | | | | | | | | | | | | | |
| | | | | |
| | | Shares/
Face
Amount | | | | | | | | | | | | | |
| | | (000) | | | | | | | | | | | | | |
SECURITIES LENDING COLLATERAL — (13.7%) | | | | | | | | | | | | | | | | | | | | |
§@DFA Short Term Investment Fund | | | 146,838,427 | | | | | | | | 146,838,427 | | | | | | | | 15.7% | |
@Repurchase Agreement, Deutsche Bank Securities, Inc. 0.22%, 11/01/10 (Collateralized by $42,295,271 FNMA 7.000%, 08/01/38, valued at $370,085)## to be repurchased at $362,835 | | $ | 363 | | | | | | | | 362,828 | | | | | | | | 0.0% | |
| | | | | | | | | | | | | | | | | | | | |
TOTAL SECURITIES LENDING COLLATERAL | | | | | | | | | | | 147,201,255 | | | | | | | | 15.7% | |
| | | | | | | | | | | | | | | | | | | | |
TOTAL INVESTMENTS — (100.0%) | | | | | | | | | | | | | | | | | | | | |
(Cost $876,704,734) | | | | | | | | | | $ | 1,073,872,622 | | | | | | | | 114.8% | |
| | | | | | | | | | | | | | | | | | | | |
213
THE ASIA PACIFIC SMALL COMPANY SERIES
CONTINUED
Summary of inputs used to value the Series’ investments as of October 31, 2010 is as follows (See Security Valuation Note):
| | | | | | | | | | | | | | | | |
| | | Valuation Inputs | |
| |
| | | Investment in Securities (Market Value) | |
| | | Level 1 | | | Level 2 | | | Level 3 | | | Total | |
Common Stocks | | | | | | | | | | | | | | | | |
Australia | | $ | 1,165,043 | | | $ | 554,219,925 | | | | — | | | $ | 555,384,968 | |
Hong Kong | | | 405,141 | | | | 205,798,187 | | | | — | | | | 206,203,328 | |
Malaysia | | | — | | | | 4,146 | | | | — | | | | 4,146 | |
New Zealand | | | — | | | | 53,339,280 | | | | — | | | | 53,339,280 | |
Singapore | | | 791,703 | | | | 109,871,025 | | | | — | | | | 110,662,728 | |
Preferred Stocks | | | | | | | | | | | | | | | | |
Australia | | | — | | | | 780,533 | | | | — | | | | 780,533 | |
Rights/Warrants | | | | | | | | | | | | | | | | |
Australia | | | 4,411 | | | | 16,480 | | | | — | | | | 20,891 | |
Hong Kong | | | 6,899 | | | | 8,866 | | | | — | | | | 15,765 | |
Singapore | | | 178,498 | | | | 4,230 | | | | — | | | | 182,728 | |
Temporary Cash Investments | | | — | | | | 77,000 | | | | — | | | | 77,000 | |
Securities Lending Collateral | | | — | | | | 147,201,255 | | | | — | | | | 147,201,255 | |
| | | | | | | | | | | | | | | | |
TOTAL | | $ | 2,551,695 | | | $ | 1,071,320,927 | | | | — | | | $ | 1,073,872,622 | |
| | | | | | | | | | | | | | | | |
See accompanying Notes to Financial Statements.
214
THE UNITED KINGDOM SMALL COMPANY SERIES
SUMMARY SCHEDULE OF PORTFOLIO HOLDINGS
October 31, 2010
| | | | | | | | | | | | |
| | | Shares | | | Value†† | | | Percentage of Net Assets** | |
COMMON STOCKS — (98.0%) | | | | | | | | | | | | |
Consumer Discretionary — (21.1%) | | | | | | | | | | | | |
Aegis Group P.L.C. | | | 3,149,142 | | | $ | 6,347,400 | | | | 0.6% | |
Daily Mail & General Trust P.L.C. Series A | | | 939,198 | | | | 8,093,650 | | | | 0.8% | |
GKN P.L.C. | | | 3,830,675 | | | | 10,884,024 | | | | 1.0% | |
*Inchcape P.L.C. | | | 1,428,910 | | | | 7,985,145 | | | | 0.8% | |
Informa P.L.C. | | | 1,449,124 | | | | 10,132,278 | | | | 1.0% | |
*ITV P.L.C. | | | 6,035,176 | | | | 6,610,726 | | | | 0.6% | |
Thomas Cook Group P.L.C. | | | 2,420,264 | | | | 7,015,506 | | | | 0.7% | |
United Business Media P.L.C. | | | 864,643 | | | | 9,112,387 | | | | 0.9% | |
Other Securities | | | | | | | 155,308,325 | | | | 15.0% | |
| | | | | | | | | | | | |
Total Consumer Discretionary | | | | | | | 221,489,441 | | | | 21.4% | |
| | | | | | | | | | | | |
| | | |
Consumer Staples — (4.4%) | | | | | | | | | | | | |
Britvic P.L.C. | | | 834,762 | | | | 6,452,199 | | | | 0.6% | |
PZ Cussons P.L.C. | | | 1,298,024 | | | | 8,383,476 | | | | 0.8% | |
Tate & Lyle P.L.C. | | | 1,062,662 | | | | 8,557,114 | | | | 0.8% | |
Other Securities | | | | | | | 22,240,791 | | | | 2.2% | |
| | | | | | | | | | | | |
Total Consumer Staples | | | | | | | 45,633,580 | | | | 4.4% | |
| | | | | | | | | | | | |
| | | |
Energy — (4.9%) | | | | | | | | | | | | |
John Wood Group P.L.C. | | | 1,070,261 | | | | 7,467,982 | | | | 0.7% | |
*Premier Oil P.L.C. | | | 380,328 | | | | 10,244,418 | | | | 1.0% | |
Other Securities | | | | | | | 33,232,071 | | | | 3.2% | |
| | | | | | | | | | | | |
Total Energy | | | | | | | 50,944,471 | | | | 4.9% | |
| | | | | | | | | | | | |
| | | |
Financials — (13.2%) | | | | | | | | | | | | |
Aberdeen Asset Management P.L.C. | | | 2,558,118 | | | | 7,286,080 | | | | 0.7% | |
Amlin P.L.C. | | | 1,697,546 | | | | 11,055,901 | | | | 1.1% | |
Catlin Group, Ltd. P.L.C. | | | 1,219,427 | | | | 6,808,962 | | | | 0.7% | |
Close Brothers Group P.L.C. | | | 504,375 | | | | 6,234,621 | | | | 0.6% | |
Hiscox, Ltd. P.L.C. | | | 1,517,006 | | | | 8,610,598 | | | | 0.8% | |
IG Group Holdings P.L.C. | | | 1,241,907 | | | | 10,506,913 | | | | 1.0% | |
Other Securities | | | | | | | 88,142,014 | | | | 8.5% | |
| | | | | | | | | | | | |
Total Financials | | | | | | | 138,645,089 | | | | 13.4% | |
| | | | | | | | | | | | |
| | | |
Health Care — (3.1%) | | | | | | | | | | | | |
SSL International P.L.C. | | | 753,239 | | | | 13,988,081 | | | | 1.4% | |
Other Securities | | | | | | | 18,005,851 | | | | 1.7% | |
| | | | | | | | | | | | |
Total Health Care | | | | | | | 31,993,932 | | | | 3.1% | |
| | | | | | | | | | | | |
| | | |
Industrials — (30.2%) | | | | | | | | | | | | |
Babcock International Group P.L.C. | | | 1,286,052 | | | | 11,951,794 | | | | 1.1% | |
Balfour Beatty P.L.C. | | | 2,390,347 | | | | 10,598,680 | | | | 1.0% | |
Carillion P.L.C. | | | 1,523,518 | | | | 8,415,082 | | | | 0.8% | |
Charter International P.L.C. | | | 614,873 | | | | 7,280,103 | | | | 0.7% | |
*Cookson Group P.L.C. | | | 963,139 | | | | 7,951,358 | | | | 0.8% | |
Firstgroup P.L.C. | | | 1,591,971 | | | | 10,410,372 | | | | 1.0% | |
Hays P.L.C. | | | 4,753,935 | | | | 8,419,027 | | | | 0.8% | |
Homeserve P.L.C. | | | 1,100,525 | | | | 7,992,806 | | | | 0.8% | |
IMI P.L.C. | | | 1,191,221 | | | | 15,063,796 | | | | 1.5% | |
Intertek Group P.L.C. | | | 539,854 | | | | 16,045,765 | | | | 1.5% | |
Meggitt P.L.C. | | | 2,289,633 | | | | 12,104,196 | | | | 1.2% | |
Melrose P.L.C. | | | 1,598,881 | | | | 7,213,870 | | | | 0.7% | |
Michael Page International P.L.C. | | | 1,235,568 | | | | 9,325,627 | | | | 0.9% | |
Rotork P.L.C. | | | 348,025 | | | | 9,332,212 | | | | 0.9% | |
Spirax-Sarco Engineering P.L.C. | | | 301,608 | | | | 8,735,351 | | | | 0.8% | |
*Travis Perkins P.L.C. | | | 667,086 | | | | 8,842,161 | | | | 0.8% | |
215
THE UNITED KINGDOM SMALL COMPANY SERIES
CONTINUED
| | | | | | | | | | | | |
| | | Shares | | | Value†† | | | Percentage
of Net Assets** | |
Industrials — (Continued) | | | | | | | | | | | | |
Ultra Electronics Holdings P.L.C. | | | 267,145 | | | $ | 7,961,510 | | | | 0.8% | |
Weir Group P.L.C. (The) | | | 362,747 | | | | 9,053,724 | | | | 0.9% | |
Other Securities | | | | | | | 139,720,768 | | | | 13.5% | |
| | | | | | | | | | | | |
Total Industrials | | | | | | | 316,418,202 | | | | 30.5% | |
| | | | | | | | | | | | |
| | | |
Information Technology — (10.9%) | | | | | | | | | | | | |
Aveva Group P.L.C. | | | 274,171 | | | | 6,542,840 | | | | 0.6% | |
Halma P.L.C. | | | 1,461,044 | | | | 7,648,991 | | | | 0.7% | |
Logica P.L.C. | | | 5,706,484 | | | | 11,833,154 | | | | 1.2% | |
*Misys P.L.C. | | | 1,833,430 | | | | 8,254,976 | | | | 0.8% | |
Spectris P.L.C. | | | 490,382 | | | | 8,864,013 | | | | 0.9% | |
Other Securities | | | | | | | 70,641,956 | | | | 6.8% | |
| | | | | | | | | | | | |
Total Information Technology | | | | | | | 113,785,930 | | | | 11.0% | |
| | | | | | | | | | | | |
| | | |
Materials — (5.5%) | | | | | | | | | | | | |
Croda International P.L.C. | | | 484,717 | | | | 11,168,074 | | | | 1.1% | |
Mondi P.L.C. | | | 1,078,021 | | | | 8,976,093 | | | | 0.9% | |
Victrex P.L.C. | | | 321,880 | | | | 6,661,744 | | | | 0.6% | |
Other Securities | | | | | | | 30,630,959 | | | | 2.9% | |
| | | | | | | | | | | | |
Total Materials | | | | | | | 57,436,870 | | | | 5.5% | |
| | | | | | | | | | | | |
| | | |
Telecommunication Services — (2.0%) | | | | | | | | | | | | |
*Cable & Wireless Communications P.L.C. | | | 8,687,193 | | | | 7,446,715 | | | | 0.7% | |
Other Securities | | | | | | | 13,913,823 | | | | 1.3% | |
| | | | | | | | | | | | |
Total Telecommunication Services | | | | | | | 21,360,538 | | | | 2.0% | |
| | | | | | | | | | | | |
| | | |
Utilities — (2.7%) | | | | | | | | | | | | |
*Drax Group P.L.C. | | | 1,259,220 | | | | 7,673,881 | | | | 0.8% | |
Northumbrian Water Group P.L.C. | | | 1,699,783 | | | | 9,642,375 | | | | 0.9% | |
Pennon Group P.L.C. | | | 1,133,145 | | | | 11,308,526 | | | | 1.1% | |
Other Securities | | | | | | | 194,931 | | | | 0.0% | |
| | | | | | | | | | | | |
Total Utilities | | | | | | | 28,819,713 | | | | 2.8% | |
| | | | | | | | | | | | |
TOTAL COMMON STOCKS | | | | | | | 1,026,527,766 | | | | 99.0% | |
| | | | | | | | | | | | |
PREFERRED STOCKS — (0.0%) | | | | | | | | | | | | |
Consumer Staples — (0.0%) | | | | | | | | | | | | |
Other Securities | | | | | | | 4,351 | | | | 0.0% | |
| | | | | | | | | | | | |
RIGHTS/WARRANTS — (0.0%) | | | | | | | | | | | | |
Other Securities | | | | | | | 41,892 | | | | 0.0% | |
| | | | | | | | | | | | |
| | | |
| | | Face Amount | | | Value† | | | | |
| | | (000) | | | | | | | | | |
| | | |
TEMPORARY CASH INVESTMENTS — (0.0%) | | | | | | | | | | | | |
Repurchase Agreement, PNC Capital Markets, Inc. 0.19%,
11/01/10 (Collateralized by $5,000 FHLMC 5.00%, 10/15/19,valued at $5,656) to be repurchased at $3,000 | | $ | 3 | | | | 3,000 | | | | 0.0% | |
| | | | | | | | | | | | |
| | | |
| | | Shares/ Face Amount | | | | | | | |
| | | (000) | | | | | | | | | |
| | | |
SECURITIES LENDING COLLATERAL — (2.0%) | | | | | | | | | | | | |
§@DFA Short Term Investment Fund | | | 19,629,803 | | | | 19,629,803 | | | | 1.9% | |
216
THE UNITED KINGDOM SMALL COMPANY SERIES
CONTINUED
| | | | | | | | | | | | |
| | | Shares/
Face
Amount | | | Value† | | | Percentage
of Net Assets** | |
| | | (000) | | | | | | | |
@Repurchase Agreement, Deutsche Bank Securities, Inc. 0.22%, 11/01/10 (Collateralized by $42,295,271 FNMA 7.000%, 08/01/38, valued at $1,711,232)## to be repurchased at $1,677,709 | | $ | 1,678 | | | $ | 1,677,678 | | | | 0.2% | |
| | | | | | | | | | | | |
TOTAL SECURITIES LENDING COLLATERAL | | | | | | | 21,307,481 | | | | 2.1% | |
| | | | | | | | | | | | |
TOTAL INVESTMENTS — (100.0%) | | | | | | | | | | | | |
(Cost $953,563,812) | | | | | | $ | 1,047,884,490 | | | | 101.1% | |
| | | | | | | | | | | | |
Summary of inputs used to value the Series’ investments as of October 31, 2010 is as follows (See Security Valuation Note):
| | | | | | | | | | | | | | |
| | | Valuation Inputs | |
| |
| | | Investment in Securities (Market Value) | |
| | | Level 1 | | | Level 2 | | | Level 3 | | Total | |
Common Stocks | | | | | | | | | | | | | | |
Consumer Discretionary | | $ | 743,701 | | | $ | 220,745,740 | | | — | | $ | 221,489,441 | |
Consumer Staples | | | 757,384 | | | | 44,876,196 | | | — | | | 45,633,580 | |
Energy | | | — | | | | 50,944,471 | | | — | | | 50,944,471 | |
Financials | | | 6,802 | | | | 138,638,287 | | | — | | | 138,645,089 | |
Health Care | | | — | | | | 31,993,932 | | | — | | | 31,993,932 | |
Industrials | | | 624,113 | | | | 315,794,089 | | | — | | | 316,418,202 | |
Information Technology | | | — | | | | 113,785,930 | | | — | | | 113,785,930 | |
Materials | | | — | | | | 57,436,870 | | | — | | | 57,436,870 | |
Telecommunication Services | | | — | | | | 21,360,538 | | | — | | | 21,360,538 | |
Utilities | | | — | | | | 28,819,713 | | | — | | | 28,819,713 | |
Preferred Stocks | | | | | | | | | | | | | | |
Consumer Staples | | | — | | | | 4,351 | | | — | | | 4,351 | |
Rights/Warrants | | | — | | | | 41,892 | | | — | | | 41,892 | |
Temporary Cash Investments | | | — | | | | 3,000 | | | — | | | 3,000 | |
Securities Lending Collateral | | | — | | | | 21,307,481 | | | — | | | 21,307,481 | |
| | | | | | | | | | | | | | |
TOTAL | | $ | 2,132,000 | | | $ | 1,045,752,490 | | | — | | $ | 1,047,884,490 | |
| | | | | | | | | | | | | | |
See accompanying Notes to Financial Statements.
217
THE CONTINENTAL SMALL COMPANY SERIES
SUMMARY SCHEDULE OF PORTFOLIO HOLDINGS
October 31, 2010
| | | | | | | | | | | | | | | | | | |
| | | Shares | | | | | | Value†† | | | Percentage
of Net Assets** |
COMMON STOCKS — (85.5%) | | | | | | | | | | | | | | | | | | |
AUSTRIA — (2.3%) | | | | | | | | | | | | | | | | | | |
Andritz AG | | | 116,739 | | | | | | | $ | 8,946,425 | | | | | | | 0.4% |
Other Securities | | | | | | | | | | | 47,555,943 | | | | | | | 2.3% |
| | | | | | | | | | | | | | | | | | |
TOTAL AUSTRIA | | | | | | | | | | | 56,502,368 | | | | | | | 2.7% |
| | | | | | | | | | | | | | | | | | |
| | | | | |
BELGIUM — (3.4%) | | | | | | | | | | | | | | | | | | |
Ackermans & van Haaren NV | | | 81,854 | | | | | | | | 7,061,891 | | | | | | | 0.3% |
Bekaert SA | | | 32,765 | | | | | | | | 10,044,157 | | | | | | | 0.5% |
D’Ieteren SA | | | 12,906 | | | | | | | | 7,043,989 | | | | | | | 0.3% |
Other Securities | | | | | | | | | | | 57,597,781 | | | | | | | 2.8% |
| | | | | | | | | | | | | | | | | | |
TOTAL BELGIUM | | | | | | | | | | | 81,747,818 | | | | | | | 3.9% |
| | | | | | | | | | | | | | | | | | |
| | | | | |
DENMARK — (2.5%) | | | | | | | | | | | | | | | | | | |
Other Securities | | | | | | | | | | | 60,941,548 | | | | | | | 2.9% |
| | | | | | | | | | | | | | | | | | |
| | | | | |
FINLAND — (5.7%) | | | | | | | | | | | | | | | | | | |
KCI Konecranes Oyj | | | 232,703 | | | | | | | | 9,278,182 | | | | | | | 0.5% |
Kesko Oyj | | | 138,078 | | | | | | | | 6,852,025 | | | | | | | 0.3% |
Other Securities | | | | | | | | | | | 121,719,940 | | | | | | | 5.9% |
| | | | | | | | | | | | | | | | | | |
TOTAL FINLAND | | | | | | | | | | | 137,850,147 | | | | | | | 6.7% |
| | | | | | | | | | | | | | | | | | |
| | | | | |
FRANCE — (11.0%) | | | | | | | | | | | | | | | | | | |
Arkema SA | | | 199,362 | | | | | | | | 12,882,495 | | | | | | | 0.6% |
#Bourbon SA | | | 155,755 | | | | | | | | 7,098,282 | | | | | | | 0.3% |
Gemalto NV | | | 149,247 | | | | | | | | 6,801,849 | | | | | | | 0.3% |
#Neopost SA | | | 86,402 | | | | | | | | 7,177,299 | | | | | | | 0.4% |
*Rhodia SA | | | 311,738 | | | | | | | | 8,691,016 | | | | | | | 0.4% |
SEB SA | | | 87,918 | | | | | | | | 8,430,197 | | | | | | | 0.4% |
Societe BIC SA | | | 84,787 | | | | | | | | 7,526,006 | | | | | | | 0.4% |
*Valeo SA | | | 232,962 | | | | | | | | 12,592,625 | | | | | | | 0.6% |
Zodiac Aerospace SA | | | 105,911 | | | | | | | | 7,489,218 | | | | | | | 0.4% |
Other Securities | | | | | | | | | | | 187,174,892 | | | | | | | 9.0% |
| | | | | | | | | | | | | | | | | | |
TOTAL FRANCE | | | | | | | | | | | 265,863,879 | | | | | | | 12.8% |
| | | | | | | | | | | | | | | | | | |
| | | | | |
GERMANY — (12.7%) | | | | | | | | | | | | | | | | | | |
*Aareal Bank AG | | | 302,222 | | | | | | | | 7,378,490 | | | | | | | 0.3% |
#Aixtron AG | | | 314,748 | | | | | | | | 10,249,247 | | | | | | | 0.5% |
#Aurubis AG | | | 144,707 | | | | | | | | 7,460,677 | | | | | | | 0.4% |
Bilfinger Berger SE | | | 162,980 | | | | | | | | 11,946,841 | | | | | | | 0.6% |
MTU Aero Engines Holding AG | | | 165,906 | | | | | | | | 10,009,105 | | | | | | | 0.5% |
Rheinmetall AG | | | 111,360 | | | | | | | | 8,031,101 | | | | | | | 0.4% |
Rhoen-Klinikum AG | | | 379,608 | | | | | | | | 8,894,423 | | | | | | | 0.4% |
#*SGL Carbon SE | | | 217,830 | | | | | | | | 8,077,263 | | | | | | | 0.4% |
Software AG | | | 70,053 | | | | | | | | 9,809,297 | | | | | | | 0.5% |
Symrise AG | | | 278,877 | | | | | | | | 8,494,967 | | | | | | | 0.4% |
Wincor Nixdorf AG | | | 112,151 | | | | | | | | 8,204,044 | | | | | | | 0.4% |
Other Securities | | | | | | | | | | | 207,265,186 | | | | | | | 10.0% |
| | | | | | | | | | | | | | | | | | |
TOTAL GERMANY | | | | | | | | | | | 305,820,641 | | | | | | | 14.8% |
| | | | | | | | | | | | | | | | | | |
| | | | | |
GREECE — (2.4%) | | | | | | | | | | | | | | | | | | |
Other Securities | | | | | | | | | | | 57,410,789 | | | | | | | 2.8% |
| | | | | | | | | | | | | | | | | | |
| | | | | |
IRELAND — (2.4%) | | | | | | | | | | | | | | | | | | |
DCC P.L.C. | | | 308,989 | | | | | | | | 8,941,049 | | | | | | | 0.4% |
*Dragon Oil P.L.C. | | | 1,347,570 | | | | | | | | 9,665,121 | | | | | | | 0.5% |
Paddy Power P.L.C. | | | 180,573 | | | | | | | | 7,291,136 | | | | | | | 0.3% |
218
THE CONTINENTAL SMALL COMPANY SERIES
CONTINUED
| | | | | | | | | | | | | | | | | | |
| | | Shares | | | | | | Value†† | | | Percentage
of Net Assets** |
IRELAND — (Continued) | | | | | | | | | | | | | | | | | | |
Other Securities | | | | | | | | | | $ | 32,432,703 | | | | | | | 1.6% |
| | | | | | | | | | | | | | | | | | |
TOTAL IRELAND | | | | | | | | | | | 58,330,009 | | | | | | | 2.8% |
| | | | | | | | | | | | | | | | | | |
| | | | | |
ISRAEL — (2.5%) | | | | | | | | | | | | | | | | | | |
Other Securities | | | | | | | | | | | 59,837,955 | | | | | | | 2.9% |
| | | | | | | | | | | | | | | | | | |
| | | | | |
ITALY — (7.4%) | | | | | | | | | | | | | | | | | | |
#Pirelli & Co. SpA | | | 782,291 | | | | | | | | 6,684,015 | | | | | | | 0.3% |
Prysmian SpA | | | 542,696 | | | | | | | | 10,518,765 | | | | | | | 0.5% |
Other Securities | | | | | | | | | | | 161,636,889 | | | | | | | 7.8% |
| | | | | | | | | | | | | | | | | | |
TOTAL ITALY | | | | | | | | | | | 178,839,669 | | | | | | | 8.6% |
| | | | | | | | | | | | | | | | | | |
| | | | | |
NETHERLANDS — (4.9%) | | | | | | | | | | | | | | | | | | |
*Crucell NV | | | 230,971 | | | | | | | | 7,476,179 | | | | | | | 0.4% |
#Imtech NV | | | 249,209 | | | | | | | | 8,372,256 | | | | | | | 0.4% |
Nutreco NV | | | 136,273 | | | | | | | | 9,927,338 | | | | | | | 0.5% |
SBM Offshore NV | | | 556,537 | | | | | | | | 11,359,298 | | | | | | | 0.5% |
Other Securities | | | | | | | | | | | 80,715,939 | | | | | | | 3.9% |
| | | | | | | | | | | | | | | | | | |
TOTAL NETHERLANDS | | | | | | | | | | | 117,851,010 | | | | | | | 5.7% |
| | | | | | | | | | | | | | | | | | |
| | | | | |
NORWAY — (2.9%) | | | | | | | | | | | | | | | | | | |
#TGS Nopec Geophysical Co. ASA | | | 404,241 | | | | | | | | 7,005,340 | | | | | | | 0.3% |
Other Securities | | | | | | | | | | | 62,350,129 | | | | | | | 3.0% |
| | | | | | | | | | | | | | | | | | |
TOTAL NORWAY | | | | | | | | | | | 69,355,469 | | | | | | | 3.3% |
| | | | | | | | | | | | | | | | | | |
| | | | | |
PORTUGAL — (0.9%) | | | | | | | | | | | | | | | | | | |
Other Securities | | | | | | | | | | | 22,377,327 | | | | | | | 1.1% |
| | | | | | | | | | | | | | | | | | |
| | | | | |
SPAIN — (5.2%) | | | | | | | | | | | | | | | | | | |
Ebro Foods SA | | | 312,280 | | | | | | | | 6,867,586 | | | | | | | 0.3% |
Other Securities | | | | | | | | | | | 119,346,366 | | | | | | | 5.8% |
| | | | | | | | | | | | | | | | | | |
TOTAL SPAIN | | | | | | | | | | | 126,213,952 | | | | | | | 6.1% |
| | | | | | | | | | | | | | | | | | |
| | | | | |
SWEDEN — (6.3%) | | | | | | | | | | | | | | | | | | |
#Elekta AB Series B | | | 302,500 | | | | | | | | 11,441,870 | | | | | | | 0.6% |
Trelleborg AB Series B | | | 878,565 | | | | | | | | 8,280,093 | | | | | | | 0.4% |
Other Securities | | | | | | | | | | | 133,282,089 | | | | | | | 6.4% |
| | | | | | | | | | | | | | | | | | |
TOTAL SWEDEN | | | | | | | | | | | 153,004,052 | | | | | | | 7.4% |
| | | | | | | | | | | | | | | | | | |
| | | | | |
SWITZERLAND — (13.0%) | | | | | | | | | | | | | | | | | | |
Aryzta AG | | | 289,080 | | | | | | | | 12,810,535 | | | | | | | 0.6% |
*Clariant AG | | | 877,755 | | | | | | | | 14,844,717 | | | | | | | 0.7% |
#Galenica Holding AG | | | 17,786 | | | | | | | | 8,595,752 | | | | | | | 0.4% |
*GAM Holding AG | | | 664,563 | | | | | | | | 10,499,380 | | | | | | | 0.5% |
#*Logitech International SA | | | 590,988 | | | | | | | | 11,204,264 | | | | | | | 0.5% |
Nobel Biocare Holding AG | | | 439,153 | | | | | | | | 7,260,518 | | | | | | | 0.4% |
PSP Swiss Property AG | | | 141,111 | | | | | | | | 10,844,983 | | | | | | | 0.5% |
Sulzer AG | | | 76,216 | | | | | | | | 9,279,827 | | | | | | | 0.5% |
Swiss Life Holding AG | | | 66,645 | | | | | | | | 8,155,630 | | | | | | | 0.4% |
#*Temenos Group AG | | | 198,827 | | | | | | | | 6,664,445 | | | | | | | 0.3% |
#Valiant Holding AG | | | 45,484 | | | | | | | | 7,107,562 | | | | | | | 0.4% |
Other Securities | | | | | | | | | | | 205,411,944 | | | | | | | 9.9% |
| | | | | | | | | | | | | | | | | | |
TOTAL SWITZERLAND | | | | | | | | | | | 312,679,557 | | | | | | | 15.1% |
| | | | | | | | | | | | | | | | | | |
TOTAL COMMON STOCKS | | | | | | | | | | | 2,064,626,190 | | | | | | | 99.6% |
| | | | | | | | | | | | | | | | | | |
RIGHTS/WARRANTS — (0.0%) | | | | | | | | | | | | | | | | | | |
AUSTRIA — (0.0%) | | | | | | | | | | | | | | | | | | |
Other Securities | | | | | | | | | | | 2,777 | | | | | | | 0.0% |
| | | | | | | | | | | | | | | | | | |
219
THE CONTINENTAL SMALL COMPANY SERIES
CONTINUED
| | | | | | | | | | | | |
| | | Shares | | | | Value†† | | | Percentage
of Net Assets** |
BELGIUM — (0.0%) | | | | | | | | | | | | |
Other Securities | | | | | | $ | 1,158 | | | | | 0.0% |
| | | | | | | | | | | | |
| | | | | |
ITALY — (0.0%) | | | | | | | | | | | | |
Other Securities | | | | | | | 21,088 | | | | | 0.0% |
| | | | | | | | | | | | |
TOTAL RIGHTS/WARRANTS | | | | | | | 25,023 | | | | | 0.0% |
| | | | | | | | | | | | |
| | | | | | | | | | | | |
| | | | | |
| | | Face Amount | | | | Value† | | | | | |
| | | (000) | | | | | | | | | |
TEMPORARY CASH INVESTMENTS — (0.2%) | | | | | | | | | | | | |
Repurchase Agreement, PNC Capital Markets, Inc. 0.19%, 11/01/10 (Collateralized by $8,480,000 FNMA 5.50%, 12/01/38, valued at $4,364,113) to be repurchased at $4,298,068 | | $4,298 | | | | | 4,298,000 | | | | | 0.2% |
| | | | | | | | | | | | |
| | | | | | | | | | |
| | | | | |
| | | Shares/ Face Amount | | | | | | | | |
| | | (000) | | | | | | | | |
SECURITIES LENDING COLLATERAL — (14.3%) | | | | | | | | | | |
§@DFA Short Term Investment Fund | | 339,465,423 | | | | 339,465,423 | | | | 16.4% |
@Repurchase Agreement, Deutsche Bank Securities, Inc. 0.22%, 11/01/10 (Collateralized by $42,295,271 FNMA 7.000%, 08/01/38, valued at $5,121,648)## to be repurchased at $5,021,316 | | $5,021 | | | | 5,021,224 | | | | 0.3% |
| | | | | | | | | | |
TOTAL SECURITIES LENDING COLLATERAL | | | | | | 344,486,647 | | | | 16.7% |
| | | | | | | | | | |
| | | | | |
TOTAL INVESTMENTS — (100.0%) (Cost $2,089,127,748) | | | | | | $2,413,435,860 | | | | 116.5% |
| | | | | | | | | | |
220
THE CONTINENTAL SMALL COMPANY SERIES
CONTINUED
Summary of inputs used to value the Series’ investments as of October 31, 2010 is as follows (See Security Valuation Note):
| | | | | | | | | | | | | | | | | | |
| | | Valuation Inputs | |
| |
| | | Investment in Securities (Market Value) | |
| | | Level 1 | | | Level 2 | | | Level 3 | | Total | |
Common Stocks | | | | | | | | | | | | | | | | | | |
Austria | | $ | 107,937 | | | $ | 56,394,431 | | | | | — | | | | $ | 56,502,368 | |
Belgium | | | 12 | | | | 81,747,806 | | | | | — | | | | | 81,747,818 | |
Denmark | | | 74,652 | | | | 60,866,896 | | | | | — | | | | | 60,941,548 | |
Finland | | | — | | | | 137,850,147 | | | | | — | | | | | 137,850,147 | |
France | | | 243,069 | | | | 265,620,810 | | | | | — | | | | | 265,863,879 | |
Germany | | | 116,993 | | | | 305,703,648 | | | | | — | | | | | 305,820,641 | |
Greece | | | 249,728 | | | | 57,161,061 | | | | | — | | | | | 57,410,789 | |
Ireland | | | 433,218 | | | | 57,896,791 | | | | | — | | | | | 58,330,009 | |
Israel | | | 4,001,787 | | | | 55,836,168 | | | | | — | | | | | 59,837,955 | |
Italy | | | — | | | | 178,839,669 | | | | | — | | | | | 178,839,669 | |
Netherlands | | | 1,759,091 | | | | 116,091,919 | | | | | — | | | | | 117,851,010 | |
Norway | | | — | | | | 69,355,469 | | | | | — | | | | | 69,355,469 | |
Portugal | | | 1,012,387 | | | | 21,364,940 | | | | | — | | | | | 22,377,327 | |
Spain | | | — | | | | 126,213,952 | | | | | — | | | | | 126,213,952 | |
Sweden | | | — | | | | 153,004,052 | | | | | — | | | | | 153,004,052 | |
Switzerland | | | 494,724 | | | | 312,184,833 | | | | | — | | | | | 312,679,557 | |
Rights/Warrants | | | | | | | | | | | | | | | | | | |
Austria | | | — | | | | 2,777 | | | | | — | | | | | 2,777 | |
Belgium | | | 1,050 | | | | 108 | | | | | — | | | | | 1,158 | |
Italy | | | 9,127 | | | | 11,961 | | | | | — | | | | | 21,088 | |
Temporary Cash Investments | | | — | | | | 4,298,000 | | | | | — | | | | | 4,298,000 | |
Securities Lending Collateral | | | — | | | | 344,486,647 | | | | | — | | | | | 344,486,647 | |
| | | | | | | | | | | | | | | | | | |
TOTAL | | $ | 8,503,775 | | | $ | 2,404,932,085 | | | | | — | | | | $ | 2,413,435,860 | |
| | | | | | | | | | | | | | | | | | |
See accompanying Notes to Financial Statements.
221
THE CANADIAN SMALL COMPANY SERIES
SUMMARY SCHEDULE OF PORTFOLIO HOLDINGS
October 31, 2010
| | | | | | | | | | | | | | | | | | |
| | | Shares | | | | | | Value†† | | | Percentage
of Net Assets** |
COMMON STOCKS — (79.4%) | | | | | | | | | | | | | | | | | | |
Consumer Discretionary — (8.3%) | | | | | | | | | | | | | | | | | | |
Astral Media, Inc. Class A | | | 186,347 | | | | | | | $ | 7,472,882 | | | | | | | 1.1% |
Corus Entertainment, Inc. Class B | | | 278,300 | | | | | | | | 6,008,595 | | | | | | | 0.9% |
#Groupe Aeroplan, Inc. | | | 593,776 | | | | | | | | 7,219,161 | | | | | | | 1.1% |
#*Imax Corp. | | | 270,137 | | | | | | | | 5,861,488 | | | | | | | 0.9% |
#Quebecor, Inc. Class B | | | 159,493 | | | | | | | | 5,753,258 | | | | | | | 0.9% |
*RONA, Inc. | | | 442,375 | | | | | | | | 5,638,666 | | | | | | | 0.9% |
Other Securities | | | | | | | | | | | 31,398,080 | | | | | | | 4.7% |
| | | | | | | | | | | | | | | | | | |
Total Consumer Discretionary | | | | | | | | | | | 69,352,130 | | | | | | | 10.5% |
| | | | | | | | | | | | | | | | | | |
| | | | | |
Consumer Staples — (2.0%) | | | | | | | | | | | | | | | | | | |
Other Securities | | | | | | | | | | | 16,936,325 | | | | | | | 2.6% |
| | | | | | | | | | | | | | | | | | |
| | | | | |
Energy — (14.2%) | | | | | | | | | | | | | | | | | | |
#*Bankers Petroleum, Ltd. | | | 759,182 | | | | | | | | 5,322,239 | | | | | | | 0.8% |
*Crew Energy, Inc. | | | 268,096 | | | | | | | | 5,183,698 | | | | | | | 0.8% |
#Progress Energy Resources Corp. | | | 387,604 | | | | | | | | 4,115,846 | | | | | | | 0.6% |
ShawCor, Ltd. | | | 209,500 | | | | | | | | 6,445,838 | | | | | | | 1.0% |
Trican Well Service, Ltd. | | | 494,693 | | | | | | | | 8,575,519 | | | | | | | 1.3% |
#*Uranium One, Inc. | | | 1,819,900 | | | | | | | | 7,440,909 | | | | | | | 1.1% |
Other Securities | | | | | | | | | | | 81,350,490 | | | | | | | 12.2% |
| | | | | | | | | | | | | | | | | | |
Total Energy | | | | | | | | | | | 118,434,539 | | | | | | | 17.8% |
| | | | | | | | | | | | | | | | | | |
| | | | | |
Financials — (5.4%) | | | | | | | | | | | | | | | | | | |
AGF Management, Ltd. Class B | | | 330,879 | | | | | | | | 5,375,689 | | | | | | | 0.8% |
#Canadian Western Bank | | | 226,200 | | | | | | | | 5,624,504 | | | | | | | 0.8% |
#Home Capital Group, Inc. | | | 113,700 | | | | | | | | 5,354,457 | | | | | | | 0.8% |
#TMX Group, Inc. | | | 194,874 | | | | | | | | 6,481,151 | | | | | | | 1.0% |
Other Securities | | | | | | | | | | | 22,319,762 | | | | | | | 3.4% |
| | | | | | | | | | | | | | | | | | |
Total Financials | | | | | | | | | | | 45,155,563 | | | | | | | 6.8% |
| | | | | | | | | | | | | | | | | | |
| | | | | |
Health Care — (3.6%) | | | | | | | | | | | | | | | | | | |
#*MDS, Inc. | | | 464,108 | | | | | | | | 5,196,699 | | | | | | | 0.8% |
*SXC Health Solutions Corp. | | | 184,318 | | | | | | | | 7,196,336 | | | | | | | 1.1% |
#Valeant Pharmaceuticals International, Inc. | | | 302,138 | | | | | | | | 8,359,971 | | | | | | | 1.2% |
Other Securities | | | | | | | | | | | 9,196,218 | | | | | | | 1.4% |
| | | | | | | | | | | | | | | | | | |
Total Health Care | | | | | | | | | | | 29,949,224 | | | | | | | 4.5% |
| | | | | | | | | | | | | | | | | | |
| | | | | |
Industrials — (7.6%) | | | | | | | | | | | | | | | | | | |
#CAE, Inc. | | | 358,590 | | | | | | | | 4,022,227 | | | | | | | 0.6% |
IESI-BFC, Ltd. | | | 293,935 | | | | | | | | 6,879,330 | | | | | | | 1.0% |
Russel Metals, Inc. | | | 229,900 | | | | | | | | 4,526,318 | | | | | | | 0.7% |
*Stantec, Inc. | | | 159,195 | | | | | | | | 4,400,144 | | | | | | | 0.7% |
#Superior Plus Corp. | | | 367,830 | | | | | | | | 4,381,934 | | | | | | | 0.7% |
Toromont Industries, Ltd. | | | 262,959 | | | | | | | | 7,495,066 | | | | | | | 1.1% |
Other Securities | | | | | | | | | | | 32,005,570 | | | | | | | 4.8% |
| | | | | | | | | | | | | | | | | | |
Total Industrials | | | | | | | | | | | 63,710,589 | | | | | | | 9.6% |
| | | | | | | | | | | | | | | | | | |
| | | | | |
Information Technology — (4.5%) | | | | | | | | | | | | | | | | | | |
*Celestica, Inc. | | | 797,607 | | | | | | | | 6,717,761 | | | | | | | 1.0% |
*MacDonald Dettweiler & Associates, Ltd. | | | 143,020 | | | | | | | | 7,125,058 | | | | | | | 1.1% |
#*Open Text Corp. | | | 135,242 | | | | | | | | 5,983,056 | | | | | | | 0.9% |
Other Securities | | | | | | | | | | | 17,352,359 | | | | | | | 2.6% |
| | | | | | | | | | | | | | | | | | |
Total Information Technology | | | | | | | | | | | 37,178,234 | | | | | | | 5.6% |
| | | | | | | | | | | | | | | | | | |
| | | | | |
Materials — (32.8%) | | | | | | | | | | | | | | | | | | |
#Alamos Gold, Inc. | | | 396,920 | | | | | | | | 6,145,080 | | | | | | | 0.9% |
222
THE CANADIAN SMALL COMPANY SERIES
CONTINUED
| | | | | | | | | | | | | | | | | | |
| | | Shares | | | | | | Value†† | | | Percentage
of Net Assets** |
Materials — (Continued) | | | | | | | | | | | | | | | | | | |
#*Consolidated Thompson Iron Mines, Ltd. | | | 656,633 | | | | | | | $ | 6,360,951 | | | | | | | 1.0% |
*Detour Gold Corp. | | | 237,256 | | | | | | | | 6,929,950 | | | | | | | 1.0% |
#*Eastern Platinum, Ltd. | | | 2,845,360 | | | | | | | | 5,189,106 | | | | | | | 0.8% |
#*Equinox Minerals, Ltd. | | | 1,652,990 | | | | | | | | 8,978,885 | | | | | | | 1.4% |
#*Euro Goldfields, Ltd. | | | 494,960 | | | | | | | | 6,687,468 | | | | | | | 1.0% |
#*Golden Star Resources, Ltd. | | | 870,710 | | | | | | | | 4,567,407 | | | | | | | 0.7% |
#HudBay Minerals, Inc. | | | 498,098 | | | | | | | | 7,862,906 | | | | | | | 1.2% |
*Lundin Mining Corp. | | | 1,147,100 | | | | | | | | 7,265,679 | | | | | | | 1.1% |
Methanex Corp. | | | 359,200 | | | | | | | | 10,002,236 | | | | | | | 1.5% |
*New Gold, Inc. | | | 908,957 | | | | | | | | 6,728,724 | | | | | | | 1.0% |
#*Novagold Resources, Inc. | | | 499,855 | | | | | | | | 5,606,767 | | | | | | | 0.8% |
#Pan Amer Silver Corp. | | | 220,900 | | | | | | | | 7,067,327 | | | | | | | 1.1% |
#*Quadra FNX Mining, Ltd. | | | 543,917 | | | | | | | | 7,679,581 | | | | | | | 1.2% |
#*SEMAFO, Inc. | | | 867,985 | | | | | | | | 10,416,841 | | | | | | | 1.6% |
Sherritt International Corp. | | | 888,402 | | | | | | | | 6,907,567 | | | | | | | 1.0% |
#*Silver Standard Resources, Inc. | | | 266,867 | | | | | | | | 6,489,167 | | | | | | | 1.0% |
Silvercorp Metals, Inc. | | | 528,430 | | | | | | | | 4,942,859 | | | | | | | 0.7% |
#*Taseko Mines, Ltd. | | | 649,000 | | | | | | | | 4,104,373 | | | | | | | 0.6% |
#*Thompson Creek Metals Co., Inc. | | | 474,700 | | | | | | | | 5,715,576 | | | | | | | 0.9% |
#West Fraser Timber Co., Ltd. | | | 123,716 | | | | | | | | 5,373,683 | | | | | | | 0.8% |
#*Western Coal Corp. | | | 688,705 | | | | | | | | 4,659,344 | | | | | | | 0.7% |
Other Securities | | | | | | | | | | | 128,192,410 | | | | | | | 19.3% |
| | | | | | | | | | | | | | | | | | |
Total Materials | | | | | | | | | | | 273,873,887 | | | | | | | 41.3% |
| | | | | | | | | | | | | | | | | | |
| | | | | |
Telecommunication Services — (0.3%) | | | | | | | | | | | | | | | | | | |
Other Securities | | | | | | | | | | | 2,260,301 | | | | | | | 0.3% |
| | | | | | | | | | | | | | | | | | |
| | | | | |
Utilities — (0.7%) | | | | | | | | | | | | | | | | | | |
Other Securities | | | | | | | | | | | 6,102,692 | | | | | | | 0.9% |
| | | | | | | | | | | | | | | | | | |
TOTAL COMMON STOCKS | | | | | | | | | | | 662,953,484 | | | | | | | 99.9% |
| | | | | | | | | | | | | | | | | | |
| | | | | |
| | | Face Amount | | | | | | Value† | | | | | | |
| | | (000) | | | | | | | | | | | | |
TEMPORARY CASH INVESTMENTS — (0.1%) | | | | | | | | | | | | | | | | | | |
Repurchase Agreement, PNC Capital Markets, Inc. 0.19%, 11/01/10 (Collateralized by $585,000 FHLMC 5.00%, 10/15/19valued at $661,781) to be repurchased at $649,010 | | | $649 | | | | | | | | 649,000 | | | | | | | 0.1% |
| | | | | | | | | | | | | | | | | | |
| | | | | |
| | | Shares/ Face Amount | | | | | | | | | | | | |
| | | (000) | | | | | | | | | | | | |
SECURITIES LENDING COLLATERAL — (20.5%) | | | | | | | | | | | | | | | | | | |
§@DFA Short Term Investment Fund | | | 168,636,615 | | | | | | | | 168,636,615 | | | | | | | 25.4% |
@Repurchase Agreement, Deutsche Bank Securities, Inc. 0.22%, 11/01/10 (Collateralized by $42,295,271 FNMA 7.000%, 08/01/38, valued at $2,868,042)## to be repurchased at $2,811,858 | | | $2,812 | | | | | | | | 2,811,806 | | | | | | | 0.4% |
| | | | | | | | | | | | | | | | | | |
TOTAL SECURITIES LENDING COLLATERAL | | | | | | | | | | | 171,448,421 | | | | | | | 25.8% |
| | | | | | | | | | | | | | | | | | |
TOTAL INVESTMENTS — (100.0%) (Cost $792,036,344) | | | | | | | | | | $ | 835,050,905 | | | | | | | 125.8% |
| | | | | | | | | | | | | | | | | | |
223
THE CANADIAN SMALL COMPANY SERIES
CONTINUED
Summary of inputs used to value the Series’ investments as of October 31, 2010 is as follows (See Security Valuation Note):
| | | | | | | | | | | | | | | | | | |
| | | Valuation Inputs | |
| |
| | | Investment in Securities (Market Value) | |
| | | Level 1 | | | Level 2 | | | Level 3 | | Total | |
Common Stocks | | | | | | | | | | | | | | | | | | |
Consumer Discretionary | | $ | 69,352,130 | | | | — | | | | | — | | | | $ | 69,352,130 | |
Consumer Staples | | | 16,936,325 | | | | — | | | | | — | | | | | 16,936,325 | |
Energy | | | 118,434,539 | | | | — | | | | | — | | | | | 118,434,539 | |
Financials | | | 45,155,563 | | | | — | | | | | — | | | | | 45,155,563 | |
Health Care | | | 29,949,224 | | | | — | | | | | — | | | | | 29,949,224 | |
Industrials | | | 63,710,589 | | | | — | | | | | — | | | | | 63,710,589 | |
Information Technology | | | 37,178,234 | | | | — | | | | | — | | | | | 37,178,234 | |
Materials | | | 273,873,887 | | | | — | | | | | — | | | | | 273,873,887 | |
Telecommunication Services | | | 2,260,301 | | | | — | | | | | — | | | | | 2,260,301 | |
Utilities | | | 6,102,692 | | | | — | | | | | — | | | | | 6,102,692 | |
Temporary Cash Investments | | | — | | | $ | 649,000 | | | | | — | | | | | 649,000 | |
Securities Lending Collateral | | | — | | | | 171,448,421 | | | | | — | | | | | 171,448,421 | |
| | | | | | | | | | | | | | | | | | |
TOTAL | | $ | 662,953,484 | | | $ | 172,097,421 | | | | | — | | | | $ | 835,050,905 | |
| | | | | | | | | | | | | | | | | | |
See accompanying Notes to Financial Statements.
224
THE EMERGING MARKETS SERIES
SUMMARY SCHEDULE OF PORTFOLIO HOLDINGS
October 31, 2010
| | | | | | | | | | | | | | | | | | |
| | | Shares | | | | | | Value†† | | | Percentage
of Net Assets** |
COMMON STOCKS — (84.7%) | | | | | | | | | | | | | | | | | | |
BRAZIL — (3.1%) | | | | | | | | | | | | | | | | | | |
Cia Siderurgica Nacional SA | | | 734,552 | | | | | | | $ | 12,161,171 | | | | | | | 0.5% |
Petroleo Brasilerio SA ADR | | | 1,009,389 | | | | | | | | 34,440,353 | | | | | | | 1.4% |
Other Securities | | | | | | | | | | | 38,669,099 | | | | | | | 1.5% |
| | | | | | | | | | | | | | | | | | |
TOTAL BRAZIL | | | | | | | | | | | 85,270,623 | | | | | | | 3.4% |
| | | | | | | | | | | | | | | | | | |
| | | | | |
CHILE — (2.0%) | | | | | | | | | | | | | | | | | | |
Other Securities | | | | | | | | | | | 53,671,271 | | | | | | | 2.1% |
| | | | | | | | | | | | | | | | | | |
| | | | | |
CHINA — (11.3%) | | | | | | | | | | | | | | | | | | |
Bank of China, Ltd. | | | 36,691,000 | | | | | | | | 22,085,287 | | | | | | | 0.9% |
China Construction Bank Corp. | | | 21,737,000 | | | | | | | | 20,780,648 | | | | | | | 0.8% |
#China Life Insurance Co., Ltd. ADR | | | 250,705 | | | | | | | | 16,488,868 | | | | | | | 0.6% |
#China Mobile, Ltd. Sponsored ADR | | | 696,697 | | | | | | | | 35,789,325 | | | | | | | 1.4% |
#CNOOC, Ltd. ADR | | | 68,756 | | | | | | | | 14,364,504 | | | | | | | 0.6% |
Industrial & Commercial Bank of China, Ltd. Series H | | | 34,093,000 | | | | | | | | 27,543,516 | | | | | | | 1.1% |
PetroChina Co., Ltd. ADR | | | 115,210 | | | | | | | | 14,165,070 | | | | | | | 0.6% |
Tencent Holdings, Ltd. | | | 700,600 | | | | | | | | 16,123,103 | | | | | | | 0.6% |
Other Securities | | | | | | | | | | | 136,946,084 | | | | | | | 5.4% |
| | | | | | | | | | | | | | | | | | |
TOTAL CHINA | | | | | | | | | | | 304,286,405 | | | | | | | 12.0% |
| | | | | | | | | | | | | | | | | | |
| | | | | |
COLOMBIA — (0.3%) | | | | | | | | | | | | | | | | | | |
Other Securities | | | | | | | | | | | 7,472,398 | | | | | | | 0.3% |
| | | | | | | | | | | | | | | | | | |
| | | | | |
CZECH REPUBLIC — (0.7%) | | | | | | | | | | | | | | | | | | |
CEZ A.S. | | | 254,916 | | | | | | | | 11,272,835 | | | | | | | 0.4% |
Other Securities | | | | | | | | | | | 7,245,270 | | | | | | | 0.3% |
| | | | | | | | | | | | | | | | | | |
TOTAL CZECH REPUBLIC | | | | | | | | | | | 18,518,105 | | | | | | | 0.7% |
| | | | | | | | | | | | | | | | | | |
| | | | | |
EGYPT — (0.1%) | | | | | | | | | | | | | | | | | | |
Other Securities | | | | | | | | | | | 3,589,496 | | | | | | | 0.1% |
| | | | | | | | | | | | | | | | | | |
| | | | | |
HUNGARY — (1.0%) | | | | | | | | | | | | | | | | | | |
Other Securities | | | | | | | | | | | 26,401,798 | | | | | | | 1.0% |
| | | | | | | | | | | | | | | | | | |
| | | | | |
INDIA — (10.8%) | | | | | | | | | | | | | | | | | | |
HDFC Bank, Ltd. | | | 378,035 | | | | | | | | 19,427,251 | | | | | | | 0.8% |
Infosys Technologies, Ltd. | | | 398,967 | | | | | | | | 26,735,874 | | | | | | | 1.1% |
#Infosys Technologies, Ltd. Sponsored ADR | | | 233,496 | | | | | | | | 15,746,970 | | | | | | | 0.6% |
ITC, Ltd. | | | 3,212,684 | | | | | | | | 12,399,207 | | | | | | | 0.5% |
Larsen & Toubro, Ltd. | | | 282,173 | | | | | | | | 12,860,404 | | | | | | | 0.5% |
Reliance Industries, Ltd. | | | 1,898,511 | | | | | | | | 46,866,998 | | | | | | | 1.8% |
Tata Consultancy Services, Ltd. | | | 641,575 | | | | | | | | 15,223,695 | | | | | | | 0.6% |
Other Securities | | | | | | | | | | | 142,815,741 | | | | | | | 5.6% |
| | | | | | | | | | | | | | | | | | |
TOTAL INDIA | | | | | | | | | | | 292,076,140 | | | | | | | 11.5% |
| | | | | | | | | | | | | | | | | | |
| | | | | |
INDONESIA — (2.8%) | | | | | | | | | | | | | | | | | | |
PT Astra International Tbk | | | 2,821,561 | | | | | | | | 18,065,369 | | | | | | | 0.7% |
PT Telekomunikasi Indonesia Tbk | | | 13,911,140 | | | | | | | | 14,122,335 | | | | | | | 0.6% |
Other Securities | | | | | | | | | | | 43,866,000 | | | | | | | 1.7% |
| | | | | | | | | | | | | | | | | | |
TOTAL INDONESIA | | | | | | | | | | | 76,053,704 | | | | | | | 3.0% |
| | | | | | | | | | | | | | | | | | |
| | | | | |
ISRAEL — (0.0%) | | | | | | | | | | | | | | | | | | |
Other Securities | | | | | | | | | | | 38 | | | | | | | 0.0% |
| | | | | | | | | | | | | | | | | | |
| | | | | |
MALAYSIA — (4.5%) | | | | | | | | | | | | | | | | | | |
CIMB Group Holdings Berhad | | | 5,354,954 | | | | | | | | 14,300,384 | | | | | | | 0.6% |
225
THE EMERGING MARKETS SERIES
CONTINUED
| | | | | | | | | | | | | | | | | | |
| | | Shares | | | | | | Value†† | | | Percentage
of Net Assets** |
MALAYSIA — (Continued) | | | | | | | | | | | | | | | | | | |
Other Securities | | | | | | | | | | $ | 106,241,503 | | | | | | | 4.2% |
| | | | | | | | | | | | | | | | | | |
TOTAL MALAYSIA | | | | | | | | | | | 120,541,887 | | | | | | | 4.8% |
| | | | | | | | | | | | | | | | | | |
| | | | | |
MEXICO — (6.7%) | | | | | | | | | | | | | | | | | | |
America Movil S.A.B. de C.V. Series L | | | 23,307,621 | | | | | | | | 66,725,332 | | | | | | | 2.7% |
#Fomento Economico Mexicano S.A.B. de C.V. Series B & D | | | 2,109,900 | | | | | | | | 11,602,058 | | | | | | | 0.5% |
Grupo Mexico S.A.B. de C.V. Series B | | | 4,075,517 | | | | | | | | 13,426,630 | | | | | | | 0.5% |
#Wal-Mart de Mexico S.A.B. de C.V. Series V | | | 8,551,980 | | | | | | | | 23,402,284 | | | | | | | 0.9% |
Other Securities | | | | | | | | | | | 66,525,865 | | | | | | | 2.6% |
| | | | | | | | | | | | | | | | | | |
TOTAL MEXICO | | | | | | | | | | | 181,682,169 | | | | | | | 7.2% |
| | | | | | | | | | | | | | | | | | |
| | | | | |
PERU — (0.4%) | | | | | | | | | | | | | | | | | | |
Other Securities | | | | | | | | | | | 9,785,049 | | | | | | | 0.4% |
| | | | | | | | | | | | | | | | | | |
| | | | | |
PHILIPPINES — (0.6%) | | | | | | | | | | | | | | | | | | |
Other Securities | | | | | | | | | | | 15,583,766 | | | | | | | 0.6% |
| | | | | | | | | | | | | | | | | | |
| | | | | |
POLAND — (1.4%) | | | | | | | | | | | | | | | | | | |
Other Securities | | | | | | | | | | | 39,187,798 | | | | | | | 1.5% |
| | | | | | | | | | | | | | | | | | |
| | | | | |
RUSSIA — (4.0%) | | | | | | | | | | | | | | | | | | |
Gazprom OAO Sponsored ADR | | | 1,743,505 | | | | | | | | 38,174,119 | | | | | | | 1.5% |
Lukoil OAO Sponsored ADR | | | 354,178 | | | | | | | | 19,750,701 | | | | | | | 0.8% |
Other Securities | | | | | | | | | | | 49,770,935 | | | | | | | 2.0% |
| | | | | | | | | | | | | | | | | | |
TOTAL RUSSIA | | | | | | | | | | | 107,695,755 | | | | | | | 4.3% |
| | | | | | | | | | | | | | | | | | |
| | | | | |
SOUTH AFRICA — (7.9%) | | | | | | | | | | | | | | | | | | |
Impala Platinum Holdings, Ltd. | | | 478,692 | | | | | | | | 13,514,497 | | | | | | | 0.5% |
MTN Group, Ltd. | | | 1,659,950 | | | | | | | | 29,395,910 | | | | | | | 1.2% |
Naspers, Ltd. Series N | | | 324,237 | | | | | | | | 16,882,139 | | | | | | | 0.7% |
#Sasol, Ltd. Sponsored ADR | | | 920,291 | | | | | | | | 41,643,168 | | | | | | | 1.6% |
Standard Bank Group, Ltd. | | | 861,864 | | | | | | | | 12,676,857 | | | | | | | 0.5% |
Other Securities | | | | | | | | | | | 100,238,872 | | | | | | | 4.0% |
| | | | | | | | | | | | | | | | | | |
TOTAL SOUTH AFRICA | | | | | | | | | | | 214,351,443 | | | | | | | 8.5% |
| | | | | | | | | | | | | | | | | | |
| | | | | |
SOUTH KOREA — (12.0%) | | | | | | | | | | | | | | | | | | |
#Hyundai Heavy Industries Co., Ltd. | | | 47,395 | | | | | | | | 15,460,234 | | | | | | | 0.6% |
Hyundai Mobis | | | 53,070 | | | | | | | | 13,216,066 | | | | | | | 0.5% |
Hyundai Motor Co., Ltd. | | | 95,919 | | | | | | | | 14,520,680 | | | | | | | 0.6% |
#POSCO | | | 46,060 | | | | | | | | 19,010,253 | | | | | | | 0.8% |
Samsung Electronics Co., Ltd. | | | 97,139 | | | | | | | | 64,444,531 | | | | | | | 2.5% |
Samsung Electronics Co., Ltd. GDR | | | 49,372 | | | | | | | | 16,479,096 | | | | | | | 0.7% |
Other Securities | | | | | | | | | | | 180,231,033 | | | | | | | 7.1% |
| | | | | | | | | | | | | | | | | | |
TOTAL SOUTH KOREA | | | | | | | | | | | 323,361,893 | | | | | | | 12.8% |
| | | | | | | | | | | | | | | | | | |
| | | | | |
TAIWAN — (10.8%) | | | | | | | | | | | | | | | | | | |
Formosa Chemicals & Fiber Co., Ltd. | | | 4,232,445 | | | | | | | | 12,103,668 | | | | | | | 0.5% |
Formosa Plastics Corp. | | | 5,051,648 | | | | | | | | 14,473,970 | | | | | | | 0.6% |
Hon Hai Precision Industry Co., Ltd. | | | 5,190,997 | | | | | | | | 19,632,544 | | | | | | | 0.8% |
#HTC Corp. | | | 553,558 | | | | | | | | 12,553,253 | | | | | | | 0.5% |
Nan Ya Plastic Corp. | | | 6,817,564 | | | | | | | | 15,144,810 | | | | | | | 0.6% |
#Taiwan Semiconductor Manufacturing Co., Ltd. | | | 22,386,808 | | | | | | | | 46,056,661 | | | | | | | 1.8% |
Other Securities | | | | | | | | | | | 173,173,003 | | | | | | | 6.8% |
| | | | | | | | | | | | | | | | | | |
TOTAL TAIWAN | | | | | | | | | | | 293,137,909 | | | | | | | 11.6% |
| | | | | | | | | | | | | | | | | | |
| | | | | |
THAILAND — (1.9%) | | | | | | | | | | | | | | | | | | |
Other Securities | | | | | | | | | | | 52,250,619 | | | | | | | 2.1% |
| | | | | | | | | | | | | | | | | | |
226
THE EMERGING MARKETS SERIES
CONTINUED
| | | | | | | | | | | | | | | | | | |
| | | Shares | | | | | | Value†† | | | Percentage
of Net Assets** |
TURKEY — (2.4%) | | | | | | | | | | | | | | | | | | |
Turkiye Garanti Bankasi A.S. | | | 2,842,585 | | | | | | | | $ 17,159,207 | | | | | | | 0.7% |
Other Securities | | | | | | | | | | | 47,443,189 | | | | | | | 1.9% |
| | | | | | | | | | | | | | | | | | |
TOTAL TURKEY | | | | | | | | | | | 64,602,396 | | | | | | | 2.6% |
| | | | | | | | | | | | | | | | | | |
TOTAL COMMON STOCKS | | | | | | | | | | | 2,289,520,662 | | | | | | | 90.5% |
| | | | | | | | | | | | | | | | | | |
PREFERRED STOCKS — (8.7%) | | | | | | | | | | | | | | | | | | |
BRAZIL — (8.7%) | | | | | | | | | | | | | | | | | | |
Banco Bradesco SA | | | 1,584,132 | | | | | | | | 32,459,659 | | | | | | | 1.3% |
Cia de Bebidas das Americas SA Preferred ADR | | | 151,600 | | | | | | | | 21,108,784 | | | | | | | 0.8% |
Itau Unibanco Holding SA | | | 1,765,755 | | | | | | | | 42,682,192 | | | | | | | 1.7% |
Petroleo Brasilerio SA ADR | | | 1,376,550 | | | | | | | | 42,934,594 | | | | | | | 1.7% |
Vale SA Series A | | | 1,412,691 | | | | | | | | 39,672,996 | | | | | | | 1.6% |
Other Securities | | | | | | | | | | | 56,392,921 | | | | | | | 2.2% |
| | | | | | | | | | | | | | | | | | |
TOTAL BRAZIL | | | | | | | | | | | 235,251,146 | | | | | | | 9.3% |
| | | | | | | | | | | | | | | | | | |
TOTAL PREFERRED STOCKS | | | | | | | | | | | 235,251,146 | | | | | | | 9.3% |
| | | | | | | | | | | | | | | | | | |
RIGHTS/WARRANTS — (0.0%) | | | | | | | | | | | | | | | | | | |
CHINA — (0.0%) | | | | | | | | | | | | | | | | | | |
Other Securities | | | | | | | | | | | 1,932 | | | | | | | 0.0% |
| | | | | | | | | | | | | | | | | | |
| | | | | |
TAIWAN — (0.0%) | | | | | | | | | | | | | | | | | | |
Other Securities | | | | | | | | | | | 6,600 | | | | | | | 0.0% |
| | | | | | | | | | | | | | | | | | |
TOTAL RIGHTS/WARRANTS | | | | | | | | | | | 8,532 | | | | | | | 0.0% |
| | | | | | | | | | | | | | | | | | |
| | | | | |
| | | Face Amount | | | | | | Value† | | | | | | |
| | | (000) | | | | | | | | | | | | |
TEMPORARY CASH INVESTMENTS — (0.6%) | | | | | | | | | | | | | | | | | | |
Repurchase Agreement, PNC Capital Markets, Inc. 0.19%, 11/01/10 (Collateralized by $13,610,000 FHLMC 5.00%, 10/15/19, valued at $15,396,313) to be repurchased at $15,165,240 | | | $15,165 | | | | | | | | 15,165,000 | | | | | | | 0.6% |
| | | | | | | | | | | | | | | | | | |
| | | | | |
| | | Shares/ Face Amount | | | | | | | | | | | | |
| | | (000) | | | | | | | | | | | | |
SECURITIES LENDING COLLATERAL — (6.0%) | | | | | | | | | | | | | | | | | | |
§@DFA Short Term Investment Fund | | | 162,574,034 | | | | | | | | 162,574,034 | | | | | | | 6.4% |
@Repurchase Agreement, Deutsche Bank Securities, Inc. 0.22%, 11/01/10 (Collateralized by $42,295,271 FNMA 7.000%, 08/01/38, valued at $906,014)## to be repurchased at $888,265 | | | $888 | | | | | | | | 888,249 | | | | | | | 0.1% |
| | | | | | | | | | | | | | | | | | |
TOTAL SECURITIES LENDING COLLATERAL | | | | | | | | | | | 163,462,283 | | | | | | | 6.5% |
| | | | | | | | | | | | | | | | | | |
TOTAL INVESTMENTS — (100.0%) (Cost $1,331,491,186) | | | | | | | | | | | $2,703,407,623 | | | | | | | 106.9% |
| | | | | | | | | | | | | | | | | | |
227
THE EMERGING MARKETS SERIES
CONTINUED
Summary of inputs used to value the Series’ investments as of October 31, 2010 is as follows (See Security Valuation Note):
| | | | | | | | | | | | | | | | | | |
| | | Valuation Inputs | |
| |
| | | Investment in Securities (Market Value) | |
| | | Level 1 | | | Level 2 | | | Level 3 | | Total | |
Common Stocks | | | | | | | | | | | | | | | | | | |
Brazil | | $ | 85,270,623 | | | | — | | | | | — | | | | $ | 85,270,623 | |
Chile | | | 53,671,271 | | | | — | | | | | — | | | | | 53,671,271 | |
China | | | 95,237,645 | | | $ | 209,048,760 | | | | | — | | | | | 304,286,405 | |
Colombia | | | 7,472,398 | | | | — | | | | | — | | | | | 7,472,398 | |
Czech Republic | | | — | | | | 18,518,105 | | | | | — | | | | | 18,518,105 | |
Egypt | | | — | | | | 3,589,496 | | | | | — | | | | | 3,589,496 | |
Hungary | | | — | | | | 26,401,798 | | | | | — | | | | | 26,401,798 | |
India | | | 25,482,298 | | | | 266,593,842 | | | | | — | | | | | 292,076,140 | |
Indonesia | | | — | | | | 76,053,704 | | | | | — | | | | | 76,053,704 | |
Israel | | | — | | | | 38 | | | | | — | | | | | 38 | |
Malaysia | | | 10,037 | | | | 120,531,850 | | | | | — | | | | | 120,541,887 | |
Mexico | | | 181,674,371 | | | | 7,798 | | | | | — | | | | | 181,682,169 | |
Peru | | | 9,785,049 | | | | — | | | | | — | | | | | 9,785,049 | |
Philippines | | | — | | | | 15,583,766 | | | | | — | | | | | 15,583,766 | |
Poland | | | — | | | | 39,187,798 | | | | | — | | | | | 39,187,798 | |
Russia | | | 153,300 | | | | 107,542,455 | | | | | — | | | | | 107,695,755 | |
South Africa | | | 61,497,185 | | | | 152,854,258 | | | | | — | | | | | 214,351,443 | |
South Korea | | | 3,515,103 | | | | 319,846,790 | | | | | — | | | | | 323,361,893 | |
Taiwan | | | 10,914,911 | | | | 282,222,998 | | | | | — | | | | | 293,137,909 | |
Thailand | | | 52,250,619 | | | | — | | | | | — | | | | | 52,250,619 | |
Turkey | | | — | | | | 64,602,396 | | | | | — | | | | | 64,602,396 | |
Preferred Stocks | | | | | | | | | | | | | | | | | | |
Brazil | | | 235,251,146 | | | | — | | | | | — | | | | | 235,251,146 | |
Rights/Warrants | | | | | | | | | | | | | | | | | | |
China | | | — | | | | 1,932 | | | | | — | | | | | 1,932 | |
Taiwan | | | — | | | | 6,600 | | | | | — | | | | | 6,600 | |
Temporary Cash Investments | | | — | | | | 15,165,000 | | | | | — | | | | | 15,165,000 | |
Securities Lending Collateral | | | — | | | | 163,462,283 | | | | | — | | | | | 163,462,283 | |
| | | | | | | | | | | | | | | | | | |
TOTAL | | $ | 822,185,956 | | | $ | 1,881,221,667 | | | | | — | | | | $ | 2,703,407,623 | |
| | | | | | | | | | | | | | | | | | |
See accompanying Notes to Financial Statements.
228
THE EMERGING MARKETS SMALL CAP SERIES
SUMMARY SCHEDULE OF PORTFOLIO HOLDINGS
October 31, 2010
| | | | | | | | | | | | | | |
| | | Shares | | | | | Value†† | | | Percentage
of Net Assets** |
COMMON STOCKS — (88.0%) | | | | | | | | | | | | | | |
ARGENTINA — (0.0%) | | | | | | | | | | | | | | |
Other Securities | | | | | | | | $ | — | | | | | 0.0% |
| | | | | | | | | | | | | | |
| | | | | |
BRAZIL — (7.5%) | | | | | | | | | | | | | | |
BR Malls Participacoes SA | | | 567,258 | | | | | | 5,327,948 | | | | | 0.3% |
Diagnosticos Da America SA | | | 507,200 | | | | | | 6,159,901 | | | | | 0.3% |
Duratex SA | | | 624,462 | | | | | | 7,198,409 | | | | | 0.4% |
*Lojas Renner SA | | | 273,700 | | | | | | 10,859,144 | | | | | 0.6% |
PDG Realty SA Empreendimentos e Participacoes | | | 459,817 | | | | | | 5,692,612 | | | | | 0.3% |
Sul America SA | | | 344,448 | | | | | | 4,049,589 | | | | | 0.2% |
Totvs SA | | | 49,764 | | | | | | 4,516,018 | | | | | 0.2% |
Other Securities | | | | | | | | | 111,262,919 | | | | | 5.9% |
| | | | | | | | | | | | | | |
TOTAL BRAZIL | | | | | | | | | 155,066,540 | | | | | 8.2% |
| | | | | | | | | | | | | | |
| | | | | |
CHILE — (2.5%) | | | | | | | | | | | | | | |
Corpbanca SA | | | 285,638,523 | | | | | | 4,493,486 | | | | | 0.3% |
*Empresas La Polar SA | | | 801,254 | | | | | | 5,715,006 | | | | | 0.3% |
Other Securities | | | | | | | | | 41,816,909 | | | | | 2.2% |
| | | | | | | | | | | | | | |
TOTAL CHILE | | | | | | | | | 52,025,401 | | | | | 2.8% |
| | | | | | | | | | | | | | |
| | | | | |
CHINA — (12.2%) | | | | | | | | | | | | | | |
#*Brilliance China Automotive Holdings, Ltd. | | | 12,088,000 | | | | | | 10,635,308 | | | | | 0.6% |
China Yurun Food Group, Ltd. | | | 1,688,000 | | | | | | 6,555,071 | | | | | 0.4% |
ENN Energy Holdings, Ltd. | | | 2,178,000 | | | | | | 6,519,695 | | | | | 0.3% |
#*Hunan Non-Ferrous Metal Corp., Ltd. | | | 8,774,000 | | | | | | 3,944,343 | | | | | 0.2% |
#*Semiconductor Manufacturing International Corp. | | | 93,483,000 | | | | | | 7,834,980 | | | | | 0.4% |
#Skyworth Digital Holdings, Ltd. | | | 6,672,815 | | | | | | 3,915,246 | | | | | 0.2% |
Other Securities | | | | | | | | | 212,074,509 | | | | | 11.3% |
| | | | | | | | | | | | | | |
TOTAL CHINA | | | | | | | | | 251,479,152 | | | | | 13.4% |
| | | | | | | | | | | | | | |
| | | | | |
HUNGARY — (0.2%) | | | | | | | | | | | | | | |
Other Securities | | | | | | | | | 3,422,269 | | | | | 0.2% |
| | | | | | | | | | | | | | |
| | | | | |
INDIA — (12.0%) | | | | | | | | | | | | | | |
Bhushan Steel, Ltd. | | | 391,545 | | | | | | 4,382,078 | | | | | 0.2% |
LIC Housing Finance, Ltd. | | | 148,431 | | | | | | 4,477,435 | | | | | 0.2% |
Shriram Transport Finance Co., Ltd. | | | 260,052 | | | | | | 5,166,633 | | | | | 0.3% |
Other Securities | | | | | | | | | 234,355,119 | | | | | 12.5% |
| | | | | | | | | | | | | | |
TOTAL INDIA | | | | | | | | | 248,381,265 | | | | | 13.2% |
| | | | | | | | | | | | | | |
| | | | | |
INDONESIA — (3.7%) | | | | | | | | | | | | | | |
PT Charoen Pokphand Indonesia Tbk | | | 6,835,500 | | | | | | 6,559,173 | | | | | 0.4% |
PT Kalbe Farma Tbk | | | 14,904,238 | | | | | | 4,476,715 | | | | | 0.2% |
Other Securities | | | | | | | | | 66,018,951 | | | | | 3.5% |
| | | | | | | | | | | | | | |
TOTAL INDONESIA | | | | | | | | | 77,054,839 | | | | | 4.1% |
| | | | | | | | | | | | | | |
| | | | | |
ISRAEL — (0.0%) | | | | | | | | | | | | | | |
Other Securities | | | | | | | | | 790,735 | | | | | 0.0% |
| | | | | | | | | | | | | | |
| | | | | |
MALAYSIA — (5.0%) | | | | | | | | | | | | | | |
Other Securities | | | | | | | | | 103,078,350 | | | | | 5.5% |
| | | | | | | | | | | | | | |
| | | | | |
MEXICO — (3.8%) | | | | | | | | | | | | | | |
#Banco Compartamos S.A. de C.V. | | | 612,400 | | | | | | 4,314,772 | | | | | 0.2% |
#*Corporacion GEO S.A.B. de C.V. Series B | | | 1,330,000 | | | | | | 4,222,222 | | | | | 0.2% |
#Embotelladora Arca S.A.B. de C.V. | | | 1,909,100 | | | | | | 7,885,010 | | | | | 0.4% |
#*Empresas ICA S.A.B. de C.V. Sponsored ADR | | | 681,589 | | | | | | 7,183,948 | | | | | 0.4% |
Grupo Continental S.A.B. de C.V. | | | 3,036,559 | | | | | | 8,557,844 | | | | | 0.5% |
229
THE EMERGING MARKETS SMALL CAP SERIES
CONTINUED
| | | | | | | | | | | | | | | | | | |
| | | Shares | | | | | | Value†† | | | Percentage
of Net Assets** |
MEXICO — (Continued) | | | | | | | | | | | | | | | | | | |
#*Industrias CH S.A.B. de C.V. Series B | | | 1,172,808 | | | | | | | $ | 4,226,592 | | | | | | | 0.2% |
#TV Azteca S.A.B. de C.V. Series A | | | 6,581,300 | | | | | | | | 4,940,772 | | | | | | | 0.3% |
Other Securities | | | | | | | | | | | 36,696,292 | | | | | | | 1.9% |
| | | | | | | | | | | | | | | | | | |
TOTAL MEXICO | | | | | | | | | | | 78,027,452 | | | | | | | 4.1% |
| | | | | | | | | | | | | | | | | | |
| | | | | |
PHILIPPINES — (2.3%) | | | | | | | | | | | | | | | | | | |
Aboitiz Equity Ventures, Inc. | | | 6,767,000 | | | | | | | | 5,276,577 | | | | | | | 0.3% |
Other Securities | | | | | | | | | | | 41,813,722 | | | | | | | 2.2% |
| | | | | | | | | | | | | | | | | | |
TOTAL PHILIPPINES | | | | | | | | | | | 47,090,299 | | | | | | | 2.5% |
| | | | | | | | | | | | | | | | | | |
| | | | | |
POLAND — (2.2%) | | | | | | | | | | | | | | | | | | |
Other Securities | | | | | | | | | | | 45,259,624 | | | | | | | 2.4% |
| | | | | | | | | | | | | | | | | | |
| | | | | |
SOUTH AFRICA — (8.6%) | | | | | | | | | | | | | | | | | | |
Adcock Ingram Holdings, Ltd. | | | 565,230 | | | | | | | | 5,239,226 | | | | | | | 0.3% |
*Aveng, Ltd. | | | 981,591 | | | | | | | | 6,169,886 | | | | | | | 0.3% |
Barloworld, Ltd. | | | 579,959 | | | | | | | | 4,344,138 | | | | | | | 0.2% |
Clicks Group, Ltd. | | | 918,874 | | | | | | | | 5,984,671 | | | | | | | 0.3% |
Foschini Group, Ltd. (The) | | | 672,822 | | | | | | | | 8,160,841 | | | | | | | 0.4% |
Grindrod, Ltd. | | | 1,607,864 | | | | | | | | 3,896,553 | | | | | | | 0.2% |
Imperial Holdings, Ltd. | | | 422,517 | | | | | | | | 6,904,540 | | | | | | | 0.4% |
JD Group, Ltd. | | | 983,807 | | | | | | | | 6,913,498 | | | | | | | 0.4% |
Metropolitan Holdings, Ltd. | | | 2,025,393 | | | | | | | | 4,888,202 | | | | | | | 0.3% |
Mr. Price Group, Ltd. | | | 693,186 | | | | | | | | 6,263,264 | | | | | | | 0.3% |
Reunert, Ltd. | | | 594,843 | | | | | | | | 5,436,191 | | | | | | | 0.3% |
Spar Group, Ltd. (The) | | | 622,477 | | | | | | | | 8,462,463 | | | | | | | 0.5% |
Tongaat-Hulett, Ltd. | | | 629,016 | | | | | | | | 8,799,490 | | | | | | | 0.5% |
Woolworths Holdings, Ltd. | | | 1,831,592 | | | | | | | | 7,176,559 | | | | | | | 0.4% |
Other Securities | | | | | | | | | | | 89,316,610 | | | | | | | 4.7% |
| | | | | | | | | | | | | | | | | | |
TOTAL SOUTH AFRICA | | | | | | | | | | | 177,956,132 | | | | | | | 9.5% |
| | | | | | | | | | | | | | | | | | |
| | | | | |
SOUTH KOREA — (11.3%) | | | | | | | | | | | | | | | | | | |
Busan Bank | | | 401,750 | | | | | | | | 5,005,650 | | | | | | | 0.3% |
Daegu Bank, Ltd. | | | 315,263 | | | | | | | | 4,136,509 | | | | | | | 0.2% |
#Hanwha Chemical Corp. | | | 187,517 | | | | | | | | 5,106,807 | | | | | | | 0.3% |
Hyundai Securities Co. | | | 300,510 | | | | | | | | 3,938,888 | | | | | | | 0.2% |
Other Securities | | | | | | | | | | | 216,279,152 | | | | | | | 11.5% |
| | | | | | | | | | | | | | | | | | |
TOTAL SOUTH KOREA | | | | | | | | | | | 234,467,006 | | | | | | | 12.5% |
| | | | | | | | | | | | | | | | | | |
| | | | | |
TAIWAN — (10.8%) | | | | | | | | | | | | | | | | | | |
Other Securities | | | | | | | | | | | 223,970,240 | | | | | | | 11.9% |
| | | | | | | | | | | | | | | | | | |
| | | | | |
THAILAND — (3.3%) | | | | | | | | | | | | | | | | | | |
Other Securities | | | | | | | | | | | 67,206,616 | | | | | | | 3.6% |
| | | | | | | | | | | | | | | | | | |
| | | | | |
TURKEY — (2.6%) | | | | | | | | | | | | | | | | | | |
Other Securities | | | | | | | | | | | 53,708,911 | | | | | | | 2.8% |
| | | | | | | | | | | | | | | | | | |
TOTAL COMMON STOCKS | | | | | | | | | | | 1,818,984,831 | | | | | | | 96.7% |
| | | | | | | | | | | | | | | | | | |
| | | | | |
PREFERRED STOCKS — (2.9%) | | | | | | | | | | | | | | | | | | |
BRAZIL — (2.9%) | | | | | | | | | | | | | | | | | | |
#Braskem SA Preferred A Sponsored ADR | | | 301,000 | | | | | | | | 6,275,850 | | | | | | | 0.3% |
Klabin SA | | | 1,412,700 | | | | | | | | 3,946,554 | | | | | | | 0.2% |
Suzano Papel e Celullose SA | | | 488,293 | | | | | | | | 4,592,016 | | | | | | | 0.3% |
Ultrapar Participacoes SA | | | 112,095 | | | | | | | | 6,810,218 | | | | | | | 0.4% |
Other Securities | | | | | | | | | | | 38,173,102 | | | | | | | 2.0% |
| | | | | | | | | | | | | | | | | | |
TOTAL BRAZIL | | | | | | | | | | | 59,797,740 | | | | | | | 3.2% |
| | | | | | | | | | | | | | | | | | |
| | | | | |
CHILE — (0.0%) | | | | | | | | | | | | | | | | | | |
Other Securities | | | | | | | | | | | 28,478 | | | | | | | 0.0% |
| | | | | | | | | | | | | | | | | | |
230
THE EMERGING MARKETS SMALL CAP SERIES
CONTINUED
| | | | | | | | | | | | |
| | | Shares | | | | Value†† | | | Percentage of Net Assets** |
INDIA — (0.0%) | | | | | | | | | | | | |
Other Securities | | | | | | $ | 37,093 | | | | | 0.0% |
| | | | | | | | | | | | |
| | | | | |
MALAYSIA — (0.0%) | | | | | | | | | | | | |
Other Securities | | | | | | | 9,384 | | | | | 0.0% |
| | | | | | | | | | | | |
TOTAL PREFERRED STOCKS | | | | | | | 59,872,695 | | | | | 3.2% |
| | | | | | | | | | | | |
RIGHTS/WARRANTS — (0.0%) | | | | | | | | | | | | |
CHINA — (0.0%) | | | | | | | | | | | | |
Other Securities | | | | | | | 30,821 | | | | | 0.0% |
| | | | | | | | | | | | |
| | | | | |
INDIA — (0.0%) | | | | | | | | | | | | |
Other Securities | | | | | | | 118,976 | | | | | 0.0% |
| | | | | | | | | | | | |
| | | | | |
INDONESIA — (0.0%) | | | | | | | | | | | | |
Other Securities | | | | | | | 14,863 | | | | | 0.0% |
| | | | | | | | | | | | |
| | | | | |
MALAYSIA — (0.0%) | | | | | | | | | | | | |
Other Securities | | | | | | | 63,540 | | | | | 0.0% |
| | | | | | | | | | | | |
| | | | | |
POLAND — (0.0%) | | | | | | | | | | | | |
Other Securities | | | | | | | 769,887 | | | | | 0.0% |
| | | | | | | | | | | | |
| | | | | |
SOUTH KOREA — (0.0%) | | | | | | | | | | | | |
Other Securities | | | | | | | 76,648 | | | | | 0.0% |
| | | | | | | | | | | | |
| | | | | |
THAILAND — (0.0%) | | | | | | | | | | | | |
Other Securities | | | | | | | 113,211 | | | | | 0.0% |
| | | | | | | | | | | | |
TOTAL RIGHTS/WARRANTS | | | | | | | 1,187,946 | | | | | 0.0% |
| | | | | | | | | | | | |
| | | | | |
| | | Face Amount | | | | Value† | | | | | |
| | | (000) | | | | | | | | | |
TEMPORARY CASH INVESTMENTS — (0.3%) | | | | | | | | | | | | |
Repurchase Agreement, PNC Capital Markets, Inc. 0.19%, 11/01/10 (Collateralized by $5,715,000 FNMA 3.126%(r), 09/01/40, valued at $5,872,937) to be repurchased at $5,786,092 | | $5,786 | | | | | 5,786,000 | | | | | 0.3% |
| | | | | | | | | | | | |
| | | | | |
| | | Shares/ Face Amount | | | | | | | | | |
| | | (000) | | | | | | | | | |
SECURITIES LENDING COLLATERAL — (8.8%) | | | | | | | | | | | | |
§@DFA Short Term Investment Fund | | 180,694,390 | | | | | 180,694,390 | | | | | 9.6% |
@Repurchase Agreement, Deutsche Bank Securities, Inc. 0.22%, 11/01/10 (Collateralized by $42,295,271 FNMA 7.000%, 08/01/38, valued at $1,145,517)## to be repurchased at $1,123,077 | | $1,123 | | | | | 1,123,056 | | | | | 0.1% |
| | | | | | | | | | | | |
TOTAL SECURITIES LENDING COLLATERAL | | | | | | | 181,817,446 | | | | | 9.7% |
| | | | | | | | | | | | |
TOTAL INVESTMENTS — (100.0%) (Cost $1,391,523,697) | | | | | | $ | 2,067,648,918 | | | | | 109.9% |
| | | | | | | | | | | | |
231
THE EMERGING MARKETS SMALL CAP SERIES
CONTINUED
Summary of inputs used to value the Series’ investments as of October 31, 2010 is as follows (See Security Valuation Note):
| | | | | | | | | | | | | | | | | | |
| | | Valuation Inputs | |
| |
| | | Investment in Securities (Market Value) | |
| | | Level 1 | | | Level 2 | | | Level 3 | | Total | |
Common Stocks | | | | | | | | | | | | | | | | | | |
Argentina | | | — | | | | — | | | | | — | | | | | — | |
Brazil | | $ | 155,066,540 | | | | — | | | | | — | | | | $ | 155,066,540 | |
Chile | | | 52,025,401 | | | | — | | | | | — | | | | | 52,025,401 | |
China | | | 3,878,440 | | | $ | 247,600,712 | | | | | — | | | | | 251,479,152 | |
Hungary | | | — | | | | 3,422,269 | | | | | — | | | | | 3,422,269 | |
India | | | 1,768,808 | | | | 246,612,457 | | | | | — | | | | | 248,381,265 | |
Indonesia | | | 323,334 | | | | 76,731,505 | | | | | — | | | | | 77,054,839 | |
Israel | | | 3,185 | | | | 787,550 | | | | | — | | | | | 790,735 | |
Malaysia | | | 81,368 | | | | 102,996,982 | | | | | — | | | | | 103,078,350 | |
Mexico | | | 77,708,646 | | | | 318,806 | | | | | — | | | | | 78,027,452 | |
Philippines | | | 45,479 | | | | 47,044,820 | | | | | — | | | | | 47,090,299 | |
Poland | | | 480,316 | | | | 44,779,308 | | | | | — | | | | | 45,259,624 | |
South Africa | | | 765,167 | | | | 177,190,965 | | | | | — | | | | | 177,956,132 | |
South Korea | | | 1,319,141 | | | | 233,147,865 | | | | | — | | | | | 234,467,006 | |
Taiwan | | | 248,717 | | | | 223,721,523 | | | | | — | | | | | 223,970,240 | |
Thailand | | | 66,450,408 | | | | 756,208 | | | | | — | | | | | 67,206,616 | |
Turkey | | | — | | | | 53,708,911 | | | | | — | | | | | 53,708,911 | |
Preferred Stocks | | | | | | | | | | | | | | | | | | |
Brazil | | | 59,761,877 | | | | 35,863 | | | | | — | | | | | 59,797,740 | |
Chile | | | 28,478 | | | | — | | | | | — | | | | | 28,478 | |
India | | | — | | | | 37,093 | | | | | — | | | | | 37,093 | |
Malaysia | | | 9,384 | | | | — | | | | | — | | | | | 9,384 | |
Rights/Warrants | | | | | | | | | | | | | | | | | | |
China | | | 20,134 | | | | 10,687 | | | | | — | | | | | 30,821 | |
India | | | — | | | | 118,976 | | | | | — | | | | | 118,976 | |
Indonesia | | | — | | | | 14,863 | | | | | — | | | | | 14,863 | |
Malaysia | | | 20,361 | | | | 43,179 | | | | | — | | | | | 63,540 | |
Poland | | | — | | | | 769,887 | | | | | — | | | | | 769,887 | |
South Korea | | | — | | | | 76,648 | | | | | — | | | | | 76,648 | |
Thailand | | | 50,261 | | | | 62,950 | | | | | — | | | | | 113,211 | |
Temporary Cash Investments | | | — | | | | 5,786,000 | | | | | — | | | | | 5,786,000 | |
Securities Lending Collateral | | | — | | | | 181,817,446 | | | | | — | | | | | 181,817,446 | |
| | | | | | | | | | | | | | | | | | |
TOTAL | | $ | 420,055,445 | | | $ | 1,647,593,473 | | | | | — | | | | $ | 2,067,648,918 | |
| | | | | | | | | | | | | | | | | | |
See accompanying Notes to Financial Statements.
232
THE DFA INVESTMENT TRUST COMPANY
STATEMENTS OF ASSETS AND LIABILITIES
OCTOBER 31, 2010
(Amounts in thousands)
| | | | | | | | | | | | | | | | |
| | | The U.S.
Large Cap
Value
Series | | | The DFA
International
Value
Series | | | The Japanese
Small
Company
Series | | | The Asia Pacific
Small
Company
Series | |
ASSETS: | | | | | | | | | | | | | | | | |
Investments at Value (including $907,199, $1,113,371, $157,308 and $128,176 of securities on loan, respectively) | | $ | 8,790,214 | | | $ | 6,883,172 | | | $ | 1,201,990 | | | $ | 926,595 | |
Temporary Cash Investments at Value & Cost | | | 32,141 | | | | 19,298 | | | | 2,483 | | | | 77 | |
Collateral Received from Securities on Loan at Value & Cost | | | 940,825 | | | | 1,179,043 | | | | 168,208 | | | | 147,201 | |
Foreign Currencies at Value | | | — | | | | 5,268 | | | | 193 | | | | 5,311 | |
Cash | | | — | | | | 15 | | | | 15 | | | | 16 | |
Receivables: | | | | | | | | | | | | | | | | |
Investment Securities Sold | | | 22,909 | | | | — | | | | 144 | | | | 1,266 | |
Dividends, Interest and Tax Reclaims | | | 10,683 | | | | 17,428 | | | | 8,552 | | | | 2,014 | |
Securities Lending Income | | | 552 | | | | 314 | | | | 167 | | | | 187 | |
Fund Shares Sold | | | — | | | | 817 | | | | 10 | | | | — | |
Unrealized Gain on Foreign Currency Contracts | | | — | | | | 54 | | | | 17 | | | | — | |
| | | | | | | | | | | | | | | | |
Total Assets | | | 9,797,324 | | | | 8,105,409 | | | | 1,381,779 | | | | 1,082,667 | |
| | | | | | | | | | | | | | | | |
LIABILITIES: | | | | | | | | | | | | | | | | |
Payables: | | | | | | | | | | | | | | | | |
Upon Return of Securities Loaned | | | 940,825 | | | | 1,179,043 | | | | 168,208 | | | | 147,201 | |
Investment Securities Purchased | | | 34,042 | | | | 4,564 | | | | 1,779 | | | | 139 | |
Fund Shares Redeemed | | | 4,926 | | | | 403 | | | | — | | | | 40 | |
Due to Advisor | | | 725 | | | | 1,168 | | | | 102 | | | | 78 | |
Accrued Expenses and Other Liabilities | | | 406 | | | | 598 | | | | 90 | | | | 71 | |
| | | | | | | | | | | | | | | | |
Total Liabilities | | | 980,924 | | | | 1,185,776 | | | | 170,179 | | | | 147,529 | |
| | | | | | | | | | | | | | | | |
NET ASSETS | | $ | 8,816,400 | | | $ | 6,919,633 | | | $ | 1,211,600 | | | $ | 935,138 | |
| | | | | | | | | | | | | | | | |
Investments at Cost | | $ | 6,950,120 | | | $ | 5,304,390 | | | $ | 1,417,496 | | | $ | 729,427 | |
| | | | | | | | | | | | | | | | |
Foreign Currencies at Cost | | $ | — | | | $ | 5,262 | | | $ | 191 | | | $ | 5,292 | |
| | | | | | | | | | | | | | | | |
See accompanying Notes to Financial Statements.
233
THE DFA INVESTMENT TRUST COMPANY
STATEMENTS OF ASSETS AND LIABILITIES
OCTOBER 31, 2010
(Amounts in thousands)
| | | | | | | | | | | | | | | | | | | | |
| | | The United
Kingdom
Small
Company
Series | | | The
Continental
Small
Company
Series | | | The
Canadian
Small
Company
Series | | | The
Emerging
Markets
Series | | | The Emerging
Markets
Small Cap
Series | |
ASSETS: | | | | | | | | | | | | | | | | | | | | |
Investments at Value (including $20,169, $317,386, $162,680, $155,961 and $161,114 of securities on loan, respectively) | | $ | 1,026,574 | | | $ | 2,064,651 | | | $ | 662,954 | | | $ | 2,524,780 | | | $ | 1,880,046 | |
Temporary Cash Investments at Value & Cost | | | 3 | | | | 4,298 | | | | 649 | | | | 15,165 | | | | 5,786 | |
Collateral Received from Securities on Loan at Value & Cost | | | 21,307 | | | | 344,487 | | | | 171,448 | | | | 163,462 | | | | 181,817 | |
Foreign Currencies at Value | | | 12,317 | | | | 2,670 | | | | 113 | | | | 3,772 | | | | 388 | |
Cash | | | 16 | | | | 16 | | | | 27 | | | | 43 | | | | 66 | |
Receivables: | | | | | | | | | | | | | | | | | | | | |
Investment Securities Sold | | | — | | | | 2,884 | | | | 1 | | | | 12,252 | | | | 60 | |
Dividends, Interest and Tax Reclaims | | | 2,284 | | | | 2,413 | | | | 184 | | | | 2,383 | | | | 1,137 | |
Securities Lending Income | | | 8 | | | | 417 | | | | 135 | | | | 260 | | | | 331 | |
Fund Shares Sold | | | 13 | | | | 13 | | | | — | | | | 161 | | | | 161 | |
Unrealized Gain on Foreign Currency Contracts | | | — | | | | 2 | | | | — | | | | 6 | | | | — | |
| | | | | | | | | | | | | | | | | | | | |
Total Assets | | | 1,062,522 | | | | 2,421,851 | | | | 835,511 | | | | 2,722,284 | | | | 2,069,792 | |
| | | | | | | | | | | | | | | | | | | | |
LIABILITIES: | | | | | | | | | | | | | | | | | | | | |
Payables: | | | | | | | | | | | | | | | | | | | | |
Upon Return of Securities Loaned | | | 21,307 | | | | 344,487 | | | | 171,448 | | | | 163,462 | | | | 181,817 | |
Investment Securities Purchased | | | 4,385 | | | | 4,574 | | | | 252 | | | | 56 | | | | 2,097 | |
Fund Shares Redeemed | | | — | | | | — | | | | — | | | | 24,164 | | | | — | |
Due to Advisor | | | 85 | | | | 169 | | | | 54 | | | | 211 | | | | 309 | |
Unrealized Loss on Foreign Currency Contracts | | | — | | | | — | | | | — | | | | 8 | | | | — | |
Deferred Thailand Capital Gains Tax | | | — | | | | — | | | | — | | | | 4,459 | | | | 3,997 | |
Accrued Expenses and Other Liabilities | | | 51 | | | | 137 | | | | 35 | | | | 431 | | | | 216 | |
| | | | | | | | | | | | | | | | | | | | |
Total Liabilities | | | 25,828 | | | | 349,367 | | | | 171,789 | | | | 192,791 | | | | 188,436 | |
| | | | | | | | | | | | | | | | | | | | |
NET ASSETS | | $ | 1,036,694 | | | $ | 2,072,484 | | | $ | 663,722 | | | $ | 2,529,493 | | | $ | 1,881,356 | |
| | | | | | | | | | | | | | | | | | | | |
Investments at Cost | | $ | 932,253 | | | $ | 1,740,343 | | | $ | 619,939 | | | $ | 1,152,864 | | | $ | 1,203,920 | |
| | | | | | | | | | | | | | | | | | | | |
Foreign Currencies at Cost | | $ | 12,159 | | | $ | 2,556 | | | $ | 112 | | | $ | 3,671 | | | $ | 387 | |
| | | | | | | | | | | | | | | | | | | | |
See accompanying Notes to Financial Statements.
234
THE DFA INVESTMENT TRUST COMPANY
STATEMENTS OF OPERATIONS
FOR THE YEAR ENDED OCTOBER 31, 2010
(Amounts in thousands)
| | | | | | | | | | | | | | | | |
| | | The U.S.
Large Cap Value
Series | | | The DFA
International
Value Series | | | The Japanese
Small Company Series | | | The Asia
Pacific
Small
Company
Series | |
Investment Income | | | | | | | | | | | | | | | | |
Dividends (Net of Foreign Taxes Withheld of $0, $15,467, $1,667 and $624, respectively) | | $ | 172,913 | | | $ | 171,182 | | | $ | 22,210 | | | $ | 27,220 | |
Interest | | | 42 | | | | 37 | | | | 4 | | | | 6 | |
Income from Securities Lending | | | 3,974 | | | | 8,478 | | | | 2,464 | | | | 2,095 | |
| | | | | | | | | | | | | | | | |
Total Investment Income | | | 176,929 | | | | 179,697 | | | | 24,678 | | | | 29,321 | |
| | | | | | | | | | | | | | | | |
Expenses | | | | | | | | | | | | | | | | |
Investment Advisory Services Fees | | | 8,301 | | | | 12,890 | | | | 1,181 | | | | 770 | |
Accounting & Transfer Agent Fees | | | 827 | | | | 651 | | | | 140 | | | | 100 | |
Custodian Fees | | | 92 | | | | 1,256 | | | | 264 | | | | 386 | |
Shareholders’ Reports | | | 49 | | | | 38 | | | | 7 | | | | 4 | |
Directors’/Trustees’ Fees & Expenses | | | 78 | | | | 62 | | | | 10 | | | | 7 | |
Professional Fees | | | 162 | | | | 188 | | | | 24 | | | | 20 | |
Other | | | 74 | | | | 130 | | | | 20 | | | | 14 | |
| | | | | | | | | | | | | | | | |
Total Expenses | | | 9,583 | | | | 15,215 | | | | 1,646 | | | | 1,301 | |
| | | | | | | | | | | | | | | | |
Net Investment Income (Loss) | | | 167,346 | | | | 164,482 | | | | 23,032 | | | | 28,020 | |
| | | | | | | | | | | | | | | | |
Realized and Unrealized Gain (Loss) | | | | | | | | | | | | | | | | |
Net Realized Gain (Loss) on: | | | | | | | | | | | | | | | | |
Investment Securities Sold | | | 638,095 | | | | 360,748 | | | | (15,709 | ) | | | 46,684 | |
Foreign Currency Transactions | | | — | | | | (156 | ) | | | 792 | | | | (20 | ) |
Change in Unrealized Appreciation (Depreciation) of: | | | | | | | | | | | | | | | | |
Investment Securities and Foreign Currency | | | 678,724 | | | | 182,952 | | | | (460 | ) | | | 129,509 | |
Translation of Foreign Currency Denominated Amounts | | | — | | | | 537 | | | | 315 | | | | (75 | ) |
| | | | | | | | | | | | | | | | |
Net Realized and Unrealized Gain (Loss) | | | 1,316,819 | | | | 544,081 | | | | (15,062 | ) | | | 176,098 | |
| | | | | | | | | | | | | | | | |
Net Increase (Decrease) in Net Assets Resulting from Operations | | $ | 1,484,165 | | | $ | 708,563 | | | $ | 7,970 | | | $ | 204,118 | |
| | | | | | | | | | | | | | | | |
See accompanying Notes to Financial Statements.
235
THE DFA INVESTMENT TRUST COMPANY
STATEMENTS OF OPERATIONS
FOR THE YEAR ENDED OCTOBER 31, 2010
(Amounts in thousands)
| | | | | | | | | | | | | | | | | | | | |
| | | The United
Kingdom
Small
Company
Series | | | The
Continental
Small
Company
Series | | | The Canadian
Small
Company
Series | | | The
Emerging
Markets
Series | | | The Emerging
Markets
Small Cap
Series | |
Investment Income | | | | | | | | | | | | | | | | | | | | |
Dividends (Net of Foreign Taxes Withheld of $61, $5,672, $824, $6,189 and $3,313, respectively) | | $ | 25,291 | | | $ | 35,967 | | | $ | 4,796 | | | $ | 51,067 | | | $ | 32,627 | |
Interest | | | 4 | | | | 12 | | | | 6 | | | | 8 | | | | 9 | |
Income from Securities Lending | | | 175 | | | | 5,216 | | | | 1,169 | | | | 2,046 | | | | 2,552 | |
| | | | | | | | | | | | | | | | | | | | |
Total Investment Income | | | 25,470 | | | | 41,195 | | | | 5,971 | | | | 53,121 | | | | 35,188 | |
| | | | | | | | | | | | | | | | | | | | |
Expenses | | | | | | | | | | | | | | | | | | | | |
Investment Advisory Services Fees | | | 851 | | | | 1,724 | | | | 500 | | | | 2,246 | | | | 2,840 | |
Accounting & Transfer Agent Fees | | | 107 | | | | 192 | | | | 73 | | | | 244 | | | | 162 | |
Custodian Fees | | | 77 | | | | 585 | | | | 133 | | | | 1,565 | | | | 1,369 | |
Shareholders’ Reports | | | 5 | | | | 10 | | | | 3 | | | | 13 | | | | 8 | |
Directors’/Trustees’ Fees & Expenses | | | 8 | | | | 17 | | | | 5 | | | | 22 | | | | 14 | |
Professional Fees | | | 16 | | | | 48 | | | | 10 | | | | 84 | | | | 64 | |
Other | | | 14 | | | | 36 | | | | 7 | | | | 56 | | | | 32 | |
| | | | | | | | | | | | | | | | | | | | |
Total Expenses | | | 1,078 | | | | 2,612 | | | | 731 | | | | 4,230 | | | | 4,489 | |
| | | | | | | | | | | | | | | | | | | | |
Net Investment Income (Loss) | | | 24,392 | | | | 38,583 | | | | 5,240 | | | | 48,891 | | | | 30,699 | |
| | | | | | | | | | | | | | | | | | | | |
Realized and Unrealized Gain (Loss) | | | | | | | | | | | | | | | | | | | | |
Net Realized Gain (Loss) on: | | | | | | | | | | | | | | | | | | | | |
Investment Securities Sold | | | 35,525 | | | | 72,573 | | | | 6,585 | | | | 160,587 | | | | 102,089 | |
Foreign Currency Transactions | | | 126 | | | | 811 | | | | 40 | | | | 541 | | | | 77 | ** |
Change in Unrealized Appreciation (Depreciation) of: | | | | | | | | | | | | | | | | | | | | |
Investment Securities and Foreign Currency | | | 152,112 | | | | 156,901 | | | | 168,950 | | | | 337,045 | | | | 382,774 | |
Translation of Foreign Currency Denominated Amounts | | | (30 | ) | | | 30 | | | | (11 | ) | | | (5 | ) | | | (76 | ) |
Change in Deferred Thailand Capital Gains Tax | | | — | | | | — | | | | — | | | | (2,275 | ) | | | (3,052 | ) |
| | | | | | | | | | | | | | | | | | | | |
| | | | | |
Net Realized and Unrealized Gain (Loss) | | | 187,733 | | | | 230,315 | | | | 175,564 | | | | 495,893 | | | | 481,812 | |
| | | | | | | | | | | | | | | | | | | | |
Net Increase (Decrease) in Net Assets Resulting from Operations | | $ | 212,125 | | | $ | 268,898 | | | $ | 180,804 | | | $ | 544,784 | | | $ | 512,511 | |
| | | | | | | | | | | | | | | | | | | | |
| ** | Net of foreign capital gain taxes withheld of $184. |
See accompanying Notes to Financial Statements.
236
THE DFA INVESTMENT TRUST COMPANY
STATEMENTS OF CHANGES IN NET ASSETS
(Amounts in thousands)
| | | | | | | | | | | | | | | | | | | | | | | | |
| | | The U.S.
Large Cap Value
Series | | | The DFA
International Value
Series | | | The Japanese
Small Company
Series | |
| | | Year
Ended
Oct. 31,
2010 | | | Year
Ended
Oct. 31,
2009 | | | Year
Ended
Oct. 31,
2010 | | | Year
Ended
Oct. 31,
2009 | | | Year
Ended
Oct. 31,
2010 | | | Year
Ended
Oct. 31,
2009 | |
Increase (Decrease) in Net Assets | | | | | | | | | | | | | | | | | | | | | | | | |
Operations: | | | | | | | | | | | | | | | | | | | | | | | | |
Net Investment Income (Loss) | | $ | 167,346 | | | $ | 155,080 | | | $ | 164,482 | | | $ | 161,170 | | | $ | 23,032 | | | $ | 23,685 | |
Net Realized Gain (Loss) on: | | | | | | | | | | | | | | | | | | | | | | | | |
Investment Securities Sold | | | 638,095 | | | | (122,113 | ) | | | 360,748 | | | | 63,984 | | | | (15,709 | ) | | | (27,421 | ) |
Futures | | | — | | | | 7,204 | | | | — | | | | (1,125 | ) | | | — | | | | 1,131 | |
Foreign Currency Transactions | | | — | | | | — | | | | (156 | ) | | | 3,828 | | | | 792 | | | | 2,027 | |
Change in Unrealized Appreciation (Depreciation) of: | | | | | | | | | | | | | | | | | | | | | | | | |
Investment Securities and Foreign Currency | | | 678,724 | | | | 1,161,370 | | | | 182,952 | | | | 1,395,836 | | | | (460 | ) | | | 227,157 | |
Futures | | | — | | | | (29 | ) | | | — | | | | — | | | | — | | | | — | |
Translation of Foreign Currency Denominated Amounts | | | — | | | | — | | | | 537 | | | | 240 | | | | 315 | | | | (641 | ) |
| | | | | | | | | | | | | | | | | | | | | | | | |
Net Increase (Decrease) in Net Assets Resulting from Operations | | | 1,484,165 | | | | 1,201,512 | | | | 708,563 | | | | 1,623,933 | | | | 7,970 | | | | 225,938 | |
| | | | | | | | | | | | | | | | | | | | | | | | |
Transactions in Interest: | | | | | | | | | | | | | | | | | | | | | | | | |
Contributions | | | 512,765 | | | | 734,173 | | | | 611,794 | | | | 449,410 | | | | 61,990 | | | | 37,597 | |
Withdrawals | | | (688,930 | ) | | | (1,166,648 | ) | | | (592,688 | ) | | | (581,716 | ) | | | (41,396 | ) | | | (143,463 | ) |
| | | | | | | | | | | | | | | | | | | | | | | | |
Net Increase (Decrease) from Transactions in Interest | | | (176,165 | ) | | | (432,475 | ) | | | 19,106 | | | | (132,306 | ) | | | 20,594 | | | | (105,866 | ) |
| | | | | | | | | | | | | | | | | | | | | | | | |
Total Increase (Decrease) in Net Assets | | | 1,308,000 | | | | 769,037 | | | | 727,669 | | | | 1,491,627 | | | | 28,564 | | | | 120,072 | |
Net Assets | | | | | | | | | | | | | | | | | | | | | | | | |
Beginning of Period | | | 7,508,400 | | | | 6,739,363 | | | | 6,191,964 | | | | 4,700,337 | | | | 1,183,036 | | | | 1,062,964 | |
| | | | | | | | | | | | | | | | | | | | | | | | |
End of Period | | $ | 8,816,400 | | | $ | 7,508,400 | | | $ | 6,919,633 | | | $ | 6,191,964 | | | $ | 1,211,600 | | | $ | 1,183,036 | |
| | | | | | | | | | | | | | | | | | | | | | | | |
See accompanying Notes to Financial Statements.
237
THE DFA INVESTMENT TRUST COMPANY
STATEMENTS OF CHANGES IN NET ASSETS
(Amounts in thousands)
| | | | | | | | | | | | | | | | | | | | | | | | |
| | | The Asia Pacific
Small Company
Series | | | The United Kingdom
Small Company
Series | | | The Continental
Small Company
Series | |
| | | Year
Ended
Oct. 31,
2010 | | | Year
Ended
Oct. 31,
2009 | | | Year
Ended
Oct. 31,
2010 | | | Year
Ended
Oct. 31,
2009 | | | Year
Ended
Oct. 31,
2010 | | | Year
Ended
Oct. 31,
2009 | |
Increase (Decrease) in Net Assets | | | | | | | | | | | | | | | | | | | | | | | | |
Operations: | | | | | | | | | | | | | | | | | | | | | | | | |
Net Investment Income (Loss) | | $ | 28,020 | | | $ | 19,547 | | | $ | 24,392 | | | $ | 23,533 | | | $ | 38,583 | | | $ | 36,091 | |
Net Realized Gain (Loss) on: | | | | | | | | | | | | | | | | | | | | | | | | |
Investment Securities Sold | | | 46,684 | | | | (32,245 | ) | | | 35,525 | | | | (34,448 | ) | | | 72,573 | | | | (13,321 | ) |
Futures | | | — | | | | (432 | ) | | | — | | | | 534 | | | | — | | | | (476 | ) |
Foreign Currency Transactions | | | (20 | ) | | | 146 | | | | 126 | | | | (50 | ) | | | 811 | | | | (549 | ) |
Change in Unrealized Appreciation (Depreciation) of: | | | | | | | | | | | | | | | | | | | | | | | | |
Investment Securities and Foreign Currency | | | 129,509 | | | | 330,580 | | | | 152,112 | | | | 234,459 | | | | 156,901 | | | | 468,759 | |
Futures | | | — | | | | (3 | ) | | | — | | | | (1 | ) | | | — | | | | (9 | ) |
Translation of Foreign Currency Denominated Amounts | | | (75 | ) | | | 209 | | | | (30 | ) | | | (199 | ) | | | 30 | | | | 305 | |
| | | | | | | | | | | | | | | | | | | | | | | | |
Net Increase (Decrease) in Net Assets Resulting from Operations | | | 204,118 | | | | 317,802 | | | | 212,125 | | | | 223,828 | | | | 268,898 | | | | 490,800 | |
| | | | | | | | | | | | | | | | | | | | | | | | |
Transactions in Interest: | | | | | | | | | | | | | | | | | | | | | | | | |
Contributions | | | 85,604 | | | | 21,607 | | | | 59,131 | | | | 26,861 | | | | 199,653 | | | | 118,904 | |
Withdrawals | | | (35,581 | ) | | | (99,649 | ) | | | (5,034 | ) | | | (35,607 | ) | | | (26,959 | ) | | | (90,397 | ) |
| | | | | | | | | | | | | | | | | | | | | | | | |
Net Increase (Decrease) from Transactions in Interest | | | 50,023 | | | | (78,042 | ) | | | 54,097 | | | | (8,746 | ) | | | 172,694 | | | | 28,507 | |
| | | | | | | | | | | | | | | | | | | | | | | | |
Total Increase (Decrease) in Net Assets | | | 254,141 | | | | 239,760 | | | | 266,222 | | | | 215,082 | | | | 441,592 | | | | 519,307 | |
Net Assets | | | | | | | | | | | | | | | | | | | | | | | | |
Beginning of Period | | | 680,997 | | | | 441,237 | | | | 770,472 | | | | 555,390 | | | | 1,630,892 | | | | 1,111,585 | |
| | | | | | | | | | | | | | | | | | | | | | | | |
End of Period | | $ | 935,138 | | | $ | 680,997 | | | $ | 1,036,694 | | | $ | 770,472 | | | $ | 2,072,484 | | | $ | 1,630,892 | |
| | | | | | | | | | | | | | | | | | | | | | | | |
See accompanying Notes to Financial Statements.
238
THE DFA INVESTMENT TRUST COMPANY
STATEMENTS OF CHANGES IN NET ASSETS
(Amounts in thousands)
| | | | | | | | | | | | | | | | | | | | | | | | |
| | | The Canadian
Small Company
Series | | | The Emerging
Markets Series | | | The Emerging
Markets Small Cap
Series | |
| | | Year
Ended
Oct. 31,
2010 | | | Year
Ended
Oct. 31,
2009 | | | Year
Ended
Oct. 31,
2010 | | | Year
Ended
Oct. 31,
2009 | | | Year
Ended
Oct. 31,
2010 | | | Year
Ended
Oct. 31,
2009 | |
Increase (Decrease) in Net Assets | | | | | | | | | | | | | | | | | | | | | | | | |
Operations: | | | | | | | | | | | | | | | | | | | | | | | | |
Net Investment Income (Loss) | | $ | 5,240 | | | $ | 3,432 | | | $ | 48,891 | | | $ | 43,700 | | | $ | 30,699 | | | $ | 20,144 | |
Net Realized Gain (Loss) on: | | | | | | | | | | | | | | | | | | | | | | | | |
Investment Securities Sold | | | 6,585 | | | | (38,817 | ) | | | 160,587 | | | | 40,421 | | | | 102,089 | | | | (13,070 | ) |
Futures | | | — | | | | (322 | ) | | | — | | | | (2,920 | ) | | | — | | | | (181 | ) |
Foreign Currency Transactions | | | 40 | | | | (182 | ) | | | 541 | | | | (24 | ) | | | 77 | ** | | | (182 | ) |
In-Kind Redemptions | | | — | | | | — | | | | — | | | | 17,805 | * | | | — | | | | — | |
Change in Unrealized Appreciation (Depreciation) of: | | | | | | | | | | | | | | | | | | | | | | | | |
Investment Securities and Foreign Currency | | | 168,950 | | | | 159,928 | | | | 337,045 | | | | 642,058 | | | | 382,774 | | | | 535,144 | |
Futures | | | — | | | | — | | | | — | | | | (32 | ) | | | — | | | | (10 | ) |
Translation of Foreign Currency Denominated Amounts | | | (11 | ) | | | 19 | | | | (5 | ) | | | 210 | | | | (76 | ) | | | 185 | |
Change in Deferred Thailand Capital Gains Tax | | | — | | | | — | | | | (2,275 | ) | | | (1,366 | ) | | | (3,052 | ) | | | (786 | ) |
| | | | | | | | | | | | | | | | | | | | | | | | |
Net Increase (Decrease) in Net Assets Resulting from Operations | | | 180,804 | | | | 124,058 | | | | 544,784 | | | | 739,852 | | | | 512,511 | | | | 541,244 | |
| | | | | | | | | | | | | | | | | | | | | | | | |
Transactions in Interest: | | | | | | | | | | | | | | | | | | | | | | | | |
Contributions | | | 117,737 | | | | 37,000 | | | | 199,169 | | | | 162,102 | | | | 344,585 | | | | 168,060 | |
Withdrawals | | | — | | | | (28,750 | ) | | | (323,776 | ) | | | (417,162 | )* | | | (143,713 | ) | | | (107,710 | ) |
| | | | | | | | | | | | | | | | | | | | | | | | |
Net Increase (Decrease) from Transactions in Interest | | | 117,737 | | | | 8,250 | | | | (124,607 | ) | | | (255,060 | ) | | | 200,872 | | | | 60,350 | |
| | | | | | | | | | | | | | | | | | | | | | | | |
Total Increase (Decrease) in Net Assets | | | 298,541 | | | | 132,308 | | | | 420,177 | | | | 484,792 | | | | 713,383 | | | | 601,594 | |
Net Assets | | | | | | | | | | | | | | | | | | | | | | | | |
Beginning of Period | | | 365,181 | | | | 232,873 | | | | 2,109,316 | | | | 1,624,524 | | | | 1,167,973 | | | | 566,379 | |
| | | | | | | | | | | | | | | | | | | | | | | | |
End of Period | | $ | 663,722 | | | $ | 365,181 | | | $ | 2,529,493 | | | $ | 2,109,316 | | | $ | 1,881,356 | | | $ | 1,167,973 | |
| | | | | | | | | | | | | | | | | | | | | | | | |
* See Note K in the Notes to Financial Statements.
** Net of foreign capital gain taxes withheld of $184.
See accompanying Notes to Financial Statements.
239
THE DFA INVESTMENT TRUST COMPANY
FINANCIAL HIGHLIGHTS
| | | | | | | | | | | | | | | | | | | | | | | | |
| | | The U.S. Large Cap Value Series† | |
| | | Year Ended Oct. 31, 2010 | | | Year Ended Oct. 31, 2009 | | | Period Dec. 1, 2007 to Oct. 31, 2008 | | | Year Ended Nov. 30, 2007 | | | Year Ended Nov. 30,
2006 | | | Year Ended Nov. 30,
2005 | |
Total Return | | | 19.96 | % | | | 11.90 | % | | | (36.53 | )%(C) | | | (0.32 | )% | | | 18.16 | % | | | 14.66 | % |
Net Assets, End of Period (thousands) | | $ | 8,816,400 | | | $ | 7,508,400 | | | $ | 6,739,363 | | | $ | 10,159,322 | | | $ | 8,866,306 | | | $ | 5,831,587 | |
Ratio of Expenses to Average Net Assets | | | 0.12 | % | | | 0.13 | % | | | 0.11 | %(B) | | | 0.11 | % | | | 0.12 | % | | | 0.14 | % |
Ratio of Net Investment Income to Average Net Assets | | | 2.02 | % | | | 2.42 | % | | | 1.97 | %(B) | | | 1.44 | % | | | 1.68 | % | | | 1.56 | % |
Portfolio Turnover Rate | | | 28 | % | | | 29 | % | | | 19 | %(C) | | | 9 | % | | | 13 | % | | | 9 | % |
| |
| | | The DFA International Value Series† | |
| | | Year
Ended Oct. 31,
2010 | | | Year
Ended Oct. 31,
2009 | | | Period
Dec. 1,
2007 to
Oct. 31,
2008 | | | Year Ended Nov. 30,
2007 | | | Year
Ended
Nov. 30,
2006 | | | Year
Ended
Nov. 30,
2005 | |
Total Return | | | 11.13 | % | | | 35.41 | % | | | (47.87 | )%(C) | | | 17.32 | % | | | 35.73 | % | | | 15.61 | % |
Net Assets, End of Period (thousands) | | $ | 6,919,633 | | | $ | 6,191,964 | | | $ | 4,700,337 | | | | $9,638,721 | | | $ | 7,457,252 | | | $ | 4,367,698 | |
Ratio of Expenses to Average Net Assets | | | 0.24 | % | | | 0.24 | % | | | 0.23 | %(B) | | | 0.23 | % | | | 0.23 | % | | | 0.27 | % |
Ratio of Net Investment Income to Average Net Assets | | | 2.55 | % | | | 3.22 | % | | | 4.15 | %(B) | | | 3.04 | % | | | 3.29 | % | | | 2.71 | % |
Portfolio Turnover Rate | | | 20 | % | | | 18 | % | | | 16 | %(C) | | | 16 | % | | | 8 | % | | | 10 | % |
See page 1 for the Definitions of Abbreviations and Footnotes.
| † | See Note A in the Notes to Financial Statements. |
See accompanying Notes to Financial Statements.
240
THE DFA INVESTMENT TRUST COMPANY
FINANCIAL HIGHLIGHTS
| | | | | | | | | | | | | | | | | | | | | | | | |
| | | The Japanese Small Company Series | |
| | | Year Ended Oct 31, 2010 | | | Year Ended Oct. 31, 2009 | | | Period Dec. 1, 2007 to Oct. 31, 2008 | | | Year Ended Nov. 30,
2007 | | | Year Ended Nov. 30,
2006 | | | Year Ended Nov. 30,
2005 | |
| | |
Total Return | | | 0.72 | % | | | 22.69 | % | | | (26.87 | )%(C) | | | (1.16 | )% | | | (2.28 | )% | | | 31.03 | % |
| | |
Net Assets, End of Period (thousands) | | $ | 1,211,600 | | | $ | 1,183,036 | | | $ | 1,062,964 | | | $ | 1,504,821 | | | $ | 1,385,722 | | | $ | 1,151,429 | |
Ratio of Expenses to Average Net Assets | | | 0.14 | % | | | 0.15 | % | | | 0.13 | %(B) | | | 0.13 | % | | | 0.14 | % | | | 0.22 | % |
Ratio of Net Investment Income to Average Net Assets | | | 1.95 | % | | | 2.15 | % | | | 2.64 | %(B) | | | 1.94 | % | | | 1.68 | % | | | 1.51 | % |
Portfolio Turnover Rate | | | 10 | % | | | 7 | % | | | 10 | %(C) | | | 9 | % | | | 9 | % | | | 6 | % |
| | |
| |
| | | The Asia Pacific Small Company Series | |
| | | Year
Ended Oct. 31,
2010 | | | Year
Ended Oct. 31,
2009 | | | Period
Dec. 1,
2007 to
Oct. 31,
2008 | | | Year
Ended
Nov. 30,
2007 | | | Year
Ended
Nov. 30,
2006 | | | Year
Ended
Nov. 30,
2005 | |
| | |
Total Return | | | 28.91 | % | | | 84.98 | % | | | (57.75 | )%(C) | | | 47.23 | % | | | 38.26 | % | | | 9.30 | % |
| | |
Net Assets, End of Period (thousands) | | | $935,138 | | | | $680,997 | | | | $441,237 | | | $ | 1,205,154 | | | | $749,627 | | | | $395,923 | |
Ratio of Expenses to Average Net Assets | | | 0.17 | % | | | 0.18 | % | | | 0.15 | %(B) | | | 0.15 | % | | | 0.17 | % | | | 0.27 | % |
Ratio of Net Investment Income to Average Net Assets | | | 3.64 | % | | | 4.00 | % | | | 4.33 | %(B) | | | 3.58 | % | | | 4.19 | % | | | 4.33 | % |
Portfolio Turnover Rate | | | 18 | % | | | 23 | % | | | 20 | %(C) | | | 25 | % | | | 14 | % | | | 10 | % |
| | |
See page 1 & 2 for the Definitions of Abbreviations and Footnotes.
See accompanying Notes to Financial Statements.
241
THE DFA INVESTMENT TRUST COMPANY
FINANCIAL HIGHLIGHTS
| | | | | | | | | | | | | | | | | | | | | | | | |
| | | The United Kingdom Small Company Series | |
| | | Year Ended Oct. 31, 2010 | | | Year Ended Oct. 31, 2009 | | | Period Dec. 1, 2007 to Oct. 31, 2008 | | | Year Ended Nov. 30,
2007 | | | Year Ended Nov. 30,
2006 | | | Year Ended Nov. 30,
2005 | |
| | |
Total Return | | | 25.94 | % | | | 43.51 | % | | | (50.77 | )%(C) | | | 2.42 | % | | | 44.80 | % | | | 12.88 | % |
| | |
Net Assets, End of Period (thousands) | | $ | 1,036,694 | | | $ | 770,472 | | | $ | 555,390 | | | $ | 1,158,580 | | | $ | 1,117,826 | | | $ | 643,038 | |
Ratio of Expenses to Average Net Assets | | | 0.13 | % | | | 0.14 | % | | | 0.12 | %(B) | | | 0.12 | % | | | 0.13 | % | | | 0.22 | % |
Ratio of Net Investment Income to Average Net Assets | | | 2.86 | % | | | 4.02 | % | | | 3.79 | %(B) | | | 2.72 | % | | | 2.70 | % | | | 3.19 | % |
Portfolio Turnover Rate | | | 15 | % | | | 10 | % | | | 25 | %(C) | | | 12 | % | | | 8 | % | | | 12 | % |
| | |
| |
| | | The Continental Small Company Series | |
| | | Year Ended Oct. 31, 2010 | | | Year Ended Oct. 31, 2009 | | | Period Dec. 1, 2007 to Oct. 31, 2008 | | | Year Ended Nov. 30,
2007 | | | Year Ended Nov. 30,
2006 | | | Year Ended Nov. 30,
2005 | |
| | |
Total Return | | | 15.37 | % | | | 43.78 | % | | | (49.66 | )%(C) | | | 17.49 | % | | | 47.10 | % | | | 18.97 | % |
| | |
Net Assets, End of Period (thousands) | | $ | 2,072,484 | | | $ | 1,630,892 | | | $ | 1,111,585 | | | $ | 2,256,122 | | | $ | 1,875,194 | | | $ | 981,938 | |
Ratio of Expenses to Average Net Assets | | | 0.15 | % | | | 0.16 | % | | | 0.14 | %(B) | | | 0.14 | % | | | 0.15 | % | | | 0.24 | % |
Ratio of Net Investment Income to Average Net Assets | | | 2.24 | % | | | 2.93 | % | | | 3.49 | %(B) | | | 2.16 | % | | | 2.27 | % | | | 2.16 | % |
Portfolio Turnover Rate | | | 12 | % | | | 7 | % | | | 18 | %(C) | | | 12 | % | | | 7 | % | | | 18 | % |
| | |
See page 1 & 2 for the Definitions of Abbreviations and Footnotes.
See accompanying Notes to Financial Statements.
242
THE DFA INVESTMENT TRUST COMPANY
FINANCIAL HIGHLIGHTS
| | | | | | | | | | | | | | | | | | | | | | | | |
| | | The Canadian Small Company Series | |
| | | Year Ended Oct. 31, 2010 | | | Year Ended Oct. 31, 2009 | | | Period Dec. 1, 2007 to Oct. 31, 2008 | | | Period
April 2, 2007(a)
to Nov. 30, 2007 | | | | | | | |
| | |
Total Return | | | 43.17 | % | | | 61.67 | % | | | (56.44 | )%(C) | | | 10.20 | %(C) | | | | | | | | |
| | |
Net Assets, End of Period (thousands) | | | $663,722 | | | | $365,181 | | | | $232,873 | | | | $213,529 | | | | | | | | | |
Ratio of Expenses to Average Net Assets | | | 0.15 | % | | | 0.17 | % | | | 0.18 | %(B) | | | 0.26 | %(B)(E) | | | | | | | | |
Ratio of Net Investment Income to Average Net Assets | | | 1.05 | % | | | 1.37 | % | | | 0.97 | %(B) | | | 0.47 | %(B)(E) | | | | | | | | |
Portfolio Turnover Rate | | | 10 | % | | | 23 | % | | | 21 | %(C) | | | 6 | %(C) | | | | | | | | |
| | |
| |
| | | The Emerging Markets Series | |
| | | Year Ended Oct. 31, 2010 | | | Year Ended Oct. 31, 2009 | | | Period Dec. 1, 2007 to Oct. 31, 2008 | | | Year Ended Nov. 30, 2007 | | | Year Ended Nov. 30,
2006 | | | Year Ended Nov. 30,
2005 | |
| | |
Total Return | | | 27.04 | % | | | 53.99 | % | | | (48.15 | )%(C) | | | 42.62 | % | | | 31.87 | % | | | 31.23 | % |
| | |
Net Assets, End of Period (thousands) | | $ | 2,529,493 | | | $ | 2,109,316 | | | $ | 1,624,524 | | | | $3,707,790 | | | $ | 2,414,971 | | | $ | 1,852,565 | |
Ratio of Expenses to Average Net Assets | | | 0.19 | % | | | 0.20 | % | | | 0.18 | %(B) | | | 0.19 | % | | | 0.20 | % | | | 0.27 | % |
Ratio of Net Investment Income to Average Net Assets | | | 2.18 | % | | | 2.57 | % | | | 3.00 | %(B) | | | 2.52 | % | | | 2.54 | % | | | 3.70 | % |
Portfolio Turnover Rate | | | 12 | % | | | 14 | % | | | 19 | %(C) | | | 7 | % | | | 11 | % | | | 9 | % |
| | |
See page 1 & 2 for the Definitions of Abbreviations and Footnotes.
See accompanying Notes to Financial Statements.
243
THE DFA INVESTMENT TRUST COMPANY
FINANCIAL HIGHLIGHTS
| | | | | | | | | | | | | | | | | | | | | | | | |
| | | The Emerging Markets Small Cap Series | |
| | | Year Ended Oct. 31, 2010 | | | Year Ended Oct. 31, 2009 | | | Period
Dec. 1,
2007 to
Oct. 31,
2008 | | | Year Ended Nov. 30,
2007 | | | Year Ended Nov. 30,
2006 | | | Year Ended Nov. 30,
2005 | |
| | |
Total Return | | | 41.96 | % | | | 92.08 | % | | | (56.84 | )%(C) | | | 43.32 | % | | | 40.55 | % | | | 24.85 | % |
| | |
Net Assets, End of Period (thousands) | | $ | 1,881,356 | | | $ | 1,167,973 | | | $ | 566,379 | | | $ | 1,525,571 | | | $ | 903,529 | | | $ | 545,271 | |
Ratio of Expenses to Average Net Assets | | | 0.32 | % | | | 0.33 | % | | | 0.30 | %(B) | | | 0.31 | % | | | 0.34 | % | | | 0.49 | % |
Ratio of Net Investment Income to Average Net Assets | | | 2.16 | % | | | 2.52 | % | | | 3.07 | %(B) | | | 1.94 | % | | | 2.39 | % | | | 2.70 | % |
Portfolio Turnover Rate | | | 15 | % | | | 13 | % | | | 19 | %(C) | | | 16 | % | | | 18 | % | | | 8 | % |
| | |
See page 1 & 2 for the Definitions of Abbreviations and Footnotes.
See accompanying Notes to Financial Statements.
244
THE DFA INVESTMENT TRUST COMPANY
NOTES TO FINANCIAL STATEMENTS
A. Organization:
The DFA Investment Trust Company (the “Trust”) is an open-end management investment company registered under the Investment Company Act of 1940. The Trust consists of twelve investment portfolios, of which nine are included in this section of the report (collectively, the “Series”), and three are presented in separate reports.
| | |
Domestic Equity Portfolio | | International Equity Portfolios |
The U.S. Large Cap Value Series | | The DFA International Value Series |
| | The Japanese Small Company Series |
| | The Asia Pacific Small Company Series |
| | The United Kingdom Small Company Series |
| | The Continental Small Company Series |
| | The Canadian Small Company Series |
| | The Emerging Markets Series |
| | The Emerging Markets Small Cap Series |
Effective December 31, 2008 and November 1, 2008, The U.S. Large Cap Value Series and The DFA International Value Series, respectively, each a master fund in a RIC/RIC master-feeder structure, elected with the consent of their respective Holder(s) to change their U.S. federal income tax classification from that of an association taxable as a corporation to a partnership pursuant to Treasury Regulation § 301.7701-3. The change in capital structure and retroactive reclassification of the statement of changes in net assets and financial highlights for the respective funds is a result of the treatment of a partnership for book purposes. Each Series/Portfolio will maintain its books and records and present its financial statements in accordance with generally accepted accounting principles for investment partnerships.
At a regular meeting of the Board of Directors/Trustees (the “Board”) on September 16, 2008, the Board voted to change the fiscal and tax year ends of the Series from November 30 to October 31.
B. Significant Accounting Policies:
The following significant accounting policies are in conformity with accounting principles generally accepted in the United States of America. Such policies are consistently followed by the Trust in preparation of its financial statements. The preparation of financial statements in accordance with accounting principles generally accepted in the United States of America requires management to make estimates and assumptions that affect the reported amounts of assets and liabilities and disclosure of contingent assets and liabilities at the date of the financial statements and the reported amounts of increases and decreases in net assets from operations during the reporting period. Actual results could differ from those estimates and those differences could be material.
1. Security Valuation: The Series utilizes a fair value hierarchy which prioritizes the inputs to valuation techniques used to measure fair value into three broad levels described below:
— Level 1 – quoted prices in active markets for identical securities
— Level 2 – other significant observable inputs (including quoted prices for similar securities, interest rates, prepayment speeds, credit risk, etc.)
— Level 3 – significant unobservable inputs (including the Series’ own assumptions in determining the fair value of investments)
245
Securities held by the Domestic Equity Portfolio and the International Equity Portfolios, including over-the-counter securities, are valued at the last quoted sale price of the day. Securities held by the Domestic Equity Portfolio and the International Equity Portfolios that are listed on Nasdaq are valued at the Nasdaq Official Closing Price (“NOCP”). If there is no last reported sale price or NOCP for the day, the Domestic Equity Portfolio and International Equity Portfolios value the securities at the mean of the most recent quoted bid and asked prices. Price information on listed securities is taken from the exchange where the security is primarily traded. Generally, securities issued by open-end investment companies are valued using their respective net asset values or public offering prices, as appropriate, for purchase orders placed at the close of the New York Stock Exchange (NYSE). These securities are generally categorized as Level 1 in the hierarchy.
Securities for which no market quotations are readily available (including restricted securities), or for which market quotations have become unreliable, are valued in good faith at fair value in accordance with procedures adopted by the Board of Directors/Trustees. These securities are generally categorized as Level 2 in the hierarchy. Fair value pricing may also be used if events that have a significant effect on the value of an investment (as determined in the discretion of the Investment Committee of the Advisor) occur before the net asset value is calculated. When fair value pricing is used, the prices of securities used by the Domestic Equity Portfolios and International Equity Portfolios may differ from the quoted or published prices for the same securities on their primary markets or exchanges.
The International Equity Portfolios will also apply a fair value price in the circumstances described below. Generally, trading in foreign securities markets is completed each day at various times prior to the close of the NYSE. For example, trading in the Japanese securities markets is completed each day at the close of the Tokyo Stock Exchange (normally, 11:00 p.m. PT), which is fourteen hours prior to the close of the NYSE (normally, 1:00 p.m. PT) and the time that the net asset values of the International Equity Portfolios are computed. Due to the time differences between the closings of the relevant foreign securities exchanges and the time the International Equity Portfolios price their shares at the close of the NYSE, the International Equity Portfolios will fair value their foreign investments when it is determined that the market quotations for the foreign investments are either unreliable or not readily available. The fair value prices will attempt to reflect the impact of the U.S. financial markets’ perceptions and trading activities on the International Equity Portfolios’ foreign investments since the last closing prices of the foreign investments were calculated on their primary foreign securities markets or exchanges. For these purposes, the Board of Directors/Trustees of the Trust have determined that movements in relevant indices or other appropriate market indicators, after the close of the Tokyo Stock Exchange or the London Stock Exchange, demonstrate that market quotations may be unreliable. Fair valuation of portfolio securities may occur on a daily basis. The fair value pricing by the International Equity Portfolios utilizes data furnished by an independent pricing service (and that data draws upon, among other information, the market values of foreign investments). When an International Equity Portfolio uses fair value pricing, the values assigned to the International Equity Portfolio’s foreign investments may not be the quoted or published prices of the investments on their primary markets or exchanges. Certain foreign equity securities that are fair value adjusted through an independent pricing service which considers statistically relevent trading patterns may periodically move from input valuation Level 2 to input valuation Level 1 when not meeting the fair value adjustment trigger requirements.
Futures contracts held by the Series are valued using the settlement price established each day on the exchange on which they are traded. These valuations are generally categorized as Level 1 in the hierarchy.
A summary of the inputs used to value the Series’ investments by each major security type, industry and/or country is disclosed at the end of the Summary Schedule of Portfolio Holdings. The inputs or methodology used for valuing securities are not necessarily an indication of the risk associated with investing in those securities.
The Series did not have any significant transfers between Level 1 and Level 2 during the year ended October 31, 2010.
2. Foreign Currency Translation: Securities and other assets and liabilities of the International Equity Portfolios, whose values are initially expressed in foreign currencies, are translated to U.S. dollars using the mean between the most recently quoted bid and asked prices for the U.S. dollar as quoted by generally recognized reliable sources. Dividend and interest income and certain expenses are translated to U.S. dollars at the rate of exchange on their
246
respective accrual dates. Receivables and payables denominated in foreign currencies are marked to market daily based on daily exchange rates and exchange gains or losses are realized upon ultimate receipt or disbursement.
The International Equity Portfolios do not isolate the effect of fluctuations in foreign exchange rates from the effect of fluctuations in the market prices of securities held whether realized or unrealized.
Realized gains or losses on foreign currency transactions represent net foreign exchange gains or losses from the disposition of foreign currencies, currency gains or losses realized between the trade and settlement dates on securities transactions, and the difference between amounts of interest, dividends and foreign withholding taxes recorded on the books of the International Equity Portfolios and the U.S. dollar equivalent amounts actually received or paid.
3. Deferred Compensation Plan: Each eligible Trustee of the Trust may elect participation in the Deferred Compensation Plan (the “Plan”). Under the Plan, effective January 1, 2002, such Trustees may defer payment of all or a portion of their total fees earned as a Trustee. These deferred amounts may be treated as though such amounts had been invested in shares of the following funds: U.S. Large Cap Value Portfolio; U.S. Core Equity 1 Portfolio; U.S. Core Equity 2 Portfolio; U.S. Vector Equity Portfolio; U.S. Micro Cap Portfolio; DFA International Value Portfolio; International Core Equity Portfolio; Emerging Markets Portfolio; Emerging Markets Core Equity Portfolio; and/or DFA Two-Year Global Fixed Income Portfolio. Contributions made under the Plan and the change in unrealized appreciation (depreciation) and income are included in Directors’/Trustees’ Fees & Expenses.
Each Trustee has the option to receive their distribution of proceeds in one of the following methods: lump sum; annual installments over a period of agreed upon years; or quarterly installments over a period of agreed upon years. Each Trustee shall have the right in a notice of election to defer compensation (the “Notice”) to elect to defer the receipt of the Trustee’s deferred compensation until a date specified by such Trustee in the Notice, which date may not be sooner than the earlier of: (i) the first business day of January following the year in which such Trustee ceases to be a member of the Board of the Fund; and (ii) five years following the effective date of the Trustee’s first deferral election. If a Trustee who elects to defer fees fails to designate in the Notice a time or date as of which payment of the Trustee’s deferred fee account shall commence, payment of such amount shall commence as of the first business day of January following the year in which the Trustee ceases to be a member of the Board of the Fund (unless the Trustee files an amended Notice selecting a different distribution date). Robert C. Merton resigned from the Board of the Fund on December 1, 2009 and received a lump sum payment of the proceeds of his deferred fee account on January 4, 2010 in the amount of $241,764. As of October 31, 2010, no other Trustees have requested or received a distribution of proceeds of a deferred fee account.
4. Other: Security transactions are accounted for as of the trade date. Costs used in determining realized gains and losses on the sale of investment securities are on the basis of identified cost. Dividend income and distributions to shareholders are recorded on the ex-dividend date. Distributions received on securities that represent a return of capital or capital gain are recorded as a reduction of cost of investments or as a realized gain, respectively. The Series estimate the character of distributions received that may be considered return of capital distributions. Interest income is recorded on an accrual basis. Discount and premium on securities purchased are amortized over the lives of the respective securities, utilizing the effective interest method. Expenses directly attributable to a Series are directly charged. Common expenses of the Trust or Series are allocated using methods approved by the Board of Directors/Trustees, generally based on average net assets.
The International Portfolios may be subject to taxes imposed by countries in which they invest, with respect to their investments in issuers existing or operating in such countries. Such taxes are generally based on income earned or repatriated and capital gains realized on the sale of such investments. The Series accrue such taxes when the related income or capital gains are earned or throughout the holding period. Some countries require governmental approval for the repatriation of investment income, capital or the proceeds of sales earned by foreign investors. In addition, if there is a deterioration in a country’s balance of payments or for other reasons, a country may impose temporary restrictions on foreign capital remittances abroad.
The Emerging Markets Series and The Emerging Markets Small Cap Series investments in Thailand are subject to a 15% governmental capital gains tax. Such taxes are due upon sale of individual securities. The Emerging
247
Markets Series and The Emerging Markets Small Cap Series accrue for taxes on the capital gains throughout the holding period based on the unrealized gain of the underlying securities. These Series are also subject to a 15% governmental capital gains tax on short-term capital gains for investments in India. Such taxes are due upon sale of individual securities. The taxes for the capital gains are accrued when the capital gains are earned.
C. Investment Advisor:
Dimensional Fund Advisors LP (“Dimensional” or the “Advisor”) provides investment advisory services to the Trust. For the year ended October 31, 2010, the Series’ investment advisory services fees were accrued daily and paid monthly to the Advisor based on the following effective annual rates of average daily net assets:
| | |
The U.S. Large Cap Value Series | | 0.10% |
The DFA International Value Series | | 0.20% |
The Japanese Small Company Series | | 0.10% |
The Asia Pacific Small Company Series | | 0.10% |
The United Kingdom Small Company Series | | 0.10% |
The Continental Small Company Series | | 0.10% |
The Canadian Small Company Series | | 0.10% |
The Emerging Markets Series | | 0.10% |
The Emerging Markets Small Cap Series | | 0.20% |
Fees Paid to Officers and Directors/Trustees:
Certain Officers and Directors/Trustees of the Advisor are also Officers and Directors/Trustees of the Trust; however, such Officers and Directors/Trustees (with the exception of the Chief Compliance Officer (“CCO”)) receive no compensation from the Trust. For the year ended October 31, 2010, the total related amounts paid by the Trust to the CCO were $68 (in thousands). The total related amounts paid by each of the Series are included in Other Expenses on the Statement of Operations.
D. Deferred Compensation:
At October 31, 2010, the total liability for deferred compensation to Directors/Trustees is included in Accrued Expenses and Other Liabilities on the Statement of Assets and Liabilities as follows (amounts in thousands):
| | | | |
The U.S. Large Cap Value Series | | | $214 | |
The DFA International Value Series | | | 167 | |
The Japanese Small Company Series | | | 36 | |
The Asia Pacific Small Company Series | | | 17 | |
The United Kingdom Small Company Series | | | 20 | |
The Continental Small Company Series | | | 42 | |
The Canadian Small Company Series | | | 9 | |
The Emerging Markets Series | | | 57 | |
The Emerging Markets Small Cap Series | | | 28 | |
E. Purchases and Sales of Securities:
For the year ended October 31, 2010, the Series made the following purchases and sales of investment securities, other than short-term securities and U.S. government securities (amounts in thousands):
| | | | |
| | | Purchases | | Sales |
The U.S. Large Cap Value Series | | $2,275,573 | | $2,324,050 |
The DFA International Value Series | | $1,456,793 | | $1,277,745 |
The Japanese Small Company Series | | 163,391 | | 117,375 |
248
| | | | |
| | | Purchases | | Sales |
The Asia Pacific Small Company Series | | 206,699 | | 138,132 |
The United Kingdom Small Company Series | | 189,382 | | 121,594 |
The Continental Small Company Series | | 416,808 | | 200,743 |
The Canadian Small Company Series | | 167,163 | | 50,262 |
The Emerging Markets Series | | 276,316 | | 352,561 |
The Emerging Markets Small Cap Series | | 447,425 | | 215,575 |
There were no purchases or sales of long-term U.S. government securities.
F. Federal Income Taxes:
No provision for federal income taxes is required since the Series are treated as partnerships for Federal income tax purposes. Any net investment income and realized and unrealized gains and losses have been deemed to have been “passed down” to their respective partners.
Some of the Series’ investments are in securities considered to be “passive foreign investment companies” for which any unrealized appreciation (depreciation) (mark to market) and/or realized gains are required to be included in distributable net investment income for federal income tax purposes. At October 31, 2010, the following Series had cumulative unrealized appreciation (depreciation) (mark to market) to be included in distributable net investment income for federal tax purposes. For the year ended October 31, 2010, realized gains on the sale of passive foreign investment companies have been reclassified from accumulated net realized gains to accumulated net investment income for federal tax purposes. Amounts listed below are in thousands.
| | | | |
| | | Mark to Market | | Realized Gains |
The Japanese Small Company Series | | $ 715 | | $ 32 |
The Asia Pacific Small Company Series | | 20,807 | | 310 |
The United Kingdom Small Company Series | | 2,607 | | — |
The Continental Small Company Series | | 328 | | 6,878 |
The Canadian Small Company Series | | 10,180 | | 2,733 |
The Emerging Markets Series | | 462 | | — |
The Emerging Markets Small Cap Series | | 718 | | 293 |
At October 31, 2010, the total cost and aggregate gross unrealized appreciation and (depreciation) of securities for federal income tax purposes were different from amounts reported for financial reporting purposes (amounts in thousands):
| | | | | | | | | | | | | | | | |
| | | Federal Tax
Cost | | | Unrealized
Appreciation | | | Unrealized
(Depreciation) | | | Net
Unrealized
Appreciation
(Depreciation) | |
The U.S. Large Cap Value Series | | | $7,923,103 | | | | $1,950,355 | | | | $(110,278 | ) | | | $1,840,077 | |
The DFA International Value Series | | | 6,502,935 | | | | 1,696,236 | | | | (117,658 | ) | | | 1,578,578 | |
The Japanese Small Company Series | | | 1,590,149 | | | | 122,117 | | | | (339,585 | ) | | | (217,468 | ) |
The Asia Pacific Small Company Series | | | 901,611 | | | | 308,290 | | | | (136,028 | ) | | | 172,262 | |
The United Kingdom Small Company Series | | | 960,749 | | | | 259,623 | | | | (172,488 | ) | | | 87,135 | |
The Continental Small Company Series | | | 2,090,469 | | | | 575,896 | | | | (252,929 | ) | | | 322,967 | |
The Canadian Small Company Series | | | 802,216 | | | | 136,111 | | | | (103,276 | ) | | | 32,835 | |
The Emerging Markets Series | | | 1,332,379 | | | | 1,390,857 | | | | (19,829 | ) | | | 1,371,028 | |
The Emerging Markets Small Cap Series | | | 1,392,722 | | | | 759,335 | | | | (84,408 | ) | | | 674,927 | |
Accounting for Uncertainty in Income Taxes sets forth a minimum threshold for financial statement recognition of the benefit of a tax position taken or expected to be taken in a tax return. Management has analyzed each Series’
249
tax positions and has concluded that no provision for income tax is required in any Series’ financial statements. No Series is aware of any tax positions for which it is reasonably possible that the total amounts of unrecognized tax benefits will significantly change in the next twelve months. Each of the Series’ federal tax returns for the prior three fiscal years remains subject to examination by the Internal Revenue Service.
On November 1, 2008, The DFA International Value Series, a master fund in a RIC/RIC master-feeder structure with five RIC feeders and other direct client investor(s), made a “Check-the-box” election for federal income tax purposes pursuant to Treasury Regulation §301.7701-3, to change its federal entity classification from a corporation taxable as a regulated investment company to a partnership. As a result of this election, the master fund is deemed to have distributed all of its assets and liabilities, in a taxable transaction, to its shareholders in liquidation of the master fund. Immediately thereafter, the shareholders contributed all of the distributed assets and liabilities to a newly formed partnership. The final tax year end of The DFA International Value Series was October 31, 2008. For Federal income tax purposes, pursuant to Internal Revenue Code §336(a), the master fund recognizes gain or loss as if the master’s investment securities were sold to its shareholders and, pursuant to IRC Code §331, each of the Portfolios recognizes gain or loss as if it liquidated its investment in the master. As a result of the transaction, The DFA International Value Series recognized a ($2,309,440,866) and ($718,733) capital and currency loss respectively for tax year ended October 31, 2008. For tax purposes, pursuant to IRC Code §334(a), each of the Portfolios will take a fair market value basis in the securities deemed received by them and a new holding period for those securities commences on the deemed liquidation date.
Effective December 31, 2008, The U.S. Large Cap Value Series, a master fund in a RIC/RIC master-feeder structure with four RIC feeders and other direct client investor(s), made a “Check-the-box” election for federal income tax purposes pursuant to Treasury Regulation §301.7701-3, to change its federal entity classification from a corporation taxable as a regulated investment company to a partnership. As a result of this election, the master fund is deemed to have distributed all of its assets and liabilities, in a taxable transaction, to its shareholders in liquidation of the master fund. Immediately thereafter, the shareholders contributed all of the distributed assets and liabilities to a newly formed partnership. The final tax year end of The U.S. Large Cap Value Series was December 30, 2008. For Federal income tax purposes, pursuant to IRC Code §336(a), the master fund recognized a loss as if the master’s investment securities were sold to its shareholders and, pursuant to IRC Code §331, each of the Portfolios recognized a gain as if it liquidated its investment in the master. For tax purposes, pursuant to IRC Code §334(a), each of the Portfolios took a fair market value basis in the securities deemed received by them and a new holding period for those securities commenced on the deemed liquidation date. As a result of the transaction, The U.S. Large Cap Value Series recognized a ($2,303,664,484) capital loss for tax year ended December 30, 2008.
G. Financial Instruments:
In accordance with the Series’ investment objectives and policies, the Series may invest in certain financial instruments that have off-balance sheet risk in excess of the amounts recognized in the financial statements and concentrations of credit and market risk. These instruments and their significant corresponding risks are described below:
1. Repurchase Agreements: The Series may purchase certain U.S. Government securities subject to the counterparty’s agreement to repurchase them at an agreed upon date and price. The counterparty will be required on a daily basis to maintain the value of the collateral subject to the agreement at not less than the repurchase price (including accrued interest). The agreements are conditioned upon the collateral being deposited under the Federal Reserve book-entry system with the Trust’s custodian or a third party sub-custodian. In the event of default or bankruptcy by the other party to the agreement, retention of the collateral may be subject to legal proceedings. All open repurchase agreements were entered into on October 29, 2010.
2. Foreign Markets Risks: Investments in foreign markets may involve certain consideration and risks not typically associated with investments in the United States of America, including the possibility of future political and economic developments and the level of foreign government supervision and regulation of foreign securities markets. These markets are generally smaller, less liquid and more volatile than the major securities markets in the United States of America. Consequently, acquisition and disposition of securities by the Master Funds may be inhibited.
250
Derivative Financial Instruments:
Disclosures on derivative instruments and hedging activities are intended to improve financial reporting for derivative instruments by enabling investors to understand how and why a fund uses derivatives, how derivatives are accounted for and how derivative instruments affect a fund’s results of operations and financial position. Summarized below are the specific types of derivative instruments used by the Series.
3. Futures Contracts: The Series may enter into futures contracts to gain market exposure on uninvested cash pending investment in securities or to maintain liquidity to pay redemptions. Upon entering into a futures contract, the Series deposits cash or pledges U.S. Government securities to a broker, equal to the minimum “initial margin” requirements of the exchange on which the contract is traded. Subsequent payments are received from or paid to the broker each day, based on the daily fluctuation in the market value of the contract. These receipts or payments are known as “variation margin” and are recorded daily by the Series as unrealized gains or losses until the contracts are closed. When the contracts are closed, the Series record a realized gain or loss, which is presented in the Statements of Operations as a net realized gain or loss on futures, equal to the difference between the value of the contract at the time it was opened and the value at the time it was closed.
Risks may arise upon entering into futures contracts from potential imperfect price correlations between the futures contracts and the underlying securities, from the possibility of an illiquid secondary market for these instruments and from the possibility that the Series could lose more than the initial margin requirements. The Series entering into stock index futures are subject to equity price risk from those futures contracts. Counterparty credit risk related to exchange-traded futures is minimal because the exchange’s clearinghouse, as counterparty to all exchange-traded futures, guarantees the futures against default.
Additional disclosure on derivative instruments is required showing a summary by primary risk exposure of the derivatives instruments’ (i) location in the balance sheet and fair value at period end and (ii) the location in the Statements of Operations and the realized and change in unrealized gain or loss over the reporting period.
At October 31, 2010, the Series had no outstanding futures contracts.
H. Line of Credit:
The Trust, together with other Dimensional-advised portfolios, has entered into an amended and restated $250 million unsecured discretionary line of credit effective July 8, 2009 with an affiliate of its domestic custodian bank. Each portfolio is permitted to borrow, subject to its investment limitations, up to a maximum of $250 million, as long as total borrowings under the line of credit do not exceed $250 million in the aggregate. Borrowings under the line of credit are charged interest at rates agreed upon by the parties at the time of borrowing. Each portfolio is individually, and not jointly, liable for its particular advances under the line of credit. There is no commitment fee on the unused portion of the line of credit. The agreement for the discretionary line of credit may be terminated by either party at any time. The line of credit is scheduled to expire on June 21, 2011.
For the year ended October 31, 2010, borrowings by the Series under this line of credit were as follows (amounts in thousands, except percentages and days):
| | | | | | | | | | | | | | | | | | | | |
| | | Weighted
Average
Interest Rate | | | Weighted
Average
Loan Balance | | | Number of
Days
Outstanding | | | Interest
Expense
Incurred | | | Maximum Amount
Borrowed During
the Period | |
The U.S. Large Cap Value Series | | | 1.97% | | | | $8,884 | | | | 25 | | | | $12 | | | | $25,114 | |
There were no outstanding borrowings by the Series under this line of credit as of October 31, 2010.
The Trust, together with other Dimensional-advised portfolios, has also entered into an additional $500 million unsecured line of credit effective January 15, 2010 with its international custodian bank. Each portfolio is permitted to borrow, subject to its investment limitations, up to a maximum of $500 million, as long as total borrowings under the line of credit do not exceed $500 million in the aggregate. Each portfolio is individually, and not jointly, liable for its particular advances under the line of credit. Borrowings under the line of credit are charged interest at rates
251
agreed to by the parties at the time of borrowing. There is no commitment fee on the unused portion of the line of credit. The agreement for the line of credit expires on January 15, 2011.
For the year ended October 31, 2010, borrowings by the Series under this line of credit were as follows (amounts in thousands, except percentages and days):
| | | | | | | | | | |
| | | Weighted
Average
Interest Rate | | Weighted
Average
Loan Balance | | Number of
Days
Outstanding | | Interest
Expense
Incurred | | Maximum Amount
Borrowed During
the Period |
| | | | | |
The DFA International Value Series | | 0.94% | | $3,278 | | 14 | | $ 1 | | $ 6,386 |
The Japanese Small Company Series | | 0.88% | | 80 | | 12 | | — | | 199 |
The Asia Pacific Small Company Series | | 0.92% | | 459 | | 31 | | — | | 1,736 |
The United Kingdom Small Company Series | | 0.93% | | 139 | | 9 | | — | | 1,003 |
The Continental Small Company Series | | 0.94% | | 993 | | 16 | | — | | 2,421 |
The Emerging Markets Series | | 0.89% | | 6,211 | | 63 | | 10 | | 41,407 |
The Emerging Markets Small Cap Series | | 0.90% | | 2,974 | | 39 | | 3 | | 6,471 |
There were no outstanding borrowings by the Series under this line of credit as of October 31, 2010.
I. Securities Lending:
As of October 31, 2010, some of the Series had securities on loan to brokers/dealers, for which each Series received cash collateral. In addition, The Emerging Market Series and The Emerging Markets Small Cap Series received non-cash collateral with a market value of $85,839 and $125, respectively (in thousands). Each Series invests the cash collateral, as described below, and records a liability for the return of the collateral, during the period the securities are on loan. Loans of securities are expected at all times to be secured by collateral equal to at least (i) 100% of the current market value of the loaned securities with respect to securities of the U.S. government or its agencies, (ii) 102% of the current market value of the loaned securities with respect to U.S. securities, and (iii) 105% of the current market value of the loaned securities with respect to foreign securities. However, daily market fluctuations could cause the Series’ collateral to be lower or higher than the expected thresholds. If this were to occur, the collateral would be adjusted the next business day to ensure adequate collateralization. In the event of default or bankruptcy by the other party to the agreement, realization and/or retention of the collateral may be subject to legal proceedings. If the borrower fails to return loaned securities, and cash collateral being maintained by the borrower is insufficient to cover the value of loaned securities and provided such collateral insufficiency is not the result of investment losses, the lending agent has agreed to pay the amount of the shortfall to the Series or, at the option of the lending agent, to replace the securities.
Subject to their stated investment policies, each Series will generally invest the cash collateral received for the loaned securities in The DFA Short Term Investment Fund (the “Money Market Series”), an affiliated registered money market fund advised by the Advisor for which the Advisor receives a management fee of 0.05% of the average daily net assets of the Money Market Series. Each Series also may invest the cash collateral received for the loaned securities in securities of the U.S. government or its agencies, repurchase agreements collateralized by securities of the U.S. government or its agencies, and affiliated and unaffiliated registered and unregistered money market funds. For purposes of this paragraph, agencies include both agency debentures and agency mortgage-backed securities. In addition, each Series will be able to terminate the loan at any time and will receive reasonable interest on the loan, as well as amounts equal to any dividends, interest or other distributions on the loaned securities. However, dividend income received from loaned securities may not be eligible to be taxed at qualified dividend income rates.
J. Indemnitees; Contractual Obligations:
Under the Trust’s organizational documents, its officers and directors are indemnified against certain liabilities arising out of the performance of their duties to the Trust.
252
In the normal course of business, the Trust enters into contracts that contain a variety of representations and warranties which provide general indemnification. The Trust’s maximum exposure under these arrangements is unknown as this would involve future claims that may be made against the Trust and/or its affiliates that have not yet occurred. However, based on experience, the Trust expects the risk of loss to be remote.
K. In-Kind Redemptions:
In accordance with guidelines described in the Series’ prospectus, the fund may distribute portfolio securities rather than cash as payment for a redemption of fund shares (in-kind redemption). For financial reporting purposes, the fund recognizes a gain on in-kind redemptions to the extent the value of the distributed securities on the date of redemption exceeds the cost of those securities. Gains and losses realized on in-kind redemptions are not recognized for tax purposes and are reclassified from undistributed realized gain (loss) to paid-in capital.
During the year ended October 31, 2009, The Emerging Markets Series realized net gains of $17,805 (in thousands) of in-kind redemptions.
L. Recently Issued Accounting Standards:
In January 2010, the Financial Accounting Standards Board (“FASB”) issued Accounting Standards Update (“ASU”) No. 2010-06 “Improving Disclosures about Fair Value Measurements.” ASU No. 2010-06 amends FASB Accounting Standards Codification Topic 820, Fair Value Measurements and Disclosures, to require additional disclosures in the roll forward of activity in Level 3 fair value measurements effective for interim and annual reporting periods beginning after December 15, 2010. Management is currently evaluating the impact ASU No. 2010-06 will have on its financial statement disclosures.
M. Other:
The Series are subject to claims and suits that arise from time to time in the ordinary course of business (for example, in The Tribune Company Bankruptcy, certain creditors have filed an action against all shareholders of The Tribune Company who tendered shares when the Tribune Company went private in 2007 in a leveraged buy out transaction, seeking the return of all proceeds received by the shareholders). Although management currently believes that resolving claims against us, individually or in aggregate, will not have a material adverse impact on our financial position, our results of operations, or our cash flows, these matters are subject to inherent uncertainties and management’s view of these matters may change in the future.
N. Subsequent Event Evaluations:
Management has evaluated the impact of all subsequent events on the Series and has determined that the following subsequent event requires recognition or disclosure in the financial statements.
A class action complaint (the “Complaint”) has been filed in the bankruptcy case of the Tribune Company (the “Tribune”) in the United States Bankruptcy Court for the District of Delaware. The Complaint is against The U.S. Large Cap Value Series and all other Tribune shareholders as a group, which includes hundreds of mutual funds, institutional investors and others who sold shares of Tribune in 2007 when the Tribune became private in a leveraged buyout transaction (the “LBO Transaction”). The U.S. Large Cap Value Series, and all shareholders who participated in the LBO Transaction, received cash in the amount of $34 per share. The Complaint alleges that this transfer violated the rights of creditors and that the cash paid to shareholders in connection with the LBO Transaction should be paid back to the Tribune’s bankruptcy estate and used to pay creditors.
253
Litigation counsel to The U.S. Large Cap Value Series does not believe that it is possible, at this early stage in the proceedings, to predict with any reasonable certainty the probable outcome of the lawsuit or quantify the potential ultimate exposure to The U.S. Large Cap Value Series. However, even if the plaintiff in the lawsuit were to obtain the recovery it seeks, the amount would be less than 1% of The U.S. Large Cap Value Series’ net asset value at this time. The U.S. Large Cap Value Series’ litigation counsel does not believe at this time that recovery of the full amount the plaintiff seeks is a likely outcome.
Since The U.S. Large Cap Value Series cannot predict with reasonable specificity what the actual outcome of the lawsuit may be or what the size of The U.S. Large Cap Value Series might be at the time the outcome of the lawsuit may be determined, no deduction from the net asset value of The U.S. Large Cap Value Series will be made at this time. Therefore, at this time, those buying or redeeming shares of The U.S. Large Cap Value Series will pay or receive, as the case may be, a price based on net asset value of The U.S. Large Cap Value Series, with no deduction relating to the lawsuit. The attorneys’ fees and costs relating to the lawsuit will be taken as expenses by The U.S. Large Cap Value Series as incurred and in a manner similar to any other expense incurred by The U.S. Large Cap Value Series.
254
REPORT OF INDEPENDENT REGISTERED PUBLIC ACCOUNTING FIRM
To the Shareholders of the Series, as defined, and
Board of Trustees of The DFA Investment Trust Company:
In our opinion, the accompanying statements of assets and liabilities, including the summary schedules of portfolio holdings, and the related statements of operations and of changes in net assets and the financial highlights present fairly, in all material respects, the financial position of The U.S. Large Cap Value Series, The DFA International Value Series, The Japanese Small Company Series, The Asia Pacific Small Company Series, The United Kingdom Small Company Series, The Continental Small Company Series, The Canadian Small Company Series, The Emerging Market Series and The Emerging Markets Small Cap Series (constituting portfolios within The DFA Investment Trust Company, hereafter referred to as the “Series”) at October 31, 2010, the results of each of their operations for the year then ended, the changes in each of their net assets and the financial highlights for each of the periods indicated, in conformity with accounting principles generally accepted in the United States of America. These financial statements and financial highlights (hereafter referred to as “financial statements”) are the responsibility of the Series’ management; our responsibility is to express an opinion on these financial statements based on our audits. We conducted our audits of these financial statements in accordance with the standards of the Public Company Accounting Oversight Board (United States). Those standards require that we plan and perform the audit to obtain reasonable assurance about whether the financial statements are free of material misstatement. An audit includes examining, on a test basis, evidence supporting the amounts and disclosures in the financial statements, assessing the accounting principles used and significant estimates made by management, and evaluating the overall financial statement presentation. We believe that our audits, which included confirmation of securities at October 31, 2010 by correspondence with the custodians, brokers, and the transfer agent of the investee fund, provide a reasonable basis for our opinion.
PricewaterhouseCoopers LLP
Philadelphia, Pennsylvania
December 22, 2010
255
DIMENSIONAL EMERGING MARKETS VALUE FUND
PERFORMANCE CHART
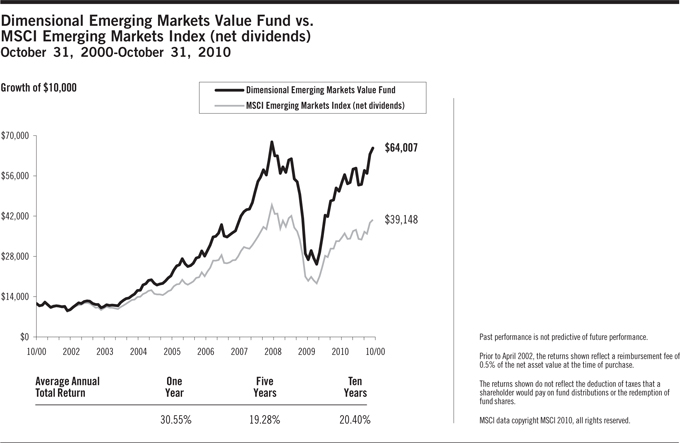
256
DIMENSIONAL EMERGING MARKETS VALUE FUND
MANAGEMENT’S DISCUSSION AND ANALYSIS
| | |
International Equity Market Review | | 12 Months Ended October 31, 2010 |
Emerging markets performed well for the fiscal year ended October 31, 2010, although results varied widely among the individual emerging markets countries. For the one-year period ended October 31, 2010, returns in US dollars were 23.56% for the MSCI Emerging Markets Index (net dividends) versus 9.61% for the MSCI World ex USA Index (net dividends). As measured by the MSCI indices, emerging markets growth stocks outperformed their value counterparts, while emerging markets small cap stocks outperformed large caps.
12 Months Ended October 31, 2010
| | |
| | | U.S. Dollar
Return |
MSCI Emerging Markets Index | | 23.56% |
MSCI Emerging Markets Small Cap Index | | 37.02% |
MSCI Emerging Markets Value Index | | 21.96% |
MSCI Emerging Markets Growth Index | | 25.17% |
The US dollar (USD) generally depreciated against most major emerging markets currencies during the period, increasing most local country returns when denominated in USD.
12 Months Ended October 31, 2010
| | | | |
Ten Largest Emerging Markets by Market Cap | | Local
Currency
Return | | U.S. Dollar
Return |
China | | 11.14% | | 11.11% |
Brazil | | 11.67% | | 14.86% |
South Korea | | 18.52% | | 24.52% |
Taiwan | | 13.20% | | 20.23% |
India | | 27.64% | | 34.93% |
South Africa | | 18.71% | | 33.55% |
Russia | | 19.19% | | 13.38% |
Mexico | | 25.55% | | 33.87% |
Malaysia | | 23.94% | | 35.93% |
Indonesia | | 41.78% | | 51.50% |
Source: Returns are of MSCI standard indices net of foreign withholding taxes on dividends. Copyright MSCI 2010, all rights reserved.
International Equity Fund Performance Overview
Dimensional Emerging Markets Value Fund
The Dimensional Emerging Markets Value Fund seeks to capture the returns of large and small cap value stocks as measured by book to market ratio in selected emerging markets countries. The investment strategy employs a disciplined, quantitative approach, emphasizing broad diversification and consistent exposure to emerging markets value stocks, but does not attempt to track a specific equity index. As of October 31, 2010, the Fund held 2,016 stocks in 17 emerging markets countries. In general, the Fund was fully invested in equities throughout the year. The average cash level for the period was less than 1% of the Fund’s assets. The Fund’s target country weights were capped at 15% upon purchase by the manager to limit single-country risk exposure.
257
As a result of the Fund’s diversified investment approach, performance was generally determined by broad structural trends in emerging markets countries, rather than the behavior of a limited number of stocks. For the 12 months ended October 31, 2010, total returns were 30.55% for the Fund and 23.56% for the MSCI Emerging Markets Index (net dividends). The Fund targets large and small cap value stocks while the Index primarily targets large and mid cap stocks. The Fund’s relative outperformance was primarily due to its higher allocation than the Index to small cap value stocks, which outperformed, and a lower allocation than the Index to large cap stocks, which underperformed. To a lesser extent, an additional component of the Fund’s outperformance was due to differences in valuation timing and methodology between the Fund and the Index. The Fund prices foreign exchange rates at the closing of the U.S. markets while the Index uses rates at 4 pm London time. The Fund utilizes fair value pricing to price portfolio securities at the closing of the U.S. markets while the Index uses local market closing prices.
258
DIMENSIONAL EMERGING MARKETS VALUE FUND
DISCLOSURE OF FUND EXPENSES
(Unaudited)
The following Expense Table is shown so that you can understand the impact of fees on your investment. All mutual funds have operating expenses. As a shareholder of the fund, you incur ongoing costs, which include costs for portfolio management, administrative services, and shareholder reports, among others. Operating expenses, legal and audit services, which are deducted from a fund’s gross income, directly reduce the investment return of the fund. A fund’s expenses are expressed as a percentage of its average net assets. This figure is known as the expense ratio. The following examples are intended to help you understand the ongoing costs, in dollars, of investing in the fund and to compare these costs with those of other mutual funds. The examples are based on an investment of $1,000 made at the beginning of the period shown and held for the entire period.
The Expense Table below illustrates your fund’s costs in two ways.
Actual Fund Return
This section helps you to estimate the actual expenses after fee waivers that you paid over the period. The “Ending Account Value” shown is derived from the fund’s actual return and “Expenses Paid During Period” reflect the dollar amount that would have been paid by an investor who started with $1,000 in the fund. You may use the information here, together with the amount you invested, to estimate the expenses that you paid over the period.
To do so, simply divide your account value by $1,000 (for example, a $7,500 account value divided by $1,000 = 7.5), then multiply the result by the number given for your fund under the heading “Expenses Paid During Period.”
Hypothetical Example for Comparison Purposes
This section is intended to help you compare your fund’s costs with those of other mutual funds. The hypothetical “Ending Account Value” and “Expenses Paid During Period” are derived from the fund’s actual expense ratio and an assumed 5% annual return before expenses. In this case, because the return used is not the fund’s actual return, the results do not apply to your investment. The example is useful in making comparisons because the SEC requires all mutual funds to calculate expenses based on a 5% annual return. You can assess your fund’s costs by comparing this hypothetical example with the hypothetical examples that appear in shareholder reports of other funds.
Please note that the expenses shown in the table are meant to highlight and help you compare ongoing costs only and do not reflect any transactional costs, if applicable. The “Annualized Expense Ratio” represents the actual expenses for the six-month period indicated.
| | | | | | | | | | | | | | | | |
| | | | | | Six Months Ended October 31, 2010 | |
| EXPENSE TABLE | | | | | | | | | | | | | | | | |
| | | Beginning
Account
Value
05/01/10 | | | Ending Account Value 10/31/10 | | | Annualized Expense Ratio* | | | Expenses Paid During Period* | |
| | | | |
| | | | |
| | | | |
Actual Fund Return | | | $1,000.00 | | | | $1,121.50 | | | | 0.21% | | | | $1.12 | |
Hypothetical 5% Annual Return | | | $1,000.00 | | | | $1,024.15 | | | | 0.21% | | | | $1.07 | |
| * | Expenses are equal to the fund’s annualized expense ratio for the six-month period, multiplied by the average account value over the period, multiplied by the number of days in the most recent six-month period (184), then divided by the number of days in the year (365) to reflect the six-month period. |
259
DIMENSIONAL EMERGING MARKETS VALUE FUND
DISCLOSURE OF PORTFOLIO HOLDINGS
(Unaudited)
The SEC requires that all Funds file a complete Schedule of Investments with the SEC for their first and third fiscal quarters on Form N-Q. For Dimensional Emerging Markets Value Fund, this would be for the fiscal quarters ending January 31 and July 31. The Form N-Q filing must be made within 60 days of the end of the quarter. Dimensional Emerging Markets Value Fund filed its most recent Form N-Q with the SEC on September 29, 2010. It is available upon request without charge, by calling collect: (512) 306-7400 or by mailing a request to Dimensional Fund Advisors LP, 6300 Bee Cave Road, Building One, Austin, Texas 78746, or by visiting the SEC’s website at http://www.sec.gov, or they may be reviewed and copied at the SEC’s Public Reference Room in Washington, D.C. (call 1-800-732-0330 for information on the operation of the Public Reference Room).
SEC regulations permit a fund to include in its reports to shareholders a “Summary Schedule of Portfolio Holdings” in lieu of a full Schedule of Investments. The Summary Schedule of Portfolio Holdings reports the fund’s 50 largest holdings in unaffiliated issuers and any investments that exceed one percent of the fund’s net assets at the end of the reporting period. The amendments also require that the Summary Schedule of Portfolio Holdings identify each category of investments that are held.
The fund is required to file a complete Schedule of Investments with the SEC on Form N-CSR within ten days after mailing the annual and semi-annual reports to shareholders. It will be available upon request, without charge, by calling collect: (512) 306-7400 or by mailing a request to Dimensional Fund Advisors LP, 6300 Bee Cave Road, Building One, Austin, Texas 78746, or by visiting the SEC’s website at http://www.sec.gov, or they may be reviewed and copied at the SEC’s Public Reference Room in Washington, D.C. (call 1-800-732-0330 for information on the operation of the Public Reference Room).
PORTFOLIO HOLDINGS
The SEC requires that all Funds present their categories of portfolio holdings in a table, chart or graph format in their annual and semi-annual shareholder reports, whether or not a Schedule of Investments is utilized. The following table, which presents portfolio holdings as a percent of total investments before short-term investments and collateral for loaned securities, is provided in compliance with such requirement. The categories shown below represent broad industry sectors. Each industry sector consists of one or more specific industry classifications.
| | | | |
| Dimensional Emerging Markets Value Fund | |
Consumer Discretionary | | | 8.8% | |
Consumer Staples | | | 6.7% | |
Energy | | | 12.9% | |
Financials | | | 30.8% | |
Health Care | | | 0.7% | |
Industrials | | | 11.5% | |
Information Technology | | | 6.6% | |
Materials | | | 18.8% | |
Other | | | — | |
Real Estate Investment Trusts | | | — | |
Telecommunication Services | | | 1.7% | |
Utilities | | | 1.5% | |
| | | | |
| | | 100.0% | |
260
DIMENSIONAL EMERGING MARKETS VALUE FUND
SUMMARY SCHEDULE OF PORTFOLIO HOLDINGS
October 31, 2010
| | | | | | | | | | | | |
| | | Shares | | | Value†† | | | Percentage
of Net Assets** |
COMMON STOCKS — (88.2%) | | | | | | | | | | | | |
BRAZIL — (7.9%) | | | | | | | | | | | | |
#Banco Santander Brasil SA ADR | | | 10,011,893 | | | $ | 144,171,259 | | | | | 1.2% |
BM&F Bovespa SA | | | 22,558,150 | | | | 188,128,311 | | | | | 1.6% |
BRF - Brasil Foods SA ADR | | | 2,898,191 | | | | 42,400,534 | | | | | 0.3% |
#*Fibria Celulose SA Sponsored ADR | | | 2,444,493 | | | | 43,903,094 | | | | | 0.4% |
#Petroleo Brasileiro SA ADR | | | 2,310,397 | | | | 78,830,746 | | | | | 0.7% |
Other Securities | | | | | | | 511,654,175 | | | | | 4.3% |
| | | | | | | | | | | | |
TOTAL BRAZIL | | | | | | | 1,009,088,119 | | | | | 8.5% |
| | | | | | | | | | | | |
| | | | |
CHILE — (2.5%) | | | | | | | | | | | | |
Empresas CMPC SA | | | 1,512,741 | | | | 81,335,149 | | | | | 0.7% |
#Enersis SA Sponsored ADR | | | 3,017,368 | | | | 68,826,164 | | | | | 0.6% |
Other Securities | | | | | | | 172,239,889 | | | | | 1.4% |
| | | | | | | | | | | | |
TOTAL CHILE | | | | | | | 322,401,202 | | | | | 2.7% |
| | | | | | | | | | | | |
| | | | |
CHINA — (12.1%) | | | | | | | | | | | | |
Bank of China, Ltd. | | | 470,554,474 | | | | 283,239,227 | | | | | 2.4% |
China Construction Bank Corp. | | | 72,842,000 | | | | 69,637,206 | | | | | 0.6% |
#China Petroleum & Chemical Corp. ADR | | | 606,083 | | | | 57,765,771 | | | | | 0.5% |
#China Unicom Hong Kong, Ltd. ADR | | | 4,715,857 | | | | 66,021,998 | | | | | 0.5% |
Other Securities | | | | | | | 1,072,566,776 | | | | | 9.0% |
| | | | | | | | | | | | |
TOTAL CHINA | | | | | | | 1,549,230,978 | | | | | 13.0% |
| | | | | | | | | | | | |
| | | | |
CZECH REPUBLIC — (0.4%) | | | | | | | | | | | | |
Other Securities | | | | | | | 44,808,463 | | | | | 0.4% |
| | | | | | | | | | | | |
| | | | |
HUNGARY — (1.1%) | | | | | | | | | | | | |
#*MOL Hungarian Oil & Gas P.L.C. | | | 451,154 | | | | 47,937,453 | | | | | 0.4% |
#*OTP Bank P.L.C. | | | 2,633,742 | | | | 78,216,750 | | | | | 0.7% |
Other Securities | | | | | | | 16,419,394 | | | | | 0.1% |
| | | | | | | | | | | | |
TOTAL HUNGARY | | | | | | | 142,573,597 | | | | | 1.2% |
| | | | | | | | | | | | |
| | | | |
INDIA — (10.2%) | | | | | | | | | | | | |
Hindalco Industries, Ltd. | | | 9,934,662 | | | | 47,243,508 | | | | | 0.4% |
#ICICI Bank, Ltd. Sponsored ADR | | | 3,332,795 | | | | 175,238,361 | | | | | 1.5% |
Reliance Industries, Ltd. | | | 7,365,013 | | | | 181,814,091 | | | | | 1.5% |
Other Securities | | | | | | | 899,743,882 | | | | | 7.5% |
| | | | | | | | | | | | |
TOTAL INDIA | | | | | | | 1,304,039,842 | | | | | 10.9% |
| | | | | | | | | | | | |
| | | | |
INDONESIA — (3.1%) | | | | | | | | | | | | |
PT Bumi Resources Tbk | | | 280,320,500 | | | | 70,190,067 | | | | | 0.6% |
Other Securities | | | | | | | 331,711,535 | | | | | 2.8% |
| | | | | | | | | | | | |
TOTAL INDONESIA | | | | | | | 401,901,602 | | | | | 3.4% |
| | | | | | | | | | | | |
| | | | |
ISRAEL — (0.0%) | | | | | | | | | | | | |
Other Securities | | | | | | | 3,639,775 | | | | | 0.0% |
| | | | | | | | | | | | |
| | | | |
MALAYSIA — (3.4%) | | | | | | | | | | | | |
AMMB Holdings Berhad | | | 21,831,262 | | | | 44,387,897 | | | | | 0.4% |
PPB Group Berhad | | | 6,909,766 | | | | 42,656,648 | | | | | 0.3% |
Other Securities | | | | | | | 354,846,470 | | | | | 3.0% |
| | | | | | | | | | | | |
TOTAL MALAYSIA | | | | | | | 441,891,015 | | | | | 3.7% |
| | | | | | | | | | | | |
| | | | |
MEXICO — (5.5%) | | | | | | | | | | | | |
#*Cemex S.A.B. de C.V. Sponsored ADR | | | 11,578,134 | | | | 101,540,235 | | | | | 0.9% |
Fomento Economico Mexicano S.A.B. de C.V. Sponsored ADR | | | 1,617,816 | | | | 88,834,277 | | | | | 0.7% |
#Grupo Carso S.A.B. de C.V. Series A-1 | | | 10,578,093 | | | | 60,960,244 | | | | | 0.5% |
261
DIMENSIONAL EMERGING MARKETS VALUE FUND
CONTINUED
| | | | | | | | | | | | |
| | | Shares | | | Value†† | | | Percentage
of Net Assets** |
MEXICO — (Continued) | | | | | | | | | | | | |
#Grupo Financiero Banorte S.A.B. de C.V. | | | 10,027,360 | | | $ | 42,901,314 | | | | | 0.4% |
#Grupo Mexico S.A.B. de C.V. Series B | | | 24,866,224 | | | | 81,920,796 | | | | | 0.7% |
#Organizacion Soriana S.A.B. de C.V. Series B | | | 14,451,500 | | | | 44,016,919 | | | | | 0.4% |
Other Securities | | | | | | | 290,330,610 | | | | | 2.4% |
| | | | | | | | | | | | |
TOTAL MEXICO | | | | | | | 710,504,395 | | | | | 6.0% |
| | | | | | | | | | | | |
| | | | |
PHILIPPINES — (1.0%) | | | | | | | | | | | | |
Other Securities | | | | | | | 121,877,101 | | | | | 1.0% |
| | | | | | | | | | | | |
| | | | |
POLAND — (1.7%) | | | | | | | | | | | | |
*Polski Koncern Naftowy Orlen SA | | | 5,310,008 | | | | 74,871,545 | | | | | 0.7% |
Other Securities | | | | | | | 146,060,520 | | | | | 1.2% |
| | | | | | | | | | | | |
TOTAL POLAND | | | | | | | 220,932,065 | | | | | 1.9% |
| | | | | | | | | | | | |
| | | | |
RUSSIA — (4.4%) | | | | | | | | | | | | |
Gazprom OAO Sponsored ADR | | | 18,589,632 | | | | 407,020,812 | | | | | 3.4% |
Lukoil OAO Sponsored ADR | | | 2,257,507 | | | | 125,889,656 | | | | | 1.1% |
Other Securities | | | | | | | 29,266,180 | | | | | 0.2% |
| | | | | | | | | | | | |
TOTAL RUSSIA | | | | | | | 562,176,648 | | | | | 4.7% |
| | | | | | | | | | | | |
| | | | |
SOUTH AFRICA — (7.6%) | | | | | | | | | | | | |
ABSA Group, Ltd. | | | 3,202,004 | | | | 62,031,775 | | | | | 0.5% |
#Gold Fields, Ltd. Sponsored ADR | | | 7,845,589 | | | | 123,724,939 | | | | | 1.1% |
#Nedbank Group, Ltd. | | | 2,742,435 | | | | 51,214,855 | | | | | 0.4% |
Sanlam, Ltd. | | | 28,700,406 | | | | 107,458,594 | | | | | 0.9% |
Other Securities | | | | | | | 631,684,711 | | | | | 5.3% |
| | | | | | | | | | | | |
TOTAL SOUTH AFRICA | | | | | | | 976,114,874 | | | | | 8.2% |
| | | | | | | | | | | | |
| | | | |
SOUTH KOREA — (11.7%) | | | | | | | | | | | | |
Hyundai Motor Co., Ltd. | | | 909,723 | | | | 137,718,248 | | | | | 1.1% |
#KB Financial Group, Inc. ADR | | | 2,538,946 | | | | 113,998,675 | | | | | 1.0% |
#LG Display Co., Ltd. ADR | | | 2,809,493 | | | | 48,351,375 | | | | | 0.4% |
#*LG Electronics, Inc. | | | 747,229 | | | | 65,798,650 | | | | | 0.5% |
#POSCO ADR | | | 1,058,114 | | | | 109,980,369 | | | | | 0.9% |
Samsung Corp. | | | 834,818 | | | | 49,026,745 | | | | | 0.4% |
Shinhan Financial Group Co., Ltd. | | | 1,534,998 | | | | 59,466,140 | | | | | 0.5% |
#Shinhan Financial Group Co., Ltd. ADR | | | 802,794 | | | | 62,433,289 | | | | | 0.5% |
#SK Energy Co., Ltd. | | | 320,419 | | | | 43,117,922 | | | | | 0.4% |
Other Securities | | | | | | | 817,269,532 | | | | | 6.9% |
| | | | | | | | | | | | |
TOTAL SOUTH KOREA | | | | | | | 1,507,160,945 | | | | | 12.6% |
| | | | | | | | | | | | |
| | | | |
TAIWAN — (11.0%) | | | | | | | | | | | | |
#*AU Optronics Corp. Sponsored ADR | | | 6,421,347 | | | | 64,406,110 | | | | | 0.5% |
*Chimei Innolux Corp. | | | 49,903,746 | | | | 66,965,890 | | | | | 0.6% |
Fubon Financial Holding Co., Ltd. | | | 35,221,501 | | | | 43,089,224 | | | | | 0.3% |
Mega Financial Holding Co., Ltd. | | | 73,353,000 | | | | 50,855,439 | | | | | 0.4% |
United Microelectronics Corp. | | | 116,004,069 | | | | 55,645,336 | | | | | 0.5% |
Other Securities | | | | | | | 1,130,452,372 | | | | | 9.5% |
| | | | | | | | | | | | |
TOTAL TAIWAN | | | | | | | 1,411,414,371 | | | | | 11.8% |
| | | | | | | | | | | | |
| | | | |
THAILAND — (2.4%) | | | | | | | | | | | | |
Other Securities | | | | | | | 303,985,751 | | | | | 2.6% |
| | | | | | | | | | | | |
| | | | |
TURKEY — (2.2%) | | | | | | | | | | | | |
Other Securities | | | | | | | 284,884,341 | | | | | 2.4% |
| | | | | | | | | | | | |
TOTAL COMMON STOCKS | | | | | | | 11,318,625,084 | | | | | 95.0% |
| | | | | | | | | | | | |
262
DIMENSIONAL EMERGING MARKETS VALUE FUND
CONTINUED
| | | | | | | | | | | | |
| | | Shares | | | Value†† | | | Percentage
of Net Assets** |
PREFERRED STOCKS — (4.3%) | | | | | | | | | | | | |
BRAZIL — (4.3%) | | | | | | | | | | | | |
#Gerdau SA Sponsored ADR | | | 4,348,258 | | | $ | 56,701,284 | | | | | 0.5% |
Metalurgica Gerdau SA | | | 4,022,600 | | | | 61,582,237 | | | | | 0.5% |
Petroleo Brasileiro SA ADR | | | 3,327,243 | | | | 103,776,709 | | | | | 0.9% |
Usinas Siderurgicas de Minas Gerais SA Series A | | | 7,092,710 | | | | 88,935,233 | | | | | 0.7% |
Other Securities | | | | | | | 240,405,478 | | | | | 2.0% |
| | | | | | | | | | | | |
TOTAL BRAZIL | | | | | | | 551,400,941 | | | | | 4.6% |
| | | | | | | | | | | | |
| | | | |
INDIA — (0.0%) | | | | | | | | | | | | |
Other Securities | | | | | | | 87,486 | | | | | 0.0% |
| | | | | | | | | | | | |
| | | | |
MALAYSIA — (0.0%) | | | | | | | | | | | | |
Other Securities | | | | | | | 80,926 | | | | | 0.0% |
| | | | | | | | | | | | |
TOTAL PREFERRED STOCKS | | | | | | | 551,569,353 | | | | | 4.6% |
| | | | | | | | | | | | |
RIGHTS/WARRANTS — (0.0%) | | | | | | | | | | | | |
| | | | |
CHINA — (0.0%) | | | | | | | | | | | | |
Other Securities | | | | | | | 205,255 | | | | | 0.0% |
| | | | | | | | | | | | |
| | | | |
INDONESIA — (0.0%) | | | | | | | | | | | | |
Other Securities | | | | | | | 1,733 | | | | | 0.0% |
| | | | | | | | | | | | |
| | | | |
MALAYSIA — (0.0%) | | | | | | | | | | | | |
Other Securities | | | | | | | 450,428 | | | | | 0.0% |
| | | | | | | | | | | | |
| | | | |
POLAND — (0.0%) | | | | | | | | | | | | |
Other Securities | | | | | | | 1,486,062 | | | | | 0.0% |
| | | | | | | | | | | | |
| | | | |
SOUTH KOREA — (0.0%) | | | | | | | | | | | | |
Other Securities | | | | | | | 186,825 | | | | | 0.0% |
| | | | | | | | | | | | |
| | | | |
TAIWAN — (0.0%) | | | | | | | | | | | | |
Other Securities | | | | | | | 74,585 | | | | | 0.0% |
| | | | | | | | | | | | |
| | | | |
THAILAND — (0.0%) | | | | | | | | | | | | |
Other Securities | | | | | | | 305,184 | | | | | 0.0% |
| | | | | | | | | | | | |
TOTAL RIGHTS/WARRANTS | | | | | | | 2,710,072 | | | | | 0.0% |
| | | | | | | | | | | | |
| | | | |
| | | Face Amount | | | Value† | | | | | |
| | | (000) | | | | | | | | |
TEMPORARY CASH INVESTMENTS — (0.7%) | | | | | | | | | | | | |
Repurchase Agreement, PNC Capital Markets, Inc. 0.19%, 11/01/10 (Collateralized by $81,705,000 FHLMC 4.00%, 09/01/24, valued at $71,456,943) to be repurchased at $83,314,319 | | | $83,313 | | | | 83,313,000 | | | | | 0.7% |
| | | | | | | | | | | | |
| | | | |
| | | Shares/ Face Amount | | | | | | | | |
| | | (000) | | | | | | | | |
SECURITIES LENDING COLLATERAL — (6.8%) | | | | | | | | | | | | |
§@DFA Short Term Investment Fund | | | 877,175,369 | | | | 877,175,369 | | | | | 7.4% |
263
DIMENSIONAL EMERGING MARKETS VALUE FUND
CONTINUED
| | | | | | | | | | | | |
| | | Shares/
Face
Amount | | | Value† | | | Percentage
of Net Assets** |
| | | (000) | | | | | | | | |
@Repurchase Agreement, Deutsche Bank Securities, Inc. 0.22%, 11/01/10 (Collateralized by $42,295,271 FNMA 7.000%, 08/01/38, valued at $1,439,213)## to be repurchased at $1,411,019 | | | $1,411 | | | $ | 1,410,993 | | | | | 0.0% |
| | | | | | | | | | | | |
| | | | |
TOTAL SECURITIES LENDING COLLATERAL | | | | | | | 878,586,362 | | | | | 7.4% |
| | | | | | | | | | | | |
| | | | |
TOTAL INVESTMENTS — (100.0%)
(Cost $9,604,404,435) | | | | | | $ | 12,834,803,871 | | | | | 107.7% |
| | | | | | | | | | | | |
264
DIMENSIONAL EMERGING MARKETS VALUE FUND
CONTINUED
Summary of inputs used to value the Fund’s investments as of October 31, 2010 is as follows (See Security Valuation Note):
| | | | | | | | | | | | | | | | | | |
| | | Valuation Inputs | |
| |
| | | Investment in Securities (Market Value) | |
| | | Level 1 | | | Level 2 | | | Level 3 | | Total | |
Common Stocks | | | | | | | | | | | | | | | | | | |
Brazil | | | $1,009,088,119 | | | | — | | | | | — | | | | | $1,009,088,119 | |
Chile | | | 322,401,202 | | | | — | | | | | — | | | | | 322,401,202 | |
China | | | 200,110,080 | | | | $1,349,120,898 | | | | | — | | | | | 1,549,230,978 | |
Czech Republic | | | — | | | | 44,808,463 | | | | | — | | | | | 44,808,463 | |
Hungary | | | — | | | | 142,573,597 | | | | | — | | | | | 142,573,597 | |
India | | | 195,153,304 | | | | 1,108,886,538 | | | | | — | | | | | 1,304,039,842 | |
Indonesia | | | 723,328 | | | | 401,178,274 | | | | | — | | | | | 401,901,602 | |
Israel | | | 31,353 | | | | 3,608,422 | | | | | — | | | | | 3,639,775 | |
Malaysia | | | 425,797 | | | | 441,465,218 | | | | | — | | | | | 441,891,015 | |
Mexico | | | 709,803,830 | | | | 700,565 | | | | | — | | | | | 710,504,395 | |
Philippines | | | — | | | | 121,877,101 | | | | | — | | | | | 121,877,101 | |
Poland | | | — | | | | 220,932,065 | | | | | — | | | | | 220,932,065 | |
Russia | | | — | | | | 562,176,648 | | | | | — | | | | | 562,176,648 | |
South Africa | | | 180,709,172 | | | | 795,405,702 | | | | | — | | | | | 976,114,874 | |
South Korea | | | 335,419,044 | | | | 1,171,741,901 | | | | | — | | | | | 1,507,160,945 | |
Taiwan | | | 76,080,903 | | | | 1,335,333,468 | | | | | — | | | | | 1,411,414,371 | |
Thailand | | | 295,095,677 | | | | 8,890,074 | | | | | — | | | | | 303,985,751 | |
Turkey | | | — | | | | 284,884,341 | | | | | — | | | | | 284,884,341 | |
Preferred Stocks | | | | | | | | | | | | | | | | | | |
Brazil | | | 551,400,941 | | | | — | | | | | — | | | | | 551,400,941 | |
India | | | — | | | | 87,486 | | | | | — | | | | | 87,486 | |
Malaysia | | | 80,926 | | | | — | | | | | — | | | | | 80,926 | |
Rights/Warrants | | | | | | | | | | | | | | | | | | |
China | | | 190,603 | | | | 14,652 | | | | | — | | | | | 205,255 | |
Indonesia | | | — | | | | 1,733 | | | | | — | | | | | 1,733 | |
Malaysia | | | 450,428 | | | | — | | | | | — | | | | | 450,428 | |
Poland | | | — | | | | 1,486,062 | | | | | — | | | | | 1,486,062 | |
South Korea | | | — | | | | 186,825 | | | | | — | | | | | 186,825 | |
Taiwan | | | — | | | | 74,585 | | | | | — | | | | | 74,585 | |
Thailand | | | 65,435 | | | | 239,749 | | | | | — | | | | | 305,184 | |
Temporary Cash Investments | | | — | | | | 83,313,000 | | | | | — | | | | | 83,313,000 | |
Securities Lending Collateral | | | — | | | | 878,586,362 | | | | | — | | | | | 878,586,362 | |
| | | | | | | | | | | | | | | | | | |
TOTAL | | | $3,877,230,142 | | | | $8,957,573,729 | | | | | — | | | | | $12,834,803,871 | |
| | | | | | | | | | | | | | | | | | |
See accompanying Notes to Financial Statements.
265
DIMENSIONAL EMERGING MARKETS VALUE FUND
STATEMENT OF ASSETS AND LIABILITIES
OCTOBER 31, 2010
(Amounts in thousands, except share and per share amounts)
| | | | |
ASSETS: | | | | |
Investments at Value (including $817,079 of securities on loan) | | $ | 11,872,905 | |
Temporary Cash Investments at Value & Cost | | | 83,313 | |
Collateral Received from Securities on Loan at Value & Cost | | | 878,586 | |
Foreign Currencies at Value | | | 10,524 | |
Cash | | | 547 | |
Receivables: | | | | |
Investment Securities Sold | | | 979 | |
Dividends, Interest and Tax Reclaims | | | 10,196 | |
Fund Shares Sold | | | 13,173 | |
Securities Lending Income | | | 918 | |
Unrealized Gain on Foreign Currency Contracts | | | 25 | |
| | | | |
Total Assets | | | 12,871,166 | |
| | | | |
LIABILITIES: | | | | |
Payables: | | | | |
Upon Return of Securities Loaned | | | 878,586 | |
Investment Securities Purchased | | | 55,280 | |
Due to Advisor | | | 988 | |
Unrealized Loss on Foreign Currency Contracts | | | 5 | |
Deferred Thailand Capital Gains Tax | | | 16,976 | |
Accrued Expenses and Other Liabilities | | | 1,376 | |
| | | | |
Total Liabilities | | | 953,211 | |
| | | | |
NET ASSETS | | $ | 11,917,955 | |
| | | | |
Investments at Cost | | $ | 8,642,505 | |
| | | | |
Foreign Currencies at Cost | | $ | 10,371 | |
| | | | |
See accompanying Notes to Financial Statements.
266
DIMENSIONAL EMERGING MARKETS VALUE FUND
STATEMENT OF OPERATIONS
FOR THE YEAR ENDED OCTOBER 31, 2010
(Amounts in thousands)
| | | | |
Investment Income | | | | |
Dividends (Net of Foreign Taxes Withheld of $21,174) | | $ | 180,635 | |
Interest | | | 82 | |
Income from Securities Lending | | | 8,842 | |
| | | | |
Total Investment Income | | | 189,559 | |
| | | | |
Expenses | | | | |
Investment Advisory Services Fees | | | 9,448 | |
Accounting & Transfer Agent Fees | | | 940 | |
Custodian Fees | | | 6,991 | |
Shareholders’ Reports | | | 50 | |
Directors’/Trustees’ Fees & Expenses | | | 93 | |
Professional Fees | | | 420 | |
Other | | | 251 | |
| | | | |
Total Expenses | | | 18,193 | |
| | | | |
Net Investment Income (Loss) | | | 171,366 | |
| | | | |
Realized and Unrealized Gain (Loss) | | | | |
Net Realized Gain (Loss) on: | | | | |
Investment Securities Sold | | | 591,224 | |
Foreign Currency Transactions | | | (3,254 | )** |
Change in Unrealized Appreciation (Depreciation) of: | | | | |
Investment Securities and Foreign Currency | | | 1,841,702 | |
Translation of Foreign Currency Denominated Amounts | | | (154 | ) |
Change in Deferred Thailand Capital Gains Tax | | | (10,266 | ) |
| | | | |
Net Realized and Unrealized Gain (Loss) | | | 2,419,252 | |
| | | | |
Net Increase (Decrease) in Net Assets Resulting from Operations | | $ | 2,590,618 | |
| | | | |
** Net of foreign capital gain taxes withheld of $1,806.
See accompanying Notes to Financial Statements.
267
DIMENSIONAL EMERGING MARKETS VALUE FUND
STATEMENTS OF CHANGES IN NET ASSETS
(Amounts in thousands)
| | | | | | | | |
| | | Year
Ended
Oct. 31,
2010 | | | Year
Ended
Oct. 31,
2009 | |
Increase (Decrease) in Net Assets | | | | | | | | |
Operations: | | | | | | | | |
Net Investment Income (Loss) | | $ | 171,366 | | | $ | 119,269 | |
Net Realized Gain (Loss) on: | | | | | | | | |
Investment Securities Sold | | | 591,224 | | | | 346,115 | |
Futures | | | — | | | | (3,835 | ) |
Foreign Currency Transactions | | | (3,254 | )** | | | (2,499 | ) |
In-Kind Redemptions | | | — | | | | 25,938 | * |
Change in Unrealized Appreciation (Depreciation) of: | | | | | | | | |
Investment Securities and Foreign Currency | | | 1,841,702 | | | | 2,817,363 | |
Futures | | | — | | | | (30 | ) |
Translation of Foreign Currency Denominated Amounts | | | (154 | ) | | | 449 | |
Change in Deferred Thailand Capital Gains Tax | | | (10,266 | ) | | | (3,804 | ) |
| | | | | | | | |
Net Increase (Decrease) in Net Assets Resulting from Operations | | | 2,590,618 | | | | 3,298,966 | |
| | | | | | | | |
Transactions in Interest: | | | | | | | | |
Contributions | | | 2,372,583 | | | | 1,430,899 | |
Withdrawals | | | (1,010,371 | ) | | | (813,144 | )* |
| | | | | | | | |
Net Increase (Decrease) from Transactions in Interest | | | 1,362,212 | | | | 617,755 | |
| | | | | | | | |
Total Increase (Decrease) in Net Assets | | | 3,952,830 | | | | 3,916,721 | |
Net Assets | | | | | | | | |
Beginning of Period | | | 7,965,125 | | | | 4,048,404 | |
| | | | | | | | |
End of Period | | $ | 11,917,955 | | | $ | 7,965,125 | |
| | | | | | | | |
| * | See Note J in the Notes to Financial Statements. |
| ** | Net of foreign capital gain taxes withheld of $1,806. |
See accompanying Notes to Financial Statements.
268
DIMENSIONAL EMERGING MARKETS VALUE FUND†
FINANCIAL HIGHLIGHTS
(for a share outstanding throughout each period)
| | | | | | | | | | | | | | | | | | | | | | | | |
| | | Year Ended Oct. 31, 2010 | | | Year Ended Oct. 31, 2009 | | | Period Dec. 1, 2007
to Oct. 31,
2008 | | | Year Ended Nov. 30,
2007 | | | Year Ended Nov. 30,
2006 | | | Year Ended Nov. 30,
2005 | |
| | | | | | |
Total Return | | | 30.55 | % | | | 79.39 | % | | | (55.47 | )%(C) | | | 51.59 | % | | | 42.14 | % | | | 31.60 | % |
Net Assets, End of Period
(thousands) | | $ | 11,917,955 | | | $ | 7,965,125 | | | $ | 4,048,404 | | | $ | 8,188,710 | | | $ | 4,837,912 | | | $ | 2,417,064 | |
Ratio of Expenses to Average Net Assets | | | 0.19 | % | | | 0.21 | % | | | 0.19 | %(B) | | | 0.19 | % | | | 0.22 | % | | | 0.29 | % |
Ratio of Net Investment Income to Average Net Assets | | | 1.81 | % | | | 2.17 | % | | | 3.19 | %(B) | | | 2.50 | % | | | 2.57 | % | | | 3.23 | % |
Portfolio Turnover Rate | | | 15 | % | | | 20 | % | | | 14 | %(C) | | | 14 | % | | | 9 | % | | | 7 | % |
See page 1 & 2 for the Definitions of Abbreviations and Footnotes.
| † | See Note A in the Notes to Financial Statements. |
See accompanying Notes to Financial Statements.
269
DIMENSIONAL EMERGING MARKETS VALUE FUND
NOTES TO FINANCIAL STATEMENTS
A. Organization:
Dimensional Emerging Markets Value Fund Inc. (“DEM I”) was organized as a closed-end management investment company registered under the Investment Company Act of 1940, as amended. Effective November 21, 1997, DEM I was reorganized as an open-end management investment company. On October 27, 2009, the Board of Directors and shareholders of DEM I approved an Agreement and Plan of Reorganization that provided for the reorganization of DEM I from a Maryland corporation to a Delaware statutory trust. Effective October 30, 2009, DEM I transferred all of its assets and liabilities to Dimensional Emerging Markets Value Fund (“DEM II” or the “Fund”), a Delaware statutory trust, in a tax-free exchange under IRC §368(a)(1)(F).
Effective November 1, 2009, Dimensional Emerging Markets Value Fund (“DEM II”), a master fund in a master-feeder structure, elected with the consent of its Holder(s) to change its U.S. federal income tax classification from that of an association taxable as a corporation to a partnership pursuant to Treasury Regulation §301.7701-3. The change in capital structure and retroactive reclassification of the statement of changes in net assets and financial highlights for DEM II is a result of the treatment of a partnership for book purposes. DEM II and Emerging Markets Value Portfolio (“Portfolio”) will maintain their books and records and present their financial statements in accordance with generally accepted accounting principles for investment partnerships.
At a regular meeting of the Board of Directors/Trustees (the “Board”) on September 16, 2008, the Board voted to change the fiscal and tax year ends of the Fund from November 30 to October 31.
B. Significant Accounting Policies:
The following significant accounting policies are in conformity with accounting principles generally accepted in the United States of America. Such policies are consistently followed by the Fund in preparation of its financial statements. The preparation of financial statements in accordance with accounting principles generally accepted in the United States of America requires management to make estimates and assumptions that affect the reported amounts of assets and liabilities and disclosure of contingent assets and liabilities at the date of the financial statements and the reported amounts of increases and decreases in net assets from operations during the reporting period. Actual results could differ from those estimates and those differences could be material.
1. Security Valuation: The Fund utilizes a fair value hierarchy which prioritizes the inputs to valuation techniques used to measure fair value into three broad levels described below:
— Level 1 – quoted prices in active markets for identical securities
— Level 2 – other significant observable inputs (including quoted prices for similar securities, interest rates, prepayment speeds, credit risk, etc.)
— Level 3 – significant unobservable inputs (including the Fund’s own assumptions in determining the fair value of investments)
Securities held by the Fund (including over-the-counter securities) are valued at the last quoted sale price of the day. Securities held by the Fund that are listed on Nasdaq are valued at the Nasdaq Official Closing Price (“NOCP”). If there is no last reported sale price or NOCP for the day, the Fund values the securities at the mean of the most recent quoted bid and asked prices. Price information on listed securities is taken from the exchange where the security is primarily traded. Generally, securities issued by open-end investment companies are valued using their respective net asset values or public offering prices, as appropriate, for purchase orders placed at the close of the New York Stock Exchange (NYSE). These securities are generally categorized as Level 1 in the hierarchy.
270
Securities for which no market quotations are readily available (including restricted securities), or for which market quotations have become unreliable, are valued in good faith at fair value in accordance with procedures adopted by the Board of Directors/Trustees. These securities are generally categorized as Level 2 in the hierarchy. Fair value pricing may also be used if events that have a significant effect on the value of an investment (as determined in the discretion of the Investment Committee of the Advisor) occur before the net asset value is calculated. When fair value pricing is used, the prices of securities used by the Fund may differ from the quoted or published prices for the same securities on their primary markets or exchanges.
The Fund will also fair value price in the circumstances described below. Generally, trading in foreign securities markets is completed each day at various times prior to the close of the NYSE. For example, trading in the Japanese securities markets is completed each day at the close of the Tokyo Stock Exchange (normally, 11:00 p.m. PT), which is fourteen hours prior to the close of the NYSE (normally, 1:00 p.m. PT) and the time that the net asset value of the Fund is computed. Due to the time differences between the closings of the relevant foreign securities exchanges and the time the Fund prices its shares at the close of the NYSE, the Fund will fair value its foreign investments when it is determined that the market quotations for the foreign investments are either unreliable or not readily available. The fair value prices will attempt to reflect the impact of the U.S. financial markets’ perceptions and trading activities on the Fund’s foreign investments since the last closing prices of the foreign investments were calculated on their primary foreign securities markets or exchanges. For these purposes, the Board of Directors/Trustees of the Fund has determined that movements in relevant indices or other appropriate market indicators, after the close of the Tokyo Stock Exchange or the London Stock Exchange, demonstrate that market quotations may be unreliable. Fair valuation of portfolio securities may occur on a daily basis. The fair value pricing by the Fund utilizes data furnished by an independent pricing service (and that data draws upon, among other information, the market values of foreign investments). When the Fund uses fair value pricing, the values assigned to the Fund’s foreign investments may not be the quoted or published prices of the investments on their primary markets or exchanges. Certain foreign equity securities that are fair value adjusted through an independent pricing service which considers statistically relevant trading patterns may periodically move from input valuation Level 2 to input valuation Level 1 when not meeting the fair value adjustment trigger requirements.
Futures contracts held by the Fund are valued using the settlement price established each day on the exchange on which they are traded. These valuations are generally categorized as Level 1 in the hierarchy.
A summary of the inputs used to value the Fund’s investments by each major security type, industry and/or country is disclosed at the end of the Summary Schedule of Portfolio Holdings. The inputs or methodology used for valuing securities are not necessarily an indication of the risk associated with investing in those securities.
The Fund did not have any significant transfers between Level 1 and Level 2 during the year ended October 31, 2010.
2. Foreign Currency Translation: Securities and other assets and liabilities of the Fund whose values are initially expressed in foreign currencies are translated to U.S. dollars using the mean between the most recently quoted bid and asked prices for the U.S. dollar as quoted by generally recognized reliable sources. Dividend and interest income and certain expenses are translated to U.S. dollars at the rate of exchange on their respective accrual dates. Receivables and payables denominated in foreign currencies are marked to market based on daily exchange rates and exchange gains or losses are realized upon ultimate receipt or disbursement.
The Fund does not isolate the effect of fluctuations in foreign exchange rates from the effect of fluctuations in the market prices of securities held whether realized or unrealized.
Realized gains or losses on foreign currency transactions represent net foreign exchange gains or losses from the disposition of foreign currencies, currency gains or losses realized between the trade and settlement dates on securities transactions, and the difference between amounts of interest, dividends and foreign withholding taxes recorded on the Fund’s books and the U.S. dollar equivalent amounts actually received or paid.
3. Deferred Compensation Plan: Each eligible Director of the Fund may elect participation in the Deferred Compensation Plan (the “Plan”). Under the Plan, effective January 1, 2002, such Directors may defer payment of all or a portion of their total fees earned as a Director. These deferred amounts may be treated as though such
271
amounts had been invested in shares of the following funds: U.S. Large Cap Value Portfolio; U.S. Core Equity 1 Portfolio; U.S. Core Equity 2 Portfolio; U.S. Vector Equity Portfolio; U.S. Micro Cap Portfolio; DFA International Value Portfolio; International Core Equity Portfolio; Emerging Markets Portfolio; Emerging Markets Core Equity Portfolio; and/or DFA Two-Year Global Fixed Income Portfolio. Contributions made under the Plan and the change in unrealized appreciation (depreciation) and income are included in Directors’/Trustees’ Fees & Expenses. At October 31, 2010, the total liability for deferred compensation to Directors is included in Accrued Expenses and Other Liabilities on the Statement of Assets and Liabilities in the amount of $192 (in thousands).
Each Director has the option to receive their distribution of proceeds in one of the following methods: lump sum; annual installments over a period of agreed upon years; or quarterly installments over a period of agreed upon years. Each Director shall have the right in a notice of election to defer compensation (the “Notice”) to elect to defer the receipt of the Director’s deferred compensation until a date specified by such Director in the Notice, which date may not be sooner than the earlier of: (i) the first business day of January following the year in which such Director ceases to be a member of the Board of the Fund; and (ii) five years following the effective date of the Director’s first deferral election. If a Director who elects to defer fees fails to designate in the Notice a time or date as of which payment of the Director’s deferred fee account shall commence, payment of such amount shall commence as of the first business day of January following the year in which the Director ceases to be a member of the Board of the Fund (unless the Director files an amended Notice selecting a different distribution date). Robert C. Merton resigned from the Board of the Fund on December 1, 2009 and received a lump sum payment of the proceeds of his deferred fee account on January 4, 2010 in the amount of $241,764. As of October 31, 2010, no other Directors have requested or received a distribution of proceeds of a deferred fee account.
4. Other: Security transactions are accounted for as of the trade date. Costs used in determining realized gains and losses on the sale of investment securities are on the basis of identified cost. Dividend income and distributions to shareholders are recorded on the ex-dividend date. Distributions received on securities that represent a return of capital or capital gain are recorded as a reduction of cost of investments or as a realized gain, respectively. The Fund estimates the character of distributions received that may be considered return of capital distributions. Interest income is recorded on the accrual basis. Expenses directly attributable to the Fund are directly charged.
The Fund may be subject to taxes imposed by countries in which it invests, with respect to its investment in issuers existing or operating in such countries. Such taxes are generally based on income earned or repatriated and capital gains realized on the sale of such investments. The Fund accrues such taxes when the related income or capital gains are earned or throughout the holding period. Some countries require governmental approval for the repatriation of investment income, capital or the proceeds of sales earned by foreign investors. In addition, if there is a deterioration in a country’s balance of payments or for other reasons, a country may impose temporary restrictions on foreign capital remittances abroad.
The Fund’s investments in Chile are subject to governmental taxes on investment income. Such taxes are due when currencies are repatriated from the country. The Fund accrues for taxes on income as the income is earned.
The Fund’s investments in Thailand are subject to a 15% governmental capital gains tax. Such taxes are due upon sale of individual securities. The Fund accrues for taxes on the capital gains throughout the holding period based on the unrealized gain of the underlying securities. The Fund is also subject to a 15% governmental capital gains tax on short-term capital gains for investments in India. Such taxes are due upon sale of individual securities. The taxes for the capital gains are accrued when the capital gains are earned.
C. Investment Advisor:
Dimensional Fund Advisors LP (“Dimensional” or the “Advisor”) provides investment advisory services to the Fund. For the year ended October 31, 2010, the Fund’s advisory services fees were accrued daily and paid monthly to the Advisor based on an effective annual rate of 0.10% of average daily net assets.
272
Fees Paid to Officers and Directors/Trustees:
Certain Officers and Directors/Trustees of the Advisor are also Officers and Directors/Trustees of the Fund; however, such Officers and Directors/Trustees (with the exception of the Chief Compliance Officer (“CCO”)) receive no compensation from the Fund. For the year ended October 31, 2010, the total related amounts paid by the Fund to the CCO were $19 (in thousands). The total related amounts paid by the Fund are included in Other Expenses on the Statement of Operations.
D. Purchases and Sales of Securities:
For the year ended October 31, 2010, the Fund made the following purchases and sales of investment securities, other than short-term securities and U.S. government securities (amounts in thousands):
| | | | |
Purchases | | $ | 2,866,979 | |
Sales | | | 1,412,511 | |
There were no purchases or sales of long-term U.S. government securities.
E. Federal Income Taxes:
No provision for federal income taxes is required since the Series’ are treated as partnerships for Federal income tax purposes. Any net investment income and realized and unrealized gains and losses have been deemed to have been “passed down” to their respective partners.
Some of the Fund’s investments are in securities considered to be “passive foreign investment companies” for which any unrealized appreciation (depreciation) (mark to market) and/or realized gains are required to be included in distributable net investment income for tax purposes. At October 31, 2010, the Fund had cumulative unrealized appreciation (depreciation) (mark to market) of $1,547 (in thousands) to be included in distributable net investment income for federal tax purposes. For the year ended October 31, 2010, realized gains on the sale of passive foreign investment companies totaling $4 (in thousands) have been reclassified from accumulated net realized gains to accumulated net investment income for federal tax purposes.
At October 31, 2010, the total cost and aggregate gross unrealized appreciation and (depreciation) of securities for federal income tax purposes were different from amounts reported for financial reporting purposes (amounts in thousands):
| | | | | | |
Federal Tax Cost | | Unrealized Appreciation | | Unrealized
(Depreciation) | | Net Unrealized Appreciation
(Depreciation) |
$9,616,484 | | $3,784,673 | | $(566,353) | | $3,218,320 |
Accounting for Uncertainty in Income Taxes sets forth a minimum threshold for financial statement recognition of the benefit of a tax position taken or expected to be taken on a tax return. Management has analyzed the Fund’s tax position and has concluded that no provision for income tax is required in the Fund’s financial statements. The Fund is not aware of any tax position for which it is reasonably possible that the total amounts of unrecognized tax benefits will significantly change in the next twelve months. The Fund federal tax returns for the prior three fiscal years remain subject to examination by the Internal Revenue Service.
Effective November 1, 2009, Dimensional Emerging Markets Value Fund (“DEM II”), a master fund in a master-feeder structure with one RIC feeder and other direct client investors has made a “Check-the-Box” election for federal income tax purposes pursuant to Treasury Regulation §301.7701-3, to change their federal entity classifications from a corporation taxable as a regulated investment company to a partnership. DEM II and the Portfolio will maintain their books and records and present their financial statements in accordance with generally accepted accounting principals for investment partnerships. As a result of this election, the master fund is deemed to have distributed all of its assets and liabilities on October 31, 2009 to its shareholders in liquidation of the master fund. Since the master fund has a shareholder owning 80% or more of the fund’s shares, and also has shareholders owning less than 80%,
273
the transaction creates a non-taxable transaction, pursuant to Internal Revenue Code §332, for those owning more than 80%, and a taxable transaction, pursuant to Internal Revenue Code §331, for those shareholders owning less than 80%. Immediately after the deemed liquidation, the shareholders contributed all of the distributed assets and liabilities to a newly formed partnership. The final tax year end of the Master Fund was October 31, 2009.
For federal income tax purposes, pursuant to Code §336(a), the master fund recognizes gain or loss relative to the investment of the less than 80% shareholders as if the master’s investment securities were sold to those shareholders and, pursuant to Code §331, each of those shareholders recognizes gain or loss as if it liquidated its investment in the master. Pursuant to Code §334(a), each of these shareholders will take a fair market value basis in the securities deemed received by them and a new holding period for those securities commences on the deemed liquidation date. In regards to the shareholder owning 80% or more of the master fund, pursuant to Code §332(a), the shareholder will not recognize any gain or loss on the deemed liquidation. However, pursuant to Code §332(c), a portion of the deemed distribution, which otherwise would have been tax-free as discussed above, since it is utilized by the master fund to satisfy its dividends paid deduction for the tax year, must be recognized and treated as a dividend by the 80% or greater shareholder. Pursuant to Code §334(b)(1) and §1223, the 80% or greater shareholder’s basis and holding period in the securities received in liquidation is the same as it was in the possession of the master. As a result of the transaction, Dimensional Emerging Markets Value Fund recognized a $104,402,506 and ($16,523) capital gain and currency loss respectively, for tax year ended October 31, 2009.
F. Financial Instruments:
In accordance with the Fund’s investment objectives and policies, the Fund may invest in certain financial instruments that have off-balance sheet risk in excess of the amounts recognized in the financial statements and concentrations of credit and market risk. These instruments and their significant corresponding risks are described below:
1. Repurchase Agreements: The Fund may purchase certain U.S. Government securities subject to the counterparty’s agreement to repurchase them at an agreed upon date and price. The counterparty will be required on a daily basis to maintain the value of the collateral subject to the agreement at not less than the repurchase price (including accrued interest). Due to a clerical error at the repurchase trading agent from October 29, 2010 through November 1, 2010, the collateral held by the Fund was less than the repurchase price. On November 2, 2010, the additional collateral was posted and the repurchase agreement was fully collateralized. The agreements are conditioned upon the collateral being deposited under the Federal Reserve book-entry system or with the Fund’s custodian or a third party sub-custodian. In the event of default or bankruptcy by the other party to the agreement, retention of the collateral may be subject to legal proceedings. All open repurchase agreements were entered into on October 29, 2010.
2. Foreign Market Risks: Investments in foreign markets may involve certain considerations and risks not typically associated with investments in the United States, including the possibility of future political and economic developments and the level of foreign governmental supervision and regulation of foreign securities markets. These markets are generally smaller, less liquid and more volatile than the major securities markets in the United States. Consequently, acquisition and disposition of securities by the Fund may be inhibited.
Derivative Financial Instruments:
Disclosures on derivative instruments and hedging activities are intended to improve financial reporting for derivative instruments by enabling investors to understand how and why a fund uses derivatives, how derivatives are accounted for and how derivative instruments affect a fund’s results of operations and financial position. Summarized below are the specific types of derivative instruments used by the Fund.
3. Futures Contracts: The Fund may enter into futures contracts to gain market exposure on uninvested cash pending investment in securities or to maintain liquidity to pay redemptions. Upon entering into a futures contract, the Fund deposits cash or pledges U.S. Government securities to a broker, equal to the minimum “initial margin” requirements of the exchange on which the contract is traded. Subsequent payments are received from or paid to the broker each day, based on the daily fluctuation in the market value of the contract. These receipts or
274
payments are known as “variation margin” and are recorded daily by the Fund as unrealized gains or losses until the contracts are closed. When the contracts are closed, the Fund records a realized gain or loss, which is presented in the Statement of Operations as a net realized gain or loss on futures, equal to the difference between the value of the contract at the time it was opened and the value at the time it was closed.
Risks may arise upon entering into futures contracts from potential imperfect price correlations between the futures contracts and the underlying securities, from the possibility of an illiquid secondary market for these instruments and from the possibility that the Fund could lose more than the initial margin requirements. The Fund entering into stock index futures are subject to equity price risk from those futures contracts. Counterparty credit risk related to exchange-traded futures is minimal because the exchange’s clearinghouse, as counterparty to all exchange-traded futures, guarantees the futures against default.
Additional disclosure on derivative instruments is required showing a summary by primary risk exposure of the derivatives instruments’ (i) location in the balance sheet and fair value at period end and (ii) the location in the Statement of Operations and the realized and change in unrealized gain or loss over the reporting period.
At October 31, 2010, the Fund had no outstanding futures contracts.
G. Line of Credit:
The Fund, together with other Dimensional-advised portfolios, has entered into an amended and restated $250 million unsecured discretionary line of credit effective July 8, 2009 with an affiliate of its domestic custodian bank. Each portfolio is permitted to borrow, subject to its investment limitations, up to a maximum of $250 million, as long as total borrowings under the line of credit do not exceed $250 million in the aggregate. Borrowings under the line of credit are charged interest at rates agreed upon by the parties at the time of borrowing. Each portfolio is individually, and not jointly, liable for its particular advances under the line of credit. There is no commitment fee on the unused portion of the line of credit. The agreement for the discretionary line of credit may be terminated by either party at any time. The line of credit is scheduled to expire on June 21, 2011. There were no borrowings by the Fund under this line of credit during the year ended October 31, 2010.
The Fund, together with other Dimensional-advised portfolios, has also entered into an additional $500 million unsecured line of credit effective January 15, 2010 with its international custodian bank. Each portfolio is permitted to borrow, subject to its investment limitations, up to a maximum of $500 million, as long as total borrowings under the line of credit do not exceed $500 million in the aggregate. Each portfolio is individually, and not jointly, liable for its particular advances under the line of credit. Borrowings under the line of credit are charged interest at rates agreed to by the parties at the time of borrowing. There is no commitment fee on the unused portion of the line of credit. The agreement for the line of credit expires on January 15, 2011.
For the year ended October 31, 2010, borrowings by the Fund under this line of credit were as follows (amounts in thousands, except percentage and days):
| | | | | | | | |
Weighted Average Interest Rate | | Weighted Average
Loan Balance | | Number of Days Outstanding | | Interest Expense Incurred | | Maximum Amount
Borrowed During
the Period |
0.87% | | $23,610 | | 32 | | $18 | | $60,454 |
There were no outstanding borrowings by the Fund under this line of credit as of October 31, 2010.
H. Securities Lending:
As of October 31, 2010, the Fund had securities on loan to brokers/dealers, for which the Fund received cash collateral. The Fund invests the cash collateral, as described below, and records a liability for the return of the collateral, during the period the securities are on loan. Loans of securities are required at all times to be secured by collateral equal to at least (i) 100% of the current market value of the loaned securities with respect to securities of the U.S. government or its agencies, (ii) 102% of the current market value of the loaned securities with respect to U.S. securities, and (iii) 105% of the current market value of the loaned securities with respect to foreign securities.
275
However, daily market fluctuations could cause the Fund’s collateral to be lower or higher than the expected thresholds. If this were to occur, the collateral would be adjusted the next business day to ensure adequate collateralization. In the event of default or bankruptcy by the other party to the agreement, realization and/or retention of the collateral may be subject to legal proceedings. If the borrower fails to return loaned securities, and cash collateral being maintained by the borrower is insufficient to cover the value of loaned securities and provided such collateral insufficiency is not the result of investment losses, the lending agent has agreed to pay the amount of the shortfall to the Fund or, at the option of the lending agent, to replace the securities.
Subject to its stated investment policy, the Fund will generally invest the cash collateral received for the loaned securities in The DFA Short Term Investment Fund (the “Money Market Series”), an affiliated registered money market fund advised by the Advisor for which the Advisor receives a management fee of 0.05% of the average daily net assets of the Money Market Series. The Fund also may invest the cash collateral received for the loaned securities in securities of the U.S. government or its agencies, repurchase agreements collateralized by securities of the U.S. government or its agencies, and affiliated and unaffiliated registered and unregistered money market funds. For purposes of this paragraph, agencies include both agency debentures and agency mortgage-backed securities. In addition, the Fund will be able to terminate the loan at any time and will receive reasonable interest on the loan, as well as amounts equal to any dividends, interest or other distributions on the loaned securities. However, dividend income received from loaned securities may not be eligible to be taxed at qualified dividend income rates.
I. Indemnitees; Contractual Obligations:
Under the Fund’s organizational documents, its officers and directors are indemnified against certain liabilities arising out of the performance of their duties to the Fund.
In the normal course of business, the Fund enters into contracts that contain a variety of representations and warranties which provide general indemnification. The Fund’s maximum exposure under these arrangements is unknown as this would involve future claims that may be made against the Fund and/or its affiliates that have not yet occurred. However, based on experience, the Fund expects the risk of loss to be remote.
J. In-Kind Redemptions:
In accordance with guidelines described in the Fund’s prospectus, the Fund may distribute portfolio securities rather than cash as payment for a redemption of Fund shares (in-kind redemption). For financial reporting purposes, the Fund recognizes a gain on in-kind redemptions to the extent the value of the distributed securities on the date of redemption exceeds the cost of those securities. Gains and losses realized on in-kind redemptions are not recognized for tax purposes and are reclassified from undistributed realized gain (loss) to paid-in capital. During the year ended October 31, 2009, the Fund realized $25,938 (in thousands) of net gain.
K. Recently Issued Accounting Standards:
In January 2010, the Financial Accounting Standards Board (“FASB”) issued Accounting Standards Update (“ASU”) No. 2010-06 “Improving Disclosures about Fair Value Measurements.” ASU No. 2010-06 amends FASB Accounting Standards Codification Topic 820, Fair Value Measurements and Disclosures, to require additional disclosures in the roll forward of activity in Level 3 fair value measurements effective for interim and annual reporting periods beginning after December 15, 2010. Management is currently evaluating the impact ASU No. 2010-06 will have on its financial statement disclosures.
276
L. Other
The Fund is subject to claims and suits that arise from time to time in the ordinary course of business (for example, in The Tribune Company Bankruptcy, certain creditors have filed an action against all shareholders of The Tribune Company who tendered shares when the Tribune Company went private in 2007 in a leveraged buy out transaction, seeking the return of all proceeds received by the shareholders). Although management currently believes that resolving claims against us, individually or in aggregate, will not have a material adverse impact on our financial position, our results of operations, or our cash flows, these matters are subject to inherent uncertainties and management’s view of these matters may change in the future.
M. Subsequent Event Evaluations:
Management has evaluated the impact of all subsequent events on the Fund and has determined that there are no subsequent events requiring recognition or disclosure in the financial statements.
277
REPORT OF INDEPENDENT REGISTERED PUBLIC ACCOUNTING FIRM
To the Shareholders and Board of Directors of Dimensional Emerging Markets Value Fund:
In our opinion, the accompanying statement of assets and liabilities, including the summary schedule of portfolio holdings, and the related statements of operations and of changes in net assets and the financial highlights present fairly, in all material respects, the financial position of Dimensional Emerging Markets Value Fund (the “Fund”) at October 31, 2010, the results of its operations for the year then ended, the changes in its net assets and the financial highlights for each of the periods indicated, in conformity with accounting principles generally accepted in the United States of America. These financial statements and financial highlights (hereafter referred to as “financial statements”) are the responsibility of the Fund’s management; our responsibility is to express an opinion on these financial statements based on our audits. We conducted our audits of these financial statements in accordance with the standards of the Public Company Accounting Oversight Board (United States). Those standards require that we plan and perform the audit to obtain reasonable assurance about whether the financial statements are free of material misstatement. An audit includes examining, on a test basis, evidence supporting the amounts and disclosures in the financial statements, assessing the accounting principles used and significant estimates made by management, and evaluating the overall financial statement presentation. We believe that our audits, which included confirmation of securities at October 31, 2010 by correspondence with the custodian, broker and the transfer agent of the investee fund, provide a reasonable basis for our opinion.
PricewaterhouseCoopers LLP
Philadelphia, Pennsylvania
December 22, 2010
278
FUND MANAGEMENT
(Unaudited)
Trustees/Directors
Each Board of Trustees/Directors of The DFA Investment Trust Company Inc. (“DFAITC”), DFA Investment Dimensions Group Inc. (“DFAIDG”), Dimensional Investment Group Inc. (“DIG”) and Dimensional Emerging Markets Value Fund (“DEM”) (each, the “Fund” and collectively, the “Funds”) is responsible for establishing the Funds’ policies and for overseeing the management of the Funds. The Trustees/Directors of the Funds, including all of the disinterested Directors, have adopted written procedures to monitor potential conflicts of interest that might develop between portfolios of the Funds (the “Feeder Portfolios”) that invest in certain series of DFAITC or DEM (the “Master Funds”).
Each Board has two standing committees, an Audit Committee and a Portfolio Performance and Service Review Committee (the “Performance Committee”). The Audit Committee is comprised of George M. Constantinides, Roger G. Ibbotson and Abbie J. Smith. Each member of the Audit Committee is a disinterested Director. The Audit Committee oversees the Fund’s accounting and financial reporting policies and practices, the Fund’s internal controls, the Fund’s financial statements and the independent audits thereof and performs other oversight functions as requested by the Board. The Audit Committee recommends the appointment of each Fund’s independent registered certified public accounting firm and also acts as a liaison between the Fund’s independent registered certified public accounting firm and the full Board. There were two Audit Committee meetings held during the fiscal year ended October 31, 2010.
Each Board’s Performance Committee is comprised of Messrs. Constantinides and Ibbotson, Ms. Smith, John P. Gould and Myron S. Scholes. Each member of the Fund’s Performance Committee is a disinterested Director. The Performance Committee regularly reviews and monitors the investment performance of the Fund’s series and reviews the performance of the Fund’s service providers. There were seven Performance Committee meetings held during the fiscal year ended October 31, 2010.
Certain biographical information for each disinterested Trustee/Director and each interested Trustee/Director of the Funds is set forth in the tables below, including a description of each Trustee/Director’s experience as a Trustee/ Director of the Funds and as a director or trustee of other funds, as well as other recent professional experience.
The statements of additional information (together, “SAI”) of the Funds include additional information about each Trustee/Director. You may obtain copies of the SAI and prospectus of each Fund advised by Dimensional Fund Advisors LP by calling collect (512) 306-7400 or by mailing a request to Dimensional Fund Advisors LP, 6300 Bee Cave Road, Building One, Austin, Texas 78746. Prospectuses are also available at www.dimensional.com.
| | | | | | |
Name, Position with the Fund, Address and Age | | Term of Office1 and Length of Service | | Portfolios within the DFA Fund Complex2
Overseen | | Principal Occupation(s) During Past 5 Years and Other Directorships of Public Companies Held |
Disinterested Trustees/Directors |
George M. Constantinides Director of DFAIDG, DIG and DEM. Trustee of DFAITC. The University of Chicago Booth School of Business 5807 S. Woodlawn Avenue Chicago, IL 60637 Age: 63 | | DFAITC - since 1993 DFAIDG - since 1983 DIG - since 1993 DEM - since 1993 | | 86 portfolios in 4 investment companies | | Leo Melamed Professor of Finance, The University of Chicago Booth School of Business. |
279
| | | | | | |
Name, Position with the Fund, Address and Age | | Term of Office1 and Length of Service | | Portfolios within the DFA Fund Complex2 Overseen | | Principal Occupation(s) During Past 5 Years and
Other Directorships of Public Companies Held |
John P. Gould Director of DFAIDG, DIG and DEM. Trustee of DFAITC. The University of Chicago Booth School of Business 5807 S. Woodlawn Avenue Chicago, IL 60637 Age: 71 | | DFAITC - since 1993 DFAIDG - since 1986 DIG - since 1993 DEM - since 1993 | | 86 portfolios in 4 investment companies | | Steven G. Rothmeier Distinguished Service Professor of Economics, The University of Chicago Booth School of Business (since 1965). Member of the Boards of Milwaukee Mutual Insurance Company (since 1997). Member and Chair, Competitive Markets Advisory Committee, Chicago Mercantile Exchange (futures trading exchange) (since 2004). Formerly, Director of UNext, Inc. (1999-2006). Formerly, Senior Vice-President, Lexecon Inc. (economics, law, strategy and finance consulting) (1994-2004). Trustee, Harbor Fund (registered investment company) (27 Portfolios) (since 1994). |
Roger G. Ibbotson Director of DFAIDG, DIG and DEM. Trustee of DFAITC. Yale School of Management 135 Prospect Street New Haven, CT 06520-8200 Age: 67 | | DFAITC - since 1993 DFAIDG - since 1981 DIG - since 1993 DEM - since 1993 | | 86 portfolios in 4 investment companies | | Professor in Practice of Finance, Yale School of Management (since 1984). Director, BIRR Portfolio Analysis, Inc. (software products) (since 1990). Chairman, CIO and Partner, Zebra Capital Management, LLC (hedge fund manager) (since 2001). Formerly, Chairman, Ibbotson Associates, Inc., Chicago, IL (software data publishing and consulting) (1977-2006). |
Myron S. Scholes Director of DFAIDG, DIG and DEM. Trustee of DFAITC. Platinum Grove Asset Management, L.P. Reckson Executive Park 1100 King Street Building 4 Rye Brook, NY 10573 Age: 69 | | DFAITC - since 1993 DFAIDG - since 1981 DIG - since 1993 DEM - since 1993 | | 86 portfolios in 4 investment companies | | Frank E. Buck Professor Emeritus of Finance, Stanford University (since 1981). Chairman, Platinum Grove Asset Management, L.P. (hedge fund) (formerly, Oak Hill Platinum Partners) (since 1999). Formerly, Managing Partner, Oak Hill Capital Management (private equity firm) (until 2004). Formerly, Director, Chicago Mercantile Exchange (2001-2008). Director, American Century Fund Complex (registered investment companies) (37 Portfolios) (since 1981). |
Abbie J. Smith Director of DFAIDG, DIG and DEM. Trustee of DFAITC. The University of Chicago Booth School of Business 5807 S. Woodlawn Avenue Chicago, IL 60637 Age: 57 | | DFAITC - since 2000 DFAIDG - since 2000 DIG - since 2000 DEM - since 2000 | | 86 portfolios in 4 investment companies | | Boris and Irene Stern Professor of Accounting, The University of Chicago Booth School of Business (since 1980), and Co-Director Investment Research, Fundamental Investment Advisors (hedge fund) (since 2008). Director, HNI Corporation (formerly known as HON Industries Inc.) (office furniture) (since 2000). Director, Ryder System Inc. (transportation, logistics and supply-chain management) (since 2003). Director/ Trustee, UBS Funds (fund complex) (5 portfolios) (since 2008). |
280
| | | | | | |
Name, Position with the Fund, Address and Age | | Term of Office1 and Length of Service | | Portfolios within the DFA Fund Complex2 Overseen | | Principal Occupation(s) During Past 5 Years and Other Directorships of Public Companies Held |
Interested Trustees/Directors* |
David G. Booth Chairman, Director, Co-Chief Executive Officer and President of DFAIDG, DIG and DEM. Chairman, Trustee, Co-Chief Executive Officer and President of DFAITC. 6300 Bee Cave Road, Building One Austin, Texas 78746 Age: 63 | | DFAITC - since 1993 DFAIDG - since 1981 DIG - since 1992 DEM - since 1993 | | 86 portfolios in 4 investment companies | | Chairman, Director/Trustee, President, Co-Chief Executive Officer and, formerly, Chief Executive Officer (until 1/1/2010) and Chief Investment Officer (2003 to 3/30/2007) of the following companies: Dimensional Fund Advisors LP, DFA Securities LLC, Dimensional Emerging Markets Value Fund, DFAIDG, Dimensional Investment Group Inc. and The DFA Investment Trust Company. Chairman, Director, President and Co- Chief Executive Officer of Dimensional Holdings Inc. and formerly Chief Executive Officer (until 1/1/2010) and Chief Investment Officer (until 3/30/2007). Director of Dimensional Fund Advisors Ltd. and formerly, Chief Investment Officer. Director of DFA Australia Limited and formerly, President and Chief Investment Officer. Director of Dimensional Funds PLC and Dimensional Funds II PLC. Limited Partner, Oak Hill Partners (since 2001) and VSC Investors, LLC (since 2007). Trustee, University of Chicago. Trustee, University of Kansas Endowment Association. Formerly, Director, SA Funds (registered investment company). Chairman, Director and Co-Chief Executive Officer of Dimensional Fund Advisors Canada ULC. Director of Dimensional Cayman Commodity Fund I Ltd. Chairman, and President of Dimensional SmartNest LLC and Dimensional SmartNest (U.S.) LLC. |
Eduardo A. Repetto Director, Co-Chief Executive Officer and Chief Investment Officer of DFAIDG, DIG and DEM. Trustee, Co-Chief Executive Officer, Chief Investment Officer and Vice President of DFAITC. 6300 Bee Cave Road, Building One Austin, TX 78746 Age: 43 | | DFAITC - since 2009 DFAIDG - since 2009 DIG - since 2009 DEM - since 2009 | | 86 portfolios in 4 investment companies | | Co-Chief Executive Officer (beginning January 2010), Chief Investment Officer (beginning March 2007) and formerly, Vice President of Dimensional Fund Advisors LP, Dimensional Holdings Inc., DFA Securities LLC, Dimensional Emerging Markets Value Fund, DFAIDG, Dimensional Investment Group Inc., The DFA Investment Trust Company, and Dimensional Fund Advisors Canada ULC; Director of all such entities except Dimensional Fund Advisors LP and DFA Securities LLC. Chief Investment Officer, Vice President and Director of DFA Australia Limited. Director of Dimensional Fund Advisors Ltd., Dimensional Funds PLC and Dimensional Funds II PLC. Director of Dimensional Cayman Commodity Fund I Ltd. |
| 1 | Each Trustee/Director holds office for an indefinite term until his or her successor is elected and qualified. |
| 2 | Each Trustee/Director is a director or trustee of each of the four registered investment companies within the DFA Fund Complex, which includes the Funds. |
| * | Interested Trustees/Directors are described as such because they are deemed to be “interested persons,” as that term is defined under the Investment Company Act of 1940, as amended, due to their positions with Dimensional Fund Advisors LP. |
281
Officers
The name, age, information regarding positions with the Funds and the principal occupation for each officer of the Funds are set forth below. Each officer listed below holds the same office (except as otherwise noted) in the following entities: Dimensional Fund Advisors LP (prior to November 3, 2006, Dimensional Fund Advisors Inc.) (“Dimensional”), DFA Securities Inc., DFAIDG, DIG, DFAITC and DEM (collectively, the “DFA Entities”). The address of each officer is: Dimensional Fund Advisors LP, 6300 Bee Cave Road, Building One, Austin, Texas 78746, unless otherwise indicated.
| | | | |
Name, Position with the Fund and Age | | Term of Office1 and Length of Service | | Principal Occupation(s) During Past 5 Years |
Officers |
April A. Aandal Vice President and Chief Learning Officer Age: 47 | | Since 2008 | | Vice President of all the DFA Entities. Chief Learning Officer of Dimensional (since September 2008). Formerly, Regional Director of Dimensional (2004-2008); Vice President of Professional Development at Assante Asset Management (June 2002-January 2005). |
Darryl D. Avery Vice President Age: 44 | | Since 2005 | | Vice President of all the DFA Entities. From June 2002 to January 2005, institutional client service representative of Dimensional. |
Arthur H. Barlow Vice President Age: 54 | | Since 1993 | | Vice President of all the DFA Entities. Formerly, Vice President of DFA Australia Limited and Dimensional Fund Advisors Ltd. |
Scott A. Bosworth Vice President Age: 41 | | Since 2007 | | Vice President of all the DFA Entities. Regional Director of Dimensional (since November 1997). |
Valerie A. Brown Vice President and Assistant Secretary Age: 43 | | Since 2001 | | Vice President and Assistant Secretary of all the DFA Entities, DFA Australia Limited, Dimensional Fund Advisors Ltd., and since June 2003, Dimensional Fund Advisors Canada ULC. |
David P. Butler Vice President Age: 46 | | Since 2007 | | Vice President of all the DFA Entities. Director of Global Financial Services of Dimensional (since 2008). Formerly, Regional Director of Dimensional Fund Advisors LP (January 1995 to January 2005). |
Joseph H. Chi Vice President Age: 44 | | Since 2009 | | Vice President of all the DFA Entities. Portfolio Manager for Dimensional Fund Advisors LP (since October 2005). Prior to October 2005, Corporate Counsel at Hewitt Associates (July 2002-August 2005). |
Stephen A. Clark Vice President Age: 38 | | Since 2004 | | Vice President of all the DFA Entities. Formerly, Portfolio Manager of Dimensional (April 2001-April 2004). |
Robert P. Cornell Vice President Age: 61 | | Since 2007 | | Vice President of all the DFA Entities. Regional Director of Financial Services Group of Dimensional (since August 1993). |
Christopher S. Crossan Vice President and Chief Compliance Officer Age: 44 | | Since 2004 | | Vice President and Chief Compliance Officer of all the DFA Entities. |
James L. Davis Vice President Age: 53 | | Since 1999 | | Vice President of all the DFA Entities. Formerly, Vice President of DFA Australia Limited and Dimensional Fund Advisors Ltd. |
Robert T. Deere Vice President Age: 53 | | Since 1994 | | Vice President of all the DFA Entities and DFA Australia Limited. |
Peter F. Dillard Vice President Age: 38 | | Since 2010 | | Vice President of all the DFA Entities. Research Associate for Dimensional (since August 2008). Formerly, Research Assistant for Dimensional from April 2006-August 2008. Prior to April 2006, Manager at Hilton Hotels Corp. (September 2004-April 2006). |
282
| | | | |
Name, Position with the Fund and Age | | Term of Office1 and Length of Service | | Principal Occupation(s) During Past 5 Years |
Robert W. Dintzner Vice President Age: 40 | | Since 2001 | | Vice President of all the DFA Entities. |
Beth Ann Dranguet Vice President Age: 40 | | Since 2010 | | Vice President of all the DFA Entities. Counsel for Dimensional (since July 2007). Formerly, Associate at Vinson & Elkins LLP (September 1999-July 2007). |
Kenneth N. Elmgren Vice President Age: 56 | | Since 2007 | | Vice President of all the DFA Entities. Formerly, Managing Principal of Beverly Capital (May 2004 to September 2006). |
Richard A. Eustice Vice President and Assistant Secretary Age: 45 | | Since 1998 | | Vice President and Assistant Secretary of all the DFA Entities and DFA Australia Limited. Chief Operating Officer of Dimensional Fund Advisors Ltd. (since July 2008). Formerly, Vice President of Dimensional Fund Advisors Ltd. |
Eugene F. Fama, Jr. Vice President Age: 49 | | Since 1993 | | Vice President of all the DFA Entities. Formerly, Vice President of DFA Australia Limited and Dimensional Fund Advisors Ltd. |
Gretchen A. Flicker Vice President Age: 39 | | Since 2004 | | Vice President of all the DFA Entities. Prior to April 2004, institutional client service representative of Dimensional. |
Jed S. Fogdall Vice President Age: 36 | | Since 2008 | | Vice President of all the DFA Entities. Portfolio Manager for Dimensional (since September 2004). Prior to September 2004, Staff Engineer at the Boeing Company (1997-2004). |
Jeremy P. Freeman Vice President Age: 39 | | Since 2009 | | Vice President of all the DFA Entities. Senior Technology Manager for Dimensional Fund Advisors LP (since June 2006). Formerly, Principal at AIM Investments/Amvescap PLC (now Invesco) (June 1998-June 2006). |
Mark R. Gochnour Vice President Age: 43 | | Since 2007 | | Vice President of all the DFA Entities. Regional Director of Dimensional. |
Henry F. Gray Vice President Age: 43 | | Since 2000 | | Vice President of all the DFA Entities. Prior to July 2000, Portfolio Manager of Dimensional. Formerly, Vice President of DFA Australia Limited. |
John T. Gray Vice President Age: 36 | | Since 2007 | | Vice President of all the DFA Entities. Formerly, Regional Director of Dimensional (January 2005 to February 2007). |
Joel H. Hefner Vice President Age: 42 | | Since 2007 | | Vice President of all the DFA Entities. Regional Director of Dimensional (since June 1998). |
Julie C. Henderson Vice President and Fund Controller Age: 36 | | Since 2005 | | Vice President and Fund Controller of all the DFA Entities. Formerly, Senior Manager at PricewaterhouseCoopers LLP (July 1996 to April 2005). |
Kevin B. Hight Vice President Age: 42 | | Since 2005 | | Vice President of all the DFA Entities. Formerly, Regional Director of Dimensional (since March 2003 to March 2005). |
Christine W. Ho Vice President Age: 42 | | Since 2004 | | Vice President of all the DFA Entities. Prior to April 2004, Assistant Controller of Dimensional. |
Jeff J. Jeon Vice President Age: 36 | | Since 2004 | | Vice President of all the DFA Entities. Counsel for Dimensional (since September 2001). |
283
| | | | |
Name, Position with the Fund and Age | | Term of Office1 and Length of Service | | Principal Occupation(s) During Past 5 Years |
Patrick M. Keating Vice President Age: 55 | | Since 2003 | | Vice President of all the DFA Entities and Chief Operating Officer of Dimensional. Director, Vice President and Chief Privacy Officer of Dimensional Fund Advisors Canada ULC. Director of DFA Australia Limited. |
David M. Kershner Vice President Age: 39 | | Since 2010 | | Vice President of all the DFA Entities. Portfolio Manager for Dimensional (since June 2004). |
Joseph F. Kolerich Vice President Age: 38 | | Since 2004 | | Vice President of all the DFA Entities. Portfolio Manager for Dimensional (since April 2001). |
Michael F. Lane Vice President Age: 43 | | Since 2004 | | Vice President of all the DFA Entities. Formerly, Vice President of Advisor Services at TIAA-CREF (July 2001 to September 2004). |
Kristina M. LaRusso Vice President Age: 35 | | Since 2006 | | Vice President of all DFA Entities. Formerly, Operations Supervisor of Dimensional (March 2003 to December 2006). |
Juliet Lee Vice President Age: 39 | | Since 2005 | | Vice President of all the DFA Entities. Human Resources Manager of Dimensional (since January 2004). |
Apollo D. Lupescu Vice President Age: 41 | | Since 2009 | | Vice President of all the DFA Entities. Regional Director for Dimensional (since February 2004). |
Kenneth M. Manell Vice President Age: 37 | | Since 2010 | | Vice President of all the DFA Entities. Counsel for Dimensional (since September 2006). Formerly, Assistant General Counsel at Castle & Cooke (January 2004-September 2006). |
Aaron M. Marcus Vice President & Head of Global Human Resources Age: 40 | | Since 2008 | | Vice President and Head of Global Human Resources of Dimensional. Formerly, Global Head of Recruiting and Vice President of Goldman Sachs & Co. (June 2006 to January 2008); Global Co-Head of HR of the Equities & FICC Division, and Vice President of Goldman Sachs & Co. (May 2005 to May 2006); Head of Americas Campus Recruiting and Vice President of Goldman Sachs & Co. (April 2003 to May 2005). |
David R. Martin Vice President, Chief Financial Officer and Treasurer Age: 53 | | Since 2007 | | Vice President, Chief Financial Officer and Treasurer of all the DFA Entities. Director, Vice President, Chief Financial Officer and Treasurer of Dimensional Fund Advisors Ltd. and DFA Australia Limited. Chief Financial Officer, Treasurer, and Vice President of Dimensional Fund Advisors Canada ULC. Director of Dimensional Funds PLC and Dimensional Funds II PLC. Formerly, Executive Vice President and Chief Financial Officer of Janus Capital Group Inc. (June 2005 to March 2007); Senior Vice President of Finance at Charles Schwab & Co., Inc. (March 1999 to May 2005). |
Catherine L. Newell Vice President and Secretary Age: 46 | | Vice President since 1997 and Secretary since 2000 | | Vice President and Secretary of all the DFA Entities. Director, Vice President and Secretary of DFA Australia Limited and Dimensional Fund Advisors Ltd. (since February 2002, April 1997 and May 2002, respectively). Vice President and Secretary of Dimensional Fund Advisors Canada ULC (since June 2003). Director, Dimensional Funds PLC and Dimensional Funds II PLC (since 2002 and 2006, respectively). Formerly, Assistant Secretary of all DFA Entities, DFA Australia Limited and Dimensional Fund Advisors Ltd. |
Christian A. Newton Vice President Age: 35 | | Since 2009 | | Vice President of all DFA Entities. Web Services Manager for Dimensional Fund Advisors LP (Since January 2008). Formerly Design Manager (2005-2008) and Web Developer (2002-2005) of Dimensional Fund Advisors LP. |
284
| | | | |
Name, Position with the Fund and Age | | Term of Office1 and Length of Service | | Principal Occupation(s) During Past 5 Years |
Carolyn L. O Vice President Age: 36 | | Since 2010 | | Vice President of all the DFA Entities. Counsel for Dimensional (since September 2007). Prior to September 2007, Associate at K&L Gates LLP (January 2004-September 2007). |
Gerard K. O’Reilly Vice President Age: 33 | | Since 2007 | | Vice President of all the DFA Entities. Formerly, Research Associate of Dimensional Fund Advisors LP (2004 to 2006); Research Assistant in PhD program, Aeronautics Department California Institute of Technology (1998 to 2004). |
Daniel C. Ong Vice President Age: 36 | | Since 2009 | | Vice President of all the DFA Entities. Portfolio Manager for Dimensional Fund Advisors LP (since July 2005). Prior to 2005, Graduate Student at the University of Chicago Booth School of Business (2003-2005). |
Kyle K. Ozaki Vice President Age: 32 | | Since 2010 | | Vice President of all the DFA Entities. Senior Compliance Officer for Dimensional (since Januay 2008). Formerly, Compliance Officer (February 2006-December 2007) and Compliance Analyst (August 2004-January 2006) for Dimensional. |
Carmen E. Palafox Vice President Age: 36 | | Since 2006 | | Vice President of all the DFA Entities. Operations Manager of Dimensional Fund Advisors LP (since May 1996). |
Sonya K. Park Vice President Age: 38 | | Since 2005 | | Vice President of all the DFA Entities. From February 2002 to January 2005, institutional client service representative of Dimensional. |
David A. Plecha Vice President Age: 49 | | Since 1993 | | Vice President of all the DFA Entities, DFA Australia Limited and Dimensional Fund Advisors Ltd |
Theodore W. Randall Vice President Age: 37 | | Since 2008 | | Vice President of all the DFA Entities. Formerly, Research Associate of Dimensional (2006-2008). Systems Developer of Dimensional (2001-2006). |
L. Jacobo Rodriguez Vice President Age: 39 | | Since 2005 | | Vice President of all the DFA Entities. From August 2004 to July 2005, institutional client service representative of Dimensional. Formerly, Financial Services Analyst, Cato Institute (September 2001 to June 2004); Book Review Editor, Cato Journal, Cato Institute (May 1996 to June 2004). |
Julie A. Saft Vice President Age: 51 | | Since 2010 | | Vice President of all the DFA Entities. Client Systems Manager for Dimensional (since July 2008). Formerly, Senior Manager at Vanguard (November 1997-July 2008). |
David E. Schneider Vice President Age: 64 | | Since 2001 | | Vice President of all the DFA Entities. Currently, Director of Institutional Services. |
Walid A. Shinnawi Vice President Age: 48 | | Since 2010 | | Vice President of all the DFA Entities. Regional Director for Dimensional (since March 2006). Formerly, Senior Manager at Moody’s KMV (1999-March 2006). |
Bruce A. Simmons Vice President Age: 45 | | Since 2009 | | Vice President of all the DFA Entities. Investment Operations Manager for Dimensional Fund Advisors LP (since May 2007). Formerly, Vice President Client and Fund Reporting at Mellon Financial (September 2005-May 2007); Vice President Business Development at CUADPRO Marketing (July 2003-September 2005). |
Edward R. Simpson Vice President Age: 42 | | Since 2007 | | Vice President of all the DFA Entities. Regional Director of Dimensional (since December 2002). |
Bryce D. Skaff Vice President Age: 35 | | Since 2007 | | Vice President of all the DFA Entities. Formerly, Regional Director of Dimensional (December 1999 to January 2007). |
Grady M. Smith Vice President Age: 54 | | Since 2004 | | Vice President of all the DFA Entities. Prior to April 2004, Portfolio Manager of Dimensional. |
285
| | | | |
Name, Position with the Fund and Age | | Term of Office1 and Length of Service | | Principal Occupation(s) During Past 5 Years |
Carl G. Snyder Vice President Age: 47 | | Since 2000 | | Vice President of all the DFA Entities. Formerly, Vice President of DFA Australia Limited. |
Lawrence R. Spieth Vice President Age: 62 | | Since 2004 | | Vice President of all the DFA Entities. Prior to April 2004, Regional Director of Dimensional. |
Bradley G. Steiman Vice President Age: 37 | | Since 2004 | | Vice President of all the DFA Entities and Director and Vice President of Dimensional Fund Advisors Canada ULC. |
Robert C. Trotter Vice President Age: 52 | | Since 2009 | | Vice President of all the DFA Entities. Senior Manager Technology for Dimensional Fund Advisors LP (since March 2007). Formerly, Director of Technology at AMVESCAP (2002-2007). |
Karen E. Umland Vice President Age: 44 | | Since 1997 | | Vice President of all the DFA Entities, DFA Australia Limited, Dimensional Fund Advisors Ltd., and Dimensional Fund Advisors Canada ULC. |
Brian J. Walsh Vice President Age: 40 | | Since 2009 | | Vice President of all the DFA Entities. Portfolio Manager for Dimensional Fund Advisors LP (since 2004). Formerly, Trader for Dimensional Fund Advisors LP (1997-2004). |
Weston J. Wellington Vice President Age: 59 | | Since 1997 | | Vice President of all the DFA Entities. Formerly, Vice President of DFA Australia Limited. |
Ryan J. Wiley Vice President Age: 34 | | Since 2007 | | Vice President of all the DFA Entities. Senior Trader of Dimensional. Formerly, Portfolio Manager (2006 to 2007); Trader (2001 to 2006). |
Paul E. Wise Vice President Age: 55 | | Since 2005 | | Vice President of all the DFA Entities. Chief Technology Officer for Dimensional (since 2004). Formerly, Principal of Turnbuckle Management Group (January 2002 to August 2004). |
| 1 | Each officer holds office for an indefinite term at the pleasure of the Boards of Trustees/Directors and until his or her successor is elected and qualified. |
286
VOTING PROXIES ON FUND PORTFOLIO SECURITIES
A description of the policies and procedures that the Fund and the Trust use in voting proxies relating to securities held in the portfolios is available without charge, upon request, by calling collect: (512) 306-7400. Information regarding how the Advisor votes these proxies is available from the EDGAR database on the SEC’s website at http://www.sec.gov and from the Advisor’s website at http://www.dimensional.com and reflects the twelve-month period beginning July 1st and ending June 30th.
287
NOTICE TO SHAREHOLDERS
(Unaudited)
For shareholders that do not have an October 31, 2010 tax year end, this notice is for informational purposes only. For shareholders with an October 31, 2010 tax year end, please consult your tax advisor as to the pertinence of this notice. For the fiscal year November 1, 2009 to October 31, 2010, each Portfolio is designating the following items with regard to distributions paid during the fiscal year. All designations are based on financial information available as of the date of this annual report and, accordingly are subject to change. For each item, it is the intention of the Portfolio to designate the maximum amount permitted under the Internal Revenue Code and the regulations thereunder.
| | | | | | | | | | | | | | | | | | | | | | | | | | |
DFA Investment Dimensions Group Inc. | | Net
Investment
Income
Distributions | | Short-Term
Capital Gain
Distributions | | Long-Term
Capital Gain
Distributions | | Return
of
Capital | | Tax-Exempt
Interest | | Total
Distributions | | Qualifying
For Corporate
Dividends
Received
Deduction(1) | | Qualifying
Dividend
Income(2) | | U.S.
Government
Interest(3) | | Foreign
Tax
Credit(4) | | Foreign
Source
Income(5) | | Qualifying
Interest
Income(6) | | Qualifying
Short-
Term
Capital Gain(7) |
Enhanced U.S. Large Company Portfolio | | 100% | | — | | — | | — | | — | | 100% | | — | | — | | 5% | | — | | — | | 100% | | 100% |
U.S. Large Cap Value Portfolio | | 100% | | — | | — | | — | | — | | 100% | | 100% | | 100% | | — | | — | | — | | 100% | | 100% |
U.S. Targeted Value Portfolio | | 100% | | — | | — | | — | | — | | 100% | | 100% | | 100% | | — | | — | | — | | 100% | | 100% |
U.S. Small Cap Value Portfolio | | 100% | | — | | — | | — | | — | | 100% | | 100% | | 100% | | — | | — | | — | | 100% | | 100% |
U.S. Core Equity 1 Portfolio | | 100% | | — | | — | | — | | — | | 100% | | 100% | | 100% | | — | | — | | — | | 100% | | 100% |
U.S. Core Equity 2 Portfolio | | 100% | | — | | — | | — | | — | | 100% | | 100% | | 100% | | — | | — | | — | | 100% | | 100% |
U.S. Vector Equity Portfolio | | 100% | | — | | — | | — | | — | | 100% | | 100% | | 100% | | — | | — | | — | | 100% | | 100% |
U. S Small Cap Portfolio | | 100% | | — | | — | | — | | — | | 100% | | 100% | | 100% | | — | | — | | — | | 100% | | 100% |
U.S. Micro Cap Portfolio | | 100% | | — | | — | | — | | — | | 100% | | 100% | | 100% | | — | | — | | — | | 100% | | 100% |
DFA Real Estate Securities Portfolio | | 100% | | — | | — | | — | | — | | 100% | | 100% | | 100% | | — | | — | | — | | 100% | | 100% |
Large Cap International Portfolio | | 100% | | — | | — | | — | | — | | 100% | | 100% | | 100% | | — | | 4% | | 110% | | 100% | | 100% |
International Core Equity Portfolio | | 100% | | — | | — | | — | | — | | 100% | | 100% | | 100% | | — | | 4% | | 138% | | 100% | | 100% |
International Small Company Portfolio | | 100% | | — | | — | | — | | — | | 100% | | 100% | | 100% | | — | | 3% | | 136% | | 100% | | 100% |
Japanese Small Company Portfolio | | 100% | | — | | — | | — | | — | | 100% | | 100% | | 100% | | — | | 7% | | 125% | | 100% | | 100% |
Asia Pacific Small Company Portfolio | | 100% | | — | | — | | — | | — | | 100% | | 100% | | 100% | | — | | 1% | | 125% | | 100% | | 100% |
United Kingdom Small Company Portfolio | | 100% | | — | | — | | — | | — | | 100% | | 100% | | 100% | | — | | — | | — | | 100% | | 100% |
Continental Small Company Portfolio | | 100% | | — | | — | | — | | — | | 100% | | 100% | | 100% | | — | | 6% | | 144% | | 100% | | 100% |
DFA International Real Estate Securities Portfolio | | 100% | | — | | — | | — | | — | | 100% | | 100% | | 100% | | — | | 1% | | 73% | | 100% | | 100% |
DFA Global Real Estate Securities Portfolio | | 100% | | — | | — | | — | | — | | 100% | | 100% | | 100% | | — | | — | | — | | 100% | | 100% |
DFA International Small Cap Value Portfolio | | 94% | | — | | 6% | | — | | — | | 100% | | 100% | | 100% | | — | | 4% | | 150% | | 100% | | 100% |
International Vector Equity Portfolio | | 99% | | — | | 1% | | — | | — | | 100% | | 100% | | 100% | | — | | 4% | | 136% | | 100% | | 100% |
Emerging Markets Portfolio | | 46% | | 3% | | 51% | | — | | — | | 100% | | 100% | | 100% | | — | | 6% | | 134% | | 100% | | 100% |
Emerging Markets Small Cap Portfolio | | 93% | | — | | 7% | | — | | — | | 100% | | 100% | | 100% | | — | | 6% | | 153% | | 100% | | 100% |
Emerging Markets Value Portfolio | | 36% | | 21% | | 43% | | — | | — | | 100% | | 100% | | 100% | | — | | 4% | | 101% | | 100% | | 100% |
Emerging Markets Core Equity Portfolio | | 100% | | — | | — | | ��� | | — | | 100% | | 100% | | 100% | | — | | 6% | | 158% | | 100% | | 100% |
Dimensional Investment Group Inc. | | | | | | | | | | | | | | | | | | | | | | | | | | |
DFA International Value Portfolio | | 100% | | — | | — | | — | | — | | 100% | | 100% | | 100% | | — | | 3% | | 126% | | 100% | | 100% |
U.S. Large Company Portfolio | | 100% | | — | | — | | — | | — | | 100% | | 100% | | 100% | | — | | — | | — | | 100% | | 100% |
| (1) | Qualifying dividends represent dividends which qualify for the corporate dividends received deduction and is reflected as a percentage of ordinary Income distributions (the total of short-term capital gain and net investment income distributions). |
| (2) | The percentage in this column represents the amount of “Qualifying Dividend Income” as created by the Jobs and Growth Tax Relief Reconciliation Act of 2003 and is reflected as a percentage of ordinary income distributions (the total of short-term capital gain and net investment income distributions). Please note that these percentages are designated only, refer to your 1099 for actual qualified dividend income. |
| (3) | “U.S. Government Interest” represents the amount of interest that was derived from direct U.S. Government obligations and distributed during the fiscal year. This amount is reflected as a percentage of total ordinary income distributions (the total of short-term capital gain and net investment income distributions). Generally, interest from direct U.S. Government obligations is exempt from state income tax. However, for residents of California, Connecticut and New York, the statutory threshold requirements were satisfied for DFA Five-Year Government Portfolio, DFA Intermediate Government Fixed Income Portfolio, and DFA Inflation-Protected Securities Portfolio to permit exemption of these amounts from state income for these funds. |
| (4) | “Foreign Tax Credit” represents dividends which qualify for the foreign tax credit pass through and is reflected as a percentage of investment company taxable income (the total of short-term capital gain and net investment income distributions). |
| (5) | “Foreign Source Income” represents the portion of dividends derived from foreign sources, and is reflected as a percentage of investment company taxbale income (the total of short-term capital gain and net investment income distributions). |
| (6) | The percentage in this column represents the amount of “Qualifying Interest Income” as created by The American Jobs Creation Act of 2004. The information is reflected as a percentage ordinary income distributions (the total of short-term capital gain and net investment income distributions). |
| (7) | The percentage in this column represents the amount of “Qualifying Short-Term Capital Gain” as created by The American Jobs Creation Act of 2004. The information is reflected as a percentage of ordinary income distributions (the total of short-term capital gain and net investment income distributions). |
288
[THIS PAGE INTENTIONALLY LEFT BLANK]
[THIS PAGE INTENTIONALLY LEFT BLANK]
| | |
 | | DFA103110-001A |
The Registrant has adopted, as of the end of the period covered by this Form N-CSR (the “Report”), a code of ethics that applies to the Registrant’s principal executive officer and principal financial officer (the “Code of Business Ethics”). The Registrant has not made any substantive amendments to the Code of Business Ethics during the period covered by this Report. The Registrant also has not granted any waiver from any provisions of the Code of Business Ethics during the period covered by this Report. A copy of the Code of Business Ethics is filed as an exhibit to this Report.
| ITEM 3. | AUDIT COMMITTEE FINANCIAL EXPERT. |
The Registrant’s Board of Trustees has determined that Abbie J. Smith possesses the technical attributes to qualify as an “audit committee financial expert” serving on the Registrant’s Audit Committee and has designated Ms. Smith as the “audit committee financial expert.” Ms. Smith
earned a Ph.D. in Accounting, and has taught Accounting at the graduate level since 1980. Ms. Smith’s education and career have provided her with an understanding of generally accepted accounting principles and financial statements; the ability to assess the general application of such principles in connection with the accounting for estimates, accruals and reserves; and experience preparing, analyzing and evaluating financial statements that present a breadth and level of complexity of issues that can reasonably be expected to be raised by the Registrant’s financial statements. In addition, Ms. Smith has served on the boards of directors and audit committees of entities other than the Registrant. Ms. Smith is independent under the standards set forth in Item 3 of Form N-CSR.
| | | | |
ITEM 4. PRINCIPAL ACCOUNTANT FEES AND SERVICES. |
|
(a) Audit Fees |
| |
| | Fiscal Year Ended October 31, 2010: $23,082 |
| |
| | Fiscal Year Ended October 31, 2009: $21,565 |
|
(b) Audit-Related Fees |
| | |
| | Fees for Registrant | | Fiscal Year Ended October 31, 2010: $1,301 |
| | |
| | | | Fiscal Year Ended October 31, 2009: $1,172 |
|
For fiscal years ended October 31, 2010 and October 31, 2009, Audited-Related Fees included fees for services related to limited procedures performed in connection with the production of the Registrant’s semi-annual financial statements. |
| |
| | Audit-Related Fees required to be approved pursuant to paragraph (c)(7)(ii) of Rule 2-01 of Regulation S-X |
| | |
| | | | Fiscal Year Ended October 31, 2010: $159,000 |
| | |
| | | | Fiscal Year Ended October 31, 2009: $158,695 |
|
For the fiscal years ended October 31, 2010 and October 31, 2009, Audit-Related Fees required to be approved pursuant to paragraph (c)(7)(ii) of Rule 2-01 of Regulation S-X included fees for services rendered in connection with the issuance of a Type II SAS 70 over controls at the Registrant’s investment adviser. |
|
(c) Tax Fees |
| | |
| | Fees for Registrant | | Fiscal Year Ended October 31, 2010: $17,216 |
| | |
| | | | Fiscal Year Ended October 31, 2009: $16,557 |
|
Tax Fees included, for the fiscal years ended October 31, 2010 and October 31, 2009, fees for tax services in connection with the Registrant’s excise tax calculations, limited review of the Registrant’s applicable tax returns and capital gains tax services in India. |
|
There were no Tax Fees required to be approved pursuant to paragraph (c)(7)(ii) of Rule 2-01 of Regulation S-X during the fiscal years indicated above. |
|
(d) All Other Fees |
| | |
| | Fees for Registrant | | Fiscal Year Ended October 31, 2010: $0 |
| | |
| | | | Fiscal Year Ended October 31, 2009: $0 |
There were no “All Other Fees” required to be approved pursuant to paragraph (c)(7)(ii) of Rule 2-01 of Regulation S-X during the fiscal years indicated above.
(e)(1) Audit Committee’s Pre-Approval Policies and Procedures
Pre-Approval Policies and Procedures
as adopted by the
Audit Committees
of
DFA Investment Dimensions Group Inc.
Dimensional Emerging Markets Value Fund
Dimensional Investment Group Inc.
The DFA Investment Trust Company
(together, the “Funds”)
The Sarbanes-Oxley Act of 2002 (the “Act”) and the rules (the “Rules”) adopted by the U.S. Securities and Exchange Commission (the “SEC”) require that the Funds’ Audit Committees (together, the “Committee”) pre-approve all audit services and non-audit services provided to the Funds by their independent registered public accounting firm (the “Auditor”). The Act and the Rules also require that the Committee pre-approve all non-audit services provided by the Auditor to Dimensional Fund Advisors LP (“Dimensional”), the Funds’ investment advisor, and to affiliates of Dimensional that provide ongoing services to the Funds (with Dimensional, together the “Service Affiliates”) if the services directly impact the Funds’ operations and financial reporting.
The following policies and procedures govern the ways in which the Committee will pre-approve audit and various types of non-audit services that the Auditor provides to the Funds and to Service Affiliates. These policies and procedures do not apply in the case of audit services that the Auditor provides to Service Affiliates, nor do they apply to services that an audit firm other than the Auditor provides to such entities.
These policies and procedures comply with the requirements for pre-approval, but also provide mechanisms by which management of the Funds may request and secure pre-approval of audit and non-audit services in an orderly manner with minimal disruption to normal business operations. Pre-approval of non-audit services may be achieved through a combination of the procedures described in Sections C and D below.
| | 1. | The Committee must pre-approve all audit services and non-audit services that the Auditor provides to the Funds. |
| | 2. | The Committee must pre-approve any engagement of the Auditor to provide non-audit services to any Service Affiliate during the period of the Auditor’s engagement to provide audit services to the Funds, if the non- audit services to the Service Affiliate directly impact the Funds’ operations and financial reporting. |
| | B. | Pre-Approval of Audit Services to the Funds |
| | 1. | The Committee shall approve the engagement of an independent registered public accounting firm to certify the Funds’ financial statements for each fiscal year (the “Engagement”). The approval of the Engagement shall not be delegated to a Designated Member (as that term is defined in Section D below). In approving the Engagement, the Committee shall obtain, review and consider sufficient information concerning the proposed Auditor to enable the Committee to make a reasonable evaluation of the Auditor’s qualifications and independence. The Committee also shall consider the Auditor’s proposed fees for the Engagement, in light of the scope and nature of the audit services that the Funds will receive. |
| | 2. | The Committee shall report to the Boards of Directors/Trustees of the Funds (together, the “Board”) regarding its approval of the Engagement and of the proposed fees for the Engagement, and the basis for such approval. |
| | 3. | Unless otherwise in accordance with applicable law, the Engagement, in any event, shall require that the Auditor be selected by the vote, cast in person, of a majority of the members of the Board who are not “interested persons” of the Funds (as that term is defined in Section 2(a)(19) of the Investment Company Act of 1940) (the “Independent Directors”). |
| | C. | Pre-Approval of Non-Audit Services to the Funds and to Service Affiliates—by Types of Services |
| | 1. | The Committee may pre-approve types of non-audit services (including tax services) to the Funds and their Service Affiliates pursuant to this Section C. |
| | 2. | Annually, at such time as the Committee considers the Engagement of the Auditor, management of the Funds, in consultation with the Auditor, shall provide to the Committee, for its consideration and action, the following: (a) a list of those types of non-audit services, if any, that the Funds may request from the Auditor during the fiscal year; and (b) a list of those types of non-audit services directly impacting the Funds’ operations and financial reporting that Service Affiliates may request from the Auditor during the fiscal year. |
| | 3. | The lists submitted to the Committee shall describe the types of non-audit services in reasonable detail (which may include a range of tax services) and shall include an estimated budget (or budgeted range) of fees, where possible, and such other information as the Committee may request. If |
| | management and the Auditor desire the Committee to preapprove the furnishing of a range of tax services, the Auditor shall provide an estimated range of fees for such tax services for the consideration and approval by the Committee. |
| | 4. | The Committee’s pre-approval of the types of non-audit services submitted pursuant to this Section C shall constitute authorization for management of the Funds to utilize the Auditor for the types of non-audit services so pre-approved, if needed or desired during the fiscal year. |
| | 5. | A list of the types of non-audit services pre-approved by the Committee pursuant to this Section C will be distributed to management of the Service Affiliates and the appropriate partners of the Auditor. Periodically, the Auditor will discuss with the Committee those non-audit services that have been or are being provided pursuant to this Section C. |
| | D. | Pre-Approval of Non-Audit Services to the Funds and to Service Affiliates—Project-by-Project Basis |
| | 1. | The Committee also may pre-approve non-audit services on a project-by-project basis pursuant to this Section D. |
| | 2. | Management of the Funds, in consultation with the Auditor, may submit either to the Committee or to the Designated Member, as provided in this Section D, for their consideration and action, a pre-approval request identifying one or more non-audit service projects. The request so submitted shall describe the project(s) in reasonable detail and shall include an estimated budget (or budgeted range) of fees and such other information as the Committee or the Designated Member, as appropriate, shall request. |
| | 3. | The Committee, from time to time, shall designate one or more of its members who are Independent Directors (each a “Designated Member”) to consider, on the Committee’s behalf, any non-audit services, whether to the Funds or to any Service Affiliate, that have not been pre-approved by the Committee. The Designated Member also shall review, on the Committee’s behalf, any proposed material change in the nature or extent of any non-audit services previously approved. The Funds’ management, in consultation with the Auditor, shall explain why such non-audit services or material change in non-audit services are necessary and appropriate and the anticipated costs thereof. |
| | 4. | The Designated Member will review the requested non-audit services or proposed material change in such services and will either: |
| | (a) | pre-approve, pre-approve subject to conditions, or disapprove any such requested services, or any proposed material change in services, whether to the Funds or to a Service Affiliate; or |
| | (b) | refer such matter to the full Committee for its consideration and action. |
In considering any requested non-audit services or proposed material change in such services, the Designated Member’s authority shall be limited to approving non-audit services or proposed material changes that do not exceed $10,000 in value.
| | 5. | The Designated Member’s pre-approval (or pre-approval subject to conditions) of the requested non-audit services or proposed material change in services pursuant to this Section D shall constitute authorization for the management of the Funds or the Service Affiliate, as the case may be, to utilize the Auditor for the non-audit services so pre-approved. Any action by the Designated Member in approving a requested non-audit service shall be presented for ratification by the Committee not later than at its next scheduled meeting. If the Designated Member does not approve the Auditor providing the requested non-audit service, the matter may be presented to the full Committee for its consideration and action. |
| | E. | Amendment; Annual Review |
| | 1. | The Committee may amend these procedures from time to time. |
| | 2. | These procedures shall be reviewed annually by the Committee. |
| | 1. | The Funds shall maintain a written record of all decisions made by the Committee or by a Designated Member pursuant to these procedures, together with appropriate supporting materials. |
| | 2. | In connection with the approval of any non-audit service pursuant to the de minimis exception provided in the Rules, a record shall be made indicating that each of the conditions for this exception, as set forth in the Rules, has been satisfied. |
| | 3. | A copy of these Procedures (and of any amendments to these Procedures) shall be maintained and preserved permanently in an easily accessible place. The written records referred to in paragraphs 1 and 2 of this Section F shall be maintained and preserved for six years from the end of the fiscal year in which the actions recorded were taken, for at least the first two years in an easily accessible location. |
| | |
| (e)(2) | | The fees disclosed in Items 4(b), 4(c) or 4(d) were approved by the Registrant’s Audit Committee but not pursuant to paragraph (c)(7)(i)(C) of Rule 2-01 of Regulation S-X. |
| | (f) | The percentage of hours expended on the principal accountant’s engagement to audit the Registrant’s financial statements for the fiscal year ended October 31, 2010 that were attributed to work performed by persons other than the principal accountant’s full time, permanent employees was not greater than 50%. |
| | (g) | Aggregate Non-Audit Fees |
| | Fiscal | Year Ended October 31, 2010: $529,590 |
| | Fiscal | Year Ended October 31, 2009: $530,954 |
| | (h) | The Registrant’s Audit Committee has considered whether the provision of non-audit services that were rendered to the Registrant’s investment adviser, and any entity controlling, controlled by, or under common control with the investment adviser that provides ongoing services to the Registrant, that were not pre-approved pursuant to paragraph (c)(7)(ii) of Rule 2-01 of Regulation S-X is compatible with maintaining the principal accountant’s independence. |
| ITEM 5. | AUDIT COMMITTEE OF LISTED REGISTRANTS. |
This item is not applicable to the Registrant because it is not a listed issuer.
(a) The Registrant’s schedule of investments is provided below.
DIMENSIONAL EMERGING MARKETS VALUE FUND
DEFINITIONS OF ABBREVIATIONS AND FOOTNOTES
| | |
| Schedule of Investments |
Investment Abbreviations |
| ADR | | American Depository Receipt |
| FHLMC | | Federal Home Loan Mortgage Corporation |
| FNMA | | Federal National Mortgage Association |
| GDR | | Global Depository Receipt |
| NVDR | | Non-Voting Depository Receipt |
| P.L.C. | | Public Limited Company |
| | |
| Investment Footnotes |
† | | See Security Valuation Note within the Notes to Schedule of Investments. |
†† | | Securities have generally been fair valued. See Security Valuation Note within the Notes to Schedule of Investments. |
* | | Non-Income Producing Securities. |
# | | Total or Partial Securities on Loan. |
@ | | Security purchased with cash proceeds from securities on loan. |
— | | Amounts designated as — are either zero or rounded to zero. |
§ | | Affiliated Fund. |
## | | Par amount of collateral is a part of a pooled collateral facility. Value is indicative of the value allocated to this Fund as a part of this facility. |
1
DIMENSIONAL EMERGING MARKETS VALUE FUND
SCHEDULE OF INVESTMENTS
October 31, 2010
| | | | | | | | |
| | | Shares | | | Value†† | |
COMMON STOCKS — (88.2%) | | | | | | | | |
BRAZIL — (7.9%) | | | | | | | | |
Banco ABC Brasil SA | | | 647,946 | | | $ | 5,963,862 | |
Banco Alfa de Investimento SA | | | 97,200 | | | | 436,180 | |
Banco Daycoval SA | | | 558,550 | | | | 3,942,010 | |
Banco do Brasil SA | | | 165,559 | | | | 3,205,436 | |
Banco Industrial e Comercial SA | | | 1,292,200 | | | | 12,159,737 | |
Banco Panamericano SA | | | 1,150,400 | | | | 5,135,291 | |
Banco Pine SA | | | 296,900 | | | | 2,540,666 | |
Banco Santander Brasil SA | | | 219,225 | | | | 3,095,684 | |
#Banco Santander Brasil SA ADR | | | 10,011,893 | | | | 144,171,259 | |
Banco Sofisa SA | | | 715,300 | | | | 2,229,659 | |
Bematech SA | | | 443,000 | | | | 2,592,395 | |
BM&F Bovespa SA | | | 22,558,150 | | | | 188,128,311 | |
BR Malls Participacoes SA | | | 4,327,854 | | | | 40,649,196 | |
*Brasil Ecodiesel Industria e Comercio de Biocombustiveis e Oleos Vegetais SA | | | 8,441,712 | | | | 5,362,024 | |
BRF - Brasil Foods SA | | | 739,298 | | | | 10,670,101 | |
BRF - Brasil Foods SA ADR | | | 2,898,191 | | | | 42,400,534 | |
Brookfield Incorporacoes SA | | | 3,310,800 | | | | 17,855,694 | |
Camargo Correa Desenvolvimento Imobiliario SA | | | 711,600 | | | | 3,406,707 | |
Cia Providencia Industria e Comercio SA | | | 283,150 | | | | 1,192,351 | |
Cosan SA Industria e Comercio | | | 1,937,900 | | | | 30,784,379 | |
CR2 Empreendimentos Imobiliarios SA | | | 69,900 | | | | 272,973 | |
Cremer SA | | | 293,270 | | | | 3,111,563 | |
Duratex SA | | | 1,917,444 | | | | 22,103,101 | |
#Empresa Brasileira de Aeronautica SA ADR | | | 1,235,461 | | | | 35,643,050 | |
Eternit SA | | | 666,723 | | | | 4,011,396 | |
Even Construtora e Incorporadora SA | | | 1,422,651 | | | | 7,982,174 | |
EZ Tec Empreendimentos e Participacoes SA | | | 878,300 | | | | 6,250,326 | |
*Fertilizantes Heringer SA | | | 252,000 | | | | 1,422,808 | |
*Fibria Celulose SA | | | 238,671 | | | | 4,258,824 | |
#*Fibria Celulose SA Sponsored ADR | | | 2,444,493 | | | | 43,903,094 | |
Financeira Alfa SA | | | 36,400 | | | | 83,277 | |
Gafisa SA | | | 3,540,876 | | | | 29,175,835 | |
#Gafisa SA ADR | | | 336,554 | | | | 5,650,742 | |
*General Shopping Brasil SA | | | 377,630 | | | | 2,793,969 | |
Gerdau SA | | | 1,869,600 | | | | 18,472,787 | |
*Globex Utilidades SA | | | 45,131 | | | | 395,490 | |
Grendene SA | | | 1,199,745 | | | | 6,223,461 | |
Guararapes Confeccoes SA | | | 21,950 | | | | 1,148,944 | |
Helbor Empreendimentos SA | | | 46,900 | | | | 532,359 | |
*IdeiasNet SA | | | 832,130 | | | | 1,849,939 | |
Iguatemi Empresa de Shopping Centers SA | | | 358,760 | | | | 8,391,393 | |
Industrias Romi SA | | | 626,500 | | | | 5,202,717 | |
*Inpar SA | | | 2,408,625 | | | | 4,603,912 | |
JBS SA | | | 7,254,700 | | | | 27,904,333 | |
JHSF Participacoes SA | | | 1,733,800 | | | | 3,140,683 | |
*Kepler Weber SA | | | 4,157,400 | | | | 904,686 | |
*Kroton Educacional SA | | | 410,836 | | | | 4,240,529 | |
*Log-in Logistica Intermodal SA | | | 778,700 | | | | 4,236,297 | |
M Dias Branco SA | | | 164,300 | | | | 4,155,090 | |
*Magnesita Refratarios SA | | | 1,645,806 | | | | 10,860,403 | |
Marfrig Alimentos SA | | | 1,349,830 | | | | 12,035,184 | |
Metalfrio Solutions SA | | | 100,200 | | | | 735,456 | |
*Minerva SA | | | 712,125 | | | | 2,550,633 | |
*MPX Energia SA | | | 386,000 | | | | 6,460,954 | |
Multiplan Empreendimentos Imobiliarios SA | | | 256,869 | | | | 5,965,863 | |
Obrascon Huarte Lain Brasil SA | | | 263,100 | | | | 8,919,064 | |
Parana Banco SA | | | 116,200 | | | | 839,909 | |
*Paranapanema SA | | | 1,826,578 | | | | 5,779,562 | |
2
DIMENSIONAL EMERGING MARKETS VALUE FUND
CONTINUED
| | | | | | | | |
| | | Shares | | | Value†† | |
BRAZIL — (Continued) | | | | | | | | |
#Petroleo Brasileiro SA ADR | | | 2,310,397 | | | $ | 78,830,746 | |
*Plascar Participacoes Industriais SA | | | 1,198,400 | | | | 2,706,497 | |
Porto Seguro SA | | | 455,430 | | | | 6,645,426 | |
Profarma Distribuidora de Produtos Farmaceuticos SA | | | 105,125 | | | | 1,026,334 | |
Rodobens Negocios Imobiliarios SA | | | 246,901 | | | | 2,555,701 | |
Rossi Residencial SA | | | 1,583,200 | | | | 15,521,934 | |
Santos Brasil Participacoes SA | | | 29,100 | | | | 390,214 | |
Sao Carlos Empreendimentos e Participacoes SA | | | 78,600 | | | | 824,692 | |
Sao Martinho SA | | | 607,186 | | | | 7,281,375 | |
SLC Agricola SA | | | 170,825 | | | | 2,109,819 | |
Springs Global Participacoes SA | | | 368,400 | | | | 899,171 | |
Sul America SA | | | 1,401,285 | | | | 16,474,556 | |
Tecnisa SA | | | 50,354 | | | | 307,994 | |
Trisul SA | | | 101,461 | | | | 471,412 | |
Triunfo Participacoes e Investimentos SA | | | 125,300 | | | | 588,069 | |
Universo Online SA | | | 479,100 | | | | 2,888,182 | |
Usinas Siderurgicas de Minas Gerais SA | | | 2,163,700 | | | | 31,431,741 | |
| | | | | | | | |
TOTAL BRAZIL | | | | | | | 1,009,088,119 | |
| | | | | | | | |
| | |
CHILE — (2.5%) | | | | | | | | |
Almendral SA | | | 1,120,749 | | | | 132,891 | |
Banco de Credito e Inversiones SA Series A | | | 131,142 | | | | 7,924,017 | |
Besalco SA | | | 105,670 | | | | 162,021 | |
Cementos Bio-Bio SA | | | 665,307 | | | | 1,931,383 | |
Centros Comerciales Sudamericanos SA | | | 3,680,515 | | | | 28,674,383 | |
Cia Cervecerias Unidas SA | | | 23,000 | | | | 257,187 | |
Cia General de Electricidad SA | | | 891,089 | | | | 5,609,042 | |
*Cia SudAmericana de Vapores SA | | | 10,840,439 | | | | 14,452,589 | |
Cintac SA | | | 153,487 | | | | 122,375 | |
Corpbanca SA | | | 1,179,769,735 | | | | 18,559,395 | |
Corpbanca SA ADR | | | 400 | | | | 31,216 | |
Cristalerias de Chile SA | | | 264,624 | | | | 3,573,763 | |
CTI Cia Tecno Industrial SA | | | 488,163 | | | | 31,925 | |
Embotelladora Andina SA Series A ADR | | | 29,985 | | | | 722,039 | |
Empresas CMPC SA | | | 1,512,741 | | | | 81,335,149 | |
Empresas Copec SA | | | 2,027,911 | | | | 38,173,564 | |
*Empresas Iansa SA | | | 34,270,156 | | | | 3,910,084 | |
*Empresas La Polar SA | | | 269,173 | | | | 1,919,897 | |
Enersis SA | | | 31,903,095 | | | | 14,539,828 | |
#Enersis SA Sponsored ADR | | | 3,017,368 | | | | 68,826,164 | |
Gasco SA | | | 155,648 | | | | 995,969 | |
*Grupo Security SA | | | 581,161 | | | | 286,333 | |
Industrias Forestales SA | | | 3,436,382 | | | | 828,975 | |
Inversiones Aguas Metropolitanas SA | | | 3,170,757 | | | | 4,926,455 | |
Madeco SA | | | 49,034,820 | | | | 2,855,979 | |
*Masisa SA | | | 36,930,742 | | | | 6,073,961 | |
Minera Valparaiso SA | | | 7,500 | | | | 278,672 | |
Parque Arauco SA | | | 1,761,407 | | | | 3,728,429 | |
*PAZ Corp. SA | | | 1,313,243 | | | | 1,124,908 | |
Ripley Corp SA | | | 3,392,739 | | | | 4,739,361 | |
Salfacorp SA | | | 472,731 | | | | 1,377,844 | |
Sociedad Quimica y Minera de Chile SA Series A | | | 32,260 | | | | 1,648,778 | |
Socovesa SA | | | 2,644,207 | | | | 1,669,718 | |
Sonda SA | | | 107,000 | | | | 231,740 | |
Soquimic Comercial SA | | | 198,000 | | | | 96,739 | |
Vina Concha Y Toro SA Sponsored ADR | | | 2,846 | | | | 136,523 | |
Vina San Pedro Tarapaca SA | | | 57,038,434 | | | | 511,906 | |
| | | | | | | | |
TOTAL CHILE | | | | | | | 322,401,202 | |
| | | | | | | | |
| | |
CHINA — (12.1%) | | | | | | | | |
#Agile Property Holdings, Ltd. | | | 8,038,000 | | | | 10,602,314 | |
3
DIMENSIONAL EMERGING MARKETS VALUE FUND
CONTINUED
| | | | | | | | |
| | | Shares | | | Value†† | |
CHINA — (Continued) | | | | | | | | |
*Aluminum Corp. of China, Ltd. | | | 28,000 | | | $ | 26,586 | |
#*Aluminum Corp. of China, Ltd. ADR | | | 287,695 | | | | 6,896,049 | |
#AMVIG Holdings, Ltd. | | | 3,639,100 | | | | 2,953,222 | |
#Angang Steel Co., Ltd. | | | 8,503,640 | | | | 13,359,919 | |
*Anhui Conch Cement Co., Ltd. | | | 76,000 | | | | 319,886 | |
Anhui Tianda Oil Pipe Co., Ltd. | | | 747,000 | | | | 328,752 | |
#Anton Oilfield Services Group | | | 4,846,000 | | | | 495,051 | |
#Asia Cement China Holdings Corp. | | | 3,202,000 | | | | 1,449,861 | |
Bank of China, Ltd. | | | 470,554,474 | | | | 283,239,227 | |
#Bank of Communications Co., Ltd. | | | 16,494,050 | | | | 18,113,983 | |
Baoye Group Co., Ltd. | | | 1,689,120 | | | | 1,111,071 | |
#Beijing Capital International Airport Co., Ltd. | | | 11,976,000 | | | | 6,608,218 | |
#Beijing Capital Land, Ltd. | | | 7,932,000 | | | | 2,914,177 | |
*Beijing Development HK, Ltd. | | | 1,501,000 | | | | 299,526 | |
Beijing Enterprises Holdings, Ltd. | | | 5,599,500 | | | | 38,296,880 | |
Beijing Jingkelong Co., Ltd. | | | 430,000 | | | | 515,975 | |
#Beijing North Star Co., Ltd. Series H | | | 5,732,000 | | | | 1,556,835 | |
Bosideng International Holdings, Ltd. | | | 9,472,000 | | | | 4,795,633 | |
*Brilliance China Automotive Holdings, Ltd. | | | 20,112,000 | | | | 17,695,013 | |
#BYD Electronic International Co., Ltd. | | | 7,606,000 | | | | 4,047,118 | |
*Catic Shenzhen Holdings, Ltd. | | | 2,458,000 | | | | 1,119,923 | |
Central China Real Estate, Ltd. | | | 4,191,000 | | | | 951,714 | |
#Centron Telecom International Holdings, Ltd. | | | 2,674,600 | | | | 639,722 | |
#Chaoda Modern Agriculture Holdings, Ltd. | | | 30,559,412 | | | | 24,938,728 | |
China Aerospace International Holdings, Ltd. | | | 18,666,000 | | | | 2,703,129 | |
#China Agri-Industries Holdings, Ltd. | | | 4,584,000 | | | | 6,710,951 | |
China Aoyuan Property Group, Ltd. | | | 9,821,000 | | | | 1,700,363 | |
#China BlueChemical, Ltd. | | | 9,710,878 | | | | 7,695,360 | |
#*China Chengtong Development Group, Ltd. | | | 2,618,000 | | | | 157,259 | |
China Citic Bank Corp., Ltd. | | | 39,145,000 | | | | 28,490,697 | |
China Coal Energy Co., Ltd. | | | 21,853,000 | | | | 37,996,498 | |
China Communications Construction Co., Ltd. | | | 32,735,327 | | | | 31,349,882 | |
China Communications Services Corp., Ltd. | | | 14,199,382 | | | | 8,251,081 | |
China Construction Bank Corp. | | | 72,842,000 | | | | 69,637,206 | |
#*China COSCO Holdings Co., Ltd. | | | 2,551,000 | | | | 2,989,504 | |
#*China Energine International Holdings, Ltd. | | | 2,178,000 | | | | 219,868 | |
#China Everbright, Ltd. | | | 7,443,600 | | | | 19,409,000 | |
#*China Grand Forestry Green Resources Group, Ltd. | | | 53,216,000 | | | | 1,891,478 | |
#China Green Holdings, Ltd. | | | 3,753,800 | | | | 3,863,260 | |
China Haidian Holdings, Ltd. | | | 12,343,000 | | | | 2,059,585 | |
China Haisheng Juice Holdings Co., Ltd. | | | 48,000 | | | | 7,451 | |
#China Huiyuan Juice Group, Ltd. | | | 6,321,983 | | | | 4,244,732 | |
#China Merchants Holdings International Co., Ltd. | | | 4,190,176 | | | | 14,707,934 | |
#*China Mining Resources Group, Ltd. | | | 32,788,000 | | | | 924,154 | |
#China Molybdenum Co., Ltd. | | | 1,780,000 | | | | 1,708,788 | |
China National Materials Co., Ltd. | | | 957,000 | | | | 854,279 | |
China Nickel Resources Holding Co., Ltd. | | | 4,726,000 | | | | 879,710 | |
China Oilfield Services, Ltd. | | | 266,000 | | | | 430,950 | |
China Petroleum & Chemical Corp. | | | 33,806,000 | | | | 32,077,164 | |
#China Petroleum & Chemical Corp. ADR | | | 606,083 | | | | 57,765,771 | |
#China Pharmaceutical Group, Ltd. | | | 12,982,000 | | | | 7,286,097 | |
#*China Properties Group, Ltd. | | | 4,410,000 | | | | 1,425,486 | |
*China Qinfa Group, Ltd. | | | 1,592,000 | | | | 822,363 | |
China Railway Construction Corp., Ltd. | | | 14,452,014 | | | | 18,095,006 | |
#*China Rare Earth Holdings, Ltd. | | | 14,431,000 | | | | 7,889,810 | |
China Resources Enterprise, Ltd. | | | 6,298,000 | | | | 26,534,380 | |
China Resources Land, Ltd. | | | 11,829,727 | | | | 23,348,792 | |
*China Resources Microelectronics, Ltd. | | | 31,880,000 | | | | 1,465,111 | |
*China Shanshui Cement Group, Ltd. | | | 1,842,000 | | | | 1,311,745 | |
#*China Shipping Container Lines Co., Ltd. | | | 32,569,700 | | | | 13,299,508 | |
#China Shipping Development Co., Ltd. | | | 5,027,142 | | | | 7,348,866 | |
4
DIMENSIONAL EMERGING MARKETS VALUE FUND
CONTINUED
| | | | | | | | |
| | | Shares | | | Value†† | |
CHINA — (Continued) | | | | | | | | |
China State Construction International Holdings, Ltd. | | | 1,454,000 | | | $ | 1,113,683 | |
*China Travel International Investment Hong Kong, Ltd. | | | 25,371,000 | | | | 6,069,456 | |
#China Unicom Hong Kong, Ltd. | | | 2,354,000 | | | | 3,310,673 | |
#China Unicom Hong Kong, Ltd. ADR | | | 4,715,857 | | | | 66,021,998 | |
*China Zenith Chemical Group, Ltd. | | | 13,420,000 | | | | 451,275 | |
#*China Zhongwang Holdings, Ltd. | | | 1,484,400 | | | | 887,548 | |
#*Chongqing Iron & Steel Co., Ltd. | | | 3,804,000 | | | | 1,077,194 | |
Chongqing Machinery & Electric Co., Ltd. | | | 6,266,000 | | | | 2,133,767 | |
*CIMC Enric Holdings, Ltd. | | | 10,000 | | | | 4,600 | |
CITIC Pacific, Ltd. | | | 6,664,000 | | | | 17,731,715 | |
*CITIC Resources Holdings, Ltd. | | | 20,644,000 | | | | 5,294,015 | |
*Clear Media, Ltd. | | | 641,000 | | | | 383,521 | |
*Coastal Greenland, Ltd. | | | 6,814,000 | | | | 387,831 | |
COSCO International Holdings, Ltd. | | | 5,146,000 | | | | 3,133,712 | |
COSCO Pacific, Ltd. | | | 16,806,000 | | | | 26,187,436 | |
#Coslight Technology International Group, Ltd. | | | 470,000 | | | | 341,563 | |
Country Garden Holdings Co. | | | 29,651,079 | | | | 10,464,244 | |
Dachan Food Asia, Ltd. | | | 2,426,000 | | | | 476,795 | |
Dalian Port PDA Co., Ltd. | | | 13,298,000 | | | | 5,760,772 | |
Dongyue Group | | | 3,526,000 | | | | 1,557,538 | |
Dynasty Fine Wines Group, Ltd. | | | 9,454,600 | | | | 5,855,456 | |
Embry Holdings, Ltd. | | | 600,000 | | | | 580,765 | |
#First Tractor Co., Ltd. | | | 3,036,000 | | | | 2,926,008 | |
Fosun International, Ltd. | | | 8,391,500 | | | | 6,941,521 | |
#Franshion Properties China, Ltd. | | | 21,660,000 | | | | 7,004,101 | |
Fushan International Energy Group, Ltd. | | | 2,010,000 | | | | 1,355,196 | |
*GCL Poly Energy Holdings, Ltd. | | | 1,063,186 | | | | 340,729 | |
#*Global Bio-Chem Technology Group Co., Ltd. | | | 34,338,360 | | | | 5,589,346 | |
#*Global Sweeteners Holdings, Ltd. | | | 1,932,350 | | | | 406,588 | |
Goldbond Group Holdings, Ltd. | | | 2,960,000 | | | | 174,278 | |
#*Golden Meditech Holdings, Ltd. | | | 2,632,000 | | | | 489,412 | |
Goldlion Holdings, Ltd. | | | 978,000 | | | | 410,385 | |
#Great Wall Motor Co., Ltd. | | | 3,555,000 | | | | 11,181,970 | |
#Great Wall Technology Co., Ltd. | | | 3,388,000 | | | | 1,626,940 | |
Greentown China Holdings, Ltd. | | | 5,206,500 | | | | 6,013,424 | |
#Guangshen Railway Co., Ltd. Sponsored ADR | | | 417,917 | | | | 8,500,432 | |
#Guangzhou Automobile Group Co., Ltd. | | | 27,145,572 | | | | 41,674,866 | |
#*Guangzhou Investment Co., Ltd. | | | 43,560,400 | | | | 10,420,366 | |
Guangzhou Pharmaceutical Co., Ltd. | | | 2,870,000 | | | | 3,061,076 | |
#Guangzhou R&F Properties Co., Ltd. | | | 6,985,914 | | | | 9,985,959 | |
GZI Transportation, Ltd. | | | 1,003 | | | | 525 | |
Hainan Meilan International Airport Co., Ltd. | | | 1,891,000 | | | | 2,183,526 | |
Haitian International Holdings, Ltd. | | | 771,000 | | | | 786,017 | |
Harbin Power Equipment Co., Ltd. | | | 6,788,000 | | | | 9,186,272 | |
#*Heng Tai Consumables Group, Ltd. | | | 15,955,000 | | | | 2,949,493 | |
#Hidili Industry International Development, Ltd. | | | 5,276,000 | | | | 5,625,310 | |
#*HKC Holdings, Ltd. | | | 20,031,878 | | | | 1,243,552 | |
#*Hong Kong Energy Holdings, Ltd. | | | 235,959 | | | | 19,858 | |
#*Honghua Group, Ltd. | | | 9,542,000 | | | | 1,429,971 | |
#*Hopson Development Holdings, Ltd. | | | 6,300,000 | | | | 7,035,613 | |
#Hua Han Bio-Pharmaceutical Holdings, Ltd. | | | 3,788,850 | | | | 1,276,867 | |
#*Hunan Non-Ferrous Metal Corp., Ltd. | | | 8,438,000 | | | | 3,793,294 | |
Industrial & Commercial Bank of China, Ltd. Series H | | | 19,791,000 | | | | 15,989,022 | |
#*Inspur International, Ltd. | | | 16,600,000 | | | | 1,481,055 | |
*Jingwei Textile Machinery Co., Ltd. | | | 626,000 | | | | 242,703 | |
#Ju Teng International Holdings, Ltd. | | | 6,498,000 | | | | 3,235,351 | |
*Kai Yuan Holdings, Ltd. | | | 43,100,000 | | | | 1,450,741 | |
*Kasen International Holdings, Ltd. | | | 1,906,000 | | | | 369,564 | |
Kingboard Chemical Holdings, Ltd. | | | 4,231,000 | | | | 20,564,842 | |
Kingboard Laminates Holdings, Ltd. | | | 1,694,000 | | | | 1,639,084 | |
*Kingway Brewery Holdings, Ltd. | | | 1,870,000 | | | | 443,906 | |
5
DIMENSIONAL EMERGING MARKETS VALUE FUND
CONTINUED
| | | | | | | | |
| | | Shares | | | Value†† | |
CHINA — (Continued) | | | | | | | | |
KWG Property Holding, Ltd. | | | 10,519,000 | | | $ | 8,331,563 | |
Lai Fung Holdings, Ltd. | | | 14,339,000 | | �� | | 509,750 | |
Lingbao Gold Co., Ltd. | | | 1,846,000 | | | | 1,297,272 | |
#Lonking Holdings, Ltd. | | | 2,056,000 | | | | 1,106,048 | |
#Maanshan Iron & Steel Co., Ltd. | | | 23,102,000 | | | | 13,340,636 | |
*Media China Corp, Ltd. | | | 39,162,500 | | | | 222,916 | |
MIN XIN Holdings, Ltd. | | | 1,308,000 | | | | 699,082 | |
#Mingyuan Medicare Development Co., Ltd. | | | 3,031,900 | | | | 423,077 | |
#*Minmetals Land, Ltd. | | | 7,792,000 | | | | 1,571,861 | |
*Minmetals Resources, Ltd. | | | 6,136,000 | | | | 4,717,894 | |
Minth Group, Ltd. | | | 4,000 | | | | 7,484 | |
*Nan Hai Corp, Ltd. | | | 30,600,000 | | | | 268,518 | |
NetDragon Websoft, Inc. | | | 1,419,500 | | | | 650,681 | |
New World China Land, Ltd. | | | 12,350,400 | | | | 4,632,603 | |
Nine Dragons Paper Holdings, Ltd. | | | 4,053,000 | | | | 6,557,389 | |
#*Oriental Ginza Holdings, Ltd. | | | 955,000 | | | | 189,674 | |
#*PetroAsian Energy Holdings, Ltd. | | | 5,676,000 | | | | 358,198 | |
#PetroChina Co., Ltd. ADR | | | 32,000 | | | | 3,934,400 | |
*PICC Property & Casualty Co., Ltd. | | | 238,000 | | | | 350,176 | |
#Poly Hong Kong Investment, Ltd. | | | 7,411,000 | | | | 7,660,382 | |
#*Pou Sheng International Holdings, Ltd. | | | 2,085,000 | | | | 331,479 | |
#Prosperity International Holdings HK, Ltd. | | | 10,880,000 | | | | 729,892 | |
Qin Jia Yuan Media Services Co., Ltd. | | | 2,767,450 | | | | 486,387 | |
Qingling Motors Co., Ltd. Series H | | | 12,306,000 | | | | 4,578,170 | |
*Qunxing Paper Holdings Co., Ltd. | | | 2,216,381 | | | | 945,731 | |
Regent Manner International, Ltd. | | | 944,000 | | | | 452,172 | |
REXLot Holdings, Ltd. | | | 32,281,150 | | | | 2,993,994 | |
Samson Holding, Ltd. | | | 4,259,000 | | | | 781,245 | |
Scud Group, Ltd. | | | 752,000 | | | | 87,636 | |
*Semiconductor Manufacturing International Corp. | | | 67,505,000 | | | | 5,657,716 | |
#*Semiconductor Manufacturing International Corp. ADR | | | 1,167,388 | | | | 4,809,639 | |
#Shandong Chenming Paper Holdings, Ltd. Series H | | | 2,747,000 | | | | 2,310,325 | |
Shandong Molong Petroleum Machinery Co., Ltd. | | | 158,000 | | | | 193,469 | |
*Shandong Xinhua Pharmaceutical Co., Ltd. | | | 158,000 | | | | 70,449 | |
#Shanghai Forte Land Co., Ltd. | | | 6,388,000 | | | | 1,904,672 | |
Shanghai Industrial Holdings, Ltd. | | | 7,847,000 | | | | 36,333,584 | |
*Shanghai Industrial Urban Development Group, Ltd. | | | 9,446,000 | | | | 4,886,755 | |
#Shanghai Jin Jiang International Hotels Group Co., Ltd. | | | 9,810,000 | | | | 2,473,068 | |
Shanghai Prime Machinery Co., Ltd. | | | 5,448,000 | | | | 1,302,562 | |
Shanghai Zendai Property, Ltd. | | | 18,545,000 | | | | 801,658 | |
Shenzhen International Holdings, Ltd. | | | 51,585,000 | | | | 4,065,811 | |
Shenzhen Investment, Ltd. | | | 18,112,000 | | | | 6,530,102 | |
#Shimao Property Holdings, Ltd. | | | 13,759,500 | | | | 22,797,015 | |
Shougang Concord Century Holdings, Ltd. | | | 6,972,299 | | | | 919,488 | |
*Shougang Concord International Enterprises Co., Ltd. | | | 36,960,000 | | | | 6,219,198 | |
#Shui On Land, Ltd. | | | 23,258,798 | | | | 11,659,320 | |
#Silver Grant International Industries, Ltd. | | | 10,840,000 | | | | 3,655,607 | |
#SIM Technology Group, Ltd. | | | 6,760,000 | | | | 1,453,418 | |
#*Sino Union Energy Investment Group, Ltd. | | | 21,350,000 | | | | 1,903,075 | |
SinoCom Software Group, Ltd. | | | 1,602,000 | | | | 187,755 | |
#*Sinofert Holdings, Ltd. | | | 12,540,000 | | | | 6,663,643 | |
Sinolink Worldwide Holdings, Ltd. | | | 12,830,000 | | | | 1,873,922 | |
#SinoMedia Holding, Ltd. | | | 1,375,830 | | | | 508,207 | |
#Sino-Ocean Land Holdings, Ltd. | | | 23,578,033 | | | | 16,271,225 | |
Sinopec Kantons Holdings, Ltd. | | | 9,174,300 | | | | 4,853,824 | |
Sinopec Shanghai Petrochemical Co., Ltd. Sponsored ADR | | | 18,537 | | | | 834,350 | |
#Sinotrans Shipping, Ltd. | | | 7,244,000 | | | | 2,933,269 | |
Sinotrans, Ltd. | | | 26,720,000 | | | | 7,259,723 | |
#Sinotruk Hong Kong, Ltd. | | | 5,603,500 | | | | 6,464,310 | |
#Skyworth Digital Holdings, Ltd. | | | 30,000 | | | | 17,602 | |
#Soho China, Ltd. | | | 16,068,000 | | | | 13,680,725 | |
6
DIMENSIONAL EMERGING MARKETS VALUE FUND
CONTINUED
| | | | | | | | |
| | | Shares | | | Value†† | |
CHINA — (Continued) | | | | | | | | |
#*Solargiga Energy Holdings, Ltd. | | | 1,201,000 | | | $ | 276,259 | |
#SPG Land Holdings, Ltd. | | | 2,568,575 | | | | 1,402,697 | |
#SRE Group, Ltd. | | | 21,776,000 | | | | 2,226,265 | |
Sunny Optical Technology Group Co., Ltd. | | | 1,305,000 | | | | 315,692 | |
Tak Sing Alliance Holdings, Ltd. | | | 3,949,066 | | | | 510,087 | |
TCC International Holdings, Ltd. | | | 994,000 | | | | 410,361 | |
#TCL Multimedia Technology Holdings, Ltd. | | | 4,478,200 | | | | 1,878,430 | |
#Tian An China Investments Co., Ltd. | | | 7,489,000 | | | | 5,743,542 | |
Tiangong International Co., Ltd. | | | 955,000 | | | | 467,847 | |
#*Tianneng Power International, Ltd. | | | 4,262,000 | | | | 1,920,081 | |
Tomson Group, Ltd. | | | 2,429,206 | | | | 949,991 | |
TPV Technology, Ltd. | | | 1,864,222 | | | | 1,151,923 | |
Travelsky Technology, Ltd. | | | 8,035,000 | | | | 7,800,714 | |
#Truly International Holdings, Ltd. | | | 1,226,000 | | | | 1,743,260 | |
#*Uni-President China Holdings, Ltd. | | | 405,000 | | | | 288,508 | |
*United Energy Group, Ltd. | | | 64,000 | | | | 7,346 | |
#*Wasion Group Holdings, Ltd. | | | 358,000 | | | | 261,292 | |
#Weiqiao Textile Co., Ltd. | | | 3,656,500 | | | | 2,885,466 | |
#Wuyi International Pharmaceutical Co., Ltd. | | | 5,257,500 | | | | 488,794 | |
Xiamen International Port Co., Ltd. | | | 6,980,000 | | | | 1,307,300 | |
Xingda International Holdings, Ltd. | | | 4,197,000 | | | | 4,387,168 | |
Xinhua Winshare Publishing & Media Co., Ltd. | | | 3,369,000 | | | | 2,014,079 | |
#Xinjiang Xinxin Mining Industry Co., Ltd. | | | 4,816,000 | | | | 3,258,560 | |
#Xiwang Sugar Holdings Co., Ltd. | | | 5,980,736 | | | | 2,023,804 | |
Yanzhou Coal Mining Co., Ltd. Sponsored ADR | | | 165,714 | | | | 4,785,820 | |
#Yip’s Chemical Holdings, Ltd. | | | 726,000 | | | | 864,679 | |
#*Zhejiang Glass Co., Ltd. | | | 437,000 | | | | 139,817 | |
#*Zhong An Real Estate, Ltd. | | | 3,812,800 | | | | 906,079 | |
| | | | | | | | |
TOTAL CHINA | | | | | | | 1,549,230,978 | |
| | | | | | | | |
| | |
CZECH REPUBLIC — (0.4%) | | | | | | | | |
#*Central European Media Enterprises, Ltd. | | | 299,842 | | | | 7,079,803 | |
*Pegas Nonwovens SA | | | 127,092 | | | | 3,014,405 | |
Telefonica 02 Czech Republic A.S. | | | 853,614 | | | | 18,762,703 | |
*Unipetrol A.S. | | | 1,411,781 | | | | 15,951,552 | |
| | | | | | | | |
TOTAL CZECH REPUBLIC | | | | | | | 44,808,463 | |
| | | | | | | | |
| | |
HUNGARY — (1.1%) | | | | | | | | |
*Danubius Hotel & Spa NYRT | | | 136,180 | | | | 2,544,015 | |
Egis Gyogyszergyar NYRT | | | 57,430 | | | | 6,744,171 | |
*Fotex Holding SE Co., Ltd. | | | 913,849 | | | | 1,965,246 | |
#*MOL Hungarian Oil & Gas P.L.C. | | | 451,154 | | | | 47,937,453 | |
#*OTP Bank P.L.C. | | | 2,633,742 | | | | 78,216,750 | |
*PannErgy P.L.C. | | | 200,940 | | | | 1,022,397 | |
*Tisza Chemical Group P.L.C. | | | 237,913 | | | | 4,143,565 | |
| | | | | | | | |
TOTAL HUNGARY | | | | | | | 142,573,597 | |
| | | | | | | | |
| | |
INDIA — (10.2%) | | | | | | | | |
3i Infotech, Ltd. | | | 422,692 | | | | 639,783 | |
Aban Offshore, Ltd. | | | 58,486 | | | | 1,039,964 | |
ABG Shipyard, Ltd. | | | 140,808 | | | | 1,445,601 | |
ACC, Ltd. | | | 8,174 | | | | 181,498 | |
Aditya Birla Nuvo, Ltd. | | | 354,483 | | | | 6,540,559 | |
AGC Networks, Ltd. | | | 139 | | | | 719 | |
Ajmera Realty & Infra India, Ltd. | | | 70,083 | | | | 400,750 | |
Akzo Nobel India, Ltd. | | | 50,729 | | | | 993,814 | |
Alembic, Ltd. | | | 619,600 | | | | 1,039,651 | |
Allahabad Bank, Ltd. | | | 1,091,889 | | | | 6,092,986 | |
Alok Industries, Ltd. | | | 3,717,329 | | | | 2,275,114 | |
Amara Raja Batteries, Ltd. | | | 19,579 | | | | 87,496 | |
7
DIMENSIONAL EMERGING MARKETS VALUE FUND
CONTINUED
| | | | | | | | |
| | | Shares | | | Value†† | |
INDIA — (Continued) | | | | | | | | |
Ambuja Cements, Ltd. | | | 5,354,209 | | | $ | 16,881,909 | |
Amtek Auto, Ltd. | | | 789,486 | | | | 2,827,437 | |
Anant Raj Industries, Ltd. | | | 661,011 | | | | 1,936,884 | |
Andhra Bank | | | 1,052,102 | | | | 4,226,903 | |
Ansal Properties & Infrastructure, Ltd. | | | 682,306 | | | | 1,340,321 | |
Apollo Hospitals Enterprise, Ltd. | | | 367,830 | | | | 4,325,712 | |
Apollo Tyres, Ltd. | | | 1,676,970 | | | | 2,706,758 | |
*Arvind Mills, Ltd. | | | 1,526,154 | | | | 1,986,254 | |
*Ashapura Minechem, Ltd. | | | 36,874 | | | | 42,285 | |
Ashok Leyland, Ltd. | | | 6,240,668 | | | | 10,641,046 | |
Asian Hotels East, Ltd. | | | 1,050 | | | | 9,903 | |
Asian Hotels West, Ltd. | | | 1,050 | | | | 5,613 | |
Asian Hotels, Ltd. | | | 1,050 | | | | 7,144 | |
Aurobindo Pharma, Ltd. | | | 11,802 | | | | 313,784 | |
Axis Bank, Ltd. | | | 1,080,231 | | | | 35,755,908 | |
Bajaj Finance, Ltd. | | | 92,800 | | | | 1,644,008 | |
Bajaj Hindusthan, Ltd. | | | 838,582 | | | | 2,334,808 | |
Bajaj Holdings & Investment, Ltd. | | | 299,410 | | | | 5,908,638 | |
Balkrishna Industries, Ltd. | | | 4,449 | | | | 75,193 | |
Ballarpur Industries, Ltd. | | | 3,218,873 | | | | 2,911,093 | |
Balmer Lawrie & Co., Ltd. | | | 52,331 | | | | 766,951 | |
Balrampur Chini Mills, Ltd. | | | 1,820,136 | | | | 3,469,109 | |
Bank of Baroda | | | 797,959 | | | | 18,194,057 | |
Bank of India | | | 876,391 | | | | 9,612,011 | |
Bank of Maharashtra, Ltd. | | | 1,128,356 | | | | 1,981,510 | |
*BASF India, Ltd. | | | 1,928 | | | | 29,080 | |
BEML, Ltd. | | | 133,202 | | | | 3,357,386 | |
Bengal & Assam Co., Ltd. | | | 9,237 | | | | 78,216 | |
Bharati Shipyard, Ltd. | | | 56,986 | | | | 339,272 | |
Bhushan Steel, Ltd. | | | 945,780 | | | | 10,584,945 | |
Binani Cement, Ltd. | | | 51,025 | | | | 104,307 | |
Birla Corp., Ltd. | | | 114,223 | | | | 1,009,954 | |
Bl Kashyap & Sons, Ltd. | | | 225,880 | | | | 183,453 | |
Bombay Rayon Fashions, Ltd. | | | 393,115 | | | | 1,943,303 | |
Brigade Enterprises, Ltd. | | | 22,619 | | | | 68,944 | |
*Cairn India, Ltd. | | | 3,309,459 | | | | 23,930,693 | |
Canara Bank | | | 926,391 | | | | 15,036,465 | |
Central Bank of India | | | 629,701 | | | | 3,212,853 | |
Century Enka, Ltd. | | | 54,052 | | | | 295,798 | |
Century Textiles & Industries, Ltd. | | | 152,552 | | | | 1,727,759 | |
Chambal Fertilizers & Chemicals, Ltd. | | | 1,344,619 | | | | 2,434,763 | |
City Union Bank, Ltd. | | | 1,076,331 | | | | 1,226,254 | |
Coromandel International, Ltd. | | | 106,481 | | | | 1,539,337 | |
Corp. Bank | | | 106,714 | | | | 1,803,566 | |
*Cranes Software International, Ltd. | | | 127,339 | | | | 20,440 | |
*Dalmia Bharat Enterprises, Ltd. | | | 159,852 | | | | 633,291 | |
Dalmia Cement (Bharat), Ltd. | | | 159,852 | | | | 174,220 | |
DCM Shriram Consolidated, Ltd. | | | 271,706 | | | | 285,374 | |
Deepak Fertilizers & Petrochemicals Corp., Ltd. | | | 401,220 | | | | 1,609,176 | |
Dena Bank | | | 99,442 | | | | 306,154 | |
*Development Credit Bank, Ltd. | | | 1,075,089 | | | | 1,681,674 | |
Dhanalakshmi Bank, Ltd. | | | 36,681 | | | | 153,626 | |
Dishman Pharmaceuticals & Chemicals, Ltd. | | | 106,182 | | | | 437,366 | |
DLF, Ltd. | | | 691,014 | | | | 5,460,052 | |
Dredging Corp. of India, Ltd. | | | 66,061 | | | | 771,063 | |
E.I.D. - Parry (India), Ltd. | | | 357,212 | | | | 3,995,386 | |
Edelweiss Capital, Ltd. | | | 594,520 | | | | 836,373 | |
Eicher Motors, Ltd. | | | 46,001 | | | | 1,334,146 | |
EIH, Ltd. | | | 600,040 | | | | 1,683,270 | |
Elder Pharmaceuticals, Ltd. | | | 97,715 | | | | 876,391 | |
Electrosteel Casings, Ltd. | | | 654,010 | | | | 611,731 | |
8
DIMENSIONAL EMERGING MARKETS VALUE FUND
CONTINUED
| | | | | | | | |
| | | Shares | | | Value†† | |
INDIA — (Continued) | | | | | | | | |
Elgi Equipments, Ltd. | | | 24,745 | | | $ | 102,629 | |
Escorts, Ltd. | | | 551,568 | | | | 2,741,770 | |
*Essar Shipping Ports & Logistics, Ltd. | | | 808,040 | | | | 1,993,744 | |
Essel Propack, Ltd. | | | 476,584 | | | | 556,030 | |
Everest Industries, Ltd. | | | 9,843 | | | | 50,874 | |
Everest Kanto Cylinder, Ltd. | | | 397,388 | | | | 1,131,109 | |
FAG Bearings (India), Ltd. | | | 500 | | | | 10,377 | |
FDC, Ltd. | | | 179,858 | | | | 420,083 | |
Federal Bank, Ltd. | | | 1,334,943 | | | | 14,180,604 | |
Financial Technologies (India), Ltd. | | | 74,561 | | | | 1,659,819 | |
Finolex Cables, Ltd. | | | 565,734 | | | | 749,774 | |
Finolex Industries, Ltd. | | | 695,629 | | | | 1,823,733 | |
*Firstsource Solutions, Ltd. | | | 462,206 | | | | 284,119 | |
*Future Capital Holdings, Ltd. | | | 825 | | | | 4,475 | |
GAIL India, Ltd. | | | 700,109 | | | | 7,738,413 | |
Gammon India, Ltd. | | | 405,301 | | | | 1,862,679 | |
*Ganesh Housing Corp., Ltd. | | | 637 | | | | 3,507 | |
Gateway Distriparks, Ltd. | | | 207,427 | | | | 516,998 | |
Geodesic, Ltd. | | | 355,739 | | | | 936,737 | |
*GIC Housing Finance, Ltd. | | | 13,690 | | | | 46,264 | |
Gitanjali Gems, Ltd. | | | 513,757 | | | | 3,423,399 | |
Godawari Power & Ispat, Ltd. | | | 51,305 | | | | 232,801 | |
Godfrey Phillips India, Ltd. | | | 784 | | | | 29,964 | |
*Goetze (India), Ltd. | | | 9,195 | | | | 36,263 | |
Graphite India, Ltd. | | | 386,627 | | | | 815,571 | |
Grasim Industries, Ltd. | | | 15,142 | | | | 766,284 | |
Great Eastern Shipping Co., Ltd. | | | 942,893 | | | | 6,728,062 | |
Great Offshore, Ltd. | | | 140,299 | | | | 1,189,732 | |
*GTL Infrastructure, Ltd. | | | 691,128 | | | | 695,248 | |
GTL, Ltd. | | | 350,140 | | | | 3,291,370 | |
Gujarat Alkalies & Chemicals, Ltd. | | | 421,803 | | | | 1,241,495 | |
Gujarat Fluorochemicals, Ltd. | | | 181,278 | | | | 754,322 | |
Gujarat Narmada Valley Fertilizers Co., Ltd. | | | 647,256 | | | | 1,815,345 | |
Gujarat State Fertilizers & Chemicals, Ltd. | | | 445,889 | | | | 3,613,548 | |
Gulf Oil Corp., Ltd. | | | 194,724 | | | | 560,997 | |
H.E.G., Ltd. | | | 131,606 | | | | 807,862 | |
HBL Power Systems, Ltd. | | | 474,970 | | | | 290,698 | |
HCL Infosystems, Ltd. | | | 496,002 | | | | 1,268,740 | |
HCL Technologies, Ltd. | | | 224,791 | | | | 2,051,252 | |
*HeidelbergCement India, Ltd. | | | 520,445 | | | | 536,651 | |
Hexaware Technologies, Ltd. | | | 1,266,493 | | | | 2,507,397 | |
Hikal, Ltd. | | | 4,933 | | | | 47,365 | |
Hindalco Industries, Ltd. | | | 9,934,662 | | | | 47,243,508 | |
Hinduja Global Solutions, Ltd. | | | 65,909 | | | | 576,764 | |
Hinduja Ventures, Ltd. | | | 68,545 | | | | 689,709 | |
Hotel Leelaventure, Ltd. | | | 1,357,335 | | | | 1,578,483 | |
*Housing Development & Infrastructure, Ltd. | | | 1,228,907 | | | | 6,868,679 | |
*ICICI Bank, Ltd. | | | 111,742 | | | | 2,938,646 | |
#ICICI Bank, Ltd. Sponsored ADR | | | 3,332,795 | | | | 175,238,361 | |
ICSA (India), Ltd. | | | 290,435 | | | | 849,075 | |
IDBI Bank, Ltd. | | | 2,354,413 | | | | 9,589,849 | |
*Idea Cellular, Ltd. | | | 3,687,714 | | | | 5,583,056 | |
IFCI, Ltd. | | | 4,121,140 | | | | 6,432,346 | |
India Cements, Ltd. | | | 2,016,703 | | | | 5,038,413 | |
India Infoline, Ltd. | | | 1,395,726 | | | | 3,662,303 | |
Indiabulls Financial Services, Ltd. | | | 1,877,333 | | | | 9,355,932 | |
*Indiabulls Real Estate, Ltd. | | | 2,924,244 | | | | 12,649,066 | |
Indiabulls Securities, Ltd. | | | 6,234 | | | | 3,771 | |
Indian Bank | | | 766,855 | | | | 5,060,689 | |
Indian Hotels Co., Ltd. | | | 3,531,468 | | | | 7,967,801 | |
Indian Overseas Bank | | | 1,005,458 | | | | 3,618,703 | |
9
DIMENSIONAL EMERGING MARKETS VALUE FUND
CONTINUED
| | | | | | | | |
| | | Shares | | | Value†† | |
INDIA — (Continued) | | | | | | | | |
*Indo Rama Synthetics (India), Ltd. | | | 202,314 | | | $ | 308,058 | |
IndusInd Bank, Ltd. | | | 1,092,668 | | | | 6,518,587 | |
INEIS ABS India, Ltd. | | | 28,114 | | | | 239,486 | |
Infotech Enterprises, Ltd. | | | 21,152 | | | | 77,471 | |
Infrastructure Development Finance Co., Ltd. | | | 2,790,613 | | | | 12,628,909 | |
ING Vysya Bank, Ltd. | | | 289,910 | | | | 2,630,496 | |
Ingersoll-Rand India, Ltd. | | | 18,256 | | | | 201,183 | |
Ipca Laboratories, Ltd. | | | 251,146 | | | | 1,841,809 | |
*ISMT, Ltd. | | | 161,991 | | | | 188,944 | |
*Ispat Industries, Ltd. | | | 4,133,543 | | | | 1,826,179 | |
*IVRCL Assets & Holdings, Ltd. | | | 89,922 | | | | 226,890 | |
IVRCL Infrastructures & Projects, Ltd. | | | 2,864,100 | | | | 9,654,824 | |
J.B. Chemicals & Pharmaceuticals, Ltd. | | | 377,474 | | | | 1,038,115 | |
Jammu & Kashmir Bank, Ltd. | | | 233,400 | | | | 4,795,229 | |
JBF Industries, Ltd. | | | 96,294 | | | | 464,322 | |
*Jet Airways (India), Ltd. | | | 244,572 | | | | 4,476,071 | |
Jindal Poly Films, Ltd. | | | 108,626 | | | | 1,537,798 | |
Jindal Saw, Ltd. | | | 1,180,076 | | | | 5,780,069 | |
JK Cement, Ltd. | | | 87,998 | | | | 344,854 | |
JK Lakshmi Cement, Ltd. | | | 290,053 | | | | 402,159 | |
JK Tyre & Industries, Ltd. | | | 158,673 | | | | 583,696 | |
JM Financial, Ltd. | | | 205,032 | | | | 179,464 | |
*JSL Stainless, Ltd. | | | 726,612 | | | | 1,999,063 | |
JSW Steel, Ltd. | | | 1,091,845 | | | | 32,971,365 | |
Jubilant Organosys, Ltd. | | | 228,068 | | | | 1,618,198 | |
K.S.B. Pumps, Ltd. | | | 3,791 | | | | 43,001 | |
Kalpataru Power Transmission, Ltd. | | | 5,000 | | | | 19,548 | |
*Kalyani Investment Co., Ltd. | | | 8,518 | | | | 161,348 | |
Kalyani Steels, Ltd. | | | 85,188 | | | | 227,864 | |
Karnataka Bank, Ltd. | | | 629,365 | | | | 2,618,988 | |
Karur Vysya Bank, Ltd. | | | 189,576 | | | | 2,287,190 | |
Karuturi Global, Ltd. | | | 555,213 | | | | 436,094 | |
Kesoram Industries, Ltd. | | | 212,331 | | | | 1,416,866 | |
*Kirloskar Eng India, Ltd. | | | 328,770 | | | | 1,516,916 | |
Kirloskar Industries, Ltd. | | | 21,918 | | | | 187,392 | |
Koutons Retail India, Ltd. | | | 2,849 | | | | 6,481 | |
KS Oils, Ltd. | | | 1,831,255 | | | | 2,364,361 | |
Lakshmi Machine Works, Ltd. | | | 4,697 | | | | 283,354 | |
Lakshmi Vilas Bank, Ltd. | | | 247,979 | | | | 724,675 | |
*Landmark Property Development Co., Ltd. | | | 240,241 | | | | 24,152 | |
LIC Housing Finance, Ltd. | | | 317,938 | | | | 9,590,629 | |
Madhucon Projects, Ltd. | | | 183,396 | | | | 607,738 | |
Madras Cements, Ltd. | | | 409,184 | | | | 1,070,724 | |
*Mahanagar Telephone Nigam, Ltd. | | | 137,633 | | | | 209,209 | |
#*Mahanagar Telephone Nigam, Ltd. ADR | | | 100,249 | | | | 310,772 | |
Maharashtra Scooters, Ltd. | | | 4,450 | | | | 41,681 | |
Maharashtra Seamless, Ltd. | | | 149,749 | | | | 1,408,629 | |
Mahindra & Mahindra Financial Services, Ltd. | | | 34,564 | | | | 573,773 | |
Mahindra & Mahindra, Ltd. | | | 1,172,012 | | | | 19,328,233 | |
Mahindra Lifespace Developers, Ltd. | | | 135,781 | | | | 1,454,219 | |
*Manaksia, Ltd. | | | 147,412 | | | | 278,249 | |
Maruti Suzuki India, Ltd. | | | 262,121 | | | | 9,169,674 | |
Mastek, Ltd. | | | 83,250 | | | | 384,660 | |
McLeod Russel India, Ltd. | | | 637,181 | | | | 3,307,515 | |
Mercator Lines, Ltd. | | | 2,078,028 | | | | 3,017,778 | |
Merck, Ltd. | | | 29,241 | | | | 503,088 | |
*Monnet Ispat, Ltd. | | | 132,630 | | | | 1,786,591 | |
Moser Baer (India), Ltd. | | | 1,516,872 | | | | 2,215,435 | |
MRF, Ltd. | | | 17,453 | | | | 3,658,677 | |
Mukand, Ltd. | | | 324,653 | | | | 498,828 | |
Nagarjuna Construction Co., Ltd. | | | 1,407,751 | | | | 4,688,174 | |
10
DIMENSIONAL EMERGING MARKETS VALUE FUND
CONTINUED
| | | | | | | | |
| | | Shares | | | Value†† | |
INDIA — (Continued) | | | | | | | | |
Nagarjuna Fertilizers & Chemicals, Ltd. | | | 1,893,177 | | | $ | 1,442,163 | |
Nahar Capital & Financial Services, Ltd. | | | 37,492 | | | | 92,004 | |
Nahar Spinning Mills, Ltd. | | | 33,942 | | | | 104,304 | |
National Aluminium Co., Ltd. | | | 133,467 | | | | 1,208,900 | |
Nava Bharat Ventures, Ltd. | | | 5,395 | | | | 46,315 | |
Navneet Publications (India), Ltd. | | | 25,344 | | | | 34,883 | |
NIIT Technologies, Ltd. | | | 342,060 | | | | 1,684,022 | |
NIIT, Ltd. | | | 1,020,094 | | | | 1,508,980 | |
Nirma, Ltd. | | | 374,728 | | | | 1,956,115 | |
NOCIL, Ltd. | | | 981,740 | | | | 496,570 | |
*Noida Toll Bridge Co., Ltd. | | | 557,474 | | | | 398,840 | |
OCL India, Ltd. | | | 84,049 | | | | 249,729 | |
*OMAXE, Ltd. | | | 316,351 | | | | 1,067,234 | |
*Orbit Corp., Ltd. | | | 366,251 | | | | 958,459 | |
Orchid Chemicals & Pharmaceuticals, Ltd. | | | 445,419 | | | | 2,877,261 | |
Orient Paper & Industries, Ltd. | | | 323,741 | | | | 429,290 | |
Oriental Bank of Commerce | | | 466,459 | | | | 5,246,609 | |
Panacea Biotec, Ltd. | | | 72,446 | | | | 326,631 | |
*Parsvnath Developers, Ltd. | | | 766,592 | | | | 1,152,000 | |
Patel Engineering, Ltd. | | | 85,212 | | | | 699,427 | |
Patni Computer Systems, Ltd. | | | 690,149 | | | | 7,172,766 | |
Patni Computer Systems, Ltd. ADR | | | 55,441 | | | | 1,157,608 | |
Peninsula Land, Ltd. | | | 198,415 | | | | 274,466 | |
Petronet LNG, Ltd. | | | 2,943,666 | | | | 7,372,477 | |
Plethico Pharmaceuticals, Ltd. | | | 35,619 | | | | 315,830 | |
Polaris Software Lab, Ltd. | | | 396,842 | | | | 1,451,791 | |
Power Finance Corp, Ltd. | | | 129,000 | | | | 1,045,320 | |
Prism Cement, Ltd. | | | 437,332 | | | | 581,246 | |
Provogue India, Ltd. | | | 119,777 | | | | 201,759 | |
PSL, Ltd. | | | 113,833 | | | | 281,805 | |
PTC India, Ltd. | | | 1,929,101 | | | | 5,833,626 | |
Punj Lloyd, Ltd. | | | 1,229,016 | | | | 3,271,578 | |
Rain Commodities, Ltd. | | | 215,083 | | | | 780,029 | |
Rajesh Exports, Ltd. | | | 489,295 | | | | 1,303,842 | |
*Ranbaxy Laboratories, Ltd. | | | 719,916 | | | | 9,416,912 | |
*Raymond, Ltd. | | | 340,181 | | | | 3,318,082 | |
REI Agro, Ltd. | | | 3,175,410 | | | | 1,953,702 | |
Rei Six Ten Retail, Ltd. | | | 439,400 | | | | 733,308 | |
*Reliance Broadcast Network, Ltd. | | | 20,606 | | | | 45,478 | |
Reliance Capital, Ltd. | | | 923,214 | | | | 16,973,495 | |
Reliance Communications, Ltd. | | | 5,398,403 | | | | 21,846,408 | |
Reliance Industries, Ltd. | | | 7,365,013 | | | | 181,814,091 | |
*Reliance MediaWorks, Ltd. | | | 109,133 | | | | 603,644 | |
*Reliance Power, Ltd. | | | 4,580,850 | | | | 16,217,100 | |
*Resurgere Mines & Minerals India, Ltd. | | | 4,231,830 | | | | 191,107 | |
Rolta India, Ltd. | | | 1,217,326 | | | | 4,578,596 | |
Ruchi Soya Industries, Ltd. | | | 1,172,211 | | | | 3,485,569 | |
*S.Kumars Nationwide, Ltd. | | | 1,242,979 | | | | 2,279,914 | |
Sanghvi Movers, Ltd. | | | 6,290 | | | | 26,096 | |
SEAMEC, Ltd. | | | 77,043 | | | | 265,056 | |
Shipping Corp. of India, Ltd. | | | 171,233 | | | | 667,087 | |
Shiv-Vani Oil & Gas Exploration Services, Ltd. | | | 115,578 | | | | 1,111,618 | |
Simplex Infrastructures, Ltd. | | | 1,570 | | | | 17,390 | |
SKF India, Ltd. | | | 15,701 | | | | 205,542 | |
Sobha Developers, Ltd. | | | 152,727 | | | | 1,241,402 | |
Sona Koyo Steering Systems, Ltd. | | | 118,568 | | | | 53,761 | |
South Indian Bank, Ltd. | | | 6,247,570 | | | | 3,885,992 | |
SPML Infra, Ltd. | | | 372 | | | | 2,399 | |
SREI Infrastructure Finance, Ltd. | | | 818,844 | | | | 2,440,321 | |
SRF, Ltd. | | | 266,306 | | | | 2,417,492 | |
State Bank of India | | | 552,879 | | | | 39,347,433 | |
11
DIMENSIONAL EMERGING MARKETS VALUE FUND
CONTINUED
| | | | | | | | |
| | | Shares | | | Value†† | |
INDIA — (Continued) | | | | | | | | |
Sterling Biotech, Ltd. | | | 449,228 | | | $ | 1,103,377 | |
#Sterlite Industries (India), Ltd. ADR | | | 1,164,402 | | | | 18,013,299 | |
Sterlite Industries (India), Ltd. Series A | | | 5,746,256 | | | | 21,999,759 | |
Sterlite Technologies, Ltd. | | | 447,261 | | | | 835,426 | |
Strides Arcolab, Ltd. | | | 64,603 | | | | 609,368 | |
Sundaram Finance, Ltd. | | | 4,276 | | | | 67,022 | |
Sundram Fastners, Ltd. | | | 55,097 | | | | 78,379 | |
*Suzlon Energy, Ltd. | | | 3,384,835 | | | | 4,221,281 | |
Syndicate Bank | | | 1,422,728 | | | | 4,460,857 | |
Tamilnadu Newsprint & Papers, Ltd. | | | 39,142 | | | | 134,629 | |
Tanla Solutions, Ltd. | | | 617,458 | | | | 359,037 | |
Tata Chemicals, Ltd. | | | 763,975 | | | | 6,721,093 | |
#*Tata Communications, Ltd. ADR | | | 20,500 | | | | 285,360 | |
Tata Investment Corp., Ltd. | | | 58,932 | | | | 769,961 | |
Tata Steel, Ltd. | | | 2,571,275 | | | | 34,201,464 | |
Tata Tea, Ltd. | | | 2,775,743 | | | | 7,790,606 | |
*TCI Developers | | | 3,427 | | | | 16,202 | |
*Teledata Marine Solutions, Ltd. | | | 267,258 | | | | 206,046 | |
Time Technoplast, Ltd. | | | 365,124 | | | | 499,353 | |
Titagarh Wagons, Ltd. | | | 22,658 | | | | 252,952 | |
Transport Corp of India, Ltd. | | | 68,548 | | | | 189,739 | |
Trent, Ltd. | | | 14,497 | | | | 331,333 | |
*Trent, Ltd. Series A | | | 3,220 | | | | 67,046 | |
*Trent, Ltd. Series B | | | 3,220 | | | | 65,342 | |
Triveni Engineering & Industries, Ltd. | | | 240,000 | | | | 648,414 | |
Tube Investments of India | | | 642,055 | | | | 2,188,644 | |
TVS Motor Co., Ltd. | | | 152,419 | | | | 251,203 | |
UCO Bank | | | 1,022,797 | | | | 2,904,109 | |
Uflex, Ltd. | | | 153,357 | | | | 1,048,647 | |
Unichem Laboratories, Ltd. | | | 199,000 | | | | 1,019,155 | |
Union Bank of India | | | 797,003 | | | | 6,800,960 | |
United Phosphorus, Ltd. | | | 530,310 | | | | 2,385,079 | |
Unity Infraprojects, Ltd. | | | 180,846 | | | | 429,421 | |
Usha Martin, Ltd. | | | 1,066,559 | | | | 2,085,252 | |
*UTV Software Communications, Ltd. | | | 11,056 | | | | 143,300 | |
Vardhman Textiles, Ltd. | | | 98,045 | | | | 745,620 | |
Varun Shipping Co., Ltd. | | | 549,032 | | | | 509,598 | |
Videocon Industries, Ltd. | | | 782,287 | | | | 4,468,781 | |
*Videsh Sanchar Nigam, Ltd. | | | 727,705 | | | | 5,040,382 | |
Vijaya Bank | | | 807,166 | | | | 1,938,562 | |
*Walchandnagar Industries, Ltd. | | | 106,847 | | | | 494,360 | |
Welspun Corp., Ltd. | | | 206,876 | | | | 1,163,140 | |
*Wockhardt, Ltd. | | | 174,816 | | | | 1,163,358 | |
Yes Bank, Ltd. | | | 386,982 | | | | 3,138,751 | |
Zee Entertainment Enterprises, Ltd. | | | 1,188,271 | | | | 7,433,046 | |
*Zee Learn, Ltd. | | | 297,068 | | | | 34,772 | |
Zuari Industries, Ltd. | | | 127,958 | | | | 2,387,767 | |
Zylog Systems, Ltd. | | | 26,158 | | | | 337,458 | |
| | | | | | | | |
TOTAL INDIA | | | | | | | 1,304,039,842 | |
| | | | | | | | |
INDONESIA — (3.1%) | | | | | | | | |
*PT Adhi Karya Tbk | | | 492,000 | | | | 55,158 | |
*PT Agis Tbk | | | 2,012,000 | | | | 38,389 | |
PT AKR Corporindo Tbk | | | 20,492,400 | | | | 3,466,640 | |
PT Aneka Tambang Tbk | | | 52,723,000 | | | | 15,103,603 | |
PT Asahimas Flat Glass Tbk | | | 5,333,500 | | | | 3,769,075 | |
PT Astra International Tbk | | | 901,696 | | | | 5,773,212 | |
*PT Bakrie & Brothers Tbk | | | 910,038,250 | | | | 5,516,739 | |
PT Bakrie Sumatera Plantations Tbk | | | 82,736,500 | | | | 3,590,224 | |
*PT Bakrie Telecom Tbk | | | 279,478,500 | | | | 7,537,567 | |
PT Bakrieland Development Tbk | | | 352,127,520 | | | | 6,256,244 | |
12
DIMENSIONAL EMERGING MARKETS VALUE FUND
CONTINUED
| | | | | | | | |
| | | Shares | | | Value†† | |
INDONESIA — (Continued) | | | | | | | | |
PT Bank Bukopin Tbk | | | 24,796,000 | | | $ | 1,940,866 | |
PT Bank Danamon Indonesia Tbk | | | 7,856,303 | | | | 5,908,584 | |
PT Bank Negara Indonesia Persero Tbk | | | 44,927,000 | | | | 19,643,577 | |
*PT Bank Pan Indonesia Tbk | | | 122,909,826 | | | | 15,416,892 | |
*PT Barito Pacific Tbk | | | 10,265,500 | | | | 1,462,392 | |
*PT Berlian Laju Tanker Tbk | | | 139,931,466 | | | | 6,044,272 | |
*PT Bhakti Investama Tbk | | | 242,272,700 | | | | 3,489,591 | |
PT Budi Acid Jaya Tbk | | | 14,289,000 | | | | 342,568 | |
PT Bumi Resources Tbk | | | 280,320,500 | | | | 70,190,067 | |
*PT Central Proteinaprima Tbk | | | 178,071,500 | | | | 1,055,976 | |
PT Charoen Pokphand Indonesia Tbk | | | 19,902,666 | | | | 19,098,095 | |
*PT Ciputra Development Tbk | | | 83,344,500 | | | | 3,938,533 | |
*PT Ciputra Surya Tbk | | | 17,718,000 | | | | 1,394,524 | |
PT Clipan Finance Indonesia Tbk | | | 3,636,000 | | | | 167,474 | |
*PT Darma Henwa Tbk | | | 137,802,300 | | | | 1,194,301 | |
*PT Davomas Adabi Tbk | | | 139,739,500 | | | | 1,236,313 | |
PT Dynaplast Tbk | | | 3,040,000 | | | | 955,134 | |
PT Elnusa Tbk | | | 32,023,000 | | | | 1,204,765 | |
*PT Energi Mega Persada Tbk | | | 331,341,282 | | | | 4,399,362 | |
PT Ever Shine Textile Tbk | | | 19,347,215 | | | | 195,907 | |
PT Gajah Tunggal Tbk | | | 9,707,500 | | | | 2,533,449 | |
PT Global Mediacom Tbk | | | 96,453,500 | | | | 5,362,733 | |
PT Gozco Plantations Tbk | | | 13,388,500 | | | | 645,828 | |
*PT Great River International Tbk | | | 1,788,000 | | | | — | |
PT Gudang Garam Tbk | | | 6,628,500 | | | | 35,463,235 | |
*PT Hero Supermarket Tbk | | | 220,000 | | | | 103,385 | |
*PT Indah Kiat Pulp & Paper Corp. Tbk | | | 28,149,500 | | | | 6,551,039 | |
PT Indika Energy Tbk | | | 19,721,000 | | | | 8,081,291 | |
PT Indofood Sukses Makmur Tbk | | | 23,893,000 | | | | 13,934,943 | |
PT International Nickel Indonesia Tbk | | | 39,701,500 | | | | 21,209,280 | |
PT Japfa Comfeed Indonesia Tbk | | | 2,455,500 | | | | 867,655 | |
PT Jaya Real Property Tbk | | | 25,528,000 | | | | 4,295,278 | |
*PT Kawasan Industri Jababeka Tbk | | | 187,435,000 | | | | 2,819,481 | |
PT Lautan Luas Tbk | | | 2,102,000 | | | | 192,960 | |
*PT Lippo Karawaci Tbk | | | 190,150,750 | | | | 13,197,607 | |
PT Matahari Putra Prima Tbk | | | 35,314,400 | | | | 5,563,885 | |
PT Mayorah Indah Tbk | | | 8,807,572 | | | | 11,908,609 | |
PT Medco Energi Internasional Tbk | | | 28,604,500 | | | | 13,102,605 | |
*PT Media Nusantara Citra Tbk | | | 4,646,000 | | | | 318,452 | |
*PT Mitra Adiperkasa Tbk | | | 230,000 | | | | 65,640 | |
*PT Mitra International Resources Tbk | | | 40,757,660 | | | | 1,098,090 | |
*PT Panasia Indosyntec Tbk | | | 403,200 | | | | 10,602 | |
*PT Panin Financial Tbk | | | 183,439,000 | | | | 4,010,538 | |
*PT Panin Insurance Tbk | | | 30,688,500 | | | | 1,893,246 | |
PT Perusahaan Perkebunan London Sumatra Indonesia Tbk | | | 4,726,500 | | | | 6,212,079 | |
PT Ramayana Lestari Sentosa Tbk | | | 12,324,000 | | | | 1,257,168 | |
PT Sampoerna Agro Tbk | | | 3,412,000 | | | | 1,148,740 | |
*PT Samudera Indonesia Tbk | | | 415,500 | | | | 194,733 | |
PT Selamat Sempurna Tbk | | | 15,274,000 | | | | 1,779,273 | |
*PT Sentul City Tbk | | | 123,241,000 | | | | 1,616,866 | |
PT Sinar Mas Agro Resources & Technology Tbk | | | 8,067,900 | | | | 4,710,170 | |
PT Sorini Agro Asia Corporindo Tbk | | | 7,941,000 | | | | 2,735,442 | |
PT Summarecon Agung Tbk | | | 43,122,357 | | | | 5,472,776 | |
*PT Sunson Textile Manufacturer Tbk | | | 6,012,000 | | | | 141,261 | |
*PT Surya Dumai Industri Tbk | | | 5,145,000 | | | | — | |
PT Surya Toto Indonesia Tbk | | | 46,400 | | | | 186,119 | |
*PT Suryainti Permata Tbk | | | 17,378,000 | | | | 173,051 | |
PT Tigaraksa Satria Tbk | | | 165,200 | | | | 11,460 | |
PT Timah Tbk | | | 10,142,000 | | | | 3,246,907 | |
PT Trimegah Sec Tbk | | | 34,298,000 | | | | 452,693 | |
*PT Truba Alam Manunggal Engineering Tbk | | | 129,244,500 | | | | 1,207,808 | |
13
DIMENSIONAL EMERGING MARKETS VALUE FUND
CONTINUED
| | | | | | | | |
| | | Shares | | | Value†† | |
INDONESIA — (Continued) | | | | | | | | |
*PT Tunas Baru Lampung Tbk | | | 291,000 | | | $ | 13,718 | |
PT Tunas Ridean Tbk | | | 42,862,000 | | | | 3,749,387 | |
*PT Ultrajaya Milk Industry & Trading Co. Tbk | | | 13,717,500 | | | | 2,609,156 | |
PT Unggul Indah Cahaya Tbk | | | 371,435 | | | | 85,196 | |
PT Wijaya Karya Tbk | | | 15,842,000 | | | | 1,281,724 | |
| | | | | | | | |
TOTAL INDONESIA | | | | | | | 401,901,602 | |
| | | | | | | | |
ISRAEL — (0.0%) | | | | | | | | |
*Bank of Jerusalem, Ltd. | | | 23,972 | | | | 45,717 | |
Delta-Galil Industries, Ltd. | | | — | | | | 4 | |
*Electra Real Estate, Ltd. | | | — | | | | 1 | |
*Elron Electronic Industries, Ltd. | | | 1 | | | | 4 | |
*Feuchtwanger Investments, Ltd. | | | 10,500 | | | | 35 | |
Formula Systems, Ltd. | | | — | | | | — | |
*Formula Vision Technologies, Ltd. | | | — | | | | — | |
*Israel Steel Mills, Ltd. | | | 97,000 | | | | 1,041 | |
*Kardan Israel, Ltd. | | | — | | | | 1 | |
*Knafaim Arkia Holdings, Ltd. | | | 92,777 | | | | 512,144 | |
Koor Industries, Ltd. | | | 1 | | | | 22 | |
*Liberty Properties, Ltd. | | | 2,533 | | | | 31,353 | |
*Makhteshim-Agan Industries, Ltd. | | | 1 | | | | 3 | |
*Mivtach Shamir Holdings, Ltd. | | | 41,934 | | | | 1,302,255 | |
*Naphtha Israel Petroleum Corp., Ltd. | | | — | | | | 1 | |
Scailex Corp, Ltd. | | | 90,240 | | | | 1,747,194 | |
| | | | | | | | |
TOTAL ISRAEL | | | | | | | 3,639,775 | |
| | | | | | | | |
MALAYSIA — (3.4%) | | | | | | | | |
*A&M Realty Berhad | | | 720,700 | | | | 131,381 | |
*Adventa Berhad | | | 3,200 | | | | 2,479 | |
Affin Holdings Berhad | | | 9,611,900 | | | | 9,957,347 | |
*Airasia Berhad | | | 11,014,200 | | | | 8,764,497 | |
Alliance Financial Group Berhad | | | 11,988,000 | | | | 12,656,836 | |
*Amcorp Properties Berhad | | | 927,567 | | | | 126,908 | |
AMMB Holdings Berhad | | | 21,831,262 | | | | 44,387,897 | |
Ann Joo Resources Berhad | | | 2,857,200 | | | | 2,748,608 | |
APM Automotive Holdings Berhad | | | 1,178,000 | | | | 1,978,941 | |
Apollo Food Holdings Berhad | | | 109,000 | | | | 119,098 | |
*Asas Dunia Berhad | | | 350,000 | | | | 104,129 | |
*Asia Pacific Land Berhad | | | 5,644,300 | | | | 682,353 | |
*Axiata Group Berhad | | | 1,074,850 | | | | 1,554,465 | |
Bandar Raya Developments Berhad | | | 4,087,800 | | | | 3,158,245 | |
Batu Kawan Berhad | | | 2,242,250 | | | | 10,896,535 | |
*Berjaya Assets Berhad | | | 37,100 | | | | 8,369 | |
Berjaya Corp. Berhad | | | 23,239,780 | | | | 8,088,904 | |
Berjaya Land Berhad | | | 13,220,000 | | | | 4,981,736 | |
*Berjaya Media Berhad | | | 425,300 | | | | 70,172 | |
*Berjaya Retail Berhad | | | 1,775,788 | | | | 242,555 | |
Bimb Holdings Berhad | | | 2,170,800 | | | | 844,655 | |
Bina Darulaman Berhad | | | 60,800 | | | | 21,779 | |
Bolton Berhad | | | 1,277,400 | | | | 464,214 | |
Boustead Holdings Berhad | | | 4,738,580 | | | | 8,568,860 | |
Cahya Mata Sarawak Berhad | | | 1,786,600 | | | | 1,553,473 | |
Chemical Co. of Malaysia Berhad | | | 311,000 | | | | 201,550 | |
Chin Teck Plantations Berhad | | | 304,700 | | | | 847,870 | |
*Coastal Contracts Berhad | | | 84,900 | | | | 62,085 | |
*Country Heights Holdings Berhad | | | 37,300 | | | | 7,333 | |
CSC Steel Holdings Berhad | | | 1,685,200 | | | | 1,018,542 | |
Cycle & Carriage Bintang Berhad | | | 241,300 | | | | 378,426 | |
*Datuk Keramik Holdings Berhad | | | 127,000 | | | | — | |
Dijaya Corp. Berhad | | | 714,500 | | | | 245,931 | |
DNP Holdings Berhad | | | 1,861,100 | | | | 1,089,309 | |
14
DIMENSIONAL EMERGING MARKETS VALUE FUND
CONTINUED
| | | | | | | | |
| | | Shares | | | Value†† | |
MALAYSIA — (Continued) | | | | | | | | |
DRB-Hicom Berhad | | | 9,932,000 | | | $ | 3,833,990 | |
*Eastern & Oriental Berhad | | | 8,512,115 | | | | 3,128,374 | |
Eastern Pacific Industrial Corp. Berhad | | | 497,700 | | | | 321,945 | |
ECM Libra Avenue Berhad | | | 7,178,982 | | | | 1,670,290 | |
*EON Capital Berhad | | | 3,626,007 | | | | 8,141,678 | |
Esso Malaysia Berhad | | | 954,100 | | | | 887,341 | |
Evergreen Fibreboard Berhad | | | 1,092,900 | | | | 524,305 | |
Far East Holdings Berhad | | | 388,800 | | | | 862,899 | |
*Fountain View Development Berhad | | | 2,573,200 | | | | — | |
General Corp. Berhad | | | 1,681,400 | | | | 869,549 | |
Genting Malaysia Berhad | | | 842,600 | | | | 950,024 | |
Genting Plantations Berhad | | | 356,800 | | | | 985,668 | |
Glomac Berhad | | | 1,706,800 | | | | 879,389 | |
*Gold Is Berhad | | | 3,016,125 | | | | 1,191,979 | |
*GuocoLand (Malaysia) Berhad | | | 522,800 | | | | 213,683 | |
Hap Seng Consolidated Berhad | | | 2,582,300 | | | | 3,321,682 | |
Hap Seng Plantations Holdings Berhad | | | 1,701,400 | | | | 1,497,268 | |
Hong Leong Financial Group Berhad | | | 1,796,551 | | | | 5,271,281 | |
Hong Leong Industries Berhad | | | 1,225,800 | | | | 2,007,972 | |
Hubline Berhad | | | 1,629,600 | | | | 86,436 | |
Hunza Properties Berhad | | | 1,033,300 | | | | 541,918 | |
Hwang-DBS (Malaysia) Berhad | | | 908,700 | | | | 586,684 | |
IGB Corp. Berhad | | | 11,559,000 | | | | 7,443,679 | |
IJM Corp. Berhad | | | 15,038,680 | | | | 27,243,541 | |
IJM Land Berhad | | | 3,923,300 | | | | 3,497,012 | |
*Insas Berhad | | | 4,347,408 | | | | 755,948 | |
*Jaks Resources Berhad | | | 3,438,000 | | | | 826,141 | |
*Jaya Tiasa Holdings Berhad | | | 1,192,135 | | | | 1,496,129 | |
Jerneh Asia Berhad | | | 633,720 | | | | 632,650 | |
K & N Kenanga Holdings Berhad | | | 2,220,800 | | | | 532,863 | |
*Karambunai Corp. Berhad | | | 6,839,800 | | | | 494,181 | |
Keck Seng (Malaysia) Berhad | | | 1,671,800 | | | | 3,189,859 | |
Kian Joo Can Factory Berhad | | | 3,566,680 | | | | 1,844,495 | |
*KIG Glass Industrial Berhad | | | 260,000 | | | | 2,507 | |
Kim Loong Resources Berhad | | | 324,800 | | | | 256,412 | |
Kinsteel Berhad | | | 7,509,500 | | | | 2,442,966 | |
KLCC Property Holdings Berhad | | | 6,581,100 | | | | 6,976,757 | |
*KNM Group Berhad | | | 16,388,600 | | | | 2,527,460 | |
*Knusford Berhad | | | 139,300 | | | | 72,079 | |
KPJ Healthcare Berhad | | | 375,650 | | | | 448,532 | |
KrisAssets Holdings Berhad | | | 250,377 | | | | 282,141 | |
KSL Holdings Berhad | | | 256,566 | | | | 134,769 | |
Kub Malaysia Berhad | | | 5,214,000 | | | | 874,828 | |
Kulim Malaysia Berhad | | | 2,761,625 | | | | 8,603,793 | |
*Kumpulan Hartanah Selangor Berhad | | | 520,000 | | | | 75,238 | |
Kumpulan Perangsang Selangor Berhad | | | 1,128,400 | | | | 529,783 | |
Kwantas Corp. Berhad | | | 246,000 | | | | 142,831 | |
Landmarks Berhad | | | 4,118,808 | | | | 1,751,515 | |
Leader Universal Holdings Berhad | | | 5,383,033 | | | | 1,561,130 | |
*Lion Corp Berhad | | | 7,984,307 | | | | 758,674 | |
Lion Diversified Holdings Berhad | | | 5,448,100 | | | | 930,745 | |
*Lion Forest Industries Berhad | | | 136,800 | | | | 95,259 | |
Lion Industries Corp. Berhad | | | 7,446,081 | | | | 4,751,051 | |
*MAA Holdings Berhad | | | 888,700 | | | | 181,723 | |
*Mah Sing Group Berhad | | | 50,200 | | | | 30,465 | |
*Malayan United Industries Berhad (6556756) | | | 1,526,067 | | | | 100,544 | |
*Malayan United Industries Berhad (B4TWFT8) | | | 200,244 | | | | 10,619 | |
Malaysia Airports Holdings Berhad | | | 161,600 | | | | 315,457 | |
Malaysia Building Society Berhad | | | 815,000 | | | | 412,262 | |
Malaysian Bulk Carriers Berhad | | | 1,164,825 | | | | 1,119,907 | |
Malaysian Mosaics Berhad | | | 293,040 | | | | 215,912 | |
15
DIMENSIONAL EMERGING MARKETS VALUE FUND
CONTINUED
| | | | | | | | |
| | | Shares | | | Value†† | |
MALAYSIA — (Continued) | | | | | | | | |
Malaysian Resources Corp. Berhad | | | 75,000 | | | $ | 50,247 | |
MBM Resources Berhad | | | 531,533 | | | | 528,608 | |
Mega First Corp. Berhad | | | 1,101,700 | | | | 636,237 | |
*Merge Housing Berhad | | | 63,162 | | | | 10,564 | |
*Metro Kajang Holdings Berhad | | | 562,099 | | | | 251,027 | |
*Metroplex Berhad | | | 817,000 | | | | — | |
MISC Berhad | | | 373,740 | | | | 1,055,832 | |
*MK Land Holdings Berhad | | | 10,344,500 | | | | 1,283,765 | |
MMC Corp. Berhad | | | 10,879,779 | | | | 10,782,924 | |
*MNRB Holdings Berhad | | | 1,150,800 | | | | 1,033,545 | |
Muhibbah Engineering Berhad | | | 4,845,400 | | | | 1,607,865 | |
MUI Properties Berhad | | | 557,000 | | | | 29,763 | |
*Mulpha International Berhad | | | 33,546,200 | | | | 5,070,287 | |
MWE Holdings Berhad | | | 270,000 | | | | 89,402 | |
Naim Holdings Berhad | | | 1,130,000 | | | | 1,317,441 | |
NCB Holdings Berhad | | | 2,447,800 | | | | 2,869,615 | |
Negri Sembilan Oil Palms Berhad | | | 167,600 | | | | 282,012 | |
NV Multi Corp. Berhad | | | 165,700 | | | | 39,356 | |
Oriental Holdings Berhad | | | 3,653,779 | | | | 6,165,625 | |
Oriental Interest Berhad | | | 164,800 | | | | 72,095 | |
OSK Holdings Berhad | | | 6,549,647 | | | | 3,208,537 | |
*OSK Ventures International Berhad | | | 727,597 | | | | 91,898 | |
P.I.E. Industrial Berhad | | | 323,600 | | | | 424,551 | |
*Pacific & Orient Berhad | | | 566,730 | | | | 193,921 | |
Panasonic Manufacturing Malaysia Berhad | | | 383,380 | | | | 2,253,721 | |
*Paracorp Berhad | | | 252,000 | | | | 810 | |
Paramount Corp. Berhad | | | 211,700 | | | | 331,634 | |
PBA Holdings Berhad | | | 1,502,500 | | | | 480,788 | |
Pelikan International Corp. Berhad | | | 4,130,320 | | | | 1,661,914 | |
*Permaju Industries Berhad | | | 1,703,300 | | | | 210,479 | |
Petronas Dagangan Berhad | | | 310,700 | | | | 1,091,426 | |
PJ Development Holdings Berhad | | | 2,768,800 | | | | 752,859 | |
POS Malaysia Berhad | | | 2,274,517 | | | | 2,370,133 | |
PPB Group Berhad | | | 6,909,766 | | | | 42,656,648 | |
*Press Metal Berhad | | | 11,300 | | | | 6,358 | |
*Prime Utilities Berhad | | | 39,000 | | | | 1,128 | |
Protasco Berhad | | | 282,200 | | | | 94,351 | |
Proton Holdings Berhad | | | 3,786,000 | | | | 5,998,579 | |
*Pulai Springs Berhad | | | 132,500 | | | | 20,014 | |
QSR Brands Berhad | | | 56,800 | | | | 96,335 | |
*Ramunia Holdings Berhad | | | 2,434,736 | | | | 313,881 | |
Ranhill Berhad | | | 3,162,200 | | | | 802,462 | |
RCE Capital Berhad | | | 2,613,100 | | | | 518,334 | |
RHB Capital Berhad | | | 5,561,200 | | | | 14,366,619 | |
Salcon Berhad | | | 574,000 | | | | 132,204 | |
Sarawak Oil Palms Berhad | | | 391,820 | | | | 439,401 | |
Scientex, Inc. Berhad | | | 645,048 | | | | 381,414 | |
*Scomi Group Berhad | | | 13,422,000 | | | | 1,796,578 | |
Selangor Dredging Berhad | | | 1,312,700 | | | | 354,333 | |
Shangri-La Hotels (Malaysia) Berhad | | | 738,000 | | | | 674,382 | |
Shell Refining Co. Federation of Malaysia Berhad | | | 217,100 | | | | 742,703 | |
SHL Consolidated Berhad | | | 1,008,700 | | | | 422,720 | |
*Sino Hua-An International Berhad | | | 2,515,000 | | | | 303,844 | |
Subur Tiasa Holdings Berhad | | | 460,530 | | | | 325,287 | |
Sunrise Berhad | | | 4,480,534 | | | | 3,287,830 | |
Sunway City Berhad | | | 3,565,000 | | | | 4,614,686 | |
Sunway Holdings Berhad | | | 4,319,400 | | | | 2,767,435 | |
Suria Capital Holdings Berhad | | | 590,800 | | | | 351,846 | |
Ta Ann Holdings Berhad | | | 231,960 | | | | 342,969 | |
TA Enterprise Berhad | | | 14,799,300 | | | | 3,505,944 | |
TA Global Berhad (B3X17H6) | | | 8,465,880 | | | | 1,265,245 | |
16
DIMENSIONAL EMERGING MARKETS VALUE FUND
CONTINUED
| | | | | | | | |
| | | Shares | | | Value†† | |
MALAYSIA — (Continued) | | | | | | | | |
*TA Global Berhad (B4LM6X7) | | | 8,465,880 | | | $ | 1,034,732 | |
Tahp Group Berhad | | | 27,000 | | | | 40,546 | |
*Talam Corp. Berhad | | | 17,833,050 | | | | 544,359 | |
*Tamco Corp. Holdings Berhad | | | 71 | | | | 1 | |
Tan Chong Motor Holdings Berhad | | | 4,857,500 | | | | 8,847,378 | |
*Tanjung Offshore Berhad | | | 206,000 | | | | 108,875 | |
TDM Berhad | | | 1,178,500 | | | | 923,197 | |
*Tebrau Teguh Berhad | | | 5,320,066 | | | | 1,320,665 | |
*Time Dotcom Berhad | | | 16,781,400 | | | | 3,867,398 | |
Tiong Nam Transport Holdings Berhad | | | 133,500 | | | | 40,781 | |
Titan Chemicals Corp. Berhad | | | 5,325,500 | | | | 3,954,403 | |
Tradewinds (Malaysia) Berhad | | | 926,300 | | | | 1,200,308 | |
*Tradewinds Corp. Berhad | | | 5,413,100 | | | | 1,564,265 | |
UAC Berhad | | | 77,398 | | | | 90,902 | |
UMW Holdings Berhad | | | 2,059,686 | | | | 4,487,354 | |
Unico-Desa Plantations Berhad | | | 4,194,428 | | | | 1,457,992 | |
Unisem (Malaysia) Berhad | | | 3,100,600 | | | | 1,861,794 | |
United Malacca Rubber Estates Berhad | | | 870,600 | | | | 2,016,278 | |
United Plantations Berhad | | | 617,400 | | | | 3,390,530 | |
VS Industry Berhad | | | 1,337,193 | | | | 688,908 | |
Wah Seong Corp. Berhad | | | 386,300 | | | | 271,118 | |
WCT Berhad | | | 1,235,300 | | | | 1,226,657 | |
WTK Holdings Berhad | | | 4,386,550 | | | | 1,696,275 | |
Yeo Hiap Seng (Malaysia) Berhad | | | 355,320 | | | | 170,544 | |
YTL Cement Berhad | | | 11,100 | | | | 16,700 | |
YTL Corp. Berhad | | | 6,494,072 | | | | 16,508,181 | |
Yu Neh Huat Berhad | | | 5,024,459 | | | | 2,911,158 | |
*Zelan Berhad | | | 6,765,900 | | | | 1,515,611 | |
| | | | | | | | |
TOTAL MALAYSIA | | | | | | | 441,891,015 | |
| | | | | | | | |
MEXICO — (5.5%) | | | | | | | | |
#Alfa S.A.B. de C.V. Series A | | | 4,088,867 | | | | 34,113,628 | |
#Alsea de Mexico S.A.B. de C.V. | | | 2,618,100 | | | | 2,660,929 | |
#*Axtel S.A.B. de C.V. | | | 5,663,540 | | | | 3,366,568 | |
#Bolsa Mexicana de Valores S.A. de C.V. | | | 2,597,088 | | | | 4,717,580 | |
#*Carso Infraestructura y Construccion S.A.B. de C.V. | | | 112,800 | | | | 75,638 | |
#*Cemex S.A.B. de C.V. Sponsored ADR | | | 11,578,134 | | | | 101,540,235 | |
#Coca-Cola Femsa S.A.B. de C.V. Sponsored ADR | | | 266,807 | | | | 21,203,152 | |
#Consorcio ARA S.A.B. de C.V. | | | 10,672,300 | | | | 6,784,706 | |
#*Corporacion GEO S.A.B. de C.V. Series B | | | 5,771,482 | | | | 18,322,165 | |
*Corporacion Interamericana de Entramiento S.A.B. de C.V. Series B | | | 1,561,686 | | | | 796,779 | |
#*Desarrolladora Homex S.A.B. de C.V. | | | 1,653,700 | | | | 9,254,184 | |
#*Desarrolladora Homex S.A.B. de C.V. ADR | | | 115,455 | | | | 3,876,979 | |
*Dine S.A.B. de C.V. | | | 1,028,367 | | | | 499,692 | |
El Puerto de Liverpool S.A.B. de C.V. | | | 328,600 | | | | 1,889,157 | |
El Puerto de Liverpool S.A.B. de C.V. Series 1 | | | 20,000 | | | | 115,808 | |
Embotelladora Arca S.A.B. de C.V. | | | 3,256,100 | | | | 13,448,421 | |
*Empaques Ponderosa S.A. de C.V. Series B | | | 90,000 | | | | 6,560 | |
#*Empresas ICA S.A.B. de C.V. | | | 2,999,272 | | | | 7,908,673 | |
#*Empresas ICA S.A.B. de C.V. Sponsored ADR | | | 1,118,155 | | | | 11,785,354 | |
#Fomento Economico Mexicano S.A.B. de C.V. Series B & D | | | 1,465,100 | | | | 8,056,389 | |
Fomento Economico Mexicano S.A.B. de C.V. Sponsored ADR | | | 1,617,816 | | | | 88,834,277 | |
*Gruma S.A.B. de C.V. ADR | | | 15,222 | | | | 119,493 | |
#*Gruma S.A.B. de C.V. Series B | | | 931,300 | | | | 1,846,309 | |
#Grupo Aeroportuario del Centro Norte, S.A.B. de C.V. | | | 696,600 | | | | 1,312,754 | |
#Grupo Aeroportuario del Centro Norte, S.A.B. de C.V. ADR | | | 41,146 | | | | 621,305 | |
#Grupo Aeroportuario del Pacifico S.A.B. de C.V. ADR | | | 616,489 | | | | 22,859,412 | |
#Grupo Aeroportuario del Sureste S.A.B. de C.V. | | | 727,300 | | | | 3,657,704 | |
#Grupo Aeroportuario del Sureste S.A.B. de C.V. ADR | | | 220,143 | | | | 11,095,207 | |
#Grupo Carso S.A.B. de C.V. Series A-1 | | | 10,578,093 | | | | 60,960,244 | |
*Grupo Cementos de Chihuahua S.A.B. de C.V. | | | 2,799,892 | | | | 8,888,546 | |
17
DIMENSIONAL EMERGING MARKETS VALUE FUND
CONTINUED
| | | | | | | | |
| | | Shares | | | Value†† | |
MEXICO — (Continued) | | | | | | | | |
#*Grupo Famsa S.A.B. de C.V. | | | 1,918,478 | | | $ | 2,765,542 | |
#Grupo Financiero Banorte S.A.B. de C.V. | | | 10,027,360 | | | | 42,901,314 | |
Grupo Financiero Inbursa S.A.B. de C.V. Series O | | | 8,260,033 | | | | 35,721,231 | |
#Grupo Gigante S.A.B. de C.V. Series B | | | 471,076 | | | | 774,445 | |
Grupo Herdez S.A.B. de C.V. | | | 319,000 | | | | 493,432 | |
Grupo Industrial Maseca S.A.B. de C.V. Series B | | | 2,726,900 | | | | 2,855,427 | |
*Grupo Industrial Saltillo S.A.B. de C.V. | | | 1,332,569 | | | | 1,266,955 | |
Grupo Kuo S.A.B. de C.V. Series B | | | 2,038,967 | | | | 2,922,718 | |
#Grupo Mexico S.A.B. de C.V. Series B | | | 24,866,224 | | | | 81,920,796 | |
Grupo Posadas S.A. de C.V. Series L | | | 356,000 | | | | 469,938 | |
*Grupo Qumma S.A. de C.V. Series B | | | 5,301 | | | | 77 | |
#*Grupo Simec S.A. de C.V. | | | 1,380,200 | | | | 3,328,665 | |
#*Grupo Simec S.A. de C.V. Sponsored ADR | | | 19,072 | | | | 138,463 | |
#Industrias Bachoco S.A.B. de C.V. Series B | | | 810,300 | | | | 1,453,526 | |
#*Industrias CH S.A.B. de C.V. Series B | | | 2,810,192 | | | | 10,127,433 | |
Industrias Penoles S.A.B. de C.V. | | | 428,720 | | | | 12,150,539 | |
*Maxcom Telecomunicaciones S.A.B. de C.V. | | | 400,181 | | | | 205,470 | |
*Megacable Holdings S.A.B. de C.V. | | | 12,600 | | | | 32,143 | |
#Organizacion Soriana S.A.B. de C.V. Series B | | | 14,451,500 | | | | 44,016,919 | |
Qualitas Compania de Seguros S.A. de C.V. | | | 2,048,200 | | | | 1,683,611 | |
#*Sare Holding S.A.B. de C.V. | | | 3,301,100 | | | | 842,117 | |
*Savia S.A. de C.V. | | | 3,457,285 | | | | 223,990 | |
#*Urbi Desarrollos Urbanos S.A.B. de C.V. | | | 5,658,750 | | | | 12,011,325 | |
*Vitro S.A.B. de C.V. | | | 1,558,758 | | | | 1,580,471 | |
| | | | | | | | |
TOTAL MEXICO | | | | | | | 710,504,395 | |
| | | | | | | | |
PHILIPPINES — (1.0%) | | | | | | | | |
A. Soriano Corp. | | | 20,195,000 | | | | 1,445,947 | |
Alaska Milk Corp. | | | 7,874,000 | | | | 2,381,083 | |
Alsons Consolidated Resources, Inc. | | | 16,904,000 | | | | 555,239 | |
Banco de Oro Unibank, Inc. | | | 7,364,320 | | | | 10,442,607 | |
Cebu Holdings, Inc. | | | 7,590,250 | | | | 423,601 | |
China Banking Corp. | | | 9,675 | | | | 100,582 | |
*Digital Telecommunications Phils., Inc. | | | 53,909,000 | | | | 1,967,249 | |
DMCI Holdings, Inc. | | | 7,561,260 | | | | 6,719,241 | |
*Empire East Land Holdings, Inc. | | | 37,000,000 | | | | 491,647 | |
*Export & Industry Bank, Inc. | | | 14,950 | | | | 90 | |
Filinvest Land, Inc. | | | 168,982,031 | | | | 5,425,842 | |
*Filipina Water Bottling Corp. | | | 5,471,786 | | | | — | |
First Philippines Holdings Corp. | | | 3,810,100 | | | | 5,930,385 | |
*Lopez Holdings Corp. | | | 25,704,000 | | | | 3,347,407 | |
Macroasia Corp. | | | 1,663,000 | | | | 127,188 | |
Megaworld Corp. | | | 176,933,600 | | | | 10,535,019 | |
Metro Bank & Trust Co. | | | 8,451,855 | | | | 15,368,891 | |
*Mondragon International Philippines, Inc. | | | 2,464,000 | | | | 7,159 | |
*Philippine National Bank | | | 3,866,918 | | | | 6,379,490 | |
*Philippine National Construction Corp. | | | 398,900 | | | | 45,435 | |
*Philippine Realty & Holdings Corp. | | | 5,860,000 | | | | 103,535 | |
Philippine Savings Bank | | | 1,232,313 | | | | 1,810,596 | |
*Philippine Townships, Inc. | | | 226,200 | | | | 24,976 | |
Phinma Corp. | | | 2,550,498 | | | | 652,040 | |
*Prime Media Holdings, Inc. | | | 330,000 | | | | 16,443 | |
*Prime Orion Philippines, Inc. | | | 12,310,000 | | | | 124,349 | |
Rizal Commercial Banking Corp. | | | 4,481,648 | | | | 2,916,813 | |
Robinson’s Land Corp. Series B | | | 17,781,700 | | | | 7,015,488 | |
Security Bank Corp. | | | 2,362,810 | | | | 4,616,734 | |
Shang Properties, Inc. | | | 614,285 | | | | 25,260 | |
SM Development Corp. | | | 42,477,329 | | | | 8,768,290 | |
*Solid Group, Inc. | | | 10,454,000 | | | | 235,502 | |
Union Bank of Philippines | | | 2,567,094 | | | | 3,633,965 | |
Universal Robina Corp. | | | 16,573,345 | | | | 16,762,187 | |
18
DIMENSIONAL EMERGING MARKETS VALUE FUND
CONTINUED
| | | | | | | | |
| | | Shares | | | Value†† | |
PHILIPPINES — (Continued) | | | | | | | | |
Vista Land & Lifescapes, Inc. | | | 45,259,868 | | | $ | 3,476,821 | |
| | | | | | | | |
TOTAL PHILIPPINES | | | | | | | 121,877,101 | |
| | | | | | | | |
POLAND — (1.7%) | | | | | | | | |
Agora SA | | | 559,848 | | | | 5,491,046 | |
*Amica Wronki SA | | | 36,320 | | | | 651,855 | |
Asseco Poland SA | | | 591,461 | | | | 10,931,591 | |
Bank Handlowy w Warszawie SA | | | 83,949 | | | | 2,650,240 | |
*Bank Millennium SA | | | 7,878,968 | | | | 13,972,989 | |
*Bank Przemyslowo Handlowy BPH SA | | | 1,013 | | | | 21,533 | |
*Bioton SA | | | 31,475,429 | | | | 2,102,856 | |
*BOMI SA | | | 121,150 | | | | 453,847 | |
*Boryszew SA | | | 1,114,644 | | | | 780,977 | |
*Ciech SA | | | 176,209 | | | | 1,203,891 | |
*ComArch SA | | | 93 | | | | 2,610 | |
Debica SA | | | 111,346 | | | | 2,459,701 | |
Dom Development SA | | | 46,421 | | | | 764,144 | |
*Dom Maklerski IDM SA | | | 1,704,829 | | | | 2,115,797 | |
*Echo Investment SA | | | 2,417,470 | | | | 4,490,181 | |
Emperia Holding SA | | | 19,149 | | | | 657,368 | |
*Energomontaz Poludnie SA | | | 30,110 | | | | 40,126 | |
*Farmacol SA | | | 5,526 | | | | 81,953 | |
*Gant Development SA | | | 40,117 | | | | 277,091 | |
*Getin Holdings SA | | | 1,681,394 | | | | 6,303,858 | |
Grupa Kety SA | | | 126,858 | | | | 5,266,829 | |
*Grupa Lotos SA | | | 970,047 | | | | 10,303,474 | |
*Impexmetal SA | | | 5,899,609 | | | | 8,579,921 | |
*ING Bank Slaski SA | | | 4,428 | | | | 1,348,573 | |
KGHM Polska Miedz SA | | | 671,360 | | | | 30,150,553 | |
*Koelner SA | | | 133,110 | | | | 677,207 | |
*Kredyt Bank SA | | | 619,815 | | | | 3,258,264 | |
*LC Corp. SA | | | 1,811,902 | | | | 1,047,333 | |
*MCI Management SA | | | 115,308 | | | | 331,189 | |
*MNI SA | | | 275,976 | | | | 313,889 | |
*Mostostal Siedlce SA | | | 462,476 | | | | 673,293 | |
Mostostal Warszawa SA | | | 1,467 | | | | 34,970 | |
*Netia Holdings SA | | | 3,441,202 | | | | 6,696,447 | |
*Orbis SA | | | 541,449 | | | | 7,877,775 | |
*Pfleiderer Grajewo SA | | | 55,572 | | | | 215,592 | |
*Pol-Aqua SA | | | 12,548 | | | | 73,473 | |
Polnord SA | | | 129,030 | | | | 1,678,792 | |
*Polska Grupa Farmaceutyczna SA | | | 1,548 | | | | 25,862 | |
*Polski Koncern Naftowy Orlen SA | | | 5,310,008 | | | | 74,871,545 | |
*Przedsiebiorstwo Eksportu Inzyn Importu Kopex SA | | | 349,860 | | | | 2,207,903 | |
*Stalexport SA | | | 498,734 | | | | 241,233 | |
*Sygnity SA | | | 158,271 | | | | 854,910 | |
*Synthos SA | | | 9,098,514 | | | | 8,194,071 | |
Zaklady Azotowe Pulawy SA | | | 15,544 | | | | 408,580 | |
*Zaklady Azotowe w Tarnowie-Moscicach SA | | | 18,179 | | | | 130,731 | |
*Zaklady Chemiczne Police SA | | | 8,000 | | | | 16,002 | |
| | | | | | | | |
TOTAL POLAND | | | | | | | 220,932,065 | |
| | | | | | | | |
RUSSIA — (4.4%) | | | | | | | | |
Gazprom OAO Sponsored ADR | | | 18,589,632 | | | | 407,020,812 | |
Lukoil OAO Sponsored ADR | | | 2,257,507 | | | | 125,889,656 | |
Magnitogorsk Iron & Steel Works Sponsored GDR | | | 51,321 | | | | 640,388 | |
*RusHydro Sponsored ADR | | | 643,944 | | | | 3,327,950 | |
Surgutneftegas Sponsonsored ADR | | | 2,583,456 | | | | 25,297,842 | |
| | | | | | | | |
TOTAL RUSSIA | | | | | | | 562,176,648 | |
| | | | | | | | |
19
DIMENSIONAL EMERGING MARKETS VALUE FUND
CONTINUED
| | | | | | | | |
| | | Shares | | | Value†† | |
SOUTH AFRICA — (7.6%) | | | | | | | | |
ABSA Group, Ltd. | | | 3,202,004 | | | $ | 62,031,775 | |
Adcorp Holdings, Ltd. | | | 448,309 | | | | 1,855,083 | |
Advtech, Ltd. | | | 32,106 | | | | 27,909 | |
Aeci, Ltd. | | | 1,635,500 | | | | 18,145,642 | |
Afgri, Ltd. | | | 4,178,939 | | | | 3,972,788 | |
African Bank Investments, Ltd. | | | 3,883,766 | | | | 19,905,781 | |
African Oxygen, Ltd. | | | 483,204 | | | | 1,439,732 | |
African Rainbow Minerals, Ltd. | | | 994,154 | | | | 25,158,033 | |
Allied Electronics Corp., Ltd. | | | 542,971 | | | | 2,211,380 | |
ArcelorMittal South Africa, Ltd. | | | 1,392,395 | | | | 15,975,665 | |
*Argent Industrial, Ltd. | | | 1,278,773 | | | | 1,627,323 | |
*Aveng, Ltd. | | | 3,857,895 | | | | 24,249,175 | |
AVI, Ltd. | | | 3,586,407 | | | | 14,252,059 | |
Avusa, Ltd. | | | 448,854 | | | | 1,442,847 | |
Barloworld, Ltd. | | | 2,566,028 | | | | 19,220,633 | |
Basil Read Holdings, Ltd. | | | 126,175 | | | | 225,450 | |
*Bell Equipment, Ltd. | | | 411,045 | | | | 615,628 | |
Bidvest Group, Ltd. | | | 46,870 | | | | 998,292 | |
Blue Label Telecoms, Ltd. | | | 366,891 | | | | 377,870 | |
Brait SA | | | 305,789 | | | | 1,069,215 | |
Business Connexion Group, Ltd. | | | 641,608 | | | | 578,353 | |
*Cadiz Holdings, Ltd. | | | 6,673 | | | | 3,188 | |
Capitec Bank Holdings, Ltd. | | | 140,813 | | | | 2,935,636 | |
Cashbuild, Ltd. | | | 3,398 | | | | 45,874 | |
Caxton & CTP Publishers & Printers, Ltd. | | | 3,015,054 | | | | 6,575,619 | |
*Cipla Medpro South Africa, Ltd. | | | 3,379,408 | | | | 3,374,438 | |
*Corpgro, Ltd. | | | 579,166 | | | | — | |
Data Tec, Ltd. | | | 2,446,932 | | | | 12,153,814 | |
Datacentrix Holdings, Ltd. | | | 797,381 | | | | 557,683 | |
Delta EMD, Ltd. | | | 234,340 | | | | 323,234 | |
Discovery Holdings, Ltd. | | | 66 | | | | 372 | |
Distell Group, Ltd. | | | 378,471 | | | | 3,801,354 | |
*Distribution & Warehousing Network, Ltd. | | | 216,722 | | | | 240,464 | |
*Durban Roodeport Deep, Ltd. | | | 1,657,408 | | | | 820,819 | |
ElementOne, Ltd. | | | 391,810 | | | | 657,212 | |
*Eqstra Holdings, Ltd. | | | 1,744,753 | | | | 1,570,798 | |
*Evraz Highveld Steel & Vanadium, Ltd. | | | 162,634 | | | | 2,011,495 | |
FirstRand, Ltd. | | | 4,353,231 | | | | 12,762,620 | |
Freeworld Coatings, Ltd. | | | 2,187,407 | | | | 3,170,094 | |
Gijima Group, Ltd. | | | 2,011,303 | | | | 223,920 | |
Gold Fields, Ltd. | | | 507,817 | | | | 7,932,409 | |
#Gold Fields, Ltd. Sponsored ADR | | | 7,845,589 | | | | 123,724,939 | |
Gold Reef Resorts, Ltd. | | | 422,178 | | | | 1,101,035 | |
Grindrod, Ltd. | | | 3,321,966 | | | | 8,050,566 | |
Group Five, Ltd. | | | 571,837 | | | | 3,192,740 | |
Harmony Gold Mining Co., Ltd. | | | 2,923,251 | | | | 33,570,189 | |
#Harmony Gold Mining Co., Ltd. Sponsored ADR | | | 1,575,339 | | | | 18,179,412 | |
*Health Strategic Investments, Ltd. | | | 1,380,233 | | | | 2,768,347 | |
Hudaco Industries, Ltd. | | | 162,006 | | | | 1,955,809 | |
*Hulamin, Ltd. | | | 1,303,406 | | | | 1,598,437 | |
Iliad Africa, Ltd. | | | 152,511 | | | | 162,471 | |
Illovo Sugar, Ltd. | | | 1,131,367 | | | | 4,213,774 | |
Impala Platinum Holdings, Ltd. | | | 68,686 | | | | 1,939,152 | |
Imperial Holdings, Ltd. | | | 1,354,335 | | | | 22,131,797 | |
Investec, Ltd. | | | 2,346,934 | | | | 19,301,807 | |
*JCI, Ltd. | | | 10,677,339 | | | | — | |
JD Group, Ltd. | | | 1,660,436 | | | | 11,668,367 | |
Lewis Group, Ltd. | | | 1,220,867 | | | | 12,437,426 | |
Liberty Holdings, Ltd. | | | 1,449,071 | | | | 15,494,403 | |
M Cubed Holdings, Ltd. | | | 1,850,526 | | | | — | |
Medi-Clinic Corp., Ltd. | | | 2,567,629 | | | | 9,914,239 | |
20
DIMENSIONAL EMERGING MARKETS VALUE FUND
CONTINUED
| | | | | | | | |
| | | Shares | | | Value†† | |
SOUTH AFRICA — (Continued) | | | | | | | | |
Merafe Resources, Ltd. | | | 18,528,486 | | | $ | 3,646,086 | |
Metair Investments, Ltd. | | | 1,650,332 | | | | 2,631,114 | |
*Metorex, Ltd. | | | 4,480,253 | | | | 2,768,592 | |
Metropolitan Holdings, Ltd. | | | 8,819,158 | | | | 21,284,674 | |
Mondi, Ltd. | | | 1,529,202 | | | | 12,718,156 | |
Murray & Roberts Holdings, Ltd. | | | 175,083 | | | | 1,085,105 | |
*Mvelaphanda Group, Ltd. | | | 4,233,693 | | | | 3,217,450 | |
Nampak, Ltd. | | | 5,874,237 | | | | 16,483,487 | |
#Nedbank Group, Ltd. | | | 2,742,435 | | | | 51,214,855 | |
#Northam Platinum, Ltd. | | | 1,101,749 | | | | 7,618,429 | |
*Omnia Holdings, Ltd. | | | 567,350 | | | | 5,280,195 | |
Palabora Mining Co., Ltd. | | | 181,577 | | | | 2,715,944 | |
Peregrine Holdings, Ltd. | | | 1,383,001 | | | | 2,562,486 | |
Petmin, Ltd. | | | 214,597 | | | | 94,103 | |
*Pioneer Foods, Ltd. | | | 66,726 | | | | 466,183 | |
PSG Group, Ltd. | | | 1,194,364 | | | | 6,079,947 | |
*Randgold & Exploration Co., Ltd. | | | 256,811 | | | | 239,030 | |
Raubex Group, Ltd. | | | 289,129 | | | | 1,028,834 | |
Redefine Properties, Ltd. | | | 32,990 | | | | 38,450 | |
Reunert, Ltd. | | | 300,475 | | | | 2,746,001 | |
Sanlam, Ltd. | | | 28,700,406 | | | | 107,458,594 | |
*Sappi, Ltd. | | | 3,911,432 | | | | 19,363,928 | |
#*Sappi, Ltd. Sponsored ADR | | | 792,283 | | | | 3,929,724 | |
Sasol, Ltd. Sponsored ADR | | | 704,259 | | | | 31,867,720 | |
*Sentula Mining, Ltd. | | | 657,544 | | | | 246,019 | |
*Simmer & Jack Mines, Ltd. | | | 2,619,539 | | | | 328,728 | |
Spur Corp., Ltd. | | | 369,908 | | | | 737,337 | |
Standard Bank Group, Ltd. | | | 2,428,660 | | | | 35,722,314 | |
Stefanutti Stocks Holdings, Ltd. | | | 34,781 | | | | 55,436 | |
#Steinhoff International Holdings, Ltd. | | | 12,458,365 | | | | 39,090,753 | |
*Super Group, Ltd. | | | 6,144,790 | | | | 525,350 | |
Telkom South Africa, Ltd. | | | 2,992,666 | | | | 15,461,823 | |
Tongaat-Hulett, Ltd. | | | 197,230 | | | | 2,759,109 | |
*Trans Hex Group, Ltd. | | | 34,840 | | | | 14,958 | |
Trencor, Ltd. | | | 1,468,675 | | | | 7,446,942 | |
UCS Group, Ltd. | | | 1,547,424 | | | | 429,194 | |
Value Group, Ltd. | | | 976,777 | | | | 516,453 | |
*Wesizwe Platinum, Ltd. | | | 14,355 | | | | 3,206 | |
Zeder Investments, Ltd. | | | 850,029 | | | | 291,579 | |
| | | | | | | | |
TOTAL SOUTH AFRICA | | | | | | | 976,114,874 | |
| | | | | | | | |
SOUTH KOREA — (11.7%) | | | | | | | | |
#Aekyung Petrochemical Co., Ltd. | | | 25,450 | | | | 900,959 | |
#Asia Cement Manufacturing Co., Ltd. | | | 28,888 | | | | 1,167,175 | |
#Asia Paper Manufacturing Co., Ltd. | | | 34,410 | | | | 380,313 | |
*Asiana Airlines, Inc. | | | 367,480 | | | | 2,992,415 | |
*Basic House Co., Ltd. (The) | | | 3,604 | | | | 72,682 | |
#Bing Grae Co., Ltd. | | | 24,704 | | | | 1,192,194 | |
#*BNG Steel Co., Ltd. | | | 55,130 | | | | 564,352 | |
Boo Kook Securities Co., Ltd. | | | 27,705 | | | | 438,461 | |
#Boryung Pharmaceutical Co., Ltd. | | | 34,556 | | | | 653,167 | |
Busan Bank | | | 1,097,521 | | | | 13,674,687 | |
BYC Co., Ltd. | | | 810 | | | | 114,974 | |
Byuck San Corp. | | | 10,472 | | | | 169,004 | |
*Byuck San Engineering & Construction Co., Ltd. | | | 45,950 | | | | 71,423 | |
#*Chin Hung International, Inc. | | | 3,001,643 | | | | 1,303,634 | |
#Chong Kun Dang Pharmaceutical Corp. | | | 42,960 | | | | 924,462 | |
#Choongwae Pharma Corp. | | | 53,015 | | | | 804,344 | |
#Chosun Refractories Co., Ltd. | | | 10,390 | | | | 545,489 | |
Chungho Comnet Co., Ltd. | | | 23,200 | | | | 181,109 | |
CJ Cheiljedang Corp. | | | 31,639 | | | | 6,095,868 | |
21
DIMENSIONAL EMERGING MARKETS VALUE FUND
CONTINUED
| | | | | | | | |
| | | Shares | | | Value†† | |
SOUTH KOREA — (Continued) | | | | | | | | |
#CJ Corp. | | | 133,605 | | | $ | 9,417,681 | |
#*Cosmochemical Co., Ltd. | | | 47,640 | | | | 318,234 | |
Crown Confectionery Co., Ltd. | | | 3,342 | | | | 397,950 | |
#Dae Dong Industrial Co., Ltd. | | | 98,790 | | | | 562,645 | |
#Dae Han Flour Mills Co., Ltd. | | | 8,122 | | | | 1,071,570 | |
#Dae Won Kang Up Co., Ltd. | | | 318,816 | | | | 1,229,358 | |
#*Daechang Co., Ltd. | | | 378,720 | | | | 585,013 | |
Daeduck Electronics Co., Ltd. | | | 246,280 | | | | 1,833,621 | |
#Daeduck Industries Co., Ltd. | | | 128,410 | | | | 1,022,751 | |
Daegu Bank, Ltd. | | | 953,532 | | | | 12,511,121 | |
#Daegu Department Store Co., Ltd. | | | 55,901 | | | | 600,613 | |
#Daehan Steel Co., Ltd. | | | 73,180 | | | | 605,172 | |
Daehan Synthetic Fiber Co., Ltd. | | | 5,193 | | | | 581,346 | |
Daekyo Co., Ltd. | | | 346,480 | | | | 1,813,244 | |
Daelim Industrial Co., Ltd. | | | 218,237 | | | | 17,818,548 | |
Daelim Trading Co., Ltd. | | | 31,734 | | | | 121,364 | |
#*Daesang Corp. | | | 158,432 | | | | 1,165,571 | |
#Daesang Holdings Co., Ltd. | | | 113,486 | | | | 341,140 | |
#Daesung Group Holdings Co., Ltd. | | | 4,040 | | | | 410,331 | |
*Daesung Holdings Co., Ltd. | | | 6,310 | | | | 48,922 | |
#*Daesung Industrial Co., Ltd. | | | 7,075 | | | | 335,123 | |
#Daewoo Engineering & Construction Co., Ltd. | | | 951,350 | | | | 8,916,754 | |
*Daewoo Motor Sales Corp. | | | 247,197 | | | | 664,661 | |
*Daewoo Shipbuilding & Marine Engineering Co., Ltd. | | | 469,292 | | | | 12,489,918 | |
#Daewoong Co., Ltd. | | | 17,680 | | | | 294,084 | |
#Dahaam E-Tec Co., Ltd. | | | 9,515 | | | | 235,525 | |
Daishin Securities Co., Ltd. | | | 306,421 | | | | 4,202,070 | |
*Daiyang Metal Co., Ltd. | | | 122,645 | | | | 101,859 | |
#Daou Technology, Inc. | | | 224,410 | | | | 1,794,977 | |
*DCM Corp. | | | 1,010 | | | | 8,809 | |
Digital Power Communications Co., Ltd. | | | 62,160 | | | | 86,863 | |
Dong Ah Tire Industrial Co., Ltd. | | | 69,104 | | | | 570,390 | |
*Dong IL Rubber Belt Co., Ltd. | | | 86,330 | | | | 574,450 | |
#Dongbang Agro Co., Ltd. | | | 53,610 | | | | 305,009 | |
#Dongbu Corp. | | | 73,520 | | | | 523,026 | |
#*Dongbu HiTek Co., Ltd. | | | 149,604 | | | | 1,483,965 | |
Dongbu Securities Co., Ltd. | | | 161,166 | | | | 1,058,454 | |
#Dongbu Steel Co., Ltd. | | | 171,834 | | | | 1,500,789 | |
#Dong-Il Corp. | | | 7,511 | | | | 443,491 | |
#Dongil Industries Co., Ltd. | | | 10,368 | | | | 823,864 | |
#Dongkuk Steel Mill Co., Ltd. | | | 339,302 | | | | 7,818,401 | |
Dongwha Pharm Co., Ltd. | | | 166,110 | | | | 778,671 | |
Dongwon F&B Co., Ltd. | | | 13,886 | | | | 639,598 | |
*Dongwon Industries Co., Ltd. | | | 769 | | | | 95,749 | |
*Dongwon Systems Corp. | | | 165,560 | | | | 225,584 | |
Dongyang Engineering & Construction Corp. | | | 5,765 | | | | 58,920 | |
Dongyang Express Bus Corp. | | | 639 | | | | 13,251 | |
Dongyang Mechatronics Corp. | | | 79,027 | | | | 864,961 | |
Doosan Construction & Engineering Co., Ltd. | | | 203,030 | | | | 1,337,128 | |
#*Eagon Industrial Co., Ltd. | | | 29,120 | | | | 215,931 | |
*e-Starco Co., Ltd. | | | 17,940 | | | | 9,709 | |
*Eugene Investment & Securities Co., Ltd. | | | 3,707,969 | | | | 2,261,495 | |
Fursys, Inc. | | | 33,450 | | | | 839,961 | |
Gaon Cable Co., Ltd. | | | 14,154 | | | | 324,854 | |
#Global & Yuasa Battery Co., Ltd. | | | 50,280 | | | | 1,429,191 | |
Golden Bridge Investment & Securities Co., Ltd. | | | 21,530 | | | | 45,437 | |
#Green Cross Holdings Corp. | | | 9,276 | | | | 977,375 | |
GS Engineering & Construction Corp. | | | 146,898 | | | | 12,483,773 | |
GS Holdings Corp. | | | 400,285 | | | | 21,014,753 | |
Gwangju Shinsegae Co., Ltd. | | | 3,608 | | | | 596,897 | |
Halla Climate Control Corp. | | | 51,167 | | | | 950,964 | |
22
DIMENSIONAL EMERGING MARKETS VALUE FUND
CONTINUED
| | | | | | | | |
| | | Shares | | | Value†† | |
SOUTH KOREA — (Continued) | | | | | | | | |
#Halla Engineering & Construction Corp. | | | 91,861 | | | $ | 1,726,980 | |
#Han Kuk Carbon Co., Ltd. | | | 137,700 | | | | 793,651 | |
Han Yang Securities Co., Ltd. | | | 80,350 | | | | 683,560 | |
Hana Financial Group, Inc. | | | 1,474,671 | | | | 41,903,978 | |
Handok Pharmaceuticals Co., Ltd. | | | 18,150 | | | | 238,887 | |
#Handsome Corp. | | | 124,860 | | | | 1,813,192 | |
#Hanil Cement Manufacturing Co., Ltd. | | | 32,489 | | | | 1,756,415 | |
*Hanil Construction Co., Ltd. | | | 24,575 | | | | 49,241 | |
Hanil E-Wha Co., Ltd. | | | 1,003 | | | | 6,639 | |
#Hanjin Heavy Industries & Construction Co., Ltd. | | | 279,094 | | | | 10,639,583 | |
#Hanjin Heavy Industries & Construction Holdings Co., Ltd. | | | 91,460 | | | | 1,566,130 | |
#*Hanjin Shipping Co., Ltd. | | | 358,384 | | | | 9,946,157 | |
*Hanjin Shipping Holdings Co., Ltd. | | | 23,121 | | | | 331,464 | |
#Hanjin Transportation Co., Ltd. | | | 61,370 | | | | 1,900,076 | |
*Hankook Cosmetics Co., Ltd. | | | 86,470 | | | | 304,855 | |
#Hankook Cosmetics Manufacturing Co., Ltd. | | | 24,389 | | | | 187,099 | |
Hankuk Electric Glass Co., Ltd. | | | 4,400 | | | | 209,379 | |
#Hankuk Glass Industries, Inc. | | | 29,050 | | | | 810,480 | |
Hankuk Paper Manufacturing Co., Ltd. | | | 23,220 | | | | 631,080 | |
*Hanmi Holdings Co., Ltd. | | | 1,040 | | | | 34,412 | |
#*Hanmi Semiconductor Co., Ltd. | | | 2,820 | | | | 20,135 | |
#Hanshin Construction Co., Ltd. | | | 24,880 | | | | 243,931 | |
#Hansol Chemical Co., Ltd. | | | 51,607 | | | | 760,016 | |
#*Hansol CSN Co., Ltd. | | | 162,960 | | | | 348,828 | |
#Hansol Paper Co., Ltd. | | | 271,724 | | | | 2,708,619 | |
Hanssem Co., Ltd. | | | 23,330 | | | | 224,949 | |
#Hanwha Chemical Corp. | | | 713,542 | | | | 19,432,483 | |
*Hanwha Corp. | | | 50,332 | | | | 1,900,686 | |
*Hanwha General Insurance Co., Ltd. | | | 19,663 | | | | 163,196 | |
Hanwha Securities Co., Ltd. | | | 463,260 | | | | 3,367,218 | |
Hanwha Timeworld Co., Ltd. | | | 9,000 | | | | 153,397 | |
#Heung-A Shipping Co., Ltd. | | | 106,352 | | | | 142,204 | |
#Hite Holdings Co., Ltd. | | | 86,500 | | | | 1,632,813 | |
*HMC Investment Securities Co., Ltd. | | | 118,451 | | | | 2,069,478 | |
#Honam Petrochemical Corp. | | | 90,706 | | | | 20,050,289 | |
*HS R&A Co., Ltd. | | | 12,390 | | | | 340,940 | |
#Husteel Co., Ltd. | | | 31,810 | | | | 515,920 | |
*Hwa Sung Industrial Co., Ltd. | | | 42,380 | | | | 168,882 | |
Hwacheon Machine Tool Co., Ltd. | | | 2,050 | | | | 74,675 | |
#Hyosung T & C Co., Ltd. | | | 158,717 | | | | 17,641,890 | |
#Hyundai Cement Co., Ltd. | | | 32,875 | | | | 263,512 | |
*Hyundai Development Co. | | | 437,410 | | | | 12,301,891 | |
#Hyundai DSF Co., Ltd. | | | 38,700 | | | | 380,354 | |
#Hyundai Elevator Co., Ltd. | | | 22,090 | | | | 1,541,900 | |
#Hyundai Greenfood Co., Ltd. | | | 304,440 | | | | 2,957,790 | |
Hyundai Hysco | | | 270,550 | | | | 5,495,018 | |
Hyundai Merchant Marine Co., Ltd. | | | 170,511 | | | | 6,034,669 | |
Hyundai Mipo Dockyard Co., Ltd. | | | 73,953 | | | | 12,369,248 | |
Hyundai Motor Co., Ltd. | | | 909,723 | | | | 137,718,248 | |
Hyundai Pharmaceutical Ind. Co., Ltd. | | | 61,370 | | | | 97,372 | |
Hyundai Securities Co. | | | 959,239 | | | | 12,573,075 | |
#Hyundai Steel Co. | | | 358,229 | | | | 34,784,133 | |
#Il Dong Pharmaceutical Co., Ltd. | | | 25,184 | | | | 823,055 | |
#*Iljin Electric Co., Ltd. | | | 128,110 | | | | 1,338,474 | |
#Iljin Holdings Co., Ltd. | | | 106,484 | | | | 391,437 | |
#Ilshin Spinning Co., Ltd. | | | 5,389 | | | | 450,260 | |
Ilsung Pharmaceutical Co., Ltd. | | | 9,060 | | | | 601,628 | |
Industrial Bank of Korea, Ltd. | | | 1,266,880 | | | | 18,203,839 | |
InziControls Co., Ltd. | | | 27,640 | | | | 149,751 | |
IS Dongseo Co., Ltd. | | | 49,650 | | | | 679,158 | |
#ISU Chemical Co., Ltd. | | | 56,790 | | | | 1,187,169 | |
23
DIMENSIONAL EMERGING MARKETS VALUE FUND
CONTINUED
| | | | | | | | |
| | | Shares | | | Value†† | |
SOUTH KOREA — (Continued) | | | | | | | | |
#IsuPetasys Co., Ltd. | | | 196,240 | | | $ | 609,828 | |
#Jahwa Electronics Co., Ltd. | | | 79,680 | | | | 464,732 | |
Jeil Pharmaceutical Co. | | | 39,600 | | | | 542,794 | |
Jeonbuk Bank, Ltd. | | | 300,136 | | | | 1,843,539 | |
*Jinheung Savings Bank | | | 144,760 | | | | 485,652 | |
#K.C. Tech Co., Ltd. | | | 154,554 | | | | 837,005 | |
#KB Financial Group, Inc. ADR | | | 2,538,946 | | | | 113,998,675 | |
KCC Corp. | | | 35,626 | | | | 11,813,891 | |
#*Keangnam Enterprises, Ltd. | | | 66,230 | | | | 671,757 | |
#Keyang Electric Machinery Co., Ltd. | | | 187,450 | | | | 575,843 | |
#KG Chemical Corp. | | | 48,893 | | | | 485,406 | |
#*KIC, Ltd. | | | 69,340 | | | | 365,779 | |
#KISCO Corp. | | | 29,571 | | | | 747,527 | |
*Kishin Corp. | | | 21,990 | | | | 136,035 | |
#KISWIRE, Ltd. | | | 50,083 | | | | 1,772,926 | |
#Kolon Corp. | | | 23,654 | | | | 785,074 | |
#Kolon Engineering & Construction Co., Ltd. | | | 124,640 | | | | 526,301 | |
*Kolon Industries, Inc. | | | 51,054 | | | | 3,228,538 | |
#Korea Cast Iron Pipe Co., Ltd. | | | 81,218 | | | | 291,259 | |
*Korea Cottrell Co., Ltd. | | | 45,360 | | | | 171,164 | |
#*Korea Development Co., Ltd. | | | 99,040 | | | | 418,977 | |
Korea Development Leasing Corp. | | | 23,598 | | | | 427,140 | |
#Korea Electric Terminal Co., Ltd. | | | 42,160 | | | | 772,253 | |
#Korea Exchange Bank | | | 1,982,090 | | | | 23,627,626 | |
#*Korea Express Co., Ltd. | | | 55,848 | | | | 3,534,195 | |
*Korea Flange Co., Ltd. | | | 18,630 | | | | 247,476 | |
Korea Investment Holdings Co., Ltd. | | | 306,256 | | | | 9,673,738 | |
#Korea Iron & Steel Co., Ltd. | | | 11,043 | | | | 535,919 | |
*Korea Komho Petrochemical Co., Ltd. | | | 14,436 | | | | 956,267 | |
#*Korea Line Corp. | | | 62,896 | | | | 2,273,659 | |
#Korea Petrochemical Industrial Co., Ltd. | | | 11,947 | | | | 919,764 | |
*Korea Savings Bank | | | 22,973 | | | | 196,267 | |
*Korean Air Co., Ltd. | | | 124,180 | | | | 7,910,592 | |
#Korean Air Terminal Service Co., Ltd. | | | 12,340 | | | | 509,807 | |
#KP Chemical Corp. | | | 304,576 | | | | 4,542,388 | |
KPX Chemical Co., Ltd. | | | 10,134 | | | | 486,486 | |
#KPX Holdings Corp. | | | 7,249 | | | | 349,356 | |
*KTB Securities Co., Ltd. | | | 392,760 | | | | 1,784,537 | |
#Kukdo Chemical Co., Ltd. | | | 26,200 | | | | 1,329,199 | |
#*Kumho Electric Co., Ltd. | | | 13,630 | | | | 503,185 | |
*Kumho Industrial Co., Ltd. | | | 23,955 | | | | 92,920 | |
Kumho Investment Bank | | | 637,880 | | | | 460,137 | |
#*Kumho Tire Co., Inc. | | | 111,990 | | | | 706,624 | |
#Kunsul Chemical Industrial Co., Ltd. | | | 24,240 | | | | 398,340 | |
#Kwang Dong Pharmaceutical Co., Ltd. | | | 312,960 | | | | 863,898 | |
#Kyeryong Construction Industrial Co., Ltd. | | | 39,280 | | | | 662,702 | |
Kyobo Securities Co., Ltd. | | | 131,490 | | | | 1,077,701 | |
Kyung Dong Navien Co., Ltd. | | | 3,860 | | | | 112,505 | |
Kyung Nong Corp. | | | 60,670 | | | | 230,854 | |
*Kyungbang Co., Ltd. | | | 5,174 | | | | 533,569 | |
Kyung-In Synthetic Corp. | | | 152,760 | | | | 492,918 | |
LG Display Co., Ltd. | | | 444,000 | | | | 15,224,967 | |
#LG Display Co., Ltd. ADR | | | 2,809,493 | | | | 48,351,375 | |
#*LG Electronics, Inc. | | | 747,229 | | | | 65,798,650 | |
LG Fashion Corp. | | | 30 | | | | 855 | |
*LG Uplus Corp. | | | 1,209,861 | | | | 7,850,452 | |
Livart Furniture Co., Ltd. | | | 19,740 | | | | 142,764 | |
#Lotte Chilsung Beverage Co., Ltd. | | | 5,263 | | | | 3,606,668 | |
#Lotte Confectionary Co., Ltd. | | | 5,117 | | | | 5,585,439 | |
#Lotte Midopa Co., Ltd. | | | 124,640 | | | | 1,601,175 | |
#Lotte Sam Kang Co., Ltd. | | | 6,861 | | | | 1,605,407 | |
24
DIMENSIONAL EMERGING MARKETS VALUE FUND
CONTINUED
| | | | | | | | |
| | | Shares | | | Value†† | |
SOUTH KOREA — (Continued) | | | | | | | | |
Lotte Shopping Co., Ltd. | | | 80,336 | | | $ | 32,911,644 | |
*Meritz Securities Co., Ltd. | | | 1,252,375 | | | | 1,119,818 | |
Mi Chang Oil Industrial Co., Ltd. | | | 3,650 | | | | 183,112 | |
*Moorim P&P Co., Ltd. | | | 30,487 | | | | 304,709 | |
#Moorim Paper Co., Ltd. | | | 61,740 | | | | 522,199 | |
Motonic Corp. | | | 47,980 | | | | 414,270 | |
#*Namkwang Engineering & Construction Co., Ltd. | | | 134,576 | | | | 504,464 | |
Namyang Dairy Products Co., Ltd. | | | 3,311 | | | | 1,812,369 | |
#Nexen Corp. | | | 9,587 | | | | 523,156 | |
NH Investment & Securities Co., Ltd. | | | 189,302 | | | | 1,736,364 | |
#*NK Co., Ltd. | | | 9,670 | | | | 109,505 | |
Nong Shim Co., Ltd. | | | 25,517 | | | | 4,687,969 | |
Nong Shim Holdings Co., Ltd. | | | 13,419 | | | | 733,317 | |
Noroo Holdings Co., Ltd. | | | 22,738 | | | | 134,265 | |
Noroo Paint Co., Ltd. | | | 37,899 | | | | 120,371 | |
*ON*Media Corp. | | | 484,150 | | | | 1,472,985 | |
#Ottogi Corp. | | | 12,003 | | | | 1,557,066 | |
Pacific Corp. | | | 24,304 | | | | 3,802,983 | |
Pacific Pharmaceutical Co., Ltd. | | | 3,840 | | | | 109,800 | |
*Pang Rim Co., Ltd. | | | 13,690 | | | | 158,719 | |
*PaperCorea, Inc. | | | 19,552 | | | | 187,801 | |
*Poong Lim Industrial Co., Ltd. | | | 49,480 | | | | 90,666 | |
#Poongsan Corp. | | | 150,690 | | | | 5,392,188 | |
Poongsan Holdings Corp. | | | 33,118 | | | | 1,134,278 | |
POSCO | | | 5,616 | | | | 2,317,881 | |
#POSCO ADR | | | 1,058,114 | | | | 109,980,369 | |
#POSCO Coated & Color Steel Co., Ltd. | | | 17,630 | | | | 511,080 | |
Pulmuone Co., Ltd. | | | 6,125 | | | | 250,588 | |
Pum Yang Construction Co., Ltd. | | | 31,885 | | | | 147,148 | |
#Pusan City Gas Co., Ltd. | | | 65,770 | | | | 1,315,094 | |
#*S&T Daewoo Co., Ltd. | | | 48,220 | | | | 1,459,473 | |
#S&T Dynamics Co., Ltd. | | | 174,594 | | | | 3,800,737 | |
#S&T Holdings Co., Ltd. | | | 52,273 | | | | 760,098 | |
*Saeron Automotive Corp. | | | 6,000 | | | | 32,876 | |
*Sajo Industries Co., Ltd. | | | 1,310 | | | | 55,064 | |
Sam Kwang Glass Industrial Co., Ltd. | | | 18,397 | | | | 1,189,316 | |
Sam Yung Trading Co., Ltd. | | | 14,352 | | | | 73,999 | |
#Sambu Construction Co., Ltd. | | | 33,665 | | | | 486,183 | |
*Samho International Co., Ltd. | | | 2,600 | | | | 7,214 | |
Samhwa Crown & Closure Co., Ltd. | | | 1,749 | | | | 34,234 | |
#Samhwa Paints Industrial Co., Ltd. | | | 48,610 | | | | 226,774 | |
#Samick Musical Instruments Co., Ltd. | | | 621,710 | | | | 717,872 | |
Samsung Corp. | | | 834,818 | | | | 49,026,745 | |
Samsung Fine Chemicals Co., Ltd. | | | 23 | | | | 1,366 | |
#Samsung SDI Co., Ltd. | | | 232,542 | | | | 31,941,566 | |
#Samwhan Corp. | | | 50,250 | | | | 445,669 | |
Samyang Corp. | | | 43,666 | | | | 2,485,411 | |
Samyang Genex Co., Ltd. | | | 13,685 | | | | 789,436 | |
#Samyang Tongsang Co., Ltd. | | | 8,060 | | | | 169,602 | |
#Samyoung Electronics Co., Ltd. | | | 78,430 | | | | 957,578 | |
*SAVEZONE I&C Corp. | | | 2,710 | | | | 6,611 | |
#*SBS Media Holdings Co., Ltd. | | | 164,950 | | | | 429,171 | |
SC Engineering Co., Ltd. | | | 34,640 | | | | 120,118 | |
Seah Besteel Corp. | | | 100,300 | | | | 2,614,869 | |
SeAH Holdings Corp. | | | 12,561 | | | | 1,237,493 | |
#SeAH Steel Corp. | | | 17,133 | | | | 766,711 | |
#Sebang Co., Ltd. | | | 80,550 | | | | 1,422,806 | |
#Sejong Industrial Co., Ltd. | | | 112,200 | | | | 1,374,133 | |
*Shell-Line Co., Ltd. | | | 17,510 | | | | 131,848 | |
#Shin Won Corp. | | | 348,090 | | | | 445,732 | |
Shin Young Securities Co., Ltd. | | | 29,240 | | | | 943,516 | |
25
DIMENSIONAL EMERGING MARKETS VALUE FUND
CONTINUED
| | | | | | | | |
| | | Shares | | | Value†† | |
SOUTH KOREA — (Continued) | | | | | | | | |
Shin Young Wacoal, Inc. | | | 273 | | | $ | 23,385 | |
*Shinhan Engineering & Construction Co., Ltd. | | | 17,130 | | | | 117,563 | |
Shinhan Financial Group Co., Ltd. | | | 1,534,998 | | | | 59,466,140 | |
#Shinhan Financial Group Co., Ltd. ADR | | | 802,794 | | | | 62,433,289 | |
#Shinpoong Pharmaceutical Co., Ltd. | | | 13,450 | | | | 407,205 | |
Shinsegae Engineering & Construction Co., Ltd. | | | 5,140 | | | | 62,650 | |
#*Shinsegae Information & Communication Co., Ltd. | | | 3,159 | | | | 199,248 | |
*Shinsung Tongsang Co., Ltd. | | | 342,500 | | | | 152,362 | |
#Silla Trading Co., Ltd. | | | 26,403 | | | | 305,218 | |
#Sindo Ricoh Co., Ltd. | | | 33,293 | | | | 1,609,645 | |
*SJM Co., Ltd. | | | 29,248 | | | | 177,570 | |
SJM Holdings Co., Ltd. | | | 31,331 | | | | 133,658 | |
*SK Chemicals Co., Ltd. | | | 41,114 | | | | 2,295,604 | |
SK Co., Ltd. | | | 187,280 | | | | 19,514,129 | |
#SK Energy Co., Ltd. | | | 320,419 | | | | 43,117,922 | |
SK Gas Co., Ltd. | | | 30,216 | | | | 1,115,417 | |
SK Networks Co., Ltd. | | | 634,570 | | | | 6,100,598 | |
#SKC Co., Ltd. | | | 152,050 | | | | 5,187,847 | |
#SL Corp. | | | 89,640 | | | | 1,536,474 | |
*Songwon Industrial Co., Ltd. | | | 25,230 | | | | 268,424 | |
#*Ssangyong Cement Industrial Co., Ltd. | | | 193,556 | | | | 1,130,146 | |
#*STX Corp. | | | 185,047 | | | | 5,681,963 | |
#STX Engine Co., Ltd. | | | 140,460 | | | | 5,087,040 | |
#STX Offshore & Shipbuilding Co., Ltd. | | | 366,540 | | | | 8,867,649 | |
#STX Pan Ocean Co., Ltd. | | | 804,550 | | | | 8,568,209 | |
#Suheung Capsule Co., Ltd. | | | 52,170 | | | | 371,166 | |
Sung Bo Chemicals Co., Ltd. | | | 3,980 | | | | 93,339 | |
#*Sung Shin Cement Co., Ltd. | | | 85,800 | | | | 344,330 | |
#*Sunjin Co., Ltd. | | | 7,650 | | | | 309,461 | |
#Tae Kwang Industrial Co., Ltd. | | | 3,447 | | | | 3,938,957 | |
#Tae Kyung Industrial Co., Ltd. | | | 98,860 | | | | 448,735 | |
#Taeyoung Engineering & Construction | | | 310,360 | | | | 1,869,556 | |
#*Tai Han Electric Wire Co., Ltd. | | | 532,197 | | | | 3,381,695 | |
Tai Lim Packaging Industries Co., Ltd. | | | 176,930 | | | | 230,091 | |
*Tec & Co. | | | 427,170 | | | | 76,276 | |
#Telcoware Co., Ltd. | | | 36,000 | | | | 229,114 | |
*Tong Kook Corp. | | | 607 | | | | 843 | |
*Tong Yang Major Corp. | | | 11,110 | | | | 22,746 | |
Tong Yang Securities, Inc. | | | 300,000 | | | | 3,036,940 | |
#TS Corp. | | | 15,393 | | | | 754,974 | |
*Uangel Corp. | | | 7,970 | | | | 31,189 | |
#Unid Co., Ltd. | | | 32,400 | | | | 1,607,894 | |
*Union Steel Manufacturing Co., Ltd. | | | 38,857 | | | | 892,519 | |
Wiscom Co., Ltd. | | | 32,980 | | | | 137,885 | |
#*Woongjin Holdings Co., Ltd. | | | 254,150 | | | | 2,595,907 | |
Woori Finance Holdings Co., Ltd. | | | 2,136,852 | | | | 26,944,392 | |
*Woori Finance Holdings Co., Ltd. ADR | | | 8,505 | | | | 320,213 | |
Woori Financial Co., Ltd. | | | 65,220 | | | | 699,552 | |
Woori Investment & Securities Co., Ltd. | | | 693,180 | | | | 12,258,038 | |
#YESCO Co., Ltd. | | | 18,780 | | | | 412,950 | |
Yoosung Enterprise Co., Ltd. | | | 109,715 | | | | 309,376 | |
Youlchon Chemical Co., Ltd. | | | 82,970 | | | | 691,453 | |
*Young Poong Mining & Construction Corp. | | | 18,030 | | | | 881 | |
Youngone Holdings Co., Ltd. | | | 48,452 | | | | 1,400,570 | |
Youngpoong Corp. | | | 4,628 | | | | 2,692,911 | |
Yuhwa Securities Co., Ltd. | | | 28,680 | | | | 403,164 | |
*Zinus, Inc. | | | 1,866 | | | | 6,219 | |
| | | | | | | | |
TOTAL SOUTH KOREA | | | | | | | 1,507,160,945 | |
| | | | | | | | |
TAIWAN — (11.0%) | | | | | | | | |
*A.G.V. Products Corp. | | | 3,642,429 | | | | 1,626,865 | |
26
DIMENSIONAL EMERGING MARKETS VALUE FUND
CONTINUED
| | | | | | | | |
| | | Shares | | | Value†† | |
TAIWAN — (Continued) | | | | | | | | |
*Abocom Systems, Inc. | | | 340,752 | | | $ | 141,871 | |
Acbel Polytech, Inc. | | | 1,453,219 | | | | 1,309,777 | |
Accton Technology Corp. | | | 5,114,000 | | | | 3,665,048 | |
*Action Electronics Co., Ltd. | | | 2,129,000 | | | | 833,786 | |
Advanced Semiconductor Engineering, Inc. | | | 1,045,375 | | | | 909,678 | |
Advancetek Enterprise Co., Ltd. | | | 2,000 | | | | 1,444 | |
Allis Electric Co., Ltd. | | | 1,523,000 | | | | 594,938 | |
Alpha Networks, Inc. | | | 1,162,000 | | | | 1,033,286 | |
Altek Corp. | | | 463,166 | | | | 661,895 | |
Ambassador Hotel (The) | | | 274,000 | | | | 433,216 | |
*Ampoc Far East Co., Ltd. | | | 645,000 | | | | 415,700 | |
Amtran Technology Co., Ltd. | | | 1,541,727 | | | | 1,306,782 | |
Apex Science & Engineering Corp. | | | 545,840 | | | | 231,930 | |
*Arima Communications Corp. | | | 2,587,000 | | | | 1,010,506 | |
*Arima Optoelectronics Corp. | | | 1,045,000 | | | | 265,147 | |
Asia Cement Corp. | | | 16,287,725 | | | | 16,778,524 | |
Asia Chemical Corp. | | | 1,756,000 | | | | 1,249,507 | |
*Asia Optical Co, Inc. | | | 1,917,000 | | | | 3,268,855 | |
Asia Polymer Corp. | | | 2,088,586 | | | | 2,293,944 | |
Asia Vital Components Co., Ltd. | | | 202,307 | | | | 223,325 | |
Asustek Computer, Inc. | | | 3,107,913 | | | | 25,220,469 | |
*AU Optronics Corp. | | | 7,613,812 | | | | 7,596,235 | |
#*AU Optronics Corp. Sponsored ADR | | | 6,421,347 | | | | 64,406,110 | |
Audix Corp. | | | 1,122,164 | | | | 1,062,997 | |
Aurora Systems Corp. | | | 572,281 | | | | 565,018 | |
Avision, Inc. | | | 1,581,555 | | | | 817,248 | |
*Bank of Kaohsiung | | | 4,018,926 | | | | 1,681,984 | |
Bes Engineering Corp. | | | 13,303,443 | | | | 3,452,272 | |
Biostar Microtech International Corp. | | | 514,055 | | | | 314,746 | |
C Sun Manufacturing, Ltd. | | | 233,837 | | | | 192,349 | |
Cameo Communications, Inc. | | | 1,809,130 | | | | 934,165 | |
Capital Securities Corp. | | | 3,026,357 | | | | 1,379,836 | |
*Carnival Industrial Corp. | | | 2,813,000 | | | | 1,050,286 | |
Catcher Technology Co., Ltd. | | | 1,676,326 | | | | 4,464,268 | |
Cathay Chemical Works, Inc. | | | 857,000 | | | | 368,529 | |
Cathay Real Estate Development Co., Ltd. | | | 8,268,421 | | | | 4,625,985 | |
Central Reinsurance Co., Ltd. | | | 2,477,781 | | | | 1,294,281 | |
Chain Qui Development Co., Ltd. | | | 1,077,173 | | | | 841,616 | |
Champion Building Materials Co., Ltd. | | | 2,594,809 | | | | 2,072,414 | |
Chang Hwa Commercial Bank | | | 44,281,459 | | | | 29,259,266 | |
*Chang-Ho Fibre Corp. | | | 192,000 | | | | 101,723 | |
Charoen Pokphand Enterprises Co., Ltd. | | | 1,690,000 | | | | 1,046,902 | |
Cheng Loong Corp. | | | 9,094,480 | | | | 4,099,066 | |
Cheng Uei Precision Industry Co., Ltd. | | | 1,098,496 | | | | 2,251,950 | |
Chenming Mold Industrial Corp. | | | 593,040 | | | | 462,472 | |
Chia Hsin Cement Corp. | | | 4,805,825 | | | | 2,428,587 | |
*Chia Hsin Food & Synthetic Fiber Co., Ltd. | | | 514,966 | | | | — | |
Chien Kuo Construction Co., Ltd. | | | 393,300 | | | | 208,746 | |
*Chien Shing Stainless Steel Co., Ltd. | | | 2,280,000 | | | | 447,688 | |
Chilisin Electronics Corp. | | | 289,300 | | | | 262,958 | |
*Chimei Innolux Corp. | | | 49,903,746 | | | | 66,965,890 | |
*China Airlines, Ltd. | | | 16,952,252 | | | | 13,220,238 | |
China Chemical & Pharmaceutical Co. | | | 480,264 | | | | 469,534 | |
China Development Financial Holding Corp. | | | 84,819,832 | | | | 25,208,900 | |
China Electric Manufacturing Co., Ltd. | | | 361,200 | | | | 290,429 | |
China General Plastics Corp. | | | 3,008,000 | | | | 1,200,628 | |
China Glaze Co., Ltd. | | | 1,062,960 | | | | 1,022,847 | |
*China Man-Made Fiber Co., Ltd. | | | 10,798,813 | | | | 5,087,306 | |
China Metal Products Co., Ltd. | | | 1,724,248 | | | | 1,766,898 | |
China Motor Co., Ltd. | | | 6,039,749 | | | | 4,904,490 | |
*China Petrochemical Development Corp. | | | 16,397,580 | | | | 13,865,704 | |
27
DIMENSIONAL EMERGING MARKETS VALUE FUND
CONTINUED
| | | | | | | | |
| | | Shares | | | Value†† | |
TAIWAN — (Continued) | | | | | | | | |
*China Rebar Co., Ltd. | | | 439,188 | | | $ | — | |
China Steel Structure Co., Ltd. | | | 1,127,219 | | | | 842,848 | |
China Synthetic Rubber Corp. | | | 3,919,711 | | | | 3,907,019 | |
*China United Trust & Investment Corp. | | | 493,999 | | | | — | |
*China Wire & Cable Co., Ltd. | | | 2,541,000 | | | | 947,637 | |
Chinatrust Financial Holdings Co., Ltd. | | | 63,452,646 | | | | 39,612,756 | |
Chin-Poon Industrial Co., Ltd. | | | 3,823,815 | | | | 3,121,565 | |
*Chun Yu Works & Co., Ltd. | | | 2,106,000 | | | | 632,568 | |
Chun Yuan Steel Industrial Co., Ltd. | | | 3,877,191 | | | | 1,887,929 | |
Chung Hsin Electric & Machinery Co., Ltd. | | | 3,325,000 | | | | 2,002,154 | |
*Chung Hung Steel Corp. | | | 1,301,000 | | | | 569,319 | |
*Chung Hwa Pulp Corp. | | | 4,942,419 | | | | 2,656,206 | |
*Chung Shing Textile Co., Ltd. | | | 600 | | | | 9 | |
*Chungwa Picture Tubes Co., Ltd. | | | 23,264,692 | | | | 3,512,350 | |
*CMC Magnetics Corp. | | | 25,520,000 | | | | 6,699,230 | |
Collins Co., Ltd. | | | 1,894,823 | | | | 853,405 | |
*Compal Communications, Inc. | | | 38,000 | | | | 32,201 | |
Compal Electronics, Inc. | | | 3,578,332 | | | | 4,565,316 | |
*Compeq Manufacturing Co., Ltd. | | | 10,138,000 | | | | 3,352,546 | |
*Compex International Co., Ltd. | | | 46,400 | | | | 303 | |
*Continental Holdings Corp. | | | 5,097,848 | | | | 1,952,969 | |
*Cosmos Bank Taiwan | | | 852,756 | | | | 188,567 | |
Coxon Precise Industrial Co., Ltd. | | | 180,000 | | | | 343,508 | |
CSBC Corp. Taiwan | | | 77,256 | | | | 68,695 | |
DA CIN Construction Co., Ltd. | | | 824,579 | | | | 463,877 | |
Darfon Electronics Corp. | | | 1,312,950 | | | | 1,612,579 | |
Delpha Construction Co., Ltd. | | | 2,011,078 | | | | 908,923 | |
Depo Auto Parts Industrial Co., Ltd. | | | 50,000 | | | | 136,360 | |
*Der Pao Construction Co., Ltd. | | | 1,139,000 | | | | 30,501 | |
Diamond Flower Electric Instrument Co., Ltd. | | | 138,280 | | | | 134,146 | |
D-Link Corp. | | | 4,416,780 | | | | 4,458,912 | |
Dynamic Electronics Co., Ltd. | | | 1,306,000 | | | | 878,621 | |
E.Sun Financial Holding Co., Ltd. | | | 24,509,937 | | | | 12,588,896 | |
*Eastern Media International Corp. | | | 8,183,399 | | | | 2,148,129 | |
Eclat Textile Co., Ltd. | | | 1,090,980 | | | | 1,415,885 | |
Edom Technology Co., Ltd. | | | 797,800 | | | | 440,225 | |
Elite Material Co., Ltd. | | | 36,991 | | | | 34,558 | |
Elitegroup Computer Systems Co., Ltd. | | | 6,985,066 | | | | 2,653,871 | |
*EnTie Commercial Bank | | | 802,232 | | | | 366,787 | |
*Eva Airways Corp. | | | 12,631,944 | | | | 12,767,001 | |
*Ever Fortune Industrial Co., Ltd. | | | 409,000 | | | | 4,408 | |
*Everest Textile Co., Ltd. | | | 3,553,002 | | | | 883,098 | |
Evergreen International Storage & Transport Corp. | | | 3,846,000 | | | | 3,412,348 | |
*Evergreen Marine Corp., Ltd. | | | 10,611,527 | | | | 8,843,741 | |
*Everspring Industry Co. | | | 1,510,180 | | | | 592,499 | |
*Excel Cell Electronics Co., Ltd. | | | 76,000 | | | | 47,196 | |
Far Eastern Department Stores Co., Ltd. | | | 6,956,740 | | | | 8,634,255 | |
Far Eastern International Bank | | | 14,639,192 | | | | 6,479,996 | |
Federal Corp. | | | 3,451,546 | | | | 2,188,685 | |
First Copper Technology Co., Ltd. | | | 2,596,750 | | | | 1,188,490 | |
First Financial Holding Co., Ltd. | | | 59,477,019 | | | | 39,227,040 | |
First Hotel | | | 724,130 | | | | 705,619 | |
First Insurance Co., Ltd. | | | 2,220,064 | | | | 1,168,303 | |
*Forhouse Corp. | | | 868,635 | | | | 854,944 | |
Formosa Chemicals & Fiber Co., Ltd. | | | 3,318,660 | | | | 9,490,485 | |
*Formosa Oilseed Processing Co., Ltd. | | | 555,070 | | | | 282,467 | |
Formosa Taffeta Co., Ltd. | | | 7,804,511 | | | | 7,097,502 | |
Formosan Rubber Group, Inc. | | | 2,838,000 | | | | 2,237,505 | |
*Formosan Union Chemical Corp. | | | 1,203,176 | | | | 678,583 | |
*Founding Construction & Development Co., Ltd. | | | 128,000 | | | | 93,730 | |
*Froch Enterprise Co., Ltd. | | | 78,000 | | | | 42,221 | |
28
DIMENSIONAL EMERGING MARKETS VALUE FUND
CONTINUED
| | | | | | | | |
| | | Shares | | | Value†† | |
TAIWAN — (Continued) | | | | | | | | |
*FU I Industrial Co., Ltd. | | | 290,400 | | | $ | 86,952 | |
Fubon Financial Holding Co., Ltd. | | | 35,221,501 | | | | 43,089,224 | |
Fullerton Technology Co., Ltd. | | | 576,000 | | | | 639,263 | |
Fwusow Industry Co., Ltd. | | | 2,034,002 | | | | 959,377 | |
G Shank Enterprise Co., Ltd. | | | 792,880 | | | | 638,763 | |
*Gamma Optical Co., Ltd. | | | 737,000 | | | | 572,873 | |
Getac Technology Corp. | | | 3,167,065 | | | | 1,867,617 | |
*Giantplus Technology Co., Ltd. | | | 1,869,000 | | | | 1,254,219 | |
Giga-Byte Technology Co., Ltd. | | | 5,303,287 | | | | 5,213,116 | |
*Global Brands Manufacture, Ltd. | | | 205,000 | | | | 124,432 | |
Gold Circuit Electronics, Ltd. | | | 4,396,965 | | | | 1,585,467 | |
Goldsun Development & Construction Co., Ltd. | | | 12,194,534 | | | | 6,284,655 | |
Good Will Instrument Co., Ltd. | | | 402,853 | | | | 301,865 | |
*Gordon Auto Body Parts Co., Ltd. | | | 131,000 | | | | 44,252 | |
Grand Pacific Petrochemical Corp. | | | 6,971,000 | | | | 3,850,513 | |
Great China Metal Industry Co., Ltd. | | | 1,577,000 | | | | 1,512,831 | |
Great Wall Enterprise Co., Ltd. | | | 1,906,162 | | | | 1,998,968 | |
*Greatek Co., Ltd. | | | 65,000 | | | | 62,088 | |
*GTM Corp. | | | 1,458,000 | | | | 1,031,191 | |
Hannstar Board Corp. | | | 2,229,666 | | | | 1,551,698 | |
*HannStar Display Corp. | | | 44,847,000 | | | | 8,967,430 | |
*Helix Technology, Inc. | | | 29,585 | | | | — | |
Hey Song Corp. | | | 4,473,000 | | | | 3,600,626 | |
Hitron Technologies, Inc. | | | 774,525 | | | | 524,247 | |
*Ho Tung Holding Corp. | | | 4,787,403 | | | | 2,515,597 | |
*Hocheng Corp. | | | 2,917,300 | | | | 1,061,431 | |
*Hold-Key Electric Wire & Cable Co., Ltd. | | | 1,689,548 | | | | 1,191,608 | |
Holystone Enterprise Co., Ltd. | | | 1,446,767 | | | | 1,758,366 | |
Hong Tai Electric Industrial Co., Ltd. | | | 2,292,000 | | | | 1,208,275 | |
Hsin Kuang Steel Co., Ltd. | | | 1,584,124 | | | | 1,473,131 | |
Hsing Ta Cement Co., Ltd. | | | 2,071,980 | | | | 676,645 | |
Hua Eng Wire & Cable Co., Ltd. | | | 4,854,035 | | | | 1,762,122 | |
Hua Nan Financial Holding Co., Ltd. | | | 12,973,307 | | | | 8,552,295 | |
*Hualon Corp. | | | 257,040 | | | | 9,066 | |
Hung Ching Development & Construction Co., Ltd. | | | 1,838,468 | | | | 1,030,475 | |
Hung Sheng Construction Co., Ltd. | | | 5,354,800 | | | | 3,101,040 | |
*Hwa Fong Rubber Co., Ltd. | | | 2,495,960 | | | | 865,782 | |
Ichia Technologies, Inc. | | | 3,181,260 | | | | 1,629,240 | |
*Inotera Memories, Inc. | | | 16,795,728 | | | | 8,230,534 | |
Inventec Appliances Corp. | | | 686,000 | | | | 532,758 | |
Inventec Corp. | | | 19,221,151 | | | | 10,108,074 | |
*Jui Li Enterprise Co., Ltd. | | | 693,760 | | | | 188,736 | |
K Laser Technology, Inc. | | | 843,601 | | | | 622,229 | |
Kang Na Hsiung Enterprise Co., Ltd. | | | 1,409,078 | | | | 946,246 | |
*Kao Hsing Chang Iron & Steel Corp. | | | 1,589,000 | | | | 456,288 | |
Kaulin Manufacturing Co., Ltd. | | | 1,477,656 | | | | 1,342,144 | |
Kee Tai Properties Co., Ltd. | | | 1,086,750 | | | | 546,072 | |
*King Yuan Electronics Co., Ltd. | | | 11,179,861 | | | | 5,070,827 | |
Kingdom Construction Co., Ltd. | | | 907,000 | | | | 796,530 | |
*King’s Town Bank | | | 8,288,012 | | | | 3,777,648 | |
*Kinko Optical Co., Ltd. | | | 734,131 | | | | 764,731 | |
*Kinpo Electronics, Inc. | | | 12,274,375 | | | | 4,301,393 | |
*Kuoyang Construction Co., Ltd. | | | 641,029 | | | | 455,196 | |
*Kwong Fong Industries Corp. | | | 3,210,900 | | | | 1,518,716 | |
L&K Engineering Co., Ltd. | | | 595,000 | | | | 591,367 | |
*Lan Fa Textile Co., Ltd. | | | 2,481,994 | | | | 1,271,399 | |
LCY Chemical Corp. | | | 2,306,713 | | | | 4,661,953 | |
*Lead Data Co., Ltd. | | | 2,542,457 | | | | 477,967 | |
*Leader Electronics, Inc. | | | 86,000 | | | | 57,500 | |
Lealea Enterprise Co., Ltd. | | | 6,426,473 | | | | 3,797,131 | |
Lee Chi Enterprises Co., Ltd. | | | 1,708,900 | | | | 809,900 | |
29
DIMENSIONAL EMERGING MARKETS VALUE FUND
CONTINUED
| | | | | | | | |
| | | Shares | | | Value†† | |
TAIWAN — (Continued) | | | | | | | | |
*Lelon Electronics Corp. | | | 732,000 | | | $ | 541,315 | |
*Leofoo Development Co., Ltd. | | | 1,948,000 | | | | 1,309,739 | |
*Li Peng Enterprise Co., Ltd. | | | 4,587,712 | | | | 2,410,501 | |
Lian Hwa Foods Corp. | | | 157,000 | | | | 119,776 | |
Lien Chang Electronic Enterprise Co., Ltd. | | | 666,610 | | | | 422,083 | |
Lien Hwa Industrial Corp. | | | 4,770,640 | | | | 3,511,756 | |
Lingsen Precision Industries, Ltd. | | | 2,810,480 | | | | 1,895,598 | |
*LITE-ON IT Corp. | | | 673,000 | | | | 714,665 | |
*Lite-On Semiconductor Corp. | | | 2,041,190 | | | | 1,167,051 | |
Lite-On Technology Corp. | | | 17,546,965 | | | | 23,177,602 | |
Long Bon International Co., Ltd. | | | 2,101,301 | | | | 849,733 | |
Long Chen Paper Co., Ltd. | | | 4,588,369 | | | | 1,893,934 | |
Lucky Cement Corp. | | | 3,099,000 | | | | 758,420 | |
Macronix International Co., Ltd. | | | 26,827,028 | | | | 16,497,329 | |
Marketech International Corp. | | | 909,000 | | | | 510,136 | |
Masterlink Securities Corp. | | | 11,634,000 | | | | 4,666,046 | |
Mayer Steel Pipe Corp. | | | 1,087,200 | | | | 923,975 | |
Maywufa Co., Ltd. | | | 197,070 | | | | 109,985 | |
Mega Financial Holding Co., Ltd. | | | 73,353,000 | | | | 50,855,439 | |
*Megamedia Corp. | | | 782 | | | | 6 | |
Meiloon Co., Ltd. | | | 1,124,352 | | | | 634,179 | |
Mercuries & Associates, Ltd. | | | 3,710,520 | | | | 2,588,813 | |
*Mercuries Data Systems, Ltd. | | | 649,800 | | | | 429,848 | |
Merry Electronics Co., Ltd. | | | 175,000 | | | | 292,073 | |
*Microelectronics Technology, Inc. | | | 3,297,123 | | | | 2,066,179 | |
Micro-Star International Co., Ltd. | | | 9,023,985 | | | | 4,823,983 | |
Mitac International Corp. | | | 10,726,000 | | | | 4,814,327 | |
Mobiletron Electronics Co., Ltd. | | | 96,000 | | | | 71,989 | |
*Mosel Vitelic, Inc. | | | 1,456,206 | | | | 768,975 | |
Nantex Industry Co., Ltd. | | | 1,702,329 | | | | 1,161,304 | |
*New Asia Construction & Development Co., Ltd. | | | 1,011,542 | | | | 333,957 | |
Nien Hsing Textile Co., Ltd. | | | 3,664,226 | | | | 2,788,843 | |
*Ocean Plastics Co., Ltd. | | | 7,776 | | | | 5,712 | |
*Optimax Technology Corp. | | | 1,702,957 | | | | 328,806 | |
*Orient Semiconductor Electronics, Ltd. | | | 2,566,276 | | | | 667,090 | |
Oriental Union Chemical Corp. | | | 3,567,225 | | | | 3,768,326 | |
*Pacific Construction Co., Ltd. | | | 3,365,256 | | | | 526,478 | |
*Pan Jit International, Inc. | | | 2,316,837 | | | | 2,876,421 | |
*Pegatron Corp. | | | 8,364,998 | | | | 11,323,063 | |
Phihong Technology Co., Ltd. | | | 1,180,320 | | | | 2,425,947 | |
*Picvue Electronics, Ltd. | | | 241,600 | | | | — | |
Plotech Co., Ltd. | | | 779,000 | | | | 507,465 | |
Polaris Securities Co., Ltd. | | | 18,333,502 | | | | 10,182,073 | |
*Potrans Electrical Corp. | | | 1,139,000 | | | | 162,175 | |
Pou Chen Corp. | | | 17,626,878 | | | | 16,703,381 | |
President Securities Corp. | | | 5,553,710 | | | | 3,266,014 | |
Prince Housing & Development Corp. | | | 4,734,846 | | | | 3,464,155 | |
*Procomp Informatics, Ltd. | | | 391,440 | | | | — | |
*Prodisc Technology, Inc. | | | 6,185,157 | | | | 78,706 | |
Promate Electronic Co., Ltd. | | | 331,000 | | | | 262,461 | |
*Qisda Corp. | | | 8,547,952 | | | | 5,964,715 | |
*Quintain Steel Co., Ltd. | | | 2,637,250 | | | | 928,481 | |
Radiant Opto-Electronics Corp. | | | 3,536,050 | | | | 5,308,274 | |
Radium Life Tech Corp. | | | 1,292,510 | | | | 1,723,970 | |
Ralec Electronic Corp. | | | 403,087 | | | | 804,330 | |
*Rechi Precision Co., Ltd. | | | 2,962,000 | | | | 1,591,763 | |
*Rexon Industrial Corp., Ltd. | | | 112,000 | | | | 36,790 | |
*Ritek Corp. | | | 25,133,622 | | | | 7,071,730 | |
*Sainfoin Technology Corp. | | | 835,498 | | | | — | |
*Sampo Corp. | | | 5,163,925 | | | | 1,252,054 | |
*Sanyang Industrial Co., Ltd. | | | 6,639,268 | | | | 3,587,212 | |
30
DIMENSIONAL EMERGING MARKETS VALUE FUND
CONTINUED
| | | | | | | | |
| | | Shares | | | Value†† | |
TAIWAN — (Continued) | | | | | | | | |
Sanyo Electric Taiwan Co., Ltd. | | | 368,000 | | | $ | 380,451 | |
Sheng Yu Steel Co., Ltd. | | | 1,716,000 | | | | 1,249,501 | |
Shihlin Electric & Engineering Corp. | | | 3,104,000 | | | | 3,710,233 | |
*Shin Kong Financial Holding Co., Ltd. | | | 32,958,021 | | | | 12,118,252 | |
Shinkong Insurance Co., Ltd. | | | 1,322,412 | | | | 1,027,305 | |
Shinkong Synthetic Fibers Co., Ltd. | | | 11,044,342 | | | | 5,583,340 | |
*Shuttle, Inc. | | | 408,015 | | | | 314,993 | |
Sigurd Microelectronics Corp. | | | 3,015,608 | | | | 2,587,101 | |
Silicon Integrated Systems Corp. | | | 6,006,165 | | | | 3,769,169 | |
Sinbon Electronics Co., Ltd. | | | 1,535,000 | | | | 1,206,390 | |
Sincere Navigation Corp. | | | 538,692 | | | | 651,925 | |
Sinkang Industries, Ltd. | | | 806,669 | | | | 471,728 | |
Sinon Corp. | | | 3,486,877 | | | | 1,614,225 | |
SinoPac Holdings Co., Ltd. | | | 63,420,809 | | | | 23,895,874 | |
*Siward Crystal Technology Co., Ltd. | | | 933,875 | | | | 552,827 | |
*Solomon Technology Corp. | | | 1,364,950 | | | | 651,632 | |
South East Soda Manufacturing Co., Ltd. | | | 927,500 | | | | 1,121,440 | |
Southeast Cement Co., Ltd. | | | 3,208,700 | | | | 1,278,063 | |
SPI Electronic Co., Ltd. | | | 277,938 | | | | 355,007 | |
Spirox Corp. | | | 938,661 | | | | 791,506 | |
Springsoft, Inc. | | | 1,577,000 | | | | 2,102,285 | |
Standard Chemical & Pharmaceutical Co., Ltd. | | | 155,310 | | | | 181,264 | |
*Star Comgistic Capital Co., Ltd. | | | 275,460 | | | | 351,730 | |
Stark Technology, Inc. | | | 847,200 | | | | 841,044 | |
Sunonwealth Electric Machine Industry Co., Ltd. | | | 486,421 | | | | 424,834 | |
*Sunplus Technology Co., Ltd. | | | 4,538,620 | | | | 3,369,809 | |
Supreme Electronics Co., Ltd. | | | 1,302,681 | | | | 885,694 | |
Sweeten Construction Co., Ltd. | | | 656,250 | | | | 354,393 | |
Sysware Systex Corp. | | | 828,801 | | | | 1,167,012 | |
T JOIN Transportation Co., Ltd. | | | 2,026,000 | | | | 1,777,832 | |
Ta Chen Stainless Pipe Co., Ltd. | | | 3,450,550 | | | | 2,277,137 | |
*Ta Chong Bank, Ltd. | | | 19,694,906 | | | | 4,666,335 | |
Ta Ya Electric Wire & Cable Co., Ltd. | | | 5,559,732 | | | | 1,620,344 | |
Tah Hsin Industrial Corp. | | | 1,452,000 | | | | 1,121,616 | |
TA-I Technology Co., Ltd. | | | 506,583 | | | | 528,809 | |
*Taichung Commercial Bank | | | 11,814,754 | | | | 3,919,100 | |
Tainan Enterprises Co., Ltd. | | | 773,850 | | | | 1,056,574 | |
Tainan Spinning Co., Ltd. | | | 10,408,080 | | | | 6,852,280 | |
*Taishin Financial Holdings Co., Ltd. | | | 48,846,396 | | | | 21,364,088 | |
Taisun Enterprise Co., Ltd. | | | 2,465,549 | | | | 1,448,950 | |
*Taita Chemical Co., Ltd. | | | 2,190,400 | | | | 911,384 | |
*Taiwan Business Bank | | | 33,106,890 | | | | 11,023,599 | |
Taiwan Cement Corp. | | | 28,127,741 | | | | 29,908,268 | |
Taiwan Cogeneration Corp. | | | 3,035,760 | | | | 1,735,737 | |
Taiwan Cooperative Bank | | | 39,316,092 | | | | 28,082,293 | |
*Taiwan Flourescent Lamp Co., Ltd. | | | 756,000 | | | | 73,572 | |
Taiwan Fu Hsing Industrial Co., Ltd. | | | 636,000 | | | | 415,519 | |
Taiwan Glass Industrial Corp. | | | 8,296,447 | | | | 10,034,324 | |
*Taiwan Kolin Co., Ltd. | | | 5,797,000 | | | | — | |
*Taiwan Land Development Corp. | | | 83,264 | | | | 37,744 | |
Taiwan Mask Corp. | | | 2,384,250 | | | | 1,005,830 | |
Taiwan Paiho Co., Ltd. | | | 1,634,850 | | | | 1,808,237 | |
*Taiwan Pulp & Paper Corp. | | | 2,594,000 | | | | 1,619,742 | |
Taiwan Sakura Corp. | | | 890,326 | | | | 696,123 | |
Taiwan Sogo Shinkong Security Co., Ltd. | | | 1,411,205 | | | | 1,083,927 | |
Taiwan Styrene Monomer Corp. | | | 4,480,856 | | | | 2,111,416 | |
Taiwan Tea Corp. | | | 5,604,092 | | | | 3,680,111 | |
Taiyen Biotech Co., Ltd. | | | 1,858,000 | | | | 1,470,499 | |
*Tatung Co., Ltd. | | | 39,242,000 | | | | 9,249,393 | |
*Teapo Electronic Corp. | | | 2,859,670 | | | | 525,772 | |
Teco Electric & Machinery Co., Ltd. | | | 17,546,834 | | | | 11,000,324 | |
31
DIMENSIONAL EMERGING MARKETS VALUE FUND
CONTINUED
| | | | | | | | |
| | | Shares | | | Value†† | |
TAIWAN — (Continued) | | | | | | | | |
*Tecom, Ltd. | | | 805,753 | | | $ | 255,205 | |
Test-Rite International Co., Ltd. | | | 1,786,331 | | | | 1,399,202 | |
Ton Yi Industrial Corp. | | | 7,349,810 | | | | 3,812,464 | |
Tong Yang Industry Co., Ltd. | | | 666,489 | | | | 1,058,156 | |
Tong-Tai Machine & Tool Co., Ltd. | | | 185,000 | | | | 192,364 | |
Topco Scientific Co., Ltd. | | | 712,980 | | | | 913,450 | |
*Topoint Technology Co., Ltd. | | | 91,000 | | | | 79,835 | |
Tsann Kuen Enterprise Co., Ltd. | | | 479,992 | | | | 900,600 | |
Tung Ho Steel Enterprise Corp. | | | 3,875,769 | | | | 3,623,830 | |
TYC Brother Industrial Co., Ltd. | | | 1,755,651 | | | | 1,100,803 | |
*Tycoons Group Enterprise Co., Ltd. | | | 2,680,938 | | | | 686,977 | |
Tze Shin International Co., Ltd. | | | 1,011,113 | | | | 456,719 | |
Unimicron Technology Corp. | | | 8,508,363 | | | | 14,447,048 | |
*Union Bank of Taiwan | | | 7,284,282 | | | | 2,137,387 | |
Unitech Electronics Co., Ltd. | | | 1,249,739 | | | | 701,508 | |
*Unitech Printed Circuit Board Corp. | | | 3,603,265 | | | | 1,693,589 | |
United Integration Service Co., Ltd. | | | 1,309,000 | | | | 1,768,632 | |
United Microelectronics Corp. | | | 116,004,069 | | | | 55,645,336 | |
Universal Cement Corp. | | | 4,607,551 | | | | 2,887,527 | |
*Universal Microelectronics Co., Ltd. | | | 927,491 | | | | 552,307 | |
Universal, Inc. | | | 48,059 | | | | 40,123 | |
UPC Technology Corp. | | | 5,561,415 | | | | 4,218,066 | |
USI Corp. | | | 5,806,080 | | | | 5,032,748 | |
*U-Tech Media Corp. | | | 1,760,799 | | | | 679,809 | |
Ve Wong Corp. | | | 1,457,806 | | | | 1,146,887 | |
*Waffer Technology Co., Ltd. | | | 1,507,000 | | | | 338,007 | |
Wah Lee Industrial Corp. | | | 16,000 | | | | 29,877 | |
*Walsin Lihwa Corp. | | | 25,949,412 | | | | 15,542,629 | |
*Walsin Technology Corp., Ltd. | | | 4,730,876 | | | | 2,770,659 | |
Walton Advanced Engineering, Inc. | | | 2,045,853 | | | | 970,757 | |
*Wan Hai Lines Co., Ltd. | | | 2,462,000 | | | | 1,806,757 | |
Wan Hwa Enterprise Co., Ltd. | | | 663,515 | | | | 375,442 | |
Waterland Financial Holding Co., Ltd. | | | 24,413,080 | | | | 7,886,938 | |
*Wei Chih Steel Industrial Co., Ltd. | | | 1,615,898 | | | | 457,385 | |
Weikeng Industrial Co., Ltd. | | | 1,428,000 | | | | 1,250,282 | |
*Well Shin Technology Co., Ltd. | | | 35,000 | | | | 62,505 | |
Wellypower Optronics Corp. | | | 1,189,000 | | | | 1,195,206 | |
*Winbond Electronics Corp. | | | 29,524,000 | | | | 7,693,121 | |
*Wintek Corp. | | | 5,285,000 | | | | 8,909,622 | |
WT Microelectronics Co., Ltd. | | | 2,215,000 | | | | 3,526,117 | |
*WUS Printed Circuit Co., Ltd. | | | 3,217,928 | | | | 1,957,194 | |
*Yageo Corp. | | | 26,995,840 | | | | 11,507,452 | |
*Yang Ming Marine Transport Corp. | | | 12,943,615 | | | | 9,849,703 | |
Yeung Cyang Industrial Co., Ltd. | | | 1,153,667 | | | | 872,957 | |
Yieh Phui Enterprise Co., Ltd. | | | 10,369,986 | | | | 3,722,128 | |
Yosun Industrial Corp. | | | 2,743,353 | | | | 4,741,553 | |
Yuanta Financial Holding Co., Ltd. | | | 24,924,422 | | | | 15,652,289 | |
Yuen Foong Yu Paper Manufacturing Co., Ltd. | | | 10,716,138 | | | | 5,278,373 | |
Yulon Motor Co., Ltd. | | | 11,058,572 | | | | 21,659,423 | |
*Yulon Nissan Motor Co., Ltd. | | | 167,000 | | | | 774,688 | |
Yung Chi Paint & Varnish Manufacturing Co., Ltd. | | | 84,687 | | | | 121,958 | |
Yung Tay Engineering Co., Ltd. | | | 3,582,000 | | | | 4,747,075 | |
Zenitron Corp. | | | 1,529,000 | | | | 944,363 | |
Zig Sheng Industrial Co., Ltd. | | | 4,071,548 | | | | 2,185,526 | |
Zippy Technology Corp. | | | 343,000 | | | | 291,141 | |
*Zyxel Communication Corp. | | | 4,187,000 | | | | 2,786,996 | |
| | | | | | | | |
TOTAL TAIWAN | | | | | | | 1,411,414,371 | |
| | | | | | | | |
THAILAND — (2.4%) | | | | | | | | |
Aapico Hitech PCL (Foreign) | | | 539,800 | | | | 302,490 | |
Asia Plus Securities PCL (Foreign) | | | 7,008,500 | | | | 654,563 | |
32
DIMENSIONAL EMERGING MARKETS VALUE FUND
CONTINUED
| | | | | | | | |
| | | Shares | | | Value†† | |
THAILAND — (Continued) | | | | | | | | |
Ayudhya Insurance PCL (Foreign) | | | 228,500 | | | $ | 133,381 | |
Bangchak Petroleum PCL (Foreign) | | | 7,266,900 | | | | 3,708,591 | |
Bangkok Bank PCL (Foreign) | | | 5,983,200 | | | | 30,834,036 | |
Bangkok Bank PCL (Foreign) NVDR | | | 4,793,500 | | | | 23,823,599 | |
Bangkok Expressway PCL (Foreign) | | | 4,439,200 | | | | 2,754,140 | |
Bangkok First Investment & Trust PCL (Foreign) | | | 426,100 | | | | 64,242 | |
Bangkok Insurance PCL (Foreign) | | | 135,820 | | | | 1,159,771 | |
*Bangkokland PCL (Foreign) | | | 89,137,003 | | | | 2,259,644 | |
Bank of Ayudhya PCL (Foreign) | | | 16,269,800 | | | | 13,078,792 | |
Cal-Comp Electronics (Thailand) PCL (Foreign) | | | 18,405,400 | | | | 2,308,349 | |
Capital Nomura Securities PCL (Foreign) | | | 478,400 | | | | 538,559 | |
Capital Nomura Securities PCL (Foreign) NVDR | | | 45,000 | | | | 50,659 | |
Central Plaza Hotel PCL (Foreign) | | | 6,525,000 | | | | 1,099,108 | |
Delta Electronics (Thailand) PCL (Foreign) | | | 4,830,100 | | | | 5,115,266 | |
Eastern Water Resources Development & Management PCL (Foreign) | | | 9,535,200 | | | | 2,178,656 | |
*Erawan Group PCL (Foreign) | | | 4,288,950 | | | | 326,178 | |
*Esso Thailand PCL (Foreign) | | | 8,898,200 | | | | 1,988,590 | |
*G J Steel PCL (Foreign) | | | 214,856,100 | | | | 1,791,662 | |
*G Steel PCL (Foreign) | | | 43,035,100 | | | | 918,695 | |
Hana Microelectronics PCL (Foreign) | | | 1,555,000 | | | | 1,296,698 | |
Hermraj Land & Development PCL (Foreign) | | | 64,383,100 | | | | 4,080,317 | |
ICC International PCL (Foreign) | | | 2,710,500 | | | | 3,571,206 | |
IRPC PCL (Foreign) | | | 99,669,500 | | | | 14,096,020 | |
*Italian-Thai Development PCL (Foreign) NVDR | | | 27,016,800 | | | | 4,379,641 | |
Jasmine International PCL (Foreign) | | | 27,831,800 | | | | 1,429,652 | |
*Kang Yong Electric PCL (Foreign) | | | 1,900 | | | | 13,626 | |
Kasikornbank PCL (Foreign) | | | 1,193,700 | | | | 5,016,885 | |
Kasikornbank PCL (Foreign) NVDR | | | 164,500 | | | | 641,978 | |
*KGI Securities Thailand PLC (Foreign) | | | 11,847,800 | | | | 1,059,110 | |
Kiatnakin Finance PCL (Foreign) | | | 3,374,300 | | | | 4,473,930 | |
Krung Thai Bank PCL (Foreign) | | | 54,147,700 | | | | 30,523,553 | |
Laguna Resorts & Hotels PCL (Foreign) | | | 1,342,400 | | | | 2,384,350 | |
*Loxley PCL (Foreign) | | | 3,313,700 | | | | 294,011 | |
MBK PCL (Foreign) | | | 905,500 | | | | 3,171,364 | |
Padaeng Industry PCL (Foreign) NVDR | | | 1,600,800 | | | | 1,244,117 | |
Polyplex PCL (Foreign) | | | 1,132,600 | | | | 1,256,136 | |
Precious Shipping PCL (Foreign) | | | 5,065,000 | | | | 3,226,868 | |
PTT Aromatics & Refining PCL (Foreign) | | | 14,786,216 | | | | 14,672,779 | |
PTT Chemical PCL (Foreign) | | | 5,203,910 | | | | 24,474,693 | |
Quality Houses PCL (Foreign) | | | 4,500,000 | | | | 348,232 | |
*Regional Container Lines PCL (Foreign) | | | 5,884,700 | | | | 3,003,199 | |
Rojana Industrial Park PCL (Foreign) | | | 322,500 | | | | 120,480 | |
Saha Pathana Inter-Holding PCL (Foreign) | | | 3,262,400 | | | | 2,045,801 | |
Saha Pathanapibul PCL (Foreign) | | | 1,594,833 | | | | 1,449,606 | |
Saha-Union PCL (Foreign) | | | 2,976,400 | | | | 3,722,982 | |
*Sahaviriya Steel Industries PCL (Foreign) | | | 68,900,700 | | | | 3,677,155 | |
*Samart Corporation PCL (Foreign) | | | 800,000 | | | | 214,810 | |
Sansiri PCL (Foreign) | | | 9,982,900 | | | | 1,914,666 | |
Serm Suk PCL (Foreign) NVDR | | | 39,000 | | | | 53,661 | |
*Shinawatra Satellite PCL (Foreign) | | | 5,868,900 | | | | 1,380,112 | |
Siam Commercial Bank PCL (Foreign) | | | 944,800 | | | | 3,230,220 | |
Sri Trang Agro Industry PCL (Foreign) | | | 50,000 | | | | 49,616 | |
Supalai PCL (Foreign) | | | 495,566 | | | | 198,359 | |
*Tata Steel (Thailand) PCL (Foreign) | | | 35,972,800 | | | | 2,135,810 | |
*Thai Airways International PCL (Foreign) | | | 5,697,111 | | | | 8,836,413 | |
*Thai Carbon Black PCL (Foreign) | | | 118,700 | | | | 139,566 | |
Thai Oil PCL (Foreign) | | | 9,889,800 | | | | 17,483,636 | |
Thai Plastic & Chemicals PCL (Foreign) | | | 3,787,100 | | | | 2,374,833 | |
Thai Rayon PCL (Foreign) | | | 165,000 | | | | 514,593 | |
Thai Stanley Electric (Thailand) PCL (Foreign) | | | 136,700 | | | | 845,826 | |
Thai Union Frozen Products PCL (Foreign) | | | 216,090 | | | | 414,449 | |
33
DIMENSIONAL EMERGING MARKETS VALUE FUND
CONTINUED
| | | | | | | | |
| | | Shares | | | Value†† | |
THAILAND — (Continued) | | | | | | | | |
Thai Wacoal PCL (Foreign) | | | 93,300 | | | $ | 132,263 | |
Thanachart Capital PCL (Foreign) | | | 6,758,500 | | | | 8,904,628 | |
Thoresen Thai Agencies PCL (Foreign) | | | 3,578,400 | | | | 2,781,078 | |
Ticon Industrial Connection PCL (Foreign) | | | 607,000 | | | | 279,406 | |
Tisco Financial Group PCL (Foreign) | | | 1,041,700 | | | | 1,459,353 | |
Total Access Communication PCL (Foreign) | | | 1,264,380 | | | | 1,719,557 | |
*Total Access Communication PCL (Foreign) NVDR | | | 7,336,800 | | | | 10,278,372 | |
TPI Polene PCL (Foreign) | | | 10,203,724 | | | | 4,220,353 | |
*Tycoons Worldwide Group PCL (Foreign) | | | 1,243,300 | | | | 275,782 | |
Univentures PCL (Foreign) | | | 3,481,400 | | | | 339,082 | |
Vanachai Group PCL (Foreign) | | | 5,869,000 | | | | 1,350,771 | |
Vinythai PCL (Foreign) | | | 5,239,317 | | | | 1,695,176 | |
| | | | | | | | |
TOTAL THAILAND | | | | | | | 303,985,751 | |
| | | | | | | | |
TURKEY — (2.2%) | | | | | | | | |
Adana Cimento Sanayii Ticaret A.S. Class A | | | 549,768 | | | | 2,068,489 | |
Adana Cimento Sanayii Ticaret A.S. Class C | | | 554,691 | | | | 334,805 | |
*Advansa Sasa Polyester Sanayi A.S. | | | 1,240,215 | | | | 685,158 | |
Akcansa Cimento Sanayi ve Ticaret A.S. | | | 317,432 | | | | 1,679,559 | |
*Akenerji Elektrik Uretim A.S. | | | 13,804 | | | | 36,610 | |
Aksa Akrilik Kimya Sanayii A.S. | | | 1,424,767 | | | | 3,165,400 | |
Aksigorta A.S. | | | 1,324,168 | | | | 2,052,932 | |
Alarko Holding A.S. | | | 1,013,092 | | | | 2,450,796 | |
*Altinyildiz Mensucat ve Konfeksiyon Fabrikalari A.S. | | | 100,296 | | | | 558,579 | |
Anadolu Anonim Turk Sigorta Sirketi A.S. | | | 2,955,644 | | | | 2,606,040 | |
*Anadolu Cam Sanayii A.S. | | | 1,486,817 | | | | 2,965,009 | |
Arcelik A.S. | | | 1,576,149 | | | | 8,609,487 | |
Aydiner Enerji A.S. | | | 415,323 | | | | 950,164 | |
Aygaz A.S. | | | 1,118,602 | | | | 5,847,057 | |
Bati Anabolu Cimento A.S. | | | 299,730 | | | | 1,622,415 | |
Bolu Cimento Sanayii A.S. | | | 836,227 | | | | 995,170 | |
Borusan Mannesmann Boru Sanayi ve Ticaret A.S. | | | 87,735 | | | | 1,130,028 | |
Cimsa Cimento Sanayi ve Ticaret A.S. | | | 518,069 | | | | 3,982,621 | |
*Deva Holding A.S. | | | 885,272 | | | | 2,017,586 | |
*Dogan Gazetecilik A.S. | | | 590,940 | | | | 1,183,695 | |
*Dogan Sirketler Grubu Holdings A.S. | | | 9,540,148 | | | | 6,829,331 | |
*Dogan Yayin Holding A.S. | | | 2,881,725 | | | | 2,961,010 | |
*Dogus Otomotiv Servis ve Ticaret A.S. | | | 390,717 | | | | 2,893,103 | |
*EGE Seramik Sanayi ve Ticaret A.S. | | | 410,796 | | | | 461,602 | |
EIS Eczacibasi Ilac ve Sinai ve Finansal Yatirimlar Sanayi ve Ticaret A.S. | | | 2,225,408 | | | | 4,046,238 | |
Enka Insaat ve Sanayi A.S. | | | — | | | | 1 | |
*Eregli Demir ve Celik Fabrikalari Turk A.S. | | | 7,385,547 | | | | 27,326,077 | |
Galatasaray Sportif Sinai ve Ticari Yatirimlar A.S. | | | 2,246 | | | | 556,922 | |
Gentas Genel Metal Sanayi A.S. | | | 247,933 | | | | 273,557 | |
*Global Yatirim Holding A.S. | | | 2,770,251 | | | | 1,566,616 | |
*Goldas Kuyumculuk Sanayi Ithalat Ve Ihracat A.S. | | | 552,019 | | | | 396,637 | |
Goltas Goller Bolgesi Cimento Sanayi ve Ticaret A.S. | | | 24,412 | | | | 1,077,059 | |
*Goodyear Lastikleri T.A.S. | | | 124,529 | | | | 1,645,085 | |
*GSD Holding A.S. | | | 2,568,369 | | | | 1,961,425 | |
*Gunes Sigorta A.S. | | | 439,694 | | | | 654,027 | |
Haci Omer Sabanci Holding A.S. | | | 948,114 | | | | 5,136,757 | |
Hurriyet Gazetecilik ve Matbaacilik A.S. | | | 2,245,783 | | | | 2,582,810 | |
*Ihlas EV Aletleri A.S. | | | 575,000 | | | | 415,872 | |
*Ihlas Holding A.S. | | | 3,918,431 | | | | 2,442,387 | |
Is Yatirim Menkul Degerler A.S. | | | 286,457 | | | | 429,263 | |
*Isiklar Yatirim Holding A.S. | | | 1,053,525 | | | | 983,949 | |
*Izmir Demir Celik Sanayi A.S. | | | 796,660 | | | | 1,525,127 | |
*Kardemir Karabuk Demir Celik Sanayi ve Ticaret A.S. | | | 2,360,622 | | | | 1,838,720 | |
Koc Holding A.S. Series B | | | 6,374,972 | | | | 30,008,184 | |
Konya Cimento Sanayii A.S. | | | 6,740 | | | | 702,379 | |
*Kordsa Global Endustriyel Iplik ve Kord Bezi Sanayi ve Ticaret A.S. | | | 1,257,505 | | | | 2,876,879 | |
34
DIMENSIONAL EMERGING MARKETS VALUE FUND
CONTINUED
| | | | | | | | |
| | | Shares | | | Value†† | |
TURKEY — (Continued) | | | | | | | | |
Marshall Boya ve Vernik A.S. | | | 4,496 | | | $ | 96,145 | |
*Marti Otel Isletmeleri A.S. | | | 1,429,951 | | | | 1,095,128 | |
*Net Turizm Ticaret ve Sanayi A.S. | | | 2,067,073 | | | | 1,430,848 | |
Nortel Networks Netas Telekomuenikasyon A.S. | | | 67,409 | | | | 2,476,727 | |
*Park Elektrik Madencilik Sanayi Ve Ticaret A.S. | | | 94,308 | | | | 184,096 | |
*Petkim Petrokimya Holding A.S. | | | 4,417,470 | | | | 7,637,792 | |
Pinar Entegre Et ve Un Sanayi A.S. | | | 231,479 | | | | 1,051,824 | |
Pinar SUT Mamulleri Sanayii A.S. | | | 195,977 | | | | 1,566,921 | |
*Raks Elektronik Sanayi ve Ticaret A.S. | | | 5,859 | | | | 3,227 | |
*Sabah Yayincilik A.S. | | | 31,938 | | | | 84,613 | |
Sarkuysan Elektrolitik Bakir Sanayi ve Ticaret A.S. | | | 649,929 | | | | 1,807,936 | |
Sekerbank T.A.S. | | | 2,811,226 | | | | 3,524,953 | |
Selcuk Ecza Deposu Ticaret ve Sanayi A.S. | | | 498,657 | | | | 956,975 | |
*Soda Sanayii A.S. | | | 555,287 | | | | 802,391 | |
Tekfen Holding A.S. | | | 1,437,073 | | | | 6,134,645 | |
*Tekstil Bankasi A.S. | | | 1,166,413 | | | | 890,084 | |
Tofas Turk Otomobil Fabrikasi A.S. | | | 935,573 | | | | 5,116,776 | |
*Trakya Cam Sanayii A.S. | | | 2,393,774 | | | | 4,984,132 | |
Turcas Petrol A.S. | | | 473,978 | | | | 2,226,072 | |
*Turk Ekonomi Bankasi A.S. | | | 2,246,859 | | | | 3,824,998 | |
*Turk Hava Yollari A.S. | | | 4,113,865 | | | | 16,886,727 | |
Turkiye Garanti Bankasi A.S. | | | 61,890 | | | | 373,599 | |
Turkiye Is Bankasi A.S. | | | 4,921,910 | | | | 21,793,410 | |
Turkiye Sinai Kalkinma Bankasi A.S. | | | 3,448,034 | | | | 6,278,892 | |
*Turkiye Sise ve Cam Fabrikalari A.S. | | | 4,350,665 | | | | 7,937,965 | |
Turkiye Vakiflar Bankasi T.A.O. | | | 7,707,611 | | | | 24,466,483 | |
Ulker Biskuvi Sanayi A.S. | | | 1,289,012 | | | | 4,151,199 | |
*Uzel Makina Sanayii A.S. | | | 275,043 | | | | 149,568 | |
Vestel Beyaz Esya Sanayi ve Ticaret A.S. | | | 716,001 | | | | 1,898,251 | |
*Vestel Elektronik Sanayi ve Ticaret A.S. | | | 1,086,476 | | | | 1,815,598 | |
*Yapi ve Kredi Bankasi A.S. | | | 1,777,322 | | | | 6,703,749 | |
| | | | | | | | |
TOTAL TURKEY | | | | | | | 284,884,341 | |
| | | | | | | | |
TOTAL COMMON STOCKS | | | | | | | 11,318,625,084 | |
| | | | | | | | |
PREFERRED STOCKS — (4.3%) | | | | | | | | |
BRAZIL — (4.3%) | | | | | | | | |
Banco Alfa de Investimento SA | | | 61,726 | | | | 236,151 | |
#Banco Bradesco SA Sponsored ADR | | | 16,708 | | | | 347,526 | |
Banco Cruzeiro do Sul SA | | | 5,100 | | | | 45,862 | |
Banco do Estado do Rio Grande do Sul SA | | | 1,412,133 | | | | 15,447,670 | |
*Braskem SA Preferred A | | | 1,479,200 | | | | 15,050,379 | |
#Braskem SA Preferred A Sponsored ADR | | | 346,836 | | | | 7,231,531 | |
Cia Brasileira de Distribuicao Grupo Pao de Acucar | | | 359,221 | | | | 14,102,218 | |
#Cia Brasileira de Distribuicao Grupo Pao de Acucar SA Sponsored ADR Series A | | | 284,882 | | | | 11,284,176 | |
Cia de Tecidos Norte de Minas - Coteminas SA | | | 899,675 | | | | 2,301,703 | |
Confab Industrial SA | | | 3,394,571 | | | | 12,417,945 | |
Ferbasa-Ferro Ligas Da Bahia | | | 556,965 | | | | 4,215,809 | |
Forjas Taurus SA | | | 828,769 | | | | 2,193,413 | |
Gerdau SA | | | 2,445,084 | | | | 31,406,596 | |
#Gerdau SA Sponsored ADR | | | 4,348,258 | | | | 56,701,284 | |
Gol Linhas Aereas Inteligentes SA | | | 63,600 | | | | 1,100,086 | |
*Inepar SA Industria e Construcoes | | | 225,432 | | | | 673,525 | |
*Inepar SA Industria e Construcoes Receipt | | | 132,403 | | | | 397,139 | |
Itausa - Investimentos Itau SA | | | 2,031,145 | | | | 15,899,865 | |
Klabin SA | | | 5,296,604 | | | | 14,796,724 | |
Mahle-Metal Leve SA Industria e Comercio | | | 4,000 | | | | 97,324 | |
Mangels Industrial SA | | | 3,600 | | | | 23,290 | |
Marcopolo SA | | | 3,772,060 | | | | 15,085,578 | |
Metalurgica Gerdau SA | | | 4,022,600 | | | | 61,582,237 | |
Petroleo Brasileiro SA ADR | | | 3,327,243 | | | | 103,776,709 | |
Randon e Participacoes SA | | | 716,950 | | | | 6,000,234 | |
35
DIMENSIONAL EMERGING MARKETS VALUE FUND
CONTINUED
| | | | | | | | |
| | | Shares | | | Value†† | |
BRAZIL — (Continued) | | | | | | | | |
Sao Paulo Alpargatas SA | | | 864,000 | | | $ | 5,310,122 | |
Suzano Papel e Celullose SA | | | 2,456,049 | | | | 23,097,232 | |
*Telemar Norte Leste SA | | | 549,500 | | | | 15,577,192 | |
Ultrapar Participacoes SA | | | 99,641 | | | | 6,053,588 | |
Ultrapar Participacoes SA Sponsored ADR | | | 273,378 | | | | 16,963,105 | |
*Unipar Participacoes SA Class B | | | 7,370,473 | | | | 2,904,321 | |
Usinas Siderurgicas de Minas Gerais SA Series A | | | 7,092,710 | | | | 88,935,233 | |
*Vale SA Series B | | | 239,144 | | | | — | |
Whirlpool SA | | | 72,600 | | | | 145,174 | |
| | | | | | | | |
TOTAL BRAZIL | | | | | | | 551,400,941 | |
| | | | | | | | |
INDIA — (0.0%) | | | | | | | | |
*Ispat Industries, Ltd. | | | 1,463,759 | | | | 87,486 | |
| | | | | | | | |
MALAYSIA — (0.0%) | | | | | | | | |
*Malayan United Industries Berhad Series A2 | | | 1,526,067 | | | | 80,926 | |
| | | | | | | | |
TOTAL PREFERRED STOCKS | | | | | | | 551,569,353 | |
| | | | | | | | |
RIGHTS/WARRANTS — (0.0%) | | | | | | | | |
CHINA — (0.0%) | | | | | | | | |
*HKC Holdings, Ltd. Warrants 06/09/11 | | | 1,821,079 | | | | 13,627 | |
*Hong Kong Energy Holdings, Ltd. Warrants 06/09/11 | | | 110,368 | | | | 1,025 | |
*Kingboard Chemical Holdings, Ltd. Warrants 10/31/12 | | | 332,750 | | | | 190,603 | |
| | | | | | | | |
TOTAL CHINA | | | | | | | 205,255 | |
| | | | | | | | |
INDONESIA — (0.0%) | | | | | | | | |
*PT Intiland Development Tbk Warrants 04/13/12 | | | 163,000 | | | | 1,733 | |
| | | | | | | | |
MALAYSIA — (0.0%) | | | | | | | | |
*KPJ Healthcare Berhad Warrants 01/10/15 | | | 635,073 | | | | 398,005 | |
*Media Prima Berhad Warrants 12/31/14 | | | 57,521 | | | | 11,092 | |
*OSK Holdings Berhad Warrants 09/30/12 | | | 93,339 | | | | 2,250 | |
*Sarawak Oil Palms Berhad Warrants 01/19/11 | | | 53,568 | | | | 39,081 | |
| | | | | | | | |
TOTAL MALAYSIA | | | | | | | 450,428 | |
| | | | | | | | |
POLAND — (0.0%) | | | | | | | | |
*Boryszew SA Rights | | | 1,114,644 | | | | 1,486,062 | |
| | | | | | | | |
SOUTH KOREA — (0.0%) | | | | | | | | |
*Kolon Industries, Inc. Rights 12/02/10 | | | 12,152 | | | | 186,825 | |
| | | | | | | | |
TAIWAN — (0.0%) | | | | | | | | |
*Shin Kong Financial Holding Co., Ltd. Rights 11/25/10 | | | 1,827,131 | | | | 74,585 | |
| | | | | | | | |
THAILAND — (0.0%) | | | | | | | | |
*Bangkok Land PCL (Foreign) NVDR Warrants 05/02/13 | | | 15,090,426 | | | | 65,435 | |
*Bangkok Land PCL (Foreign) Warrants 12/31/10 | | | 10,015,389 | | | | — | |
*Sansiri PCL (Foreign) Warrants 01/20/15 | | | 4,991,450 | | | | 239,749 | |
| | | | | | | | |
TOTAL THAILAND | | | | | | | 305,184 | |
| | | | | | | | |
TOTAL RIGHTS/WARRANTS | | | | | | | 2,710,072 | |
| | | | | | | | |
| | |
| | | Face
Amount | | | Value† | |
| | | (000) | | | | |
TEMPORARY CASH INVESTMENTS — (0.7%) | | | | | | | | |
Repurchase Agreement, PNC Capital Markets, Inc. 0.19%, 11/01/10 (Collateralized by $81,705,000 FHLMC 4.00%, 09/01/24, valued at $71,456,943) to be repurchased at $83,314,319 | | | $83,313 | | | | 83,313,000 | |
| | | | | | | | |
36
DIMENSIONAL EMERGING MARKETS VALUE FUND
CONTINUED
| | | | | | | | |
| | | Shares/ Face Amount | | | Value† | |
| | | (000) | | | | |
SECURITIES LENDING COLLATERAL — (6.8%) | | | | | | | | |
§@DFA Short Term Investment Fund | | | 877,175,369 | | | $ | 877,175,369 | |
@Repurchase Agreement, Deutsche Bank Securities, Inc. 0.22%, 11/01/10 (Collateralizedby $42,295,271 FNMA 7.000%, 08/01/38, valued at $1,439,213)## to be repurchased at $1,411,019 | | | $1,411 | | | | 1,410,993 | |
| | | | | | | | |
TOTAL SECURITIES LENDING COLLATERAL | | | | | | | 878,586,362 | |
| | | | | | | | |
TOTAL INVESTMENTS — (100.0%)
(Cost $9,604,404,435) | | | | | | $ | 12,834,803,871 | |
| | | | | | | | |
37
Report of Independent Registered Public Accounting Firm
To the Board of Directors and Shareholders of Dimensional Emerging Markets Value Fund:
We have audited, in accordance with the standards of the Public Company Accounting Oversight Board (United States), the financial statements of Dimensional Emerging Markets Value Fund (hereafter referred to as the “Fund”) as of October 31, 2010, and for the year then ended and have issued our unqualified report thereon dated December 22, 2010 (which report and financial statements are included in Item 1 of this Certified Shareholder Report on Form N-CSR). Our audit included an audit of the Fund’s investment portfolio (the “Portfolio”) as of October 31, 2010 appearing in Item 6 of this Form N-CSR. This Portfolio is the responsibility of the Fund’s management. Our responsibility is to express an opinion on this Portfolio based on our audit. In our opinion, the Portfolio referred to above, when read in conjunction with the financial statements of the Fund referred to above, presents fairly, in all material respects, the information set forth therein.
PricewaterhouseCoopers LLP
Philadelphia, Pennsylvania
December 22, 2010
(b) Not applicable.
| ITEM 7. | DISCLOSURE OF PROXY VOTING POLICIES AND PROCEDURES FOR CLOSED-END MANAGEMENT INVESTMENT COMPANIES. |
This item is not applicable to the Registrant, which is an open-end management investment company.
| ITEM 8. | PORTFOLIO MANAGERS OF CLOSED-END MANAGEMENT INVESTMENT COMPANIES. |
This item is not applicable to the Registrant, which is an open-end management investment company.
| ITEM 9. | PURCHASES OF EQUITY SECURITIES BY CLOSED-END MANAGEMENT INVESTMENT COMPANY AND AFFILIATED PURCHASERS |
This item is not applicable to the Registrant, which is an open-end management investment company.
| ITEM 10. | SUBMISSION OF MATTERS TO A VOTE OF SECURITY HOLDERS. |
None.
| ITEM 11. | CONTROLS AND PROCEDURES. |
| | (a) | Based on their evaluation of the Registrant’s disclosure controls and procedures as of a date within 90 days of the filing date of this Report, the Registrant’s Principal Executive Officer and Principal Financial Officer believe that the disclosure controls and procedures (as defined in Rule 30a-3(c) under the Investment Company Act of 1940, as amended) are effectively designed to ensure that information required to be disclosed by the Registrant in the Report is recorded, processed, summarized and reported by the filing date, including ensuring that information required to be disclosed in the Report is accumulated and communicated to the Registrant’s officers that are making certifications in the Report, as appropriate, to allow timely decisions regarding required disclosure. The Registrant’s management, including the Principal Executive Officer and the Principal Financial Officer, recognizes that any set of controls and procedures, no matter how well designed and operated, can provide only reasonable assurance of achieving the desired control objectives. |
| | (b) | There were no changes in the Registrant’s internal control over financial reporting (as defined in Rule 30a-3(d) under the Investment Company Act of 1940, as amended) that occurred during the second fiscal quarter of the period covered by this Report that have materially affected, or are reasonably likely to materially affect, the Registrant’s internal control over financial reporting. |
| | | | |
| | (a)(1) | | Code of Ethics is filed herewith. |
| | |
| | (a)(2) | | Certifications pursuant to Section 302 of the Sarbanes-Oxley Act of 2002 are filed herewith. |
| | |
| | (a)(3) | | This item is not applicable. |
| | |
| | (b) | | Certifications pursuant to Section 906 of the Sarbanes-Oxley Act of 2002 are filed herewith. |
SIGNATURES
Pursuant to the requirements of the Securities Exchange Act of 1934 and the Investment Company Act of 1940, the Registrant has duly caused this Report to be signed on its behalf by the undersigned, thereunto duly authorized.
Dimensional Emerging Markets Value Fund
| | |
| By: | | /S/ DAVID G. BOOTH |
| | David G. Booth |
| | Chairman, Trustee, President and |
| | Co-Chief Executive Officer |
| |
Date: | | January 5, 2011 |
Pursuant to the requirements of the Securities Exchange Act of 1934 and the Investment Company Act of 1940, this Report has been signed below by the following persons on behalf of the Registrant and in the capacities and on the dates indicated.
| | |
| By: | | /S/ DAVID G. BOOTH |
| | David G. Booth |
| | Principal Executive Officer |
| | Dimensional Emerging Markets Value Fund |
| |
Date: | | January 5, 2011 |
| | |
| By: | | /S/ DAVID R. MARTIN |
| | David R. Martin |
| | Principal Financial Officer |
| | Dimensional Emerging Markets Value Fund |
| |
Date: | | January 4, 2011 |