UNITED STATES
SECURITIES AND EXCHANGE COMMISSION
Washington, D.C. 20549
FORM N-CSR
CERTIFIED SHAREHOLDER REPORT OF REGISTERED
MANAGEMENT INVESTMENT COMPANIES
Investment Company Act file number 811-07454
Pacific Capital Funds
(Exact name of registrant as specified in charter)
| | |
| 3435 Stelzer Rd. Columbus, OH | | 43219 |
|
| (Address of principal executive offices) | | (Zip code) |
BISYS Fund Services 3435 Stelzer Road Columbus, OH 43219
(Name and address of agent for service)
Registrant’s telephone number, including area code: 614-470-8000
Date of fiscal year end: 7/31/05
Date of reporting period: 7/31/05
Item 1. Reports to Stockholders.

PACIFIC CAPITAL FUNDS
Annual Report
As of July 31, 2005
MUTUAL FUNDS: ARE NOT FDIC INSURED HAVE NO BANK GUARANTEE MAY LOSE VALUE
Table of Contents
Letter to Shareholders
Page 1
Fund Performance Review
Page 3
Statements of Assets and Liabilities
Page 29
Statements of Operations
Page 32
Statements of Changes in Net Assets
Page 35
Schedules of Portfolio Investments
Page 39
Notes to Financial Statements
Page 69
Financial Highlights
Page 83
Report of Independent Registered Public Accounting Firm
Page 95
Trustees and Executive Officers
Page 96
Additional Tax Information (unaudited)
Page 99
Expense Examples
Page 100
Letter to Shareholders
Dear Shareholders:
Thank you for investing with Pacific Capital Funds. We value the trust you place in us and we seek to provide world-class investment management to help you meet your financial goals.
Pacific Capital Funds draw on the expertise of the Asset Management Group of Bank of Hawaii (AMG). Founded in 1898, AMG represents the largest, most experienced staff of investment professionals in Hawaii, and oversees $6.4 billion in assets under management. In specialized securities markets, AMG has partnered with a select list of sub-advisors to provide Pacific Capital Funds’ shareholders with greater investment opportunities, broader diversification, and access to an elite group of institutional money managers:
| | • | | Bankoh Investment Partners, LLC, a joint venture between Bank of Hawaii and Chicago Equity Partners (CEP), serves as Sub-Adviser to the Pacific Capital Mid-Cap Fund. CEP specializes in core domestic equity markets and currently oversees $8.6 billion in assets under management. The firm’s investment management team has an average of 17 years experience. |
| | • | | First State Investments (FSI), which specializes in single-country, regional and sector-specific investments, serves as Sub-Adviser to the Pacific Capital New Asia Growth Fund. FSI oversees almost $82 billion in assets under management. |
| | • | | Hansberger Global Investors (HGI), founded in 1995 by former Templeton Worldwide President and CEO Thomas L. Hansberger, serves as Sub-Adviser to the Pacific Capital International Stock Fund. The firm’s 19 investment professionals represent 16 different nationalities and oversee $6.4 billion in assets under management. |
| | • | | Nicholas Applegate Capital Management (NACM), which specializes in global, international and domestic equity and special strategy management, serves as Sub-Adviser to the Pacific Capital Small Cap Fund. NACM employs 58 investment professionals and oversees $14.8 billion in assets under management. |
Annual Review
The U.S. economy posted better-than-expected growth during the 12-month period between August 1, 2004 and July 31, 2005. Despite rising interest rates, historically high energy prices, and a relatively weak U.S. Dollar, business and consumer spending remained strong. In the business sector, corporations with large cash stakes, supported by powerful earnings and cash flows, increased outlays for equipment and personnel. Meanwhile, in the consumer sector, low mortgage rates enabled homeowners to free up cash by refinancing their home loans.
The Federal Reserve Board (the “Fed”) increased short-term interest rates eight times during the period, bringing the benchmark federal funds rate from 1.25% at the beginning of the period to 3.25% as of July 31, 2005. These rate increases had only a modest impact on economic growth, however, as consistently low interest rates on long-term debt allowed businesses and individuals to continue borrowing at low cost.
Energy prices rose considerably during the year and finished the period at historically high levels. However, rising energy prices had only a modestly negative impact on economic growth, as low mortgage rates enabled consumers to offset rising costs by refinancing home loans, while improvements in energy efficiency at U.S. corporations reduced the business sector’s exposure to rising fuel costs.
The U.S. dollar began the period relatively weak against major foreign currencies. That weakness boosted the manufacturing sector of the economy by making U.S. exporters’ products more affordable for foreign consumers. The dollar strengthened during the first half of the period, reducing that competitive advantage, but declined again during early 2005.
Stocks Post Healthy Gains
The Standard & Poor’s 500 Index1 gained 14.04% during the 12-month period ended July 31, 2005. Strong corporate earnings gains helped to propel stock prices higher across most segments of the market with particularly strong gains concentrated in the energy, utilities, basic materials and homebuilding sectors.
| 1 | Standard & Poor’s 500 Index is an unmanaged index of 500 selected common stocks, most of which are listed on the New York Stock Exchange, and is a measure of the U.S. stock market as a whole. Investors cannot invest directly in an index, although they can invest in its underlying securities. |
Past performance does not guarantee future results. The performance data quoted represents past performance and current returns may be lower or higher. The investment return and principal value will fluctuate so that an investor’s shares, when redeemed, may be worth more or less than the original cost. To obtain performance information current to the most recent month end, please call 1-800-258-9232 or visit the Funds’ website at pacificcapitalfunds.com.
1
Letter to Shareholders (cont.)
Energy stocks led the market, as surging oil and gas prices led to powerful profit growth within the sector. Utilities stocks also performed well, particularly those with oil and gas properties and/or low cost generating capacity. Basic materials stocks benefited, as robust construction activity and demand from China and India supported high prices for products such as steel, copper and concrete. Meanwhile, continued strength in the residential real estate markets resulted in a banner year for the home builders.
Technology and healthcare were two weaker performing segments of the market. Although technology stocks rebounded near the end of the period, they struggled during much of the year due to concerns about inventories and the sustainability of corporate spending on information technology. Health-care stocks suffered due to troubles at some of the larger pharmaceutical companies, including product related litigation, weak new drug pipelines and patent expirations.
Smaller market capitalization stocks performed better than larger capitalization stocks during the year and those with a value orientation performed better than those with a growth orientation. This multi year pattern reflects superior earnings growth in the stronger segments of the market and investor preference for higher risk/higher return investments.
The Yield Curve Flattens
Yields on short-term bonds rose consistently in response to the Fed’s interest rate hikes. Long-term bond yields declined modestly, helping those bonds post solid returns.
The decline in long-term bond yields surprised most market observers, who expected economic growth and higher short-term rates to push long-term yields higher. However, strong demand for risk-free income, a benign inflationary environment and Treasury bond purchases by foreign central banks helped to push long-term yields down.
Corporate bonds generally outperformed government issues during the period. Corporations’ large cash positions, clean balance sheets and healthy earnings and cash flows encouraged fixed-income investors to move into corporate issues. Lower-quality bonds outperformed higher-quality bonds during much of the period, but that trend reversed itself in the spring.
Looking Forward
We expect the economy to continue to generate healthy growth during the coming months. Stocks currently look more attractive than fixed-income securities given the solid economy, corporations’ strong, high-quality earnings, modest stock valuations and relatively low bond yields.
We would like to take this opportunity to remind investors of the importance of constructing diversified portfolios that provide the proper balance of risk and reward for your goals. Pacific Capital Funds are designed to offer shareholders all the elements necessary to construct such portfolios, including funds that invest in a wide range of stocks and bonds.
Thank you for your confidence in Pacific Capital Funds. If you have any questions or would like a Fund prospectus, please contact your registered investment professional or call Pacific Capital Funds at (800) 258-9232 or visit our website at www.pacificcapitalfunds.com.
Sincerely,

Peter Ho
Vice Chairman
Asset Management Group of Bank of Hawaii
The foregoing information and opinions are for general information only. Bank of Hawaii Asset Management Group does not guarantee the accuracy or completeness, nor assume liability for any loss, which may result from the reliance by any person upon any such information or opinions. Such information and opinions are subject to change without notice, are for general information only and are not intended as an offer or solicitation with respect to the purchase or sale of any security or offering of individual or personalized investment advice.
NOTICE ABOUT DUPLICATE MAILINGS
In order to reduce expenses of the Pacific Capital Funds incurred in connection with the mailing of prospectuses, prospectus supplements, semi-annual reports and annual reports to multiple shareholders at the same address, Pacific Capital Funds may in the future deliver one copy of a prospectus, prospectus supplement, semi-annual report or annual report to a single investor sharing a street address or post office box with other investors, provided that all such investors have the same last name or are believed to be members of the same family. This process, called “householding,” will continue indefinitely unless you instruct us otherwise. If you share an address with another investor and wish to receive your own prospectus, prospectus supplements, semi-annual reports and annual reports, please call the Trust toll-free at (800) 258-9232.
2
Pacific Capital New Asia Growth Fund
Investment Style
Regional, multi-cap, growth.
Investment Objective
Long-term capital appreciation by investing in a broadly diversified portfolio of companies located in Asia’s developing regions, excluding Japan. Investments are not limited to any size or sector.
Investment Considerations
An investment in this Fund entails the special risks of international investing, including currency exchange fluctuation, government regulations, and the potential for political and economic instability. The Fund’s share price is expected to be more volatile than that of a U.S.-only fund. Equity securities (stocks) are more volatile and carry more risk than other forms of investments, such as investments in high-grade fixed income securities. The net asset value per share of this Fund will fluctuate as the value of the securities in the portfolio changes.
Investment Process
| • | | Follow active bottom-up investment approach |
| • | | Invest for absolute versus relative return |
| • | | Look outside benchmark representation for fresh opportunities |
| • | | Identify sensibly priced, high-quality companies that exhibit long-term growth potential |
Investment Management
Advised by Asset Management Group of Bank of Hawaii
Sub-Advised by First State (Hong Kong) LLC
| • | | Founded in 1988, with offices in Sydney, London, Edinburgh, Hong Kong, Singapore and Indonesia |
| • | | Specializes in single country, regional and sector specific investments |
| • | | Oversees almost $82 billion in assets |
How did the Fund perform compared to its benchmark?
For the 12-month period ended July 31, 2005, the Fund gained 36.68% (Class A Shares without sales charge), compared to its benchmark, the MSCI® AC Far East Free Index1 (excluding Japan), which returned 37.53%.
What were the major factors in the market that influenced the Fund’s performance?
Within Asia, all markets delivered positive returns with Korea being one of the strongest in the largest markets. Korea benefited from increased confidence in the domestic economic outlook. Indonesia, Hong Kong and Taiwan also featured on the upside. Malaysia underperformed due to its defensive characteristics, and Thailand disappointed due to a weaker than expected economic performance. Other developments in the region included both China and Malaysia announcing changes to their currency regimes by removing their pegs to the U.S. dollar. The Chinese renminbi and the Malaysian ringgit will now be linked to a basket of currencies.
Across the Asia Pacific region, the Health Care and Energy sectors delivered the strongest returns. Oil prices rallied above US$60 per barrel due to a series of supply disruptions and continued demand growth from China and the U.S. The Utilities sector underperformed the Index.
Stock selection in the Financials sector, particularly overweight positions in non-Index HDFC Bank (India) and Samsung Fire & Marine (Korea), aided Fund returns. The former continued to deliver solid results, while the latter benefited from signs of improving underwriting quality and a gradual recovery in Korean domestic consumption. Hong Kong Land and Swire Pacific (Hong Kong) were other notable performers from the Financials sector. Keppel Corp. (Singapore) a new holding in the Industrial sector of our portfolio also helped performance.†
Holding Samsung Electronics was positive in absolute terms, but being underweight the stock, which makes up 5% of the benchmark, hurt relative performance. Some concerns about corporate governance and our overall avoidance of highly cyclical businesses make it difficult to justify a benchmark weight in the stock. Having no exposure to Hyundai Motors (Korea: Consumer Discretionary) and PetroChina (Energy) also detracted from performance.†
What major changes have occurred in the portfolio during the period covered by the report?
We continue to be heavily overweight in the Consumer sectors where high quality businesses with steady growth are attractively valued.
What is your outlook for the Fund?
We believe the appetite for emerging market assets could surpass the high levels seen in January leaving room for a possible sharp decline in the prices of some stocks. Asian consumption growth could remain strong irrespective of what happens to U.S. demand. It is becoming increasingly difficult to identify value in many quality companies in the region and we continue to expect an extended period of market consolidation at around current levels.†
Past performance does not guarantee future results.
| 1 | The Morgan Stanley Capital International (MSCI) All Country (AC) Far East Free Index (excluding Japan) is generally representative of the 48 developed and emerging markets around the world that collectively comprise virtually all of the foreign equity stock markets. Investors cannot invest directly in an index, although they can invest in its underlying securities. |
| † | The composition of the Fund’s portfolio is subject to change. |
3
Pacific Capital New Asia Growth Fund (cont.)
Country Weightings as of July 31, 2005
(as a percentage of total investments)
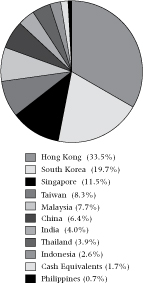
The composition of the Fund’s portfolio is subject to change.
Growth of a $10,000 Investment
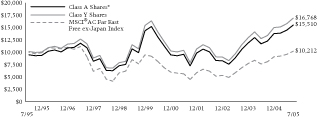
The chart above represents a comparison of a hypothetical $10,000 investment in the indicated share class versus a similar investment in the Fund’s benchmark. The chart above does not reflect the deduction of taxes that a shareholder would pay on Fund distributions or redemption of Fund shares.
Average Annual Total Returns as of July 31, 2005
| | | | | | | | | |
| | | 1 Year
| | | 5 Year
| | | 10 Year
| |
Class A Shares* | | 29.56 | % | | 3.64 | % | | 4.49 | % |
Class B Shares** | | 31.66 | % | | 3.91 | % | | 4.53 | % |
Class C Shares** | | 35.73 | % | | 4.09 | % | | 4.54 | % |
Class Y Shares | | 37.07 | % | | 5.02 | % | | 5.31 | % |
| * | Reflects 5.25% maximum front-end sales charge. |
| ** | Reflects maximum contingent deferred sales charge (CDSC) of up to 5.00% for the Class B Shares and a maximum CDSC of 1.00% for the Class C Shares (applicable only to redemptions within one year of purchase). |
The table above does not reflect the deduction of taxes that a shareholder would pay on Fund distributions or redemption of Fund shares.
Past performance does not guarantee future results. The performance data quoted represents past performance and current returns may be lower or higher. The investment return and principal value will fluctuate so that an investor’s shares, when redeemed, may be worth more or less than the original cost. To obtain performance information current to the most recent month end, please call 1-800-258-9232 or visit the Funds’ website at pacificcapitalfunds.com.
The Pacific Capital Funds are distributed by BISYS Fund Services. The Asset Management Group of Bank of Hawaii provides investment advisory services to the Fund and receives a fee for its services. First State (Hong Kong) LLC is sub-advisor to the Fund and is paid a fee for its services.
The Class B and Class C shares of the Fund commenced operations on March 2, 1998 and April 30, 2004, respectively. Performance information for Class C shares is based upon the performance of Class B shares from inception. Performance calculated for any period up to and through March 2, 1998 is based upon the performance of Class A shares, which does not reflect the higher 12b-1 fees. Had the higher 12b-1 fees been incorporated, total return figures may have been adversely affected.
The performance of the Pacific Capital New Asia Growth Fund is measured against the MSCI® AC Far East Free Index ex-Japan, which is unmanaged and is generally representative of the 48 developed and emerging markets around the world that collectively comprise virtually all of the foreign equity stock markets. The index does not reflect the deduction of fees associated with a mutual fund, such as investment management and fund accounting fees. The Fund’s performance reflects the deduction of fees for these services. Investors cannot invest directly in an index, although they can invest in its underlying securities.
4
Pacific Capital International Stock Fund
Investment Style
International, multi-cap, blend
Investment Objective
Long-term capital appreciation by investing in a broadly diversified portfolio of companies domiciled outside the United States. Investments are not limited to any particular country or market capitalization.
Investment Considerations
An investment in this Fund entails the special risks of international investing, including currency exchange fluctuation, government regulations, and the potential for political and economic instability. The Fund’s share price is expected to be more volatile than that of a U.S.-only fund. Equity securities (stocks) are more volatile and carry more risk than other forms of investments, such as investments in high-grade fixed income securities. The net asset value per share of this Fund will fluctuate as the value of the securities in the portfolio changes.
Investment Process
| • | | Style neutral growth and value discipline |
| • | | 50% managed by growth team—50% managed by value team |
| • | | Disciplined bottom-up stock selection |
| • | | Disciplined risk management framework to control industry and regional weightings |
Investment Management
Advised by Asset Management Group of Bank of Hawaii
Sub-Advised by Hansberger Global Investors, Inc.
| • | | Founded in 1994 by Thomas L. Hansberger, former President and CEO of Templeton Worldwide |
| • | | Headquartered in Ft. Lauderdale, Florida, with satellite offices in Hong Kong, Moscow and Toronto |
| • | | 19 investment professionals, 16 nationalities |
| • | | $6.4 billion in assets under management |
How did the Fund perform compared to its benchmark?
For the 12-month period ended July 31, 2005, the Fund underperformed its benchmark, the MSCI® ACWI ex US Index1. The Fund (Class A shares without sales charge) was up 21.17% while the MSCI® ACWI ex US Index1 was up 24.90%.
What were the major factors in the market that influenced the Fund’s performance?
The largest factors influencing the Fund’s performance relative to the benchmark were:
The Fund’s average 3.2% cash level had a negative effect on relative return during this period of strong performance.†
The underweighting of 1.7% in the Australian sector, and disappointing results of the Fund’s Australian securities lowered the Fund’s relative return. The Fund’s Australian securities were up 22.1% while the MSCI Australia Index was up 42.2%. Underexposure to the Australian dollar also hurt as that currency strengthened over the past year.†
The Fund had a 1.3% overweighting in the Emerging Markets. The Fund’s Emerging Markets stocks were up 55.3% while the benchmark was up 47.0%. Overweightings to Brazil and Korea were helpful as those currencies strengthened over the year.†
What major changes have occurred in the portfolio during the period covered by the report?
The Fund’s commitment to Europe excluding the United Kingdom increased, with 41.9% of its assets in the Europe ex United Kingdom sector for the period ended July 31, 2005. The Fund’s relative weighting in the Emerging Markets declined by 1.7%, which was about even with the MSCI Index weight in that region. Other large regional weighting differences are an underweighting of 3.1% to Canada and an underweighting of 3.1% to the United Kingdom.†
Financial stocks are the Fund’s largest commitment. The Fund increased the weighting in this sector by 1.9% relative to the benchmark weighting. The Fund’s largest relative weightings were Information Technology, overweighted by 3.3%, Health Care, overweighted by 2.7%, Materials, underweighted by 2.7%, and Energy underweighted by 2.6%.†
What is your outlook for the Fund
Our analysts feel that the combination of commodity price inflation, high oil prices, rising U.S. interest rates, and difficult consumer conditions in the United Kingdom, Japan, Germany, and France could provide a good relative environment for companies that have demonstrated their ability to create their own opportunities for growth in difficult market conditions. We believe that the Fund is structured to excel in that type of environment. Large, well-diversified companies with wide geographic reach and strong market share could be able to provide a better foundation for above average performance over the remainder of 2005. The valuations for these types of companies also remain very attractive versus history and current bond yields in our opinion.†
Past performance does not guarantee future results.
| 1 | The Morgan Stanley Capital International (MSCI) All Country World (ACWI) ex US is a free float-adjusted market capitalization index that is designed to measure equity market performance in the global developed and emerging markets outside the U.S. Investors cannot invest directly in an index, although they can invest in its underlying securities. |
| † | The composition of the Fund’s portfolio is subject to change. |
5
Pacific Capital International Stock Fund (cont.)
Country Weightings as of July 31, 2005
(as a percentage of total investments)
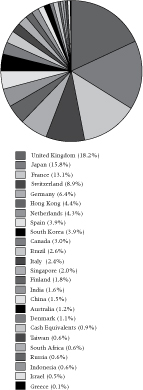
The composition of the Fund’s portfolio is subject to change.
Growth of a $10,000 Investment
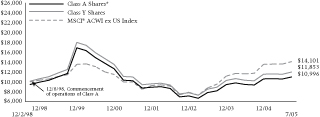
The chart above represents a comparison of a hypothetical $10,000 investment in the indicated share class versus a similar investment in the Fund’s benchmark. The chart above does not reflect the deduction of taxes that a shareholder would pay on Fund distributions or redemption of Fund shares.
Average Annual Total Returns as of July 31, 2005
| | | | | | | | | |
| | | 1 Year
| | | 5 Year
| | | Since
Inception
(12/2/98)
| |
Class A Shares* | | 14.82 | % | | -6.06 | % | | 1.43 | % |
Class B Shares** | | 16.43 | % | | -5.78 | % | | 1.59 | % |
Class C Shares** | | 20.30 | % | | -5.65 | % | | 1.57 | % |
Class Y Shares | | 21.61 | % | | -4.68 | % | | 2.58 | % |
| * | Reflects 5.25% maximum front-end sales charge. |
| ** | Reflects maximum contingent deferred sales charge (CDSC) of up to 5.00% for the Class B Shares and a maximum CDSC of 1.00% for the Class C Shares (applicable only to redemptions within one year of purchase). |
The table above does not reflect the deduction of taxes that a shareholder would pay on Fund distributions or redemption of Fund shares.
Past performance does not guarantee future results. The performance data quoted represents past performance and current returns may be lower or higher. The investment return and principal value will fluctuate so that an investor’s shares, when redeemed, may be worth more or less than the original cost. To obtain performance information current to the most recent month end, please call 1-800-258-9232 or visit the Funds’ website at pacificcapitalfunds.com.
The Pacific Capital Funds are distributed by BISYS Fund Services. The Asset Management Group of Bank of Hawaii provides investment advisory services to the Fund and receives a fee for its services. Hansberger Global Investors, Inc. is sub-advisor to the Fund and is paid a fee for its services.
The Pacific Capital International Stock Fund’s inception date was December 2, 1998. Class A Shares were not in existence prior to December 8, 1998. Performance calculated for any period up to and through December 8, 1998, is based upon the performance of Class Y Shares, which does not reflect the higher 12b-1 fees. Had the higher 12b-1 fees been incorporated, total return figures may have been adversely affected.
Class B and Class C shares were not in existence prior to December 20, 1998 and April 30, 2004, respectively. Performance information for Class C shares is based upon the performance of Class B shares from inception. Performance calculated for any period up to and through such inception dates is based upon the performance of Class Y shares, which does not reflect the higher 12b-1 fees. Had the higher 12b-1 fees been incorporated, total return figures may have been adversely affected.
The performance of the Pacific Capital International Stock Fund is measured against the MSCI® ACWI ex US Index, which is designed to measure equity market performance in the global developed and emerging markets outside the U.S. The index is unmanaged and does not reflect the deduction of fees associated with a mutual fund, such as investment management and fund accounting fees. The Fund’s performance reflects the deduction of fees for these services. Investors cannot invest directly in an index, although they can invest in its underlying securities.
6
Pacific Capital Small Cap Fund
Investment Style
Domestic, small-cap, value
Investment Objective
Long-term capital appreciation by investing in a diversified portfolio of small-capitalization companies —with a current average market cap of $16 million to $2.7 billion—believed to be undervalued, fundamentally strong and undergoing positive change.
Investment Considerations
Small-capitalization stocks typically carry additional risk, since smaller companies generally have a higher risk of failure and their stocks have experienced a greater degree of volatility. Equity securities (stocks) are more volatile and carry more risk than other forms of investments, such as investments in high-grade fixed income securities. The net asset value per share of this Fund will fluctuate as the value of the securities in the portfolio changes.
Investment Process
| • | | Follow active bottom-up investment approach |
| • | | Assess attractive valuations through price-to-book, price-to-earnings and dividend yield ratios |
| • | | Identify potential improvement based on free cash flow, balance sheet liquidity, inventory sales ratio, insider buying and management change |
Investment Management
Advised by Asset Management Group of Bank of Hawaii
Sub-Advised by Nicholas Applegate Capital Management
| • | | Founded in 1984, NACM employs 58 investment professionals |
| • | | Specializes in global and international equity, domestic equity and special strategy management |
| • | | $14.8 billion in assets under management |
How did the Fund perform compared to its benchmark?
For the 12-month period ended July 31, 2005, the Fund returned 27.98% (Class A Shares without sales charge), outperforming the Russell 2000® Value Index1 return of 26.72%.
For the same period, the Fund ranked in the 18th percentile among 594 funds in the Lipper Small-Cap Core Funds universe.2
What were the major factors in the market that influenced the Fund’s performance?
The Fund’s outperformance relative to the benchmark was largely a result of strong stock selection in the Information Technology, Utilities, and Consumer Discretionary sectors.†
The Fund posted positive stock selection in seven of the 10 sectors of the Russell Index. That outperformance occurred in an environment in which the U.S. equity markets delivered strong returns. Small cap stocks outpaced large cap stocks during the 12 months ended July 31, 2005, a trend, which has persisted since 1999. The Dow Jones Industrial Average3 gained 4.94% and the NASDAQ Composite Index4 was up 16.49% for the one-year period, while the cyclically heavy Russell Index gained 26.7%.
The broad-based economic recovery that began in the second half of 2003 continued through the first half of 2005. Corporate profits remained healthy, but concerns that record-high oil prices and rising short-term rates would dampen economic and corporate profit growth weighed on investor sentiment. The Fed increased the fed funds target rate beginning in June 2004, and has tightened 2.25% in nine 0.25% increments in its effort to preempt inflation.
Our private placement Real Estate Investment Trust investments contributed nicely to the portfolio. KKR Financial and Diamond Rock Hospitality both priced initial public offerings in 2005 and Ventas acquired Provident Senior Living Trust at a premium.†
Within Information Technology for the period, Comtech Telecommunications Corp. rose 165%, ROFIN-SINAR Technologies gained over 69%, and MTS Systems also contributed to the portfolio, returning 85.3%.†
In Utilities, stock selection was strong relative to the benchmark. The UGI Corp. rose 86.4%, Aquila Inc., rose 48%, and Energen Corp. rose 50.2%, each positively impacting performance during the period.†
The Consumer Discretionary sector added value compared to the benchmark. Hibbett Sporting Goods, Inc. gained over 74% and the Neiman-Marcus Group, Inc. rose 82%, for the period.†
Stock selection in the Financials sector and our underweight in the Energy sector detracted from relative performance.†
Past performance does not guarantee future results.
| 1 | The Russell 2000® Value Index (“Russell Index”) is an unmanaged index which measures the performance of those Russell 2000 companies with lower price-to-book ratios and lower forecasted growth values. Investors cannot invest directly in an index, although they can invest in its underlying securities. |
| 2 | The Lipper Small-Cap Core Funds universe is comprised of mutual of funds that, by portfolio practice, invest at least 75% of their equity assets in companies with market capitalizations (on a three-year weighted basis) less than 250% of the dollar-weighted median of the smallest 500 of the middle 1,000 securities of the S&P SuperComposite 1500 Index. Small-cap core funds have more latitude in the companies in which they invest. These funds typically have an average price-to-earnings ratio, price-to-book ratio, and three-year sales-per-share growth value, compared to the S&P SmallCap 600 Index. For the one-, three- and five-year periods ended July 31, 2005 the Pacific Capital Small Cap Fund ranked 105, 40 and 5 out of 594, 475 and 334 funds in the Lipper Small-Cap Core Funds category, respectively. The Lipper Rankings are based on total returns and do not reflect a sales charge. Funds with multiple share classes have a common portfolio. |
| † | The composition of the Fund’s portfolio is subject to change. |
7
Pacific Capital Small Cap Fund (cont.)
In Financials, Quanta Capital Holdings Ltd. declined 33% over the period. Knight Capital Group, Inc. (formerly Knight Trading) declined 10.7%.†
What major changes have occurred in the portfolio during the period covered by the report?
The Fund’s holdings remain diversified across sectors and industries. Because of the Russell reconstitution on June 30, we are less underweight in Energy and Utilities, less overweight in Technology and more overweight in Producers/ Manufacturers. We are underweight in the banking sector due to a lack of liquidity.
What is your outlook for the Fund?
We believe the outlook for U.S. equities remains mixed. Slowing corporate earnings growth and a spate of new layoff announcements create a headwind for the U.S. economy. Overall, however, corporate balance sheets are in good shape and could provide companies with flexibility to better withstand any economic weakness. Nicholas-Applegate believes that it will be able to successfully invest in companies that can take advantage of the current environment.†
| 3 | The Dow Jones Industrial Average is a price-weighted average based on the price-only performance of 30 blue chip stocks (the average is computed by adding the prices of the 30 stocks and dividing by a denominator, which has been adjusted over the years for stocks splits, stock dividends and substitutions of stocks). |
| 4 | The NASDAQ Composite Index is a market price only index that tracks the performance of U.S. domestic common stocks traded on the regular Nasdaq market as well as National Market System traded foreign common stocks and American Depository Receipts. |
Investors cannot invest directly in an index, although they can invest in its underlying securities.
| † | The composition of the Fund’s portfolio is subject to change. |
8
Pacific Capital Small Cap Fund (cont.)
Sector Weightings as of July 31, 2005
(as a percentage of total investments)
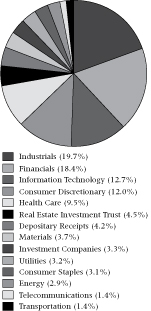
The composition of the Fund’s portfolio is subject to change.
Growth of a $10,000 Investment
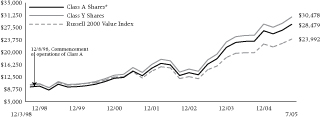
The chart above represents a comparison of a hypothetical $10,000 investment in the indicated share class versus a similar investment in the Fund’s benchmark. The chart above does not reflect the deduction of taxes that a shareholder would pay on Fund distributions or redemption of Fund shares.
Average Annual Total Returns as of July 31, 2005
| | | | | | | | | |
| | | 1 Year
| | | 5 Year
| | | Since
Inception
(12/3/98)
| |
Class A Shares* | | 21.23 | % | | 21.33 | % | | 17.01 | % |
Class B Shares** | | 23.02 | % | | 21.59 | % | | 17.06 | % |
Class C Shares** | | 27.00 | % | | 21.70 | % | | 17.06 | % |
Class Y Shares | | 28.30 | % | | 22.90 | % | | 18.21 | % |
| * | Reflects 5.25% maximum front-end sales charge. |
| ** | Reflects maximum contingent deferred sales charge (CDSC) of up to 5.00% for the Class B Shares and a maximum CDSC of 1.00% for the Class C Shares (applicable only to redemptions within one year of purchase). |
The table above does not reflect the deduction of taxes that a shareholder would pay on Fund distributions or redemption of Fund shares.
Past performance does not guarantee future results. The performance data quoted represents past performance and current returns may be lower or higher. The investment return and principal value will fluctuate so that an investor’s shares, when redeemed, may be worth more or less than the original cost. To obtain performance information current to the most recent month end, please call 1-800-258-9232 or visit the Funds’ website at pacificcapitalfunds.com.
The Pacific Capital Funds are distributed by BISYS Fund Services. The Asset Management Group of Bank of Hawaii provides investment advisory services to the Fund and receives a fee for its services. Nicholas-Applegate Capital Management is sub-advisor to the Fund and is paid a fee for its services.
The Pacific Capital Small Cap Fund’s inception date was December 3, 1998. Class A, Class B and Class C shares were not in existence prior to December 8, 1998, December 20, 1998 and April 30, 2004, respectively. Performance information for Class C shares is based upon the performance of Class B shares from inception. Performance calculated for any period up to and through such inception dates is based upon the performance of Class Y shares, which does not reflect the higher 12b-1 fees. Had the higher 12b-1 fees been incorporated, total return figures may have been adversely affected.
The performance of the Pacific Capital Small Cap Fund is measured against the Russell 2000® Value Index, is an unmanaged index which measures the performance of those Russell 2000 companies with lower price-to-book ratios and lower forecasted growth values. The index does not reflect the deduction of fees associated with a mutual fund, such as investment management and fund accounting fees. The Fund’s performance reflects the deduction of fees for these services. Investors cannot invest directly in an index, although they can invest in its underlying securities.
9
Pacific Capital Mid-Cap Fund
Investment Style
Domestic, mid-cap, blend
Investment Objective
Long-term capital appreciation by investing in a diversified portfolio of mid-capitalization companies–currently average market cap of $410 million to $11.3 billion–that are reasonably priced, fundamentally strong and exhibit better growth expectations relative to peers.
Investment Considerations
Mid-capitalization stocks typically carry additional risk, since smaller companies generally have a higher risk of failure and have experienced a greater degree of volatility. Equity securities (stocks) are more volatile and carry more risk than other forms of investments, such as investments in high-grade fixed income securities. The net asset value per share of this Fund will fluctuate as the value of the securities in the portfolio changes.
Investment Process
| • | | Quantitative research analysis with fundamental research overlay |
| • | | Quantitative analysts use proprietary screen to evaluate expectations, valuation and quality of 3,000 stocks |
| • | | Fundamental analysts identify factors not included in the screen to determine most attractive stocks |
| • | | Portfolio construction emphasizes stock selection and seeks to neutralize risk elements that are not consistently rewarded |
Investment Management
Advised by Asset Management Group of Bank of Hawaii
Sub-Advised by Bankoh Investment Partners, LLC (BIP), a joint venture between Bank of Hawaii and Chicago Equity Partners (CEP)
| • | | Founded in 1989, CEP specializes in core domestic equity markets |
| • | | CEP investment management team averages 17 years experience |
| • | | CEP currently oversees $8.6 billion in assets |
How did the Fund perform compared to its benchmark?
For the 12-month period ended July 31, 2005, the Fund underperformed its benchmark, the S&P 400 MidCap Index1. The Fund produced a total return of 23.69% (Class A Shares without sales charge) compared to the Index which was up 25.89% for the same period.
What were the major factors in the market that influenced the Fund’s performance?
The equity markets returned to positive territory during the quarter even with powerful headwinds—runaway oil prices, bad trade numbers, the downgrading of GM’s credit ratings, and mostly uninspiring job gains. These factors were countered by the strength of corporate profits, the rise of the U.S. dollar and the decline of long term interest rates.
For the period, momentum factors had positive returns, while value and quality factors were not as strong in the last quarter as they have been in the last twelve months. Over the last 12 months, we have seen positive returns from all three factors (Value, Quality, Momentum), but we have not seen as much discrimination between stocks that have strength in all three factor groups and those that do not. We construct the portfolio with companies that have the broadest exposure to these groups. Because we have not seen the discrimination over the last few months, it has been difficult to produce the expected performance.†
What major changes have occurred in the portfolio during the period covered by the report?
No major changes have occurred in the portfolio other than the typical re-balancing.
What is your outlook for the Fund?
We expect our model to add value and assist in our portfolio construction process as investors focus on companies that exhibit favorable long term fundamentals. As the economy and earnings growth wains, we believe there will be a divergence between companies’ fundamentals and related returns. After mid-cycle slowdowns, the market tends to reward those companies which are more suited to endure a range of market conditions. These are companies that exhibit stronger longer term fundamentals, such as favorable valuations, increasing earnings outlooks and stronger balance sheets. Our model focuses on these factors and we tend to buy companies that have positive exposure to all of these factor groups.†
Past performance does not guarantee future results.
| 1 | The S&P 400 MidCap Index is a market capitalization-weighted index of 400 medium capitalization stocks. Investors cannot invest directly in an index, although they can invest in its underlying securities. |
| † | The composition of the Fund’s portfolio is subject to change. |
10
Pacific Capital Mid-Cap Fund (cont.)
Sector Weightings as of July 31, 2005
(as a percentage of total investments)
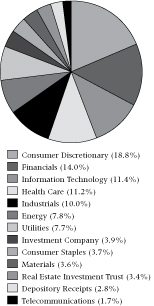
The composition of the Fund’s portfolio is subject to change.
Growth of a $10,000 Investment
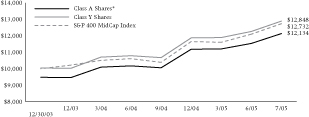
The chart above represents a comparison of a hypothetical $10,000 investment in the indicated share class versus a similar investment in the Fund’s benchmark. The chart above does not reflect the deduction of taxes that a shareholder would pay on Fund distributions or redemption of Fund shares.
Average Annual Total Returns as of July 31, 2005
| | | | | | |
| | | 1 Year
| | | Since
Inception
(12/30/03)
| |
Class A Shares* | | 17.22 | % | | 12.97 | % |
Class C Shares** | | 22.87 | % | | 16.23 | % |
Class Y Shares | | 23.92 | % | | 17.12 | % |
| * | Reflects 5.25% maximum front-end sales charge. |
| ** | Reflects maximum contingent deferred sales charge (CDSC) of up to 1.00% (applicable only to redemptions within one year of purchase). |
The table above does not reflect the deduction of taxes that a shareholder would pay on Fund distributions or redemption of Fund shares.
Past performance does not guarantee future results. The performance data quoted represents past performance and current returns may be lower or higher. The investment return and principal value will fluctuate so that an investor’s shares, when redeemed, may be worth more or less than the original cost. To obtain performance information current to the most recent month end, please call 1-800-258-9232 or visit the Funds’ website at pacificcapitalfunds.com.
The Pacific Capital Funds are distributed by BISYS Fund Services. The Asset Management Group of Bank of Hawaii provides investment advisory services to the Fund and receives a fee for its services. Bankoh Investment Partners, LLC is sub-advisor to the Fund and is paid a fee for its services.
The Pacific Capital Mid-Cap Fund’s inception date was December 30, 2003. The Class C shares were not in existence prior to April 30, 2004. Performance calculated for any period up to and through April 30, 2004, is based upon the performance of Class A shares, which does not reflect the higher 12b-1 fees. Had the higher 12b-1 fees been incorporated, total return figures may have been adversely affected.
The performance of the Pacific Capital Mid-Cap Fund is measured against the S&P 400 MidCap Index, an unmanaged market capitalization-weighted index of 400 medium capitalization stocks. The index does not reflect the deduction of fees associated with a mutual fund, such as investment management and fund accounting fees. The Fund’s performance reflects the deduction of fees for these services. Investors cannot invest directly in an index, although they can invest in its underlying securities.
11
Pacific Capital Growth Stock Fund
Investment Style
Domestic, large-cap, growth
Investment Objective
Long-term capital appreciation with a secondary emphasis on dividend income, by investing in a diversified portfolio of large-capitalization companies – currently greater than $1 billion – whose earnings are expected to grow faster than the average for the U.S. market.
Investment Considerations
Equity securities (stocks) are more volatile and carry more risk than other forms of investments, such as investments in high-grade fixed income securities. The net asset value per share of this Fund will fluctuate as the value of the securities in the portfolio changes.
Investment Process
| • | | Top-down macroeconomic analysis of sector trends |
| • | | Bottom-up fundamental research to identify attractive stocks |
| • | | Rigorous quantitative risk analysis |
Investment Management
Advised by Asset Management Group of Bank of Hawaii (AMG)
| • | | Founded in 1898, AMG represents the largest, most experienced staff of investment professionals in Hawaii |
| • | | $6.4 billion in assets under management |
How did the Fund perform compared to its benchmark?
For the 12-month period ended July 31, 2005, the Fund (Class A Shares without sales charge) gained 10.29%. The Fund’s benchmark, the Russell 1000® Growth Index1, gained 13.04% during this same period.
What were the major factors in the market that influenced the Fund’s performance?
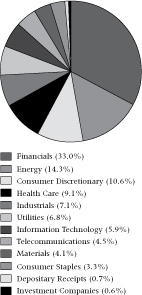
The stock market advanced sharply during the 12 months ended July 31, 2005, reflecting continued expansion of the economy and solid corporate earnings gains. Smaller market capitalization securities were particularly strong as investors showed a preference for riskier issues. In addition, value stocks continued to outperform growth stocks during the period. Leading sectors included Energy, Utilities, and Consumer Discretionary. Lagging sectors included Financials, Consumer Staples, and Industrials.
The Fund’s underperformance relative to its Russell benchmark was primarily due to the conservative nature of the Fund’s holdings that left it under exposed to some of the more aggressive and mostly smaller segments of the growth stock universe. Sector selection had a relatively minor negative impact on the Fund’s performance as the benefit from an overweight in the Consumer Discretionary sector was offset by unfavorable weightings in most of the other sectors.†
The Fund’s difficult comparisons against its benchmark emerged most noticeably in the fiscal second and fourth quarters in which the stock market underwent a rally which propelled smaller, more volatile stocks sharply higher.
What major changes have occurred in the portfolio during the period covered by the report?
The structure of the portfolio was not changed significantly during the fiscal year although numerous trades were completed to maintain the Fund’s exposure and to comply with its individual security sell discipline. The Fund continues to emphasize securities that possess favorable momentum, value and quality characteristics.†
What is your outlook for the Fund?
The stock market appears to be in the process of regaining its upward momentum after stumbling earlier in the year on worries about high oil prices and its impact on economic growth. The outlook for corporate earnings and domestic economic growth is improving and stock prices are responding positively. Technology stocks, laggards earlier in the year, have sprung back to life and are showing renewed strength, particularly semiconductor stocks. Economically sensitive stocks in the Materials and Industrial sectors are also showing renewed strength after selling off sharply earlier in the year. Therefore, in recent weeks we have taken steps to position the portfolio somewhat more aggressively with a focus on stocks offering the potential to rebound as economic and earnings worries ease. Such purchases include Nucor, Phelps Dodge, Micrel, International Rectifier, Polaris Industries and Grainger.†
Past performance does not guarantee future results.
| 1 | The Russell 1000® Growth Index measures the performance of 1,000 securities found in the Russell universe with higher price-to-book ratios and higher forecasted growth values. Investors cannot invest directly in an index, although they can invest in the underlying securities. |
| † | The composition of the Fund’s portfolio is subject to change. |
12
Pacific Capital Growth Stock Fund (cont.)
Sector Weightings as of July 31, 2005
(as a percentage of total investments)
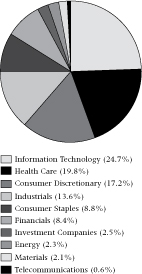
The composition of the Fund’s portfolio is subject to change.
Growth of a $10,000 Investment
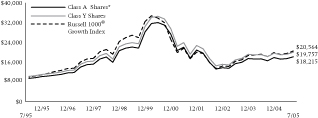
The chart above represents a comparison of a hypothetical $10,000 investment in the indicated share class versus a similar investment in the Fund’s benchmark. The chart above does not reflect the deduction of taxes that a shareholder would pay on Fund distributions or redemption of Fund shares.
Average Annual Total Returns as of July 31, 2005
| | | | | | | | | |
| | | 1 Year
| | | 5 Year
| | | 10 Year
| |
Class A Shares* | | 4.45 | % | | -10.91 | % | | 6.18 | % |
Class B Shares** | | 5.56 | % | | -10.71 | % | | 6.20 | % |
Class C Shares** | | 9.59 | % | | -10.57 | % | | 6.21 | % |
Class Y Shares | | 10.50 | % | | -9.69 | % | | 7.05 | % |
| * | Reflects 5.25% maximum front-end sales charge. |
| ** | Reflects maximum contingent deferred sales charge (CDSC) of up to 5.00% for the Class B Shares and a maximum CDSC of 1.00% for the Class C Shares (applicable only to redemptions within one year of purchase). |
The table above does not reflect the deduction of taxes that a shareholder would pay on Fund distributions or redemption of Fund shares.
Past performance does not guarantee future results. The performance data quoted represents past performance and current returns may be lower or higher. The investment return and principal value will fluctuate so that an investor’s shares, when redeemed, may be worth more or less than the original cost. To obtain performance information current to the most recent month end, please call 1-800-258-9232 or visit the Funds’ website at pacificcapitalfunds.com.
The Pacific Capital Funds are distributed by BISYS Fund Services. The Asset Management Group of Bank of Hawaii provides investment advisory services to the Fund and receives a fee for its services.
Class B and Class C shares of the Fund commenced operations on March 2, 1998 and April 30, 2004, respectively. Performance information for Class C shares is based upon the performance of Class B shares from inception. Performance calculated for any period up to and through March 2, 1998 is based upon the performance of Class A shares, which does not reflect the higher 12b-1 fees. Had the higher 12b-1 fees been incorporated, total return figures may have been adversely affected.
The performance of the Pacific Capital Growth Stock Fund is measured against the Russell 1000® Growth Index which measures the performance of 1,000 securities found in the Russell universe with higher price-to-book ratios and higher forecasted growth values. The index does not reflect the deduction of fees associated with a mutual fund, such as investment management and fund accounting fees. The Fund’s performance reflects the deduction of fees for these services. Investors cannot invest directly in an index, although they can invest in the underlying securities.
13
Pacific Capital Growth and Income Fund
Investment Style
Domestic, large-cap, blend
Investment Objective
Long-term capital appreciation with a secondary emphasis on dividend income, by investing in a diversified portfolio of large-capitalization dividend-paying companies – currently greater than $1 billion – whose earnings are expected to grow at above-average rates in relation to industry peers.
Investment Considerations
Equity securities (stocks) are more volatile and carry more risk than other forms of investments, such as investments in high-grade fixed income securities. The net asset value per share of this Fund will fluctuate as the value of the securities in the portfolio changes.
Investment Process
| • | | Top-down macroeconomic analysis of sector trends |
| • | | Bottom-up fundamental research to identify attractive stocks |
| • | | Rigorous quantitative risk analysis |
Investment Management
Advised by Asset Management Group of Bank of Hawaii (AMG)
| • | | Founded in 1898, AMG represents the largest, most experienced staff of investment professionals in Hawaii |
| • | | $6.4 billion in assets under management |
How did the Fund perform compared to its benchmark?
For the 12-month period ended July 31, 2005, the Fund (Class A Shares without sales charge) gained 14.83%. The Fund’s benchmark, the S&P 5001, gained 14.04% during this same period.
For the same period, the Fund ranked in the 27th percentile among 882 funds in the Lipper Large-Cap Core universe2.
What were the major factors in the market that influenced the Fund’s performance?
The stock market advanced sharply during the 12 months ended July 31, 2005, reflecting continued expansion of the economy and solid corporate earnings gains. Smaller market capitalization securities were particularly strong as investors showed a preference for riskier issues. In addition, value stocks continued to outperform growth stocks during the period. Leading sectors included Energy, Utilities, and Consumer Discretionary. Lagging sectors included Financials, Consumer Staples, and Industrials.
During the fiscal year, the Fund’s performance outpaced its S&P 500 benchmark primarily due to successful security selection, particularly in the Consumer Cyclical and Technology sectors. Standout performers included the Fund’s holdings in Autodesk, Amphenol Corp., Coach and American Eagle Outfitters. To a lesser extent, sector selection helped the Fund, particularly with over-weighted positions in the Consumer Discretionary and Basic Materials sectors.†
The performance of the Fund compared favorably against its peer group because of its positive relative performance against the S&P 500 and its true core positioning. A fair number of funds within the peer group have a large growth orientation which caused them to substantially under perform the S&P 500.†
What major changes have occurred in the portfolio during the period covered by the report?
The structure of the portfolio was not changed significantly during the fiscal year although numerous trades were completed to maintain the Fund’s exposure and to comply with its individual security sell discipline. The Fund continues to emphasize securities that possess favorable momentum, value and quality characteristics.†
What is your outlook for the Fund?
The stock market appears to be in the process of regaining its upward momentum after stumbling earlier in the year on worries about high oil prices and their impact on economic growth. The outlook for corporate earnings and domestic economic growth is improving and stock prices are responding positively. Technology stocks, laggards earlier in the year, have sprung back to life and are showing renewed strength, particularly semiconductor stocks. Economically sensitive stocks in the Materials and Industrial sectors are also showing renewed strength after selling off sharply earlier in the year. Therefore, in recent weeks we have taken steps to position the portfolio somewhat more aggressively with a focus on stocks offering the potential to rebound as economic and earnings worries ease. Such purchases include Nucor, Phelps Dodge, Sandisk, Polaris Industries and Williams Companies.†
Past performance does not guarantee future results.
| 1 | The Standard & Poor’s 500 Stock Index (“S&P 500”) is a capitalization weighted index that measures the performance of 500 large-capitalization stocks representing all major industries. It is not possible to invest directly in any index. |
| 2 | The Lipper Large-Cap Core universe is comprised of mutual funds that, by portfolio practice, invest at least 75% of their equity assets in companies with market capitalizations (on a three-year weighted basis) greater than 300% of the dollar-weighted median market capitalization of the middle 1,000 securities of the S&P SuperComposite 1500 Index. Large-cap core funds have more latitude in the companies in which they invest. These funds typically have an average price-to-earnings ratio, price-to-book ratio, and three-year sales-per-share growth value, compared to the S&P 500 Index. For the one-, five- and ten-year periods ended July 31, 2005 the Pacific Capital Growth and Income Fund ranked 234, 519 and 13 out of 882, 606 and 221 funds in the Lipper Large-Cap Core Funds category, respectively. The Lipper Rankings are based on total returns and do not reflect a sales charge. Funds with multiple share classes have a common portfolio. |
| † | The composition of the Fund’s portfolio is subject to change. |
14
Pacific Capital Growth and Income Fund (cont.)
Sector Weightings as of July 31, 2005
(as a percentage of total investments)
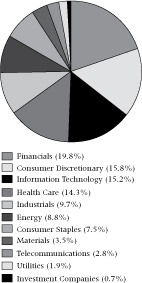
The composition of the Fund’s portfolio is subject to change.
Growth of a $10,000 Investment
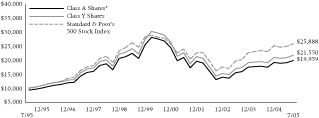
The chart above represents a comparison of a hypothetical $10,000 investment in the indicated share class versus a similar investment in the Fund’s benchmark. The chart above does not reflect the deduction of taxes that a shareholder would pay on Fund distributions or redemption of Fund shares.
Average Annual Total Returns as of July 31, 2005
| | | | | | | | | |
| | | 1 Year
| | | 5 Year
| | | 10 Year
| |
Class A Shares* | | 8.76 | % | | -7.09 | % | | 7.16 | % |
Class B Shares** | | 9.93 | % | | -6.95 | % | | 7.12 | % |
Class C Shares** | | 14.00 | % | | -6.78 | % | | 7.13 | % |
Class Y Shares | | 15.12 | % | | -5.85 | % | | 7.98 | % |
| * | Reflects 5.25% maximum front-end sales charge. |
| ** | Reflects maximum contingent deferred sales charge (CDSC) of up to 5.00% for the Class B Shares and a maximum CDSC of 1.00% for the Class C Shares (applicable only to redemptions within one year of purchase). |
The table above does not reflect the deduction of taxes that a shareholder would pay on Fund distributions or redemption of Fund shares.
Past performance does not guarantee future results. The performance data quoted represents past performance and current returns may be lower or higher. The investment return and principal value will fluctuate so that an investor’s shares, when redeemed, may be worth more or less than the original cost. To obtain performance information current to the most recent month end, please call 1-800-258-9232 or visit the Funds’ website at pacificcapitalfunds.com.
The Pacific Capital Funds are distributed by BISYS Fund Services. The Asset Management Group of Bank of Hawaii provides investment advisory services to the Fund and receives a fee for its services.
The Class B and Class C shares of the Fund commenced operations on March 2, 1998 and April 30, 2004, respectively. Performance information for Class C shares is based upon the performance of Class B shares from inception. Performance calculated for any period up to and through March 2, 1998 is based upon the performance of Class A shares, which does not reflect the higher 12b-1 fees. Had the higher 12b-1 fees been incorporated, total return figures may have been adversely affected.
The performance of the Pacific Capital Growth and Income Fund is measured against the Standard & Poor’s 500 Stock Index, an unmanaged index generally representative of the broad domestic stock universe. The index does not reflect the deduction of fees associated with a mutual fund, such as investment management and fund accounting fees. The Fund’s performance reflects the deduction of fees for these services. Investors cannot invest directly in an index, although they can invest in its underlying securities.
15
Pacific Capital Value Fund
Investment Style
Domestic, large-cap, value
Investment Objective
Long-term capital appreciation with a secondary emphasis on dividend income, by investing in a diversified portfolio of large-capitalization companies – currently greater than $1 billion – believed to be undervalued, fundamentally strong and undergoing positive change.
Investment Considerations
Value-based investments are subject to the risk that the broad market may not recognize their intrinsic value. Equity securities (stocks) are more volatile and carry more risk than other forms of investments, such as investments in high-grade fixed income securities. The net asset value per share of this Fund will fluctuate as the value of the securities in the portfolio changes.
Investment Process
| • | | Top-down macroeconomic analysis of sector trends |
| • | | Bottom-up fundamental research to identify attractive stocks |
| • | | Rigorous quantitative risk analysis |
Investment Management
Advised by Asset Management Group of Bank of Hawaii (AMG)
| • | | Founded in 1898, AMG represents the largest, most experienced staff of investment professionals in Hawaii |
| • | | $6.4 billion in assets under management |
How did the Fund perform compared to its benchmark?
For the 12-month period ended July 31, 2005, the Fund (Class A Shares without sales charge) rose 18.75%. The Fund’s benchmark, the Russell 1000® Value Index1, rose 19.04% during this same period.
The Fund was ranked in the 14th percentile among 442 funds within the Lipper Large Cap Value universe2.
What were the major factors in the market that influenced the Fund’s performance?
The stock market advanced sharply during the 12 months ended July 31, 2005, reflecting continued expansion of the economy and solid corporate earnings gains. Smaller market capitalization securities were particularly strong as investors showed a preference for more volatile issues. In addition, value stocks continued to outperform growth stocks during the period. Leading sectors included Energy, Utilities, and Consumer Discretionary. Lagging sectors included Financials, Consumer Staples, and Industrials.†
For the period ended July 31, 2005 the Fund underperformed its benchmark index, the Russell 1000® Value Index because of Fund expenses which are not included in the index return. Securities negatively impacting performance included Advanced Micro Devices, Rent-A-Center and Smithfield Foods, while stocks such as United Defense Industries, Hibernia and CVS had a positive impact.†
The performance of the Fund compared favorably against its peer group because of its true to style positioning within the value space in a year during which value oriented stocks substantially outperformed growth oriented stocks. A fair number of funds within the peer group have large core orientations which caused them to substantially under perform the Russell Index.
What major changes have occurred in the portfolio during the period covered by the report?
The structure of the portfolio was not changed significantly during the fiscal year although numerous trades were completed to maintain the Fund’s exposure and to comply with its individual security sell discipline. The Fund continues to emphasize securities that possess favorable momentum, value and quality characteristics.†
What is your outlook for the Fund?
The stock market appears to be in the process of regaining its upward momentum after stumbling earlier in the year on worries about high oil prices and their impact on economic growth. The outlook for corporate earnings and domestic economic growth is improving and stock prices are responding positively. Technology stocks, laggards earlier in the year, have sprung back to life and are showing renewed strength, particularly semiconductor stocks. Economically sensitive stocks in the Materials and Industrial sectors are also showing renewed strength after selling off sharply earlier in the year. In recent weeks we have taken steps to position the portfolio somewhat more aggressively with a focus on stocks offering the potential to rebound as economic and earnings worries ease. Such purchases include U.S. Steel, Phelps Dodge, National Semiconductor, Williams Companies, and Polaris Industries.†
Past performance does not guarantee future results.
| 1 | The Russell 1000® Value Index (“Russell Index”) measures the performance of those Russell 1000 companies with lower price-to-book ratios and lower forecasted growth values. It is not possible to invest directly in any index. |
| 2 | The Lipper Large-Cap Value universe is comprised of mutual funds that, by portfolio practice, invest at least 75% of their equity assets in companies with market capitalizations (on a three-year weighted basis) greater than 300% of the dollar-weighted median market capitalization of the middle 1,000 securities of the S&P SuperComposite 1500 Index. Large-cap value funds typically have a below-average price-to-earnings ratio, price-to-book ratio, and three-year sales-per-share growth value, compared to the S&P 500 Index. For the one- and five-year periods ended July 31, 2005, the Pacific Capital Value Fund ranked 60 and 196 out of 442 and 239 funds in the Lipper Large-Cap Value Funds category, respectively. The Lipper Rankings are based on total returns and do not reflect a sales charge. Funds with multiple share classes have a common portfolio. |
| † | The composition of the Fund’s portfolio is subject to change. |
16
Pacific Capital Value Fund (cont.)
Sector Weightings as of July 31, 2005
(as a percentage of total investments)
The composition of the Fund’s portfolio is subject to change.
Growth of a $10,000 Investment
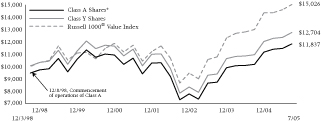
The chart above represents a comparison of a hypothetical $10,000 investment in the indicated share class versus a similar investment in the Fund’s benchmark. The chart above does not reflect the deduction of taxes that a shareholder would pay on Fund distributions or redemption of Fund shares.
Average Annual Total Returns as of July 31, 2005
| | | | | | | | | |
| | | 1 Year
| | | 5 Year
| | | Since
Inception
(12/3/98)
| |
Class A Shares* | | 12.57 | % | | 0.76 | % | | 2.56 | % |
Class B Shares** | | 14.00 | % | | 0.93 | % | | 2.63 | % |
Class C Shares** | | 18.00 | % | | 1.13 | % | | 2.65 | % |
Class Y Shares | | 19.12 | % | | 2.11 | % | | 3.66 | % |
| * | Reflects 5.25% maximum front-end sales charge. |
| ** | Reflects maximum contingent deferred sales charge (CDSC) of up to 5.00% for the Class B Shares and a maximum CDSC of 1.00% for the Class C Shares (applicable only to redemptions within one year of purchase). |
The table above does not reflect the deduction of taxes that a shareholder would pay on Fund distributions or redemption of Fund shares.
Past performance does not guarantee future results. The performance data quoted represents past performance and current returns may be lower or higher. The investment return and principal value will fluctuate so that an investor’s shares, when redeemed, may be worth more or less than the original cost. To obtain performance information current to the most recent month end, please call 1-800-258-9232 or visit the Funds’ website at pacificcapitalfunds.com.
The Pacific Capital Funds are distributed by BISYS Fund Services. The Asset Management Group of Bank of Hawaii provides investment advisory services to the Fund and receives a fee for its services.
The Pacific Capital Value Fund’s inception date was December 3, 1998. The Class A, Class B and Class C shares were not in existence prior to December 8, 1998, December 13, 1998 and April 30, 2004, respectively. Performance information for Class C shares is based upon the performance of Class B shares from inception. Performance calculated for any period up to and through such inception dates is based upon the performance of Class Y shares, which does not reflect the higher 12b-1 fees. Had the higher 12b-1 fees been incorporated, total return figures may have been adversely affected.
The performance of the Pacific Capital Value Fund is measured against the Russell 1000® Value Index, an unmanaged index comprised of the securities in the Russell universe that tend to exhibit low price-to-book and price-to-earnings ratios. The index does not reflect the deduction of fees associated with a mutual fund, such as investment management and fund accounting fees. The Fund’s performance reflects the deduction of fees for these services. Investors cannot invest directly in an index, although they can invest in its underlying securities.
17
Pacific Capital Diversified Fixed Income Fund
Investment Style
High-quality, intermediate-term, taxable
Investment Objective
High current income consistent with capital preservation by investing at least 80% in fixed income securities, with most of its assets in debt securities issued or guaranteed by the U.S. Government and corporate debt securities rated “A” or better by Standard & Poor’s.
Investment Considerations
Bonds offer a relatively stable level of income, although bond prices will fluctuate with interest rate changes providing the potential for principal gain or loss. Generally, bond prices fall when interest rates rise, and vice versa. Intermediate-term, higher-quality bonds generally offer less risk than longer-term bonds and a lower rate of return.
Investment Process
| • | | Top-down macroeconomic analysis of interest rate trends |
| • | | Bottom-up credit research to identify high quality bonds |
| • | | Rigorous quantitative risk analysis |
Investment Management
Advised by Asset Management Group of Bank of Hawaii (AMG)
| • | | Founded in 1898, AMG represents the largest, most experienced staff of investment professionals in Hawaii |
| • | | $6.4 billion in assets under management |
How did the Fund perform compared to its benchmark?
For the 12-month period ended July 31, 2005, the Fund underperformed its benchmark. The return for the Fund was 3.67% (Class A Shares without sales charge), versus the Merrill Lynch Government/Corporate Master Index1 return of 4.99%.
What were the major factors in the market that influenced the Fund’s performance?
The most significant negative impact on portfolio performance was the higher quality of our corporate bonds. Spreads on lower quality bonds tightened significantly through the end of March, resulting in better performance. Investors moved further out on the credit curve, taking on more risk to achieve higher income in the persistent low-rate environment. Subsequently through the end of June, 2005, lower quality bond spreads widened markedly as investors shunned risk and higher quality bonds prevailed.
What major changes have occurred in the portfolio during the period covered by the report?
Although the rate on the 10-year Treasury was little changed year-over-year, there was some volatility during the period that gave us opportunities to adjust the average maturity of the portfolio to address market conditions. During the calendar quarter ended September 30, 2004, the 10-year rate fell to 4%, below our trading range forecast. We shortened the average maturity of the portfolio in anticipation of higher rates, and extended back to benchmark maturity in late March when the 10-year Treasury rose to our “re-entry” level.†
Although corporate bond spreads remain at fairly narrow levels, issuance (supply) has declined and demand, especially from foreign entities, has been strong. We don’t anticipate that this situation will change dramatically and thus will likely maintain our overweight position in higher quality corporate bonds.†
We increased our positions in floating rate notes, which has worked out well as a defense in an environment of rising short term rates. These securities maintain a more stable market value, while providing an increasing income stream as their coupon rates adjust to higher rates.†
What is your outlook for the Fund?
We anticipate the Fed may increase short term rates at least one, possibly two more times through year-end. We expect that longer rates may remain in a trading range of approximately 4-4.5% given our current inflation and economic outlook. In this environment, we believe the next fiscal year to be very similar in performance to this reporting period, with income being the major contributor to performance.†
Past performance does not guarantee future results.
| 1 | The Merrill Lynch Government/ Corporate Master Index is generally representative of the performance of corporate and U.S. Government bonds. Investors cannot invest directly in an index, although they can invest in its underlying securities. |
| † | The composition of the Fund’s portfolio is subject to change. |
18
Pacific Capital Diversified Fixed Income Fund (cont.)
Credit Quality as of July 31, 2005
(as a percentage of total investments)
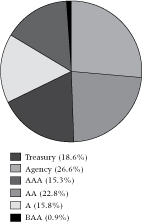
The composition of the Fund’s portfolio is subject to change.
Growth of a $10,000 Investment
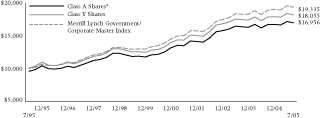
The chart above represents a comparison of a hypothetical $10,000 investment in the indicated share class versus a similar investment in the Fund’s benchmark. The chart above does not reflect the deduction of taxes that a shareholder would pay on Fund distributions or redemption of Fund shares.
Average Annual Total Returns as of July 31, 2005
| | | | | | | | | |
| | | 1 Year
| | | 5 Year
| | | 10 Year
| |
Class A Shares* | | -0.48 | % | | 5.77 | % | | 5.42 | % |
Class B Shares** | | -1.09 | % | | 5.70 | % | | 5.30 | % |
Class C Shares** | | 3.00 | % | | 5.86 | % | | 5.30 | % |
Class Y Shares | | 3.90 | % | | 6.92 | % | | 6.09 | % |
| * | Reflects 4.00% Maximum Front-End Sales Charge. |
| ** | Reflects maximum contingent deferred sales charge (CDSC) of up to 5.00% for the Class B Shares and a maximum CDSC of 1.00% for the Class C Shares (applicable only to redemptions within one year of purchase). |
The table above does not reflect the deduction of taxes that a shareholder would pay on Fund distributions or redemption of Fund shares.
Past performance does not guarantee future results. The performance data quoted represents past performance and current returns may be lower or higher. The investment return and principal value will fluctuate so that an investor’s shares, when redeemed, may be worth more or less than the original cost. To obtain performance information current to the most recent month end, please call 1-800-258-9232 or visit the Funds’ website at pacificcapitalfunds.com.
The Pacific Capital Funds are distributed by BISYS Fund Services. The Asset Management Group of Bank of Hawaii provides investment advisory services to the Fund and receives a fee for its services.
The Class B and Class C shares of the Fund commenced operations on March 2, 1998 and April 30, 2004, respectively. Performance information for Class C shares is based upon the performance of Class B shares from inception. Performance calculated for any period up to and through March 2, 1998 is based upon the performance of Class A shares, which does not reflect the higher 12b-1 fees. Had the higher 12b-1 fees been incorporated, total return figures may have been adversely affected.
The performance of the Pacific Capital Diversified Fixed Income Fund is measured against the Merrill Lynch Government/Corporate Master Index, an unmanaged index generally representative of the performance of corporate and U.S. Government bonds. The index does not reflect the deduction of fees associated with a mutual fund, such as investment management and fund accounting fees. The Fund’s performance reflects the deduction of fees for these services. Investors cannot invest directly in an index, although they can invest in its underlying securities.
19
Pacific Capital Tax Free Securities Fund
Investment Style
High-quality, intermediate-term, tax-exempt
Investment Objective
High level of tax-exempt income by investing at least 80% in debt securities exempt from federal and alternative minimum tax, with 50% to 60% in Hawaii municipal obligations exempt from Hawaii state tax.
Investment Considerations
Income received from the Fund may be subject to certain state and local taxes and, depending on one’s tax status, to the federal alternative minimum tax. Bonds offer a relatively stable level of income, although bond prices will fluctuate providing the potential for principal gain or loss. Generally, bond prices and values fall when interest rates rise, and vice versa.
Investment Process
| • | | Top-down macroeconomic analysis of interest rate trends |
| • | | Bottom-up credit research to identify high quality bonds |
| • | | Rigorous quantitative risk analysis |
Investment Management
Advised by Asset Management Group of Bank of Hawaii (AMG)
| • | | Founded in 1898, AMG represents the largest, most experienced staff of investment professionals in Hawaii |
| • | | $6.4 billion in assets under management |
How did the Fund perform compared to its benchmark?
For the 12-month period ended July 31, 2005, the Fund gained 3.49% (Class A Shares without sales charge), compared to the Lipper General Municipal Debt Funds Average1 return of 5.57%, and the Fund’s benchmarks, the Lehman Brothers Municipal Bond Index2 and the Lehman Brothers Municipal Hawaii Index2, which returned 6.35% and 4.60%, respectively. The Fund has changed its standardized benchmark from the Lehman Brothers Municipal Bond Index to the Lehman Brothers Municipal Hawaii Index to provide a more appropriate market comparison.
What were the major factors in the market that influenced the Fund’s performance?
The shape of the municipal yield curve changed during the year. The curve “flattening” involved increases in the short term by as much as 1.20% for one year securities; stability around the 7-year range; and decreases in rates of as much as 0.50% for long term securities. The Fed raised the fed funds rate from 1.00% in June 2004 to 3.25% by July 2005. The Fund is slightly defensive against its benchmarks, the Lehman Brothers Municipal Hawaii index and the Lehman Brothers Municipal Bond Index and has performed in line with these benchmarks.†
What major changes have occurred in the portfolio during the period covered by the report?
During the report period, there were no significant changes to the portfolio. The Fund continues to hold primarily high-quality insured municipal bonds. We were defensively positioned for an increasing interest rate environment relative to the benchmarks.
What is your outlook for the Fund?
We believe the pace of economic activity is improving in the face of higher energy prices. We believe oil price increases in excess of $60 per barrel could have a moderating impact on the economy, possibly by year-end. Bonds have traded within a narrow range so we plan to take advantage of the opportunity and extend the duration of the Fund’s portfolio to potentially enhance return and yield.†
Past performance does not guarantee future results.
| 1 | The Lipper General Municipal Debt Funds Average is comprised of mutual funds that invest at 65% of their assets in municipal debt issues in the top four credit ratings. |
| 2 | The Lehman Brothers Municipal Bond Index is generally representative of a broad range of maturities which include investment-grade, tax-exempt, and fixed-rate bonds with long-term maturities (greater than two years) selected from issues larger than $50 million. |
The Lehman Brothers Municipal Hawaii Bond Index is a rules-based, market-value-weighted index engineered for the long-term tax-exempt bond market. The index has four main sectors: general obligation bonds, revenue bonds, insured bonds, and prerefunded bonds.
Investors cannot invest directly in an index, although they can invest in its underlying securities.
| † | The composition of the Fund’s portfolio is subject to change. |
20
Pacific Capital Tax Free Securities Fund (cont.)
Credit Quality as of July 31, 2005
(as a percentage of total investments)
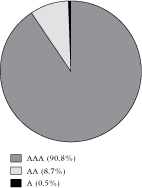
The composition of the Fund’s portfolio is subject to change.
Growth of a $10,000 Investment
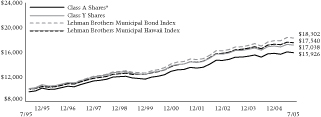
The chart above represents a comparison of a hypothetical $10,000 investment in the indicated share class versus a similar investment in the Fund’s benchmark. The chart above does not reflect the deduction of taxes that a shareholder would pay on Fund distributions or redemption of Fund shares.
Average Annual Total Returns as of July 31, 2005
| | | | | | | | | |
| | | 1 Year
| | | 5 Year
| | | 10 Year
| |
Class A Shares* | | -0.68 | % | | 4.50 | % | | 4.76 | % |
Class B Shares** | | -1.21 | % | | 4.41 | % | | 4.66 | % |
Class C Shares** | | 2.83 | % | | 4.60 | % | | 4.67 | % |
Class Y Shares | | 3.83 | % | | 5.63 | % | | 5.47 | % |
| * | Reflects 4.00% Maximum Front-End Sales Charge. |
| ** | Reflects maximum contingent deferred sales charge (CDSC) of up to 5.00% for the Class B Shares and a maximum CDSC of 1.00% for the Class C Shares (applicable only to redemptions within one year of purchase) |
The table above does not reflect the deduction of taxes that a shareholder would pay on Fund distributions or redemption of Fund shares.
Past performance does not guarantee future results. The performance data quoted represents past performance and current returns may be lower or higher. The investment return and principal value will fluctuate so that an investor’s shares, when redeemed, may be worth more or less than the original cost. To obtain performance information current to the most recent month end, please call 1-800-258-9232 or visit the Funds’ website at pacificcapitalfunds.com.
The Pacific Capital Funds are distributed by BISYS Fund Services. The Asset Management Group of Bank of Hawaii provides investment advisory services to the Fund and receives a fee for its services.
The Class B and Class C shares of the Fund commenced operations on March 2, 1998 and April 30, 2004, respectively. Performance information for Class C shares is based upon the performance of Class B shares from inception. Performance calculated for any period up to and through March 2, 1998 is based upon the performance of Class A shares, which does not reflect the higher 12b-1 fees. Had the higher 12b-1 fees been incorporated, total return figures may have been adversely affected.
The performance of the Pacific Capital Tax-Free Securities Fund is measured against the Lehman Brothers Municipal Bond Index and the Lehman Brothers Municipal Hawaii Index. The Fund has changed its standardized benchmark from the Lehman Brothers Municipal Bond Index to the Lehman Brothers Municipal Hawaii Index to provide a more appropriate market comparison. The Lehman Brothers Municipal Bond Index is generally representative of a broad range of maturities which include investment-grade, tax-exempt, and fixed-rate bonds with long-term maturities (greater than two years) selected from issues larger than $50 million; and the Lehman Brothers Municipal Hawaii Index is a rules-based, market-value-weighted index engineered for the long-term tax-exempt bond market. The Lehman Brothers Municipal Hawaii Index has four main sectors: general obligation bonds, revenue bonds, insured bonds, and prerefunded bonds. The indices do not reflect the deduction of fees associated with a mutual fund, such as investment management and fund accounting fees. The Fund’s performance reflects the deduction of fees for these services. Investors cannot invest directly in an index, although they can invest in its underlying securities.
21
Pacific Capital Short Intermediate U.S. Government Securities Fund
Investment Style
High-quality, short-term, taxable
Investment Objective
High current income consistent with capital preservation with a secondary emphasis on capital appreciation, by investing 100% of total investable assets in short-term (one to five years) bonds, notes and Treasury bills issued by the U.S. Government and it agencies, and in collateralized repurchase agreements.
Investment Considerations
Bonds offer a relatively stable level of income, although bond prices will fluctuate with interest rate changes providing the potential for principal gain or loss. Generally, bond prices and values fall when interest rates rise, and vice versa. Intermediate-term, higher-quality bonds generally offer less risk than longer-term bonds and a lower rate of return. Government and agency guarantees apply only to the underlying securities and not to the Fund.
Investment Process
| • | | Top-down macroeconomic analysis of interest rate trends |
| • | | Bottom-up credit research to identify high quality bonds |
| • | | Rigorous quantitative risk analysis |
Investment Management
Advised by Asset Management Group of Bank of Hawaii (AMG)
| • | | Founded in 1898, AMG represents the largest, most experienced staff of investment professionals in Hawaii |
| • | | $6.4 billion in assets under management |
How did the Fund perform compared to its benchmark?
For the 12-month period ended July 31, 2005, the Fund underperformed its benchmark. The Fund gained 1.27% (Class A Shares without sales charge) compared to the Lipper Short U.S. Government Funds Average1 return of 1.29%, and its benchmark, the Merrill Lynch 1-5 Year U.S. Treasury Index2, which returned 1.38%.
What were the major factors in the market that influenced the Fund’s performance?
For the year, yields on Treasury securities out to 5 years moved higher across the yield curve. Three-month and six-month bills were up the most by 1.90%, two-year and three-year notes increased 1.38% and 1.09%, respectively, and the 5-year moved up by 0.45%. The hike in short Treasury yields reflected steady rate increases by the Federal Open Market Committee (“FOMC”) from 1.25% to 3.25% by period end.
For the period ended July 31, 2005, the Fund underperformed its benchmark, the Merrill Lynch 1-5-Year U.S. Treasury Index, because of Fund expenses, which are not included in the benchmark return. The Fund’s U.S. Government agency allocation and short of index duration had a positive relative impact on performance.
What major changes have occurred in the portfolio during the period covered by the report?
We continue to emphasize in our security selection smaller size Agency issues that offer a spread over Agency Global/ Designated notes.†
What is your outlook for the Fund?
We believe the rapid rise in interest rates appears to be nearing a peak, making the yield curve roll down trade more attractive versus recent quarters. We anticipate that as higher oil prices take their hold on the economy and the FOMC gives its first indications that rate hikes are complete we will likely extend duration opportunistically to potentially enhance return and yield for the Fund’s shareholders.
Past performance does not guarantee future results.
| 1 | The Lipper Short U.S. Government Funds Average is comprised of the top funds in the category that invest at least 65% of their assets in securities issued or guaranteed by the U.S. Government, its agencies, or its instrumentalities, with dollar- weighted average maturities of less than three years. |
| 2 | The Merrill Lynch 1–5-Year U.S. Treasury Index tracks the performance of Treasury bonds in a maturity range of one to five years. Investors cannot invest directly in an index, although they can invest in its underlying securities. |
| † | The composition of the Fund’s portfolio is subject to change. |
22
Pacific Capital Short Intermediate U.S. Government Securities Fund (cont.)
Portfolio Composition as of July 31, 2005
(as a percentage of total investments)
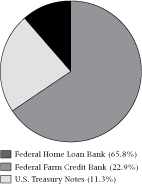
The composition of the Fund’s portfolio is subject to change.
Growth of a $10,000 Investment
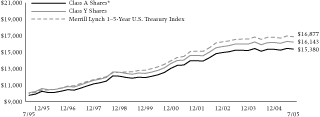
The chart above represents a comparison of a hypothetical $10,000 investment in the indicated share class versus a similar investment in the Fund’s benchmark. The chart above does not reflect the deduction of taxes that a shareholder would pay on Fund distributions or redemption of Fund shares.
Average Annual Total Returns as of July 31, 2005
| | | | | | | | | |
| | | 1 Year
| | | 5 Year
| | | 10 Year
| |
Class A Shares* | | -1.06 | % | | 4.06 | % | | 4.40 | % |
Class C Shares** | | 0.40 | % | | 4.31 | % | | 4.53 | % |
Class Y Shares | | 1.52 | % | | 4.77 | % | | 4.91 | % |
| * | Reflects 2.25% Maximum Front-End Sales Charge. |
| ** | Reflects maximum contingent deferred sales charge (CDSC) of up to 1.00% (applicable only to redemptions within one year of purchase). |
The table above does not reflect the deduction of taxes that a shareholder would pay on Fund distributions or redemption of Fund shares.
Past performance does not guarantee future results. The performance data quoted represents past performance and current returns may be lower or higher. The investment return and principal value will fluctuate so that an investor’s shares, when redeemed, may be worth more or less than the original cost. To obtain performance information current to the most recent month end, please call 1-800-258-9232 or visit the Funds’ website at pacificcapitalfunds.com.
The Pacific Capital Funds are distributed by BISYS Fund Services. The Asset Management Group of Bank of Hawaii provides investment advisory services to the Fund and receives a fee for its services.
The Class C Shares of the Fund commenced operations on April 30, 2004. Performance information for Class C shares is based upon the performance of Class A shares, which does not reflect the higher 12b-1 fees. Had the higher 12b-1 fees been incorporated, total return figures may have been adversely affected.
The performance of the Pacific Capital Short Intermediate U.S. Government Securities Fund is measured against the Merrill Lynch 1–5-Year U.S. Treasury Index, an unmanaged index which tracks the performance of Treasury bonds in a maturity range of one to five years. The index does not reflect the deduction of fees associated with a mutual fund, such as investment management and fund accounting fees. The Fund’s performance reflects the deduction of fees for these services. Investors cannot invest directly in an index, although they can invest in its underlying securities.
23
Pacific Capital Tax-Free Short Intermediate Securities Fund
Investment Style
High-quality, short-term, tax-exempt
Investment Objective
High level of tax-exempt income by investing at least 80% in debt securities exempt from federal and the alternative minimum tax, with 50% to 60% in Hawaii municipal obligations exempt from Hawaii state tax. Seeks to provide greater price stability by maintaining an average maturity of two to five years.
Investment Considerations
Income received from the Fund may be subject to certain state and local taxes and, depending on one’s tax status, to the federal alternative minimum tax. Bonds offer a relatively stable level of income, although bond prices will fluctuate providing the potential for principal gain or loss. Generally, bond prices and values fall when interest rates rise, and vice versa. Intermediate-term, higher-quality bonds generally offer less risk than longer-term bonds and a lower rate of return.
Investment Process
| • | | Top-down macroeconomic analysis of interest rate trends |
| • | | Bottom-up credit research to identify high quality bonds |
| • | | Rigorous quantitative risk analysis |
Investment Management
Advised by Asset Management Group of Bank of Hawaii (AMG)
| • | | Founded in 1898, AMG represents the largest, most experienced staff of investment professionals in Hawaii |
| • | | $6.4 billion in assets under management |
How did the Fund perform compared to its benchmark?
For the 12-month period ended July 31, 2005, the Fund gained 1.40% (Class A Shares without sales charge), compared to the Lipper Short Intermediate Municipal Debt Funds Average1 return of 2.16%, and its benchmarks, the Lehman Brothers 5-Year Municipal Bond Index2 and the Lehman Brothers Municipal 3-Year Hawaii Index2, which returned 2.91% and 1.47%, respectively. The Fund has changed its standardized benchmark from the Lehman Brothers 5-Year Municipal Bond Index to the Lehman Brothers Municipal Hawaii 3-Year Index to provide a more appropriate market comparison.
What were the major factors in the market that influenced the Fund’s performance?
The shape of the municipal yield curve changed during the year. The curve “flattening” involved increases in the short term by as much as 1.20% for one year securities; stability around the 7-year range; and decreases in rates of as much as 0.50% for long term securities. The Fed raised the fed funds rate from 1.00% in June 2004, to 3.25% by July 2005. This Fund is slightly defensive against its benchmarks, the Lehman Brothers 5-Year Municipal index and the Lehman Brothers Municipal 3-Year Hawaii Index. The “barbell” structure of the Fund’s portfolio helped performance, as the “near cash” equivalents took advantage of rising rates at the very front of the yield curve while the longer end of the portfolio maintained value in the flattening environment and enhanced income.
What major changes have occurred in the portfolio during the period covered by the report?
During the reporting period, there were no significant changes to the portfolio although we did establish a small allocation to Government Agency securities (within prospectus limits), to take advantage of the overall net after tax yield of these securities. The Fund continues to hold primarily high-quality insured municipal bonds. We were defensively positioned for an increasing interest rate environment relative to the benchmarks.
What is your outlook for the Fund?
We believe the pace of economic activity is improving in the face of higher energy prices. Oil price increases past $60 per barrel, however, will have a moderating impact on the economy possibly by year-end. Bonds are trading within a narrow range, so we expect to extend the Fund’s duration to potentially enhance return and yield.
Past performance does not guarantee future results.
| 1 | The Lipper Short Intermediate Municipal Debt Funds Average is comprised of the top mutual funds in the category that invest in municipal debt issues with dollar-weighted average maturities of one to five years. |
| 2 | The Lehman Brothers 5-Year Municipal Bond Index is composed of a broad range of investment-grade municipal bonds. |
The Lehman Brothers Municipal Hawaii 3-Year Index is the 2-4 year component of the Lehman Hawaii Municipal Bond index. The index is a rules-based, market-value-weighted index engineered for the tax-exempt bond market. The index has four main sectors: general obligation bonds, revenue bonds, insured bonds, and prerefunded bonds.
| † | The composition of the Fund’s portfolio is subject to change. |
24
Pacific Capital Tax-Free Short Intermediate Securities Fund (cont.)
Credit Quality as of July 31, 2005
(as a percentage of total investments)
The composition of the Fund’s portfolio is subject to change.
Growth of a $10,000 Investment
The chart above represents a comparison of a hypothetical $10,000 investment in the indicated share class versus a similar investment in the Fund’s benchmark. The chart above does not reflect the deduction of taxes that a shareholder would pay on Fund distributions or redemption of Fund shares.
Average Annual Total Returns as of July 31, 2005
| | | | | | | | | |
| | | 1 Year
| | | 5 Year
| | | 10 Year
| |
Class A Shares* | | -0.91 | % | | 2.99 | % | | 3.24 | % |
Class C Shares** | | 0.54 | % | | 3.27 | % | | 3.38 | % |
Class Y Shares | | 1.65 | % | | 3.73 | % | | 3.75 | % |
| * | Reflects 2.25% Maximum Front-End Sales Charge. |
| ** | Reflects maximum contingent deferred sales charge (CDSC) of up to 1.00% (applicable only to redemptions within one year of purchase). |
The table above does not reflect the deduction of taxes that a shareholder would pay on Fund distributions or redemption of Fund shares.
Past performance does not guarantee future results. The performance data quoted represents past performance and current returns may be lower or higher. The investment return and principal value will fluctuate so that an investor’s shares, when redeemed, may be worth more or less than the original cost. To obtain performance information current to the most recent month end, please call 1-800-258-9232 or visit the Funds’ website at pacificcapitalfunds.com.
The Pacific Capital Funds are distributed by BISYS Fund Services. The Asset Management Group of Bank of Hawaii provides investment advisory services to the Fund and receives a fee for its services.
The Class C shares of the Fund commenced operations on April 30, 2004. Performance information for Class C shares is based upon the performance of Class A shares, which does not reflect the higher 12b-1 fees. Had the higher 12b-1 fees been incorporated, total return figures may have been adversely affected.
The performance of the Pacific Capital Tax-Free Short Intermediate Securities Fund is measured against the Lehman Brothers 5-Year Municipal Bond Index and the Lehman Brothers Municipal Hawaii 3-Year Index. The Fund has changed its standardized benchmark from the Lehman Brothers 5-Year Municipal Bond Index to the Lehman Brothers Municipal Hawaii 3-Year Index to provide a more appropriate market comparison. The Lehman Brothers 5-Year Municipal Bond Index is composed of a broad range of investment-grade municipal bonds, whereas the Fund may invest only in bonds with maturities of five years or less. The Lehman Brothers Municipal Hawaii 3-Year Index is the 2-4 year component of the Lehman Hawaii Municipal Bond index. The Index is a rules-based, market-value-weighted index engineered for the tax-exempt bond market. The index has four main sectors: general obligation bonds, revenue bonds, insured bonds, and prerefunded bonds. The indices do not reflect the deduction of fees associated with a mutual fund, such as investment management and fund accounting fees. The Fund’s performance reflects the deduction of fees for these services. Investors cannot invest directly in an index, although they can invest in its underlying securities.
25
Pacific Capital Ultra Short Government Fund
Investment Style
High-quality, short-term, taxable
Investment Objective
High current income consistent with capital preservation by investing 100% of total investable assets in short-term debt securities (target duration of one year or less) issued or guaranteed by the U.S. Government and its agencies.
Investment Considerations
Bonds offer a relatively stable level of income, although bond prices will fluctuate with interest rate changes providing the potential for principal gain or loss. Generally, bond prices fall when interest rates rise, and vice versa. Intermediate-term, higher-quality bonds generally offer less risk than longer-term bonds and a lower rate of return. Government and agency guarantees apply only to the underlying securities and not to the Fund.
Investment Process
| • | | Top-down macroeconomic analysis of interest rate trends |
| • | | Bottom-up credit research to identify high quality bonds |
| • | | Rigorous quantitative risk analysis |
Investment Management
Advised by Asset Management Group of Bank of Hawaii (AMG)
| • | | Founded in 1898, AMG represents the largest, most experienced staff of investment professionals in Hawaii |
| • | | $6.4 billion in assets under management |
How did the Fund perform compared to its benchmark?
For the 12-month period ended July 31, 2005, the Fund gained 1.19% (Class A Shares without sales charge), compared to the Lipper Ultra Short Obligations Funds Average1 return of 1.95%, and its benchmark, the Merrill Lynch 6-Month U.S. Treasury Bill Index2, which returned 2.16%.
What were the major factors in the market that influenced the Fund’s performance?
For the year, short Treasury yields moved higher across the yield curve. Three-month and six-month Treasury bills were up the most by 1.90%, and two-year and three-year notes increased 1.38% and 1.09%, respectively. The hike in short Treasury yields reflected steady rate increases by the Federal Open Market Committee (“FOMC”) from 1.25% to 3.25% by period end. The Fund’s performance compared to the Fund’s index stalled as a result of its more significant weighting in 1-3 year maturities and underperformed versus the Fund’s universe due to our conservative asset allocation to U.S. Government agency securities paying state tax exempt interest.
What major changes have occurred in the portfolio during the period covered by the report?
We continue to emphasize in our security selection smaller size Agency issues that offer a spread over Agency Global/ Designated notes.
What is your outlook for the Fund?
We believe the rapid rise in interest rates appears to be nearing a peak, making the yield curve roll down trade more attractive versus recent quarters. We anticipate that as higher oil prices take their hold on the economy and the FOMC gives its first indications that rate hikes are complete, we will likely extend duration opportunistically to help potentially enhance return and yield for the Fund’s shareholders.
Past performance does not guarantee future results.
| 1 | Lipper Ultra Short Obligations Funds Average is comprised of the top funds in the category that invest at least 65% of their assets in investment grade debt issues, or better, and maintain a portfolio dollar-weighted average maturity between 91 days and 365 days. |
| 2 | The Merrill Lynch 6-Month U.S. Treasury Bill Index reflects the monthly return equivalents of yield averages that are not marked to the market. The fixed maturities are constructed by the Treasury department, and are based on the most actively traded marketable Treasury securities. Yields on these issues are based on composite quotes reported by U.S. Government securities dealers to the Federal Reserve Bank of New York. To obtain the constant maturity yields, personnel at Treasury construct a yield curve each business day, and yield values are then read from the curve at fixed maturities. Investors cannot invest directly in an index, although they can invest in the underlying securities. |
| † | The composition of the Fund’s portfolio is subject to change. |
26
Pacific Capital Ultra Short Government Fund (cont.)
Portfolio Composition as of July 31, 2005
(as a percentage of total investments)
The composition of the Fund’s portfolio is subject to change.
Growth of a $10,000 Investment
The chart above represents a comparison of a hypothetical $10,000 investment in the indicated share class versus a similar investment in the Fund’s benchmark. The chart above does not reflect the deduction of taxes that a shareholder would pay on Fund distributions or redemption of Fund shares.
Average Annual Total Returns as of July 31, 2005
| | | | | | | | | |
| | | 1 Year
| | | 5 Year
| | | Since Inception
(6/1/00)
| |
Class A Shares* | | -1.07 | % | | 2.46 | % | | 2.63 | % |
Class B Shares** | | -3.55 | % | | 1.98 | % | | 2.16 | % |
Class C Shares** | | 0.43 | % | | 2.16 | % | | 2.34 | % |
Class Y Shares | | 1.44 | % | | 3.20 | % | | 3.35 | % |
| * | Reflects 2.25% Maximum Front-End Sales Charge. |
| ** | Reflects maximum contingent deferred sales charge (CDSC) of up to 5.00% for the Class B Shares and a maximum CDSC of 1.00% for the Class C Shares (applicable only to redemptions within one year of purchase). |
The table above does not reflect the deduction of taxes that a shareholder would pay on Fund distributions or redemption of Fund shares.
Past performance does not guarantee future results. The performance data quoted represents past performance and current returns may be lower or higher. The investment return and principal value will fluctuate so that an investor’s shares, when redeemed, may be worth more or less than the original cost. To obtain performance information current to the most recent month end, please call 1-800-258-9232 or visit the Funds’ website at pacificcapitalfunds.com.
The Pacific Capital Funds are distributed by BISYS Fund Services. The Asset Management Group of Bank of Hawaii provides investment advisory services to the Fund and receives a fee for its services.
The Pacific Capital Ultra Short Government Fund’s inception date was June 1, 2000. The Class A, Class B and Class C shares were not in existence prior to August 1, 2000, August 1, 2000 and April 30, 2004, respectively. Performance information for Class C shares is based upon the performance of Class B shares from inception. Performance calculated for any period up to and through August 1, 2000 is based upon the performance of Class Y shares, which does not reflect the higher 12b-1 fees. Had the higher 12b-1 fees been incorporated, total return figures may have been adversely affected.
The Merrill Lynch 6-Month U.S. Treasury Bill Index reflects the monthly return equivalents of yield averages that are not marked to the market. The fixed maturities are constructed by the Treasury department, and are based on the most actively traded marketable Treasury securities. Yields on these issues are based on composite quotes reported by U.S. Government securities dealers to the Federal Reserve Bank of New York. To obtain the constant maturity yields, personnel at Treasury construct a yield curve each business day, and yield values are then read from the curve at fixed maturities. The index does not reflect the deduction of fees associated with a mutual fund, such as investment management and fund accounting fees. The Fund’s performance reflects the deduction of fees for these services. Investors cannot invest directly in an index, although they can invest in its underlying securities.
27
PACIFIC CAPITAL FUNDS
Statements of Assets and Liabilities
July 31, 2005
| | | | | | | | | | | | | | | | |
| | | New Asia
Growth
Fund
| | | International
Stock
Fund
| | | Small Cap
Fund
| | | Mid-Cap
Fund
| |
| ASSETS: | | | | | | | | | | | | | | | | |
Investments, at value (cost $35,010,334; $84,560,402; $199,073,837; and $74,398,635, respectively) | | $ | 46,694,358 | | | $ | 94,739,587 | | | $ | 240,708,770 | | | $ | 86,587,440 | |
Foreign currency, at value (cost $138,524; $24,460; $0; and $0, respectively) | | | 137,375 | | | | 24,552 | | | | — | | | | — | |
Interest and dividends receivable | | | 57,075 | | | | 97,898 | | | | 56,794 | | | | 55,832 | |
Receivable for capital shares issued | | | — | | | | — | | | | 272,867 | | | | — | |
Receivable for investments sold | | | 226,895 | | | | 428,648 | | | | 1,131,970 | | | | 446,719 | |
Reclaims receivable | | | — | | | | 125,334 | | | | — | | | | — | |
Receivable from Administrator | | | — | | | | — | | | | 21,398 | | | | — | |
Prepaid expenses and other assets | | | 729 | | | | 1,350 | | | | 6,922 | | | | 986 | |
| | |
|
|
| |
|
|
| |
|
|
| |
|
|
|
Total Assets | | | 47,116,432 | | | | 95,417,369 | | | | 242,198,721 | | | | 87,090,977 | |
| | |
|
|
| |
|
|
| |
|
|
| |
|
|
|
| LIABILITIES: | | | | | | | | | | | | | | | | |
Payable for capital shares redeemed | | | — | | | | — | | | | 42,682 | | | | — | |
Payable for investments purchased | | | 474,703 | | | | 164,774 | | | | 3,491,996 | | | | 2,622,012 | |
Payable for foreign currency contracts | | | — | | | | 895 | | | | — | | | | — | |
Accrued expenses and other payables: | | | | | | | | | | | | | | | | |
Investment advisory fees | | | 15,308 | | | | 27,693 | | | | 76,518 | | | | 21,395 | |
Sub-investment advisory fees | | | 19,135 | | | | 43,618 | | | | 115,324 | | | | 13,762 | |
Administration fees | | | 1,228 | | | | 2,695 | | | | 5,176 | | | | 948 | |
Compliance services fees | | | 1,185 | | | | 2,987 | | | | 8,609 | | | | 2,667 | |
Distribution fees | | | 939 | | | | 1,152 | | | | 28,152 | | | | 568 | |
Other fees | | | 23,607 | | | | 31,998 | | | | 44,970 | | | | 20,064 | |
| | |
|
|
| |
|
|
| |
|
|
| |
|
|
|
Total Liabilities | | | 536,105 | | | | 275,812 | | | | 3,813,427 | | | | 2,681,416 | |
| | |
|
|
| |
|
|
| |
|
|
| |
|
|
|
| NET ASSETS: | | | | | | | | | | | | | | | | |
Capital (no par value) | | | 34,268,847 | | | | 111,552,793 | | | | 180,293,729 | | | | 69,843,967 | |
Undistributed (distributions in excess of) net investment income | | | (31,718 | ) | | | (167,757 | ) | | | — | | | | 5,842 | |
Accumulated net realized gains (losses) on investments and foreign
currency transactions | | | 662,527 | | | | (26,416,546 | ) | | | 16,456,632 | | | | 2,370,947 | |
Net unrealized appreciation on investments and foreign currency transactions | | | 11,680,671 | | | | 10,173,067 | | | | 41,634,933 | | | | 12,188,805 | |
| | |
|
|
| |
|
|
| |
|
|
| |
|
|
|
Net Assets | | $ | 46,580,327 | | | $ | 95,141,557 | | | $ | 238,385,294 | | | $ | 84,409,561 | |
| | |
|
|
| |
|
|
| |
|
|
| |
|
|
|
Net Assets | | | | | | | | | | | | | | | | |
Class A | | $ | 1,770,477 | | | $ | 949,142 | | | $ | 103,699,755 | | | $ | 759,803 | |
Class B | | | 445,678 | | | | 648,804 | | | | 3,554,504 | | | | N/A | |
Class C | | | 271,872 | | | | 494,367 | | | | 5,831,741 | | | | 508,710 | |
Class Y | | | 44,092,300 | | | | 93,049,244 | | | | 125,299,294 | | | | 83,141,048 | |
| | |
|
|
| |
|
|
| |
|
|
| |
|
|
|
Total | | $ | 46,580,327 | | | $ | 95,141,557 | | | $ | 238,385,294 | | | $ | 84,409,561 | |
| | |
|
|
| |
|
|
| |
|
|
| |
|
|
|
Outstanding units of beneficial interest (shares) | | | | | | | | | | | | | | | | |
Class A | | | 114,056 | | | | 106,006 | | | | 5,729,474 | | | | 59,591 | |
Class B | | | 29,779 | | | | 76,008 | | | | 206,373 | | | | N/A | |
Class C | | | 18,174 | | | | 57,955 | | | | 338,456 | | | | 40,119 | |
Class Y | | | 2,805,180 | | | | 10,195,167 | | | | 6,850,236 | | | | 6,513,947 | |
| | |
|
|
| |
|
|
| |
|
|
| |
|
|
|
Total | | | 2,967,189 | | | | 10,435,136 | | | | 13,124,539 | | | | 6,613,657 | |
| | |
|
|
| |
|
|
| |
|
|
| |
|
|
|
Net Asset Value | | | | | | | | | | | | | | | | |
Class A—redemption price per share | | $ | 15.52 | | | $ | 8.95 | | | $ | 18.10 | | | $ | 12.75 | |
| | |
|
|
| |
|
|
| |
|
|
| |
|
|
|
Class A—maximum sales charge | | | 5.25 | % | | | 5.25 | % | | | 5.25 | % | | | 5.25 | % |
| | |
|
|
| |
|
|
| |
|
|
| |
|
|
|
Class A—Maximum offering price per share
(100%/(100%-maximum sales charge) of net asset value adjusted to the nearest cent) | | $ | 16.38 | | | $ | 9.45 | | | $ | 19.10 | | | $ | 13.46 | |
| | |
|
|
| |
|
|
| |
|
|
| |
|
|
|
Class B—offering price per share* | | $ | 14.97 | | | $ | 8.54 | | | $ | 17.22 | | | | N/A | |
| | |
|
|
| |
|
|
| |
|
|
| |
|
|
|
Class C—offering price per share* | | $ | 14.96 | | | $ | 8.53 | | | $ | 17.23 | | | $ | 12.68 | |
| | |
|
|
| |
|
|
| |
|
|
| |
|
|
|
Class Y—offering and redemption price per share | | $ | 15.72 | | | $ | 9.13 | | | $ | 18.29 | | | $ | 12.76 | |
| | |
|
|
| |
|
|
| |
|
|
| |
|
|
|
| * | Redemption price per share varies based on length of time shares are held. |
See notes to financial statements.
29
PACIFIC CAPITAL FUNDS
Statements of Assets and Liabilities, Continued
July 31, 2005
| | | | | | | | | | | | | | | | |
| | | Growth Stock Fund
| | | Growth and
Income Fund
| | | Value Fund
| | | Diversified
Fixed Income
Fund
| |
| ASSETS: | | | | | | | | | | | | | | | | |
Investments, at value (cost $225,173,356; $137,240,368; $164,774,668; and $297,331,080, respectively) | | $ | 242,979,614 | | | $ | 150,992,256 | | | $ | 188,389,316 | | | $ | 304,070,728 | |
Interest and dividends receivable | | | 142,539 | | | | 128,538 | | | | 270,184 | | | | 4,038,088 | |
Prepaid expenses and other assets | | | 5,559 | | | | 4,133 | | | | 3,986 | | | | 6,326 | |
| | |
|
|
| |
|
|
| |
|
|
| |
|
|
|
Total Assets | | | 243,127,712 | | | | 151,124,927 | | | | 188,663,486 | | | | 308,115,142 | |
| | |
|
|
| |
|
|
| |
|
|
| |
|
|
|
| LIABILITIES: | | | | | | | | | | | | | | | | |
Distributions payable | | | — | | | | — | | | | — | | | | 99,166 | |
Payable for capital shares redeemed | | | 27,201 | | | | 3,200 | | | | 2,129 | | | | — | |
Payable for investments purchased | | | — | | | | — | | | | — | | | | 3,788,296 | |
Accrued expenses and other payables: | | | | | | | | | | | | | | | | |
Investment advisory fees | | | 162,461 | | | | 101,262 | | | | 127,398 | | | | 116,721 | |
Administration fees | | | 7,480 | | | | 4,549 | | | | 4,617 | | | | 8,817 | |
Compliance services fees | | | 3,031 | | | | 3,092 | | | | 3,498 | | | | 7,329 | |
Distribution fees | | | 14,038 | | | | 8,819 | | | | 3,382 | | | | 5,440 | |
Other fees | | | 52,617 | | | | 34,514 | | | | 39,486 | | | | 66,065 | |
| | |
|
|
| |
|
|
| |
|
|
| |
|
|
|
Total Liabilities | | | 266,828 | | | | 155,436 | | | | 180,510 | | | | 4,091,834 | |
| | |
|
|
| |
|
|
| |
|
|
| |
|
|
|
| NET ASSETS: | | | | | | | | | | | | | | | | |
Capital (no par value) | | | 334,092,015 | | | | 157,369,034 | | | | 172,458,703 | | | | 297,312,896 | |
Undistributed (distributions in excess of) net investment income | | | 6,790 | | | | 6,258 | | | | 40,026 | | | | (54,617 | ) |
Accumulated net realized gains (losses) on investment transactions | | | (109,044,179 | ) | | | (20,157,689 | ) | | | (7,630,401 | ) | | | 25,381 | |
Net unrealized appreciation on investments | | | 17,806,258 | | | | 13,751,888 | | | | 23,614,648 | | | | 6,739,648 | |
| | |
|
|
| |
|
|
| |
|
|
| |
|
|
|
Net Assets | | $ | 242,860,884 | | | $ | 150,969,491 | | | $ | 188,482,976 | | | $ | 304,023,308 | |
| | |
|
|
| |
|
|
| |
|
|
| |
|
|
|
Net Assets | | | | | | | | | | | | | | | | |
Class A | | $ | 9,996,692 | | | $ | 5,554,422 | | | $ | 2,910,247 | | | $ | 4,576,992 | |
Class B | | | 12,126,638 | | | | 7,193,099 | | | | 1,460,355 | | | | 4,018,834 | |
Class C | | | 1,987,457 | | | | 1,911,042 | | | | 1,833,362 | | | | 1,187,598 | |
Class Y | | | 218,750,097 | | | | 136,310,928 | | | | 182,279,012 | | | | 294,239,884 | |
| | |
|
|
| |
|
|
| |
|
|
| |
|
|
|
Total | | $ | 242,860,884 | | | $ | 150,969,491 | | | $ | 188,482,976 | | | $ | 304,023,308 | |
| | |
|
|
| |
|
|
| |
|
|
| |
|
|
|
Outstanding units of beneficial interest (shares) | | | | | | | | | | | | | | | | |
Class A | | | 1,152,559 | | | | 417,026 | | | | 294,818 | | | | 415,354 | |
Class B | | | 1,489,820 | | | | 572,282 | | | | 150,540 | | | | 365,358 | |
Class C | | | 244,364 | | | | 152,193 | | | | 188,279 | | | | 107,970 | |
Class Y | | | 24,513,060 | | | | 10,156,433 | | | | 18,430,857 | | | | 26,533,352 | |
| | |
|
|
| |
|
|
| |
|
|
| |
|
|
|
Total | | | 27,399,803 | | | | 11,297,934 | | | | 19,064,494 | | | | 27,422,034 | |
| | |
|
|
| |
|
|
| |
|
|
| |
|
|
|
Net Asset Value | | | | | | | | | | | | | | | | |
Class A—redemption price per share | | $ | 8.67 | | | $ | 13.32 | | | $ | 9.87 | | | $ | 11.02 | |
| | |
|
|
| |
|
|
| |
|
|
| |
|
|
|
Class A—maximum sales charge | | | 5.25 | % | | | 5.25 | % | | | 5.25 | % | | | 4.00 | % |
| | |
|
|
| |
|
|
| |
|
|
| |
|
|
|
Class A—Maximum offering price per share
(100%/(100%-maximum sales charge) of net asset value adjusted to the nearest cent) | | $ | 9.15 | | | $ | 14.06 | | | $ | 10.42 | | | $ | 11.48 | |
| | |
|
|
| |
|
|
| |
|
|
| |
|
|
|
Class B—offering price per share* | | $ | 8.14 | | | $ | 12.57 | | | $ | 9.70 | | | $ | 11.00 | |
| | |
|
|
| |
|
|
| |
|
|
| |
|
|
|
Class C—offering price per share* | | $ | 8.13 | | | $ | 12.56 | | | $ | 9.74 | | | $ | 11.00 | |
| | |
|
|
| |
|
|
| |
|
|
| |
|
|
|
Class Y—offering and redemption price per share | | $ | 8.92 | | | $ | 13.42 | | | $ | 9.89 | | | $ | 11.09 | |
| | |
|
|
| |
|
|
| |
|
|
| |
|
|
|
| * | Redemption price per share varies based on length of time shares are held. |
See notes to financial statements.
30
PACIFIC CAPITAL FUNDS
Statements of Assets and Liabilities, Continued
July 31, 2005
| | | | | | | | | | | | | | | | |
| | | Tax-Free
Securities Fund
| | | Short Intermediate
U.S. Government
Securities
Fund
| | | Tax-Free Short
Intermediate
Securities
Fund
| | | Ultra Short
Government
Fund
| |
| ASSETS: | | | | | | | | | | | | | | | | |
Investments, at value (cost $301,906,622; $88,669,798; $67,552,828; and $129,457,985, respectively) | | $ | 325,980,743 | | | $ | 87,509,340 | | | $ | 68,150,133 | | | $ | 128,465,645 | |
Cash | | | — | | | | 385 | | | | — | | | | 2,819 | |
Interest and dividends receivable | | | 3,641,869 | | | | 960,414 | | | | 770,791 | | | | 956,392 | |
Receivable for investments sold | | | — | | | | — | | | | — | | | | 6,000,000 | |
Prepaid expenses and other assets | | | 7,736 | | | | 1,829 | | | | 1,708 | | | | 4,824 | |
| | |
|
|
| |
|
|
| |
|
|
| |
|
|
|
Total Assets | | | 329,630,348 | | | | 88,471,968 | | | | 68,922,632 | | | | 135,429,680 | |
| | |
|
|
| |
|
|
| |
|
|
| |
|
|
|
| LIABILITIES: | | | | | | | | | | | | | | | | |
Cash overdraft | | | 1,159,108 | | | | — | | | | — | | | | — | |
Distributions payable | | | 110,419 | | | | 23,227 | | | | 15,578 | | | | 27,435 | |
Payable for capital shares redeemed | | | — | | | | — | | | | — | | | | 1,000 | |
Payable for investments purchased | | | — | | | | — | | | | — | | | | 1,999 | |
Investment advisory fees | | | 125,807 | | | | 21,896 | | | | 23,156 | | | | 19,290 | |
Administration fees | | | 10,374 | | | | 2,001 | | | | 1,885 | | | | 1,573 | |
Compliance services fees | | | 4,557 | | | | 1,226 | | | | 917 | | | | — | |
Distribution fees | | | 4,804 | | | | 920 | | | | 816 | | | | 4,333 | |
Other fees | | | 33,451 | | | | 20,239 | | | | 16,616 | | | | 30,757 | |
| | |
|
|
| |
|
|
| |
|
|
| |
|
|
|
Total Liabilities | | | 1,448,520 | | | | 69,509 | | | | 58,968 | | | | 86,387 | |
| | |
|
|
| |
|
|
| |
|
|
| |
|
|
|
| NET ASSETS: | | | | | | | | | | | | | | | | |
Capital (no par value) | | | 302,196,590 | | | | 89,920,251 | | | | 68,328,605 | | | | 138,323,366 | |
Undistributed net investment income | | | 36 | | | | 51 | | | | 762 | | | | 7,143 | |
Accumulated net realized gains (losses) on investment transactions | | | 1,911,081 | | | | (357,385 | ) | | | (63,008 | ) | | | (1,994,876 | ) |
Net unrealized appreciation (depreciation) on investments | | | 24,074,121 | | | | (1,160,458 | ) | | | 597,305 | | | | (992,340 | ) |
| | |
|
|
| |
|
|
| |
|
|
| |
|
|
|
Net Assets | | $ | 328,181,828 | | | $ | 88,402,459 | | | $ | 68,863,664 | | | $ | 135,343,293 | |
| | |
|
|
| |
|
|
| |
|
|
| |
|
|
|
Net Assets | | | | | | | | | | | | | | | | |
Class A | | $ | 8,973,223 | | | $ | 1,780,909 | | | $ | 3,783,682 | | | $ | 6,552,178 | |
Class B | | | 3,344,151 | | | | N/A | | | | N/A | | | | 1,608,529 | |
Class C | | | 10,361 | | | | 630,823 | | | | 10,082 | | | | 1,833,743 | |
Class Y | | | 315,854,093 | | | | 85,990,727 | | | | 65,069,900 | | | | 125,348,843 | |
| | |
|
|
| |
|
|
| |
|
|
| |
|
|
|
Total | | $ | 328,181,828 | | | $ | 88,402,459 | | | $ | 68,863,664 | | | $ | 135,343,293 | |
| | |
|
|
| |
|
|
| |
|
|
| |
|
|
|
Outstanding units of beneficial interest (shares) | | | | | | | | | | | | | �� | | | |
Class A | | | 852,589 | | | | 184,368 | | | | 370,493 | | | | 652,701 | |
Class B | | | 317,747 | | | | N/A | | | | N/A | | | | 160,239 | |
Class C | | | 984 | | | | 65,364 | | | | 987 | | | | 182,712 | |
Class Y | | | 29,893,581 | | | | 8,885,685 | | | | 6,337,250 | | | | 12,478,461 | |
| | |
|
|
| |
|
|
| |
|
|
| |
|
|
|
Total | | | 31,064,901 | | | | 9,135,417 | | | | 6,708,730 | | | | 13,474,113 | |
| | |
|
|
| |
|
|
| |
|
|
| |
|
|
|
Net Asset Value | | | | | | | | | | | | | | | | |
Class A—redemption price per share | | $ | 10.52 | | | $ | 9.66 | | | $ | 10.21 | | | $ | 10.04 | |
| | |
|
|
| |
|
|
| |
|
|
| |
|
|
|
Class A—maximum sales charge | | | 4.00 | % | | | 2.25 | % | | | 2.25 | % | | | 2.25 | % |
| | |
|
|
| |
|
|
| |
|
|
| |
|
|
|
Class A—Maximum offering price per share
(100%/(100%-maximum sales charge) of net asset value adjusted to the nearest cent) | | $ | 10.96 | | | $ | 9.88 | | | $ | 10.45 | | | $ | 10.27 | |
| | |
|
|
| |
|
|
| |
|
|
| |
|
|
|
Class B—offering price per share* | | $ | 10.52 | | | | N/A | | | | N/A | | | $ | 10.04 | |
| | |
|
|
| |
|
|
| |
|
|
| |
|
|
|
Class C—offering price per share* | | $ | 10.53 | | | $ | 9.65 | | | $ | 10.21 | | | $ | 10.04 | |
| | |
|
|
| |
|
|
| |
|
|
| |
|
|
|
Class Y—offering and redemption price per share | | $ | 10.57 | | | $ | 9.68 | | | $ | 10.27 | | | $ | 10.05 | |
| | |
|
|
| |
|
|
| |
|
|
| |
|
|
|
| * | Redemption price per share varies based on length of time shares are held. |
See notes to financial statements.
31
PACIFIC CAPITAL FUNDS
Statements of Operations
Year Ended July 31, 2005
| | | | | | | | | | | | | | | | |
| | | New Asia
Growth
Fund
| | | International
Stock
Fund
| | | Small Cap
Fund
| | | Mid-Cap
Fund
| |
| Investment Income: | | | | | | | | | | | | | | | | |
Interest income | | $ | 7,609 | | | $ | — | | | $ | 53,173 | | | $ | 167 | |
Dividend income | | | 1,211,018 | | | | 2,046,971 | | | | 1,654,814 | | | | 812,776 | |
Foreign tax withholding | | | (122,700 | ) | | | (167,186 | ) | | | — | | | | — | |
| | |
|
|
| |
|
|
| |
|
|
| |
|
|
|
Total Investment Income | | | 1,095,927 | | | | 1,879,785 | | | | 1,707,987 | | | | 812,943 | |
| | |
|
|
| |
|
|
| |
|
|
| |
|
|
|
| Expenses: | | | | | | | | | | | | | | | | |
Investment advisory fees | | | 154,628 | | | | 345,690 | | | | 793,825 | | | | 382,933 | |
Sub-investment advisory fees | | | 193,284 | | | | 446,074 | | | | 913,160 | | | | 127,645 | |
Administration fees | | | 61,852 | | | | 122,913 | | | | 254,215 | | | | 102,116 | |
Distribution fees—Class A | | | 11,830 | | | | 6,935 | | | | 288,323 | | | | 3,418 | |
Distribution fees—Class B | | | 4,202 | | | | 6,501 | | | | 33,148 | | | | | |
Distribution fees—Class C | | | 1,339 | | | | 2,653 | | | | 16,524 | | | | 2,710 | |
Accounting fees | | | 49,970 | | | | 73,686 | | | | 58,700 | | | | 25,630 | |
Compliance services fees | | | 5,051 | | | | 10,622 | | | | 10,274 | | | | 8,590 | |
Custodian fees | | | 97,721 | | | | 83,103 | | | | 22,706 | | | | 35,452 | |
Transfer agent fees | | | 64,191 | | | | 64,542 | | | | 132,122 | | | | 37,271 | |
Legal and audit fees | | | 19,314 | | | | 24,026 | | | | 46,090 | | | | 19,769 | |
Trustee fees | | | 2,616 | | | | 5,104 | | | | 10,539 | | | | 4,124 | |
Registration and filing fees | | | 3,832 | | | | 19,730 | | | | 30,559 | | | | 1,608 | |
Other fees | | | 18,045 | | | | 26,924 | | | | 72,467 | | | | 19,337 | |
| | |
|
|
| |
|
|
| |
|
|
| |
|
|
|
Total expenses before voluntary fee reductions | | | 687,875 | | | | 1,238,503 | | | | 2,682,652 | | | | 770,603 | |
Expenses voluntarily reduced: | | | | | | | | | | | | | | | | |
Investment advisory fees | | | — | | | | (76,819 | ) | | | (158,881 | ) | | | (195,587 | ) |
Administration fees | | | (9,382 | ) | | | (13,739 | ) | | | (29,640 | ) | | | (58,078 | ) |
Distribution fees—Class A | | | (7,886 | ) | | | (4,623 | ) | | | (192,215 | ) | | | (2,278 | ) |
| | |
|
|
| |
|
|
| |
|
|
| |
|
|
|
Net Expenses | | | 670,607 | | | | 1,143,322 | | | | 2,301,916 | | | | 514,660 | |
| | |
|
|
| |
|
|
| |
|
|
| |
|
|
|
Net Investment Income (Loss) | | | 425,320 | | | | 736,463 | | | | (593,929 | ) | | | 298,283 | |
| | |
|
|
| |
|
|
| |
|
|
| |
|
|
|
| Realized/Unrealized Gains from Investments and Foreign Currency Transactions: | | | | | | | | | | | | | | | | |
Net realized gains from investments and foreign currency transactions | | | 2,583,113 | | | | 1,884,497 | | | | 22,221,235 | | | | 2,966,126 | |
Change in unrealized appreciation/depreciation on investments and foreign currency transactions | | | 9,023,390 | | | | 11,417,855 | | | | 21,192,522 | | | | 11,205,226 | |
| | |
|
|
| |
|
|
| |
|
|
| |
|
|
|
Net realized/unrealized gains on investments and foreign currency transactions | | | 11,606,503 | | | | 13,302,352 | | | | 43,413,757 | | | | 14,171,352 | |
| | |
|
|
| |
|
|
| |
|
|
| |
|
|
|
Change in net assets resulting from operations | | $ | 12,031,823 | | | $ | 14,038,815 | | | $ | 42,819,828 | | | $ | 14,469,635 | |
| | |
|
|
| |
|
|
| |
|
|
| |
|
|
|
See notes to financial statements.
32
PACIFIC CAPITAL FUNDS
Statements of Operations, Continued
Year Ended July 31, 2005
| | | | | | | | | | | | | | | | |
| | | Growth
Stock
Fund
| | | Growth and
Income
Fund
| | | Value
Fund
| | | Diversified
Fixed Income
Fund
| |
| Investment Income: | | | | | | | | | | | | | | | | |
Interest income | | $ | — | | | $ | 4 | | | $ | 14 | | | $ | 12,951,259 | |
Dividend income | | | 3,352,694 | | | | 2,635,189 | | | | 3,976,358 | | | | 102,149 | |
| | |
|
|
| |
|
|
| |
|
|
| |
|
|
|
Total Investment Income | | | 3,352,694 | | | | 2,635,193 | | | | 3,976,372 | | | | 13,053,408 | |
| | |
|
|
| |
|
|
| |
|
|
| |
|
|
|
| Expenses: | | | | | | | | | | | | | | | | |
Investment advisory fees | | | 2,004,734 | | | | 1,147,835 | | | | 1,477,290 | | | | 1,718,912 | |
Administration fees | | | 401,027 | | | | 229,569 | | | | 295,461 | | | | 458,379 | |
Distribution fees—Class A | | | 77,757 | | | | 40,849 | | | | 19,981 | | | | 36,645 | |
Distribution fees—Class B | | | 124,620 | | | | 73,796 | | | | 13,927 | | | | 42,138 | |
Distribution fees—Class C | | | 10,100 | | | | 9,556 | | | | 9,473 | | | | 6,778 | |
Accounting fees | | | 91,355 | | | | 53,704 | | | | 67,788 | | | | 111,350 | |
Custodian fees | | | 31,336 | | | | 23,405 | | | | 19,856 | | | | 22,265 | |
Compliance services fees | | | 29,534 | | | | 17,904 | | | | 22,603 | | | | 36,471 | |
Transfer agent fees | | | 165,456 | | | | 112,310 | | | | 67,819 | | | | 82,764 | |
Legal and audit fees | | | 63,444 | | | | 39,071 | | | | 49,310 | | | | 75,165 | |
Trustee fees | | | 18,441 | | | | 10,267 | | | | 13,299 | | | | 20,028 | |
Registration and filing fees | | | 17,886 | | | | 15,693 | | | | 2,356 | | | | 2,918 | |
Other fees | | | 86,473 | | | | 52,138 | | | | 57,421 | | | | 81,110 | |
| | |
|
|
| |
|
|
| |
|
|
| |
|
|
|
Total expenses before voluntary fee reductions | | | 3,122,163 | | | | 1,826,097 | | | | 2,116,584 | | | | 2,694,923 | |
Expenses voluntarily reduced: | | | | | | | | | | | | | | | | |
Investment advisory fees | | | — | | | | — | | | | — | | | | (429,728 | ) |
Administration fees | | | (35,618 | ) | | | (21,734 | ) | | | (27,642 | ) | | | (45,311 | ) |
Distribution fees—Class A | | | (51,838 | ) | | | (27,233 | ) | | | (13,321 | ) | | | (24,430 | ) |
| | |
|
|
| |
|
|
| |
|
|
| |
|
|
|
Net Expenses | | | 3,034,707 | | | | 1,777,130 | | | | 2,075,621 | | | | 2,195,454 | |
| | |
|
|
| |
|
|
| |
|
|
| |
|
|
|
Net Investment Income | | | 317,987 | | | | 858,063 | | | | 1,900,751 | | | | 10,857,954 | |
| | |
|
|
| |
|
|
| |
|
|
| |
|
|
|
| Realized/Unrealized Gains (Losses) from Investments: | | | | | | | | | | | | | | | | |
Net realized gains from investments | | | 11,157,491 | | | | 15,377,467 | | | | 24,968,577 | | | | 275,702 | |
Change in unrealized appreciation/depreciation on investments | | | 13,535,551 | | | | 3,986,953 | | | | 5,729,456 | | | | (345,138 | ) |
| | |
|
|
| |
|
|
| |
|
|
| |
|
|
|
Net realized/unrealized gains (losses) on investments | | | 24,693,042 | | | | 19,364,420 | | | | 30,698,033 | | | | (69,436 | ) |
| | |
|
|
| |
|
|
| |
|
|
| |
|
|
|
Change in net assets resulting from operations | | $ | 25,011,029 | | | $ | 20,222,483 | | | $ | 32,598,784 | | | $ | 10,788,518 | |
| | |
|
|
| |
|
|
| |
|
|
| |
|
|
|
See notes to financial statements.
33
PACIFIC CAPITAL FUNDS
Statements of Operations, Continued
Year Ended July 31, 2005
| | | | | | | | | | | | | | | | |
| | | Tax-Free
Securities
Fund
| | | Short Intermediate
U.S. Government
Securities
Fund
| | | Tax-Free Short
Intermediate
Securities
Fund
| | | Ultra Short
Government
Fund
| |
| Investment Income: | | | | | | | | | | | | | | | | |
Interest income | | $ | 16,459,971 | | | $ | 3,114,160 | | | $ | 2,266,551 | | | $ | 4,365,946 | |
Dividend income | | | 4,486 | | | | — | | | | 21,717 | | | | — | |
| | |
|
|
| |
|
|
| |
|
|
| |
|
|
|
Total Investment Income | | | 16,464,457 | | | | 3,114,160 | | | | 2,288,268 | | | | 4,365,946 | |
| | |
|
|
| |
|
|
| |
|
|
| |
|
|
|
| Expenses: | | | | | | | | | | | | | | | | |
Investment advisory fees | | | 2,051,522 | | | | 447,311 | | | | 352,410 | | | | 743,396 | |
Administration fees | | | 547,076 | | | | 143,141 | | | | 112,773 | | | | 297,361 | |
Distribution fees—Class A | | | 72,154 | | | | 12,763 | | | | 34,254 | | | | 55,151 | |
Distribution fees—Class B | | | 35,302 | | | | | | | | | | | | 18,251 | |
Distribution fees—Class C | | | 102 | | | | 3,832 | | | | 102 | | | | 10,482 | |
Accounting fees | | | 140,918 | | | | 39,539 | | | | 32,969 | | | | 75,417 | |
Custodian fees | | | 79,196 | | | | 9,321 | | | | 17,092 | | | | 14,820 | |
Compliance services fees | | | 40,327 | | | | 10,665 | | | | 8,195 | | | | 20,380 | |
Transfer agent fees | | | 66,166 | | | | 39,339 | | | | 37,115 | | | | 64,800 | |
Legal and audit fees | | | 86,310 | | | | 25,285 | | | | 21,110 | | | | 47,329 | |
Trustee fees | | | 24,752 | | | | 6,387 | | | | 5,123 | | | | 14,262 | |
Registration and filing fees | | | 2,606 | | | | 1,720 | | | | 1,408 | | | | 2,343 | |
Other fees | | | 92,282 | | | | 25,465 | | | | 19,913 | | | | 47,904 | |
| | |
|
|
| |
|
|
| |
|
|
| |
|
|
|
Total expenses before voluntary fee reductions | | | 3,238,713 | | | | 764,768 | | | | 642,464 | | | | 1,411,896 | |
Expenses voluntarily reduced: | | | | | | | | | | | | | | | | |
Investment advisory fees | | | (512,880 | ) | | | (220,099 | ) | | | (70,481 | ) | | | (471,125 | ) |
Administration fees | | | (49,413 | ) | | | (36,664 | ) | | | (15,632 | ) | | | (169,123 | ) |
Distribution fees—Class A | | | (48,103 | ) | | | (8,509 | ) | | | (22,836 | ) | | | (36,767 | ) |
| | |
|
|
| |
|
|
| |
|
|
| |
|
|
|
Net Expenses | | | 2,628,317 | | | | 499,496 | | | | 533,515 | | | | 734,881 | |
| | |
|
|
| |
|
|
| |
|
|
| |
|
|
|
Net Investment Income | | | 13,836,140 | | | | 2,614,664 | | | | 1,754,753 | | | | 3,631,065 | |
| | |
|
|
| |
|
|
| |
|
|
| |
|
|
|
| Realized/Unrealized Gains (Losses) from Investments: | | | | | | | | | | | | | | | | |
Net realized gains (losses) from investments | | | 2,616,007 | | | | (357,386 | ) | | | (63,008 | ) | | | (694,029 | ) |
Change in unrealized appreciation/depreciation on investments | | | (3,540,022 | ) | | | (998,722 | ) | | | (557,077 | ) | | | (399,825 | ) |
| | |
|
|
| |
|
|
| |
|
|
| |
|
|
|
Net realized/unrealized losses on investments | | | (924,015 | ) | | | (1,356,108 | ) | | | (620,085 | ) | | | (1,093,854 | ) |
| | |
|
|
| |
|
|
| |
|
|
| |
|
|
|
Change in net assets resulting from operations | | $ | 12,912,125 | | | $ | 1,258,556 | | | $ | 1,134,668 | | | $ | 2,537,211 | |
| | |
|
|
| |
|
|
| |
|
|
| |
|
|
|
See notes to financial statements.
34
PACIFIC CAPITAL FUNDS
Statements of Changes in Net Assets
| | | | | | | | | | | | | | | | | | | | | | | | |
| | | New Asia Growth Fund
| | | International Stock Fund
| | | Small Cap Fund
| |
| | | Year Ended
July 31,
2005
| | | Year Ended
July 31,
2004
| | | Year Ended
July 31,
2005
| | | Year Ended
July 31,
2004
| | | Year Ended
July 31,
2005
| | | Year Ended
July 31,
2004
| |
| From Investment Activities: | | | | | | | | | | | | | | | | | | | | | | | | |
| Operations: | | | | | | | | | | | | | | | | | | | | | | | | |
Net investment income (loss) | | $ | 425,320 | | | $ | 279,105 | | | $ | 736,463 | | | $ | 132,180 | | | $ | (593,929 | ) | | $ | (182,707 | ) |
Net realized gains on investments and foreign currency transactions | | | 2,583,113 | | | | 3,954,070 | | | | 1,884,497 | | | | 15,856,634 | | | | 22,221,235 | | | | 20,130,145 | |
Change in unrealized appreciation/depreciation on investments and foreign currency transactions | | | 9,023,390 | | | | (54,003 | ) | | | 11,417,855 | | | | (7,285,430 | ) | | | 21,192,522 | | | | 5,505,970 | |
| | |
|
|
| |
|
|
| |
|
|
| |
|
|
| |
|
|
| |
|
|
|
Change in net assets resulting from operations | | | 12,031,823 | | | | 4,179,172 | | | | 14,038,815 | | | | 8,703,384 | | | | 42,819,828 | | | | 25,453,408 | |
| | |
|
|
| |
|
|
| |
|
|
| |
|
|
| |
|
|
| |
|
|
|
| Distributions to Class A Shareholders: | | | | | | | | | | | | | | | | | | | | | | | | |
From net investment income | | | (14,518 | ) | | | (8,179 | ) | | | (3,039 | ) | | | — | | | | — | | | | — | |
From net realized gains | | | — | | | | — | | | | — | | | | — | | | | (3,504,316 | ) | | | (65,734 | ) |
| Distributions to Class B Shareholders: | | | | | | | | | | | | | | | | | | | | | | | | |
From net investment income | | | (2,083 | ) | | | (835 | ) | | | (809 | ) | | | — | | | | — | | | | — | |
From net realized gains | | | — | | | | — | | | | — | | | | — | | | | (515,464 | ) | | | (65,678 | ) |
| Distributions to Class C Shareholders: | | | | | | | | | | | | | | | | | | | | | | | | |
From net investment income | | | (488 | ) | | | — | | | | (677 | ) | | | — | | | | — | | | | — | |
From net realized gains | | | — | | | | — | | | | — | | | | — | | | | (52,384 | ) | | | — | |
| Distributions to Class Y Shareholders: | | | | | | | | | | | | | | | | | | | | | | | | |
From net investment income | | | (413,438 | ) | | | (230,042 | ) | | | (503,746 | ) | | | — | | | | — | | | | — | |
From net realized gains | | | — | | | | — | | | | — | | | | — | | | | (18,502,150 | ) | | | (2,281,678 | ) |
| | |
|
|
| |
|
|
| |
|
|
| |
|
|
| |
|
|
| |
|
|
|
Change in net assets from shareholder distributions | | | (430,527 | ) | | | (239,056 | ) | | | (508,271 | ) | | | — | | | | (22,574,314 | ) | | | (2,413,090 | ) |
| | |
|
|
| |
|
|
| |
|
|
| |
|
|
| |
|
|
| |
|
|
|
| Capital Transactions: | | | | | | | | | | | | | | | | | | | | | | | | |
Change in net assets from share transactions | | | 3,388,115 | (a) | | | 2,025,973 | | | | 20,945,030 | (b) | | | (10,005,847 | )(b) | | | 86,728,759 | | | | 18,779,910 | |
| | |
|
|
| |
|
|
| |
|
|
| |
|
|
| |
|
|
| |
|
|
|
Change in net assets | | | 14,989,411 | | | | 5,966,089 | | | | 34,475,574 | | | | (1,302,463 | ) | | | 106,974,273 | | | | 41,820,228 | |
| | |
|
|
| |
|
|
| |
|
|
| |
|
|
| |
|
|
| |
|
|
|
| Net Assets: | | | | | | | | | | | | | | | | | | | | | | | | |
Beginning of year | | | 31,590,916 | | | | 25,624,827 | | | | 60,665,983 | | | | 61,968,446 | | | | 131,411,021 | | | | 89,590,793 | |
| | |
|
|
| |
|
|
| |
|
|
| |
|
|
| |
|
|
| |
|
|
|
End of year | | $ | 46,580,327 | | | $ | 31,590,916 | | | $ | 95,141,557 | | | $ | 60,665,983 | | | $ | 238,385,294 | | | $ | 131,411,021 | |
| | |
|
|
| |
|
|
| |
|
|
| |
|
|
| |
|
|
| |
|
|
|
Undistributed (distributions in excess of) net investment income | | $ | (31,718 | ) | | $ | (6,600 | ) | | $ | (167,757 | ) | | $ | (153,281 | ) | | $ | — | | | $ | — | |
| | |
|
|
| |
|
|
| |
|
|
| |
|
|
| |
|
|
| |
|
|
|
| (a) | Includes redemption fees collected of $393. |
| (b) | Includes redemption fees collected of $1,414 and $5,141 for the years ended July 31, 2005 and 2004 respectively. |
See notes to financial statements.
35
PACIFIC CAPITAL FUNDS
Statements of Changes in Net Assets, Continued
| | | | | | | | | | | | | | | | | | | | | | | | |
| | | Mid-Cap Fund
| | | Growth Stock Fund
| | | Growth and Income Fund
| |
| | | Year Ended
July 31,
2005
| | | Period Ended
July 31,
2004 (a)
| | | Year Ended
July 31,
2005
| | | Year Ended
July 31,
2004
| | | Year Ended
July 31,
2005
| | | Year Ended
July 31,
2004
| |
| From Investment Activities: | | | | | | | | | | | | | | | | | | | | | | | | |
| Operations: | | | | | | | | | | | | | | | | | | | | | | | | |
Net investment income (loss) | | $ | 298,283 | | | $ | 84,764 | | | $ | 317,987 | | | $ | (1,086,679 | ) | | $ | 858,063 | | | $ | 477,693 | |
Net realized gains (losses) on investments | | | 2,966,126 | | | | (595,179 | ) | | | 11,157,491 | | | | 13,073,624 | | | | 15,377,467 | | | | 4,474,683 | |
Change in unrealized appreciation/depreciation on investments | | | 11,205,226 | | | | 983,579 | | | | 13,535,551 | | | | 1,041,744 | | | | 3,986,953 | | | | 8,976,819 | |
| | |
|
|
| |
|
|
| |
|
|
| |
|
|
| |
|
|
| |
|
|
|
Change in net assets resulting from operations | | | 14,469,635 | | | | 473,164 | | | | 25,011,029 | | | | 13,028,689 | | | | 20,222,483 | | | | 13,929,195 | |
| | |
|
|
| |
|
|
| |
|
|
| |
|
|
| |
|
|
| |
|
|
|
Distributions to Class A
Shareholders: | | | | | | | | | | | | | | | | | | | | | | | | |
From net investment income | | | (1,294 | ) | | | (244 | ) | | | (10,054 | ) | | | — | | | | (24,043 | ) | | | (7,101 | ) |
Distributions to Class B
Shareholders: | | | | | | | | | | | | | | | | | | | | | | | | |
From net investment income | | | | | | | | | | | — | | | | — | | | | (18,925 | ) | | | — | |
Distributions to Class C
Shareholders: | | | | | | | | | | | | | | | | | | | | | | | | |
From net investment income | | | — | | | | — | | | | (2,290 | ) | | | — | | | | (2,917 | ) | | | — | |
Distributions to Class Y
Shareholders: | | | | | | | | | | | | | | | | | | | | | | | | |
From net investment income | | | (294,553 | ) | | | (81,114 | ) | | | (500,630 | ) | | | — | | | | (824,567 | ) | | | (472,057 | ) |
| | |
|
|
| |
|
|
| |
|
|
| |
|
|
| |
|
|
| |
|
|
|
Change in net assets from shareholder distributions | | | (295,847 | ) | | | (81,358 | ) | | | (512,974 | ) | | | — | | | | (870,452 | ) | | | (479,158 | ) |
| | |
|
|
| |
|
|
| |
|
|
| |
|
|
| |
|
|
| |
|
|
|
| Capital Transactions: | | | | | | | | | | | | | | | | | | | | | | | | |
Change in net assets from share transactions | | | 39,350,437 | | | | 30,493,530 | | | | (43,127,154 | ) | | | (27,709,543 | ) | | | (9,323,376 | ) | | | (23,591,266 | ) |
| | |
|
|
| |
|
|
| |
|
|
| |
|
|
| |
|
|
| |
|
|
|
Change in net assets | | | 53,524,225 | | | | 30,885,336 | | | | (18,629,099 | ) | | | (14,680,854 | ) | | | 10,028,655 | | | | (10,141,229 | ) |
| | |
|
|
| |
|
|
| |
|
|
| |
|
|
| |
|
|
| |
|
|
|
| Net Assets: | | | | | | | | | | | | | | | | | | | | | | | | |
Beginning of period | | | 30,885,336 | | | | — | | | | 261,489,983 | | | | 276,170,837 | | | | 140,940,836 | | | | 151,082,065 | |
| | |
|
|
| |
|
|
| |
|
|
| |
|
|
| |
|
|
| |
|
|
|
End of period | | $ | 84,409,561 | | | $ | 30,885,336 | | | $ | 242,860,884 | | | $ | 261,489,983 | | | $ | 150,969,491 | | | $ | 140,940,836 | |
| | |
|
|
| |
|
|
| |
|
|
| |
|
|
| |
|
|
| |
|
|
|
Undistributed net investment income | | $ | 5,842 | | | $ | 3,406 | | | $ | 6,790 | | | $ | — | | | $ | 6,258 | | | $ | 18,647 | |
| | |
|
|
| |
|
|
| |
|
|
| |
|
|
| |
|
|
| |
|
|
|
| (a) | For the period from December 30, 2003 (commencement of operations) to July 31, 2004. |
See notes to financial statements.
36
PACIFIC CAPITAL FUNDS
Statements of Changes in Net Assets, Continued
| | | | | | | | | | | | | | | | | | | | | | | | |
| | | Value Fund
| | | Diversified Fixed
Income Fund
| | | Tax-Free Securities Fund
| |
| | | Year Ended
July 31,
2005
| | | Year Ended
July 31,
2004
| | | Year Ended
July 31,
2005
| | | Year Ended
July 31,
2004
| | | Year Ended
July 31,
2005
| | | Year Ended
July 31,
2004
| |
| From Investment Activities: | | | | | | | | | | | | | | | | | | | | | | | | |
| Operations: | | | | | | | | | | | | | | | | | | | | | | | | |
Net investment income | | $ | 1,900,751 | | | $ | 1,783,921 | | | $ | 10,857,954 | | | $ | 10,994,992 | | | $ | 13,836,140 | | | $ | 16,570,810 | |
Net realized gains on investments | | | 24,968,577 | | | | 15,033,655 | | | | 275,702 | | | | 1,052,158 | | | | 2,616,007 | | | | 4,910,728 | |
Change in unrealized appreciation/depreciation on investments | | | 5,729,456 | | | | 11,813,971 | | | | (345,138 | ) | | | (2,349,080 | ) | | | (3,540,022 | ) | | | (3,327,446 | ) |
| | |
|
|
| |
|
|
| |
|
|
| |
|
|
| |
|
|
| |
|
|
|
Change in net assets resulting from operations | | | 32,598,784 | | | | 28,631,547 | | | | 10,788,518 | | | | 9,698,070 | | | | 12,912,125 | | | | 18,154,092 | |
| | |
|
|
| |
|
|
| |
|
|
| |
|
|
| |
|
|
| |
|
|
|
Distributions to Class A
Shareholders: | | | | | | | | | | | | | | | | | | | | | | | | |
From net investment income | | | (21,647 | ) | | | (17,905 | ) | | | (175,491 | ) | | | (223,693 | ) | | | (368,370 | ) | | | (450,273 | ) |
From net realized gains | | | — | | | | — | | | | (14,334 | ) | | | (96,653 | ) | | | (147,134 | ) | | | (57,424 | ) |
Distributions to Class B
Shareholders: | | | | | | | | | | | | | | | | | | | | | | | | |
From net investment income | | | (5,090 | ) | | | (877 | ) | | | (119,901 | ) | | | (140,288 | ) | | | (108,644 | ) | | | (149,394 | ) |
From net realized gains | | | — | | | | — | | | | (12,425 | ) | | | (83,363 | ) | | | (52,587 | ) | | | (23,132 | ) |
Distributions to Class C
Shareholders: | | | | | | | | | | | | | | | | | | | | | | | | |
From net investment income | | | (86 | ) | | | (1 | ) | | | (19,664 | ) | | | (76 | ) | | | (319 | ) | | | (81 | ) |
From net realized gains | | | — | | | | — | | | | (433 | ) | | | — | | | | (152 | ) | | | — | |
Distributions to Class Y
Shareholders: | | | | | | | | | | | | | | | | | | | | | | | | |
From net investment income | | | (1,886,095 | ) | | | (1,801,706 | ) | | | (10,577,047 | ) | | | (10,635,339 | ) | | | (13,358,806 | ) | | | (15,971,064 | ) |
From net realized gains | | | — | | | | — | | | | (777,307 | ) | | | (4,687,113 | ) | | | (4,823,386 | ) | | | (1,898,709 | ) |
| | |
|
|
| |
|
|
| |
|
|
| |
|
|
| |
|
|
| |
|
|
|
Change in net assets from shareholder distributions | | | (1,912,918 | ) | | | (1,820,489 | ) | | | (11,696,602 | ) | | | (15,866,525 | ) | | | (18,859,398 | ) | | | (18,550,077 | ) |
| | |
|
|
| |
|
|
| |
|
|
| |
|
|
| |
|
|
| |
|
|
|
Change in net assets from share transactions | | | (24,428,322 | ) | | | (58,903,429 | ) | | | 27,173,989 | | | | 33,990,285 | | | | (23,752,446 | ) | | | (55,351,621 | ) |
| | |
|
|
| |
|
|
| |
|
|
| |
|
|
| |
|
|
| |
|
|
|
Change in net assets | | | 6,257,544 | | | | (32,092,371 | ) | | | 26,265,905 | | | | 27,821,830 | | | | (29,699,719 | ) | | | (55,747,606 | ) |
| | |
|
|
| |
|
|
| |
|
|
| |
|
|
| |
|
|
| |
|
|
|
| Net Assets: | | | | | | | | | | | | | | | | | | | | | | | | |
Beginning of year | | | 182,225,432 | | | | 214,317,803 | | | | 277,757,403 | | | | 249,935,573 | | | | 357,881,547 | | | | 413,629,153 | |
| | |
|
|
| |
|
|
| |
|
|
| |
|
|
| |
|
|
| |
|
|
|
End of year | | $ | 188,482,976 | | | $ | 182,225,432 | | | $ | 304,023,308 | | | $ | 277,757,403 | | | $ | 328,181,828 | | | $ | 357,881,547 | |
| | |
|
|
| |
|
|
| |
|
|
| |
|
|
| |
|
|
| |
|
|
|
Undistributed (distributions in excess of) net investment income | | $ | 40,026 | | | $ | 56,787 | | | $ | (54,617 | ) | | $ | (54,739 | ) | | $ | 36 | | | $ | 35 | |
| | |
|
|
| |
|
|
| |
|
|
| |
|
|
| |
|
|
| |
|
|
|
See notes to financial statements.
37
PACIFIC CAPITAL FUNDS
Statements of Changes in Net Assets, Continued
| | | | | | | | | | | | | | | | | | | | | | | | |
| | | Short Intermediate
U.S. Government
Securities Fund
| | | Tax-Free
Short Intermediate
Securities Fund
| | | Ultra Short
Government Fund
| |
| | | Year Ended
July 31,
2005
| | | Year Ended
July 31,
2004
| | | Year Ended
July 31,
2005
| | | Year Ended
July 31,
2004
| | | Year Ended
July 31,
2005
| | | Year Ended
July 31,
2004
| |
| From Investment Activities: | | | | | | | | | | | | | | | | | | | | | | | | |
| Operations: | | | | | | | | | | | | | | | | | | | | | | | | |
Net investment income | | $ | 2,614,664 | | | $ | 2,570,114 | | | $ | 1,754,753 | | | $ | 1,663,390 | | | $ | 3,631,065 | | | $ | 5,306,124 | |
Net realized gains (losses) on investments | | | (357,386 | ) | | | 306,514 | | | | (63,008 | ) | | | 763 | | | | (694,029 | ) | | | (1,296,620 | ) |
Change in unrealized appreciation/depreciation on investments | | | (998,722 | ) | | | (1,657,833 | ) | | | (557,077 | ) | | | (413,702 | ) | | | (399,825 | ) | | | (2,714,011 | ) |
| | |
|
|
| |
|
|
| |
|
|
| |
|
|
| |
|
|
| |
|
|
|
Change in net assets resulting from operations | | | 1,258,556 | | | | 1,218,795 | | | | 1,134,668 | | | | 1,250,451 | | | | 2,537,211 | | | | 1,295,493 | |
| | |
|
|
| |
|
|
| |
|
|
| |
|
|
| |
|
|
| |
|
|
|
Distributions to Class A
Shareholders: | | | | | | | | | | | | | | | | | | | | | | | | |
From net investment income | | | (45,749 | ) | | | (117,965 | ) | | | (103,438 | ) | | | (87,837 | ) | | | (129,299 | ) | | | (173,327 | ) |
From net realized gains | | | (235 | ) | | | (18,642 | ) | | | — | | | | — | | | | — | | | | — | |
Distributions to Class B
Shareholders: | | | | | | | | | | | | | | | | | | | | | | | | |
From net investment income | | | | | | | | | | | | | | | | | | | (18,454 | ) | | | (20,878 | ) |
Distributions to Class C
Shareholders: | | | | | | | | | | | | | | | | | | | | | | | | |
From net investment income | | | (7,612 | ) | | | (44 | ) | | | (153 | ) | | | (36 | ) | | | (12,539 | ) | | | (23 | ) |
From net realized gains | | | (22 | ) | | | — | | | | — | | | | — | | | | — | | | | — | |
Distributions to Class Y
Shareholders: | | | | | | | | | | | | | | | | | | | | | | | | |
From net investment income | | | (2,561,303 | ) | | | (2,452,105 | ) | | | (1,651,185 | ) | | | (1,575,504 | ) | | | (3,470,787 | ) | | | (5,111,890 | ) |
From net realized gains | | | (12,012 | ) | | | (304,360 | ) | | | — | | | | — | | | | — | | | | — | |
| | |
|
|
| |
|
|
| |
|
|
| |
|
|
| |
|
|
| |
|
|
|
Change in net assets from shareholder distributions | | | (2,626,933 | ) | | | (2,893,116 | ) | | | (1,754,776 | ) | | | (1,663,377 | ) | | | (3,631,079 | ) | | | (5,306,118 | ) |
| | |
|
|
| |
|
|
| |
|
|
| |
|
|
| |
|
|
| |
|
|
|
Change in net assets from share transactions | | | 6,691,216 | | | | (9,396,958 | ) | | | (2,913,326 | ) | | | 7,039,439 | | | | (89,404,837 | ) | | | (25,844,463 | ) |
| | |
|
|
| |
|
|
| |
|
|
| |
|
|
| |
|
|
| |
|
|
|
Change in net assets | | | 5,322,839 | | | | (11,071,279 | ) | | | (3,533,434 | ) | | | 6,626,513 | | | | (90,498,705 | ) | | | (29,855,088 | ) |
| | |
|
|
| |
|
|
| |
|
|
| |
|
|
| |
|
|
| |
|
|
|
| Net Assets: | | | | | | | | | | | | | | | | | | | | | | | | |
Beginning of year | | | 83,079,620 | | | | 94,150,899 | | | | 72,397,098 | | | | 65,770,585 | | | | 225,841,998 | | | | 255,697,086 | |
| | |
|
|
| |
|
|
| |
|
|
| |
|
|
| |
|
|
| |
|
|
|
End of year | | $ | 88,402,459 | | | $ | 83,079,620 | | | $ | 68,863,664 | | | $ | 72,397,098 | | | $ | 135,343,293 | | | $ | 225,841,998 | |
| | |
|
|
| |
|
|
| |
|
|
| |
|
|
| |
|
|
| |
|
|
|
Undistributed net investment income | | $ | 51 | | | $ | 51 | | | $ | 762 | | | $ | 785 | | | $ | 7,143 | | | $ | 7,157 | |
| | |
|
|
| |
|
|
| |
|
|
| |
|
|
| |
|
|
| |
|
|
|
See notes to financial statements.
38
PACIFIC CAPITAL FUNDS
New Asia Growth Fund
Schedule of Portfolio Investments
July 31, 2005
| | | | | |
Shares
| | Security Description
| | Value
|
| Common Stocks (98.5%) | | | |
| China (6.4%) | | | |
| Consumer Discretionary (3.1%) | | | |
| 863,000 | | China Resources Enterprise Ltd. | | $ | 1,426,510 |
| | | | |
|
|
| Energy (0.4%) | | | |
| 510,000 | | China Oilfield Services Ltd.,
Class H | | | 193,532 |
| | | | |
|
|
| Industrials (2.9%) | | | |
| 606,000 | | Anhui Expressway Co. Ltd.,
Class H | | | 420,947 |
| 214,000 | | Cosco Pacific Ltd. | | | 421,179 |
| 992,000 | | Jiangsu Expressway Co. Ltd.,
Class H | | | 526,377 |
| | | | |
|
|
| | | | | | 1,368,503 |
| | | | |
|
|
| | | | | | 2,988,545 |
| | | | |
|
|
| Hong Kong (33.6%) | | | |
| Consumer Discretionary (10.7%) | | | |
| 484,000 | | Cafe De Coral Holdings Ltd. | | | 550,998 |
| 72,000 | | Cheung Kong Holdings Ltd. | | | 776,599 |
| 149,000 | | Esprit Holdings Ltd. | | | 1,111,669 |
| 946,000 | | Giordano International Ltd. | | | 705,798 |
| 300,000 | | Li & Fung Ltd. | | | 634,817 |
| 420,000 | | Shangri-La Asia Ltd. | | | 740,169 |
| 126,500 | | Yue Yuen Industrial Holdings Ltd. | | | 399,487 |
| | | | |
|
|
| | | | | | 4,919,537 |
| | | | |
|
|
| Energy (2.5%) | | | |
| 1,718,500 | | CNOOC Ltd. | | | 1,171,618 |
| | | | |
|
|
| Financials (10.0%) | | | |
| 349,120 | | Dah Sing Banking Group Ltd. | | | 702,830 |
| 565,000 | | Hang Lung Group Ltd. | | | 1,126,525 |
| 174,000 | | Hongkong Land Holdings Ltd. | | | 567,240 |
| 28,178 | | HSBC Holdings PLC | | | 458,161 |
| 23,786 | | Standard Chartered PLC | | | 464,791 |
| 3,700 | | Standard Chartered PLC | | | 73,868 |
| 64,000 | | Sun Hung Kai Properties Ltd. | | | 659,849 |
| 87,500 | | Wing Hang Bank Ltd. | | | 625,249 |
| | | | |
|
|
| | | | | | 4,678,513 |
| | | | |
|
|
| Industrials (5.2%) | | | |
| 164,242 | | Kerry Properties Ltd. | | | 424,660 |
| 270,000 | | Lung Kee (Bermuda) Holdings Ltd. | | | 196,234 |
| 522,500 | | Swire Pacific Ltd., Class B | | | 914,084 |
| 349,500 | | Techtronic Industries Co. Ltd. | | | 867,692 |
| | | | |
|
|
| | | | | | 2,402,670 |
| | | | |
|
|
| Information Technology (1.2%) | | | |
| 1,700,000 | | Solomon Systech International Ltd. | | | 541,234 |
| | | | |
|
|
| Telecommunications (1.9%) | | | |
| 797,500 | | SmarTone Telecommunications Holdings Ltd. | | | 902,764 |
| | | | |
|
|
| Utilities (2.1%) | | | |
| 474,000 | | Hong Kong & China Gas Co. Ltd. | | | 987,767 |
| | | | |
|
|
| | | | | | 15,604,103 |
| | | | |
|
|
| India (4.0%) | | | |
| Consumer Discretionary (1.0%) | | | |
| 42,800 | | Tata Motors Ltd., ADR | | | 485,780 |
| | | | |
|
|
| | | | | |
Shares
| | Security Description
| | Value
|
| Common Stocks, continued | | | |
| India, continued | | | |
| Financials (1.1%) | | | |
| 9,800 | | HDFC Bank Ltd., ADR | | $ | 497,840 |
| | | | |
|
|
| Health Care (0.9%) | | | |
| 36,926 | | Ranbaxy Laboratories Ltd., GDR | | | 415,418 |
| | | | |
|
|
| Materials (1.0%) | | | |
| 15,919 | | Hindalco Industries Ltd., GDR (c) | | | 477,570 |
| | | | |
|
|
| | | | | | 1,876,608 |
| | | | |
|
|
| Indonesia (2.6%) | | | |
| Consumer Discretionary (1.1%) | | | |
| 382,500 | | PT Astra International, Inc. | | | 515,204 |
| | | | |
|
|
| Financials (1.5%) | | | |
| 1,249,500 | | PT Bank Danamon Indonesia | | | 714,000 |
| | | | |
|
|
| | | | | | 1,229,204 |
| | | | |
|
|
| Malaysia (7.7%) | | | |
| Consumer Discretionary (3.9%) | | | |
| 390,700 | | Astro All Asia Networks PLC (b) | | | 599,073 |
| 98,700 | | Genting Berhad | | | 526,400 |
| 178,400 | | Tanjong PLC | | | 666,027 |
| | | | |
|
|
| | | | | | 1,791,500 |
| | | | |
|
|
| Consumer Staples (1.3%) | | | |
| 212,100 | | IOI Corp. Berhad | | | 622,160 |
| | | | |
|
|
| Financials (1.1%) | | | |
| 502,500 | | Southern Bank Berhad | | | 460,960 |
| 63,000 | | Southern Bank Berhad, Foreign | | | 53,760 |
| | | | |
|
|
| | | | | | 514,720 |
| | | | |
|
|
| Telecommunications (1.4%) | | | |
| 251,800 | | Maxis Communications Berhad | | | 671,467 |
| | | | |
|
|
| | | | | | 3,599,847 |
| | | | |
|
|
| Philippines (0.7%) | | | |
| Financials (0.7%) | | | |
| 52,356 | | Ayala Corp. | | | 303,689 |
| | | | |
|
|
| Singapore (11.5%) | | | |
| Consumer Staples (1.6%) | | | |
| 74,400 | | Fraser & Neave Ltd. | | | 735,080 |
| | | | |
|
|
| Financials (4.5%) | | | |
| 76,000 | | Great Eastern Holdings Ltd. | | | 673,053 |
| 217,000 | | Keppel Land Ltd. | | | 420,953 |
| 129,673 | | Oversea-Chinese Banking Corp. Ltd. | | | 1,007,761 |
| | | | |
|
|
| | | | | | 2,101,767 |
| | | | |
|
|
| Industrials (1.8%) | | | |
| 110,000 | | Keppel Corp. Ltd. | | | 834,990 |
| | | | |
|
|
| Telecommunications (3.6%) | | | |
| 539,285 | | Singapore Telecommunications Ltd. (b) | | | 899,945 |
| 688,000 | | StarHub Ltd. (b) | | | 787,517 |
| | | | |
|
|
| | | | | | 1,687,462 |
| | | | |
|
|
| | | | | | 5,359,299 |
| | | | |
|
|
See notes to financial statements.
39
PACIFIC CAPITAL FUNDS
New Asia Growth Fund
Schedule of Portfolio Investments, Continued
July 31, 2005
| | | | | |
Shares
| | Security Description
| | Value
|
| Common Stocks, continued | | | |
| South Korea (19.8%) | | | |
| Consumer Discretionary (8.9%) | | | |
| 3,769 | | Amorepacific Corp. | | $ | 1,033,584 |
| 9,070 | | Hyundai Mobis | | | 662,689 |
| 9,170 | | Hyundai Motor Co. Ltd. | | | 635,155 |
| 25,500 | | LG Corp. | | | 696,810 |
| 3,260 | | Shinsegae Co. Ltd. | | | 1,154,417 |
| | | | |
|
|
| | | | | | 4,182,655 |
| | | | |
|
|
| Financials (6.4%) | | | |
| 16,489 | | Kookmin Bank | | | 875,451 |
| 11,550 | | Samsung Fire & Marine Insurance
Co. Ltd. | | | 1,044,170 |
| 34,330 | | Shinhan Financial Group Co. Ltd. | | | 1,041,773 |
| | | | |
|
|
| | | | | | 2,961,394 |
| | | | |
|
|
| Information Technology (4.5%) | | | |
| 3,804 | | Samsung Electronics Co. Ltd. | | | 2,093,774 |
| | | | |
|
|
| | | | | | 9,237,823 |
| | | | |
|
|
| Taiwan (8.3%) | | | |
| Financials (1.6%) | | | |
| 708,178 | | Chinatrust Financial Holding Co. Ltd. | | | 750,047 |
| | | | |
|
|
| Industrials (2.7%) | | | |
| 174,030 | | Asia Optical Co., Inc. | | | 1,239,715 |
| | | | |
|
|
| Information Technology (4.0%) | | | |
| 201,985 | | Advantech Co. Ltd. | | | 529,905 |
| 83,000 | | Hon Hai Precision Industry Co., Ltd. | | | 466,234 |
| 158,567 | | Powertech Technology, Inc. | | | 512,532 |
| 267,300 | | Sunplus Technology Co. Ltd. | | | 358,598 |
| | | | |
|
|
| | | | | | 1,867,269 |
| | | | |
|
|
| | | | | | 3,857,031 |
| | | | |
|
|
| | | | | | |
Shares
| | Security Description
| | Value
| |
| Common Stocks, continued | | | | |
| Thailand (3.9%) | | | | |
| Energy (1.3%) | | | | |
| 112,000 | | PTT Public Co. Ltd., Foreign | | $ | 624,916 | |
| | | | |
|
|
|
| Financials (2.6%) | | | | |
| 833,100 | | Kasikornbank Public Co. Ltd., Foreign | | | 1,202,164 | |
| | | | |
|
|
|
| | | | | | 1,827,080 | |
| | | | |
|
|
|
| Total Common Stocks (Cost $34,199,205) | | | 45,883,229 | |
| | | | |
|
|
|
| Investment Company (1.7%) | | | | |
| 811,129 | | Victory Institutional Money Market Fund, Investor Shares | | | 811,129 | |
| | | | |
|
|
|
| Total Investment Company (Cost $811,129) | | | 811,129 | |
| | | | |
|
|
|
Total Investments (Cost $35,010,334)
(a)—100.2% | | | 46,694,358 | |
| Liabilities in excess of other assets—(0.2)% | | | (114,031 | ) |
| | | | |
|
|
|
| Net Assets—100.0% | | $ | 46,580,327 | |
| | | | |
|
|
|
| (a) | Represents cost for financial reporting purposes and differs from cost basis for federal income tax purposes by the amount of losses recognized for financial reporting purposes in excess of federal income tax reporting of approximately $196,983. Cost for federal income tax purposes differs from value by net unrealized appreciation of securities as follows: |
| | | | |
Unrealized appreciation | | $ | 11,762,018 | |
Unrealized depreciation | | | (274,977 | ) |
| | |
|
|
|
Net unrealized appreciation | | $ | 11,487,041 | |
| | |
|
|
|
| (b) | Non-income producing security. |
| (c) | Security exempt from registration under Rule 144A of the Securities Act of 1933, as amended. This security may be resold in transactions exempt from registration normally to qualified institutional buyers. The Fund’s adviser has deemed this security to be liquid based upon procedures approved by the Board of Trustees. |
| | | | | | | | | | | | | | |
Issue description
| | Acquisition
date
| | Cost
| | Value
| | Percent of
total
investments
| | | Percent of
net assets
| |
Hindalco Industries Ltd., GDR | | * | | $ | 441,233 | | $ | 477,570 | | 1.0 | % | | 1.0 | % |
| * | 911 shares of this security were acquired on 4/3/03, 3,385 shares on 3/18/04, 2,568 shares on 5/19/04, 5,137 shares on 12/21/04, 2,478 shares on 3/14/05, and 1,440 shares on 3/31/05. |
ADR—American Depositary Receipt
GDR—Global Depositary Receipt
PLC—Public Limited Company
See notes to financial statements.
40
PACIFIC CAPITAL FUNDS
International Stock Fund
Schedule of Portfolio Investments
July 31, 2005
| | | | | |
Shares
| | Security
Description
| | Value
|
| Common Stocks (98.7%) | | | |
| Australia (1.2%) | | | |
| Energy (0.8%) | | | |
| 32,503 | | Woodside Petroleum Ltd. | | $ | 747,045 |
| | | | |
|
|
| Financials (0.4%) | | | |
| 26,500 | | Westpac Banking Corp. | | | 397,659 |
| | | | |
|
|
| | | | | | 1,144,704 |
| | | | |
|
|
| Brazil (2.6%) | | | |
| Consumer Staples (0.6%) | | | |
| 17,883 | | Companhia de Bebidas das Americas, ADR | | | 556,340 |
| | | | |
|
|
| Energy (0.7%) | | | |
| 13,849 | | Petroleo Brasileiro SA, ADR | | | 728,042 |
| | | | |
|
|
| Financials (0.6%) | | | |
| 15,300 | | Banco Bradesco SA, ADR | | | 532,746 |
| | | | |
|
|
| Utilities (0.7%) | | | |
| 19,600 | | Companhia Energetica de Minas Gerais SA, ADR | | | 636,216 |
| | | | |
|
|
| | | | | | 2,453,344 |
| | | | |
|
|
| Canada (3.0%) | | | |
| Energy (0.9%) | | | |
| 16,700 | | Suncor Energy, Inc. | | | 816,630 |
| | | | |
|
|
| Financials (1.0%) | | | |
| 19,689 | | Manulife Financial Corp. | | | 990,357 |
| | | | |
|
|
| Information Technology (0.4%) | | | |
| 29,000 | | Celestica, Inc. (b) | | | 337,850 |
| | | | |
|
|
| Materials (0.7%) | | | |
| 20,100 | | Alcan, Inc. | | | 678,978 |
| | | | |
|
|
| | | | | | 2,823,815 |
| | | | |
|
|
| China (1.5%) | | | |
| Consumer Discretionary (0.5%) | | | |
| 1,302,000 | | Denway Motors Ltd. | | | 510,825 |
| | | | |
|
|
| Financials (0.4%) | | | |
| 237,000 | | Ping An Insurance Co. of China Ltd. (Group) | | | 396,326 |
| | | | |
|
|
| Information Technology (0.6%) | | | |
| 16,132 | | Shanda Interactive Entertainment Ltd., ADR (b) | | | 527,676 |
| | | | |
|
|
| | | | | | 1,434,827 |
| | | | |
|
|
| Denmark (1.1%) | | | |
| Industrials (1.1%) | | | |
| 56,402 | | Vestas Wind Systems A/S (b) | | | 1,037,933 |
| | | | |
|
|
| Finland (1.8%) | | | |
| Information Technology (1.8%) | | | |
| 37,067 | | Nokia Corp., Class A, ADR | | | 591,219 |
| 33,000 | | Nokia Oyj | | | 527,836 |
| 18,050 | | TietoEnator Oyj | | | 589,697 |
| | | | |
|
|
| | | | | | 1,708,752 |
| | | | |
|
|
| France (13.0%) | | | |
| Consumer Discretionary (0.7%) | | | |
| 29,509 | | Thomson SA | | | 670,187 |
| | | | |
|
|
| | | | | |
Shares
| | Security
Description
| | Value
|
| Common Stocks, continued | | | |
| France, continued | | | |
| Consumer Staples (1.8%) | | | |
| 13,696 | | Carrefour SA | | $ | 647,723 |
| 5,268 | | Groupe Danone | | | 522,078 |
| 6,607 | | L’Oreal SA | | | 522,378 |
| | | | |
|
|
| | | | | | 1,692,179 |
| | | | |
|
|
| Energy (2.2%) | | | |
| 16,511 | | Total SA, ADR | | | 2,063,875 |
| | | | |
|
|
| Financials (3.3%) | | | |
| 54,517 | | Axa, ADR | | | 1,488,315 |
| 9,392 | | BNP Paribas SA | | | 680,406 |
| 9,086 | | Societe Generale | | | 995,909 |
| | | | |
|
|
| | | | | | 3,164,630 |
| | | | |
|
|
| Health Care (1.1%) | | | |
| 7,048 | | Essilor International SA | | | 513,162 |
| 6,400 | | Sanofi-Aventis | | | 554,592 |
| | | | |
|
|
| | | | | | 1,067,754 |
| | | | |
|
|
| Industrials (2.0%) | | | |
| 16,411 | | Schneider Electric SA | | | 1,292,543 |
| 11,600 | | Technip SA | | | 621,574 |
| | | | |
|
|
| | | | | | 1,914,117 |
| | | | |
|
|
| Telecommunications (0.9%) | | | |
| 20,364 | | Bouygues SA | | | 893,080 |
| | | | |
|
|
| Utilities (1.0%) | | | |
| 14,515 | | Suez SA | | | 399,287 |
| 13,300 | | Veolia Environnement | | | 517,055 |
| | | | |
|
|
| | | | | | 916,342 |
| | | | |
|
|
| | | | | | 12,382,164 |
| | | | |
|
|
| Germany (6.4%) | | | |
| Consumer Discretionary (1.1%) | | | |
| 2,517 | | Adidas-Salomon AG | | | 456,550 |
| 695 | | Porsche AG | | | 553,253 |
| | | | |
|
|
| | | | | | 1,009,803 |
| | | | |
|
|
| Financials (1.7%) | | | |
| 5,576 | | Allianz AG | | | 709,376 |
| 10,711 | | Deutsche Bank AG | | | 930,764 |
| | | | |
|
|
| | | | | | 1,640,140 |
| | | | |
|
|
| Health Care (1.3%) | | | |
| 6,408 | | Fresenius Medical Care AG | | | 560,733 |
| 10,429 | | Schering AG | | | 658,003 |
| | | | |
|
|
| | | | | | 1,218,736 |
| | | | |
|
|
| Industrials (0.6%) | | | |
| 6,879 | | Siemens AG | | | 530,934 |
| | | | |
|
|
| Information Technology (0.5%) | | | |
| 11,829 | | SAP AG, ADR | | | 506,518 |
| | | | |
|
|
| Materials (0.5%) | | | |
| 6,639 | | Linde AG | | | 468,708 |
| | | | |
|
|
| Utilities (0.7%) | | | |
| 7,328 | | E.ON AG | | | 679,062 |
| | | | |
|
|
| | | | | | 6,053,901 |
| | | | |
|
|
See notes to financial statements.
41
PACIFIC CAPITAL FUNDS
International Stock Fund
Schedule of Portfolio Investments, Continued
July 31, 2005
| | | | | |
Shares
| | Security
Description
| | Value
|
| Common Stocks, continued | | | |
| Greece (0.1%) | | | |
| Consumer Discretionary (0.1%) | | | |
| 3,270 | | Folli-Follie SA, Registered Shares | | $ | 103,257 |
| | | | |
|
|
| Hong Kong (4.4%) | | | |
| Consumer Discretionary (1.8%) | | | |
| 135,500 | | Esprit Holdings Ltd. | | | 1,010,947 |
| 373,462 | | Shangri-La Asia Ltd. | | | 658,155 |
| | | | |
|
|
| | | | | | 1,669,102 |
| | | | |
|
|
| Financials (0.7%) | | | |
| 40,400 | | HSBC Holdings PLC | | | 656,885 |
| | | | |
|
|
| Industrials (1.9%) | | | |
| 116,000 | | Hutchison Whampoa Ltd. | | | 1,133,305 |
| 712,500 | | Johnson Electric Holdings Ltd. | | | 682,814 |
| | | | |
|
|
| | | | | | 1,816,119 |
| | | | |
|
|
| | | | | | 4,142,106 |
| | | | |
|
|
| India (1.6%) | | | |
| Financials (0.9%) | | | |
| 16,400 | | HDFC Bank Ltd., ADR | | | 833,120 |
| | | | |
|
|
| Information Technology (0.7%) | | | |
| 9,776 | | Infosys Technologies Ltd., ADR | | | 695,856 |
| | | | |
|
|
| | | | | | 1,528,976 |
| | | | |
|
|
| Indonesia (0.6%) | | | |
| Telecommunications (0.6%) | | | |
| 900,000 | | PT Indosat | | | 532,653 |
| | | | |
|
|
| Israel (0.5%) | | | |
| Health Care (0.5%) | | | |
| 16,572 | | Teva Pharmaceutical Industries Ltd., ADR | | | 520,361 |
| | | | |
|
|
| Italy (2.4%) | | | |
| Energy (1.5%) | | | |
| 32,233 | | ENI SpA | | | 917,218 |
| 35,524 | | Saipem SpA | | | 529,378 |
| | | | |
|
|
| | | | | | 1,446,596 |
| | | | |
|
|
| Financials (0.9%) | | | |
| 161,145 | | UniCredito Italiano SpA | | | 855,260 |
| | | | |
|
|
| | | | | | 2,301,856 |
| | | | |
|
|
| Japan (15.7%) | | | |
| Consumer Discretionary (4.4%) | | | |
| 37,500 | | Denso Corp. | | | 908,392 |
| 45,000 | | Nissan Motor Co. Ltd. | | | 468,951 |
| 28,800 | | Pioneer Corp. | | | 425,268 |
| 54,000 | | Sharp Corp. | | | 820,022 |
| 17,900 | | Sony Corp. | | | 592,514 |
| 13,200 | | Toyota Motor Corp. | | | 500,535 |
| 11,100 | | World Co. Ltd. | | | 463,490 |
| | | | |
|
|
| | | | | | 4,179,172 |
| | | | |
|
|
| Financials (2.7%) | | | |
| 69,000 | | Bank of Yokohama Ltd. (The) | | | 392,773 |
| 4,500 | | ORIX Corp. | | | 667,291 |
| 104 | | Sumitomo Mitsui Financial Group, Inc. | | | 687,580 |
| | | | | |
Shares
| | Security
Description
| | Value
|
| Common Stocks, continued | | | |
| Japan, continued | | | |
| Financials, continued | | | |
| 128,000 | | Sumitomo Trust & Banking Co. Ltd. (The) | | $ | 791,435 |
| | | | |
|
|
| | | | | | 2,539,079 |
| | | | |
|
|
| Health Care (1.5%) | | | |
| 15,122 | | Astellas Pharma, Inc. | | | 493,813 |
| 30,000 | | Shionogi & Co. Ltd. | | | 372,859 |
| 11,400 | | Takeda Pharmaceutical Co. Ltd. | | | 584,849 |
| | | | |
|
|
| | | | | | 1,451,521 |
| | | | |
|
|
| Industrials (3.5%) | | | |
| 55,000 | | Asahi Glass Co., Ltd. | | | 532,923 |
| 371,000 | | Kawasaki Heavy Industries Ltd. | | | 741,470 |
| 149,000 | | Marubeni Corp. | | | 555,692 |
| 8,500 | | SMC Corp. | | | 968,460 |
| 30,400 | | JS Group Corp. | | | 496,360 |
| | | | |
|
|
| | | | | | 3,294,905 |
| | | | |
|
|
| Information Technology (2.9%) | | | |
| 22,400 | | Canon, Inc. | | | 1,111,207 |
| 2,300 | | Keyence Corp. | | | 553,658 |
| 80,000 | | NEC Corp. | | | 410,421 |
| 6,400 | | Nidec Corp. | | | 694,361 |
| | | | |
|
|
| | | | | | 2,769,647 |
| | | | |
|
|
| Materials (0.7%) | | | |
| 12,800 | | Nitto Denko Corp. | | | 705,782 |
| | | | |
|
|
| | | | | | 14,940,106 |
| | | | |
|
|
| Netherlands (4.3%) | | | |
| Consumer Discretionary (0.6%) | | | |
| 21,673 | | Koninklijke (Royal) Philips Electronics NV, ADR | | | 587,772 |
| | | | |
|
|
| Consumer Staples (0.5%) | | | |
| 7,688 | | Unilever NV | | | 514,404 |
| | | | |
|
|
| Financials (1.5%) | | | |
| 25,621 | | ABN AMRO Holding NV | | | 641,630 |
| 22,413 | | ING Groep NV | | | 679,973 |
| | | | |
|
|
| | | | | | 1,321,603 |
| | | | |
|
|
| Information Technology (1.2%) | | | |
| 38,800 | | ASML Holding N.V., NY Registered Shares (b) | | | 682,880 |
| 28,500 | | STMicroelectronics N.V., NY Registered Shares | | | 491,625 |
| | | | |
|
|
| | | | | | 1,174,505 |
| | | | |
|
|
| Materials (0.5%) | | | |
| 12,132 | | Akzo Nobel NV | | | 500,085 |
| | | | |
|
|
| | | | | | 4,098,369 |
| | | | |
|
|
| Russia (0.6%) | | | |
| Energy (0.6%) | | | |
| 12,800 | | LUKOIL, ADR | | | 528,000 |
| | | | |
|
|
| Singapore (2.0%) | | | |
| Financials (1.5%) | | | |
| 146,000 | | DBS Group Holdings Ltd. | | | 1,416,109 |
| | | | |
|
|
See notes to financial statements.
42
PACIFIC CAPITAL FUNDS
International Stock Fund
Schedule of Portfolio Investments, Continued
July 31, 2005
| | | | | |
Shares
| | Security
Description
| | Value
|
| Common Stocks, continued | | | |
| Singapore, continued | | | |
| Industrials (0.5%) | | | |
| 66,000 | | Singapore Airlines Ltd. | | $ | 473,161 |
| | | | |
|
|
| | | | | | 1,889,270 |
| | | | |
|
|
| South Africa (0.6%) | | | |
| Financials (0.6%) | | | |
| 229,737 | | Old Mutual PLC | | | 527,782 |
| | | | |
|
|
| South Korea (3.9%) | | | |
| Consumer Discretionary (0.5%) | | | |
| 1,360 | | Shinsegae Co. Ltd. | | | 481,598 |
| | | | |
|
|
| Financials (1.2%) | | | |
| 22,390 | | Kookmin Bank | | | 1,188,753 |
| | | | |
|
|
| Information Technology (1.8%) | | | |
| 3,150 | | Samsung Electronics Co. Ltd. | | | 1,733,804 |
| | | | |
|
|
| Materials (0.4%) | | | |
| 9,440 | | LG Chem Ltd. | | | 349,459 |
| | | | |
|
|
| | | | | | 3,753,614 |
| | | | |
|
|
| Spain (3.9%) | | | |
| Financials (1.9%) | | | |
| 65,718 | | Banco Bilbao Vizcaya Argentaria SA | | | 1,110,226 |
| 56,900 | | Banco Santander Central Hispano SA | | | 706,257 |
| | | | |
|
|
| | | | | | 1,816,483 |
| | | | |
|
|
| Telecommunications (2.0%) | | | |
| 80,496 | | Telefonica Moviles SA | | | 847,604 |
| 64,303 | | Telefonica SA | | | 1,084,758 |
| | | | |
|
|
| | | | | | 1,932,362 |
| | | | |
|
|
| | | | | | 3,748,845 |
| | | | |
|
|
| Switzerland (8.8%) | | | |
| Consumer Staples (1.4%) | | | |
| 4,808 | | Nestle SA | | | 1,322,874 |
| | | | |
|
|
| Financials (1.7%) | | | |
| 17,200 | | Credit Suisse Group | | | 722,914 |
| 11,323 | | UBS AG, Registered Shares | | | 933,302 |
| | | | |
|
|
| | | | | | 1,656,216 |
| | | | |
|
|
| Health Care (3.3%) | | | |
| 2,963 | | Nobel Biocare Holding AG | | | 627,285 |
| 28,863 | | Novartis AG | | | 1,408,554 |
| 4,800 | | Roche Holding AG, Genusschien | | | 654,545 |
| 620 | | Serono SA, Class B | | | 417,660 |
| | | | |
|
|
| | | | | | 3,108,044 |
| | | | |
|
|
| Industrials (0.7%) | | | |
| 92,706 | | ABB Ltd. (b) | | | 633,529 |
| | | | |
|
|
| Materials (1.7%) | | | |
| 7,300 | | Ciba Specialty Chemicals AG, Registered Shares | | | 438,068 |
| 12,600 | | Lonza Group AG, Registered Shares | | | 697,767 |
| 783 | | Sika AG, Bearer (b) | | | 519,237 |
| | | | |
|
|
| | | | | | 1,655,072 |
| | | | |
|
|
| | | | | | 8,375,735 |
| | | | |
|
|
| | | | | |
Shares
| | Security
Description
| | Value
|
| Common Stocks, continued | | | |
| Taiwan (0.6%) | | | |
| Information Technology (0.6%) | | | |
| 368,498 | | Taiwan Semiconductor Manufacturing Co. Ltd. | | $ | 615,204 |
| | | | |
|
|
| United Kingdom (18.1%) | | | |
| Consumer Discretionary (2.7%) | | | |
| 110,911 | | British Sky Broadcasting Group PLC | | | 1,043,605 |
| 147,020 | | Compass Group PLC | | | 636,038 |
| 97,182 | | Kingfisher PLC | | | 440,959 |
| 216,805 | | Signet Group PLC | | | 446,548 |
| | | | |
|
|
| | | | | | 2,567,150 |
| | | | |
|
|
| Consumer Staples (1.6%) | | | |
| 21,211 | | Reckitt Benckiser PLC | | | 638,514 |
| 160,583 | | Tesco PLC | | | 920,162 |
| | | | |
|
|
| | | | | | 1,558,676 |
| | | | |
|
|
| Energy (0.6%) | | | |
| 8,926 | | BP PLC, ADR | | | 588,045 |
| | | | |
|
|
| Financials (6.0%) | | | |
| 67,956 | | Barclays PLC | | | 666,341 |
| 105,724 | | HBOS PLC | | | 1,608,986 |
| 47,770 | | ICAP PLC | | | 257,540 |
| 66,509 | | Lloyds TSB Group PLC | | | 564,340 |
| 16,100 | | Man Group PLC | | | 460,850 |
| 51,935 | | Royal Bank of Scotland Group
PLC (The) | | | 1,548,770 |
| 24,063 | | Standard Chartered PLC | | | 470,204 |
| | | | |
|
|
| | | | | | 5,577,031 |
| | | | |
|
|
| Health Care (2.0%) | | | |
| 16,200 | | AstraZeneca PLC, ADR | | | 729,506 |
| 28,494 | | GlaxoSmithKline PLC | | | 672,660 |
| 55,900 | | Smith & Nephew PLC | | | 532,381 |
| | | | |
|
|
| | | | | | 1,934,547 |
| | | | |
|
|
| Industrials (2.3%) | | | |
| 42,331 | | Exel PLC | | | 701,604 |
| 220,941 | | Group 4 Securicor PLC | | | 613,563 |
| 52,400 | | Smiths Group PLC | | | 884,172 |
| | | | |
|
|
| | | | | | 2,199,339 |
| | | | |
|
|
| Materials (1.1%) | | | |
| 39,282 | | BHP Billiton PLC | | | 557,714 |
| 26,700 | | Johnson Matthey PLC | | | 517,032 |
| | | | |
|
|
| | | | | | 1,074,746 |
| | | | |
|
|
| Telecommunications (1.8%) | | | |
| 66,794 | | Vodafone Group PLC, ADR | | | 1,725,289 |
| | | | |
|
|
| | | | | | 17,224,823 |
| | | | |
|
|
| Total Common Stocks (Cost $83,691,212) | | | 93,870,397 |
| | | | |
|
|
| Investment Company (0.9%) | | | |
| 869,190 | | Victory Institutional Money Market Fund, Investor Shares | | | 869,190 |
| | | | |
|
|
| Total Investment Company (Cost $869,190) | | | 869,190 |
| | | | |
|
|
Total Investments (Cost $84,560,402)
(a)—99.6% | | | 94,739,587 |
| Other assets in excess of liabilities—0.4% | | | 401,970 |
| | | | |
|
|
| Net Assets—100.0% | | $ | 95,141,557 |
| | | | |
|
|
See notes to financial statements.
43
PACIFIC CAPITAL FUNDS
International Stock Fund
Schedule of Portfolio Investments, Continued
July 31, 2005
| (a) | Represents cost for financial reporting purposes and differs from cost basis for federal income tax purposes by the amount of losses recognized for financial reporting purposes in excess of federal income tax reporting of approximately $190,131. Cost for federal income tax purposes differs from value by net unrealized appreciation of securities as follows: |
| | | | |
Unrealized appreciation | | $ | 11,546,208 | |
Unrealized depreciation | | | (1,557,154 | ) |
| | |
|
|
|
Net unrealized appreciation | | $ | 9,989,054 | |
| | |
|
|
|
| (b) | Non-income producing security. |
At July 31, 2005 the Fund’s foreign currency exchange contracts were as follows:
| | | | | | | | | | | | | | |
Currency
| | Delivery
Date
| | Contract Amount
in Local
Currency
| | Contract
Value in
USD
| | Market
Value
| | Unrealized
Appreciation
(Depreciation)
| |
Short | | | | | | | | | | | | | | |
Japanese Yen | | 8/1/05 | | 9,365,087 | | $ | 83,112 | | $ | 83,557 | | $ | (445 | ) |
Euro | | 8/2/05 | | 99,461 | | | 120,348 | | | 120,796 | | | (448 | ) |
| | | | | | |
|
| |
|
| |
|
|
|
Total Short Contracts | | | | | | $ | 203,460 | | $ | 204,353 | | $ | (893 | ) |
| | | | | | |
|
| |
|
| |
|
|
|
Long | | | | | | | | | | | | | | |
Euro | | 8/1/05 | | 15,731 | | $ | 19,107 | | $ | 19,105 | | $ | (2 | ) |
Euro | | 8/2/05 | | 22,241 | | | 26,911 | | | 27,011 | | | 100 | |
| | | | | | |
|
| |
|
| |
|
|
|
Total Long Contracts | | | | | | $ | 46,018 | | $ | 46,116 | | $ | 98 | |
| | | | | | |
|
| |
|
| |
|
|
|
ADR—American Depository Receipt
AG—Aktiengesellschaft (German Stock Co.)
NV—Naamloze Vennootschaap (Dutch Corp.)
PLC—Public Limited Company
SA—Societe Anonyme (French Corp.)
SpA—Societa per Azioni (Italian Corp.)
See notes to financial statements.
44
PACIFIC CAPITAL FUNDS
Small Cap Fund
Schedule of Portfolio Investments
July 31, 2005
| | | | | |
Shares
| | Security
Description
| | Value
|
| Common Stocks (93.5%) | | | |
| Consumer Discretionary (12.1%) | | | |
| 21,900 | | Buckle, Inc. (The) (b) | | $ | 946,518 |
| 39,200 | | Carmike Cinemas, Inc. | | | 1,183,056 |
| 88,500 | | Charlotte Russe Holding, Inc. (b) | | | 1,300,065 |
| 237,600 | | Charming Shoppes, Inc. (b) | | | 2,787,048 |
| 26,900 | | Children’s Place Retail Stores, Inc. (The) | | | 1,229,330 |
| 67,300 | | Claire’s Stores, Inc. | | | 1,710,093 |
| 104,800 | | Cooper Tire & Rubber Co. | | | 2,108,576 |
| 92,700 | | Denny’s Corp. (b) | | | 520,974 |
| 24,600 | | Entercom Communications
Corp. (b) | | | 780,312 |
| 21,600 | | Famous Dave’s of America, Inc. | | | 212,112 |
| 100,900 | | Gemstar-TV Guide International, Inc. (b) | | | 310,772 |
| 20,700 | | Genesco, Inc. (b) | | | 771,489 |
| 3,300 | | Golf Galaxy, Inc. (b) | | | 61,413 |
| 31,100 | | Hartmarx Corp. (b) | | | 317,842 |
| 691,200 | | Jameson Inns, Inc. (b) | | | 1,638,144 |
| 34,900 | | Lee Enterprises, Inc. | | | 1,494,069 |
| 156,400 | | Lions Gate Entertainment Corp. (b) | | | 1,603,100 |
| 52,600 | | Lone Star Steakhouse & Saloon, Inc. | | | 1,581,156 |
| 19,500 | | Media General, Inc. (b) | | | 1,335,750 |
| 41,200 | | Movie Gallery, Inc. | | | 1,033,296 |
| 21,700 | | Neiman Marcus Group, Inc. (The), Class A | | | 2,137,450 |
| 32,800 | | Payless ShoeSource, Inc. (b) | | | 636,976 |
| 49,400 | | Prestige Brands Holdings, Inc. (b) | | | 555,750 |
| 58,400 | | Radio One, Inc., Class D (b) | | | 771,464 |
| 34,400 | | Rent-Way, Inc. | | | 334,712 |
| 19,500 | | Ryan’s Restaurant Group, Inc. | | | 254,085 |
| 36,400 | | Select Comfort Corp. | | | 775,684 |
| 10,300 | | Tupperware Corp. | | | 219,699 |
| 6,800 | | Wolverine World Wide, Inc. | | | 149,600 |
| | | | |
|
|
| | | | | | 28,760,535 |
| | | | |
|
|
| Consumer Staples (3.1%) | | | |
| 54,600 | | Casey’s General Stores, Inc. | | | 1,188,096 |
| 19,800 | | Flowers Foods, Inc. | | | 498,762 |
| 75,900 | | Gold Kist, Inc. (b) | | | 1,548,360 |
| 25,700 | | Longs Drug Stores Corp. | | | 1,115,123 |
| 112,600 | | Playtex Products, Inc. (b) | | | 1,200,316 |
| 42,200 | | Ralcorp Holdings, Inc. (b) | | | 1,814,600 |
| | | | |
|
|
| | | | | | 7,365,257 |
| | | | |
|
|
| Energy (2.9%) | | | |
| 5,700 | | Atmos Energy Corp. (b) | | | 166,212 |
| 5,100 | | Berry Petroleum Co. (b) | | | 290,751 |
| 17,000 | | Cal Dive International, Inc. (b) | | | 1,006,740 |
| 10,400 | | Callon Petroleum Co. | | | 189,384 |
| 3,400 | | Cimarex Energy Co. | | | 142,596 |
| 30,600 | | Core Laboratories N.V. | | | 985,320 |
| 48,400 | | Frontier Oil Corp. (b) | | | 1,356,168 |
| 7,500 | | Goodrich Petroleum Corp. | | | 164,475 |
| 23,400 | | Houston Exploration Co. (The) (b) | | | 1,352,286 |
| 41,600 | | TODCO | | | 1,277,536 |
| | | | |
|
|
| | | | | | 6,931,468 |
| | | | |
|
|
| | | | | |
Shares
| | Security
Description
| | Value
|
| Common Stocks, continued | | | |
| Financials (18.7%) | | | |
| 57,400 | | AMCORE Financial, Inc. | | $ | 1,816,136 |
| 8,600 | | American Physicians Capital, Inc. | | | 342,710 |
| 70,300 | | AmeriCredit Corp. (b) | | | 1,878,416 |
| 125,300 | | Ashford Hospitality Trust, Inc. | | | 1,489,817 |
| 55,140 | | Associated Banc-Corp | | | 1,878,068 |
| 18,800 | | BankAtlantic Bancorp, Inc. | | | 337,272 |
| 87,750 | | Brookline Bancorp, Inc. | | | 1,404,878 |
| 95,900 | | Cash America International, Inc. | | | 1,996,638 |
| 65,300 | | Community Bank System, Inc. | | | 1,570,465 |
| 64,000 | | Equity One, Inc. | | | 1,523,200 |
| 105,400 | | Fieldstone Investment Corp. | | | 1,543,056 |
| 76,500 | | First Financial Bancorp | | | 1,380,060 |
| 137,900 | | First Niagara Financial Group, Inc. | | | 2,031,267 |
| 5,300 | | FPIC Insurance Group, Inc. (b) | | | 176,649 |
| 116,800 | | Gold Banc Corp., Inc. | | | 1,775,360 |
| 80,800 | | Greater Bay Bancorp | | | 2,119,384 |
| 4,200 | | Integra Bank Corp. | | | 97,608 |
| 39,900 | | Investment Technology Group, Inc. (b) | | | 1,022,238 |
| 76,700 | | JER Investors Trust, Inc. Real Estate Investment Trust (b) | | | 1,417,416 |
| 32,600 | | Jones Lang LaSalle, Inc. | | | 1,605,550 |
| 7,500 | | KNBT Bancorp, Inc. | | | 121,200 |
| 154,200 | | Knight Capital Group, Inc. | | | 1,218,180 |
| 87,800 | | Kohlberg Kravis Roberts & Co. Real Estate Investment Trust (b)(c) | | | 2,149,343 |
| 33,143 | | Macatawa Bank Corp. | | | 1,311,469 |
| 43,800 | | MAF Bancorp, Inc. | | | 1,932,018 |
| 232,100 | | Meadowbrook Insurance Group, Inc. (b) | | | 1,204,599 |
| 24,800 | | Mfa Mortgage Investments Inc. | | | 172,608 |
| 9,800 | | Midwest Banc Holdings, Inc. | | | 201,782 |
| 21,400 | | Nasdaq Stock Market, Inc.
(The) (b) | | | 484,710 |
| 15,100 | | National Financial Partners Corp. | | | 683,275 |
| 49,300 | | Navigators Group, Inc. (The) (b) | | | 1,818,184 |
| 39,300 | | Oak Hill Financial, Inc. | | | 1,261,530 |
| 5,500 | | Old National Bancorp | | | 119,625 |
| 36,200 | | Parkvale Financial Corp. | | | 1,082,380 |
| 191,100 | | Quanta Capital Holdings Ltd. (b) | | | 1,270,815 |
| 131,800 | | Tower Group, Inc. | | | 2,091,666 |
| | | | |
|
|
| | | | | | 44,529,572 |
| | | | |
|
|
| Health Care (9.6%) | | | |
| 17,100 | | Alliance Imaging, Inc. | | | 175,446 |
| 20,600 | | Amedisys, Inc. | | | 806,284 |
| 57,500 | | Applera Corp. (b) | | | 709,550 |
| 168,600 | | Candela Corp. (b) | | | 1,856,286 |
| 8,200 | | Chattem, Inc. | | | 373,592 |
| 32,600 | | CNS, Inc. | | | 828,040 |
| 38,500 | | CV Therapeutics, Inc. (b) | | | 1,084,545 |
| 21,200 | | Genesis HealthCare Corp. | | | 953,364 |
| 19,700 | | Greatbatch, Inc. (b) | | | 476,937 |
| 16,700 | | HealthTronics, Inc. | | | 215,096 |
| 35,100 | | Hologic, Inc. | | | 1,600,209 |
| 27,100 | | Hooper Holmes, Inc. (b) | | | 113,549 |
| 23,200 | | Horizon Health (b) | | | 603,664 |
| 7,900 | | ICU Medical, Inc. (b) | | | 260,858 |
See notes to financial statements.
45
PACIFIC CAPITAL FUNDS
Small Cap Fund
Schedule of Portfolio Investments, Continued
July 31, 2005
| | | | | |
Shares
| | Security
Description
| | Value
|
| Common Stocks, continued | | | |
| Health Care, continued | | | |
| 15,900 | | IDEXX Laboratories, Inc. (b) | | $ | 1,009,014 |
| 10,900 | | Kindred Healthcare, Inc. (b) | | | 400,466 |
| 2,800 | | Kos Pharmaceuticals, Inc. | | | 200,200 |
| 40,600 | | LifePoint Hospitals, Inc. (b) | | | 1,898,456 |
| 18,200 | | Magellan Health Services, Inc. | | | 651,924 |
| 158,400 | | Medarex, Inc. (b) | | | 1,544,400 |
| 10,300 | | Molecular Devices Corp. | | | 219,081 |
| 56,000 | | Nektar Therapeutics (b) | | | 1,050,560 |
| 20,300 | | Odyssey HealthCare, Inc. | | | 298,207 |
| 25,000 | | Orthofix International N.V. | | | 1,131,250 |
| 27,100 | | Pediatrix Medical Group, Inc. (b) | | | 2,125,182 |
| 120,100 | | Quidel Corp. | | | 852,710 |
| 21,900 | | Res-Care, Inc. | | | 324,777 |
| 9,400 | | U.S. Physical Therapy, Inc. | | | 171,644 |
| 89,800 | | ViroPharma, Inc. | | | 1,040,782 |
| | | | |
|
|
| | | | | | 22,976,073 |
| | | | |
|
|
| Industrials (20.0%) | | | |
| 156,700 | | AAR Corp. (b) | | | 2,815,899 |
| 27,200 | | Actuant Corp., Class A (b) | | | 1,265,616 |
| 52,900 | | Albany International Corp., Class A | | | 1,853,616 |
| 2,300 | | Ameron International Corp. | | | 87,860 |
| 111,700 | | Artesyn Technologies, Inc. (b) | | | 1,033,225 |
| 29,800 | | BE Aerospace, Inc. (b) | | | 522,394 |
| 41,600 | | Concorde Career Colleges, Inc. (b) | | | 586,560 |
| 46,200 | | Corrections Corp. of America (b) | | | 1,736,658 |
| 32,200 | | CP Ships Ltd. | | | 572,838 |
| 12,100 | | CRA International, Inc. | | | 643,720 |
| 41,500 | | Duratek, Inc. (b) | | | 1,033,143 |
| 87,200 | | Dycom Industries, Inc. (b) | | | 2,127,680 |
| 11,900 | | EMCOR Group, Inc. (b) | | | 612,850 |
| 22,100 | | ESCO Technologies, Inc. (b) | | | 2,422,602 |
| 37,200 | | Foundation Coal Holdings, Inc. | | | 1,236,900 |
| 66,400 | | Gardner Denver, Inc. (b) | | | 2,729,040 |
| 12,700 | | GATX Corp. | | | 480,060 |
| 69,800 | | Genesee & Wyoming, Inc., Class A (b) | | | 2,112,846 |
| 82,900 | | Global Industries Ltd. | | | 813,249 |
| 66,973 | | Heartland Express, Inc. | | | 1,393,708 |
| 69,600 | | Hughes Supply, Inc. (b) | | | 1,978,032 |
| 73,000 | | IXYS Corp. (b) | | | 854,830 |
| 42,500 | | Joy Global, Inc. | | | 1,745,475 |
| 43,400 | | Kennametal, Inc. | | | 2,062,802 |
| 88,200 | | Korn/Ferry International | | | 1,755,180 |
| 58,950 | | Old Dominion Freight Line, Inc. (b) | | | 1,952,424 |
| 28,100 | | Rush Enterprises, Inc., Class A (b) | | | 446,790 |
| 53,553 | | SOURCECORP, Inc. (b) | | | 1,177,630 |
| 369,100 | | Stewart Enterprises, Inc., Class A | | | 2,771,941 |
| 51,900 | | Superior Energy Services, Inc. | | | 1,107,546 |
| 15,200 | | Terex Corp. (b) | | | 735,984 |
| 14,900 | | Thomas & Betts Corp. (b) | | | 503,173 |
| 78,200 | | Tredegar Corp. | | | 1,259,802 |
| 71,200 | | Wabtec Corp. | | | 1,739,416 |
| 9,100 | | Walter Industries, Inc. | | | 405,041 |
| 94,300 | | World Air Holdings, Inc. | | | 1,186,294 |
| | | | |
|
|
| | | | | | 47,762,824 |
| | | | |
|
|
| | | | | |
Shares
| | Security
Description
| | Value
|
| Common Stocks, continued | | | |
| Information Technology (12.9%) | | | |
| 112,200 | | ASE Test Ltd. (b) | | $ | 779,790 |
| 44,200 | | Axcelis Technologies, Inc. | | | 305,422 |
| 31,400 | | Benchmark Electronics, Inc. (b) | | | 1,004,800 |
| 10,400 | | Bottomline Technologies (de), Inc. | | | 163,696 |
| 27,800 | | Captiva Software Corp. | | | 449,248 |
| 138,400 | | ChipMOS TECHNOLOGIES (Bermuda) Ltd. (b) | | | 963,264 |
| 33,100 | | Comtech Telecommunications Corp. (b) | | | 1,170,085 |
| 3,900 | | Consolidated Graphics, Inc. | | | 166,140 |
| 15,100 | | CryptoLogic, Inc. | | | 425,216 |
| 35,100 | | Cymer, Inc. (b) | | | 1,217,970 |
| 32,300 | | Entrust, Inc. (b) | | | 193,800 |
| 33,500 | | Hutchinson Technology, Inc. (b) | | | 1,115,215 |
| 14,700 | | Integrated Device Technology, Inc. (b) | | | 169,932 |
| 19,700 | | Interwoven, Inc. | | | 156,024 |
| 13,200 | | Itron, Inc. (b) | | | 639,540 |
| 14,700 | | Komag, Inc. | | | 521,556 |
| 77,400 | | Kulicke & Soffa Industries, Inc. | | | 749,232 |
| 35,100 | | ManTech International Corp. | | | 1,106,001 |
| 192,000 | | MatrixOne, Inc. (b) | | | 948,480 |
| 134,900 | | Mattson Technology, Inc. (b) | | | 1,146,650 |
| 93,200 | | Maxtor Corp. (b) | | | 549,880 |
| 147,500 | | Methode Electronics, Inc. | | | 1,864,400 |
| 35,900 | | MTS Systems Corp. | | | 1,423,435 |
| 94,300 | | O2Micro International Ltd. | | | 1,618,188 |
| 49,800 | | Orbital Sciences Corp. | | | 573,696 |
| 56,900 | | Parametric Technology Corp. | | | 392,610 |
| 20,500 | | Phoenix Technologies Ltd. | | | 139,400 |
| 45,300 | | PMC-Sierra, Inc. (b) | | | 445,299 |
| 57,800 | | Polycom, Inc. (b) | | | 957,746 |
| 130,000 | | Power-One, Inc. (b) | | | 639,600 |
| 53,900 | | RadiSys Corp. (b) | | | 934,626 |
| 23,900 | | Reynolds & Reynolds Co. (The), Class A | | | 668,722 |
| 32,400 | | ROFIN-SINAR Technologies, Inc. (b) | | | 1,162,512 |
| 44,900 | | Rogers Corp. (b) | | | 1,832,818 |
| 53,000 | | Secure Computing Corp. | | | 655,080 |
| 5,100 | | SERENA Software, Inc. | | | 104,652 |
| 32,700 | | Symmetricom, Inc. | | | 342,042 |
| 126,100 | | TIBCO Software, Inc. (b) | | | 969,709 |
| 25,600 | | TriZetto Group, Inc. (The) | | | 411,904 |
| 52,700 | | UNOVA, Inc. (b) | | | 1,451,885 |
| 31,200 | | Verity, Inc. | | | 314,184 |
| | | | |
|
|
| | | | | | 30,844,449 |
| | | | |
|
|
| Materials (3.7%) | | | |
| 23,600 | | Aviall, Inc. (b) | | | 798,860 |
| 81,200 | | Century Aluminum Co. (b) | | | 1,986,964 |
| 33,500 | | Chemtura Corp. | | | 527,290 |
| 19,500 | | ElkCorp | | | 649,350 |
| 39,450 | | Florida Rock Industries, Inc. | | | 2,165,411 |
| 21,300 | | LSI Industries, Inc. (b) | | | 317,157 |
| 37,400 | | Northern Orion Resources, Inc. | | | 90,882 |
| 76,100 | | OM Group, Inc. (b) | | | 1,783,023 |
See notes to financial statements.
46
PACIFIC CAPITAL FUNDS
Small Cap Fund
Schedule of Portfolio Investments, Continued
July 31, 2005
| | | | | |
Shares
| | Security
Description
| | Value
|
| Common Stocks, continued | | | |
| Materials, continued | | | |
| 3,600 | | Reliance Steel & Aluminum Co. (b) | | $ | 168,192 |
| 57,900 | | U.S. Concrete, Inc. (b) | | | 387,930 |
| | | | |
|
|
| | | | | | 8,875,059 |
| | | | |
|
|
| Real Estate Investment Trust (4.5%) | | | |
| 37,600 | | Capital Automotive Real Estate Investment Trust | | | 1,476,552 |
| 142,400 | | DiamondRock Hospitality Co. (b)(c) | | | 1,710,224 |
| 252,700 | | ECC Capital Corp. | | | 1,612,226 |
| 15,400 | | Hersha Hospitality Trust | | | 150,920 |
| 76,900 | | Newcastle Investment Corp. | | | 2,376,210 |
| 21,300 | | Senior Housing Properties Trust | | | 420,036 |
| 53,421 | | Ventas, Inc. | | | 1,724,964 |
| 40,300 | | Washington Real Estate Investment Trust | | | 1,295,645 |
| | | | |
|
|
| | | | | | 10,766,777 |
| | | | |
|
|
| Telecommunications (1.4%) | | | |
| 25,200 | | ADTRAN, Inc. | | | 674,352 |
| 78,200 | | ARRIS Group, Inc. (b) | | | 863,328 |
| 18,200 | | CSG Systems International,
Inc. (b) | | | 339,430 |
| 17,500 | | Intrado, Inc. | | | 285,425 |
| 76,200 | | Premiere Global Services, Inc. (b) | | | 778,764 |
| 21,300 | | SBA Communications Corp. | | | 353,367 |
| | | | |
|
|
| | | | | | 3,294,666 |
| | | | |
|
|
| | | | | | |
Shares
| | Security
Description
| | Value
| |
| Common Stocks, continued | | | | |
| Transportation (1.4%) | | | | |
| 38,200 | | Genco Shipping & Trading Ltd. (b) | | $ | 730,384 | |
| 9,800 | | OMI Corp. (b) | | | 176,694 | |
| 129,900 | | Universal Truckload Services, Inc. | | | 2,370,675 | |
| | | | |
|
|
|
| | | | | | 3,277,753 | |
| | | | |
|
|
|
| Utilities (3.2%) | | | | |
| 79,500 | | CMS Energy Corp. (b) | | | 1,259,280 | |
| 69,000 | | Energen Corp. | | | 2,421,900 | |
| 25,100 | | Forest Oil Corp. (b) | | | 1,123,476 | |
| 91,400 | | UGI Corp. | | | 2,681,676 | |
| 5,700 | | Westar Energy, Inc. | | | 138,681 | |
| | | | |
|
|
|
| | | | | | 7,625,013 | |
| | | | |
|
|
|
| Total Common Stocks (Cost $182,499,317) | | | 223,009,446 | |
| | | | |
|
|
|
| Depositary Receipts (4.2%) | | | | |
| 120,600 | | iShares Russell 2000 Value Index Fund | | | 8,203,212 | |
| 25,400 | | iShares Trust Russell 2000 Index Fund | | | 1,721,358 | |
| | | | |
|
|
|
| Total Depositary Receipts (Cost $8,799,766) | | | 9,924,570 | |
| | | | |
|
|
|
| Investment Company (3.3%) | | | | |
| 7,774,754 | | The Bank of New York Cash Reserve Fund | | | 7,774,754 | |
| | | | |
|
|
|
| Total Investment Company (Cost $7,774,754) | | | 7,774,754 | |
| | | | |
|
|
|
Total Investments (Cost $199,073,837)
(a)—101.0% | | | 240,708,770 | |
| Liabilities in excess of other assets—(1.0)% | | | (2,323,476 | ) |
| | | | |
|
|
|
| Net Assets—100.0% | | $ | 238,385,294 | |
| | | | |
|
|
|
| (a) | Represents cost for financial reporting purposes and differs from cost basis for federal income tax purposes by the amount of losses recognized for financial reporting purposes in excess of federal income tax reporting of approximately $98,507. Cost for federal income tax purposes differs from value by net unrealized appreciation of securities as follows: |
| | | | |
Unrealized appreciation | | $ | 44,944,638 | |
Unrealized depreciation | | | (3,408,212 | ) |
| | |
|
|
|
Net unrealized appreciation | | $ | 41,536,426 | |
| | |
|
|
|
| (b) | Non-income producing security. |
| (c) | The shares of these securities were purchased through private placement under Rule 144A of the Securities Act of 1933, as amended. These securities are considered liquid based on procedures approved by the Board of Trustees. |
| | | | | | | | | | | | | | |
Issue Description
| | Acquisition
date
| | Cost
| | Value
| | Percent of
total
investments
| | | Percent of
net assets
| |
DiamondRock Hospitality Co. | | 6/29/04 | | $ | 1,424,000 | | $ | 1,710,224 | | 0.7 | % | | 0.7 | % |
Kohlberg Kravis Roberts & Co. Real Estate Investment Trust | | 7/22/05 | | | 1,756,000 | | | 2,149,343 | | 0.9 | % | | 0.9 | % |
| | | | | | | |
|
| |
|
| |
|
|
Fund Total: | | | | | | | $ | 3,859,567 | | 1.6 | % | | 1.6 | % |
| | | | | | | |
|
| |
|
| |
|
|
See notes to financial statements.
47
PACIFIC CAPITAL FUNDS
Mid-Cap Fund
Schedule of Portfolio Investments
July 31, 2005
| | | | | |
Shares
| | Security
Description
| | Value
|
| Common Stocks (95.8%) | | | |
| Consumer Discretionary (19.3%) | | | |
| 19,600 | | Abercrombie & Fitch Co., Class A | | $ | 1,412,180 |
| 16,500 | | Aeropostale, Inc. (b) | | | 492,525 |
| 2,800 | | Alaska Air Group, Inc. (b) | | | 97,944 |
| 33,000 | | American Eagle Outfitters, Inc. | | | 1,087,350 |
| 21,700 | | American Greetings Corp., Class A | | | 552,048 |
| 7,500 | | Autoliv, Inc. | | | 334,125 |
| 4,700 | | Banta Corp. | | | 224,378 |
| 14,400 | | Barnes & Noble, Inc. (b) | | | 590,688 |
| 19,000 | | BJ’s Wholesale Club, Inc. (b) | | | 605,910 |
| 12,300 | | Brinker International, Inc. (b) | | | 503,070 |
| 6,000 | | Brunswick Corp. | | | 279,360 |
| 20,500 | | Circuit City Stores, Inc. | | | 374,125 |
| 34,000 | | Copart, Inc. (b) | | | 831,640 |
| 21,100 | | Darden Restaurants, Inc. | | | 732,170 |
| 15,900 | | GTECH Holdings Corp. | | | 476,364 |
| 14,600 | | Harte-Hanks, Inc. | | | 397,120 |
| 7,200 | | ITT Educational Services, Inc. (b) | | | 369,000 |
| 4,100 | | Lennar Corp., Class A | | | 275,807 |
| 6,800 | | M.D.C. Holdings, Inc. | | | 580,856 |
| 24,500 | | Michaels Stores, Inc. | | | 1,004,500 |
| 6,000 | | Molson Coors Brewing Co., Class B | | | 376,200 |
| 3,500 | | Neiman Marcus Group, Inc. (The), Class A | | | 344,750 |
| 1,710 | | NVR, Inc. (b) | | | 1,603,981 |
| 7,800 | | Polaris Industries, Inc. | | | 431,340 |
| 32,300 | | Sabre Holdings Corp., Class A | | | 620,160 |
| 7,600 | | Timberland Co. (The), Class A (b) | | | 253,688 |
| 6,300 | | Urban Outfitters, Inc. (b) | | | 382,473 |
| 8,800 | | Valassis Communications, Inc. (b) | | | 348,040 |
| 780 | | Washington Post Co. (The), Class B | | | 693,264 |
| | | | |
|
|
| | | | | | 16,275,056 |
| | | | |
|
|
| Consumer Staples (3.8%) | | | |
| 13,800 | | Energizer Holdings, Inc. (b) | | | 881,820 |
| 6,100 | | Hormel Foods Corp. | | | 180,621 |
| 17,600 | | PepsiAmericas, Inc. | | | 453,728 |
| 7,200 | | Pilgrim’s Pride Corp. | | | 272,520 |
| 13,300 | | Smithfield Foods, Inc. (b) | | | 347,396 |
| 15,400 | | SUPERVALU, Inc. | | | 545,160 |
| 28,800 | | Tyson Foods, Inc., Class A | | | 536,832 |
| | | | |
|
|
| | | | | | 3,218,077 |
| | | | |
|
|
| Energy (8.0%) | | | |
| 32,200 | | Chesapeake Energy Corp. | | | 840,742 |
| 22,500 | | Diamond Offshore Drilling, Inc. | | | 1,283,850 |
| 30,700 | | Newfield Exploration Co. (b) | | | 1,304,443 |
| 25,900 | | Patterson-UTI Energy, Inc. | | | 850,297 |
| 12,400 | | Peabody Energy Corp. | | | 815,176 |
| 5,800 | | Sunoco, Inc. | | | 729,234 |
| 15,200 | | Tidewater, Inc. | | | 613,624 |
| 5,500 | | Weatherford International Ltd. (b) | | | 348,040 |
| | | | |
|
|
| | | | | | 6,785,406 |
| | | | |
|
|
| Financials (14.4%) | | | |
| 15,400 | | A.G. Edwards, Inc. | | | 682,220 |
| 15,100 | | Allmerica Financial Corp. (b) | | | 588,900 |
| 24,600 | | American Financial Group, Inc. | | | 832,464 |
| 20,000 | | AmeriCredit Corp. (b) | | | 534,400 |
| | | | | |
Shares
| | Security
Description
| | Value
|
| Common Stocks, continued | | | |
| Financials, continued | | | |
| 15,800 | | AmerUs Group Co. | | $ | 814,964 |
| 25,550 | | Associated Banc-Corp | | | 870,233 |
| 8,200 | | City National Corp. | | | 599,174 |
| 31,600 | | Colonial BancGroup, Inc. (The) | | | 735,332 |
| 5,000 | | Compass Bancshares, Inc. | | | 241,050 |
| 21,500 | | Equifax, Inc. | | | 782,600 |
| 12,100 | | First American Corp. | | | 531,795 |
| 10,700 | | Hibernia Corp., Class A | | | 361,874 |
| 25,700 | | Huntington Bancshares, Inc. | | | 640,958 |
| 19,600 | | IndyMac Bancorp, Inc. | | | 854,756 |
| 8,300 | | Legg Mason, Inc. | | | 847,845 |
| 9,100 | | Mercantile Bankshares Corp. | | | 506,324 |
| 9,200 | | Protective Life Corp. | | | 400,752 |
| 4,000 | | StanCorp Financial Group, Inc. | | | 345,360 |
| 26,400 | | W. R. Berkley Corp. | | | 988,152 |
| | | | |
|
|
| | | | | | 12,159,153 |
| | | | |
|
|
| Health Care (11.5%) | | | |
| 11,100 | | Barr Pharmaceuticals, Inc. (b) | | | 526,362 |
| 8,000 | | Bausch & Lomb, Inc. | | | 677,200 |
| 8,800 | | C. R. Bard, Inc. | | | 587,752 |
| 9,900 | | Cerner Corp. (b) | | | 746,658 |
| 10,700 | | Charles River Laboratories | | | 521,090 |
| | | International, Inc. (b) | | | |
| 17,650 | | Coventry Health Care, Inc. (b) | | | 1,248,384 |
| 21,000 | | Endo Pharmaceuticals Holdings, Inc. (b) | | | 597,660 |
| 5,800 | | Humana, Inc. (b) | | | 231,130 |
| 10,700 | | Invitrogen Corp. (b) | | | 917,739 |
| 13,800 | | PacifiCare Health Systems, Inc. (b) | | | 1,051,560 |
| 5,350 | | Renal Care Group, Inc. (b) | | | 251,183 |
| 22,100 | | STERIS Corp. | | | 600,457 |
| 7,800 | | Techne Corp. (b) | | | 382,746 |
| 16,500 | | Triad Hospitals, Inc. (b) | | | 819,555 |
| 10,200 | | Universal Health Services, Inc., Class B | | | 530,808 |
| | | | |
|
|
| | | | | | 9,690,284 |
| | | | |
|
|
| Industrials (10.3%) | | | |
| 13,500 | | AGCO Corp. (b) | | | 279,315 |
| 4,700 | | Black & Decker Corp. (The) | | | 424,457 |
| 10,100 | | BorgWarner, Inc. | | | 587,517 |
| 11,000 | | Cabot Microelectronics Corp. (b) | | | 330,770 |
| 4,800 | | Cummins, Inc. | | | 410,112 |
| 133 | | D.R. Horton, Inc. | | | 5,464 |
| 26,250 | | Graco, Inc. | | | 1,003,537 |
| 5,400 | | J.B. Hunt Transport Services, Inc. | | | 106,002 |
| 6,300 | | Joy Global, Inc. | | | 258,741 |
| 14,500 | | Kennametal, Inc. | | | 689,185 |
| 27,100 | | Korn/Ferry International (b) | | | 539,290 |
| 12,400 | | Martin Marietta Materials, Inc. | | | 901,356 |
| 15,300 | | Overseas Shipholding Group, Inc. | | | 949,365 |
| 7,800 | | Precision Castparts Corp. | | | 701,844 |
| 10,400 | | Steel Dynamics, Inc. | | | 334,464 |
| 10,800 | | Thomas & Betts Corp. (b) | | | 364,716 |
| 15,400 | | Yellow Roadway Corp. (b) | | | 814,814 |
| | | | |
|
|
| | | | | | 8,700,949 |
| | | | |
|
|
See notes to financial statements.
48
PACIFIC CAPITAL FUNDS
Mid-Cap Fund
Schedule of Portfolio Investments, Continued
July 31, 2005
| | | | | |
Shares
| | Security
Description
| | Value
|
| Common Stocks, continued | | | |
| Information Technology (11.7%) | | | |
| 1 | | Activision, Inc. (b) | | $ | 20 |
| 7,400 | | Amphenol Corp., Class A | | | 329,596 |
| 24,300 | | Avnet, Inc. (b) | | | 636,174 |
| 1,100 | | CACI International, Inc., Class A (b) | | | 72,369 |
| 15,700 | | CheckFree Corp. (b) | | | 531,602 |
| 19,000 | | Cognizant Technology Solutions Corp. (b) | | | 932,520 |
| 23,950 | | FactSet Research Systems, Inc. | | | 878,486 |
| 10,300 | | Imation Corp. | | | 446,505 |
| 10,100 | | Ingram Micro, Inc. (b) | | | 188,264 |
| 30,800 | | Integrated Device Technology, Inc. (b) | | | 356,048 |
| 49,100 | | Intersil Corp. | | | 951,067 |
| 13,800 | | Lam Research Corp. (b) | | | 392,610 |
| 12,000 | | McAfee Inc. (b) | | | 376,800 |
| 24,300 | | OmniVision Technologies, Inc. (b) | | | 343,359 |
| 23,100 | | PerkinElmer, Inc. | | | 484,638 |
| 18,800 | | SanDisk Corp. (b) | | | 635,816 |
| 7,700 | | Storage Technology Corp. (b) | | | 282,821 |
| 29,700 | | Sybase, Inc. (b) | | | 632,016 |
| 13,300 | | Transaction Systems Architects, Inc. (b) | | | 355,775 |
| 22,600 | | United Online, Inc. | | | 260,126 |
| 23,300 | | Vishay Intertechnology, Inc. (b) | | | 326,666 |
| 29,100 | | Western Digital Corp. (b) | | | 436,209 |
| | | | |
|
|
| | | | | | 9,849,487 |
| | | | |
|
|
| Materials (3.7%) | | | |
| 28,800 | | Chemtura Corp. | | | 453,312 |
| 13,600 | | Cree, Inc. (b) | | | 403,240 |
| 15,800 | | FMC Corp. (b) | | | 955,584 |
| 23,700 | | Louisiana-Pacific Corp. | | | 635,634 |
| 14,400 | | Lubrizol Corp. (The) | | | 633,600 |
| | | | |
|
|
| | | | | | 3,081,370 |
| | | | |
|
|
| Real Estate Investment Trust (3.5%) | | | |
| 21,900 | | CBL & Associates Properties, Inc. | | | 1,004,772 |
| 17,700 | | Highwoods Properties, Inc. | | | 560,205 |
| 28,000 | | New Plan Excel Realty Trust | | | 766,640 |
| 8,600 | | SL Green Realty Corp. | | | 599,420 |
| | | | |
|
|
| | | | | | 2,931,037 |
| | | | |
|
|
| | | | | | |
Shares
| | Security
Description
| | Value
| |
| Common Stocks, continued | | | | |
| Telecommunications (1.7%) | | | | |
| 19,900 | | ADTRAN, Inc. | | $ | 532,524 | |
| 4,400 | | Commonwealth Telephone Enterprises, Inc. | | | 188,320 | |
| 15,200 | | Harris Corp. | | | 563,464 | |
| 17,700 | | Premiere Global Services, Inc. (b) | | | 180,894 | |
| | | | |
|
|
|
| | | | | | 1,465,202 | |
| | | | |
|
|
|
| Utilities (7.9%) | | | | |
| 56,500 | | CMS Energy Corp. (b) | | | 894,960 | |
| 17,100 | | Energen Corp. | | | 600,210 | |
| 38,400 | | Energy East Corp. | | | 1,070,208 | |
| 5,300 | | MDU Resources Group, Inc. | | | 162,710 | |
| 41,900 | | ONEOK, Inc. | | | 1,464,405 | |
| 25,600 | | Questar Corp. | | | 1,796,608 | |
| 19,800 | | Republic Services, Inc. | | | 717,750 | |
| | | | |
|
|
|
| | | | | | 6,706,851 | |
| | | | |
|
|
|
| Total Common Stocks (Cost $68,690,757) | | | 80,862,872 | |
| | | | |
|
|
|
| Investment Company (4.0%) | | | | |
| 3,357,028 | | Victory Institutional Money Market Fund, Investor Shares | | | 3,357,028 | |
| | | | |
|
|
|
| Total Investment Company (Cost $3,357,028) | | | 3,357,028 | |
| | | | |
|
|
|
| Depositary Receipts (2.8%) | | | | |
| 18,000 | | S&P MidCap 400 Depositary Receipts | | | 2,367,540 | |
| | | | |
|
|
|
| Total Depositary Receipts (Cost $2,350,850) | | | 2,367,540 | |
| | | | |
|
|
|
Total Investments (Cost $74,398,635)
(a)—102.6% | | | 86,587,440 | |
| Liabilities in excess of other assets—(2.6)% | | | (2,177,879 | ) |
| | | | |
|
|
|
| Net Assets—100.0% | | $ | 84,409,561 | |
| | | | |
|
|
|
| (a) | Represents cost for financial reporting purposes and differs from cost basis for federal income tax purposes by the amount of losses recognized for financial reporting purposes in excess of federal income tax reporting of approximately $65,247. Cost for federal income tax purposes differs from value by net unrealized appreciation of securities as follows: |
| | | | |
Unrealized appreciation | | $ | 12,843,697 | |
Unrealized depreciation | | | (720,139 | ) |
| | |
|
|
|
Net unrealized appreciation | | $ | 12,123,558 | |
| | |
|
|
|
| (b) | Non-income producing security. |
See notes to financial statements.
49
PACIFIC CAPITAL FUNDS
Growth Stock Fund
Schedule of Portfolio Investments
July 31, 2005
| | | | | |
Shares
| | Security
Description
| | Value
|
| Common Stocks (97.5%) | | | |
| Consumer Discretionary (17.2%) | | | |
| 79,960 | | American Eagle Outfitters, Inc. | | $ | 2,634,682 |
| 63,350 | | Bed Bath & Beyond, Inc. (b) | | | 2,907,765 |
| 39,980 | | Boyd Gaming Corp. | | | 2,096,551 |
| 64,780 | | Brinker International, Inc. (b) | | | 2,649,502 |
| 40,900 | | Choice Hotels International, Inc. | | | 2,712,488 |
| 50,250 | | eBay, Inc. (b) | | | 2,099,445 |
| 32,630 | | Fortune Brands, Inc. | | | 3,085,167 |
| 58,620 | | Harley-Davidson, Inc. | | | 3,117,998 |
| 88,610 | | Home Depot, Inc. (The) | | | 3,855,420 |
| 47,990 | | ITT Educational Services, Inc. (b) | | | 2,459,488 |
| 111,540 | | Marvel Enterprises, Inc. (b) | | | 2,162,761 |
| 102,500 | | Pacific Sunwear of California, Inc. (b) | | | 2,499,975 |
| 37,200 | | Panera Bread Co. (b) | | | 2,166,900 |
| 40,450 | | Polaris Industries, Inc. | | | 2,236,885 |
| 87,110 | | Target Corp. | | | 5,117,712 |
| | | | |
|
|
| | | | | | 41,802,739 |
| | | | |
|
|
| Consumer Staples (8.8%) | | | |
| 40,560 | | Gillette Co. (The) | | | 2,176,855 |
| 43,650 | | Hershey Co. (The) | | | 2,787,926 |
| 75,170 | | Hormel Foods Corp. | | | 2,225,784 |
| 105,014 | | PepsiCo, Inc. | | | 5,726,413 |
| 99,630 | | Procter & Gamble Co. (The) | | | 5,542,417 |
| 41,600 | | Wm. Wrigley Jr. Co. | | | 2,959,424 |
| | | | |
|
|
| | | | | | 21,418,819 |
| | | | |
|
|
| Energy (2.3%) | | | |
| 78,510 | | Patterson-UTI Energy, Inc. | | | 2,577,483 |
| 51,780 | | Transocean, Inc. (b) | | | 2,921,946 |
| | | | |
|
|
| | | | | | 5,499,429 |
| | | | |
|
|
| Financials (8.4%) | | | |
| 39,680 | | Allstate Corp. (The) | | | 2,430,797 |
| 89,160 | | AmeriCredit Corp. (b) | | | 2,382,355 |
| 89,090 | | First American Corp. | | | 3,915,506 |
| 166,910 | | First BanCorp | | | 4,092,632 |
| 23,740 | | Goldman Sachs Group, Inc. (The) | | | 2,551,575 |
| 84,430 | | North Fork Bancorporation, Inc. | | | 2,312,538 |
| 71,890 | | W. R. Berkley Corp. | | | 2,690,843 |
| | | | |
|
|
| | | | | | 20,376,246 |
| | | | |
|
|
| Health Care (19.8%) | | | |
| 55,590 | | Abbott Laboratories | | | 2,592,162 |
| 54,250 | | American Pharmaceutical Partners, Inc. (b) | | | 2,462,408 |
| 14,960 | | Amgen, Inc. (b) | | | 1,193,060 |
| 54,950 | | Barr Pharmaceuticals, Inc. (b) | | | 2,605,729 |
| 29,530 | | Bausch & Lomb, Inc. | | | 2,499,715 |
| 66,050 | | Caremark Rx, Inc. (b) | | | 2,944,509 |
| 32,900 | | Cerner Corp. (b) | | | 2,481,318 |
| 67,860 | | Community Health Systems, Inc. (b) | | | 2,620,075 |
| 42,120 | | Coventry Health Care, Inc. (b) | | | 2,979,148 |
| 62,950 | | Genentech, Inc. (b) | | | 5,623,323 |
| 42,790 | | Genzyme Corp. (b) | | | 3,184,003 |
| 112,180 | | Johnson & Johnson | | | 7,175,032 |
| 57,230 | | McKesson Corp. | | | 2,575,350 |
| 81,584 | | Pfizer, Inc. | | | 2,161,976 |
| 44,260 | | Triad Hospitals, Inc. (b) | | | 2,198,394 |
| 83,890 | | Watson Pharmaceuticals, Inc. (b) | | | 2,801,926 |
| | | | |
|
|
| | | | | | 48,098,128 |
| | | | |
|
|
| | | | | | |
Shares
| | Security
Description
| | Value
| |
| Common Stocks, continued | | | | |
| Industrials (13.6%) | | | | |
| 35,470 | | 3M Co. | | $ | 2,660,250 | |
| 31,880 | | Boeing Co. (The) | | | 2,104,399 | |
| 47,260 | | Burlington Northern Santa Fe Corp. | | | 2,563,855 | |
| 235,533 | | General Electric Co. | | | 8,125,888 | |
| 54,600 | | Goodrich Corp. | | | 2,415,504 | |
| 66,970 | | Graco, Inc. | | | 2,560,263 | |
| 28,300 | | Ingersoll-Rand Co. Ltd., Class A | | | 2,212,211 | |
| 65,240 | | Rockwell Collins, Inc. | | | 3,183,712 | |
| 38,230 | | Teleflex, Inc. | | | 2,535,796 | |
| 74,960 | | Tyco International Ltd. | | | 2,284,031 | |
| 38,390 | | W.W. Grainger, Inc. | | | 2,392,465 | |
| | | | |
|
|
|
| | | | | | 33,038,374 | |
| | | | |
|
|
|
| Information Technology (24.7%) | | | | |
| 210,140 | | Applied Materials, Inc. | | | 3,879,184 | |
| 70,320 | | Autodesk, Inc. | | | 2,404,241 | |
| 391,294 | | Cisco Systems, Inc. (b) | | | 7,493,280 | |
| 70,500 | | Cognizant Technology Solutions Corp. (b) | | | 3,460,140 | |
| 89,250 | | Cree, Inc. (b) | | | 2,646,263 | |
| 102,130 | | Dell, Inc. (b) | | | 4,133,201 | |
| 131,500 | | Ingram Micro, Inc. (b) | | | 2,451,160 | |
| 232,950 | | Intel Corp. | | | 6,322,263 | |
| 45,000 | | International Rectifier Corp. (b) | | | 2,117,250 | |
| 184,780 | | Micrel, Inc. (b) | | | 2,233,990 | |
| 314,700 | | Microsoft Corp. | | | 8,059,466 | |
| 103,910 | | Motorola, Inc. | | | 2,200,814 | |
| 169,370 | | Oracle Corp. (b) | | | 2,300,045 | |
| 74,330 | | SanDisk Corp. (b) | | | 2,513,841 | |
| 139,500 | | Texas Instruments, Inc. | | | 4,430,520 | |
| 76,730 | | VeriSign, Inc. (b) | | | 2,018,766 | |
| 40,440 | | Yahoo!, Inc. (b) | | | 1,348,270 | |
| | | | |
|
|
|
| | | | | | 60,012,694 | |
| | | | |
|
|
|
| Materials (2.1%) | | | | |
| 48,420 | | Nucor Corp. | | | 2,684,889 | |
| 23,390 | | Phelps Dodge Corp. | | | 2,489,866 | |
| | | | |
|
|
|
| | | | | | 5,174,755 | |
| | | | |
|
|
|
| Telecommunications (0.6%) | | | | |
| 43,040 | | Nextel Communications, Inc., Class A (b) | | | 1,497,792 | |
| | | | |
|
|
|
| Total Common Stocks (Cost $219,112,718) | | | 236,918,976 | |
| | | | |
|
|
|
| Investment Company (2.5%) | | | | |
| 6,060,638 | | Victory Institutional Money Market Fund, Investor Shares | | | 6,060,638 | |
| | | | |
|
|
|
| Total Investment Company (Cost $6,060,638) | | | 6,060,638 | |
| | | | |
|
|
|
Total Investments (Cost $225,173,356)
(a)—100.0% | | | 242,979,614 | |
| Liabilities in excess of other assets—0.0% | | | (118,730 | ) |
| | | | |
|
|
|
| Net Assets—100.0% | | $ | 242,860,884 | |
| | | | |
|
|
|
See notes to financial statements.
50
PACIFIC CAPITAL FUNDS
Growth Stock Fund
Schedule of Portfolio Investments, Continued
July 31, 2005
| (a) | Represents cost for financial reporting purposes and differs from cost basis for federal income tax purposes by the amount of losses recognized for financial reporting purposes in excess of federal income tax reporting of approximately $1,518,013. Cost for federal income tax purposes differs from value by net unrealized appreciation of securities as follows: |
| | | | |
Unrealized appreciation | | $ | 19,778,429 | |
Unrealized depreciation | | | (3,490,184 | ) |
| | |
|
|
|
Net unrealized appreciation | | $ | 16,288,245 | |
| | |
|
|
|
| (b) | Non-income producing security. |
See notes to financial statements.
51
PACIFIC CAPITAL FUNDS
Growth and Income Fund
Schedule of Portfolio Investments
July 31, 2005
| | | | | |
Shares
| | Security
Description
| | Value
|
| Common Stocks (99.3%) | | | |
| Consumer Discretionary (15.8%) | | | |
| 44,930 | | American Eagle Outfitters, Inc. | | $ | 1,480,444 |
| 37,070 | | Bed Bath & Beyond, Inc. (b) | | | 1,701,513 |
| 24,940 | | Boyd Gaming Corp. | | | 1,307,854 |
| 36,950 | | Brinker International, Inc. (b) | | | 1,511,255 |
| 26,850 | | Choice Hotels International, Inc. | | | 1,780,691 |
| 56,470 | | Coach, Inc. (b) | | | 1,982,661 |
| 20,820 | | eBay, Inc. (b) | | | 869,860 |
| 18,060 | | Fortune Brands, Inc. | | | 1,707,573 |
| 33,450 | | Harley-Davidson, Inc. | | | 1,779,206 |
| 30,730 | | Home Depot, Inc. (The) | | | 1,337,062 |
| 30,950 | | ITT Educational Services, Inc. (b) | | | 1,586,188 |
| 68,830 | | Marvel Enterprises, Inc. (b) | | | 1,334,614 |
| 61,560 | | Pacific Sunwear of California, Inc. (b) | | | 1,501,448 |
| 23,280 | | Panera Bread Co. (b) | | | 1,356,060 |
| 25,020 | | Polaris Industries, Inc. | | | 1,383,606 |
| 21,020 | | Target Corp. | | | 1,234,925 |
| | | | |
|
|
| | | | | | 23,854,960 |
| | | | |
|
|
| Consumer Staples (7.5%) | | | |
| 40,860 | | Dean Foods Co. (b) | | | 1,458,702 |
| 12,820 | | Gillette Co. (The) | | | 688,049 |
| 25,970 | | Hershey Co. (The) | | | 1,658,704 |
| 49,215 | | PepsiCo, Inc. | | | 2,683,695 |
| 38,160 | | Pilgrim’s Pride Corp. | | | 1,444,356 |
| 33,140 | | Procter & Gamble Co. (The) | | | 1,843,578 |
| 21,330 | | Wm. Wrigley Jr. Co. | | | 1,517,416 |
| | | | |
|
|
| | | | | | 11,294,500 |
| | | | |
|
|
| Energy (8.8%) | | | |
| 25,630 | | Chevron Corp. | | | 1,486,796 |
| 44,780 | | ConocoPhillips | | | 2,802,780 |
| 65,550 | | Exxon Mobil Corp. | | | 3,851,063 |
| 49,770 | | Patterson-UTI Energy, Inc. | | | 1,633,949 |
| 31,500 | | Transocean, Inc. (b) | | | 1,777,545 |
| 81,790 | | Williams Cos., Inc. (The) | | | 1,737,220 |
| | | | |
|
|
| | | | | | 13,289,353 |
| | | | |
|
|
| Financials (19.8%) | | | |
| 33,100 | | A.G. Edwards, Inc. | | | 1,466,330 |
| 55,550 | | AmeriCredit Corp. (b) | | | 1,484,296 |
| 52,980 | | Bank of America Corp. | | | 2,309,928 |
| 32,670 | | CIT Group, Inc. | | | 1,442,054 |
| 38,460 | | Citigroup, Inc. | | | 1,673,010 |
| 25,920 | | Comerica, Inc. | | | 1,583,712 |
| 37,690 | | Countrywide Financial Corp. | | | 1,356,840 |
| 47,280 | | Equifax, Inc. | | | 1,720,992 |
| 55,310 | | First American Corp. | | | 2,430,875 |
| 104,190 | | First BanCorp. Puerto Rico | | | 2,554,739 |
| 18,930 | | Goldman Sachs Group, Inc. (The) | | | 2,034,596 |
| 46,045 | | JPMorgan Chase & Co. | | | 1,618,021 |
| 41,300 | | KeyCorp | | | 1,414,112 |
| 16,340 | | Lehman Brothers Holdings, Inc. | | | 1,717,824 |
| 45,530 | | Thornburg Mortgage, Inc. | | | 1,351,330 |
| 39,540 | | W. R. Berkley Corp. | | | 1,479,982 |
| 20,180 | | Wachovia Corp. | | | 1,016,668 |
| 21,280 | | Wells Fargo & Co. | | | 1,305,315 |
| | | | |
|
|
| | | | | | 29,960,624 |
| | | | |
|
|
| | | | | |
Shares
| | Security
Description
| | Value
|
| Common Stocks, continued | | | |
| Health Care (14.3%) | | | |
| 35,140 | | American Pharmaceutical Partners, Inc. (b) | | $ | 1,595,005 |
| 27,840 | | Barr Pharmaceuticals, Inc. (b) | | | 1,320,173 |
| 17,100 | | Bausch & Lomb, Inc. | | | 1,447,515 |
| 44,780 | | Bristol-Myers Squibb Co. | | | 1,118,604 |
| 38,500 | | Caremark Rx, Inc. (b) | | | 1,716,330 |
| 40,650 | | Community Health Systems, Inc. (b) | | | 1,569,497 |
| 22,970 | | Coventry Health Care, Inc. (b) | | | 1,624,668 |
| 27,900 | | Genentech, Inc. (b) | | | 2,492,307 |
| 39,716 | | Johnson & Johnson | | | 2,540,235 |
| 36,900 | | McKesson Corp. | | | 1,660,500 |
| 98,088 | | Pfizer, Inc. | | | 2,599,332 |
| 25,870 | | WellPoint, Inc. (b) | | | 1,830,044 |
| | | | |
|
|
| | | | | | 21,514,210 |
| | | | |
|
|
| Industrials (9.7%) | | | |
| 10,880 | | 3M Co. | | | 816,000 |
| 11,910 | | Boeing Co. (The) | | | 786,179 |
| 24,780 | | Deere & Co. | | | 1,822,073 |
| 15,690 | | General Dynamics Corp. | | | 1,807,331 |
| 142,100 | | General Electric Co. | | | 4,902,450 |
| 34,000 | | Goodrich Corp. | | | 1,504,160 |
| 19,690 | | Ingersoll-Rand Co. Ltd., Class A | | | 1,539,167 |
| 40,650 | | Norfolk Southern Corp. | | | 1,512,587 |
| | | | |
|
|
| | | | | | 14,689,947 |
| | | | |
|
|
| Information Technology (15.2%) | | | |
| 90,700 | | Activision, Inc. (b) | | | 1,844,838 |
| 60,080 | | Applied Materials, Inc. | | | 1,109,077 |
| 154,160 | | Cisco Systems, Inc. (b) | | | 2,952,164 |
| 51,000 | | Cree, Inc. (b) | | | 1,512,150 |
| 30,620 | | Dell, Inc. (b) | | | 1,239,191 |
| 79,190 | | Ingram Micro, Inc. (b) | | | 1,476,102 |
| 80,360 | | Intel Corp. | | | 2,180,970 |
| 142,440 | | Microsoft Corp. | | | 3,647,888 |
| 104,570 | | Oracle Corp. (b) | | | 1,420,061 |
| 44,900 | | SanDisk Corp. (b) | | | 1,518,518 |
| 72,670 | | Texas Instruments, Inc. | | | 2,307,999 |
| 46,770 | | VeriSign, Inc. (b) | | | 1,230,519 |
| 17,340 | | Yahoo!, Inc. (b) | | | 578,116 |
| | | | |
|
|
| | | | | | 23,017,593 |
| | | | |
|
|
| Materials (3.5%) | | | |
| 30,440 | | FMC Corp. (b) | | | 1,841,011 |
| 30,400 | | Nucor Corp. | | | 1,685,680 |
| 16,330 | | Phelps Dodge Corp. | | | 1,738,329 |
| | | | |
|
|
| | | | | | 5,265,020 |
| | | | |
|
|
| Telecommunications (2.8%) | | | |
| 29,560 | | ALLTEL Corp. | | | 1,965,740 |
| 81,640 | | Sprint Corp. | | | 2,196,116 |
| | | | |
|
|
| | | | | | 4,161,856 |
| | | | |
|
|
| Utilities (1.9%) | | | |
| 42,120 | | Edison International | | | 1,721,866 |
| 19,680 | | PPL Corp. | | | 1,211,894 |
| | | | |
|
|
| | | | | | 2,933,760 |
| | | | |
|
|
| Total Common Stocks (Cost $136,229,935) | | | 149,981,823 |
| | | | |
|
|
See notes to financial statements.
52
PACIFIC CAPITAL FUNDS
Growth and Income Fund
Schedule of Portfolio Investments, Continued
July 31, 2005
| | | | | | |
Shares
| | Security
Description
| | Value
| |
| Investment Company (0.7%) | | | | |
| 1,010,433 | | Victory Institutional Money Market Fund, Investor Shares | | $ | 1,010,433 | |
| | | | |
|
|
|
| Total Investment Company (Cost $1,010,433) | | | 1,010,433 | |
| | | | |
|
|
|
Total Investments (Cost $137,240,368)
(a)—100.0% | | | 150,992,256 | |
| Liabilities in excess of other assets—0.0% | | | (22,765 | ) |
| | | | |
|
|
|
| Net Assets—100.0% | | $ | 150,969,491 | |
| | | | |
|
|
|
| (a) | Represents cost for financial reporting purposes and differs from cost basis for federal income tax purposes by the amount of losses recognized for financial reporting purposes in excess of federal income tax reporting of approximately $497,086. Cost for federal income tax purposes differs from value by net unrealized appreciation of securities as follows: |
| | | | |
Unrealized appreciation | | $ | 15,231,350 | |
Unrealized depreciation | | | (1,976,548 | ) |
| | |
|
|
|
Net unrealized appreciation | | $ | 13,254,802 | |
| | |
|
|
|
| (b) | Non-income producing security. |
See notes to financial statements.
53
PACIFIC CAPITAL FUNDS
Value Fund
Schedule of Portfolio Investments
July 31, 2005
| | | | | |
Shares
| | Security
Description
| | Value
|
| Common Stocks (98.7%) | | | |
| Consumer Discretionary (10.6%) | | | |
| 34,410 | | BorgWarner, Inc. | | $ | 2,001,630 |
| 42,560 | | Brinker International, Inc. (b) | | | 1,740,704 |
| 20,910 | | Fortune Brands, Inc. | | | 1,977,041 |
| 36,350 | | Harley-Davidson, Inc. | | | 1,933,457 |
| 41,380 | | J.C. Penney Co., Inc. (Holding Co.) | | | 2,323,072 |
| 77,130 | | Pacific Sunwear of California, Inc. (b) | | | 1,881,201 |
| 31,380 | | Polaris Industries, Inc. | | | 1,735,314 |
| 227,060 | | Time Warner, Inc. (b) | | | 3,864,560 |
| 38,465 | | Viacom, Inc., Class B | | | 1,288,193 |
| 46,740 | | Walt Disney Co. (The) | | | 1,198,414 |
| | | | |
|
|
| | | | | | 19,943,586 |
| | | | |
|
|
| Consumer Staples (3.3%) | | | |
| 36,904 | | Altria Group, Inc. | | | 2,471,092 |
| 57,300 | | Dean Foods Co. (b) | | | 2,045,610 |
| 47,340 | | Pilgrim’s Pride Corp. | | | 1,791,819 |
| | | | |
|
|
| | | | | | 6,308,521 |
| | | | |
|
|
| Energy (14.3%) | | | |
| 60,150 | | Chevrontexaco Corp. | | | 3,489,302 |
| 71,880 | | ConocoPhillips | | | 4,498,969 |
| 54,828 | | Devon Energy Corp. | | | 3,075,303 |
| 147,098 | | Exxon Mobil Corp. | | | 8,642,007 |
| 35,910 | | Occidental Petroleum Corp. | | | 2,954,675 |
| 31,780 | | Transocean, Inc. (b) | | | 1,793,345 |
| 113,990 | | Williams Cos., Inc. (The) | | | 2,421,148 |
| | | | |
|
|
| | | | | | 26,874,749 |
| | | | |
|
|
| Financials (33.0%) | | | |
| 42,640 | | A.G. Edwards, Inc. | | | 1,888,952 |
| 52,400 | | Allstate Corp. (The) | | | 3,210,024 |
| 30,120 | | American International Group, Inc. | | | 1,813,224 |
| 72,310 | | AmeriCredit Corp. (b) | | | 1,932,123 |
| 37,430 | | AmerUs Group Co. | | | 1,930,639 |
| 120,680 | | Bank of America Corp. | | | 5,261,648 |
| 42,830 | | CBL & Associates Properties, Inc. | | | 1,965,040 |
| 44,060 | | CIT Group, Inc. | | | 1,944,808 |
| 120,670 | | Citigroup, Inc. | | | 5,249,145 |
| 34,040 | | Comerica, Inc. | | | 2,079,844 |
| 47,110 | | Countrywide Financial Corp. | | | 1,695,960 |
| 59,690 | | Equifax, Inc. | | | 2,172,716 |
| 72,760 | | First American Corp. | | | 3,197,802 |
| 129,900 | | First BanCorp. Puerto Rico | | | 3,185,148 |
| 20,540 | | Freddie Mac | | | 1,299,771 |
| 26,140 | | Goldman Sachs Group, Inc. (The) | | | 2,809,527 |
| 103,839 | | JPMorgan Chase & Co. | | | 3,648,902 |
| 64,500 | | KeyCorp | | | 2,208,480 |
| 31,660 | | Lehman Brothers Holdings, Inc. | | | 3,328,416 |
| 66,490 | | National City Corp. | | | 2,454,146 |
| 56,510 | | Thornburg Mortgage, Inc. | | | 1,677,217 |
| 46,810 | | Wachovia Corp. | | | 2,358,288 |
| 50,870 | | Wells Fargo & Co. | | | 3,120,366 |
| 27,310 | | Zions Bancorporation | | | 1,952,119 |
| | | | |
|
|
| | | | | | 62,384,305 |
| | | | |
|
|
| Health Care (9.1%) | | | |
| 17,990 | | Aetna, Inc. | | | 1,392,426 |
| 43,060 | | American Pharmaceutical Partners, Inc. (b) | | | 1,954,493 |
| | | | | |
Shares
| | Security
Description
| | Value
|
| Common Stocks, continued | | | |
| Health Care, continued | | | |
| 21,630 | | Bausch & Lomb, Inc. | | $ | 1,830,980 |
| 37,250 | | Bristol-Myers Squibb Co. | | | 930,505 |
| 44,900 | | McKesson Corp. | | | 2,020,500 |
| 229,420 | | Pfizer, Inc. | | | 6,079,630 |
| 26,110 | | Triad Hospitals, Inc. (b) | | | 1,296,884 |
| 49,590 | | Watson Pharmaceuticals, Inc. (b) | | | 1,656,306 |
| | | | |
|
|
| | | | | | 17,161,724 |
| | | | |
|
|
| Industrials (7.1%) | | | |
| 30,890 | | Deere & Co. | | | 2,271,342 |
| 74,730 | | General Electric Co. | | | 2,578,185 |
| 24,360 | | Honeywell International, Inc. | | | 956,861 |
| 66,130 | | Norfolk Southern Corp. | | | 2,460,697 |
| 58,540 | | Republic Services, Inc. | | | 2,122,075 |
| 20,020 | | United Technologies Corp. | | | 1,015,014 |
| 35,680 | | Yellow Roadway Corp. (b) | | | 1,887,829 |
| | | | |
|
|
| | | | | | 13,292,003 |
| | | | |
|
|
| Information Technology (5.9%) | | | |
| 115,650 | | Activision, Inc. (b) | | | 2,352,321 |
| 93,363 | | Hewlett-Packard Co. | | | 2,298,597 |
| 71,150 | | Microsoft Corp. | | | 1,822,152 |
| 85,520 | | National Semiconductor Corp. | | | 2,113,199 |
| 158,770 | | Nokia Corp., ADR | | | 2,532,381 |
| | | | |
|
|
| | | | | | 11,118,650 |
| | | | |
|
|
| Materials (4.1%) | | | |
| 36,410 | | FMC Corp. (b) | | | 2,202,077 |
| 30,660 | | Phelps Dodge Corp. | | | 3,263,757 |
| 51,760 | | United States Steel Corp. | | | 2,207,564 |
| | | | |
|
|
| | | | | | 7,673,398 |
| | | | |
|
|
| Telecommunications (4.5%) | | | |
| 83,220 | | SBC Communications, Inc. | | | 2,034,729 |
| 108,260 | | Sprint Corp. | | | 2,912,194 |
| 102,151 | | Verizon Communications, Inc. | | | 3,496,629 |
| | | | |
|
|
| | | | | | 8,443,552 |
| | | | |
|
|
| Utilities (6.8%) | | | |
| 76,780 | | Edison International | | | 3,138,767 |
| 52,910 | | Exelon Corp. | | | 2,831,743 |
| 47,270 | | FirstEnergy Corp. | | | 2,353,101 |
| 60,410 | | PG&E Corp. | | | 2,273,228 |
| 34,600 | | PPL Corp. | | | 2,130,668 |
| | | | |
|
|
| | | | | | 12,727,507 |
| | | | |
|
|
| Total Common Stocks (Cost $162,328,864) | | | 185,927,995 |
| | | | |
|
|
| Depositary Receipts (0.7%) | | | |
| 46,060 | | Materials Select Sector SPDR Trust | | | 1,319,158 |
| | | | |
|
|
| Total Depositary Receipts (Cost $1,303,641) | | | 1,319,158 |
| | | | |
|
|
| Investment Company (0.6%) | | | |
| 1,142,163 | | Victory Institutional Money Market Fund, Investor Shares | | | 1,142,163 |
| | | | |
|
|
| Total Investment Company (Cost $1,142,163) | | | 1,142,163 |
| | | | |
|
|
Total Investments (Cost $164,774,668)
(a)—100.0% | | | 188,389,316 |
| Other assets in excess of liabilities—0.0% | | | 93,660 |
| | | | |
|
|
| Net Assets—100.0% | | $ | 188,482,976 |
| | | | |
|
|
See notes to financial statements.
54
PACIFIC CAPITAL FUNDS
Value Fund
Schedule of Portfolio Investments, Continued
July 31, 2005
| (a) | Represents cost for financial reporting purposes and differs from cost basis for federal income tax purposes by the amount of losses recognized for financial reporting purposes in excess of federal income tax reporting of approximately $507,769. Cost for federal income tax purposes differs from value by net unrealized appreciation of securities as follows: |
| | | | |
Unrealized appreciation | | $ | 26,139,920 | |
Unrealized depreciation | | | (3,033,041 | ) |
| | |
|
|
|
Net unrealized appreciation | | $ | 23,106,879 | |
| | |
|
|
|
| (b) | Non-income producing security. |
ADR—American Depositary Receipt
SPDR—Standard & Poor’s Depositary Receipt
See notes to financial statements.
55
PACIFIC CAPITAL FUNDS
Diversified Fixed Income Fund
Schedule of Portfolio Investments
July 31, 2005
| | | | | | |
Principal
Amount
| | Security
Description
| | Value
|
| | Corporate Bonds (52.0%) | | | |
| | Consumer Discretionary (4.3%) | | | |
| $ | 5,250,000 | | Estee Lauder Cos., Inc. (The), 6.00%, 1/15/12 | | $ | 5,615,495 |
| | 1,400,000 | | McDonald’s Corp., 6.50%, 8/1/07 | | | 1,454,250 |
| | 2,500,000 | | Wal-Mart Stores, Inc., 8.85%, 1/2/15 | | | 3,090,450 |
| | 3,000,000 | | Wm. Wrigley Jr. Co., 4.30%, 7/15/10 | | | 2,975,535 |
| | | | | |
|
|
| | | | | | | 13,135,730 |
| | | | | |
|
|
| | Consumer Staples (4.3%) | | | |
| | 1,625,000 | | Bestfoods, Series F, 6.625%, 4/15/28, MTN | | | 1,891,729 |
| | 1,388,000 | | Colgate-Palmolive Co., Series B, 7.60%, 5/19/25, MTN | | | 1,830,425 |
| | 300,000 | | Kellogg Co., 2.875%, 6/1/08 | | | 286,709 |
| | 400,000 | | Kimberly-Clark Corp., 6.875%, 2/15/14 | | | 458,906 |
| | 3,615,000 | | Kraft Foods, Inc., 4.00%, 10/1/08 | | | 3,555,153 |
| | 2,200,000 | | Procter & Gamble Co. (The), 8.50%, 8/10/09 | | | 2,527,250 |
| | 2,495,000 | | SYSCO Corp., 7.25%, 4/15/07 | | | 2,604,156 |
| | | | | |
|
|
| | | | | | | 13,154,328 |
| | | | | |
|
|
| | Energy (4.5%) | | | |
| | 2,295,000 | | Alabama Power Co., Series 1, 5.65%, 3/15/35,
Callable 3/15/15 @ 100 | | | 2,278,841 |
| | 5,000,000 | | Amoco Corp., 6.50%, 8/1/07 | | | 5,200,000 |
| | 800,000 | | Amoco Corp. Argentina, 6.625%, 9/15/05 | | | 803,016 |
| | 438,000 | | Anadarko Petroleum Corp., 7.20%, 3/15/29 | | | 522,979 |
| | 1,030,000 | | Atlantic Richfield Co., 8.50%, 4/1/12 | | | 1,250,314 |
| | 3,462,000 | | Rowan Cos., Inc., Title XI Shipping Bonds, 5.88%, 3/15/12, U.S. Government Guaranteed | | | 3,580,778 |
| | | | | |
|
|
| | | | | | | 13,635,928 |
| | | | | |
|
|
| | Financials (21.3%) | | | |
| | Banking (4.2%) | | | |
| | 975,000 | | Bank of New York Co., Inc. (The), Series E, 2.20%, 5/12/06, MTN | | | 960,312 |
| | 3,000,000 | | Chase Manhattan Corp., 7.25%, 6/1/07 | | | 3,138,750 |
| | 3,702,265 | | Fifth Third Bancorp, Series BKNT, 2.87%, 8/10/09 | | | 3,570,997 |
| | 1,350,000 | | U.S. Bancorp, 5.10%, 7/15/07 | | | 1,367,628 |
| | 4,000,000 | | Wells Fargo Co., 3.12%, 8/15/08 | | | 3,858,552 |
| | | | | |
|
|
| | | | | | | 12,896,239 |
| | | | | |
|
|
| | Broker-Dealer (0.7%) | | | |
| | 2,100,000 | | Goldman Sachs Group, Inc. (The), 5.15%, 1/15/14 | | | 2,116,693 |
| | | | | |
|
|
| | Financial Services (9.4%) | | | |
| | 1,025,000 | | FGIC Corp., 6.00%, 1/15/34 (b) | | | 1,096,035 |
| | 825,000 | | Ford Motor Credit Co., 6.50%, 1/25/07 | | | 833,922 |
| | | | | | |
Principal
Amount
| | Security
Description
| | Value
|
| | Corporate Bonds, continued | | | |
| | Financial Services, continued | | | |
| $ | 1,150,000 | | Ford Motor Credit Co., 7.75%, 2/15/07, MTN | | $ | 1,175,875 |
| | 350,000 | | General Electric Capital Corp., 5.00%, 2/15/07, MTN | | | 353,427 |
| | 3,000,000 | | General Electric Capital Corp., 8.625%, 6/15/08 | | | 3,312,204 |
| | 4,230,000 | | Pitney Bowes Credit Corp., 5.75%, 8/15/08 | | | 4,397,559 |
| | 3,000,000 | | Private Export Funding Co.,, 4.55%, 5/15/15 | | | 2,997,723 |
| | 5,575,000 | | SLM Corp., 3.86%, 7/25/08 | | | 5,596,613 |
| | 4,812,535 | | Toyota Motor Credit Corp., 2.75%, 8/6/09, MTN | | | 4,675,719 |
| | 2,450,000 | | Toyota Motor Credit Corp., Series B, 5.42%, 3/22/17,
Callable 3/22/07 @ 100, MTN | | | 2,448,929 |
| | 1,423,124 | | UPFC Auto Receivables Trust, Series 2004-A, Class A2, 2.56%, 6/15/07 | | | 1,415,525 |
| | | | | |
|
|
| | | | | | | 28,303,531 |
| | | | | |
|
|
| | Insurance (7.0%) | | | |
| | 5,000,000 | | Berkshire Hathaway Financial, Inc., 4.20%, 12/15/10 | | | 4,877,715 |
| | 2,500,000 | | Genworth Financial, Inc., 5.75%, 6/15/14 | | | 2,626,793 |
| | 1,000,000 | | International Lease Finance Corp., Series MTNP, 4.00%*, 1/15/10, MTN | | | 998,750 |
| | 5,000,000 | | Monumental Global Funding, 4.625%, 3/15/10 (b) | | | 5,012,499 |
| | 3,000,000 | | Principal Life, Inc. Funding, 2.78%*, 2/14/07, MTN | | | 3,003,750 |
| | 4,625,000 | | Protective Life Secured Trust, Series 2003-1, 3.70%, 11/24/08, MTN | | | 4,514,592 |
| | | | | |
|
|
| | | | | | | 21,034,099 |
| | | | | |
|
|
| | | | | | | 64,350,562 |
| | | | | |
|
|
| | Foreign Government (2.6%) | | | |
| | 3,000,000 | | Province of Ontario, 3.28%, 3/28/08 | | | 2,913,750 |
| | 5,000,000 | | Republic of Finland, 4.75%, 3/6/07 | | | 5,028,795 |
| | | | | |
|
|
| | | | | | | 7,942,545 |
| | | | | |
|
|
| | Health Care (2.8%) | | | |
| | 5,000,000 | | Astrazeneca PLC, 5.40%, 6/1/14 | | | 5,217,485 |
| | 500,000 | | Pfizer, Inc., 4.65%, 3/1/18 | | | 487,661 |
| | 2,400,000 | | Pharmacia Corp., 6.75%, 12/15/27 | | | 2,879,287 |
| | | | | |
|
|
| | | | | | | 8,584,433 |
| | | | | |
|
|
| | Industrials (3.0%) | | | |
| | 5,258,509 | | FedEx Corp., Pass Thru Certificates, 7.50%, 1/15/18 | | | 5,961,036 |
| | 3,000,000 | | General Electric Co., 5.00%, 2/1/13 | | | 3,040,308 |
| | | | | |
|
|
| | | | | | | 9,001,344 |
| | | | | |
|
|
See notes to financial statements.
56
PACIFIC CAPITAL FUNDS
Diversified Fixed Income Fund
Schedule of Portfolio Investments, Continued
July 31, 2005
| | | | | | |
Principal
Amount
| | Security
Description
| | Value
|
| | Corporate Bonds, continued | | | |
| | Materials (0.7%) | | | |
| $ | 2,000,000 | | North Finance (Bermuda) Ltd., 7.00%, 9/15/05 (b) | | $ | 2,004,300 |
| | | | | |
|
|
| | Special Purpose Entity (2.7%) | | | |
| | 5,000,000 | | MBIA Global Funding LLC, 5.375%, 6/20/14 (b) | | | 5,132,975 |
| | 3,000,000 | | Ohana Military Communities LLC, Series A, Class I, 5.47%, 10/1/21 (b) | | | 3,221,250 |
| | | | | |
|
|
| | | | | 8,354,225 |
| | | | | |
|
|
| | Supranational Agency (3.2%) | | | |
| | 920,000 | | African Development Bank, 6.875%, 10/15/15 | | | 1,067,700 |
| | 4,779,000 | | Inter-American Development Bank, 8.50%, 3/15/11 | | | 5,659,933 |
| | 3,000,000 | | International Bank for Reconstruction & Development, 4.00%, 4/29/10,
Callable 4/29/06 @ 100 | | | 2,986,380 |
| | | | | |
|
|
| | | | | | | 9,714,013 |
| | | | | |
|
|
| | Telecommunications (2.3%) | | | |
| | 4,075,000 | | GTE Southwest, Inc., First Mortgage Bond, 8.50%, 11/15/31 | | | 5,312,781 |
| | 1,577,000 | | Southwestern Bell Telephone Co., 7.00%, 7/1/15 | | | 1,795,809 |
| | | | | |
|
|
| | | | | | | 7,108,590 |
| | | | | |
|
|
| | Transportation (0.3%) | | | |
| | 847,112 | | Burlington Northern & Santa Fe Railway Co. (The),
Series 2002-2, 5.14%, 1/15/21 | | | 862,521 |
| | | | | |
|
|
| | Total Corporate Bonds (Cost $154,680,664) | | | 157,848,519 |
| | | | | |
|
|
| | U.S. Government Agencies (28.6%) | | | |
| | Federal Agricultural Mortgage Corp. (1.2%) |
| | 3,800,000 | | 4.25%, 7/29/08 | | | 3,788,296 |
| | | | | |
|
|
| | Federal Home Loan Bank (7.6%) | | | |
| | 5,000,000 | | 6.50%, 11/15/05 | | | 5,035,135 |
| | 2,500,000 | | 4.88%, 11/15/06 | | | 2,521,905 |
| | 2,025,000 | | 4.00%, 3/10/08,
Callable 3/10/06 @ 100 | | | 2,010,224 |
| | 3,000,000 | | 5.50%, 8/15/08, Series 3W08 | | | 3,093,900 |
| | 1,000,000 | | 3.25%, 8/21/09,
Callable 8/22/05 @ 100 (d) | | | 999,075 |
| | 3,000,000 | | 7.625%, 5/14/10 | | | 3,412,317 |
| | 400,000 | | 3.50%, 5/26/10,
Callable 5/26/06 @ 100* | | | 400,000 |
| | 5,000,000 | | 4.00%, 12/30/10,
Callable 6/30/05 @ 100 (d) | | | 4,952,875 |
| | 535,000 | | 4.87%, 9/7/12 (c) | | | 531,672 |
| | | | | |
|
|
| | | | | | | 22,957,103 |
| | | | | |
|
|
| | | | | | |
Principal
Amount
| | Security
Description
| | Value
|
| | U.S. Government Agencies, continued | | | |
| | Federal Home Loan Mortgage Corp. (8.3%) | | | |
| $ | 2,075,000 | | 6.75%, 5/30/06 | | $ | 2,120,380 |
| | 2,000,000 | | 2.50%, 3/9/07, Callable
3/9/06 @ 100, MTN (d) | | | 1,958,610 |
| | 2,025,000 | | 3.00%, 4/19/07, Callable 10/19/05 @ 100, MTN (d) | | | 1,986,566 |
| | 3,750,000 | | 3.80%, 6/28/07,
Callable 6/28/06 @ 100, MTN | | | 3,723,465 |
| | 7,000,000 | | 4.15%, 12/18/08 | | | 6,929,726 |
| | 5,000,000 | | 6.25%, 3/5/12 | | | 5,152,840 |
| | 3,547,624 | | 4.50%, 6/1/14 | | | 3,499,944 |
| | | | | |
|
|
| | | | | | | 25,371,531 |
| | | | | |
|
|
| | Federal National Mortgage Assoc. (4.6%) | | | |
| | 5,000,000 | | 5.50%, 5/2/06 | | | 5,052,210 |
| | 5,000,000 | | 6.00%, 5/15/08 | | | 5,226,855 |
| | 2,000,000 | | 3.80%, 2/3/09 | | | 1,962,986 |
| | 750,000 | | 3.625%, 12/28/09,
Callable 12/28/06 @ 100 (d) | | | 743,438 |
| | 1,000,000 | | 6.875%, 9/10/12 | | | 1,049,035 |
| | | | | |
|
|
| | | | | | | 14,034,524 |
| | | | | |
|
|
| | Housing & Urban Development (1.0%) | | | |
| | 2,950,000 | | 6.41%, 8/1/14 | | | 3,107,149 |
| | | | | |
|
|
| | New Valley Generation IV (0.8%) | | | |
| | 2,305,469 | | 4.687%, 1/15/22 | | | 2,306,068 |
| | | | | |
|
|
| | Private Export Funding (2.1%) | | | |
| | 565,000 | | 7.11%, 4/15/07 | | | 592,544 |
| | 3,100,000 | | 6.67%, 9/15/09 | | | 3,371,250 |
| | 2,200,000 | | 4.97%, 8/15/13 | | | 2,268,750 |
| | | | | |
|
|
| | | | | | | 6,232,544 |
| | | | | |
|
|
| | Small Business Administration Corp. (1.2%) | | | |
| | 3,229,887 | | 6.34%, 8/1/11 | | | 3,524,175 |
| | | | | |
|
|
| | Tennessee Valley Authority (1.8%) | | | |
| | 5,750,000 | | 4.65%, 6/15/35 | | | 5,552,534 |
| | | | | |
|
|
| Total U.S. Government Agencies
(Cost $86,022,667) | | | 86,873,924 |
| | | | | |
|
|
| | U.S. Treasury Bonds (12.9%) | | | |
| | 6,400,000 | | 7.25%, 5/15/16 | | | 7,977,005 |
| | 2,850,000 | | 7.875%, 2/15/21 | | | 3,911,739 |
| | 8,000,000 | | 6.25%, 8/15/23 | | | 9,649,064 |
| | 9,815,000 | | 5.50%, 8/15/28 | | | 11,157,594 |
| | 6,000,000 | | 5.25%, 11/15/28 | | | 6,611,700 |
| | | | | |
|
|
| | Total U.S. Treasury Bonds (Cost $36,457,812) | | | 39,307,102 |
| | | | | |
|
|
| | U.S. Treasury Notes (4.3%) | | | |
| | 3,000,000 | | 6.625%, 5/15/07 | | | 3,136,056 |
| | 2,150,000 | | 3.375%, 11/15/08 | | | 2,103,474 |
| | 3,000,000 | | 4.00%, 6/15/09 | | | 2,987,814 |
| | 5,000,000 | | 4.25%, 11/15/14 | | | 4,986,525 |
| | | | | |
|
|
| | Total U.S. Treasury Notes (Cost $13,342,623) | | | 13,213,869 |
| | | | | |
|
|
See notes to financial statements.
57
PACIFIC CAPITAL FUNDS
Diversified Fixed Income Fund
Schedule of Portfolio Investments, Continued
July 31, 2005
| | | | | | |
Shares
| | Security
Description
| | Value
| |
| Investment Company (2.2%) | | | | |
| 6,827,314 | | Victory Institutional Money Market Fund, Investor Shares | | $ | 6,827,314 | |
| | | | |
|
|
|
| Total Investment Company (Cost $6,827,314) | | | 6,827,314 | |
| | | | |
|
|
|
Total Investments (Cost $297,331,080)
(a)—100.0% | | | 304,070,728 | |
| Liabilities in excess of other assets—0.0% | | | (47,420 | ) |
| | | | |
|
|
|
| Net Assets—100.0% | | $ | 304,023,308 | |
| | | | |
|
|
|
| * | Variable rate security. Rate presented represents rate in effect at July 31, 2005. Date presented reflects final maturity date. |
| (a) | Represents cost for federal income tax purpose and differs from value by net unrealized appreciation of securities as follows: |
| | | | |
Unrealized appreciation | | $ | 8,822,362 | |
Unrealized depreciation | | | (2,082,714 | ) |
| | |
|
|
|
Net unrealized appreciation | | $ | 6,739,648 | |
| | |
|
|
|
| (b) | Security exempt from registration under Rule 144A of the Securities Act of 1933, as amended. These securities may be resold in transactions exempt from registration normally to qualified institutional buyers. The Fund’s adviser has deemed these securities to be liquid (unless noted) based upon procedures approved by the Board of Trustees. |
| | | | | | | | | | | | | | |
Issue description
| | Acquisition
date
| | Cost
| | Value
| | Percent of
total
investments
| | | Percent of
net assets
| |
FGIC Corp., 6.00%, 1/15/34 | | * | | $ | 1,105,603 | | $ | 1,096,035 | | 0.4 | % | | 0.4 | % |
MBIA Global Funding LLC, 5.375%, 6/20/14 | | 5/27/04 | | | 4,982,070 | | | 5,132,975 | | 1.7 | % | | 1.7 | % |
Monumental Global Funding, 4.625%, 3/15/10 | | 3/9/05 | | | 4,999,814 | | | 5,012,499 | | 1.6 | % | | 1.6 | % |
North Finance (Bermuda) Ltd., 7.00%, 9/15/05 | | 1/3/02 | | | 2,003,336 | | | 2,004,300 | | 0.7 | % | | 0.7 | % |
Ohana Military Communities LLC, Series A, Class I, 5.47%, 10/1/21** | | 4/23/04 | | | 3,000,000 | | | 3,221,250 | | 1.1 | % | | 1.1 | % |
| | | | | | | |
|
| |
|
| |
|
|
Fund Total | | | | | | | $ | 16,467,059 | | 5.4 | % | | 5.4 | % |
| | | | | | | |
|
| |
|
| |
|
|
| * | 365,000 shares of this security were acquired on 5/31/05 and 660,000 shares were acquired on 7/15/05. |
| ** | Determined to be illiquid based upon procedures approved by the Board of Trustees. |
| (c) | Security is continuously callable with five days notice. |
| (d) | Step rate bond. Rate presented represents rate in effect at July 31, 2005. |
MTN—Medium Term Note
See notes to financial statements.
58
PACIFIC CAPITAL FUNDS
Tax-Free Securities Fund
Schedule of Portfolio Investments
July 31, 2005
| | | | | | |
Principal
Amount
| | Security
Description
| | Value
|
| | Alternative Minimum Tax Paper (11.1%) | | | |
| | Hawaii (11.1%) | | | |
| $ | 3,000,000 | | Hawaii Airport System Revenue, 5.625%, 7/1/18, Callable 7/1/11 @ 100, FGIC | | $ | 3,264,150 |
| | 15,375,000 | | Hawaii Airport System Revenue, Second Series, 6.90%, 7/1/12, Escrowed to Maturity, MBIA | | | 17,513,663 |
| | 3,000,000 | | Hawaii Department of Budget & Finance Special Purpose Revenue, Hawaiian Electric Co., 5.70%, 7/1/20, Callable 7/1/10 @ 101, AMBAC | | | 3,241,590 |
| | 5,000,000 | | Hawaii Department of Budget & Finance Special Purpose Revenue, Hawaiian Electric Co., Series A, 6.20%, 5/1/26, Callable 5/1/06 @ 101, MBIA | | | 5,158,400 |
| | 5,200,000 | | Hawaii Department of Budget & Finance Special Purpose Revenue, Hawaiian Electric Co., Series A, 5.65%, 10/1/27, Callable 10/1/12 @ 101, MBIA | | | 5,690,308 |
| | 1,500,000 | | Hawaii Harbor System Revenue, Series B, 5.50%, 7/1/19, Callable 7/1/12 @ 100, AMBAC | | | 1,624,275 |
| | | | | |
|
|
| Total Alternative Minimum Tax Paper
(Cost $33,121,477) | | | 36,492,386 |
| | | | | |
|
|
| | Municipal Bonds (88.2%) | | | |
| | Arizona (1.9%) | | | |
| | 2,150,000 | | Phoenix Civic Improvement Corp. Revenue, 5.25%, 7/1/16, Callable 7/1/07 @ 100, MBIA | | | 2,232,646 |
| | 1,040,000 | | Pima County Unified School District No.1 Tucson GO, 4.75%, 7/1/14, Callable 7/1/12 @ 100, FSA | | | 1,107,330 |
| | 905,000 | | Scottsdale GO, 5.375%, 7/1/11, Prerefunded 7/1/11 @ 101 | | | 1,008,405 |
| | 1,605,000 | | Scottsdale GO, 5.375%, 7/1/16, Callable 7/1/11 @ 101 | | | 1,779,271 |
| | | | | |
|
|
| | | | | | | 6,127,652 |
| | | | | |
|
|
| | Colorado (0.2%) | | | |
| | 600,000 | | Adams & Arapahoe Counties School District No. 28 GO, Series C, 5.35%, 12/1/15, Prerefunded 12/1/12 @ 100, FGIC | | | 632,808 |
| | | | | |
|
|
| | Florida (4.5%) | | | |
| | 700,000 | | Florida State Board of Education Capital Outlay GO, Series 99E, 5.25%, 6/1/12, Callable 6/1/11 @ 101 | | | 770,147 |
| | 3,000,000 | | Florida State Board of Education Capital Outlay GO, Series C, 5.875%, 6/1/20, Callable 6/1/10 @ 101, FGIC | | | 3,370,470 |
| | | | | | |
Principal
Amount
| | Security
Description
| | Value
|
| | Municipal Bonds, continued | | | |
| | Florida, continued | | | |
| $ | 3,500,000 | | Florida State Turnpike Authority Revenue, Department of Transportation, Series A, 5.75%, 7/1/17, Callable 7/1/10 @ 101 | | $ | 3,920,595 |
| | 2,000,000 | | Miami-Dade County Expressway Authority Toll System Revenue, 6.00%, 7/1/20, Prerefunded 7/1/10 @ 101, FGIC | | | 2,262,860 |
| | 3,725,000 | | Orlando Utilities Community Water & Electric Revenue, Series D, 6.75%, 10/1/17, Escrowed to Maturity | | | 4,538,615 |
| | | | | |
|
|
| | | | | | | 14,862,687 |
| | | | | |
|
|
| | Georgia (4.3%) | | | |
| | 390,000 | | Georgia Municipal Electric Authority Power Revenue, Series W, 6.60%, 1/1/18, Escrowed to Maturity, MBIA | | | 493,689 |
| | 6,420,000 | | Georgia Municipal Electric Authority Power Revenue, Series W, 6.60%, 1/1/18, MBIA | | | 7,828,419 |
| | 2,330,000 | | Metropolitan Atlanta Rapid Transportation Authority Sales Tax Revenue, Series P, 6.25%, 7/1/11, AMBAC | | | 2,643,082 |
| | 2,800,000 | | Milledgeville Water & Sewer Revenue, 6.00%, 12/1/16, FSA | | | 3,277,652 |
| | | | | |
|
|
| | | | | | | 14,242,842 |
| | | | | |
|
|
| | Hawaii (45.0%) | | | |
| | 2,000,000 | | Hawaii County GO, Series A, 5.50%, 5/1/08, FGIC | | | 2,127,420 |
| | 605,000 | | Hawaii County GO, Series A, 5.60%, 5/1/13, FGIC | | | 686,112 |
| | 1,065,000 | | Hawaii County GO, Series A, 5.50%, 7/15/14, Callable 7/15/11 @ 100, FGIC | | | 1,174,290 |
| | 1,340,000 | | Hawaii County GO, Series A, 5.50%, 7/15/15, Callable 7/15/11 @ 100, FGIC | | | 1,474,496 |
| | 2,000,000 | | Hawaii County GO, Series A, 5.50%, 5/15/16, Callable 5/15/09 @ 101, FSA | | | 2,166,900 |
| | 3,000,000 | | Hawaii Department of Budget & Finance, Special Purpose Revenue, Hawaiian Electric Co., Series A, 4.95%, 4/1/12, MBIA | | | 3,252,630 |
| | 2,000,000 | | Hawaii Department of Budget & Finance, Special Purpose Revenue, Hawaiian Electric Co., Series A, 5.50%, 12/1/14, Callable 12/1/09 @ 101, AMBAC | | | 2,181,500 |
See notes to financial statements.
59
PACIFIC CAPITAL FUNDS
Tax-Free Securities Fund
Schedule of Portfolio Investments, Continued
July 31, 2005
| | | | | | |
Principal
Amount
| | Security
Description
| | Value
|
| | Municipal Bonds, continued | | | |
| | Hawaii, continued | | | |
| $ | 1,455,000 | | Hawaii Department of Budget & Finance, Special Purpose Revenue, Queens Health System, Series A, 5.875%, 7/1/11, Prerefunded 7/1/06 @ 102 | | $ | 1,523,036 |
| | 2,500,000 | | Hawaii Department of Budget & Finance, Special Purpose Revenue, Queens Health System, Series B,
5.25%, 7/1/23, Callable
7/1/08 @ 102, MBIA | | | 2,653,725 |
| | 1,725,000 | | Hawaii Housing Finance & Development Corp., Single Family Mortgage Revenue, Series B, 5.70%, 7/1/13, Callable 8/1/05 @ 101, FNMA | | | 1,742,250 |
| | 1,030,000 | | Hawaii Housing Finance & Development Corp., Single Family Mortgage Revenue, Series B, 6.90%, 7/1/16, Callable 8/1/05 @ 100, FNMA | | | 1,030,000 |
| | 3,650,000 | | Hawaii Housing Finance & Development Corp., Single Family Mortgage Revenue, Series B, 5.85%, 7/1/17, Callable 8/1/05 @ 101, FNMA | | | 3,686,500 |
| | 2,660,000 | | Hawaii Housing Finance & Development Corp., Single Family Mortgage Revenue, Series B, 7.00%, 7/1/31, Callable 8/1/05 @ 100, FNMA | | | 2,660,000 |
| | 2,340,000 | | Hawaii Housing Finance & Development Corp., University of Hawaii Faculty Housing Project Revenue,
5.70%, 10/1/25, Callable 10/1/05 @ 101, AMBAC | | | 2,373,790 |
| | 2,000,000 | | Hawaii State GO, Series BZ, 6.00%, 10/1/12, FGIC | | | 2,304,600 |
| | 1,350,000 | | Hawaii State GO, Series CH, 4.75%, 11/1/11, MBIA | | | 1,446,201 |
| | 1,335,000 | | Hawaii State GO, Series CH, 4.75%, 11/1/13, MBIA | | | 1,443,616 |
| | 3,000,000 | | Hawaii State GO, Series CM, 6.50%, 12/1/13, FGIC | | | 3,621,030 |
| | 1,500,000 | | Hawaii State GO, Series CN, 6.25%, 3/1/08, FGIC | | | 1,617,690 |
| | 2,000,000 | | Hawaii State GO, Series CN, 5.50%, 3/1/14, Callable 3/1/07 @ 102, FGIC | | | 2,121,020 |
| | 4,975,000 | | Hawaii State GO, Series CN, 5.25%, 3/1/15, Callable 3/1/07 @ 102, FGIC | | | 5,256,983 |
| | | | | | |
Principal
Amount
| | Security
Description
| | Value
|
| | Municipal Bonds, continued | | | |
| | Hawaii, continued | | | |
| $ | 2,255,000 | | Hawaii State GO, Series CP, 5.00%, 10/1/12, Callable 10/1/07 @ 101, FGIC | | $ | 2,355,235 |
| | 5,300,000 | | Hawaii State GO, Series CP, 5.00%, 10/1/13, Callable 10/1/07 @ 101, FGIC | | | 5,537,863 |
| | 4,310,000 | | Hawaii State GO, Series CP, 5.00%, 10/1/15, Callable 10/1/07 @ 101, FGIC | | | 4,503,433 |
| | 3,000,000 | | Hawaii State GO, Series CP, 5.00%, 10/1/16, Callable 10/1/07 @ 101, FGIC | | | 3,131,430 |
| | 2,050,000 | | Hawaii State GO, Series CP, 5.00%, 10/1/17, Callable 10/1/07 @ 101, FGIC | | | 2,139,811 |
| | 3,150,000 | | Hawaii State GO, Series CR, 5.00%, 4/1/16, Callable 4/1/08 @ 101, MBIA | | | 3,343,127 |
| | 5,500,000 | | Hawaii State GO, Series CR, 5.00%, 4/1/17, Callable 4/1/08 @ 101, MBIA | | | 5,837,204 |
| | 2,000,000 | | Hawaii State GO, Series CT, 5.875%, 9/1/16, Prerefunded 9/1/09 @ 101, FSA | | | 2,224,580 |
| | 2,000,000 | | Hawaii State GO, Series CT, 5.875%, 9/1/17, Prerefunded 9/1/09 @ 101, FSA | | | 2,224,580 |
| | 500,000 | | Hawaii State GO, Series CY, 5.75%, 2/1/15, FSA | | | 578,830 |
| | 750,000 | | Hawaii State GO, Series CZ, 5.50%, 7/1/13, Callable 7/1/12 @ 100, FSA | | | 843,803 |
| | 5,000,000 | | Hawaii State GO, Series DD, 5.00%, 5/1/16, Callable 5/1/14 @ 100, MBIA | | | 5,430,950 |
| | 1,000,000 | | Hawaii State GO, Series DD, 5.00%, 5/1/17, Callable 5/1/14 @ 100, MBIA | | | 1,081,550 |
| | 4,240,000 | | Hawaii State GO, Series DD, 5.00%, 5/1/18, Callable 5/1/14 @ 100, MBIA | | | 4,566,226 |
| | 1,000,000 | | Hawaii State Highway Revenue, 5.25%, 7/1/14, Callable 7/1/08 @ 101, FGIC | | | 1,071,420 |
| | 2,000,000 | | Hawaii State Highway Revenue, 5.375%, 7/1/14, Callable 7/1/11 @ 100, FSA | | | 2,212,100 |
| | 2,325,000 | | Hawaii State Highway Revenue, 5.375%, 7/1/15, Callable 7/1/11 @ 100, FSA | | | 2,571,566 |
| | 1,250,000 | | Hawaii State Highway Revenue, 5.25%, 7/1/16, Callable 7/1/06 @ 102, MBIA | | | 1,302,625 |
| | 1,350,000 | | Hawaii State Highway Revenue, 5.375%, 7/1/17, Callable 7/1/10 @ 100, FSA | | | 1,477,926 |
See notes to financial statements.
60
PACIFIC CAPITAL FUNDS
Tax-Free Securities Fund
Schedule of Portfolio Investments, Continued
July 31, 2005
| | | | | | |
Principal
Amount
| | Security
Description
| | Value
|
| | Municipal Bonds, continued | | | |
| | Hawaii, continued | | | |
| $ | 2,530,000 | | Hawaii State Highway Revenue, 5.375%, 7/1/18, Callable 7/1/10 @ 100, FSA | | $ | 2,769,743 |
| | 2,125,000 | | Honolulu City & County GO, Series A, 6.00%, 1/1/11, Escrowed to Maturity, FGIC | | | 2,406,010 |
| | 875,000 | | Honolulu City & County GO, Series A, 6.00%, 1/1/11, FGIC | | | 985,626 |
| | 4,820,000 | | Honolulu City & County GO, Series A, 5.75%, 4/1/11, Escrowed to Maturity, FGIC | | | 5,422,355 |
| | 465,000 | | Honolulu City & County GO, Series A, 5.75%, 4/1/12, Escrowed to Maturity, FGIC | | | 528,733 |
| | 1,865,000 | | Honolulu City & County GO, Series A, 5.75%, 4/1/12, FGIC | | | 2,109,949 |
| | 850,000 | | Honolulu City & County GO, Series A, 5.75%, 4/1/13, Escrowed to Maturity, FGIC | | | 976,268 |
| | 3,345,000 | | Honolulu City & County GO, Series A, 5.75%, 4/1/13, FGIC | | | 3,822,599 |
| | 1,670,000 | | Honolulu City & County GO, Series A, 5.625%, 9/1/13, Prerefunded 9/1/08 @ 100, FGIC | | | 1,797,922 |
| | 3,500,000 | | Honolulu City & County GO, Series A, 5.375%, 9/1/18, Prerefunded 9/1/11 @ 100, FSA | | | 3,880,625 |
| | 1,000,000 | | Honolulu City & County GO, Series B, 5.125%, 7/1/10, Callable 7/1/09 @ 101, FGIC | | | 1,080,960 |
| | 640,000 | | Honolulu City & County GO, Series B, 5.25%, 10/1/12, FGIC | | | 707,386 |
| | 2,595,000 | | Honolulu City & County GO, Series B, 5.125%, 7/1/18, Callable 7/1/09 @ 101, FGIC | | | 2,805,091 |
| | 2,500,000 | | Honolulu City & County GO, Series C, 5.125%, 7/1/16, Callable 7/1/09 @ 101, FGIC | | | 2,672,825 |
| | 2,000,000 | | Honolulu City & County Waste Water System Revenue, Junior Series, 5.00%, 7/1/23, Callable 7/1/09 @ 101, FGIC | | | 2,110,380 |
| | 2,320,000 | | Honolulu City & County Water GO, 6.00%, 12/1/11, Escrowed to Maturity, FGIC | | | 2,659,277 |
| | 935,000 | | Honolulu City & County Water GO, 6.00%, 12/1/14, Escrowed to Maturity, FGIC | | | 1,104,095 |
| | 1,340,000 | | Kauai County GO, Series C, 5.90%, 8/1/09, AMBAC | | | 1,476,760 |
| | 1,000,000 | | Maui County GO,
6.00%, 12/15/08, FGIC | | | 1,091,660 |
| | | | | | |
Principal
Amount
| | Security
Description
| | Value
|
| | Municipal Bonds, continued | | | |
| | Hawaii, continued | | | |
| $ | 1,160,000 | | Maui County GO, Series A, 5.125%, 3/1/15, Callable 3/1/08 @ 101, FGIC | | $ | 1,232,918 |
| | 2,040,000 | | Maui County GO, Series A, 5.375%, 3/1/17, Callable 3/1/08 @ 101, FGIC | | | 2,180,801 |
| | 1,125,000 | | Maui County GO, Series C, 5.25%, 3/1/18, Callable 3/1/11 @ 100, FGIC | | | 1,212,716 |
| | 1,000,000 | | University of Hawaii System Revenue, Series A, 5.50%, 7/15/16, Callable 7/15/12 @ 100, FGIC | | | 1,113,940 |
| | 1,205,000 | | University of Hawaii System Revenue, Series A, 5.50%, 7/15/22, Callable 7/15/12 @ 100, FGIC | | | 1,325,211 |
| | 1,000,000 | | University of Hawaii System Revenue, Series A, 5.50%, 7/15/29, Callable 7/15/12 @ 100, FGIC | | | 1,090,840 |
| | | | | |
|
|
| | | | | | | 147,542,738 |
| | | | | |
|
|
| | Illinois (2.1%) | | | |
| | 1,000,000 | | Central Lake County Joint Action Water Agency Revenue, 5.25%, 5/1/13, AMBAC | | | 1,105,610 |
| | 105,000 | | Chicago GO, Series A, 5.375%, 1/1/14, Callable 7/1/12 @ 100, AMBAC | | | 115,693 |
| | 3,125,000 | | Chicago GO, Series A, 5.375%, 1/1/14, Prerefunded 7/1/12 @ 100, AMBAC | | | 3,485,906 |
| | 2,000,000 | | Chicago Midway Airport Revenue, Series C, 5.50%, 1/1/15, MBIA | | | 2,246,640 |
| | | | | |
|
|
| | | | | | | 6,953,849 |
| | | | | |
|
|
| | Indiana (2.4%) | | | |
| | 4,405,000 | | Hamilton Southeastern Consolidated School Building Corp., First Mortgage Revenue, 5.00%, 7/15/15, Callable 1/15/14 @ 100, FSA | | | 4,777,267 |
| | 1,780,000 | | Indianapolis Local Public Improvement Bond Bank Revenue, Series E, 5.00%, 1/1/19, Callable 1/1/14 @ 100, AMBAC | | | 1,900,773 |
| | 1,000,000 | | Tri School Indiana School Revenue, 5.00%, 7/15/15, FSA | | | 1,080,230 |
| | | | | |
|
|
| | | | | | | 7,758,270 |
| | | | | |
|
|
| | Kentucky (0.4%) | | | |
| | 1,250,000 | | Kentucky State Property & Buildings Commission Revenue, 2nd Series,
5.50%, 11/1/16, FSA | | | 1,395,125 |
| | | | | |
|
|
See notes to financial statements.
61
PACIFIC CAPITAL FUNDS
Tax-Free Securities Fund
Schedule of Portfolio Investments, Continued
July 31, 2005
| | | | | | |
Principal
Amount
| | Security
Description
| | Value
|
| | Municipal Bonds, continued | | | |
| | Massachusetts (2.0%) | | | |
| $ | 1,000,000 | | Massachusetts State GO, Series C, 5.75%, 10/1/20, Prerefunded 10/1/10 @ 100 | | $ | 1,109,330 |
| | 5,000,000 | | Massachusetts State GO, Series D, 5.25%, 11/1/17, Prerefunded 11/1/11 @ 100, MBIA | | | 5,469,099 |
| | | | | |
|
|
| | | | | | | 6,578,429 |
| | | | | |
|
|
| | Michigan (6.8%) | | | |
| | 700,000 | | Anchor Bay School District GO, 4.40%, 5/1/13, Callable 5/1/12 @ 100, Q-SBLF | | | 730,674 |
| | 3,000,000 | | Caledonia Community Schools GO, 5.50%, 5/1/23, Callable 5/1/10 @ 100, FGIC | | | 3,290,250 |
| | 4,500,000 | | Detroit Series A-1 GO, 5.25%, 4/1/19, Callable 4/1/14 @ 100, AMBAC | | | 4,921,875 |
| | 1,000,000 | | Kentwood Public Schools GO, 5.00%, 5/1/16, Callable 5/1/13 @ 100, MBIA | | | 1,077,710 |
| | 3,000,000 | | Michigan Municipal Building Authority Revenue, Clean Water Revolving Fund,
5.50%, 10/1/21, Prerefunded 10/1/10 @ 101 | | | 3,340,590 |
| | 3,000,000 | | Michigan State GO, 5.50%, 12/1/13 | | | 3,397,620 |
| | 2,245,000 | | Michigan State Strategic Fund Ltd. Obligation Revenue, 6.95%, 5/1/11, FGIC | | | 2,648,561 |
| | 2,800,000 | | Wyoming Public Schools GO, 5.00%, 5/1/23, Callable 5/1/15 @ 100, FSA | | | 3,007,564 |
| | | | | |
|
|
| | | | | | | 22,414,844 |
| | | | | |
|
|
| | Missouri (0.7%) | | | |
| | 2,000,000 | | University of Missouri Revenue, Series B, 5.375%, 11/1/16, Callable 11/1/11 @ 100 | | | 2,210,960 |
| | | | | |
|
|
| | Nevada (0.7%) | | | |
| | 2,000,000 | | Henderson Water & Sewer GO, 5.00%, 9/1/16, Callable 9/1/15 @ 100, MBIA | | | 2,185,320 |
| | | | | |
|
|
| | New York (2.6%) | | | |
| | 5,000,000 | | New York State Thruway Authority General Revenue, Series D, 5.50%, 1/1/16, Callable 1/1/07 @ 102 | | | 5,285,100 |
| | 2,000,000 | | New York State Thruway Authority Revenue, Highway & Bridge Trust Fund, Series A, 5.80%, 4/1/18, Callable 4/1/10 @ 101, FSA | | | 2,219,540 |
| | 1,000,000 | | New York State Thruway Authority Revenue, Highway & Bridge Trust Fund, Series B, 5.25%, 4/1/12, AMBAC | | | 1,104,380 |
| | | | | |
|
|
| | | | | | | 8,609,020 |
| | | | | |
|
|
| | | | | | |
Principal
Amount
| | Security
Description
| | Value
|
| | Municipal Bonds, continued | | | |
| | Ohio (3.1%) | | | |
| $ | 3,165,000 | | Columbus Municipal Airport Authority Revenue, Port Columbus Improvement, Series B, 5.00%, 1/1/16, Callable 1/1/08 @ 101, AMBAC | | $ | 3,300,620 |
| | 1,000,000 | | Hamilton County Sales Tax Revenue, Series B, 5.25%, 12/1/18, Callable 12/1/10 @ 100, AMBAC | | | 1,077,790 |
| | 2,085,000 | | Ohio State Building Authority, Adult Correction Facility Revenue, Series A, 5.25%, 4/1/14, MBIA | | | 2,329,070 |
| | 1,000,000 | | Ohio State Building Authority, Adult Correction Facility Revenue, Series A, 5.50%, 10/1/14, Callable 10/1/11 @ 100, FSA | | | 1,107,010 |
| | 2,250,000 | | Ohio State Community Turnpike Revenue, Series B, 5.50%, 2/15/12, FSA | | | 2,513,543 |
| | | | | |
|
|
| | | | | | | 10,328,033 |
| | | | | |
|
|
| | Oregon (2.7%) | | | |
| | 3,100,000 | | Clackamas Community College District GO, 5.25%, 6/15/16, Callable 6/15/11 @ 100, FGIC | | | 3,363,097 |
| | 5,000,000 | | Portland Sewer System Revenue, Series A, 5.75%, 8/1/18, Callable 8/1/10 @ 100, FGIC | | | 5,567,099 |
| | | | | |
|
|
| | | | | | | 8,930,196 |
| | | | | |
|
|
| | Puerto Rico (0.9%) | | | |
| | 1,500,000 | | Puerto Rico Commonwealth Public Improvement GO, Series A, 5.50%, 7/1/13, FGIC | | | 1,707,915 |
| | 1,000,000 | | Puerto Rico Commonwealth Public Improvement GO, Series A, 5.00%, 7/1/16, Callable 7/1/14 @ 100, FSA | | | 1,097,890 |
| | | | | |
|
|
| | | | | | | 2,805,805 |
| | | | | |
|
|
| | Tennessee (0.5%) | | | |
| | 1,600,000 | | Shelby County GO, Series B, 5.25%, 8/1/17, Callable 8/1/07 @ 101 | | | 1,682,672 |
| | | | | |
|
|
| | Texas (1.4%) | | | |
| | 1,345,000 | | Denton County Permanent Improvement GO, 5.00%, 7/15/16, Callable 7/15/12 @ 100 | | | 1,435,128 |
| | 1,505,000 | | Flower Mound GO, 5.00%, 3/1/20, Callable 3/1/15 @ 100, AMBAC | | | 1,616,295 |
| | 1,365,000 | | New Braunfels GO, 5.00%, 10/1/16, Callable 10/1/14 @ 100, AMBAC | | | 1,481,858 |
| | | | | |
|
|
| | | | | | | 4,533,281 |
| | | | | |
|
|
See notes to financial statements.
62
PACIFIC CAPITAL FUNDS
Tax-Free Securities Fund
Schedule of Portfolio Investments, Continued
July 31, 2005
| | | | | | |
Principal
Amount
| | Security
Description
| | Value
|
| | Municipal Bonds, continued | | | |
| | Washington (5.7%) | | | |
| $ | 3,475,000 | | Douglas County School District No. 206 Eastmont GO, 5.00%, 12/1/17, Callable 6/1/11 @ 100, FGIC | | $ | 3,689,095 |
| | 4,800,000 | | Seattle Public Improvement GO, Limited Tax, 5.00%, 8/1/24, Callable 8/1/15 @ 100 | | | 5,074,656 |
| | 1,125,000 | | Skagit County Public Hospital District GO, Series B, 5.375%, 12/1/17, Callable 12/1/14 @ 100, MBIA | | | 1,248,075 |
| | 1,000,000 | | Snohomish County GO, 5.70%, 12/1/14, Callable 12/1/09 @ 100, MBIA | | | 1,100,240 |
| | 2,880,000 | | Snohomish County Limited Tax GO, 5.25%, 12/1/12, Callable 12/1/11 @ 100, MBIA | | | 3,146,630 |
| | | | | | |
Principal
Amount
| | Security
Description
| | Value
|
| | Municipal Bonds, continued | | | |
| | Washington, continued | | | |
| $ | 4,000,000 | | Washington State GO, Series A, 5.625%, 7/1/19, Callable 7/1/10 @ 100 | | $ | 4,367,160 |
| | | | | |
|
|
| | | | | | | 18,625,856 |
| | | | | |
|
|
| | Wisconsin (0.3%) | | | |
| | 1,000,000 | | Milwaukee Sewage Revenue, Series S4, 5.00%, 6/1/18, Callable 6/1/13 @ 100, FGIC | | | 1,067,970 |
| | | | | |
|
|
| | Total Municipal Bonds (Cost $268,785,145) | | | 289,488,357 |
| | | | | |
|
|
| Total Investments (Cost $301,906,622)
(a)—99.3% | | | 325,980,743 |
| | Other assets in excess of liabilities—0.7% | | | 2,201,085 |
| | | | | |
|
|
| | Net Assets—100.0% | | $ | 328,181,828 |
| | | | | |
|
|
| (a) | Represents cost for federal income tax purpose and differs from value by net unrealized appreciation of securities as follows: |
| | | | |
Unrealized appreciation | | $ | 24,154,619 | |
Unrealized depreciation | | | (80,498 | ) |
| | |
|
|
|
Net unrealized appreciation | | $ | 24,074,121 | |
| | |
|
|
|
| (b) | Collaterized by various U.S. Government Securities. |
AMBAC—Insured by AMBAC Indemnity Corporation
FGIC—Insured by the Financial Guaranty Insurance Corporation
FNMA—Insured by Federal National Mortgage Association Collateral
FSA—Insured by Financial Security Assurance
GO—General Obligation
MBIA—Insured by Municipal Bond Insurance Association
Q-SBLF—Insured by Qualified School Board Loan Fund
See notes to financial statements.
63
PACIFIC CAPITAL FUNDS
Short Intermediate U.S. Government Securities Fund
Schedule of Portfolio Investments
July 31, 2005
| | | | | | |
Principal
Amount
| | Security
Description
| | Value
|
| | U.S. Government Agencies (87.8%) | | | |
| | Federal Farm Credit Bank (22.7%) | | | |
| $ | 73,000 | | 3.20%, 8/1/05 (b) | | $ | 72,994 |
| | 500,000 | | 5.10%, 11/9/05 | | | 501,890 |
| | 10,000 | | 6.50%, 11/22/05 | | | 10,086 |
| | 1,000,000 | | 5.50%, 6/15/06 | | | 1,012,500 |
| | 1,825,000 | | 2.95%, 9/8/06 | | | 1,802,160 |
| | 2,000,000 | | 3.35%, 1/19/07 | | | 1,977,632 |
| | 250,000 | | 6.30%, 8/8/07 | | | 260,119 |
| | 200,000 | | 6.52%, 9/24/07 | | | 209,404 |
| | 130,000 | | 3.61%, 4/15/08 (d) | | | 127,765 |
| | 1,000,000 | | 2.95%, 6/12/08 | | | 964,197 |
| | 1,610,000 | | 3.50%, 7/28/08 (d) | | | 1,573,192 |
| | 1,250,000 | | 3.875%, 2/18/09 | | | 1,228,785 |
| | 200,000 | | 3.375%, 3/16/09, Callable
3/16/06 @ 100 | | | 192,034 |
| | 5,000,000 | | 3.30%, 3/17/09 | | | 4,824,910 |
| | 1,000,000 | | 4.125%, 7/17/09 | | | 991,750 |
| | 4,415,000 | | 4.25%, 2/22/10, Callable
2/22/07 @ 100 | | | 4,358,038 |
| | | | | |
|
|
| | | | | | | 20,107,456 |
| | | | | |
|
|
| | Federal Home Loan Bank (65.1%) | | | |
| | 290,000 | | 3.25%, 8/15/05 | | | 289,986 |
| | 1,000,000 | | 6.88%, 8/15/05 | | | 1,001,429 |
| | 15,000 | | 6.34%, 10/19/05 | | | 15,087 |
| | 100,000 | | 6.50%, 11/15/05 | | | 100,703 |
| | 500,000 | | 2.50%, 12/15/05 | | | 497,858 |
| | 1,000,000 | | 5.29%, 1/27/06 | | | 1,006,611 |
| | 1,000,000 | | 2.125%, 5/15/06 | | | 985,397 |
| | 5,000,000 | | 5.375%, 5/15/06 | | | 5,051,735 |
| | 1,000,000 | | 2.20%, 6/5/06 | | | 984,656 |
| | 1,000,000 | | 2.07%, 6/30/06, Callable
9/30/05 @ 100 | | | 982,009 |
| | 500,000 | | 1.90%, 7/7/06 | | | 489,989 |
| | 1,000,000 | | 5.25%, 8/15/06 | | | 1,011,250 |
| | 1,000,000 | | 2.875%, 9/15/06 | | | 986,250 |
| | 400,000 | | 3.125%, 9/15/06 | | | 395,675 |
| | 500,000 | | 2.75%, 9/29/06, Callable
9/29/05 @ 100 | | | 492,500 |
| | 1,000,000 | | 2.75%, 9/29/06 | | | 984,473 |
| | 150,000 | | 4.61%, 11/6/06 | | | 150,938 |
| | 1,000,000 | | 4.875%, 11/15/06 | | | 1,008,762 |
| | 1,000,000 | | 2.75%, 12/15/06 | | | 981,250 |
| | 2,000,000 | | 6.79%, 2/5/07 | | | 2,076,310 |
| | 1,000,000 | | 2.76%, 2/9/07 | | | 979,573 |
| | 3,000,000 | | 4.88%, 2/15/07 | | | 3,028,485 |
| | 890,000 | | 5.00%, 3/8/07 | | | 901,360 |
| | 365,000 | | 6.995%, 4/2/07 | | | 380,878 |
| | 1,000,000 | | 4.00%, 4/18/07, Callable
1/18/06 @ 100 | | | 996,551 |
| | | | | | |
Principal
Amount
| | Security
Description
| | Value
|
| | U.S. Government Agencies, continued | | | |
| | Federal Home Loan Bank, continued | | | |
| $ | 1,520,000 | | 3.26%, 4/19/07, Callable
8/19/05 @ 100 | | $ | 1,497,200 |
| | 500,000 | | 4.875%, 5/15/07 | | | 505,518 |
| | 1,500,000 | | 7.625%, 5/15/07 | | | 1,589,256 |
| | 210,000 | | 7.325%, 5/30/07 | | | 221,246 |
| | 50,000 | | 2.60%, 6/4/07 (c) | | | 48,599 |
| | 255,000 | | 6.50%, 8/15/07 | | | 265,983 |
| | 425,000 | | 3.45%, 11/5/07 | | | 417,837 |
| | 225,000 | | 3.50%, 11/15/07 | | | 221,063 |
| | 1,000,000 | | 3.25%, 12/17/07 | | | 977,552 |
| | 670,833 | | 3.75%, 2/6/08 (c) | | | 662,257 |
| | 1,000,000 | | 3.375%, 2/15/08 | | | 976,791 |
| | 1,000,000 | | 4.625%, 4/14/08, Callable
10/14/05 @ 100 | | | 999,392 |
| | 250,000 | | 3.50%, 4/15/08 | | | 244,927 |
| | 400,000 | | 3.625%, 4/23/08 (c) | | | 393,000 |
| | 1,000,000 | | 6.185%, 5/6/08 | | | 1,045,576 |
| | 1,925,000 | | 3.00%, 6/30/08 | | | 1,856,175 |
| | 7,500,000 | | 3.375%, 7/21/08 | | | 7,283,272 |
| | 1,000,000 | | 3.625%, 11/14/08 | | | 978,489 |
| | 1,000,000 | | 3.505%, 12/5/08, Callable
9/5/05 @ 100 | | | 973,659 |
| | 4,700,000 | | 3.00%, 4/15/09 | | | 4,490,479 |
| | 6,175,000 | | 3.75%, 8/18/09 | | | 6,052,221 |
| | | | | |
|
|
| | | | | | | 57,480,207 |
| | | | | |
|
|
| Total U.S. Government Agencies
(Cost $78,591,167) | | | 77,587,663 |
| | | | | |
|
|
| | U.S. Treasury Notes (11.2%) | | | |
| | 169,000 | | 6.50%, 8/15/05 | | | 169,250 |
| | 100,000 | | 2.75%, 8/15/07 | | | 97,567 |
| | 200,000 | | 3.00%, 11/15/07 | | | 195,641 |
| | 1,000,000 | | 3.00%, 2/15/08 | | | 975,352 |
| | 110,000 | | 2.625%, 5/15/08 | | | 105,918 |
| | 250,000 | | 3.25%, 8/15/08 | | | 244,278 |
| | 1,500,000 | | 3.125%, 10/15/08 | | | 1,457,579 |
| | 296,000 | | 3.00%, 2/15/09 | | | 285,397 |
| | 3,250,000 | | 3.875%, 5/15/10 | | | 3,211,279 |
| | 3,250,000 | | 3.625%, 6/15/10 | | | 3,179,416 |
| | | | | |
|
|
| | Total U.S. Treasury Notes (Cost $10,078,631) | | | 9,921,677 |
| | | | | |
|
|
| Total Investments (Cost $88,669,798)
(a)—99.0% | | | 87,509,340 |
| | Other assets in excess of liabilities—1.0% | | | 893,119 |
| | | | | |
|
|
| | Net Assets—100.0% | | $ | 88,402,459 |
| | | | | |
|
|
| (a) | Represents cost for federal income tax purpose and differs from value by net unrealized depreciation of securities follows: |
| | | | |
Unrealized appreciation | | $ | 136,577 | |
Unrealized depreciation | | | (1,297,035 | ) |
| | |
|
|
|
Net unrealized depreciation | | $ | (1,160,458 | ) |
| | |
|
|
|
| (b) | Rate represents the effective yield at purchase. |
| (c) | Security continuously callable with five days notice. |
| (d) | Security continuously callable with seven days notice. |
See notes to financial statements.
64
PACIFIC CAPITAL FUNDS
Tax-Free Short Intermediate Securities Fund
Schedule of Portfolio Investments
July 31, 2005
| | | | | | |
Principal
Amount
| | Security
Description
| | Value
|
| | Alternative Minimum Tax Paper (5.8%) |
| | Hawaii (4.3%) |
| $ | 610,000 | | Hawaii Airport System Revenue, Second Series, 6.90%, 7/1/12, Escrowed to Maturity, MBIA | | $ | 694,851 |
| | 1,000,000 | | Hawaii State Airport System Revenue, 4.75%, 7/1/06, FGIC | | | 1,016,310 |
| | 1,265,000 | | Hawaii State Housing Finance & Development Corp., Single Family Mortgage Revenue, Series A, 4.75%, 7/1/06, FNMA | | | 1,275,171 |
| | | | | |
|
|
| | | | | | | 2,986,332 |
| | | | | |
|
|
| | Utah (1.5%) |
| | 1,000,000 | | Utah State Board of Regents Student Loan Revenue, Series N, 5.90%, 11/1/07, Callable
11/1/05 @ 102, AMBAC | | | 1,028,940 |
| | | | | |
|
|
| Total Alternative Minimum Tax Paper
(Cost $3,970,096) | | | 4,015,272 |
| | | | | |
|
|
| | Municipal Bonds (85.4%) |
| | Hawaii (51.3%) |
| | 600,000 | | Hawaii County GO, Series A, 4.50%, 7/15/09, FSA | | | 629,628 |
| | 1,065,000 | | Hawaii County GO, Series A, 5.25%, 5/15/12, Callable
5/15/09 @ 101, FSA | | | 1,146,473 |
| | 1,000,000 | | Hawaii County GO, Series B, 4.00%, 7/15/06, MBIA | | | 1,011,440 |
| | 1,235,000 | | Hawaii County GO, Series B, 4.25%, 7/15/08, MBIA | | | 1,276,138 |
| | 1,640,000 | | Hawaii County GO, Series B, 4.50%, 7/15/10, MBIA | | | 1,732,250 |
| | 500,000 | | Hawaii State GO, Series BW, 6.40%, 3/1/09, FSA | | | 555,635 |
| | 500,000 | | Hawaii State GO, Series CC, 5.125%, 2/1/07 | | | 515,935 |
| | 1,000,000 | | Hawaii State GO, Series CN, 6.25%, 3/1/08, FGIC | | | 1,078,460 |
| | 800,000 | | Hawaii State GO, Series CO, 6.00%, 9/1/05, FGIC | | | 802,144 |
| | 1,000,000 | | Hawaii State GO, Series CO, 6.00%, 9/1/06, FGIC | | | 1,033,820 |
| | 1,150,000 | | Hawaii State GO, Series CP, 5.50%, 10/1/07, FGIC | | | 1,209,927 |
| | 1,000,000 | | Hawaii State GO, Series CR, 5.25%, 4/1/13, Callable
4/1/08 @ 101, MBIA | | | 1,067,660 |
| | 1,000,000 | | Hawaii State GO, Series CS, 5.00%, 4/1/07, MBIA | | | 1,033,120 |
| | 1,000,000 | | Hawaii State GO, Series CT, 5.25%, 9/1/07, FSA | | | 1,044,350 |
| | 1,000,000 | | Hawaii State GO, Series CU, 5.75%, 10/1/10, MBIA | | | 1,114,840 |
| | 1,250,000 | | Hawaii State GO, Series CV, 5.50%, 8/1/08, FGIC | | | 1,336,638 |
| | 250,000 | | Hawaii State GO, Series CX, 3.80%, 2/1/08, FSA | | | 254,410 |
| | | | | | |
Principal
Amount
| | Security
Description
| | Value
|
| | Municipal Bonds, continued |
| | Hawaii, continued |
| $ | 250,000 | | Hawaii State GO, Series CX, 4.00%, 2/1/09, FSA | | $ | 256,895 |
| | 1,000,000 | | Hawaii State GO, Series CZ, 5.25%, 7/1/12, FSA | | | 1,105,280 |
| | 400,000 | | Hawaii State GO, Series DC, 3.00%, 9/1/05 | | | 400,132 |
| | 3,000,000 | | Hawaii State GO, Series DD, 4.25%, 5/1/10, MBIA | | | 3,133,469 |
| | 1,000,000 | | Hawaii State Harbor System Revenue, Series A, 4.50%, 7/1/08, AMBAC | | | 1,039,790 |
| | 650,000 | | Hawaii State Highway Revenue, 6.00%, 7/1/07 | | | 686,062 |
| | 750,000 | | Hawaii State Highway Revenue, 4.85%, 7/1/09, FSA | | | 796,268 |
| | 250,000 | | Hawaii State Highway Revenue, 5.125%, 7/1/13, Callable
7/1/10 @ 100, FSA | | | 270,875 |
| | 1,200,000 | | Hawaii State Housing Finance & Development Corp., Single Family Mortgage Revenue, Series B, 4.80%, 7/1/07, FNMA | | | 1,226,100 |
| | 1,850,000 | | Honolulu City & County GO, Series A, 7.35%, 7/1/06, FGIC | | | 1,924,796 |
| | 1,000,000 | | Honolulu City & County GO, Series A, 5.00%, 3/1/08, MBIA | | | 1,047,710 |
| | 2,640,000 | | Honolulu City & County GO, Series C, 5.50%, 11/1/09, FGIC | | | 2,877,969 |
| | 1,150,000 | | Honolulu City & County Waste Water System Revenue, 5.00%, 7/1/09, FGIC | | | 1,227,246 |
| | 1,000,000 | | Honolulu City & County Waste Water System Revenue, Series SR, 5.00%, 7/1/07, AMBAC | | | 1,037,420 |
| | 1,465,000 | | Maui County GO, 3.50%, 3/1/10, MBIA | | | 1,479,811 |
| | | | | |
|
|
| | | | | | | 35,352,691 |
| | | | | |
|
|
| | Illinois (1.5%) |
| | 950,000 | | Du Page, Cook & Will Counties, Community College District #502 GO, 5.00%, Series A 6/1/13 | | | 1,037,951 |
| | | | | |
|
|
| | Kansas (1.6%) |
| | 1,075,000 | | Johnson County, Unified School District #233 GO, Series C, 5.00%, 9/1/05, FGIC | | | 1,077,081 |
| | | | | |
|
|
| | Michigan (6.1%) |
| | 1,000,000 | | Detroit Convention Facilities Revenue, Cobo Hall, 5.00%, 9/30/12, MBIA | | | 1,092,220 |
| | 1,500,000 | | Detroit Convention Facilities Revenue, Cobo Hall Expansion Project, 5.25%, 9/30/06, FSA | | | 1,540,845 |
| | 1,500,000 | | Michigan State Building Authority Revenue, Series II, 5.00%, 10/15/12, Prerefunded
10/15/07 @ 101 | | | 1,580,355 |
| | | | | |
|
|
| | | | | | | 4,213,420 |
| | | | | |
|
|
See notes to financial statements.
65
PACIFIC CAPITAL FUNDS
Tax-Free Short Intermediate Securities Fund
Schedule of Portfolio Investments, Continued
July 31, 2005
| | | | | | |
| | |
Principal
Amount
| | Security
Description
| | Value
|
| | Municipal Bonds, continued |
| | Mississippi (1.9%) |
| $ | 1,200,000 | | Mississippi State GO, 5.50%, 9/1/09 | | $ | 1,304,220 |
| | | | | |
|
|
| | Nevada (4.4%) |
| | 3,000,000 | | Clark County Nevada Airport Revenue, Series C, 2.33%*, 7/1/29, FGIC | | | 2,999,999 |
| | | | | |
|
|
| | New Jersey (1.7%) |
| | 1,160,000 | | New Jersey State Transportation Corp., Capital Grant Revenue Anticipation Notes, Series B, 5.50%, 2/1/11, Callable 2/1/06 @ 100, AMBAC | | | 1,162,587 |
| | | | | |
|
|
| | New York (1.6%) |
| | 1,000,000 | | New York State Thruway Authority Revenue, Highway & Bridge Trust Fund, Series B, 5.25%, 4/1/12, AMBAC | | | 1,104,380 |
| | | | | |
|
|
| | North Carolina (2.8%) |
| | 1,900,000 | | Charlotte Airport Revenue, Series A, 2.33%*, 7/1/16, MBIA | | | 1,900,000 |
| | | | | |
|
|
| | Pennsylvania (1.7%) |
| | 1,030,000 | | Philadelphia Water & Wastewater Revenue, Series B, 5.50%, 11/1/11, FGIC | | | 1,149,490 |
| | | | | |
|
|
| | Texas (6.2%) |
| | 650,000 | | Mesquite Texas GO, 5.00%, 2/15/13 | | | 706,888 |
| | 1,000,000 | | Pasadena Texas GO, 5.00%, 2/15/14 | | | 1,090,550 |
| | | | | | |
Shares or
Principal
Amount
| | Security
Description
| | Value
|
| | Municipal Bonds, continued |
| | Texas, continued |
| $ | 2,500,000 | | Texas State Turnpike Authority Central Texas Turnpike System Revenue, Series B, 2.33%*, 8/15/42, AMBAC | | $ | 2,499,999 |
| | | | | |
|
|
| | | | | | | 4,297,437 |
| | | | | |
|
|
| | Utah (1.5%) |
| | 1,000,000 | | Utah State GO, Series F, 5.00%, 7/1/12, Prerefunded 7/1/07 @ 100 | | | 1,039,500 |
| | | | | |
|
|
| | Washington (3.1%) |
| | 2,000,000 | | Seattle Municipal Light & Power Revenue, 5.00%, 11/1/09, FSA | | | 2,137,620 |
| | | | | |
|
|
| | Total Municipal Bonds (Cost $58,187,528) | | | 58,776,376 |
| | | | | |
|
|
| | U.S. Government Agencies (7.7%) |
| | Federal Home Loan Bank (7.7%) |
| | 1,350,000 | | 3.125%, 9/15/06 | | | 1,335,407 |
| | 2,000,000 | | 3.125%, 11/15/06 | | | 1,973,840 |
| | 2,000,000 | | 3.375%, 2/15/07 | | | 1,976,800 |
| | | | | |
|
|
| Total U.S. Government Agencies
(Cost $5,322,766) | | | 5,286,047 |
| | | | | |
|
|
| | Investment Company (0.1%) |
| | 72,438 | | Dreyfus Tax Exempt Cash Management Fund, Institutional Shares | | | 72,438 |
| | | | | |
|
|
| | Total Investment Company (Cost $72,438) | | | 72,438 |
| | | | | |
|
|
| Total Investments (Cost $67,552,828)
(a)—99.0% | | | 68,150,133 |
| | Other assets in excess of liabilities—1.0% | | | 713,531 |
| | | | | |
|
|
| | Net Assets—100.0% | | $ | 68,863,664 |
| | | | | |
|
|
| * | Variable rate security. Rate presented represents rate in effect at July 31, 2005. Date presented reflects final maturity date. |
| (a) | Represents cost for federal income tax purpose and differs from value by net unrealized appreciation of securities as follows: |
| | | | |
Unrealized appreciation | | $ | 801,445 | |
Unrealized depreciation | | | (204,140 | ) |
| | |
|
|
|
Net unrealized appreciation | | $ | 597,305 | |
| | |
|
|
|
AMBAC—Insured by AMBAC Indemnity Corporation
FGIC—Insured by the Financial Guaranty Insurance Corporation
FSA—Insured by Financial Security Assurance
FNMA—Insured by Federal National Mortgage Association Collateral
GO—General Obligation
MBIA—Insured by Municipal Bond Insurance Association
See notes to financial statements.
66
PACIFIC CAPITAL FUNDS
Ultra Short Government Fund
Schedule of Portfolio Investments
July 31, 2005
| | | | | | |
Principal
Amount
| | Security
Description
| | Value
|
| | U.S. Government Agencies (81.3%) | | | |
| | Federal Farm Credit Bank (11.0%) | | | |
| $ | 2,000,000 | | 1.70%, 1/3/06 | | $ | 1,982,888 |
| | 2,000,000 | | 2.48%, 2/27/06 | | | 1,983,578 |
| | 1,385,000 | | 2.10%, 3/17/06 | | | 1,369,103 |
| | 2,000,000 | | 2.88%, 6/29/06 | | | 1,978,964 |
| | 2,000,000 | | 2.95%, 9/8/06 | | | 1,974,970 |
| | 2,000,000 | | 3.35%, 1/19/07 | | | 1,977,632 |
| | 304,000 | | 2.74%, 2/2/07 | | | 297,837 |
| | 3,475,000 | | 2.75%, 6/18/07 (d) | | | 3,385,637 |
| | | | | |
|
|
| | | | | | | 14,950,609 |
| | | | | |
|
|
| | Federal Home Loan Bank (70.3%) | | | |
| | 2,404,000 | | 3.10%, 8/1/05 (b) | | | 2,403,793 |
| | 1,750,000 | | 1.80%, 8/4/05 | | | 1,749,707 |
| | 5,000,000 | | 2.20%, 9/12/05 | | | 4,991,187 |
| | 2,000,000 | | 2.375%, 11/4/05 | | | 1,992,500 |
| | 4,000,000 | | 2.25%, 12/15/05 | | | 3,979,208 |
| | 500,000 | | 2.50%, 12/15/05 | | | 497,858 |
| | 1,000,000 | | 1.83%, 12/30/05 | | | 992,473 |
| | 1,300,000 | | 1.80%, 1/23/06 | | | 1,287,334 |
| | 1,000,000 | | 5.29%, 1/27/06 | | | 1,006,611 |
| | 2,000,000 | | 2.00%, 2/13/06 | | | 1,979,800 |
| | 1,000,000 | | 2.16%, 2/17/06 | | | 990,556 |
| | 1,750,000 | | 2.00%, 2/27/06 | | | 1,730,906 |
| | 1,500,000 | | 2.17%, 3/27/06 | | | 1,482,570 |
| | 125,000 | | 2.00%, 3/30/06 | | | 123,372 |
| | 1,000,000 | | 2.50%, 4/11/06 | | | 990,000 |
| | 750,000 | | 2.60%, 5/11/06, Callable
8/11/05 @ 100 | | | 741,845 |
| | 1,940,000 | | 2.21%, 5/12/06, Callable
8/12/05 @ 100 | | | 1,913,325 |
| | 2,000,000 | | 2.125%, 5/15/06 | | | 1,970,794 |
| | 1,000,000 | | 2.40%, 5/19/06 | | | 987,305 |
| | 1,000,000 | | 2.20%, 6/5/06 | | | 984,656 |
| | 1,500,000 | | 1.875%, 6/15/06 | | | 1,472,271 |
| | 400,000 | | 6.665%, 6/23/06 | | | 409,256 |
| | 100,000 | | 2.10%, 6/26/06 | | | 98,276 |
| | 915,000 | | 1.90%, 7/7/06 | | | 896,679 |
| | 500,000 | | 2.08%, 7/14/06 | | | 490,720 |
| | 1,000,000 | | 2.55%, 8/14/06 | | | 984,307 |
| | 1,000,000 | | 2.375%, 8/15/06 | | | 982,525 |
| | 1,000,000 | | 2.875%, 8/15/06 | | | 987,857 |
| | 1,000,000 | | 2.70%, 8/21/06 | | | 985,530 |
| | 1,250,000 | | 2.57%, 8/25/06 | | | 1,230,061 |
| | 1,175,000 | | 2.60%, 9/1/06 | | | 1,156,314 |
| | 1,570,000 | | 2.36%, 9/15/06 | | | 1,539,996 |
| | 1,600,000 | | 3.125%, 9/15/06 | | | 1,582,701 |
| | 3,000,000 | | 3.50%, 9/15/06 | | | 2,978,778 |
| | 1,380,000 | | 2.33%, 10/16/06 | | | 1,350,965 |
| | 1,000,000 | | 2.625%, 10/16/06 | | | 982,500 |
| | 750,000 | | 3.03%, 10/19/06, Callable
8/19/05 @ 100 | | | 740,256 |
| | 1,750,000 | | 3.00%, 10/20/06 (c) | | | 1,726,583 |
| | 5,000,000 | | 4.01%, 10/27/06, Callable
10/27/05 @ 100 | | | 4,990,909 |
| | 4,115,000 | | 3.125%, 11/15/06 | | | 4,061,175 |
| | 1,000,000 | | 2.54%, 12/5/06 | | | 979,113 |
| | | | | | |
Principal
Amount
| | Security
Description
| | Value
|
| | U.S. Government Agencies, continued | | | |
| | Federal Home Loan Bank, continued | | | |
| $ | 1,550,000 | | 2.72%, 12/8/06 | | $ | 1,521,325 |
| | 250,000 | | 2.75%, 12/15/06 | | | 245,313 |
| | 925,000 | | 2.33%, 12/29/06 | | | 902,197 |
| | 750,000 | | 2.50%, 12/29/06, Callable
9/29/05 @ 100 | | | 733,187 |
| | 1,690,000 | | 2.875%, 12/29/06 | | | 1,660,570 |
| | 500,000 | | 2.30%, 1/12/07 | | | 487,132 |
| | 200,000 | | 3.50%, 1/18/07, Callable
1/18/06 @ 100 | | | 198,187 |
| | 860,000 | | 2.65%, 1/22/07 | | | 841,680 |
| | 1,500,000 | | 2.74%, 2/2/07 | | | 1,469,370 |
| | 1,785,000 | | 2.80%, 2/9/07 | | | 1,749,614 |
| | 220,000 | | 2.80%, 2/9/07 | | | 215,639 |
| | 335,000 | | 2.625%, 2/16/07 | | | 326,662 |
| | 2,000,000 | | 3.625%, 2/26/07, Callable
8/26/05 @ 100 | | | 1,983,616 |
| | 500,000 | | 2.65%, 4/5/07, Callable
9/5/05 @ 100 | | | 487,772 |
| | 3,000,000 | | 4.00%, 4/18/07, Callable
1/18/06 @ 100 | | | 2,989,653 |
| | 675,000 | | 2.75%, 4/27/07, Callable
8/27/05 @ 100 | | | 658,843 |
| | 1,700,000 | | 3.28%, 5/7/07 (d) | | | 1,673,987 |
| | 300,000 | | 3.70%, 5/10/07 (d) | | | 297,482 |
| | 2,000,000 | | 3.625%, 6/20/07 | | | 1,979,450 |
| | 3,550,000 | | 3.08%, 6/26/07, Callable
8/26/05 @ 100 | | | 3,477,520 |
| | 200,000 | | 3.70%, 8/10/07 (c) | | | 196,524 |
| | 5,000,000 | | 3.875%, 9/14/07 | | | 4,960,319 |
| | 90,000 | | 6.20%, 10/10/07 | | | 93,669 |
| | 755,000 | | 3.385%, 11/6/07, Callable
11/6/05 @ 100 | | | 741,116 |
| | 160,000 | | 3.02%, 12/28/07, Callable
9/28/05 @ 100 | | | 155,511 |
| | 470,000 | | 3.70%, 3/12/08 (c) | | | 463,064 |
| | 1,185,000 | | 4.25%, 4/21/08, Callable
10/21/05 @ 100 | | | 1,179,620 |
| | | | | |
|
|
| | | | | | | 95,111,594 |
| | | | | |
|
|
| Total U.S. Government Agencies
(Cost $110,981,810) | | | 110,062,203 |
| | | | | |
|
|
| | U.S. Treasury Notes (13.6%) | | | |
| | 9,000,000 | | 2.00%, 8/31/05 | | | 8,992,499 |
| | 5,000,000 | | 1.625%, 10/31/05 | | | 4,978,910 |
| | 500,000 | | 2.00%, 5/15/06 | | | 493,086 |
| | 250,000 | | 2.25%, 2/15/07 | | | 243,731 |
| | 3,750,000 | | 3.125%, 5/15/07 | | | 3,695,216 |
| | | | | |
|
|
| | Total U.S. Treasury Notes (Cost $18,476,175) | | | 18,403,442 |
| | | | | |
|
|
| Total Investments (Cost $129,457,985)
(a)—94.9% | | | 128,465,645 |
| | Other assets in excess of liabilities—5.1% | | | 6,877,648 |
| | | | | |
|
|
| | Net Assets—100.0% | | $ | 135,343,293 |
| | | | | |
|
|
See notes to financial statements.
67
PACIFIC CAPITAL FUNDS
Ultra Short Government Fund
Schedule of Portfolio Investments, Continued
July 31, 2005
| (a) | Represents cost for federal income tax purpose and differs from value by net unrealized depreciation of securities as follows: |
| | | | |
Unrealized appreciation | | $ | 3,332 | |
Unrealized depreciation | | | (995,672 | ) |
| | |
|
|
|
Net unrealized depreciation | | $ | (992,340 | ) |
| | |
|
|
|
| (b) | Rate represents the effective yield at purchase. |
| (c) | Security continuously callable with five days notice. |
| (d) | Security continuously callable with seven days notice. |
See notes to financial statements.
68
PACIFIC CAPITAL FUNDS
Notes to Financial Statements
July 31, 2005
Pacific Capital Funds (the “Trust”) was organized as a Massachusetts business trust on October 30, 1992, and is registered under the Investment Company Act of 1940, as amended (“the 1940 Act”), as an open-end management investment company. The Trust currently consists of the following investment portfolios (individually, a “Fund” and collectively, the “Funds”): New Asia Growth Fund, International Stock Fund, Small Cap Fund, Mid-Cap Fund, Growth Stock Fund, Growth and Income Fund, Value Fund, Diversified Fixed Income Fund, Tax-Free Securities Fund, Short Intermediate U.S. Government Securities Fund, Tax-Free Short Intermediate Securities Fund and Ultra Short Government Fund. The Trust is authorized to issue an unlimited number of shares without par value in four classes of shares for each Fund: Class A, Class B, Class C and Class Y. Each class of shares for each Fund has identical rights and privileges except with respect to sales charges, distribution (12b-1) fees paid by Class A, B and C shares, voting rights on matters affecting a single class of shares, and the exchange privileges of each class of shares.
Effective June 1, 2003, investors are not able to make new purchases of Class B shares, except through dividend or distribution reinvestments in Class B shares and exchanges of Class B shares of a Fund for Class B shares of another Fund.
Under the Trust’s organizational documents, its officers and trustees are indemnified against certain liabilities arising out of the performance of their duties to the Trust. In addition, in the normal course of business, the Trust may enter into contracts with its vendors and others that provide for general indemnifications. The Trust’s maximum exposure under these arrangements is unknown as this would involve future claims that may be made against the Trust.
| 2. | | Significant Accounting Policies |
The following is a summary of significant accounting policies followed by the Trust in the preparation of its financial statements. The policies are in conformity with United States generally accepted accounting principles (“GAAP”). The preparation of financial statements requires management to make estimates and assumptions that affect the reported amounts of assets and liabilities and disclosure of contingent assets and liabilities at the date of the financial statements and the reported amounts of income and expenses for the period. Actual results could differ from those estimates.
Securities Valuation:
Investments in securities, the principal market for which is a securities exchange or an over-the-counter market are valued at their latest available sale price (except for those securities that are traded on NASDAQ, which are valued at the NASDAQ official closing price) or in the absence of such a price, by reference to the latest available mean of the bid and asked quotations in the principal market in which such securities are normally traded. Investments in securities, the principal market for which is not an exchange or an over-the-counter market, are valued using an independent pricing service. Such prices reflect fair values, which may be established through the use of electronic and matrix techniques. Short-term obligations that mature in 60 days or less are valued at either amortized cost or original cost plus interest, which approximates fair value. Investments in open-end investment companies are valued at their respective net asset values as reported by such companies. The differences between costs and fair values of investments are reflected as either unrealized appreciation or depreciation.
In cases where market prices for portfolio securities are not readily available, a Pricing Committee established and appointed by the Trust’s Board of Trustees determines in good faith, subject to Trust procedures, the fair value of portfolio securities held by a Fund (“good faith fair valuation”). In addition, if events materially affecting the value of foreign securities occur between the time when the exchange on which they are traded closes and the time when the Funds’ net asset value is calculated, such securities may be valued at fair value in accordance with procedures adopted by the Board of Trustees. Management identifies possible fluctuations in international securities by monitoring the increase or decrease
Continued
69
PACIFIC CAPITAL FUNDS
Notes to Financial Statements, Continued
July 31, 2005
in the value of a designated benchmark index. In the event of an increase or decrease greater than predetermined levels, the New Asia Growth Fund and the International Stock Fund may use a systematic valuation model provided by an independent third party to fair value their international equity securities.
Securities Transactions and Related Income:
Security transactions are accounted for no later than one business day after trade date. However, for financial reporting purposes, portfolio securities transactions are reported on trade date. Interest income is recognized on the accrual basis and includes, where applicable, the amortization of premium or accretion of discount. Dividend income is recorded on the ex-dividend date. Gains or losses realized from sales of securities are determined by comparing the identified cost of the security lot sold with the net sales proceeds.
Foreign Currency Translation:
The accounting records of the Trust are maintained in U.S. dollars. Investment securities and other assets and liabilities of the New Asia Growth Fund and International Stock Fund denominated in a foreign currency are translated into U.S. dollars at current exchange rates. Purchases and sales of securities, income receipts and expense payments are translated into U.S. dollars at the exchange rate on the date of the transactions.
The New Asia Growth Fund and International Stock Fund do not isolate the portion of operations resulting from changes in foreign exchange rates on investments from fluctuations arising from changes in market prices of securities held. Such fluctuations are included with the net realized and unrealized gain or loss from investments and foreign currencies.
Reported net realized foreign currency exchange gains or losses arise from sales and maturities of portfolio securities, sales of foreign currencies, currency exchange fluctuations between the trade and settlement dates of securities transactions, and the differences between the amounts of assets and liabilities recorded and the U.S. dollar equivalents of the amounts actually received or paid. Net unrealized foreign currency appreciation or depreciation arises from changes in the values of assets and liabilities, including investments in securities, resulting from changes in currency exchange rates.
Forward Currency Exchange Contracts:
The New Asia Growth Fund and International Stock Fund may enter into foreign currency exchange contracts to convert U.S. dollars to and from various foreign currencies. A foreign currency exchange contract is an obligation by a Fund to purchase or sell a specific foreign currency at a future date at a price (in U.S. dollars) set at the time of the contract. The Funds do not engage in “cross-currency” foreign exchange contracts (i.e., contracts to purchase or sell one foreign currency in exchange for another foreign currency). The Funds’ foreign currency contracts might be considered spot (typically a contract of one week or less) contracts or forward (contract length over one week) contracts. Spot contracts are entered into for purposes of hedging against foreign currency fluctuations relating to a specific portfolio transaction, such as the delay between a security transaction trade date and settlement date. Forward contracts are entered into for purposes of hedging portfolio holdings or concentrations of such holdings. These Funds enter into foreign currency exchange contracts solely for spot or forward hedging purposes, and not for speculative purposes (i.e., the Funds do not enter into such contracts for the purpose of earning foreign currency gains). Foreign currency exchange contracts are adjusted daily by the prevailing spot or forward rate of the underlying currency, and any appreciation or depreciation is recorded for financial statement purposes as unrealized until the contract settlement date, at which time the Fund records realized gains or losses equal to the difference between the value of the contract at the time it was opened and the value at the time it was closed. A Fund could be exposed to risk if a counterparty is unable to meet the terms of a forward foreign exchange currency contract or if the value of the foreign currency changes unfavorably.
Continued
70
PACIFIC CAPITAL FUNDS
Notes to Financial Statements, Continued
July 31, 2005
Risks and Special Considerations of Investing in Foreign Securities:
Investing on an international basis involves certain risks not involved in domestic investments, including fluctuations in foreign exchange rates, future political and economic developments, and the possible imposition of exchange controls or other foreign governmental laws or restrictions. In addition, with respect to certain foreign countries, there is the possibility of expropriation of assets, confiscatory taxation, political or social instability or diplomatic developments, which could effect investments in those countries. Moreover, individual foreign economies may differ favorably or unfavorably from the U.S. economy in such respects as growth of gross national product, rates of inflation, capital reinvestment, resources, self-sufficiency and balance of payments position. Certain foreign investments may also be subject to foreign withholding taxes.
Dividends to Shareholders:
Dividends from net investment income are declared daily and paid monthly for the Diversified Fixed Income Fund, Tax-Free Securities Fund, Short Intermediate U.S. Government Securities Fund, Tax-Free Short Intermediate Securities Fund and Ultra Short Government Fund. Dividends from net investment income are declared and paid quarterly for the New Asia Growth Fund, International Stock Fund, Small Cap Fund, Mid-Cap Fund, Growth Stock Fund, Growth and Income Fund and Value Fund. Distributable net realized capital gains, if any, are declared and distributed annually for all the Funds.
The characters of dividends from net investment income and of distributions from net realized gains are determined in accordance with federal income tax regulations, which may differ from GAAP. As a result, net investment income (loss) and net realized gains (loss) on investment transactions for a reporting period may differ significantly from distributions during such period. These “book/tax” differences are either considered temporary or permanent in nature. To the extent these differences are permanent in nature (i.e. reclassification of market discounts and premiums on bonds, paydown gain/(loss), security basis adjustments and foreign currency transactions), such amounts are reclassified within the composition of net assets based on their federal tax-basis treatment; temporary differences do not require reclassification.
Concentration of Credit Risk:
The Tax-Free Securities Fund and the Tax-Free Short Intermediate Securities Fund have a majority of their investments in the securities of issuers in Hawaii. Such concentration may subject the Fund to the effects of economic changes occurring within Hawaii.
The New Asia Growth Fund has a majority of its investments in securities of the Far East Asia region. Such concentration may subject the Fund to the effects of economic changes occurring within that region.
Allocation Methodology:
Expenses directly related to one Fund are charged to that Fund. Other operating expenses for the Funds or the Trust are prorated to the Funds on the basis of relative net assets or other appropriate basis.
Income, expenses (other than expenses attributable to a specific share class), and realized and unrealized gains or losses on investments are allocated to each class of shares based on its relative net assets or another appropriate basis. Class specific expenses are charged directly to the class incurring the expense.
Restricted Securities:
A restricted security is a security which has been purchased through a private offering and cannot be resold to the general public without prior registration under the Securities Act of 1933 (the “1933 Act”) or pursuant to the resale limitations provided by Rule 144 under the 1933 Act, or an exemption from the registration requirements of the 1933 Act. Whether a restricted security is illiquid is determined pursuant of guidelines established by the Board. Not all restricted securities are
Continued
71
PACIFIC CAPITAL FUNDS
Notes to Financial Statements, Continued
July 31, 2005
considered illiquid. The restricted securities held as of July 31, 2005 are identified on each Fund’s Schedule of Portfolio Investments.
| 3. | | Purchases and Sales of Securities |
Purchases and sales of securities (excluding short-term investments and U.S. Government securities) for the year ended July 31, 2005 are as follows:
| | | | | | |
| | | Purchases
| | Sales
|
New Asia Growth Fund | | $ | 20,247,061 | | $ | 16,776,952 |
International Stock Fund | | | 49,415,657 | | | 28,381,047 |
Small Cap Fund | | | 160,751,678 | | | 100,038,506 |
Mid-Cap Fund | | | 97,271,548 | | | 60,421,050 |
Growth Stock Fund | | | 419,537,294 | | | 448,518,183 |
Growth and Income Fund | | | 254,048,208 | | | 257,645,895 |
Value Fund | | | 231,730,652 | | | 260,038,856 |
Diversified Fixed Income Fund | | | 31,890,773 | | | 39,300,700 |
Tax-Free Securities Fund | | | 29,424,727 | | | 56,297,961 |
Short Intermediate U.S. Government Securities Fund | | | — | | | — |
Tax-Free Short Intermediate Securities Fund | | | 21,043,559 | | | 17,944,214 |
Ultra Short Government Fund | | | — | | | — |
Purchases and sales of securities of long-term U.S. Government securities for the year ended July 31, 2005 are as follows:
| | | | | | |
| | | Purchases
| | Sales
|
Diversified Fixed Income Fund | | $ | 76,196,390 | | $ | 38,076,672 |
Short Intermediate U.S. Government Securities Fund | | | 37,091,463 | | | 30,278,121 |
Tax-Free Short Intermediate Securities Fund | | | 5,314,399 | | | — |
Ultra Short Government Fund | | | 88,491,004 | | | 86,424,456 |
| 4. | | Transactions with Affiliates |
Investment advisory services are provided to the Trust by The Asset Management Group of Bank of Hawaii (the “Adviser”). Under terms of an advisory agreement, the Funds are charged the following annual fees based upon average daily net assets which are computed daily and paid monthly:
| | | | | | |
| | | Maximum Annual
Advisory Fee
| | | Net Fees
Paid
| |
New Asia Growth Fund | | 0.40 | % | | 0.40 | % |
International Stock Fund | | 0.45 | | | 0.35 | |
Small Cap Fund | | 0.50 | | | 0.40 | |
Mid-Cap Fund | | 0.60 | | | 0.29 | |
Growth Stock Fund | | 0.80 | | | 0.80 | |
Growth and Income Fund | | 0.80 | | | 0.80 | |
Value Fund | | 0.80 | | | 0.80 | |
Diversified Fixed Income Fund | | 0.60 | | | 0.45 | |
Tax-Free Securities Fund | | 0.60 | | | 0.45 | |
Short Intermediate U.S. Government Securities Fund | | 0.50 | | | 0.25 | |
Tax-Free Short Intermediate Securities Fund | | 0.50 | | | 0.40 | |
Ultra Short Government Fund | | 0.40 | | | 0.15 | |
The Adviser has voluntarily agreed to waive a portion of its fees. Fee waivers are voluntary and may be terminated at any time.
Continued
72
PACIFIC CAPITAL FUNDS
Notes to Financial Statements, Continued
July 31, 2005
First State (Hong Kong) LLC is the Sub-Adviser to the New Asia Growth Fund. Hansberger Global Investors, Inc. is the Sub-Adviser to the International Stock Fund. Nicholas-Applegate Capital Management is the Sub-Adviser to the Small Cap Fund. Bankoh Investment Partners, LLC, a joint venture between Chicago Equity Partners and Bank of Hawaii, is the Sub-Adviser to the Mid-Cap Fund. For the Sub-Advisers’ services, the Funds pay their respective Sub-Advisers as follows: New Asia Growth Fund—0.50% of the Fund’s average daily net assets; International Stock Fund—0.60% of the first $75 million of the Fund’s average daily net assets, and 0.35% of its average daily net assets in excess of $75 million; Small Cap Fund—0.60% of the first $50 million of the Fund’s average daily net assets, and 0.55% of its average daily net assets in excess of $50 million, for all assets invested in the Fund before May 1, 2005 (and all earnings and reinvested dividends with respect to such shares), and 0.70% of assets invested in the Fund thereafter (this increase is offset by a reduction in the fee paid to the Adviser); Mid-Cap Fund—0.20% of the Fund’s average daily net assets.
BISYS Fund Services Limited Partnership d/b/a BISYS Fund Services (“BISYS”), and BISYS Fund Services Ohio, Inc. (“BISYS Ohio”) are subsidiaries of The BISYS Group, Inc. BISYS serves the Trust as principal underwriter and distributor. BISYS Ohio serves the Trust as administrator. Under the terms of the administration agreement, BISYS Ohio is entitled to receive an annual fee of $60,000 from the Trust and an annual fee of 0.16% of the average daily net assets of each Fund. In addition, effective October 5, 2004, BISYS Ohio began providing an employee and staff to serve as Chief Compliance Officer for the Trust and provide certain related services, and receives an annual fee for this service of $150,000 allocated across the assets of the Trust, as shown on the Statements of Operations as “Compliance Services Fees.” Bank of Hawaii (“BOH”) has entered into a sub-administration agreement with BISYS Ohio to serve as sub-administrator to the Trust. The administrator is solely responsible for paying BOH any fees for such services. Through June 9, 2005, BISYS Ohio directly or through an affiliate, used a portion of its fee revenue, past profits, or other revenue sources, without limitation, to pay promotional, administrative, shareholder support and other expenses to third parties, including broker-dealers, in connection with the offer, sale and administration of shares of the Funds.
The Trust has adopted for the Class A, Class B and Class C shares of each of the Funds a Class A Distribution Plan, Class B Distribution Plan and Class C Distribution Plan (the “Plans”) pursuant to Rule 12b-1 under the 1940 Act. Under the Plans each Fund pays BISYS a fee which will not exceed on an annual basis 0.75%, 1.00% and 1.00%, respectively, of the average daily net assets attributable to the Class A, Class B and Class C shares of each Fund. These fees are for payments BISYS makes to banks, including the Adviser or its affiliates, other institutions and broker/dealers, and for expenses BISYS and any of its affiliates or subsidiaries incur for providing distribution or shareholder service assistance.
For the year ended July 31, 2005, BISYS, as the Trust’s principal underwriter, received approximately $495,296 from commissions on sales of Class A, Class B and Class C shares, of which $100,472 was retained by the principal underwriter or other affiliated broker-dealer.
BISYS Ohio also serves the Trust as fund accountant and transfer agent. Under the terms of the fund accounting and transfer agency agreement, BISYS Ohio is entitled to receive fees and reimbursement for certain out-of-pocket expenses incurred in providing fund accounting and transfer agent services.
BISYS Ohio has voluntarily agreed to waive fees as disclosed on the Statements of Operations. These voluntary waivers may be terminated at any time.
Certain Officers and Trustees of the Trust are affiliated with Bank of Hawaii, the Adviser, BISYS or BISYS Ohio. Such Officers and Trustees, except the Chief Compliance Officer, receive no compensation from the Funds for serving in their respective roles. During the year ended July 31, 2005, the five Independent Trustees were compensated a total of $135,000 in quarterly meeting and annual retainer fees, plus reimbursement for certain expenses incurred.
Continued
73
PACIFIC CAPITAL FUNDS
Notes to Financial Statements, Continued
July 31, 2005
| 5. | | Capital Share Transactions |
Transactions in capital shares for the Trust were as follows:
| | | | | | | | | | | | | | |
| | | New Asia Growth Fund
| | | International Stock Fund
| |
| | | Amount
| | | Shares
| | | Amount
| | | Shares
| |
| | | Year Ended
July 31, 2005
| | | Year Ended
July 31, 2005
| |
Class A: | | | | | | | | | | | | | | |
Shares issued | | $ | 110,470 | | | 8,137 | | | $ | 120,641 | | | 14,104 | |
Dividends reinvested | | | 12,846 | | | 956 | | | | 2,943 | | | 331 | |
Shares redeemed | | | (213,232 | ) | | (15,943 | ) | | | (231,690 | ) | | (27,702 | ) |
| | |
|
|
| |
|
| |
|
|
| |
|
|
Net Change | | $ | (89,916 | ) | | (6,850 | ) | | $ | (108,106 | ) | | (13,267 | ) |
| | |
|
|
| |
|
| |
|
|
| |
|
|
Class B: | | | | | | | | | | | | | | |
Shares issued | | $ | 10,739 | | | 833 | | | $ | 30,170 | | | 3,870 | |
Dividends reinvested | | | 2,049 | | | 161 | | | | 8 | | | 1 | |
Shares redeemed | | | (59,525 | ) | | (4,463 | ) | | | (107,350 | ) | | (13,393 | ) |
| | |
|
|
| |
|
| |
|
|
| |
|
|
Net Change | | $ | (46,737 | ) | | (3,469 | ) | | $ | (77,172 | ) | | (9,522 | ) |
| | |
|
|
| |
|
| |
|
|
| |
|
|
Class C: | | | | | | | | | | | | | | |
Shares issued | | $ | 253,226 | | | 19,123 | | | $ | 511,484 | | | 62,738 | |
Dividends reinvested | | | 488 | | | 37 | | | | 677 | | | 80 | |
Shares redeemed | | | (24,439 | ) | | (1,821 | ) | | | (50,873 | ) | | (6,200 | ) |
| | |
|
|
| |
|
| |
|
|
| |
|
|
Net Change | | $ | 229,275 | | | 17,339 | | | $ | 461,288 | | | 56,618 | |
| | |
|
|
| |
|
| |
|
|
| |
|
|
Class Y: | | | | | | | | | | | | | | |
Shares issued | | $ | 13,111,860 | | | 952,582 | | | $ | 35,231,284 | | | 4,071,785 | |
Dividends reinvested | | | 98,569 | | | 7,123 | | | | 42,090 | | | 4,725 | |
Shares redeemed | | | (9,914,936 | ) | | (725,540 | ) | | | (14,604,354 | ) | | (1,715,358 | ) |
| | |
|
|
| |
|
| |
|
|
| |
|
|
Net Change | | $ | 3,295,493 | | | 234,165 | | | $ | 20,669,020 | | | 2,361,152 | |
| | |
|
|
| |
|
| |
|
|
| |
|
|
| | |
| | | Period Ended
July 31, 2004
| | | Period Ended
July 31, 2004
| |
Class A: | | | | | | | | | | | | | | |
Shares issued | | $ | 113,706 | | | 9,364 | | | $ | 97,417 | | | 12,695 | |
Dividends reinvested | | | 7,273 | | | 606 | | | | — | | | — | |
Shares redeemed | | | (220,616 | ) | | (18,456 | ) | | | (222,467 | ) | | (28,768 | ) |
| | |
|
|
| |
|
| |
|
|
| |
|
|
Net Change | | $ | (99,637 | ) | | (8,486 | ) | | $ | (125,050 | ) | | (16,073 | ) |
| | |
|
|
| |
|
| |
|
|
| |
|
|
Class B: | | | | | | | | | | | | | | |
Shares issued | | $ | 6,972 | | | 573 | | | $ | 25,081 | | | 3,304 | |
Dividends reinvested | | | 825 | | | 71 | | | | — | | | — | |
Shares redeemed | | | (135,577 | ) | | (12,065 | ) | | | (27,065 | ) | | (3,715 | ) |
| | |
|
|
| |
|
| |
|
|
| |
|
|
Net Change | | $ | (127,780 | ) | | (11,421 | ) | | $ | (1,984 | ) | | (411 | ) |
| | |
|
|
| |
|
| |
|
|
| |
|
|
Class C (a): | | | | | | | | | | | | | | |
Shares issued | | $ | 10,000 | | | 835 | | | $ | 10,000 | | | 1,337 | |
| | |
|
|
| |
|
| |
|
|
| |
|
|
Net Change | | $ | 10,000 | | | 835 | | | $ | 10,000 | | | 1,337 | |
| | |
|
|
| |
|
| |
|
|
| |
|
|
Class Y: | | | | | | | | | | | | | | |
Shares issued | | $ | 15,793,661 | | | 1,311,359 | | | $ | 21,522,256 | | | 2,788,002 | |
Dividends reinvested | | | 59,426 | | | 4,902 | | | | — | | | — | |
Shares redeemed | | | (13,609,697 | ) | | (1,165,718 | ) | | | (31,411,069 | ) | | (4,172,063 | ) |
| | |
|
|
| |
|
| |
|
|
| |
|
|
Net Change | | $ | 2,243,390 | | | 150,543 | | | $ | (9,888,813 | ) | | (1,384,061 | ) |
| | |
|
|
| |
|
| |
|
|
| |
|
|
| | (a) | For the period from April 30, 2004 (commencement of operations) to July 31, 2004. |
Continued
74
PACIFIC CAPITAL FUNDS
Notes to Financial Statements, Continued
July 31, 2005
| 5. | | Capital Share Transactions (continued) |
Transactions in capital shares for the Trust were as follows:
| | | | | | | | | | | | | | |
| | | Small Cap Fund
| | | Mid-Cap Fund
| |
| | | Amount
| | | Shares
| | | Amount
| | | Shares
| |
| | | Year Ended
July 31, 2005
| | | Year Ended
July 31, 2005
| |
Class A: | | | | | | | | | | | | | | |
Shares issued | | $ | 87,222,098 | | | 5,261,910 | | | $ | 497,340 | | | 43,678 | |
Dividends reinvested | | | 3,190,344 | | | 196,271 | | | | 1,226 | | | 104 | |
Shares redeemed | | | (6,248,342 | ) | | (371,965 | ) | | | (26,822 | ) | | (2,215 | ) |
| | |
|
|
| |
|
| |
|
|
| |
|
|
Net Change | | $ | 84,164,100 | | | 5,086,216 | | | $ | 471,744 | | | 41,567 | |
| | |
|
|
| |
|
| |
|
|
| |
|
|
Class B: | | | | | | | | | | | | | | |
Shares issued | | $ | 61,059 | | | 3,789 | | | | | | | | |
Dividends reinvested | | | 501,620 | | | 32,279 | | | | | | | | |
Shares redeemed | | | (386,592 | ) | | (24,080 | ) | | | | | | | |
| | |
|
|
| |
|
| | | | | | | |
Net Change | | $ | 176,087 | | | 11,988 | | | | | | | | |
| | |
|
|
| |
|
| | | | | | | |
Class C: | | | | | | | | | | | | | | |
Shares issued | | $ | 5,418,148 | | | 338,763 | | | $ | 509,696 | | | 44,808 | |
Dividends reinvested | | | 48,571 | | | 3,124 | | | | — | | | — | |
Shares redeemed | | | (97,769 | ) | | (6,335 | ) | | | (65,216 | ) | | (5,667 | ) |
| | |
|
|
| |
|
| |
|
|
| |
|
|
Net Change | | $ | 5,368,950 | | | 335,552 | | | $ | 444,480 | | | 39,141 | |
| | |
|
|
| |
|
| |
|
|
| |
|
|
Class Y: | | | | | | | | | | | | | | |
Shares issued | | $ | 47,475,047 | | | 2,813,070 | | | $ | 62,168,284 | | | 5,616,069 | |
Dividends reinvested | | | 14,791,147 | | | 901,899 | | | | 7,973 | | | 665 | |
Shares redeemed | | | (65,246,572 | ) | | (3,939,534 | ) | | | (23,742,044 | ) | | (2,071,526 | ) |
| | |
|
|
| |
|
| |
|
|
| |
|
|
Net Change | | $ | (2,980,378 | ) | | (224,565 | ) | | $ | 38,434,213 | | | 3,545,208 | |
| | |
|
|
| |
|
| |
|
|
| |
|
|
| | |
| | | Period Ended
July 31, 2004
| | | Period Ended
July 31, 2004 (a)
| |
Class A: | | | | | | | | | | | | | | |
Shares issued | | $ | 9,212,600 | | | 561,644 | | | $ | 190,173 | | | 18,272 | |
Dividends reinvested | | | 62,098 | | | 4,030 | | | | 244 | | | 24 | |
Shares redeemed | | | (696,597 | ) | | (42,864 | ) | | | (2,839 | ) | | (272 | ) |
| | |
|
|
| |
|
| |
|
|
| |
|
|
Net Change | | $ | 8,578,101 | | | 522,810 | | | $ | 187,578 | | | 18,024 | |
| | |
|
|
| |
|
| |
|
|
| |
|
|
Class B: | | | | | | | | | | | | | | |
Shares issued | | $ | 168,574 | | | 11,319 | | | | | | | | |
Dividends reinvested | | | 63,891 | | | 4,276 | | | | | | | | |
Shares redeemed | | | (208,610 | ) | | (13,289 | ) | | | | | | | |
| | |
|
|
| |
|
| | | | | | | |
Net Change | | $ | 23,855 | | | 2,306 | | | | | | | | |
| | |
|
|
| |
|
| | | | | | | |
Class C (b): | | | | | | | | | | | | | | |
Shares issued | | $ | 46,889 | | | 2,904 | | | $ | 10,000 | | | 978 | |
| | |
|
|
| |
|
| |
|
|
| |
|
|
Net Change | | $ | 46,889 | | | 2,904 | | | $ | 10,000 | | | 978 | |
| | |
|
|
| |
|
| |
|
|
| |
|
|
Class Y: | | | | | | | | | | | | | | |
Shares issued | | $ | 45,130,030 | | | 2,843,693 | | | $ | 34,811,884 | | | 3,404,108 | |
Dividends reinvested | | | 1,913,530 | | | 123,533 | | | | 4,756 | | | 463 | |
Shares redeemed | | | (36,912,495 | ) | | (2,321,905 | ) | | | (4,520,688 | ) | | (435,832 | ) |
| | |
|
|
| |
|
| |
|
|
| |
|
|
Net Change | | $ | 10,131,065 | | | 645,321 | | | $ | 30,295,952 | | | 2,968,739 | |
| | |
|
|
| |
|
| |
|
|
| |
|
|
| | (a) | For the period from December 30, 2003 (commencement of operations) to July 31, 2004. |
| | (b) | For the period from April 30, 2004 (commencement of operations) to July 31, 2004. |
Continued
75
PACIFIC CAPITAL FUNDS
Notes to Financial Statements, Continued
July 31, 2005
| 5. | | Capital Share Transactions (continued) |
Transactions in capital shares for the Trust were as follows:
| | | | | | | | | | | | | | |
| | | Growth Stock Fund
| | | Growth and Income Fund
| |
| | | Amount
| | | Shares
| | | Amount
| | | Shares
| |
| | | Year Ended
July 31, 2005
| | | Year Ended
July 31, 2005
| |
Class A: | | | | | | | | | | | | | | |
Shares issued | | $ | 446,889 | | | 54,869 | | | $ | 351,776 | | | 27,625 | |
Dividends reinvested | | | 10,351 | | | 1,265 | | | | 23,091 | | | 1,813 | |
Shares redeemed | | | (2,346,787 | ) | | (285,341 | ) | | | (1,087,566 | ) | | (87,861 | ) |
| | |
|
|
| |
|
| |
|
|
| |
|
|
Net Change | | $ | (1,889,547 | ) | | (229,207 | ) | | $ | (712,699 | ) | | (58,423 | ) |
| | |
|
|
| |
|
| |
|
|
| |
|
|
Class B: | | | | | | | | | | | | | | |
Shares issued | | $ | 14,195 | | | 1,835 | | | $ | 39,720 | | | 3,308 | |
Dividends reinvested | | | — | | | — | | | | 18,326 | | | 1,503 | |
Shares redeemed | | | (1,808,803 | ) | | (234,287 | ) | | | (1,313,786 | ) | | (111,674 | ) |
| | |
|
|
| |
|
| |
|
|
| |
|
|
Net Change | | $ | (1,794,608 | ) | | (232,452 | ) | | $ | (1,255,740 | ) | | (106,863 | ) |
| | |
|
|
| |
|
| |
|
|
| |
|
|
Class C: | | | | | | | | | | | | | | |
Shares issued | | $ | 1,973,665 | | | 250,464 | | | $ | 1,864,821 | | | 155,299 | |
Dividends reinvested | | | 2,288 | | | 297 | | | | 2,917 | | | 240 | |
Shares redeemed | | | (62,014 | ) | | (7,908 | ) | | | (50,696 | ) | | (4,241 | ) |
| | |
|
|
| |
|
| |
|
|
| |
|
|
Net Change | | $ | 1,913,939 | | | 242,853 | | | $ | 1,817,042 | | | 151,298 | |
| | |
|
|
| |
|
| |
|
|
| |
|
|
Class Y: | | | | | | | | | | | | | | |
Shares issued | | $ | 41,048,561 | | | 4,886,607 | | | $ | 28,302,401 | | | 2,252,011 | |
Dividends reinvested | | | 43,331 | | | 5,152 | | | | 81,808 | | | 6,406 | |
Shares redeemed | | | (82,448,830 | ) | | (9,781,134 | ) | | | (37,556,188 | ) | | (3,002,102 | ) |
| | |
|
|
| |
|
| |
|
|
| |
|
|
Net Change | | $ | (41,356,938 | ) | | (4,889,375 | ) | | $ | (9,171,979 | ) | | (743,685 | ) |
| | |
|
|
| |
|
| |
|
|
| |
|
|
| | |
| | | Period Ended
July 31, 2004
| | | Period Ended
July 31, 2004
| |
Class A: | | | | | | | | | | | | | | |
Shares issued | | $ | 1,069,101 | | | 132,271 | | | $ | 594,010 | | | 51,703 | |
Dividends reinvested | | | — | | | — | | | | 6,636 | | | 574 | |
Shares redeemed | | | (1,853,417 | ) | | (228,385 | ) | | | (1,117,748 | ) | | (95,892 | ) |
| | |
|
|
| |
|
| |
|
|
| |
|
|
Net Change | | $ | (784,316 | ) | | (96,114 | ) | | $ | (517,102 | ) | | (43,615 | ) |
| | |
|
|
| |
|
| |
|
|
| |
|
|
Class B: | | | | | | | | | | | | | | |
Shares issued | | $ | 97,684 | | | 12,451 | | | $ | 159,574 | | | 14,196 | |
Shares redeemed | | | (1,343,820 | ) | | (174,777 | ) | | | (777,661 | ) | | (70,441 | ) |
| | |
|
|
| |
|
| |
|
|
| |
|
|
Net Change | | $ | (1,246,136 | ) | | (162,326 | ) | | $ | (618,087 | ) | | (56,245 | ) |
| | |
|
|
| |
|
| |
|
|
| |
|
|
Class C (a): | | | | | | | | | | | | | | |
Shares issued | | $ | 11,653 | | | 1,511 | | | $ | 10,000 | | | 895 | |
| | |
|
|
| |
|
| |
|
|
| |
|
|
Net Change | | $ | 11,653 | | | 1,511 | | | $ | 10,000 | | | 895 | |
| | |
|
|
| |
|
| |
|
|
| |
|
|
Class Y: | | | | | | | | | | | | | | |
Shares issued | | $ | 81,799,064 | | | 10,079,824 | | | $ | 27,371,710 | | | 2,387,553 | |
Dividends reinvested | | | — | | | — | | | | 45,043 | | | 3,859 | |
Shares redeemed | | | (107,489,808 | ) | | (12,938,771 | ) | | | (49,882,830 | ) | | (4,317,913 | ) |
| | |
|
|
| |
|
| |
|
|
| |
|
|
Net Change | | $ | (25,690,744 | ) | | (2,858,947 | ) | | $ | (22,466,077 | ) | | (1,926,501 | ) |
| | |
|
|
| |
|
| |
|
|
| |
|
|
| | (a) | For the period from April 30, 2004 (commencement of operations) to July 31, 2004. |
Continued
76
PACIFIC CAPITAL FUNDS
Notes to Financial Statements, Continued
July 31, 2005
| 5. | | Capital Share Transactions (continued) |
Transactions in capital shares for the Trust were as follows:
| | | | | | | | | | | | | | |
| | | Value Fund
| | | Diversified Fixed Income Fund
| |
| | | Amount
| | | Shares
| | | Amount
| | | Shares
| |
| | | Year Ended
July 31, 2005
| | | Year Ended
July 31, 2005
| |
Class A: | | | | | | | | | | | | | | |
Shares issued | | $ | 465,501 | | | 50,251 | | | $ | 423,285 | | | 38,242 | |
Dividends reinvested | | | 12,080 | | | 1,310 | | | | 133,586 | | | 12,021 | |
Shares redeemed | | | (482,258 | ) | | (52,552 | ) | | | (1,194,430 | ) | | (107,605 | ) |
| | |
|
|
| |
|
| |
|
|
| |
|
|
Net Change | | $ | (4,677 | ) | | (991 | ) | | $ | (637,559 | ) | | (57,342 | ) |
| | |
|
|
| |
|
| |
|
|
| |
|
|
Class B: | | | | | | | | | | | | | | |
Shares issued | | $ | 40,800 | | | 4,462 | | | $ | 112,161 | | | 10,041 | |
Dividends reinvested | | | 5,027 | | | 553 | | | | 116,795 | | | 10,530 | |
Shares redeemed | | | (158,300 | ) | | (17,920 | ) | | | (599,157 | ) | | (53,979 | ) |
| | |
|
|
| |
|
| |
|
|
| |
|
|
Net Change | | $ | (112,473 | ) | | (12,905 | ) | | $ | (370,201 | ) | | (33,408 | ) |
| | |
|
|
| |
|
| |
|
|
| |
|
|
Class C: | | | | | | | | | | | | | | |
Shares issued | | $ | 1,793,426 | | | 195,778 | | | $ | 1,325,473 | | | 119,790 | |
Dividends reinvested | | | 74 | | | 8 | | | | 19,803 | | | 1,791 | |
Shares redeemed | | | (81,412 | ) | | (8,728 | ) | | | (160,222 | ) | | (14,525 | ) |
| | |
|
|
| |
|
| |
|
|
| |
|
|
Net Change | | $ | 1,712,088 | | | 187,058 | | | $ | 1,185,054 | | | 107,056 | |
| | |
|
|
| |
|
| |
|
|
| |
|
|
Class Y: | | | | | | | | | | | | | | |
Shares issued | | $ | 31,949,876 | | | 3,461,432 | | | $ | 90,979,692 | | | 8,139,234 | |
Dividends reinvested | | | 48,275 | | | 5,235 | | | | 1,643,366 | | | 146,760 | |
Shares redeemed | | | (58,021,411 | ) | | (6,300,163 | ) | | | (65,626,363 | ) | | (5,872,449 | ) |
| | |
|
|
| |
|
| |
|
|
| |
|
|
Net Change | | $ | (26,023,260 | ) | | (2,833,496 | ) | | $ | 26,996,695 | | | 2,413,545 | |
| | |
|
|
| |
|
| |
|
|
| |
|
|
| | |
| | | Period Ended
July 31, 2004
| | | Period Ended
July 31, 2004
| |
Class A: | | | | | | | | | | | | | | |
Shares issued | | $ | 476,704 | | | 58,832 | | | $ | 359,010 | | | 31,834 | |
Dividends reinvested | | | 13,253 | | | 1,621 | | | | 254,926 | | | 22,711 | |
Shares redeemed | | | (460,742 | ) | | (55,798 | ) | | | (4,157,216 | ) | | (365,534 | ) |
| | |
|
|
| |
|
| |
|
|
| |
|
|
Net Change | | $ | 29,215 | | | 4,655 | | | $ | (3,543,280 | ) | | (310,989 | ) |
| | |
|
|
| |
|
| |
|
|
| |
|
|
Class B: | | | | | | | | | | | | | | |
Shares issued | | $ | 71,917 | | | 8,942 | | | $ | 104,140 | | | 9,223 | |
Dividends reinvested | | | 867 | | | 106 | | | | 201,087 | | | 17,965 | |
Shares redeemed | | | (187,024 | ) | | (23,231 | ) | | | (1,004,322 | ) | | (89,443 | ) |
| | |
|
|
| |
|
| |
|
|
| |
|
|
Net Change | | $ | (114,240 | ) | | (14,183 | ) | | $ | (699,095 | ) | | (62,255 | ) |
| | |
|
|
| |
|
| |
|
|
| |
|
|
Class C (a): | | | | | | | | | | | | | | |
Shares issued | | $ | 10,000 | | | 1,221 | | | $ | 10,000 | | | 907 | |
Dividends reinvested | | | 1 | | | — | | | | 74 | | | 7 | |
| | |
|
|
| |
|
| |
|
|
| |
|
|
Net Change | | $ | 10,001 | | | 1,221 | | | $ | 10,074 | | | 914 | |
| | |
|
|
| |
|
| |
|
|
| |
|
|
Class Y: | | | | | | | | | | | | | | |
Shares issued | | $ | 35,788,762 | | | 4,479,331 | | | $ | 97,204,316 | | | 8,539,583 | |
Dividends reinvested | | | 40,229 | | | 4,895 | | | | 4,788,259 | | | 425,383 | |
Shares redeemed | | | (94,657,396 | ) | | (11,794,159 | ) | | | (63,769,989 | ) | | (5,623,736 | ) |
| | |
|
|
| |
|
| |
|
|
| |
|
|
Net Change | | $ | (58,828,405 | ) | | (7,309,933 | ) | | $ | 38,222,586 | | | 3,341,230 | |
| | |
|
|
| |
|
| |
|
|
| |
|
|
| | (a) | For the period from April 30, 2004 (commencement of operations) to July 31, 2004. |
Continued
77
PACIFIC CAPITAL FUNDS
Notes to Financial Statements, Continued
July 31, 2005
| 5. | | Capital Share Transactions (continued) |
Transactions in capital shares for the Trust were as follows:
| | | | | | | | | | | | | | |
| | | Tax-Free Securities Fund
| | | Short Intermediate U.S. Government Securities Fund
| |
| | | Amount
| | | Shares
| | | Amount
| | | Shares
| |
| | | Year Ended
July 31, 2005
| | | Year Ended
July 31, 2005
| |
Class A: | | | | | | | | | | | | | | |
Shares issued | | $ | 807,895 | | | 75,198 | | | $ | 293,228 | | | 30,112 | |
Dividends reinvested | | | 219,060 | | | 20,481 | | | | 34,677 | | | 3,550 | |
Shares redeemed | | | (1,807,577 | ) | | (168,914 | ) | | | (246,451 | ) | | (25,129 | ) |
| | |
|
|
| |
|
| |
|
|
| |
|
|
Net Change | | $ | (780,622 | ) | | (73,235 | ) | | $ | 81,454 | | | 8,533 | |
| | |
|
|
| |
|
| |
|
|
| |
|
|
Class B: | | | | | | | | | | | | | | |
Dividends reinvested | | $ | 99,929 | | | 9,347 | | | | | | | | |
Shares redeemed | | | (747,598 | ) | | (69,726 | ) | | | | | | | |
| | |
|
|
| |
|
| | | | | | | |
Net Change | | $ | (647,669 | ) | | (60,379 | ) | | | | | | | |
| | |
|
|
| |
|
| | | | | | | |
Class C: | | | | | | | | | | | | | | |
Shares issued | | $ | 70 | | | 7 | | | $ | 689,422 | | | 70,465 | |
Dividends reinvested | | | 470 | | | 44 | | | | 7,520 | | | 774 | |
Shares redeemed | | | (70 | ) | | (7 | ) | | | (66,960 | ) | | (6,896 | ) |
| | |
|
|
| |
|
| |
|
|
| |
|
|
Net Change | | $ | 470 | | | 44 | | | $ | 629,982 | | | 64,343 | |
| | |
|
|
| |
|
| |
|
|
| |
|
|
Class Y: | | | | | | | | | | | | | | |
Shares issued | | $ | 35,715,265 | | | 3,335,237 | | | $ | 37,424,651 | | | 3,823,881 | |
Dividends reinvested | | | 4,788,015 | | | 446,226 | | | | 260,539 | | | 26,651 | |
Shares redeemed | | | (62,827,905 | ) | | (5,835,291 | ) | | | (31,705,410 | ) | | (3,246,236 | ) |
| | |
|
|
| |
|
| |
|
|
| |
|
|
Net Change | | $ | (22,324,625 | ) | | (2,053,828 | ) | | $ | 5,979,780 | | | 604,296 | |
| | |
|
|
| |
|
| |
|
|
| |
|
|
| | |
| | | Period Ended
July 31, 2004
| | | Period Ended
July 31, 2004
| |
Class A: | | | | | | | | | | | | | | |
Shares issued | | $ | 1,458,277 | | | 135,248 | | | $ | 3,026,635 | | | 303,458 | |
Dividends reinvested | | | 346,078 | | | 31,825 | | | | 54,321 | | | 5,466 | |
Shares redeemed | | | (3,671,095 | ) | | (341,990 | ) | | | (6,595,358 | ) | | (667,224 | ) |
| | |
|
|
| |
|
| |
|
|
| |
|
|
Net Change | | $ | (1,866,740 | ) | | (174,917 | ) | | $ | (3,514,402 | ) | | (358,300 | ) |
| | |
|
|
| |
|
| |
|
|
| |
|
|
Class B: | | | | | | | | | | | | | | |
Shares issued | | $ | 120,421 | | | 11,340 | | | | | | | | |
Dividends reinvested | | | 85,089 | | | 7,844 | | | | | | | | |
Shares redeemed | | | (779,017 | ) | | (73,103 | ) | | | | | | | |
| | |
|
|
| |
|
| | | | | | | |
Net Change | | $ | (573,507 | ) | | (53,919 | ) | | | | | | | |
| | |
|
|
| |
|
| | | | | | | |
Class C (a): | | | | | | | | | | | | | | |
Shares issued | | $ | 10,000 | | | 933 | | | $ | 10,000 | | | 1,017 | |
Dividends reinvested | | | 80 | | | 7 | | | | 43 | | | 4 | |
| | |
|
|
| |
|
| |
|
|
| |
|
|
Net Change | | $ | 10,080 | | | 940 | | | $ | 10,043 | | | 1,021 | |
| | |
|
|
| |
|
| |
|
|
| |
|
|
Class Y: | | | | | | | | | | | | | | |
Shares issued | | $ | 23,814,661 | | | 2,184,198 | | | $ | 48,015,908 | | | 4,806,146 | |
Dividends reinvested | | | 1,915,995 | | | 175,611 | | | | 383,869 | | | 38,626 | |
Shares redeemed | | | (78,652,110 | ) | | (7,227,566 | ) | | | (54,292,376 | ) | | (5,453,065 | ) |
| | |
|
|
| |
|
| |
|
|
| |
|
|
Net Change | | $ | (52,921,454 | ) | | (4,867,757 | ) | | $ | (5,892,599 | ) | | (608,293 | ) |
| | |
|
|
| |
|
| |
|
|
| |
|
|
| | (a) | For the period from April 30, 2004 (commencement of operations) to July 31, 2004. |
Continued
78
PACIFIC CAPITAL FUNDS
Notes to Financial Statements, Continued
July 31, 2005
| 5. | | Capital Share Transactions (continued) |
Transactions in capital shares for the Trust were as follows:
| | | | | | | | | | | | | | |
| | | Tax-Free Short Intermediate
Securities Fund
| | | Ultra Short Government Fund
| |
| | | Amount
| | | Shares
| | | Amount
| | | Shares
| |
| | | Year Ended
July 31, 2005
| | | Year Ended
July 31, 2005
| |
Class A: | | | | | | | | | | | | | | |
Shares issued | | $ | 546,100 | | | 52,729 | | | $ | 7,255 | | | 722 | |
Dividends reinvested | | | 87,925 | | | 8,534 | | | | 33,286 | | | 3,305 | |
Shares redeemed | | | (1,591,226 | ) | | (154,728 | ) | | | (2,188,736 | ) | | (216,967 | ) |
| | |
|
|
| |
|
| |
|
|
| |
|
|
Net Change | | $ | (957,201 | ) | | (93,465 | ) | | $ | (2,148,195 | ) | | (212,940 | ) |
| | |
|
|
| |
|
| |
|
|
| |
|
|
Class B: | | | | | | | | | | | | | | |
Shares issued | | | | | | | | | $ | 97,737 | | | 9,664 | |
Dividends reinvested | | | | | | | | | | 17,513 | | | 1,740 | |
Shares redeemed | | | | | | | | | | (460,531 | ) | | (45,699 | ) |
| | | | | | | | | |
|
|
| |
|
|
Net Change | | | | | | | | | $ | (345,281 | ) | | (34,295 | ) |
| | | | | | | | | |
|
|
| |
|
|
Class C: | | | | | | | | | | | | | | |
Shares issued | | $ | 70 | | | 7 | | | $ | 2,009,183 | | | 199,590 | |
Dividends reinvested | | | 152 | | | 15 | | | | 11,825 | | | 1,176 | |
Shares redeemed | | | (70 | ) | | (7 | ) | | | (191,257 | ) | | (19,041 | ) |
| | |
|
|
| |
|
| |
|
|
| |
|
|
Net Change | | $ | 152 | | | 15 | | | $ | 1,829,751 | | | 181,725 | |
| | |
|
|
| |
|
| |
|
|
| |
|
|
Class Y: | | | | | | | | | | | | | | |
Shares issued | | $ | 16,459,279 | | | 1,588,466 | | | $ | 60,660,048 | | | 6,017,407 | |
Dividends reinvested | | | 35,533 | | | 3,413 | | | | 534,341 | | | 53,033 | |
Shares redeemed | | | (18,451,089 | ) | | (1,779,569 | ) | | | (149,935,501 | ) | | (14,879,103 | ) |
| | |
|
|
| |
|
| |
|
|
| |
|
|
Net Change | | $ | (1,956,277 | ) | | (187,690 | ) | | $ | (88,741,112 | ) | | (8,808,663 | ) |
| | |
|
|
| |
|
| |
|
|
| |
|
|
| | |
| | | Period Ended
July 31, 2004
| | | Period Ended
July 31, 2004
| |
Class A: | | | | | | | | | | | | | | |
Shares issued | | $ | 3,426,667 | | | 329,834 | | | $ | 1,222,937 | | | 120,375 | |
Dividends reinvested | | | 77,749 | | | 7,474 | | | | 117,454 | | | 11,501 | |
Shares redeemed | | | (1,017,836 | ) | | (97,501 | ) | | | (5,254,542 | ) | | (514,736 | ) |
| | |
|
|
| |
|
| |
|
|
| |
|
|
Net Change | | $ | 2,486,580 | | | 239,807 | | | $ | (3,914,151 | ) | | (382,860 | ) |
| | |
|
|
| |
|
| |
|
|
| |
|
|
Class B: | | | | | | | | | | | | | | |
Shares issued | | | | | | | | | $ | 488,732 | | | 47,904 | |
Dividends reinvested | | | | | | | | | | 19,846 | | | 1,948 | |
Shares redeemed | | | | | | | | | | (509,841 | ) | | (50,012 | ) |
| | | | | | | | | |
|
|
| |
|
|
Net Change | | | | | | | | | $ | (1,263 | ) | | (160 | ) |
| | | | | | | | | |
|
|
| |
|
|
Class C (a): | | | | | | | | | | | | | | |
Shares issued | | $ | 10,000 | | | 969 | | | $ | 10,000 | | | 985 | |
Dividends reinvested | | | 35 | | | 3 | | | | 23 | | | 2 | |
| | |
|
|
| |
|
| |
|
|
| |
|
|
Net Change | | $ | 10,035 | | | 972 | | | $ | 10,023 | | | 987 | |
| | |
|
|
| |
|
| |
|
|
| |
|
|
Class Y: | | | | | | | | | | | | | | |
Shares issued | | $ | 21,189,950 | | | 2,021,315 | | | $ | 224,769,043 | | | 22,007,203 | |
Dividends reinvested | | | 74,110 | | | 7,084 | | | | 883,982 | | | 86,679 | |
Shares redeemed | | | (16,721,236 | ) | | (1,596,356 | ) | | | (247,592,097 | ) | | (24,317,646 | ) |
| | |
|
|
| |
|
| |
|
|
| |
|
|
Net Change | | $ | 4,542,824 | | | 432,043 | | | $ | (21,939,072 | ) | | (2,223,764 | ) |
| | |
|
|
| |
|
| |
|
|
| |
|
|
| | (a) | For the period from April 30, 2004 (commencement of operations) to July 31, 2004. |
Continued
79
PACIFIC CAPITAL FUNDS
Notes to Financial Statements, Continued
July 31, 2005
The New Asia Growth Fund and International Stock Fund may impose a redemption fee. This fee can be assessed on redemptions and exchanges of Fund shares within 90 days from the date the Fund shares were acquired. For the year ended July 31, 2005, the New Asia Growth Fund and the International Stock Fund collected redemption fees during the year which are disclosed in the Statements of Changes in Net Assets. Redemption fees are recorded as an addition to paid-in-capital.
| 7. | | Federal Income Tax Information |
It is the policy of each Fund to continue to qualify as a regulated investment company by complying with the provisions available to certain investment companies as defined in applicable sections of the Internal Revenue Code, and to make distributions from net investment income and from net realized gains sufficient to relieve it from all, or substantially all, federal income taxes. Withholding taxes on foreign dividends have been paid or provided for in accordance with applicable country’s tax rules and rates.
The tax character of distributions paid during the year ended July 31, 2005 were as follows (amounts in thousands):
| | | | | | | | | | | | | | | |
| | | Distribution Paid From
| | Total
Taxable
Distributions
| | Tax
Exempt
Distributions
| | Total
Distributions
Paid
|
| | Net
Investment
Income
| | Net
Long-Term
Capital Gains
| | | |
New Asia Growth Fund | | $ | 431 | | $ | — | | $ | 431 | | $ | — | | $ | 431 |
International Stock Fund | | | 508 | | | — | | | 508 | | | — | | | 508 |
Small Cap Fund | | | 9,961 | | | 12,613 | | | 22,574 | | | — | | | 22,574 |
Mid-Cap Fund | | | 296 | | | — | | | 296 | | | — | | | 296 |
Growth Stock Fund | | | 513 | | | — | | | 513 | | | — | | | 513 |
Growth and Income Fund | | | 870 | | | — | | | 870 | | | — | | | 870 |
Value Fund | | | 1,913 | | | — | | | 1,913 | | | — | | | 1,913 |
Diversified Fixed Income Fund | | | 10,851 | | | 804 | | | 11,655 | | | — | | | 11,655 |
Tax-Free Securities Fund | | | 92 | | | 5,021 | | | 5,113 | | | 13,715 | | | 18,828 |
Short Intermediate U.S. Government Securities Fund | | | 2,604 | | | 12 | | | 2,616 | | | — | | | 2,616 |
Tax-Free Short Intermediate Securities Fund | | | 7 | | | — | | | 7 | | | 1,741 | | | 1,748 |
Ultra Short Government Fund | | | 3,623 | | | — | | | 3,623 | | | — | | | 3,623 |
The tax character of distributions during the fiscal year ended July 31, 2004 were as follows (amounts in thousands):
| | | | | | | | | | | | | | | |
| | | Distribution Paid From
| | Total
Taxable
Distributions
| | Tax
Exempt
Distributions
| | Total
Distributions
Paid
|
| | Net
Investment
Income
| | Net
Long-Term
Capital Gains
| | | |
New Asia Growth Fund | | $ | 239 | | $ | — | | $ | 239 | | $ | — | | $ | 239 |
Small Cap Fund | | | 1,560 | | | 853 | | | 2,413 | | | — | | | 2,413 |
Mid-Cap Fund | | | 81 | | | — | | | 81 | | | — | | | 81 |
Growth and Income Fund | | | 479 | | | — | | | 479 | | | — | | | 479 |
Value Fund | | | 1,820 | | | — | | | 1,820 | | | — | | | 1,820 |
Diversified Fixed Income Fund | | | 12,143 | | | 3,724 | | | 15,867 | | | — | | | 15,867 |
Tax-Free Securities Fund | | | 110 | | | 1,979 | | | 2,089 | | | 16,461 | | | 18,550 |
Short Intermediate U.S. Government
Securities Fund | | | 2,592 | | | 301 | | | 2,893 | | | — | | | 2,893 |
Tax-Free Short Intermediate Securities Fund | | | 1 | | | — | | | 1 | | | 1,661 | | | 1,662 |
Ultra Short Government Fund | | | 5,306 | | | — | | | 5,306 | | | — | | | 5,306 |
Continued
80
PACIFIC CAPITAL FUNDS
Notes to Financial Statements, Continued
July 31, 2005
As of July 31, 2005, the components of accumulated earnings/(deficit) on a tax basis were as follows (amounts in thousands):
| | | | | | | | | | | | | | | | | | | | | | | | | |
| | | Undistributed
Ordinary
Income
| | Undistributed
Long-Term
Capital Gains
| | Accumulated
Earnings
| | Distributions
Payable
| | | Accumulated
Capital &
Other Losses
| | | Unrealized
Appreciation/
(Depreciation)*
| | | Total
Accumulated
Earnings/
(Deficit)
| |
New Asia Growth Fund | | $ | 8 | | $ | 819 | | $ | 827 | | $ | — | | | $ | — | | | $ | 11,484 | | | $ | 12,311 | |
International Stock Fund | | | — | | | — | | | — | | | — | | | | (26,395 | ) | | | 9,984 | | | | (16,411 | ) |
Small Cap Fund | | | 5,369 | | | 11,187 | | | 16,556 | | | — | | | | — | | | | 41,536 | | | | 58,092 | |
Mid-Cap Fund | | | 1,314 | | | 1,128 | | | 2,442 | | | — | | | | — | | | | 12,124 | | | | 14,566 | |
Growth Stock Fund | | | — | | | — | | | — | | | — | | | | (107,519 | ) | | | 16,288 | | | | (91,231 | ) |
Growth and Income Fund | | | 2 | | | — | | | 2 | | | — | | | | (19,657 | ) | | | 13,255 | | | | (6,400 | ) |
Value Fund | | | 40 | | | — | | | 40 | | | — | | | | (7,123 | ) | | | 23,107 | | | | 16,024 | |
Diversified Fixed Income Fund | | | 44 | | | 46 | | | 90 | | | (99 | ) | | | (21 | ) | | | 6,740 | | | | 6,710 | |
Short Intermediate U.S. Government Securities Fund | | | 23 | | | — | | | 23 | | | (23 | ) | | | (358 | ) | | | (1,160 | ) | | | (1,518 | ) |
Ultra Short Government Fund | | | 35 | | | — | | | 35 | | | (27 | ) | | | (1,996 | ) | | | (992 | ) | | | (2,980 | ) |
| | * | Any differences between book-basis and tax basis unrealized appreciation/(depreciation) are attributable to the tax deferral of losses on wash sales and/or passive foreign investment companies. |
| | | | | | | | | | | | | | | | | | | | | | | | | |
| | | Undistributed
| | Accumulated
Earnings
| | Distributions
Payable
| | | Accumulated
Capital &
Other Losses
| | Unrealized
Appreciation/
(Depreciation)
| | Total
Accumulated
Earnings/
(Deficit)
|
| | | Tax Exempt
Income
| | Ordinary
Income
| | Long-Term
Capital Gains
| | | | | |
Tax-Free Securities Fund | | $ | 110 | | $ | 187 | | $ | 1,724 | | $ | 2,021 | | $ | (110 | ) | | $ | — | | $ | 24,074 | | $ | 25,985 |
Tax-Free Short Intermediate Securities Fund | | | 16 | | | — | | | — | | | 16 | | | (16 | ) | | | (62) | | | 597 | | | 535 |
Capital Loss Carryforward
As of July 31, 2005, the Funds’ most recent fiscal year end for tax purposes, the following Funds had net capital loss carryforwards to offset future net capital gains, if any. To the extent that these carryforwards are used to offset future capital gains, it is probable that the gains that are offset will not be distributed to shareholders:
| | | | | | | | | | | | |
| | | Expires
|
| | | 2010
| | 2011
| | 2012
| | 2013
|
International Stock Fund | | $ | 16,537,800 | | $ | 9,834,840 | | $ | — | | $ | — |
Growth Stock Fund | | | 25,497,442 | | | 82,021,934 | | | — | | | — |
Growth and Income Fund | | | — | | | 19,656,110 | | | — | | | — |
Value Fund | | | — | | | 7,122,632 | | | — | | | — |
Short Intermediate U.S. Government Securities Fund | | | — | | | — | | | — | | | 55,178 |
Tax-Free Short Intermediate Securities Fund | | | — | | | — | | | — | | | 14,258 |
Ultra Short Government Fund | | | — | | | — | | | 32,741 | | | 1,268,106 |
Continued
81
PACIFIC CAPITAL FUNDS
Notes to Financial Statements, Concluded
July 31, 2005
Post October Loss Deferral
Capital (and foreign currency) losses incurred after October 31 within a Fund’s fiscal year are deemed to arise on the first business day of the following fiscal year for tax purposes. For the year ended July 31, 2005, the following Funds deferred to August 1, 2005 post October capital losses (and foreign currency losses) (amounts in thousands):
| | | | | | |
| | | Post October
Capital Losses
| | Foreign
Currency Losses
|
International Stock Fund | | $ | — | | $ | 22 |
Diversified Fixed Income Fund | | | 20 | | | — |
Short Intermediate U.S. Government Securities Fund | | | 302 | | | — |
Tax-Free Short Intermediate Securities Fund | | | 49 | | | — |
Ultra Short Government Fund | | | 694 | | | — |
Legal and Regulatory Matters
Management of the Funds has reported to the Funds’ Board of Trustees (the “Board”) that, like many U.S. financial services companies, the Funds and certain of its affiliates have from time to time received formal requests for information from various governmental and self-regulatory agencies in connection with investigations related to mutual funds. Management has advised the Board that the Funds and its affiliates have cooperated fully with each request. Each of the Funds, The Asset Management Group of Bank of Hawaii, the Bank’s parent company, and four present or former officers of the Bank three of whom also are serving or have served as officers or Trustees of the Funds, has received a letter (generally referred to as a “Wells Notice”) from a member of the staff of the Pacific Regional Office of the Securities and Exchange Commission (“SEC”), indicating that the staff intends to recommend to the SEC institution of a civil enforcement action against the recipient related to the SEC’s investigation of alleged market timing and/or excessive trading in shares of the Funds (primarily the New Asia Growth Fund) by a former shareholder of the Funds who was at the time an employee of the Bank. Each of these recipients has submitted a response (generally referred to as a “Wells Submission”) to the SEC staff related to this matter asserting that none of them engaged in wrongdoing. Under the direction of the Funds’ Audit Committee, management has conducted an investigation of this matter with the assistance of outside counsel. Based on this investigation, the Audit Committee and management believe that the trading by such former shareholder was not material to the Funds, that there is no evidence of other material market timing activities with respect to the Funds by employees of the Bank or its affiliates or of any arrangements to permit any “market timing” or “late trading” with respect to the Funds, and that no other similar wrongdoing occurred. Management and the Audit Committee further believe that appropriate administrative arrangements have been put in place and are being implemented to deter market timing with respect to the Funds. It is uncertain whether the SEC staff will make such a recommendation to the SEC or whether the SEC will bring an enforcement action against any individual or entity in connection with its investigation. The Bank has agreed to reimburse the Funds for the loss caused by such former shareholder’s market timing activities and for expenses incurred by the Funds in connection with responding to the SEC’s inquiries. Based on management’s review and consideration of the matter to date, management does not believe the Funds’ financial statements would be adversely impacted as a result of this investigation.
In addition, the Funds’ administrator, BISYS Fund Services Ohio, Inc., is currently the subject of an SEC investigation related to its past payment of certain marketing and other expenses with respect to certain of its mutual fund clients, including the Funds. Based on management’s review and consideration of the matter to date, management does not believe the Funds’ financial statements would be adversely impacted as a result of this investigation.
82
PACIFIC CAPITAL FUNDS — NEW ASIA GROWTH FUND
Financial Highlights
(Selected data for a share of capital stock outstanding throughout the period)
| | | | | | | | | | | | | | | | | | | | | | | | | | | | | | | | | | | | | | | | | | | | |
| | | | | Investment Activities
| | | Distributions
| | | | | | | | Ratios/Supplemental Data
|
| | | Net Asset
Value,
Beginning
of Period | | Net
Investment
Income
(Loss) | | | Net Realized
and Unrealized
Gains (Losses)
on Investments
and Foreign
Currency
Transactions | | | Total from
Investment
Activities | | | Net
Investment
Income | | | Net
Realized
Gains on
Investments
and Foreign
Currencies | | Total
Distributions | | | Net Asset
Value,
End of
Period | | Total
Return (a)(b) | | | Net Assets,
End of
Period (000’s) | | Ratio of
Expenses
to Average
Net Assets (c) | | Ratio of Net
Investment
Income
(Loss) to
Average
Net Assets (c) | | | Ratio of
Expenses
to Average
Net Assets (c)(d) | | Portfolio Turnover (e) |
CLASS A | | | | | | | | | | | | | | | | | | | | | | | | | | | | | | | | | | | | | | | | | | | | |
Year Ended July 31, 2005 | | $ | 11.46 | | $ | 0.11 | (f) | | $ | 4.07 | | | $ | 4.18 | | | $ | (0.12 | ) | | $ | — | | $ | (0.12 | ) | | $ | 15.52 | | 36.68% | | | $ | 1,770 | | 1.96% | | 0.84% | | | 2.48% | | 44.06% |
Year Ended July 31, 2004 | | | 9.77 | | | 0.08 | | | | 1.68 | | | | 1.76 | | | | (0.07 | ) | | | — | | | (0.07 | ) | | | 11.46 | | 17.94% | | | | 1,386 | | 1.88% | | 0.52% | | | 2.39% | | 78.13% |
Year Ended July 31, 2003 | | | 9.83 | | | 0.02 | | | | (0.07 | ) | | | (0.05 | ) | | | (0.01 | ) | | | — | | | (0.01 | ) | | | 9.77 | | (0.47% | ) | | | 1,264 | | 2.10% | | 0.22% | | | 2.61% | | 110.44% |
Year Ended July 31, 2002 | | | 9.42 | | | (0.01 | ) | | | 0.42 | | | | 0.41 | | | | — | | | | — | | | — | | | | 9.83 | | 4.35% | | | | 1,530 | | 1.96% | | (0.07% | ) | | 2.48% | | 70.55% |
Year Ended July 31, 2001 | | | 12.50 | | | (0.05 | ) | | | (3.03 | ) | | | (3.08 | ) | | | — | | | | — | | | — | | | | 9.42 | | (24.64% | ) | | | 1,673 | | 1.98% | | (0.40% | ) | | 2.53% | | 115.95% |
CLASS B | | | | | | | | | | | | | | | | | | | | | | | | | | | | | | | | | | | | | | | | | | | | |
Year Ended July 31, 2005 | | $ | 11.09 | | $ | 0.01 | (f) | | $ | 3.93 | | | $ | 3.94 | | | $ | (0.06 | ) | | $ | — | | $ | (0.06 | ) | | $ | 14.97 | | 35.66% | | | $ | 446 | | 2.71% | | 0.09% | | | 2.73% | | 44.06% |
Year Ended July 31, 2004 | | | 9.48 | | | (0.02 | ) | | | 1.65 | | | | 1.63 | | | | (0.02 | ) | | | — | | | (0.02 | ) | | | 11.09 | | 17.18% | | | | 369 | | 2.64% | | (0.23% | ) | | 2.65% | | 78.13% |
Year Ended July 31, 2003 | | | 9.60 | | | (0.04 | ) | | | (0.08 | ) | | | (0.12 | ) | | | — | | | | — | | | — | | | | 9.48 | | (1.25% | ) | | | 424 | | 2.85% | | (0.51% | ) | | 2.86% | | 110.44% |
Year Ended July 31, 2002 | | | 9.22 | | | (0.10 | ) | | | 0.48 | | | | 0.38 | | | | — | | | | — | | | — | | | | 9.60 | | 4.12% | | | | 426 | | 2.71% | | (0.91% | ) | | 2.74% | | 70.55% |
Year Ended July 31, 2001 | | | 12.34 | | | (0.15 | ) | | | (2.97 | ) | | | (3.12 | ) | | | — | | | | — | | | — | | | | 9.22 | | (25.28% | ) | | | 473 | | 2.73% | | (1.16% | ) | | 2.78% | | 115.95% |
CLASS C | | | | | | | | | | | | | | | | | | | | | | | | | | | | | | | | | | | | | | | | | | | | |
Year Ended July 31, 2005 | | $ | 11.09 | | $ | 0.04 | (f) | | $ | 3.91 | | | $ | 3.95 | | | $ | (0.08 | ) | | $ | — | | $ | (0.08 | ) | | $ | 14.96 | | 35.73% | | | $ | 272 | | 2.70% | | 0.27% | | | 2.74% | | 44.06% |
Period Ended July 31, 2004* | | | 11.98 | | | (0.01 | ) | | | (0.88 | ) | | | (0.89 | ) | | | — | | | | — | | | — | | | | 11.09 | | (7.43% | ) | | | 9 | | 2.53% | | (0.66% | ) | | 2.53% | | 78.13% |
CLASS Y | | | | | | | | | | | | | | | | | | | | | | | | | | | | | | | | | | | | | | | | | | | | |
Year Ended July 31, 2005 | | $ | 11.60 | | $ | 0.15 | (f) | | $ | 4.13 | | | $ | 4.28 | | | $ | (0.16 | ) | | $ | — | | $ | (0.16 | ) | | $ | 15.72 | | 37.07% | | | $ | 44,092 | | 1.71% | | 1.13% | | | 1.73% | | 44.06% |
Year Ended July 31, 2004 | | | 9.89 | | | 0.11 | | | | 1.70 | | | | 1.81 | | | | (0.10 | ) | | | — | | | (0.10 | ) | | | 11.60 | | 18.21% | | | | 29,827 | | 1.63% | | 0.80% | | | 1.64% | | 78.13% |
Year Ended July 31, 2003 | | | 9.93 | | | 0.05 | | | | (0.06 | ) | | | (0.01 | ) | | | (0.03 | ) | | | — | | | (0.03 | ) | | | 9.89 | | (0.13% | ) | | | 23,937 | | 1.85% | | 0.59% | | | 1.86% | | 110.44% |
Year Ended July 31, 2002 | | | 9.49 | | | 0.01 | | | | 0.43 | | | | 0.44 | | | | — | (g) | | | — | | | — | (g) | | | 9.93 | | 4.64% | | | | 19,870 | | 1.71% | | 0.13% | | | 1.73% | | 70.55% |
Year Ended July 31, 2001 | | | 12.58 | | | (0.02 | ) | | | (3.07 | ) | | | (3.09 | ) | | | — | | | | — | | | — | | | | 9.49 | | (24.56% | ) | | | 20,512 | | 1.73% | | (0.17% | ) | | 1.78% | | 115.95% |
| * | For the period from April 30, 2004 (commencement of operations) to July 31, 2004. |
| (a) | Excludes sales charge and/or redemption fees, if applicable. |
| (b) | Not annualized for periods less than one year. |
| (c) | Annualized for periods less than one year. |
| (d) | During the period certain fees were voluntarily reduced. If such voluntary fee reductions had not occurred the ratios would have been as indicated. Voluntary fee reductions may be terminated at any time. |
| (e) | Portfolio turnover is calculated on the basis of the Fund, as a whole, without distinguishing between the classes of shares issued. |
| (f) | Amounts have been calculated using the average daily shares method. |
| (g) | Less than $0.01 per share. |
See notes to financial statements.
83
PACIFIC CAPITAL FUNDS — INTERNATIONAL STOCK FUND
Financial Highlights
(Selected data for a share of capital stock outstanding throughout the period)
| | | | | | | | | | | | | | | | | | | | | | | | | | | | | | | | | | | | | | | | | | | | | |
| | | Investment Activities
| | | Distributions
| | | | | | Ratios/Supplemental Data
|
| | | Net Asset
Value,
Beginning
of Period | | Net
Investment
Income
(Loss) | | | Net Realized
and Unrealized
Gains (Losses)
on Investments
and Foreign
Currency
Transactions | | | Total from
Investment
Activities | | | Net
Investment
Income | | | Net
Realized
Gains on
Investments
and Foreign
Currencies | | | Total
Distributions | | | Net Asset
Value,
End of
Period | | Total
Return (a)(b) | | | Net Assets,
End of
Period (000’s) | | Ratio of
Expenses
to Average
Net Assets (c) | | Ratio of Net
Investment
Income
(Loss) to
Average
Net Assets (c) | | | Ratio of
Expenses
to Average
Net Assets (c)(d) | | Portfolio
Turnover (e) |
CLASS A | | | | | | | | | | | | | | | | | | | | | | | | | | | | | | | | | | | | | | | | | | | | | |
Year Ended July 31, 2005 | | $ | 7.41 | | $ | 0.05 | (f) | | $ | 1.52 | | | $ | 1.57 | | | $ | (0.03 | ) | | $ | — | | | $ | (0.03 | ) | | $ | 8.95 | | 21.17% | | | $ | 949 | | 1.73% | | 0.60% | | | 2.35% | | 37.98% |
Year Ended July 31, 2004 | | | 6.46 | | | (0.01 | ) | | | 0.96 | | | | 0.95 | | | | — | | | | — | | | | — | | | | 7.41 | | 14.71% | | | | 884 | | 1.78% | | (0.05% | ) | | 2.38% | | 237.06% |
Year Ended July 31, 2003 | | | 6.37 | | | 0.03 | | | | 0.06 | | | | 0.09 | | | | — | | | | — | | | | — | | | | 6.46 | | 1.41% | | | | 874 | | 1.84% | | 0.43% | | | 2.44% | | 178.04% |
Year Ended July 31, 2002 | | | 8.15 | | | (0.04 | ) | | | (1.74 | ) | | | (1.78 | ) | | | — | | | | — | | | | — | | | | 6.37 | | (21.84% | ) | | | 1,137 | | 1.81% | | (0.15% | ) | | 2.44% | | 244.40% |
Year Ended July 31, 2001 | | | 14.55 | | | (0.05 | ) | | | (3.77 | ) | | | (3.82 | ) | | | — | | | | (2.58 | ) | | | (2.58 | ) | | | 8.15 | | (29.92% | ) | | | 2,210 | | 1.75% | | (0.41% | ) | | 2.39% | | 213.53% |
CLASS B | | | | | | | | | | | | | | | | | | | | | | | | | | | | | | | | | | | | | | | | | | | | | |
Year Ended July 31, 2005 | | $ | 7.10 | | $ | (0.01 | )(f) | | $ | 1.46 | | | $ | 1.45 | | | $ | (0.01 | ) | | $ | — | | | $ | (0.01 | ) | | $ | 8.54 | | 20.43% | | | $ | 649 | | 2.48% | | (0.16% | ) | | 2.60% | | 37.98% |
Year Ended July 31, 2004 | | | 6.24 | | | (0.05 | ) | | | 0.91 | | | | 0.86 | | | | — | | | | — | | | | — | | | | 7.10 | | 13.78% | | | | 608 | | 2.53% | | (0.80% | ) | | 2.63% | | 237.06% |
Year Ended July 31, 2003 | | | 6.18 | | | (0.03 | ) | | | 0.09 | | | | 0.06 | | | | — | | | | — | | | | — | | | | 6.24 | | 0.97% | | | | 536 | | 2.59% | | (0.36% | ) | | 2.69% | | 178.04% |
Year Ended July 31, 2002 | | | 7.94 | | | (0.07 | ) | | | (1.69 | ) | | | (1.76 | ) | | | — | | | | — | | | | — | | | | 6.18 | | (22.17% | ) | | | 612 | | 2.56% | | (0.95% | ) | | 2.69% | | 244.40% |
Year Ended July 31, 2001 | | | 14.35 | | | (0.11 | ) | | | (3.72 | ) | | | (3.83 | ) | | | — | | | | (2.58 | ) | | | (2.58 | ) | | | 7.94 | | (30.48% | ) | | | 860 | | 2.50% | | (1.15% | ) | | 2.64% | | 213.53% |
CLASS C | | | | | | | | | | | | | | | | | | | | | | | | | | | | | | | | | | | | | | | | | | | | | |
Year Ended July 31, 2005 | | $ | 7.10 | | $ | 0.05 | (f) | | $ | 1.39 | | | $ | 1.44 | | | $ | (0.01 | ) | | $ | — | | | $ | (0.01 | ) | | $ | 8.53 | | 20.30% | | | $ | 494 | | 2.42% | | 0.57% | | | 2.55% | | 37.98% |
Period Ended July 31, 2004* | | | 7.48 | | | (0.01 | ) | | | (0.37 | ) | | | (0.38 | ) | | | — | | | | — | | | | — | | | | 7.10 | | (5.08% | ) | | | 9 | | 2.60% | | (0.45% | ) | | 2.71% | | 237.06% |
CLASS Y | | | | | | | | | | | | | | | | | | | | | | | | | | | | | | | | | | | | | | | | | | | | | |
Year Ended July 31, 2005 | | $ | 7.55 | | $ | 0.08 | (f) | | $ | 1.55 | | | $ | 1.63 | | | $ | (0.05 | ) | | $ | — | | | $ | (0.05 | ) | | $ | 9.13 | | 21.61% | | | $ | 93,049 | | 1.47% | | 0.97% | | | 1.59% | | 37.98% |
Year Ended July 31, 2004 | | | 6.57 | | | 0.01 | | | | 0.97 | | | | 0.98 | | | | — | | | | — | | | | — | | | | 7.55 | | 14.92% | | | | 59,165 | | 1.53% | | 0.20% | | | 1.63% | | 237.06% |
Year Ended July 31, 2003 | | | 6.44 | | | 0.05 | | | | 0.08 | | | | 0.13 | | | | — | | | | — | | | | — | | | | 6.57 | | 2.02% | | | | 60,558 | | 1.59% | | 0.74% | | | 1.69% | | 178.04% |
Year Ended July 31, 2002 | | | 8.19 | | | (0.01 | ) | | | (1.74 | ) | | | (1.75 | ) | | | — | | | | — | | | | — | | | | 6.44 | | (21.37% | ) | | | 50,422 | | 1.56% | | 0.03% | | | 1.69% | | 244.40% |
Year Ended July 31, 2001 | | | 14.59 | | | (0.02 | ) | | | (3.80 | ) | | | (3.82 | ) | | | — | | | | (2.58 | ) | | | (2.58 | ) | | | 8.19 | | (29.82% | ) | | | 79,177 | | 1.50% | | (0.14% | ) | | 1.64% | | 213.53% |
| * | For the period from April 30, 2004 (commencement of operations) to July 31, 2004. |
| (a) | Excludes sales charge and/or redemption fees, if applicable. |
| (b) | Not annualized for periods less than one year. |
| (c) | Annualized for periods less than one year. |
| (d) | During the period certain fees were voluntarily reduced. If such voluntary fee reductions had not occurred the ratios would have been as indicated. Voluntary fee reductions may be terminated at any time. |
| (e) | Portfolio turnover is calculated on the basis of the Fund, as a whole, without distinguishing between the classes of shares issued. |
| (f) | Amounts have been calculated using the average daily shares method. |
See notes to financial statements.
84
PACIFIC CAPITAL FUNDS — SMALL CAP FUND
Financial Highlights
(Selected data for a share of capital stock outstanding throughout the period)
| | | | | | | | | | | | | | | | | | | | | | | | | | | | | | | | | | | | | | | | | | | | | |
| | | | | Investment Activities
| | | Distributions
| | | | | | Ratios/Supplemental Data
|
| | | Net Asset
Value,
Beginning
of Period | | Net
Investment
Income
(Loss) | | | Net Realized
and Unrealized
Gains (Losses)
on Investments | | | Total from
Investment
Activities | | | Net
Investment
Income | | | Net
Realized
Gains | | | Total
Distributions | | | Net Asset
Value,
End of
Period | | Total
Return (a)(b) | | | Net Assets,
End of
Period (000’s) | | Ratio of
Expenses
to Average
Net Assets (c) | | Ratio of Net
Investment
Income
(Loss) to
Average
Net Assets (c) | | | Ratio of
Expenses
to Average
Net Assets (c)(d) | | Portfolio
Turnover (e) |
CLASS A | | | | | | | | | | | | | | | | | | | | | | | | | | | | | | | | | | | | | | | | | | | | | |
Year Ended July 31, 2005 | | $ | 16.52 | | $ | (0.08 | )(f) | | $ | 4.39 | | | $ | 4.31 | | | $ | — | | | $ | (2.73 | ) | | $ | (2.73 | ) | | $ | 18.10 | | 27.98% | | | $ | 103,700 | | 1.63% | | (0.49% | ) | | 2.26% | | 67.75% |
Year Ended July 31, 2004 | | | 13.24 | | | (0.02 | ) | | | 3.64 | | | | 3.62 | | | | — | | | | (0.34 | ) | | | (0.34 | ) | | | 16.52 | | 27.53% | | | | 10,625 | | 1.55% | | (0.37% | ) | | 2.15% | | 90.26% |
Year Ended July 31, 2003 | | | 12.15 | | | (0.01 | ) | | | 2.59 | | | | 2.58 | | | | (0.02 | ) | | | (1.47 | ) | | | (1.49 | ) | | | 13.24 | | 24.62% | | | | 1,595 | | 1.60% | | (0.08% | ) | | 2.20% | | 105.27% |
Year Ended July 31, 2002 | | | 13.47 | | | 0.03 | | | | (0.36 | ) | | | (0.33 | ) | | | (0.03 | ) | | | (0.96 | ) | | | (0.99 | ) | | | 12.15 | | (2.72% | ) | | | 1,265 | | 1.58% | | 0.20% | | | 2.20% | | 81.67% |
Year Ended July 31, 2001 | | | 10.40 | | | 0.05 | | | | 3.90 | | | | 3.95 | | | | (0.08 | ) | | | (0.80 | ) | | | (0.88 | ) | | | 13.47 | | 40.28% | | | | 1,245 | | 1.65% | | 0.31% | | | 2.29% | | 90.31% |
CLASS B | | | | | | | | | | | | | | | | | | | | | | | | | | | | | | | | | | | | | | | | | | | | | |
Year Ended July 31, 2005 | | $ | 15.94 | | $ | (0.21 | ) | | $ | 4.22 | | | $ | 4.01 | | | $ | — | | | $ | (2.73 | ) | | $ | (2.73 | ) | | $ | 17.22 | | 27.09% | | | $ | 3,555 | | 2.35% | | (1.29% | ) | | 2.46% | | 67.75% |
Year Ended July 31, 2004 | | | 12.89 | | | (0.17 | ) | | | 3.56 | | | | 3.39 | | | | — | | | | (0.34 | ) | | | (0.34 | ) | | | 15.94 | | 26.48% | | | | 3,099 | | 2.29% | | (1.12% | ) | | 2.39% | | 90.26% |
Year Ended July 31, 2003 | | | 11.92 | | | (0.08 | ) | | | 2.52 | | | | 2.44 | | | | — | | | | (1.47 | ) | | | (1.47 | ) | | | 12.89 | | 23.74% | | | | 2,476 | | 2.35% | | (0.83% | ) | | 2.45% | | 105.27% |
Year Ended July 31, 2002 | | | 13.29 | | | (0.06 | ) | | | (0.35 | ) | | | (0.41 | ) | | | — | (g) | | | (0.96 | ) | | | (0.96 | ) | | | 11.92 | | (3.38% | ) | | | 2,013 | | 2.33% | | (0.61% | ) | | 2.44% | | 81.67% |
Year Ended July 31, 2001 | | | 10.31 | | | (0.03 | ) | | | 3.82 | | | | 3.79 | | | | (0.01 | ) | | | (0.80 | ) | | | (0.81 | ) | | | 13.29 | | 38.92% | | | | 890 | | 2.40% | | (0.46% | ) | | 2.54% | | 90.31% |
CLASS C | | | | | | | | | | | | | | | | | | | | | | | | | | | | | | | | | | | | | | | | | | | | | |
Year Ended July 31, 2005 | | $ | 15.95 | | $ | (0.21 | )(f) | | $ | 4.22 | | | $ | 4.01 | | | $ | — | | | $ | (2.73 | ) | | $ | (2.73 | ) | | $ | 17.23 | | 27.00% | | | $ | 5,832 | | 2.40% | | (1.33% | ) | | 2.54% | | 67.75% |
Period Ended July 31, 2004 (c)* | | | 15.84 | | | (0.03 | ) | | | 0.14 | | | | 0.11 | | | | — | | | | — | | | | — | | | | 15.95 | | 0.69% | | | | 46 | | 2.32% | | (1.27% | ) | | 2.42% | | 90.26% |
CLASS Y | | | | | | | | | | | | | | | | | | | | | | | | | | | | | | | | | | | | | | | | | | | | | |
Year Ended July 31, 2005 | | $ | 16.63 | | $ | (0.05 | ) | | $ | 4.44 | | | $ | 4.39 | | | $ | — | | | $ | (2.73 | ) | | $ | (2.73 | ) | | $ | 18.29 | | 28.30% | | | $ | 125,299 | | 1.35% | | (0.29% | ) | | 1.46% | | 67.75% |
Year Ended July 31, 2004 | | | 13.30 | | | (0.02 | ) | | | 3.69 | | | | 3.67 | | | | — | | | | (0.34 | ) | | | (0.34 | ) | | | 16.63 | | 27.78% | | | | 117,641 | | 1.29% | | (0.12% | ) | | 1.39% | | 90.26% |
Year Ended July 31, 2003 | | | 12.18 | | | 0.03 | | | | 2.60 | | | | 2.63 | | | | (0.04 | ) | | | (1.47 | ) | | | (1.51 | ) | | | 13.30 | | 24.96% | | | | 85,520 | | 1.35% | | 0.19% | | | 1.45% | | 105.27% |
Year Ended July 31, 2002 | | | 13.49 | | | 0.06 | | | | (0.35 | ) | | | (0.29 | ) | | | (0.06 | ) | | | (0.96 | ) | | | (1.02 | ) | | | 12.18 | | (2.47% | ) | | | 68,001 | | 1.33% | | 0.47% | | | 1.45% | | 81.67% |
Year Ended July 31, 2001 | | | 10.42 | | | 0.08 | | | | 3.88 | | | | 3.96 | | | | (0.09 | ) | | | (0.80 | ) | | | (0.89 | ) | | | 13.49 | | 40.34% | | | | 53,558 | | 1.40% | | 0.67% | | | 1.54% | | 90.31% |
| * | For the period from April 30, 2004 (commencement of operations) to July 31, 2004. |
| (a) | Excludes sales charge, if applicable. |
| (b) | Not annualized for periods less than one year. |
| (c) | Annualized for periods less than one year. |
| (d) | During the period certain fees were voluntarily reduced. If such voluntary fee reductions had not occurred the ratios would have been as indicated. Voluntary fee reductions may be terminated at any time. |
| (e) | Portfolio turnover is calculated on the basis of the Fund, as a whole, without distinguishing between the classes of shares issued. |
| (f) | Amounts have been calculated using the average daily shares method. |
| (g) | Less than $0.01 per share. |
See notes to financial statements.
85
PACIFIC CAPITAL FUNDS — MID-CAP FUND
Financial Highlights
(Selected data for a share of capital stock outstanding throughout the period)
| | | | | | | | | | | | | | | | | | | | | | | | | | | | | | | | | | | | | | |
| | | Investment Activities
| | Distributions
| | | | | | | Ratios/Supplemental Data
|
| | | Net Asset
Value,
Beginning
of Period | | Net
Investment
Income
(Loss) | | | Net Realized
and Unrealized
Gains
on Investments | | Total from
Investment
Activities | | Net
Investment
Income | | | Total
Distributions | | | Net Asset
Value,
End of
Period | | Total
Return (a)(b) | | Net Assets,
End of
Period (000’s) | | Ratio of
Expenses
to Average
Net Assets (c) | | Ratio of Net
Investment
Income
(Loss) to
Average
Net Assets (c) | | | Ratio of
Expenses
to Average
Net Assets (c)(d) | | Portfolio
Turnover (e) |
CLASS A | | | | | | | | | | | | | | | | | | | | | | | | | | | | | | | | | | | | | | |
Year Ended July 31, 2005 | | $ | 10.33 | | $ | 0.03 | | | $ | 2.42 | | $ | 2.45 | | $ | (0.03 | ) | | $ | (0.03 | ) | | $ | 12.75 | | 23.69% | | $ | 760 | | 1.05% | | 0.25% | | | 1.95% | | 97.23% |
Period Ended July 31, 2004* | | | 10.00 | | | 0.02 | | | | 0.33 | | | 0.35 | | | (0.02 | ) | | | (0.02 | ) | | | 10.33 | | 3.50% | | | 186 | | 1.05% | | 0.34% | | | 2.08% | | 47.75% |
CLASS C | | | | | | | | | | | | | | | | | | | | | | | | | | | | | | | | | | | | | | |
Year Ended July 31, 2005 | | $ | 10.32 | | $ | (0.03 | ) | | $ | 2.39 | | $ | 2.36 | | $ | — | | | $ | — | | | $ | 12.68 | | 22.87% | | $ | 509 | | 1.80% | | (0.50% | ) | | 2.21% | | 97.23% |
Period Ended July 31, 2004** | | | 10.23 | | | (0.01 | ) | | | 0.10 | | | 0.09 | | | — | | | | — | | | | 10.32 | | 0.88% | | | 10 | | 1.80% | | (0.52% | ) | | 2.35% | | 47.75% |
CLASS Y | | | | | | | | | | | | | | | | | | | | | | | | | | | | | | | | | | | | | | |
Year Ended July 31, 2005 | | $ | 10.34 | | $ | 0.05 | | | $ | 2.42 | | $ | 2.47 | | $ | (0.05 | ) | | $ | (0.05 | ) | | $ | 12.76 | | 23.92% | | $ | 83,141 | | 0.80% | | 0.47% | | | 1.19% | | 97.23% |
Period Ended July 31, 2004* | | | 10.00 | | | 0.03 | | | | 0.34 | | | 0.37 | | | (0.03 | ) | | | (0.03 | ) | | | 10.34 | | 3.69% | | | 30,689 | | 0.80% | | 0.60% | | | 1.35% | | 47.75% |
| * | For the period from December 30, 2003 (commencement of operations) to July 31, 2004. |
| ** | For the period from April 30, 2004 (commencement of operations) to July 31, 2004. |
| (a) | Excludes sales charge, if applicable. |
| (b) | Not annualized for periods less than one year. |
| (c) | Annualized for periods less than one year. |
| (d) | During the period certain fees were voluntarily reduced. If such voluntary fee reductions had not occurred the ratios would have been as indicated. Voluntary fee reductions may be terminated at any time. |
| (e) | Portfolio turnover is calculated on the basis of the Fund, as a whole, without distinguishing between the classes of shares issued. |
See notes to financial statements.
86
PACIFIC CAPITAL FUNDS — GROWTH STOCK FUND
Financial Highlights
(Selected data for a share of capital stock outstanding throughout the period)
| | | | | | | | | | | | | | | | | | | | | | | | | | | | | | | | | | | | | | | | | | | | | |
| | | | | Investment Activities
| | | Distributions
| | | | | | | | Ratios/Supplemental Data
|
| | | Net Asset
Value,
Beginning
of Period | | Net
Investment
Income
(Loss) | | | Net Realized
and Unrealized
Gains (Losses)
on Investments | | | Total from
Investment
Activities | | | Net
Investment
Income | | | Net
Realized
Gains | | | Total
Distributions | | | Net Asset
Value,
End of
Period | | Total Return (a)(b) | | | Net Assets,
End of Period (000’s) | | Ratio of
Expenses
to Average
Net Assets (c) | | Ratio of Net
Investment
Income
(Loss) to
Average
Net Assets (c) | | | Ratio of
Expenses
to Average
Net Assets (c)(d) | | Portfolio
Turnover (e) |
CLASS A | | | | | | | | | | | | | | | | | | | | | | | | | | | | | | | | | | | | | | | | | | | | | |
Year Ended July 31, 2005 | | $ | 7.87 | | $ | — | | | $ | 0.81 | | | $ | 0.81 | | | $ | (0.01 | ) | | $ | — | | | $ | (0.01 | ) | | $ | 8.67 | | 10.29% | | | $ | 9,997 | | 1.40% | | (0.06% | ) | | 1.91% | | 174.37% |
Year Ended July 31, 2004 | | | 7.60 | | | (0.05 | ) | | | 0.32 | | | | 0.27 | | | | — | | | | — | | | | — | | | | 7.87 | | 3.55% | | | | 10,875 | | 1.35% | | (0.56% | ) | | 1.85% | | 60.70% |
Year Ended July 31, 2003 | | | 6.90 | | | (0.04 | ) | | | 0.74 | | | | 0.70 | | | | — | | | | — | | | | — | | | | 7.60 | | 10.14% | | | | 11,231 | | 1.35% | | (0.58% | ) | | 1.85% | | 33.11% |
Year Ended July 31, 2002 | | | 10.25 | | | (0.08 | ) | | | (3.27 | ) | | | (3.35 | ) | | | — | | | | — | | | | — | | | | 6.90 | | (32.68% | ) | | | 11,701 | | 1.34% | | (0.80% | ) | | 1.86% | | 36.85% |
Year Ended July 31, 2001 | | | 19.73 | | | (0.09 | ) | | | (4.67 | ) | | | (4.76 | ) | | | — | | | | (4.72 | ) | | | (4.72 | ) | | | 10.25 | | (30.04% | ) | | | 22,182 | | 1.33% | | (0.69% | ) | | 1.87% | | 97.27% |
CLASS B | | | | | | | | | | | | | | | | | | | | | | | | | | | | | | | | | | | | | | | | | | | | | |
Year Ended July 31, 2005 | | $ | 7.43 | | $ | (0.07 | ) | | $ | 0.78 | | | $ | 0.71 | | | $ | — | | | $ | — | | | $ | — | | | $ | 8.14 | | 9.56% | | | $ | 12,127 | | 2.15% | | (0.82% | ) | | 2.16% | | 174.37% |
Year Ended July 31, 2004 | | | 7.23 | | | (0.11 | ) | | | 0.31 | | | | 0.20 | | | | — | | | | — | | | | — | | | | 7.43 | | 2.77% | | | | 12,804 | | 2.10% | | (1.31% | ) | | 2.10% | | 60.70% |
Year Ended July 31, 2003 | | | 6.62 | | | (0.09 | ) | | | 0.70 | | | | 0.61 | | | | — | | | | — | | | | — | | | | 7.23 | | 9.21% | | | | 13,630 | | 2.10% | | (1.33% | ) | | 2.10% | | 33.11% |
Year Ended July 31, 2002 | | | 9.89 | | | (0.14 | ) | | | (3.13 | ) | | | (3.27 | ) | | | — | | | | — | | | | — | | | | 6.62 | | (33.06% | ) | | | 14,431 | | 2.09% | | (1.55% | ) | | 2.11% | | 36.85% |
Year Ended July 31, 2001 | | | 19.32 | | | (0.16 | ) | | | (4.55 | ) | | | (4.71 | ) | | | — | | | | (4.72 | ) | | | (4.72 | ) | | | 9.89 | | (30.51% | ) | | | 24,084 | | 2.08% | | (1.45% | ) | | 2.12% | | 97.27% |
CLASS C | | | | | | | | | | | | | | | | | | | | | | | | | | | | | | | | | | | | | | | | | | | | | |
Year Ended July 31, 2005 | | $ | 7.43 | | $ | (0.05 | ) | | $ | 0.76 | | | $ | 0.71 | | | $ | (0.01 | ) | | $ | — | | | $ | (0.01 | ) | | $ | 8.13 | | 9.59% | | | $ | 1,987 | | 2.15% | | (1.15% | ) | | 2.18% | | 174.37% |
Period Ended July 31, 2004* | | | 7.69 | | | (0.02 | ) | | | (0.24 | ) | | | (0.26 | ) | | | — | | | | — | | | | — | | | | 7.43 | | (3.38% | ) | | | 11 | | 2.13% | | (1.24% | ) | | 2.13% | | 60.70% |
CLASS Y | | | | | | | | | | | | | | | | | | | | | | | | | | | | | | | | | | | | | | | | | | | | | |
Year Ended July 31, 2005 | | $ | 8.09 | | $ | 0.02 | | | $ | 0.83 | | | $ | 0.85 | | | $ | (0.02 | ) | | $ | — | | | $ | (0.02 | ) | | $ | 8.92 | | 10.50% | | | $ | 218,750 | | 1.15% | | 0.19% | | | 1.16% | | 174.37% |
Year Ended July 31, 2004 | | | 7.79 | | | (0.03 | ) | | | 0.33 | | | | 0.30 | | | | — | | | | — | | | | — | | | | 8.09 | | 3.85% | | | | 237,799 | | 1.10% | | (0.31% | ) | | 1.10% | | 60.70% |
Year Ended July 31, 2003 | | | 7.06 | | | (0.02 | ) | | | 0.75 | | | | 0.73 | | | | — | | | | — | | | | — | | | | 7.79 | | 10.34% | | | | 251,310 | | 1.10% | | (0.33% | ) | | 1.10% | | 33.11% |
Year Ended July 31, 2002 | | | 10.44 | | | (0.05 | ) | | | (3.33 | ) | | | (3.38 | ) | | | — | | | | — | | | | — | | | | 7.06 | | (32.38% | ) | | | 195,252 | | 1.09% | | (0.55% | ) | | 1.11% | | 36.85% |
Year Ended July 31, 2001 | | | 19.95 | | | (0.06 | ) | | | (4.73 | ) | | | (4.79 | ) | | | — | | | | (4.72 | ) | | | (4.72 | ) | | | 10.44 | | (29.84% | ) | | | 329,572 | | 1.08% | | (0.44% | ) | | 1.12% | | 97.27% |
| * | For the period from April 30, 2004 (commencement of operations) to July 31, 2004. |
| (a) | Excludes sales charge, if applicable. |
| (b) | Not annualized for periods less than one year. |
| (c) | Annualized for periods less than one year. |
| (d) | During the period certain fees were voluntarily reduced. If such voluntary fee reductions had not occurred the ratios would have been as indicated. Voluntary fee reductions may be terminated at any time. |
| (e) | Portfolio turnover is calculated on the basis of the Fund, as a whole, without distinguishing between the classes of shares issued. |
See notes to financial statements.
87
PACIFIC CAPITAL FUNDS — GROWTH AND INCOME FUND
Financial Highlights
(Selected data for a share of capital stock outstanding throughout the period)
| | | | | | | | | | | | | | | | | | | | | | | | | | | | | | | | | | | | | | | | | | | | | |
| | | | | Investment Activities
| | | Distributions
| | | | | | | | Ratios/Supplemental Data
|
| | | Net Asset
Value,
Beginning
of Period | | Net
Investment
Income
(Loss) | | | Net Realized
and Unrealized
Gains (Losses)
on Investments | | | Total from
Investment
Activities | | | Net
Investment
Income | | | Net
Realized
Gains | | | Total
Distributions | | | Net Asset
Value,
End of
Period | | Total
Return (a)(b) | | | Net Assets,
End of
Period (000’s) | | Ratio of
Expenses
to Average
Net Assets (c) | | Ratio of Net
Investment
Income
(Loss) to
Average
Net Assets (c) | | | Ratio of
Expenses
to Average
Net Assets (c)(d) | | Portfolio
Turnover (e) |
CLASS A |
Year Ended July 31, 2005 | | $ | 11.65 | | $ | 0.06 | | | $ | 1.67 | | | $ | 1.73 | | | $ | (0.06 | ) | | $ | — | | | $ | (0.06 | ) | | $ | 13.32 | | 14.83% | | | $ | 5,554 | | 1.42% | | 0.42% | | | 1.94% | | 181.04% |
Year Ended July 31, 2004 | | | 10.69 | | | 0.01 | | | | 0.96 | | | | 0.97 | | | | (0.01 | ) | | | — | | | | (0.01 | ) | | | 11.65 | | 9.11% | | | | 5,539 | | 1.38% | | 0.12% | | | 1.88% | | 48.46% |
Year Ended July 31, 2003 | | | 9.89 | | | 0.02 | | | | 0.80 | | | | 0.82 | | | | (0.02 | ) | | | — | | | | (0.02 | ) | | | 10.69 | | 8.31% | | | | 5,548 | | 1.37% | | 0.24% | | | 1.87% | | 46.92% |
Year Ended July 31, 2002 | | | 13.89 | | | — | | | | (4.00 | ) | | | (4.00 | ) | | | — | | | | — | | | | — | | | | 9.89 | | (28.80% | ) | | | 5,696 | | 1.35% | | (0.03% | ) | | 1.88% | | 43.28% |
Year Ended July 31, 2001 | | | 21.33 | | | (0.03 | ) | | | (4.72 | ) | | | (4.75 | ) | | | — | | | | (2.69 | ) | | | (2.69 | ) | | | 13.89 | | (24.39% | ) | | | 9,669 | | 1.35% | | (0.16% | ) | | 1.89% | | 43.24% |
CLASS B |
Year Ended July 31, 2005 | | $ | 11.06 | | $ | (0.04 | ) | | $ | 1.58 | | | $ | 1.54 | | | $ | (0.03 | ) | | $ | — | | | $ | (0.03 | ) | | $ | 12.57 | | 13.93% | | | $ | 7,193 | | 2.17% | | (0.33% | ) | | 2.19% | | 181.04% |
Year Ended July 31, 2004 | | | 10.21 | | | (0.07 | ) | | | 0.92 | | | | 0.85 | | | | — | | | | — | | | | — | | | | 11.06 | | 8.33% | | | | 7,509 | | 2.13% | | (0.63% | ) | | 2.13% | | 48.46% |
Year Ended July 31, 2003 | | | 9.50 | | | (0.05 | ) | | | 0.76 | | | | 0.71 | | | | — | | | | — | | | | — | | | | 10.21 | | 7.47% | | | | 7,507 | | 2.12% | | (0.51% | ) | | 2.12% | | 46.92% |
Year Ended July 31, 2002 | | | 13.44 | | | (0.10 | ) | | | (3.84 | ) | | | (3.94 | ) | | | — | | | | — | | | | — | | | | 9.50 | | (29.32% | ) | | | 8,222 | | 2.10% | | (0.79% | ) | | 2.13% | | 43.28% |
Year Ended July 31, 2001 | | | 20.88 | | | (0.14 | ) | | | (4.61 | ) | | | (4.75 | ) | | | — | | | | (2.69 | ) | | | (2.69 | ) | | | 13.44 | | (24.97% | ) | | | 13,282 | | 2.10% | | (0.92% | ) | | 2.14% | | 43.24% |
CLASS C | | | | | | | | | | | | | | | | | | | | | | | | | | | | | | | | | | | | | | | | | | | | | |
Year Ended July 31, 2005 | | $ | 11.06 | | $ | (0.02 | ) | | $ | 1.57 | | | $ | 1.55 | | | $ | (0.05 | ) | | $ | — | | | $ | (0.05 | ) | | $ | 12.56 | | 14.00% | | | $ | 1,911 | | 2.17% | | (0.74% | ) | | 2.20% | | 181.04% |
Period Ended July 31, 2004* | | | 11.17 | | | (0.02 | ) | | | (0.09 | ) | | | (0.11 | ) | | | — | | | | — | | | | — | | | | 11.06 | | (0.98% | ) | | | 10 | | 2.17% | | (0.78% | ) | | 2.17% | | 48.46% |
CLASS Y | | | | | | | | | | | | | | | | | | | | | | | | | | | | | | | | | | | | | | | | | | | | | |
Year Ended July 31, 2005 | | $ | 11.73 | | $ | 0.09 | | | $ | 1.68 | | | $ | 1.77 | | | $ | (0.08 | ) | | $ | — | | | $ | (0.08 | ) | | $ | 13.42 | | 15.12% | | | $ | 136,311 | | 1.17% | | 0.67% | | | 1.19% | | 181.04% |
Year Ended July 31, 2004 | | | 10.76 | | | 0.05 | | | | 0.96 | | | | 1.01 | | | | (0.04 | ) | | | — | | | | (0.04 | ) | | | 11.73 | | 9.39% | | | | 127,883 | | 1.13% | | 0.38% | | | 1.13% | | 48.46% |
Year Ended July 31, 2003 | | | 9.96 | | | 0.04 | | | | 0.80 | | | | 0.84 | | | | (0.04 | ) | | | — | | | | (0.04 | ) | | | 10.76 | | 8.52% | | | | 138,027 | | 1.12% | | 0.49% | | | 1.12% | | 46.92% |
Year Ended July 31, 2002 | | | 13.97 | | | 0.03 | | | | (4.02 | ) | | | (3.99 | ) | | | (0.02 | ) | | | — | | | | (0.02 | ) | | | 9.96 | | (28.60% | ) | | | 116,719 | | 1.10% | | 0.20% | | | 1.13% | | 43.28% |
Year Ended July 31, 2001 | | | 21.39 | | | 0.01 | | | | (4.74 | ) | | | (4.73 | ) | | | — | (f) | | | (2.69 | ) | | | (2.69 | ) | | | 13.97 | | (24.19% | ) | | | 162,138 | | 1.10% | | 0.09% | | | 1.14% | | 43.24% |
| * | For the period from April 30, 2004 (commencement of operations) to July 31, 2004. |
| (a) | Excludes sales charge, if applicable. |
| (b) | Not annualized for periods less than one year. |
| (c) | Annualized for periods less than one year. |
| (d) | During the period certain fees were voluntarily reduced. If such voluntary fee reductions had not occurred the ratios would have been as indicated. Voluntary fee reductions may be terminated at any time. |
| (e) | Portfolio turnover is calculated on the basis of the Fund, as a whole, without distinguishing between the classes of shares issued. |
| (f) | Less than $0.01 per share. |
See notes to financial statements.
88
PACIFIC CAPITAL FUNDS — VALUE FUND
Financial Highlights
(Selected data for a share of capital stock outstanding throughout the period)
| | | | | | | | | | | | | | | | | | | | | | | | | | | | | | | | | | | | | | | | | | | | | |
| | | Investment Activities
| | | Distributions
| | | | | | Ratios/Supplemental Data
|
| | | Net Asset
Value,
Beginning
of Period | | Net
Investment
Income
(Loss) | | | Net Realized
and Unrealized
Gains (Losses)
on Investments | | | Total from
Investment
Activities | | | Net
Investment
Income | | | Net
Realized
Gains | | | Total
Distributions | | | Net Asset
Value,
End of
Period | | Total
Return (a)(b) | | | Net Assets,
End of
Period (000’s) | | Ratio of
Expenses
to Average
Net Assets (c) | | Ratio of Net
Investment
Income
(Loss) to
Average
Net Assets (c) | | | Ratio of
Expenses
to Average
Net Assets (c)(d) | | Portfolio
Turnover (e) |
CLASS A | | | | | | | | | | | | | | | | | | | | | | | | | | | | | | | | | | | | | | | | | | | | | |
Year Ended July 31, 2005 | | $ | 8.37 | | $ | 0.08 | | | $ | 1.50 | | | $ | 1.58 | | | $ | (0.08 | ) | | $ | — | | | $ | (0.08 | ) | | $ | 9.87 | | 18.75% | | | $ | 2,910 | | 1.36% | | 0.78% | | | 1.87% | | 129.24% |
Year Ended July 31, 2004 | | | 7.37 | | | 0.06 | | | | 1.00 | | | | 1.06 | | | | (0.06 | ) | | | — | | | | (0.06 | ) | | | 8.37 | | 14.52% | | | | 2,477 | | 1.33% | | 0.63% | | | 1.83% | | 73.48% |
Year Ended July 31, 2003 | | | 7.02 | | | 0.07 | | | | 0.35 | | | | 0.42 | | | | (0.07 | ) | | | — | | | | (0.07 | ) | | | 7.37 | | 6.07% | | | | 2,146 | | 1.32% | | 1.05% | | | 1.82% | | 77.62% |
Year Ended July 31, 2002 | | | 9.13 | | | 0.04 | | | | (2.11 | ) | | | (2.07 | ) | | | (0.04 | ) | | | — | | | | (0.04 | ) | | | 7.02 | | (22.74% | ) | | | 2,032 | | 1.30% | | 0.48% | | | 1.82% | | 48.18% |
Year Ended July 31, 2001 | | | 10.73 | | | 0.04 | | | | (0.22 | ) | | | (0.18 | ) | | | (0.05 | ) | | | (1.37 | ) | | | (1.42 | ) | | | 9.13 | | (1.66% | ) | | | 2,504 | | 1.31% | | 0.49% | | | 1.85% | | 79.05% |
CLASS B | | | | | | | | | | | | | | | | | | | | | | | | | | | | | | | | | | | | | | | | | | | | | |
Year Ended July 31, 2005 | | $ | 8.25 | | $ | — | | | $ | 1.48 | | | $ | 1.48 | | | $ | (0.03 | ) | | $ | — | | | $ | (0.03 | ) | | $ | 9.70 | | 18.00% | | | $ | 1,460 | | 2.11% | | 0.04% | | | 2.12% | | 129.24% |
Year Ended July 31, 2004 | | | 7.27 | | | — | | | | 0.99 | | | | 0.99 | | | | (0.01 | ) | | | — | | | | (0.01 | ) | | | 8.25 | | 13.55% | | | | 1,349 | | 2.08% | | (0.11% | ) | | 2.08% | | 73.48% |
Year Ended July 31, 2003 | | | 6.93 | | | 0.02 | | | | 0.34 | | | | 0.36 | | | | (0.02 | ) | | | — | | | | (0.02 | ) | | | 7.27 | | 5.22% | | | | 1,291 | | 2.07% | | 0.31% | | | 2.07% | | 77.62% |
Year Ended July 31, 2002 | | | 9.04 | | | (0.02 | ) | | | (2.09 | ) | | | (2.11 | ) | | | — | | | | — | | | | — | | | | 6.93 | | (23.34% | ) | | | 1,427 | | 2.05% | | (0.28% | ) | | 2.07% | | 48.18% |
Year Ended July 31, 2001 | | | 10.65 | | | (0.02 | ) | | | (0.22 | ) | | | (0.24 | ) | | | — | (f) | | | (1.37 | ) | | | (1.37 | ) | | | 9.04 | | (2.25% | ) | | | 1,544 | | 2.06% | | (0.26% | ) | | 2.10% | | 79.05% |
CLASS C | | | | | | | | | | | | | | | | | | | | | | | | | | | | | | | | | | | | | | | | | | | | | |
Year Ended July 31, 2005 | | $ | 8.25 | | $ | — | | | $ | 1.50 | | | $ | 1.50 | | | $ | (0.01 | ) | | $ | — | | | $ | (0.01 | ) | | $ | 9.74 | | 18.00% | | | $ | 1,833 | | 2.11% | | (0.19% | ) | | 2.14% | | 129.24% |
Period Ended July 31, 2004* | | | 8.19 | | | — | | | | 0.06 | | | | 0.06 | | | | — | | | | — | | | | — | | | | 8.25 | | 0.87% | | | | 10 | | 2.11% | | (0.05% | ) | | 2.11% | | 73.48% |
CLASS Y | | | | | | | | | | | | | | | | | | | | | | | | | | | | | | | | | | | | | | | | | | | | | |
Year Ended July 31, 2005 | | $ | 8.39 | | $ | 0.10 | | | $ | 1.50 | | | $ | 1.60 | | | $ | (0.10 | ) | | $ | — | | | $ | (0.10 | ) | | $ | 9.89 | | 19.12% | | | $ | 182,279 | | 1.11% | | 1.05% | | | 1.12% | | 129.24% |
Year Ended July 31, 2004 | | | 7.38 | | | 0.08 | | | | 1.01 | | | | 1.09 | | | | (0.08 | ) | | | — | | | | (0.08 | ) | | | 8.39 | | 14.76% | | | | 178,389 | | 1.08% | | 0.89% | | | 1.08% | | 73.48% |
Year Ended July 31, 2003 | | | 7.03 | | | 0.09 | | | | 0.35 | | | | 0.44 | | | | (0.09 | ) | | | — | | | | (0.09 | ) | | | 7.38 | | 6.32% | | | | 210,881 | | 1.07% | | 1.30% | | | 1.07% | | 77.62% |
Year Ended July 31, 2002 | | | 9.15 | | | 0.06 | | | | (2.12 | ) | | | (2.06 | ) | | | (0.06 | ) | | | — | | | | (0.06 | ) | | | 7.03 | | (22.59% | ) | | | 198,862 | | 1.05% | | 0.71% | | | 1.07% | | 48.18% |
Year Ended July 31, 2001 | | | 10.74 | | | 0.07 | | | | (0.22 | ) | | | (0.15 | ) | | | (0.07 | ) | | | (1.37 | ) | | | (1.44 | ) | | | 9.15 | | (1.34% | ) | | | 231,106 | | 1.06% | | 0.76% | | | 1.10% | | 79.05% |
| * | For the period from April 30, 2004 (commencement of operations) to July 31, 2004. |
| (a) | Excludes sales charge, if applicable. |
| (b) | Not annualized for periods less than one year. |
| (c) | Annualized for periods less than one year. |
| (d) | During the period certain fees were voluntarily reduced. If such voluntary fee reductions had not occurred the ratios would have been as indicated. Voluntary fee reductions may be terminated at any time. |
| (e) | Portfolio turnover is calculated on the basis of the Fund, as a whole, without distinguishing between the classes of shares issued. |
| (f) | Less than $0.01 per share. |
See notes to financial statements.
89
PACIFIC CAPITAL FUNDS — DIVERSIFIED FIXED INCOME FUND
Financial Highlights
(Selected data for a share of capital stock outstanding throughout the period)
| | | | | | | | | | | | | | | | | | | | | | | | | | | | | | | | | | | | | | | | | |
| | | | | Investment Activities
| | Distributions
| | | | | | | Ratios/Supplemental Data
|
| | | Net Asset
Value,
Beginning
of Period | | Net
Investment
Income | | Net Realized
and Unrealized
Gains (Losses)
on Investments | | | Total from
Investment
Activities | | Net
Investment
Income | | | Net
Realized
Gains | | | Total
Distributions | | | Net Asset
Value,
End of
Period | | Total
Return (a)(b) | | Net Assets,
End of
Period (000’s) | | Ratio of
Expenses
to Average
Net Assets (c) | | Ratio of Net
Investment
Income to
Average
Net Assets (c) | | Ratio of
Expenses
to Average
Net Assets (c)(d) | | Portfolio
Turnover (e) |
CLASS A | | | | | | | | | | | | | | | | | | | | | | | | | | | | | | | | | | | | | | | | | |
Year Ended July 31, 2005 | | $ | 11.05 | | $ | 0.40 | | $ | — | | | $ | 0.40 | | $ | (0.40 | ) | | $ | (0.03 | ) | | $ | (0.43 | ) | | $ | 11.02 | | 3.67% | | $ | 4,577 | | 1.00% | | 3.58% | | 1.67% | | 27.95% |
Year Ended July 31, 2004 | | | 11.28 | | | 0.42 | | | (0.03 | ) | | | 0.39 | | | (0.42 | ) | | | (0.20 | ) | | | (0.62 | ) | | | 11.05 | | 3.46% | | | 5,222 | | 0.98% | | 3.72% | | 1.63% | | 48.55% |
Year Ended July 31, 2003 | | | 11.22 | | | 0.47 | | | 0.17 | | | | 0.64 | | | (0.47 | ) | | | (0.11 | ) | | | (0.58 | ) | | | 11.28 | | 5.76% | | | 8,841 | | 0.97% | | 4.04% | | 1.62% | | 52.53% |
Year Ended July 31, 2002 | | | 10.89 | | | 0.53 | | | 0.33 | | | | 0.86 | | | (0.53 | ) | | | — | | | | (0.53 | ) | | | 11.22 | | 8.13% | | | 6,755 | | 0.96% | | 4.86% | | 1.63% | | 71.59% |
Year Ended July 31, 2001 | | | 10.22 | | | 0.58 | | | 0.67 | | | | 1.25 | | | (0.58 | ) | | | — | | | | (0.58 | ) | | | 10.89 | | 12.48% | | | 7,702 | | 0.95% | | 5.43% | | 1.65% | | 58.91% |
CLASS B | | | | | | | | | | | | | | | | | | | | | | | | | | | | | | | | | | | | | | | | | |
Year Ended July 31, 2005 | | $ | 11.03 | | $ | 0.32 | | $ | 0.00 | | | $ | 0.32 | | $ | (0.32 | ) | | $ | (0.03 | ) | | $ | (0.35 | ) | | $ | 11.00 | | 2.90% | | $ | 4,019 | | 1.75% | | 2.83% | | 1.92% | | 27.95% |
Year Ended July 31, 2004 | | | 11.26 | | | 0.33 | | | (0.03 | ) | | | 0.30 | | | (0.33 | ) | | | (0.20 | ) | | | (0.53 | ) | | | 11.03 | | 2.70% | | | 4,397 | | 1.73% | | 2.97% | | 1.88% | | 48.55% |
Year Ended July 31, 2003 | | | 11.20 | | | 0.38 | | | 0.17 | | | | 0.55 | | | (0.38 | ) | | | (0.11 | ) | | | (0.49 | ) | | | 11.26 | | 4.96% | | | 5,193 | | 1.72% | | 3.30% | | 1.87% | | 52.53% |
Year Ended July 31, 2002 | | | 10.87 | | | 0.45 | | | 0.33 | | | | 0.78 | | | (0.45 | ) | | | — | | | | (0.45 | ) | | | 11.20 | | 7.34% | | | 4,997 | | 1.71% | | 4.11% | | 1.88% | | 71.59% |
Year Ended July 31, 2001 | | | 10.20 | | | 0.50 | | | 0.67 | | | | 1.17 | | | (0.50 | ) | | | — | | | | (0.50 | ) | | | 10.87 | | 11.68% | | | 4,367 | | 1.70% | | 4.67% | | 1.90% | | 58.91% |
CLASS C | | | | | | | | | | | | | | | | | | | | | | | | | | | | | | | | | | | | | | | | | |
Year Ended July 31, 2005 | | $ | 11.02 | | $ | 0.32 | | $ | 0.01 | | | $ | 0.33 | | $ | (0.32 | ) | | $ | (0.03 | ) | | $ | (0.35 | ) | | $ | 11.00 | | 3.00% | | $ | 1,188 | | 1.75% | | 2.90% | | 1.93% | | 27.95% |
Period Ended July 31, 2004* | | | 11.02 | | | 0.08 | | | (0.00 | ) | | | 0.08 | | | (0.08 | ) | | | — | | | | (0.08 | ) | | | 11.02 | | 0.76% | | | 10 | | 1.75% | | 2.98% | | 1.90% | | 48.55% |
CLASS Y | | | | | | | | | | | | | | | | | | | | | | | | | | | | | | | | | | | | | | | | | |
Year Ended July 31, 2005 | | $ | 11.12 | | $ | 0.43 | | $ | 0.00 | | | $ | 0.43 | | $ | (0.43 | ) | | $ | (0.03 | ) | | $ | (0.46 | ) | | $ | 11.09 | | 3.90% | | $ | 294,240 | | 0.74% | | 3.81% | | 0.91% | | 27.95% |
Year Ended July 31, 2004 | | | 11.35 | | | 0.45 | | | (0.03 | ) | | | 0.42 | | | (0.45 | ) | | | (0.20 | ) | | | (0.65 | ) | | | 11.12 | | 3.73% | | | 268,129 | | 0.73% | | 3.97% | | 0.88% | | 48.55% |
Year Ended July 31, 2003 | | | 11.29 | | | 0.50 | | | 0.17 | | | | 0.67 | | | (0.50 | ) | | | (0.11 | ) | | | (0.61 | ) | | | 11.35 | | 6.00% | | | 235,902 | | 0.72% | | 4.30% | | 0.87% | | 52.53% |
Year Ended July 31, 2002 | | | 10.96 | | | 0.56 | | | 0.33 | | | | 0.89 | | | (0.56 | ) | | | — | | | | (0.56 | ) | | | 11.29 | | 8.38% | | | 222,500 | | 0.71% | | 5.11% | | 0.88% | | 71.59% |
Year Ended July 31, 2001 | | | 10.28 | | | 0.61 | | | 0.68 | | | | 1.29 | | | (0.61 | ) | | | — | | | | (0.61 | ) | | | 10.96 | | 12.83% | | | 230,523 | | 0.70% | | 5.70% | | 0.90% | | 58.91% |
| * | For the period from April 30, 2004 (commencement of operations) to July 31, 2004. |
| (a) | Excludes sales charge, if applicable. |
| (b) | Not annualized for periods less than one year. |
| (c) | Annualized for periods less than one year. |
| (d) | During the period certain fees were voluntarily reduced. If such voluntary fee reductions had not occurred the ratios would have been as indicated. Voluntary fee reductions may be terminated at any time. |
| (e) | Portfolio turnover is calculated on the basis of the Fund, as a whole, without distinguishing between the classes of shares issued. |
See notes to financial statements.
90
PACIFIC CAPITAL FUNDS — TAX-FREE SECURITIES FUND
Financial Highlights
(Selected data for a share of capital stock outstanding throughout the period)
| | | | | | | | | | | | | | | | | | | | | | | | | | | | | | | | | | | | | | | | | |
| | | | | Investment Activities
| | Distributions
| | | | | Ratios/Supplemental Data
|
| | | Net Asset
Value,
Beginning
of Period | | Net
Investment
Income | | Net Realized
and Unrealized
Gains (Losses)
on Investments | | | Total from
Investment
Activities | | Net
Investment
Income | | | Net
Realized
Gains | | | Total
Distributions | | | Net Asset
Value,
End of
Period | | Total
Return (a)(b) | | Net Assets,
End of
Period (000’s) | | Ratio of
Expenses
to Average
Net Assets (c) | | Ratio of Net
Investment
Income to
Average
Net Assets (c) | | Ratio of
Expenses
to Average
Net Assets (c)(d) | | Portfolio
Turnover (e) |
CLASS A | | | | | | | | | | | | | | | | | | | | | | | | | | | | | | | | | | | | | | | | | |
Year Ended July 31, 2005 | | $ | 10.72 | | $ | 0.41 | | $ | (0.04 | ) | | $ | 0.37 | | $ | (0.41 | ) | | $ | (0.16 | ) | | $ | (0.57 | ) | | $ | 10.52 | | 3.49% | | $ | 8,973 | | 1.00% | | 3.83% | | 1.67% | | 8.65% |
Year Ended July 31, 2004 | | | 10.75 | | | 0.44 | | | 0.02 | | | | 0.46 | | | (0.44 | ) | | | (0.05 | ) | | | (0.49 | ) | | | 10.72 | | 4.32% | | | 9,928 | | 0.97% | | 4.03% | | 1.62% | | 8.87% |
Year Ended July 31, 2003 | | | 10.86 | | | 0.43 | | | (0.05 | ) | | | 0.38 | | | (0.43 | ) | | | (0.06 | ) | | | (0.49 | ) | | | 10.75 | | 3.54% | | | 11,829 | | 0.96% | | 3.93% | | 1.61% | | 1.24% |
Year Ended July 31, 2002 | | | 10.74 | | | 0.45 | | | 0.23 | | | | 0.68 | | | (0.45 | ) | | | (0.11 | ) | | | (0.56 | ) | | | 10.86 | | 6.47% | | | 11,765 | | 0.94% | | 4.17% | | 1.61% | | 13.40% |
Year Ended July 31, 2001 | | | 10.29 | | | 0.47 | | | 0.45 | | | | 0.92 | | | (0.47 | ) | | | — | | | | (0.47 | ) | | | 10.74 | | 9.07% | | | 8,413 | | 0.95% | | 4.41% | | 1.64% | | 19.05% |
CLASS B | | | | | | | | | | | | | | | | | | | | | | | | | | | | | | | | | | | | | | | | | |
Year Ended July 31, 2005 | | $ | 10.72 | | $ | 0.33 | | $ | (0.04 | ) | | $ | 0.29 | | $ | (0.33 | ) | | $ | (0.16 | ) | | $ | (0.49 | ) | | $ | 10.52 | | 2.71% | | $ | 3,344 | | 1.75% | | 3.08% | | 1.92% | | 8.65% |
Year Ended July 31, 2004 | | | 10.75 | | | 0.35 | | | 0.02 | | | | 0.37 | | | (0.35 | ) | | | (0.05 | ) | | | (0.40 | ) | | | 10.72 | | 3.55% | | | 4,054 | | 1.72% | | 3.28% | | 1.87% | | 8.87% |
Year Ended July 31, 2003 | | | 10.85 | | | 0.35 | | | (0.04 | ) | | | 0.31 | | | (0.35 | ) | | | (0.06 | ) | | | (0.41 | ) | | | 10.75 | | 2.86% | | | 4,643 | | 1.71% | | 3.18% | | 1.86% | | 1.24% |
Year Ended July 31, 2002 | | | 10.74 | | | 0.37 | | | 0.22 | | | | 0.59 | | | (0.37 | ) | | | (0.11 | ) | | | (0.48 | ) | | | 10.85 | | 5.58% | | | 5,458 | | 1.69% | | 3.42% | | 1.86% | | 13.40% |
Year Ended July 31, 2001 | | | 10.29 | | | 0.39 | | | 0.45 | | | | 0.84 | | | (0.39 | ) | | | — | | | | (0.39 | ) | | | 10.74 | | 8.28% | | | 5,019 | | 1.70% | | 3.65% | | 1.89% | | 19.05% |
CLASS C | | | | | | | | | | | | | | | | | | | | | | | | | | | | | | | | | | | | | | | | | |
Year Ended July 31, 2005 | | $ | 10.72 | | $ | 0.33 | | $ | (0.03 | ) | | $ | 0.30 | | $ | (0.33 | ) | | $ | (0.16 | ) | | $ | (0.49 | ) | | $ | 10.53 | | 2.83% | | $ | 10 | | 1.74% | | 3.09% | | 1.90% | | 8.65% |
Period Ended July 31, 2004* | | | 10.72 | | | 0.09 | | | — | | | | 0.09 | | | (0.09 | ) | | | — | | | | (0.09 | ) | | | 10.72 | | 0.82% | | | 10 | | 1.74% | | 3.22% | | 1.89% | | 8.87% |
CLASS Y | | | | | | | | | | | | | | | | | | | | | | | | | | | | | | | | | | | | | | | | | |
Year Ended July 31, 2005 | | $ | 10.76 | | $ | 0.44 | | $ | (0.03 | ) | | $ | 0.41 | | $ | (0.44 | ) | | $ | (0.16 | ) | | $ | (0.60 | ) | | $ | 10.57 | | 3.83% | | $ | 315,854 | | 0.75% | | 4.06% | | 0.92% | | 8.65% |
Year Ended July 31, 2004 | | | 10.79 | | | 0.47 | | | 0.02 | | | | 0.49 | | | (0.47 | ) | | | (0.05 | ) | | | (0.52 | ) | | | 10.76 | | 4.59% | | | 343,890 | | 0.72% | | 4.28% | | 0.87% | | 8.87% |
Year Ended July 31, 2003 | | | 10.90 | | | 0.46 | | | (0.05 | ) | | | 0.41 | | | (0.46 | ) | | | (0.06 | ) | | | (0.52 | ) | | | 10.79 | | 3.80% | | | 397,157 | | 0.71% | | 4.18% | | 0.86% | | 1.24% |
Year Ended July 31, 2002 | | | 10.78 | | | 0.47 | | | 0.23 | | | | 0.70 | | | (0.47 | ) | | | (0.11 | ) | | | (0.58 | ) | | | 10.90 | | 6.73% | | | 445,733 | | 0.69% | | 4.42% | | 0.86% | | 13.40% |
Year Ended July 31, 2001 | | | 10.33 | | | 0.49 | | | 0.45 | | | | 0.94 | | | (0.49 | ) | | | — | | | | (0.49 | ) | | | 10.78 | | 9.33% | | | 463,426 | | 0.70% | | 4.66% | | 0.89% | | 19.05% |
| * | For the period from April 30, 2004 (commencement of operations) to July 31, 2004. |
| (a) | Excludes sales charge, if applicable. |
| (b) | Not annualized for periods less than one year. |
| (c) | Annualized for periods less than one year. |
| (d) | During the period certain fees were voluntarily reduced. If such voluntary fee reductions had not occurred the ratios would have been as indicated. Voluntary fee reductions may be terminated at any time. |
| (e) | Portfolio turnover is calculated on the basis of the Fund, as a whole, without distinguishing between the classes of shares issued. |
See notes to financial statements.
91
PACIFIC CAPITAL FUNDS — SHORT INTERMEDIATE U.S. GOVERNMENT SECURITIES FUND
Financial Highlights
(Selected data for a share of capital stock outstanding throughout the period)
| | | | | | | | | | | | | | | | | | | | | | | | | | | | | | | | | | | | | | | | | |
| | | | | Investment Activities
| | Distributions
| | | | | Ratios/Supplemental Data
|
| | | Net Asset
Value,
Beginning
of Period | | Net
Investment
Income | | Net Realized
and Unrealized
Gains (Losses)
on Investments | | | Total from
Investment
Activities | | Net
Investment
Income | | | Net
Realized
Gains | | | Total
Distributions | | | Net Asset
Value,
End of
Period | | Total
Return (a)(b) | | Net Assets,
End of
Period (000’s) | | Ratio of
Expenses
to Average
Net Assets (c) | | Ratio of Net
Investment
Income to
Average
Net Assets (c) | | Ratio of
Expenses
to Average
Net Assets (c)(d) | | Portfolio
Turnover (e) |
CLASS A | | | | | | | | | | | | | | | | | | | | | | | | | | | | | | | | | | | | | | | | | |
Year Ended July 31, 2005 | | $ | 9.80 | | $ | 0.26 | | $ | (0.14 | ) | | $ | 0.12 | | $ | (0.26 | ) | | $ | — | (f) | | $ | (0.26 | ) | | $ | 9.66 | | 1.27% | | $ | 1,781 | | 0.80% | | 2.69% | | 1.59% | | 35.32% |
Year Ended July 31, 2004 | | | 9.97 | | | 0.25 | | | (0.13 | ) | | | 0.12 | | | (0.25 | ) | | | (0.04 | ) | | | (0.29 | ) | | | 9.80 | | 1.11% | | | 1,724 | | 0.80% | | 2.48% | | 1.55% | | 49.42% |
Year Ended July 31, 2003 | | | 10.06 | | | 0.31 | | | 0.02 | | | | 0.33 | | | (0.31 | ) | | | (0.11 | ) | | | (0.42 | ) | | | 9.97 | | 3.28% | | | 5,327 | | 0.80% | | 2.93% | | 1.55% | | 17.50% |
Year Ended July 31, 2002 | | | 9.81 | | | 0.34 | | | 0.30 | | | | 0.64 | | | (0.34 | ) | | | (0.05 | ) | | | (0.39 | ) | | | 10.06 | | 6.68% | | | 2,148 | | 0.81% | | 3.44% | | 1.57% | | 62.60% |
Year Ended July 31, 2001 | | | 9.30 | | | 0.45 | | | 0.51 | | | | 0.96 | | | (0.45 | ) | | | — | | | | (0.45 | ) | | | 9.81 | | 10.58% | | | 1,090 | | 0.90% | | 4.66% | | 1.65% | | 107.46% |
CLASS C | | | | | | | | | | | | | | | | | | | | | | | | | | | | | | | | | | | | | | | | | |
Year Ended July 31, 2005 | | $ | 9.80 | | $ | 0.19 | | $ | (0.15 | ) | | $ | 0.04 | | $ | (0.19 | ) | | $ | — | (f) | | $ | (0.19 | ) | | $ | 9.65 | | 0.40% | | $ | 631 | | 1.55% | | 1.99% | | 1.84% | | 35.32% |
Period Ended July 31, 2004* | | | 9.84 | | | 0.04 | | | (0.04 | ) | | | — | | | (0.04 | ) | | | — | | | | (0.04 | ) | | | 9.80 | | 0.04% | | | 10 | | 1.55% | | 1.75% | | 1.82% | | 49.42% |
CLASS Y | | | | | | | | | | | | | | | | | | | | | | | | | | | | | | | | | | | | | | | | | |
Year Ended July 31, 2005 | | $ | 9.82 | | $ | 0.29 | | $ | (0.14 | ) | | $ | 0.15 | | $ | (0.29 | ) | | $ | — | (f) | | $ | (0.29 | ) | | $ | 9.68 | | 1.52% | | $ | 85,991 | | 0.55% | | 2.93% | | 0.84% | | 35.32% |
Year Ended July 31, 2004 | | | 9.99 | | | 0.27 | | | (0.13 | ) | | | 0.14 | | | (0.27 | ) | | | (0.04 | ) | | | (0.31 | ) | | | 9.82 | | 1.38% | | | 81,346 | | 0.55% | | 2.73% | | 0.81% | | 49.42% |
Year Ended July 31, 2003 | | | 10.09 | | | 0.33 | | | 0.01 | | | | 0.34 | | | (0.33 | ) | | | (0.11 | ) | | | (0.44 | ) | | | 9.99 | | 3.41% | | | 88,824 | | 0.55% | | 3.23% | | 0.80% | | 17.50% |
Year Ended July 31, 2002 | | | 9.83 | | | 0.37 | | | 0.31 | | | | 0.68 | | | (0.37 | ) | | | (0.05 | ) | | | (0.42 | ) | | | 10.09 | | 7.03% | | | 62,156 | | 0.56% | | 3.69% | | 0.82% | | 62.60% |
Year Ended July 31, 2001 | | | 9.32 | | | 0.48 | | | 0.51 | | | | 0.99 | | | (0.48 | ) | | | — | | | | (0.48 | ) | | | 9.83 | | 10.84% | | | 47,000 | | 0.65% | | 4.96% | | 0.90% | | 107.46% |
| * | For the period from April 30, 2004 (commencement of operations) to July 31, 2004. |
| (a) | Excludes sales charge, if applicable. |
| (b) | Not annualized for periods less than one year. |
| (c) | Annualized for periods less than one year. |
| (d) | During the period certain fees were voluntarily reduced. If such voluntary fee reductions had not occurred the ratios would have been as indicated. Voluntary fee reductions may be terminated at any time. |
| (e) | Portfolio turnover is calculated on the basis of the Fund, as a whole, without distinguishing between the classes of shares issued. |
| (f) | Less than $0.01 per share. |
See notes to financial statements.
92
PACIFIC CAPITAL FUNDS — TAX-FREE SHORT INTERMEDIATE SECURITIES FUND
Financial Highlights
(Selected data for a share of capital stock outstanding throughout the period)
| | | | | | | | | | | | | | | | | | | | | | | | | | | | | | | | | | | | | | | | | | | | | | |
| | | Investment Activities
| | Distributions
| | | | | | Ratios/Supplemental Data
| |
| | | Net Asset
Value,
Beginning
of Period | | Net
Investment
Income | | Net Realized
and Unrealized
Gains (Losses)
on Investments | | | Total from
Investment
Activities | | Net
Investment
Income | | | Net
Realized
Gains | | | Total
Distributions | | | Net Asset
Value,
End of
Period | | Total
Return (a)(b) | | | Net Assets,
End of
Period (000’s) | | Ratio of
Expenses
to Average
Net Assets (c) | | | Ratio of Net
Investment
Income to
Average
Net Assets (c) | | | Ratio of
Expenses
to Average
Net Assets (c)(d) | | | Portfolio
Turnover (e) | |
CLASS A | | | | | | | | | | | | | | | | | | | | | | | | | | | | | | | | | | | | | | | | | | | | | | |
Year Ended July 31, 2005 | | $ | 10.30 | | $ | 0.23 | | $ | (0.09 | ) | | $ | 0.14 | | $ | (0.23 | ) | | $ | — | | | $ | (0.23 | ) | | $ | 10.21 | | 1.40 | % | | $ | 3,784 | | 1.00 | % | | 2.26 | % | | 1.62 | % | | 28.31 | % |
Year Ended July 31, 2004 | | | 10.36 | | | 0.22 | | | (0.06 | ) | | | 0.16 | | | (0.22 | ) | | | — | | | | (0.22 | ) | | | 10.30 | | 1.53 | % | | | 4,781 | | 0.97 | % | | 2.09 | % | | 1.58 | % | | 11.30 | % |
Year Ended July 31, 2003 | | | 10.39 | | | 0.25 | | | 0.02 | | | | 0.27 | | | (0.25 | ) | | | (0.05 | ) | | | (0.30 | ) | | | 10.36 | | 2.62 | % | | | 2,322 | | 0.97 | % | | 2.40 | % | | 1.58 | % | | 6.01 | % |
Year Ended July 31, 2002 | | | 10.18 | | | 0.29 | | | 0.21 | | | | 0.50 | | | (0.29 | ) | | | — | | | | (0.29 | ) | | | 10.39 | | 4.98 | % | | | 2,157 | | 0.98 | % | | 2.82 | % | | 1.61 | % | | 37.24 | % |
Year Ended July 31, 2001 | | | 9.86 | | | 0.35 | | | 0.32 | | | | 0.67 | | | (0.35 | ) | | | — | | | | (0.35 | ) | | | 10.18 | | 6.89 | % | | | 1,732 | | 0.98 | % | | 3.48 | % | | 1.63 | % | | 73.06 | % |
CLASS C | | | | | | | | | | | | | | | | | | | | | | | | | | | | | | | | | | | | | | | | | | | | | | |
Year Ended July 31, 2005 | | $ | 10.31 | | $ | 0.16 | | $ | (0.10 | ) | | $ | 0.06 | | $ | (0.16 | ) | | $ | — | | | $ | (0.16 | ) | | $ | 10.21 | | 0.54 | % | | $ | 10 | | 1.75 | % | | 1.52 | % | | 1.87 | % | | 28.31 | % |
Period Ended July 31, 2004* | | | 10.32 | | | 0.04 | | | (0.01 | ) | | | 0.03 | | | (0.04 | ) | | | — | | | | (0.04 | ) | | | 10.31 | | 0.26 | % | | | 10 | | 1.72 | % | | 1.41 | % | | 1.83 | % | | 11.30 | % |
CLASS Y | | | | | | | | | | | | | | | | | | | | | | | | | | | | | | | | | | | | | | | | | | | | | | |
Year Ended July 31, 2005 | | $ | 10.36 | | $ | 0.26 | | $ | (0.09 | ) | | $ | 0.17 | | $ | (0.26 | ) | | $ | — | | | $ | (0.26 | ) | | $ | 10.27 | | 1.65 | % | | $ | 65,070 | | 0.74 | % | | 2.51 | % | | 0.86 | % | | 28.31 | % |
Year Ended July 31, 2004 | | | 10.41 | | | 0.24 | | | (0.05 | ) | | | 0.19 | | | (0.24 | ) | | | — | | | | (0.24 | ) | | | 10.36 | | 1.87 | % | | | 67,606 | | 0.72 | % | | 2.34 | % | | 0.83 | % | | 11.30 | % |
Year Ended July 31, 2003 | | | 10.45 | | | 0.28 | | | 0.01 | | | | 0.29 | | | (0.28 | ) | | | (0.05 | ) | | | (0.33 | ) | | | 10.41 | | 2.78 | % | | | 63,449 | | 0.72 | % | | 2.64 | % | | 0.83 | % | | 6.01 | % |
Year Ended July 31, 2002 | | | 10.23 | | | 0.32 | | | 0.22 | | | | 0.54 | | | (0.32 | ) | | | — | | | | (0.32 | ) | | | 10.45 | | 5.33 | % | | | 49,599 | | 0.73 | % | | 3.06 | % | | 0.86 | % | | 37.24 | % |
Year Ended July 31, 2001 | | | 9.91 | | | 0.38 | | | 0.32 | | | | 0.70 | | | (0.38 | ) | | | — | | | | (0.38 | ) | | | 10.23 | | 7.15 | % | | | 39,857 | | 0.73 | % | | 3.73 | % | | 0.88 | % | | 73.06 | % |
| * | For the period from April 30, 2004 (commencement of operations) to July 31, 2004. |
| (a) | Excludes sales charge, if applicable. |
| (b) | Not annualized for periods less than one year. |
| (c) | Annualized for periods less than one year. |
| (d) | During the period certain fees were voluntarily reduced. If such voluntary fee reductions had not occurred the ratios would have been as indicated. Voluntary fee reductions may be terminated at any time. |
| (e) | Portfolio turnover is calculated on the basis of the Fund, as a whole, without distinguishing between the classes of shares issued. |
See notes to financial statements.
93
PACIFIC CAPITAL FUNDS — ULTRA SHORT GOVERNMENT FUND
Financial Highlights
(Selected data for a share of capital stock outstanding throughout the period)
| | | | | | | | | | | | | | | | | | | | | | | | | | | | | | | | | | | | | | | | | | | |
| | | | | Investment Activities
| | | Distributions
| | | | | | Ratios/Supplemental Data
|
| | | Net Asset
Value,
Beginning
of Period | | Net
Investment
Income | | Net Realized
and Unrealized
Gains (Losses)
on Investments | | | Total from
Investment
Activities | | | Net
Investment
Income | | | Net
Realized
Gains | | | Total
Distributions | | | Net Asset
Value,
End of
Period | | Total
Return (a)(b) | | | Net Assets,
End of
Period (000’s) | | Ratio of
Expenses
to Average
Net Assets (c) | | Ratio of Net
Investment
Income to
Average
Net Assets (c) | | Ratio of
Expenses
to Average
Net Assets (c)(d) | | Portfolio
Turnover (e) |
CLASS A | | | | | | | | | | | | | | | | | | | | | | | | | | | | | | | | | | | | | | | | | | | |
Year Ended July 31, 2005 | | $ | 10.10 | | $ | 0.18 | | $ | (0.06 | ) | | $ | 0.12 | | | $ | (0.18 | ) | | $ | — | | | $ | (0.18 | ) | | $ | 10.04 | | 1.19% | | | $ | 6,552 | | 0.62% | | 1.76% | | 1.47% | | 64.16% |
Year Ended July 31, 2004 | | | 10.24 | | | 0.18 | | | (0.14 | ) | | | 0.04 | | | | (0.18 | ) | | | — | | | | (0.18 | ) | | | 10.10 | | 0.36% | | | | 8,743 | | 0.62% | | 1.74% | | 1.43% | | 111.13% |
Year Ended July 31, 2003 | | | 10.31 | | | 0.23 | | | (0.06 | ) | | | 0.17 | | | | (0.23 | ) | | | (0.01 | ) | | | (0.24 | ) | | | 10.24 | | 1.67% | | | | 12,787 | | 0.62% | | 2.23% | | 1.42% | | 17.41% |
Year Ended July 31, 2002 | | | 10.20 | | | 0.30 | | | 0.11 | | | | 0.41 | | | | (0.30 | ) | | | — | (f) | | | (0.30 | ) | | | 10.31 | | 4.10% | | | | 14,116 | | 0.62% | | 2.93% | | 1.42% | | 26.15% |
Year Ended July 31, 2001 | | | 10.02 | | | 0.55 | | | 0.18 | | | | 0.73 | | | | (0.55 | ) | | | — | | | | (0.55 | ) | | | 10.20 | | 7.46% | | | | 15,002 | | 0.64% | | 5.20% | | 1.51% | | 8.22% |
CLASS B | | | | | | | | | | | | | | | | | | | | | | | | | | | | | | | | | | | | | | | | | | | |
Year Ended July 31, 2005 | | $ | 10.10 | | $ | 0.10 | | $ | (0.06 | ) | | $ | 0.04 | | | $ | (0.10 | ) | | $ | — | | | $ | (0.10 | ) | | $ | 10.04 | | 0.43% | | | $ | 1,609 | | 1.37% | | 1.01% | | 1.72% | | 64.16% |
Year Ended July 31, 2004 | | | 10.24 | | | 0.10 | | | (0.14 | ) | | | (0.04 | ) | | | (0.10 | ) | | | — | | | | (0.10 | ) | | | 10.10 | | (0.38% | ) | | | 1,965 | | 1.37% | | 0.99% | | 1.68% | | 111.13% |
Year Ended July 31, 2003 | | | 10.31 | | | 0.15 | | | (0.06 | ) | | | 0.09 | | | | (0.15 | ) | | | (0.01 | ) | | | (0.16 | ) | | | 10.24 | | 0.91% | | | | 1,994 | | 1.37% | | 1.46% | | 1.67% | | 17.41% |
Year Ended July 31, 2002 | | | 10.21 | | | 0.22 | | | 0.10 | | | | 0.32 | | | | (0.22 | ) | | | — | (f) | | | (0.22 | ) | | | 10.31 | | 3.22% | | | | 1,403 | | 1.37% | | 2.14% | | 1.67% | | 26.15% |
Year Ended July 31, 2001 | | | 10.02 | | | 0.48 | | | 0.19 | | | | 0.67 | | | | (0.48 | ) | | | — | | | | (0.48 | ) | | | 10.21 | | 6.79% | | | | 858 | | 1.39% | | 4.48% | | 1.76% | | 8.22% |
CLASS C | | | | | | | | | | | | | | | | | | | | | | | | | | | | | | | | | | | | | | | | | | | |
Year Ended July 31, 2005 | | $ | 10.10 | | $ | 0.10 | | $ | (0.06 | ) | | $ | 0.04 | | | $ | (0.10 | ) | | $ | — | | | $ | (0.10 | ) | | $ | 10.04 | | 0.43% | | | $ | 1,834 | | 1.37% | | 1.20% | | 1.72% | | 64.16% |
Period Ended July 31, 2004* | | | 10.15 | | | 0.02 | | | (0.05 | ) | | | (0.03 | ) | | | (0.02 | ) | | | — | | | | (0.02 | ) | | | 10.10 | | (0.26% | ) | | | 10 | | 1.37% | | 0.85% | | 1.58% | | 111.13% |
CLASS Y | | | | | | | | | | | | | | | | | | | | | | | | | | | | | | | | | | | | | | | | | | | |
Year Ended July 31, 2005 | | $ | 10.11 | | $ | 0.20 | | $ | (0.06 | ) | | $ | 0.14 | | | $ | (0.20 | ) | | $ | — | | | $ | (0.20 | ) | | $ | 10.05 | | 1.44% | | | $ | 125,349 | | 0.37% | | 1.98% | | 0.71% | | 64.16% |
Year Ended July 31, 2004 | | | 10.25 | | | 0.20 | | | (0.14 | ) | | | 0.06 | | | | (0.20 | ) | | | — | | | | (0.20 | ) | | | 10.11 | | 0.61% | | | | 215,124 | | 0.37% | | 1.99% | | 0.68% | | 111.13% |
Year Ended July 31, 2003 | | | 10.32 | | | 0.26 | | | (0.06 | ) | | | 0.20 | | | | (0.26 | ) | | | (0.01 | ) | | | (0.27 | ) | | | 10.25 | | 1.92% | | | | 240,916 | | 0.37% | | 2.47% | | 0.67% | | 17.41% |
Year Ended July 31, 2002 | | | 10.21 | | | 0.33 | | | 0.11 | | | | 0.44 | | | | (0.33 | ) | | | — | (f) | | | (0.33 | ) | | | 10.32 | | 4.35% | | | | 185,806 | | 0.37% | | 3.16% | | 0.67% | | 26.15% |
Year Ended July 31, 2001 | | | 10.02 | | | 0.58 | | | 0.19 | | | | 0.77 | | | | (0.58 | ) | | | — | | | | (0.58 | ) | | | 10.21 | | 7.85% | | | | 149,445 | | 0.39% | | 5.56% | | 0.76% | | 8.22% |
| * | For the period from April 30, 2004 (commencement of operations) to July 31, 2004. |
| (a) | Excludes sales charge, if applicable. |
| (b) | Not annualized for periods less than one year. |
| (c) | Annualized for periods less than one year. |
| (d) | During the period certain fees were voluntarily reduced. If such voluntary fee reductions had not occurred the ratios would have been as indicated. Voluntary fee reductions may be terminated at any time. |
| (e) | Portfolio turnover is calculated on the basis of the Fund, as a whole, without distinguishing between the classes of shares issued. |
| (f) | Less than $0.01 per share. |
See notes to financial statements.
94
PACIFIC CAPITAL FUNDS
Report of Independent Registered Public Accounting Firm
To the Shareholders and Board of Trustees of
Pacific Capital Funds:
We have audited the accompanying statements of assets and liabilities of Pacific Capital Funds—New Asia Growth Fund, International Stock Fund, Small Cap Fund, Mid-Cap Fund, Growth Stock Fund, Growth and Income Fund, Value Fund, Diversified Fixed Income Fund, Tax-Free Securities Fund, Short Intermediate U.S. Government Securities Fund, Tax-Free Short Intermediate Securities Fund and Ultra Short Government Fund (collectively, the Funds), including the schedules of portfolio investments, as of July 31, 2005, and the related statements of operations, changes in net assets and financial highlights for the year then ended. These financial statements and financial highlights are the responsibility of the Funds’ management. Our responsibility is to express an opinion on these financial statements and financial highlights based on our audits. The accompanying statements of changes in net assets and financial highlights for the periods ended July 31, 2004 and prior were audited by other auditors whose report thereon dated September 1, 2004, expressed an unqualified opinion on those financial statements and financial highlights.
We conducted our audits in accordance with the standards of the Public Company Accounting Oversight Board (United States). Those standards require that we plan and perform the audit to obtain reasonable assurance about whether the financial statements and financial highlights are free of material misstatement. An audit includes examining, on a test basis, evidence supporting the amounts and disclosures in the financial statements. Our procedures included confirmation of securities owned as of July 31, 2005, by correspondence with the custodian and brokers; where replies were not received from brokers, we performed other auditing procedures. An audit also includes assessing the accounting principles used and significant estimates made by management, as well as evaluating the overall financial statement presentation. We believe that our audits provide a reasonable basis for our opinion.
In our opinion, the financial statements and financial highlights referred to above present fairly, in all material respects, the financial position of the Funds as of July 31, 2005, and the results of their operations, changes in their net assets and financial highlights for the year then ended, in conformity with U.S. generally accepted accounting principles.
KPMG LLP
Columbus, Ohio
September 28, 2005
95
PACIFIC CAPITAL FUNDS
Trustees and Executive Officers of the Pacific Capital Funds (unaudited)
Interested Trustees. The table below sets forth certain information about each of the Trustees of the Trust who are “interested persons” of the Trust as defined by the Investment Company Act of 1940, as amended (“1940 Act”).
| | | | | | | | | | |
Name, Address and Age
| | Position(s)
Held with
Trust
| | Term of
Office;
Term
Served in
Office
| | Principal Occupation(s) During Past 5 Years
| | Number of
Portfolios
in Fund
Complex
Overseen
| | Other Directorships Held by Trustee
|
Peter S. Ho* 111 South King Street Honolulu, Hawaii 96813 Age: 40 | | Trustee | | Indefinite; Since: 5/04 | | Vice Chairman, Bank of Hawaii—Investment Services Group (since 2004); Executive Vice President, Bank of Hawaii—Commercial Group (2003-2004); Executive Vice President/Senior Vice President/Vice President, Bank of Hawaii—Corporate Banking (1996-2003) | | 12 | | Member of the Board of: Rehabilitation Hospital Foundation, Hawaii Chapter of the American Red Cross, the Hawaii Foodbank, Hawaii Dental Service, Special Olympics of Hawaii, Oceanic Institute and Hawaii Pacific University. |
| * | Mr. Ho is an “interested person” of the Trust, as defined by the 1940 Act, because of his employment with The Asset Management Group of Bank of Hawaii, the investment adviser to the Trust. |
Independent Trustees. The table below sets forth certain information about the Trustees of the Trust who are not “interested persons” of the Trust as defined in the 1940 Act.
| | | | | | | | | | |
Name, Address and Age
| | Position(s)
Held with
Trust
| | Term of
Office;
Term
Served in
Office
| | Principal Occupation(s) During Past 5 Years
| | Number of
Portfolios
in Fund
Complex
Overseen
| | Other Directorships Held by Trustee
|
Richard L. Humphreys 130 Merchant Street Suite 240 Honolulu, Hawaii 96813 Age: 61 | | Trustee | | Indefinite; Since: 3/05 | | President of Hawaii Receivables Management LLC (since 2001); President of Lynk Payment Systems Hawaii LLC (since 2002). | | 12 | | Board member of Pantheon Corporation, The Castle Group, Inc., and other charitable and civic organizations. |
| | | | | |
Stanley W. Hong 4976 Poola Street Honolulu, Hawaii 96821 Age: 69 | | Trustee | | Indefinite; Since: 10/92 | | President of Waste Management of Hawaii, Inc. (landfill management) ( 2002-2005); Trustee of The King Williams Charles Lunalilo Trust Estate (since 2001); President and Chief Executive Officer of The Chamber of Commerce of Hawaii
(1996-2002) | | 12 | | Trustee of Cash Assets Trust and Hawaiian Tax-Free Trust (registered investment companies) (since 1993); Member of the Board of: First Insurance Co. of Hawaii, Ltd., Lanihau Properties, Ltd., Diagnostic Lab Services, Inc., WESTYE Group—West, Inc.; Member of the Board of the following non-profit organizations: Chaminade University of Honolulu, The Nature Conservancy of Hawaii, PBS Hawaii Foundation, Heald College of Business & Technology, Katuro Watanabe Charitable Foundation, and Honolulu Festival Foundation. |
96
PACIFIC CAPITAL FUNDS
| | | | | | | | | | |
Name, Address and Age
| | Position(s)
Held with
Trust
| | Term of
Office;
Term
Served in
Office
| | Principal Occupation(s) During Past 5 Years
| | Number of
Portfolios
in Fund
Complex
Overseen
| | Other Directorships Held by Trustee
|
Russell K. Okata 1015 Wilder Avenue, #203 Honolulu, Hawaii 96822 Age: 61 | | Trustee and (Since 3/05) Chairman | | Indefinite; Since: 10/92 | | Executive Director of the Hawaii Government Employees Association (since 1981) | | 12 | | Trustee of Cash Assets Trust and Hawaiian Tax-Free Trust (registered investment companies) (since 1993); Vice President of the Hawaii State AFL-CIO (since 1972) and the American Federation of State, County & Municipal Employees, AFL-CIO (since 1981); Chairman of the Royal State Group (since 1988); Member of the Boards of Blood Bank of Hawaii, Public Schools of Hawaii Foundation, and other community organizations. |
| | | | | |
Douglas Philpotts 55 Dowsett Avenue Honolulu, Hawaii 96817 Age: 73 | | Trustee | | Indefinite; Since: 10/92 | | Retired. Formerly Director, Chairman of the Board and President of Hawaiian Trust Co., Ltd. (until 1994), a predecessor of The Asset Management Group of Bank of Hawaii. | | 12 | | Trustee of Cash Assets Trust and Hawaiian Tax-Free Trust (registered investment companies) (since 1993); Trustee of The Strong Foundation (support of programs for Hawaiian youth) (since 1974). |
| | | | | |
Oswald K. Stender 1056 Maunawili Kailua, Hawaii 96734 Age: 73 | | Trustee | | Indefinite; Since: 10/92 | | Trustee, Office of Hawaiian Affairs (since 2000). Previously Retired. | | 12 | | Trustee of Cash Assets Trust and Hawaiian Tax-Free Trust (registered investment companies) (since 1993); Director of Grace Pacific Ltd.; Member of Advisory Board of Hawaiian Telecom; former Trustee of the Bernice Pauahi Bishop Estate (operation of school for children of Hawaiian ancestry) (1990-1999); Board member of various housing and real estate associations and community organizations. |
The Statement of Additional Information includes additional information about the Trustees of the Trust and is available, without charge, by calling (800) 258-9232.
97
PACIFIC CAPITAL FUNDS
Executive Officers. The table below sets forth certain information about each of the Trust’s executive officers.
| | | | | | |
Name, Address and Age
| | Position(s) Held
with Trust
| | Term of Office
and Length of
Time Served
| | Principal Occupation(s) During Past 5 Years*
|
William P. Henry, Jr. 130 Merchant Street Suite 240 Honolulu, Hawaii 96813 Age: 40 | | President | | Indefinite; Since 12/02 | | Executive Vice President of Bank of Hawaii (2003); President of Trinity Solutions, Inc. and advisor to CEO of Bank of Hawaii (2001-2002); Senior Vice President, Strategic Business Development of Jubilee Tech International (2000); Senior Manager of Marakon Associates (1991-1998). |
| | | |
Irimga McKay 3435 Stelzer Road Columbus, Ohio 43219 Age: 45 | | Executive Vice President | | Indefinite; Since: 12/02 | | Senior Vice President, Client Services of BISYS Fund Services (since 1988). |
| | | |
Andrew Spencer 130 Merchant Street Suite 240 Honolulu, Hawaii 96813 Age: 40 | | Executive Vice President | | Indefinite; Since: 6/01 | | Vice President and Manager of Bank of Hawaii—Investment Products Division (since 2001); Assistant Vice President of M&T Bank (1998-2001); Manager of Xerox Corporation—Product Development (1988-1998). |
| | | |
Frank Pavlak 3435 Stelzer Road Columbus, Ohio 43219 Age: 57 | | Chief Compliance Officer | | Indefinite; Since: 9/04 | | Senior Vice President, BISYS Fund Services (since 2004); Vice President, OppenheimerFunds, Inc. (1999-2004). |
| | | |
Alaina Metz 3435 Stelzer Road Columbus, Ohio 43219 Age: 38 | | Vice President | | Indefinite; Since: 9/96 | | Vice President, Regulatory Services of BISYS Fund Services—Blue Sky Compliance (since 1995). |
| | | |
Mark Sichley 3435 Stelzer Road Columbus, Ohio 43219 Age: 47 | | Vice President | | Indefinite; Since: 6/02 | | Director, Client Services of BISYS Fund Services (since 1987). |
| | | |
Christopher E. Sabato 3435 Stelzer Road Columbus, Ohio 43219 Age: 36 | | Treasurer | | Indefinite; Since: 9/05 | | Director, Fund Administration of BISYS Fund Services (since 1993). |
| | | |
Patrick Keniston 100 Summer Street, Suite 1500 Boston, Massachusetts 02110 Age: 41 | | Secretary | | Indefinite; Since: 3/05 | | Counsel, Legal Services of BISYS Fund Services (since 2005); Attorney, Citigroup GTS Fund Services (2001-2005); Senior Tax Consultant, PricewaterhouseCoopers LLP (1998-2001). |
| * | Each officer may have served in various other capacities for the same organization during the length of time served. |
98
PACIFIC CAPITAL FUNDS
Additional Tax Information (unaudited)
For the fiscal year ended July 31, 2005, certain dividends paid by the Funds may be subject to a maximum tax rate of 15%, as provided for by the Jobs and Growth Tax Relief Reconciliation Act of 2003. The Funds intend to designate the maximum amount allowable as taxed at a maximum rate of 15%. Complete information will be reported in conjunction with your 2005 Form 1099-DIV.
For the year ended July 31, 2005, the following Funds paid qualified dividend income of (amounts in thousands):
| | | |
| | | Amount
|
New Asia Growth Fund | | $ | 542 |
International Stock Fund | | | 675 |
Small Cap Fund | | | 1,105 |
Mid-Cap Fund | | | 139 |
Growth Stock Fund | | | 513 |
Growth and Income Fund | | | 870 |
Value Fund | | | 1,913 |
For corporate shareholders, the following percentages of the total ordinary income distributions paid during the fiscal year ended July 31, 2005 qualify for the corporate dividends received deduction for the following Funds:
| | | |
| | | Percentage
| |
International Stock Fund | | 3.57 | % |
Small Cap Fund | | 11.14 | % |
Mid-Cap Fund | | 47.62 | % |
Growth Stock Fund | | 100.00 | % |
Growth and Income Fund | | 100.00 | % |
Value Fund | | 100.00 | % |
The Funds may elect to pass through foreign taxes paid by the Funds to its shareholders under Code 853 of the Internal Revenue Code. The following Funds intend to pass through to shareholders the income tax credit for taxes paid to foreign countries. Foreign source income and foreign tax expense per share outstanding on July 31, 2005 are as follows:
| | | | | | |
| | | Foreign
Source
Income
| | Foreign
Tax
Expense
|
New Asia Growth Fund | | $ | 0.36 | | $ | 0.04 |
International Stock Fund | | | 0.17 | | | 0.02 |
The pass through of the foreign tax credit will only affect those persons who are shareholders on the dividend record date in December 2005. These shareholders will receive more detailed information along with their 2005 Form 1099-DIV.
The Tax-Free Securities Fund and the Tax-Free Short Intermediate Securities Fund designate 100% of its income dividends as exempt-interest dividends.
The accompanying table below details distributions designated from long-term capital gains for the following funds for the fiscal year ended July 31, 2005 (amounts in thousands):
| | | |
| | | Amount
|
Small Cap Fund | | $ | 12,613 |
Diversified Fixed Income Fund | | | 804 |
Tax-Free Securities Fund | | | 5,021 |
Short Intermediate U.S. Government Securities Fund | | | 12 |
99
PACIFIC CAPITAL FUNDS
Expense Examples (unaudited)
As a shareholder of the Pacific Capital Funds, you incur two types of costs: (1) transaction costs, including sales charges (loads) on purchases; and redemption fees; (2) ongoing costs, including management fees; distribution 12b-1 fees; and other Fund expenses. This example is intended to help you understand your ongoing costs (in dollars) of investing in the Pacific Capital Funds and to compare these costs with the ongoing costs of investing in other mutual funds.
The Example is based on an investment of $1,000 invested at the beginning of the period and held for the entire period from February 1, 2005 through July 31, 2005.
Actual Expenses
The table below provides information about actual account values and actual expenses. You may use the information below, together with the amount you invested, to estimate the expenses that you paid over the period. Simply divide your account value by $1,000 (for example, an $8,600 account value divided by $1,000 = 8.6), then multiply the result by the number in the table under the heading entitled “Expenses Paid During Period” to estimate the expenses you paid on your account during this period.
| | | | | | | | | | | | | |
| | | | | Beginning
Account Value
2/1/05
| | Ending
Account Value
7/31/05
| | Expense Paid
During Period*
2/1/05 - 7/31/05
| | Expense Ratio
During Period**
2/1/05 - 7/31/05
|
New Asia Growth Fund | | Class A | | $ | 1,000.00 | | $ | 1,131.20 | | $ | 10.25 | | 1.94% |
| | | Class B | | | 1,000.00 | | | 1,127.30 | | | 14.19 | | 2.69% |
| | | Class C | | | 1,000.00 | | | 1,127.40 | | | 14.14 | | 2.68% |
| | | Class Y | | | 1,000.00 | | | 1,132.50 | | | 8.94 | | 1.69% |
| | | | | |
International Stock Fund | | Class A | | | 1,000.00 | | | 1,058.80 | | | 8.42 | | 1.65% |
| | | Class B | | | 1,000.00 | | | 1,055.60 | | | 12.23 | | 2.40% |
| | | Class C | | | 1,000.00 | | | 1,054.50 | | | 12.23 | | 2.40% |
| | | Class Y | | | 1,000.00 | | | 1,060.20 | | | 7.15 | | 1.40% |
| | | | | |
Small Cap Fund | | Class A | | | 1,000.00 | | | 1,111.80 | | | 8.64 | | 1.65% |
| | | Class B | | | 1,000.00 | | | 1,108.80 | | | 12.44 | | 2.38% |
| | | Class C | | | 1,000.00 | | | 1,108.00 | | | 12.60 | | 2.41% |
| | | Class Y | | | 1,000.00 | | | 1,113.20 | | | 7.23 | | 1.38% |
| | | | | |
Mid-Cap Fund | | Class A | | | 1,000.00 | | | 1,113.50 | | | 5.50 | | 1.05% |
| | | Class C | | | 1,000.00 | | | 1,109.40 | | | 9.41 | | 1.80% |
| | | Class Y | | | 1,000.00 | | | 1,114.70 | | | 4.19 | | 0.80% |
| | | | | |
Growth Stock Fund | | Class A | | | 1,000.00 | | | 1,052.20 | | | 7.12 | | 1.40% |
| | | Class B | | | 1,000.00 | | | 1,049.00 | | | 10.92 | | 2.15% |
| | | Class C | | | 1,000.00 | | | 1,047.70 | | | 10.87 | | 2.14% |
| | | Class Y | | | 1,000.00 | | | 1,053.10 | | | 5.85 | | 1.15% |
| | | | | |
Growth and Income Fund | | Class A | | | 1,000.00 | | | 1,059.90 | | | 7.25 | | 1.42% |
| | | Class B | | | 1,000.00 | | | 1,056.30 | | | 11.06 | | 2.17% |
| | | Class C | | | 1,000.00 | | | 1,056.40 | | | 11.01 | | 2.16% |
| | | Class Y | | | 1,000.00 | | | 1,061.20 | | | 5.98 | | 1.17% |
| | | | | |
Value Fund | | Class A | | | 1,000.00 | | | 1,071.50 | | | 6.99 | | 1.36% |
| | | Class B | | | 1,000.00 | | | 1,068.30 | | | 10.82 | | 2.11% |
| | | Class C | | | 1,000.00 | | | 1,068.00 | | | 10.77 | | 2.10% |
| | | Class Y | | | 1,000.00 | | | 1,073.80 | | | 5.71 | | 1.11% |
| | | | | |
Diversified Fixed Income Fund | | Class A | | | 1,000.00 | | | 1,008.20 | | | 4.98 | | 1.00% |
| | | Class B | | | 1,000.00 | | | 1,004.50 | | | 8.70 | | 1.75% |
| | | Class C | | | 1,000.00 | | | 1,004.50 | | | 8.70 | | 1.75% |
| | | Class Y | | | 1,000.00 | | | 1,009.40 | | | 3.69 | | 0.74% |
100
PACIFIC CAPITAL FUNDS
| | | | | | | | | | | | | |
| | | | | Beginning
Account Value
2/1/05
| | Ending
Account Value
7/31/05
| | Expense Paid
During Period*
2/1/05 - 7/31/05
| | Expense Ratio
During Period**
2/1/05 - 7/31/05
|
Tax-Free Securities Fund | | Class A | | $ | 1,000.00 | | $ | 1,003.30 | | $ | 5.02 | | 1.01% |
| | | Class B | | | 1,000.00 | | | 999.60 | | | 8.73 | | 1.76% |
| | | Class C | | | 1,000.00 | | | 1,000.60 | | | 8.68 | | 1.75% |
| | | Class Y | | | 1,000.00 | | | 1,005.50 | | | 3.78 | | 0.76% |
| | | | | |
Short Intermediate U.S. Government Securities Fund | | Class A | | | 1,000.00 | | | 1,002.30 | | | 3.97 | | 0.80% |
| | | Class C | | | 1,000.00 | | | 998.60 | | | 7.68 | | 1.55% |
| | | Class Y | | | 1,000.00 | | | 1,003.60 | | | 2.73 | | 0.55% |
| | | | | |
Tax-Free Short Intermediate Securities Fund | | Class A | | | 1,000.00 | | | 1,001.30 | | | 4.96 | | 1.00% |
| | | Class C | | | 1,000.00 | | | 997.50 | | | 8.67 | | 1.75% |
| | | Class Y | | | 1,000.00 | | | 1,002.50 | | | 3.67 | | 0.74% |
| | | | | |
Ultra Short Government Fund | | Class A | | | 1,000.00 | | | 1,007.90 | | | 3.09 | | 0.62% |
| | | Class B | | | 1,000.00 | | | 1,004.20 | | | 6.81 | | 1.37% |
| | | Class C | | | 1,000.00 | | | 1,004.20 | | | 6.81 | | 1.37% |
| | | Class Y | | | 1,000.00 | | | 1,009.10 | | | 1.84 | | 0.37% |
| * | Expenses are equal to the average account value times the Fund’s annualized expense ratio multiplied by the number of days in the most recent fiscal half-year divided by the number of days in the fiscal year. |
Hypothetical Example
The table below provides information about hypothetical account values and hypothetical expenses based on each Pacific Capital Fund’s actual expense ratio and an assumed rate of return of 5% per year before expenses, which is not the Fund’s actual return. The hypothetical account values and expenses may not be used to estimate the actual ending account balance or expenses you paid for the period. You may use this information to compare this 5% hypothetical example with the 5% hypothetical examples that appear in the shareholder reports of other funds.
Please note that the expenses shown in the table are meant to highlight your ongoing costs only and do not reflect any transactional costs. Therefore, the table is useful in comparing ongoing costs only, and will not help you determine the relative total costs of owning different funds. In addition, if these transactional costs were included, your costs would have been higher.
| | | | | | | | | | | | | |
| | | | | Beginning
Account Value
2/1/05
| | Ending
Account Value
7/31/05
| | Expense Paid
During Period*
2/1/05 - 7/31/05
| | Expense Ratio
During Period**
2/1/05 - 7/31/05
|
New Asia Growth Fund | | Class A | | $ | 1,000.00 | | $ | 1,015.17 | | $ | 9.69 | | 1.94% |
| | | Class B | | | 1,000.00 | | | 1,011.46 | | | 13.42 | | 2.69% |
| | | Class C | | | 1,000.00 | | | 1,011.50 | | | 13.37 | | 2.68% |
| | | Class Y | | | 1,000.00 | | | 1,016.41 | | | 8.45 | | 1.69% |
| | | | | |
International Stock Fund | | Class A | | | 1,000.00 | | | 1,016.61 | | | 8.25 | | 1.65% |
| | | Class B | | | 1,000.00 | | | 1,012.89 | | | 11.98 | | 2.40% |
| | | Class C | | | 1,000.00 | | | 1,012.89 | | | 11.98 | | 2.40% |
| | | Class Y | | | 1,000.00 | | | 1,017.85 | | | 7.00 | | 1.40% |
| | | | | |
Small Cap Fund | �� | Class A | | | 1,000.00 | | | 1,016.61 | | | 8.25 | | 1.65% |
| | | Class B | | | 1,000.00 | | | 1,012.99 | | | 11.88 | | 2.38% |
| | | Class C | | | 1,000.00 | | | 1,012.84 | | | 12.03 | | 2.41% |
| | | Class Y | | | 1,000.00 | | | 1,017.95 | | | 6.90 | | 1.38% |
101
PACIFIC CAPITAL FUNDS
| | | | | | | | | | | | | |
| | | | | Beginning
Account Value
2/1/05
| | Ending
Account Value
7/31/05
| | Expense Paid
During Period*
2/1/05 - 7/31/05
| | Expense Ratio
During Period**
2/1/05 - 7/31/05
|
Mid-Cap Fund | | Class A | | $ | 1,000.00 | | $ | 1,019.59 | | $ | 5.26 | | 1.05% |
| | | Class C | | | 1,000.00 | | | 1,015.87 | | | 9.00 | | 1.80% |
| | | Class Y | | | 1,000.00 | | | 1,020.83 | | | 4.01 | | 0.80% |
| | | | | |
Growth Stock Fund | | Class A | | | 1,000.00 | | | 1,017.85 | | | 7.00 | | 1.40% |
| | | Class B | | | 1,000.00 | | | 1,014.13 | | | 10.74 | | 2.15% |
| | | Class C | | | 1,000.00 | | | 1,014.18 | | | 10.69 | | 2.14% |
| | | Class Y | | | 1,000.00 | | | 1,019.09 | | | 5.76 | | 1.15% |
| | | | | |
Growth and Income Fund | | Class A | | | 1,000.00 | | | 1,017.75 | | | 7.10 | | 1.42% |
| | | Class B | | | 1,000.00 | | | 1,014.03 | | | 10.84 | | 2.17% |
| | | Class C | | | 1,000.00 | | | 1,014.08 | | | 10.79 | | 2.16% |
| | | Class Y | | | 1,000.00 | | | 1,018.99 | | | 5.86 | | 1.17% |
| | | | | |
Value Fund | | Class A | | | 1,000.00 | | | 1,018.05 | | | 6.80 | | 1.36% |
| | | Class B | | | 1,000.00 | | | 1,014.33 | | | 10.54 | | 2.11% |
| | | Class C | | | 1,000.00 | | | 1,014.38 | | | 10.49 | | 2.10% |
| | | Class Y | | | 1,000.00 | | | 1,019.29 | | | 5.56 | | 1.11% |
| | | | | |
Diversified Fixed Income Fund | | Class A | | | 1,000.00 | | | 1,019.84 | | | 5.01 | | 1.00% |
| | | Class B | | | 1,000.00 | | | 1,016.12 | | | 8.75 | | 1.75% |
| | | Class C | | | 1,000.00 | | | 1,016.12 | | | 8.75 | | 1.75% |
| | | Class Y | | | 1,000.00 | | | 1,021.12 | | | 3.71 | | 0.74% |
| | | | | |
Tax-Free Securities Fund | | Class A | | | 1,000.00 | | | 1,019.79 | | | 5.06 | | 1.01% |
| | | Class B | | | 1,000.00 | | | 1,016.07 | | | 8.80 | | 1.76% |
| | | Class C | | | 1,000.00 | | | 1,016.12 | | | 8.75 | | 1.75% |
| | | Class Y | | | 1,000.00 | | | 1,021.03 | | | 3.81 | | 0.76% |
| | | | | |
Short Intermediate U.S. Government Securities Fund | | Class A | | | 1,000.00 | | | 1,020.83 | | | 4.01 | | 0.80% |
| | | Class C | | | 1,000.00 | | | 1,017.11 | | | 7.75 | | 1.55% |
| | | Class Y | | | 1,000.00 | | | 1,022.07 | | | 2.76 | | 0.55% |
| | | | | |
Tax-Free Short Intermediate Securities Fund | | Class A | | | 1,000.00 | | | 1,019.84 | | | 5.01 | | 1.00% |
| | | Class C | | | 1,000.00 | | | 1,016.12 | | | 8.75 | | 1.75% |
| | | Class Y | | | 1,000.00 | | | 1,021.12 | | | 3.71 | | 0.74% |
| | | | | |
Ultra Short Government Fund | | Class A | | | 1,000.00 | | | 1,021.72 | | | 3.11 | | 0.62% |
| | | Class B | | | 1,000.00 | | | 1,018.00 | | | 6.85 | | 1.37% |
| | | Class C | | | 1,000.00 | | | 1,018.00 | | | 6.85 | | 1.37% |
| | | Class Y | | | 1,000.00 | | | 1,022.96 | | | 1.86 | | 0.37% |
| * | Expenses are equal to the average account value times the Fund’s annualized expense ratio multiplied by the number of days in the most recent fiscal half-year divided by the number of days in the fiscal year. |
102
PACIFIC CAPITAL FUNDS
Proxy Voting
Information regarding the policies and procedures that the Funds use to determine how to vote proxies relating to portfolio securities is available without charge, upon request, by calling 1-800-258-9232. The information also is included in the Funds’ Statement of Additional Information, which is available on the Funds’ website at www.pacificcapitalfunds.com and on the Securities and Exchange Commission’s website at www.sec.gov.
Information relating to how each Fund voted proxies relating to portfolio securities held during the most recent twelve months ended June 30 is available on the Funds’ website at www.pacificcapitalfunds.com and on the Securities and Exchange Commission’s website at www.sec.gov.
Portfolio Holdings Information
The Funds file a complete list of their portfolio holdings with the Securities and Exchange Commission for the first and third quarters of each fiscal year on Form N-Q. Forms N-Q are available free of charge on the Securities and Exchange Commission’s website at www.sec.gov. You may also review, or for a fee copy, those documents by visiting the Securities and Exchange Commission’s Public Reference Room in Washington, D.C. Information on the operation of the Public Reference Room may be obtained by calling the Securities and Exchange Commission at 1-800-SEC-0330.
103

PACIFIC CAPITAL FUNDS
For more information, call 800.258.9232 or visit our website at: www.pacificcapitalfunds.com
INVESTMENT ADVISER
Asset Management Group of Bank of Hawaii 111 South King Street Honolulu, HI 96813
SUB-ADVISERS
First State (Hong Kong) LLC 3 Exchange Square 8 Connaught Place Central Hong Kong
Hansberger Global Investors, Inc. 515 East Las Olas Blvd. Fort Lauderdale, FL 33301
Nicholas-Applegate Capital Management 600 West Broadway San Diego, CA 92101
Bankoh Investment Partners, LLC 130 Merchant Street, Suite 240 Honolulu, HI 96813
DISTRIBUTOR
BISYS Fund Services Limited Partnership 3435 Stelzer Road Columbus, OH 43219
LEGAL COUNSEL
Paul, Hastings, Janofsky & Walker LLP 515 South Flower Street Los Angeles, CA 90071
INDEPENDENT REGISTERED PUBLIC ACCOUNTING FIRM
KPMG LLP 191 W. Nationwide Blvd, Suite 500 Columbus, OH 43215
ADMINISTRATOR AND TRANSFER AGENT
BISYS Fund Services Ohio, Inc. 3435 Stelzer Road Columbus, OH 43219
To view Proxy Voting Records please visit the Pacific Capital Funds web site at www.pacificcapitalfunds.com.
This material is authorized for distribution to prospective investors only when preceded or accompanied by a current prospectus. An investor should consider the funds’ investment objectives, risk, and charges and expenses carefully before investing or sending money. This and other important information about an investment company can be found in the fund prospectus. To obtain a prospectus, please call 800.258.9232. Please read it carefully before investing.
BISYS Fund Services, Distributor.
Pacific Capital Funds
MUTUAL FUNDS: ARE NOT FDIC INSURED HAVE NO BANK GUARANTEE MAY LOSE VALUE
PCR-0008 9/05
Item 2. Code of Ethics.
(a) The registrant has adopted a code of ethics that applies to the registrant’s principal executive officer, principal financial officer, principal accounting officer or controller, or persons performing similar functions. This code of ethics is included as an Exhibit.
(b) During the period covered by the report, with respect to the registrant’s code of ethics that applies to its principal executive officer, principal financial officer, principal accounting officer or controller, or persons performing similar functions; there have been no amendments to, nor any waivers granted from, a provision that relates to any element of the code of ethics definition enumerated in paragraph (b) of this Item 2.
Item 3. Audit Committee Financial Expert.
The Registrant’s Board of Trustees has determined that no member of the Board’s audit committee qualifies as an audit committee financial expert (“ACFE”). After evaluating the matter, the Board concluded that it was not necessary to add a Trustee to the Board who qualified as an ACFE, as the business experience of the current independent members of the Board was adequate to exercise their oversight responsibilities.
Item 4. Principal Accountant Fees and Services.
(KPMG LLP was the principal accountant for 2005; Ernst & Young LLP was the principal accountant for 2004).
| | | | | | | | | |
| | | 2005 (KPMG LLP)
| | 2004
| | 2005 (Ernst & Young LLP)
|
a) Audit Fees | | $ | 120,000 | | $ | 148,700 | | $ | 17,500 |
b) Audit-Related Fees | | $ | 4,000 | | $ | 0 | | $ | 0 |
c) Tax Fees | | $ | 51,000 | | $ | 30,000 | | $ | 0 |
d) All Other Fees | | $ | 0 | | $ | 0 | | $ | 0 |
Nature of services regarding Audit-Related Fees:
2005:
Nature of services regarding Tax Fees:
2005:
| | * | preparation of the Funds’ fiscal and taxable year ended July 31, 2005 federal income and United States excise tax returns, respectively, on Form 1120-RIC and Form 8613. |
| | * | preparation of the Funds’ fiscal and taxable year ended July 31, 2005 Hawaiian corporate tax return on Form M- 30. |
| | * | review of the Funds’ projected calendar year 2005 required excise tax distributions. |
2004:
| | * | tax compliance, tax advice and tax planning |
(e) (1) Registrants’s audit committee meets with the principal accountants and management to review and pre-approve all audit services to be provided by the principal accountants. The audit committee shall pre-approve all auditing services and permissible non-audit services (e.g., tax services) to be provided to the Funds by the auditor, including the fees therefore and has not adopted pre-approval policies and procedures as described in Rule 2-01 (c)(7)(i)(B) of Reg. S-X.
(e) (2) None of the services summarized in (a)-(d), above, were approved by the Audit Committee pursuant to Rule 2-01(c)(7)(i)(C) of Regulation S-X.
(f) If greater than 50 percent, disclose the percentage of hours expended on the principal accountant’s engagement to audit the registrant’s financial statements for the most recent fiscal year that were attributed to work performed by persons other than the principal accountant’s full-time, permanent employees.
Not applicable.
(g) Disclose the aggregate non-audit fees billed by the registrant’s accountant for services rendered to the registrant, and rendered to the registrant’s investment adviser (not including any sub-adviser whose role is primarily portfolio management and is subcontracted with or overseen by another investment adviser), and any entity controlling, controlled by, or under common control with the adviser that provides ongoing services to the registrant for each of the last two fiscal years of the registrant.
For the fiscal years ended July 31, 2005 and July 31, 2004, Non-Audit Fees billed to the Funds for services provided to the Funds and any of the Funds’ investment advisers and any entity controlling, controlled by, or under common control with the investment adviser that provides ongoing services to the Funds for each of the last two fiscal years of the Funds, totaled approximately $0 (2005 KPMG LLP), $31,200 (2005 Ernst & Young LLP), and $260,000 (2004 Ernst & Young LLP), respectively.
(h) Disclose whether the registrant’s audit committee of the board of directors has considered whether the provision of nonaudit services that were rendered to the registrant’s investment adviser (not including any subadviser whose role is primarily portfolio management and is subcontracted with or overseen by another investment adviser), and any entity controlling, controlled by, or under common control with the investment adviser that provides ongoing services to the registrant that were not pre-approved pursuant to paragraph (c)(7)(ii) of Rule 2-01 of Regulation S-X is compatible with maintaining the principal accountant’s independence.
Not applicable.
Item 5. Audit Committee of Listed Registrants.
Not applicable.
Item 6. Schedule of Investments.
Not applicable.
Item 7. Disclosure of Proxy Voting Policies and Procedures for Closed-End Management Investment Companies.
Not applicable.
Item 8. Portfolio Managers of Closed-End Management Investment Companies.
Not applicable.
Item 9. Purchases of Equity Securities by Closed-End Management Investment Company and Affiliated Purchasers.
Not applicable.
Item 10. Submission of Matters to a Vote of Security Holders.
Not applicable.
Item 11. Controls and Procedures.
(a) The registrant’s principal executive officer and principal financial officer have concluded, based on their evaluation of the registrant’s disclosure controls and procedures as conducted within 90 days of the filing date of this report, that these disclosure controls and procedures are adequately designed and are operating effectively to ensure that information required to be disclosed by the registrant on Form N-CSR is recorded, processed, summarized and reported within the time periods specified in the Securities and Exchange Commission’s rules and forms.
(b) There were no changes in the registrant’s internal control over financial reporting (as defined in Rule 30a-3(d) under the Act (17 CFR 270.30a-3(d)) that occurred during the second fiscal quarter of the period covered by this report that have materially affected or are reasonably likely to materially affect, the registrant’s internal control over financial reporting.
Item 12. Exhibits.
(a)(1) The code of ethics that is the subject of the disclosure required by Item 2 is attached hereto.
(a)(2) Certifications pursuant to Rule 30a-2(a) are attached hereto.
(a)(3) Not applicable.
(b) Certifications pursuant to Rule 30a-2(b) are furnished herewith.
SIGNATURES
Pursuant to the requirements of the Securities Exchange Act of 1934 and the Investment Company Act of 1940, the registrant has duly caused this report to be signed on its behalf by the undersigned, thereunto duly authorized.
| | |
| (Registrant) Pacific Capital Funds |
| |
| By (Signature and Title)* | | /s/ William P. Henry, Jr.
|
| | | William P. Henry, Jr., President |
|
| Date Oct. 6, 2005 |
Pursuant to the requirements of the Securities Exchange Act of 1934 and the Investment Company Act of 1940, this report has been signed below by the following persons on behalf of the registrant and in the capacities and on the dates indicated.
| | |
| By (Signature and Title)* | | /s/ William P. Henry, Jr.
|
| | | William P. Henry, Jr., President |
|
| Date Oct. 6, 2005 |
| |
| By (Signature and Title)* | | /s/ Christopher E. Sabato
|
| | | Christopher E. Sabato, Treasurer |
|
| Date Oct. 6, 2005 |
| * | Print the name and title of each signing officer under his or her signature. |