UNITED STATES
SECURITIES AND EXCHANGE COMMISSION
Washington, D.C. 20549
FORM N-CSR
CERTIFIED SHAREHOLDER REPORT OF REGISTERED MANAGEMENT INVESTMENT COMPANIES
Investment Company Act File Number 811-07470
Carillon Series Trust
(Exact name of registrant as specified in charter)
880 Carillon Parkway
St. Petersburg, FL 33716
(Address of principal executive offices)
Susan L. Walzer, Principal Executive Officer
880 Carillon Parkway
St. Petersburg, FL 33716
(Name and address of agent for service)
Registrant’s telephone number, including area code: (727) 567-8143
Date of fiscal year end: June 30
Date of reporting period: October 31, 2017
Explanatory Note: The information included in this filing relates to Scout Core Bond Fund, Scout Core Plus Bond Fund, Scout International Fund, Scout Low Duration Bond Fund, Scout Mid Cap Fund, Scout Small Cap Fund, and Scout Unconstrained Bond Fund (each a “Target Fund” and collectively, the “Target Funds”), each a series of the Scout Funds. Subsequent to the date of the reporting period, each of the Target Funds was reorganized into a corresponding new series of Carillon Series Trust (the “Acquiring Funds”). Therefore, although this filing is being made by Carillon Series Trust, certain of the information in this filing relates to the Target Funds for the period July 1, 2017 to October 31, 2017, as indicated below.
Item 1. Reports to Stockholders
The following is a copy of the report transmitted to shareholders pursuant to Rule 30e-1 under the Investment Company Act of 1940 (17 CFR 270.30e-1).

| Financial Report | |
| and Investment Performance Review | |
| for the Fiscal Period Ended October 31, 2017 | |
| International Fund | |
| Scout International Fund (UMBWX) | |
| Domestic Equity Funds | |
| Scout Mid Cap Fund (UMBMX) | |
| Scout Small Cap Fund (UMBHX) | |
| Fixed Income Funds | |
| Scout Low Duration Bond Fund (SCLDX) | |
| Scout Core Bond Fund | |
| Institutional Class (SCCIX) | |
| Class Y (SCCYX) | |
| Scout Core Plus Bond Fund | |
| Institutional Class (SCPZX) | |
| Class Y (SCPYX) | |
| Scout Unconstrained Bond Fund | |
| Institutional Class (SUBFX) | |
| Class Y (SUBYX) |
Table of Contents
| International Fund | 1 |
| Mid Cap Fund | 7 |
| Small Cap Fund | 13 |
| Low Duration Bond Fund | 18 |
| Core Bond Fund | 26 |
| Core Plus Bond Fund | 32 |
| Unconstrained Bond Fund | 39 |
| Statements of Assets and Liabilities | 46 |
| Statements of Operations | 48 |
| Statements of Changes in Net Assets | 50 |
| Financial Highlights | 54 |
| Notes to Financial Statements | 60 |
| Report of Independent Registered Certified Public Accounting Firm | 73 |
| Expense Examples | 74 |
| Results of the Special Meeting of Shareholders | 75 |
| Other Information | 76 |
| Trustees and Officers | 82 |
| Privacy Policy | 84 |
| Glossary of Investment Terms | 86 |
Shares of the Scout Funds are not deposits or obligations of, nor guaranteed by, UMB Bank, n.a. or any other banking institution; nor are they insured by the Federal Deposit Insurance Corporation (“FDIC”) or any other government agency. These shares involve investment risks, including the possible loss of the principal invested.
SCOUT FUNDS ANNUAL REPORT
Scout International Fund
UMBWX
As a result of a reorganization that was completed after the close of business on November 17, 2017, the Scout International Fund is now the Carillon Scout International Fund. The commentary that follows is for the 12 months ended October 31, 2017.
MARKET REVIEW
International markets, represented by the MSCI EAFE® Index, were strong during the 12-month period ending Oct. 31, 2017, delivering a 23.44 percent return. Investors experienced a whirlwind of political events during the time period. In December, the Italian constitutional referendum was decisively defeated and subsequently Prime Minister Matteo Renzi submitted his resignation. In May, Emmanuel Macron was elected president of France inspiring hopes of a new approach and the possibility of a better integrated Eurozone. The following month, Prime Minister Theresa May failed to consolidate her position after calling a snap election, thus weakening her standing, which could lead to a softer Brexit than had previously been expected. But the biggest impact on global equity markets was the surprise election of Donald Trump as president of the United States in November. Markets initially treated his election with skepticism but this reaction was soon overshadowed by optimism regarding increased spending programs, reduced regulation, and tax reform. Much of the early hype has dwindled amid dramatic reorganizations in the White House. But, in spite of this and a few Federal Reserve interest-rate increases, equity markets have powered ahead.
Against this backdrop, Europe continues to show signs of recovery, with unemployment levels at their lowest since 2009. Some of the highlights included Spain reporting its best economic performance in two years, Portugal obtaining an investment-grade credit rating (after having a junk rating since 2012) and continued progress in Germany with regard to forming a coalition government. Additionally, Mario Draghi, the European Central Bank (ECB) President, implied that the central bank is nearing a formal tightening of its monetary policy. Meanwhile, returns in emerging markets have generally outpaced those of developed markets. That said, concerns around the stability of the Chinese financial sector, a flattening Chinese yield curve and the slowing Chinese economy generated angst among some investors. Nevertheless, overall, equity investor optimism remains high in most developed and emerging markets leaving equity-market volatility near historical lows and the popularity of the momentum trade high.
PORTFOLIO REVIEW
The Scout International Fund (UMBWX) returned 22.98 percent for the 12 months ended October 31, 2017, slightly underperforming the MSCI EAFE® Index’s return of 23.44 percent. At the country level, China, Taiwan, Australia, Sweden and Ireland added the most value, while Netherlands, France, Canada, Denmark and Singapore detracted from relative results.
At the sector level, holdings in information technology, industrials and healthcare were the Fund’s top performers. AAC Technologies Holdings, Inc. and Tokyo Electron Ltd. propelled the information technology sector. AAC Technologies, a manufacturer of mico-components used within smartphones, continues to benefit from market-share gains as stereo sound and waterproof designs gain adoption across a variety of digital devices. Tokyo Electron, a Japanese manufacturer and distributor of semiconductors and flat-panel display equipment, advanced after reporting significantly higher orders. Additionally, management suggested that the semiconductor market may grow by 10 percent year-over-year during 2017, while the flat panel display equipment market is expected to grow by 30 percent. Leading the industrials sector was discount airline Ryanair Holdings PLC, which has reported strong growth. Additionally, stock performance has been buoyed by the improving economic backdrop in Europe, a material decline in fuel prices during the second half of the fiscal year and support from an ongoing stock buyback program.
In contrast, consumer discretionary, energy and consumer staples detracted from relative results. Holdings in the consumer discretionary sector provided mixed results. The detractors were led by Pandora A/S, a hand-crafted jewelry manufacturer that has delivered weaker than expected total retail sales. Within the energy sector, Enbridge, Inc. and Imperial Oil Ltd. suffered during the time period as both crude oil and natural gas prices declined throughout much of the fiscal year. Enbridge, an energy transportation company and distributor, suffered as natural gas retreated from
| OCTOBER 31, 2017 | 1 |
Scout International Fund
UMBWX
highs reached in late December. Imperial Oil, an oil sands producer, suffered as a result of the company’s sensitivity to fluctuations in oil prices. Specifically, oil sands projects are more costly to develop per barrel of oil than a typical onshore project. As such, these projects require higher oil prices to generate free-cash-flow. Consumer staples company Carrefour, a hypermarket and supermarket operator in Europe, struggled as the company’s French hypermarket business showed no signs of improving. In addition, the company continues to lose market share to competitors who moved earlier and more aggressively into online food offerings.
MARKET OUTLOOK
Even with the Federal Reserve having announced that it would begin to pare back its huge balance sheet in October and continue increasing interest rates toward the end of the year, markets continued to march higher on the back of economic strength and hopes for tax reform. Continued economic improvements throughout much of the Eurozone has left European market conditions favorable in the short term at least and while China has allowed monetary conditions to tighten throughout much of 2017, central bank policy remains accommodative. Additionally, the Japanese corporate sector is performing well this year on the back of solid earnings and revenue growth.
Michael D. Stack, CFA
Lead Portfolio Manager
Angel M. Lupercio
Co-Portfolio Manager
| 2 | SCOUT FUNDS ANNUAL REPORT |
| Scout International Fund |
| UMBWX |
OBJECTIVE & STRATEGY (Unaudited)
The Scout International Fund seeks long-term growth of capital and income by investing in a diversified portfolio consisting primarily of equity securities of established companies either located outside the United States or whose primary business is carried on outside the United States.
PORTFOLIO MANAGEMENT TEAM
Michael D. Stack, CFA
Lead Portfolio Manager
Angel M. Lupercio
Co-Portfolio Manager
HYPOTHETICAL GROWTH OF $10,000 (Unaudited)
as of October 31, 2017
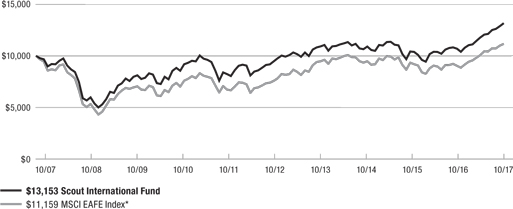
Performance returns for the Scout International Fund and MSCI EAFE Index assume dividends were reinvested for the entire period.
For illustrative purposes only; may not represent your returns.
| * | Unmanaged index of stocks, bonds or mutual funds. It is not possible to invest directly in an index. The MSCI EAFE Index (Europe, Australasia, Far East) is a free float-adjusted market capitalization index that is designed to measure the equity market performance of developed markets, excluding the U.S. and Canada. |
REGION/COUNTRY ALLOCATION (Unaudited)
(as a % of total portfolio equities)
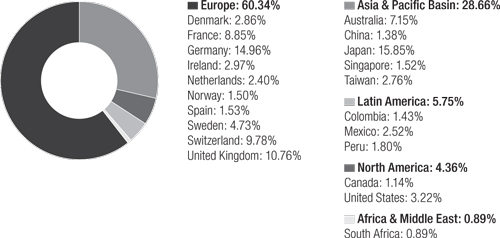
Portfolio composition will change due to ongoing management of the Fund. References to specific securities should not be construed as recommendations by the Fund, its Advisor or Distributor.
Risk considerations: Foreign investments present additional risks due to currency fluctuations, economic and political factors, government regulations, differences in accounting standards, reduced liquidity and other factors. Investments in emerging markets involve even greater risks.
| OCTOBER 31, 2017 | 3 |
Scout International Fund
UMBWX
COMPARATIVE RATES OF RETURN (Unaudited)
as of October 31, 2017
| 1 Year | 3 Years | 5 Years | 10 Years | |||||
| Scout International Fund | 22.98% | 7.30% | 7.45% | 2.78% | ||||
| MSCI EAFE Index* | 23.44% | 6.08% | 8.53% | 1.10% |
Returns for periods greater than one year are compounded average annual rates of return.
The performance data quoted represents past performance and past performance is not a guarantee of future results. Investment return and principal value of an investment will fluctuate so that an investor’s shares, when redeemed, may be worth more or less than their original cost. Current performance may be lower or higher than the performance information quoted. To obtain performance information current to the most recent month-end, please call 800-996-2862. For the fiscal year ended June 30, 2017, the gross/net expense ratio for the Fund was 1.06% (as disclosed in the most recent Prospectus) compared to the October 31, 2017, gross/net expense ratio of 1.08%.
The performance shown in the above table and in the graph on the preceding page does not reflect the deduction of taxes that a shareholder would pay on Fund distributions or the redemption of Fund shares.
PORTFOLIO CHARACTERISTICS (Unaudited)
| Scout | ||||
| International | MSCI EAFE* | |||
| Number of Holdings | 67 | 927 | ||
| Weighted Average Market Cap | $56.88B | $63.85B | ||
| Weighted Median Market Cap | $31.61B | $41.16B | ||
| Price/Earnings Ratio (Trailing 1 Year) | 17.69 | 17.86 | ||
| Price/Book Ratio | 2.34 | 1.72 | ||
| EPS Growth (Hist. 5 Yr.) | 8.24% | 7.46% | ||
| Return on Equity | 21.14% | 14.88% | ||
| Standard Deviation (Trailing 3 Years) | 11.39% | 12.23% | ||
| Sharpe Ratio (Trailing 3 Years) | 0.61 | 0.46 | ||
| Beta† | 0.89 | 1.00 | ||
| Alpha† | 1.74% | — | ||
| R-squared† | 0.91 | 1.00 | ||
| Upside Capture† | 90% | 100% | ||
| Downside Capture† | 78% | 100% | ||
| Turnover Ratio (Trailing 1 Year) | 21% | — | ||
| % in Emerging Markets | 10.78% | 0.00% | ||
| Total Net Assets (in Millions) | $1,160.88 | — | ||
| Inception Date | 9/14/1993 | — |
† Measured against the MSCI EAFE Index over the trailing three year time period.
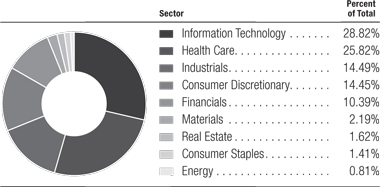
FUND DIVERSIFICATION (Unaudited)

Based on total investments as of October 31, 2017. Subject to change.
TOP 10 EQUITY HOLDINGS (Unaudited)
| Percent of Total | |
| Volkswagen A.G. | 2.26% |
| Subaru Corp. | 1.91% |
| SKF A.B. | 1.85% |
| Tokyo Electron Ltd. | 1.85% |
| Prudential PLC | 1.80% |
| ORIX Corp. | 1.79% |
| AXA S.A. | 1.78% |
| Continental A.G. | 1.77% |
| Credicorp Ltd. | 1.77% |
| Adecco Group A.G. | 1.74% |
| Top 10 Holdings Total | 18.52% |
Based on total investments as of October 31, 2017. Subject to change.
HISTORICAL PER-SHARE RECORD (Unaudited)
| Income & | Cumulative(c) | |||||||||||||||
| Net Asset | Short-Term(b) Gains | Long-Term(b) Gains | Value Per Share | |||||||||||||
| Value | Distribution | Distribution | Plus Distributions | |||||||||||||
| 12/31/12 | $ | 33.35 | $ | 0.53 | $ | — | $ | 43.45 | ||||||||
| 12/31/13 | 37.26 | 0.44 | — | 47.80 | ||||||||||||
| 12/31/14 | 32.59 | 0.52 | 2.57 | 46.22 | ||||||||||||
| 12/31/15 | 23.19 | 0.74 | 7.15 | 44.71 | ||||||||||||
| 12/31/16 | 20.83 | 0.55 | 3.34 | 46.24 | ||||||||||||
| 10/31/17(a) | 25.18 | 0.20 | — | 50.79 | ||||||||||||
| (a) | Ten months only. Distributions typically occur in June and/or December. |
| (b) | Represents distributions for the respective calendar year-to-date period ended. |
| (c) | Does not assume any compounding of reinvested distributions. |
Table shows calendar-year distributions and net asset values; may differ from fiscal-year annual reports.
| * | Unmanaged index of stocks, bonds or mutual funds. It is not possible to invest directly in an index. |
Portfolio composition will change due to ongoing management of the Fund. References to specific securities or sectors should not be construed as a recommendation by the Fund, its Advisor or Distributor. See the accompanying Schedule of Investments for the percentage of the Fund’s portfolio represented by the securities or sectors mentioned above.
| 4 | SCOUT FUNDS ANNUAL REPORT |
SCHEDULE OF INVESTMENTS
October 31, 2017
INTERNATIONAL FUND
| Shares | Value | |||||||
| COMMON STOCKS — 98.1% | ||||||||
| AUSTRALIA — 7.0% | ||||||||
| BHP Billiton Ltd.(a) | 385,986 | $ | 15,817,706 | |||||
| Caltex Australia Ltd. | 644,476 | 16,898,629 | ||||||
| CSL Ltd. | 154,751 | 16,454,582 | ||||||
| Macquarie Group Ltd. | 231,122 | 17,396,945 | ||||||
| Woodside Petroleum Ltd. | 630,711 | 14,833,728 | ||||||
| 81,401,590 | ||||||||
| CANADA — 1.1% | ||||||||
| Enbridge, Inc.(b) | 337,910 | 12,996,019 | ||||||
| CHINA — 1.4% | ||||||||
| AAC Technologies Holdings, Inc. | 861,963 | 15,777,721 | ||||||
| COLOMBIA — 1.4% | ||||||||
| Bancolombia S.A.(a) | 430,457 | 16,249,752 | ||||||
| DENMARK — 2.8% | ||||||||
| Novo Nordisk A/S(a) | 342,920 | 17,073,987 | ||||||
| Pandora A/S | 163,817 | 15,462,901 | ||||||
| 32,536,888 | ||||||||
| FRANCE — 8.7% | ||||||||
| Air Liquide S.A. | 135,987 | 17,313,196 | ||||||
| AXA S.A. | 683,075 | 20,631,491 | ||||||
| BNP Paribas S.A. | 242,718 | 18,953,774 | ||||||
| Dassault Systemes S.E. | 100,159 | 10,636,571 | ||||||
| L’Oreal S.A. | 65,912 | 14,668,011 | ||||||
| TOTAL S.A. | 334,761 | 18,666,289 | ||||||
| 100,869,332 | ||||||||
| GERMANY — 14.7% | ||||||||
| Allianz S.E.(a) | 839,031 | 19,633,661 | ||||||
| BASF S.E. | 182,168 | 19,920,225 | ||||||
| Continental A.G. | 80,508 | 20,488,334 | ||||||
| Fresenius S.E. & Co. KGaA | 170,412 | 14,265,916 | ||||||
| Henkel A.G. & Co. KGaA(a) | 117,220 | 16,557,911 | ||||||
| Muenchener Rueckversicherungs-Gesellschaft A.G. | 83,029 | 18,639,764 | ||||||
| SAP S.E.(a) | 127,762 | 14,590,420 | ||||||
| Siemens A.G. | 139,973 | 20,104,231 | ||||||
| Volkswagen A.G. | 143,018 | 26,186,438 | ||||||
| 170,386,900 | ||||||||
| IRELAND — 2.9% | ||||||||
| Kerry Group PLC — Class A | 153,765 | 15,483,965 | ||||||
| Ryanair Holdings PLC*(a) | 164,023 | 18,388,619 | ||||||
| 33,872,584 | ||||||||
| JAPAN — 15.5% | ||||||||
| Astellas Pharma, Inc. | 1,520,216 | 20,168,381 | ||||||
| FANUC Corp. | 50,502 | 11,712,218 | ||||||
| JGC Corp. | 949,639 | 15,776,510 | ||||||
| Komatsu Ltd. | 509,030 | 16,550,582 | ||||||
| Kubota Corp. | 953,587 | 17,791,960 | ||||||
| Nitto Denko Corp. | 175,459 | 16,210,341 | ||||||
| ORIX Corp. | 1,216,483 | 20,739,214 | ||||||
| Subaru Corp. | 648,558 | 22,176,628 | ||||||
| Sysmex Corp. | 263,978 | 17,946,000 | ||||||
| Tokyo Electron Ltd. | 123,466 | 21,450,867 | ||||||
| 180,522,701 | ||||||||
| MEXICO — 2.5% | ||||||||
| Grupo Financiero Banorte S.A.B. de C.V. — Class O | 2,350,248 | 13,948,154 | ||||||
| Wal-Mart de Mexico S.A.B. de C.V.(a) | 660,819 | 14,785,825 | ||||||
| 28,733,979 | ||||||||
| NETHERLANDS — 2.4% | ||||||||
| Gemalto N.V. | 282,594 | 11,185,258 | ||||||
| Royal Dutch Shell PLC — Class B(a) | 247,662 | 16,187,188 | ||||||
| 27,372,446 | ||||||||
| NORWAY — 1.5% | ||||||||
| DNB A.S.A. | 886,528 | 17,094,535 | ||||||
| PERU — 1.8% | ||||||||
| Credicorp Ltd. | 97,774 | 20,477,787 | ||||||
| SINGAPORE — 1.5% | ||||||||
| Singapore Telecommunications Ltd. | 6,299,987 | 17,331,781 | ||||||
| SOUTH AFRICA — 0.9% | ||||||||
| MTN Group Ltd. | 1,171,615 | 10,173,365 | ||||||
| SPAIN — 1.5% | ||||||||
| Banco Bilbao Vizcaya Argentaria S.A. | 1,997,953 | 17,484,707 | ||||||
| SWEDEN — 4.6% | ||||||||
| Essity A.B. — Class B* | 484,509 | 14,486,019 | ||||||
| Sandvik A.B. | 979,757 | 17,894,196 | ||||||
| SKF A.B.(a) | 924,430 | 21,465,265 | ||||||
| 53,845,480 | ||||||||
| SWITZERLAND — 9.6% | ||||||||
| ABB Ltd. | 685,535 | 17,919,969 | ||||||
| Adecco Group A.G. | 254,946 | 20,225,495 | ||||||
| Coca-Cola HBC A.G.* | 400,516 | 13,538,494 | ||||||
| Givaudan S.A. | 7,612 | 16,998,633 | ||||||
| Nestle S.A.(a) | 169,557 | 14,281,786 | ||||||
| Novartis A.G.(a) | 149,119 | 12,314,247 | ||||||
| Roche Holding A.G. | 69,684 | 16,099,190 | ||||||
| 111,377,814 | ||||||||
(Continued on next page)
| OCTOBER 31, 2017 | 5 |
| SCHEDULE OF INVESTMENTS |
| October 31, 2017 |
| INTERNATIONAL FUND (Continued) |
| Shares | Value | |||||||
| TAIWAN — 2.7% | ||||||||
| Largan Precision Co., Ltd. | 81,500 | $ | 15,443,641 | |||||
| MediaTek, Inc. | 1,407,930 | 15,988,860 | ||||||
| 31,432,501 | ||||||||
| UNITED KINGDOM — 10.5% | ||||||||
| British American Tobacco PLC | 278,347 | 18,008,079 | ||||||
| Compass Group PLC | 797,984 | 17,519,824 | ||||||
| Diageo PLC(a) | 122,787 | 16,823,047 | ||||||
| Next PLC | 279,315 | 18,256,197 | ||||||
| Prudential PLC(a) | 424,977 | 20,836,622 | ||||||
| Reckitt Benckiser Group PLC | 175,233 | 15,675,312 | ||||||
| WPP PLC | 869,316 | 15,402,677 | ||||||
| 122,521,758 | ||||||||
| UNITED STATES — 3.1% | ||||||||
| Aflac, Inc. | 219,413 | 18,406,556 | ||||||
| Mettler-Toledo International, Inc.* | 26,717 | 18,237,826 | ||||||
| 36,644,382 | ||||||||
| TOTAL COMMON STOCKS | ||||||||
| (Cost $755,775,461) — 98.1% | 1,139,104,022 | |||||||
| SHORT-TERM INVESTMENTS — 1.7% | ||||||||
| MONEY MARKET FUNDS | ||||||||
| Fidelity Investments Money Market Funds — | ||||||||
| Treasury Portfolio — Class I, 0.915% | 20,000,000 | 20,000,000 | ||||||
| TOTAL SHORT-TERM INVESTMENTS | ||||||||
| (Cost $20,000,000) — 1.7% | 20,000,000 | |||||||
| TOTAL INVESTMENTS | ||||||||
| (Cost $775,775,461) — 99.8% | 1,159,104,022 | |||||||
| Other assets less liabilities — 0.2% | 1,773,233 | |||||||
| TOTAL NET ASSETS — 100.0% | ||||||||
| (equivalent to $25.18 per share; | ||||||||
| unlimited shares of $1.00 par value | ||||||||
| capital shares authorized; | ||||||||
| 46,099,545 shares outstanding) | $ | 1,160,877,255 | ||||||
| PLC — Public Limited Company |
| * | Non-income producing security. |
| (a) | ADR — American Depositary Receipt. |
| (b) | Canadian security traded on U.S. stock exchange |
See accompanying Notes to Financial Statements.
| 6 | SCOUT FUNDS ANNUAL REPORT |
Scout Mid Cap Fund
UMBMX
As a result of a reorganization that was completed after the close of business on November 17, 2017, the Scout Mid Cap Fund is now the Carillon Scout Mid Cap Fund. The commentary that follows is for the 12 months ended October 31, 2017.
MARKET REVIEW
The Russell Midcap® Index, a measure of domestic mid-capitalization stocks, gained 21.09 percent during the 12 months ending Oct. 31, 2017. Strong gains during the fiscal year followed the November U.S. elections as investors anticipated tax and regulatory reform. Investor optimism was also bolstered by steadily growing U.S. and foreign economies, which may have improved due to quantitative easing in the European Union and Japan as well as stimulus in China. The Federal Reserve was able to successfully increase short-term interest rates three times this fiscal year given the tighter labor markets and improvement in the U.S. economy. There are some developing credit concerns in subprime auto loans and credit cards but, with unemployment continuing to fall and wages still rising, the yield curve remains upwardly sloped in tandem with positive economic growth.
While showing positive signs, the global economies continue to face significant hurdles to longer-term economic growth, such as poor demographics and high debt levels. To date, this reality has helped constrain long-term U.S. interest rates, as well as in many developed markets overseas. Continued low interest rates may support higher equity prices for now, despite below-average global growth.
PORTFOLIO REVIEW
The Scout Mid Cap Fund (UMBMX) returned 31.32 percent for the 12 months ended October 31, 2017, significantly outperforming the Russell Midcap Index return of 21.09 percent. Stock selection was positive, while sector allocation also provided a favorable impact on relative performance.
At the sector level, we added the most value in information technology, consumer discretionary and industrials. Within technology, global IT provider DXC Technology (formerly known as Computer Sciences Corp.) soared after announcing a lucrative merger with Hewlett-Packard Enterprise - Enterprises Services that promises significant potential for earnings accretion. In addition, NVIDIA Corp. reported better-than-expected earnings driven by growth potential for graphics processing chips for the gaming, artificial intelligence and automotive markets. Within consumer discretionary, Thor Industries, Inc., continued to benefit from the acquisition of a key competitor, Jayco, which provided higher earnings, further industry consolidation and a leading position in the entry-level RV market. Meanwhile, consumer demand for recreational vehicles continued to grow in the United States due to the general popularity of camping. Finally, industrials holding Orbital ATK Inc., soared post a takeover bid from larger defense contractor Northrop Grumman Corp.
In contrast, energy was the weakest sector on a relative basis. A slight underweight position and disappointing performance from Pioneer Natural Resources Co., Parsley Energy Inc. and US Silica Holdings, Inc. resulted in the largest drag on relative performance. Pioneer produces oil and natural gas primarily from the Permian Basin in West Texas, and the Eagleford formation, also in Texas, with additional operations in Colorado. The stock suffered due to temporary weakness in the oil price and as the company announced additional well-completion expenses due to water handling in the Permian field. Parsley Energy, a natural gas and oil company, engages in exploration, production and sale of crude oil and natural gas, primarily in West Texas and Southeast New Mexico. Lower oil prices weighed temporarily on Parsley’s financial results, and investor sentiment for Permian oil producers dropped due to fears others would face similar water-handling issues as Pioneer. U.S. Silica mines and distributes sand products for the fracking of oil and natural gas wells in the United States, and silica for industrial and specialty applications. The stock suffered due to temporary weakness in the oil price and from investor concerns of sand overcapacity. Finally, the portfolio’s underweight in utilities and cash exposure resulted in a drag on relative performance.
OUTLOOK & POSITIONING
Our outlook for U.S. equities remains positive. Within the United States, expected legislation regarding deregulation, tax reform and infrastructure may result in faster economic growth. Risks of protectionism around the globe remain, although growth in major global economies is steady and the near-term risk of deflation in the major economic zones has receded due to aggressive monetary policy actions by foreign central banks. The risk of recession appears remote based on our indicators, so the portfolio is positioned to potentially benefit from continued global economic growth.
| OCTOBER 31, 2017 | 7 |
Scout Mid Cap Fund
UMBMX
We are currently exposed to cyclical sectors that benefit from stronger economic growth, especially technology, and basic materials. We are also slightly overweight in healthcare due to strong company-specific fundamentals and demographics-driven growth in demand. The overall macro environment appears reasonable but we continue to focus on attractive themes and stock-specific ideas. In the financials sector, we favor banks that are realizing higher margins, steady loan growth and low loan losses. We are witnessing exciting innovations within healthcare. One example is ABIOMED, which is improving the treatment of cardiovascular diseases. The defense industry is favored under the current administration; so, we believe that sales in aerospace and defense should grow. We are tuned into the changes in consumer behavior, which is more focused on experiences including travel and entertainment and less likely to shop frequently at physical retail locations. And to benefit from the potential growth in zero- and low-emission vehicles, we retain an investment in Albemarle Corp., the leading producer and processor of lithium used for electric vehicle batteries.
We remain steadfast in our approach to allocate toward equities that adhere to the quality investment process that has benefited our investors in the past, using what we believe are timeless investment principles to select stocks with sound fundamentals and reasonable valuations while steering the portfolio away from perceived problems.
G. Patrick Dunkerley, CFA
Lead Portfolio Manager
Derek M. Smashey, CFA
Co-Portfolio Manager
John A. Indellicate II, CFA
Co-Portfolio Manager
Jason J. Votruba, CFA
Co-Portfolio Manager
| 8 | SCOUT FUNDS ANNUAL REPORT |
Scout Mid Cap Fund
UMBMX
OBJECTIVE & STRATEGY (Unaudited)
The Scout Mid Cap Fund seeks long-term growth of capital by investing in common stocks of mid cap companies.
PORTFOLIO MANAGEMENT TEAM
G. Patrick Dunkerley, CFA
Lead Portfolio Manager
Derek M. Smashey, CFA
Co-Portfolio Manager
John A. Indellicate II, CFA
Co-Portfolio Manager
Jason J. Votruba, CFA
Co-Portfolio Manager
HYPOTHETICAL GROWTH OF $10,000 (Unaudited)
as of October 31, 2017
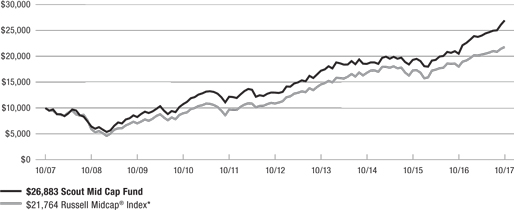
| Performance returns for the Scout Mid Cap Fund and Russell Midcap® Index assume dividends were reinvested for the entire period. |
| For illustrative purposes only; may not represent your returns. |
| * | Unmanaged index of stocks, bonds or mutual funds. It is not possible to invest directly in an index. The Russell Midcap® Index is a subset of the Russell 1000® Index and measures the performance of approximately 800 of the smallest companies in the Russell 1000® Index. |
Portfolio composition will change due to ongoing management of the Fund. References to specific securities should not be construed as recommendations by the Fund, its Advisor or Distributor.
Risk considerations: Mid-cap stocks may temporarily fall out of favor or perform poorly relative to other types of investments. While stocks of mid-cap companies may be slightly less volatile than those of small-cap companies, they still involve substantial risk. Real Estate Investment Trusts (REITS) may be affected by economic conditions including credit risk, interest rate risk and other factors that affect property values, rents or occupancies of real estate. Foreign investments present additional risks due to currency fluctuations, economic and political factors, government regulations, differences in accounting standards and other factors. Investments in emerging markets involve even greater risks. Groups of stocks, such as value and growth, go in and out of favor which may cause certain funds to underperform other equity funds.
The Fund may, at times, experience higher-than-average portfolio turnover which may generate significant taxable gains and increased trading expenses which in turn may lower the Fund’s return.
| OCTOBER 31, 2017 | 9 |
Scout Mid Cap Fund
UMBMX
COMPARATIVE RATES OF RETURN (Unaudited)
as of October 31, 2017
| 1 Year | 3 Years | 5 Years | 10 Years | |||||
| Scout Mid Cap Fund | 31.32% | 13.25% | 15.69% | 10.39% | ||||
| Russell Midcap® Index* | 21.09% | 9.04% | 14.87% | 8.09% |
Returns for periods greater than one year are compounded average annual rates of return.
The performance data quoted represents past performance and past performance is not a guarantee of future results. Investment return and principal value of an investment will fluctuate so that an investor’s shares, when redeemed, may be worth more or less than their original cost. Current performance may be lower or higher than the performance information quoted. To obtain performance information current to the most recent month-end, please call 800-996-2862. For the fiscal year ended June 30, 2017, the gross/net expense ratio for the Fund was 1.03% (as disclosed in the most recent Prospectus) compared to the October 31, 2017, gross/net expense ratio of 1.01%.
The “10 Years” performance return for the Fund reflects a fee waiver that was in effect. In absence of such waiver, the return would be reduced.
The Fund may, at times, experience higher-than-average portfolio turnover which may generate significant taxable gains and increased trading expenses which in turn may lower the Fund’s return.
The performance shown in the above table and in the graph on the preceding page does not reflect the deduction of taxes that a shareholder would pay on Fund distributions or the redemption of Fund shares.
PORTFOLIO CHARACTERISTICS (Unaudited)
| Scout | Russell | |||
| Mid Cap | Midcap®* | |||
| Number of Holdings | 145 | 781 | ||
| Weighted Average Market Cap | $14.01B | $14.46B | ||
| Weighted Median Market Cap | $10.96B | $12.80B | ||
| Price to Earnings Ratio (Trailing 1 Year) | 23.47 | 21.41 | ||
| Price/Book Ratio | 3.02 | 2.66 | ||
| EPS Growth (Hist. 5 Yr.) | 13.52% | 8.22% | ||
| Return on Equity | 18.82% | 15.02% | ||
| Standard Deviation (Trailing 3 Years) | 10.07% | 10.46% | ||
| Sharpe Ratio (Trailing 3 Years) | 1.27 | 0.82 | ||
| Beta† | 0.91 | 1.00 | ||
| Alpha† | 4.58% | — | ||
| R-squared† | 0.89 | 1.00 | ||
| Upside Capture† | 114% | 100% | ||
| Downside Capture† | 85% | 100% | ||
| Turnover Ratio (Trailing 1 Year) | 75% | — | ||
| Total Net Assets (in Millions) | $1,675.21 | — | ||
| Inception Date | 10/31/2006 | — |
† Measured against the Russell Midcap® Index over the trailing three year time period.
FUND DIVERSIFICATION (Unaudited)
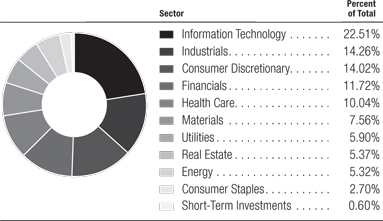
Based on total investments as of October 31, 2017. Subject to change.
TOP 10 EQUITY HOLDINGS (Unaudited)
| Percent | ||
| of Total | ||
| DXC Technology Co. | 3.61% | |
| ABIOMED, Inc. | 3.43% | |
| Atmos Energy Corp. | 1.88% | |
| Thor Industries, Inc. | 1.73% | |
| Citizens Financial Group, Inc. | 1.53% | |
| Xcel Energy, Inc. | 1.52% | |
| IPG Photonics Corp. | 1.40% | |
| SunTrust Banks, Inc. | 1.17% | |
| Arista Networks, Inc. | 1.17% | |
| Comerica, Inc. | 1.15% | |
| Top 10 Holdings Total | 18.59% |
Based on total investments as of October 31, 2017. Subject to change.
HISTORICAL PER-SHARE RECORD (Unaudited)
| Income & | Cumulative(c) | |||||||||||||||
| Net Asset | Short-Term(b) Gains | Long-Term(b) Gains | Value Per Share | |||||||||||||
| Value | Distribution | Distribution | Plus Distributions | |||||||||||||
| 12/31/12 | $ | 13.67 | $ | 0.24 | $ | 0.06 | $ | 16.22 | ||||||||
| 12/31/13 | 17.81 | 0.44 | 0.55 | 21.35 | ||||||||||||
| 12/31/14 | 15.44 | 0.61 | 2.48 | 22.07 | ||||||||||||
| 12/31/15 | 14.38 | 0.13 | 1.13 | 22.27 | ||||||||||||
| 12/31/16 | 16.61 | 0.11 | 0.29 | 24.90 | ||||||||||||
| 10/31/17(a) | 19.77 | 0.03 | — | 28.09 | ||||||||||||
| (a) | Ten months only. Distributions typically occur in June and/or December. |
| (b) | Represents distributions for the respective calendar year-to-date period ended. |
| (c) | Does not assume any compounding of reinvested distributions. |
Table shows calendar-year distributions and asset values; may differ from fiscal-year annual reports.
| * | Unmanaged index of stocks, bonds or mutual funds. It is not possible to invest directly in an index. |
Portfolio composition will change due to ongoing management of the Fund. References to specific securities or sectors should not be construed as a recommendation by the Fund, its Advisor or Distributor. See the accompanying Schedule of Investments for the percentage of the Fund’s portfolio represented by the securities or sectors mentioned above.
| 10 | SCOUT FUNDS ANNUAL REPORT |
SCHEDULE OF INVESTMENTS
October 31, 2017
MID CAP FUND
| Shares | Value | |||||||
| COMMON STOCKS — 99.4% | ||||||||
| CONSUMER DISCRETIONARY — 14.0% | ||||||||
| American Eagle Outfitters, Inc. | 596,525 | $ | 7,766,756 | |||||
| Brunswick Corp. | 152,025 | 7,700,066 | ||||||
| Chipotle Mexican Grill, Inc.* | 30,179 | 8,205,670 | ||||||
| Darden Restaurants, Inc. | 94,150 | 7,745,721 | ||||||
| DISH Network Corp. — Class A* | 117,950 | 5,725,293 | ||||||
| DR Horton, Inc. | 191,600 | 8,470,636 | ||||||
| Expedia, Inc. | 87,500 | 10,907,750 | ||||||
| Garmin Ltd.(a) | 102,500 | 5,802,525 | ||||||
| Hilton Grand Vacations, Inc.* | 322,950 | 13,228,032 | ||||||
| Lear Corp. | 53,500 | 9,394,065 | ||||||
| Live Nation Entertainment, Inc.* | 321,275 | 14,065,419 | ||||||
| Mohawk Industries, Inc.* | 42,425 | 11,105,168 | ||||||
| NVR, Inc.* | 1,359 | 4,459,382 | ||||||
| Polaris Industries, Inc. | 73,675 | 8,725,330 | ||||||
| PulteGroup, Inc. | 212,625 | 6,427,654 | ||||||
| PVH Corp. | 49,550 | 6,283,436 | ||||||
| Ross Stores, Inc. | 158,600 | 10,069,514 | ||||||
| Royal Caribbean Cruises Ltd.(a) | 121,000 | 14,976,170 | ||||||
| Six Flags Entertainment Corp. | 139,025 | 8,729,380 | ||||||
| Skechers U.S.A., Inc. — Class A* | 341,675 | 10,906,266 | ||||||
| Tenneco, Inc. | 94,625 | 5,498,659 | ||||||
| Texas Roadhouse, Inc. | 120,644 | 6,033,406 | ||||||
| Thor Industries, Inc. | 212,024 | 28,881,909 | ||||||
| Ulta Beauty, Inc.* | 17,875 | 3,606,996 | ||||||
| Vail Resorts, Inc. | 44,825 | 10,265,821 | ||||||
| 234,981,024 | ||||||||
| CONSUMER STAPLES — 2.7% | ||||||||
| Clorox Co. | 55,325 | 7,000,272 | ||||||
| Conagra Brands, Inc. | 152,450 | 5,207,692 | ||||||
| Hormel Foods Corp. | 227,300 | 7,082,668 | ||||||
| Monster Beverage Corp.* | 169,095 | 9,795,674 | ||||||
| Tyson Foods, Inc. — Class A | 222,175 | 16,198,779 | ||||||
| 45,285,085 | ||||||||
| ENERGY — 5.3% | ||||||||
| Andeavor | 63,325 | 6,727,648 | ||||||
| Devon Energy Corp. | 496,075 | 18,305,167 | ||||||
| Energen Corp.* | 220,375 | 11,393,388 | ||||||
| Marathon Petroleum Corp. | 271,825 | 16,238,825 | ||||||
| Newfield Exploration Co.* | 306,150 | 9,426,359 | ||||||
| Oceaneering International, Inc. | 305,541 | 6,178,039 | ||||||
| Patterson-UTI Energy, Inc. | 335,300 | 6,632,234 | ||||||
| RPC, Inc. | 333,050 | 8,096,446 | ||||||
| TechnipFMC PLC*(a) | 227,775 | 6,238,757 | ||||||
| 89,236,863 | ||||||||
| FINANCIALS — 11.7% | ||||||||
| Affiliated Managers Group, Inc. | 29,128 | 5,432,372 | ||||||
| Arch Capital Group Ltd.*(a) | 76,875 | 7,659,825 | ||||||
| Axis Capital Holdings Ltd.(a) | 47,903 | 2,605,444 | ||||||
| Cboe Global Markets, Inc. | 91,971 | 10,398,241 | ||||||
| Citizens Financial Group, Inc. | 671,942 | 25,540,515 | ||||||
| Comerica, Inc. | 245,350 | 19,277,149 | ||||||
| KeyCorp. | 947,900 | 17,299,175 | ||||||
| LendingTree, Inc.* | 52,850 | 14,166,443 | ||||||
| Lincoln National Corp. | 114,525 | 8,678,705 | ||||||
| MarketAxess Holdings, Inc. | 39,875 | 6,938,250 | ||||||
| S&P Global, Inc. | 72,000 | 11,265,840 | ||||||
| SunTrust Banks, Inc. | 324,875 | 19,560,724 | ||||||
| T. Rowe Price Group, Inc. | 61,996 | 5,759,428 | ||||||
| Umpqua Holdings Corp. | 511,475 | 10,464,779 | ||||||
| Unum Group | 123,850 | 6,445,154 | ||||||
| Voya Financial, Inc. | 442,275 | 17,761,764 | ||||||
| White Mountains Insurance Group Ltd.(a) | 7,950 | 7,068,743 | ||||||
| 196,322,551 | ||||||||
| HEALTH CARE — 10.0% | ||||||||
| ABIOMED, Inc.* | 297,250 | 57,345,470 | ||||||
| Align Technology, Inc.* | 31,125 | 7,438,252 | ||||||
| BioMarin Pharmaceutical, Inc.* | 84,125 | 6,905,821 | ||||||
| Edwards Lifesciences Corp.* | 149,175 | 15,250,160 | ||||||
| Hologic, Inc.* | 164,975 | 6,244,304 | ||||||
| Humana, Inc. | 30,548 | 7,800,432 | ||||||
| Illumina, Inc.* | 41,225 | 8,458,958 | ||||||
| Incyte Corp.* | 50,475 | 5,716,294 | ||||||
| Ionis Pharmaceuticals, Inc.* | 83,275 | 4,755,835 | ||||||
| Molina Healthcare, Inc.* | 184,497 | 12,514,432 | ||||||
| NuVasive, Inc.* | 147,150 | 8,347,819 | ||||||
| Supernus Pharmaceuticals, Inc.* | 229,625 | 9,552,400 | ||||||
| Teleflex, Inc. | 39,175 | 9,283,691 | ||||||
| Universal Health Services, Inc. — Class B | 11,775 | 1,209,293 | ||||||
| Veeva Systems, Inc. — Class A* | 121,600 | 7,410,304 | ||||||
| 168,233,465 | ||||||||
(Continued on next page)
| OCTOBER 31, 2017 | 11 |
SCHEDULE OF INVESTMENTS
October 31, 2017
MID CAP FUND (Continued)
| Shares | Value | |||||||
| INDUSTRIALS — 14.3% | ||||||||
| Aerojet Rocketdyne Holdings, Inc.* | 407,325 | $ | 12,863,323 | |||||
| AGCO Corp. | 114,900 | 7,878,693 | ||||||
| Alaska Air Group, Inc. | 123,175 | 8,133,245 | ||||||
| Allison Transmission Holdings, Inc. | 196,425 | 8,346,098 | ||||||
| AMERCO | 18,225 | 7,155,864 | ||||||
| BWX Technologies, Inc. | 286,575 | 17,171,574 | ||||||
| Dycom Industries, Inc.* | 128,750 | 11,308,112 | ||||||
| Hexcel Corp. | 169,975 | 10,315,783 | ||||||
| Huntington Ingalls Industries, Inc. | 61,925 | 14,417,998 | ||||||
| ManpowerGroup, Inc. | 132,025 | 16,276,042 | ||||||
| Masco Corp. | 220,575 | 8,783,297 | ||||||
| Norfolk Southern Corp. | 89,400 | 11,748,948 | ||||||
| Old Dominion Freight Line, Inc. | 71,475 | 8,657,767 | ||||||
| Owens Corning | 148,800 | 12,304,272 | ||||||
| Parker-Hannifin Corp. | 63,150 | 11,531,821 | ||||||
| Robert Half International, Inc. | 167,800 | 8,687,006 | ||||||
| Rockwell Automation, Inc. | 50,725 | 10,186,595 | ||||||
| Textron, Inc. | 256,584 | 13,532,240 | ||||||
| Timken Co. | 210,125 | 9,907,394 | ||||||
| United Rentals, Inc.* | 94,875 | 13,422,915 | ||||||
| Xylem, Inc. | 246,375 | 16,391,329 | ||||||
| 239,020,316 | ||||||||
| INFORMATION TECHNOLOGY — 22.5% | ||||||||
| Analog Devices, Inc. | 93,000 | 8,490,900 | ||||||
| Arista Networks, Inc.* | 97,850 | 19,559,236 | ||||||
| Aspen Technology, Inc.* | 52,400 | 3,380,848 | ||||||
| Coherent, Inc.* | 35,975 | 9,450,992 | ||||||
| CSRA, Inc. | 409,155 | 13,088,868 | ||||||
| DXC Technology Co. | 662,675 | 60,648,016 | ||||||
| eBay, Inc.* | 164,325 | 6,185,193 | ||||||
| Ellie Mae, Inc.* | 64,550 | 5,806,273 | ||||||
| Fiserv, Inc.* | 85,350 | 11,046,851 | ||||||
| Harris Corp. | 116,850 | 16,279,542 | ||||||
| IAC/InterActiveCorp* | 85,625 | 11,049,906 | ||||||
| IPG Photonics Corp.* | 109,875 | 23,393,486 | ||||||
| Jack Henry & Associates, Inc. | 112,725 | 12,414,404 | ||||||
| Keysight Technologies, Inc.* | 408,150 | 18,232,060 | ||||||
| KLA-Tencor Corp. | 46,300 | 5,041,607 | ||||||
| Lam Research Corp. | 76,700 | 15,997,319 | ||||||
| Match Group, Inc.* | 489,925 | 13,100,595 | ||||||
| Micron Technology, Inc.* | 261,550 | 11,589,281 | ||||||
| ON Semiconductor Corp.* | 469,800 | 10,016,136 | ||||||
| Palo Alto Networks, Inc.* | 30,525 | 4,493,280 | ||||||
| Proofpoint, Inc.* | 81,000 | 7,485,210 | ||||||
| Red Hat, Inc.* | 86,475 | 10,448,774 | ||||||
| Science Applications International Corp. | 174,008 | 12,761,747 | ||||||
| ServiceNow, Inc.* | 77,500 | 9,793,675 | ||||||
| Skyworks Solutions, Inc. | 136,178 | 15,505,227 | ||||||
| Take-Two Interactive Software, Inc.* | 74,300 | 8,221,295 | ||||||
| Universal Display Corp. | 56,000 | 8,204,000 | ||||||
| Western Digital Corp. | 105,950 | 9,458,157 | ||||||
| Workday, Inc. — Class A* | 71,775 | 7,966,307 | ||||||
| Xilinx, Inc. | 109,075 | 8,037,737 | ||||||
| 377,146,922 | ||||||||
| MATERIALS — 7.6% | ||||||||
| Albemarle Corp. | 114,250 | 16,096,682 | ||||||
| Celanese Corp. | 102,275 | 10,668,305 | ||||||
| CF Industries Holdings, Inc. | 406,255 | 15,429,565 | ||||||
| Chemours Co. | 279,425 | 15,818,249 | ||||||
| Martin Marietta Materials, Inc. | 56,873 | 12,332,910 | ||||||
| Newmont Mining Corp. | 432,475 | 15,638,296 | ||||||
| Steel Dynamics, Inc. | 342,825 | 12,756,518 | ||||||
| Vulcan Materials Co. | 81,025 | 9,864,794 | ||||||
| Westlake Chemical Corp. | 192,200 | 16,319,702 | ||||||
| Wheaton Precious Metals Corp.(a) | 82,875 | 1,718,828 | ||||||
| 126,643,849 | ||||||||
| REAL ESTATE — 5.4% | ||||||||
| Cousins Properties, Inc. REIT | 1,476,225 | 13,315,550 | ||||||
| EPR Properties REIT | 194,375 | 13,446,862 | ||||||
| Host Hotels & Resorts, Inc. REIT | 857,875 | 16,780,035 | ||||||
| Lamar Advertising Co. — Class A REIT | 238,730 | 16,816,141 | ||||||
| Omega Healthcare Investors, Inc. REIT | 223,623 | 6,453,760 | ||||||
| Outfront Media, Inc. REIT | 600,614 | 14,084,398 | ||||||
| Senior Housing Properties Trust REIT | 491,719 | 9,047,630 | ||||||
| 89,944,376 | ||||||||
| UTILITIES — 5.9% | ||||||||
| American Water Works Co., Inc. | 113,100 | 9,925,656 | ||||||
| Atmos Energy Corp. | 360,399 | 31,441,209 | ||||||
| CMS Energy Corp. | 179,425 | 8,678,787 | ||||||
| ONE Gas, Inc. | 164,231 | 12,642,502 | ||||||
| PG&E Corp. | 183,700 | 10,612,349 | ||||||
| Xcel Energy, Inc. | 514,925 | 25,499,086 | ||||||
| 98,799,589 | ||||||||
| TOTAL COMMON STOCKS | ||||||||
| (Cost $1,323,490,686) — 99.4% | 1,665,614,040 | |||||||
| SHORT-TERM INVESTMENTS — 0.6% | ||||||||
| MONEY MARKET FUNDS | ||||||||
| Fidelity Investments Money Market Funds — | ||||||||
| Treasury Portfolio — Class I, 0.915% | 10,000,000 | 10,000,000 | ||||||
| TOTAL SHORT-TERM INVESTMENTS | ||||||||
| (Cost $10,000,000) — 0.6% | 10,000,000 | |||||||
| TOTAL INVESTMENTS | ||||||||
| (Cost $1,333,490,686) — 100.0% | 1,675,614,040 | |||||||
| Liabilities less other assets — 0.0% | (399,842 | ) | ||||||
| TOTAL NET ASSETS — 100.0% | ||||||||
| (equivalent to $19.77 per share; | ||||||||
| unlimited shares of $1.00 par value | ||||||||
| capital shares authorized; | ||||||||
| 84,714,099 shares outstanding) | $ | 1,675,214,198 | ||||||
PLC — Public Limited Company
REIT — Real Estate Investment Trust
| * | Non-income producing security. |
| (a) | Foreign security denominated in U.S. dollars. |
See accompanying Notes to Financial Statements.
| 12 | SCOUT FUNDS ANNUAL REPORT |
Scout Small Cap Fund
UMBHX
As a result of a reorganization that was completed after the close of business on November 17, 2017, the Scout Small Cap Fund is now the Carillon Scout Small Cap Fund. The commentary that follows is for the 12 months ended October 31, 2017.
MARKET REVIEW
Small-cap stocks, broadly represented by the Russell 2000® Index, provided solid returns during the fiscal year ended Oct. 31, 2017, with the index gaining 27.85 percent. A vast majority of the gains during the fiscal year followed the U.S. presidential election as investors anticipated tax and regulatory reform.
The Federal Reserve (the Fed) was able to successfully hike interest rates three times this fiscal year given the tighter labor markets and improvement in the U.S. economy. There are some developing credit concerns in subprime auto loans and credit cards but, with unemployment continuing to fall and wages still rising, the yield curve remains upwardly sloped and economic growth is still positive.
The price of oil, a key component in the overall economy, closed the fiscal year relatively unchanged. We believe Saudi Arabia would like to conduct an initial public offering of its national oil company, Aramco, sometime in 2018; so, we expect they will be supportive of orderly oil markets to set the stage for the offering and shore up their government’s budget.
PORTFOLIO REVIEW
The Scout Small Cap Fund (UMBHX) returned 40.69 percent for the 12 months ended October 31, 2017, outperforming the Russell 2000 Growth Index return of 31.00 percent. Positive stock selection in information technology, consumer discretionary and financials accounted for the majority of the relative outperformance. An overweight in healthcare along with an underweight in the consumer staples and the real estate sectors also added to relative performance. In contrast, disappointing stock selection in the energy sector offset the positive effect of the Fund’s underweight position. An underweight position and disappointing stock selection in the materials sector also provided a negative impact on relative performance.
Stocks providing the most positive contribution to performance included LendingTree, Inc.; ePlus, Inc.; Cognex Corp.; Supernus Pharmaceuticals, Inc.; and Thor Industries, Inc. The financials sector benefited from LendingTree, Inc., an online loan marketplace for consumers seeking loans, which reported strong earnings and provided encouraging guidance for fiscal year 2017. In addition, the company has executed well and continues to diversify revenue streams away from mortgage-related products. ePLUS provides IT solutions for data center, cloud computing and security via hardware, software and services. Better-than-expected results driven by a large networking infrastructure contract for Apple drove the stock higher. The company continues to expect above industry growth, as well as continued mergers and acquisition activity. Cognex produces machine vision systems and software used in industrial automation and barcode ID reading. Very strong demand across the company’s end markets and geographies has driven earnings results and guidance well above expectations. Supernus Pharmaceuticals is focused on developing and commercializing products for the treatment of central nervous system diseases. The company recently received approval for an expanded label for Trokendi and Oxtellar XR, which has increased revenues. Thor is the leading manufacturer of motorhomes and towable RVs. The company reported significantly better-than-expected earnings results that were driven by strong results in both “towables” and motorhomes from its core business and recently acquired Jayco Company.
Some of the Fund’s main detractors on an individual stock basis were Electronics for Imaging; Adeptus Health, Inc.; Cambrex Corp.; Gulfport Energy Corp.; and Monro, Inc. Electronics for Imaging is a leading provider of industrial inkjet printers, inks and software. The stock has been weak following a pair of disappointing earnings results and guidance. Adeptus Health operates an independent network of free-standing emergency rooms. The company announced a significant miss and reset of expectations along with multiple management changes, which negatively impacted the stock. Cambrex is a company that produces small-molecule Active Pharmaceutical Ingredients. The company’s largest customer, Gilead, has struggled with slower Hepatitis C sales. Continued outsourcing of small-molecule production should be beneficial to Cambrex. Gulfport Energy is engaged in the exploration and production of oil and natural gas, primarily in the Northeast and Midwestern United States. The stock has been weak following a large acquisition that broadened the company’s exposure to a second major oil and gas basin.
| OCTOBER 31, 2017 | 13 |
Scout Small Cap Fund
UMBHX
Monro Muffler Brake operates a chain of automotive repair and service stores throughout the United States. The stock has been weak due to continued sluggishness in same-store sales across all categories of the business. Additionally, in late June the company announced the retirement of both its longtime CEO and the chairman of its board of directors.
MARKET OUTLOOK
Markets continue to climb on optimism for faster economic growth within the United States due in part to the promise of deregulation, tax reform and infrastructure investments. However, investor concerns have emerged as the potential for a trade war due to tough rhetoric from the administration, the unknown reaction to the Fed’s balance sheet reduction and the uncertainty of passing tax reform could place a damper on the markets. Overall the growth in the world economy appears strong.
PORTFOLIO STRATEGY
The Scout Small Cap Fund invests in a diversified portfolio of equity securities that are selected based on their above-average potential for long-term growth of capital. Today, we are finding many of those opportunities in the financials, information technology and healthcare sectors. While sector allocations are a by-product of the investment process (with each portfolio candidate assessed on its own merit) these sectors represent the Fund’s largest overweight positions relative to the benchmark. In contrast, the Fund’s largest underweight position is in industrials, reflecting fewer growth investment opportunities in this area.
James R. McBride, CFA
Lead Portfolio Manager
Timothy L. Miller, CFA
Co-Portfolio Manager
| 14 | SCOUT FUNDS ANNUAL REPORT |
Scout Small Cap Fund
UMBHX
OBJECTIVE & STRATEGY (Unaudited)
The Scout Small Cap Fund seeks long-term growth of capital by investing in a diversified portfolio of equity securities of small cap companies located anywhere in the United States.
PORTFOLIO MANAGEMENT TEAM
James R. McBride, CFA
Lead Portfolio Manager
Timothy L. Miller, CFA
Co-Portfolio Manager
HYPOTHETICAL GROWTH OF $10,000 (Unaudited)
as of October 31, 2017

Performance returns for the Scout Small Cap Fund and Russell 2000® Growth Index assume dividends were reinvested for the entire period.
For illustrative purposes only; may not represent your returns.
| * | Unmanaged index of stocks, bonds or mutual funds. It is not possible to invest directly in an index. The Russell 2000® Growth Index measures the performance of those Russell 2000 companies with higher price-to-book ratios and higher forecasted growth values. The Russell 2000 Index is a small-cap stock market index that measures the performance of the 1001st through 3000th largest companies in the US as measured by float-adjusted market capitalization. |
Portfolio composition will change due to ongoing management of the Fund. References to specific securities should not be construed as recommendations by the Fund, its Advisor or Distributor.
Risk considerations: Due to the limited focus, the Fund is more susceptible to market volatility because smaller companies may not have the management experience, financial resources, product diversification and competitive strengths of larger companies. Additionally, smaller company stocks tend to be sold less often and in smaller amounts than larger company stocks. Real Estate Investment Trusts (REITS) may be affected by economic conditions including credit risk, interest rate risk and other factors that affect property values, rents or occupancies of real estate. Foreign investments present additional risks due to currency fluctuations, economic and political factors, government regulations, differences in accounting standards and other factors. Investments in emerging markets involve even greater risks. Groups of stocks, such as value and growth, go in and out of favor which may cause certain funds to underperform other equity funds.
| OCTOBER 31, 2017 | 15 |
Scout Small Cap Fund
UMBHX
COMPARATIVE RATES OF RETURN (Unaudited)
as of October 31, 2017
| 1 Year | 3 Years | 5 Years | 10 Years | |||||
| Scout Small Cap Fund | 40.69% | 12.65% | 16.99% | 7.02% | ||||
| Russell 2000® Growth Index* | 31.00% | 10.51% | 15.36% | 8.16% |
Returns for periods greater than one year are compounded average annual rates of return.
The performance data quoted represents past performance and past performance is not a guarantee of future results. Investment return and principal value of an investment will fluctuate so that an investor’s shares, when redeemed, may be worth more or less than their original cost. Current performance may be lower or higher than the performance information quoted. To obtain performance information current to the most recent month-end, please call 800-996-2862. For the fiscal year ended June 30, 2017, the gross/net expense ratio for the Fund was 1.04% (as disclosed in the most recent Prospectus) compared to the October 31, 2017, gross/net expense ratio of 1.03%.
The performance shown in the above table and in the graph on the preceding page does not reflect the deduction of taxes that a shareholder would pay on Fund distributions or the redemption of Fund shares.
PORTFOLIO CHARACTERISTICS (Unaudited)
| Scout | Russell 2000® | |||
| Small Cap | Growth* | |||
| Number of Holdings | 72 | 1,163 | ||
| Weighted Average Market Cap | $2.87B | $2.52B | ||
| Weighted Median Market Cap | $2.26B | $2.38B | ||
| Price to Earnings Ratio (Trailing 1 Year) | 28.96 | 26.17 | ||
| Price/Book Ratio | 3.52 | 4.29 | ||
| EPS Growth (Hist. 5 Yr.) | 7.29% | 8.12% | ||
| Return on Equity | 14.37% | 8.29% | ||
| Standard Deviation (Trailing 3 Years) | 13.64% | 14.80% | ||
| Sharpe Ratio (Trailing 3 Years) | 0.90 | 0.68 | ||
| Beta† | 0.87 | 1.00 | ||
| Alpha† | 3.18% | — | ||
| R-squared† | 0.89 | 1.00 | ||
| Upside Capture† | 96% | 100% | ||
| Downside Capture† | 82% | 100% | ||
| Turnover Ratio (Trailing 1 Year) | 28% | — | ||
| Total Net Assets (in Millions) | $270.53 | — | ||
| Inception Date | 12/18/1986 | — |
† Measured against the Russell 2000® Growth Index over the trailing three year time period.
FUND DIVERSIFICATION (Unaudited)
Based on total investments as of October 31, 2017. Subject to change.
TOP 10 EQUITY HOLDINGS (Unaudited)
| Percent of Total | ||
| ICU Medical, Inc. | 2.88% | |
| Thor Industries, Inc. | 2.85% | |
| BroadSoft, Inc. | 2.83% | |
| II-VI, Inc. | 2.71% | |
| ePlus, Inc. | 2.69% | |
| Omnicell, Inc. | 2.68% | |
| LendingTree, Inc. | 2.67% | |
| Teledyne Technologies, Inc. | 2.38% | |
| Supernus Pharmaceuticals, Inc. | 2.34% | |
| Cracker Barrel Old Country Store, Inc. | 2.18% | |
| Top 10 Holdings Total | 26.21% |
Based on total investments as of October 31, 2017. Subject to change.
HISTORICAL PER-SHARE RECORD (Unaudited)
| Income & | Cumulative(c) | |||||||||||||||
| Net Asset | Short-Term(b) Gains | Long-Term(b) Gains | Value Per Share | |||||||||||||
| Value | Distribution | Distribution | Plus Distributions | |||||||||||||
| 12/31/12 | $ | 17.45 | $ | 0.06 | $ | — | $ | 31.61 | ||||||||
| 12/31/13 | 23.91 | — | — | 38.07 | ||||||||||||
| 12/31/14 | 25.03 | — | 0.18 | 39.37 | ||||||||||||
| 12/31/15 | 21.60 | — | 3.54 | 39.48 | ||||||||||||
| 12/31/16 | 23.24 | 0.01 | 1.05 | 42.18 | ||||||||||||
| 10/31/17(a) | 29.33 | — | — | 48.27 | ||||||||||||
| (a) | Ten months only. Distributions typically occur in June and/or December. |
| (b) | Represents distributions for the respective calendar year-to-date period ended. |
| (c) | Does not assume any compounding of reinvested distributions. |
Table shows calendar-year distributions and net asset values; may differ from fiscal-year annual reports.
| * | Unmanaged index of stocks, bonds or mutual funds. It is not possible to invest directly in an index. |
Portfolio composition will change due to ongoing management of the Fund. References to specific securities or sectors should not be construed as a recommendation by the Fund, its Advisor or Distributor. See the accompanying Schedule of Investments for the percentage of the Fund’s portfolio represented by the securities or sectors mentioned above.
| 16 | SCOUT FUNDS ANNUAL REPORT |
SCHEDULE OF INVESTMENTS
October 31, 2017
SMALL CAP FUND
| Shares | Value | |||||||
| COMMON STOCKS — 99.3% | ||||||||
| CONSUMER DISCRETIONARY — 14.4% | ||||||||
| Camping World Holdings, Inc. — Class A | 67,500 | $ | 2,836,350 | |||||
| Cheesecake Factory, Inc. | 58,800 | 2,630,712 | ||||||
| Cracker Barrel Old Country Store, Inc. | 37,900 | 5,917,327 | ||||||
| G-III Apparel Group Ltd.* | 68,100 | 1,725,654 | ||||||
| Installed Building Products, Inc.* | 66,500 | 4,635,050 | ||||||
| iRobot Corp.* | 60,900 | 4,091,871 | ||||||
| LGI Homes, Inc.* | 49,800 | 3,004,434 | ||||||
| Lindblad Expeditions Holdings, Inc.* | 155,200 | 1,663,744 | ||||||
| Monro, Inc. | 92,700 | 4,574,745 | ||||||
| Thor Industries, Inc. | 56,631 | 7,714,275 | ||||||
| 38,794,162 | ||||||||
| CONSUMER STAPLES — 1.4% | ||||||||
| Performance Food Group Co.* | 134,200 | 3,797,860 | ||||||
| ENERGY — 0.8% | ||||||||
| Geospace Technologies Corp.* | 61,060 | 917,121 | ||||||
| Gulfport Energy Corp.* | 92,800 | 1,271,360 | ||||||
| 2,188,481 | ||||||||
| FINANCIALS — 10.3% | ||||||||
| BofI Holding, Inc.* | 112,500 | 3,026,250 | ||||||
| CNO Financial Group, Inc. | 202,400 | 4,851,528 | ||||||
| Cohen & Steers, Inc. | 104,826 | 4,558,883 | ||||||
| Financial Engines, Inc. | 89,200 | 3,220,120 | ||||||
| Hilltop Holdings, Inc. | 119,900 | 2,824,844 | ||||||
| LendingTree, Inc.* | 27,000 | 7,237,350 | ||||||
| PRA Group, Inc.* | 77,910 | 2,173,689 | ||||||
| 27,892,664 | ||||||||
| HEALTH CARE — 25.6% | ||||||||
| Acorda Therapeutics, Inc.* | 43,800 | 1,163,985 | ||||||
| Almost Family, Inc.* | 57,800 | 2,557,650 | ||||||
| AMN Healthcare Services, Inc.* | 95,600 | 4,196,840 | ||||||
| BioTelemetry, Inc.* | 118,600 | 3,445,330 | ||||||
| Bruker Corp. | 163,200 | 5,124,480 | ||||||
| Cambrex Corp.* | 77,900 | 3,369,175 | ||||||
| Cutera, Inc.* | 54,290 | 2,133,597 | ||||||
| Exactech, Inc.* | 20,500 | 857,925 | ||||||
| Genomic Health, Inc.* | 70,700 | 2,318,253 | ||||||
| HealthEquity, Inc.* | 79,600 | 3,997,512 | ||||||
| HMS Holdings Corp.* | 140,600 | 2,705,144 | ||||||
| ICU Medical, Inc.* | 40,845 | 7,805,479 | ||||||
| Impax Laboratories, Inc.* | 92,300 | 1,675,245 | ||||||
| Molina Healthcare, Inc.* | 57,100 | 3,873,093 | ||||||
| Omnicell, Inc.* | 145,600 | 7,250,880 | ||||||
| PRA Health Sciences, Inc.* | 67,400 | 5,488,382 | ||||||
| Supernus Pharmaceuticals, Inc.* | 152,100 | 6,327,360 | ||||||
| U.S. Physical Therapy, Inc. | 74,550 | 5,065,673 | ||||||
| 69,356,003 | ||||||||
| INDUSTRIALS — 14.4% | ||||||||
| Albany International Corp. — Class A | 57,000 | 3,439,950 | ||||||
| Astronics Corp.* | 89,900 | 3,092,560 | ||||||
| Chart Industries, Inc.* | 45,500 | 1,979,250 | ||||||
| Dycom Industries, Inc.* | 64,400 | 5,656,252 | ||||||
| Healthcare Services Group, Inc. | 66,800 | 3,533,052 | ||||||
| InnerWorkings, Inc.* | 194,558 | 2,116,791 | ||||||
| Insperity, Inc. | 35,100 | 3,330,990 | ||||||
| Proto Labs, Inc.* | 55,300 | 4,824,925 | ||||||
| Radiant Logistics, Inc.* | 263,800 | 1,287,344 | ||||||
| Teledyne Technologies, Inc.* | 37,900 | 6,441,484 | ||||||
| WageWorks, Inc.* | 50,200 | 3,200,250 | ||||||
| 38,902,848 | ||||||||
| INFORMATION TECHNOLOGY — 28.6% | ||||||||
| Acxiom Corp.* | 44,400 | 1,117,104 | ||||||
| Ambarella, Inc.*(a) | 63,500 | 3,583,940 | ||||||
| Barracuda Networks, Inc.* | 132,800 | 3,095,568 | ||||||
| BroadSoft, Inc.* | 139,600 | 7,657,060 | ||||||
| Cognex Corp. | 33,600 | 4,137,840 | ||||||
| Descartes Systems Group, Inc.*(a) | 112,900 | 3,279,745 | ||||||
| Electronics For Imaging, Inc.* | 80,100 | 2,471,886 | ||||||
| Entegris, Inc. | 101,100 | 3,311,025 | ||||||
| Envestnet, Inc.* | 83,400 | 4,453,560 | ||||||
| ePlus, Inc.* | 76,300 | 7,294,280 | ||||||
| II-VI, Inc.* | 162,200 | 7,331,440 | ||||||
| Impinj, Inc.* | 45,900 | 1,567,026 | ||||||
| Inphi Corp.* | 42,800 | 1,753,944 | ||||||
| j2 Global, Inc. | 71,000 | 5,263,940 | ||||||
| Jack Henry & Associates, Inc. | 49,400 | 5,440,422 | ||||||
| Pegasystems, Inc. | 92,000 | 5,363,600 | ||||||
| Semtech Corp.* | 139,300 | 5,718,265 | ||||||
| Veeco Instruments, Inc.* | 125,800 | 2,270,690 | ||||||
| Virtusa Corp.* | 59,800 | 2,281,968 | ||||||
| 77,393,303 | ||||||||
| MATERIALS — 2.2% | ||||||||
| Balchem Corp. | 50,600 | 4,265,074 | ||||||
| Carpenter Technology Corp. | 32,500 | 1,618,175 | ||||||
| 5,883,249 | ||||||||
| REAL ESTATE — 1.6% | ||||||||
| CareTrust REIT, Inc. | 113,100 | 2,137,590 | ||||||
| QTS Realty Trust, Inc. — Class A REIT | 38,300 | 2,215,655 | ||||||
| 4,353,245 | ||||||||
| TOTAL COMMON STOCKS | ||||||||
| (Cost $170,041,724) — 99.3% | 268,561,815 | |||||||
| TOTAL INVESTMENTS | ||||||||
| (Cost $170,041,724) — 99.3% | 268,561,815 | |||||||
| Other assets less liabilities — 0.7% | 1,969,221 | |||||||
| TOTAL NET ASSETS — 100.0% | ||||||||
| (equivalent to $29.33 per share; | ||||||||
| unlimited shares of $1.00 par value | ||||||||
| capital shares authorized; | ||||||||
| 9,223,646 shares outstanding) | $ | 270,531,036 | ||||||
REIT — Real Estate Investment Trust
| * | Non-income producing security. |
| (a) | Foreign security denominated in U.S. dollars. |
See accompanying Notes to Financial Statements.
| OCTOBER 31, 2017 | 17 |
Scout Low Duration Bond Fund
SCLDX
As a result of a reorganization that was completed after the close of business on November 17, 2017, the Scout Low Duration Bond Fund is now the Carillon Reams Low Duration Bond Fund. The commentary that follows is for the 12 months ended October 31, 2017.
MARKET REVIEW
The Bloomberg Barclays U.S. Aggregate Index® returned 0.90 percent for the 12 months ending Oct. 31, 2017.1 Interest-rates increased sharply following President Donald Trump’s election as investors anticipated significant fiscal stimulus. The yield on the bellwether 10-Year Treasury Bond also improved, increasing from 1.83 percent on Nov. 1, 2016, to 2.38 percent by Oct. 31, 2017. Risk-asset valuations rose and spreads continued to tighten throughout 2017.
Volatility, as measured by the Chicago Board Options Exchange (CBOE) Volatility Index® (“VIX”), hit a record low and asset prices crept steadily higher. Even the typically volatile months of September and October passed quietly. The Fed surprised the market a bit as it formally began to reduce its balance sheet in October. This action joins other central banks around the globe in a fledgling effort to scale back the emergency monetary stimulus that has been in place for many years. The combination of increasing short-term rates and lowered inflation expectations has caused classic, Fed-induced yield-curve flattening. Historically, a flat yield curve is negative for spread sectors but credit spreads remained very tight in the current environment of risk apathy.
The European Central Bank (ECB) was late in arriving to the global quantitative easing (QE) party, but it has now indicated that a tapering of its program is near. ECB tightening might in fact have occurred earlier were it not for the headwind of a sharply higher euro. Now, as the ECB prepares to halt its QE program, the downward pressure on their currency has begun to relent. Fallout from disappointing U.S. fiscal stimulus has exacerbated the euro’s move higher vs. the dollar, providing an example of how “beggar thy neighbor” QE polices frequently provide only temporary help in currency depreciation.
Given the number of threats to fixed-income security prices — from rising interest rates and geopolitical uncertainty to the choppy transition from monetary to fiscal stimulus — we view rising yields and tighter spreads as further evidence that bond investors have become desensitized to risk.
PORTFOLIO REVIEW
The Scout Low Duration Bond Fund (SCLDX) returned 1.19 percent for the 12 months ended October 31, 2017, outperforming the Bloomberg Barclays 1-3 Year U.S. Government/Credit Index® return of 0.67 percent. Macroeconomic factors were positive over the time period. The Fund benefited from a shorter duration position as short-term interest rates rose. Yield curve modestly added to performance.
Performance was overwhelmingly positive at the sector level. Investment-grade credit, high-yield credit, asset-backed securities (ABS) and commercial mortgage-backed securities (CMBS) all added to performance due to the Fund’s overweight positions in these outperforming sectors. Mortgage-backed securities (MBS) further bolstered returns due to gains in the Fund’s multi-family agency holdings. In contrast, government-related securities detracted from relative results due to the Fund’s underweight position.
MARKET OUTLOOK
For much of 2017, volatility has been anchored near the low end of its historic range. This is inconsistent with the increasingly risky geopolitical climate as well as the anticipated trend away from global monetary stimulus, which has been dampening volatility since central banks opened the spigot in the wake of 2008’s financial crisis. At the same time, general corporate spreads remain near historic tights and anecdotal evidence suggests that we are in the late stages of the credit cycle. For these reasons, we expect to see an increase in volatility as global central banks pull back their monetary stimulus.
Recent Fed communication points to three rate increases in 2018. This is aggressive, and we believe that the consensus view of one or two rate increases is more realistic, albeit still optimistic. Inflation, apart from asset-price inflation, has remained stubbornly low and below the Fed’s target levels. Short of significant fiscal stimulus hitting the market, we do not expect inflation to be a problem. If the capital markets falter, the Fed may quickly back away from the rate-hike action, as it seems more
| 1 | https://www.treasury.gov/resource-center/data-chart-center/interest-rates/Pages/TextView.aspx?data=yieldYear&year=2017 |
| 18 | SCOUT FUNDS ANNUAL REPORT |
| Scout Low Duration Bond Fund |
| SCLDX |
focused on enabling capital markets instead of holding to a constant rate-setting rationale. A flat yield curve indicates concern that the Fed may raise rates too far and choke off growth.
Meanwhile, Treasury rates remain at modest levels as President Trump’s fiscal stimulus agenda continues to experience setbacks. A bold tax-reform plan has been proposed by the administration but the combination of delays, distraction from failed healthcare reform and lack of concentrated support in Congress leaves its fate in question, although its prospects improved late in 2017. We expect that some tax cut will be passed eventually but how much it adds in stimulus is difficult to ascertain at this point. This confirms our initial skepticism regarding the ease of the handoff from monetary to fiscal stimulus that was anticipated with Trump’s election.
PORTFOLIO STRATEGY
The factors above reinforce our belief that current bond market valuations do not reflect its risks. While we continue to be cautious on valuations broadly in the fixed-income markets, we do view the low-duration investment-grade credit and mortgage-backed securities sectors as attractive. If the Fed continues down the path of raising the front end of the yield curve, the danger of a flat or inverted curve increases. Both scenarios are almost always negative for spread sector performance, with an inverted yield curve being particularly problematic. For these reasons, we are continuing to position our portfolios defensively and avoiding the intermediate and longer-term portions of the spread sectors. We expect that this will enable us to protect our clients from the price declines that may be on the horizon as well as to take advantage of the opportunities for future outperformance that those declines may create.
Mark M. Egan, CFA
Lead Portfolio Manager
Thomas M. Fink, CFA
Co-Portfolio Manager
Todd C. Thompson, CFA
Co-Portfolio Manager
Stephen T. Vincent, CFA
Co-Portfolio Manager
Clark W. Holland, CFA
Co-Portfolio Manager
| OCTOBER 31, 2017 | 19 |
| Scout Low Duration Bond Fund |
| SCLDX |
| OBJECTIVE & STRATEGY (Unaudited) |
The Scout Low Duration Bond Fund seeks a high level of total return consistent with the preservation of capital by investing in fixed income instruments and targeting an estimated average portfolio duration of one to four years.
| PORTFOLIO MANAGEMENT TEAM |
Mark M. Egan, CFA
Lead Portfolio Manager
Thomas M. Fink, CFA
Co-Portfolio Manager
Todd C. Thompson, CFA
Co-Portfolio Manager
Stephen T. Vincent, CFA
Co-Portfolio Manager
Clark W. Holland, CFA
Co-Portfolio Manager
| HYPOTHETICAL GROWTH OF $10,000 (Unaudited) |
as of October 31, 2017
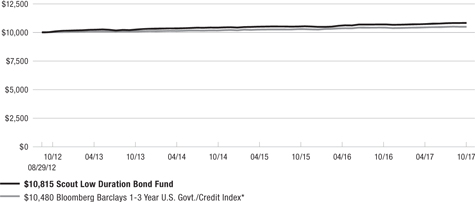
Performance returns for the Scout Low Duration Bond Fund and Bloomberg Barclays 1-3 Year U.S. Government/Credit Index assume dividends were reinvested for the entire period.
For Illustrative purposes only; may not represent your returns.
| * | Unmanaged index of stocks, bonds or mutual funds. It is not possible to invest directly in an index. The Bloomberg Barclays 1-3 Year U.S. Government/Credit Index measures the performance of Treasuries, government-related issues and corporate bonds with maturities from one to three years. |
Portfolio composition will change due to ongoing management of the Fund. References to specific securities should not be construed as recommendations by the Fund, its Advisor or Distributor.
Risk considerations: The return of principal in a fixed income fund is not guaranteed. Fixed income funds have the same issuer, interest rate, inflation, maturity and credit risks that are associated with underlying fixed income securities owned by the Fund. High yield securities involve greater risk than investment grade securities. Mortgage- and Asset-Backed Securities are subject to prepayment risk and the risk of default on the underlying mortgages or other assets. Foreign investments present additional risks due to currency fluctuations, economic and political factors, government regulations, differences in accounting standards and other factors.
Derivatives such as options, futures contracts, currency forwards or swap agreements may involve greater risks than if the Fund invested in the referenced obligation directly. Derivatives are subject to risks such as market risk, liquidity risk, interest rate risk, credit risk, and management risk. Derivative investments could lose more than the principal amount invested. The Fund may use derivatives for hedging purposes or as part of its investment strategy. The use of leverage and derivatives investments could accelerate losses to the Fund. These losses could exceed the amount originally invested.
The Fund may, at times, experience higher-than-average portfolio turnover which may generate significant taxable gains and increased trading expenses which in turn may lower the Fund’s return.
| 20 | SCOUT FUNDS ANNUAL REPORT |
| Scout Low Duration Bond Fund |
| SCLDX |
| COMPARATIVE RATES OF RETURN (Unaudited) |
as of October 31, 2017
| Since | ||||||||
| 1 Year | 3 Years | 5 Years | Inception† | |||||
| Scout Low Duration Bond Fund | 1.19% | 1.21% | 1.32% | 1.53% | ||||
| Bloomberg Barclays 1-3 Year U.S. Government/Credit Index* | 0.67% | 0.95% | 0.90% | 0.91% |
| † | Inception – August 29, 2012. |
Returns for periods greater than one year are compounded average annual rates of return.
The performance data quoted represents past performance and past performance is not a guarantee of future results. Investment return and principal value of an investment will fluctuate so that an investor’s shares, when redeemed, may be worth more or less than their original cost. Current performance may be lower or higher than the performance information quoted. To obtain performance information current to the most recent month-end, please call 800-996-2862. For the fiscal year ended June 30, 2017, the gross expense ratio for the Fund was 0.76% (as disclosed in the most recent Prospectus) compared to the October 31, 2017, gross expense ratio of 0.75%.
The performance returns for the Fund reflect a fee waiver in effect. In absence of such waiver, the returns would be reduced. The Advisor has contractually agreed to waive fees and assume certain fund expenses through October 30, 2018, and may recoup previously waived fees and expenses that it assumed during the previous three fiscal years.
The Fund may, at times, experience higher-than-average portfolio turnover which may generate significant taxable gains and increased trading expenses which in turn may lower the Fund’s return.
The performance shown in the above table and in the graph on the preceding page does not reflect the deduction of taxes that a shareholder would pay on Fund distributions or the redemption of Fund shares.
| FUND DIVERSIFICATION (Unaudited) |

Based on total investments as of October 31, 2017. Subject to change.
| HISTORICAL PER-SHARE RECORD (Unaudited) |
| Income & | Cumulative(c) | |||||||||||||||
| Net Asset | Short-Term(b) Gains | Long-Term(b) Gains | Value Per Share | |||||||||||||
| Value | Distribution | Distribution | Plus Distributions | |||||||||||||
| 12/31/12 | $ | 10.10 | $ | 0.07 | $ | — | $ | 10.17 | ||||||||
| 12/31/13 | 10.09 | 0.15 | — | 10.31 | ||||||||||||
| 12/31/14 | 10.04 | 0.13 | 0.02 | 10.41 | ||||||||||||
| 12/31/15 | 9.98 | 0.12 | — | 10.47 | ||||||||||||
| 12/31/16 | 10.03 | 0.13 | — | 10.65 | ||||||||||||
| 10/31/17(a) | 10.05 | 0.12 | — | 10.79 | ||||||||||||
| (a) | Ten months only. Distributions typically are declared every business day and accumulated dividends are distributed monthly. Capital gain distributions typically occur in December. |
| (b) | Represents distributions for the respective calendar year-to-date period ended. |
| (c) | Does not assume any compounding of reinvested distributions. |
Table shows calendar-year distributions and net asset values; may differ from fiscal-year annual reports.
| PORTFOLIO CHARACTERISTICS (Unaudited) |
| Bloomberg | ||
| Scout | Barclays 1-3 | |
| Low Duration | U.S. Govt. / | |
| Bond | Credit Index* | |
| Average Maturity | 2.2 years | 2.0 years |
| Average Duration | 1.9 years | 1.9 years |
| 30-Day SEC Yield** (Unsubsidized/Subsidized) | 1.28%/1.67% | — |
| Number of Holdings | 182 | 1,497 |
| Total Net Assets (in millions) | $45.62 | — |
| Inception Date | 8/29/2012 | — |
| * | Unmanaged index of stocks, bonds or mutual funds. It is not possible to invest directly in an index. |
| ** | 30-Day SEC Yield is computed under an SEC standardized formula and is an annualized yield based on the most recent trailing 30-day period. Subsidized yields reflect fee waivers in effect. Without such waivers, yields would be reduced. Unsubsidized yields do not reflect fee waivers in effect. A negative 30-Day SEC Yield occurs when accrued expenses of the past 30 days exceed the income collected during the past 30 days. The Fund’s actual distribution rate will differ from the SEC yield, and any income distributions from the Fund may be higher or lower than the SEC yield. |
Portfolio composition will change due to ongoing management of the Fund. References to specific securities or sectors should not be construed as a recommendation by the Fund, its Advisor or Distributor. See the accompanying Schedule of Investments for the percentage of the Fund’s portfolio represented by the securities or sectors mentioned above.
| OCTOBER 31, 2017 | 21 |
| SCHEDULE OF INVESTMENTS |
| October 31, 2017 |
| LOW DURATION BOND FUND |
| Principal | ||||||||
| Amount | Value | |||||||
| ASSET-BACKED SECURITIES — 2.2% | ||||||||
| Bank of The West Auto Trust | ||||||||
| Series 2015-1, Class A3, | ||||||||
| 1.310%, 10/15/19(a)(b) | $ | 223,334 | $ | 223,217 | ||||
| Series 2017-1, Class A2, | ||||||||
| 1.780%, 2/15/21(a)(b) | 225,000 | 224,881 | ||||||
| Fifth Third Auto Trust | ||||||||
| Series 2017-1, Class A2A, | ||||||||
| 1.590%, 4/15/20(a) | 200,000 | 199,774 | ||||||
| GMACM Home Equity Loan Trust | ||||||||
| Series 2003-HE1, Class A3, | ||||||||
| 1.738% (LIBOR 1 Month+50 basis points), | ||||||||
| 4/25/33(a)(c) | 98,769 | 94,082 | ||||||
| GSAA Trust | ||||||||
| Series 2006-S1, Class 1A1, | ||||||||
| 1.558% (LIBOR 1 Month+32 basis points), | ||||||||
| 1/25/37(a)(c) | 233,710 | 70,415 | ||||||
| Nomura Asset Acceptance Corp. Alternative Loan Trust | ||||||||
| Series 2006-S1, Class A2, | ||||||||
| 1.858% (LIBOR 1 Month+62 basis points), | ||||||||
| 1/25/36(a)(b)(c) | 25,207 | 25,785 | ||||||
| Santander Drive Auto Receivables Trust | ||||||||
| Series 2017-3, Class A2, | ||||||||
| 1.670%, 6/15/20(a) | 155,000 | 154,883 | ||||||
| TOTAL ASSET-BACKED SECURITIES | ||||||||
| (Cost $988,304) — 2.2% | 993,037 | |||||||
| COMMERCIAL MORTGAGE-BACKED SECURITIES — 9.3% | ||||||||
| Banc of America Commercial Mortgage Trust | ||||||||
| Series 2016-UB10, Class A1, | ||||||||
| 1.559%, 7/15/49(a) | 154,608 | 153,326 | ||||||
| Citigroup Commercial Mortgage Trust | ||||||||
| Series 2014-GC19, Class A1, | ||||||||
| 1.199% 3/10/47(a) | 8,819 | 8,814 | ||||||
| Series 2016-C1, Class A1, | ||||||||
| 1.506% 5/10/49(a) | 360,809 | 357,753 | ||||||
| Series 2017-P8, Class A1, | ||||||||
| 2.065% 9/15/50(a) | 242,673 | 241,552 | ||||||
| Series 2017-C4, Class A1, | ||||||||
| 2.121% 10/12/50(a) | 135,000 | 134,905 | ||||||
| COMM Mortgage Trust | ||||||||
| Series 2013-CR6, Class A2, | ||||||||
| 2.122% 3/10/46(a) | 43,925 | 43,906 | ||||||
| Series 2013-LC13, Class A1, | ||||||||
| 1.309% 8/10/46(a) | 22,818 | 22,790 | ||||||
| Series 2013-CR13, Class A2, | ||||||||
| 3.039% 11/12/46(a) | 725,000 | 733,063 | ||||||
| Series 2014-CR16, Class A1, | ||||||||
| 1.445% 4/10/47(a) | 33,185 | 33,121 | ||||||
| Series 2014-CR16, Class A2, | ||||||||
| 3.042% 4/10/47(a) | 160,000 | 162,231 | ||||||
| DBJPM Mortgage Trust | ||||||||
| Series 2016-C1, Class A1, | ||||||||
| 1.676%, 5/10/49(a) | 78,998 | 78,514 | ||||||
| GS Mortgage Securities Trust | ||||||||
| Series 2014-GC22, Class A1, | ||||||||
| 1.290%, 6/10/47(a) | 59,403 | 59,181 | ||||||
| JP Morgan Chase Commercial Mortgage Securities Trust | ||||||||
| Series 2014-CBM, Class A, | ||||||||
| 2.139% (LIBOR 1 Month+90 basis points), | ||||||||
| 10/15/29(b)(c) | 460,000 | 460,000 | ||||||
| JPMBB Commercial Mortgage Securities Trust | ||||||||
| Series 2015-C30, Class A1, | ||||||||
| 1.738% 7/15/48(a) | 300,138 | 299,384 | ||||||
| Series 2015-C33, Class A1, | ||||||||
| 1.898% 12/15/48(a) | 95,123 | 94,976 | ||||||
| Series 2016-C1, Class A1, | ||||||||
| 1.695% 3/15/49(a) | 339,621 | 337,879 | ||||||
| Morgan Stanley Bank of America Merrill Lynch Trust | ||||||||
| Series 2015-C26, Class A1, | ||||||||
| 1.591%, 10/15/48(a) | 195,713 | 193,258 | ||||||
| UBS-Barclays Commercial Mortgage Trust | ||||||||
| Series 2013-C6, Class A1, | ||||||||
| 0.802% 4/10/46(a) | 22,992 | 22,952 | ||||||
| Series 2013-C6, Class A2, | ||||||||
| 2.067% 4/10/46(a) | 170,000 | 170,155 | ||||||
| Wells Fargo Commercial Mortgage Trust | ||||||||
| Series 2015-C27, Class A1, | ||||||||
| 1.730% 2/15/48 | 56,889 | 56,867 | ||||||
| Series 2015-C31, Class A1, | ||||||||
| 1.679% 11/15/48(a) | 201,696 | 200,825 | ||||||
| Series 2016-C34, Class A1, | ||||||||
| 1.423% 6/15/49(a) | 125,884 | 124,506 | ||||||
| WF-RBS Commercial Mortgage Trust | ||||||||
| Series 2013-UBS1, Class A2, | ||||||||
| 2.927% 3/15/46(a) | 130,000 | 131,119 | ||||||
| Series 2013-C17, Class A1, | ||||||||
| 1.154% 12/15/46(a) | 122,388 | 122,120 | ||||||
| TOTAL COMMERCIAL MORTGAGE-BACKED SECURITIES | ||||||||
| (Cost $4,258,225) — 9.3% | 4,243,197 | |||||||
| CORPORATE BONDS — 70.4% | ||||||||
| 21st Century Fox America, Inc. | ||||||||
| 4.500%, 2/15/21 | 360,000 | 383,712 | ||||||
| AIG Global Funding | ||||||||
| 1.950% 10/18/19(b) | 225,000 | 224,691 | ||||||
| 1.900% 10/6/21(b) | 240,000 | 234,783 | ||||||
| Air Lease Corp. | ||||||||
| 2.125% 1/15/20 | 105,000 | 104,885 | ||||||
| 3.875% 4/1/21(a) | 340,000 | 355,179 | ||||||
| Allergan Funding SCS | ||||||||
| 3.000%, 3/12/20(a) | 565,000 | 573,583 | ||||||
| Ally Financial, Inc. | ||||||||
| 3.750%, 11/18/19 | 230,000 | 234,600 | ||||||
| American Airlines 2013-2 Class A Pass-Through Trust | ||||||||
| 4.950%, 7/15/24 | 437,688 | 467,866 | ||||||
| American Express Credit Corp. | ||||||||
| 2.125% 3/18/19 | 300,000 | 301,115 | ||||||
| 1.875% 5/3/19(a) | 490,000 | 489,625 | ||||||
| 2.600% 9/14/20(a) | 170,000 | 172,158 | ||||||
| American Honda Finance Corp. | ||||||||
| 1.200% 7/12/19 | 265,000 | 262,239 | ||||||
| 1.700% 9/9/21 | 230,000 | 225,840 | ||||||
| 22 | SCOUT FUNDS ANNUAL REPORT |
| SCHEDULE OF INVESTMENTS |
| October 31, 2017 |
| LOW DURATION BOND FUND (Continued) |
| Principal | ||||||||
| Amount | Value | |||||||
| CORPORATE BONDS (Continued) | ||||||||
| American International Group, Inc. | ||||||||
| 6.400% 12/15/20 | $ | 80,000 | $ | 89,816 | ||||
| 3.300% 3/1/21(a) | 405,000 | 416,944 | ||||||
| Amgen, Inc. | ||||||||
| 4.500% 3/15/20 | 185,000 | 195,239 | ||||||
| 4.100% 6/15/21(a) | 255,000 | 269,019 | ||||||
| Anglo American Capital PLC | ||||||||
| 9.375%, 4/8/19(b) | 195,000 | 214,557 | ||||||
| AT&T, Inc. | ||||||||
| 2.450%, 6/30/20(a) | 720,000 | 726,770 | ||||||
| AvalonBay Communities, Inc. | ||||||||
| 3.625%, 10/1/20(a) | 115,000 | 119,373 | ||||||
| Bank of America Corp. | ||||||||
| 2.650% 4/1/19 | 480,000 | 483,935 | ||||||
| 5.625% 7/1/20 | 380,000 | 412,360 | ||||||
| 2.365% (LIBOR 3 Month+100 basis points), | ||||||||
| 4/24/23(a)(c) | 495,000 | 501,855 | ||||||
| Bank of Montreal | ||||||||
| 1.750%, 9/11/19 | 290,000 | 288,982 | ||||||
| BB&T Corp. | ||||||||
| 2.250%, 2/1/19(a) | 480,000 | 482,386 | ||||||
| Becton, Dickinson and Co. | ||||||||
| 2.133% 6/6/19 | 235,000 | 235,094 | ||||||
| 2.404% 6/5/20 | 235,000 | 235,364 | ||||||
| BP Capital Markets PLC | ||||||||
| 4.500%, 10/1/20 | 150,000 | 159,972 | ||||||
| Broadcom Corp. / Broadcom Cayman Finance Ltd. | ||||||||
| 2.200%, 1/15/21(b) | 310,000 | 308,092 | ||||||
| Capital One Financial Corp. | ||||||||
| 2.500%, 5/12/20(a) | 500,000 | 501,816 | ||||||
| Capital One N.A. | ||||||||
| 1.850% 9/13/19(a) | 230,000 | 228,561 | ||||||
| 2.350% 1/31/20(a) | 250,000 | 250,286 | ||||||
| Caterpillar Financial Services Corp. | ||||||||
| 1.900% 3/22/19 | 120,000 | 120,186 | ||||||
| 2.100% 1/10/20 | 170,000 | 170,693 | ||||||
| Chevron Corp. | ||||||||
| 1.561% 5/16/19 | 280,000 | 279,267 | ||||||
| 1.961% 3/3/20(a) | 130,000 | 130,319 | ||||||
| Citigroup, Inc. | ||||||||
| 2.050% 12/7/18 | 420,000 | 420,419 | ||||||
| 2.050% 6/7/19 | 310,000 | 309,900 | ||||||
| 2.450% 1/10/20(a) | 745,000 | 749,215 | ||||||
| Constellation Brands, Inc. | ||||||||
| 2.250% 11/6/20(a) | 320,000 | 319,373 | ||||||
| 3.750% 5/1/21 | 225,000 | 234,277 | ||||||
| Credit Suisse A.G. | ||||||||
| 2.300%, 5/28/19 | 210,000 | 211,147 | ||||||
| CSX Corp. | ||||||||
| 3.700%, 10/30/20(a) | 65,000 | 67,676 | ||||||
| CVS Health Corp. | ||||||||
| 2.800%, 7/20/20(a) | 520,000 | 526,180 | ||||||
| Daimler Finance North America, LLC | ||||||||
| 1.750% 10/30/19(b) | 150,000 | 148,998 | ||||||
| 2.200% 5/5/20(b) | 350,000 | 350,054 | ||||||
| Danone S.A. | ||||||||
| 1.691%, 10/30/19(b) | 315,000 | 312,577 | ||||||
| Delta Air Lines 2007-1 Class A Pass-Through Trust | ||||||||
| 6.821%, 2/10/24 | 179,183 | 206,293 | ||||||
| Deutsche Telekom International Finance B.V. | ||||||||
| 2.225%, 1/17/20(b) | 305,000 | 305,037 | ||||||
| Discovery Communications, LLC | ||||||||
| 2.200%, 9/20/19 | 120,000 | 120,146 | ||||||
| EI du Pont de Nemours & Co. | ||||||||
| 2.200%, 5/1/20 | 390,000 | 391,494 | ||||||
| ERAC USA Finance, LLC | ||||||||
| 2.600%, 12/1/21(a)(b) | 485,000 | 481,975 | ||||||
| ERP Operating LP | ||||||||
| 4.750%, 7/15/20(a) | 110,000 | 116,879 | ||||||
| Ford Motor Credit Co., LLC | ||||||||
| 2.021% 5/3/19 | 410,000 | 409,710 | ||||||
| 1.897% 8/12/19 | 280,000 | 278,792 | ||||||
| 2.681% 1/9/20 | 750,000 | 756,570 | ||||||
| GE Capital International Funding Co. Unlimited Co. | ||||||||
| 2.342%, 11/15/20 | 240,000 | 241,188 | ||||||
| General Motors Financial Co., Inc. | ||||||||
| 2.400% 5/9/19 | 480,000 | 482,026 | ||||||
| 3.200% 7/13/20(a) | 230,000 | 235,172 | ||||||
| Gilead Sciences, Inc. | ||||||||
| 2.550%, 9/1/20 | 515,000 | 522,145 | ||||||
| Goldman Sachs Group, Inc. | ||||||||
| 2.600%, 12/27/20(a) | 480,000 | 482,662 | ||||||
| HCA, Inc. | ||||||||
| 6.500%, 2/15/20 | 215,000 | 231,662 | ||||||
| IBM Credit, LLC | ||||||||
| 1.800%, 1/20/21 | 245,000 | 242,180 | ||||||
| ING Bank N.V. | ||||||||
| 1.650% 8/15/19(b) | 350,000 | 347,202 | ||||||
| 2.500% 10/1/19(b) | 200,000 | 201,546 | ||||||
| JPMorgan Chase & Co. | ||||||||
| 2.350% 1/28/19 | 555,000 | 558,417 | ||||||
| 6.300% 4/23/19 | 85,000 | 90,274 | ||||||
| 2.750% 6/23/20(a) | 710,000 | 721,120 | ||||||
| Kraft Heinz Foods Co. | ||||||||
| 2.800%, 7/2/20(a) | 325,000 | 329,197 | ||||||
| L3 Technologies, Inc. | ||||||||
| 5.200%, 10/15/19 | 100,000 | 105,915 | ||||||
| Lockheed Martin Corp. | ||||||||
| 2.500%, 11/23/20(a) | 125,000 | 126,591 | ||||||
| Manufacturers & Traders Trust Co. | ||||||||
| 2.300%, 1/30/19(a) | 105,000 | 105,410 | ||||||
| MassMutual Global Funding II | ||||||||
| 1.550% 10/11/19(b) | 240,000 | 238,180 | ||||||
| 1.950% 9/22/20(b) | 220,000 | 218,788 | ||||||
| McDonald’s Corp. | ||||||||
| 2.750%, 12/9/20(a) | 175,000 | 178,491 | ||||||
| Metropolitan Life Global Funding I | ||||||||
| 1.550% 9/13/19(b) | 150,000 | 148,971 | ||||||
| 1.750% 9/19/19(b) | 500,000 | 498,087 | ||||||
| Morgan Stanley | ||||||||
| 2.800%, 6/16/20 | 280,000 | 284,088 | ||||||
(Continued on next page)
| OCTOBER 31, 2017 | 23 |
| SCHEDULE OF INVESTMENTS |
| October 31, 2017 |
| LOW DURATION BOND FUND (Continued) |
| Principal | ||||||||
| Amount | Value | |||||||
| CORPORATE BONDS (Continued) | ||||||||
| New York Life Global Funding | ||||||||
| 1.700%, 9/14/21(b) | $ | 235,000 | $ | 229,704 | ||||
| NextEra Energy Capital Holdings, Inc. | ||||||||
| 1.649%, 9/1/18 | 160,000 | 159,778 | ||||||
| Nissan Motor Acceptance Corp. | ||||||||
| 1.550%, 9/13/19(b) | 185,000 | 183,229 | ||||||
| Noble Holding International Ltd. | ||||||||
| 5.750%, 3/16/18 | 90,000 | 90,675 | ||||||
| Norfolk Southern Corp. | ||||||||
| 3.250%, 12/1/21(a) | 115,000 | 118,189 | ||||||
| Northrop Grumman Corp. | ||||||||
| 2.080%, 10/15/20 | 250,000 | 250,004 | ||||||
| Northwest Airlines 2007-1 Class A Pass-Through Trust | ||||||||
| 7.027%, 5/1/21 | 53,523 | 58,340 | ||||||
| Philip Morris International, Inc. | ||||||||
| 1.625%, 2/21/19 | 240,000 | 239,500 | ||||||
| PNC Bank N.A. | ||||||||
| 2.000%, 5/19/20(a) | 775,000 | 773,596 | ||||||
| Pricoa Global Funding I | ||||||||
| 1.450%, 9/13/19(b) | 240,000 | 237,639 | ||||||
| Principal Life Global Funding II | ||||||||
| 2.150%, 1/10/20(b) | 550,000 | 551,895 | ||||||
| Protective Life Global Funding | ||||||||
| 1.555%, 9/13/19(b) | 465,000 | 460,866 | ||||||
| Prudential Financial, Inc. | ||||||||
| 5.375%, 6/21/20 | 215,000 | 232,925 | ||||||
| PSEG Power, LLC | ||||||||
| 2.450%, 11/15/18(a) | 245,000 | 246,376 | ||||||
| Ryder System, Inc. | ||||||||
| 2.500%, 5/11/20(a) | 140,000 | 140,989 | ||||||
| Sherwin-Williams Co. | ||||||||
| 2.250%, 5/15/20 | 485,000 | 486,149 | ||||||
| Sysco Corp. | ||||||||
| 2.600%, 10/1/20(a) | 235,000 | 237,869 | ||||||
| Teva Pharmaceutical Finance Netherlands III B.V. | ||||||||
| 1.700%, 7/19/19 | 195,000 | 190,847 | ||||||
| Time Warner Cable, LLC | ||||||||
| 8.250%, 4/1/19 | 135,000 | 146,178 | ||||||
| Toyota Motor Credit Corp. | ||||||||
| 1.700% 2/19/19 | 280,000 | 279,862 | ||||||
| 1.950% 4/17/20 | 120,000 | 120,048 | ||||||
| Tyson Foods, Inc. | ||||||||
| 2.250%, 8/23/21(a) | 85,000 | 84,328 | ||||||
| Union Pacific Railroad Co. 2005 Pass-Through Trust | ||||||||
| 5.082%, 1/2/29 | 93,127 | 100,859 | ||||||
| Verizon Communications, Inc. | ||||||||
| 4.500% 9/15/20 | 450,000 | 479,556 | ||||||
| 3.125% 3/16/22 | 235,000 | 240,122 | ||||||
| VMware, Inc. | ||||||||
| 2.300%, 8/21/20 | 255,000 | 254,462 | ||||||
| Wells Fargo & Co. | ||||||||
| 2.125% 4/22/19 | 140,000 | 140,465 | ||||||
| 2.600% 7/22/20 | 760,000 | 769,280 | ||||||
| Wells Fargo Bank N.A. | ||||||||
| 1.750%, 5/24/19 | 470,000 | 468,998 | ||||||
| TOTAL CORPORATE BONDS | ||||||||
| (Cost $32,137,277) — 70.4% | 32,129,914 | |||||||
| MORTGAGE-BACKED SECURITIES — 14.1% | ||||||||
| Fannie Mae Pool | ||||||||
| 3.860% 3/1/18 | 302,818 | 302,505 | ||||||
| 3.726% 6/1/18 | 309,946 | 311,329 | ||||||
| 2.348% 10/1/22 | 183,719 | 185,379 | ||||||
| 2.000% 9/1/23 | 230,038 | 230,019 | ||||||
| Fannie Mae REMICS | ||||||||
| Series 2011-6, Class BA, | ||||||||
| 2.750% 6/25/20 | 13,022 | 13,106 | ||||||
| Series 2011-143, Class AC, | ||||||||
| 1.750% 4/25/21 | 88,735 | 88,527 | ||||||
| Series 2011-145, Class A, | ||||||||
| 1.750% 6/25/21 | 112,720 | 112,444 | ||||||
| Series 2011-141, Class EA, | ||||||||
| 1.750% 7/25/21 | 88,653 | 88,359 | ||||||
| Series 2011-143, Class M, | ||||||||
| 1.750% 1/25/22 | 66,501 | 66,181 | ||||||
| Series 2008-76, Class GF, | ||||||||
| 1.888% (LIBOR 1 Month+65 basis points), | ||||||||
| 9/25/23(c) | 6,785 | 6,789 | ||||||
| Series 2013-136, Class KA, | ||||||||
| 2.000% 5/25/25 | 89,644 | 89,506 | ||||||
| Series 2011-122, Class A, | ||||||||
| 3.000% 12/25/25 | 71,530 | 72,187 | ||||||
| Series 2011-88, Class AB, | ||||||||
| 2.500% 9/25/26 | 34,062 | 34,129 | ||||||
| Fannie Mae-Aces | ||||||||
| Series 2012-M9, Class ASQ2, | ||||||||
| 1.513% 12/25/17 | 54,210 | 54,230 | ||||||
| Series 2014-M6, Class FA, | ||||||||
| 1.521% (LIBOR 1 Month+29 basis points), | ||||||||
| 12/25/17(c) | 14,217 | 14,213 | ||||||
| Series 2013-M4, Class ASQ2, | ||||||||
| 1.451% 2/25/18 | 51,458 | 51,410 | ||||||
| Series 2015-M7, Class ASQ2, | ||||||||
| 1.550% 4/25/18 | 117,701 | 117,619 | ||||||
| Series 2013-M13, Class A, | ||||||||
| 1.600% 5/25/18 | 91,713 | 91,585 | ||||||
| Series 2016-M6, Class ASQ2, | ||||||||
| 1.815% 6/25/19 | 387,138 | 387,058 | ||||||
| Series 2012-M8, Class ASQ2, | ||||||||
| 1.520% 12/25/19 | 31,521 | 31,489 | ||||||
| Series 2016-M1, Class ASQ1, | ||||||||
| 1.374% 2/25/21(a) | 596 | 595 | ||||||
| Series 2013-M5, Class ASQ4, | ||||||||
| 1.919% 1/25/22 | 244,956 | 242,900 | ||||||
| Series 2012-M2, Class A1, | ||||||||
| 1.824% 2/25/22 | 445,802 | 445,119 | ||||||
| Series 2016-M3, Class ASQ1, | ||||||||
| 1.468% 2/25/23 | 178,214 | 176,951 | ||||||
| Series 2016-M7, Class AV1, | ||||||||
| 1.557% 10/25/23 | 229,216 | 226,207 | ||||||
| Freddie Mac Gold Pool | ||||||||
| 3.000%, 7/1/24 | 214,949 | 220,659 | ||||||
| 24 | SCOUT FUNDS ANNUAL REPORT |
| SCHEDULE OF INVESTMENTS |
| October 31, 2017 |
LOW DURATION BOND FUND (Continued)
| Principal | ||||||||
| Amount | Value | |||||||
| MORTGAGE-BACKED SECURITIES (Continued) | ||||||||
| Freddie Mac Multifamily Structured Pass-Through Certificates | ||||||||
| Series KP03, Class A2, | ||||||||
| 1.780% 7/25/19(a) | $ | 765,976 | $ | 764,831 | ||||
| Series K504, Class A1, | ||||||||
| 1.680% 10/25/19(a) | 194,551 | 194,038 | ||||||
| Series K007, Class A1, | ||||||||
| 3.342% 12/25/19(a) | 11,359 | 11,382 | ||||||
| Series K009, Class A1, | ||||||||
| 2.757% 5/25/20(a) | 37,084 | 37,348 | ||||||
| Series KP02, Class A2, | ||||||||
| 2.355% 4/25/21(a)(d) | 201,356 | 202,531 | ||||||
| Series KF15, Class A, | ||||||||
| 1.902% (LIBOR 1 Month+67 basis points), | ||||||||
| 2/25/23(a)(c) | 646,762 | 648,786 | ||||||
| Freddie Mac REMICS | ||||||||
| Series 4350, Class CA, | ||||||||
| 2.000% 10/15/19(a) | 18,111 | 18,130 | ||||||
| Series 3836, Class MC, | ||||||||
| 2.000% 5/15/20(a) | 19,913 | 19,877 | ||||||
| Series 4383, Class JC, | ||||||||
| 2.000% 5/15/23(a) | 60,085 | 60,063 | ||||||
| Series 4399, Class A, | ||||||||
| 2.500% 7/15/24(a) | 28,284 | 28,312 | ||||||
| Series 3939, Class WB, | ||||||||
| 3.000% 10/15/25(a) | 236,012 | 237,856 | ||||||
| Series 4083, Class DC, | ||||||||
| 1.500% 7/15/27(a) | 275,790 | 270,241 | ||||||
| Series 3768, Class DE, | ||||||||
| 2.250% 11/15/28(a) | 20,199 | 20,249 | ||||||
| Series 4302, Class AB, | ||||||||
| 1.750% 11/15/29(a) | 240,984 | 238,355 | ||||||
| Series 2764, Class UE, | ||||||||
| 5.000% 10/15/32(a) | 12,824 | 12,909 | ||||||
| TOTAL MORTGAGE-BACKED SECURITIES | ||||||||
| (Cost $6,470,138) — 14.1% | 6,425,403 | |||||||
| U.S. GOVERNMENT AND AGENCIES — 3.2% | ||||||||
| NCUA Guaranteed Notes Trust | ||||||||
| Series 2010-A1, Class A, | ||||||||
| 1.587% (LIBOR 1 Month+35 basis points), | ||||||||
| 12/7/20(a)(c) | 304,706 | 304,885 | ||||||
| United States Treasury Note | ||||||||
| 1.375% 12/15/19 | 695,000 | 691,471 | ||||||
| 2.250% 3/31/21 | 450,000 | 456,504 | ||||||
| TOTAL U.S. GOVERNMENT AND AGENCIES | ||||||||
| (Cost $1,455,143) — 3.2% | 1,452,860 | |||||||
| SHORT-TERM INVESTMENTS — 1.0% | ||||||||
| UMB Money Market Fiduciary, 0.010% | 451,026 | 451,026 | ||||||
| TOTAL SHORT-TERM INVESTMENTS | ||||||||
| (Cost $451,026) — 1.0% | 451,026 | |||||||
| TOTAL INVESTMENTS | ||||||||
| (Cost $45,760,113) — 100.2% | 45,695,437 | |||||||
| Liabilities less other assets — (0.2)% | (79,463 | ) | ||||||
| TOTAL NET ASSETS — 100.0% | ||||||||
| (equivalent to $10.05 per share; | ||||||||
| unlimited shares of $1.00 par value | ||||||||
| capital shares authorized; | ||||||||
| 4,541,062 shares outstanding) | $ | 45,615,974 | ||||||
LLC — Limited Liability Company
LP — Limited Partnership
PLC — Public Limited Company
REMICS — Real Estate Mortgage Investment Conduits
| (a) | Callable. |
| (b) | Rule 144A restricted security. Total value of these securities is $ 6,830,754 which represents 15.0% of total net assets of the Fund. Rule 144A restricted securities may be treated as liquid securities as long as the Advisor determines that an adequate trading market exists. |
| (c) | Floating rate security. Interest rates are based on an index rate. Rate shown is the rate in effect at period end. |
| (d) | Variable rate security. Interest rate adjusts periodically based on changes in current interest rates. Rate shown is the rate in effect as period end. |
See accompanying Notes to Financial Statements. | (Continued on next page) |
| OCTOBER 31, 2017 | 25 |
| Scout Core Bond Fund |
| SCCIX — Institutional Class, SCCYX — Class Y |
As a result of a reorganization that was completed after the close of business on November 17, 2017, the Scout Core Bond Fund is now the Carillon Reams Core Bond Fund. The commentary that follows is for the 12 months ended October 31, 2017.
MARKET REVIEW
The Bloomberg Barclays U.S. Aggregate Index® returned 0.90 percent for the 12 months ending Oct. 31, 2017. Interest-rates increased sharply following President Donald Trump’s election as investors anticipated significant fiscal stimulus. The yield on the bellwether 10-Year Treasury Bond also improved, increasing from 1.83 percent on Nov. 1, 2016, to 2.38 percent by Oct. 31, 20171. Risk-asset valuations rose and spreads continued to tighten throughout 2017.
Volatility, as measured by the Chicago Board Options Exchange (CBOE) Volatility Index® (“VIX”), hit a record low and asset prices crept steadily higher. Even the typically volatile months of September and October passed by quietly. The Fed surprised the market a bit as it formally began to reduce its balance sheet in October. This action joins other central banks around the globe in a fledgling effort to scale back the emergency monetary stimulus that has been in place for many years. The combination of increasing short-term rates and lowered inflation expectations has caused classic, Fed-induced yield-curve flattening. Historically, a flat yield curve is negative for spread sectors but credit spreads remained very tight in the current environment of risk apathy.
The European Central Bank (ECB) was late in arriving to the global quantitative easing (QE) party but it has now indicated that a tapering of its program is near. ECB tightening might in fact have occurred earlier were it not for the headwind of a sharply higher euro. Now, as the ECB prepares to halt its QE program, the downward pressure on their currency has begun to relent. Fallout from disappointing U.S. fiscal stimulus has exacerbated the euro’s move higher vs. the dollar, providing an example of how “beggar thy neighbor” QE polices frequently provide only temporary help in currency depreciation.
Given the number of threats to fixed-income security prices — from rising interest rates and geopolitical uncertainty to the choppy transition from monetary to fiscal stimulus — we view rising yields and tighter spreads as further evidence that bond investors have become desensitized to risk.
PORTFOLIO REVIEW
The Scout Core Bond Fund - Institutional (SCCIX) returned 0.44 percent for the 12 months ended October 31, 2017, lagging the Bloomberg Barclays U.S. Aggregate Index return of 0.90 percent. Macroeconomic factors produced mixed results over the time period. The Fund’s shorter duration position added value as interest rates rose, while its yield-curve position detracted due to an underweight in the outperforming long end of the curve.
Performance was negative at the sector level. Mortgage-backed securities (MBS) added to relative results due to outperformance in the Fund’s agency pass-through holdings. Commercial mortgage-backed securities (CMBS) and asset-backed securities (ABS) also slightly bolstered returns due to the Fund’s overweight position in this outperforming sector. In contrast, the Fund’s underweight in both the investment-grade credit and government-related sectors detracted from performance. Investment-grade credit further hurt relative returns as the Fund’s shorter-duration financial holdings did not keep up with outperforming longer-duration securities. All other sectors had a minimal impact on Fund performance.
MARKET OUTLOOK
For much of 2017, volatility has been anchored near the low end of its historic range. This is inconsistent with the increasingly risky geopolitical climate as well as the anticipated trend away from global monetary stimulus, which has been dampening volatility since central banks opened the spigot in the wake of 2008 financial crisis. At the same time, general corporate spreads remain near historic tights and anecdotal evidence suggests that we are in the late stages of the credit cycle. For these reasons, we expect to see an increase in volatility as global central banks pull back their monetary stimulus.
Recent Fed communication points to three rate increases in 2018. This is aggressive, and we believe that the consensus view of one or two rate increases is more realistic, albeit still optimistic. Inflation, apart from asset-price inflation, has remained stubbornly low and
1 https://www.treasury.gov/resource-center/data-chart-center/interest-rates/Pages/TextView.aspx?data=yieldYear&year=2017
| 26 | SCOUT FUNDS ANNUAL REPORT |
| Scout Core Bond Fund |
| SCCIX — Institutional Class, SCCYX — Class Y |
below the Fed’s target levels. Short of significant fiscal stimulus hitting the market, we do not expect inflation to be a problem. If the capital markets falter, the Fed may quickly back away from the rate-hike action, as it seems more focused on enabling capital markets instead of holding to a constant rate-setting rationale. A flat yield curve indicates concern that the Fed may raise rates too far and choke off growth.
Meanwhile, Treasury rates remain at modest levels as President Trump’s fiscal stimulus agenda continues to experience setbacks. A bold tax-reform plan has been proposed by the administration but the combination of delays, distraction from failed healthcare reform and lack of concentrated support in Congress leaves its fate in question, although its prospects improved late in 2017. We expect that some tax cut will be passed eventually but how much it adds in stimulus is difficult to ascertain at this point. This confirms our initial skepticism regarding the ease of the handoff from monetary to fiscal stimulus that was anticipated with Trump’s election.
PORTFOLIO STRATEGY
The factors above reinforce our belief that current bond-market valuations do not reflect its risks. We continue to be cautious on the valuations in the investment-grade corporate sector. Mortgage pass-through valuations also remain uncompelling. If the Fed continues down the path of raising the front end of the yield curve, the danger of a flat or inverted curve increases. Both scenarios are almost always negative for spread sector performance, with an inverted yield curve being particularly problematic. For these reasons, we are continuing to position our portfolios defensively. We expect that this will enable us to protect our clients from the price declines that may be on the horizon as well as to take advantage of the opportunities for future outperformance that those declines may create.
Mark M. Egan, CFA
Lead Portfolio Manager
Thomas M. Fink, CFA
Co-Portfolio Manager
Todd C. Thompson, CFA
Co-Portfolio Manager
Stephen T. Vincent, CFA
Co-Portfolio Manager
Clark W. Holland, CFA
Co-Portfolio Manager
| OCTOBER 31, 2017 | 27 |
| Scout Core Bond Fund |
| SCCIX — Institutional Class, SCCYX — Class Y |
| OBJECTIVE & STRATEGY (Unaudited) |
The Scout Core Bond Fund seeks a high level of total return consistent with the preservation of capital by investing in bonds of varying maturities, including mortgage-and asset-backed securities.
| PORTFOLIO MANAGEMENT TEAM |
Mark M. Egan, CFA
Lead Portfolio Manager
Thomas M. Fink, CFA
Co-Portfolio Manager
Todd C. Thompson, CFA
Co-Portfolio Manager
Stephen T. Vincent, CFA
Co-Portfolio Manager
Clark W. Holland, CFA
Co-Portfolio Manager
| HYPOTHETICAL GROWTH OF $10,000 (Unaudited) |
Institutional Class
as of October 31, 2017
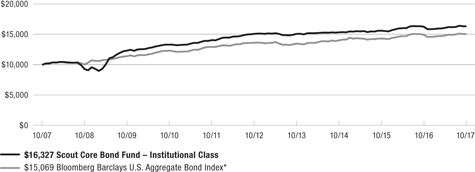
Class Y
as of October 31, 2017

Performance returns for the Scout Core Bond Fund and Bloomberg Barclays U.S. Aggregate Bond Index assume dividends were reinvested for the entire period.
For illustrative purposes only; may not represent your returns.
| * | Unmanaged index of stocks, bonds or mutual funds. It is not possible to invest directly in an index. The Bloomberg Barclays U.S. Aggregate Bond Index is an unmanaged, market-value-weighted index of taxable investment-grade fixed rate debt issues including government, corporate, asset-backed and mortgage-backed securities with maturities of one year or more. |
Portfolio composition will change due to ongoing management of the Fund. References to specific securities should not be construed as recommendations by the Fund, its Advisor or Distributor.
Risk considerations: The return of principal in a fixed income fund is not guaranteed. Fixed income funds have the same interest rate, inflation, issuer, maturity and credit risks that are associated with underlying fixed income securities owned by the Fund. Mortgage- and Asset-Backed Securities are subject to prepayment risk and the risk of default on the underlying mortgages or other assets. Foreign investments present additional risks due to currency fluctuations, economic and political factors, government regulations, differences in accounting standards and other factors.
Derivatives such as credit default swap agreements and futures contracts may involve greater risks than if the Fund invested in the referenced obligation directly. Derivatives are subject to risks such as market risk, liquidity risk, interest rate risk, credit risk and management risk. Derivative investments could lose more than the principal amount invested. The Fund may use derivatives for hedging purposes or as part of its investment strategy. The use of leverage and derivatives investments could accelerate losses to the Fund. These losses could exceed the amount originally invested.
The Fund may, at times, experience higher-than-average portfolio turnover which may generate significant taxable gains and increased trading expenses which in turn may lower the Fund’s return.
| 28 | SCOUT FUNDS ANNUAL REPORT |
Scout Core Bond Fund
SCCIX — Institutional Class, SCCYX — Class Y
COMPARATIVE RATES OF RETURN (Unaudited)
as of October 31, 2017
| 1 Year | 3 Years | 5 Years | 10 Years | |
| Scout Core Bond Fund – Institutional Class | 0.44% | 2.09% | 1.58% | 5.02% |
| Bloomberg Barclays U.S. Aggregate Bond Index* | 0.90% | 2.40% | 2.04% | 4.19% |
| 1 Year | 3 Years | 5 Years | Since Inception† | |
| Scout Core Bond Fund – Class Y | 0.04% | 1.71% | 1.21% | 2.72% |
| Bloomberg Barclays U.S. Aggregate Bond Index* | 0.90% | 2.40% | 2.04% | 3.22% |
| † | Inception – April 21, 2011. |
Returns for periods greater than one year are compounded average annual rates of return.
The performance data quoted represents past performance and past performance is not a guarantee of future results. Investment return and principal value of an investment will fluctuate so that an investor’s shares, when redeemed, may be worth more or less than their original cost. Current performance may be lower or higher than the performance information quoted. To obtain performance information current to the most recent month-end, please call 800-996-2862. The performance of the Scout Core Bond Fund – Institutional Class reflects the historical performance of the Frontegra Columbus Core Fund – Institutional Class (the “Predecessor Fund”). Effective after the close of business on April 21, 2011, the Predecessor Fund was reorganized into the Fund. The Predecessor Fund and the Fund have substantially similar principal investment strategies. The Predecessor Fund’s original Institutional Class returns reflect the total annual operating fees and expenses, net of any fee and expense waivers, of the Scout Core Bond Fund – Institutional Class. For the fiscal year ended June 30, 2017, the gross expense ratios for the Institutional Class and Class Y were 0.66% and 0.97%, respectively (as disclosed in the most recent Prospectus), compared to the October 31, 2017, gross expense ratios of 0.69% and 1.00%, respectively.
The performance returns for the Fund reflect a fee waiver in effect. In absence of such waiver, the returns would be reduced. The Advisor has contractually agreed to waive fees and assume certain fund expenses through October 30, 2018, and may recoup previously waived fees and expenses that it assumed during the previous three fiscal years.
The Fund may, at times, experience higher-than-average portfolio turnover which may generate significant taxable gains and increased trading expenses which in turn may lower the Fund’s return.
The performance shown in the above table and in the graph on the preceding page does not reflect the deduction of taxes that a shareholder would pay on Fund distributions or the redemption of Fund shares.
FUND DIVERSIFICATION (Unaudited)

Based on total investments as of October 31, 2017. Subject to change.
HISTORICAL PER-SHARE RECORD (Unaudited)
Institutional Class
| Income & | Cumulative(c) | |||||||||||||||
| Net Asset | Short-Term(b) Gains | Long-Term(b) Gains | Value Per Share | |||||||||||||
| Value | Distribution | Distribution | Plus Distributions | |||||||||||||
| 12/31/12 | $ | 11.66 | $ | 0.38 | $ | 0.01 | $ | 17.55 | ||||||||
| 12/31/13 | 11.36 | 0.16 | 0.04 | 17.45 | ||||||||||||
| 12/31/14 | 11.48 | 0.14 | — | 17.71 | ||||||||||||
| 12/31/15 | 11.40 | 0.19 | — | 17.82 | ||||||||||||
| 12/31/16 | 11.24 | 0.43 | — | 18.09 | ||||||||||||
| 10/31/17(a) | 11.40 | 0.17 | — | 18.42 | ||||||||||||
Class Y
| Income & | Cumulative(c) | |||||||||||||||
| Net Asset | Short-Term(b) Gains | Long-Term(b) Gains | Value Per Share | |||||||||||||
| Value | Distribution | Distribution | Plus Distributions | |||||||||||||
| 12/31/12 | $ | 11.66 | $ | 0.36 | $ | 0.01 | $ | 12.55 | ||||||||
| 12/31/13 | 11.36 | 0.12 | 0.04 | 12.41 | ||||||||||||
| 12/31/14 | 11.48 | 0.09 | — | 12.62 | ||||||||||||
| 12/31/15 | 11.40 | 0.15 | — | 12.69 | ||||||||||||
| 12/31/16 | 11.24 | 0.39 | — | 12.92 | ||||||||||||
| 10/31/17(a) | 11.40 | 0.13 | — | 13.21 | ||||||||||||
| (a) | Ten months only. Distributions typically are declared every business day and accumulated dividends are distributed monthly. Capital gain distributions typically occur in December. |
| (b) | Represents distributions for the respective calendar year-to-date period ended. |
| (c) | Does not assume any compounding of reinvested distributions. |
Table shows calendar-year distributions and net asset values; may differ from fiscal-year annual reports.
PORTFOLIO CHARACTERISTICS (Unaudited)
| Bloomberg | ||
| Barclays U.S. | ||
| Scout | Aggregate | |
| Core Bond | Bond* | |
| Average Maturity | 9.0 years | 8.3 years |
| Average Duration | 6.3 years | 6.0 years |
| 30-Day SEC Yield — Institutional Class** | ||
| (Unsubsidized/Subsidized) | 1.45%/1.74% | — |
| 30-Day SEC Yield — Class Y** | ||
| (Unsubsidized/Subsidized) | 1.16%/1.34% | — |
| Number of Holdings | 96 | 9,650 |
| Total Net Assets (in millions, all share classes) | $143.84 | — |
| Institutional Class Inception Date | 2/23/2001 | — |
| Class Y Inception Date | 4/21/2011 | — |
| * | Unmanaged index of stocks, bonds or mutual funds. It is not possible to invest directly in an index. |
| ** | 30-Day SEC Yield is computed under an SEC standardized formula and is an annualized yield based on the most recent trailing 30-day period. Subsidized yields reflect fee waivers in effect. Without such waivers, yields would be reduced. Unsubsidized yields do not reflect fee waivers in effect. A negative 30-Day SEC Yield occurs when accrued expenses of the past 30 days exceed the income collected during the past 30 days. The Fund’s actual distribution rate will differ from the SEC yield, and any income distributions from the Fund may be higher or lower than the SEC yield. |
Portfolio composition will change due to ongoing management of the Fund. References to specific securities or sectors should not be construed as a recommendation by the Fund, its Advisor or Distributor. See the accompanying Schedule of Investments for the percentage of the Fund’s portfolio represented by the securities or sectors mentioned above.
| OCTOBER 31, 2017 | 29 |
SCHEDULE OF INVESTMENTS
October 31, 2017
CORE BOND FUND
| Principal | ||||||||
| Amount | Value | |||||||
| ASSET-BACKED SECURITIES — 1.4% | ||||||||
| Hertz Vehicle Financing II LP | ||||||||
| Series 2015-2A, Class A, | ||||||||
| 2.020%, 9/25/19(a)(b)(c) | $ | 1,155,000 | $ | 1,153,865 | ||||
| Mercedes-Benz Auto Receivables Trust | ||||||||
| Series 2016-1, Class A2A, | ||||||||
| 1.110%, 3/15/19(a)(c) | 590,592 | 590,228 | ||||||
| USAA Auto Owner Trust | ||||||||
| Series 2016-1, Class A2, | ||||||||
| 1.070%, 3/15/19(a)(c) | 306,036 | 305,909 | ||||||
| TOTAL ASSET-BACKED SECURITIES | ||||||||
| (Cost $2,051,350) — 1.4% | 2,050,002 | |||||||
| COMMERCIAL MORTGAGE-BACKED SECURITIES — 1.7% | ||||||||
| CFCRE Commercial Mortgage Trust | ||||||||
| Series 2016-C3, Class A3, | ||||||||
| 3.865%, 1/10/48(a) | 1,435,000 | 1,512,741 | ||||||
| Morgan Stanley Bank of America Merrill Lynch Trust | ||||||||
| Series 2015-C26, Class A3, | ||||||||
| 3.211%, 10/15/48(a) | 955,000 | 965,565 | ||||||
| TOTAL COMMERCIAL MORTGAGE-BACKED SECURITIES | ||||||||
| (Cost $2,440,872) — 1.7% | 2,478,306 | |||||||
| CORPORATE BONDS — 24.0% | ||||||||
| Abbott Laboratories | ||||||||
| 2.350%, 11/22/19 | 665,000 | 669,109 | ||||||
| American Airlines 2011-1 Class A Pass-Through Trust | ||||||||
| 5.250%, 7/31/22 | 285,395 | 303,589 | ||||||
| American Airlines 2013-1 Class A Pass-Through Trust | ||||||||
| 4.000%, 1/15/27 | 564,734 | 586,646 | ||||||
| American Airlines 2013-2 Class A Pass-Through Trust | ||||||||
| 4.950%, 7/15/24 | 273,555 | 292,417 | ||||||
| American Express Co. | ||||||||
| 2.200%, 10/30/20(a) | 665,000 | 663,139 | ||||||
| American Express Credit Corp. | ||||||||
| 1.875% 5/3/19(a) | 95,000 | 94,927 | ||||||
| 1.700% 10/30/19(a) | 750,000 | 746,873 | ||||||
| 2.600% 9/14/20(a) | 1,105,000 | 1,119,028 | ||||||
| American International Group, Inc. | ||||||||
| 6.400%, 12/15/20 | 535,000 | 600,645 | ||||||
| AT&T, Inc. | ||||||||
| 3.800% 3/1/24(a) | 280,000 | 287,319 | ||||||
| 3.400% 8/14/24(a) | 965,000 | 964,219 | ||||||
| 4.250% 3/1/27(a) | 495,000 | 507,997 | ||||||
| Bank of America Corp. | ||||||||
| 3.500%, 4/19/26 | 595,000 | 605,684 | ||||||
| Bank of America N.A. | ||||||||
| 2.050%, 12/7/18 | 390,000 | 391,416 | ||||||
| Burlington Northern and Santa Fe Railway Co. | ||||||||
| 2001-2 Pass-Through Trust | ||||||||
| 6.462%, 1/15/21 | 180,661 | 191,727 | ||||||
| Burlington Northern and Santa Fe Railway Co. | ||||||||
| 2004-1 Pass-Through Trust | ||||||||
| 4.575%, 1/15/21 | 435,279 | 448,513 | ||||||
| Capital One N.A. | ||||||||
| 1.650% 2/5/18(a) | 525,000 | 524,833 | ||||||
| 2.350% 8/17/18(a) | 740,000 | 742,215 | ||||||
| Citigroup, Inc. | ||||||||
| 2.150%, 7/30/18 | 595,000 | 596,454 | ||||||
| ConocoPhillips Co. | ||||||||
| 3.350%, 5/15/25(a) | 845,000 | 870,577 | ||||||
| CSX Transportation, Inc. | ||||||||
| 6.251%, 1/15/23 | 499,216 | 570,654 | ||||||
| Daimler Finance North America, LLC | ||||||||
| 2.000% 8/3/18(b) | 1,330,000 | 1,332,397 | ||||||
| 1.750% 10/30/19(b) | 675,000 | 670,489 | ||||||
| 2.300% 1/6/20(b) | 880,000 | 883,543 | ||||||
| Delta Air Lines 2007-1 Class A Pass-Through Trust | ||||||||
| 6.821%, 2/10/24 | 520,599 | 599,366 | ||||||
| Ford Motor Credit Co., LLC | ||||||||
| 2.145% 1/9/18 | 1,095,000 | 1,096,029 | ||||||
| 2.875% 10/1/18 | 2,045,000 | 2,063,117 | ||||||
| 2.551% 10/5/18 | 555,000 | 558,349 | ||||||
| JPMorgan Chase & Co. | ||||||||
| 2.750% 6/23/20(a) | 470,000 | 477,361 | ||||||
| 2.550% 3/1/21(a) | 540,000 | 543,483 | ||||||
| 1.867% (LIBOR 3 Month+55 basis points), | ||||||||
| 3/9/21(a)(d) | 1,880,000 | 1,885,728 | ||||||
| MassMutual Global Funding II | ||||||||
| 1.950%, 9/22/20(b) | 1,075,000 | 1,069,076 | ||||||
| McDonald’s Corp. | ||||||||
| 2.100%, 12/7/18 | 405,000 | 406,851 | ||||||
| Metropolitan Life Global Funding I | ||||||||
| 1.350%, 9/14/18(b) | 1,685,000 | 1,677,825 | ||||||
| New York Life Global Funding | ||||||||
| 1.450%, 12/15/17(b)(c) | 925,000 | 923,946 | ||||||
| Northwest Airlines 2007-1 Class A Pass-Through Trust | ||||||||
| 7.027%, 5/1/21 | 384,693 | 419,315 | ||||||
| Philip Morris International, Inc. | ||||||||
| 2.000%, 2/21/20 | 1,250,000 | 1,249,977 | ||||||
| Reliance Standard Life Global Funding II | ||||||||
| 2.500%, 1/15/20(b) | 385,000 | 387,043 | ||||||
| Sherwin-Williams Co. | ||||||||
| 2.250%, 5/15/20 | 415,000 | 415,983 | ||||||
| Toyota Motor Credit Corp. | ||||||||
| 1.478% (LIBOR 3 Month+15 basis points), | ||||||||
| 12/24/18(c)(d) | 2,000,000 | 2,001,546 | ||||||
| Union Pacific Railroad Co. 2004 Pass-Through Trust | ||||||||
| 5.404%, 7/2/25 | 355,120 | 379,371 | ||||||
| Union Pacific Railroad Co. 2005 Pass-Through Trust | ||||||||
| 5.082%, 1/2/29 | 654,552 | 708,898 | ||||||
| Union Pacific Railroad Co. 2006 Pass-Through Trust | ||||||||
| 5.866%, 7/2/30 | 555,204 | 631,020 | ||||||
| Wells Fargo & Co. | ||||||||
| 2.600% 7/22/20 | 795,000 | 804,708 | ||||||
| 2.610% (LIBOR 3 Month+123 basis points), | ||||||||
| 10/31/23(a)(d) | 1,475,000 | 1,517,557 | ||||||
| TOTAL CORPORATE BONDS | ||||||||
| (Cost $34,038,444) — 24.0% | 34,480,959 | |||||||
| 30 | SCOUT FUNDS ANNUAL REPORT |
SCHEDULE OF INVESTMENTS
October 31, 2017
CORE BOND FUND (Continued)
| Principal | ||||||||
| Amount | Value | |||||||
| MORTGAGE-BACKED SECURITIES — 34.1% | ||||||||
| Fannie Mae Pool | ||||||||
| 3.170% 8/1/18(c) | $ | 1,377,073 | $ | 1,381,898 | ||||
| 3.330% 7/1/20 | 405,825 | 412,688 | ||||||
| 3.330% 10/1/20 | 1,179,517 | 1,216,885 | ||||||
| 3.230% 11/1/20 | 1,254,195 | 1,290,793 | ||||||
| 2.500% 9/1/22 | 419,782 | 424,326 | ||||||
| 2.000% 1/1/23 | 400,813 | 400,778 | ||||||
| 2.160% 1/1/23 | 3,457,073 | 3,440,538 | ||||||
| 2.000% 3/1/23 | 166,775 | 166,761 | ||||||
| 2.000% 4/1/23 | 164,499 | 164,485 | ||||||
| 2.000% 5/1/23 | 464,379 | 464,339 | ||||||
| 4.000% 4/1/24 | 198,371 | 207,650 | ||||||
| 2.500% 7/1/25 | 483,817 | 489,405 | ||||||
| 2.500% 3/1/26 | 294,467 | 299,037 | ||||||
| 2.000% 7/1/26 | 4,340,604 | 4,354,898 | ||||||
| 4.500% 1/1/27(c) | 155,335 | 157,983 | ||||||
| 2.100% 12/1/27 | 1,055,835 | 1,019,440 | ||||||
| 4.550% 10/1/33 | 873,061 | 873,051 | ||||||
| 5.970% 1/1/40 | 339,035 | 394,954 | ||||||
| 5.970% 1/1/40 | 180,819 | 210,642 | ||||||
| 5.100% 12/1/40 | 285,544 | 314,055 | ||||||
| 3.000% 12/15/42(e) | 14,920,000 | 14,904,558 | ||||||
| 2.500% 12/15/46(e) | 1,405,000 | 1,354,601 | ||||||
| Fannie Mae REMICS | ||||||||
| Series 2008-76, Class GF, | ||||||||
| 1.888% (LIBOR 1 Month+65 basis points), | ||||||||
| 9/25/23(c)(d) | 34,766 | 34,786 | ||||||
| Fannie Mae-Aces | ||||||||
| Series 2015-M7, Class ASQ2, | ||||||||
| 1.550% 4/25/18(c) | 293,183 | 292,978 | ||||||
| Series 2013-M14, Class A, | ||||||||
| 1.700% 8/25/18(c) | 1,200,603 | 1,199,532 | ||||||
| Series 2016-M2, Class ABV2, | ||||||||
| 2.131% 1/25/23 | 754,304 | 748,755 | ||||||
| Series 2016-M3, Class ASQ2, | ||||||||
| 2.263% 2/25/23 | 1,080,000 | 1,073,453 | ||||||
| Series 2014-M1, Class A1, | ||||||||
| 2.325% 7/25/23(f) | 392,380 | 394,364 | ||||||
| Series 2016-M7, Class AV2, | ||||||||
| 2.157% 10/25/23 | 2,495,000 | 2,465,180 | ||||||
| Series 2014-M13, Class AB2, | �� | |||||||
| 2.951% 8/25/24(f) | 438,104 | 443,855 | ||||||
| Series 2015-M11, Class A1, | ||||||||
| 2.097% 4/25/25 | 587,462 | 586,290 | ||||||
| Series 2016-M6, Class AB2, | ||||||||
| 2.375% 5/25/26 | 1,005,000 | 972,689 | ||||||
| Freddie Mac Gold Pool | ||||||||
| 4.500% 8/1/18(c) | 190,140 | 193,794 | ||||||
| 4.500% 8/1/18(c) | 289,905 | 295,476 | ||||||
| 4.500% 8/1/20(c) | 1,469,795 | 1,498,039 | ||||||
| Freddie Mac Multifamily Structured Pass-Through Certificates | ||||||||
| Series KF17, Class A, | ||||||||
| 1.782% (LIBOR 1 Month+55 basis points), | ||||||||
| 3/25/23(a)(d) | 1,440,922 | 1,443,627 | ||||||
| Freddie Mac REMICS | ||||||||
| Series 3609, Class LA, | ||||||||
| 4.000% 12/15/24(a)(c) | 53,311 | 53,884 | ||||||
| Series 4233, Class MD, | ||||||||
| 1.750% 3/15/25(a)(c) | 170,991 | 170,715 | ||||||
| Ginnie Mae I Pool | ||||||||
| 2.140% 8/15/23 | 708,184 | 693,201 | ||||||
| 2.730% 6/15/32 | 2,657,013 | 2,567,323 | ||||||
| TOTAL MORTGAGE-BACKED SECURITIES | ||||||||
| (Cost $49,054,149) — 34.1% | 49,071,706 | |||||||
| U.S. GOVERNMENT AND AGENCIES — 49.1% | ||||||||
| United States Treasury Bond | ||||||||
| 2.750%, 8/15/47 | 13,775,000 | 13,429,551 | ||||||
| United States Treasury Note | ||||||||
| 0.750% 2/28/18(c) | 5,365,000 | 5,356,684 | ||||||
| 1.375% 9/30/20 | 4,555,000 | 4,509,095 | ||||||
| 1.250% 10/31/21 | 14,815,000 | 14,447,514 | ||||||
| 1.625% 10/31/23 | 6,900,000 | 6,702,701 | ||||||
| 2.250% 8/15/27 | 26,485,000 | 26,193,241 | ||||||
| TOTAL U.S. GOVERNMENT AND AGENCIES | ||||||||
| (Cost $70,956,891) — 49.1% | 70,638,786 | |||||||
| SHORT-TERM INVESTMENTS — 0.8% | ||||||||
| UMB Money Market Fiduciary, 0.010% | 1,108,223 | 1,108,223 | ||||||
| TOTAL SHORT-TERM INVESTMENTS | ||||||||
| (Cost $1,108,223) — 0.8% | 1,108,223 | |||||||
| TOTAL INVESTMENTS | ||||||||
| (Cost $159,649,929) — 111.1% | 159,827,982 | |||||||
| Liabilities less other assets — (11.1)% | (15,985,403 | ) | ||||||
| TOTAL NET ASSETS — 100.0% | ||||||||
| (equivalent to $11.40 per share; unlimited shares | ||||||||
| of $1.00 par value capital shares authorized; | ||||||||
| 12,392,781 shares outstanding for Institutional Class; | ||||||||
| equivalent to $11.40 per share; unlimited shares of | ||||||||
| $1.00 par value capital shares authorized; | ||||||||
| 219,552 shares outstanding for Class Y) | $ | 143,842,579 | ||||||
LLC — Limited Liability Company
LP — Limited Partnership
REMICS — Real Estate Mortgage Investment Conduits
| (a) | Callable. |
| (b) | Rule 144A restricted security. Total value of these securities is $8,098,184 which represents 5.6% of total net assets of the Fund. Rule 144A restricted securities may be treated as liquid securities as long as the Advisor determines that an adequate trading market exists. |
| (c) | Security has been earmarked as commitment for to-be-announced securities. The Advisor earmarks securities to ensure enough asset coverage. |
| (d) | Floating rate security. Interest rates are based on an index rate. Rate shown is the rate in effect at period end. |
| (e) | To-be-announced security. Securities are being used in dollar roll transactions. |
| (f) | Variable rate security. Interest rate adjusts periodically based on changes in current interest rates. Rate shown is the rate in effect as period end. |
See accompanying Notes to Financial Statements.
| OCTOBER 31, 2017 | 31 |
Scout Core Plus Bond Fund
SCPZX — Institutional Class, SCPYX — Class Y
As a result of a reorganization that was completed after the close of business on November 17, 2017, the Scout Core Plus Bond Fund is now the Carillon Reams Core Plus Bond Fund. The commentary that follows is for the 12 months ended October 31, 2017.
MARKET REVIEW
The Bloomberg Barclays U.S. Aggregate Index® returned 0.90 percent for the 12 months ending Oct. 31, 2017. Interest-rates increased sharply following President Donald Trump’s election as investors anticipated significant fiscal stimulus. The yield on the bellwether 10-Year Treasury Bond also improved, increasing from 1.83 percent on Nov. 1, 2016, to 2.38 percent by Oct. 31, 2017.1 Risk-asset valuations rose and spreads continued to tighten throughout 2017.
Volatility, as measured by the Chicago Board Options Exchange (CBOE) Volatility Index® (“VIX”), hit a record low and asset prices crept steadily higher. Even the typically volatile months of September and October passed by quietly. The Fed surprised the market a bit as it formally began to reduce its balance sheet in October. This action joins other central banks around the globe in a fledgling effort to scale back the emergency monetary stimulus that has been in place for many years. The combination of increasing short-term rates and lowered inflation expectations has caused classic, Fed-induced yield-curve flattening. Historically, a flat yield curve is negative for spread sectors but credit spreads remained very tight in the current environment of risk apathy.
The European Central Bank (ECB) was late in arriving to the global quantitative easing (QE) party but it has now indicated that a tapering of its program is near. ECB tightening might in fact have occurred earlier were it not for the headwind of a sharply higher euro. Now, as the ECB prepares to halt its QE program, the downward pressure on their currency has begun to relent. Fallout from disappointing U.S. fiscal stimulus has exacerbated the euro’s move higher vs. the dollar, providing an example of how “beggar thy neighbor” QE polices frequently provide only temporary help in currency depreciation.
Given the number of threats to fixed income security prices – from rising interest rates and geopolitical uncertainty to the choppy transition from monetary to fiscal stimulus – we view rising yields and tighter spreads as further evidence that bond investors have become desensitized to risk.
PORTFOLIO REVIEW
The Scout Core Plus Bond Fund - Institutional (SCPZX) returned 0.76 percent for the 12 months ended October 31, 2017, underperforming the Bloomberg Barclays U.S. Aggregate Index return of 0.90 percent. Macroeconomic factors produced mixed results over the time period. The Fund’s shorter duration position added value as interest rates rose, while its yield curve position detracted due to an underweight in the outperforming long end of the curve.
Performance was negative at the sector level. High-yield credit and asset-backed securities (ABS) bolstered returns due to the Fund’s overweight in these outperforming sectors. In contrast, investment-grade credit and government-related securities detracted due to the Fund’s underweight positions. Investment-grade credit further hurt relative returns as the Fund’s shorter-duration financial holdings did not keep up with outperforming longer-duration securities. Mortgage-backed securities (MBS) added to relative results due to outperformance in the Fund’s agency pass-through holdings. Non-U.S. dollar added to performance as our Mexican peso position benefited when it appreciated vs. the U.S. dollar. All other sectors had a minimal impact on Fund performance.
MARKET OUTLOOK
For much of 2017, volatility has been anchored near the low end of its historic range. This is inconsistent with the increasingly risky geopolitical climate as well as the anticipated trend away from global monetary stimulus, which has been dampening volatility since central banks opened the spigot in the wake of 2008 financial crisis. At the same time, general corporate spreads remain near historic tights and anecdotal evidence suggests that we are in the late stages of the credit cycle. For these reasons, we expect to see an increase in volatility as global central banks pull back their monetary stimulus.
| 1 | https://www.treasury.gov/resource-center/data-chart-center/interest-rates/Pages/TextView.aspx?data=yieldYear&year=2017 |
| 32 | SCOUT FUNDS ANNUAL REPORT |
Scout Core Plus Bond Fund
SCPZX — Institutional Class, SCPYX — Class Y
Recent Fed communication points to three rate increases in 2018. This is aggressive, and we believe that the consensus view of one or two rate increases is more realistic, albeit still optimistic. Inflation, apart from asset-price inflation, has remained stubbornly low and below the Fed’s target levels. Short of significant fiscal stimulus hitting the market, we do not expect inflation to be a problem. If the capital markets falter, the Fed may quickly back away from the rate-hike action, as it seems more focused on enabling capital markets instead of holding to a constant rate-setting rationale. A flat yield curve indicates concern that the Fed may raise rates too far and choke off growth.
Meanwhile, Treasury rates remain at modest levels as President Trump’s fiscal stimulus agenda continues to experience setbacks. A bold tax-reform plan has been proposed by the administration but the combination of delays, distraction from failed healthcare reform and lack of concentrated support in Congress leaves its fate in question, although its prospects improved late in 2017. We expect that some tax cut will be passed eventually but how much it adds in stimulus is difficult to ascertain at this point. This confirms our initial skepticism regarding the ease of the handoff from monetary to fiscal stimulus that was anticipated with Trump’s election.
PORTFOLIO STRATEGY
The factors above reinforce our belief that current bond-market valuations do not reflect its risks. We continue to be cautious on the valuations in the corporate sector, both investment-grade and high-yield. Mortgage pass-through valuations also remain uncompelling. If the Fed continues down the path of raising the front end of the yield curve, the danger of a flat or inverted curve increases. Both scenarios are almost always negative for spread sector performance, with an inverted yield curve being particularly problematic. For these reasons, we are continuing to position our portfolios defensively. We expect that this will enable us to protect our clients from the price declines that may be on the horizon as well as to take advantage of the opportunities for future outperformance that those declines may create.
Mark M. Egan, CFA
Lead Portfolio Manager
Thomas M. Fink, CFA
Co-Portfolio Manager
Todd C. Thompson, CFA
Co-Portfolio Manager
Stephen T. Vincent, CFA
Co-Portfolio Manager
Clark W. Holland, CFA
Co-Portfolio Manager
| OCTOBER 31, 2017 | 33 |
Scout Core Plus Bond Fund
SCPZX — Institutional Class, SCPYX — Class Y
OBJECTIVE & STRATEGY (Unaudited)
The Scout Core Plus Bond Fund seeks a high level of total return consistent with the preservation of capital by investing in bonds of varying maturities, including mortgage-and asset-backed securities.
PORTFOLIO MANAGEMENT TEAM
Mark M. Egan, CFA
Lead Portfolio Manager
Thomas M. Fink, CFA
Co-Portfolio Manager
Todd C. Thompson, CFA
Co-Portfolio Manager
Stephen T. Vincent, CFA
Co-Portfolio Manager
Clark W. Holland, CFA
Co-Portfolio Manager
HYPOTHETICAL GROWTH OF $10,000 (Unaudited)
Institutional Class
as of October 31, 2017

Class Y
as of October 31, 2017

Performance returns for the Scout Core Plus Bond Fund and Bloomberg Barclays U.S. Aggregate Bond Index assume dividends were reinvested for the entire period.
For illustrative purposes only; may not represent your returns.
| * | Unmanaged index of stocks, bonds or mutual funds. It is not possible to invest directly in an index. The Bloomberg Barclays U.S. Aggregate Bond Index is an unmanaged, market-value-weighted index of taxable investment-grade fixed rate debt issues including government, corporate, asset-backed and mortgage-backed securities with maturities of one year or more. |
Portfolio composition will change due to ongoing management of the Fund. References to specific securities should not be construed as recommendations by the Fund, its Advisor or Distributor.
Risk considerations: The return of principal in a fixed income fund is not guaranteed. Fixed income funds have the same interest rate, inflation, issuer, maturity and credit risks that are associated with underlying fixed income securities owned by the Fund. Mortgage- and Asset-Backed Securities are subject to prepayment risk and the risk of default on the underlying mortgages or other assets. High yield securities involve greater risk than investment grade securities and tend to be more sensitive to economic conditions and credit risk. Foreign investments present additional risks due to currency fluctuations, economic and political factors, government regulations, differences in accounting standards and other factors. Investments in emerging markets involve even greater risks.
Derivatives such as options, futures contracts, currency forwards or swap agreements may involve greater risks than if the Fund invested in the referenced obligation directly. Derivatives are subject to risks such as market risk, liquidity risk, interest rate risk, credit risk, and management risk. Derivative investments could lose more than the principal amount invested. The Fund may use derivatives for hedging purposes or as part of its investment strategy. The use of leverage and derivatives investments could accelerate losses to the Fund. These losses could exceed the amount originally invested.
The Fund may, at times, experience higher-than-average portfolio turnover which may generate significant taxable gains and increased trading expenses which in turn may lower the Fund’s return.
| 34 | SCOUT FUNDS ANNUAL REPORT |
Scout Core Plus Bond Fund
SCPZX — Institutional Class, SCPYX — Class Y
COMPARATIVE RATES OF RETURN (Unaudited)
as of October 31, 2017
| 1 Year | 3 Years | 5 Years | 10 Years | |
| Scout Core Plus Bond Fund – Institutional Class | 0.76% | 2.29% | 1.84% | 5.98% |
| Bloomberg Barclays U.S. Aggregate Bond Index* | 0.90% | 2.40% | 2.04% | 4.19% |
| Since | ||||
| 1 Year | 3 Years | 5 Years | Inception† | |
| Scout Core Plus Bond Fund – Class Y | 0.36% | 1.89% | 1.46% | 4.22% |
| Bloomberg Barclays U.S. Aggregate Bond Index* | 0.90% | 2.40% | 2.04% | 3.53% |
| † | Inception – November 12, 2009. |
Returns for periods greater than one year are compounded average annual rates of return.
The performance data quoted represents past performance and past performance is not a guarantee of future results. Investment return and principal value of an investment will fluctuate so that an investor’s shares, when redeemed, may be worth more or less than their original cost. Current performance may be lower or higher than the performance information quoted. To obtain performance information current to the most recent month-end, please call 800-996-2862. The performance of the Scout Core Plus Bond Fund – Institutional Class and Class Y reflects the historical performance of the Frontegra Columbus Core Plus Fund – Institutional Class and Class Y (the “Predecessor Fund”), respectively. Effective after the close of business on April 21, 2011, the Predecessor Fund was reorganized into the Fund. The Predecessor Fund and the Fund have substantially similar principal investment strategies. The Predecessor Fund’s original Institutional Class and Class Y returns reflect the total annual operating fees and expenses, net of any fee and expense waivers, of the Scout Core Plus Bond Fund – Institutional Class and Class Y, respectively. For the fiscal year ended June 30, 2017, the gross expense ratios for the Institutional Class and Class Y were 0.59% and 0.91%, respectively (as disclosed in the most recent Prospectus), compared to the October 31, 2017, gross expense ratios of 0.58% and 0.93%, respectively.
The performance returns for the Fund reflect a fee waiver in effect. In absence of such waiver, the returns would be reduced. The Advisor has contractually agreed to waive fees and assume certain fund expenses through October 30, 2018, and may recoup previously waived fees and expenses that it assumed during the previous three fiscal years.
The Fund may, at times, experience higher-than-average portfolio turnover which may generate significant taxable gains and increased trading expenses which in turn may lower the Fund’s return.
The performance shown in the above table and in the graph on the preceding page does not reflect the deduction of taxes that a shareholder would pay on Fund distributions or the redemption of Fund shares.
FUND DIVERSIFICATION (Unaudited)

Based on total investments as of October 31, 2017. Subject to change.
HISTORICAL PER-SHARE RECORD (Unaudited)
Institutional Class
| Income & | Cumulative(c) | |||||||||||||||
| Net Asset | Short-Term(b) Gains | Long-Term(b) Gains | Value Per Share | |||||||||||||
| Value | Distribution | Distribution | Plus Distributions | |||||||||||||
| 12/31/12 | $ | 32.69 | $ | 2.00 | $ | 0.07 | $ | 66.66 | ||||||||
| 12/31/13 | 31.95 | 0.50 | 0.13 | 66.55 | ||||||||||||
| 12/31/14 | 32.21 | 0.46 | 0.02 | 67.29 | ||||||||||||
| 12/31/15 | 31.34 | 0.79 | 0.11 | 67.32 | ||||||||||||
| 12/31/16 | 31.23 | 1.22 | — | 68.43 | ||||||||||||
| 10/31/17(a) | 31.74 | 0.45 | — | 69.39 | ||||||||||||
Class Y
| Income & | Cumulative(c) | |||||||||||||||
| Net Asset | Short-Term(b) Gains | Long-Term(b) Gains | Value Per Share | |||||||||||||
| Value | Distribution | Distribution | Plus Distributions | |||||||||||||
| 12/31/12 | $ | 32.69 | $ | 1.94 | $ | 0.07 | $ | 39.54 | ||||||||
| 12/31/13 | 31.94 | 0.38 | 0.13 | 39.30 | ||||||||||||
| 12/31/14 | 32.20 | 0.34 | 0.02 | 39.92 | ||||||||||||
| 12/31/15 | 31.33 | 0.66 | 0.11 | 39.82 | ||||||||||||
| 12/31/16 | 31.22 | 1.11 | — | 40.82 | ||||||||||||
| 10/31/17(a) | 31.73 | 0.34 | — | 41.67 | ||||||||||||
| (a) | Ten months only. Distributions typically are declared every business day and accumulated dividends are distributed monthly. Capital gain distributions typically occur in December. |
| (b) | Represents distributions for the respective calendar year-to-date period ended. |
| (c) | Does not assume any compounding of reinvested distributions. |
Table shows calendar-year distributions and net asset values; may differ from fiscal-year annual reports.
PORTFOLIO CHARACTERISTICS (Unaudited)
| Bloomberg | ||
| Barclays U.S. | ||
| Scout Core | Aggregate | |
| Plus Bond | Bond* | |
| Average Maturity | 8.7 years | 8.3 years |
| Average Duration | 5.3 years | 6.0 years |
| 30-Day SEC Yield — Institutional Class** | ||
| (Unsubsidized/Subsidized) | 1.45%/1.63% | — |
| 30-Day SEC Yield — Class Y** | ||
| (Unsubsidized/Subsidized) | 1.11%/1.23% | — |
| Number of Holdings | 110 | 9,650 |
| Total Net Assets (in millions, all share classes) | $768.56 | — |
| Institutional Class Inception Date | 11/25/1996 | — |
| Class Y Inception Date | 11/12/2009 | — |
| * | Unmanaged index of stocks, bonds or mutual funds. It is not possible to invest directly in an index. |
| ** | 30-Day SEC Yield is computed under an SEC standardized formula and is an annualized yield based on the most recent trailing 30-day period. Subsidized yields reflect fee waivers in effect. Without such waivers, yields would be reduced. Unsubsidized yields do not reflect fee waivers in effect. A negative 30-Day SEC Yield occurs when accrued expenses of the past 30 days exceed the income collected during the past 30 days. The Fund’s actual distribution rate will differ from the SEC yield, and any income distributions from the Fund may be higher or lower than the SEC yield. |
Portfolio composition will change due to ongoing management of the Fund. References to specific securities or sectors should not be construed as a recommendation by the Fund, its Advisor or Distributor. See the accompanying Schedule of Investments for the percentage of the Fund’s portfolio represented by the securities or sectors mentioned above.
| OCTOBER 31, 2017 | 35 |
SCHEDULE OF INVESTMENTS
October 31, 2017
CORE PLUS BOND FUND
| Principal | ||||||||
| Amount | Value | |||||||
| ASSET-BACKED SECURITIES — 1.4% | ||||||||
| Hertz Vehicle Financing II LP | ||||||||
| Series 2015-2A, Class A, | ||||||||
| 2.020%, 9/25/19(a)(b)(c) | $ | 4,165,000 | $ | 4,160,906 | ||||
| Home Equity Loan Trust | ||||||||
| Series 2003-HS3, Class A2A, | ||||||||
| 1.518% 8/25/33(a)(d) | 27,037 | 26,917 | ||||||
| Series 2006-HSA2, Class AI3, | ||||||||
| 5.550% 3/25/36(a)(e) | 407,747 | 243,068 | ||||||
| Series 2006-HSA2, Class AI4, | ||||||||
| 5.810% 3/25/36(a)(f) | 820,000 | 211,661 | ||||||
| Mercedes-Benz Auto Receivables Trust | ||||||||
| Series 2016-1, Class A2A, | ||||||||
| 1.110%, 3/15/19(a)(c) | 2,990,950 | 2,989,108 | ||||||
| Nomura Asset Acceptance Corp. Alternative Loan Trust | ||||||||
| Series 2006-S1, Class A2, | ||||||||
| 1.858% (LIBOR 1 Month+62 basis points), | ||||||||
| 1/25/36(a)(b)(d) | 153,850 | 157,377 | ||||||
| RFMSII Trust | ||||||||
| Series 2006-HSA1, Class A4, | ||||||||
| 5.990%, 2/25/36(a)(f) | 972,265 | 941,287 | ||||||
| SACO I Trust | ||||||||
| Series 2006-9, Class A1, | ||||||||
| 1.538% (LIBOR 1 Month+30 basis points), | ||||||||
| 8/25/36(a)(d) | 237,199 | 419,267 | ||||||
| USAA Auto Owner Trust | ||||||||
| Series 2016-1, Class A2, | ||||||||
| 1.070%, 3/15/19(a)(c) | 1,461,723 | 1,461,119 | ||||||
| TOTAL ASSET-BACKED SECURITIES | ||||||||
| (Cost $10,093,904) — 1.4% | 10,610,710 | |||||||
| COMMERCIAL MORTGAGE-BACKED SECURITIES — 1.3% | ||||||||
| CFCRE Commercial Mortgage Trust | ||||||||
| Series 2016-C3, Class A3, | ||||||||
| 3.865%, 1/10/48(a) | 5,600,000 | 5,903,380 | ||||||
| Morgan Stanley Bank of America Merrill Lynch Trust | ||||||||
| Series 2015-C26, Class A3, | ||||||||
| 3.211%, 10/15/48(a) | 4,075,000 | 4,120,082 | ||||||
| TOTAL COMMERCIAL MORTGAGE-BACKED SECURITIES | ||||||||
| (Cost $9,875,756) — 1.3% | 10,023,462 | |||||||
| CORPORATE BONDS — 25.3% | ||||||||
| Abbott Laboratories | ||||||||
| 2.350%, 11/22/19 | 4,100,000 | 4,125,334 | ||||||
| Ally Financial, Inc. | ||||||||
| 3.250%, 11/5/18 | 2,440,000 | 2,458,422 | ||||||
| American Airlines 2011-1 Class A Pass-Through Trust | ||||||||
| 5.250%, 7/31/22 | 1,003,978 | 1,067,982 | ||||||
| American Airlines 2013-1 Class A Pass-Through Trust | ||||||||
| 4.000%, 1/15/27 | 112,146 | 116,497 | ||||||
| American Airlines 2013-2 Class A Pass-Through Trust | ||||||||
| 4.950%, 7/15/24 | 1,469,902 | 1,571,252 | ||||||
| American Express Co. | ||||||||
| 2.200%, 10/30/20(a) | 3,230,000 | 3,220,962 | ||||||
| American Express Credit Corp. | ||||||||
| 1.875% 5/3/19(a) | 1,920,000 | 1,918,529 | ||||||
| 1.700% 10/30/19(a) | 3,520,000 | 3,505,325 | ||||||
| 2.600% 9/14/20(a) | 4,915,000 | 4,977,396 | ||||||
| American International Group, Inc. | ||||||||
| 6.400%, 12/15/20 | 3,175,000 | 3,564,576 | ||||||
| AT&T, Inc. | ||||||||
| 3.800% 3/1/24(a) | 1,445,000 | 1,482,769 | ||||||
| 3.400% 8/14/24(a) | 4,770,000 | 4,766,141 | ||||||
| 4.250% 3/1/27(a) | 2,170,000 | 2,226,975 | ||||||
| Bank of America Corp. | ||||||||
| 3.500%, 4/19/26 | 3,060,000 | 3,114,948 | ||||||
| Bank of America N.A. | ||||||||
| 1.750% 6/5/18 | 6,555,000 | 6,558,291 | ||||||
| 2.050% 12/7/18 | 1,490,000 | 1,495,410 | ||||||
| Burlington Northern and Santa Fe Railway Co. | ||||||||
| 2001-2 Pass-Through Trust | ||||||||
| 6.462%, 1/15/21 | 562,991 | 597,474 | ||||||
| Burlington Northern and Santa Fe Railway Co. | ||||||||
| 2005-4 Pass-Through Trust | ||||||||
| 4.967%, 4/1/23 | 429,107 | 459,007 | ||||||
| Capital One N.A. | ||||||||
| 1.650% 2/5/18(a) | 2,940,000 | 2,939,065 | ||||||
| 2.350% 8/17/18(a) | 2,870,000 | 2,878,590 | ||||||
| Citigroup, Inc. | ||||||||
| 1.800% 2/5/18 | 7,055,000 | 7,056,242 | ||||||
| 2.150% 7/30/18 | 3,440,000 | 3,448,407 | ||||||
| Credit Suisse A.G. | ||||||||
| 1.750%, 1/29/18(c)(g) | 4,625,000 | 4,627,336 | ||||||
| Daimler Finance North America, LLC | ||||||||
| 2.000% 8/3/18(b) | 4,350,000 | 4,357,839 | ||||||
| 1.750% 10/30/19(b) | 3,780,000 | 3,754,738 | ||||||
| 2.300% 1/6/20(b) | 4,830,000 | 4,849,446 | ||||||
| Delta Air Lines 2007-1 Class A Pass-Through Trust | ||||||||
| 6.821%, 2/10/24 | 818,430 | 942,259 | ||||||
| Energy Transfer Partners LP | ||||||||
| 4.050%, 3/15/25(a) | 2,205,000 | 2,242,247 | ||||||
| Ford Motor Credit Co., LLC | ||||||||
| 2.145% 1/9/18 | 4,625,000 | 4,629,347 | ||||||
| 5.000% 5/15/18 | 6,170,000 | 6,275,155 | ||||||
| 2.551% 10/5/18 | 2,800,000 | 2,816,898 | ||||||
| JPMorgan Chase & Co. | ||||||||
| 2.750% 6/23/20(a) | 5,945,000 | 6,038,111 | ||||||
| 2.550% 3/1/21(a) | 2,835,000 | 2,853,286 | ||||||
| 1.867% (LIBOR 3 Month+55 basis points), | ||||||||
| 3/9/21(a)(d) | 8,345,000 | 8,370,427 | ||||||
| 3.250% 9/23/22 | 1,780,000 | 1,830,410 | ||||||
| MassMutual Global Funding II | ||||||||
| 1.950%, 9/22/20(b) | 5,920,000 | 5,887,375 | ||||||
| McDonald’s Corp. | ||||||||
| 2.100%, 12/7/18 | 2,090,000 | 2,099,553 | ||||||
| Metropolitan Life Global Funding I | ||||||||
| 1.350%, 9/14/18(b) | 9,520,000 | 9,479,464 | ||||||
| New York Life Global Funding | ||||||||
| 1.450% 12/15/17(b)(c) | 2,745,000 | 2,741,871 | ||||||
| 1.477% (LIBOR 3 Month+12 basis points), | ||||||||
| 4/12/19(b)(c)(d) | 7,720,000 | 7,721,698 | ||||||
| Northwest Airlines 2007-1 Class A Pass-Through Trust | ||||||||
| 7.027%, 5/1/21 | 2,672,780 | 2,913,331 | ||||||
| Philip Morris International, Inc. | ||||||||
| 2.000%, 2/21/20 | 6,130,000 | 6,129,890 | ||||||
| Reliance Standard Life Global Funding II | ||||||||
| 2.500%, 1/15/20(b) | 2,050,000 | 2,060,877 | ||||||
| Sherwin-Williams Co. | ||||||||
| 2.250%, 5/15/20 | 1,950,000 | 1,954,620 | ||||||
| Toyota Motor Credit Corp. | ||||||||
| 1.478% (LIBOR 3 Month+15 basis points), | ||||||||
| 12/24/18(c)(d) | 9,770,000 | 9,777,552 | ||||||
| U.S. Airways 2011-1 Class A Pass-Through Trust | ||||||||
| 7.125%, 4/22/25 | 859,002 | 993,006 | ||||||
| U.S. Airways 2012-1 Class A Pass-Through Trust | ||||||||
| 5.900%, 4/1/26 | 2,035,201 | 2,290,944 | ||||||
| UBS A.G. | ||||||||
| 1.800%, 3/26/18(g) | 6,620,000 | 6,627,355 | ||||||
| 36 | SCOUT FUNDS ANNUAL REPORT |
SCHEDULE OF INVESTMENTS
October 31, 2017
CORE PLUS BOND FUND (Continued)
| Principal | ||||||||
| Amount | Value | |||||||
| CORPORATE BONDS (Continued) | ||||||||
| UnitedHealth Group, Inc. | ||||||||
| 1.900%, 7/16/18 | $ | 2,475,000 | $ | 2,480,215 | ||||
| Wells Fargo & Co. | ||||||||
| 2.600% 7/22/20 | 5,377,000 | 5,442,658 | ||||||
| 2.610% (LIBOR 3 Month+123 basis points), | ||||||||
| 10/31/23(a)(d) | 8,390,000 | 8,632,068 | ||||||
| TOTAL CORPORATE BONDS | ||||||||
| (Cost $192,239,765) — 25.3% | 194,369,570 | |||||||
| MORTGAGE-BACKED SECURITIES — 24.5% | ||||||||
| Fannie Mae Pool | ||||||||
| 3.170% 8/1/18(c) | 5,086,648 | 5,104,472 | ||||||
| 3.330% 7/1/20 | 864,794 | 879,418 | ||||||
| 3.330% 10/1/20 | 3,313,249 | 3,418,216 | ||||||
| 3.230% 11/1/20 | 3,220,703 | 3,314,683 | ||||||
| 2.500% 9/1/22 | 2,003,295 | 2,024,980 | ||||||
| 2.000% 1/1/23 | 1,745,191 | 1,745,037 | ||||||
| 2.160% 1/1/23 | 6,729,107 | 6,696,922 | ||||||
| 2.000% 3/1/23 | 732,617 | 732,555 | ||||||
| 2.000% 4/1/23 | 722,282 | 722,220 | ||||||
| 2.000% 5/1/23 | 2,170,154 | 2,169,970 | ||||||
| 2.000% 7/1/23 | 1,471,022 | 1,470,897 | ||||||
| 4.000% 4/1/24 | 592,751 | 620,478 | ||||||
| 2.500% 7/1/25 | 2,287,487 | 2,313,907 | ||||||
| 2.500% 3/1/26 | 614,071 | 623,602 | ||||||
| 4.500% 1/1/27(c) | 685,068 | 696,745 | ||||||
| 2.100% 12/1/27 | 2,045,681 | 1,975,164 | ||||||
| 5.970% 1/1/40 | 519,854 | 605,597 | ||||||
| 5.970% 1/1/40 | 673,550 | 784,642 | ||||||
| 5.100% 12/1/40 | 457,777 | 503,486 | ||||||
| 3.000% 12/15/42(h) | 80,375,000 | 80,291,812 | ||||||
| 2.500% 12/15/46(h) | 7,590,000 | 7,317,739 | ||||||
| Fannie Mae-Aces | ||||||||
| Series 2015-M7, Class ASQ2, | ||||||||
| 1.550% 4/25/18(c) | 815,349 | 814,779 | ||||||
| Series 2013-M14, Class A, | ||||||||
| 1.700% 8/25/18(c) | 2,728,642 | 2,726,208 | ||||||
| Series 2016-M2, Class ABV2, | ||||||||
| 2.131% 1/25/23 | 2,952,428 | 2,930,710 | ||||||
| Series 2016-M3, Class ASQ2, | ||||||||
| 2.263% 2/25/23 | 4,145,000 | 4,119,873 | ||||||
| Series 2014-M1, Class A1, | ||||||||
| 2.325% 7/25/23(e) | 953,290 | 958,110 | ||||||
| Series 2016-M7, Class AV2, | ||||||||
| 2.157% 10/25/23 | 9,610,000 | 9,495,141 | ||||||
| Series 2014-M13, Class AB2, | ||||||||
| 2.951% 8/25/24(e) | 2,166,183 | 2,194,618 | ||||||
| Series 2015-M11, Class A1, | ||||||||
| 2.097% 4/25/25 | 1,919,791 | 1,915,962 | ||||||
| Series 2016-M6, Class AB2, | ||||||||
| 2.375% 5/25/26 | 4,655,000 | 4,505,342 | ||||||
| Freddie Mac Gold Pool | ||||||||
| 4.500% 8/1/18(c) | 834,512 | 850,549 | ||||||
| 4.500% 8/1/18(c) | 1,271,891 | 1,296,332 | ||||||
| 4.500% 8/1/20(c) | 6,477,895 | 6,602,375 | ||||||
| Freddie Mac Multifamily Structured Pass-Through Certificates | ||||||||
| Series KF15, Class A, | ||||||||
| 1.902% (LIBOR 1 Month+67 basis points), | ||||||||
| 2/25/23(a)(d) | 10,290,889 | 10,323,090 | ||||||
| Series KF17, Class A, | ||||||||
| 1.782% (LIBOR 1 Month+55 basis points), | ||||||||
| 3/25/23(a)(d) | 5,391,451 | 5,401,571 | ||||||
| Freddie Mac REMICS | ||||||||
| Series 3609, Class LA, | ||||||||
| 4.000% 12/15/24(a)(c) | 251,903 | 254,606 | ||||||
| Series 4233, Class MD, | ||||||||
| 1.750% 3/15/25(a)(c) | 505,224 | 504,409 | ||||||
| Ginnie Mae I Pool | ||||||||
| 2.140% 8/15/23 | 1,833,283 | 1,794,496 | ||||||
| 2.730% 6/15/32 | 7,873,084 | 7,607,320 | ||||||
| TOTAL MORTGAGE-BACKED SECURITIES | ||||||||
| (Cost $188,510,451) — 24.5% | 188,308,033 | |||||||
| U.S. GOVERNMENT AND AGENCIES — 56.0% | ||||||||
| United States Treasury Bond | ||||||||
| 2.750%, 8/15/47 | 71,765,000 | 69,965,277 | ||||||
| United States Treasury Note | ||||||||
| 0.750% 2/28/18(c) | 9,560,000 | 9,545,182 | ||||||
| 0.875% 3/31/18(c) | 13,520,000 | 13,498,882 | ||||||
| 1.375% 9/30/20 | 53,680,000 | 53,139,013 | ||||||
| 1.250% 10/31/21 | 95,505,000 | 93,135,998 | ||||||
| 1.625% 10/31/23 | 71,480,000 | 69,436,101 | ||||||
| 2.250% 8/15/27 | 123,185,000 | 121,827,994 | ||||||
| TOTAL U.S. GOVERNMENT AND AGENCIES | ||||||||
| (Cost $433,122,235) — 56.0% | 430,548,447 | |||||||
| SHORT-TERM INVESTMENTS — 2.3% | ||||||||
| UMB Money Market Fiduciary, 0.010% | 17,586,541 | 17,586,541 | ||||||
| TOTAL SHORT-TERM INVESTMENTS | ||||||||
| (Cost $17,586,541) — 2.3% | 17,586,541 | |||||||
| TOTAL INVESTMENTS | ||||||||
| (Cost $851,428,652) — 110.8% | 851,446,763 | |||||||
| Liabilities less other assets — (10.8)% | (82,884,968 | ) | ||||||
| TOTAL NET ASSETS — 100.0% | ||||||||
| (equivalent to $31.74 per share; unlimited shares | ||||||||
| of $1.00 par value capital shares authorized; | ||||||||
| 23,336,435 shares outstanding for Institutional Class; | ||||||||
| equivalent to $31.73 per share; unlimited shares of | ||||||||
| $1.00 par value capital shares authorized; | ||||||||
| 881,151 shares outstanding for Class Y) | $ | 768,561,795 | ||||||
LLC — Limited Liability Company
LP — Limited Partnership
REMICS — Real Estate Mortgage Investment Conduits
| (a) | Callable. |
| (b) | Rule 144A restricted security. Total value of these securities is $45,171,591 which represents 5.9% of total net assets of the Fund. Rule 144A restricted securities may be treated as liquid securities as long as the Advisor determines that an adequate trading market exists. |
| (c) | Security has been earmarked as commitment for to-be-announced securities. The Advisor earmarks securities to ensure enough asset coverage. |
| (d) | Floating rate security. Interest rates are based on an index rate. Rate shown is the rate in effect at period end. |
| (e) | Variable rate security. Interest rate adjusts periodically based on changes in current interest rates. Rate shown is the rate in effect as period end. |
| (f) | Step rate security. Coupon rate will either increase (step-up bond) or decrease (step-down bond) at regular intervals until maturity. Interest rate shown reflects the rate in effect as of period end. |
| (g) | Foreign security denominated in U.S. dollars. |
| (h) | To-be-announced security. Securities are being used in dollar roll transactions. |
(Continued on next page)
| OCTOBER 31, 2017 | 37 |
SCHEDULE OF INVESTMENTS
October 31, 2017
CORE PLUS BOND FUND (Continued)
FUTURES CONTRACTS
| Fair Value/ | ||||||||||||||||
| Number of | Unrealized | |||||||||||||||
| Contracts | Notional Value at | Notional Value at | Appreciation | |||||||||||||
| Description | Expiration Date | Long (Short) | Trade Date | October 31, 2017 | (Depreciation) | |||||||||||
| Euro-Bund Futures | December 2017 | (345) | $ | (65,216,627 | ) | $ | (65,403,306 | ) | $ | (186,679 | ) | |||||
| TOTAL FUTURES CONTRACTS | $ | (65,216,627 | ) | $ | (65,403,306 | ) | $ | (186,679 | ) | |||||||
SWAP CONTRACTS
CREDIT DEFAULT SWAPS
| Rating of | Implied | Premiums | Unrealized | |||||||||||||||||||||||||||
| Buy/Sell(i) | Reference Entity | Pay/Receive | Fixed Rate/ | Expiration | Credit | Notional | Paid | Appreciation | ||||||||||||||||||||||
| Exchange | Reference Entity | Protection | (Moody’s/S&P) | Fixed Rate | Frequency | Date | Spread(j) | Value(k) | Value(l) | (Received) | (Depreciation) | |||||||||||||||||||
| Intercontinental | CDX North | Sell | B1/B+ | Receive | 5%/Quarterly | 12/20/2022 | 3.10% | $ | 7,060,000 | $ | 633,288 | $ | 525,589 | $ | 107,699 | |||||||||||||||
| Exchange | America High Yield | |||||||||||||||||||||||||||||
| Index Series 29 | ||||||||||||||||||||||||||||||
| TOTAL SWAP CONTRACTS | $ | 7,060,000 | $ | 633,288 | $ | 525,589 | $ | 107,699 | ||||||||||||||||||||||
| (i) | If the Fund is a seller of protection and a credit event occurs, as defined under the terms of that particular swap agreement, the Fund will either (i) pay to the buyer of protection an amount equal to the notional amount of the swap and take delivery of the referenced obligation or underlying securities comprising the referenced index or (ii) pay a net settlement amount in the form of cash or securities equal to the notional amount of the swap less the recovery value of the referenced obligation of underlying securities comprising the referenced index. |
| (j) | Implied credit spreads represent the current level as of October 31, 2017 at which protection could be bought or sold given the terms of the existing credit default swap contract and serve as an indicator of the current status of the payment/performance risk of the credit default swap contract. An implied credit spread has widened or increased since entry into initial contract and may indicate a deteriorating credit profile and increased risk of default for the reference entity. A declining or narrowing spread may indicate an improving credit profile or decreased risk of default for the reference entity. Alternatively, credit spreads may increase or decrease reflecting the general tolerance for risk in the credit spread markets generally. |
| (k) | The maximum potential amount the Fund could be required to make as a seller of credit protection or receive as a buyer of credit protection if a credit event occurs as defined under the terms of that particular swap agreement. |
| (l) | The prices and resulting values for credit default swap agreements on credit indices serve as an indicator of the current status of the payment/performance risk and represent the likelihood of an expected liability (or profit) for the credit derivative should the notional amount of the swap agreement be closed/sold as of the period end. Increasing market values, in absolute terms when compared to the notional amount of the swap, represent a deterioration of the referenced entity’s credit soundness and a greater likelihood or risk of default or other credit event occurring as defined under the terms of the agreement. |
See accompanying Notes to Financial Statements.
| 38 | SCOUT FUNDS ANNUAL REPORT |
Scout Unconstrained Bond Fund
SUBFX — Institutional Class, SUBYX — Class Y
As a result of a reorganization that was completed after the close of business on November 17, 2017, the Scout Unconstrained Bond Fund is now the Carillon Reams Unconstrained Bond Fund. The commentary that follows is for the 12 months ended October 31, 2017.
MARKET REVIEW
The Bloomberg Barclays U.S. Aggregate Index® returned 0.90 percent for the 12 months ending Oct. 31, 2017. Interest-rates increased sharply following President Donald Trump’s election as investors anticipated significant fiscal stimulus. The yield on the bellwether 10-Year Treasury Bond also improved, increasing from 1.83 percent on Nov. 1, 2016, to 2.38 percent by Oct. 31, 2017.1 Risk-asset valuations rose and spreads continued to tighten throughout 2017.
Volatility, as measured by the Chicago Board Options Exchange (CBOE) Volatility Index® (“VIX”), hit a record low and asset prices crept steadily higher. Even the typically volatile months of September and October passed by quietly. The Fed surprised the market a bit as it formally began to reduce its balance sheet in October. This action joins other central banks around the globe in a fledgling effort to scale back the emergency monetary stimulus that has been in place for many years. The combination of increasing short-term rates and lowered inflation expectations has caused classic, Fed-induced yield-curve flattening. Historically, a flat yield curve is negative for spread sectors but credit spreads remained very tight in the current environment of risk apathy.
The European Central Bank (ECB) was late in arriving to the global quantitative easing (QE) party but it has now indicated that a tapering of its program is near. ECB tightening might in fact have occurred earlier were it not for the headwind of a sharply higher euro. Now, as the ECB prepares to halt its QE program, the downward pressure on their currency has begun to relent. Fallout from disappointing U.S. fiscal stimulus has exacerbated the euro’s move higher vs. the dollar, providing an example of how “beggar thy neighbor” QE polices frequently provide only temporary help in currency depreciation.
Given the number of threats to fixed income security prices – from rising interest rates and geopolitical uncertainty to the choppy transition from monetary to fiscal stimulus – we view rising yields and tighter spreads as further evidence that bond investors have become desensitized to risk.
PORTFOLIO REVIEW
The Scout Unconstrained Bond Fund - Institutional (SUBFX) returned 1.64 percent for the 12 months ended October 31, 2017, outperforming the BofA Merrill Lynch 3-Month LIBOR Constant Maturity Index® return of 1.06 percent. Macroeconomic performance factors added to Fund performance due to our dynamic duration positioning as rates rose during the time period.
Performance was positive at the sector level as well. Investment-grade and high-yield credit bolstered returns due to general spread tightening. Asset-backed securities (ABS) added to performance due to strength in the Fund’s home equity holdings and the government-related sector modestly added to performance. The Fund’s non-U.S. dollar holdings benefited from appreciation in the Mexican peso vs. the U.S. dollar. In contrast, mortgage-backed securities (MBS) detracted from relative returns due to underperformance in the Fund’s agency pass-through holdings. Commercial mortgage-backed securities (CMBS) had a minimal impact on performance.
MARKET OUTLOOK
For much of 2017, volatility has been anchored near the low end of its historic range. This is inconsistent with the increasingly risky geopolitical climate as well as the anticipated trend away from global monetary stimulus, which has been dampening volatility since central banks opened the spigot in the wake of 2008 financial crisis. At the same time, general corporate spreads remain near historic tights and anecdotal evidence suggests that we are in the late stages of the credit cycle. For these reasons, we expect to see an increase in volatility as global central banks pull back their monetary stimulus.
Recent Fed communication points to three rate increases in 2018. This is aggressive, and we believe that the consensus view of one or two rate increases is more realistic, albeit still optimistic. Inflation, apart from asset-price inflation, has remained stubbornly low and below the Fed’s target levels. Short of significant fiscal stimulus hitting the market, we do not expect inflation to be a problem. If the capital markets falter, the Fed
1 https://www.treasury.gov/resource-center/data-chart-center/interest-rates/Pages/TextView.aspx?data=yieldYear&year=2017
| OCTOBER 31, 2017 | 39 |
Scout Unconstrained Bond Fund
SUBFX — Institutional Class, SUBYX — Class Y
may quickly back away from the rate-hike action, as it seems more focused on enabling capital markets instead of holding to a constant rate-setting rationale. A flat yield curve indicates concern that the Fed may raise rates too far and choke off growth.
Meanwhile, Treasury rates remain at modest levels as President Trump’s fiscal stimulus agenda continues to experience setbacks. A bold tax-reform plan has been proposed by the administration but the combination of delays, distraction from failed healthcare reform and lack of concentrated support in Congress leaves its fate in question, although its prospects improved late in 2017. We expect that some tax cut will be passed eventually but how much it adds in stimulus is difficult to ascertain at this point. This confirms our initial skepticism regarding the ease of the handoff from monetary to fiscal stimulus that was anticipated with Trump’s election.
PORTFOLIO STRATEGY
The factors above reinforce our belief that current bond-market valuations do not reflect its risks. We continue to be cautious on the valuations in the corporate sector, both investment-grade and high-yield. Mortgage pass-through valuations also remain uncompelling. If the Fed continues down the path of raising the front end of the yield curve, the danger of a flat or inverted curve increases. Both scenarios are almost always negative for spread sector performance, with an inverted yield curve being particularly problematic. For these reasons, we are continuing to position our portfolios defensively. We expect that this will enable us to protect our clients from the price declines that may be on the horizon as well as to take advantage of the opportunities for future outperformance that those declines may create.
Mark M. Egan, CFA
Lead Portfolio Manager
Thomas M. Fink, CFA
Co-Portfolio Manager
Todd C. Thompson, CFA
Co-Portfolio Manager
Stephen T. Vincent, CFA
Co-Portfolio Manager
Clark W. Holland, CFA
Co-Portfolio Manager
| 40 | SCOUT FUNDS ANNUAL REPORT |
Scout Unconstrained Bond Fund
SUBFX — Institutional Class, SUBYX — Class Y
OBJECTIVE & STRATEGY (Unaudited)
The Scout Unconstrained Bond Fund seeks to maximize total return consistent with the preservation of capital by investing in fixed income instruments.
PORTFOLIO MANAGEMENT TEAM
Mark M. Egan, CFA
Lead Portfolio Manager
Thomas M. Fink, CFA
Co-Portfolio Manager
Todd C. Thompson, CFA
Co-Portfolio Manager
Stephen T. Vincent, CFA
Co-Portfolio Manager
Clark W. Holland, CFA
Co-Portfolio Manager
HYPOTHETICAL GROWTH OF $10,000 (Unaudited)
Institutional Class
as of October 31, 2017
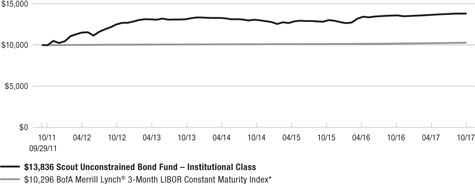
Class Y
as of October 31, 2017

Performance returns for the Scout Unconstrained Bond Fund and BofA Merrill Lynch® 3-Month LIBOR Constant Maturity Index assume dividends were reinvested for the entire period.
For illustrative purposes only; may not represent your returns.
| * | Unmanaged index of stocks, bonds or mutual funds. It is not possible to invest directly in an index. The BofA Merrill Lynch® 3-Month LIBOR Constant Maturity Index represents the London interbank offered rate (LIBOR) with a constant 3-month average maturity. Published by the British Bankers’ Association, LIBOR is a composite of the rates of interest at which banks borrow from one another in the London market. |
Portfolio composition will change due to ongoing management of the Fund. References to specific securities should not be construed as recommendations by the Fund, its Advisor or Distributor.
Risk considerations: The Fund employs an unconstrained investment approach which creates considerable exposure to certain types of securities that present significant volatility in the Fund’s performance, particularly over short periods of time. The return of principal in a fixed income fund is not guaranteed. Fixed income funds have the same interest rate, inflation, issuer, maturity and credit risks that are associated with underlying fixed income securities owned by the Fund. Foreign investments present additional risks due to currency fluctuations, economic and political factors, government regulations, differences in accounting standards and other factors. Investments in emerging markets involve even greater risks. Mortgage- and Asset-Backed Securities are subject to prepayment risk and the risk of default on the underlying mortgages or other assets. High yield securities involve greater risk than investment grade securities and tend to be more sensitive to economic conditions and credit risk.
Derivatives such as options, futures contracts, currency forwards or swap agreements may involve greater risks than if the Fund invested in the referenced obligation directly. Derivatives are subject to risks such as market risk, liquidity risk, interest rate risk, credit risk and management risk. Derivative investments could lose more than the principal amount invested. The Fund may use derivatives for hedging purposes or as part of its investment strategy. The use of leverage, derivatives, and short sales could accelerate losses to the Fund. These losses could exceed the amount originally invested.
The Fund may, at times, experience higher-than-average portfolio turnover which may generate significant taxable gains and increased trading expenses which in turn may lower the Fund’s return.
| OCTOBER 31, 2017 | 41 |
Scout Unconstrained Bond Fund
SUBFX — Institutional Class, SUBYX — Class Y
COMPARATIVE RATES OF RETURN (Unaudited)
as of October 31, 2017
| Since | ||||
| 1 Year | 3 Years | 5 Years | Inception† | |
| Scout Unconstrained Bond Fund – Institutional Class | 1.64% | 2.05% | 1.71% | 5.48% |
| BofA Merrill Lynch® 3-Month LIBOR Constant Maturity Index* | 1.06% | 0.62% | 0.48% | 0.48% |
| Since | ||||
| 1 Year | 3 Years | Inception‡ | ||
| Scout Unconstrained Bond Fund – Class Y | 1.34% | 1.74% | 1.20% | |
| BofA Merrill Lynch® 3-Month LIBOR Constant Maturity Index* | 1.06% | 0.62% | 0.48% |
| † | Inception – September 29, 2011. |
| ‡ | Inception – December 31, 2012. |
Returns for periods greater than one year are compounded average annual rates of return.
The performance data quoted represents past performance and past performance is not a guarantee of future results. Investment return and principal value of an investment will fluctuate so that an investor’s shares, when redeemed, may be worth more or less than their original cost. Current performance may be lower or higher than the performance information quoted. To obtain performance information current to the most recent month-end, please call 800-996-2862. For the fiscal year ended June 30, 2017, the gross expense ratios for the Institutional Class and Class Y were 0.80% and 1.09%, respectively (as disclosed in the most recent Prospectus), compared to the October 31, 2017, gross expense ratios of 0.80% and 1.07%, respectively.
The performance returns for the Fund reflect a fee waiver in effect. In absence of such waiver, the returns would be reduced. The Advisor has contractually agreed to waive fees and assume certain fund expenses through October 30, 2018, and may recoup previously waived fees and expenses that it assumed during the previous three fiscal years.
The Fund may, at times, experience higher-than-average portfolio turnover which may generate significant taxable gains and increased trading expenses which in turn may lower the Fund’s return.
The performance shown in the above table and in the graph on the preceding page does not reflect the deduction of taxes that a shareholder would pay on Fund distributions or the redemption of Fund shares.
FUND DIVERSIFICATION (Unaudited)

Based on total investments as of October 31, 2017. Subject to change.
HISTORICAL PER-SHARE RECORD (Unaudited)
Institutional Class
| Income & | Cumulative(c) | |||||||||||||||
| Net Asset | Short-Term(b) Gains | Long-Term(b) Gains | Value Per Share | |||||||||||||
| Value | Distribution | Distribution | Plus Distributions | |||||||||||||
| 12/31/12 | $ | 11.62 | $ | 0.69 | $ | 0.03 | $ | 12.75 | ||||||||
| 12/31/13 | 11.84 | 0.18 | 0.02 | 13.17 | ||||||||||||
| 12/31/14 | 11.24 | 0.12 | — | 12.69 | ||||||||||||
| 12/31/15 | 11.17 | 0.06 | — | 12.68 | ||||||||||||
| 12/31/16 | 11.70 | 0.12 | — | 13.33 | ||||||||||||
| 10/31/17(a) | 11.85 | 0.10 | — | 13.58 | ||||||||||||
Class Y
| Income & | Cumulative(c) | |||||||||||||||
| Net Asset | Short-Term(b) Gains | Long-Term(b) Gains | Value Per Share | |||||||||||||
| Value | Distribution | Distribution | Plus Distributions | |||||||||||||
| 12/31/12 | $ | 11.62 | $ | — | $ | — | $ | 11.62 | ||||||||
| 12/31/13 | 11.83 | 0.17 | 0.02 | 12.02 | ||||||||||||
| 12/31/14 | 11.23 | 0.09 | — | 11.51 | ||||||||||||
| 12/31/15 | 11.17 | 0.01 | — | 11.46 | ||||||||||||
| 12/31/16 | 11.76 | 0.03 | — | 12.08 | ||||||||||||
| 10/31/17(a) | 11.90 | 0.07 | — | 12.29 | ||||||||||||
| (a) | Ten months only. Distributions typically are declared every business day and accumulated dividends are distributed monthly. Capital gain distributions typically occur in December. |
| (b) | Represents distributions for the respective calendar year-to-date period ended. |
| (c) | Does not assume any compounding of reinvested distributions. |
Table shows calendar-year distributions and net asset values; may differ from fiscal-year annual reports.
PORTFOLIO CHARACTERISTICS (Unaudited)
| Scout Unconstrained Bond | |
| Average Maturity | 3.3 years |
| Average Duration | 1.1 years |
| 30-Day SEC Yield — Institutional Class** | |
| (Unsubsidized/Subsidized) | 0.69%/0.98% |
| 30-Day SEC Yield — Class Y** | |
| (Unsubsidized/Subsidized) | 0.40%/0.68% |
| Number of Holdings | 81 |
| Total Net Assets (in millions, all share classes) | $1,591.78 |
| Institutional Class Inception Date | 9/29/2011 |
| Class Y Inception Date | 12/31/2012 |
| * | Unmanaged index of stocks, bonds or mutual funds. It is not possible to invest directly in an index. |
| ** | 30-Day SEC Yield is computed under an SEC standardized formula and is an annualized yield based on the most recent trailing 30-day period. Subsidized yields reflect fee waivers in effect. Without such waivers, yields would be reduced. Unsubsidized yields do not reflect fee waivers in effect. A negative 30-Day SEC Yield occurs when accrued expenses of the past 30 days exceed the income collected during the past 30 days. The Fund’s actual distribution rate will differ from the SEC yield, and any income distributions from the Fund may be higher or lower than the SEC yield. |
Portfolio composition will change due to ongoing management of the Fund. References to specific securities or sectors should not be construed as a recommendation by the Fund, its Advisor or Distributor. See the accompanying Schedule of Investments for the percentage of the Fund’s portfolio represented by the securities or sectors mentioned above.
| 42 | SCOUT FUNDS ANNUAL REPORT |
SCHEDULE OF INVESTMENTS
October 31, 2017
UNCONSTRAINED BOND FUND
| Principal | ||||||||
| Amount | Value | |||||||
| ASSET-BACKED SECURITIES — 2.8% | ||||||||
| Bank of The West Auto Trust | ||||||||
| Series 2015-1, Class A3, | ||||||||
| 1.310%, 10/15/19(a)(b) | $ | 2,035,579 | $ | 2,034,508 | ||||
| Series 2017-1, Class A2, | ||||||||
| 1.780%, 2/15/21(a)(b) | 14,815,000 | 14,807,148 | ||||||
| Countrywide Asset-Backed Certificates | ||||||||
| Series 2006-S10, Class A3, | ||||||||
| 1.558% (LIBOR 1 Month+32 basis points), | ||||||||
| 10/25/36(a)(c) | 1,734,220 | 1,633,740 | ||||||
| GSAA Trust | ||||||||
| Series 2006-S1, Class 1A1, | ||||||||
| 1.558% (LIBOR 1 Month+32 basis points), | ||||||||
| 1/25/37(a)(c) | 1,182,420 | 356,255 | ||||||
| Hertz Vehicle Financing II LP | ||||||||
| Series 2015-2A, Class A, | ||||||||
| 2.020%, 9/25/19(a)(b)(d) | 9,455,000 | 9,445,706 | ||||||
| Home Equity Loan Trust | ||||||||
| Series 2003-HS3, Class A2A, | ||||||||
| 1.518% (LIBOR 1 Month+28 basis points), | ||||||||
| 8/25/33(a)(c) | 1,722 | 1,714 | ||||||
| Series 2006-HSA2, Class AI3, | ||||||||
| 5.550% 3/25/36(a)(e) | 4,121,413 | 2,456,877 | ||||||
| Hyundai Auto Receivables Trust | ||||||||
| Series 2016-B, Class A2, | ||||||||
| 1.120%, 10/15/19(a) | 11,348,741 | 11,327,507 | ||||||
| Nomura Asset Acceptance Corp. Alternative Loan Trust | ||||||||
| Series 2006-S1, Class A2, | ||||||||
| 1.858% (LIBOR 1 Month+62 basis points), | ||||||||
| 1/25/36(a)(b)(c) | 378,540 | 387,218 | ||||||
| SunTrust Auto Receivables Trust | ||||||||
| Series 2015-1A, Class A3, | ||||||||
| 1.420%, 9/16/19(a)(b)(d) | 1,819,121 | 1,818,881 | ||||||
| TOTAL ASSET-BACKED SECURITIES | ||||||||
| (Cost $43,974,420) — 2.8% | 44,269,554 | |||||||
| CORPORATE BONDS — 25.1% | ||||||||
| Abbott Laboratories | ||||||||
| 2.350%, 11/22/19 | 7,075,000 | 7,118,716 | ||||||
| AIG Global Funding | ||||||||
| 1.950% 10/18/19(b) | 8,255,000 | 8,243,649 | ||||||
| 1.815% (LIBOR 3 Month+48 basis points), | ||||||||
| 7/2/20(b)(c) | 4,770,000 | 4,780,785 | ||||||
| Ally Financial, Inc. | ||||||||
| 3.250%, 11/5/18 | 9,325,000 | 9,395,404 | ||||||
| American Airlines 2013-2 Class A Pass-Through Trust | ||||||||
| 4.950%, 7/15/24 | 2,319,746 | 2,479,692 | ||||||
| American Express Co. | ||||||||
| 2.200%, 10/30/20(a) | 6,450,000 | 6,431,953 | ||||||
| American Express Credit Corp. | ||||||||
| 1.700% 10/30/19(a) | 5,500,000 | 5,477,071 | ||||||
| 2.600% 9/14/20(a) | 6,435,000 | 6,516,692 | ||||||
| AT&T, Inc. | ||||||||
| 3.200% 3/1/22(a) | 8,460,000 | 8,607,407 | ||||||
| 3.400% 8/14/24(a) | 8,340,000 | 8,333,253 | ||||||
| Bank of America Corp. | ||||||||
| 2.600%, 1/15/19 | 6,625,000 | 6,668,698 | ||||||
| Bank of America N.A. | ||||||||
| 1.650% 3/26/18 | 6,905,000 | 6,907,783 | ||||||
| 1.750% 6/5/18 | 7,415,000 | 7,418,722 | ||||||
| 2.050% 12/7/18 | 2,635,000 | 2,644,568 | ||||||
| Becton, Dickinson and Co. | ||||||||
| 2.133% 6/6/19 | 4,855,000 | 4,856,937 | ||||||
| 2.404% 6/5/20 | 6,700,000 | 6,710,392 | ||||||
| Capital One N.A. | ||||||||
| 1.650% 2/5/18(a) | 6,925,000 | 6,922,798 | ||||||
| 2.350% 8/17/18(a) | 3,800,000 | 3,811,373 | ||||||
| Caterpillar Financial Services Corp. | ||||||||
| 1.496% (LIBOR 3 Month+18 basis points), | ||||||||
| 12/6/18(c) | 17,925,000 | 17,935,791 | ||||||
| Citigroup, Inc. | ||||||||
| 1.800% 2/5/18 | 9,850,000 | 9,851,734 | ||||||
| 2.315% (LIBOR 3 Month+95 basis points), | ||||||||
| 7/24/23(a)(c) | 11,970,000 | 12,023,673 | ||||||
| CNH Industrial Capital, LLC | ||||||||
| 3.875%, 7/16/18 | 2,740,000 | 2,776,963 | ||||||
| Continental Airlines 2007-1 Class A Pass-Through Trust | ||||||||
| 5.983%, 10/19/23 | 1,811,742 | 2,003,624 | ||||||
| Credit Suisse A.G. | ||||||||
| 1.750% 1/29/18(d)(f) | 4,195,000 | 4,197,118 | ||||||
| 1.700% 4/27/18(f) | 8,500,000 | 8,503,459 | ||||||
| Daimler Finance North America, LLC | ||||||||
| 2.000% 8/3/18(b) | 5,945,000 | 5,955,713 | ||||||
| 1.750% 10/30/19(b) | 5,150,000 | 5,115,583 | ||||||
| 2.300% 1/6/20(b) | 8,650,000 | 8,684,825 | ||||||
| Energy Transfer Partners LP | ||||||||
| 4.050%, 3/15/25(a) | 6,392,000 | 6,499,974 | ||||||
| Ford Motor Credit Co., LLC | ||||||||
| 2.875% 10/1/18 | 15,510,000 | 15,647,403 | ||||||
| 2.551% 10/5/18 | 5,690,000 | 5,724,339 | ||||||
| 2.943% 1/8/19 | 8,500,000 | 8,590,159 | ||||||
| 2.425% 6/12/20 | 8,440,000 | 8,462,940 | ||||||
| Goldman Sachs Group, Inc. | ||||||||
| 2.750%, 9/15/20(a) | 2,750,000 | 2,779,598 | ||||||
| JPMorgan Chase & Co. | ||||||||
| 2.750% 6/23/20(a) | 5,485,000 | 5,570,906 | ||||||
| 1.867% (LIBOR 3 Month+55 basis points), | ||||||||
| 3/9/21(a)(c) | 24,075,000 | 24,148,357 | ||||||
| MassMutual Global Funding II | ||||||||
| 1.950%, 9/22/20(b) | 12,055,000 | 11,988,565 | ||||||
| Metropolitan Life Global Funding I | ||||||||
| 1.350%, 9/14/18(b) | 14,300,000 | 14,239,111 | ||||||
| New York Life Global Funding | ||||||||
| 1.450% 12/15/17(b)(d) | 5,210,000 | 5,204,061 | ||||||
| 1.477% (LIBOR 3 Month+12 basis points), | ||||||||
| 4/12/19(b)(c)(d) | 14,175,000 | 14,178,118 | ||||||
| Northwest Airlines 2007-1 Class A Pass-Through Trust | ||||||||
| 7.027%, 5/1/21 | 3,532,486 | 3,850,410 | ||||||
(Continued on next page)
| OCTOBER 31, 2017 | 43 |
SCHEDULE OF INVESTMENTS
October 31, 2017
UNCONSTRAINED BOND FUND (Continued)
| Principal | ||||||||
| Amount | Value | |||||||
| CORPORATE BONDS (Continued) | ||||||||
| Philip Morris International, Inc. | ||||||||
| 2.000%, 2/21/20 | $ | 8,800,000 | $ | 8,799,842 | ||||
| Reliance Standard Life Global Funding II | ||||||||
| 2.500%, 1/15/20(b) | 4,550,000 | 4,574,142 | ||||||
| Sherwin-Williams Co. | ||||||||
| 2.250%, 5/15/20 | 3,895,000 | 3,904,227 | ||||||
| Toyota Motor Credit Corp. | ||||||||
| 1.478% (LIBOR 3 Month+15 basis points), | ||||||||
| 12/24/18(c)(d) | 18,750,000 | 18,764,494 | ||||||
| U.S. Airways 2010-1 Class A Pass-Through Trust | ||||||||
| 6.250%, 10/22/24 | 5,092,132 | 5,690,458 | ||||||
| U.S. Airways 2012-1 Class A Pass-Through Trust | ||||||||
| 5.900%, 4/1/26 | 2,809,304 | 3,162,321 | ||||||
| UBS A.G. | ||||||||
| 1.800%, 3/26/18(f) | 10,900,000 | 10,912,110 | ||||||
| UnitedHealth Group, Inc. | ||||||||
| 1.900%, 7/16/18 | 6,500,000 | 6,513,695 | ||||||
| Wells Fargo & Co. | ||||||||
| 2.550% 12/7/20 | 6,005,000 | 6,056,637 | ||||||
| 2.610% (LIBOR 3 Month+123 basis points), | ||||||||
| 10/31/23(a)(c) | 13,305,000 | 13,688,876 | ||||||
| TOTAL CORPORATE BONDS | ||||||||
| (Cost $395,795,989) — 25.1% | 399,325,119 | |||||||
| MORTGAGE-BACKED SECURITIES — 5.2% | ||||||||
| Fannie Mae Pool | ||||||||
| 1.472% (LIBOR 1 Month+24 basis points), | ||||||||
| 10/1/19(c) | 16,465,000 | 16,469,001 | ||||||
| 3.000% 12/15/42(g) | 24,575,000 | 24,549,565 | ||||||
| Fannie Mae-Aces | ||||||||
| Series 2014-M6, Class FA, | ||||||||
| 1.521% (LIBOR 1 Month+29 basis points), | ||||||||
| 12/25/17(c) | 356,623 | 356,518 | ||||||
| Series 2013-M9, Class ASQ2, | ||||||||
| 1.825% 6/25/18 | 9,707,739 | 9,699,527 | ||||||
| Series 2016-M1, Class ASQ1, | ||||||||
| 1.374% 2/25/21(a) | 13,350 | 13,335 | ||||||
| Series 2014-M1, Class A1, | ||||||||
| 2.325% 7/25/23(e) | 3,602,174 | 3,620,387 | ||||||
| Freddie Mac Multifamily Structured Pass-Through Certificates | ||||||||
| Series KF15, Class A, | ||||||||
| 1.902% (LIBOR 1 Month+67 basis points), | ||||||||
| 2/25/23(a)(c) | 19,791,746 | 19,853,674 | ||||||
| Series KF17, Class A, | ||||||||
| 1.782% (LIBOR 1 Month+55 basis points), | ||||||||
| 3/25/23(a)(c) | 7,144,574 | 7,157,984 | ||||||
| TOTAL MORTGAGE-BACKED SECURITIES | ||||||||
| (Cost $81,751,580) — 5.2% | 81,719,991 | |||||||
| U.S. GOVERNMENT AND AGENCIES — 62.8% | ||||||||
| United States Treasury Note | ||||||||
| 0.875% 11/30/17 | 38,975,000 | 38,968,848 | ||||||
| 0.750% 12/31/17(d) | 44,940,000 | 44,908,317 | ||||||
| 0.875% 1/31/18 | 105,000,000 | 104,915,160 | ||||||
| 0.750% 2/28/18(d) | 108,290,000 | 108,122,151 | ||||||
| 0.875% 3/31/18(d) | 32,615,000 | 32,564,055 | ||||||
| 0.750% 4/30/18 | 70,000,000 | 69,814,080 | ||||||
| 1.250% 10/31/21 | 215,800,000 | 210,447,081 | ||||||
| 2.000% 12/31/21 | 157,705,000 | 158,191,678 | ||||||
| 1.875% 2/28/22 | 31,265,000 | 31,174,613 | ||||||
| 2.250% 8/15/27 | 202,920,000 | 200,684,633 | ||||||
| TOTAL U.S. GOVERNMENT AND AGENCIES | ||||||||
| (Cost $1,001,055,807) — 62.8% | 999,790,616 | |||||||
| SHORT-TERM INVESTMENTS — 4.5% | ||||||||
| UMB Money Market Fiduciary, 0.010% | 72,275,442 | 72,275,442 | ||||||
| TOTAL SHORT-TERM INVESTMENTS | ||||||||
| (Cost $72,275,442) — 4.5% | 72,275,442 | |||||||
| TOTAL INVESTMENTS | ||||||||
| (Cost $1,594,853,238) — 100.4% | 1,597,380,722 | |||||||
| Liabilities less other assets — (0.4)% | (5,598,935 | ) | ||||||
| TOTAL NET ASSETS — 100.0% | ||||||||
| (equivalent to $11.85 per share; unlimited shares | ||||||||
| of $1.00 par value capital shares authorized; | ||||||||
| 128,375,289 shares outstanding for Institutional Class; | ||||||||
| equivalent to $11.90 per share; unlimited shares of | ||||||||
| $1.00 par value capital shares authorized; | ||||||||
| 5,972,556 shares outstanding for Class Y) | $ | 1,591,781,787 | ||||||
LLC — Limited Liability Company
LP — Limited Partnership
| (a) | Callable. |
| (b) | Rule 144A restricted security. Total value of these securities is $111,458,013 which represents 7.0% of total net assets of the Fund. Rule 144A restricted securities may be treated as liquid securities as long as the Advisor determines that an adequate trading market exists. |
| (c) | Floating rate security. Interest rates are based on an index rate. Rate shown is the rate in effect at period end. |
| (d) | Security has been earmarked as commitment for to-be-announced securities. The Advisor earmarks securities to ensure enough asset coverage. |
| (e) | Variable rate security. Interest rate adjusts periodically based on changes in current interest rates. Rate shown is the rate in effect as period end. |
| (f) | Foreign security denominated in U.S. dollars. |
| (g) | To-be-announced security. Securities are being used in dollar roll transactions. |
| 44 | SCOUT FUNDS ANNUAL REPORT |
SCHEDULE OF INVESTMENTS
October 31, 2017
UNCONSTRAINED BOND FUND (Continued)
FUTURES CONTRACTS
| Fair Value/ | ||||||||||||||||
| Number of | Unrealized | |||||||||||||||
| Contracts | Notional Value at | Notional Value at | Appreciation | |||||||||||||
| Description | Expiration Date | Long (Short) | Trade Date | October 31, 2017 | (Depreciation) | |||||||||||
| Euro-Bund Futures | December 2017 | (1,495) | $ | (281,596,950 | ) | $ | (283,414,326 | ) | $ | (1,817,376 | ) | |||||
| TOTAL FUTURES CONTRACTS | $ | (281,596,950 | ) | $ | (283,414,326 | ) | $ | (1,817,376 | ) | |||||||
SWAP CONTRACTS
CREDIT DEFAULT SWAPS
| Rating of | Implied | Premiums | Unrealized | |||||||||||||||||||||||||||
| Reference | Buy/Sell(h) | Reference Entity | Pay/Receive | Fixed Rate/ | Expiration | Credit | Notional | Paid | Appreciation | |||||||||||||||||||||
| Exchange | Entity | Protection | (Moody’s/S&P) | Fixed Rate | Frequency | Date | Spread(i) | Value(j) | Value(k) | (Received) | (Depreciation) | |||||||||||||||||||
| Intercontinental | CDX North | Sell | B1/B+ | Receive | 5%/Quarterly | 12/20/2022 | 3.10% | $ | 29,130,000 | $ | 2,612,983 | $ | 2,168,612 | $ | 444,371 | |||||||||||||||
| Exchange | America High Yield | |||||||||||||||||||||||||||||
| Index Series 29 | ||||||||||||||||||||||||||||||
| TOTAL SWAP CONTRACTS | $ | 29,130,000 | $ | 2,612,983 | $ | 2,168,612 | $ | 444,371 | ||||||||||||||||||||||
| (h) | If the Fund is a seller of protection and a credit event occurs, as defined under the terms of that particular swap agreement, the Fund will either (i) pay to the buyer of protection an amount equal to the notional amount of the swap and take delivery of the referenced obligation or underlying securities comprising the referenced index or (ii) pay a net settlement amount in the form of cash or securities equal to the notional amount of the swap less the recovery value of the referenced obligation of underlying securities comprising the referenced index. |
| (i) | credit spreads represent the current level as of October 31, 2017 at which protection could be bought or sold given the terms of the existing credit default swap contract and serve as an indicator of the current status of the payment/performance risk of the credit default swap contract. An implied credit spread has widened or increased since entry into initial contract and may indicate a deteriorating credit profile and increased risk of default for the reference entity. A declining or narrowing spread may indicate an improving credit profile or decreased risk of default for the reference entity. Alternatively, credit spreads may increase or decrease reflecting the general tolerance for risk in the credit spread markets generally. |
| (j) | The maximum potential amount the Fund could be required to make as a seller of credit protection or receive as a buyer of credit protection if a credit event occurs as defined under the terms of that particular swap agreement. |
| (k) | The prices and resulting values for credit default swap agreements on credit indices serve as an indicator of the current status of the payment/performance risk and represent the likelihood of an expected liability (or profit) for the credit derivative should the notional amount of the swap agreement be closed/sold as of the period end. Increasing market values, in absolute terms when compared to the notional amount of the swap, represent a deterioration of the referenced entity’s credit soundness and a greater likelihood or risk of default or other credit event occurring as defined under the terms of the agreement. |
See accompanying Notes to Financial Statements.
| OCTOBER 31, 2017 | 45 |
STATEMENTS OF ASSETS AND LIABILITIES
October 31, 2017
(in thousands except per share data)
| Low Duration | ||||||||||||||||
| International | Mid Cap | Small Cap | Bond | |||||||||||||
| Fund | Fund | Fund | Fund | |||||||||||||
| ASSETS: | ||||||||||||||||
| Investments, at cost | $ | 775,775 | $ | 1,333,491 | $ | 170,042 | $ | 45,760 | ||||||||
| Investments, at value | $ | 1,159,104 | $ | 1,675,614 | $ | 268,562 | $ | 45,695 | ||||||||
| Cash | 219 | 3,736 | 2,209 | 3 | ||||||||||||
| Receivables: | ||||||||||||||||
| Fund shares sold | 184 | 2,958 | 107 | — | ||||||||||||
| Dividends | 3,990 | 961 | 79 | — | ||||||||||||
| Interest | 12 | 10 | — | 244 | ||||||||||||
| Due from Advisor(a) | — | — | — | 3 | ||||||||||||
| Prepaid and other assets | 35 | 58 | 18 | 24 | ||||||||||||
| Total assets | 1,163,544 | 1,683,337 | 270,975 | 45,969 | ||||||||||||
| LIABILITIES: | ||||||||||||||||
| Payables: | ||||||||||||||||
| Investments purchased | — | 5,963 | — | 319 | ||||||||||||
| Fund shares redeemed | 1,379 | 633 | 192 | 3 | ||||||||||||
| Accrued investment advisory fees | 780 | 1,051 | 172 | — | ||||||||||||
| Accrued transfer agent and related service fees and expenses | 245 | 229 | 32 | 13 | ||||||||||||
| Accrued custody fees | 32 | 11 | 3 | 2 | ||||||||||||
| Accrued administration and fund accounting fees | 27 | 37 | 6 | 1 | ||||||||||||
| Accrued administrative fees | 51 | 68 | 11 | 2 | ||||||||||||
| Accrued auditing fees | 2 | 5 | 5 | 5 | ||||||||||||
| Accrued pricing fees | 4 | — | — | 4 | ||||||||||||
| Other accrued expenses | 147 | 126 | 23 | 4 | ||||||||||||
| Total liabilities | 2,667 | 8,123 | 444 | 353 | ||||||||||||
| NET ASSETS | $ | 1,160,877 | $ | 1,675,214 | $ | 270,531 | $ | 45,616 | ||||||||
| NET ASSETS CONSIST OF: | ||||||||||||||||
| Capital (capital stock and paid-in capital) | $ | 633,270 | $ | 1,213,185 | $ | 145,975 | $ | 45,721 | ||||||||
| Accumulated: | ||||||||||||||||
| Net investment income (loss) | 5,238 | 462 | — | — | ||||||||||||
| Net realized gain on investments, foreign currency transactions and swap contracts | 139,089 | 119,444 | 26,036 | (40 | ) | |||||||||||
| Net unrealized appreciation (depreciation) on: | ||||||||||||||||
| Investments | 383,329 | 342,123 | 98,520 | (65 | ) | |||||||||||
| Foreign currency translations | (49 | ) | — | — | — | |||||||||||
| NET ASSETS APPLICABLE TO OUTSTANDING SHARES | $ | 1,160,877 | $ | 1,675,214 | $ | 270,531 | $ | 45,616 | ||||||||
| Capital Shares, $1.00 par value: | ||||||||||||||||
| Authorized | Unlimited | Unlimited | Unlimited | Unlimited | ||||||||||||
| SHARES ISSUED AND OUTSTANDING | 46,100 | 84,714 | 9,224 | 4,541 | ||||||||||||
| NET ASSET VALUE PER SHARE | $ | 25.18 | $ | 19.77 | $ | 29.33 | $ | 10.05 | ||||||||
| (a) | Represents amounts due to the Fund from the Advisor, due to Total Annual Fund Operating Expenses exceeding the contractual expense cap in place for each respective Fund. (Note 2.(a)) |
See accompanying Notes to Financial Statements.
| 46 | SCOUT FUNDS ANNUAL REPORT |
STATEMENTS OF ASSETS AND LIABILITIES
October 31, 2017
(in thousands except per share data)
| Core | Unconstrained | |||||||||||
| Core Bond | Plus Bond | Bond | ||||||||||
| Fund | Fund | Fund | ||||||||||
| ASSETS: | ||||||||||||
| Investments, at cost | $ | 159,650 | $ | 851,429 | $ | 1,594,853 | ||||||
| Investments, at value | $ | 159,828 | $ | 851,447 | $ | 1,597,381 | ||||||
| Cash | — | 18 | 3 | |||||||||
| Cash at broker deposited as margin for open futures contracts | — | 978 | 4,265 | |||||||||
| Cash at broker deposited as collateral for open swap contracts | — | 362 | 1,495 | |||||||||
| Cash at custodian segregated as margin for open futures contracts | — | 319 | 514 | |||||||||
| Receivables: | ||||||||||||
| Investments sold | 20,122 | 111,033 | 27,950 | |||||||||
| Fund shares sold | 17 | 233 | 9,896 | |||||||||
| Premiums paid on open swap contracts | — | 526 | 2,169 | |||||||||
| Interest | 517 | 2,475 | 4,677 | |||||||||
| Prepaid and other assets | 24 | 43 | 64 | |||||||||
| Total assets | 180,508 | 967,434 | 1,648,414 | |||||||||
| LIABILITIES: | ||||||||||||
| Payables: | ||||||||||||
| Variation margin on open swap contracts | — | 516 | 2,130 | |||||||||
| Investments purchased | 36,455 | 197,311 | 52,576 | |||||||||
| Fund shares redeemed | 113 | 422 | 894 | |||||||||
| Variation margin on open futures contracts | — | 16 | 79 | |||||||||
| Dividends | 3 | 210 | 61 | |||||||||
| Accrued investment advisory fees | 14 | 144 | 412 | |||||||||
| Accrued transfer agent and related service fees and expenses | 34 | 84 | 189 | |||||||||
| Accrued custody fees | 3 | 9 | 12 | |||||||||
| Accrued administration and fund accounting fees | 3 | 18 | 36 | |||||||||
| Accrued administrative fees | 6 | 32 | 66 | |||||||||
| Accrued auditing fees | 5 | 5 | 5 | |||||||||
| Accrued pricing fees | 3 | 4 | 3 | |||||||||
| Accrued distribution fees | 9 | 32 | 41 | |||||||||
| Accrued shareholder servicing fees | 1 | 5 | — | |||||||||
| Other accrued expenses | 16 | 64 | 128 | |||||||||
| Total liabilities | 36,665 | 198,872 | 56,632 | |||||||||
| NET ASSETS | $ | 143,843 | $ | 768,562 | $ | 1,591,782 | ||||||
| NET ASSETS CONSIST OF: | ||||||||||||
| Capital (capital stock and paid-in capital) | $ | 145,782 | $ | 778,781 | $ | 1,623,168 | ||||||
| Accumulated: | ||||||||||||
| Net investment gain (loss) | — | (318 | ) | 688 | ||||||||
| Net realized loss on investments, foreign currency transactions, forward contracts, futures contracts and swap contracts | (2,117 | ) | (9,840 | ) | (33,227 | ) | ||||||
| Net unrealized appreciation (depreciation) on: | ||||||||||||
| Investments | 178 | 18 | 2,528 | |||||||||
| Futures contracts | — | (187 | ) | (1,817 | ) | |||||||
| Foreign currency translations | — | — | (2 | ) | ||||||||
| Swap contracts | — | 108 | 444 | |||||||||
| NET ASSETS APPLICABLE TO OUTSTANDING SHARES | $ | 143,843 | $ | 768,562 | $ | 1,591,782 | ||||||
| Capital Shares, $1.00 par value: | ||||||||||||
| Authorized | Unlimited | Unlimited | Unlimited | |||||||||
| Shares issued and outstanding: | ||||||||||||
| Institutional Class | 12,393 | 23,336 | 128,375 | |||||||||
| Class Y | 220 | 881 | 5,973 | |||||||||
| TOTAL SHARES ISSUED AND OUTSTANDING | 12,613 | 24,217 | 134,348 | |||||||||
| NET ASSET VALUE PER SHARE — INSTITUTIONAL CLASS | $ | 11.40 | $ | 31.74 | $ | 11.85 | ||||||
| NET ASSET VALUE PER SHARE — CLASS Y | $ | 11.40 | $ | 31.73 | $ | 11.90 | ||||||
| OCTOBER 31, 2017 | 47 |
STATEMENTS OF OPERATIONS
(in thousands)
| International Fund | Mid Cap Fund | |||||||||||||||
| For the | For the | For the | For the | |||||||||||||
| Period Ended | Year Ended | Period Ended | Year Ended | |||||||||||||
| October 31, 2017* | June 30 2017** | October 31, 2017* | June 30 2017** | |||||||||||||
| INVESTMENT INCOME: | ||||||||||||||||
| Dividend income | $ | 7,372 | (a) | $ | 35,037 | (a) | $ | 5,306 | (a) | $ | 19,310 | (a) | ||||
| Interest income | 73 | 109 | 43 | 51 | ||||||||||||
| Total investment income | 7,445 | 35,146 | 5,349 | 19,361 | ||||||||||||
| EXPENSES: | ||||||||||||||||
| Investment advisory fees | 3,101 | 10,204 | 3,919 | 10,265 | ||||||||||||
| Administration and fund accounting fees | 106 | 351 | 137 | 354 | ||||||||||||
| Transfer agent and related service fees and expenses | 641 | 2,014 | 706 | 1,907 | ||||||||||||
| Custody fees | 66 | 186 | 24 | 66 | ||||||||||||
| Auditing fees | 11 | 44 | 7 | 28 | ||||||||||||
| Federal and state registration fees | 17 | 60 | 22 | 43 | ||||||||||||
| Reports to shareholders | 52 | 137 | 43 | 106 | ||||||||||||
| Administrative fees | 194 | 644 | 251 | 648 | ||||||||||||
| Insurance fees | 8 | 26 | 8 | 23 | ||||||||||||
| Directors fees | — | 77 | — | 79 | ||||||||||||
| Distribution fees | — | — | — | — | ||||||||||||
| Shareholder servicing fees | — | — | — | — | ||||||||||||
| Pricing expenses | 9 | 29 | 4 | 11 | ||||||||||||
| Other expenses | 50 | 211 | 55 | 114 | ||||||||||||
| Total expenses before waiver | 4,255 | 13,983 | 5,176 | 13,644 | ||||||||||||
| Waiver of fees and/or other expenses assumed by Advisor | — | — | — | — | ||||||||||||
| Net expenses | 4,255 | 13,983 | 5,176 | 13,644 | ||||||||||||
| Net investment income (loss) | 3,190 | 21,163 | 173 | 5,717 | ||||||||||||
| NET REALIZED AND UNREALIZED GAIN (LOSS) ON INVESTMENTS, FOREIGN CURRENCY, FORWARD CONTRACTS, FUTURES CONTRACTS AND SWAP CONTRACTS: | ||||||||||||||||
| Net realized gain (loss) on: | ||||||||||||||||
| Investments | 56,397 | 212,777 | 24,726 | 170,049 | ||||||||||||
| Foreign currency transactions | 1,497 | (1,037 | ) | — | — | |||||||||||
| Forward Contracts | — | — | — | — | ||||||||||||
| Futures contracts | — | — | — | — | ||||||||||||
| Swap contracts | — | — | — | — | ||||||||||||
| Net increase (decrease) in unrealized appreciation/depreciation on: | ||||||||||||||||
| Investments | 34,763 | (8,963 | ) | 111,794 | 93,669 | |||||||||||
| Foreign currency translations | (63 | ) | 325 | — | — | |||||||||||
| Futures contracts | — | — | — | — | ||||||||||||
| Swap contracts | — | — | — | — | ||||||||||||
| Net realized and unrealized gain (loss) on investments, foreign currency, forward contracts, future contracts and swap contracts | 92,594 | 203,102 | 136,520 | 263,718 | ||||||||||||
| Net increase (decrease) in net assets resulting from operations | $ | 95,784 | $ | 224,265 | $ | 136,693 | $ | 269,435 | ||||||||
* Fiscal year end changed to October 31, 2017.
** Fiscal year end June 30, 2017.
(a) Net of foreign tax withholding of (in thousands) $625, $3,282, $2 and $6, respectively.
See accompanying Notes to Financial Statements.
| 48 | SCOUT FUNDS ANNUAL REPORT |
| Small Cap Fund | Low Duration Bond Fund | Core Bond Fund | Core Plus Bond Fund | Unconstrained Bond Fund | ||||||||||||||||||||||||||||||||||
| For the | For the | For the | For the | For the | For the | For the | For the | For the | For the | |||||||||||||||||||||||||||||
| Period Ended | Year Ended | Period Ended | Year Ended | Period Ended | Year Ended | Period Ended | Year Ended | Period Ended | Year Ended | |||||||||||||||||||||||||||||
| October 31, 2017* | June 30 2017** | October 31, 2017* | June 30 2017** | October 31, 2017* | June 30 2017** | October 31, 2017* | June 30 2017** | October 31, 2017* | June 30 2017** | |||||||||||||||||||||||||||||
| $ | 495 | $ | 1,395 | $ | — | $ | — | $ | — | $ | — | $ | — | $ | — | $ | — | $ | — | |||||||||||||||||||
| — | — | 290 | 766 | 1,074 | 3,325 | 5,220 | 15,460 | 7,904 | 20,875 | |||||||||||||||||||||||||||||
| 495 | 1,395 | 290 | 766 | 1,074 | 3,325 | 5,220 | 15,460 | 7,904 | 20,875 | |||||||||||||||||||||||||||||
| 638 | 1,597 | 48 | 145 | 209 | 781 | 1,081 | 3,587 | 3,173 | 9,237 | |||||||||||||||||||||||||||||
| 23 | 57 | 4 | 13 | 14 | 52 | 72 | 240 | 142 | 411 | |||||||||||||||||||||||||||||
| 130 | 331 | 23 | 59 | 66 | 199 | 181 | 605 | 485 | 1,432 | |||||||||||||||||||||||||||||
| 1 | 11 | 4 | 10 | 5 | 17 | 15 | 48 | 21 | 67 | |||||||||||||||||||||||||||||
| 7 | 28 | 7 | 28 | 7 | 28 | 7 | 28 | 7 | 28 | |||||||||||||||||||||||||||||
| 11 | 23 | 4 | 22 | 12 | 34 | 17 | 48 | 29 | 67 | |||||||||||||||||||||||||||||
| 9 | 24 | 2 | 4 | 4 | 10 | 10 | 25 | 32 | 72 | |||||||||||||||||||||||||||||
| 42 | 104 | 8 | 24 | 26 | 96 | 132 | 439 | 260 | 754 | |||||||||||||||||||||||||||||
| 1 | 3 | — | 1 | 1 | 4 | 5 | 17 | 9 | 25 | |||||||||||||||||||||||||||||
| — | 13 | — | 3 | — | 12 | — | 56 | — | 94 | |||||||||||||||||||||||||||||
| — | — | — | — | 2 | 8 | 25 | 169 | 70 | 297 | |||||||||||||||||||||||||||||
| — | — | — | — | 1 | 4 | 15 | 91 | — | — | |||||||||||||||||||||||||||||
| 3 | 8 | 16 | 49 | 10 | 30 | 11 | 35 | 8 | 24 | |||||||||||||||||||||||||||||
| 11 | 22 | 3 | 8 | 9 | 26 | 34 | 89 | 60 | 143 | |||||||||||||||||||||||||||||
| 876 | 2,221 | 119 | 366 | 366 | 1,301 | 1,605 | 5,477 | 4,296 | 12,651 | |||||||||||||||||||||||||||||
| — | — | (55 | ) | (173 | ) | (153 | ) | (507 | ) | (485 | ) | (1,630 | ) | (1,568 | ) | (4,597 | ) | |||||||||||||||||||||
| 876 | 2,221 | 64 | 193 | 213 | 794 | 1,120 | 3,847 | 2,728 | 8,054 | |||||||||||||||||||||||||||||
| (381 | ) | (826 | ) | 226 | 573 | 861 | 2,531 | 4,100 | 11,613 | 5,176 | 12,821 | |||||||||||||||||||||||||||
| 5,886 | 21,034 | 12 | 33 | 996 | (742 | ) | 4,728 | (1,885 | ) | 1,005 | 16,685 | |||||||||||||||||||||||||||
| — | — | — | — | — | — | (20 | ) | (58 | ) | (137 | ) | (275 | ) | |||||||||||||||||||||||||
| — | — | — | — | — | — | — | 679 | 2,022 | ||||||||||||||||||||||||||||||
| — | — | — | — | — | — | 247 | (2,717 | ) | 5,277 | (3,463 | ) | |||||||||||||||||||||||||||
| — | — | — | 38 | — | 88 | 164 | 1,759 | 608 | 5,193 | |||||||||||||||||||||||||||||
| 17,318 | 36,720 | 5 | (258 | ) | (370 | ) | (3,466 | ) | (1,857 | ) | (16,781 | ) | 459 | (9,753 | ) | |||||||||||||||||||||||
| — | — | — | — | — | — | — | 1 | (6 | ) | 6 | ||||||||||||||||||||||||||||
| — | — | — | — | — | — | (544 | ) | 2,599 | (5,162 | ) | 9,035 | |||||||||||||||||||||||||||
| — | — | — | — | — | (58 | ) | 50 | (473 | ) | 285 | (1,020 | ) | ||||||||||||||||||||||||||
| 23,204 | 57,754 | 17 | (187 | ) | 626 | (4,178 | ) | 2,768 | (16,876 | ) | 2,329 | 18,430 | ||||||||||||||||||||||||||
| $ | 22,823 | $ | 56,928 | $ | 243 | $ | 386 | $ | 1,487 | $ | (1,647 | ) | $ | 6,868 | $ | (5,263 | ) | $ | 7,505 | $ | 31,251 | |||||||||||||||||
| OCTOBER 31, 2017 | 49 |
STATEMENTS OF CHANGES IN NET ASSETS
(in thousands)
| International Fund | ||||||||||||
| For the | For the | For the | ||||||||||
| Period Ended | Year Ended | Year Ended | ||||||||||
| October 31, 2017* | June 30, 2017 | June 30, 2016 | ||||||||||
| INCREASE (DECREASE) IN NET ASSETS FROM OPERATIONS: | ||||||||||||
| Net investment income (loss) | $ | 3,190 | $ | 21,163 | $ | 36,153 | ||||||
| Net realized gain (loss) on investments, foreign currency transactions and swap contracts | 57,894 | 211,740 | 538,431 | |||||||||
| Net increase (decrease) in unrealized appreciation/depreciation on investments and foreign currencies translations | 34,700 | (8,638 | ) | (899,742 | ) | |||||||
| Net increase (decrease) in net assets resulting from operations | 95,784 | 224,265 | (325,158 | ) | ||||||||
| DISTRIBUTIONS TO SHAREHOLDERS: | ||||||||||||
| Net investment income | — | (21,855 | ) | (43,420 | ) | |||||||
| Net realized gain on securities | — | (178,101 | ) | (598,526 | ) | |||||||
| Total distributions to shareholders | — | (199,956 | ) | (641,946 | ) | |||||||
| CAPITAL SHARE TRANSACTIONS: | ||||||||||||
| Shares sold | 16,931 | 89,419 | 154,841 | |||||||||
| Shares issued for reinvestment of distributions | — | 191,438 | 596,860 | |||||||||
| Redemption fees | — | — | — | |||||||||
| Shares redeemed | (137,909 | ) | (603,354 | ) | (3,075,299 | ) | ||||||
| Net increase (decrease) from capital share transactions | (120,978 | ) | (322,497 | ) | (2,323,598 | ) | ||||||
| Net increase (decrease) in net assets | (25,194 | ) | (298,188 | ) | (3,290,702 | ) | ||||||
| NET ASSETS: | ||||||||||||
| Beginning of period | 1,186,071 | 1,484,259 | 4,774,961 | |||||||||
| End of period | $ | 1,160,877 | $ | 1,186,071 | $ | 1,484,259 | ||||||
| Accumulated net investment income (loss) | 5,238 | 1,735 | 2,241 | |||||||||
| TRANSACTIONS IN SHARES: | ||||||||||||
| Shares sold | 698 | 3,937 | 5,778 | |||||||||
| Shares reinvested | — | 9,219 | 26,108 | |||||||||
| Shares redeemed | (5,699 | ) | (26,321 | ) | (109,343 | ) | ||||||
| Net increase (decrease) | (5,001 | ) | (13,165 | ) | (77,457 | ) | ||||||
*Fiscal year end changed to October 31, 2017, effective November 17, 2017.
See accompanying Notes to Financial Statements.
| 50 | SCOUT FUNDS ANNUAL REPORT |
| Mid Cap Fund | Small Cap Fund | Low Duration Bond Fund | ||||||||||||||||||||||||||||||||
| For the | For the | For the | For the | For the | For the | For the | For the | For the | ||||||||||||||||||||||||||
| Period Ended | Year Ended | Year Ended | Period Ended | Year Ended | Year Ended | Period Ended | Year Ended | Year Ended | ||||||||||||||||||||||||||
| October 31, 2017* | June 30, 2017 | June 30, 2016 | October 31, 2017* | June 30, 2017 | June 30, 2016 | October 31, 2017* | June 30, 2017 | June 30, 2016 | ||||||||||||||||||||||||||
| $ | 173 | $ | 5,717 | $ | 18,497 | $ | (381 | ) | $ | (826 | ) | $ | (680 | ) | $ | 226 | $ | 573 | $ | 547 | ||||||||||||||
| 24,726 | 170,049 | (22,423 | ) | 5,886 | 21,034 | 14,131 | 12 | 71 | 48 | |||||||||||||||||||||||||
| 111,794 | 93,669 | 31,225 | 17,318 | 36,720 | (27,982 | ) | 5 | (258 | ) | 240 | ||||||||||||||||||||||||
| 136,693 | 269,435 | 27,299 | 22,823 | 56,928 | (14,531 | ) | 243 | 386 | 835 | |||||||||||||||||||||||||
| — | (5,660 | ) | (15,463 | ) | — | — | — | (243 | ) | (667 | ) | (608 | ) | |||||||||||||||||||||
| — | (23,066 | ) | (99,754 | ) | — | (9,177 | ) | (29,639 | ) | — | — | — | ||||||||||||||||||||||
| — | (28,726 | ) | (115,217 | ) | — | (9,177 | ) | (29,639 | ) | (243 | ) | (667 | ) | (608 | ) | |||||||||||||||||||
| 196,139 | 275,358 | 216,825 | 16,258 | 23,421 | 17,218 | 1,770 | 5,885 | 13,388 | ||||||||||||||||||||||||||
| — | 25,509 | 101,042 | — | 8,913 | 29,048 | 235 | 635 | 608 | ||||||||||||||||||||||||||
| — | — | — | — | — | — | — | — | — | ||||||||||||||||||||||||||
| (94,475 | ) | (397,184 | ) | (522,006 | ) | (10,521 | ) | (35,743 | ) | (53,275 | ) | (5,125 | ) | (5,357 | ) | (13,644 | ) | |||||||||||||||||
| 101,664 | (96,317 | ) | (204,139 | ) | 5,737 | (3,409 | ) | (7,009 | ) | (3,120 | ) | 1,163 | 352 | |||||||||||||||||||||
| 238,357 | 144,392 | (292,057 | ) | 28,560 | 44,342 | (51,179 | ) | (3,120 | ) | 882 | 579 | |||||||||||||||||||||||
| 1,436,857 | 1,292,465 | 1,584,522 | 241,971 | 197,629 | 248,808 | 48,736 | 47,854 | 47,275 | ||||||||||||||||||||||||||
| $ | 1,675,214 | $ | 1,436,857 | $ | 1,292,465 | $ | 270,531 | $ | 241,971 | $ | 197,629 | $ | 45,616 | $ | 48,736 | $ | 47,854 | |||||||||||||||||
| 462 | 300 | 1,166 | — | — | (1 | ) | — | (5 | ) | 10 | ||||||||||||||||||||||||
| 10,448 | 16,183 | 14,816 | 574 | 936 | 775 | 176 | 585 | 1,335 | ||||||||||||||||||||||||||
| — | 1,520 | 7,136 | — | 382 | 1,364 | 23 | 63 | 60 | ||||||||||||||||||||||||||
| (5,060 | ) | (24,205 | ) | (35,054 | ) | (377 | ) | (1,506 | ) | (2,273 | ) | (509 | ) | (532 | ) | (1,356 | ) | |||||||||||||||||
| 5,388 | (6,502 | ) | (13,102 | ) | 197 | (188 | ) | (134 | ) | (310 | ) | 116 | 39 | |||||||||||||||||||||
| OCTOBER 31, 2017 | 51 |
STATEMENTS OF CHANGES IN NET ASSETS
(in thousands)
| Core Bond Fund | ||||||||||||
| For the | For the | For the | ||||||||||
| Period Ended | Year Ended | Year Ended | ||||||||||
| October 31, 2017* | June 30, 2017 | June 30, 2016 | ||||||||||
| INCREASE (DECREASE) IN NET ASSETS FROM OPERATIONS: | ||||||||||||
| Net investment income | $ | 861 | $ | 2,531 | $ | 3,348 | ||||||
| Net realized gain (loss) on investments, foreign currency transactions, forward contracts, futures contracts and swap contracts | 996 | (654 | ) | 4,857 | ||||||||
| Net increase (decrease) in unrealized appreciation/depreciation on investments, forward contracts, futures contracts and swap contracts | (370 | ) | (3,524 | ) | 3,842 | |||||||
| Net increase (decrease) in net assets resulting from operations | 1,487 | (1,647 | ) | 12,047 | ||||||||
| DISTRIBUTIONS TO SHAREHOLDERS: | ||||||||||||
| Net investment income: | ||||||||||||
| Institutional Class | (890 | ) | (3,156 | ) | (3,498 | ) | ||||||
| Class Y | (11 | ) | (37 | ) | (45 | ) | ||||||
| Net realized gain on securities: | ||||||||||||
| Institutional Class | — | (4,146 | ) | — | ||||||||
| Class Y | — | (63 | ) | — | ||||||||
| Net return of capital: | ||||||||||||
| Institutional Class | — | — | — | |||||||||
| Class Y | — | — | — | |||||||||
| Total distributions to shareholders | (901 | ) | (7,402 | ) | (3,543 | ) | ||||||
| CAPITAL SHARE TRANSACTIONS: | ||||||||||||
| Institutional Class: | ||||||||||||
| Shares sold | 3,577 | 37,722 | 34,723 | |||||||||
| Shares issued for reinvestment of distributions | 836 | 6,943 | 3,277 | |||||||||
| Shares redeemed | (30,037 | ) | (73,695 | ) | (52,524 | ) | ||||||
| Net increase (decrease) from capital share transactions | (25,624 | ) | (29,030 | ) | (14,524 | ) | ||||||
| Class Y: | ||||||||||||
| Shares sold | 50 | 333 | 1,352 | |||||||||
| Shares issued for reinvestment of distributions | 11 | 100 | 45 | |||||||||
| Shares redeemed | (114 | ) | (1,387 | ) | (1,554 | ) | ||||||
| Net increase (decrease) from capital share transactions | (53 | ) | (954 | ) | (157 | ) | ||||||
| Net increase (decrease) from capital share transactions | (25,677 | ) | (29,984 | ) | (14,681 | ) | ||||||
| Net increase (decrease) in net assets | (25,091 | ) | (39,033 | ) | (6,177 | ) | ||||||
| NET ASSETS: | ||||||||||||
| Beginning of period | 168,934 | 207,967 | 214,144 | |||||||||
| End of period | $ | 143,843 | $ | 168,934 | $ | 207,967 | ||||||
| Accumulated net investment income (loss) | — | — | 51 | |||||||||
| TRANSACTIONS IN SHARES: | ||||||||||||
| Institutional Class: | ||||||||||||
| Shares sold | 313 | 3,278 | 2,994 | |||||||||
| Shares reinvested | 73 | 616 | 283 | |||||||||
| Shares redeemed | (2,628 | ) | (6,426 | ) | (4,545 | ) | ||||||
| Net increase (decrease) | (2,242 | ) | (2,532 | ) | (1,268 | ) | ||||||
| Class Y: | ||||||||||||
| Shares sold | 4 | 28 | 116 | |||||||||
| Shares reinvested | 1 | 9 | 4 | |||||||||
| Shares redeemed | (10 | ) | (120 | ) | (135 | ) | ||||||
| Net increase (decrease) | (5 | ) | (83 | ) | (15 | ) | ||||||
| Net increase (decrease) | (2,247 | ) | (2,615 | ) | (1,283 | ) | ||||||
*Fiscal year end changed to October 31, 2017.
See accompanying Notes to Financial Statements.
| 52 | SCOUT FUNDS ANNUAL REPORT |
| Core Plus Bond Fund | Unconstrained Bond Fund | |||||||||||||||||||||
| For the | For the | For the | For the | For the | For the | |||||||||||||||||
| Period Ended | Year Ended | Year Ended | Period Ended | Year Ended | Year Ended | |||||||||||||||||
| October 31, 2017* | June 30, 2017 | June 30, 2016 | October 31, 2017* | June 30, 2017 | June 30, 2016 | |||||||||||||||||
| $ | 4,100 | $ | 11,613 | $ | 14,697 | $ | 5,176 | $ | 12,821 | $ | 26,648 | |||||||||||
| 5,119 | (2,222 | ) | 16,666 | 6,753 | 20,162 | 25,424 | ||||||||||||||||
| (2,351 | ) | (14,654 | ) | 13,978 | (4,424 | ) | (1,732 | ) | 1,845 | |||||||||||||
| 6,868 | (5,263 | ) | 45,341 | 7,505 | 31,251 | 53,917 | ||||||||||||||||
| (3,876 | ) | (13,399 | ) | (12,828 | ) | (4,692 | ) | (14,623 | ) | (11,188 | ) | |||||||||||
| (110 | ) | (781 | ) | (759 | ) | (175 | ) | (832 | ) | — | ||||||||||||
| — | (19,296 | ) | (10,803 | ) | — | — | — | |||||||||||||||
| — | (1,508 | ) | (719 | ) | — | — | — | |||||||||||||||
| (192 | ) | — | — | — | — | — | ||||||||||||||||
| (5 | ) | — | — | — | — | — | ||||||||||||||||
| (4,183 | ) | (34,984 | ) | (25,109 | ) | (4,867 | ) | (15,455 | ) | (11,188 | ) | |||||||||||
| 30,110 | 184,300 | 346,503 | 166,300 | 562,802 | 437,961 | |||||||||||||||||
| 3,131 | 25,793 | 19,085 | 4,401 | 13,971 | 10,638 | |||||||||||||||||
| (79,411 | ) | (233,425 | ) | (178,801 | ) | (127,565 | ) | (397,526 | ) | (684,024 | ) | |||||||||||
| (46,170 | ) | (23,332 | ) | 186,787 | 43,136 | 179,247 | (235,425 | ) | ||||||||||||||
| 420 | 33,193 | 52,632 | 6,608 | 87,759 | 47,003 | |||||||||||||||||
| 110 | 2,189 | 1,438 | 171 | 805 | — | |||||||||||||||||
| (2,951 | ) | (82,859 | ) | (30,732 | ) | (34,339 | ) | (83,123 | ) | (218,189 | ) | |||||||||||
| (2,421 | ) | (47,477 | ) | 23,338 | (27,560 | ) | 5,441 | (171,186 | ) | |||||||||||||
| (48,591 | ) | (70,809 | ) | 210,125 | 15,576 | 184,688 | (406,611 | ) | ||||||||||||||
| (45,906 | ) | (111,056 | ) | 230,357 | 18,214 | 200,484 | (363,882 | ) | ||||||||||||||
| 814,468 | 925,524 | 695,167 | 1,573,568 | 1,373,084 | 1,736,966 | |||||||||||||||||
| $ | 768,562 | $ | 814,468 | $ | 925,524 | $ | 1,591,782 | $ | 1,573,568 | $ | 1,373,084 | |||||||||||
| (318 | ) | (638 | ) | (284 | ) | 688 | 190 | 932 | ||||||||||||||
| 946 | 5,707 | 10,793 | 14,025 | 47,895 | 38,392 | |||||||||||||||||
| 99 | 823 | 600 | 371 | 1,189 | 924 | |||||||||||||||||
| (2,497 | ) | (7,338 | ) | (5,583 | ) | (10,764 | ) | (33,804 | ) | (60,267 | ) | |||||||||||
| (1,452 | ) | (808 | ) | 5,810 | 3,632 | 15,280 | (20,951 | ) | ||||||||||||||
| 13 | 1,014 | 1,630 | 555 | 7,437 | 4,143 | |||||||||||||||||
| 4 | 70 | 45 | 15 | 68 | — | |||||||||||||||||
| (93 | ) | (2,597 | ) | (961 | ) | (2,885 | ) | (7,029 | ) | (19,358 | ) | |||||||||||
| (76 | ) | (1,513 | ) | 714 | (2,315 | ) | 476 | (15,215 | ) | |||||||||||||
| (1,528 | ) | (2,321 | ) | 6,524 | 1,317 | 15,756 | (36,166 | ) | ||||||||||||||
| OCTOBER 31, 2017 | 53 |
FINANCIAL HIGHLIGHTS
Per share income and capital changes for a share outstanding throughout each year.
SCOUT INTERNATIONAL FUND
| For the | ||||||||||||||||||||||||
| Period Ended | For the Years Ended June 30, | |||||||||||||||||||||||
| October 31, 2017 | 2017 | 2016 | 2015 | 2014 | 2013 | |||||||||||||||||||
| Net asset value, beginning of period | $ | 23.21 | $ | 23.10 | $ | 33.69 | $ | 37.81 | $ | 33.52 | $ | 29.24 | ||||||||||||
| Income from investment operations: | ||||||||||||||||||||||||
| Net investment income | 0.07 | (a) | 0.37 | (a) | 0.56 | 0.65 | 0.50 | 0.44 | ||||||||||||||||
| Net realized and unrealized gain (loss) on securities | 1.90 | 3.50 | (3.41 | ) | (1.59 | ) | 4.29 | 4.49 | ||||||||||||||||
| Total from investment operations | 1.97 | 3.87 | (2.85 | ) | (0.94 | ) | 4.79 | 4.93 | ||||||||||||||||
| Distributions from: | ||||||||||||||||||||||||
| Net investment income | — | (0.42 | ) | (0.59 | ) | (0.60 | ) | (0.50 | ) | (0.65 | ) | |||||||||||||
| Net realized gain on securities | — | (3.34 | ) | (7.15 | ) | (2.58 | ) | — | — | |||||||||||||||
| Total distributions | — | (3.76 | ) | (7.74 | ) | (3.18 | ) | (0.50 | ) | (0.65 | ) | |||||||||||||
| Net asset value, end of period | $ | 25.18 | $ | 23.21 | $ | 23.10 | $ | 33.69 | $ | 37.81 | $ | 33.52 | ||||||||||||
| Total return | 8.49 | %(b) | 18.80 | % | (7.89 | )% | (2.22 | )% | 14.30 | % | 16.86 | % | ||||||||||||
| Ratios/Supplemental Data: | ||||||||||||||||||||||||
| Net assets, end of period (in millions) | $ | 1,161 | $ | 1,186 | $ | 1,484 | $ | 4,775 | $ | 8,580 | $ | 9,202 | ||||||||||||
| Ratio of expenses to average net assets | 1.08 | %(c) | 1.06 | % | 1.05 | % | 1.02 | % | 1.01 | % | 1.01 | % | ||||||||||||
| Ratio of net investment income to average net assets | 0.81 | %(c) | 1.61 | % | 1.38 | % | 1.48 | % | 1.23 | % | 1.39 | % | ||||||||||||
| Portfolio turnover rate | 7 | %(b) | 20 | % | 23 | % | 17 | % | 12 | % | 31 | % | ||||||||||||
(a) Based on average shares outstanding for the period.
(b) Not annualized.
(c) Annualized.
SCOUT MID CAP FUND
| For the | ||||||||||||||||||||||||
| Period Ended | For the Years Ended June 30, | |||||||||||||||||||||||
| October 31, 2017 | 2017 | 2016 | 2015 | 2014 | 2013 | |||||||||||||||||||
| Net asset value, beginning of period | $ | 18.11 | $ | 15.06 | $ | 16.02 | $ | 18.79 | $ | 15.75 | $ | 13.25 | ||||||||||||
| Income from investment operations: | ||||||||||||||||||||||||
| Net investment income | — | (a)(b) | 0.07 | (a) | 0.21 | 0.03 | — | (b) | 0.14 | |||||||||||||||
| Net realized and unrealized gain on securities | 1.66 | 3.35 | 0.13 | 0.30 | 3.99 | 2.67 | ||||||||||||||||||
| Total from investment operations | 1.66 | 3.42 | 0.34 | 0.33 | 3.99 | 2.81 | ||||||||||||||||||
| Distributions from: | ||||||||||||||||||||||||
| Net investment income | — | (0.07 | ) | (0.17 | ) | (0.02 | ) | — | (b) | (0.11 | ) | |||||||||||||
| Net realized gain on securities | — | (0.30 | ) | (1.13 | ) | (3.08 | ) | (0.95 | ) | (0.20 | ) | |||||||||||||
| Total distributions | — | (0.37 | ) | (1.30 | ) | (3.10 | ) | (0.95 | ) | (0.31 | ) | |||||||||||||
| Net asset value, end of period | $ | 19.77 | $ | 18.11 | $ | 15.06 | $ | 16.02 | $ | 18.79 | $ | 15.75 | ||||||||||||
| Total return | 9.17 | %(c) | 22.93 | % | 2.69 | % | 2.42 | % | 25.75 | % | 21.53 | % | ||||||||||||
| Ratios/Supplemental Data: | ||||||||||||||||||||||||
| Net assets, end of period (in millions) | $ | 1,675 | $ | 1,437 | $ | 1,292 | $ | 1,585 | $ | 2,538 | $ | 1,601 | ||||||||||||
| Ratio of expenses to average net assets | 1.01 | %(d) | 1.03 | % | 1.04 | % | 1.04 | % | 1.02 | % | 1.07 | % | ||||||||||||
| Ratio of net investment income to average net assets | 0.03 | %(d) | 0.43 | % | 1.34 | % | 0.17 | % | 0.01 | % | 0.97 | % | ||||||||||||
| Portfolio turnover rate | 20 | %(c) | 87 | % | 161 | % | 158 | % | 134 | % | 127 | % | ||||||||||||
(a) Based on average shares outstanding for the period.
(b) Resulted in less than $0.005 per share.
(c) Not annualized.
(d) Annualized.
See accompanying Notes to Financial Statements.
| 54 | SCOUT FUNDS ANNUAL REPORT |
FINANCIAL HIGHLIGHTS
Per share income and capital changes for a share outstanding throughout each period.
SCOUT SMALL CAP FUND
| For the | ||||||||||||||||||||||||
| Period Ended | For the Years Ended June 30, | |||||||||||||||||||||||
| October 31, 2017 | 2017 | 2016 | 2015 | 2014 | 2013 | |||||||||||||||||||
| Net asset value, beginning of period | $ | 26.81 | $ | 21.45 | $ | 26.61 | $ | 24.49 | $ | 20.55 | $ | 15.82 | ||||||||||||
| Income from investment operations: | ||||||||||||||||||||||||
| Net investment income (loss) | (0.04 | )(a) | (0.09 | )(a) | (0.07 | ) | (0.07 | ) | (0.04 | ) | 0.02 | |||||||||||||
| Net realized and unrealized gain (loss) on securities | 2.56 | 6.52 | (1.55 | ) | 2.37 | 3.98 | 4.77 | |||||||||||||||||
| Total from investment operations | 2.52 | 6.43 | (1.62 | ) | 2.30 | 3.94 | 4.79 | |||||||||||||||||
| Distributions from: | ||||||||||||||||||||||||
| Net investment income | — | — | — | — | — | (0.06 | ) | |||||||||||||||||
| Net realized gain on securities | — | (1.07 | ) | (3.54 | ) | (0.18 | ) | — | — | |||||||||||||||
| Total distributions | — | (1.07 | ) | (3.54 | ) | (0.18 | ) | — | (0.06 | ) | ||||||||||||||
| Net asset value, end of period | $ | 29.33 | $ | 26.81 | $ | 21.45 | $ | 26.61 | $ | 24.49 | $ | 20.55 | ||||||||||||
| Total return | 9.40 | %(b) | 30.70 | % | (6.01 | )% | 9.44 | % | 19.17 | % | 30.39 | % | ||||||||||||
| Ratios/Supplemental Data: | ||||||||||||||||||||||||
| Net assets, end of period (in millions) | $ | 271 | $ | 242 | $ | 198 | $ | 249 | $ | 251 | $ | 244 | ||||||||||||
| Ratio of expenses to average net assets | 1.03 | %(c) | 1.04 | % | 1.13 | % | 1.12 | % | 1.12 | % | 1.13 | % | ||||||||||||
| Ratio of net investment income (loss) to average net assets | (0.45 | )%(c) | (0.39 | )% | (0.32 | )% | (0.27 | )% | (0.15 | )% | 0.14 | % | ||||||||||||
| Portfolio turnover rate | 6 | %(b) | 25 | % | 16 | % | 22 | % | 17 | % | 23 | % | ||||||||||||
(a) Based on average shares outstanding for the period.
(b) Not annualized.
(c) Annualized.
See accompanying Notes to Financial Statements.
| OCTOBER 31, 2017 | 55 |
FINANCIAL HIGHLIGHTS
Per share income and capital changes for a share outstanding throughout each period.
SCOUT LOW DURATION BOND FUND (Fund Inception August 29, 2012)
| For the | For the | |||||||||||||||||||||||
| Period Ended | For the Years Ended June 30, | Period Ended | ||||||||||||||||||||||
| October 31, 2017 | 2017 | 2016 | 2015 | 2014 | June 30, 2013 | |||||||||||||||||||
| Net asset value, beginning of period | $ | 10.05 | $ | 10.11 | $ | 10.07 | $ | 10.12 | $ | 10.02 | $ | 10.00 | ||||||||||||
| Income from investment operations: | ||||||||||||||||||||||||
| Net investment income | 0.05 | (a) | 0.12 | (a) | 0.11 | 0.11 | 0.10 | 0.14 | ||||||||||||||||
| Net realized and unrealized gain (loss) on securities | — | (b) | (0.04 | ) | 0.05 | (0.01 | ) | 0.14 | 0.02 | |||||||||||||||
| Total from investment operations | 0.05 | 0.08 | 0.16 | 0.10 | 0.24 | 0.16 | ||||||||||||||||||
| Distributions from: | ||||||||||||||||||||||||
| Net investment income | (0.05 | ) | (0.14 | ) | (0.12 | ) | (0.13 | ) | (0.13 | ) | (0.14 | ) | ||||||||||||
| Net realized gain on securities | — | — | — | (0.02 | ) | (0.01 | ) | — | (b) | |||||||||||||||
| Total distributions | (0.05 | ) | (0.14 | ) | (0.12 | ) | (0.15 | ) | (0.14 | ) | (0.14 | ) | ||||||||||||
| Net asset value, end of period | $ | 10.05 | $ | 10.05 | $ | 10.11 | $ | 10.07 | $ | 10.12 | $ | 10.02 | ||||||||||||
| Total return | 0.52 | %(c) | 0.78 | % | 1.60 | % | 1.01 | % | 2.38 | % | 1.60 | %(c) | ||||||||||||
| Ratios/Supplemental Data: | ||||||||||||||||||||||||
| Net assets, end of period (in millions) | $ | 46 | $ | 49 | $ | 48 | $ | 47 | $ | 27 | $ | 34 | ||||||||||||
| Ratio of expenses to average net assets: | ||||||||||||||||||||||||
| Net of waivers | 0.40 | %(d) | 0.40 | % | 0.40 | % | 0.40 | % | 0.40 | % | 0.40 | %(d) | ||||||||||||
| Before waivers | 0.75 | %(d) | 0.76 | % | 0.92 | % | 1.03 | % | 0.97 | % | 1.73 | %(d) | ||||||||||||
| Ratio of net investment income to average net assets: | ||||||||||||||||||||||||
| Net of waivers | 1.43 | %(d) | 1.18 | % | 1.07 | % | 1.10 | % | 1.02 | % | 1.49 | %(d) | ||||||||||||
| Before waivers | 1.08 | %(d) | 0.82 | % | 0.55 | % | 0.47 | % | 0.45 | % | 0.15 | %(d) | ||||||||||||
| Portfolio turnover rate | 19 | %(c) | 82 | % | 94 | % | 69 | % | 170 | % | 121 | %(c) | ||||||||||||
(a) Based on average shares outstanding for the period.
(b) Resulted in less than $0.005 per share.
(c) Not annualized.
(d) Annualized.
See accompanying Notes to Financial Statements.
| 56 | SCOUT FUNDS ANNUAL REPORT |
FINANCIAL HIGHLIGHTS
Per share income and capital changes for a share outstanding throughout each period.
SCOUT CORE BOND FUND — INSTITUTIONAL CLASS
| For the | ||||||||||||||||||||||||
| Period Ended | For the Years Ended June 30, | |||||||||||||||||||||||
| October 31, 2017 | 2017 | 2016 | 2015 | 2014 | 2013 | |||||||||||||||||||
| Net asset value, beginning of period | $ | 11.37 | $ | 11.90 | $ | 11.42 | $ | 11.50 | $ | 11.41 | $ | 11.61 | ||||||||||||
| Income from investment operations: | ||||||||||||||||||||||||
| Net investment income | 0.07 | (a) | 0.15 | (a) | 0.18 | 0.14 | 0.15 | 0.13 | ||||||||||||||||
| Net realized and unrealized gain (loss) on securities | 0.03 | (0.24 | ) | 0.49 | (0.07 | ) | 0.15 | 0.01 | ||||||||||||||||
| Total from investment operations | 0.10 | (0.09 | ) | 0.67 | 0.07 | 0.30 | 0.14 | |||||||||||||||||
| Distributions from: | ||||||||||||||||||||||||
| Net investment income | (0.07 | ) | (0.19 | ) | (0.19 | ) | (0.15 | ) | (0.17 | ) | (0.15 | ) | ||||||||||||
| Net realized gain on securities | — | (0.25 | ) | — | — | (0.04 | ) | (0.19 | ) | |||||||||||||||
| Total distributions | (0.07 | ) | (0.44 | ) | (0.19 | ) | (0.15 | ) | (0.21 | ) | (0.34 | ) | ||||||||||||
| Net asset value, end of period | $ | 11.40 | $ | 11.37 | $ | 11.90 | $ | 11.42 | $ | 11.50 | $ | 11.41 | ||||||||||||
| Total return | 0.85 | %(b) | (0.71 | )% | 6.00 | % | 0.61 | % | 2.65 | % | 1.20 | % | ||||||||||||
| Ratios/Supplemental Data: | ||||||||||||||||||||||||
| Net assets, end of period (in millions) | $ | 141 | $ | 166 | $ | 204 | $ | 210 | $ | 219 | $ | 259 | ||||||||||||
| Ratio of expenses to average net assets: | ||||||||||||||||||||||||
| Net of waivers | 0.40 | %(c) | 0.40 | % | 0.40 | % | 0.40 | % | 0.40 | % | 0.40 | % | ||||||||||||
| Before waivers | 0.69 | %(c) | 0.66 | % | 0.62 | % | 0.61 | % | 0.62 | % | 0.64 | % | ||||||||||||
| Ratio of net investment income to average net assets: | ||||||||||||||||||||||||
| Net of waivers | 1.65 | %(c) | 1.30 | % | 1.62 | % | 1.21 | % | 1.32 | % | 1.13 | % | ||||||||||||
| Before waivers | 1.36 | %(c) | 1.04 | % | 1.40 | % | 1.00 | % | 1.10 | % | 0.89 | % | ||||||||||||
| Portfolio turnover rate | 126 | %(b) | 390 | % | 453 | % | 158 | % | 636 | % | 607 | % | ||||||||||||
(a) Based on average shares outstanding for the period.
(b) Not annualized.
(c) Annualized.
SCOUT CORE BOND FUND — CLASS Y
| For the | ||||||||||||||||||||||||
| Period Ended | For the Years Ended June 30, | |||||||||||||||||||||||
| October 31, 2017 | 2017 | 2016 | 2015 | 2014 | 2013 | |||||||||||||||||||
| Net asset value, beginning of period | $ | 11.37 | $ | 11.90 | $ | 11.42 | $ | 11.50 | $ | 11.40 | $ | 11.61 | ||||||||||||
| Income from investment operations: | ||||||||||||||||||||||||
| Net investment income | 0.05 | (a) | 0.10 | (a) | 0.15 | 0.10 | 0.11 | 0.10 | ||||||||||||||||
| Net realized and unrealized gain (loss) on securities | 0.03 | (0.24 | ) | 0.49 | (0.07 | ) | 0.16 | — | (b) | |||||||||||||||
| Total from investment operations | 0.08 | (0.14 | ) | 0.64 | 0.03 | 0.27 | 0.10 | |||||||||||||||||
| Distributions from: | ||||||||||||||||||||||||
| Net investment income | (0.05 | ) | (0.14 | ) | (0.16 | ) | (0.11 | ) | (0.13 | ) | (0.12 | ) | ||||||||||||
| Net realized gain on securities | — | (0.25 | ) | — | — | (0.04 | ) | (0.19 | ) | |||||||||||||||
| Total distributions | (0.05 | ) | (0.39 | ) | (0.16 | ) | (0.11 | ) | (0.17 | ) | (0.31 | ) | ||||||||||||
| Net asset value, end of period | $ | 11.40 | $ | 11.37 | $ | 11.90 | $ | 11.42 | $ | 11.50 | $ | 11.40 | ||||||||||||
| Total return | 0.71 | %(c) | (1.09 | )% | 5.63 | % | 0.24 | % | 2.34 | % | 0.83 | % | ||||||||||||
| Ratios/Supplemental Data: | ||||||||||||||||||||||||
| Net assets, end of period (in millions) | $ | 3 | $ | 3 | $ | 4 | $ | 4 | $ | 4 | $ | 6 | ||||||||||||
| Ratio of expenses to average net assets: | ||||||||||||||||||||||||
| Net of waivers | 0.80 | %(d) | 0.79 | % | 0.75 | % | 0.76 | % | 0.79 | % | 0.71 | % | ||||||||||||
| Before waivers | 1.00 | %(d) | 0.97 | % | 0.97 | % | 0.97 | % | 1.01 | % | 0.95 | % | ||||||||||||
| Ratio of net investment income to average net assets: | ||||||||||||||||||||||||
| Net of waivers | 1.25 | %(d) | 0.91 | % | 1.27 | % | 0.85 | % | 0.93 | % | 0.82 | % | ||||||||||||
| Before waivers | 1.05 | %(d) | 0.73 | % | 1.05 | % | 0.64 | % | 0.71 | % | 0.58 | % | ||||||||||||
| Portfolio turnover rate | 126 | %(c) | 390 | % | 453 | % | 158 | % | 636 | % | 607 | % | ||||||||||||
(a) Based on average shares outstanding for the period.
(b) Resulted in less than $0.005 per share.
(c) Not annualized.
(d) Annualized.
See accompanying Notes to Financial Statements.
| OCTOBER 31, 2017 | 57 |
FINANCIAL HIGHLIGHTS
Per share income and capital changes for a share outstanding throughout each period.
SCOUT CORE PLUS BOND FUND — INSTITUTIONAL CLASS
| For the | ||||||||||||||||||||||||
| Period Ended | For the Years Ended June 30, | |||||||||||||||||||||||
| October 31, 2017 | 2017 | 2016 | 2015 | 2014 | 2013 | |||||||||||||||||||
| Net asset value, beginning of period | $ | 31.64 | $ | 32.98 | $ | 32.27 | $ | 32.30 | $ | 31.94 | $ | 33.03 | ||||||||||||
| Income from investment operations: | ||||||||||||||||||||||||
| Net investment income | 0.16 | (a) | 0.42 | (a) | 0.60 | 0.39 | 0.49 | 0.55 | ||||||||||||||||
| Net realized and unrealized gain (loss) on securities | 0.11 | (0.51 | ) | 1.14 | (0.01 | ) | 0.44 | 0.35 | ||||||||||||||||
| Total from investment operations | 0.27 | (0.09 | ) | 1.74 | 0.38 | 0.93 | 0.90 | |||||||||||||||||
| Distributions from: | ||||||||||||||||||||||||
| Net investment income | (0.16 | ) | (0.52 | ) | (0.56 | ) | (0.38 | ) | (0.44 | ) | (0.56 | ) | ||||||||||||
| Net realized gain on securities | — | (0.73 | ) | (0.47 | ) | (0.03 | ) | (0.13 | ) | (1.43 | ) | |||||||||||||
| Net return of capital | (0.01 | ) | — | — | — | — | — | |||||||||||||||||
| Total distributions | (0.17 | ) | (1.25 | ) | (1.03 | ) | (0.41 | ) | (0.57 | ) | (1.99 | ) | ||||||||||||
| Net asset value, end of period | $ | 31.74 | $ | 31.64 | $ | 32.98 | $ | 32.27 | $ | 32.30 | $ | 31.94 | ||||||||||||
| Total return | 0.85 | %(b) | (0.18 | )% | 5.53 | % | 1.19 | % | 2.94 | % | 2.64 | % | ||||||||||||
| Ratios/Supplemental Data: | ||||||||||||||||||||||||
| Net assets, end of period (in millions) | $ | 741 | $ | 784 | $ | 844 | $ | 638 | $ | 448 | $ | 430 | ||||||||||||
| Ratio of expenses to average net assets: | ||||||||||||||||||||||||
| Net of waivers | 0.40 | %(c) | 0.40 | % | 0.40 | % | 0.40 | % | 0.40 | % | 0.40 | % | ||||||||||||
| Before waivers | 0.58 | %(c) | 0.59 | % | 0.55 | % | 0.56 | % | 0.57 | % | 0.59 | % | ||||||||||||
| Ratio of net investment income to average net assets: | ||||||||||||||||||||||||
| Net of waivers | 1.53 | %(c) | 1.32 | % | 1.87 | % | 1.22 | % | 1.53 | % | 1.65 | % | ||||||||||||
| Before waivers | 1.35 | %(c) | 1.13 | % | 1.72 | % | 1.06 | % | 1.36 | % | 1.46 | % | ||||||||||||
| Portfolio turnover rate | 123 | %(b) | 433 | % | 480 | % | 187 | % | 663 | % | 604 | % | ||||||||||||
(a) Based on average shares outstanding for the period.
(b) Not annualized.
(c) Annualized.
SCOUT CORE PLUS BOND FUND — CLASS Y
| For the | ||||||||||||||||||||||||
| Period Ended | For the Years Ended June 30, | |||||||||||||||||||||||
| October 31, 2017 | 2017 | 2016 | 2015 | 2014 | 2013 | |||||||||||||||||||
| Net asset value, beginning of period | $ | 31.63 | $ | 32.97 | $ | 32.27 | $ | 32.29 | $ | 31.94 | $ | 33.03 | ||||||||||||
| Income from investment operations: | ||||||||||||||||||||||||
| Net investment income | 0.12 | (a) | 0.30 | (a) | 0.48 | 0.26 | 0.38 | 0.48 | ||||||||||||||||
| Net realized and unrealized gain (loss) on securities | 0.10 | (0.51 | ) | 1.14 | (0.01 | ) | 0.43 | 0.31 | ||||||||||||||||
| Total from investment operations | 0.22 | (0.21 | ) | 1.62 | 0.25 | 0.81 | 0.79 | |||||||||||||||||
| Distributions from: | ||||||||||||||||||||||||
| Net investment income | (0.11 | ) | (0.39 | ) | (0.45 | ) | (0.24 | ) | (0.33 | ) | (0.45 | ) | ||||||||||||
| Net realized gain on securities | — | (0.74 | ) | (0.47 | ) | (0.03 | ) | (0.13 | ) | (1.43 | ) | |||||||||||||
| Net return of capital | (0.01 | ) | — | — | — | — | — | |||||||||||||||||
| Total distributions | (0.12 | ) | (1.13 | ) | (0.92 | ) | (0.27 | ) | (0.46 | ) | (1.88 | ) | ||||||||||||
| Net asset value, end of period | $ | 31.73 | $ | 31.63 | $ | 32.97 | $ | 32.27 | $ | 32.29 | $ | 31.94 | ||||||||||||
| Total return | 0.71 | %(b) | (0.57 | )% | 5.16 | % | 0.79 | % | 2.54 | % | 2.30 | % | ||||||||||||
| Ratios/Supplemental Data: | ||||||||||||||||||||||||
| Net assets, end of period (in millions) | $ | 28 | $ | 30 | $ | 82 | $ | 57 | $ | 102 | $ | 54 | ||||||||||||
| Ratio of expenses to average net assets: | ||||||||||||||||||||||||
| Net of waivers | 0.80 | %(c) | 0.78 | % | 0.74 | % | 0.80 | % | 0.78 | % | 0.75 | % | ||||||||||||
| Before waivers | 0.93 | %(c) | 0.91 | % | 0.89 | % | 0.96 | % | 0.95 | % | 0.94 | % | ||||||||||||
| Ratio of net investment income to average net assets: | ||||||||||||||||||||||||
| Net of waivers | 1.13 | %(c) | 0.94 | % | 1.53 | % | 0.82 | % | 1.15 | % | 1.30 | % | ||||||||||||
| Before waivers | 1.00 | %(c) | 0.81 | % | 1.38 | % | 0.66 | % | 0.98 | % | 1.11 | % | ||||||||||||
| Portfolio turnover rate | 123 | %(b) | 433 | % | 480 | % | 187 | % | 663 | % | 604 | % | ||||||||||||
(a) Based on average shares outstanding for the period.
(b) Not annualized.
(c) Annualized.
See accompanying Notes to Financial Statements.
| 58 | SCOUT FUNDS ANNUAL REPORT |
FINANCIAL HIGHLIGHTS
Per share income and capital changes for a share outstanding throughout each period.
SCOUT UNCONSTRAINED BOND FUND — INSTITUTIONAL CLASS
| For the | ||||||||||||||||||||||||
| Period Ended | For the Years Ended June 30, | |||||||||||||||||||||||
| October 31, 2017 | 2017 | 2016 | 2015 | 2014 | 2013 | |||||||||||||||||||
| Net asset value, beginning of period | $ | 11.83 | $ | 11.70 | $ | 11.32 | $ | 11.65 | $ | 11.70 | $ | 11.02 | ||||||||||||
| Income from investment operations: | ||||||||||||||||||||||||
| Net investment income | 0.04 | (a) | 0.10 | (a) | 0.21 | 0.08 | 0.04 | 0.24 | ||||||||||||||||
| Net realized and unrealized gain (loss) on securities | 0.02 | 0.15 | 0.27 | (0.29 | ) | 0.01 | 1.15 | |||||||||||||||||
| Total from investment operations | 0.06 | 0.25 | 0.48 | (0.21 | ) | 0.05 | 1.39 | |||||||||||||||||
| Distributions from: | ||||||||||||||||||||||||
| Net investment income | (0.04 | ) | (0.12 | ) | (0.10 | ) | (0.12 | ) | (0.03 | ) | (0.23 | ) | ||||||||||||
| Net realized gain on securities | — | — | — | — | (0.07 | ) | (0.48 | ) | ||||||||||||||||
| Total distributions | (0.04 | ) | (0.12 | ) | (0.10 | ) | (0.12 | ) | (0.10 | ) | (0.71 | ) | ||||||||||||
| Net asset value, end of period | $ | 11.85 | $ | 11.83 | $ | 11.70 | $ | 11.32 | $ | 11.65 | $ | 11.70 | ||||||||||||
| Total return | 0.48 | %(b) | 2.15 | % | 4.28 | % | (1.77 | )% | 0.44 | % | 12.72 | % | ||||||||||||
| Ratios/Supplemental Data: | ||||||||||||||||||||||||
| Net assets, end of period (in millions) | $ | 1,521 | $ | 1,475 | $ | 1,281 | $ | 1,477 | $ | 1,806 | $ | 420 | ||||||||||||
| Ratio of expenses to average net assets: | ||||||||||||||||||||||||
| Net of waivers | 0.50 | %(c) | 0.50 | % | 0.50 | % | 0.50 | % | 0.50 | % | 0.59 | % | ||||||||||||
| Before waivers | 0.80 | %(c) | 0.80 | % | 0.82 | % | 0.81 | % | 0.84 | % | 0.96 | % | ||||||||||||
| Ratio of net investment income to average net assets: | ||||||||||||||||||||||||
| Net of waivers | 1.00 | %(c) | 0.86 | % | 1.88 | % | 0.79 | % | 0.40 | % | 1.36 | % | ||||||||||||
| Before waivers | 0.70 | %(c) | 0.56 | % | 1.56 | % | 0.48 | % | 0.06 | % | 0.99 | % | ||||||||||||
| Portfolio turnover rate | 83 | %(b) | 370 | % | 615 | % | 116 | % | 422 | % | 140 | % | ||||||||||||
(a) Based on average shares outstanding for the period.
(b) Not annualized.
(c) Annualized.
SCOUT UNCONSTRAINED BOND FUND — CLASS Y (Class Inception December 31, 2012)
| For the | For the | |||||||||||||||||||||||
| Period Ended | For the Years Ended June 30, | Period Ended | ||||||||||||||||||||||
| October 31, 2017 | 2017 | 2016 | 2015 | 2014 | June 30, 2013 | |||||||||||||||||||
| Net asset value, beginning of period | $ | 11.88 | $ | 11.75 | $ | 11.30 | $ | 11.64 | $ | 11.71 | $ | 11.62 | ||||||||||||
| Income from investment operations: | ||||||||||||||||||||||||
| Net investment income | 0.03 | (a) | 0.07 | (a) | 0.13 | 0.03 | 0.01 | 0.11 | ||||||||||||||||
| Net realized and unrealized gain (loss) on securities | 0.02 | 0.14 | 0.32 | (0.27 | ) | — | (b) | 0.09 | ||||||||||||||||
| Total from investment operations | 0.05 | 0.21 | 0.45 | (0.24 | ) | 0.01 | 0.20 | |||||||||||||||||
| Distributions from: | ||||||||||||||||||||||||
| Net investment income | (0.03 | ) | (0.08 | ) | — | (0.10 | ) | (0.01 | ) | (0.11 | ) | |||||||||||||
| Net realized gain on securities | — | — | — | — | (0.07 | ) | — | |||||||||||||||||
| Total distributions | (0.03 | ) | (0.08 | ) | — | (0.10 | ) | (0.08 | ) | (0.11 | ) | |||||||||||||
| Net asset value, end of period | $ | 11.90 | $ | 11.88 | $ | 11.75 | $ | 11.30 | $ | 11.64 | $ | 11.71 | ||||||||||||
| Total return | 0.38 | %(c) | 1.78 | % | 3.98 | % | (2.05 | )% | 0.12 | % | 1.68 | %(c) | ||||||||||||
| Ratios/Supplemental Data: | ||||||||||||||||||||||||
| Net assets, end of period (in millions) | $ | 71 | $ | 99 | $ | 92 | $ | 260 | $ | 555 | $ | 125 | ||||||||||||
| Ratio of expenses to average net assets: | ||||||||||||||||||||||||
| Net of waivers | 0.80 | %(d) | 0.80 | % | 0.79 | % | 0.80 | % | 0.78 | % | 0.77 | %(b) | ||||||||||||
| Before waivers | 1.07 | %(d) | 1.09 | % | 1.11 | % | 1.11 | % | 1.12 | % | 1.17 | %(b) | ||||||||||||
| Ratio of net investment income to average net assets: | ||||||||||||||||||||||||
| Net of waivers | 0.69 | %(d) | 0.56 | % | 1.59 | % | 0.49 | % | 0.12 | % | 0.84 | %(b) | ||||||||||||
| Before waivers | 0.42 | %(d) | 0.27 | % | 1.27 | % | 0.18 | % | (0.22 | )% | 0.44 | %(b) | ||||||||||||
| Portfolio turnover rate | 83 | %(c) | 370 | % | 615 | % | 116 | % | 422 | % | 140 | %(a) | ||||||||||||
(a) Based on average shares outstanding for the period.
(b) Resulted in less than $0.05 per share.
(c) Not Annualized.
(d) Annualized.
See accompanying Notes to Financial Statements.
| OCTOBER 31, 2017 | 59 |
NOTES TO FINANCIAL STATEMENTS
October 31, 2017
The following notes are as of October 31, 2017, when the Funds were series of the Scout Funds and advised by Scout Investments, Inc. The Funds were reorganized after the close of business on November 17, 2017 into corresponding newly created series of Carillon Series Trust.
| 1. | ORGANIZATION AND SUMMARY OF SIGNIFICANT ACCOUNTING POLICIES |
Scout Funds, a Delaware statutory trust (the “Trust”), is registered under the Investment Company Act of 1940, as amended (the “1940 Act”), as an open-end management investment company. The Trust currently consists of the following seven diversified portfolios: Scout International Fund (“International” or “International Fund”), Scout Mid Cap Fund (“Mid Cap” or “Mid Cap Fund”), Scout Small Cap Fund (“Small Cap” or “Small Cap Fund”), Scout Low Duration Bond Fund (“Low Duration Bond” or “Low Duration Bond Fund”), Scout Core Bond Fund (“Core Bond” or “Core Bond Fund”), Scout Core Plus Bond Fund (“Core Plus Bond” or “Core Plus Bond Fund”), and Scout Unconstrained Bond Fund (“Unconstrained Bond” or “Unconstrained Bond Fund”) (individually referred to as a “Fund,” or collectively as the “Funds”).
The Funds’ investment objectives are as follows:
| Fund | Investment Objective |
| International | Long-term growth of capital and income |
| Mid Cap | Long-term growth of capital |
| Small Cap | Long-term growth of capital |
| Low Duration Bond | High level of total return consistent with the preservation of capital |
| Core Bond | High level of total return consistent with the preservation of capital |
| Core Plus Bond | High level of total return consistent with the preservation of capital |
| Unconstrained Bond | Maximize total return consistent with the preservation of capital |
The following is a summary of significant accounting policies consistently followed by the Funds in the preparation of their financial statements. The policies are in conformity with accounting principles generally accepted in the United States of America (“GAAP”). The Funds are investment companies and accordingly, follow the investment company accounting and reporting guidance of the Financial Accounting Standards Board (“FASB”) Accounting Standards Codification Topic 946 - Investment Companies, which is part of GAAP.
| (a) | Security Valuations — Each security owned by a Fund that is listed on an exchange, except the NASDAQ National Market® and NASDAQ Capital Market® exchanges, is valued at its last sale price on that exchange on the date when Fund assets are valued. Where the security is listed on more than one exchange, the Fund will use the price of that exchange that it generally considers to be the principal exchange on which the security is traded. NASDAQ National Market® and NASDAQ Capital Market® securities will be valued at the NASDAQ Official Closing Price (“NOCP”). The NOCP will be based on the last trade price if it falls within the concurrent best bid and asked prices and will be normalized pursuant to NASDAQ’s published procedures if it falls outside this range. If an exchange is open for trading on a day but there are no sales, the security is valued at the mean between the last current closing bid and asked prices. An unlisted security for which over-the-counter market quotations are readily available is valued at the mean between the last current bid and asked prices. Debt securities (other than short-term instruments maturing within 60 days), including listed issues, are valued by using an evaluated bid price furnished by an independent pricing service, which may use matrix and valuation models as necessary to formulate its prices. Short-term instruments maturing within 60 days may be valued at amortized cost. Swaps, such as credit default swaps, interest rate swaps and currency swaps, are valued by an independent pricing service. In the absence of an evaluated bid price from an independent pricing service for a debt security (other than short-term instruments maturing within 60 days) or swap, or when a Fund buys a when-issued security or a mortgage-backed security and the security is not yet being priced by a pricing service, the securities will be valued at their fair value as determined in good faith by Scout Investments, Inc. (the “Advisor”) implementing procedures adopted by, and under the supervision of, the Board of Trustees of the Trust (the “Board”). |
Options are valued at the mean between the current bid and asked prices. Futures contracts are valued at the last reported sale price at valuation time on the exchange on which they are traded. Foreign equity securities or debt securities, currencies and other assets denominated in foreign currencies are translated into U.S. dollars at the exchange rate of such currencies against the U.S. dollar, as provided by an independent pricing service. All assets denominated in foreign currencies will be converted into U.S. dollars using the applicable currency exchange rates as of 4:00 p.m. Eastern Standard Time. Foreign forward currency contracts are valued at the mean between the bid and asked exchange rates. Rights and warrants are generally valued at the last sale price at the close of the exchange on which the security is principally traded. Redeemable securities issued by open-end investment companies are valued on any given business day using the respective closing Net Asset Values (“NAVs”) of such companies for purchase and/or redemption orders placed on that day. Restricted securities will generally be priced at fair value in accordance with the procedures adopted by the Board. If any short positions are maintained by the Funds, including short positions in options and futures contracts, they shall be valued in accordance with the same methodologies and procedures with respect to equity investments.
A Fund will also value a security at fair value when significant events that materially affect the security’s price occur after the last available market price and before the Fund calculates its NAV.
The Funds’ fair value pricing of securities traded on foreign exchanges utilizes data furnished by an independent pricing service (and that data draws upon, among other information, the market values of foreign investments). The Funds may rely on the third-party pricing service’s prices to reflect events materially affecting the values of the Funds’ foreign investments during the period between the close of foreign markets and the close of regular trading on the New York Stock Exchange (“NYSE”). In certain circumstances, if events occur that materially affect the values of the Funds’ foreign investments, the third-party pricing services will provide revised values to the Funds. The use of fair value pricing by the Funds may cause the NAVs of their shares to differ from the NAVs that would be calculated by using closing market prices.
In the event that a fair valuation determination is necessary with respect to a security or other asset of the Funds for which a market quotation is not readily available or is unreliable, the Advisor’s Valuation Committee shall consider all appropriate factors relevant to the value of the security or other asset and shall determine the method of arriving at the fair value thereof. Generally, any member of the Advisor’s Valuation Committee can make the valuation determination with consent of another voting member of the Advisor’s Valuation Committee that is not on the Fund team affected, but, if feasible, should involve a member of fund accounting and the Fund manager. As a general principle, the “fair value” of a security or other asset should be the amount that the Fund might reasonably expect to realize upon the current sale of the security or other asset. Valuation policies and procedures are reviewed annually by the Advisor’s Valuation Committee. Quarterly, the Board analyzes fair valued securities utilized in the Funds during the period as well as reviews the independent third party fair valuation analysis report.
| 60 | SCOUT FUNDS ANNUAL REPORT |
Various inputs are used in determining the value of a Fund’s investments. These inputs are summarized into three broad levels as described below:
| • | Level 1 — | quoted prices in active markets for identical securities; | |
| • | Level 2 — | other significant observable inputs (including quoted prices for similar investments, interest rates, benchmark yields, bids, offers, transactions, spreads and other relationships observed in the markets among market securities, underlying equity of the issuer, proprietary pricing models, credit risk, etc.); or | |
| • | Level 3 — | significant unobservable inputs (including the Fund’s own assumptions in determining the fair value of investments). |
The following is a summary of the inputs used, as of October 31, 2017, in valuing the Funds’ assets:
| International: | Level 1 | Level 2 | Level 3 | Total | ||||||||||||
| Investments | ||||||||||||||||
| Common Stocks(a) | ||||||||||||||||
| Australia | $ | 81,401,590 | $ | — | $ | — | $ | 81,401,590 | ||||||||
| Canada | 12,996,019 | — | — | 12,996,019 | ||||||||||||
| China | 15,777,721 | — | — | 15,777,721 | ||||||||||||
| Colombia | 16,249,752 | — | — | 16,249,752 | ||||||||||||
| Denmark | 32,536,888 | — | — | 32,536,888 | ||||||||||||
| France | 100,869,332 | — | — | 100,869,332 | ||||||||||||
| Germany | 50,781,992 | 119,604,908 | — | 170,386,900 | ||||||||||||
| Ireland | 33,872,584 | — | — | 33,872,584 | ||||||||||||
| Japan | 180,522,701 | — | — | 180,522,701 | ||||||||||||
| Mexico | 28,733,979 | — | — | 28,733,979 | ||||||||||||
| Netherlands | 27,372,446 | — | — | 27,372,446 | ||||||||||||
| Norway | 17,094,535 | — | — | 17,094,535 | ||||||||||||
| Peru | 20,477,787 | — | — | 20,477,787 | ||||||||||||
| Singapore | 17,331,781 | — | — | 17,331,781 | ||||||||||||
| South Africa | 10,173,365 | — | — | 10,173,365 | ||||||||||||
| Spain | 17,484,707 | — | — | 17,484,707 | ||||||||||||
| Sweden | 53,845,480 | — | — | 53,845,480 | ||||||||||||
| Switzerland | 111,377,814 | — | — | 111,377,814 | ||||||||||||
| Taiwan | 31,432,501 | — | — | 31,432,501 | ||||||||||||
| United Kingdom | 122,521,758 | — | — | 122,521,758 | ||||||||||||
| United States | 36,644,382 | — | — | 36,644,382 | ||||||||||||
| Short-Term Investments | 20,000,000 | — | — | 20,000,000 | ||||||||||||
| Total Investments | $ | 1,039,499,114 | $ | 119,604,908 | $ | — | $ | 1,159,104,022 | ||||||||
| Mid Cap: | Level 1 | Level 2 | Level 3 | Total | ||||||||||||
| Investments | ||||||||||||||||
| Common Stocks(a) | $ | 1,665,614,040 | $ | — | $ | — | $ | 1,665,614,040 | ||||||||
| Short-Term Investments | 10,000,000 | — | — | 10,000,000 | ||||||||||||
| Total Investments | $ | 1,675,614,040 | $ | — | $ | — | $ | 1,675,614,040 | ||||||||
| Small Cap: | Level 1 | Level 2 | Level 3 | Total | ||||||||||||
| Common Stocks(a) | $ | 268,561,815 | $ | — | $ | — | $ | 268,561,815 | ||||||||
| (Continued on next page) | |
| OCTOBER 31, 2017 | 61 |
NOTES TO FINANCIAL STATEMENTS (Continued)
October 31, 2017
| Low Duration Bond: | Level 1 | Level 2 | Level 3 | Total | ||||||||||||
| Investments | ||||||||||||||||
| Asset-Backed Securities | $ | — | $ | 993,037 | $ | — | $ | 993,037 | ||||||||
| Commercial Mortgage-Backed Securities | — | 4,243,197 | — | 4,243,197 | ||||||||||||
| Corporate Bonds | — | 32,129,914 | — | 32,129,914 | ||||||||||||
| Mortgage-Backed Securities | — | 6,425,403 | — | 6,425,403 | ||||||||||||
| U.S. Government and Agencies | — | 1,452,860 | — | 1,452,860 | ||||||||||||
| Short-Term Investments | 451,026 | — | — | 451,026 | ||||||||||||
| Total Investments | $ | 451,026 | $ | 45,244,411 | $ | — | $ | 45,695,437 | ||||||||
| Core Bond: | Level 1 | Level 2 | Level 3 | Total | ||||||||||||
| Investments | ||||||||||||||||
| Asset-Backed Securities | $ | — | $ | 2,050,002 | $ | — | $ | 2,050,002 | ||||||||
| Commercial Mortgage-Backed Securities | — | 2,478,306 | — | 2,478,306 | ||||||||||||
| Corporate Bonds | — | 34,480,959 | — | 34,480,959 | ||||||||||||
| Mortgage-Backed Securities | — | 49,071,706 | — | 49,071,706 | ||||||||||||
| U.S. Government and Agencies | — | 70,638,786 | — | 70,638,786 | ||||||||||||
| Short-Term Investments | 1,108,223 | — | — | 1,108,223 | ||||||||||||
| Total Investments | $ | 1,108,223 | $ | 158,719,759 | $ | — | $ | 159,827,982 | ||||||||
| Core Plus Bond: | Level 1 | Level 2 | Level 3 | Total | ||||||||||||
| Assets | ||||||||||||||||
| Investments | ||||||||||||||||
| Asset-Backed Securities | $ | — | $ | 10,610,710 | $ | — | $ | 10,610,710 | ||||||||
| Commercial Mortgage-Backed Securities | — | 10,023,462 | — | 10,023,462 | ||||||||||||
| Corporate Bonds | — | 194,369,570 | — | 194,369,570 | ||||||||||||
| Mortgage-Backed Securities | — | 188,308,033 | — | 188,308,033 | ||||||||||||
| U.S. Government and Agencies | — | 430,548,447 | — | 430,548,447 | ||||||||||||
| Short-Term Investments | 17,586,541 | — | — | 17,586,541 | ||||||||||||
| Total Investments | $ | 17,586,541 | $ | 833,860,222 | $ | — | $ | 851,446,763 | ||||||||
| Other Financial Instruments(b) | ||||||||||||||||
| Swap Contracts | $ | — | $ | 633,288 | $ | — | $ | 633,288 | ||||||||
| Liabilities | ||||||||||||||||
| Other Financial Instruments(b) | ||||||||||||||||
| Futures Contracts | $ | 186,679 | $ | — | $ | — | $ | 186,679 | ||||||||
| Unconstrained Bond: | Level 1 | Level 2 | Level 3 | Total | ||||||||||||
| Assets | ||||||||||||||||
| Investments | ||||||||||||||||
| Asset-Backed Securities | $ | — | $ | 44,269,554 | $ | — | $ | 44,269,554 | ||||||||
| Corporate Bonds | — | 399,325,119 | — | 399,325,119 | ||||||||||||
| Mortgage-Backed Securities | — | 81,719,991 | — | 81,719,991 | ||||||||||||
| U.S. Government and Agencies | — | 999,790,616 | — | 999,790,616 | ||||||||||||
| Short-Term Investments | 72,275,442 | — | — | 72,275,442 | ||||||||||||
| Total Investments | $ | 72,275,442 | $ | 1,525,105,280 | $ | — | $ | 1,597,380,722 | ||||||||
| Other Financial Instruments(b) | ||||||||||||||||
| Swap Contracts | $ | — | $ | 2,612,983 | $ | — | $ | 2,612,983 | ||||||||
| Liabilities | ||||||||||||||||
| Other Financial Instruments(b) | ||||||||||||||||
| Futures Contracts | $ | 1,817,376 | $ | — | $ | — | $ | 1,817,376 | ||||||||
(a) For a detailed break-out of common stocks by sector or country classification, please refer to the Schedule of Investments.
(b) Other financial instruments are derivative instruments, such as forward contracts, futures contracts and swap contracts.
| 62 | SCOUT FUNDS ANNUAL REPORT |
The Funds did not hold any Level 3 investments during the period ended October 31, 2017. It is the Funds’ policy to recognize transfers between Levels at the end of the period. As of June 30, 2017 the International Fund held all Level 1 securities. As of October 31, 2017, the International Fund held some Level 2 securities due to specific foreign markets observing holiday market closure, resulting in a fair value price utilized in accordance with the Funds’ Pricing and Fair Value Determination Policies and Procedures. A security’s classification as Level 1 or Level 2 within the International Fund can move on a daily basis throughout the year depending on whether or not a Fund has determined the value of securities principally traded in foreign markets has become stale between the close of the foreign exchanges and the time the Fund calculate it’s NAV. Per the Funds’ Pricing and Fair Value Determination Procedures, if the price has become stale, a fair value adjustment will be made to the impacted securities and these fair value adjusted securities are considered to be priced using Level 2 inputs.
The following is a reconciliation of transfers between Levels from June 30, 2017 to October 31, 2017, represented by recognizing the October 31, 2017 market value of securities classified as Level 1 as of June 30, 2017 that transferred hierarchies to Level 2 as of October 31, 2017:
| International | ||||
| Transfers into Level 1 | $ | — | ||
| Transfers out of Level 1 | (119,604,908 | ) | ||
| Net transfers in (out) of Level 1 | $ | (119,604,908 | ) | |
| Transfers into Level 2 | $ | 119,604,908 | ||
| Transfers out of Level 2 | — | |||
| Net transfers in (out) of Level 2 | $ | 119,604,908 | ||
| (b) | Derivatives — The following disclosure provides certain information about the Funds’ derivative and hedging activities. See Notes 6 and 7 regarding other derivative information. |
| i. | Forward currency contracts — The Low Duration Bond, Core Plus Bond and Unconstrained Bond Funds’ policies permit the Funds to enter into forward currency contracts (“forward contracts”) for hedging (such as to hedge the impact of adverse changes in the relationships between the US$ and various foreign currencies), including transaction hedging, anticipatory hedging, cross hedging, proxy hedging, and position hedging, or for any other lawful purpose consistent with their investment objectives. Forward contracts are agreements between two parties to exchange different currencies at a specified rate at an agreed upon future date. The fair value of a forward contract fluctuates with changes in currency exchange rates. Outstanding forward contracts are valued daily at current forward rates and the resulting change in market value is recorded as unrealized appreciation or depreciation. When a forward contract is closed, the Fund records a realized gain or loss equal to the difference between the value at the time the forward contract was opened and the value at the time it was closed. |
The risks to the Funds of entering into forward contracts include the inability of counterparties to meet the terms of their contracts, future adverse movement in currency values and contract positions that are not exact offsets.
Details of open forward contracts, if any, at period end are included in the Schedules of Investments under the caption “Forward Contracts.”
For the period ended October 31, 2017 the funds held no Forward Contracts
| ii. | Credit default swap contracts — The Low Duration Bond, Core Bond, Core Plus Bond and Unconstrained Bond Funds’ policies permit the Funds to enter into credit default swap agreements to enhance the Funds’ returns, increase liquidity, manage the duration of the Funds’ portfolios and/or gain exposure to certain instruments or markets (i.e., the corporate bond market) in a relatively efficient way. The credit default swap agreement may have as a reference obligation one or more securities that are or are not currently held by a Fund. The Funds may enter into credit default swap agreements either as a buyer or seller. The buyer in a credit default swap agreement is obligated to pay the seller a periodic fee, typically expressed in basis points on the principal amount of the underlying obligation (the “notional” amount), over the term of the agreement in return for a contingent payment upon the occurrence of a credit event with respect to the underlying reference obligation. A credit event is typically a default. If a Fund is a buyer and no credit event occurs, the Fund may lose its investment and recover nothing. If a Fund is a buyer of protection and a credit event occurs, as defined under the terms of that particular swap agreement, a Fund will either (i) receive from the seller of protection an amount equal to the notional amount of the swap and deliver the referenced obligation, other deliverable obligations or underlying securities comprising the referenced index or (ii) receive a net settlement amount in the form of cash or securities equal to the notional amount of the swap less the recovery value of the referenced obligation or underlying securities comprising the referenced index. As a seller, a Fund accrues for and receives a fixed rate of income throughout the term of the agreement, which typically is between one month and five years, provided that no credit event occurs. As the seller, a Fund would effectively add leverage to its portfolio because, in addition to its total net assets, a Fund would be subject to investment exposure on the notional amount of the swap. If a Fund is a seller of protection and a credit event occurs, as defined under the terms of that particular swap agreement, a Fund will either (i) pay to the buyer of protection an amount equal to the notional amount of the swap and take delivery of the referenced obligation, other deliverable obligations or underlying securities comprising the referenced index or (ii) pay a net settlement amount in the form of cash or securities equal to the notional amount of the swap less the recovery value of the referenced obligation or underlying securities comprising the referenced index. If a credit event occurs, the maximum payout amount for a sale contract is limited to the notional amount of the swap contract (“Maximum Payout Amount”). Recovery values are estimated by market makers considering either industry standard recovery rates or entity specific factors and considerations until a credit event occurs. If a credit event has occurred, the recovery value is determined by a facilitated auction whereby a minimum number of allowable broker bids, together with a specified valuation method, are used to calculate the settlement value. |
Credit default swap agreements on credit indices involve one party making a stream of payments to another party in exchange for the right to receive a specified return in the event of a write-down, principal shortfall, interest shortfall or default of all or part of the referenced entities comprising the credit index. A credit index is a basket of credit instruments or exposures designed to be representative of some part of the credit market as a whole. These indices are made up of reference credits that are judged by a poll of dealers to be the most liquid entities in the credit default swap market based on the sector of the index. Components of the indices may include, but are not limited to, investment grade securities, high yield securities, asset-backed securities, emerging markets, and/or various credit ratings within each sector. Credit indices are traded using credit default swaps with
| (Continued on next page) | |
| OCTOBER 31, 2017 | 63 |
NOTES TO FINANCIAL STATEMENTS (Continued)
October 31, 2017
standardized terms including a fixed spread and standard maturity dates. An index credit default swap references all the names in the index, and if there is a default, the credit event is settled based on that name’s weight in the index. The composition of the indices changes periodically, usually every six months, and for most indices, each name has an equal weight in the index. A Fund may use credit default swaps on credit indices to hedge a portfolio of credit default swaps or bonds, which is less expensive than it would be to buy many credit default swaps to achieve a similar effect. Credit default swaps on indices are benchmarks for protecting investors owning bonds against default, and traders use them to speculate on changes in credit quality. Interest paid to or by the Funds is accrued daily and included in realized gain (loss) on swap agreements. The contracts are marked-to-market daily using fair value estimates provided by an independent pricing service. Changes in value are recorded as unrealized appreciation (depreciation). Unrealized gains are reported as an asset and unrealized losses are reported as a liability. The change in value of swap agreements, including accruals of periodic amounts of interest to be paid or received is reported as unrealized gains or losses. Gains or losses are realized upon termination of the contracts.
Credit default swaps sold by a Fund may involve greater risks than if a Fund had invested in the reference obligation directly. Credit default swaps are subject to general market risk, liquidity risk, counterparty credit risk and credit risk of the issuer.
In addition, the value of the reference obligation received by a Fund as a seller if a credit event occurs, coupled with the periodic payments previously received, may be less than the full notional value it pays to the buyer, resulting in a loss of value to the Fund. The Fund bears the risk that the counterparty will default, and this could result in a loss of the expected benefit of the transaction and possibly other losses to the Fund. Segregated collateral for swap contracts is presented in the Statements of Assets and Liabilities.
Details of swap contracts, if any, at period end are included in the Schedules of Investments under the caption “Swap Contracts.”
| iii. | Futures contracts — The Low Duration Bond, Core Bond, Core Plus Bond and Unconstrained Bond Funds’ policies permit the Funds to enter into futures contracts (“Futures”), including interest rate, bond, U.S. Treasury and fixed income index Futures, as a hedge against movements in the equity and bond markets in order to establish more definitively the effective return on securities held or intended to be acquired by the Funds or for other purposes permissible under the Commodity Exchange Act, including as a means to gain or reduce exposure to a reference instrument without actually buying or selling it. |
When a Fund enters into Futures, it must deliver to an account controlled by the futures commission merchant (“FCM”) an amount referred to as “initial margin.” Initial margin requirements are determined by the respective exchanges on which the Futures are traded and the FCM. Thereafter, a “variation margin” amount may be required to be paid by the Fund or received by the Fund in accordance with margin controls set for such accounts, depending upon changes in the marked-to-market value of the Futures. The account is marked-to-market daily and the unrealized gains or losses are recorded as variation margin and monitored by the Advisor and custodian on a daily basis. When Futures are closed out, the Fund recognizes a realized gain or loss.
The risks of entering into Futures include the possibility that a change in the value of the contract may not correlate with the changes in the value of the underlying instrument. The purchase of Futures involves the risk that the Fund could lose more than the amount invested in Futures. Margin for Futures is presented in the Statements of Assets and Liabilities.
Details of Futures, if any, at period end are included in the Schedules of Investments under the caption “Futures Contracts.”
For the period ended October 31, 2017, the average of month-end derivative positions were as follows:
| Low Duration | Core | Core Plus | Unconstrained | |||||||||||||
| Bond | Bond | Bond | Bond | |||||||||||||
| Forward currency contracts purchased (U.S. Dollar amounts) | $ | — | $ | N/A | $ | — | $ | — | ||||||||
| Forward currency contracts sold (U.S. Dollar amounts) | — | N/A | — | — | ||||||||||||
| Futures contracts long position (number of contracts) | — | — | — | — | ||||||||||||
| Futures contracts short position (number of contracts) | — | — | 111 | 867 | ||||||||||||
| Credit default swap contracts (Notional amount in U.S. Dollars) | — | — | 7,060,000 | 29,130,000 | ||||||||||||
For the period ended October 31, 2017, the total number of derivative contracts entered into were as follows:
| Low Duration | Core | Core Plus | Unconstrained | |||||||||||||
| Bond | Bond | Bond | Bond | |||||||||||||
| Forward currency contracts purchased | — | N/A | — | — | ||||||||||||
| Forward currency contracts sold | — | N/A | — | — | ||||||||||||
| Futures contracts long position | — | — | — | — | ||||||||||||
| Futures contracts short position | — | — | 460 | 5,495 | ||||||||||||
| Credit default swap contracts | — | — | 1 | 1 | ||||||||||||
| 64 | SCOUT FUNDS ANNUAL REPORT |
For the year ended June 30, 2017, the average of month-end derivative positions were as follows:
| Low Duration | Core | Core Plus | Unconstrained | |||||||||||||
| Bond | Bond | Bond | Bond | |||||||||||||
| Forward currency contracts purchased (U.S. Dollar amounts) | $ | — | $ | N/A | $ | 676,665 | $ | 3,643,855 | ||||||||
| Forward currency contracts sold (U.S. Dollar amounts) | — | N/A | — | — | ||||||||||||
| Futures contracts long position (number of contracts) | — | — | 43 | 137 | ||||||||||||
| Futures contracts short position (number of contracts) | — | — | 187 | 983 | ||||||||||||
| Credit default swap contracts (Notional amount in U.S. Dollars) | $ | 205,385 | $ | 943,846 | $ | 12,626,154 | $ | 31,551,538 | ||||||||
For the year ended June 30, 2017, the total number of derivative contracts entered into were as follows:
| Low Duration | Core | Core Plus | Unconstrained | |||||||||||||
| Bond | Bond | Bond | Bond | |||||||||||||
| Forward currency contracts purchased | — | N/A | 1 | 3 | ||||||||||||
| Forward currency contracts sold | — | N/A | — | — | ||||||||||||
| Futures contracts long position | — | — | 550 | 4,125 | ||||||||||||
| Futures contracts short position | — | — | 450 | 9,380 | ||||||||||||
| Credit default swap contracts | 2 | — | 5 | 9 | ||||||||||||
| (c) | To-Be-Announced Securities — The Low Duration Bond, Core Bond, Core Plus Bond and Unconstrained Bond Funds’ policies permit the Funds to enter into to-be-announced securities. |
A to-be-announced mortgage-backed security (“TBA”) is a mortgage-backed security, such as a Ginnie Mae pass-through security, that is purchased or sold with specific pools of cash that will constitute that Ginnie Mae pass-through security, to be announced on a future settlement date. At the time of purchase of a TBA, the seller does not specify the particular mortgage-backed securities to be delivered but rather agrees to accept any mortgage-backed security that meets specified terms. The Fund and the seller would agree upon the issuer, interest rate and terms of the underlying mortgages, but the seller would not identify the specific underlying mortgages until shortly before it issues the mortgage-backed security.
TBAs increase interest rate risks because the underlying mortgages may be less favorable than anticipated by a Fund. As a purchaser of a TBA, the Fund will segregate or “earmark” cash or cash equivalent securities in accordance with procedures adopted by the Board equal to the value of the TBA, marked-to-market daily in accordance with pertinent SEC positions. As a seller of a TBA, the Fund will segregate or “earmark” in accordance with procedures adopted by the Board the equivalent deliverable security up to the obligation required to be delivered. Earmarked commitment for to-be-announced securities is presented in the Schedule of Investments. Earmarked commitments for TBAs, if any, are presented in the Schedule of Investments.
| (d) | Security Transactions and Related Investment Income — Security transactions are recorded on the trade date. Interest income is recorded on the accrual basis and includes accretion of discounts and amortization of premiums. Dividend income and distributions to shareholders are recorded on ex-dividend dates. Withholding taxes on foreign dividends are paid (a portion of which may be reclaimable) or provided for in accordance with the applicable country’s tax rules and rates. Withholding tax reclaims are filed in certain countries to recover a portion of the amounts previously withheld. The Funds record a reclaim receivable based on, among other things, a jurisdiction’s legal obligation to pay reclaims as well as payment history and market convention. Realized gains and losses on investments and unrealized appreciation and depreciation of investments are reported on the identified cost basis, which is also used for income tax purposes. |
| (e) | Foreign Currency and Risk — Amounts denominated in, or expected to settle in, foreign currencies (“FCs”) are translated into United States dollars (“US$”) at rates provided by an independent pricing service on the following basis: |
| i. | Assets and liabilities — at the closing rate of exchange as of 4:00 p.m. Eastern Standard Time on October 31, 2017. |
| ii. | Purchases and sales of investment securities, income and expenses — at the rate of exchange prevailing on the respective dates of such transactions (or the average rate if significant rate fluctuations have not occurred). |
The Funds do not isolate the portion of the results of operations resulting from changes in foreign exchange rates on investments from fluctuations arising from changes in market prices of securities held. Such fluctuations are included within the net realized and unrealized gain (loss) on investments on the Statements of Operations.
Reported net realized foreign currency gains or losses arise from sales of FCs, currency gains or losses realized between the trade and settlement dates on securities transactions and the difference between the amounts of dividends, interest and foreign withholding taxes recorded on the Funds’ books and the US$ equivalent of the amounts actually received or paid. Net unrealized foreign currency gains and losses arise from changes in the fair values of assets and liabilities, other than investments in securities at period end, resulting from changes in the exchange rate.
Foreign investments present additional risks due to currency fluctuations, economic and political factors, government regulations, differences in accounting standards and other factors. Investments in emerging markets involve even greater risks.
| (f) | Federal Income Taxes — The Funds’ policy is to comply with the requirements of the Internal Revenue Code that are applicable to regulated investment companies and to distribute all of their taxable income to their shareholders. Therefore no federal income tax provision is required. Certain Funds may utilize earnings and profits on redemption of shares as part of the dividends paid deduction. |
| (Continued on next page) | |
| OCTOBER 31, 2017 | 65 |
NOTES TO FINANCIAL STATEMENTS (Continued)
October 31, 2017
GAAP requires an evaluation of tax positions taken (or expected to be taken) in the course of preparing a Fund’s tax returns to determine whether these positions meet a “more-likely-than-not” standard that, based on the technical merits, have a more than fifty percent likelihood of being sustained by a taxing authority upon examination. A tax position that meets the “more-likely-than-not” recognition threshold is measured to determine the amount of benefit to recognize in the financial statements. The Funds recognize interest and penalties, if any, related to unrecognized tax benefits as income tax expense in the Statements of Operations.
Management of the Funds has analyzed all open tax years for all major jurisdictions, which the Funds consider to be its federal income tax filings. The open tax years include the current year plus the prior three tax years, or all years for those Funds which have been in existence fewer than three years. As of and during the period ended October 31, 2017 the Funds did not record a liability for any unrecognized tax benefits. The Funds have no examination in progress and are not aware of any tax positions for which it is reasonably possible that the total amounts of unrecognized tax benefits will significantly change in the next twelve months.
As of October 31, 2017, the following Funds had net capital loss carryovers:
| Low Duration | Core | Core Plus | Unconstrained | |||||||||||||
| (in thousands) | Bond | Bond | Bond | Bond | ||||||||||||
| Not subject to expiration: | ||||||||||||||||
| Short-term | $ | — | $ | 1,510 | $ | 7,085 | $ | — | ||||||||
| Long-term | 40 | 326 | 838 | 33,582 | ||||||||||||
| $ | 40 | $ | 1,836 | $ | 7,923 | $ | 33,582 | |||||||||
Capital loss carryovers are available to offset future realized capital gains and thereby reduce further taxable gain distributions. During the year ended October 31, 2017, the Funds utilized capital loss carryovers as follows:
| Core | Core Plus | Unconstrained | ||||||||||
| (in thousands) | Bond | Bond | Bond | |||||||||
| Not subject to expiration: | ||||||||||||
| Short-term | $ | 1,168 | $ | 5,687 | $ | — | ||||||
| Long-term | 10 | — | 2,989 | |||||||||
| $ | 1,178 | $ | 5,687 | $ | 2,989 | |||||||
| (g) | Distributions to Shareholders — Net investment income dividends and capital gains distributions are determined in accordance with income tax regulations which may differ from GAAP. If the total dividends and distributions made in any tax year exceeds net investment income and accumulated realized capital gains, a portion of the total distribution may be treated as a tax return of capital. |
| (h) | Amortization — Discounts and premiums on securities purchased are amortized over the life of the respective securities. |
| (i) | Use of Estimates — The preparation of financial statements requires management to make estimates and assumptions that affect the reported amounts of assets and liabilities and disclosure of contingent assets and liabilities at the date of the financial statements and reported amounts of income and expenses during the reporting period. Actual results could differ from those estimates and assumptions. |
| (j) | Guarantees and Indemnifications — In the normal course of business, the Funds enter into contracts with service providers that contain general indemnification clauses. The Funds’ maximum exposure under these arrangements is unknown, as this would involve future claims against the Funds that have not yet occurred. Based on experience, the Funds expect the risk of loss to be remote. |
| (k) | Multiple Share Classes – Bond Funds — The Core Bond, Core Plus Bond and Unconstrained Bond Funds each offer two classes of shares (Institutional Class and Class Y). Income, expenses (other than expenses attributable to a specific class) and realized and unrealized gains and losses on investments are allocated to each class of shares in proportion to their relative shares outstanding. |
| (l) | Segregation and Collateralization — In cases in which the 1940 Act and the interpretive positions of the Securities and Exchange Commission (“SEC”) require that a Fund either delivers collateral or segregates assets in connection with certain investments (e.g., foreign currency exchange contracts, securities with extended settlement periods, and swaps), the Fund will segregate collateral or designate on its books and records cash or other liquid securities having a value at least equal to the amount that is required to be physically segregated for the benefit of the counterparty. Furthermore, based on requirements and agreements with certain exchanges and third party broker-dealers, each party has requirements to deliver/deposit cash or securities as collateral for certain investments. |
| 66 | SCOUT FUNDS ANNUAL REPORT |
| 2. | INVESTMENT ADVISORY FEES AND OTHER TRANSACTIONS WITH AFFILIATES |
| (a) | Investment Advisory Fees — The Trust, on behalf of the Funds, has entered into an Investment Advisory Agreement (the “Agreement”) with the Advisor. Each of the Funds were subject to fees at the following annual rates under the Agreement for the period from July 1, 2017 through October 31, 2017: |
International — 0.80% of the first $1 billion of average daily net assets and 0.70% of average daily net assets over $1 billion.
Mid Cap — 0.80% of the first $1 billion of average daily net assets and 0.70% of average daily net assets over $1 billion.
Small Cap — 0.75% of the first $1 billion of average daily net assets and 0.65% of average daily net assets over $1 billion.
Low Duration Bond — 0.30% of average daily net assets.
Core Bond and Core Plus Bond — 0.40% of the respective Fund’s average daily net assets.
Unconstrained Bond — 0.60% of the first $3 billion of average daily net assets and 0.55% of average daily net assets over $3 billion.
The Advisor has entered into a contractual agreement to waive all or a portion of its advisory fees and, if necessary, to assume certain other expenses through October 30, 2018 for the Mid Cap and Low Duration Bond Funds to the extent necessary so that Total Annual Fund Operating Expenses (excluding any acquired fund fees and expenses, taxes, interest, brokerage fees and non-routine expenses and, with respect to the Low Duration Bond Fund, excluding any short sale dividend and interest expenses) do not exceed 1.40% and 0.40%, respectively, of each Fund’s average daily net assets. Effective October 31, 2016, the Advisor has entered into a contractual agreement to waive all or a portion of its advisory fees and, if necessary, to assume certain other expenses through October 30, 2018 for the Core Bond and Core Plus Bond Funds to the extent necessary so that Total Annual Fund Operating Expenses (excluding any acquired fund fees and expenses, taxes, interest, brokerage fees, short sale dividend and interest expenses, and non-routine expenses) do not exceed 0.40% of the average daily net assets of the Institutional Class shares of the Funds and 0.80% of the average daily net assets of the Class Y shares of the Funds. Prior to October 31, 2016, the Advisor had agreed to waive all or a portion of its advisory fees and, if necessary, to assume certain other expenses through October 30, 2016 for the Core Bond and Core Plus Bond Funds to the extent necessary so that Total Annual Fund Operating Expenses (excluding any acquired fund fees and expenses, taxes, interest, brokerage fees, non-routine expenses, Rule 12b-1 fees, shareholder servicing fees, and short sale dividend and interest expenses) did not exceed 0.40% of each Fund’s average daily net assets. The Advisor has entered into a contractual agreement to waive all or a portion of its advisory fees and, if necessary, to assume certain other expenses through October 30, 2018 for the Unconstrained Bond Fund to the extent necessary so that Total Annual Fund Operating Expenses (excluding any acquired fund fees and expenses, taxes, interest, brokerage fees, short sale dividend and interest expenses, and non-routine expenses) do not exceed 0.50% of the average daily net assets of the Institutional Class shares and 0.80% of the average daily net assets of the Class Y shares. After their expiration date, the Trust’s Board and the Advisor may agree to continue, modify or terminate the expense limitation arrangements.
Under the expense limitation agreements described above, if Total Annual Fund Operating Expenses would fall below the current expense limit, the Advisor may cause a Fund’s expenses to remain at the current expense limit while it is reimbursed for fees previously waived or expenses previously assumed to the extent such fees were waived or expenses were assumed during the three years following the end of the fiscal year in which the Advisor waived fees or assumed expenses for the Fund, provided that such reimbursement will not cause a Fund to exceed any applicable expense limit that was in place when the fees were waived or expenses assumed.
The following table presents fee and/or expense waivers eligible for reimbursement to the Advisor as well as reimbursement (waiver) activity as of October 31, 2017:
| Low Duration | Core | Core Plus | Unconstrained | |||||||||||||
| (in thousands) | Bond | Bond | Bond | Bond | ||||||||||||
| Eligible for Reimbursement: | ||||||||||||||||
| 6/30/15 | $ | (252 | ) | $ | (480 | ) | $ | (1,035 | ) | $ | (6,385 | ) | ||||
| 6/30/16 | (264 | ) | (461 | ) | (1,223 | ) | (4,590 | ) | ||||||||
| 6/30/17 | (173 | ) | (507 | ) | (1,630 | ) | (4,597 | ) | ||||||||
| 10/31/17 | (55 | ) | (153 | ) | (485 | ) | (1,568 | ) | ||||||||
| Total Eligible for Reimbursement | $ | (744 | ) | $ | (1,601 | ) | $ | (4,373 | ) | $ | (17,140 | ) | ||||
| (b) | Administrative Fees — The Trust, on behalf of the Funds, has entered into an Administrative Services Agreement with the Advisor for administrative services the Advisor provides to the Funds. |
For the period from July 1, 2017 through October 31, 2017, each of the Funds were subject to a fee, payable monthly, at the following annual rates based on the aggregate average daily net assets of the Funds – 0.05% of the Funds’ first $5 billion of aggregate average daily net assets, 0.04% of the Funds’ next $1 billion of aggregate average daily net assets, 0.03% of the Funds’ next $1 billion of aggregate average daily net assets, 0.02% of the Funds’ next $1 billion of aggregate average daily net assets, and 0.01% of the Funds’ aggregate average daily net assets in excess of $8 billion.
The fees are allocated proportionately between the Funds each month based on their share of the Funds’ aggregate assets.
| (Continued on next page) | |
| OCTOBER 31, 2017 | 67 |
NOTES TO FINANCIAL STATEMENTS (Continued)
October 31, 2017
| (c) | Administration and Fund Accounting Fees — The Trust, on behalf of the Funds, has entered into an Administration and Fund Accounting Agreement (the “Agreement”) with UMB Fund Services, Inc. (“UMBFS”), an affiliate of the Advisor. |
For the period from July 1, 2017 through October 31, 2017, each of the Funds were subject to a fee at the following annual rates based on the aggregate average daily net assets of the Funds – 0.04% of the Funds’ first $1.25 billion of aggregate average daily net assets, 0.03% of the Funds’ next $1.25 billion of aggregate average daily net assets, and 0.02% of the Funds’ aggregate average daily net assets in excess of $2.5 billion. The fees are allocated proportionately between the Funds each month based on their share of the Funds’ aggregate assets.
The Funds are subject to a minimum fee calculated by multiplying the number of funds in the Trust by $70,000 per fund. Minimum fees are allocated proportionately between the Funds each month based on their share of the Funds’ aggregate assets, subject to an annual escalation equal to an increase in the Consumer Price Index.
| (d) | Transfer Agent Fees — UMBFS also serves as the Funds’ transfer agent. UMBFS is paid a fee for these services based on the number of shareholder accounts and activity levels. |
| (e) | Custodian Fees — UMB Bank, n.a. (the “Bank”), an affiliate of the Advisor, serves as the Funds’ custodian. The Bank receives a fee for its services based on the value of securities held in the Funds and the number of transactions. |
| (f) | Director Fees — Prior to June 30, 2017 each Trustee, other than those affiliated with the Advisor, received an annual retainer of $70,000, plus reimbursements of related expenses. In addition the independent chair received an annual retainer of $26,000 and each committee chair received an annual retainer of $10,000. These expenses were allocated on a pro-rata basis to each Fund according to its respective net assets. The funds did not accrue trustee fees for the period ended October 31, 2017. |
| (g) | Related Party Transactions — The Funds may invest in the UMB Money Market Fiduciary, which acts as a bank deposit that provides interest income for short-term investment purposes. This investment vehicle is not publicly traded on open markets. UMB Bank, n.a. is an affiliate of the Advisor. |
3. DISTRIBUTION PLAN, SHAREHOLDER SERVICING PLAN AND SUB-TRANSFER AGENT FEES
The Trust has adopted distribution plans pursuant to Rule 12b-1 under the 1940 Act on behalf of the Class Y shares of the Core Bond, Core Plus Bond and Unconstrained Bond Funds (the “12b-1 Plans”). Pursuant to the 12b-1 Plans, each Fund pays a monthly fee of 0.25% per annum of the average daily net assets of each such Fund’s respective Class Y shares to the Distributor, various brokers, dealers or other financial intermediaries who perform activities or incur expenses intended to result in the sale of Class Y shares of the Funds. For the period ended October 31, 2017, the Core Bond, Core Plus Bond and Unconstrained Bond Funds incurred (in thousands) $2, $25, and $70, respectively, under the 12b-1 Plans.
The Trust has adopted a shareholder servicing plan on behalf of the Class Y shares of the Core Bond and Core Plus Bond Funds (the “Shareholder Servicing Plan”). Pursuant to the Shareholder Servicing Plan, each Fund pays a fee, as directed by the Advisor, of up to 0.15% on an annual basis of the average daily net asset value of the Class Y shares of a Fund to the various brokers, dealers and other financial intermediaries who provide certain shareholder services to shareholders of the Funds, including establishing and maintaining shareholder accounts, mailing prospectuses, account statements and other Fund documents to shareholders, processing shareholder transactions and providing other recordkeeping and administrative services. For the period ended October 31, 2017, the Core Bond and Core Plus Bond Funds incurred (in thousands) $1 and $15, respectively, under the Shareholder Servicing Plan.
Shares of the Scout Funds serviced through financial intermediaries are subject to asset-based fees payable for recordkeeping and shareholder services provided by those intermediaries. The Funds are authorized to pay an annual fee of up to 0.15% or 0.10%, or an annual fee of $5.00 per account, depending on the share class and account type. With respect to the Class Y shares of the Core Bond and Core Plus Bond Funds, the payment for these fees is made through the Shareholder Servicing Plan, as described above. These fees are included within the “Transfer agent and related service fees and expenses” line items in the Statements of Assets and Liabilities and Statements of Operations.
| 68 | SCOUT FUNDS ANNUAL REPORT |
| 4. | INVESTMENT TRANSACTIONS |
The aggregate amount of security transactions during the period ended October 31, 2017, excluding short-term investments, were as follows:
| Other than | ||||||||
| U.S. Government | U.S. Government | |||||||
| Fund (in thousands) | Securities | Securities | ||||||
| International: | ||||||||
| Purchases | $ | 74,337 | $ | — | ||||
| Sales | 194,300 | — | ||||||
| Mid Cap: | ||||||||
| Purchases | 400,375 | — | ||||||
| Sales | 298,925 | — | ||||||
| Small Cap: | ||||||||
| Purchases | 18,651 | — | ||||||
| Sales | 14,285 | — | ||||||
| Low Duration Bond: | ||||||||
| Purchases | 6,313 | 4,303 | ||||||
| Sales/Maturity proceeds | 4,261 | 8,370 | ||||||
| Core Bond: | ||||||||
| Purchases | 4,584 | 200,555 | ||||||
| Sales/Maturity proceeds | 9,551 | 212,340 | ||||||
| Core Plus Bond: | ||||||||
| Purchases | 23,193 | 1,028,414 | ||||||
| Sales/Maturity proceeds | 9,531 | 1,078,809 | ||||||
| Unconstrained Bond: | ||||||||
| Purchases | 78,852 | 1,331,273 | ||||||
| Sales/Maturity proceeds | 39,329 | 1,264,821 | ||||||
The aggregate amount of security transactions during the year ended June 30, 2017, excluding short-term investments, were as follows:
| Other than | ||||||||
| U.S. Government | U.S. Government | |||||||
| Fund (in thousands) | Securities | Securities | ||||||
| International: | ||||||||
| Purchases | $ | 252,197 | $ | — | ||||
| Sales | 747,993 | — | ||||||
| Mid Cap: | ||||||||
| Purchases | 1,144,058 | — | ||||||
| Sales | 1,266,564 | — | ||||||
| Small Cap: | ||||||||
| Purchases | 53,043 | — | ||||||
| Sales | 65,365 | — | ||||||
| Low Duration Bond: | ||||||||
| Purchases | 29,093 | 12,353 | ||||||
| Sales/Maturity proceeds | 19,049 | 21,469 | ||||||
| Core Bond: | ||||||||
| Purchases | 28,202 | 747,844 | ||||||
| Sales/Maturity proceeds | 42,952 | 740,439 | ||||||
| Core Plus Bond: | ||||||||
| Purchases | 146,269 | 3,957,045 | ||||||
| Sales/Maturity proceeds | 147,181 | 3,904,515 | ||||||
| Unconstrained Bond: | ||||||||
| Purchases | 276,447 | 4,913,110 | ||||||
| Sales/Maturity proceeds | 249,054 | 4,756,141 | ||||||
| (Continued on next page) | |
| OCTOBER 31, 2017 | 69 |
NOTES TO FINANCIAL STATEMENTS (Continued)
October 31, 2017
5. FEDERAL TAX INFORMATION
Financial reporting records are adjusted for permanent book/tax differences to reflect tax character; these adjustments have no effect on net assets or NAV per share. Financial reporting records are not adjusted for temporary differences. The reclassifications arise from permanent book/tax differences primarily attributable to net operating losses not utilized, foreign currency transactions, capital loss carryforwards expired, return of capital distributions from REITs, return of capital distributions from non-REITs, paydowns on debt securities, and adjustments for partnership distributions and income. The reclassifications were as follows (in thousands):
| Undistributed Net | Accumulated | |||||||||||
| Investment | Net Realized | Paid | ||||||||||
| (in thousands) | Income/(Loss) | Gains/(Losses) | In Capital | |||||||||
| International | $ | 313 | $ | (3,041 | ) | $ | 2,728 | |||||
| Mid Cap | (11 | ) | (384 | ) | 395 | |||||||
| Small Cap | 381 | 5 | (386 | ) | ||||||||
| Low Duration Bond | 22 | (17 | ) | (5 | ) | |||||||
| Core Bond | 40 | (40 | ) | — | ||||||||
| Core Plus Bond | 206 | (165 | ) | (41 | ) | |||||||
| Unconstrained Bond | 189 | (19 | ) | (170 | ) | |||||||
The tax cost of investments includes adjustments to net unrealized appreciation (depreciation) which may not necessarily be final tax cost basis adjustments, but closely approximate the tax basis unrealized gains and losses that may be realized and distributed to shareholders. The tax basis components of distributable earnings and the federal tax cost as of October 31, 2017, were as follows:
| Low Duration | Core Plus | Unconstrained | ||||||||||||||||||||||||||
| (in thousands) | International | Mid Cap | Small Cap | Bond | Core Bond | Bond | Bond | |||||||||||||||||||||
| Unrealized appreciation | $ | 406,789 | $ | 355,059 | $ | 110,086 | $ | 77 | $ | 931 | $ | 4,220 | $ | 5,508 | ||||||||||||||
| Unrealized depreciation | (45,829 | ) | (30,266 | ) | (11,270 | ) | (142 | ) | (1,034 | ) | (6,306 | ) | (4,443 | ) | ||||||||||||||
| Net unrealized appreciation (depreciation) | $ | 360,960 | $ | 324,793 | $ | 98,816 | $ | (65 | ) | $ | (103 | ) | $ | (2,086 | ) | $ | 1,065 | |||||||||||
| Cost of securities on a tax basis | $ | 798,144 | $ | 1,350,821 | $ | 169,746 | $ | 45,760 | $ | 159,931 | $ | 795,376 | $ | 1,342,849 | ||||||||||||||
The difference between cost amounts for financial statement and federal income tax purposes is due primarily to timing differences in recognizing certain gains and losses in security transactions and investments in passive foreign investment companies (“PFICs”).
The tax character of distributions paid during the years or periods ended October 31, 2017, June 30, 2017 and June 30, 2016 were as follows:
| International | Mid Cap | Small Cap | Low Duration Bond | |||||||||||||||||||||||||||||||||||||||||||||
| Period | Year | Year | Period | Year | Year | Period | Year | Year | Period | Year | Year | |||||||||||||||||||||||||||||||||||||
| Ended | Ended | Ended | Ended | Ended | Ended | Ended | Ended | Ended | Ended | Ended | Ended | |||||||||||||||||||||||||||||||||||||
| October 31, | June 30, | June 30, | October 31, | June 30, | June 30, | October 31, | June 30, | June 30, | October 31, | June 30, | June 30, | |||||||||||||||||||||||||||||||||||||
| (in thousands) | 2017 | 2017 | 2016 | 2017 | 2017 | 2016 | 2017 | 2017 | 2016 | 2017 | 2017 | 2016 | ||||||||||||||||||||||||||||||||||||
| Distributions paid from: | ||||||||||||||||||||||||||||||||||||||||||||||||
| Ordinary Income | $ | — | $ | 21,855 | $ | 43,420 | $ | — | $ | 6,621 | $ | 15,463 | $ | — | $ | 140 | $ | — | $ | 243 | $ | 667 | $ | 608 | ||||||||||||||||||||||||
| Net long-term capital gains | — | 178,101 | 598,526 | — | 22,105 | 99,754 | — | 9,037 | 29,639 | — | — | — | ||||||||||||||||||||||||||||||||||||
| Total distributions paid | $ | — | $ | 199,956 | $ | 641,946 | $ | — | $ | 28,726 | $ | 115,217 | $ | — | $ | 9,177 | $ | 29,639 | $ | 243 | $ | 667 | $ | 608 | ||||||||||||||||||||||||
| Core Bond | Core Plus Bond | Unconstrained Bond | ||||||||||||||||||||||||||||||||||
| Period | Year | Year | Period | Year | Year | Period | Year | Year | ||||||||||||||||||||||||||||
| Ended | Ended | Ended | Ended | Ended | Ended | Ended | Ended | Ended | ||||||||||||||||||||||||||||
| October 31, | June 30, | June 30, | October 31, | June 30, | June 30, | October 31, | June 30, | June 30, | ||||||||||||||||||||||||||||
| (in thousands) | 2017 | 2017 | 2016 | 2017 | 2017 | 2016 | 2017 | 2017 | 2016 | |||||||||||||||||||||||||||
| Distributions paid from: | ||||||||||||||||||||||||||||||||||||
| Ordinary Income | $ | 901 | $ | 7,402 | $ | 3,543 | $ | 3,986 | $ | 34,896 | $ | 22,545 | $ | 4,867 | $ | 15,455 | $ | 11,188 | ||||||||||||||||||
| Net long-term capital gains | — | — | — | — | 88 | 2,564 | — | — | — | |||||||||||||||||||||||||||
| Return of capital | — | — | — | 197 | — | — | — | — | — | |||||||||||||||||||||||||||
| Total distributions paid | $ | 901 | $ | 7,402 | $ | 3,543 | $ | 4,183 | $ | 34,984 | $ | 25,109 | $ | 4,867 | $ | 15,455 | $ | 11,188 | ||||||||||||||||||
| 70 | SCOUT FUNDS ANNUAL REPORT |
As of October 31, 2017, the components of accumulated earnings (deficit) on a tax basis were as follows:
| Low Duration | Core Plus | Unconstrained | ||||||||||||||||||||||||||
| (in thousands) | International | Mid Cap | Small Cap | Bond | Core Bond | Bond | Bond | |||||||||||||||||||||
| Undistributed ordinary income | $ | 13,275 | $ | 38,444 | $ | 200 | $ | — | $ | — | $ | — | $ | 1,133 | ||||||||||||||
| Undistributed long-term capital gains | 153,421 | 98,792 | 25,540 | — | — | — | — | |||||||||||||||||||||
| Tax accumulated earnings | 166,696 | 137,236 | 25,740 | — | — | — | 1,133 | |||||||||||||||||||||
| Accumulated capital and other losses | — | — | — | (40 | ) | (1,836 | ) | (7,923 | ) | (33,582 | ) | |||||||||||||||||
| Other | — | — | — | — | — | (210 | ) | — | ||||||||||||||||||||
| Unrealized appreciation (depreciation) on investments | 360,960 | 324,793 | 98,816 | (65 | ) | (103 | ) | (2,086 | ) | 1,065 | ||||||||||||||||||
| Unrealized depreciation on foreign currency | (49 | ) | — | — | — | — | — | (2 | ) | |||||||||||||||||||
| Total accumulated earnings (deficit) | $ | 527,607 | $ | 462,029 | $ | 124,556 | $ | (105 | ) | $ | (1,939 | ) | $ | (10,219 | ) | $ | (31,386 | ) | ||||||||||
| 6. | OTHER DERIVATIVE INFORMATION |
At October 31, 2017, the Funds have invested in derivative contracts which are reflected on the Statements of Assets and Liabilities as follows:
| Asset Derivatives | Liability Derivatives | |||||||||||||
| Risk Exposure Category | Statement of Assets and Liabilities Location | Fair Value Amount | Statement of Assets and Liabilities Location | Fair Value Amount | ||||||||||
| Core Plus Bond (in thousands) | Credit contracts | Premium paid on open swap contracts | $ | 526 | $ | — | ||||||||
| Variation margin | 516 | — | ||||||||||||
| Interest rate contracts | Variation margin | — | 16 | |||||||||||
| Total | $ | 1,042 | $ | 16 | ||||||||||
| Unconstrained Bond (in thousands) | Credit contracts | Premium paid on open swap contracts | $ | 2,169 | $ | — | ||||||||
| Variation margin | 2,130 | — | ||||||||||||
| Interest rate contracts | Variation margin | — | 79 | |||||||||||
| Total | $ | 4,299 | $ | 79 | ||||||||||
| (a) | The amount reflected on the Statement of Assets and Liabilities is only the unsettled variation margin receivable/payable. |
For the period ended October 31, 2017, the effect of derivative contracts on the Funds’ Statements of Operations was as follows:
| Net Realized | Net Increase (Decrease) | |||||||||||
| Gain on | in Unrealized Appreciation/ | |||||||||||
| Derivatives | Depreciation on | |||||||||||
| Recognized | Derivatives Recognized | |||||||||||
| Risk Exposure Category | Derivative Instrument | in Income | in Income | |||||||||
| Core Plus Bond (in thousands) | Interest rates contracts | Futures contracts | $ | 247 | $ | (544 | ) | |||||
| Credit contracts | Swap contracts | 164 | 50 | |||||||||
| Total | $ | 411 | $ | (494 | ) | |||||||
| Unconstrained Bond (in thousands) | Interest rates contracts | Futures contracts | $ | 5,277 | $ | (5,162 | ) | |||||
| Credit contracts | Swap contracts | 608 | 285 | |||||||||
| Total | $ | 5,885 | $ | (4,877 | ) | |||||||
See Note 1(b) regarding derivative financial instruments.
| (Continued on next page) | |
| OCTOBER 31, 2017 | 71 |
NOTES TO FINANCIAL STATEMENTS (Continued)
October 31, 2017
| 7. | DISCLOSURES ABOUT OFFSETTING ASSETS AND LIABILITIES |
Financial Accounting Standards Board Accounting Standards Update 2011-11, Disclosures about Offsetting Assets and Liabilities requires an entity that has financial instruments that are either 1) offset or 2) subject to an enforceable master netting arrangement or similar agreement to disclose information about offsetting and related arrangements to enable users of its financial statements to understand the effect of those arrangements on its financial position. As of October 31, 2017, the Funds did not hold any financial or derivative instruments that are offset or subject to enforceable master netting agreements (or related arrangements).
| 8. | RECENTLY ISSUED ACCOUNTING PRONOUNCEMENT |
In October 2016, the Securities and Exchange Commission released its Final Rules on Investment Company Reporting Modernization (the “Rules”). The Rules introduce new regulatory reporting forms for investment companies; Form N-PORT and Form N-CEN. The compliance date for Form N-PORT and Form N-CEN is June 1, 2018 and compliance should be based on the reporting period-end date.
In March 2017, the Financial Accounting Standards Board issued Accounting Standards Update “Premium Amortization on Purchase Callable Debt Securities” which amends the amortization period for certain purchased callable debt securities. Under the new guidance, premium amortization of purchased callable debt securities that have explicit, non-contingent call features and are callable at fixed prices will be amortized to the earliest call date. The guidance will be applied on a modified retrospective basis and is effective for fiscal years, and their interim periods, beginning after December 15, 2018. Management is currently evaluating the impact of this guidance to the Funds.
| 9. | SUBSEQUENT EVENTS |
Management has evaluated the Funds’ related events and transactions that occurred after year end through the date of issuance of the Funds’ financial statements.
Fund Reorganizations: On November 17, 2017, Carillon Tower Advisers, Inc. (“Carillon Tower”) completed its purchase of Scout Investments, Inc. (“Scout”) from UMB Financial Corporation (the “Transaction”). In connection with the Transaction, each series of Scout Funds was reorganized into a corresponding newly created series of the Carillon Series Trust (“Carillon Scout Funds”) after the close of business on November 17, 2017. The Carillon Scout Funds are advised by Carillon Tower and sub-advised by Scout.
Fund Liquidations: Subject to Board approval, it is expected that the Carillon Reams Low Duration Bond Fund will be liquidated on or about February 28, 2018 (“Liquidation Date”). On the Liquidation Date, the Fund will cease its investment operations, liquidate its assets and make a liquidating distribution to shareholders of record. In connection with the liquidation, the Fund may depart from its stated investment objective and strategy as it begins to convert all portfolio securities to cash or cash equivalents in preparation for a final distribution to shareholders.
Advisory and Sub-advisory Fee Rate Reduction: Effective March 1, 2018, the advisory fee rate paid by the Carillon Scout Small Cap Fund to Carillon Tower and the sub-advisory fee rate paid by Carillon Tower to Scout will be 0.60% on the first $500 million, 0.55% on assets of $500 to $1 billion, and 0.50% on assets over $1 billion.
Share Classes: Effective November 20, 2017, each Fund is authorized and currently offers Class A, Class C, Class I, Class R-3, Class R-5, Class R-6 and Class Y shares.
There were no other events or transactions that occurred during this period that materially impacted the amounts or disclosures in the Funds’ financial statements.
| 72 | SCOUT FUNDS ANNUAL REPORT |
REPORT OF INDEPENDENT REGISTERED CERTIFIED PUBLIC ACCOUNTING FIRM
To the Board of Trustees of Carillon Series Trust and Shareholders of Carillon Scout International Fund, Carillon Scout Mid Cap Fund, Carillon Scout Small Cap Fund, Scout Reams Low Duration Bond Fund, Scout Reams Core Bond Fund, Scout Reams Core Plus Bond Fund, and Scout Reams Unconstrained Bond Fund (formerly Scout International Fund, Scout Mid Cap Fund, Scout Small Cap Fund, Scout Low Duration Bond Fund, Scout Core Bond Fund, Scout Core Plus Bond Fund, and Scout Unconstrained Bond Fund, respectively)
In our opinion, the accompanying statements of assets and liabilities, including the schedules of investments, and the related statements of operations and of changes in net assets and the financial highlights present fairly, in all material respects, the financial position of Scout International Fund, Scout Mid Cap Fund, Scout Small Cap Fund, Scout Low Duration Bond Fund, Scout Core Bond Fund, Scout Core Plus Bond Fund, and Scout Unconstrained Bond Fund (constituting the Scout Funds, hereafter collectively referred to as the “Funds”) as of October 31, 2017, and the results of each of their operations, the changes in each of their net assets and the financial highlights for the period July 1, 2017 through October 31, 2017, in conformity with accounting principles generally accepted in the United States of America. These financial statements and financial highlights (hereafter referred to as “financial statements”) are the responsibility of the Funds’ management. Our responsibility is to express an opinion on these financial statements based on our audits. We conducted our audits of these financial statements in accordance with the standards of the Public Company Accounting Oversight Board (United States). Those standards require that we plan and perform the audits to obtain reasonable assurance about whether the financial statements are free of material misstatement. An audit includes examining, on a test basis, evidence supporting the amounts and disclosures in the financial statements, assessing the accounting principles used and significant estimates made by management, and evaluating the overall financial statement presentation. We believe that our audits, which included confirmation of securities as of October 31, 2017 by correspondence with the custodian, brokers and the application of alternative auditing procedures where securities purchased had not been received, provide a reasonable basis for our opinions. The financial statements of the Funds as of and for the years ended June 30, 2017 and 2016 and the financial highlights for each of the periods ended on or prior to June 30, 2017 (not presented herein, other than the statements of operations and of changes in net assets and the financial highlights) were audited by other auditors whose report dated August 28, 2017 expressed an unqualified opinion on those financial statements and financial highlights.

| Tampa, Florida December 29, 2017 | |
| OCTOBER 31, 2017 | 73 |
EXPENSE EXAMPLES
October 31, 2017 (Unaudited)
The following expense examples are as of October 31, 2017, when the Funds were series of the Scout Funds and advised by Scout Investments, Inc. The Funds were reorganized after the close of business on November 17, 2017 into corresponding newly created series of Carillon Series Trust.
As a shareholder of the Scout Funds, you incur ongoing costs, including management fees and other Fund expenses. If you invest through a financial intermediary, you may also incur additional costs such as a transaction fee charged on the purchase or sale of the Fund or an asset-based management fee. The following Example is intended to help you understand your ongoing costs (in dollars) of investing in the Funds and to compare these costs with the ongoing costs of investing in other mutual funds.
The Example is based on an investment of $1,000 invested at the beginning of the period and held for the entire period from July 1, 2017 to October 31, 2017.
Actual Expenses
The first line of the following table under each Fund’s name titled “Actual” provides information about actual account values and actual expenses. You may use the information in this line, together with the amount you invested, to estimate the expenses you paid over the period. Simply divide your account value by $1,000 (for example, an $8,600 account value divided by $1,000 = 8.6), then multiply the result by the number in the first line under the heading entitled “Expenses Paid During Period” to estimate the expenses you paid on your account during the period.
Hypothetical Example for Comparison Purposes
The second line of the following table under each Fund’s name titled “Hypothetical” provides information about hypothetical account values and hypothetical expenses based on the Funds’ actual expense ratios and an assumed rate of return of 5% per year before expenses, which are not the Funds’ actual returns. The hypothetical is based on an investment of $1,000 invested at the beginning of the period and held for the entire six month period from May 1, 2017 to October 31, 2017. The hypothetical account values and expenses may not be used to estimate the actual ending account balance or expenses you paid for the period. You may use this information to compare the ongoing costs of investing in the Funds and other funds. To do so, compare this 5% hypothetical example with the 5% hypothetical examples that appear in the shareholder reports of the other funds.
Please note that the expenses shown in the table are meant to highlight your ongoing costs only and do not reflect any costs that may be associated with investing in a Fund through a financial intermediary. Therefore, the second line of the table is useful in comparing the ongoing costs only, and will not help you determine the relative total costs of owning different funds. In addition, if any costs associated with investing through a financial intermediary were included, your costs would have been higher.
| Beginning | Ending | |||||||||||||||
| Account | Account | Expenses | ||||||||||||||
| Fund | Value | Value | Annualized | Paid | ||||||||||||
| Actual | 7/1/17 | 10/31/17 | Expense | During | ||||||||||||
| Hypothetical | 5/1/17 | 10/31/17 | Ratio | Period* | ||||||||||||
| International: | ||||||||||||||||
| Actual | $ | 1,000.00 | $ | 1,084.90 | 1.0776 | % | $ | 3.79 | ||||||||
| Hypothetical | 1,000.00 | 1,019.57 | 1.0776 | 5.49 | ||||||||||||
| Mid Cap: | ||||||||||||||||
| Actual | 1,000.00 | 1,091.70 | 1.0111 | 3.56 | ||||||||||||
| Hypothetical | 1,000.00 | 1,019.90 | 1.0111 | 5.15 | ||||||||||||
| Small Cap: | ||||||||||||||||
| Actual | 1,000.00 | 1,094.00 | 1.0286 | 3.63 | ||||||||||||
| Hypothetical | 1,000.00 | 1,019.81 | 1.0286 | 5.24 | ||||||||||||
| Low Duration Bond: | ||||||||||||||||
| Actual | 1,000.00 | 1,005.20 | 0.4000 | 1.35 | ||||||||||||
| Hypothetical | 1,000.00 | 1,022.98 | 0.4000 | 2.04 | ||||||||||||
| Core Bond - Institutional Class: | ||||||||||||||||
| Actual | 1,000.00 | 1,008.50 | 0.4001 | 1.35 | ||||||||||||
| Hypothetical | 1,000.00 | 1,022.98 | 0.4001 | 2.04 | ||||||||||||
| Core Bond - Class Y: | ||||||||||||||||
| Actual | 1,000.00 | 1,007.10 | 0.8002 | 2.71 | ||||||||||||
| Hypothetical | 1,000.00 | 1,020.97 | 0.8002 | 4.08 | ||||||||||||
| Core Plus Bond - Institutional Class: | ||||||||||||||||
| Actual | 1,000.00 | 1,008.50 | 0.4001 | 1.35 | ||||||||||||
| Hypothetical | 1,000.00 | 1,022.98 | 0.4001 | 2.04 | ||||||||||||
| Core Plus Bond - Class Y: | ||||||||||||||||
| Actual | 1,000.00 | 1,007.10 | 0.8002 | 2.71 | ||||||||||||
| Hypothetical | 1,000.00 | 1,020.97 | 0.8002 | 4.08 | ||||||||||||
| Unconstrained Bond - Institutional Class: | ||||||||||||||||
| Actual | 1,000.00 | 1,004.80 | 0.5000 | 1.69 | ||||||||||||
| Hypothetical | 1,000.00 | 1,022.48 | 0.5000 | 2.55 | ||||||||||||
| Unconstrained Bond - Class Y: | ||||||||||||||||
| Actual | 1,000.00 | 1,003.80 | 0.7998 | 2.70 | ||||||||||||
| Hypothetical | 1,000.00 | 1,020.97 | 0.7998 | 4.07 | ||||||||||||
| * | Actual expenses are equal to each Fund’s annualized expense ratio, multiplied by the average account value over the four month period, multiplied by the number of days in the period 123/365 (to reflect the four month period). Hypothtical expenses are equal to each Fund’s annualized expense ratio, multiplied by the average account value over the six month period, multiplied by the number of days in the period 184/365 (to reflect the six month period). |
| 74 | SCOUT FUNDS ANNUAL REPORT |
RESULTS OF THE SPECIAL MEETING OF SHAREHOLDERS
The special meetings of the shareholders of Scout Funds were held on October 20, 2017 and November 2, 2017.
The matters voted on by the shareholders of record as of July 24, 2017 and the results of the vote at the shareholder meetings held October 20, 2017 are as follows:
To approve an Agreement and Plan of Reorganization pursuant to which the Scout Funds (The “Acquired Funds”) will be reorganized with and into the newly created series of the Carillon Series Trust.
| Outstanding | Total Shares | % of O/S | ||||||||||||||||||||||||||||||||||
| Shares (“O/S”) | Voted | Voted | Affirmative | % | Against | % | Abstain | % | ||||||||||||||||||||||||||||
| Scout International Fund | 49,133,549 | 24,996,309 | 50.87 | 20,233,503 | 80.95 | 954,383 | 3.82 | 3,808,423 | 15.24 | |||||||||||||||||||||||||||
| Scout Mid Cap Fund | 80,112,452 | 40,522,199 | 50.58 | 34,821,034 | 85.93 | 1,049,397 | 2.59 | 4,651,768 | 11.48 | |||||||||||||||||||||||||||
| Scout Small Cap Fund | 9,000,354 | 4,586,328 | 50.96 | 4,080,702 | 88.98 | 257,278 | 5.61 | 248,348 | 5.41 | |||||||||||||||||||||||||||
| Scout Low Duration Fund | 4,797,738 | 2,401,587 | 50.06 | 2,041,722 | 85.02 | 433 | 0.02 | 359,432 | 14.97 | |||||||||||||||||||||||||||
| Scout Core Bond Fund | 14,057,719 | 7,086,886 | 50.41 | 6,090,334 | 85.94 | 661,331 | 9.33 | 335,221 | 4.73 | |||||||||||||||||||||||||||
| Scout Core Plus Bond Fund | 25,663,520 | 14,939,045 | 58.21 | 14,049,698 | 94.05 | 20,706 | 0.14 | 868,642 | 5.81 | |||||||||||||||||||||||||||
| Scout Unconstrained Bond Fund | 132,840,528 | 75,045,364 | 56.49 | 73,737,768 | 98.26 | 204,222 | 0.27 | 1,103,374 | 1.47 | |||||||||||||||||||||||||||
| OCTOBER 31, 2017 | 75 |
OTHER INFORMATION
October 31, 2017 (Unaudited)
Approval of New Investment Advisory and Subadvisory Agreements for the Scout Funds
Overview. At a meeting held on June 12, 2017, the Board of Trustees for the Carillon Series Trust (“Trust”), including their independent members (together, the “Board”), approved an investment advisory agreement between Carillon Tower Advisers, Inc. (“Carillon”) and the Trust, on behalf of seven new series of the Trust (“Advisory Agreement”): Carillon Reams Core Bond Fund, the Carillon Reams Core Plus Bond Fund, the Carillon Scout International Fund, the Carillon Reams Low Duration Bond Fund, the Carillon Scout Mid Cap Fund, the Carillon Scout Small Cap Fund and the Carillon Reams Unconstrained Bond Fund (each, a “Fund” and collectively, the “Funds”).
The Board also approved an investment subadvisory agreement with Scout Investments, Inc. (“Scout”) to serve as the subadviser to each Fund (“Subadvisory Agreement”). The Advisory Agreement and Subadvisory Agreement are collectively referred to herein as the “Agreements.”
As part of the approval process, the Board, with the assistance of independent legal counsel, requested and received reports containing substantial and detailed information regarding the Funds, Carillon and Scout. Among other matters, these reports included information regarding Carillon’s and Scout’s investment philosophy, investment strategies, personnel and operations and compliance processes. The Board also considered information that had been provided to the Board by Eagle Asset Management, Inc. (“Eagle”) in connection with the Board’s considerations at the meeting of the renewal of the Investment Advisory Agreement between Eagle and Eagle Capital Appreciation Fund, Eagle Growth & Income Fund and Eagle Series Trust (“EST”), on behalf of the series of EST (collectively, the “Existing Funds”).
In approving the Agreements, the Board also reviewed information provided by Carillon and Scout regarding: (1) the advisory services proposed to be provided by Carillon and sub-advisory services proposed to be provided by Scout; (2) the professional personnel who are proposed to be assigned primary responsibility for managing the Funds; (3) the financial condition of Scout; (4) the proposed advisory and subadvisory fee rates and each Fund’s projected expense structure, both in absolute terms and relative to funds within a refined Morningstar Category population (“Morningstar Population”) and peer funds (“Peer Group”), and proposed contractual expense limitations; (5) the performance of mutual funds managed by Scout (each, a “Scout Fund”) and, as applicable, Carillon, and other accounts managed by Scout in the strategy of each Fund, net of fees (each, a “Composite”) as compared to funds within the applicable Morningstar category (“Morningstar Category”), Lipper, Inc. category (“Lipper Category”) and a benchmark index; (6) the anticipated effect of growth and size on the Funds’ expenses; (7) Scout’s compliance program and any material compliance matters, as well as its trading activities; (8) benefits to be realized by Carillon and Scout and their affiliates; (9) the estimated profitability of Carillon and Scout under the Agreements; (10) the potential purchase of Scout by Carillon; (11) the proposed reorganizations of certain Scout Funds into the Funds (each, a “Reorganizations”); and (12) any other information the Carillon and Scout believed would be material to the Board’s consideration of the Agreements.
The Board did not identify any particular information that was most relevant to its consideration of the Agreements, and each Trustee may have afforded different weight to the various factors. The Trustees posed questions to various management personnel of Carillon regarding certain key aspects of the materials submitted in support of the approval. Legal counsel to the independent Trustees provided the Board with a memorandum regarding its responsibilities pertaining to the approval of the Agreements. The memorandum explained the regulatory requirements surrounding the Trustees’ process for evaluating investment advisors and the terms of investment advisory contracts. Based on its evaluation, the Board unanimously concluded that the terms of the Agreements were reasonable and fair and that the approval of the Agreements was in the best interests of each Fund.
Provided below is an overview of the primary factors the Board considered at its June 12 meeting at which the Board considered the approval of the Agreements. In determining whether to approve the Agreements, the Board considered, among other things, the following factors: (1) the nature, extent and quality of services to be provided to the Funds; (2) the investment performance of the Composites and Scout Funds; (3) the estimated costs to be incurred by Carillon, Scout and their affiliates and the resulting profits or losses; (4) the extent to which economies of scale, if any, have been taken into account in setting the fee schedule; (5) whether the level of fees reflects economies of scale, if any, for the benefit of the Funds’ investors; (6) comparisons of services and fees with contracts entered into by Carillon and Scout with the Existing Funds and other clients (such as pension funds and other institutional investors); and (7) any other benefits derived by Carillon or Scout from their relationships with the Funds.
Nature, Extent and Quality of Services. The Board considered information regarding the services to be provided by Carillon and the background and experience of the Carillon personnel who would be responsible for overseeing the Funds. The Board also considered Carillon’s representation that the advisory and related services proposed to be provided to the Funds will be consistent with the services provided to the Existing Funds. The Board considered that Carillon would monitor the subadvisory services provided by Scout and sub-administration, transfer agency, fund accounting and custody services provided by U.S. Bancorp Fund Services, LLC and its affiliates, and reviewed Carillon’s description of its oversight programs. The Board also considered that Carillon would be responsible for overseeing compliance with the Funds’ investment objectives and policies, reviewing brokerage matters, overseeing the Funds’ compliance with applicable law and implementing Board directives as they relate to the Funds. Additionally, the Board noted that Carillon and its affiliates, Carillon Fund Distributors, Inc. (“CFD”) and Carillon Fund Services, Inc. (“CFS”), would provide certain administration, distribution and shareholder services to the Funds.
The Board considered that Carillon had reached a definitive agreement with UMB Financial Corp., Scout’s parent company, whereby Scout would be acquired by Carillon (the “Transaction”). The Board reviewed information regarding Scout’s principal business activities, its financial condition and overall capabilities to perform the services under the Subadvisory Agreement. The Board noted that Scout would be placing all orders for the purchase and sale of the Funds’ securities with brokers or dealers. In addition, the Board considered the background and experience of the personnel who will be assigned responsibility for managing the Funds. The Board also considered Scout’s infrastructure and the adequacy of its compliance program. In addition, the Board took into consideration Carillon’s recommendation of Scout. The Board considered Scout’s representation that its financial condition is adequate to provide high quality advisory services to the Funds and that its current staffing levels were adequate to service the Funds. The Board also considered the potential changes to Scout that may occur following the Transaction. Based on this information, the Board concluded that the nature, extent and quality of the advisory services to be provided by Scout were appropriate for each Fund in light of its investment objective, and, thus, supported a decision to approve the Subadvisory Agreement.
| 76 | SCOUT FUNDS ANNUAL REPORT |
Investment Performance. The Board noted that the Funds are new and, therefore, had no historical performance for the Board to review. However, as each Fund would be adopting the historical performance of a corresponding Scout Fund, in connection with their consideration of the Subadvisory Agreement, the Board considered comparisons of the performance of each Composite and Scout Fund for the year-to-date, one-year, three-year and five-year periods ended April 30, 2017, relative to the performance of the relevant Morningstar Category, Lipper Category and benchmark index. In this connection, the Board also noted that they had previously approved the Reorganizations. Additionally, the Board considered the performance of Existing Funds managed by Carillon in a similar style as the Funds but noted that Scout would be responsible for the day-to-day management of the Funds rather than Carillon.
With respect to the strategy pursuant to which Scout would manage the Carillon Reams Core Bond Fund, the Board noted that the Composite and the Scout Fund underperformed the Bloomberg Barclays U.S. Aggregate Bond Total Return Index (the “U.S. Aggregate Index”), the Morningstar Category and the Lipper Category for the year-to-date, one-, three- and five-year periods. The Board considered Scout’s representation that the underperformance of the Scout Fund was primarily attributable to Scout’s defensive positioning and duration positioning. The Board also considered Scout’s representation that the Scout Fund outperformed the U.S. Aggregate Index and Morningstar Category for the ten-year period.
With respect to the strategy pursuant to which Scout would manage the Carillon Reams Core Plus Bond Fund, the Board noted that the Composite outperformed the U.S. Aggregate Index for the year-to-date, one- and five-year periods and underperformed the U.S. Aggregate Index for the three-year period. The Board also noted that the Composite outperformed the Morningstar Category for the three- and five-year periods and underperformed the Morningstar Category for year-to-date and one-year periods. Additionally, the Board noted that the Composite underperformed the Lipper Category for the year-to-date and one-, three- and five-year periods. The Board also noted that the Scout Fund outperformed the U.S. Aggregate Index for the year-to-date and five-year periods and underperformed the U.S. Aggregate Index for the one- and three-year periods; outperformed the Morningstar Category for the five-year period and underperformed the Morningstar Category for the year-to-date and one- and three-year periods; and underperformed the Lipper Category for the year-to-date and one-, three- and five-year periods. The Board considered Scout’s representation that the underperformance of the Scout Fund was primarily attributable to Scout’s defensive positioning and duration positioning. The Board also considered Scout’s representation that the Scout Fund outperformed the U.S. Aggregate Index and Morningstar Category for the ten-year period.
With respect to the strategy pursuant to which Scout would manage the Carillon Scout International Fund, the Board noted that the Scout Fund and one Composite outperformed the MSCI EAFE Index, the Morningstar Category and the Lipper Category for the one- and three-year periods and underperformed the MSCI EAFE Index, the Morningstar Category and the Lipper Category for the year-to-date and five-year periods. The Board also noted that the other Composite outperformed the MSCI EAFE Index for the one- and three-year periods; underperformed the MSCI EAFE Index for the year-to-date and five-year periods; outperformed the Morningstar Category for the three-year period; underperformed the Morningstar Category for the year-to-date and one- and five-year periods; outperformed the Lipper Category for the one-, three-, and five-year periods; and underperformed the Lipper Category for the year-to-date period. The Board also considered the performance of the Existing Fund managed in the same style by Carillon. The Board considered Scout’s representation that the underperformance of the Scout Fund for the five-year period was primarily attributable to stock selection and the Scout Fund’s allocation to emerging markets.
With respect to the strategy pursuant to which Scout would manage the Carillon Reams Low Duration Bond Fund, the Board noted that the Composite outperformed the Bloomberg Barclays 1-3 Year U.S. Government/Credit Index (the “U.S. Government Index”) for the year-to-date, one- and three-year periods; outperformed the Morningstar Category for the three-year period; underperformed the Morningstar Category for the year-to-date and one-year periods; and underperformed the Lipper Category for the year-to-date, one- and three-year periods. The Board also noted that the Scout Fund outperformed the U.S. Government Index for the one- and three-year periods; underperformed the U.S. Government Index for the year-to-date period; outperformed the Morningstar Category for the three-year period; underperformed the Morningstar Category for the year-to-date and one-year periods; and underperformed the Lipper Category for the year-to-date, one- and three-year periods. Additionally, the Board considered the performance of the Existing Fund managed in the same style by Carillon.
With respect to the strategy pursuant to which Scout would manage the Carillon Scout Mid Cap Fund, the Board noted that the Composite and each Scout Fund outperformed the Morningstar Category and the Lipper Category for the year-to-date and one-, three- and five-year periods; outperformed the Russell Midcap Index for the year-to-date, one- and three-year periods; and underperformed the Russell Midcap Index for the five-year period. The Board also considered the performance of the Existing Fund managed in the same style by Carillon. The Board considered Scout’s representation that, among other things, the underperformance of the Scout Funds for the five-year period was attributable to stock selection in the energy, healthcare and financial sectors.
With respect to the strategy pursuant to which Scout would manage the Carillon Scout Small Cap Fund, the Board noted that the Composite outperformed the Russell 2000 Growth Index, the Morningstar Category and the Lipper Category for the year-to-date, one-, three- and five-year periods. Additionally, the Board considered the performance of the Existing Funds managed in the same style by Carillon.
With respect to the strategy pursuant to which Scout would manage the Carillon Reams Unconstrained Bond Fund, the Board noted that the Composite and one of the Scout Funds outperformed the BofA Merrill Lynch 3-Month LIBOR Constant Maturity Index (the “BofA Index”) for the year-to-date and the one-, three- and five-year periods; outperformed the Morningstar Category and the Lipper Category for the five-year period; and underperformed the Morningstar Category and the Lipper Category for the year-to-date and the one- and three-year periods. The Board also noted that the other Scout Fund outperformed the BofA Index for the year-to-date and the one-year periods; underperformed the BofA Index for the three-year period; and underperformed the Morningstar Category and the Lipper Category for the year-to-date, one- and three-year periods. The Board considered Scout’s representation that, among other things, the underperformance of the Scout Funds relative to the Morningstar Category one- and three-year periods reflects the Scout Funds’ defensive positioning relative to their peers.
| (Continued on next page) | |
| OCTOBER 31, 2017 | 77 |
OTHER INFORMATION (Continued)
October 31, 2017 (Unaudited)
Fees and Expenses. The Board considered the proposed advisory fee rate payable by each Fund to Carillon under the Agreement, the proposed subadvisory fee rates payable to Scout, each Fund’s projected total expense ratio and its proposed Rule 12b-1 fees. The Board also considered comparisons of each Fund’s proposed advisory fee rate and projected expense ratio (including Rule 12b-1 fees) to the average expense ratio of its Morningstar Category and Peer Group within that Morningstar Category based on data ended February 28, 2017. To the extent applicable, the Board considered the proposed advisory fee rate relative to the advisory fee rates charged to the Existing Funds. The Board also considered that the proposed advisory fee rate for each Fund is the same as the advisory fee rate currently charged to the applicable Scout Fund. The Board considered that Carillon has agreed to contractually limit the expenses of each Fund for at least two years from the date of the Reorganizations at levels that are equal to the current expense caps, if any, for the applicable Scout Fund. In considering the proposed subadvisory fee rate to be paid by Carillon, the Board considered comparisons of the subadvisory fee rate to the average fee rate charged by Scout to the accounts within the applicable Composite, noting Carillon’s representation that variances in such rates are attributable to differences in the level of services provided.
With respect to the Carillon Reams Core Bond Fund, the Board considered that the Fund’s proposed advisory fee rate and combined advisory and administrative fee rate were lower than the average advisory fee rate and combined advisory and administrative fee rate of the Morningstar Peer Group and equal to the average advisory fee rate and combined advisory and administrative fee rate of the Morningstar Population. The Board also considered that the Fund’s projected net expense ratio for Class I was lower than the average net expense ratios of its Morningstar Peer Group and Population. The Board noted that the proposed subadvisory fee rate was higher than the average fee rate charged by Scout to the accounts within the Composite. The Board also noted that Carillon does not manage any similar accounts in the strategy of a Fund.
With respect to the Carillon Reams Core Plus Bond Fund, the Board considered that the Fund’s proposed advisory fee rate and combined advisory and administrative fee rate were higher than the average advisory fee rate and combined advisory and administrative fee rate of the Morningstar Peer Group and equal to the average advisory fee rate and combined advisory and administrative fee rate of the Morningstar Population. The Board also considered that the Fund’s projected net expense ratio for Class I was lower than the average net expense ratios of its Morningstar Peer Group and Population. The Board noted that the proposed subadvisory fee rate was higher than the average fee rate charged by Scout to the accounts within the Composite. The Board also noted that Carillon does not manage any similar accounts in the strategy of a Fund.
With respect to the Carillon Scout International Fund, the Board considered that the Fund’s proposed advisory fee rate and combined advisory and administrative fee rate were lower than the average advisory fee rate and combined advisory and administrative fee rate of the Morningstar Peer Group and Population. The Board also considered that the Fund’s projected net expense ratio for Class I was higher than the average net expense ratio of its Morningstar Peer Group and lower than the average net expense ratio of its Morningstar Population. The Board noted that the proposed advisory fee rate was lower than the advisory fee rate charged by Carillon to the comparable Existing Fund. The Board also noted that the proposed subadvisory fee rate was higher than the average fee rate charged by Scout to the accounts within the Composites.
With respect to the Carillon Reams Low Duration Bond Fund, the Board considered that the Fund’s proposed advisory fee rate was lower than the average advisory fee rate of the Morningstar Peer Group and Population, but that the Fund’s proposed combined advisory and administrative fee rate was equal to the average combined advisory and administrative fee rate of the Morningstar Peer Group and higher than the average combined advisory and administrative fee rate of the Morningstar Population. The Board also considered that the Fund’s projected net expense ratio for Class I was lower than the average net expense ratio of its Morningstar Peer Group and Population. The Board noted that the proposed advisory fee rate was equal to the advisory fee rate charged by Carillon to the comparable Existing Fund. The Board also noted that the proposed subadvisory fee rate was lower than the average fee rate charged by Scout to the accounts within the Composite. Additionally, the Board noted that the proposed subadvisory fee is higher than the subadvisory fee charged by Scout to a mutual fund for which it serves as one of multiple subadvisers.
With respect to the Carillon Scout Mid Cap Fund, the Board considered that the Fund’s proposed advisory fee rate and combined advisory and administrative fee rate were higher than the average advisory fee rate and combined advisory and administrative fee rate of the Morningstar Peer Group and Population. The Board also considered that the Fund’s projected net expense ratio for Class I was higher than the average net expense ratio of its Morningstar Peer Group and lower than the average expense ratio of its Morningstar Population. The Board noted that the proposed advisory fee rate was higher than the advisory fee rate charged by Carillon to the comparable Existing Fund. The Board also noted that the proposed subadvisory fee rate was equal to the average fee rate charged by Scout to the accounts within the Composite. Additionally, the Board noted that the proposed subadvisory fee is higher than the subadvisory fee charged by Scout to a mutual fund for which Scout serves as subadviser.
With respect to the Carillon Scout Small Cap Fund, the Board considered that the Fund’s proposed advisory fee rate and combined advisory and administrative fee rate were lower than the average advisory fee rate and combined advisory and administrative fee rate of the Morningstar Peer Group and Population. The Board also considered that the Fund’s projected net expense ratio for Class I was lower than the average net expense ratio of its Morningstar Peer Group and Population. The Board noted that the proposed advisory fee rate was higher than the advisory fee rate charged by Carillon to the comparable Existing Funds. The Board also noted that the proposed subadvisory fee rate was higher than the average fee rate charged by Scout to the accounts within the Composite.
With respect to the Carillon Reams Unconstrained Bond Fund, the Board considered that the Fund’s proposed advisory fee rate was lower than the average advisory fee rate of the Morningstar Peer Group and Population for Class I. The Board also considered that the Fund’s combined advisory and administrative fee rate was higher than the average combined advisory and administrative fee rate of the Morningstar Peer Group for Class I and lower than the average combined advisory and administrative fee rate of the Morningstar Population for Class I. The Board also considered that the Fund’s projected net expense ratio for Class I was lower than the average net expense ratio of its Morningstar Peer Group and Population. The Board noted that the proposed subadvisory fee rate was higher than the average fee rate charged by Scout to the accounts within the Composite and a mutual fund for which Scout serves as subadviser. The Board also noted that Carillon does not manage any similar accounts in the strategy of a Fund.
| 78 | SCOUT FUNDS ANNUAL REPORT |
Costs, Profitability and Economies of Scale. In analyzing the cost of services and profitability of Carillon and Scout, the Board considered the estimated revenues to be earned and the expenses to be incurred by Carillon and Scout. The Board also considered that Carillon will pay to Scout a subadvisory fee equal to the entirety of the advisory fee to be paid by the Funds, but that Carillon will receive fees for providing administrative services to the Funds. Additionally, the Board noted that Carillon expects to earn a profit on certain Funds for the first two years and does not expect to earn a profit on other Funds for the first two years. The Board also noted that, during the first quarter of 2017, Scout earned a profit with respect to certain of the Scout Funds and did not earn a profit with respect to other of the Scout Funds.
The Board considered that, because Carillon would pay to Scout a subadvisory fee equal to the entirety of the advisory fee to be paid by the Funds, Carillon would not benefit economically from the proposed fee arrangement, other than as a result of Scout’s expected affiliation with Carillon following the Transaction. The Board noted Carillon’s representation that many of the Funds’ proposed advisory fee schedules include breakpoints that will result in overall lower advisory fees as Fund assets grow. The Board also noted Scout’s representation that economies of scale would be realized as assets in the Funds grow, but that the Scout does not believe that breakpoints are appropriate at the present time for Funds that have contractual expense limitations.
Benefits. In evaluating compensation, the Board considered other benefits that may be realized by Carillion, Scout and their affiliates from their relationship with the Funds. In this connection, the Board also considered Scout’s representation that it expects to receive soft dollar services from broker-dealers that it selects to execute trades on behalf of the Funds, including brokerage services, proprietary research and third-party research. The Board considered that Funds would compensate Carillon for providing administrative services and CFS for providing shareholder services. The Board recognized that, as the Funds’ principal underwriter and distributor, CFD would receive Rule 12b-1 payments from the Funds to compensate it for providing services and distribution activities. These activities could lead to growth in the Funds’ assets and the corresponding benefits of that growth, including economies of scale and greater diversification. In addition, other affiliates of Carillon have entered into agreements with CFD to sell Fund shares and receive compensation from CFD. In this regard, the Board also considered that Scout also is expected to be an affiliate of Carillon following the Transaction.
Conclusions. Based on these considerations, the Board concluded with respect to the Funds that: (1) each Fund was reasonably likely to benefit from the nature, quality and extent of Carillon’s and Scout’s services, as applicable to the Funds; (2) the performance of the Composites, the Scout Funds and the Existing Funds, as applicable, was satisfactory in light of all the factors considered by the Board; (3) the fees payable under the Agreements and profits projected by Carillon and Scout were reasonable in the context of all the factors considered by the Board; and (4) the proposed advisory fee rate structure provides each Fund’s shareholders with reasonable benefits associated with economies of scale. Based on these conclusions and other factors, the Board determined in its business judgment to approve the Advisory Agreement between each Fund and Carillon, and the Subadvisory Agreement between Carillon and Scout.
| (Continued on next page) | |
| OCTOBER 31, 2017 | 79 |
OTHER INFORMATION (Continued)
October 31, 2017 (Unaudited)
Foreign Taxes Paid
Pursuant to Section 853 of the Internal Revenue Code of 1986, the International Fund designates (in thousands): $7,893 of income derived from foreign sources and $587 of foreign taxes paid for the year ended October 31, 2017.
Of the ordinary income (including short-term capital gains) distributions made by the International Fund during the year ended October 31, 2017, the proportionate share of income derived from foreign sources attributable to one share of stock, or amounts determined to be necessary, is $0.1712 and the proportionate share of foreign taxes paid attributable to one share of stock is $0.0127.
Qualified Dividend Income
For the period ended October 31, 2017, 72.87%, 100% and 100%, respectively, of the dividends paid from net investment income, including short-term capital gains (if any), for the International, Mid Cap and Small Cap Funds are designated as qualified dividend income.
Corporate Dividends Received Deduction
Dividends paid by the International, Mid Cap, and Small Cap Funds during the period ended October 31, 2017, which are not designated as capital gain distributions, should be multiplied by 1.45%, 100% and 100%, respectively, to arrive at the net amount eligible for the corporate dividend received deduction.
Independent Registered Certified Public Accounting Firm
In connection with the November 17, 2017 reorganization of the Scout Funds, comprising the Scout International Fund, Scout Mid Cap Fund, Scout Small Cap Fund, Scout Low Duration Bond Fund, Scout Core Bond Fund, Scout Core Plus Bond Fund, and Scout Unconstrained Bond Fund, into newly created corresponding series of the Carillion Series Trust (“Reorganization”), the Audit Committee of the Board of Trustees of the Carillon Series Trust appointed, and the Board of Trustees ratified and approved, effective as of the close of the Reorganization, PricewaterhouseCoopers LLP (“PwC”) as the independent registered certified public accounting firm of the Scout Funds for the interim period July 1, 2017 to October 31, 2017. Prior to the Reorganization, the Scout Funds financial statements were audited by Deloitte & Touche LLP (the “Prior Auditor”). By letter dated November 17, 2017, the Prior Auditor confirmed to the Chief Financial Officer of the Scout Funds that the client-auditor relationship with the Scout Funds had ceased.
The Prior Auditor’s reports on the financial statements of the Scout Funds for the two most recent fiscal years ended June 30, 2017 did not contain an adverse opinion or a disclaimer of opinion, and were not qualified or modified as to uncertainty, audit scope or accounting principles. During the previous two most recent fiscal years ended June 30, 2017 and during the period from the end of the most recent fiscal year through November 17, 2017, there were no disagreements with the Prior Auditor on any matter of accounting principles or practices, financial statement disclosure, or auditing scope or procedure which, if not resolved to the Prior Auditor’s satisfaction, would have caused it to make reference to the subject matter of the disagreement in connection with its report. In addition, there have been no reportable events of the kind described in Item 304(a)(1)(v) of Regulation S-K under the Securities Exchange Act of 1934.
During the prior two fiscal years, PwC was not contacted by the Scout Funds regarding the application of accounting principles to any particular financial matter or any matter that was the subject of a disagreement with the Prior Auditor.
| 80 | SCOUT FUNDS ANNUAL REPORT |
This page intentionally left blank.
| OCTOBER 31, 2017 | 81 |
TRUSTEES AND OFFICERS
October 31, 2017 (Unaudited)
Independent Trustees
| Name, Address and Birthdate | Positions Held with Funds | Term of Office and Length of Time Served | Principal Occupation(s) During Past 5 Years | Number of Portfolios in Fund Complex Overseen by Trustee | Other Directorships Held by Trustee During Past 5 Years | ||||||||||
| Andrea F. Bielsker c/o Scout Funds 928 Grand Boulevard Kansas City, Missouri 64106 11/16/58 | Trustee Chair | Indefinite; until successor elected. Served as a Trustee since 2005. | Principal, AFB Consulting, from 2008 to 2012; Chief Financial Officer, Brooke Credit Corporation, from 2007 to May 2008; Vice President, Liberty Power Corp., 2007; Senior Vice President, Finance, Chief Financial Officer and Treasurer, Great Plains Energy Company from 2002 to 2005. | 7 | None | ||||||||||
| Charlotte T. Petersen c/o Scout Funds 928 Grand Boulevard Kansas City, Missouri 64106 07/28/60 | Trustee | Indefinite; until successor elected. Served as a Trustee since August 2012. | Chief Investment Officer/Consulting Investment Officer, Alexander Capital/CoBiz Investment Management, from 2006 to 2010; Portfolio Manager and Partner, Denver Investment Advisors, from 1993 to 2002; Investment Analyst and Assistant Vice President, United Capital Management, from 1986 to 1993. | 7 | None | ||||||||||
| Allen R. Strain c/o Scout Funds 928 Grand Boulevard Kansas City, Missouri 64106 05/12/52 | Trustee | Indefinite; until successor elected. Served as a Trustee since August 2012. | Teaching Professor, University of Missouri-Kansas City Bloch School of Business, from 2014 to August 2015 and 2009 to 2010; Vice President and Chief Financial Officer (January 2012 to April 2014) and Director (from 2010 to 2011), Ewing Marion Kauffman Foundation; Managing Director (from 2004 to 2008) and Senior Vice President (from 2000 to 2008), State Street - Kansas City (securities processing/custody). | 7 | None | ||||||||||
| Jerry T. Golden c/o Scout Funds 928 Grand Boulevard Kansas City, Missouri 64106 06/16/53 | Trustee | Indefinite; until successor elected. Served as a Trustee since May 2015. | National Seminar Instructor for Ernst & Young Financial Services Program, from 2014 to August 2015; Partner, Ernst & Young LLP, from 1986 to 2012. | 7 | None | ||||||||||
| Interested Trustee | |||||||||||||||
| Andrew J. Iseman* c/o Scout Funds 928 Grand Boulevard Kansas City, Missouri 64106 11/09/64 | Trustee; President | Indefinite; until successor elected. Served as a Trustee since April 2013. Served as President since November 2010. | Chief Executive Officer, Scout Investments, Inc., since August 2010; Chief Operating Officer, RK Capital Management, February 2009 to 2010; Executive Vice President & Chief Operating Officer, Janus Capital Group, from February 2007 to April 2008; President & Chief Operating Officer, Janus Investment Fund, Janus Adviser Series and Janus Aspen Series, from February 2007 to April 2008; Senior Vice President of Operations, INTECH, from May 2005 to February 2007; Vice President of Investment Operations, Janus Capital Group, from January 2003 to May 2005. | 7 | None |
The Scout Funds’ Statement of Additional Information (SAI) includes additional information about the Funds’ Trustees and is available, without charge, upon request, by calling toll-free 800-996-2862. On November 17, 2017, Carillon Tower Advisers, Inc. completed its purchase of Scout Investments, Inc. from UMB Financial Corporation. In connection with the transaction, each series of Scout Funds covered by this report was reorganized into a corresponding newly created series of the Carillon Series Trust (“Carillon Scout Funds”) after the close of business on November 17, 2017. The Trustees and Officers of the Carillon Series Trust currently oversee the operations of the Carillon Scout Funds. Additional information about the Carillon Series Trust’s Trustees and Officers can be found in its Statement of Additional Information, which is available, without charge, upon request, by calling the Carillon Family of Funds toll free at 1-800-421-4184 or by accessing the website at www.carillontower.com.
*Andrew J. Iseman is an “interested person” of the Funds within the meaning of Section 2(a)(19) of the 1940 Act due to his position as Chief Executive Officer of the Funds’ Advisor.
| 82 | SCOUT FUNDS ANNUAL REPORT |
Executive Officers
The Officers of the Trust not named above are:
| Name, Address and Birthdate | Positions Held with Funds | Term of Office and Length of Time Served | Principal Occupation(s) During Past 5 Years | ||||||
| Scott A. Betz c/o Scout Funds 928 Grand Boulevard Kansas City, Missouri 64106 12/16/77 | Treasurer and Chief Compliance Officer | Indefinite, until successor elected. Served as Treasurer since May 2011. Served as Chief Compliance Officer since June 2016. | Chief Compliance Officer (since June 2016), Chief Operating Officer (since 2012), Treasurer (since May 2011), Senior Vice President (since 2009), and Chief Administrative Officer (since 2005), Scout Investments, Inc. | ||||||
| �� | |||||||||
| Jessica A. Schubel c/o Scout Funds 928 Grand Boulevard Kansas City, Missouri 64106 09/11/78 | Secretary and Anti-Money Laundering Compliance Officer | Indefinite, until successor elected. Served as Secretary since May 2012. Served as AML Compliance Officer since June 2016. | AML Compliance Officer (since June 2016), Compliance Officer (since March 2011), Scout Investments, Inc., Fund Administrator (from 2007 to 2011) and Senior Portfolio Administrator (from 2004 to 2007), State Street. | ||||||
| OCTOBER 31, 2017 | 83 |
PRIVACY POLICY
October 31, 2017 (Unaudited)
| FACTS | WHAT DOES CARILLON FAMILY OF FUNDS DO WITH YOUR PERSONAL INFORMATION? |  | |
| Why? | Financial companies choose how they share your personal information. Federal law gives consumers the right to limit some but not all sharing. Federal law also requires us to tell you how we collect, share, and protect your personal information. Please read this notice carefully to understand what we do. | |
| What? | The types of personal information we collect and share depend on the product or service you have with us. This information can include: < Social security number < Birth date | |
| How? | All financial companies need to share customers’ personal information to run their everyday business. In the section below, we list the reasons financial companies can share their customers’ personal information; the reasons Carillon Family of Funds chooses to share; and whether you can limit this sharing. |
| Reasons we can share your personal information | Does Carillon Family of Funds share? | Can you limit this sharing? | ||
| For our everyday business purposes— such as to process your transactions, maintain your account(s), respond to court orders and legal investigations, or report to credit bureaus | Yes | No | ||
| For our marketing purposes— to offer our products and services to you | No | No | ||
| For joint marketing with other financial companies | No | No | ||
| For our affiliates’ everyday business purposes— information about your transactions and experiences | Yes | No | ||
| For our affiliates’ everyday business purposes— information about your creditworthiness | No | No | ||
| For our affiliates to market to you | No | No | ||
| For non-affiliates to market to you | No | No |
| To limit our sharing | < Call 800-421-4184 — our menu will prompt you through your choice(s) or < Visit us online: carillontower.com Please note: If you are a new customer, we can begin sharing your information 30 days from the date we sent this notice. When you are no longer our customer, we continue to share your information as described in this notice.
However, you can contact us at any time to limit our sharing. | |
| Questions? | Call 800-421-4184 or go to carillontower.com |
| 84 | SCOUT FUNDS ANNUAL REPORT |
| Who we are | ||
| Who is providing this notice? | Carillon Tower Advisers, Inc., Carillon Fund Services, Inc. and Carillon Family of Funds (collectively, “Carillon Family of Funds”) | |
| What we do | ||
| How does Carillon Family of Funds protect my personal information? | To protect your personal information from unauthorized access and use, we use security measures that comply with federal law. These measures include computer safeguards and secured files and buildings. | |
| How does Carillon Fund Services collect my personal information? | We collect your personal information, for example, when you open an account or deposit money
We also collect your personal information from others, such as affiliates, or other companies. | |
| Why can’t I limit all sharing? | Federal law gives you the right to limit only | |
< sharing for affiliates’ everyday business purposes—information about your creditworthiness < affiliates from using your information to market to you < sharing for non-affiliates to market to you
State laws and individual companies may give you additional rights to limit sharing. | ||
| What happens when I limit sharing for an account I hold jointly with someone else? | Your choices will apply to everyone on your account—unless you tell us otherwise. | |
| Definitions | ||
| Affiliates | Companies related by common ownership or control. They can be financial and non-financial companies. < Raymond James & Associates, Inc., Raymond James Financial Services, Inc., Carillon Tower Advisers, Inc., Carillon Fund Distributors, Inc., Carillon Fund Services, Inc., ClariVest Asset Management LLC, Cougar Global Investments Limited, Eagle Asset Management, Inc., Scout Investments, Inc., and Reams Asset Management (a division of Scout Investments). | |
| Non-affiliates | Companies not related by common ownership or control. They can be financial and non-financial companies. < Broker-dealers for business related matters. | |
| Joint marketing | A formal agreement between non-affiliated financial companies that together market financial products or services to you. < N/A |
| OCTOBER 31, 2017 | 85 |
GLOSSARY OF INVESTMENT TERMS
EQUITY FUNDS
Alpha is a measure of the difference between a portfolio’s actual returns and its expected performance, given its level of risk as measured by beta. A positive Alpha figure indicates the portfolio has performed better than its beta would predict. In contrast, a negative Alpha indicates the portfolio has underperformed, given the expectations established by beta.
Beta is a measure of the funds sensitivity to market movements. A portfolio with a beta greater than 1 is more volatile than the market and a portfolio with a beta less than 1 is less volatile than the market.
Downside Capture is a statistical measure of an investment manager’s overall performance in down-markets. The downside capture ratio is used to evaluate how well or poorly an investment manager performed relative to an index during periods when that index has dropped.
EPS (earnings per share) is a rough measurement of the amount of a company’s profit that can be allocated to one share of its stock.
EPS Growth (Hist 5 Yr) is a measure of the annualized growth rate of net-income-per share over the trailing 5 years for the stocks currently held by the fund.
Market Cap is the total dollar market value of all of a company’s outstanding shares.
Price/Book Ratio is used to compare a stock’s market value to its book value. It is calculated by dividing the current closing price of the stock by the latest quarter’s book value per share.
R-squared reflects the percentage of a fund’s movement explained by movements in its benchmark.
Return On Equity amount of net income returned as a percentage of shareholders equity.
Sharpe Ratio uses a fund’s standard deviation and its excess return (the difference between the fund’s return and risk-free return of 90-day Treasury Bills) to determine reward per unit of risk.
Standard Deviation is a calculation used to measure variability of a portfolio’s performance.
Stock Multiples measure a company’s financial well-being by dividing one financial metric by another.
Turnover Ratio is a measure of the fund’s trading activity, which is computed by taking the lesser of purchases or sales (excluding all securities with maturities of less than one year) and dividing by average monthly net assets.
Upside Capture is a statistical measure of an investment manager’s overall performance in up-markets. The upside capture ratio is used to evaluate how well or poorly an investment manager performed relative to an index during periods when that index has risen.
12-Month Historical P/E ratio is the ratio of a stock’s latest closing price to its per share earnings over the last 12 months.
BOND FUNDS
Average Duration is a time measure of a bond’s interest-rate sensitivity, based on the weighted average of the time periods over which a bond’s cash flows accrue to the bondholder. Time periods are weighted by multiplying by the present value of its cash flow divided by the bond’s price.
Average Maturity is computed by weighting the maturity of each security in the portfolio by the market value of the security, then averaging these weighted figures.
Basis Point is 1/100 of a percentage point in the context of interest rates and bond yields. For example, an interest rate increase of 0.25 percentage point by the Federal Reserve would be generally referred to as an increase of 25 basis points.
Yield Curve is a line that plots the interest rates, at a set point in time, of bonds having equal credit quality, but differing maturity dates.
30-Day SEC Yield is an annualized yield based on the most recent trailing 30 day period. This hypothetical income will differ (at times, significantly) from the fund’s actual experience; as a result, income distributions from the fund may be higher or lower than implied by the SEC yield.
| 86 | SCOUT FUNDS ANNUAL REPORT |
This page intentionally left blank.
This page intentionally left blank.
PROXY VOTING POLICIES AND PROCEDURES
For a description of the policies and procedures that the Funds use to determine how to vote proxies relating to portfolio securities, please call 800-996-2862 and request a Statement of Additional Information. One will be mailed to you free of charge. The Statement of Additional Information is also available on the website of the U.S. Securities and Exchange Commission at www.sec.gov as well as the Funds’ website at www.scoutinv.com. Information on how the Funds voted proxies relating to portfolio securities during the 12-month period ended October 31, 2017 is available without charge, upon request, by calling 800-996-2862 or by accessing the website of the U.S. Securities and Exchange Commission.
DISCLOSURE OF PORTFOLIO HOLDINGS
The Funds file complete schedules of portfolio holdings with the U.S. Securities and Exchange Commission for the first and third quarters of each fiscal year on Form N-Q. Each Fund’s Form N-Q is available on the website of the U.S. Securities and Exchange Commission at www.sec.gov, and may also be reviewed and copied at the Commission’s Public Reference Room in Washington, DC. Information on the operation of the Public Reference Room may be obtained by calling 1-800-SEC-0330.
This report has been prepared for the information of the Shareholders of the Scout International Fund, the Scout Mid Cap Fund, the Scout Small Cap Fund, the Scout Low Duration Bond Fund, the Scout Core Bond Fund, the Scout Core Plus Bond Fund, and the Scout Unconstrained Bond Fund, and is not to be construed as an offering of the shares of the Funds.
Not authorized for distribution unless accompanied or preceded by a current Scout Funds Prospectus.
SCOUT FUNDS
International Fund Scout International Fund (UMBWX) Domestic Equity Funds Scout Mid Cap Fund (UMBMX) Scout Small Cap Fund (UMBHX) Fixed Income Funds Scout Low Duration Bond Fund (SCLDX) Scout Core Bond Fund Institutional Class (SCCIX) Class Y (SCCYX) Scout Core Plus Bond Fund Institutional Class (SCPZX) Class Y (SCPYX) Scout Unconstrained Bond Fund Institutional Class (SUBFX) Class Y (SUBYX) |  |
Item 2. Code of Ethics
The Scout Funds has adopted a code of ethics (the “Code”), as that term is defined in Item 2 of Form N-CSR, that applies to the Registrant’s principal executive officer and principal financial officer. A copy of the Code is attached as an exhibit. There were no amendments to the Code or waivers from the provisions of the Code.
Item 3. Audit Committee Financial Expert
The Scout Fund’s board has determined that Ms. Andrea Bielsker, Mr. Allen Strain and Mr. Jerry T. Golden possess the technical attributes to qualify as an “audit committee financial expert” serving on the Scout Funds’ audit committee and designated Ms. Andrea Bielsker, Mr. Allen Strain and Mr. Jerry T. Golden as “audit committee financial experts.” Ms. Andrea Bielsker, Mr. Allen Strain and Mr. Jerry T. Golden are independent under the standards set forth in Item 3 of Form N-CSR.
Item 4. Principal Accountant Fees and Services
(a) Audit Fees for Scout Funds.
The aggregate fees billed for each of the last two fiscal years for professional services rendered by the principal accountant for the audit of the Scout Funds’ annual financial statements and services normally provided by the accountant in connection with the statutory and regulatory filings and engagements for the last two fiscal years are as follows:
| Fiscal period ended October 31, 2017 | $ | 150,600 | ||
| Fiscal year ended June 30, 2017 | $ | 196,400 | ||
| Fiscal year ended June 30, 2016 | $ | 190,700 |
(b) Audit-Related Fees for Scout Funds.
The aggregate fees billed in each of the last two fiscal years for custody audits and services by the principal accountant that are reasonably related to the performance of the audit of the Registrant’s financial statements and are not reported under paragraph (a) of this Item are as follows:
| Fiscal period ended October 31, 2017 | $ | 28,000 | ||
| Fiscal year ended June 30, 2017 | $ | 48,000 | ||
| Fiscal year ended June 30, 2016 | $ | 46,500 |
(c) Tax Fees for Scout Funds.
The aggregate fees billed in each of the last two fiscal years for professional services rendered by the principal accountant for tax review of Scout Fund’s tax returns are as follows:
| Fiscal period ended October 31, 2017 | $ | 29,600 | ||
| Fiscal year ended June 30, 2017 | $ | 42,300 | ||
| Fiscal year ended June 30, 2016 | $ | 42,300 |
(d) All Other Fees.
The aggregate fees billed in each of the last two fiscal years for products and services provided by the principal accountant, other than the services reported in paragraphs (a) through (c) of this Item.
| Fiscal period ended October 31, 2017 | $ | 0 | ||
| Fiscal year ended June 30, 2017 | $ | 0 | ||
| Fiscal year ended June 30, 2016 | $ | 0 |
(e)
(1) The Scout Fund’s Audit Committee has adopted an Audit Committee Charter that provides that the Audit Committee shall approve, prior to appointment, the engagement of the auditor to provide audit services to the Scout Funds and non-audit services to the Scout Funds, its investment adviser or any entity controlling, controlled by or under common control with the investment adviser that provides on-going services to the Scout Funds if the engagement relates directly to the operations and financial reporting of the Scout Funds.
(2) The percentage of services described in each of paragraphs (b) through (d) of this Item that were approved by the audit committee pursuant to paragraph (c)(7)(i)(C) of Rule 2-01 of Regulation S-X are as follows:
| (b) | Not applicable. |
| (c) | Not applicable. |
| (d) | Not applicable. |
(f) All of the principal accountant’s hours spent on auditing the Scout Fund’s financial statements were attributed to work performed by full-time permanent employees of the principal accountant.
(g) Non-Audit Fees Billed for Scout Funds.
None.
(h) Not applicable.
Item 5. Audit Committee of Listed Registrants
Not applicable.
Item 6. Schedule of Investments
Included as part of the report to shareholders filed under Item 1 of this Form N-CSR.
Item 7. Disclosure of Proxy Voting Policies and Procedures for Closed-End Management Investment Companies
Not applicable to open-end investment companies.
Item 8. Portfolio Managers of Closed-end Management Investment Companies
Not applicable to open-end investment companies.
Item 9. Purchase of Equity Securities by Closed-End Management Investment Company and Affiliated Purchasers
Not applicable to open-end investment companies.
Item 10. Submission of Matters to a Vote of Security Holders
Not applicable.
Item 11. Controls and Procedures
| (a) | The Registrant’s principal executive officer and principal financial officer have reviewed the Registrant’s disclosure controls and procedures (as defined in Rule 30a-3(c) under the Investment Company Act of 1940 (the “Act”)) as of a date within 90 days of the filing of this report, as required by Rule 30a-3(b) under the Act and Rule 13a-15(b) or 15d-15(b) under the Securities Exchange Act of 1934. Based on their review, such officers have concluded that the disclosure controls and procedures are effective in ensuring that information required to be disclosed in this report is appropriately recorded, processed, summarized and reported and made known to them by others within the Registrant and by the Registrant’s service provider. |
| (b) | There were no changes in the Registrant’s internal control over financial reporting (as defined in Rule 30a-3(d) under the Act (17 CFR 270.30a-3(d)) that occurred during the Registrant’s second fiscal quarter of the period covered by this report that materially affected, or were reasonably likely to materially affect, the Registrant’s internal control over financial reporting. |
Item 12. Disclosure of Securities Lending Activities for Closed-End Management Investment Companies.
Not applicable.
Item 13. Exhibits
| (a) | (1) Code of Ethics as required by Item 2. Filed as an attachment to this filing. |
| (2) | Certifications of the principal executive officer and principal financial officer of the registrant as required by Rule 30a-2(a) of the 1940 Act and Section 302 of the Sarbanes-Oxley Act of 2002. Filed herewith. |
| (3) | Any written solicitation to purchase securities under Rule 23c-1 under the Act sent or given during the period covered by the report by or on behalf of the Registrant to 10 or more persons. Not applicable to open-end investment companies. |
| (b) | Certification of the principal executive officer and principal financial officer of the Registrant as required by Rule 30a-2(b) of 1940 Act and Section 906 of the Sarbanes-Oxley Act of 2002. Filed herewith. |
SIGNATURES
Pursuant to the requirements of the Securities Exchange Act of 1934 and the Investment Company Act of 1940, the Registrant has duly caused this report to be signed on its behalf by the undersigned, thereunto duly authorized.
Carillon Series Trust
| /s/ Susan L. Walzer | |
| Susan L. Walzer | |
| Principal Executive Officer | |
| January 3, 2018 |
Pursuant to the requirements of the Securities Exchange Act of 1934 and the Investment Company Act of 1940, this report has been signed below by the following persons on behalf of the Registrant and in the capacities and on the dates indicated.
| /s/ Susan L. Walzer | |
| Susan L. Walzer | |
| Principal Executive Officer | |
| January 3, 2018 |
| /s/ Carolyn Gill | |
| Carolyn Gill | |
| Principal Financial Officer | |
| January 3, 2018 |