UNITED STATES
SECURITIES AND EXCHANGE COMMISSION
Washington, D.C. 20549
FORM N-CSR
CERTIFIED SHAREHOLDER REPORT OF REGISTERED
MANAGEMENT INVESTMENT COMPANIES
Investment Company Act file Number: 811-07470
CARILLON SERIES TRUST
(Exact name of Registrant as Specified in Charter)
880 Carillon Parkway
St. Petersburg, FL 33716
(Address of Principal Executive Office) (Zip Code)
Registrant’s Telephone Number, including Area Code: (727) 567-1000
SUSAN L. WALZER, PRINCIPAL EXECUTIVE OFFICER
880 Carillon Parkway
St. Petersburg, FL 33716
(Name and Address of Agent for Service)
Copy to:
KATHY KRESCH INGBER, ESQ.
K&L Gates, LLP
1601 K Street, NW
Washington, D.C. 20006
Date of fiscal year end: October 31
Date of reporting period: October 31, 2018
Item 1. Reports to Shareholders

Annual Report | ||
and Investment Performance Review for the fiscal year ended October 31, 2018 | ||
Equity Funds | ||
Carillon ClariVest Capital Appreciation Fund | ||
Carillon ClariVest International Stock Fund | ||
Carillon Cougar Tactical Allocation Fund | ||
Carillon Eagle Growth & Income Fund | ||
Carillon Eagle Mid Cap Growth Fund | ||
Carillon Eagle Small Cap Growth Fund | ||
Carillon Scout International Fund | ||
Carillon Scout Mid Cap Fund | ||
Carillon Scout Small Cap Fund | ||
Fixed Income Funds | ||
Carillon Reams Core Bond Fund | ||
Carillon Reams Core Plus Bond Fund | ||
Carillon Reams Unconstrained Bond Fund | ||


Visit carillontower.com/eDelivery to receive shareholder communications including prospectuses and fund reports with a service that helps protect the environment:
Environmentally friendly. Go green with eDelivery by reducing the number of trees used to produce paper.
Efficient. Stop waiting on regular mail. Your documents will be sent via email as soon as they are available.
Easy. Download and save files using your home computer with a few clicks of a mouse.
Dear Fellow Shareholders:
I am pleased to present the annual report and investment-performance review of the Carillon Family of Funds for the 12-month period that ended on October 31, 2018.
In the past year, the dedicated women and men at Carillon Tower Advisers, Inc. (“Carillon”) have worked to enhance investment opportunities and control costs for you and your funds. As part of our efforts to bring high quality managers to you, alpha-oriented* equity manager Scout Investments, Inc., and its fixed income specialist division, Reams Asset Management, joined our existing affiliate line up of Eagle Asset Management, Inc., ClariVest Asset Management LLC, and Cougar Global Investments Ltd., resulting in fund options covering an expanded range of asset classes and investment strategies. We are delighted to have this new firm in our family.
Fiscal year 2018 presented different market conditions throughout the reporting period, suggesting increased volatility and long-term opportunities to come. The S&P 500 Index, buoyed in part by the Tax Cuts and Jobs Act of 2017 and strong corporate earnings, presented early gains; yet the period also saw heightened volatility and sharp market declines. A decade’s worth of accommodative monetary policy by the U.S. Federal Reserve (“the Fed”) continues to be withdrawn, and the Fed has indicated rates will continue to rise: our investment teams strive to identify which companies stand to benefit amidst these changes.
With an outlook growing potentially more complex, we continue to believe that our investment teams’ abilities to distinguish among competitive businesses, quality companies and earnings potential can help investors seek their long-term financial goals. Our multi-boutique affiliate model offers an array of actively managed solutions for clients navigating uncertain times.
As with all investments, investing in any mutual fund carries certain risks. The principal risk factors for each fund are described at the end of this annual report. Carefully consider the investment objectives, charges and expenses of any fund before you invest. Contact us at 800.421.4184 or carillontower.com or call your financial advisor for a prospectus, or summary prospectus, which contains this and other important information about the Carillon Family of Funds. Read the prospectus, or summary prospectus, carefully before you invest or send money.
We are grateful for your continued support of the Carillon Family of Funds.
Sincerely,

J. Cooper Abbott, CAIA, CFA
President
December 19, 2018
Performance data represented are historical and do not guarantee future results. Investment return and principal value of an investment will fluctuate, and you may have a gain or loss when you sell shares. Current performance may be higher or lower than the performance data quoted. To obtain more current performance data as of the most recent month-end, please call us at 800.421.4184 or visit our website at carillontower.com.
* Alpha measures performance vs. a benchmark on a risk-adjusted basis. A positive alpha of 1.0 means the portfolio has outperformed its benchmark on a risk adjusted basis. Correspondingly, a similar negative alpha would indicate an underperformance of 1%.
The Global Industry Classification Standard (GICS®) was developed by and/or is the exclusive property of Morgan Stanley Capital International, Inc. (“MSCI”) and Standard & Poor’s Financial Services LLC (“S&P”). GICS is a service mark of MSCI and S&P and has been licensed for use by U.S. Bancorp Fund Services, LLC.
| 1 |
Performance Summary and Commentary
| Carillon ClariVest Capital Appreciation Fund |
Portfolio Managers | David J. Pavan, CFA®, C. Frank Feng, Ph.D., Ed Wagner, CFA®, and Stacey R. Nutt, Ph.D., of ClariVest Asset Management LLC (“ClariVest”), are Co-Portfolio Managers of the ClariVest Capital Appreciation Fund (the “Fund”) and have been responsible for the day-to-day management of the Fund’s investment portfolio since June 2013.
Performance discussion | For the fiscal year ended October 31, 2018, the Fund’s Class I shares returned 6.15%, underperforming its benchmark index, the Russell 1000® Growth Index, which returned 10.71%. The Fund’s performance, relative to the benchmark, was negative, primarily due to stock selection, where selection within the Health Care and Materials sectors was strongest, and was weak within the Consumer Discretionary and Information Technology sectors. Sector selection was also negative, where underweights to the Industrials and Real Estate sectors contributed to performance, while the Fund lost ground from an underweight to the Consumer Staples sector and an overweight to the Energy sector. As you review this summary and the table below, please keep in mind that an index is not available for direct investment; therefore, its performance does not reflect the expenses associated with the management of an actual portfolio.
Growth of a $100,000 investment from 10/31/08 to 10/31/18 (a)
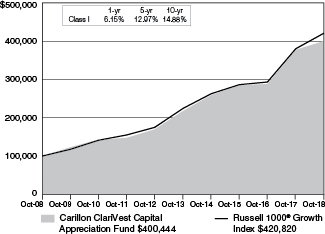
(a) The Fund’s values and returns reflect fund expenses and the reinvestment of dividends; however, they do not reflect the deduction of taxes that you would pay on fund distributions or redemption of fund shares. As of October 31, 2018, the Fund also offered Class A, Class C, Class R-3, Class R-5, Class R-6, and Class Y shares. The value of an investment in other share classes will differ due to each class’s respective sales charges (as applicable) and expenses. Additional information regarding the performance and the expenses of the Fund’s share classes, including fee waivers and/or expense reimbursements or recoupments, which affect performance, is included in the Fund’s Prospectus dated March 1, 2018, and elsewhere in this report. Returns shown are
calculated using the net asset values (“NAV’s”) that were used for shareholder transactions as of the respective period ends. These NAV’s, and the returns calculated from them, may differ from the NAV’s and returns shown elsewhere in this report.
Performance data represented is historical and does not guarantee future results. The investment return and principal value of an investment will fluctuate, and you may have a gain or loss when you sell shares. Current performance may be higher or lower than the performance data quoted. To obtain more current performance data as of the most recent month-end, please visit our website at carillontower.com.
Underperformers | Facebook, the social media company, was hurt by concerns widely publicized regarding the security of user data. The company missed estimates on revenue for the first time in three years, and it expects the revenue slowdown to continue. The position was trimmed. Owens Corning is in the business of residential and commercial building materials such as composites, insulation, and roofing. A weak outlook for roofing and composites appeared to weigh on the company due to inflationary cost pressures for oil, asphalt, and transportation. The stock was sold from the portfolio. Micron Technology Inc. engages in the provision of innovative memory and storage solutions. The stock struggled as the markets for both DRAM and NAND continued to slide. Meanwhile, supply growth accelerated, leading to oversupply in both markets. The Fund continues to hold this security. Applied Materials, the worldwide semiconductor equipment manufacturer and services company, fell on a weak forward guidance driven by weaker adoption of its organic light-emitting diode (OLED) display in smartphones. Trade disputes also have appeared to negatively impact sentiment for the semiconductor industry. The stock was sold from the portfolio. Lam Research, a semiconductor manufacturing equipment maker, fell after a lower forecast for shipments overshadowed strong results. The stock was sold from the portfolio.
Top performers | Apple, the tech giant, released better-than-expected second and third quarter earnings. iPhone revenue grew, with iPhone X as the best-selling iPhone model for every week of the fiscal second quarter. The Fund continues to hold this security. Microsoft develops and markets software and hardware services. The company’s focus on cloud computing and its Azure cloud platform contributed to strong growth and margins. The stock rose following its announcement to acquire GitHub, a leading software development platform. Microsoft also announced a quarterly dividend increase of about 9.5%. The Fund continues to hold this security. Amazon, the world’s largest online retailer, appeared to benefit from strong retail sales in North America; accelerating revenue across its advertising, cloud computing, and third-party marketplace services; improving fulfillment efficiency; and stronger margin guidance. The Fund continues to hold this security. UnitedHealth Group, the largest U.S. health insurer, appeared to benefit from the growth of enrollment in its Medicare Advantage plans. The company also appeared to reduce its risk by withdrawing from the Affordable Care Act (ACA) individual marketplace, while maintaining strong momentum and performance. The Fund continues to hold this security. Boeing Corp., the world’s largest aerospace company, rose on a stronger outlook for commercial aircraft production and margins, in addition to a federal budget deal that increased defense spending. The Fund continues to hold this security.
| 2 |
Performance Summary and Commentary
| Carillon ClariVest International Stock Fund |
Portfolio Managers | David Vaughn, CFA®, Stacey R. Nutt, Ph.D., Alex Turner, CFA®, and Priyanshu Mutreja, CFA®, are Co-Portfolio Managers of the ClariVest International Stock Fund (the “Fund”). Mr. Vaughn and Dr. Nutt have been responsible for the day-to-day management of the Fund’s investment portfolio since 2013. Mr. Turner has been a Co-Portfolio Manager of the Fund since March 2015 and previously served as Assistant Portfolio Manager of the Fund since its inception in 2013. Mr. Mutreja has been a Co-Portfolio Manager since March 2017 and previously served as Assistant Portfolio Manager of the Fund since March 2015.
Performance discussion | For the fiscal year ended October 31, 2018, the Fund’s Class I shares returned (8.29)%,underperforming its benchmark index, the MSCI-EAFE Index, which returned (6.85)%. The Fund’s performance, relative to the benchmark, was negative primarily due to stock selection within countries, where selection was strong within Switzerland and Japan, and weak within France and Germany. An overweight to Switzerland and an underweight to Hong Kong contributed to performance, while underweights to Australia and Finland hurt. Stock selection within sectors was strong within the financials and industrials sectors and weak within the information technology and materials sectors. An overweight to the energy sector and an underweight to the consumer discretionary sector helped performance, while underweights to the health care and consumer staples sectors tempered returns. As you review this summary and the table below, please keep in mind that an index is not available for direct investment; therefore, its performance does not reflect the expenses associated with the management of an actual portfolio.
Growth of a $100,000 investment from 2/28/13 to 10/31/18 (a)
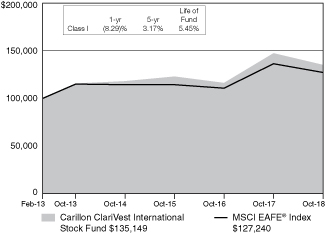
(a) The Fund’s values and returns reflect fund expenses and the reinvestment of dividends; however, they do not reflect the deduction of taxes that you would pay on fund distributions or redemption of fund shares. As of October 31, 2018, the Fund also offered
Class A, Class C, Class R-3, Class R-5, Class R-6, and Class Y shares. The value of an investment in other share classes will differ due to each class’s respective sales charges (as applicable) and expenses. Additional information regarding the performance and the expenses of the Fund’s share classes, including fee waivers and/or expense reimbursements or recoupments, which affect performance, is included in the Fund’s Prospectus dated March 1, 2018, and elsewhere in this report. Returns shown are calculated using the net asset values (“NAV’s”) that were used for shareholder transactions as of the respective period ends. These NAV’s, and the returns calculated from them, may differ from the NAV’s and returns shown elsewhere in this report.
Performance data represented is historical and does not guarantee future results. The investment return and principal value of an investment will fluctuate, and you may have a gain or loss when you sell shares. Current performance may be higher or lower than the performance data quoted. To obtain more current performance data as of the most recent month-end, please visit our website at carillontower.com.
Underperformers | Covestro, based in Germany, manufactures polymers and high-performance plastics. The share price fell in concert with other European stocks apparently on tariff concerns, despite announcing fourth quarter earnings that beat expectations. Hitachi Ltd, based in Japan, manufactures electrical equipment. Despite reporting record profits early in the year, the share price fell alongside industry peers apparently due to renewed trade war concerns. NXP Semiconductors NV is a semiconductor company based in Netherlands. The company revised its guidance lower, fueling concerns of a peaking industry. Investors were also disappointed by the ultimate collapse of its proposed acquisition by Qualcomm, as trade relations between the US and China continued to sour. The position was trimmed. Enel SpA, based in Italy, is a holding company which engages in the distribution of electricity and gas. The company struggled apparently due to macroeconomic factors including falling margins in domestic retail activities and the adverse evolution of Latin American exchange rates. BASF SE is a German-based chemical company. The company reported profit that missed analysts’ expectations as it appeared to experience the effects of an automotive slowdown and higher raw-material prices.
Top performers | Xinyi Glass is one of China’s largest glass producers. Strong demand for float glass appeared to help drive price increases which in turn led to higher margins. Marubeni Corporation, a Japanese trading company, posted strong results apparently helped by the rally in commodity prices, the announcement of a higher-than-expected dividend and improved sentiment with regards to global trade. The Fund continues to hold this security. Cosmo Energy, a Japanese holding company involved in the oil business, released strong quarterly results apparently driven by rising Japanese refining margins and an improving balance sheet. Sony Corporation is a Japanese consumer electronics and media company. Apparently contributing to better-than-expected earnings were robust sales of the PlayStation console due to the popularity of new game launches, and strength in the company’s image sensing division. The Fund continues to hold this security. Lonza Group AG is a Switzerland-based chemicals producer. It appeared that strong end-market demand coupled with fast progress in integrating a recent acquisition led to better-than-expected results and improved confidence in its earnings outlook. The Fund continues to hold this security.
| 3 |
Performance Summary and Commentary
| Carillon Cougar Tactical Allocation Fund |
Portfolio Managers | Abdullah Sheikh, FSA, MAAA, of Cougar Global Investments Ltd. (“Cougar”), is the Portfolio Manager of the Cougar Tactical Allocation Fund (the “Fund”) and has been responsible for the day-to-day management of the Fund’s investment portfolio since April 2018. From the Fund’s inception, through September 30, 2018, James Breech, Ph.D. also served as a Portfolio Manager of the Fund.
Performance discussion | During the fiscal period, Cougar’s 12-month forward looking outlook and Macro Economic Scenario analysis (MES) for the U.S. economy remained positive, boosted by the stimulative effects of the Trump administration’s tax cuts, as well as the continued positive performance of the U.S. consumer. The probability assigned to the most optimistic scenario, Growth, rose from 29% to peak at 71% in April, before falling back to 35%. Overall, the outlook remained positive given the continued strength of the labor market and modest inflation. Recession risks remained at 0%. The probability assigned to Inflation hovered at 1 to 3% as transitory effects faded and higher energy prices fed through, but remains at modest levels. Wage inflation has accelerated somewhat in line with expectations. The chance that a high impact, low probability event, Chaos, would occur was stable. It decreased in May to 7% from 8% around a de-escalation of geopolitical risks, in particular North and South Korea holding a historic summit committing to a nuclear-free peninsula and ending the Korean War. The ex-U.S. growth trends showed signs of slowing, albeit from solid levels. Risks stemmed primarily from rising interest rates in the U.S., as well as effects of trade wars initiated by the Trump administration. The firm’s Portfolio Management team (“PM team”) further increased overall equity exposure with an emphasis on diversified exposure in large, mid and small-caps in the U.S. market, which benefitted the Fund’s performance. International holdings were sold given the combination of a rising USD, fallout from tariffs and trade, and geopolitical risks. The improvement in U.S. growth, robust corporate earnings, and modest pace in removal of monetary policy appeared to fuel a continuation of the equity market rally. After new highs in September, October saw what appeared to be a correction take hold as the U.S. succumbed to fears of slowing growth and earnings ahead. Fixed income suffered modest losses as the Fed continued on its tightening path and rates normalized. With the rest of the world’s major central banks largely still in easing mode, the USD strengthened.
For the fiscal year ended October 31, 2018, the Fund’s Class I shares returned 0.74%, outperforming the Bloomberg Barclays U.S. Aggregate Bond Index and the MSCI ACWI® Index, which performed (2.05)% and (0.52)%, respectively. The Fund also outperformed a custom blended index, which is a combination of the Bloomberg Barclays U.S. Aggregate Bond Index (60%) and the MSCI ACWI® Index (40%), which returned (1.29)% for the same period. The Fund, relative to the blended benchmark, outperformed due to a higher weight to equities than the benchmark for most of the year. At the start of the fiscal year, the Fund’s investments in exchange-traded funds (ETFs) that invest in primarily equity securities represented 67% of its portfolio. This equity allocation was gradually increased to 85%, where it peaked at the end of Q2, before falling back to 80% where it ended the fiscal year. Within equities, international equities peaked at 17% in April and were sold in June, avoiding most of the losses that occurred particularly in Emerging Markets. Within fixed income, the duration of the holdings of the Fund’s investments in ETFs that invested in fixed income was in line with the index exposure. Gold was not held in the fiscal period. The PM team believes that the next 12-month period could be a good year for U.S. large, mid and small cap stocks if economic growth holds up or accelerates. However, the PM team believes that a cautious stance on Emerging Markets is still warranted as the U.S.-China trade war is likely to continue.
Growth of a $100,000 investment from 12/31/15 to 10/31/18 (a)
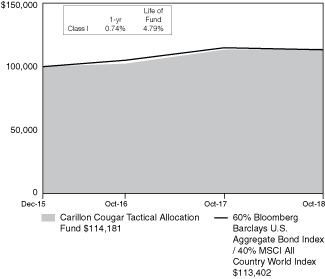
(a) The Fund’s values and returns reflect fund expenses and the reinvestment of dividends; however, they do not reflect the deduction of taxes that you would pay on fund distributions or redemption of fund shares. As of October 31, 2018, the Fund also offered Class A, Class C, Class R-3, Class R-5, Class R-6, and Class Y shares. The value of an investment in other share classes will differ due to each class’s respective sales charges (as applicable) and expenses. Additional information regarding the performance and the expenses of the Fund’s share classes, including fee waivers and/or expense reimbursements or recoupments, which affect performance, is included in the Fund’s Prospectus dated March 1, 2018, and elsewhere in this report. Returns shown are calculated using the net asset values (“NAV’s”) that were used for shareholder transactions as of the respective period ends. These NAV’s, and the returns calculated from them, may differ from the NAV’s and returns shown elsewhere in this report.
Performance data represented is historical and does not guarantee future results. The investment return and principal value of an investment will fluctuate, and you may have a gain or loss when you sell shares. Current performance may be higher or lower than the performance data quoted. To obtain more current performance data as of the most recent month-end, please visit our website at carillontower.com.
Top performers | The largest contributors to performance were the ETFs that held large cap U.S. equities. The two S&P 500 ETFs, SPY and IVV represented an average 50% weight over the year and as such the largest asset class exposure.
Underperformers | U.S. small and mid-cap ETFs (IJR, MDY, IJH) at an average 10% and 12% holding respectively were mild detractors due to underperformance later in the fiscal year. The Fund moved to increasing mid- and small-cap equity ETFs as it favored more domestically oriented companies. The largest detractors were Emerging Markets ETFs (IEMG) which entered a bear market apparently due to trade risks and a strong USD, followed by fixed income ETFs (AGG) which was impacted by higher yields. Japan (IJH) and Europe (EWJ) ETFs were very mild detractors.
| 4 |
Performance Summary and Commentary
| Carillon Eagle Growth & Income Fund |
Portfolio Managers | Edmund Cowart, CFA®, David Blount, CFA®, CPA, and Harald Hvideberg, CFA®, are Co-Portfolio Managers of the Eagle Growth & Income Fund (the “Fund”). Messrs. Cowart and Blount have been responsible for the day-to-day management of the Fund’s investment portfolio since June 2011 and Mr. Hvideberg since August 2014.
Performance discussion | For the fiscal year ended October 31, 2018, the Fund’s Class A shares returned 9.76% (excluding front-end sales charges of 4.75%), outperforming its benchmark index, the S&P 500® Index, which returned 7.35%. The Fund’s Portfolio Management team (“PM team”) was satisfied with performance compared to the benchmark given the market environment. Positive stock selection in the health care, information technology and industrials sectors contributed positively to the Fund’s outperformance relative to the benchmark. Meanwhile, investments in the materials and consumer discretionary sectors, as well as a small cash position, all were detractors from performance. As you review this summary and the table below, please keep in mind that an index is not available for direct investment; therefore its performance does not reflect the expenses associated with the management of an actual portfolio.
Growth of a $10,000 investment from 10/31/08 to 10/31/18 (a)
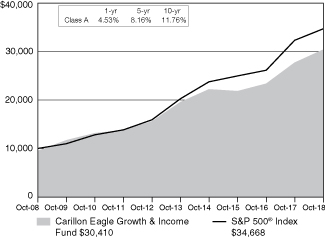
(a) The Fund’s values and returns reflect the maximum front-end sales charge of 4.75%, fund expenses and the reinvestment of dividends; however, they do not reflect the deduction of taxes that you would pay on fund distributions or redemption of fund shares. As of October 31, 2018, the Fund also offered Class C, Class I, Class R-3, Class R-5, Class R-6, and Class Y shares. The value of an investment in other share classes will differ due to each class’s respective sales charges and expenses. Additional information regarding the performance and the expenses of the Fund’s share classes, including fee waivers and/or expense reimbursements or recoupments, which affect performance, is included in the Fund’s Prospectus dated March 1, 2018, and elsewhere in this report. Returns shown are calculated using the net asset values (“NAV’s”) that were used for shareholder transactions as of the respective period ends. These NAV’s, and the returns calculated from them, may differ from the NAV’s and returns shown elsewhere in this report.
Performance data represented is historical and does not guarantee future results. The investment return and principal value of an
investment will fluctuate, and you may have a gain or loss when you sell shares. Current performance may be higher or lower than the performance data quoted. To obtain more current performance data as of the most recent month-end, please visit our website at carillontower.com.
Top performers | Microsoft Corp., developer and marketer of software and hardware services, appreciated as the company continued to gain market share in its cloud business. Azure, Microsoft’s cloud based business, continued to see higher utilization levels with additional margin expansion. The PM team believes this growth will continue and remains invested in the company. Apple Inc., designer, manufacturer, and marketer of mobile communication and media devices, personal computing products, and portable digital music players, traded higher as the company launched its next generation of iPhones. The PM team believes that built-up demand will lead to a successful launch and increase unit sales growth. The Fund continues to hold this position. Regal Entertainment Group (Class A), an operator of multi-screen theaters, traded higher after the announcement that it was being acquired by a competitor, Cineworld. The acquisition appeared to be a commanding premium so the Fund sold the position prior to the deal closing in early 2018. Cisco Systems, a manufacturer of networking products and services, returned to revenue growth after facing headwinds during its transition to a recurring-revenue model. The company also announced it would bring back all foreign cash and return it to shareholders, thus increasing its dividend and announcing a share buyback. The PM team likes the growth outlook for the company and continues to own the stock. Management at Pfizer, a pharmaceutical products manufacturer, provided bullish commentary around the company’s long term growth prospects, and expressed comfort with the Trump Administration’s efforts to reshape the country’s drug pricing and reimbursement landscape. The PM team believes the stock also benefited from a sector rotation into health care, with favorable Fund flows into the pharmaceutical industry in particular. The Fund continues to hold the position.
Underperformers | DowDuPont, a global chemicals company, traded lower due to what the PM team believed were continued questions surrounding upcoming corporate actions. The company is expected to split into three units next year. The PM team views the split as positive and believes the market has yet to price the change into the stock. The Fund continues to hold the stock. Management at Carnival Corp., a cruise ship operator, issued forward looking guidance that disappointed many investors. Last year’s hurricane season appears to have softened demand, especially in the affected Eastern Caribbean. The PM team believes the weakness is temporary and continues to own the stock. Management at 3M, a global manufacturer, reduced its growth guidance as well as earnings expectations. The company appears to have signaled a deceleration in organic growth tied to auto aftermarket, oral care and slowing in electronics markets. The company had been growing faster than peers but the deceleration puts it in a weaker position relative to peers. The PM team believes this trend is likely to reverse and the Fund continues to hold the stock. PNC Financial Services Group, Inc, a large financial institution, underperformed apparently as a result of bearish sentiment surrounding financials given the recent trade war fears. Moreover, the bank noted it has become slightly more conservative in its underwriting, which will in turn modestly impact loan growth. The PM team believes the conservative guidance is appropriate in the current economic environment and the Fund continues to own the stock. AT&T, a telecommunications and digital entertainment services provider, reported weakness in its traditional video segment. Cord-cutting accelerated as customers continue to drop or switch to lower margin products. The stock also traded lower following the turbulence surrounding the proposed acquisition of Time Warner. The PM team believes the valuation remains attractive and the Fund continues to own the stock.
| 5 |
Performance Summary and Commentary
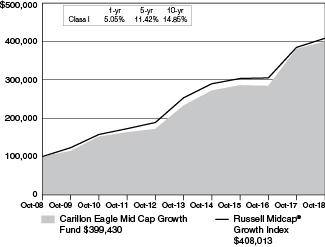
| Carillon Eagle Mid Cap Growth Fund |
Portfolio Managers | Bert L. Boksen, CFA®, and Eric Mintz, CFA®, are Co-Portfolio Managers of the Eagle Mid Cap Growth Fund (the “Fund”). Mr. Boksen has been responsible for the day-to-day management of the Fund’s investment portfolio since its inception in 1998. Mr. Mintz has been a Co-Portfolio Manager of the Fund since March 2011, and had previously served as Assistant Portfolio Manager since 2008. Christopher Sassouni, D.M.D., has served as Assistant Portfolio Manager of the Fund since January 2006.
Performance discussion | For the fiscal year ended October 31, 2018, the Fund’s Class I shares returned 5.05%, underperforming its benchmark index, the Russell Midcap® Growth Index, which returned 6.14%. The Fund’s underperformance relative to the benchmark was driven by weak relative returns within the consumer staples and discretionary sectors which lagged their benchmark counterparts during the reporting period. The Fund did generate solid absolute as well as relative returns within the health care and information technology sectors, offsetting a substantial portion of the Fund’s broader underperformance during the reporting period. As you review this summary and the table below, please keep in mind that an index is not available for direct investment; therefore, its performance does not reflect the expenses associated with the management of an actual portfolio.
Growth of a $100,000 investment from 10/31/08 to 10/31/18 (a)
(a) The Fund’s values and returns reflect fund expenses and the reinvestment of dividends; however, they do not reflect the deduction of taxes that you would pay on fund distributions or redemption of fund shares. As of October 31, 2018, the Fund also offered Class A, Class C, Class R-3, Class R-5, Class R-6, and Class Y shares. The value of an investment in other share classes will differ due to each class’s respective sales charges (as applicable) and expenses. Additional information regarding the performance and the expenses of the Fund’s share classes, including fee waivers and/or expense reimbursements or recoupments, which affect performance, is included in the Fund’s Prospectus dated March 1, 2018, and elsewhere in this report. Returns shown are calculated using the net asset values (“NAV’s”) that were used for shareholder
transactions as of the respective period ends. These NAV’s, and the returns calculated from them, may differ from the NAV’s and returns shown elsewhere in this report.
Performance data represented is historical and does not guarantee future results. The investment return and principal value of an investment will fluctuate, and you may have a gain or loss when you sell shares. Current performance may be higher or lower than the performance data quoted. To obtain more current performance data as of the most recent month-end, please visit our website at carillontower.com.
Underperformers | Coherent makes laser systems primarily used for industrial applications. Following success in 2017 driven by a new laser integral to producing organic light-emitting diode (OLED) display, shares fell after an underwhelming initial launch, relative to expectations, of Apple’s iPhone X early in the period. Despite the near-term setback, the Portfolio Management team (“PM team”) believes the OLED market will rebound in 2020 and Coherent is oversold at current levels. Veoneer develops and produces automotive safety components. While the firm’s investments in process enhancements are expected to improve longer-term capabilities, the PM team believes that the combination of the near-term costs with softening auto production volumes has weighed on margins and subsequently the stock during the reporting period. Microchip Technology is a microcontroller semiconductor company. The firm encountered what appeared to be acquisition-related growing pains during the period, which have proven challenging in the context of a potential slowdown in the semiconductor industry. The PM team believes the firm possesses a solid track record of effectively integrating and leveraging strategic acquisitions and is keeping a close eye on signs of deterioration within the semiconductor end markets. Fortune Brands Home & Security is a home and security consumer products company. Shares waned as signs of growth moderation in the housing end market, coupled with some weather-related headwinds, appeared to weigh on results within the firm’s building products segment during the period. The PM team maintains a cautiously optimistic view of management’s ability to navigate the firm’s near-term difficulties, through repositioning of some of its existing business segments while continuing to pursue strategic acquisitions to enhance growth prospects going forward. Ameriprise Financial saw what appeared to be the combination of significant market volatility, coupled with outflows from its asset management arm Columbia Threadneedle subsequently lead shares lower during the period. Near-term difficulties aside, the PM team expects Ameriprise’s wealth-management segment to perform well and believes the firm also appears poised to benefit from a rising-interest-rate environment. The Fund continues to hold each of the securities noted above as “under performers.”
Top Performers | Clothing retailer Burlington Stores saw shares climb over the course of the period, benefitting from solid positioning within the strong off-price retail channel. Advanced Micro Devices saw increased adoption in datacenter markets through the application of its graphics-processing units used in artificial intelligence, machine learning and other heavy-duty computing. Square, a mobile-payment service, is experiencing rapid growth due to its easy-to-use hardware and strong capabilities in software. ABIOMED, which sells cardiac medical devices, generated strong results during the period, while possessing a strong pipeline of new technologies in addition to implementing enhancements to its existing platforms. Shares of Illumina, which manufactures genetic sequencing equipment and systems, posted strong results during the period in addition to raising guidance. Demand for its high-end sequencers appears to have continued to remain robust. The Fund continues to hold each of the securities noted above as “top performers.”
| 6 |
Performance Summary and Commentary
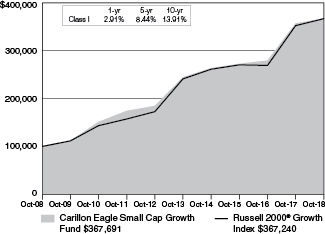
| Carillon Eagle Small Cap Growth Fund |
Portfolio Managers | Bert L. Boksen, CFA®, and Eric Mintz, CFA®, are Co-Portfolio Managers of the Eagle Small Cap Growth Fund (the “Fund”). Mr. Boksen has been responsible for the day-to-day management of the Fund’s investment portfolio since August 1995 and Mr. Mintz since March 2011. Christopher Sassouni, D.M.D., has served as Assistant Portfolio Manager of the Fund since March 2015.
Performance discussion | For the fiscal year ended October 31, 2018, the Fund’s Class I shares returned 2.91%, underperforming its benchmark index, the Russell 2000® Growth Index, which returned 4.13%. The Fund’s underperformance relative to the benchmark was driven by weak relative returns within the information technology and, to a lesser extent, financials sectors which trailed their benchmark counterparts during the reporting period. A bright spot for the Fund was the health care sector which generated very strong absolute and relative returns, offsetting a substantial portion of the Fund’s broader underperformance during the reporting period. As you review this summary and the table below, please keep in mind that an index is not available for direct investment; therefore its performance does not reflect the expenses associated with the management of an actual portfolio.
Growth of a $100,000 investment from 10/31/08 to 10/31/18 (a)
(a) The Fund’s values and returns reflect fund expenses and the reinvestment of dividends; however, they do not reflect the deduction of taxes that you would pay on fund distributions or redemption of fund shares. As of October 31, 2018, the Fund also offered Class A, Class C, Class R-3, Class R-5, Class R-6, and Class Y shares. The value of an investment in other share classes will differ due to each class’s respective sales charges (as applicable) and expenses. Additional information regarding the performance and the expenses of the Fund’s share classes, including fee waivers and/or expense reimbursements or recoupments, which affect performance, is included in the Fund’s Prospectus dated March 1, 2018, and elsewhere in this report. Returns shown are calculated using the net asset values (“NAV’s”) that were used for shareholder transactions as of the respective period ends. These NAV’s, and the returns calculated from them, may differ from the NAV’s and returns shown elsewhere in this report.
Performance data represented is historical and does not guarantee future results. The investment return and principal value of an investment will fluctuate, and you may have a gain or loss when you sell shares. Current performance may be higher or lower than the
performance data quoted. To obtain more current performance data as of the most recent month-end, please visit our website at carillontower.com.
Under performers | Coherent makes laser systems primarily used for industrial applications. Following success in 2017 driven by a new laser integral to producing organic light-emitting diode (OLED) displays, shares fell after an underwhelming initial launch, relative to expectations, of Apple’s iPhone X early in the period. Despite the near-term setback, the Portfolio Management team (“PM team”) believes the OLED market will rebound in 2020 and that Coherent is oversold at current levels. Universal Electronics, a manufacturer of voice-activated remote controls, provided weak guidance during the period which reflected a significant cutback in orders from Comcast (a 20 percent customer), as well as continued delays in the start-up of multiple new programs for advanced remote controls. Long-delayed programs are now starting to ramp and the PM team believes that 2018 is shaping up as a strong revenue year with margins improving sequentially. Construction materials provider Summit Materials saw shares wane as the firm missed consensus estimates and reduced guidance towards the end of the period. The decline appeared to be attributed in part to a weaker-than-expected pricing environment within its cement segment as well as weather-related delays in projects which tempered cement volumes. The PM team remains constructive on the name at current levels given the reset in investor expectations, and they believe that going forward Summit is also poised to benefit from the easing “year-over-year comparisons. Camping World Holdings, Inc. is a leading retailer of recreational vehicles (RVs) and outdoor lifestyle products across the U.S. Investor concerns arose as moderating growth in the firm’s core RV segment, coupled with Camping World’s recent acquisition of Gander Mountain appear to have pressured the stock during the period. While disappointing in the near-term, the PM team maintains a cautiously optimistic view on the name given Camping World’s favorable alignment with consumers’ increasing preference for experiential-related purchases. Cognex sells “machine vision” systems used to optimize manufacturing processes, which the PM team believes to be a secular growth story. After a very strong run in 2017, Cognex stock performed poorly in 2018 due to what the PM team believes is the cyclicality of a large customer in the consumer electronics segment, as well as geopolitical concerns (tariffs) affecting end demand in China. The PM team continues to like the company’s technology and competitive position and believe that the consumer electronics segment may rebound in 2019. The Fund continues to hold each of the securities noted above as “underperformers.”
Top performers | Sarepta Therapeutics develops therapies used to treat rare neuromuscular diseases. Preliminary results from one of the firm’s clinical trials assessing a Duchenne Muscular Dystrophy (DMD) drug candidate exceeded expectations, which sent shares of Sarepta higher. Planet Fitness operates fitness centers across the United States. The PM team believes that firm’s strong value proposition via clean and well maintained fitness centers providing members with “judgment-free zones” at an affordable price has generated strong membership growth, which has helped drive shares of Planet Fitness higher during the period. Teladoc Health is a telemedicine provider that offers remote physician access to patients. The PM team believes that Teladoc is benefitting from an increasing awareness of its compelling value proposition, while leveraging strategic acquisitions to expand its customer base and further drive growth. Off-price retailer Ollie’s Bargain Outlet Holdings performed well as the PM team believes that its business model demonstrated resiliency to online competition, while management has continued to successfully execute the firm’s prudent growth strategy during the period. SAGE Therapeutics, which develops therapies used to treat rare central-nervous system disorders, saw shares rise during the period after announcing positive trial results for drugs aimed at treating postpartum depression and major depressive disorder. The Fund continues to hold each of the securities noted above as “top performers.”
| 7 |
Performance Summary and Commentary
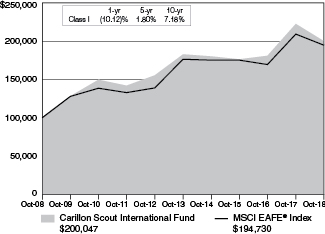
| Carillon Scout International Fund |
Portfolio Managers | Michael D. Stack, CFA®, is Lead Portfolio Manager, and Angel M. Lupercio is Co-Portfolio Manager of the Scout International Fund (the “Fund”). Messrs. Stack and Lupercio have been responsible for the day-to-day management of the Fund’s investment portfolio since its inception in 2017. Mr. Stack was Assistant Portfolio Manager of the Fund’s predecessor from February 2006 through December 2007; Co-Portfolio Manager of the Fund’s predecessor from April 2012 through March 30, 2014; Co-Lead Portfolio Manager of the Fund’s predecessor from March 31, 2014 through December 2014; and Lead Portfolio Manager of the Fund’s predecessor from 2015 to 2017. Mr. Lupercio served as Co-Portfolio Manager of the Fund’s predecessor from 2015 to 2017.
Performance discussion | For the fiscal year ended October 31, 2018, the Fund’s Class I shares returned (10.12)%, underperforming its benchmark index, the MSCI-EAFE Index, which returned (6.85)%. The Fund’s performance, relative to the benchmark, was negative primarily due to stock selection. Stock selection within the financials sector was strong, but stock selection within the industrials and information technology sectors was weak. Country stock selection was strongest in Australia and the Netherlands, while stock selection in Japan and the United Kingdom detracted from performance. An overweight in the energy and consumer staples sectors as well as an underweight in the consumer discretionary sector slightly mitigated the underperformance of those sectors. Exposure to Mexico and Peru positively contributed to performance, while exposure to China and Taiwan detracted from performance. As you review this summary and the table below, please keep in mind that an index is not available for direct investment; therefore, its performance does not reflect the expenses associated with the management of an actual portfolio.
Growth of a $100,000 investment from 10/31/08 to 10/31/18 (a)
(a) The Fund’s values and returns reflect fund expenses and the reinvestment of dividends; however, they do not reflect the deduction of taxes that you would pay on fund distributions or redemption of fund shares. As of October 31, 2018, the Fund also offered Class A, Class C, Class R-3, Class R-5, Class R-6, and Class Y shares. The value of an investment in other share classes will differ due to each class’s respective sales charges (as applicable) and expenses. Additional information regarding the performance and the expenses of the Fund’s share classes, including fee waivers and/or expense reimbursements or recoupments, which affect performance, is included in the Fund’s Prospectus dated March 1, 2018, and elsewhere in this report. Returns shown are
calculated using the net asset values (“NAV’s”) that were used for shareholder transactions as of the respective period ends. These NAV’s, and the returns calculated from them, may differ from the NAV’s and returns shown elsewhere in this report.
Performance data represented is historical and does not guarantee future results. The investment return and principal value of an investment will fluctuate, and you may have a gain or loss when you sell shares. Current performance may be higher or lower than the performance data quoted. To obtain more current performance data as of the most recent month-end, please visit our website at carillontower.com.
Underperformers | AAC Holdings, Inc., a Chinese miniaturized technologies manufacturer company which is a key supplier of acoustic and haptic components used in Apple products, underperformed due to lower projected demand for the iPhone. Over the long run, the Portfolio Management team (“PM team”) believes that AAC is likely to benefit from an increasing dollar content in smartphones as phone makers migrate to acoustic, radio frequency and haptic components with higher capability. The Fund continues to hold this security. Banco Bilbao Vizcaya Argentaria, S.A. (BBVA), is the largest financial institution in Spain and Mexico with substantial business across the Americas and Turkey. BBVA slumped as the European economic outlook became less certain and the value of the Turkish lira and Argentine peso fell. The PM team believes that market concerns surrounding the Turkish financial system appear to be overblown and BBVA’s diversification across regions will offset risks in individual emerging markets. The Fund continues to hold this security. Adecco Group AG, a generalist human resource and employment services company, underperformed as new staffing technology appeared to create headwinds and the company faced negative outlooks in the European staffing markets. The Fund continues to hold this stock as the company is trading on a FCF yield of 10% and at a discount to the median of global service providers. The PM team believes that BNP Paribas S.A., a global financial service company based in France, underperformed under an uncertain European economic outlook and concerns surrounding the company’s exposure to political and financial stresses in Italy and Turkey. The PM team maintains that the global diversification and growth prospects of BNP’s services remain positive. The Fund continues to hold the stock. Continental AG, a German automobile parts and service provider, underperformed after the company lowered full-year guidance for the second time this year. The PM team believes that several company-specific issues continued to plague the parts supplier and that announced changes following a structural review were less than anticipated. The Fund still holds this stock.
Top performers | CSL Limited is an Australian biotechnology company specializing in pharmaceuticals and diagnostic products derived from human plasma. The PM team believes that CSL benefited from strong sales of the company’s flu vaccines during the past year’s flu season. The company’s core immunoglobulin and hemophilia franchises appear to be showing stable growth due to new drug launches along with greater usage of chronic therapies and earlier diagnosis. The Fund continues to hold this position. Gemalto N.V. is a Dutch software and services company. News of an expected tender offer from Thales S.A. drove Gemalto’s stock price upward. The PM team capitalized and sold the holding. The PM team believes that Astellas Pharma Inc., one of the largest Japanese prescription drug companies, has benefited from the company’s main drug Xtandi’s approval as treatment for non-metastatic prostate cancer. The Fund continues to hold this position. BHP Billiton Limited, a metals and mining industry company, outperformed as it continued to divest oil holdings and iron ore prices surged in October. The Fund continues to hold this security. Credicorp, Ltd., a financials service holding company operating in Peru, outperformed as political uncertainty declined after Peru’s President Pedro Pablo Kuczynski resigned. The PM team believes that positive Peruvian economic outlook will continue to drive the stock. The Fund still holds this stock.
| 8 |
Performance Summary and Commentary
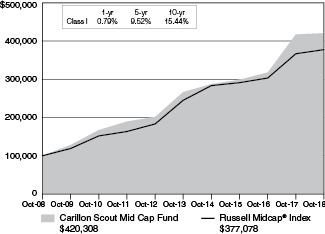
| Carillon Scout Mid Cap Fund |
Portfolio Managers | G. Patrick Dunkerley, CFA® is the Lead Portfolio Manager, and Derek M. Smashey, CFA®, John A. Indellicate II, CFA® and Jason J. Vortruba, CFA®, are Co-Portfolio Managers of the Scout Mid Cap Fund (the “Fund”). Messrs. Dunkerley, Smashey, Indelliate and Vortruba have been responsible for the day-to-day management of the Fund’s investment portfolio since its inception in 2017. Mr. Dunkerley served as Lead Portfolio Manager of the Fund’s predecessor and Mr. Smashey served as Co-Portfolio Manager of the Fund’s predecessor from its inception in 2006 to 2017. Messrs. Indellicate and Votruba served as Co-Portfolio Managers of the Fund’s predecessor from 2011 and 2013, respectively, to 2017.
Performance discussion | For the fiscal year ended October 31, 2018, the Fund’s Class I shares returned 0.79%, underperforming its benchmark index, the Russell Midcap® Index, which returned 2.79%. The Fund’s performance, relative to the benchmark, underperformed due to both sector allocation and stock selection. Positive stock selection in the health care sector, specifically the health care equipment and supplies industry, partially offset negative selection in the information technology, financials, consumer discretionary, and energy sectors. Underweight in the real estate sector benefited the Fund. The Fund’s positioning in the financials and information technology sectors were a slight drag on performance. As you review this summary and the table below, please keep in mind that an index is not available for direct investment; therefore its performance does not reflect the expenses associated with the management of an actual portfolio.
Growth of a $100,000 investment from 10/31/08 to 10/31/18 (a)
(a) The Fund’s values and returns reflect fund expenses and the reinvestment of dividends; however, they do not reflect the deduction of taxes that you would pay on fund distributions or redemption of fund shares. As of October 31, 2018, the Fund also offered Class A, Class C, Class R-3, Class R-5, Class R-6, and Class Y shares. The value of an investment in other share classes will differ due to each class’s respective sales charges (as applicable) and expenses. Additional information regarding the performance and the expenses of the Fund’s share classes, including fee waivers and/or expense reimbursements or recoupments, which affect performance, is included in the Fund’s Prospectus dated March 1, 2018, and elsewhere in this report. Returns shown are calculated using the net asset values (“NAV’s”) that were used for shareholder
transactions as of the respective period ends. These NAV’s, and the returns calculated from them, may differ from the NAV’s and returns shown elsewhere in this report.
Performance data represented is historical and does not guarantee future results. The investment return and principal value of an investment will fluctuate, and you may have a gain or loss when you sell shares. Current performance may be higher or lower than the performance data quoted. To obtain more current performance data as of the most recent month-end, please visit our website at carillontower.com.
Under performers | Nektar Therapeutics, a biopharmaceutical company focused on cancer, autoimmune diseases and chronic pain, suffered upon disappointing preliminary clinical trial data on an experimental cancer drug. The Portfolio Management team (“PM team”) has historically believed that the expected FDA approval and release of a non-addictive opioid back pain reliever remains a potential growth driver for this company. The Fund continues to hold the security but the PM team is monitoring the FDA approval process closely. The PM team believes that Newfield Exploration Company, an oil and gas exploration and development company, failed to rally with oil prices in the third quarter due to ongoing concern about their pace of oil production growth versus natural gas. The PM team believes these concerns are short-sighted. The Fund continues to hold this stock. Thor Industries, Inc. produces and sells recreational vehicles. The PM team believes that the company underperformed as fears regarding excess recreational vehicle inventory and rising interest rates mount. The Fund still holds this security but the PM team is monitoring inventory levels as well as the Federal Reserve’s interest rate policy which could hinder Thor’s business. SVB Financial Group runs Silicon Valley Bank, focused on serving niche technology and life science industry growth companies. This holding underperformed late in the fiscal year after missing third quarter net interest income estimates. The PM team believes that SVB Financial Group’s dominant position in niche markets (tech and life sciences) offers unique growth opportunities. The Fund still holds this security. Albemarle Corporation, a specialty chemical production company that includes the production of low-cost lithium, underperformed apparently under expectations that the company will lose market share and lithium will be oversupplied after a lithium production competitor resolved a four-year mining dispute allowing them to increase production. The PM team expects ALB to benefit as the transportation industry moves toward battery electric vehicles/plug-in hybrid electric vehicles (BEV/PHEVs) and grid-tied stationary energy storage. The Fund still holds this security.
Top performers | ABIOMED, Inc., a medical device company specializing in cardiovascular pumps, outperformed as it maintained a near monopoly market position in small cardiovascular pumps. The Fund continues to hold this security. Advanced Micro Devices, Inc. (AMD) designs and markets semiconductor products including central processing units (CPUs) and graphics processing units (GPUs). AMD partnered with Taiwan Semiconductor Manufacturing to produce advanced semiconductors that are expected to compete effectively with market leader Intel for the first time in many years. The Fund sold AMD after a strong run in the name pushed valuations higher. Andeavor refines and markets petroleum products. During the second quarter of 2018, Andeavor benefited from a merger offered at a significant premium from Marathon Petroleum Corp. The Fund continues to hold the Marathon Petroleum shares received from this acquisition. Molina Healthcare provides government funded healthcare insurance through Medicaid, Medicare, and state insurance marketplaces. The PM team believes that Molina benefited from a strong cost-cutting initiative instituted by its new management team. The Fund continues to hold this security. The PM team believes that American Eagle Outfitters, Inc., a mall-based clothing retailer, outperformed due, in part, to the growth in market share gained by Aerie, the company’s lingerie brand. The Fund still holds this security.
| 9 |
Performance Summary and Commentary
| Carillon Scout Small Cap Fund |
Portfolio Managers | James R. McBride, CFA®, is Lead Portfolio Manager, and Timothy L. Miller, CFA® is Co-Portfolio Manager of the Scout Small Cap Fund (the “Fund”). Messrs. McBride and Miller have been responsible for the day-to-day management of the Fund’s investment portfolio since its inception in 2017. Mr. McBride was Co-Portfolio Manager of the Fund’s predecessor from 2010 through 2015 and served as Lead Portfolio Manager of the Fund’s predecessor from 2015 to 2017. Mr. Miller served as Co-Portfolio Manager of the Fund’s predecessor from 2013 to 2017.
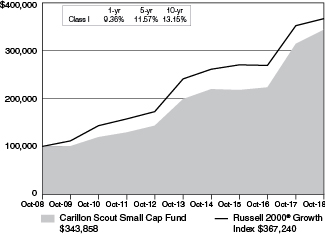
Performance discussion | For the fiscal year ended October 31, 2017, the Fund’s Class I shares returned 9.36%, outperforming its benchmark index, the Russell 2000® Growth Index, which returned 4.13%. The Fund outperformed largely due to positive stock selection, especially the health care and industrials sectors. Within the health care sector, the health care providers and services industry stock selection, which was also positioned largely overweight, was a major contributor to the sector’s relative success. Stock selection within the consumer discretionary and information technology sectors tempered returns. The underweight positioning in the materials sector worked well for the portfolio, while the underweighting in communication services and consumer staples was a drag on performance. As you review this summary and the table below, please keep in mind that an index is not available for direct investment; therefore its performance does not reflect the expenses associated with the management of an actual portfolio.
Growth of a $100,000 investment from 10/31/08 to 10/31/18 (a)
(a) The Fund’s values and returns reflect fund expenses and the reinvestment of dividends; however, they do not reflect the deduction of taxes that you would pay on fund distributions or redemption of fund shares. As of October 31, 2018, the Fund also offered Class A, Class C, Class R-3, Class R-5, Class R-6, and Class Y shares. The value of an investment in other share classes will differ due to each class’s respective sales charges (as applicable) and expenses. Additional information regarding the performance and the expenses of the Fund’s share classes, including fee waivers and/or expense reimbursements or recoupments, which affect performance, is included in the Fund’s Prospectus dated March 1, 2018, and elsewhere in this report. Returns shown are calculated using the net asset values (“NAV’s”) that were used for shareholder transactions as of the respective period ends. These NAV’s, and the returns calculated from them, may differ from the NAV’s and returns shown elsewhere in this report.
Performance data represented is historical and does not guarantee future results. The investment return and principal value of an investment will fluctuate, and you may have a gain or loss when you sell
shares. Current performance may be higher or lower than the performance data quoted. To obtain more current performance data as of the most recent month-end, please visit our website at carillontower.com.
Top performers | Insperity, Inc. provides an array of human resources and business solutions designed to help improve business performance. The Fund’s Portfolio Management team (“PM team”) believes that the holding outperformed as healthy client retention and new sales positioned the company to increase guidance. The PM team believes that good worksite employee (“WSE”) growth as well as gross profit per WSE/month also drove the stock price upward. The Fund continues to hold this security. BioTelemetry, Inc., a medical monitoring and management company, saw strong second quarter results, increased guidance, and well-executed integration synergies from the LifeWatch acquisition that lifted the stock. The Fund continues to hold this security. The Trade Desk, Inc., a global technology company, announced better-than-expected earnings and raised guidance during the third quarter. In addition, Trade Desk has started to experience success in the growth of digital TV ad budgets as well as expectations for new product rollouts. The Fund still holds the security. Molina Healthcare, Inc. provides government-funded healthcare insurance through Medicaid, Medicare, and state insurance marketplaces. The company reported a strong third quarter and increased guidance. The new management team has continued to focus on improved efficiencies and margin performance. The Fund still holds this security. HealthEquity, Inc. provides health savings accounts (HSA) and related services. The holding’s price rose steadily throughout the year, which the PM team believes was driven by growth in custodial assets and higher interest rates. The Fund still holds this security.
Underperformers | The PM team believes that Thor Industries, Inc., a leading manufacturer of motorhomes and towable recreational vehicles (RVs), weakened over concerns about slowing unit growth in the RV industry, heavier dealer inventories, and bad weather that slowed dealer foot traffic during the spring selling season. PM team believes these inventory issues will prove temporary and remains positive on Thor’s future growth prospects. The Fund still holds this security. Installed Building Products, Inc. installs residential insulation. The PM team believes that the company saw stock prices fall due to increased fuel costs, worker compensation, and medical expenses resulting in weaker margins. It also faced headwinds from slower housing starts as rising interest rates impacted housing demand. However revenue results have been positive and the company has continued to diversify its revenue stream by acquiring firms engaged in the installation of other home related items. The Fund still owns this security. Camping World Holdings, Inc. runs RV dealerships. During the first quarter, the stock lagged as the company was unable to file a timely 10-K due to financial reporting issues which have since been corrected. Additionally, the company trailed estimates furthering concerns regarding higher inventory and slowing unit growth within the recreational vehicle industry. Despite the relative underperformance, the PM team believes secular trends point to growth in the RV industry and should benefit the stock. The Fund still holds this security. WageWorks, Inc. is a leading provider and administrator of consumer directed health and commuter benefit programs including Health Savings (HSA) and Flexible Spending (FSA) accounts. The PM team believes that the stock price dropped sharply during the first quarter due to delays in reporting fourth quarter 2017 earnings and filing the company’s 10-K due to an internal financial reporting issue. Looking ahead, the PM team believes WageWorks is positioned to benefit from an increase in the amount of consumer directed plans. The Fund continues to hold this security. Cutera, Inc. develops and manufactures aesthetic laser systems. The PM team believes that the stock underperformed, missing average gross margin estimates, as company management awaited operational and infrastructure improvements to take effect. On the positive side, it appears that Cutera has seen favorable adoption trends with their TruSculpt ID product which, the PM team believes, could provide a strong tailwind for organic growth. The Fund continues to hold this security.
| 10 |
Performance Summary and Commentary
| Carillon Reams Core Bond Fund |
Portfolio Managers | Mark M. Egan, CFA®, is Lead Portfolio Manager, and Thomas M. Fink, CFA®, Todd C. Thompson, CFA®, Stephen T. Vincent, CFA®, Clark W. Holland, CFA® and Jason Hoyer, CFA® are Co-Portfolio Managers of the Reams Core Bond Fund (the “Fund”). Messrs. Egan, Fink, Thompson, Vincent and Holland have been responsible for the day-to-day management of the Fund’s investment portfolio since its inception in 2017. Mr. Hoyer has been responsible for the day-to-day management of the Fund’s investment portfolio since April 2018. Mr. Egan served as the Lead Portfolio Manager of the Fund’s predecessor and Messrs. Fink and Thompson served as Co-Portfolio Managers of the Fund’s predecessor from its inception in 2001 to 2017. Messrs. Vincent and Holland served as Co-Portfolio Managers of the Fund’s predecessor from 2009 and 2014, respectively, to 2017.
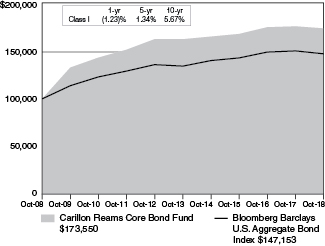
Performance discussion | For the fiscal year ended October 31, 2018, the Fund’s Class I shares returned (1.23)%, outperforming its benchmark index, the Bloomberg Barclays U.S. Aggregate Bond Index, which returned (2.05)%. The primary contributor to the Fund’s performance, relative to the benchmark, was the Fund’s lower-than-benchmark duration positioning. Security selection within the investment-grade corporate sector also contributed to relative performance due to the Fund’s overweight to shorter-maturity corporate bonds. The main detractor from relative performance was security selection within the mortgage-backed securities sector. The Fund’s lack of exposure to the Government-Related sector, which outperformed duration-matched U.S. Treasuries, also detracted from relative performance. As you review this summary and the table below, please keep in mind that an index is not available for direct investment; therefore its performance does not reflect the expenses associated with the management of an actual portfolio.
Growth of a $100,000 investment from 10/31/08 to 10/31/18 (a)
(a) The Fund’s values and returns reflect fund expenses and the reinvestment of dividends; however, they do not reflect the deduction of taxes that you would pay on fund distributions or redemption of fund shares. As of October 31, 2018, the Fund also offered Class A, Class C, Class R-3, Class R-5, Class R-6, and Class Y shares. The value of an investment in other share classes will differ due to each class’s respective sales charges (as applicable) and expenses. Additional information regarding the performance and the expenses of the Fund’s share classes, including fee waivers and/or expense
reimbursements or recoupments, which affect performance, is included in the Fund’s Prospectus dated March 1, 2018, and elsewhere in this report. Returns shown are calculated using the net asset values (“NAV’s”) that were used for shareholder transactions as of the respective period ends. These NAV’s, and the returns calculated from them, may differ from the NAV’s and returns shown elsewhere in this report.
Performance data represented is historical and does not guarantee future results. The investment return and principal value of an investment will fluctuate, and you may have a gain or loss when you sell shares. Current performance may be higher or lower than the performance data quoted. To obtain more current performance data as of the most recent month-end, please visit our website at carillontower.com.
Top performers | Early in the fiscal year, the portfolio maintained overall interest rate exposure below that of the benchmark. This appeared to benefit the Fund on a relative basis as interest rates rose. As of the date hereof the Fund’s interest rate exposure is similar to that of the benchmark. Two corporate bonds backed by aircraft leases of Delta Airlines, an air transportation provider, contributed to performance due to their higher ratings and shorter maturities as these more defensive positions outperformed the broadly underperforming corporate sector. The Fund continues to hold these positions as the Fund’s Portfolio Management team (“PM team”) continues to prefer a defensive posture in the investment grade corporate sector. Various corporate bonds issued by AT&T, Inc., a company that, through its subsidiaries provides wireline and wireless phone and data communications, internet, and other telecommunications services, outperformed other holdings during the period. The shorter maturity holdings appeared to benefit the Fund due to their defensive characteristics. The Fund continues to hold these positions. The Fund also benefited from several positions in JP Morgan, a provider of global financial services and retail banking. The Fund continues to hold positions in short-maturity bonds issued by JP Morgan. The Commercial Mortgage Backed Security, MSBAM 2015-C26 A3, is a conduit, or trust, of commercial loans originated by Bank of America and Morgan Stanley in 2015. This CMBS contributed to performance as this sector broadly outperformed. The Fund continues to hold this security as the PM team believes that the credit protection and relative spread remains attractive.
Underperformers | Several bonds issued by American Express, a global payments and travel company, underperformed as the PM team believes that a flattening yield curve hurt the outlook for the company’s profitability in the future. The Fund continues to hold these bonds as the PM team believes the stability of the business and cash flow potential will not be impacted in the short term by the flat yield curve. The PM team believes that the bonds issued by Wells Fargo, a diversified financial services company, underperformed as the firm underwent scrutiny regarding its client treatment while also facing profitability concerns with a flat yield curve. The PM team maintains its holdings in these positions as the team is comfortable with asset protections for the short maturity holdings. Fannie Mae Conventional 30 year 3.0% coupon Mortgages underperformed relative to the benchmark as rates rose leading to the duration extension of the underlying mortgage loans. This security remains a holding in the Fund although the Fund is underweight to Agency MBS versus the benchmark. A bond issued by AIG, an international insurance organization, AIG 6.4 12/15/20 underperformed modestly. The Fund continues to hold this position. The PM team believes that a bond issued by Bank of America, a provider of banking, investing, asset management, and other financial services, BAC 3.5 4/19/26 underperformed due to the flat yield curve. The Fund continues to hold this position as the PM team believes the stability of the business and cash flow potential will not be impacted in the short term by the flat yield curve.
| 11 |
Performance Summary and Commentary
| Carillon Reams Core Plus Bond Fund |
Portfolio Managers | Mark M. Egan, CFA®, is Lead Portfolio Manager, and Thomas M. Fink, CFA®, Todd C. Thompson, CFA®, Stephen T. Vincent, CFA®, Clark W. Holland, CFA® and Jason Hoyer, CFA® are Co- Portfolio Managers of the Reams Core Plus Bond Fund (the “Fund”). Messrs. Egan, Fink, Thompson, Vincent and Holland have been responsible for the day-to-day management of the Fund’s investment portfolio since its inception in 2017. Mr. Hoyer has been responsible for the day-to-day management of the Fund’s investment portfolio since April 2018. Mr. Egan served as the Lead Portfolio Manager of the Fund’s predecessor from its inception in 1996 or from 2000, 2001, 2009 and 2014, respectively, to 2017.
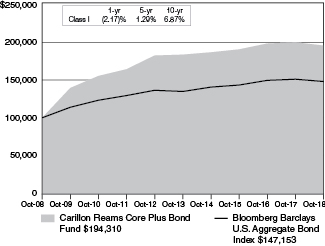
Performance Discussion | For the fiscal year ended October 31, 2018, the Fund’s Class I shares returned (2.17)%, underperforming its benchmark index, the Bloomberg Barclays U.S. Aggregate Bond Index, which returned (2.05)%. The main detractor from the Fund’s performance, relative to the benchmark, was security selection within the mortgage-backed securities sector. The Fund’s lack of exposure to the Government-Related sector, which outperformed duration-matched U.S. Treasuries, also detracted from relative performance. Security selection within the investment-grade corporate sector contributed to relative performance due to the Fund’s overweight to shorter-maturity corporate bonds. Exposure to high yield corporate bonds also contributed to relative performance, as this sector outperformed duration-matched U.S. Treasuries. The Fund’s lower-than-benchmark duration positioning also contributed to relative performance. As you review this summary and the table below, please keep in mind that an index is not available for direct investment; therefore its performance does not reflect the expenses associated with the management of an actual portfolio.
Growth of a $100,000 investment from 10/31/08 to 10/31/18 (a)
(a) The Fund’s values and returns reflect fund expenses and the reinvestment of dividends; however, they do not reflect the deduction of taxes that you would pay on fund distributions or redemption of fund shares. As of October 31, 2018, the Fund also offered Class A, Class C, Class R-3, Class R-5, Class R-6, and Class Y shares. The value of an investment in other share classes will differ due to each class’s respective sales charges (as applicable) and expenses. Additional information regarding the performance and the expenses of the Fund’s share classes, including fee waivers and/or expense reimbursements or recoupments, which affect performance, is included in the Fund’s
Prospectus dated March 1, 2018, and elsewhere in this report. Returns shown are calculated using the net asset values (“NAV’s”) that were used for shareholder transactions as of the respective period ends. These NAV’s, and the returns calculated from them, may differ from the NAV’s and returns shown elsewhere in this report.
Performance data represented is historical and does not guarantee future results. The investment return and principal value of an investment will fluctuate, and you may have a gain or loss when you sell shares. Current performance may be higher or lower than the performance data quoted. To obtain more current performance data as of the most recent month-end, please visit our website at carillontower.com.
Underperformers | Several bonds issued by American Express, a global payments and travel company, underperformed as the Fund’s Portfolio Management team (“PM team”) believes that a flattening yield curve hurt the outlook for the company’s profitability in the future. The Fund continues to hold these bonds as the PM team believes the stability of the business and cash flow potential will not be impacted in the short term by the flat yield curve. The PM team believes that bonds issued by Wells Fargo, a diversified financial services company, underperformed as the firm underwent scrutiny regarding its client treatment while also facing profitability concerns with a flat yield curve. The PM team maintains its holdings in these positions as the team is comfortable with asset protections for the short maturity holdings. A bond issued by AIG, an international insurance organization, AIG 6.4 12/15/20 underperformed modestly. The Fund continues to hold this position. The PM team believes that a bond issued by Bank of America, a provider of banking, investing, asset management, and other financial services, BAC 3.5 4/19/26 underperformed due to the flat yield curve. The Fund continues to hold this position as the PM team believes the stability of the business and cash flow potential will not be impacted in the short term by the flat yield curve. Fannie Mae Conventional 30 year 3.0% coupon Mortgages underperformed relative to the benchmark as rates rose leading to the duration extension of the underlying mortgage loans. This security remains a holding in the Fund although the Fund is underweight to Agency MBS versus the benchmark.
Top performers | Early in the fiscal year, the portfolio maintained overall interest rate exposure below that of the benchmark. This appeared to benefit the Fund on a relative basis as interest rates rose. As of the date hereof the Fund’s interest rate exposure is similar to that of the benchmark. Two corporate bonds backed by aircraft leases of Delta Airlines, an air transportation provider, contributed to performance due to their higher ratings and shorter maturities as these more defensive positions outperformed the broadly underperforming corporate sector. The Fund continues to hold these positions as the PM team continues to prefer a defensive posture in the investment grade corporate sector. Various corporate bonds issued by AT&T, Inc., a company that, through its subsidiaries provides wireline and wireless phone and data communications, internet, and other telecommunications services, outperformed other holdings during the period. The shorter maturity holdings appeared to benefit the Fund due to their defensive characteristics. The Fund continues to hold these positions. The Fund also benefited from several positions in JP Morgan, a provider of global financial services and retail banking. The Fund continues to hold positions in short-maturity bonds issued by JP Morgan. The Commercial Mortgage Backed Security, MSBAM 2015-C26 A3, is a conduit, or trust, of commercial loans originated by Bank of America and Morgan Stanley in 2015. This CMBS contributed to performance as this sector broadly outperformed. The Fund continues to hold this security as the PM team believes that the credit protection and relative spread remains attractive. The holding of high yield CDX positively impacted the Fund’s performance during the fiscal year as high yield was the strongest performing sector in the fixed income universe during the fiscal year. The Fund continues to hold positions in high yield CDX.
| 12 |
Performance Summary and Commentary
| Carillon Reams Unconstrained Bond Fund |
Portfolio Managers | Mark M. Egan, CFA®, is Lead Portfolio Manager, and Thomas M. Fink, CFA®, Todd C. Thompson, CFA®, Stephen T. Vincent, CFA®, Clark W. Holland, CFA® and Jason Hoyer, CFA® are Co- Portfolio Managers of the Reams Core Plus Bond Fund (the “Fund”). Messrs. Egan, Fink, Thompson, Vincent and Holland have been responsible for the day-to-day management of the Fund’s investment portfolio since its inception in 2017. Mr. Hoyer has been responsible for the day-to-day management of the Fund’s investment portfolio since April 2018. Mr. Egan served as the Lead Portfolio Manager of the Fund’s predecessor and Messrs. Fink, Thompson and Vincent served as Co-Portfolio Managers of the Fund’s predecessor from its inception in 2011 to 2017. Mr. Holland served as Co-Portfolio Manager of the Fund’s predecessor from 2014 to 2017.
Performance Discussion | For the fiscal year ended October 31, 2018, the Fund’s Class I shares returned (1.79)%, underperforming its benchmark index, the BofA Merrill Lynch 3-Month LIBOR Constant Maturity Index, which returned 1.85%. The main detractor from the Fund’s performance, relative to the benchmark, was the Fund’s U.S. Treasury holdings. The Fund’s exposure to U.S. Treasury Inflation-Protected Securities and mortgage-backed securities also detracted from relative performance. The Fund’s allocation to investment-grade corporate bonds, high yield corporate bonds, asset-backed securities and commercial mortgage-backed securities added to relative performance, as these sectors outperformed duration-matched U.S. Treasuries. As you review this summary and the table below, please keep in mind that an index is not available for direct investment; therefore its performance does not reflect the expenses associated with the management of an actual portfolio.
Growth of a $100,000 investment from 9/29/11 to 10/31/18 (a)
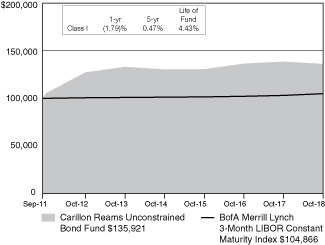
(a) The Fund’s values and returns reflect fund expenses and the reinvestment of dividends; however, they do not reflect the deduction of taxes that you would pay on fund distributions or redemption of fund shares. As of October 31, 2018, the Fund also offered Class A, Class C, Class R-3, Class R-5, Class R-6, and Class Y shares. The value of an investment in other share classes will differ due to each class’s respective sales charges (as applicable) and expenses. Additional information regarding the performance and the expenses of the Fund’s share classes, including fee waivers and/or expense reimbursements or recoupments, which affect performance, is included in the Fund’s
Prospectus dated March 1, 2018, and elsewhere in this report. Returns shown are calculated using the net asset values (“NAV’s”) that were used for shareholder transactions as of the respective period ends. These NAV’s, and the returns calculated from them, may differ from the NAV’s and returns shown elsewhere in this report.
Performance data represented is historical and does not guarantee future results. The investment return and principal value of an investment will fluctuate, and you may have a gain or loss when you sell shares. Current performance may be higher or lower than the performance data quoted. To obtain more current performance data as of the most recent month-end, please visit our website at carillontower.com.
Underperformers | During the fiscal year, the portfolio maintained overall interest rate exposure above that of the benchmark. This cost the Fund on a relative basis as interest rates rose. Currently the Fund’s interest rate exposure remains above that of the benchmark which has minimal exposure. Several bonds issued by American Express, a global payments and travel company, underperformed as the Fund’s Portfolio Management team (“PM team”) believes that a flattening yield curve hurt the outlook for the company’s profitability in the future. The Fund continues to hold these bonds as the PM team believes the stability of the business and cash flow potential will not be impacted in the short term by the flat yield curve. The PM team believes that bonds issued by Wells Fargo, a diversified financial services company, underperformed as the firm underwent scrutiny regarding its client treatment while also facing profitability concerns with a flat yield curve. The PM team maintains its holdings in these positions as the team is comfortable with asset protections for the short maturity holdings. Fannie Mae Conventional 30 year 3.0% coupon Mortgages underperformed as rates rose and led to the duration extension of the underlying mortgage loans. This security remains a holding in the Fund. The PM team believes that various bonds issued by the Ford Motor Company, a manufacturer and servicer of cars and trucks, detracted from performance over concerns that a global trade war and slowing economy would hurt profitability. The PM team continues to hold positions in this issuer as they offer attractive upside and limited downside due to assets and cash flow available to service the debt.
Top performers | Two corporate bonds backed by aircraft leases of American Airlines, an air transportation provider, contributed to performance due to their higher ratings and shorter maturities as these more defensive positions outperformed the broadly underperforming corporate sector. The Fund continues to hold these positions as the PM team continues to prefer a defensive posture in the investment grade corporate sector. Various corporate bonds issued by AT&T, Inc., a company that, through its subsidiaries provides wireline and wireless phone and data communications, internet, and other telecommunications services, outperformed other holdings during the period. The shorter maturity holdings appeared to benefit the Fund due to their defensive characteristics. The Fund continues to hold these positions. The Fund also benefited from several positions in JP Morgan, a provider of global financial services and retail banking. The Fund continues to hold positions in short-maturity bonds issued by JP Morgan. The Commercial Mortgage Backed Security, GSMS 2014-GC22 A3, is a conduit, or trust, of commercial loans originated by Citigroup and GoldmanSachs in 2014. This CMBS contributed to performance as this sector broadly outperformed. The Fund continues to hold this security as the PM team believes that the credit protection and relative spread remains attractive. The holding of high yield CDX positively impacted the Fund’s performance during the fiscal year as high yield was the strongest performing sector in the fixed income universe during the fiscal year. The Fund continues to hold positions in high yield CDX.
| 13 |
The Bloomberg Barclays U.S. Aggregate Bond Index is a broad-based benchmark that measures the investment grade, US dollar-denominated, fixed-rate taxable bond market. The returns of the index do not include the effect of any sales charges. That means that actual returns would be lower if they included the effect of sales charges.
The BofA Merrill Lynch 3-Month LIBOR Constant Maturity Index represents the London interbank offered rate (LIBOR) with a constant three-month average maturity. Published by the British Bankers’ Association, LIBOR is a composite of the rates of interest at which banks borrow from one another in the London market.
The MSCI ACWI® Index captures large and mid cap representation across 23 developed markets and 23 emerging markets countries. With 2,484 constituents, the index covers approximately 85% of the global investable equity opportunity set.
The MSCI EAFE® Index is an equity index which captures large and mid cap representation across 21 developed markets countries around the world, excluding the US and Canada. With 928 constituents, the index covers approximately 85% of the free float-adjusted market capitalization in each country. Its returns do not include the effect of any sales charges. That means that actual returns would be lower if they included the effect of sales charges.
The Russell 1000® Growth Index measures the performance of the large-cap growth segment of the U.S. equity universe. It includes those Russell 1000 Index companies with higher price-to-book ratios and higher forecasted growth values. Its returns do not include the effect of any sales charges. That means that actual returns would be lower if they included the effect of sales charges.
The Russell 2000® Growth Index measures the performance of the small-cap growth segment of the U.S. equity universe. It includes those Russell 2000 Index companies with higher price-to-value ratios and higher forecasted growth values. Its returns do not include the effect of any sales charges. That means that actual returns would be lower if they included the effect of sales charges.
The Russell Midcap® Index measures the performance of the mid-cap segment of the U.S. equity universe. The Russell Midcap is a subset of the Russell 1000® Index. It includes approximately 800 of the smallest securities based on a combination of their market cap and current index membership. Its returns do not include the effect of any sales charges. That means that actual returns would be lower if they included the effect of sales charges.
The Russell Midcap® Growth Index measures the performance of the mid-cap growth segment of the U.S. equity universe. It includes those Russell Midcap Index companies with higher price-to-book ratios and higher forecasted growth values. Its returns do not include the effect of any sales charges. That means that actual returns would be lower if they included the effect of sales charges.
The S&P 500® Index is an unmanaged index of 500 U.S. stocks and gives a broad look at how stock prices have performed. The index includes 500 leading companies and captures approximately 80% coverage of available market capitalization. Its returns do not include the effect of any sales charges. That means that actual returns would be lower if they included the effect of sales charges.
Frank Russell Company (“Russell”) is the source and owner of the trademarks, service marks and copyrights related to the Russell Indexes. Russell® is a trademark of Frank Russell Company. Neither Russell nor its licensors accept any liability for any errors or omissions in the Russell Indexes and/or Russell ratings or underlying data and no party may rely on any Russell Indexes and/or Russell ratings and/or underlying data contained in this communication. No further distribution of Russell Data is permitted without Russell’s express written consent. Russell does not promote, sponsor or endorse the content of this communication.
| 14 |
Investment Portfolios
| 10.31.2018 |
| COMMON STOCKS—99.8% | Shares | Value | ||||||||||
| Internet & direct marketing retail—5.1% | ||||||||||||
Amazon.com, Inc.* | 14,400 | $ 23,011,344 | ||||||||||
| IT services—10.8% | ||||||||||||
Amdocs Ltd. | 54,800 | 3,467,196 | ||||||||||
Fiserv, Inc.* | 72,100 | 5,717,530 | ||||||||||
Global Payments, Inc. | 21,700 | 2,478,791 | ||||||||||
MasterCard, Inc., Class A | 60,330 | 11,925,431 | ||||||||||
PayPal Holdings, Inc.* | 42,300 | 3,561,237 | ||||||||||
Visa, Inc., Class A | 107,800 | 14,860,230 | ||||||||||
Worldpay, Inc., Class A* | 73,846 | 6,782,017 | ||||||||||
| Life sciences tools & services—1.4% | ||||||||||||
Thermo Fisher Scientific, Inc. | 26,900 | 6,285,185 | ||||||||||
| Machinery—2.0% | ||||||||||||
Caterpillar, Inc. | 34,900 | 4,234,068 | ||||||||||
Ingersoll-Rand PLC | 37,100 | 3,559,374 | ||||||||||
Oshkosh Corp. | 21,000 | 1,178,940 | ||||||||||
| Media—0.5% | ||||||||||||
Comcast Corp., Class A | 60,800 | 2,318,912 | ||||||||||
| Metals & mining—0.5% | ||||||||||||
Steel Dynamics, Inc. | 52,300 | 2,071,080 | ||||||||||
| Multiline retail—1.2% | ||||||||||||
Kohl’s Corp. | 70,833 | 5,364,183 | ||||||||||
| Oil, gas & consumable fuels—2.1% | ||||||||||||
Occidental Petroleum Corp. | 56,500 | 3,789,455 | ||||||||||
Phillips 66 | 29,500 | 3,033,190 | ||||||||||
Valero Energy Corp. | 30,400 | 2,769,136 | ||||||||||
| Pharmaceuticals—2.8% | ||||||||||||
Johnson & Johnson | 37,600 | 5,263,624 | ||||||||||
Merck & Co., Inc. | 98,700 | 7,265,307 | ||||||||||
| Real estate management & development—0.9% | ||||||||||||
CBRE Group, Inc., Class A* | 100,485 | 4,048,541 | ||||||||||
| Road & rail—3.0% | ||||||||||||
CSX Corp. | 102,600 | 7,065,036 | ||||||||||
Norfolk Southern Corp. | 38,600 | 6,478,238 | ||||||||||
| Semiconductors & semiconductor equipment—2.2% | ||||||||||||
KLA-Tencor Corp. | 19,600 | 1,794,184 | ||||||||||
Micron Technology, Inc.* | 56,800 | 2,142,496 | ||||||||||
NVIDIA Corp. | 29,200 | 6,156,236 | ||||||||||
| Software—12.8% | ||||||||||||
Adobe, Inc.* | 43,000 | 10,567,680 | ||||||||||
Microsoft Corp. | 320,700 | 34,253,967 | ||||||||||
salesforce.com, Inc.* | 55,800 | 7,657,992 | ||||||||||
Synopsys, Inc.* | 61,700 | 5,524,001 | ||||||||||
| Specialty retail—4.2% | ||||||||||||
Burlington Stores, Inc.* | 28,581 | 4,901,356 | ||||||||||
Ross Stores, Inc. | 36,300 | 3,593,700 | ||||||||||
The Home Depot, Inc. | 59,100 | 10,394,508 | ||||||||||
| Technology hardware, storage & peripherals—9.2% | ||||||||||||
Apple, Inc. | 160,166 | 35,053,931 | ||||||||||
NetApp, Inc. | 87,400 | 6,860,026 | ||||||||||
| Textiles, apparel & luxury goods—2.1% | ||||||||||||
Michael Kors Holdings Ltd.* | 40,700 | 2,255,187 | ||||||||||
PVH Corp. | 39,200 | 4,734,968 | ||||||||||
VF Corp. | 31,600 | 2,619,008 | ||||||||||
| The accompanying notes are an integral part of the financial statements. | 15 |
Investment Portfolios
| 10.31.2018 |
| CARILLON CLARIVEST CAPITAL APPRECIATION FUND (cont’d) | ||||||||||||
| COMMON STOCKS—99.8% | Shares | Value | ||||||||||
| Trading companies & distributors—0.8% | ||||||||||||
United Rentals, Inc.* | 29,500 | $ 3,542,065 | ||||||||||
| Total common stocks (cost $303,721,853) | 451,440,748 | |||||||||||
| Total investment portfolio (cost $303,721,853)—99.8% |
| 451,440,748 | ||||||||||
Other assets in excess of liabilities—0.2% | 902,793 | |||||||||||
| Total net assets—100.0% | $452,343,541 | |||||||||||
* Non-income producing security
| Sector allocation (unaudited) | ||||
| Sector | Percent of net assets | |||
| Information technology | 37.0% | |||
| Health care | 17.0% | |||
| Consumer discretionary | 14.8% | |||
| Communication services | 9.6% | |||
| Industrials | 9.4% | |||
| Financials | 3.7% | |||
| Consumer staples | 3.6% | |||
| Energy | 2.1% | |||
| Real estate | 1.8% | |||
| Materials | 0.8% | |||
| COMMON STOCKS—96.0% | Shares | Value | ||||||||||
| Germany—7.1% | ||||||||||||
Allianz SE | 1,834 | $ 382,057 | ||||||||||
BASF SE | 1,975 | 151,558 | ||||||||||
CANCOM SE | 1,659 | 67,643 | ||||||||||
Covestro AG | 3,950 | 254,729 | ||||||||||
Deutsche Lufthansa AG | 2,844 | 57,088 | ||||||||||
ProSiebenSat.1 Media SE | 2,469 | 57,013 | ||||||||||
Siltronic AG | 649 | 59,438 | ||||||||||
TAG Immobilien AG | 4,069 | 92,822 | ||||||||||
Wirecard AG | 652 | 121,960 | ||||||||||
| Hong Kong—0.4% | ||||||||||||
CK Asset Holdings Ltd. | 9,672 | 62,943 | ||||||||||
| Israel—2.7% | ||||||||||||
Bank Leumi Le-Israel B.M. | 13,036 | 81,289 | ||||||||||
Israel Discount Bank Ltd., Class A | 47,286 | 154,529 | ||||||||||
Teva Pharmaceutical Industries Ltd., Sponsored ADR | 9,900 | 197,802 | ||||||||||
Tower Semiconductor Ltd.* | 2,686 | 41,627 | ||||||||||
| Italy—2.8% | ||||||||||||
Enel SpA | 55,503 | 272,134 | ||||||||||
Eni SpA | 8,059 | 143,125 | ||||||||||
Intesa Sanpaolo SpA | 30,438 | 67,422 | ||||||||||
| Japan—29.0% | ||||||||||||
ANA Holdings, Inc. | 2,000 | 67,251 | ||||||||||
Asahi Group Holdings Ltd. | 3,400 | 149,413 | ||||||||||
Cosmo Energy Holdings Co. Ltd. | 1,900 | 69,879 | ||||||||||
Fuji Soft, Inc. | 4,000 | 183,269 | ||||||||||
Haseko Corp. | 9,100 | 115,312 | ||||||||||
Hitachi Ltd. | 8,000 | 244,562 | ||||||||||
Honda Motor Co. Ltd. | 5,900 | 168,419 | ||||||||||
ITOCHU Corp. | 23,700 | 439,539 | ||||||||||
JXTG Holdings, Inc. | 29,600 | 200,007 | ||||||||||
KDDI Corp. | 4,000 | 96,799 | ||||||||||
Kyocera Corp. | 2,000 | 108,246 | ||||||||||
Marubeni Corp. | 55,300 | 448,411 | ||||||||||
Meiko Electronics Co. Ltd. | 2,000 | 50,015 | ||||||||||
Mitsubishi Chemical Holdings Corp. | 7,900 | 61,584 | ||||||||||
Mitsubishi Corp. | 4,000 | 112,581 | ||||||||||
Mitsubishi UFJ Financial Group, Inc. | 31,600 | 191,259 | ||||||||||
Mitsui Chemicals, Inc. | 4,000 | 89,697 | ||||||||||
Nihon Unisys Ltd. | 2,000 | 43,828 | ||||||||||
Nippon Carbon Co. Ltd. | 1,800 | 101,789 | ||||||||||
Nippon Light Metal Holdings Co. Ltd. | 13,400 | 28,255 | ||||||||||
Nippon Suisan Kaisha Ltd. | 9,900 | 63,238 | ||||||||||
Nippon Telegraph & Telephone Corp. | 7,900 | 325,785 | ||||||||||
Nipro Corp. | 5,900 | 75,132 | ||||||||||
NS Solutions Corp. | 4,000 | 119,369 | ||||||||||
Penta-Ocean Construction Co. Ltd. | 11,500 | 68,801 | ||||||||||
Ricoh Co. Ltd. | 9,900 | 98,825 | ||||||||||
SCREEN Holdings Co. Ltd. | 2,000 | 108,725 | ||||||||||
Showa Denko KK | 1,600 | 69,670 | ||||||||||
SoftBank Group Corp. | 2,000 | 158,278 | ||||||||||
Sony Corp. | 4,000 | 216,467 | ||||||||||
Sumitomo Corp. | 11,900 | 180,483 | ||||||||||
Sumitomo Mitsui Financial Group, Inc. | 4,000 | 155,740 | ||||||||||
The Hiroshima Bank Ltd. | 7,900 | 48,728 | ||||||||||
The Kansai Electric Power Co., Inc. | 11,900 | 182,135 | ||||||||||
Toyota Motor Corp. | 4,000 | 234,324 | ||||||||||
| 16 | The accompanying notes are an integral part of the financial statements. |
Investment Portfolios
| 10.31.2018 |
| CARILLON CLARIVEST INTERNATIONAL STOCK FUND (cont’d) | ||||||||||||
| COMMON STOCKS—96.0% | Shares | Value | ||||||||||
| Netherlands—3.7% | ||||||||||||
Aegon N.V. | 17,105 | $104,899 | ||||||||||
ASR Nederland N.V. | 1,205 | 54,703 | ||||||||||
Koninklijke Ahold Delhaize N.V. | 2,726 | 62,399 | ||||||||||
NN Group N.V. | 7,427 | 318,900 | ||||||||||
NXP Semiconductors N.V. | 1,397 | 104,761 | ||||||||||
| Norway—0.8% | ||||||||||||
Leroy Seafood Group ASA | 15,308 | 141,116 | ||||||||||
| Singapore—0.2% | ||||||||||||
Yanlord Land Group Ltd. | 39,500 | 36,025 | ||||||||||
| Spain—2.1% | ||||||||||||
Almirall S.A. | 2,548 | 46,164 | ||||||||||
Banco Bilbao Vizcaya Argentaria S.A. | 12,128 | 66,935 | ||||||||||
Banco Santander S.A. | 17,876 | 85,053 | ||||||||||
Iberdrola S.A. | 15,011 | 106,215 | ||||||||||
Repsol S.A. | 3,674 | 65,650 | ||||||||||
| Sweden—3.2% | ||||||||||||
Ahlsell AB | 23,169 | 117,269 | ||||||||||
Boliden AB | 2,528 | 57,731 | ||||||||||
SSAB AB, Class B | 12,997 | 42,150 | ||||||||||
Svenska Cellulosa AB SCA, Class B | 16,532 | 156,284 | ||||||||||
Volvo AB, Class B | 12,720 | 189,963 | ||||||||||
| Switzerland—14.3% | ||||||||||||
Lonza Group AG* | 1,264 | 397,451 | ||||||||||
Nestle S.A. | 5,452 | 460,275 | ||||||||||
Novartis AG | 5,215 | 456,690 | ||||||||||
Roche Holding AG | 1,659 | 403,738 | ||||||||||
Straumann Holding AG | 277 | 189,082 | ||||||||||
Swiss Life Holding AG* | 553 | 208,600 | ||||||||||
UBS Group AG* | 10,646 | 148,800 | ||||||||||
Zurich Insurance Group AG | 751 | 233,172 | ||||||||||
| United Kingdom—16.3% | ||||||||||||
3i Group PLC | 18,922 | 211,876 | ||||||||||
Ashtead Group PLC | 5,531 | 136,543 | ||||||||||
Aviva PLC | 19,811 | 108,265 | ||||||||||
Barclays PLC | 64,826 | 142,831 | ||||||||||
Bellway PLC | 2,923 | 107,209 | ||||||||||
BP PLC | 49,972 | 360,984 | ||||||||||
Electrocomponents PLC | 7,921 | 62,714 | ||||||||||
GlaxoSmithKline PLC | 15,683 | 303,745 | ||||||||||
HSBC Holdings PLC | 15,525 | 127,764 | ||||||||||
Imperial Brands PLC | 3,259 | 110,391 | ||||||||||
Lloyds Banking Group PLC | 145,789 | 106,388 | ||||||||||
Persimmon PLC | 2,627 | 76,885 | ||||||||||
Redrow PLC | 7,367 | 49,742 | ||||||||||
Royal Dutch Shell PLC, Class B | 14,616 | 476,671 | ||||||||||
Shire PLC | 1,620 | 97,768 | ||||||||||
Standard Chartered PLC | 12,740 | 89,291 | ||||||||||
Tesco PLC | 102,039 | 277,896 | ||||||||||
| Total common stocks (cost $16,642,595) | 16,804,024 | |||||||||||
| PREFERRED STOCKS—1.1% | Shares | Value | ||||||||||
| Germany—1.1% | ||||||||||||
Volkswagen AG | 1,126 | $ 189,170 | ||||||||||
| Total preferred stocks (cost $211,783) | 189,170 | |||||||||||
| Total investment portfolio (cost $16,854,378)—97.1% | 16,993,194 | |||||||||||
Other assets in excess of liabilities—2.9% | 498,716 | |||||||||||
| Total net assets—100.0% | $17,491,910 | |||||||||||
* Non-income producing security
ADR—American Depository Receipt
| Sector allocation (unaudited) | ||||
| Sector | Percent of net assets | |||
| Financials | 19.0% | |||
| Industrials | 15.3% | |||
| Health care | 13.7% | |||
| Consumer discretionary | 9.5% | |||
| Energy | 9.4% | |||
| Information technology | 8.1% | |||
| Consumer staples | 7.9% | |||
| Materials | 6.0% | |||
| Communication services | 3.6% | |||
| Utilities | 3.5% | |||
| Real estate | 1.1% | |||
| Industry allocation (unaudited) | ||||||||
| Industry | Value | Percent of net assets | ||||||
| Oil, gas & consumable fuels | $1,652,950 | 9.4% | ||||||
| Banks | 1,552,912 | 8.9% | ||||||
| Trading companies & distributors | 1,434,827 | 8.2% | ||||||
| Insurance | 1,410,595 | 8.1% | ||||||
| Pharmaceuticals | 1,408,139 | 8.1% | ||||||
| Automobiles | 1,018,397 | 5.8% | ||||||
| Food products | 664,628 | 3.8% | ||||||
| Chemicals | 627,237 | 3.6% | ||||||
| Household durables | 565,614 | 3.2% | ||||||
| Electric utilities | 560,483 | 3.2% | ||||||
| Construction & engineering | 542,047 | 3.1% | ||||||
| Electronic equipment, instruments & components | 465,537 | 2.7% | ||||||
| Life sciences tools & services | 397,451 | 2.3% | ||||||
| Capital markets | 360,676 | 2.1% | ||||||
| IT services | 352,801 | 2.0% | ||||||
| Food & staples retailing | 340,295 | 1.9% | ||||||
| The accompanying notes are an integral part of the financial statements. | 17 |
Investment Portfolios
| 10.31.2018 |
| CARILLON CLARIVEST INTERNATIONAL STOCK FUND (cont’d) | ||||||||
| Industry allocation (unaudited) (cont’d) | ||||||||
| Industry | Value | Percent of net assets | ||||||
| Airlines | $338,209 | 1.9% | ||||||
| Diversified telecommunication services | 325,785 | 1.9% | ||||||
| Health care equipment & supplies | 318,680 | 1.8% | ||||||
| Semiconductors & semiconductor equipment | 314,552 | 1.8% | ||||||
| Biotechnology | 269,179 | 1.5% | ||||||
| Beverages | 264,137 | 1.5% | ||||||
| Wireless telecommunication services | 255,077 | 1.5% | ||||||
| Paper & forest products | 230,779 | 1.3% | ||||||
| Real estate management & development | 191,790 | 1.1% | ||||||
| Machinery | 189,963 | 1.1% | ||||||
| Metals & mining | 187,610 | 1.1% | ||||||
| Software | 183,269 | 1.0% | ||||||
| Tobacco | 110,391 | 0.6% | ||||||
| Electrical equipment | 101,789 | 0.6% | ||||||
| Technology hardware, storage & peripherals | 98,825 | 0.6% | ||||||
| Marine | 74,387 | 0.4% | ||||||
| Auto components | 70,740 | 0.4% | ||||||
| Media | 57,013 | 0.3% | ||||||
| Multi-utilities | 56,430 | 0.3% | ||||||
ETF—Exchange Traded Fund
| Asset allocation (unaudited) | ||||
| Asset class | Percent of net assets | |||
| Equity | 78.9% | |||
| Fixed income | 17.4% | |||
| 18 | The accompanying notes are an integral part of the financial statements. |
Investment Portfolios
| 10.31.2018 |
| CARILLON EAGLE GROWTH & INCOME FUND (cont’d) | ||||||||||||
| COMMON STOCKS—97.1% | Shares | Value | ||||||||||
| Software—4.8% | ||||||||||||
Microsoft Corp. | 264,026 | $ 28,200,617 | ||||||||||
| Specialty retail—1.7% | ||||||||||||
The Home Depot, Inc. | 57,027 | 10,029,909 | ||||||||||
| Technology hardware, storage & peripherals—4.7% | ||||||||||||
Apple, Inc. | 128,193 | 28,056,320 | ||||||||||
| Tobacco—2.4% | ||||||||||||
Altria Group, Inc. | 214,522 | 13,952,511 | ||||||||||
| Total common stocks (cost $377,354,355) | 574,834,299 | |||||||||||
| Total investment portfolio (cost $377,354,355)—97.1% |
| 574,834,299 | ||||||||||
Other assets in excess of liabilities—2.9% | 17,305,886 | |||||||||||
| Total net assets—100.0% | $592,140,185 | |||||||||||
* Non-income producing security
ADR—American depository receipt
| Sector allocation (unaudited) | ||||
| Sector | Percent of net assets | |||
| Health care | 16.5% | |||
| Information technology | 12.9% | |||
| Consumer staples | 12.4% | |||
| Industrials | 11.5% | |||
| Financials | 10.6% | |||
| Energy | 7.7% | |||
| Consumer discretionary | 6.8% | |||
| Real estate | 6.6% | |||
| Communication services | 6.2% | |||
| Utilities | 4.1% | |||
| Materials | 1.8% | |||
| COMMON STOCKS—96.7% | Shares | Value | ||||||||||
| Biotechnology (cont’d) | ||||||||||||
Sage Therapeutics, Inc.* | 227,166 | $29,231,721 | ||||||||||
Sarepta Therapeutics, Inc.* | 306,703 | 41,024,593 | ||||||||||
Seattle Genetics, Inc.* | 453,409 | 25,449,847 | ||||||||||
| Building products—2.3% | ||||||||||||
A.O. Smith Corp. | 705,682 | 32,129,701 | ||||||||||
Allegion PLC | 280,246 | 24,025,490 | ||||||||||
Fortune Brands Home & Security, Inc. | 948,381 | 42,515,920 | ||||||||||
| Capital markets—5.4% | ||||||||||||
Ameriprise Financial, Inc. | 524,111 | 66,687,884 | ||||||||||
MarketAxess Holdings, Inc. | 268,204 | 56,234,333 | ||||||||||
Moody’s Corp. | 282,845 | 41,148,290 | ||||||||||
Morningstar, Inc. | 216,751 | 27,050,525 | ||||||||||
MSCI, Inc. | 267,154 | 40,174,618 | ||||||||||
| Chemicals—0.8% | ||||||||||||
Huntsman Corp. | 1,591,733 | 34,827,118 | ||||||||||
| Commercial services & supplies—3.1% | ||||||||||||
Ritchie Bros Auctioneers, Inc. | 673,811 | 22,646,788 | ||||||||||
Waste Connections, Inc. | 1,440,657 | 110,123,821 | ||||||||||
| Construction & engineering—0.7% | ||||||||||||
Fluor Corp. | 708,162 | 31,059,985 | ||||||||||
| Construction materials—1.4% | ||||||||||||
Martin Marietta Materials, Inc. | 341,353 | 58,466,942 | ||||||||||
| Distributors—1.4% | ||||||||||||
Pool Corp. | 405,916 | 59,162,257 | ||||||||||
| Diversified consumer services—1.6% | ||||||||||||
Bright Horizons Family Solutions, Inc.* | 333,339 | 38,303,984 | ||||||||||
ServiceMaster Global Holdings, Inc.* | 666,162 | 28,565,027 | ||||||||||
| Diversified telecommunication services—0.9% | ||||||||||||
Zayo Group Holdings, Inc.* | 1,281,371 | 38,287,366 | ||||||||||
| Electronic equipment, instruments & components—6.5% |
| |||||||||||
Amphenol Corp., Class A | 546,582 | 48,919,089 | ||||||||||
Cognex Corp. | 1,201,446 | 51,469,947 | ||||||||||
Coherent, Inc.* | 301,601 | 37,139,147 | ||||||||||
FLIR Systems, Inc. | 1,024,553 | 47,447,049 | ||||||||||
IPG Photonics Corp.* | 225,372 | 30,098,431 | ||||||||||
Keysight Technologies, Inc.* | 1,091,269 | 62,289,634 | ||||||||||
| Entertainment—2.5% | ||||||||||||
Electronic Arts, Inc.* | 310,371 | 28,237,554 | ||||||||||
Lions Gate Entertainment Corp., Class A | 1,379,903 | 26,438,941 | ||||||||||
Spotify Technology S.A.* | 202,201 | 30,267,468 | ||||||||||
Take-Two Interactive Software, Inc.* | 176,218 | 22,709,214 | ||||||||||
| Equity real estate investment trusts (REITs)—1.9% | ||||||||||||
SBA Communications Corp.* | 500,952 | 81,239,386 | ||||||||||
| Health care equipment & supplies—6.5% | ||||||||||||
ABIOMED, Inc.* | 118,638 | 40,479,286 | ||||||||||
Align Technology, Inc.* | 207,644 | 45,930,853 | ||||||||||
DexCom, Inc.* | 203,938 | 27,076,848 | ||||||||||
Edwards Lifesciences Corp.* | 358,559 | 52,923,308 | ||||||||||
IDEXX Laboratories, Inc.* | 329,240 | 69,838,389 | ||||||||||
Intuitive Surgical, Inc.* | 77,953 | 40,627,545 | ||||||||||
| Health care providers & services—2.3% | ||||||||||||
Centene Corp.* | 516,320 | 67,286,822 | ||||||||||
WellCare Health Plans, Inc.* | 107,430 | 29,649,606 | ||||||||||
| The accompanying notes are an integral part of the financial statements. | 19 |
Investment Portfolios
| 10.31.2018 |
| CARILLON EAGLE MID CAP GROWTH FUND (cont’d) | ||||||||||||
| COMMON STOCKS—96.7% | Shares | Value | ||||||||||
| Hotels, restaurants & leisure—3.2% | ||||||||||||
Chipotle Mexican Grill, Inc.* | 87,227 | $ 40,153,205 | ||||||||||
Royal Caribbean Cruises Ltd. | 404,300 | 42,342,339 | ||||||||||
Vail Resorts, Inc. | 210,964 | 53,019,472 | ||||||||||
| Insurance—1.2% | ||||||||||||
The Progressive Corp. | 766,887 | 53,452,024 | ||||||||||
| Interactive media & services—3.0% | ||||||||||||
IAC/InterActiveCorp* | 264,518 | 52,001,593 | ||||||||||
Twitter, Inc.* | 2,197,913 | 76,377,477 | ||||||||||
| Internet & direct marketing retail—1.9% | ||||||||||||
Qurate Retail, Inc., Class A* | 3,786,973 | 83,086,188 | ||||||||||
| IT services—4.6% | ||||||||||||
Global Payments, Inc. | 357,634 | 40,852,532 | ||||||||||
Perspecta, Inc. | 1,855,776 | 45,447,954 | ||||||||||
Shopify, Inc., Class A* | 232,152 | 32,071,799 | ||||||||||
Square, Inc., Class A* | 390,981 | 28,717,554 | ||||||||||
Worldpay, Inc., Class A* | 529,696 | 48,647,281 | ||||||||||
| Leisure products—1.0% | ||||||||||||
Brunswick Corp. | 824,377 | 42,859,360 | ||||||||||
| Life sciences tools & services—2.8% | ||||||||||||
Illumina, Inc.* | 153,154 | 47,653,867 | ||||||||||
IQVIA Holdings, Inc.* | 395,495 | 48,618,200 | ||||||||||
PRA Health Sciences, Inc.* | 263,780 | 25,552,369 | ||||||||||
| Machinery—0.9% | ||||||||||||
WABCO Holdings, Inc.* | 352,909 | 37,920,072 | ||||||||||
| Media—1.8% | ||||||||||||
Sirius XM Holdings, Inc. | 12,755,822 | 76,790,049 | ||||||||||
| Multiline retail—1.1% | ||||||||||||
Dollar Tree, Inc.* | 572,656 | 48,274,901 | ||||||||||
| Oil, gas & consumable fuels—2.1% | ||||||||||||
Diamondback Energy, Inc. | 456,379 | 51,278,744 | ||||||||||
Parsley Energy, Inc., Class A* | 1,612,923 | 37,774,657 | ||||||||||
| Pharmaceuticals—1.2% | ||||||||||||
Zoetis, Inc. | 586,860 | 52,905,429 | ||||||||||
| Professional services—3.4% | ||||||||||||
IHS Markit Ltd.* | 1,253,275 | 65,834,536 | ||||||||||
TransUnion | 1,245,049 | 81,861,972 | ||||||||||
| Road & rail—0.7% | ||||||||||||
Old Dominion Freight Line, Inc. | 228,848 | 29,846,356 | ||||||||||
| Semiconductors & semiconductor equipment—4.2% |
| |||||||||||
Advanced Micro Devices, Inc.* | 3,205,132 | 58,365,454 | ||||||||||
Maxim Integrated Products, Inc. | 875,707 | 43,802,864 | ||||||||||
Microchip Technology, Inc. | 629,874 | 41,433,112 | ||||||||||
NVIDIA Corp. | 167,924 | 35,403,417 | ||||||||||
| Software—9.5% | ||||||||||||
Autodesk, Inc.* | 348,444 | 45,036,387 | ||||||||||
PTC, Inc.* | 546,943 | 45,073,573 | ||||||||||
ServiceNow, Inc.* | 306,229 | 55,439,698 | ||||||||||
Splunk, Inc.* | 609,593 | 60,861,765 | ||||||||||
Synopsys, Inc.* | 549,196 | 49,169,518 | ||||||||||
Tableau Software, Inc., Class A* | 509,134 | 54,314,415 | ||||||||||
The Ultimate Software Group, Inc.* | 178,366 | 47,557,726 | ||||||||||
Tyler Technologies, Inc.* | 226,510 | 47,943,107 | ||||||||||
| COMMON STOCKS—96.7% | Shares | Value | ||||||||||
| Specialty retail—3.9% | ||||||||||||
AutoZone, Inc.* | 58,671 | $ 43,033,418 | ||||||||||
Burlington Stores, Inc.* | 719,108 | 123,319,831 | ||||||||||
| Textiles, apparel & luxury goods—2.2% | ||||||||||||
Canada Goose Holdings, Inc.* | 538,313 | 29,375,740 | ||||||||||
Lululemon Athletica, Inc.* | 474,815 | 66,820,715 | ||||||||||
| Trading companies & distributors—1.4% | ||||||||||||
United Rentals, Inc.* | 255,906 | 30,726,633 | ||||||||||
W.W. Grainger, Inc. | 107,950 | 30,654,562 | ||||||||||
| Total common stocks (cost $3,613,996,333) | 4,145,006,787 | |||||||||||
| Total investment portfolio (cost $3,613,996,333)—96.7% |
| 4,145,006,787 | ||||||||||
Other assets in excess of liabilities—3.3% | 143,000,026 | |||||||||||
| Total net assets—100.0% | $4,288,006,813 | |||||||||||
* Non-income producing security
| Sector allocation (unaudited) | ||||
| Sector | Percent of net assets | |||
| Information technology | 24.7% | |||
| Consumer discretionary | 17.7% | |||
| Health care | 16.1% | |||
| Industrials | 15.4% | |||
| Communication services | 8.2% | |||
| Financials | 6.6% | |||
| Materials | 2.2% | |||
| Energy | 2.1% | |||
| Real estate | 1.9% | |||
| Consumer staples | 1.8% | |||
| 20 | The accompanying notes are an integral part of the financial statements. |
Investment Portfolios
| 10.31.2018 |
| CARILLON EAGLE SMALL CAP GROWTH FUND (cont’d) | ||||||||||||
| COMMON STOCKS—99.5% | Shares | Value | ||||||||||
| Biotechnology (cont’d) | ||||||||||||
Dynavax Technologies Corp.* | 1,636,176 | $ 16,181,781 | ||||||||||
Exact Sciences Corp.* | 453,023 | 32,187,284 | ||||||||||
FibroGen, Inc.* | 708,315 | 30,365,464 | ||||||||||
Heron Therapeutics, Inc.* | 1,274,695 | 35,385,533 | ||||||||||
Kura Oncology, Inc.* | 1,502,217 | 16,329,099 | ||||||||||
Ligand Pharmaceuticals, Inc.* | 224,422 | 36,986,990 | ||||||||||
Loxo Oncology, Inc.* | 256,146 | 39,103,248 | ||||||||||
Progenics Pharmaceuticals, Inc.* | 3,948,024 | 19,779,600 | ||||||||||
Sage Therapeutics, Inc.* | 262,656 | 33,798,574 | ||||||||||
Sarepta Therapeutics, Inc.* | 522,334 | 69,867,396 | ||||||||||
| Building products—2.5% | ||||||||||||
Builders FirstSource, Inc.* | 3,048,889 | 37,745,246 | ||||||||||
Trex Co., Inc.* | 1,261,900 | 77,354,470 | ||||||||||
| Capital markets—1.3% | ||||||||||||
PJT Partners, Inc., Class A | 694,343 | 31,481,512 | ||||||||||
Stifel Financial Corp. | 612,446 | 28,001,031 | ||||||||||
| Chemicals—3.5% | ||||||||||||
Quaker Chemical Corp. | 683,441 | 122,951,036 | ||||||||||
Sensient Technologies Corp. | 619,608 | 40,187,775 | ||||||||||
| Commercial services & supplies—1.7% | ||||||||||||
Ritchie Bros Auctioneers, Inc. | 1,436,989 | 48,297,201 | ||||||||||
The Brink’s Co. | 495,004 | 32,828,665 | ||||||||||
| Communications equipment—0.7% | ||||||||||||
Lumentum Holdings, Inc.* | 594,857 | 32,508,935 | ||||||||||
| Construction materials—0.6% | ||||||||||||
Summit Materials, Inc., Class A* | 2,180,026 | 29,430,351 | ||||||||||
| Consumer finance—2.5% | ||||||||||||
FirstCash, Inc. | 529,354 | 42,560,062 | ||||||||||
Green Dot Corp., Class A* | 954,592 | 72,300,798 | ||||||||||
| Distributors—0.6% | ||||||||||||
Pool Corp. | 195,828 | 28,541,931 | ||||||||||
| Diversified consumer services—0.8% | ||||||||||||
Weight Watchers International, Inc.* | 578,118 | 38,213,600 | ||||||||||
| Electrical equipment—1.2% | ||||||||||||
Bloom Energy Corp., Class A* | 826,442 | 19,627,997 | ||||||||||
Thermon Group Holdings, Inc.* | 1,616,313 | 34,880,035 | ||||||||||
| Electronic equipment, instruments & components—4.5% | ||||||||||||
Cognex Corp. | 1,426,764 | 61,122,570 | ||||||||||
Coherent, Inc.* | 566,591 | 69,770,015 | ||||||||||
IPG Photonics Corp.* | 338,736 | 45,238,193 | ||||||||||
Littelfuse, Inc. | 180,457 | 32,691,590 | ||||||||||
| Entertainment—0.8% | ||||||||||||
Take-Two Interactive Software, Inc.* | 300,445 | 38,718,347 | ||||||||||
| Equity real estate investment trusts (REITs)—1.2% | ||||||||||||
Seritage Growth Properties, Class A | 1,032,564 | 39,258,083 | ||||||||||
The GEO Group, Inc. | 663,576 | 14,671,666 | ||||||||||
| Food & staples retailing—1.6% | ||||||||||||
Casey’s General Stores, Inc. | 580,187 | 73,167,383 | ||||||||||
| Health care equipment & supplies—8.0% | ||||||||||||
AxoGen, Inc.* | 635,364 | 23,692,724 | ||||||||||
Haemonetics Corp.* | 424,133 | 44,309,174 | ||||||||||
Inogen, Inc.* | 139,746 | 26,491,649 | ||||||||||
Insulet Corp.* | 404,355 | 35,668,155 | ||||||||||
| COMMON STOCKS—99.5% | Shares | Value | ||||||||||
| Health care equipment & supplies (cont’d) | ||||||||||||
Merit Medical Systems, Inc.* | 1,068,907 | $ 61,055,968 | ||||||||||
Natus Medical, Inc.* | 1,206,572 | 36,052,371 | ||||||||||
NuVasive, Inc.* | 739,039 | 41,511,821 | ||||||||||
Penumbra, Inc.* | 197,677 | 26,884,072 | ||||||||||
Quidel Corp.* | 397,803 | 25,602,601 | ||||||||||
Tandem Diabetes Care, Inc.* | 732,007 | 27,530,783 | ||||||||||
West Pharmaceutical Services, Inc. | 235,498 | 24,943,948 | ||||||||||
| Health care providers & services—2.7% | ||||||||||||
Encompass Health Corp. | 348,769 | 23,472,154 | ||||||||||
HealthEquity, Inc.* | 752,482 | 69,077,848 | ||||||||||
Tivity Health, Inc.* | 992,903 | 34,165,792 | ||||||||||
| Health care technology—4.3% | ||||||||||||
Evolent Health, Inc., Class A* | 1,633,453 | 36,262,656 | ||||||||||
Medidata Solutions, Inc.* | 511,726 | 35,974,338 | ||||||||||
Omnicell, Inc.* | 500,403 | 35,378,492 | ||||||||||
Teladoc Health, Inc.* | 1,357,735 | 94,145,345 | ||||||||||
| Hotels, restaurants & leisure—5.4% | ||||||||||||
Dave & Buster’s Entertainment, Inc. | 803,966 | 47,876,175 | ||||||||||
Penn National Gaming, Inc.* | 2,403,342 | 58,353,144 | ||||||||||
Planet Fitness, Inc., Class A* | 2,133,092 | 104,713,486 | ||||||||||
Wingstop, Inc. | 712,878 | 44,640,421 | ||||||||||
| Household durables—1.0% | ||||||||||||
Universal Electronics, Inc.* | 1,502,697 | 46,989,335 | ||||||||||
| Insurance—0.9% | ||||||||||||
Enstar Group Ltd.* | 244,572 | 44,414,275 | ||||||||||
| Internet & direct marketing retail—2.0% | ||||||||||||
Etsy, Inc.* | 568,092 | 24,155,272 | ||||||||||
Nutrisystem, Inc. | 1,957,557 | 69,610,727 | ||||||||||
| IT services—1.2% | ||||||||||||
Everi Holdings, Inc.* | 4,272,139 | 30,759,401 | ||||||||||
EVO Payments, Inc., Class A* | 975,000 | 23,146,500 | ||||||||||
| Life sciences tools & services—1.8% | ||||||||||||
NeoGenomics, Inc.* | 2,002,651 | 36,928,884 | ||||||||||
PRA Health Sciences, Inc.* | 504,819 | 48,901,817 | ||||||||||
| Machinery—6.0% | ||||||||||||
Chart Industries, Inc.* | 1,216,688 | 82,795,618 | ||||||||||
Graco, Inc. | 947,349 | 38,490,790 | ||||||||||
John Bean Technologies Corp. | 684,254 | 71,141,888 | ||||||||||
Kennametal, Inc. | 890,978 | 31,585,170 | ||||||||||
Woodward, Inc. | 777,879 | 57,283,010 | ||||||||||
| Multiline retail—1.5% | ||||||||||||
Ollie’s Bargain Outlet Holdings, Inc.* | 764,657 | 71,036,635 | ||||||||||
| Oil, Gas & Consumable Fuels—0.6% | ||||||||||||
Viper Energy Partners LP | 825,400 | 29,681,384 | ||||||||||
| Pharmaceuticals—1.8% | ||||||||||||
Cymabay Therapeutics, Inc.* | 2,061,772 | 21,751,695 | ||||||||||
Horizon Pharma PLC* | 1,805,886 | 32,885,184 | ||||||||||
Zogenix, Inc.* | 693,531 | 28,961,854 | ||||||||||
| Professional services—0.3% | ||||||||||||
WageWorks, Inc.* | 368,864 | 14,684,476 | ||||||||||
| Road & rail—1.2% | ||||||||||||
Landstar System, Inc. | 583,979 | 58,450,458 | ||||||||||
| The accompanying notes are an integral part of the financial statements. | 21 |
Investment Portfolios
| 10.31.2018 |
| CARILLON EAGLE SMALL CAP GROWTH FUND (cont’d) | ||||||||||||
| COMMON STOCKS—99.5% | Shares | Value | ||||||||||
| Semiconductors & semiconductor equipment—2.3% | ||||||||||||
Cabot Microelectronics Corp. | 252,552 | $24,654,126 | ||||||||||
Entegris, Inc. | 2,077,267 | 55,130,666 | ||||||||||
Silicon Laboratories, Inc.* | 367,464 | 29,959,340 | ||||||||||
| Software—11.7% | ||||||||||||
Alarm.com Holdings, Inc.* | 648,459 | 28,843,456 | ||||||||||
Cornerstone OnDemand, Inc.* | 1,509,541 | 74,344,894 | ||||||||||
Ellie Mae, Inc.* | 355,896 | 23,588,787 | ||||||||||
Guidewire Software, Inc.* | 636,923 | 56,667,039 | ||||||||||
Manhattan Associates, Inc.* | 785,826 | 37,515,333 | ||||||||||
Pegasystems, Inc. | 1,065,831 | 57,043,275 | ||||||||||
Proofpoint, Inc.* | 486,515 | 44,248,539 | ||||||||||
PTC, Inc.* | 423,284 | 34,882,835 | ||||||||||
RealPage, Inc.* | 1,568,452 | 83,127,956 | ||||||||||
SailPoint Technologies Holding, Inc.* | 1,373,769 | 35,772,945 | ||||||||||
Tableau Software, Inc., Class A* | 363,248 | 38,751,297 | ||||||||||
The Ultimate Software Group, Inc.* | 126,956 | 33,850,278 | ||||||||||
| Specialty retail—4.9% | ||||||||||||
At Home Group, Inc.* | 1,336,549 | 36,541,250 | ||||||||||
Camping World Holdings, Inc., Class A | 1,670,876 | 28,655,523 | ||||||||||
Floor & Decor Holdings, Inc., Class A* | 953,632 | 24,393,907 | ||||||||||
Genesco, Inc.* | 920,238 | 39,376,984 | ||||||||||
MarineMax, Inc.* | 1,861,655 | 42,371,268 | ||||||||||
National Vision Holdings, Inc.* | 1,387,401 | 57,480,023 | ||||||||||
| Textiles, apparel & luxury goods—1.1% | ||||||||||||
Steven Madden Ltd. | 1,684,619 | 52,678,036 | ||||||||||
| Total common stocks (cost $3,630,159,934) | 4,665,343,835 | |||||||||||
| Total investment portfolio (cost $3,630,159,934)—99.5% |
| 4,665,343,835 | ||||||||||
Other assets in excess of liabilities—0.5% | 25,490,508 | |||||||||||
| Total net assets—100.0% | $4,690,834,343 | |||||||||||
* Non-income producing security
| Sector allocation (unaudited) | ||||
| Sector | Percent of net assets | |||
| Health care | 29.5% | |||
| Information technology | 20.3% | |||
| Consumer discretionary | 18.4% | |||
| Industrials | 15.3% | |||
| Financials | 7.7% | |||
| Materials | 4.1% | |||
| Consumer staples | 1.6% | |||
| Real estate | 1.2% | |||
| Communication services | 0.8% | |||
| Energy | 0.6% | |||
| 22 | The accompanying notes are an integral part of the financial statements. |
Investment Portfolios
| 10.31.2018 |
| CARILLON SCOUT INTERNATIONAL FUND (cont’d) | ||||||||||||
| COMMON STOCKS—91.4% | Shares | Value | ||||||||||
| Switzerland—10.6% | ||||||||||||
ABB Ltd. | 597,452 | $ 12,021,655 | ||||||||||
Adecco Group AG | 221,868 | 10,864,883 | ||||||||||
Coca-Cola HBC AG* | 322,404 | 9,523,366 | ||||||||||
Givaudan S.A. | 5,485 | 13,295,192 | ||||||||||
Nestle S.A., Sponsored ADR | 171,636 | 14,465,482 | ||||||||||
Novartis AG, Sponsored ADR | 145,343 | 12,711,699 | ||||||||||
Roche Holding AG | 60,357 | 14,688,625 | ||||||||||
| Taiwan—2.4% | ||||||||||||
Largan Precision Co. Ltd. | 87,500 | 9,560,551 | ||||||||||
MediaTek, Inc. | 1,346,930 | 9,949,284 | ||||||||||
| Turkey—0.8% | ||||||||||||
Turkiye Garanti Bankasi AS | 5,493,719 | 6,910,652 | ||||||||||
| United Kingdom—12.5% | ||||||||||||
British American Tobacco PLC | 285,245 | 12,365,450 | ||||||||||
Compass Group PLC | 641,996 | 12,627,298 | ||||||||||
Diageo PLC, Sponsored ADR | 96,906 | 13,388,533 | ||||||||||
Next PLC | 206,119 | 13,693,066 | ||||||||||
Prudential PLC, Sponsored ADR | 338,212 | 13,470,984 | ||||||||||
Reckitt Benckiser Group PLC | 179,000 | 14,474,680 | ||||||||||
Royal Dutch Shell PLC, Class B, Sponsored ADR | 203,615 | 13,379,542 | ||||||||||
WPP PLC | 842,844 | 9,537,399 | ||||||||||
| United States—5.4% | ||||||||||||
Aflac, Inc. | 326,754 | 14,073,295 | ||||||||||
Credicorp Ltd. | 77,045 | 17,389,827 | ||||||||||
Mettler-Toledo International, Inc.* | 23,765 | 12,995,177 | ||||||||||
| Total common stocks (cost $560,800,671) | 753,368,401 | |||||||||||
| PREFERRED STOCKS—5.4% | ||||||||||||
| Colombia—1.6% | ||||||||||||
Bancolombia S.A., Sponsored ADR | 346,990 | 12,817,811 | ||||||||||
| Germany—3.8% | ||||||||||||
Henkel AG & Co. KGaA, Sponsored ADR | 109,579 | 11,982,464 | ||||||||||
Volkswagen AG | 115,109 | 19,338,546 | ||||||||||
| Total preferred stocks (cost $32,616,529) | 44,138,821 | |||||||||||
| Total investment portfolio (cost $593,417,200)—96.8% |
| 797,507,222 | ||||||||||
Other assets in excess of liabilities—3.2% | 26,658,389 | |||||||||||
| Total net assets—100.0% | $824,165,611 | |||||||||||
ADR—American depository receipt
* Non-income producing security
| Sector allocation (unaudited) | ||||
| Sector | Percent of net assets | |||
| Financials | 23.1% | |||
| Consumer staples | 14.9% | |||
| Industrials | 12.7% | |||
| Health care | 11.4% | |||
| Energy | 8.3% | |||
| Consumer discretionary | 7.7% | |||
| Sector allocation (unaudited) (cont’d) | ||||
| Sector | Percent of net assets | |||
| Materials | 7.5% | |||
| Information technology | 7.4% | |||
| Communication services | 3.8% | |||
| Industry allocation (unaudited) | ||||||||
| Industry | Value | Percent of net assets | ||||||
| Banks | $90,692,786 | 11.0% | ||||||
| Insurance | 71,590,487 | 8.7% | ||||||
| Oil, gas & consumable fuels | 68,485,628 | 8.3% | ||||||
| Pharmaceuticals | 52,004,923 | 6.3% | ||||||
| Chemicals | 50,643,988 | 6.1% | ||||||
| Machinery | 46,641,362 | 5.7% | ||||||
| Household products | 38,991,923 | 4.7% | ||||||
| Food products | 25,090,768 | 3.0% | ||||||
| Semiconductors & semiconductor equipment | 23,355,224 | 2.8% | ||||||
| Beverages | 22,911,899 | 2.8% | ||||||
| Electronic equipment, instruments & components | 20,291,052 | 2.5% | ||||||
| Automobiles | 19,338,546 | 2.4% | ||||||
| Software | 17,129,592 | 2.1% | ||||||
| Diversified financial services | 15,873,725 | 1.9% | ||||||
| Multiline retail | 13,693,067 | 1.7% | ||||||
| Diversified telecommunication services | 13,410,506 | 1.6% | ||||||
| Airlines | 13,142,844 | 1.6% | ||||||
| Food & staples retailing | 13,141,502 | 1.6% | ||||||
| Life sciences tools & services | 12,995,177 | 1.6% | ||||||
| Hotels, restaurants & leisure | 12,627,298 | 1.5% | ||||||
| Capital markets | 12,422,937 | 1.5% | ||||||
| Tobacco | 12,365,450 | 1.5% | ||||||
| Electrical equipment | 12,021,655 | 1.5% | ||||||
| Industrial conglomerates | 11,276,911 | 1.4% | ||||||
| Professional services | 10,864,884 | 1.3% | ||||||
| Biotechnology | 10,855,056 | 1.3% | ||||||
| Metals & mining | 10,795,776 | 1.3% | ||||||
| Construction & engineering | 10,793,842 | 1.3% | ||||||
| Health care providers & services | 10,449,476 | 1.3% | ||||||
| Personal products | 10,178,834 | 1.2% | ||||||
| Auto components | 10,147,133 | 1.2% | ||||||
| Media | 9,537,399 | 1.2% | ||||||
| Wireless telecommunication services | 8,274,183 | 1.0% | ||||||
| Health care equipment & supplies | 7,847,142 | 1.0% | ||||||
| Textiles, apparel & luxury goods | 7,624,247 | 0.9% | ||||||
| The accompanying notes are an integral part of the financial statements. | 23 |
Investment Portfolios
| 10.31.2018 |
| COMMON STOCKS—96.7% | Shares | Value | ||||||||||
| Electric utilities—4.2% | ||||||||||||
Evergy, Inc. | 816,323 | $ 45,705,925 | ||||||||||
FirstEnergy Corp. | 331,550 | 12,360,184 | ||||||||||
Xcel Energy, Inc. | 934,800 | 45,814,548 | ||||||||||
| Electrical equipment—1.3% | ||||||||||||
Acuity Brands, Inc. | 88,325 | 11,097,153 | ||||||||||
Rockwell Automation, Inc. | 127,375 | 20,982,484 | ||||||||||
| Electronic equipment, instruments & components—1.6% | ||||||||||||
IPG Photonics Corp.* | 63,900 | 8,533,845 | ||||||||||
Keysight Technologies, Inc.* | 521,850 | 29,787,198 | ||||||||||
| Energy equipment & services—1.2% | ||||||||||||
Ensco PLC, Class A | 3,557,500 | 25,400,550 | ||||||||||
Patterson-UTI Energy, Inc. | 299,350 | 4,981,184 | ||||||||||
| Entertainment—2.1% | ||||||||||||
Live Nation Entertainment, Inc.* | 170,450 | 8,914,535 | ||||||||||
Take-Two Interactive Software, Inc.* | 237,300 | 30,580,851 | ||||||||||
The Madison Square Garden Co., Class A* | 43,619 | 12,065,888 | ||||||||||
| Equity real estate investment trusts (REITs)—9.1% | ||||||||||||
Cousins Properties, Inc. | 3,156,440 | 26,230,016 | ||||||||||
EPR Properties | 631,299 | 43,395,493 | ||||||||||
Host Hotels & Resorts, Inc. | 2,115,559 | 40,428,333 | ||||||||||
Lamar Advertising Co., Class A | 350,698 | 25,713,177 | ||||||||||
Mid-America Apartment Communities, Inc. | 453,250 | 44,287,058 | ||||||||||
Omega Healthcare Investors, Inc. | 847,973 | 28,279,900 | ||||||||||
OUTFRONT Media, Inc. | 973,131 | 17,243,881 | ||||||||||
| Food & staples retailing—0.6% | ||||||||||||
Casey’s General Stores, Inc. | 125,500 | 15,826,805 | ||||||||||
| Food products—1.0% | ||||||||||||
Hormel Foods Corp. | 256,775 | 11,205,661 | ||||||||||
Tyson Foods, Inc., Class A | 236,900 | 14,195,048 | ||||||||||
| Gas utilities—2.9% | ||||||||||||
Atmos Energy Corp. | 513,099 | 47,759,255 | ||||||||||
ONE Gas, Inc. | 297,931 | 23,509,735 | ||||||||||
| Health care equipment & supplies—4.7% | ||||||||||||
ABIOMED, Inc.* | 43,750 | 14,927,500 | ||||||||||
Align Technology, Inc.* | 109,050 | 24,121,860 | ||||||||||
Edwards Lifesciences Corp.* | 260,450 | 38,442,420 | ||||||||||
Masimo Corp.* | 264,525 | 30,579,090 | ||||||||||
Teleflex, Inc. | 36,700 | 8,835,158 | ||||||||||
| Health care providers & services—1.2% | ||||||||||||
Humana, Inc. | 27,160 | 8,702,335 | ||||||||||
Molina Healthcare, Inc.* | 161,997 | 20,536,360 | ||||||||||
| Health care technology—0.4% | ||||||||||||
Veeva Systems, Inc., Class A* | 104,425 | 9,539,224 | ||||||||||
| Hotels, restaurants & leisure—3.7% | ||||||||||||
Cracker Barrel Old Country Store, Inc. | 68,300 | 10,837,844 | ||||||||||
Darden Restaurants, Inc. | 181,750 | 19,365,462 | ||||||||||
Hilton Grand Vacations, Inc.* | 352,675 | 9,476,377 | ||||||||||
Royal Caribbean Cruises Ltd. | 130,675 | 13,685,593 | ||||||||||
Six Flags Entertainment Corp. | 226,100 | 12,177,746 | ||||||||||
Texas Roadhouse, Inc. | 165,569 | 10,010,302 | ||||||||||
Vail Resorts, Inc. | 59,200 | 14,878,144 | ||||||||||
| Household durables—1.7% | ||||||||||||
D.R. Horton, Inc. | 377,050 | 13,558,718 | ||||||||||
Garmin Ltd. | 209,525 | 13,862,174 | ||||||||||
PulteGroup, Inc. | 608,825 | 14,958,830 | ||||||||||
| 24 | The accompanying notes are an integral part of the financial statements. |
Investment Portfolios
| 10.31.2018 |
| CARILLON SCOUT MID CAP FUND (cont’d) | ||||||||||||
| COMMON STOCKS—96.7% | Shares | Value | ||||||||||
| Household products—0.5% | ||||||||||||
The Clorox Co. | 81,500 | $12,098,675 | ||||||||||
| Insurance—5.1% | ||||||||||||
Arch Capital Group Ltd.* | 306,525 | 8,696,114 | ||||||||||
Everest Re Group Ltd. | 112,750 | 24,563,715 | ||||||||||
Lincoln National Corp. | 218,975 | 13,180,105 | ||||||||||
The Hanover Insurance Group, Inc. | 213,900 | 23,824,182 | ||||||||||
The Hartford Financial Services Group, Inc. | 281,225 | 12,773,240 | ||||||||||
White Mountains Insurance Group Ltd. | 16,275 | 14,430,554 | ||||||||||
W.R. Berkley Corp. | 391,275 | 29,697,773 | ||||||||||
| Interactive media & services—1.0% | ||||||||||||
IAC/InterActiveCorp* | 82,475 | 16,213,760 | ||||||||||
Match Group, Inc.* | 180,475 | 9,334,167 | ||||||||||
| Internet & direct marketing retail—0.6% | ||||||||||||
eBay, Inc.* | 115,300 | 3,347,159 | ||||||||||
Expedia Group, Inc. | 97,700 | 12,254,511 | ||||||||||
| IT services—3.4% | ||||||||||||
DXC Technology Co. | 506,000 | 36,851,980 | ||||||||||
Fiserv, Inc.* | 43,150 | 3,421,795 | ||||||||||
Jack Henry & Associates, Inc. | 94,350 | 14,136,461 | ||||||||||
Paychex, Inc. | 320,000 | 20,956,800 | ||||||||||
Science Applications International Corp. | 140,608 | 9,773,662 | ||||||||||
| Leisure products—0.1% | ||||||||||||
Brunswick Corp. | 62,800 | 3,264,972 | ||||||||||
| Machinery—0.8% | ||||||||||||
AGCO Corp. | 52,075 | 2,918,283 | ||||||||||
Allison Transmission Holdings, Inc. | 98,175 | 4,327,554 | ||||||||||
The Timken Co. | 86,550 | 3,423,052 | ||||||||||
Xylem Inc. | 150,325 | 9,858,314 | ||||||||||
| Marine—0.4% | ||||||||||||
Kirby Corp.* | 123,400 | 8,877,396 | ||||||||||
| Metals & mining—0.6% | ||||||||||||
Newmont Mining Corp. | 412,075 | 12,741,359 | ||||||||||
Steel Dynamics, Inc. | 62,300 | 2,467,080 | ||||||||||
| Mortgage real estate investment trusts (REITs)—2.0% | ||||||||||||
AGNC Investment Corp. | 2,829,850 | 50,484,524 | ||||||||||
| Multiline retail—0.3% | ||||||||||||
Big Lots, Inc. | 180,625 | 7,499,550 | ||||||||||
| Multi-utilities—2.2% | ||||||||||||
CMS Energy Corp. | 1,095,000 | 54,224,400 | ||||||||||
| Oil, gas & consumable fuels—3.6% | ||||||||||||
Cabot Oil & Gas Corp. | 420,600 | 10,191,138 | ||||||||||
HollyFrontier Corp. | 231,100 | 15,585,384 | ||||||||||
Marathon Petroleum Corp. | 70,650 | 4,977,293 | ||||||||||
Newfield Exploration Co.* | 1,536,465 | 31,036,593 | ||||||||||
PBF Energy, Inc., Class A | 199,600 | 8,353,260 | ||||||||||
WPX Energy, Inc.* | 1,121,275 | 17,985,251 | ||||||||||
| Pharmaceuticals—0.6% | ||||||||||||
Nektar Therapeutics* | 99,925 | 3,865,099 | ||||||||||
Supernus Pharmaceuticals, Inc.* | 243,325 | 11,572,537 | ||||||||||
| Road & rail—1.1% | ||||||||||||
AMERCO | 22,575 | 7,370,286 | ||||||||||
Norfolk Southern Corp. | 72,000 | 12,083,760 | ||||||||||
Old Dominion Freight Line, Inc. | 53,775 | 7,013,335 | ||||||||||
| COMMON STOCKS—96.7% | Shares | Value | ||||||||||
| Semiconductors & semiconductor equipment—3.1% | ||||||||||||
ON Semiconductor Corp.* | 1,764,300 | $ 29,993,100 | ||||||||||
Skyworks Solutions, Inc. | 55,903 | 4,850,144 | ||||||||||
Universal Display Corp. | 103,875 | 12,777,664 | ||||||||||
Xilinx, Inc. | 348,925 | 29,787,727 | ||||||||||
| Software—4.2% | ||||||||||||
Aspen Technology, Inc.* | 91,075 | 7,731,357 | ||||||||||
Ellie Mae, Inc.* | 116,200 | 7,701,736 | ||||||||||
Proofpoint, Inc.* | 73,500 | 6,684,825 | ||||||||||
Red Hat, Inc.* | 64,925 | 11,143,727 | ||||||||||
ServiceNow, Inc.* | 178,425 | 32,302,062 | ||||||||||
Splunk, Inc.* | 82,425 | 8,229,312 | ||||||||||
Workday, Inc., Class A* | 223,175 | 29,686,738 | ||||||||||
| Specialty retail—4.4% | ||||||||||||
American Eagle Outfitters, Inc. | 611,800 | 14,108,108 | ||||||||||
Best Buy Co., Inc. | 173,300 | 12,158,728 | ||||||||||
Foot Locker, Inc. | 257,025 | 12,116,159 | ||||||||||
O’Reilly Automotive, Inc.* | 51,675 | 16,574,756 | ||||||||||
Ross Stores, Inc. | 210,400 | 20,829,600 | ||||||||||
Tractor Supply Co. | 184,025 | 16,910,057 | ||||||||||
Ulta Beauty, Inc.* | 56,850 | 15,606,462 | ||||||||||
| Technology hardware, storage & peripherals—0.3% | ||||||||||||
Pure Storage, Inc., Class A* | 352,725 | 7,117,991 | ||||||||||
| Textiles, apparel & luxury goods—0.5% | ||||||||||||
Ralph Lauren Corp. | 62,650 | 8,120,067 | ||||||||||
Tapestry, Inc. | 70,275 | 2,973,335 | ||||||||||
| Trading companies & distributors—2.3% | ||||||||||||
United Rentals, Inc.* | 308,275 | 37,014,579 | ||||||||||
W.W. Grainger, Inc. | 73,062 | 20,747,416 | ||||||||||
| Water utilities—1.2% | ||||||||||||
American Water Works Co., Inc. | 324,000 | 28,683,720 | ||||||||||
| Wireless telecommunication services—0.9% | ||||||||||||
Sprint Corp.* | 3,752,274 | 22,963,917 | ||||||||||
| Total common stocks (cost $2,234,959,007) | 2,392,488,990 | |||||||||||
| Total investment portfolio (cost $2,234,959,007)—96.7% |
| 2,392,488,990 | ||||||||||
Other assets in excess of liabilities—3.3% | 81,200,167 | |||||||||||
| Total net assets—100.0% | $2,473,689,157 | |||||||||||
* Non-income producing security
| Sector allocation (unaudited) | ||||
| Sector | Percent of net assets | |||
| Information technology | 14.5% | |||
| Industrials | 13.7% | |||
| Financials | 13.3% | |||
| Consumer discretionary | 12.8% | |||
| Utilities | 10.4% | |||
| Real estate | 9.1% | |||
| Health care | 8.4% | |||
| Energy | 4.8% | |||
| The accompanying notes are an integral part of the financial statements. | 25 |
Investment Portfolios
| 10.31.2018 |
| CARILLON SCOUT MID CAP FUND (cont’d) | ||||
| Sector allocation (unaudited) (cont’d) | ||||
| Sector | Percent of net assets | |||
| Communication services | 4.1% | |||
| Materials | 3.3% | |||
| Consumer staples | 2.3% | |||
| COMMON STOCKS—99.5% | Shares | Value | ||||||||||
| Health care providers & services—12.9% | ||||||||||||
AMN Healthcare Services, Inc.* | 106,477 | $ 5,389,866 | ||||||||||
BioTelemetry, Inc.* | 137,489 | 7,988,111 | ||||||||||
HealthEquity, Inc.* | 73,906 | 6,784,571 | ||||||||||
LHC Group, Inc.* | 58,983 | 5,392,791 | ||||||||||
Molina Healthcare, Inc.* | 62,136 | 7,876,981 | ||||||||||
U.S. Physical Therapy, Inc. | 71,476 | 7,685,099 | ||||||||||
| Health care technology—4.5% | ||||||||||||
HMS Holdings Corp.* | 149,577 | 4,310,809 | ||||||||||
Omnicell, Inc.* | 142,109 | 10,047,106 | ||||||||||
| Hotels, restaurants & leisure—4.4% | ||||||||||||
Cracker Barrel Old Country Store, Inc. | 25,913 | 4,111,875 | ||||||||||
Dave & Buster’s Entertainment, Inc. | 71,400 | 4,251,870 | ||||||||||
Lindblad Expeditions Holdings, Inc.* | 179,555 | 2,425,788 | ||||||||||
The Cheesecake Factory, Inc. | 67,489 | 3,262,418 | ||||||||||
| Household durables—3.0% | ||||||||||||
Installed Building Products, Inc.* | 77,897 | 2,372,743 | ||||||||||
iRobot Corp.* | 51,429 | 4,534,495 | ||||||||||
LGI Homes, Inc.* | 57,880 | 2,476,685 | ||||||||||
| Insurance—1.0% | ||||||||||||
CNO Financial Group, Inc. | 170,582 | 3,224,000 | ||||||||||
| Internet & direct marketing retail—0.7% | ||||||||||||
PetMed Express, Inc. | 78,164 | 2,183,902 | ||||||||||
| IT services—3.0% | ||||||||||||
Carbonite, Inc.* | 181,815 | 6,219,891 | ||||||||||
Virtusa Corp.* | 66,913 | 3,318,216 | ||||||||||
| Life sciences tools & services—5.4% | ||||||||||||
Bruker Corp. | 182,267 | 5,710,425 | ||||||||||
Cambrex Corp.* | 86,930 | 4,632,500 | ||||||||||
PRA Health Sciences, Inc.* | 72,386 | 7,012,032 | ||||||||||
| Machinery—4.9% | ||||||||||||
Albany International Corp., Class A | 68,855 | 4,818,473 | ||||||||||
Chart Industries, Inc.* | 50,897 | 3,463,541 | ||||||||||
Proto Labs, Inc.* | 61,034 | 7,290,511 | ||||||||||
| Metals & mining—0.5% | ||||||||||||
Carpenter Technology Corp. | 36,359 | 1,585,616 | ||||||||||
| Oil, gas & consumable fuels—0.3% | ||||||||||||
Gulfport Energy Corp.* | 107,325 | 977,731 | ||||||||||
| Pharmaceuticals—3.0% | ||||||||||||
Amneal Pharmaceuticals, Inc.* | 103,119 | 1,902,545 | ||||||||||
Supernus Pharmaceuticals, Inc.* | 158,660 | 7,545,870 | ||||||||||
| Professional services—4.9% | ||||||||||||
InnerWorkings, Inc.* | 490,720 | 3,528,277 | ||||||||||
Insperity, Inc. | 77,949 | 8,562,697 | ||||||||||
WageWorks, Inc.* | 84,233 | 3,353,316 | ||||||||||
| Semiconductors & semiconductor equipment—6.0% | ||||||||||||
Ambarella, Inc.* | 70,320 | 2,445,730 | ||||||||||
Entegris, Inc. | 111,293 | 2,953,716 | ||||||||||
Impinj, Inc.* | 86,857 | 1,702,397 | ||||||||||
Inphi Corp.* | 68,539 | 2,193,248 | ||||||||||
Power Integrations, Inc. | 56,083 | 3,158,594 | ||||||||||
Semtech Corp.* | 151,171 | 6,793,625 | ||||||||||
| Software—8.0% | ||||||||||||
Envestnet, Inc.* | 87,803 | 4,567,512 | ||||||||||
j2 Global, Inc. | 79,076 | 5,759,896 | ||||||||||
| 26 | The accompanying notes are an integral part of the financial statements. |
Investment Portfolios
| 10.31.2018 |
| CARILLON SCOUT SMALL CAP FUND (cont’d) | ||||||||||||
| COMMON STOCKS—99.5% | Shares | Value | ||||||||||
| Software (cont’d) | ||||||||||||
Pegasystems, Inc. | 97,138 | $ 5,198,826 | ||||||||||
The Descartes Systems Group, Inc.* | 119,366 | 3,651,406 | ||||||||||
The Trade Desk, Inc., Class A* | 51,812 | 6,401,372 | ||||||||||
| Specialty retail—2.8% | ||||||||||||
Camping World Holdings, Inc., Class A | 79,800 | 1,368,570 | ||||||||||
Monro, Inc. | 102,696 | 7,640,582 | ||||||||||
| Technology hardware, storage & peripherals—0.9% | ||||||||||||
Electronics For Imaging, Inc.* | 92,011 | 2,801,735 | ||||||||||
| Textiles, apparel & luxury goods—1.1% | ||||||||||||
G-III Apparel Group Ltd.* | 89,201 | 3,555,552 | ||||||||||
| Thrifts & mortgage finance—2.5% | ||||||||||||
Axos Financial, Inc.* | 125,244 | 3,802,408 | ||||||||||
LendingTree, Inc.* | 20,588 | 4,152,394 | ||||||||||
| Total common stocks (cost $214,866,767) | 317,389,959 | |||||||||||
| Total investment portfolio (cost $214,866,767)—99.5% |
| 317,389,959 | ||||||||||
Other assets in excess of liabilities—0.5% | 1,579,237 | |||||||||||
| Total net assets—100.0% | $318,969,196 | |||||||||||
* Non-income producing security
| Sector allocation (unaudited) | ||||
| Sector | Percent of net assets | |||
| Health care | 32.2% | |||
| Information technology | 22.8% | |||
| Industrials | 16.9% | |||
| Consumer discretionary | 14.2% | |||
| Financials | 7.8% | |||
| Materials | 2.1% | |||
| Real estate | 1.5% | |||
| Consumer staples | 1.4% | |||
| Energy | 0.6% | |||
| CORPORATE BONDS—22.9% | Principal Amount | Value | ||||||||||
| Auto manufacturers (cont’d) | ||||||||||||
Daimler Finance North America LLC, (cont’d) | ||||||||||||
144A, 2.30%, 01/06/20 (a) | $ 560,000 | $ 553,012 | ||||||||||
144A, 3.35%, 05/04/21 (a) | 1,080,000 | 1,071,773 | ||||||||||
Ford Motor Credit Co. LLC, 3.81%, 10/12/21 | 435,000 | 425,877 | ||||||||||
| Banks—7.4% | ||||||||||||
Bank of America Corp., 3.50%, 04/19/26 | 595,000 | 566,060 | ||||||||||
Citibank NA, 3.40%, 07/23/21 | 895,000 | 891,232 | ||||||||||
JPMorgan Chase & Co., | ||||||||||||
2.55%, 03/01/21 | 540,000 | 529,232 | ||||||||||
2.75%, 06/23/20 | 320,000 | 316,946 | ||||||||||
(3 Month LIBOR USD + 0.55%), 2.88%, 03/09/21 | 1,880,000 | 1,882,416 | ||||||||||
UBS AG, 144A, 2.45%, 12/01/20 (a) | 415,000 | 405,964 | ||||||||||
U.S. Bank NA, 3.15%, 04/26/21 | 1,130,000 | 1,125,510 | ||||||||||
Wells Fargo & Co., | ||||||||||||
2.60%, 07/22/20 | 795,000 | 784,575 | ||||||||||
(3 Month LIBOR USD + 1.23%), 3.76%, 10/31/23 | 1,475,000 | 1,495,748 | ||||||||||
| Chemicals—0.3% | ||||||||||||
The Sherwin-Williams Co., 2.25%, 05/15/20 | 315,000 | 309,626 | ||||||||||
| Consumer finance—1.2% | ||||||||||||
American Express Co., 2.20%, 10/30/20 | 665,000 | 649,347 | ||||||||||
American Express Credit Corp., | ||||||||||||
1.88%, 05/03/19 | 95,000 | 94,484 | ||||||||||
2.60%, 09/14/20 | 540,000 | 532,689 | ||||||||||
| Diversified telecommunication services—0.5% | ||||||||||||
AT&T, Inc., | ||||||||||||
3.80%, 03/01/24 | 280,000 | 274,828 | ||||||||||
4.25%, 03/01/27 | 245,000 | 237,623 | ||||||||||
| Food products—0.1% | ||||||||||||
Campbell Soup Co., (3 Month LIBOR USD + 0.63%), 2.96%, 03/15/21 | 90,000 | 89,661 | ||||||||||
| Health care providers & services—0.4% | ||||||||||||
CVS Health Corp., 3.70%, 03/09/23 | 460,000 | 454,485 | ||||||||||
| Healthcare-services—1.3% | ||||||||||||
Halfmoon Parent, Inc., 144A, 3.20%, 09/17/20 (a) | 1,420,000 | 1,412,327 | ||||||||||
| Insurance—4.8% | ||||||||||||
American International Group, Inc., 6.40%, 12/15/20 | 535,000 | 564,653 | ||||||||||
Jackson National Life Global Funding (3 Month LIBOR USD + 0.30%), 144A, 2.81%, 04/27/20 (a) | 2,080,000 | 2,080,416 | ||||||||||
MassMutual Global Funding II, 144A, 1.95%, 09/22/20 (a) | 875,000 | 854,291 | ||||||||||
Metropolitan Life Global Funding I (3 Month LIBOR USD + 0.23%), 144A, 2.64%, 01/08/21 (a) | 1,275,000 | 1,273,716 | ||||||||||
Reliance Standard Life Global Funding II, 144A, 2.50%, 01/15/20 (a) | 385,000 | 381,101 | ||||||||||
| Tobacco—0.8% | ||||||||||||
Philip Morris International, Inc., 2.00%, 02/21/20 | 850,000 | 837,318 | ||||||||||
| Transportation—1.8% | ||||||||||||
Burlington Northern and Santa Fe Railway Co., Pass Through Trust, | ||||||||||||
Series 2001-2, 6.46%, 01/15/21 | 120,194 | 122,816 | ||||||||||
Series 2004-1, 4.58%, 01/15/21 | 245,510 | 247,569 | ||||||||||
CSX Transportation, Inc., 6.25%, 01/15/23 | 226,287 | 243,507 | ||||||||||
Union Pacific Railroad Co., Pass Through Trust, | ||||||||||||
Series 2004, 5.40%, 07/02/25 | 291,454 | 296,617 | ||||||||||
Series 2005, 5.08%, 01/02/29 | 560,928 | 585,246 | ||||||||||
Series 2006, 5.87%, 07/02/30 | 456,183 | 493,539 | ||||||||||
| Total corporate bonds (cost $24,829,864) | 24,671,586 | |||||||||||
| The accompanying notes are an integral part of the financial statements. | 27 |
Investment Portfolios
| 10.31.2018 |
| CARILLON REAMS CORE BOND FUND (cont’d) | ||||||||||||
| MORTGAGE AND ASSET-BACKED SECURITIES—25.1% | Principal Amount | Value | ||||||||||
| Commercial mortgage-backed securities—3.3% | ||||||||||||
CFCRE Commercial Mortgage Trust, Series 2016-C3, Class A3, 3.87%, 01/10/48 | $ 800,000 | $ 795,027 | ||||||||||
COMM Mortgage Trust, Series 2013-CCRE9, Class ASB, 3.83%, 07/12/45 | 602,033 | 607,912 | ||||||||||
GS Mortgage Securities Trust, | ||||||||||||
Series 2012-GCJ7, Class A4, 3.38%, 05/12/45 | 877,445 | 876,049 | ||||||||||
Series 2013-GCJ14, Class AAB, 3.82%, 08/10/46 | 343,225 | 345,970 | ||||||||||
Morgan Stanley Bank of America Merrill Lynch Trust, Series 2015-C26, Class A3, 3.21%, 10/19/48 | 955,000 | 937,292 | ||||||||||
| Federal agency mortgage-backed obligations—21.8% | ||||||||||||
Fannie Mae Pool, | ||||||||||||
Series 1313, Class MA, 2.00%, 01/01/23 | 271,805 | 264,371 | ||||||||||
Series 1671, Class AM, 2.10%, 12/01/27 | 968,114 | 901,018 | ||||||||||
Series 2182, Class AM, 2.16%, 01/01/23 | 1,280,477 | 1,225,766 | ||||||||||
Series 2822, Class AB, 2.50%, 03/01/26 | 228,777 | 221,585 | ||||||||||
Series 5796, Class AN, 3.03%, 06/01/27 | 355,000 | 338,553 | ||||||||||
Series 6090, Class AB, 2.50%, 09/01/22 | 274,698 | 270,021 | ||||||||||
Series 8744, Class AB, 2.00%, 03/01/23 | 113,088 | 109,984 | ||||||||||
Series 8874, Class AB, 2.00%, 04/01/23 | 111,796 | 108,727 | ||||||||||
Series 9180, Class AB, 2.00%, 05/01/23 | 343,583 | 334,147 | ||||||||||
Series 9550, Class AL, 2.50%, 07/01/25 | 349,007 | 342,988 | ||||||||||
Series 387770, 3.63%, 07/01/28 | 455,000 | 449,002 | ||||||||||
Series 465468, 3.33%, 07/01/20 | 265,756 | 266,125 | ||||||||||
TBA, 3.00%, 12/15/48 | 5,490,000 | 5,187,621 | ||||||||||
TBA, 3.50%, 12/15/48 | 5,540,000 | 5,386,905 | ||||||||||
Fannie Mae-Aces, | ||||||||||||
Series 2014-M13, Class AB2, VR, 2.95%, 08/25/24 | 135,012 | 132,952 | ||||||||||
Series 2015-M11, Class A1, 2.10%, 04/25/25 | 196,204 | 194,423 | ||||||||||
Series 2016-M2, Class ABV2, 2.13%, 01/25/23 | 520,733 | 498,161 | ||||||||||
Series 2016-M3, Class ASQ2, 2.26%, 02/25/23 | 1,043,099 | 1,007,995 | ||||||||||
Series 2016-M6, Class AB2, 2.40%, 05/25/26 | 1,005,000 | 931,099 | ||||||||||
Series 2016-M7, Class AV2, 2.16%, 10/25/23 | 2,495,000 | 2,375,000 | ||||||||||
Freddie Mac Gold Pool, | ||||||||||||
Series 14660, Class G, 2.00%, 01/01/28 | 1,020,185 | 975,390 | ||||||||||
Series 15226, Class G, 4.50%, 08/01/20 | 3,633 | 3,689 | ||||||||||
Freddie Mac REMIC, | ||||||||||||
Series 3609, Class LA, 4.00%, 12/15/24 | 11,912 | 11,928 | ||||||||||
Series 4233, Class MD, 1.75%, 03/15/25 | 31,691 | 31,578 | ||||||||||
Ginnie Mae I Pool, | ||||||||||||
Series 0091, Class AD, 2.73%, 06/15/32 | 1,353,509 | 1,255,559 | ||||||||||
Series 2583, Class AB, 2.14%, 08/15/23 | 593,820 | 571,299 | ||||||||||
| Total mortgage and asset-backed securities (cost $27,596,071) |
| 26,958,136 | ||||||||||
| U.S. TREASURIES—56.8% | ||||||||||||
U.S. Treasury Bonds, | ||||||||||||
2.75%, 08/15/47 | 7,050,000 | 6,219,697 | ||||||||||
2.75%, 11/15/47 | 1,670,000 | 1,472,275 | ||||||||||
U.S. Treasury Notes, | ||||||||||||
1.25%, 10/31/21 | 335,000 | 318,878 | ||||||||||
1.63%, 10/31/23 | 11,510,000 | 10,785,230 | ||||||||||
2.25%, 11/15/27 | 11,250,000 | 10,468,213 | ||||||||||
2.50%, 01/31/25 | 6,620,000 | 6,415,194 | ||||||||||
2.88%, 04/30/25 | 20,165,000 | 19,951,534 | ||||||||||
2.88%, 08/15/28 | 5,600,000 | 5,471,156 | ||||||||||
| Total U.S. Treasuries (cost $62,609,390) | 61,102,177 | |||||||||||
| SHORT-TERM INVESTMENTS—1.1% | Principal Amount | Value | ||||||||||
| Auto manufacturers—1.1% | ||||||||||||
Ford Motor Credit Co. LLC, Commercial paper, 144A, ZCI, 3.16%, 04/15/19 (a) | $1,185,000 | $1,167,487 | ||||||||||
| Total short-term investments (cost $1,168,380) | 1,167,487 | |||||||||||
| Total investment portfolio (cost $116,203,705)—105.9% |
| 113,899,386 | ||||||||||
Liabilities in excess of other assets—(5.9)% | (6,334,741 | ) | ||||||||||
| Total net assets—100.0% | $107,564,645 | |||||||||||
(a) Restricted securities deemed to be liquid for purpose of compliance limitations on holdings of illiquid securities. At October 31, 2018, these securities aggregated $9,865,416 or 9.2% of the net assets of the Fund.
144A—Securities are purchased under Rule 144A of the Securities Act of 1933 or are private placements and, unless registered under the Securities Act of 1933 or exempted from registration, generally may only be sold to qualified institutional buyers.
TBA—To-be-announced security. Securities are being used in dollar roll transactions.
VR—Variable rate security. Interest rate adjusts periodically based on changes in current interest rates. Rate shown is the rate in effect at period end.
REMIC—Real estate mortgage investment conduit
ZCI—Zero coupon instrument. Rate disclosed is yield to maturity at October 31, 2018.
| Credit quality breakdown (unaudited)* | ||||
| Rating | Percent of net assets | |||
| AAA/Aaa | 81.9% | |||
| AA/Aa | 4.2% | |||
| A/A | 16.5% | |||
| BBB/Baa | 3.3% | |||
| BB/Ba | 0.0% | |||
| Not rated | 0.0% | |||
* The table depicts the long-term credit-quality ratings assigned to the Fund’s portfolio holdings by Standard & Poor’s® (“S&P”), Moody’s Investors Service (“Moody’s”), and Fitch Ratings Inc. (“Fitch”), each of which is a widely used independent nationally recognized statistical rating organization (“NRSRO”). NRSRO ratings are shown because they provide an independent analysis of the credit quality of the Fund’s investments. These credit quality ratings are shown without regard to gradations within a given rating category. For example, securities rated “A-” have been included in the “A” rated category. Securities may be rated by other NRSROs and these ratings may be higher or lower. When ratings from multiple agencies are available, the highest is used, consistent with the Fund’s portfolio investment process. Credit quality ratings are subject to change without notice. For more information on S&P’s rating methodology, please visit standardandpoors.com and select “Understanding Ratings” under Rating Resources on the homepage. For more information on Moody’s rating methodology, please visit moodys.com and select “Rating Methodologies” under Research & Ratings on the homepage. For more information on Fitch’s rating methodology, please visit fitchratings.com and select “Ratings Definitions” at the bottom of the homepage. Carillon Tower Advisers, Inc. (“Manager”) also performs its own fundamental credit analysis of each security. As part of its fundamental credit analysis, the Manager considers various criteria, including industry specific actions, peer comparisons, payment ranking, and structure-specific characteristics. Any securities that are not rated by S&P, Moody’s, or Fitch appear in the table as “Not rated.” However, these securities are analyzed and monitored by the Manager on an ongoing basis. Government securities that are issued or guaranteed as to principal and interest by the U.S. government are not rated, but are treated by the Fund, and reflected in the table above, as being rated AAA and Aaa for credit quality purposes.
| 28 | The accompanying notes are an integral part of the financial statements. |
Investment Portfolios
| 10.31.2018 |
| CORPORATE BONDS—21.2% | Principal Amount | Value | ||||||||||
| Insurance (cont’d) | ||||||||||||
MassMutual Global Funding II, 144A, 1.95%, 09/22/20 (a) | $ 5,920,000 | $ 5,779,889 | ||||||||||
Metropolitan Life Global Funding I, (3 Month LIBOR USD + 0.23%), 144A, 2.64%, 01/08/21 (a) | 7,515,000 | 7,507,436 | ||||||||||
Reliance Standard Life Global Funding II, 144A, 2.50%, 01/15/20 (a) | 2,050,000 | 2,029,237 | ||||||||||
| Oil, gas & consumable fuels—0.3% | ||||||||||||
Energy Transfer Operating LP, 4.05%, 03/15/25 | 2,205,000 | 2,113,331 | ||||||||||
| Tobacco—0.7% | ||||||||||||
Philip Morris International, Inc., 2.00%, 02/21/20 | 4,130,000 | 4,068,380 | ||||||||||
| Transportation—0.1% | ||||||||||||
Burlington Northern and Santa Fe Railway Co., Pass Through Trust, | ||||||||||||
Series 2001-2, 6.46%, 01/15/21 | 374,559 | 382,729 | ||||||||||
Series 2005-4, 4.97%, 04/01/23 | 355,317 | 365,654 | ||||||||||
| Total corporate bonds (cost $132,655,593) | 132,218,211 | |||||||||||
| MORTGAGE AND ASSET-BACKED SECURITIES—22.8% |
| |||||||||||
| Asset-backed securities—0.2% | ||||||||||||
Home Equity Loan Trust, Series 2006-HSA2, Class AI3, VR, 5.55%, 11/25/27 | 343,933 | 181,946 | ||||||||||
RFMSII Trust, Series 2006-HSA1, Class A4, SB, 5.99%, 02/25/36 | 753,097 | 735,095 | ||||||||||
| Commercial mortgage-backed securities—3.2% | ||||||||||||
CFCRE Commercial Mortgage Trust, Series 2016-C3, Class A3, 3.87%, 01/10/48 | 5,600,000 | 5,565,187 | ||||||||||
COMM Mortgage Trust, Series 2013-CCRE9, Class ASB, 3.83%, 07/12/45 | 3,822,433 | 3,859,760 | ||||||||||
GS Mortgage Securities Trust, | ||||||||||||
Series 2012-GCJ7, Class A4, 3.38%, 05/12/45 | 4,659,693 | 4,652,281 | ||||||||||
Series 2013-GCJ14, Class AAB, 3.82%, 08/10/46 | 2,160,865 | 2,178,151 | ||||||||||
Morgan Stanley Bank of America Merrill Lynch Trust, Series 2015-C26, Class A3, 3.21%, 10/19/48 | 4,075,000 | 3,999,440 | ||||||||||
| Federal agency mortgage-backed obligations—19.4% | ||||||||||||
Fannie Mae Pool, | ||||||||||||
Series 1313, Class MA, 2.00%, 01/01/23 | 1,183,473 | 1,151,103 | ||||||||||
Series 1500, Class MA, 2.00%, 07/01/23 | 1,046,665 | 1,022,313 | ||||||||||
Series 1671, Class AM, 2.10%, 12/01/27 | 1,875,720 | 1,745,723 | ||||||||||
Series 2182, Class AM, 2.16%, 01/01/23 | 6,560,795 | 6,280,473 | ||||||||||
Series 2822, Class AB, 2.50%, 03/01/26 | 477,083 | 462,085 | ||||||||||
Series 5796, Class AN, 3.03%, 06/01/27 | 2,045,000 | 1,950,257 | ||||||||||
Series 6090, Class AB, 2.50%, 09/01/22 | 1,310,919 | 1,288,598 | ||||||||||
Series 8744, Class AB, 2.00%, 03/01/23 | 496,781 | 483,143 | ||||||||||
Series 8874, Class AB, 2.00%, 04/01/23 | 490,874 | 477,398 | ||||||||||
Series 9180, Class AB, 2.00%, 05/01/23 | 1,605,647 | 1,561,551 | ||||||||||
Series 9550, Class AL, 2.50%, 07/01/25 | 1,650,106 | 1,621,646 | ||||||||||
Series 387770, 3.63%, 07/01/28 | 2,495,000 | 2,462,109 | ||||||||||
Series 465468, 3.33%, 07/01/20 | 566,314 | 567,100 | ||||||||||
Series 466284, 3.33%, 10/01/20 | 3,237,371 | 3,242,199 | ||||||||||
Series 466319, 3.23%, 11/01/20 | 3,141,018 | 3,139,745 | ||||||||||
TBA, 3.00%, 12/15/48 | 32,335,000 | 30,554,050 | ||||||||||
TBA, 3.50%, 12/15/48 | 29,670,000 | 28,850,083 | ||||||||||
Fannie Mae-Aces, | ||||||||||||
Series 2014-M13, Class AB2, VR, 2.95%, 08/25/24 | 667,559 | 657,373 | ||||||||||
Series 2015-M11, Class A1, 2.10%, 04/25/25 | 641,185 | 635,364 | ||||||||||
Series 2016-M2, Class ABV2, 2.13%, 01/25/23 | 2,038,206 | 1,949,856 | ||||||||||
| The accompanying notes are an integral part of the financial statements. | 29 |
Investment Portfolios
| 10.31.2018 |
| CARILLON REAMS CORE PLUS BOND FUND (cont’d) | ||||||||||||
| MORTGAGE AND ASSET-BACKED SECURITIES—22.8% | Principal Amount | Value | ||||||||||
| Federal agency mortgage-backed obligations (cont’d) |
| |||||||||||
Fannie Mae-Aces, (cont’d) | ||||||||||||
Series 2016-M3, Class ASQ2, 2.26%, 02/25/23 | $4,003,376 | $3,868,646 | ||||||||||
Series 2016-M6, Class AB2, 2.40%, 05/25/26 | 4,655,000 | 4,312,702 | ||||||||||
Series 2016-M7, Class AV2, 2.16%, 10/25/23 | 9,610,000 | 9,147,796 | ||||||||||
Freddie Mac Gold Pool, | ||||||||||||
Series 14660, Class G, 2.00%, 01/01/28 | 5,456,646 | 5,217,053 | ||||||||||
Series 15226, Class G, 4.50%, 08/01/20 | 16,010 | 16,259 | ||||||||||
Freddie Mac REMIC, | ||||||||||||
Series 3609, Class LA, 4.00%, 12/15/24 | 56,288 | 56,362 | ||||||||||
Series 4233, Class MD, 1.75%, 03/15/25 | 93,637 | 93,304 | ||||||||||
Ginnie Mae I Pool, | ||||||||||||
Series 0091, Class AD, 2.73%, 06/15/32 | 7,438,514 | 6,900,211 | ||||||||||
Series 2583, Class AB, 2.14%, 08/15/23 | 1,537,226 | 1,478,926 | ||||||||||
| Total mortgage and asset-backed securities (cost $145,031,214) |
| 142,365,288 | ||||||||||
| U.S. TREASURIES—61.4% | ||||||||||||
U.S. Treasury Bonds, | ||||||||||||
2.75%, 08/15/47 | 40,420,000 | 35,659,598 | ||||||||||
2.75%, 11/15/47 | 8,325,000 | 7,339,333 | ||||||||||
U.S. Treasury Notes, | ||||||||||||
1.25%, 10/31/21 | 1,765,000 | 1,680,059 | ||||||||||
1.63%, 10/31/23 | 88,410,000 | 82,842,933 | ||||||||||
2.25%, 11/15/27 | 83,780,000 | 77,957,944 | ||||||||||
2.50%, 01/31/25 | 37,970,000 | 36,795,303 | ||||||||||
2.88%, 04/30/25 | 112,780,000 | 111,586,118 | ||||||||||
2.88%, 08/15/28 | 30,830,000 | 30,120,669 | ||||||||||
| Total U.S. Treasuries (cost $394,712,815) | 383,981,957 | |||||||||||
| SHORT-TERM INVESTMENTS—1.1% | ||||||||||||
| Auto manufacturers—1.1% | ||||||||||||
Ford Motor Credit Co. LLC, Commercial paper, 144A, ZCI, 3.16%, 04/15/19 (a) | 6,995,000 | 6,891,624 | ||||||||||
| Total short-term investments (cost $6,896,895) | 6,891,624 | |||||||||||
| Total investment portfolio (cost $679,296,517)—106.5% |
| 665,457,080 | ||||||||||
Liabilities in excess of other assets—(6.5)% | (40,586,218 | ) | ||||||||||
| Total net assets—100.0% | $624,870,862 | |||||||||||
(a) Restricted securities deemed to be liquid for purpose of compliance limitations on holdings of illiquid securities. At October 31, 2018, these securities aggregated $58,313,893 or 9.3% of the net assets of the Fund.
144A—Securities are purchased under Rule 144A of the Securities Act of 1933 or are private placements and, unless registered under the Securities Act of 1933 or exempted from registration, generally may only be sold to qualified institutional buyers.
TBA—To-be-announced security. Securities are being used in dollar roll transactions.
VR—Variable rate security. Interest rate adjusts periodically based on changes in current interest rates. Rate shown is the rate in effect at period end.
SB—Step bond. Coupon rate will either increase (step-up bond) or decrease (step-down bond) at regular intervals until maturity. Interest rate shown is the rate in effect as of October 31, 2018.
REMIC—Real estate mortgage investment conduit
ZCI—Zero coupon instrument. Rate disclosed is yield to maturity at October 31, 2018.
| Credit quality breakdown (unaudited)* | ||||
| Rating | Percent of net assets | |||
| AAA/Aaa | 84.1% | |||
| AA/Aa | 2.9% | |||
| A/A | 15.2% | |||
| BBB/Baa | 3.8% | |||
| BB/Ba | 0.4% | |||
| Caa/CCC | 0.0% | |||
| Ca/CC | 0.0% | |||
| C/C | 0.1% | |||
| Not rated | 0.0% | |||
* The table depicts the long-term credit-quality ratings assigned to the Fund’s portfolio holdings by Standard & Poor’s® (“S&P”), Moody’s Investors Service (“Moody’s”), and Fitch Ratings Inc. (“Fitch”), each of which is a widely used independent nationally recognized statistical rating organization (“NRSRO”). NRSRO ratings are shown because they provide an independent analysis of the credit quality of the Fund’s investments. These credit quality ratings are shown without regard to gradations within a given rating category. For example, securities rated “A-” have been included in the “A” rated category. Securities may be rated by other NRSROs and these ratings may be higher or lower. When ratings from multiple agencies are available, the highest is used, consistent with the Fund’s portfolio investment process. Credit quality ratings are subject to change without notice. For more information on S&P’s rating methodology, please visit standardandpoors.com and select “Understanding Ratings” under Rating Resources on the homepage. For more information on Moody’s rating methodology, please visit moodys.com and select “Rating Methodologies” under Research & Ratings on the homepage. For more information on Fitch’s rating methodology, please visit fitchratings.com and select “Ratings Definitions” at the bottom of the homepage. Carillon Tower Advisers, Inc. (“Manager”) also performs its own fundamental credit analysis of each security. As part of its fundamental credit analysis, the Manager considers various criteria, including industry specific actions, peer comparisons, payment ranking, and structure-specific characteristics. Any securities that are not rated by S&P, Moody’s, or Fitch appear in the table as “Not rated.” However, these securities are analyzed and monitored by the Manager on an ongoing basis. Government securities that are issued or guaranteed as to principal and interest by the U.S. government are not rated, but are treated by the Fund, and reflected in the table above, as being rated AAA and Aaa for credit quality purposes.
| FUTURES CONTRACTS—LONG | ||||||||||||||||||||
| Description | Expiration Date | Number of Contracts | Notional Value at Trade Date | Notional Value at October 31, 2018 | Unrealized Appreciation (Depreciation) | |||||||||||||||
| 10-Year U.S. Treasury Note | December 2018 | 1,352 | $161,667,103 | $160,127,500 | $ | (1,539,603 | ) | |||||||||||||
| 30 | The accompanying notes are an integral part of the financial statements. |
Investment Portfolios
| 10.31.2018 |
| CARILLON REAMS CORE PLUS BOND FUND (cont’d) | ||||||||||||||||||||
| FUTURES CONTRACTS—SHORT | ||||||||||||||||||||
| Description | Expiration Date | Number of Contracts | Notional Value at Trade Date | Notional Value at October 31, 2018 | Unrealized Appreciation (Depreciation) | |||||||||||||||
| Euro-Bond Futures^ | December 2018 | (790 | ) | $(142,968,020) | $(143,398,838) | $(430,818 | ) | |||||||||||||
| Total futures contracts | $(1,970,421) | |||||||||||||||||||
^ Euro-Bond futures contracts are denominated in Euro. Notional Value at Trade Date, Notional Value at October 31, 2018 and Unrealized Appreciation (Depreciation) have been translated into U.S. Dollars as of October 31, 2018.
There is $112,621 of variation margin due from the Fund to the broker as of October 31, 2018.
| SWAP CONTRACTS—CREDIT DEFAULT SWAPS | ||||||||||||||||||||||||||||||||||||
| Exchange | Reference Entity | Rating of Reference Entity (Moody’s/S&P) | Buy/Sell(b) Protection | Pay/Receive Fixed Rate | Fixed Rate | Expiration Date | Notional Value(c) | Value(d) | Premiums Paid (Received) | Unrealized Appreciation (Depreciation) | ||||||||||||||||||||||||||
| Intercontinental Exchange | CDX North America High Yield Index Series 31 | B2/B | Sell | Receive | 5%/Quarterly | 12/20/2023 | $16,120,000 | $877,840 | $809,698 | $68,142 | ||||||||||||||||||||||||||
| Total swap contracts | $16,120,000 | $877,840 | $809,698 | $68,142 | ||||||||||||||||||||||||||||||||
There is $40,529 of variation margin due from the broker to the Fund as of October 31, 2018.
(b) If the Fund is a seller of protection and a credit event occurs, as defined under the terms of that particular swap agreement, the Fund will either (i) pay to the buyer of protection an amount equal to the notional amount of the swap and take delivery of the referenced obligation or underlying securities comprising the referenced index or (ii) pay a net settlement amount in the form of cash or securities equal to the notional amount of the swap less the recovery value of the referenced obligation of underlying securities comprising the referenced index.
(c) The maximum potential amount the Fund could be required to make as a seller of credit protection or receive as a buyer of credit protection if a credit event occurs as defined under the terms of that particular swap agreement.
(d) The prices and resulting values for credit default swap agreements on credit indices serve as an indicator of the current status of the payment/performance risk and represent the likelihood of an expected liability (or profit) for the credit derivative should the notional amount of the swap agreement be closed/sold as of the period end. Increasing market values, in absolute terms when compared to the notional amount of the swap, represent a deterioration of the referenced entity’s credit soundness and a greater likelihood or risk of default or other credit event occurring as defined under the terms of the agreement.
| The accompanying notes are an integral part of the financial statements. | 31 |
Investment Portfolios
| 10.31.2018 |
| CORPORATE BONDS—18.2% | Principal Amount | Value | ||||||||||
| Oil, gas & consumable fuels—0.5% | ||||||||||||
Energy Transfer Operating LP, 4.05%, 03/15/25 | $ 6,392,000 | $ 6,126,265 | ||||||||||
| Total corporate bonds (cost $228,167,843) | 227,228,269 | |||||||||||
| MORTGAGE AND ASSET-BACKED SECURITIES—8.6% |
| |||||||||||
| Asset-backed securities—0.9% | ||||||||||||
Bank of The West Auto Trust, Series 2017-1, Class A2, 144A, 1.78%, 02/15/21 (a) | 8,678,643 | 8,642,110 | ||||||||||
Countrywide Asset-Backed Certificates, Series 2006-S10, Class A3, (1 Month LIBOR USD + 0.32%), 2.60%, 10/25/36 | 1,307,135 | 1,242,079 | ||||||||||
Home Equity Loan Trust, Series 2006-HSA2, Class AI3, VR, 5.55%, 11/25/27 | 3,476,390 | 1,839,070 | ||||||||||
| Commercial mortgage-backed securities—5.3% | ||||||||||||
COMM Mortgage Trust, Series 2012-CCRE4, Class ASB, 2.44%, 10/17/45 | 8,218,568 | 8,077,957 | ||||||||||
GS Mortgage Securities Trust, | ||||||||||||
Series 2013-GCJ14, Class AAB, 3.82%, 08/10/46 | 4,592,443 | 4,629,180 | ||||||||||
Series 2014-GC22, Class A3, 3.52%, 06/12/47 | 14,937,222 | 14,968,735 | ||||||||||
UBS Commercial Mortgage Trust, Series 2018-C11, Class A1, 3.21%, 06/16/51 | 4,850,036 | 4,821,409 | ||||||||||
Wells Fargo Commercial Mortgage Trust, Series 2013-LC12, Class ASB, VR, 3.93%, 07/17/46 | 10,592,805 | 10,723,365 | ||||||||||
WFRBS Commercial Mortgage Trust, | ||||||||||||
Series 2012-C10, Class ASB, 2.45%, 12/15/45 | 5,510,833 | 5,425,614 | ||||||||||
Series 2013-C18, Class A3, 3.65%, 12/17/46 | 7,315,000 | 7,339,227 | ||||||||||
Series 2014-C21, Class A3, 3.43%, 08/16/47 | 9,870,000 | 9,862,923 | ||||||||||
| Federal agency mortgage-backed obligations—2.4% |
| |||||||||||
Fannie Mae Pool, | ||||||||||||
Series 5796, Class AN, 3.03%, 06/01/27 | 4,095,000 | 3,905,282 | ||||||||||
Series 387770, 3.63%, 07/01/28 | 4,760,000 | 4,697,250 | ||||||||||
TBA, 3.00%, 12/15/48 | 23,465,000 | 22,172,593 | ||||||||||
| Total mortgage and asset-backed securities (cost $109,574,674) |
| 108,346,794 | ||||||||||
| U.S. TREASURIES—70.6% |
| |||||||||||
U.S. Treasury Inflation Indexed Bonds, 1.00%, 02/15/48 | 14,238,313 | 13,180,080 | ||||||||||
U.S. Treasury Inflation Indexed Notes, | ||||||||||||
0.50%, 01/15/28 | 14,055,525 | 13,280,275 | ||||||||||
0.75%, 07/15/28 | 44,680,160 | 43,258,307 | ||||||||||
U.S. Treasury Bonds, 2.75%, 11/15/47 | 5,795,000 | 5,108,881 | ||||||||||
U.S. Treasury Notes, | ||||||||||||
1.25%, 10/31/21 | 99,120,000 | 94,349,850 | ||||||||||
1.88%, 02/28/22 | 26,650,000 | 25,748,481 | ||||||||||
2.00%, 12/31/21 | 137,325,000 | 133,435,913 | ||||||||||
2.25%, 08/15/27 | 51,525,000 | 48,036,999 | ||||||||||
2.25%, 11/15/27 | 279,570,000 | 260,142,068 | ||||||||||
2.75%, 02/28/25 | 63,845,000 | 62,750,158 | ||||||||||
2.75%, 02/15/28 | 126,075,000 | 122,095,758 | ||||||||||
2.88%, 08/15/28 | 61,725,000 | 60,304,843 | ||||||||||
| Total U.S. Treasuries (cost $907,538,225) | 881,691,613 | |||||||||||
| 32 | The accompanying notes are an integral part of the financial statements. |
Investment Portfolios
| 10.31.2018 |
| CARILLON REAMS UNCONSTRAINED BOND FUND (cont’d) | ||||||||||||
| SHORT-TERM INVESTMENTS—2.7% | Principal Amount | Value | ||||||||||
| Auto manufacturers—2.7% | ||||||||||||
Ford Motor Credit Co. LLC, Commercial paper, 144A, ZCI, 3.16%, 04/15/19 (a) | $ 34,000,000 | $ 33,497,527 | ||||||||||
| Total short-term investments (cost $33,523,150) |
| 33,497,527 | ||||||||||
| Total investment portfolio (cost $1,278,803,892)—100.1% |
| 1,250,764,203 | ||||||||||
Liabilities in excess of other assets—(0.1)% | (1,564,909 | ) | ||||||||||
| Total net assets—100.0% | $1,249,199,294 | |||||||||||
(a) Restricted securities deemed to be liquid for purpose of compliance limitations on holdings of illiquid securities. At October 31, 2018, these securities aggregated $122,499,334 or 9.8% of the net assets of the Fund.
144A—Securities are purchased under Rule 144A of the Securities Act of 1933 or are private placements and, unless registered under the Securities Act of 1933 or exempted from registration, generally may only be sold to qualified institutional buyers.
VR—Variable rate security. Interest rate adjusts periodically based on changes in current interest rates. Rate shown is the rate in effect at period end.
TBA—To-be-announced security. Securities are being used in dollar roll transactions.
ZCI—Zero coupon instrument. Rate disclosed is yield to maturity at October 31, 2018.
| Credit quality breakdown (unaudited)* | ||||
| Rating | Percent of net assets | |||
| AAA/Aaa | 79.0% | |||
| AA/Aa | 2.7% | |||
| A/A | 10.5% | |||
| BBB/Baa | 7.7% | |||
| BB/Ba | 0.0% | |||
| Caa/CCC | 0.1% | |||
| Ca/CC | 0.1% | |||
| Not rated | 0.0% | |||
* The table depicts the long-term credit-quality ratings assigned to the Fund’s portfolio holdings by Standard & Poor’s® (“S&P”), Moody’s Investors Service (“Moody’s”), and Fitch Ratings Inc. (“Fitch”), each of which is a widely used independent nationally recognized statistical rating organization (“NRSRO”). NRSRO ratings are shown because they provide an independent analysis of the credit quality of the Fund’s investments. These credit quality ratings are shown without regard to gradations within a given rating category. For example, securities rated “A-” have been included in the “A” rated category. Securities may be rated by other NRSROs and these ratings may be higher or lower. When ratings from multiple agencies are available, the highest is used, consistent with the Fund’s portfolio investment process. Credit quality ratings are subject to change without notice. For more information on S&P’s rating methodology, please visit standardandpoors.com and select “Understanding Ratings” under Rating Resources on the homepage. For more information on Moody’s rating methodology, please visit moodys.com and select “Rating Methodologies” under Research & Ratings on the homepage. For more information on Fitch’s rating methodology, please visit fitchratings.com and select “Ratings Definitions” at the bottom of the homepage. Carillon Tower Advisers, Inc. (“Manager”) also performs its own fundamental credit analysis of each security. As part of its fundamental credit analysis, the Manager considers various criteria, including industry specific actions, peer comparisons, payment ranking, and structure-specific characteristics. Any securities that are not rated by S&P, Moody’s, or Fitch appear in the table as “Not rated.” However, these securities are analyzed and monitored by the Manager on an ongoing basis. Government securities that are issued or guaranteed as to principal and interest by the U.S. government are not rated, but are treated by the Fund, and reflected in the table above, as being rated AAA and Aaa for credit quality purposes.
| FUTURES CONTRACTS—LONG | ||||||||||||||||||||
| Description | Expiration Date | Number of Contracts | Notional Value at Trade Date | Notional Value at October 31, 2018 | Unrealized Appreciation (Depreciation) | |||||||||||||||
| 5-Year U.S. Treasury Note | December 2018 | 1,593 | $180,311,065 | $179,025,821 | $(1,285,244 | ) | ||||||||||||||
| 10-Year U.S. Treasury Note | December 2018 | 1,015 | 121,691,238 | 120,214,063 | (1,477,175 | ) | ||||||||||||||
| FUTURES CONTRACTS—SHORT | ||||||||||||||||||||
| Description | Expiration Date | Number of Contracts | Notional Value at Trade Date | Notional Value at October 31, 2018 | Unrealized Appreciation (Depreciation) | |||||||||||||||
| Euro-Bond Futures^ | December 2018 | (2,761 | ) | $(498,736,637) | $(501,169,862) | $(2,433,225) | ||||||||||||||
| Total futures contracts | $(5,195,644) | |||||||||||||||||||
^ Euro-Bond futures contracts are denominated in Euro. Notional Value at Trade Date, Notional Value at October 31, 2018 and Unrealized Appreciation (Depreciation) have been translated into U.S. Dollars as of October 31, 2018.
There is $60,362 of variation margin due from the Fund to the broker as of October 31, 2018.
| The accompanying notes are an integral part of the financial statements. | 33 |
Investment Portfolios
| 10.31.2018 |
| CARILLON REAMS UNCONSTRAINED BOND FUND (cont’d) | ||||||||||||||||||||||||||||||||||||
| SWAP CONTRACTS—CREDIT DEFAULT SWAPS | ||||||||||||||||||||||||||||||||||||
| Exchange | Reference Entity | Rating of Reference Entity (Moody’s/S&P) | Buy/Sell(b) Protection | Pay/Receive Fixed Rate | Fixed Rate | Expiration Date | Notional Value(c) | Value(d) | Premiums Paid (Received) | Unrealized Appreciation (Depreciation) | ||||||||||||||||||||||||||
| Intercontinental Exchange | CDX North America High Yield Index Series 31 | B2/B | Sell | Receive | 5%/Quarterly | 12/20/2023 | $32,280,000 | $1,757,792 | $1,620,224 | $137,568 | ||||||||||||||||||||||||||
| Total swap contracts | $32,280,000 | $1,757,792 | $1,620,224 | $137,568 | ||||||||||||||||||||||||||||||||
There is $81,159 of variation margin due from the broker to the Fund as of October 31, 2018.
(b) If the Fund is a seller of protection and a credit event occurs, as defined under the terms of that particular swap agreement, the Fund will either (i) pay to the buyer of protection an amount equal to the notional amount of the swap and take delivery of the referenced obligation or underlying securities comprising the referenced index or (ii) pay a net settlement amount in the form of cash or securities equal to the notional amount of the swap less the recovery value of the referenced obligation of underlying securities comprising the referenced index.
(c) The maximum potential amount the Fund could be required to make as a seller of credit protection or receive as a buyer of credit protection if a credit event occurs as defined under the terms of that particular swap agreement.
(d) The prices and resulting values for credit default swap agreements on credit indices serve as an indicator of the current status of the payment/performance risk and represent the likelihood of an expected liability (or profit) for the credit derivative should the notional amount of the swap agreement be closed/sold as of the period end. Increasing market values, in absolute terms when compared to the notional amount of the swap, represent a deterioration of the referenced entity’s credit soundness and a greater likelihood or risk of default or other credit event occurring as defined under the terms of the agreement.
| 34 | The accompanying notes are an integral part of the financial statements. |
Statements of Assets and Liabilities
| 10.31.2018 |
| Carillon ClariVest Capital Appreciation Fund | Carillon ClariVest International Stock Fund | Carillon Cougar Tactical Allocation Fund | Carillon Eagle Growth & Income Fund | |||||||||||||
| Assets | ||||||||||||||||
Investments, at value (a) | $451,440,748 | $16,993,194 | $22,934,727 | $574,834,299 | ||||||||||||
Cash | 2,518,541 | 510,070 | 413,737 | 16,740,518 | ||||||||||||
Foreign currency, at value (b) | — | 234 | — | — | ||||||||||||
Receivable for investments sold | 3,465,722 | — | — | 485,490 | ||||||||||||
Receivable for fund shares sold | 642,660 | 1,494 | 495,067 | 730,257 | ||||||||||||
Receivable for dividends and interest, net | 156,259 | 123,169 | 841 | 597,980 | ||||||||||||
Receivable due from adviser, net | — | 16,049 | 22,046 | — | ||||||||||||
Prepaid expenses | 15,903 | 4,060 | 4,979 | 10,873 | ||||||||||||
| Total assets | 458,239,833 | 17,648,270 | 23,871,397 | 593,399,417 | ||||||||||||
| Liabilities | ||||||||||||||||
Payable for investments purchased | 4,689,315 | — | — | — | ||||||||||||
Payable for fund shares redeemed | 829,658 | 89,669 | 9,897 | 704,250 | ||||||||||||
Accrued custody fees | 3,434 | 4,985 | 131 | 2,760 | ||||||||||||
Accrued investment advisory fees, net | 161,607 | — | — | 238,253 | ||||||||||||
Accrued administrative fees | 39,881 | 1,549 | 1,401 | 51,068 | ||||||||||||
Accrued distribution fees | 57,295 | 3,822 | 2,075 | 144,100 | ||||||||||||
Accrued transfer agent and shareholder servicing fees | 53,552 | 4,963 | 4,171 | 58,672 | ||||||||||||
Accrued internal audit fees | 783 | 783 | 784 | 783 | ||||||||||||
Accrued trustees and officers compensation | 16,114 | 16,114 | 16,114 | 16,114 | ||||||||||||
Other accrued expenses | 44,653 | 34,475 | 26,403 | 43,232 | ||||||||||||
| Total liabilities | 5,896,292 | 156,360 | 60,976 | 1,259,232 | ||||||||||||
| Net assets | 452,343,541 | 17,491,910 | 23,810,421 | 592,140,185 | ||||||||||||
| Net assets consists of | ||||||||||||||||
Paid-in capital | 267,174,416 | 17,230,443 | 22,479,056 | 351,267,108 | ||||||||||||
Total distributable earnings (loss) | 185,169,125 | 261,467 | 1,331,365 | 240,873,077 | ||||||||||||
| Net assets | 452,343,541 | 17,491,910 | 23,810,421 | 592,140,185 | ||||||||||||
| Net assets, at market value | ||||||||||||||||
Class A | 177,098,391 | 4,979,659 | 1,302,538 | 146,548,976 | ||||||||||||
Class C | 19,828,710 | 2,607,707 | 2,022,595 | 129,613,487 | ||||||||||||
Class I | 203,027,020 | 8,882,975 | 20,416,381 | 271,535,907 | ||||||||||||
Class R-3 | 1,398,082 | 883,474 | 11,253 | 1,900,486 | ||||||||||||
Class R-5 | 7,329,218 | 3,374 | 35,104 | 481,876 | ||||||||||||
Class R-6 | 43,651,653 | 102,122 | 11,455 | 41,997,319 | ||||||||||||
Class Y | 10,467 | 32,599 | 11,095 | 62,134 | ||||||||||||
| NAV, offering and redemption price per share (c) | ||||||||||||||||
Class A | $42.91 | $16.92 | $15.73 | $21.44 | ||||||||||||
Maximum offering price (d) | 45.05 | 17.76 | 16.51 | 22.51 | ||||||||||||
Class C | 31.12 | 16.53 | 15.52 | 20.52 | ||||||||||||
Class I | 45.09 | 16.92 | 15.76 | 21.39 | ||||||||||||
Class R-3 | 41.17 | 16.74 | 15.70 | 21.35 | ||||||||||||
Class R-5 | 44.97 | 16.94 | 15.77 | 21.41 | ||||||||||||
Class R-6 | 44.77 | 16.97 | 15.79 | 21.34 | ||||||||||||
Class Y | 44.90 | 16.86 | 15.71 | 21.35 | ||||||||||||
| Shares of beneficial interest outstanding | ||||||||||||||||
Class A | 4,127,237 | 294,318 | 82,786 | 6,836,371 | ||||||||||||
Class C | 637,266 | 157,724 | 130,352 | 6,315,680 | ||||||||||||
Class I | 4,502,856 | 525,040 | 1,295,541 | 12,696,661 | ||||||||||||
Class R-3 | 33,958 | 52,770 | 717 | 89,019 | ||||||||||||
Class R-5 | 162,997 | 199 | 2,226 | 22,507 | ||||||||||||
Class R-6 | 974,991 | 6,018 | 725 | 1,968,034 | ||||||||||||
Class Y | 233 | 1,933 | 706 | 2,910 | ||||||||||||
| (a) Identified cost | $303,721,853 | $16,854,378 | $22,460,123 | $377,354,355 | ||||||||||||
| (b) Cost | $ — | $ 234 | $ — | $ — | ||||||||||||
(c) NAV amounts may not recalculate due to rounding of net assets and / or shares outstanding.
(d) The maximum offering price is computed as 100/95.25 of NAV.
| The accompanying notes are an integral part of the financial statements. | 35 |
Statements of Assets and Liabilities
| 10.31.2018 |
| Carillon Eagle Mid Cap Growth Fund | Carillon Eagle Small Cap Growth Fund | Carillon Scout International Fund | Carillon Scout Mid Cap Fund | |||||||||||||
| Assets | ||||||||||||||||
Investments, at value (a) | $4,145,006,787 | $4,665,343,835 | $797,507,222 | $2,392,488,990 | ||||||||||||
Cash | 150,538,251 | 25,597,489 | 22,525,956 | 237,670,509 | ||||||||||||
Receivable for investments sold | 10,850,140 | — | — | 39,243,892 | ||||||||||||
Receivable for fund shares sold | 10,463,290 | 6,319,689 | 618,662 | 11,674,948 | ||||||||||||
Receivable for dividends and interest, net | 445,234 | 835,706 | 5,426,245 | 2,414,764 | ||||||||||||
Prepaid expenses | 36,574 | 56,479 | 23,846 | 30,112 | ||||||||||||
| Total assets | 4,317,340,276 | 4,698,153,198 | 826,101,931 | 2,683,523,215 | ||||||||||||
| Liabilities | ||||||||||||||||
Payable for investments purchased | 21,720,339 | — | — | 204,857,795 | ||||||||||||
Payable for fund shares redeemed | 4,456,480 | 3,785,538 | 1,026,231 | 2,759,101 | ||||||||||||
Accrued custody fees | 19,322 | 22,926 | 25,761 | 14,180 | ||||||||||||
Accrued investment advisory fees, net | 1,946,749 | 2,144,626 | 586,719 | 1,601,090 | ||||||||||||
Accrued administrative fees | 376,610 | 416,186 | 73,344 | 216,594 | ||||||||||||
Accrued distribution fees | 300,154 | 259,053 | 137 | 9,343 | ||||||||||||
Accrued transfer agent and shareholder servicing fees | 332,258 | 426,562 | 126,296 | 232,597 | ||||||||||||
Accrued internal audit fees | 782 | 784 | 783 | 784 | ||||||||||||
Accrued trustees and officers compensation | 16,115 | 16,114 | 16,114 | 16,114 | ||||||||||||
Other accrued expenses | 164,654 | 247,066 | 80,935 | 126,460 | ||||||||||||
| Total liabilities | 29,333,463 | 7,318,855 | 1,936,320 | 209,834,058 | ||||||||||||
| Net assets | 4,288,006,813 | 4,690,834,343 | 824,165,611 | 2,473,689,157 | ||||||||||||
| Net assets consists of | ||||||||||||||||
Paid-in capital | 3,649,414,499 | 2,858,135,874 | 566,036,656 | 2,186,697,335 | ||||||||||||
Total distributable earnings (loss) | 638,592,314 | 1,832,698,469 | 258,128,955 | 286,991,822 | ||||||||||||
| Net assets | 4,288,006,813 | 4,690,834,343 | 824,165,611 | 2,473,689,157 | ||||||||||||
| Net assets, at market value | ||||||||||||||||
Class A | 687,557,648 | 544,173,571 | 379,717 | 6,507,156 | ||||||||||||
Class C | 146,753,034 | 110,724,250 | 56,451 | 8,766,629 | ||||||||||||
Class I | 1,134,161,237 | 1,368,553,270 | 821,004,101 | 2,419,862,544 | ||||||||||||
Class R-3 | 35,154,863 | 85,349,481 | 8,983 | 1,516,380 | ||||||||||||
Class R-5 | 647,966,349 | 441,149,041 | 9,030 | 739,510 | ||||||||||||
Class R-6 | 1,636,223,366 | 2,140,805,323 | 2,697,876 | 34,459,689 | ||||||||||||
Class Y | 190,316 | 79,407 | 9,453 | 1,837,249 | ||||||||||||
| NAV, offering and redemption price per share (b) | ||||||||||||||||
Class A | $56.19 | $59.15 | $19.02 | $18.37 | ||||||||||||
Maximum offering price (c) | 58.99 | 62.10 | 19.97 | 19.29 | ||||||||||||
Class C | 44.61 | 43.65 | 18.89 | 18.26 | ||||||||||||
Class I | 59.38 | 62.28 | 19.07 | 18.41 | ||||||||||||
Class R-3 | 54.42 | 57.14 | 18.97 | 18.32 | ||||||||||||
Class R-5 | 59.22 | 62.56 | 19.06 | 18.35 | ||||||||||||
Class R-6 | 59.78 | 63.11 | 19.08 | 18.41 | ||||||||||||
Class Y | 59.14 | 62.03 | 19.01 | 18.37 | ||||||||||||
| Shares of beneficial interest outstanding | ||||||||||||||||
Class A | 12,237,305 | 9,199,466 | 19,963 | 354,179 | ||||||||||||
Class C | 3,289,389 | 2,536,825 | 2,988 | 480,204 | ||||||||||||
Class I | 19,099,875 | 21,973,575 | 43,041,717 | 131,465,411 | ||||||||||||
Class R-3 | 645,966 | 1,493,685 | 474 | 82,766 | ||||||||||||
Class R-5 | 10,940,811 | 7,052,110 | 474 | 40,293 | ||||||||||||
Class R-6 | 27,372,896 | 33,922,630 | 141,429 | 1,871,628 | ||||||||||||
Class Y | 3,218 | 1,280 | 497 | 100,022 | ||||||||||||
| (a) Identified cost | $3,613,996,333 | $3,630,159,934 | $593,417,200 | $2,234,959,007 | ||||||||||||
(b) NAV amounts may not recalculate due to rounding of net assets and / or shares outstanding.
(c) The maximum offering price is computed as 100/95.25 of NAV.
| 36 | The accompanying notes are an integral part of the financial statements. |
Statements of Assets and Liabilities
| 10.31.2018 |
| Carillon Scout Small Cap Fund | Carillon Reams Core Bond Fund | Carillon Reams Fund | Carillon Reams Unconstrained Bond Fund | |||||||||||||
| Assets | ||||||||||||||||
Investments, at value (a) | $317,389,959 | $113,899,386 | $665,457,080 | $1,250,764,203 | ||||||||||||
Premiums paid—open swap contracts | — | — | 809,698 | 1,620,224 | ||||||||||||
Net unrealized appreciation—open swap contracts | — | — | 68,142 | 137,568 | ||||||||||||
Cash | 1,003,957 | 4,259,579 | 12,274,967 | 1,271,394 | ||||||||||||
Cash deposit at broker—open futures contracts | — | — | 5,673,514 | 15,079,634 | ||||||||||||
Cash segregated at custodian—open TBA positions | — | — | 539,187 | 272,000 | ||||||||||||
Variation margin receivable—open swap contracts | — | — | 40,529 | 81,159 | ||||||||||||
Receivable for investments sold | 827,426 | 10,593,571 | 64,071,765 | 22,207,164 | ||||||||||||
Receivable for fund shares sold | 199,352 | 5,302 | 541,872 | 1,773,170 | ||||||||||||
Receivable for dividends and interest, net | 75,866 | 462,828 | 2,749,523 | 7,716,622 | ||||||||||||
Receivable due from adviser, net | — | 25,169 | — | — | ||||||||||||
Prepaid expenses | 18,990 | 9,690 | 16,741 | 28,078 | ||||||||||||
| Total assets | 319,515,550 | 129,255,525 | 752,243,018 | 1,300,951,216 | ||||||||||||
| Liabilities | ||||||||||||||||
Net unrealized depreciation—open futures contracts | — | — | 1,970,421 | 5,195,644 | ||||||||||||
Cash collateral received from broker—open swap contracts | — | — | 110,577 | 221,428 | ||||||||||||
Variation margin payable—open futures contracts | — | — | 112,621 | 60,362 | ||||||||||||
Payable for investments purchased | — | 21,315,836 | 124,349,674 | 44,659,319 | ||||||||||||
Payable for fund shares redeemed | 246,572 | 292,651 | 592,989 | 1,059,848 | ||||||||||||
Accrued custody fees | 2,452 | 1,238 | 4,045 | 6,153 | ||||||||||||
Accrued investment advisory fees, net | 142,830 | — | 64,466 | 128,136 | ||||||||||||
Accrued administrative fees | 28,057 | 9,254 | 53,743 | 108,503 | ||||||||||||
Accrued distribution fees | 15,499 | 774 | 3,909 | 8,105 | ||||||||||||
Accrued transfer agent and shareholder servicing fees | 42,708 | 19,411 | 47,581 | 181,117 | ||||||||||||
Accrued internal audit fees | 707 | 783 | 783 | 783 | ||||||||||||
Accrued trustees and officers compensation | 16,115 | 16,114 | 16,114 | 16,114 | ||||||||||||
Other accrued expenses | 51,414 | 34,819 | 45,233 | 106,410 | ||||||||||||
| Total liabilities | 546,354 | 21,690,880 | 127,372,156 | 51,751,922 | ||||||||||||
| Net assets | 318,969,196 | 107,564,645 | 624,870,862 | 1,249,199,294 | ||||||||||||
| Net assets consists of | ||||||||||||||||
Paid-in capital | 216,291,151 | 113,213,009 | 663,922,416 | 1,331,909,114 | ||||||||||||
Total distributable earnings (loss) | 102,678,045 | (5,648,364 | ) | (39,051,554 | ) | (82,709,820 | ) | |||||||||
| Net assets | 318,969,196 | 107,564,645 | 624,870,862 | 1,249,199,294 | ||||||||||||
| Net assets, at market value | ||||||||||||||||
Class A | 12,344,337 | 615,493 | 210,938 | 85,018 | ||||||||||||
Class C | 14,215,513 | 300,561 | 208,931 | 43,968 | ||||||||||||
Class I | 286,735,572 | 104,862,102 | 607,130,701 | 1,183,480,893 | ||||||||||||
Class R-3 | 303,069 | 9,806 | 9,717 | 9,788 | ||||||||||||
Class R-5 | 65,336 | 9,857 | 9,768 | 9,839 | ||||||||||||
Class R-6 | 5,205,251 | 9,866 | 9,777 | 29,029,939 | ||||||||||||
Class Y | 100,118 | 1,756,960 | 17,291,030 | 36,539,849 | ||||||||||||
| NAV, offering and redemption price per share (b) | ||||||||||||||||
Class A | $27.10 | $11.03 | $30.44 | $11.45 | ||||||||||||
Maximum offering price (c) | 28.45 | 11.46 | 31.63 | 11.90 | ||||||||||||
Class C | 26.89 | 11.02 | 30.41 | 11.42 | ||||||||||||
Class I | 27.17 | 11.04 | 30.46 | 11.43 | ||||||||||||
Class R-3 | 27.02 | 11.04 | 30.44 | 11.43 | ||||||||||||
Class R-5 | 27.17 | 11.05 | 30.46 | 11.43 | ||||||||||||
Class R-6 | 27.20 | 11.05 | 30.46 | 11.43 | ||||||||||||
Class Y | 27.09 | 11.04 | 30.44 | 11.49 | ||||||||||||
| Shares of beneficial interest outstanding | ||||||||||||||||
Class A | 455,590 | 55,779 | 6,930 | 7,428 | ||||||||||||
Class C | 528,599 | 27,265 | 6,869 | 3,850 | ||||||||||||
Class I | 10,552,774 | 9,494,905 | 19,931,587 | 103,514,295 | ||||||||||||
Class R-3 | 11,215 | 888 | 319 | 857 | ||||||||||||
Class R-5 | 2,404 | 892 | 321 | 861 | ||||||||||||
Class R-6 | 191,355 | 893 | 321 | 2,540,176 | ||||||||||||
Class Y | 3,696 | 159,154 | 568,082 | 3,181,339 | ||||||||||||
| (a) Identified cost | $214,866,767 | $116,203,705 | $679,296,517 | $1,278,803,892 | ||||||||||||
(b) NAV amounts may not recalculate due to rounding of net assets and / or shares outstanding.
(c) The maximum offering price for the Carillon Scout Small Cap Fund is computed as 100/95.25 of NAV. The maximum offering price for the Carillon Reams Core Bond Fund, Carillon Reams Core Plus Bond Fund and Carillon Reams Unconstrained Bond Fund is computed as 100/96.25 of NAV.
| The accompanying notes are an integral part of the financial statements. | 37 |
| 11.01.2017 to 10.31.2018 |
| Carillon ClariVest Capital Appreciation Fund | Carillon ClariVest International Stock Fund | Carillon Cougar Tactical Allocation Fund | Carillon Eagle Growth & Income Fund | |||||||||||||
| Investment income | ||||||||||||||||
Dividends (a) | $ 5,387,154 | $ 539,488 | $318,437 | $17,334,345 | ||||||||||||
Interest | 48,900 | 7,107 | 4,420 | 179,870 | ||||||||||||
| Total income | 5,436,054 | 546,595 | 322,857 | 17,514,215 | ||||||||||||
| Expenses | ||||||||||||||||
Investment advisory fees | 2,755,834 | 139,531 | 96,112 | 2,828,505 | ||||||||||||
Administrative fees: | ||||||||||||||||
Class A | 188,906 | 6,055 | 1,626 | 160,438 | ||||||||||||
Class C | 39,108 | 4,000 | 1,993 | 151,091 | ||||||||||||
Class I | 185,390 | 9,164 | 13,255 | 258,913 | ||||||||||||
Class R-3 | 1,388 | 911 | 12 | 2,196 | ||||||||||||
Class R-5 | 4,908 | 4 | 36 | 460 | ||||||||||||
Class R-6 | 44,902 | 33 | 12 | 41,419 | ||||||||||||
Class Y | 16 | 10 | 10 | 14 | ||||||||||||
Distribution and service fees: | ||||||||||||||||
Class A | 462,715 | 14,879 | 3,972 | 392,541 | ||||||||||||
Class C | 376,447 | 38,789 | 19,477 | 1,471,638 | ||||||||||||
Class R-3 | 6,799 | 4,458 | 58 | 10,703 | ||||||||||||
Class Y | 39 | 25 | 25 | 36 | ||||||||||||
Transfer agent and shareholder servicing fees: | ||||||||||||||||
Class A | 163,600 | 10,293 | 2,370 | 147,025 | ||||||||||||
Class C | 40,336 | 8,054 | 3,265 | 145,558 | ||||||||||||
Class I | 188,396 | 14,261 | 26,647 | 232,141 | ||||||||||||
Class R-3 | 2,489 | 2,083 | 90 | 3,720 | ||||||||||||
Class R-5 | 4,069 | 84 | 135 | 676 | ||||||||||||
Class R-6 | 3,834 | 121 | 84 | 3,129 | ||||||||||||
Class Y | 83 | 86 | 87 | 80 | ||||||||||||
Custodian fees | 17,948 | 33,217 | 488 | 16,755 | ||||||||||||
Professional fees | 80,012 | 83,216 | 75,748 | 78,986 | ||||||||||||
State registration fees | 101,573 | 91,626 | 91,036 | 106,721 | ||||||||||||
Trustees and officers compensation | 65,412 | 65,413 | 65,412 | 65,412 | ||||||||||||
Internal audit fees | 8,368 | 8,368 | 8,368 | 8,368 | ||||||||||||
Interest expense on line of credit | 1,598 | 70 | 163 | — | ||||||||||||
Other expenses | 103,671 | 44,788 | 20,064 | 116,499 | ||||||||||||
| Total expenses before adjustments | 4,847,841 | 579,539 | 430,545 | 6,243,024 | ||||||||||||
Fees and expenses waived | (612,519 | ) | (286,824 | ) | (258,549 | ) | (26 | ) | ||||||||
| Total expenses after adjustments | 4,235,322 | 292,715 | 171,996 | 6,242,998 | ||||||||||||
| Net investment income (loss) | 1,200,732 | 253,880 | 150,861 | 11,271,217 | ||||||||||||
| Realized and unrealized gain (loss) | ||||||||||||||||
Net realized gain (loss) on: | ||||||||||||||||
Investments | 36,674,734 | 665,029 | 800,208 | 42,111,759 | ||||||||||||
Foreign currency transactions | — | (3,286 | ) | — | — | |||||||||||
| Net realized gain (loss) | 36,674,734 | 661,743 | 800,208 | 42,111,759 | ||||||||||||
Net change in unrealized appreciation (depreciation) on | ||||||||||||||||
investments and foreign currency translations | (14,784,125 | ) | (2,632,476 | ) | (632,361 | ) | 3,264,320 | |||||||||
| Net gain (loss) on investments | 21,890,609 | (1,970,733 | ) | 167,847 | 45,376,079 | |||||||||||
| Net increase (decrease) in assets resulting from operations | 23,091,341 | (1,716,853 | ) | 318,708 | 56,647,296 | |||||||||||
| (a) Net of foreign withholding taxes | $ — | $ 55,973 | $ — | $ 138,943 | ||||||||||||
| 38 | The accompanying notes are an integral part of the financial statements. |
Statements of Operations
| 11.01.2017 to 10.31.2018 |
| Carillon Eagle Mid Cap Growth Fund | Carillon Eagle Small Cap Growth Fund | Carillon Scout International Fund | Carillon Scout Mid Cap Fund | |||||||||||||
| Investment income | ||||||||||||||||
Dividends (a) | $ 19,226,220 | $ 21,094,299 | $ 28,164,308 | $ 29,374,998 | ||||||||||||
Interest | 1,153,543 | 1,117,779 | 336,246 | 572,876 | ||||||||||||
| Total income | 20,379,763 | 22,212,078 | 28,500,554 | 29,947,874 | ||||||||||||
| Expenses | ||||||||||||||||
Investment advisory fees | 18,404,072 | 27,315,480 | 8,104,100 | 16,281,233 | ||||||||||||
Administrative fees: | ||||||||||||||||
Class A | 605,668 | 650,840 | 149 | 2,105 | ||||||||||||
Class C | 151,627 | 147,965 | 42 | 2,839 | ||||||||||||
Class I | 999,983 | 1,662,655 | 986,623 | 2,124,336 | ||||||||||||
Class R-3 | 36,012 | 99,150 | 9 | 502 | ||||||||||||
Class R-5 | 533,499 | 480,449 | 9 | 161 | ||||||||||||
Class R-6 | 1,218,851 | 2,292,855 | 1,462 | 7,201 | ||||||||||||
Class Y | 41 | 44 | 10 | 522 | ||||||||||||
Distribution and service fees: | ||||||||||||||||
Class A | 1,487,343 | 1,590,281 | 373 | 5,262 | ||||||||||||
Class C | 1,482,114 | 1,440,816 | 419 | 28,391 | ||||||||||||
Class R-3 | 176,456 | 484,491 | 47 | 2,509 | ||||||||||||
Class Y | 102 | 111 | 24 | 1,305 | ||||||||||||
Transfer agent and shareholder servicing fees: | ||||||||||||||||
Class A | 836,861 | 964,039 | 131 | 1,078 | ||||||||||||
Class C | 132,474 | 147,408 | 114 | 1,522 | ||||||||||||
Class I | 937,575 | 1,753,796 | 1,074,872 | 2,035,521 | ||||||||||||
Class R-3 | 57,643 | 171,783 | 69 | 249 | ||||||||||||
Class R-5 | 503,394 | 509,649 | 69 | 155 | ||||||||||||
Class R-6 | 68,981 | 129,466 | 328 | 236 | ||||||||||||
Class Y | 94 | 101 | 94 | 278 | ||||||||||||
Custodian fees | 97,654 | 147,909 | 183,559 | 75,615 | ||||||||||||
Professional fees | 121,263 | 78,508 | 54,265 | 47,505 | ||||||||||||
State registration fees | 182,992 | 110,585 | 81,497 | 183,007 | ||||||||||||
Trustees and officers compensation | 63,476 | 65,413 | 64,734 | 64,734 | ||||||||||||
Internal audit fees | 8,378 | 8,368 | 7,689 | 7,689 | ||||||||||||
Interest expense on line of credit | — | 21,341 | — | — | ||||||||||||
Other expenses | 635,014 | 1,067,645 | 274,181 | 438,224 | ||||||||||||
| Total expenses before adjustments | 28,741,567 | 41,341,148 | 10,834,869 | 21,312,179 | ||||||||||||
Fees and expenses waived | — | — | (175 | ) | — | |||||||||||
| Total expenses after adjustments | 28,741,567 | 41,341,148 | 10,834,694 | 21,312,179 | ||||||||||||
| Net investment income (loss) | (8,361,804 | ) | (19,129,070 | ) | 17,665,860 | 8,635,695 | ||||||||||
| Realized and unrealized gain (loss) | ||||||||||||||||
Net realized gain (loss) on: | ||||||||||||||||
Investments | 214,018,556 | 842,608,510 | 70,039,380 | 139,695,786 | ||||||||||||
Foreign currency transactions | — | — | (190,037 | ) | — | |||||||||||
| Net realized gain (loss) | 214,018,556 | 842,608,510 | 69,849,343 | 139,695,786 | ||||||||||||
Net change in unrealized appreciation (depreciation) on | ||||||||||||||||
investments and foreign currency translations | (187,637,581 | ) | (624,220,253 | ) | (179,307,662 | ) | (184,593,371 | ) | ||||||||
| Net gain (loss) on investments | 26,380,975 | 218,388,257 | (109,458,319 | ) | (44,897,585 | ) | ||||||||||
| Net increase (decrease) in assets resulting from operations | 18,019,171 | 199,259,187 | (91,792,459 | ) | (36,261,890 | ) | ||||||||||
| (a) Net of foreign withholding taxes | $ 140,738 | $ 185,071 | $ 2,899,965 | $ 1,119 | ||||||||||||
| The accompanying notes are an integral part of the financial statements. | 39 |
Statements of Operations
| 11.01.2017 to 10.31.2018 |
| Carillon Scout Small Cap Fund | Carillon Reams Core Bond Fund | Carillon Reams Core Plus Bond Fund | Carillon Reams Unconstrained Bond Fund | |||||||||||||
| Investment income | ||||||||||||||||
Dividends (a) | $ 1,345,584 | $ — | $ — | $ — | ||||||||||||
Interest | 31,866 | 2,968,214 | 17,613,781 | 35,417,987 | ||||||||||||
| Total income | 1,377,450 | 2,968,214 | 17,613,781 | 35,417,987 | ||||||||||||
| Expenses | ||||||||||||||||
Investment advisory fees | 1,927,655 | 471,332 | 2,802,463 | 8,849,799 | ||||||||||||
Administrative fees: | ||||||||||||||||
Class A | 4,497 | 335 | 146 | 57 | ||||||||||||
Class C | 4,955 | 189 | 127 | 22 | ||||||||||||
Class I | 279,985 | 111,788 | 657,735 | 1,365,811 | ||||||||||||
Class R-3 | 104 | 9 | 9 | 9 | ||||||||||||
Class R-5 | 28 | 9 | 9 | 9 | ||||||||||||
Class R-6 | 1,528 | 9 | 9 | 13,635 | ||||||||||||
Class Y | 28 | 2,064 | 22,248 | 53,063 | ||||||||||||
Distribution and service fees: | ||||||||||||||||
Class A | 11,242 | 837 | 364 | 143 | ||||||||||||
Class C | 49,551 | 1,889 | 1,267 | 224 | ||||||||||||
Class R-3 | 519 | 47 | 47 | 47 | ||||||||||||
Class Y | 71 | 5,326 | 57,445 | 137,368 | ||||||||||||
Transfer agent and shareholder servicing fees: | ||||||||||||||||
Class A | 6,610 | 472 | 240 | 123 | ||||||||||||
Class C | 6,438 | 432 | 384 | 153 | ||||||||||||
Class I | 314,405 | 144,596 | 354,516 | 1,241,483 | ||||||||||||
Class R-3 | 340 | 71 | 69 | 97 | ||||||||||||
Class R-5 | 135 | 72 | 69 | 69 | ||||||||||||
Class R-6 | 291 | 72 | 69 | 862 | ||||||||||||
Class Y | 140 | 4,304 | 37,178 | 85,125 | ||||||||||||
Custodian fees | 11,172 | 7,032 | 24,377 | 41,817 | ||||||||||||
Professional fees | 98,748 | 79,258 | 63,137 | 46,121 | ||||||||||||
State registration fees | 74,650 | 83,434 | 101,537 | 113,528 | ||||||||||||
Trustees and officers compensation | 62,797 | 64,734 | 64,734 | 64,734 | ||||||||||||
Internal audit fees | 8,148 | 7,689 | 7,689 | 7,689 | ||||||||||||
Interest expense on line of credit | — | — | — | 54 | ||||||||||||
Other expenses | 83,131 | 47,027 | 107,505 | 347,109 | ||||||||||||
| Total expenses before adjustments | 2,947,168 | 1,033,027 | 4,303,373 | 12,369,151 | ||||||||||||
Fees and expenses waived | (41,614 | ) | (549,593 | ) | (1,406,888 | ) | (4,842,654 | ) | ||||||||
| Total expenses after adjustments | 2,905,554 | 483,434 | 2,896,485 | 7,526,497 | ||||||||||||
| Net investment income (loss) | (1,528,104 | ) | 2,484,780 | 14,717,296 | 27,891,490 | |||||||||||
| Realized and unrealized gain (loss) on investments | ||||||||||||||||
Net realized gain (loss) on: | ||||||||||||||||
Investments | 22,581,767 | (1,404,466 | ) | (11,405,061 | ) | (12,121,905 | ) | |||||||||
Foreign currency transactions | — | — | (35,625 | ) | (28,044 | ) | ||||||||||
Swap Contracts | — | — | 410,894 | 1,321,504 | ||||||||||||
Futures contracts | — | — | (3,467,444 | ) | (7,905,063 | ) | ||||||||||
| Net realized gain (loss) | 22,581,767 | (1,404,466 | ) | (14,497,236 | ) | (18,733,508 | ) | |||||||||
Net change in unrealized appreciation (depreciation) on: | ||||||||||||||||
Investments and foreign currency translations | (784,842 | ) | (2,482,372 | ) | (13,857,430 | ) | (30,565,945 | ) | ||||||||
Swap Contracts | — | — | (39,557 | ) | (306,803 | ) | ||||||||||
Futures contracts | — | — | (1,783,742 | ) | (3,378,268 | ) | ||||||||||
| Net change in unrealized appreciation (depreciation) | (784,842 | ) | (2,482,372 | ) | (15,680,729 | ) | (34,251,016 | ) | ||||||||
| Net gain (loss) on investments | 21,796,925 | (3,886,838 | ) | (30,177,965 | ) | (52,984,524 | ) | |||||||||
| Net increase (decrease) in assets resulting from operations | 20,268,821 | (1,402,058 | ) | (15,460,669 | ) | (25,093,034 | ) | |||||||||
| (a) Net of foreign withholding taxes | $— | $ — | $ — | $ — | ||||||||||||
| 40 | The accompanying notes are an integral part of the financial statements. |
[THIS PAGE INTENTIONALLY LEFT BLANK]
Statements of Changes in Net Assets
| Carillon ClariVest Capital Appreciation Fund | Carillon ClariVest International Stock Fund | Carillon Cougar Tactical Allocation Fund | Carillon Eagle Growth & Income Fund | |||||||||||||||||||||||||||||
| 11/1/17 to 10/31/18 | 11/1/16 to 10/31/17 | 11/1/17 to 10/31/18 | 11/1/16 to 10/31/17 | 11/1/17 to 10/31/18 | 11/1/16 to 10/31/17 | 11/1/17 to 10/31/18 | 11/1/16 to 10/31/17 | |||||||||||||||||||||||||
Net assets, beginning of period | $390,895,027 | $339,629,417 | $18,837,745 | $15,173,586 | $17,248,864 | $7,702,229 | $604,140,235 | $553,144,966 | ||||||||||||||||||||||||
| Increase (decrease) in net assets from operations | ||||||||||||||||||||||||||||||||
Net investment income (loss) | 1,200,732 | 237,145 | 253,880 | 147,557 | 150,861 | 130,344 | 11,271,217 | 9,727,133 | ||||||||||||||||||||||||
Net realized gain (loss) | 36,674,734 | 25,222,151 | 661,743 | 975,148 | 800,208 | 270,576 | 42,111,759 | 15,696,282 | ||||||||||||||||||||||||
Net change in unrealized appreciation (depreciation) | (14,784,125 | ) | 72,880,416 | (2,632,476 | ) | 2,515,759 | (632,361 | ) | 1,070,850 | 3,264,320 | 73,789,804 | |||||||||||||||||||||
| Net increase (decrease) in net assets resulting from operations | 23,091,341 | 98,339,712 | (1,716,853 | ) | 3,638,464 | 318,708 | 1,471,770 | 56,647,296 | 99,213,219 | |||||||||||||||||||||||
Distributions to shareholders from earnings (Note 9) | (25,472,949 | ) | (21,800,817 | ) | (206,971 | ) | (249,166 | ) | (446,042 | ) | (57,009 | ) | (26,272,595 | ) | (38,057,185 | ) | ||||||||||||||||
| Fund share transactions | ||||||||||||||||||||||||||||||||
Proceeds from shares sold-Class A | 49,558,565 | 6,795,240 | 3,706,159 | 966,809 | 411,667 | 806,285 | 38,687,158 | 9,824,277 | ||||||||||||||||||||||||
Issued as reinvestment of distributions-Class A | 9,810,169 | 8,461,224 | 53,718 | 46,859 | 35,648 | 7,495 | 6,144,566 | 9,358,425 | ||||||||||||||||||||||||
Cost of shares redeemed-Class A | (44,356,804 | ) | (28,813,068 | ) | (2,620,004 | ) | (1,027,215 | ) | (715,369 | ) | (1,379,780 | ) | (52,947,759 | ) | (40,102,590 | ) | ||||||||||||||||
Proceeds from shares sold-Class C | 2,871,775 | 2,860,366 | 520,399 | 719,093 | 715,621 | 1,124,089 | 9,892,575 | 10,370,279 | ||||||||||||||||||||||||
Issued as reinvestment of distributions-Class C | 5,106,005 | 4,718,569 | 28,462 | 50,527 | 36,455 | 1,498 | 5,072,430 | 9,423,544 | ||||||||||||||||||||||||
Cost of shares redeemed-Class C | (51,131,138 | ) | (18,742,990 | ) | (2,863,251 | ) | (1,471,053 | ) | (596,293 | ) | (512,177 | ) | (61,909,752 | ) | (54,002,995 | ) | ||||||||||||||||
Proceeds from shares sold-Class I | 118,549,302 | 41,711,259 | 2,881,277 | 2,151,420 | 12,887,704 | 11,283,307 | 65,439,163 | 88,518,674 | ||||||||||||||||||||||||
Issued as reinvestment of distributions-Class I | 7,117,568 | 5,648,884 | 115,509 | 137,212 | 366,673 | 46,925 | 8,964,349 | 10,193,980 | ||||||||||||||||||||||||
Cost of shares redeemed-Class I | (40,782,238 | ) | (76,370,699 | ) | (1,528,823 | ) | (1,319,428 | ) | (6,466,185 | ) | (3,246,189 | ) | (61,303,674 | ) | (55,059,836 | ) | ||||||||||||||||
Proceeds from shares sold-Class R-3 | 413,599 | 767,737 | 159,179 | 37,886 | — | — | 222,408 | 396,916 | ||||||||||||||||||||||||
Issued as reinvestment of distributions-Class R-3 | 80,730 | 42,012 | 7,995 | 13,703 | 262 | 12 | 80,464 | 133,127 | ||||||||||||||||||||||||
Cost of shares redeemed-Class R-3 | (301,074 | ) | (845,394 | ) | (16,478 | ) | (7,081 | ) | — | — | (870,732 | ) | (1,069,899 | ) | ||||||||||||||||||
Proceeds from shares sold-Class R-5 | 7,695,419 | 1,236,365 | — | — | — | 20,000 | 32,918 | 124,842 | ||||||||||||||||||||||||
Issued as reinvestment of distributions-Class R-5 | 195,042 | 466,138 | 45 | 604 | 978 | 337 | 20,226 | 24,913 | ||||||||||||||||||||||||
Cost of shares redeemed-Class R-5 | (3,469,801 | ) | (7,075,399 | ) | — | (25,140 | ) | — | (20,000 | ) | (13,106 | ) | (3,193 | ) | ||||||||||||||||||
Proceeds from shares sold-Class R-6 | 6,027,841 | 36,802,300 | 100,072 | 804 | — | — | 5,641,896 | 4,528,156 | ||||||||||||||||||||||||
Issued as reinvestment of distributions-Class R-6 | 2,575,449 | 1,841,311 | 177 | 219 | 333 | 72 | 1,918,066 | 2,565,438 | ||||||||||||||||||||||||
Cost of shares redeemed-Class R-6 | (6,141,206 | ) | (4,777,140 | ) | (91 | ) | (358 | ) | — | — | (7,508,808 | ) | (5,384,823 | ) | ||||||||||||||||||
Proceeds from shares sold-Class Y | 17,500 | N/A | 33,500 | N/A | 11,108 | N/A | 62,300 | N/A | ||||||||||||||||||||||||
Issued as reinvestment of distributions-Class Y | 619 | N/A | 144 | N/A | 289 | N/A | 561 | N/A | ||||||||||||||||||||||||
Cost of shares redeemed-Class Y | (7,200 | ) | N/A | — | N/A | — | N/A | — | N/A | |||||||||||||||||||||||
Proceeds from shares issued—fund reorganization (Note 8) | N/A | N/A | N/A | N/A | N/A | N/A | N/A | N/A | ||||||||||||||||||||||||
| Net increase (decrease) from fund share transactions | 63,830,122 | (25,273,285 | ) | 577,989 | 274,861 | 6,688,891 | 8,131,874 | (42,374,751 | ) | (10,160,765 | ) | |||||||||||||||||||||
| Increase (decrease) in net assets | 61,448,514 | 51,265,610 | (1,345,835 | ) | 3,664,159 | 6,561,557 | 9,546,635 | (12,000,050 | ) | 50,995,269 | ||||||||||||||||||||||
Net assets, end of period | 452,343,541 | 390,895,027 | 17,491,910 | 18,837,745 | 23,810,421 | 17,248,864 | 592,140,185 | 604,140,235 | ||||||||||||||||||||||||
| Shares issued and redeemed | ||||||||||||||||||||||||||||||||
Shares sold-Class A | 1,108,742 | 174,563 | 195,834 | 58,651 | 25,051 | 54,084 | 1,824,095 | 511,170 | ||||||||||||||||||||||||
Issued as reinvestment of distributions-Class A | 232,303 | 246,468 | 2,847 | 3,128 | 2,213 | 510 | 291,946 | 503,417 | ||||||||||||||||||||||||
Shares redeemed-Class A | (1,004,030 | ) | (771,842 | ) | (141,686 | ) | (63,784 | ) | (43,477 | ) | (91,722 | ) | (2,486,963 | ) | (2,070,819 | ) | ||||||||||||||||
Shares sold-Class C | 88,835 | 101,959 | 27,750 | 42,647 | 43,374 | 75,395 | 482,826 | 568,124 | ||||||||||||||||||||||||
Issued as reinvestment of distributions-Class C | 165,618 | 182,749 | 1,534 | 3,423 | 2,280 | 102 | 251,402 | 530,410 | ||||||||||||||||||||||||
Shares redeemed-Class C | (1,568,891 | ) | (657,104 | ) | (154,641 | ) | (91,947 | ) | (36,418 | ) | (34,171 | ) | (3,048,515 | ) | (2,916,422 | ) | ||||||||||||||||
Shares sold-Class I | 2,573,878 | 1,075,924 | 155,026 | 123,174 | 814,535 | 753,518 | 3,076,647 | 4,625,761 | ||||||||||||||||||||||||
Issued as reinvestment of distributions-Class I | 160,777 | 157,702 | 6,138 | 9,190 | 22,774 | 3,194 | 426,255 | 547,143 | ||||||||||||||||||||||||
Shares redeemed-Class I | (869,401 | ) | (1,981,381 | ) | (83,556 | ) | (85,412 | ) | (392,283 | ) | (214,603 | ) | (2,893,264 | ) | (2,854,755 | ) | ||||||||||||||||
Shares sold-Class R-3 | 9,805 | 20,685 | 8,580 | 2,347 | — | — | 10,457 | 20,772 | ||||||||||||||||||||||||
Issued as reinvestment of distributions-Class R-3 | 1,988 | 1,265 | 427 | 922 | 16 | 1 | 3,837 | 7,205 | ||||||||||||||||||||||||
Shares redeemed-Class R-3 | (7,235 | ) | (24,129 | ) | (903 | ) | (421 | ) | — | — | (41,853 | ) | (54,951 | ) | ||||||||||||||||||
Shares sold-Class R-5 | 167,340 | 31,850 | — | — | — | 1,357 | 1,539 | 6,604 | ||||||||||||||||||||||||
Issued as reinvestment of distributions-Class R-5 | 4,418 | 13,064 | 2 | 41 | 61 | 23 | 961 | 1,338 | ||||||||||||||||||||||||
Shares redeemed-Class R-5 | (76,355 | ) | (174,308 | ) | — | (1,587 | ) | — | (1,286 | ) | (608 | ) | (166 | ) | ||||||||||||||||||
Shares sold-Class R-6 | 130,821 | 988,409 | 5,366 | 48 | — | — | 265,422 | 237,517 | ||||||||||||||||||||||||
Issued as reinvestment of distributions-Class R-6 | 58,640 | 51,795 | 9 | 15 | 21 | 5 | 91,436 | 138,259 | ||||||||||||||||||||||||
Shares redeemed-Class R-6 | (133,602 | ) | (121,141 | ) | (5 | ) | (21 | ) | — | — | (355,727 | ) | (281,241 | ) | ||||||||||||||||||
Shares sold-Class Y | 378 | N/A | 1,925 | N/A | 688 | N/A | 2,884 | N/A | ||||||||||||||||||||||||
Issued as reinvestment of distributions-Class Y | 14 | N/A | 8 | N/A | 18 | N/A | 26 | N/A | ||||||||||||||||||||||||
Shares redeemed-Class Y | (159 | ) | N/A | — | N/A | — | N/A | — | N/A | |||||||||||||||||||||||
Shares issued—fund reorganization (Note 8) | N/A | N/A | N/A | N/A | N/A | N/A | N/A | N/A | ||||||||||||||||||||||||
| Shares issued and redeemed | 1,043,884 | (683,472 | ) | 24,655 | 414 | 438,853 | 546,407 | (2,097,197 | ) | (480,634 | ) | |||||||||||||||||||||
| 42 | The accompanying notes are an integral part of the financial statements. |
Statements of Changes in Net Assets
| Carillon Eagle Mid Cap Growth Fund | Carillon Eagle Small Cap Growth Fund | Carillon Scout International Fund | Carillon Scout Mid Cap Fund | |||||||||||||||||||||||||||||||||||
| 11/1/17 to 10/31/18 | 11/1/16 to 10/31/17 | 11/1/17 to 10/31/18 | 11/1/16 to 10/31/17 | 11/1/17 to 10/31/18 | 7/1/17 to 10/31/17 | 7/1/16 to 6/30/17 | 11/1/17 to 10/31/18 | 7/1/17 to 10/31/17 | 7/1/16 to 6/30/17 | |||||||||||||||||||||||||||||
| $2,375,246,768 | $1,373,092,497 | $5,071,793,231 | $4,065,433,794 | $1,160,877,255 | $1,186,071,198 | $1,484,259,258 | $1,675,214,198 | $1,436,856,791 | $1,292,464,719 | |||||||||||||||||||||||||||||
| (8,361,804 | ) | (5,967,322 | ) | (19,129,070 | ) | (10,074,287 | ) | 17,665,860 | 3,189,699 | 21,163,293 | 8,635,695 | 173,160 | 5,716,443 | |||||||||||||||||||||||||
| 214,018,556 | 78,036,959 | 842,608,510 | 403,184,419 | 69,849,343 | 57,894,069 | 211,739,514 | 139,695,786 | 24,725,864 | 170,048,847 | |||||||||||||||||||||||||||||
| (187,637,581 | ) | 433,729,847 | (624,220,253 | ) | 713,850,775 | (179,307,662 | ) | 34,699,691 | (8,637,483 | ) | (184,593,371 | ) | 111,794,470 | 93,669,684 | ||||||||||||||||||||||||
| 18,019,171 | 505,799,484 | 199,259,187 | 1,106,960,907 | (91,792,459 | ) | 95,783,459 | 224,265,324 | (36,261,890 | ) | 136,693,494 | 269,434,974 | |||||||||||||||||||||||||||
| (158,724,314 | ) | (97,570 | ) | (381,398,349 | ) | (125,420,017 | ) | (177,685,091 | ) | — | (199,956,322 | ) | (138,762,254 | ) | — | (28,725,492 | ) | |||||||||||||||||||||
| 290,123,467 | 133,239,573 | 146,346,713 | 140,727,292 | 449,120 | N/A | N/A | 7,430,873 | N/A | N/A | |||||||||||||||||||||||||||||
| 24,654,672 | — | 44,021,081 | 24,299,552 | 1,591 | N/A | N/A | 3,347 | N/A | N/A | |||||||||||||||||||||||||||||
| (221,781,650 | ) | (101,471,121 | ) | (258,789,196 | ) | (546,392,709 | ) | (25,020 | ) | N/A | N/A | (435,440 | ) | N/A | N/A | |||||||||||||||||||||||
| 39,467,799 | 27,777,900 | 12,169,837 | 11,830,049 | 65,498 | N/A | N/A | 9,580,393 | N/A | N/A | |||||||||||||||||||||||||||||
| 8,528,282 | — | 15,524,267 | 6,031,652 | 1,583 | N/A | N/A | 1,837 | N/A | N/A | |||||||||||||||||||||||||||||
| (70,094,544 | ) | (28,869,024 | ) | (76,758,455 | ) | (49,512,086 | ) | — | N/A | N/A | (181,801 | ) | N/A | N/A | ||||||||||||||||||||||||
| 566,665,458 | 310,616,072 | 333,391,456 | 553,933,274 | 60,189,648 | 16,931,833 | 89,419,257 | 1,317,744,550 | 196,138,852 | 275,358,446 | |||||||||||||||||||||||||||||
| 40,420,186 | 6,580 | 103,735,532 | 32,479,254 | 171,813,988 | — | 191,437,939 | 127,201,107 | — | 25,508,611 | |||||||||||||||||||||||||||||
| (267,949,969 | ) | (125,455,278 | ) | (722,667,447 | ) | (583,745,867 | ) | (302,805,384 | ) | (137,909,235 | ) | (603,354,258 | ) | (530,416,882 | ) | (94,474,939 | ) | (397,184,467 | ) | |||||||||||||||||||
| 12,945,227 | 9,688,099 | 17,082,373 | 14,821,449 | 10,000 | N/A | N/A | 1,649,875 | N/A | N/A | |||||||||||||||||||||||||||||
| 1,661,600 | — | 7,176,466 | 2,846,912 | 1,588 | N/A | N/A | 770 | N/A | N/A | |||||||||||||||||||||||||||||
| (11,050,282 | ) | (6,624,642 | ) | (31,495,675 | ) | (34,012,061 | ) | — | N/A | N/A | (14,805 | ) | N/A | N/A | ||||||||||||||||||||||||
| 559,748,449 | 117,002,843 | 110,789,186 | 147,981,495 | 10,000 | N/A | N/A | 1,153,765 | N/A | N/A | |||||||||||||||||||||||||||||
| 23,700,917 | 13,068 | 34,589,597 | 13,833,099 | 1,594 | N/A | N/A | 775 | N/A | N/A | |||||||||||||||||||||||||||||
| (194,371,904 | ) | (43,861,460 | ) | (154,481,135 | ) | (235,670,530 | ) | — | N/A | N/A | (345,533 | ) | N/A | N/A | ||||||||||||||||||||||||
| 1,175,594,466 | 289,700,454 | 730,103,437 | 814,962,934 | 3,303,278 | N/A | N/A | 38,476,930 | N/A | N/A | |||||||||||||||||||||||||||||
| 52,993,487 | 77,414 | 147,039,395 | 36,051,096 | 1,594 | N/A | N/A | 775 | N/A | N/A | |||||||||||||||||||||||||||||
| (221,850,346 | ) | (85,388,121 | ) | (656,682,217 | ) | (325,646,258 | ) | (265,263 | ) | N/A | N/A | (323,638 | ) | N/A | N/A | |||||||||||||||||||||||
| 199,790 | N/A | 84,326 | N/A | 10,500 | N/A | N/A | 2,041,705 | N/A | N/A | |||||||||||||||||||||||||||||
| 739 | N/A | 733 | N/A | 1,591 | N/A | N/A | 1,692 | N/A | N/A | |||||||||||||||||||||||||||||
| (2,845 | ) | N/A | — | N/A | — | N/A | N/A | (71,192 | ) | N/A | N/A | |||||||||||||||||||||||||||
| 243,862,189 | N/A | N/A | N/A | N/A | N/A | N/A | N/A | N/A | N/A | |||||||||||||||||||||||||||||
| 2,053,465,188 | 496,452,357 | (198,819,726 | ) | 24,818,547 | (67,234,094 | ) | (120,977,402 | ) | (322,497,062 | ) | 973,499,103 | 101,663,913 | (96,317,410 | ) | ||||||||||||||||||||||||
| 1,912,760,045 | 1,002,154,271 | (380,958,888 | ) | 1,006,359,437 | (336,711,644 | ) | (25,193,943 | ) | (298,188,060 | ) | 798,474,959 | 238,357,407 | 144,392,072 | |||||||||||||||||||||||||
| 4,288,006,813 | 2,375,246,768 | 4,690,834,343 | 5,071,793,231 | 824,165,611 | 1,160,877,255 | 1,186,071,198 | 2,473,689,157 | 1,675,214,198 | 1,436,856,791 | |||||||||||||||||||||||||||||
| 4,805,747 | 2,634,506 | 2,291,711 | 2,473,642 | 21,081 | N/A | N/A | 376,289 | N/A | N/A | |||||||||||||||||||||||||||||
| 416,693 | — | 737,495 | 461,355 | 75 | N/A | N/A | 175 | N/A | N/A | |||||||||||||||||||||||||||||
| (3,704,313 | ) | (2,068,456 | ) | (4,101,199 | ) | (9,469,427 | ) | (1,193 | ) | N/A | N/A | (22,285 | ) | N/A | N/A | |||||||||||||||||||||||
| 820,256 | 681,231 | 261,415 | 273,490 | 2,914 | N/A | N/A | 489,371 | N/A | N/A | |||||||||||||||||||||||||||||
| 181,436 | — | 350,356 | 149,335 | 74 | N/A | N/A | 96 | N/A | N/A | |||||||||||||||||||||||||||||
| (1,435,017 | ) | (721,593 | ) | (1,622,667 | ) | (1,130,584 | ) | — | N/A | N/A | (9,263 | ) | N/A | N/A | ||||||||||||||||||||||||
| 8,951,579 | 5,761,173 | 5,007,733 | 9,142,861 | 2,723,323 | 698,462 | 3,936,668 | 67,125,594 | 10,448,240 | 16,183,075 | |||||||||||||||||||||||||||||
| 648,183 | 139 | 1,654,738 | 591,392 | 8,047,494 | — | 9,218,609 | 6,663,233 | — | 1,520,389 | |||||||||||||||||||||||||||||
| (4,242,627 | ) | (2,401,812 | ) | (10,634,607 | ) | (9,935,536 | ) | (13,828,645 | ) | (5,699,663 | ) | (26,320,445 | ) | (27,037,515 | ) | (5,060,023 | ) | (24,205,520 | ) | |||||||||||||||||||
| 222,557 | 199,556 | 275,083 | 267,123 | 399 | N/A | N/A | 83,463 | N/A | N/A | |||||||||||||||||||||||||||||
| 28,995 | — | 124,160 | 55,539 | 75 | N/A | N/A | 40 | N/A | N/A | |||||||||||||||||||||||||||||
| (190,624 | ) | (138,206 | ) | (517,058 | ) | (619,358 | ) | — | N/A | N/A | (737 | ) | N/A | N/A | ||||||||||||||||||||||||
| 8,819,967 | 2,184,137 | 1,658,538 | 2,473,948 | 399 | N/A | N/A | 57,573 | N/A | N/A | |||||||||||||||||||||||||||||
| 379,950 | 278 | 549,303 | 250,827 | 75 | N/A | N/A | 41 | N/A | N/A | |||||||||||||||||||||||||||||
| (3,067,438 | ) | (841,367 | ) | (2,327,766 | ) | (3,971,896 | ) | — | N/A | N/A | (17,321 | ) | N/A | N/A | ||||||||||||||||||||||||
| 18,433,936 | 5,465,348 | 10,906,856 | 13,715,564 | 154,129 | N/A | N/A | 1,887,914 | N/A | N/A | |||||||||||||||||||||||||||||
| 838,973 | 1,632 | 2,317,041 | 649,686 | 75 | N/A | N/A | 41 | N/A | N/A | |||||||||||||||||||||||||||||
| (3,504,133 | ) | (1,639,474 | ) | (9,719,866 | ) | (5,405,986 | ) | (12,775 | ) | N/A | N/A | (16,327 | ) | N/A | N/A | |||||||||||||||||||||||
| 3,045 | N/A | 1,268 | N/A | 423 | N/A | N/A | 103,503 | N/A | N/A | |||||||||||||||||||||||||||||
| 12 | N/A | 12 | N/A | 74 | N/A | N/A | 89 | N/A | N/A | |||||||||||||||||||||||||||||
| (47 | ) | N/A | — | N/A | — | N/A | N/A | (3,570 | ) | N/A | N/A | |||||||||||||||||||||||||||
| 4,000,263 | N/A | N/A | N/A | N/A | N/A | N/A | N/A | N/A | N/A | |||||||||||||||||||||||||||||
| 32,407,393 | 9,117,092 | (2,787,454 | ) | (28,025 | ) | (2,892,003 | ) | (5,001,201 | ) | (13,165,168 | ) | 49,680,404 | 5,388,217 | (6,502,056 | ) | |||||||||||||||||||||||
| The accompanying notes are an integral part of the financial statements. | 43 |
Statements of Changes in Net Assets
| Carillon Scout Small Cap Fund | Carillon Reams Core Bond Fund | |||||||||||||||||||||||
| 11/1/17 to 10/31/18 | 7/1/17 to 10/31/17 | 7/1/16 to 6/30/17 | 11/1/17 to 10/31/18 | 7/1/17 to 10/31/17 | 7/1/16 to 6/30/17 | |||||||||||||||||||
Net assets, beginning of period | $270,531,036 | $241,971,178 | $197,628,825 | $143,842,579 | $168,933,582 | $207,967,407 | ||||||||||||||||||
| Increase (decrease) in net assets from operations | ||||||||||||||||||||||||
Net investment income (loss) | (1,528,104 | ) | (380,967 | ) | (826,064 | ) | 2,484,780 | 860,985 | 2,531,418 | |||||||||||||||
Net realized gain (loss) on investments | 22,581,767 | 5,885,428 | 21,034,270 | (1,404,466 | ) | 995,576 | (653,745 | ) | ||||||||||||||||
Net change in unrealized appreciation (depreciation) | (784,842 | ) | 17,318,653 | 36,719,366 | (2,482,372 | ) | (369,667 | ) | (3,524,209 | ) | ||||||||||||||
| Net increase (decrease) in net assets resulting from operations | 20,268,821 | 22,823,114 | 56,927,572 | (1,402,058 | ) | 1,486,894 | (1,646,536 | ) | ||||||||||||||||
| Distributions to shareholders from | ||||||||||||||||||||||||
Earnings (Note 9) | (46,763,407 | ) | — | (9,176,002 | ) | (2,307,527 | ) | (900,936 | ) | (7,402,842 | ) | |||||||||||||
Return of capital | — | — | — | — | — | — | ||||||||||||||||||
| Total distributions to shareholders | (46,763,407 | ) | — | (9,176,002 | ) | (2,307,527 | ) | (900,936 | ) | (7,402,842 | ) | |||||||||||||
| Fund share transactions | ||||||||||||||||||||||||
Proceeds from shares sold-Class A | 1,257,331 | N/A | N/A | 619,013 | N/A | N/A | ||||||||||||||||||
Issued as reinvestment of distributions-Class A | 11,163 | N/A | N/A | 5,814 | N/A | N/A | ||||||||||||||||||
Cost of shares redeemed-Class A | (2,425,430 | ) | N/A | N/A | (2,383 | ) | N/A | N/A | ||||||||||||||||
Proceeds from shares sold-Class C | 379,686 | N/A | N/A | 512,094 | N/A | N/A | ||||||||||||||||||
Issued as reinvestment of distributions-Class C | 10,951 | N/A | N/A | 2,454 | N/A | N/A | ||||||||||||||||||
Cost of shares redeemed-Class C | (2,307,193 | ) | N/A | N/A | (208,754 | ) | N/A | N/A | ||||||||||||||||
Proceeds from shares sold-Class I | 56,513,638 | 16,257,579 | 23,420,649 | 23,273,667 | 3,576,959 | 37,721,554 | ||||||||||||||||||
Issued as reinvestment of distributions-Class I | 45,114,741 | — | 8,913,446 | 2,251,072 | 835,914 | 6,943,328 | ||||||||||||||||||
Cost of shares redeemed-Class I | (69,534,464 | ) | (10,520,835 | ) | (35,743,312 | ) | (58,375,035 | ) | (30,037,064 | ) | (73,695,489 | ) | ||||||||||||
Proceeds from shares sold-Class R-3 | 24,210 | N/A | N/A | 10,000 | N/A | N/A | ||||||||||||||||||
Issued as reinvestment of distributions-Class R-3 | 1,741 | N/A | N/A | 139 | N/A | N/A | ||||||||||||||||||
Cost of shares redeemed-Class R-3 | (8,490 | ) | N/A | N/A | — | N/A | N/A | |||||||||||||||||
Proceeds from shares sold-Class R-5 | 10,000 | N/A | N/A | 10,000 | N/A | N/A | ||||||||||||||||||
Issued as reinvestment of distributions-Class R-5 | 1,741 | N/A | N/A | 186 | N/A | N/A | ||||||||||||||||||
Cost of shares redeemed-Class R-5 | (65 | ) | N/A | N/A | — | N/A | N/A | |||||||||||||||||
Proceeds from shares sold-Class R-6 | 5,549,041 | N/A | N/A | 10,000 | N/A | N/A | ||||||||||||||||||
Issued as reinvestment of distributions-Class R-6 | 216,374 | N/A | N/A | 195 | N/A | N/A | ||||||||||||||||||
Cost of shares redeemed-Class R-6 | (378,155 | ) | N/A | N/A | — | N/A | N/A | |||||||||||||||||
Proceeds from shares sold-Class Y | 92,700 | N/A | N/A | 178,750 | 49,907 | 333,047 | ||||||||||||||||||
Issued as reinvestment of distributions-Class Y | 1,764 | N/A | N/A | 33,728 | 11,211 | 100,478 | ||||||||||||||||||
Cost of shares redeemed-Class Y | — | N/A | N/A | (889,289 | ) | (113,888 | ) | (1,387,365 | ) | |||||||||||||||
Proceeds from shares issued—fund reorganization (Note 8) | 40,401,462 | N/A | N/A | N/A | N/A | N/A | ||||||||||||||||||
| Net increase (decrease) from fund share transactions | 74,932,746 | 5,736,744 | (3,409,217 | ) | (32,568,349 | ) | (25,676,961 | ) | (29,984,447 | ) | ||||||||||||||
| Increase (decrease) in net assets | 48,438,160 | 28,559,858 | 44,342,353 | (36,277,934 | ) | (25,091,003 | ) | (39,033,825 | ) | |||||||||||||||
Net assets, end of period | 318,969,196 | 270,531,036 | 241,971,178 | 107,564,645 | 143,842,579 | 168,933,582 | ||||||||||||||||||
| Shares issued and redeemed | ||||||||||||||||||||||||
Shares sold-Class A | 42,461 | N/A | N/A | 55,471 | N/A | N/A | ||||||||||||||||||
Issued as reinvestment of distributions-Class A | 387 | N/A | N/A | 521 | N/A | N/A | ||||||||||||||||||
Shares redeemed-Class A | (86,553 | ) | N/A | N/A | (213 | ) | N/A | N/A | ||||||||||||||||
Shares sold-Class C | 13,233 | N/A | N/A | 45,751 | N/A | N/A | ||||||||||||||||||
Issued as reinvestment of distributions-Class C | 381 | N/A | N/A | 220 | N/A | N/A | ||||||||||||||||||
Shares redeemed-Class C | (78,343 | ) | N/A | N/A | (18,706 | ) | N/A | N/A | ||||||||||||||||
Shares sold-Class I | 1,911,641 | 573,693 | 935,976 | 2,068,956 | 313,169 | 3,277,843 | ||||||||||||||||||
Issued as reinvestment of distributions-Class I | 1,580,008 | — | 381,896 | 200,883 | 73,151 | 615,646 | ||||||||||||||||||
Shares redeemed-Class I | (2,436,745 | ) | (376,822 | ) | (1,506,470 | ) | (5,167,715 | ) | (2,628,930 | ) | (6,425,619 | ) | ||||||||||||
Shares sold-Class R-3 | 843 | N/A | N/A | 876 | N/A | N/A | ||||||||||||||||||
Issued as reinvestment of distributions-Class R-3 | 61 | N/A | N/A | 12 | N/A | N/A | ||||||||||||||||||
Shares redeemed-Class R-3 | (289 | ) | N/A | N/A | — | N/A | N/A | |||||||||||||||||
Shares sold-Class R-5 | 337 | N/A | N/A | 875 | N/A | N/A | ||||||||||||||||||
Issued as reinvestment of distributions-Class R-5 | 61 | N/A | N/A | 17 | N/A | N/A | ||||||||||||||||||
Shares redeemed-Class R-5 | (2 | ) | N/A | N/A | — | N/A | N/A | |||||||||||||||||
Shares sold-Class R-6 | 183,537 | N/A | N/A | 876 | N/A | N/A | ||||||||||||||||||
Issued as reinvestment of distributions-Class R-6 | 7,460 | N/A | N/A | 17 | N/A | N/A | ||||||||||||||||||
Shares redeemed-Class R-6 | (13,563 | ) | N/A | N/A | — | N/A | N/A | |||||||||||||||||
Shares sold-Class Y | 3,236 | N/A | N/A | 15,863 | 4,371 | 28,217 | ||||||||||||||||||
Issued as reinvestment of distributions-Class Y | 62 | N/A | N/A | 3,010 | 981 | 8,919 | ||||||||||||||||||
Shares redeemed-Class Y | — | N/A | N/A | (79,271 | ) | (9,973 | ) | (120,246 | ) | |||||||||||||||
Shares issued—fund reorganization (Note 8) | 1,393,774 | N/A | N/A | N/A | N/A | N/A | ||||||||||||||||||
| Shares issued and redeemed | 2,521,987 | 196,871 | (188,598 | ) | (2,872,557 | ) | (2,247,231 | ) | (2,615,240 | ) | ||||||||||||||
| 44 | The accompanying notes are an integral part of the financial statements. |
Statements of Changes in Net Assets
| Carillon Reams Core Plus Bond Fund | Carillon Reams Unconstrained Bond Fund | |||||||||||||||||||||
| 11/1/17 to 10/31/18 | 7/1/17 to 10/31/17 | 7/1/16 to 6/30/17 | 11/1/17 to 10/31/18 | 7/1/17 to 10/31/17 | 7/1/16 to 6/30/17 | |||||||||||||||||
| $768,561,795 | $814,467,884 | $925,524,225 | $1,591,781,787 | $1,573,568,177 | $1,373,083,803 | |||||||||||||||||
| 14,717,296 | 4,100,068 | 11,613,056 | 27,891,490 | 5,175,944 | 12,821,365 | |||||||||||||||||
| (14,497,236 | ) | 5,118,881 | (2,222,573 | ) | (18,733,508 | ) | 6,753,052 | 20,161,638 | ||||||||||||||
| (15,680,729 | ) | (2,350,781 | ) | (14,654,117 | ) | (34,251,016 | ) | (4,424,302 | ) | (1,731,471 | ) | |||||||||||
| (15,460,669 | ) | 6,868,168 | (5,263,634 | ) | (25,093,034 | ) | 7,504,694 | 31,251,532 | ||||||||||||||
| (13,372,045 | ) | (3,986,035 | ) | (34,983,149 | ) | (26,231,399 | ) | (4,867,007 | ) | (15,454,884 | ) | |||||||||||
| — | (197,332 | ) | — | — | — | — | ||||||||||||||||
| (13,372,045 | ) | (4,183,367 | ) | (34,983,149 | ) | (26,231,399 | ) | (4,867,007 | ) | (15,454,884 | ) | |||||||||||
| 225,876 | N/A | N/A | 234,199 | N/A | N/A | |||||||||||||||||
| 2,400 | N/A | N/A | 848 | N/A | N/A | |||||||||||||||||
| (12,300 | ) | N/A | N/A | (148,617 | ) | N/A | N/A | |||||||||||||||
| 230,768 | N/A | N/A | 71,637 | N/A | N/A | |||||||||||||||||
| 1,315 | N/A | N/A | 253 | N/A | N/A | |||||||||||||||||
| (18,277 | ) | N/A | N/A | (26,851 | ) | N/A | N/A | |||||||||||||||
| 94,150,257 | 30,109,489 | 184,300,025 | 469,850,335 | 166,300,043 | 562,801,577 | |||||||||||||||||
| 10,111,364 | 3,131,477 | 25,792,908 | 23,015,289 | 4,401,083 | 13,971,363 | |||||||||||||||||
| (209,835,364 | ) | (79,410,892 | ) | (233,425,295 | ) | (781,026,245 | ) | (127,564,904 | ) | (397,526,066 | ) | |||||||||||
| 10,000 | N/A | N/A | 10,000 | N/A | N/A | |||||||||||||||||
| 135 | N/A | N/A | 132 | N/A | N/A | |||||||||||||||||
| — | N/A | N/A | — | N/A | N/A | |||||||||||||||||
| 10,000 | N/A | N/A | 10,000 | N/A | N/A | |||||||||||||||||
| 182 | N/A | N/A | 179 | N/A | N/A | |||||||||||||||||
| — | N/A | N/A | — | N/A | N/A | |||||||||||||||||
| 10,000 | N/A | N/A | 41,307,294 | N/A | N/A | |||||||||||||||||
| 191 | N/A | N/A | 290,370 | N/A | N/A | |||||||||||||||||
| — | N/A | N/A | (12,128,000 | ) | N/A | N/A | ||||||||||||||||
| 2,415,673 | 420,311 | 33,193,213 | 10,068,156 | 6,608,004 | 87,759,264 | |||||||||||||||||
| 343,230 | 109,494 | 2,188,398 | 815,539 | 170,833 | 804,443 | |||||||||||||||||
| (12,503,669 | ) | (2,950,769 | ) | (82,858,807 | ) | (43,602,578 | ) | (34,339,136 | ) | (83,122,855 | ) | |||||||||||
| N/A | N/A | N/A | N/A | N/A | N/A | |||||||||||||||||
| (114,858,219 | ) | (48,590,890 | ) | (70,809,558 | ) | (291,258,060 | ) | 15,575,923 | 184,687,726 | |||||||||||||
| (143,690,933 | ) | (45,906,089 | ) | (111,056,341 | ) | (342,582,493 | ) | 18,213,610 | 200,484,374 | |||||||||||||
| 624,870,862 | 768,561,795 | 814,467,884 | 1,249,199,294 | 1,591,781,787 | 1,573,568,177 | |||||||||||||||||
| 7,252 | N/A | N/A | 20,176 | N/A | N/A | |||||||||||||||||
| 78 | N/A | N/A | 73 | N/A | N/A | |||||||||||||||||
| (400 | ) | N/A | N/A | (12,821 | ) | N/A | N/A | |||||||||||||||
| 7,414 | N/A | N/A | 6,127 | N/A | N/A | |||||||||||||||||
| 42 | N/A | N/A | 22 | N/A | N/A | |||||||||||||||||
| (587 | ) | N/A | N/A | (2,299 | ) | N/A | N/A | |||||||||||||||
| 3,015,596 | 946,333 | 5,707,300 | 40,214,342 | 14,025,178 | 47,894,813 | |||||||||||||||||
| 324,975 | 98,455 | 823,334 | 1,975,490 | 371,239 | 1,189,203 | |||||||||||||||||
| (6,745,419 | ) | (2,496,559 | ) | (7,337,898 | ) | (67,050,826 | ) | (10,763,667 | ) | (33,804,727 | ) | |||||||||||
| 315 | N/A | N/A | 846 | N/A | N/A | |||||||||||||||||
| 4 | N/A | N/A | 11 | N/A | N/A | |||||||||||||||||
| — | N/A | N/A | — | N/A | N/A | |||||||||||||||||
| 315 | N/A | N/A | 846 | N/A | N/A | |||||||||||||||||
| 6 | N/A | N/A | 15 | N/A | N/A | |||||||||||||||||
| — | N/A | N/A | — | N/A | N/A | |||||||||||||||||
| 315 | N/A | N/A | 3,564,946 | N/A | N/A | |||||||||||||||||
| 6 | N/A | N/A | 25,134 | N/A | N/A | |||||||||||||||||
| — | N/A | N/A | (1,049,904 | ) | N/A | N/A | ||||||||||||||||
| 77,458 | 13,219 | 1,014,292 | 856,445 | 554,934 | 7,436,866 | |||||||||||||||||
| 11,028 | 3,443 | 69,914 | 69,660 | 14,343 | 68,155 | |||||||||||||||||
| (401,555 | ) | (92,923 | ) | (2,597,161 | ) | (3,717,322 | ) | (2,885,189 | ) | (7,028,404 | ) | |||||||||||
| N/A | N/A | N/A | N/A | N/A | N/A | |||||||||||||||||
| (3,703,157 | ) | (1,528,032 | ) | (2,320,219 | ) | (25,099,039 | ) | 1,316,838 | 15,755,906 | |||||||||||||
| The accompanying notes are an integral part of the financial statements. | 45 |
Fiscal periods | From investment operations | Dividends & distributions | Ratios to average net asset (%) | |||||||||||||||||||||||||||||||||||||||||||||||||||||||||||||
| Beginning net asset value | Income (loss) | Realized & unrealized gain (loss) | Total | From investment income | From realized gains | From return of capital | Total | Ending net asset value | With expenses waived/ recovered (a) | Without expenses waived/ recovered (a) | Net income (loss) (a) | Portfolio turnover rate (%) (b) | Total return (%) (b)(c) | Ending net assets (millions) | ||||||||||||||||||||||||||||||||||||||||||||||||||
| Beginning | Ending | |||||||||||||||||||||||||||||||||||||||||||||||||||||||||||||||
| Carillon ClariVest Capital Appreciation Fund |
| |||||||||||||||||||||||||||||||||||||||||||||||||||||||||||||||
| Class A* | ||||||||||||||||||||||||||||||||||||||||||||||||||||||||||||||||
| 11/01/17 | 10/31/18 | $43.14 | $0.07 | $2.40 | $2.47 | $— | $ | (2.70 | ) | $— | $ | (2.70 | ) | $42.91 | 1.02 | 1.12 | 0.15 | 45 | 5.83 | $177 | ||||||||||||||||||||||||||||||||||||||||||||
| 11/01/16 | 10/31/17 | 35.05 | 0.02 | 10.24 | 10.26 | (0.03 | ) | (2.14 | ) | — | (2.17 | ) | 43.14 | 1.20 | 1.20 | 0.07 | 33 | 30.84 | 164 | |||||||||||||||||||||||||||||||||||||||||||||
| 11/01/15 | 10/31/16 | 40.32 | 0.08 | (0.09 | ) | (0.01 | ) | (0.01 | ) | (5.25 | ) | — | (5.26 | ) | 35.05 | 1.23 | 1.23 | 0.22 | 35 | 0.30 | 145 | |||||||||||||||||||||||||||||||||||||||||||
| 11/01/14 | 10/31/15 | 42.02 | 0.09 | 3.80 | 3.89 | — | (5.59 | ) | — | (5.59 | ) | 40.32 | 1.19 | 1.19 | 0.22 | 42 | 10.29 | 168 | ||||||||||||||||||||||||||||||||||||||||||||||
| 11/01/13 | 10/31/14 | 39.59 | 0.01 | 6.64 | 6.65 | — | (4.22 | ) | — | (4.22 | ) | 42.02 | 1.23 | 1.23 | 0.02 | 33 | 18.34 | 157 | ||||||||||||||||||||||||||||||||||||||||||||||
| Class C* | ||||||||||||||||||||||||||||||||||||||||||||||||||||||||||||||||
| 11/01/17 | 10/31/18 | 32.23 | (0.17 | ) | 1.76 | 1.59 | — | (2.70 | ) | — | (2.70 | ) | 31.12 | 1.80 | 1.90 | (0.53 | ) | 45 | 5.02 | 20 | ||||||||||||||||||||||||||||||||||||||||||||
| 11/01/16 | 10/31/17 | 26.88 | (0.20 | ) | 7.69 | 7.49 | — | (2.14 | ) | — | (2.14 | ) | 32.23 | 1.97 | 1.97 | (0.70 | ) | 33 | 29.83 | 63 | ||||||||||||||||||||||||||||||||||||||||||||
| 11/01/15 | 10/31/16 | 32.37 | (0.15 | ) | (0.09 | ) | (0.24 | ) | — | (5.25 | ) | — | (5.25 | ) | 26.88 | 2.00 | 2.00 | (0.55 | ) | 35 | (0.45 | ) | 62 | |||||||||||||||||||||||||||||||||||||||||
| 11/01/14 | 10/31/15 | 35.05 | (0.17 | ) | 3.08 | 2.91 | — | (5.59 | ) | — | (5.59 | ) | 32.37 | 1.96 | 1.96 | (0.54 | ) | 42 | 9.42 | 69 | ||||||||||||||||||||||||||||||||||||||||||||
| 11/01/13 | 10/31/14 | 33.93 | (0.24 | ) | 5.58 | 5.34 | — | (4.22 | ) | — | (4.22 | ) | 35.05 | 1.97 | 1.97 | (0.73 | ) | 33 | 17.45 | 68 | ||||||||||||||||||||||||||||||||||||||||||||
| Class I* | ||||||||||||||||||||||||||||||||||||||||||||||||||||||||||||||||
| 11/01/17 | 10/31/18 | 45.13 | 0.21 | 2.51 | 2.72 | (0.06 | ) | (2.70 | ) | — | (2.76 | ) | 45.09 | 0.72 | 0.88 | 0.46 | 45 | 6.15 | 203 | |||||||||||||||||||||||||||||||||||||||||||||
| 11/01/16 | 10/31/17 | 36.55 | 0.16 | 10.68 | 10.84 | (0.12 | ) | (2.14 | ) | — | (2.26 | ) | 45.13 | 0.88 | 0.88 | 0.39 | 33 | 31.26 | 119 | |||||||||||||||||||||||||||||||||||||||||||||
| 11/01/15 | 10/31/16 | 41.83 | 0.19 | (0.09 | ) | 0.10 | (0.13 | ) | (5.25 | ) | — | (5.38 | ) | 36.55 | 0.92 | 0.92 | 0.52 | 35 | 0.61 | 124 | ||||||||||||||||||||||||||||||||||||||||||||
| 11/01/14 | 10/31/15 | 43.34 | 0.21 | 3.93 | 4.14 | (0.06 | ) | (5.59 | ) | — | (5.65 | ) | 41.83 | 0.90 | 0.90 | 0.51 | 42 | 10.59 | 103 | |||||||||||||||||||||||||||||||||||||||||||||
| 11/01/13 | 10/31/14 | 40.60 | 0.13 | 6.83 | 6.96 | — | (4.22 | ) | — | (4.22 | ) | 43.34 | 0.94 | 0.93 | 0.32 | 33 | 18.68 | 88 | ||||||||||||||||||||||||||||||||||||||||||||||
| Class R-3* | ||||||||||||||||||||||||||||||||||||||||||||||||||||||||||||||||
| 11/01/17 | 10/31/18 | 41.60 | (0.04 | ) | 2.31 | 2.27 | — | (2.70 | ) | — | (2.70 | ) | 41.17 | 1.29 | 1.47 | (0.11 | ) | 45 | 5.56 | 1 | ||||||||||||||||||||||||||||||||||||||||||||
| 11/01/16 | 10/31/17 | 33.95 | (0.10 | ) | 9.89 | 9.79 | — | (2.14 | ) | — | (2.14 | ) | 41.60 | 1.51 | 1.56 | (0.28 | ) | 33 | 30.43 | 1 | ||||||||||||||||||||||||||||||||||||||||||||
| 11/01/15 | 10/31/16 | 39.33 | (0.04 | ) | (0.09 | ) | (0.13 | ) | — | (5.25 | ) | — | (5.25 | ) | 33.95 | 1.57 | 1.57 | (0.12 | ) | 35 | (0.04 | ) | 1 | |||||||||||||||||||||||||||||||||||||||||
| 11/01/14 | 10/31/15 | 41.24 | (0.04 | ) | 3.72 | 3.68 | — | (5.59 | ) | — | (5.59 | ) | 39.33 | 1.51 | 1.51 | (0.10 | ) | 42 | 9.94 | 1 | ||||||||||||||||||||||||||||||||||||||||||||
| 11/01/13 | 10/31/14 | 39.05 | (0.11 | ) | 6.52 | 6.41 | — | (4.22 | ) | — | (4.22 | ) | 41.24 | 1.56 | 1.56 | (0.30 | ) | 33 | 17.94 | 1 | ||||||||||||||||||||||||||||||||||||||||||||
| Class R-5* | ||||||||||||||||||||||||||||||||||||||||||||||||||||||||||||||||
| 11/01/17 | 10/31/18 | 44.97 | 0.18 | 2.53 | 2.71 | (0.01 | ) | (2.70 | ) | — | (2.71 | ) | 44.97 | 0.72 | 0.86 | 0.38 | 45 | 6.14 | 7 | |||||||||||||||||||||||||||||||||||||||||||||
| 11/01/16 | 10/31/17 | 36.44 | 0.17 | 10.63 | 10.80 | (0.13 | ) | (2.14 | ) | — | (2.27 | ) | 44.97 | 0.89 | 0.89 | 0.45 | 33 | 31.26 | 3 | |||||||||||||||||||||||||||||||||||||||||||||
| 11/01/15 | 10/31/16 | 41.70 | 0.20 | (0.08 | ) | 0.12 | (0.13 | ) | (5.25 | ) | — | (5.38 | ) | 36.44 | 0.90 | 0.90 | 0.55 | 35 | 0.64 | 7 | ||||||||||||||||||||||||||||||||||||||||||||
| 11/01/14 | 10/31/15 | 43.20 | 0.18 | 3.93 | 4.11 | (0.02 | ) | (5.59 | ) | — | (5.61 | ) | 41.70 | 0.95 | 0.86 | 0.46 | 42 | 10.54 | 8 | |||||||||||||||||||||||||||||||||||||||||||||
| 11/01/13 | 10/31/14 | 40.50 | 0.10 | 6.82 | 6.92 | — | (4.22 | ) | — | (4.22 | ) | 43.20 | 0.95 | 0.94 | 0.25 | 33 | 18.62 | 5 | ||||||||||||||||||||||||||||||||||||||||||||||
| Class R-6* | ||||||||||||||||||||||||||||||||||||||||||||||||||||||||||||||||
| 11/01/17 | 10/31/18 | 44.82 | 0.26 | 2.48 | 2.74 | (0.09 | ) | (2.70 | ) | — | (2.79 | ) | 44.77 | 0.63 | 0.79 | 0.55 | 45 | 6.23 | 44 | |||||||||||||||||||||||||||||||||||||||||||||
| 11/01/16 | 10/31/17 | 36.35 | 0.14 | 10.66 | 10.80 | (0.19 | ) | (2.14 | ) | — | (2.33 | ) | 44.82 | 0.82 | 0.82 | 0.34 | 33 | 31.36 | 41 | |||||||||||||||||||||||||||||||||||||||||||||
| 11/01/15 | 10/31/16 | 41.66 | 0.22 | (0.09 | ) | 0.13 | (0.19 | ) | (5.25 | ) | — | (5.44 | ) | 36.35 | 0.85 | 1.49 | 0.60 | 35 | 0.68 | 0 | ||||||||||||||||||||||||||||||||||||||||||||
| 07/31/15 | 10/31/15 | 41.71 | 0.06 | (0.11 | ) | (0.05 | ) | — | — | — | — | 41.66 | 0.82 | 0.82 | 0.57 | 42 | (0.12 | ) | 0 | |||||||||||||||||||||||||||||||||||||||||||||
| Class Y* | ||||||||||||||||||||||||||||||||||||||||||||||||||||||||||||||||
| 11/20/17 | 10/31/18 | 45.64 | 0.08 | 2.00 | 2.08 | (0.12 | ) | (2.70 | ) | — | (2.82 | ) | 44.90 | 1.01 | 1.55 | 0.18 | 45 | 4.67 | 0 | |||||||||||||||||||||||||||||||||||||||||||||
| Carillon ClariVest International Stock Fund |
| |||||||||||||||||||||||||||||||||||||||||||||||||||||||||||||||
| Class A* | ||||||||||||||||||||||||||||||||||||||||||||||||||||||||||||||||
| 11/01/17 | 10/31/18 | 18.71 | 0.28 | (1.86 | ) | (1.58 | ) | (0.21 | ) | — | — | (0.21 | ) | 16.92 | 1.45 | 2.85 | 1.50 | 49 | (8.56 | ) | 5 | |||||||||||||||||||||||||||||||||||||||||||
| 11/01/16 | 10/31/17 | 15.02 | 0.17 | 3.71 | 3.88 | (0.19 | ) | — | — | (0.19 | ) | 18.71 | 1.54 | 3.72 | 1.03 | 80 | 26.15 | 4 | ||||||||||||||||||||||||||||||||||||||||||||||
| 11/01/15 | 10/31/16 | 16.02 | 0.21 | (1.14 | ) | (0.93 | ) | (0.07 | ) | — | — | (0.07 | ) | 15.02 | 1.67 | 3.45 | 1.40 | 100 | (5.84 | ) | 4 | |||||||||||||||||||||||||||||||||||||||||||
| 11/01/14 | 10/31/15 | 16.54 | 0.14 | 0.40 | 0.54 | (0.39 | ) | (0.67 | ) | — | (1.06 | ) | 16.02 | 1.58 | 4.04 | 0.88 | 86 | 3.63 | 10 | |||||||||||||||||||||||||||||||||||||||||||||
| 11/01/13 | 10/31/14 | 16.48 | 0.42 | (0.13 | ) | 0.29 | (0.14 | ) | (0.09 | ) | — | (0.23 | ) | 16.54 | 1.57 | 5.96 | 2.49 | 96 | 1.73 | 4 | ||||||||||||||||||||||||||||||||||||||||||||
| Class C* | ||||||||||||||||||||||||||||||||||||||||||||||||||||||||||||||||
| 11/01/17 | 10/31/18 | 18.32 | 0.04 | (1.73 | ) | (1.69 | ) | (0.10 | ) | — | — | (0.10 | ) | 16.53 | 2.20 | 3.68 | 0.21 | 49 | (9.28 | ) | 3 | |||||||||||||||||||||||||||||||||||||||||||
| 11/01/16 | 10/31/17 | 14.79 | 0.04 | 3.65 | 3.69 | (0.16 | ) | — | — | (0.16 | ) | 18.32 | 2.29 | 4.50 | 0.27 | 80 | 25.21 | 5 | ||||||||||||||||||||||||||||||||||||||||||||||
| 11/01/15 | 10/31/16 | 15.83 | 0.08 | (1.12 | ) | (1.04 | ) | — | — | — | — | 14.79 | 2.47 | 4.31 | 0.52 | 100 | (6.57 | ) | 5 | |||||||||||||||||||||||||||||||||||||||||||||
| 11/01/14 | 10/31/15 | 16.38 | 0.03 | 0.38 | 0.41 | (0.29 | ) | (0.67 | ) | — | (0.96 | ) | 15.83 | 2.35 | 4.95 | 0.18 | 86 | 2.80 | 5 | |||||||||||||||||||||||||||||||||||||||||||||
| 11/01/13 | 10/31/14 | 16.38 | 0.30 | (0.14 | ) | 0.16 | (0.07 | ) | (0.09 | ) | — | (0.16 | ) | 16.38 | 2.35 | 6.68 | 1.78 | 96 | 0.94 | 4 | ||||||||||||||||||||||||||||||||||||||||||||
| 46 | The accompanying notes are an integral part of the financial statements. |
Financial Highlights
Fiscal periods | From investment operations | Dividends & distributions | Ratios to average net asset (%) | |||||||||||||||||||||||||||||||||||||||||||||||||||||||||||||
| Beginning net asset value | Income (loss) | Realized & unrealized gain (loss) | Total | From investment income | From realized gains | From return of capital | Total | Ending net asset value | With expenses waived/ recovered (a) | Without expenses waived/ recovered (a) | Net income (loss) (a) | Portfolio turnover rate (%) (b) | Total return (%) (b)(c) | Ending net assets (millions) | ||||||||||||||||||||||||||||||||||||||||||||||||||
| Beginning | Ending | |||||||||||||||||||||||||||||||||||||||||||||||||||||||||||||||
| Carillon ClariVest International Stock Fund (cont’d) |
| |||||||||||||||||||||||||||||||||||||||||||||||||||||||||||||||
| Class I* | ||||||||||||||||||||||||||||||||||||||||||||||||||||||||||||||||
| 11/01/17 | 10/31/18 | $18.70 | $0.30 | $(1.82 | ) | $(1.52 | ) | $(0.26 | ) | $— | $— | $(0.26 | ) | $16.92 | 1.15 | 2.59 | 1.60 | 49 | (8.29 | ) | $9 | |||||||||||||||||||||||||||||||||||||||||||
| 11/01/16 | 10/31/17 | 15.11 | 0.23 | 3.71 | 3.94 | (0.35 | ) | — | — | (0.35 | ) | 18.70 | 1.15 | 3.28 | 1.40 | 80 | 26.63 | 8 | ||||||||||||||||||||||||||||||||||||||||||||||
| 11/01/15 | 10/31/16 | 16.08 | 0.30 | (1.15 | ) | (0.85 | ) | (0.12 | ) | — | — | (0.12 | ) | 15.11 | 1.15 | 3.12 | 2.03 | 100 | (5.31 | ) | 6 | |||||||||||||||||||||||||||||||||||||||||||
| 11/01/14 | 10/31/15 | 16.62 | 0.21 | 0.39 | 0.60 | (0.47 | ) | (0.67 | ) | — | (1.14 | ) | 16.08 | 1.15 | 3.82 | 1.31 | 86 | 4.04 | 2 | |||||||||||||||||||||||||||||||||||||||||||||
| 11/01/13 | 10/31/14 | 16.52 | 0.53 | (0.17 | ) | 0.36 | (0.17 | ) | (0.09 | ) | — | (0.26 | ) | 16.62 | 1.15 | 5.43 | 3.16 | 96 | 2.18 | 1 | ||||||||||||||||||||||||||||||||||||||||||||
| Class R-3* | ||||||||||||||||||||||||||||||||||||||||||||||||||||||||||||||||
| 11/01/17 | 10/31/18 | 18.53 | 0.19 | (1.80 | ) | (1.61 | ) | (0.18 | ) | — | — | (0.18 | ) | 16.74 | 1.70 | 3.17 | 1.01 | 49 | (8.80 | ) | 1 | |||||||||||||||||||||||||||||||||||||||||||
| 11/01/16 | 10/31/17 | 15.04 | 0.15 | 3.67 | 3.82 | (0.33 | ) | — | — | (0.33 | ) | 18.53 | 1.71 | 3.98 | 0.89 | 80 | 25.91 | 1 | ||||||||||||||||||||||||||||||||||||||||||||||
| 11/01/15 | 10/31/16 | 15.99 | 0.12 | (1.05 | ) | (0.93 | ) | (0.02 | ) | — | — | (0.02 | ) | 15.04 | 1.75 | 3.86 | 0.77 | 100 | (5.84 | ) | 1 | |||||||||||||||||||||||||||||||||||||||||||
| 11/01/14 | 10/31/15 | 16.53 | 0.13 | 0.37 | 0.50 | (0.37 | ) | (0.67 | ) | — | (1.04 | ) | 15.99 | 1.74 | 4.38 | 0.79 | 86 | 3.37 | 0 | |||||||||||||||||||||||||||||||||||||||||||||
| 11/01/13 | 10/31/14 | 16.45 | 0.40 | (0.13 | ) | 0.27 | (0.10 | ) | (0.09 | ) | — | (0.19 | ) | 16.53 | 1.73 | 6.22 | 2.37 | 96 | 1.64 | 0 | ||||||||||||||||||||||||||||||||||||||||||||
| Class R-5* | ||||||||||||||||||||||||||||||||||||||||||||||||||||||||||||||||
| 11/01/17 | 10/31/18 | 18.69 | 0.29 | (1.81 | ) | (1.52 | ) | (0.23 | ) | — | — | (0.23 | ) | 16.94 | 1.15 | 4.65 | 1.56 | 49 | (8.26 | ) | 0 | |||||||||||||||||||||||||||||||||||||||||||
| 11/01/16 | 10/31/17 | 15.11 | 0.08 | 3.85 | 3.93 | (0.35 | ) | — | — | (0.35 | ) | 18.69 | 1.15 | 3.69 | 0.49 | 80 | 26.56 | 0 | ||||||||||||||||||||||||||||||||||||||||||||||
| 11/01/15 | 10/31/16 | 16.09 | 0.27 | (1.13 | ) | (0.86 | ) | (0.12 | ) | — | — | (0.12 | ) | 15.11 | 1.15 | 3.22 | 1.79 | 100 | (5.36 | ) | 0 | |||||||||||||||||||||||||||||||||||||||||||
| 11/01/14 | 10/31/15 | 16.63 | 0.25 | 0.35 | 0.60 | (0.47 | ) | (0.67 | ) | — | (1.14 | ) | 16.09 | 1.15 | 3.59 | 1.58 | 86 | 4.01 | 0 | |||||||||||||||||||||||||||||||||||||||||||||
| 11/01/13 | 10/31/14 | 16.52 | 0.50 | (0.14 | ) | 0.36 | (0.16 | ) | (0.09 | ) | — | (0.25 | ) | 16.63 | 1.15 | 5.67 | 2.96 | 96 | 2.18 | 0 | ||||||||||||||||||||||||||||||||||||||||||||
| Class R-6* | ||||||||||||||||||||||||||||||||||||||||||||||||||||||||||||||||
| 11/01/17 | 10/31/18 | 18.75 | 0.29 | (1.80 | ) | (1.51 | ) | (0.27 | ) | — | — | (0.27 | ) | 16.97 | 1.05 | 2.81 | 1.55 | 49 | (8.21 | ) | 0 | |||||||||||||||||||||||||||||||||||||||||||
| 11/01/16 | 10/31/17 | 15.14 | 0.26 | 3.71 | 3.97 | (0.36 | ) | — | — | (0.36 | ) | 18.75 | 1.05 | 3.78 | 1.55 | 80 | 26.82 | 0 | ||||||||||||||||||||||||||||||||||||||||||||||
| 11/01/15 | 10/31/16 | 16.11 | 0.27 | (1.11 | ) | (0.84 | ) | (0.13 | ) | — | — | (0.13 | ) | 15.14 | 1.05 | 3.73 | 1.80 | 100 | (5.26 | ) | 0 | |||||||||||||||||||||||||||||||||||||||||||
| 11/01/14 | 10/31/15 | 16.65 | 0.24 | 0.37 | 0.61 | (0.48 | ) | (0.67 | ) | — | (1.15 | ) | 16.11 | 1.05 | 3.80 | 1.48 | 86 | 4.11 | 0 | |||||||||||||||||||||||||||||||||||||||||||||
| 11/01/13 | 10/31/14 | 16.53 | 0.51 | (0.13 | ) | 0.38 | (0.17 | ) | (0.09 | ) | — | (0.26 | ) | 16.65 | 1.05 | 5.67 | 3.05 | 96 | 2.31 | 0 | ||||||||||||||||||||||||||||||||||||||||||||
| Class Y* | ||||||||||||||||||||||||||||||||||||||||||||||||||||||||||||||||
| 11/20/17 | 10/31/18 | 18.54 | 0.21 | (1.62 | ) | (1.41 | ) | (0.27 | ) | — | — | (0.27 | ) | 16.86 | 1.45 | 3.59 | 1.20 | 49 | (7.77 | ) | 0 | |||||||||||||||||||||||||||||||||||||||||||
| Carillon Cougar Tactical Allocation Fund |
| |||||||||||||||||||||||||||||||||||||||||||||||||||||||||||||||
| Class A* | ||||||||||||||||||||||||||||||||||||||||||||||||||||||||||||||||
| 11/01/17 | 10/31/18 | 16.05 | 0.13 | (0.05 | ) | 0.08 | (0.11 | ) | (0.29 | ) | — | (0.40 | ) | 15.73 | 1.17 | 2.62 | 0.79 | 88 | 0.44 | 1 | ||||||||||||||||||||||||||||||||||||||||||||
| 11/01/16 | 10/31/17 | 14.59 | 0.12 | 1.40 | 1.52 | (0.04 | ) | (0.02 | ) | — | (0.06 | ) | 16.05 | 1.17 | 3.55 | 0.79 | 152 | 10.42 | 2 | |||||||||||||||||||||||||||||||||||||||||||||
| 12/31/15 | 10/31/16 | 14.29 | 0.06 | 0.24 | 0.30 | — | — | — | — | 14.59 | 1.17 | 17.33 | 0.47 | 66 | 2.10 | 2 | ||||||||||||||||||||||||||||||||||||||||||||||||
| Class C* | ||||||||||||||||||||||||||||||||||||||||||||||||||||||||||||||||
| 11/01/17 | 10/31/18 | 15.87 | — | (d) | (0.03 | ) | (0.03 | ) | (0.03 | ) | (0.29 | ) | — | (0.32 | ) | 15.52 | 1.92 | 3.40 | 0.02 | 88 | (0.29 | ) | 2 | |||||||||||||||||||||||||||||||||||||||||
| 11/01/16 | 10/31/17 | 14.50 | 0.01 | 1.38 | 1.39 | — | (0.02 | ) | — | (0.02 | ) | 15.87 | 1.93 | 4.11 | 0.05 | 152 | 9.58 | 2 | ||||||||||||||||||||||||||||||||||||||||||||||
| 12/31/15 | 10/31/16 | 14.29 | (0.04 | ) | 0.25 | 0.21 | — | — | — | — | 14.50 | 1.97 | 10.40 | (0.31 | ) | 66 | 1.47 | 1 | ||||||||||||||||||||||||||||||||||||||||||||||
| Class I* | ||||||||||||||||||||||||||||||||||||||||||||||||||||||||||||||||
| 11/01/17 | 10/31/18 | 16.09 | 0.17 | (0.04 | ) | 0.13 | (0.17 | ) | (0.29 | ) | — | (0.46 | ) | 15.76 | 0.87 | 2.42 | 1.03 | 88 | 0.74 | 20 | ||||||||||||||||||||||||||||||||||||||||||||
| 11/01/16 | 10/31/17 | 14.62 | 0.17 | 1.40 | 1.57 | (0.08 | ) | (0.02 | ) | — | (0.10 | ) | 16.09 | 0.87 | 3.00 | 1.09 | 152 | 10.79 | 14 | |||||||||||||||||||||||||||||||||||||||||||||
| 12/31/15 | 10/31/16 | 14.29 | 0.10 | 0.23 | 0.33 | — | — | — | — | 14.62 | 0.87 | 8.81 | 0.77 | 66 | 2.31 | 5 | ||||||||||||||||||||||||||||||||||||||||||||||||
| Class R-3* | ||||||||||||||||||||||||||||||||||||||||||||||||||||||||||||||||
| 11/01/17 | 10/31/18 | 16.03 | 0.09 | (0.04 | ) | 0.05 | (0.09 | ) | (0.29 | ) | — | (0.38 | ) | 15.70 | 1.42 | 3.49 | 0.52 | 88 | 0.21 | 0 | ||||||||||||||||||||||||||||||||||||||||||||
| 11/01/16 | 10/31/17 | 14.57 | 0.09 | 1.39 | 1.48 | — | (0.02 | ) | — | (0.02 | ) | 16.03 | 1.40 | 3.62 | 0.57 | 152 | 10.15 | 0 | ||||||||||||||||||||||||||||||||||||||||||||||
| 12/31/15 | 10/31/16 | 14.29 | 0.03 | 0.25 | 0.28 | — | — | — | — | 14.57 | 1.37 | 22.76 | 0.21 | 66 | 1.96 | 0 | ||||||||||||||||||||||||||||||||||||||||||||||||
| Class R-5* | ||||||||||||||||||||||||||||||||||||||||||||||||||||||||||||||||
| 11/01/17 | 10/31/18 | 16.09 | 0.18 | (0.05 | ) | 0.13 | (0.16 | ) | (0.29 | ) | — | (0.45 | ) | 15.77 | 0.87 | 2.60 | 1.07 | 88 | 0.76 | 0 | ||||||||||||||||||||||||||||||||||||||||||||
| 11/01/16 | 10/31/17 | 14.63 | 0.17 | 1.39 | 1.56 | (0.08 | ) | (0.02 | ) | — | (0.10 | ) | 16.09 | 0.87 | 3.18 | 1.15 | 152 | 10.71 | 0 | |||||||||||||||||||||||||||||||||||||||||||||
| 12/31/15 | 10/31/16 | 14.29 | 0.08 | 0.26 | 0.34 | — | — | — | — | 14.63 | 0.87 | 21.86 | 0.69 | 66 | 2.38 | 0 | ||||||||||||||||||||||||||||||||||||||||||||||||
| Class R-6* | ||||||||||||||||||||||||||||||||||||||||||||||||||||||||||||||||
| 11/01/17 | 10/31/18 | 16.12 | 0.19 | (0.05 | ) | 0.14 | (0.18 | ) | (0.29 | ) | — | (0.47 | ) | 15.79 | 0.77 | 2.92 | 1.17 | 88 | 0.82 | 0 | ||||||||||||||||||||||||||||||||||||||||||||
| 11/01/16 | 10/31/17 | 14.64 | 0.18 | 1.41 | 1.59 | (0.09 | ) | (0.02 | ) | — | (0.11 | ) | 16.12 | 0.77 | 3.04 | 1.21 | 152 | 10.88 | 0 | |||||||||||||||||||||||||||||||||||||||||||||
| 12/31/15 | 10/31/16 | 14.29 | 0.10 | 0.25 | 0.35 | — | — | — | — | 14.64 | 0.77 | 22.16 | 0.82 | 66 | 2.45 | 0 | ||||||||||||||||||||||||||||||||||||||||||||||||
| Class Y* | ||||||||||||||||||||||||||||||||||||||||||||||||||||||||||||||||
| 11/20/17 | 10/31/18 | 16.11 | 0.13 | (0.06 | ) | 0.07 | (0.18 | ) | (0.29 | ) | — | (0.47 | ) | 15.71 | 1.17 | 3.32 | 0.82 | 88 | 0.34 | 0 | ||||||||||||||||||||||||||||||||||||||||||||
| The accompanying notes are an integral part of the financial statements. | 47 |
Financial Highlights
Fiscal periods | From investment operations | Dividends & distributions | Ratios to average net asset (%) | |||||||||||||||||||||||||||||||||||||||||||||||||||||||||||||
| Beginning net asset value | Income (loss) | Realized & unrealized gain (loss) | Total | From investment income | From realized gains | From return of capital | Total | Ending net asset value | With expenses waived/ recovered (a) | Without expenses waived/ recovered (a) | Net income (loss) (a) | Portfolio turnover rate (%) (b) | Total return (%) (b)(c) | Ending net assets (millions) | ||||||||||||||||||||||||||||||||||||||||||||||||||
| Beginning | Ending | |||||||||||||||||||||||||||||||||||||||||||||||||||||||||||||||
| Carillon Eagle Growth & Income Fund |
| |||||||||||||||||||||||||||||||||||||||||||||||||||||||||||||||
| Class A* | ||||||||||||||||||||||||||||||||||||||||||||||||||||||||||||||||
| 11/01/17 | 10/31/18 | $20.39 | $0.40 | $1.57 | $1.97 | $(0.42 | ) | $(0.50 | ) | $— | $(0.92 | ) | $21.44 | 0.98 | 0.98 | 1.91 | 10 | 9.76 | $147 | |||||||||||||||||||||||||||||||||||||||||||||
| 11/01/16 | 10/31/17 | 18.39 | 0.34 | 2.93 | 3.27 | (0.33 | ) | (0.94 | ) | — | (1.27 | ) | 20.39 | 1.03 | 1.03 | 1.74 | 10 | 18.56 | 147 | |||||||||||||||||||||||||||||||||||||||||||||
| 11/01/15 | 10/31/16 | 17.52 | 0.34 | 0.85 | 1.19 | (0.32 | ) | — | — | (0.32 | ) | 18.39 | 1.06 | 1.06 | 1.91 | 15 | 6.87 | 152 | ||||||||||||||||||||||||||||||||||||||||||||||
| 11/01/14 | 10/31/15 | 18.27 | 0.36 | (0.64 | ) | (0.28 | ) | (0.32 | ) | (0.13 | ) | (0.02 | ) | (0.47 | ) | 17.52 | 1.02 | 1.02 | 1.99 | 25 | (1.55 | ) | 180 | |||||||||||||||||||||||||||||||||||||||||
| 11/01/13 | 10/31/14 | 16.68 | 0.30 | 1.91 | 2.21 | (0.28 | ) | (0.34 | ) | — | (0.62 | ) | 18.27 | 1.02 | 1.02 | 1.71 | 10 | 13.52 | 223 | |||||||||||||||||||||||||||||||||||||||||||||
| Class C* | ||||||||||||||||||||||||||||||||||||||||||||||||||||||||||||||||
| 11/01/17 | 10/31/18 | 19.54 | 0.24 | 1.49 | 1.73 | (0.25 | ) | (0.50 | ) | — | (0.75 | ) | 20.52 | 1.73 | 1.73 | 1.16 | 10 | 8.94 | 130 | |||||||||||||||||||||||||||||||||||||||||||||
| 11/01/16 | 10/31/17 | 17.68 | 0.18 | 2.81 | 2.99 | (0.19 | ) | (0.94 | ) | — | (1.13 | ) | 19.54 | 1.79 | 1.79 | 0.98 | 10 | 17.62 | 169 | |||||||||||||||||||||||||||||||||||||||||||||
| 11/01/15 | 10/31/16 | 16.86 | 0.20 | 0.82 | 1.02 | (0.20 | ) | — | — | (0.20 | ) | 17.68 | 1.82 | 1.82 | 1.14 | 15 | 6.07 | 185 | ||||||||||||||||||||||||||||||||||||||||||||||
| 11/01/14 | 10/31/15 | 17.60 | 0.21 | (0.60 | ) | (0.39 | ) | (0.20 | ) | (0.13 | ) | (0.02 | ) | (0.35 | ) | 16.86 | 1.79 | 1.79 | 1.21 | 25 | (2.30 | ) | 197 | |||||||||||||||||||||||||||||||||||||||||
| 11/01/13 | 10/31/14 | 16.10 | 0.16 | 1.83 | 1.99 | (0.15 | ) | (0.34 | ) | — | (0.49 | ) | 17.60 | 1.79 | 1.79 | 0.92 | 10 | 12.63 | 212 | |||||||||||||||||||||||||||||||||||||||||||||
| Class I* | ||||||||||||||||||||||||||||||||||||||||||||||||||||||||||||||||
| 11/01/17 | 10/31/18 | 20.34 | 0.46 | 1.56 | 2.02 | (0.47 | ) | (0.50 | ) | — | (0.97 | ) | 21.39 | 0.72 | 0.72 | 2.16 | 10 | 10.06 | 272 | |||||||||||||||||||||||||||||||||||||||||||||
| 11/01/16 | 10/31/17 | 18.35 | 0.39 | 2.93 | 3.32 | (0.39 | ) | (0.94 | ) | — | (1.33 | ) | 20.34 | 0.75 | 0.75 | 2.00 | 10 | 18.90 | 246 | |||||||||||||||||||||||||||||||||||||||||||||
| 11/01/15 | 10/31/16 | 17.48 | 0.39 | 0.85 | 1.24 | (0.37 | ) | — | — | (0.37 | ) | 18.35 | 0.79 | 0.79 | 2.17 | 15 | 7.18 | 179 | ||||||||||||||||||||||||||||||||||||||||||||||
| 11/01/14 | 10/31/15 | 18.24 | 0.40 | (0.64 | ) | (0.24 | ) | (0.37 | ) | (0.13 | ) | (0.02 | ) | (0.52 | ) | 17.48 | 0.76 | 0.76 | 2.23 | 25 | (1.33 | ) | 200 | |||||||||||||||||||||||||||||||||||||||||
| 11/01/13 | 10/31/14 | 16.65 | 0.33 | 1.93 | 2.26 | (0.33 | ) | (0.34 | ) | — | (0.67 | ) | 18.24 | 0.77 | 0.77 | 1.89 | 10 | 13.86 | 207 | |||||||||||||||||||||||||||||||||||||||||||||
| Class R-3* | ||||||||||||||||||||||||||||||||||||||||||||||||||||||||||||||||
| 11/01/17 | 10/31/18 | 20.30 | 0.33 | 1.56 | 1.89 | (0.34 | ) | (0.50 | ) | — | (0.84 | ) | 21.35 | 1.31 | 1.31 | 1.59 | 10 | 9.40 | 2 | |||||||||||||||||||||||||||||||||||||||||||||
| 11/01/16 | 10/31/17 | 18.32 | 0.28 | 2.91 | 3.19 | (0.27 | ) | (0.94 | ) | — | (1.21 | ) | 20.30 | 1.34 | 1.34 | 1.44 | 10 | 18.15 | 2 | |||||||||||||||||||||||||||||||||||||||||||||
| 11/01/15 | 10/31/16 | 17.44 | 0.28 | 0.87 | 1.15 | (0.27 | ) | — | — | (0.27 | ) | 18.32 | 1.37 | 1.37 | 1.60 | 15 | 6.61 | 3 | ||||||||||||||||||||||||||||||||||||||||||||||
| 11/01/14 | 10/31/15 | 18.19 | 0.28 | (0.63 | ) | (0.35 | ) | (0.25 | ) | (0.13 | ) | (0.02 | ) | (0.40 | ) | 17.44 | 1.44 | 1.44 | 1.57 | 25 | (1.99 | ) | 3 | |||||||||||||||||||||||||||||||||||||||||
| 11/01/13 | 10/31/14 | 16.61 | 0.23 | 1.90 | 2.13 | (0.21 | ) | (0.34 | ) | — | (0.55 | ) | 18.19 | 1.40 | 1.40 | 1.33 | 10 | 13.08 | 4 | |||||||||||||||||||||||||||||||||||||||||||||
| Class R-5* | ||||||||||||||||||||||||||||||||||||||||||||||||||||||||||||||||
| 11/01/17 | 10/31/18 | 20.36 | 0.45 | 1.56 | 2.01 | (0.46 | ) | (0.50 | ) | — | (0.96 | ) | 21.41 | 0.78 | 0.78 | 2.10 | 10 | 9.99 | 0 | |||||||||||||||||||||||||||||||||||||||||||||
| 11/01/16 | 10/31/17 | 18.38 | 0.38 | 2.93 | 3.31 | (0.39 | ) | (0.94 | ) | — | (1.33 | ) | 20.36 | 0.76 | 0.76 | 1.97 | 10 | 18.82 | 0 | |||||||||||||||||||||||||||||||||||||||||||||
| 11/01/15 | 10/31/16 | 17.50 | 0.39 | 0.87 | 1.26 | (0.38 | ) | — | — | (0.38 | ) | 18.38 | 0.75 | 0.75 | 2.21 | 15 | 7.27 | 0 | ||||||||||||||||||||||||||||||||||||||||||||||
| 11/01/14 | 10/31/15 | 18.21 | 0.44 | (0.76 | ) | (0.32 | ) | (0.24 | ) | (0.13 | ) | (0.02 | ) | (0.39 | ) | 17.50 | 0.78 | 0.79 | 2.39 | 25 | (1.82 | ) | 0 | |||||||||||||||||||||||||||||||||||||||||
| 11/01/13 | 10/31/14 | 16.63 | 0.34 | 1.90 | 2.24 | (0.32 | ) | (0.34 | ) | — | (0.66 | ) | 18.21 | 0.76 | 0.76 | 1.95 | 10 | 13.80 | 4 | |||||||||||||||||||||||||||||||||||||||||||||
| Class R-6* | ||||||||||||||||||||||||||||||||||||||||||||||||||||||||||||||||
| 11/01/17 | 10/31/18 | 20.30 | 0.47 | 1.56 | 2.03 | (0.49 | ) | (0.50 | ) | — | (0.99 | ) | 21.34 | 0.64 | 0.64 | 2.24 | 10 | 10.12 | 42 | |||||||||||||||||||||||||||||||||||||||||||||
| 11/01/16 | 10/31/17 | 18.32 | 0.40 | 2.93 | 3.33 | (0.41 | ) | (0.94 | ) | — | (1.35 | ) | 20.30 | 0.65 | 0.65 | 2.10 | 10 | 18.98 | 40 | |||||||||||||||||||||||||||||||||||||||||||||
| 11/01/15 | 10/31/16 | 17.46 | 0.39 | 0.87 | 1.26 | (0.40 | ) | — | — | (0.40 | ) | 18.32 | 0.67 | 0.67 | 2.18 | 15 | 7.30 | 34 | ||||||||||||||||||||||||||||||||||||||||||||||
| 11/01/14 | 10/31/15 | 18.26 | 0.45 | (0.71 | ) | (0.26 | ) | (0.39 | ) | (0.13 | ) | (0.02 | ) | (0.54 | ) | 17.46 | 0.65 | 0.65 | 2.47 | 25 | (1.46 | ) | 0 | |||||||||||||||||||||||||||||||||||||||||
| 11/01/13 | 10/31/14 | 16.67 | 0.35 | 1.92 | 2.27 | (0.34 | ) | (0.34 | ) | — | (0.68 | ) | 18.26 | 0.66 | 0.66 | 2.01 | 10 | 13.94 | 0 | |||||||||||||||||||||||||||||||||||||||||||||
| Class Y* | ||||||||||||||||||||||||||||||||||||||||||||||||||||||||||||||||
| 11/20/17 | 10/31/18 | 20.48 | 0.28 | 1.49 | 1.77 | (0.40 | ) | (0.50 | ) | — | (0.90 | ) | 21.35 | 1.25 | 1.43 | 1.35 | 10 | 8.74 | 0 | |||||||||||||||||||||||||||||||||||||||||||||
| Carillon Eagle Mid Cap Growth Fund |
| |||||||||||||||||||||||||||||||||||||||||||||||||||||||||||||||
| Class A* | ||||||||||||||||||||||||||||||||||||||||||||||||||||||||||||||||
| 11/01/17 | 10/31/18 | 56.41 | (0.28 | ) | 3.06 | 2.78 | — | (3.00 | ) | — | (3.00 | ) | 56.19 | 1.05 | 1.05 | (0.46 | ) | 44 | 4.75 | 688 | ||||||||||||||||||||||||||||||||||||||||||||
| 11/01/16 | 10/31/17 | 42.29 | (0.26 | ) | 14.38 | 14.12 | — | — | — | — | 56.41 | 1.12 | 1.12 | (0.53 | ) | 44 | 33.39 | 459 | ||||||||||||||||||||||||||||||||||||||||||||||
| 11/01/15 | 10/31/16 | 43.39 | (0.17 | ) | (0.23 | ) | (0.40 | ) | — | (0.70 | ) | — | (0.70 | ) | 42.29 | 1.17 | 1.17 | (0.40 | ) | 34 | (0.87 | ) | 320 | |||||||||||||||||||||||||||||||||||||||||
| 11/01/14 | 10/31/15 | 45.68 | (0.26 | ) | 2.26 | 2.00 | — | (4.29 | ) | — | (4.29 | ) | 43.39 | 1.14 | 1.14 | (0.59 | ) | 52 | 4.70 | 354 | ||||||||||||||||||||||||||||||||||||||||||||
| 11/01/13 | 10/31/14 | 41.03 | (0.17 | ) | 6.74 | 6.57 | — | (1.92 | ) | — | (1.92 | ) | 45.68 | 1.19 | 1.19 | (0.40 | ) | 60 | 16.58 | 283 | ||||||||||||||||||||||||||||||||||||||||||||
| Class C* | ||||||||||||||||||||||||||||||||||||||||||||||||||||||||||||||||
| 11/01/17 | 10/31/18 | 45.67 | (0.55 | ) | 2.49 | 1.94 | — | (3.00 | ) | — | (3.00 | ) | 44.61 | 1.74 | 1.74 | (1.14 | ) | 44 | 4.00 | 147 | ||||||||||||||||||||||||||||||||||||||||||||
| 11/01/16 | 10/31/17 | 34.48 | (0.50 | ) | 11.69 | 11.19 | — | — | — | — | 45.67 | 1.84 | 1.84 | (1.24 | ) | 44 | 32.45 | 146 | ||||||||||||||||||||||||||||||||||||||||||||||
| 11/01/15 | 10/31/16 | 35.76 | (0.38 | ) | (0.20 | ) | (0.58 | ) | — | (0.70 | ) | — | (0.70 | ) | 34.48 | 1.88 | 1.88 | (1.11 | ) | 34 | (1.58 | ) | 112 | |||||||||||||||||||||||||||||||||||||||||
| 11/01/14 | 10/31/15 | 38.65 | (0.48 | ) | 1.88 | 1.40 | — | (4.29 | ) | — | (4.29 | ) | 35.76 | 1.87 | 1.88 | (1.32 | ) | 52 | 3.92 | 117 | ||||||||||||||||||||||||||||||||||||||||||||
| 11/01/13 | 10/31/14 | 35.24 | (0.41 | ) | 5.74 | 5.33 | — | (1.92 | ) | — | (1.92 | ) | 38.65 | 1.89 | 1.89 | (1.12 | ) | 60 | 15.75 | 105 | ||||||||||||||||||||||||||||||||||||||||||||
| 48 | The accompanying notes are an integral part of the financial statements. |
Financial Highlights
Fiscal periods | From investment operations | Dividends & distributions | Ratios to average net asset (%) | |||||||||||||||||||||||||||||||||||||||||||||||||||||||||||||
| Beginning net asset value | Income (loss) | Realized & unrealized gain (loss) | Total | From investment income | From realized gains | From return of capital | Total | Ending net asset value | With expenses waived/ recovered (a) | Without expenses waived/ recovered (a) | Net income (loss) (a) | Portfolio turnover rate (%) (b) | Total return (%) (b)(c) | Ending net assets (millions) | ||||||||||||||||||||||||||||||||||||||||||||||||||
| Beginning | Ending | |||||||||||||||||||||||||||||||||||||||||||||||||||||||||||||||
| Carillon Eagle Mid Cap Growth Fund (cont’d) |
| |||||||||||||||||||||||||||||||||||||||||||||||||||||||||||||||
| Class I* | ||||||||||||||||||||||||||||||||||||||||||||||||||||||||||||||||
| 11/01/17 | 10/31/18 | $59.29 | $(0.10 | ) | $3.19 | $3.09 | $— | $(3.00 | ) | $— | $(3.00 | ) | $59.38 | 0.75 | 0.75 | (0.16 | ) | 44 | 5.05 | $1,134 | ||||||||||||||||||||||||||||||||||||||||||||
| 11/01/16 | 10/31/17 | 44.30 | (0.11 | ) | 15.10 | 14.99 | — | (d) | — | — | — | (d) | 59.29 | 0.78 | 0.78 | (0.21 | ) | 44 | 33.84 | 763 | ||||||||||||||||||||||||||||||||||||||||||||
| 11/01/15 | 10/31/16 | 45.26 | (0.02 | ) | (0.24 | ) | (0.26 | ) | — | (0.70 | ) | — | (0.70 | ) | 44.30 | 0.82 | 0.82 | (0.06 | ) | 34 | (0.52 | ) | 421 | |||||||||||||||||||||||||||||||||||||||||
| 11/01/14 | 10/31/15 | 47.33 | (0.13 | ) | 2.35 | 2.22 | — | (4.29 | ) | — | (4.29 | ) | 45.26 | 0.82 | 0.83 | (0.28 | ) | 52 | 5.02 | 358 | ||||||||||||||||||||||||||||||||||||||||||||
| 11/01/13 | 10/31/14 | 42.31 | (0.05 | ) | 6.99 | 6.94 | — | (1.92 | ) | — | (1.92 | ) | 47.33 | 0.85 | 0.85 | (0.12 | ) | 60 | 16.97 | 210 | ||||||||||||||||||||||||||||||||||||||||||||
| Class R-3* | ||||||||||||||||||||||||||||||||||||||||||||||||||||||||||||||||
| 11/01/17 | 10/31/18 | 54.88 | (0.42 | ) | 2.96 | 2.54 | — | (3.00 | ) | — | (3.00 | ) | 54.42 | 1.32 | 1.32 | (0.72 | ) | 44 | 4.43 | 35 | ||||||||||||||||||||||||||||||||||||||||||||
| 11/01/16 | 10/31/17 | 41.25 | (0.39 | ) | 14.02 | 13.63 | — | — | — | — | 54.88 | 1.38 | 1.38 | (0.80 | ) | 44 | 33.04 | 32 | ||||||||||||||||||||||||||||||||||||||||||||||
| 11/01/15 | 10/31/16 | 42.46 | (0.28 | ) | (0.23 | ) | (0.51 | ) | — | (0.70 | ) | — | (0.70 | ) | 41.25 | 1.46 | 1.46 | (0.69 | ) | 34 | (1.16 | ) | 21 | |||||||||||||||||||||||||||||||||||||||||
| 11/01/14 | 10/31/15 | 44.90 | (0.37 | ) | 2.22 | 1.85 | — | (4.29 | ) | — | (4.29 | ) | 42.46 | 1.41 | 1.42 | (0.86 | ) | 52 | 4.42 | 24 | ||||||||||||||||||||||||||||||||||||||||||||
| 11/01/13 | 10/31/14 | 40.48 | (0.31 | ) | 6.65 | 6.34 | — | (1.92 | ) | — | (1.92 | ) | 44.90 | 1.48 | 1.48 | (0.73 | ) | 60 | 16.23 | 16 | ||||||||||||||||||||||||||||||||||||||||||||
| Class R-5* | ||||||||||||||||||||||||||||||||||||||||||||||||||||||||||||||||
| 11/01/17 | 10/31/18 | 59.14 | (0.11 | ) | 3.19 | 3.08 | — | (3.00 | ) | — | (3.00 | ) | 59.22 | 0.75 | 0.75 | (0.18 | ) | 44 | 5.04 | 648 | ||||||||||||||||||||||||||||||||||||||||||||
| 11/01/16 | 10/31/17 | 44.19 | (0.11 | ) | 15.06 | 14.95 | — | (d) | — | — | — | (d) | 59.14 | 0.79 | 0.79 | (0.22 | ) | 44 | 33.84 | 284 | ||||||||||||||||||||||||||||||||||||||||||||
| 11/01/15 | 10/31/16 | 45.15 | (0.03 | ) | (0.23 | ) | (0.26 | ) | — | (0.70 | ) | — | (0.70 | ) | 44.19 | 0.83 | 0.83 | (0.06 | ) | 34 | (0.52 | ) | 153 | |||||||||||||||||||||||||||||||||||||||||
| 11/01/14 | 10/31/15 | 47.28 | (0.13 | ) | 2.29 | 2.16 | — | (4.29 | ) | — | (4.29 | ) | 45.15 | 0.82 | 0.83 | (0.28 | ) | 52 | 4.89 | 133 | ||||||||||||||||||||||||||||||||||||||||||||
| 11/01/13 | 10/31/14 | 42.27 | (0.06 | ) | 6.99 | 6.93 | — | (1.92 | ) | — | (1.92 | ) | 47.28 | 0.87 | 0.87 | (0.14 | ) | 60 | 16.96 | 55 | ||||||||||||||||||||||||||||||||||||||||||||
| Class R-6* | ||||||||||||||||||||||||||||||||||||||||||||||||||||||||||||||||
| 11/01/17 | 10/31/18 | 59.62 | (0.06 | ) | 3.22 | 3.16 | — | (3.00 | ) | — | (3.00 | ) | 59.78 | 0.66 | 0.66 | (0.09 | ) | 44 | 5.14 | 1,636 | ||||||||||||||||||||||||||||||||||||||||||||
| 11/01/16 | 10/31/17 | 44.51 | (0.07 | ) | 15.19 | 15.12 | (0.01 | ) | — | — | (0.01 | ) | 59.62 | 0.69 | 0.69 | (0.12 | ) | 44 | 33.97 | 692 | ||||||||||||||||||||||||||||||||||||||||||||
| 11/01/15 | 10/31/16 | 45.43 | 0.02 | (0.24 | ) | (0.22 | ) | — | (0.70 | ) | — | (0.70 | ) | 44.51 | 0.72 | 0.72 | 0.04 | 34 | (0.43 | ) | 346 | |||||||||||||||||||||||||||||||||||||||||||
| 11/01/14 | 10/31/15 | 47.44 | (0.10 | ) | 2.38 | 2.28 | — | (4.29 | ) | — | (4.29 | ) | 45.43 | 0.73 | 0.74 | (0.21 | ) | 52 | 5.15 | 190 | ||||||||||||||||||||||||||||||||||||||||||||
| 11/01/13 | 10/31/14 | 42.36 | (0.05 | ) | 7.05 | 7.00 | — | (1.92 | ) | — | (1.92 | ) | 47.44 | 0.77 | 0.77 | (0.10 | ) | 60 | 17.10 | 30 | ||||||||||||||||||||||||||||||||||||||||||||
| Class Y* | ||||||||||||||||||||||||||||||||||||||||||||||||||||||||||||||||
| 11/20/17 | 10/31/18 | 60.71 | (0.44 | ) | 1.87 | 1.43 | — | (3.00 | ) | — | (3.00 | ) | 59.14 | 1.13 | 1.13 | (0.72 | ) | 44 | 2.18 | 0 | ||||||||||||||||||||||||||||||||||||||||||||
| Carillon Eagle Small Cap Growth Fund |
| |||||||||||||||||||||||||||||||||||||||||||||||||||||||||||||||
| Class A* | ||||||||||||||||||||||||||||||||||||||||||||||||||||||||||||||||
| 11/01/17 | 10/31/18 | 62.31 | (0.40 | ) | 2.07 | 1.67 | — | (4.83 | ) | — | (4.83 | ) | 59.15 | 1.05 | 1.05 | (0.63 | ) | 35 | 2.61 | 544 | ||||||||||||||||||||||||||||||||||||||||||||
| 11/01/16 | 10/31/17 | 50.48 | (0.27 | ) | 13.72 | 13.45 | — | (1.62 | ) | — | (1.62 | ) | 62.31 | 1.13 | 1.13 | (0.47 | ) | 40 | 27.22 | 640 | ||||||||||||||||||||||||||||||||||||||||||||
| 11/01/15 | 10/31/16 | 52.98 | (0.33 | ) | 1.29 | 0.96 | — | (3.46 | ) | — | (3.46 | ) | 50.48 | 1.15 | 1.15 | (0.66 | ) | 32 | 2.07 | 848 | ||||||||||||||||||||||||||||||||||||||||||||
| 11/01/14 | 10/31/15 | 57.57 | (0.33 | ) | 2.22 | 1.89 | — | (6.48 | ) | — | (6.48 | ) | 52.98 | 1.10 | 1.10 | (0.60 | ) | 45 | 3.23 | 711 | ||||||||||||||||||||||||||||||||||||||||||||
| 11/01/13 | 10/31/14 | 54.33 | (0.34 | ) | 4.27 | 3.93 | — | (0.69 | ) | — | (0.69 | ) | 57.57 | 1.11 | 1.11 | (0.61 | ) | 37 | 7.30 | 759 | ||||||||||||||||||||||||||||||||||||||||||||
| Class C* | ||||||||||||||||||||||||||||||||||||||||||||||||||||||||||||||||
| 11/01/17 | 10/31/18 | 47.51 | (0.62 | ) | 1.59 | 0.97 | — | (4.83 | ) | — | (4.83 | ) | 43.65 | 1.75 | 1.75 | (1.31 | ) | 35 | 1.89 | 111 | ||||||||||||||||||||||||||||||||||||||||||||
| 11/01/16 | 10/31/17 | 39.10 | (0.51 | ) | 10.54 | 10.03 | — | (1.62 | ) | — | (1.62 | ) | 47.51 | 1.82 | 1.82 | (1.17 | ) | 40 | 26.37 | 169 | ||||||||||||||||||||||||||||||||||||||||||||
| 11/01/15 | 10/31/16 | 42.10 | (0.52 | ) | 0.98 | 0.46 | — | (3.46 | ) | — | (3.46 | ) | 39.10 | 1.85 | 1.85 | (1.36 | ) | 32 | 1.37 | 166 | ||||||||||||||||||||||||||||||||||||||||||||
| 11/01/14 | 10/31/15 | 47.33 | (0.59 | ) | 1.84 | 1.25 | — | (6.48 | ) | — | (6.48 | ) | 42.10 | 1.82 | 1.82 | (1.32 | ) | 45 | 2.49 | 186 | ||||||||||||||||||||||||||||||||||||||||||||
| 11/01/13 | 10/31/14 | 45.11 | (0.61 | ) | 3.52 | 2.91 | — | (0.69 | ) | — | (0.69 | ) | 47.33 | 1.82 | 1.82 | (1.32 | ) | 37 | 6.52 | 190 | ||||||||||||||||||||||||||||||||||||||||||||
| Class I* | ||||||||||||||||||||||||||||||||||||||||||||||||||||||||||||||||
| 11/01/17 | 10/31/18 | 65.18 | (0.22 | ) | 2.15 | 1.93 | — | (4.83 | ) | — | (4.83 | ) | 62.28 | 0.75 | 0.75 | (0.33 | ) | 35 | 2.91 | 1,369 | ||||||||||||||||||||||||||||||||||||||||||||
| 11/01/16 | 10/31/17 | 52.55 | (0.08 | ) | 14.33 | 14.25 | — | (1.62 | ) | — | (1.62 | ) | 65.18 | 0.78 | 0.78 | (0.13 | ) | 40 | 27.68 | 1,691 | ||||||||||||||||||||||||||||||||||||||||||||
| 11/01/15 | 10/31/16 | 54.84 | (0.16 | ) | 1.33 | 1.17 | — | (3.46 | ) | — | (3.46 | ) | 52.55 | 0.81 | 0.81 | (0.32 | ) | 32 | 2.40 | 1,374 | ||||||||||||||||||||||||||||||||||||||||||||
| 11/01/14 | 10/31/15 | 59.19 | (0.16 | ) | 2.29 | 2.13 | — | (6.48 | ) | — | (6.48 | ) | 54.84 | 0.78 | 0.78 | (0.28 | ) | 45 | 3.58 | 1,757 | ||||||||||||||||||||||||||||||||||||||||||||
| 11/01/13 | 10/31/14 | 55.68 | (0.16 | ) | 4.36 | 4.20 | — | (0.69 | ) | — | (0.69 | ) | 59.19 | 0.78 | 0.78 | (0.29 | ) | 37 | 7.61 | 1,770 | ||||||||||||||||||||||||||||||||||||||||||||
| Class R-3* | ||||||||||||||||||||||||||||||||||||||||||||||||||||||||||||||||
| 11/01/17 | 10/31/18 | 60.51 | (0.55 | ) | 2.01 | 1.46 | — | (4.83 | ) | — | (4.83 | ) | 57.14 | 1.32 | 1.32 | (0.90 | ) | 35 | 2.32 | 85 | ||||||||||||||||||||||||||||||||||||||||||||
| 11/01/16 | 10/31/17 | 49.18 | (0.40 | ) | 13.35 | 12.95 | — | (1.62 | ) | — | (1.62 | ) | 60.51 | 1.38 | 1.38 | (0.73 | ) | 40 | 26.92 | 98 | ||||||||||||||||||||||||||||||||||||||||||||
| 11/01/15 | 10/31/16 | 51.82 | (0.43 | ) | 1.25 | 0.82 | — | (3.46 | ) | — | (3.46 | ) | 49.18 | 1.39 | 1.39 | (0.90 | ) | 32 | 1.83 | 94 | ||||||||||||||||||||||||||||||||||||||||||||
| 11/01/14 | 10/31/15 | 56.59 | (0.48 | ) | 2.19 | 1.71 | — | (6.48 | ) | — | (6.48 | ) | 51.82 | 1.38 | 1.38 | (0.88 | ) | 45 | 2.94 | 119 | ||||||||||||||||||||||||||||||||||||||||||||
| 11/01/13 | 10/31/14 | 53.58 | (0.50 | ) | 4.20 | 3.70 | — | (0.69 | ) | — | (0.69 | ) | 56.59 | 1.42 | 1.42 | (0.92 | ) | 37 | 6.97 | 127 | ||||||||||||||||||||||||||||||||||||||||||||
| The accompanying notes are an integral part of the financial statements. | 49 |
Financial Highlights
Fiscal periods | From investment operations | Dividends & distributions | Ratios to average net asset (%) | |||||||||||||||||||||||||||||||||||||||||||||||||||||||||||||
| Beginning net asset value | Income (loss) | Realized & unrealized gain (loss) | Total | From investment income | From realized gains | From return of capital | Total | Ending net asset value | With expenses waived/ recovered (a) | Without expenses waived/ recovered (a) | Net income (loss) (a) | Portfolio turnover rate (%) (b) | Total return (%) (b)(c) | Ending net assets (millions) | ||||||||||||||||||||||||||||||||||||||||||||||||||
| Beginning | Ending | |||||||||||||||||||||||||||||||||||||||||||||||||||||||||||||||
| Carillon Eagle Small Cap Growth Fund (cont’d) |
| |||||||||||||||||||||||||||||||||||||||||||||||||||||||||||||||
| Class R-5* | ||||||||||||||||||||||||||||||||||||||||||||||||||||||||||||||||
| 11/01/17 | 10/31/18 | $65.45 | $(0.22 | ) | $2.16 | $1.94 | $— | $(4.83 | ) | $— | $(4.83 | ) | $62.56 | 0.75 | 0.75 | (0.33 | ) | 35 | 2.92 | $441 | ||||||||||||||||||||||||||||||||||||||||||||
| 11/01/16 | 10/31/17 | 52.75 | (0.07 | ) | 14.39 | 14.32 | — | (1.62 | ) | — | (1.62 | ) | 65.45 | 0.77 | 0.77 | (0.11 | ) | 40 | 27.71 | 469 | ||||||||||||||||||||||||||||||||||||||||||||
| 11/01/15 | 10/31/16 | 55.02 | (0.15 | ) | 1.34 | 1.19 | — | (3.46 | ) | — | (3.46 | ) | 52.75 | 0.78 | 0.78 | (0.30 | ) | 32 | 2.43 | 444 | ||||||||||||||||||||||||||||||||||||||||||||
| 11/01/14 | 10/31/15 | 59.37 | (0.15 | ) | 2.28 | 2.13 | — | (6.48 | ) | — | (6.48 | ) | 55.02 | 0.75 | 0.75 | (0.25 | ) | 45 | 3.57 | 418 | ||||||||||||||||||||||||||||||||||||||||||||
| 11/01/13 | 10/31/14 | 55.83 | (0.16 | ) | 4.39 | 4.23 | — | (0.69 | ) | — | (0.69 | ) | 59.37 | 0.77 | 0.77 | (0.28 | ) | 37 | 7.64 | 348 | ||||||||||||||||||||||||||||||||||||||||||||
| Class R-6* | ||||||||||||||||||||||||||||||||||||||||||||||||||||||||||||||||
| 11/01/17 | 10/31/18 | 65.92 | (0.16 | ) | 2.18 | 2.02 | — | (4.83 | ) | — | (4.83 | ) | 63.11 | 0.65 | 0.65 | (0.24 | ) | 35 | 3.02 | 2,141 | ||||||||||||||||||||||||||||||||||||||||||||
| 11/01/16 | 10/31/17 | 53.06 | (0.04 | ) | 14.52 | 14.48 | — | (1.62 | ) | — | (1.62 | ) | 65.92 | 0.66 | 0.66 | (0.06 | ) | 40 | 27.86 | 2,005 | ||||||||||||||||||||||||||||||||||||||||||||
| 11/01/15 | 10/31/16 | 55.27 | (0.10 | ) | 1.35 | 1.25 | — | (3.46 | ) | — | (3.46 | ) | 53.06 | 0.67 | 0.67 | (0.19 | ) | 32 | 2.53 | 1,139 | ||||||||||||||||||||||||||||||||||||||||||||
| 11/01/14 | 10/31/15 | 59.55 | (0.10 | ) | 2.30 | 2.20 | — | (6.48 | ) | — | (6.48 | ) | 55.27 | 0.66 | 0.66 | (0.17 | ) | 45 | 3.68 | 737 | ||||||||||||||||||||||||||||||||||||||||||||
| 11/01/13 | 10/31/14 | 55.92 | (0.10 | ) | 4.42 | 4.32 | — | (0.69 | ) | — | (0.69 | ) | 59.55 | 0.66 | 0.66 | (0.17 | ) | 37 | 7.79 | 576 | ||||||||||||||||||||||||||||||||||||||||||||
| Class Y* | ||||||||||||||||||||||||||||||||||||||||||||||||||||||||||||||||
| 11/20/17 | 10/31/18 | 65.89 | (0.50 | ) | 1.47 | 0.97 | — | (4.83 | ) | — | (4.83 | ) | 62.03 | 1.12 | 1.12 | (0.77 | ) | 35 | 1.40 | 0 | ||||||||||||||||||||||||||||||||||||||||||||
| Carillon Scout International Fund |
| |||||||||||||||||||||||||||||||||||||||||||||||||||||||||||||||
| Class A* | ||||||||||||||||||||||||||||||||||||||||||||||||||||||||||||||||
| 11/20/17 | 10/31/18 | 25.05 | 0.21 | (2.26 | ) | (2.05 | ) | (0.22 | ) | (3.76 | ) | — | (3.98 | ) | 19.02 | 1.31 | 1.31 | 1.05 | 13 | (9.90 | ) | 0 | ||||||||||||||||||||||||||||||||||||||||||
| Class C* | ||||||||||||||||||||||||||||||||||||||||||||||||||||||||||||||||
| 11/20/17 | 10/31/18 | 25.05 | 0.18 | (2.38 | ) | (2.20 | ) | (0.20 | ) | (3.76 | ) | — | (3.96 | ) | 18.89 | 2.20 | 2.23 | 0.87 | 13 | (10.59 | ) | 0 | ||||||||||||||||||||||||||||||||||||||||||
| Class I* | ||||||||||||||||||||||||||||||||||||||||||||||||||||||||||||||||
| 11/01/17 | 10/31/18 | 25.18 | 0.38 | (2.51 | ) | (2.13 | ) | (0.22 | ) | (3.76 | ) | — | (3.98 | ) | 19.07 | 1.06 | 1.06 | 1.73 | 13 | (10.12 | ) | 821 | ||||||||||||||||||||||||||||||||||||||||||
| 07/01/17 | 10/31/17 | 23.21 | 0.07 | 1.90 | 1.97 | — | — | — | — | 25.18 | 1.08 | 1.08 | 0.81 | 7 | 8.49 | 1,161 | ||||||||||||||||||||||||||||||||||||||||||||||||
| 07/01/16 | 06/30/17 | 23.10 | 0.37 | 3.50 | 3.87 | (0.42 | ) | (3.34 | ) | — | (3.76 | ) | 23.21 | 1.06 | 1.06 | 1.61 | 20 | 18.80 | 1,186 | |||||||||||||||||||||||||||||||||||||||||||||
| 07/01/15 | 06/30/16 | 33.69 | 0.56 | (3.41 | ) | (2.85 | ) | (0.59 | ) | (7.15 | ) | — | (7.74 | ) | 23.10 | 1.05 | 1.05 | 1.38 | 23 | (7.89 | ) | 1,484 | ||||||||||||||||||||||||||||||||||||||||||
| 07/01/14 | 06/30/15 | 37.81 | 0.65 | (1.59 | ) | (0.94 | ) | (0.60 | ) | (2.58 | ) | — | (3.18 | ) | 33.69 | 1.02 | 1.02 | 1.48 | 17 | (2.22 | ) | 4,775 | ||||||||||||||||||||||||||||||||||||||||||
| 07/01/13 | 06/30/14 | 33.52 | 0.50 | 4.29 | 4.79 | (0.50 | ) | — | — | (0.50 | ) | 37.81 | 1.01 | 1.01 | 1.23 | 12 | 14.30 | 8,580 | ||||||||||||||||||||||||||||||||||||||||||||||
| Class R-3* | ||||||||||||||||||||||||||||||||||||||||||||||||||||||||||||||||
| 11/20/17 | 10/31/18 | 25.05 | 0.23 | (2.33 | ) | (2.10 | ) | (0.22 | ) | (3.76 | ) | — | (3.98 | ) | 18.97 | 1.70 | 2.16 | 1.14 | 13 | (10.16 | ) | 0 | ||||||||||||||||||||||||||||||||||||||||||
| Class R-5* | ||||||||||||||||||||||||||||||||||||||||||||||||||||||||||||||||
| 11/20/17 | 10/31/18 | 25.05 | 0.34 | (2.34 | ) | (2.00 | ) | (0.23 | ) | (3.76 | ) | — | (3.99 | ) | 19.06 | 1.15 | 1.66 | 1.69 | 13 | (9.68 | ) | 0 | ||||||||||||||||||||||||||||||||||||||||||
| Class R-6* | ||||||||||||||||||||||||||||||||||||||||||||||||||||||||||||||||
| 11/20/17 | 10/31/18 | 25.05 | 0.32 | (2.30 | ) | (1.98 | ) | (0.23 | ) | (3.76 | ) | — | (3.99 | ) | 19.08 | 0.99 | 0.99 | 1.60 | 13 | (9.59 | ) | 3 | ||||||||||||||||||||||||||||||||||||||||||
| Class Y* | ||||||||||||||||||||||||||||||||||||||||||||||||||||||||||||||||
| 11/20/17 | 10/31/18 | 25.05 | 0.28 | (2.34 | ) | (2.06 | ) | (0.22 | ) | (3.76 | ) | — | (3.98 | ) | 19.01 | 1.45 | 2.16 | 1.39 | 13 | (9.94 | ) | 0 | ||||||||||||||||||||||||||||||||||||||||||
| Carillon Scout Mid Cap Fund |
| |||||||||||||||||||||||||||||||||||||||||||||||||||||||||||||||
| Class A* | ||||||||||||||||||||||||||||||||||||||||||||||||||||||||||||||||
| 11/20/17 | 10/31/18 | 20.18 | 0.05 | (0.30 | ) | (0.25 | ) | (0.02 | ) | (1.54 | ) | — | (1.56 | ) | 18.37 | 1.19 | 1.19 | 0.28 | 106 | (1.51 | ) | 7 | ||||||||||||||||||||||||||||||||||||||||||
| Class C* | ||||||||||||||||||||||||||||||||||||||||||||||||||||||||||||||||
| 11/20/17 | 10/31/18 | 20.18 | (0.09 | ) | (0.28 | ) | (0.37 | ) | (0.01 | ) | (1.54 | ) | — | (1.55 | ) | 18.26 | 1.94 | 1.94 | (0.47 | ) | 106 | (2.16 | ) | 9 | ||||||||||||||||||||||||||||||||||||||||
| Class I* | ||||||||||||||||||||||||||||||||||||||||||||||||||||||||||||||||
| 11/01/17 | 10/31/18 | 19.77 | 0.08 | 0.12 | 0.20 | (0.02 | ) | (1.54 | ) | — | (1.56 | ) | 18.41 | 0.97 | 0.97 | 0.40 | 106 | 0.74 | 2,420 | |||||||||||||||||||||||||||||||||||||||||||||
| 07/01/17 | 10/31/17 | 18.11 | — | (d) | 1.66 | 1.66 | — | — | — | — | 19.77 | 1.01 | 1.01 | 0.03 | 20 | 9.17 | 1,675 | |||||||||||||||||||||||||||||||||||||||||||||||
| 07/01/16 | 06/30/17 | 15.06 | 0.07 | 3.35 | 3.42 | (0.07 | ) | (0.30 | ) | — | (0.37 | ) | 18.11 | 1.03 | 1.03 | 0.43 | 87 | 22.93 | 1,437 | |||||||||||||||||||||||||||||||||||||||||||||
| 07/01/15 | 06/30/16 | 16.02 | 0.21 | 0.13 | 0.34 | (0.17 | ) | (1.13 | ) | — | (1.30 | ) | 15.06 | 1.04 | 1.04 | 1.34 | 161 | 2.69 | 1,292 | |||||||||||||||||||||||||||||||||||||||||||||
| 07/01/14 | 06/30/15 | 18.79 | 0.03 | 0.30 | 0.33 | (0.02 | ) | (3.08 | ) | — | (3.10 | ) | 16.02 | 1.04 | 1.04 | 0.17 | 158 | 2.42 | 1,585 | |||||||||||||||||||||||||||||||||||||||||||||
| 07/01/13 | 06/30/14 | 15.75 | — | (d) | 3.99 | 3.99 | — | (d) | (0.95 | ) | — | (0.95 | ) | 18.79 | 1.02 | 1.02 | 0.01 | 134 | 25.75 | 2,538 | ||||||||||||||||||||||||||||||||||||||||||||
| Class R-3* | ||||||||||||||||||||||||||||||||||||||||||||||||||||||||||||||||
| 11/20/17 | 10/31/18 | 20.18 | 0.01 | (0.32 | ) | (0.31 | ) | (0.01 | ) | (1.54 | ) | — | (1.55 | ) | 18.32 | 1.44 | 1.44 | 0.04 | 106 | (1.83 | ) | 2 | ||||||||||||||||||||||||||||||||||||||||||
| Class R-5* | ||||||||||||||||||||||||||||||||||||||||||||||||||||||||||||||||
| 11/20/17 | 10/31/18 | 20.18 | 0.10 | (0.36 | ) | (0.26 | ) | (0.03 | ) | (1.54 | ) | — | (1.57 | ) | 18.35 | 0.99 | 0.99 | 0.53 | 106 | (1.62 | ) | 1 | ||||||||||||||||||||||||||||||||||||||||||
| Class R-6* | ||||||||||||||||||||||||||||||||||||||||||||||||||||||||||||||||
| 11/20/17 | 10/31/18 | 20.18 | 0.12 | (0.32 | ) | (0.20 | ) | (0.03 | ) | (1.54 | ) | — | (1.57 | ) | 18.41 | 0.90 | 0.90 | 0.62 | 106 | (1.29 | ) | 34 | ||||||||||||||||||||||||||||||||||||||||||
| Class Y* | ||||||||||||||||||||||||||||||||||||||||||||||||||||||||||||||||
| 11/20/17 | 10/31/18 | 20.18 | 0.07 | (0.32 | ) | (0.25 | ) | (0.02 | ) | (1.54 | ) | — | (1.56 | ) | 18.37 | 1.19 | 1.19 | 0.36 | 106 | (1.51 | ) | 2 | ||||||||||||||||||||||||||||||||||||||||||
| 50 | The accompanying notes are an integral part of the financial statements. |
Financial Highlights
Fiscal periods | From investment operations | Dividends & distributions | Ratios to average net asset (%) | |||||||||||||||||||||||||||||||||||||||||||||||||||||||||||||
| Beginning net asset value | Income (loss) | Realized & unrealized gain (loss) | Total | From investment income | From realized gains | From return of capital | Total | Ending net asset value | With expenses waived/ recovered (a) | Without expenses waived/ recovered (a) | Net income (loss) (a) | Portfolio turnover rate (%) (b) | Total return (%) (b)(c) | Ending net assets (millions) | ||||||||||||||||||||||||||||||||||||||||||||||||||
| Beginning | Ending | |||||||||||||||||||||||||||||||||||||||||||||||||||||||||||||||
| Carillon Scout Small Cap Fund |
| |||||||||||||||||||||||||||||||||||||||||||||||||||||||||||||||
| Class A* | ||||||||||||||||||||||||||||||||||||||||||||||||||||||||||||||||
| 11/20/17 | 10/31/18 | $29.63 | $(0.26 | ) | $2.68 | $2.42 | $— | $(4.95 | ) | $— | $(4.95 | ) | $27.10 | 1.23 | 1.23 | (0.95 | ) | 22 | 8.00 | $12 | ||||||||||||||||||||||||||||||||||||||||||||
| Class C* | ||||||||||||||||||||||||||||||||||||||||||||||||||||||||||||||||
| 11/20/17 | 10/31/18 | 29.63 | (0.47 | ) | 2.68 | 2.21 | — | (4.95 | ) | — | (4.95 | ) | 26.89 | 1.97 | 1.97 | (1.69 | ) | 22 | 7.21 | 14 | ||||||||||||||||||||||||||||||||||||||||||||
| Class I* | ||||||||||||||||||||||||||||||||||||||||||||||||||||||||||||||||
| 11/01/17 | 10/31/18 | 29.33 | (0.14 | ) | 2.93 | 2.79 | — | (4.95 | ) | — | (4.95 | ) | 27.17 | 0.95 | 0.97 | (0.49 | ) | 22 | 9.36 | 287 | ||||||||||||||||||||||||||||||||||||||||||||
| 07/01/17 | 10/31/17 | 26.81 | (0.04 | ) | 2.56 | 2.52 | — | — | — | — | 29.33 | 1.03 | 1.03 | (0.45 | ) | 6 | 9.40 | 271 | ||||||||||||||||||||||||||||||||||||||||||||||
| 07/01/16 | 06/30/17 | 21.45 | (0.09 | ) | 6.52 | 6.43 | — | (1.07 | ) | — | (1.07 | ) | 26.81 | 1.04 | 1.04 | (0.39 | ) | 25 | 30.70 | 242 | ||||||||||||||||||||||||||||||||||||||||||||
| 07/01/15 | 06/30/16 | 26.61 | (0.07 | ) | (1.55 | ) | (1.62 | ) | — | (3.54 | ) | — | (3.54 | ) | 21.45 | 1.13 | 1.13 | (0.32 | ) | 16 | (6.01 | ) | 198 | |||||||||||||||||||||||||||||||||||||||||
| 07/01/14 | 06/30/15 | 24.49 | (0.07 | ) | 2.37 | 2.30 | — | (0.18 | ) | — | (0.18 | ) | 26.61 | 1.12 | 1.12 | (0.27 | ) | 22 | 9.44 | 249 | ||||||||||||||||||||||||||||||||||||||||||||
| 07/01/13 | 06/30/14 | 20.55 | (0.04 | ) | 3.98 | 3.94 | — | — | — | — | 24.49 | 1.12 | 1.12 | (0.15 | ) | 17 | 19.17 | 251 | ||||||||||||||||||||||||||||||||||||||||||||||
| Class R-3* | ||||||||||||||||||||||||||||||||||||||||||||||||||||||||||||||||
| 11/20/17 | 10/31/18 | 29.63 | (0.33 | ) | 2.67 | 2.34 | — | (4.95 | ) | — | (4.95 | ) | 27.02 | 1.50 | 1.67 | (1.20 | ) | 22 | 7.70 | 0 | ||||||||||||||||||||||||||||||||||||||||||||
| Class R-5* | ||||||||||||||||||||||||||||||||||||||||||||||||||||||||||||||||
| 11/20/17 | 10/31/18 | 29.63 | (0.17 | ) | 2.66 | 2.49 | — | (4.95 | ) | — | (4.95 | ) | 27.17 | 0.95 | 1.32 | (0.60 | ) | 22 | 8.26 | 0 | ||||||||||||||||||||||||||||||||||||||||||||
| Class R-6* | ||||||||||||||||||||||||||||||||||||||||||||||||||||||||||||||||
| 11/20/17 | 10/31/18 | 29.63 | (0.13 | ) | 2.65 | 2.52 | — | (4.95 | ) | — | (4.95 | ) | 27.20 | 0.85 | 0.86 | (0.47 | ) | 22 | 8.37 | 5 | ||||||||||||||||||||||||||||||||||||||||||||
| Class Y* | ||||||||||||||||||||||||||||||||||||||||||||||||||||||||||||||||
| 11/20/17 | 10/31/18 | 29.63 | (0.24 | ) | 2.65 | 2.41 | — | (4.95 | ) | — | (4.95 | ) | 27.09 | 1.25 | 1.59 | (0.87 | ) | 22 | 7.96 | 0 | ||||||||||||||||||||||||||||||||||||||||||||
| Carillon Reams Core Bond Fund |
| |||||||||||||||||||||||||||||||||||||||||||||||||||||||||||||||
| Class A* | ||||||||||||||||||||||||||||||||||||||||||||||||||||||||||||||||
| 11/20/17 | 10/31/18 | 11.42 | 0.20 | (0.40 | ) | (0.20 | ) | (0.19 | ) | — | — | (0.19 | ) | 11.03 | 0.80 | 1.16 | 1.88 | 278 | (1.78 | ) | 1 | |||||||||||||||||||||||||||||||||||||||||||
| Class C* | ||||||||||||||||||||||||||||||||||||||||||||||||||||||||||||||||
| 11/20/17 | 10/31/18 | 11.42 | 0.12 | (0.40 | ) | (0.28 | ) | (0.12 | ) | — | — | (0.12 | ) | 11.02 | 1.55 | 1.99 | 1.11 | 278 | (2.43 | ) | 0 | |||||||||||||||||||||||||||||||||||||||||||
| Class I* | ||||||||||||||||||||||||||||||||||||||||||||||||||||||||||||||||
| 11/01/17 | 10/31/18 | 11.40 | 0.24 | (0.38 | ) | (0.14 | ) | (0.22 | ) | — | — | (0.22 | ) | 11.04 | 0.40 | 0.87 | 2.12 | 278 | (1.23 | ) | 105 | |||||||||||||||||||||||||||||||||||||||||||
| 07/01/17 | 10/31/17 | 11.37 | 0.07 | 0.03 | 0.10 | (0.07 | ) | — | — | (0.07 | ) | 11.40 | 0.40 | 0.69 | 1.65 | 126 | 0.85 | 141 | ||||||||||||||||||||||||||||||||||||||||||||||
| 07/01/16 | 06/30/17 | 11.90 | 0.15 | (0.24 | ) | (0.09 | ) | (0.19 | ) | (0.25 | ) | — | (0.44 | ) | 11.37 | 0.40 | 0.66 | 1.30 | 390 | (0.71 | ) | 166 | ||||||||||||||||||||||||||||||||||||||||||
| 07/01/15 | 06/30/16 | 11.42 | 0.18 | 0.49 | 0.67 | (0.19 | ) | — | — | (0.19 | ) | 11.90 | 0.40 | 0.62 | 1.62 | 453 | 6.00 | 204 | ||||||||||||||||||||||||||||||||||||||||||||||
| 07/01/14 | 06/30/15 | 11.50 | 0.14 | (0.07 | ) | 0.07 | (0.15 | ) | — | — | (0.15 | ) | 11.42 | 0.40 | 0.61 | 1.21 | 158 | 0.61 | 210 | |||||||||||||||||||||||||||||||||||||||||||||
| 07/01/13 | 06/30/14 | 11.41 | 0.15 | 0.15 | 0.30 | (0.17 | ) | (0.04 | ) | — | (0.21 | ) | 11.50 | 0.40 | 0.62 | 1.32 | 636 | 2.65 | 219 | |||||||||||||||||||||||||||||||||||||||||||||
| Class R-3* | ||||||||||||||||||||||||||||||||||||||||||||||||||||||||||||||||
| 11/20/17 | 10/31/18 | 11.42 | 0.16 | (0.38 | ) | (0.22 | ) | (0.16 | ) | — | — | (0.16 | ) | 11.04 | 1.05 | 2.02 | 1.51 | 278 | (1.96 | ) | 0 | |||||||||||||||||||||||||||||||||||||||||||
| Class R-5* | ||||||||||||||||||||||||||||||||||||||||||||||||||||||||||||||||
| 11/20/17 | 10/31/18 | 11.42 | 0.22 | (0.38 | ) | (0.16 | ) | (0.21 | ) | — | — | (0.21 | ) | 11.05 | 0.50 | 1.52 | 2.06 | 278 | (1.40 | ) | 0 | |||||||||||||||||||||||||||||||||||||||||||
| Class R-6* | ||||||||||||||||||||||||||||||||||||||||||||||||||||||||||||||||
| 11/20/17 | 10/31/18 | 11.42 | 0.23 | (0.38 | ) | (0.15 | ) | (0.22 | ) | — | — | (0.22 | ) | 11.05 | 0.40 | 1.52 | 2.16 | 278 | (1.32 | ) | 0 | |||||||||||||||||||||||||||||||||||||||||||
| Class Y* | ||||||||||||||||||||||||||||||||||||||||||||||||||||||||||||||||
| 11/01/17 | 10/31/18 | 11.40 | 0.19 | (0.37 | ) | (0.18 | ) | (0.18 | ) | — | — | (0.18 | ) | 11.04 | 0.80 | 1.19 | 1.71 | 278 | (1.60 | ) | 2 | |||||||||||||||||||||||||||||||||||||||||||
| 07/01/17 | 10/31/17 | 11.37 | 0.05 | 0.03 | 0.08 | (0.05 | ) | — | — | (0.05 | ) | 11.40 | 0.80 | 1.00 | 1.25 | 126 | 0.71 | 3 | ||||||||||||||||||||||||||||||||||||||||||||||
| 07/01/16 | 06/30/17 | 11.90 | 0.10 | (0.24 | ) | (0.14 | ) | (0.14 | ) | (0.25 | ) | — | (0.39 | ) | 11.37 | 0.79 | 0.97 | 0.91 | 390 | (1.09 | ) | 3 | ||||||||||||||||||||||||||||||||||||||||||
| 07/01/15 | 06/30/16 | 11.42 | 0.15 | 0.49 | 0.64 | (0.16 | ) | — | — | (0.16 | ) | 11.90 | 0.75 | 0.97 | 1.27 | 453 | 5.63 | 4 | ||||||||||||||||||||||||||||||||||||||||||||||
| 07/01/14 | 06/30/15 | 11.50 | 0.10 | (0.07 | ) | 0.03 | (0.11 | ) | — | — | (0.11 | ) | 11.42 | 0.76 | 0.97 | 0.85 | 158 | 0.24 | 4 | |||||||||||||||||||||||||||||||||||||||||||||
| 07/01/13 | 06/30/14 | 11.40 | 0.11 | 0.16 | 0.27 | (0.13 | ) | (0.04 | ) | — | (0.17 | ) | 11.50 | 0.79 | 1.01 | 0.93 | 636 | 2.34 | 4 | |||||||||||||||||||||||||||||||||||||||||||||
| Carillon Reams Core Plus Bond Fund |
| |||||||||||||||||||||||||||||||||||||||||||||||||||||||||||||||
| Class A* | ||||||||||||||||||||||||||||||||||||||||||||||||||||||||||||||||
| 11/20/17 | 10/31/18 | 31.76 | 0.54 | (1.36 | ) | (0.82 | ) | (0.50 | ) | — | — | (0.50 | ) | 30.44 | 0.80 | 0.97 | 1.85 | 292 | (2.60 | ) | 0 | |||||||||||||||||||||||||||||||||||||||||||
| Class C* | ||||||||||||||||||||||||||||||||||||||||||||||||||||||||||||||||
| 11/20/17 | 10/31/18 | 31.76 | 0.32 | (1.36 | ) | (1.04 | ) | (0.31 | ) | — | — | (0.31 | ) | 30.41 | 1.55 | 1.85 | 1.09 | 292 | (3.31 | ) | 0 | |||||||||||||||||||||||||||||||||||||||||||
| The accompanying notes are an integral part of the financial statements. | 51 |
Financial Highlights
Fiscal periods | From investment operations | Dividends & distributions | Ratios to average net asset (%) | |||||||||||||||||||||||||||||||||||||||||||||||||||||||||||||
| Beginning net asset value | Income (loss) | Realized & unrealized gain (loss) | Total | From investment income | From realized gains | From return of capital | Total | Ending net asset value | With expenses waived/ recovered (a) | Without expenses waived/ recovered (a) | Net income (loss) (a) | Portfolio turnover rate (%) (b) | Total return (%) (b)(c) | Ending net assets (millions) | ||||||||||||||||||||||||||||||||||||||||||||||||||
| Beginning | Ending | |||||||||||||||||||||||||||||||||||||||||||||||||||||||||||||||
| Carillon Reams Core Plus Bond Fund (cont’d) |
| |||||||||||||||||||||||||||||||||||||||||||||||||||||||||||||||
| Class I* | ||||||||||||||||||||||||||||||||||||||||||||||||||||||||||||||||
| 11/01/17 | 10/31/18 | $31.74 | $0.66 | $(1.34 | ) | $(0.68 | ) | $(0.60 | ) | $— | $— | $(0.60 | ) | $30.46 | 0.40 | 0.60 | 2.11 | 292 | (2.17 | ) | $607 | |||||||||||||||||||||||||||||||||||||||||||
| 07/01/17 | 10/31/17 | 31.64 | 0.16 | 0.11 | 0.27 | (0.16 | ) | — | (0.01 | ) | (0.17 | ) | 31.74 | 0.40 | 0.58 | 1.53 | 123 | 0.85 | 741 | |||||||||||||||||||||||||||||||||||||||||||||
| 07/01/16 | 06/30/17 | 32.98 | 0.42 | (0.51 | ) | (0.09 | ) | (0.52 | ) | (0.73 | ) | — | (1.25 | ) | 31.64 | 0.40 | 0.59 | 1.32 | 433 | (0.18 | ) | 784 | ||||||||||||||||||||||||||||||||||||||||||
| 07/01/15 | 06/30/16 | 32.27 | 0.60 | 1.14 | 1.74 | (0.56 | ) | (0.47 | ) | — | (1.03 | ) | 32.98 | 0.40 | 0.55 | 1.87 | 480 | 5.53 | 844 | |||||||||||||||||||||||||||||||||||||||||||||
| 07/01/14 | 06/30/15 | 32.30 | 0.39 | (0.01 | ) | 0.38 | (0.38 | ) | (0.03 | ) | — | (0.41 | ) | 32.27 | 0.40 | 0.56 | 1.22 | 187 | 1.19 | 638 | ||||||||||||||||||||||||||||||||||||||||||||
| 07/01/13 | 06/30/14 | 31.94 | 0.49 | 0.44 | 0.93 | (0.44 | ) | (0.13 | ) | — | (0.57 | ) | 32.30 | 0.40 | 0.57 | 1.53 | 663 | 2.94 | 448 | |||||||||||||||||||||||||||||||||||||||||||||
| Class R-3* | ||||||||||||||||||||||||||||||||||||||||||||||||||||||||||||||||
| 11/20/17 | 10/31/18 | 31.76 | 0.45 | (1.34 | ) | (0.89 | ) | (0.43 | ) | — | — | (0.43 | ) | 30.44 | 1.05 | 1.77 | 1.51 | 292 | (2.84 | ) | 0 | |||||||||||||||||||||||||||||||||||||||||||
| Class R-5* | ||||||||||||||||||||||||||||||||||||||||||||||||||||||||||||||||
| 11/20/17 | 10/31/18 | 31.76 | 0.61 | (1.34 | ) | (0.73 | ) | (0.57 | ) | — | — | (0.57 | ) | 30.46 | 0.50 | 1.27 | 2.07 | 292 | (2.31 | ) | 0 | |||||||||||||||||||||||||||||||||||||||||||
| Class R-6* | ||||||||||||||||||||||||||||||||||||||||||||||||||||||||||||||||
| 11/20/17 | 10/31/18 | 31.76 | 0.64 | (1.34 | ) | (0.70 | ) | (0.60 | ) | — | — | (0.60 | ) | 30.46 | 0.40 | 1.27 | 2.17 | 292 | (2.23 | ) | 0 | |||||||||||||||||||||||||||||||||||||||||||
| Class Y* | ||||||||||||||||||||||||||||||||||||||||||||||||||||||||||||||||
| 11/01/17 | 10/31/18 | 31.73 | 0.53 | (1.34 | ) | (0.81 | ) | (0.48 | ) | — | — | (0.48 | ) | 30.44 | 0.80 | 0.96 | 1.70 | 292 | (2.56 | ) | 17 | |||||||||||||||||||||||||||||||||||||||||||
| 07/01/17 | 10/31/17 | 31.63 | 0.12 | 0.10 | 0.22 | (0.11 | ) | — | (0.01 | ) | (0.12 | ) | 31.73 | 0.80 | 0.93 | 1.13 | 123 | 0.71 | 28 | |||||||||||||||||||||||||||||||||||||||||||||
| 07/01/16 | 06/30/17 | 32.97 | 0.30 | (0.51 | ) | (0.21 | ) | (0.39 | ) | (0.74 | ) | — | (1.13 | ) | 31.63 | 0.78 | 0.91 | 0.94 | 433 | (0.57 | ) | 30 | ||||||||||||||||||||||||||||||||||||||||||
| 07/01/15 | 06/30/16 | 32.27 | 0.48 | 1.14 | 1.62 | (0.45 | ) | (0.47 | ) | — | (0.92 | ) | 32.97 | 0.74 | 0.89 | 1.53 | 480 | 5.16 | 82 | |||||||||||||||||||||||||||||||||||||||||||||
| 07/01/14 | 06/30/15 | 32.29 | 0.26 | (0.01 | ) | 0.25 | (0.24 | ) | (0.03 | ) | — | (0.27 | ) | 32.27 | 0.80 | 0.96 | 0.82 | 187 | 0.79 | 57 | ||||||||||||||||||||||||||||||||||||||||||||
| 07/01/13 | 06/30/14 | 31.94 | 0.38 | 0.43 | 0.81 | (0.33 | ) | (0.13 | ) | — | (0.46 | ) | 32.29 | 0.78 | 0.95 | 1.15 | 663 | 2.54 | 102 | |||||||||||||||||||||||||||||||||||||||||||||
| Carillon Reams Unconstrained Bond Fund |
| |||||||||||||||||||||||||||||||||||||||||||||||||||||||||||||||
| Class A* | ||||||||||||||||||||||||||||||||||||||||||||||||||||||||||||||||
| 11/20/17 | 10/31/18 | 11.83 | 0.21 | (0.41 | ) | (0.20 | ) | (0.18 | ) | — | — | (0.18 | ) | 11.45 | 0.80 | 1.20 | 1.85 | 139 | (1.71 | ) | 0 | |||||||||||||||||||||||||||||||||||||||||||
| Class C* | ||||||||||||||||||||||||||||||||||||||||||||||||||||||||||||||||
| 11/20/17 | 10/31/18 | 11.83 | 0.11 | (0.41 | ) | (0.30 | ) | (0.11 | ) | — | — | (0.11 | ) | 11.42 | 1.55 | 2.42 | 0.99 | 139 | (2.55 | ) | 0 | |||||||||||||||||||||||||||||||||||||||||||
| Class I* | ||||||||||||||||||||||||||||||||||||||||||||||||||||||||||||||||
| 11/01/17 | 10/31/18 | 11.85 | 0.22 | (0.43 | ) | (0.21 | ) | (0.21 | ) | — | — | (0.21 | ) | 11.43 | 0.50 | 0.83 | 1.90 | 139 | (1.79 | ) | 1,183 | |||||||||||||||||||||||||||||||||||||||||||
| 07/01/17 | 10/31/17 | 11.83 | 0.04 | 0.02 | 0.06 | (0.04 | ) | — | — | (0.04 | ) | 11.85 | 0.50 | 0.80 | 1.00 | 83 | 0.48 | 1,521 | ||||||||||||||||||||||||||||||||||||||||||||||
| 07/01/16 | 06/30/17 | 11.70 | 0.10 | 0.15 | 0.25 | (0.12 | ) | — | — | (0.12 | ) | 11.83 | 0.50 | 0.80 | 0.86 | 370 | 2.15 | 1,475 | ||||||||||||||||||||||||||||||||||||||||||||||
| 07/01/15 | 06/30/16 | 11.32 | 0.21 | 0.27 | 0.48 | (0.10 | ) | — | — | (0.10 | ) | 11.70 | 0.50 | 0.82 | 1.88 | 615 | 4.28 | 1,281 | ||||||||||||||||||||||||||||||||||||||||||||||
| 07/01/14 | 06/30/15 | 11.65 | 0.08 | (0.29 | ) | (0.21 | ) | (0.12 | ) | — | — | (0.12 | ) | 11.32 | 0.50 | 0.81 | 0.79 | 116 | (1.77 | ) | 1,477 | |||||||||||||||||||||||||||||||||||||||||||
| 07/01/13 | 06/30/14 | 11.70 | 0.04 | 0.01 | 0.05 | (0.03 | ) | (0.07 | ) | — | (0.10 | ) | 11.65 | 0.50 | 0.84 | 0.40 | 422 | 0.44 | 1,806 | |||||||||||||||||||||||||||||||||||||||||||||
| Class R-3* | ||||||||||||||||||||||||||||||||||||||||||||||||||||||||||||||||
| 11/20/17 | 10/31/18 | 11.83 | 0.15 | (0.39 | ) | (0.24 | ) | (0.16 | ) | — | — | (0.16 | ) | 11.43 | 1.05 | 2.25 | 1.40 | 139 | (2.09 | ) | 0 | |||||||||||||||||||||||||||||||||||||||||||
| Class R-5* | ||||||||||||||||||||||||||||||||||||||||||||||||||||||||||||||||
| 11/20/17 | 10/31/18 | 11.83 | 0.21 | (0.40 | ) | (0.19 | ) | (0.21 | ) | — | — | (0.21 | ) | 11.43 | 0.50 | 1.45 | 1.95 | 139 | (1.62 | ) | 0 | |||||||||||||||||||||||||||||||||||||||||||
| Class R-6* | ||||||||||||||||||||||||||||||||||||||||||||||||||||||||||||||||
| 11/20/17 | 10/31/18 | 11.83 | 0.25 | (0.43 | ) | (0.18 | ) | (0.22 | ) | — | — | (0.22 | ) | 11.43 | 0.40 | 0.76 | 2.32 | 139 | (1.53 | ) | 29 | |||||||||||||||||||||||||||||||||||||||||||
| Class Y* | ||||||||||||||||||||||||||||||||||||||||||||||||||||||||||||||||
| 11/01/17 | 10/31/18 | 11.90 | 0.18 | (0.41 | ) | (0.23 | ) | (0.18 | ) | — | — | (0.18 | ) | 11.49 | 0.80 | 1.14 | 1.58 | 139 | (1.97 | ) | 37 | |||||||||||||||||||||||||||||||||||||||||||
| 07/01/17 | 10/31/17 | 11.88 | 0.03 | 0.02 | 0.05 | (0.03 | ) | — | — | (0.03 | ) | 11.90 | 0.80 | 1.07 | 0.69 | 83 | 0.38 | 71 | ||||||||||||||||||||||||||||||||||||||||||||||
| 07/01/16 | 06/30/17 | 11.75 | 0.07 | 0.14 | 0.21 | (0.08 | ) | — | — | (0.08 | ) | 11.88 | 0.80 | 1.09 | 0.56 | 370 | 1.78 | 99 | ||||||||||||||||||||||||||||||||||||||||||||||
| 07/01/15 | 06/30/16 | 11.30 | 0.13 | 0.32 | 0.45 | — | — | — | — | 11.75 | 0.79 | 1.11 | 1.59 | 615 | 3.98 | 92 | ||||||||||||||||||||||||||||||||||||||||||||||||
| 07/01/14 | 06/30/15 | 11.64 | 0.03 | (0.27 | ) | (0.24 | ) | (0.10 | ) | — | — | (0.10 | ) | 11.30 | 0.80 | 1.11 | 0.49 | 116 | (2.05 | ) | 260 | |||||||||||||||||||||||||||||||||||||||||||
| 07/01/13 | 06/30/14 | 11.71 | 0.01 | — | (d) | 0.01 | (0.01 | ) | (0.07 | ) | — | (0.08 | ) | 11.64 | 0.78 | 1.12 | 0.12 | 422 | 0.12 | 555 | ||||||||||||||||||||||||||||||||||||||||||||
* Per share amounts have been calculated using the daily average share method.
(a) Annualized for periods less than one year.
(b) Not annualized for periods less than one year.
(c) Total returns are calculated without the imposition of either front-end or contingent deferred sales charges.
(d) Per share amount is less than $0.005.
| 52 | The accompanying notes are an integral part of the financial statements. |
| 10.31.2018 |
NOTE 1. Organization and investment objective
The Carillon Series Trust (the “Trust” or the “Carillon Family of Funds”) is a Delaware statutory trust, and is registered under the Investment Company Act of 1940, as amended, as an open-end diversified management investment company. The Trust offers shares in the following series (each a “Fund” and collectively the “Funds”), each of which is advised by Carillon Tower Advisers, Inc. (“Carillon Tower” or “Manager”):
| • | The Carillon ClariVest Capital Appreciation Fund (“Capital Appreciation Fund”) seeks long-term capital appreciation, |
| • | The Carillon ClariVest International Stock Fund (“International Stock Fund”) seeks capital appreciation, |
| • | The Carillon Cougar Tactical Allocation Fund (“Tactical Allocation Fund”) seeks long-term capital appreciation, |
| • | The Carillon Eagle Growth & Income Fund (“Growth & Income Fund”) primarily seeks long-term capital appreciation and, secondarily, seeks current income, |
| • | The Carillon Eagle Mid Cap Growth Fund (“Mid Cap Growth Fund”) seeks long-term capital appreciation, |
| • | The Carillon Eagle Small Cap Growth Fund (“Small Cap Growth Fund”) seeks long-term capital appreciation, |
| • | The Carillon Scout International Fund (“International Fund”) seeks long-term growth of capital and income, |
| • | The Carillon Scout Mid Cap Fund (“Mid Cap Fund”) seeks long-term growth of capital, |
| • | The Carillon Scout Small Cap Fund (“Small Cap Fund”) seeks long-term growth of capital, |
| • | The Carillon Reams Core Bond Fund (“Core Bond Fund”) seeks a high level of total return consistent with the preservation of capital, |
| • | The Carillon Reams Core Plus Bond Fund (“Core Plus Bond Fund”) seeks a high level of total return consistent with the preservation of capital, and |
| • | The Carillon Reams Unconstrained Bond Fund (“Unconstrained Bond Fund”) seeks to maximize total return consistent with the preservation of capital. |
Class offerings | As of October 31, 2018, each Fund was authorized and offered Class A, Class C, Class I, Class R-3, Class R-5, Class R-6, and Class Y shares to qualified buyers.
| • | For all Funds except the Core Bond Fund, Core Plus Bond Fund and Unconstrained Bond Fund, Class A shares are sold at a maximum front-end sales charge of 4.75%. For the Core Bond Fund, Core Plus Bond Fund, and Unconstrained Bond Fund, Class A shares are sold at a maximum front-end sales charge of 3.75%. Class A share investments greater than $1 million, which are not sold subject to a sales charge, may be subject to a contingent deferred sales charge (“CDSC”) of up to 1.00% of the lower of net asset value (“NAV”) or purchase price if redeemed within 18 months of purchase. |
| • | Class C shares are sold subject to a CDSC of 1.00% of the lower of NAV or purchase price if redeemed within one year of purchase. |
| • | Class I, Class R-3, Class R-5, Class R-6 and Class Y shares are each sold without a front-end sales charge or a CDSC. |
NOTE 2. Significant accounting policies
The following is a summary of significant accounting policies of the Funds. The policies are in conformity with accounting principles generally accepted in the United States of America (“U.S. GAAP”). The Funds are investment companies and, accordingly, follow the investment company accounting and reporting guidance of the Financial Accounting Standards Board (“FASB”) Accounting Standards Codification Topic 946—Investment Companies, which is part of U.S. GAAP.
Use of estimates | The preparation of financial statements in accordance with U.S. GAAP requires management to make estimates and assumptions that affect the reported amounts and disclosures. Actual results could differ from those estimates and those differences could be material.
Valuation of securities | The price of each Fund’s shares is based on the NAV per share of each class of a Fund. Each Fund normally determines the NAV of its shares each business day as of the scheduled close of regular trading on the New York Stock Exchange (NYSE) and the Nasdaq (typically 4:00 p.m. ET). A Fund will not treat an intraday unscheduled disruption in trading on either the NYSE or Nasdaq as a closure of that particular market, and will price its shares as of the normally scheduled close of the NYSE and Nasdaq if the disruption directly affects only one of those markets. If the NYSE or other securities exchange modifies the published closing price of securities traded on that exchange after the NAV is calculated, the Funds are not required to recalculate their NAV.
Generally, the Funds value portfolio securities for which market quotations are readily available at market value; however, a Fund may adjust the market quotation price to reflect events that occur between the close of those markets and the time of the Fund’s determination of the NAV.
A market quotation may be considered unreliable or unavailable for various reasons, such as:
| • | The quotation may be stale; |
| • | The security is not actively traded; |
| • | Trading on the security halted before the close of the trading market; |
| • | The security is newly issued; |
| • | Issuer-specific or vendor specific events occurred after the security halted trading; or |
| • | Due to the passage of time between the close of the market on which the security trades and the close of the NYSE and the Nasdaq. |
Issuer-specific events may cause the last market quotation to be unreliable. Such events may include:
| • | A merger or insolvency; |
| • | Events which affect a geographical area or an industry segment, such as political events or natural disasters; or |
| • | Market events, such as a significant movement in the U.S. markets. |
For most securities, both the latest transaction prices and adjustments are furnished by independent pricing services, subject to oversight by the Trust’s Board of Trustees (“Board”). The Funds value all other securities and assets for which market quotations are unavailable or unreliable at their fair value in good faith using Pricing and Valuation Procedures (“Procedures”) approved by the Board. A Fund may fair value small-cap securities, for example, that are thinly traded or illiquid. Fair value is the amount that the owner might reasonably expect to receive for the security upon its current sale. Fair value requires consideration of all appropriate factors, including indications of fair value available from independent pricing services. A fair value price is an estimated price and may vary from the prices used by other mutual funds to calculate their NAV.
| 53 |
Notes to Financial Statements
| 10.31.2018 |
Pursuant to the Procedures, the Board has delegated the day-to-day responsibility for applying and administering the Procedures to a valuation committee (“Valuation Committee”), comprised of certain officers of the Trust and other employees of Carillon Tower. The composition of this Valuation Committee may change from time to time. The Valuation Committee follows fair valuation guidelines as set forth in the Procedures to make fair value determinations on all securities and assets for which market quotations are unavailable or unreliable. For portfolio securities fair valued by the Valuation Committee, Carillon Tower checks fair value prices by comparing the fair value of the security with values that are available from other sources (if any). Carillon Tower compares the fair value of the security to the next-day opening price or next actual sale price, when applicable. Carillon Tower documents and reports to the Valuation Committee such comparisons when they are made. The Valuation Committee reports such comparisons to the Board at their regularly scheduled meetings. The Board retains the responsibility for periodic review and consideration of the appropriateness of any fair value pricing methodology established or implemented for a Fund. Fair value pricing methods, the Procedures and independent pricing services can change from time to time as approved by the Board, and may occur as a result of lookback testing results or changes in industry best practices.
There can be no assurance, however, that a fair value price used by a Fund on any given day will more accurately reflect the market value of a security than a market price of such security on that day, as fair valuation determinations may involve subjective judgments made by the Valuation Committee. Fair value pricing may deter shareholders from trading a Fund’s shares on a frequent basis in an attempt to take advantage of arbitrage opportunities resulting from potentially stale prices of portfolio holdings. However, it cannot eliminate the possibility of frequent trading. Specific types of securities are valued as follows:
| • | Domestic exchange-traded equity securities | Market quotations are generally available and reliable for domestic exchange-traded equity securities. If the prices provided by the independent pricing service and independent quoted prices are unavailable or unreliable, the Valuation Committee will fair value the security using the Procedures. |
| • | Foreign exchange-traded equity securities | If market quotations are available and reliable for foreign exchange-traded equity securities, the securities will be valued at the market quotations. Because trading hours for certain foreign securities end before the close of the NYSE and the Nasdaq, closing market quotations may become unreliable. Consequently, fair valuation of portfolio securities may occur on a daily basis. The Valuation Committee, using the Procedures, may fair value a security if certain events occur between the time trading ends in a foreign market on a particular security and a Fund’s NAV calculation. The Valuation Committee, using the Procedures, may also fair value a particular security if the events are significant and make the closing price unavailable or unreliable. If an issuer-specific event has occurred that Carillon Tower determines, in its judgment, is likely to have affected the closing price of a foreign security, the security will be priced at fair value. Carillon Tower also utilizes a screening process from a pricing vendor to indicate the degree of certainty, based on historical data, that the closing price in the principal market where a foreign security trades is not the current market value as of the close of the NYSE. Securities and other assets quoted in foreign currencies are valued in U.S. dollars based on exchange rates provided by an independent pricing service. The pricing vendor, pricing methodology or degree of certainty may change from time to time. Securities primarily traded on foreign markets may trade on days that are not business days of the Funds. Because the NAV of a Fund’s shares is determined only on business days of the Fund, the value of the securities of a Fund that invests in foreign securities may change on days when shareholders would not be able to purchase or redeem shares of the Fund. |
| • | Fixed income securities | Government bonds, corporate bonds, asset-backed bonds, municipal bonds, short-term securities (investments that have a maturity date of 60 days or less), commercial paper and convertible securities, including high yield or junk bonds, normally are valued on the basis of evaluated prices provided by independent pricing services. Evaluated prices provided by the independent pricing services may be determined without exclusive reliance on quoted prices, and may reflect appropriate factors such as institution-size trading in similar groups of securities, developments related to special securities, dividend rate, maturity and other market data. In accordance with SEC guidance, before using certain evaluated prices from a Pricing Service to determine the fair value of a Fund’s securities, Carillon Tower or the Valuation Committee shall, as appropriate, consider the inputs, methods, models, and assumptions used by the Pricing Service to determine the evaluated prices, and how those inputs, methods, models and assumptions are affected, if at all, as market conditions change. If the evaluated prices provided by the independent pricing service and independent quoted prices are unavailable or unreliable, the Valuation Committee will fair value the security using the Procedures. |
| • | Futures and Options | Futures and options are valued on the basis of market quotations, if available and reliable. If prices provided by independent pricing services and independent quoted prices are unavailable or unreliable, the Valuation Committee will fair value the security using the Procedures. During the fiscal year ended October 31, 2018, only the Core Plus Bond Fund and Unconstrained Bond Fund held futures. None of the Funds held options during the fiscal year ended October 31, 2018. |
| • | Credit default swaps | Credit default swaps are valued with prices provided by independent pricing services. If prices provided by independent pricing services are unavailable or unreliable, the Valuation Committee will fair value the security using the Procedures. During the fiscal year ended October 31, 2018, only the Core Plus Bond Fund and Unconstrained Bond Fund held credit default swaps. |
| • | Investment companies and exchange-traded funds (ETFs) | Investments in other open-end investment companies are valued at their reported NAV. The prospectuses for these companies explain the circumstances under which these companies will use fair value pricing and the effect of the fair value pricing. In addition, investments in closed-end funds and ETFs are valued on the basis of market quotations, if available and reliable. If the prices provided by independent pricing services and independent quoted prices are unavailable or unreliable, the Valuation Committee will fair value the security using the Procedures. |
Fair value measurements | Each Fund utilizes a three-level hierarchy of inputs to establish a classification of fair value measurements. The three levels are defined as:
Level 1—Valuations based on unadjusted quoted prices for identical securities in active markets;
Level 2—Valuations based on inputs other than quoted prices that are observable, either directly or indirectly, including inputs in markets that are not considered active; and
Level 3—Valuations based on inputs that are unobservable and significant to the fair value measurement, and may include the Valuation Committee’s own assumptions on determining fair value of investments.
Inputs that are used in determining fair value of an investment may include price information, credit data, volatility statistics, and other factors. These inputs can be either observable or unobservable. The availability of observable inputs can vary between investments and is affected by various factors such as the type of investment and the volume and/or level of activity for that investment or similar investments in the marketplace. The inputs will be considered by the Valuation
| 54 |
Notes to Financial Statements
| 10.31.2018 |
Committee, along with any other relevant factors in the calculation of an investment’s fair value. A Fund uses prices and inputs that are current as of the valuation date, which may include periods of market dislocations. During these periods, the availability of prices and inputs may be reduced for many investments. This condition could cause an investment to be reclassified between the various levels within the hierarchy. Investments falling into the Level 3 category may be classified as such due to a lack of market transparency and corroboration to support the quoted prices. Additionally, valuation models may be used as the pricing source for any remaining investments classified as Level 3. These models may rely on one or more significant unobservable inputs and/or significant assumptions by the Valuation Committee. Inputs used in valuations may include, but are not limited to, financial statement analysis, capital account balances, discount rates and estimated cash flows, and comparable entity data.
The following is a summary of the inputs used to value each Fund’s investments as of October 31, 2018:
| Quoted prices in active markets for identical assets (Level 1) | Significant other observable inputs (Level 2) | Significant unobservable inputs (Level 3) | ||||||||||
| Capital Appreciation Fund |
| |||||||||||
| Common stocks (a) | $451,440,748 | $— | $— | |||||||||
| Total investment portfolio | $451,440,748 | $— | $— | |||||||||
| International Stock Fund |
| |||||||||||
| Common stocks (a): | ||||||||||||
Australia | $— | $549,563 | $— | |||||||||
Belgium | — | 29,215 | — | |||||||||
Denmark | — | 214,362 | — | |||||||||
Finland | — | 212,365 | — | |||||||||
France | — | 1,356,537 | — | |||||||||
Germany | — | 1,244,308 | — | |||||||||
Hong Kong | — | 62,943 | — | |||||||||
Israel | 197,802 | 277,445 | — | |||||||||
Italy | — | 482,681 | — | |||||||||
Japan | — | 5,075,815 | — | |||||||||
Netherlands | 104,761 | 540,901 | — | |||||||||
Norway | — | 141,116 | — | |||||||||
Singapore | — | 36,025 | — | |||||||||
Spain | — | 370,017 | — | |||||||||
Sweden | — | 563,397 | — | |||||||||
Switzerland | — | 2,497,808 | — | |||||||||
United Kingdom | — | 2,846,963 | — | |||||||||
| Preferred stocks: | ||||||||||||
Germany | — | 189,170 | — | |||||||||
| Total investment portfolio | $302,563 | $16,690,631 | $— | |||||||||
| Tactical Allocation Fund |
| |||||||||||
| Exchange traded funds | $22,934,727 | $— | $— | |||||||||
| Total investment portfolio | $22,934,727 | $— | $— | |||||||||
| Growth & Income Fund |
| |||||||||||
| Common stocks (a) | $574,834,299 | $— | $— | |||||||||
| Total investment portfolio | $574,834,299 | $— | $— | |||||||||
| Mid Cap Growth Fund |
| |||||||||||
| Common stocks (a) | $4,145,006,787 | $— | $— | |||||||||
| Total investment portfolio | $4,145,006,787 | $— | $— | |||||||||
| Quoted prices in active markets for identical assets (Level 1) | Significant other observable inputs (Level 2) | Significant unobservable inputs (Level 3) | ||||||||||
| Small Cap Growth Fund |
| |||||||||||
| Common stocks (a) | $4,665,343,835 | $— | $— | |||||||||
| Total investment portfolio | $4,665,343,835 | $— | $— | |||||||||
| International Fund | ||||||||||||
| Common stocks (a): | ||||||||||||
Australia | $10,795,776 | $52,371,150 | $— | |||||||||
Canada | 11,396,900 | — | — | |||||||||
Denmark | 12,673,719 | 7,624,247 | — | |||||||||
France | — | 71,057,429 | — | |||||||||
Germany | 27,188,493 | 58,873,278 | — | |||||||||
Hong Kong | — | 10,730,502 | — | |||||||||
Ireland | 13,142,844 | 10,625,286 | — | |||||||||
Japan | — | 107,022,728 | — | |||||||||
Mexico | 26,432,042 | — | — | |||||||||
Norway | — | 13,158,718 | — | |||||||||
Singapore | — | 13,410,506 | — | |||||||||
South Africa | — | 8,274,183 | — | |||||||||
Spain | — | 14,022,224 | — | |||||||||
Sweden | — | 23,181,736 | — | |||||||||
Switzerland | 27,177,181 | 60,393,721 | — | |||||||||
Taiwan | — | 19,509,835 | — | |||||||||
Turkey | — | 6,910,652 | — | |||||||||
United Kingdom | 40,239,059 | 62,697,893 | — | |||||||||
United States | 44,458,299 | — | — | |||||||||
| Preferred stocks: | ||||||||||||
Colombia | 12,817,811 | — | — | |||||||||
Germany | 11,982,464 | 19,338,546 | — | |||||||||
| Total investment portfolio | $238,304,588 | $559,202,634 | $— | |||||||||
| Mid Cap Fund |
| |||||||||||
| Common stocks (a) | $2,392,488,990 | $— | $— | |||||||||
| Total investment portfolio | $2,392,488,990 | $— | $— | |||||||||
| Small Cap Fund |
| |||||||||||
| Common stocks (a) | $317,389,959 | $— | $— | |||||||||
| Total investment portfolio | $317,389,959 | $— | $— | |||||||||
| 55 |
Notes to Financial Statements
| 10.31.2018 |
| Quoted prices in active markets for identical assets (Level 1) | Significant other observable inputs (Level 2) | Significant unobservable inputs (Level 3) | ||||||||||
| Core Bond Fund |
| |||||||||||
| Corporate bonds (a) | $— | $24,671,586 | $— | |||||||||
| Mortgage and asset-backed securities | — | 26,958,136 | — | |||||||||
| U.S. Treasuries | — | 61,102,177 | — | |||||||||
| Short-term investments | — | 1,167,487 | — | |||||||||
| Total investment portfolio | $— | $113,899,386 | $— | |||||||||
| Core Plus Bond Fund |
| |||||||||||
| Corporate bonds (a) | $— | $132,218,211 | $— | |||||||||
| Mortgage and asset-backed securities | — | 142,365,288 | — | |||||||||
| U.S. Treasuries | — | 383,981,957 | — | |||||||||
| Short-term investments | — | 6,891,624 | — | |||||||||
| Total investment portfolio | $— | $665,457,080 | $— | |||||||||
| Futures contracts - long (b) | $(1,539,603) | $— | $— | |||||||||
| Futures contracts - short (b) | $(430,818) | $— | $— | |||||||||
| Credit default swaps | $— | $877,840 | $— | |||||||||
| Quoted prices in active markets for identical assets (Level 1) | Significant other observable inputs (Level 2) | Significant unobservable inputs (Level 3) | ||||||||||
| Unconstrained Bond Fund |
| |||||||||||
| Corporate bonds (a) | $— | $227,228,269 | $— | |||||||||
| Mortgage and asset-backed securities | — | 108,346,794 | — | |||||||||
| U.S. Treasuries | — | 881,691,613 | — | |||||||||
| Short-term investments | — | 33,497,527 | — | |||||||||
| Total investment portfolio | $— | $1,250,764,203 | $— | |||||||||
| Futures contracts - long (b) | $(2,762,419) | $— | $— | |||||||||
| Futures contracts - short (b) | $(2,433,225) | $— | $— | |||||||||
| Credit default swaps | $— | $1,757,792 | $— | |||||||||
(a) Please see the investment portfolio for detail by industry. (b) Amounts presented for Futures Contracts represent total unrealized appreciation (depreciation) as of October 31, 2018. |
| |||||||||||
The following is a reconciliation of Level 3 securities held by the Small Cap Growth Fund as of October 31, 2018 for which significant unobservable inputs were used to determine fair value:
| Small Cap Growth Fund | Common Stocks1 | Contingent Value Rights2 | ||||||
| Balance as of October 31, 2017 | $14,746,830 | $242,594 | ||||||
| Purchases | — | — | ||||||
| Change in unrealized appreciation (depreciation) | — | 970,378 | ||||||
| Sales | (14,746,830 | ) | (1,212,972 | ) | ||||
| Balance as of October 31, 2018 | $— | $— | ||||||
The Funds’ policy for disclosing the valuation techniques and significant unobservable inputs for Level 3 assets and liabilities is to provide such disclosures when aggregate exposure to Level 3 investments exceeds 1.00% of net asset value. At October 31, 2018, the Funds did not hold any Level 3 investments.
1Common stocks | On August 29, 2017, Thermo Fisher Scientific, Inc. acquired 95.3% of the outstanding Patheon N.V. ordinary shares, and Patheon N.V. was no longer exchange traded and was delisted. The Fund’s position in Patheon N.V. was sold during the fiscal year ended October 31, 2018 and is no longer held by the Fund. The Fund recognized realized gains of $2,604,859 from the sale of Patheon N.V.
2Contingent value rights | The contingent value rights (“CVR”) were acquired as a result of Dyax Corp. (which was a portfolio holding of the Fund) being acquired by Shire PLC. In exchange for the Fund’s shares in Dyax Corp., the Fund received cash consideration from Shire PLC as well as the CVR. On September 10, 2018, the Fund received $1,212,972 from Shire PLC in exchange for the CVR. The Fund recognized realized gains of $1,070,190 in connection with the disposition of the CVR.
Derivatives | The following disclosure provides certain information about the Funds’ derivative and hedging activities.
| • | Forward currency contracts | Each of the Funds’ policies, except Small Cap Growth, Core Bond, International, Mid Cap, and Small Cap, permit the Funds to enter into forward currency contracts (“forward contracts”) for hedging (such as to hedge the impact of adverse changes in the relationships between the US dollar and various foreign currencies), including transaction hedging, anticipatory hedging, cross hedging, proxy hedging, and position hedging, or for any other lawful purpose consistent with their investment objectives. Forward contracts are agreements between two parties to exchange different currencies at a specified rate at an agreed upon future date. The fair value of a forward contract fluctuates with changes in currency exchange rates. Outstanding forward contracts are valued daily at current forward rates and the resulting change in market value is recorded as unrealized appreciation or depreciation. When a forward contract is closed, the Fund records a realized gain or loss equal to the difference between the value at the time the forward contract was opened and |
| 56 |
Notes to Financial Statements
| 10.31.2018 |
| the value at the time it was closed. The risks to the Funds of entering into forward contracts include the inability of counterparties to meet the terms of their contracts, future adverse movement in currency values and contract positions that are not exact offsets. During the fiscal year ended October 31, 2018, none of the Funds held forward contracts. |
| • | Credit default swap contracts | The International Stock, Core Bond, Core Plus Bond and Unconstrained Bond Funds’ policies permit the Funds to enter into credit default swap agreements to enhance the Funds’ returns, increase liquidity, manage the duration of the Funds’ portfolios and/or gain exposure to certain instruments or markets (i.e., the corporate bond market) in a relatively efficient way. The credit default swap agreement may have as a reference obligation one or more securities that are or are not currently held by a Fund. The Funds may enter into credit default swap agreements either as a buyer or seller. The buyer in a credit default swap agreement is obligated to pay the seller a periodic fee, typically expressed in basis points on the principal amount of the underlying obligation (the “notional value”), over the term of the agreement in return for a contingent payment upon the occurrence of a credit event with respect to the underlying reference obligation. A credit event is typically a default. If a Fund is a buyer and no credit event occurs, the Fund may lose its investment and recover nothing. If a Fund is a buyer of protection and a credit event occurs, as defined under the terms of that particular swap agreement, a Fund will either (i) receive from the seller of protection an amount equal to the notional value of the swap and deliver the referenced obligation, other deliverable obligations or underlying securities comprising the referenced index or (ii) receive a net settlement amount in the form of cash or securities equal to the notional value of the swap less the recovery value of the referenced obligation or underlying securities comprising the referenced index. As a seller, a Fund accrues for and receives a fixed rate of income throughout the term of the agreement, which typically is between one month and five years, provided that no credit event occurs. As the seller, a Fund would effectively add leverage to its portfolio because, in addition to its total net assets, a Fund would be subject to investment exposure on the notional value of the swap. If a Fund is a seller of protection and a credit event occurs, as defined under the terms of that particular swap agreement, a Fund will either (i) pay to the buyer of protection an amount equal to the notional value of the swap and take delivery of the referenced obligation, other deliverable obligations or underlying securities comprising the referenced index or (ii) pay a net settlement amount in the form of cash or securities equal to the notional value of the swap less the recovery value of the referenced obligation or underlying securities comprising the referenced index. If a credit event occurs, the maximum payout amount for a sale contract is limited to the notional value of the swap contract (“Maximum Payout Amount”). Recovery values are estimated by market makers considering either industry standard recovery rates or entity specific factors and considerations until a credit event occurs. If a credit event has occurred, the recovery value is determined by a facilitated auction whereby a minimum number of allowable broker bids, together with a specified valuation method, are used to calculate the settlement value. Credit default swap agreements on credit indices involve one party making a stream of payments to another party in exchange for the right to receive a specified return in the event of a write-down, principal shortfall, interest shortfall or default of all or part of the referenced entities comprising the credit index. A credit index is a basket of credit instruments or exposures designed to be representative of some part of the credit market as a whole. These indices are made up of reference credits that are judged by a poll of dealers to be the most liquid entities in the credit default swap market based on the sector of the index. Components of the indices may include, but are not limited to, investment grade securities, high yield securities, asset-backed securities, emerging markets, and/or various credit ratings within each sector. Credit indices are traded using credit default swaps with standardized terms including a fixed spread and standard maturity dates. An index credit default swap references all the names in the index, and if there is a default, the credit event is settled based on that name’s weight in the index. The composition of the indices changes periodically, usually every six months, and for most indices, each name has an equal weight in the index. A Fund may use credit default swaps on credit indices to hedge a portfolio of credit default swaps or bonds, which is less expensive than it would be to buy many credit default swaps to achieve a similar effect. Credit default swaps on indices are benchmarks for protecting investors owning bonds against default, and traders use them to speculate on changes in credit quality. Interest paid to or by the Funds is accrued daily and included in realized gain (loss) on swap agreements. The contracts are marked-to-market daily using fair value estimates provided by an independent pricing service. Changes in value are recorded as unrealized appreciation (depreciation). Unrealized gains are reported as an asset and unrealized losses are reported as a liability. The change in value of swap agreements, including accruals of periodic amounts of interest to be paid or received is reported as unrealized gains or losses. Gains or losses are realized upon termination of the contracts. Credit default swaps sold by a Fund may involve greater risks than if a Fund had invested in the reference obligation directly. Credit default swaps are subject to general market risk, liquidity risk, counterparty credit risk and credit risk of the issuer. Details of swap contracts, if any, at period end are included in the Investment Portfolios under the caption “Swap Contracts.” Refer to Note 6 for additional information. |
| • | Futures contracts | Each of the Funds’ policies, except Small Cap Growth, International, Mid Cap, and Small Cap, permit the Funds to enter into futures contracts (“Futures”), including interest rate, bond, U.S. Treasury and fixed income index Futures, as a hedge against movements in the equity and bond markets in order to establish more definitively the effective return on securities held or intended to be acquired by the Funds or for other purposes permissible under the Commodity Exchange Act, including as a means to gain or reduce exposure to a reference instrument without actually buying or selling it. When a Fund enters into Futures, it must deliver to an account controlled by the futures commission merchant (“FCM”) an amount referred to as “initial margin.” Initial margin requirements are determined by the respective exchanges on which the Futures are traded and the FCM. Thereafter, a “variation margin” amount may be required to be paid by the Fund or received by the Fund in accordance with margin controls set for such accounts, depending upon changes in the marked-to-market value of the Futures. The account is marked-to-market daily and the unrealized gains or losses are recorded as variation margin and monitored by the Manager and custodian on a daily basis. When Futures are closed out, the Fund recognizes a realized gain or loss. The risks of entering into Futures include the possibility that a change in the value of the contract may not correlate with the changes in the value of the underlying instrument. The purchase of Futures involves the risk that the Fund could lose more than the amount invested in Futures. Details of futures contracts, if any, at period end are included in the Investment Portfolios under the caption “Futures Contracts.” Refer to Note 6 for additional information. |
During the fiscal year ended October 31, 2018, the average of month-end derivative positions (notional value in U.S. dollars) were as follows:
| Credit Default Swap Contracts | Futures Contracts - Long | Futures Contracts - Short | ||||||||||
| Core Plus Bond Fund | $8,054,615 | $71,473,209 | $(129,503,127 | ) | ||||||||
| Unconstrained Bond Fund | 17,836,154 | 148,856,050 | (408,015,098 | ) | ||||||||
| 57 |
Notes to Financial Statements
| 10.31.2018 |
Foreign currency transactions | The books and records of each Fund are maintained in U.S. dollars. Foreign currency transactions are translated into U.S. dollars on the following basis: (i) market value of investment securities, other assets and other liabilities at the daily rates of exchange, and (ii) purchases and sales of investment securities, dividend and interest income and certain expenses at the rates of exchange prevailing on the respective dates of such transactions. The Funds do not isolate that portion of gains and losses on investments which is due to changes in foreign exchange rates from that which is due to changes in market prices of the investments. Such fluctuations are included with the net realized and unrealized gains and losses from investment transactions. Net realized gain (loss) on foreign currency transactions and the net change in unrealized appreciation (depreciation) on translation of assets and liabilities denominated in foreign currencies include gains and losses between trade and settlement date on securities transactions, gains and losses arising from the purchase and sale of forward foreign currency exchange contracts and gains and losses between the ex and payment dates on dividends, interest and foreign withholding taxes.
To-Be-Announced Securities | The Core Bond, Core Plus Bond and Unconstrained Bond Funds’ policies permit the Funds to enter into to-be-announced securities. A to-be-announced mortgage-backed security (“TBA”) is a mortgage-backed security, such as a Ginnie Mae pass-through security, that is purchased or sold with specific pools of cash that will constitute that Ginnie Mae pass-through security, to be announced on a future settlement date. At the time of purchase of a TBA, the seller does not specify the particular mortgage-backed securities to be delivered but rather agrees to accept any mortgage-backed security that meets specified terms. The Fund and the seller would agree upon the issuer, interest rate and terms of the underlying mortgages, but the seller would not identify the specific underlying mortgages until shortly before it issues the mortgage-backed security. TBAs increase interest rate risks because the underlying mortgages may be less favorable than anticipated by a Fund. As a purchaser of a TBA, the Fund will segregate or “earmark” cash or cash equivalent securities in accordance with procedures adopted by the Board equal to the value of the TBA, marked to-market daily in accordance with pertinent SEC positions. As a seller of a TBA, the Fund will segregate or “earmark” in accordance with procedures adopted by the Board the equivalent deliverable security up to the obligation required to be delivered.
Real estate investment trusts (“REIT(s)”) | There are certain additional risks involved in investing in REITs. These include, but are not limited to, economic conditions, changes in zoning laws, real estate values, property taxes and interest rates. Dividend income is recorded at the Manager’s estimate of the income included in distributions from the REITs. Distributions received in excess of the estimated amount are recorded as a reduction of the cost of the investments. The actual amounts of income, return of capital and capital gains are only determined by each REIT after the Funds’ fiscal year-end and may differ from the estimated amounts.
Repurchase agreements | Each Fund may enter into repurchase agreements whereby a Fund, through its custodian, receives delivery of the underlying securities, the market value of which at the time of purchase is required to be in an amount of at least 100% of the resale price. Repurchase agreements involve the risk that the seller will fail to repurchase the security, as agreed. In that case, the Fund will bear the risk of market value fluctuations until the security can be sold and may encounter delays and incur costs in liquidating the security. In the event of bankruptcy or insolvency of the seller, delays and costs may be incurred. During the fiscal year ended October 31, 2018, none of the Funds held any repurchase agreements.
Revenue recognition | Investment security transactions are accounted for on a trade date basis. Dividend income is recorded on the ex-dividend date. Interest income is recorded on an accrual basis.
Foreign taxes | The Funds may be subject to taxes imposed by countries in which they invest, with respect to their investments in issuers existing or operating in such countries. The Funds may also be subject to foreign taxes on income, gains on investments or currency repatriation, a portion of which may or may not be recoverable. The Funds record such taxes and recoveries as applicable, when the related income or capital gains are earned and based upon the current interpretation of tax rules and regulations that exist in the markets in which a Fund invests. Some countries require governmental approval for the repatriation of investment income, capital or the proceeds of sales earned by foreign investors.
Expenses | Each Fund is charged for certain expenses which are directly attributable to it and certain other expenses which are allocated proportionately among the Carillon Family of Funds based upon methods approved by the Board. Expenses that are directly attributable to a specific class of shares, such as distribution fees, shareholder servicing fees and administrative fees, are charged directly to that class of shares. Other expenses of each Fund are allocated to each class of shares based upon its relative percentage of net assets.
Class allocations | Each class of shares has equal rights to earnings and assets except that each class may bear different expenses for administration, distribution and/or shareholder services. Income, expenses (other than expenses attributable to a specific class), and realized and unrealized gains or losses on investments are allocated to each class of shares based on its relative percentage of net assets
Segregation and Collateralization | In cases in which the 1940 Act and the interpretive positions of the Securities and Exchange Commission (“SEC”) require that a Fund either deliver collateral or segregate assets in connection with certain investments (e.g., forward currency contracts, securities with extended settlement periods, futures and swaps), the Fund will segregate collateral or designate on its books and records cash or other liquid securities having a value at least equal to the amount that is required to be physically segregated for the benefit of the counterparty. Furthermore, based on requirements and agreements with certain exchanges and third party broker- dealers, each party has requirements to deliver/deposit cash or securities as collateral for certain investments.
Distributions | Each Fund, except the Growth & Income Fund, Core Bond Fund, Core Plus Bond Fund and Unconstrained Bond Fund, distributes net investment income annually. Distributions of net investment income are made quarterly in the Growth & Income Fund and monthly in the Core Bond Fund, Core Plus Bond Fund and Unconstrained Bond Fund. Net realized gains from investment transactions during any particular fiscal year in excess of available capital loss carryforwards, which, if not distributed, would be taxable to each applicable Fund, will be distributed to shareholders annually in the following fiscal year. If a fund is involved in a reorganization wherein it acquires the net assets of another fund, or has its net assets acquired by another fund, a separate and additional distribution of net investment income and / or net realized gains may be made prior to such reorganization. Each Fund uses the identified cost method for determining realized gain or loss on investments for both financial and federal income tax reporting purposes.
| 58 |
Notes to Financial Statements
| 10.31.2018 |
Distributions made to shareholders from earnings were as follows:
| Distributions from earnings | Class A | Class C | Class I | Class R-3 | Class R-5 | Class R-6 | Class Y | |||||||||||||||||||||||||
| Capital Appreciation Fund | 11/1/17 to 10/31/18 | $10,158,703 | $5,182,715 | $7,279,691 | $80,730 | $195,042 | $2,575,449 | $619 | ||||||||||||||||||||||||
| 11/1/16 to 10/31/17 | 8,784,424 | 4,827,925 | 5,837,778 | 43,242 | 466,137 | 1,841,311 | N/A | |||||||||||||||||||||||||
| International Stock Fund | 11/1/17 to 10/31/18 | 54,124 | 28,696 | 115,789 | 7,995 | 45 | 177 | 145 | ||||||||||||||||||||||||
| 11/1/16 to 10/31/17 | 46,900 | 50,527 | 137,212 | 13,703 | 604 | 220 | N/A | |||||||||||||||||||||||||
| Tactical Allocation Fund | 11/1/17 to 10/31/18 | 38,585 | 36,455 | 369,140 | 262 | 978 | 333 | 289 | ||||||||||||||||||||||||
| 11/1/16 to 10/31/17 | 7,638 | 1,498 | 47,453 | 12 | 336 | 72 | N/A | |||||||||||||||||||||||||
| Growth & Income Fund | 11/1/17 to 10/31/18 | 6,621,319 | 5,933,158 | 11,688,591 | 90,673 | 20,226 | 1,918,067 | 561 | ||||||||||||||||||||||||
| 11/1/16 to 10/31/17 | 10,226,402 | 11,271,182 | 13,799,315 | 169,936 | 24,913 | 2,565,437 | N/A | |||||||||||||||||||||||||
| Mid Cap Growth Fund | 11/1/17 to 10/31/18 | 26,571,373 | 8,923,843 | 44,360,044 | 1,786,131 | 24,087,214 | 52,994,970 | 739 | ||||||||||||||||||||||||
| 11/1/16 to 10/31/17 | — | — | 7,063 | — | 13,093 | 77,414 | N/A | |||||||||||||||||||||||||
| Small Cap Growth Fund | 11/1/17 to 10/31/18 | 48,179,886 | 16,819,785 | 124,152,495 | 7,662,535 | 35,062,954 | 149,519,961 | 733 | ||||||||||||||||||||||||
| 11/1/16 to 10/31/17 | 25,774,205 | 6,681,303 | 39,849,621 | 3,012,673 | 13,984,353 | 36,117,862 | N/A | |||||||||||||||||||||||||
| International Fund | 11/1/17 to 10/31/18 | 1,591 | 1,583 | 177,675,550 | 1,588 | 1,594 | 1,594 | 1,591 | ||||||||||||||||||||||||
| 7/1/17 to 10/31/17 | N/A | N/A | — | N/A | N/A | N/A | N/A | |||||||||||||||||||||||||
| 7/1/16 to 6/30/17 | N/A | N/A | 199,956,322 | N/A | N/A | N/A | N/A | |||||||||||||||||||||||||
| Mid Cap Fund | 11/1/17 to 10/31/18 | 3,347 | 1,837 | 138,752,902 | 770 | 775 | 775 | 1,848 | ||||||||||||||||||||||||
| 7/1/17 to 10/31/17 | N/A | N/A | — | N/A | N/A | N/A | N/A | |||||||||||||||||||||||||
| 7/1/16 to 6/30/17 | N/A | N/A | 28,725,492 | N/A | N/A | N/A | N/A | |||||||||||||||||||||||||
| Small Cap Fund | 11/1/17 to 10/31/18 | 11,163 | 10,951 | 46,518,857 | 1,741 | 1,741 | 216,374 | 2,580 | ||||||||||||||||||||||||
| 7/1/17 to 10/31/17 | N/A | N/A | — | N/A | N/A | N/A | N/A | |||||||||||||||||||||||||
| 7/1/16 to 6/30/17 | N/A | N/A | 9,176,002 | N/A | N/A | N/A | N/A | |||||||||||||||||||||||||
| Core Bond Fund | 11/1/17 to 10/31/18 | 5,814 | 2,454 | 2,264,998 | 139 | 187 | 195 | 33,740 | ||||||||||||||||||||||||
| 7/1/17 to 10/31/17 | N/A | N/A | 889,536 | N/A | N/A | N/A | 11,400 | |||||||||||||||||||||||||
| 7/1/16 to 6/30/17 | N/A | N/A | 7,302,546 | N/A | N/A | N/A | 100,296 | |||||||||||||||||||||||||
| Core Plus Bond Fund | 11/1/17 to 10/31/18 | 2,399 | 1,317 | 13,013,527 | 135 | 182 | 190 | 354,295 | ||||||||||||||||||||||||
| 7/1/17 to 10/31/17 | N/A | N/A | 4,068,161 | * | N/A | N/A | N/A | 115,206 | * | |||||||||||||||||||||||
| 7/1/16 to 6/30/17 | N/A | N/A | 32,694,641 | N/A | N/A | N/A | 2,288,508 | |||||||||||||||||||||||||
| Unconstrained Bond Fund | 11/1/17 to 10/31/18 | 1,119 | 253 | 25,119,317 | 132 | 179 | 290,370 | 820,029 | ||||||||||||||||||||||||
| 7/1/17 to 10/31/17 | N/A | N/A | 4,691,505 | N/A | N/A | N/A | 175,502 | |||||||||||||||||||||||||
| 7/1/16 to 6/30/17 | N/A | N/A | 14,623,343 | N/A | N/A | N/A | 831,541 | |||||||||||||||||||||||||
| * Includes return of capital in the amount of $197,332 |
| |||||||||||||||||||||||||||||||
Other | In the normal course of business the Funds enter into contracts that contain a variety of representations and warranties which provide general indemnifications. The Funds’ maximum exposure under these arrangements is unknown, as this would involve future claims that may be made against the Funds and/or their affiliates that have not yet occurred. However, based on experience, the risk of loss to each Fund is expected to be remote.
NOTE 3 | Purchases and sales of securities | During the fiscal year ended October 31, 2018, purchases and sales of investment securities (excluding short-term obligations) were as follows:
| Capital Appreciation Fund | International Stock Fund | Tactical Allocation Fund | Growth & Income Fund | Mid Cap Growth Fund | Small Cap Growth Fund | |||||||||||||||||||
| Purchases | $243,433,809 | $10,322,499 | $20,921,322 | $60,256,837 | $3,052,730,261 | $1,842,605,240 | ||||||||||||||||||
| Sales | 201,744,856 | 9,469,810 | 15,007,328 | 113,830,051 | 1,497,208,551 | 2,429,154,460 | ||||||||||||||||||
| 59 |
Notes to Financial Statements
| 10.31.2018 |
| International Fund | Mid Cap Fund | Small Cap Fund | Core Bond Fund | Core Plus Bond Fund | Unconstrained Bond Fund | |||||||||||||||||||
| Purchases | $132,359,164 | $3,034,858,126 | $65,328,142 | $179,530,559 | $1,044,496,178 | $537,632,469 | ||||||||||||||||||
| Purchases - U.S. Treasury securities | — | — | — | 175,268,536 | 1,139,854,794 | 1,546,682,190 | ||||||||||||||||||
| Sales | 364,125,035 | 2,261,282,450 | 77,934,337 | 214,073,867 | 1,163,334,150 | 721,324,930 | ||||||||||||||||||
| Sales - U.S. Treasury securities | — | — | — | 177,573,950 | 1,162,627,338 | 1,264,769,009 | ||||||||||||||||||
Rule 17a-7 Affiliated Transactions | Each Fund is permitted to purchase securities from and sell securities to certain affiliated entities under specified conditions outlined in procedures adopted by the Board of Trustees pursuant to Rule 17a-7 under the 1940 Act. Pursuant to these procedures, during the fiscal year ended October 31, 2018, the Small Cap Fund engaged in securities purchases of $2,850,667. These purchases are included in the total purchases amount shown for the Small Cap Fund in the preceding table.
NOTE 4 | Investment advisory fees and other transactions with affiliates | Each Fund has agreed to pay to the Manager an investment advisory and an administrative fee equal to an annualized rate based on a percentage of each Fund’s average daily net assets, computed daily and payable monthly. For advisory services provided by the Manager, the investment advisory rate for each Fund is as follows:
| Investment advisory fee rate schedule | Breakpoint | Investment advisory fee | ||||
| Capital Appreciation Fund | First $1 billion Over $1 billion | | 0.60% 0.55% |
| ||
| International Stock Fund | All assets | 0.70% | ||||
| Tactical Allocation Fund | All assets | 0.57% | ||||
| Growth & Income Fund | First $100 million $100 million to $500 million Over $500 million | | 0.60% 0.45% 0.40% |
| ||
| Investment advisory fee rate schedule (cont’d) | Breakpoint | Investment advisory fee | ||||
| Mid Cap Growth Fund, Small Cap Growth Fund, Small Cap Fund* | First $500 million $500 million to $1 billion | | 0.60 0.55 0.50 | % % % | ||
| International Fund, Mid Cap Fund | First $1 billion Over $1 billion | | 0.80 0.70 | % % | ||
| Core Bond Fund, Core Plus Bond Fund | All assets | 0.40 | % | |||
| Unconstrained Bond Fund | First $3 billion Over $3 billion | | 0.60 0.55 | % % | ||
| * Prior to the Board approved change effective March 1, 2018, the investment advisory fee for the Small Cap Fund was 0.75% on the first $1 billion assets and 0.65% on assets over $1 billion. | ||||
Subadvisory fees | The Manager has entered into subadvisory agreements with certain parties (the “subadviser” or “subadvisers”) to provide investment advice, portfolio management services (including the placement of brokerage orders), certain compliance and other services to the Funds. Under these agreements, Carillon Tower pays the subadvisers, each an affiliate of Carillon Tower, annualized rates identical* to those disclosed in the investment advisory fee rate schedule. The subadvisers for the Funds are as follows:
| • | ClariVest Asset Management LLC (“ClariVest”) serves as subadviser for the Capital Appreciation Fund and the International Stock Fund, |
| • | Cougar Global Investments Limited serves as subadviser for the Tactical Allocation Fund, |
| • | Eagle Asset Management, Inc. serves as subadviser for the Growth & Income Fund, Mid Cap Growth Fund, and Small Cap Growth Fund, and |
| • | Scout Investments, Inc. serves as subadviser for the International Fund, Mid Cap Fund, Small Cap Fund, Core Bond Fund, Core Plus Bond Fund, and Unconstrained Bond Fund. |
* Prior to the Board approved change effective March 1, 2018, Carillon Tower paid ClariVest an annualized rate 0.60% on all assets of the Capital Appreciation Fund.
Administrative fees | For administrative services provided by the Manager, each Fund has agreed to pay an administrative rate of 0.10% of the average daily net assets of all share classes. Prior to the Board approved change effective November 20, 2017, the Capital Appreciation Fund, International Stock Fund, Tactical Allocation Fund, Growth & Income Fund, Mid Cap Growth Fund, and Small Cap Growth Fund paid an administrative rate of 0.15% of the average daily net assets of Class A, Class C, and Class R-3 shares and 0.10% of the average daily net assets of Class I, Class R-5, and Class R-6 shares.
Distribution and service fees | Pursuant to the Class A, Class C, Class R-3 and Class Y Distribution plans and in accordance with Rule 12b-1 of the Investment Company Act of 1940, as amended (“Rule 12b-1 Plans”), the Funds are authorized to pay Carillon Fund Distributors, Inc. (“Distributor”), an affiliate of the Manager, a fee based on the average daily net assets for each class of shares, accrued daily and payable monthly. Each Fund of the Carillon Series Trust is authorized to pay the Distributor distribution and service fees of up to 0.35% of that fund’s average daily net assets attributable to Class A shares of that fund. The Capital Appreciation Fund and the Growth & Income Fund are authorized to pay the Distributor distribution and service fees of up to 0.50% of those Funds’ average daily net assets attributable to Class A shares of those Funds. Currently, the distribution and service fee is 0.25% for Class A shares of each Fund. Each Fund also is authorized, and currently pays, the Distributor distribution and service fees of 1.00% for Class C shares, 0.50% for Class R-3 shares, and 0.25% for Class Y shares. The Funds do not incur any distribution expenses related to Class I, Class R-5 or Class R-6 shares. However, Carillon Tower or any third party may make payments for the sale and distribution of all share classes, including Class I, Class R-5 or Class R-6 shares, from its own resources.
| 60 |
Notes to Financial Statements
| 10.31.2018 |
Sales charges | During the fiscal year ended October 31, 2018, total front-end sales charges and contingent deferred sales charges (“CDSC”) paid to the Distributor were as follows:
| Capital Appreciation Fund | International Stock Fund | Tactical Allocation Fund | Growth & Income Fund | Mid Cap Growth Fund | Small Cap Growth Fund | |||||||||||||||||||
| Front-end sales charges - Class A | $93,941 | $17,514 | $11,173 | $111,372 | $704,255 | $170,425 | ||||||||||||||||||
| CDSC - Class A | — | — | — | — | — | — | ||||||||||||||||||
| CDSC - Class C | 82 | 145 | 150 | 2,715 | 3,384 | 1,251 | ||||||||||||||||||
| International Fund | Mid Cap Fund | Small Cap Fund | Core Bond Fund | Core Plus Bond Fund | Unconstrained Bond Fund | |||||||||||||||||||
| Front-end sales charges - Class A | $377 | $157,710 | $24,309 | $1,420 | $25 | $1 | ||||||||||||||||||
| CDSC - Class A | — | — | — | — | — | — | ||||||||||||||||||
| CDSC - Class C | — | 280 | 38 | 4 | 5 | — | ||||||||||||||||||
The Distributor paid commissions to salespersons from these fees and incurred other distribution costs.
Agency commissions | During the fiscal year ended October 31, 2018, total agency brokerage commissions paid and agency brokerage commissions paid directly to Raymond James & Associates, Inc. (“RJA”), an affiliate of the Manager, were as follows:
| Capital Appreciation Fund | International Stock Fund | Tactical Allocation Fund | Growth & Income Fund | Mid Cap Growth Fund | Small Cap Growth Fund | |||||||||||||||||||
| Total agency brokerage commissions | $80,421 | $9,895 | $3,092 | $75,784 | $1,438,656 | $1,880,339 | ||||||||||||||||||
| Paid to RJA | — | — | — | — | 131,388 | 59,931 | ||||||||||||||||||
| International Fund | Mid Cap Fund | Small Cap Fund | Core Bond Fund | Core Plus Bond Fund | Unconstrained Bond Fund | |||||||||||||||||||
| Total agency brokerage commissions | $618,689 | $2,450,043 | $77,571 | $— | $10,458 | $27,384 | ||||||||||||||||||
| Paid to RJA | — | — | — | — | — | — | ||||||||||||||||||
Internal audit fees | RJA provides internal audit services to the Funds. Each Fund pays RJA a fixed and/or hourly fee for these services.
Shareholder servicing fees | Carillon Fund Services, Inc. (“CFS”), an affiliate of the Manager, is the shareholder servicing agent for each of the Funds. CFS’ actual cost of providing such services is reimbursed by the Funds on a pro-rata basis of each Fund’s relative total net assets. During the fiscal year ended October 31, 2018, the amount of shareholder servicing fees charged to the Funds were as follows:
| Shareholder servicing fees | Class A | Class C | Class I | Class R-3 | Class R-5 | Class R-6 | Class Y | |||||||||||||||||||||
| Capital Appreciation Fund | $2,518 | $464 | $2,568 | $19 | $69 | $— | $— | |||||||||||||||||||||
| International Stock Fund | 81 | 50 | 124 | 12 | — | — | — | |||||||||||||||||||||
| Tactical Allocation Fund | 21 | 26 | 184 | — | — | — | — | |||||||||||||||||||||
| Growth & Income Fund | 2,124 | 1,943 | 3,497 | 28 | 6 | — | — | |||||||||||||||||||||
| Mid Cap Growth Fund | 8,237 | 1,995 | 13,816 | 482 | 7,450 | — | 1 | |||||||||||||||||||||
| Small Cap Growth Fund | 8,546 | 1,893 | 22,132 | 1,307 | 6,481 | — | 1 | |||||||||||||||||||||
| International Fund | 2 | 1 | 12,483 | — | — | — | — | |||||||||||||||||||||
| Mid Cap Fund | 33 | 46 | 28,441 | 8 | 3 | — | 8 | |||||||||||||||||||||
| Small Cap Fund | 69 | 76 | 3,660 | 2 | — | — | — | |||||||||||||||||||||
| Core Bond Fund | 5 | 3 | 1,444 | — | — | — | 26 | |||||||||||||||||||||
| Core Plus Bond Fund | 2 | 2 | 8,438 | — | — | — | 280 | |||||||||||||||||||||
| Unconstrained Bond Fund | 1 | — | 17,249 | — | — | — | 660 | |||||||||||||||||||||
| 61 |
Notes to Financial Statements
| 10.31.2018 |
Expense limitations | Carillon Tower has contractually agreed to reduce its fees and/or reimburse expenses to each class of the Funds to the extent that the annual operating expense ratio for each class of shares exceeds the following annualized ratios as a percentage of average daily net assets of each class of shares.
| Expense limitations rate schedule | Class A | Class C | Class I | Class R-3 | Class R-5 | Class R-6 | Class Y | |||||||||||||||||||||
| Capital Appreciation Fund* | 1.00% | 1.75% | 0.70% | 1.25% | 0.70% | 0.60% | 1.00% | |||||||||||||||||||||
| International Stock Fund | 1.45% | 2.20% | 1.15% | 1.70% | 1.15% | 1.05% | 1.45% | |||||||||||||||||||||
| Tactical Allocation Fund | 1.17% | 1.92% | 0.87% | 1.42% | 0.87% | 0.77% | 1.17% | |||||||||||||||||||||
| Growth & Income Fund | 1.25% | 2.00% | 0.95% | 1.50% | 0.95% | 0.85% | 1.25% | |||||||||||||||||||||
| Mid Cap Growth Fund | 1.25% | 2.00% | 0.95% | 1.50% | 0.95% | 0.85% | 1.25% | |||||||||||||||||||||
| Small Cap Growth Fund | 1.25% | 2.00% | 0.95% | 1.50% | 0.95% | 0.85% | 1.25% | |||||||||||||||||||||
| International Fund | 1.45% | 2.20% | 1.15% | 1.70% | 1.15% | 1.05% | 1.45% | |||||||||||||||||||||
| Mid Cap Fund | 1.45% | 2.20% | 1.15% | 1.70% | 1.15% | 1.05% | 1.45% | |||||||||||||||||||||
| Small Cap Fund | 1.25% | 2.00% | 0.95% | 1.50% | 0.95% | 0.85% | 1.25% | |||||||||||||||||||||
| Core Bond Fund | 0.80% | 1.55% | 0.40% | 1.05% | 0.50% | 0.40% | 0.80% | |||||||||||||||||||||
| Core Plus Bond Fund | 0.80% | 1.55% | 0.40% | 1.05% | 0.50% | 0.40% | 0.80% | |||||||||||||||||||||
| Unconstrained Bond Fund | 0.80% | 1.55% | 0.50% | 1.05% | 0.50% | 0.40% | 0.80% | |||||||||||||||||||||
| * Prior to the Board approved changes effective January 1, 2018, the expense limitation rate schedule for the Capital Appreciation Fund was as follows: | ||||||
| Expense limitations rate schedule | Class A | Class C | Class I | Class R-3 | Class R-5 | Class R-6 | Class Y | |||||||||||||||||||||
| Capital Appreciation Fund | 1.25% | 2.00% | 0.95% | 1.50% | 0.95% | 0.85% | 1.25% | |||||||||||||||||||||
Fees and expenses waived and/or reimbursed based on the expense rate limitation schedule were as follows:
| Expenses waived and/or reimbursed 11/1/17 to 10/31/18 | Fund Level | Class A | Class C | Class I | Class R-3 | Class R-5 | Class R-6 | Class Y | ||||||||||||||||||||||||
| Capital Appreciation Fund | $314,098 | $63,195 | $14,943 | $174,217 | $1,515 | $3,459 | $41,017 | $75 | ||||||||||||||||||||||||
| International Stock Fund | 256,931 | 7,421 | 6,236 | 14,261 | 1,657 | 84 | 153 | 81 | ||||||||||||||||||||||||
| Tactical Allocation Fund | 227,556 | 1,613 | 2,336 | 26,647 | 84 | 135 | 96 | 82 | ||||||||||||||||||||||||
| Growth & Income Fund | — | — | — | — | — | — | — | 26 | ||||||||||||||||||||||||
| Mid Cap Growth Fund | — | — | — | — | — | — | — | — | ||||||||||||||||||||||||
| Small Cap Growth Fund | — | — | — | — | — | — | — | — | ||||||||||||||||||||||||
| International Fund | — | — | 13 | — | 44 | 49 | — | 69 | ||||||||||||||||||||||||
| Mid Cap Fund | — | — | — | — | — | — | — | — | ||||||||||||||||||||||||
| Small Cap Fund | — | — | — | 41,117 | 172 | 104 | 123 | 98 | ||||||||||||||||||||||||
| Core Bond Fund | 294,804 | 304 | 337 | 250,866 | 66 | 72 | 81 | 3,063 | ||||||||||||||||||||||||
| Core Plus Bond Fund | 392,455 | 168 | 321 | 989,643 | 64 | 69 | 78 | 24,090 | ||||||||||||||||||||||||
| Unconstrained Bond Fund | 3,602,818 | 95 | 141 | 1,170,586 | 92 | 69 | 14,497 | 54,356 | ||||||||||||||||||||||||
A portion or all of a Fund’s fees and expenses waived and/or reimbursed by the Manager in prior fiscal years may be recoverable by Carillon Tower prior to their expiration date. Any previously waived and/or reimbursed fees and expenses are recoverable by Carillon Tower only from the same class of shares and within two years from the Fund’s fiscal year-end during which the fees and expenses were originally waived and/or reimbursed. Previously waived and/or reimbursed fees and expenses are recovered by Carillon Tower within the following two fiscal years when fees and expenses in the current fiscal year fall below the lesser of the current expense cap or the expense cap in effect at the time of the waiver and/or reimbursement. The following tables show the amounts that Carillon Tower may be allowed to recover by class of shares and the dates that these amounts will expire:
| Recoverable expenses - 10/31/2020 | Fund Level | Class A | Class C | Class I | Class R-3 | Class R-5 | Class R-6 | Class Y | ||||||||||||||||||||||||
| Capital Appreciation Fund | $314,098 | $63,195 | $14,943 | $174,217 | $1,515 | $3,459 | $41,017 | $75 | ||||||||||||||||||||||||
| International Stock Fund | 256,931 | 7,421 | 6,236 | 14,261 | 1,657 | 84 | 153 | 81 | ||||||||||||||||||||||||
| Tactical Allocation Fund | 227,556 | 1,613 | 2,336 | 26,647 | 84 | 135 | 96 | 82 | ||||||||||||||||||||||||
| Growth & Income Fund | — | — | — | — | — | — | — | 26 | ||||||||||||||||||||||||
| Mid Cap Growth Fund | — | — | — | — | — | — | — | — | ||||||||||||||||||||||||
| Small Cap Growth Fund | — | — | — | — | — | — | — | — | ||||||||||||||||||||||||
| 62 |
Notes to Financial Statements
| 10.31.2018 |
| Recoverable expenses - 10/31/2020 (cont’d) | Fund Level | Class A | Class C | Class I | Class R-3 | Class R-5 | Class R-6 | Class Y | ||||||||||||||||||||||||
| International Fund* | $— | $— | $13 | $— | $44 | $49 | $— | $69 | ||||||||||||||||||||||||
| Mid Cap Fund* | — | — | — | — | — | — | — | — | ||||||||||||||||||||||||
| Small Cap Fund* | — | — | — | 41,117 | 172 | 104 | 123 | 98 | ||||||||||||||||||||||||
| Core Bond Fund* | 289,738 | 304 | 337 | 245,255 | 66 | 72 | 81 | 3,063 | ||||||||||||||||||||||||
| Core Plus Bond Fund* | 362,422 | 168 | 321 | 966,207 | 64 | 69 | 78 | 24,090 | ||||||||||||||||||||||||
| Unconstrained Bond Fund* | 3,540,247 | 95 | 141 | 1,170,586 | 92 | 69 | 14,497 | 54,356 | ||||||||||||||||||||||||
| Recoverable expenses - 10/31/2019 | Fund Level | Class A | Class C | Class I | Class R-3 | Class R-5 | Class R-6 | Class Y | ||||||||||||||||||||||||
| Capital Appreciation Fund | $— | $— | $— | $— | $424 | $— | $— | N/A | ||||||||||||||||||||||||
| International Stock Fund | 318,472 | 5,471 | 8,001 | 7,594 | 1,682 | 49 | 74 | N/A | ||||||||||||||||||||||||
| Tactical Allocation Fund | 278,988 | 2,731 | 2,441 | 19,305 | 11 | 64 | 16 | N/A | ||||||||||||||||||||||||
| Growth & Income Fund | — | — | — | — | — | — | — | N/A | ||||||||||||||||||||||||
| Mid Cap Growth Fund | — | — | — | — | — | — | — | N/A | ||||||||||||||||||||||||
| Small Cap Growth Fund | — | — | — | — | — | — | — | N/A | ||||||||||||||||||||||||
| International Fund* | N/A | N/A | N/A | N/A | N/A | N/A | N/A | N/A | ||||||||||||||||||||||||
| Mid Cap Fund* | N/A | N/A | N/A | N/A | N/A | N/A | N/A | N/A | ||||||||||||||||||||||||
| Small Cap Fund* | N/A | N/A | N/A | N/A | N/A | N/A | N/A | N/A | ||||||||||||||||||||||||
| Core Bond Fund* | N/A | N/A | N/A | N/A | N/A | N/A | N/A | N/A | ||||||||||||||||||||||||
| Core Plus Bond Fund* | N/A | N/A | N/A | N/A | N/A | N/A | N/A | N/A | ||||||||||||||||||||||||
| Unconstrained Bond Fund* | N/A | N/A | N/A | N/A | N/A | N/A | N/A | N/A | ||||||||||||||||||||||||
| * Fees waived and/or reimbursed in the Core Bond Fund, Core Plus Bond Fund and Unconstrained Bond Fund prior to the reorganization on November 20, 2017 are not eligible to be recovered by Carillon Tower. There were no fees waived and/or reimbursed in the International Fund, Mid Cap Fund or Small Cap Fund prior to the reorganization on November 20, 2017. |
| |||||||||||||||||||||||||||||||
Trustees and officers compensation | Each Trustee of the Carillon Family of Funds who is not an employee of the Manager receives an annual retainer along with meeting fees for those Carillon Family of Funds’ regular or special meetings attended in person and 25% of such meeting fees are received for telephonic meetings. All reasonable out-of-pocket expenses are also reimbursed. Except when directly attributable to a Fund, Trustees’ fees and expenses are paid equally by each Fund in the Carillon Family of Funds. Certain officers of the Carillon Family of Funds may also be officers and/or directors of Carillon Tower. Such officers receive no compensation from the Funds except for the Funds’ Chief Compliance Officer. A portion of the Chief Compliance Officer’s total compensation is paid equally by each Fund in the Carillon Family of Funds.
NOTE 5 | Federal income taxes and distributions | Each Fund is treated as a single corporate taxpayer as provided for in the Tax Reform Act of 1986, as amended. Accordingly, no provision for federal income taxes is required since each of the Funds intends to continue to qualify as a regulated investment company under Subchapter M of the Internal Revenue Code and distribute to shareholders all of its taxable income and gains. The Manager has analyzed the Funds’ tax positions taken or expected to be taken on federal income tax returns for all open tax years (tax years ended October 31, 2015 to October 31, 2018 for all Funds except for the International Fund, Mid Cap Fund, Small Cap Fund, Core Bond Fund, Core Plus Bond Fund and Unconstrained Bond Fund which have open tax years ended June 30, 2015 to June 30, 2017, October 31, 2017 and October 31, 2018) and has concluded that no provision for federal income tax is required in the Funds’ financial statements.
Federal income tax regulations differ from GAAP; therefore, distributions determined in accordance with tax regulations may differ significantly in amount or character from net investment income and net realized gains for financial reporting purposes. These differences primarily relate to deferral of losses from wash sales and non-REIT return of capital.
For income tax purposes, distributions paid during the fiscal periods indicated were as follows:
| Capital Appreciation Fund | International Stock Fund | Tactical Allocation Fund | Growth & Income Fund | Mid Cap Growth Fund | Small Cap Growth Fund | |||||||||||||||||||||||
| 11/1/17 to 10/31/18 | $236,305 | $206,971 | $410,930 | $11,609,719 | $— | $— | ||||||||||||||||||||||
| Ordinary Income | 11/1/16 to 10/31/17 | 587,760 | 249,166 | 57,009 | 9,370,031 | — | 2,166,663 | |||||||||||||||||||||
| 11/1/17 to 10/31/18 | 25,236,644 | — | 35,112 | 14,662,876 | 158,724,314 | 381,398,349 | ||||||||||||||||||||||
| Long-term capital gain | 11/1/16 to 10/31/17 | 21,213,057 | — | — | 28,687,154 | 97,570 | 123,253,354 | |||||||||||||||||||||
| 63 |
Notes to Financial Statements
| 10.31.2018 |
| International Fund | Mid Cap Fund | Small Cap Fund | Core Bond Fund | Core Plus Bond Fund | Unconstrained Bond Fund | |||||||||||||||||||||||
| 11/1/17 to 10/31/18 | $13,650,008 | $39,970,028 | $1,482,156 | $2,307,527 | $13,372,045 | $26,231,399 | ||||||||||||||||||||||
| Ordinary Income | 7/1/17 to 10/31/17 | — | — | — | 900,936 | 3,986,035 | 4,867,007 | |||||||||||||||||||||
| 7/1/16 to 6/30/17 | 21,855,165 | 6,620,827 | 139,596 | 7,402,842 | 34,895,248 | 15,454,884 | ||||||||||||||||||||||
| 11/1/17 to 10/31/18 | 164,035,083 | 98,792,226 | 45,281,251 | — | — | — | ||||||||||||||||||||||
| Long-term capital gain | 7/1/17 to 10/31/17 | — | — | — | — | — | — | |||||||||||||||||||||
| 7/1/16 to 6/30/17 | 178,101,157 | 22,104,665 | 9,036,406 | — | 87,901 | — | ||||||||||||||||||||||
| Return of capital | 7/1/17 to 10/31/17 | — | — | — | — | 197,332 | — | |||||||||||||||||||||
Financial reporting records are adjusted for permanent book/tax differences to reflect tax character; these adjustments have no effect on net assets or NAV per share. Financial reporting records are not adjusted for temporary differences. The reclassifications arise from permanent book/tax differences primarily attributable to net operating losses not utilized, foreign currency transactions, return of capital distributions from REITs, return of capital distributions from non-REITs, paydowns on debt securities, sales adjustments due to passive foreign investment companies, and merger adjustments. The reclassifications were as follows:
| Capital Appreciation Fund | International Stock Fund | Tactical Allocation Fund | Growth & Income Fund | Mid Cap Growth Fund | Small Cap Growth Fund | |||||||||||
| Paid-in capital | $— | $3 | $1 | $— | $(189,502) | $— | ||||||||||
| Total distributable earnings (loss) | — | (3 | ) | (1) | — | 189,502 | — | |||||||||
| International Fund | Mid Cap Fund | Small Cap Fund | Core Bond Fund | Core Plus Bond Fund | Unconstrained Bond Fund | |||||||||||
| Paid-in capital | $(1 | ) | $12,574 | 171,238 | $— | $1 | $— | |||||||||
| Total distributable earnings (loss) | 1 | (12,574 | ) | (171,238) | — | (1) | — | |||||||||
At October 31, 2018, capital loss carryforwards and late year loss deferrals are as follows:
| Capital loss carryforwards utilized 11/1/17 to 10/31/18 | Capital loss carryforwards available indefinitely at 10/31/18 | Late year loss deferrals available at 10/31/18 | ||||||||
| Capital Appreciation Fund | $— | $— | $— | |||||||
| International Stock Fund | 661,917 | 28,906 | — | |||||||
| Tactical Allocation Fund | — | — | — | |||||||
| Growth & Income Fund | — | — | — | |||||||
| Mid Cap Growth Fund | — | — | — | |||||||
| Small Cap Growth Fund | — | — | 17,054,458 | |||||||
| International Fund | — | — | — | |||||||
| Mid Cap Fund | — | — | — | |||||||
| Small Cap Fund | — | — | — | |||||||
| Core Bond Fund | — | 3,274,181 | — | |||||||
| Core Plus Bond Fund | — | 23,494,715 | — | |||||||
| Unconstrained Bond Fund | — | 55,129,644 | — | |||||||
Capital loss carryforwards may be used to offset future realized gains and late year loss deferrals may be used to offset future ordinary income.
| 64 |
Notes to Financial Statements
| 10.31.2018 |
As of October 31, 2018, the components of distributable earnings (losses) on a tax basis were as follows:
| Capital Appreciation Fund | International Stock Fund | Tactical Allocation Fund | Growth & Income Fund | Mid Cap Growth Fund | Small Cap Growth Fund | |||||||||||
| Cost of investments | $304,394,611 | $16,927,741 | $22,493,976 | $377,515,161 | $3,621,460,988 | $3,634,344,758 | ||||||||||
| Gross unrealized appreciation | 157,989,717 | 1,591,043 | 733,771 | 201,022,834 | 776,378,592 | 1,345,019,872 | ||||||||||
| Gross unrealized depreciation | (10,943,580 | ) | (1,525,590 | ) | (293,020) | (3,703,696) | (252,832,793) | (314,020,795) | ||||||||
| Net unrealized appreciation/(depreciation) | 147,046,137 | 65,453 | 440,751 | 197,319,138 | 523,545,799 | 1,030,999,077 | ||||||||||
| Undistributed ordinary income | 1,198,625 | 226,693 | 160,299 | 974,236 | 10,819,279 | — | ||||||||||
| Undistributed long-term gain | 36,924,363 | — | 730,315 | 42,583,590 | 104,227,236 | 818,753,850 | ||||||||||
| Total distributable earnings | 38,122,988 | 226,693 | 890,614 | 43,557,826 | 115,046,515 | 818,753,850 | ||||||||||
| Other accumulated losses | — | (30,679 | ) | — | (3,887) | — | (17,054,458) | |||||||||
| Total accumulated gains (losses) | $185,169,125 | $261,467 | $1,331,365 | $240,873,077 | $638,592,314 | $1,832,698,469 | ||||||||||
| International Fund | Mid Cap Fund | Small Cap Fund | Core Bond Fund | Core Plus Bond Fund | Unconstrained Bond Fund | |||||||||||
| Cost of investments | $608,062,310 | $2,274,862,488 | $215,273,659 | $116,497,607 | $681,038,800 | $1,277,175,362 | ||||||||||
| Gross unrealized appreciation | 258,660,948 | 276,815,386 | 122,939,229 | 87,050 | 1,216,963 | 1,561,117 | ||||||||||
| Gross unrealized depreciation | (69,216,036 | ) | (159,188,884 | ) | (20,822,929) | (2,685,271) | (17,891,264) | (31,410,128) | ||||||||
| Net unrealized appreciation/(depreciation) | 189,444,912 | 117,626,502 | 102,116,300 | (2,598,221) | (16,674,301) | (29,849,011) | ||||||||||
| Undistributed ordinary income | 22,614,737 | 7,090,325 | 356,978 | 224,038 | 1,117,464 | 2,268,829 | ||||||||||
| Undistributed long-term gain | 46,187,760 | 162,274,995 | 215,038 | — | — | — | ||||||||||
| Total distributable earnings | 68,802,497 | 169,365,320 | 572,016 | 224,038 | 1,117,464 | 2,268,829 | ||||||||||
| Other accumulated losses | (118,454 | ) | — | (10,271) | (3,274,181) | (23,494,717) | (55,129,638) | |||||||||
| Total accumulated gains (losses) | $258,128,955 | $286,991,822 | $102,678,045 | $(5,648,364) | $(39,051,554) | $(82,709,820) | ||||||||||
The difference between book-basis and tax-basis unrealized appreciation (depreciation) is attributable primarily to the tax deferral of losses from wash sales and differences in the accounting treatment for non-REIT returns of capital and investments in passive foreign investment companies.
NOTE 6 | Other Derivative Information | At October 31, 2018, the Funds have invested in derivative contracts which are reflected on the Statements of Assets and Liabilities as follows:
| Asset | Liability | |||||||||||
| Risk Exposure Category | Statements of Assets and Liabilities Location | Fair Value Amount | Fair Value Amount | |||||||||
| Core Plus Bond Fund | Credit contracts | Premiums paid - open swap contracts | $809,698 | N/A | ||||||||
| Net unrealized appreciation - open swap contracts | 68,142 | N/A | ||||||||||
| Interest rate contracts* | Net unrealized depreciation - open futures contracts | N/A | $1,970,421 | |||||||||
|
| |||||||||||
| Total | $877,840 | $1,970,421 | ||||||||||
|
| |||||||||||
| Unconstrained Bond Fund | Credit contracts | Premiums paid - open swap contracts | $1,620,224 | N/A | ||||||||
| Net unrealized appreciation - open swap contracts | 137,568 | N/A | ||||||||||
| Interest rate contracts* | Net unrealized depreciation - open futures contracts | N/A | $5,195,644 | |||||||||
|
| |||||||||||
| Total | $1,757,792 | $5,195,644 | ||||||||||
|
| |||||||||||
| * Some of these futures contracts are denomiated in Euro, which also gives the Fund exposure to foreign currency risk. |
| |||||||||||
Financial Accounting Standards Board Accounting Update 2011-11, Disclosures about Offsetting Assets and Liabilities requires an entity that has financial instruments that are either 1) offset or 2) subject to an enforceable master netting arrangement or similar agreement to disclose information about offsetting and related arrangements to enable users of its financial statements to understand the effect of those arrangements on its financial position. As of October 31, 2018, the Funds did not hold any financial or derivative instruments that are offset or subject to enforceable master netting agreements (or related arrangements).
| 65 |
Notes to Financial Statements
| 10.31.2018 |
For the fiscal year ended October 31, 2018, the effect of derivative contracts on the Funds’ Statements of Operations was as follows:
| Risk Exposure Category | Derivative Instrument | Net Realized Gains (Losses) | Net Change in Unrealized Appreciation (Depreciation) | |||||||||||
| Core Plus Bond Fund | Credit contracts | Swap contracts | $410,894 | $(39,557 | ) | |||||||||
| Interest rate contracts* | Future contracts | (3,467,444 | ) | (1,783,742 | ) | |||||||||
|
| |||||||||||||
| Total | $(3,056,550 | ) | $ | (1,823,299 | ) | |||||||||
|
| |||||||||||||
| Unconstrained Bond Fund | Credit contracts | Swap contracts | $1,321,504 | $(306,803 | ) | |||||||||
| Interest rate contracts* | Future contracts | (7,905,063 | ) | (3,378,268 | ) | |||||||||
|
| |||||||||||||
| Total | $(6,583,559 | ) | $ | (3,685,071 | ) | |||||||||
|
| |||||||||||||
| * Some of these futures contracts were denominated in Euro, which also gave the Fund exposure to foreign currency risk. |
| |||||||||||||
Refer to Note 2 for additional information regarding investments in derivatives.
NOTE 7 | Line of Credit | As of October 31, 2018, the Trust has a secured line of credit of up to $350,000,000 with U.S. Bank N.A, secured by a first priority lien on the Trust’s assets. Each Fund may borrow up to 33.33% of the net market value of such Fund’s assets, with the maximum aggregate limit of $350,000,000 for all Funds. Borrowings under this arrangement bear interest at U.S. Bank N.A.‘s prime rate minus 1.00%, which as of October 31, 2018 was 4.25% (prime rate of 5.25% minus 1.00%). The following table shows the details of the Funds’ borrowing activity for the fiscal year ended October 31, 2018. Funds that are not listed did not utilize the line of credit during the period.
| Maximum Outstanding Balance | Average Daily Balance | Total Interest Incurred | Average Interest Rate | |||||||||||||
| Capital Appreciation Fund | $1,848,000 | $42,219 | $1,598 | 3.75% | ||||||||||||
| International Stock Fund | 104,000 | 1,633 | 70 | 4.25 | ||||||||||||
| Tactical Allocation Fund | 338,000 | 4,408 | 163 | 3.65 | ||||||||||||
| Small Cap Growth Fund | 28,015,000 | 601,403 | 21,341 | 3.50 | ||||||||||||
| Unconstrained Bond Fund | 394,000 | 1,488 | 54 | 3.57 | ||||||||||||
As of October 31, 2018, none of the Funds had any amounts outstanding under the line of credit.
NOTE 8 | Fund Reorganizations | After the close of business on July 13, 2018, the Mid Cap Growth Fund acquired the net assets of the Carillon Eagle Mid Cap Stock Fund (“Mid Cap Stock Fund”) and the Small Cap Fund acquired the net assets of the Carillon Eagle Smaller Company Fund (“Smaller Company Fund”) pursuant to Plans of Reorganization and Termination as approved by the Board of Trustees on November 17, 2017. The purpose was to consolidate funds of the Trust that are similar investment products and potentially increase the Trust’s operational efficiency. The reorganizations were accomplished with tax-free exchanges resulting in the following issuances of shares by the Mid Cap Growth Fund and Small Cap Fund in exchange for the outstanding shares of the Mid Cap Stock Fund and Smaller Company Fund, respectively:
| Mid Cap Growth Fund | Small Cap Fund | |||||||||||||||||||||||
| Proceeds from shares issued | Shares issued | Exchange ratio | Proceeds from shares issued | Shares issued | Exchange ratio | |||||||||||||||||||
| Class A | $159,878,746 | 2,585,006 | 0.37058436 | $14,499,671 | 499,295 | 0.37308862 | ||||||||||||||||||
| Class C | 25,654,033 | 521,362 | 0.29652840 | 17,139,889 | 593,328 | 0.29641154 | ||||||||||||||||||
| Class I | 57,584,318 | 881,790 | 0.37952233 | 7,979,259 | 274,224 | 0.41951090 | ||||||||||||||||||
| Class R-3 | 508,614 | 8,485 | 0.36027165 | 307,237 | 10,600 | 0.35043085 | ||||||||||||||||||
| Class R-5 | 145,691 | 2,237 | 0.38352976 | 58,434 | 2,008 | 0.41145025 | ||||||||||||||||||
| Class R-6 | 77,229 | 1,175 | 0.38275682 | 405,422 | 13,921 | 0.41604668 | ||||||||||||||||||
| Class Y | 13,558 | 208 | 0.37967811 | 11,550 | 398 | 0.41923122 | ||||||||||||||||||
|
| |||||||||||||||||||||||
| Total | $243,862,189 | 4,000,263 | N/A | $40,401,462 | 1,393,774 | N/A | ||||||||||||||||||
|
| |||||||||||||||||||||||
The Mid Cap Stock Fund’s net assets at the reorganization date of $243,862,189, including $40,052,505 of unrealized appreciation, were combined with those of the Mid Cap Growth Fund. Assuming the acquisition had been completed on November 1, 2017, the beginning of the annual reporting period of the Mid Cap Growth Fund, pro forma results of operations for the fiscal year ended October 31, 2018 would include net investment loss of $(9,203,530), and net gain on investments of $50,933,922 resulting in an increase in net assets from operations of $41,730,392. Because the combined investment portfolios have been managed as a single integrated portfolio since the reorganization date, it is not practicable to separate the amounts of revenue and earnings of the Mid Cap Stock Fund that have been included in the Mid Cap Growth Fund‘s statement of operations since the reorganization date. Prior to the reorganization, the net assets of the Mid Cap Growth Fund totaled $4,001,129,839. Immediately after the reorganization, the net assets of the Mid Cap Growth Fund totaled $4,244,992,028.
The Smaller Company Fund’s net assets at the reorganization date of $40,401,462, including $4,787,943 of unrealized appreciation, were combined with those of the Small Cap Fund.
| 66 |
Notes to Financial Statements
| 10.31.2018 |
Assuming the acquisition had been completed on November 1, 2017, the beginning of the annual reporting period of the Small Cap Fund, pro forma results of operations for the fiscal year ended October 31, 2018 would include net investment loss of $(1,675,966), and net gain on investments of $28,395,697, resulting in an increase in net assets from operations of $26,719,731. Because the combined investment portfolios have been managed as a single integrated portfolio since the reorganization date, it is not practicable to separate the amounts of revenue and earnings of the Smaller Company Fund that have been included in the Small Cap Fund‘s statement of operations since the reorganization date. Prior to the reorganization, the net assets of the Small Cap Fund totaled $297,780,253. Immediately after the reorganization, the net assets of the Small Cap Fund totaled $338,181,715.
Note 9 | SEC Disclosure Update and Simplification Release | The SEC Disclosure Update and Simplification Release has prescribed that distributions presented in the Statements of Changes in Net Assets will no longer be presented separately as from net investment income and net realized gains and will instead be shown only in total (except for distributions deemed to be a return of capital). For reference, prior year distributions which are no longer presented separately on the Statements of Changes in Net Assets as from net investment income and net realized gains were categorized as follows:
| Distributions from net investment income | Class A | Class C | Class I | Class R-3 | Class R-5 | Class R-6 | Class Y | |||||||||||||||||||||||||
| Capital Appreciation Fund | 11/1/16 to 10/31/17 | $103,196 | $— | $309,650 | $— | $27,256 | $147,658 | N/A | ||||||||||||||||||||||||
| International Stock Fund | 11/1/16 to 10/31/17 | 46,900 | 50,527 | 137,212 | 13,703 | 604 | 220 | N/A | ||||||||||||||||||||||||
| Tactical Allocation Fund | 11/1/16 to 10/31/17 | 5,272 | — | 39,118 | — | 277 | 60 | N/A | ||||||||||||||||||||||||
| Growth & Income Fund | 11/1/16 to 10/31/17 | 2,603,605 | 1,818,162 | 4,499,599 | 36,917 | 7,686 | 793,603 | N/A | ||||||||||||||||||||||||
| Mid Cap Growth Fund | 11/1/16 to 10/31/17 | — | — | 7,063 | — | 13,093 | 77,414 | N/A | ||||||||||||||||||||||||
| Small Cap Growth Fund | 11/1/16 to 10/31/17 | — | — | — | — | — | — | N/A | ||||||||||||||||||||||||
| International Fund | 7/1/17 to 10/31/17 | N/A | N/A | — | N/A | N/A | N/A | N/A | ||||||||||||||||||||||||
| 7/1/16 to 6/30/17 | N/A | N/A | 21,855,165 | N/A | N/A | N/A | N/A | |||||||||||||||||||||||||
| Mid Cap Fund | 7/1/17 to 10/31/17 | N/A | N/A | — | N/A | N/A | N/A | N/A | ||||||||||||||||||||||||
| 7/1/16 to 6/30/17 | N/A | N/A | 5,659,420 | N/A | N/A | N/A | N/A | |||||||||||||||||||||||||
| Small Cap Fund | 7/1/17 to 10/31/17 | N/A | N/A | — | N/A | N/A | N/A | N/A | ||||||||||||||||||||||||
| 7/1/16 to 6/30/17 | N/A | N/A | — | N/A | N/A | N/A | N/A | |||||||||||||||||||||||||
| Core Bond Fund | 7/1/17 to 10/31/17 | N/A | N/A | 889,536 | N/A | N/A | N/A | $11,400 | ||||||||||||||||||||||||
| 7/1/16 to 6/30/17 | N/A | N/A | 3,156,156 | N/A | N/A | N/A | 37,676 | |||||||||||||||||||||||||
| Core Plus Bond Fund | 7/1/17 to 10/31/17 | N/A | N/A | 4,068,161 | * | N/A | N/A | N/A | 115,206 | * | ||||||||||||||||||||||
| 7/1/16 to 6/30/17 | N/A | N/A | 13,398,540 | N/A | N/A | N/A | 780,476 | |||||||||||||||||||||||||
| Unconstrained Bond Fund | 7/1/17 to 10/31/17 | N/A | N/A | 4,691,505 | N/A | N/A | N/A | 175,502 | ||||||||||||||||||||||||
| 7/1/16 to 6/30/17 | N/A | N/A | 14,623,343 | N/A | N/A | N/A | 831,541 | |||||||||||||||||||||||||
| * Includes return of capital in the amount of $197,332 |
| |||||||||||||||||||||||||||||||
| Distributions from net realized gains | Class A | Class C | Class I | Class R-3 | Class R-5 | Class R-6 | Class Y | |||||||||||||||||||||||||
| Capital Appreciation Fund | 11/1/16 to 10/31/17 | $8,681,228 | $4,827,925 | $5,528,128 | $43,242 | $438,881 | $1,693,653 | N/A | ||||||||||||||||||||||||
| International Stock Fund | 11/1/16 to 10/31/17 | — | — | — | — | — | — | N/A | ||||||||||||||||||||||||
| Tactical Allocation Fund | 11/1/16 to 10/31/17 | 2,366 | 1,498 | 8,335 | 12 | 59 | 12 | N/A | ||||||||||||||||||||||||
| Growth & Income Fund | 11/1/16 to 10/31/17 | 7,622,797 | 9,453,020 | 9,299,716 | 133,019 | 17,227 | 1,771,834 | N/A | ||||||||||||||||||||||||
| Mid Cap Growth Fund | 11/1/16 to 10/31/17 | — | — | — | — | — | — | N/A | ||||||||||||||||||||||||
| Small Cap Growth Fund | 11/1/16 to 10/31/17 | 25,774,205 | 6,681,303 | 39,849,621 | 3,012,673 | 13,984,353 | 36,117,862 | N/A | ||||||||||||||||||||||||
| International Fund | 7/1/17 to 10/31/17 | N/A | N/A | — | N/A | N/A | N/A | N/A | ||||||||||||||||||||||||
| 7/1/16 to 6/30/17 | N/A | N/A | 178,101,157 | N/A | N/A | N/A | N/A | |||||||||||||||||||||||||
| Mid Cap Fund | 7/1/17 to 10/31/17 | N/A | N/A | — | N/A | N/A | N/A | N/A | ||||||||||||||||||||||||
| 7/1/16 to 6/30/17 | N/A | N/A | 23,066,072 | N/A | N/A | N/A | N/A | |||||||||||||||||||||||||
| Small Cap Fund | 7/1/17 to 10/31/17 | N/A | N/A | — | N/A | N/A | N/A | N/A | ||||||||||||||||||||||||
| 7/1/16 to 6/30/17 | N/A | N/A | 9,176,002 | N/A | N/A | N/A | N/A | |||||||||||||||||||||||||
| Core Bond Fund | 7/1/17 to 10/31/17 | N/A | N/A | — | N/A | N/A | N/A | — | ||||||||||||||||||||||||
| 7/1/16 to 6/30/17 | N/A | N/A | 4,146,390 | N/A | N/A | N/A | $62,620 | |||||||||||||||||||||||||
| Core Plus Bond Fund | 7/1/17 to 10/31/17 | N/A | N/A | — | N/A | N/A | N/A | — | ||||||||||||||||||||||||
| 7/1/16 to 6/30/17 | N/A | N/A | 19,296,101 | N/A | N/A | N/A | 1,508,032 | |||||||||||||||||||||||||
| Unconstrained Bond Fund | 7/1/17 to 10/31/17 | N/A | N/A | — | N/A | N/A | N/A | — | ||||||||||||||||||||||||
| 7/1/16 to 6/30/17 | N/A | N/A | — | N/A | N/A | N/A | — | |||||||||||||||||||||||||
NOTE 10 | Subsequent events | The Manager has evaluated subsequent events through December 19, 2018, the date these financial statements were issued, and determined that no other material events or transactions would require recognition or disclosure in the Funds’ financial statements.
| 67 |
Report of the Independent Registered Public Accounting Firm
To the Board of Trustees of Carillon Series Trust and Shareholders of Carillon ClariVest Capital Appreciation Fund, Carillon ClariVest International Stock Fund, Carillon Cougar Tactical Allocation Fund, Carillon Eagle Growth & Income Fund, Carillon Eagle Mid Cap Growth Fund, Carillon Eagle Small Cap Growth Fund, Carillon Scout International Fund, Carillon Scout Mid Cap Fund, Carillon Scout Small Cap Fund, Carillon Reams Core Bond Fund, Carillon Reams Core Plus Bond Fund and Carillon Reams Unconstrained Bond Fund
Opinions on the Financial Statements
We have audited the accompanying statements of assets and liabilities, including the investment portfolios, of Carillon ClariVest Capital Appreciation Fund, Carillon ClariVest International Stock Fund, Carillon Cougar Tactical Allocation Fund, Carillon Eagle Growth & Income Fund, Carillon Eagle Mid Cap Growth Fund, Carillon Eagle Small Cap Growth Fund, Carillon Scout International Fund, Carillon Scout Mid Cap Fund, Carillon Scout Small Cap Fund, Carillon Reams Core Bond Fund, Carillon Reams Core Plus Bond Fund and Carillon Reams Unconstrained Bond Fund (constituting Carillon Series Trust, hereafter collectively referred to as the “Funds”) as of October 31, 2018, the related statements of operations for the year ended October 31, 2018, the statements of changes in net assets for each of the periods indicated in the table below, including the related notes, and the financial highlights for each of the periods indicated therein (collectively referred to as the “financial statements”). In our opinion, the financial statements present fairly, in all material respects, the financial position of each of the Funds as of October 31, 2018, the results of each of their operations for the year then ended, the changes in each of their net assets for each of the periods indicated in the table below and each of the financial highlights for each of the periods indicated therein in conformity with accounting principles generally accepted in the United States of America.
| Carillon Series Trust | ||
| Carillon ClariVest Capital Appreciation Fund (1) | Carillon Scout International Fund (2) | |
| Carillon ClariVest International Stock Fund (1) | Carillon Scout Mid Cap Fund (2) | |
| Carillon Cougar Tactical Allocation Fund (1) | Carillon Scout Small Cap Fund (2) | |
| Carillon Eagle Growth & Income Fund (1) | Carillon Reams Core Bond Fund (2) | |
| Carillon Eagle Mid Cap Growth Fund (1) | Carillon Reams Core Plus Bond Fund (2) | |
| Carillon Eagle Small Cap Growth Fund (1) | Carillon Reams Unconstrained Bond Fund (2) | |
| (1) the statement of changes in net assets for each of the two years in the period ended October 31, 2018 |
| (2) the statement of changes in net assets for the year ended October 31, 2018, for the period from July 1, 2017 through October 31, 2017, and for the year ended June 30, 2017 |
The financial statements of the Carillon Scout International Fund, Carillon Scout Mid Cap Fund, Carillon Scout Small Cap Fund, Carillon Reams Core Bond Fund, Carillon Reams Core Plus Bond Fund and Carillon Reams Unconstrained Bond Fund as of and for the year ended June 30, 2017 and the financial highlights for each of the periods ended on or prior to June 30, 2017 (not presented herein, other than the statements of changes in net assets and the financial highlights) were audited by other auditors whose report dated August 28, 2017 expressed an unqualified opinion on those financial statements and financial highlights.
Basis for Opinions
These financial statements are the responsibility of the Funds’ management. Our responsibility is to express an opinion on the Funds’ financial statements based on our audits. We are a public accounting firm registered with the Public Company Accounting Oversight Board (United States) (“PCAOB”) and are required to be independent with respect to the Funds in accordance with the U.S. federal securities laws and the applicable rules and regulations of the Securities and Exchange Commission and the PCAOB.
We conducted our audits of these financial statements in accordance with the standards of the PCAOB. Those standards require that we plan and perform the audit to obtain reasonable assurance about whether the financial statements are free of material misstatement, whether due to error or fraud.
Our audits included performing procedures to assess the risks of material misstatement of the financial statements, whether due to error or fraud, and performing procedures that respond to those risks. Such procedures included examining, on a test basis, evidence regarding the amounts and disclosures in the financial statements. Our audits also included evaluating the accounting principles used and significant estimates made by management, as well as evaluating the overall presentation of the financial statements. Our procedures included confirmation of securities owned as of October 31, 2018 by correspondence with the custodian and brokers; when replies were not received from brokers, we performed other auditing procedures. We believe that our audits provide a reasonable basis for our opinions.
/s/ PricewaterhouseCoopers LLP
Tampa, Florida
December 19, 2018
We have served as the auditor of one or more investment companies in Carillon Series Trust since 1985.
| 68 |
Understanding Your Ongoing Costs
| (UNAUDITED) | 10.31.2018 |
As a shareholder of a Fund, you incur two types of costs: (1) transaction costs, including sales charges on purchases, contingent deferred sales charges, or redemption fees; and (2) ongoing costs, including investment advisory fees, distribution (12b-1) fees, and other fund expenses. The following sections are intended to help you understand your ongoing costs (in dollars) of investing in each Fund and to compare these costs with the ongoing costs of investing in other mutual funds. Please note that the expenses shown in the table are meant to highlight your ongoing costs only and do not reflect one-time transaction expenses, such as sales charges or redemption fees. Therefore, if these transactional costs were included, your costs would have been higher. For more information, see your Fund’s prospectus or contact your financial adviser.
Actual expenses | The table below shows the actual expenses you would have paid on a $1,000 investment made in each Fund on May 1, 2018 and held through October 31, 2018. It also shows how much a $1,000 investment would be worth at the close of the period, assuming actual returns after ongoing expenses. This table is useful in comparing ongoing costs only, and
will not help you determine the relative total costs of owning different funds. Simply divide your account value by $1,000 (for example, an $8,600 account value divided by $1,000 = 8.6), then multiply the result by the number in the line under the heading entitled “Expenses paid during period” to estimate the expenses you paid on your account during this period.
Hypothetical example for comparison purposes | The table below shows each Fund’s expenses based on a $1,000 investment held from May 1, 2018 through October 31, 2018 and assuming for this period a hypothetical 5% annualized rate of return before ongoing expenses, which is not the Fund’s actual return. Please note that you should not use this information to estimate your actual ending account balance and expenses paid during the period. You can use this information to compare the ongoing expenses (but not transaction expenses or total costs) of investing in the Funds with those of other funds. All mutual fund shareholder reports will provide this information to help you make this comparison.
| Actual expenses | Hypothetical expenses | |||||||||||||||||||||||
| Beginning Account Value | Ending Account Value | Expenses paid during period (a) | Ending Account Value | Expenses paid during period (a) | Annualized expense ratio | |||||||||||||||||||
| Capital Appreciation Fund | ||||||||||||||||||||||||
Class A | $1,000.00 | $1,008.90 | $5.06 | $1,020.16 | $5.09 | 1.00 | % | |||||||||||||||||
Class C | 1,000.00 | 1,005.20 | 8.84 | 1,016.38 | 8.89 | 1.75 | ||||||||||||||||||
Class I | 1,000.00 | 1,010.30 | 3.55 | 1,021.68 | 3.57 | 0.70 | ||||||||||||||||||
Class R-3 | 1,000.00 | 1,007.60 | 6.33 | 1,018.90 | 6.36 | 1.25 | ||||||||||||||||||
Class R-5 | 1,000.00 | 1,010.30 | 3.55 | 1,021.68 | 3.57 | 0.70 | ||||||||||||||||||
Class R-6 | 1,000.00 | 1,010.80 | 3.04 | 1,022.18 | 3.06 | 0.60 | ||||||||||||||||||
Class Y | 1,000.00 | 1,008.80 | 5.06 | 1,020.16 | 5.09 | 1.00 | ||||||||||||||||||
| International Stock Fund | ||||||||||||||||||||||||
Class A | 1,000.00 | 893.80 | 6.92 | 1,017.90 | 7.37 | 1.45 | ||||||||||||||||||
Class C | 1,000.00 | 890.10 | 10.48 | 1,014.12 | 11.17 | 2.20 | ||||||||||||||||||
Class I | 1,000.00 | 895.20 | 5.49 | 1,019.41 | 5.85 | 1.15 | ||||||||||||||||||
Class R-3 | 1,000.00 | 892.80 | 8.11 | 1,016.64 | 8.64 | 1.70 | ||||||||||||||||||
Class R-5 | 1,000.00 | 895.30 | 5.49 | 1,019.41 | 5.85 | 1.15 | ||||||||||||||||||
Class R-6 | 1,000.00 | 896.00 | 5.02 | 1,019.91 | 5.35 | 1.05 | ||||||||||||||||||
Class Y | 1,000.00 | 894.00 | 6.92 | 1,017.90 | 7.37 | 1.45 | ||||||||||||||||||
| Tactical Allocation Fund | ||||||||||||||||||||||||
Class A | 1,000.00 | 991.80 | 5.87 | 1,019.31 | 5.96 | 1.17 | ||||||||||||||||||
Class C | 1,000.00 | 988.50 | 9.62 | 1,015.53 | 9.75 | 1.92 | ||||||||||||||||||
Class I | 1,000.00 | 993.70 | 4.37 | 1,020.82 | 4.43 | 0.87 | ||||||||||||||||||
Class R-3 | 1,000.00 | 991.20 | 7.13 | 1,018.05 | 7.22 | 1.42 | ||||||||||||||||||
Class R-5 | 1,000.00 | 993.10 | 4.37 | 1,020.82 | 4.43 | 0.87 | ||||||||||||||||||
Class R-6 | 1,000.00 | 993.70 | 3.87 | 1,021.32 | 3.92 | 0.77 | ||||||||||||||||||
Class Y | 1,000.00 | 992.40 | 5.88 | 1,019.31 | 5.96 | 1.17 | ||||||||||||||||||
| Growth & Income Fund | ||||||||||||||||||||||||
Class A | 1,000.00 | 1,057.10 | 5.08 | 1,020.27 | 4.99 | 0.98 | ||||||||||||||||||
Class C | 1,000.00 | 1,052.60 | 8.90 | 1,016.53 | 8.74 | 1.72 | ||||||||||||||||||
Class I | 1,000.00 | 1,058.70 | 3.74 | 1,021.58 | 3.67 | 0.72 | ||||||||||||||||||
Class R-3 | 1,000.00 | 1,055.50 | 6.63 | 1,018.75 | 6.51 | 1.28 | ||||||||||||||||||
Class R-5 | 1,000.00 | 1,057.70 | 4.25 | 1,021.07 | 4.18 | 0.82 | ||||||||||||||||||
Class R-6 | 1,000.00 | 1,058.70 | 3.27 | 1,022.03 | 3.21 | 0.63 | ||||||||||||||||||
Class Y | 1,000.00 | 1,055.50 | 6.48 | 1,018.90 | 6.36 | 1.25 | ||||||||||||||||||
| Mid Cap Growth Fund | ||||||||||||||||||||||||
Class A | 1,000.00 | 993.70 | 5.33 | 1,019.86 | 5.40 | 1.06 | ||||||||||||||||||
Class C | 1,000.00 | 990.20 | 8.73 | 1,016.43 | 8.84 | 1.74 | ||||||||||||||||||
Class I | 1,000.00 | 995.10 | 3.82 | 1,021.37 | 3.87 | 0.76 | ||||||||||||||||||
Class R-3 | 1,000.00 | 992.30 | 6.58 | 1,018.60 | 6.67 | 1.31 | ||||||||||||||||||
Class R-5 | 1,000.00 | 995.20 | 3.82 | 1,021.37 | 3.87 | 0.76 | ||||||||||||||||||
Class R-6 | 1,000.00 | 995.80 | 3.27 | 1,021.93 | 3.31 | 0.65 | ||||||||||||||||||
Class Y | 1,000.00 | 993.10 | 5.58 | 1,019.61 | 5.65 | 1.11 | ||||||||||||||||||
| 69 |
Understanding Your Ongoing Costs
| (UNAUDITED) | 10.31.2018 |
| Actual expenses | Hypothetical expenses | |||||||||||||||||||||||
| Beginning Account Value | Ending Account Value | Expenses paid during period (a) | Ending Account Value | Expenses paid during period (a) | Annualized expense ratio | |||||||||||||||||||
| Small Cap Growth Fund | ||||||||||||||||||||||||
Class A | $1,000.00 | $980.40 | $5.04 | $1,020.11 | $5.14 | 1.01 | % | |||||||||||||||||
Class C | 1,000.00 | 976.90 | 8.62 | 1,016.48 | 8.79 | 1.73 | ||||||||||||||||||
Class I | 1,000.00 | 981.70 | 3.75 | 1,021.42 | 3.82 | 0.75 | ||||||||||||||||||
Class R-3 | 1,000.00 | 978.90 | 6.63 | 1,018.50 | 6.77 | 1.33 | ||||||||||||||||||
Class R-5 | 1,000.00 | 981.90 | 3.70 | 1,021.48 | 3.77 | 0.74 | ||||||||||||||||||
Class R-6 | 1,000.00 | 982.40 | 3.25 | 1,021.93 | 3.31 | 0.65 | ||||||||||||||||||
Class Y | 1,000.00 | 979.90 | 5.49 | 1,019.66 | 5.60 | 1.10 | ||||||||||||||||||
| International Fund | ||||||||||||||||||||||||
Class A | 1,000.00 | 886.70 | 6.18 | 1,018.65 | 6.61 | 1.30 | ||||||||||||||||||
Class C | 1,000.00 | 882.70 | 10.44 | 1,014.12 | 11.17 | 2.20 | ||||||||||||||||||
Class I | 1,000.00 | 887.80 | 5.04 | 1,019.86 | 5.40 | 1.06 | ||||||||||||||||||
Class R-3 | 1,000.00 | 885.20 | 8.08 | 1,016.64 | 8.64 | 1.70 | ||||||||||||||||||
Class R-5 | 1,000.00 | 887.70 | 5.47 | 1,019.41 | 5.85 | 1.15 | ||||||||||||||||||
Class R-6 | 1,000.00 | 888.30 | 4.71 | 1,020.21 | 5.04 | 0.99 | ||||||||||||||||||
Class Y | 1,000.00 | 886.20 | 6.89 | 1,017.90 | 7.37 | 1.45 | ||||||||||||||||||
| Mid Cap Fund | ||||||||||||||||||||||||
Class A | 1,000.00 | 971.50 | 5.91 | 1,019.21 | 6.06 | 1.19 | ||||||||||||||||||
Class C | 1,000.00 | 967.70 | 9.62 | 1,015.43 | 9.86 | 1.94 | ||||||||||||||||||
Class I | 1,000.00 | 972.50 | 4.92 | 1,020.21 | 5.04 | 0.99 | ||||||||||||||||||
Class R-3 | 1,000.00 | 970.40 | 7.10 | 1,018.00 | 7.27 | 1.43 | ||||||||||||||||||
Class R-5 | 1,000.00 | 970.40 | 4.87 | 1,020.27 | 4.99 | 0.98 | ||||||||||||||||||
Class R-6 | 1,000.00 | 973.10 | 4.48 | 1,020.67 | 4.58 | 0.90 | ||||||||||||||||||
Class Y | 1,000.00 | 971.50 | 5.91 | 1,019.21 | 6.06 | 1.19 | ||||||||||||||||||
| Small Cap Fund | ||||||||||||||||||||||||
Class A | 1,000.00 | 1,044.50 | 6.34 | 1,019.00 | 6.26 | 1.23 | ||||||||||||||||||
Class C | 1,000.00 | 1,040.10 | 10.13 | 1,015.27 | 10.01 | 1.97 | ||||||||||||||||||
Class I | 1,000.00 | 1,045.50 | 4.90 | 1,020.42 | 4.84 | 0.95 | ||||||||||||||||||
Class R-3 | 1,000.00 | 1,042.60 | 7.72 | 1,017.64 | 7.63 | 1.50 | ||||||||||||||||||
Class R-5 | 1,000.00 | 1,045.50 | 4.90 | 1,020.42 | 4.84 | 0.95 | ||||||||||||||||||
Class R-6 | 1,000.00 | 1,046.30 | 4.38 | 1,020.92 | 4.33 | 0.85 | ||||||||||||||||||
Class Y | 1,000.00 | 1,044.10 | 6.44 | 1,018.90 | 6.36 | 1.25 | ||||||||||||||||||
| Core Bond Fund | ||||||||||||||||||||||||
Class A | 1,000.00 | 999.60 | 4.03 | 1,021.17 | 4.08 | 0.80 | ||||||||||||||||||
Class C | 1,000.00 | 996.00 | 7.80 | 1,017.39 | 7.88 | 1.55 | ||||||||||||||||||
Class I | 1,000.00 | 1,001.60 | 2.02 | 1,023.19 | 2.04 | 0.40 | ||||||||||||||||||
Class R-3 | 1,000.00 | 998.40 | 5.29 | 1,019.91 | 5.35 | 1.05 | ||||||||||||||||||
Class R-5 | 1,000.00 | 1,002.00 | 2.52 | 1,022.68 | 2.55 | 0.50 | ||||||||||||||||||
Class R-6 | 1,000.00 | 1,002.50 | 2.02 | 1,023.19 | 2.04 | 0.40 | ||||||||||||||||||
Class Y | 1,000.00 | 1,000.50 | 4.03 | 1,021.17 | 4.08 | 0.80 | ||||||||||||||||||
| Core Plus Bond Fund | ||||||||||||||||||||||||
Class A | 1,000.00 | 992.60 | 4.02 | 1,021.17 | 4.08 | 0.80 | ||||||||||||||||||
Class C | 1,000.00 | 988.90 | 7.77 | 1,017.39 | 7.88 | 1.55 | ||||||||||||||||||
Class I | 1,000.00 | 994.60 | 2.01 | 1,023.19 | 2.04 | 0.40 | ||||||||||||||||||
Class R-3 | 1,000.00 | 991.40 | 5.27 | 1,019.91 | 5.35 | 1.05 | ||||||||||||||||||
Class R-5 | 1,000.00 | 994.50 | 2.51 | 1,022.68 | 2.55 | 0.50 | ||||||||||||||||||
Class R-6 | 1,000.00 | 994.60 | 2.01 | 1,023.19 | 2.04 | 0.40 | ||||||||||||||||||
Class Y | 1,000.00 | 992.60 | 4.02 | 1,021.17 | 4.08 | 0.80 | ||||||||||||||||||
| Unconstrained Bond Fund | ||||||||||||||||||||||||
Class A | 1,000.00 | 993.80 | 4.02 | 1,021.17 | 4.08 | 0.80 | ||||||||||||||||||
Class C | 1,000.00 | 988.10 | 7.77 | 1,017.39 | 7.88 | 1.55 | ||||||||||||||||||
Class I | 1,000.00 | 993.70 | 2.51 | 1,022.68 | 2.55 | 0.50 | ||||||||||||||||||
Class R-3 | 1,000.00 | 990.90 | 5.27 | 1,019.91 | 5.35 | 1.05 | ||||||||||||||||||
Class R-5 | 1,000.00 | 993.70 | 2.51 | 1,022.68 | 2.55 | 0.50 | ||||||||||||||||||
Class R-6 | 1,000.00 | 994.20 | 2.01 | 1,023.19 | 2.04 | 0.40 | ||||||||||||||||||
Class Y | 1,000.00 | 992.10 | 4.02 | 1,021.17 | 4.08 | 0.80 | ||||||||||||||||||
(a) Expenses are calculated using each Fund’s annualized expense ratios for each class of shares, multiplied by the average account value for the period, then multiplying the result by the actual number of days in the period (184), and then dividing that result by the actual number of days in the fiscal year (365).
| 70 |
Renewal of Investment Advisory and Subadvisory Agreements
| (UNAUDITED) | ||||
Overview | At a meeting held on August 17, 2018, the Board of Trustees of Carillon Series Trust (“Board” or “Trustees”), including its independent members (the “Independent Trustees”), approved the renewal of the investment advisory agreement between Carillon Tower Advisers, Inc. (“Carillon Tower”) and Carillon Series Trust, on behalf of the Carillon ClariVest Capital Appreciation Fund, Carillon ClariVest International Stock Fund, Carillon Cougar Tactical Allocation Fund, Carillon Eagle Growth & Income Fund, Carillon Eagle Mid Cap Growth Fund and Carillon Eagle Small Cap Growth Fund. Each of the funds mentioned is referred to as a “Fund” and, collectively, as the “Funds.”
The Board also approved the renewal of the investment subadvisory agreements between Carillon Tower and: (1) Eagle Asset Management, Inc. (“Eagle”), the subadviser to the Carillon Eagle Growth & Income Fund, Carillon Eagle Mid Cap Growth Fund and Carillon Eagle Small Cap Growth Fund; (2) ClariVest Asset Management LLC (“ClariVest”), the subadviser to the Carillon ClariVest Capital Appreciation Fund and Carillon ClariVest International Stock Fund; and (3) Cougar Global Investments Ltd. (“Cougar”), the subadviser to the Carillon Cougar Tactical Allocation Fund. Each of the investment advisory and subadvisory agreements is referred to herein as an “Agreement” and, collectively, as the “Agreements.”
On an annual basis, the Board considers renewal of the Agreements. As part of the annual renewal process, the Board took into consideration information and reports it was provided relevant to the annual renewal of the Agreements, including: reports regarding the services and support provided to the Funds and their shareholders by Carillon Tower, Eagle, ClariVest, Cougar, U.S. Bancorp Fund Services, LLC (“USBFS”), a third party that provides sub-administration, transfer agent and fund accounting services to the Funds, and U.S. Bank National Association (“USBNA”), which provides custody services to the Funds; information on the Funds’ performance and commentary on the performance presented by Raymond James Asset Management Services and Fund portfolio managers; presentations by Fund portfolio managers addressing, as applicable, the investment philosophy, investment strategies, personnel and operations of Eagle, ClariVest and Cougar; compliance and financial reports concerning the Funds, and responses by Carillon Tower, Eagle, ClariVest and Cougar to issues raised therein. The Board also considered information on relevant developments in the mutual fund industry and how the Funds and/or Carillon Tower are responding to them.
Carillon Tower, Eagle, ClariVest and Cougar also prepared comprehensive responses to items of information requested by counsel to the Independent Trustees in letters to Carillon Tower, Eagle, ClariVest and Cougar, to assist the Board in determining whether to renew the agreements. These responses contained substantial and detailed information regarding the Funds, Carillon Tower, Eagle, ClariVest and Cougar. Among other matters, these reports included information on: (1) the nature and extent of the advisory and other services provided by Carillon Tower, Eagle, ClariVest and Cougar; (2) the personnel of Carillon Tower, Eagle, ClariVest and Cougar who provide services to the Funds; (3) the financial condition of Carillon Tower, Eagle, ClariVest and Cougar; (4) the compliance programs and records of Carillon Tower, Eagle, ClariVest and Cougar; (5) the performance of the Funds as compared to funds within their Morningstar, Inc. category (“Morningstar Category”), Lipper, Inc. category (“Lipper Category”) and benchmark indices; (6) the Funds’ expenses, including the advisory fee rates, the overall expense structures of the Funds, both in absolute terms and relative to funds within a refined Morningstar Category population (“Morningstar Population”), and any applicable contractual expense limitations; (7) the anticipated effect of growth and size on the Funds’ performance and expenses, where applicable; (8) benefits to be realized by Carillon Tower, Eagle, ClariVest, Cougar and their respective affiliates; and (9) the estimated profitability of Carillon Tower, Eagle, ClariVest and Cougar under the Agreements, if available. The Board posed questions to various management personnel of Carillon Tower regarding certain key aspects of the materials submitted in support of the renewal. Many of the materials presented at these meetings were first supplied in draft form prior to the meetings to designated independent Board representatives, i.e., counsel to the Fund and
the Independent Trustees, and the final materials were revised to include information reflective of requests made by the Board. The Board also accorded appropriate weight to the work, deliberations and conclusions of the various committees in determining whether to continue the Agreements.
In addition, throughout the year, the Board regularly met with portfolio management teams and senior management personnel and reviewed information prepared by Eagle, Carillon Tower and the Funds’ subadvisers addressing the services provided by Carillon Tower and the Funds’ subadvisers, as well as Fund performance. Eagle, Carillon Tower or affiliates prepared detailed reports for the Board in November 2017 and in February, May and August 2018, including reports providing the results of analyses of the Funds’ performance and expenses.
With respect to the renewal of the Agreements, the Board took into consideration various factors, including: (1) the nature, extent and quality of services provided to the Funds; (2) the investment performance of the Funds; (3) the estimated costs of the services provided to the Funds and the estimated profits realized by Carillon Tower and its affiliates, including Eagle, ClariVest and Cougar, from their relationships with the Funds; (4) the extent to which economies of scale have been realized as the Funds grow; (5) whether the level of fees reflects those economies of scale for the benefit of the Funds’ investors; (6) comparisons of services and fees with contracts entered into by Carillon Tower, Eagle, ClariVest and Cougar with other clients (such as pension funds and other institutional investors); and (7) any benefits derived by Carillon Tower, Eagle, ClariVest and Cougar from their relationships with the Funds.
Provided below is a discussion of the factors the Board considered at its August 2018 meeting to form the basis of its renewal of the Agreements. The Board did not identify any particular information that was most relevant to its consideration to renew the Agreements and each Trustee may have accorded different weight to the various factors.
Nature, Extent and Quality of Services | The Board considered that the personnel responsible for the Funds at Carillon Tower are experienced in providing investment advisory services to the Funds, and that the personnel responsible for the Funds at Eagle, ClariVest and Cougar are experienced in providing portfolio management services for the Funds, and that Carillon Tower, Eagle, ClariVest and Cougar have provided a continuous investment program for the Funds. The Board considered that Carillon Tower oversees and monitors the performance and services provided by Eagle, ClariVest, Cougar and the Funds’ other service providers, and is responsible for recommending the Funds’ subadvisers to the Board. The Board also considered that Carillon Tower and its affiliates, Carillon Fund Distributors, Inc. (“CFD”) and Carillon Fund Services, Inc. (“CFS”), provide certain administration, distribution and shareholder services to the Funds. In addition, the Board considered that Carillon Tower is responsible for oversight of compliance with the Funds’ policies and objectives, review of brokerage matters, oversight of the Funds’ compliance with applicable law and implementation of Board directives as they relate to the Funds. The Board considered that shareholders in the Funds have a broad range of investment choices available to them, including a wide choice among mutual funds offered by Carillon Tower’s competitors, and that the Funds’ shareholders, with the opportunity to review and weigh the disclosure provided by the Funds in their prospectuses and other public disclosures, have chosen to invest in the Funds.
The Board considered that: Eagle is responsible for making investment decisions on behalf of the Carillon Eagle Growth & Income Fund, Carillon Eagle Mid Cap Growth Fund and Carillon Eagle Small Cap Growth Fund; ClariVest is responsible for making investment decisions on behalf of the Carillon ClariVest Capital Appreciation Fund and Carillon ClariVest International Stock Fund; and Cougar is responsible for making investment decisions on behalf of the Carillon Cougar Tactical Allocation Fund. The Board considered that Eagle, ClariVest and Cougar are responsible for placing all orders for the purchase and sale of securities with broker-dealers for the Funds that they manage. The Board also
| 71 |
Renewal of Investment Advisory and Subadvisory Agreements
| (UNAUDITED) | ||
considered: (1) information regarding the Carillon Tower, Eagle, ClariVest and Cougar personnel who provide services to the Funds; (2) certifications as to the adequacy of the compliance programs of Carillon Tower, Eagle, ClariVest and Cougar; (3) the financial information regarding Carillon Tower, Eagle, ClariVest and Cougar, as provided; and (4) Carillon Tower’s recommendations to continue to retain Eagle, ClariVest and Cougar to provide portfolio management services to the Funds.
Investment Performance | The Board considered comparisons of each Fund’s Class A performance, including, if applicable, a Fund’s year-to-date, one-, three-, five- and ten-year annualized total returns for the period ended June 30, 2018, relative to the average performance of its Morningstar Category and Lipper Category funds and benchmark indices.
With respect to the Carillon ClariVest Capital Appreciation Fund, the Board considered a number of factors regarding performance, including: (1) the Fund outperformed the average performance of its Morningstar Category for the one-, three- and five-year periods and underperformed for the year-to-date and ten-year periods; (2) the Fund outperformed the average performance of its Lipper Category for the three- and five-year periods and underperformed for the year-to-date, one- and ten-year periods; and (3) the Fund underperformed its benchmark index for all relevant periods. The Board also considered Carillon Tower’s representation that the Fund’s underperformance relative to the benchmark is primarily attributable to ClariVest’s investment style, which favors stocks that are more attractively priced than many of the stocks included in the Fund’s benchmark index.
With respect to the Carillon ClariVest International Stock Fund, the Board considered a number of factors regarding performance, including: (1) the Fund outperformed its benchmark index for the five-year period and underperformed for the year-to-date, one- and three-year periods; (2) the Fund outperformed the average performance of its Morningstar Category for the one-, three- and five-year periods and underperformed for the year-to-date period; and (3) the Fund outperformed the average performance of its Lipper Category one- and five-year periods and underperformed for the year-to-date and three-year periods.
With respect to the Carillon Cougar Tactical Allocation Fund, the Board considered a number of factors regarding performance, including: (1) the Fund outperformed its custom benchmark index (comprised 60% of the Barclays US Aggregate Bond Index and 40% of the MSCI All Country World Index), the performance of the Barclays US Aggregate Bond Index and the average performance of its Morningstar Category and Lipper Category for the year-to-date and one-year periods; and (2) the Fund outperformed the MSCI All Country World Index for the year-to-date period and underperformed for the one-year period.
With respect to the Carillon Eagle Growth & Income Fund, the Board considered a number of factors regarding performance, including: (1) the Fund outperformed the average performance of its Morningstar Category for the year-to-date, one-, three- and ten-year periods and its Lipper Category for the one-, three-, five-, and ten-year periods; and (2) the Fund underperformed its benchmark index for all relevant periods. The Board also considered Carillon Tower’s representation that the Fund’s underperformance relative to the benchmark is primarily attributable to the Fund’s investment style favoring dividend-paying stocks, which have underperformed relative to the non-dividend-paying stocks included in the Fund’s benchmark index.
With respect to the Carillon Eagle Mid Cap Growth Fund, the Board considered a number of factors regarding performance, including: the Fund outperformed its benchmark index and the average performance of its Morningstar Category and Lipper Category for all relevant periods.
With respect to the Carillon Eagle Small Cap Growth Fund, the Board considered a number of factors regarding performance, including: (1) the Fund outperformed the average performance of its Morningstar Category and Lipper Category for the ten-year period and underperformed for the year-to-date,
one-, three- and five-year periods; and (2) the Fund underperformed its benchmark index for all relevant periods. The Board also considered Carillon Tower’s representation that the Fund’s underperformance relative to the benchmark is primarily attributable to the Fund’s investment style favoring higher quality companies, which have underperformed relative to other growth-oriented companies included in the Fund’s benchmark index.
Fees and Expenses | The Board considered the advisory fee rate payable by each Fund to Carillon Tower under the Agreements, the subadvisory fee rate payable by Carillon Tower to Eagle, ClariVest and Cougar, each Fund’s total expense ratio and its Rule 12b-1 fees. The Board considered that the subadvisory fee rate paid by Carillon Tower to Eagle, ClariVest or Cougar, as applicable, is identical to the advisory fee rate paid to Carillon Tower by the Fund. The Board also considered comparisons of a Fund’s expense ratio (with Rule 12b-1 fees) to the average expense ratio of its Morningstar Category and peer group within that Morningstar Category (“Morningstar Peer Group”) based on data ended June 30, 2018. In addition, the Board considered that Carillon Tower had undertaken contractual expense limitations with respect to the Funds for its 2018 fiscal year and that Carillon Tower was requesting that the Board approve the same expense cap levels for the Funds through February 28, 2019.
With respect to the Carillon ClariVest Capital Appreciation Fund, the Board considered that the net expense ratio of the Fund’s Class A shares was lower than the average net expense ratio of its Morningstar Population and Morningstar Peer Group. The Board also considered that ClariVest sub-advises a multi-manager mutual fund and that the subadvisory fee rate paid to ClariVest by Carillon Tower is higher than the subadvisory fee rate paid to ClariVest by that multi-manager mutual fund. The Board further considered that, for assets up to $1 billion, the subadvisory fee rate paid to ClariVest by Carillon Tower was higher than ClariVest’s standard fee schedule for its large cap growth strategy.
With respect to Carillon ClariVest International Stock Fund, the Board also considered that the net expense ratio of the Fund’s Class A shares was lower than the average net expense ratio of its Morningstar Peer Group but higher than its Morningstar Population. The Board also considered that ClariVest does not manage any comparable accounts in the Fund’s strategy, and that the subadvisory fee rate paid to ClariVest by Carillon Tower was higher than ClariVest’s standard fee rate for its international core strategy at certain asset levels.
With respect to the Carillon Cougar Tactical Allocation Fund, the Board considered that the net expense ratio of the Fund’s Class A shares was lower than the average net expense ratio of its Morningstar Population and Morningstar Peer Group. The Board also considered that, while Cougar does not currently manage institutional accounts in the same strategy as the Fund, the subadvisory fee rate paid to Cougar by Carillon Tower was lower than the advisory fee rates paid to Cougar by direct retail accounts in the same strategy.
With respect to Carillon Eagle Growth & Income Fund, the Board considered that the net expense ratio of the Fund’s Class A shares was lower than the average net expense ratio of its Morningstar Population and Morningstar Peer Group. The Board also considered that the contractual subadvisory fee rate paid to Eagle by Carillon Tower was higher than Eagle’s standard fee rates for separate accounts, but that the effective fee rate paid by the Fund was lower than the average advisory fee paid to Eagle by institutional accounts in the same strategy and the fee rate Eagle charges to an investment company subadvisory client.
With respect to the Carillon Eagle Mid Cap Growth Fund, the Board considered that the net expense ratio of the Fund’s Class A shares was lower than the average net expense ratio of its Morningstar Population and Morningstar Peer Group. The Board also considered that the effective subadvisory fee rate paid to Eagle by Carillon Tower was lower than the average advisory fee rate paid by institutional accounts in the same strategy.
| 72 |
Renewal of Investment Advisory and Subadvisory Agreements
| (UNAUDITED) | ||||
With respect to the Carillon Eagle Small Cap Growth Fund, the Board considered that the net expense ratio of the Fund’s Class A shares was lower than the average net expense ratio of its Morningstar Population and Morningstar Peer Group. The Board also considered that the effective subadvisory fee rate paid to Eagle by Carillon Tower was lower than the average advisory fee rate paid by institutional accounts in the same strategy.
Costs, Profitability and Economies of Scale | The Board considered Carillon Tower’s estimated costs and profitability in providing services to the Funds, consolidated with its affiliated subadvisers. The Board considered that the estimated costs and profitability of Eagle, ClariVest and Cougar generally are less significant to the Board’s evaluation of the fee rates and expenses paid by a Fund than Carillon Tower’s advisory fee rate and estimated profitability and the Funds’ overall expense ratios. The Board also considered that Carillon Tower’s estimated profits on the services it provided to the Funds are reasonable in light of Carillon Tower’s estimated costs in providing services to each Fund and that Carillon Tower manages each Fund’s assets and provides a comprehensive compliance program for each Fund.
In addition, the Board considered that the advisory fee rate structures for certain of the Funds provide for breakpoints, which is a reduction of the applicable fee rate as assets increase. The Board also considered that each Fund may benefit from economies of scale, and shareholders may realize such economies of scale, through: (1) reduced advisory fees achieved when a Fund’s asset size reaches breakpoints in the fee schedules instituted by Carillon Tower; (2) increased services to a Fund; or (3) allocation of fixed fund expenses over a large asset size.
Benefits | In evaluating compensation, the Board considered benefits that may be realized by Carillon Tower, Eagle, ClariVest and Cougar and their respective affiliates from their relationships with the Funds. The Board took
into consideration that Carillon Tower and its affiliates have entered into revenue sharing and services agreements with third parties for marketing and/or shareholder services. The Board also considered that the Funds compensate Carillon Tower for providing administrative services and CFS for providing shareholder services. The Board further considered that, as the Funds’ principal underwriter and distributor, CFD receives Rule 12b-1 payments from the Funds to compensate it for providing services and distribution activities. These activities could lead to growth in the Funds’ assets and the corresponding benefits of that growth, including economies of scale and greater diversification. In addition, other affiliates of Carillon Tower have entered into agreements with CFD to sell Fund shares and receive compensation from CFD. The Board considered that ClariVest and Cougar do not enter into formal soft dollar arrangements. However, the Board also considered that Carillon Tower has entered into marketing agreements with Eagle, ClariVest and Cougar pursuant to which ClariVest and Cougar pay Carillon Tower a fee for performing marketing and client services for the Funds and other clients of ClariVest and Cougar.
Conclusions | The Board concluded with respect to the Funds that: (1) each Fund was reasonably likely to benefit from the nature, quality and extent of Carillon Tower’s, Eagle’s, ClariVest’s and Cougar’s services, as applicable to the Funds; (2) each Fund’s performance was satisfactory in light of all the factors considered by the Board; (3) the fees payable under the Agreements and estimated profits earned by Carillon Tower, Eagle, ClariVest were reasonable in the context of all the factors considered by the Board; and (4) the current advisory fee rate structure provides each Fund’s shareholders with reasonable benefits associated with economies of scale. The Board also determined in its business judgment to renew the Agreements and to approve the Agreements between each Fund and Carillon Tower and between Carillon Tower and each of Eagle, ClariVest and Cougar.
2018 Federal Tax Notice
(UNAUDITED)
The following information for the fiscal year ended October 31, 2018 for the Carillon Family of Funds is provided pursuant to provisions of the Internal Revenue Code.
The information and distributions reported herein may differ from the information and distributions taxable to the shareholders for the calendar year ended December 31, 2018. All dividends paid by the Funds from net investment income are deemed to be ordinary income for federal income tax purposes. Complete information will be computed and reported in conjunction with your 2018 Form 1099-DIV.
The amounts shown may differ from amounts disclosed elsewhere in this report due to differences between tax and financial reporting requirements.
| Capital Appreciation Fund | International Stock Fund | Tactical Allocation Fund | Growth & Income Fund | Mid Cap Growth Fund | Small Cap Growth Fund | |||||||||||||||||||
| Qualified dividend income | 100.00 | % | 100.00 | % | 33.31 | % | 100.00 | % | 0.00 | % | 0.00 | % | ||||||||||||
| Dividends received deduction | 100.00 | % | 0.00 | % | 27.50 | % | 100.00 | % | 0.00 | % | 0.00 | % | ||||||||||||
| Long-term capital gains | $25,236,644 | $— | $35,112 | $14,662,876 | $158,724,314 | $381,398,349 | ||||||||||||||||||
| International Fund | Mid Cap Fund | Small Cap Fund | Core Bond Fund | Core Plus Bond Fund | Unconstrained Bond Fund | |||||||||||||||||||
| Qualified dividend income | 73.62 | % | 100.00 | % | 93.54 | % | 0.00 | % | 0.00 | % | 0.00 | % | ||||||||||||
| Dividends received deduction | 1.48 | % | 100.00 | % | 93.58 | % | 0.00 | % | 0.00 | % | 0.00 | % | ||||||||||||
| Long-term capital gains | $164,035,083 | $98,792,226 | $45,281,251 | $— | $— | $— | ||||||||||||||||||
The funds, as applicable, may elect to pass through to shareholders the credit for taxes paid to foreign countries. Such credits for taxes paid to foreign countries will be included in shareholders’ Form 1099-DIV.
| 73 |
| (UNAUDITED) | ||
The greatest risk of investing in a mutual fund is that its returns will fluctuate and you could lose money. Turbulence in financial markets and reduced liquidity in equity, credit and fixed income markets may negatively affect many issuers worldwide, which could have an adverse effect on the Funds. Additionally, while the portfolio managers seek to take advantage of investment opportunities that will maximize a fund’s investment returns, there is no guarantee that such opportunities will ultimately benefit the fund. There is no assurance that the portfolio managers’ investment strategy will enable a fund to achieve its investment objective. An investment in a fund is not a deposit with a bank and is not insured or guaranteed by the Federal Deposit Insurance Corporation or any other government agency. The following table identifies the risk factors of each fund in light of its principal investment strategies. These risk factors are explained following the table.
The Carillon Cougar Tactical Allocation Fund is a “fund of funds” that seeks to achieve its investment objective by investing its assets primarily in underlying funds. Therefore, in this section, the term “fund” may include a fund, an underlying fund, or both a fund and an underlying fund.
| Risk | Carillon ClariVest Capital Appreciation Fund | Carillon ClariVest International Stock Fund | Carillon Cougar Tactical Allocation Fund | Carillon Eagle Growth & Income Fund | Carillon Eagle Mid Cap Growth Fund | Carillon Eagle Small Cap Growth Fund | ||||||||||||||||||
| Call | X | |||||||||||||||||||||||
| Commodities | X | |||||||||||||||||||||||
| Credit | X | |||||||||||||||||||||||
| Credit ratings | ||||||||||||||||||||||||
| Derivatives | ||||||||||||||||||||||||
| Emerging markets | X | |||||||||||||||||||||||
| Equity securities | X | X | X | X | X | X | ||||||||||||||||||
| Fixed income market | X | |||||||||||||||||||||||
| Focused holdings | X | X | ||||||||||||||||||||||
| Foreign and emerging market securities | X | X | X | |||||||||||||||||||||
| Fund of funds | X | |||||||||||||||||||||||
| Growth stocks | X | X | X | X | X | X | ||||||||||||||||||
| High-yield securities | X | |||||||||||||||||||||||
| Income | ||||||||||||||||||||||||
| Inflation | X | |||||||||||||||||||||||
| Interest rates | X | |||||||||||||||||||||||
| Issuer | ||||||||||||||||||||||||
| Leverage | ||||||||||||||||||||||||
| Liquidity | X | X | ||||||||||||||||||||||
| Market and Stock Market | X | X | X | X | X | X | ||||||||||||||||||
| Market timing | X | X | X | |||||||||||||||||||||
| Maturity | ||||||||||||||||||||||||
| Mid-cap companies | X | X | X | X | X | |||||||||||||||||||
| Mortgage and asset-backed securities | X | |||||||||||||||||||||||
| Municipal securities | X | |||||||||||||||||||||||
| Other investments companies and ETFs | X | X | ||||||||||||||||||||||
| Portfolio turnover | X | X | ||||||||||||||||||||||
| Redemptions | X | |||||||||||||||||||||||
| Sectors | X | X | X | |||||||||||||||||||||
| Short sale | ||||||||||||||||||||||||
| Small-cap companies | X | X | X | |||||||||||||||||||||
| U.S. Government securities and Government sponsored enterprises | X | |||||||||||||||||||||||
| Valuation | ||||||||||||||||||||||||
| Value stocks | X | X | ||||||||||||||||||||||
| 74 |
Principal Risks
| (UNAUDITED) | ||||
| Risk | Carillon Scout International Fund | Carillon Scout Mid Cap Fund | Carillon Scout Small Cap Fund | Carillon Reams Core Bond Fund | Carillon Reams Core Plus Bond Fund | Carillon Reams Unconstrained Bond Fund | ||||||||||||||||||
| Call | ||||||||||||||||||||||||
| Commodities | ||||||||||||||||||||||||
| Credit | X | X | X | |||||||||||||||||||||
| Credit ratings | X | X | X | |||||||||||||||||||||
| Derivatives | X | X | X | |||||||||||||||||||||
| Emerging markets | X | X | X | X | ||||||||||||||||||||
| Equity securities | X | X | X | |||||||||||||||||||||
| Fixed income market | X | X | X | |||||||||||||||||||||
| Focused holdings | X | |||||||||||||||||||||||
| Foreign and emerging market securities | X | X | X | X | X | X | ||||||||||||||||||
| Fund of funds | ||||||||||||||||||||||||
| Growth stocks | X | X | X | |||||||||||||||||||||
| High-yield securities | X | X | ||||||||||||||||||||||
| Income | X | X | X | |||||||||||||||||||||
| Inflation | ||||||||||||||||||||||||
| Interest rates | X | X | X | |||||||||||||||||||||
| Issuer | X | X | X | |||||||||||||||||||||
| Leverage | X | X | X | |||||||||||||||||||||
| Liquidity | X | X | X | X | ||||||||||||||||||||
| Market and Stock Market | X | X | X | |||||||||||||||||||||
| Market timing | X | X | ||||||||||||||||||||||
| Maturity | X | X | X | |||||||||||||||||||||
| Mid-cap companies | X | X | ||||||||||||||||||||||
| Mortgage and asset-backed securities | X | X | X | |||||||||||||||||||||
| Municipal securities | ||||||||||||||||||||||||
| Other investment companies and ETFs | ||||||||||||||||||||||||
| Portfolio turnover | X | X | X | X | X | |||||||||||||||||||
| Redemptions | X | X | X | |||||||||||||||||||||
| Sectors | X | |||||||||||||||||||||||
| Short sale | X | |||||||||||||||||||||||
| Small-cap companies | X | X | ||||||||||||||||||||||
| U.S. Government securities and Government sponsored enterprises | ||||||||||||||||||||||||
| Valuation | X | X | X | |||||||||||||||||||||
| Value stocks | X | X | X | |||||||||||||||||||||
Call | Call risk is the possibility that, as interest rates decline to a level that is significantly lower than the rate assigned to the fixed income security, the security may be called (redeemed) prior to maturity. A fund would lose the benefit of holding a fixed income security that is paying a rate above the current market rate and would likely have to reinvest the proceeds in other fixed income securities that have lower yields.
Commodities | The value of commodities may be more volatile than the value of equity securities or debt instruments and their value may be affected by changes in overall market movements, commodity index volatility, changes in interest rates, or factors affecting a particular industry or commodity.
Investments in commodities, such as gold, or in commodity-linked instruments, will subject a fund’s portfolio to volatility that may also deviate from price movements in equity and fixed income securities. The value of commodity-linked instruments typically is based upon the price movements of underlying commodities and, therefore, may fluctuate widely based on a variety of both macroeconomic and commodity-specific factors. At times, these price fluctuations may be significant or rapid, and may not correlate to price movements in other asset classes. There may also be an imperfect correlation between the value of commodity-linked instruments and the underlying assets. Investments in these types of instruments may subject a fund to additional expenses.
| 75 |
Principal Risks
| (UNAUDITED) | ||
Credit | A fund could lose money if the issuer of a fixed income security is unable or unwilling, or is perceived as unable or unwilling (whether by market participants, ratings agencies, pricing services or otherwise) to meet its financial obligations or goes bankrupt. Securities are subject to varying degrees of credit risk, which are often reflected in their credit ratings. The downgrade of the credit rating of a security held by a fund may decrease its value. Credit risk usually applies to most fixed income securities. U.S. government securities, especially those that are not backed by the full faith and credit of the U.S. Treasury, such as securities supported only by the credit of the issuing governmental agency or government-sponsored enterprise, carry at least some risk of nonpayment, and the maximum potential liability of the issuers of such securities may greatly exceed their current resources. There is no assurance that the U.S. government would provide financial support to the issuing entity if not obligated to do so by law. Further, any government guarantees on U.S. government securities that a fund owns extend only to the timely payment of interest and the repayment of principal on the securities themselves and do not extend to the market value of the securities themselves or to shares of the fund.
Credit Ratings | Ratings by nationally recognized rating agencies represent the agencies’ opinion of the credit quality of an issuer. However, these ratings are not absolute standards of quality and do not guarantee the creditworthiness of an issuer. Ratings do not necessarily address market risk and may not be revised quickly enough to reflect changes in an issuer’s financial condition.
Derivatives | Derivatives, such as options, futures contracts, currency forwards or swap agreements, may involve greater risks than if a fund had invested in the reference obligation directly. Derivatives are subject to general market risks, liquidity risks, interest rate risk, and credit risks. Derivatives also present the risk that the other party to the transaction will fail to perform. Derivatives also involve an increased risk of mispricing or improper valuation of the derivative instrument, and imperfect correlation between the value of the derivative and the underlying instrument so that a fund may not realize the intended benefits. When used for hedging, changes in the value of the derivative may also not correlate perfectly with the underlying asset, rate or index. Derivatives risk may be more significant when derivatives are used to enhance fund returns, increase liquidity, manage the duration of a fund’s portfolio and/or gain exposure to certain instruments or markets, rather than solely to hedge the risk of a position held by the fund. Derivatives can cause a fund to participate in losses (as well as gains) in an amount that significantly exceeds the fund’s initial investment. Also, suitable derivative transactions may not be available in all circumstances and there can be no assurance that a fund will engage in these transactions to reduce exposure to other risks when that would be beneficial. The regulation of cleared and uncleared swap agreements, as well as other derivatives, is a rapidly changing area of law and is subject to modification by government and judicial action. It is not possible to predict fully the effects of current or future regulation. Changes in government regulation of various types of derivatives instruments may make derivatives more costly or limit the availability of derivatives, which may limit or prevent a fund from using certain types of derivative instruments as part of its investment strategy; may affect the character, timing of recognition and amount of a fund’s taxable income or recognized gains or losses; or may otherwise adversely affect the value or performance of derivatives. Compared to other types of investments, derivatives may also be less tax efficient. A fund’s use of derivatives may be limited by the requirements for taxation of the fund as a regulated investment company.
Emerging Markets | When investing in emerging markets, the risks of investing in foreign securities discussed below are heightened. Emerging markets have unique risks that are greater than or in addition to investing in developed markets because emerging markets are generally smaller, less developed, less liquid and more volatile than the securities markets of the U.S. and other developed markets. There are also risks of: greater political uncertainties; an economy’s dependence on revenues from particular commodities or on international aid or development assistance; currency transfer restrictions; a limited number of potential buyers for such securities; and delays and disruptions in securities
settlement procedures. In addition, there may be less information available to make investment decisions and more volatile rates of return.
Equity Securities | A fund’s equity securities investments are subject to stock market risk. Such investments may also expose a fund to additional risks:
| • | Common Stocks. The value of a company’s common stock may fall as a result of factors directly relating to that company, such as decisions made by its management or decreased demand for the company’s products or services. A stock’s value may also decline because of factors affecting not just the company, but also companies in the same industry or sector. The price of a company’s stock may also be affected by changes in financial markets that are unrelated to the company, such as changes in interest rates, exchange rates or industry regulation. Companies that pay dividends on their common stock generally only do so after they invest in their own business and make required payments to bondholders and on other debt and preferred stock. Therefore, the value of a company’s common stock will usually be more volatile than its bonds, other debt and preferred stock. |
| • | Preferred Stocks. Preferred securities are subject to issuer-specific and stock market risks; however, preferred securities may be less liquid than common stocks and offer more limited participation in the growth of an issuer. If interest rates rise, the dividend on preferred stocks may be less attractive, causing the price of preferred stocks to decline. Preferred shareholders may have only certain limited rights if distributions are not paid for a stated period, but generally have no legal recourse against the issuer and may suffer a loss of value if distributions are not paid. Preferred stocks may have mandatory sinking fund provisions, as well as provisions for their call or redemption prior to maturity which can have a negative effect on their prices when interest rates decline. Because the rights of preferred stock on distribution of a corporation’s assets in the event of its liquidation are generally subordinated to the rights associated with a corporation’s debt securities, in the event of an issuer’s bankruptcy, there is substantial risk that there will be nothing left to pay preferred stockholders after payments, if any, to bondholders have been made. For this reason, the value of preferred securities will usually react more strongly than bonds and other debt securities to actual or perceived changes in the company’s financial condition or prospects. |
| • | Convertible Securities. The investment value of a convertible security (“convertible”) is based on its yield and tends to decline as interest rates increase. The conversion value of a convertible is the market value that would be received if the convertible were converted to its underlying common stock. Since it derives a portion of its value from the common stock into which it may be converted, a convertible is also subject to the same types of market and issuer-specific risks that apply to the underlying common stock. A convertible may be subject to redemption at the option of the issuer at a price established in the convertible’s governing instrument, which may be less than the current market price of the security. Convertibles typically are “junior” securities, which means an issuer may pay interest on its non-convertible debt before it can make payments on its convertibles. In the event of a liquidation, holders of convertibles may be paid before a company’s common stockholders but after holders of a company’s senior debt obligations. |
| • | Depositary Receipts. A fund may invest in securities issued by foreign companies through ADRs, GDRs and EDRs. These securities are subject to many of the risks inherent in investing in foreign securities, including, but not limited to, currency fluctuations and political and financial instability in the home country of a particular depositary receipt. |
| • | REITs. REITs or other real estate-related securities are subject to the risks associated with direct ownership of real estate, including declines in the value of real estate, risks related to general and local economic conditions or changes in demographic trends or tastes, increases in operating |
| 76 |
Principal Risks
| (UNAUDITED) | ||||
| expenses, and adverse governmental, legal or regulatory action (such as changes to zoning laws, changes in interest rates, condemnation, tax increases, regulatory limitations on rents, or enforcement of or changes to environmental regulations). Shares of REITs may trade less frequently and, therefore, are subject to more erratic price movements than securities of larger issuers. REITs typically incur fees that are separate from those incurred by a fund, meaning a fund’s investment in REITs will result in the layering of expenses such that as a shareholder, a fund will indirectly bear a proportionate share of a REIT’s operating expenses. |
| • | Rights and Warrants. Investments in rights and warrants may be more speculative than certain other types of investments because rights and warrants do not carry dividend or voting rights with respect to the underlying securities or any rights in the assets of the issuer. In addition, the value of a right or a warrant does not necessarily change with the value of the underlying securities and a right or a warrant ceases to have value if it is not exercised prior to its expiration date. |
Fixed income market | Fixed income market risk is the risk that the prices of, and the income generated by, fixed income securities held by a fund may decline significantly and/or rapidly in response to adverse issuer, political, regulatory, general economic and market conditions, or other developments, such as regional or global economic instability (including terrorism and related geopolitical risks), interest rate fluctuations, and those events directly involving the issuers that may cause broad changes in market value, public perceptions concerning these developments, and adverse investor sentiment. These events may lead to periods of volatility, which may be exacerbated by changes in bond market size and structure. In addition, adverse market events may lead to increased redemptions, which could cause a fund to experience a loss when selling securities to meet redemption requests by shareholders. The risk of loss increases if the redemption requests are unusually large or frequent.
Floating rate securities | Floating rate securities generally are less sensitive to interest rate changes but may decline in value if their interest rates do not rise as much, or as quickly, as interest rates in general. Conversely, floating rate securities will not generally increase in value if interest rates decline. When a fund holds floating rate securities, a decrease in market interest rates will adversely affect the income received from such securities and the net asset value (“NAV”) of the fund’s shares.
Focused holdings | For funds that normally hold a core portfolio of securities of fewer companies than other more diversified funds, the increase or decrease of the value of a single security may have a greater impact on the fund’s NAV and total return when compared to other diversified funds.
Foreign securities | Investments in foreign securities involve greater risks than investing in domestic securities. As a result, a fund’s return and NAV may be affected by fluctuations in currency exchange rates or political or economic conditions and regulatory requirements in a particular country. Foreign markets, as well as foreign economies and political systems, may be less stable than U.S. markets, and changes in the exchange rates of foreign currencies can affect the value of a fund’s foreign assets. Foreign laws and accounting standards typically are not as strict as they are in the U.S., and there may be less public information available about foreign companies. Custodial and/or settlement systems in foreign markets may not be fully developed and the laws of certain countries may limit the ability to recover assets if a foreign bank or depository or their agents goes bankrupt. Over a given period of time, foreign securities may underperform U.S. securities—sometimes for years. A fund could also underperform if it invests in countries or regions whose economic performance falls short. The risks associated with investments in governmental or quasi-governmental entities of a foreign country are heightened by the potential for unexpected governmental change, which may lead to default or expropriation, and inadequate government oversight and accounting. Obligations of supranational entities are subject to the risk that the governments on whose support the entity depends for its
financial backing or repayment may be unable or unwilling to provide that support. The effect of recent, worldwide economic instability on specific foreign markets or issuers may be difficult to predict or evaluate. Some national economies continue to show profound instability, which may in turn affect their international trading and financial partners or other members of their currency bloc. Foreign security risk may also apply to ADRs, GDRs and EDRs.
Fund of funds | Because investments in securities of other investment companies, including ETFs, are subject to statutory limitations prescribed in the 1940 Act and the rules thereunder if the Tactical Allocation Fund is unable to rely on an ETF’s exemptive order permitting unaffiliated funds to invest in the ETF’s shares beyond these statutory limitations, the fund may be unable to allocate its investments in the manner the subadviser considers prudent, or the subadviser may have to select an investment other than that which the subadviser considers suitable.
Because the Tactical Allocation Fund invests principally in underlying funds, and the fund’s performance is directly related to the performance of such underlying funds, the ability of the fund to achieve its investment objectives is directly related to the ability of the underlying funds to meet their investment objectives. The investment techniques and risk analysis used by the fund’s and the underlying funds’ portfolio managers may not produce the desired results.
Growth stocks | Growth companies are expected to increase their earnings at a certain rate. When these expectations are not met, investors may punish the prices of stocks excessively, even if earnings showed an absolute increase. Growth company stocks also typically lack the dividend yield that can cushion stock prices in market downturns.
High-yield securities | Investments in securities rated below investment grade, or “junk bonds,” generally involve significantly greater risks of loss of your money than an investment in investment grade bonds. Compared with issuers of investment grade bonds, junk bonds are more likely to encounter financial difficulties and to be materially affected by these difficulties. Rising interest rates may compound these difficulties and reduce an issuer’s ability to repay principal and interest obligations. Issuers of lower-rated securities also have a greater risk of default or bankruptcy. Additionally, due to the greater number of considerations involved in the selection of a fund’s securities, the achievement of a fund’s objective depends more on the skills of the portfolio manager than investing only in higher-rated securities. Therefore, your investment may experience greater volatility in price and yield. High-yield securities may be less liquid than higher quality investments. A security whose credit rating has been lowered may be particularly difficult to sell.
Income | A fund’s income could decline due to falling market interest rates. In a falling interest rate environment, a Fund may be required to invest its assets in lower-yielding securities. Because interest rates vary, it is impossible to predict the income or yield of a fund for any particular period.
Inflation | Inflation risk is the risk that the market value of securities will decrease as higher inflation shrinks the purchasing power of any affected currencies, thus causing the purchasing power not to keep pace with inflation.
Interest rates | Investments in investment grade and non-investment grade fixed income securities are subject to interest rate risk. The value of a fund’s fixed income investments typically will fall when interest rates rise. A fund may be particularly sensitive to changes in interest rates if it invests in debt securities with intermediate and long terms to maturity. Debt securities with longer durations tend to be more sensitive to changes in interest rates, usually making them more volatile than debt securities with shorter durations. For example, if a bond has a duration of five years, a 1% increase in interest rates could be expected to result in a 5% decrease in the value of the bond. The Federal Reserve raised the federal funds rate several times since December 2015 and has signaled additional increases in the near future. Interest rates may rise significantly and/or rapidly, potentially resulting in substantial losses to the fund. During periods of very low or negative interest rates, a fund may be
| 77 |
Principal Risks
| (UNAUDITED) | ||
unable to maintain positive returns. Certain European countries and Japan have recently experienced negative interest rates on deposits and debt securities have traded at negative yields. Negative interest rates may become more prevalent among non-U.S. issuers, and potentially within the United States. Changing interest rates, including rates that fall below zero, may have unpredictable effects on markets, may result in heightened market volatility and may detract from Fund performance to the extent the Fund is exposed to such interest rates.
Issuer | The value of a security may decline for a number of reasons which directly relate to the issuer, such as management performance, financial leverage and reduced demand for the issuer’s goods or services, as well as the historical and prospective earnings of the issuer and the value of its assets.
Leverage | Certain transactions of a fund may give rise to a form of leverage. Such transactions may include, among others, the use of buybacks, dollar rolls, and when-issued, delayed delivery or forward commitment transactions. Certain derivatives that a fund may use may create leverage. Derivatives that involve leverage can result in losses to a fund that exceed the amount originally invested in the derivatives. Certain types of leveraging transactions, such as short sales that are not “against the box,” could be subject to unlimited losses in cases where a fund, for any reason, is unable to close out the transaction. The use of leverage may cause a fund to liquidate portfolio positions when it may not be advantageous to do so to satisfy its obligations or to meet segregation requirements. Leveraging may cause a fund to be more volatile than if the fund had not been leveraged. This is because leveraging tends to exaggerate the effect of any increase or decrease in the value of a fund’s portfolio securities.
Liquidity | Liquidity risk is the possibility that the fund might be unable to sell a security promptly and at an acceptable price, which could have the effect of decreasing the overall level of the fund’s liquidity. Market developments may cause the fund’s investments to become less liquid and subject to erratic price movements. In addition, the market-making capacity of dealers in certain types of securities has been reduced in recent years, in part as a result of structural and regulatory changes, such as fewer proprietary trading desks and increased capital requirements for broker-dealers. Further, many broker-dealers have reduced their inventory of certain debt securities. This could negatively affect a fund’s ability to buy or sell debt securities and increase the related volatility and trading costs. The fund could lose money if it cannot sell a security at the time and price that would be most beneficial to the fund.
Market and Stock Market | Markets may at times be volatile and the value of a fund’s stock holdings may decline in price, sometimes significantly and/or rapidly, because of changes in prices of its holdings or a broad stock market decline. The value of a security may decline due to adverse issuer-specific conditions or general market conditions which are not specifically related to a particular company, such as real or perceived adverse political, regulatory, market, economic or other developments that may cause broad changes in market value, changes in the general outlook for corporate earnings, changes in interest or currency rates, public perceptions concerning these developments or adverse investment sentiment generally. During a general downturn in the securities markets, multiple asset classes may decline in value simultaneously. Terrorism and related geopolitical risks have led, and may in the future lead, to increased short-term market volatility and may have adverse long-term effects on world economies and markets generally. In addition, markets and market participants are increasingly reliant upon both publicly available and proprietary information data systems. Data imprecision, software or other technology malfunctions, programming inaccuracies, unauthorized use or access, and similar circumstances may impair the performance of these systems and may have an adverse impact upon a single issuer, a group of issuers, or the market at large. In certain cases, an exchange or market may close or issue trading halts on either specific securities or even the entire market, which may result in a fund being, among other things, unable to buy or sell certain securities or
financial instruments or accurately price its investments. These fluctuations in stock prices could be a sustained trend or a drastic movement. The stock markets generally move in cycles, with periods of rising prices followed by periods of declining prices. The value of your investment may reflect these fluctuations. The impact of new financial regulation legislation on the markets and the practical implications for market participants may not be fully known for some time. Regulatory changes are causing some financial services companies to exit long-standing lines of business, resulting in dislocations for other market participants. In addition, political and diplomatic events within the United States and abroad, such as the U.S. government’s inability at times to agree on a long-term budget and deficit reduction plan, the threat of a federal government shutdown and threats not to increase the federal government’s debt limit, may affect investor and consumer confidence and may adversely impact financial markets and the broader economy, perhaps suddenly and to a significant degree. The U.S. government has recently reduced federal corporate income tax rates, and future legislative, regulatory and policy changes may result in more restrictions on international trade, less stringent prudential regulation of certain players in the financial market , and significant new investments in infrastructure and national defense. Markets may react strongly to expectations about the changes in these policies, which could increase volatility, especially if the markets’ expectations for changes in government policies are not borne out.
Market timing | Because of specific securities a fund may invest in, it could be subject to the risk of market timing activities by fund shareholders. Some examples of these types of securities are high-yield, small-cap and foreign securities. Typically, foreign securities offer the most opportunity for these market timing activities. A fund generally prices these foreign securities using their closing prices from the foreign markets in which they trade, typically prior to a fund’s calculation of its NAV. These prices may be affected by events that occur after the close of a foreign market but before a fund prices its shares. In such instances, a fund may fair value foreign securities. However, some investors may engage in frequent short-term trading in a fund to take advantage of any price differentials that may be reflected in the NAV of a fund’s shares. There is no assurance that fair valuation of securities can reduce or eliminate market timing. There is no guarantee that Carillon Tower Advisers, Inc. (the “Manager”) and transfer agent of the Funds can detect all market timing activities.
Maturity | A Fund will invest in fixed income securities of varying maturities. A fixed income security’s maturity is one indication of the interest rate exposure of a security. Generally, the longer a fixed income security’s maturity, the greater the risk. Conversely, the shorter a fixed income security’s maturity, the lower the risk.
Mid-cap companies | Investments in mid-cap companies generally involve greater risks than investing in large-capitalization companies. Mid-cap companies often have narrower markets and limited managerial and financial resources compared to larger, more established companies. The performance of mid-cap companies can be more volatile, and their stocks less liquid, compared to larger, more established companies, which could increase the volatility of a fund’s portfolio and performance. Shareholders of a fund that invests in mid-cap companies should expect that the value of the fund’s shares will be more volatile than a fund that invests exclusively in large-cap companies. Generally, the smaller the company size, the greater these risks.
Mortgage- and asset-backed securities | Mortgage- and asset-backed security risk, which is possible in an unstable or depressed housing market, arises from the potential for mortgage failure or premature repayment of principal, or a delay in the repayment of principal. The reduced value of the fund’s securities and the potential loss of principal as a result of a mortgagee’s failure to repay would have a negative impact on the fund. Premature repayment of principal would make it difficult for the fund to reinvest the prepaid principal at a time when interest rates on new mortgages are declining, thereby reducing the
| 78 |
Principal Risks
| (UNAUDITED) | ||||
fund’s income. Conversely, a delay in the repayment of principal could lengthen the expected maturity of the securities, thereby increasing the potential for loss when prevailing interest rates rise, which could cause the values of the securities to fall sharply.
Municipal securities | A municipal security’s value, interest payments or repayment of principal could be affected by economic, legislative or political changes. Municipal securities are also subject to potential volatility in the municipal market and the fund’s share price, yield and total return may fluctuate in response to municipal bond market movements. Municipal securities with principal and interest payments that are made from the revenues of a specific project or facility, as opposed to general tax revenues, may have increased risks. Changes in a municipality’s financial health may affect its ability to make interest and principal payments when due.
Other investment companies, including ETFs | Investments in the securities of other investment companies, including exchange-traded funds (“ETFs”) (which may, in turn invest in equities, bonds, and other financial vehicles), may involve duplication of advisory fees and certain other expenses. By investing in another investment company, a fund becomes a shareholder of that investment company. As a result, fund shareholders indirectly bear the fund’s proportionate share of the fees and expenses paid by the other investment company, in addition to the fees and expenses fund shareholders indirectly bear in connection with the fund’s own operations. Investments in other investment companies will subject a fund to the risks of the types of investments in which the investment companies invest.
As a shareholder, a fund must rely on the other investment company to achieve its investment objective. If the other investment company fails to achieve its investment objective, the value of the fund’s investment will typically decline, adversely affecting the fund’s performance. In addition, because ETFs are listed on national stock exchanges and are traded like stocks listed on an exchange, ETF shares may potentially trade at a discount or a premium. Investments in ETFs are also subject to brokerage and other trading costs, which could result in greater expenses to a fund. Finally, because the value of ETF shares depends on the demand in the market, the portfolio manager may not be able to liquidate a fund’s holdings of ETF shares at the most optimal time, adversely affecting the fund’s performance. An ETF that tracks an index may not precisely replicate the returns of its benchmark index.
Portfolio turnover | A fund may engage in more active and frequent trading of portfolio securities to a greater extent than certain other mutual funds with similar investment objectives. A fund’s turnover rate may vary greatly from year to year or during periods within a year. A high rate of portfolio turnover may lead to greater transaction costs, result in adverse tax consequences to investors (from increased recognition of net capital gains, which are taxable to shareholders when distributed to them) and adversely affect performance.
Redemptions | A fund may experience periods of heavy redemptions that could cause a fund to sell assets at inopportune times or at a loss or depressed value. Redemption risk is greater to the extent that one or more investors or intermediaries control a large percentage of investments in a fund, have short investment horizons, or have unpredictable cash flow needs. A general rise in interest rates has the potential to cause investors to move out of fixed income securities on a large scale, which may increase redemptions from mutual funds that hold large amounts of fixed income securities. This, coupled with a reduction in the ability or willingness of dealers and other institutional investors to buy or hold fixed income securities, may result in decreased liquidity and increased volatility in the fixed income markets, and heightened redemption risk. Heavy redemptions, whether by a few large investors or many smaller investors, could hurt a fund’s performance.
Sectors | Companies that are in similar businesses may be similarly affected by particular economic or market events, which may, in certain circumstances, cause the value of securities of all companies in a particular sector of the
market to change. To the extent a fund has substantial holdings within a particular sector, the risks associated with that sector increase.
Information technology sector | The information technology sector includes companies engaged in internet software and services, technology hardware and storage peripherals, electronic equipment instruments and components, and semiconductors and semiconductor equipment. Information technology companies face intense competition, both domestically and internationally, which may have an adverse effect on profit margins. Information technology companies may have limited product lines, markets, financial resources or personnel. The products of information technology companies may face rapid product obsolescence due to technological developments and frequent new product introduction, unpredictable changes in growth rates and competition for the services of qualified personnel. Failure to introduce new products, develop and maintain a loyal customer base or achieve general market acceptance for their products could have a material adverse effect on a company’s business. Companies in the information technology sector are heavily dependent on intellectual property and the loss of patent, copyright and trademark protections may adversely affect the profitability of these companies.
Short sales | A short sale creates the risk of a loss if the price of the underlying security increases, thus increasing the cost to a fund of buying those securities to cover the short position. The potential for greater losses may be incurred due to general market forces, such as a lack of securities available for short sellers to borrow for delivery, or increases in the price of a security sold short. A fund may lose more money than the actual cost of a short sale investment. Also, there is the risk that the third party to the short sale may fail to honor its contract terms, causing a loss to a fund.
Small-cap companies | Investments in small-cap companies generally involve greater risks than investing in large-capitalization companies. Companies with smaller market capitalizations generally have lower volume of shares traded daily, less liquid stock and more volatile stock prices. Companies with smaller market capitalizations also tend to have a limited product or service base and limited access to capital. Newer companies with unproven business strategies also tend to be smaller companies. The above factors increase risks and make these companies more likely to fail than companies with larger market capitalizations, and could increase the volatility of a fund’s portfolio and performance. Shareholders of a fund that invests in small-cap companies should expect that the value of the fund’s shares will be more volatile than a fund that invests exclusively in mid-cap or large-cap companies. Generally, the smaller the company size, the greater these risks.
U.S. Government securities and Government sponsored enterprises | A security backed by the U.S. Treasury or the full faith and credit of the United States is only guaranteed by the applicable entity only as to the timely payment of interest and principal when held to maturity. The market prices for such securities are not guaranteed and will fluctuate. Investments in securities issued by Government sponsored enterprises are debt obligations issued by agencies and instrumentalities of the U.S. Government. These obligations vary in the level of support they receive from the U.S. Government. They may be: (1) supported by the full faith and credit of the U.S. Treasury, such as those of the Government National Mortgage Association; (2) supported by the right of the issuer to borrow from the U.S. Treasury, such as those of the Federal Home Loan Bank and the Federal Farm Credit Banks; (3) supported by the discretionary authority of the U.S. Government to purchase the agency obligations, such as those of the Federal National Mortgage Association and the Federal Home Loan Mortgage Corporation; or (4) supported only by the credit of the issuer, such as those of the Federal Farm Credit Bureau. The U.S. Government may choose not to provide financial support to U.S. Government sponsored agencies or instrumentalities if it is not legally obligated to do so. In such circumstances, if the issuer defaulted, a fund may not be able to recover
| 79 |
Principal Risks
| (UNAUDITED) | ||
its investment from the U.S. Government. Like all bonds, U.S. Government securities and Government-sponsored enterprise bonds are also subject to credit risk.
Valuation | Securities held by a fund may be priced by an independent pricing service and may also be priced using dealer quotes or fair valuation methodologies in accordance with valuation procedures adopted by the fund’s Board. The prices provided by the independent pricing service or dealers or the
fair valuations may be different from the prices used by other mutual funds or from the prices at which securities are actually bought and sold.
Value stocks | Investments in value stocks are subject to the risk that their true worth may not be fully realized by the market. This may result in the value stocks’ prices remaining undervalued for extended periods of time. A fund’s performance also may be affected adversely if value stocks remain unpopular with or lose favor among investors.
| 80 |
Background of Trustees and Officers | The following is a list of the Trustees and Officers of the Trust with their principal occupations and positions as of October 31, 2018, including any affiliation with Raymond James Financial, Inc. (“RJF”), the Distributor or Carillon Tower, the length of service to the Trust, and the position, if any, that the Trustees hold on the board of directors/trustees of companies other than the Trust. The principal address of each Trustee and Officer is P.O. Box 23572, St. Petersburg, Florida 33742.
| Trustees | ||||||
| Name, Birth Year and Position, Term of Office (a) and Length of Time Served | Principal Occupation(s) During Past Five Years | Number of Funds Overseen in Fund Complex | Other Directorships held by Trustee for the Past Five Years | |||
Interested Trustee (b): | ||||||
J. Cooper Abbott (1969) Trustee since 2017 (Carillon Series Trust) Trustee from 2012 to 2017 (Eagle Series Trust) | Executive Vice President, Investments and Co-Chief Operating Officer of Carillon Tower since 2017; Executive Vice President, Investments and Co-Chief Operating Officer of Eagle since 2009; Director of ClariVest Asset Management LLC since 2012; Director, Carillon Fund Services, Inc. since 2017; Director, Eagle Fund Services, Inc. 2017-2019; President, Eagle Boston Management, Inc. since 2009 | 12 | N/A | |||
Court James (1974) Trustee since 2017 (Carillon Series Trust) Trustee from 2016 to 2017 (Eagle Series Trust) | Executive Vice President, Carillon Tower Advisers since 2016, Vice President, New Business Development of Eagle 2010-2016 | 12 | Raymond James Bank | |||
Independent Trustees: | ||||||
John Carter (1961) Trustee since 2017 (Carillon Series Trust) Trustee from 2016 to 2017 (Eagle Series Trust) | Law Office of John K. Carter, P.A. since 2015; Trustee, RiverNorth Funds since 2013; Director, Operation PAR Inc.; Founder, Global Recruiters of St. Petersburg 2012-2015; President and Chief Executive Officer, Transamerica Asset Management 2006-2012; Chairman, Board Member, Transamerica Partners Portfolios, Transamerica Partners Funds Group, Transamerica Partners Funds Group II and Transamerica Asset Allocation Variable Funds 2007-2012 | 12 | N/A | |||
Keith B. Jarrett, PhD (1948) Trustee since 2017 (Carillon Series Trust) Trustee from 2005 to 2017 (Eagle Series Trust) | Managing Partner, PW1 LLC since 2013; Founder, Rockport Funding, LLC (private equity), and Ajax Partners (investment partnership) since 2003 | 12 | Safeguard Scientific, Inc. Retired 2015. | |||
William J. Meurer (1943) Trustee since 2017 (Carillon Series Trust) Trustee from 2003 to 2017 (Eagle Series Trust) | Private investor and financial consultant since 2000 | 12 | Sykes Enterprises, Inc.; Walter Investment Mgmt. Corp. (ended 2018); LifeLink Foundation (private) | |||
Liana O’Drobinak (1963) Trustee since 2017 (Carillon Series Trust) Trustee from 2014 to 2017 (Eagle Series Trust) | Managing Member, Bay Consulting Partners, LLC since 2010; Board Member, Florida Prepaid College Board, 2012-2014 | 12 | Health Insurance Innovations, Inc. (2/2013-10/2013) | |||
Stephen Roussin (1963) Trustee since 2017 (Carillon Series Trust) Trustee from 2016 to 2017 (Eagle Series Trust) | President, SR2X Consulting since 2013; Chief Executive Officer and President, Campbell & Company 2011-2012 | 12 | Ramius IDF Master Fund (ended 2016) | |||
Deborah L. Talbot, PhD (1950) Trustee since 2017 (Carillon Series Trust) Trustee from 2002 to 2017 (Eagle Series Trust) | Independent Consultant; Principal, Lazure Enterprises, since 2013; Deans’ Advisory Board, College of Arts and Sciences, University of Memphis since 2002 | 12 | N/A | |||
| 81 |
Trustees and Officers
| Name, Birth Year and Position, Term of Office (a) and Length of Time Served | Principal Occupation(s) During Past Five Years | |||||
Officers (c) | ||||||
J. Cooper Abbott (1969) President since 2017 (Carillon Series Trust) President from 2016 to 2017 (Eagle Family of Funds) | President and Chairman of Carillon Tower since 2017; President and Chief Operating Officer of Eagle since 2016; Executive Vice President, Investments and Co-Chief Operating Officer of Eagle 2009-2016; Director of ClariVest Asset Management LLC since 2012; Director, Eagle Fund Services, Inc. (“EFS”) (d) since 2009 | |||||
Susan L. Walzer (1967) Principal Executive Officer since 2017 (Carillon Series Trust) Principal Executive Officer from 2011 to 2017 (Eagle Family of Funds) | Senior Vice President of Fund Administration, Carillon Tower, since 2018; Vice President of Fund Administration, Carillon Tower, 2017-2018; Vice President of Fund Administration, Eagle, since 2011 | |||||
Carolyn K. Gill (1978) Principal Financial Officer and Treasurer since 2017 (Carillon Series Trust) Principal Financial Officer and Treasurer from 2011 to 2017 (Eagle Family of Funds) | Vice President of Fund Administration, Carillon Tower, since 2018; Manager of Fund Accounting for Carillon Tower 2017-2018; Manager of Fund Accounting and Fund Reporting for Eagle since 2005 and 2010, respectively | |||||
Daniel R. Dzibinski (1974) Chief Compliance Officer and Secretary since 2017 (Carillon Series Trust) Chief Compliance Officer and Secretary from 2011 to 2017 (Eagle Family of Funds) | Vice President of Fund Compliance, Carillon Tower, since 2018; Manager of Fund Compliance for Carillon Tower 2017-2018; Manager of Fund Compliance for Eagle since 2011 | |||||
Additional information about the Funds’ Board Members can be found in the Statement of Additional Information, which is available, without charge, upon request, by calling the Carillon Family of Funds toll free at 1-800-421-4184 or by accessing our website at www.carillontower.com.
(a) Trustees serve for life or until they are removed, resign or retire. The Board has adopted a Board Governance Policy that requires Independent Trustees to retire no later than at the end of the meeting which occurs immediately after his or her 75th birthday.
(b) Messrs. Abbott and James are Interested Trustees as that term is defined by the 1940 Act. Messrs. Abbott and James are affiliated with ClariVest, Cougar Global Investments, Carillon Fund Distributors, Eagle, Carillon Tower and Raymond James Financial.
(c) Officers each serve one year terms.
(d) Prior to September 13, 2010, EFS served as the Funds’ transfer agent.
| 82 |
| FACTS | WHAT DOES CARILLON DO WITH YOUR PERSONAL INFORMATION? |  |
| Why? | Financial companies choose how they share your personal information. Federal law gives consumers the right to limit some but not all sharing. Federal law also requires us to tell you how we collect, share, and protect your personal information. Please read this notice carefully to understand what we do. | |
| What? | The types of personal information we collect and share depend on the product or service you have with us. This information can include:
| |||||
∎ Social Security number and birth date | ||||||
∎ Account transactions, account balances, and transaction history
When you are no longer our customer, we continue to share information as described in this notice. | ||||||
| How? | All financial companies need to share customers’ personal information to run their everyday business. In the section below, we list the reasons financial companies can share their customers’ personal information; the reasons Carillon chooses to share; and whether you can limit this sharing. |
Reasons we can share your personal information | Does Carillon share? | Can you limit this sharing? | ||
For our everyday business purposes – such as to process your transactions, maintain your account(s), respond to court orders and legal investigations, or report to credit bureaus | Yes | No | ||
For our marketing purposes – to offer our products and services to you | No | We don’t share | ||
| For joint marketing with other financial companies | No | We don’t share | ||
For our affiliates’ everyday business purposes – information about your transactions and experiences | Yes | No | ||
For our affiliates’ everyday business purposes – information about your creditworthiness | No | We don’t share | ||
| For our affiliates to market to you | No | We don’t share | ||
| For non-affiliates to market to you | No | We don’t share | ||
| To limit our sharing | ∎ Call 800-421-4184 – our menu will prompt you through your choice(s) or
∎ Visit us online: carillontower.com
Please note:
If you are a new customer, we can begin sharing your information 30 days from the date we sent this notice. When you are no longer our customer, we continue to share your information as described in this notice.
However, you can contact us at any time to limit our sharing. | |||||
| Questions? | Call 800-421-4184 or go to carillontower.com | |
| Page 2 |
| Who we are | ||||
| Who is providing this notice? | Carillon Tower Advisers, Inc., Carillon Fund Distributors, Inc., Carillon Fund Services, Inc. and Carillon Family of Funds (collectively, “Carillon”) | |||
| What we do | ||||
| How does Carillon protect my personal information? | To protect your personal information from unauthorized access and use, we use security measures that comply with federal law. These measures include electronic, physical, and procedural safeguards, including computer safeguards and secured files and buildings. | |||
| How does Carillon collect my personal information? | We collect your personal information, for example, when you open an account or deposit money
We also collect your personal information from others, such as affiliates or other companies. | |||
| Why can’t I limit all sharing? | Federal law gives you the right to limit only
∎ sharing for affiliates’ everyday business purposes – information about your creditworthiness ∎ affiliates from using your information to market to you ∎ sharing for non-affiliates to market to you
State laws and individual companies may give you additional rights to limit sharing. | |||
| What happens when I limit sharing for an account I hold jointly with someone else? | Your choices will apply to everyone on your account – unless you tell us otherwise. | |||
| Definitions | ||||
| Affiliates | Companies related by common ownership or control. They can be financial and non-financial companies. ∎ Our affiliates include Raymond James & Associates, Inc., Raymond James Financial Services, Inc., Carillon Tower Advisers, Inc., Carillon Fund Distributors, Inc., Carillon Fund Services, Inc., ClariVest Asset Management LLC, Cougar Global Investments Limited, Eagle Asset Management, Inc., Scout Investments, Inc., and Reams Asset Management (a division of Scout Investments). | |||
| Non-affiliates | Companies not related by common ownership or control. They can be financial and non-financial companies. ∎ Examples of non-affiliates are broker-dealers for business related matters. | |||
| Joint marketing | A formal agreement between non-affiliated financial companies that together market financial products or services to you. ∎ Carillon does not jointly market financial services or products. | |||
[THIS PAGE INTENTIONALLY LEFT BLANK]

Go Paperless with eDelivery
eDelivery is the most convenient, economical and
environmentally-conscious way to receive information about your fund.
To enroll, please visit
carillontower.com/eDelivery
Please consider the investment objectives, risks, charges and expenses of any fund carefully before investing. Contact Carillon Fund Services at 800.421.4184 or www.carillontower.com or your financial advisor for a prospectus, or summary prospectus, which contains this and other important information about the Carillon Family of Funds. Read the prospectus, or summary prospectus, carefully before you invest or send money.
This report is for the information of Shareholders of the Carillon Mutual Funds. If you wish to review additional information on the portfolio holdings of a fund, a complete schedule has been filed with the Securities and Exchange Commission (“Commission”) for the first and third quarters of each fund’s fiscal year end on Form N-Q. These filings are available on the Commissions’s website at www.sec.gov and may be reviewed and copied at the Commission’s Public Reference Room in Washington, D.C. Information on the operations of the Public Reference Room may be obtained by calling 800.SEC.0330. A description of each fund’s proxy voting policies, procedures and information regarding how each fund voted proxies relating to portfolio securities for the most recent 12-month period ending June 30th of that year, and is available without charge, upon request, by calling the Carillon Family of Funds, toll-free at the number above, by accessing our website at carillontower.com or by accessing the Commission’s website at www.sec.gov.
Item 2. Code of Ethics
As of the end of the fiscal period October 31, 2018, Carillon Series Trust (the “Trust”) has adopted a code of ethics, as defined in Item 2 of Form N-CSR that applies to the Principal Executive Officer and Principal Financial Officer. The Trust has not made any amendments to its code of ethics during the covered period. The Trust has not granted any waivers from any provisions of the code of ethics during the covered period. A copy of this code of ethics is filed as an exhibit to this Form N-CSR.
Item 3. Audit Committee Financial Expert
The Trust’s Board of Trustees (“Board”) has determined that Liana O’Drobinak is an audit committee financial expert, as defined in Item 3 of Form N-CSR, serving on its audit committee. Mr. Meurer is independent for purposes of Item 3 of Form N-CSR.
Item 4. Principal Accountant Fees and Services1
(a) Audit Fees
The aggregate fees billed by the Trust’s independent public accountants, PricewaterhouseCoopers LLP (“PwC”) for professional services rendered in connection with the audit of the Trust’s annual financial statements or services that are normally provided by the accountant in connection with statutory and regulatory filings or engagements were $262,000 for the fiscal period ended October 31, 2017, and $390,000 for the fiscal period ended October 31, 2018.
(b) Audit-Related Fees
There were no aggregate fees PwC billed to the Trust for assurance and other services which are reasonably related to the performance of the Trust’s audit and are not reported under Item 4(a) for the fiscal periods ended October 31, 2017, and October 31, 2018. The aggregate fees PwC billed to the Trust’s investment adviser and any entity controlling, controlled by, or under common control with the Trust’s investment adviser for assurance and other services directly related to the operations and financial reporting of the Trust were $0.00 for the fiscal period ended October 31, 2017, and $0.00 for the fiscal period ended October 31, 2018.
(c) Tax Fees
The aggregate tax fees PwC billed to the Trust for tax compliance, tax advice, and tax planning services were $37,000 for the fiscal period ended October 31, 2017, and $77,000 for the fiscal period ended October 31, 2018. There were no aggregate tax fees PwC billed to the Trust’s investment adviser and any entity controlling, controlled by, or under common control with the Trust’s investment adviser for services directly related to the operations and financial reporting of the Trust for the fiscal periods ended October 31, 2017, and October 31, 2018.
| 1 | All accountant fees and services amounts are rounded to the nearest whole thousand. |
(d) All Other Fees
For the fiscal periods ended October 31, 2017, and October 31, 2018, the Trust paid PwC no other fees. There were no aggregate fees PwC billed to the Trust’s investment adviser and any entity controlling, controlled by, or under common control with the Trust’s investment adviser for any other services directly related to the operations and financial reporting of the Trust for the fiscal periods ended October 31, 2017, and October 31, 2018.
(e) The Trust’s Audit Committee Charter provides that the Audit Committee (comprised of the Independent Trustees of the Trust) is responsible for pre-approval of all auditing services performed for the Trust. The Audit Committee reports to the Board regarding its approval of the engagement of the auditor and the proposed fees for the engagement, and the majority of the Board (including the members of the Board who are Independent Trustees) must approve the auditor at an in-person meeting. The Audit Committee also is responsible for pre-approval (subject to the de minimis exception for non-audit services described in the Securities Exchange Act of 1934, as amended, and applicable rule thereunder and not expecting to exceed $5,000) of all non-auditing services performed for the Trust or for any service affiliate of the Trust. The Trust’s Audit Committee Charter also permits a designated member of the Audit Committee to pre-approve, between meetings, one or more non-audit service projects, subject to ratification by the Audit Committee at the next meeting of the Audit Committee. The Trust’s Audit Committee pre-approved all fees described above which PwC billed to the Trust.
(f) Less than 50% of the hours billed by PwC for auditing services to the Trust for the fiscal period ended October 31, 2018, were for work performed by persons other than full-time, permanent employees of PwC.
(g) There were no aggregate non-audit fees billed by PwC to the Trust and to the Trust’s investment adviser and any entity controlling, controlled by, or under common control with the Trust’s investment adviser for the fiscal periods ended October 31, 2017, and October 31, 2018.
(h) The Trust’s Audit Committee has considered the non-audit services provided to the Trust and the Trust’s investment adviser and any entity controlling, controlled by, or under common control with the Trust’s investment adviser as described above and determined that these services do not compromise PwC’s independence.
Item 5. Audit Committee of Listed Registrants
Not applicable to the Trust.
Item 6. Schedule of Investments
Included as part of report to shareholders under Item 1.
Item 7. Disclosure of Proxy Voting Policies and Procedures for Closed-End Management Investment Companies.
Not applicable to the Trust.
Item 8. Portfolio Managers of Closed-End Management Investment Companies
Not applicable to the Trust.
Item 9. Purchases of Equity Securities by Closed-End Management Investment Company and Affiliated Purchasers
Not applicable to the Trust.
Item 10. Submission of Matters to a Vote of Security Holders.
There have been no material changes to the Trust’s Nominating Committee Charter, which sets forth procedures by which shareholders may recommend nominees to the Board, since the Trust last provided disclosure in response to this item.
Item 11. Controls and Procedures
| (a) | Based on an evaluation of the disclosure controls and procedures (as defined in Rule 30a-3(c) under the Investment Company Act of 1940, as amended), the Principal Executive Officer and Principal Financial Officer of the Trust have concluded that such disclosure controls and procedures are effective as of December 20, 2018. |
| (b) | There was no change in the internal controls over financial reporting (as defined in Rule 30a-3(d) under the Investment Company Act of 1940, as amended) of the Trust that occurred during the second fiscal quarter of the period covered by this report that has materially affected or is reasonably likely to materially affect, its internal control over financial reporting. |
Item 12. Disclosure of Securities Lending Activities for Closed-End Management Investment Companies.
Not applicable to the Trust.
Item 13. Exhibits
(a)(1) Code of Ethics pursuant to Item 2 of Form N-CSR is filed and attached hereto as Exhibit 99.CODEETH.
(a)(2) The certifications required by Rule 30a-2(a) of the Investment Company Act of 1940, as amended, and Section 302 of the Sarbanes-Oxley Act of 2002 is filed and attached hereto as Exhibit 99.CERT.
SIGNATURES
Pursuant to the requirements of the Securities Exchange Act of 1934 and the Investment Company Act of 1940, the Trust has duly caused this report to be signed on its behalf by the undersigned, thereunto duly authorized.
| CARILLON SERIES TRUST | ||||||
| Date: December 20, 2018 | ||||||
| /s/ Susan L. Walzer | ||||||
Susan L. Walzer Principal Executive Officer | ||||||
Pursuant to the requirements of the Securities Exchange Act of 1934 and the Investment Company Act of 1940, this report has been signed below by the following persons on behalf of the Trust and in the capacities and on the dates indicated.
CARILLON SERIES TRUST | ||||||
Date: December 20, 2018 | /s/ Susan L. Walzer | |||||
Susan L. Walzer Principal Executive Officer | ||||||
Date: December 20, 2018 | /s/ Carolyn Gill | |||||
Carolyn Gill | ||||||
Principal Financial Officer | ||||||