UNITED STATES
SECURITIES AND EXCHANGE COMMISSION
Washington, D.C. 20549
FORM N-CSR
CERTIFIED SHAREHOLDER REPORT OF REGISTERED
MANAGEMENT INVESTMENT COMPANIES
Investment Company Act file Number: 811-07470
EAGLE SERIES TRUST
(Exact name of Registrant as Specified in Charter)
880 Carillon Parkway
St. Petersburg, FL 33716
(Address of Principal Executive Office) (Zip Code)
Registrant’s Telephone Number, including Area Code: (727) 567-8143
SUSAN L. WALZER, PRINCIPAL EXECUTIVE OFFICER
880 Carillon Parkway
St. Petersburg, FL 33716
(Name and Address of Agent for Service)
Copy to:
KATHY KRESCH INGBER, ESQ.
K&L Gates, LLP
1601 K Street, NW
Washington, D.C. 20006
Date of fiscal year end: October 31
Date of reporting period: October 31, 2017
| Item 1. | Reports to Shareholders |
EAGLE MUTUAL FUNDS
(now known as Carillon Mutual Funds)
Annual Report
and Investment Performance Review for the
fiscal year ended October 31, 2017
Eagle Capital Appreciation Fund
Eagle Growth & Income Fund
Eagle International Stock Fund
Eagle Investment Grade Bond Fund
Eagle Mid Cap Growth Fund
Eagle Mid Cap Stock Fund
Eagle Small Cap Growth Fund
Eagle Smaller Company Fund
Eagle Tactical Allocation Fund

 | ||||
| Go Paperless with eDelivery | visit carillontower.com/eDelivery | For more information, see inside. | ||
Table of Contents

Visit eagleasset.com/eDelivery to receive shareholder communications including prospectuses and fund reports with a service that helps protect the environment:
Environmentally friendly. Go green with eDelivery by reducing the number of trees used to produce paper.
Efficient. Stop waiting on regular mail. Your documents will be sent via email as soon as they are available.
Easy. Download and save files using your home computer with a few clicks of a mouse.
Dear Fellow Shareholders:
I am pleased to present the annual report and investment-performance review of the Eagle Family of Funds for the 12-month period that ended October 31, 2017.
As we head into the last months of 2017, the broad equity market (as measured by the S&P 500 Index) is at or near nominal highs with unusually low volatility while the U.S. Federal Reserve Board has kept interest rates low. Over the last year, it appears to us that markets alternatively have ridden waves of optimism (a new U.S. president perceived to be pro-business and signs of global economic growth) and worry (disasters, both man-made and natural). It has been almost a decade since the financial crisis but this period has not been “normal” and we believe some historical cyclicality trends may re-emerge.
Against this backdrop, we believe that the fund managers’ ability to identify competitive businesses, quality companies and future earnings potential can provide an opportunity to deliver value and help investors achieve their long-term financial goals. We believe that our strategies can provide opportunities to take advantage of these market dynamics.
Our fund managers believe that there remain pockets of longer-term opportunity as global economies continue to improve. We also believe that macroeconomic developments, political uncertainty and the markets’ dynamism may result in increased volatility that could create an environment in which well-seasoned, research-based investment strategies can demonstrate their advantages for long-term investors.
On November 17, 2017, the Eagle Mutual Funds were reorganized into Carillon Series Trust, a Delaware statutory trust. The fund family is now known as Carillon Mutual Funds and the Funds’ names include “Carillon” to help connect them with the Carillon Family of investment managers and funds.
Additionally, we are pleased to report that, on November 17, 2017, Carillon Tower Advisers, Inc. (“Carillon Tower”) acquired Scout Investments, Inc. (“Scout”) and seven series of the Scout Funds, which were advised by Scout, were reorganized into Carillon Series Trust. This acquisition significantly increases Carillon Tower’s mutual fund assets under management and enhances its portfolio management and research staff. Carillon Tower now serves as the investment adviser and Scout serves as the subadviser to each Fund that previously was advised by Scout. Please refer to the “Subsequent events” section of the Notes to the Financial Statements for more information regarding these and other material events or transactions that occurred after the close of the reporting period.
As with all investments, I would remind you that investing in any mutual fund carries certain risks. The principal risk factors for each fund are described at the end of this annual report. Carefully consider the investment objectives, charges and expenses of any fund before you invest. Contact us at 800.421.4184 or carillontower.com or your financial advisor for a prospectus, or summary prospectus, which contains this and other important information about the Eagle Family of Funds. Read the prospectus, or summary prospectus, carefully before you invest or send money.
I hope you will find the portfolio manager commentaries that follow of interest. In uncertain times, I believe that there is little substitute for active research and experience. We are grateful for your continued support of the Eagle Family of Funds.
Sincerely,

J. Cooper Abbott, CFA
President
November 10, 2017
Performance data represented are historical and do not guarantee future results. The investment return and principal value of an investment will fluctuate, and you may have a gain or loss when you sell shares. Current performance may be higher or lower than the performance data quoted. To obtain more current performance data as of the most recent month-end, please visit our website at carillontower.com.
The Global Industry Classification Standard (GICS®) was developed by and/or is the exclusive property of Morgan Stanley Capital International, Inc. (“MSCI”) and Standard & Poor’s Financial Services LLC (“S&P”). GICS is a service mark of MSCI and S&P and has been licensed for use by U.S. Bancorp Fund Services, LLC.
| 1 |
Performance Summary and Commentary
| Eagle Capital Appreciation Fund | ||
Portfolio Managers | David J. Pavan, CFA®, C. Frank Feng, Ph.D., Ed Wagner, CFA®, and Stacey R. Nutt, Ph.D., of ClariVest Asset Management LLC (“ClariVest”), are Co-Portfolio Managers of the Eagle Capital Appreciation Fund (the “Fund”) and have been responsible for the day-to-day management of the Fund’s investment portfolio since 2013.
Performance discussion | For the fiscal year ended October 31, 2017, the Fund’s Class A shares returned 30.84% (excluding front-end sales charges of 4.75%), outperforming its benchmark index, the Russell 1000® Growth Index, which returned 29.71%. The Fund’s performance relative to the benchmark was positive, primarily due to stock selection, where selection within the consumer discretionary and information technology sectors was strongest, and was weak within the financials and health care sectors. Sector selection was also positive, where an overweight to information technology and an underweight to real estate contributed to performance, while the Fund lost ground due to an overweight position in the energy and financials sectors. As you review this summary and the table below, please keep in mind that an index is not available for direct investment; therefore, its performance does not reflect the expenses associated with the management of an actual portfolio.
Growth of a $10,000 investment from 10/31/07 to 10/31/17 (a)
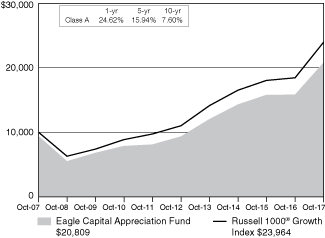
(a) The Fund’s values and returns reflect the maximum front-end sales charge of 4.75%, fund expenses and the reinvestment of dividends; however, they do not reflect the deduction of taxes that you would pay on fund distributions or redemption of fund shares. As of October 31, 2017, the Fund also offered Class C, Class I, Class R-3, Class R-5 and Class R-6 shares. The value of an investment in other share classes will differ due to each class’s respective sales charges and expenses. Additional information regarding the performance and the expenses of the Fund’s share classes, including fee waivers and/ or expense reimbursements or recoupments, which affect performance, is included in the Fund’s prospectus dated November 20, 2017, and elsewhere in this report.
Performance data represented is historical and does not guarantee future results. The investment return and principal value of an investment will fluctuate, and you may have a gain or loss when you sell shares. Current performance may be higher or lower than the performance data quoted. To obtain more current performance data as of the most recent month-end, please visit our website at carillontower.com.
Top performers | Apple Inc., designer, manufacturer, and marketer of mobile communication and media devices, personal computing products, and portable digital music players, outperformed other stocks in the information technology sector during the time period leading up to the launch of its new iPhone 8 and iPhone X. Additionally, strong sales of its Mac and Service products drove higher-than-expected earnings. Microsoft Corp. develops and markets software and hardware services. The Fund’s Portfolio Management team (“PM team”) believes that the momentum of the company’s cloud services platform and strong Office 365 sales drove outperformance when compared to other stocks in the information technology sector. Applied Materials, Inc., the worldwide semiconductor equipment manufacturer and services company, appeared to benefit from strong demand for chip equipment and strength in its OLED display segment. NVIDIA Corp., a visual computing company that primarily focuses on 3D graphics, had strong growth in its data center business, core gaming segment, and auto division, which is focused on autonomous car driving technologies. The PM team believes that acceleration of AI (artificial intelligence) technology is driving strong demand for the company’s high-performance processors. Facebook Inc. (Class A), is a social media company. The PM team believes that the company benefitted from continued growth of its active users and was helped by strength in its mobile advertising business. The Fund continues to hold each of the securities noted above as “top performers.”
Underperformers | Dick’s Sporting Goods, Inc. is a sporting goods retailer that operates stores across the United States. The sporting goods retail industry is under duress due to online competition, and the company forecast weaker margins due to a continuing highly competitive environment. The stock was sold from the portfolio. CVS Health Corporation, is an integrated pharmacy health care provider. The PM Team believes the company was hurt by increasing competition and related rumors that Amazon.com will enter the pharmacy business. Prospects that CVS will acquire the health insurer Aetna, also appeared to weigh on the share price. The position is still held by the Fund; however, it was trimmed. EOG Resources, Inc. explores, develops, produces, and markets natural gas and crude oil. The share price declined with falling crude oil prices. The stock was sold from the portfolio. Foot Locker, Inc., the athletic shoe and sportswear retailer, appeared to be hurt by a decline in same store sales as online traffic increased and mall traffic thinned. The company also cited the challenge to capitalize on new trends as consumers are more quickly moving from one trend to another. The stock was sold from the portfolio. FleetCor Technologies, Inc., is a provider of gas cards. The PM team believes performance was hurt by weakness in Brazil and Russia as well as lower gas prices and a weaker U.K. pound. The stock was sold from the portfolio.
| 2 |
Performance Summary and Commentary
| Eagle Growth & Income Fund | ||
Portfolio Managers | Edmund Cowart, CFA®, David Blount, CFA®, CPA, and Harald Hvideberg, CFA®, are Co-Portfolio Managers of the Eagle Growth & Income Fund (the “Fund”). Messrs. Cowart and Blount have been responsible for the day-to-day management of the Fund’s investment portfolio since 2011 and Mr. Hvideberg since 2014.
Performance discussion | For the fiscal year ended October 31, 2017, the Fund’s Class A shares returned 18.56% (excluding front-end sales charges of 4.75%), underperforming its benchmark index, the S&P 500® Index, which returned 23.63%. The Fund’s Portfolio Management team (“PM team”) was satisfied with performance compared to the benchmark given the market environment. The underperformance was due, in part, to a dividend-yield headwind. During the fiscal year, dividend paying stocks returned 22.6%, while non-dividend paying stocks returned 29.0%. Furthermore, returns on stocks with above median yields underperformed their below median yield counterparts by 10.76%. This represents a headwind for the strategy. Investments in the consumer discretionary, industrials, and energy sectors contributed positively to performance relative to the benchmark. Meanwhile, investments in the health care sector, as well as an underweight position in information technology and an overweight position in consumer staples, all were detractors from performance. As you review this summary and the table below, please keep in mind that an index is not available for direct investment; therefore its performance does not reflect the expenses associated with the management of an actual portfolio.
Growth of a $10,000 investment from 10/31/07 to 10/31/17 (a)
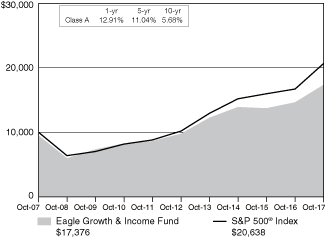
(a) The Fund’s values and returns reflect the maximum front-end sales charge of 4.75%, fund expenses and the reinvestment of dividends; however, they do not reflect the deduction of taxes that you would pay on fund distributions or redemption of fund shares. As of October 31, 2017, the Fund also offered Class C, Class I, Class R-3, Class R-5 and Class R-6 shares. The value of an investment in other share classes will differ due to each class’s respective sales charges and expenses. Additional information regarding the performance and the expenses of the Fund’s share classes, including fee waivers and/or expense reimbursements or recoupments, which affect performance, is included in the Fund’s prospectus dated November 20, 2017, and elsewhere in this report.
Performance data represented is historical and does not guarantee future results. The investment return and principal value of an
investment will fluctuate, and you may have a gain or loss when you sell shares. Current performance may be higher or lower than the performance data quoted. To obtain more current performance data as of the most recent month-end, please visit our website at carillontower.com.
Underperformers | Regal Entertainment Group (Class A), an operator of multi-screen theaters, traded lower due to what the PM team believed was fears of technology-based businesses that could disrupt the market. Premium movie-on-demand releases or subscription-based models could disrupt the movie-theater business, but the PM team believes that these fears are unwarranted and the Fund continues to hold the stock. Oil and gas exploration and production company, Occidental Petroleum Corp., experienced weakness after the price of crude oil experienced greater volatility surrounding the Organization of the Petroleum Exporting Countries (OPEC) meeting in November 2016. The company has affirmed its commitment to the dividend and continues to take a long-term approach to developing its rich, unconventional resource base in a measured, efficient manner. The PM team believes the company is in a great position to develop its resources while continuing to drive revenues higher. The Fund continues to hold this position. General Mills Inc., a consumer food manufacturer, traded lower after the company’s management lowered guidance for the year. The company has struggled with falling organic food sales as the PM team believes consumers are switching to smaller, local brands. While the company is working on a cost-savings initiative, weaker margins are still in focus. The PM team believes a new promotion cycle during the upcoming key seasons could boost sales. The Fund continues to hold this position. Nielsen Holdings PLC, a consumer research and consulting services company, continued to experience weakening growth trends in its Buy segment, which is 49% of total company revenue. The PM team believes that growth in developed markets decelerated with sales trends in the broader consumer staples market under pressure and companies reducing/changing their procurement spending patterns. The PM team did not believe that this trend would reverse so the Fund exited its position. Simon Property Group, Inc. an owner of premium retail space, traded lower as online sales continue to gain market share. The PM team believes that these fears are unwarranted and demand for premium retail space will increase as more outdated malls are losing disproportionately greater market share. The Fund continues to hold this position.
Top performers | Apple Inc., designer, manufacturer, and marketer of mobile communication and media devices, personal computing products, and portable digital music players, traded higher as the company prepared for the launch of its next generation of iPhones. The PM team believes that built-up demand will lead to a successful launch and increase unit sales growth. The Fund continues to hold this position. Microsoft Corp., developer and marketer of software and hardware services, appreciated as the company continues to gain market share in its cloud business. Azure, Microsoft’s cloud based business, continued to see higher utilization levels with additional margin expansion. The PM team believes this growth will continue and remains invested in the company. Global investment bank, JPMorgan Chase & Co. traded higher after the outcome of the U.S. presidential election. The PM team believed that the new administration would ease regulatory burdens. The Fed also began raising interest rates, which also enables banks to earn higher fees on loans. The PM team believes these trends will continue and the Fund remains invested in the stock. The PNC Financial Services Group, Inc., another large financial institution, stock also appreciated on many of the same trends. The PM team believes that increased economic-growth expectations will lead to higher loan-growth. The Fund continues to hold this position. Bookings at Carnival Corp., a luxury cruise ship operator, has been at a higher trend than historical levels. Management also increased the company’s dividend by 14.3 percent and authorized an additional $1 billion repurchase program. The PM team believes the company will continue to be competitive and continues to own the stock.
| 3 |
Performance Summary and Commentary
| Eagle International Stock Fund | ||
Portfolio Managers | David V. Vaughn, CFA®, Stacey R. Nutt, Ph.D., Alex Turner, CFA®, and Priyanshu Mutreja, CFA®, are Co-Portfolio Managers of the Eagle International Stock Fund (the “Fund”). Mr. Vaughn and Dr. Nutt have been responsible for the day-to-day management of the Fund’s investment portfolio since 2013. Mr. Turner has been a Co-Portfolio Manager of the Fund since 2015 and previously served as Assistant Portfolio Manager of the Fund since its inception. Mr. Mutreja has been a Co-Portfolio Manager since March 2017 and previously served as Assistant Portfolio Manager of the Fund since 2015.
Performance discussion | For the fiscal year ended October 31, 2017, the Fund’s Class A shares returned 26.15% (excluding front-end sales charges of 4.75%), outperforming its benchmark index, the MSCI EAFE® Index which returned 23.44%. The Fund’s performance, relative to the benchmark, was positive primarily due to stock selection, where selection within the information technology and financials sectors was strong, and weak within the health care and consumer discretionary sectors. Stock selection within countries was strongest within Japan and Australia, while investments in the U.K. and Italy detracted from performance. An underweight position in the consumer staples sector and an overweight position in the information technology sector helped performance. Conversely, overweight positions in the telecommunication services and materials sectors tempered returns. An overweight position in Italy and an underweight position in Australia contributed to performance, while overweight positions in Japan and Israel detracted from performance. As you review this summary and the table below, please keep in mind that an index is not available for direct investment; therefore, its performance does not reflect the expenses associated with the management of an actual portfolio.
Growth of a $10,000 investment from 2/28/13 to 10/31/17 (a)
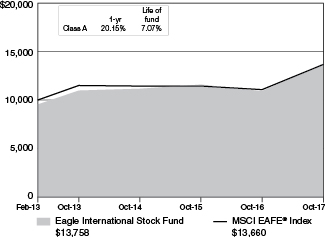
(a) The Fund’s values and returns reflect the maximum front-end sales charge of 4.75%, fund expenses and the reinvestment of dividends; however, they do not reflect the deduction of taxes that you would pay on fund distributions or redemption of fund shares. As of October 31, 2017, the Fund also offered Class C, Class I, Class R-3,
Class R-5 and Class R-6 shares. The value of an investment in other share classes will differ due to each class’s respective sales charges and expenses. Additional information regarding the performance and the expenses of the Fund’s share classes, including fee waivers and/or expense reimbursements or recoupments, which affect performance, is included in the Fund’s prospectus dated November 20, 2017, and elsewhere in this report.
Performance data represented is historical and does not guarantee future results. The investment return and principal value of an investment will fluctuate, and you may have a gain or loss when you sell shares. Current performance may be higher or lower than the performance data quoted. To obtain more current performance data as of the most recent month-end, please visit our website at carillontower.com.
Top performers | Tokyo Electron Ltd. is a Japanese semiconductor equipment manufacturer. The Fund’s Portfolio Management team (“PM team”) believes that rising semiconductor demand driven by the push for artificial intelligence (AI) and cloud computing technologies drove growth. Additionally, increased investment by semiconductor manufacturers, particularly in China, appeared to drive strong earnings. The Fund continues to hold this position. The PM team believes that Mitsubishi UFJ Financial Group, Inc., Japan’s largest financial group, benefitted from the changing macro environment following the U.S. election and the subsequent optimism for eased financial regulations and tax cuts. The Fund still holds this stock. BlueScope Steel Ltd., an Australia-based global steel company, appeared to benefit from strong steel prices and demand primarily driven by China and the U.S. The Fund no longer holds this security. NN Group N.V. is a Netherlands-based insurance company. The PM team believes that the company benefited from underappreciated synergies from its recent acquisition of Delta Lloyd. The Fund still holds this position. The PM team believes that ITOCHU Corp., a Japanese trading firm, saw strong contribution from its metals and minerals segment on the back of higher resource prices. The PM team also believes that improved cash flow and the prospect of additional returns to shareholders helped investor sentiment. The Fund still holds this stock.
Underperformers | Teva Pharmaceutical Industries Ltd., a drug manufacturing company based in Israel, underperformed amid what the PM team believed were concerns about a U.S. investigation into generic drug price collusion. The company’s revenues also fell short of expectations due to pricing pressures. The Fund no longer holds this security. Medipal Holdings Corp., a Japanese pharmaceutical company, appeared to be hurt by a slump in the prescription pharmaceuticals market and lower-than-expected margins. The Fund no longer holds this security. The PM team believed that Toyo Tire & Rubber Co., Ltd., the rubber and chemical goods company based in Japan, underperformed due to pricing competition and higher raw materials costs. The Fund no longer holds this position. Shire PLC, a biotechnology group based in the U.K., was weighed down by drug pricing concerns and weaker sales of one of its key drugs. The Fund continues to hold this stock. Daito Trust Construction Co. Ltd., a construction company in Japan, fell as a slump in orders led investors to believe that tighter rules on apartment loans would impact future earnings. The Fund no longer holds this security.
| 4 |
Performance Summary and Commentary
| Eagle Investment Grade Bond Fund | ||
Portfolio Managers | James C. Camp, CFA®, and Joseph Jackson, CFA®, are Co-Portfolio Managers of the Eagle Investment Grade Bond Fund (the “Fund”) and have been responsible for the day-to-day management of the Fund’s investment portfolio since its inception in 2010.
Performance discussion | For the fiscal year ended October 31, 2017, the Fund’s Class A shares returned 0.82% (excluding front-end sales charges of 3.75%), outperforming its benchmark index, the Bloomberg Barclays U.S. Intermediate Government/Credit Bond Index, which returned 0.63%. The beginning of the fiscal year was marked by an unprecedented spike in interest rates following the U.S. presidential election. The new administration’s proposed “reflation” policies, including an fiscal stimulus plan and tax reform, added fuel to already rising inflation expectations along with economic data that lead to an unexpected spike in the market. However, following the spike, longer-term interest rates generally stayed range bound for the rest of the period as persistent inflation never materialized nor did any legislative accomplishments. Short-term rates continued to trend higher due to the Federal Reserve Board’s continued efforts to normalize monetary policy through rate hikes and balance sheet tapering. Meanwhile, a strong recovery in corporate earnings along with steady improvement in economic growth in the U.S. and abroad led corporate-credit spreads to tighten during the fiscal year—reaching post-crisis lows in October. The main detractors from the Fund’s performance, relative to the benchmark, were the shorter duration corporate bonds that were held by the Fund. Security selection in agency bonds also hurt the Fund’s performance. The Fund earned positive relative performance largely due to an overweight position to longer duration corporate bonds, which outperformed duration-matched U.S. Treasuries. The Fund’s allocation to asset-backed securities and mortgage-backed securities also added to performance, relative to the benchmark. As you review this summary and the table below, please keep in mind that an index is not available for direct investment; therefore its performance does not reflect the expenses associated with the management of an actual portfolio.
Growth of a $10,000 investment from 3/1/10 to 10/31/17 (a)
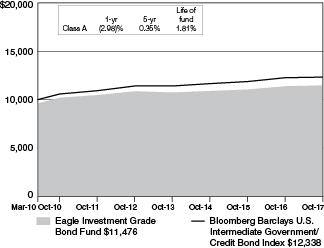
(a) The Fund’s values and returns reflect the maximum front-end sales charge of 3.75%, fund expenses and the reinvestment of dividends; however, they do not reflect the deduction of taxes that you would pay on fund distributions or redemption of fund shares. As of October 31, 2017, the Fund also offered Class C, Class I, Class R-3, Class R-5 and Class R-6 shares. The value of an investment in other share classes will differ due to each class’s respective sales charges and expenses. Additional information regarding the performance and the expenses of the Fund’s share classes,
including fee waivers and/or expense reimbursements or recoupments, which affect performance, is included in the Fund’s prospectus dated November 20, 2017, and elsewhere in this report.
Performance data represented is historical and does not guarantee future results. The investment return and principal value of an investment will fluctuate, and you may have a gain or loss when you sell shares. Current performance may be higher or lower than the performance data quoted. To obtain more current performance data as of the most recent month-end, please visit our website at carilontower.com.
Top performers | The corporate bond issued by Andeavor, 4.750%, 12/15/23, formerly known as Tesoro Corp., a company which operates refineries and a network of retail and refueling stations, and the corporate bond issued by Valero Energy Partners LP, 4.375%, 12/15/26, a midstream oil and gas master limited partnership that owns, operates, develops, and acquires crude oil and refined petroleum-related assets, contributed to performance due to the recovery in oil prices. The Fund continues to hold these positions as the Fund’s Portfolio Management team (“PM team”) continues to prefer the midstream/downstream segment of the energy sector. The corporate bond issued by BankUnited, Inc., 4.875%, 11/17/25, a bank holding company that, through its subsidiaries, provides a range of financial products and services, including personal, commercial, and business banking, outperformed other holdings during the period. This security appeared to benefit from a general tightening in the financial sector. The Fund continues to hold this position as the PM team believes the credit risk is attractive relative to the rating. The corporate bond issued by Avnet, Inc., 3.750%, 12/01/21, a technology distributor that markets and distributes computer products and semiconductors and provides supply-chain integration, engineering design, and technical services, was a top performer during the period due to what the PM team believes was attractive pricing in the primary market. The PM team continues to feel comfortable owning this security due to the company’s sale of its technology business solutions unit to help fund an acquisition of a components distribution business, which the PM team believes indicates management’s willingness to defend the company’s credit rating. The corporate bond issued by Apollo Management Holding LP, 144A, 4.400%, 05/27/26, a financial services holding company that, through its subsidiaries, invests in private equity, credit, and real estate, as well as manages pension and endowment funds, was a top performer during a period of record fundraising for alternative asset managers. The Fund continues to own this security.
Underperformers | The U.S. Treasury note, 2.250%, 11/15/25, contributed to Fund underperformance relative to the benchmark as it was a longer-dated Treasury held during the unprecedented spike in interest rates following the U.S. presidential election. This security was sold to manage the Fund’s duration and sector characteristics. The following four securities were underperformers due to the timing of their respective holding periods. The corporate bond issued by Home Depot, 2.125%, 09/15/26, a home improvement retailer, and the corporate bond issued by Illinois Tool Works, Inc., 2.650%, 11/15/26, a designer and manufacturer of fasteners, components, equipment, consumable systems, and a variety of specialty products and equipment, were sold because the PM team felt the spreads were fully priced and that there were better relative-value opportunities. The corporate bond issued by Dr. Snapple Group, Inc., 2.550%, 09/15/26, an integrated brand owner, manufacturer, and distributor of non-alcoholic beverages in the U.S., Canada, and Mexico, and the corporate bond issued by Mondelez International, Inc., 144A, 2.000%, 10/28/21, a food and beverage company that manufactures and markets packaged food products, were sold over concerns for the potential of leveraging M&A activity in the mature global consumer sector. The Fund sold out of these four positions toward the beginning of the fiscal year.
| 5 |
Performance Summary and Commentary
| Eagle Mid Cap Growth Fund | ||
Portfolio Managers | Bert L. Boksen, CFA®, and Eric Mintz, CFA®, are Co-Portfolio Managers of the Eagle Mid Cap Growth Fund (the “Fund”). Mr. Boksen has been responsible for the day-to-day management of the Fund’s investment portfolio since its inception in 1998. Mr. Mintz has been a Co-Portfolio Manager of the Fund since 2011, and had previously served as Assistant Portfolio Manager since 2008. Christopher Sassouni, D.M.D., has served as Assistant Portfolio Manager of the Fund since 2006.
Performance discussion | For the fiscal year ended October 31, 2017, the Fund’s Class A shares returned 33.39% (excluding front-end sales charges of 4.75%), outperforming its benchmark index, the Russell Midcap® Growth Index, which returned 26.25%. The Fund’s outperformance relative to the benchmark was broad-based across multiple sectors, the most notable of which were the consumer discretionary, information technology, and health care sectors, which all generated strong absolute and relative returns during the reporting period. A minimal amount of underperformance was experienced within the real estate and financials sectors which, despite solid absolute returns, were slightly outpaced by those of the benchmark. As you review this summary and the table below, please keep in mind that an index is not available for direct investment; therefore, its performance does not reflect the expenses associated with the management of an actual portfolio.
Growth of a $10,000 investment from 10/31/07 to 10/31/17 (a)
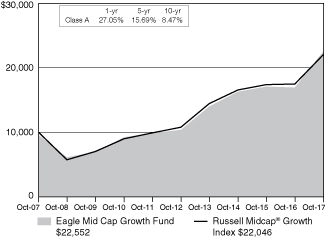
(a) The Fund’s values and returns reflect the maximum front-end sales charge of 4.75%, fund expenses and the reinvestment of dividends; however, they do not reflect the deduction of taxes that you would pay on fund distributions or redemption of fund shares. As of October 31, 2017, the Fund also offered Class C, Class I, Class R-3, Class R-5 and Class R-6 shares. The value of an investment in other share classes will differ due to each class’s respective sales charges and expenses. Additional information regarding the performance and the expenses of the Fund’s share classes, including fee waivers and/ or expense reimbursements or recoupments, which affect performance, is included in the Fund’s prospectus dated November 20, 2017, and elsewhere in this report.
Performance data represented is historical and does not guarantee future results. The investment return and principal value of an
investment will fluctuate, and you may have a gain or loss when you sell shares. Current performance may be higher or lower than the performance data quoted. To obtain more current performance data as of the most recent month-end, please visit our website at carillontower.com.
Top Performers | NVIDIA Corp. manufactures graphics processors used in traditional computers as well as tablets, smartphones and gaming devices. NVIDIA appears to be establishing a favorable position in the fast-developing virtual reality (VR) market while also leveraging its technology in the automotive “infotainment” market. The Fund’s Portfolio Management team (‘PM team”) believes the company remains poised to see increased adoption in datacenter markets through the application of its graphics-processing units used in heavy-duty computing. Align Technology Inc. sells clear “dental-aligner systems” (what used to be called braces). The firm has continued to report solid results: The PM team believes that Align continued to see solid growth in volumes due in part to tailwinds associated with improved products, increased penetration of existing accounts, direct-to-consumer advertising and geographic expansion. Coherent Inc. makes laser-based equipment used in such applications as smartphone and tablet displays. The PM team believes that the firm continues to benefit from strong orders for its product which is used in the fabrication of organic light-emitting diode (OLED) displays that are increasingly used in next-generation smartphones. Further, the PM team believes that the potential for alternative applications of Coherent’s equipment (e.g., in tablets, autos and television) may provide additional upside over the longer term. Micron Technology, Inc. is a key supplier of semiconductor technology products. The firm is benefitting from robust demand for its memory products that, in turn, has kept supply levels in check and translated into strong pricing power. Royal Caribbean Cruises Ltd. has benefited from a healthy pricing and bookings-growth environment while prudently maintaining cost controls to drive earnings growth. The Fund continues to hold each of the securities noted above as “top performers.”
Underperformers | Freeport-McMoRan Inc., a global metals and mining operator, arrived at an unexpected impasse in contract negotiations with the Indonesian government—relating to one of its key copper mines there—which led to production cuts and ultimately pressured the stock. The Fund no longer holds a position in the stock. International Game Technology PLC makes electronic gaming equipment, software and network systems. The PM team believes that results disappointed largely due to poor results in the unpredictable international lottery business. The Fund no longer holds a position in the stock as the PM team believes there are better opportunities in gaming. Brixmor Property Group Inc. owns and operates grocery store-anchored U.S. shopping centers. The PM team believes that the ongoing proliferation of online shopping and retailing has created headwinds for more traditional brick-and-mortar retailers in the current environment, which—in turn—drove an increased occurrence of bankruptcies among Brixmor’s retail-property tenants. The Fund no longer holds a position in the stock. Acuity Brands, Inc., which makes LED lighting fixtures, declined as the firm’s results failed to meet investor expectations due in part to softer-than-expected demand. The PM team continues to believe Acuity is well-aligned with positive trends in non-residential construction as well as from what is expected to be a multibillion-dollar upgrade cycle in general lighting to LED fixtures. The Fund continues to hold this position. Sally Beauty Holdings, Inc. is a retailer of cosmetics, hair- and skin-care goods. Despite ongoing efforts to adjust its strategy through e-commerce enhancements and loyalty programs, Sally Beauty has endured sustained operational and competitive difficulties in recent periods. The Fund no longer holds a position in the stock.
| 6 |
Performance Summary and Commentary
| Eagle Mid Cap Stock Fund | ||
Portfolio Managers | Charles Schwartz, CFA®, Betsy Pecor, CFA®, and Matthew McGeary, CFA®, are Co-Portfolio Managers of the Eagle Mid Cap Stock Fund (the “Fund”) and have been responsible for the day-to-day management of the Fund’s investment portfolio since 2012.
Performance discussion | For the fiscal year ended October 31, 2017, the Fund’s Class A shares returned 22.40% (excluding front-end sales charges of 4.75%), outperforming its primary benchmark index, the Russell Midcap® Index and, underperforming its secondary index, the S&P MidCap 400® Index, which returned 21.09% and 23.48%, respectively. The Fund’s performance, relative to the benchmarks, benefited from strong stock selection in the consumer discretionary and health care sectors. This was partially offset by poor stock selection in the energy, information technology and financial sectors. As you review this summary and the table below, please keep in mind that an index is not available for direct investment; therefore its performance does not reflect the expenses associated with the management of an actual portfolio.
Growth of a $10,000 investment from 10/31/07 to 10/31/17 (a)
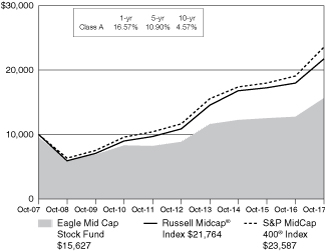
(a) The Fund’s values and returns reflect the maximum front-end sales charge of 4.75%, fund expenses and the reinvestment of dividends; however, they do not reflect the deduction of taxes that you would pay on fund distributions or redemption of fund shares. As of October 31, 2017, the Fund also offered Class C, Class I, Class R-3, Class R-5 and Class R-6 shares. The value of an investment in other share classes will differ due to each class’s respective sales charges and expenses. Additional information regarding the performance and the expenses of the Fund’s share classes, including fee waivers and/or expense reimbursements or recoupments, which affect performance, is included in the Fund’s prospectus dated November 20, 2017, and elsewhere in this report.
Performance data represented is historical and does not guarantee future results. The investment return and principal value of an investment will fluctuate, and you may have a gain or loss when you sell shares. Current performance may be higher or lower than the performance data quoted. To obtain more current performance data as of the most recent month-end, please visit our website at carillontower.com.
Top performers | Cognex Corp. is a leader in machine vision systems for manufacturing, inspection, distribution, and logistical automation. The demands for more accurate, faster, and more cost effective work flows (especially in manufacturing and distribution) appears to be a powerful secular driver for the company’s industry leading solutions. Management reported favorable financial results in the quarter and a better than expected outlook. The Fund’s Portfolio Management team (“PM team”) believes that the combination of these solid results and favorable press on the industrial automation space drove the shares higher in the period. The Fund continues to hold this stock. AMETEK Inc., which makes and sells electronic instruments and electromechanical devices used in a variety of markets, reported better-than-expected quarterly results on solid growth following an uncharacteristically soft 2016. The Fund continues to hold this security. Microchip Technology Inc. is a leading provider of microcontrollers, analog, and memory semiconductor solutions to a broad market. The stock performed well as the company reported favorable financial results and outlook in the quarter. Investors also appeared to be pleased that the operating metrics continue to exceed expectations since the Atmel acquisition. In addition, the company is receiving favorable press as its products are at the forefront in addressing industrial, consumer and automotive Iot applications. The Fund continues to hold this position. Panera Bread Company, a fast-casual restaurant and bakery, appreciated apparently as a result of an announcement it was being acquired. The Fund sold its position ahead of the acquisition. Arthur J Gallagher & Co. is one of the world’s largest insurance brokers and the largest third-party property and casualty claims administrator. The stock performed well as the company reported solid financial results and management suggested that the near-term outlook for organic revenue growth is positive. The PM team believes Gallagher is well positioned to benefit from increased insurance pricing driven by property insurance with catastrophe exposed lines as well as continued acquisition activity. The Fund continues to hold this position.
Under performers | Range Resources Corp. is an oil and gas exploration and production company. While the company has a history of solid execution, the PM team believes that investors remain concerned about the large acquisition the company made for assets in northern Louisiana. The Fund sold the shares as the PM team saw better opportunities elsewhere. Spectrum Brands Holdings, Inc. is a consumer products company that operates through five segments: Global Batteries and Appliances, Global Pet Supplies, Home and Garden, Hardware & Home Improvement, and Global Auto Care. The company’s shares underperformed expectations following a second straight quarter of year-over-year declines in sales that the PM team believes were driven by category weakness, retailer inventory management, unfavorable weather, the exit of unprofitable businesses, a voluntary recall, increased competitor promotions, and supply chain disruption from production facility consolidation. While it could take a few quarters for sales to normalize, the PM team continues to like the company’s proven acquisition track record, white space opportunities into new categories and strong margin profile and free cash flow generation. Therefore, the Fund continues to maintain a position in the company. The PM team believes that Hanesbrands, Inc., a leading marketer of basic apparel, underperformed expectations due to volatility in sales, a levered balance sheet, complex acquisition accounting, exposure to mass/department stores, the potential for a higher foreign tax rate and the potential for supply-chain disruption in the event of increased tariffs/import taxes. The Fund exited its position. For many years MEDNAX, Inc. was solely an outsourcing company for neonatal and pediatric care for hospitals with an excellent track record. The company later became involved in anesthesia, a few years ago, to re-accelerate its growth and, most recently, announced its introduction into telemedicine for radiology. Over the past two years, execution has been inconsistent and this quarter proved more of the same with core trends in neonatal deteriorating due to lower volumes. Although the PM team has had a long-term relationship with the management, they decided to exit the Fund’s position. Noble Energy, Inc., an oil and gas exploration-and-production firm, traded down along with its sector peers on lower oil prices. The PM team continues to believe that the company’s long-term fundamentals remain intact and, therefore, the Fund continues to hold this stock.
| 7 |
Performance Summary and Commentary
| Eagle Small Cap Growth Fund | ||
Portfolio Managers | Bert L. Boksen, CFA®, and Eric Mintz, CFA®, are Co-Portfolio Managers of the Eagle Small Cap Growth Fund (the “Fund”). Mr. Boksen has been responsible for the day-to-day management of the Fund’s investment portfolio since August 1995 and Mr. Mintz since March 2011. Christopher Sassouni, D.M.D., has served as Assistant Portfolio Manager of the Fund since March 2015.
Performance discussion | For the fiscal year ended October 31, 2017, the Fund’s Class A shares returned 27.22% (excluding front-end sales charges of 4.75%), underperforming its benchmark index, the Russell 2000® Growth Index, which returned 31.00%. The Fund’s underperformance relative to the benchmark was driven by weak relative returns within the health care and consumer discretionary sectors which, despite solid absolute returns, failed to keep up with strong benchmark returns during the reporting period. A bright spot for the Fund was the information technology sector which generated very strong absolute and relative returns, offsetting some of the Fund’s broader underperformance during the reporting period. As you review this summary and the table below, please keep in mind that an index is not available for direct investment; therefore its performance does not reflect the expenses associated with the management of an actual portfolio.
Growth of a $10,000 investment from 10/31/07 to 10/31/17 (a)
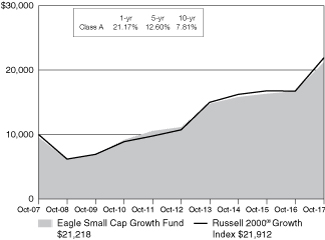
(a) The Fund’s values and returns reflect the maximum front-end sales charge of 4.75%, fund expenses and the reinvestment of dividends; however, they do not reflect the deduction of taxes that you would pay on fund distributions or redemption of fund shares. As of October 31, 2017, the Fund also offered Class C, Class I, Class R-3, Class R-5 and Class R-6 shares. The value of an investment in other share classes will differ due to each class’s respective sales charges and expenses. Additional information regarding the performance and the expenses of the Fund’s share classes, including fee waivers and/ or expense reimbursements or recoupments, which affect performance, is included in the Fund’s prospectus dated November 20, 2017, and elsewhere in this report.
Performance data represented is historical and does not guarantee future results. The investment return and principal value of an investment will fluctuate, and you may have a gain or loss when you sell shares. Current performance may be higher or lower than the performance data quoted. To obtain more current performance data as of the most recent month-end, please visit our website at carillontower.com.
Under performers | Shares of long-term holding Genesco Inc.—a footwear, apparel and accessories retailer—have faced ongoing pressure in what the Fund’s Portfolio Management team (‘PM team”) believes remains a difficult environment for mall-based retailers as Amazon continues to redevelop the landscape. Genesco continues to drive improved results within its e-commerce channel, which—when coupled with sharp rent reductions—the PM team believes should help offset some of the headwinds affecting the traditional brick-and-mortar channel. The Fund continues to hold a position in the stock. Specialty retailer Vitamin Shoppe, Inc. lagged as ever-evolving competitive pressures appear to have plagued the firm in recent periods. The PM team believes that expanded product offerings from conventional retailers and online vendors continue to encroach on Vitamin Shoppe’s market share. The Fund no longer holds a position in the stock. Universal Electronics Inc., a manufacturer of remote controls for television sets, has encountered some weakness during the period that the PM team believes is the result of pushouts of anticipated orders for its next-generation remote control. The delays appear to have been primarily a function of its end-market cable-service providers taking longer than expected to get rid of old remotes. The PM team expects order growth of the company’s advanced remote to accelerate as its customers work through their remaining inventory, which should help position the stock for renewed strength. The Fund continues to hold a position in the stock. Adeptus Health, Inc. (Class A) operates a network of independent, freestanding emergency rooms across the United States. The PM team believes that the confluence of the ongoing deterioration of inpatient volumes, in tandem with the firm’s sizeable capital expenditures (used to build new facilities to expand its network), combined to weigh heavily on Adeptus’ results and, in the PM team’s view, have compromised earnings visibility. The Fund no longer holds a position in the stock. Ambarella Inc. is a provider of video chips that enable high definition video capture, sharing and display. Shares encountered some downward pressure resulting in part from product release delays as well as softer-than-expected demand for its products within its drone segment during the reporting period. The Fund no longer holds a position in the stock.
Top performers | Coherent, Inc. makes laser-based equipment used in such applications as smartphone and tablet displays. The PM team believes that the firm continues to benefit from strong orders for its product which is used in the fabrication of organic light-emitting diode (OLED) displays that are increasingly used in next-generation smartphones. Further, the PM team believes that the potential for alternative applications of Coherent’s equipment (e.g., in tablets, autos and television) may provide additional upside over the longer term. Cognex Corp. manufactures machine “vision” systems used to monitor various aspects of manufacturing and distribution processes. The stock has performed very well as the PM team believes that the company continues to enhance its positioning as a key player within the growing factory- and industrial-automation and logistics markets. IPG Photonics Corp. makes lasers used in research markets, such as communications and medical applications. The firm has benefitted from the solid competitive positioning of its high-power lasers as well as via cost advantages generated through efficient vertical integration. The PM team believes that solid-waste company, Waste Connections, Inc. has continued to benefit from strong pricing power while leveraging a measured approach of organic growth and strategic acquisitions. The PM team believes that the firm is also indirectly benefitting from gradual improvements in consumer sentiment via increased consumption. Exact Sciences Corp. designs and develops molecular diagnostic tests used in cancer screening. Shares continued their upward trend as the firm appears to have benefitted from substantially increased insurance coverage (e.g., United Healthcare and Aetna) for its Cologuard exam product. In addition, increased physician adoption and an effective direct-to-consumer campaign are combining to help drive sales growth. The Fund continues to hold each of the securities noted above as “top performers.”
| 8 |
Performance Summary and Commentary
| Eagle Smaller Company Fund | ||
Portfolio Managers | Charles Schwartz, CFA®, Betsy Pecor, CFA®, and Matthew McGeary, CFA®, are Co-Portfolio Managers of the Eagle Smaller Company Fund (the “Fund”) and have been responsible for the day-to-day management of the Fund’s investment portfolio since October 2014.
Performance discussion | For the fiscal year ended October 31, 2017, the Fund’s Class A shares returned 26.11% (excluding front-end sales charges of 4.75%), outperforming its primary benchmark index, the Russell 2500® Index and underperforming its secondary index, the Russell 2000® Index, which returned 24.68% and 27.85%, respectively. The Fund’s performance benefited from strong stock selection in the real estate sector, primarily within real estate investment trusts, as well as an overall underweight position relative to the benchmark. In addition, the Fund also outperformed in the financial sector, where stock selection in the thrifts and mortgage finance industry benefited the Fund. In contrast, the Fund’s holdings in the energy sector led to underperformance versus the benchmark. Furthermore, the Fund’s relative performance suffered due to stock selection within the information technology sector. As you review this summary and the table below, please keep in mind that an index is not available for direct investment; therefore its performance does not reflect the expenses associated with the management of an actual portfolio.
Growth of a $10,000 investment from 11/3/08 to 10/31/17 (a)
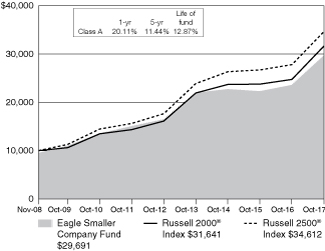
(a) The Fund’s values and returns reflect the maximum front-end sales charge of 4.75%, fund expenses and the reinvestment of dividends; however, they do not reflect the deduction of taxes that you would pay on fund distributions or redemption of fund shares. As of October 31, 2017, the Fund also offered Class C, Class I, Class R-3, Class R-5 and Class R-6 shares. The value of an investment in other share classes will differ due to each class’s respective sales charges and expenses. Additional information regarding the performance and the expenses of the Fund’s share classes, including fee waivers and/or expense reimbursements or recoupments, which affect performance, is included in the Fund’s prospectus dated November 20, 2017, and elsewhere in this report.
Performance data represented is historical and does not guarantee future results. The investment return and principal value of an investment will fluctuate, and you may have a gain or loss when you sell shares. Current performance may be higher or lower than the performance data quoted. To obtain more current performance data as of the most recent month-end, please visit our website at carillontower.com.
Top performers | Cognex Corporation is a leader in machine “vision” systems for manufacturing and other automation uses. The demand for more accurate, faster and
cost-effective work flows is a powerful driver for the company. Cognex reported favorable financial results and a better-than-expected outlook. The Fund continues to hold this stock. LendingTree Inc., an online marketplace connecting prospective borrowers with lenders, continued its upward momentum when it reported another strong quarter. The Fund’s Portfolio Management team (“PM team”) believes that this financial performance helped demonstrate the company’s ability to continue to grow its mortgage business and, more importantly, diversify its growth among home-equity loans, credit cards and personal loans. The company continues to launch new products and make small acquisitions that may allow it to enter new channels, such as small-business loans, insurance and deposits. After a period of significant outperformance by the company, as compared to their peers in the financials sector, the price exceeded the price target set by the PM team and pushed the valuation beyond what was supported by their discipline and the Fund exited its position. HEICO Corporation drove the Fund’s strong results in the aerospace industry. HEICO has continued to exceed consensus expectations and raised its outlook due to solid execution in its core businesses and completing beneficial acquisitions. The Fund continues to hold this stock. Catalent, Inc. is a global leader in the drug delivery outsourcing market. The PM team continues to believe in the company because there are a lot of secular trends in its favor including low penetration rates for outsourcing and growing demand for complex dose forms for a growing biopharmaceutical market. Catalent reported a strong quarter with revenue growth of 19% and over 25% growth in profitability. The company continues to guide conservatively, and the PM team believes that the company has plenty of levers to exceed expectations. The Fund continues to maintain a position in this health care company. Graco Inc. is a manufacturer of precision dispensing equipment used in numerous industrial applications. The stock performed well as the company posted its third consecutive quarter of double-digit organic sales growth and management raised its 2017 outlook to high single digit growth across every geography. The PM team continues to believe in the company’s consistent sales growth (which appears to be driven by new product and program launches as well as emerging market expansion), operating margin expansion opportunities, under-levered balance sheet, and optionality to deploy capital and best-in-class returns. The Fund continues to hold this stock.
Underperformers | Carrizo Oil & Gas Inc. is an oil and gas exploration and development company operating in several basins throughout North America. The company’s shares performed poorly due primarily to overall weakness in the sector resulting from lower oil prices and poor investor sentiment. Investors also appeared to be concerned about Carrizo making a large acquisition in the Permian basin. Late in the quarter, the company did purchase acreage in the Permian basin, however the company’s assets appear attractive and the price is reasonable. The PM team will be watching for non-core asset sales to help finance this deal. The Fund continues to hold this position. Gulfport Energy Corp. is an oil and gas exploration and production company with assets focused in the Utica Shale region. The company’s shares contributed to the Fund’s underperformance for two primary reasons. First, the entire energy sector traded off on commodity-price concerns and the company’s shares appeared to be caught in that downdraft. Second, Gulfport announced an acquisition of assets outside its core area of operation. Although, the PM team believes the deal makes sense because it offers geographic and geologic diversification to the business model, the Fund no longer holds this position. MDC Partners, Inc. (Class A), a global marketing consultancy, contributed to Fund underperformance as it posted weak 4Q16 results and lowered its earnings guidance. The company also hired LionTree Advisors to explore “financial and capital structure” strategies and suspended its dividend to improve its balance sheet and reinvest in the business. The Fund sold its position. Ellie Mae, Inc. is a leading provider of software solutions for the mortgage-origination business. The company reported underwhelming results and guidance. Refinancing volumes in particular were lower than expected as were purchase volumes due to tight supply issues. The Fund continues to hold this stock. IMAX Corp. offers a unique end-to-end cinematic solution combining its proprietary software, theater architecture and equipment to create a high-quality, immersive motion picture experience. The stock price decreased due to concerns over weaker second quarter box office results, declining global per screen averages/moviegoer frequency and competition from premium video on demand (due to the possibility of a shortened movie release window). The Fund no longer holds this stock.
| 9 |
Performance Summary and Commentary
| Eagle Tactical Allocation Fund | ||
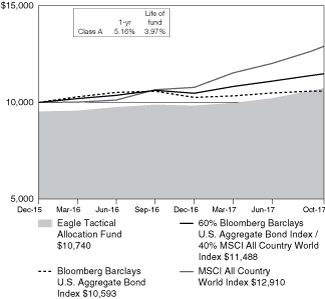
Portfolio Managers | James Breech, Ph.D., of Cougar Global Investments Ltd. (“Cougar”), is the Portfolio Manager of the Eagle Tactical Allocation Fund (the “Fund”) and has been responsible for the day-to-day management of the Fund’s investment portfolio since its inception in December 2015.
Performance discussion | For the fiscal year ended October 31 2017, Cougar’s 12-month forward looking outlook improved to incorporate a more robust assessment of the macro economic environment. This improvement was largely attributed to the global economy, where essentially every major developed and emerging market economy is growing simultaneously for the first time since the Global Financial Crisis. The probability assigned to the most optimistic scenario, Growth, rose from 0% over the course of the year and stood at a high of 45% in August. The increase came primarily from the sluggish growth scenario, Stagnation. The U.S. economy once again emerged from a weak start to the year, with employment gains fueling consumption as the growth driver. The probability assigned to Inflation decreased from 8% to 1% as energy prices remained range-bound, wage inflation muted, and some dampening potentially transitory factors. The chance that a high impact, low probability event, Chaos, would occur was increased in September from 6% to 8% to account for heightened geopolitical risks primarily stemming from tensions around North Korea and the immense progress of its nuclear program. Given the improved outlook, the Fund’s Portfolio Management team (“PM team”) increased equity exposure, and added international exposure. The improvement in global growth, corporate earnings recovery, and continuation of accommodative monetary policy appeared to fuel a continuation of the equity market rally. Fixed income also performed well, given that the Federal Reserve Board (“Fed”) refrained again from raising interest rates as much as had been originally expected. This led to a weakening of the U.S. dollar, benefitting commodities and non-U.S. exposures, in particular the Emerging Markets, which the Fund held. Meanwhile, the economic recovery and improved political climate in Europe boosted both equities and the Euro, which the Fund also held. The PM team believes that, while the Fed is inching away from ultra-loose monetary policy and unwinding its balance sheet, other major central banks are still likely to pursue accommodative policies, resulting in modest rises to bond yields globally.
For the fiscal year ended October 31, 2017, the Fund’s Class A shares returned 10.42% (excluding front-end sales charges of 4.75%), outperforming the Bloomberg Barclays U.S. Aggregate Bond Index and underperforming the MSCI ACWI® Index, which performed 0.90% and 23.20%, respectively. The Fund also outperformed a custom blended index, which is a combination of the Bloomberg Barclays U.S. Aggregate Bond Index (60%) and the MSCI ACWI® Index (40%), which returned 9.35% for the same period. The Fund, relative to the blended benchmark, outperformed due to a higher weight to equities than the benchmark for most of the year. At the start of the fiscal year, the Fund’s investments in exchange-traded funds (ETFs) that invest in primarily equity securities represented 34% of its portfolio. This equity allocation was gradually increased to over 50% at the end of Q1, peaking at 78% during Q2, before falling back to 67% in Q3. Within equities, the increase in international exposures to 17% also contributed to outperformance. Within fixed income, the duration of the aggregate holdings of the Fund’s investments in ETFs that invested in fixed income was broadly in line with the index exposure. Gold was sold early in the fiscal period as its relative attractiveness as a safe haven declined.
Top performers | The largest contributors to performance were U.S. equities. Both the SPDR S&P 500 ETF Trust (SPY) and the iShares Core S&P 500 ETF (IVV) represented an average 36% weight over the year and, as such, the largest asset class exposure. U.S. mid-caps, SPDR S&P Midcap 400 ETF Trust (MDY), at an average 12% holding also contributed to performance, as did a smaller average 7% weight in U.S. small-caps. International results were also positive. This includes the following European holdings, both currency hedged and then unhedged, iShares Currency Hedged MSCI Eurozone ETF (HEZU) and iShares MSCI Eurozone ETF (EZU), Japan, iShares MSCI Japan ETF (EWJ), and Emerging Markets holdings, iShares Core MSCI Emerging Markets ETF (IEMG). The Fund reduced equities and sold most of the international exposure as a softening in the outlook
and increase in Chaos required additional fixed income exposure to meet its risk constraint. The Fund however remains overweight equities, and favors e-globally oriented U.S. large cap equities.
Underperformers | Currency hedged Japan, iShares Currency Hedged MSCI Japan ETF (HEWJ), was the only outright detractor from performance, albeit only mildly. It was held early in the period on a currency hedged basis. The PM team believes that the yen strengthened as it benefitted from its safe haven status as the North Korea tensions escalated, resulting in a period of underperformance of North Korea’s stock market. The ETF was sold so the Fund could purchase into iShares MSCI Japan ETF (EWJ) to diversify currency exposure within the portfolio. U.S. small and mid-caps were relative underperformers. This holding was sold during Q1 so the Fund could purchase into U.S. large cap given uncertainty over tax reform and a better outlook for large-caps given the global environment and more stable dollar.
Growth of a $10,000 investment from 12/31/15 to 10/31/17 (a)
(a) The Fund’s values and returns reflect the maximum front-end sales charge of 4.75%, fund expenses and the reinvestment of dividends; however, they do not reflect the deduction of taxes that you would pay on fund distributions or redemption of fund shares. As of October 31, 2017, the Fund also offered Class C, Class I, Class R-3, Class R-5 and Class R-6 shares. The value of an investment in other share classes will differ due to each class’s respective sales charges and expenses. Additional information regarding the performance and the expenses of the Fund’s share classes, including fee waivers and/or expense reimbursements or recoupments, which affect performance, is included in the Fund’s prospectus dated November 20, 2017, and elsewhere in this report.
Performance data represented is historical and does not guarantee future results. The investment return and principal value of an investment will fluctuate, and you may have a gain or loss when you sell shares. Current performance may be higher or lower than the performance data quoted. To obtain more current performance data as of the most recent month-end, please visit our website at carillontower.com.
| 10 |
The Bloomberg Barclays U.S. Aggregate Bond Index is a broad-based benchmark that measures the investment grade, US dollar-denominated, fixed-rate taxable bond market. The index includes Treasuries, government-related and corporate securities, MBS (agency fixed-rate and hybrid ARM pass-throughs), ABS and CMBS (agency and non-agency).
The Bloomberg Barclays U.S. Intermediate Government/Credit Bond Index includes U.S. government and investment grade credit securities that have a greater than or equal to one year and less than ten years remaining to maturity and have $250,000,000 or more of outstanding face value. The returns of the index do not include the effect of any sales charges. That means that actual returns would be lower if they included the effect of sales charges.
The MSCI All Country World Index is a market capitalization weighted index designed to provide a broad measure of equity-market performance throughout the world. The index is maintained by Morgan Stanley Capital International, and is comprised of stocks from both developed and emerging markets.
The MSCI EAFE® Index is a free float-adjusted market capitalization index that is designed to measure the equity market performance of developed markets, excluding the U.S. and Canada. The index consists of 21 developed market country indices. Its returns do not include the effect of any sales charges. That means that actual returns would be lower if they included the effect of sales charges.
The Russell 1000® Growth Index measures the performance of the large-cap growth segment of the U.S. equity universe. It includes those Russell 1000 Index companies with higher price-to-book ratios and higher forecasted growth values. Its returns do not include the effect of any sales charges. That means that actual returns would be lower if they included the effect of sales charges.
The Russell 2000® Index measures the performance of the small-cap segment of the U.S. equity universe. The Russell 2000 is a subset of the Russell 3000® Index representing approximately 10% of the total market capitalization of that index. It includes approximately 2000 of the smallest securities based on a combination of their market cap and current index membership. Its returns do not include the effect of any sales charges. That means that actual returns would be lower if they included the effect of sales charges.
The Russell 2500® Index measures the performance of the small to mid-cap segment of the U.S. equity universe, commonly referred to as “smid” cap. The Russell 2500® Index is a subset of the Russell 3000® Index. It includes approximately 2,500 of the smallest securities based on a combination of their market cap and current index membership. Its returns do not include the effect of any sales charges. That means that actual returns would be lower if they included the effect of sales charges.
The Russell 2000® Growth Index measures the performance of the small-cap growth segment of the U.S. equity universe. It includes those Russell 2000® Index companies with higher price-to-value ratios and higher forecasted growth values. Its returns do not include the effect of any sales charges. That means that actual returns would be lower if they included the effect of sales charges.
The Russell Midcap® Index measures the performance of the mid-cap segment of the U.S. equity universe. The index is a subset of the Russell 1000® Index. It includes approximately 800 of the smallest securities based on a combination of their market cap and current index membership. Its returns do not include the effect of any sales charges. That means that actual returns would be lower if they included the effect of sales charges.
The Russell Midcap® Growth Index measures the performance of the mid-cap growth segment of the U.S. equity universe. It includes those Russell Midcap® Index companies with higher price-to-book ratios and higher forecasted growth values. Its returns do not include the effect of any sales charges. That means that actual returns would be lower if they included the effect of sales charges.
The S&P 500® Index is an unmanaged index of 500 U.S. stocks and gives a broad look at how stock prices have performed. Its returns do not include the effect of any sales charges. That means that actual returns would be lower if they included the effect of sales charges.
The S&P MidCap 400® Index is an unmanaged index that measures the performance of the mid-sized company segment of the U.S. market. Its returns do not include the effect of any sales charges. That means that actual returns would be lower if they included the effect of sales charges.
Frank Russell Company (“Russell”) is the source and owner of the trademarks, service marks and copyrights related to the Russell Indexes. Russell® is a trademark of Frank Russell Company. Neither Russell nor its licensors accept any liability for any errors or omissions in the Russell Indexes and / or Russell ratings or underlying data and no party may rely on any Russell Indexes and / or Russell ratings and / or underlying data contained in this communication. No further distribution of Russell Data is permitted without Russell’s express written consent. Russell does not promote, sponsor or endorse the content of this communication.
| 11 |
Investment Portfolios
| 10.31.2017 |
| COMMON STOCKS—99.2% | Shares | Value | ||||||||||
| Household durables—2.0% | ||||||||||||
D.R. Horton, Inc. | 123,800 | $5,473,198 | ||||||||||
Mohawk Industries, Inc.* | 9,300 | 2,434,368 | ||||||||||
| Insurance—0.5% | ||||||||||||
The Progressive Corp. | 38,400 | 1,868,160 | ||||||||||
| Internet & direct marketing retail—3.5% | ||||||||||||
Amazon.com, Inc.* | 12,500 | 13,816,000 | ||||||||||
| Internet software & services—11.4% | ||||||||||||
Alphabet, Inc., Class A* | 11,014 | 11,377,902 | ||||||||||
Alphabet, Inc., Class C* | 11,012 | 11,195,240 | ||||||||||
eBay, Inc.* | 102,500 | 3,858,100 | ||||||||||
Facebook, Inc., Class A* | 100,100 | 18,024,006 | ||||||||||
| IT services—6.4% | ||||||||||||
Amdocs Ltd. | 18,900 | 1,230,390 | ||||||||||
Fiserv, Inc.* | 33,000 | 4,271,190 | ||||||||||
Global Payments, Inc. | 19,800 | 2,058,210 | ||||||||||
MasterCard, Inc., Class A | 44,730 | 6,654,482 | ||||||||||
Vantiv, Inc., Class A* | 67,504 | 4,725,280 | ||||||||||
Visa, Inc., Class A | 56,700 | 6,235,866 | ||||||||||
| Life sciences tools & services—1.5% | ||||||||||||
Thermo Fisher Scientific, Inc. | 31,200 | 6,047,496 | ||||||||||
| Machinery—3.5% | ||||||||||||
Caterpillar, Inc. | 34,800 | 4,725,840 | ||||||||||
Ingersoll-Rand PLC | 42,600 | 3,774,360 | ||||||||||
Oshkosh Corp. | 32,100 | 2,939,076 | ||||||||||
Parker-Hannifin Corp. | 12,500 | 2,282,625 | ||||||||||
| Media—1.2% | ||||||||||||
Comcast Corp., Class A | 125,900 | 4,536,177 | ||||||||||
| Metals & mining—1.0% | ||||||||||||
Steel Dynamics, Inc. | 107,300 | 3,992,633 | ||||||||||
| Semiconductors & semiconductor equipment—6.9% | ||||||||||||
Applied Materials, Inc. | 165,900 | 9,361,737 | ||||||||||
KLA-Tencor Corp. | 17,900 | 1,949,131 | ||||||||||
Lam Research Corp. | 33,400 | 6,966,238 | ||||||||||
Microchip Technology, Inc. | 32,500 | 3,081,000 | ||||||||||
NVIDIA Corp. | 26,700 | 5,521,827 | ||||||||||
| Software—11.2% | ||||||||||||
Activision Blizzard, Inc. | 68,100 | 4,459,869 | ||||||||||
Adobe Systems, Inc.* | 24,300 | 4,256,388 | ||||||||||
Electronic Arts, Inc.* | 45,100 | 5,393,960 | ||||||||||
Microsoft Corp. | 258,300 | 21,485,394 | ||||||||||
Oracle Corp. | 64,000 | 3,257,600 | ||||||||||
Synopsys, Inc.* | 56,400 | 4,879,728 | ||||||||||
| Specialty retail—2.8% | ||||||||||||
Ross Stores, Inc. | 33,300 | 2,114,217 | ||||||||||
The Home Depot, Inc. | 54,000 | 8,952,120 | ||||||||||
| Technology hardware, storage & peripherals—6.4% | ||||||||||||
Apple, Inc. | 132,366 | 22,375,149 | ||||||||||
NetApp, Inc. | 59,300 | 2,634,106 | ||||||||||
| Textiles, apparel & luxury goods—1.1% | ||||||||||||
PVH Corp. | 34,100 | 4,324,221 | ||||||||||
| 12 | The accompanying notes are an integral part of the financial statements. |
Investment Portfolios
| 10.31.2017 |
| EAGLE CAPITAL APPRECIATION FUND (cont’d) | ||||||||||||
| COMMON STOCKS—99.2% | Shares | Value | ||||||||||
| Trading companies & distributors—0.7% | ||||||||||||
United Rentals, Inc.* | 18,400 | $2,603,232 | ||||||||||
| Total common stocks (cost $225,358,650) | 387,861,670 | |||||||||||
| Total investment portfolio (cost $225,358,650)—99.2% | 387,861,670 | |||||||||||
Other assets in excess of liabilities—0.8% |
| 3,033,357 | ||||||||||
| Total net assets—100.0% | $390,895,027 | |||||||||||
* Non-income producing security
| Sector allocation (unaudited) | ||||
| Sector | Percent of net assets | |||
| Information technology | 42.3% | |||
| Consumer discretionary | 17.0% | |||
| Health care | 14.5% | |||
| Industrials | 11.6% | |||
| Consumer staples | 7.2% | |||
| Financials | 3.0% | |||
| Materials | 2.7% | |||
| Real estate | 0.9% | |||
| COMMON STOCKS—96.5% | Shares | Value | ||||||||||
| Food products—1.7% | ||||||||||||
General Mills, Inc. | 193,875 | $10,065,990 | ||||||||||
| Health care equipment & supplies—3.9% | ||||||||||||
Abbott Laboratories | 242,099 | 13,129,029 | ||||||||||
Medtronic PLC | 128,275 | 10,328,703 | ||||||||||
| Hotels, restaurants & leisure—5.9% | ||||||||||||
Carnival Corp. | 334,608 | 22,214,625 | ||||||||||
McDonald’s Corp. | 81,079 | 13,532,896 | ||||||||||
| Household products—2.3% | ||||||||||||
The Procter & Gamble Co. | 158,140 | 13,653,808 | ||||||||||
| Industrial conglomerates—6.2% | ||||||||||||
3M Co. | 66,586 | 15,327,431 | ||||||||||
Honeywell International, Inc. | 154,193 | 22,228,463 | ||||||||||
| Media—2.6% | ||||||||||||
Regal Entertainment Group, Class A | 966,060 | 15,795,081 | ||||||||||
| Multi-utilities—2.0% | ||||||||||||
Sempra Energy | 102,793 | 12,078,177 | ||||||||||
| Oil, gas & consumable fuels—8.2% | ||||||||||||
Chevron Corp. | 153,728 | 17,815,538 | ||||||||||
Occidental Petroleum Corp. | 227,379 | 14,681,862 | ||||||||||
TOTAL S.A., Sponsored ADR | 304,174 | 16,948,575 | ||||||||||
| Pharmaceuticals—9.5% | ||||||||||||
Johnson & Johnson | 163,277 | 22,762,447 | ||||||||||
Merck & Co., Inc. | 245,981 | 13,551,093 | ||||||||||
Pfizer, Inc. | 596,524 | 20,914,131 | ||||||||||
| Road & rail—2.5% | ||||||||||||
Union Pacific Corp. | 133,501 | 15,458,081 | ||||||||||
| Software—4.5% | ||||||||||||
Microsoft Corp. | 326,064 | 27,122,004 | ||||||||||
| Specialty retail—3.2% | ||||||||||||
The Home Depot, Inc. | 118,307 | 19,612,934 | ||||||||||
| Technology hardware, storage & peripherals—4.8% | ||||||||||||
Apple, Inc. | 170,906 | 28,889,950 | ||||||||||
| Tobacco—2.5% | ||||||||||||
Altria Group, Inc. | 236,030 | 15,157,847 | ||||||||||
| Total common stocks (cost $388,758,208) | 582,973,249 | |||||||||||
| Total investment portfolio (cost $388,758,208)—96.5% | 582,973,249 | |||||||||||
Other assets in excess of liabilities—3.5% |
| 21,166,986 | ||||||||||
| Total net assets—100.0% | $604,140,235 | |||||||||||
ADR—American depository receipt
| The accompanying notes are an integral part of the financial statements. | 13 |
Investment Portfolios
| 10.31.2017 |
| EAGLE GROWTH & INCOME FUND (cont’d) | ||||||
| Sector allocation (unaudited) | ||||
| Sector | Percent of net assets | |||
| Health care | 13.3% | |||
| Consumer staples | 13.2% | |||
| Industrials | 12.3% | |||
| Information technology | 12.0% | |||
| Consumer discretionary | 11.8% | |||
| Financials | 10.9% | |||
| Energy | 8.2% | |||
| Real estate | 6.0% | |||
| Utilities | 4.0% | |||
| Materials | 2.6% | |||
| Telecommunication services | 2.2% | |||
| COMMON STOCKS—95.6% | Shares | Value | ||||||||||
| Hong Kong (cont’d) | ||||||||||||
CK Asset Holdings Ltd. | 6,172 | $50,795 | ||||||||||
Kerry Properties Ltd. | 13,000 | 58,504 | ||||||||||
Xinyi Glass Holdings Ltd.* | 194,000 | 187,990 | ||||||||||
| Israel—1.1% | ||||||||||||
Israel Discount Bank Ltd., Class A* | 46,819 | 124,370 | ||||||||||
Tower Semiconductor Ltd.* | 2,644 | 87,575 | ||||||||||
| Italy—1.8% | ||||||||||||
Enel SpA | 38,313 | 237,605 | ||||||||||
Intesa Sanpaolo SpA | 28,712 | 96,527 | ||||||||||
| Japan—28.9% | ||||||||||||
Asahi Group Holdings Ltd. | 6,100 | 278,516 | ||||||||||
Cosmo Energy Holdings Co. Ltd. | 4,000 | 91,888 | ||||||||||
Daiwa House Industry Co. Ltd. | 6,100 | 223,583 | ||||||||||
Fujitsu Ltd. | 14,000 | 109,095 | ||||||||||
Fukuoka Financial Group, Inc. | 13,000 | 67,096 | ||||||||||
Hanwa Co. Ltd. | 2,000 | 75,910 | ||||||||||
Haseko Corp. | 4,700 | 68,251 | ||||||||||
Hitachi Ltd. | 51,000 | 406,131 | ||||||||||
Honda Motor Co. Ltd. | 6,000 | 188,022 | ||||||||||
ITOCHU Corp. | 23,300 | 408,138 | ||||||||||
JFE Holdings, Inc. | 6,300 | 135,395 | ||||||||||
JXTG Holdings, Inc. | 29,100 | 150,267 | ||||||||||
KDDI Corp. | 3,600 | 95,913 | ||||||||||
Maeda Corp. | 12,000 | 150,449 | ||||||||||
Marubeni Corp. | 47,500 | 318,489 | ||||||||||
Mitsubishi Chemical Holdings Corp. | 32,800 | 342,606 | ||||||||||
Mitsubishi UFJ Financial Group, Inc. | 31,800 | 215,704 | ||||||||||
Nichirei Corp. | 3,500 | 90,098 | ||||||||||
Nippon Electric Glass Co. Ltd. | 1,600 | 65,326 | ||||||||||
Nippon Light Metal Holdings Co. Ltd. | 13,400 | 39,441 | ||||||||||
Nippon Suisan Kaisha Ltd. | 10,100 | 61,797 | ||||||||||
Nippon Telegraph & Telephone Corp. | 7,600 | 367,441 | ||||||||||
Nipro Corp. | 6,700 | 97,680 | ||||||||||
Penta-Ocean Construction Co. Ltd. | 10,700 | 70,787 | ||||||||||
SCREEN Holdings Co. Ltd. | 1,100 | 86,217 | ||||||||||
Sekisui House Ltd. | 2,100 | 39,267 | ||||||||||
SoftBank Group Corp. | 2,200 | 194,969 | ||||||||||
Sony Corp. | 3,300 | 138,054 | ||||||||||
Sumitomo Corp. | 11,000 | 159,105 | ||||||||||
Sumitomo Mitsui Financial Group, Inc. | 3,100 | 124,194 | ||||||||||
The Kansai Electric Power Co., Inc. | 4,700 | 64,362 | ||||||||||
Tokyo Electron Ltd. | 1,400 | 246,512 | ||||||||||
Toyota Motor Corp. | 4,500 | 279,117 | ||||||||||
| Netherlands—4.9% | ||||||||||||
Aegon N.V. | 15,941 | 94,113 | ||||||||||
AerCap Holdings N.V.* | 2,000 | 105,280 | ||||||||||
ASR Nederland N.V. | 5,860 | 240,229 | ||||||||||
NN Group N.V. | 7,349 | 307,758 | ||||||||||
Unilever N.V. | 2,956 | 171,714 | ||||||||||
| Norway—0.8% | ||||||||||||
Austevoll Seafood ASA | 3,437 | 34,402 | ||||||||||
DNO ASA* | 60,698 | 73,745 | ||||||||||
Leroy Seafood Group ASA | 6,850 | 41,137 | ||||||||||
| Singapore—2.2% | ||||||||||||
DBS Group Holdings Ltd. | 8,600 | 143,608 | ||||||||||
Oversea-Chinese Banking Corp. Ltd. | 25,500 | 222,707 | ||||||||||
Yanlord Land Group Ltd. | 36,700 | 48,226 | ||||||||||
| 14 | The accompanying notes are an integral part of the financial statements. |
Investment Portfolios
| 10.31.2017 |
| EAGLE INTERNATIONAL STOCK FUND (cont’d) | ||||||||||||
| COMMON STOCKS—95.6% | Shares | Value | ||||||||||
| Spain—2.0% | ||||||||||||
Banco Santander S.A. | 27,567 | $186,885 | ||||||||||
Iberdrola S.A. | 14,869 | 120,157 | ||||||||||
Repsol S.A. | 3,778 | 70,797 | ||||||||||
| Sweden—2.1% | ||||||||||||
Ahlsell AB | 11,097 | 73,449 | ||||||||||
Boliden AB | 2,379 | 83,245 | ||||||||||
Scandic Hotels Group AB | 3,600 | 46,440 | ||||||||||
Svenska Cellulosa AB SCA, Class B | 6,704 | 62,950 | ||||||||||
Volvo AB, Class B | 6,758 | 133,851 | ||||||||||
| Switzerland—11.7% | ||||||||||||
Baloise Holding AG | 1,688 | 266,125 | ||||||||||
Bossard Holding AG, Class A | 166 | 39,236 | ||||||||||
Lonza Group AG* | 812 | 215,717 | ||||||||||
Nestle S.A. | 5,359 | 450,898 | ||||||||||
Novartis AG | 4,115 | 339,402 | ||||||||||
Sika AG | 20 | 148,030 | ||||||||||
Swiss Life Holding AG* | 526 | 182,821 | ||||||||||
UBS Group AG* | 10,589 | 180,152 | ||||||||||
VAT Group AG* | 1,230 | 160,136 | ||||||||||
Zurich Insurance Group AG | 719 | 219,414 | ||||||||||
| United Kingdom—15.1% | ||||||||||||
3i Group PLC | 15,637 | 199,561 | ||||||||||
Ashtead Group PLC | 5,475 | 141,033 | ||||||||||
Aviva PLC | 18,780 | 125,984 | ||||||||||
Barclays PLC | 41,620 | 102,706 | ||||||||||
Bellway PLC | 2,900 | 140,608 | ||||||||||
BP PLC | 24,813 | 168,297 | ||||||||||
British American Tobacco PLC | 3,082 | 199,127 | ||||||||||
Carnival PLC | 3,286 | 216,640 | ||||||||||
Electrocomponents PLC | 7,612 | 70,205 | ||||||||||
GlaxoSmithKline PLC | 5,778 | 103,699 | ||||||||||
Glencore PLC* | 28,617 | 138,025 | ||||||||||
HSBC Holdings PLC | 21,108 | 206,121 | ||||||||||
Imperial Brands PLC | 1,144 | 46,642 | ||||||||||
Lloyds Banking Group PLC | 144,395 | 130,884 | ||||||||||
National Grid PLC | 4,714 | 56,748 | ||||||||||
Persimmon PLC | 2,551 | 94,934 | ||||||||||
Playtech PLC | 5,259 | 68,718 | ||||||||||
Redrow PLC | 6,943 | 60,031 | ||||||||||
Royal Dutch Shell PLC, Class B | 6,867 | 221,098 | ||||||||||
Shire PLC | 4,498 | 221,551 | ||||||||||
Standard Chartered PLC | 12,637 | 125,863 | ||||||||||
| Total common stocks (cost $15,250,017) | 18,004,628 | |||||||||||
| PREFERRED STOCKS—0.6% | ||||||||||||
| Germany—0.6% | ||||||||||||
Volkswagen AG | 596 | 109,129 | ||||||||||
| Total preferred stocks (cost $94,092) | 109,129 | |||||||||||
| Total investment portfolio (cost $15,344,109)—96.2% | 18,113,757 | |||||||||||
Other assets in excess of liabilities—3.8% |
| 723,988 | ||||||||||
| Total net assets—100.0% | $18,837,745 | |||||||||||
* Non-income producing security
| Sector allocation (unaudited) | ||||
| Sector | Percent of net assets | |||
| Financials | 24.3% | |||
| Industrials | 15.3% | |||
| Consumer discretionary | 11.6% | |||
| Information technology | 8.7% | |||
| Consumer staples | 8.5% | |||
| Materials | 7.4% | |||
| Health care | 7.1% | |||
| Energy | 4.1% | |||
| Utilities | 3.7% | |||
| Telecommunication services | 3.5% | |||
| Real estate | 2.0% | |||
| Industry allocation (unaudited) | ||||||||
| Industry | Value | Percent of net assets | ||||||
| Banks | $2,453,340 | 13.0% | ||||||
| Insurance | 1,743,209 | 9.3% | ||||||
| Trading companies & distributors | 1,320,640 | 7.0% | ||||||
| Automobiles | 890,533 | 4.7% | ||||||
| Chemicals | 814,298 | 4.3% | ||||||
| Oil, gas & consumable fuels | 776,092 | 4.1% | ||||||
| Food products | 727,866 | 3.9% | ||||||
| Pharmaceuticals | 682,753 | 3.6% | ||||||
| Airlines | 652,017 | 3.5% | ||||||
| Semiconductors & semiconductor equipment | 605,072 | 3.2% | ||||||
| Electronic equipment, instruments & components | 541,662 | 2.9% | ||||||
| Household durables | 541,146 | 2.9% | ||||||
| Metals & mining | 514,282 | 2.7% | ||||||
| Auto components | 495,069 | 2.6% | ||||||
| Construction & engineering | 470,711 | 2.5% | ||||||
| Beverages | 453,742 | 2.4% | ||||||
| IT services | 422,522 | 2.2% | ||||||
| Electric utilities | 422,123 | 2.2% | ||||||
| Real estate management & development | 381,107 | 2.0% | ||||||
| Capital markets | 379,713 | 2.0% | ||||||
| Diversified telecommunication services | 367,441 | 2.0% | ||||||
| Machinery | 293,986 | 1.6% | ||||||
| Wireless telecommunication services | 290,882 | 1.6% | ||||||
| Multi-utilities | 267,544 | 1.4% | ||||||
| Hotels, restaurants & leisure | 263,079 | 1.4% | ||||||
| Tobacco | 245,769 | 1.3% | ||||||
| The accompanying notes are an integral part of the financial statements. | 15 |
Investment Portfolios
| 10.31.2017 |
| EAGLE INTERNATIONAL STOCK FUND (cont’d) | ||||||||
| Industry allocation (unaudited) (cont’d) | ||||||||
| Industry | Value | Percent of net assets | ||||||
| Biotechnology | $221,551 | 1.2% | ||||||
| Life sciences tools & services | 215,717 | 1.2% | ||||||
| Personal products | 171,714 | 0.9% | ||||||
| Health care providers & services | 111,929 | 0.6% | ||||||
| Health care equipment & supplies | 97,680 | 0.5% | ||||||
| Marine | 93,251 | 0.5% | ||||||
| Software | 68,718 | 0.4% | ||||||
| Paper & forest products | 62,950 | 0.3% | ||||||
| Building products | 53,649 | 0.3% | ||||||
| CORPORATE BONDS—54.4% | Principal Amount | Value | ||||||||||
| Commercial services & supplies—0.6% | ||||||||||||
Pitney Bowes, Inc., 3.88%, 05/15/22 | $250,000 | $242,679 | ||||||||||
| Communications equipment—0.2% | ||||||||||||
Juniper Networks, Inc., 3.13%, 02/26/19 | 100,000 | 101,304 | ||||||||||
| Computers—0.6% | ||||||||||||
Dell International LLC/EMC Corp., 144A, 4.42%, 06/15/21 (a) | 250,000 | 262,815 | ||||||||||
| Diversified financial services—1.3% | ||||||||||||
Oaktree Capital Management LP, 144A, 6.75%, 12/02/19 (a) | 500,000 | 541,761 | ||||||||||
| Diversified telecommunication services—0.6% | ||||||||||||
AT&T, Inc., 5.88%, 10/01/19 | 250,000 | 267,395 | ||||||||||
| Electric—0.6% | ||||||||||||
NextEra Energy Capital Holdings, Inc., 2.70%, 09/15/19 | 250,000 | 252,458 | ||||||||||
| Electric Utilities—0.6% | ||||||||||||
Edison International, 2.40%, 09/15/22 | 250,000 | 247,654 | ||||||||||
| Electronic equipment, instruments & components—1.7% | ||||||||||||
Amphenol Corp., 3.13%, 09/15/21 | 250,000 | 254,691 | ||||||||||
Avnet, Inc., 3.75%, 12/01/21 | 250,000 | 256,020 | ||||||||||
FLIR Systems, Inc., 3.13%, 06/15/21 | 200,000 | 201,418 | ||||||||||
| Equity real estate investment trusts (REITs)—1.8% | ||||||||||||
American Tower Corp., 3.30%, 02/15/21 | 250,000 | 256,214 | ||||||||||
Omega Healthcare Investors, Inc., 4.38%, 08/01/23 | 250,000 | 257,187 | ||||||||||
Ventas Realty LP, 3.13%, 06/15/23 | 250,000 | 250,764 | ||||||||||
| Food products—0.6% | ||||||||||||
The J.M. Smucker Co., 2.50%, 03/15/20 | 250,000 | 251,751 | ||||||||||
| Health care equipment & supplies—0.2% | ||||||||||||
Abbott Laboratories, 2.80%, 09/15/20 | 100,000 | 101,329 | ||||||||||
| Health care providers & services—0.6% | ||||||||||||
Cardinal Health, Inc., 1.95%, 06/14/19 | 250,000 | 249,443 | ||||||||||
| Insurance—2.6% | ||||||||||||
Berkshire Hathaway Finance Corp. (3 Month LIBOR USD + 0.26%), 1.58%, 08/15/19 | 500,000 | 501,858 | ||||||||||
Chubb INA Holdings, Inc., 2.30%, 11/03/20 | 100,000 | 100,554 | ||||||||||
Metropolitan Life Global Funding I, 144A, 2.30%, 04/10/19 (a) | 250,000 | 251,576 | ||||||||||
Nuveen Finance LLC, 144A, 2.95%, 11/01/19 (a) | 250,000 | 253,675 | ||||||||||
| IT services—2.6% | ||||||||||||
Broadridge Financial Solutions, Inc., 3.95%, 09/01/20 | 250,000 | 260,757 | ||||||||||
Fidelity National Information Services, Inc., 2.25%, 08/15/21 | 250,000 | 248,004 | ||||||||||
Fiserv, Inc., 4.63%, 10/01/20 | 100,000 | 106,313 | ||||||||||
International Business Machines Corp. (3 Month LIBOR USD + 0.23%), 1.60%, 01/27/20 | 500,000 | 501,250 | ||||||||||
| Life sciences tools & services—0.6% | ||||||||||||
Thermo Fisher Scientific, Inc., 3.00%, 04/15/23 | 250,000 | 252,954 | ||||||||||
| Machinery-diversified—0.3% | ||||||||||||
John Deere Capital Corp. (3 Month LIBOR USD + 0.29%), 1.64%, 10/09/19 | 150,000 | 150,526 | ||||||||||
| Media—2.2% | ||||||||||||
Discovery Communications LLC, 5.63%, 08/15/19 | 123,000 | 130,192 | ||||||||||
Scripps Networks Interactive, Inc., 2.80%, 06/15/20 | 250,000 | 252,023 | ||||||||||
The Interpublic Group of Cos., Inc., 4.20%, 04/15/24 | 291,000 | 305,386 | ||||||||||
Time Warner Cable LLC, 5.00%, 02/01/20 | 250,000 | 263,126 | ||||||||||
| Multi-utilities—0.6% | ||||||||||||
Sempra Energy, 1.63%, 10/07/19 | 250,000 | 247,531 | ||||||||||
| 16 | The accompanying notes are an integral part of the financial statements. |
Investment Portfolios
| 10.31.2017 |
| EAGLE INVESTMENT GRADE BOND FUND (cont’d) | ||||||||||||
| CORPORATE BONDS—54.4% | Principal Amount | Value | ||||||||||
| Oil, gas & consumable fuels—2.1% | ||||||||||||
Andeavor, 144A, 4.75%, 12/15/23 (a) | $250,000 | $270,625 | ||||||||||
ONEOK Partners LP, 3.80%, 03/15/20 | 100,000 | 102,255 | ||||||||||
Valero Energy Partners LP, 4.38%, 12/15/26 | 250,000 | 261,620 | ||||||||||
Williams Partners LP, 4.13%, 11/15/20 | 250,000 | 261,742 | ||||||||||
| Pharmaceuticals—0.6% | ||||||||||||
Bayer US Finance LLC, 144A, 3.00%, 10/08/21 (a) | 250,000 | 254,573 | ||||||||||
| Private equity—0.6% | ||||||||||||
Apollo Management Holdings LP, 144A, 4.40%, 05/27/26 (a) | 250,000 | 261,025 | ||||||||||
| Road & rail—0.3% | ||||||||||||
Ryder System, Inc., 2.65%, 03/02/20 | 150,000 | 151,427 | ||||||||||
| Semiconductors—0.6% | ||||||||||||
Broadcom Corp./Broadcom Cayman Finance Ltd., 144A, 3.00%, 01/15/22 (a) | 250,000 | 252,791 | ||||||||||
| Semiconductors & semiconductor equipment—0.6% | ||||||||||||
KLA-Tencor Corp., 3.38%, 11/01/19 | 250,000 | 254,707 | ||||||||||
| Software—2.9% | ||||||||||||
Activision Blizzard, Inc., 2.30%, 09/15/21 | 250,000 | 248,560 | ||||||||||
CA, Inc., 5.38%, 12/01/19 | 250,000 | 264,626 | ||||||||||
Oracle Corp. (3 Month LIBOR USD + 0.58%), 1.94%, 01/15/19 | 500,000 | 503,295 | ||||||||||
VMware, Inc., 2.95%, 08/21/22 | 250,000 | 250,701 | ||||||||||
| Specialty retail—0.5% | ||||||||||||
O’Reilly Automotive, Inc., 3.80%, 09/01/22 | 200,000 | 210,113 | ||||||||||
| Technology hardware, storage & peripherals—3.0% | ||||||||||||
Apple, Inc. | ||||||||||||
(3 Month LIBOR USD + 0.14%), 1.45%, 08/02/19 | 250,000 | 250,313 | ||||||||||
(3 Month LIBOR USD + 0.30%), 1.61%, 05/06/20 | 250,000 | 251,303 | ||||||||||
EMC Corp., 1.88%, 06/01/18 | 250,000 | 249,476 | ||||||||||
HP, Inc., 4.65%, 12/09/21 | 250,000 | 268,926 | ||||||||||
NetApp, Inc., 3.38%, 06/15/21 | 250,000 | 256,329 | ||||||||||
| Trading companies & distributors—0.6% | ||||||||||||
Air Lease Corp., 2.63%, 09/04/18 | 250,000 | 251,553 | ||||||||||
| Total domestic corporate bonds (cost $20,167,065) | 20,332,833 | |||||||||||
| Foreign—7.0% | ||||||||||||
| Aerospace & defense—0.4% | ||||||||||||
Rolls-Royce PLC, 144A, 2.38%, 10/14/20 (a) | 200,000 | 199,707 | ||||||||||
| Banks—1.2% | ||||||||||||
National Australia Bank Ltd., 144A, 2.25%, 07/01/19 (a) | 250,000 | 251,326 | ||||||||||
Royal Bank Of Canada, 2.10%, 10/14/20 | 250,000 | 249,229 | ||||||||||
| Diversified financial services—0.6% | ||||||||||||
Genpact Luxembourg Sarl, 144A, 3.70%, 04/01/22 (a) | 250,000 | 252,127 | ||||||||||
| Food products—0.6% | ||||||||||||
Danone SA, 144A, 2.59%, 11/02/23 (a) | 250,000 | 245,467 | ||||||||||
| Hotels, restaurants & leisure—0.6% | ||||||||||||
Carnival Corp., 3.95%, 10/15/20 | 250,000 | 262,380 | ||||||||||
| Insurance—0.6% | ||||||||||||
Trinity Acquisition PLC, 3.50%, 09/15/21 | 250,000 | 254,286 | ||||||||||
| Internet software & services—0.6% | ||||||||||||
Tencent Holdings Ltd., 144A, 2.88%, 02/11/20 (a) | 250,000 | 253,405 | ||||||||||
| Media—0.5% | ||||||||||||
Sky PLC, 144A, 9.50%, 11/15/18 (a) | 205,000 | 220,605 | ||||||||||
| CORPORATE BONDS—54.4% | Principal Amount | Value | ||||||||||
| Pharmaceuticals—0.7% | ||||||||||||
Mylan NV, 2.50%, 06/07/19 | $50,000 | $50,133 | ||||||||||
Shire Acquisitions Investments Ireland DAC, 2.40%, 09/23/21 | 250,000 | 248,229 | ||||||||||
| Semiconductors—1.2% | ||||||||||||
NXP BV/NXP Funding LLC, 144A, 3.88%, 09/01/22 (a) | 500,000 | 520,974 | ||||||||||
| Total foreign corporate bonds (cost $2,993,763) | 3,007,868 | |||||||||||
| Total corporate bonds (cost $23,160,828) | 23,340,701 | |||||||||||
| MORTGAGE AND ASSET-BACKED SECURITIES—30.3% | ||||||||||||
| Asset-backed securities—5.0% | ||||||||||||
Citibank Credit Card Issuance Trust, | 415,000 | 419,244 | ||||||||||
Ford Credit Auto Owners Trust, | 350,000 | 349,831 | ||||||||||
Hyundai Auto Receivables Trust, | 1,000,000 | 1,000,368 | ||||||||||
Toyota Auto Receivables Owner Trust, | 350,000 | 349,720 | ||||||||||
| Federal agency mortgage-backed obligations—25.3% | ||||||||||||
Fannie Mae Pool, | ||||||||||||
Series 0323, Class AS, 2.50%, 08/01/23 | 279,802 | 283,376 | ||||||||||
Series 0798, Class AK, 3.50%, 01/01/27 | 289,620 | 300,956 | ||||||||||
Series 1558, Class AL, 4.00%, 01/01/27 | 151,941 | 159,773 | ||||||||||
Series 1895, Class MA, 2.50%, 05/01/24 | 253,833 | 257,045 | ||||||||||
Series 1935, Class MA, 3.00%, 06/01/24 | 245,879 | 252,324 | ||||||||||
Series 2020, Class MA, 2.50%, 09/01/24 | 261,652 | 264,964 | ||||||||||
Series 2126, Class MA, 3.50%, 12/01/24 | 384,194 | 399,352 | ||||||||||
Series 2154, Class MA, 3.00%, 01/01/25 | 302,757 | 310,693 | ||||||||||
Series 2185, Class MA, 3.00%, 02/01/25 | 257,625 | 264,377 | ||||||||||
Series 2233, Class MA, 2.50%, 04/01/25 | 288,349 | 291,999 | ||||||||||
Series 2239, Class MA, 3.00%, 04/01/25 | 555,164 | 569,716 | ||||||||||
Series 2570, Class MA, 3.00%, 03/01/26 | 440,355 | 451,897 | ||||||||||
Series 2612, Class MA, 2.50%, 05/01/26 | 409,092 | 414,269 | ||||||||||
Series 6384, Class AE, 4.00%, 01/01/26 | 209,748 | 220,461 | ||||||||||
Series 7446, Class AA, 4.00%, 06/01/24 | 180,534 | 188,743 | ||||||||||
Freddie Mac Gold Pool, | ||||||||||||
Series 13368, Class G, 6.00%, 11/01/23 | 218,340 | 230,276 | ||||||||||
Series 15449, Class J, 4.00%, 05/01/26 | 132,478 | 139,188 | ||||||||||
Series 18317, Class G, 4.50%, 07/01/24 | 106,641 | 111,927 | ||||||||||
Series 18509, Class G, 3.50%, 04/01/29 | 360,974 | 376,119 | ||||||||||
Series 18513, Class G, 3.50%, 05/01/29 | 306,074 | 318,915 | ||||||||||
Series 18519, Class G, 3.50%, 07/01/29 | 665,779 | 693,503 | ||||||||||
Series 18592, Class G, 3.00%, 03/01/31 | 462,475 | 474,449 | ||||||||||
Series 18597, Class G, 3.50%, 04/01/31 | 580,347 | 604,333 | ||||||||||
Freddie Mac REMIC, | ||||||||||||
Series K-007, Class A-1, 3.34%, 12/25/19 | 9,545 | 9,568 | ||||||||||
Series K-024, Class A-2, 2.57%, 09/25/22 | 169,000 | 170,879 | ||||||||||
Series K-026, Class A-2, 2.51%, 11/25/22 | 250,000 | 252,027 | ||||||||||
Series K-027, Class A-2, 2.64%, 01/25/23 | 1,110,000 | 1,125,477 | ||||||||||
Series K-051, Class A-1, 2.89%, 04/25/25 | 240,309 | 244,405 | ||||||||||
Series K-055, Class A-1, 2.26%, 04/25/25 | 476,650 | 473,939 | ||||||||||
Series K-065, Class A-1, 2.86%, 10/25/26 | 497,501 | 504,252 | ||||||||||
Ginnie Mae I Pool, Series 783112, 5.50%, 09/15/22 | 149,525 | 155,694 | ||||||||||
Ginnie Mae II Pool, Series 5107, 4.00%, 07/20/26 | 325,409 | 342,220 | ||||||||||
| Total mortgage and asset-backed securities (cost $12,982,476) | 12,976,279 | |||||||||||
| The accompanying notes are an integral part of the financial statements. | 17 |
Investment Portfolios
| 10.31.2017 |
| EAGLE INVESTMENT GRADE BOND FUND (cont’d) | ||||||||||||
| FOREIGN GOVERNMENT BONDS—0.3% | Principal Amount | Value | ||||||||||
Province of Alberta Canada, 144A, 1.75%, 08/26/20 (a) | $150,000 | $148,657 | ||||||||||
| Total foreign government bonds (cost $149,308) | 148,657 | |||||||||||
| U.S. TREASURIES—1.8% | ||||||||||||
U.S. Treasury Notes, 2.00%, 11/30/20 | 750,000 | 755,156 | ||||||||||
| Total U.S. Treasuries (cost $758,177) | 755,156 | |||||||||||
| U.S. GOVERNMENT AGENCY SECURITIES—2.5% | ||||||||||||
Fannie Mae, 2.00%, 01/05/22 | 250,000 | 250,032 | ||||||||||
Private Export Funding Corp., 4.30%, 12/15/21 | 750,000 | 815,191 | ||||||||||
| Total U.S. Government agency securities (cost $1,077,249) | 1,065,223 | |||||||||||
| SUPRANATIONAL BANKS—8.2% | ||||||||||||
Inter-American Development Bank, | ||||||||||||
(3 Month LIBOR USD + 0.00%), 1.36%, 01/15/22 | 1,000,000 | 997,470 | ||||||||||
1.75%, 10/15/19 | 1,000,000 | 999,644 | ||||||||||
1.88%, 06/16/20 | 500,000 | 500,462 | ||||||||||
International Bank for Reconstruction & Development (3 Month LIBOR USD + 0.10%), 1.46%, 10/13/20 | 1,000,000 | 1,001,119 | ||||||||||
| Total supranational banks (cost $3,492,840) | 3,498,695 | |||||||||||
| Total investment portfolio (cost $41,620,878)—97.5% | 41,784,711 | |||||||||||
Other assets in excess of liabilities—2.5% |
| 1,060,112 | ||||||||||
| Total net assets—100.0% | $42,844,823 | |||||||||||
(a) Restricted securities deemed to be liquid for purpose of compliance limitations on holdings of illiquid securities. At October 31, 2017, these securities aggregated $5,182,667 or 12.1% of the net assets of the Fund.
144A—Securities are purchased under Rule 144A of the Securities Act of 1933 or are private placements and, unless registered under the Securities Act of 1933 or exempted from registration, generally may only be sold to qualified institutional buyers.
REMIC—Real estate mortgage investment conduit
| Credit quality breakdown (unaudited)* | ||||
| Rating | Percent of net assets | |||
| AAA/Aaa | 43.3% | |||
| AA/Aa | 8.0% | |||
| A/A | 18.5% | |||
| BBB/Baa | 27.1% | |||
| BB/Ba | 0.6% | |||
| Not rated | 0.0% | |||
* The table depicts the long-term credit-quality ratings assigned to the Fund’s portfolio holdings by Standard & Poor’s® (“S&P”), Moody’s Investors Service (“Moody’s”), and Fitch Ratings Inc. (“Fitch”), each of which is a widely used independent nationally recognized statistical rating organization (“NRSRO”). NRSRO ratings are shown because they provide an independent analysis of the credit quality of the Fund’s investments. These credit quality ratings are shown without regard to gradations within a given rating category. For example, securities rated “A-” have been included in the “A” rated category. Securities may be rated by other NRSROs and these ratings may be higher or lower. When ratings from multiple agencies are available, the highest is used, consistent with the Fund’s portfolio investment process. Credit quality ratings are subject to change without notice.
For more information on S&P’s rating methodology, please visit standardandpoors.com and select “Understanding Ratings” under Rating Resources on the homepage. For more information on Moody’s rating methodology, please visit moodys.com and select “Rating Methodologies” under Research & Ratings on the homepage. For more information on Fitch’s rating methodology, please visit fitchratings.com and select “Ratings Definitions” at the bottom of the homepage. Carillon Tower Advisers, Inc. (“Manager”) also performs its own fundamental credit analysis of each security. As part of its fundamental credit analysis, the Manager considers various criteria, including industry specific actions, peer comparisons, payment ranking, and structure-specific characteristics. Any securities that are not rated by S&P, Moody’s, or Fitch appear in the table as “Not rated.” However, these securities are analyzed and monitored by the Manager on an ongoing basis. Government securities that are issued or guaranteed as to principal and interest by the U.S. government are not rated, but are treated by the Fund, and reflected in the table above, as being rated AAA and Aaa for credit quality purposes.
| 18 | The accompanying notes are an integral part of the financial statements. |
Investment Portfolios
| 10.31.2017 |
| EAGLE MID CAP GROWTH FUND (cont’d) | ||||||||||||
| COMMON STOCKS—97.7% | Shares | Value | ||||||||||
| Distributors—1.0% | ||||||||||||
Pool Corp. | 203,225 | $ 24,545,515 | ||||||||||
| Diversified telecommunication services—0.8% | ||||||||||||
Zayo Group Holdings, Inc.* | 533,984 | 19,255,463 | ||||||||||
| Electrical equipment—0.7% | ||||||||||||
Acuity Brands, Inc. | 100,965 | 16,881,348 | ||||||||||
| Electronic equipment, instruments & components—6.3% | ||||||||||||
Amphenol Corp., Class A | 269,080 | 23,409,960 | ||||||||||
Coherent, Inc.* | 188,139 | 49,425,997 | ||||||||||
FLIR Systems, Inc. | 428,939 | 20,082,924 | ||||||||||
IPG Photonics Corp.* | 141,153 | 30,052,885 | ||||||||||
Keysight Technologies, Inc.* | 584,324 | 26,101,753 | ||||||||||
| Equity real estate investment trusts (REITs)—2.7% | ||||||||||||
Crown Castle International Corp. | 235,644 | 25,232,760 | ||||||||||
SBA Communications Corp.* | 249,408 | 39,201,949 | ||||||||||
| Food products—0.8% | ||||||||||||
The Hain Celestial Group, Inc.* | 543,708 | 19,584,362 | ||||||||||
| Health care equipment & supplies—9.5% | ||||||||||||
ABIOMED, Inc.* | 136,199 | 26,275,511 | ||||||||||
Align Technology, Inc.* | 256,928 | 61,400,654 | ||||||||||
Edwards Lifesciences Corp.* | 295,088 | 30,166,846 | ||||||||||
IDEXX Laboratories, Inc.* | 220,132 | 36,579,334 | ||||||||||
Intuitive Surgical, Inc.* | 109,914 | 41,257,319 | ||||||||||
The Cooper Companies, Inc. | 121,578 | 29,210,330 | ||||||||||
| Health care providers & services—1.6% | ||||||||||||
Centene Corp.* | 160,784 | 15,060,637 | ||||||||||
Cigna Corp. | 116,688 | 23,013,208 | ||||||||||
| Hotels, restaurants & leisure—6.6% | ||||||||||||
Dominos Pizza, Inc. | 139,709 | 25,566,747 | ||||||||||
ILG, Inc. | 902,483 | 26,776,671 | ||||||||||
MGM Resorts International | 1,016,317 | 31,861,538 | ||||||||||
Royal Caribbean Cruises Ltd. | 395,604 | 48,963,907 | ||||||||||
Vail Resorts, Inc. | 98,406 | 22,536,942 | ||||||||||
| Household durables—1.7% | ||||||||||||
Lennar Corp., Class A | 732,895 | 40,800,265 | ||||||||||
| Household products—0.6% | ||||||||||||
Church & Dwight Co., Inc. | 327,471 | 14,791,865 | ||||||||||
| Insurance—1.6% | ||||||||||||
The Progressive Corp. | 781,079 | 37,999,493 | ||||||||||
| Internet & direct marketing retail—1.7% | ||||||||||||
Liberty Interactive Corp. QVC Group, Class A* | 1,768,205 | 40,173,618 | ||||||||||
| IT services—2.2% | ||||||||||||
Square, Inc., Class A* | 819,425 | 30,474,416 | ||||||||||
Vantiv, Inc., Class A* | 299,084 | 20,935,880 | ||||||||||
| Leisure products—0.8% | ||||||||||||
Brunswick Corp. | 374,137 | 18,950,039 | ||||||||||
| Life sciences tools & services—3.2% | ||||||||||||
Charles River Laboratories International, Inc.* | 211,996 | 24,653,015 | ||||||||||
Illumina, Inc.* | 139,354 | 28,594,047 | ||||||||||
Mettler-Toledo International, Inc.* | 34,922 | 23,838,805 | ||||||||||
| Machinery—1.3% | ||||||||||||
WABCO Holdings, Inc.* | 210,631 | 31,082,817 | ||||||||||
| COMMON STOCKS—97.7% | Shares | Value | ||||||||||
| Media—2.8% | ||||||||||||
Lions Gate Entertainment Corp., Class A* | 375,243 | $ 10,889,552 | ||||||||||
Lions Gate Entertainment Corp., Class B* | 310,166 | 8,579,192 | ||||||||||
Sirius XM Holdings, Inc. | 8,819,278 | 47,976,872 | ||||||||||
| Oil, gas & consumable fuels—2.2% | ||||||||||||
Diamondback Energy, Inc.* | 287,341 | 30,791,462 | ||||||||||
RSP Permian, Inc.* | 607,710 | 20,911,301 | ||||||||||
| Pharmaceuticals—1.3% | ||||||||||||
Zoetis, Inc. | 502,545 | 32,072,422 | ||||||||||
| Professional services—2.8% | ||||||||||||
IHS Markit Ltd.* | 596,722 | 25,426,324 | ||||||||||
TransUnion* | 768,935 | 40,361,398 | ||||||||||
| Road & rail—0.9% | ||||||||||||
Old Dominion Freight Line, Inc. | 186,575 | 22,599,830 | ||||||||||
| Semiconductors & semiconductor equipment—6.3% | ||||||||||||
Advanced Micro Devices, Inc.* | 1,709,383 | 18,777,572 | ||||||||||
Microchip Technology, Inc. | 373,124 | 35,372,155 | ||||||||||
Micron Technology, Inc.* | 807,667 | 35,787,725 | ||||||||||
Microsemi Corp.* | 324,199 | 17,302,501 | ||||||||||
NVIDIA Corp. | 203,259 | 42,035,994 | ||||||||||
| Software—8.7% | ||||||||||||
Autodesk, Inc.* | 249,349 | 31,158,651 | ||||||||||
Electronic Arts, Inc.* | 377,755 | 45,179,498 | ||||||||||
PTC, Inc.* | 306,486 | 20,365,995 | ||||||||||
ServiceNow, Inc.* | 180,093 | 22,758,353 | ||||||||||
Splunk, Inc.* | 355,252 | 23,908,460 | ||||||||||
Synopsys, Inc.* | 274,593 | 23,757,786 | ||||||||||
The Ultimate Software Group, Inc.* | 88,648 | 17,959,198 | ||||||||||
Tyler Technologies, Inc.* | 121,815 | 21,596,581 | ||||||||||
| Specialty retail—1.6% | ||||||||||||
Burlington Stores, Inc.* | 407,777 | 38,286,182 | ||||||||||
| Technology hardware, storage & peripherals—0.7% | ||||||||||||
Seagate Technology PLC | 466,858 | 17,259,740 | ||||||||||
| Trading companies & distributors—1.1% | ||||||||||||
United Rentals, Inc.* | 186,935 | 26,447,564 | ||||||||||
| Total common stocks (cost $1,642,354,330) | 2,320,949,860 | |||||||||||
| Total investment portfolio (cost $1,642,354,330)—97.7% | 2,320,949,860 | |||||||||||
Other assets in excess of liabilities—2.3% |
| 54,296,908 | ||||||||||
| Total net assets- 100.0% | $2,375,246,768 | |||||||||||
* Non-income producing security
| The accompanying notes are an integral part of the financial statements. | 19 |
Investment Portfolios
| 10.31.2017 |
| EAGLE MID CAP GROWTH FUND (cont’d) | ||||||
| Sector allocation (unaudited) | ||||
| Sector | Percent of net assets | |||
| Information technology | 24.9% | |||
| Health care | 17.2% | |||
| Consumer discretionary | 16.7% | |||
| Industrials | 15.6% | |||
| Financials | 7.5% | |||
| Materials | 5.6% | |||
| Consumer staples | 4.5% | |||
| Real estate | 2.7% | |||
| Energy | 2.2% | |||
| Telecommunication services | 0.8% | |||
| COMMON STOCKS—98.6% | Shares | Value | ||||||||||
| Electronic equipment, instruments & components—5.2% | ||||||||||||
Amphenol Corp., Class A | 54,010 | $4,698,870 | ||||||||||
Cognex Corp. | 34,604 | 4,261,483 | ||||||||||
FLIR Systems, Inc. | 96,203 | 4,504,224 | ||||||||||
| Energy equipment & services—0.9% | ||||||||||||
Core Laboratories N.V. | 24,651 | 2,462,635 | ||||||||||
| Equity real estate investment trusts (REITs)—2.5% | ||||||||||||
Boston Properties, Inc. | 15,882 | 1,924,581 | ||||||||||
Duke Realty Corp. | 71,192 | 2,027,548 | ||||||||||
Equinix, Inc. | 5,297 | 2,455,159 | ||||||||||
| Food products—0.7% | ||||||||||||
Pinnacle Foods, Inc. | 31,583 | 1,718,747 | ||||||||||
| Health care equipment & supplies—6.3% | ||||||||||||
DENTSPLY SIRONA, Inc. | 71,649 | 4,375,604 | ||||||||||
STERIS PLC | 49,738 | 4,642,048 | ||||||||||
Teleflex, Inc. | 16,058 | 3,805,425 | ||||||||||
The Cooper Companies, Inc. | 15,180 | 3,647,147 | ||||||||||
| Health care providers & services—4.4% | ||||||||||||
Centene Corp.* | 34,393 | 3,221,592 | ||||||||||
Henry Schein, Inc.* | 30,810 | 2,421,666 | ||||||||||
Laboratory Corp. of America Holdings* | 38,395 | 5,901,696 | ||||||||||
| Health care technology—0.7% | ||||||||||||
Medidata Solutions, Inc.* | 24,330 | 1,830,346 | ||||||||||
| Hotels, restaurants & leisure—1.2% | ||||||||||||
Wyndham Worldwide Corp. | 30,378 | 3,245,889 | ||||||||||
| Household durables—2.1% | ||||||||||||
Mohawk Industries, Inc.* | 21,007 | 5,498,792 | ||||||||||
| Household products—2.6% | ||||||||||||
Church & Dwight Co., Inc. | 73,078 | 3,300,933 | ||||||||||
Spectrum Brands Holdings, Inc. | 31,807 | 3,496,226 | ||||||||||
| Industrial conglomerates—2.1% | ||||||||||||
Roper Technologies, Inc. | 21,093 | 5,445,580 | ||||||||||
| Insurance—7.0% | ||||||||||||
Arch Capital Group Ltd.* | 59,208 | 5,899,485 | ||||||||||
Arthur J Gallagher & Co. | 111,770 | 7,078,394 | ||||||||||
Reinsurance Group of America, Inc. | 35,638 | 5,323,605 | ||||||||||
| IT services—4.2% | ||||||||||||
Amdocs Ltd. | 37,343 | 2,431,029 | ||||||||||
Fiserv, Inc.* | 49,859 | 6,453,250 | ||||||||||
Gartner, Inc.* | 15,483 | 1,940,175 | ||||||||||
| Life sciences tools & services—1.9% | ||||||||||||
Agilent Technologies, Inc. | 71,021 | 4,831,559 | ||||||||||
| Machinery—3.1% | ||||||||||||
Snap-on, Inc. | 29,641 | 4,676,757 | ||||||||||
The Middleby Corp.* | 29,917 | 3,467,380 | ||||||||||
| Media—0.8% | ||||||||||||
Omnicom Group, Inc. | 31,530 | 2,118,501 | ||||||||||
| Metals & mining—1.4% | ||||||||||||
Reliance Steel & Aluminum Co. | 47,127 | 3,621,239 | ||||||||||
| Multiline retail—1.0% | ||||||||||||
Dollar Tree, Inc.* | 27,792 | 2,536,020 | ||||||||||
| 20 | The accompanying notes are an integral part of the financial statements. |
Investment Portfolios
| 10.31.2017 |
| EAGLE MID CAP STOCK FUND (cont’d) | ||||||||||||
| COMMON STOCKS—98.6% | Shares | Value | ||||||||||
| Oil, gas & consumable fuels—4.2% | ||||||||||||
Cimarex Energy Co. | 25,503 | $2,982,066 | ||||||||||
Concho Resources, Inc.* | 34,682 | 4,654,671 | ||||||||||
Noble Energy, Inc. | 121,660 | 3,390,664 | ||||||||||
| Pharmaceuticals—2.5% | ||||||||||||
Catalent, Inc.* | 64,088 | 2,729,508 | ||||||||||
Zoetis, Inc. | 57,944 | 3,697,986 | ||||||||||
| Professional services—1.0% | ||||||||||||
Verisk Analytics, Inc.* | 29,468 | 2,506,253 | ||||||||||
| Road & rail—2.2% | ||||||||||||
Genesee & Wyoming, Inc., Class A* | 37,267 | 2,675,025 | ||||||||||
J.B. Hunt Transport Services, Inc. | 29,531 | 3,141,803 | ||||||||||
| Semiconductors & semiconductor equipment—4.2% | ||||||||||||
Analog Devices, Inc. | 25,691 | 2,345,588 | ||||||||||
Microchip Technology, Inc. | 63,220 | 5,993,256 | ||||||||||
Skyworks Solutions, Inc. | 21,911 | 2,494,787 | ||||||||||
| Software—5.7% | ||||||||||||
ANSYS, Inc.* | 15,445 | 2,111,486 | ||||||||||
Nice Ltd., Sponsored ADR | 84,002 | 6,998,206 | ||||||||||
The Ultimate Software Group, Inc.* | 28,598 | 5,793,669 | ||||||||||
| Specialty retail—0.6% | ||||||||||||
Ulta Beauty, Inc.* | 7,986 | 1,611,495 | ||||||||||
| Textiles, apparel & luxury goods—1.0% | ||||||||||||
PVH Corp. | 20,325 | 2,577,413 | ||||||||||
| Trading companies & distributors—0.8% | ||||||||||||
Fastenal Co. | 47,041 | 2,209,516 | ||||||||||
| Total common stocks (cost $176,419,630) | 256,999,702 | |||||||||||
| Total investment portfolio (cost $176,419,630)—98.6% | 256,999,702 | |||||||||||
Other assets in excess of liabilities—1.4% |
| 3,620,792 | ||||||||||
| Total net assets—100.0% | $260,620,494 | |||||||||||
* Non-income producing security
ADR—American depository receipt
| Sector allocation (unaudited) | ||||
| Sector | Percent of net assets | |||
| Information technology | 19.2% | |||
| Financials | 16.3% | |||
| Industrials | 16.3% | |||
| Health care | 15.8% | |||
| Consumer discretionary | 12.6% | |||
| Consumer staples | 5.6% | |||
| Energy | 5.2% | |||
| Materials | 5.1% | |||
| Real estate | 2.5% | |||
| The accompanying notes are an integral part of the financial statements. | 21 |
Investment Portfolios
| 10.31.2017 |
| EAGLE SMALL CAP GROWTH FUND (cont’d) | ||||||||||||
| COMMON STOCKS—99.3% | Shares | Value | ||||||||||
| Electrical equipment—1.5% | ||||||||||||
Acuity Brands, Inc. | 268,780 | $44,940,016 | ||||||||||
Thermon Group Holdings, Inc.* | 1,391,128 | 29,923,163 | ||||||||||
| Electronic equipment, instruments & components—8.7% | ||||||||||||
Cognex Corp. | 960,140 | 118,241,241 | ||||||||||
Coherent, Inc.* | 655,969 | 172,329,616 | ||||||||||
IPG Photonics Corp.* | 472,561 | 100,612,962 | ||||||||||
Littelfuse, Inc. | 226,749 | 47,390,541 | ||||||||||
| Energy equipment & services—0.1% | ||||||||||||
Geospace Technologies Corp.* | 484,147 | 7,271,888 | ||||||||||
| Equity real estate investment trusts (REITs)—1.9% | ||||||||||||
CubeSmart | 496,701 | 13,520,201 | ||||||||||
Physicians Realty Trust | 572,516 | 9,950,328 | ||||||||||
Seritage Growth Properties, Class A | 988,364 | 40,651,412 | ||||||||||
The GEO Group, Inc. | 1,170,714 | 30,380,028 | ||||||||||
| Food & staples retailing—1.0% | ||||||||||||
Casey’s General Stores, Inc. | 426,552 | 48,870,063 | ||||||||||
| Food products—1.6% | ||||||||||||
Pinnacle Foods, Inc. | 498,586 | 27,133,050 | ||||||||||
Snyder’s-Lance, Inc. | 1,486,044 | 55,919,836 | ||||||||||
| Health care equipment & supplies—2.3% | ||||||||||||
NuVasive, Inc.* | 723,991 | 41,072,009 | ||||||||||
Penumbra, Inc.* | 361,292 | 36,327,911 | ||||||||||
West Pharmaceutical Services, Inc. | 395,622 | 40,116,071 | ||||||||||
| Health care providers & services—2.7% | ||||||||||||
HealthEquity, Inc.* | 493,384 | 24,777,744 | ||||||||||
HealthSouth Corp. | 768,748 | 35,470,032 | ||||||||||
Teladoc, Inc.* | 1,305,936 | 43,161,185 | ||||||||||
Tivity Health, Inc.* | 770,179 | 35,620,779 | ||||||||||
| Health care technology—3.6% | ||||||||||||
Cotiviti Holdings, Inc.* | 1,325,183 | 46,593,434 | ||||||||||
Evolent Health, Inc., Class A* | 945,560 | 15,365,350 | ||||||||||
HMS Holdings Corp.* | 2,162,862 | 41,613,465 | ||||||||||
Medidata Solutions, Inc.* | 511,726 | 38,497,147 | ||||||||||
Omnicell, Inc.* | 767,545 | 38,223,741 | ||||||||||
| Hotels, restaurants & leisure—2.8% | ||||||||||||
Dave & Buster’s Entertainment, Inc.* | 458,604 | 22,104,713 | ||||||||||
Penn National Gaming, Inc.* | 2,291,957 | 59,797,158 | ||||||||||
Planet Fitness, Inc., Class A | 2,344,082 | 62,446,344 | ||||||||||
| Household durables—1.8% | ||||||||||||
Universal Electronics, Inc.* | 1,502,697 | 90,161,820 | ||||||||||
| Insurance—1.8% | ||||||||||||
Enstar Group Ltd.* | 244,572 | 55,713,502 | ||||||||||
ProAssurance Corp. | 631,527 | 35,397,088 | ||||||||||
| Internet & direct marketing retail—2.5% | ||||||||||||
HSN, Inc. | 1,019,364 | 38,430,023 | ||||||||||
Nutrisystem, Inc. | 1,727,248 | 86,276,037 | ||||||||||
| Internet software & services—1.1% | ||||||||||||
Cornerstone OnDemand, Inc.* | 1,481,811 | 56,842,270 | ||||||||||
| IT services—0.5% | ||||||||||||
Everi Holdings, Inc.* | 3,111,906 | 25,797,701 | ||||||||||
| Life sciences tools & services—1.5% | ||||||||||||
Patheon N.V.* (a) | 421,338 | 14,746,830 | ||||||||||
PRA Health Sciences, Inc.* | 732,105 | 59,615,310 | ||||||||||
| COMMON STOCKS—99.3% | Shares | Value | ||||||||||
| Machinery—4.9% | ||||||||||||
Chart Industries, Inc.* | 882,160 | $38,373,960 | ||||||||||
Graco, Inc. | 315,783 | 41,617,042 | ||||||||||
John Bean Technologies Corp. | 598,990 | 64,032,031 | ||||||||||
REV Group, Inc. | 275,190 | 7,099,902 | ||||||||||
WABCO Holdings, Inc.* | 378,643 | 55,876,347 | ||||||||||
Woodward, Inc. | 507,148 | 39,217,755 | ||||||||||
| Multiline retail—0.9% | ||||||||||||
Ollie’s Bargain Outlet Holdings, Inc.* | 1,074,621 | 47,981,828 | ||||||||||
| Oil, gas & consumable fuels—2.0% | ||||||||||||
Diamondback Energy, Inc.* | 253,580 | 27,173,633 | ||||||||||
RSP Permian, Inc.* | 2,179,049 | 74,981,076 | ||||||||||
| Pharmaceuticals—2.5% | ||||||||||||
Aclaris Therapeutics, Inc.* | 957,762 | 24,145,180 | ||||||||||
Catalent, Inc.* | 584,355 | 24,887,680 | ||||||||||
Dermira, Inc.* | 854,147 | 22,865,515 | ||||||||||
Prestige Brands Holdings, Inc.* | 777,376 | 36,458,934 | ||||||||||
The Medicines Co.* | 558,810 | 16,060,199 | ||||||||||
| Professional services—0.7% | ||||||||||||
WageWorks, Inc.* | 589,854 | 37,603,192 | ||||||||||
| Road & rail—1.1% | ||||||||||||
Landstar System, Inc. | 583,979 | 57,667,926 | ||||||||||
| Semiconductors & semiconductor equipment—3.2% | ||||||||||||
Cavium, Inc.* | 733,253 | 50,587,125 | ||||||||||
Entegris, Inc. | 1,683,299 | 55,128,042 | ||||||||||
Teradyne, Inc. | 686,438 | 29,441,326 | ||||||||||
Veeco Instruments, Inc.* | 1,632,083 | 29,459,098 | ||||||||||
| Software—13.1% | ||||||||||||
Ellie Mae, Inc.* | 355,896 | 32,012,845 | ||||||||||
Guidewire Software, Inc.* | 770,979 | 61,662,900 | ||||||||||
Imperva, Inc.* | 927,014 | 39,583,498 | ||||||||||
Manhattan Associates, Inc.* | 611,746 | 25,607,688 | ||||||||||
Pegasystems, Inc. | 972,639 | 56,704,854 | ||||||||||
Proofpoint, Inc.* | 632,558 | 58,454,685 | ||||||||||
PTC, Inc.* | 1,511,888 | 100,464,958 | ||||||||||
RealPage, Inc.* | 1,568,452 | 67,913,972 | ||||||||||
Tableau Software, Inc., Class A* | 592,916 | 48,079,558 | ||||||||||
Take-Two Interactive Software, Inc.* | 616,713 | 68,239,293 | ||||||||||
The Ultimate Software Group, Inc.* | 370,970 | 75,154,812 | ||||||||||
Tyler Technologies, Inc.* | 176,531 | 31,297,181 | ||||||||||
| Specialty retail—3.2% | ||||||||||||
Burlington Stores, Inc.* | 526,901 | 49,470,735 | ||||||||||
Camping World Holdings, Inc., Class A | 935,381 | 39,304,710 | ||||||||||
Genesco, Inc.* | 1,317,268 | 32,273,066 | ||||||||||
MarineMax, Inc.* | 1,794,050 | 33,279,627 | ||||||||||
National Vision Holdings, Inc.* | 231,944 | 6,679,987 | ||||||||||
| Textiles, apparel & luxury goods—0.8% | ||||||||||||
Steven Madden Ltd.* | 1,066,198 | 41,581,722 | ||||||||||
| Total common stocks (cost $3,377,467,453) | 5,036,771,795 | |||||||||||
| CONTINGENT VALUE RIGHTS—0.0% | ||||||||||||
Dyax Corp.* (a) | 303,243 | 242,594 | ||||||||||
| Total contingent value rights (cost $142,782) | 242,594 | |||||||||||
| Total investment portfolio (cost $3,377,610,235)—99.3% | 5,037,014,389 | |||||||||||
Other assets in excess of liabilities—0.7% |
| 34,778,842 | ||||||||||
| Total net assets—100.0% | $5,071,793,231 | |||||||||||
| 22 | The accompanying notes are an integral part of the financial statements. |
Investment Portfolios
| 10.31.2017 |
(a) Security is fair valued as determined in good faith in accordance with the Pricing and Valuation Procedures approved by the Board of Trustees. The security is also illiquid and may not be sold by the fund. As of October 31, 2017, the total market value of fair valued and illiquid securities held by the Fund is $14,989,424, representing 0.3% of the Fund’s net assets.
* Non-income producing security
| Sector allocation (unaudited) | ||||
| Sector | Percent of net assets | |||
| Information technology | 27.7% | |||
| Health care | 22.6% | |||
| Industrials | 16.5% | |||
| Consumer discretionary | 15.1% | |||
| Financials | 6.8% | |||
| Materials | 3.9% | |||
| Consumer staples | 2.6% | |||
| Energy | 2.2% | |||
| Real estate | 1.9% | |||
| COMMON STOCKS—98.8% | Shares | Value | ||||||||||
| Diversified consumer services—1.3% | ||||||||||||
Bright Horizons Family Solutions, Inc.* | 7,050 | $608,415 | ||||||||||
| Electronic equipment, instruments & components—6.0% | ||||||||||||
Cognex Corp. | 6,455 | 794,934 | ||||||||||
Dolby Laboratories, Inc., Class A | 9,913 | 574,359 | ||||||||||
FLIR Systems, Inc. | 17,744 | 830,774 | ||||||||||
Littelfuse, Inc. | 2,606 | 544,654 | ||||||||||
| Energy equipment & services—1.9% | ||||||||||||
Core Laboratories N.V. | 4,809 | 480,419 | ||||||||||
Forum Energy Technologies, Inc.* | 25,725 | 370,440 | ||||||||||
| Equity real estate investment trusts (REITs)—3.3% | ||||||||||||
CoreSite Realty Corp. | 6,636 | 734,937 | ||||||||||
Hudson Pacific Properties, Inc. | 13,461 | 455,251 | ||||||||||
Terreno Realty Corp. | 9,126 | 335,107 | ||||||||||
| Food products—1.4% | ||||||||||||
Pinnacle Foods, Inc. | 11,443 | 622,728 | ||||||||||
| Health care equipment & supplies—8.3% | ||||||||||||
Globus Medical, Inc., Class A* | 12,737 | 405,928 | ||||||||||
ICU Medical, Inc.* | 3,559 | 680,125 | ||||||||||
Integra LifeSciences Holdings Corp.* | 10,515 | 491,892 | ||||||||||
NuVasive, Inc.* | 7,868 | 446,351 | ||||||||||
STERIS PLC | 7,303 | 681,589 | ||||||||||
Teleflex, Inc. | 2,116 | 501,450 | ||||||||||
West Pharmaceutical Services, Inc. | 5,710 | 578,994 | ||||||||||
| Health care technology—1.7% | ||||||||||||
Medidata Solutions, Inc.* | 3,981 | 299,490 | ||||||||||
Omnicell, Inc.* | 9,836 | 489,833 | ||||||||||
| Hotels, restaurants & leisure—1.1% | ||||||||||||
Texas Roadhouse, Inc. | 10,458 | 523,005 | ||||||||||
| Household durables—1.1% | ||||||||||||
Helen of Troy Ltd.* | 5,663 | 526,093 | ||||||||||
| Household products—1.4% | ||||||||||||
Spectrum Brands Holdings, Inc. | 5,742 | 631,161 | ||||||||||
| Insurance—5.9% | ||||||||||||
AMERISAFE, Inc. | 11,200 | 724,640 | ||||||||||
Arthur J Gallagher & Co. | 11,388 | 721,202 | ||||||||||
James River Group Holdings Ltd. | 12,903 | 546,055 | ||||||||||
Reinsurance Group of America, Inc. | 4,764 | 711,646 | ||||||||||
| IT services—1.7% | ||||||||||||
Gartner, Inc.* | 3,075 | 385,328 | ||||||||||
Jack Henry & Associates, Inc. | 3,468 | 381,931 | ||||||||||
| Life sciences tools & services—2.2% | ||||||||||||
Bio-Rad Laboratories, Inc., Class A* | 2,492 | 547,717 | ||||||||||
Bio-Techne Corp. | 3,603 | 472,065 | ||||||||||
| Machinery—6.4% | ||||||||||||
Graco, Inc. | 4,444 | 585,675 | ||||||||||
IDEX Corp. | 4,106 | 526,430 | ||||||||||
Lincoln Electric Holdings, Inc. | 4,377 | 401,239 | ||||||||||
Snap-on, Inc. | 3,033 | 478,547 | ||||||||||
The Middleby Corp.* | 4,342 | 503,238 | ||||||||||
The Toro Co. | 7,007 | 440,390 | ||||||||||
| Media—1.2% | ||||||||||||
John Wiley & Sons, Inc., Class A | 10,227 | 558,905 | ||||||||||
| Metals & mining—1.0% | ||||||||||||
Reliance Steel & Aluminum Co. | 6,199 | 476,331 | ||||||||||
| The accompanying notes are an integral part of the financial statements. | 23 |
Investment Portfolios
| 10.31.2017 |
| EAGLE SMALLER COMPANY FUND (cont’d) | ||||||||||||
| COMMON STOCKS—98.8% | Shares | Value | ||||||||||
| Multiline retail—1.5% | ||||||||||||
Ollie’s Bargain Outlet Holdings, Inc.* | 15,146 | $676,269 | ||||||||||
| Multi-utilities—1.0% | ||||||||||||
Black Hills Corp. | 7,269 | 474,375 | ||||||||||
| Oil, gas & consumable fuels—2.6% | ||||||||||||
Carrizo Oil & Gas, Inc.* | 15,447 | 273,258 | ||||||||||
Diamondback Energy, Inc.* | 6,215 | 665,999 | ||||||||||
SRC Energy, Inc.* | 24,696 | 235,600 | ||||||||||
| Pharmaceuticals—2.7% | ||||||||||||
Catalent, Inc.* | 18,598 | 792,089 | ||||||||||
Prestige Brands Holdings, Inc.* | 8,999 | 422,053 | ||||||||||
| Professional services—0.8% | ||||||||||||
WageWorks, Inc.* | 5,796 | 369,495 | ||||||||||
| Road & rail—2.0% | ||||||||||||
Genesee & Wyoming, Inc., Class A* | 6,743 | 484,012 | ||||||||||
Landstar System, Inc. | 4,216 | 416,330 | ||||||||||
| Semiconductors & semiconductor equipment—3.9% | ||||||||||||
Monolithic Power Systems, Inc. | 4,943 | 601,415 | ||||||||||
Power Integrations, Inc. | 7,310 | 587,358 | ||||||||||
Semtech Corp.* | 14,316 | 587,672 | ||||||||||
| Software—6.9% | ||||||||||||
Ellie Mae, Inc.* | 4,849 | 436,167 | ||||||||||
Nice Ltd., Sponsored ADR | 15,744 | 1,311,633 | ||||||||||
Qualys, Inc.* | 12,273 | 649,242 | ||||||||||
The Ultimate Software Group, Inc.* | 3,770 | 763,764 | ||||||||||
| Specialty retail—1.3% | ||||||||||||
Burlington Stores, Inc.* | 6,107 | 573,386 | ||||||||||
| Textiles, apparel & luxury goods—0.7% | ||||||||||||
Steven Madden Ltd.* | 8,719 | 340,041 | ||||||||||
| Trading companies & distributors—1.5% | ||||||||||||
Watsco, Inc. | 4,188 | 697,595 | ||||||||||
| Total common stocks (cost $31,046,501) | 45,284,579 | |||||||||||
| Total investment portfolio (cost $31,046,501)—98.8% | 45,284,579 | |||||||||||
Other assets in excess of liabilities—1.2% | 541,936 | |||||||||||
| Total net assets—100.0% | $45,826,515 | |||||||||||
* Non-income producing security
ADR—American depository receipt
| Sector allocation (unaudited) | ||||
| Sector | Percent of net assets | |||
| Information technology | 18.5% | |||
| Financials | 16.9% | |||
| Industrials | 16.1% | |||
| Health care | 14.9% | |||
| Consumer discretionary | 11.6% | |||
| Materials | 9.4% | |||
| Energy | 4.4% | |||
| Real estate | 3.3% | |||
| Consumer staples | 2.7% | |||
| Utilities | 1.0% | |||
ETF—Exchange Traded Fund
| Asset allocation (unaudited) | ||||
| Asset class | Percent of net assets | |||
| Equity | 67.4% | |||
| Fixed income | 30.3% | |||
| 24 | The accompanying notes are an integral part of the financial statements. |
[THIS PAGE INTENTIONALLY LEFT BLANK]
Statements of Assets and Liabilities
| 10.31.2017 |
| Eagle Capital Appreciation Fund | Eagle Growth & Income Fund | Eagle International Stock Fund | Eagle Investment Grade Bond Fund | |||||||||||||
| Assets | ||||||||||||||||
Investments, at value (a) | $387,861,670 | $582,973,249 | $18,113,757 | $41,784,711 | ||||||||||||
Cash | 1,972,034 | 24,000,158 | 698,922 | 802,684 | ||||||||||||
Foreign currency, at value (b) | — | — | 168 | — | ||||||||||||
Receivable for investments sold | — | 3,477,310 | — | — | ||||||||||||
Receivable for fund shares sold | 1,735,326 | 500,050 | 3,866 | 118,343 | ||||||||||||
Receivable for dividends and interest, net | 143,571 | 740,212 | 91,739 | 243,426 | ||||||||||||
Receivable due from advisor, net | — | — | 6,653 | 14,456 | ||||||||||||
Prepaid expenses | 10,096 | 12,191 | 3,574 | 4,847 | ||||||||||||
| Total assets | 391,722,697 | 611,703,170 | 18,918,679 | 42,968,467 | ||||||||||||
| Liabilities | ||||||||||||||||
Payable for investments purchased | — | 5,814,633 | — | — | ||||||||||||
Payable for fund shares redeemed | 398,563 | 1,128,294 | — | 31,731 | ||||||||||||
Accrued custody fees | 2,101 | 2,604 | 6,787 | 509 | ||||||||||||
Accrued investment advisory fees, net | 195,463 | 239,543 | — | — | ||||||||||||
Accrued administrative fees | 42,043 | 64,973 | 1,989 | 4,905 | ||||||||||||
Accrued distribution fees | 87,095 | 176,169 | 5,588 | 16,541 | ||||||||||||
Accrued transfer agent and shareholder servicing fees | 32,171 | 58,669 | 4,022 | 5,874 | ||||||||||||
Accrued internal audit fees | 1,028 | 1,028 | 1,028 | 1,028 | ||||||||||||
Accrued trustees and officers compensation | 19,062 | 19,062 | 19,062 | 19,062 | ||||||||||||
Other accrued expenses | 50,144 | 57,960 | 42,458 | 43,994 | ||||||||||||
| Total liabilities | 827,670 | 7,562,935 | 80,934 | 123,644 | ||||||||||||
| Net assets | 390,895,027 | 604,140,235 | 18,837,745 | 42,844,823 | ||||||||||||
| Net assets consists of | ||||||||||||||||
Paid-in capital | 203,344,294 | 393,641,859 | 16,652,451 | 42,720,120 | ||||||||||||
Undistributed net investment income (loss) | 234,198 | 772,078 | 141,167 | (19,521 | ) | |||||||||||
Accumulated net realized gain (loss) | 24,813,515 | 15,514,561 | (725,392 | ) | (19,609 | ) | ||||||||||
Net unrealized appreciation on investments and translation of assets and liabilities denominated in foreign currencies | 162,503,020 | 194,211,737 | 2,769,519 | 163,833 | ||||||||||||
| Net assets | 390,895,027 | 604,140,235 | 18,837,745 | 42,844,823 | ||||||||||||
| Net assets, at market value | ||||||||||||||||
Class A | 163,508,973 | 146,930,306 | 4,441,104 | 13,585,608 | ||||||||||||
Class C | 62,898,657 | 168,660,282 | 5,185,792 | 15,897,025 | ||||||||||||
Class I | 119,033,232 | 245,841,346 | 8,367,285 | 11,212,906 | ||||||||||||
Class R-3 | 1,223,141 | 2,366,434 | 827,731 | 175,839 | ||||||||||||
Class R-5 | 3,039,397 | 419,753 | 3,679 | 271,347 | ||||||||||||
Class R-6 | 41,191,627 | 39,922,114 | 12,154 | 1,702,098 | ||||||||||||
| Net asset value (“NAV”), offering and redemption price per share (c) | ||||||||||||||||
Class A | $43.14 | $20.39 | $18.71 | $14.82 | ||||||||||||
Class A Maximum offering price (d) | 45.29 | 21.41 | 19.64 | 15.40 | ||||||||||||
Class C | 32.23 | 19.54 | 18.32 | 14.79 | ||||||||||||
Class I | 45.13 | 20.34 | 18.70 | 14.85 | ||||||||||||
Class R-3 | 41.60 | 20.30 | 18.53 | 14.81 | ||||||||||||
Class R-5 | 44.97 | 20.36 | 18.69 | 14.83 | ||||||||||||
Class R-6 | 44.82 | 20.30 | 18.75 | 14.89 | ||||||||||||
| Shares of beneficial interest outstanding | ||||||||||||||||
Class A | 3,790,222 | 7,207,293 | 237,323 | 916,546 | ||||||||||||
Class C | 1,951,704 | 8,629,967 | 283,081 | 1,074,818 | ||||||||||||
Class I | 2,637,602 | 12,087,023 | 447,432 | 754,910 | ||||||||||||
Class R-3 | 29,400 | 116,578 | 44,666 | 11,869 | ||||||||||||
Class R-5 | 67,594 | 20,615 | 197 | 18,295 | ||||||||||||
Class R-6 | 919,132 | 1,966,903 | 648 | 114,297 | ||||||||||||
| (a) Identified cost | $225,358,650 | $388,758,208 | $15,344,109 | $41,620,878 | ||||||||||||
| (b) Cost | — | — | 168 | — | ||||||||||||
(c) NAV amounts may not recalculate due to rounding of net assets and / or shares outstanding.
(d) For all funds except Eagle Investment Grade Bond Fund, the maximum offering price is computed as 100/95.25 of NAV. The maximum offering price for the Eagle Investment Grade Bond Fund is computed as 100/96.25 of NAV.
| 26 | The accompanying notes are an integral part of the financial statements. |
Statements of Assets and Liabilities
| 10.31.2017 |
| Eagle Mid Cap Growth Fund | Eagle Mid Cap Stock Fund | Eagle Small Cap Growth Fund | Eagle Smaller Company Fund | Eagle Tactical Allocation Fund | ||||||||||||||
| $2,320,949,860 | $256,999,702 | $5,037,014,389 | $45,284,579 | $16,852,886 | ||||||||||||||
| 51,126,407 | 4,088,778 | 38,708,166 | 358,230 | 456,091 | ||||||||||||||
| — | — | — | — | — | ||||||||||||||
| — | — | 8,915,106 | 207,318 | — | ||||||||||||||
| 6,702,737 | 112,948 | 3,864,441 | 43,567 | 14,500 | ||||||||||||||
| 177,072 | 36,767 | 656,392 | 12,167 | 395 | ||||||||||||||
| — | — | — | 9,084 | 9,293 | ||||||||||||||
| 22,569 | 7,388 | 47,173 | 7,268 | 1,509 | ||||||||||||||
| 2,378,978,645 | 261,245,583 | 5,089,205,667 | 45,922,213 | 17,334,674 | ||||||||||||||
| — | — | 4,932,513 | — | — | ||||||||||||||
| 1,920,703 | 254,025 | 8,694,945 | 4,116 | 22,802 | ||||||||||||||
| 8,865 | 1,180 | 22,253 | 739 | 361 | ||||||||||||||
| 1,039,541 | 135,835 | 2,201,430 | — | — | ||||||||||||||
| 221,615 | 30,495 | 466,082 | 5,299 | 1,616 | ||||||||||||||
| 229,915 | 94,771 | 320,276 | 18,366 | 1,976 | ||||||||||||||
| 148,099 | 36,934 | 461,230 | 8,304 | 3,824 | ||||||||||||||
| 1,028 | 1,028 | 1,028 | 1,028 | 1,028 | ||||||||||||||
| 19,062 | 19,062 | 19,061 | 19,062 | 19,061 | ||||||||||||||
| 143,049 | 51,759 | 293,618 | 38,784 | 35,142 | ||||||||||||||
| 3,731,877 | 625,089 | 17,412,436 | 95,698 | 85,810 | ||||||||||||||
| 2,375,246,768 | 260,620,494 | 5,071,793,231 | 45,826,515 | 17,248,864 | ||||||||||||||
| 1,636,191,318 | 168,469,035 | 3,056,955,600 | 27,438,162 | 15,790,164 | ||||||||||||||
| (4,599,825 | ) | (1,469,395 | ) | (8,673,552 | ) | (15,409 | ) | 99,645 | ||||||||||
| 65,059,745 | 13,040,782 | 364,107,029 | 4,165,684 | 252,090 | ||||||||||||||
| 678,595,530 |
| 80,580,072 | 1,659,404,154 | 14,238,078 | 1,106,965 | ||||||||||||
| 2,375,246,768 | 260,620,494 | 5,071,793,231 | 45,826,515 | 17,248,864 | ||||||||||||||
| 458,866,518 | 114,421,657 | 640,065,186 | 15,698,231 | 1,588,827 | ||||||||||||||
| 146,211,548 | 82,294,335 | 168,540,417 | 17,596,282 | 1,921,726 | ||||||||||||||
| 762,545,711 | 61,480,726 | 1,691,195,045 | 8,849,310 | 13,680,888 | ||||||||||||||
| 31,639,629 | 1,281,217 | 97,511,364 | 550,734 | 11,229 | ||||||||||||||
| 284,240,675 | 298,356 | 469,399,164 | 50,326 | 34,837 | ||||||||||||||
| 691,742,687 | 844,203 | 2,005,082,055 | 3,081,632 | 11,357 | ||||||||||||||
| $56.41 | $28.77 | $62.31 | �� | $14.94 | $16.05 | |||||||||||||
| 59.22 | 30.20 | 65.42 | 15.69 | 16.85 | ||||||||||||||
| 45.67 | 21.29 | 47.51 | 13.04 | 15.87 | ||||||||||||||
| 59.29 | 30.40 | 65.18 | 16.08 | 16.09 | ||||||||||||||
| 54.88 | 27.60 | 60.51 | 14.38 | 16.03 | ||||||||||||||
| 59.14 | 30.58 | 65.45 | 15.88 | 16.09 | ||||||||||||||
| 59.62 | 30.72 | 65.92 | 15.97 | 16.12 | ||||||||||||||
| 8,134,172 | 3,977,609 | 10,271,459 | 1,050,991 | 98,999 | ||||||||||||||
| 3,201,352 | 3,865,602 | 3,547,721 | 1,349,051 | 121,116 | ||||||||||||||
| 12,860,950 | 2,022,152 | 25,945,711 | 550,190 | 850,515 | ||||||||||||||
| 576,553 | 46,414 | 1,611,500 | 38,306 | 701 | ||||||||||||||
| 4,806,095 | 9,755 | 7,172,035 | 3,169 | 2,165 | ||||||||||||||
| 11,602,945 | 27,482 | 30,418,599 | 192,930 | 705 | ||||||||||||||
| $1,642,354,330 | $176,419,630 | $3,377,610,235 | $31,046,501 | $15,745,921 | ||||||||||||||
| — | — | — | — | — | ||||||||||||||
| The accompanying notes are an integral part of the financial statements. | 27 |
| 11.01.2016 to 10.31.2017 |
| Eagle Capital Appreciation Fund | Eagle Growth & Income Fund | Eagle International Stock Fund | Eagle Investment Grade Bond Fund | |||||||||||||
| Investment income | ||||||||||||||||
Dividends (a) | $4,618,990 | $16,405,018 | $399,887 | $— | ||||||||||||
Interest | 8,302 | 67,385 | 2,477 | 954,489 | ||||||||||||
| Total income | 4,627,292 | 16,472,403 | 402,364 | 954,489 | ||||||||||||
| Expenses | ||||||||||||||||
Investment advisory fees | 2,201,972 | 2,787,068 | 117,390 | 134,374 | ||||||||||||
Administrative fees: | ||||||||||||||||
Class A | 226,825 | 229,991 | 5,801 | 22,814 | ||||||||||||
Class C | 94,426 | 269,292 | 7,167 | 26,044 | ||||||||||||
Class I | 113,797 | 222,989 | 6,332 | 10,963 | ||||||||||||
Class R-3 | 1,289 | 4,064 | 1,083 | 315 | ||||||||||||
Class R-5 | 6,298 | 376 | 12 | 66 | ||||||||||||
Class R-6 | 31,874 | 37,837 | 11 | 981 | ||||||||||||
Distribution and service fees: | ||||||||||||||||
Class A | 378,041 | 383,318 | 9,668 | 38,023 | ||||||||||||
Class C | 629,506 | 1,795,277 | 47,780 | 173,630 | ||||||||||||
Class R-3 | 4,296 | 13,547 | 3,611 | 1,049 | ||||||||||||
Transfer agent and shareholder servicing fees: | ||||||||||||||||
Class A | 130,138 | 135,043 | 9,127 | 16,295 | ||||||||||||
Class C | 71,044 | 180,322 | 12,512 | 20,170 | ||||||||||||
Class I | 84,841 | 236,472 | 7,594 | 11,278 | ||||||||||||
Class R-3 | 1,741 | 3,952 | 1,788 | 657 | ||||||||||||
Class R-5 | 4,849 | 452 | 49 | 89 | ||||||||||||
Class R-6 | 3,900 | 4,307 | 64 | 387 | ||||||||||||
Custodian fees | 13,431 | 15,798 | 37,883 | 3,053 | ||||||||||||
Professional fees | 109,248 | 109,204 | 111,434 | 116,520 | ||||||||||||
State registration fees | 87,629 | 95,619 | 73,751 | 71,941 | ||||||||||||
Trustees and officers compensation | 85,314 | 85,314 | 85,314 | 85,314 | ||||||||||||
Internal audit fees | 12,354 | 12,354 | 12,354 | 12,354 | ||||||||||||
Interest expense on line of credit | 5,721 | — | 112 | 42 | ||||||||||||
Offering costs | — | — | — | — | ||||||||||||
Other expenses | 92,021 | 122,674 | 45,313 | 41,362 | ||||||||||||
| Total expenses before adjustments | 4,390,555 | 6,745,270 | 596,150 | 787,721 | ||||||||||||
Fees and expenses waived | (424 | ) | — | (341,343 | ) | (367,006 | ) | |||||||||
Recovered fees previously waived by Manager | 16 | — | — | — | ||||||||||||
| Total expenses after adjustments | 4,390,147 | 6,745,270 | 254,807 | 420,715 | ||||||||||||
| Net investment income (loss) | 237,145 | 9,727,133 | 147,557 | 533,774 | ||||||||||||
| Realized and unrealized gain (loss) on investments | ||||||||||||||||
Net realized gain (loss) on investments | 25,222,151 | 15,696,282 | 979,357 | 59,729 | ||||||||||||
Net realized loss on foreign currency transactions | — | — | (4,209 | ) | — | |||||||||||
Net change in unrealized appreciation (depreciation) on investments and | ||||||||||||||||
translation of assets and liabilities denominated in foreign currencies | 72,880,416 | 73,789,804 | 2,515,759 | (371,319 | ) | |||||||||||
| Net gain (loss) on investments | 98,102,567 | 89,486,086 | 3,490,907 | (311,590 | ) | |||||||||||
| Net increase (decrease) in assets resulting from operations | 98,339,712 | 99,213,219 | 3,638,464 | 222,184 | ||||||||||||
| (a) Net of foreign withholding taxes | $— | $135,654 | $40,195 | $— | ||||||||||||
| 28 | The accompanying notes are an integral part of the financial statements. |
Statements of Operations
| 11.01.2016 to 10.31.2017 |
| Eagle Mid Cap Growth Fund | Eagle Mid Cap Stock Fund | Eagle Small Cap Growth Fund | Eagle Smaller Company Fund | Eagle Tactical Allocation Fund | ||||||||||||||
| $10,020,493 | $2,174,316 | $28,947,631 | $451,472 | $272,090 | ||||||||||||||
| 201,236 | 27,516 | 473,324 | 7,521 | 2,794 | ||||||||||||||
| 10,221,729 | 2,201,832 | 29,420,955 | 458,993 | 274,884 | ||||||||||||||
| 9,625,554 | 1,564,123 | 24,024,458 | 275,476 | 79,734 | ||||||||||||||
| 565,570 | 175,086 | 1,217,364 | 23,941 | 2,757 | ||||||||||||||
| 191,265 | 130,105 | 261,231 | 26,639 | 2,438 | ||||||||||||||
| 544,897 | 54,755 | 1,457,334 | 8,831 | 10,458 | ||||||||||||||
| 39,083 | 2,267 | 145,591 | 718 | 16 | ||||||||||||||
| 205,209 | 263 | 455,741 | 46 | 46 | ||||||||||||||
| 494,393 | 697 | 1,659,027 | 2,837 | 11 | ||||||||||||||
| 942,616 | 291,810 | 2,028,940 | 39,902 | 4,596 | ||||||||||||||
| 1,275,100 | 867,367 | 1,741,538 | 177,591 | 16,252 | ||||||||||||||
| 130,277 | 7,557 | 485,303 | 2,392 | 53 | ||||||||||||||
| 499,221 | 144,828 | 1,478,015 | 30,316 | 2,731 | ||||||||||||||
| 129,802 | 116,180 | 206,040 | 26,472 | 2,658 | ||||||||||||||
| 522,914 | 64,422 | 1,825,657 | 14,932 | 19,304 | ||||||||||||||
| 38,638 | 2,848 | 171,626 | 1,005 | 10 | ||||||||||||||
| 212,590 | 555 | 542,503 | 111 | 64 | ||||||||||||||
| 53,496 | 154 | 161,899 | 461 | 6 | ||||||||||||||
| 47,123 | 8,067 | 129,475 | 4,497 | 1,403 | ||||||||||||||
| 109,247 | 109,290 | 109,215 | 109,265 | 105,631 | ||||||||||||||
| 88,976 | 78,139 | 109,804 | 75,901 | 68,482 | ||||||||||||||
| 85,314 | 85,314 | 85,315 | 85,314 | 85,314 | ||||||||||||||
| 12,354 | 12,354 | 12,355 | 12,354 | 12,354 | ||||||||||||||
| — | — | 17,129 | — | 127 | ||||||||||||||
| — | — | — | — | 22,150 | ||||||||||||||
| 375,412 | 84,152 | 1,169,682 | 29,586 | 11,501 | ||||||||||||||
| 16,189,051 | 3,800,333 | 39,495,242 | 948,587 | 448,096 | ||||||||||||||
| — | (41,001 | ) | — | (260,039 | ) | (303,556 | ) | |||||||||||
| — | — | — | — | — | ||||||||||||||
| 16,189,051 | 3,759,332 | 39,495,242 | 688,548 | 144,540 | ||||||||||||||
| (5,967,322 | ) | (1,557,500 | ) | (10,074,287 | ) | (229,555 | ) | 130,344 | ||||||||||
| 78,036,959 | 15,234,061 | 403,184,419 | 5,112,918 | 270,576 | ||||||||||||||
| — | — | — | — | — | ||||||||||||||
| 433,729,847 |
| 38,583,152 | 713,850,775 | 5,694,665 | 1,070,850 | ||||||||||||
| 511,766,806 | 53,817,213 | 1,117,035,194 | 10,807,583 | 1,341,426 | ||||||||||||||
| 505,799,484 | 52,259,713 | 1,106,960,907 | 10,578,028 | 1,471,770 | ||||||||||||||
| $57,007 | $17,429 | $245,856 | $3,214 | $— | ||||||||||||||
| The accompanying notes are an integral part of the financial statements. | 29 |
Statements of Changes in Net Assets
| Eagle Capital Appreciation Fund | Eagle Growth & Income Fund | Eagle International Stock Fund | Eagle Investment Grade Bond Fund | |||||||||||||||||||||||||||||
| 11/1/16 to 10/31/17 | 11/1/15 to 10/31/16 | 11/1/16 to 10/31/17 | 11/1/15 to 10/31/16 | 11/1/16 to 10/31/17 | 11/1/15 to 10/31/16 | 11/1/16 to 10/31/17 | 11/1/15 to 10/31/16 | |||||||||||||||||||||||||
Net assets, beginning of period | $339,629,417 | $348,684,017 | $553,144,966 | $580,909,868 | $15,173,586 | $17,008,658 | $49,128,736 | $49,945,886 | ||||||||||||||||||||||||
| Increase (decrease) in net assets from operations | ||||||||||||||||||||||||||||||||
Net investment income (loss) | 237,145 | 598,438 | 9,727,133 | 9,586,796 | 147,557 | 250,218 | 533,774 | 395,300 | ||||||||||||||||||||||||
Net realized gain (loss) on investments | 25,222,151 | 21,232,051 | 15,696,282 | 29,351,277 | 979,357 | (1,539,094 | ) | 59,729 | 512,388 | |||||||||||||||||||||||
Net realized loss on foreign currency transactions | — | — | — | — | (4,209 | ) | (17,466 | ) | — | — | ||||||||||||||||||||||
| Net change in unrealized appreciation (depreciation) on investments and translation of assets and liabilities denominated in foreign currencies | 72,880,416 | (21,034,003 | ) | 73,789,804 | (5,078,173 | ) | 2,515,759 | (88,453 | ) | (371,319 | ) | 320,350 | ||||||||||||||||||||
| Net increase (decrease) in net assets resulting from operations | 98,339,712 | 796,486 | 99,213,219 | 33,859,900 | 3,638,464 | (1,394,795 | ) | 222,184 | 1,228,038 | |||||||||||||||||||||||
| Distributions to shareholders from | ||||||||||||||||||||||||||||||||
Net investment income | (587,760 | ) | (402,552 | ) | (9,759,572 | ) | (9,307,511 | ) | (249,166 | ) | (74,253 | ) | (598,574 | ) | (489,308 | ) | ||||||||||||||||
Net realized gains | (21,213,057 | ) | (46,902,728 | ) | (28,297,613 | ) | — | — | — | (406,707 | ) | (141,621 | ) | |||||||||||||||||||
| Total distributions to shareholders | (21,800,817 | ) | (47,305,280 | ) | (38,057,185 | ) | (9,307,511 | ) | (249,166 | ) | (74,253 | ) | (1,005,281 | ) | (630,929 | ) | ||||||||||||||||
| Fund share transactions | ||||||||||||||||||||||||||||||||
Proceeds from shares sold-Class A | 6,795,240 | 9,408,142 | 9,824,277 | 22,327,409 | 966,809 | 3,063,961 | 1,215,734 | 6,708,336 | ||||||||||||||||||||||||
Issued as reinvestment of distributions-Class A | 8,461,224 | 21,122,750 | 9,358,425 | 2,709,691 | 46,859 | 45,124 | 350,777 | 262,021 | ||||||||||||||||||||||||
Cost of shares redeemed-Class A | (28,813,068 | ) | (31,700,321 | ) | (40,102,590 | ) | (62,312,787 | ) | (1,027,215 | ) | (8,368,988 | ) | (4,549,711 | ) | (10,045,720 | ) | ||||||||||||||||
Proceeds from shares sold-Class C | 2,860,366 | 5,737,822 | 10,370,279 | 14,881,038 | 719,093 | 1,081,959 | 2,384,141 | 4,042,193 | ||||||||||||||||||||||||
Issued as reinvestment of distributions-Class C | 4,718,569 | 10,927,535 | 9,423,544 | 1,787,872 | 50,527 | — | 296,197 | 163,391 | ||||||||||||||||||||||||
Cost of shares redeemed-Class C | (18,742,990 | ) | (11,759,361 | ) | (54,002,995 | ) | (38,004,277 | ) | (1,471,053 | ) | (941,886 | ) | (6,263,174 | ) | (5,799,756 | ) | ||||||||||||||||
Proceeds from shares sold-Class I | 41,711,259 | 44,130,215 | 88,518,674 | 59,475,750 | 2,151,420 | 4,940,337 | 2,905,387 | 8,122,827 | ||||||||||||||||||||||||
Issued as reinvestment of distributions-Class I | 5,648,884 | 13,171,755 | 10,193,980 | 2,477,931 | 137,212 | 28,889 | 280,460 | 163,420 | ||||||||||||||||||||||||
Cost of shares redeemed-Class I | (76,370,699 | ) | (24,145,581 | ) | (55,059,836 | ) | (87,252,412 | ) | (1,319,428 | ) | (822,015 | ) | (3,360,160 | ) | (5,922,702 | ) | ||||||||||||||||
Proceeds from shares sold-Class R-3 | 767,737 | 510,405 | 396,916 | 555,522 | 37,886 | 634,891 | 161,595 | 196,192 | ||||||||||||||||||||||||
Issued as reinvestment of distributions-Class R-3 | 42,012 | 129,413 | 133,127 | 34,218 | 13,703 | 3 | 4,113 | 1,373 | ||||||||||||||||||||||||
Cost of shares redeemed-Class R-3 | (845,394 | ) | (321,275 | ) | (1,069,899 | ) | (1,212,853 | ) | (7,081 | ) | (34,823 | ) | (188,221 | ) | (26,572 | ) | ||||||||||||||||
Proceeds from shares sold-Class R-5 | 1,236,365 | 845,331 | 124,842 | 79,912 | — | — | 249,699 | 20,548 | ||||||||||||||||||||||||
Issued as reinvestment of distributions-Class R-5 | 466,138 | 1,022,592 | 24,913 | 6,226 | 604 | 212 | 1,422 | 271 | ||||||||||||||||||||||||
Cost of shares redeemed-Class R-5 | (7,075,399 | ) | (1,625,554 | ) | (3,193 | ) | (199,803 | ) | (25,140 | ) | — | (2,262 | ) | — | ||||||||||||||||||
Proceeds from shares sold-Class R-6 | 36,802,300 | — | 4,528,156 | 34,978,843 | 804 | 6,323 | 999,994 | 700,000 | ||||||||||||||||||||||||
Issued as reinvestment of distributions-Class R-6 | 1,841,311 | 326 | 2,565,438 | 714,390 | 219 | 25 | 24,247 | 2,032 | ||||||||||||||||||||||||
Cost of shares redeemed-Class R-6 | (4,777,140 | ) | — | (5,384,823 | ) | (3,363,961 | ) | (358 | ) | (36 | ) | (11,054 | ) | (2,113 | ) | |||||||||||||||||
| Net increase (decrease) from fund share transactions | (25,273,285 | ) | 37,454,194 | (10,160,765 | ) | (52,317,291 | ) | 274,861 | (366,024 | ) | (5,500,816 | ) | (1,414,259 | ) | ||||||||||||||||||
| Increase (decrease) in net assets | 51,265,610 | (9,054,600 | ) | 50,995,269 | (27,764,902 | ) | 3,664,159 | (1,835,072 | ) | (6,283,913 | ) | (817,150 | ) | |||||||||||||||||||
Net assets, end of period (a) | 390,895,027 | 339,629,417 | 604,140,235 | 553,144,966 | 18,837,745 | 15,173,586 | 42,844,823 | 49,128,736 | ||||||||||||||||||||||||
| (a) includes undistributed (accumulated) net investment income (loss) of | $234,198 | $584,813 | $772,078 | $389,631 | $141,167 | $232,875 | $(19,521 | ) | $(31,692 | ) | ||||||||||||||||||||||
| Shares issued and redeemed | ||||||||||||||||||||||||||||||||
Shares sold-Class A | 174,563 | 266,630 | 511,170 | 1,290,839 | 58,651 | 203,642 | 82,382 | 446,225 | ||||||||||||||||||||||||
Issued as reinvestment of distributions-Class A | 246,468 | 618,166 | 503,417 | 151,024 | 3,128 | 2,851 | 23,782 | 17,587 | ||||||||||||||||||||||||
Shares redeemed-Class A | (771,842 | ) | (904,628 | ) | (2,070,819 | ) | (3,474,938 | ) | (63,784 | ) | (575,262 | ) | (307,006 | ) | (670,868 | ) | ||||||||||||||||
Shares sold-Class C | 101,959 | 211,539 | 568,124 | 861,248 | 42,647 | 71,980 | 161,027 | 271,430 | ||||||||||||||||||||||||
Issued as reinvestment of distributions-Class C | 182,749 | 414,236 | 530,410 | 103,095 | 3,423 | — | 20,162 | 11,010 | ||||||||||||||||||||||||
Shares redeemed-Class C | (657,104 | ) | (436,179 | ) | (2,916,422 | ) | (2,216,752 | ) | (91,947 | ) | (64,327 | ) | (423,887 | ) | (388,853 | ) | ||||||||||||||||
Shares sold-Class I | 1,075,924 | 1,219,155 | 4,625,761 | 3,262,354 | 123,174 | 320,739 | 195,953 | 541,380 | ||||||||||||||||||||||||
Issued as reinvestment of distributions-Class I | 157,702 | 370,722 | 547,143 | 138,031 | 9,190 | 1,823 | 18,971 | 10,928 | ||||||||||||||||||||||||
Shares redeemed-Class I | (1,981,381 | ) | (667,804 | ) | (2,854,755 | ) | (5,061,524 | ) | (85,412 | ) | (55,788 | ) | (226,482 | ) | (395,581 | ) | ||||||||||||||||
Shares sold-Class R-3 | 20,685 | 14,555 | 20,772 | 31,174 | 2,347 | 43,975 | 10,945 | 13,129 | ||||||||||||||||||||||||
Issued as reinvestment of distributions-Class R-3 | 1,265 | 3,899 | 7,205 | 1,903 | 922 | — | 279 | 92 | ||||||||||||||||||||||||
Shares redeemed-Class R-3 | (24,129 | ) | (9,348 | ) | (54,951 | ) | (68,171 | ) | (421 | ) | (2,346 | ) | (12,730 | ) | (1,766 | ) | ||||||||||||||||
Shares sold-Class R-5 | 31,850 | 23,091 | 6,604 | 4,475 | — | — | 16,760 | 1,377 | ||||||||||||||||||||||||
Issued as reinvestment of distributions-Class R-5 | 13,064 | 28,871 | 1,338 | 349 | 41 | 13 | 96 | 18 | ||||||||||||||||||||||||
Shares redeemed-Class R-5 | (174,308 | ) | (44,779 | ) | (166 | ) | (10,924 | ) | (1,587 | ) | — | (152 | ) | — | ||||||||||||||||||
Shares sold-Class R-6 | 988,409 | — | 237,517 | 2,018,887 | 48 | 416 | 67,069 | 46,174 | ||||||||||||||||||||||||
Issued as reinvestment of distributions-Class R-6 | 51,795 | 9 | 138,259 | 39,882 | 15 | 2 | 1,634 | 134 | ||||||||||||||||||||||||
Shares redeemed-Class R-6 | (121,141 | ) | — | (281,241 | ) | (186,640 | ) | (21 | ) | (3 | ) | (743 | ) | (140 | ) | |||||||||||||||||
| Shares issued and redeemed | (683,472 | ) | 1,108,135 | (480,634 | ) | (3,115,688 | ) | 414 | (52,285 | ) | (371,940 | ) | (97,724 | ) | ||||||||||||||||||
| (b) Commencement of operations. | ||||||||||||||||||||||||||||||||
| 30 | The accompanying notes are an integral part of the financial statements. |
Statements of Changes in Net Assets
| Eagle Mid Cap Growth Fund | Eagle Mid Cap Stock Fund | Eagle Small Cap Growth Fund | Eagle Smaller Company Fund | Eagle Tactical Allocation Fund | ||||||||||||||||||||||||||||||||||
| 11/1/16 to 10/31/17 | 11/1/15 to 10/31/16 | 11/1/16 to 10/31/17 | 11/1/15 to 10/31/16 | 11/1/16 to 10/31/17 | 11/1/15 to 10/31/16 | 11/1/16 to 10/31/17 | 11/1/15 to 10/31/16 | 11/1/16 to 10/31/17 | 12/31/15 (b) to 10/31/16 | |||||||||||||||||||||||||||||
| $1,373,092,497 | $1,175,711,953 | $255,357,699 | $308,982,156 | $4,065,433,794 | $3,927,386,017 | $44,458,814 | $65,465,101 | $7,702,229 | $— | |||||||||||||||||||||||||||||
| (5,967,322 | ) | (2,951,104 | ) | (1,557,500 | ) | (1,735,216 | ) | (10,074,287 | ) | (16,188,302 | ) | (229,555 | ) | (234,498 | ) | 130,344 | 14,570 | |||||||||||||||||||||
| 78,036,959 | (9,513,352 | ) | 15,234,061 | 21,574,456 | 403,184,419 | 120,976,307 | 5,112,918 | 4,749,918 | 270,576 | (6,746 | ) | |||||||||||||||||||||||||||
| — | — | — | — | — | — | — | — | — | — | |||||||||||||||||||||||||||||
| 433,729,847 |
| 12,315,658 | 38,583,152 | (15,751,380 | ) | 713,850,775 | (17,599,544 | ) | 5,694,665 | (2,470,248 | ) | 1,070,850 | 36,115 | ||||||||||||||||||||||||
| 505,799,484 |
| (148,798 | ) | 52,259,713 | 4,087,860 | 1,106,960,907 | 87,188,461 | 10,578,028 | 2,045,172 | 1,471,770 | 43,939 | ||||||||||||||||||||||||||
| (97,570 | ) | — | — | — | — | — | — | — | (44,727 | ) | — | |||||||||||||||||||||||||||
| — | (20,306,456 | ) | (21,546,258 | ) | (38,425,850 | ) | (125,420,017 | ) | (253,307,437 | ) | (4,398,626 | ) | — | (12,282 | ) | — | ||||||||||||||||||||||
| (97,570 | ) | (20,306,456 | ) | (21,546,258 | ) | (38,425,850 | ) | (125,420,017 | ) | (253,307,437 | ) | (4,398,626 | ) | — | (57,009 | ) | — | |||||||||||||||||||||
| 133,239,573 | 95,945,020 | 3,730,550 | 2,275,061 | 140,727,292 | 403,472,777 | 700,895 | 1,318,989 | 806,285 | 2,141,138 | |||||||||||||||||||||||||||||
| — | 5,550,337 | 8,876,493 | 16,352,942 | 24,299,552 | 42,318,007 | 1,421,448 | — | 7,495 | — | |||||||||||||||||||||||||||||
| (101,471,121 | ) | (126,132,961 | ) | (30,589,070 | ) | (32,973,233 | ) | (546,392,709 | ) | (276,940,673 | ) | (3,926,139 | ) | (6,334,042 | ) | (1,379,780 | ) | (201,205 | ) | |||||||||||||||||||
| 27,777,900 | 15,664,121 | 1,356,614 | 2,308,926 | 11,830,049 | 14,950,597 | 778,632 | 1,607,280 | 1,124,089 | 1,311,431 | |||||||||||||||||||||||||||||
| — | 2,188,795 | 8,734,608 | 15,409,781 | 6,031,652 | 13,522,945 | 1,796,210 | — | 1,498 | — | |||||||||||||||||||||||||||||
| (28,869,024 | ) | (18,651,431 | ) | (26,387,954 | ) | (21,329,175 | ) | (49,512,086 | ) | (35,063,833 | ) | (4,230,290 | ) | (6,032,773 | ) | (512,177 | ) | (148,929 | ) | |||||||||||||||||||
| 310,616,072 | 183,630,819 | 20,570,228 | 9,204,987 | 553,933,274 | 374,998,016 | 1,942,826 | 2,525,558 | 11,283,307 | 4,507,105 | |||||||||||||||||||||||||||||
| 6,580 | 5,709,718 | 3,272,151 | 5,272,356 | 32,479,254 | 87,038,982 | 682,837 | — | 46,925 | — | |||||||||||||||||||||||||||||
| (125,455,278 | ) | (119,637,905 | ) | (14,981,857 | ) | (15,717,152 | ) | (583,745,867 | ) | (777,809,595 | ) | (4,218,511 | ) | (8,794,026 | ) | (3,246,189 | ) | (1,250 | ) | |||||||||||||||||||
| 9,688,099 | 5,397,183 | 305,042 | 270,966 | 14,821,449 | 13,030,120 | 164,499 | 294,921 | — | 10,000 | |||||||||||||||||||||||||||||
| — | 378,859 | 104,157 | 198,370 | 2,846,912 | 7,278,883 | 17,126 | — | 12 | — | |||||||||||||||||||||||||||||
| (6,624,642 | ) | (7,428,281 | ) | (673,390 | ) | (709,521 | ) | (34,012,061 | ) | (38,831,699 | ) | (58,710 | ) | (287,100 | ) | — | — | |||||||||||||||||||||
| 117,002,843 | 55,776,767 | 82,327 | 64,074 | 147,981,495 | 129,715,335 | — | 31,396 | 20,000 | 30,000 | |||||||||||||||||||||||||||||
| 13,068 | 2,154,918 | 15,754 | 27,645 | 13,833,099 | 27,210,413 | 3,692 | — | 337 | — | |||||||||||||||||||||||||||||
| (43,861,460 | ) | (36,051,594 | ) | (83,241 | ) | (96,140 | ) | (235,670,530 | ) | (113,696,849 | ) | — | (2,859 | ) | (20,000 | ) | — | |||||||||||||||||||||
| 289,700,454 | 211,609,641 | 253,836 | 820,876 | 814,962,934 | 639,509,039 | 100,377 | 2,755,200 | — | 10,000 | |||||||||||||||||||||||||||||
| 77,414 | 3,455,584 | 39,211 | 123,684 | 36,051,096 | 50,703,433 | 233,473 | — | 72 | — | |||||||||||||||||||||||||||||
| (85,388,121 | ) | (61,723,792 | ) | (76,119 | ) | (790,914 | ) | (325,646,258 | ) | (257,239,145 | ) | (220,066 | ) | (10,134,003 | ) | — | — | |||||||||||||||||||||
| 496,452,357 | 217,835,798 | (25,450,660 | ) | (19,286,467 | ) | 24,818,547 | 304,166,753 | (4,811,701 | ) | (23,051,459 | ) | 8,131,874 | 7,658,290 | |||||||||||||||||||||||||
| 1,002,154,271 | 197,380,544 | 5,262,795 | (53,624,457 | ) | 1,006,359,437 | 138,047,777 | 1,367,701 | (21,006,287 | ) | 9,546,635 | 7,702,229 | |||||||||||||||||||||||||||
| 2,375,246,768 | 1,373,092,497 | 260,620,494 | 255,357,699 | 5,071,793,231 | 4,065,433,794 | 45,826,515 | 44,458,814 | 17,248,864 | 7,702,229 | |||||||||||||||||||||||||||||
| $(4,599,825 | ) | $(2,030,907 | ) | $(1,469,395 | ) | $(1,555,941 | ) | $(8,673,552 | ) | $(12,763,413 | ) | $(15,409 | ) | $(255,092 | ) | $99,645 | $14,570 | ||||||||||||||||||||
| 2,634,506 | 2,328,823 | 139,884 | 90,431 | 2,473,642 | 8,099,726 | 51,336 | 105,766 | 54,084 | 150,458 | |||||||||||||||||||||||||||||
| — | 135,242 | 354,209 | 684,797 | 461,355 | 871,458 | 109,595 | — | 510 | — | |||||||||||||||||||||||||||||
| (2,068,456 | ) | (3,044,695 | ) | (1,156,925 | ) | (1,302,901 | ) | (9,469,427 | ) | (5,576,046 | ) | (284,378 | ) | (518,646 | ) | (91,722 | ) | (14,331 | ) | |||||||||||||||||||
| 681,231 | 460,651 | 68,846 | 119,981 | 273,490 | 392,695 | 65,084 | 145,129 | 75,395 | 89,945 | |||||||||||||||||||||||||||||
| — | 65,008 | 467,842 | 838,400 | 149,335 | 357,372 | 157,562 | — | 102 | — | |||||||||||||||||||||||||||||
| (721,593 | ) | (547,429 | ) | (1,329,185 | ) | (1,098,863 | ) | (1,130,584 | ) | (910,679 | ) | (350,772 | ) | (548,752 | ) | (34,171 | ) | (10,155 | ) | |||||||||||||||||||
| 5,761,173 | 4,224,248 | 740,216 | 342,660 | 9,142,861 | 7,348,981 | 131,722 | 192,208 | 753,518 | 308,490 | |||||||||||||||||||||||||||||
| 139 | 133,218 | 123,851 | 210,979 | 591,392 | 1,726,964 | 49,019 | — | 3,194 | — | |||||||||||||||||||||||||||||
| (2,401,812 | ) | (2,776,628 | ) | (534,291 | ) | (599,541 | ) | (9,935,536 | ) | (14,976,720 | ) | (287,896 | ) | (680,240 | ) | (214,603 | ) | (84 | ) | |||||||||||||||||||
| 199,556 | 134,192 | 11,985 | 11,293 | 267,123 | 274,175 | 12,350 | 25,658 | — | 700 | |||||||||||||||||||||||||||||
| — | 9,441 | 4,322 | 8,588 | 55,539 | 153,530 | 1,369 | — | 1 | — | |||||||||||||||||||||||||||||
| (138,206 | ) | (185,799 | ) | (25,752 | ) | (28,749 | ) | (619,358 | ) | (806,232 | ) | (4,529 | ) | (24,167 | ) | — | — | |||||||||||||||||||||
| 2,184,137 | 1,299,631 | 2,976 | 2,357 | 2,473,948 | 2,484,981 | — | 2,478 | 1,357 | 2,071 | |||||||||||||||||||||||||||||
| 278 | 50,395 | 593 | 1,100 | 250,827 | 537,861 | 269 | — | 23 | — | |||||||||||||||||||||||||||||
| (841,367 | ) | (833,263 | ) | (3,028 | ) | (3,520 | ) | (3,971,896 | ) | (2,202,764 | ) | — | (225 | ) | (1,286 | ) | — | |||||||||||||||||||||
| 5,465,348 | 4,920,699 | 9,088 | 28,977 | 13,715,564 | 12,087,277 | 6,793 | 216,206 | — | 700 | |||||||||||||||||||||||||||||
| 1,632 | 80,307 | 1,470 | 4,910 | 649,686 | 997,314 | 16,894 | — | 5 | — | |||||||||||||||||||||||||||||
| (1,639,474 | ) | (1,414,062 | ) | (2,757 | ) | (29,372 | ) | (5,405,986 | ) | (4,959,395 | ) | (15,237 | ) | (789,023 | ) | — | — | |||||||||||||||||||||
| 9,117,092 | 5,039,979 | (1,126,656 | ) | (718,473 | ) | (28,025 | ) | 5,900,498 | (340,819 | ) | (1,873,608 | ) | 546,407 | 527,794 | ||||||||||||||||||||||||
| The accompanying notes are an integral part of the financial statements. | 31 |
Fiscal periods | From investment operations | Dividends & distributions |
| Ratios to average net asset (%) | ||||||||||||||||||||||||||||||||||||||||||||||||||||||||||||
| Beginning net asset value | Income (loss) | Realized & unrealized gain (loss) | Total | From investment income | From realized gains | From return of capital | Total | Ending net asset value | With expenses waived/ recovered (a) | Without expenses waived/ recovered (a) | Net income (loss) (a) | Portfolio turnover rate (%) (b) | Total return (%) (b)(c) | Ending net assets (millions) | ||||||||||||||||||||||||||||||||||||||||||||||||||
| Beginning | Ending | |||||||||||||||||||||||||||||||||||||||||||||||||||||||||||||||
| Eagle Capital Appreciation Fund | ||||||||||||||||||||||||||||||||||||||||||||||||||||||||||||||||
| Class A* | ||||||||||||||||||||||||||||||||||||||||||||||||||||||||||||||||
| 11/01/16 | 10/31/17 | $35.05 | $0.02 | $10.24 | $10.26 | $(0.03 | ) | $(2.14 | ) | $— | $(2.17 | ) | $43.14 | 1.20 | 1.20 | 0.07 | 33 | 30.84 | $164 | |||||||||||||||||||||||||||||||||||||||||||||
| 11/01/15 | 10/31/16 | 40.32 | 0.08 | (0.09 | ) | (0.01 | ) | (0.01 | ) | (5.25 | ) | — | (5.26 | ) | 35.05 | 1.23 | 1.23 | 0.22 | 35 | 0.30 | 145 | |||||||||||||||||||||||||||||||||||||||||||
| 11/01/14 | 10/31/15 | 42.02 | 0.09 | 3.80 | 3.89 | — | (5.59 | ) | — | (5.59 | ) | 40.32 | 1.19 | 1.19 | 0.22 | 42 | 10.29 | 168 | ||||||||||||||||||||||||||||||||||||||||||||||
| 11/01/13 | 10/31/14 | 39.59 | 0.01 | 6.64 | 6.65 | — | (4.22 | ) | — | (4.22 | ) | 42.02 | 1.23 | 1.23 | 0.02 | 33 | 18.34 | 157 | ||||||||||||||||||||||||||||||||||||||||||||||
| 11/01/12 | 10/31/13 | 30.95 | 0.10 | 8.66 | 8.76 | (0.12 | ) | — | — | (0.12 | ) | 39.59 | 1.30 | 1.30 | 0.30 | 69 | (d) | 28.41 | 205 | |||||||||||||||||||||||||||||||||||||||||||||
| Class C* | ||||||||||||||||||||||||||||||||||||||||||||||||||||||||||||||||
| 11/01/16 | 10/31/17 | 26.88 | (0.20 | ) | 7.69 | 7.49 | — | (2.14 | ) | — | (2.14 | ) | 32.23 | 1.97 | 1.97 | (0.70 | ) | 33 | 29.83 | 63 | ||||||||||||||||||||||||||||||||||||||||||||
| 11/01/15 | 10/31/16 | 32.37 | (0.15 | ) | (0.09 | ) | (0.24 | ) | — | (5.25 | ) | — | (5.25 | ) | 26.88 | 2.00 | 2.00 | (0.55 | ) | 35 | (0.45 | ) | 62 | |||||||||||||||||||||||||||||||||||||||||
| 11/01/14 | 10/31/15 | 35.05 | (0.17 | ) | 3.08 | 2.91 | — | (5.59 | ) | — | (5.59 | ) | 32.37 | 1.96 | 1.96 | (0.54 | ) | 42 | 9.42 | 69 | ||||||||||||||||||||||||||||||||||||||||||||
| 11/01/13 | 10/31/14 | 33.93 | (0.24 | ) | 5.58 | 5.34 | — | (4.22 | ) | — | (4.22 | ) | 35.05 | 1.97 | 1.97 | (0.73 | ) | 33 | 17.45 | 68 | ||||||||||||||||||||||||||||||||||||||||||||
| 11/01/12 | 10/31/13 | 26.62 | (0.13 | ) | 7.44 | 7.31 | — | — | — | — | 33.93 | 2.03 | 2.03 | (0.43 | ) | 69 | (d) | 27.46 | 68 | |||||||||||||||||||||||||||||||||||||||||||||
| Class I* | ||||||||||||||||||||||||||||||||||||||||||||||||||||||||||||||||
| 11/01/16 | 10/31/17 | 36.55 | 0.16 | 10.68 | 10.84 | (0.12 | ) | (2.14 | ) | — | (2.26 | ) | 45.13 | 0.88 | 0.88 | 0.39 | 33 | 31.26 | 119 | |||||||||||||||||||||||||||||||||||||||||||||
| 11/01/15 | 10/31/16 | 41.83 | 0.19 | (0.09 | ) | 0.10 | (0.13 | ) | (5.25 | ) | — | (5.38 | ) | 36.55 | 0.92 | 0.92 | 0.52 | 35 | 0.61 | 124 | ||||||||||||||||||||||||||||||||||||||||||||
| 11/01/14 | 10/31/15 | 43.34 | 0.21 | 3.93 | 4.14 | (0.06 | ) | (5.59 | ) | — | (5.65 | ) | 41.83 | 0.90 | 0.90 | 0.51 | 42 | 10.59 | 103 | |||||||||||||||||||||||||||||||||||||||||||||
| 11/01/13 | 10/31/14 | 40.60 | 0.13 | 6.83 | 6.96 | — | (4.22 | ) | — | (4.22 | ) | 43.34 | 0.94 | 0.93 | 0.32 | 33 | 18.68 | 88 | ||||||||||||||||||||||||||||||||||||||||||||||
| 11/01/12 | 10/31/13 | 31.72 | 0.19 | 8.92 | 9.11 | (0.23 | ) | — | — | (0.23 | ) | 40.60 | 0.95 | 0.99 | 0.51 | 69 | (d) | 28.87 | 30 | |||||||||||||||||||||||||||||||||||||||||||||
| Class R-3* | ||||||||||||||||||||||||||||||||||||||||||||||||||||||||||||||||
| 11/01/16 | 10/31/17 | 33.95 | (0.10 | ) | 9.89 | 9.79 | — | (2.14 | ) | — | (2.14 | ) | 41.60 | 1.51 | 1.56 | (0.28 | ) | 33 | 30.43 | 1 | ||||||||||||||||||||||||||||||||||||||||||||
| 11/01/15 | 10/31/16 | 39.33 | (0.04 | ) | (0.09 | ) | (0.13 | ) | — | (5.25 | ) | — | (5.25 | ) | 33.95 | 1.57 | 1.57 | (0.12 | ) | 35 | (0.04 | ) | 1 | |||||||||||||||||||||||||||||||||||||||||
| 11/01/14 | 10/31/15 | 41.24 | (0.04 | ) | 3.72 | 3.68 | — | (5.59 | ) | — | (5.59 | ) | 39.33 | 1.51 | 1.51 | (0.10 | ) | 42 | 9.94 | 1 | ||||||||||||||||||||||||||||||||||||||||||||
| 11/01/13 | 10/31/14 | 39.05 | (0.11 | ) | 6.52 | 6.41 | — | (4.22 | ) | — | (4.22 | ) | 41.24 | 1.56 | 1.56 | (0.30 | ) | 33 | 17.94 | 1 | ||||||||||||||||||||||||||||||||||||||||||||
| 11/01/12 | 10/31/13 | 30.53 | 0.01 | 8.52 | 8.53 | (0.01 | ) | — | — | (0.01 | ) | 39.05 | 1.60 | 1.60 | 0.02 | 69 | (d) | 27.94 | 1 | |||||||||||||||||||||||||||||||||||||||||||||
| Class R-5* | ||||||||||||||||||||||||||||||||||||||||||||||||||||||||||||||||
| 11/01/16 | 10/31/17 | 36.44 | 0.17 | 10.63 | 10.80 | (0.13 | ) | (2.14 | ) | — | (2.27 | ) | 44.97 | 0.89 | 0.89 | 0.45 | 33 | 31.26 | 3 | |||||||||||||||||||||||||||||||||||||||||||||
| 11/01/15 | 10/31/16 | 41.70 | 0.20 | (0.08 | ) | 0.12 | (0.13 | ) | (5.25 | ) | — | (5.38 | ) | 36.44 | 0.90 | 0.90 | 0.55 | 35 | 0.64 | 7 | ||||||||||||||||||||||||||||||||||||||||||||
| 11/01/14 | 10/31/15 | 43.20 | 0.18 | 3.93 | 4.11 | (0.02 | ) | (5.59 | ) | — | (5.61 | ) | 41.70 | 0.95 | 0.86 | 0.46 | 42 | 10.54 | 8 | |||||||||||||||||||||||||||||||||||||||||||||
| 11/01/13 | 10/31/14 | 40.50 | 0.10 | 6.82 | 6.92 | — | (4.22 | ) | — | (4.22 | ) | 43.20 | 0.95 | 0.94 | 0.25 | 33 | 18.62 | 5 | ||||||||||||||||||||||||||||||||||||||||||||||
| 11/01/12 | 10/31/13 | 31.66 | 0.25 | 8.83 | 9.08 | (0.24 | ) | — | — | (0.24 | ) | 40.50 | 0.95 | 0.99 | 0.73 | 69 | (d) | 28.84 | 20 | |||||||||||||||||||||||||||||||||||||||||||||
| Class R-6* | ||||||||||||||||||||||||||||||||||||||||||||||||||||||||||||||||
| 11/01/16 | 10/31/17 | 36.35 | 0.14 | 10.66 | 10.80 | (0.19 | ) | (2.14 | ) | — | (2.33 | ) | 44.82 | 0.82 | 0.82 | 0.34 | 33 | 31.36 | 41 | |||||||||||||||||||||||||||||||||||||||||||||
| 11/01/15 | 10/31/16 | 41.66 | 0.22 | (0.09 | ) | 0.13 | (0.19 | ) | (5.25 | ) | — | (5.44 | ) | 36.35 | 0.85 | 1.49 | 0.60 | 35 | 0.68 | 0 | ||||||||||||||||||||||||||||||||||||||||||||
| 07/31/15 | 10/31/15 | 41.71 | 0.06 | (0.11 | ) | (0.05 | ) | — | — | — | — | 41.66 | 0.82 | 0.82 | 0.57 | 42 | (0.12 | ) | 0 | |||||||||||||||||||||||||||||||||||||||||||||
| Eagle Growth & Income Fund | ||||||||||||||||||||||||||||||||||||||||||||||||||||||||||||||||
| Class A* | ||||||||||||||||||||||||||||||||||||||||||||||||||||||||||||||||
| 11/01/16 | 10/31/17 | 18.39 | 0.34 | 2.93 | 3.27 | (0.33 | ) | (0.94 | ) | — | (1.27 | ) | 20.39 | 1.03 | 1.03 | 1.74 | 10 | 18.56 | 147 | |||||||||||||||||||||||||||||||||||||||||||||
| 11/01/15 | 10/31/16 | 17.52 | 0.34 | 0.85 | 1.19 | (0.32 | ) | — | — | (0.32 | ) | 18.39 | 1.06 | 1.06 | 1.91 | 15 | 6.87 | 152 | ||||||||||||||||||||||||||||||||||||||||||||||
| 11/01/14 | 10/31/15 | 18.27 | 0.36 | (0.64 | ) | (0.28 | ) | (0.32 | ) | (0.13 | ) | (0.02 | ) | (0.47 | ) | 17.52 | 1.02 | 1.02 | 1.99 | 25 | (1.55 | ) | 180 | |||||||||||||||||||||||||||||||||||||||||
| 11/01/13 | 10/31/14 | 16.68 | 0.30 | 1.91 | 2.21 | (0.28 | ) | (0.34 | ) | — | (0.62 | ) | 18.27 | 1.02 | 1.02 | 1.71 | 10 | 13.52 | 223 | |||||||||||||||||||||||||||||||||||||||||||||
| 11/01/12 | 10/31/13 | 13.87 | 0.33 | 3.06 | 3.39 | (0.33 | ) | (0.25 | ) | — | (0.58 | ) | 16.68 | 1.09 | 1.09 | 2.17 | 28 | 25.14 | 214 | |||||||||||||||||||||||||||||||||||||||||||||
| Class C* | ||||||||||||||||||||||||||||||||||||||||||||||||||||||||||||||||
| 11/01/16 | 10/31/17 | 17.68 | 0.18 | 2.81 | 2.99 | (0.19 | ) | (0.94 | ) | — | (1.13 | ) | 19.54 | 1.79 | 1.79 | 0.98 | 10 | 17.62 | 169 | |||||||||||||||||||||||||||||||||||||||||||||
| 11/01/15 | 10/31/16 | 16.86 | 0.20 | 0.82 | 1.02 | (0.20 | ) | — | — | (0.20 | ) | 17.68 | 1.82 | 1.82 | 1.14 | 15 | 6.07 | 185 | ||||||||||||||||||||||||||||||||||||||||||||||
| 11/01/14 | 10/31/15 | 17.60 | 0.21 | (0.60 | ) | (0.39 | ) | (0.20 | ) | (0.13 | ) | (0.02 | ) | (0.35 | ) | 16.86 | 1.79 | 1.79 | 1.21 | 25 | (2.30 | ) | 197 | |||||||||||||||||||||||||||||||||||||||||
| 11/01/13 | 10/31/14 | 16.10 | 0.16 | 1.83 | 1.99 | (0.15 | ) | (0.34 | ) | — | (0.49 | ) | 17.60 | 1.79 | 1.79 | 0.92 | 10 | 12.63 | 212 | |||||||||||||||||||||||||||||||||||||||||||||
| 11/01/12 | 10/31/13 | 13.41 | 0.21 | 2.95 | 3.16 | (0.22 | ) | (0.25 | ) | — | (0.47 | ) | 16.10 | 1.84 | 1.84 | 1.39 | 28 | 24.23 | 170 | |||||||||||||||||||||||||||||||||||||||||||||
| Class I* | ||||||||||||||||||||||||||||||||||||||||||||||||||||||||||||||||
| 11/01/16 | 10/31/17 | 18.35 | 0.39 | 2.93 | 3.32 | (0.39 | ) | (0.94 | ) | — | (1.33 | ) | 20.34 | 0.75 | 0.75 | 2.00 | 10 | 18.90 | 246 | |||||||||||||||||||||||||||||||||||||||||||||
| 11/01/15 | 10/31/16 | 17.48 | 0.39 | 0.85 | 1.24 | (0.37 | ) | — | — | (0.37 | ) | 18.35 | 0.79 | 0.79 | 2.17 | 15 | 7.18 | 179 | ||||||||||||||||||||||||||||||||||||||||||||||
| 11/01/14 | 10/31/15 | 18.24 | 0.40 | (0.64 | ) | (0.24 | ) | (0.37 | ) | (0.13 | ) | (0.02 | ) | (0.52 | ) | 17.48 | 0.76 | 0.76 | 2.23 | 25 | (1.33 | ) | 200 | |||||||||||||||||||||||||||||||||||||||||
| 11/01/13 | 10/31/14 | 16.65 | 0.33 | 1.93 | 2.26 | (0.33 | ) | (0.34 | ) | — | (0.67 | ) | 18.24 | 0.77 | 0.77 | 1.89 | 10 | 13.86 | 207 | |||||||||||||||||||||||||||||||||||||||||||||
| 11/01/12 | 10/31/13 | 13.85 | 0.37 | 3.06 | 3.43 | (0.38 | ) | (0.25 | ) | — | (0.63 | ) | 16.65 | 0.80 | 0.80 | 2.37 | 28 | 25.49 | 94 | |||||||||||||||||||||||||||||||||||||||||||||
| 32 | The accompanying notes are an integral part of the financial statements. |
Financial Highlights
Fiscal periods | From investment operations | Dividends & distributions |
| Ratios to average net asset (%) | ||||||||||||||||||||||||||||||||||||||||||||||||||||||||||||
| Beginning net asset value | Income (loss) | Realized & unrealized gain (loss) | Total | From investment income | From realized gains | From return of capital | Total | Ending net asset value | With expenses waived/ recovered (a) | Without expenses waived/ recovered (a) | Net income (loss) (a) | Portfolio turnover rate (%) (b) | Total return (%) (b)(c) | Ending net assets (millions) | ||||||||||||||||||||||||||||||||||||||||||||||||||
| Beginning | Ending | |||||||||||||||||||||||||||||||||||||||||||||||||||||||||||||||
| Eagle Growth & Income Fund (cont’d) | ||||||||||||||||||||||||||||||||||||||||||||||||||||||||||||||||
| Class R-3* | ||||||||||||||||||||||||||||||||||||||||||||||||||||||||||||||||
| 11/01/16 | 10/31/17 | $18.32 | $0.28 | $2.91 | $3.19 | $(0.27 | ) | $(0.94 | ) | $— | $(1.21 | ) | $20.30 | 1.34 | 1.34 | 1.44 | 10 | 18.15 | $2 | |||||||||||||||||||||||||||||||||||||||||||||
| 11/01/15 | 10/31/16 | 17.44 | 0.28 | 0.87 | 1.15 | (0.27 | ) | — | — | (0.27 | ) | 18.32 | 1.37 | 1.37 | 1.60 | 15 | 6.61 | 3 | ||||||||||||||||||||||||||||||||||||||||||||||
| 11/01/14 | 10/31/15 | 18.19 | 0.28 | (0.63 | ) | (0.35 | ) | (0.25 | ) | (0.13 | ) | (0.02 | ) | (0.40 | ) | 17.44 | 1.44 | 1.44 | 1.57 | 25 | (1.99 | ) | 3 | |||||||||||||||||||||||||||||||||||||||||
| 11/01/13 | 10/31/14 | 16.61 | 0.23 | 1.90 | 2.13 | (0.21 | ) | (0.34 | ) | — | (0.55 | ) | 18.19 | 1.40 | 1.40 | 1.33 | 10 | 13.08 | 4 | |||||||||||||||||||||||||||||||||||||||||||||
| 11/01/12 | 10/31/13 | 13.82 | 0.28 | 3.04 | 3.32 | (0.28 | ) | (0.25 | ) | — | (0.53 | ) | 16.61 | 1.43 | 1.43 | 1.81 | 28 | 24.71 | 4 | |||||||||||||||||||||||||||||||||||||||||||||
| Class R-5* | ||||||||||||||||||||||||||||||||||||||||||||||||||||||||||||||||
| 11/01/16 | 10/31/17 | 18.38 | 0.38 | 2.93 | 3.31 | (0.39 | ) | (0.94 | ) | — | (1.33 | ) | 20.36 | 0.76 | 0.76 | 1.97 | 10 | 18.82 | 0 | |||||||||||||||||||||||||||||||||||||||||||||
| 11/01/15 | 10/31/16 | 17.50 | 0.39 | 0.87 | 1.26 | (0.38 | ) | — | — | (0.38 | ) | 18.38 | 0.75 | 0.75 | 2.21 | 15 | 7.27 | 0 | ||||||||||||||||||||||||||||||||||||||||||||||
| 11/01/14 | 10/31/15 | 18.21 | 0.44 | (0.76 | ) | (0.32 | ) | (0.24 | ) | (0.13 | ) | (0.02 | ) | (0.39 | ) | 17.50 | 0.78 | 0.79 | 2.39 | 25 | (1.82 | ) | 0 | |||||||||||||||||||||||||||||||||||||||||
| 11/01/13 | 10/31/14 | 16.63 | 0.34 | 1.90 | 2.24 | (0.32 | ) | (0.34 | ) | — | (0.66 | ) | 18.21 | 0.76 | 0.76 | 1.95 | 10 | 13.80 | 4 | |||||||||||||||||||||||||||||||||||||||||||||
| 11/01/12 | 10/31/13 | 13.84 | 0.33 | 3.10 | 3.43 | (0.39 | ) | (0.25 | ) | — | (0.64 | ) | 16.63 | 0.72 | 0.72 | 2.07 | 28 | 25.54 | 3 | |||||||||||||||||||||||||||||||||||||||||||||
| Class R-6* | ||||||||||||||||||||||||||||||||||||||||||||||||||||||||||||||||
| 11/01/16 | 10/31/17 | 18.32 | 0.40 | 2.93 | 3.33 | (0.41 | ) | (0.94 | ) | — | (1.35 | ) | 20.30 | 0.65 | 0.65 | 2.10 | 10 | 18.98 | 40 | |||||||||||||||||||||||||||||||||||||||||||||
| 11/01/15 | 10/31/16 | 17.46 | 0.39 | 0.87 | 1.26 | (0.40 | ) | — | — | (0.40 | ) | 18.32 | 0.67 | 0.67 | 2.18 | 15 | 7.30 | 34 | ||||||||||||||||||||||||||||||||||||||||||||||
| 11/01/14 | 10/31/15 | 18.26 | 0.45 | (0.71 | ) | (0.26 | ) | (0.39 | ) | (0.13 | ) | (0.02 | ) | (0.54 | ) | 17.46 | 0.65 | 0.65 | 2.47 | 25 | (1.46 | ) | 0 | |||||||||||||||||||||||||||||||||||||||||
| 11/01/13 | 10/31/14 | 16.67 | 0.35 | 1.92 | 2.27 | (0.34 | ) | (0.34 | ) | — | (0.68 | ) | 18.26 | 0.66 | 0.66 | 2.01 | 10 | 13.94 | 0 | |||||||||||||||||||||||||||||||||||||||||||||
| 11/01/12 | 10/31/13 | 13.86 | 0.34 | 3.10 | 3.44 | (0.38 | ) | (0.25 | ) | — | (0.63 | ) | 16.67 | 0.71 | 0.71 | 2.09 | 28 | 25.59 | 0 | |||||||||||||||||||||||||||||||||||||||||||||
| Eagle International Stock Fund | ||||||||||||||||||||||||||||||||||||||||||||||||||||||||||||||||
| Class A* | ||||||||||||||||||||||||||||||||||||||||||||||||||||||||||||||||
| 11/01/16 | 10/31/17 | 15.02 | 0.17 | 3.71 | 3.88 | (0.19 | ) | — | — | (0.19 | ) | 18.71 | 1.54 | 3.72 | 1.03 | 80 | 26.15 | 4 | ||||||||||||||||||||||||||||||||||||||||||||||
| 11/01/15 | 10/31/16 | 16.02 | 0.21 | (1.14 | ) | (0.93 | ) | (0.07 | ) | — | — | (0.07 | ) | 15.02 | 1.67 | 3.45 | 1.40 | 100 | (5.84 | ) | 4 | |||||||||||||||||||||||||||||||||||||||||||
| 11/01/14 | 10/31/15 | 16.54 | 0.14 | 0.40 | 0.54 | (0.39 | ) | (0.67 | ) | — | (1.06 | ) | 16.02 | 1.58 | 4.04 | 0.88 | 86 | 3.63 | 10 | |||||||||||||||||||||||||||||||||||||||||||||
| 11/01/13 | 10/31/14 | 16.48 | 0.42 | (0.13 | ) | 0.29 | (0.14 | ) | (0.09 | ) | — | (0.23 | ) | 16.54 | 1.57 | 5.96 | 2.49 | 96 | 1.73 | 4 | ||||||||||||||||||||||||||||||||||||||||||||
| 02/28/13 | 10/31/13 | 14.29 | 0.15 | 2.04 | 2.19 | — | — | — | — | 16.48 | 1.55 | 11.48 | 1.50 | 42 | 15.33 | 4 | ||||||||||||||||||||||||||||||||||||||||||||||||
| Class C* | ||||||||||||||||||||||||||||||||||||||||||||||||||||||||||||||||
| 11/01/16 | 10/31/17 | 14.79 | 0.04 | 3.65 | 3.69 | (0.16 | ) | — | — | (0.16 | ) | 18.32 | 2.29 | 4.50 | 0.27 | 80 | 25.21 | 5 | ||||||||||||||||||||||||||||||||||||||||||||||
| 11/01/15 | 10/31/16 | 15.83 | 0.08 | (1.12 | ) | (1.04 | ) | — | — | — | — | 14.79 | 2.47 | 4.31 | 0.52 | 100 | (6.57 | ) | 5 | |||||||||||||||||||||||||||||||||||||||||||||
| 11/01/14 | 10/31/15 | 16.38 | 0.03 | 0.38 | 0.41 | (0.29 | ) | (0.67 | ) | — | (0.96 | ) | 15.83 | 2.35 | 4.95 | 0.18 | 86 | 2.80 | 5 | |||||||||||||||||||||||||||||||||||||||||||||
| 11/01/13 | 10/31/14 | 16.38 | 0.30 | (0.14 | ) | 0.16 | (0.07 | ) | (0.09 | ) | — | (0.16 | ) | 16.38 | 2.35 | 6.68 | 1.78 | 96 | 0.94 | 4 | ||||||||||||||||||||||||||||||||||||||||||||
| 02/28/13 | 10/31/13 | 14.29 | 0.11 | 1.98 | 2.09 | — | — | — | — | 16.38 | 2.39 | 12.03 | 1.07 | 42 | 14.63 | 3 | ||||||||||||||||||||||||||||||||||||||||||||||||
| Class I* | ||||||||||||||||||||||||||||||||||||||||||||||||||||||||||||||||
| 11/01/16 | 10/31/17 | 15.11 | 0.23 | 3.71 | 3.94 | (0.35 | ) | — | — | (0.35 | ) | 18.70 | 1.15 | 3.28 | 1.40 | 80 | 26.63 | 8 | ||||||||||||||||||||||||||||||||||||||||||||||
| 11/01/15 | 10/31/16 | 16.08 | 0.30 | (1.15 | ) | (0.85 | ) | (0.12 | ) | — | — | (0.12 | ) | 15.11 | 1.15 | 3.12 | 2.03 | 100 | (5.31 | ) | 6 | |||||||||||||||||||||||||||||||||||||||||||
| 11/01/14 | 10/31/15 | 16.62 | 0.21 | 0.39 | 0.60 | (0.47 | ) | (0.67 | ) | — | (1.14 | ) | 16.08 | 1.15 | 3.82 | 1.31 | 86 | 4.04 | 2 | |||||||||||||||||||||||||||||||||||||||||||||
| 11/01/13 | 10/31/14 | 16.52 | 0.53 | (0.17 | ) | 0.36 | (0.17 | ) | (0.09 | ) | — | (0.26 | ) | 16.62 | 1.15 | 5.43 | 3.16 | 96 | 2.18 | 1 | ||||||||||||||||||||||||||||||||||||||||||||
| 02/28/13 | 10/31/13 | 14.29 | 0.13 | 2.10 | 2.23 | — | — | — | 16.52 | 1.15 | 4.25 | 1.21 | 42 | 15.61 | 0 | |||||||||||||||||||||||||||||||||||||||||||||||||
| Class R-3* | ||||||||||||||||||||||||||||||||||||||||||||||||||||||||||||||||
| 11/01/16 | 10/31/17 | 15.04 | 0.15 | 3.67 | 3.82 | (0.33 | ) | — | — | (0.33 | ) | 18.53 | 1.71 | 3.98 | 0.89 | 80 | 25.91 | 1 | ||||||||||||||||||||||||||||||||||||||||||||||
| 11/01/15 | 10/31/16 | 15.99 | 0.12 | (1.05 | ) | (0.93 | ) | (0.02 | ) | — | — | (0.02 | ) | 15.04 | 1.75 | 3.86 | 0.77 | 100 | (5.84 | ) | 1 | |||||||||||||||||||||||||||||||||||||||||||
| 11/01/14 | 10/31/15 | 16.53 | 0.13 | 0.37 | 0.50 | (0.37 | ) | (0.67 | ) | — | (1.04 | ) | 15.99 | 1.74 | 4.38 | 0.79 | 86 | 3.37 | 0 | |||||||||||||||||||||||||||||||||||||||||||||
| 11/01/13 | 10/31/14 | 16.45 | 0.40 | (0.13 | ) | 0.27 | (0.10 | ) | (0.09 | ) | — | (0.19 | ) | 16.53 | 1.73 | 6.22 | 2.37 | 96 | 1.64 | 0 | ||||||||||||||||||||||||||||||||||||||||||||
| 02/28/13 | 10/31/13 | 14.29 | 0.19 | 1.97 | 2.16 | — | — | — | — | 16.45 | 1.75 | 13.83 | 1.84 | 42 | 15.12 | 0 | ||||||||||||||||||||||||||||||||||||||||||||||||
| Class R-5* | ||||||||||||||||||||||||||||||||||||||||||||||||||||||||||||||||
| 11/01/16 | 10/31/17 | 15.11 | 0.08 | 3.85 | 3.93 | (0.35 | ) | — | — | (0.35 | ) | 18.69 | 1.15 | 3.69 | 0.49 | 80 | 26.56 | 0 | ||||||||||||||||||||||||||||||||||||||||||||||
| 11/01/15 | 10/31/16 | 16.09 | 0.27 | (1.13 | ) | (0.86 | ) | (0.12 | ) | — | — | (0.12 | ) | 15.11 | 1.15 | 3.22 | 1.79 | 100 | (5.36 | ) | 0 | |||||||||||||||||||||||||||||||||||||||||||
| 11/01/14 | 10/31/15 | 16.63 | 0.25 | 0.35 | 0.60 | (0.47 | ) | (0.67 | ) | — | (1.14 | ) | 16.09 | 1.15 | 3.59 | 1.58 | 86 | 4.01 | 0 | |||||||||||||||||||||||||||||||||||||||||||||
| 11/01/13 | 10/31/14 | 16.52 | 0.50 | (0.14 | ) | 0.36 | (0.16 | ) | (0.09 | ) | — | (0.25 | ) | 16.63 | 1.15 | 5.67 | 2.96 | 96 | 2.18 | 0 | ||||||||||||||||||||||||||||||||||||||||||||
| 02/28/13 | 10/31/13 | 14.29 | 0.25 | 1.98 | 2.23 | — | — | — | — | 16.52 | 1.15 | 13.27 | 2.44 | 42 | 15.61 | 0 | ||||||||||||||||||||||||||||||||||||||||||||||||
| Class R-6* | ||||||||||||||||||||||||||||||||||||||||||||||||||||||||||||||||
| 11/01/16 | 10/31/17 | 15.14 | 0.26 | 3.71 | 3.97 | (0.36 | ) | — | — | (0.36 | ) | 18.75 | 1.05 | 3.78 | 1.55 | 80 | 26.82 | 0 | ||||||||||||||||||||||||||||||||||||||||||||||
| 11/01/15 | 10/31/16 | 16.11 | 0.27 | (1.11 | ) | (0.84 | ) | (0.13 | ) | — | — | (0.13 | ) | 15.14 | 1.05 | 3.73 | 1.80 | 100 | (5.26 | ) | 0 | |||||||||||||||||||||||||||||||||||||||||||
| 11/01/14 | 10/31/15 | 16.65 | 0.24 | 0.37 | 0.61 | (0.48 | ) | (0.67 | ) | — | (1.15 | ) | 16.11 | 1.05 | 3.80 | 1.48 | 86 | 4.11 | 0 | |||||||||||||||||||||||||||||||||||||||||||||
| 11/01/13 | 10/31/14 | 16.53 | 0.51 | (0.13 | ) | 0.38 | (0.17 | ) | (0.09 | ) | — | (0.26 | ) | 16.65 | 1.05 | 5.67 | 3.05 | 96 | 2.31 | 0 | ||||||||||||||||||||||||||||||||||||||||||||
| 02/28/13 | 10/31/13 | 14.29 | 0.26 | 1.98 | 2.24 | — | — | — | — | 16.53 | 1.05 | 13.27 | 2.54 | 42 | 15.68 | 0 | ||||||||||||||||||||||||||||||||||||||||||||||||
| The accompanying notes are an integral part of the financial statements. | 33 |
Financial Highlights
Fiscal periods | From investment operations | Dividends & distributions |
| Ratios to average net asset (%) | ||||||||||||||||||||||||||||||||||||||||||||||||||||||||||||
| Beginning net asset value | Income (loss) | Realized & unrealized gain (loss) | Total | From investment income | From realized gains | From return of capital | Total | Ending net asset value | With expenses waived/ recovered (a) | Without expenses waived/ recovered (a) | Net income (loss) (a) | Portfolio turnover rate (%) (b) | Total return (%) (b)(c) | Ending net assets (millions) | ||||||||||||||||||||||||||||||||||||||||||||||||||
| Beginning | Ending | |||||||||||||||||||||||||||||||||||||||||||||||||||||||||||||||
| Eagle Investment Grade Bond Fund | ||||||||||||||||||||||||||||||||||||||||||||||||||||||||||||||||
| Class A* | ||||||||||||||||||||||||||||||||||||||||||||||||||||||||||||||||
| 11/01/16 | 10/31/17 | $ 15.06 | $ 0.21 | $ (0.09 | ) | $ 0.12 | $ (0.23 | ) | $ (0.13 | ) | $ — | $ (0.36 | ) | $ 14.82 | 0.73 | 1.55 | 1.40 | 40 | 0.82 | $14 | ||||||||||||||||||||||||||||||||||||||||||||
| 11/01/15 | 10/31/16 | 14.87 | 0.17 | 0.26 | 0.43 | (0.20 | ) | (0.04 | ) | — | (0.24 | ) | 15.06 | 0.85 | 1.54 | 1.11 | 90 | 2.91 | 17 | |||||||||||||||||||||||||||||||||||||||||||||
| 11/01/14 | 10/31/15 | 14.89 | 0.17 | 0.04 | 0.21 | (0.17 | ) | (0.06 | ) | — | (0.23 | ) | 14.87 | 0.85 | 1.36 | 1.14 | 82 | 1.46 | 20 | |||||||||||||||||||||||||||||||||||||||||||||
| 11/01/13 | 10/31/14 | 14.89 | 0.17 | 0.04 | 0.21 | (0.17 | ) | (0.04 | ) | — | (0.21 | ) | 14.89 | 0.85 | 1.21 | 1.15 | 139 | 1.42 | 23 | |||||||||||||||||||||||||||||||||||||||||||||
| 11/01/12 | 10/31/13 | 15.51 | 0.12 | (0.27 | ) | (0.15 | ) | �� | (0.11 | ) | (0.36 | ) | — | (0.47 | ) | 14.89 | 0.85 | 1.01 | 0.80 | 136 | (1.00 | ) | 37 | |||||||||||||||||||||||||||||||||||||||||
| Class C* | ||||||||||||||||||||||||||||||||||||||||||||||||||||||||||||||||
| 11/01/16 | 10/31/17 | 15.03 | 0.10 | (0.09 | ) | 0.01 | (0.12 | ) | (0.13 | ) | — | (0.25 | ) | 14.79 | 1.48 | 2.30 | 0.65 | 40 | 0.05 | 16 | ||||||||||||||||||||||||||||||||||||||||||||
| 11/01/15 | 10/31/16 | 14.84 | 0.05 | 0.26 | 0.31 | (0.08 | ) | (0.04 | ) | — | (0.12 | ) | 15.03 | 1.65 | 2.30 | 0.31 | 90 | 2.10 | 20 | |||||||||||||||||||||||||||||||||||||||||||||
| 11/01/14 | 10/31/15 | 14.86 | 0.05 | 0.04 | 0.09 | (0.05 | ) | (0.06 | ) | — | (0.11 | ) | 14.84 | 1.65 | 2.12 | 0.34 | 82 | 0.64 | 21 | |||||||||||||||||||||||||||||||||||||||||||||
| 11/01/13 | 10/31/14 | 14.86 | 0.05 | 0.04 | 0.09 | (0.05 | ) | (0.04 | ) | — | (0.09 | ) | 14.86 | 1.65 | 1.96 | 0.35 | 139 | 0.60 | 26 | |||||||||||||||||||||||||||||||||||||||||||||
| 11/01/12 | 10/31/13 | 15.49 | — | (e) | (0.26 | ) | (0.26 | ) | (0.01 | ) | (0.36 | ) | — | (0.37 | ) | 14.86 | 1.65 | 1.77 | 0.01 | 136 | (1.75 | ) | 41 | |||||||||||||||||||||||||||||||||||||||||
| Class I* | ||||||||||||||||||||||||||||||||||||||||||||||||||||||||||||||||
| 11/01/16 | 10/31/17 | 15.09 | 0.25 | (0.09 | ) | 0.16 | (0.27 | ) | (0.13 | ) | — | (0.40 | ) | 14.85 | 0.43 | 1.24 | 1.70 | 40 | 1.12 | 11 | ||||||||||||||||||||||||||||||||||||||||||||
| 11/01/15 | 10/31/16 | 14.90 | 0.20 | 0.26 | 0.46 | (0.23 | ) | (0.04 | ) | — | (0.27 | ) | 15.09 | 0.60 | 1.25 | 1.36 | 90 | 3.17 | 12 | |||||||||||||||||||||||||||||||||||||||||||||
| 11/01/14 | 10/31/15 | 14.92 | 0.21 | 0.04 | 0.25 | (0.21 | ) | (0.06 | ) | — | (0.27 | ) | 14.90 | 0.60 | 1.09 | 1.39 | 82 | 1.71 | 9 | |||||||||||||||||||||||||||||||||||||||||||||
| 11/01/13 | 10/31/14 | 14.92 | 0.21 | 0.04 | 0.25 | (0.21 | ) | (0.04 | ) | — | (0.25 | ) | 14.92 | 0.60 | 0.91 | 1.40 | 139 | 1.67 | 9 | |||||||||||||||||||||||||||||||||||||||||||||
| 11/01/12 | 10/31/13 | 15.54 | 0.16 | (0.27 | ) | (0.11 | ) | (0.15 | ) | (0.36 | ) | — | (0.51 | ) | 14.92 | 0.60 | 0.72 | 1.04 | 136 | (0.74 | ) | 7 | ||||||||||||||||||||||||||||||||||||||||||
| Class R-3* | ||||||||||||||||||||||||||||||||||||||||||||||||||||||||||||||||
| 11/01/16 | 10/31/17 | 15.06 | 0.17 | (0.10 | ) | 0.07 | (0.19 | ) | (0.13 | ) | — | (0.32 | ) | 14.81 | 0.98 | 2.01 | 1.16 | 40 | 0.50 | 0 | ||||||||||||||||||||||||||||||||||||||||||||
| 11/01/15 | 10/31/16 | 14.87 | 0.13 | 0.26 | 0.39 | (0.16 | ) | (0.04 | ) | — | (0.20 | ) | 15.06 | 1.15 | 1.94 | 0.83 | 90 | 2.64 | 0 | |||||||||||||||||||||||||||||||||||||||||||||
| 11/01/14 | 10/31/15 | 14.89 | 0.13 | 0.04 | 0.17 | (0.13 | ) | (0.06 | ) | — | (0.19 | ) | 14.87 | 1.15 | 1.69 | 0.84 | 82 | 1.15 | 0 | |||||||||||||||||||||||||||||||||||||||||||||
| 11/01/13 | 10/31/14 | 14.89 | 0.13 | 0.04 | 0.17 | (0.13 | ) | (0.04 | ) | — | (0.17 | ) | 14.89 | 1.15 | 1.55 | 0.85 | 139 | 1.12 | 0 | |||||||||||||||||||||||||||||||||||||||||||||
| 11/01/12 | 10/31/13 | 15.51 | 0.08 | (0.27 | ) | (0.19 | ) | (0.07 | ) | (0.36 | ) | — | (0.43 | ) | 14.89 | 1.15 | 1.34 | 0.50 | 136 | (1.28 | ) | 0 | ||||||||||||||||||||||||||||||||||||||||||
| Class R-5* | ||||||||||||||||||||||||||||||||||||||||||||||||||||||||||||||||
| 11/01/16 | 10/31/17 | 15.08 | 0.25 | (0.09 | ) | 0.16 | (0.28 | ) | (0.13 | ) | — | (0.41 | ) | 14.83 | 0.43 | 1.22 | 1.67 | 40 | 1.06 | 0 | ||||||||||||||||||||||||||||||||||||||||||||
| 11/01/15 | 10/31/16 | 14.88 | 0.21 | 0.26 | 0.47 | (0.23 | ) | (0.04 | ) | — | (0.27 | ) | 15.08 | 0.60 | 1.46 | 1.39 | 90 | 3.24 | 0 | |||||||||||||||||||||||||||||||||||||||||||||
| 11/01/14 | 10/31/15 | 14.90 | 0.18 | 0.06 | 0.24 | (0.20 | ) | (0.06 | ) | — | (0.26 | ) | 14.88 | 0.60 | 1.01 | 1.23 | 82 | 1.66 | 0 | |||||||||||||||||||||||||||||||||||||||||||||
| 11/01/13 | 10/31/14 | 14.89 | 0.20 | 0.05 | 0.25 | (0.20 | ) | (0.04 | ) | — | (0.24 | ) | 14.90 | 0.60 | 0.81 | 1.34 | 139 | 1.70 | 0 | |||||||||||||||||||||||||||||||||||||||||||||
| 11/01/12 | 10/31/13 | 15.51 | 0.16 | (0.27 | ) | (0.11 | ) | (0.15 | ) | (0.36 | ) | — | (0.51 | ) | 14.89 | 0.60 | 0.64 | 1.04 | 136 | (0.77 | ) | 0 | ||||||||||||||||||||||||||||||||||||||||||
| Class R-6* | ||||||||||||||||||||||||||||||||||||||||||||||||||||||||||||||||
| 11/01/16 | 10/31/17 | 15.13 | 0.27 | (0.09 | ) | 0.18 | (0.29 | ) | (0.13 | ) | — | (0.42 | ) | 14.89 | 0.33 | 1.16 | 1.78 | 40 | 1.22 | 2 | ||||||||||||||||||||||||||||||||||||||||||||
| 11/01/15 | 10/31/16 | 14.94 | 0.23 | 0.25 | 0.48 | (0.25 | ) | (0.04 | ) | — | (0.29 | ) | 15.13 | 0.50 | 1.17 | 1.49 | 90 | 3.27 | 1 | |||||||||||||||||||||||||||||||||||||||||||||
| 07/31/15 | 10/31/15 | 14.87 | 0.05 | 0.06 | 0.11 | (0.04 | ) | — | — | (0.04 | ) | 14.94 | 0.50 | 0.99 | 1.33 | 82 | 0.71 | 0 | ||||||||||||||||||||||||||||||||||||||||||||||
| Eagle Mid Cap Growth Fund | ||||||||||||||||||||||||||||||||||||||||||||||||||||||||||||||||
| Class A* | ||||||||||||||||||||||||||||||||||||||||||||||||||||||||||||||||
| 11/01/16 | 10/31/17 | 42.29 | (0.26 | ) | 14.38 | 14.12 | — | — | — | — | 56.41 | 1.12 | 1.12 | (0.53 | ) | 44 | 33.39 | 459 | ||||||||||||||||||||||||||||||||||||||||||||||
| 11/01/15 | 10/31/16 | 43.39 | (0.17 | ) | (0.23 | ) | (0.40 | ) | — | (0.70 | ) | — | (0.70 | ) | 42.29 | 1.17 | 1.17 | (0.40 | ) | 34 | (0.87 | ) | 320 | |||||||||||||||||||||||||||||||||||||||||
| 11/01/14 | 10/31/15 | 45.68 | (0.26 | ) | 2.26 | 2.00 | — | (4.29 | ) | — | (4.29 | ) | 43.39 | 1.14 | 1.14 | (0.59 | ) | 52 | 4.70 | 354 | ||||||||||||||||||||||||||||||||||||||||||||
| 11/01/13 | 10/31/14 | 41.03 | (0.17 | ) | 6.74 | 6.57 | — | (1.92 | ) | — | (1.92 | ) | 45.68 | 1.19 | 1.19 | (0.40 | ) | 60 | 16.58 | 283 | ||||||||||||||||||||||||||||||||||||||||||||
| 11/01/12 | 10/31/13 | 31.52 | (0.03 | ) | 10.68 | 10.65 | — | (1.14 | ) | — | (1.14 | ) | 41.03 | 1.20 | 1.20 | (0.08 | ) | 52 | 34.81 | 304 | ||||||||||||||||||||||||||||||||||||||||||||
| Class C* | ||||||||||||||||||||||||||||||||||||||||||||||||||||||||||||||||
| 11/01/16 | 10/31/17 | 34.48 | (0.50 | ) | 11.69 | 11.19 | — | — | — | — | 45.67 | 1.84 | 1.84 | (1.24 | ) | 44 | 32.45 | 146 | ||||||||||||||||||||||||||||||||||||||||||||||
| 11/01/15 | 10/31/16 | 35.76 | (0.38 | ) | (0.20 | ) | (0.58 | ) | — | (0.70 | ) | — | (0.70 | ) | 34.48 | 1.88 | 1.88 | (1.11 | ) | 34 | (1.58 | ) | 112 | |||||||||||||||||||||||||||||||||||||||||
| 11/01/14 | 10/31/15 | 38.65 | (0.48 | ) | 1.88 | 1.40 | — | (4.29 | ) | — | (4.29 | ) | 35.76 | 1.87 | 1.88 | (1.32 | ) | 52 | 3.92 | 117 | ||||||||||||||||||||||||||||||||||||||||||||
| 11/01/13 | 10/31/14 | 35.24 | (0.41 | ) | 5.74 | 5.33 | — | (1.92 | ) | — | (1.92 | ) | 38.65 | 1.89 | 1.89 | (1.12 | ) | 60 | 15.75 | 105 | ||||||||||||||||||||||||||||||||||||||||||||
| 11/01/12 | 10/31/13 | 27.41 | (0.25 | ) | 9.22 | 8.97 | — | (1.14 | ) | — | (1.14 | ) | 35.24 | 1.92 | 1.92 | (0.80 | ) | 52 | 33.87 | 106 | ||||||||||||||||||||||||||||||||||||||||||||
| Class I* | ||||||||||||||||||||||||||||||||||||||||||||||||||||||||||||||||
| 11/01/16 | 10/31/17 | 44.30 | (0.11 | ) | 15.10 | 14.99 | — | (e) | — | — | — | (e) | 59.29 | 0.78 | 0.78 | (0.21 | ) | 44 | 33.84 | 763 | ||||||||||||||||||||||||||||||||||||||||||||
| 11/01/15 | 10/31/16 | 45.26 | (0.02 | ) | (0.24 | ) | (0.26 | ) | — | (0.70 | ) | — | (0.70 | ) | 44.30 | 0.82 | 0.82 | (0.06 | ) | 34 | (0.52 | ) | 421 | |||||||||||||||||||||||||||||||||||||||||
| 11/01/14 | 10/31/15 | 47.33 | (0.13 | ) | 2.35 | 2.22 | — | (4.29 | ) | — | (4.29 | ) | 45.26 | 0.82 | 0.83 | (0.28 | ) | 52 | 5.02 | 358 | ||||||||||||||||||||||||||||||||||||||||||||
| 11/01/13 | 10/31/14 | 42.31 | (0.05 | ) | 6.99 | 6.94 | — | (1.92 | ) | — | (1.92 | ) | 47.33 | 0.85 | 0.85 | (0.12 | ) | 60 | 16.97 | 210 | ||||||||||||||||||||||||||||||||||||||||||||
| 11/01/12 | 10/31/13 | 32.36 | 0.08 | 11.01 | 11.09 | — | (1.14 | ) | — | (1.14 | ) | 42.31 | 0.87 | 0.87 | 0.22 | 52 | 35.28 | 126 | ||||||||||||||||||||||||||||||||||||||||||||||
| 34 | The accompanying notes are an integral part of the financial statements. |
Financial Highlights
Fiscal periods | From investment operations | Dividends & distributions |
| Ratios to average net asset (%) | ||||||||||||||||||||||||||||||||||||||||||||||||||||||||||||
| Beginning net asset value | Income (loss) | Realized & unrealized gain (loss) | Total | From investment income | From realized gains | From return of capital | Total | Ending net asset value | With expenses waived/ recovered (a) | Without expenses waived/ recovered (a) | Net income (loss) (a) | Portfolio turnover rate (%) (b) | Total return (%) (b)(c) | Ending net assets (millions) | ||||||||||||||||||||||||||||||||||||||||||||||||||
| Beginning | Ending | |||||||||||||||||||||||||||||||||||||||||||||||||||||||||||||||
| Eagle Mid Cap Growth Fund (cont’d) | ||||||||||||||||||||||||||||||||||||||||||||||||||||||||||||||||
| Class R-3* | ||||||||||||||||||||||||||||||||||||||||||||||||||||||||||||||||
| 11/01/16 | 10/31/17 | $ 41.25 | $ (0.39 | ) | $ 14.02 | $ 13.63 | $ — | $ — | $ — | $ — | $ 54.88 | 1.38 | 1.38 | (0.80 | ) | 44 | 33.04 | $32 | ||||||||||||||||||||||||||||||||||||||||||||||
| 11/01/15 | 10/31/16 | 42.46 | (0.28 | ) | (0.23 | ) | (0.51 | ) | — | (0.70 | ) | — | (0.70 | ) | 41.25 | 1.46 | 1.46 | (0.69 | ) | 34 | (1.16 | ) | 21 | |||||||||||||||||||||||||||||||||||||||||
| 11/01/14 | 10/31/15 | 44.90 | (0.37 | ) | 2.22 | 1.85 | — | (4.29 | ) | — | (4.29 | ) | 42.46 | 1.41 | 1.42 | (0.86 | ) | 52 | 4.42 | 24 | ||||||||||||||||||||||||||||||||||||||||||||
| 11/01/13 | 10/31/14 | 40.48 | (0.31 | ) | 6.65 | 6.34 | — | (1.92 | ) | — | (1.92 | ) | 44.90 | 1.48 | 1.48 | (0.73 | ) | 60 | 16.23 | 16 | ||||||||||||||||||||||||||||||||||||||||||||
| 11/01/12 | 10/31/13 | 31.19 | (0.14 | ) | 10.57 | 10.43 | — | (1.14 | ) | — | (1.14 | ) | 40.48 | 1.49 | 1.49 | (0.39 | ) | 52 | 34.46 | 12 | ||||||||||||||||||||||||||||||||||||||||||||
| Class R-5* | ||||||||||||||||||||||||||||||||||||||||||||||||||||||||||||||||
| 11/01/16 | 10/31/17 | 44.19 | (0.11 | ) | 15.06 | 14.95 | — | (e) | — | — | — | (e) | 59.14 | 0.79 | 0.79 | (0.22 | ) | 44 | 33.84 | 284 | ||||||||||||||||||||||||||||||||||||||||||||
| 11/01/15 | 10/31/16 | 45.15 | (0.03 | ) | (0.23 | ) | (0.26 | ) | — | (0.70 | ) | — | (0.70 | ) | 44.19 | 0.83 | 0.83 | (0.06 | ) | 34 | (0.52 | ) | 153 | |||||||||||||||||||||||||||||||||||||||||
| 11/01/14 | 10/31/15 | 47.28 | (0.13 | ) | 2.29 | 2.16 | — | (4.29 | ) | — | (4.29 | ) | 45.15 | 0.82 | 0.83 | (0.28 | ) | 52 | 4.89 | 133 | ||||||||||||||||||||||||||||||||||||||||||||
| 11/01/13 | 10/31/14 | 42.27 | (0.06 | ) | 6.99 | 6.93 | — | (1.92 | ) | — | (1.92 | ) | 47.28 | 0.87 | 0.87 | (0.14 | ) | 60 | 16.96 | 55 | ||||||||||||||||||||||||||||||||||||||||||||
| 11/01/12 | 10/31/13 | 32.34 | 0.09 | 10.98 | 11.07 | — | (1.14 | ) | — | (1.14 | ) | 42.27 | 0.89 | 0.89 | 0.24 | 52 | 35.24 | 39 | ||||||||||||||||||||||||||||||||||||||||||||||
| Class R-6* | ||||||||||||||||||||||||||||||||||||||||||||||||||||||||||||||||
| 11/01/16 | 10/31/17 | 44.51 | (0.07 | ) | 15.19 | 15.12 | (0.01 | ) | — | — | (0.01 | ) | 59.62 | 0.69 | 0.69 | (0.12 | ) | 44 | 33.97 | 692 | ||||||||||||||||||||||||||||||||||||||||||||
| 11/01/15 | 10/31/16 | 45.43 | 0.02 | (0.24 | ) | (0.22 | ) | — | (0.70 | ) | — | (0.70 | ) | 44.51 | 0.72 | 0.72 | 0.04 | 34 | (0.43 | ) | 346 | |||||||||||||||||||||||||||||||||||||||||||
| 11/01/14 | 10/31/15 | 47.44 | (0.10 | ) | 2.38 | 2.28 | — | (4.29 | ) | — | (4.29 | ) | 45.43 | 0.73 | 0.74 | (0.21 | ) | 52 | 5.15 | 190 | ||||||||||||||||||||||||||||||||||||||||||||
| 11/01/13 | 10/31/14 | 42.36 | (0.05 | ) | 7.05 | 7.00 | — | (1.92 | ) | — | (1.92 | ) | 47.44 | 0.77 | 0.77 | (0.10 | ) | 60 | 17.10 | 30 | ||||||||||||||||||||||||||||||||||||||||||||
| 11/01/12 | 10/31/13 | 32.37 | 0.02 | 11.11 | 11.13 | — | (1.14 | ) | — | (1.14 | ) | 42.36 | 0.78 | 0.78 | 0.05 | 52 | 35.40 | 7 | ||||||||||||||||||||||||||||||||||||||||||||||
| Eagle Mid Cap Stock Fund | ||||||||||||||||||||||||||||||||||||||||||||||||||||||||||||||||
| Class A* | ||||||||||||||||||||||||||||||||||||||||||||||||||||||||||||||||
| 11/01/16 | 10/31/17 | 25.38 | (0.11 | ) | 5.50 | 5.39 | — | (2.00 | ) | — | (2.00 | ) | 28.77 | 1.25 | 1.27 | (0.41 | ) | 16 | 22.40 | 114 | ||||||||||||||||||||||||||||||||||||||||||||
| 11/01/15 | 10/31/16 | 28.35 | (0.11 | ) | 0.48 | 0.37 | — | (3.34 | ) | — | (3.34 | ) | 25.38 | 1.29 | 1.29 | (0.42 | ) | 44 | 2.06 | 118 | ||||||||||||||||||||||||||||||||||||||||||||
| 11/01/14 | 10/31/15 | 30.05 | (0.12 | ) | 0.75 | 0.63 | — | (2.33 | ) | — | (2.33 | ) | 28.35 | 1.24 | 1.24 | (0.40 | ) | 56 | 2.07 | 147 | ||||||||||||||||||||||||||||||||||||||||||||
| 11/01/13 | 10/31/14 | 30.48 | (0.13 | ) | 1.72 | 1.59 | — | (2.02 | ) | — | (2.02 | ) | 30.05 | 1.22 | 1.22 | (0.43 | ) | 32 | 5.51 | 171 | ||||||||||||||||||||||||||||||||||||||||||||
| 11/01/12 | 10/31/13 | 27.14 | (0.04 | ) | 7.40 | 7.36 | — | (4.02 | ) | — | (4.02 | ) | 30.48 | 1.22 | 1.22 | (0.14 | ) | 27 | 30.90 | 208 | ||||||||||||||||||||||||||||||||||||||||||||
| Class C* | ||||||||||||||||||||||||||||||||||||||||||||||||||||||||||||||||
| 11/01/16 | 10/31/17 | 19.40 | (0.23 | ) | 4.12 | 3.89 | — | (2.00 | ) | — | (2.00 | ) | 21.29 | 2.01 | 2.03 | (1.16 | ) | 16 | 21.50 | 82 | ||||||||||||||||||||||||||||||||||||||||||||
| 11/01/15 | 10/31/16 | 22.64 | (0.23 | ) | 0.33 | 0.10 | — | (3.34 | ) | — | (3.34 | ) | 19.40 | 2.04 | 2.04 | (1.17 | ) | 44 | 1.28 | 90 | ||||||||||||||||||||||||||||||||||||||||||||
| 11/01/14 | 10/31/15 | 24.62 | (0.27 | ) | 0.62 | 0.35 | — | (2.33 | ) | — | (2.33 | ) | 22.64 | 1.99 | 1.99 | (1.16 | ) | 56 | 1.32 | 109 | ||||||||||||||||||||||||||||||||||||||||||||
| 11/01/13 | 10/31/14 | 25.52 | (0.28 | ) | 1.40 | 1.12 | — | (2.02 | ) | — | (2.02 | ) | 24.62 | 1.96 | 1.96 | (1.17 | ) | 32 | 4.69 | 124 | ||||||||||||||||||||||||||||||||||||||||||||
| 11/01/12 | 10/31/13 | 23.49 | (0.21 | ) | 6.26 | 6.05 | — | (4.02 | ) | — | (4.02 | ) | 25.52 | 1.95 | 1.95 | (0.90 | ) | 27 | 30.00 | 138 | ||||||||||||||||||||||||||||||||||||||||||||
| Class I* | ||||||||||||||||||||||||||||||||||||||||||||||||||||||||||||||||
| 11/01/16 | 10/31/17 | 26.64 | (0.04 | ) | 5.80 | 5.76 | — | (2.00 | ) | — | (2.00 | ) | 30.40 | 0.95 | 0.96 | (0.12 | ) | 16 | 22.75 | 61 | ||||||||||||||||||||||||||||||||||||||||||||
| 11/01/15 | 10/31/16 | 29.50 | (0.02 | ) | 0.50 | 0.48 | — | (3.34 | ) | — | (3.34 | ) | 26.64 | 0.95 | 0.99 | (0.08 | ) | 44 | 2.39 | 45 | ||||||||||||||||||||||||||||||||||||||||||||
| 11/01/14 | 10/31/15 | 31.09 | (0.03 | ) | 0.77 | 0.74 | — | (2.33 | ) | — | (2.33 | ) | 29.50 | 0.95 | 1.06 | (0.10 | ) | 56 | 2.37 | 51 | ||||||||||||||||||||||||||||||||||||||||||||
| 11/01/13 | 10/31/14 | 31.39 | (0.05 | ) | 1.77 | 1.72 | — | (2.02 | ) | — | (2.02 | ) | 31.09 | 0.95 | 1.10 | (0.16 | ) | 32 | 5.78 | 87 | ||||||||||||||||||||||||||||||||||||||||||||
| 11/01/12 | 10/31/13 | 27.76 | 0.03 | 7.62 | 7.65 | — | (4.02 | ) | — | (4.02 | ) | 31.39 | 0.95 | 1.12 | 0.11 | 27 | 31.31 | 98 | ||||||||||||||||||||||||||||||||||||||||||||||
| Class R-3* | ||||||||||||||||||||||||||||||||||||||||||||||||||||||||||||||||
| 11/01/16 | 10/31/17 | 24.48 | (0.16 | ) | 5.28 | 5.12 | — | (2.00 | ) | — | (2.00 | ) | 27.60 | 1.50 | 1.58 | (0.64 | ) | 16 | 22.10 | 1 | ||||||||||||||||||||||||||||||||||||||||||||
| 11/01/15 | 10/31/16 | 27.55 | (0.17 | ) | 0.44 | 0.27 | — | (3.34 | ) | — | (3.34 | ) | 24.48 | 1.58 | 1.58 | (0.71 | ) | 44 | 1.72 | 1 | ||||||||||||||||||||||||||||||||||||||||||||
| 11/01/14 | 10/31/15 | 29.36 | (0.21 | ) | 0.73 | 0.52 | — | (2.33 | ) | — | (2.33 | ) | 27.55 | 1.59 | 1.59 | (0.73 | ) | 56 | 1.71 | 2 | ||||||||||||||||||||||||||||||||||||||||||||
| 11/01/13 | 10/31/14 | 29.92 | (0.21 | ) | 1.67 | 1.46 | — | (2.02 | ) | — | (2.02 | ) | 29.36 | 1.53 | 1.53 | (0.73 | ) | 32 | 5.16 | 5 | ||||||||||||||||||||||||||||||||||||||||||||
| 11/01/12 | 10/31/13 | 26.78 | (0.13 | ) | 7.29 | 7.16 | — | (4.02 | ) | — | (4.02 | ) | 29.92 | 1.52 | 1.52 | (0.48 | ) | 27 | 30.53 | 6 | ||||||||||||||||||||||||||||||||||||||||||||
| Class R-5* | ||||||||||||||||||||||||||||||||||||||||||||||||||||||||||||||||
| 11/01/16 | 10/31/17 | 26.79 | (0.03 | ) | 5.82 | 5.79 | — | (2.00 | ) | — | (2.00 | ) | 30.58 | 0.95 | 1.06 | (0.11 | ) | 16 | 22.74 | 0 | ||||||||||||||||||||||||||||||||||||||||||||
| 11/01/15 | 10/31/16 | 29.65 | (0.02 | ) | 0.50 | 0.48 | — | (3.34 | ) | — | (3.34 | ) | 26.79 | 0.95 | 1.07 | (0.08 | ) | 44 | 2.38 | 0 | ||||||||||||||||||||||||||||||||||||||||||||
| 11/01/14 | 10/31/15 | 31.24 | (0.03 | ) | 0.77 | 0.74 | — | (2.33 | ) | — | (2.33 | ) | 29.65 | 0.95 | 0.99 | (0.10 | ) | 56 | 2.36 | 0 | ||||||||||||||||||||||||||||||||||||||||||||
| 11/01/13 | 10/31/14 | 31.53 | (0.05 | ) | 1.78 | 1.73 | — | (2.02 | ) | — | (2.02 | ) | 31.24 | 0.94 | 0.94 | (0.16 | ) | 32 | 5.79 | 0 | ||||||||||||||||||||||||||||||||||||||||||||
| 11/01/12 | 10/31/13 | 27.77 | 0.19 | 7.59 | 7.78 | — | (4.02 | ) | — | (4.02 | ) | 31.53 | 0.84 | 0.84 | 0.69 | 27 | 31.84 | 1 | ||||||||||||||||||||||||||||||||||||||||||||||
| Class R-6* | ||||||||||||||||||||||||||||||||||||||||||||||||||||||||||||||||
| 11/01/16 | 10/31/17 | 26.87 | (0.01 | ) | 5.86 | 5.85 | — | (2.00 | ) | — | (2.00 | ) | 30.72 | 0.85 | 0.87 | (0.02 | ) | 16 | 22.90 | 1 | ||||||||||||||||||||||||||||||||||||||||||||
| 11/01/15 | 10/31/16 | 29.70 | 0.01 | 0.50 | 0.51 | — | (3.34 | ) | — | (3.34 | ) | 26.87 | 0.85 | 0.87 | 0.02 | 44 | 2.48 | 1 | ||||||||||||||||||||||||||||||||||||||||||||||
| 11/01/14 | 10/31/15 | 31.25 | — | (e) | 0.78 | 0.78 | — | (2.33 | ) | — | (2.33 | ) | 29.70 | 0.83 | 0.84 | 0.01 | 56 | 2.49 | 0 | |||||||||||||||||||||||||||||||||||||||||||||
| 11/01/13 | 10/31/14 | 31.50 | (0.01 | ) | 1.78 | 1.77 | — | (2.02 | ) | — | (2.02 | ) | 31.25 | 0.82 | 0.82 | (0.04 | ) | 32 | 5.93 | 1 | ||||||||||||||||||||||||||||||||||||||||||||
| 11/01/12 | 10/31/13 | 27.81 | (0.02 | ) | 7.73 | 7.71 | — | (4.02 | ) | — | (4.02 | ) | 31.50 | 0.79 | 0.79 | (0.08 | ) | 27 | 31.49 | 0 | ||||||||||||||||||||||||||||||||||||||||||||
| The accompanying notes are an integral part of the financial statements. | 35 |
Financial Highlights
Fiscal periods | From investment operations | Dividends & distributions |
| Ratios to average net asset (%) | ||||||||||||||||||||||||||||||||||||||||||||||||||||||||||||
| Beginning net asset value | Income (loss) | Realized & unrealized gain (loss) | Total | From investment income | From realized gains | From return of capital | Total | Ending net asset value | With expenses waived/ recovered (a) | Without expenses waived/ recovered (a) | Net income (loss) (a) | Portfolio turnover rate (%) (b) | Total return (%) (b)(c) | Ending net assets (millions) | ||||||||||||||||||||||||||||||||||||||||||||||||||
| Beginning | Ending | |||||||||||||||||||||||||||||||||||||||||||||||||||||||||||||||
| Eagle Small Cap Growth Fund | ||||||||||||||||||||||||||||||||||||||||||||||||||||||||||||||||
| Class A* | ||||||||||||||||||||||||||||||||||||||||||||||||||||||||||||||||
| 11/01/16 | 10/31/17 | $ 50.48 | $ (0.27 | ) | $ 13.72 | $ 13.45 | $ — | $ (1.62 | ) | $ — | $ (1.62 | ) | $ 62.31 | 1.13 | 1.13 | (0.47 | ) | 40 | 27.22 | $640 | ||||||||||||||||||||||||||||||||||||||||||||
| 11/01/15 | 10/31/16 | 52.98 | (0.33 | ) | 1.29 | 0.96 | — | (3.46 | ) | — | (3.46 | ) | 50.48 | 1.15 | 1.15 | (0.66 | ) | 32 | 2.07 | 848 | ||||||||||||||||||||||||||||||||||||||||||||
| 11/01/14 | 10/31/15 | 57.57 | (0.33 | ) | 2.22 | 1.89 | — | (6.48 | ) | — | (6.48 | ) | 52.98 | 1.10 | 1.10 | (0.60 | ) | 45 | 3.23 | 711 | ||||||||||||||||||||||||||||||||||||||||||||
| 11/01/13 | 10/31/14 | 54.33 | (0.34 | ) | 4.27 | 3.93 | — | (0.69 | ) | — | (0.69 | ) | 57.57 | 1.11 | 1.11 | (0.61 | ) | 37 | 7.30 | 759 | ||||||||||||||||||||||||||||||||||||||||||||
| 11/01/12 | 10/31/13 | 41.13 | (0.16 | ) | 13.36 | 13.20 | — | — | — | — | 54.33 | 1.10 | 1.10 | (0.33 | ) | 38 | 32.09 | 999 | ||||||||||||||||||||||||||||||||||||||||||||||
| Class C* | ||||||||||||||||||||||||||||||||||||||||||||||||||||||||||||||||
| 11/01/16 | 10/31/17 | 39.10 | (0.51 | ) | 10.54 | 10.03 | — | (1.62 | ) | — | (1.62 | ) | 47.51 | 1.82 | 1.82 | (1.17 | ) | 40 | 26.37 | 169 | ||||||||||||||||||||||||||||||||||||||||||||
| 11/01/15 | 10/31/16 | 42.10 | (0.52 | ) | 0.98 | 0.46 | — | (3.46 | ) | — | (3.46 | ) | 39.10 | 1.85 | 1.85 | (1.36 | ) | 32 | 1.37 | 166 | ||||||||||||||||||||||||||||||||||||||||||||
| 11/01/14 | 10/31/15 | 47.33 | (0.59 | ) | 1.84 | 1.25 | — | (6.48 | ) | — | (6.48 | ) | 42.10 | 1.82 | 1.82 | (1.32 | ) | 45 | 2.49 | 186 | ||||||||||||||||||||||||||||||||||||||||||||
| 11/01/13 | 10/31/14 | 45.11 | (0.61 | ) | 3.52 | 2.91 | — | (0.69 | ) | — | (0.69 | ) | 47.33 | 1.82 | 1.82 | (1.32 | ) | 37 | 6.52 | 190 | ||||||||||||||||||||||||||||||||||||||||||||
| 11/01/12 | 10/31/13 | 34.40 | (0.42 | ) | 11.13 | 10.71 | — | — | — | — | 45.11 | 1.82 | 1.82 | (1.05 | ) | 38 | 31.13 | 189 | ||||||||||||||||||||||||||||||||||||||||||||||
| Class I* | ||||||||||||||||||||||||||||||||||||||||||||||||||||||||||||||||
| 11/01/16 | 10/31/17 | 52.55 | (0.08 | ) | 14.33 | 14.25 | — | (1.62 | ) | — | (1.62 | ) | 65.18 | 0.78 | 0.78 | (0.13 | ) | 40 | 27.68 | 1,691 | ||||||||||||||||||||||||||||||||||||||||||||
| 11/01/15 | 10/31/16 | 54.84 | (0.16 | ) | 1.33 | 1.17 | — | (3.46 | ) | — | (3.46 | ) | 52.55 | 0.81 | 0.81 | (0.32 | ) | 32 | 2.40 | 1,374 | ||||||||||||||||||||||||||||||||||||||||||||
| 11/01/14 | 10/31/15 | 59.19 | (0.16 | ) | 2.29 | 2.13 | — | (6.48 | ) | — | (6.48 | ) | 54.84 | 0.78 | 0.78 | (0.28 | ) | 45 | 3.58 | 1,757 | ||||||||||||||||||||||||||||||||||||||||||||
| 11/01/13 | 10/31/14 | 55.68 | (0.16 | ) | 4.36 | 4.20 | — | (0.69 | ) | — | (0.69 | ) | 59.19 | 0.78 | 0.78 | (0.29 | ) | 37 | 7.61 | 1,770 | ||||||||||||||||||||||||||||||||||||||||||||
| 11/01/12 | 10/31/13 | 42.04 | (0.01 | ) | 13.67 | 13.66 | (0.02 | ) | — | — | (0.02 | ) | 55.68 | 0.79 | 0.79 | (0.01 | ) | 38 | 32.49 | 1,815 | ||||||||||||||||||||||||||||||||||||||||||||
| Class R-3* | ||||||||||||||||||||||||||||||||||||||||||||||||||||||||||||||||
| 11/01/16 | 10/31/17 | 49.18 | (0.40 | ) | 13.35 | 12.95 | — | (1.62 | ) | — | (1.62 | ) | 60.51 | 1.38 | 1.38 | (0.73 | ) | 40 | 26.92 | 98 | ||||||||||||||||||||||||||||||||||||||||||||
| 11/01/15 | 10/31/16 | 51.82 | (0.43 | ) | 1.25 | 0.82 | — | (3.46 | ) | — | (3.46 | ) | 49.18 | 1.39 | 1.39 | (0.90 | ) | 32 | 1.83 | 94 | ||||||||||||||||||||||||||||||||||||||||||||
| 11/01/14 | 10/31/15 | 56.59 | (0.48 | ) | 2.19 | 1.71 | — | (6.48 | ) | — | (6.48 | ) | 51.82 | 1.38 | 1.38 | (0.88 | ) | 45 | 2.94 | 119 | ||||||||||||||||||||||||||||||||||||||||||||
| 11/01/13 | 10/31/14 | 53.58 | (0.50 | ) | 4.20 | 3.70 | — | (0.69 | ) | — | (0.69 | ) | 56.59 | 1.42 | 1.42 | (0.92 | ) | 37 | 6.97 | 127 | ||||||||||||||||||||||||||||||||||||||||||||
| 11/01/12 | 10/31/13 | 40.68 | (0.29 | ) | 13.19 | 12.90 | — | — | — | — | 53.58 | 1.37 | 1.37 | (0.62 | ) | 38 | 31.71 | 134 | ||||||||||||||||||||||||||||||||||||||||||||||
| Class R-5* | ||||||||||||||||||||||||||||||||||||||||||||||||||||||||||||||||
| 11/01/16 | 10/31/17 | 52.75 | (0.07 | ) | 14.39 | 14.32 | — | (1.62 | ) | — | (1.62 | ) | 65.45 | 0.77 | 0.77 | (0.11 | ) | 40 | 27.71 | 469 | ||||||||||||||||||||||||||||||||||||||||||||
| 11/01/15 | 10/31/16 | 55.02 | (0.15 | ) | 1.34 | 1.19 | — | (3.46 | ) | — | (3.46 | ) | 52.75 | 0.78 | 0.78 | (0.30 | ) | 32 | 2.43 | 444 | ||||||||||||||||||||||||||||||||||||||||||||
| 11/01/14 | 10/31/15 | 59.37 | (0.15 | ) | 2.28 | 2.13 | — | (6.48 | ) | — | (6.48 | ) | 55.02 | 0.75 | 0.75 | (0.25 | ) | 45 | 3.57 | 418 | ||||||||||||||||||||||||||||||||||||||||||||
| 11/01/13 | 10/31/14 | 55.83 | (0.16 | ) | 4.39 | 4.23 | — | (0.69 | ) | — | (0.69 | ) | 59.37 | 0.77 | 0.77 | (0.28 | ) | 37 | 7.64 | 348 | ||||||||||||||||||||||||||||||||||||||||||||
| 11/01/12 | 10/31/13 | 42.14 | 0.01 | 13.69 | 13.70 | (0.01 | ) | — | — | (0.01 | ) | 55.83 | 0.77 | 0.77 | 0.02 | 38 | 32.51 | 341 | ||||||||||||||||||||||||||||||||||||||||||||||
| Class R-6* | ||||||||||||||||||||||||||||||||||||||||||||||||||||||||||||||||
| 11/01/16 | 10/31/17 | 53.06 | (0.04 | ) | 14.52 | 14.48 | — | (1.62 | ) | — | (1.62 | ) | 65.92 | 0.66 | 0.66 | (0.06 | ) | 40 | 27.86 | 2,005 | ||||||||||||||||||||||||||||||||||||||||||||
| 11/01/15 | 10/31/16 | 55.27 | (0.10 | ) | 1.35 | 1.25 | — | (3.46 | ) | — | (3.46 | ) | 53.06 | 0.67 | 0.67 | (0.19 | ) | 32 | 2.53 | 1,139 | ||||||||||||||||||||||||||||||||||||||||||||
| 11/01/14 | 10/31/15 | 59.55 | (0.10 | ) | 2.30 | 2.20 | — | (6.48 | ) | — | (6.48 | ) | 55.27 | 0.66 | 0.66 | (0.17 | ) | 45 | 3.68 | 737 | ||||||||||||||||||||||||||||||||||||||||||||
| 11/01/13 | 10/31/14 | 55.92 | (0.10 | ) | 4.42 | 4.32 | — | (0.69 | ) | — | (0.69 | ) | 59.55 | 0.66 | 0.66 | (0.17 | ) | 37 | 7.79 | 576 | ||||||||||||||||||||||||||||||||||||||||||||
| 11/01/12 | 10/31/13 | 42.20 | 0.03 | 13.74 | 13.77 | (0.05 | ) | — | — | (0.05 | ) | 55.92 | 0.68 | 0.68 | 0.07 | 38 | 32.68 | 502 | ||||||||||||||||||||||||||||||||||||||||||||||
| Eagle Smaller Company Fund | ||||||||||||||||||||||||||||||||||||||||||||||||||||||||||||||||
| Class A* | ||||||||||||||||||||||||||||||||||||||||||||||||||||||||||||||||
| 11/01/16 | 10/31/17 | 13.01 | (0.04 | ) | 3.24 | 3.20 | — | (1.27 | ) | — | (1.27 | ) | 14.94 | 1.31 | 1.88 | (0.31 | ) | 35 | 26.11 | 16 | ||||||||||||||||||||||||||||||||||||||||||||
| 11/01/15 | 10/31/16 | 12.32 | (0.05 | ) | 0.74 | 0.69 | — | — | — | — | 13.01 | 1.43 | 1.83 | (0.38 | ) | 46 | 5.60 | 15 | ||||||||||||||||||||||||||||||||||||||||||||||
| 11/01/14 | 10/31/15 | 23.65 | (0.10 | ) | 0.08 | (0.02 | ) | — | (11.31 | ) | — | (11.31 | ) | 12.32 | 1.41 | 1.60 | (0.70 | ) | 79 | (1.88 | ) | 20 | ||||||||||||||||||||||||||||||||||||||||||
| 11/01/13 | 10/31/14 | 23.38 | (0.09 | ) | 0.87 | 0.78 | — | (0.51 | ) | — | (0.51 | ) | 23.65 | 1.38 | 1.36 | (0.38 | ) | 68 | (f) | 3.34 | 18 | |||||||||||||||||||||||||||||||||||||||||||
| 11/01/12 | 10/31/13 | 18.93 | (0.03 | ) | 5.96 | 5.93 | (0.09 | ) | (1.39 | ) | — | (1.48 | ) | 23.38 | 1.37 | 1.40 | (0.13 | ) | 14 | 33.60 | 19 | |||||||||||||||||||||||||||||||||||||||||||
| Class C* | ||||||||||||||||||||||||||||||||||||||||||||||||||||||||||||||||
| 11/01/16 | 10/31/17 | 11.59 | (0.13 | ) | 2.85 | 2.72 | — | (1.27 | ) | — | (1.27 | ) | 13.04 | 2.05 | 2.59 | (1.05 | ) | 35 | 25.07 | 18 | ||||||||||||||||||||||||||||||||||||||||||||
| 11/01/15 | 10/31/16 | 11.05 | (0.12 | ) | 0.66 | 0.54 | — | — | — | — | 11.59 | 2.16 | 2.57 | (1.12 | ) | 46 | 4.89 | 17 | ||||||||||||||||||||||||||||||||||||||||||||||
| 11/01/14 | 10/31/15 | 22.46 | (0.18 | ) | 0.08 | (0.10 | ) | — | (11.31 | ) | — | (11.31 | ) | 11.05 | 2.17 | 2.35 | (1.49 | ) | 79 | (2.64 | ) | 21 | ||||||||||||||||||||||||||||||||||||||||||
| 11/01/13 | 10/31/14 | 22.38 | (0.25 | ) | 0.84 | 0.59 | — | (0.51 | ) | — | (0.51 | ) | 22.46 | 2.11 | 2.09 | (1.11 | ) | 68 | (f) | 2.63 | 11 | |||||||||||||||||||||||||||||||||||||||||||
| 11/01/12 | 10/31/13 | 18.22 | (0.18 | ) | 5.73 | 5.55 | — | (1.39 | ) | — | (1.39 | ) | 22.38 | 2.12 | 2.14 | (0.88 | ) | 14 | 32.62 | 11 | ||||||||||||||||||||||||||||||||||||||||||||
| Class I* | ||||||||||||||||||||||||||||||||||||||||||||||||||||||||||||||||
| 11/01/16 | 10/31/17 | 13.87 | 0.01 | 3.47 | 3.48 | — | (1.27 | ) | — | (1.27 | ) | 16.08 | 0.95 | 1.56 | 0.06 | 35 | 26.53 | 9 | ||||||||||||||||||||||||||||||||||||||||||||||
| 11/01/15 | 10/31/16 | 13.07 | 0.02 | 0.78 | 0.80 | — | — | — | — | 13.87 | 0.95 | 1.52 | 0.13 | 46 | 6.12 | 9 | ||||||||||||||||||||||||||||||||||||||||||||||||
| 11/01/14 | 10/31/15 | 24.27 | (0.03 | ) | 0.14 | 0.11 | — | (11.31 | ) | — | (11.31 | ) | 13.07 | 0.95 | 1.27 | (0.17 | ) | 79 | (0.99 | ) | 15 | |||||||||||||||||||||||||||||||||||||||||||
| 11/01/13 | 10/31/14 | 23.86 | 0.02 | 0.91 | 0.93 | (0.01 | ) | (0.51 | ) | — | (0.52 | ) | 24.27 | 0.95 | 1.10 | 0.10 | 68 | (f) | 3.93 | 33 | ||||||||||||||||||||||||||||||||||||||||||||
| 11/01/12 | 10/31/13 | 19.28 | 0.06 | 6.07 | 6.13 | (0.16 | ) | (1.39 | ) | — | (1.55 | ) | 23.86 | 0.95 | 1.16 | 0.27 | 14 | 34.20 | 106 | |||||||||||||||||||||||||||||||||||||||||||||
| 36 | The accompanying notes are an integral part of the financial statements. |
Financial Highlights
Fiscal periods | From investment operations | Dividends & distributions |
| Ratios to average net asset (%) | ||||||||||||||||||||||||||||||||||||||||||||||||||||||||||||
| Beginning net asset value | Income (loss) | Realized & unrealized gain (loss) | Total | From investment income | From realized gains | From return of capital | Total | Ending net asset value | With expenses waived/ recovered (a) | Without expenses waived/ recovered (a) | Net income (loss) (a) | Portfolio turnover rate (%) (b) | Total return (%) (b)(c) | Ending net assets (millions) | ||||||||||||||||||||||||||||||||||||||||||||||||||
| Beginning | Ending | |||||||||||||||||||||||||||||||||||||||||||||||||||||||||||||||
| Eagle Smaller Company Fund (cont’d) | ||||||||||||||||||||||||||||||||||||||||||||||||||||||||||||||||
| Class R-3* | ||||||||||||||||||||||||||||||||||||||||||||||||||||||||||||||||
| 11/01/16 | 10/31/17 | $ 12.60 | $ (0.08 | ) | $ 3.13 | $ 3.05 | $ — | $ (1.27 | ) | $ — | $ (1.27 | ) | $ 14.38 | 1.56 | 2.15 | (0.58 | ) | 35 | 25.74 | $1 | ||||||||||||||||||||||||||||||||||||||||||||
| 11/01/15 | 10/31/16 | 11.96 | (0.08 | ) | 0.72 | 0.64 | — | — | — | — | 12.60 | 1.70 | 2.19 | (0.65 | ) | 46 | 5.35 | 0 | ||||||||||||||||||||||||||||||||||||||||||||||
| 11/01/14 | 10/31/15 | 23.33 | (0.13 | ) | 0.07 | (0.06 | ) | — | (11.31 | ) | — | (11.31 | ) | 11.96 | 1.70 | 2.07 | (0.94 | ) | 79 | (2.19 | ) | 0 | ||||||||||||||||||||||||||||||||||||||||||
| 11/01/13 | 10/31/14 | 23.12 | (0.17 | ) | 0.89 | 0.72 | — | (0.51 | ) | — | (0.51 | ) | 23.33 | 1.70 | 1.77 | (0.72 | ) | 68 | (f) | 3.11 | 0 | |||||||||||||||||||||||||||||||||||||||||||
| 11/01/12 | 10/31/13 | 18.77 | (0.08 | ) | 5.89 | 5.81 | (0.07 | ) | (1.39 | ) | — | (1.46 | ) | 23.12 | 1.70 | 1.85 | (0.40 | ) | 14 | 33.17 | 0 | |||||||||||||||||||||||||||||||||||||||||||
| Class R-5* | ||||||||||||||||||||||||||||||||||||||||||||||||||||||||||||||||
| 11/01/16 | 10/31/17 | 13.71 | 0.01 | 3.43 | 3.44 | — | (1.27 | ) | — | (1.27 | ) | 15.88 | 0.95 | 1.63 | 0.04 | 35 | 26.55 | 0 | ||||||||||||||||||||||||||||||||||||||||||||||
| 11/01/15 | 10/31/16 | 12.93 | (0.01 | ) | 0.79 | 0.78 | — | — | — | — | 13.71 | 0.95 | 1.67 | (0.08 | ) | 46 | 6.03 | 0 | ||||||||||||||||||||||||||||||||||||||||||||||
| 11/01/14 | 10/31/15 | 24.20 | (0.03 | ) | 0.07 | 0.04 | — | (11.31 | ) | — | (11.31 | ) | 12.93 | 0.95 | 1.14 | (0.24 | ) | 79 | (1.41 | ) | 0 | |||||||||||||||||||||||||||||||||||||||||||
| 11/01/13 | 10/31/14 | 23.82 | 0.04 | 0.87 | 0.91 | (0.02 | ) | (0.51 | ) | — | (0.53 | ) | 24.20 | 0.95 | 1.04 | 0.18 | 68 | (f) | 3.85 | 0 | ||||||||||||||||||||||||||||||||||||||||||||
| 11/01/12 | 10/31/13 | 19.25 | (0.02 | ) | 6.15 | 6.13 | (0.17 | ) | (1.39 | ) | — | (1.56 | ) | 23.82 | 0.95 | 1.00 | (0.11 | ) | 14 | 34.25 | 0 | |||||||||||||||||||||||||||||||||||||||||||
| Class R-6* | ||||||||||||||||||||||||||||||||||||||||||||||||||||||||||||||||
| 11/01/16 | 10/31/17 | 13.77 | 0.02 | 3.45 | 3.47 | — | (1.27 | ) | — | (1.27 | ) | 15.97 | 0.85 | 1.41 | 0.14 | 35 | 26.66 | 3 | ||||||||||||||||||||||||||||||||||||||||||||||
| 11/01/15 | 10/31/16 | 12.96 | 0.04 | 0.77 | 0.81 | — | — | — | — | 13.77 | 0.85 | 1.31 | 0.32 | 46 | 6.25 | 3 | ||||||||||||||||||||||||||||||||||||||||||||||||
| 11/01/14 | 10/31/15 | 24.22 | (0.01 | ) | 0.06 | 0.05 | — | (11.31 | ) | — | (11.31 | ) | 12.96 | 0.85 | 1.20 | (0.07 | ) | 79 | (1.33 | ) | 10 | |||||||||||||||||||||||||||||||||||||||||||
| 11/01/13 | 10/31/14 | 23.86 | 0.03 | 0.87 | 0.90 | (0.03 | ) | (0.51 | ) | — | (0.54 | ) | 24.22 | 0.85 | 0.94 | 0.13 | 68 | (f) | 3.78 | 25 | ||||||||||||||||||||||||||||||||||||||||||||
| 11/01/12 | 10/31/13 | 19.28 | 0.01 | 6.14 | 6.15 | (0.18 | ) | (1.39 | ) | — | (1.57 | ) | 23.86 | 0.85 | 0.96 | 0.04 | 14 | 34.33 | 18 | |||||||||||||||||||||||||||||||||||||||||||||
| Eagle Tactical Allocation Fund | ||||||||||||||||||||||||||||||||||||||||||||||||||||||||||||||||
| Class A* | ||||||||||||||||||||||||||||||||||||||||||||||||||||||||||||||||
| 11/01/16 | 10/31/17 | 14.59 | 0.12 | 1.40 | 1.52 | (0.04 | ) | (0.02 | ) | — | (0.06 | ) | 16.05 | 1.17 | 3.55 | 0.79 | 152 | 10.42 | 2 | |||||||||||||||||||||||||||||||||||||||||||||
| 12/31/15 | 10/31/16 | 14.29 | 0.06 | 0.24 | 0.30 | — | — | — | — | 14.59 | 1.17 | 17.33 | 0.47 | 66 | 2.10 | 2 | ||||||||||||||||||||||||||||||||||||||||||||||||
| Class C* | ||||||||||||||||||||||||||||||||||||||||||||||||||||||||||||||||
| 11/01/16 | 10/31/17 | 14.50 | 0.01 | 1.38 | 1.39 | — | (0.02 | ) | — | (0.02 | ) | 15.87 | 1.93 | 4.11 | 0.05 | 152 | 9.58 | 2 | ||||||||||||||||||||||||||||||||||||||||||||||
| 12/31/15 | 10/31/16 | 14.29 | (0.04 | ) | 0.25 | 0.21 | — | — | — | — | 14.50 | 1.97 | 10.40 | (0.31 | ) | 66 | 1.47 | 1 | ||||||||||||||||||||||||||||||||||||||||||||||
| Class I* | ||||||||||||||||||||||||||||||||||||||||||||||||||||||||||||||||
| 11/01/16 | 10/31/17 | 14.62 | 0.17 | 1.40 | 1.57 | (0.08 | ) | (0.02 | ) | — | (0.10 | ) | 16.09 | 0.87 | 3.00 | 1.09 | 152 | 10.79 | 14 | |||||||||||||||||||||||||||||||||||||||||||||
| 12/31/15 | 10/31/16 | 14.29 | 0.10 | 0.23 | 0.33 | — | — | — | — | 14.62 | 0.87 | 8.81 | 0.77 | 66 | 2.31 | 5 | ||||||||||||||||||||||||||||||||||||||||||||||||
| Class R-3* | ||||||||||||||||||||||||||||||||||||||||||||||||||||||||||||||||
| 11/01/16 | 10/31/17 | 14.57 | 0.09 | 1.39 | 1.48 | — | (0.02 | ) | — | (0.02 | ) | 16.03 | 1.40 | 3.62 | 0.57 | 152 | 10.15 | 0 | ||||||||||||||||||||||||||||||||||||||||||||||
| 12/31/15 | 10/31/16 | 14.29 | 0.03 | 0.25 | 0.28 | — | — | — | — | 14.57 | 1.37 | 22.76 | 0.21 | 66 | 1.96 | 0 | ||||||||||||||||||||||||||||||||||||||||||||||||
| Class R-5* | ||||||||||||||||||||||||||||||||||||||||||||||||||||||||||||||||
| 11/01/16 | 10/31/17 | 14.63 | 0.17 | 1.39 | 1.56 | (0.08 | ) | (0.02 | ) | — | (0.10 | ) | 16.09 | 0.87 | 3.18 | 1.15 | 152 | 10.71 | 0 | |||||||||||||||||||||||||||||||||||||||||||||
| 12/31/15 | 10/31/16 | 14.29 | 0.08 | 0.26 | 0.34 | — | — | — | — | 14.63 | 0.87 | 21.86 | 0.69 | 66 | 2.38 | 0 | ||||||||||||||||||||||||||||||||||||||||||||||||
| Class R-6* | ||||||||||||||||||||||||||||||||||||||||||||||||||||||||||||||||
| 11/01/16 | 10/31/17 | 14.64 | 0.18 | 1.41 | 1.59 | (0.09 | ) | (0.02 | ) | — | (0.11 | ) | 16.12 | 0.77 | 3.04 | 1.21 | 152 | 10.88 | 0 | |||||||||||||||||||||||||||||||||||||||||||||
| 12/31/15 | 10/31/16 | 14.29 | 0.10 | 0.25 | 0.35 | — | — | — | — | 14.64 | 0.77 | 22.16 | 0.82 | 66 | 2.45 | 0 | ||||||||||||||||||||||||||||||||||||||||||||||||
* Per share amounts have been calculated using the daily average share method.
(a) Annualized for periods less than one year.
(b) Not annualized for periods less than one year.
(c) Total returns are calculated without the imposition of either front-end or contingent deferred sales charges.
(d) The Eagle Capital Appreciation Fund changed its subadvisor effective June 28, 2013.
(e) Per share amount is less than $0.005.
(f) The Eagle Smaller Company Fund changed its subadvisor effective October 20, 2014.
| The accompanying notes are an integral part of the financial statements. | 37 |
| 10.31.2017 |
NOTE 1 | Organization and investment objective | The Eagle Capital Appreciation Fund, the Eagle Growth & Income Fund and the Eagle Series Trust (each a “Trust” and collectively the “Trusts” or the “Eagle Family of Funds”) are organized as separate Massachusetts business trusts, and are registered under the Investment Company Act of 1940, as amended, as open-end diversified management investment companies. Currently, all members of the Board of Trustees (“Board”) for the Trusts serve as Trustees for each of the Trusts. The Trusts offer shares in the following series (each a “Fund” and collectively the “Funds”) and are advised by Carillon Tower Advisers, Inc. (“Carillon Tower” or “Manager”). Prior to June 1, 2017 the Funds were advised by Eagle Asset Management, Inc. (“Eagle” or “Prior Manager”).
| • | The Eagle Capital Appreciation Fund (“Capital Appreciation Fund”) seeks long-term capital appreciation. |
| • | The Eagle Growth & Income Fund (“Growth & Income Fund”) primarily seeks long-term capital appreciation and, secondarily, seeks current income. |
The Eagle Series Trust currently offers shares in seven series:
| • | The Eagle International Stock Fund (“International Stock Fund”) seeks capital appreciation, |
| • | The Eagle Investment Grade Bond Fund (“Investment Grade Bond Fund”) seeks current income and preservation of capital, |
| • | The Eagle Mid Cap Growth Fund (“Mid Cap Growth Fund”) seeks long-term capital appreciation, |
| • | The Eagle Mid Cap Stock Fund (“Mid Cap Stock Fund”) seeks long-term capital appreciation, |
| • | The Eagle Small Cap Growth Fund (“Small Cap Growth Fund”) seeks long-term capital appreciation, |
| • | The Eagle Smaller Company Fund (“Smaller Company Fund”) seeks capital growth, and |
| • | The Eagle Tactical Allocation Fund (“Tactical Allocation Fund”) seeks long-term capital appreciation. |
Class offerings | As of October 31, 2017, each Fund was authorized and offered Class A, Class C, Class I, Class R-3, Class R-5, and Class R-6 shares to qualified buyers.
| • | For all Funds except the Investment Grade Bond Fund, Class A shares are sold at a maximum front-end sales charge of 4.75%. For the Investment Grade Bond Fund, Class A shares are sold at a maximum front-end sales charge of 3.75%. Class A share investments greater than $1 million, which are not sold subject to a sales charge, may be subject to a contingent deferred sales charge (“CDSC”) of up to 1% of the lower of net asset value (“NAV”) or purchase price if redeemed within 18 months of purchase. |
| • | Class C shares are sold subject to a CDSC of 1% of the lower of NAV or purchase price if redeemed within one year of purchase. |
| • | Class I, Class R-3, Class R-5 and Class R-6 shares are each sold without a front-end sales charge or a CDSC to qualified buyers. |
NOTE 2 | Significant accounting policies | The following is a summary of significant accounting policies of the Funds. The policies are in conformity with accounting principles generally accepted in the United States of America (“U.S. GAAP”). The Funds are investment companies and, accordingly, follow the investment company accounting and reporting guidance of the Financial Accounting Standards Board (“FASB”) Accounting Standards Codification Topic 946 – Investment Companies, which is part of U.S. GAAP.
Use of estimates | The preparation of financial statements in accordance with U.S. GAAP requires management to make estimates and assumptions that affect the reported amounts and disclosures. Actual results could differ from those estimates and those differences could be material.
Valuation of securities | The price of each Fund’s shares is based on the NAV per share of each class of a Fund. The NAV of each Fund’s shares is normally calculated each business day as of the scheduled close of regular trading on the New York Stock Exchange (NYSE) and the Nasdaq, typically 4:00 p.m., Eastern time. A Fund will not treat an intraday unscheduled disruption in trading on either the NYSE or Nasdaq as a closure of that particular market, and will price its shares as of the normally scheduled close of the NYSE and Nasdaq if the disruption directly affects only one of those markets. If the NYSE or other securities exchange modifies the published closing price of securities traded on that exchange after the NAV is calculated, the Funds are not required to recalculate their NAVs.
Generally, the Funds value portfolio securities for which market quotations are readily available at market value; however, a Fund may adjust the market quotation price to reflect events that occur between the close of those markets and the time of the Fund’s determination of the NAV.
A market quotation may be considered unreliable or unavailable for various reasons, such as:
| • | The quotation may be stale; |
| • | The security is not actively traded; |
| • | Trading on the security halted before the close of the trading market; |
| • | The security is newly issued; |
| • | Issuer-specific or vendor specific events occurred after the security halted trading; or |
| • | Due to the passage of time between the close of the market on which the security trades and the close of the NYSE and the Nasdaq. |
Issuer-specific events may cause the last market quotation to be unreliable. Such events may include:
| • | A merger or insolvency; |
| • | Events which affect a geographical area or an industry segment, such as political events or natural disasters; or |
| • | Market events, such as a significant movement in the U.S. markets. |
For most securities, both the latest transaction prices and adjustments are furnished by independent pricing services, subject to supervision by the Board. The Funds value all other securities and assets for which market quotations are unavailable or unreliable at their fair value in good faith using Pricing and Valuation Procedures (“Procedures”) approved by the Board. A Fund may fair value small-cap securities, for example, that are thinly traded or illiquid. Fair value is the amount that the owner might reasonably expect to receive for the security upon its current sale. Fair value requires consideration of all appropriate factors, including indications of fair value available from independent pricing services. A fair value price is an estimated price and may vary from the prices used by other mutual funds to calculate their NAV.
Pursuant to the Procedures, the Board has delegated the day-to-day responsibility for applying and administering the Procedures to a valuation committee (“Valuation Committee”), comprised of certain officers of the Trusts and other employees of Carillon Tower. The composition of this Valuation Committee may change from time to time. The Valuation Committee follows fair valuation guidelines as set forth in the Procedures to make fair value determinations on all securities and assets for which market quotations are unavailable or unreliable. For portfolio securities fair valued by the Valuation Committee, Carillon Tower checks fair value prices by comparing the fair value of the security with values that are available from other sources (if any). Carillon Tower compares the fair value of the security to the next-day opening price or next actual sale price, when applicable. Carillon Tower documents and reports to the Valuation Committee such comparisons when they are made. The
| 38 |
Notes to Financial Statements
| 10.31.2017 |
Valuation Committee reports such comparisons to the Board at their regularly scheduled meetings. The Board retains the responsibility for periodic review and consideration of the appropriateness of any fair value pricing methodology established or implemented for a Fund. Fair value pricing methods, the Procedures and independent pricing services can change from time to time as approved by the Board, and may occur as a result of lookback testing results or changes in industry best practices.
There can be no assurance, however, that a fair value price used by a Fund on any given day will more accurately reflect the market value of a security than a market price of such security on that day, as fair valuation determinations may involve subjective judgments made by the Valuation Committee. Fair value pricing may deter shareholders from trading a Fund’s shares on a frequent basis in an attempt to take advantage of arbitrage opportunities resulting from potentially stale prices of portfolio holdings. However, it cannot eliminate the possibility of frequent trading. Specific types of securities are valued as follows
| • | Domestic exchange-traded equity securities | Market quotations are generally available and reliable for domestic exchange-traded equity securities. If the prices provided by the independent pricing service and independent quoted prices are unavailable or unreliable, the Valuation Committee will fair value the security using the Procedures. |
| • | Foreign exchange-traded equity securities | If market quotations are available and reliable for foreign exchange-traded equity securities, the securities will be valued at the market quotations. Because trading hours for certain foreign securities end before the close of the NYSE and the Nasdaq, closing market quotations may become unreliable. Consequently, fair valuation of portfolio securities may occur on a daily basis. The Valuation Committee, using the Procedures, may fair value a security if certain events occur between the time trading ends in a foreign market on a particular security and a Fund’s NAV calculation. The Valuation Committee, using the Procedures, may also fair value a particular security if the events are significant and make the closing price unavailable or unreliable. If an issuer-specific event has occurred that a Fund or Carillon Tower determines, in its judgment, is likely to have affected the closing price of a foreign security, the security will be priced at fair value. Carillon Tower also utilizes a screening process from a pricing vendor to indicate the degree of certainty, based on historical data, that the closing price in the principal market where a foreign security trades is not the current market value as of the NYSE Close. Securities and other assets quoted in foreign currencies are valued in U.S. dollars based on exchange rates provided by an independent pricing service. The pricing vendor, pricing methodology or degree of certainty may change from time to time. Securities primarily traded on foreign markets may trade on days that are not business days of the Funds. Because the NAV of a Fund’s shares is determined only on business days of the Fund, the value of the securities of a Fund that invests in foreign securities may change on days when shareholders would not be able to purchase or redeem shares of the Fund. |
| • | Fixed income securities | Government bonds, corporate bonds, asset- backed bonds, municipal bonds, short-term securities (investments that have a maturity date of 60 days or less) and convertible securities, including high yield or junk bonds, normally are valued on the basis of evaluated prices provided by independent pricing services. Evaluated prices provided by the independent pricing services may be determined without exclusive reliance on quoted prices, and may reflect appropriate factors such as institution-size trading in similar groups of securities, developments related to special securities, dividend rate, maturity and other market data. If the evaluated prices provided by the independent pricing service and independent quoted prices are unavailable or unreliable, the Valuation Committee will fair value the security using the Procedures. |
| • | Futures and Options Futures and options are valued on the basis of market quotations, if available and reliable. If prices provided by independent pricing services and independent quoted prices are unavailable or |
unreliable, the Valuation Committee will fair value the security using the Procedures. During the fiscal year ended October 31, 2017, none of the Funds held futures or options. |
| • | Investment companies and exchange-traded funds (ETFs) | Investments in other open-end investment companies are valued at their reported NAV. The prospectuses for these companies explain the circumstances under which these companies will use fair value pricing and the effect of the fair value pricing. In addition, investments in closed-end funds and ETFs are valued on the basis of market quotations, if available and reliable. If the prices provided by independent pricing services and independent quoted prices are unavailable or unreliable, the Valuation Committee will fair value the security using the Procedures. |
Fair value measurements | Each Fund utilizes a three-level hierarchy of inputs to establish a classification of fair value measurements. The three levels are defined as:
Level 1—Valuations based on unadjusted quoted prices for identical securities in active markets;
Level 2—Valuations based on inputs other than quoted prices that are observable, either directly or indirectly, including inputs in markets that are not considered active; and
Level 3—Valuations based on inputs that are unobservable and significant to the fair value measurement, and may include the Valuation Committee’s own assumptions on determining fair value of investments.
Inputs that are used in determining fair value of an investment may include price information, credit data, volatility statistics, and other factors. These inputs can be either observable or unobservable. The availability of observable inputs can vary between investments and is affected by various factors such as the type of investment and the volume and/or level of activity for that investment or similar investments in the marketplace. The inputs will be considered by the Valuation Committee, along with any other relevant factors in the calculation of an investment’s fair value. A Fund uses prices and inputs that are current as of the valuation date, which may include periods of market dislocations. During these periods, the availability of prices and inputs may be reduced for many investments. This condition could cause an investment to be reclassified between the various levels within the hierarchy.
Investments falling into the Level 3 category may be classified as such due to a lack of market transparency and corroboration to support the quoted prices.
Additionally, valuation models may be used as the pricing source for any remaining investments classified as Level 3. These models may rely on one or more significant unobservable inputs and/or significant assumptions by the Valuation Committee. Inputs used in valuations may include, but are not limited to, financial statement analysis, capital account balances, discount rates and estimated cash flows, and comparable entity data.
The following is a summary of the inputs used to value each Fund’s investments as of October 31, 2017.
| Quoted prices in active markets for identical assets (Level 1) | Significant other observable inputs (Level 2) | Significant unobservable inputs (Level 3) | ||||||||||
| Capital Appreciation Fund | ||||||||||||
| Common stocks (a) | $387,861,670 | $— | $— | |||||||||
| Total investment portfolio | $387,861,670 | $— | $— | |||||||||
| Growth & Income Fund | ||||||||||||
| Common stocks (a) | $582,973,249 | $— | $— | |||||||||
| Total investment portfolio | $582,973,249 | $— | $— | |||||||||
| 39 |
Notes to Financial Statements
| 10.31.2017 |
| Quoted prices in active markets for identical assets (Level 1) | Significant other observable inputs (Level 2) | Significant unobservable inputs (Level 3) | ||||||||||
| International Stock Fund | ||||||||||||
| Common stocks (a): | ||||||||||||
Australia | $— | $473,403 | $— | |||||||||
Belgium | — | 175,226 | ||||||||||
Denmark | — | 291,854 | — | |||||||||
Finland | — | 136,571 | — | |||||||||
France | — | 1,756,726 | — | |||||||||
Germany | — | 1,400,252 | — | |||||||||
Hong Kong | — | 473,600 | — | |||||||||
Israel | — | 211,945 | — | |||||||||
Italy | — | 334,132 | — | |||||||||
Japan | — | 5,449,820 | — | |||||||||
Netherlands | 105,280 | 813,814 | — | |||||||||
Norway | — | 149,284 | — | |||||||||
Singapore | — | 414,541 | — | |||||||||
Spain | — | 377,839 | — | |||||||||
Sweden | — | 399,935 | — | |||||||||
Switzerland | — | 2,201,931 | — | |||||||||
United Kingdom | — | 2,838,475 | — | |||||||||
| Preferred stocks: | ||||||||||||
Germany | — | 109,129 | — | |||||||||
| Total investment portfolio | $105,280 | $18,008,477 | $— | |||||||||
| Investment Grade Bond Fund | ||||||||||||
| Domestic corporate bonds (a) | $— | $20,332,833 | $— | |||||||||
| Foreign corporate bonds (a) | — | 3,007,868 | — | |||||||||
| Mortgage and asset-backed securities | — | 12,976,279 | — | |||||||||
| Foreign government bonds | — | 148,657 | — | |||||||||
| U.S. Treasuries | — | 755,156 | — | |||||||||
| U.S. Government agency securities | — | 1,065,223 | — | |||||||||
| Supranational banks | — | 3,498,695 | — | |||||||||
| Total investment portfolio | $— | $41,784,711 | $— | |||||||||
| Mid Cap Growth Fund | ||||||||||||
| Common stocks (a) | $2,320,949,860 | $— | $— | |||||||||
| Total investment portfolio | $2,320,949,860 | $— | $— | |||||||||
| Mid Cap Stock Fund | ||||||||||||
| Common stocks (a) | $256,999,702 | $— | $— | |||||||||
| Total investment portfolio | $256,999,702 | $— | $— | |||||||||
| Small Cap Growth Fund | ||||||||||||
| Common stocks (a) | $5,022,024,965 | $— | $14,746,830 | |||||||||
| Contingent value rights | — | — | 242,594 | |||||||||
| Total investment portfolio | $5,022,024,965 | $— | $14,989,424 | |||||||||
| Quoted prices in active markets for identical assets (Level 1) | Significant other observable inputs (Level 2) | Significant unobservable inputs (Level 3) | ||||||||||
| Smaller Company Fund | ||||||||||||
| Common stocks (a) | $45,284,579 | $— | $— | |||||||||
| Total investment portfolio | $45,284,579 | $— | $— | |||||||||
| Tactical Allocation Fund | ||||||||||||
| Exchange traded funds | $16,852,886 | $— | $— | |||||||||
| Total investment portfolio | $16,852,886 | $— | $— | |||||||||
| (a) Please see the investment portfolio for detail by industry. | ||||||||||||
The Fund recognizes transfers between levels at the end of the reporting period. During the fiscal year ended October 31, 2017, there was a transfer of one security, Patheon N.V., held in the Small Cap Growth Fund, into level 3 from level 1.
The following is a reconciliation of Level 3 securities held by the Small Cap Growth Fund as of October 31, 2017 for which significant unobservable inputs were used to determine fair value:
| Small Cap Growth Fund | Common stocks | Contingent value rights | ||||||
| Balance as of October 31, 2016 | $— | $242,594 | ||||||
| Purchases | — | — | ||||||
| Change in unrealized appreciation (depreciation) | — | — | ||||||
| Transfer into Level 3 | 14,746,830 | — | ||||||
| Balance as of October 31, 2017 | $14,746,830 | $242,594 | ||||||
The Funds’ policy for disclosing the valuation techniques and significant unobservable inputs for Level 3 assets and liabilities is to provide such disclosures when aggregate exposure to Level 3 investments exceeds 1% of net asset value. At October 31, 2017, the Level 3 investments within the Fund did not exceed such threshold and therefore have not been disclosed.
Common stocks | On August 29, 2017, Thermo Fisher Scientific, Inc. acquired 95.3% of the outstanding Patheon N.V. ordinary shares, and Patheon N.V. is no longer exchange traded and has been delisted. As of October 31, 2017, Patheon N.V. was valued at the acquisition price without adjustment.
Contingent value rights | The contingent value rights (“CVR”) were acquired as a result of Dyax Corp. (which was a portfolio holding of the Fund) being acquired by Shire PLC. In exchange for the Fund’s shares in Dyax Corp., the Fund received cash consideration from Shire PLC as well as the CVR.
Foreign currency transactions | The books and records of each Fund are maintained in U.S. dollars. Foreign currency transactions are translated into U.S. dollars on the following basis: (i) market value of investment securities, other assets and other liabilities at the daily rates of exchange, and (ii) purchases and sales of investment securities, dividend and interest income and certain expenses at the rates of exchange prevailing on the respective dates of such transactions. The Funds do not isolate that portion of gains and losses on investments which is due to changes in foreign exchange rates from that which is due to changes in market prices of the investments. Such fluctuations are included with the net realized and unrealized gains and losses from investment transactions. Net realized gain (loss) on foreign currency transactions and the net change in unrealized appreciation (depreciation) on translation of assets and liabilities denominated in foreign currencies include gains and losses between trade and settlement date on securities transactions, gains and losses arising from the purchase and sale of forward foreign
| 40 |
Notes to Financial Statements
| 10.31.2017 |
currency exchange contracts and gains and losses between the ex and payment dates on dividends, interest and foreign withholding taxes.
Forward currency exchange contracts | Each of the Funds, except the Small Cap Growth Fund, is authorized to enter into forward currency contracts, which are used primarily to hedge against foreign currency exchange rate risk on its non-U.S. dollar denominated investment securities. Forward currency exchange contracts are valued in U.S. dollars based upon forward exchange rates provided by an independent pricing service as of the close of the NYSE each valuation day and the unrealized gain or loss is included in the related Statement of Assets and Liabilities. When the contracts are closed, the gain or loss is realized. Realized and unrealized gains and losses are included in the related Statement of Operations. Risks may arise from unanticipated movements in the currency’s value relative to the U.S. dollar and from the possible inability of counter-parties to meet the terms of their contracts. During the fiscal year ended October 31, 2017, none of the Funds held forward currency exchange contracts.
Real estate investment trusts (“REIT(s)”) | There are certain additional risks involved in investing in REITs. These include, but are not limited to, economic conditions, changes in zoning laws, real estate values, property taxes and interest rates. Dividend income is recorded at the Manager’s estimate of the income included in distributions from the REITs. Distributions received in excess of the estimated amount are recorded as a reduction of the cost of the investments. The actual amounts of income, return of capital and capital gains are only determined by each REIT after the Funds’ fiscal year-end and may differ from the estimated amounts.
Repurchase agreements | Each Fund may enter into repurchase agreements whereby a Fund, through its custodian, receives delivery of the underlying securities, the market value of which at the time of purchase is required to be in an amount of at least 100% of the resale price. Repurchase agreements involve the risk that the seller will fail to repurchase the security, as agreed. In that case, the Fund will bear the risk of market value fluctuations until the security can be sold and may encounter delays and incur costs in liquidating the security. In the event of bankruptcy or insolvency of the seller, delays and costs may be incurred. During the fiscal year ended October 31, 2017, none of the Funds held any repurchase agreements.
Revenue recognition | Investment security transactions are accounted for on a trade date basis. Dividend income is recorded on the ex-dividend date. Interest income is recorded on an accrual basis.
Foreign taxes | The Funds may be subject to taxes imposed by countries in which they invest, with respect to their investments in issuers existing or operating in such countries. The Funds may also be subject to foreign taxes on income, gains on investments or currency repatriation, a portion of which may or may not be recoverable. The Funds accrue such taxes and recoveries as applicable, when the related income or capital gains are earned and based upon the current interpretation of tax rules and regulations that exist in the markets in which a Fund invests. Some countries require governmental approval for the repatriation of investment income, capital or the proceeds of sales earned by foreign investors.
Expenses | Each Fund is charged for certain expenses which are directly attributable to it and certain other expenses which are allocated proportionately among the Eagle Family of Funds based upon methods approved by the Board. Expenses that are directly attributable to a specific class of shares, such as distribution fees, shareholder servicing fees and administrative fees, are charged directly to that class of shares. Other expenses of each Fund are allocated to each class of shares based upon its relative percentage of net assets.
Class allocations | Each class of shares has equal rights to earnings and assets except that each class may bear different expenses for administration, distribution and/or shareholder services. Income, expenses (other than
expenses attributable to a specific class), and realized and unrealized gains or losses on investments are allocated to each class of shares based on its relative percentage of net assets
Distributions | Each Fund, except the Investment Grade Bond Fund and the Growth & Income Fund, distributes net investment income annually. Distributions of net investment income in the Investment Grade Bond Fund and the Growth & Income Fund are made monthly and quarterly, respectively. Net realized gains from investment transactions during any particular fiscal year in excess of available capital loss carryforwards, which, if not distributed, would be taxable to each applicable Fund, will be distributed to shareholders annually in the following fiscal year. Each Fund uses the identified cost method for determining realized gain or loss on investments for both financial and federal income tax reporting purposes.
Dividends paid to shareholders from net investment income were as follows:
| Distributions from net investment income | 11/1/16 to 10/31/17 | 11/1/15 to 10/31/16 | ||||||
| Capital Appreciation Fund | ||||||||
| Class A | $103,196 | $46,043 | ||||||
| Class C | — | — | ||||||
| Class I | 309,650 | 332,588 | ||||||
| Class R-3 | — | — | ||||||
| Class R-5 | 27,256 | 23,910 | ||||||
| Class R-6 | 147,658 | 11 | ||||||
| Growth & Income Fund | ||||||||
| Class A | 2,603,605 | 3,012,861 | ||||||
| Class C | 1,818,162 | 2,167,962 | ||||||
| Class I | 4,499,599 | 3,364,278 | ||||||
| Class R-3 | 36,917 | 41,794 | ||||||
| Class R-5 | 7,686 | 6,226 | ||||||
| Class R-6 | 793,603 | 714,390 | ||||||
| International Stock Fund | ||||||||
| Class A | 46,900 | 45,124 | ||||||
| Class C | 50,527 | — | ||||||
| Class I | 137,212 | 28,889 | ||||||
| Class R-3 | 13,703 | 3 | ||||||
| Class R-5 | 604 | 212 | ||||||
| Class R-6 | 220 | 25 | ||||||
| Investment Grade Bond Fund | ||||||||
| Class A | 237,245 | 230,287 | ||||||
| Class C | 137,043 | 106,098 | ||||||
| Class I | 201,959 | 149,267 | ||||||
| Class R-3 | 2,828 | 1,369 | ||||||
| Class R-5 | 1,217 | 262 | ||||||
| Class R-6 | 18,282 | 2,025 | ||||||
| Mid Cap Growth Fund | ||||||||
| Class A | — | — | ||||||
| Class C | — | — | ||||||
| Class I | 7,063 | — | ||||||
| 41 |
Notes to Financial Statements
| 10.31.2017 |
| Distributions from net investment income (cont’d) | 11/1/16 to 10/31/17 | 11/1/15 to 10/31/16 | ||||||
| Mid Cap Growth Fund (cont’d) | ||||||||
| Class R-3 | $— | $— | ||||||
| Class R-5 | 13,093 | — | ||||||
| Class R-6 | 77,414 | — | ||||||
| Tactical Allocation Fund | ||||||||
| Class A | 5,272 | — | ||||||
| Class C | — | — | ||||||
| Class I | 39,118 | — | ||||||
| Class R-3 | — | — | ||||||
| Class R-5 | 277 | — | ||||||
| Class R-6 | 60 | — | ||||||
Distributions paid to shareholders from net realized gains were as follows:
| Distributions from net realized gains | 11/1/16 to 10/31/17 | 11/1/15 to 10/31/16 | ||||||
| Capital Appreciation Fund | ||||||||
| Class A | $8,681,228 | $21,628,944 | ||||||
| Class C | 4,827,925 | 11,141,899 | ||||||
| Class I | 5,528,128 | 13,002,521 | ||||||
| Class R-3 | 43,242 | 130,368 | ||||||
| Class R-5 | 438,881 | 998,682 | ||||||
| Class R-6 | 1,693,653 | 314 | ||||||
| Growth & Income Fund | ||||||||
| Class A | 7,622,797 | — | ||||||
| Class C | 9,453,020 | — | ||||||
| Class I | 9,299,716 | — | ||||||
| Class R-3 | 133,019 | — | ||||||
| Class R-5 | 17,227 | — | ||||||
| Class R-6 | 1,771,834 | — | ||||||
| Investment Grade Bond Fund | ||||||||
| Class A | 139,393 | 56,240 | ||||||
| Class C | 165,785 | 61,745 | ||||||
| Class I | 93,612 | 23,537 | ||||||
| Class R-3 | 1,747 | 83 | ||||||
| Class R-5 | 205 | 9 | ||||||
| Class R-6 | 5,965 | 7 | ||||||
| Mid Cap Growth Fund | ||||||||
| Class A | — | 5,805,631 | ||||||
| Class C | — | 2,320,335 | ||||||
| Class I | — | 6,175,640 | ||||||
| Class R-3 | — | 394,348 | ||||||
| Class R-5 | — | 2,154,918 | ||||||
| Class R-6 | — | 3,455,584 | ||||||
| Distributions from net realized gains (cont’d) | 11/1/16 to 10/31/17 | 11/1/15 to 10/31/16 | ||||||
| Mid Cap Stock Fund | ||||||||
| Class A | $9,063,060 | $16,786,955 | ||||||
| Class C | 8,860,065 | 15,689,307 | ||||||
| Class I | 3,459,045 | 5,595,464 | ||||||
| Class R-3 | 109,122 | 202,795 | ||||||
| Class R-5 | 15,755 | 27,645 | ||||||
| Class R-6 | 39,211 | 123,684 | ||||||
| Small Cap Growth Fund | ||||||||
| Class A | 25,774,205 | 45,836,967 | ||||||
| Class C | 6,681,303 | 15,163,196 | ||||||
| Class I | 39,849,621 | 106,369,790 | ||||||
| Class R-3 | 3,012,673 | 7,617,115 | ||||||
| Class R-5 | 13,984,353 | 27,455,433 | ||||||
| Class R-6 | 36,117,862 | 50,864,936 | ||||||
| Smaller Company Fund | ||||||||
| Class A | 1,475,728 | — | ||||||
| Class C | 1,831,245 | — | ||||||
| Class I | 811,665 | — | ||||||
| Class R-3 | 42,823 | — | ||||||
| Class R-5 | 3,692 | — | ||||||
| Class R-6 | 233,473 | — | ||||||
| Tactical Allocation Fund | ||||||||
| Class A | 2,366 | — | ||||||
| Class C | 1,498 | — | ||||||
| Class I | 8,335 | — | ||||||
| Class R-3 | 12 | — | ||||||
| Class R-5 | 59 | — | ||||||
| Class R-6 | 12 | — | ||||||
Offering costs | Offering costs of $155,956 associated with the formation of the Tactical Allocation Fund were accounted for as a deferred charge and were amortized on a straight line basis over 12 months from the date of commencement of operations, December 31, 2015. For the period ended October 31, 2016, the Tactical Allocation Fund amortized expenses of $133,806, and the remaining $22,150 was amortized during the fiscal year ended October 31, 2017.
Other | In the normal course of business the Funds enter into contracts that contain a variety of representations and warranties which provide general indemnifications. The Funds’ maximum exposure under these arrangements is unknown, as this would involve future claims that may be made against the Funds and/or their affiliates that have not yet occurred. However, based on experience, the risk of loss to each Fund is expected to be remote.
| 42 |
Notes to Financial Statements
| 10.31.2017 |
NOTE 3 | Purchases and sales of securities | For the fiscal year ended October 31, 2017, purchases and sales of investment securities (excluding short-term obligations) were as follows:
| Purchases | Sales | |||||||
| Capital Appreciation Fund | $121,332,636 | $168,739,787 | ||||||
| Growth & Income Fund | 58,027,737 | 109,941,601 | ||||||
| International Stock Fund | 12,368,496 | 12,639,024 | ||||||
| Investment Grade Bond Fund | ||||||||
Debt securities | 14,356,047 | 19,875,834 | ||||||
U.S. Treasury securities | 3,427,461 | 4,399,694 | ||||||
| Mid Cap Growth Fund | 1,223,203,550 | 771,027,722 | ||||||
| Mid Cap Stock Fund | 40,840,110 | 86,188,524 | ||||||
| Small Cap Growth Fund | 1,809,578,150 | 1,898,504,708 | ||||||
| Smaller Company Fund | 15,635,030 | 24,738,873 | ||||||
| Tactical Allocation Fund | 28,715,482 | 20,226,126 | ||||||
NOTE 4 | Investment advisory fees and other transactions with affiliates | Each Fund has agreed to pay to the Manager an investment advisory and an administrative fee equal to an annualized rate based on a percentage of each Fund’s average daily net assets, computed daily and payable monthly. For advisory services provided by the Manager, the investment advisory rate for each Fund is as follows:
| Investment advisory fee rate schedule | Breakpoint | Investment advisory fee | ||||||
| Capital Appreciation Fund | | First $1 billion Over $1 billion |
| | 0.60 0.55 | % % | ||
| Growth & Income Fund | | First $100 million $100 million to $500 million | | | 0.60 0.45 0.40 | % % % | ||
| International Stock Fund* | All assets | 0.70 | % | |||||
| Investment Grade Bond Fund | All assets | 0.30 | % | |||||
Mid Cap Growth Fund, Mid Cap Stock Fund, Small Cap Growth Fund, Smaller Company Fund | | First $500 million $500 million to $1 billion Over $1 billion | | | 0.60 0.55 0.50 | % % % | ||
| Tactical Allocation Fund | All assets | 0.57 | % | |||||
| * Prior to the Board approved change effective March 1, 2017, the investment advisory fee was 0.85% for all assets. | ||||||||
For administrative services provided by the Manager, each Fund has agreed to pay an administrative rate of 0.15% of the average daily net assets of Class A, Class C and Class R-3 shares and 0.10% of the average daily net assets of Class I, Class R-5 and Class R-6 shares.
Subadvisory fees | The Manager has entered into subadvisory agreements with certain parties to provide investment advice, portfolio management services (including the placement of brokerage orders), certain compliance and other services to the Funds.
The Manager entered into subadvisory agreements with ClariVest Asset Management LLC (“ClariVest”), an affiliate of Carillon Tower, to serve as subadvisor for the Capital Appreciation Fund and the International Stock Fund. Under these agreements, Carillon Tower pays ClariVest an annualized rate of 0.55% and 0.70%, respectively, on all assets as a percentage of the Fund’s average daily net assets, computed daily and payable monthly for the Capital Appreciation Fund and the International Stock Fund, respectively. Prior to March 1, 2017, the subadvisory fee for the International Stock Fund was 0.85% on all assets.
The Manager entered into a subadvisory agreement with Cougar Global Investments Limited (“Cougar Global”), an affiliate of Carillon Tower, to serve as subadvisor for the Tactical Allocation Fund. Under this agreement, Carillon Tower pays Cougar Global an annualized rate of 0.57% on all assets as a percentage of the Fund’s average daily net assets, computed daily and payable monthly for the Tactical Allocation Fund.
Effective June 1, 2017 the Manager entered into a subadvisory agreement with Eagle, an affiliate of Carillon Tower, to serve as subadvisor for the Growth & Income Fund, Investment Grade Bond Fund, Mid Cap Growth Fund, Mid Cap Stock Fund, Small Cap Growth Fund, and Smaller Company Fund. Under this agreement, Carillon Tower pays Eagle annualized rates according to the following payment schedule:
| Investment subadvisory fee rate schedule | Breakpoint | Investment subadvisory fee | ||||||
| Growth & Income Fund | | First $100 million $100 million to $500 million Over $500 million | | | 0.60 0.45 0.40 | % % % | ||
| Investment Grade Bond Fund | All assets | 0.30 | % | |||||
Mid Cap Growth Fund, Mid Cap Stock Fund, Small Cap Growth Fund, Smaller Company Fund | | First $500 million $500 million to $1 billion Over $1 billion | | | 0.60 0.55 0.50 | % % % | ||
Distribution and service fees | Pursuant to the Class A, Class C and Class R-3 Distribution plans and in accordance with Rule 12b-1 of the Investment Company Act of 1940, as amended (“Rule 12b-1 Plans”), the Funds are authorized to pay Carillon Fund Distributors, Inc. (“Distributor”), an affiliate of the Manager, a fee based on the average daily net assets for each class of shares, accrued daily and payable monthly. Each Fund of the Eagle Series Trust is authorized to pay the Distributor distribution and service fees of up to 0.35% of that fund’s average daily net assets attributable to Class A shares of that fund. The Capital Appreciation Fund and the Growth & Income Fund are authorized to pay the Distributor distribution and service fees of up to 0.50% of those Funds’ average daily net assets attributable to Class A shares of those Funds. Currently, the distribution and service fee is 0.25% for Class A shares of each Fund. Each Fund also is authorized, and currently pays, the Distributor distribution and service fees of 1% for Class C shares, and 0.50% for Class R-3 shares. The Funds do not incur any direct distribution expenses related to Class I, Class R-5 or Class R-6 shares. However, Carillon Tower or any third party may make payments for the sale and distribution of all share classes, including Class I, Class R-5 or Class R-6 shares, from its own resources.
Sales charges | For the fiscal year ended October 31, 2017, total front-end sales charges and CDSCs paid to the Distributor were as follows:
| Front-end sales charge | Contingent deferred sales charges | |||||||||||
| Class A | Class A | Class C | ||||||||||
| Capital Appreciation Fund | $68,414 | $— | $205 | |||||||||
| Growth & Income Fund | 151,872 | — | 5,504 | |||||||||
| International Stock Fund | 12,202 | — | 87 | |||||||||
| Investment Grade Bond Fund | 12,259 | — | 470 | |||||||||
| Mid Cap Growth Fund | 388,625 | — | 1,222 | |||||||||
| Mid Cap Stock Fund | 26,553 | — | 452 | |||||||||
| Small Cap Growth Fund | 192,097 | — | 1,257 | |||||||||
| Smaller Company Fund | 7,813 | — | 16 | |||||||||
| Tactical Allocation Fund | 18,785 | — | 1,340 | |||||||||
| 43 |
Notes to Financial Statements
| 10.31.2017 |
The Distributor paid commissions to salespersons from these fees and incurred other distribution costs.
Agency commissions | For the fiscal year ended October 31, 2017, total agency brokerage commissions paid and agency brokerage commissions paid directly to Raymond James & Associates, Inc. (“RJA”), an affiliate of the Manager, were as follows:
| Total agency brokerage commissions | Paid to Raymond James & Associates, Inc. | |||||||
| Capital Appreciation Fund | $69,889 | $— | ||||||
| Growth & Income Fund | 64,180 | — | ||||||
| International Stock Fund | 12,507 | — | ||||||
| Investment Grade Bond Fund | — | — | ||||||
| Mid Cap Growth Fund | 819,956 | 27,194 | ||||||
| Mid Cap Stock Fund | 56,631 | — | ||||||
| Small Cap Growth Fund | 2,074,801 | 118,407 | ||||||
| Smaller Company Fund | 21,149 | — | ||||||
| Tactical Allocation Fund | 6,144 | — | ||||||
Internal audit fees | RJA provides internal audit services to the Funds.
RJA charges a fixed fee for these services which is then allocated to each Fund evenly.
Shareholder servicing fees | Carillon Fund Services, Inc. (“CFS”), an affiliate of the Manager, is the shareholder servicing agent for each of the Funds. Prior to June 1, 2017, CFS was known as Eagle Fund Services, Inc. (“EFS”). CFS’ actual cost of providing such services is reimbursed by the Funds on a pro-rata basis of each Fund’s relative total net assets. The amount of shareholder servicing fees charged to the Funds were as follows:
| Shareholder servicing fees | 11/1/16 to 10/31/17 | |||
| Capital Appreciation Fund Class A | $5,152 | |||
| Capital Appreciation Fund Class C | 2,141 | |||
| Capital Appreciation Fund Class I | 3,924 | |||
| Capital Appreciation Fund Class R-3 | 29 | |||
| Capital Appreciation Fund Class R-5 | 208 | |||
| Capital Appreciation Fund Class R-6 | — | |||
| Growth & Income Fund Class A | 5,207 | |||
| Growth & Income Fund Class C | 6,091 | |||
| Growth & Income Fund Class I | 7,632 | |||
| Growth & Income Fund Class R-3 | 92 | |||
| Growth & Income Fund Class R-5 | 13 | |||
| Growth & Income Fund Class R-6 | — | |||
| International Stock Fund Class A | 132 | |||
| International Stock Fund Class C | 162 | |||
| International Stock Fund Class I | 216 | |||
| International Stock Fund Class R-3 | 25 | |||
| International Stock Fund Class R-5 | — | |||
| International Stock Fund Class R-6 | — | |||
| Investment Grade Bond Fund Class A | 517 | |||
| Investment Grade Bond Fund Class C | 587 | |||
| Shareholder servicing fees (cont’d) | 11/1/16 to 10/31/17 | |||
| Investment Grade Bond Fund Class I | $373 | |||
| Investment Grade Bond Fund Class R-3 | 7 | |||
| Investment Grade Bond Fund Class R-5 | 2 | |||
| Investment Grade Bond Fund Class R-6 | — | |||
| Mid Cap Growth Fund Class A | 12,923 | |||
| Mid Cap Growth Fund Class C | 4,366 | |||
| Mid Cap Growth Fund Class I | 18,656 | |||
| Mid Cap Growth Fund Class R-3 | 894 | |||
| Mid Cap Growth Fund Class R-5 | 7,068 | |||
| Mid Cap Growth Fund Class R-6 | — | |||
| Mid Cap Stock Fund Class A | 3,970 | |||
| Mid Cap Stock Fund Class C | 2,948 | |||
| Mid Cap Stock Fund Class I | 1,879 | |||
| Mid Cap Stock Fund Class R-3 | 52 | |||
| Mid Cap Stock Fund Class R-5 | 9 | |||
| Mid Cap Stock Fund Class R-6 | — | |||
| Small Cap Growth Fund Class A | 28,023 | |||
| Small Cap Growth Fund Class C | 5,946 | |||
| Small Cap Growth Fund Class I | 49,370 | |||
| Small Cap Growth Fund Class R-3 | 3,315 | |||
| Small Cap Growth Fund Class R-5 | 15,466 | |||
| Small Cap Growth Fund Class R-6 | — | |||
| Smaller Company Fund Class A | 544 | |||
| Smaller Company Fund Class C | 606 | |||
| Smaller Company Fund Class I | 301 | |||
| Smaller Company Fund Class R-3 | 16 | |||
| Smaller Company Fund Class R-5 | 2 | |||
| Smaller Company Fund Class R-6 | — | |||
| Tactical Allocation Fund Class A | 61 | |||
| Tactical Allocation Fund Class C | 56 | |||
| Tactical Allocation Fund Class I | 360 | |||
| Tactical Allocation Fund Class R-3 | — | |||
| Tactical Allocation Fund Class R-5 | 2 | |||
| Tactical Allocation Fund Class R-6 | — | |||
Expense limitations | Carillon Tower has contractually agreed to reduce its fees and/or reimburse expenses to each class of the Funds through February 28, 2018, to the extent that the annual operating expense ratio for each class of shares exceeds the following annualized ratios as a percentage of average daily net assets of each class of shares.
| Expense limitations rate schedule* | Class A | Class C | Class I | |||||||||
| Capital Appreciation Fund | 1.25 | % | 2.00 | % | 0.95 | % | ||||||
| Growth & Income Fund | 1.25 | % | 2.00 | % | 0.95 | % | ||||||
| International Stock Fund | 1.45 | % | 2.20 | % | 1.15 | % | ||||||
| Investment Grade Bond Fund | 0.73 | % | 1.48 | % | 0.43 | % | ||||||
| 44 |
Notes to Financial Statements
| 10.31.2017 |
| Expense limitations rate schedule* (cont’d) | Class A | Class C | Class I | |||||||||
| Mid Cap Growth Fund | 1.25 | % | 2.00 | % | 0.95 | % | ||||||
| Mid Cap Stock Fund | 1.25 | % | 2.00 | % | 0.95 | % | ||||||
| Small Cap Growth Fund | 1.25 | % | 2.00 | % | 0.95 | % | ||||||
| Smaller Company Fund | 1.25 | % | 2.00 | % | 0.95 | % | ||||||
| Tactical Allocation Fund | 1.17 | % | 1.92 | % | 0.87 | % | ||||||
| Expense limitations rate schedule* (cont’d) | Class R-3 | Class R-5 | Class R-6 | |||||||||
| Capital Appreciation Fund | 1.50 | % | 0.95 | % | 0.85 | % | ||||||
| Growth & Income Fund | 1.50 | % | 0.95 | % | 0.85 | % | ||||||
| International Stock Fund | 1.70 | % | 1.15 | % | 1.05 | % | ||||||
| Investment Grade Bond Fund | 0.98 | % | 0.43 | % | 0.33 | % | ||||||
| Mid Cap Growth Fund | 1.50 | % | 0.95 | % | 0.85 | % | ||||||
| Mid Cap Stock Fund | 1.50 | % | 0.95 | % | 0.85 | % | ||||||
| Small Cap Growth Fund | 1.50 | % | 0.95 | % | 0.85 | % | ||||||
| Smaller Company Fund | 1.50 | % | 0.95 | % | 0.85 | % | ||||||
| Tactical Allocation Fund | 1.42 | % | 0.87 | % | 0.77 | % | ||||||
| * Prior to the Board approved changes effective March 1, 2017 that affected all Funds except the Investment Grade Bond Fund, the expense limitation rate schedules were as follows: | ||||||||||||
| Expense limitations rate schedule | Class A | Class C | Class I | |||||||||
| Capital Appreciation Fund | 1.40 | % | 2.20 | % | 0.95 | % | ||||||
| Growth & Income Fund | 1.40 | % | 2.20 | % | 0.95 | % | ||||||
| International Stock Fund | 1.75 | % | 2.55 | % | 1.15 | % | ||||||
| Mid Cap Growth Fund | 1.50 | % | 2.30 | % | 0.95 | % | ||||||
| Mid Cap Stock Fund | 1.50 | % | 2.30 | % | 0.95 | % | ||||||
| Small Cap Growth Fund | 1.50 | % | 2.30 | % | 0.95 | % | ||||||
| Smaller Company Fund | 1.50 | % | 2.30 | % | 0.95 | % | ||||||
| Tactical Allocation Fund | 1.17 | % | 1.97 | % | 0.87 | % | ||||||
| Expense limitations rate schedule (cont’d) | Class R-3 | Class R-5 | Class R-6 | |||||||||
| Capital Appreciation Fund | 1.65 | % | 0.95 | % | 0.85 | % | ||||||
| Growth & Income Fund | 1.65 | % | 0.95 | % | 0.85 | % | ||||||
| International Stock Fund | 1.75 | % | 1.15 | % | 1.05 | % | ||||||
| Mid Cap Growth Fund | 1.70 | % | 0.95 | % | 0.85 | % | ||||||
| Mid Cap Stock Fund | 1.70 | % | 0.95 | % | 0.85 | % | ||||||
| Small Cap Growth Fund | 1.70 | % | 0.95 | % | 0.85 | % | ||||||
| Smaller Company Fund | 1.70 | % | 0.95 | % | 0.85 | % | ||||||
| Tactical Allocation Fund | 1.37 | % | 0.87 | % | 0.77 | % | ||||||
Fees and expenses waived and/or reimbursed based on the expense rate limitation schedule were as follows:
| Expenses waived and/or reimbursed | 11/1/16 to 10/31/17 | |||
| Capital Appreciation Fund Class R-3 | $424 | |||
| International Stock Fund | 318,472 | |||
| Expenses waived and/or reimbursed (cont’d) | 11/1/16 to 10/31/17 | |||
| International Stock Fund Class A | $5,471 | |||
| International Stock Fund Class C | 8,001 | |||
| International Stock Fund Class I | 7,594 | |||
| International Stock Fund Class R-3 | 1,682 | |||
| International Stock Fund Class R-5 | 49 | |||
| International Stock Fund Class R-6 | 74 | |||
| Investment Grade Bond Fund | 317,149 | |||
| Investment Grade Bond Fund Class A | 16,295 | |||
| Investment Grade Bond Fund Class C | 20,170 | |||
| Investment Grade Bond Fund Class I | 11,278 | |||
| Investment Grade Bond Fund Class R-3 | 657 | |||
| Investment Grade Bond Fund Class R-5 | 89 | |||
| Investment Grade Bond Fund Class R-6 | 1,368 | |||
| Mid Cap Stock Fund Class A | 16,971 | |||
| Mid Cap Stock Fund Class C | 17,613 | |||
| Mid Cap Stock Fund Class I | 4,802 | |||
| Mid Cap Stock Fund Class R-3 | 1,256 | |||
| Mid Cap Stock Fund Class R-5 | 268 | |||
| Mid Cap Stock Fund Class R-6 | 91 | |||
| Smaller Company Fund | 202,135 | |||
| Smaller Company Fund Class A | 21,199 | |||
| Smaller Company Fund Class C | 17,645 | |||
| Smaller Company Fund Class I | 14,932 | |||
| Smaller Company Fund Class R-3 | 719 | |||
| Smaller Company Fund Class R-5 | 111 | |||
| Smaller Company Fund Class R-6 | 3,298 | |||
| Tactical Allocation Fund | 278,988 | |||
| Tactical Allocation Fund Class A | 2,731 | |||
| Tactical Allocation Fund Class C | 2,441 | |||
| Tactical Allocation Fund Class I | 19,305 | |||
| Tactical Allocation Fund Class R-3 | 11 | |||
| Tactical Allocation Fund Class R-5 | 64 | |||
| Tactical Allocation Fund Class R-6 | 16 | |||
A portion or all of a Fund’s fees and expenses reduced and/or reimbursed by the Manager in prior fiscal years may be recoverable by Carillon Tower prior to their expiration date. Carillon Tower must recover from the same class of shares any previously reduced and/or reimbursed fees and expenses within two years from the Fund’s fiscal year-end during which the fees and expenses were originally reduced and/or reimbursed. Previously reduced and/or reimbursed fees and expenses are recovered by Carillon Tower when expenses in the current fiscal year fall below the expense rate limitation then in effect. The following table shows the amounts that Carillon Tower may be allowed to recover by class of shares and the date in which these amounts will expire:
| Recoverable expenses | 10/31/2019 | 10/31/2018 | ||||||
| Capital Appreciation Fund Class R-3 | $424 | $— | ||||||
| International Stock Fund | 318,472 | 342,061 | ||||||
| 45 |
Notes to Financial Statements
| 10.31.2017 |
| Recoverable expenses (cont’d) | 10/31/2019 | 10/31/2018 | ||||||
| International Stock Fund Class A | $5,471 | $— | ||||||
| International Stock Fund Class C | 8,001 | — | ||||||
| International Stock Fund Class I | 7,594 | 6,353 | ||||||
| International Stock Fund Class R-3 | 1,682 | 103 | ||||||
| International Stock Fund Class R-5 | 49 | 59 | ||||||
| International Stock Fund Class R-6 | 74 | 42 | ||||||
| Investment Grade Bond Fund | 317,149 | 256,356 | ||||||
| Investment Grade Bond Fund Class A | 16,295 | 28,222 | ||||||
| Investment Grade Bond Fund Class C | 20,170 | 24,088 | ||||||
| Investment Grade Bond Fund Class I | 11,278 | 11,037 | ||||||
| Investment Grade Bond Fund Class R-3 | 657 | 309 | ||||||
| Investment Grade Bond Fund Class R-5 | 89 | 49 | ||||||
| Investment Grade Bond Fund Class R-6 | 1,368 | 228 | ||||||
| Mid Cap Stock Fund Class A | 16,971 | — | ||||||
| Mid Cap Stock Fund Class C | 17,613 | — | ||||||
| Mid Cap Stock Fund Class I | 4,802 | 20,277 | ||||||
| Mid Cap Stock Fund Class R-3 | 1,256 | — | ||||||
| Mid Cap Stock Fund Class R-5 | 268 | 299 | ||||||
| Mid Cap Stock Fund Class R-6 | 91 | 219 | ||||||
| Smaller Company Fund | 202,135 | 199,163 | ||||||
| Smaller Company Fund Class A | 21,199 | — | ||||||
| Smaller Company Fund Class C | 17,645 | — | ||||||
| Smaller Company Fund Class I | 14,932 | 19,684 | ||||||
| Smaller Company Fund Class R-3 | 719 | 296 | ||||||
| Smaller Company Fund Class R-5 | 111 | 62 | ||||||
| Smaller Company Fund Class R-6 | 3,298 | 9,014 | ||||||
| Tactical Allocation Fund | 278,988 | 335,970 | ||||||
| Tactical Allocation Fund Class A | 2,731 | 7,408 | ||||||
| Tactical Allocation Fund Class C | 2,441 | 1,451 | ||||||
| Tactical Allocation Fund Class I | 19,305 | 2,263 | ||||||
| Tactical Allocation Fund Class R-3 | 11 | 95 | ||||||
| Tactical Allocation Fund Class R-5 | 64 | 91 | ||||||
| Tactical Allocation Fund Class R-6 | 16 | 98 | ||||||
The Manager recovered previously waived expenses during the current period as follows:
| Recovered fees previously waived | 11/1/16 to 10/31/17 | |||
| Capital Appreciation Fund Class R-6 | $16 | |||
Trustees and officers compensation | Each Trustee of the Eagle Family of Funds who is not an employee of the Manager receives an annual retainer along with meeting fees for those C Family of Funds’ regular or special meetings attended in person and 25% of such meeting fees are received for telephonic meetings. All reasonable out-of-pocket expenses are also reimbursed. Except when directly attributable to a Fund, Trustees’ fees and expenses are paid equally by each Fund in the Eagle Family of Funds. Certain officers of the Eagle Family of Funds may also be officers and/or directors of Carillon Tower. Such officers receive no compensation from the Funds except for the Funds’ Chief Compliance Officer. A portion of the Chief Compliance Officer’s total compensation is paid equally by each Fund in the Eagle Family of Funds.
NOTE 5 | Federal income taxes and distributions Each Fund is treated as a single corporate taxpayer as provided for in the Tax Reform Act of 1986, as amended. Accordingly, no provision for federal income taxes is required since each of the Funds intends to continue to qualify as a regulated investment company under Subchapter M of the Internal Revenue Code and distribute to shareholders all of its taxable income and gains. The Manager has analyzed the Funds’ tax positions taken or expected to be taken on federal income tax returns for all open tax years (tax years ended October 31, 2014 to October 31, 2017) and has concluded that no provision for federal income tax is required in the Funds’ financial statements.
Federal income tax regulations differ from GAAP; therefore, distributions determined in accordance with tax regulations may differ significantly in amount or character from net investment income and net realized gains for financial reporting purposes. These differences primarily relate to deferral of losses from wash sales and non-REIT return of capital.
For income tax purposes, distributions paid during the fiscal years indicated were as follows:
| Ordinary income | Long-term capital gains | |||||||||||||||
| 10/31/17 | 10/31/16 | 10/31/17 | 10/31/16 | |||||||||||||
| Capital Appreciation Fund | $587,760 | $402,552 | $21,213,057 | $46,902,728 | ||||||||||||
| Growth & Income Fund | 9,370,031 | 9,307,511 | 28,687,154 | — | ||||||||||||
| International Stock Fund | 249,166 | 74,253 | — | — | ||||||||||||
| Investment Grade Bond Fund | 846,111 | 626,460 | 159,170 | 4,469 | ||||||||||||
| Mid Cap Growth Fund | — | — | 97,570 | 20,306,456 | ||||||||||||
| Mid Cap Stock Fund | — | — | 21,546,258 | 38,425,850 | ||||||||||||
| Small Cap Growth Fund | 2,166,663 | — | 123,253,354 | 253,307,437 | ||||||||||||
| Smaller Company Fund | — | — | 4,398,626 | — | ||||||||||||
| Tactical Allocation Fund | 57,009 | — | — | — | ||||||||||||
Financial reporting records are adjusted for permanent book/tax differences to reflect tax character; these adjustments have no effect on net assets or NAV per share. Financial reporting records are not adjusted for temporary differences. The reclassifications arise from permanent book/tax differences primarily attributable to net operating losses not utilized, foreign currency transactions, capital loss carryforwards expired, return of capital distributions from REITs, return of capital distributions from non-REITs, paydowns on debt securities, adjustments for partnership distributions and income, merger adjustments, and the tax practice of equalization which treats a portion of the proceeds from each redemption of Fund shares as a distribution of undistributed taxable net investment income or realized gains. The reclassifications were as follows:
| Paid-in capital | Undistributed net investment income (loss) | Accumulated net realized gain (loss) | ||||||||||
| Fund | ||||||||||||
| Capital Appreciation Fund | $— | $— | $— | |||||||||
| Growth & Income Fund | — | 414,886 | (414,886 | ) | ||||||||
| International Stock Fund | — | 9,901 | (9,901 | ) | ||||||||
| Investment Grade Bond Fund | — | 76,971 | (76,971 | ) | ||||||||
| Mid Cap Growth Fund | (3,398,404 | ) | 3,495,974 | (97,570 | ) | |||||||
| Mid Cap Stock Fund | (702,452 | ) | 1,644,046 | (941,594 | ) | |||||||
| Small Cap Growth Fund | — | 14,164,148 | (14,164,148 | ) | ||||||||
| Smaller Company Fund | 1,082 | 469,238 | (470,320 | ) | ||||||||
| Tactical Allocation Fund | — | (542 | ) | 542 | ||||||||
| 46 |
Notes to Financial Statements
| 10.31.2017 |
At October 31, 2017, capital loss carryforwards and late year loss deferrals are as follows:
| Fund | Capital loss carryforwards utilized 11/1/16 to 10/31/17 | Capital loss carryforwards available indefinitely at 10/31/17 | Late year loss deferrals available at 10/31/17 | |||||||||
| Capital Appreciation Fund | $— | $— | $— | |||||||||
| Growth & Income Fund | 715,724 | — | — | |||||||||
| International Stock Fund | 961,960 | 690,823 | — | |||||||||
| Investment Grade Bond Fund | — | 19,609 | — | |||||||||
| Mid Cap Growth Fund | 6,832,132 | — | 4,599,825 | |||||||||
| Mid Cap Stock Fund | — | — | 1,469,395 | |||||||||
| Small Cap Growth Fund | — | — | 8,673,552 | |||||||||
| Smaller Company Fund | — | — | — | |||||||||
| Tactical Allocation Fund | — | — | — | |||||||||
Capital loss carryforwards may be used to offset future realized gains and late year loss deferrals may be used to offset future ordinary income. No capital loss carryforwards expired during the fiscal year ended October 31, 2017.
As of October 31, 2017, the components of distributable earnings (losses) on a tax basis were as follows:
| Capital Appreciation Fund | Growth & Income Fund | International Stock Fund | Investment Grade Bond Fund | Mid Cap Growth Fund | Mid Cap Stock Fund | Small Cap Growth Fund | Smaller Company Fund | Tactical Allocation Fund | ||||||||||||||||||||||||||||
| Cost of investments | $225,781,712 | $387,903,557 | $15,444,482 | $41,620,878 | $1,645,890,867 | $177,214,359 | $3,394,777,724 | $31,316,434 | $15,788,136 | |||||||||||||||||||||||||||
| Gross unrealized appreciation | 163,296,263 | 200,270,129 | 3,025,922 | 272,542 | 701,811,058 | 82,916,824 | 1,844,331,379 | 14,663,019 | 1,113,495 | |||||||||||||||||||||||||||
| Gross unrealized depreciation | (1,216,305 | ) | (5,200,437 | ) | (356,647 | ) | (108,709 | ) | (26,752,065 | ) | (3,131,481 | ) | (202,094,714 | ) | (694,874 | ) | (48,745 | ) | ||||||||||||||||||
| Net unrealized appreciation/(depreciation) | 162,079,958 | 195,069,692 | 2,669,275 | 163,833 | 675,058,993 | 79,785,343 | 1,642,236,665 | 13,968,145 | 1,064,750 | |||||||||||||||||||||||||||
| Undistributed ordinary income | 234,198 | 772,078 | 206,971 | 39,668 | — | — | — | 11,154 | 358,848 | |||||||||||||||||||||||||||
| Undistributed long-term gain | 25,236,577 | 14,659,910 | — | — | 68,596,282 | 13,835,511 | 381,274,518 | 4,424,463 | 35,102 | |||||||||||||||||||||||||||
| Total distributable earnings | 25,470,775 | 15,431,988 | 206,971 | 39,668 | 68,596,282 | 13,835,511 | 381,274,518 | 4,435,617 | 393,950 | |||||||||||||||||||||||||||
| Other accumulated losses | — | (3,304 | ) | (690,952 | ) | (78,798 | ) | (4,599,825 | ) | (1,469,395 | ) | (8,673,552 | ) | (15,409 | ) | — | ||||||||||||||||||||
| Total accumulated gains (losses) | $187,550,733 | $210,498,376 | $2,185,294 | $124,703 | $739,055,450 | $92,151,459 | $2,014,837,631 | $18,388,353 | $1,458,700 | |||||||||||||||||||||||||||
The difference between book-basis and tax-basis unrealized appreciation (depreciation) is attributable primarily to the tax deferral of losses from wash sales and differences in the accounting treatment for non-REIT returns of capital and investments in passive foreign investment companies.
NOTE 6 | Line of Credit | As of October 31, 2017, the Trusts have a secured line of credit of up to $250,000,000 with U.S. Bank N.A, secured by a first priority lien on the Trusts’ assets. Each Fund may borrow up to 33.33% of the net market value of such Fund’s assets, with the maximum aggregate limit of
$250,000,000 for all Funds. Borrowings under this arrangement bear interest at U.S. Bank N.A.‘s prime rate minus one percent, which as of October 31, 2017 was 3.25%. The following table shows the details of the Funds’ borrowing activity during the fiscal year ended October 31, 2017. Funds that are not listed did not utilize the line of credit during the period.
| Maximum Outstanding Balance | Average Daily Balance | Total Interest Incurred | Average Interest Rate | |||||||||||||
| Capital Appreciation Fund | $12,064,000 | $185,266 | $5,721 | 3.07 | % | |||||||||||
| International Stock Fund | $302,000 | $4,000 | $112 | 2.75 | % | |||||||||||
| Investment Grade Bond Fund | $183,000 | $1,504 | $42 | 2.75 | % | |||||||||||
| Small Cap Growth Fund | $146,110,000 | $531,975 | $17,129 | 3.19 | % | |||||||||||
| Tactical Allocation Fund | $316,000 | $4,679 | $127 | 2.69 | % | |||||||||||
As of October 31, 2017, none of the Funds had any amounts outstanding under the line of credit.
| 47 |
Notes to Financial Statements
| 10.31.2017 |
NOTE 7 | Subsequent events | Special Shareholder Meeting: On November 16, 2017, at a special meeting of shareholders (“Special Meeting”), the shareholders of each Fund approved an agreement and plan of reorganization and termination pursuant to which each Fund would be reorganized into a corresponding newly-created series of Carillon Series Trust, a new Delaware statutory trust (“Carillon Reorganizations”). At the Special Meeting, shareholders also approved the implementation of the multi-manager relief that was granted to the Funds by the Securities and Exchange Commission, as well as a pending request for multi-manager relief. The Carillon Reorganizations were completed on November 17, 2017.
Fund Names: Effective upon the completion of the Carillon Reorganizations: (1) Eagle Capital Appreciation Fund is now known as Carillon ClariVest Capital Appreciation Fund; (2) Eagle Growth & Income Fund is now known as Carillon Eagle Growth & Income Fund; (3) Eagle International Stock Fund is now known as Carillon ClariVest International Stock Fund; (4) Eagle Investment Grade Bond Fund is now known as Carillon Eagle Investment Grade Bond Fund; (5) Eagle Mid Cap Growth Fund is now known as Carillon Eagle Mid Cap Growth Fund; (6) Eagle Mid Cap Stock Fund is now known as Carillon Eagle Mid Cap Stock Fund; (7) Eagle Small Cap Growth Fund is now known as Carillon Eagle Small Cap Growth Fund; (8) Eagle Smaller Company Fund is now known as Carillon Eagle Smaller Company Fund; and (9) Eagle Tactical Allocation Fund is now known as Carillon Cougar Tactical Allocation Fund.
Scout Reorganizations: On November 17, 2017, seven series of Scout Funds (each a “Scout Fund”) were reorganized into corresponding newly-created series of Carillon Series Trust (“Carillon Scout Funds”) that are advised by Carillon Tower and subadvised by Scout Investments, Inc. (“Scout”). The Scout Funds previously were advised by Scout, an investment advisor that became a wholly-owned subsidiary of Carillon Tower on November 17, 2017. The Carillon Scout Funds commenced operations on November 20, 2017. They currently include the Carillon Reams Core Bond Fund, the Carillon Reams Core Plus Bond Fund, the Carillon Reams Low Duration Bond Fund, the Carillon Reams Unconstrained Bond Fund, the Carillon Scout Mid Cap Fund, the Carillon Scout Small Cap Fund, and the Carillon Scout International Fund.
Fund Realignments: On November 17, 2017, the Board of Trustees of Carillon Series Trust (“Board”) approved a Plan of Reorganization and Termination pursuant to which: (1) the Carillon Eagle Mid Cap Stock Fund would be reorganized into the Carillon Eagle Mid Cap Growth Fund; and (2) the Carillon Eagle Smaller Company Fund would be reorganized into the Carillon Scout Small Cap Fund. In addition, the Board approved the appointment of Scout to replace Eagle as the subadvisor for the Carillon Eagle Smaller Company Fund, as well as a reduction in the investment advisory fee rate paid by the Carillon Scout Small Cap Fund to Carillon Tower and the subadvisory fee rate paid by Carillon Tower to Scout to 0.60% on the first $500 million, 0.55% on assets of $500 million to $1 billion, and 0.50% on assets over $1 billion, effective March 1, 2018.
Class Y Shares: Effective November 20, 2017, each Fund is authorized and currently offers Class Y shares.
Fund Liquidations: Subject to Board approval, Management expects to liquidate the Carillon Eagle Investment Grade Bond Fund and the Carillon Reams Low Duration Bond Fund on or about February 28, 2018 (“Liquidation Date”). On the Liquidation Date, each Fund will cease its investment operations, liquidate its assets and make a liquidating distribution to shareholders of record. In connection with the liquidation, each Fund may depart from its stated investment objectives and strategies as it begins to convert all portfolio securities to cash or cash equivalents in preparation for a final distribution to shareholders.
Expense Cap Reduction: Effective January 1, 2018, Carillon Tower has contractually agreed to waive its investment advisory fee and/or reimburse certain expenses of the Carillon ClariVest Capital Appreciation Fund (formerly, the Eagle Capital Appreciation Fund) to the extent that: annual operating expenses of each class exceed a percentage of that class’ average daily net assets through February 28, 2019 as follows: Class A—1.00%, Class C—1.75%, Class I—0.70%, Class Y—1.00%, Class R-3—1.25%, Class R-5—0.70%, and Class R-6—0.60%. This expense limitation excludes interest, taxes, brokerage commissions, costs relating to investments in other investment companies (acquired fund fees and expenses), dividends, and extraordinary expenses. The contractual fee waiver can be changed only with the approval of a majority of the Fund’s Board of Trustees. Any reimbursement of fund expenses or reduction in Carillon Tower’s investment advisory fees is subject to reimbursement by the Fund within the following two fiscal years, if overall expenses fall below the lesser of its then current expense cap or the expense cap in effect at the time of the fee reimbursement.
The Manager has evaluated subsequent events through December 20, 2017, the date these financial statements were issued, and determined that no other material events or transactions would require recognition or disclosure in the Funds’ financial statements.
NOTE 8 | Regulatory Changes and Accounting Pronouncements | In October 2016, the Securities and Exchange Commission (“SEC”) adopted its Final Rules on Investment Company Reporting Modernization (the “Rules”). The Rules introduce new regulatory reporting forms for investment companies: Form N-PORT and Form N-CEN. The compliance date for Form N-PORT and Form N-CEN is June 1, 2018, except that mutual fund families with assets of $1 billion or more, such as the Carillon Mutual Funds, need not begin filing form N-PORT with the SEC until April 30, 2019 and the dates on which a Fund must first comply with the rules are based on its reporting period-end date.
In March 2017, the Financial Accounting Standards Board issued Accounting Standards Update “Premium Amortization on Purchase Callable Debt Securities,” which amends the amortization period for certain purchased callable debt securities. Under the new guidance, premium amortization of purchased callable debt securities that have explicit, non-contingent call features and are callable at fixed prices will be amortized to the earliest call date. The guidance will be applied on a modified retrospective basis and is effective for fiscal years, and their interim periods, beginning after December 15, 2018. Management is currently evaluating the impact of this guidance to the Funds.
| 48 |

Report of Independent Registered Certified Public Accounting Firm
To the Board of Trustees of Eagle Family of Funds and Shareholders of Eagle Capital Appreciation Fund, Eagle Growth & Income Fund, Eagle International Stock Fund, Eagle Investment Grade Bond Fund, Eagle Mid Cap Growth Fund, Eagle Mid Cap Stock Fund, Eagle Small Cap Growth Fund, Eagle Smaller Company Fund, and Eagle Tactical Allocation Fund
In our opinion, the accompanying statements of assets and liabilities, including the investment portfolios, and the related statements of operations and of changes in net assets and the financial highlights present fairly, in all material respects, the financial position of Eagle Capital Appreciation Fund, Eagle Growth & Income Fund, Eagle International Stock Fund, Eagle Investment Grade Bond Fund, Eagle Mid Cap Growth Fund, Eagle Mid Cap Stock Fund, Eagle Small Cap Growth Fund, Eagle Smaller Company Fund, and Eagle Tactical Allocation Fund (constituting the Eagle Family of Funds, hereafter collectively referred to as the “Funds”) as of October 31, 2017, and the results of each of their operations, the changes in each of their net assets and the financial highlights for each of the periods indicated therein, in conformity with accounting principles generally accepted in the United States of America. These financial statements and financial highlights (hereafter referred to as “financial statements”) are the responsibility of the Funds’ management. Our responsibility is to express an opinion on these financial statements based on our audits. We conducted our audits of these financial statements in accordance with the standards of the Public Company Accounting Oversight Board (United States). Those standards require that we plan and perform the audits to obtain reasonable assurance about whether the financial statements are free of material misstatement. An audit includes examining, on a test basis, evidence supporting the amounts and disclosures in the financial statements, assessing the accounting principles used and significant estimates made by management, and evaluating the overall financial statement presentation. We believe that our audits, which included confirmation of securities as of October 31, 2017 by correspondence with the custodian, brokers and the application of alternative auditing procedures where securities purchased had not been received, provide a reasonable basis for our opinions.

Tampa, Florida
December 20, 2017
PricewaterhouseCoopers LLP, 4040 West Boy Scout Blvd., Suite 1000, Tampa, FL 33607
T: (813)229-0221, F: (813)229-3646, www.pwc.com/us
| 49 |
Understanding Your Ongoing Costs
| (UNAUDITED) | 10.31.2017 |
As a shareholder of a Fund, you incur two types of costs: (1) transaction costs, including sales charges on purchases, contingent deferred sales charges, or redemption fees; and (2) ongoing costs, including investment advisory fees, distribution (12b-1) fees, and other fund expenses. The following sections are intended to help you understand your ongoing costs (in dollars) of investing in each Fund and to compare these costs with the ongoing costs of investing in other mutual funds. Please note that the expenses shown in the table are meant to highlight your ongoing costs only and do not reflect one-time transaction expenses, such as sales charges or redemption fees. Therefore, if these transactional costs were included, your costs would have been higher. For more information, see your Fund’s prospectus or contact your financial advisor.
Actual expenses | The table below shows the actual expenses you would have paid on a $1,000 investment made in each Fund on May 1, 2017 and held through October 31, 2017. It also shows how much a $1,000 investment would be worth at the close of the period, assuming actual returns after
ongoing expenses. This table is useful in comparing ongoing costs only, and will not help you determine the relative total costs of owning different funds. Simply divide your account value by $1,000 (for example, an $8,600 account value divided by $1,000 = 8.6), then multiply the result by the number in the line under the heading entitled “Expenses paid during the period” to estimate the expenses you paid on your account during this period.
Hypothetical example for comparison purposes | The table below shows each Fund’s expenses based on a $1,000 investment held from May 1, 2017 through October 31, 2017 and assuming for this period a hypothetical 5% annualized rate of return before ongoing expenses, which is not the Fund’s actual return. Please note that you should not use this information to estimate your actual ending account balance and expenses paid during the period. You can use this information to compare the ongoing expenses (but not transaction expenses or total costs) of investing in the Funds with those of other funds. All mutual fund shareholder reports will provide this information to help you make this comparison.
| Actual expenses | Hypothetical expenses | |||||||||||||||||||||||
| Beginning Account Value | Ending Account Value | Expenses paid during period (a) | Ending Account Value | Expenses paid during period (a) | Annualized expense ratio | |||||||||||||||||||
| Capital Appreciation Fund | ||||||||||||||||||||||||
Class A | $1,000.00 | $1,142.80 | $6.41 | $1,019.22 | $6.04 | 1.19 | % | |||||||||||||||||
Class C | 1,000.00 | 1,138.50 | 10.59 | 1,015.30 | 9.98 | 1.96 | ||||||||||||||||||
Class I | 1,000.00 | 1,144.60 | 4.71 | 1,020.81 | 4.44 | 0.87 | ||||||||||||||||||
Class R-3 | 1,000.00 | 1,141.00 | 8.09 | 1,017.64 | 7.63 | 1.50 | ||||||||||||||||||
Class R-5 | 1,000.00 | 1,144.90 | 4.70 | 1,020.82 | 4.43 | 0.87 | ||||||||||||||||||
Class R-6 | 1,000.00 | 1,144.80 | 4.44 | 1,021.06 | 4.19 | 0.82 | ||||||||||||||||||
| Growth & Income Fund | ||||||||||||||||||||||||
Class A | 1,000.00 | 1,066.30 | 5.35 | 1,020.03 | 5.23 | 1.03 | ||||||||||||||||||
Class C | 1,000.00 | 1,061.90 | 9.28 | 1,016.20 | 9.08 | 1.79 | ||||||||||||||||||
Class I | 1,000.00 | 1,067.50 | 3.87 | 1,021.46 | 3.78 | 0.74 | ||||||||||||||||||
Class R-3 | 1,000.00 | 1,064.10 | 7.09 | 1,018.34 | 6.93 | 1.36 | ||||||||||||||||||
Class R-5 | 1,000.00 | 1,066.80 | 4.13 | 1,021.21 | 4.04 | 0.79 | ||||||||||||||||||
Class R-6 | 1,000.00 | 1,068.20 | 3.38 | 1,021.94 | 3.30 | 0.65 | ||||||||||||||||||
| International Stock Fund | ||||||||||||||||||||||||
Class A | 1,000.00 | 1,138.10 | 7.81 | 1,017.90 | 7.37 | 1.45 | ||||||||||||||||||
Class C | 1,000.00 | 1,133.70 | 11.83 | 1,014.12 | 11.17 | 2.20 | ||||||||||||||||||
Class I | 1,000.00 | 1,139.50 | 6.20 | 1,019.41 | 5.85 | 1.15 | ||||||||||||||||||
Class R-3 | 1,000.00 | 1,136.10 | 9.15 | 1,016.64 | 8.64 | 1.70 | ||||||||||||||||||
Class R-5 | 1,000.00 | 1,139.60 | 6.21 | 1,019.40 | 5.86 | 1.15 | ||||||||||||||||||
Class R-6 | 1,000.00 | 1,140.50 | 5.67 | 1,019.91 | 5.35 | 1.05 | ||||||||||||||||||
| Investment Grade Bond Fund | ||||||||||||||||||||||||
Class A | 1,000.00 | 1,007.10 | 3.69 | 1,021.53 | 3.72 | 0.73 | ||||||||||||||||||
Class C | 1,000.00 | 1,003.30 | 7.47 | 1,017.74 | 7.53 | 1.48 | ||||||||||||||||||
Class I | 1,000.00 | 1,008.70 | 2.18 | 1,023.04 | 2.19 | 0.43 | ||||||||||||||||||
Class R-3 | 1,000.00 | 1,005.80 | 4.95 | 1,020.27 | 4.99 | 0.98 | ||||||||||||||||||
Class R-5 | 1,000.00 | 1,008.10 | 2.18 | 1,023.04 | 2.19 | 0.43 | ||||||||||||||||||
Class R-6 | 1,000.00 | 1,009.20 | 1.67 | 1,023.54 | 1.68 | 0.33 | ||||||||||||||||||
| Mid Cap Growth Fund | ||||||||||||||||||||||||
Class A | 1,000.00 | 1,140.30 | 5.97 | 1,019.63 | 5.63 | 1.11 | ||||||||||||||||||
Class C | 1,000.00 | 1,136.10 | 9.83 | 1,016.00 | 9.28 | 1.83 | ||||||||||||||||||
Class I | 1,000.00 | 1,142.20 | 4.14 | 1,021.34 | 3.91 | 0.77 | ||||||||||||||||||
Class R-3 | 1,000.00 | 1,138.80 | 7.42 | 1,018.27 | 7.00 | 1.38 | ||||||||||||||||||
Class R-5 | 1,000.00 | 1,142.10 | 4.24 | 1,021.25 | 4.00 | 0.78 | ||||||||||||||||||
Class R-6 | 1,000.00 | 1,142.60 | 3.71 | 1,021.74 | 3.50 | 0.69 | ||||||||||||||||||
(a) Expenses are calculated using each Fund’s annualized expense ratios for each class of shares, multiplied by the average account value for the period, then multiplying the result by the actual number of days in the period (184), and then dividing that result by the actual number of days in the fiscal year (365).
| 50 |
Understanding Your Ongoing Costs
| (UNAUDITED) | 10.31.2017 |
| 51 |
| Actual expenses | Hypothetical expenses | |||||||||||||||||||||||
| Beginning Account Value | Ending Account Value | Expenses paid during period (a) | Ending Account Value | Expenses paid during period (a) | Annualized expense ratio | |||||||||||||||||||
| Mid Cap Stock Fund | ||||||||||||||||||||||||
Class A | $1,000.00 | $1,088.50 | $6.58 | $1,018.90 | $6.36 | 1.25 | % | |||||||||||||||||
Class C | 1,000.00 | 1,084.00 | 10.51 | 1,015.12 | 10.16 | 2.00 | ||||||||||||||||||
Class I | 1,000.00 | 1,090.00 | 5.00 | 1,020.42 | 4.84 | 0.95 | ||||||||||||||||||
Class R-3 | 1,000.00 | 1,086.60 | 7.89 | 1,017.64 | 7.63 | 1.50 | ||||||||||||||||||
Class R-5 | 1,000.00 | 1,089.80 | 5.00 | 1,020.42 | 4.84 | 0.95 | ||||||||||||||||||
Class R-6 | 1,000.00 | 1,090.50 | 4.48 | 1,020.92 | 4.33 | 0.85 | ||||||||||||||||||
| Small Cap Growth Fund | ||||||||||||||||||||||||
Class A | 1,000.00 | 1,065.10 | 5.88 | 1,019.51 | 5.75 | 1.13 | ||||||||||||||||||
Class C | 1,000.00 | 1,061.70 | 9.44 | 1,016.05 | 9.23 | 1.82 | ||||||||||||||||||
Class I | 1,000.00 | 1,067.30 | 3.94 | 1,021.40 | 3.85 | 0.76 | ||||||||||||||||||
Class R-3 | 1,000.00 | 1,063.60 | 7.42 | 1,018.02 | 7.25 | 1.43 | ||||||||||||||||||
Class R-5 | 1,000.00 | 1,067.20 | 4.01 | 1,021.32 | 3.92 | 0.77 | ||||||||||||||||||
Class R-6 | 1,000.00 | 1,067.90 | 3.45 | 1,021.87 | 3.37 | 0.66 | ||||||||||||||||||
| Smaller Company Fund | ||||||||||||||||||||||||
Class A | 1,000.00 | 1,091.30 | 6.59 | 1,018.90 | 6.36 | 1.25 | ||||||||||||||||||
Class C | 1,000.00 | 1,086.70 | 10.52 | 1,015.12 | 10.16 | 2.00 | ||||||||||||||||||
Class I | 1,000.00 | 1,092.40 | 5.01 | 1,020.42 | 4.84 | 0.95 | ||||||||||||||||||
Class R-3 | 1,000.00 | 1,090.20 | 7.90 | 1,017.64 | 7.63 | 1.50 | ||||||||||||||||||
Class R-5 | 1,000.00 | 1,092.90 | 5.01 | 1,020.42 | 4.84 | 0.95 | ||||||||||||||||||
Class R-6 | 1,000.00 | 1,093.10 | 4.48 | 1,020.92 | 4.33 | 0.85 | ||||||||||||||||||
| Tactical Allocation Fund | ||||||||||||||||||||||||
Class A | 1,000.00 | 1,068.60 | 6.10 | 1,019.31 | 5.95 | 1.17 | ||||||||||||||||||
Class C | 1,000.00 | 1,064.40 | 9.99 | 1,015.53 | 9.75 | 1.92 | ||||||||||||||||||
Class I | 1,000.00 | 1,070.50 | 4.54 | 1,020.82 | 4.43 | 0.87 | ||||||||||||||||||
Class R-3 | 1,000.00 | 1,067.20 | 7.40 | 1,018.05 | 7.22 | 1.42 | ||||||||||||||||||
Class R-5 | 1,000.00 | 1,069.80 | 4.54 | 1,020.82 | 4.43 | 0.87 | ||||||||||||||||||
Class R-6 | 1,000.00 | 1,071.10 | 4.01 | 1,021.33 | 3.92 | 0.77 | ||||||||||||||||||
(a) Expenses are calculated using each Fund’s annualized expense ratios for each class of shares, multiplied by the average account value for the period, then multiplying the result by the actual number of days in the period (184), and then dividing that result by the actual number of days in the fiscal year (365).
Approval/Renewal of Investment Advisory and Subadvisory Agreements
| (UNAUDITED) | ||
Overview | At a meeting held on May 12, 2017, the Boards of Trustees for the Eagle Capital Appreciation Fund, Eagle Growth & Income Fund and Eagle Series Trust, including their independent members (together, the “Board”), approved new investment advisory agreements between Carillon Tower Advisers, Inc. (“Carillon”) and: (1) Eagle Capital Appreciation Fund; (2) Eagle Growth & Income Fund; and (3) Eagle Series Trust, on behalf of the Eagle International Stock Fund, Eagle Investment Grade Bond Fund, Eagle Mid Cap Growth Fund, Eagle Mid Cap Stock Fund, Eagle Small Cap Growth Fund, Eagle Smaller Company Fund and Eagle Tactical Allocation Fund. Each of the funds mentioned is referred to as a “Fund” and, collectively, as the “Funds.”
The Board also approved new investment subadvisory agreements between Carillon and each of: (1) Eagle Asset Management, Inc., with respect to the Eagle Growth & Income Fund, Eagle Investment Grade Bond Fund, Eagle Mid Cap Growth Fund, Eagle Mid Cap Stock Fund, Eagle Small Cap Growth Fund and Eagle Smaller Company Fund; (2) ClariVest Asset Management LLC (“ClariVest”), with respect to the Eagle Capital Appreciation Fund and the Eagle International Stock Fund; and (3) Cougar Global Investments Ltd. (“Cougar”), with respect to the Eagle Tactical Allocation Fund. Each of the investment advisory and subadvisory agreements is referred to herein as an “Agreement” and, collectively, as the “Agreements.”
In connection with the Board’s review of the Agreements, the Board considered that, effective June 1, 2017, Eagle will, as part of an internal corporate reorganization (the “Restructuring”), terminate the investment advisory agreement that it has entered into with the Funds (the “Prior Agreement”), and Eagle’s affiliate, Carillon, will enter into a new investment advisory agreement with the Funds pursuant to which Carillon will serve as the investment adviser for each Fund. The Board also considered that, effective June 1, 2017, Eagle will terminate the investment subadvisory agreements that it has entered into with ClariVest, with respect to the Eagle Capital Appreciation Fund and Eagle International Stock Fund, and Cougar, with respect to the Eagle Tactical Allocation Fund. The Board considered that, in connection with the Reorganization: (1) the investment professionals of Eagle who currently provide services to the Funds under the Prior Agreement will continue to provide the same services under the Agreement; (2) the investment processes with respect to each Fund, the level of services provided, and the fees the Funds will pay under the Agreements will not differ from the Prior Agreement; and (3) the investment professionals of, and services provided by, ClariVest, with respect to the Eagle Capital Appreciation Fund and Eagle International Stock Fund, and Cougar, with respect to the Eagle Tactical Allocation Fund, will remain unchanged.
The Board determined that it did not need to consider certain factors that it typically considers during its review of the Funds’ investment advisory and subadvisory agreements because, at a meeting held on August 18, 2016, when the Board approved the renewal of the prior investment advisory and subadvisory agreements with Eagle and ClariVest, respectively, and on August 15, 2015, when the Board initially approved of the prior investment subadvisory agreement with Cougar, the Board had reviewed, among other matters, information regarding: (1) the nature and extent of the advisory and other services provided or to be provided by Eagle, ClariVest and Cougar; (2) the personnel of Eagle, ClariVest and Cougar; (3) the financial condition of Eagle, ClariVest and Cougar; (4) the compliance programs of Eagle, ClariVest and Cougar; (5) the performance of Eagle, ClariVest and Cougar; (6) the Funds’ expenses or proposed expenses, including the advisory fee rates, the overall expense structures of the Funds, both in absolute terms and relative to funds within a refined Morningstar Category population, and any applicable contractual expense limitations; (7) the anticipated effect of growth and size on the Funds’ performance and expenses, where applicable; (8) benefits to be realized by Eagle, ClariVest, Cougar and their respective affiliates; and (9) the estimated profitability of Eagle and ClariVest under the Agreements, if available.
Based on the various considerations described above, the Board, including a majority of Trustees who are not “interested persons” of the Funds, Carillon,
Eagle, Cougar or ClariVest, as that term is defined in the 1940 Act, determined in its business judgment to approve the Agreements.
At a meeting held on May 12, 2017, the Board of Trustees for the Carillon Series Trust, including its independent members (the “Board”), approved an investment advisory agreement between Carillon Tower Advisers, Inc. (“Carillon”) and Carillon ClariVest Capital Appreciation Fund, Carillon Eagle Growth & Income Fund, Carillon ClariVest International Stock Fund, Carillon Eagle Investment Grade Bond Fund, Carillon Eagle Mid Cap Stock Fund, Carillon Eagle Mid Cap Growth Fund, Carillon Eagle Small Cap Growth Fund, Carillon Eagle Smaller Company Fund and Carillon Cougar Tactical Allocation Fund. Each of the funds mentioned is referred to as a “Fund” and, collectively, as the “Funds.”
The Board also approved investment subadvisory agreements between Carillon and each of: (1) Eagle Asset Management, Inc. (“Eagle”), with respect to the Carillon Eagle Growth & Income Fund, Carillon Eagle Investment Grade Bond Fund, Carillon Eagle Mid Cap Stock Fund, Carillon Eagle Mid Cap Growth Fund, Carillon Eagle Small Cap Growth Fund, Carillon Eagle Smaller Company Fund; (2) ClariVest Asset Management LLC (“ClariVest”), with respect to the Carillon ClariVest Capital Appreciation Fund and Carillon ClariVest International Stock Fund; and (3) Cougar Global Investments Ltd. (“Cougar”), with respect to the Carillon Cougar Tactical Allocation Fund. Each of the investment advisory and subadvisory agreements is referred to herein as an “Agreement” and, collectively, as the “Agreements.”
In connection with the approval of the Agreements, the Board noted that effective upon the approval of shareholders of Eagle Capital Appreciation Fund, Eagle Growth & Income Fund and the separate series of Eagle Series Trust (collectively, the “Existing Funds”), each Fund would acquire all of the assets and liabilities of a corresponding Existing Fund in a fund reorganization. The Board noted that the purpose of the reorganizations was to redomicile the Existing Funds from Massachusetts to Delaware. With respect to the Agreements, the Board considered that: (1) the investment professionals of Eagle who currently provide services to the Existing Funds will provide the same services to the Funds under the Agreement; (2) the investment processes with respect to each Fund, the level of services provided, and the fees the Funds will pay under the Agreements will not differ from the agreements with respect to the Existing Funds; and (3) the investment professionals of, and services provided by, ClariVest, with respect to the Carillon ClariVest Capital Appreciation Fund and Carillon ClariVest International Stock Fund, and Cougar, with respect to the Carillon Cougar Tactical Allocation Fund, will be the same as the investment professionals of, and services provided by, ClariVest and Cougar with respect to the applicable Existing Funds.
The Board considered that the Agreements were the same as the existing investment advisory and subadvisory agreements for the Existing Funds, with the exception of the names and the parties. The Board determined that it did not need to consider certain factors that it typically considers during its approval of investment advisory and subadvisory agreements because, at a meeting held on August 18, 2016, when the Board approved the renewal of the investment advisory and subadvisory agreements with Eagle and ClariVest, respectively, on behalf of the applicable Existing Funds, and on August 15, 2015, when the Board initially approved of the investment subadvisory agreement with Cougar, on behalf of the Eagle Tactical Allocation Fund, the Board had reviewed, among other matters, information regarding: (1) the nature and extent of the advisory and other services provided or to be provided by Eagle, ClariVest and Cougar; (2) the personnel of Eagle, ClariVest and Cougar; (3) the financial condition of Eagle, ClariVest and Cougar; (4) the compliance programs of Eagle, ClariVest and Cougar; (5) the performance of Eagle, ClariVest and Cougar; (6) the Funds’ expenses or proposed expenses, including the advisory fee rates, the overall expense structures of the Funds, both in absolute terms and relative to funds within a refined Morningstar Category population, and any applicable contractual expense limitations; (7) the anticipated effect of growth and size on the Funds’ performance and expenses,
| 52 |
Approval/Renewal of Investment Advisory and Subadvisory Agreements
| (UNAUDITED) | ||||
where applicable; (8) benefits to be realized by Eagle, ClariVest, Cougar and their respective affiliates; and (9) the estimated profitability of Eagle and ClariVest under the Agreements, if available.
Based on the various considerations described above, the Board, including a majority of Trustees who are not “interested persons” of the Funds, Carillon, Eagle, Cougar or ClariVest, as that term is defined in the 1940 Act, determined in its business judgment to approve the Agreements.
Overview | At a meeting held on June 12, 2017, the Board of Trustees for the Eagle Series Trust and the Carillon Series Trust (collectively, the “Trust”), including their independent members (together, the “Board”), approved an investment advisory agreement between Carillon Tower Advisers, Inc. (“Carillon”) and the Trust, on behalf of seven new series of the Trust (“Advisory Agreement”): Carillon Reams Core Bond Fund, the Carillon Reams Core Plus Bond Fund, the Carillon Scout International Fund, the Carillon Reams Low Duration Bond Fund, the Carillon Scout Mid Cap Fund, the Carillon Scout Small Cap Fund and the Carillon Reams Unconstrained Bond Fund (each, a “Fund” and collectively, the “Funds”).
The Board also approved an investment subadvisory agreement with Scout Investments, Inc. (“Scout”) to serve as the subadviser to each Fund (“Subadvisory Agreement”). The Advisory Agreement and Subadvisory Agreement are collectively referred to herein as the “Agreements.”
As part of the approval process, the Board, with the assistance of independent legal counsel, requested and received reports containing substantial and detailed information regarding the Funds, Carillon and Scout. Among other matters, these reports included information regarding Carillon’s and Scout’s investment philosophy, investment strategies, personnel and operations and compliance processes. The Board also considered information that had been provided to the Board by Eagle Asset Management, Inc. (“Eagle”) in connection with the Board’s considerations at the meeting of the renewal of the Investment Advisory Agreement between Eagle and Eagle Capital Appreciation Fund, Eagle Growth & Income Fund and Eagle Series Trust (“EST”), on behalf of the series of EST (collectively, the “Existing Funds”).
In approving the Agreements, the Board also reviewed information provided by Carillon and Scout regarding: (1) the advisory services proposed to be provided by Carillon and sub-advisory services proposed to be provided by Scout; (2) the professional personnel who are proposed to be assigned primary responsibility for managing the Funds; (3) the financial condition of Scout; (4) the proposed advisory and subadvisory fee rates and each Fund’s projected expense structure, both in absolute terms and relative to funds within a refined Morningstar Category population (“Morningstar Population”) and peer funds (“Peer Group”), and proposed contractual expense limitations; (5) the performance of mutual funds managed by Scout (each, a “Scout Fund”) and, as applicable, Carillon, and other accounts managed by Scout in the strategy of each Fund, net of fees (each, a “Composite”) as compared to funds within the applicable Morningstar category (“Morningstar Category”), Lipper, Inc. category (“Lipper Category”) and a benchmark index; (6) the anticipated effect of growth and size on the Funds’ expenses; (7) Scout’s compliance program and any material compliance matters, as well as its trading activities; (8) benefits to be realized by Carillon and Scout and their affiliates; (9) the estimated profitability of Carillon and Scout under the Agreements; (10) the potential purchase of Scout by Carillon; (11) the proposed reorganizations of certain Scout Funds into the Funds (each, a “Reorganizations”); and (12) any other information the Carillon and Scout believed would be material to the Board’s consideration of the Agreements.
The Board did not identify any particular information that was most relevant to its consideration of the Agreements, and each Trustee may have afforded different weight to the various factors. The Trustees posed questions to various management personnel of Carillon regarding certain key aspects of the materials submitted in support of the approval. Legal counsel to the independent Trustees provided the Board with a memorandum regarding its
responsibilities pertaining to the approval of the Agreements. The memorandum explained the regulatory requirements surrounding the Trustees’ process for evaluating investment advisors and the terms of investment advisory contracts. Based on its evaluation, the Board unanimously concluded that the terms of the Agreements were reasonable and fair and that the approval of the Agreements was in the best interests of each Fund.
Provided below is an overview of the primary factors the Board considered at its June 12 meeting at which the Board considered the approval of the Agreements. In determining whether to approve the Agreements, the Board considered, among other things, the following factors: (1) the nature, extent and quality of services to be provided to the Funds; (2) the investment performance of the Composites and Scout Funds; (3) the estimated costs to be incurred by Carillon, Scout and their affiliates and the resulting profits or losses; (4) the extent to which economies of scale, if any, have been taken into account in setting the fee schedule; (5) whether the level of fees reflects economies of scale, if any, for the benefit of the Funds’ investors; (6) comparisons of services and fees with contracts entered into by Carillon and Scout with the Existing Funds and other clients (such as pension funds and other institutional investors); and (7) any other benefits derived by Carillon or Scout from their relationships with the Funds.
Nature, Extent and Quality of Services | The Board considered information regarding the services to be provided by Carillon and the background and experience of the Carillon personnel who would be responsible for overseeing the Funds. The Board also considered Carillon’s representation that the advisory and related services proposed to be provided to the Funds will be consistent with the services provided to the Existing Funds. The Board considered that Carillon would monitor the subadvisory services provided by Scout and sub-administration, transfer agency, fund accounting and custody services provided by U.S. Bancorp Fund Services, LLC and its affiliates, and reviewed Carillon’s description of its oversight programs. The Board also considered that Carillon would be responsible for overseeing compliance with the Funds’ investment objectives and policies, reviewing brokerage matters, overseeing the Funds’ compliance with applicable law and implementing Board directives as they relate to the Funds. Additionally, the Board noted that Carillon and its affiliates, Carillon Fund Distributors, Inc. (“CFD”) and Carillon Fund Services, Inc. (“CFS”), would provide certain administration, distribution and shareholder services to the Funds.
The Board considered that Carillon had reached a definitive agreement with UMB Financial Corp., Scout’s parent company, whereby Scout would be acquired by Carillon (the “Transaction”). The Board reviewed information regarding Scout’s principal business activities, its financial condition and overall capabilities to perform the services under the Subadvisory Agreement. The Board noted that Scout would be placing all orders for the purchase and sale of the Funds’ securities with brokers or dealers. In addition, the Board considered the background and experience of the personnel who will be assigned responsibility for managing the Funds. The Board also considered Scout’s infrastructure and the adequacy of its compliance program. In addition, the Board took into consideration Carillon’s recommendation of Scout. The Board considered Scout’s representation that its financial condition is adequate to provide high quality advisory services to the Funds and that its current staffing levels were adequate to service the Funds. The Board also considered the potential changes to Scout that may occur following the Transaction. Based on this information, the Board concluded that the nature, extent and quality of the advisory services to be provided by Scout were appropriate for each Fund in light of its investment objective, and, thus, supported a decision to approve the Subadvisory Agreement.
Investment Performance | The Board noted that the Funds are new and, therefore, had no historical performance for the Board to review. However, as each Fund would be adopting the historical performance of a corresponding Scout Fund, in connection with their consideration of the Subadvisory Agreement, the Board considered comparisons of the performance of each Composite and Scout Fund for the year-to-date, one-year, three-year and
| 53 |
Approval/Renewal of Investment Advisory and Subadvisory Agreements
| (UNAUDITED) | ||
five-year periods ended April 30, 2017, relative to the performance of the relevant Morningstar Category, Lipper Category and benchmark index. In this connection, the Board also noted that they had previously approved the Reorganizations. Additionally, the Board considered the performance of Existing Funds managed by Carillon in a similar style as the Funds but noted that Scout would be responsible for the day-to-day management of the Funds rather than Carillon.
With respect to the strategy pursuant to which Scout would manage the Carillon Reams Core Bond Fund, the Board noted that the Composite and the Scout Fund underperformed the Bloomberg Barclays U.S. Aggregate Bond Total Return Index (the “U.S. Aggregate Index”), the Morningstar Category and the Lipper Category for the year-to-date, one-, three- and five-year periods. The Board considered Scout’s representation that the underperformance of the Scout Fund was primarily attributable to Scout’s defensive positioning and duration positioning. The Board also considered Scout’s representation that the Scout Fund outperformed the U.S. Aggregate Index and a subset of peer funds within the Morningstar Category for the ten-year period.
With respect to the strategy pursuant to which Scout would manage the Carillon Reams Core Plus Bond Fund, the Board noted that the Composite outperformed the U.S. Aggregate Index for the year-to-date, one- and five-year periods and underperformed the U.S. Aggregate Index for the three-year period. The Board also noted that the Composite outperformed the Morningstar Category for the three- and five-year periods and underperformed the Morningstar Category for year-to-date and one-year periods. Additionally, the Board noted that the Composite underperformed the Lipper Category for the year-to-date and one-, three- and five-year periods. The Board also noted that the Scout Fund outperformed the U.S. Aggregate Index for the year-to-date and five-year periods and underperformed the U.S. Aggregate Index for the one- and three-year periods; outperformed the Morningstar Category for the five-year period and underperformed the Morningstar Category for the year-to-date and one- and three-year periods; and underperformed the Lipper Category for the year-to-date and one-, three- and five-year periods. The Board considered Scout’s representation that the underperformance of the Scout Fund was primarily attributable to Scout’s defensive positioning and duration positioning. The Board also considered Scout’s representation that the Scout Fund outperformed the U.S. Aggregate Index and a subset of peer funds within the Morningstar Category for the ten-year period.
With respect to the strategy pursuant to which Scout would manage the Carillon Scout International Fund, the Board noted that the Scout Fund and one Composite outperformed the MSCI EAFE Index, the Morningstar Category and the Lipper Category for the one- and three-year periods and underperformed the MSCI EAFE Index, the Morningstar Category and the Lipper Category for the year-to-date and five-year periods. The Board also noted that the other Composite outperformed the MSCI EAFE Index for the one- and three-year periods; underperformed the MSCI EAFE Index for the year-to-date and five-year periods; outperformed the Morningstar Category for the three-year period; underperformed the Morningstar Category for the year-to-date and one- and five-year periods; outperformed the Lipper Category for the one-, three-, and five-year periods; and underperformed the Lipper Category for the year-to-date period. The Board also considered the performance of the Existing Fund managed in the same style by Carillon. The Board considered Scout’s representation that the underperformance of the Scout Fund for the five-year period was primarily attributable to stock selection and the Scout Fund’s allocation to emerging markets.
With respect to the strategy pursuant to which Scout would manage the Carillon Reams Low Duration Bond Fund, the Board noted that the Composite outperformed the Bloomberg Barclays 1-3 Year U.S. Government/Credit Index (the “U.S. Government Index”) for the year-to-date, one- and three-year periods; outperformed the Morningstar Category for the three-year period; underperformed the Morningstar Category for the year-to-date and one-year periods; and underperformed the Lipper Category for the year-to-date, one-
and three-year periods. The Board also noted that the Scout Fund outperformed the U.S. Government Index for the one- and three-year periods; underperformed the U.S. Government Index for the year-to-date period; outperformed the Morningstar Category for the three-year period; underperformed the Morningstar Category for the year-to-date and one-year periods; and underperformed the Lipper Category for the year-to-date, one- and three-year periods. Additionally, the Board considered the performance of the Existing Fund managed in the same style by Carillon.
With respect to the strategy pursuant to which Scout would manage the Carillon Scout Mid Cap Fund, the Board noted that the Composite and each Scout Fund outperformed the Morningstar Category and the Lipper Category for the year-to-date and one-, three- and five-year periods; outperformed the Russell Midcap Index for the year-to-date, one- and three-year periods; and underperformed the Russell Midcap Index for the five-year period. The Board also considered the performance of the Existing Fund managed in the same style by Carillon. The Board considered Scout’s representation that, among other things, the underperformance of the Scout Funds for the five-year period was attributable to stock selection in the energy, healthcare and financial sectors.
With respect to the strategy pursuant to which Scout would manage the Carillon Scout Small Cap Fund, the Board noted that the Composite and the Scout Fund outperformed the Russell 2000 Growth Index, the Morningstar Category and the Lipper Category for the year-to-date, one-, three- and five-year periods. Additionally, the Board considered the performance of the Existing Funds managed in the same style by Carillon.
With respect to the strategy pursuant to which Scout would manage the Carillon Reams Unconstrained Bond Fund, the Board noted that the Composite and one of the Scout Funds outperformed the BofA Merrill Lynch 3-Month LIBOR Constant Maturity Index (the “BofA Index”) for the year-to-date and the one-, three- and five-year periods; outperformed the Morningstar Category and the Lipper Category for the five-year period; and underperformed the Morningstar Category and the Lipper Category for the year-to-date and the one- and three-year periods. The Board also noted that the other Scout Fund outperformed the BofA Index for the year-to-date and the one-year periods; underperformed the BofA Index for the three-year period; and underperformed the Morningstar Category and the Lipper Category for the year-to-date, one- and three-year periods. The Board considered Scout’s representation that, among other things, the underperformance of the Scout Funds relative to the Morningstar Category one- and three-year periods reflects the Scout Funds’ defensive positioning relative to their peers.
Fees and Expenses | The Board considered the proposed advisory fee rate payable by each Fund to Carillon under the Agreement, the proposed subadvisory fee rates payable to Scout, each Fund’s projected total expense ratio and its proposed Rule 12b-1 fees. The Board also considered comparisons of each Fund’s proposed advisory fee rate and projected expense ratio (including Rule 12b-1 fees) to the average expense ratio of its Morningstar Category and Peer Group within that Morningstar Category based on data ended February 28, 2017. To the extent applicable, the Board considered the proposed advisory fee rate relative to the advisory fee rates charged to the Existing Funds. The Board also considered that the proposed advisory fee rate for each Fund is the same as the advisory fee rate currently charged to the applicable Scout Fund. The Board considered that Carillon has agreed to contractually limit the expenses of each Fund for at least two years from the date of the Reorganizations at levels that are equal to the current expense caps, if any, for the applicable Scout Fund. In considering the proposed subadvisory fee rate to be paid by Carillon, the Board considered comparisons of the subadvisory fee rate to the average fee rate charged by Scout to the accounts within the applicable Composite, noting Carillon’s representation that variances in such rates are attributable to differences in the level of services provided.
| 54 |
Approval/Renewal of Investment Advisory and Subadvisory Agreements
| (UNAUDITED) | ||||
With respect to the Carillon Reams Core Bond Fund, the Board considered that the Fund’s proposed advisory fee rate and combined advisory and administrative fee rate were lower than the average advisory fee rate and combined advisory and administrative fee rate of the Morningstar Peer Group and equal to the average advisory fee rate and combined advisory and administrative fee rate of the Morningstar Population. The Board also considered that the Fund’s projected net expense ratio for Class I was lower than the average net expense ratios of its Morningstar Peer Group and Population. The Board noted that the proposed subadvisory fee rate was higher than the average fee rate charged by Scout to the accounts within the Composite. The Board also noted that Carillon does not manage any similar accounts in the strategy of a Fund.
With respect to the Carillon Reams Core Plus Bond Fund, the Board considered that the Fund’s proposed advisory fee rate and combined advisory and administrative fee rate were higher than the average advisory fee rate and combined advisory and administrative fee rate of the Morningstar Peer Group and equal to the average advisory fee rate and combined advisory and administrative fee rate of the Morningstar Population. The Board also considered that the Fund’s projected net expense ratio for Class I was lower than the average net expense ratios of its Morningstar Peer Group and Population. The Board noted that the proposed subadvisory fee rate was higher than the average fee rate charged by Scout to the accounts within the Composite. The Board also noted that Carillon does not manage any similar accounts in the strategy of a Fund.
With respect to the Carillon Scout International Fund, the Board considered that the Fund’s proposed advisory fee rate and combined advisory and administrative fee rate were lower than the average advisory fee rate and combined advisory and administrative fee rate of the Morningstar Peer Group and Population. The Board also considered that the Fund’s projected net expense ratio for Class I was higher than the average net expense ratio of its Morningstar Peer Group and lower than the average net expense ratio of its Morningstar Population. The Board noted that the proposed advisory fee rate was lower than the advisory fee rate charged by Carillon to the comparable Existing Fund. The Board also noted that the proposed subadvisory fee rate was higher than the average fee rate charged by Scout to the accounts within the Composites.
With respect to the Carillon Reams Low Duration Bond Fund, the Board considered that the Fund’s proposed advisory fee rate was lower than the average advisory fee rate of the Morningstar Peer Group and Population, but that the Fund’s proposed combined advisory and administrative fee rate was equal to the average combined advisory and administrative fee rate of the Morningstar Peer Group and higher than the average combined advisory and administrative fee rate of the Morningstar Population. The Board also considered that the Fund’s projected net expense ratio for Class I was lower than the average net expense ratio of its Morningstar Peer Group and Population. The Board noted that the proposed advisory fee rate was equal to the advisory fee rate charged by Carillon to the comparable Existing Fund. The Board also noted that the proposed subadvisory fee rate was lower than the average fee rate charged by Scout to the accounts within the Composite. Additionally, the Board noted that the proposed subadvisory fee is higher than the subadvisory fee charged by Scout to a mutual fund for which it serves as one of multiple subadvisers.
With respect to the Carillon Scout Mid Cap Fund, the Board considered that the Fund’s proposed advisory fee rate and combined advisory and administrative fee rate were higher than the average advisory fee rate and combined advisory and administrative fee rate of the Morningstar Peer Group and Population. The Board also considered that the Fund’s projected net expense ratio for Class I was higher than the average net expense ratio of its Morningstar Peer Group and lower than the average expense ratio of its Morningstar Population. The Board noted that the proposed advisory fee rate was higher than the advisory fee rate charged by Carillon to the comparable Existing Fund. The Board also
noted that the proposed subadvisory fee rate was equal to the average fee rate charged by Scout to the accounts within the Composite. Additionally, the Board noted that the proposed subadvisory fee is higher than the subadvisory fee charged by Scout to a mutual fund for which Scout serves as subadviser.
With respect to the Carillon Scout Small Cap Fund, the Board considered that the Fund’s proposed advisory fee rate and combined advisory and administrative fee rate were lower than the average advisory fee rate and combined advisory and administrative fee rate of the Morningstar Peer Group and Population. The Board also considered that the Fund’s projected net expense ratio for Class I was lower than the average net expense ratio of its Morningstar Peer Group and Population. The Board noted that the proposed advisory fee rate was higher than the advisory fee rate charged by Carillon to the comparable Existing Funds. The Board also noted that the proposed subadvisory fee rate was higher than the average fee rate charged by Scout to the accounts within the Composite.
With respect to the Carillon Reams Unconstrained Bond Fund, the Board considered that the Fund’s proposed advisory fee rate was lower than the average advisory fee rate of the Morningstar Peer Group and Population for Class I. The Board also considered that the Fund’s combined advisory and administrative fee rate was higher than the average combined advisory and administrative fee rate of the Morningstar Peer Group for Class I and lower than the average combined advisory and administrative fee rate of the Morningstar Population for Class I. The Board also considered that the Fund’s projected net expense ratio for Class I was lower than the average net expense ratio of its Morningstar Peer Group and Population. The Board noted that the proposed subadvisory fee rate was higher than the average fee rate charged by Scout to the accounts within the Composite and a mutual fund for which Scout serves as subadviser. The Board also noted that Carillon does not manage any similar accounts in the strategy of a Fund.
Costs, Profitability and Economies of Scale | In analyzing the cost of services and profitability of Carillon and Scout, the Board considered the estimated revenues to be earned and the expenses to be incurred by Carillon and Scout. The Board also considered that Carillon will pay to Scout a subadvisory fee equal to the entirety of the advisory fee to be paid by the Funds, but that Carillon will receive fees for providing administrative services to the Funds. Additionally, the Board noted that Carillon expects to earn a profit on certain Funds for the first two years and does not expect to earn a profit on other Funds for the first two years. The Board also noted that, during the first quarter of 2017, Scout earned a profit with respect to certain of the Scout Funds and did not earn a profit with respect to other of the Scout Funds.
The Board considered that, because Carillon would pay to Scout a subadvisory fee equal to the entirety of the advisory fee to be paid by the Funds, Carillon would not benefit economically from the proposed fee arrangement, other than as a result of Scout’s expected affiliation with Carillon following the Transaction. The Board noted Carillon’s representation that many of the Funds’ proposed advisory fee schedules include breakpoints that will result in overall lower advisory fees as Fund assets grow. The Board also noted Scout’s representation that economies of scale would be realized as assets in the Funds grow, but that the Scout does not believe that breakpoints are appropriate at the present time for Funds that have contractual expense limitations.
Benefits | In evaluating compensation, the Board considered other benefits that may be realized by Carillion, Scout and their affiliates from their relationship with the Funds. In this connection, the Board also considered Scout’s representation that it expects to receive soft dollar services from broker-dealers that it selects to execute trades on behalf of the Funds, including brokerage services, proprietary research and third-party research. The Board considered that Funds would compensate Carillon for providing administrative services and CFS for providing shareholder services. The Board recognized that, as the Funds’ principal underwriter and distributor, CFD would
| 55 |
Approval/Renewal of Investment Advisory and Subadvisory Agreements
| (UNAUDITED) | ||
receive Rule 12b-1 payments from the Funds to compensate it for providing services and distribution activities. These activities could lead to growth in the Funds’ assets and the corresponding benefits of that growth, including economies of scale and greater diversification. In addition, other affiliates of Carillon have entered into agreements with CFD to sell Fund shares and receive compensation from CFD. In this regard, the Board also considered that Scout also is expected to be an affiliate of Carillon following the Transaction.
Conclusions | Based on these considerations, the Board concluded with respect to the Funds that: (1) each Fund was reasonably likely to benefit from the nature, quality and extent of Carillon’s and Scout’s services, as applicable to the Funds; (2) the performance of the Composites, the Scout Funds and the Existing Funds, as applicable, was satisfactory in light of all the factors considered by the Board; (3) the fees payable under the Agreements and profits projected by Carillon and Scout were reasonable in the context of all the factors considered by the Board; and (4) the proposed advisory fee rate structure provides each Fund’s shareholders with reasonable benefits associated with economies of scale. Based on these conclusions and other factors, the Board determined in its business judgment to approve the Advisory Agreement between each Fund and Carillon, and the Subadvisory Agreement between Carillon and Scout.
Overview | At a meeting held on August 18, 2017, the Boards of Trustees for the Eagle Capital Appreciation Fund, Eagle Growth & Income Fund, Eagle Series Trust and Carillon Series Trust including their independent members (the “Independent Trustees”) (together, the “Board”), approved the renewal of the investment advisory agreement between Carillon Tower Advisers, Inc. (“Carillon Tower”) and: (1) Eagle Capital Appreciation Fund; (2) Eagle Growth & Income Fund; and (3) Carillon Series Trust/Eagle Series Trust, on behalf of the Eagle International Stock Fund, Eagle Investment Grade Bond Fund, Eagle Mid Cap Growth Fund, Eagle Mid Cap Stock Fund, Eagle Small Cap Growth Fund, Eagle Smaller Company Fund and Eagle Tactical Allocation Fund. Each of the funds mentioned is referred to as a “Fund” and, collectively, as the “Funds.”
The Board also approved the renewal of the investment subadvisory agreements between Carillon Tower and: (1) Eagle Asset Management, Inc. (“Eagle”), the subadviser to the Eagle Growth & Income Fund, Eagle Investment Grade Bond Fund, Eagle Mid Cap Growth Fund, Eagle Mid Cap Stock Fund, Eagle Small Cap Growth Fund and Eagle Smaller Company Fund; (2) ClariVest Asset Management LLC (“ClariVest”), the subadviser to the Eagle Capital Appreciation Fund and the Eagle International Stock Fund; and (3) Cougar Global Investments Ltd. (“Cougar”), the subadviser to the Eagle Tactical Allocation Fund. Each of the investment advisory and subadvisory agreements is referred to herein as an “Agreement” and, collectively, as the “Agreements.”
On an annual basis, the Board considers renewal of the Agreements. As part of the annual renewal process, the Board took into consideration information and reports it was provided relevant to the annual renewal of the Agreements, including: reports regarding the services and support provided to the Funds and their shareholders by Carillon Tower, Eagle, ClariVest, Cougar, U.S. Bancorp Fund Services, LLC (“USBFS”), a third party that provides sub-administration, transfer agent and fund accounting services to the Funds, and U.S. Bank National Association (“USBNA”), which provides custody services to the Funds; information on the Funds’ performance and commentary on the performance presented by Raymond James Asset Management Services and Fund portfolio managers; presentations by Fund portfolio managers addressing, as applicable, the investment philosophy, investment strategies, personnel and operations of Eagle, ClariVest and Cougar; compliance and financial reports concerning the Funds, and responses by Carillon Tower, Eagle, ClariVest and Cougar to issues raised therein. The Board also considered information on relevant developments in the mutual fund industry and how the Funds and/or Carillon Tower are responding to them.
Carillon Tower, Eagle, ClariVest and Cougar also prepared comprehensive responses to items of information requested by counsel to the Independent
Trustees in letters to Carillon Tower, Eagle, ClariVest and Cougar, to assist the Board in determining whether to renew the agreements. These responses contained substantial and detailed information regarding the Funds, Carillon Tower, Eagle, ClariVest and Cougar. Among other matters, these reports included information on: (1) the nature and extent of the advisory and other services provided by Carillon Tower, Eagle, ClariVest and Cougar; (2) the personnel of Carillon Tower, Eagle, ClariVest and Cougar who provide services to the Funds; (3) the financial condition of Carillon Tower, Eagle, ClariVest and Cougar; (4) the compliance programs and records of Carillon Tower, Eagle, ClariVest and Cougar; (5) the performance of the Funds as compared to funds within their Morningstar, Inc. category (“Morningstar Category”), Lipper, Inc. category (“Lipper Category”) and benchmark indices; (6) the Funds’ expenses, including the advisory fee rates, the overall expense structures of the Funds, both in absolute terms and relative to funds within a refined Morningstar Category population (“Morningstar Population”), and any applicable contractual expense limitations; (7) the anticipated effect of growth and size on the Funds’ performance and expenses, where applicable; (8) benefits to be realized by Carillon Tower, Eagle, ClariVest, Cougar and their respective affiliates; and (9) the estimated profitability of Carillon Tower, Eagle, ClariVest and Cougar under the Agreements, if available. The Board posed questions to various management personnel of Carillon Tower regarding certain key aspects of the materials submitted in support of the renewal. Many of the materials presented at these meetings were first supplied in draft form to designated independent Board representatives, i.e., counsel to the Fund and the Independent Trustees, and the final materials were revised to include information reflective of requests made by the Board. The Board also accorded appropriate weight to the work, deliberations and conclusions of the various committees in determining whether to continue the Agreements.
In addition, throughout the year, the Board regularly met with portfolio management teams and senior management personnel and reviewed information prepared by Eagle, Carillon Tower and the Funds’ subadvisers addressing the services provided by Carillon Tower and the Funds’ subadvisers, as well as Fund performance. Eagle, Carillon Tower or affiliates prepared detailed reports for the Board in November 2016 and in February, May and August 2017, including reports providing the results of analyses of the Funds’ performance and expenses.
In connection with their review of the Agreements, the Board also took into consideration that, on June 1, 2017, Raymond James Financial, Inc., the parent company of Carillon Tower and indirect owner of Eagle and Cougar, completed an internal restructuring of its investment management business (the “Restructuring”) in which Carillon Tower replaced Eagle as the investment adviser and administrator for the Funds. Under its Agreements with the Funds, Carillon Tower provides advisory and administrative services to the Funds on the same terms and at the same fee rates that Eagle provided advisory and administrative services to the Funds prior to the Restructuring. In connection with the Restructuring: (1) Eagle became the subadviser to the Eagle Growth & Income Fund, Eagle Investment Grade Bond Fund, Eagle Mid Cap Growth Fund, Eagle Mid Cap Stock Fund, Eagle Small Cap Growth Fund and Eagle Smaller Company Fund; (2) ClariVest remained the subadviser to the Eagle Capital Appreciation Fund and Eagle International Stock Fund; and (3) Cougar remained the subadviser to the Eagle Tactical Allocation Fund.
With respect to the renewal of the Agreements, the Board took into consideration various factors, including: (1) the nature, extent and quality of services provided to the Funds; (2) the investment performance of the Funds; (3) the estimated costs of the services provided to the Funds and the estimated profits realized by Carillon Tower and its affiliates from their relationship with the Funds; (4) the extent to which economies of scale have been realized as the Funds grow; (5) whether the level of fees reflects those economies of scale for the benefit of the Funds’ investors; (6) comparisons of services and fees with contracts entered into by Carillon Tower, Eagle, ClariVest and Cougar with other clients (such as pension funds and other institutional investors); and (7) any benefits derived by Carillon Tower from its relationship with the Funds.
| 56 |
Approval/Renewal of Investment Advisory and Subadvisory Agreements
| (UNAUDITED) | ||||
Provided below is a discussion of the factors the Board considered at its August meeting to form the basis of its renewal of the Agreements. The Board did not identify any particular information that was most relevant to its consideration to renew the Agreements and each Trustee may have accorded different weight to the various factors.
Nature, Extent and Quality of Services | The Board considered that the personnel responsible for the Funds at Carillon Tower are experienced in providing investment advisory services to the Funds, and that the personnel responsible for the Funds at Eagle, ClariVest and Cougar are experienced in providing portfolio management services for the Funds, and that Carillon Tower, Eagle, ClariVest and Cougar have provided a continuous investment program for the Funds. The Board considered that Carillon Tower oversees and monitors the performance and services provided by Eagle, ClariVest, Cougar and the Funds’ other service providers, and is responsible for recommending the Funds’ subadvisers to the Board. The Board also considered that Carillon Tower and its affiliates, Carillon Fund Distributors, Inc. (“CFD”) and Carillon Fund Services, Inc. (“CFS”), provide certain administration, distribution and shareholder services to the Funds. In addition, the Board considered that Carillon Tower is responsible for oversight of compliance with the Funds’ policies and objectives, review of brokerage matters, oversight of the Funds’ compliance with applicable law and implementation of Board directives as they relate to the Funds. The Board considered that shareholders in the Funds have a broad range of investment choices available to them, including a wide choice among mutual funds offered by Carillon Tower’s competitors, and that the Funds’ shareholders, with the opportunity to review and weigh the disclosure provided by the Funds in their prospectuses and other public disclosures, have chosen to invest in the Funds.
The Board considered that the Restructuring had not affected the services provided to the Funds and that the same investment personnel who provided services to the Funds before the Restructuring continued to provide the same services to the Funds after the Restructuring. The Board also considered that: Eagle is responsible for making investment decisions on behalf of the Eagle Growth & Income Fund, Eagle Investment Grade Bond Fund, Eagle Mid Cap Growth Fund, Eagle Mid Cap Stock Fund, Eagle Small Cap Growth Fund and Eagle Smaller Company Fund; ClariVest is responsible for making investment decisions on behalf of the Eagle Capital Appreciation Fund and the Eagle International Stock Fund; and Cougar is responsible for making investment decisions on behalf of the Eagle Tactical Allocation Fund. The Board considered that Eagle, ClariVest and Cougar are responsible for placing all orders for the purchase and sale of securities with broker-dealers for the Funds that they manage. The Board also considered: (1) information regarding the Carillon Tower, Eagle, ClariVest and Cougar personnel who provide services to the Funds; (2) certifications as to the adequacy of the compliance programs of Carillon Tower, Eagle, ClariVest and Cougar; (3) the financial information regarding Carillon Tower, Eagle, ClariVest and Cougar, as provided; and (4) Carillon Tower’s recommendations to continue to retain Eagle, ClariVest and Cougar to manage the Funds.
Investment Performance | The Board considered comparisons of each Fund’s Class A performance, including, if applicable, a Fund’s year-to-date, one-, three-, five- and ten-year annualized total returns for the period ended June 30, 2017, relative to the average performance of its Morningstar Category and Lipper Category funds and benchmark indices. The Board also considered each Fund’s performance relative to the composite performance of comparable accounts managed by Eagle, ClariVest and Cougar, to the extent such information was available and provided by Carillon Tower.
With respect to the Eagle Capital Appreciation Fund, the Board considered a number of factors regarding performance, including: (1) the Fund outperformed its benchmark index for all periods, other than the ten-year period; (2) the Fund outperformed the average performance of its Morningstar Category for all relevant periods and its Lipper Category for all periods other than the year-to-date and the ten-year period; (3) the Fund underperformed an
institutional composite managed by ClariVest for all relevant periods; and (4) the Fund’s overall 4-star Morningstar rating. The Board also considered ClariVest’s representation that the underperformance of the Fund relative to the ClariVest composite is attributable to the difference in expense ratios between products. The Board considered that the Fund was added to ClariVest’s composite as of December 31, 2014.
With respect to the Eagle Growth & Income Fund, the Board considered a number of factors regarding performance, including: (1) the Fund underperformed its benchmark index for all relevant periods; (2) the Fund outperformed the average performance of its Morningstar Category for the year-to-date and ten-year periods and its Lipper Category for the year-to-date, five-year and ten-year periods and underperformed its Morningstar Category and Lipper Category for all other relevant periods; (3) the Fund outperformed the composite performance of comparable institutional accounts managed by Eagle for all relevant periods; and (3) the Fund’s overall 3-star Morningstar rating.
With respect to the Eagle International Stock Fund, the Board considered a number of factors regarding performance, including: (1) the Fund outperformed its benchmark index for all relevant periods; (2) the Fund underperformed its Lipper Category for the year-to-date period but outperformed for the one-year and three-year periods and outperformed its Morningstar Category for all relevant periods; (3) the Fund outperformed the composite performance of comparable institutional accounts managed by ClariVest for the year-to-date period and underperformed for the one- and three-year periods; and (4) the Fund’s overall 5-star Morningstar rating.
With respect to the Eagle Investment Grade Bond Fund, the Board considered a number of factors regarding performance, including: (1) the Fund outperformed its benchmark index for the one-year period and underperformed for all other relevant periods; (2) the Fund outperformed the average performance of its Morningstar Category and Lipper Category for the year-to-date and three-year periods and underperformed for all other relevant periods; (3) the Fund outperformed the composite performance of comparable institutional accounts managed by Eagle for all relevant periods; and (4) the Fund’s overall 3-star Morningstar rating.
With respect to the Eagle Mid Cap Growth Fund, the Board considered a number of factors regarding performance, including: (1) the Fund outperformed its benchmark index, Morningstar Category and Lipper Category for all relevant periods; (2) the Fund underperformed the composite performance of comparable institutional accounts managed by Eagle for all relevant periods; and (3) the Fund’s overall 4-star Morningstar rating.
With respect to the Eagle Mid Cap Stock Fund, the Board considered a number of factors regarding performance, including: (1) the Fund outperformed its primary and secondary benchmark indices for the year-to-date period and underperformed these indices for all other relevant periods; (2) the Fund underperformed the average performance of its Morningstar Category and Lipper Category for all relevant periods; (3) the Fund outperformed the composite performance of comparable institutional accounts managed by Eagle for all relevant periods; and (4) the Fund’s overall 2-star Morningstar rating. The Board also considered its discussions with management regarding the steps that would be taken to improve performance.
With respect to the Eagle Small Cap Growth Fund, the Board considered a number of factors regarding performance, including: (1) the Fund outperformed its benchmark index for the year-to-date and three-year periods and underperformed for all other relevant periods; (2) the Fund outperformed its Morningstar Category and Lipper Category for the year-to-date, three-year, five-year and ten-year periods and underperformed for the one-year period; (3) the Fund outperformed the composite performance of comparable institutional accounts managed by Eagle for all periods except the one-year period, during which it underperformed; and (3) the Fund’s overall 3-star Morningstar rating.
| 57 |
Approval/Renewal of Investment Advisory and Subadvisory Agreements
| (UNAUDITED) | ||
With respect to the Eagle Smaller Company Fund, the Board considered a number of factors regarding performance, including: (1) the Fund outperformed its primary and secondary benchmark indices for the year-to-date period and underperformed for all other relevant periods; (2) the Fund underperformed its Morningstar Category, Lipper Category and composite of comparable institutional accounts managed by Eagle for all relevant periods; and (3) the Fund’s overall 3-star Morningstar rating. The Board also considered its discussions with management regarding the steps that would be taken to improve performance.
With respect to the Eagle Tactical Allocation Fund, the Board considered a number of factors regarding performance, including: (1) the fund underperformed its custom benchmark index (comprised 60% of the Barclays US Aggregate Bond Index and 40% of the MSCI All Country World Index), the MSCI All Country World Index and its Morningstar Category and Lipper Category for the year-to-date and one-year periods, but outperformed the Barclays US Aggregate Bond Index for the year-to-date and one-year periods; and (2) the fund outperformed the composite performance of comparable institutional accounts managed by Cougar for the year-to-date and one-year periods.
Fees and Expenses | The Board considered the advisory fee rate payable by each Fund to Carillon Tower under the Agreements, the subadvisory fee rate payable by Carillon Tower to Eagle, ClariVest and Cougar, each Fund’s total expense ratio and its Rule 12b-1 fees. The Board considered that, with the exception of the Eagle Capital Appreciation Fund, the subadvisory fee rate paid by Carillon Tower to Eagle, ClariVest or Cougar, as applicable, is identical to the advisory fee rate paid to Carillon Tower by the Fund. The Board also considered comparisons of a Fund’s expense ratio (with Rule 12b-1 fees) to the average expense ratio of its Morningstar Category and peer group within that Morningstar Category (“Morningstar Peer Group”) based on data ended June 30, 2017. In addition, the Board considered that Eagle had undertaken contractual expense limitations with respect to the Funds for its 2017 fiscal year and that Carillon Tower was requesting that the Board approve the same expense cap levels for the Funds through March 1, 2019. The Board also considered that Carillon Tower had proposed to reduce the administration fee rate for all share classes of all Funds.
With respect to the Eagle Capital Appreciation Fund, the Board also considered that the net expense ratio of the Fund’s Class A shares was higher than the average net expense ratio of its Morningstar Population and Morningstar Peer Group but, after the administration fee reduction, would be lower than the Morningstar Peer Group and equal to the Morningstar Population. The Board also considered that ClariVest sub-advises a multi-manager mutual fund and that the subadvisory fee rate paid to ClariVest by Carillon Tower is higher than the subadvisory fee rate paid to ClariVest by that multi-manager mutual fund. The Board further considered that, for assets of up to $100 million, the subadvisory fee rate paid to ClariVest by Carillon Tower is the same as ClariVest’s standard fee schedule for its large cap growth strategy.
With respect to Eagle Growth & Income Fund, the Board also considered that the net expense ratio of the Fund’s Class A shares was lower than the average net expense ratio of its Morningstar Population and Morningstar Peer Group. The Board also considered that the contractual subadvisory fee rate to be paid to Eagle by Carillon Tower was higher than Eagle’s standard fee rates for separate accounts, but that the effective fee rate paid by the Fund was lower than the average advisory fee paid to Eagle by institutional accounts in the same strategy and the fee rate Eagle charges to an investment company subadvisory client.
With respect to the Eagle International Stock Fund, the Board also considered that the net expense ratio of the Fund’s Class A shares was lower than the average net expense ratio of its Morningstar Peer Group but higher than its Morningstar Population. The Board also considered that ClariVest does not manage any comparable accounts in this strategy, and that the subadvisory fee
rate paid to ClariVest by Carillon Tower was higher than ClariVest’s standard fee rate for its international core strategy at certain asset levels.
With respect to the Eagle Investment Grade Bond Fund, the Board also considered that the net expense ratio of the Fund’s Class A shares was lower than the average net expense ratio of its Morningstar Population and Morningstar Peer Group. The Board further considered that Eagle also sub-advises a closed end fund in the short/intermediate investment grade strategy, for which the subadvisory fee rate Eagle receives is higher than the subadvisory fee rate paid to Eagle by Carillon Tower, and that the subadvisory fee rate paid to Eagle by Carillon Tower was higher than the average advisory fee rate paid by institutional accounts in the same strategy.
With respect to the Eagle Mid Cap Growth Fund, the Board also considered that the net expense ratio of the Fund’s Class A shares was lower than the average net expense ratio of its Morningstar Population and equal to its Morningstar Peer Group but, after the administration fee reduction, would be lower than both the Morningstar Population and Morningstar Peer Group. The Board also considered that the effective subadvisory fee rate paid to Eagle by Carillon Tower was lower than the average advisory fee rate paid by institutional accounts in the same strategy.
With respect to the Eagle Mid Cap Stock Fund, the Board also considered that the net expense ratio of the Fund’s Class A shares was lower than the average net expense ratio of its Morningstar Population and Morningstar Peer Group. The Board also considered Eagle’s representation that it does not manage any similar institutional accounts in the mid-cap strategy that pay a subadvisory fee, but that the subadvisory fee rate paid to Eagle by Carillon Tower was lower than Eagle’s standard advisory fee rate for separate accounts in the same strategy.
With respect to the Eagle Small Cap Growth Fund, the Board also considered that the net expense ratio of the Fund’s Class A shares was lower than the average net expense ratio of its Morningstar Population and Morningstar Peer Group. The Board also considered that the effective subadvisory fee rate paid to Eagle by Carillon Tower was lower than the average advisory fee rate paid by institutional accounts in the same strategy.
With respect to the Eagle Smaller Company Fund, the Board also considered that the net expense ratio of the Fund’s Class A shares was lower than the average net expense ratio of its Morningstar Population and Morningstar Peer Group. The Board also considered that the subadvisory fee rate schedule paid to Eagle by Carillon Tower was lower than Eagle’s standard advisory fee rate schedule for separate accounts in the same strategy at all asset levels, but was higher than the subadvisory fee rate charged to a multi-managed investment company subadvisory client.
With respect to the Eagle Tactical Allocation Fund, the Board also considered that the net expense ratio of the Fund’s Class A shares was lower than the average net expense ratio of its Morningstar Population and Morningstar Peer Group. The Board also considered that, while Cougar does not currently manage institutional accounts in the same strategy as the Fund, the subadvisory fee rate paid to Cougar by Carillon Tower was lower than the advisory fee rates paid to Cougar by direct retail accounts in the same strategy.
Costs, Profitability and Economies of Scale | The Board considered Carillon Tower’s estimated costs and profitability in providing services to the Funds, consolidated with its affiliated subadvisers. The Board considered that the estimated costs and profitability of Eagle, ClariVest and Cougar generally are less significant to the Board’s evaluation of the fee rates and expenses paid by a Fund than Carillon Tower’s advisory fee rate and estimated profitability and the Funds’ overall expense ratios. The Board also considered that Carillon Tower’s estimated profits on the services it provided to the Funds are reasonable in light of Carillon Tower’s estimated costs in providing services to each Fund and that Carillon Tower manages each Fund’s assets and provides a comprehensive compliance program for each Fund.
| 58 |
Approval/Renewal of Investment Advisory and Subadvisory Agreements
| (UNAUDITED) |
In addition, the Board considered that the advisory fee rate structures for certain of the Funds provide for breakpoints, which is a reduction of the applicable fee rate as assets increase. The Board also considered that each Fund may benefit from economies of scale, and shareholders may realize such economies of scale, through: (1) reduced advisory fees achieved when a Fund’s asset size reaches breakpoints in the fee schedules instituted by Carillon Tower; (2) increased services to a Fund; or (3) allocation of fixed fund expenses over a large asset size.
Benefits | In evaluating compensation, the Board considered benefits that may be realized by Carillon Tower, Eagle, ClariVest and Cougar and their respective affiliates from their relationship with the Funds. The Board took into consideration that Carillon Tower and its affiliates have entered into revenue sharing and services agreements with third parties for marketing and/or shareholder services. The Board also considered that the Funds compensate Carillon Tower for providing administrative services and CFS for providing shareholder services. The Board further considered that, as the Funds’ principal underwriter and distributor, CFD receives Rule 12b-1 payments from the Funds to compensate it for providing services and distribution activities. These activities could lead to growth in the Funds’ assets and the corresponding benefits of that growth, including economies of scale and
greater diversification. In addition, other affiliates of Carillon Tower have entered into agreements with CFD to sell Fund shares and receive compensation from CFD. The Board considered that ClariVest and Cougar do not enter into formal soft dollar arrangements. However, the Board also considered that Carillon Tower has entered into marketing agreements with ClariVest and Cougar pursuant to which ClariVest and Cougar pay Carillon Tower a fee for performing marketing and client services for the Funds and other clients of ClariVest and Cougar.
Conclusions | The Board concluded with respect to the Funds that: (1) each Fund was reasonably likely to benefit from the nature, quality and extent of Carillon Tower’s, Eagle’s, ClariVest’s and Cougar’s services, as applicable to the Funds; (2) each Fund’s performance was satisfactory in light of all the factors considered by the Board; (3) the fees payable under the Agreements and estimated profits earned by Carillon Tower, Eagle, ClariVest were reasonable in the context of all the factors considered by the Board; and (4) the current advisory fee rate structure provides each Fund’s shareholders with reasonable benefits associated with economies of scale. The Board also determined in its business judgment to renew the Agreements and to approve the Agreements between each Fund and Carillon Tower and between Carillon Tower and each of Eagle, ClariVest and Cougar.
2017 Federal Tax Notice
| (UNAUDITED) | ||
The following information for the fiscal year ended October 31, 2017 for the Eagle Family of Funds is provided pursuant to provisions of the Internal Revenue Code.
The information and distributions reported herein may differ from the information and distributions taxable to the shareholders for the calendar year ended December 31, 2017. All dividends paid by the Funds from net investment income are deemed to be ordinary income for federal income tax purposes. Complete information will be computed and reported in conjunction with your 2017 Form 1099-DIV.
The amounts shown may differ from amounts disclosed else where in this report due to differences between tax and financial reporting requirements.
| Fund | Qualified dividend income | Dividends Received Deduction | Long-term capital gains | |||||||||
| Capital Appreciation Fund | 100.00 | % | 100.00 | % | $21,213,057 | |||||||
| Growth & Income Fund | 100.00 | % | 100.00 | % | 28,687,154 | |||||||
| International Stock Fund | 100.00 | % | — | — | ||||||||
| Investment Grade Bond Fund | — | — | 159,170 | |||||||||
| Mid Cap Growth Fund | — | — | 97,570 | |||||||||
| Mid Cap Stock Fund | — | — | 21,546,258 | |||||||||
| Small Cap Growth Fund | 100.00 | % | 100.00 | % | 123,253,354 | |||||||
| Smaller Company Fund | — | — | 4,398,626 | |||||||||
| Tactical Allocation Fund | 21.19 | % | 18.11 | % | — | |||||||
| 59 |
Additional Information
| (UNAUDITED) | 10.31.2017 |
Special Shareholder Meeting | A Special Meeting of shareholders (“Special Meeting”) of each Trust was held on August 16, 2017, at 10:00 a.m., Eastern time, and duly adjourned for each Fund until 10:00 a.m., Eastern time on each of the following dates: September 13, 2017, October 11, 2017, October 30, 2017, November 2, 2017, November 10, 2017 and November 16, 2017. At the Special Meeting, shareholders were asked to vote on the following:
Proposal No. 1. To approve an Agreement and Plan of Reorganization and Termination for the Funds, pursuant to which each Fund will be organized into a corresponding new series of Carillon Series Trust, a newly established Delaware statutory trust. This proposal was approved by the shareholders of each Fund as set forth below.
| Fund | Votes For | Votes Against or Withheld | Abstained | Broker Non-Vote | ||||||||||||
| Eagle Capital Appreciation Fund | 4,295,629 | 136,703 | 184,595 | 749,584 | ||||||||||||
| Eagle Growth & Income Fund | 15,586,561 | 238,511 | 504,736 | N/A | ||||||||||||
| Eagle International Stock Fund | 411,742 | 9,379 | 12,192 | 89,040 | ||||||||||||
| Eagle Investment Grade Bond Fund | 1,105,756 | 44,398 | 70,761 | 308,430 | ||||||||||||
| Eagle Mid Cap Growth Fund | 13,470,882 | 1,077,953 | 895,011 | 2,717,264 | ||||||||||||
| Eagle Mid Cap Stock Fund | 4,013,840 | 165,599 | 250,376 | 1,021,012 | ||||||||||||
| Eagle Small Cap Growth Fund | 34,035,600 | 1,147,895 | 1,925,878 | 3,135,512 | ||||||||||||
| Eagle Smaller Company Fund | 1,250,525 | 56,127 | 61,985 | 381,781 | ||||||||||||
| Eagle Tactical Allocation Fund | 377,185 | 37,190 | 47,032 | 63,406 | ||||||||||||
Proposal No. 2. To approve “multi-manager” arrangements for the Fund whereby the Fund’s investment adviser, subject to approval by the Fund’s Board of Trustees, would be able to select subadvisers to manage all or a portion of the assets of the Fund and materially amend subadvisory agreements with subadvisers that are affiliated or unaffiliated with the investment adviser or the Fund, without obtaining shareholder approval. This proposal was approved by the shareholders of each Fund as set forth below.
| Trustee | Votes For | Votes Against or Withheld | Abstained | Broker Non-Vote | ||||||||||||
| Eagle Capital Appreciation Fund | 4,228,209 | 193,447 | 195,272 | 749,584 | ||||||||||||
| Eagle Growth & Income Fund | 15,466,826 | 392,352 | 470,629 | N/A | ||||||||||||
| Eagle International Stock Fund | 409,306 | 9,785 | 14,223 | 89,040 | ||||||||||||
| Eagle Investment Grade Bond Fund | 1,072,075 | 76,628 | 72,212 | 308,430 | ||||||||||||
| Eagle Mid Cap Growth Fund | 12,892,670 | 1,614,730 | 936,448 | 2,717,264 | ||||||||||||
| Eagle Mid Cap Stock Fund | 3,905,071 | 266,880 | 257,865 | 1,021,012 | ||||||||||||
| Eagle Small Cap Growth Fund | 31,617,178 | 3,491,539 | 2,000,655 | 3,135,512 | ||||||||||||
| Eagle Smaller Company Fund | 1,231,283 | 73,048 | 64,306 | 381,781 | ||||||||||||
| Eagle Tactical Allocation Fund | 364,600 | 50,537 | 46,271 | 63,406 | ||||||||||||
| 60 |
| (UNAUDITED) | ||||
The greatest risk of investing in a mutual fund is that its returns will fluctuate and you could lose money. Turbulence in financial markets and reduced liquidity in equity, credit and fixed income markets may negatively affect many issuers worldwide, which could have an adverse effect on the Funds. Additionally, while the portfolio managers seek to take advantage of investment opportunities that will maximize a fund’s investment returns, there is no guarantee that such opportunities will ultimately benefit the fund. There is no assurance that the portfolio managers’ investment strategy will enable a fund to achieve its investment objective. An investment in a fund is not a deposit with a bank and is not insured or guaranteed by the Federal Deposit Insurance Corporation or any other government agency. The following table identifies the risk factors of each fund in light of its principal investment strategies. These risk factors are explained following the table.
The Tactical Allocation Fund is a “fund of funds” that seeks to achieve its investment objective by investing its assets primarily in underlying funds. Therefore, in this section, the term “fund” may include a fund, an underlying fund, or both a fund and an underlying fund.
| Risk | Capital Appreciation Fund | Growth & Fund | International Fund | Investment Grade Bond Fund | Mid Cap Growth Fund | Mid Cap Stock Fund | Small Cap Growth Fund | Smaller Fund | Tactical Allocation Fund | |||||||||||||||||||||||||||
| Call | X | X | ||||||||||||||||||||||||||||||||||
| Commodities | X | |||||||||||||||||||||||||||||||||||
| Credit | X | X | ||||||||||||||||||||||||||||||||||
| Emerging Markets | X | |||||||||||||||||||||||||||||||||||
| Equity securities | X | X | X | X | X | X | X | X | ||||||||||||||||||||||||||||
| Fixed income market | X | X | ||||||||||||||||||||||||||||||||||
| Floating Rate Securities | X | |||||||||||||||||||||||||||||||||||
| Focused holdings | X | X | ||||||||||||||||||||||||||||||||||
| Foreign securities | X | X | X | X | ||||||||||||||||||||||||||||||||
| Fund of funds | X | |||||||||||||||||||||||||||||||||||
| Growth stocks | X | X | X | X | X | X | X | |||||||||||||||||||||||||||||
| High-yield securities | X | X | ||||||||||||||||||||||||||||||||||
| Inflation | X | X | ||||||||||||||||||||||||||||||||||
| Information technology sector risk | X | X | X | |||||||||||||||||||||||||||||||||
| Interest rates | X | X | ||||||||||||||||||||||||||||||||||
| Liquidity | X | X | X | |||||||||||||||||||||||||||||||||
| Market | X | X | X | X | X | X | X | X | ||||||||||||||||||||||||||||
| Market timing | X | X | X | X | ||||||||||||||||||||||||||||||||
| Maturity | X | |||||||||||||||||||||||||||||||||||
| Mid-cap companies | X | X | X | X | X | X | X | |||||||||||||||||||||||||||||
| Mortgage- and asset-backed securities | X | X | ||||||||||||||||||||||||||||||||||
| Municipal securities | X | X | ||||||||||||||||||||||||||||||||||
| Other investments companies and ETFs | X | X | ||||||||||||||||||||||||||||||||||
| Portfolio turnover | X | X | X | |||||||||||||||||||||||||||||||||
| Redemptions | X | X | ||||||||||||||||||||||||||||||||||
| Sectors | X | X | X | |||||||||||||||||||||||||||||||||
| Small-cap companies | X | X | X | X | X | |||||||||||||||||||||||||||||||
| U.S. Government securities and Government sponsored enterprises | X | X | ||||||||||||||||||||||||||||||||||
| Valuation | X | |||||||||||||||||||||||||||||||||||
| Value stocks | X | X | X | X | ||||||||||||||||||||||||||||||||
| 61 |
Principal Risks
| (UNAUDITED) | ||
Call | Call risk is the possibility that, as interest rates decline to a level that is significantly lower than the rate assigned to the fixed income security, the security may be called (redeemed) prior to maturity. A fund would lose the benefit of holding a fixed income security that is paying a rate above the current market rate and would likely have to reinvest the proceeds in other fixed income securities that have lower yields.
Commodities | The value of commodities may be more volatile than the value of equity securities or debt instruments and their value may be affected by changes in overall market movements, commodity index volatility, changes in interest rates, or factors affecting a particular industry or commodity. Investments in commodities, such as gold, or in commodity-linked instruments, will subject a fund’s portfolio to volatility that may also deviate from price movements in equity and fixed income securities. The value of commodity-linked instruments typically is based upon the price movements of underlying commodities and, therefore, may fluctuate widely based on a variety of both macroeconomic and commodity-specific factors. At times, these price fluctuations may be significant or rapid, and may not correlate to price movements in other asset classes. There may also be an imperfect correlation between the value of commodity-linked instruments and the underlying assets. Investments in these types of instruments may subject a fund to additional expenses.
Credit | A fund could lose money if the issuer of a fixed income security is unable or unwilling, or is perceived as unable or unwilling (whether by market participants, ratings agencies, pricing services or otherwise) to meet its financial obligations or goes bankrupt. Securities are subject to varying degrees of credit risk, which are often reflected in their credit ratings. The downgrade of the credit rating of a security held by a fund may decrease its value. Credit risk usually applies to most fixed income securities. U.S. government securities, especially those that are not backed by the full faith and credit of the U.S. Treasury, such as securities supported only by the credit of the issuing governmental agency or government-sponsored enterprise, carry at least some risk of nonpayment, and the maximum potential liability of the issuers of such securities may greatly exceed their current resources. There is no assurance that the U.S. government would provide financial support to the issuing entity if not obligated to do so by law. Further, any government guarantees on U.S. government securities that a fund owns extend only to the timely payment of interest and the repayment of principal on the securities themselves and do not extend to the market value of the securities themselves or to shares of the fund.
Emerging Markets | When investing in emerging markets, the risks of investing in foreign securities discussed below are heightened. Emerging markets have unique risks that are greater than or in addition to investing in developed markets because emerging markets are generally smaller, less developed, less liquid and more volatile than the securities markets of the U.S. and other developed markets. There are also risks of: greater political uncertainties; an economy’s dependence on revenues from particular commodities or on international aid or development assistance; currency transfer restrictions; a limited number of potential buyers for such securities; and delays and disruptions in securities settlement procedures. In addition, there may be less information available to make investment decisions and more volatile rates of return.
Equity Securities | A fund’s equity securities investments are subject to stock market risk. Such investments may also expose a fund to additional risks:
| • | Common Stocks. The value of a company’s common stock may fall as a result of factors directly relating to that company, such as decisions made by its management or decreased demand for the company’s products or services. A stock’s value may also decline because of factors affecting not just the company, but also companies in the same industry or sector. The price of a company’s stock may also be affected by changes in financial markets that are unrelated to the company, such as changes in interest |
rates, exchange rates or industry regulation. Companies that pay dividends on their common stock generally only do so after they invest in their own business and make required payments to bondholders and on other debt and preferred stock. Therefore, the value of a company’s common stock will usually be more volatile than its bonds, other debt and preferred stock. |
| • | Preferred Stocks. Preferred securities are subject to issuer-specific and stock market risks; however, preferred securities may be less liquid than common stocks and offer more limited participation in the growth of an issuer. If interest rates rise, the dividend on preferred stocks may be less attractive, causing the price of preferred stocks to decline. Preferred shareholders may have only certain limited rights if distributions are not paid for a stated period, but generally have no legal recourse against the issuer and may suffer a loss of value if distributions are not paid. Preferred stocks may have mandatory sinking fund provisions, as well as provisions for their call or redemption prior to maturity which can have a negative effect on their prices when interest rates decline. Because the rights of preferred stock on distribution of a corporation’s assets in the event of its liquidation are generally subordinated to the rights associated with a corporation’s debt securities, in the event of an issuer’s bankruptcy, there is substantial risk that there will be nothing left to pay preferred stockholders after payments, if any, to bondholders have been made. For this reason, the value of preferred securities will usually react more strongly than bonds and other debt securities to actual or perceived changes in the company’s financial condition or prospects. |
| • | Convertible Securities. The investment value of a convertible security (“convertible”) is based on its yield and tends to decline as interest rates increase. The conversion value of a convertible is the market value that would be received if the convertible were converted to its underlying common stock. Since it derives a portion of its value from the common stock into which it may be converted, a convertible is also subject to the same types of market and issuer-specific risks that apply to the underlying common stock. A convertible may be subject to redemption at the option of the issuer at a price established in the convertible’s governing instrument, which may be less than the current market price of the security. Convertibles typically are “junior” securities, which means an issuer may pay interest on its non-convertible debt before it can make payments on its convertibles. In the event of a liquidation, holders of convertibles may be paid before a company’s common stockholders but after holders of a company’s senior debt obligations. |
| • | Depositary Receipts. A fund may invest in securities issued by foreign companies through ADRs, GDRs and EDRs. These securities are subject to many of the risks inherent in investing in foreign securities, including, but not limited to, currency fluctuations and political and financial instability in the home country of a particular depositary receipt. |
| • | REITs. REITs or other real estate-related securities are subject to the risks associated with direct ownership of real estate, including declines in the value of real estate, risks related to general and local economic conditions or changes in demographic trends or tastes, increases in operating expenses, and adverse governmental, legal or regulatory action (such as changes to zoning laws, changes in interest rates, condemnation, tax increases, regulatory limitations on rents, or enforcement of or changes to environmental regulations). Shares of REITs may trade less frequently and, therefore, are subject to more erratic price movements than securities of larger issuers. REITs typically incur fees that are separate from those incurred by a fund, meaning a fund’s investment in REITs will result in the layering of expenses such that as a shareholder, a fund will indirectly bear a proportionate share of a REIT’s operating expenses. |
| • | Rights and Warrants. Investments in rights and warrants may be more speculative than certain other types of investments because rights and warrants do not carry dividend or voting rights with respect to the |
| 62 |
Principal Risks
| (UNAUDITED) | ||||
| underlying securities or any rights in the assets of the issuer. In addition, the value of a right or a warrant does not necessarily change with the value of the underlying securities and a right or a warrant ceases to have value if it is not exercised prior to its expiration date. |
Fixed income market | Fixed income market risk is the risk that the prices of, and the income generated by, fixed income securities held by a fund may decline significantly and/or rapidly in response to adverse issuer, political, regulatory, general economic and market conditions, or other developments, such as regional or global economic instability (including terrorism and related geopolitical risks), interest rate fluctuations, and those events directly involving the issuers that may cause broad changes in market value, public perceptions concerning these developments, and adverse investor sentiment. These events may lead to periods of volatility, which may be exacerbated by changes in bond market size and structure. In addition, adverse market events may lead to increased redemptions, which could cause a fund to experience a loss when selling securities to meet redemption requests by shareholders. The risk of loss increases if the redemption requests are unusually large or frequent.
Floating rate securities | Floating rate securities generally are less sensitive to interest rate changes but may decline in value if their interest rates do not rise as much, or as quickly, as interest rates in general. Conversely, floating rate securities will not generally increase in value if interest rates decline. When a fund holds floating rate securities, a decrease in market interest rates will adversely affect the income received from such securities and the net asset value (“NAV”) of the fund’s shares.
Focused holdings | For funds that normally hold a core portfolio of securities of fewer companies than other more diversified funds, the increase or decrease of the value of a single security may have a greater impact on the fund’s NAV and total return when compared to other diversified funds.
Foreign securities | Investments in foreign securities involve greater risks than investing in domestic securities. As a result, a fund’s return and NAV may be affected by fluctuations in currency exchange rates or political or economic conditions and regulatory requirements in a particular country. Foreign markets, as well as foreign economies and political systems, may be less stable than U.S. markets, and changes in the exchange rates of foreign currencies can affect the value of a fund’s foreign assets. Foreign laws and accounting standards typically are not as strict as they are in the U.S., and there may be less public information available about foreign companies. Custodial and/or settlement systems in foreign markets may not be fully developed and the laws of certain countries may limit the ability to recover assets if a foreign bank or depository or their agents goes bankrupt. Over a given period of time, foreign securities may underperform U.S. securities—sometimes for years. A fund could also underperform if it invests in countries or regions whose economic performance falls short. The risks associated with investments in governmental or quasi-governmental entities of a foreign country are heightened by the potential for unexpected governmental change, which may lead to default or expropriation, and inadequate government oversight and accounting. Obligations of supranational entities are subject to the risk that the governments on whose support the entity depends for its financial backing or repayment may be unable or unwilling to provide that support. The effect of recent, worldwide economic instability on specific foreign markets or issuers may be difficult to predict or evaluate. Some national economies continue to show profound instability, which may in turn affect their international trading and financial partners or other members of their currency bloc. Foreign security risk may also apply to ADRs, GDRs and EDRs.
Fund of funds | Because investments in securities of other investment companies, including ETFs, are subject to statutory limitations prescribed in the 1940 Act and the rules thereunder if the Tactical Allocation Fund is unable to rely on an ETF’s exemptive order permitting unaffiliated funds to invest in the ETF’s shares beyond these statutory limitations, the fund may be unable to allocate its investments in the manner the subadviser considers prudent, or the
subadviser may have to select an investment other than that which the subadviser considers suitable.
Because the Tactical Allocation Fund invests principally in underlying funds, and the fund’s performance is directly related to the performance of such underlying funds, the ability of the fund to achieve its investment objectives is directly related to the ability of the underlying funds to meet their investment objectives. The investment techniques and risk analysis used by the fund’s and the underlying funds’ portfolio managers may not produce the desired results.
Growth stocks | Growth companies are expected to increase their earnings at a certain rate. When these expectations are not met, investors may punish the prices of stocks excessively, even if earnings showed an absolute increase. Growth company stocks also typically lack the dividend yield that can cushion stock prices in market downturns.
High-yield securities | Investments in securities rated below investment grade, or “junk bonds,” generally involve significantly greater risks of loss of your money than an investment in investment grade bonds. Compared with issuers of investment grade bonds, junk bonds are more likely to encounter financial difficulties and to be materially affected by these difficulties. Rising interest rates may compound these difficulties and reduce an issuer’s ability to repay principal and interest obligations. Issuers of lower-rated securities also have a greater risk of default or bankruptcy. Additionally, due to the greater number of considerations involved in the selection of a fund’s securities, the achievement of a fund’s objective depends more on the skills of the portfolio manager than investing only in higher-rated securities. Therefore, your investment may experience greater volatility in price and yield. High-yield securities may be less liquid than higher quality investments. A security whose credit rating has been lowered may be particularly difficult to sell.
Inflation | Inflation risk is the risk that the market value of securities will decrease as higher inflation shrinks the purchasing power of any affected currencies, thus causing the purchasing power not to keep pace with inflation.
Information technology sector | The information technology sector includes companies engaged in internet software and services, technology hardware and storage peripherals, electronic equipment instruments and components, and semiconductors and semiconductor equipment. Information technology companies face intense competition, both domestically and internationally, which may have an adverse effect on profit margins. Information technology companies may have limited product lines, markets, financial resources or personnel. The products of information technology companies may face rapid product obsolescence due to technological developments and frequent new product introduction, unpredictable changes in growth rates and competition for the services of qualified personnel. Failure to introduce new products, develop and maintain a loyal customer base or achieve general market acceptance for their products could have a material adverse effect on a company’s business. Companies in the information technology sector are heavily dependent on intellectual property and the loss of patent, copyright and trademark protections may adversely affect the profitability of these companies.
Interest rates | Investments in investment grade and non-investment grade fixed income securities are subject to interest rate risk. The value of a fund’s fixed income investments typically will fall when interest rates rise. A fund may be particularly sensitive to changes in interest rates if it invests in debt securities with intermediate and long terms to maturity. Debt securities with longer durations tend to be more sensitive to changes in interest rates, usually making them more volatile than debt securities with shorter durations. For example, if a bond has a duration of five years, a 1% increase in interest rates could be expected to result in a 5% decrease in the value of the bond. The Federal Reserve raised the federal funds rate in December 2016, March 2017 and June 2017 and has signaled additional increases in 2017. Interest rates may rise significantly and/or rapidly, potentially resulting in substantial losses to the fund. During periods of very low or negative interest rates, a fund may be unable to maintain positive returns. Certain European countries and Japan have
| 63 |
Principal Risks
| (UNAUDITED) | ||
recently experienced negative interest rates on deposits and debt securities have traded at negative yields. Negative interest rates may become more prevalent among non-U.S. issuers, and potentially within the United States. Changing interest rates, including rates that fall below zero, may have unpredictable effects on markets, may result in heightened market volatility and may detract from Fund performance to the extent the Fund is exposed to such interest rates.
Liquidity | Liquidity risk is the possibility that the fund might be unable to sell a security promptly and at an acceptable price, which could have the effect of decreasing the overall level of the fund’s liquidity. Market developments may cause the fund’s investments to become less liquid and subject to erratic price movements. In addition, the market-making capacity of dealers in certain types of securities has been reduced in recent years, in part as a result of structural and regulatory changes, such as fewer proprietary trading desks and increased capital requirements for broker-dealers. Further, many broker-dealers have reduced their inventory of certain debt securities. This could negatively affect a fund’s ability to buy or sell debt securities and increase the related volatility and trading costs. The fund could lose money if it cannot sell a security at the time and price that would be most beneficial to the fund.
Market | Markets may at times be volatile and the value of a fund’s stock holdings may decline in price, sometimes significantly and/or rapidly, because of changes in prices of its holdings or a broad stock market decline. The value of a security may decline due to adverse issuer-specific conditions or general market conditions which are not specifically related to a particular company, such as real or perceived adverse political, regulatory, market, economic or other developments that may cause broad changes in market value, changes in the general outlook for corporate earnings, changes in interest or currency rates, public perceptions concerning these developments or adverse investment sentiment generally. During a general downturn in the securities markets, multiple asset classes may decline in value simultaneously. Terrorism and related geopolitical risks have led, and may in the future lead, to increased short-term market volatility and may have adverse long-term effects on world economies and markets generally. In addition, markets and market participants are increasingly reliant upon both publicly available and proprietary information data systems. Data imprecision, software or other technology malfunctions, programming inaccuracies, unauthorized use or access, and similar circumstances may impair the performance of these systems and may have an adverse impact upon a single issuer, a group of issuers, or the market at large. In certain cases, an exchange or market may close or issue trading halts on either specific securities or even the entire market, which may result in a fund being, among other things, unable to buy or sell certain securities or financial instruments or accurately price its investments. These fluctuations in stock prices could be a sustained trend or a drastic movement. The stock markets generally move in cycles, with periods of rising prices followed by periods of declining prices. The value of your investment may reflect these fluctuations. The results of the recent U.S. presidential election may result in significant changes in certain policies. These changes may result in lower corporate taxes, higher levels of public debt, higher interest rates, more restrictions on international trade, and less stringent prudential regulation of certain players in the financial markets.
Market timing | Because of specific securities a fund may invest in, it could be subject to the risk of market timing activities by fund shareholders. Some examples of these types of securities are high-yield, small-cap and foreign securities. Typically, foreign securities offer the most opportunity for these market timing activities. A fund generally prices these foreign securities using their closing prices from the foreign markets in which they trade, typically prior to a fund’s calculation of its NAV. These prices may be affected by events that occur after the close of a foreign market but before a fund prices its shares. In such instances, a fund may fair value foreign securities. However, some investors may engage in frequent short-term trading in a fund to take advantage of any price differentials that may be reflected in the NAV of a fund’s shares. There is no assurance that fair valuation of securities can reduce or
eliminate market timing. There is no guarantee that Carillon Tower Advisers, Inc. (the “Manager”) and transfer agent of the Funds can detect all market timing activities.
Maturity | A Fund will invest in fixed income securities of varying maturities. A fixed income security’s maturity is one indication of the interest rate exposure of a security. Generally, the longer a fixed income security’s maturity, the greater the risk. Conversely, the shorter a fixed income security’s maturity, the lower the risk.
Mid-cap companies | Investments in mid-cap companies generally involve greater risks than investing in large-capitalization companies. Mid-cap companies often have narrower markets and limited managerial and financial resources compared to larger, more established companies. The performance of mid-cap companies can be more volatile, and their stocks less liquid, compared to larger, more established companies, which could increase the volatility of a fund’s portfolio and performance. Shareholders of a fund that invests in mid-cap companies should expect that the value of the fund’s shares will be more volatile than a fund that invests exclusively in large-cap companies. Generally, the smaller the company size, the greater these risks.
Mortgage- and asset-backed securities | Mortgage- and asset-backed security risk, which is possible in an unstable or depressed housing market, arises from the potential for mortgage failure or premature repayment of principal, or a delay in the repayment of principal. The reduced value of the fund’s securities and the potential loss of principal as a result of a mortgagee’s failure to repay would have a negative impact on the fund. Premature repayment of principal would make it difficult for the fund to reinvest the prepaid principal at a time when interest rates on new mortgages are declining, thereby reducing the fund’s income. Conversely, a delay in the repayment of principal could lengthen the expected maturity of the securities, thereby increasing the potential for loss when prevailing interest rates rise, which could cause the values of the securities to fall sharply.
Municipal securities | A municipal security’s value, interest payments or repayment of principal could be affected by economic, legislative or political changes. Municipal securities are also subject to potential volatility in the municipal market and the fund’s share price, yield and total return may fluctuate in response to municipal bond market movements. Municipal securities with principal and interest payments that are made from the revenues of a specific project or facility, as opposed to general tax revenues, may have increased risks. Changes in a municipality’s financial health may affect its ability to make interest and principal payments when due.
Other investment companies, including ETFs | Investments in the securities of other investment companies, including exchange-traded funds (“ETFs”) (which may, in turn invest in equities, bonds, and other financial vehicles), may involve duplication of advisory fees and certain other expenses. By investing in another investment company, a fund becomes a shareholder of that investment company. As a result, fund shareholders indirectly bear the fund’s proportionate share of the fees and expenses paid by the other investment company, in addition to the fees and expenses fund shareholders indirectly bear in connection with the fund’s own operations. Investments in other investment companies will subject a fund to the risks of the types of investments in which the investment companies invest.
As a shareholder, a fund must rely on the other investment company to achieve its investment objective. If the other investment company fails to achieve its investment objective, the value of the fund’s investment will typically decline, adversely affecting the fund’s performance. In addition, because ETFs are listed on national stock exchanges and are traded like stocks listed on an exchange, ETF shares may potentially trade at a discount or a premium. Investments in ETFs are also subject to brokerage and other trading costs, which could result in greater expenses to a fund. Finally, because the value of ETF shares depends on the demand in the market, the portfolio manager may not be able to liquidate a fund’s holdings of ETF shares at the most optimal time, adversely
| 64 |
Principal Risks
| (UNAUDITED) | ||||
affecting the fund’s performance. An ETF that tracks an index may not precisely replicate the returns of its benchmark index.
Portfolio turnover | A fund may engage in more active and frequent trading of portfolio securities to a greater extent than certain other mutual funds with similar investment objectives. A fund’s turnover rate may vary greatly from year to year or during periods within a year. A high rate of portfolio turnover may lead to greater transaction costs, result in adverse tax consequences to investors (from increased recognition of net capital gains, which are taxable to shareholders when distributed to them) and adversely affect performance.
Redemptions | A fund may experience periods of heavy redemptions that could cause a fund to sell assets at inopportune times or at a loss or depressed value. Redemption risk is greater to the extent that one or more investors or intermediaries control a large percentage of investments in a fund, have short investment horizons, or have unpredictable cash flow needs. A general rise in interest rates has the potential to cause investors to move out of fixed income securities on a large scale, which may increase redemptions from mutual funds that hold large amounts of fixed income securities. This, coupled with a reduction in the ability or willingness of dealers and other institutional investors to buy or hold fixed income securities, may result in decreased liquidity and increased volatility in the fixed income markets, and heightened redemption risk. Heavy redemptions, whether by a few large investors or many smaller investors, could hurt a fund’s performance.
Sectors | Companies that are in similar businesses may be similarly affected by particular economic or market events, which may, in certain circumstances, cause the value of securities of all companies in a particular sector of the market to change. To the extent a fund has substantial holdings within a particular sector, the risks associated with that sector increase.
Small-cap companies | Investments in small-cap companies generally involve greater risks than investing in large-capitalization companies. Companies with smaller market capitalizations generally have lower volume of shares traded daily, less liquid stock and more volatile stock prices. Companies with smaller market capitalizations also tend to have a limited product or service base and limited access to capital. Newer companies with unproven business strategies also tend to be smaller companies. The above factors increase risks and make these companies more likely to fail than companies with larger market capitalizations, and could increase the volatility of a fund’s portfolio and
performance. Shareholders of a fund that invests in small-cap companies should expect that the value of the fund’s shares will be more volatile than a fund that invests exclusively in mid-cap or large-cap companies. Generally, the smaller the company size, the greater these risks.
U.S. Government securities and Government sponsored enterprises | A security backed by the U.S. Treasury or the full faith and credit of the United States is only guaranteed by the applicable entity only as to the timely payment of interest and principal when held to maturity. The market prices for such securities are not guaranteed and will fluctuate. Investments in securities issued by Government sponsored enterprises are debt obligations issued by agencies and instrumentalities of the U.S. Government. These obligations vary in the level of support they receive from the U.S. Government. They may be: (1) supported by the full faith and credit of the U.S. Treasury, such as those of the Government National Mortgage Association; (2) supported by the right of the issuer to borrow from the U.S. Treasury, such as those of the Federal Home Loan Bank and the Federal Farm Credit Banks; (3) supported by the discretionary authority of the U.S. Government to purchase the agency obligations, such as those of the Federal National Mortgage Association and the Federal Home Loan Mortgage Corporation; or (4) supported only by the credit of the issuer, such as those of the Federal Farm Credit Bureau. The U.S. Government may choose not to provide financial support to U.S. Government sponsored agencies or instrumentalities if it is not legally obligated to do so. In such circumstances, if the issuer defaulted, a fund may not be able to recover its investment from the U.S. Government. Like all bonds, U.S. Government securities and Government-sponsored enterprise bonds are also subject to credit risk.
Valuation | Securities held by a fund may be priced by an independent pricing service and may also be priced using dealer quotes or fair valuation methodologies in accordance with valuation procedures adopted by the fund’s Board. The prices provided by the independent pricing service or dealers or the fair valuations may be different from the prices used by other mutual funds or from the prices at which securities are actually bought and sold.
Value stocks | Investments in value stocks are subject to the risk that their true worth may not be fully realized by the market. This may result in the value stocks’ prices remaining undervalued for extended periods of time. A fund’s performance also may be affected adversely if value stocks remain unpopular with or lose favor among investors.
| 65 |
| Name, Birth Year and Position, Term of Office (a) and Length of Time Served | Principal Occupation(s) During Past Five Years | Number of Funds Overseen in Fund | Directorships of other public companies during the past five years | |||
Interested Trustee (b) | ||||||
J. Cooper Abbott (1969) Trustee since 2012 | Executive Vice President, Investments and Co-Chief Operating Officer of Carillon Tower since 2017; Executive Vice President, Investments and Co-Chief Operating Officer of Eagle since 2009; Director of ClariVest Asset Management LLC since 2012; Director, Eagle Fund Services, Inc. since 2009; President, Eagle Boston Management, Inc. since 2009 | 9 | N/A | |||
Court James (1974) Trustee since 2016 | Executive Vice President, Carillon Tower Advisers since 2016, Vice President, New Business Development of Eagle 2010-2016 | 9 | Raymond James Bank | |||
Independent Trustees | ||||||
Keith B. Jarrett, PhD (1948) Trustee since 2005 | Managing Partner, PW1 LLC since 2013; Founder, Rockport Funding, LLC (private equity), and Ajax Partners (investment partnership) since 2003 | 9 | Safeguard Scientific, Inc. (ended 2015) | |||
William J. Meurer (1943) Trustee since 2003 | Private investor and financial consultant since 2000 | 9 | Sykes Enterprises, Inc.; Walter Investment Mgmt. Corp.; LifeLink Foundation (private) | |||
Liana O’Drobinak (1963) Trustee since 2014 | Managing Member, Bay Consulting Partners, LLC since 2010; Board Member, Florida Prepaid College Board, 2012-2014; Board Member, Health Insurance Innovations, Inc., 2/2013-10/2013 | 9 | N/A | |||
James L. Pappas, PhD (1943) Trustee since 1989; Chairman of the Board of Trustees since 2012 | Private investor | 9 | Walter Investment Mgmt. Corp. (ended 2017) | |||
Deborah L. Talbot, PhD (1950) Trustee since 2002 | Independent Consultant; Principal, Lazure Enterprises, since 2013; Deans’ Advisory Board, College of Arts and Sciences, University of Memphis since 2002 | 9 | N/A | |||
John Carter (1961) Trustee since 2016 | Law Office of John K. Carter, P.A. since 2015, Founder, Global Recruiters of St. Petersburg since 2012; President and Chief Executive Officer, Transamerica Asset Management 2006-2012; Chairman, Board Member, Transamerica Partners Portfolios, Transamerica Partners Funds Group, Transamerica Partners Funds Group II and Transamerica Asset Allocation Variable Funds 2007-2012 | 9 | N/A | |||
Stephen Roussin (1963) Trustee since 2016 | President, SR2X Consulting since 2013; Chief Executive Officer and President, Campbell & Company 2011-2012 | 9 | Ramius IDF Master Fund (ended 2016) | |||
Officers (c) | ||||||
Susan L. Walzer (1967) Principal Executive Officer since May 2011 | Vice President of Fund Administration since May 2011; Chief Compliance Officer of Eagle Family of Funds and Eagle Fund Services (“EFS”) (d) 2007-2011; Director of Compliance for Eagle 2005-2007 | |||||
Carolyn K. Gill (1978) Principal Financial Officer and Treasurer since May 2011 | Manager of Fund Accounting and Fund Reporting for Eagle since 2005 and 2010, respectively | |||||
Daniel R. Dzibinski (1974) Chief Compliance Officer and Secretary since May 2011 | Manager of Fund Compliance for Eagle since May 2011; Director of Compliance for Eagle 2007-2011 | |||||
| 66 |
Trustees and Officers
The principal address for each Trustee and Officer is P.O. Box 33022, St. Petersburg, Florida, 33733-8022.
Additional information about the Funds’ Board Members can be found in the Statement of Additional Information, which is available, without charge, upon request, by calling the Carillon Family of Funds toll free at 1-800-421-4184 or by accessing our website at www.carillontower.com.
(a) Trustees serve for life or until they are removed, resign or retire. The Board has adopted a Board Governance Policy that requires Independent Trustees to retire no later than at the end of the meeting which occurs immediately after his or her 75th birthday.
(b) Messrs. Abbott and James are Interested Trustees as that term is defined by the 1940 Act. Messrs. Abbott and James are affiliated with ClariVest, Cougar Global Investments, Carillon Fund Distributors, Eagle, Carillon Tower and Raymond James Financial.
(c) Officers each serve one year terms.
(d) Prior to September 13, 2010, EFS served as the Funds’ transfer agent.
| 67 |
Rev. 11-20-2017
| FACTS | WHAT DOES CARILLON FAMILY OF FUNDS DO WITH YOUR PERSONAL INFORMATION? |  |
| Why? | Financial companies choose how they share your personal information. Federal law gives consumers the right to limit some but not all sharing. Federal law also requires us to tell you how we collect, share, and protect your personal information. Please read this notice carefully to understand what we do. | |
| What? | The types of personal information we collect and share depend on the product or service you have with us. This information can include:
| |
∎ Social security number | ||
∎ Birth date |
| How? | All financial companies need to share customers’ personal information to run their everyday business. In the section below, we list the reasons financial companies can share their customers’ personal information; the reasons Carillon Family of Funds chooses to share; and whether you can limit this sharing. |
Reasons we can share your personal information | Does Carillon Family of Funds share? | Can you limit this sharing? | ||
For our everyday business purposes – such as to process your transactions, maintain your account(s), respond to court orders and legal investigations, or report to credit bureaus | Yes | No | ||
For our marketing purposes – to offer our products and services to you | No | No | ||
| For joint marketing with other financial companies | No | No | ||
For our affiliates’ everyday business purposes – information about your transactions and experiences | Yes | No | ||
For our affiliates’ everyday business purposes – information about your creditworthiness | No | No | ||
| For our affiliates to market to you | No | No | ||
| For non-affiliates to market to you | No | No | ||
| To limit our sharing | ∎ Call 800-421-4184 – our menu will prompt you through your choice(s) or | |
∎ Visit us online: carillontower.com | ||
Please note: | ||
| If you are a new customer, we can begin sharing your information 30 days from the date we sent this notice. When you are no longer our customer, we continue to share your information as described in this notice. | ||
| However, you can contact us at any time to limit our sharing. |
| Questions? | Call 800-421-4184 or go to carillontower.com | |
| Page 2 |
| Who we are | ||
| Who is providing this notice? | Carillon Tower Advisers, Inc., Carillon Fund Services, Inc. and Carillon Family of Funds (collectively, “Carillon Family of Funds”) | |
| What we do | ||
| How does Carillon Family of Funds protect my personal information? | To protect your personal information from unauthorized access and use, we use security measures that comply with federal law. These measures include computer safeguards and secured files and buildings. | |
| How does Carillon Fund Services collect my personal information? | We collect your personal information, for example, when you open an account or deposit money
We also collect your personal information from others, such as affiliates, or other companies. | |
| Why can’t I limit all sharing? | Federal law gives you the right to limit only
∎ sharing for affiliates’ everyday business purposes – information about your creditworthiness ∎ affiliates from using your information to market to you ∎ sharing for non-affiliates to market to you
State laws and individual companies may give you additional rights to limit sharing. | |
| What happens when I limit sharing for an account I hold jointly with someone else? | Your choices will apply to everyone on your account – unless you tell us otherwise. | |
| Definitions | ||
| Affiliates | Companies related by common ownership or control. They can be financial and non-financial companies. ∎ Raymond James & Associates, Inc., Raymond James Financial Services, Inc., Carillon Tower Advisers, Inc., Carillon Fund Distributors, Inc., Carillon Fund Services, Inc., ClariVest Asset Management LLC, Cougar Global Investments Limited, Eagle Asset Management, Inc., Scout Investments, Inc., and Reams Asset Management (a division of Scout Investments). | |
| Non-affiliates | Companies not related by common ownership or control. They can be financial and non-financial companies. ∎ Broker-dealers for business related matters. | |
| Joint marketing | A formal agreement between non-affiliated financial companies that together market financial products or services to you. ∎ N/A | |


eDelivery is the most convenient, economical and
environmentally-conscious way to receive information about your fund.
To enroll, please visit
carillontower.com/eDelivery
Please consider the investment objectives, risks, charges and expenses of any fund carefully before investing. Contact Carillon Tower at 800.421.4184 or your financial advisor for a prospectus, which contains this and other important information about the Funds. Read the prospectus carefully before you invest or send money.
This report is for the information of shareholders of the Eagle Mutual Funds (now known as Carillon Mutual Funds). If you wish to review additional information on the portfolio holdings of a fund, a complete schedule has been filed with the Securities and Exchange Commission (“Commission”) for the first and third quarters of each fund’s fiscal year end on Form N-Q. These filings are available on the Commission’s website at www.sec.gov and may be reviewed and copied at the Commission’s Public Reference Room in Washington, D.C. Information on the operations of the Public Reference Room may be obtained by calling 800.SEC.0330. A description of each fund’s proxy voting policies, procedures and information regarding how each fund voted proxies relating to portfolio securities during the 12-month period ended June 30, 2017, is available without charge, upon request, by calling the Carillon Family of Funds, toll-free at the number above, by accessing our website at carillontower.com or by accessing the Commission’s website at www.sec.gov.
800.421.4184
Carillon Fund Distributors, Inc., Member FINRA | Not FDIC Insured | May Lose Value | No Bank Guarantee
| Item 2. | Code of Ethics |
As of the end of the fiscal period October 31, 2017, Eagle Series Trust (the “Trust”) has adopted a code of ethics, as defined in Item 2 of Form N-CSR that applies to the Principal Executive Officer and Principal Financial Officer. The Trust has not made any amendments to its code of ethics during the covered period. The Trust has not granted any waivers from any provisions of the code of ethics during the covered period. A copy of this code of ethics is filed as an exhibit to this Form N-CSR.
| Item 3. | Audit Committee Financial Expert |
The Trust’s Board of Trustees (“Board”) has determined that William J. Meurer is an audit committee financial expert, as defined in Item 3 of Form N-CSR, serving on its audit committee. Mr. Meurer is independent for purposes of Item 3 of Form N-CSR.
| Item 4. | Principal Accountant Fees and Services1 |
(a) Audit Fees
The aggregate fees billed by the Trust’s independent public accountants, PricewaterhouseCoopers LLP (“PwC”) for professional services rendered in connection with the audit of the Trust’s annual financial statements or services that are normally provided by the accountant in connection with statutory and regulatory filings or engagements were $253,000 for the fiscal period ended October 31, 2016, and $262,000 for the fiscal period ended October 31, 2017.
(b) Audit-Related Fees
There were no aggregate fees PwC billed to the Trust for assurance and other services which are reasonably related to the performance of the Trust’s audit and are not reported under Item 4(a) for the fiscal periods ended October 31, 2016, and October 31, 2017. The aggregate fees PwC billed to the Trust’s investment adviser and any entity controlling, controlled by, or under common control with the Trust’s investment adviser for assurance and other services directly related to the operations and financial reporting of the Trust were $0.00 for the fiscal period ended October 31, 2016, and $0.00 for the fiscal period ended October 31, 2017.
(c) Tax Fees
The aggregate tax fees PwC billed to the Trust for tax compliance, tax advice, and tax planning services were $43,000 for the fiscal period ended October 31, 2016, and $37,000 for the fiscal period ended October 31, 2017. There were no aggregate tax fees PwC billed to the Trust’s investment adviser and any entity controlling, controlled by, or under common control with the Trust’s investment adviser for services directly related to the operations and financial reporting of the Trust for the fiscal periods ended October 31, 2016, and October 31, 2017.
| 1 | All accountant fees and services amounts are rounded to the nearest whole thousand. |
(d) All Other Fees
For the fiscal periods ended October 31, 2016, and October 31, 2017, the Trust paid PwC no other fees. There were no aggregate fees PwC billed to the Trust’s investment adviser and any entity controlling, controlled by, or under common control with the Trust’s investment adviser for any other services directly related to the operations and financial reporting of the Trust for the fiscal periods ended October 31, 2016, and October 31, 2017.
(e) The Trust’s Audit Committee Charter provides that the Audit Committee (comprised of the Independent Trustees of the Trust) is responsible for pre-approval of all auditing services performed for the Trust. The Audit Committee reports to the Board regarding its approval of the engagement of the auditor and the proposed fees for the engagement, and the majority of the Board (including the members of the Board who are Independent Trustees) must approve the auditor at an in-person meeting. The Audit Committee also is responsible for pre-approval (subject to the de minimis exception for non-audit services described in the Securities Exchange Act of 1934, as amended, and applicable rule thereunder and not expecting to exceed $5,000) of all non-auditing services performed for the Trust or for any service affiliate of the Trust. The Trust’s Audit Committee Charter also permits a designated member of the Audit Committee to pre-approve, between meetings, one or more non-audit service projects, subject to ratification by the Audit Committee at the next meeting of the Audit Committee. The Trust’s Audit Committee pre-approved all fees described above which PwC billed to the Trust.
(f) Less than 50% of the hours billed by PwC for auditing services to the Trust for the fiscal period ended October 31, 2017, were for work performed by persons other than full-time, permanent employees of PwC.
(g) There were no aggregate non-audit fees billed by PwC to the Trust and to the Trust’s investment adviser and any entity controlling, controlled by, or under common control with the Trust’s investment adviser for the fiscal periods ended October 31, 2016, and October 31, 2017.
(h) The Trust’s Audit Committee has considered the non-audit services provided to the Trust and the Trust’s investment adviser and any entity controlling, controlled by, or under common control with the Trust’s investment adviser as described above and determined that these services do not compromise PwC’s independence.
| Item 5. | Audit Committee of Listed Registrants |
Not applicable to the Trust.
| Item 6. | Schedule of Investments |
Included as part of report to shareholders under Item 1.
Item 7. Disclosure of Proxy Voting Policies and Procedures for Closed-End Management Investment Companies.
Not applicable to the Trust.
| Item 8. | Portfolio Managers of Closed-End Management Investment Companies |
Not applicable to the Trust.
Item 9. Purchases of Equity Securities by Closed-End Management Investment Company and Affiliated Purchasers
Not applicable to the Trust.
| Item 10. | Submission of Matters to a Vote of Security Holders. |
There have been no material changes to the Trust’s Nominating Committee Charter, which sets forth procedures by which shareholders may recommend nominees to the Board, since the Trust last provided disclosure in response to this item.
| Item 11. | Controls and Procedures |
| (a) | Based on an evaluation of the disclosure controls and procedures (as defined in Rule 30a-3(c) under the Investment Company Act of 1940, as amended), the Principal Executive Officer and Principal Financial Officer of the Trust have concluded that such disclosure controls and procedures are effective as of December 20, 2017. |
| (b) | There was no change in the internal controls over financial reporting (as defined in Rule 30a-3(d) under the Investment Company Act of 1940, as amended) of the Trust that occurred during the second fiscal quarter of the period covered by this report that has materially affected or is reasonably likely to materially affect, its internal control over financial reporting. |
| Item 12. | Exhibits |
(a)(1) Code of Ethics pursuant to Item 2 of Form N-CSR is filed and attached hereto as Exhibit 99.CODEETH.
(a)(2) The certifications required by Rule 30a-2(a) of the Investment Company Act of 1940, as amended, and Section 302 of the Sarbanes-Oxley Act of 2002 is filed and attached hereto as Exhibit 99.CERT.
(a)(3) Not applicable to the Trust.
(b) The certification required by Rule 30a-2(b) of the Investment Company Act of 1940, as amended, and Section 906 of the Sarbanes-Oxley Act of 2002 is filed and attached hereto as Exhibit 99.906CERT.
SIGNATURES
Pursuant to the requirements of the Securities Exchange Act of 1934 and the Investment Company Act of 1940, the Trust has duly caused this report to be signed on its behalf by the undersigned, thereunto duly authorized.
| EAGLE SERIES TRUST | ||||||
| Date: December 20, 2017 | ||||||
/s/ Susan L. Walzer | ||||||
| Susan L. Walzer | ||||||
| Principal Executive Officer | ||||||
Pursuant to the requirements of the Securities Exchange Act of 1934 and the Investment Company Act of 1940, this report has been signed below by the following persons on behalf of the Trust and in the capacities and on the dates indicated.
| EAGLE SERIES TRUST | ||||||
| Date: December 20, 2017 | /s/ Susan L. Walzer | |||||
| Susan L. Walzer | ||||||
| Principal Executive Officer | ||||||
| Date: December 20, 2017 | /s/ Carolyn Gill | |||||
| Carolyn Gill | ||||||
| Principal Financial Officer | ||||||