UNITED STATES
SECURITIES AND EXCHANGE COMMISSION
Washington, D.C. 20549
FORM N-CSR
CERTIFIED SHAREHOLDER REPORT OF REGISTERED
MANAGEMENT INVESTMENT COMPANIES
Investment Company Act File Number: 811-07538
LORD ABBETT SECURITIES TRUST
(Exact name of Registrant as specified in charter)
90 Hudson Street, Jersey City, NJ 07302
(Address of principal executive offices) (Zip code)
Brooke A. Fapohunda, Esq., Vice President & Assistant Secretary
90 Hudson Street, Jersey City, NJ 07302
(Name and address of agent for service)
Registrant’s telephone number, including area code: (800) 201-6984
Date of fiscal year end: 10/31
Date of reporting period: 10/31/2016
| Item 1: | Report(s) to Shareholders. |

2016 LORD ABBETT
ANNUAL REPORT
Lord Abbett
Alpha Strategy Fund
Fundamental Equity Fund
Growth Leaders Fund
International Core Equity Fund
International Dividend Income Fund
International Opportunities Fund
Value Opportunities Fund
For the fiscal year ended October 31, 2016
Table of Contents
Lord Abbett Securities Trust
Lord Abbett Alpha Strategy Fund, Lord Abbett Fundamental Equity Fund, Lord Abbett Growth Leaders Fund, Lord Abbett International Core Equity Fund, Lord Abbett International Dividend Income Fund, Lord Abbett International Opportunities Fund, and Lord Abbett Value Opportunities Fund Annual Report
For the fiscal year ended October 31, 2016

Daria L. Foster, Trustee, President and Chief Executive Officer of the Lord Abbett Funds, and E. Thayer Bigelow, Independent Chairman of the Lord Abbett Funds.
Dear Shareholders: We are pleased to provide you with this overview of the performance of the Funds for the fiscal year ended October 31, 2016. On this page and the following pages, we discuss the major factors that influenced fiscal year performance. For detailed and more timely information about the Funds, please visit our website at www.lordabbett.com, where you also can access the quarterly commentaries that provide updates on each Fund’s performance and other portfolio related updates.
Thank you for investing in Lord Abbett mutual funds. We value the trust that you place in us and look forward to serving your investment needs in the years to come.
Best regards,

Daria L. Foster
Trustee, President and Chief Executive Officer
1
Alpha Strategy Fund
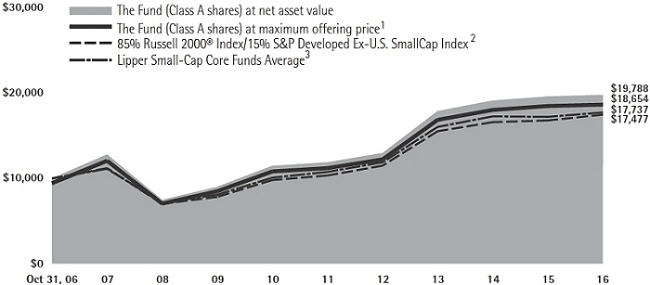
For the fiscal year ended October 31, 2016, the Fund returned 0.91%, reflecting performance at the net asset value (NAV) of Class A shares, with all distributions reinvested, compared to its benchmark, a blend consisting of 85% Russell 2000® Index1 / 15% S&P Developed Ex-U.S. SmallCap® Index,2 which returned 3.99% over the same period.
Domestic equity markets (as represented by the S&P 500® Index3) returned 4.51% over the past year. Despite this general move higher, there were a few bouts of volatility within U.S. stock markets, notably experiencing their worst start to a calendar year on record, in the early part of 2016. The Federal Reserve (Fed) raised target rates in December 2015, from 0%-0.25% to 0.25%-0.5%, citing an improved economic outlook and delayed policy-response time as the rationale for their actions. This marked the first rate hike by the Fed since 2006. In contrast to the equity market volatility, the U.S. economy continued to expand during the trailing 12-month period. In October, the unemployment rate reached 4.9%, while U.S. gross domestic product grew at a 2.9% pace during the third quarter, a significant increase over the second quarter. The U.S. Bureau of Economic Analysis stated that during the third quarter personal and disposable income increased along with savings, quarter-over-quarter.
Geopolitical events also contributed to volatility in global markets. The United
Kingdom’s referendum in June (“Brexit”), to leave the European Union, was a surprise that caused a sell-off in global markets. More recently, uncertainty around the impact of the U.S election weighed on the markets’ expectations.
During the period, performance of the Fund’s underlying investment strategies (underlying funds) detracted from the Fund performance. The Fund’s exposure to international small cap stocks and domestic small cap growth equities detracted from relative performance, as each of these investment strategies significantly underperformed their respective indexes as well as the Fund’s benchmark index. Within the Fund’s international equity allocation, security selection in the materials and consumer discretionary sectors detracted from performance relative to the underlying index. Similarly, stock selection in the industrials and information technology sectors in the domestic small cap growth strategy detracted from performance.
The Fund’s exposure to domestic micro cap value equities contributed to performance, as this investment strategy outperformed its underlying index. Within this strategy, stock selection in the energy and industrials sectors contributed to the performance relative to the underlying index. Also contributing to the Fund’s performance relative to its benchmark was exposure to the domestic small cap value strategy. Stock selection within the health care and energy sectors caused this
2
investment strategy to outperform its underlying index.
Fundamental Equity Fund
For the fiscal year ended October 31, 2016, the Fund returned 4.36%, reflecting performance at the net asset value (NAV) of Class A shares, with all distributions reinvested, compared to its benchmark, the Russell 1000® Value Index,4 which returned 6.37% over the same period.
Domestic equity markets (as represented by the S&P 500® Index3) returned 4.51% over the past year. Despite this general move higher, there were a few bouts of volatility within U.S. stock markets, notably experiencing their worst start to a calendar year on record, in the early part of 2016. The Federal Reserve (Fed) raised target rates in December 2015, from 0%-0.25% to 0.25%-0.5%, citing an improved economic outlook and delayed policy-response time as the rationale for their actions. This marked the first rate hike by the Fed since 2006. In contrast to the equity market volatility, the U.S. economy continued to expand during the trailing 12-month period. In October, the unemployment rate reached 4.9%, while U.S. gross domestic product grew at a 2.9% pace during the third quarter, a significant increase over the second quarter. The U.S. Bureau of Economic Analysis stated that during the third quarter personal and disposable income increased along with savings, quarter-over-quarter.
Geopolitical events also contributed to volatility in global markets. The United
Kingdom’s referendum in June (“Brexit”) was a surprise that caused a sell-off in global markets. More recently, uncertainty around the impact of the U.S election weighed on the markets’ expectations.
The Fund underperformed its index for the period. During the trailing 12-month period, the consumer staples and materials sectors detracted from relative performance the most. Within the consumer staples sector, shares of CVS Health Corporation, a pharmacy and health care company, fell after the California Public Employee’s Retirement System switched their PMB (pharmacy benefit manager) contract to United Healthcare’s OptumRx. Shares of Kroger Co., an operator of retail food and drug stores, dropped as meat and dairy prices deflated and competition offering discounted prices accelerated. Within the materials sector, shares of E.I. DuPont de Neumours and Co., a science and technology-based company, declined as the company faced fundamental headwinds from agriculture volatility, weaker global currencies, and slowing industrial production. Shares in Lyondellbasell Industries N.V., a global, chemical company, also fell as emerging industry headwinds, including increased capacity and waning global demand, weighed on its share price.
The largest contributors to relative performance during the trailing 12-month period were the consumer discretionary and telecommunication services sectors. Within the consumer discretionary sector,
3
shares in Time Warner Inc., a media and entertainment company, rose due to strong revenue from their film studio, lower-than-expected costs from HBO, and a recent buyout offer from AT&T, Inc. Shares of McDonald’s Corp., the operator and franchiser of McDonald’s restaurants, accelerated as sales increased when the company made efforts to expand its offerings by adding All-Day Breakfast menu items and through their “McPick 2” promotion, improving restaurant assets, and upgrading food quality. Within the telecommunication services sector, shares of AT&T, Inc., a provider of communications and digital entertainment services, and Verizon Communications Inc., a provider of communications, information, and entertainment products and services, were the top contributors. These two large telecommunications companies benefited from investor demand during the period for stable, income-producing securities amid a volatile and low-interest rate environment.
Growth Leaders Fund
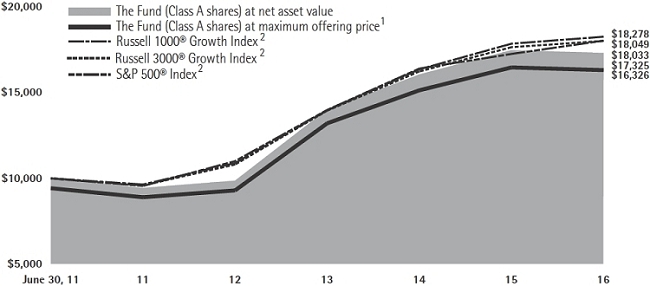
For the fiscal year ended October 31, 2016, the Growth Leaders Fund returned -0.96%, reflecting performance at the net asset value (NAV) of Class A shares, with all distributions reinvested, compared to its benchmark, the Russell 1000® Growth Index,5 which returned 2.28% over the same period.
Domestic equity markets (as represented by the S&P 500® Index3) returned 4.51% over the past year. Despite
this general move higher, there were a few bouts of volatility within U.S. stock markets, notably experiencing their worst start to a calendar year on record, in the early part of 2016. The Federal Reserve (Fed) raised target rates in December 2015, from 0%-0.25% to 0.25%-0.5%, citing an improved economic outlook and delayed policy-response time as the rationale for their actions. This marked the first rate hike by the Fed since 2006. In contrast to the equity market volatility, the U.S. economy continued to expand during the trailing 12-month period. In October, the unemployment rate reached 4.9%, while U.S. gross domestic product grew at a 2.9% pace during the third quarter, a significant increase over the second quarter. The U.S. Bureau of Economic Analysis stated that during the third quarter personal and disposable income increased along with savings, quarter-over-quarter.
Geopolitical events also contributed to volatility in global markets. The United Kingdom’s referendum in June (“Brexit”), to leave the European Union, was a surprise that caused a sell-off in global markets. More recently, uncertainty around the impact of the U.S election weighed on the markets’ expectations.
Security selection in the consumer staples sector detracted from the Fund’s performance relative to the benchmark during the trailing 12-month period. Within this sector, the Fund’s holdings of Monster Beverage Corp., a beverages company, detracted the most. In February 2016,
4
shares of Monster fell sharply after concerns were raised over its market valuation. Another detractor from performance within the consumer staples sector was the Fund’s position in Costco Wholesale Corp., a specialty retailer engaged in the operation of warehouses. Costco experienced slower customer traffic and weaker same-store sales, which management attributed to external factors.
Security selection in the industrials sector also detracted from relative performance during the period. Within this sector, the Fund’s holdings of Delta Air Lines, Inc., a passenger and cargo air transportation company, detracted most. Shares of Delta Air Lines continued to face general headwinds with passenger revenue per available seat miles declining across the whole industry. Also detracting from relative performance within the industrials sector was the Fund’s position in Boeing Co., an aerospace and defense company. Shares of Boeing fell in January after a report that Securities and Exchange Commission staff had inquired about accounting practices related to Boeing’s best-known jets.
The leading contributor to the Fund’s relative performance during the period was the Fund’s positions in the health care sector. Within this sector, the Fund’s holdings of Medivation, Inc., a biopharmaceutical company, contributed most, after Pfizer completed its acquisition of the company in September 2016. Another contributor was the Fund’s
position in Intuitive Surgical, Inc., a manufacturer and marketer of da Vinci Surgical Systems. Shares of Intuitive Surgical advanced after the Food and Drug Administration cleared several of its product launches, and procedure growth on its systems looked favorable.
Another contributor to the Fund’s relative performance during the period was its overweight position in the information technology sector. Within this sector, NVIDIA Corp., a semiconductor company focused on visual computing, contributed the most. NVIDIA had a record fourth quarter in 2015, and both sales and earnings per share growth posted ahead of Street estimates. Facebook, Inc., a social media company, saw its shares rise as revenue and margins expanded in the second quarter of 2016.
International Core Equity Fund
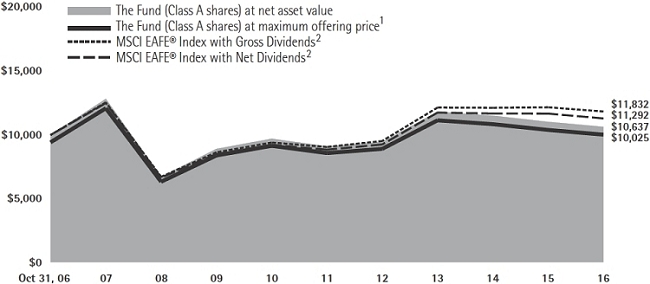
For the fiscal year ended October 31, 2016, the Fund returned -3.54%, reflecting performance at the net asset value (NAV) of Class A Shares, with all distributions reinvested, compared to its benchmark, the MSCI EAFE® Index with Gross Dividends,6 which returned -2.74% over the same period.
Over the period, global equity markets experienced significant volatility, as a result of continued central bank stimulus, sharp moves in commodity prices, the United Kingdom’s Brexit vote, and uncertainty around Chinese economic
5
growth. Overall, European markets (as measured by the EURO STOXX 50® Index7) fell roughly -7.8% in U.S. dollars for the period, while Japan’s Nikkei 2258 fell 6.9%.
At the end of 2015, the Federal Reserve (Fed) raised interest rates for the first time since the financial crisis to a range between 0.25%-0.50%. At that time, Fed expectations were for four rate hikes in 2016, however that did not materialize and the Fed once again left rates unchanged at the 0.25%-0.50% range at the September meeting. Similarly, other central banks continued the same theme, as the European Central Bank cut the deposit rate in the Eurozone from -0.2% to -0.3% in December 2015 and increased its existing monetary easing program from €60 billion to €80 billion per month in March 2016. In January, the Bank of Japan introduced negative rates on excess reserves in an effort to stimulate economic growth and, at its September meeting, introduced “yield curve control” to regulate both short- and long-term rates. The Bank of Japan also committed itself to expand the monetary base until inflation – as measured by the Consumer Price Index – exceeds 2%.
By February of 2016, crude oil prices had fallen to under $27/bbl. By October, however, prices had recovered to above $45, despite production continuing to outpace demand and OPEC failing to reach a deal on production cuts.
Adding to the volatility during the quarter was the United Kingdom’s vote on June 23, 2016, to leave the European Union,
which rattled global financial markets that had largely expected a “remain” vote. Following the vote, the British pound fell to a 30-year low and yields on U.K. bonds also fell to historical lows.
During the period, stock selection within the industrials and consumer discretionary sectors contributed to the Fund’s underperformance relative to the benchmark. Within the industrials sector, Safran SA, a French-based high-technology producer of rocket engines and propulsion systems, detracted from relative performance. Shares of the company declined as the company transitioned to more expensive engine designs leading to realized losses on its engine sales. In addition, Japan Airlines Co. Ltd., a Japan-based airline company, performed poorly over the period after company earnings decreased due to employee cost increases and decreased travel volume stemming from increased terrorist acts around the world.
In the consumer discretionary sector, Berkeley Group Holdings plc, an English mixed-use property development company, detracted from relative performance. The company’s stock declined significantly after the United Kingdom’s Brexit vote, with a broad decline in the country’s biggest homebuilders.
Stock selection within the materials sector contributed to the Fund’s relative performance during the period. Within materials, shares of Fortescue Metals Group, an iron ore exploration,
6
development, production, and processing company, rallied last year on the back of both higher iron ore prices and greater production. In addition, shares of South32 Ltd., an Australian metals and mining company, rose as the company was able to reduce costs while its higher margin mining assets performed better than expected.
Stock selection within the information technology sector also bolstered the Fund’s relative performance. Within the sector, shares of Taiwan Semiconductor Manufacturing Co. Ltd., a foundry, performed well, supported by higher margins and sustained sales momentum.
International Dividend Income Fund
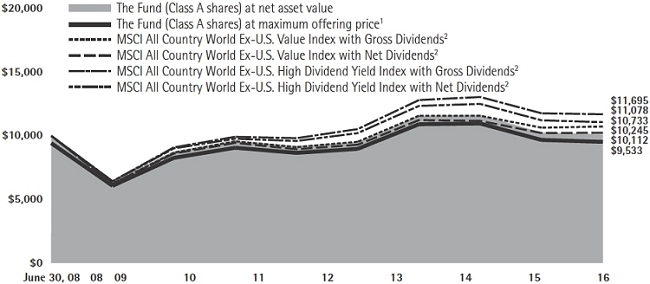
For the fiscal year ended October 31, 2016, the Fund returned -1.52%, reflecting performance at the net asset value (NAV) of Class A Shares, with all distributions reinvested, compared to its benchmark, the MSCI All Country World Index ex-U.S. High Dividend Yield Gross Index,9 which returned -0.63% over the same period.
Over the period, global equity markets experienced significant volatility, as a result of continued central bank stimulus, sharp moves in commodity prices, the United Kingdom’s Brexit vote, and uncertainty around Chinese economic growth. Overall, European markets (as measured by the Euro Stoxx 507) fell roughly -7.8% in U.S. dollars for the period, while Japan’s Nikkei 2258 fell 6.9%.
At the end of 2015, the Federal Reserve (Fed) raised interest rates for the first time since the financial crisis to a range between 0.25%-0.50%. At that time, Fed expectations were for four rate hikes in 2016, however that did not materialize, and the Fed once again left rates unchanged at the 0.25%-0.50% range at the September meeting. Similarly, other central banks continued the same theme, as the European Central Bank cut the deposit rate in the Eurozone from -0.2% to -0.3% in December 2015 and increased its existing monetary easing program from €60 billion to €80 billion per month in March 2016. In January, the Bank of Japan introduced negative rates on excess reserves in an effort to stimulate economic growth and, at its September meeting, introduced “yield curve control” to regulate both short- and long-term rates. The Bank of Japan also committed itself to expand the monetary base until inflation – as measured by the Consumer Price Index – exceeds 2%.
By February of 2016, crude oil prices had fallen to under $27/bbl. By October, however, prices had recovered to above $45, despite production continuing to outpace demand and OPEC failing to reach a deal on production cuts.
Adding to the volatility during the quarter was the United Kingdom’s vote on June 23, 2016, to leave the European Union, which rattled global financial markets that had largely expected a “remain” vote. Following the vote, the British pound fell to
7
a 30-year low and yields on U.K. bonds also fell to historical lows.
During the period, the Fund’s underperformance relative to the benchmark was driven by stock selection, particularly within the financials and consumer staples sectors. Within the financials sector, shares of Barclays PLC, a global financial services company, fell after the United Kingdom’s referendum to leave the European Union raised questions regarding the sustainability of the company’s investment bank. Additionally, shares of Prudential plc, a financial services company, detracted from performance. The company reported poor fourth quarter 2015 earnings that missed earnings estimates, driven by higher expenses and weakness in its retirement and life insurance sectors.
Within the consumer staples sector, shares of Woolworths Ltd., an Australian operator of supermarkets, specialty, and department stores, detracted from relative performance as the company suffered from a foreign exchange hit due to Brexit and weak consumer staples data from the United States. Additionally, Anheuser Busch Inbev SA NV, a Belgium-based beer brewer, detracted from performance. The company reported a challenging third quarter of 2016 mainly driven by poor performance in Brazil, causing the company to reduce earnings guidance for 2016.
Conversely, stock selection within the utilities and materials sectors, contributed to relative performance. Within the utilities
sector, shares of AES Tiete Energia S.A., a Brazilian electric power generation company, rose as the company benefited from strong performance in the Brazilian market along with increased prices for the company’s generation capacity. Shares of AusNet Services, an Australian energy delivery service provider, also contributed to performance as the company continued to pay down debt, and has benefited from a regulator decision on revenue allowance.
Within the materials sector, shares of Fletcher Building Limited, a manufacturer and distributor of building and construction materials, contributed to relative performance, as the company benefited from strong construction growth in New Zealand. Additionally, shares of BHP Billiton Ltd., a global resources company, contributed to performance, as the company reported strong iron ore production and higher margins in third quarter 2016.
International Opportunities Fund
For the fiscal year ended October 31, 2016, the Fund returned -0.99%, reflecting performance at the net asset value (NAV) of Class A Shares, with all distributions reinvested, compared to its benchmark, the S&P Developed Ex-U.S. Small Cap® Index,2 which returned 3.33% over the same period.
Over the period, global equity markets experienced significant volatility, as a result of continued central bank stimulus,
8
sharp moves in commodity prices, the United Kingdom’s Brexit vote, and uncertainty around Chinese economic growth. Overall, European markets (as measured by the Euro Stoxx 507) fell roughly -7.8% in U.S. dollars for the period, while Japan’s Nikkei 2258 fell 6.9%.
At the end of 2015, the Federal Reserve (Fed) raised interest rates for the first time since the financial crisis to a range between 0.25%-0.50%. At that time, Fed expectations were for 4 rate hikes in 2016, however that did not materialize, and the Fed once again left rates unchanged at the 0.25%-0.50% range at the September meeting. Similarly, other central banks continued the same theme, as the European Central Bank cut the deposit rate in the Eurozone from -0.2% to -0.3% in December 2015 and increased its existing monetary easing program from €60 billion to €80 billion per month in March 2016. In January, the Bank of Japan introduced negative rates on excess reserves in an effort to stimulate economic growth and, at its September meeting, introduced “yield curve control” to regulate both short- and long-term rates. The Bank of Japan also committed itself to expand the monetary base until inflation – as measured by the Consumer Price Index – exceeds 2%.
By February of 2016, crude oil prices had fallen to under $27/bbl. By October, however, prices had recovered to above $45, despite production continuing to outpace demand and OPEC failing to reach a deal on production cuts.
Adding to the volatility during the quarter was the United Kingdom’s vote on June 23, 2016, to leave the European Union, which rattled global financial markets that had largely expected a “remain” vote. Following the vote, the British pound fell to a 30-year low and yields on U.K. bonds also fell to historical lows.
Stock selection, most notably in the materials and consumer discretionary sectors, was the primary driver of relative underperformance during the period. Within materials, shares of Essentra plc, a United-Kingdom based manufacturer and distributor of tobacco supplies, declined after missing earnings for the first half of 2016 and a decline in revenue. In addition, Hill & Smith Holdings PLC, a United Kingdom based manufacturer and supplier of infrastructure products and galvanizing services, detracted from performance as shares reversed from strong gains earlier in the year.
Within the consumer discretionary sector, shares of DFS Furniture PLC, a United Kingdom based furniture and fixture manufacturer declined, after the U.K.’s Brexit vote in June and concerns for the housing market.
Conversely, stock selection in the financials and consumer staples sectors contributed to relative performance. Within the financials sector, shares of Bank Tabungan Negara, an Indonesian commercial bank, rose significantly over the period as the company was helped by a government program to build 1 million
9
homes for low-income citizens. In addition, shares of Dewan Housing Finance, an Indian housing financial services provider, rose as the company reported an improvement in net interest margin and continued improvement in cost and income ratios.
Within the consumer staples sector, Sundrug Co. Ltd., a Japanese pharmaceutical retailer, contributed to the Fund’s performance. The company’s stock rose as the company reported the highest return on assets of its competitors and continued to benefit from Japan’s aging population.
Value Opportunities Fund
For the fiscal year ended October 31, 2016, the Fund returned 4.33%, reflecting performance at the net asset value (NAV) of Class A shares, with all distributions reinvested, compared to its benchmark, the Russell 2500™ Index,10 which returned 3.98% over the same period.
Domestic equity markets (as represented by the S&P 500® Index3) returned 4.51% over the past year. Despite this general move higher, there were a few bouts of volatility within U.S. stock markets, notably experiencing their worst start to a calendar year on record, in the early part of 2016. The Federal Reserve (Fed) raised target rates in December 2015, from 0%-0.25% to 0.25%-0.5%, citing an improved economic outlook and delayed policy-response time as the rationale for their actions. This marked the first rate hike by the Fed since 2006. In contrast to the
equity market volatility, the U.S. economy continued to expand during the trailing 12-month period. In October, the unemployment rate reached 4.9%, while U.S. gross domestic product grew at a 2.9% pace during the third quarter, a significant increase over the second quarter. The U.S. Bureau of Economic Analysis stated that during the third quarter personal and disposable income increased along with savings, quarter-over-quarter.
Geopolitical events also contributed to volatility in global markets. The United Kingdom’s referendum in June (“Brexit”), to leave the European Union, was a surprise that caused a sell-off in global markets. More recently, uncertainty around the impact of the U.S election weighed on the markets’ expectations.
During the period the Fund outperformed its benchmark. Security selection in the health care and energy sectors contributed to the Fund’s outperformance relative to the benchmark. Within the health care sector, shares of ExamWorks Group, Inc., a provider of independent medical examinations and medical-related services, increased following the announcement that the company would be acquired by Leonard Green & Partners, L.P. HealthSouth Corp., an owner and operator of inpatient rehabilitation hospitals, beat consensus first quarter earnings expectations due to strong growth and free cash flow. Both ExamWorks Group, Inc. and HealthSouth Corp. were the biggest detractors to the
10
Fund’s performance in the health care sector last year.
Within the energy sector, shares of Rice Energy, Inc. an independent natural gas and oil company, rose due to increased production and a reduction in costs. Shares of Cimarex Energy Co., an independent oil and gas exploration and production company, rose in tandem with the increase in the price of Western Texas Intermediate Oil in the second quarter of 2016.
Conversely, security selection in the information technology and industrials sectors were main detractors from the Fund’s relative performance during the period. Within the information technology sector, shares of MAXIMUS, Inc., a business process services company focused on government-sponsored programs, detracted from relative performance due to fears that the United Kingdom’s Work and Pensions
Secretary wanted to exit MAXIMUS’ Fit-for-Work program. Shares of Synaptics, Inc., a developer and designer of unique interface product solutions, suffered due to a decline in revenue from one of its clients, Apple Inc.
Within the industrials sector, shares of Snap-on, Inc., a manufacturer of diagnostic and repair solutions, faced headwinds from a soft commercial and industrial production market, despite posting strong Q4 earnings. In addition, Kirby Corp., a U.S.-based barge operator, lowered fiscal year 2016 guidance due to a decrease in marine and costal market utilization and revenue, which had a negative effect on its share price.
Each Fund’s portfolio is actively managed and, therefore, its holdings and the weightings of a particular issuer or particular sector as a percentage of portfolio assets are subject to change. Sectors may include many industries.
1 The Russell 2000® Index measures the performance of the 2,000 smallest companies in the Russell 3000 Index, which represents approximately 10% of the total market capitalization of the Russell 3000 Index.
2 The S&P Developed Ex-U.S. SmallCap® Index captures the bottom 15% of companies domiciled in the developed markets excluding the United States within the S&P Global BMI with a float-adjusted market capitalization of at least US$100 million and a minimum annual trading liquidity of US$50 million. Stocks are excluded if their market capitalization falls below US$75 million, or if the value that is traded is less than US$35 million at the time of reconstitution.
3 The S&P 500® Index is widely regarded as the standard for measuring large cap U.S. stock market performance and includes a representative sample of leading companies in leading industries.
4 The Russell 1000® Value Index measures the performance of those Russell 1000 companies with lower price-to-book ratios and lower forecasted growth values.
5 The Russell 1000® Growth Index measures the performance of those Russell 1000 companies with higher price-to-book ratios and higher forecasted growth values.
6 The MSCI EAFE® Index (Europe, Australasia, Far East) is a free float-adjusted market capitalization index that is designed to measure the equity market performance of developed markets, excluding the US & Canada. The MSCI EAFE® Index consists of the following 21 developed market country indices: Australia, Austria, Belgium, Denmark, Finland, France, Germany, Hong Kong, Ireland, Israel, Italy, Japan, the Netherlands, New Zealand, Norway, Portugal, Singapore, Spain, Sweden, Switzerland, and the United Kingdom.
11
The MSCI EAFE® Index with Gross Dividends approximates the maximum possible dividend reinvestment. The amount reinvested is the entire dividend distributed to individuals resident in the country of the company, but does not include tax credits.
7 The EURO STOXX 50® Index represents the performance of the 50 largest companies among the 19 supersectors in terms of free-float market cap in 12 eurozone countries. These countries include Austria, Belgium, Finland, France, Germany, Greece, Ireland, Italy, Luxembourg, the Netherlands, Portugal and Spain. The index has a fixed number of components and is part of the STOXX blue-chip index family. The index captures about 60% of the free-float market cap of the EURO STOXX Total Market Index (TMI).
8 The Nikkei Stock Average, the Nikkei 225 is used around the globe as the premier index of Japanese stocks. Because of the prominent nature of the index, many financial products linked to the Nikkei 225 have been created are traded worldwide while the index has been sufficiently used as the indicator of the movement of Japanese stock markets. The Nikkei 225 is a price-weighted equity index, which consists of 225 stocks in the 1st section of the Tokyo Stock Exchange.
9 The MSCI All Country World Index ex-U.S. High Dividend Yield Index is based on MSCI ACWI ex USA, its parent index, and includes large and mid-cap stocks across 45 Developed Markets (DM) and Emerging Markets (EM) countries. The index is designed to reflect the performance of equities in the parent index (excluding REITs) with higher dividend income and quality characteristics than average dividend yields that are both sustainable and persistent. The index also applies quality screens and reviews 12-month past performance to omit stocks with potentially deteriorating fundamentals that could force them to cut or reduce dividends.
10 The Russell 2500™ Index is a market cap weighted index that includes the smallest 2,500 companies covered in the Russell 3000® universe of United States-based listed equities.
Unless otherwise specified, indexes reflect total return, with all dividends reinvested. Indexes are unmanaged, do not reflect the deduction of fees or expenses, and are not available for direct investment.
Important Performance and Other Information
Performance data quoted in the following pages reflect past performance and are no guarantee of future results. Current performance may be higher or lower than the performance quoted. The investment return and principal value of an investment in the Funds will fluctuate so that shares, on any given day or when redeemed, may be worth more or less than their original cost. You can obtain performance data current to the most recent month end by calling Lord Abbett at 888-522-2388 or referring to www.lordabbett.com.
Except where noted, comparative Fund performance does not account for the deduction of sales charges and would be different if sales charges were included. Each Fund offers classes of shares with distinct pricing options. For a full description of the differences in pricing alternatives, please see each Fund’s prospectus.
During certain periods shown, expense waivers and reimbursements were in place for Alpha Strategy Fund, Growth Leaders Fund, International Core Equity Fund and International Dividend Income Fund. Without such waivers and expense reimbursements, each Fund’s returns would have been lower.
The annual commentary above discusses the views of the Funds’ management and various portfolio holdings of the Funds as of October 31, 2016. These views and portfolio holdings may have changed after this date. Information provided in the commentary is not a recommendation to buy or sell securities. Because the Funds’ portfolio is actively managed and may change significantly, the Funds may no longer own the securities described above or may have otherwise changed their positions in the securities. For more recent information about the Funds’ portfolio holdings, please visit www.lordabbett.com.
A Note about Risk: See Notes to Financial Statements for a discussion of investment risks. For a more detailed discussion of the risks associated with each Fund, please see each Fund’s prospectus.
Mutual funds are not insured by the FDIC, are not deposits or other obligations of, or guaranteed by, banks, and are subject to investment risks including possible loss of principal amount invested.
12
Alpha Strategy Fund
Investment Comparison
Below is a comparison of a $10,000 investment in Class A shares with the same investment in the 85% Russell 2000® Index/15% S&P Developed Ex-U.S. SmallCap Index and the Lipper Small-Cap Core Funds Average, assuming reinvestment of all dividends and distributions. The performance of other classes will be greater than or less than the performance shown in the graph below due to different sales loads and expenses applicable to such classes. The graph and performance table below do not reflect the deduction of taxes that a shareholder would pay on Fund distributions or the redemption of Fund shares. During certain periods, expenses of the Fund have been waived or reimbursed by Lord Abbett; without such waiver or reimbursement of expenses, the Fund’s returns would have been lower. Past performance is no guarantee of future results.
Average Annual Total Returns at Maximum Applicable
Sales Charge for the Periods Ended October 31, 2016
| | | 1 Year | | 5 Years | | 10 Years | | Life of Class | |
| Class A4 | | -4.90% | | 9.43% | | 6.43% | | – | |
| Class B5 | | -4.13% | | 9.63% | | 6.47% | | – | |
| Class C6 | | -0.73% | | 9.90% | | 6.31% | | – | |
| Class F7 | | 1.05% | | 10.90% | | – | | 5.64% | |
| Class I8 | | 1.15% | | 11.00% | | 7.38% | | – | |
| Class R27 | | 0.57% | | 10.35% | | – | | 5.12% | |
| Class R37 | | 0.68% | | 10.46% | | – | | 5.23% | |
| Class R49 | | 0.91% | | – | | – | | -4.27% | |
| Class R59 | | 1.19% | | – | | – | | -4.01% | |
| Class R69 | | 1.17% | | – | | – | | -4.03% | |
1 Reflects the deduction of the maximum initial sales charge of 5.75%.
2 Performance for each unmanaged index does not reflect any fees or expenses. The performance of each index is not necessarily representative of the Fund’s performance.
3 Source: Lipper Inc. The performance of the average is not necessarily representative of the Fund’s performance.
4 Total return, which is the percentage change in net asset value, after deduction of the maximum initial sales charge of 5.75% applicable to Class A shares, with all dividends and distributions reinvested for the periods shown ended October 31, 2016, is calculated using the SEC-required uniform method to compute such return.
5 Performance reflects the deduction of a CDSC of 5% for 1 year, 2% for 5 years, and 0% for 10 years. Class B shares automatically convert to Class A shares after approximately 8 years. (There is no initial sales charge for automatic conversions.) All returns for periods greater than 8 years reflect this conversion.
6 The 1% CDSC for Class C shares normally applies before the first anniversary of the purchase date. Performance for other periods is at net asset value.
7 Commenced operations and performance for the Class began on September 28, 2007. Performance is at net asset value.
8 Performance is at net asset value.
9 Commenced operations and performance for the classes began on June 30, 2015. Performance is at net asset value.
13
Fundamental Equity Fund
Investment Comparison
Below is a comparison of a $10,000 investment in Class A shares with the same investment in the Russell 1000® Value Index, Russell 3000® Value Index, Russell 3000® Index, and S&P 500® Index, assuming reinvestment of all dividends and distributions. The performance of other classes will be greater than or less than the performance shown in the graph below due to different sales loads and expenses applicable to such classes. The graph and performance table below do not reflect the deduction of taxes that a shareholder would pay on Fund distributions or the redemption of Fund shares. Past performance is no guarantee of future results.

Average Annual Total Returns at Maximum Applicable
Sales Charge for the Periods Ended October 31, 2016
| | | 1 Year | | 5 Years | | 10 Years | | Life of Class | |
| Class A3 | | -1.62% | | 9.32% | | 5.88% | | – | |
| Class B4 | | -1.03% | | 9.60% | | 5.97% | | – | |
| Class C5 | | 2.66% | | 9.85% | | 5.80% | | – | |
| Class F6 | | 4.48% | | 10.85% | | – | | 6.04% | |
| Class I7 | | 4.64% | | 10.95% | | 6.87% | | – | |
| Class P7 | | 4.17% | | 10.46% | | 6.38% | | – | |
| Class R26 | | 3.97% | | 10.29% | | – | | 5.52% | |
| Class R36 | | 4.09% | | 10.42% | | – | | 5.62% | |
| Class R48 | | 4.37% | | – | | – | | 2.10% | |
| Class R58 | | 4.64% | | – | | – | | 2.37% | |
| Class R68 | | 4.73% | | – | | – | | 2.43% | |
1 Reflects the deduction of the maximum initial sales charge of 5.75%.
2 Performance for each unmanaged index does not reflect any fees or expenses. The performance of each index is not necessarily representative of the Fund’s performance.
3 Total return, which is the percentage change in net asset value, after deduction of the maximum initial sales charge of 5.75% applicable to Class A shares, with all dividends and distributions reinvested for the periods shown ended October 31, 2016, is calculated using the SEC-required uniform method to compute such return.
4 Performance reflects the deduction of a CDSC of 5% for 1 year, 2% for 5 years, and 0% for 10 years. Class B shares
automatically convert to Class A shares after approximately 8 years. (There is no initial sales charge for automatic conversions.) All returns for periods greater than 8 years reflect this conversion.
5 The 1% CDSC for Class C shares normally applies before the first anniversary of the purchase date. Performance for other periods is at net asset value.
6 Commenced operations and performance for the Class began on September 28, 2007. Performance is at net asset value.
7 Performance is at net asset value.
8 Commenced operations and performance for the classes began on June 30, 2015. Performance is at net asset value.
14
Growth Leaders Fund
Investment Comparison
Below is a comparison of a $10,000 investment in Class A shares with the same investment in the Russell 1000® Growth Index, Russell 3000® Growth Index, and S&P 500® Index, assuming reinvestment of all dividends and distributions. The performance of other classes will be greater than or less than the performance shown in the graph below due to different sales loads and expenses applicable to such classes. The graph and performance table below do not reflect the deduction of taxes that a shareholder would pay on Fund distributions or the redemption of Fund shares. During certain periods, expenses of the Fund have been waived or reimbursed by Lord Abbett; without such waiver or reimbursement of expenses, the Fund’s returns would have been lower. Past performance is no guarantee of future results.
Average Annual Total Returns at Maximum Applicable
Sales Charge for the Periods Ended October 31, 2016
| | | 1 Year | | 5 Years | | Life of Class | |
| Class A3 | | -6.66% | | 11.59% | | 9.62% | |
| Class B4 | | -6.42% | | – | | 12.10% | |
| Class C5 | | -2.65% | | 12.12% | | 10.08% | |
| Class F6 | | -0.82% | | 13.12% | | 11.05% | |
| Class I6 | | -0.73% | | 13.24% | | 11.16% | |
| Class R26 | | -1.35% | | 12.82% | | 10.75% | |
| Class R36 | | -1.23% | | 12.74% | | 10.68% | |
| Class R47 | | -1.00% | | – | | 0.26% | |
| Class R57 | | -0.68% | | – | | 0.56% | |
| Class R67 | | -0.64% | | – | | 0.62% | |
1 Reflects the deduction of the maximum initial sales charge of 5.75%.
2 Performance for each unmanaged index does not reflect any fees or expenses. The performance of each index is not necessarily representative of the Fund’s performance. Performance for each index begins on June 30, 2011.
3 Class A shares commenced operations on June 24, 2011 and performance for the Class began on June 30, 2011. Total return, which is the percentage change in net asset value, after deduction of the maximum initial sales charge of 5.75% applicable to Class A shares, with all dividends and distributions reinvested for the periods shown ended October 31, 2016, is calculated using the SEC-required uniform method to compute such return.
4 Class B shares commenced operations and performance for the Class began on February 11, 2013. Performance reflects the
deduction of a CDSC of 5% for 1 year, 2% for 5 years, and 0% for 10 years. Class B shares automatically convert to Class A shares after approximately 8 years. (There is no initial sales charge for automatic conversions.) All returns for periods greater than 8 years reflect this conversion.
5 Class C shares commenced operations on June 24, 2011 and performance for the Class began on June 30, 2011. The 1% CDSC for Class C shares normally applies before the first anniversary of the purchase date. Performance for other periods is at net asset value.
6 Commenced operations on June 24, 2011 and performance for the Class began on June 30, 2011. Performance is at net asset value.
7 Commenced operations and performance for the classes began on June 30, 2015. Performance is at net asset value.
15
International Core Equity Fund
Investment Comparison
Below is a comparison of a $10,000 investment in Class A shares with the same investment in the Morgan Stanley Capital International Europe, Australasia, Far East Index (“MSCI EAFE® Index”) with Gross Dividends and the MSCI EAFE® Index with Net Dividends assuming reinvestment of all dividends and distributions. The MSCI EAFE® Index with Net Dividends reflects a reduction in dividends after taking into account withholding of taxes by certain foreign countries represented in the MSCI EAFE® Index. The performance of other classes will be greater than or less than the performance shown in the graph below due to different sales loads and expenses applicable to such classes. The graph and performance table below do not reflect the deduction of taxes that a shareholder would pay on Fund distributions or the redemption of Fund shares. During certain periods, expenses of the Fund have been waived or reimbursed by Lord Abbett; without such waiver or reimbursement of expenses, the Fund’s returns would have been lower. Past performance is no guarantee of future results.
Average Annual Total Returns at Maximum Applicable
Sales Charge for the Periods Ended October 31, 2016
| | | 1 Year | | 5 Years | | 10 Years | | Life of Class | |
| Class A3 | | -9.08% | | 1.92% | | 0.02% | | – | |
| Class B4 | | -9.01% | | 2.07% | | 0.10% | | – | |
| Class C5 | | -5.17% | | 2.46% | | -0.04% | | – | |
| Class F6 | | -3.24% | | 3.39% | | – | | -1.38% | |
| Class I7 | | -3.15% | | 3.50% | | 0.98% | | – | |
| Class P7 | | -3.65% | | 3.00% | | 0.50% | | – | |
| Class R26 | | -3.85% | | 2.85% | | – | | -1.73% | |
| Class R36 | | -3.79% | | 2.95% | | – | | -1.77% | |
| Class R48 | | -3.55% | | – | | – | | -5.07% | |
| Class R58 | | -3.31% | | – | | – | | -4.83% | |
| Class R68 | | -3.14% | | – | | – | | -4.64% | |
1 Reflects the deduction of the maximum initial sales charge of 5.75%.
2 Performance for each unmanaged index does not reflect any fees or expenses. The performance of each index is not necessarily representative of the Fund’s performance. Performance of each index begins on December 31, 2003.
3 Total return, which is the percentage change in net asset value, after deduction of the maximum initial sales charge of 5.75% applicable to Class A shares, with all dividends and distributions reinvested for the periods shown ended October 31, 2016, is calculated using the SEC-required uniform method to compute such return.
4 Performance reflects the deduction of a CDSC of 5% for 1 year, 2% for 5 years and 0% for 10 years. Class B shares automatically convert
to Class A shares after approximately 8 years. (There is no initial sales charge for automatic conversions.) All returns for periods greater than 8 years reflect this conversion.
5 The 1% CDSC for Class C shares normally applies before the first anniversary of the purchase date. Performance for other periods is at net asset value.
6 Commenced operations and performance for the Class began on September 28, 2007. Performance is at net asset value.
7 Performance is at net asset value.
8 Commenced operations and performance for the classes began on June 30, 2015. Performance is at net asset value.
16
International Dividend Income Fund
Investment Comparison
Below is a comparison of a $10,000 investment in Class A shares with the same investment in the Morgan Stanley Capital International (MSCI) All Country World Ex-U.S. Value Index with Gross Dividends and the MSCI All Country World Ex-U.S. Value Index with Net Dividends, assuming reinvestment of all dividends and distributions. The MSCI All Country World Ex-U.S. Value Index with Net Dividends reflects a reduction in dividends after taking into account withholding of taxes by certain foreign countries represented in the MSCI All Country World Ex-U.S. Value Index. The Fund believes that the MSCI All Country World Ex-U.S. High Dividend Yield Index with Gross Dividends and the MSCI All Country World Ex-U.S. High Dividend Yield Index with Net Dividends, which were not available at the Fund’s inception, more closely reflect the Fund’s investment strategies than the MSCI All Country World Ex-U.S. Value Index with Gross Dividends and MSCI All Country World Ex-U.S. Value Index with Net Dividends. Therefore, the Fund will remove the MSCI All Country World Ex-U.S. Value Index with Gross Dividends and MSCI All Country World Ex-U.S. Value Index with Net Dividends from its next annual report. The performance of other classes will be greater than or less than the performance shown in the graph below due to different sales loads and expenses applicable to such classes. The graph and performance table below do not reflect the deduction of taxes that a shareholder would pay on Fund distributions or the redemption of Fund shares. During certain periods, expenses of the Fund have been waived or reimbursed by Lord Abbett; without such waiver or reimbursements of expense, the Fund’s returns would have been lower. Past performance is no guarantee of future results.
Average Annual Total Returns at Maximum Applicable
Sales Charge for the Periods Ended October 31, 2016
| | | 1 Year | | 5 Years | | Life of Class | |
| Class A3 | | -7.18% | | 0.72% | | -0.57% | |
| Class C4 | | -2.97% | | 1.25% | | -0.52% | |
| Class F5 | | -1.22% | | 2.16% | | 0.37% | |
| Class I5 | | -1.10% | | 2.26% | | 0.49% | |
| Class R25 | | -1.70% | | 1.64% | | 0.08% | |
| Class R35 | | -1.58% | | 1.74% | | 0.05% | |
| Class R46 | | -1.48% | | – | | -7.51% | |
| Class R56 | | -1.24% | | – | | -7.27% | |
| Class R66 | | -1.09% | | – | | -7.16% | |
17
1 Reflects the deduction of the maximum initial sales charge of 5.75%.
2 Performance for each unmanaged index does not reflect any fees or expenses. The performance of each index is not necessarily representative of the Fund’s performance. Performance of each index begins on June 30, 2008.
3 Class A shares commenced operations on June 23, 2008 and performance for the Class began on June 30, 2008. Total return, which is the percentage change in net asset value, after deduction of the maximum initial sales charge of 5.75% applicable to Class A shares, with all dividends and distributions reinvested for the periods shown ended October 31,
2016, is calculated using the SEC-required uniform method to compute such return.
4 Class C shares commenced operations on June 23, 2008 and performance for the Class began on June 30, 2008. The 1% CDSC for Class C shares normally applies before the first anniversary of the purchase date. Performance for other periods is at net asset value.
5 Commenced operations on June 23, 2008 and performance for the Class began on June 30, 2008. Performance is at net asset value.
6 Commenced operations and performance for the classes began on June 30, 2015. Performance is at net asset value.
18
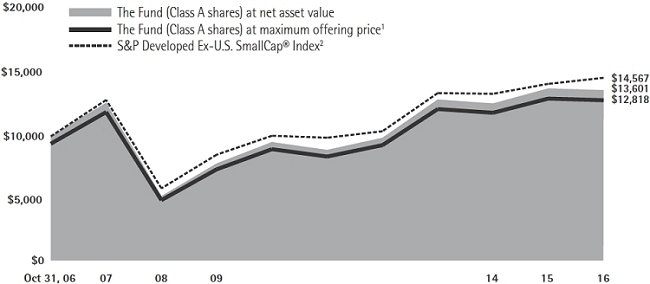
International Opportunities Fund
Investment Comparison
Below is a comparison of a $10,000 investment in Class A shares with the same investment in the S&P Developed Ex-U.S. SmallCap® Index, assuming reinvestment of all dividends and distributions. The performance of other classes will be greater than or less than the performance shown in the graph below due to different sales loads and expenses applicable to such classes. The graph and performance table below do not reflect the deduction of taxes that a shareholder would pay on Fund distributions or the redemption of Fund shares. Past performance is no guarantee of future results.
Average Annual Total Returns at Maximum Applicable
Sales Charge for the Periods Ended October 31, 2016
| | | 1 Year | | 5 Years | | 10 Years | | Life of Class | |
| Class A3 | | -6.69% | | 7.49% | | 2.51% | | – | |
| Class B4 | | -6.45% | | 7.72% | | 2.59% | | – | |
| Class C5 | | -2.69% | | 8.03% | | 2.44% | | – | |
| Class F6 | | -0.84% | | 8.98% | | – | | 1.62% | |
| Class I7 | | -0.75% | | 9.09% | | 3.46% | | – | |
| Class P7 | | -1.17% | | 8.61% | | 3.00% | | – | |
| Class R26 | | -1.34% | | 8.45% | | – | | 1.12% | |
| Class R36 | | -1.20% | | 8.58% | | – | | 1.27% | |
| Class R48 | | -1.03% | | – | | – | | -2.81% | |
| Class R58 | | -0.75% | | – | | – | | -2.56% | |
| Class R68 | | -0.56% | | – | | – | | -2.38% | |
1 Reflects the deduction of the maximum initial sales charge of 5.75%.
2 Performance for the unmanaged index does not reflect any fees or expenses. The performance of the index is not necessarily representative of the Fund’s performance.
3 Total return, which is the percentage change in net asset value, after deduction of the maximum initial sales charge of 5.75% applicable to Class A shares, with all dividends and distributions reinvested for the periods shown ended October 31, 2016, is calculated using the SEC-required uniform method to compute such return.
4 Performance reflects the deduction of a CDSC of 5% for 1 year, 2% for 5 years, and 0% for 10 years. Class B shares
automatically convert to Class A shares after approximately 8 years. (There is no initial sales charge for automatic conversions.) All returns for periods greater than 8 years reflect this conversion.
5 The 1% CDSC for Class C shares normally applies before the first anniversary of the purchase date. Performance is at net asset value.
6 Commenced operations and performance for the Class began on September 28, 2007. Performance is at net asset value.
7 Performance is at net asset value.
8 Commenced operations and performance for the classes began on June 30, 2015. Performance is at net asset value.
19
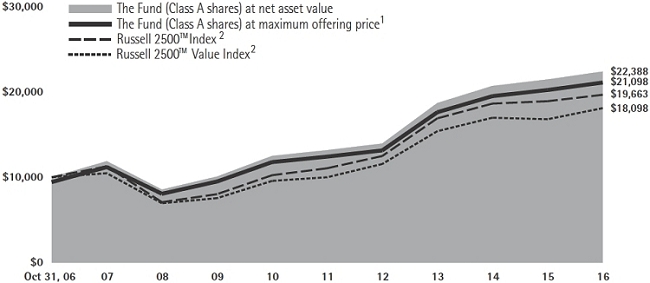
Value Opportunities Fund
Investment Comparison
Below is a comparison of a $10,000 investment in Class A shares with the same investment in the Russell 2500TM Index and the Russell 2500TM Value Index, assuming reinvestment of all dividends and distributions. The performance of other classes will be greater than or less than the performance shown in the graph below due to different sales loads and expenses applicable to such classes. The graph and performance table below do not reflect the deduction of taxes that a shareholder would pay on Fund distributions or the redemption of Fund shares. During certain periods, expenses of the Fund have been waived or reimbursed by Lord Abbett; without such waiver or reimbursement of expenses, the Fund’s returns would have been lower. Past performance is no guarantee of future results.
Average Annual Total Returns at Maximum Applicable
Sales Charge for the Periods Ended October 31, 2016
| | | 1 Year | | 5 Years | | 10 Years | | Life of Class | |
| Class A3 | | -1.65% | | 9.90% | | 7.75% | | – | |
| Class B4 | | -1.26% | | 10.17% | | 7.83% | | – | |
| Class C5 | | 2.62% | | 10.45% | | 7.67% | | – | |
| Class F6 | | 4.48% | | 11.45% | | – | | 7.56% | |
| Class I7 | | 4.57% | | 11.54% | | 8.75% | | – | |
| Class P7 | | 4.10% | | 11.06% | | 8.27% | | – | |
| Class R26 | | 3.94% | | 10.88% | | – | | 7.02% | |
| Class R36 | | 4.03% | | 10.99% | | – | | 7.13% | |
| Class R48 | | 4.28% | | – | | – | | 0.28% | |
| Class R58 | | 4.62% | | – | | – | | 0.58% | |
| Class R68 | | 4.72% | | – | | – | | 0.69% | |
1 Reflects the deduction of the maximum initial sales charge of 5.75%.
2 Performance for each unmanaged index does not reflect any fees or expenses. The performance of each index is not necessarily representative of the Fund’s performance.
3 Total return, which is the percentage change in net asset value, after deduction of the maximum initial sales charge of 5.75% applicable to Class A shares, with all dividends and distributions reinvested for the periods shown ended October 31, 2016, is calculated using the SEC-required uniform method to compute such return.
4 Performance reflects the deduction of a CDSC of 5% for 1 year, 2% for 5 years, and 0% for Life of the Class. Class B shares automatically
convert to Class A shares after approximately 8 years. (There is no initial sales charge for automatic conversions.) All returns for periods greater than 8 years reflect this conversion.
5 The 1% CDSC for Class C shares normally applies before the first anniversary of the purchase date. Performance for other periods is at net asset value.
6 Commenced operations and performance for the Class began on September 28, 2007. Performance is at net asset value.
7 Performance is at net asset value.
8 Commenced operations and performance for the classes began on June 30, 2015. Performance is at net asset value.
20
Expense Example
As a shareholder of a Fund, you incur two types of costs: (1) transaction costs, including sales charges (loads) on purchase payments (these charges vary among the share classes); and (2) ongoing costs, including management fees; distribution and service (12b-1) fees (these charges vary among the share classes); and other Fund expenses. This Example is intended to help you understand your ongoing costs (in dollars) of investing in each Fund and to compare these costs with the ongoing costs of investing in other mutual funds.
The Example is based on an investment of $1,000 invested at the beginning of the period and held for the entire period (May 1, 2016 through October 31, 2016).
Actual Expenses
For each class of each Fund, the first line of the table on the following page provides information about actual account values and actual expenses. You may use the information in this line, together with the amount you invested, to estimate the expenses that you paid over the period. Simply divide your account value by $1,000 (for example, an $8,600 account value divided by $1,000 = 8.6), then multiply the result by the number in the first line under the heading titled “Expenses Paid During Period 5/1/16 – 10/31/16” to estimate the expenses you paid on your account during this period.
Hypothetical Example for Comparison Purposes
For each class of each Fund, the second line of the table on the following page provides information about hypothetical account values and hypothetical expenses based on the Fund’s actual expense ratio and an assumed rate of return of 5% per year before expenses, which is not the Fund’s actual return. The hypothetical account values and expenses may not be used to estimate the actual ending account balance or expenses you paid for the period. You may use this information to compare the ongoing costs of investing in each Fund and other funds. To do so, compare this 5% hypothetical example with the 5% hypothetical examples that appear in the shareholder reports of the other funds.
21
Alpha Strategy Fund
Please note that the expenses shown in the table are meant to highlight your ongoing costs only and do not reflect any transactional costs, such as sales charges (loads). Therefore, the second line of the table is useful in comparing ongoing costs only, and will not help you determine the relative total costs of owning different funds. In addition, if these transactional costs were included, your costs would have been higher.
| | | Beginning | | Ending | | Expenses | |
| | | Account | | Account | | Paid During | |
| | | Value | | Value | | Period†# | |
| | | | | | | 5/1/16 – | |
| | | 5/1/16 | | 10/31/16 | | 10/31/16 | |
| Class A | | | | | | | |
| Actual | | $1,000.00 | | $1,047.70 | | $1.49 | |
| Hypothetical (5% Return Before Expenses) | | $1,000.00 | | $1,023.68 | | $1.48 | |
| Class B | | | | | | | |
| Actual | | $1,000.00 | | $1,043.90 | | $5.34 | |
| Hypothetical (5% Return Before Expenses) | | $1,000.00 | | $1,019.91 | | $5.28 | |
| Class C | | | | | | | |
| Actual | | $1,000.00 | | $1,043.60 | | $5.34 | |
| Hypothetical (5% Return Before Expenses) | | $1,000.00 | | $1,019.91 | | $5.28 | |
| Class F | | | | | | | |
| Actual | | $1,000.00 | | $1,048.40 | | $0.72 | |
| Hypothetical (5% Return Before Expenses) | | $1,000.00 | | $1,024.43 | | $0.71 | |
| Class I | | | | | | | |
| Actual | | $1,000.00 | | $1,049.00 | | $0.21 | |
| Hypothetical (5% Return Before Expenses) | | $1,000.00 | | $1,024.94 | | $0.20 | |
| Class R2 | | | | | | | |
| Actual | | $1,000.00 | | $1,045.80 | | $3.29 | |
| Hypothetical (5% Return Before Expenses) | | $1,000.00 | | $1,021.92 | | $3.25 | |
| Class R3 | | | | | | | |
| Actual | | $1,000.00 | | $1,046.40 | | $2.78 | |
| Hypothetical (5% Return Before Expenses) | | $1,000.00 | | $1,022.42 | | $2.75 | |
| Class R4 | | | | | | | |
| Actual | | $1,000.00 | | $1,047.30 | | $1.49 | |
| Hypothetical (5% Return Before Expenses) | | $1,000.00 | | $1,023.68 | | $1.48 | |
| Class R5 | | | | | | | |
| Actual | | $1,000.00 | | $1,049.40 | | $0.21 | |
| Hypothetical (5% Return Before Expenses) | | $1,000.00 | | $1,024.94 | | $0.20 | |
| Class R6 | | | | | | | |
| Actual | | $1,000.00 | | $1,049.00 | | $0.21 | |
| Hypothetical (5% Return Before Expenses) | | $1,000.00 | | $1,024.94 | | $0.20 | |
| † | For each class of the Fund, net expenses are equal to the annualized expense ratio for such class (0.29% for Class A, 1.04% for Classes B and C, 0.14% for Class F, 0.04% for Class I, 0.64% for Class R2, 0.54% for Class R3, 0.29% for Class R4, 0.04% for Classes R5 and R6) multiplied by the average account value over the period, multiplied by 184/366 (to reflect one-half year period). |
| # | Does not include expenses of Underlying Funds in which Alpha Strategy Fund invests. |
22
Portfolio Holdings Presented by Portfolio Allocation
October 31, 2016
| Underlying Fund Name | %* |
| Lord Abbett Developing Growth Fund, Inc. – Class I | | 19.45 | % |
| Lord Abbett Securities Trust-International Opportunities Fund – Class I | | 20.26 | % |
| Lord Abbett Securities Trust-Micro-Cap Growth Fund – Class I | | 9.77 | % |
| Lord Abbett Securities-Trust Micro-Cap Value Fund – Class I | | 10.18 | % |
| Lord Abbett Research Fund, Inc.-Small-Cap Value Fund – Class I | | 20.21 | % |
| Lord Abbett Securities Trust-Value Opportunities – Class I | | 20.13 | % |
| Total | | 100.00 | % |
| * | Represents percent of total investments. |
23
Fundamental Equity Fund
Please note that the expenses shown in the table are meant to highlight your ongoing costs only and do not reflect any transactional costs, such as sales charges (loads). Therefore, the second line of the table is useful in comparing ongoing costs only, and will not help you determine the relative total costs of owning different funds. In addition, if these transactional costs were included, your costs would have been higher.
| | | Beginning | | Ending | | Expenses | |
| | | Account | | Account | | Paid During | |
| | | Value | | Value | | Period† | |
| | | | | | | 5/1/16 – | |
| | | 5/1/16 | | 10/31/16 | | 10/31/16 | |
| Class A | | | | | | | |
| Actual | | $1,000.00 | | $1,039.80 | | $4.87 | |
| Hypothetical (5% Return Before Expenses) | | $1,000.00 | | $1,020.36 | | $4.82 | |
| Class B | | | | | | | |
| Actual | | $1,000.00 | | $1,036.20 | | $8.70 | |
| Hypothetical (5% Return Before Expenses) | | $1,000.00 | | $1,016.59 | | $8.62 | |
| Class C | | | | | | | |
| Actual | | $1,000.00 | | $1,035.60 | | $8.70 | |
| Hypothetical (5% Return Before Expenses) | | $1,000.00 | | $1,016.59 | | $8.62 | |
| Class F | | | | | | | |
| Actual | | $1,000.00 | | $1,040.10 | | $4.10 | |
| Hypothetical (5% Return Before Expenses) | | $1,000.00 | | $1,021.11 | | $4.06 | |
| Class I | | | | | | | |
| Actual | | $1,000.00 | | $1,040.40 | | $3.59 | |
| Hypothetical (5% Return Before Expenses) | | $1,000.00 | | $1,021.62 | | $3.56 | |
| Class P | | | | | | | |
| Actual | | $1,000.00 | | $1,038.80 | | $5.89 | |
| Hypothetical (5% Return Before Expenses) | | $1,000.00 | | $1,019.36 | | $5.84 | |
| Class R2 | | | | | | | |
| Actual | | $1,000.00 | | $1,037.20 | | $6.66 | |
| Hypothetical (5% Return Before Expenses) | | $1,000.00 | | $1,018.60 | | $6.60 | |
| Class R3 | | | | | | | |
| Actual | | $1,000.00 | | $1,038.70 | | $6.15 | |
| Hypothetical (5% Return Before Expenses) | | $1,000.00 | | $1,019.10 | | $6.09 | |
| Class R4 | | | | | | | |
| Actual | | $1,000.00 | | $1,039.90 | | $4.82 | |
| Hypothetical (5% Return Before Expenses) | | $1,000.00 | | $1,020.41 | | $4.77 | |
| Class R5 | | | | | | | |
| Actual | | $1,000.00 | | $1,041.20 | | $3.44 | |
| Hypothetical (5% Return Before Expenses) | | $1,000.00 | | $1,021.77 | | $3.40 | |
| Class R6 | | | | | | | |
| Actual | | $1,000.00 | | $1,041.20 | | $3.08 | |
| Hypothetical (5% Return Before Expenses) | | $1,000.00 | | $1,022.12 | | $3.05 | |
| † | For each class of the Fund, net expenses are equal to the annualized expense ratio for such class (0.95% for Class A, 1.70% for Classes B and C, 0.80% for Class F, 0.70% for Class I, 1.15% for Class P, 1.30% for Class R2, 1.20% for Class R3, 0.94% for Class R4, 0.67% for Class R5 and 0.60% for Class R6) multiplied by the average account value over the period, multiplied by 184/366 (to reflect one-half year period). |
24
Portfolio Holdings Presented by Sector
October 31, 2016
| Sector* | %** |
| Consumer Discretionary | | 6.53 | % |
| Consumer Staples | | 7.02 | % |
| Energy | | 11.87 | % |
| Financials | | 22.86 | % |
| Health Care | | 13.85 | % |
| Industrials | | 11.45 | % |
| Information Technology | | 11.26 | % |
| Sector* | %** |
| Materials | | 3.79 | % |
| Real Estate | | 2.19 | % |
| Telecommunication Services | | 2.64 | % |
| Utilities | | 4.33 | % |
| Repurchase Agreement | | 2.21 | % |
| Total | | 100.00 | % |
| * | | A sector may comprise several industries. |
| ** | | Represents percent of total investments. |
25
Growth Leaders Fund
Please note that the expenses shown in the table are meant to highlight your ongoing costs only and do not reflect any transactional costs, such as sales charges (loads). Therefore, the second line of the table is useful in comparing ongoing costs only, and will not help you determine the relative total costs of owning different funds. In addition, if these transactional costs were included, your costs would have been higher.
| | | Beginning | | Ending | | Expenses | |
| | | Account | | Account | | Paid During | |
| | | Value | | Value | | Period† | |
| | | | | | | 5/1/16 – | |
| | | 5/1/16 | | 10/31/16 | | 10/31/16 | |
| Class A | | | | | | | |
| Actual | | $1,000.00 | | $1,048.60 | | $4.38 | |
| Hypothetical (5% Return Before Expenses) | | $1,000.00 | | $1,020.86 | | $4.32 | |
| Class B | | | | | | | |
| Actual | | $1,000.00 | | $1,044.60 | | $8.22 | |
| Hypothetical (5% Return Before Expenses) | | $1,000.00 | | $1,017.09 | | $8.11 | |
| Class C | | | | | | | |
| Actual | | $1,000.00 | | $1,044.60 | | $8.22 | |
| Hypothetical (5% Return Before Expenses) | | $1,000.00 | | $1,017.09 | | $8.11 | |
| Class F | | | | | | | |
| Actual | | $1,000.00 | | $1,049.20 | | $3.61 | |
| Hypothetical (5% Return Before Expenses) | | $1,000.00 | | $1,021.62 | | $3.56 | |
| Class I | | | | | | | |
| Actual | | $1,000.00 | | $1,049.50 | | $3.09 | |
| Hypothetical (5% Return Before Expenses) | | $1,000.00 | | $1,022.12 | | $3.05 | |
| Class R2 | | | | | | | |
| Actual | | $1,000.00 | | $1,046.30 | | $6.17 | |
| Hypothetical (5% Return Before Expenses) | | $1,000.00 | | $1,019.10 | | $6.09 | |
| Class R3 | | | | | | | |
| Actual | | $1,000.00 | | $1,047.10 | | $5.66 | |
| Hypothetical (5% Return Before Expenses) | | $1,000.00 | | $1,019.61 | | $5.58 | |
| Class R4 | | | | | | | |
| Actual | | $1,000.00 | | $1,048.20 | | $4.38 | |
| Hypothetical (5% Return Before Expenses) | | $1,000.00 | | $1,020.86 | | $4.32 | |
| Class R5 | | | | | | | |
| Actual | | $1,000.00 | | $1,050.00 | | $3.09 | |
| Hypothetical (5% Return Before Expenses) | | $1,000.00 | | $1,022.12 | | $3.05 | |
| Class R6 | | | | | | | |
| Actual | | $1,000.00 | | $1,050.40 | | $2.58 | |
| Hypothetical (5% Return Before Expenses) | | $1,000.00 | | $1,022.62 | | $2.54 | |
| † | For each class of the Fund, net expenses are equal to the annualized expense ratio for such class (0.85% for Class A, 1.60% for Classes B and C, 0.70% for Class F, 0.60% for Class I, 1.20% for Class R2, 1.10% for Class R3, 0.85% for Class R4, 0.60% for Class R5 and 0.50% for Class R6) multiplied by the average account value over the period, multiplied by 184/366 (to reflect one-half year period). |
26
Portfolio Holdings Presented by Sector
October 31, 2016
| Sector* | %** |
| Consumer Discretionary | | 17.73 | % |
| Consumer Staples | | 4.34 | % |
| Financials | | 4.22 | % |
| Health Care | | 11.63 | % |
| Industrials | | 7.92 | % |
| Sector* | %** |
| Information Technology | | 48.12 | % |
| Real Estate | | 1.01 | % |
| Telecommunication Services | | 0.75 | % |
| Repurchase Agreement | | 4.28 | % |
| Total | | 100.00 | % |
| * | | A sector may comprise several industries. |
| ** | | Represents percent of total investments. |
27
International Core Equity Fund
Please note that the expenses shown in the table are meant to highlight your ongoing costs only and do not reflect any transactional costs, such as sales charges (loads). Therefore, the second line of the table is useful in comparing ongoing costs only, and will not help you determine the relative total costs of owning different funds. In addition, if these transactional costs were included, your costs would have been higher.
| | | Beginning | | Ending | | Expenses | |
| | | Account | | Account | | Paid During | |
| | | Value | | Value | | Period† | |
| | | | | | | 5/1/16 – | |
| | | 5/1/16 | | 10/31/16 | | 10/31/16 | |
| Class A | | | | | | | |
| Actual | | $1,000.00 | | $1,016.90 | | $5.68 | |
| Hypothetical (5% Return Before Expenses) | | $1,000.00 | | $1,019.51 | | $5.69 | |
| Class B | | | | | | | |
| Actual | | $1,000.00 | | $1,012.70 | | $9.46 | |
| Hypothetical (5% Return Before Expenses) | | $1,000.00 | | $1,015.74 | | $9.48 | |
| Class C | | | | | | | |
| Actual | | $1,000.00 | | $1,012.80 | | $9.36 | |
| Hypothetical (5% Return Before Expenses) | | $1,000.00 | | $1,015.84 | | $9.37 | |
| Class F | | | | | | | |
| Actual | | $1,000.00 | | $1,017.90 | | $4.41 | |
| Hypothetical (5% Return Before Expenses) | | $1,000.00 | | $1,020.76 | | $4.42 | |
| Class I | | | | | | | |
| Actual | | $1,000.00 | | $1,018.50 | | $3.91 | |
| Hypothetical (5% Return Before Expenses) | | $1,000.00 | | $1,021.27 | | $3.91 | |
| Class P | | | | | | | |
| Actual | | $1,000.00 | | $1,016.00 | | $6.69 | |
| Hypothetical (5% Return Before Expenses) | | $1,000.00 | | $1,018.50 | | $6.70 | |
| Class R2 | | | | | | | |
| Actual | | $1,000.00 | | $1,015.20 | | $7.45 | |
| Hypothetical (5% Return Before Expenses) | | $1,000.00 | | $1,017.75 | | $7.46 | |
| Class R3 | | | | | | | |
| Actual | | $1,000.00 | | $1,015.40 | | $6.89 | |
| Hypothetical (5% Return Before Expenses) | | $1,000.00 | | $1,018.30 | | $6.90 | |
| Class R4 | | | | | | | |
| Actual | | $1,000.00 | | $1,016.10 | | $5.68 | |
| Hypothetical (5% Return Before Expenses) | | $1,000.00 | | $1,019.51 | | $5.69 | |
| Class R5 | | | | | | | |
| Actual | | $1,000.00 | | $1,017.60 | | $4.41 | |
| Hypothetical (5% Return Before Expenses) | | $1,000.00 | | $1,020.76 | | $4.42 | |
| Class R6 | | | | | | | |
| Actual | | $1,000.00 | | $1,018.50 | | $3.30 | |
| Hypothetical (5% Return Before Expenses) | | $1,000.00 | | $1,021.87 | | $3.30 | |
| † | For each class of the Fund, net expenses are equal to the annualized expense ratio for such class (1.12% for Class A, 1.87% for Class B, 1.85% for Class C, 0.87% for Class F, 0.77% for Class I, 1.32% for Class P, 1.47% for Class R2, 1.36% for Class R3, 1.12% for Class R4, 0.87% for Class R5 and 0.65% for Class R6) multiplied by the average account value over the period, multiplied by 184/366 (to reflect one-half year period). |
28
Portfolio Holdings Presented by Sector
October 31, 2016
| Sector* | %** |
| Consumer Discretionary | | 11.57 | % |
| Consumer Staples | | 11.52 | % |
| Energy | | 5.21 | % |
| Financials | | 20.73 | % |
| Health Care | | 9.11 | % |
| Industrials | | 14.62 | % |
| Information Technology | | 7.94 | % |
| Sector* | %** |
| Materials | | 8.20 | % |
| Real Estate | | 4.10 | % |
| Telecommunication Services | | 4.50 | % |
| Utilities | | 1.99 | % |
| Repurchase Agreement | | 0.51 | % |
| Total | | 100.00 | % |
| * | | A sector may comprise several industries. |
| ** | | Represents percent of total investments. |
29
International Dividend Income Fund
Please note that the expenses shown in the table are meant to highlight your ongoing costs only and do not reflect any transactional costs, such as sales charges (loads). Therefore, the second line of the table is useful in comparing ongoing costs only, and will not help you determine the relative total costs of owning different funds. In addition, if these transactional costs were included, your costs would have been higher.
| | | Beginning | | Ending | | Expenses | |
| | | Account | | Account | | Paid During | |
| | | Value | | Value | | Period† | |
| | | | | | | 5/1/16 – | |
| | | 5/1/16 | | 10/31/16 | | 10/31/16 | |
| Class A | | | | | | | |
| Actual | | $1,000.00 | | $1,000.60 | | $5.63 | |
| Hypothetical (5% Return Before Expenses) | | $1,000.00 | | $1,019.51 | | $5.69 | |
| Class C | | | | | | | |
| Actual | | $1,000.00 | | $ 998.10 | | $9.39 | |
| Hypothetical (5% Return Before Expenses) | | $1,000.00 | | $1,015.74 | | $9.48 | |
| Class F | | | | | | | |
| Actual | | $1,000.00 | | $1,002.80 | | $4.58 | |
| Hypothetical (5% Return Before Expenses) | | $1,000.00 | | $1,020.56 | | $4.62 | |
| Class I | | | | | | | |
| Actual | | $1,000.00 | | $1,003.40 | | $4.08 | |
| Hypothetical (5% Return Before Expenses) | | $1,000.00 | | $1,021.06 | | $4.12 | |
| Class R2 | | | | | | | |
| Actual | | $1,000.00 | | $1,000.00 | | $7.39 | |
| Hypothetical (5% Return Before Expenses) | | $1,000.00 | | $1,017.75 | | $7.46 | |
| Class R3 | | | | | | | |
| Actual | | $1,000.00 | | $1,000.90 | | $6.89 | |
| Hypothetical (5% Return Before Expenses) | | $1,000.00 | | $1,018.25 | | $6.95 | |
| Class R4 | | | | | | | |
| Actual | | $1,000.00 | | $1,002.20 | | $5.64 | |
| Hypothetical (5% Return Before Expenses) | | $1,000.00 | | $1,019.51 | | $5.69 | |
| Class R5 | | | | | | | |
| Actual | | $1,000.00 | | $1,003.40 | | $4.48 | |
| Hypothetical (5% Return Before Expenses) | | $1,000.00 | | $1,020.66 | | $4.52 | |
| Class R6 | | | | | | | |
| Actual | | $1,000.00 | | $1,003.40 | | $4.03 | |
| Hypothetical (5% Return Before Expenses) | | $1,000.00 | | $ 1,021.11 | | $4.06 | |
| † | For each class of the Fund, net expenses are equal to the annualized expense ratio for such class (1.12% for Class A, 1.87% for Class C, 0.91% for Class F, 0.81% for Class I, 1.47% for Class R2, 1.37% for Class R3, 1.12% for Class R4, 0.89% for Class R5 and 0.80% for Class R6) multiplied by the average account value over the period, multiplied by 184/366 (to reflect one-half year period). |
30
Portfolio Holdings Presented by Sector
October 31, 2016
| Sector* | %** |
| Consumer Discretionary | | 6.88 | % |
| Consumer Staples | | 6.03 | % |
| Energy | | 13.45 | % |
| Financials | | 25.19 | % |
| Health Care | | 4.24 | % |
| Industrials | | 9.07 | % |
| Sector* | %** |
| Information Technology | | 4.40 | % |
| Materials | | 6.66 | % |
| Real Estate | | 6.97 | % |
| Telecommunication Services | | 9.33 | % |
| Utilities | | 7.78 | % |
| Total | | 100.00 | % |
| * | | A sector may comprise several industries. |
| ** | | Represents percent of total investments. |
31
International Opportunities Fund
Please note that the expenses shown in the table are meant to highlight your ongoing costs only and do not reflect any transactional costs, such as sales charges (loads). Therefore, the second line of the table is useful in comparing ongoing costs only, and will not help you determine the relative total costs of owning different funds. In addition, if these transactional costs were included, your costs would have been higher.
| | | Beginning | | Ending | | Expenses |
| | | Account | | Account | | Paid During |
| | | Value | | Value | | Period† |
| | | | | | | | | 5/1/16 – |
| | | 5/1/16 | | 10/31/16 | | 10/31/16 |
| Class A | | | | | | | | | | | | |
| Actual | | $1,000.00 | | | $ | 994.50 | | | | $ | 6.87 | |
| Hypothetical (5% Return Before Expenses) | | $1,000.00 | | | $ | 1,018.25 | | | | $ | 6.95 | |
| Class B | | | | | | | | | | | | |
| Actual | | $1,000.00 | | | $ | 990.90 | | | | $ | 10.61 | |
| Hypothetical (5% Return Before Expenses) | | $1,000.00 | | | $ | 1,014.48 | | | | $ | 10.74 | |
| Class C | | | | | | | | | | | | |
| Actual | | $1,000.00 | | | $ | 990.80 | | | | $ | 10.61 | |
| Hypothetical (5% Return Before Expenses) | | $1,000.00 | | | $ | 1,014.48 | | | | $ | 10.74 | |
| Class F | | | | | | | | | | | | |
| Actual | | $1,000.00 | | | $ | 995.00 | | | | $ | 6.12 | |
| Hypothetical (5% Return Before Expenses) | | $1,000.00 | | | $ | 1,019.00 | | | | $ | 6.19 | |
| Class I | | | | | | | | | | | | |
| Actual | | $1,000.00 | | | $ | 995.80 | | | | $ | 5.67 | |
| Hypothetical (5% Return Before Expenses) | | $1,000.00 | | | $ | 1,019.46 | | | | $ | 5.74 | |
| Class P | | | | | | | | | | | | |
| Actual | | $1,000.00 | | | $ | 993.90 | | | | $ | 7.92 | |
| Hypothetical (5% Return Before Expenses) | | $1,000.00 | | | $ | 1,017.19 | | | | $ | 8.01 | |
| Class R2 | | | | | | | | | | | | |
| Actual | | $1,000.00 | | | $ | 992.50 | | | | $ | 8.61 | |
| Hypothetical (5% Return Before Expenses) | | $1,000.00 | | | $ | 1,016.49 | | | | $ | 8.72 | |
| Class R3 | | | | | | | | | | | | |
| Actual | | $1,000.00 | | | $ | 993.70 | | | | $ | 8.07 | |
| Hypothetical (5% Return Before Expenses) | | $1,000.00 | | | $ | 1,017.04 | | | | $ | 8.16 | |
| Class R4 | | | | | | | | | | | | |
| Actual | | $1,000.00 | | | $ | 993.80 | | | | $ | 6.97 | |
| Hypothetical (5% Return Before Expenses) | | $1,000.00 | | | $ | 1,018.15 | | | | $ | 7.05 | |
| Class R5 | | | | | | | | | | | | |
| Actual | | $1,000.00 | | | $ | 995.80 | | | | $ | 5.67 | |
| Hypothetical (5% Return Before Expenses) | | $1,000.00 | | | $ | 1,019.46 | | | | $ | 5.74 | |
| Class R6 | | | | | | | | | | | | |
| Actual | | $1,000.00 | | | $ | 997.00 | | | | $ | 4.72 | |
| Hypothetical (5% Return Before Expenses) | | $1,000.00 | | | $ | 1,020.41 | | | | $ | 4.77 | |
| † | For each class of the Fund, net expenses are equal to the annualized expense ratio for such class (1.37% for Class A, 2.12% for Classes B and C, 1.22% for Class F, 1.13% for Class I, 1.58% for Class P, 1.72% for Class R2, 1.61% for Class R3, 1.39% for Class R4, 1.13% for Class R5 and 0.94% for Class R6) multiplied by the average account value over the period, multiplied by 184/366 (to reflect one-half year period). |
32
Portfolio Holdings Presented by Sector
October 31, 2016
| Sector* | %** |
| Consumer Discretionary | | 14.64 | % |
| Consumer Staples | | 7.39 | % |
| Energy | | 4.55 | % |
| Financials | | 16.23 | % |
| Health Care | | 4.41 | % |
| Industrials | | 17.80 | % |
| Information Technology | | 13.15 | % |
| Sector* | %** |
| Materials | | 5.33 | % |
| Real Estate | | 7.99 | % |
| Telecommunication Services | | 1.29 | % |
| Utilities | | 3.29 | % |
| Repurchase Agreement | | 3.93 | % |
| Total | | 100.00 | % |
| * | | A sector may comprise several industries. |
| ** | | Represents percent of total investments. |
33
Value Opportunities Fund
Please note that the expenses shown in the table are meant to highlight your ongoing costs only and do not reflect any transactional costs, such as sales charges (loads). Therefore, the second line of the table is useful in comparing ongoing costs only, and will not help you determine the relative total costs of owning different funds. In addition, if these transactional costs were included, your costs would have been higher.
| | | Beginning | | Ending | | Expenses | |
| | | Account | | Account | | Paid During | |
| | | Value | | Value | | Period† | |
| | | | | | | 5/1/16 – | |
| | | 5/1/16 | | 10/31/16 | | 10/31/16 | |
| Class A | | | | | | | |
| Actual | | $1,000.00 | | $1,034.40 | | $5.88 | |
| Hypothetical (5% Return Before Expenses) | | $1,000.00 | | $1,019.36 | | $5.84 | |
| Class B | | | | | | | |
| Actual | | $1,000.00 | | $1,030.40 | | $9.70 | |
| Hypothetical (5% Return Before Expenses) | | $1,000.00 | | $1,015.58 | | $9.63 | |
| Class C | | | | | | | |
| Actual | | $1,000.00 | | $1,030.40 | | $9.70 | |
| Hypothetical (5% Return Before Expenses) | | $1,000.00 | | $1,015.58 | | $9.63 | |
| Class F | | | | | | | |
| Actual | | $1,000.00 | | $1,035.40 | | $5.12 | |
| Hypothetical (5% Return Before Expenses) | | $1,000.00 | | $1,020.11 | | $5.08 | |
| Class I | | | | | | | |
| Actual | | $1,000.00 | | $1,035.40 | | $4.60 | |
| Hypothetical (5% Return Before Expenses) | | $1,000.00 | | $1,020.61 | | $4.57 | |
| Class P | | | | | | | |
| Actual | | $1,000.00 | | $1,033.70 | | $6.90 | |
| Hypothetical (5% Return Before Expenses) | | $1,000.00 | | $1,018.35 | | $6.85 | |
| Class R2 | | | | | | | |
| Actual | | $1,000.00 | | $1,032.60 | | $7.66 | |
| Hypothetical (5% Return Before Expenses) | | $1,000.00 | | $1,017.60 | | $7.61 | |
| Class R3 | | | | | | | |
| Actual | | $1,000.00 | | $1,032.90 | | $7.15 | |
| Hypothetical (5% Return Before Expenses) | | $1,000.00 | | $1,018.10 | | $7.10 | |
| Class R4 | | | | | | | |
| Actual | | $1,000.00 | | $1,034.40 | | $5.88 | |
| Hypothetical (5% Return Before Expenses) | | $1,000.00 | | $1,019.36 | | $5.84 | |
| Class R5 | | | | | | | |
| Actual | | $1,000.00 | | $1,035.90 | | $4.61 | |
| Hypothetical (5% Return Before Expenses) | | $1,000.00 | | $1,020.61 | | $4.57 | |
| Class R6 | | | | | | | |
| Actual | | $1,000.00 | | $1,036.40 | | $4.04 | |
| Hypothetical (5% Return Before Expenses) | | $1,000.00 | | $1,021.17 | | $4.01 | |
| † | For each class of the Fund, net expenses are equal to the annualized expense ratio for such class (1.15% for Class A, 1.90% for Classes B and C, 1.00% for Class F, 0.90% for Class I, 1.35% for Class P, 1.50% for Class R2, 1.40% for Class R3, 1.15% for Class R4, 0.90% for Class R5 and 0.79% for Class R6) multiplied by the average account value over the period, multiplied by 184/366 (to reflect one-half year period). |
34
Portfolio Holdings Presented by Sector
October 31, 2016
| Sector* | %** |
| Consumer Discretionary | | 10.00 | % |
| Consumer Staples | | 1.99 | % |
| Energy | | 5.32 | % |
| Financials | | 16.63 | % |
| Health Care | | 11.13 | % |
| Industrials | | 12.78 | % |
| Information Technology | | 18.79 | % |
| Sector* | %** |
| Materials | | 7.59 | % |
| Real Estate | | 5.66 | % |
| Telecommunication Services | | 2.04 | % |
| Utilities | | 4.30 | % |
| Repurchase Agreement | | 3.77 | % |
| Total | | 100.00 | % |
| * | | A sector may comprise several industries. |
| ** | | Represents percent of total investments. |
35
Schedule of Investments
ALPHA STRATEGY FUND October 31, 2016
| Investments | | Shares | | | Fair
Value
(000) | |
| INVESTMENTS IN UNDERLYING FUNDS(a) 100.16% | | | | | | | | |
| | | | | | | | | |
| Lord Abbett Developing Growth Fund, Inc. – Class I*(b) | | | 10,921,383 | | | $ | 217,117 | |
| | | | | | | | | |
| Lord Abbett Securities Trust – International Opportunities Fund – Class I(c) | | | 13,654,913 | | | | 226,125 | |
| | | | | | | | | |
| Lord Abbett Securities Trust – Micro-Cap Growth Fund – Class I*(c) | | | 7,678,517 | | | | 109,035 | |
| | | | | | | | | |
| Lord Abbett Securities Trust – Micro-Cap Value Fund – Class I*(c) | | | 3,250,885 | | | | 113,619 | |
| | | | | | | | | |
| Lord Abbett Research Fund, Inc. – Small-Cap Value Fund – Class I*(c) | | | 8,867,080 | | | | 225,490 | |
| Investments | | Shares | | | Fair
Value
(000) | |
| Lord Abbett Securities Trust – Value Opportunities Fund – Class I*(c) | | | 11,450,885 | | | $ | 224,666 | |
Total Investments in Underlying Funds
(cost $1,099,333,852) | | | | | | | 1,116,052 | |
| Liabilities in Excess of Other Assets (0.16)% | | | | | | | (1,766 | ) |
| Net Assets 100.00% | | | | | | $ | 1,114,286 | |
| (a) | | Affiliated issuers (See Note 13). |
| * | | Non-income producing security. |
| (b) | | Fund investment objective is long-term growth of capital through a diversified and actively managed portfolio consisting of developing growth companies, many of which are traded over the counter. |
| (c) | | Fund investment objective is long-term capital appreciation. |
The following is a summary of the inputs used as of October 31, 2016 in valuing the Fund’s investments carried at fair value(1):
| Investment Type(2)(3) | | Level 1
(000) | | | Level 2
(000) | | | Level 3
(000) | | | Total
(000) | |
| Investments in Underlying Funds | | $ | 1,116,052 | | | $ | – | | | $ | – | | | $ | 1,116,052 | |
| Total | | $ | 1,116,052 | | | $ | – | | | $ | – | | | $ | 1,116,052 | |
| (1) | | Refer to Note 2(k) for a description of fair value measurements and the three-tier hierarchy of inputs. |
| (2) | | See Schedule of Investments for fair values in each industry and identification of foreign issuers and/or geography. |
| (3) | | There were no Level 1/Level 2 transfers during the fiscal year ended October 31, 2016. |
| 36 | See Notes to Financial Statements. | |
Schedule of Investments
FUNDAMENTAL EQUITY FUND October 31, 2016
| Investments | | Shares | | | Fair
Value
(000) | |
| COMMON STOCKS 97.81% | | | | | | | | |
| | | | | | | | | |
| Aerospace & Defense 3.17% | | | | | | | | |
| B/E Aerospace, Inc. | | | 243,620 | | | $ | 14,500 | |
| General Dynamics Corp. | | | 500,745 | | | | 75,483 | |
| Total | | | | | | | 89,983 | |
| | | | | | | | | |
| Airlines 0.86% | | | | | | | | |
| Delta Air Lines, Inc. | | | 581,248 | | | | 24,279 | |
| | | | | | | | | |
| Banks 13.42% | | | | | | | | |
| Bank of America Corp. | | | 1,716,110 | | | | 28,316 | |
| Citizens Financial Group, Inc. | | | 2,928,903 | | | | 77,147 | |
| East West Bancorp, Inc. | | | 1,302,236 | | | | 51,451 | |
| JPMorgan Chase & Co. | | | 1,651,843 | | | | 114,407 | |
| Signature Bank* | | | 146,608 | | | | 17,675 | |
| Webster Financial Corp. | | | 1,193,223 | | | | 48,206 | |
| Wells Fargo & Co. | | | 945,651 | | | | 43,510 | |
| Total | | | | | | | 380,712 | |
| | | | | | | | | |
| Beverages 2.82% | | | | | | | | |
| PepsiCo, Inc. | | | 745,500 | | | | 79,918 | |
| | | | | | | | | |
| Biotechnology 0.31% | | | | | | | | |
| Celgene Corp.* | | | 85,582 | | | | 8,745 | |
| | | | | | | | | |
| Capital Markets 2.41% | | | | | | | | |
| Invesco Ltd. | | | 1,200,359 | | | | 33,718 | |
| TD Ameritrade Holding Corp. | | | 1,011,607 | | | | 34,607 | |
| Total | | | | | | | 68,325 | |
| | | | | | | | | |
| Chemicals 3.79% | | | | | | | | |
| Dow Chemical Co. (The) | | | 1,250,932 | | | | 67,313 | |
| LyondellBasell Industries NV Class A | | | 506,042 | | | | 40,255 | |
| Total | | | | | | | 107,568 | |
| | | | | | | | | |
| Communications Equipment 1.84% | | | | | | | | |
| Cisco Systems, Inc. | | | 1,701,948 | | | | 52,216 | |
| | | | | | | | | |
| Consumer Finance 1.26% | | | | | | | | |
| Discover Financial Services | | | 635,913 | | | | 35,821 | |
| Investments | | Shares | | | Fair
Value
(000) | |
| Diversified Telecommunication Services 2.64% | | | | | | | | |
| AT&T, Inc. | | | 1,667,982 | | | $ | 61,365 | |
| Verizon Communications, Inc. | | | 282,652 | | | | 13,596 | |
| Total | | | | | | | 74,961 | |
| | | | | | | | | |
| Electric: Utilities 4.33% | | | | | | | | |
| Duke Energy Corp. | | | 631,922 | | | | 50,566 | |
| NextEra Energy, Inc. | | | 565,251 | | | | 72,352 | |
| Total | | | | | | | 122,918 | |
| | | | | | | | | |
| Energy Equipment & Services 1.97% | | | | | | | | |
| Halliburton Co. | | | 1,212,591 | | | | 55,779 | |
| | | | | | | | | |
| Equity Real Estate Investment Trusts 2.19% | | | | | | | | |
| Boston Properties, Inc. | | | 337,917 | | | | 40,712 | |
| Vornado Realty Trust | | | 230,400 | | | | 21,377 | |
| Total | | | | | | | 62,089 | |
| | | | | | | | | |
| Food & Staples Retailing 0.76% | | | | | | | | |
| CVS Health Corp. | | | 255,393 | | | | 21,478 | |
| | | | | | | | | |
| Food Products 2.43% | | | | | | | | |
| Mondelez International, Inc. Class A | | | 1,536,953 | | | | 69,071 | |
| | | | | | | | | |
| Health Care Equipment & Supplies 2.48% | | | | | | | | |
| Abbott Laboratories | | | 1,790,400 | | | | 70,255 | |
| | | | | | | | | |
| Health Care Providers & Services 1.86% | | | | | | | | |
| UnitedHealth Group, Inc. | | | 372,607 | | | | 52,660 | |
| | | | | | | | | |
| Hotels, Restaurants & Leisure 0.74% | | | | | | | | |
| Yum! Brands, Inc. | | | 242,323 | | | | 20,908 | |
| | | | | | | | | |
| Household Durables 1.18% | | | | | | | | |
| Lennar Corp. Class A | | | 804,608 | | | | 33,544 | |
| | | | | | | | | |
| Household Products 1.02% | | | | | | | | |
| Colgate-Palmolive Co. | | | 404,297 | | | | 28,851 | |
| | | | | | | | | |
| Industrial Conglomerates 2.57% | | | | | | | | |
| General Electric Co. | | | 2,507,515 | | | | 72,969 | |
| | See Notes to Financial Statements. | 37 |
Schedule of Investments (continued)
FUNDAMENTAL EQUITY FUND October 31, 2016
| Investments | | Shares | | | Fair
Value
(000) | |
| Information Technology Services 1.09% | | | | | | | | |
| Fidelity National Information Services, Inc. | | | 418,845 | | | $ | 30,961 | |
| | | | | | | | | |
| Insurance 5.77% | | | | | | | | |
| Chubb Ltd. (Switzerland)(a) | | | 775,221 | | | | 98,453 | |
| Hartford Financial Services Group, Inc. (The) | | | 1,481,466 | | | | 65,347 | |
| Total | | | | | | | 163,800 | |
| | | | | | | | | |
| Life Sciences Tools & Services 0.29% | | | | | | | | |
| Thermo Fisher Scientific, Inc. | | | 56,232 | | | | 8,268 | |
| Machinery 3.33% | | | | | | | | |
| Caterpillar, Inc. | | | 355,747 | | | | 29,691 | |
| Dover Corp. | | | 509,419 | | | | 34,075 | |
| ITT, Inc. | | | 868,965 | | | | 30,605 | |
| Total | | | | | | | 94,371 | |
| | | | | | | | | |
| Media 2.21% | | | | | | | | |
| Comcast Corp. Class A | | | 669,849 | | | | 41,410 | |
| Time Warner, Inc. | | | 239,760 | | | | 21,336 | |
| Total | | | | | | | 62,746 | |
| | | | | | | | | |
| Oil, Gas & Consumable Fuels 9.90% | | | | | | | | |
| Devon Energy Corp. | | | 967,393 | | | | 36,654 | |
| EOG Resources, Inc. | | | 759,821 | | | | 68,703 | |
| Exxon Mobil Corp. | | | 1,248,676 | | | | 104,040 | |
| Occidental Petroleum Corp. | | | 980,500 | | | | 71,488 | |
| Total | | | | | | | 280,885 | |
| | | | | | | | | |
| Pharmaceuticals 8.92% | | | | | | | | |
| Allergan plc* | | | 63,478 | | | | 13,263 | |
| Johnson & Johnson | | | 999,203 | | | | 115,897 | |
| Merck & Co., Inc. | | | 354,258 | | | | 20,802 | |
| Pfizer, Inc. | | | 3,255,400 | | | | 103,229 | |
| Total | | | | | | | 253,191 | |
| | | | | | | | | |
| Road & Rail 1.53% | | | | | | | | |
| CSX Corp. | | | 1,422,590 | | | | 43,403 | |
| Investments | | Shares | | | Fair
Value
(000) | |
| Semiconductors & Semiconductor Equipment 5.57% | | | | | | | | |
| Intel Corp. | | | 2,603,578 | | | $ | 90,787 | |
| Microchip Technology, Inc. | | | 244,753 | | | | 14,820 | |
| QUALCOMM, Inc. | | | 764,923 | | | | 52,565 | |
| Total | | | | | | | 158,172 | |
| | | | | | | | | |
| Software 1.06% | | | | | | | | |
| Microsoft Corp. | | | 504,200 | | | | 30,212 | |
| | | | | | | | | |
| Specialty Retail 2.40% | | | | | | | | |
| Foot Locker, Inc. | | | 437,224 | | | | 29,193 | |
| L Brands, Inc. | | | 537,370 | | | | 38,793 | |
| Total | | | | | | | 67,986 | |
| | | | | | | | | |
| Technology Hardware, Storage & Peripheral 1.69% | | | | | | | | |
| Hewlett Packard Enterprise Co. | | | 2,136,617 | | | | 48,010 | |
Total Common Stocks
(cost $2,407,638,277) | | | | | | | 2,775,055 | |
| | | | | | | | | |
| | | Principal
Amount
(000) | | | | | |
| SHORT-TERM INVESTMENT 2.21% | | | | | | | | |
| | | | | | | | | |
| Repurchase Agreement | | | | | | | | |
| Repurchase Agreement dated 10/31/2016, 0.03% due 11/1/2016 with Fixed Income Clearing Corp. collateralized by $52,390,000 of U.S. Treasury Bond at 3.625% due 8/15/2043; value: $63,915,800; proceeds: $62,659,295 (cost $62,659,243) | | $ | 62,659 | | | | 62,659 | |
Total Investments in Securities 100.02%
(cost $2,470,297,520) | | | | | | | 2,837,714 | |
| Liabilities in Excess of Other Assets (0.02)% | | | | | | | (603 | ) |
| Net Assets 100.00% | | | | | | $ | 2,837,111 | |
| * | | Non-income producing security. |
| (a) | | Foreign security traded in U.S. dollars. |
| 38 | See Notes to Financial Statements. | |
Schedule of Investments (concluded)
FUNDAMENTAL EQUITY FUND October 31, 2016
The following is a summary of the inputs used as of October 31, 2016 in valuing the Fund’s investments carried at fair value(1):
| Investment Type(2)(3) | | Level 1
(000) | | | Level 2
(000) | | | Level 3
(000) | | | Total
(000) | |
| Common Stocks | | $ | 2,775,055 | | | $ | – | | | $ | – | | | $ | 2,775,055 | |
| Repurchase Agreement | | | – | | | | 62,659 | | | | – | | | | 62,659 | |
| Total | | $ | 2,775,055 | | | $ | 62,659 | | | $ | – | | | $ | 2,837,714 | |
| (1) | | Refer to Note 2(k) for a description of fair value measurements and the three-tier hierarchy of inputs. |
| (2) | | See Schedule of Investments for fair values in each industry and identification of foreign issuers and/or geography. |
| (3) | | There were no Level 1/Level 2 transfers during the fiscal year ended October 31, 2016. |
| | See Notes to Financial Statements. | 39 |
Schedule of Investments
GROWTH LEADERS FUND October 31, 2016
| Investments | | Shares | | | Fair
Value
(000) | |
| COMMON STOCKS 97.70% | | | | | | | | |
| | | | | | | | | |
| Aerospace & Defense 1.66% | | | | | | | | |
| Lockheed Martin Corp. | | | 46,749 | | | $ | 11,518 | |
| Raytheon Co. | | | 173,542 | | | | 23,708 | |
| Total | | | | | | | 35,226 | |
| | | | | | | | | |
| Air Freight & Logistics 1.29% | | | | | | | | |
| FedEx Corp. | | | 156,564 | | | | 27,292 | |
| | | | | | | | | |
| Banks 0.50% | | | | | | | | |
| SVB Financial Group* | | | 86,698 | | | | 10,601 | |
| Beverages 2.68% | | | | | | | | |
| Constellation Brands, Inc. Class A | | | 145,053 | | | | 24,241 | |
| PepsiCo, Inc. | | | 303,915 | | | | 32,580 | |
| Total | | | | | | | 56,821 | |
| | | | | | | | | |
| Biotechnology 4.49% | | | | | | | | |
| Biogen, Inc.* | | | 90,548 | | | | 25,370 | |
| Celgene Corp.* | | | 163,666 | | | | 16,723 | |
| Exelixis, Inc.* | | | 831,149 | | | | 8,802 | |
| Incyte Corp.* | | | 231,546 | | | | 20,137 | |
| Regeneron Pharmaceuticals, Inc.* | | | 14,424 | | | | 4,977 | |
| TESARO, Inc.* | | | 159,074 | | | | 19,229 | |
| Total | | | | | | | 95,238 | |
| | | | | | | | | |
| Building Products 1.13% | | | | | | | | |
| A.O. Smith Corp. | | | 531,208 | | | | 23,995 | |
| | | | | | | | | |
| Capital Markets 3.80% | | | | | | | | |
| E*TRADE Financial Corp.* | | | 367,514 | | | | 10,349 | |
| Intercontinental Exchange, Inc. | | | 81,187 | | | | 21,952 | |
| MarketAxess Holdings, Inc. | | | 171,089 | | | | 25,794 | |
| MSCI, Inc. | | | 147,876 | | | | 11,858 | |
| S&P Global, Inc. | | | 87,525 | | | | 10,665 | |
| Total | | | | | | | 80,618 | |
| Investments | | Shares | | | Fair
Value
(000) | |
| Diversified Consumer Services 0.85% | | | | | | | | |
| New Oriental Education & Technology Group, Inc. ADR* | | | 358,148 | | | $ | 17,954 | |
| | | | | | | | | |
| Diversified Telecommunication Services 0.77% | | | | | | | | |
| Zayo Group Holdings, Inc.* | | | 506,727 | | | | 16,306 | |
| | | | | | | | | |
| Electronic Equipment, Instruments & Components 0.70% | | | | | | | | |
| Trimble, Inc.* | | | 532,779 | | | | 14,726 | |
| | | | | | | | | |
| Equity Real Estate Investment Trusts 1.03% | | | | | | | | |
| American Tower Corp. | | | 94,807 | | | | 11,110 | |
| Equinix, Inc. | | | 30,115 | | | | 10,760 | |
| Total | | | | | | | 21,870 | |
| | | | | | | | | |
| Food Products 0.75% | | | | | | | | |
| Blue Buffalo Pet Products, Inc.* | | | 420,460 | | | | 10,562 | |
| Kellogg Co. | | | 72,199 | | | | 5,424 | |
| Total | | | | | | | 15,986 | |
| | | | | | | | | |
| Health Care Equipment & Supplies 3.81% | | | | | | | | |
| Boston Scientific Corp.* | | | 751,311 | | | | 16,529 | |
| IDEXX Laboratories, Inc.* | | | 113,864 | | | | 12,199 | |
| Intuitive Surgical, Inc.* | | | 51,109 | | | | 34,349 | |
| ZELTIQ Aesthetics, Inc.* | | | 531,652 | | | | 17,598 | |
| Total | | | | | | | 80,675 | |
| | | | | | | | | |
| Health Care Providers & Services 1.05% | | | | | | | | |
| UnitedHealth Group, Inc. | | | 157,382 | | | | 22,243 | |
| | | | | | | | | |
| Health Care Technology 1.55% | | | | | | | | |
| Veeva Systems, Inc. Class A* | | | 844,073 | | | | 32,792 | |
| | | | | | | | | |
| Hotels, Restaurants & Leisure 2.46% | | | | | | | | |
| Dave & Buster’s Entertainment, Inc.* | | | 396,131 | | | | 16,380 | |
| Domino’s Pizza, Inc. | | | 111,600 | | | | 18,887 | |
| Vail Resorts, Inc. | | | 105,872 | | | | 16,880 | |
| Total | | | | | | | 52,147 | |
| | | | | | | | | |
| Household Products 0.99% | | | | | | | | |
| Colgate-Palmolive Co. | | | 294,666 | | | | 21,027 | |
| 40 | See Notes to Financial Statements. | |
Schedule of Investments (continued)
GROWTH LEADERS FUND October 31, 2016
| Investments | | Shares | | | Fair
Value
(000) | |
| Information Technology Services 7.07% | | | | | | | | |
| Accenture plc Class A (Ireland)(a) | | | 49,074 | | | $ | 5,704 | |
| Mastercard, Inc. Class A | | | 308,536 | | | | 33,020 | |
| PayPal Holdings, Inc.* | | | 1,227,824 | | | | 51,151 | |
| Visa, Inc. Class A | | | 726,626 | | | | 59,954 | |
| Total | | | | | | | 149,829 | |
| | | | | | | | | |
| Internet & Direct Marketing Retail 11.91% | | | | | | | | |
| Amazon.com, Inc.* | | | 145,820 | | | | 115,171 | |
| Etsy, Inc.* | | | 1,120,822 | | | | 14,548 | |
| Expedia, Inc. | | | 193,846 | | | | 25,051 | |
| Netflix, Inc.* | | | 532,683 | | | | 66,516 | |
| Priceline Group, Inc. (The)* | | | 21,120 | | | | 31,136 | |
| Total | | | | | | | 252,422 | |
| | | | | | | | | |
| Internet Software & Services 19.13% | | | | | | | | |
| 2U, Inc.* | | | 439,220 | | | | 15,311 | |
| Alibaba Group Holding Ltd. ADR* | | | 324,554 | | | | 33,004 | |
| Alphabet, Inc. Class A* | | | 151,028 | | | | 122,318 | |
| Facebook, Inc. Class A* | | | 859,126 | | | | 112,537 | |
| GoDaddy, Inc. Class A* | | | 507,653 | | | | 18,169 | |
| GrubHub, Inc.* | | | 542,084 | | | | 20,659 | |
| MercadoLibre, Inc. (Argentina)(a) | | | 127,718 | | | | 21,458 | |
| NetEase, Inc. ADR | | | 94,623 | | | | 24,317 | |
| Shopify, Inc. Class A (Canada)*(a) | | | 533,662 | | | | 22,120 | |
| Shutterstock, Inc.* | | | 263,562 | | | | 15,547 | |
| Total | | | | | | | 405,440 | |
| | | | | | | | | |
| Life Sciences Tools & Services 0.29% | | | | | | | | |
| Pacific Biosciences of California, Inc.* | | | 727,810 | | | | 6,186 | |
| | | | | | | | | |
| Machinery 1.36% | | | | | | | | |
| Middleby Corp. (The)* | | | 93,999 | | | | 10,538 | |
| Nordson Corp. | | | 181,549 | | | | 18,179 | |
| Total | | | | | | | 28,717 | |
| Investments | | Shares | | | Fair
Value
(000) | |
| Media 1.59% | | | | | | | | |
| Comcast Corp. Class A | | | 545,420 | | | $ | 33,718 | |
| | | | | | | | | |
| Pharmaceuticals 0.69% | | | | | | | | |
| Bristol-Myers Squibb Co. | | | 177,877 | | | | 9,056 | |
| Johnson & Johnson | | | 47,210 | | | | 5,476 | |
| Total | | | | | | | 14,532 | |
| | | | | | | | | |
| Professional Services 1.01% | | | | | | | | |
| TransUnion* | | | 347,320 | | | | 10,850 | |
| WageWorks, Inc.* | | | 179,262 | | | | 10,568 | |
| Total | | | | | | | 21,418 | |
| | | | | | | | | |
| Road & Rail 1.13% | | | | | | | | |
| CSX Corp. | | | 353,282 | | | | 10,779 | |
| Kansas City Southern | | | 150,511 | | | | 13,209 | |
| Total | | | | | | | 23,988 | |
| | | | | | | | | |
| Semiconductors & Semiconductor Equipment 6.37% | | | | | | | | |
| Applied Materials, Inc. | | | 957,572 | | | | 27,846 | |
| Broadcom Ltd. (Singapore)(a) | | | 192,107 | | | | 32,712 | |
| Lam Research Corp. | | | 161,730 | | | | 15,665 | |
| NVIDIA Corp. | | | 522,970 | | | | 37,215 | |
| QUALCOMM, Inc. | | | 314,885 | | | | 21,639 | |
| Total | | | | | | | 135,077 | |
| | | | | | | | | |
| Software 12.89% | | | | | | | | |
| Adobe Systems, Inc.* | | | 303,651 | | | | 32,646 | |
| Atlassian Corp. plc Class A (Australia)*(a) | | | 734,174 | | | | 19,720 | |
| Ellie Mae, Inc.* | | | 225,526 | | | | 23,881 | |
| LINE Corp. ADR* | | | 239,408 | | | | 9,686 | |
| Microsoft Corp. | | | 1,596,252 | | | | 95,647 | |
| Paycom Software, Inc.* | | | 350,948 | | | | 18,155 | |
| Paylocity Holding Corp.* | | | 363,859 | | | | 15,824 | |
| ServiceNow, Inc.* | | | 204,136 | | | | 17,946 | |
| Ultimate Software Group, Inc. (The)* | | | 53,866 | | | | 11,365 | |
| Workday, Inc. Class A* | | | 186,899 | | | | 16,200 | |
| Zendesk, Inc.* | | | 459,455 | | | | 12,079 | |
| Total | | | | | | | 273,149 | |
| | See Notes to Financial Statements. | 41 |
Schedule of Investments (concluded)
GROWTH LEADERS FUND October 31, 2016
| Investments | | Shares | | | Fair
Value
(000) | |
| Specialty Retail 1.29% | | | | | | | | |
| Home Depot, Inc. (The) | | | 42,973 | | | $ | 5,243 | |
| TJX Cos., Inc. (The) | | | 73,643 | | | | 5,431 | |
| Ulta Salon, Cosmetics & Fragrance, Inc.* | | | 68,318 | | | | 16,625 | |
| Total | | | | | | | 27,299 | |
| | | | | | | | | |
| Technology Hardware, Storage & Peripherals 2.96% | | | | | | | | |
| Apple, Inc. | | | 552,108 | | | | 62,686 | |
| | | | | | | | | |
| Trading Companies & Distributors 0.50% | | | | | | | | |
| Beacon Roofing Supply, Inc.* | | | 254,048 | | | | 10,680 | |
Total Common Stocks
(cost $1,933,576,675) | | | | | | | 2,070,658 | |
| Investments | | Principal
Amount
(000) | | | Fair
Value
(000) | |
| SHORT-TERM INVESTMENT 4.37% | | | | | | | | |
| | | | | | | | | |
| Repurchase Agreement | | | | | | | | |
Repurchase Agreement dated 10/31/2016, 0.03% due 11/1/2016 with Fixed Income Clearing Corp. collateralized by $77,415,000 of U.S. Treasury Bond at 3.625% due 8/15/2043; value: $94,446,300; proceeds: $92,589,922
(cost $92,589,845) | | $ | 92,590 | | | $ | 92,590 | |
Total Investments in Securities 102.07%
(cost $2,026,166,520) | | | | | | | 2,163,248 | |
| Liabilities in Excess of Cash and Other Assets (2.07)% | | | | | | | (43,856 | ) |
| Net Assets 100.00% | | | | | | $ | 2,119,392 | |
| ADR | | American Depositary Receipt. |
| * | | Non-income producing security. |
| (a) | | Foreign security traded in U.S. dollars. |
The following is a summary of the inputs used as of October 31, 2016 in valuing the Fund’s investments carried at fair value(1):
| Investment Type(2)(3) | | Level 1
(000) | | | Level 2
(000) | | | Level 3
(000) | | | Total
(000) | |
| Common Stocks | | $ | 2,070,658 | | | $ | – | | | $ | – | | | $ | 2,070,658 | |
| Repurchase Agreement | | | – | | | | 92,590 | | | | – | | | | 92,590 | |
| Total | | $ | 2,070,658 | | | $ | 92,590 | | | $ | – | | | $ | 2,163,248 | |
| (1) | | Refer to Note 2(k) for a description of fair value measurements and the three-tier hierarchy of inputs. |
| (2) | | See Schedule of Investments for fair values in each industry and identification of foreign issuers and/or geography. |
| (3) | | There were no Level 1/Level 2 transfers during the fiscal year ended October 31, 2016. |
| 42 | See Notes to Financial Statements. | |
Schedule of Investments
INTERNATIONAL CORE EQUITY FUND October 31, 2016
| Investments | | Shares | | | U.S. $
Fair Value
(000) | |
| COMMON STOCKS 99.17% | | | | | | | | |
| | | | | | | | | |
| Australia 2.68% | | | | | | | | |
| | | | | | | | | |
| Commercial Services & Supplies 0.42% |
| Downer EDI Ltd. | | | 522,085 | | | $ | 2,315 | |
| | | | | | | | | |
| Construction Materials 0.37% | | | | | | | | |
| CSR Ltd. | | | 717,488 | | | | 1,998 | |
| | | | | | | | | |
| Metals & Mining 1.89% | | | | | | | | |
| BlueScope Steel Ltd. | | | 589,940 | | | | 3,500 | |
| Fortescue Metals Group Ltd. | | | 416,022 | | | | 1,741 | |
| South32 Ltd. | | | 2,612,646 | | | | 5,108 | |
| | | | | | | | 10,349 | |
| Total Australia | | | | | | | 14,662 | |
| | | | | | | | | |
| Austria 1.69% | | | | | | | | |
| | | | | | | | | |
| Banks | | | | | | | | |
| Erste Group Bank AG* | | | 295,168 | | | | 9,270 | |
| | | | | | | | | |
| Belgium 3.13% | | | | | | | | |
| | | | | | | | | |
| Beverages 2.61% | | | | | | | | |
| Anheuser-Busch InBev SA | | | 124,699 | | | | 14,312 | |
| | | | | | | | | |
| Chemicals 0.52% | | | | | | | | |
| Solvay SA | | | 24,498 | | | | 2,811 | |
| Total Belgium | | | | | | | 17,123 | |
| | | | | | | | | |
| Canada 0.92% | | | | | | | | |
| | | | | | | | | |
| Electric: Utilities | | | | | | | | |
| Emera, Inc. | | | 41,100 | | | | 1,434 | |
| Fortis, Inc. | | | 110,200 | | | | 3,627 | |
| | | | | | | | 5,061 | |
| China 1.60% | | | | | | | | |
| | | | | | | | | |
| Internet Software & Services | | | | | | | | |
| Alibaba Group Holding | | | | | | | | |
| Ltd. ADR* | | | 28,558 | | | | 2,904 | |
| Tencent Holdings Ltd. | | | 220,200 | | | | 5,843 | |
| | | | | | | | 8,747 | |
| Investments | | Shares | | | U.S. $
Fair Value
(000) | |
| Denmark 1.21% | | | | | | | | |
| | | | | | | | | |
| Banks | | | | | | | | |
| Danske Bank A/S | | | 215,423 | | | $ | 6,651 | |
| | | | | | | | | |
| Finland 1.06% | | | | | | | | |
| | | | | | | | | |
| Paper & Forest Products | | | | | | | | |
| Stora Enso OYJ R Shares | | | 133,627 | | | | 1,264 | |
| UPM-Kymmene OYJ | | | 193,899 | | | | 4,512 | |
| | | | | | | | 5,776 | |
| | | | | | | | | |
| France 9.59% | | | | | | | | |
| | | | | | | | | |
| Aerospace & Defense 0.77% | | | | | | | | |
| Thales SA | | | 16,963 | | | | 1,597 | |
| Zodiac Aerospace | | | 106,434 | | | | 2,590 | |
| | | | | | | | 4,187 | |
| | | | | | | | | |
| Auto Components 1.15% | | | | | | | | |
| Valeo SA | | | 109,437 | | | | 6,307 | |
| | | | | | | | | |
| Banks 1.63% | | | | | | | | |
| BNP Paribas SA | | | 153,820 | | | | 8,922 | |
| | | | | | | | | |
| Construction & Engineering 1.29% | | | | | | | | |
| Vinci SA | | | 97,499 | | | | 7,062 | |
| | | | | | | | | |
| Diversified Telecommunication Services 1.28% |
| Orange SA | | | 445,593 | | | | 7,019 | |
| | | | | | | | | |
| Food Products 1.88% | | | | | | | | |
| Danone SA | | | 148,833 | | | | 10,306 | |
| | | | | | | | | |
| Information Technology Services 0.58% | | | | | | | | |
| Atos SE | | | 30,774 | | | | 3,197 | |
| | | | | | | | | |
| Media 0.43% | | | | | | | | |
| Publicis Groupe SA | | | 34,043 | | | | 2,336 | |
| | | | | | | | | |
| Oil, Gas & Consumable Fuels 0.58% |
| Total SA | | | 66,157 | | | | 3,175 | |
| Total France | | | | | | | 52,511 | |
| | See Notes to Financial Statements. | 43 |
Schedule of Investments (continued)
INTERNATIONAL CORE EQUITY FUND October 31, 2016
| Investments | | Shares | | | U.S. $
Fair Value
(000) | |
| Germany 6.87% | | | | | | | | |
| | | | | | | | | |
| Health Care Providers & Services 0.75% | | | | | | | | |
| Fresenius Medical Care | | | | | | | | |
| AG & Co. KGaA | | | 50,697 | | | $ | 4,130 | |
| | | | | | | | | |
| Hotels, Restaurants & Leisure 0.91% | | | | | | | | |
| TUI AG | | | 392,227 | | | | 4,978 | |
| | | | | | | | | |
| Industrial Conglomerates 2.07% | | | | | | | | |
| Siemens AG Registered | | | | | | | | |
| Shares | | | 99,558 | | | | 11,306 | |
| | | | | | | | | |
| Insurance 1.33% | | | | | | | | |
| Allianz SE Registered Shares | | | 31,032 | | | | 4,837 | |
| Muenchener | | | | | | | | |
| Rueckversicherungs- | | | | | | | | |
| Gesellschaft AG in Muenchen | | | | | | | | |
| Registered Shares | | | 12,700 | | | | 2,462 | |
| | | | | | | | 7,299 | |
| | | | | | | | | |
| Life Sciences Tools & Services 0.38% | | | | | | | | |
| MorphoSys AG* | | | 47,062 | | | | 2,084 | |
| | | | | | | | | |
| Semiconductors & Semiconductor Equipment 0.55% |
| Infineon Technologies AG | | | 166,829 | | | | 2,995 | |
| | | | | | | | | |
| Software 0.88% | | | | | | | | |
| SAP SE | | | 54,947 | | | | 4,840 | |
| Total Germany | | | | | | | 37,632 | |
| | | | | | | | | |
| Hong Kong 2.07% | | | | | | | | |
| | | | | | | | | |
| Equity Real Estate Investment Trusts 1.23% | | | | | | | | |
| Link REIT | | | 943,500 | | | | 6,728 | |
| | | | | | | | | |
| Real Estate Management & Development 0.84% |
| Cheung Kong Property | | | | | | | | |
| Holdings Ltd. | | | 621,000 | | | | 4,600 | |
| Total Hong Kong | | | | | | | 11,328 | |
| | | | | | | | | |
| India 0.62% | | | | | | | | |
| | | | | | | | | |
| Banks | | | | | | | | |
| ICICI Bank Ltd. ADR | | | 409,223 | | | | 3,392 | |
| Investments | | Shares | | | U.S. $
Fair Value
(000) | |
| Israel 0.31% | | | | | | | | |
| | | | | | | | | |
| Pharmaceuticals | | | | | | | | |
| Teva Pharmaceutical | | | | | | | | |
| Industries Ltd. ADR | | | 39,695 | | | $ | 1,697 | |
| | | | | | | | | |
| Italy 1.99% | | | | | | | | |
| | | | | | | | | |
| Banks 1.29% | | | | | | | | |
| Intesa Sanpaolo SpA | | | 1,278,935 | | | | 2,962 | |
| Unione di Banche | | | | | | | | |
| Italiane SpA | | | 1,495,315 | | | | 4,124 | |
| | | | | | | | 7,086 | |
| | | | | | | | | |
| Electric: Utilities 0.70% | | | | | | | | |
| Enel SpA | | | 884,051 | | | | 3,804 | |
| Total Italy | | | | | | | 10,890 | |
| | | | | | | | | |
| Japan 27.57% | | | | | | | | |
| | | | | | | | | |
| Airlines 1.10% | | | | | | | | |
| Japan Airlines Co., Ltd. | | | 204,600 | | | | 6,040 | |
| | | | | | | | | |
| Auto Components 0.38% | | | | | | | | |
| Unipres Corp. | | | 109,200 | | | | 2,104 | |
| | | | | | | | | |
| Automobiles 4.61% | | | | | | | | |
| Fuji Heavy Industries Ltd. | | | 173,100 | | | | 6,758 | |
| Honda Motor Co., Ltd. | | | 240,200 | | | | 7,201 | |
| Mazda Motor Corp. | | | 249,200 | | | | 4,105 | |
| Toyota Motor Corp. | | | 124,300 | | | | 7,205 | |
| | | | | | | | 25,269 | |
| | | | | | | | | |
| Banks 4.82% | | | | | | | | |
| Mitsubishi UFJ Financial | | | | | | | | |
| Group, Inc. | | | 2,489,600 | | | | 12,929 | |
| Sumitomo Mitsui Financial | | | | | | | | |
| Group, Inc. | | | 307,500 | | | | 10,711 | |
| Sumitomo Mitsui Trust | | | | | | | | |
| Holdings, Inc. | | | 81,000 | | | | 2,742 | |
| | | | | | | | 26,382 | |
| 44 | See Notes to Financial Statements. | |
Schedule of Investments (continued)
INTERNATIONAL CORE EQUITY FUND October 31, 2016
| Investments | | Shares | | | U.S. $
Fair Value
(000) | |
| Japan (continued) | | | | | | | | |
| | | | | | | | | |
| Chemicals 2.70% | | | | | | | | |
| Asahi Kasei Corp. | | | 521,486 | | | $ | 4,713 | |
| Mitsubishi Chemical | | | | | | | | |
| Holdings Corp. | | | 1,179,900 | | | | 7,775 | |
| Teijin Ltd. | | | 117,200 | | | | 2,272 | |
| | | | | | | | 14,760 | |
| | | | | | | | | |
| Construction & Engineering 1.58% | | | | | | | | |
| Obayashi Corp. | | | 242,800 | | | | 2,345 | |
| Shimizu Corp. | | | 415,000 | | | | 3,696 | |
| Taisei Corp. | | | 350,000 | | | | 2,630 | |
| | | | | | | | 8,671 | |
| | | | | | | | | |
| Diversified Financial Services 1.13% | | | | | | | | |
| ORIX Corp. | | | 390,300 | | | | 6,199 | |
| | | | | | | | | |
| Electronic Equipment, Instruments & | | | | | | | | |
| Components 0.85% | | | | | | | | |
| Hitachi Ltd. | | | 872,000 | | | | 4,650 | |
| | | | | | | | | |
| Household Durables 0.49% | | | | | | | | |
| Sony Corp. | | | 84,400 | | | | 2,705 | |
| | | | | | | | | |
| Information Technology Services 0.88% | | | | | | | | |
| Fujitsu Ltd. | | | 807,000 | | | | 4,795 | |
| | | | | | | | | |
| Insurance 1.30% | | | | | | | | |
| T&D Holdings, Inc. | | | 267,300 | | | | 3,240 | |
| Tokio Marine Holdings, Inc. | | | 97,600 | | | | 3,861 | |
| | | | | | | | 7,101 | |
| | | | | | | | | |
| Machinery 0.51% | | | | | | | | |
| FANUC Corp. | | | 15,000 | | | | 2,815 | |
| | | | | | | | | |
| Media 0.46% | | | | | | | | |
| Dentsu, Inc. | | | 50,700 | | | | 2,533 | |
| | | | | | | | | |
| Metals & Mining 0.59% | | | | | | | | |
| JFE Holdings, Inc. | | | 168,800 | | | | 2,425 | |
| Nippon Steel & Sumitomo | | | | | | | | |
| Metal Corp. | | | 41,000 | | | | 813 | |
| | | | | | | | 3,238 | |
| Investments | | Shares | | | U.S. $
Fair Value
(000) | |
| Oil, Gas & Consumable Fuels 0.23% | | | | | | | | |
| JX Holdings, Inc. | | | 319,200 | | | $ | 1,266 | |
| | | | | | | | | |
| Real Estate Management & Development 0.76% |
| Daito Trust Construction | | | | | | | | |
| Co., Ltd. | | | 24,800 | | | | 4,156 | |
| | | | | | | | | |
| Road & Rail 1.03% | | | | | | | | |
| Central Japan Railway Co. | | | 15,300 | | | | 2,607 | |
| Kyushu Railway Co.* | | | 102,300 | | | | 3,014 | |
| | | | | | | | 5,621 | |
| Software 0.68% | | | | | | | | |
| Nintendo Co., Ltd. | | | 15,300 | | | | 3,712 | |
| | | | | | | | | |
| Technology Hardware, Storage & Peripherals 0.33% |
| NEC Corp. | | | 667,000 | | | | 1,787 | |
| | | | | | | | | |
| Trading Companies & Distributors 0.94% |
| Mitsubishi Corp. | | | 235,300 | | | | 5,140 | |
| | | | | | | | | |
| Wireless Telecommunication Services 2.20% |
| NTT DOCOMO, Inc. | | | 172,900 | | | | 4,353 | |
| SoftBank Group Corp. | | | 122,500 | | | | 7,712 | |
| | | | | | | | 12,065 | |
| Total Japan | | | | | | | 151,009 | |
| | | | | | | | | |
| Mexico 0.10% | | | | | | | | |
| | | | | | | | | |
| Consumer Finance | | | | | | | | |
| Gentera SAB de CV | | | 275,815 | | | | 544 | |
| | | | | | | | | |
| Netherlands 4.30% | | | | | | | | |
| | | | | | | | | |
| Banks 0.87% | | | | | | | | |
| ING Groep NV | | | 360,906 | | | | 4,752 | |
| | | | | | | | | |
| Insurance 0.93% | | | | | | | | |
| NN Group NV | | | 168,808 | | | | 5,087 | |
| | | | | | | | | |
| Oil, Gas & Consumable Fuels 2.50% |
| Royal Dutch Shell plc | | | | | | | | |
| B Shares | | | 528,697 | | | | 13,687 | |
| Total Netherlands | | | | | | | 23,526 | |
| | See Notes to Financial Statements. | 45 |
Schedule of Investments (continued)
INTERNATIONAL CORE EQUITY FUND October 31, 2016
| Investments | | Shares | | | U.S. $
Fair Value
(000) | |
| New Zealand 0.34% | | | | | | | | |
| | | | | | | | | |
| Construction Materials | | | | | | | | |
| Fletcher Building Ltd. | | | 253,118 | | | $ | 1,877 | |
| | | | | | | | | |
| Norway 0.14% | | | | | | | | |
| | | | | | | | | |
| Metals & Mining | | | | | | | | |
| Norsk Hydro ASA | | | 167,482 | | | | 749 | |
| | | | | | | | | |
| Philippines 0.32% | | | | | | | | |
| | | | | | | | | |
| Diversified Financial Services | | | | | | | | |
| Metro Pacific | | | | | | | | |
| Investments Corp. | | | 11,852,800 | | | | 1,765 | |
| | | | | | | | | |
| Portugal 0.37% | | | | | | | | |
| | | | | | | | | |
| Electric: Utilities | | | | | | | | |
| EDP–Energias de | | | | | | | | |
| Portugal SA | | | 607,065 | | | | 2,007 | |
| | | | | | | | | |
| Singapore 1.05% | | | | | | | | |
| | | | | | | | | |
| Equity Real Estate Investment Trusts 0.49% |
| Ascendas Real Estate | | | | | | | | |
| Investment Trust | | | 1,574,200 | | | | 2,682 | |
| | | | | | | | | |
| Transportation Infrastructure 0.56% |
| Hutchison Port Holdings | | | | | | | | |
| Trust Unit | | | 6,910,500 | | | | 3,075 | |
| Total Singapore | | | | | | | 5,757 | |
| | | | | | | | | |
| South Africa 0.36% | | | | | | | | |
| | | | | | | | | |
| Oil, Gas & Consumable Fuels | | | | | | | | |
| Sasol Ltd. | | | 70,466 | | | | 1,957 | |
| | | | | | | | | |
| South Korea 1.47% | | | | | | | | |
| | | | | | | | | |
| Biotechnology 0.48% | | | | | | | | |
| Celltrion, Inc.* | | | 28,329 | | | | 2,629 | |
| | | | | | | | | |
| Technology Hardware, Storage & Peripherals 0.99% |
| Samsung Electronics Co., Ltd. 3,786 | | | | | | | 5,423 | |
| Total South Korea | | | | | | | 8,052 | |
| Investments | | Shares | | | U.S. $
Fair Value
(000) | |
| Spain 4.08% | | | | | | | | |
| | | | | | | | | |
| Banks 1.04% | | | | | | | | |
| Banco Bilbao Vizcaya | | | | | | | | |
| Argentaria SA | | | 788,497 | | | $ | 5,694 | |
| | | | | | | | | |
| Construction & Engineering 0.90% | | | | | | | | |
| Obrascon Huarte Lain SA | | | 467,326 | | | | 1,879 | |
| Sacyr SA | | | 1,339,394 | | | | 3,063 | |
| | | | | | | | 4,942 | |
| | | | | | | | | |
| Oil, Gas & Consumable Fuels 1.53% |
| Repsol SA | | | 598,082 | | | | 8,381 | |
| | | | | | | | | |
| Specialty Retail 0.61% | | | | | | | | |
| Industria de Diseno Textil SA | | | 95,789 | | | | 3,348 | |
| Total Spain | | | | | | | 22,365 | |
| | | | | | | | | |
| Sweden 1.82% | | | | | | | | |
| | | | | | | | | |
| Banks 0.49% | | | | | | | | |
| Swedbank AB A Shares | | | 114,804 | | | | 2,690 | |
| | | | | | | | | |
| Machinery 0.56% | | | | | | | | |
| Volvo AB B Shares | | | 287,293 | | | | 3,085 | |
| | | | | | | | | |
| Real Estate Management & Development 0.77% |
| Castellum AB | | | 310,741 | | | | 4,211 | |
| Total Sweden | | | | | | | 9,986 | |
| | | | | | | | | |
| Switzerland 6.96% | | | | | | | | |
| | | | | | | | | |
| Food Products 2.64% | | | | | | | | |
| Nestle SA Registered Shares | | | 199,536 | | | | 14,468 | |
| | | | | | | | | |
| Insurance 0.89% | | | | | | | | |
| Swiss Life Holding AG | | | | | | | | |
| Registered Shares* | | | 13,516 | | | | 3,578 | |
| Swiss Re AG | | | 14,091 | | | | 1,309 | |
| | | | | | | | 4,887 | |
| | | | | | | | | |
| Pharmaceuticals 3.43% | | | | | | | | |
| Novartis AG Registered | | | | | | | | |
| Shares | | | 58,221 | | | | 4,142 | |
| Roche Holding AG | | | 63,541 | | | | 14,608 | |
| | | | | | | | 18,750 | |
| Total Switzerland | | | | | | | 38,105 | |
| 46 | See Notes to Financial Statements. | |
Schedule of Investments (continued)
INTERNATIONAL CORE EQUITY FUND October 31, 2016
| Investments | | Shares | | | U.S. $
Fair Value
(000) | |
| Taiwan 0.58% | | | | | | | | |
| | | | | | | | | |
| Semiconductors & Semiconductor Equipment |
| Taiwan Semiconductor | | | | | | | | |
| Manufacturing Co., Ltd. | | | 534,000 | | | $ | 3,190 | |
| | | | | | | | | |
| United Kingdom 14.92% | | | | | | | | |
| | | | | | | | | |
| Aerospace & Defense 0.75% | | | | | | | | |
| BAE Systems plc | | | 620,588 | | | | 4,121 | |
| | | | | | | | | |
| Air Freight & Logistics 0.41% | | | | | | | | |
| Royal Mail plc | | | 371,609 | | | | 2,233 | |
| | | | | | | | | |
| Auto Components 1.44% | | | | | | | | |
| GKN plc | | | 2,018,659 | | | | 7,887 | |
| | | | | | | | | |
| Banks 0.42% | | | | | | | | |
| HSBC Holdings plc | | | 301,751 | | | | 2,276 | |
| | | | | | | | | |
| Hotels, Restaurants & Leisure 1.04% |
| Compass Group plc | | | 200,113 | | | | 3,628 | |
| Merlin Entertainments plc† | | | 371,150 | | | | 2,093 | |
| | | | | | | | 5,721 | |
| | | | | | | | | |
| Insurance 0.58% | | | | | | | | |
| Direct Line Insurance | | | | | | | | |
| Group plc | | | 745,622 | | | | 3,159 | |
| | | | | | | | | |
| Metals & Mining 0.59% | | | | | | | | |
| Anglo American plc* | | | 231,921 | | | | 3,210 | |
| | | | | | | | | |
| Personal Products 1.46% | | | | | | | | |
| Unilever NV CVA | | | 190,690 | | | | 7,992 | |
| | | | | | | | | |
| Pharmaceuticals 2.68% | | | | | | | | |
| AstraZeneca plc | | | 41,062 | | | | 2,306 | |
| GlaxoSmithKline plc | | | 624,508 | | | | 12,372 | |
| | | | | | | | 14,678 | |
| | | | | | | | | |
| Professional Services 0.17% |
| RELX plc | | | 52,284 | | | | 935 | |
| | | | | | | | | |
| Tobacco 2.88% | | | | | | | | |
| British American Tobacco plc | | | 251,204 | | | | 14,425 | |
| Imperial Brands plc | | | 28,386 | | | | 1,374 | |
| | | | | | | | 15,799 | |
| Investments | | Shares | | | U.S. $
Fair Value
(000) | |
| Trading Companies & Distributors 1.50% |
| Ashtead Group plc | | | 526,648 | | | $ | 8,238 | |
| | | | | | | | | |
| Wireless Telecommunication Services 1.00% |
| Vodafone Group plc | | | 1,990,090 | | | | 5,476 | |
| Total United Kingdom | | | | | | | 81,725 | |
| | | | | | | | | |
| United States 1.05% | | | | | | | | |
| | | | | | | | | |
| Biotechnology | | | | | | | | |
| Shire plc | | | 101,199 | | | | 5,760 | |
Total Common Stocks
(cost $528,550,574) | | | | | | | 543,114 | |
| | | | | | | | | |
| | | Principal
Amount
(000) | | | | | |
| SHORT-TERM INVESTMENT 0.51% | | | | | | | | |
| | | | | | | | | |
| Repurchase Agreement | | | | | | | | |
Repurchase Agreement dated 10/31/2016, 0.03% due 11/1/2016 with Fixed Income Clearing Corp. collateralized by $2,330,000 of U.S. Treasury Bond at 3.625% due 8/15/2043; value: $2,842,600; proceeds: $2,781,651
(cost $2,781,649) | | $ | 2,782 | | | | 2,782 | |
Total Investments in Securities 99.68%
(cost $531,332,223) | | | | | | | 545,896 | |
| Foreign Cash and Other Assets in Excess of Liabilities(a) 0.32% | | | | | | | 1,746 | |
| Net Assets 100.00% | | | | | | $ | 547,642 | |
| ADR | | American Depositary Receipt. |
| Unit | | More than one class of securities traded together. |
| * | | Non-income producing security. |
| † | | Security was purchased pursuant to Rule 144A under the Securities Act of 1933 and, unless registered under such Act or exempted from registration, may only be resold to qualified institutional buyers. |
| (a) | | Foreign Cash and Other Assets in Excess of Liabilities include net unrealized appreciation/depreciation on forward foreign currency exchange contracts as follows: |
| | See Notes to Financial Statements. | 47 |
Schedule of Investments (continued)
INTERNATIONAL CORE EQUITY FUND October 31, 2016
Open Forward Foreign Currency Exchange Contracts at October 31, 2016:
Forward
Foreign
Currency
Exchange
Contracts | | Transaction
Type | | Counterparty | | Expiration
Date | | Foreign
Currency | | | U.S. $
Cost on
Origination
Date | | | U.S. $
Current
Value | | Unrealized
Appreciation | |
| British pound | | Buy | | Goldman Sachs | | 2/6/2017 | | | 4,070,000 | | | | $4,980,482 | | | | $4,992,798 | | | $ | 12,316 | |
| British pound | | Buy | | State Street
Bank and Trust | | 2/6/2017 | | | 2,000,000 | | | | 2,447,135 | | | | 2,453,463 | | | | 6,328 | |
| euro | | Buy | | State Street
Bank and Trust | | 2/17/2017 | | | 2,600,000 | | | | 2,858,222 | | | | 2,868,423 | | | | 10,201 | |
| Swiss franc | | Buy | | Goldman Sachs | | 2/21/2017 | | | 7,765,000 | | | | 7,892,077 | | | | 7,899,059 | | | | 6,982 | |
| British pound | | Sell | | Morgan Stanley | | 1/19/2017 | | | 3,130,000 | | | | 4,176,070 | | | | 3,838,346 | | | | 337,724 | |
| British pound | | Sell | | State Street
Bank and Trust | | 2/6/2017 | | | 2,350,000 | | | | 2,932,611 | | | | 2,882,819 | | | | 49,792 | |
| Canadian dollar | | Sell | | Standard
Chartered Bank | | 12/15/2016 | | | 12,263,000 | | | | 9,462,051 | | | | 9,145,582 | | | | 316,469 | |
| euro | | Sell | | Bank of America | | 2/17/2017 | | | 6,500,000 | | | | 7,206,732 | | | | 7,171,057 | | | | 35,675 | |
| Japanese yen | | Sell | | Morgan Stanley | | 2/21/2017 | | | 130,260,000 | | | | 1,252,517 | | | | 1,247,998 | | | | 4,519 | |
| South Korean won | | Sell | | J.P. Morgan | | 2/27/2017 | | | 4,940,000,000 | | | | 4,378,113 | | | | 4,316,742 | | | | 61,371 | |
| Swedish krona | | Sell | | State Street
Bank and Trust | | 12/15/2016 | | | 17,040,000 | | | | 2,015,448 | | | | 1,890,590 | | | | 124,858 | |
| Unrealized Appreciation on Forward Foreign Currency Exchange Contracts | | | $ | 966,235 | |
Forward
Foreign
Currency
Exchange
Contracts | | Transaction
Type | | Counterparty | | Expiration
Date | | Foreign
Currency | | | U.S. $
Cost on
Origination
Date | | | U.S. $
Current
Value | | Unrealized
Depreciation | |
| Australian dollar | | Buy | | State Street
Bank and Trust | | 2/21/2017 | | | 31,650,000 | | | | $24,213,358 | | | | $24,012,442 | | | $ | (200,916 | ) |
| British pound | | Buy | | Bank of America | | 2/6/2017 | | | 2,350,000 | | | | 2,999,784 | | | | 2,882,819 | | | | (116,965 | ) |
| British pound | | Buy | | State Street
Bank and Trust | | 1/19/2017 | | | 3,130,000 | | | | 4,100,851 | | | | 3,838,346 | | | | (262,505 | ) |
| Canadian dollar | | Buy | | Bank of America | | 12/15/2016 | | | 3,075,000 | | | | 2,350,587 | | | | 2,293,294 | | | | (57,293 | ) |
| Canadian dollar | | Buy | | Goldman Sachs | | 12/15/2016 | | | 3,700,000 | | | | 2,839,096 | | | | 2,759,411 | | | | (79,685 | ) |
| Danish krone | | Buy | | Morgan Stanley | | 2/17/2017 | | | 13,166,674 | | | | 1,962,222 | | | | 1,953,227 | | | | (8,995 | ) |
| Swedish krona | | Buy | | State Street
Bank and Trust | | 12/15/2016 | | | 51,330,000 | | | | 6,123,959 | | | | 5,695,069 | | | | (428,890 | ) |
| Swiss franc | | Buy | | State Street
Bank and Trust | | 12/19/2016 | | | 4,620,000 | | | | 4,770,421 | | | | 4,681,414 | | | | (89,007 | ) |
| British pound | | Sell | | State Street
Bank and Trust | | 2/6/2017 | | | 4,070,000 | | | | 4,966,121 | | | | 4,992,798 | | | | (26,677 | ) |
| euro | | Sell | | State Street
Bank and Trust | | 2/17/2017 | | | 680,000 | | | | 745,320 | | | | 750,203 | | | | (4,883 | ) |
| Unrealized Depreciation on Forward Foreign Currency Exchange Contracts | | | $ | (1,275,816 | ) |
| 48 | See Notes to Financial Statements. | |
Schedule of Investments (concluded)
INTERNATIONAL CORE EQUITY FUND October 31, 2016
The following is a summary of the inputs used as of October 31, 2016 in valuing the Fund’s investments carried at fair value(1):
| Investment Type(2)(3) | | Level 1
(000) | | | Level 2
(000) | | | Level 3
(000) | | | Total
(000) | |
| Common Stocks | | $ | 543,114 | | | $ | – | | | $ | – | | | $ | 543,114 | |
| Repurchase Agreement | | | – | | | | 2,782 | | | | – | | | | 2,782 | |
| Total | | $ | 543,114 | | | $ | 2,782 | | | $ | – | | | $ | 545,896 | |
| Other Financial Instruments | | | | | | | | | | | | | | | | |
| Forward Foreign Currency Exchange Contracts | | | | | | | | | | | | | | | | |
| Assets | | $ | – | | | $ | 966 | | | $ | – | | | $ | 966 | |
| Liabilities | | | – | | | | (1,276 | ) | | | – | | | | (1,276 | ) |
| Total | | $ | – | | | $ | (310 | ) | | $ | – | | | $ | (310 | ) |
| (1) | | Refer to Note 2(k) for a description of fair value measurements and the three-tier hierarchy of inputs. |
| (2) | | See Schedule of Investments for fair values in each industry and identification of foreign issuers and/or geography. |
| (3) | | There were no Level 1/Level 2 transfers during the fiscal year ended October 31, 2016. |
| | See Notes to Financial Statements. | 49 |
Schedule of Investments
INTERNATIONAL DIVIDEND INCOME FUND October 31, 2016
| Investments | | Shares | | | U.S. $
Fair Value
(000) | |
| LONG-TERM INVESTMENTS 98.02% | | | | | | | | |
| | | | | | | | | |
| COMMON STOCKS 96.39% | | | | | | | | |
| | | | | | | | | |
| Australia 5.86% | | | | | | | | |
| | | | | | | | | |
| Banks 1.63% | | | | | | | | |
| National Australia Bank Ltd. | | | 1,025,634 | | | $ | 21,846 | |
| | | | | | | | | |
| Commercial Services & Supplies 0.46% | | | | | | | | |
| Spotless Group Holdings Ltd. | | | 8,223,461 | | | | 6,256 | |
| Electric: Utilities 0.30% | | | | | | | | |
| AusNet Services | | | 3,492,506 | | | | 3,985 | |
| | | | | | | | | |
| Equity Real Estate Investment Trusts 1.43% | | | | | | | | |
| Mirvac Group | | | 12,056,086 | | | | 19,167 | |
| | | | | | | | | |
| Metals & Mining 1.56% | | | | | | | | |
| BHP Billiton Ltd. | | | 1,190,482 | | | | 20,892 | |
| | | | | | | | | |
| Personal Products 0.48% | | | | | | | | |
| Asaleo Care Ltd. | | | 5,812,074 | | | | 6,455 | |
| Total Australia | | | | | | | 78,601 | |
| | | | | | | | | |
| Belgium 2.33% | | | | | | | | |
| | | | | | | | | |
| Air Freight & Logistics 1.32% | | | | | | | | |
| bpost SA | | | 662,789 | | | | 17,633 | |
| | | | | | | | | |
| Beverages 1.01% | | | | | | | | |
| Anheuser-Busch InBev SA | | | 118,391 | | | | 13,587 | |
| Total Belgium | | | | | | | 31,220 | |
| | | | | | | | | |
| Brazil 1.37% | | | | | | | | |
| | | | | | | | | |
| Independent Power & Renewable Electricity Producers | | | | | | | | |
| AES Tiete Energia SA Unit | | | 3,546,118 | | | | 18,375 | |
| | | | | | | | | |
| Canada 6.81% | | | | | | | | |
| | | | | | | | | |
| Oil, Gas & Consumable Fuels | | | | | | | | |
| ARC Resources Ltd. | | | 958,000 | | | | 16,263 | |
| Crescent Point Energy Corp. | | | 1,069,052 | | | | 12,729 | |
| | | | | | U.S. $ | |
| | | | | | Fair Value | |
| Investments | | Shares | | | (000) | |
| Pembina Pipeline Corp. | | | 637,200 | | | $ | 19,577 | |
| TransCanada Corp. | | | 436,100 | | | | 19,742 | |
| Whitecap Resources, Inc. | | | 2,876,800 | | | | 22,992 | |
| | | | | | | | 91,303 | |
| | | | | | | | | |
| China 2.37% | | | | | | | | |
| | | | | | | | | |
| Banks 1.69% | | | | | | | | |
| Bank of China Ltd. H Shares | | | 50,662,000 | | | | 22,733 | |
| | | | | | | | | |
| Real Estate Management & Development 0.68% | | | | | | | | |
| Longfor Properties Co., Ltd. | | | 6,849,800 | | | | 9,097 | |
| Total China | | | | | | | 31,830 | |
| | | | | | | | | |
| Denmark 1.09% | | | | | | | | |
| | | | | | | | | |
| Diversified Telecommunication Services | | | | | | | | |
| TDC A/S* | | | 2,646,384 | | | | 14,603 | |
| | | | | | | | | |
| France 6.84% | | | | | | | | |
| | | | | | | | | |
| Banks 1.70% | | | | | | | | |
| BNP Paribas SA | | | 392,624 | | | | 22,774 | |
| | | | | | | | | |
| Diversified Telecommunication Services 1.63% | | | | | | | | |
| Orange SA | | | 1,388,848 | | | | 21,878 | |
| | | | | | | | | |
| Insurance 1.55% | | | | | | | | |
| AXA SA | | | 923,307 | | | | 20,814 | |
| | | | | | | | | |
| Media 1.28% | | | | | | | | |
| Vivendi SA | | | 848,803 | | | | 17,163 | |
| | | | | | | | | |
| Oil, Gas & Consumable Fuels 0.68% | | | | | | | | |
| Total SA ADR | | | 192,485 | | | | 9,189 | |
| Total France | | | | | | | 91,818 | |
| | | | | | | | | |
| Germany 6.88% | | | | | | | | |
| | | | | | | | | |
| Chemicals 1.76% | | | | | | | | |
| BASF SE | | | 268,689 | | | | 23,685 | |
| 50 | See Notes to Financial Statements. |
Schedule of Investments (continued)
INTERNATIONAL DIVIDEND INCOME FUND October 31, 2016
| Investments | | Shares | | | U.S. $
Fair Value
(000) | |
| Germany (continued) | | | | | | | | |
| | | | | | | | | |
| Diversified Telecommunication Services 0.79% | | | | | | | | |
| Deutsche Telekom AG Registered Shares | | | 649,765 | | | $ | 10,588 | |
| | | | | | | | | |
| Hotels, Restaurants & Leisure 0.82% | | | | | | | | |
| TUI AG | | | 866,932 | | | | 11,004 | |
| | | | | | | | | |
| Industrial Conglomerates 1.41% | | | | | | | | |
| Siemens AG Registered Shares | | | 166,399 | | | | 18,897 | |
| | | | | | | | | |
| Insurance 2.10% | | | | | | | | |
| Allianz SE Registered Shares | | | 180,617 | | | | 28,155 | |
| Total Germany | | | | | | | 92,329 | |
| | | | | | | | | |
| Hong Kong 6.17% | | | | | | | | |
| | | | | | | | | |
| Commercial Services & Supplies 1.03% | | | | | | | | |
| China Everbright International Ltd. | | | 11,542,000 | | | | 13,841 | |
| | | | | | | | | |
| Communications Equipment 1.14% | | | | | | | | |
| VTech Holdings Ltd. | | | 1,251,300 | | | | 15,360 | |
| | | | | | | | | |
| Construction & Engineering 0.82% | | | | | | | | |
| China State Construction International Holdings Ltd. 7,516,000 | | | | | | | 10,990 | |
| | | | | | | | | |
| Equity Real Estate Investment Trusts 1.36% | | | | | | | | |
| Link REIT | | | 2,560,500 | | | | 18,257 | |
| | | | | | | | | |
| Industrial Conglomerates 0.92% | | | | | | | | |
| CK Hutchison Holdings Ltd. | | | 995,900 | | | | 12,321 | |
| | | | | | | | | |
| Real Estate Management & Development 0.90% | | | | | | | | |
| Hysan Development Co., Ltd. | | | 2,614,000 | | | | 12,066 | |
| Total Hong Kong | | | | | | | 82,835 | |
| | | | | | | | | |
| India 1.47% | | | | | | | | |
| | | | | | | | | |
| Thrifts & Mortgage Finance | | | | | | | | |
| Indiabulls Housing Finance Ltd. | | | 1,555,201 | | | | 19,751 | |
| Investments | | Shares | | | U.S. $
Fair Value
(000) | |
| Indonesia 0.84% | | | | | | | | |
| | | | | | | | | |
| Banks | | | | | | | | |
| PT Bank Negara Indonesia (Persero) Tbk | | | 26,409,300 | | | $ | 11,284 | |
| | | | | | | | | |
| Israel 0.98% | | | | | | | | |
| | | | | | | | | |
| Diversified Telecommunication Services | | | | | | | | |
| Bezeq The Israeli Telecommunication Corp., Ltd. | | | 7,243,067 | | | | 13,160 | |
| Italy 0.78% | | | | | | | | |
| | | | | | | | | |
| Gas Utilities | | | | | | | | |
| Snam SpA | | | 1,985,819 | | | | 10,468 | |
| | | | | | | | | |
| Japan 4.00% | | | | | | | | |
| | | | | | | | | |
| Automobiles 1.39% | | | | | | | | |
| Nissan Motor Co., Ltd. | | | 1,831,200 | | | | 18,658 | |
| | | | | | | | | |
| Banks 1.49% | | | | | | | | |
| Sumitomo Mitsui Financial Group, Inc. | | | 572,500 | | | | 19,942 | |
| | | | | | | | | |
| Real Estate Management & Development 1.12% | | | | | | | | |
| Nomura Real Estate Holdings, Inc. | | | 887,100 | | | | 15,032 | |
| Total Japan | | | | | | | 53,632 | |
| | | | | | | | | |
| Macau 1.83% | | | | | | | | |
| | | | | | | | | |
| Hotels, Restaurants & Leisure | | | | | | | | |
| Sands China Ltd. | | | 5,640,400 | | | | 24,545 | |
| | | | | | | | | |
| Netherlands 2.93% | | | | | | | | |
| | | | | | | | | |
| Insurance 1.29% | | | | | | | | |
| NN Group NV | | | 573,119 | | | | 17,270 | |
| | | | | | | | | |
| Oil, Gas & Consumable Fuels 1.64% | | | | | | | | |
| Royal Dutch Shell plc Class A ADR | | | 443,557 | | | | 22,093 | |
| Total Netherlands | | | | | | | 39,363 | |
| | See Notes to Financial Statements. | 51 |
Schedule of Investments (continued)
INTERNATIONAL DIVIDEND INCOME FUND October 31, 2016
| Investments | | Shares | | | U.S. $
Fair Value
(000) | |
| New Zealand 3.41% | | | | | | | | |
| | | | | | | | | |
| Airlines 0.64% | | | | | | | | |
| Air New Zealand Ltd. | | | 6,223,231 | | | $ | 8,589 | |
| | | | | | | | | |
| Construction Materials 0.92% | | | | | | | | |
| Fletcher Building Ltd. | | | 1,660,336 | | | | 12,312 | |
| | | | | | | | | |
| Diversified Telecommunication Services 1.85% | | | | | | | | |
| Spark New Zealand Ltd. | | | 9,501,339 | | | | 24,868 | |
| Total New Zealand | | | | | | | 45,769 | |
| | | | | | | | | |
| Portugal 1.20% | | | | | | | | |
| | | | | | | | | |
| Oil, Gas & Consumable Fuels | | | | | | | | |
| Galp Energia SGPS SA | | | 1,185,683 | | | | 16,075 | |
| | | | | | | | | |
| Russia 1.83% | | | | | | | | |
| | | | | | | | | |
| Oil, Gas & Consumable Fuels | | | | | | | | |
| Lukoil PJSC ADR | | | 503,834 | | | | 24,562 | |
| | | | | | | | | |
| Singapore 0.58% | | | | | | | | |
| | | | | | | | | |
| Equity Real Estate Investment Trusts | | | | | | | | |
| Ascendas Real Estate Investment Trust | | | 4,591,700 | | | | 7,822 | |
| | | | | | | | | |
| South Africa 2.03% | | | | | | | | |
| | | | | | | | | |
| Banks 1.11% | | | | | | | | |
| Barclays Africa Group Ltd. | | | 1,283,447 | | | | 14,883 | |
| | | | | | | | | |
| Capital Markets 0.92% | | | | | | | | |
| Coronation Fund Managers Ltd. | | | 2,295,677 | | | | 12,349 | |
| Total South Africa | | | | | | | 27,232 | |
| | | | | | | | | |
| South Korea 2.94% | | | | | | | | |
| | | | | | | | | |
| Technology Hardware, Storage & Peripherals 1.32% | | | | | | | | |
| Samsung Electronics Co., Ltd. 12,343 | | | | | | | 17,680 | |
| | | | | | | | | |
| Wireless Telecommunication Services 1.62% | | | | | | | | |
| SK Telecom Co., Ltd. | | | 111,591 | | | | 21,796 | |
| Total South Korea | | | | | | | 39,476 | |
| Investments | | Shares | | | U.S. $
Fair Value
(000) | |
| Spain 4.53% | | | | | | | | |
| | | | | | | | | |
| Banks 1.23% | | | | | | | | |
| Banco Bilbao Vizcaya Argentaria SA | | | 2,288,429 | | | $ | 16,525 | |
| | | | | | | | | |
| Capital Markets 1.33% | | | | | | | | |
| Bolsas y Mercados Espanoles, SHMFS, SA | | | 587,504 | | | | 17,781 | |
| | | | | | | | | |
| Gas Utilities 1.97% | | | | | | | | |
| Enagas SA | | | 922,090 | | | | 26,469 | |
| Total Spain | | | | | | | 60,775 | |
| | | | | | | | | |
| Sweden 0.87% | | | | | | | | |
| | | | | | | | | |
| Machinery | | | | | | | | |
| Volvo AB B Shares | | | 1,080,373 | | | | 11,603 | |
| | | | | | | | | |
| Switzerland 3.02% | | | | | | | | |
| | | | | | | | | |
| Food Products 1.51% | | | | | | | | |
| Nestle SA Registered Shares | | | 278,421 | | | | 20,188 | |
| | | | | | | | | |
| Pharmaceuticals 1.51% | | | | | | | | |
| Roche Holding AG | | | 88,183 | | | | 20,273 | |
| Total Switzerland | | | | | | | 40,461 | |
| | | | | | | | | |
| Taiwan 1.85% | | | | | | | | |
| | | | | | | | | |
| Semiconductors & Semiconductor Equipment | | | | | | | | |
| Taiwan Semiconductor Manufacturing Co., Ltd. | | | 4,146,000 | | | | 24,765 | |
| | | | | | | | | |
| Turkey 0.78% | | | | | | | | |
| | | | | | | | | |
| Automobiles | | | | | | | | |
| Tofas Turk Otomobil Fabrikasi AS | | | 1,390,000 | | | | 10,467 | |
| | | | | | | | | |
| United Kingdom 20.80% | | | | | | | | |
| | | | | | | | | |
| Aerospace & Defense 1.43% | | | | | | | | |
| BAE Systems plc | | | 2,892,746 | | | | 19,208 | |
| | | | | | | | | |
| Banks 1.67% | | | | | | | | |
| HSBC Holdings plc | | | 2,971,165 | | | | 22,409 | |
| 52 | See Notes to Financial Statements. |
Schedule of Investments (continued)
INTERNATIONAL DIVIDEND INCOME FUND October 31, 2016
| Investments | | Shares | | | U.S. $
Fair Value
(000) | |
| United Kingdom (continued) | | | | | | | | |
| | | | | | | | | |
| Beverages 1.32% | | | | | | | | |
| Coca-Cola European Partners plc | | | 459,823 | | | $ | 17,730 | |
| | | | | | | | | |
| Capital Markets 1.74% | | | | | | | | |
| Aberdeen Asset Management plc | | | 2,802,921 | | | | 10,985 | |
| Jupiter Fund Management plc | | | 2,341,380 | | | | 12,372 | |
| | | | | | | | 23,357 | |
| Electric: Utilities 1.37% | | | | | | | | |
| SSE plc | | | 944,920 | | | | 18,401 | |
| | | | | | | | | |
| Equity Real Estate Investment Trusts 0.76% | | | | | | | | |
| British Land Co. plc (The) | | | 1,428,579 | | | | 10,238 | |
| | | | | | | | | |
| Household Durables 0.64% | | | | | | | | |
| Berkeley Group Holdings plc | | | 299,198 | | | | 8,639 | |
| | | | | | | | | |
| Insurance 1.31% | | | | | | | | |
| Lancashire Holdings Ltd. | | | 1,222,029 | | | | 10,426 | |
| Prudential plc | | | 434,004 | | | | 7,089 | |
| | | | | | | | 17,515 | |
| | | | | | | | | |
| Metals & Mining 2.29% | | | | | | | | |
| Rio Tinto plc ADR | | | 879,983 | | | | 30,667 | |
| | | | | | | | | |
| Multi-Utilities 1.84% | | | | | | | | |
| National Grid plc | | | 1,891,713 | | | | 24,660 | |
| | | | | | | | | |
| Oil, Gas & Consumable Fuels 1.01% | | | | | | | | |
| BP plc | | | 2,300,233 | | | | 13,619 | |
| | | | | | | | | |
| Pharmaceuticals 2.65% | | | | | | | | |
| AstraZeneca plc | | | 226,394 | | | | 12,714 | |
| GlaxoSmithKline plc | | | 1,149,910 | | | | 22,780 | |
| | | | | | | | 35,494 | |
| | | | | | | | | |
| Tobacco 1.59% | | | | | | | | |
| Imperial Brands plc | | | 440,087 | | | | 21,307 | |
| Investments | | Shares | | | U.S. $
Fair Value
(000) | |
| Wireless Telecommunication Services 1.18% | | | | | | | | |
| Vodafone Group plc | | | 5,756,318 | | | $ | 15,839 | |
| Total United Kingdom | | | | | | | 279,083 | |
Total Common Stocks
(cost $1,332,752,375) | | | | | | | 1,293,207 | |
| | | | | | | | | |
| | | | Principal
Amount | | | | | |
| CORPORATE BOND 1.63% | | | | | | | | |
| | | | | | | | | |
| Spain | | | | | | | | |
| | | | | | | | | |
| Banks | | | | | | | | |
Banco Popular Espanol SA(a)
(cost $27,082,222) | | $ | 19,000,000 | | | | 21,822 | |
Total Investments in Long-Term Securities 98.02%
(cost $1,359,834,597) | | | | | | | 1,315,029 | |
| Foreign Cash and Other Assets in Excess of Liabilities(b) 1.98% | | | | | | | 26,573 | |
| Net Assets 100.00% | | | | | | $ | 1,341,602 | |
| ADR | | American Depositary Receipt. |
| Unit | | More than one class of securities traded together. |
| * | | Non-income producing security. |
| (a) | | The security has an interest rate of 11.50%, is perpetual in nature and has no stated maturity. |
| (b) | | Foreign Cash and Other Assets in Excess of Liabilities include net unrealized appreciation/depreciation on forward foreign currency exchange contracts as follows: |
| | See Notes to Financial Statements. | 53 |
Schedule of Investments (continued)
INTERNATIONAL DIVIDEND INCOME FUND October 31, 2016
Open Forward Foreign Currency Exchange Contracts at October 31, 2016:
Forward
Foreign
Currency
Exchange
Contracts | | Transaction
Type | | Counterparty | | Expiration
Date | | Foreign
Currency | | | U.S. $
Cost on
Origination
Date | | | U.S. $
Current
Value | | | Unrealized
Appreciation | |
| Australian dollar | | Buy | | J.P. Morgan | | 2/21/2017 | | | 6,500,000 | | | $ | 4,922,862 | | | $ | 4,931,465 | | | | $ 8,603 | |
| British pound | | Buy | | Bank of America | | 2/6/2017 | | | 2,530,000 | | | | 3,094,582 | | | | 3,103,631 | | | | 9,049 | |
| British pound | | Buy | | Barclays Bank plc | | 2/6/2017 | | | 1,960,000 | | | | 2,401,606 | | | | 2,404,394 | | | | 2,788 | |
| British pound | | Buy | | Goldman Sachs | | 2/6/2017 | | | 1,370,000 | | | | 1,676,477 | | | | 1,680,622 | | | | 4,145 | |
| British pound | | Buy | | Morgan Stanley | | 2/6/2017 | | | 2,750,000 | | | | 3,372,251 | | | | 3,373,512 | | | | 1,261 | |
| British pound | | Buy | | State Street
Bank and Trust | | 2/6/2017 | | | 3,760,000 | | | | 4,600,614 | | | | 4,612,511 | | | | 11,897 | |
| New Zealand dollar | | Buy | | J.P. Morgan | | 11/30/2016 | | | 6,080,000 | | | | 4,341,750 | | | | 4,342,811 | | | | 1,061 | |
| South African rand | | Buy | | Barclays Bank plc | | 11/25/2016 | | | 415,000,000 | | | | 28,429,058 | | | | 30,637,833 | | | | 2,208,775 | |
| Swiss franc | | Buy | | State Street
Bank and Trust | | 2/21/2017 | | | 4,900,000 | | | | 4,958,343 | | | | 4,984,596 | | | | 26,253 | |
| British pound | | Sell | | Standard
Chartered Bank | | 2/6/2017 | | | 34,850,000 | | | | 44,608,418 | | | | 42,751,598 | | | | 1,856,820 | |
| British pound | | Sell | | State Street
Bank and Trust | | 2/6/2017 | | | 25,300,000 | | | | 31,307,485 | | | | 31,036,311 | | | | 271,174 | |
| euro | | Sell | | Bank of America | | 2/17/2017 | | | 14,950,000 | | | | 16,575,484 | | | | 16,493,430 | | | | 82,054 | |
| euro | | Sell | | Citibank | | 2/17/2017 | | | 12,120,000 | | | | 13,455,612 | | | | 13,371,263 | | | | 84,349 | |
| euro | | Sell | | Morgan Stanley | | 2/17/2017 | | | 3,635,000 | | | | 4,108,527 | | | | 4,010,276 | | | | 98,251 | |
| euro | | Sell | | Standard
Chartered Bank | | 2/17/2017 | | | 10,450,000 | | | | 11,782,772 | | | | 11,528,852 | | | | 253,920 | |
| Israeli new shekel | | Sell | | Citibank | | 2/21/2017 | | | 29,720,000 | | | | 7,792,783 | | | | 7,769,985 | | | | 22,798 | |
| Japanese yen | | Sell | | Goldman Sachs | | 2/21/2017 | | | 4,675,000,000 | | | | 45,159,309 | | | | 44,790,352 | | | | 368,957 | |
| New Zealand dollar | | Sell | | Goldman Sachs | | 11/30/2016 | | | 20,800,000 | | | | 14,927,399 | | | | 14,856,985 | | | | 70,414 | |
| New Zealand dollar | | Sell | | Goldman Sachs | | 11/30/2016 | | | 4,200,000 | | | | 3,003,642 | | | | 2,999,968 | | | | 3,674 | |
| South Korean won | | Sell | | Bank of America | | 2/27/2017 | | | 6,400,000,000 | | | | 5,751,361 | | | | 5,592,541 | | | | 158,820 | |
| South Korean won | | Sell | | J.P. Morgan | | 2/27/2017 | | | 19,500,000,000 | | | | 17,282,025 | | | | 17,039,773 | | | | 242,252 | |
| Unrealized Appreciation on Forward Foreign Currency Exchange Contracts | | | | | $5,787,315 | |
| 54 | See Notes to Financial Statements. |
Schedule of Investments (continued)
INTERNATIONAL DIVIDEND INCOME FUND October 31, 2016
Forward
Foreign
Currency
Exchange
Contracts | | Transaction
Type | | Counterparty | | Expiration
Date | | Foreign
Currency | | | U.S. $
Cost on
Origination
Date | | | U.S. $
Current
Value | | | Unrealized
Depreciation | |
| Australian dollar | | Buy | | State Street Bank and Trust | | 2/21/2017 | | | 143,150,000 | | | $ | 109,514,760 | | | $ | 108,606,037 | | | | $ (908,723 | ) |
| British pound | | Buy | | Bank of America | | 2/6/2017 | | | 3,540,000 | | | | 4,518,824 | | | | 4,342,630 | | | | (176,194 | ) |
| British pound | | Buy | | J.P. Morgan | | 2/6/2017 | | | 5,000,000 | | | | 6,190,956 | | | | 6,133,658 | | | | (57,298 | ) |
| British pound | | Buy | | J.P. Morgan | | 2/6/2017 | | | 6,430,000 | | | | 7,905,854 | | | | 7,887,884 | | | | (17,970 | ) |
| British pound | | Buy | | State Street Bank and Trust | | 2/6/2017 | | | 1,380,000 | | | | 1,722,129 | | | | 1,692,890 | | | | (29,239 | ) |
| British pound | | Buy | | State Street Bank and Trust | | 2/6/2017 | | | 1,360,000 | | | | 1,677,128 | | | | 1,668,355 | | | | (8,773 | ) |
| Canadian dollar | | Buy | | Goldman Sachs | | 2/21/2017 | | | 4,520,000 | | | | 3,373,457 | | | | 3,373,099 | | | | (358 | ) |
| Canadian dollar | | Buy | | Standard Chartered Bank | | 2/21/2017 | | | 78,230,000 | | | | 59,829,498 | | | | 58,379,985 | | | | (1,449,513 | ) |
| New Zealand dollar | | Buy | | State Street Bank and Trust | | 11/30/2016 | | | 810,000 | | | | 582,016 | | | | 578,565 | | | | (3,451 | ) |
| Norwegian krone | | Buy | | Standard Chartered Bank | | 2/6/2017 | | | 104,400,000 | | | | 13,085,010 | | | | 12,639,451 | | | | (445,559 | ) |
| Swedish krona | | Buy | | Goldman Sachs | | 12/15/2016 | | | 38,400,000 | | | | 4,499,040 | | | | 4,260,484 | | | | (238,556 | ) |
| British pound | | Sell | | J.P. Morgan | | 2/6/2017 | | | 3,450,000 | | | | 4,229,316 | | | | 4,232,224 | | | | (2,908 | ) |
| euro | | Sell | | J.P. Morgan | | 2/17/2017 | | | 5,070,000 | | | | 5,589,422 | | | | 5,593,424 | | | | (4,002 | ) |
| euro | | Sell | | Morgan Stanley | | 2/17/2017 | | | 2,460,000 | | | | 2,686,545 | | | | 2,713,969 | | | | (27,424 | ) |
| euro | | Sell | | State Street
Bank and Trust | | 2/17/2017 | | | 3,870,000 | | | | 4,254,353 | | | | 4,269,537 | | | | (15,184 | ) |
| euro | | Sell | | State Street
Bank and Trust | | 2/17/2017 | | | 5,440,000 | | | | 5,945,953 | | | | 6,001,623 | | | | (55,670 | ) |
| euro | | Sell | | State Street
Bank and Trust | | 2/17/2017 | | | 5,160,000 | | | | 5,642,078 | | | | 5,692,716 | | | | (50,638 | ) |
| euro | | Sell | | State Street
Bank and Trust | | 2/17/2017 | | | 11,570,000 | | | | 12,681,407 | | | | 12,764,481 | | | | (83,074 | ) |
| New Zealand dollar | | Sell | | Standard Chartered Bank | | 11/30/2016 | | | 13,600,000 | | | | 9,510,426 | | | | 9,714,182 | | | | (203,756 | ) |
| South African rand | | Sell | | Bank of America | | 11/25/2016 | | | 17,750,000 | | | | 1,266,091 | | | | 1,310,413 | | | | (44,322 | ) |
| South African rand | | Sell | | Bank of America | | 11/25/2016 | | | 32,000,000 | | | | 2,267,714 | | | | 2,362,435 | | | | (94,721 | ) |
| South African rand | | Sell | | Barclays Bank plc | | 11/25/2016 | | | 26,300,000 | | | | 1,882,137 | | | | 1,941,627 | | | | (59,490 | ) |
| South African rand | | Sell | | Citibank | | 11/25/2016 | | | 13,000,000 | | | | 938,995 | | | | 959,739 | | | | (20,744 | ) |
| South African rand | | Sell | | Citibank | | 11/25/2016 | | | 39,000,000 | | | | 2,790,697 | | | | 2,879,218 | | | | (88,521 | ) |
| South African rand | | Sell | | Deutsche Bank AG | | 11/25/2016 | | | 40,500,000 | | | | 2,975,553 | | | | 2,989,957 | | | | (14,404 | ) |
| South African rand | | Sell | | Goldman Sachs | | 11/25/2016 | | | 40,000,000 | | | | 2,798,691 | | | | 2,953,044 | | | | (154,353 | ) |
| South African rand | | Sell | | J.P. Morgan | | 11/25/2016 | | | 43,200,000 | | | | 2,923,795 | | | | 3,189,288 | | | | (265,493 | ) |
| South African rand | | Sell | | J.P. Morgan | | 11/25/2016 | | | 45,000,000 | | | | 3,200,438 | | | | 3,322,175 | | | | (121,737 | ) |
| Swiss franc | | Sell | | Barclays Bank plc | | 2/21/2017 | | | 19,300,000 | | | | 19,610,648 | | | | 19,633,204 | | | | (22,556 | ) |
| Unrealized Depreciation on Forward Foreign Currency Exchange Contracts | | | | | $(4,664,631 | ) |
| | See Notes to Financial Statements. | 55 |
Schedule of Investments (concluded)
INTERNATIONAL DIVIDEND INCOME FUND October 31, 2016
The following is a summary of the inputs used as of October 31, 2016 in valuing the Fund’s investments carried at fair value(1):
| Investment Type(2)(3) | | Level 1
(000) | | | Level 2
(000) | | | Level 3
(000) | | | Total
(000) | |
| Common Stocks | | $ | 1,293,207 | | | $ | – | | | $ | – | | | $ | 1,293,207 | |
| Corporate Bond | | | – | | | | 21,822 | | | | – | | | | 21,822 | |
| Total | | $ | 1,293,207 | | | $ | 21,822 | | | $ | – | | | $ | 1,315,029 | |
| Other Financial Instruments | | | | | | | | | | | | | | | | |
| Forward Foreign Currency Exchange Contracts | | | | | | | | | | | | | | | | |
| Assets | | $ | – | | | $ | 5,787 | | | $ | – | | | $ | 5,787 | |
| Liabilities | | | – | | | | (4,665 | ) | | | – | | | | (4,665 | ) |
| Total | | $ | – | | | $ | 1,122 | | | $ | – | | | $ | 1,122 | |
| | (1) | Refer to Note 2(k) for a description of fair value measurements and the three-tier hierarchy of inputs. |
| | (2) | See Schedule of Investments for fair values in each industry and identification of foreign issuers and/or geography. |
| | (3) | There were no Level 1/Level 2 transfers during the fiscal year ended October 31, 2016. |
| 56 | See Notes to Financial Statements. |
Schedule of Investments
INTERNATIONAL OPPORTUNITIES FUND October 31, 2016
| | | | | | U.S. $ | |
| | | | | | Fair Value | |
| Investments | | | Shares | | | | (000 | ) |
| Common Stocks 95.53% | | | | | | | | |
| | | | | | | | | |
| Australia 3.27% | | | | | | | | |
| | | | | | | | | |
| Beverages 0.41% | | | | | | | | |
| Treasury Wine Estates Ltd. | | | 279,647 | | | $ | 2,285 | |
| | | | | | | | | |
| Commercial Services & Supplies 0.65% | | | | | | | | |
| Spotless Group | | | | | | | | |
| Holdings Ltd. | | | 4,850,989 | | | | 3,690 | |
| | | | | | | | | |
| Electric: Utilities 1.23% | | | | | | | | |
| AusNet Services | | | 6,107,731 | | | | 6,969 | |
| | | | | | | | | |
| Equity Real Estate Investment Trusts 0.49% | | | | | | | | |
| Charter Hall Group | | | 775,549 | | | | 2,773 | |
| | | | | | | | | |
| Hotels, Restaurants & Leisure 0.49% | | | | | | | | |
| Mantra Group Ltd. | | | 1,104,502 | | | | 2,764 | |
| Total Australia | | | | | | | 18,481 | |
| | | | | | | | | |
| Austria 0.32% | | | | | | | | |
| | | | | | | | | |
| Semiconductors & Semiconductor Equipment | | | | | | | | |
| ams AG | | | 65,413 | | | | 1,834 | |
| | | | | | | | | |
| Canada 6.26% | | | | | | | | |
| | | | | | | | | |
| Electric: Utilities 1.27% | | | | | | | | |
| Emera, Inc. | | | 205,200 | | | | 7,157 | |
| | | | | | | | | |
| Metals & Mining 0.61% | | | | | | | | |
| HudBay Minerals, Inc. | | | 819,966 | | | | 3,454 | |
| | | | | | | | | |
| Oil, Gas & Consumable Fuels 3.56% | | | | | | | | |
| Africa Oil Corp.* | | | 2,459,549 | | | | 3,570 | |
| Canacol Energy Ltd.* | | | 1,720,000 | | | | 5,309 | |
| Vermilion Energy, Inc. | | | 140,000 | | | | 5,490 | |
| Whitecap Resources, Inc. | | | 722,500 | | | | 5,774 | |
| | | | | | | | 20,143 | |
| | | | | | | | | |
| Paper & Forest Products 0.82% | | | | | | | | |
| Interfor Corp.* | | | 414,209 | | | | 4,635 | |
| Total Canada | | | | | | | 35,389 | |
| | | | | | U.S. $ | |
| | | | | | Fair Value | |
| Investments | | | Shares | | | | (000 | ) |
| Finland 2.27% | | | | | | | | |
| | | | | | | | | |
| Leisure Product 1.06% | | | | | | | | |
| Amer Sports OYJ | | | 220,514 | | | $ | 6,003 | |
| | | | | | | | | |
| Trading Companies & Distributors 1.21% | | | | | | | | |
| Cramo OYJ | | | 260,665 | | | | 6,853 | |
| Total Finland | | | | | | | 12,856 | |
| | | | | | | | | |
| France 5.36% | | | | | | | | |
| | | | | | | | | |
| Health Care Providers & Services 0.77% | | | | | | | | |
| Korian SA | | | 141,011 | | | | 4,320 | |
| | | | | | | | | |
| Hotels, Restaurants & Leisure 1.02% | | | | | | | | |
| Elior Group† | | | 257,043 | | | | 5,772 | |
| | | | | | | | | |
| Information Technology Services 1.50% | | | | | | | | |
| Altran Technologies SA* | | | 595,394 | | | | 8,497 | |
| | | | | | | | | |
| Life Sciences Tools & Services 0.17% | | | | | | | | |
| Genfit* | | | 51,980 | | | | 973 | |
| | | | | | | | | |
| Real Estate Management & Development 1.12% | | | | | | | | |
| Nexity SA* | | | 126,475 | | | | 6,351 | |
| | | | | | | | | |
| Specialty Retail 0.78% | | | | | | | | |
| Maisons du Monde SA*† | | | 155,660 | | | | 4,391 | |
| Total France | | | | | | | 30,304 | |
| | | | | | | | | |
| Germany 4.49% | | | | | | | | |
| | | | | | | | | |
| Industrial Conglomerates 1.34% | | | | | | | | |
| Rheinmetall AG | | | 109,419 | | | | 7,580 | |
| | | | | | | | | |
| Internet Software & Services 1.14% | | | | | | | | |
| XING AG | | | 31,514 | | | | 6,416 | |
| | | | | | | | | |
| Life Sciences Tools & Services 1.57% | | | | | | | | |
| Gerresheimer AG | | | 92,565 | | | | 6,982 | |
| MorphoSys AG* | | | 43,213 | | | | 1,913 | |
| | | | | | | | 8,895 | |
| | | | | | | | | |
| Machinery 0.44% | | | | | | | | |
| Deutz AG | | | 507,114 | | | | 2,505 | |
| Total Germany | | | | | | | 25,396 | |
| | See Notes to Financial Statements. | 57 |
Schedule of Investments (continued)
INTERNATIONAL OPPORTUNITIES FUND October 31, 2016
| | | | | | U.S. $ | |
| | | | | | Fair Value | |
| Investments | | | Shares | | | | (000 | ) |
| Hong Kong 2.87% | | | | | | | | |
| | | | | | | | | |
| Communications Equipment 0.74% | | | | | | | | |
| VTech Holdings Ltd. | | | 341,800 | | | $ | 4,196 | |
| | | | | | | | | |
| Diversified Telecommunication Services 0.66% | | | | | | | | |
| HKBN Ltd. | | | 3,168,706 | | | | 3,738 | |
| | | | | | | | | |
| Energy Equipment & Services 0.27% | | | | | | | | |
| Hilong Holding Ltd. | | | 6,298,900 | | | | 1,511 | |
| | | | | | | | | |
| Household Durables 0.44% | | | | | | | | |
| Techtronic Industries Co., Ltd. | | | 665,000 | | | | 2,504 | |
| | | | | | | | | |
| Paper & Forest Products 0.76% | | | | | | | | |
| Lee & Man Paper Manufacturing Ltd. | | | 5,715,000 | | | | 4,296 | |
| Total Hong Kong | | | | | | | 16,245 | |
| | | | | | | | | |
| India 4.16% | | | | | | | | |
| | | | | | | | | |
| Banks 1.41% | | | | | | | | |
| RBL Bank Ltd.*† | | | 1,360,766 | | | | 7,958 | |
| | | | | | | | | |
| Information Technology Services 0.64% | | | | | | | | |
| Vakrangee Ltd. | | | 964,165 | | | | 3,640 | |
| | | | | | | | | |
| Real Estate Management & Development 0.66% | | | | | | | | |
| Housing Development & Infrastructure Ltd.* | | | 3,007,627 | | | | 3,728 | |
| | | | | | | | | |
| Thrifts & Mortgage Finance 1.45% | | | | | | | | |
| Dewan Housing Finance Corp., Ltd. | | | 1,659,574 | | | | 8,199 | |
| Total India | | | | | | | 23,525 | |
| | | | | | | | | |
| Indonesia 2.51% | | | | | | | | |
| | | | | | | | | |
| Banks 1.27% | | | | | | | | |
| Bank Tabungan Negara | | | | | | | | |
| Persero Tbk PT | | | 48,869,804 | | | | 7,153 | |
| | | | | | | | | |
| Consumer Finance 0.18% | | | | | | | | |
| PT Clipan Finance Indonesia Tbk* | | | 52,233,850 | | | | 1,001 | |
| | | | | | U.S. $ | |
| | | | | | Fair Value | |
| Investments | | | Shares | | | | (000 | ) |
| Real Estate Management & Development 1.06% | | | | | | | | |
| Pakuwon Jati Tbk PT | | | 60,624,000 | | | $ | 3,345 | |
| Summarecon Agung Tbk PT | | | 21,102,100 | | | | 2,669 | |
| | | | | | | | 6,014 | |
| Total Indonesia | | | | | | | 14,168 | |
| | | | | | | | | |
| Ireland 4.75% | | | | | | | | |
| | | | | | | | | |
| Beverages 0.46% | | | | | | | | |
| C&C Group plc | | | 673,767 | | | | 2,611 | |
| | | | | | | | | |
| Equity Real Estate Investment Trusts 0.89% | | | | | | | | |
| Hibernia REIT plc | | | 3,584,919 | | | | 5,049 | |
| | | | | | | | | |
| Food Products 0.49% | | | | | | | | |
| Greencore Group plc | | | 680,438 | | | | 2,748 | |
| | | | | | | | | |
| Health Care Providers & Services 1.39% | | | | | | | | |
| UDG Healthcare plc | | | 981,671 | | | | 7,852 | |
| | | | | | | | | |
| Household Durables 1.52% | | | | | | | | |
| Cairn Homes plc* | | | 6,629,700 | | | | 8,570 | |
| Total Ireland | | | | | | | 26,830 | |
| | | | | | | | | |
| Israel 1.49% | | | | | | | | |
| | | | | | | | | |
| Chemicals | | | | | | | | |
| Frutarom Industries Ltd. | | | 159,037 | | | | 8,416 | |
| | | | | | | | | |
| Italy 5.16% | | | | | | | | |
| | | | | | | | | |
| Beverages 1.25% | | | | | | | | |
| Davide Campari-Milano SpA | | | 700,792 | | | | 7,058 | |
| | | | | | | | | |
| Capital Markets 1.13% | | | | | | | | |
| Anima Holding SpA† | | | 1,313,093 | | | | 6,397 | |
| | | | | | | | | |
| Electrical Equipment 1.00% | | | | | | | | |
| Prysmian SpA | | | 226,605 | | | | 5,639 | |
| | | | | | | | | |
| Textiles, Apparel & Luxury Goods 1.78% | | | | | | | | |
| Brunello Cucinelli SpA | | | 227,243 | | | | 4,501 | |
| Moncler SpA | | | 335,208 | | | | 5,582 | |
| | | | | | | | 10,083 | |
| Total Italy | | | | | | | 29,177 | |
| 58 | See Notes to Financial Statements. | |
Schedule of Investments (continued)
INTERNATIONAL OPPORTUNITIES FUND October 31, 2016
| | | | | | U.S. $ | |
| | | | | | Fair Value | |
| Investments | | | Shares | | | | (000 | ) |
| Japan 23.20% | | | | | | | | |
| | | | | | | | | |
| Banks 2.28% | | | | | | | | |
| Fukuoka Financial Group, Inc. | | | 1,540,000 | | | $ | 6,681 | |
| Shinsei Bank Ltd. | | | 3,822,000 | | | | 6,196 | |
| | | | | | | | 12,877 | |
| | | | | | | | | |
| Beverages 0.52% | | | | | | | | |
| Coca-Cola East Japan Co., Ltd. | | | 134,400 | | | | 2,968 | |
| | | | | | | | | |
| Construction & Engineering 1.01% | | | | | | | | |
| SHO-BOND Holdings Co., Ltd. | | | 117,800 | | | | 5,695 | |
| | | | | | | | | |
| Containers & Packaging 0.67% | | | | | | | | |
| Fuji Seal International, Inc. | | | 92,300 | | | | 3,815 | |
| | | | | | | | | |
| Electronic Equipment, Instruments & Components 1.05% | | | | | | | | |
| Hitachi High-Technologies Corp. | | | 141,800 | | | | 5,929 | |
| | | | | | | | | |
| Equity Real Estate Investment Trusts 1.79% | | | | | | | | |
| GLP J-Reit | | | 4,526 | | | | 5,675 | |
| Hulic Reit, Inc. | | | 2,531 | | | | 4,436 | |
| | | | | | | | 10,111 | |
| | | | | | | | | |
| Food & Staples Retailing 1.12% | | | | | | | | |
| Sundrug Co., Ltd. | | | 80,300 | | | | 6,333 | |
| | | | | | | | | |
| Food Products 1.04% | | | | | | | | |
| Nichirei Corp. | | | 267,300 | | | | 5,860 | |
| | | | | | | | | |
| Hotels, Restaurants & Leisure 2.02% | | | | | | | | |
| HIS Co., Ltd. | | | 92,600 | | | | 2,532 | |
| Resorttrust, Inc. | | | 173,900 | | | | 3,484 | |
| St. Marc Holdings Co., Ltd. | | | 192,500 | | | | 5,410 | |
| | | | | | | | 11,426 | |
| | | | | | | | | |
| Information Technology Services 2.48% | | | | | | | | |
| NS Solutions Corp. | | | 255,200 | | | | 4,879 | |
| Obic Co., Ltd. | | | 108,400 | | | | 5,644 | |
| SCSK Corp. | | | 92,900 | | | | 3,473 | |
| | | | | | | | 13,996 | |
| | | | | | U.S. $ | |
| | | | | | Fair Value | |
| Investments | | | Shares | | | | (000 | ) |
| Insurance 0.59% | | | | | | | | |
| Anicom Holdings, Inc. | | | 149,100 | | | $ | 3,351 | |
| | | | | | | | | |
| Machinery 2.90% | | | | | | | | |
| CKD Corp. | | | 365,900 | | | | 4,571 | |
| Nabtesco Corp. | | | 249,700 | | | | 7,476 | |
| Tsubakimoto Chain Co. | | | 548,000 | | | | 4,353 | |
| | | | | | | | 16,400 | |
| | | | | | | | | |
| Pharmaceuticals 0.49% | | | | | | | | |
| Sawai Pharmaceutical Co., Ltd. | | | 42,400 | | | | 2,745 | |
| | | | | | | | | |
| Professional Services 1.48% | | | | | | | | |
| en-japan, Inc. | | | 283,000 | | | | 5,465 | |
| Tanseisha Co., Ltd. | | | 384,800 | | | | 2,902 | |
| | | | | | | | 8,367 | |
| | | | | | | | | |
| Semiconductors & Semiconductor Equipment 1.91% |
| Sumco Corp. | | | 1,028,300 | | | | 10,806 | |
| | | | | | | | | |
| Software 1.23% | | | | | | | | |
| NSD Co., Ltd. | | | 222,800 | | | | 3,592 | |
| Trend Micro, Inc. | | | 95,200 | | | | 3,359 | |
| | | | | | | | 6,951 | |
| | | | | | | | | |
| Wireless Telecommunication Services 0.62% | | | | | | | | |
| Okinawa Cellular Telephone Co. | | | 112,600 | | | | 3,522 | |
| Total Japan | | | | | | | 131,152 | |
| | | | | | | | | |
| Luxembourg 0.71% | | | | | | | | |
| | | | | | | | | |
| Machinery | | | | | | | | |
| Stabilus SA* | | | 76,785 | | | | 4,000 | |
| | | | | | | | | |
| Netherlands 3.27% | | | | | | | | |
| | | | | | | | | |
| Air Freight & Logistics 1.21% | | | | | | | | |
| PostNL NV * | | | 1,450,177 | | | | 6,833 | |
| | | | | | | | | |
| Hotels, Restaurants & Leisure 1.07% | | | | | | | | |
| Basic-Fit NV*† | | | 331,814 | | | | 6,026 | |
| | See Notes to Financial Statements. | 59 |
Schedule of Investments (continued)
INTERNATIONAL OPPORTUNITIES FUND October 31, 2016
| | | | | | U.S. $ | |
| | | | | | Fair Value | |
| Investments | | | Shares | | | | (000 | ) |
| Netherlands (continued) | | | | | | | | |
| | | | | | | | | |
| Machinery 0.99% | | | | | | | | |
| Aalberts Industries NV | | | 177,953 | | | $ | 5,621 | |
| Total Netherlands | | | | | | | 18,480 | |
| | | | | | | | | |
| Philippines 1.81% | | | | | | | | |
| | | | | | | | | |
| Banks 0.79% | | | | | | | | |
| Rizal Commercial Banking Corp. | | | 2,105,280 | | | | 1,561 | |
| Security Bank Corp. | | | 637,280 | | | | 2,901 | |
| | | | | | | | 4,462 | |
| | | | | | | | | |
| Hotels, Restaurants & Leisure 0.48% | | | | | | | | |
| Bloomberry Resorts Corp.* | | | 22,426,100 | | | | 2,737 | |
| | | | | | | | | |
| Real Estate Management & Development 0.54% | | | | | | | | |
| Filinvest Land, Inc. | | | 83,138,000 | | | | 3,028 | |
| Total Philippines | | | | | | | 10,227 | |
| | | | | | | | | |
| Portugal 0.78% | | | | | | | | |
| | | | | | | | | |
| Multi-Utilities | | | | | | | | |
| REN–Redes Energeticas Nacionais SGPS SA | | | 1,503,013 | | | | 4,392 | |
| | | | | | | | | |
| Spain 2.44% | | | | | | | | |
| | | | | | | | | |
| Equity Real Estate Investment Trusts 1.39% | | | | | | | | |
| Hispania Activos Inmobiliarios SOCIMI SA | | | 226,230 | | | | 2,786 | |
| Merlin Properties Socimi SA | | | 449,582 | | | | 5,054 | |
| | | | | | | | 7,840 | |
| | | | | | | | | |
| Food Products 1.05% | | | | | | | | |
| Ebro Foods SA | | | 275,112 | | | | 5,938 | |
| Total Spain | | | | | | | 13,778 | |
| | | | | | | | | |
| Sweden 3.80% | | | | | | | | |
| | | | | | | | | |
| Auto Components 0.58% | | | | | | | | |
| Dometic Group AB*† | | | 463,939 | | | | 3,282 | |
| | | | | | U.S. $ | |
| | | | | | Fair Value | |
| Investments | | | Shares | | | | (000 | ) |
| Commercial Services & Supplies 1.28% | | | | | | | | |
| Loomis AB Class B | | | 254,831 | | | $ | 7,251 | |
| | | | | | | | | |
| Consumer Finance 0.93% | | | | | | | | |
| Hoist Finance AB† | | | 582,004 | | | | 5,252 | |
| | | | | | | | | |
| Food & Staples Retailing 1.01% | | | | | | | | |
| Axfood AB | | | 365,833 | | | | 5,719 | |
| Total Sweden | | | | | | | 21,504 | |
| | | | | | | | | |
| Switzerland 2.18% | | | | | | | | |
| | | | | | | | | |
| Consumer Finance 1.10% | | | | | | | | |
| Cembra Money Bank AG* | | | 81,310 | | | | 6,216 | |
| | | | | | | | | |
| Household Durables 1.08% | | | | | | | | |
| Forbo Holding AG | | | | | | | | |
| Registered Shares* | | | 4,789 | | | | 6,108 | |
| Total Switzerland | | | | | | | 12,324 | |
| | | | | | | | | |
| Taiwan 1.33% | | | | | | | | |
| | | | | | | | | |
| Semiconductors & Semiconductor Equipment 0.98% |
| Realtek Semiconductor Corp. | | | 1,280,000 | | | | 4,340 | |
| RichWave Technology Corp. | | | 652,600 | | | | 1,210 | |
| | | | | | | | 5,550 | |
| | | | | | | | | |
| Technology Hardware, Storage & Peripherals 0.35% | | | | | | |
| Adlink Technology, Inc. | | | 1,003,836 | | | | 1,947 | |
| Total Taiwan | | | | | | | 7,497 | |
| | | | | | | | | |
| United Kingdom 10.41% | | | | | | | | |
| | | | | | | | | |
| Capital Markets 1.51% | | | | | | | | |
| Jupiter Fund Management plc | | | 522,005 | | | | 2,758 | |
| Man Group plc | | | 3,806,519 | | | | 5,810 | |
| | | | | | | | 8,568 | |
| | | | | | | | | |
| Chemicals 0.30% | | | | | | | | |
| Essentra plc | | | 268,768 | | | | 1,678 | |
| | | | | | | | | |
| Consumer Finance 1.54% | | | | | | | | |
| Arrow Global Group plc | | | 2,371,848 | | | | 8,702 | |
| 60 | See Notes to Financial Statements. | |
Schedule of Investments (continued)
INTERNATIONAL OPPORTUNITIES FUND October 31, 2016
| | | | | | U.S. $ | |
| | | | | | Fair Value | |
| Investments | | | Shares | | | | (000 | ) |
| United Kingdom (continued) | | | | | | | | |
| | | | | | | | | |
| Household Durables 0.66% | | | | | | | | |
| Countryside Properties plc*† | | | 1,316,462 | | | $ | 3,755 | |
| | | | | | | | | |
| Internet & Direct Marketing Retail 1.03% | | | | | | | | |
| ASOS plc* | | | 90,747 | | | | 5,839 | |
| | | | | | | | | |
| Machinery 1.61% | | | | | | | | |
| Bodycote plc | | | 577,877 | | | | 4,191 | |
| Concentric AB | | | 413,220 | | | | 4,918 | |
| | | | | | | | 9,109 | |
| | | | | | | | | |
| Metals & Mining 0.65% | | | | | | | | |
| Hill & Smith Holdings plc | | | 298,012 | | | | 3,662 | |
| | | | | | | | | |
| Multi-Line Retail 0.54% | | | | | | | | |
| B&M European Value Retail SA | | | 1,060,979 | | | | 3,047 | |
| | | | | | | | | |
| Oil, Gas & Consumable Fuels 0.70% | | | | | | | | |
| Tullow Oil plc* | | | 1,219,527 | | | | 3,951 | |
| | | | | | | | | |
| Professional Services 0.76% | | | | | | | | |
| Exova Group plc | | | 1,666,655 | | | | 4,284 | |
| | | | | | | | | |
| Trading Companies & Distributors 1.11% | | | | | | | | |
| Diploma plc | | | 546,414 | | | | 6,270 | |
| Total United Kingdom | | | | | | | 58,865 | |
| | | | | | | | | |
| United States 2.69% | | | | | | | | |
| | | | | | | | | |
| Exchange-Traded Funds 1.96% | | | | | | | | |
| iShares MSCI EAFE Small-Cap | | | 57,023 | | | | 2,903 | |
| VanEck Vectors Junior Gold Miners | | | 201,214 | | | | 8,185 | |
| | | | | | | | 11,088 | |
| | | | | | | | | |
| Semiconductors & Semiconductor Equipment 0.73% |
| CEVA, Inc.* | | | 138,126 | | | | 4,151 | |
| Total United States | | | | | | | 15,239 | |
Total Common Stocks
(cost $508,378,021) | | | | | | | 540,079 | |
| | | Principal | | | U.S. $ | |
| | | Amount | | | Fair Value | |
| Investments | | | (000 | ) | | | (000 | ) |
| SHORT-TERM INVESTMENT 3.91% | | | | | | | | |
| | | | | | | | | |
| Repurchase Agreement | | | | | | | | |
| | | | | | | | | |
Repurchase Agreement dated 10/31/2016, 0.03% due 11/1/2016 with Fixed Income Clearing Corp. collateralized by $18,465,000 of U.S. Treasury Bond at 3.625% due 8/15/2043; value: $22,527,300; proceeds: $22,084,509
(cost $22,084,491) | | $ | 22,084 | | | $ | 22,084 | |
Total Investments in Securities 99.44%
(cost $530,462,512) | | | | | | | 562,163 | |
| | | | | | | | | |
| Foreign Cash and Other Assets in Excess of Liabilities(a) 0.56% | | | | | | | 3,154 | |
| Net Assets 100.00% | | | | | | $ | 565,317 | |
| * | | Non-income producing security. |
| † | | Security was purchased pursuant to Rule 144A under the Securities Act of 1933 and, unless registered under such Act or exempted from registration, may only be resold to qualified institutional buyers. |
| (a) | | Foreign Cash and Other Assets in Excess of Liabilities include net unrealized appreciation/depreciation on forward foreign currency exchange contracts as follows: |
| | See Notes to Financial Statements. | 61 |
Schedule of Investments (continued)
INTERNATIONAL OPPORTUNITIES FUND October 31, 2016
Open Forward Foreign Currency Exchange Contracts at October 31, 2016:
| Forward | | | | | | | | | | | | | | | | | | | | |
| Foreign | | | | | | | | | | | | | U.S. $ | | | | | | | |
| Currency | | | | | | | | | | | | | Cost on | | | U.S. $ | | | | |
| Exchange | | Transaction | | | | | Expiration | | | Foreign | | | Origination | | | Current | | | Unrealized | |
| Contracts | | Type | | | Counterparty | | Date | | | Currency | | | Date | | | Value | | | Appreciation | |
| British pound | | | Buy | | | J.P. Morgan | | | 2/6/2017 | | | | 1,070,000 | | | $ | 1,311,701 | | | $ | 1,312,603 | | | | $ 902 | |
| British pound | | | Buy | | | State Street
Bank and Trust | | | 12/19/2016 | | | | 330,000 | | | | 403,995 | | | | 404,370 | | | | 375 | |
| euro | | | Buy | | | J.P. Morgan | | | 2/17/2017 | | | | 730,000 | | | | 804,789 | | | | 805,365 | | | | 576 | |
| euro | | | Buy | | | State Street
Bank and Trust | | | 2/17/2017 | | | | 1,000,000 | | | | 1,099,316 | | | | 1,103,239 | | | | 3,923 | |
| euro | | | Buy | | | State Street
Bank and Trust | | | 2/17/2017 | | | | 370,000 | | | | 404,412 | | | | 408,199 | | | | 3,787 | |
| euro | | | Buy | | | State Street
Bank and Trust | | | 2/17/2017 | | | | 486,000 | | | | 532,685 | | | | 536,174 | | | | 3,489 | |
| British pound | | | Sell | | | J.P. Morgan | | | 12/19/2016 | | | | 500,000 | | | | 618,327 | | | | 612,682 | | | | 5,645 | |
| British pound | | | Sell | | | J.P. Morgan | | | 12/19/2016 | | | | 1,440,000 | | | | 1,766,145 | | | | 1,764,524 | | | | 1,621 | |
| British pound | | | Sell | | | State Street
Bank and Trust | | | 12/19/2016 | | | | 680,000 | | | | 883,376 | | | | 833,247 | | | | 50,129 | |
| British pound | | | Sell | | | State Street
Bank and Trust | | | 12/19/2016 | | | | 2,030,000 | | | | 2,569,788 | | | | 2,487,489 | | | | 82,299 | |
| British pound | | | Sell | | | State Street
Bank and Trust | | | 12/19/2016 | | | | 650,000 | | | | 810,168 | | | | 796,486 | | | | 13,682 | |
| British pound | | | Sell | | | State Street Bank and Trust | | | 12/19/2016 | | | | 4,700,000 | | | | 5,809,059 | | | | 5,759,210 | | | | 49,849 | |
| British pound | | | Sell | | | State Street
Bank and Trust | | | 12/19/2016 | | | | 1,430,000 | | | | 1,761,301 | | | | 1,752,270 | | | | 9,031 | |
| Canadian dollar | | | Sell | | | Morgan Stanley | | | 12/15/2016 | | | | 3,460,000 | | | | 2,604,660 | | | | 2,580,422 | | | | 24,238 | |
| euro | | | Sell | | | Bank of America | | | 2/17/2017 | | | | 24,750,000 | | | | 27,441,018 | | | | 27,305,177 | | | | 135,841 | |
| euro | | | Sell | | | State Street
Bank and Trust | | | 2/17/2017 | | | | 1,200,000 | | | | 1,354,393 | | | | 1,323,887 | | | | 30,506 | |
| euro | | | Sell | | | State Street
Bank and Trust | | | 2/17/2017 | | | | 1,000,000 | | | | 1,127,909 | | | | 1,103,239 | | | | 24,670 | |
| euro | | | Sell | | | State Street
Bank and Trust | | | 2/17/2017 | | | | 1,000,000 | | | | 1,106,905 | | | | 1,103,239 | | | | 3,666 | |
| Japanese yen | | | Sell | | | Goldman Sachs | | | 2/21/2017 | | | | 1,350,000,000 | | | | 13,040,656 | | | | 12,934,112 | | | | 106,544 | |
| Japanese yen | | | Sell | | | State Street
Bank and Trust | | | 2/21/2017 | | | | 154,500,000 | | | | 1,505,767 | | | | 1,480,237 | | | | 25,530 | |
| Swedish krona | | | Sell | | | Bank of America | | | 12/15/2016 | | | | 15,020,000 | | | | 1,707,026 | | | | 1,666,471 | | | | 40,555 | |
| Swedish krona | | | Sell | | | J.P. Morgan | | | 12/15/2016 | | | | 34,530,000 | | | | 4,044,784 | | | | 3,831,107 | | | | 213,677 | |
| Swedish krona | | | Sell | | | State Street
Bank and Trust | | | 12/15/2016 | | | | 45,000,000 | | | | 5,368,754 | | | | 4,992,755 | | | | 375,999 | |
| Swedish krona | | | Sell | | | State Street
Bank and Trust | | | 12/15/2016 | | | | 2,430,000 | | | | 292,532 | | | | 269,609 | | | | 22,923 | |
| Swiss franc | | | Sell | | | State Street
Bank and Trust | | | 11/18/2016 | | | | 850,000 | | | | 860,750 | | | | 859,661 | | | | 1,089 | |
| Swiss franc | | | Sell | | | State Street
Bank and Trust | | | 11/18/2016 | | | | 340,000 | | | | 345,165 | | | | 343,864 | | | | 1,301 | |
| Unrealized Appreciation on Forward Foreign Currency Exchange Contracts | | | | | | | | $1,231,847 | |
| 62 | See Notes to Financial Statements. | |
Schedule of Investments (continued)
INTERNATIONAL OPPORTUNITIES FUND October 31, 2016
| Forward | | | | | | | | | | | | | | | | | | | | |
| Foreign | | | | | | | | | | | | | U.S. $ | | | | | | | |
| Currency | | | | | | | | | | | | | Cost on | | | U.S. $ | | | | |
| Exchange | | Transaction | | | | | Expiration | | | Foreign | | | Origination | | | Current | | | Unrealized | |
| Contracts | | Type | | | Counterparty | | Date | | | Currency | | | Date | | | Value | | | Depreciation | |
| Australian dollar | | | Buy | | | State Street
Bank and Trust | | | 2/21/2017 | | | | 12,100,000 | | | $ | 9,256,924 | | | $ | 9,180,112 | | | | $ (76,812 | ) |
| Australian dollar | | | Buy | | | State Street
Bank and Trust | | | 2/21/2017 | | | | 2,500,000 | | | | 1,903,107 | | | | 1,896,717 | | | | (6,390 | ) |
| British pound | | | Buy | | | Goldman Sachs | | | 12/19/2016 | | | | 11,000,000 | | | | 14,536,589 | | | | 13,479,002 | | | | (1,057,587 | ) |
| British pound | | | Buy | | | J.P. Morgan | | | 12/19/2016 | | | | 725,000 | | | | 940,917 | | | | 888,389 | | | | (52,528 | ) |
| British pound | | | Buy | | | Morgan Stanley | | | 12/19/2016 | | | | 2,720,000 | | | | 3,531,376 | | | | 3,332,990 | | | | (198,386 | ) |
| British pound | | | Buy | | | State Street
Bank and Trust | | | 12/19/2016 | | | | 965,000 | | | | 1,262,663 | | | | 1,182,476 | | | | (80,187 | ) |
| British pound | | | Buy | | | State Street
Bank and Trust | | | 12/19/2016 | | | | 680,000 | | | | 886,638 | | | | 833,247 | | | | (53,391 | ) |
| Canadian dollar | | | Buy | | | Standard
Chartered Bank | | | 12/15/2016 | | | | 19,600,000 | | | | 15,123,233 | | | | 14,617,418 | | | | (505,815 | ) |
| Danish krone | | | Buy | | | Morgan Stanley | | | 2/17/2017 | | | | 31,325,531 | | | | 4,668,427 | | | | 4,647,025 | | | | (21,402 | ) |
| euro | | | Buy | | | Citibank | | | 2/17/2017 | | | | 1,070,000 | | | | 1,187,913 | | | | 1,180,466 | | | | (7,447 | ) |
| euro | | | Buy | | | State Street
Bank and Trust | | | 2/17/2017 | | | | 820,000 | | | | 904,775 | | | | 904,656 | | | | (119 | ) |
| euro | | | Buy | | | UBS AG | | | 2/17/2017 | | | | 820,000 | | | | 905,112 | | | | 904,656 | | | | (456 | ) |
| Japanese yen | | | Buy | | | Morgan Stanley | | | 2/21/2017 | | | | 522,400,000 | | | | 5,023,146 | | | | 5,005,022 | | | | (18,124 | ) |
| Japanese yen | | | Buy | | | Standard
Chartered Bank | | | 2/21/2017 | | | | 517,000,000 | | | | 4,999,662 | | | | 4,953,286 | | | | (46,376 | ) |
| Japanese yen | | | Buy | | | State Street
Bank and Trust | | | 2/21/2017 | | | | 112,200,000 | | | | 1,091,111 | | | | 1,074,968 | | | | (16,143 | ) |
| South Korean won | | | Buy | | | Bank of America | | | 11/28/2016 | | | | 16,710,000,000 | | | | 14,648,001 | | | | 14,603,674 | | | | (44,327 | ) |
| South Korean won | | | Buy | | | Bank of America | | | 12/27/2016 | | | | 7,600,000,000 | | | | 6,769,275 | | | | 6,640,998 | | | | (128,277 | ) |
| South Korean won | | | Buy | | | Goldman Sachs | | | 12/27/2016 | | | | 1,950,000,000 | | | | 1,704,499 | | | | 1,703,940 | | | | (559 | ) |
| Swiss franc | | | Buy | | | Bank of America | | | 11/18/2016 | | | | 1,615,000 | | | | 1,664,036 | | | | 1,633,355 | | | | (30,681 | ) |
| Swiss franc | | | Buy | | | Bank of America | | | 11/18/2016 | | | | 17,400,000 | | | | 17,863,926 | | | | 17,597,761 | | | | (266,165 | ) |
| Swiss franc | | | Buy | | | Morgan Stanley | | | 11/18/2016 | | | | 2,840,000 | | | | 2,934,948 | | | | 2,872,278 | | | | (62,670 | ) |
| Swiss franc | | | Buy | | | Morgan Stanley | | | 11/18/2016 | | | | 2,900,000 | | | | 3,016,993 | | | | 2,932,960 | | | | (84,033 | ) |
| British pound | | | Sell | | | Barclays Bank plc | | | 12/19/2016 | | | | 2,100,000 | | | | 2,569,854 | | | | 2,573,264 | | | | (3,410 | ) |
| British pound | | | Sell | | | State Street
Bank and Trust | | | 12/19/2016 | | | | 2,525,000 | | | | 3,082,336 | | | | 3,094,044 | | | | (11,708 | ) |
| British pound | | | Sell | | | State Street
Bank and Trust | | | 2/6/2017 | | | | 1,400,000 | | | | 1,709,527 | | | | 1,717,424 | | | | (7,897 | ) |
| euro | | | Sell | | | State Street
Bank and Trust | | | 2/17/2017 | | | | 1,000,000 | | | | 1,096,277 | | | | 1,103,239 | | | | (6,962 | ) |
| Indian rupee | | | Sell | | | J.P. Morgan | | | 12/13/2016 | | | | 157,500,000 | | | | 2,315,972 | | | | 2,347,779 | | | | (31,807 | ) |
| Indian rupee | | | Sell | | | Morgan Stanley | | | 12/13/2016 | | | | 101,000,000 | | | | 1,479,203 | | | | 1,505,560 | | | | (26,357 | ) |
| Indian rupee | | | Sell | | | UBS AG | | | 12/13/2016 | | | | 120,000,000 | | | | 1,766,090 | | | | 1,788,784 | | | | (22,694 | ) |
| Indian rupee | | | Sell | | | UBS AG | | | 12/13/2016 | | | | 510,000,000 | | | | 7,501,655 | | | | 7,602,331 | | | | (100,676 | ) |
| Indonesian rupiah | | | Sell | | | Goldman Sachs | | | 11/14/2016 | | | | 22,300,000,000 | | | | 1,671,355 | | | | 1,708,698 | | | | (37,343 | ) |
| Indonesian rupiah | | | Sell | | | UBS AG | | | 11/14/2016 | | | | 31,000,000,000 | | | | 2,340,900 | | | | 2,375,321 | | | | (34,421 | ) |
| Indonesian rupiah | | | Sell | | | UBS AG | | | 11/14/2016 | | | | 56,254,000,000 | | | | 4,218,523 | | | | 4,310,364 | | | | (91,841 | ) |
| Swiss franc | | | Sell | | | State Street
Bank and Trust | | | 11/18/2016 | | | | 630,000 | | | | 633,902 | | | | 637,160 | | | | (3,258 | ) |
| Unrealized Depreciation on Forward Foreign Currency Exchange Contracts | | | | | | | | $(3,136,249 | ) |
| | See Notes to Financial Statements. | 63 |
Schedule of Investments (concluded)
INTERNATIONAL OPPORTUNITIES FUND October 31, 2016
The following is a summary of the inputs used as of October 31, 2016 in valuing the Fund’s investments carried at fair value(1):
| | | Level 1 | | | Level 2 | | | Level 3 | | | Total | |
| Investment Type(2)(3) | | (000) | | | (000) | | | (000) | | | (000) | |
| Common Stocks | | $ | 540,079 | | | $ | – | | | $ | – | | | $ | 540,079 | |
| Repurchase Agreement | | | – | | | | 22,084 | | | | – | | | | 22,084 | |
| Total | | $ | 540,079 | | | $ | 22,084 | | | $ | – | | | $ | 562,163 | |
| Other Financial Instruments | | | | | | | | | | | | | | | | |
| Forward Foreign Currency Exchange Contracts | | | | | | | | | | | | | | | | |
| Assets | | $ | – | | | $ | 1,232 | | | $ | – | | | $ | 1,232 | |
| Liabilities | | | – | | | | (3,136 | ) | | | – | | | | (3,136 | ) |
| Total | | $ | – | | | $ | (1,904 | ) | | $ | – | | | $ | (1,904 | ) |
| | (1) | Refer to Note 2(k) for a description of fair value measurements and the three-tier hierarchy of inputs. |
| | (2) | See Schedule of Investments for fair values in each industry and identification of foreign issuers and/or geography. |
| | (3) | There were no Level 1/Level 2 transfers during the fiscal year ended October 31, 2016. |
| 64 | See Notes to Financial Statements. | |
Schedule of Investments
VALUE OPPORTUNITIES FUND October 31, 2016
| Investments | | Shares | | | Fair
Value
(000) | |
| COMMON STOCKS 96.39% | | | | | | | | |
| | | | | | | | | |
| Airlines 1.50% | | | | | | | | |
| Alaska Air Group, Inc. | | | 554,999 | | | $ | 40,082 | |
| | | | | | | | | |
| Automobiles 0.94% | | | | | | | | |
| Thor Industries, Inc. | | | 316,918 | | | | 25,135 | |
| | | | | | | | | |
| Banks 8.36% | | | | | | | | |
| Bank of Hawaii Corp. | | | 633,300 | | | | 47,593 | |
| Chemical Financial Corp. | | | 532,773 | | | | 22,883 | |
| Citizens Financial Group, Inc. | | | 1,480,183 | | | | 38,988 | |
| East West Bancorp, Inc. | | | 933,388 | | | | 36,878 | |
| Webster Financial Corp. | | | 728,179 | | | | 29,418 | |
| Western Alliance Bancorp* | | | 1,284,209 | | | | 47,978 | |
| Total | | | | | | | 223,738 | |
| | | | | | | | | |
| Capital Markets 0.76% | | | | | | | | |
| Moelis & Co. Class A | | | 795,784 | | | | 20,213 | |
| | | | | | | | | |
| Chemicals 2.00% | | | | | | | | |
| Ingevity Corp.* | | | 111,750 | | | | 4,626 | |
| RPM International, Inc. | | | 460,698 | | | | 21,902 | |
| Trinseo SA | | | 511,999 | | | | 26,854 | |
| Total | | | | | | | 53,382 | |
| | | | | | | | | |
| Commercial Services & Supplies 3.15% | | | | | |
| Herman Miller, Inc. | | | 1,097,397 | | | | 30,507 | |
| KAR Auction Services, Inc. | | | 1,262,627 | | | | 53,763 | |
| Total | | | | | | | 84,270 | |
| | | | | | | | | |
| Communications Equipment 1.43% | | | | | | | | |
| ARRIS International plc* | | | 1,376,158 | | | | 38,230 | |
| | | | | | | | | |
| Construction & Engineering 3.28% | | | | | | | | |
| AECOM* | | | 1,784,090 | | | | 49,687 | |
| Jacobs Engineering Group, Inc.* | | | 739,181 | | | | 38,127 | |
| Total | | | | | | | 87,814 | |
| | | | | | | | | |
| Containers & Packaging 3.72% | | | | | | | | |
| Berry Plastics Group, Inc.* | | | 905,599 | | | | 39,620 | |
| Sealed Air Corp. | | | 772,233 | | | | 35,237 | |
| Investments | | Shares | | | Fair
Value
(000) | |
| WestRock Co. | | | 534,323 | | | $ | 24,680 | |
| Total | | | | | | | 99,537 | |
| | | | | | | | | |
| Diversified Telecommunication Services 2.04% | | | | | |
| Zayo Group Holdings, Inc.* | | | 1,698,971 | | | | 54,673 | |
| | | | | | | | | |
| Electrical Equipment 1.27% | | | | | | | | |
| Hubbell, Inc. | | | 324,882 | | | | 33,957 | |
| | | | | | | | | |
Electronic Equipment, Instruments &
Components 2.20% | |
| Amphenol Corp. Class A | | | 421,839 | | | | 27,812 | |
| Belden, Inc. | | | 480,189 | | | | 31,121 | |
| Total | | | | | | | 58,933 | |
| | | | | | | | | |
| Energy Equipment & Services 0.77% | | | | | | | | |
| Helmerich & Payne, Inc. | | | 325,644 | | | | 20,551 | |
| | | | | | | | | |
| Equity Real Estate Investment Trusts 5.67% | | | | | | | | |
| Federal Realty Investment Trust | | | 321,619 | | | | 46,709 | |
| Highwoods Properties, Inc. | | | 802,800 | | | | 39,843 | |
| Physicians Realty Trust | | | 1,945,444 | | | | 38,461 | |
| Retail Opportunity Investments Corp. | | | 1,328,501 | | | | 26,716 | |
| Total | | | | | | | 151,729 | |
| | | | | | | | | |
| Food Products 1.99% | | | | | | | | |
| Pinnacle Foods, Inc. | | | 1,033,753 | | | | 53,156 | |
| | | | | | | | | |
| Health Care Equipment & Supplies 5.41% | | | | | |
| Alere, Inc.* | | | 1,844,666 | | | | 82,420 | |
| Cooper Cos., Inc. (The) | | | 186,216 | | | | 32,781 | |
| STERIS plc (United Kingdom)(a) | | | 442,131 | | | | 29,543 | |
| Total | | | | | | | 144,744 | |
| | | | | | | | | |
| Health Care Providers & Services 3.67% | | | | | |
| ExamWorks Group, Inc.* | | | 1,223,862 | | | | 42,896 | |
| HealthSouth Corp. | | | 1,379,770 | | | | 55,398 | |
| Total | | | | | | | 98,294 | |
| | | | | | | | | |
| Hotels, Restaurants & Leisure 1.35% | | | | | | | | |
| Aramark | | | 969,643 | | | | 36,100 | |
| | See Notes to Financial Statements. | 65 |
Schedule of Investments (continued)
VALUE OPPORTUNITIES FUND October 31, 2016
| Investments | | Shares | | | Fair
Value
(000) | |
| Household Durables 2.45% | | | | | | | | |
| Lennar Corp. Class A | | | 696,420 | | | $ | 29,034 | |
| Newell Brands, Inc. | | | 761,225 | | | | 36,554 | |
| Total | | | | | | | 65,588 | |
| | | | | | | | | |
| Information Technology Services 9.58% | | | | | | | | |
| Acxiom Corp.* | | | 1,607,473 | | | | 37,872 | |
| Amdocs Ltd. | | | 673,652 | | | | 39,375 | |
| Booz Allen Hamilton Holding Corp. | | | 1,680,065 | | | | 51,192 | |
| Cardtronics plc Class A (United Kingdom) (United Kingdom)*(a) | | | 521,900 | | | | 26,095 | |
| Fidelity National Information Services, Inc. | | | 690,073 | | | | 51,010 | |
| MAXIMUS, Inc. | | | 489,574 | | | | 25,487 | |
| Vantiv, Inc. Class A* | | | 432,905 | | | | 25,264 | |
| Total | | | | | | | 256,295 | |
| | | | | | | | | |
| Insurance 6.55% | | | | | | | | |
| Arch Capital Group Ltd. (Brunei)* | | | 734,094 | | | | 57,237 | |
| Hartford Financial Services Group, Inc. (The) | | | 807,935 | | | | 35,638 | |
| Markel Corp.* | | | 29,677 | | | | 26,040 | |
| RenaissanceRe Holdings Ltd. (Brunei) | | | 453,126 | | | | 56,319 | |
| Total | | | | | | | 175,234 | |
| | | | | | | | | |
| Internet Software & Services 1.64% | | | | | | | | |
| Akamai Technologies, Inc.* | | | 631,196 | | | | 43,849 | |
| | | | | | | | | |
| Life Sciences Tools & Services 1.34% | | | | | | | | |
| PerkinElmer, Inc. | | | 703,000 | | | | 35,776 | |
| | | | | | | | | |
| Machinery 1.20% | | | | | | | | |
| Wabtec Corp. | | | 415,661 | | | | 32,135 | |
| | | | | | | | | |
| Media 1.91% | | | | | | | | |
| AMC Networks, Inc. Class A* | | | 443,908 | | | | 21,720 | |
| New York Times Co. (The) Class A | | | 2,696,964 | | | | 29,397 | |
| Total | | | | | | | 51,117 | |
| Investments | | Shares | | | Fair
Value
(000) | |
| Metals & Mining 1.89% | | | | | | |
| Reliance Steel & Aluminum Co. | | | 733,100 | | | $ | 50,423 | |
| | | | | | | | | |
| Multi-Line Retail 1.04% | | | | | | | | |
| Nordstrom, Inc. | | | 533,347 | | | | 27,734 | |
| | | | | | | | | |
| Multi-Utilities 3.28% | | | | | | | | |
| Black Hills Corp. | | | 567,320 | | | | 35,089 | |
| CMS Energy Corp. | | | 1,251,099 | | | | 52,734 | |
| Total | | | | | | | 87,823 | |
| Oil, Gas & Consumable Fuels 4.56% | | | | | | | | |
| Carrizo Oil & Gas, Inc.* | | | 740,924 | | | | 25,065 | |
| Cimarex Energy Co. | | | 249,005 | | | | 32,154 | |
| EQT Corp. | | | 388,295 | | | | 25,628 | |
| Rice Energy, Inc.* | | | 1,774,478 | | | | 39,198 | |
| Total | | | | | | | 122,045 | |
| | | | | | | | | |
| Pharmaceuticals 0.73% | | | | | | | | |
| Prestige Brands Holdings, Inc.* | | | 429,163 | | | | 19,432 | |
| | | | | | | | | |
| Road & Rail 2.40% | | | | | | | | |
| Genesee & Wyoming, Inc. | | | | | | | | |
| Class A* | | | 461,934 | | | | 31,384 | |
| Old Dominion Freight Line, Inc.* | | | 439,000 | | | | 32,784 | |
| Total | | | | | | | 64,168 | |
| | | | | | | | | |
| Semiconductors & Semiconductor Equipment 3.32% | |
| Cypress Semiconductor | | | | | | | | |
| Corp. | | | 1,249,521 | | | | 12,458 | |
| Lam Research Corp. | | | 204,706 | | | | 19,828 | |
| MACOM Technology Solutions Holdings, Inc.* | | | 677,609 | | | | 24,909 | |
| Synaptics, Inc.* | | | 604,876 | | | | 31,526 | |
| Total | | | | | | | 88,721 | |
| | | | | | | | | |
| Software 0.65% | | | | | | | | |
| FireEye, Inc.* | | | 1,491,861 | | | | 17,335 | |
| 66 | See Notes to Financial Statements. |
Schedule of Investments (concluded)
VALUE OPPORTUNITIES FUND October 31, 2016
| Investments | | Shares | | | Fair
Value
(000) | |
| Textiles, Apparel & Luxury Goods 2.33% | | | | | | | | |
| Ralph Lauren Corp. | | | 205,058 | | | $ | 20,116 | |
| Steven Madden Ltd.* | | | 1,259,902 | | | | 42,081 | |
| Total | | | | | | | 62,197 | |
| | | | | | | | | |
| Thrifts & Mortgage Finance 0.99% | | | | | | | | |
| Essent Group Ltd.* | | | 998,191 | | | | 26,392 | |
| | | | | | | | | |
| Water Utilities 1.02% | | | | | | | | |
| American Water Works Co., Inc. | | | 368,071 | | | | 27,252 | |
Total Common Stocks
(cost $2,107,092,712) | | | | | | | 2,578,054 | |
| | | | | | | | | |
| Investments | | Principal
Amount
(000) | | | Fair
Value
(000) | |
| SHORT-TERM INVESTMENT 3.77% | | | | | | | | |
| | | | | | | | | |
| Repurchase Agreement | | | | | | | | |
Repurchase Agreement dated 10/31/2016, 0.03% due 11/1/2016 with Fixed Income Clearing Corp. collateralized by $84,390,000 of U.S. Treasury Bond at 3.625% due 8/15/2043; value: $102,955,800; proceeds: $100,933,994
(cost $100,933,910) | | $ | 100,934 | | | $ | 100,934 | |
Total Investments in Securities 100.16%
(cost $2,208,026,622) | | | | | | | 2,678,988 | |
| Liabilities in Excess of Other Assets (0.16)% | | | | | | | (4,339 | ) |
| Net Assets 100.00% | | | | | | $ | 2,674,649 | |
| | | |
| * | | Non-income producing security. |
| (a) | | Foreign security traded in U.S. dollars. |
The following is a summary of the inputs used as of October 31, 2016 in valuing the Fund’s investments carried at fair value(1):
| | | Level 1 | | | Level 2 | | | Level 3 | | | Total | |
| Investment Type(2)(3) | | (000) | | | (000) | | | (000) | | | (000) | |
| Common Stocks | | | | | | | | | | | | | | | | |
| Health Care Providers & Services | | $ | 55,398 | | | $ | – | | | $ | 42,896 | (4) | | $ | 98,294 | |
| Remaining Industries | | | 2,479,760 | | | | – | | | | – | | | | 2,479,760 | |
| Repurchase Agreement | | | – | | | | 100,934 | | | | – | | | | 100,934 | |
| Total | | $ | 2,535,158 | | | $ | 100,934 | | | $ | 42,896 | | | $ | 2,678,988 | |
| | | |
| | (1) | Refer to Note 2(k) for a description of fair value measurements and the three-tier hierarchy of inputs. |
| | (2) | See Schedule of Investments for fair values in each industry and identification of foreign issuers and/or geography. |
| | (3) | There were no Level 1/Level 2 transfers during the fiscal year ended October 31, 2016. |
| | (4) | Fair valued security utilizing a prior transaction cost without adjustment. |
The following is a reconciliation of investments with unobservable inputs (Level 3) that were used in determining fair value:
| Investment Type | | Common Stock | |
| Balance as of November 1, 2015 | | $ | – | |
| Accrued discounts/premiums | | | – | |
| Realized gain (loss) | | | (292,284 | ) |
| Change in unrealized appreciation/depreciation | | | 10,908,948 | |
| Purchases | | | 12,301,947 | |
| Sales | | | (3,926,250 | ) |
| Net transfers in or out of Level 3 | | | 23,904,002 | |
| Balance as of October 31, 2016 | | $ | 42,896,363 | |
| | | |
| | See Notes to Financial Statements. | 67 |
Statements of Assets and Liabilities
October 31, 2016
| | | Alpha Strategy | | | Fundamental | | | Growth | |
| | | Fund | | | Equity Fund | | | Leaders Fund | |
| ASSETS: | | | | | | | | | | | | |
| Investments in securities, at cost | | | – | | | $ | 2,470,297,520 | | | $ | 2,026,166,520 | |
| Investments in Underlying Funds, at cost | | $ | 1,099,333,852 | | | | – | | | | – | |
| Investments in securities, at fair value | | | – | | | $ | 2,837,714,178 | | | $ | 2,163,248,141 | |
| Investments in underlying funds, at value | | $ | 1,116,052,027 | | | | – | | | | – | |
| Cash | | | – | | | | – | | | | 1,478,874 | |
| Segregated cash held at custodian | | | – | | | | – | | | | – | |
| Foreign cash, at value (cost $0, $0, $0, $1,688,350, $162,525, $45,294 and $0, respectively) | | | – | | | | – | | | | – | |
| Receivables: | | | | | | | | | | | | |
| Investment securities sold | | | – | | | | 33,518,779 | | | | 24,335,211 | |
| Investment in Underlying Fund sold | | | 644,749 | | | | – | | | | – | |
| Capital shares sold | | | 1,555,390 | | | | 1,912,511 | | | | 4,701,499 | |
| Interest and dividends | | | | | | | 3,148,435 | | | | 694,911 | |
| From advisor (See Note 3) | | | – | | | | – | | | | 279,330 | |
| From affiliate (See Note 3) | | | 65,667 | | | | – | | | | – | |
| Unrealized appreciation on forward foreign currency exchange contracts | | | – | | | | – | | | | – | |
| Prepaid expenses and other assets | | | 53,417 | | | | 99,585 | | | | 25,792 | |
| Total assets | | | 1,118,371,250 | | | | 2,876,393,488 | | | | 2,194,763,758 | |
| LIABILITIES: | | | | | | | | | | | | |
| Payables: | | | | | | | | | | | | |
| Investment securities purchased | | | – | | | | 27,329,517 | | | | 62,028,120 | |
| Capital shares reacquired | | | 3,126,359 | | | | 7,890,642 | | | | 10,930,749 | |
| Management fee | | | – | | | | 1,304,865 | | | | 1,003,083 | |
| 12b-1 distribution plan | | | 438,838 | | | | 1,144,318 | | | | 788,263 | |
| Trustees’ fees | | | 150,813 | | | | 796,100 | | | | 115,765 | |
| Fund administration | | | 38,874 | | | | 97,952 | | | | 73,471 | |
| To affiliate (See Note 3) | | | – | | | | 3,938 | | | | 3,984 | |
| To bank | | | 32,293 | | | | – | | | | – | |
| Unrealized depreciation on forward foreign currency exchange contracts | | | – | | | | – | | | | – | |
| Accrued expenses | | | 298,318 | | | | 715,331 | | | | 428,635 | |
| Total liabilities | | | 4,085,495 | | | | 39,282,663 | | | | 75,372,070 | |
| NET ASSETS | | $ | 1,114,285,755 | | | $ | 2,837,110,825 | | | $ | 2,119,391,688 | |
| COMPOSITION OF NET ASSETS: | | | | | | | | | | | | |
| Paid-in capital | | $ | 985,503,817 | | | $ | 2,385,614,923 | | | $ | 2,052,672,460 | |
| Undistributed (distributions in excess of) net investment income | | | (2,999,150 | ) | | | 32,074,757 | | | | (730,007 | ) |
| Accumulated net realized gain (loss) on investments and foreign currency related transactions | | | 115,062,913 | | | | 52,004,487 | | | | (69,632,386 | ) |
| Net unrealized appreciation (depreciation) on investments and translation of assets and liabilities denominated in foreign currencies | | | 16,718,175 | | | | 367,416,658 | | | | 137,081,621 | |
| Net Assets | | $ | 1,114,285,755 | | | $ | 2,837,110,825 | | | $ | 2,119,391,688 | |
| | |
| 68 | See Notes to Financial Statements. |
| International | | | International | | | International | | | Value | |
| Core Equity | | | Dividend | | | Opportunities | | | Opportunities | |
| Fund | | | Income Fund | | | Fund | | | Fund | |
| $ | 531,332,223 | | | $ | 1,359,834,597 | | | $ | 530,462,512 | | | $ | 2,208,026,622 | |
| | – | | | | – | | | | – | | | | – | |
| $ | 545,896,352 | | | $ | 1,315,028,567 | | | $ | 562,163,431 | | | $ | 2,678,988,070 | |
| | – | | | | – | | | | – | | | | – | |
| | – | | | | – | | | | – | | | | – | |
| | 840,000 | | | | 890,000 | | | | 2,210,000 | | | | – | |
| | 1,692,233 | | | | 162,416 | | | | 45,370 | | | | – | |
| | 1,544,279 | | | | 27,358,621 | | | | 7,277,573 | | | | 5,069,894 | |
| | – | | | | – | | | | – | | | | – | |
| | 372,204 | | | | 1,808,909 | | | | 809,219 | | | | 8,952,556 | |
| | 2,217,955 | | | | 3,699,083 | | | | 1,314,464 | | | | 518,177 | |
| | 68,569 | | | | 81,832 | | | | – | | | | – | |
| | – | | | | – | | | | – | | | | – | |
| | 966,235 | | | | 5,787,315 | | | | 1,231,847 | | | | – | |
| | 42,115 | | | | 58,102 | | | | 42,955 | | | | 162,844 | |
| | 553,639,942 | | | | 1,354,874,845 | | | | 575,094,859 | | | | 2,693,691,541 | |
| | | | | | | | | | | | | | | |
| | 2,725,949 | | | | – | | | | 4,250,499 | | | | 9,020,609 | |
| | 1,218,903 | | | | 3,869,686 | | | | 1,610,683 | | | | 6,444,440 | |
| | 302,244 | | | | 817,502 | | | | 364,256 | | | | 1,619,016 | |
| | 85,341 | | | | 204,387 | | | | 94,995 | | | | 806,124 | |
| | 141,928 | | | | 212,053 | | | | 75,363 | | | | 399,799 | |
| | 17,271 | | | | 47,702 | | | | 19,427 | | | | 91,813 | |
| | 6,503 | | | | 40,089 | | | | 15,328 | | | | 15,886 | |
| | – | | | | 2,976,630 | | | | – | | | | – | |
| | 1,275,816 | | | | 4,664,631 | | | | 3,136,249 | | | | – | |
| | 224,030 | | | | 440,112 | | | | 211,527 | | | | 645,281 | |
| | 5,997,985 | | | | 13,272,792 | | | | 9,778,327 | | | | 19,042,968 | |
| $ | 547,641,957 | | | $ | 1,341,602,053 | | | $ | 565,316,532 | | | $ | 2,674,648,573 | |
| | | | | | | | | | | | | | | |
| $ | 769,099,036 | | | $ | 1,815,085,059 | | | $ | 559,618,018 | | | $ | 2,047,447,935 | |
| | 10,599,994 | | | | 2,253,932 | | | | 1,955,827 | | | | (399,799 | ) |
| | (246,211,413 | ) | | | (431,916,126 | ) | | | (25,995,134 | ) | | | 156,638,989 | |
| | 14,154,340 | | | | (43,820,812 | ) | | | 29,737,821 | | | | 470,961,448 | |
| $ | 547,641,957 | | | $ | 1,341,602,053 | | | $ | 565,316,532 | | | $ | 2,674,648,573 | |
| | | |
| | See Notes to Financial Statements. | 69 |
Statements of Assets and Liabilities (concluded)
October 31, 2016
| | | Alpha | | | Fundamental | | | Growth | |
| | | Strategy Fund | | | Equity Fund | | | Leaders Fund | |
| Net assets by class: | | | | | | | | | | | | |
| Class A Shares | | $ | 507,240,766 | | | $ | 1,653,388,693 | | | $ | 750,575,842 | |
| Class B Shares | | $ | 4,708,822 | | | $ | 15,928,261 | | | $ | 2,286,759 | |
| Class C Shares | | $ | 265,906,385 | | | $ | 544,648,835 | | | $ | 482,693,432 | |
| Class F Shares | | $ | 230,558,429 | | | $ | 304,082,939 | | | $ | 763,623,325 | |
| Class I Shares | | $ | 67,982,492 | | | $ | 142,315,642 | | | $ | 98,505,723 | |
| Class P Shares | | | – | | | $ | 10,798,218 | | | | – | |
| Class R2 Shares | | $ | 2,703,884 | | | $ | 7,952,123 | | | $ | 1,267,429 | |
| Class R3 Shares | | $ | 34,222,910 | | | $ | 157,625,807 | | | $ | 13,470,777 | |
| Class R4 Shares | | $ | 277,951 | | | $ | 121,383 | | | $ | 1,734,583 | |
| Class R5 Shares | | $ | 9,466 | | | $ | 125,455 | | | $ | 3,700,208 | |
| Class R6 Shares | | $ | 674,650 | | | $ | 123,469 | | | $ | 1,533,610 | |
| Outstanding shares by class (unlimited number of authorized shares of beneficial interest): | | | | | | | | | | | | |
| Class A Shares | | | 19,556,192 | | | | 131,826,433 | | | | 33,483,275 | |
| Class B Shares | | | 202,080 | | | | 1,392,317 | | | | 105,029 | |
| Class C Shares | | | 11,579,161 | | | | 48,051,321 | | | | 22,408,644 | |
| Class F Shares | | | 8,863,865 | | | | 24,435,923 | | | | 33,803,001 | |
| Class I Shares | | | 2,580,561 | | | | 11,273,604 | | | | 4,340,764 | |
| Class P Shares | | | – | | | | 876,269 | | | | – | |
| Class R2 Shares | | | 106,723 | | | | 647,831 | | | | 56,708 | |
| Class R3 Shares | | | 1,344,367 | | | | 12,773,802 | | | | 605,475 | |
| Class R4 Shares | | | 10,731 | | | | 9,694 | | | | 77,370 | |
| Class R5 Shares | | | 359.279 | | | | 9,934 | | | | 163,007 | |
| Class R6 Shares | | | 25,616 | | | | 9,765 | | | | 67,504 | |
| Net asset value, offering and redemption price per share (Net assets divided by outstanding shares): | | | | | | | | | | | | |
| Class A Shares-Net asset value | | | $25.94 | | | | $12.54 | | | | $22.42 | |
| Class A Shares-Maximum offering price (Net asset value plus sales charge of 5.75%) | | $27.52 | | | | $13.31 | | | | $23.79 | |
| Class B Shares-Net asset value | | | $23.30 | | | | $11.44 | | | | $21.77 | |
| Class C Shares-Net asset value | | | $22.96 | | | | $11.33 | | | | $21.54 | |
| Class F Shares-Net asset value | | | $26.01 | | | | $12.44 | | | | $22.59 | |
| Class I Shares-Net asset value | | | $26.34 | | | | $12.62 | | | | $22.69 | |
| Class P Shares-Net asset value | | | – | | | | $12.32 | | | | – | |
| Class R2 Shares-Net asset value | | | $25.34 | | | | $12.27 | | | | $22.35 | |
| Class R3 Shares-Net asset value | | | $25.46 | | | | $12.34 | | | | $22.25 | |
| Class R4 Shares-Net asset value | | | $25.90 | | | | $12.52 | | | | $22.42 | |
| Class R5 Shares-Net asset value | | | $26.35 | | | | $12.63 | | | | $22.70 | |
| Class R6 Shares-Net asset value | | | $26.34 | | | | $12.64 | | | | $22.72 | |
| | |
| 70 | See Notes to Financial Statements. |
| International | | | International | | | International | | | Value | |
| Core Equity | | | Dividend | | | Opportunities | | | Opportunities | |
| Fund | | | Income Fund | | | Fund | | | Fund | |
| $ | 263,064,393 | | | $ | 419,885,794 | | | $ | 153,000,020 | | | $ | 959,415,833 | |
| $ | 3,110,434 | | | | – | | | $ | 1,397,186 | | | $ | 7,296,303 | |
| $ | 31,797,550 | | | $ | 86,305,607 | | | $ | 27,395,564 | | | $ | 330,066,410 | |
| $ | 62,655,145 | | | $ | 111,056,115 | | | $ | 88,852,499 | | | $ | 663,068,617 | |
| $ | 160,673,187 | | | $ | 710,950,808 | | | $ | 267,187,913 | | | $ | 470,399,400 | |
| $ | 94,988 | | | | – | | | $ | 363,185 | | | $ | 36,326,538 | |
| $ | 517,469 | | | $ | 679,898 | | | $ | 2,519,591 | | | $ | 6,244,738 | |
| $ | 14,944,966 | | | $ | 12,696,729 | | | $ | 18,123,508 | | | $ | 99,544,152 | |
| $ | 9,330 | | | $ | 9,011 | | | $ | 1,882,711 | | | $ | 2,929,223 | |
| $ | 9,361 | | | $ | 9,041 | | | $ | 2,751,404 | | | $ | 42,824,676 | |
| $ | 10,765,134 | | | $ | 9,050 | | | $ | 1,842,951 | | | $ | 56,532,683 | |
| | 21,872,594 | | | | 62,535,963 | | | | 9,487,084 | | | | 50,627,848 | |
| | 260,959 | | | | – | | | | 91,736 | | | | 421,552 | |
| | 2,680,540 | | | | 12,968,293 | | | | 1,822,357 | | | | 19,070,900 | |
| | 5,239,544 | | | | 16,499,832 | | | | 5,554,236 | | | | 34,399,482 | |
| | 13,247,733 | | | | 105,368,509 | | | | 16,133,501 | | | | 23,972,651 | |
| | 7,899 | | | | – | | | | 22,139 | | | | 1,942,940 | |
| | 43,176 | | | | 99,182.7 | | | | 158,551 | | | | 339,791 | |
| | 1,261,943 | | | | 1,873,127 | | | | 1,143,737 | | | | 5,374,253 | |
| | 777.30 | | | | 1,343 | | | | 116,833 | | | | 154,544 | |
| | 773 | | | | 1,341 | | | | 166,164 | | | | 2,181,814 | |
| | 886,825 | | | | 1,341 | | | | 111,045 | | | | 2,875,919 | |
| | | | | | | | | | | | | | | |
| | $12.03 | | | | $6.71 | | | | $16.13 | | | | $18.95 | |
| | $12.76 | | | | $7.12 | | | | $17.11 | | | | $20.11 | |
| | $11.92 | | | | – | | | | $15.23 | | | | $17.31 | |
| | $11.86 | | | | $6.66 | | | | $15.03 | | | | $17.31 | |
| | $11.96 | | | | $6.73 | | | | $16.00 | | | | $19.28 | |
| | $12.13 | | | | $6.75 | | | | $16.56 | | | | $19.62 | |
| | $12.03 | | | | – | | | | $16.40 | | | | $18.70 | |
| | $11.99 | | | | $6.86 | | | | $15.89 | | | | $18.38 | |
| | $11.84 | | | | $6.78 | | | | $15.85 | | | | $18.52 | |
| | $12.00 | | | | $6.71 | | | | $16.11 | | | | $18.95 | |
| | $12.11 | | | | $6.74 | | | | $16.56 | | | | $19.63 | |
| | $12.14 | | | | $6.75 | | | | $16.60 | | | | $19.66 | |
| | | |
| | See Notes to Financial Statements. | 71 |
Statements of Operations
For the Year Ended October 31, 2016
| | | Alpha Strategy | | | Fundamental | | | Growth | |
| | | Fund | | | Equity Fund | | | Leaders Fund | |
| Investment income: | | | | | | | | | | | | |
| Dividends | | $ | – | | | $ | 79,967,160 | | | $ | 20,929,654 | |
| Dividends received from Underlying Funds | | | 2,001,129 | | | | – | | | | – | |
| Interest and other | | | 66 | | | | 14,622 | | | | 5,357 | |
| Interest earned from interfund lending (See Note 11) | | | – | | | | 2,079 | | | | 314 | |
| Total investment income | | | 2,001,195 | | | | 79,983,861 | | | | 20,935,325 | |
| Expenses: | | | | | | | | | | | | |
| Management fee | | | 1,159,459 | | | | 16,472,103 | | | | 11,873,676 | |
| 12b-1 distribution plan-Class A | | | 1,333,344 | | | | 4,437,835 | | | | 1,995,503 | |
| 12b-1 distribution plan-Class B | | | 69,222 | | | | 220,035 | | | | 29,886 | |
| 12b-1 distribution plan-Class C | | | 2,842,593 | | | | 6,011,487 | | | | 4,795,332 | |
| 12b-1 distribution plan-Class F | | | 236,756 | | | | 329,751 | | | | 776,437 | |
| 12b-1 distribution plan-Class P | | | – | | | | 53,389 | | | | – | |
| 12b-1 distribution plan-Class R2 | | | 15,707 | | | | 53,061 | | | | 7,251 | |
| 12b-1 distribution plan-Class R3 | | | 171,140 | | | | 856,663 | | | | 67,742 | |
| 12b-1 distribution plan-Class R4 | | | 311 | | | | 62 | | | | 2,072 | |
| Shareholder servicing | | | 1,663,039 | | | | 3,917,638 | | | | 2,410,829 | |
| Professional | | | 37,650 | | | | 66,996 | | | | 54,561 | |
| Reports to shareholders | | | 139,090 | | | | 277,514 | | | | 253,510 | |
| Fund administration | | | 233,767 | | | | 1,241,768 | | | | 869,900 | |
| Custody | | | 22,963 | | | | 47,344 | | | | 41,911 | |
| Trustees’ fees | | | 33,511 | | | | 91,395 | | | | 60,588 | |
| Registration | | | 153,114 | | | | 143,796 | | | | 212,321 | |
| Subsidy (See Note 3) | | | – | | | | 101,703 | | | | 101,777 | |
| Other | | | 53,195 | | | | 196,190 | | | | 103,965 | |
| Gross expenses | | | 8,164,861 | | | | 34,518,730 | | | | 23,657,261 | |
| Expense reductions (See Note 9) | | | (3,709 | ) | | | (10,070 | ) | | | (7,253 | ) |
| Expenses assumed by Underlying Funds (See Note 3) | | | (2,098,854 | ) | | | – | | | | – | |
| Fees waived and expenses reimbursed (See Note 3) | | | (1,159,459 | ) | | | – | | | | (2,928,037 | ) |
| Net expenses | | | 4,902,839 | | | | 34,508,660 | | | | 20,721,971 | |
| Net investment income (loss) | | | (2,901,644 | ) | | | 45,475,201 | | | | 213,354 | |
| Net realized and unrealized gain (loss): | | | | | | | | | | | | |
| Capital gain distributions received from Underlying Funds | | $ | 112,214,138 | | | $ | – | | | $ | – | |
| Net realized gain on Investments in Underlying Funds | | | 21,721,025 | | | | – | | | | – | |
| Net realized gain (loss) on investments | | | – | | | | 131,982,500 | | | | (36,013,707 | ) |
| Net change in unrealized appreciation/depreciation on investments and Underlying Funds | | | (121,674,817 | ) | | | (67,930,253 | ) | | | 9,283,304 | |
| Net realized and unrealized gain (loss) | | | 12,260,346 | | | | 64,052,247 | | | | (26,730,403 | ) |
| Net Increase (Decrease) in Net Assets Resulting From Operations | | $ | 9,358,702 | | | $ | 109,527,448 | | | $ | (26,517,049 | ) |
| | |
| 72 | See Notes to Financial Statements. |
Statements of Operations (continued)
For the Year Ended October 31, 2016
| | | International | | | International | |
| | | Core Equity | | | Dividend | |
| | | Fund | | | Income Fund | |
| Investment income: | | | | | | | | |
| Dividends (net of foreign withholding taxes | | | | | | | | |
| of $1,764,850 and $6,518,085, respectively) | | $ | 17,050,128 | | | $ | 75,154,101 | |
| Interest and other (net of foreign withholding | | | | | | | | |
| taxes of $0 and $2, respectively) | | | – | | | | 1,873,414 | |
| Total investment income | | | 17,050,128 | | | | 77,027,515 | |
| Expenses: | | | | | | | | |
| Management fee | | | 3,502,034 | | | | 11,163,791 | |
| 12b-1 distribution plan-Class A | | | 751,906 | | | | 1,245,931 | |
| 12b-1 distribution plan-Class B | | | 44,021 | | | | – | |
| 12b-1 distribution plan-Class C | | | 352,639 | | | | 1,069,718 | |
| 12b-1 distribution plan-Class F | | | 58,711 | | | | 135,888 | |
| 12b-1 distribution plan-Class P | | | 456 | | | | – | |
| 12b-1 distribution plan-Class R2 | | | 3,349 | | | | 4,957 | |
| 12b-1 distribution plan-Class R3 | | | 74,508 | | | | 61,085 | |
| 12b-1 distribution plan-Class R4 | | | 22 | | | | 22 | |
| Shareholder servicing | | | 875,187 | | | | 1,200,042 | |
| Professional | | | 141,930 | | | | 133,993 | |
| Reports to shareholders | | | 78,912 | | | | 142,178 | |
| Fund administration | | | 200,116 | | | | 656,522 | |
| Custody | | | 134,600 | | | | 518,630 | |
| Trustees’ fees | | | 14,322 | | | | 49,772 | |
| Registration | | | 138,153 | | | | 150,453 | |
| Subsidy (See Note 3) | | | 113,758 | | | | 1,312,974 | |
| Other | | | 75,739 | | | | 154,344 | |
| Gross expenses | | | 6,560,363 | | | | 18,000,300 | |
| Expense reductions (See Note 9) | | | (1,348 | ) | | | (2,608 | ) |
| Expenses assumed by Underlying Funds (See Note 3) | | | – | | | | – | |
| Fees waived and expenses reimbursed (See Note 3) | | | (925,310 | ) | | | (1,189,063 | ) |
| Shareholder servicing reimbursed-Class F | | | (58,059 | ) | | | (82,022 | ) |
| Shareholder servicing reimbursed-Class I | | | (81,593 | ) | | | (543,331 | ) |
| Net expenses | | | 5,494,053 | | | | 16,183,276 | |
| Net investment income | | | 11,556,075 | | | | 60,844,239 | |
| Net realized and unrealized gain (loss): | | | | | | | | |
| Net realized loss on Investments (net of foreign capital gains tax of $24,632, and $0, respectively) | | $ | (39,986,735 | ) | | $ | (266,538,388 | ) |
| Net realized gain on foreign currency related transactions | | | 2,720,137 | | | | 22,251,648 | |
| Net change in unrealized appreciation/depreciation on investments | | | 5,994,526 | | | | 119,744,426 | |
| Net change in unrealized appreciation/depreciation on transactions of assets and liabilities denominated in foreign currencies | | | 1,229,955 | | | | 15,679,414 | |
| Net realized and unrealized loss | | | (30,042,117 | ) | | | (108,862,900 | ) |
| Net Decrease in Net Assets Resulting From Operations | | $ | (18,486,042 | ) | | $ | (48,018,661 | ) |
| | | |
| | See Notes to Financial Statements. | 73 |
Statements of Operations (concluded)
For the Year Ended October 31, 2016
| | | International | | | Value | |
| | | Opportunities | | | Opportunities | |
| | | Fund | | | Fund | |
| Investment income: | | | | | | | | |
| Dividends (net of foreign withholding taxes of $1,225,542 and $0, respectively) | | $ | 12,772,605 | | | $ | 32,438,651 | |
| Interest and other (net of foreign withholding $2 and $0, respectively) | | | – | | | | 12,104 | |
| Total investment income | | | 12,772,605 | | | | 32,450,755 | |
| Expenses: | | | | | | | | |
| Management fee | | | 4,437,984 | | | | 18,297,881 | |
| 12b-1 distribution plan-Class A | | | 405,348 | | | | 2,449,066 | |
| 12b-1 distribution plan-Class B | | | 18,875 | | | | 90,546 | |
| 12b-1 distribution plan-Class C | | | 303,670 | | | | 3,315,311 | |
| 12b-1 distribution plan-Class F | | | 104,888 | | | | 551,820 | |
| 12b-1 distribution plan-Class P | | | 1,844 | | | | 170,521 | |
| 12b-1 distribution plan-Class R2 | | | 10,207 | | | | 38,845 | |
| 12b-1 distribution plan-Class R3 | | | 66,755 | | | | 511,499 | |
| 12b-1 distribution plan-Class R4 | | | 1,204 | | | | 2,424 | |
| Shareholder servicing | | | 695,777 | | | | 3,166,528 | |
| Professional | | | 119,586 | | | | 61,817 | |
| Reports to shareholders | | | 61,840 | | | | 249,038 | |
| Fund administration | | | 236,692 | | | | 1,033,716 | |
| Custody | | | 219,953 | | | | 44,480 | |
| Trustees’ fees | | | 16,900 | | | | 73,895 | |
| Registration | | | 152,053 | | | | 172,371 | |
| Subsidy (See Note 3) | | | 475,284 | | | | 491,772 | |
| Other | | | 72,199 | | | | 148,059 | |
| Gross expenses | | | 7,401,059 | | | | 30,869,589 | |
| Expense reductions (See Note 9) | | | (1,103 | ) | | | (7,666 | ) |
| Expenses assumed by Underlying Funds (See Note 3) | | | – | | | | – | |
| Fees waived and expenses reimbursed (See Note 3) | | | – | | | | – | |
| Net expenses | | | 7,399,956 | | | | 30,861,923 | |
| Net investment income | | | 5,372,649 | | | | 1,588,832 | |
| Net realized and unrealized gain (loss): | | | | | | | | |
| Net realized gain (loss) on investments (net of foreign capital gains tax of $77,477 and $0, respectively) | | $ | (23,796,866 | ) | | $ | 157,322,302 | |
| Net realized gain on foreign currency related transactions | | | 2,527,239 | | | | – | |
| Net change in unrealized appreciation/depreciation on investments | | | 10,578,107 | | | | (55,911,286 | ) |
| Net change in unrealized appreciation/depreciation on transactions of assets and liabilities denominated in foreign currencies | | | (2,586,532 | ) | | | – | |
| Net realized and unrealized gain (loss) | | | (13,278,052 | ) | | | 101,411,016 | |
| Net Increase (Decrease) in Net Assets Resulting From Operations | | $ | (7,905,403 | ) | | $ | 102,999,848 | |
| | |
| 74 | See Notes to Financial Statements. |
This page is intentionally left blank.
75
Statements of Changes in Net Assets
| | | Alpha Strategy Fund | |
| | | For the | | | For the | |
| | | Year Ended | | | Year Ended | |
| INCREASE (DECREASE) IN NET ASSETS | | October 31, 2016 | | | October 31, 2015 | |
| Operations: | | | | | | | | | | |
| Net investment income (loss) | | | $ | (2,901,644 | ) | | | $ | (1,090,786 | ) |
| Capital gain distributions received from Underlying Funds | | | | 112,214,138 | | | | | 162,371,628 | |
| Net realized gain on investments in Underlying Funds | | | | 21,721,025 | | | | | 17,427,574 | |
| Net realized gain (loss) on investments | | | | – | | | | | – | |
| Net change in unrealized appreciation/depreciation on investments in Underlying Funds | | | | (121,674,817 | ) | | | | (148,529,041 | ) |
| Net change in unrealized appreciation/depreciation on investments | | | | – | | | | | – | |
| Net increase (decrease) in net assets resulting from operations | | | | 9,358,702 | | | | | 30,179,375 | |
| Distributions to shareholders from: | | | | | | | | | | |
| Net investment income | | | | | | | | | | |
| Class A | | | | (3,540,518 | ) | | | | (8,735,703 | ) |
| Class B | | | | – | | | | | (110,177 | ) |
| Class C | | | | – | | | | | (2,903,994 | ) |
| Class F | | | | (2,025,531 | ) | | | | (4,375,758 | ) |
| Class I | | | | (368,660 | ) | | | | (876,848 | ) |
| Class P | | | | – | | | | | – | |
| Class R2 | | | | (6,227 | ) | | | | (45,570 | ) |
| Class R3 | | | | (146,537 | ) | | | | (463,657 | ) |
| Class R4 | | | | (71 | ) | | | | – | |
| Class R5 | | | | (81 | ) | | | | – | |
| Class R6 | | | | (83 | ) | | | | – | |
| Net realized gain | | | | | | | | | | |
| Class A | | | | (72,940,775 | ) | | | | (53,231,567 | ) |
| Class B | | | | (1,311,490 | ) | | | | (1,575,772 | ) |
| Class C | | | | (44,116,897 | ) | | | | (31,532,792 | ) |
| Class F | | | | (33,387,144 | ) | | | | (23,981,277 | ) |
| Class I | | | | (5,349,136 | ) | | | | (4,551,420 | ) |
| Class P | | | | – | | | | | – | |
| Class R2 | | | | (357,484 | ) | | | | (337,467 | ) |
| Class R3 | | | | (4,805,885 | ) | | | | (3,355,770 | ) |
| Class R4 | | | | (1,198 | ) | | | | – | |
| Class R5 | | | | (1,183 | ) | | | | – | |
| Class R6 | | | | (1,182 | ) | | | | – | |
| Total distributions to shareholders | | | | (168,360,082 | ) | | | | (136,077,772 | ) |
| Capital share transactions (Net of share conversions) (See Note 15): | | | | | |
| Net proceeds from sales of shares | | | | 225,073,813 | | | | | 267,736,331 | |
| Reinvestment of distributions | | | | 142,586,198 | | | | | 113,655,114 | |
| Cost of shares reacquired | | | | (354,558,513 | ) | | | | (297,467,265 | ) |
| Net increase (decrease) in net assets resulting from capital share transactions | | | | 13,101,498 | | | | | 83,924,180 | |
| Net increase (decrease) in net assets | | | | (145,899,882 | ) | | | | (21,974,217 | ) |
| NET ASSETS: | | | | | | | | | | |
| Beginning of year | | | $ | 1,260,185,637 | | | | $ | 1,282,159,854 | |
| End of year | | | $ | 1,114,285,755 | | | | $ | 1,260,185,637 | |
| Undistributed (distributions in excess of) net investment income | | | $ | (2,999,150 | ) | | | $ | (3,389,449 | ) |
| 76 | See Notes to Financial Statements. | |
| Fundamental Equity Fund | | | Growth Leaders Fund | |
| For the | | | For the | | | For the | | | For the | |
| Year Ended | | | Year Ended | | | Year Ended | | | Year Ended | |
| October 31, 2016 | | | October 31, 2015 | | | October 31, 2016 | | | October 31, 2015 | |
| $ | 45,475,201 | | | $ | 42,329,990 | | | $ | 213,354 | | | $ | (2,875,937 | ) |
| | – | | | | – | | | | – | | | | – | |
| | – | | | | – | | | | – | | | | – | |
| | 131,982,500 | | | | 305,298,883 | | | | (36,013,707 | ) | | | 86,104,090 | |
| | | | | | | | | | | | | | | |
| | – | | | | – | | | | – | | | | – | |
| | | | | | | | | | | | | | | |
| | (67,930,253 | ) | | | (283,605,428 | ) | | | 9,283,304 | | | | 46,305,726 | |
| | 109,527,448 | | | | 64,023,445 | | | | (26,517,049 | ) | | | 129,533,879 | |
| | (25,637,542 | ) | | | (16,981,478 | ) | | | – | | | | – | |
| | (140,661 | ) | | | – | | | | – | | | | – | |
| | (4,078,407 | ) | | | (273,945 | ) | | | – | | | | – | |
| | (5,816,644 | ) | | | (6,894,688 | ) | | | – | | | | – | |
| | (3,639,747 | ) | | | (4,367,437 | ) | | | – | | | | – | |
| | (147,160 | ) | | | (105,867 | ) | | | – | | | | – | |
| | (93,933 | ) | | | (34,584 | ) | | | – | | | | – | |
| | (2,043,594 | ) | | | (1,383,142 | ) | | | – | | | | – | |
| | (142 | ) | | | – | | | | – | | | | – | |
| | (153 | ) | | | – | | | | – | | | | – | |
| | (154 | ) | | | – | | | | – | | | | – | |
| | (169,563,148 | ) | | | (456,064,578 | ) | | | (35,621,327 | ) | | | (28,085,049 | ) |
| | (2,635,889 | ) | | | (8,388,211 | ) | | | (178,478 | ) | | | (357,210 | ) |
| | (65,139,785 | ) | | | (180,777,593 | ) | | | (20,530,447 | ) | | | (13,786,944 | ) |
| | (34,565,047 | ) | | | (131,065,272 | ) | | | (34,683,777 | ) | | | (27,241,459 | ) |
| | (19,814,462 | ) | | | (74,720,912 | ) | | | (4,426,828 | ) | | | (3,976,895 | ) |
| | (1,186,895 | ) | | | (3,676,969 | ) | | | – | | | | – | |
| | (917,197 | ) | | | (2,913,506 | ) | | | (42,130 | ) | | | (24,630 | ) |
| | (17,448,912 | ) | | | (50,977,599 | ) | | | (630,934 | ) | | | (573,767 | ) |
| | (840 | ) | | | – | | | | (470 | ) | | | – | |
| | (835 | ) | | | – | | | | (466 | ) | | | – | |
| | (835 | ) | | | – | | | | (11,055 | ) | | | – | |
| | (352,871,982 | ) | | | (938,625,781 | ) | | | (96,125,912 | ) | | | (74,045,954 | ) |
| | 220,760,807 | | | | 398,373,326 | | | | 1,047,526,269 | | | | 1,029,331,348 | |
| | 322,229,904 | | | | 843,553,618 | | | | 82,564,474 | | | | 63,024,578 | |
| | (1,136,868,787 | ) | | | (1,997,183,983 | ) | | | (892,874,146 | ) | | | (463,316,036 | ) |
| | (593,878,076 | ) | | | (755,257,039 | ) | | | 237,216,597 | | | | 629,039,890 | |
| | (837,222,610 | ) | | | (1,629,859,375 | ) | | | 114,573,636 | | | | 684,527,815 | |
| $ | 3,674,333,435 | | | $ | 5,304,192,810 | | | $ | 2,004,818,052 | | | $ | 1,320,290,237 | |
| $ | 2,837,110,825 | | | $ | 3,674,333,435 | | | $ | 2,119,391,688 | | | $ | 2,004,818,052 | |
| $ | 32,074,757 | | | $ | 30,684,339 | | | $ | (730,007 | ) | | $ | (626,463 | ) |
| | See Notes to Financial Statements. | 77 |
Statements of Changes in Net Assets (continued)
| | | International Core Equity Fund | |
| | | For the | | | For the | |
| | | Year Ended | | | Year Ended | |
| INCREASE (DECREASE) IN NET ASSETS | | October 31, 2016 | | | October 31, 2015 | |
| Operations: | | | | | | | | | | |
| Net investment income | | | $ | 11,556,075 | | | | $ | 8,931,028 | |
| Net realized gain (loss) on investments and foreign currency related transactions | | | | (37,266,598 | ) | | | | (10,282,061 | ) |
| Net change in unrealized appreciation/depreciation on investments and translation of assets and | | | | | | | | | | |
| liabilities denominated in foreign currencies | | | | 7,224,481 | | | | | (22,514,803 | ) |
| Net increase (decrease) in net assets resulting from operations | | | | (18,486,042 | ) | | | | (23,865,836 | ) |
| Distributions to shareholders from: | | | | | | | | | | |
| Net investment income | | | | | | | | | | |
| Class A | | | | (4,327,062 | ) | | | | (4,064,820 | ) |
| Class B | | | | (14,972 | ) | | | | (24,995 | ) |
| Class C | | | | (216,668 | ) | | | | (194,225 | ) |
| Class F | | | | (901,673 | ) | | | | (1,155,547 | ) |
| Class I | | | | (952,923 | ) | | | | (882,163 | ) |
| Class P | | | | (1,208 | ) | | | | (1,034 | ) |
| Class R2 | | | | (5,473 | ) | | | | (8,563 | ) |
| Class R3 | | | | (175,489 | ) | | | | (196,637 | ) |
| Class R4 | | | | (138 | ) | | | | – | |
| Class R5 | | | | (149 | ) | | | | – | |
| Class R6 | | | | (151 | ) | | | | – | |
| Net realized gain | | | | | | | | | | |
| Class A | | | | – | | | | | – | |
| Class B | | | | – | | | | | – | |
| Class C | | | | – | | | | | – | |
| Class F | | | | – | | | | | – | |
| Class I | | | | – | | | | | – | |
| Class P | | | | – | | | | | – | |
| Class R2 | | | | – | | | | | – | |
| Class R3 | | | | – | | | | | – | |
| Class R4 | | | | – | | | | | – | |
| Class R5 | | | | – | | | | | – | |
| Class R6 | | | | – | | | | | – | |
| Total distributions to shareholders | | | | (6,595,906 | ) | | | | (6,527,984 | ) |
| Capital share transactions (Net of share conversions) (See Note 15): | | | | | |
| Net proceeds from sales of shares | | | | 188,432,563 | | | | | 93,773,921 | |
| Reinvestment of distributions | | | | 6,187,992 | | | | | 6,119,891 | |
| Cost of shares reacquired | | | | (155,767,927 | ) | | | | (159,972,056 | ) |
| Net increase (decrease) in net assets resulting from capital share transactions | | | | 38,852,628 | | | | | (60,078,244 | ) |
| Net increase (decrease) in net assets | | | | 13,770,680 | | | | | (90,472,064 | ) |
| NET ASSETS: | | | | | | | | | | |
| Beginning of year | | | $ | 533,871,277 | | | | $ | 624,343,341 | |
| End of year | | | $ | 547,641,957 | | | | $ | 533,871,277 | |
| Undistributed (distributions in excess of) net investment income | | | $ | 10,599,994 | | | | $ | 5,520,996 | |
| 78 | See Notes to Financial Statements. | |
| International Dividend Income Fund | | | International Opportunities Fund | |
| For the | | | For the | | | For the | | | For the | |
| Year Ended | | | Year Ended | | | Year Ended | | | Year Ended | |
| October 31, 2016 | | | October 31, 2015 | | | October 31, 2016 | | | October 31, 2015 | |
| $ | 60,844,239 | | | $ | 82,000,547 | | | $ | 5,372,649 | | | $ | 3,328,296 | |
| | | | | | | | | | | | | | | |
| | (244,286,740 | ) | | | (152,130,764 | ) | | | (21,269,627 | ) | | | 16,800,972 | |
| | | | | | | | | | | | | | | |
| | 135,423,840 | | | | (245,799,213 | ) | | | 7,991,575 | | | | 19,211,279 | |
| | | | | | | | | | | | | | | |
| | (48,018,661 | ) | | | (315,929,430 | ) | | | (7,905,403 | ) | | | 39,340,547 | |
| | (16,343,755 | ) | | | (28,874,101 | ) | | | (1,050,238 | ) | | | (1,283,985 | ) |
| | – | | | | – | | | | – | | | | (10,356 | ) |
| | (2,751,461 | ) | | | (4,202,046 | ) | | | (18,260 | ) | | | (105,237 | ) |
| | (4,596,054 | ) | | | (9,566,742 | ) | | | (938,607 | ) | | | (479,849 | ) |
| | (32,191,585 | ) | | | (38,558,387 | ) | | | (2,334,522 | ) | | | (4,017,988 | ) |
| | – | | | | – | | | | (1,464 | ) | | | (8,332 | ) |
| | (23,851 | ) | | | (33,325 | ) | | | (5,781 | ) | | | (1,661 | ) |
| | (385,952 | ) | | | (368,955 | ) | | | (41,103 | ) | | | (57,901 | ) |
| | (304 | ) | | | (45 | ) | | | (68 | ) | | | – | |
| | (326 | ) | | | (51 | ) | | | (78 | ) | | | – | |
| | (326 | ) | | | (51 | ) | | | (118 | ) | | | – | |
| | | | | | | | | | | | | | | |
| | – | | | | (55,166,901 | ) | | | (6,077,165 | ) | | | (3,368,956 | ) |
| | – | | | | – | | | | (92,296 | ) | | | (120,077 | ) |
| | – | | | | (10,838,979 | ) | | | (1,231,535 | ) | | | (665,488 | ) |
| | – | | | | (17,750,095 | ) | | | (4,392,710 | ) | | | (1,070,981 | ) |
| | – | | | | (56,954,417 | ) | | | (10,107,379 | ) | | | (8,248,533 | ) |
| | – | | | | – | | | | (17,397 | ) | | | (25,750 | ) |
| | – | | | | (70,138 | ) | | | (38,773 | ) | | | (5,933 | ) |
| | – | | | | (656,902 | ) | | | (337,158 | ) | | | (181,392 | ) |
| | – | | | | – | | | | (347 | ) | | | – | |
| | – | | | | – | | | | (338 | ) | | | – | |
| | – | | | | – | | | | (502 | ) | | | – | |
| | (56,293,614 | ) | | | (223,041,135 | ) | | | (26,685,839 | ) | | | (19,652,419 | ) |
| | 142,481,586 | | | | 958,048,879 | | | | 162,415,053 | | | | 250,489,054 | |
| | 54,232,406 | | | | 212,938,615 | | | | 24,801,645 | | | | 18,576,765 | |
| | (909,403,451 | ) | | | (963,715,817 | ) | | | (208,561,854 | ) | | | (136,665,269 | ) |
| | (712,689,459 | ) | | | 207,271,677 | | | | (21,345,156 | ) | | | 132,400,550 | |
| | (817,001,734 | ) | | | (331,698,888 | ) | | | (55,936,398 | ) | | | 152,088,678 | |
| $ | 2,158,603,787 | | | $ | 2,490,302,675 | | | $ | 621,252,930 | | | $ | 469,164,252 | |
| $ | 1,341,602,053 | | | $ | 2,158,603,787 | | | $ | 565,316,532 | | | $ | 621,252,930 | |
| $ | 2,253,932 | | | $ | (202,859 | ) | | $ | 1,955,827 | | | $ | 556,711 | |
| | See Notes to Financial Statements. | 79 |
Statements of Changes in Net Assets (concluded)
| | | Value Opportunities Fund | |
| | | For the | | | For the | |
| | | Year Ended | | | Year Ended | |
| DECREASE IN NET ASSETS | | October 31, 2016 | | | October 31, 2015 | |
| Operations: | | | | | | | | | | |
| Net investment income (loss) | | | $ | 1,588,832 | | | | $ | (2,624,756 | ) |
| Net realized gain on investments | | | | 157,322,302 | | | | | 191,750,643 | |
| Net change in unrealized appreciation/depreciation on investments | | | | (55,911,286 | ) | | | | (72,964,023 | ) |
| Net increase in net assets resulting from operations | | | | 102,999,848 | | | | | 116,161,864 | |
| Distributions to shareholders from: | | | | | | | | | | |
| | | | | | | | | | | |
| Net realized gain | | | | | | | | | | |
| Class A | | | | (72,951,605 | ) | | | | (171,704,074 | ) |
| Class B | | | | (870,863 | ) | | | | (2,623,841 | ) |
| Class C | | | | (27,261,109 | ) | | | | (56,594,543 | ) |
| Class F | | | | (38,590,474 | ) | | | | (71,282,706 | ) |
| Class I | | | | (38,495,440 | ) | | | | (81,746,674 | ) |
| Class P | | | | (3,022,260 | ) | | | | (6,509,608 | ) |
| Class R2 | | | | (516,346 | ) | | | | (1,387,879 | ) |
| Class R3 | | | | (8,254,498 | ) | | | | (17,717,532 | ) |
| Class R4 | | | | (689 | ) | | | | – | |
| Class R5 | | | | (669 | ) | | | | – | |
| Class R6 | | | | (2,015,955 | ) | | | | – | |
| Total distributions to shareholders | | | | (191,979,908 | ) | | | | (409,566,857 | ) |
| Capital share transactions (Net of share conversions) (See Note 15): | | | | | |
| Net proceeds from sales of shares | | | | 649,722,205 | | | | | 495,803,327 | |
| Reinvestment of distributions | | | | 179,896,069 | | | | | 382,316,773 | |
| Cost of shares reacquired | | | | (768,820,227 | ) | | | | (1,013,074,895 | ) |
| Net increase (decrease) in net assets resulting from capital share transactions | | | | 60,798,047 | | | | | (134,954,795 | ) |
| Net decrease in net assets | | | | (28,182,013 | ) | | | | (428,359,788 | ) |
| NET ASSETS: | | | | | | | | | | |
| Beginning of year | | | $ | 2,702,830,586 | | | | $ | 3,131,190,374 | |
| End of year | | | $ | 2,674,648,573 | | | | $ | 2,702,830,586 | |
| Distributions in excess of net investment income | | | $ | (399,799 | ) | | | $ | (6,823,845 | ) |
| 80 | See Notes to Financial Statements. | |
This page is intentionally left blank.
81
Financial Highlights
ALPHA STRATEGY FUND
| | | | | Per Share Operating Performance: |
| | | | | Investment operations: | | Distributions to
shareholders from: |
| | | Net asset
value,
beginning
of period | | Net
invest-
ment
income
(loss)(a) | | Net
realized
and
unrealized
gain (loss) | | Total
from
invest-
ment
opera-
tions | | Net
investment
income | | Net
realized
gain | | Total
distri-
butions |
| Class A | | | | | | | | | | | | | | | | | | | | | | | | | | | | |
| 10/31/2016 | | | $29.79 | | | | $(0.03 | ) | | | $0.19 | | | | $0.16 | | | | $(0.19 | ) | | | $(3.82 | ) | | | $(4.01 | ) |
| 10/31/2015 | | | 32.40 | | | | 0.02 | | | | 0.78 | | | | 0.80 | | | | (0.48 | ) | | | (2.93 | ) | | | (3.41 | ) |
| 10/31/2014 | | | 32.63 | | | | 0.02 | | | | 2.16 | | | | 2.18 | | | | (1.29 | ) | | | (1.12 | ) | | | (2.41 | ) |
| 10/31/2013 | | | 24.71 | | | | 0.09 | | | | 8.92 | | | | 9.01 | | | | (0.04 | ) | | | (1.05 | ) | | | (1.09 | ) |
| 10/31/2012 | | | 22.72 | | | | (0.01 | ) | | | 2.07 | | | | 2.06 | | | | – | | | | (0.07 | ) | | | (0.07 | ) |
| | | | | | | | | | | | | | | | | | | | | | | | | | | | | |
| Class B | | | | | | | | | | | | | | | | | | | | | | | | | | | | |
| 10/31/2016 | | | 27.16 | | | | (0.18 | ) | | | 0.14 | | | | (0.04 | ) | | | – | | | | (3.82 | ) | | | (3.82 | ) |
| 10/31/2015 | | | 29.77 | | | | (0.17 | ) | | | 0.70 | | | | 0.53 | | | | (0.21 | ) | | | (2.93 | ) | | | (3.14 | ) |
| 10/31/2014 | | | 30.16 | | | | (0.19 | ) | | | 1.98 | | | | 1.79 | | | | (1.06 | ) | | | (1.12 | ) | | | (2.18 | ) |
| 10/31/2013 | | | 23.05 | | | | (0.09 | ) | | | 8.25 | | | | 8.16 | | | | – | | | | (1.05 | ) | | | (1.05 | ) |
| 10/31/2012 | | | 21.36 | | | | (0.17 | ) | | | 1.93 | | | | 1.76 | | | | – | | | | (0.07 | ) | | | (0.07 | ) |
| | | | | | | | | | | | | | | | | | | | | | | | | | | | | |
| Class C | | | | | | | | | | | | | | | | | | | | | | | | | | | | |
| 10/31/2016 | | | 26.83 | | | | (0.19 | ) | | | 0.14 | | | | (0.05 | ) | | | – | | | | (3.82 | ) | | | (3.82 | ) |
| 10/31/2015 | | | 29.51 | | | | (0.19 | ) | | | 0.71 | | | | 0.52 | | | | (0.27 | ) | | | (2.93 | ) | | | (3.20 | ) |
| 10/31/2014 | | | 29.95 | | | | (0.20 | ) | | | 1.98 | | | | 1.78 | | | | (1.10 | ) | | | (1.12 | ) | | | (2.22 | ) |
| 10/31/2013 | | | 22.89 | | | | (0.10 | ) | | | 8.21 | | | | 8.11 | | | | – | | | | (1.05 | ) | | | (1.05 | ) |
| 10/31/2012 | | | 21.21 | | | | (0.18 | ) | | | 1.93 | | | | 1.75 | | | | – | | | | (0.07 | ) | | | (0.07 | ) |
| | | | | | | | �� | | | | | | | | | | | | | | | | | | | | | |
| Class F | | | | | | | | | | | | | | | | | | | | | | | | | | | | |
| 10/31/2016 | | | 29.87 | | | | 0.02 | | | | 0.17 | | | | 0.19 | | | | (0.23 | ) | | | (3.82 | ) | | | (4.05 | ) |
| 10/31/2015 | | | 32.49 | | | | 0.07 | | | | 0.78 | | | | 0.85 | | | | (0.54 | ) | | | (2.93 | ) | | | (3.47 | ) |
| 10/31/2014 | | | 32.71 | | | | 0.06 | | | | 2.17 | | | | 2.23 | | | | (1.33 | ) | | | (1.12 | ) | | | (2.45 | ) |
| 10/31/2013 | | | 24.77 | | | | 0.14 | | | | 8.93 | | | | 9.07 | | | | (0.08 | ) | | | (1.05 | ) | | | (1.13 | ) |
| 10/31/2012 | | | 22.74 | | | | 0.03 | | | | 2.07 | | | | 2.10 | | | | – | | | | (0.07 | ) | | | (0.07 | ) |
| | | | | | | | | | | | | | | | | | | | | | | | | | | | | |
| Class I | | | | | | | | | | | | | | | | | | | | | | | | | | | | |
| 10/31/2016 | | | 30.20 | | | | 0.02 | | | | 0.20 | | | | 0.22 | | | | (0.26 | ) | | | (3.82 | ) | | | (4.08 | ) |
| 10/31/2015 | | | 32.81 | | | | 0.11 | | | | 0.78 | | | | 0.89 | | | | (0.57 | ) | | | (2.93 | ) | | | (3.50 | ) |
| 10/31/2014 | | | 33.01 | | | | 0.10 | | | | 2.18 | | | | 2.28 | | | | (1.36 | ) | | | (1.12 | ) | | | (2.48 | ) |
| 10/31/2013 | | | 24.99 | | | | 0.17 | | | | 9.01 | | | | 9.18 | | | | (0.11 | ) | | | (1.05 | ) | | | (1.16 | ) |
| 10/31/2012 | | | 22.92 | | | | 0.06 | | | | 2.08 | | | | 2.14 | | | | – | | | | (0.07 | ) | | | (0.07 | ) |
| 82 | See Notes to Financial Statements. | |
| | | | | Ratios to Average Net Assets:* | | Supplemental Data: |
| | | | | Total | | | | | | | | |
| | | | | expenses | | | | | | | | |
| | | | | after | | | | Net | | | | |
| Net | | | | waivers | | | | invest- | | Net | | |
| asset | | | | and/or | | | | ment | | assets, | | Portfolio |
| value, | | Total | | reimburse- | | Total | | income | | end of | | turnover |
| end of | | return(b) | | ments | | expenses | | (loss) | | period | | rate |
| period | | (%) | | (%) | | (%) | | (%) | | (000) | | (%) |
| | $25.94 | | | 0.91 | | | 0.27 | | | 0.55 | | | (0.10 | ) | | $507,241 | | | 12.50 | |
| | 29.79 | | | 2.54 | | | 0.25 | | | 0.53 | | | 0.08 | | | 580,945 | | | 8.24 | |
| | 32.40 | | | 6.89 | | | 0.25 | | | 0.53 | | | 0.07 | | | 586,429 | | | 5.42 | |
| | 32.63 | | | 37.98 | | | 0.25 | | | 0.54 | | | 0.33 | | | 567,124 | | | 8.12 | |
| | 24.71 | | | 9.12 | | | 0.25 | | | 0.57 | | | (0.05 | ) | | 421,927 | | | 3.84 | |
| | 23.30 | | | 0.16 | | | 1.02 | | | 1.30 | | | (0.80 | ) | | 4,709 | | | 12.50 | |
| | 27.16 | | | 1.76 | | | 1.00 | | | 1.28 | | | (0.61 | ) | | 9,907 | | | 8.24 | |
| | 29.77 | | | 6.09 | | | 1.00 | | | 1.28 | | | (0.65 | ) | | 16,870 | | | 5.42 | |
| | 30.16 | | | 36.93 | | | 1.00 | | | 1.29 | | | (0.36 | ) | | 22,883 | | | 8.12 | |
| | 23.05 | | | 8.29 | | | 1.00 | | | 1.32 | | | (0.78 | ) | | 21,776 | | | 3.84 | |
| | 22.96 | | | 0.12 | | | 1.02 | | | 1.30 | | | (0.84 | ) | | 265,906 | | | 12.50 | |
| | 26.83 | | | 1.76 | | | 1.00 | | | 1.28 | | | (0.67 | ) | | 314,946 | | | 8.24 | |
| | 29.51 | | | 6.09 | | | 1.00 | | | 1.27 | | | (0.68 | ) | | 318,668 | | | 5.42 | |
| | 29.95 | | | 36.97 | | | 0.99 | | | 1.28 | | | (0.40 | ) | | 294,780 | | | 8.12 | |
| | 22.89 | | | 8.30 | | | 0.99 | | | 1.31 | | | (0.79 | ) | | 223,165 | | | 3.84 | |
| | 26.01 | | | 1.05 | | | 0.12 | | | 0.40 | | | 0.06 | | | 230,558 | | | 12.50 | |
| | 29.87 | | | 2.68 | | | 0.10 | | | 0.38 | | | 0.23 | | | 271,865 | | | 8.24 | |
| | 32.49 | | | 7.05 | | | 0.10 | | | 0.38 | | | 0.20 | | | 267,679 | | | 5.42 | |
| | 32.71 | | | 38.19 | | | 0.10 | | | 0.39 | | | 0.49 | | | 197,939 | | | 8.12 | |
| | 24.77 | | | 9.28 | | | 0.10 | | | 0.42 | | | 0.12 | | | 140,860 | | | 3.84 | |
| | 26.34 | | | 1.15 | | | 0.02 | | | 0.30 | | | 0.09 | | | 67,982 | | | 12.50 | |
| | 30.20 | | | 2.78 | | | 0.00 | | | 0.28 | | | 0.36 | | | 43,135 | | | 8.24 | |
| | 32.81 | | | 7.14 | | | 0.00 | | | 0.28 | | | 0.31 | | | 52,339 | | | 5.42 | |
| | 33.01 | | | 38.32 | | | 0.00 | | | 0.29 | | | 0.60 | | | 44,998 | | | 8.12 | |
| | 24.99 | | | 9.39 | | | 0.00 | | | 0.32 | | | 0.24 | | | 18,677 | | | 3.84 | |
| | See Notes to Financial Statements. | 83 |
Financial Highlights (concluded)
ALPHA STRATEGY FUND
| | | | | | | Per Share Operating Performance: |
| | | | | | | Investment operations: | | Distributions to
shareholders from: ’ |
| | | Net asset
value,
beginning
of period | | Net
invest-
ment
income
(loss)(a) | | Net
realized
and
unrealized
gain (loss) | | Total
from
invest-
ment
opera-
tions | | Net
investment
income | | Net
realized
gain | | Total
distri-
butions |
| Class R2 | | | | | | | | | | | | | | | | | | | | | | | | | | | | | | | | | | | | | | | |
| 10/31/2016 | | | $ | 29.16 | | | | $ | (0.11 | ) | | | | $ | 0.18 | | | | $ | 0.07 | | | | $ | (0.07 | ) | | | | $ | (3.82 | ) | | | | $ | (3.89 | ) | |
| 10/31/2015 | | | | 31.81 | | | | | (0.07 | ) | | | | | 0.75 | | | | | 0.68 | | | | | (0.40 | ) | | | | | (2.93 | ) | | | | | (3.33 | ) | |
| 10/31/2014 | | | | 32.07 | | | | | (0.09 | ) | | | | | 2.13 | | | | | 2.04 | | | | | (1.18 | ) | | | | | (1.12 | ) | | | | | (2.30 | ) | |
| 10/31/2013 | | | | 24.35 | | | | | 0.04 | | | | | | 8.73 | | | | | 8.77 | | | | | – | | | | | | (1.05 | ) | | | | | (1.05 | ) | |
| 10/31/2012 | | | | 22.47 | | | | | (0.09 | ) | | | | | 2.04 | | | | | 1.95 | | | | | – | | | | | | (0.07 | ) | | | | | (0.07 | ) | |
| | | | | | | | | | | | | | | | | | | | | | | | | | | | | | | | | | | | | | | | |
| Class R3 | | | | | | | | | | | | | | | | | | | | | | | | | | | | | | | | | | | | | | | |
| 10/31/2016 | | | | 29.30 | | | | | (0.09 | ) | | | | | 0.19 | | | | | 0.10 | | | | | (0.12 | ) | | | | | (3.82 | ) | | | | | (3.94 | ) | |
| 10/31/2015 | | | | 31.93 | | | | | (0.05 | ) | | | | | 0.76 | | | | | 0.71 | | | | | (0.41 | ) | | | | | (2.93 | ) | | | | | (3.34 | ) | |
| 10/31/2014 | | | | 32.18 | | | | | (0.05 | ) | | | | | 2.13 | | | | | 2.08 | | | | | (1.21 | ) | | | | | (1.12 | ) | | | | | (2.33 | ) | |
| 10/31/2013 | | | | 24.41 | | | | | 0.04 | | | | | | 8.78 | | | | | 8.82 | | | | | – | | | | | | (1.05 | ) | | | | | (1.05 | ) | |
| 10/31/2012 | | | | 22.50 | | | | | (0.07 | ) | | | | | 2.05 | | | | | 1.98 | | | | | – | | | | | | (0.07 | ) | | | | | (0.07 | ) | |
| | | | | | | | | | | | | | | | | | | | | | | | | | | | | | | | | | | | | | | | |
| Class R4 | | | | | | | | | | | | | | | | | | | | | | | | | | | | | | | | | | | | | | | |
| 10/31/2016 | | | | 29.79 | | | | | (0.07 | ) | | | | | 0.23 | | | | | 0.16 | | | | | (0.23 | ) | | | | | (3.82 | ) | | | | | (4.05 | ) | |
| 6/30/2015 to 10/31/2015(c) | | | | 31.87 | | | | | (0.03 | ) | | | | | (2.05 | )(d) | | | | (2.08 | ) | | | | – | | | | | | – | | | | | | – | | |
| | | | | | | | | | | | | | | | | | | | | | | | | | | | | | | | | | | | | | | | |
| Class R5 | | | | | | | | | | | | | | | | | | | | | | | | | | | | | | | | | | | | | | | |
| 10/31/2016 | | | | 30.20 | | | | | 0.04 | | | | | | 0.19 | | | | | 0.23 | | | | | (0.26 | ) | | | | | (3.82 | ) | | | | | (4.08 | ) | |
| 6/30/2015 to 10/31/2015(c) | | | | 32.28 | | | | | – | | | | | | (2.08 | )(d) | | | | (2.08 | ) | | | | – | | | | | | – | | | | | | – | | |
| | | | | | | | | | | | | | | | | | | | | | | | | | | | | | | | | | | | | | | | |
| Class R6 | | | | | | | | | | | | | | | | | | | | | | | | | | | | | | | | | | | | | | | |
| 10/31/2016 | | | | 30.20 | | | | | – | (g) | | | | | 0.23 | | | | | 0.23 | | | | | (0.27 | ) | | | | | (3.82 | ) | | | | | (4.09 | ) | |
| 6/30/2015 to 10/31/2015(c) | | | | 32.28 | | | | | – | (g) | | | | | (2.08 | )(d) | | | | (2.08 | ) | | | | – | | | | | | – | | | | | | – | | |
| * | Does not include expenses of the Underlying Funds in which the Fund invests. |
| (a) | Calculated using average shares outstanding during the period. |
| (b) | Total return for classes A, B and C does not consider the effects of sales loads and assumes the reinvestment of all distributions. Total return for all other classes assumes the reinvestment of all distributions. |
| (c) | Commenced on June 30, 2015. |
| (d) | The per share amount does not represent the net realized and unrealized gain (loss) as presented on the Statements of Operations for the period due to the timing of sales of Fund shares and the amount of per share realized and unrealized gains and losses at such time. |
| (e) | Not annualized. |
| (f) | Annualized. |
| (g) | Amount less than $0.01. |
| 84 | See Notes to Financial Statements. |
| | | | | | | | Ratios to Average Net Assets:* | | Supplemental Data: |
Net
asset
value,
end of
period | | Total
return(b)
(%) | | Total
expenses
after
waivers
and/or
reimburse-
ments
(%) | | Total
expenses
(%) | | Net
invest-
ment
income
(loss)
(%) | | Net
assets,
end of
period
(000) | | Portfolio
turnover
rate
(%) |
| $ | 25.34 | | | 0.57 | | | 0.62 | | | 0.90 | | | (0.45 | ) | | $2,704 | | | 12.50 | |
| | 29.16 | | | 2.16 | | | 0.60 | | | 0.88 | | | (0.22 | ) | | 2,704 | | | 8.24 | |
| | 31.81 | | | 6.55 | | | 0.60 | | | 0.88 | | | (0.30 | ) | | 3,479 | | | 5.42 | |
| | 32.07 | | | 37.49 | | | 0.60 | | | 0.89 | | | 0.14 | | | 2,738 | | | 8.12 | |
| | 24.35 | | | 8.73 | | | 0.60 | | | 0.92 | | | (0.39 | ) | | 2,982 | | | 3.84 | |
| | 25.46 | | | 0.68 | | | 0.52 | | | 0.80 | | | (0.35 | ) | | 34,223 | | | 12.50 | |
| | 29.30 | | | 2.28 | | | 0.50 | | | 0.78 | | | (0.17 | ) | | 36,656 | | | 8.24 | |
| | 31.93 | | | 6.62 | | | 0.50 | | | 0.78 | | | (0.15 | ) | | 36,695 | | | 5.42 | |
| | 32.18 | | | 37.60 | | | 0.50 | | | 0.79 | | | 0.13 | | | 34,574 | | | 8.12 | |
| | 24.41 | | | 8.85 | | | 0.50 | | | 0.82 | | | (0.30 | ) | | 29,663 | | | 3.84 | |
| | 25.90 | | | 0.91 | | | 0.28 | | | 0.55 | | | (0.27 | ) | | 278 | | | 12.50 | |
| | 29.79 | | | (6.53 | )(e) | | 0.25 | (f) | | 0.53 | (f) | | (0.25 | )(f) | | 9 | | | 8.24 | |
| | 26.35 | | | 1.19 | | | – | | | 0.30 | | | 0.16 | | | 9 | | | 12.50 | |
| | 30.20 | | | (6.44 | )(e) | | 0.00 | (f) | | 0.28 | (f) | | 0.00 | (f) | | 9 | | | 8.24 | |
| | 26.34 | | | 1.17 | | | 0.03 | | | 0.17 | | | (0.01 | ) | | 675 | | | 12.50 | |
| | 30.20 | | | (6.44 | )(e) | | 0.00 | (f) | | 0.12 | (f) | | 0.03 | (f) | | 9 | | | 8.24 | |
| | See Notes to Financial Statements. | 85 |
Financial Highlights
FUNDAMENTAL EQUITY FUND
| | | | | Per Share Operating Performance: |
| | | | | Investment operations: | | Distributions to
shareholders from: |
| | | Net asset
value,
beginning
of period | | Net
invest-
ment
income
(loss)(a) | | Net
realized
and
unrealized
gain (loss) | | Total
from
invest-
ment
opera-
tions | | Net
investment
income | | Net
realized
gain | | Total
distri-
butions |
| Class A | | | | | | | | | | | | | | | | | | | | | | | | | | | | |
| 10/31/2016 | | | $13.32 | | | | $0.19 | | | | $0.34 | | | | $0.53 | | | | $(0.17 | ) | | | $(1.14 | ) | | | $(1.31 | ) |
| 10/31/2015 | | | 16.00 | | | | 0.15 | | | | 0.04 | | | | 0.19 | | | | (0.10 | ) | | | (2.77 | ) | | | (2.87 | ) |
| 10/31/2014 | | | 16.83 | | | | 0.07 | | | | 1.67 | | | | 1.74 | | | | (0.04 | ) | | | (2.53 | ) | | | (2.57 | ) |
| 10/31/2013 | | | 13.08 | | | | 0.07 | | | | 3.92 | | | | 3.99 | | | | (0.09 | ) | | | (0.15 | ) | | | (0.24 | ) |
| 10/31/2012 | | | 12.51 | | | | 0.09 | | | | 0.77 | | | | 0.86 | | | | (0.02 | ) | | | (0.27 | ) | | | (0.29 | ) |
| | | | | | | | | | | | | | | | | | | | | | | | | | | | | |
| Class B | | | | | | | | | | | | | | | | | | | | | | | | | | | | |
| 10/31/2016 | | | 12.24 | | | | 0.10 | | | | 0.30 | | | | 0.40 | | | | (0.06 | ) | | | (1.14 | ) | | | (1.20 | ) |
| 10/31/2015 | | | 14.92 | | | | 0.04 | | | | 0.05 | | | | 0.09 | | | | – | | | | (2.77 | ) | | | (2.77 | ) |
| 10/31/2014 | | | 15.91 | | | | (0.03 | ) | | | 1.57 | | | | 1.54 | | | | – | | | | (2.53 | ) | | | (2.53 | ) |
| 10/31/2013 | | | 12.36 | | | | (0.02 | ) | | | 3.72 | | | | 3.70 | | | | – | (d) | | | (0.15 | ) | | | (0.15 | ) |
| 10/31/2012 | | | 11.89 | | | | 0.01 | | | | 0.73 | | | | 0.74 | | | | – | | | | (0.27 | ) | | | (0.27 | ) |
| | | | | | | | | | | | | | | | | | | | | | | | | | | | | |
| Class C | | | | | | | | | | | | | | | | | | | | | | | | | | | | |
| 10/31/2016 | | | 12.14 | | | | 0.09 | | | | 0.31 | | | | 0.40 | | | | (0.07 | ) | | | (1.14 | ) | | | (1.21 | ) |
| 10/31/2015 | | | 14.83 | | | | 0.04 | | | | 0.04 | | | | 0.08 | | | | – | (d) | | | (2.77 | ) | | | (2.77 | ) |
| 10/31/2014 | | | 15.83 | | | | (0.03 | ) | | | 1.56 | | | | 1.53 | | | | – | | | | (2.53 | ) | | | (2.53 | ) |
| 10/31/2013 | | | 12.31 | | | | (0.02 | ) | | | 3.70 | | | | 3.68 | | | | (0.01 | ) | | | (0.15 | ) | | | (0.16 | ) |
| 10/31/2012 | | | 11.85 | | | | – | (d) | | | 0.73 | | | | 0.73 | | | | – | | | | (0.27 | ) | | | (0.27 | ) |
| | | | | | | | | | | | | | | | | | | | | | | | | | | | | |
| Class F | | | | | | | | | | | | | | | | | | | | | | | | | | | | |
| 10/31/2016 | | | 13.23 | | | | 0.21 | | | | 0.33 | | | | 0.54 | | | | (0.19 | ) | | | (1.14 | ) | | | (1.33 | ) |
| 10/31/2015 | | | 15.93 | | | | 0.17 | | | | 0.05 | | | | 0.22 | | | | (0.15 | ) | | | (2.77 | ) | | | (2.92 | ) |
| 10/31/2014 | | | 16.77 | | | | 0.10 | | | | 1.67 | | | | 1.77 | | | | (0.08 | ) | | | (2.53 | ) | | | (2.61 | ) |
| 10/31/2013 | | | 13.03 | | | | 0.11 | | | | 3.90 | | | | 4.01 | | | | (0.12 | ) | | | (0.15 | ) | | | (0.27 | ) |
| 10/31/2012 | | | 12.47 | | | | 0.12 | | | | 0.76 | | | | 0.88 | | | | (0.05 | ) | | | (0.27 | ) | | | (0.32 | ) |
| | | | | | | | | | | | | | | | | | | | | | | | | | | | | |
| Class I | | | | | | | | | | | | | | | | | | | | | | | | | | | | |
| 10/31/2016 | | | 13.40 | | | | 0.23 | | | | 0.34 | | | | 0.57 | | | | (0.21 | ) | | | (1.14 | ) | | | (1.35 | ) |
| 10/31/2015 | | | 16.11 | | | | 0.18 | | | | 0.04 | | | | 0.22 | | | | (0.16 | ) | | | (2.77 | ) | | | (2.93 | ) |
| 10/31/2014 | | | 16.93 | | | | 0.12 | | | | 1.69 | | | | 1.81 | | | | (0.10 | ) | | | (2.53 | ) | | | (2.63 | ) |
| 10/31/2013 | | | 13.15 | | | | 0.13 | | | | 3.94 | | | | 4.07 | | | | (0.14 | ) | | | (0.15 | ) | | | (0.29 | ) |
| 10/31/2012 | | | 12.59 | | | | 0.13 | | | | 0.76 | | | | 0.89 | | | | (0.06 | ) | | | (0.27 | ) | | | (0.33 | ) |
| | | | | | | | | | | | | | | | | | | | | | | | | | | | | |
| Class P | | | | | | | | | | | | | | | | | | | | | | | | | | | | |
| 10/31/2016 | | | 13.10 | | | | 0.17 | | | | 0.33 | | | | 0.50 | | | | (0.14 | ) | | | (1.14 | ) | | | (1.28 | ) |
| 10/31/2015 | | | 15.79 | | | | 0.12 | | | | 0.04 | | | | 0.16 | | | | (0.08 | ) | | | (2.77 | ) | | | (2.85 | ) |
| 10/31/2014 | | | 16.64 | | | | 0.05 | | | | 1.65 | | | | 1.70 | | | | (0.02 | ) | | | (2.53 | ) | | | (2.55 | ) |
| 10/31/2013 | | | 12.92 | | | | 0.06 | | | | 3.88 | | | | 3.94 | | | | (0.07 | ) | | | (0.15 | ) | | | (0.22 | ) |
| 10/31/2012 | | | 12.36 | | | | 0.07 | | | | 0.77 | | | | 0.84 | | | | (0.01 | ) | | | (0.27 | ) | | | (0.28 | ) |
| 86 | See Notes to Financial Statements. |
| | | | | | | | | Ratios to Average Net Assets: | | Supplemental Data: |
Net
asset
value,
end of
period | | Total
return(b)
(%) | | Total
expenses
(%) | | Net
invest-
ment
income
(loss)
(%) | | Net
assets,
end of
period
(000) | | Portfolio
turnover
rate
(%) |
| $ | 12.54 | | | | 4.36 | | | | 0.98 | | | | 1.60 | | | $ | 1,653,389 | | | | 135.08 | |
| | 13.32 | | | | 1.18 | | | | 0.97 | | | | 1.09 | | | | 2,027,292 | | | | 149.38 | |
| | 16.00 | | | | 11.65 | | | | 1.05 | | | | 0.43 | | | | 2,683,790 | | | | 112.68 | |
| | 16.83 | | | | 31.11 | | | | 1.06 | | | | 0.50 | | | | 3,031,190 | | | | 87.47 | |
| | 13.08 | | | | 7.17 | | | | 1.09 | | | | 0.68 | | | | 2,439,466 | | | | 83.80 | (c) |
| | 11.44 | | | | 3.65 | | | | 1.73 | | | | 0.87 | | | | 15,928 | | | | 135.08 | |
| | 12.24 | | | | 0.37 | | | | 1.72 | | | | 0.34 | | | | 28,798 | | | | 149.38 | |
| | 14.92 | | | | 10.91 | | | | 1.71 | | | | (0.23 | ) | | | 45,475 | | | | 112.68 | |
| | 15.91 | | | | 30.32 | | | | 1.71 | | | | (0.12 | ) | | | 62,409 | | | | 87.47 | |
| | 12.36 | | | | 6.47 | | | | 1.74 | | | | 0.04 | | | | 76,533 | | | | 83.80 | (c) |
| | 11.33 | | | | 3.59 | | | | 1.73 | | | | 0.85 | | | | 544,649 | | | | 135.08 | |
| | 12.14 | | | | 0.40 | | | | 1.72 | | | | 0.34 | | | | 713,824 | | | | 149.38 | |
| | 14.83 | | | | 10.90 | | | | 1.71 | | | | (0.22 | ) | | | 986,381 | | | | 112.68 | |
| | 15.83 | | | | 30.30 | | | | 1.71 | | | | (0.15 | ) | | | 1,012,597 | | | | 87.47 | |
| | 12.31 | | | | 6.41 | | | | 1.74 | | | | 0.03 | | | | 802,053 | | | | 83.80 | (c) |
| | 12.44 | | | | 4.48 | | | | 0.83 | | | | 1.76 | | | | 304,083 | | | | 135.08 | |
| | 13.23 | | | | 1.35 | | | | 0.82 | | | | 1.25 | | | | 436,263 | | | | 149.38 | |
| | 15.93 | | | | 11.93 | | | | 0.81 | | | | 0.68 | | | | 793,101 | | | | 112.68 | |
| | 16.77 | | | | 31.49 | | | | 0.82 | | | | 0.75 | | | | 716,579 | | | | 87.47 | |
| | 13.03 | | | | 7.40 | | | | 0.84 | | | | 0.93 | | | | 598,688 | | | | 83.80 | (c) |
| | 12.62 | | | | 4.64 | | | | 0.73 | | | | 1.87 | | | | 142,316 | | | | 135.08 | |
| | 13.40 | | | | 1.37 | | | | 0.72 | | | | 1.36 | | | | 236,867 | | | | 149.38 | |
| | 16.11 | | | | 12.05 | | | | 0.71 | | | | 0.78 | | | | 449,870 | | | | 112.68 | |
| | 16.93 | | | | 31.66 | | | | 0.72 | | | | 0.84 | | | | 531,676 | | | | 87.47 | |
| | 13.15 | | | | 7.43 | | | | 0.74 | | | | 1.00 | | | | 394,842 | | | | 83.80 | (c) |
| | 12.32 | | | | 4.17 | | | | 1.18 | | | | 1.40 | | | | 10,798 | | | | 135.08 | |
| | 13.10 | | | | 0.94 | | | | 1.17 | | | | 0.90 | | | | 13,733 | | | | 149.38 | |
| | 15.79 | | | | 11.51 | | | | 1.16 | | | | 0.32 | | | | 21,373 | | | | 112.68 | |
| | 16.64 | | | | 31.08 | | | | 1.17 | | | | 0.42 | | | | 26,424 | | | | 87.47 | |
| | 12.92 | | | | 7.03 | | | | 1.19 | | | | 0.58 | | | | 27,937 | | | | 83.80 | (c) |
| | See Notes to Financial Statements. | 87 |
Financial Highlights (concluded)
FUNDAMENTAL EQUITY FUND
| | | | | Per Share Operating Performance: |
| | | | | Investment operations: | | Distributions to
shareholders from: |
| | | Net asset
value,
beginning
of period | | Net
invest-
ment
income
(loss)(a) | | Net
realized
and
unrealized
gain (loss) | | Total
from
invest-
ment
opera-
tions | | Net
investment
income | | Net
realized
gain | | Total
distri-
butions |
| Class R2 | | | | | | | | | | | | | | | | | | | | | | | | | | | | |
| 10/31/2016 | | | $13.05 | | | | $0.15 | | | | $0.33 | | | | $0.48 | | | | $(0.12 | ) | | | $(1.14 | ) | | | $(1.26 | ) |
| 10/31/2015 | | | 15.71 | | | | 0.10 | | | | 0.04 | | | | 0.14 | | | | (0.03 | ) | | | (2.77 | ) | | | (2.80 | ) |
| 10/31/2014 | | | 16.57 | | | | 0.03 | | | | 1.64 | | | | 1.67 | | | | – | (d) | | | (2.53 | ) | | | (2.53 | ) |
| 10/31/2013 | | | 12.87 | | | | 0.04 | | | | 3.87 | | | | 3.91 | | | | (0.06 | ) | | | (0.15 | ) | | | (0.21 | ) |
| 10/31/2012 | | | 12.33 | | | | 0.05 | | | | 0.77 | | | | 0.82 | | | | (0.01 | ) | | | (0.27 | ) | | | (0.28 | ) |
| | | | | | | | | | | | | | | | | | | | | | | | | | | | | |
| Class R3 | | | | | | | | | | | | | | | | | | | | | | | | | | | | |
| 10/31/2016 | | | 13.12 | | | | 0.16 | | | | 0.33 | | | | 0.49 | | | | (0.13 | ) | | | (1.14 | ) | | | (1.27 | ) |
| 10/31/2015 | | | 15.80 | | | | 0.11 | | | | 0.06 | | | | 0.17 | | | | (0.08 | ) | | | (2.77 | ) | | | (2.85 | ) |
| 10/31/2014 | | | 16.66 | | | | 0.04 | | | | 1.65 | | | | 1.69 | | | | (0.02 | ) | | | (2.53 | ) | | | (2.55 | ) |
| 10/31/2013 | | | 12.94 | | | | 0.05 | | | | 3.89 | | | | 3.94 | | | | (0.07 | ) | | | (0.15 | ) | | | (0.22 | ) |
| 10/31/2012 | | | 12.40 | | | | 0.06 | | | | 0.77 | | | | 0.83 | | | | (0.02 | ) | | | (0.27 | ) | | | (0.29 | ) |
| | | | | | | | | | | | | | | | | | | | | | | | | | | | | |
| Class R4 | | | | | | | | | | | | | | | | | | | | | | | | | | | | |
| 10/31/2016 | | | 13.32 | | | | 0.17 | | | | 0.36 | | | | 0.53 | | | | (0.19 | ) | | | (1.14 | ) | | | (1.33 | ) |
| 6/30/2015 to 10/31/2015(e) | | | 13.52 | | | | 0.05 | | | | (0.25 | )(f) | | | (0.20 | ) | | | – | | | | – | | | | – | |
| | | | | | | | | | | | | | | | | | | | | | | | | | | | | |
| Class R5 | | | | | | | | | | | | | | | | | | | | | | | | | | | | |
| 10/31/2016 | | | 13.41 | | | | 0.17 | | | | 0.40 | | | | 0.57 | | | | (0.21 | ) | | | (1.14 | ) | | | (1.35 | ) |
| 6/30/2015 to 10/31/2015(e) | | | 13.60 | | | | 0.06 | | | | (0.25 | )(f) | | | (0.19 | ) | | | – | | | | – | | | | – | |
| | | | | | | | | | | | | | | | | | | | | | | | | | | | | |
| Class R6 | | | | | | | | | | | | | | | | | | | | | | | | | | | | |
| 10/31/2016 | | | 13.41 | | | | 0.23 | | | | 0.35 | | | | 0.58 | | | | (0.21 | ) | | | (1.14 | ) | | | (1.35 | ) |
| 6/30/2015 to 10/31/2015(e) | | | 13.60 | | | | 0.06 | | | | (0.25 | )(f) | | | (0.19 | ) | | | – | | | | – | | | | – | |
| (a) | Calculated using average shares outstanding during the period. |
| (b) | Total return for classes A, B and C does not consider the effects of sales loads and assumes the reinvestment of all distributions. Total return for all other classes assumes the reinvestment of all distributions. |
| (c) | Excludes purchases and sales of securities in connection with the acquisition of Lord Abbett Large Cap Value Fund on June 15, 2012. |
| (d) | Amount less than $0.01. |
| (e) | Commenced on June 30, 2015. |
| (f) | The per share amount does not represent the net realized and unrealized gain (loss) as presented on the Statements of Operations for the period due to the timing of sales of Fund shares and the amount of per share realized and unrealized gains and losses at such time. |
| (g) | Not annualized. |
| (h) | Annualized. |
| 88 | See Notes to Financial Statements. |
| | | | | Ratios to Average Net Assets: | | Supplemental Data: |
Net
asset
value,
end of
period | | Total
return(b)
(%) | | Total
expenses
(%) | | Net
invest-
ment
income
(loss)
(%) | | Net
assets,
end of
period
(000) | | Portfolio
turnover
rate
(%) |
| $ | 12.27 | | | | 3.97 | | | | 1.33 | | | | 1.25 | | | $ | 7,952 | | | | 135.08 | |
| | 13.05 | | | | 0.81 | | | | 1.33 | | | | 0.76 | | | | 10,543 | | | | 149.38 | |
| | 15.71 | | | | 11.33 | | | | 1.31 | | | | 0.17 | | | | 19,744 | | | | 112.68 | |
| | 16.57 | | | | 30.87 | | | | 1.31 | | | | 0.26 | | | | 25,111 | | | | 87.47 | |
| | 12.87 | | | | 6.87 | | | | 1.34 | | | | 0.43 | | | | 22,335 | | | | 83.80 | (c) |
| | 12.34 | | | | 4.09 | | | | 1.23 | | | | 1.35 | | | | 157,626 | | | | 135.08 | |
| | 13.12 | | | | 0.97 | | | | 1.22 | | | | 0.84 | | | | 206,984 | | | | 149.38 | |
| | 15.80 | | | | 11.41 | | | | 1.21 | | | | 0.28 | | | | 304,459 | | | | 112.68 | |
| | 16.66 | | | | 31.04 | | | | 1.21 | | | | 0.35 | | | | 322,951 | | | | 87.47 | |
| | 12.94 | | | | 6.95 | | | | 1.24 | | | | 0.51 | | | | 270,290 | | | | 83.80 | (c) |
| | 12.52 | | | | 4.37 | | | | 0.95 | | | | 1.40 | | | | 121 | | | | 135.08 | |
| | 13.32 | | | | (1.48 | )(g) | | | 0.93 | (h) | | | 1.12 | (h) | | | 10 | | | | 149.38 | |
| | 12.63 | | | | 4.64 | | | | 0.68 | | | | 1.40 | | | | 125 | | | | 135.08 | |
| | 13.41 | | | | (1.40 | )(g) | | | 0.68 | (h) | | | 1.37 | (h) | | | 10 | | | | 149.38 | |
| | 12.64 | | | | 4.73 | | | | 0.61 | | | | 1.88 | | | | 123 | | | | 135.08 | |
| | 13.41 | | | | (1.40 | )(g) | | | 0.59 | (h) | | | 1.46 | (h) | | | 10 | | | | 149.38 | |
| | See Notes to Financial Statements. | 89 |
Financial Highlights
GROWTH LEADERS FUND
| | | | | Per Share Operating Performance: |
| | | | | Investment operations: | | Distributions to
shareholders from: |
| | | Net asset
value,
beginning
of period | | Net
invest-
ment
income
(loss)(a) | | Net
realized
and
unrealized
gain (loss) | | Total
from
invest-
ment
opera-
tions | | Net
investment
income | | Net
realized
gain | | Total
distri-
butions |
| Class A | | | | | | | | | | | | | | | | | | | | | | | | | | | | |
| 10/31/2016 | | $ | 23.73 | | | $ | 0.03 | | | $ | (0.24 | ) | | $ | (0.21 | ) | | $ | – | | | $ | (1.10 | ) | | $ | (1.10 | ) |
| 10/31/2015 | | | 23.08 | | | | (0.02 | ) | | | 1.96 | | | | 1.94 | | | | – | | | | (1.29 | ) | | | (1.29 | ) |
| 10/31/2014 | | | 21.44 | | | | – | (d) | | | 3.01 | | | | 3.01 | | | | – | | | | (1.37 | ) | | | (1.37 | ) |
| 10/31/2013 | | | 15.15 | | | | (0.03 | ) | | | 6.36 | | | | 6.33 | | | | (0.04 | ) | | | – | | | | (0.04 | ) |
| 10/31/2012 | | | 14.50 | | | | (0.01 | ) | | | 0.66 | | | | 0.65 | | | | – | | | | – | | | | – | |
| | | | | | | | | | | | | | | | | | | | | | | | | | | | | |
| Class B | | | | | | | | | | | | | | | | | | | | | | | | | | | | |
| 10/31/2016 | | | 23.24 | | | | (0.13 | ) | | | (0.24 | ) | | | (0.37 | ) | | | – | | | | (1.10 | ) | | | (1.10 | ) |
| 10/31/2015 | | | 22.79 | | | | (0.18 | ) | | | 1.92 | | | | 1.74 | | | | – | | | | (1.29 | ) | | | (1.29 | ) |
| 10/31/2014 | | | 21.33 | | | | (0.15 | ) | | | 2.98 | | | | 2.83 | | | | – | | | | (1.37 | ) | | | (1.37 | ) |
| 2/11/2013 to 10/31/2013(c) | | | 16.56 | | | | (0.11 | ) | | | 4.88 | | | | 4.77 | | | | – | | | | – | | | | – | |
| | | | | | | | | | | | | | | | | | | | | | | | | | | | | |
| Class C | | | | | | | | | | | | | | | | | | | | | | | | | | | | |
| 10/31/2016 | | | 23.01 | | | | (0.14 | ) | | | (0.23 | ) | | | (0.37 | ) | | | – | | | | (1.10 | ) | | | (1.10 | ) |
| 10/31/2015 | | | 22.57 | | | | (0.19 | ) | | | 1.92 | | | | 1.73 | | | | – | | | | (1.29 | ) | | | (1.29 | ) |
| 10/31/2014 | | | 21.14 | | | | (0.15 | ) | | | 2.95 | | | | 2.80 | | | | – | | | | (1.37 | ) | | | (1.37 | ) |
| 10/31/2013 | | | 15.02 | | | | (0.15 | ) | | | 6.30 | | | | 6.15 | | | | (0.03 | ) | | | – | | | | (0.03 | ) |
| 10/31/2012 | | | 14.47 | | | | (0.11 | ) | | | 0.66 | | | | 0.55 | | | | – | | | | – | | | | – | |
| | | | | | | | | | | | | | | | | | | | | | | | | | | | | |
| Class F | | | | | | | | | | | | | | | | | | | | | | | | | | | | |
| 10/31/2016 | | | 23.87 | | | | 0.06 | | | | (0.24 | ) | | | (0.18 | ) | | | – | | | | (1.10 | ) | | | (1.10 | ) |
| 10/31/2015 | | | 23.17 | | | | 0.01 | | | | 1.98 | | | | 1.99 | | | | – | | | | (1.29 | ) | | | (1.29 | ) |
| 10/31/2014 | | | 21.49 | | | | 0.04 | | | | 3.01 | | | | 3.05 | | | | – | | | | (1.37 | ) | | | (1.37 | ) |
| 10/31/2013 | | | 15.18 | | | | – | (d) | | | 6.39 | | | | 6.39 | | | | (0.08 | ) | | | – | | | | (0.08 | ) |
| 10/31/2012 | | | 14.51 | | | | 0.03 | | | | 0.65 | | | | 0.68 | | | | (0.01 | ) | | | – | | | | (0.01 | ) |
| | | | | | | | | | | | | | | | | | | | | | | | | | | | | |
| Class I | | | | | | | | | | | | | | | | | | | | | | | | | | | | |
| 10/31/2016 | | | 23.95 | | | | 0.08 | | | | (0.24 | ) | | | (0.16 | ) | | | – | | | | (1.10 | ) | | | (1.10 | ) |
| 10/31/2015 | | | 23.23 | | | | 0.04 | | | | 1.97 | | | | 2.01 | | | | – | | | | (1.29 | ) | | | (1.29 | ) |
| 10/31/2014 | | | 21.51 | | | | 0.06 | | | | 3.03 | | | | 3.09 | | | | – | | | | (1.37 | ) | | | (1.37 | ) |
| 10/31/2013 | | | 15.20 | | | | 0.04 | | | | 6.36 | | | | 6.40 | | | | (0.09 | ) | | | – | | | | (0.09 | ) |
| 10/31/2012 | | | 14.51 | | | | 0.04 | | | | 0.67 | | | | 0.71 | | | | (0.02 | ) | | | – | | | | (0.02 | ) |
| 90 | See Notes to Financial Statements. |
| | | | | Ratios to Average Net Assets: | | Supplemental Data: |
Net
asset
value,
end of
period | | Total
return(b)
(%) | | Total
expenses
after
waivers
and/or
reimburse-
ments
(%) | | Total
expenses
(%) | | Net
invest-
ment
income
(loss)
(%) | | Net
assets,
end of
period
(000) | | Portfolio
turnover
rate
(%) |
| $ | 22.42 | | | | (0.96 | ) | | | 0.85 | | | | 0.98 | | | | 0.12 | | | | $750,576 | | | | 245.91 | |
| | 23.73 | | | | 8.84 | | | | 0.85 | | | | 0.99 | | | | (0.09 | ) | | | 742,393 | | | | 270.68 | |
| | 23.08 | | | | 15.59 | | | | 0.85 | | | | 1.04 | | | | 0.01 | | | | 495,861 | | | | 506.90 | |
| | 21.44 | | | | 42.20 | | | | 0.85 | | | | 1.34 | | | | (0.14 | ) | | | 191,798 | | | | 451.09 | (e) |
| | 15.15 | | | | 4.48 | | | | 0.85 | | | | 1.55 | | | | (0.06 | ) | | | 15,372 | | | | 683.50 | |
| | 21.77 | | | | (1.74 | ) | | | 1.60 | | | | 1.73 | | | | (0.60 | ) | | | 2,287 | | | | 245.91 | |
| | 23.24 | | | | 8.08 | | | | 1.59 | | | | 1.73 | | | | (0.81 | ) | | | 4,191 | | | | 270.68 | |
| | 22.79 | | | | 13.77 | | | | 1.56 | | | | 1.75 | | | | (0.69 | ) | | | 6,332 | | | | 506.90 | |
| | 21.33 | | | | 29.05 | (f) | | | 1.49 | (g) | | | 1.88 | (g) | | | (0.82 | )(g) | | | 8,041 | | | | 451.09 | (e) |
| | 21.54 | | | | (1.72 | ) | | | 1.60 | | | | 1.73 | | | | (0.64 | ) | | | 482,693 | | | | 245.91 | |
| | 23.01 | | | | 8.07 | | | | 1.59 | | | | 1.74 | | | | (0.84 | ) | | | 414,557 | | | | 270.68 | |
| | 22.57 | | | | 13.81 | | | | 1.56 | | | | 1.76 | | | | (0.71 | ) | | | 236,853 | | | | 506.90 | |
| | 21.14 | | | | 41.24 | | | | 1.45 | | | | 1.88 | | | | (0.79 | ) | | | 66,471 | | | | 451.09 | (e) |
| | 15.02 | | | | 3.80 | | | | 1.49 | | | | 2.15 | | | | (0.70 | ) | | | 1,898 | | | | 683.50 | |
| | 22.59 | | | | (0.82 | ) | | | 0.70 | | | | 0.83 | | | | 0.26 | | | | 763,623 | | | | 245.91 | |
| | 23.87 | | | | 9.03 | | | | 0.70 | | | | 0.84 | | | | 0.06 | | | | 733,463 | | | | 270.68 | |
| | 23.17 | | | | 14.80 | | | | 0.68 | | | | 0.87 | | | | 0.17 | | | | 498,908 | | | | 506.90 | |
| | 21.49 | | | | 42.51 | | | | 0.60 | | | | 1.07 | | | | 0.01 | | | | 109,011 | | | | 451.09 | (e) |
| | 15.18 | | | | 4.69 | | | | 0.60 | | | | 1.33 | | | | 0.21 | | | | 3,797 | | | | 683.50 | |
| | 22.69 | | | | (0.73 | ) | | | 0.60 | | | | 0.74 | | | | 0.36 | | | | 98,506 | | | | 245.91 | |
| | 23.95 | | | | 9.10 | | | | 0.60 | | | | 0.74 | | | | 0.16 | | | | 96,090 | | | | 270.68 | |
| | 23.23 | | | | 14.93 | | | | 0.57 | | | | 0.76 | | | | 0.29 | | | | 71,803 | | | | 506.90 | |
| | 21.51 | | | | 42.67 | | | | 0.50 | | | | 0.95 | | | | 0.21 | | | | 50,326 | | | | 451.09 | (e) |
| | 15.20 | | | | 4.87 | | | | 0.50 | | | | 1.22 | | | | 0.29 | | | | 2,697 | | | | 683.50 | |
| | See Notes to Financial Statements. | 91 |
Financial Highlights (concluded)
GROWTH LEADERS FUND
| | | | | Per Share Operating Performance: |
| | | | | Investment operations: | | Distributions to
shareholders from: |
| | | Net asset
value,
beginning
of period | | Net
invest-
ment
income
(loss)(a) | | Net
realized
and
Unrealized
gain (loss) | | Total
from
invest-
ment
opera-
tions | | Net
investment
income | | Net
realized
gain | | Total
distri-
butions |
| Class R2 | | | | | | | | | | | | | | | | | | | | | | | | | | | | |
| 10/31/2016 | | | $23.74 | | | | $(0.05 | ) | | | $(0.24 | ) | | | $(0.29 | ) | | $ | – | | | | $(1.10 | ) | | | $(1.10 | ) |
| 10/31/2015 | | | 23.17 | | | | (0.10 | ) | | | 1.96 | | | | 1.86 | | | | – | | | | (1.29 | ) | | | (1.29 | ) |
| 10/31/2014 | | | 21.58 | | | | (0.07 | ) | | | 3.03 | | | | 2.96 | | | | – | | | | (1.37 | ) | | | (1.37 | ) |
| 10/31/2013 | | | 15.19 | | | | 0.04 | | | | 6.38 | | | | 6.42 | | | | (0.03 | ) | | | – | | | | (0.03 | ) |
| 10/31/2012 | | | 14.49 | | | | 0.05 | | | | 0.65 | | | | 0.70 | | | | – | | | | – | | | | – | |
| | | | | | | | | | | | | | | | | | | | | | | | | | | | | |
| Class R3 | | | | | | | | | | | | | | | | | | | | | | | | | | | | |
| 10/31/2016 | | | 23.62 | | | | (0.04 | ) | | | (0.23 | ) | | | (0.27 | ) | | | – | | | | (1.10 | ) | | | (1.10 | ) |
| 10/31/2015 | | | 23.03 | | | | (0.08 | ) | | | 1.96 | | | | 1.88 | | | | – | | | | (1.29 | ) | | | (1.29 | ) |
| 10/31/2014 | | | 21.45 | | | | (0.04 | ) | | | 2.99 | | | | 2.95 | | | | – | | | | (1.37 | ) | | | (1.37 | ) |
| 10/31/2013 | | | 15.16 | | | | (0.06 | ) | | | 6.38 | | | | 6.32 | | | | (0.03 | ) | | | – | | | | (0.03 | ) |
| 10/31/2012 | | | 14.49 | | | | 0.01 | | | | 0.66 | | | | 0.67 | | | | – | | | | – | | | | – | |
| | | | | | | | | | | | | | | | | | | | | | | | | | | | | |
| Class R4 | | | | | | | | | | | | | | | | | | | | | | | | | | | | |
| 10/31/2016 | | | 23.74 | | | | (0.01 | ) | | | (0.21 | ) | | | (0.22 | ) | | | – | | | | (1.10 | ) | | | (1.10 | ) |
| 6/30/2015 to 10/31/2015(h) | | | 23.42 | | | | (0.01 | ) | | | 0.33 | | | | 0.32 | | | | – | | | | – | | | | – | |
| | | | | | | | | | | | | | | | | | | | | | | | | | | | | |
| Class R5 | | | | | | | | | | | | | | | | | | | | | | | | | | | | |
| 10/31/2016 | | | 23.95 | | | | 0.02 | | | | (0.17 | ) | | | (0.15 | ) | | | – | | | | (1.10 | ) | | | (1.10 | ) |
| 6/30/2015 to 10/31/2015(h) | | | 23.61 | | | | 0.01 | | | | 0.33 | | | | 0.34 | | | | – | | | | – | | | | – | |
| | | | | | | | | | | | | | | | | | | | | | | | | | | | | |
| Class R6 | | | | | | | | | | | | | | | | | | | | | | | | | | | | |
| 10/31/2016 | | | 23.96 | | | | 0.08 | | | | (0.22 | ) | | | (0.14 | ) | | | – | | | | (1.10 | ) | | | (1.10 | ) |
| 6/30/2015 to 10/31/2015(h) | | | 23.61 | | | | 0.02 | | | | 0.33 | | | | 0.35 | | | | – | | | | – | | | | – | |
| (a) | Calculated using average shares outstanding during the period. |
| (b) | Total return for classes A, B and C does not consider the effects of sales loads and assumes the reinvestment of all distributions. Total return for all other classes assumes the reinvestment of all distributions. |
| (c) | Commenced on February 11, 2013. |
| (d) | Amount less than $0.01. |
| (e) | Excludes purchases and sales of securities in connection with the acquisition of Lord Abbett Stock Appreciation Fund on March 22, 2013. |
| (f) | Not annualized. |
| (g) | Annualized. |
| (h) | Commenced on June 30, 2015. |
| 92 | See Notes to Financial Statements. |
| | | | | | Ratios to Average Net Assets: | | Supplemental Data: |
Net
asset
value,
end of
period | | Total
return(b)
(%) | | Total
expenses
after
waivers
and/or
reimburse-
ments
(%) | | Total
expenses
(%) | | Net
invest-
ment
income
(loss)
(%) | | Net
assets,
end of
period
(000) | | Portfolio
turnover
rate
(%) |
| | |
| | $22.35 | | | (1.35 | ) | | 1.20 | | | 1.34 | | | (0.24 | ) | | $1,267 | | | 245.91 | |
| | 23.74 | | | 8.49 | | | 1.20 | | | 1.34 | | | (0.44 | ) | | 593 | | | 270.68 | |
| | 23.17 | | | 14.24 | | | 1.18 | | | 1.37 | | | (0.31 | ) | | 342 | | | 506.90 | |
| | 21.58 | | | 42.62 | | | 0.58 | | | 1.70 | | | 0.22 | | | 44 | | | 451.09 | (e) |
| | 15.19 | | | 4.83 | | | 0.48 | | | 1.22 | | | 0.31 | | | 10 | | | 683.50 | |
| | |
| | 22.25 | | | (1.23 | ) | | 1.10 | | | 1.24 | | | (0.17 | ) | | 13,471 | | | 245.91 | |
| | 23.62 | | | 8.58 | | | 1.10 | | | 1.24 | | | (0.35 | ) | | 13,501 | | | 270.68 | |
| | 23.03 | | | 14.34 | | | 1.07 | | | 1.26 | | | (0.20 | ) | | 10,191 | | | 506.90 | |
| | 21.45 | | | 41.98 | | | 1.00 | | | 1.39 | | | (0.33 | ) | | 8,289 | | | 451.09 | (e) |
| | 15.16 | | | 4.62 | | | 0.72 | | | 1.42 | | | 0.08 | | | 11 | | | 683.50 | |
| | |
| | 22.42 | | | (1.00 | ) | | 0.85 | | | 1.00 | | | (0.03 | ) | | 1,735 | | | 245.91 | |
| | 23.74 | | | 1.37 | (f) | | 0.87 | (g) | | 0.99 | (g) | | (0.18 | )(g) | | 10 | | | 270.68 | |
| | |
| | 22.70 | | | (0.68 | ) | | 0.60 | | | 0.75 | | | 0.08 | | | 3,700 | | | 245.91 | |
| | 23.95 | | | 1.44 | (f) | | 0.60 | (g) | | 0.72 | (g) | | 0.09 | (g) | | 10 | | | 270.68 | |
| | |
| | 22.72 | | | (0.64 | ) | | 0.50 | | | 0.63 | | | 0.34 | | | 1,534 | | | 245.91 | |
| | 23.96 | | | 1.48 | (f) | | 0.48 | (g) | | 0.60 | (g) | | 0.21 | (g) | | 10 | | | 270.68 | |
| | | |
| | See Notes to Financial Statements. | 93 |
Financial Highlights
INTERNATIONAL CORE EQUITY FUND
| | | | | Per Share Operating Performance: | | |
| | | | | | | | | | | Distributions | | |
| | | | | | | | | | | to | | |
| | | | | | | | | | | shareholders | | |
| | | | | Investment operations: | | from: | | |
| |
| | | Net asset | | | | Net | | | | | | Net asset |
| | | value, | | Net | | realized and | | Total from | | Net | | value, |
| | | beginning of | | investment | | unrealized | | investment | | investment | | end of |
| | | period | | income(a) | | gain (loss) | | operations | | income | | period |
| Class A | | | | | | | | | | | | | | | | | | |
| 10/31/2016 | | $12.64 | | | $0.27 | | | $(0.72 | ) | | $(0.45 | ) | | $(0.16 | ) | | $12.03 | |
| 10/31/2015 | | 13.34 | | | 0.20 | | | (0.75 | ) | | (0.55 | ) | | (0.15 | ) | | 12.64 | |
| 10/31/2014 | | 13.97 | | | 0.17 | | | (0.54 | ) | | (0.37 | ) | | (0.26 | ) | | 13.34 | |
| 10/31/2013 | | 11.43 | | | 0.18 | | | 2.62 | | | 2.80 | | | (0.26 | ) | | 13.97 | |
| 10/31/2012 | | 11.25 | | | 0.28 | | | 0.12 | | | 0.40 | | | (0.22 | ) | | 11.43 | |
| | | | | | | | | | | | | | | | | | | |
| Class B | | | | | | | | | | | | | | | | | | |
| 10/31/2016 | | 12.48 | | | 0.17 | | | (0.70 | ) | | (0.53 | ) | | (0.03 | ) | | 11.92 | |
| 10/31/2015 | | 13.15 | | | 0.10 | | | (0.74 | ) | | (0.64 | ) | | (0.03 | ) | | 12.48 | |
| 10/31/2014 | | 13.76 | | | 0.08 | | | (0.53 | ) | | (0.45 | ) | | (0.16 | ) | | 13.15 | |
| 10/31/2013 | | 11.26 | | | 0.09 | | | 2.60 | | | 2.69 | | | (0.19 | ) | | 13.76 | |
| 10/31/2012 | | 11.06 | | | 0.21 | | | 0.12 | | | 0.33 | | | (0.13 | ) | | 11.26 | |
| | | | | | | | | | | | | | | | | | | |
| Class C | | | | | | | | | | | | | | | | | | |
| 10/31/2016 | | 12.45 | | | 0.18 | | | (0.70 | ) | | (0.52 | ) | | (0.07 | ) | | 11.86 | |
| 10/31/2015 | | 13.14 | | | 0.11 | | | (0.75 | ) | | (0.64 | ) | | (0.05 | ) | | 12.45 | |
| 10/31/2014 | | 13.77 | | | 0.09 | | | (0.54 | ) | | (0.45 | ) | | (0.18 | ) | | 13.14 | |
| 10/31/2013 | | 11.27 | | | 0.09 | | | 2.61 | | | 2.70 | | | (0.20 | ) | | 13.77 | |
| 10/31/2012 | | 11.08 | | | 0.21 | | | 0.12 | | | 0.33 | | | (0.14 | ) | | 11.27 | |
| | | | | | | | | | | | | | | | | | | |
| Class F | | | | | | | | | | | | | | | | | | |
| 10/31/2016 | | 12.55 | | | 0.29 | | | (0.70 | ) | | (0.41 | ) | | (0.18 | ) | | 11.96 | |
| 10/31/2015 | | 13.26 | | | 0.24 | | | (0.77 | ) | | (0.53 | ) | | (0.18 | ) | | 12.55 | |
| 10/31/2014 | | 13.89 | | | 0.18 | | | (0.51 | ) | | (0.33 | ) | | (0.30 | ) | | 13.26 | |
| 10/31/2013 | | 11.36 | | | 0.18 | | | 2.64 | | | 2.82 | | | (0.29 | ) | | 13.89 | |
| 10/31/2012 | | 11.20 | | | 0.30 | | | 0.12 | | | 0.42 | | | (0.26 | ) | | 11.36 | |
| | | | | | | | | | | | | | | | | | | |
| Class I | | | | | | | | | | | | | | | | | | |
| 10/31/2016 | | 12.73 | | | 0.33 | | | (0.73 | ) | | (0.40 | ) | | (0.20 | ) | | 12.13 | |
| 10/31/2015 | | 13.44 | | | 0.25 | | | (0.76 | ) | | (0.51 | ) | | (0.20 | ) | | 12.73 | |
| 10/31/2014 | | 14.07 | | | 0.21 | | | (0.53 | ) | | (0.32 | ) | | (0.31 | ) | | 13.44 | |
| 10/31/2013 | | 11.51 | | | 0.22 | | | 2.64 | | | 2.86 | | | (0.30 | ) | | 14.07 | |
| 10/31/2012 | | 11.34 | | | 0.27 | | | 0.17 | | | 0.44 | | | (0.27 | ) | | 11.51 | |
| | |
| 94 | See Notes to Financial Statements. |
| | Ratios to Average Net Assets: | | Supplemental Data: |
| |
| | Total | | | | | | | | |
| | expenses, | | | | | | | | |
| | after waivers | | | | Net | | Net assets, | | Portfolio |
| Total | | and/or | | Total | | investment | | end of | | turnover |
| return(b) | | reimbursements | | expenses | | income | | period | | rate |
| (%) | | (%) | | (%) | | (%) | | (000) | | (%) |
| |
| (3.54 | ) | | 1.12 | | | 1.31 | | | 2.29 | | | $263,064 | | | 163.86 | |
| (4.16 | ) | | 1.12 | | | 1.33 | | | 1.56 | | | 341,437 | | | 62.15 | |
| (2.67 | ) | | 1.12 | | | 1.36 | | | 1.25 | | | 368,087 | | | 64.06 | |
| 24.99 | | | 1.12 | | | 1.38 | | | 1.41 | | | 437,271 | | | 80.77 | |
| 3.81 | | | 1.12 | | | 1.47 | | | 2.53 | | | 383,244 | | | 81.50 | |
| |
| (4.23 | ) | | 1.87 | | | 2.06 | | | 1.46 | | | 3,110 | | | 163.86 | |
| (4.86 | ) | | 1.83 | | | 2.04 | | | 0.81 | | | 6,207 | | | 62.15 | |
| (3.33 | ) | | 1.77 | | | 2.01 | | | 0.56 | | | 11,126 | | | 64.06 | |
| 24.18 | | | 1.77 | | | 2.03 | | | 0.73 | | | 17,239 | | | 80.77 | |
| 3.13 | | | 1.77 | | | 2.12 | | | 1.91 | | | 20,125 | | | 81.50 | |
| |
| (4.21 | ) | | 1.85 | | | 2.04 | | | 1.54 | | | 31,798 | | | 163.86 | |
| (4.86 | ) | | 1.81 | | | 2.02 | | | 0.86 | | | 42,057 | | | 62.15 | |
| (3.31 | ) | | 1.75 | | | 1.99 | | | 0.65 | | | 49,491 | | | 64.06 | |
| 24.26 | | | 1.75 | | | 2.01 | | | 0.77 | | | 57,779 | | | 80.77 | |
| 3.11 | | | 1.75 | | | 2.10 | | | 1.91 | | | 54,056 | | | 81.50 | |
| |
| (3.24 | ) | | 0.87 | | | 1.16 | | | 2.48 | | | 62,655 | | | 163.86 | |
| (3.99 | ) | | 0.87 | | | 1.14 | | | 1.85 | | | 63,830 | | | 62.15 | |
| (2.46 | ) | | 0.87 | | | 1.11 | | | 1.29 | | | 78,364 | | | 64.06 | |
| 25.35 | | | 0.87 | | | 1.13 | | | 1.42 | | | 142,063 | | | 80.77 | |
| 4.02 | | | 0.87 | | | 1.22 | | | 2.71 | | | 151,246 | | | 81.50 | |
| |
| (3.15 | ) | | 0.77 | | | 1.05 | | | 2.74 | | | 160,673 | | | 163.86 | |
| (3.83 | ) | | 0.77 | | | 1.04 | | | 1.92 | | | 61,077 | | | 62.15 | |
| (2.34 | ) | | 0.77 | | | 1.01 | | | 1.50 | | | 95,958 | | | 64.06 | |
| 25.37 | | | 0.77 | | | 1.03 | | | 1.77 | | | 155,754 | | | 80.77 | |
| 4.15 | | | 0.77 | | | 1.12 | | | 2.48 | | | 107,076 | | | 81.50 | |
| | | |
| | See Notes to Financial Statements. | 95 |
Financial Highlights (concluded)
INTERNATIONAL CORE EQUITY FUND
| | | | | Per Share Operating Performance: | | |
| | | | | | | | | | | Distributions | | |
| | | | | | | | | | | to | | |
| | | | | | | | | | | shareholders | | |
| | | | | Investment operations: | | from: | | |
| |
| | | Net asset | | | | Net | | | | | | Net asset |
| | | value, | | Net | | realized and | | Total from | | Net | | value, |
| | | beginning of | | investment | | unrealized | | investment | | investment | | end of |
| | | period | | income(a) | | gain (loss) | | operations | | income | | period |
| Class P | | | | | | | | | | | | |
| 10/31/2016 | | $12.63 | | | $0.25 | | | $(0.71 | ) | | $(0.46 | ) | | $(0.14 | ) | | $12.03 | |
| 10/31/2015 | | 13.31 | | | 0.17 | | | (0.75 | ) | | (0.58 | ) | | (0.10 | ) | | 12.63 | |
| 10/31/2014 | | 13.94 | | | 0.17 | | | (0.55 | ) | | (0.38 | ) | | (0.25 | ) | | 13.31 | |
| 10/31/2013 | | 11.39 | | | 0.16 | | | 2.63 | | | 2.79 | | | (0.24 | ) | | 13.94 | |
| 10/31/2012 | | 11.17 | | | 0.27 | | | 0.12 | | | 0.39 | | | (0.17 | ) | | 11.39 | |
| | | | | | | | | | | | | | | | | | | |
| Class R2 | | | | | | | | | | | | | | | | | | |
| 10/31/2016 | | 12.58 | | | 0.23 | | | (0.71 | ) | | (0.48 | ) | | (0.11 | ) | | 11.99 | |
| 10/31/2015 | | 13.29 | | | 0.17 | | | (0.76 | ) | | (0.59 | ) | | (0.12 | ) | | 12.58 | |
| 10/31/2014 | | 13.92 | | | 0.15 | | | (0.55 | ) | | (0.40 | ) | | (0.23 | ) | | 13.29 | |
| 10/31/2013 | | 11.41 | | | 0.15 | | | 2.61 | | | 2.76 | | | (0.25 | ) | | 13.92 | |
| 10/31/2012 | | 11.24 | | | 0.23 | | | 0.14 | | | 0.37 | | | (0.20 | ) | | 11.41 | |
| | | | | | | | | | | | | | | | | | | |
| Class R3 | | | | | | | | | | | | | | | | | | |
| 10/31/2016 | | 12.44 | | | 0.23 | | | (0.70 | ) | | (0.47 | ) | | (0.13 | ) | | 11.84 | |
| 10/31/2015 | | 13.14 | | | 0.17 | | | (0.74 | ) | | (0.57 | ) | | (0.13 | ) | | 12.44 | |
| 10/31/2014 | | 13.77 | | | 0.16 | | | (0.55 | ) | | (0.39 | ) | | (0.24 | ) | | 13.14 | |
| 10/31/2013 | | 11.28 | | | 0.16 | | | 2.59 | | | 2.75 | | | (0.26 | ) | | 13.77 | |
| 10/31/2012 | | 11.11 | | | 0.26 | | | 0.12 | | | 0.38 | | | (0.21 | ) | | 11.28 | |
| | | | | | | | | | | | | | | | | | | |
| Class R4 | | | | | | | | | | | | | | | | | | |
| 10/31/2016 | | 12.63 | | | 0.27 | | | (0.72 | ) | | (0.45 | ) | | (0.18 | ) | | 12.00 | |
| 6/30/2015 to 10/31/2015(c) | | 13.06 | | | 0.04 | | | (0.47 | ) | | (0.43 | ) | | – | | | 12.63 | |
| | | | | | | | | | | | | | | | | | | |
| Class R5 | | | | | | | | | | | | | | | | | | |
| 10/31/2016 | | 12.73 | | | 0.30 | | | (0.72 | ) | | (0.42 | ) | | (0.20 | ) | | 12.11 | |
| 6/30/2015 to 10/31/2015(c) | | 13.15 | | | 0.05 | | | (0.47 | ) | | (0.42 | ) | | – | | | 12.73 | |
| | | | | | | | | | | | | | | | | | | |
| Class R6 | | | | | | | | | | | | | | | | | | |
| 10/31/2016 | | 12.74 | | | 0.17 | | | (0.57 | ) | | (0.40 | ) | | (0.20 | ) | | 12.14 | |
| 6/30/2015 to 10/31/2015(c) | | 13.15 | | | 0.06 | | | (0.47 | ) | | (0.41 | ) | | – | | | 12.74 | |
| | |
| (a) | Calculated using average shares outstanding during the period. |
| (b) | Total return for classes A, B and C does not consider the effects of sales loads and assumes the reinvestment of all distributions. Total return for all other classes assumes the reinvestment of all distributions. |
| (c) | Commenced on June 30, 2015. |
| (d) | Not annualized. |
| (e) | Annualized. |
| | |
| 96 | See Notes to Financial Statements. |
| | Ratios to Average Net Assets: | | Supplemental Data: |
| |
| | Total | | | | | | | | |
| | expenses, | | | | | | | | |
| | after waivers | | | | Net | | Net assets, | | Portfolio |
| Total | | and/or | | Total | | investment | | end of | | turnover |
| return(b) | | reimbursements | | expenses | | income | | period | | rate |
| (%) | | (%) | | (%) | | (%) | | (000) | | (%) |
| |
| (3.65 | ) | | 1.32 | | | 1.51 | | | 2.12 | | | $ 95 | | | 163.86 | |
| (4.38 | ) | | 1.28 | | | 1.49 | | | 1.32 | | | 110 | | | 62.15 | |
| (2.77 | ) | | 1.22 | | | 1.46 | | | 1.20 | | | 150 | | | 64.06 | |
| 24.91 | | | 1.22 | | | 1.48 | | | 1.30 | | | 278 | | | 80.77 | |
| 3.63 | | | 1.22 | | | 1.58 | | | 2.45 | | | 282 | | | 81.50 | |
| |
| (3.85 | ) | | 1.47 | | | 1.66 | | | 1.93 | | | 517 | | | 163.86 | |
| (4.48 | ) | | 1.43 | | | 1.64 | | | 1.31 | | | 658 | | | 62.15 | |
| (2.89 | ) | | 1.37 | | | 1.61 | | | 1.07 | | | 1,011 | | | 64.06 | |
| 24.65 | | | 1.37 | | | 1.63 | | | 1.20 | | | 868 | | | 80.77 | |
| 3.51 | | | 1.37 | | | 1.72 | | | 2.13 | | | 568 | | | 81.50 | |
| |
| (3.79 | ) | | 1.36 | | | 1.54 | | | 1.99 | | | 14,945 | | | 163.86 | |
| (4.35 | ) | | 1.33 | | | 1.53 | | | 1.35 | | | 18,466 | | | 62.15 | |
| (2.85 | ) | | 1.26 | | | 1.50 | | | 1.15 | | | 20,156 | | | 64.06 | |
| 24.80 | | | 1.26 | | | 1.52 | | | 1.27 | | | 19,739 | | | 80.77 | |
| 3.68 | | | 1.26 | | | 1.61 | | | 2.36 | | | 17,275 | | | 81.50 | |
| |
| (3.55 | ) | | 1.12 | | | 1.28 | | | 2.27 | | | 9 | | | 163.86 | |
| |
| (3.29 | )(d) | | 1.12 | (e) | | 1.25 | (e) | | 0.89 | (e) | | 10 | | | 62.15 | |
| |
| (3.31 | ) | | 0.87 | | | 1.04 | | | 2.52 | | | 9 | | | 163.86 | |
| |
| (3.19 | )(d) | | 0.87 | (e) | | 1.00 | (e) | | 1.14 | (e) | | 10 | | | 62.15 | |
| |
| (3.14 | ) | | 0.65 | | | 0.88 | | | 1.39 | | | 10,765 | | | 163.86 | |
| |
| (3.12 | )(d) | | 0.70 | (e) | | 0.84 | (e) | | 1.31 | (e) | | 10 | | | 62.15 | |
| | | |
| | See Notes to Financial Statements. | 97 |
Financial Highlights
INTERNATIONAL DIVIDEND INCOME FUND
| | | | | Per Share Operating Performance: |
| | | | | Investment operations: | | Distributions to
shareholders from: |
| | | | | | | | | Total | | | | | | |
| | | | | | | Net | | from | | | | | | |
| | | Net asset | | Net | | realized | | invest- | | | | | | |
| | | value, | | invest- | | and | | ment | | Net | | Net | | Total |
| | | beginning | | ment | | unrealized | | opera- | | investment | | realized | | distri- |
| | | of period | | income(a) | | gain (loss) | | tions | | income | | gain | | butions |
| Class A | | | | | | | | | | | | | | |
| 10/31/2016 | | $7.05 | | | $0.24 | | | $(0.35 | ) | | $(0.11 | ) | | $(0.23 | ) | | $ – | | | $(0.23 | ) |
| 10/31/2015 | | 8.75 | | | 0.25 | | | (1.22 | ) | | (0.97 | ) | | (0.24 | ) | | (0.49 | ) | | (0.73 | ) |
| 10/31/2014 | | 9.11 | | | 0.36 | | | (0.31 | ) | | 0.05 | | | (0.41 | ) | | – | | | (0.41 | ) |
| 10/31/2013 | | 7.80 | | | 0.33 | | | 1.31 | | | 1.64 | | | (0.33 | ) | | – | | | (0.33 | ) |
| 10/31/2012 | | 7.88 | | | 0.35 | | | (0.08 | ) | | 0.27 | | | (0.35 | ) | | – | | | (0.35 | ) |
| | | | | | | | | | | | | | | | | | | | | | |
| Class C | | | | | | | | | | | | | | | | | | | | | |
| 10/31/2016 | | 6.99 | | | 0.19 | | | (0.34 | ) | | (0.15 | ) | | (0.18 | ) | | – | | | (0.18 | ) |
| 10/31/2015 | | 8.68 | | | 0.19 | | | (1.20 | ) | | (1.01 | ) | | (0.19 | ) | | (0.49 | ) | | (0.68 | ) |
| 10/31/2014 | | 9.04 | | | 0.31 | | | (0.31 | ) | | – | | | (0.36 | ) | | – | | | (0.36 | ) |
| 10/31/2013 | | 7.75 | | | 0.28 | | | 1.29 | | | 1.57 | | | (0.28 | ) | | – | | | (0.28 | ) |
| 10/31/2012 | | 7.84 | | | 0.29 | | | (0.07 | ) | | 0.22 | | | (0.31 | ) | | – | | | (0.31 | ) |
| | | | | | | | | | | | | | | | | | | | | | |
| Class F | | | | | | | | | | | | | | | | | | | | | |
| 10/31/2016 | | 7.06 | | | 0.25 | | | (0.34 | ) | | (0.09 | ) | | (0.24 | ) | | – | | | (0.24 | ) |
| 10/31/2015 | | 8.77 | | | 0.27 | | | (1.23 | ) | | (0.96 | ) | | (0.26 | ) | | (0.49 | ) | | (0.75 | ) |
| 10/31/2014 | | 9.12 | | | 0.39 | | | (0.30 | ) | | 0.09 | | | (0.44 | ) | | – | | | (0.44 | ) |
| 10/31/2013 | | 7.81 | | | 0.36 | | | 1.30 | | | 1.66 | | | (0.35 | ) | | – | | | (0.35 | ) |
| 10/31/2012 | | 7.89 | | | 0.37 | | | (0.08 | ) | | 0.29 | | | (0.37 | ) | | – | | | (0.37 | ) |
| | | | | | | | | | | | | | | | | | | | | | |
| Class I | | | | | | | | | | | | | | | | | | | | | |
| 10/31/2016 | | 7.08 | | | 0.26 | | | (0.34 | ) | | (0.08 | ) | | (0.25 | ) | | – | | | (0.25 | ) |
| 10/31/2015 | | 8.79 | | | 0.27 | | | (1.22 | ) | | (0.95 | ) | | (0.27 | ) | | (0.49 | ) | | (0.76 | ) |
| 10/31/2014 | | 9.14 | | | 0.42 | | | (0.32 | ) | | 0.10 | | | (0.45 | ) | | – | | | (0.45 | ) |
| 10/31/2013 | | 7.83 | | | 0.36 | | | 1.31 | | | 1.67 | | | (0.36 | ) | | – | | | (0.36 | ) |
| 10/31/2012 | | 7.91 | | | 0.38 | | | (0.09 | ) | | 0.29 | | | (0.37 | ) | | – | | | (0.37 | ) |
| | | | | | | | | | | | | | | | | | | | | | |
| Class R2 | | | | | | | | | | | | | | | | | | | | | |
| 10/31/2016 | | 7.19 | | | 0.22 | | | (0.35 | ) | | (0.13 | ) | | (0.20 | ) | | – | | | (0.20 | ) |
| 10/31/2015 | | 8.92 | | | 0.22 | | | (1.24 | ) | | (1.02 | ) | | (0.22 | ) | | (0.49 | ) | | (0.71 | ) |
| 10/31/2014 | | 9.27 | | | 0.36 | | | (0.32 | ) | | 0.04 | | | (0.39 | ) | | – | | | (0.39 | ) |
| 10/31/2013 | | 7.94 | | | 0.32 | | | 1.32 | | | 1.64 | | | (0.31 | ) | | – | | | (0.31 | ) |
| 10/31/2012 | | 8.03 | | | 0.33 | | | (0.08 | ) | | 0.25 | | | (0.34 | ) | | – | | | (0.34 | ) |
| | |
| 98 | See Notes to Financial Statements. |
| | | | Ratios to Average Net Assets: | | Supplemental Data: |
| | | | Total | | | | | | | | |
| | | | expenses | | | | | | | | |
| | | | after | | | | | | | | |
| Net | | | | waivers | | | | Net | | Net | | |
| asset | | | | and/or | | | | invest- | | assets, | | Portfolio |
| value, | | Total | | reimburse- | | Total | | ment | | end of | | turnover |
| end of | | return(b) | | ments | | expenses | | income | | period | | rate |
| period | | (%) | | (%) | | (%) | | (%) | | (000) | | (%) |
| |
| $6.71 | | | (1.52 | ) | | 1.12 | | | 1.20 | | | 3.57 | | | $ 419,886 | | | 57.71 | |
| 7.05 | | | (11.74 | ) | | 1.12 | | | 1.19 | | | 3.14 | | | 710,835 | | | 76.52 | |
| 8.75 | | | 0.47 | | | 1.12 | | | 1.24 | | | 3.99 | | | 1,000,763 | | | 72.26 | |
| 9.11 | | | 21.54 | | | 1.12 | | | 1.27 | | | 3.94 | | | 954,305 | | | 78.39 | |
| 7.80 | | | 3.60 | | | 1.12 | | | 1.36 | | | 4.59 | | | 618,824 | | | 84.81 | |
| |
| 6.66 | | | (2.01 | ) | | 1.87 | | | 1.95 | | | 2.85 | | | 86,306 | | | 57.71 | |
| 6.99 | | | (12.49 | ) | | 1.84 | | | 1.90 | | | 2.40 | | | 142,492 | | | 76.52 | |
| 8.68 | | | (0.14 | ) | | 1.77 | | | 1.89 | | | 3.42 | | | 191,120 | | | 72.26 | |
| 9.04 | | | 20.70 | | | 1.77 | | | 1.92 | | | 3.33 | | | 143,807 | | | 78.39 | |
| 7.75 | | | 2.95 | | | 1.76 | | | 2.01 | | | 3.88 | | | 74,664 | | | 84.81 | |
| |
| 6.73 | | | (1.22 | ) | | 0.91 | | | 1.05 | | | 3.78 | | | 111,056 | | | 57.71 | |
| 7.06 | | | (11.65 | ) | | 0.90 | | | 1.00 | | | 3.38 | | | 210,696 | | | 76.52 | |
| 8.77 | | | 0.83 | | | 0.87 | | | 0.99 | | | 4.24 | | | 322,648 | | | 72.26 | |
| 9.12 | | | 21.80 | | | 0.87 | | | 1.02 | | | 4.23 | | | 228,586 | | | 78.39 | |
| 7.81 | | | 3.83 | | | 0.87 | | | 1.11 | | | 4.79 | | | 128,360 | | | 84.81 | |
| |
| 6.75 | | | (1.10 | ) | | 0.81 | | | 0.95 | | | 3.90 | | | 710,951 | | | 57.71 | |
| 7.08 | | | (11.52 | ) | | 0.80 | | | 0.91 | | | 3.50 | | | 1,080,845 | | | 76.52 | |
| 8.79 | | | 0.93 | | | 0.77 | | | 0.89 | | | 4.53 | | | 963,200 | | | 72.26 | |
| 9.14 | | | 21.86 | | | 0.77 | | | 0.92 | | | 4.28 | | | 1,005,558 | | | 78.39 | |
| 7.83 | | | 3.91 | | | 0.77 | | | 1.01 | | | 5.00 | | | 893,066 | | | 84.81 | |
| |
| 6.86 | | | (1.70 | ) | | 1.47 | | | 1.55 | | | 3.28 | | | 680 | | | 57.71 | |
| 7.19 | | | (12.13 | ) | | 1.44 | | | 1.51 | | | 2.80 | | | 1,029 | | | 76.52 | |
| 8.92 | | | 0.33 | | | 1.37 | | | 1.49 | | | 3.86 | | | 1,298 | | | 72.26 | |
| 9.27 | | | 21.13 | | | 1.37 | | | 1.52 | | | 3.73 | | | 860 | | | 78.39 | |
| 7.94 | | | 3.32 | | | 1.34 | | | 1.60 | | | 4.24 | | | 464 | | | 84.81 | |
| | | |
| | See Notes to Financial Statements. | 99 |
Financial Highlights (concluded)
INTERNATIONAL DIVIDEND INCOME FUND
| | | | | Per Share Operating Performance: |
| | | | | | | | | | | Distributions to |
| | | | | Investment operations: | | shareholders from: |
| | | | | | | | | Total | | | | | | |
| | | | | | | Net | | from | | | | | | |
| | | Net asset | | Net | | realized | | invest- | | | | | | |
| | | value, | | invest- | | and | | ment | | Net | | Net | | Total |
| | | beginning | | ment | | unrealized | | opera- | | investment | | realized | | distri- |
| | | of period | | income(a) | | gain (loss) | | tions | | income | | gain | | butions |
| Class R3 | | | | | | | | | | | | | | | | | | | | | |
| 10/31/2016 | | $7.11 | | | $0.22 | | | $(0.34 | ) | | $(0.12 | ) | | $(0.21 | ) | | $ – | | | $(0.21 | ) |
| 10/31/2015 | | 8.83 | | | 0.23 | | | (1.23 | ) | | (1.00 | ) | | (0.23 | ) | | (0.49 | ) | | (0.72 | ) |
| 10/31/2014 | | 9.18 | | | 0.37 | | | (0.32 | ) | | 0.05 | | | (0.40 | ) | | – | | | (0.40 | ) |
| 10/31/2013 | | 7.86 | | | 0.35 | | | 1.29 | | | 1.64 | | | (0.32 | ) | | – | | | (0.32 | ) |
| 10/31/2012 | | 7.94 | | | 0.37 | | | (0.12 | ) | | 0.25 | | | (0.33 | ) | | – | | | (0.33 | ) |
| | | | | | | | | | | | | | | | | | | | | | |
| Class R4 | | | | | | | | | | | | | | | | | | | | | |
| 10/31/2016 | | 7.05 | | | 0.24 | | | (0.35 | ) | | (0.11 | ) | | (0.23 | ) | | – | | | (0.23 | ) |
| 6/30/2015 to 10/31/2015(c) | | 7.75 | | | 0.05 | | | (0.72 | ) | | (0.67 | ) | | (0.03 | ) | | – | | | (0.03 | ) |
| | | | | | | | | | | | | | | | | | | | | | |
| Class R5 | | | | | | | | | | | | | | | | | | | | | |
| 10/31/2016 | | 7.08 | | | 0.26 | | | (0.35 | ) | | (0.09 | ) | | (0.25 | ) | | – | | | (0.25 | ) |
| 6/30/2015 to 10/31/2015(c) | | 7.78 | | | 0.06 | | | (0.72 | ) | | (0.66 | ) | | (0.04 | ) | | – | | | (0.04 | ) |
| | | | | | | | | | | | | | | | | | | | | | |
| Class R6 | | | | | | | | | | | | | | | | | | | | | |
| 10/31/2016 | | 7.08 | | | 0.26 | | | (0.34 | ) | | (0.08 | ) | | (0.25 | ) | | – | | | (0.25 | ) |
| 6/30/2015 to 10/31/2015(c) | | 7.78 | | | 0.06 | | | (0.72 | ) | | (0.66 | ) | | (0.04 | ) | | – | | | (0.04 | ) |
| | |
| (a) | Calculated using average shares outstanding during the period. |
| (b) | Total return for Classes A and C does not consider the effects of sales loads and assumes the reinvestment of all distributions. Total return for all other classes assumes the reinvestment of all distributions. |
| (c) | Commenced on June 30, 2015. |
| (d) | Not annualized. |
| (e) | Annualized. |
| | |
| 100 | See Notes to Financial Statements. |
| | | | Ratios to Average Net Assets: | | Supplemental Data: |
| | | | Total | | | | | | | | |
| | | | expenses | | | | | | | | |
| | | | after | | | | | | | | |
| Net | | | | waivers | | | | Net | | Net | | |
| asset | | | | and/or | | | | invest- | | assets, | | Portfolio |
| value, | | Total | | reimburse- | | Total | | ment | | end of | | turnover |
| end of | | return(b) | | ments | | expenses | | income | | period | | rate |
| period | | (%) | | (%) | | (%) | | (%) | | (000) | | (%) |
| |
| $6.78 | | | (1.58 | ) | | 1.37 | | | 1.44 | | | 3.29 | | | $12,697 | | | 57.71 | |
| 7.11 | | | (12.03 | ) | | 1.34 | | | 1.40 | | | 2.93 | | | 12,680 | | | 76.52 | |
| 8.83 | | | 0.41 | | | 1.27 | | | 1.39 | | | 4.03 | | | 11,273 | | | 72.26 | |
| 9.18 | | | 21.30 | | | 1.27 | | | 1.42 | | | 4.11 | | | 5,200 | | | 78.39 | |
| 7.86 | | | 3.39 | | | 1.27 | | | 1.50 | | | 4.80 | | | 33,065 | | | 84.81 | |
| |
| 6.71 | | | (1.48 | ) | | 1.12 | | | 1.16 | | | 3.57 | | | 9 | | | 57.71 | |
| 7.05 | | | (8.56 | )(d) | | 1.12 | (e) | | 1.15 | (e) | | 2.02 | (e) | | 9 | | | 76.52 | |
| |
| 6.74 | | | (1.24 | ) | | 0.87 | | | 0.92 | | | 3.81 | | | 9 | | | 57.71 | |
| 7.08 | | | (8.46 | )(d) | | 0.87 | (e) | | 0.90 | (e) | | 2.28 | (e) | | 9 | | | 76.52 | |
| |
| 6.75 | | | (1.09 | ) | | 0.80 | | | 0.82 | | | 3.88 | | | 9 | | | 57.71 | |
| 7.08 | | | (8.46 | )(d) | | 0.80 | (e) | | 0.80 | (e) | | 2.34 | (e) | | 9 | | | 76.52 | |
| | | |
| | See Notes to Financial Statements. | 101 |
Financial Highlights
INTERNATIONAL OPPORTUNITIES FUND
| | | | | Per Share Operating Performance: |
| | | | | | | | | | | Distributions to |
| | | | | Investment operations: | | shareholders from: |
| | | | | | | | | Total | | | | | | |
| | | | | Net | | Net | | from | | | | | | |
| | | Net asset | | invest- | | realized | | invest- | | | | | | |
| | | value, | | ment | | and | | ment | | Net | | Net | | Total |
| | | beginning | | income | | unrealized | | opera- | | investment | | realized | | distri- |
| | | of period | | (loss)(a) | | gain (loss) | | tions | | income | | gain | | butions |
| Class A | | | | | | | | | | | | | | | | | | | | | |
| 10/31/2016 | | $17.01 | | | $0.13 | | | $(0.30 | ) | | $(0.17 | ) | | $(0.10 | ) | | $(0.61 | ) | | $(0.71 | ) |
| 10/31/2015 | | 16.22 | | | 0.09 | | | 1.36 | | | 1.45 | | | (0.18 | ) | | (0.48 | ) | | (0.66 | ) |
| 10/31/2014 | | 16.83 | | | 0.11 | | | (0.51 | ) | | 0.40 | | | (0.21 | ) | | – | | | (0.21 | ) |
| 10/31/2013 | | 13.17 | | | 0.10 | | | 3.82 | | | 3.92 | | | (0.26 | ) | | – | | | (0.26 | ) |
| 10/31/2012 | | 12.00 | | | 0.15 | | | 1.10 | | | 1.25 | | | (0.08 | ) | | – | | | (0.08 | ) |
| | | | | | | | | | | | | | | | | | | | | | |
| Class B | | | | | | | | | | | | | | | | | | | | | |
| 10/31/2016 | | 16.11 | | | – | (c) | | (0.27 | ) | | (0.27 | ) | | – | | | (0.61 | ) | | (0.61 | ) |
| 10/31/2015 | | 15.37 | | | (0.04 | ) | | 1.30 | | | 1.26 | | | (0.04 | ) | | (0.48 | ) | | (0.52 | ) |
| 10/31/2014 | | 15.96 | | | (0.03 | ) | | (0.46 | ) | | (0.49 | ) | | (0.10 | ) | | – | | | (0.10 | ) |
| 10/31/2013 | | 12.49 | | | – | (c) | | 3.63 | | | 3.63 | | | (0.16 | ) | | – | | | (0.16 | ) |
| 10/31/2012 | | 11.36 | | | 0.06 | | | 1.07 | | | 1.13 | | | – | | | – | | | – | |
| | | | | | | | | | | | | | | | | | | | | | |
| Class C | | | | | | | | | | | | | | | | | | | | | |
| 10/31/2016 | | 15.92 | | | 0.01 | | | (0.28 | ) | | (0.27 | ) | | (0.01 | ) | | (0.61 | ) | | (0.62 | ) |
| 10/31/2015 | | 15.23 | | | (0.04 | ) | | 1.29 | | | 1.25 | | | (0.08 | ) | | (0.48 | ) | | (0.56 | ) |
| 10/31/2014 | | 15.84 | | | (0.02 | ) | | (0.46 | ) | | (0.48 | ) | | (0.13 | ) | | – | | | (0.13 | ) |
| 10/31/2013 | | 12.41 | | | – | (c) | | 3.61 | | | 3.61 | | | (0.18 | ) | | – | | | (0.18 | ) |
| 10/31/2012 | | 11.29 | | | 0.07 | | | 1.06 | | | 1.13 | | | (0.01 | ) | | – | | | (0.01 | ) |
| | | | | | | | | | | | | | | | | | | | | | |
| Class F | | | | | | | | | | | | | | | | | | | | | |
| 10/31/2016 | | 16.88 | | | 0.15 | | | (0.29 | ) | | (0.14 | ) | | (0.13 | ) | | (0.61 | ) | | (0.74 | ) |
| 10/31/2015 | | 16.11 | | | 0.10 | | | 1.37 | | | 1.47 | | | (0.22 | ) | | (0.48 | ) | | (0.70 | ) |
| 10/31/2014 | | 16.73 | | | 0.14 | | | (0.50 | ) | | (0.36 | ) | | (0.26 | ) | | – | | | (0.26 | ) |
| 10/31/2013 | | 13.09 | | | 0.17 | | | 3.76 | | | 3.93 | | | (0.29 | ) | | – | | | (0.29 | ) |
| 10/31/2012 | | 11.94 | | | 0.18 | | | 1.09 | | | 1.27 | | | (0.12 | ) | | – | | | (0.12 | ) |
| | | | | | | | | | | | | | | | | | | | | | |
| Class I | | | | | | | | | | | | | | | | | | | | | |
| 10/31/2016 | | 17.44 | | | 0.17 | | | (0.30 | ) | | (0.13 | ) | | (0.14 | ) | | (0.61 | ) | | (0.75 | ) |
| 10/31/2015 | | 16.63 | | | 0.13 | | | 1.39 | | | 1.52 | | | (0.23 | ) | | (0.48 | ) | | (0.71 | ) |
| 10/31/2014 | | 17.25 | | | 0.15 | | | (0.51 | ) | | (0.36 | ) | | (0.26 | ) | | – | | | (0.26 | ) |
| 10/31/2013 | | 13.49 | | | 0.15 | | | 3.91 | | | 4.06 | | | (0.30 | ) | | – | | | (0.30 | ) |
| 10/31/2012 | | 12.30 | | | 0.19 | | | 1.13 | | | 1.32 | | | (0.13 | ) | | – | | | (0.13 | ) |
| | |
| 102 | See Notes to Financial Statements. |
| | | | Ratios to Average Net Assets: | | Supplemental Data: |
| |
| | | | | | Net | | | | |
| Net | | | | | | invest- | | Net | | |
| asset | | | | | | ment | | assets, | | Portfolio |
| value, | | Total | | Total | | income | | end of | | turnover |
| end of | | return(b) | | expenses | | (loss) | | period | | rate |
| period | | (%) | | (%) | | (%) | | (000) | | (%) |
| |
| $16.13 | | | (0.99 | ) | | 1.35 | | | 0.82 | | | $153,000 | | | 81.73 | |
| 17.01 | | | 9.36 | | | 1.33 | | | 0.51 | | | 160,628 | | | 81.57 | |
| 16.22 | | | (2.39 | ) | | 1.35 | | | 0.66 | | | 117,037 | | | 80.08 | |
| 16.83 | | | 30.26 | | | 1.47 | | | 0.66 | | | 99,530 | | | 99.98 | |
| 13.17 | | | 10.59 | | | 1.52 | | | 1.20 | | | 76,139 | | | 91.18 | |
| |
| 15.23 | | | (1.72 | ) | | 2.09 | | | 0.01 | | | 1,397 | | | 81.73 | |
| 16.11 | | | 8.51 | | | 2.07 | | | (0.24 | ) | | 2,702 | | | 81.57 | |
| 15.37 | | | (3.09 | ) | | 2.07 | | | (0.16 | ) | | 3,999 | | | 80.08 | |
| 15.96 | | | 29.39 | | | 2.12 | | | (0.03 | ) | | 6,357 | | | 99.98 | |
| 12.49 | | | 9.95 | | | 2.16 | | | 0.52 | | | 6,854 | | | 91.18 | |
| |
| 15.03 | | | (1.75 | ) | | 2.09 | | | 0.08 | | | 27,396 | | | 81.73 | |
| 15.92 | | | 8.58 | | | 2.06 | | | (0.23 | ) | | 31,273 | | | 81.57 | |
| 15.23 | | | (3.12 | ) | | 2.06 | | | (0.10 | ) | | 21,868 | | | 80.08 | |
| 15.84 | | | 29.43 | | | 2.10 | | | 0.03 | | | 18,138 | | | 99.98 | |
| 12.41 | | | 10.00 | | | 2.14 | | | 0.59 | | | 13,953 | | | 91.18 | |
| |
| 16.00 | | | (0.84 | ) | | 1.20 | | | 0.96 | | | 88,852 | | | 81.73 | |
| 16.88 | | | 9.52 | | | 1.18 | | | 0.61 | | | 118,963 | | | 81.57 | |
| 16.11 | | | (2.21 | ) | | 1.18 | | | 0.80 | | | 44,607 | | | 80.08 | |
| 16.73 | | | 30.63 | | | 1.22 | | | 1.13 | | | 18,046 | | | 99.98 | |
| 13.09 | | | 10.83 | | | 1.27 | | | 1.47 | | | 944 | | | 91.18 | |
| |
| 16.56 | | | (0.75 | ) | | 1.10 | | | 1.06 | | | 267,188 | | | 81.73 | |
| 17.44 | | | 9.59 | | | 1.08 | | | 0.77 | | | 296,965 | | | 81.57 | |
| 16.63 | | | (2.10 | ) | | 1.08 | | | 0.87 | | | 274,583 | | | 80.08 | |
| 17.25 | | | 30.74 | | | 1.12 | | | 0.99 | | | 259,952 | | | 99.98 | |
| 13.49 | | | 10.96 | | | 1.17 | | | 1.54 | | | 195,785 | | | 91.18 | |
| | | |
| | See Notes to Financial Statements. | 103 |
Financial Highlights (concluded)
INTERNATIONAL OPPORTUNITIES FUND
| | | | | | Per Share Operating Performance: | |
| | | | | | Investment operations: | | | Distributions to
shareholders from: | |
| | | | | | | | | | | | | Total | | | | | | | | | | | | | |
| | | | | | Net | | Net | | | from | | | | | | | | | | | | | |
| | | Net asset | | invest- | | realized | | | invest- | | | | | | | | | | | | | |
| | | value, | | ment | | and | | | ment | | | Net | | | Net | | | Total | |
| | | beginning | | income | | unrealized | | | opera- | | | investment | | | realized | | | distri- | |
| | | of period | | (loss)(a) | | gain (loss) | | | tions | | | income | | | gain | | | butions | |
| Class P | | | | | | | | | | | | | | | | | | | | | | | | | | | | | | | | | |
| 10/31/2016 | | | $17.27 | | | $ | 0.08 | | | | $(0.29 | ) | | | | $(0.21 | ) | | | | $(0.05 | ) | | | | $(0.61 | ) | | | | $(0.66 | ) | |
| 10/31/2015 | | | 16.46 | | | | 0.05 | | | | 1.40 | | | | | 1.45 | | | | | (0.16 | ) | | | | (0.48 | ) | | | | (0.64 | ) | |
| 10/31/2014 | | | 17.08 | | | | 0.07 | | | | (0.51 | ) | | | | (0.44 | ) | | | | (0.18 | ) | | | | – | | | | | (0.18 | ) | |
| 10/31/2013 | | | 13.36 | | | | 0.09 | | | | 3.88 | | | | | 3.97 | | | | | (0.25 | ) | | | | – | | | | | (0.25 | ) | |
| 10/31/2012 | | | 12.17 | | | | 0.14 | | | | 1.12 | | | | | 1.26 | | | | | (0.07 | ) | | | | – | | | | | (0.07 | ) | |
| | | | | | | | | | | | | | | | | | | | | | | | | | | | | | | | | | |
| Class R2 | | | | | | | | | | | | | | | | | | | | | | | | | | | | | | | | | |
| 10/31/2016 | | | 16.81 | | | | 0.08 | | | | (0.30 | ) | | | | (0.22 | ) | | | | (0.09 | ) | | | | (0.61 | ) | | | | (0.70 | ) | |
| 10/31/2015 | | | 16.05 | | | | 0.02 | | | | 1.35 | | | | | 1.37 | | | | | (0.13 | ) | | | | (0.48 | ) | | | | (0.61 | ) | |
| 10/31/2014 | | | 16.69 | | | | 0.04 | | | | (0.48 | ) | | | | (0.44 | ) | | | | (0.20 | ) | | | | – | | | | | (0.20 | ) | |
| 10/31/2013 | | | 13.07 | | | | 0.06 | | | | 3.79 | | | | | 3.85 | | | | | (0.23 | ) | | | | – | | | | | (0.23 | ) | |
| 10/31/2012 | | | 11.90 | | | | 0.11 | | | | 1.11 | | | | | 1.22 | | | | | (0.05 | ) | | | | – | | | | | (0.05 | ) | |
| | | | | | | | | | | | | | | | | | | | | | | | | | | | | | | | | | |
| Class R3 | | | | | | | | | | | | | | | | | | | | | | | | | | | | | | | | | |
| 10/31/2016 | | | 16.73 | | | | 0.11 | | | | (0.31 | ) | | | | (0.20 | ) | | | | (0.07 | ) | | | | (0.61 | ) | | | | (0.68 | ) | |
| 10/31/2015 | | | 15.97 | | | | 0.05 | | | | 1.34 | | | | | 1.39 | | | | | (0.15 | ) | | | | (0.48 | ) | | | | (0.63 | ) | |
| 10/31/2014 | | | 16.57 | | | | 0.07 | | | | (0.49 | ) | | | | (0.42 | ) | | | | (0.18 | ) | | | | – | | | | | (0.18 | ) | |
| 10/31/2013 | | | 12.98 | | | | 0.06 | | | | 3.78 | | | | | 3.84 | | | | | (0.25 | ) | | | | – | | | | | (0.25 | ) | |
| 10/31/2012 | | | 11.84 | | | | 0.13 | | | | 1.09 | | | | | 1.22 | | | | | (0.08 | ) | | | | – | | | | | (0.08 | ) | |
| | | | | | | | | | | | | | | | | | | | | | | | | | | | | | | | | | |
| Class R4 | | | | | | | | | | | | | | | | | | | | | | | | | | | | | | | | | |
| 10/31/2016 | | | 17.01 | | | | 0.09 | | | | (0.26 | ) | | | | (0.17 | ) | | | | (0.12 | ) | | | | (0.61 | ) | | | | (0.73 | ) | |
| 6/30/2015 to 10/31/2015(d) | | | 17.49 | | | | – | (c) | | | (0.48 | )(e) | | | | (0.48 | ) | | | | – | | | | | – | | | | | – | | |
| | | | | | | | | | | | | | | | | | | | | | | | | | | | | | | | | | |
| Class R5 | | | | | | | | | | | | | | | | | | | | | | | | | | | | | | | | | |
| 10/31/2016 | | | 17.44 | | | | 0.18 | | | | (0.31 | ) | | | | (0.13 | ) | | | | (0.14 | ) | | | | (0.61 | ) | | | | (0.75 | ) | |
| 6/30/2015 to 10/31/2015(d) | | | 17.92 | | | | 0.02 | | | | (0.50 | )(e) | | | | (0.48 | ) | | | | – | | | | | – | | | | | – | | |
| | | | | | | | | | | | | | | | | | | | | | | | | | | | | | | | | | |
| Class R6 | | | | | | | | | | | | | | | | | | | | | | | | | | | | | | | | | |
| 10/31/2016 | | | 17.45 | | | | 0.17 | | | | (0.27 | ) | | | | (0.10 | ) | | | | (0.14 | ) | | | | (0.61 | ) | | | | (0.75 | ) | |
| 6/30/2015 to 10/31/2015(d) | | | 17.92 | | | | 0.03 | | | | (0.50 | )(e) | | | | (0.47 | ) | | | | – | | | | | – | | | | | – | | |
| | |
| (a) | Calculated using average shares outstanding during the period. |
| (b) | Total return for classes A, B and C does not consider the effects of sales loads and assumes the reinvestment of all distributions. Total return for all other classes assumes the reinvestment of all distributions. |
| (c) | Amount less than $0.01. |
| (d) | Commenced on June 30, 2015. |
| (e) | The per share amount does not represent the net realized and unrealized gain (loss) as presented on the Statements of Operations for the period due to the timing of sales of Fund shares and the amount of per share realized and unrealized gains and losses at such time. |
| (f) | Not annualized. |
| (g) | Annualized. |
| | |
| 104 | See Notes to Financial Statements. |
| | | | | | | | Ratios to Average Net Assets: | | Supplemental Data: | |
| | | | | | | | | | | |
| | | | | | | | | | | Net | | | | | | | |
| | Net | | | | | | | | invest- | | Net | | | | |
| | asset | | | | | | | | ment | | assets, | | Portfolio | |
| | value, | | Total | | Total | | income | | end of | | turnover | |
| | end of | | return(b) | | expenses | | (loss) | | period | | rate | |
| | period | | (%) | | (%) | | (%) | | (000) | | (%) | |
| | | | | | | | | | | | | | | | | | | | | | | | | |
| | $ | 16.40 | | | | (1.17 | ) | | | 1.55 | | | | 0.49 | | | $ | 363 | | | | 81.73 | | |
| | | 17.27 | | | | 9.15 | | | | 1.53 | | | | 0.29 | | | | 595 | | | | 81.57 | | |
| | | 16.46 | | | | (2.60 | ) | | | 1.53 | | | | 0.38 | | | | 872 | | | | 80.08 | | |
| | | 17.08 | | | | 30.19 | | | | 1.57 | | | | 0.57 | | | | 1,096 | | | | 99.98 | | |
| | | 13.36 | | | | 10.49 | | | | 1.62 | | | | 1.14 | | | | 929 | | | | 91.18 | | |
| | | | | | | | | | | | | | | | | | | | | | | | | |
| | | 15.89 | | | | (1.34 | ) | | | 1.71 | | | | 0.49 | | | | 2,520 | | | | 81.73 | | |
| | | 16.81 | | | | 8.92 | | | | 1.68 | | | | 0.15 | | | | 935 | | | | 81.57 | | |
| | | 16.05 | | | | (2.69 | ) | | | 1.68 | | | | 0.26 | | | | 198 | | | | 80.08 | | |
| | | 16.69 | | | | 29.97 | | | | 1.72 | | | | 0.40 | | | | 201 | | | | 99.98 | | |
| | | 13.07 | | | | 10.35 | | | | 1.76 | | | | 0.90 | | | | 91 | | | | 91.18 | | |
| | | | | | | | | | | | | | | | | | | | | | | | | |
| | | 15.85 | | | | (1.20 | ) | | | 1.59 | | | | 0.67 | | | | 18,124 | | | | 81.73 | | |
| | | 16.73 | | | | 9.11 | | | | 1.56 | | | | 0.29 | | | | 9,161 | | | | 81.57 | | |
| | | 15.97 | | | | (2.63 | ) | | | 1.56 | | | | 0.39 | | | | 6,000 | | | | 80.08 | | |
| | | 16.57 | | | | 30.14 | | | | 1.62 | | | | 0.45 | | | | 6,133 | | | | 99.98 | | |
| | | 12.98 | | | | 10.49 | | | | 1.65 | | | | 1.11 | | | | 6,212 | | | | 91.18 | | |
| | | | | | | | | | | | | | | | | | | | | | | | | |
| | | 16.11 | | | | (1.03 | ) | | | 1.38 | | | | 0.57 | | | | 1,883 | | | | 81.73 | | |
| | | 17.01 | | | | (2.74 | )(f) | | | 1.35 | (g) | | | 0.03 | (g) | | | 10 | | | | 81.57 | | |
| | | | | | | | | | | | | | | | | | | | | | | | | |
| | | 16.56 | | | | (0.75 | ) | | | 1.13 | | | | 1.06 | | | | 2,751 | | | | 81.73 | | |
| | | 17.44 | | | | (2.68 | )(f) | | | 1.10 | (g) | | | 0.28 | (g) | | | 10 | | | | 81.57 | | |
| | | | | | | | | | | | | | | | | | | | | | | | | |
| | | 16.60 | | | | (0.56 | ) | | | 0.94 | | | | 1.00 | | | | 1,843 | | | | 81.73 | | |
| | | 17.45 | | | | (2.62 | )(f) | | | 0.93 | (g) | | | 0.48 | (g) | | | 13 | | | | 81.57 | | |
| | | |
| | See Notes to Financial Statements. | 105 |
Financial Highlights
VALUE OPPORTUNITIES FUND
| | | | | | Per Share Operating Performance: | | | | | |
| | | | | | | | | | | | | | | | Distributions | | | | | |
| | | | | | | | | | | | | | | | to | | | | | |
| | | | | | | | | | | | | | | | shareholders | | | | | |
| | | | | | Investment operations: | | from: | | | | | |
| | | | | | | | | | | | | | | | | | | | | | |
| | | Net asset | | Net | | | Net | | | | | | | | Net asset | |
| | | value, | | investment | | | realized and | | Total from | | Net | | | value, | |
| | | beginning of | | income | | | unrealized | | investment | | realized | | | end of | |
| | | period | | (loss)(a) | | | gain (loss) | | operations | | gain | | | period | |
| Class A | | | | | | | | | | | | | | | | | | | | | | | | | | | |
| 10/31/2016 | | | $19.56 | | | | $ 0.02 | | | | | $0.77 | | | | $0.79 | | | | $(1.40 | ) | | | | $18.95 | | |
| 10/31/2015 | | | 21.67 | | | | (0.01 | ) | | | | 0.77 | | | | 0.76 | | | | (2.87 | ) | | | | 19.56 | | |
| 10/31/2014 | | | 21.44 | | | | (0.03 | ) | | | | 2.16 | | | | 2.13 | | | | (1.90 | ) | | | | 21.67 | | |
| 10/31/2013 | | | 15.99 | | | | – | (c) | | | | 5.45 | | | | 5.45 | | | | – | | | | | 21.44 | | |
| 10/31/2012 | | | 15.16 | | | | (0.03 | ) | | | | 0.92 | | | | 0.89 | | | | (0.06 | ) | | | | 15.99 | | |
| | | | | | | | | | | | | | | | | | | | | | | | | | | | |
| Class B | | | | | | | | | | | | | | | | | | | | | | | | | | | |
| 10/31/2016 | | | 18.12 | | | | (0.11 | ) | | | | 0.70 | | | | 0.59 | | | | (1.40 | ) | | | | 17.31 | | |
| 10/31/2015 | | | 20.41 | | | | (0.15 | ) | | | | 0.73 | | | | 0.58 | | | | (2.87 | ) | | | | 18.12 | | |
| 10/31/2014 | | | 20.42 | | | | (0.16 | ) | | | | 2.05 | | | | 1.89 | | | | (1.90 | ) | | | | 20.41 | | |
| 10/31/2013 | | | 15.32 | | | | (0.12 | ) | | | | 5.22 | | | | 5.10 | | | | – | | | | | 20.42 | | |
| 10/31/2012 | | | 14.63 | | | | (0.12 | ) | | | | 0.87 | | | | 0.75 | | | | (0.06 | ) | | | | 15.32 | | |
| | | | | | | | | | | | | | | | | | | | | | | | | | | | |
| Class C | | | | | | | | | | | | | | | | | | | | | | | | | | | |
| 10/31/2016 | | | 18.11 | | | | (0.11 | ) | | | | 0.71 | | | | 0.60 | | | | (1.40 | ) | | | | 17.31 | | |
| 10/31/2015 | | | 20.41 | | | | (0.15 | ) | | | | 0.72 | | | | 0.57 | | | | (2.87 | ) | | | | 18.11 | | |
| 10/31/2014 | | | 20.42 | | | | (0.16 | ) | | | | 2.05 | | | | 1.89 | | | | (1.90 | ) | | | | 20.41 | | |
| 10/31/2013 | | | 15.32 | | | | (0.12 | ) | | | | 5.22 | | | | 5.10 | | | | – | | | | | 20.42 | | |
| 10/31/2012 | | | 14.62 | | | | (0.13 | ) | | | | 0.89 | | | | 0.76 | | | | (0.06 | ) | | | | 15.32 | | |
| | | | | | | | | | | | | | | | | | | | | | | | | | | | |
| Class F | | | | | | | | | | | | | | | | | | | | | | | | | | | |
| 10/31/2016 | | | 19.85 | | | | 0.04 | | | | | 0.79 | | | | 0.83 | | | | (1.40 | ) | | | | 19.28 | | |
| 10/31/2015 | | | 21.92 | | | | 0.02 | | | | | 0.78 | | | | 0.80 | | | | (2.87 | ) | | | | 19.85 | | |
| 10/31/2014 | | | 21.62 | | | | 0.02 | | | | | 2.18 | | | | 2.20 | | | | (1.90 | ) | | | | 21.92 | | |
| 10/31/2013 | | | 16.07 | | | | 0.05 | | | | | 5.50 | | | | 5.55 | | | | – | | | | | 21.62 | | |
| 10/31/2012 | | | 15.20 | | | | 0.01 | | | | | 0.92 | | | | 0.93 | | | | (0.06 | ) | | | | 16.07 | | |
| | | | | | | | | | | | | | | | | | | | | | | | | | | | |
| Class I | | | | | | | | | | | | | | | | | | | | | | | | | | | |
| 10/31/2016 | | | 20.16 | | | | 0.06 | | | | | 0.80 | | | | 0.86 | | | | (1.40 | ) | | | | 19.62 | | |
| 10/31/2015 | | | 22.20 | | | | 0.04 | | | | | 0.79 | | | | 0.83 | | | | (2.87 | ) | | | | 20.16 | | |
| 10/31/2014 | | | 21.85 | | | | 0.05 | | | | | 2.20 | | | | 2.25 | | | | (1.90 | ) | | | | 22.20 | | |
| 10/31/2013 | | | 16.23 | | | | 0.06 | | | | | 5.56 | | | | 5.62 | | | | – | | | | | 21.85 | | |
| 10/31/2012 | | | 15.34 | | | | 0.02 | | | | | 0.93 | | | | 0.95 | | | | (0.06 | ) | | | | 16.23 | | |
| | | | | | | | | | | | | | | | | | | | | | | | | | | | |
| Class P | | | | | | | | | | | | | | | | | | | | | | | | | | | |
| 10/31/2016 | | | 19.36 | | | | (0.02 | ) | | | | 0.76 | | | | 0.74 | | | | (1.40 | ) | | | | 18.70 | | |
| 10/31/2015 | | | 21.51 | | | | (0.05 | ) | | | | 0.77 | | | | 0.72 | | | | (2.87 | ) | | | | 19.36 | | |
| 10/31/2014 | | | 21.32 | | | | (0.05 | ) | | | | 2.14 | | | | 2.09 | | | | (1.90 | ) | | | | 21.51 | | |
| 10/31/2013 | | | 15.90 | | | | (0.07 | ) | | | | 5.49 | | | | 5.42 | | | | – | | | | | 21.32 | | |
| 10/31/2012 | | | 15.09 | | | | (0.04 | ) | | | | 0.91 | | | | 0.87 | | | | (0.06 | ) | | | | 15.90 | | |
| | |
| 106 | See Notes to Financial Statements. |
| | | | | Ratios to Average Net Assets: | | Supplemental Data: | |
| | | | | | | | |
| | | | | | | | Net | | | | | | | |
| | | | | | | | investment | | Net assets, | | Portfolio | |
| | Total | | Total | | income | | end of | | turnover | |
| | return(b) | | expenses | | (loss) | | period | | rate | |
| | (%) | | (%) | | (%) | | (000) | | (%) | |
| | | | | | | | | | | | | | | | | | | | | |
| | | 4.33 | | | | 1.17 | | | | 0.09 | | | $ | 959,416 | | | | 36.93 | | |
| | | 3.67 | | | | 1.17 | | | | (0.05 | ) | | | 1,026,959 | | | | 46.88 | | |
| | | 10.72 | | | | 1.26 | | | | (0.13 | ) | | | 1,316,790 | | | | 53.81 | | |
| | | 34.08 | | | | 1.28 | | | | (0.01 | ) | | | 1,372,436 | | | | 69.49 | (d) | |
| | | 5.89 | | | | 1.31 | | | | (0.19 | ) | | | 870,567 | | | | 58.84 | | |
| | | | | | | | | | | | | | | | | | | | | |
| | | 3.51 | | | | 1.92 | | | | (0.65 | ) | | | 7,296 | | | | 36.93 | | |
| | | 2.93 | | | | 1.92 | | | | (0.79 | ) | | | 11,521 | | | | 46.88 | | |
| | | 10.02 | | | | 1.91 | | | | (0.78 | ) | | | 18,752 | | | | 53.81 | | |
| | | 33.29 | | | | 1.93 | | | | (0.68 | ) | | | 24,911 | | | | 69.49 | (d) | |
| | | 5.14 | | | | 1.96 | | | | (0.83 | ) | | | 13,315 | | | | 58.84 | | |
| | | | | | | | | | | | | | | | | | | | | |
| | | 3.57 | | | | 1.92 | | | | (0.66 | ) | | | 330,066 | | | | 36.93 | | |
| | | 2.87 | | | | 1.92 | | | | (0.80 | ) | | | 356,709 | | | | 46.88 | | |
| | | 10.02 | | | | 1.91 | | | | (0.79 | ) | | | 404,787 | | | | 53.81 | | |
| | | 33.29 | | | | 1.93 | | | | (0.66 | ) | | | 400,420 | | | | 69.49 | (d) | |
| | | 5.21 | | | | 1.96 | | | | (0.83 | ) | | | 248,357 | | | | 58.84 | | |
| | | | | | | | | | | | | | | | | | | | | |
| | | 4.48 | | | | 1.02 | | | | 0.23 | | | | 663,069 | | | | 36.93 | | |
| | | 3.84 | | | | 1.02 | | | | 0.09 | | | | 557,742 | | | | 46.88 | | |
| | | 10.97 | | | | 1.02 | | | | 0.11 | | | | 550,524 | | | | 53.81 | | |
| | | 34.54 | | | | 1.03 | | | | 0.26 | | | | 456,370 | | | | 69.49 | (d) | |
| | | 6.13 | | | | 1.06 | | | | 0.06 | | | | 369,321 | | | | 58.84 | | |
| | | | | | | | | | | | | | | | | | | | | |
| | | 4.57 | | | | 0.92 | | | | 0.34 | | | | 470,399 | | | | 36.93 | | |
| | | 3.94 | | | | 0.92 | | | | 0.20 | | | | 557,008 | | | | 46.88 | | |
| | | 11.10 | | | | 0.92 | | | | 0.21 | | | | 647,442 | | | | 53.81 | | |
| | | 34.63 | | | | 0.93 | | | | 0.33 | | | | 675,593 | | | | 69.49 | (d) | |
| | | 6.21 | | | | 0.97 | | | | 0.15 | | | | 411,546 | | | | 58.84 | | |
| | | | | | | | | | | | | | | | | | | | | |
| | | 4.10 | | | | 1.37 | | | | (0.11 | ) | | | 36,327 | | | | 36.93 | | |
| | | 3.50 | | | | 1.37 | | | | (0.25 | ) | | | 42,225 | | | | 46.88 | | |
| | | 10.58 | | | | 1.36 | | | | (0.23 | ) | | | 49,179 | | | | 53.81 | | |
| | | 34.09 | | | | 1.37 | | | | (0.34 | ) | | | 54,081 | | | | 69.49 | (d) | |
| | | 5.78 | | | | 1.41 | | | | (0.24 | ) | | | 918 | | | | 58.84 | | |
| | | |
| | See Notes to Financial Statements. | 107 |
Financial Highlights (concluded)
VALUE OPPORTUNITIES FUND
| | | | | | Per Share Operating Performance: | | | | |
| | | | | | | | | | | | | | | Distributions | | | | |
| | | | | | | | | | | | | | | to | | | | |
| | | | | | | | | | | | | | | shareholders | | | | |
| | | | | | Investment operations: | | from: | | | | |
| | | | | | | | | | | | | | | | | | | | |
| | | Net asset | | Net | | Net | | | | | | | | Net asset | |
| | | value, | | investment | | realized and | | Total from | | Net | | value, | |
| | | beginning of | | income | | unrealized | | investment | | realized | | end of | |
| | | period | | (loss)(a) | | gain (loss) | | operations | | gain | | period | |
| Class R2 | | | | | | | | | | | | | | | | | | | | | | | | | |
| 10/31/2016 | | | $ 19.08 | | | | $(0.05 | ) | | | $ 0.75 | | | | $ 0.70 | | | | $(1.40 | ) | | | $18.38 | | |
| 10/31/2015 | | | 21.27 | | | | (0.08 | ) | | | 0.76 | | | | 0.68 | | | | (2.87 | ) | | | 19.08 | | |
| 10/31/2014 | | | 21.13 | | | | (0.08 | ) | | | 2.12 | | | | 2.04 | | | | (1.90 | ) | | | 21.27 | | |
| 10/31/2013 | | | 15.79 | | | | (0.04 | ) | | | 5.38 | | | | 5.34 | | | | – | | | | 21.13 | | |
| 10/31/2012 | | | 15.01 | | | | (0.07 | ) | | | 0.91 | | | | 0.84 | | | | (0.06 | ) | | | 15.79 | | |
| | | | | | | | | | | | | | | | | | | | | | | | | | |
| Class R3 | | | | | | | | | | | | | | | | | | | | | | | | | |
| 10/31/2016 | | | 19.20 | | | | (0.03 | ) | | | 0.75 | | | | 0.72 | | | | (1.40 | ) | | | 18.52 | | |
| 10/31/2015 | | | 21.37 | | | | (0.06 | ) | | | 0.76 | | | | 0.70 | | | | (2.87 | ) | | | 19.20 | | |
| 10/31/2014 | | | 21.20 | | | | (0.06 | ) | | | 2.13 | | | | 2.07 | | | | (1.90 | ) | | | 21.37 | | |
| 10/31/2013 | | | 15.83 | | | | (0.03 | ) | | | 5.40 | | | | 5.37 | | | | – | | | | 21.20 | | |
| 10/31/2012 | | | 15.03 | | | | (0.05 | ) | | | 0.91 | | | | 0.86 | | | | (0.06 | ) | | | 15.83 | | |
| | | | | | | | | | | | | | | | | | | | | | | | | | |
| Class R4 | | | | | | | | | | | | | | | | | | | | | | | | | |
| 10/31/2016 | | | 19.57 | | | | (0.01 | ) | | | 0.79 | | | | 0.78 | | | | (1.40 | ) | | | 18.95 | | |
| 6/30/2015 to 10/31/2015(e) | | | 20.33 | | | | – | (c) | | | (0.76 | )(f) | | | (0.76 | ) | | | – | | | | 19.57 | | |
| | | | | | | | | | | | | | | | | | | | | | | | | | |
| Class R5 | | | | | | | | | | | | | | | | | | | | | | | | | |
| 10/31/2016 | | | 20.16 | | | | 0.05 | | | | 0.82 | | | | 0.87 | | | | (1.40 | ) | | | 19.63 | | |
| 6/30/2015 to 10/31/2015(e) | | | 20.93 | | | | 0.01 | | | | (0.78 | )(f) | | | (0.77 | ) | | | – | | | | 20.16 | | |
| | | | | | | | | | | | | | | | | | | | | | | | | | |
| Class R6 | | | | | | | | | | | | | | | | | | | | | | | | | |
| 10/31/2016 | | | 20.17 | | | | 0.09 | | | | 0.80 | | | | 0.89 | | | | (1.40 | ) | | | 19.66 | | |
| 6/30/2015 to 10/31/2015(e) | | | 20.93 | | | | 0.02 | | | | (0.78 | )(f) | | | (0.76 | ) | | | – | | | | 20.17 | | |
| | |
| (a) | Calculated using average shares outstanding during the period. |
| (b) | Total return for classes A, B and C does not consider the effects of sales loads and assumes the reinvestment of all distributions. Total return for all other classes assumes the reinvestment of all distributions. |
| (c) | Amount less than $0.01. |
| (d) | Excludes purchases and sales of securities in connection with the acquisition of Lord Abbett Small Cap Blend Fund on July 19, 2013. |
| (e) | Commenced on June 30, 2015. |
| (f) | The per share amount does not represent the net realized and unrealized gain (loss) as presented on the Statements of Operations for the period due to the timing of sales of Fund shares and the amount of per share realized and unrealized gains and losses at such time. |
| (g) | Not annualized. |
| (h) | Annualized. |
| | |
| 108 | See Notes to Financial Statements. |
| | | | | Ratios to Average Net Assets: | | Supplemental Data: | |
| | | | | | | | |
| | | | | | | | Net | | | | | |
| | | | | | | | investment | | Net assets, | | Portfolio | |
| | Total | | Total | | income | | end of | | turnover | |
| | return(b) | | expenses | | (loss) | | period | | rate | |
| | (%) | | (%) | | (%) | | (000) | | (%) | |
| | | | | | | | | | | | | | | | | | | | | |
| | | 3.94 | | | | 1.52 | | | | (0.26 | ) | | $ | 6,245 | | | | 36.93 | | |
| | | 3.33 | | | | 1.53 | | | | (0.40 | ) | | | 7,120 | | | | 46.88 | | |
| | | 10.42 | | | | 1.52 | | | | (0.38 | ) | | | 10,364 | | | | 53.81 | | |
| | | 33.82 | | | | 1.53 | | | | (0.24 | ) | | | 13,922 | | | | 69.49 | (d) | |
| | | 5.61 | | | | 1.56 | | | | (0.44 | ) | | | 11,056 | | | | 58.84 | | |
| | | | | | | | | | | | | | | | | | | | | |
| | | 4.03 | | | | 1.42 | | | | (0.16 | ) | | | 99,544 | | | | 36.93 | | |
| | | 3.42 | | | | 1.42 | | | | (0.30 | ) | | | 114,489 | | | | 46.88 | | |
| | | 10.54 | | | | 1.41 | | | | (0.29 | ) | | | 133,353 | | | | 53.81 | | |
| | | 33.92 | | | | 1.43 | | | | (0.17 | ) | | | 130,597 | | | | 69.49 | (d) | |
| | | 5.74 | | | | 1.46 | | | | (0.35 | ) | | | 86,441 | | | | 58.84 | | |
| | | | | | | | | | | | | | | | | | | | | |
| | | 4.28 | | | | 1.14 | | | | (0.06 | ) | | | 2,929 | | | | 36.93 | | |
| | | | | | | | | | | | | | | | | | | | | |
| | | (3.74 | )(g) | | | 1.15 | (h) | | | (0.07 | )(h) | | | 10 | | | | 46.88 | | |
| | | | | | | | | | | | | | | | | | | | | |
| | | 4.62 | | | | 0.89 | | | | 0.24 | | | | 42,825 | | | | 36.93 | | |
| | | | | | | | | | | | | | | | | | | | | |
| | | (3.68 | )(g) | | | 0.89 | (h) | | | 0.19 | (h) | | | 10 | | | | 46.88 | | |
| | | | | | | | | | | | | | | | | | | | | |
| | | 4.72 | | | | 0.79 | | | | 0.46 | | | | 56,533 | | | | 36.93 | | |
| | | | | | | | | | | | | | | | | | | | | |
| | | (3.63 | )(g) | | | 0.82 | (h) | | | 0.28 | (h) | | | 29,039 | | | | 46.88 | | |
| | | |
| | See Notes to Financial Statements. | 109 |
Notes to Financial Statements
Lord Abbett Securities Trust (the “Trust”) is registered under the Investment Company Act of 1940, as amended (the “Act”), as a diversified, open-end management investment company and was organized as a Delaware statutory trust on February 26, 1993.
The Trust currently consists of nine active funds. This report covers the following seven funds (separately, a “Fund” and collectively, the “Funds”) and their respective active share classes during the year ended October 31, 2016:
| Funds | | Share Classes |
| Lord Abbett Alpha Strategy Fund (“Alpha Strategy Fund”) | | A, B, C, F, I, P, R2, R3, R4, R5 and R6 |
| Lord Abbett Fundamental Equity Fund (“Fundamental Equity Fund”) | | A, B, C, F, I, P, R2, R3, R4, R5 and R6 |
| Lord Abbett Growth Leaders Fund (“Growth Leaders Fund”) | | A, B, C, F, I, R2, R3, R4, R5 and R6 |
| Lord Abbett International Core Equity Fund (“International Core Equity Fund”) | | A, B, C, F, I, P, R2, R3, R4, R5 and R6 |
| Lord Abbett International Dividend Income Fund (“International Dividend Income Fund”) | | A, C, F, I, R2, R3, R4, R5 and R6 |
| Lord Abbett International Opportunities Fund (“International Opportunities Fund”) | | A, B, C, F, I, P, R2, R3, R4, R5 and R6 |
| Lord Abbett Value Opportunities Fund (“Value Opportunities Fund”) | | A, B, C, F, I, P, R2, R3, R4, R5 and R6 |
The Funds no longer issue Class B shares for purchase. The Funds’ Class P shares are closed to substantially all investors, with certain exceptions as set forth in the Funds’ prospectus. As of the date of this report, Alpha Strategy Fund has not issued Class P shares.
Each of Alpha Strategy Fund’s, International Core Equity Fund’s, International Opportunities Fund’s, and Value Opportunities Fund’s investment objective is to seek long-term capital appreciation. Alpha Strategy Fund invests principally in other funds (“Underlying Funds”) managed by Lord, Abbett & Co. LLC (“Lord Abbett”). Fundamental Equity Fund’s investment objective is long-term growth of capital and income without excessive fluctuations in market value. Growth Leaders Fund’s investment objective is to seek capital appreciation. International Dividend Income Fund’s investment objective is to seek a high level of total return.
Each class of shares has different expenses and dividends. A front-end sales charge is normally added to the net asset value (“NAV”) for Class A shares. There is no front-end sales charge in the case of Class B, C, F, I, P, R2, R3, R4, R5 and R6 shares, although there may be a contingent deferred sales charge (“CDSC”) in certain cases as follows: Class A shares purchased without a sales charge and redeemed before the first day of the month in which the one-year anniversary of the purchase falls (subject to certain exceptions as set forth in each Fund’s prospectus); Class B shares redeemed before the sixth anniversary of purchase; and Class C shares redeemed before the first anniversary of purchase. Class B shares will automatically convert to Class A shares on the 25th day of the month (or, if the 25th day is not a business day, the next business day thereafter) following the eighth anniversary of the day on which the purchase order was accepted.
The preparation of the financial statements in conformity with accounting principles generally accepted in the United States of America (“U.S. GAAP”) requires management to make certain estimates and assumptions that affect the reported amounts of assets and liabilities and disclosure of contingent assets and liabilities at the date of the financial statements and the reported amounts of increases and decreases in net assets from operations during the reporting period.
110
Notes to Financial Statements (continued)
Actual results could differ from those estimates. These Funds are considered investment companies under U.S. GAAP and follow the accounting and reporting guidance applicable to investment companies.
| 2. | SIGNIFICANT ACCOUNTING POLICIES |
| | |
| (a) | Investment Valuation–Under procedures approved by the Funds’ Board of Trustees (the “Board”), Lord Abbett, each Fund’s investment manager, has formed a Pricing Committee to administer the pricing and valuation of portfolio investments and to ensure that prices utilized reasonably reflect fair value. Among other things, these procedures allow the Funds to utilize independent pricing services, quotations from securities and financial instrument dealers and other market sources to determine fair value. |
| | |
| | Securities actively traded on any recognized U.S. or non-U.S. exchange or on The NASDAQ Stock Market LLC are valued at the last sale price or official closing price on the exchange or system on which they are principally traded. Events occurring after the close of trading on non-U.S. exchanges may result in adjustments to the valuation of foreign securities to reflect their fair value as of the close of regular trading on the New York Stock Exchange (“NYSE”). Each Fund may utilize an independent fair valuation service in adjusting the valuations of foreign securities. Unlisted equity securities are valued at the last quoted sale price or, if no sale price is available, at the mean between the most recently quoted bid and asked prices. Exchange traded options and futures contracts are valued at the last sale price in the market where they are principally traded. If no sale has occurred, the mean between the most recently quoted bid and asked prices is used. Forward foreign currency exchange contracts are valued using daily forward exchange rates. Investments in the Underlying Funds are valued at their NAV each business day at the close of regular trading on the NYSE, normally 4:00 p.m. Eastern time. |
| | |
| | Securities for which prices are not readily available are valued at fair value as determined by the Pricing Committee. The Pricing Committee considers a number of factors, including observable and unobservable inputs, when arriving at fair value. The Pricing Committee may use related or comparable assets or liabilities, recent transactions, market multiples, book values and other relevant information to determine the fair value of portfolio investments. The Board or a designated committee thereof regularly reviews fair value determinations made by the Pricing Committee and employs techniques such as reviewing related market activity, reviewing inputs and assumptions, and retrospectively comparing prices of subsequent purchases and sales transactions to fair value determinations made by the Pricing Committee. |
| | |
| | Short-term securities with 60 days or less remaining to maturity are valued using the amortized cost method, which approximates fair value. |
| | |
| (b) | Security Transactions–Security transactions are recorded as of the date that the securities are purchased or sold (trade date). Realized gains and losses on sales of portfolio securities are calculated using the identified-cost method. Realized and unrealized gains (losses) are allocated to each class of shares based upon the relative proportion of net assets at the beginning of the day. |
| | |
| (c) | Investment Income–Dividend income is recorded on the ex-dividend date. Interest income is recorded on the accrual basis as earned. Discounts are accreted and premiums are amortized using the effective interest method and are included in Interest and other income on the Statements of Operations. Withholding taxes on foreign dividends have been provided for in |
111
Notes to Financial Statements (continued)
| | accordance with the applicable country’s tax rules and rates. Investment income is allocated to each class of shares based upon the relative proportion of net assets at the beginning of the day. |
| | |
| (d) | Income Taxes–It is the policy of each Fund to meet the requirements of Subchapter M of the Internal Revenue Code applicable to regulated investment companies and to distribute substantially all taxable income and capital gains to its shareholders. Therefore, no income tax provision is required. |
| | |
| | Each Fund files U.S. federal and various state and local tax returns. No income tax returns are currently under examination. The statute of limitations on each Fund’s filed U.S. federal tax returns remains open for the fiscal years ended October 31, 2013 through October 31, 2016. The statutes of limitations on the Trust’s state and local tax returns may remain open for an additional year depending upon the jurisdiction. |
| | |
| (e) | Expenses–Expenses incurred by the Trust that do not specifically relate to an individual fund are generally allocated to the funds within the Trust on a pro rata basis by relative net assets. Expenses, excluding class-specific expenses, are allocated to each class of shares based upon the relative proportion of net assets at the beginning of the day. Class A, B, C, F, P, R2, R3 and R4 shares bear their class-specific share of all expenses and fees relating to the Funds’ 12b-1 Distribution Plan. |
| | |
| (f) | Foreign Transactions–The books and records of each Fund are maintained in U.S. dollars and transactions denominated in foreign currencies are recorded in each Fund’s records at the rate prevailing when earned or recorded. Asset and liability accounts that are denominated in foreign currencies are adjusted daily to reflect current exchange rates and any unrealized gain (loss) is included in Net change in unrealized appreciation/depreciation on translation of assets and liabilities denominated in foreign currencies in each Fund’s Statement of Operations. The resultant exchange gains and losses upon settlement of such transactions are included in Net realized loss on foreign currency related transactions in each Fund’s Statement of Operations. The Funds do not isolate that portion of the results of operations arising as a result of changes in the foreign exchange rates from the changes in market prices of the securities. |
| | |
| | The Funds use foreign currency exchange contracts to facilitate transactions in foreign-denominated securities. Losses from these transactions may arise from changes in the value of the foreign currency or if the counterparties do not perform under the contracts’ terms. |
| | |
| (g) | Forward Foreign Currency Exchange Contracts–International Core Equity Fund, International Dividend Income Fund and International Opportunities Fund may enter into forward foreign currency exchange contracts in order to reduce their exposure to changes in foreign currency exchange rates on their foreign portfolio holdings, or gain or reduce exposure to foreign currency solely for investment purposes. A forward foreign currency exchange contract is a commitment to purchase or sell a foreign currency at a future date at a negotiated rate. The contracts are valued daily at forward exchange rates and any unrealized gain (loss) is included in Net change in unrealized appreciation/depreciation on translation of assets and liabilities denominated in foreign currencies in each Fund’s Statement of Operations. The gain (loss) arising from the difference between the U.S. dollar cost of the original contract and the value of the foreign currency in U.S. dollars upon closing of such contracts is included in Net realized loss on foreign currency related transactions in each Fund’s Statement of Operations. |
112
Notes to Financial Statements (continued)
| (h) | Futures Contracts–Each Fund may purchase and sell futures contracts to enhance returns, to attempt to economically hedge some of its investment risk, or as a substitute position in lieu of holding the underlying asset on which the instrument is based. At the time of entering into a futures transaction, an investor is required to deposit and maintain a specified amount of cash or eligible securities called “initial margin.” Subsequent payments made or received by a Fund called “variation margin” are made on a daily basis as the market price of the futures contract fluctuates. Each Fund will record an unrealized gain (loss) based on the amount of variation margin. When a contract is closed, a realized gain (loss) is recorded equal to the difference between the opening and closing value of the contract. |
| | |
| (i) | Repurchase Agreements–Each Fund may enter into repurchase agreements with respect to securities. A repurchase agreement is a transaction in which a fund acquires a security and simultaneously commits to resell that security to the seller (a bank or securities dealer) at an agreed-upon price on an agreed-upon date. Each Fund requires at all times that the repurchase agreement be collateralized by cash, or by securities of the U.S. Government, its agencies, its instrumentalities, or U.S. Government sponsored enterprises having a value equal to, or in excess of, the value of the repurchase agreement (including accrued interest). If the seller of the agreement defaults on its obligation to repurchase the underlying securities at a time when the fair value of these securities has declined, a Fund may incur a loss upon disposition of the securities. |
| | |
| (j) | When-Issued or Forward Transactions–Each Fund may purchase portfolio securities on a when-issued or forward basis. When-issued or forward transactions involve a commitment by a Fund to purchase securities, with payment and delivery (“settlement”) to take place in the future, in order to secure what is considered to be an advantageous price or yield at the time of entering into the transaction. During the period between purchase and settlement, the fair value of the securities will fluctuate and assets consisting of cash and/or marketable securities (normally short-term U.S. Government or U.S. Government sponsored enterprise securities) marked to market daily in an amount sufficient to make payment at settlement will be segregated at each Fund’s custodian in order to pay for the commitment. At the time each Fund makes the commitment to purchase a security on a when-issued basis, it will record the transaction and reflect the liability for the purchase and fair value of the security in determining its NAV. Each Fund, generally, has the ability to close out a purchase obligation on or before the settlement date rather than take delivery of the security. Under no circumstances will settlement for such securities take place more than 120 days after the purchase date. |
| | |
| (k) | Fair Value Measurements–Fair value is defined as the price that each Fund would receive upon selling an investment or transferring a liability in an orderly transaction to an independent buyer in the principal or most advantageous market of the investment. A three-tier hierarchy is used to maximize the use of observable market data and minimize the use of unobservable inputs and to establish classification of fair value measurements for disclosure purposes. Inputs refer broadly to the assumptions that market participants would use in pricing the asset or liability, including assumptions about risk–for example, the risk inherent in a particular valuation technique used to measure fair value (such as a pricing model) and/or the risk inherent in the inputs to the valuation technique. Inputs may be observable or unobservable. Observable inputs reflect the assumptions market participants would use in pricing the asset or liability. Observable inputs are based on market data obtained from sources independent of the reporting entity. Unobservable |
113
Notes to Financial Statements (continued)
| | inputs reflect the reporting entity’s own assumptions about the assumptions market participants would use in pricing the asset or liability. Unobservable inputs are based on the best information available in the circumstances. The three-tier hierarchy classification is determined based on the lowest level of inputs that is significant to the fair value measurement, and is summarized in the three broad Levels listed below: |
| | |
| | • | Level 1 – | unadjusted quoted prices in active markets for identical investments; |
| | | | |
| | • | Level 2 – | other significant observable inputs (including quoted prices for similar investments, interest rates, prepayment speeds, credit risk, etc.); and |
| | | | |
| | • | Level 3 – | significant unobservable inputs (including each Fund’s own assumptions in determining the fair value of investments). |
| | | | |
| | A summary of inputs used in valuing each Fund’s investments and other financial instruments as of October 31, 2016 and, if applicable, Level 1/Level 2 transfers and Level 3 rollforwards for the fiscal year then ended is included in each Fund’s Schedule of Investments. |
| | |
| | Changes in valuation techniques may result in transfers into or out of an assigned level within the three-tier hierarchy. All transfers between different levels within the three-tier hierarchy are deemed to have occurred as of the beginning of the reporting period. The inputs or methodology used for valuing securities are not necessarily an indication of the risk associated with investing in those securities. |
| | |
| 3. | MANAGEMENT FEE AND OTHER TRANSACTIONS WITH AFFILIATES |
Management Fee
The Trust has a management agreement with Lord Abbett, pursuant to which Lord Abbett supplies each Fund with investment management services and executive and other personnel, provides office space and pays for ordinary and necessary office and clerical expenses relating to research and statistical work and supervision of each Fund’s investment portfolio.
For the year ended October 31, 2016, the effective management fee, net of any applicable waivers, was based on each Fund’s average daily net assets at the following annualized rates:
Net Effective
Management Fee |
| Alpha Strategy Fund | | | .00 | %(1) |
| Fundamental Equity Fund | | | .53 | %(2) |
| Growth Leaders Fund | | | .41 | %(3) |
| International Core Equity Fund | | | .51 | %(4) |
| International Dividend Income Fund | | | .61 | %(4) |
| International Opportunities Fund | | | .75 | %(5) |
| Value Opportunities Fund | | | .71 | %(6) |
| | |
| (1) | The management fee for Alpha Strategy Fund is based on the Fund’s average daily net assets at an annual rate of .10%. For the fiscal year ended October 31, 2016 and continuing through February 28, 2017, Lord Abbett has contractually agreed to waive its management fee at an annual rate of .05%. For the fiscal year ended October 31, 2016, Lord Abbett voluntarily waived the remainder of its management fee at an annual rate of .05%. Lord Abbett may discontinue the voluntary waiver or change the level of its voluntary waiver at any time. |
| | |
| (2) | The management fee for Fundamental Equity Fund is based on the Fund’s average daily net assets at the following annual rates: |
| | |
| | First $200 million | .75% |
| | Next $300 million | .65% |
| | Over $500 million | .50% |
114
Notes to Financial Statements (continued)
| (3) | The management fee for Growth Leaders Fund is based on the Fund’s average daily net assets at the following annual rates: |
| | |
| | First $2 billion | .55% |
| | Over $2 billion | .50% |
| | |
| (4) | The management fee for International Core Equity Fund and International Dividend Income Fund are based on each Fund’s average daily net assets at the following annual rates: |
| | |
| | First $1 billion | .70% |
| | Next $1 billion | .65% |
| | Over $2 billion | .60% |
| | |
| (5) | The management fee for International Opportunities Fund is based on the average daily net assets at the following annual rates: |
| | |
| | First $1 billion | .75% |
| | Next $1 billion | .70% |
| | Over $2 billion | .65% |
| | |
| (6) | The management fee for Value Opportunities Fund is based on the Fund’s average daily net assets at the following annual rates: |
| | |
| | First $1 billion | .75% |
| | Next $1 billion | .70% |
| | Next $3 billion | .65% |
| | Over $5 billion | .58% |
In addition, Lord Abbett provides certain administrative services to each Fund pursuant to an Administrative Services Agreement in return for a fee at an annual rate of ..04% of each Fund’s average daily net assets. Alpha Strategy Fund did not pay such fee during the period from November 1, 2015 to April 30, 2016. For the period May 1, 2016 to October 31, 2016, Alpha Strategy Fund paid such fee.
For the fiscal year ended October 31, 2016 and continuing through February 28, 2017, Lord Abbett has contractually agreed to waive its fees and reimburse expenses to the extent necessary to limit total net annual operating expenses, excluding 12b-1 fees, to the following annual rates:
| | | | | Funds | | |
| | | Growth | | International | | International |
| | | Leaders | | Core Equity | | Dividend Income |
| Classes | | Fund | | Fund | | Fund |
| A, B, C, P, R2, R3, R4 and R5 | | 0.60% | | 0.87% | | 0.87% |
| F and I | | 0.60% | | 0.77% | | 0.81% |
| R6 | | 0.50% | * | 0.70% | | 0.80% |
| | |
| * | 0.49% prior to March 1, 2016. |
All contractual fee waiver and expense reimbursement agreements between the Funds and Lord Abbett may be terminated only upon the approval of the Funds’ Board.
During the fiscal year ended October 31, 2016 and continuing through December 31, 2016, Alpha Strategy Fund entered into a Servicing Arrangement with the Underlying Funds in which it invests, pursuant to which each Underlying Fund paid a portion of the expenses (excluding management fees, fund administration fees, and distribution and service fees) of Alpha Strategy Fund in proportion to the average daily value of total Underlying Fund shares owned by Alpha Strategy Fund. The expenses assumed by the Underlying Funds are reflected in Expenses assumed by Underlying Funds in Alpha Strategy Fund’s Statement of Operations and Receivables from affiliates on Alpha Strategy Fund’s Statement of Assets and Liabilities. Effective January 1, 2017, the Board approved the discontinuation of the Servicing Arrangement with the Underlying Funds. As a result, Alpha Strategy Fund will bear its expenses fully beginning as of that date.
115
Notes to Financial Statements (continued)
In addition, during the fiscal year ended October 31, 2016 and continuing through December 31, 2016, Fundamental Equity Fund, Growth Leaders Fund, International Core Equity Fund, International Dividend Income Fund, International Opportunities Fund, and Value Opportunities Fund, along with certain other funds managed by Lord Abbett (collectively, the “Underlying Funds”), entered into a Servicing Arrangement with certain “Fund of Funds” managed by Lord Abbett, pursuant to which each Underlying Fund paid a portion of the expenses (excluding management fees, fund administration fees, and distribution and service fees) of each Fund of Funds in proportion to the average daily value of the Underlying Fund shares owned by each Fund of Funds. Amounts paid pursuant to the Servicing Arrangement, if applicable, are included in Subsidy expense of each Fund’s Statement of Operations and Payable to affiliates on each Fund’s Statement of Assets and Liabilities. Effective January 1, 2017, the Board approved the discontinuation of the Servicing Arrangement with Fund of Funds managed by Lord Abbett. As a result, each Fund of Funds will bear its expenses fully beginning as of that date.
As of October 31, 2016, the percentages of Fundamental Equity Fund’s, Growth Leaders Fund’s, International Core Equity Fund’s, International Dividend Income Fund’s, International Opportunities Fund’s and Value Opportunities Fund’s outstanding shares owned by each Fund of Funds were as follows:
| | | | | Growth | | International | | International | | International | | Value |
| | | Fundamental | | Leaders | | Core Equity | | Dividend | | Opportunities | | Opportunities |
| Fund of Funds | | Equity Fund | | Fund | | Fund | | Income Fund | | Fund | | Fund |
| Alpha Strategy Fund | | – | | – | | – | | – | | 39.23% | | 8.10% |
| Diversified Equity Strategy Fund | | 1.28% | | 1.71% | | 5.42% | | – | | 3.46% | | 0.89% |
| Multi-Asset Balanced Opportunity Fund | | – | | – | | 7.83% | | 18.24% | | – | | – |
| Multi-Asset Global Opportunity Fund | | – | | – | | 1.02% | | 6.88% | | – | | – |
| Multi-Asset Growth Fund | | – | | – | | 4.43% | | 14.21% | | – | | – |
| Multi-Asset Income Fund | | – | | – | | 7.29% | | 10.16% | | – | | – |
12b-1 Distribution Plan
Each Fund has adopted a distribution plan with respect to Class A, B, C, F, P, R2, R3 and R4 shares pursuant to Rule 12b-1 under the Act, which provides for the payment of ongoing distribution and service fees to Lord Abbett Distributor LLC (the “Distributor”), an affiliate of Lord Abbett. The following annual rates have been authorized by the Board pursuant to the plan:
| Fees* | Class A | | Class B | | Class C | | Class F(1) | | Class P(2) | | Class R2 | | Class R3 | | Class R4 |
| Service | .25% | | .25% | | .25% | | – | | .25% | | .25% | | .25% | | .25% |
| Distribution | – | | .75% | | .75% | | .10% | | .20% | | .35% | | .25% | | – |
| | |
| * | The Funds may designate a portion of the aggregate fee as attributable to service activities for purposes of calculating Financial Industry Regulatory Authority, Inc. (“FINRA”) sales charge limitations. |
| (1) | The Class F Share Rule 12b-1 fee may be designated as a service fee in limited circumstances as described in the Fund’s prospectus. |
| (2) | Fundamental Equity Fund, International Core Equity Fund, International Opportunities Fund and Value Opportunities Fund only. |
Class I, Class R5 and Class R6 shares do not have a distribution plan.
Commissions
Distributor received the following commissions on sales of shares of the Funds, after concessions were paid to authorized dealers, for the fiscal year ended October 31, 2016:
116
Notes to Financial Statements (continued)
| | | Distributor | | | Dealers’ | |
| | | Commissions | | | Concessions | |
| Alpha Strategy Fund | | | $ | 153,492 | | | | $ | 847,486 | |
| Fundamental Equity Fund | | | | 174,458 | | | | | 956,101 | |
| Growth Leaders Fund | | | | 549,175 | | | | | 3,141,552 | |
| International Core Equity Fund | | | | 47,068 | | | | | 255,352 | |
| International Dividend Income Fund | | | | 125,060 | | | | | 660,566 | |
| International Opportunities Fund | | | | 71,213 | | | | | 381,997 | |
| Value Opportunities Fund | | | | 365,578 | | | | | 1,988,455 | |
Distributor received the following amount of CDSCs for the fiscal year ended October 31, 2016:
| | | Class A | | | Class C | |
| Alpha Strategy Fund | | $ | 3,378 | | | $ | 19,419 | |
| Fundamental Equity Fund | | | 5,665 | | | | 11,333 | |
| Growth Leaders Fund | | | 24,803 | | | | 118,167 | |
| International Core Equity Fund | | | 242 | | | | 3,533 | |
| International Dividend Income Fund | | | 8,722 | | | | 14,628 | |
| International Opportunities Fund | | | 2,351 | | | | 7,090 | |
| Value Opportunities Fund | | | 2,311 | | | | 13,184 | |
Two Trustees and certain of the Trust’s officers have an interest in Lord Abbett.
| 4. | DISTRIBUTIONS AND CAPITAL LOSS CARRYFORWARDS |
Dividends from net investment income, if any, are declared and paid quarterly for International Dividend Income Fund and annually for Alpha Strategy Fund, Fundamental Equity Fund, Growth Leaders Fund, International Core Equity Fund, International Opportunities Fund and Value Opportunities Fund. Taxable net realized gains from investment transactions, reduced by allowable capital loss carryforwards, if any, are declared and distributed to shareholders at least annually. The capital loss carryforward amount, if any, is available to offset future net capital gains. Dividends and distributions to shareholders are recorded on the ex-dividend date. The amounts of dividends and distributions from net investment income and net realized capital gains are determined in accordance with federal income tax regulations, which may differ from accounting principles generally accepted in the United States of America. These book/tax differences are either considered temporary or permanent in nature. To the extent these differences are permanent in nature, such amounts are reclassified within the components of net assets based on their federal tax basis treatment; temporary differences do not require reclassification. Dividends and distributions, which exceed earnings and profits for tax purposes, are reported as a tax return of capital.
117
Notes to Financial Statements (continued)
Subsequent to the Funds’ fiscal year ended October 31, 2016, year-end distributions were paid. The approximate amounts were as follows:
| | | Net | | Net | | | | |
| | | Investment | | Long-Term | | | | |
| | | Income | | Capital Gain | | Record Date | | Ex-Date |
| Alpha Strategy Fund | | $ | – | | | $ | 125,575,000 | | | December 20, 2016 | | December 21, 2016 |
| Fundamental Equity Fund | | | 40,226,000 | | | | 105,931,000 | | | November 21, 2016 | | November 22, 2016 |
| International Core Equity Fund | | | 11,750,000 | | | | – | | | December 15, 2016 | | December 16, 2016 |
| International Dividend Income Fund | | | 3,671,000 | | | | – | | | December 15, 2016 | | December 16, 2016 |
| International Opportunities Fund | | | 4,402,000 | | | | – | | | December 15, 2016 | | December 16, 2016 |
| Value Opportunities Fund | | | 1,829,000 | | | | 160,562,000 | | | November 21, 2016 | | November 22, 2016 |
The tax character of distributions paid during the fiscal years ended October 31, 2016 and 2015 was as follows:
| | | Alpha Strategy Fund | | | Fundamental Equity Fund | |
| | | Year Ended | | | Year Ended | | | Year Ended | | | Year Ended | |
| | | 10/31/2016 | | | 10/31/2015 | | | 10/31/2016 | | | 10/31/2015 | |
| Distributions paid from: | | | | | | | | | | | | | | | | |
| Ordinary income | | $ | 6,087,708 | | | $ | 17,527,867 | | | $ | 41,598,137 | | | $ | 225,917,626 | |
| Net long-term capital gains | | | 162,272,374 | | | | 118,549,905 | | | | 311,273,845 | | | | 712,708,155 | |
| Total distributions paid | | $ | 168,360,082 | | | $ | 136,077,772 | | | $ | 352,871,982 | | | $ | 938,625,781 | |
| | | | | | | | | | | | | | | | | |
| | | Growth Leaders Fund | | | International Core Equity Fund | |
| | | Year Ended | | | Year Ended | | | Year Ended | | | Year Ended | |
| | | 10/31/2016 | | | 10/31/2015 | | | 10/31/2016 | | | 10/31/2015 | |
| Distributions paid from: | | | | | | | | | | | | | | | | |
| Ordinary income | | $ | 86,118,259 | | | $ | 73,120,882 | | | $ | 6,595,906 | | | $ | 6,527,984 | |
| Net long-term capital gains | | | 10,007,653 | | | | 925,072 | | | | – | | | | – | |
| Total distributions paid | | $ | 96,125,912 | | | $ | 74,045,954 | | | $ | 6,595,906 | | | $ | 6,527,984 | |
| | | | | | | | | | | | | | | | | |
| | | International Dividend Income Fund | | | International Opportunities Fund | |
| | | Year Ended | | | Year Ended | | | Year Ended | | | Year Ended | |
| | | 10/31/2016 | | | 10/31/2015 | | | 10/31/2016 | | | 10/31/2015 | |
| Distributions paid from: | | | | | | | | | | | | | | | | |
| Ordinary income | | $ | 56,293,614 | | | $ | 81,607,020 | | | $ | 10,345,359 | | | $ | 5,964,486 | |
| Net long-term capital gains | | | – | | | | 141,434,115 | | | | 16,340,480 | | | | 13,687,933 | |
| Total distributions paid | | $ | 56,293,614 | | | $ | 223,041,135 | | | $ | 26,685,839 | | | $ | 19,652,419 | |
| | | | | | | | | | | | | | | | | |
| | | Value Opportunities Fund | | | | | | | | | |
| | | Year Ended | | | Year Ended | | | | | | | | | |
| | | 10/31/2016 | | | 10/31/2015 | | | | | | | | | |
| Distributions paid from: | | | | | | | | | | | | | | | | |
| Ordinary income | | $ | – | | | $ | 65,969,568 | | | | | | | | | |
| Net long-term capital gains | | | 191,979,908 | | | | 343,597,289 | | | | | | | | | |
| Total distributions paid | | $ | 191,979,908 | | | $ | 409,566,857 | | | | | | | | | |
118
Notes to Financial Statements (continued)
As of October 31, 2016, the components of accumulated gains (losses) on a tax-basis were as follows:
| | | Alpha | | | Fundamental | |
| | | Strategy Fund | | | Equity Fund | |
| Undistributed ordinary income - net | | $ | – | | | $ | 32,870,857 | |
| Undistributed long-term capital gains | | | 125,573,836 | | | | 105,913,451 | |
| Total undistributed earnings | | | 125,573,836 | | | | 138,784,308 | |
| Temporary differences | | | (2,999,150 | ) | | | (796,100 | ) |
| Unrealized gains - net | | | 6,207,252 | | | | 313,507,694 | |
| Total accumulated gains - net | | $ | 128,781,938 | | | $ | 451,495,902 | |
| | | | | | | | | |
| | | Growth | | | International | |
| | | Leaders Fund | | | Core Equity Fund | |
| Undistributed ordinary income - net | | $ | – | | | $ | 11,189,127 | |
| Total undistributed earnings | | | – | | | | 11,189,127 | |
| Capital loss carryforwards* | | | (50,721,751 | ) | | | (243,231,039 | ) |
| Temporary differences | | | (730,007 | ) | | | (141,928 | ) |
| Unrealized gains - net | | | 118,170,986 | | | | 10,726,761 | |
| Total accumulated gains (losses) - net | | $ | 66,719,228 | | | $ | (221,457,079 | ) |
| | | | | | | | | |
| | | | | | International | |
| | | International | | | Opportunities | |
| | | Dividend Income Fund | | | Fund | |
| Undistributed ordinary income - net | | $ | 4,321,841 | | | $ | 4,145,494 | |
| Total undistributed earnings | | | 4,321,841 | | | | 4,145,494 | |
| Capital loss carryforwards* | | | (376,705,020 | ) | | | (25,099,463 | ) |
| Temporary differences | | | (212,052 | ) | | | (75,363 | ) |
| Unrealized gains (losses) - net | | | (100,887,775 | ) | | | 26,727,846 | |
| Total accumulated gains (losses) - net | | $ | (473,483,006 | ) | | $ | 5,698,514 | |
| | | | | | | | | |
| | | Value | | | | | |
| | | Opportunities Fund | | | | | |
| Undistributed long-term capital gains | | $ | 160,560,473 | | | | | |
| Total undistributed earnings | | | 160,560,473 | | | | | |
| Temporary differences | | | (399,799 | ) | | | | |
| Unrealized gains - net | | | 467,039,964 | | | | | |
| Total accumulated gains - net | | $ | 627,200,638 | | | | | |
| | |
| * | As of October 31, 2016, the capital loss carryforwards, along with the related expiration dates, were as follows: |
| | |
| | | 2017 | | | Indefinite | | | Total | |
| Growth Leaders Fund | | $ | – | | | $ | 50,721,751 | | | $ | 50,721,751 | |
| International Core Equity Fund | | | 198,263,766 | | | | 44,967,273 | | | | 243,231,039 | |
| International Dividend Income Fund | | | – | | | | 376,705,020 | | | | 376,705,020 | |
| International Opportunities Fund | | | – | | | | 25,099,463 | | | | 25,099,463 | |
In accordance with the Regulated Investment Company Modernization Act of 2010, each Fund will carryforward capital losses incurred in taxable years beginning after December 22, 2010 (“post-enactment losses”) indefinitely. Post-enactment losses will also retain their character as either short-term or long-term and be utilized before any pre-enactment losses.
119
Notes to Financial Statements (continued)
At each Fund’s election, certain losses incurred within the taxable year (Qualified Late-Year Losses) are deemed to arise on the first business day of the Fund’s next taxable year. The following Funds incurred and will elect to defer late-year ordinary losses during fiscal 2016 as follows:
| Alpha Strategy Fund | $2,848,337 |
| Growth Leaders Fund | 614,242 |
As of October 31, 2016, the aggregate unrealized security gains and losses based on cost for U.S. federal income tax purposes were as follows:
| | | Alpha
Strategy Fund | | | Fundamental
Equity Fund | | | Growth
Leaders Fund | |
| Tax cost | | $ | 1,109,844,775 | | | $ | 2,524,206,484 | | | $ | 2,045,077,155 | |
| Gross unrealized gain | | | 67,632,400 | | | | 341,464,212 | | | | 150,061,818 | |
| Gross unrealized loss | | | (61,425,148 | ) | | | (27,956,518 | ) | | | (31,890,832 | ) |
| Net unrealized security gain | | $ | 6,207,252 | | | $ | 313,507,694 | | | $ | 118,170,986 | |
| | | | | | | | | | | | | |
| | | International
Core Equity Fund | | | International
Dividend
Income Fund | | | International
Opportunities Fund | |
| Tax cost | | $ | 535,062,713 | | | $ | 1,415,777,935 | | | $ | 535,194,319 | |
| Gross unrealized gain | | | 27,134,261 | �� | | | 52,379,897 | | | | 53,395,763 | |
| Gross unrealized loss | | | (16,300,622 | ) | | | (153,129,265 | ) | | | (26,426,651 | ) |
| Net unrealized security gain (loss) | | $ | 10,833,639 | | | $ | (100,749,368 | ) | | $ | 26,969,112 | |
| | | | | | | | | | | | | |
| | | Value
Opportunities Fund | | | | | | | | | |
| Tax cost | | $ | 2,211,948,106 | | | | | | | | | |
| Gross unrealized gain | | | 517,211,023 | | | | | | | | | |
| Gross unrealized loss | | | (50,171,059 | ) | | | | | | | | |
| Net unrealized security gain | | $ | 467,039,964 | | | | | | | | | |
The difference between book-basis and tax-basis unrealized gains (losses) is attributable to the tax treatment of certain securities and wash sales.
Permanent items identified during the fiscal year ended October 31, 2016 have been reclassified among the components of net assets based on their tax basis treatment as follows:
| | | Undistributed
(Distributions
in Excess of)
Net Investment
Income | | | Accumulated Net
Realized Gain (Loss) | | | Paid-in Capital | |
| Alpha Strategy Fund | | | $9,379,651 | | | | $(9,379,651 | ) | | $ | – | |
| Fundamental Equity Fund | | | (2,486,646 | ) | | | 2,486,646 | | | | – | |
| Growth Leaders Fund | | | (316,898 | ) | | | 327,030 | | | | (10,132 | ) |
| International Core Equity Fund | | | 118,829 | | | | (118,829 | ) | | | – | |
| International Dividend Income Fund | | | (2,093,834 | ) | | | 2,093,834 | | | | – | |
| International Opportunities Fund | | | 416,706 | | | | (416,706 | ) | | | – | |
| Value Opportunities Fund | | | 4,835,214 | | | | (387,981 | ) | | | (4,447,233 | ) |
The permanent differences are primarily attributable to the tax treatment of net investment losses, certain distributions, certain expenses, foreign currency transactions, and certain securities.
120
Notes to Financial Statements (continued)
| 5. | PORTFOLIO SECURITIES TRANSACTIONS |
Purchases and sales of investment securities (excluding short-term investments) for the fiscal year ended October 31, 2016 were as follows:
| | | Purchases | | | Sales | |
| Alpha Strategy Fund | | $ | 146,203,866 | | | $ | 190,898,015 | |
| Fundamental Equity Fund | | | 4,135,737,171 | | | | 5,014,438,255 | |
| Growth Leaders Fund | | | 5,370,896,144 | | | | 5,236,523,692 | |
| International Core Equity Fund | | | 877,375,786 | | | | 813,935,152 | |
| International Dividend Income Fund | | | 925,954,010 | | | | 1,578,613,259 | |
| International Opportunities Fund | | | 466,158,585 | | | | 504,079,044 | |
| Value Opportunities Fund | | | 946,701,605 | | | | 1,086,957,375 | |
There were no purchases or sales of U.S. Government securities for the fiscal year ended October 31, 2016.
| 6. | DISCLOSURES ABOUT DERIVATIVE INSTRUMENTS AND HEDGING ACTIVITIES |
International Core Equity Fund, International Dividend Income Fund and International Opportunities Fund entered into forward foreign currency exchange contracts for the year ended October 31, 2016 (as described in note 2(g)). A forward foreign currency exchange contract reduces each Fund’s exposure to changes in the value of the currency it will deliver (or settle in cash) and increases its exposure to changes in the value of the currency it will receive (or settle in cash) for the duration of the contract. Each Fund’s use of forward foreign currency exchange contracts involves the risk that Lord Abbett will not accurately predict currency movements, and each Fund’s returns could be reduced as a result. Forward foreign currency exchange contracts are subject to the risk that those currencies will decline in value relative to the U.S. dollar, or, in the case of hedged positions, that the U.S. dollar will decline relative to the currency being hedged. Currency rates in foreign countries may fluctuate significantly over short periods of time. Each Fund’s risk of loss from counterparty credit risk is the unrealized appreciation on forward foreign currency exchange contracts.
As of October 31, 2016, International Core Equity Fund, International Dividend Income Fund and International Opportunities Fund had the following derivatives at fair value, grouped into risk categories that illustrate the Funds’ use of derivative instruments:
| | | International
Core Equity Fund | | | International
Dividend Income Fund |
| Asset Derivatives(1) | | Foreign
Currency
Contracts | | | Foreign
Currency
Contracts |
| Forward Foreign Currency Exchange Contracts | | $ | 966,235 | | | $ | 5,787,315 |
| | | | | | | | |
| Liability Derivatives(2) | | | | | | | |
| Forward Foreign Currency Exchange Contracts | | $ | 1,275,816 | | | $ | 4,664,631 |
121
Notes to Financial Statements (continued)
| | | International
Opportunities Fund | | | | |
| Asset Derivatives(1) | | Foreign
Currency
Contracts | | | | |
| Forward Foreign Currency Exchange Contracts | | $ | 1,231,847 | | | | |
| | | | | | | | |
| Liability Derivatives(2) | | | | | | | |
| Forward Foreign Currency Exchange Contracts | | $ | 3,136,249 | | | | |
| (1) | Statements of Assets and Liabilities location: Unrealized appreciation on forward foreign currency exchange contracts. |
| ((2) | Statements of Assets and Liabilities location: Unrealized depreciation on forward foreign currency exchange contracts. |
Transactions in derivative instruments for the fiscal year ended October 31, 2016, were as follows:
| | | International
Core Equity Fund | | | International
Dividend Income Fund |
| | | Forward
Currency
Contracts | | | Forward
Currency
Contracts |
| Net Realized Gain (Loss)(1) | | | | | | | |
| Forward Foreign Currency Exchange Contracts | | $ | 2,539,901 | | | $ | 25,048,349 |
| Net Change in Unrealized Appreciation/Depreciation(2) | | | | | | | |
| Forward Foreign Currency Exchange Contracts | | $ | 1,301,770 | | | $ | 15,728,753 |
| Average Number of Contracts/Notional Amounts* | | | | | | | |
| Forward Foreign Currency Exchange Contracts(3) | | $ | 194,485,675 | | | $ | 984,417,330 |
| | | | | | | | |
| | | International
Opportunities Fund | | | | |
| | | Foreign
Currency
Contracts | | | | |
| Net Realized Gain (Loss)(1) | | | | | | | |
| Forward Foreign Currency Exchange Contracts | | $ | 3,135,737 | | | | |
| Net Change in Unrealized Appreciation/Depreciation(2) | | | | | | | |
| Forward Foreign Currency Exchange Contracts | | $ | (2,583,481 | ) | | | |
| Average Number of Contracts/Notional Amounts* | | | | | | | |
| Forward Foreign Currency Exchange Contracts(3) | | $ | 221,019,115 | | | | |
| * | Calculated based on the number of contracts or notional amounts for the fiscal year ended October 31, 2016. |
| (1) | Statements of Operations location: Net realized gain on foreign currency related transactions. |
| (2) | Statements of Operations location: Net change in unrealized appreciation/depreciation on translation of assets and liabilities denominated in foreign currencies. |
| (3) | Amount represents notional amounts in U.S. dollars. |
| 7. | DISCLOSURES ABOUT OFFSETTING ASSETS AND LIABILITIES |
The Financial Accounting Standards Board (“FASB”) requires disclosures intended to help better assess the effect or potential effect of offsetting arrangements on a fund’s financial position. The following tables illustrate gross and net information about recognized assets and liabilities eligible for offset in the statements of assets and liabilities; and disclose such amounts subject to an enforceable master netting agreement or similar agreement, by counterparty. A master netting agreement is an agreement between a fund and a counterparty which provides for the net settlement of amounts owed under all contracts traded under that agreement, as well as cash
122
Notes to Financial Statements (continued)
collateral, through a single payment by one party to the other in the event of default on or termination of any one contract. The Funds’ accounting policy with respect to balance sheet offsetting is that, absent an event of default by the counterparty or a termination of the agreement, the master netting agreement does not result in an offset of reported amounts of financial assets and liabilities in the statement of assets and liabilities across transactions between the Funds and the applicable counterparty:
| | | Fundamental Equity Fund | |
| Description | Gross Amounts of
Recognized Assets | | Gross Amounts
Offset in the
Statement of Assets
and Liabilities | | Net Amounts of
Assets Presented
in the Statement of
Assets and Liabilities | |
| Repurchase Agreement | | | $62,659,243 | | | $ | – | | | | $62,659,243 | |
| Total | | | $62,659,243 | | | $ | – | | | | $62,659,243 | |
| | | Net Amounts
of Assets
Presented in | | | Amounts Not Offset in the
Statement of Assets and Liabilities | | | | |
| Counterparty | | the Statement
of Assets and
Liabilities | | | Financial
Instruments | | | Cash
Collateral
Received(a) | | | Securities
Collateral
Received(a) | | | Net
Amount(b) | |
| Fixed Income Clearing Corp. | | | $62,659,243 | | | $ | – | | | $ | – | | | | $(62,659,243 | ) | | $ | – | |
| Total | | | $62,659,243 | | | $ | – | | | $ | – | | | | $(62,659,243 | ) | | $ | – | |
| | | Growth Leaders Fund | |
| Description | Gross Amounts of
Recognized Assets | | Gross Amounts
Offset in the
Statement of Assets
and Liabilities | | Net Amounts of
Assets Presented
in the Statement of
Assets and Liabilities | |
| Repurchase Agreement | | | $92,589,845 | | | $ | – | | | | $92,589,845 | |
| Total | | | $92,589,845 | | | $ | – | | | | $92,589,845 | |
| | | Net Amounts
of Assets
Presented in | | | Amounts Not Offset in the
Statement of Assets and Liabilities | | | | |
| Counterparty | | the Statement
of Assets and
Liabilities | | | Financial
Instruments | | | Cash Collateral
Received(a) | | | Securities Collateral
Received(a) | | | Net
Amount(b) | |
| Fixed Income Clearing Corp. | | | $92,589,845 | | | $ | – | | | $ | – | | | | $(92,589,845 | ) | | $ | – | |
| Total | | | $92,589,845 | | | $ | – | | | $ | – | | | | $(92,589,845 | ) | | $ | – | |
| | | International Core Equity Fund | |
| Description | Gross Amounts of
Recognized Assets | | Gross Amounts
Offset in the
Statement of Assets
and Liabilities | | Net Amounts of
Assets Presented
in the Statement of
Assets and Liabilities | |
| Forward Foreign Currency Exchange Contracts | | | $ 966,235 | | | $ | – | | | | $ 966,235 | |
| Repurchase Agreement | | | 2,781,649 | | | | – | | | | 2,781,649 | |
| Total | | | $3,747,884 | | | $ | – | | | | $3,747,884 | |
123
Notes to Financial Statements (continued)
| | Net Amounts
of Assets
Presented in | | | Amounts Not Offset in the
Statement of Assets and Liabilities | | | | |
| Counterparty | | the Statement
of Assets and
Liabilities | | | Financial
Instruments | | | Cash
Collateral
Received(a) | | | Securities
Collateral
Received(a) | | | Net
Amount(b) | |
| Bank of America | | $ | 35,675 | | | $ | (35,675 | ) | | $ | – | | | $ | – | | | $ | – | |
| Fixed Income Clearing Corp. | | | 2,781,649 | | | | – | | | | – | | | | (2,781,649 | ) | | | – | |
| Goldman Sachs | | | 19,298 | | | | (19,298 | ) | | | – | | | | – | | | | – | |
| J.P. Morgan Chase | | | 61,371 | | | | – | | | | – | | | | – | | | | 61,371 | |
| Morgan Stanley | | | 342,243 | | | | (8,995 | ) | | | (270,000 | ) | | | – | | | | 63,248 | |
| Standard Chartered Bank | | | 316,469 | | | | – | | | | (260,000 | ) | | | – | | | | 56,469 | |
| State Street Bank and Trust | | | 191,179 | | | | (191,179 | ) | | | – | | | | – | | | | – | |
| Total | | $ | 3,747,884 | | | $ | (255,147 | ) | | $ | (530,000 | ) | | $ | (2,781,649 | ) | | $ | 181,088 | |
| Description | Gross Amounts of
Recognized Liabilities | | Gross Amounts
Offset in the
Statement of Assets
and Liabilities | | Net Amounts of
Liabilities Presented
in the Statement of
Assets and Liabilities | |
| Forward Foreign Currency Exchange Contracts | | | $1,275,816 | | | $ | – | | | | $1,275,816 | |
| Total | | | $1,275,816 | | | $ | – | | | | $1,275,816 | |
| | Net Amounts
of Liabilities
Presented in | | | Amounts Not Offset in the
Statement of Assets and Liabilities | | | | |
| Counterparty | the Statement
of Assets and
Liabilities | | | Financial
Instruments | | | Cash
Collateral
Pledged(a) | | | Securities
Collateral
Pledged(a) | | | Net
Amount(c) | |
| Bank of America | | $ | 174,258 | | | $ | (35,675 | ) | | $ | (80,000 | ) | | $ | – | | | $ | 58,583 | |
| Goldman Sachs | | | 79,685 | | | | (19,298 | ) | | | (30,000 | ) | | | – | | | | 30,387 | |
| Morgan Stanley | | | 8,995 | | | | (8,995 | ) | | | – | | | | – | | | | – | |
| State Street Bank and Trust | | | 1,012,878 | | | | (191,179 | ) | | | (730,000 | ) | | | – | | | | 91,699 | |
| Total | | $ | 1,275,816 | | | $ | (255,147 | ) | | $ | (840,000 | ) | | $ | – | | | $ | 180,669 | |
| | | International Dividend Income Fund | |
| Description | | Gross Amounts of
Recognized Assets | | | Gross Amounts
Offset in the
Statement of Assets
and Liabilities | | Net Amounts of
Assets Presented
in the Statement of
Assets and Liabilities | |
| Forward Foreign Currency Exchange Contracts | | | $5,787,315 | | | $ | – | | | | $5,787,315 | |
| Total | | | $5,787,315 | | | $ | – | | | | $5,787,315 | |
124
Notes to Financial Statements (continued)
| | | Net Amounts
of Assets
Presented in | | | Amounts Not Offset in the
Statement of Assets and Liabilities | | | | |
| Counterparty | | the Statement
of Assets and
Liabilities | | | Financial
Instruments | | Cash
Collateral
Received(a) | | Securities
Collateral
Received(a) | | | Net
Amount(b) | |
| Bank of America | | $ | 249,923 | | | $ | (249,923 | ) | | $ | – | | | $ | – | | | $ | – | |
| Barclays Bank plc | | | 2,211,563 | | | | (82,046 | ) | | | (1,480,000 | ) | | | – | | | | 649,517 | |
| Citibank | | | 107,147 | | | | (107,147 | ) | | | – | | | | – | | | | – | |
| Goldman Sachs | | | 447,190 | | | | (393,267 | ) | | | (53,923 | ) | | | – | | | | – | |
| J.P. Morgan Chase | | | 251,916 | | | | (251,916 | ) | | | – | | | | – | | | | – | |
| Morgan Stanley | | | 99,512 | | | | (27,424 | ) | | | – | | | | – | | | | 72,088 | |
| Standard Chartered Bank | | | 2,110,740 | | | | (2,098,828 | ) | | | (11,912 | ) | | | – | | | | – | |
| State Street Bank and Trust | | | 309,324 | | | | (309,324 | ) | | | – | | | | – | | | | – | |
| Total | | $ | 5,787,315 | | | $ | (3,519,875 | ) | | $ | (1,545,835 | ) | | $ | – | | | $ | 721,605 | |
| Description | | Gross Amounts of
Recognized Liabilities | | Gross Amounts
Offset in the
Statement of Assets
and Liabilities | | Net Amounts of
Liabilities Presented
in the Statement of
Assets and Liabilities | |
| Forward Foreign Currency Exchange Contracts | | | $4,664,631 | | | $ | – | | | | $4,664,631 | |
| Total | | | $4,664,631 | | | $ | – | | | | $4,664,631 | |
| | | Net Amounts
of Liabilities
Presented in | | | Amounts Not Offset in the
Statement of Assets and Liabilities | | | | |
| Counterparty | | the Statement
of Assets and
Liabilities | | | Financial
Instruments | | Cash
Collateral
Pledged(a) | | | Securities
Collateral
Pledged(a) | | | Net
Amount(c) | |
| Bank of America | | $ | 315,237 | | | $ | (249,923 | ) | | $ | – | | | $ | – | | | $ | 65,314 | |
| Barclays Bank plc | | | 82,046 | | | | (82,046 | ) | | | – | | | | – | | | | – | |
| Citibank | | | 109,265 | | | | (107,147 | ) | | | – | | | | – | | | | 2,118 | |
| Deutsche Bank AG | | | 14,404 | | | | – | | | | – | | | | – | | | | 14,404 | |
| Goldman Sachs | | | 393,267 | | | | (393,267 | ) | | | – | | | | – | | | | – | |
| J.P. Morgan Chase | | | 469,408 | | | | (251,916 | ) | | | (90,000 | ) | | | – | | | | 127,492 | |
| Morgan Stanley | | | 27,424 | | | | (27,424 | ) | | | – | | | | – | | | | – | |
| Standard Chartered Bank | | | 2,098,828 | | | | (2,098,828 | ) | | | – | | | | – | | | | – | |
| State Street Bank and Trust | | | 1,154,752 | | | | (309,324 | ) | | | (800,000 | ) | | | – | | | | 45,428 | |
| Total | | $ | 4,664,631 | | | $ | (3,519,875 | ) | | $ | (890,000 | ) | | $ | – | | | $ | 254,756 | |
| | | | | | International Opportunities Fund | |
| Description | | Gross Amounts of
Recognized Assets | | Gross Amounts
Offset in the
Statement of Assets
and Liabilities | | Net Amounts of
Assets Presented
in the Statement of
Assets and Liabilities | |
| Forward Foreign Currency Exchange Contracts | | | $ 1,231,847 | | | $ | – | | | | $ 1,231,847 | |
| Repurchase Agreement | | | 22,084,491 | | | | – | | | | 22,084,491 | |
| Total | | | $23,316,338 | | | $ | – | | | | $23,316,338 | |
125
Notes to Financial Statements (continued)
| | | Net Amounts
of Assets
Presented in | | | Amounts Not Offset in the
Statement of Assets and Liabilities | | | | |
| Counterparty | | the Statement
of Assets and
Liabilities | | | Financial
Instruments | | | Cash
Collateral
Received(a) | | | Securities
Collateral
Received(a) | | | Net
Amount(b) | |
| Bank of America | | $ | 176,396 | | | $ | (176,396 | ) | | $ | – | | | $ | – | | | $ | – | |
| Fixed Income Clearing Corp. | | | 22,084,491 | | | | – | | | | – | | | | (22,084,491 | ) | | | – | |
| Goldman Sachs | | | 106,544 | | | | (106,544 | ) | | | – | | | | – | | | | – | |
| J.P. Morgan Chase | | | 222,421 | | | | (84,335 | ) | | | (138,086 | ) | | | – | | | | – | |
| Morgan Stanley | | | 24,238 | | | | (24,238 | ) | | | – | | | | – | | | | – | |
| State Street Bank and Trust | | | 702,248 | | | | (262,867 | ) | | | (390,000 | ) | | | – | | | | 49,381 | |
| Total | | $ | 23,316,338 | | | $ | (654,380 | ) | | $ | (528,086 | ) | | $ | (22,084,491 | ) | | $ | 49,381 | |
| Description | Gross Amounts of
Recognized Liabilities | | Gross Amounts
Offset in the
Statement of Assets
and Liabilities | | Net Amounts of
Liabilities Presented
in the Statement of
Assets and Liabilities | |
| Forward Foreign Currency Exchange Contracts | | | $3,136,249 | | | $ | – | | | | $3,136,249 | |
| Total | | | $3,136,249 | | | $ | – | | | | $3,136,249 | |
| | | Net Amounts
of Liabilities
Presented in | | | Amounts Not Offset in the
Statement of Assets and Liabilities | | | | |
| Counterparty | | the Statement
of Assets and
Liabilities | | | Financial
Instruments | | | Cash
Collateral
Pledged(a) | | | Securities
Collateral
Pledged(a) | | | Net
Amount(c) | |
| Bank of America | | $ | 469,450 | | | $ | (176,396 | ) | | $ | – | | | $ | – | | | $ | 293,054 | |
| Barclays Bank plc | | | 3,410 | | | | – | | | | – | | | | – | | | | 3,410 | |
| Citibank | | | 7,447 | | | | – | | | | – | | | | – | | | | 7,447 | |
| Goldman Sachs | | | 1,095,489 | | | | (106,544 | ) | | | (988,945 | ) | | | – | | | | – | |
| J.P. Morgan Chase | | | 84,335 | | | | (84,335 | ) | | | – | | | | – | | | | – | |
| Morgan Stanley | | | 410,972 | | | | (24,238 | ) | | | (270,000 | ) | | | – | | | | 116,734 | |
| Standard Chartered Bank | | | 552,191 | | | | – | | | | (540,000 | ) | | | – | | | | 12,191 | |
| State Street Bank and Trust | | | 262,867 | | | | (262,867 | ) | | | – | | | | – | | | | – | |
| UBS AG | | | 250,088 | | | | – | | | | (250,088 | ) | | | – | | | | – | |
| Total | | $ | 3,136,249 | | | $ | (654,380 | ) | | $ | (2,049,033 | ) | | $ | – | | | $ | 432,836 | |
| | Value Opportunities Fund | |
| Description | Gross Amounts of
Recognized Assets | | Gross Amounts
Offset in the
Statement of Assets
and Liabilities | | Net Amounts of
Assets Presented
in the Statement of
Assets and Liabilities | |
| Repurchase Agreement | | | $100,933,910 | | | $ | – | | | | $100,933,910 | |
| Total | | | $100,933,910 | | | $ | – | | | | $100,933,910 | |
126
Notes to Financial Statements (continued)
| | | Net Amounts | | | | | | | | | | | | | |
| | | of Assets | | | Amounts Not Offset in the | | | | |
| | | Presented in | | | Statement of Assets and Liabilities | | | | |
| | | the Statement | | | | | | Cash | | | Securities | | | | |
| | | of Assets and | | | Financial | | | Collateral | | | Collateral | | | Net | |
| Counterparty | | Liabilities | | | Instruments | | | Received(a) | | | Received(a) | | | Amount(b) | |
| Fixed Income Clearing Corp. | | $ | 100,933,910 | | | $ | – | | | $ | – | | | $ | (100,933,910 | ) | | $ | – | |
| Total | | $ | 100,933,910 | | | $ | – | | | $ | – | | | $ | (100,933,910 | ) | | $ | – | |
| (a) | Collateral disclosed is limited to an amount not to exceed 100% of the net amount of assets presented in the Statements of Assets and Liabilities, for each respective counterparty. |
| (b) | Net amount represents the amount owed to the Fund by the counterparty as of October 31, 2016. |
| (c) | Net amount represents the amount owed by the Fund to the counterparty as of October 31, 2016. |
The Trust’s officers and two Trustees, who are associated with Lord Abbett, do not receive any compensation from the Trust for serving in such capacities. Independent Trustees’ fees are allocated among all Lord Abbett-sponsored funds based on the net assets of each fund. There is an equity-based plan available to all Independent Trustees under which Independent Trustees must defer receipt of a portion of, and may elect to defer receipt of an additional portion of Trustees’ fees. The deferred amounts are treated as though equivalent dollar amounts had been invested in the funds. Such amounts and earnings accrued thereon are included in Trustees’ fees on the Statements of Operations and in Trustees’ fees payable on the Statements of Assets and Liabilities and are not deductible for U.S. federal income tax purposes until such amounts are paid.
The Trust has entered into an arrangement with its transfer agent and custodian, whereby credits realized as a result of uninvested cash balances are used to reduce a portion of each Fund’s expenses.
The Funds and certain other funds managed by Lord Abbett (collectively, the “Participating Funds”) entered into a syndicated line of credit facility with various lenders for $550 million (the “Facility”), whereas State Street Bank and Trust Company (“SSB”) participates as a lender and as agent for the lenders. The Facility is to be used for temporary or emergency purposes as an additional source of liquidity to satisfy redemptions. The Participating Funds are subject to graduated borrowing limits of one-third of Fund assets (if Fund assets are less than $750 million), $250 million, $300 million, or $350 million based on past borrowings and likelihood of future borrowings. The Facility will continue through August 28, 2017.
During the fiscal year ended October 31, 2016, the Funds did not utilize the Facility.
| 11. | INTERFUND LENDING PROGRAM |
On July 26, 2016, the U.S. Securities and Exchange Commission issued an exemptive order (“SEC exemptive order”) which permits certain registered open-end management investment companies managed by Lord Abbett, including the Funds, to participate in a joint lending and borrowing program. The SEC exemptive order allows the Funds to borrow money from and lend money to each other for temporary or emergency purposes subject to limitations and conditions.
127
Notes to Financial Statements (continued)
During the fiscal year ended October 31, 2016, two Funds of the Trust participated as a lenders in the Interfund Lending Program. The average amount loaned, interest rate and interest income were as follows:
| | | | | | Average | | Interest |
| Fund | | Average Loan | | | Interest Rate | | Income* |
| Fundamental Equity Fund | | $ | 38,040,503 | | | | 0.6650 | % | | $ | 2,079 |
| Growth Leaders Fund | | $ | 5,742,466 | | | | 0.6650 | % | | $ | 314 |
* Included in the Statement of Operations.
There were no interfund loans outstanding as of October 31, 2016.
| 12. | CUSTODIAN AND ACCOUNTING AGENT |
SSB is the Trust’s custodian and accounting agent. SSB performs custodial, accounting and recordkeeping functions relating to portfolio transactions and calculating each Fund’s NAV.
| 13. | TRANSACTIONS WITH AFFILIATED ISSUERS |
An affiliated issuer is one in which a Fund has ownership of at least 5% of the outstanding voting securities of the underlying issuer at any point during the fiscal year or any company which is under common ownership or control. Alpha Strategy Fund had the following transactions with affiliated issuers (i.e. the Underlying Funds) during the fiscal year ended October 31, 2016:
Alpha Strategy Fund
| | | Balance of | | | | | | | | | Balance of | | | | | | Net Realized | | | Dividend | |
| | | Shares | | | | | | | | | Shares | | | Fair | | | Gain | | | Income | |
| | | Held at | | | Gross | | | Gross | | | Held at | | | Value at | | | 11/1/2015 to | | | 11/1/2015 to | |
| Affiliated Issuer | | 10/31/2015 | | | Additions | | | Sales | | | 10/31/2016 | | | 10/31/2016 | | | 10/31/2016 | | | 10/31/2016 | |
| Lord Abbett Developing Growth Fund, Inc. – Class I | | | 10,212,437 | | | | 1,890,943 | | | | (1,181,997 | ) | | | 10,921,383 | | | $ | 217,117,103 | | | $ | 22,297,598 | (a) | | $ | – | |
| Lord Abbett Securities Trust – International Opportunities Fund – Class I | | | 14,820,884 | | | | 741,714 | | | | (1,907,685 | ) | | | 13,654,913 | | | | 226,125,360 | | | | 17,484,905 | (b) | | | 2,001,129 | |
| Lord Abbett Securities Trust – Micro-Cap Growth Fund – Class I | | | 6,442,039 | | | | 2,239,857 | | | | (1,003,379 | ) | | | 7,678,517 | | | | 109,034,939 | | | | 24,891,330 | (c) | | | – | |
| Lord Abbett Securities Trust – Micro-Cap Value Fund – Class I | | | 4,107,639 | | | | 105,325 | | | | (962,079 | ) | | | 3,250,885 | | | | 113,618,414 | | | | 8,267,118 | (d) | | | – | |
| Lord Abbett Research Fund, Inc. – Small-Cap Value Fund – Class I | | | 8,850,716 | | | | 1,872,210 | | | | (1,855,846 | ) | | | 8,867,080 | | | | 225,489,841 | | | | 33,311,873 | (e) | | | – | |
| Lord Abbett Securities Trust – Value Opportunities Fund – Class I | | | 12,705,466 | | | | 961,111 | | | | (2,215,692 | ) | | | 11,450,885 | | | | 224,666,370 | | | | 27,682,339 | (f) | | | – | |
| Total | | | | | | | | | | | | | | | | | | $ | 1,116,052,027 | | | $ | 133,935,163 | | | $ | 2,001,129 | |
| (a) | Includes $18,906,284 of distributed capital gains. |
| (b) | Includes $8,751,415 of distributed capital gains. |
| (c) | Includes $20,675,448 of distributed capital gains. |
| (d) | Includes $3,036,067 of distributed capital gains. |
| (e) | Includes $43,105,184 of distributed capital gains. |
| (f) | Includes $17,739,740 of distributed capital gains. |
128
Notes to Financial Statements (continued)
Each Fund is subject to the general risks and considerations associated with equity investing. The value of the Funds’ investments will fluctuate in response to movements in the equity securities markets in general and to the changing prospects of individual companies in which the Funds invest. If a Fund’s assessment of a company’s value or prospects for exceeding earnings expectations or market conditions is wrong, the Fund could suffer losses or produce poor performance relative to other funds, even in a rising market.
Large company stocks, in which Fundamental Equity Fund, Growth Leaders Fund, International Core Equity Fund and International Dividend Income Fund invest, may perform differently than the market as a whole and other types of stocks, such as small company stocks. Small and mid-sized company stocks, in which Alpha Strategy Fund, Fundamental Equity Fund, Growth Leaders Fund, International Core Equity Fund, International Opportunities Fund and Value Opportunities Fund invest, may be less able to weather economic shifts or other adverse developments than those of larger, more established companies.
In general, Growth Leaders Fund employs a growth investing style and Fundamental Equity Fund, International Dividend Income Fund and Value Opportunities Fund employ a value investing style. Growth stocks generally are more volatile than value stocks. The price of value stocks may lag the market for long periods of time.
International Core Equity Fund, International Dividend Income Fund and International Opportunities Fund are subject to the risks of investing in foreign securities. Foreign securities may pose greater risks than domestic securities, including greater price fluctuations and higher transaction costs. Foreign investments also may be affected by changes in currency rates or currency controls. These risks are generally greater for securities issued by companies in emerging market companies. Similarly, due to their investments in multinational and foreign companies, Alpha Strategy Fund, Fundamental Equity Fund, Growth Leaders Fund, and Value Opportunities Fund similarly may experience increased market, liquidity, currency, political, informational, and other risks.
International Dividend Income Fund is subject to the risks of investing in dividend paying stocks. Dividend paying stocks may be sensitive to changes in market interest rates, and the prices of such stocks may decline as rates rise. International Dividend Income Fund may be subject to the volatility of stocks that have high dividends per share due to recent decreases in their share prices.
Alpha Strategy Fund’s investments are concentrated in the Underlying Funds and, as a result, the Fund’s performance is directly related to their performance and subject to their risks.
Each Fund is subject to the risks associated with derivatives, which may be different from and greater than the risks associated with investing directly in securities and other investments.
These factors can affect each Fund’s performance.
129
Notes to Financial Statements (continued)
| 15. | SUMMARY OF CAPITAL TRANSACTIONS |
Transactions in shares of beneficial interest were as follows:
| | | | | | Year Ended | | | | | | Year Ended | |
| Alpha Strategy Fund | | | | | October 31, 2016 | | | | | | October 31, 2015 | |
| Class A Shares | | Shares | | | Amount | | | Shares | | | Amount | |
| Shares sold | | | 2,701,861 | | | $ | 68,590,147 | | | | 3,873,964 | | | $ | 120,194,959 | |
| Converted from Class B* | | | 147,789 | | | | 3,684,404 | | | | 144,500 | | | | 4,428,542 | |
| Reinvestment of distributions | | | 2,690,780 | | | | 67,808,810 | | | | 1,874,861 | | | | 55,608,381 | |
| Shares reacquired | | | (5,487,466 | ) | | | (142,043,052 | ) | | | (4,487,732 | ) | | | (138,427,381 | ) |
| Increase (decrease) | | | 52,964 | | | $ | (1,959,691 | ) | | | 1,405,593 | | | $ | 41,804,501 | |
| | | | | | | | | | | | | | | | | |
| Class B Shares | | | | | | | | | | | | | | | | |
| Shares sold | | | 9,940 | | | $ | 232,007 | | | | 13,442 | | | $ | 379,613 | |
| Reinvestment of distributions | | | 52,429 | | | | 1,194,846 | | | | 55,791 | | | | 1,518,640 | |
| Shares reacquired | | | (61,246 | ) | | | (1,446,050 | ) | | | (113,171 | ) | | | (3,187,742 | ) |
| Converted to Class A* | | | (163,815 | ) | | | (3,684,404 | ) | | | (157,919 | ) | | | (4,428,542 | ) |
| Decrease | | | (162,692 | ) | | $ | (3,703,601 | ) | | | (201,857 | ) | | $ | (5,718,031 | ) |
| | | | | | | | | | | | | | | | | |
| Class C Shares | | | | | | | | | | | | | | | | |
| Shares sold | | | 1,431,293 | | | $ | 32,204,862 | | | | 1,822,858 | | | $ | 50,634,624 | |
| Reinvestment of distributions | | | 1,611,971 | | | | 36,204,864 | | | | 1,035,610 | | | | 27,847,560 | |
| Shares reacquired | | | (3,203,478 | ) | | | (73,041,645 | ) | | | (1,917,956 | ) | | | (53,657,179 | ) |
| Increase (decrease) | | | (160,214 | ) | | $ | (4,631,919 | ) | | | 940,512 | | | $ | 24,825,005 | |
| | | | | | | | | | | | | | | | | |
| Class F Shares | | | | | | | | | | | | | | | | |
| Shares sold | | | 3,361,417 | | | $ | 85,514,460 | | | | 2,626,001 | | | $ | 81,100,949 | |
| Reinvestment of distributions | | | 1,096,453 | | | | 27,674,462 | | | | 714,237 | | | | 21,212,846 | |
| Shares reacquired | | | (4,696,551 | ) | | | (119,928,932 | ) | | | (2,476,491 | ) | | | (76,332,204 | ) |
| Increase (decrease) | | | (238,681 | ) | | $ | (6,740,010 | ) | | | 863,747 | | | $ | 25,981,591 | |
| | | | | | | | | | | | | | | | | |
| Class I Shares | | | | | | | | | | | | | | | | |
| Shares sold | | | 1,197,343 | | | $ | 27,894,935 | | | | 152,896 | | | $ | 4,801,060 | |
| Reinvestment of distributions | | | 183,234 | | | | 4,679,787 | | | | 117,541 | | | | 3,527,389 | |
| Shares reacquired | | | (228,260 | ) | | | (6,044,812 | ) | | | (437,191 | ) | | | (13,817,097 | ) |
| Increase (decrease) | | | 1,152,317 | | | $ | 26,529,910 | | | | (166,754 | ) | | $ | (5,488,648 | ) |
| | | | | | | | | | | | | | | | | |
| Class R2 Shares | | | | | | | | | | | | | | | | |
| Shares sold | | | 42,706 | | | $ | 1,065,360 | | | | 42,192 | | | $ | 1,256,292 | |
| Reinvestment of distributions | | | 3,619 | | | | 89,352 | | | | 4,158 | | | | 121,075 | |
| Shares reacquired | | | (32,344 | ) | | | (829,710 | ) | | | (62,989 | ) | | | (1,937,941 | ) |
| Increase (decrease) | | | 13,981 | | | $ | 325,002 | | | | (16,639 | ) | | $ | (560,574 | ) |
| | | | | | | | | | | | | | | | | |
| Class R3 Shares | | | | | | | | | | | | | | | | |
| Shares sold | | | 339,056 | | | $ | 8,553,804 | | | | 305,299 | | | $ | 9,338,834 | |
| Reinvestment of distributions | | | 198,882 | | | | 4,930,278 | | | | 130,616 | | | | 3,819,223 | |
| Shares reacquired | | | (444,536 | ) | | | (11,151,496 | ) | | | (334,311 | ) | | | (10,107,721 | ) |
| Increase | | | 93,402 | | | $ | 2,332,586 | | | | 101,604 | | | $ | 3,050,336 | |
130
Notes to Financial Statements (continued)
| | | | | | Year Ended | | | | | | Year Ended | |
| Alpha Strategy Fund | | | | | October 31, 2016 | | | | | | October 31, 2015 | |
| Class R4 Shares(a) | | Shares | | | Amount | | | Shares | | | Amount | |
| Shares sold | | | 12,514.58 | | | $ | 309,355 | | | | 313.78 | | | $ | 10,000 | |
| Reinvestment of distributions | | | 50.42 | | | | 1,269 | | | | – | | | | – | |
| Shares reacquired | | | (2,148 | ) | | | (52,916 | ) | | | – | | | | – | |
| Increase | | | 10,417 | | | $ | 257,708 | | | | 313.78 | | | $ | 10,000 | |
| | | | | | | | | | | | | | | | | |
| Class R5 Shares(a) | | | Shares | | | Amount | | | Shares | | | Amount | |
| Shares sold | | | 157.65 | | | $ | 3,973 | | | | 309.79 | | | $ | 10,000 | |
| Reinvestment of distributions | | | 49.49 | | | | 1,264 | | | | – | | | | – | |
| Shares reacquired | | | (157.65 | ) | | | (3,902 | ) | | | – | | | | – | |
| Increase | | | 49.49 | | | $ | 1,335 | | | | 309.79 | | | $ | 10,000 | |
| | | | | | | | | | | | | | | | | |
| Class R6 Shares(a) | | | | | | | | | | | | | | | | |
| Shares sold | | | 25,851 | | | $ | 704,910 | | | | 309.79 | | | $ | 10,000 | |
| Reinvestment of distributions | | | 49.52 | | | | 1,266 | | | | – | | | | – | |
| Shares reacquired | | | (594.31 | ) | | | (15,998 | ) | | | – | | | | – | |
| Increase | | | 25,306 | | | $ | 690,178 | | | | 309.79 | | | $ | 10,000 | |
| | | | | | | | | | | | | | | | | |
| | | | | | | Year Ended | | | | | | | Year Ended | |
| Fundamental Equity Fund | | | | | | October 31, 2016 | | | | | | | October 31, 2015 | |
| Class A Shares | | | Shares | | | Amount | | | | Shares | | | Amount | |
| Shares sold | | | 7,125,774 | | | $ | 85,074,509 | | | | 11,889,659 | | | $ | 161,233,919 | |
| Converted from Class B* | | | 634,665 | | | | 7,587,343 | | | | 674,211 | | | | 8,992,377 | |
| Reinvestment of distributions | | | 15,344,862 | | | | 184,905,854 | | | | 33,212,561 | | | | 443,387,370 | |
| Shares reacquired | | | (43,483,600 | ) | | | (524,287,644 | ) | | | (61,317,357 | ) | | | (830,840,457 | ) |
| Decrease | | | (20,378,299 | ) | | $ | (246,719,938 | ) | | | (15,540,926 | ) | | $ | (217,226,791 | ) |
| | | | | | | | | | | | | | | | | |
| Class B Shares | | | | | | | | | | | | | | | | |
| Shares sold | | | 27,626 | | | $ | 307,570 | | | | 66,635 | | | $ | 825,600 | |
| Reinvestment of distributions | | | 236,624 | | | | 2,619,413 | | | | 642,147 | | | | 7,930,518 | |
| Shares reacquired | | | (532,097 | ) | | | (5,862,298 | ) | | | (672,389 | ) | | | (8,346,215 | ) |
| Converted to Class A* | | | (693,492 | ) | | | (7,587,342 | ) | | | (730,983 | ) | | | (8,992,377 | ) |
| Decrease | | | (961,339 | ) | | $ | (10,522,657 | ) | | | (694,590 | ) | | $ | (8,582,474 | ) |
| | | | | | | | | | | | | | | | | |
| Class C Shares | | | | | | | | | | | | | | | | |
| Shares sold | | | 2,685,317 | | | $ | 29,059,965 | | | | 5,212,851 | | | $ | 64,245,185 | |
| Reinvestment of distributions | | | 5,200,487 | | | | 57,049,346 | | | | 11,783,074 | | | | 144,460,492 | |
| Shares reacquired | | | (18,614,064 | ) | | | (203,545,733 | ) | | | (24,725,022 | ) | | | (306,733,625 | ) |
| Decrease | | | (10,728,260 | ) | | $ | (117,436,422 | ) | | | (7,729,097 | ) | | $ | (98,027,948 | ) |
| | | | | | | | | | | | | | | | | |
| Class F Shares | | | | | | | | | | | | | | | | |
| Shares sold | | | 6,153,160 | | | $ | 74,838,270 | | | | 6,208,465 | | | $ | 82,756,781 | |
| Reinvestment of distributions | | | 2,862,952 | | | | 34,183,648 | | | | 8,695,953 | | | | 115,134,419 | |
| Shares reacquired | | | (17,563,279 | ) | | | (212,002,755 | ) | | | (31,709,956 | ) | | | (427,561,453 | ) |
| Decrease | | | (8,547,167 | ) | | $ | (102,980,837 | ) | | | (16,805,538 | ) | | $ | (229,670,253 | ) |
131
Notes to Financial Statements (continued)
| | | | | | Year Ended | | | | | | Year Ended | |
| Fundamental Equity Fund | | | | | October 31, 2016 | | | | | | October 31, 2015 | |
| Class I Shares | | Shares | | | Amount | | | Shares | | | Amount | |
| Shares sold | | | 1,219,181 | | | $ | 14,523,390 | | | | 4,729,463 | | | $ | 63,864,717 | |
| Reinvestment of distributions | | | 1,818,427 | | | | 22,002,971 | | | | 5,576,627 | | | | 74,782,574 | |
| Shares reacquired | | | (9,434,658 | ) | | | (113,708,876 | ) | | | (20,566,971 | ) | | | (281,269,863 | ) |
| Decrease | | | (6,397,050 | ) | | $ | (77,182,515 | ) | | | (10,260,881 | ) | | $ | (142,622,572 | ) |
| | | | | | | | | | | | | | | | | |
| Class P Shares | | | | | | | | | | | | | | | | |
| Shares sold | | | 86,346 | | | $ | 1,012,821 | | | | 125,349 | | | $ | 1,671,285 | |
| Reinvestment of distributions | | | 112,484 | | | | 1,334,055 | | | | 283,708 | | | | 3,733,602 | |
| Shares reacquired | | | (370,654 | ) | | | (4,411,638 | ) | | | (714,726 | ) | | | (9,487,970 | ) |
| Decrease | | | (171,824 | ) | | $ | (2,064,762 | ) | | | (305,669 | ) | | $ | (4,083,083 | ) |
| | | | | | | | | | | | | | | | | |
| Class R2 Shares | | | | | | | | | | | | | | | | |
| Shares sold | | | 140,926 | | | $ | 1,652,619 | | | | 204,955 | | | $ | 2,705,054 | |
| Reinvestment of distributions | | | 53,991 | | | | 638,713 | | | | 138,382 | | | | 1,816,959 | |
| Shares reacquired | | | (354,997 | ) | | | (4,132,371 | ) | | | (792,407 | ) | | | (11,000,970 | ) |
| Decrease | | | (160,080 | ) | | $ | (1,841,039 | ) | | | (449,070 | ) | | $ | (6,478,957 | ) |
| | | | | | | | | | | | | | | | | |
| Class R3 Shares | | | | | | | | | | | | | | | | |
| Shares sold | | | 1,180,295 | | | $ | 13,951,086 | | | | 1,589,478 | | | $ | 21,040,784 | |
| Reinvestment of distributions | | | 1,639,440 | | | | 19,492,945 | | | | 3,968,717 | | | | 52,307,684 | |
| Shares reacquired | | | (5,827,361 | ) | | | (68,903,142 | ) | | | (9,043,976 | ) | | | (121,943,430 | ) |
| Decrease | | | (3,007,626 | ) | | $ | (35,459,111 | ) | | | (3,485,781 | ) | | $ | (48,594,962 | ) |
| | | | | | | | | | | | | | | | | |
| Class R4 Shares(a) | | | | | | | | | | | | | | | | |
| Shares sold | | | 9,549 | | | $ | 118,606 | | | | 739.65 | | | $ | 10,000 | |
| Reinvestment of distributions | | | 81 | | | | 982 | | | | – | | | | – | |
| Shares reacquired | | | (676 | ) | | | (8,498 | ) | | | – | | | | – | |
| Increase | | | 8,954 | | | $ | 111,090 | | | | 739.65 | | | $ | 10,000 | |
| | | | | | | | | | | | | | | | | |
| Class R5 Shares(a) | | | | | | | | | | | | | | | | |
| Shares sold | | | 9,117 | | | $ | 116,754 | | | | 735 | | | $ | 10,000 | |
| Reinvestment of distributions | | | 82 | | | | 988 | | | | – | | | | – | |
| Increase | | | 9,199 | | | $ | 117,742 | | | | 735 | | | $ | 10,000 | |
| | | | | | | | | | | | | | | | | |
| Class R6 Shares(a) | | | | | | | | | | | | | | | | |
| Shares sold | | | 9,431 | | | $ | 105,217 | | | | 735.38 | | | $ | 10,001 | |
| Reinvestment of distributions | | | 82 | | | | 989 | | | | – | | | | – | |
| Shares reacquired | | | (484 | ) | | | (5,831 | ) | | | – | | | | – | |
| Increase | | | 9,029 | | | $ | 100,375 | | | | 735.38 | | | $ | 10,001 | |
| (a) Shares commenced on June 30, 2015. | | | | | | | | | | | | | | | | |
| | | | | | | | | | | | | | | | | |
| | | | | | | Year Ended | | | | | | | Year Ended | |
| Growth Leaders Fund | | | | | | October 31, 2016 | | | | | | | October 31, 2015 | |
| Class A Shares | | | Shares | | | | Amount | | | | Shares | | | | Amount | |
| Shares sold | | | 15,264,718 | | | $ | 337,560,393 | | | | 15,770,496 | | | $ | 361,927,702 | |
| Converted from Class B* | | | 55,316 | | | | 1,212,606 | | | | 59,092 | | | | 1,359,056 | |
| Reinvestment of distributions | | | 1,410,176 | | | | 32,095,614 | | | | 1,148,996 | | | | 25,277,921 | |
| Shares reacquired | | | (14,529,407 | ) | | | (317,731,181 | ) | | | (7,183,725 | ) | | | (164,150,442 | ) |
| Increase | | | 2,200,803 | | | $ | 53,137,432 | | | | 9,794,859 | | | $ | 224,414,237 | |
132
Notes to Financial Statements (continued)
| | | | | | Year Ended | | | | | | Year Ended | |
| Growth Leaders Fund | | | | | October 31, 2016 | | | | | | October 31, 2015 | |
| Class B Shares | | Shares | | | Amount | | | Shares | | | Amount | |
| Shares sold | | | 19,280 | | | $ | 419,351 | | | | 16,336 | | | $ | 370,974 | |
| Reinvestment of distributions | | | 7,585 | | | | 168,835 | | | | 15,738 | | | | 341,521 | |
| Shares reacquired | | | (45,401 | ) | | | (1,011,070 | ) | | | (69,515 | ) | | | (1,551,349 | ) |
| Converted to Class A* | | | (56,748 | ) | | | (1,212,606 | ) | | | (60,107 | ) | | | (1,359,056 | ) |
| Decrease | | | (75,284 | ) | | $ | (1,635,490 | ) | | | (97,548 | ) | | $ | (2,197,910 | ) |
| | | | | | | | | | | | | | | | | |
| Class C Shares | | | | | | | | | | | | | | | | |
| Shares sold | | | 9,177,319 | | | $ | 195,548,463 | | | | 9,261,807 | | | $ | 207,326,087 | |
| Reinvestment of distributions | | | 789,874 | | | | 17,400,924 | | | | 538,527 | | | | 11,567,556 | |
| Shares reacquired | | | (5,574,461 | ) | | | (118,105,343 | ) | | | (2,277,713 | ) | | | (50,799,246 | ) |
| Increase | | | 4,392,732 | | | $ | 94,844,044 | | | | 7,522,621 | | | $ | 168,094,397 | |
| | | | | | | | | | | | | | | | | |
| Class F Shares | | | | | | | | | | | | | | | | |
| Shares sold | | | 21,475,824 | | | $ | 475,803,724 | | | | 18,229,630 | | | $ | 421,672,703 | |
| Reinvestment of distributions | | | 1,259,864 | | | | 28,863,484 | | | | 1,002,436 | | | | 22,153,845 | |
| Shares reacquired | | | (19,656,010 | ) | | | (429,600,892 | ) | | | (10,037,981 | ) | | | (229,415,492 | ) |
| Increase | | | 3,079,678 | | | $ | 75,066,316 | | | | 9,194,085 | | | $ | 214,411,056 | |
| | | | | | | | | | | | | | | | | |
| Class I Shares | | | | | | | | | | | | | | | | |
| Shares sold | | | 1,128,081 | | | $ | 25,106,560 | | | | 1,409,386 | | | $ | 32,621,478 | |
| Reinvestment of distributions | | | 147,289 | | | | 3,386,168 | | | | 140,149 | | | | 3,104,296 | |
| Shares reacquired | | | (946,064 | ) | | | (20,987,194 | ) | | | (629,631 | ) | | | (14,588,043 | ) |
| Increase | | | 329,306 | | | $ | 7,505,534 | | | | 919,904 | | | $ | 21,137,731 | |
| | | | | | | | | | | | | | | | | |
| Class R2 Shares | | | | | | | | | | | | | | | | |
| Shares sold | | | 52,314 | | | $ | 1,141,641 | | | | 19,777 | | | $ | 461,212 | |
| Reinvestment of distributions | | | 268 | | | | 6,114 | | | | 260 | | | | 5,735 | |
| Shares reacquired | | | (20,844 | ) | | | (456,005 | ) | | | (9,815 | ) | | | (230,023 | ) |
| Increase | | | 31,738 | | | $ | 691,750 | | | | 10,222 | | | $ | 236,924 | |
| | | | | | | | | | | | | | | | | |
| Class R3 Shares | | | | | | | | | | | | | | | | |
| Shares sold | | | 205,129 | | | $ | 4,473,829 | | | | 215,725 | | | $ | 4,921,192 | |
| Reinvestment of distributions | | | 27,873 | | | | 631,344 | | | | 26,137 | | | | 573,704 | |
| Shares reacquired | | | (199,031 | ) | | | (4,395,915 | ) | | | (112,799 | ) | | | (2,581,441 | ) |
| Increase | | | 33,971 | | | $ | 709,258 | | | | 129,063 | | | $ | 2,913,455 | |
| | | | | | | | | | | | | | | | | |
| Class R4 Shares(a) | | | | | | | | | | | | | | | | |
| Shares sold | | | 82,419 | | | $ | 1,777,881 | | | | 427 | | | $ | 10,000 | |
| Reinvestment of distributions | | | 21 | | | | 470 | | | | – | | | | – | |
| Shares reacquired | | | (5,497 | ) | | | (121,704 | ) | | | – | | | | – | |
| Increase | | | 76,943 | | | $ | 1,656,647 | | | | 427 | | | $ | 10,000 | |
| | | | | | | | | | | | | | | | | |
| Class R5 Shares(a) | | | | | | | | | | | | | | | | |
| Shares sold | | | 170,194 | | | $ | 3,894,136 | | | | 423.55 | | | $ | 10,000 | |
| Reinvestment of distributions | | | 20 | | | | 466 | | | | – | | | | – | |
| Shares reacquired | | | (7,631 | ) | | | (175,323 | ) | | | – | | | | – | |
| Increase | | | 162,583 | | | $ | 3,719,279 | | | | 423.55 | | | $ | 10,000 | |
133
Notes to Financial Statements (continued)
| | | | | | Year Ended | | | | | | Year Ended | |
| Growth Leaders Fund | | | | | October 31, 2016 | | | | | | October 31, 2015 | |
| Class R6 Shares(a) | | Shares | | | Amount | | | Shares | | | Amount | |
| Shares sold | | | 79,288 | | | $ | 1,800,291 | | | | 423.55 | | | $ | 10,000 | |
| Reinvestment of distributions | | | 481 | | | | 11,055 | | | | – | | | | – | |
| Shares reacquired | | | (12,689 | ) | | | (289,519 | ) | | | – | | | | – | |
| Increase | | | 67,080 | | | $ | 1,521,827 | | | | 423.55 | | | $ | 10,000 | |
| | | | | | | | | | | | | | | | | |
| | | | | | | Year Ended | | | | | | | Year Ended | |
| International Core Equity Fund | | | | | | October 31, 2016 | | | | | | | October 31, 2015 | |
| | | | | | | | | | | | | | | | | |
| Class A Shares | | | Shares | | | | Amount | | | | Shares | | | | Amount | |
| Shares sold | | | 2,211,314 | | | $ | 26,366,020 | | | | 4,193,190 | | | $ | 54,446,897 | |
| Converted from Class B* | | | 146,302 | | | | 1,713,421 | | | | 224,438 | | | | 2,933,802 | |
| Reinvestment of distributions | | | 354,489 | | | | 4,236,145 | | | | 310,070 | | | | 3,950,295 | |
| Shares reacquired | | | (7,862,410 | ) | | | (93,356,462 | ) | | | (5,304,255 | ) | | | (68,693,198 | ) |
| Decrease | | | (5,150,305 | ) | | $ | (61,040,876 | ) | | | (576,557 | ) | | $ | (7,362,204 | ) |
| | | | | | | | | | | | | | | | | |
| Class B Shares | | | | | | | | | | | | | | | | |
| Shares sold | | | 5,090 | | | $ | 58,443 | | | | 21,673 | | | $ | 279,684 | |
| Reinvestment of distributions | | | 1,244 | | | | 14,825 | | | | 1,924 | | | | 24,377 | |
| Shares reacquired | | | (95,516 | ) | | | (1,121,471 | ) | | | (145,796 | ) | | | (1,872,858 | ) |
| Converted to Class A* | | | (147,106 | ) | | | (1,713,421 | ) | | | (226,545 | ) | | | (2,933,802 | ) |
| Decrease | | | (236,288 | ) | | $ | (2,761,624 | ) | | | (348,744 | ) | | $ | (4,502,599 | ) |
| | | | | | | | | | | | | | | | | |
| Class C Shares | | | | | | | | | | | | | | | | |
| Shares sold | | | 233,644 | | | $ | 2,755,542 | | | | 425,156 | | | $ | 5,496,648 | |
| Reinvestment of distributions | | | 16,741 | | | | 198,545 | | | | 13,665 | | | | 172,731 | |
| Shares reacquired | | | (946,769 | ) | | | (11,092,209 | ) | | | (828,050 | ) | | | (10,615,629 | ) |
| Decrease | | | (696,384 | ) | | $ | (8,138,122 | ) | | | (389,229 | ) | | $ | (4,946,250 | ) |
| | | | | | | | | | | | | | | | | |
| Class F Shares | | | | | | | | | | | | | | | | |
| Shares sold | | | 1,770,643 | | | $ | 20,883,435 | | | | 1,255,673 | | | $ | 16,208,527 | |
| Reinvestment of distributions | | | 72,915 | | | | 864,770 | | | | 87,549 | | | | 1,106,621 | |
| Shares reacquired | | | (1,688,539 | ) | | | (20,048,471 | ) | | | (2,169,782 | ) | | | (28,552,672 | ) |
| Increase (decrease) | | | 155,019 | | | $ | 1,699,734 | | | | (826,560 | ) | | $ | (11,237,524 | ) |
| | | | | | | | | | | | | | | | | |
| Class I Shares | | | | | | | | | | | | | | | | |
| Shares sold | | | 10,295,009 | | | $ | 123,267,905 | | | | 897,756 | | | $ | 11,671,127 | |
| Reinvestment of distributions | | | 57,791 | | | | 694,648 | | | | 52,035 | | | | 666,045 | |
| Shares reacquired | | | (1,902,046 | ) | | | (23,028,997 | ) | | | (3,291,855 | ) | | | (43,443,304 | ) |
| Increase (decrease) | | | 8,450,754 | | | $ | 100,933,556 | | | | (2,342,064 | ) | | $ | (31,106,132 | ) |
| | | | | | | | | | | | | | | | | |
| Class P Shares | | | | | | | | | | | | | | | | |
| Shares sold | | | 971 | | | $ | 11,398 | | | | 769 | | | $ | 10,010 | |
| Reinvestment of distributions | | | 101 | | | | 1,208 | | | | 81 | | | | 1,034 | |
| Shares reacquired | | | (1,858 | ) | | | (21,488 | ) | | | (3,469 | ) | | | (45,182 | ) |
| Decrease | | | (786 | ) | | $ | (8,882 | ) | | | (2,619 | ) | | $ | (34,138 | ) |
134
Notes to Financial Statements (continued)
| | | | | | Year Ended | | | | | | Year Ended | |
| International Core Equity Fund | | | | | October 31, 2016 | | | | | | October 31, 2015 | |
| Class R2 Shares | | Shares | | | Amount | | | Shares | | | Amount | |
| Shares sold | | | 7,444 | | | $ | 87,252 | | | | 18,765 | | | $ | 241,118 | |
| Reinvestment of distributions | | | 209 | | | | 2,495 | | | | 171 | | | | 2,178 | |
| Shares reacquired | | | (16,794 | ) | | | (198,505 | ) | | | (42,699 | ) | | | (556,709 | ) |
| Decrease | | | (9,141 | ) | | $ | (108,758 | ) | | | (23,763 | ) | | $ | (313,413 | ) |
| | | | | | | | | | | | | | | | | |
| Class R3 Shares | | | | | | | | | | | | | | | | |
| Shares sold | | | 337,247 | | | $ | 3,937,387 | | | | 422,703 | | | $ | 5,389,910 | |
| Reinvestment of distributions | | | 14,835 | | | | 174,918 | | | | 15,641 | | | | 196,610 | |
| Shares reacquired | | | (574,888 | ) | | | (6,715,309 | ) | | | (487,596 | ) | | | (6,192,504 | ) |
| Decrease | | | (222,806 | ) | | $ | (2,603,004 | ) | | | (49,252 | ) | | $ | (605,984 | ) |
| | | | | | | | | | | | | | | | | |
| Class R4 Shares(a) | | | | | | | | | | | | | | | | |
| Shares sold | | | – | | | $ | – | | | | 766 | | | $ | 10,000 | |
| Reinvestment of distributions | | | 11 | | | | 138 | | | | – | | | | – | |
| Increase | | | 11 | | | $ | 138 | | | | 766 | | | $ | 10,000 | |
| | | | | | | | | | | | | | | | | |
| Class R5 Shares(a) | | | | | | | | | | | | | | | | |
| Shares sold | | | – | | | $ | – | | | | 760.46 | | | $ | 10,000 | |
| Reinvestment of distributions | | | 13 | | | | 149 | | | | – | | | | – | |
| Increase | | | 13 | | | $ | 149 | | | | 760.46 | | | $ | 10,000 | |
| | | | | | | | | | | | | | | | | |
| Class R6 Shares(a) | | | | | | | | | | | | | | | | |
| Shares sold | | | 901,192 | | | $ | 11,065,181 | | | | 760 | | | $ | 10,000 | |
| Reinvestment of distributions | | | 13 | | | | 151 | | | | – | | | | – | |
| Shares reacquired | | | (15,140 | ) | | | (185,015 | ) | | | – | | | | – | |
| Increase | | | 886,065 | | | $ | 10,880,317 | | | | 760 | | | $ | 10,000 | |
| | | | | | | | | | | | | | | | | |
| | | | | | | Year Ended | | | | | | | Year Ended | |
| International Dividend Income Fund | | | | | | October 31, 2016 | | | | | | | October 31, 2015 | |
| Class A Shares | | | Shares | | | | Amount | | | | Shares | | | | Amount | |
| Shares sold | | | 8,897,678 | | | $ | 59,337,179 | | | | 34,157,964 | | | $ | 272,558,029 | |
| Reinvestment of distributions | | | 2,373,082 | | | | 15,886,465 | | | | 10,387,158 | | | | 81,737,095 | |
| Shares reacquired | | | (49,598,375 | ) | | | (332,044,632 | ) | | | (58,002,068 | ) | | | (441,270,867 | ) |
| Decrease | | | (38,327,615 | ) | | $ | (256,820,988 | ) | | | (13,456,946 | ) | | $ | (86,975,743 | ) |
| | | | | | | | | | | | | | | | | |
| Class C Shares | | | | | | | | | | | | | | | | |
| Shares sold | | | 878,682 | | | $ | 5,825,972 | | | | 4,874,512 | | | $ | 38,668,585 | |
| Reinvestment of distributions | | | 368,833 | | | | 2,443,942 | | | | 1,658,029 | | | | 12,971,559 | |
| Shares reacquired | | | (8,678,584 | ) | | | (57,649,616 | ) | | | (8,147,609 | ) | | | (62,688,521 | ) |
| Decrease | | | (7,431,069 | ) | | $ | (49,379,702 | ) | | | (1,615,068 | ) | | $ | (11,048,377 | ) |
| | | | | | | | | | | | | | | | | |
| Class F Shares | | | | | | | | | | | | | | | | |
| Shares sold | | | 6,615,741 | | | $ | 44,392,810 | | | | 15,483,920 | | | $ | 123,485,702 | |
| Reinvestment of distributions | | | 588,468 | | | | 3,950,449 | | | | 2,880,914 | | | | 22,721,013 | |
| Shares reacquired | | | (20,545,029 | ) | | | (138,296,073 | ) | | | (25,320,078 | ) | | | (194,252,318 | ) |
| Decrease | | | (13,340,820 | ) | | $ | (89,952,814 | ) | | | (6,955,244 | ) | | $ | (48,045,603 | ) |
135
Notes to Financial Statements (continued)
| | | | | | Year Ended | | | | | | Year Ended | |
| International Dividend Income Fund | | | | | October 31, 2016 | | | | | | October 31, 2015 | |
| Class I Shares | | Shares | | | Amount | | | Shares | | | Amount | |
| Shares sold | | | 4,355,371 | | | $ | 29,265,107 | | | | 63,634,025 | | | $ | 517,592,988 | |
| Reinvestment of distributions | | | 4,690,904 | | | | 31,556,414 | | | | 12,012,645 | | | | 94,446,085 | |
| Shares reacquired | | | (56,373,338 | ) | | | (377,699,997 | ) | | | (32,557,178 | ) | | | (262,765,559 | ) |
| Increase (decrease) | | | (47,327,063 | ) | | $ | (316,878,476 | ) | | | 43,089,492 | | | $ | 349,273,514 | |
| | | | | | | | | | | | | | | | | |
| Class R2 Shares | | | | | | | | | | | | | | | | |
| Shares sold | | | 27,058.7 | | | $ | 184,116 | | | | 47,458 | | | $ | 377,000 | |
| Reinvestment of distributions | | | 1,215 | | | | 8,302 | | | | 4,627 | | | | 37,120 | |
| Shares reacquired | | | (72,190 | ) | | | (489,261 | ) | | | (54,530 | ) | | | (431,260 | ) |
| Decrease | | | (43,916.3 | ) | | $ | (296,843 | ) | | | (2,445 | ) | | $ | (17,140 | ) |
| | | | | | | | | | | | | | | | | |
| Class R3 Shares | | | | | | | | | | | | | | | | |
| Shares sold | | | 514,921 | | | $ | 3,476,402 | | | | 673,339 | | | $ | 5,336,575 | |
| Reinvestment of distributions | | | 57,109 | | | | 385,878 | | | | 129,406 | | | | 1,025,596 | |
| Shares reacquired | | | (481,268 | ) | | | (3,223,872 | ) | | | (296,827 | ) | | | (2,307,292 | ) |
| Increase | | | 90,762 | | | $ | 638,408 | | | | 505,918 | | | $ | 4,054,879 | |
| | | | | | | | | | | | | | | | | |
| Class R4 Shares(a) | | | | | | | | | | | | | | | | |
| Shares sold | | | – | | | $ | – | | | | 1,290 | | | $ | 10,000 | |
| Reinvestment of distributions | | | 46 | | | | 304 | | | | 7 | | | | 45 | |
| Increase | | | 46 | | | $ | 304 | | | | 1,297 | | | $ | 10,045 | |
| | | | | | | | | | | | | | | | | |
| Class R5 Shares(a) | | | | | | | | | | | | | | | | |
| Shares sold | | | – | | | $ | – | | | | 1,285 | | | $ | 10,000 | |
| Reinvestment of distributions | | | 48 | | | | 326 | | | | 8 | | | | 51 | |
| Increase | | | 48 | | | $ | 326 | | | | 1,293 | | | $ | 10,051 | |
| | | | | | | | | | | | | | | | | |
| Class R6 Shares(a) | | | | | | | | | | | | | | | | |
| Shares sold | | | – | | | $ | – | | | | 1,285 | | | $ | 10,000 | |
| Reinvestment of distributions | | | 48 | | | | 326 | | | | 8 | | | | 51 | |
| Increase | | | 48 | | | $ | 326 | | | | 1,293 | | | $ | 10,051 | |
| | | | | | | | | | | | | | | | | |
| | | | | | Year Ended | | | | | | | Year Ended | |
| International Opportunities Fund | | | | | October 31, 2016 | | | | | | | October 31, 2015 | |
| Class A Shares | | | Shares | | | | Amount | | | | Shares | | | | Amount | |
| Shares sold | | | 3,205,088 | | | $ | 51,449,371 | | | | 4,674,746 | | | $ | 80,280,418 | |
| Converted from Class B* | | | 40,727 | | | | 644,781 | | | | 49,429 | | | | 827,168 | |
| Reinvestment of distributions | | | 407,053 | | | | 6,565,759 | | | | 276,906 | | | | 4,300,348 | |
| Shares reacquired | | | (3,609,366 | ) | | | (57,013,749 | ) | | | (2,772,430 | ) | | | (45,665,589 | ) |
| Increase | | | 43,502 | | | $ | 1,646,162 | | | | 2,228,651 | | | $ | 39,742,345 | |
| | | | | | | | | | | | | | | | | |
| Class B Shares | | | | | | | | | | | | | | | | |
| Shares sold | | | 7,659 | | | $ | 117,814 | | | | 9,955 | | | $ | 161,488 | |
| Reinvestment of distributions | | | 5,850 | | | | 89,673 | | | | 8,574 | | | | 126,986 | |
| Shares reacquired | | | (46,481 | ) | | | (703,040 | ) | | | (58,994 | ) | | | (937,947 | ) |
| Converted to Class A* | | | (42,967 | ) | | | (644,781 | ) | | | (52,002 | ) | | | (827,168 | ) |
| Decrease | | | (75,939 | ) | | $ | (1,140,334 | ) | | | (92,467 | ) | | $ | (1,476,641 | ) |
136
Notes to Financial Statements (continued)
| | | | | | Year Ended | | | | | | Year Ended | |
| International Opportunities Fund | | | | | October 31, 2016 | | | | | | October 31, 2015 | |
| Class C Shares | | Shares | | | Amount | | | Shares | | | Amount | |
| Shares sold | | | 501,315 | | | $ | 7,581,584 | | | | 857,829 | | | $ | 13,833,966 | |
| Reinvestment of distributions | | | 74,489 | | | | 1,127,012 | | | | 48,814 | | | | 714,146 | |
| Shares reacquired | | | (717,647 | ) | | | (10,721,752 | ) | | | (378,535 | ) | | | (5,891,665 | ) |
| Increase (decrease) | | | (141,843 | ) | | $ | (2,013,156 | ) | | | 528,108 | | | $ | 8,656,447 | |
| | | | | | | | | | | | | | | | | |
| Class F Shares | | | | | | | | | | | | | | | | |
| Shares sold | | | 4,287,342 | | | $ | 67,776,353 | | | | 6,733,269 | | | $ | 115,198,773 | |
| Reinvestment of distributions | | | 285,553 | | | | 4,563,136 | | | | 75,959 | | | | 1,169,017 | |
| Shares reacquired | | | (6,066,514 | ) | | | (94,284,169 | ) | | | (2,530,053 | ) | | | (41,734,979 | ) |
| Increase (decrease) | | | (1,493,619 | ) | | $ | (21,944,680 | ) | | | 4,279,175 | | | $ | 74,632,811 | |
| | | | | | | | | | | | | | | | | |
| Class I Shares | | | | | | | | | | | | | | | | |
| Shares sold | | | 742,472 | | | $ | 11,868,315 | | | | 2,086,280 | | | $ | 35,491,113 | |
| Reinvestment of distributions | | | 729,325 | | | | 12,048,452 | | | | 754,491 | | | | 11,988,860 | |
| Shares reacquired | | | (2,364,512 | ) | | | (39,198,394 | ) | | | (2,327,766 | ) | | | (39,949,275 | ) |
| Increase (decrease) | | | (892,715 | ) | | $ | (15,281,627 | ) | | | 513,005 | | | $ | 7,530,698 | |
| | | | | | | | | | | | | | | | | |
| Class P Shares | | | | | | | | | | | | | | | | |
| Shares sold | | | 4,010 | | | $ | 64,840 | | | | 4,948 | | | $ | 84,028 | |
| Reinvestment of distributions | | | 1,148 | | | | 18,861 | | | | 2,158 | | | | 34,082 | |
| Shares reacquired | | | (17,475 | ) | | | (277,935 | ) | | | (25,601 | ) | | | (408,320 | ) |
| Decrease | | | (12,317 | ) | | $ | (194,234 | ) | | | (18,495 | ) | | $ | (290,210 | ) |
| | | | | | | | | | | | | | | | | |
| Class R2 Shares | | | | | | | | | | | | | | | | |
| Shares sold | | | 131,494 | | | $ | 2,064,548 | | | | 54,884 | | | $ | 923,364 | |
| Reinvestment of distributions | | | 567 | | | | 9,039 | | | | 261 | | | | 4,015 | |
| Shares reacquired | | | (29,095 | ) | | | (463,995 | ) | | | (11,911 | ) | | | (195,114 | ) |
| Increase | | | 102,966 | | | $ | 1,609,592 | | | | 43,234 | | | $ | 732,265 | |
| | | | | | | | | | | | | | | | | |
| Class R3 Shares | | | | | | | | | | | | | | | | |
| Shares sold | | | 894,885 | | | $ | 14,178,267 | | | | 270,606 | | | $ | 4,482,189 | |
| Reinvestment of distributions | | | 23,820 | | | | 378,261 | | | | 15,641 | | | | 239,311 | |
| Shares reacquired | | | (322,495 | ) | | | (5,076,196 | ) | | | (114,354 | ) | | | (1,882,369 | ) |
| Increase | | | 596,210 | | | $ | 9,480,332 | | | | 171,893 | | | $ | 2,839,131 | |
| | | | | | | | | | | | | | | | | |
| Class R4 Shares(a) | | | | | | | | | | | | | | | | |
| Shares sold | | | 118,621.48 | | | $ | 1,920,357 | | | | 571.6 | | | $ | 10,000 | |
| Reinvestment of distributions | | | 25.76 | | | | 415 | | | | – | | | | – | |
| Shares reacquired | | | (2,386 | ) | | | (39,059 | ) | | | – | | | | – | |
| Increase | | | 116,261.24 | | | $ | 1,881,713 | | | | 571.6 | | | $ | 10,000 | |
| | | | | | | | | | | | | | | | | |
| Class R5 Shares(a) | | | | | | | | | | | | | | | | |
| Shares sold | | | 189,741 | | | $ | 3,157,089 | | | | 558 | | | $ | 10,000 | |
| Reinvestment of distributions | | | 25 | | | | 417 | | | | – | | | | – | |
| Shares reacquired | | | (24,160 | ) | | | (404,859 | ) | | | – | | | | – | |
| Increase | | | 165,606 | | | $ | 2,752,647 | | | | 558 | | | $ | 10,000 | |
137
Notes to Financial Statements (continued)
| | | | | | Year Ended | | | | | | Year Ended | |
| International Opportunities Fund | | | | | October 31, 2016 | | | | | | October 31, 2015 | |
| Class R6 Shares(a) | | Shares | | | Amount | | | Shares | | | Amount | |
| Shares sold | | | 132,813.42 | | | $ | 2,236,515 | | | | 765.22 | | | $ | 13,715 | |
| Reinvestment of distributions | | | 37.36 | | | | 620 | | | | – | | | | – | |
| Shares reacquired | | | (22,571 | ) | | | (378,706 | ) | | | – | | | | (11 | ) |
| Increase | | | 110,279.78 | | | $ | 1,858,429 | | | | 765.22 | | | $ | 13,704 | |
| | | | | | | | | | | | | | | | | |
| | | | | | | Year Ended | | | | | | | Year Ended | |
| Value Opportunities Fund | | | | | | October 31, 2016 | | | | | | | October 31, 2015 | |
| Class A Shares | | | Shares | | | | Amount | | | | Shares | | | | Amount | |
| Shares sold | | | 10,508,880 | | | $ | 191,757,917 | | | | 6,946,059 | | | $ | 138,580,013 | |
| Converted from Class B* | | | 162,424 | | | | 2,931,720 | | | | 228,109 | | | | 4,528,890 | |
| Reinvestment of distributions | | | 3,829,534 | | | | 69,774,112 | | | | 8,490,788 | | | | 164,126,941 | |
| Shares reacquired | | | (16,364,241 | ) | | | (300,451,414 | ) | | | (23,931,040 | ) | | | (476,865,936 | ) |
| Decrease | | | (1,863,403 | ) | | $ | (35,987,665 | ) | | | (8,266,084 | ) | | $ | (169,630,092 | ) |
| | | | | | | | | | | | | | | | | |
| Class B Shares | | | | | | | | | | | | | | | | |
| Shares sold | | | 21,778 | | | $ | 363,010 | | | | 29,738 | | | $ | 542,948 | |
| Reinvestment of distributions | | | 46,017 | | | | 771,244 | | | | 129,984 | | | | 2,342,305 | |
| Shares reacquired | | | (105,055 | ) | | | (1,769,522 | ) | | | (197,134 | ) | | | (3,652,958 | ) |
| Converted to Class A* | | | (177,149 | ) | | | (2,931,720 | ) | | | (245,486 | ) | | | (4,528,890 | ) |
| Decrease | | | (214,409 | ) | | $ | (3,566,988 | ) | | | (282,898 | ) | | $ | (5,296,595 | ) |
| | | | | | | | | | | | | | | | | |
| Class C Shares | | | | | | | | | | | | | | | | |
| Shares sold | | | 2,744,387 | | | $ | 46,310,029 | | | | 1,754,567 | | | $ | 32,414,877 | |
| Reinvestment of distributions | | | 1,416,764 | | | | 23,744,964 | | | | 2,692,059 | | | | 48,510,902 | |
| Shares reacquired | | | (4,782,166 | ) | | | (79,996,659 | ) | | | (4,589,904 | ) | | | (85,326,351 | ) |
| Decrease | | | (621,015 | ) | | $ | (9,941,666 | ) | | | (143,278 | ) | | $ | (4,400,572 | ) |
| | | | | | | | | | | | | | | | | |
| Class F Shares | | | | | | | | | | | | | | | | |
| Shares sold | | | 14,223,196 | | | $ | 269,287,074 | | | | 9,264,039 | | | $ | 189,741,767 | |
| Reinvestment of distributions | | | 1,866,670 | | | | 34,552,058 | | | | 3,203,589 | | | | 62,726,268 | |
| Shares reacquired | | | (9,790,352 | ) | | | (181,206,332 | ) | | | (9,484,403 | ) | | | (191,683,885 | ) |
| Increase | | | 6,299,514 | | | $ | 122,632,800 | | | | 2,983,225 | | | $ | 60,784,150 | |
| | | | | | | | | | | | | | | | | |
| Class I Shares | | | | | | | | | | | | | | | | |
| Shares sold | | | 2,079,301 | | | $ | 38,601,684 | | | | 3,644,497 | | | $ | 75,270,484 | |
| Reinvestment of distributions | | | 1,993,547 | | | | 37,518,542 | | | | 4,011,079 | | | | 79,700,142 | |
| Shares reacquired | | | (7,727,105 | ) | | | (143,468,732 | ) | | | (9,191,123 | ) | | | (190,561,288 | ) |
| Decrease | | | (3,654,257 | ) | | $ | (67,348,506 | ) | | | (1,535,547 | ) | | $ | (35,590,662 | ) |
| | | | | | | | | | | | | | | | | |
| Class P Shares | | | | | | | | | | | | | | | | |
| Shares sold | | | 289,322 | | | $ | 5,195,262 | | | | 327,233 | | | $ | 6,466,393 | |
| Reinvestment of distributions | | | 167,787 | | | | 3,021,853 | | | | 337,411 | | | | 6,464,784 | |
| Shares reacquired | | | (695,489 | ) | | | (12,393,812 | ) | | | (769,540 | ) | | | (15,148,909 | ) |
| Decrease | | | (238,380 | ) | | $ | (4,176,697 | ) | | | (104,896 | ) | | $ | (2,217,732 | ) |
138
Notes to Financial Statements (concluded)
| | | | | | | | | | | | | |
| | | | | | Year Ended | | | | | | Year Ended | |
| Value Opportunities Fund | | | | | October 31, 2016 | | | | | | October 31, 2015 | |
| Class R2 Shares | | Shares | | | Amount | | | Shares | | | Amount | |
| Shares sold | | | 111,936 | | | $ | 1,998,982 | | | | 119,878 | | | $ | 2,319,679 | |
| Reinvestment of distributions | | | 13,618 | | | | 241,441 | | | | 39,381 | | | | 744,696 | |
| Shares reacquired | | | (158,945 | ) | | | (2,826,912 | ) | | | (273,320 | ) | | | (5,306,824 | ) |
| Decrease | | | (33,391 | ) | | $ | (586,489 | ) | | | (114,061 | ) | | $ | (2,242,449 | ) |
| | | | | | | | | | | | | | | | | |
| Class R3 Shares | | | | | | | | | | | | | | | | |
| Shares sold | | | 938,971 | | | $ | 16,844,938 | | | | 1,052,813 | | | $ | 20,695,808 | |
| Reinvestment of distributions | | | 462,439 | | | | 8,254,542 | | | | 931,127 | | | | 17,700,735 | |
| Shares reacquired | | | (1,990,444 | ) | | | (35,433,934 | ) | | | (2,261,573 | ) | | | (44,481,384 | ) |
| Decrease | | | (589,034 | ) | | $ | (10,334,454 | ) | | | (277,633 | ) | | $ | (6,084,841 | ) |
| | | | | | | | | | | | | | | | | |
| Class R4 Shares(a) | | | | | | | | | | | | | | | | |
| Shares sold | | | 181,108 | | | $ | 3,408,944 | | | | 492 | | | $ | 10,000 | |
| Reinvestment of distributions | | | 38 | | | | 689 | | | | – | | | | – | |
| Shares reacquired | | | (27,094 | ) | | | (519,823 | ) | | | – | | | | – | |
| Increase | | | 154,052 | | | $ | 2,889,810 | | | | 492 | | | $ | 10,000 | |
| | | | | | | | | | | | | | | | | |
| Class R5 Shares(a) | | | | | | | | | | | | | | | | |
| Shares sold | | | 2,335,253 | | | $ | 45,222,883 | | | | 477.78 | | | $ | 10,000 | |
| Reinvestment of distributions | | | 35 | | | | 669 | | | | – | | | | – | |
| Shares reacquired | | | (153,952 | ) | | | (3,027,234 | ) | | | – | | | | – | |
| Increase | | | 2,181,336 | | | $ | 42,196,318 | | | | 477.78 | | | $ | 10,000 | |
| | | | | | | | | | | | | | | | | |
| Class R6 Shares(a) | | | | | | | | | | | | | | | | |
| Shares sold | | | 1,726,267 | | | $ | 30,731,482 | | | | 1,442,093 | | | $ | 29,751,358 | |
| Reinvestment of distributions | | | 107,061 | | | | 2,015,955 | | | | – | | | | – | |
| Shares reacquired | | | (397,147 | ) | | | (7,725,853 | ) | | | (2,355 | ) | | | (47,360 | ) |
| Increase | | | 1,436,181 | | | $ | 25,021,584 | | | | 1,439,738 | | | $ | 29,703,998 | |
| * | Automatic conversion of Class B shares occurs on the 25th day of the month (or, if the 25th day is not a business day, the next business day thereafter) following the eighth anniversary of the day on which the purchase order was accepted. |
| (a) | Shares commenced on June 30, 2015. |
139
Report of Independent Registered Public Accounting Firm
To the Board of Trustees of Lord Abbett Securities Trust and the Shareholders of Lord Abbett Alpha Strategy Fund, Lord Abbett Fundamental Equity Fund, Lord Abbett Growth Leaders Fund, Lord Abbett International Core Equity Fund, Lord Abbett International Dividend Income Fund, Lord Abbett International Opportunities Fund and Lord Abbett Value Opportunities Fund:
We have audited the accompanying statements of assets and liabilities, including the schedules of investments, of the Lord Abbett Alpha Strategy Fund, Lord Abbett Fundamental Equity Fund, Lord Abbett Growth Leaders Fund, Lord Abbett International Core Equity Fund, Lord Abbett International Dividend Income Fund, Lord Abbett International Opportunities Fund and Lord Abbett Value Opportunities Fund (collectively, the “Funds”), seven of the nine portfolios constituting the Lord Abbett Securities Trust (the “Trust”) as of October 31, 2016, and the related statements of operations for the year then ended, the statements of changes in net assets for each of the two years in the period then ended, and the financial highlights for each of the periods presented. These financial statements and financial highlights are the responsibility of the Trust’s management. Our responsibility is to express an opinion on these financial statements and financial highlights based on our audits.
We conducted our audits in accordance with the standards of the Public Company Accounting Oversight Board (United States). Those standards require that we plan and perform the audit to obtain reasonable assurance about whether the financial statements and financial highlights are free of material misstatement. The Trust is not required to have, nor were we engaged to perform, an audit of its internal control over financial reporting. Our audits included consideration of internal control over financial reporting as a basis for designing audit procedures that are appropriate in the circumstances, but not for the purpose of expressing an opinion on the effectiveness of the Trust’s internal control over financial reporting. Accordingly, we express no such opinion. An audit also includes examining, on a test basis, evidence supporting the amounts and disclosures in the financial statements, assessing the accounting principles used and significant estimates made by management, as well as evaluating the overall financial statement presentation. Our procedures included confirmation of securities owned as of October 31, 2016, by correspondence with the custodian and brokers; when replies were not received from brokers, we performed other auditing procedures. We believe that our audits provide a reasonable basis for our opinion.
In our opinion, the financial statements and financial highlights referred to above present fairly, in all material respects, the financial position of each of the Funds constituting the Lord Abbett Securities Trust as of October 31, 2016, the results of their operations for the year then ended, the changes in their net assets for each of the two years in the period then ended, and the financial highlights for each of the periods presented, in conformity with accounting principles generally accepted in the United States of America.
DELOITTE & TOUCHE LLP
New York, New York
December 22, 2016
140
Investments in Underlying Funds
Alpha Strategy Fund invests in Underlying Funds managed by Lord Abbett. As of October 31, 2016, Alpha Strategy Fund’s long-term investments were allocated among the Underlying Funds as follows:
| Underlying Fund Name | | % of Investments | |
| Lord Abbett Developing Growth Fund, Inc. – Class I | | | 19.46% | |
| Lord Abbett Securities Trust-International Opportunities Fund – Class I | | | 20.26% | |
| Lord Abbett Securities Trust-Micro-Cap Growth Fund – Class I | | | 9.77% | |
| Lord Abbett Securities Trust-Micro-Cap Value Fund – Class I | | | 10.18% | |
| Lord Abbett Research Fund, Inc.-Small-Cap Value Fund – Class I | | | 20.20% | |
| Lord Abbett Securities Trust-Value Opportunities Fund – Class I | | | 20.13% | |
The Ten Largest Holdings and the Holdings by Sector, as of October 31, 2016, for each Underlying Fund are presented below. Each Underlying Fund’s annual and semiannual reports, which are sent to shareholders and filed with the SEC, contain information about the Underlying Fund’s portfolio holdings, including a complete schedule of holdings. A complete schedule of holdings for each Underlying Fund is also filed with the SEC on Form N-Q as of the end of each respective Underlying Fund’s first and third quarters. In addition, on or about the first day of the second month following each calendar quarter-end, each Fund makes publicly available a complete schedule of its portfolio holdings as of the last day of each such quarter. The information for the most recently ended calendar quarter may be viewed at www.lordabbett.com or requested at no charge by calling Lord Abbett at 888-522-2388.
Lord Abbett Developing Growth Fund, Inc.
| Ten Largest Holdings | | % of Investments | |
| Beacon Roofing Supply, Inc. | | | 2.03% | |
| Paycom Software, Inc. | | | 1.95% | |
| Ellie Mae, Inc. | | | 1.89% | |
| GrubHub, Inc. | | | 1.87% | |
| Veeva Systems, Inc. Class A | | | 1.82% | |
| TESARO, Inc. | | | 1.78% | |
| Cirrus Logic, Inc. | | | 1.77% | |
| Dave & Busters Entertainment, Inc. | | | 1.72% | |
| ZELTIQ Aesthetics, Inc. | | | 1.70% | |
| Wix.com Ltd. | | | 1.69% | |
|
| | | | | |
| Holdings by Sector* | | | % of Investments | |
| Consumer Discretionary | | | 14.01% | |
| Consumer Staples | | | 2.75% | |
| Energy | | | 1.28% | |
| Financials | | | 2.81% | |
| Health Care | | | 23.44% | |
| Industrials | | | 9.44% | |
| Information Technology | | | 40.41% | |
| Materials | | | 0.93% | |
| Real Estate | | | 0.54% | |
| Telecommunication Services | | | 0.43% | |
| Utilities | | | 0.50% | |
| Repurchase Agreement | | | 3.46% | |
| Total | | | 100.00% | |
| * | A sector may comprise several industries. |
141
Investments in Underlying Funds (continued)
International Opportunities Fund
| Ten Largest Holdings | | % of Investments | |
| Sumco Corp. | | | 1.92% | |
| Arrow Global Group plc | | | 1.55% | |
| Cairn Homes plc | | | 1.52% | |
| Altran Technologies SA | | | 1.51% | |
| Frutarom Industries Ltd. | | | 1.50% | |
| Dewan Housing Finance Corp., Ltd. | | | 1.46% | |
| VanEck Vectors Junior Gold Miners | | | 1.46% | |
| RBL Bank Ltd. | | | 1.42% | |
| UDG Healthcare plc | | | 1.40% | |
| Rheinmetall AG | | | 1.35% | |
|
| | | | | |
| Holdings by Sector* | | | % of Investments | |
| Consumer Discretionary | | | 14.64% | |
| Consumer Staples | | | 7.39% | |
| Energy | | | 4.55% | |
| Financials | | | 16.23% | |
| Health Care | | | 4.41% | |
| Industrials | | | 17.80% | |
| Information Technology | | | 13.15% | |
| Materials | | | 5.33% | |
| Real Estate | | | 7.99% | |
| Telecommunication Services | | | 1.29% | |
| Utilities | | | 3.29% | |
| Repurchase Agreement | | | 3.93% | |
| Total | | | 100.00% | |
| * | A sector may comprise several industries. |
Micro Cap Growth Fund
| Ten Largest Holdings | | % of Investments | |
| Instructure, Inc. | | | 3.01% | |
| Five9, Inc. | | | 2.72% | |
| Patrick Industries, Inc. | | | 2.35% | |
| Pacific Biosciences of California, Inc. | | | 2.24% | |
| Coherus Biosciences, Inc. | | | 1.95% | |
| NV5 Global, Inc. | | | 1.92% | |
| Universal Electronics, Inc. | | | 1.91% | |
| LGI Homes, Inc. | | | 1.90% | |
| NanoString Technologies, Inc. | | | 1.78% | |
| Vascular Solutions, Inc. | | | 1.75% | |
142
Investments in Underlying Funds (continued)
| Holdings by Sector* | | % of Investments | |
| Consumer Discretionary | | | 14.01% | |
| Consumer Staples | | | 3.28% | |
| Energy | | | 1.17% | |
| Financials | | | 3.19% | |
| Health Care | | | 29.10% | |
| Industrials | | | 10.69% | |
| Information Technology | | | 32.15% | |
| Materials | | | 2.24% | |
| Real Estate | | | 1.27% | |
| Repurchase Agreement | | | 2.90% | |
| Total | | | 100.00% | |
| * | A sector may comprise several industries. |
Micro Cap Value Fund
| Ten Largest Holdings | | % of Investments | |
| First Merchants Corp. | | | 4.68% | |
| Gibraltar Industries, Inc. | | | 4.08% | |
| National Commerce Corp. | | | 3.96% | |
| ICF International, Inc. | | | 3.72% | |
| Neenah Paper, Inc. | | | 3.32% | |
| BNC Bancorp | | | 3.31% | |
| Chase Corp. | | | 3.19% | |
| Connecticut Water Service, Inc. | | | 2.75% | |
| FB Financial Corp. | | | 2.64% | |
| Orbotech Ltd. | | | 2.64% | |
| |
| Holdings by Sector* | | | % of Investments | |
| Consumer Discretionary | | | 9.14% | |
| Consumer Staples | | | 3.60% | |
| Energy | | | 5.53% | |
| Financials | | | 20.59% | |
| Health Care | | | 1.69% | |
| Industrials | | | 25.05% | |
| Information Technology | | | 9.27% | |
| Materials | | | 8.74% | |
| Real Estate | | | 7.29% | |
| Telecommunication Services | | | 0.72% | |
| Utilities | | | 5.24% | |
| Repurchase Agreement | | | 3.14% | |
| Total | | | 100.00% | |
| * | A sector may comprise several industries. |
143
Investments in Underlying Funds (continued)
Lord Abbett Research Fund, Inc. – Small Cap Value Fund
| Ten Largest Holdings | | % of Investments | |
| Alere, Inc. | | | 3.13% | |
| First Merchants Corp. | | | 2.89% | |
| Orbotech Ltd. | | | 2.78% | |
| Chemical Financial Corp. | | | 2.74% | |
| Littelfuse, Inc. | | | 2.68% | |
| IdaCorp, Inc. | | | 2.40% | |
| HealthSouth Corp. | | | 2.40% | |
| First Industrial Realty | | | 2.25% | |
| Black Hill Corp. | | | 2.16% | |
| Aecom | | | 2.09% | |
| | | | | |
| Holdings by Sector* | | | % of Investments | |
| Consumer Discretionary | | | 11.43% | |
| Consumer Staples | | | 2.86% | |
| Energy | | | 7.14% | |
| Financials | | | 11.43% | |
| Health Care | | | 8.57% | |
| Industrials | | | 15.71% | |
| Information Technology | | | 21.43% | |
| Materials | | | 8.57% | |
| Real Estate | | | 7.14% | |
| Repurchase Agreement | | | 1.43% | |
| Telecommunication Services | | | 1.43% | |
| Utilities | | | 2.86% | |
| Total | | | 100.00% | |
| * | A sector may comprise several industries. |
Value Opportunities Fund
| Ten Largest Holdings | | % of Investments | |
| Alere, Inc. | | | 3.08% | |
| Arch Capital Group Ltd. | | | 2.14% | |
| RenaissanceRe Holdings Ltd. | | | 2.10% | |
| HealthSouth Corp. | | | 2.07% | |
| Zayo Group Holdings, Inc. | | | 2.04% | |
| KAR Auction Services, Inc. | | | 2.01% | |
| Pinnacle Foods, Inc. | | | 1.98% | |
| CMS Energy Corp. | | | 1.97% | |
| Booz Allen Hamilton Holding Corp. | | | 1.91% | |
| Fidelity National Information Services, Inc. | | | 1.90% | |
144
Investments in Underlying Funds (concluded)
| Holdings by Sector* | | % of Investments | |
| Consumer Discretionary | | | 10.00% | |
| Consumer Staples | | | 1.99% | |
| Energy | | | 5.32% | |
| Financials | | | 16.63% | |
| Health Care | | | 11.13% | |
| Industrials | | | 12.78% | |
| Information Technology | | | 18.79% | |
| Materials | | | 7.59% | |
| Real Estate | | | 5.66% | |
| Telecommunication Services | | | 2.04% | |
| Utilities | | | 4.30% | |
| Repurchase Agreement | | | 3.77% | |
| Total | | | 100.00% | |
| * | A sector may comprise several industries. |
145
Basic Information About Management
The Board is responsible for the management of the business and affairs of the Trust in accordance with the laws of the State of Delaware. The Board elects officers who are responsible for the day-to-day operations of each Fund and who execute policies authorized by the Board. The Board also approves an investment adviser to each Fund and continues to monitor the cost and quality of the services the investment adviser provides, and annually considers whether to renew the contract with the adviser. Generally, each Trustee holds office until his/her successor is elected and qualified or until his/her earlier resignation or removal, as provided in the Trust’s organizational documents.
Lord Abbett, a Delaware limited liability company, is each Fund’s investment adviser. Designated Lord Abbett personnel are responsible for the day-to-day management of the Funds.
Interested Trustee
Ms. Foster and Mr. Sieg are affiliated with Lord Abbett and are “interested persons” of the Trust as defined in the Act. Ms. Foster and Mr. Sieg are directors/trustees of each of the 12 investment companies in the Lord Abbett Family of Funds, which consist of 60 portfolios or series. Ms. Foster is an officer of the Lord Abbett Family of Funds.
Name, Address and
Year of Birth | | Current Position and
Length of Service
with the Trust | | Principal Occupation and Other Directorships
During the Past Five Years |
Daria L. Foster
Lord, Abbett & Co. LLC
90 Hudson Street
Jersey City, NJ 07302
(1954) | | Trustee and President since 2006; Chief Executive Officer since 2012 | | Principal Occupation: Managing Partner of Lord Abbett, joined Lord Abbett in 1990. Other Directorships: None. |
| | | | | |
Douglas B. Sieg
Lord, Abbett & Co. LLC
90 Hudson Street
Jersey City, NJ 07302
(1969) | | Trustee since 2016 | | Principal Occupation: Partner (since 2001) and Head of Client Services (since 2013), formerly Director of Marketing and Relationship Management, joined Lord Abbett in 1994. Other Directorships: None. |
Independent Trustees
The following Independent Trustees also are directors/trustees of each of the 12 investment companies in the Lord Abbett Family of Funds, which consist of 60 portfolios or series.
Name, Address and
Year of Birth | | Current Position and
Length of Service
with the Trust | | Principal Occupation and Other Directorships
During the Past Five Years |
E. Thayer Bigelow
Lord, Abbett & Co. LLC
c/o Legal Dept.
90 Hudson Street
Jersey City, NJ 07302
(1941) | | Trustee since 1994; Chairman since 2013 | | Principal Occupation: Managing General Partner, Bigelow Media, LLC (since 2000); Senior Adviser, Time Warner Inc. (1998 – 2000). Other Directorships: Currently serves as director of Crane Co. (since 1984) and Huttig Building Products Inc. (since 1998). Previously served as a director of R.H. Donnelley Inc. (2009 – 2010). |
| | | | | |
Robert B. Calhoun, Jr.
Lord, Abbett & Co. LLC
c/o Legal Dept.
90 Hudson Street
Jersey City, NJ 07302
(1942) | | Trustee since 1998 | | Principal Occupation: Senior Advisor of Monitor Clipper Partners, a private equity investment fund (since 1997); President of Clipper Asset Management Corp. (1991 – 2009). Other Directorships: None. |
146
Basic Information About Management (continued)
Name, Address and
Year of Birth | | Current Position and
Length of Service
with the Trust | | Principal Occupation and Other Directorships
During the Past Five Years |
Eric C. Fast
Lord, Abbett & Co. LLC
c/o Legal Dept.
90 Hudson Street
Jersey City, NJ 07302
(1949) | | Trustee since 2014 | | Principal Occupation: Chief Executive Officer of Crane Co., an industrial products company (2001 – 2014). Other Directorships: Currently serves as director of Automatic Data Processing, Inc. (since 2007) and Regions Financial Corporation (since 2010). Previously served as a director of Crane Co. (1999 – 2014). |
| | | | | |
Evelyn E. Guernsey
Lord, Abbett & Co. LLC
c/o Legal Dept.
90 Hudson Street
Jersey City, NJ 07302
(1955) | | Trustee since 2011 | | Principal Occupation: CEO, Americas of J.P. Morgan Asset Management (2004 – 2010). Other Directorships: None. |
| | | | | |
Julie A. Hill
Lord, Abbett & Co. LLC
c/o Legal Dept.
90 Hudson Street
Jersey City, NJ 07302
(1946) | | Trustee since 2004 | | Principal Occupation: Owner and CEO of The Hill Company, a business consulting firm (since 1998). Other Directorships: Currently serves as director of Anthem, Inc., a health benefits company (since 1994). |
| | | | | |
Franklin W. Hobbs
Lord, Abbett & Co. LLC
c/o Legal Dept.
90 Hudson Street
Jersey City, NJ 07302
(1947) | | Trustee since 2001 | | Principal Occupation: Advisor of One Equity Partners, a private equity firm (since 2004). Other Directorships: Currently serves as director and Chairman of the Board of Ally Financial Inc., a financial services firm (since 2009), and as director of Molson Coors Brewing Company (since 2002). |
| | | | | |
James M. McTaggart
Lord, Abbett & Co. LLC
c/o Legal Dept.
90 Hudson Street
Jersey City, NJ 07302
(1947) | | Trustee since 2012 | | Principal Occupation: Independent management advisor and consultant (since 2012); Vice President, CRA International, Inc. (doing business as Charles River Associates), a global management consulting firm (2009 – 2012); Founder and Chairman of Marakon Associates, Inc., a strategy consulting firm (1978 – 2009); and Officer and Director of Trinsum Group, a holding company (2007 – 2009). Other Directorships: Currently serves as director of Blyth, Inc., a home products company (since 2004). |
| | | | | |
Mark A. Schmid
Lord, Abbett & Co. LLC
c/o Legal Dept.
90 Hudson Street
Jersey City, NJ 07302
(1959) | | Trustee since 2016 | | Principal Occupation: Vice President and Chief Investment Officer of the University of Chicago (since 2009). Other Directorships: None. |
| | | | | |
James L.L. Tullis
Lord, Abbett & Co. LLC
c/o Legal Dept.
90 Hudson Street
Jersey City, NJ 07302
(1947) | | Trustee since 2006 | | Principal Occupation: CEO of Tullis-Dickerson and Co. Inc., a venture capital management firm (since 1990); CEO of Tullis Health Investors Inc. (since 2012). Other Directorships: Currently serves as director of Crane Co. (since 1998). |
147
Basic Information About Management (continued)
Officers
None of the officers listed below have received compensation from the Trust. All of the officers of the Trust also may be officers of the other Lord Abbett Funds and maintain offices at 90 Hudson Street, Jersey City, NJ 07302. Unless otherwise indicated, the position(s) and title(s) listed under the “Principal Occupation During the Past Five Years” column indicate each officer’s position(s) and title(s) with Lord Abbett. Each officer serves for an indefinite term (i.e., until his or her death, resignation, retirement, or removal).
Name and
Year of Birth | | Current Position
with the Trust | | Length of Service
of Current
Position | | Principal Occupation
During the Past Five Years |
Daria L. Foster
(1954) | | President and Chief Executive Officer | | Elected as President in 2006 and Chief Executive Officer in 2012 | | Managing Partner of Lord Abbett, joined Lord Abbett in 1990. |
| | | | | | | |
Sean J. Aurigemma
(1969) | | Executive Vice President | | Elected in 2010 | | Portfolio Manager, joined Lord Abbett in 2007. |
| | | | | | | |
Todd D. Jacobson
(1966) | | Executive Vice President | | Elected in 2003 | | Partner and Associate Director, joined Lord Abbett in 2003. |
| | | | | | | |
Robert A. Lee
(1969) | | Executive Vice President | | Elected in 2016 | | Partner and Chief Investment Officer, and was formerly Deputy Chief Investment Officer and Director of Taxable Fixed Income, joined Lord Abbett in 1997. |
| | | | | | | |
Thomas B. Maher
(1967) | | Executive Vice President | | Elected in 2008 | | Partner and Portfolio Manager, joined Lord Abbett in 2003. |
| | | | | | | |
Giulio Martini
(1955) | | Executive Vice President | | Elected in 2015 | | Director of Strategic Asset Allocation, joined Lord Abbett in 2015 and was formerly Global Investment Strategist at Anderson Global Macro LLC (2012 – 2015) and Chief Investment Officer of Currency Strategies at AllianceBernstein (1985 – 2012). |
| | | | | | | |
Justin C. Maurer
(1969) | | Executive Vice President | | Elected in 2008 | | Partner and Portfolio Manager, joined Lord Abbett in 2001. |
| | | | | | | |
Vincent J. McBride
(1964) | | Executive Vice President | | Elected in 2003 | | Partner and Director, joined Lord Abbett in 2003. |
| | | | | | | |
F. Thomas O’Halloran, III
(1955) | | Executive Vice President | | Elected in 2003 | | Partner and Portfolio Manager, joined Lord Abbett in 2001. |
148
Basic Information About Management (continued)
Name and
Year of Birth | | Current Position
with the Trust | | Length of Service
of Current
Position | | Principal Occupation
During the Past Five Years |
Didier O. Rosenfeld
(1976) | | Executive Vice President | | Elected in 2016 | | Director of Global Equity, joined Lord Abbett in 2015 and was formerly a Portfolio Manager and Senior Analyst at Cornerstone Capital Management (2014 – 2015) and Managing Director at State Street Global Advisors (2000 – 2013). |
| | | | | | | |
Frederick J. Ruvkun
(1957) | | Executive Vice President | | Elected in 2016 | | Partner and Portfolio Manager, joined Lord Abbett in 2006. |
| | | | | | | |
A. Edward Allinson
(1961) | | Vice President | | Elected in 2011 | | Portfolio Manager, joined Lord Abbett in 2005. |
| | | | | | | |
John W. Ashbrook
(1964) | | Vice President and Assistant Secretary | | Elected in 2014 | | Assistant General Counsel, joined Lord Abbett in 2008. |
| | | | | | | |
Vernon T. Bice
(1974) | | Vice President | | Elected in 2016 | | Portfolio Manager, joined Lord Abbett in 2011. |
| | | | | | | |
Joan A. Binstock
(1954) | | Chief Financial Officer and Vice President | | Elected in 1999 | | Partner and Chief Financial Officer, and was formerly Chief Operations Officer, joined Lord Abbett in 1999. |
| | | | | | | |
Matthew R. DeCicco
(1977) | | Vice President | | Elected in 2015 | | Portfolio Manager, joined Lord Abbett in 1999. |
| | | | | | | |
Brooke A. Fapohunda
(1975) | | Vice President and Assistant Secretary | | Elected in 2014 | | Deputy General Counsel, joined Lord Abbett in 2006. |
| | | | | | | |
John K. Forst
(1960) | | Vice President and Assistant Secretary | | Elected in 2005 | | Partner and Deputy General Counsel, joined Lord Abbett in 2004. |
| | | | | | | |
Lawrence H. Kaplan
(1957) | | Vice President and Secretary | | Elected in 1997 | | Partner and General Counsel, joined Lord Abbett in 1997. |
| | | | | | | |
Linda Y. Kim
(1980) | | Vice President and Assistant Secretary | | Elected in 2016 | | Counsel, joined Lord Abbett in 2015 and was formerly an Associate at Stroock & Stroock & Lavan LLP (2007 – 2015). |
| | | | | | | |
David J. Linsen
(1974) | | Vice President | | Elected in 2011 | | Partner and Director, joined Lord Abbett in 2001. |
| | | | | | | |
Joseph M. McGill
(1962) | | Chief Compliance Officer | | Elected in 2014 | | Partner and Chief Compliance Officer, joined Lord Abbett in 2014 and was formerly Managing Director and the Chief Compliance Officer at UBS Global Asset Management (2003 – 2013). |
149
Basic Information About Management (concluded)
Name and
Year of Birth | | Current Position
with the Trust | | Length of Service
of Current
Position | | Principal Occupation
During the Past Five Years |
A. Edward Oberhaus, III
(1959) | | Vice President | | Elected in 1993 | | Partner and Director, joined Lord Abbett in 1983. |
| | | | | | | |
Lawrence B. Stoller
(1963) | | Vice President and Assistant Secretary | | Elected in 2007 | | Partner and Senior Deputy General Counsel, joined Lord Abbett in 2007. |
| | | | | | | |
Arthur K. Weise
(1970) | | Vice President | | Elected in 2011 | | Partner and Portfolio Manager, joined Lord Abbett in 2007. |
| | | | | | | |
Scott S. Wallner
(1955) | | AML Compliance Officer | | Elected in 2011 | | Assistant General Counsel, joined Lord Abbett in 2004. |
| | | | | | | |
Bernard J. Grzelak
(1971) | | Treasurer | | Elected in 2003 | | Partner and Chief Operations Officer, and was formerly Director of Fund Administration, joined Lord Abbett in 2003. |
Please call 888-522-2388 for a copy of the statement of additional information, which contains further information about the Trust’s Trustees. It is available free upon request.
150
Householding
The Trust has adopted a policy that allows it to send only one copy of each Fund’s prospectus, proxy material, annual report and semiannual report to certain shareholders residing at the same “household.” This reduces Fund expenses, which benefits you and other shareholders. If you need additional copies or do not want your mailings to be “householded,” please call Lord Abbett at 888-522-2388 or send a written request with your name, the name of your fund or funds and your account number or numbers to Lord Abbett Family of Funds, P.O. Box 219336, Kansas City, MO 64121.
Proxy Voting Policies, Procedures and Records
A description of the policies and procedures that Lord Abbett uses to vote proxies related to each Fund’s portfolio securities, and information on how Lord Abbett voted each Fund’s proxies during the 12-month period ended June 30 are available without charge, upon request, (i) by calling 888-522-2388; (ii) on Lord Abbett’s Website at www.lordabbett.com; and (iii) on the Securities and Exchange Commission’s (“SEC”) Website at www.sec.gov.
Shareholder Reports and Quarterly Portfolio Disclosure
The Funds are required to file their complete schedule of portfolio holdings with the SEC for their first and third fiscal quarters on Form N-Q. Copies of the filings are available without charge, upon request on the SEC’s Website at www.sec.gov and may be available by calling Lord Abbett at 888-522-2388. You can also obtain copies of Form N-Q by visiting the SEC’s Public Reference Room in Washington, DC (information on the operation of the Public Reference Room may be obtained by calling 800-SEC-0330).
151
Tax Information
The percentages below reflect the portion of ordinary income distributions that are eligible for the corporate dividend received deduction (DRD) and qualified dividend income (QDI) for individual shareholders:
| Fund Name | | | DRD | | | | QDI | |
| Alpha Strategy Fund | | | 16% | | | | 72% | |
| Fundamental Equity Fund | | | 100% | | | | 100% | |
| Growth Leaders Fund | | | 12% | | | | 12% | |
| International Core Equity Fund | | | – | | | | 100% | |
| International Dividend Income Fund | | | – | | | | 100% | |
| International Opportunities Fund | | | – | | | | 90% | |
Additionally, of the distributions paid to the shareholders during the fiscal year ended October 31, 2016, the following amounts represent short-term and long-term capital gains:
| | | Short-Term | | | Long-Term | |
| Fund Name | | Capital Gains | | | Capital Gains | |
| Alpha Strategy Fund | | $ | – | | | $ | 162,272,374 | |
| Fundamental Equity Fund | | | – | | | | 311,273,845 | |
| Growth Leaders Fund | | | 86,118,259 | | | | 10,007,653 | |
| International Opportunities Fund | | | 5,951,394 | | | | 16,340,480 | |
| Value Opportunities Fund | | | – | | | | 191,979,908 | |
The Funds listed below intend to pass through foreign source income and foreign taxes as follows:
| | | Foreign | | | | | |
| Fund Name | | Source Income | | | Foreign Taxes | |
| Alpha Strategy Fund | | $ | 1,120,626 | | | $ | 896,768 | |
| International Core Equity Fund | | | 18,789,606 | | | | 1,769,709 | |
| International Dividend Income Fund | | | 83,536,925 | | | | 6,358,902 | |
152

| | | We Recycle | | Lord Abbett Securities Trust Lord Abbett Alpha Strategy Fund Lord Abbett Fundamental Equity Fund Lord Abbett Growth Leaders Fund Lord Abbett International Core Equity Fund Lord Abbett International Dividend Income Fund Lord Abbett International Opportunities Fund Lord Abbett Value Opportunities Fund | LST-2 (12/16) |
| | | This document is printed on recycled paper. | |
 | | | |
| | | Go Paperless! | |
| | | Visit www.lordabbett.com to learn how to receive all your shareholder communications online. | |
| | | | |
This report, when not used for the general information of shareholders of the Fund, is to be distributed only if preceded or accompanied by a current fund prospectus. Lord Abbett mutual fund shares are distributed by LORD ABBETT DISTRIBUTOR LLC. | |

2016 LORD ABBETT
ANNUAL REPORT
Lord Abbett
Micro Cap Growth Fund
Micro Cap Value Fund
For the fiscal year ended October 31, 2016
Table of Contents
Lord Abbett Securities Trust
Lord Abbett Micro Cap Growth Fund and Lord Abbett Micro Cap Value Fund Annual Report
For the fiscal year ended October 31, 2016

Daria L. Foster, Trustee, President and Chief Executive Officer of the Lord Abbett Funds and E. Thayer Bigelow, Independent Chairman of the Lord Abbett Funds.
Dear Shareholders: We are pleased to provide you with this overview of the performance of the Funds for the fiscal year ended October 31, 2016. On this page and the following pages, we discuss the major factors that influenced fiscal year performance. For detailed and more timely information about the Funds, please visit our website at www.lordabbett.com, where you also can access the quarterly commentaries that provide updates on each Fund’s performance and other portfolio related updates.
Thank you for investing in Lord Abbett mutual funds. We value the trust that you place in us and look forward to serving your investment needs in the years to come.
Best regards,

Daria L. Foster
Trustee, President and Chief Executive Officer
Micro Cap Growth Fund
For the fiscal year ended October 31, 2016, the Micro Cap Growth Fund returned -1.30%, reflecting performance at the net asset value (NAV) of Class A shares, with all distributions reinvested, compared to its benchmark, the Russell Microcap® Growth Index1, which returned -4.63% over the same period.
Domestic equity markets (as represented by the S&P 500® Index2) returned 4.51% over the past year. Despite this general move higher, there were a few
bouts of volatility within U.S. stock markets, notably experiencing their worst start to a calendar year on record, in the early part of 2016. The Federal Reserve (Fed) raised target rates in December 2015, from 0% – 0.25% to 0.25% – 0.5%, citing an improved economic outlook and delayed policy-response time as the rationale for their actions. This marked the first rate hike by the Fed since 2006. In contrast to the equity market volatility, the U.S. economy continued to expand during the trailing 12-month period. In October,
1
the unemployment rate reached 4.9%, while U.S. gross domestic product grew at a 2.9% pace during the third quarter, a significant increase over the second quarter. The U.S. Bureau of Economic Analysis stated that during the third quarter personal and disposable income increased along with savings, quarter-over-quarter.
Geopolitical events also contributed to volatility in global markets. The United Kingdom’s referendum in June (“Brexit”), to leave the European Union, was a surprise that caused a sell-off in global markets. More recently, uncertainty around the impact of the U.S election weighed on the markets’ expectations.
The largest contributor to the Fund’s performance during the period, relative to the benchmark, was security selection in the health care sector. Shares of Nevro Corp., a developer of chronic pain treatments, climbed, as the company continuously posted strong revenue growth and improved guidance. Another contributor was Five Prime Therapeutics, Inc., a clinical-stage biotechnology company focused on immuno-oncology, which experienced positive momentum as several drugs produced compelling preclinical data points.
In addition, the Fund’s holdings in the information technology sector contributed to relative performance. Five9, Inc., a cloud software company, contributed most. Shares of Five9 surged after the company reported second quarter 2016 earnings and revenue above consensus estimates and
offered forward guidance that exceeded expectations. Another contributor within the information technology sector was the Fund’s position in Instructure, Inc., a builder and operator of cloud-based learning platforms. The company increased its market share as customers displayed high satisfaction with its flagship product, Canvas LMS.
The largest detractor from Fund performance during the period was security selection in the industrials sector. Within this sector, the Fund’s holdings of Astronics Corp., a provider of test-systems and aerospace products to the defense, electronics, and semiconductor industries, detracted most. Shares of Astronics fell sharply in February after the company reported quarterly revenue and earnings below consensus estimates due to lower test-system sells. Nv5 Holdings Inc., a consulting solutions and technical engineering provider to the public and private sector, also detracted from relative performance. Shares saw a precipitous drop after the company lowered guidance and announced the acquisition of JBA Consulting Engineers, Inc., in October.
The materials sector was another detractor from Fund performance during the period. Within this sector, the Fund’s position in Flotek Industries, Inc., a developer and supplier of oilfield products, services, and equipment to the oil, gas, and mining industries, detracted from relative performance. Flotek’s share price declined due to low oil prices and cuts to energy and production oil companies’ capital
2
expenditures, which had a negative effect on oil service companies. Flotek also reported in January that the Securities and Exchange Commission had provided notice of an inquiry related to the company’s FracMax® software. The Fund’s position in U.S. Concrete, Inc., a domestic producer of ready-mixed concrete, hurt the Fund’s relative performance, as July and August Texas cement shipments were late due to weather and concerns over margin compression.
Micro Cap Value Fund
For the fiscal year ended October 31, 2016, the Fund returned 10.00%, reflecting performance at the net asset value (NAV) of Class A shares, with all distributions reinvested, compared to its benchmark, the Russell Microcap® Value Index,3 which returned 6.12% over the same period.
Domestic equity markets (as represented by the S&P 500® Index2) returned 4.51% over the past year. Despite this general move higher, there were a few bouts of volatility within U.S. stock markets, notably experiencing their worst start to a calendar year on record, in the early part of 2016. The Federal Reserve (Fed) raised target rates in December 2015, from 0% – 0.25% to 0.25% – 0.5%, citing an improved economic outlook and delayed policy-response time as the rationale for their actions. This marked the first rate hike by the Fed since 2006. In contrast to the equity market volatility, the U.S. economy continued to expand during the trailing 12-month period. In October, the unemployment rate reached 4.9%,
while U.S. gross domestic product grew at a 2.9% pace during the third quarter, a significant increase over the second quarter. The U.S. Bureau of Economic Analysis stated that during the third quarter personal and disposable income increased along with savings, quarter-over-quarter.
Geopolitical events also contributed to volatility in global markets. The United Kingdom’s referendum in June (“Brexit”), to leave the European Union, was a surprise that caused a sell-off in global markets. More recently, uncertainty around the impact of the U.S election weighed on the markets’ expectations.
Stock selection, specifically in the energy and industrials sectors, was the primary contributor to the Fund’s outperformance relative to its benchmark during the period. Within the energy sector, shares of Parsley Energy, Inc., an oil and natural gas corporation, climbed as investors viewed the company to have a strong balance sheet and high growth rate in the sector. In addition, shares of Silver Run Acquisition Corp., a specialized holding company for acquisitions, increased after it agreed to take a controlling stake in Centennial Resource Production, LLC in July.
Within the industrials sector, shares of Gilbraltar Industries, Inc., a manufacturer and distributor of construction products, increased due to gains in overall operating efficiency. Shares of ICF International, Inc., a consulting firm, appreciated due to improving growth and low valuation.
3
Conversely, stock selection in the financials sector, along with an underweight compared to its benchmark and stock selection in the health care sector, detracted from the Fund’s relative performance during the period. Within the financials sector, shares of Marcus & Millichap, Inc., a multi-faceted real-estate brokerage firm, fell as the company experienced an increase in expenses and negative growth in year-over-year earnings. Shares of South State Corp., a South Carolina regional commercial bank, also declined due to general market concerns over a flattening yield curve.
Within the health care sector, shares of Aceto Corp., a sales and distribution firm focused on the human health, pharmaceutical, and other lines of finished products, fell on increased competition in the generic pharmaceuticals business. Shares of Providence Service Corp., a health care and workforce development service provider, also experienced weakness due to concerns over the renewal of the NJ Logisticare contract.
Each Fund’s portfolio is actively managed and, therefore, its holdings and the weightings of a particular issuer or particular sector as a percentage of portfolio assets are subject to change. Sectors may include many industries.
1 The Russell Microcap® Growth Index measures the performance of those Russell Micro Cap companies with higher price-to-book ratios and higher forecasted growth values.
2 The S&P 500® Index is widely regarded as the standard for measuring large cap U.S. stock market performance and includes a representative sample of leading companies in leading industries.
3 The Russell Microcap® Value Index measures the performance of those Russell Microcap companies with lower price-to-book ratios and lower forecasted growth values.
Unless otherwise specified, indexes reflect total return, with all dividends reinvested. Indexes are unmanaged, do not reflect the deduction of fees or expenses, and are not available for direct investment.
Important Performance and Other Information
Performance data quoted in the following pages reflect past performance and are no guarantee of future results. Current performance may be higher or lower than the performance quoted. The investment return and principal value of an investment in the Funds will fluctuate so that shares, on any given day or when redeemed, may be worth more or less than their original cost. You can obtain performance data current to the most recent month end by calling Lord Abbett at 888-522-2388 or referring to www.lordabbett.com.
Except where noted, comparative Fund performance does not account for the deduction of sales charges
and would be different if sales charges were included. Each Fund offers classes of shares with distinct pricing options. For a full description of the differences in pricing alternatives, please see each Fund’s prospectus.
During certain periods shown, expense waivers and reimbursements were in place. Without such waivers and expense reimbursements, the Funds’ returns would have been lower.
The annual commentary above discusses the views of the Funds’ management and various portfolio holdings of the Funds as of October 31, 2016. These views and portfolio holdings may have changed after this date. Information provided in the commentary is not a recommendation to buy or sell securities. Because the Funds’ portfolio is actively managed and may change significantly, the Funds may no longer own the securities described above or may have otherwise changed their positions in the securities. For more recent information about the Funds’ portfolio holdings, please visit www.lordabbett.com.
A Note about Risk: See Notes to Financial Statements for a discussion of investment risks. For a more detailed discussion of the risks associated with each Fund, please see each Fund’s prospectus.
Mutual funds are not insured by the FDIC, are not deposits or other obligations of, or guaranteed by, banks, and are subject to investment risks including possible loss of principal amount invested.
4
Micro Cap Growth Fund
Investment Comparison
Below is a comparison of a $10,000 investment in Class A shares with the same investment in the Russell Microcap® Growth Index and the Russell Microcap® Index, assuming reinvestment of all dividends and distributions. The performance of the other class will be greater than or less than the performance shown in the graph below due to different sales loads and expenses applicable to such class. The graph and performance table below do not reflect the deduction of taxes that a shareholder would pay on Fund distributions or the redemption of Fund shares. During certain periods, expenses of the Fund have been waived or reimbursed by Lord Abbett; without such waiver or reimbursement of expenses, the Fund’s returns would have been lower. Past performance is no guarantee of future results.
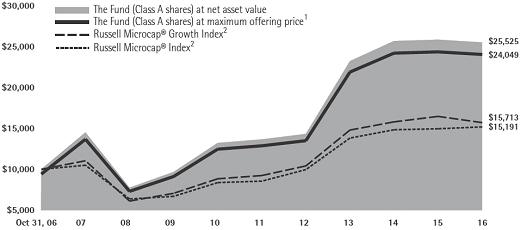
Average Annual Total Returns at Maximum Applicable
Sales Charge for the Periods Ended October 31, 2016
| | 1 Year | 5 Years | 10 Years |
| Class A3 | -7.00% | 11.98% | 9.17% |
| Class I4 | -1.39% | 13.36% | 9.99% |
1 Reflects the deduction of the maximum initial sales charge of 5.75%.
2 Performance for each unmanaged index does not reflect any fees or expenses. The performance of each index is not necessarily representative of the Fund’s performance.
3 Total return, which is the percent change in net asset value, after deduction of the maximum initial sales charge of 5.75%
applicable to Class A shares, with all dividends and distributions reinvested for the periods shown ended October 31, 2016, is calculated using the SEC required uniform method to compute such return.
4 Performance is at net asset value.
5
Micro Cap Value Fund
Investment Comparison
Below is a comparison of a $10,000 investment in Class A shares with the same investment in the Russell Microcap® Value Index and the Russell Microcap® Index, assuming reinvestment of all dividends and distributions. The performance of the other class will be greater than or less than the performance shown in the graph below due to different sales loads and expenses applicable to such class. The graph and performance table below do not reflect the deduction of taxes that a shareholder would pay on Fund distributions or the redemption of Fund shares. During certain periods, expenses of the Fund have been waived or reimbursed by Lord Abbett; without such waiver or reimbursement of expenses, the Fund’s returns would have been lower. Past performance is no guarantee of future results.
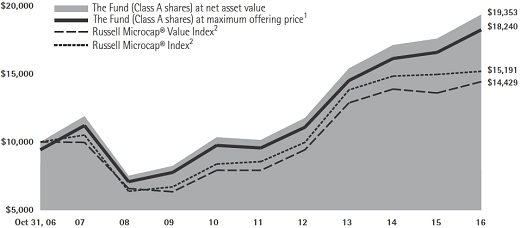
Average Annual Total Returns at Maximum Applicable
Sales Charge for the Periods Ended October 31, 2016
| | 1 Year | 5 Years | 10 Years |
| Class A3 | 3.68% | 12.45% | 6.19% |
| Class I4 | 9.97% | 13.86% | 6.99% |
1 Reflects the deduction of the maximum initial sales charge of 5.75%.
2 Performance for each unmanaged index does not reflect any fees or expenses. The performance of each index is not necessarily representative of the Fund’s performance.
3 Total return, which is the percent change in net asset value, after deduction of the maximum initial sales charge of 5.75% applicable to Class A shares, with all dividends and distributions reinvested for the periods shown ended October 31, 2016, is calculated using the SEC required uniform method to compute such return.
4 Performance is at net asset value.
6
Expense Example
As a shareholder of a Fund, you incur two types of costs: (1) transaction costs, including sales charges (loads) on purchase payments (these charges vary among the share classes); and (2) ongoing costs, including management fees; distribution and service (12b-1) fees (these charges vary among the share classes); and other Fund expenses. This Example is intended to help you understand your ongoing costs (in dollars) of investing in the Funds and to compare these costs with the ongoing costs of investing in other mutual funds.
The Example is based on an investment of $1,000 invested at the beginning of the period and held for the entire period (May 1, 2016 through October 31, 2016).
Actual Expenses
For each class of each Fund, the first line of the tables on the following pages provides information about actual account values and actual expenses. You may use the information in this line, together with the amount you invested, to estimate the expenses that you paid over the period. Simply divide your account value by $1,000 (for example, an $8,600 account value divided by $1,000 = 8.6), then multiply the result by the number in the first line under the heading titled “Expenses Paid During Period 5/1/16 – 10/31/16” to estimate the expenses you paid on your account during this period.
Hypothetical Example for Comparison Purposes
For each class of each Fund, the second line of the tables on the following pages provides information about hypothetical account values and hypothetical expenses based on the Fund’s actual expense ratio and an assumed rate of return of 5% per year before expenses, which is not each Fund’s actual return. The hypothetical account values and expenses may not be used to estimate the actual ending account balance or expenses you paid for the period. You may use this information to compare the ongoing costs of investing in each Fund and other funds. To do so, compare this 5% hypothetical example with the 5% hypothetical examples that appear in the shareholder reports of the other funds.
7
Micro Cap Growth Fund
Please note that the expenses shown in the table are meant to highlight your ongoing costs only and do not reflect any transactional costs, such as sales charges (loads). Therefore, the second line of the table is useful in comparing ongoing costs only, and will not help you determine the relative total costs of owning different funds. In addition, if these transactional costs were included, your costs would have been higher.
| | | Beginning | | Ending | | Expenses | |
| | | Account | | Account | | Paid During | |
| | | Value | | Value | | Period† | |
| | | | | | | 5/1/16 - | |
| | | 5/1/16 | | 10/31/16 | | 10/31/16 | |
| Class A | | | | | | | |
| Actual | | $1,000.00 | | $1,100.80 | | $9.51 | |
| Hypothetical (5% Return Before Expenses) | | $1,000.00 | | $1,016.09 | | $9.12 | |
| | | | | | | | |
| Class I | | | | | | | |
| Actual | | $1,000.00 | | $1,099.90 | | $9.51 | |
| Hypothetical (5% Return Before Expenses) | | $1,000.00 | | $1,016.09 | | $9.12 | |
| † | For each class of the Fund, net expenses are equal to the annualized expense ratio for such class (1.80% for Classes A and I) multiplied by the average account value over the period, multiplied by 184/366 (to reflect one-half year period). |
Portfolio Holdings Presented by Sector
October 31, 2016
| Sector* | | %** |
| Consumer Discretionary | | 14.01% | |
| Consumer Staples | | 3.28% | |
| Energy | | 1.17% | |
| Financials | | 3.19% | |
| Health Care | | 29.10% | |
| Industrials | | 10.69% | |
| Information Technology | | 32.15% | |
| Materials | | 2.24% | |
| Real Estate | | 1.27% | |
| Repurchase Agreement | | 2.90% | |
| Total | | 100.00% | |
| * | | A sector may comprise several industries. |
| ** | | Represents percent of total investments. |
8
Micro Cap Value Fund
Please note that the expenses shown in the table are meant to highlight your ongoing costs only and do not reflect any transactional costs, such as sales charges (loads). Therefore, the second line of the table is useful in comparing ongoing costs only, and will not help you determine the relative total costs of owning different funds. In addition, if these transactional costs were included, your costs would have been higher.
| | | Beginning | | Ending | | Expenses | |
| | | Account | | Account | | Paid During | |
| | | Value | | Value | | Period† | |
| | | | | | | 5/1/16 - | |
| | | 5/1/16 | | 10/31/16 | | 10/31/16 | |
| Class A | | | | | | | |
| Actual | | $1,000.00 | | $1,097.20 | | $9.44 | |
| Hypothetical (5% Return Before Expenses) | | $1,000.00 | | $1,016.14 | | $9.07 | |
| | | | | | | | |
| Class I | | | | | | | |
| Actual | | $1,000.00 | | $1,097.00 | | $9.44 | |
| Hypothetical (5% Return Before Expenses) | | $1,000.00 | | $1,016.14 | | $9.07 | |
| † | For each class of the Fund, net expenses are equal to the annualized expense ratio for such class (1.79% for Classes A and I) multiplied by the average account value over the period, multiplied by 184/366 (to reflect one-half year period). |
Portfolio Holdings Presented by Sector
October 31, 2016
| Sector* | | %** |
| Consumer Discretionary | | 9.14% | |
| Consumer Staples | | 3.60% | |
| Energy | | 5.53% | |
| Financials | | 20.59% | |
| Health Care | | 1.69% | |
| Industrials | | 25.05% | |
| Information Technology | | 9.27% | |
| Materials | | 8.74% | |
| Real Estate | | 7.29% | |
| Telecommunication Services | | 0.72% | |
| Utilities | | 5.24% | |
| Repurchase Agreement | | 3.14% | |
| Total | | 100.00% | |
| * | | A sector may comprise several industries. |
| ** | | Represents percent of total investments. |
9
Schedule of Investments
MICRO CAP GROWTH FUND October 31, 2016
| | | | | | Fair | |
| | | | | | Value | |
| Investments | | Shares | | | (000) | |
| COMMON STOCKS 98.52% | | | | | | | | |
| | | | | | | | | |
| Aerospace & Defense 1.50% | | | | | | | | |
| Mercury Systems, Inc.* | | | 76,055 | | | $ | 2,113 | |
| | | | | | | | | |
| Air Freight & Logistics 1.81% | | | | | | | | |
| Air Transport Services Group, Inc.* | | | 140,036 | | | | 1,853 | |
| Echo Global Logistics, Inc.* | | | 32,861 | | | | 696 | |
| Total | | | | | | | 2,549 | |
| | | | | | | | | |
| Auto Components 2.34% | | | | | | | | |
| Fox Factory Holding Corp.* | | | 99,707 | | | | 2,163 | |
| Stoneridge, Inc.* | | | 75,960 | | | | 1,126 | |
| Total | | | | | | | 3,289 | |
| | | | | | | | | |
| Banks 0.82% | | | | | | | | |
| Pacific Premier Bancorp, Inc.* | | | 44,600 | | | | 1,153 | |
| | | | | | | | | |
| Beverages 0.73% | | | | | | | | |
| MGP Ingredients, Inc. | | | 29,090 | | | | 1,024 | |
| | | | | | | | | |
| Biotechnology 12.08% | | | | | | | | |
| Acceleron Pharma, Inc.* | | | 45,752 | | | | 1,282 | |
| Blueprint Medicines Corp.* | | | 79,218 | | | | 2,375 | |
| Clovis Oncology, Inc.* | | | 14,820 | | | | 431 | |
| Coherus Biosciences, Inc.* | | | 101,917 | | | | 2,787 | |
| Five Prime Therapeutics, Inc.* | | | 31,931 | | | | 1,550 | |
| Foundation Medicine, Inc.* | | | 67,454 | | | | 1,531 | |
| Genomic Health, Inc.* | | | 51,984 | | | | 1,550 | |
| Natera, Inc.* | | | 108,344 | | | | 919 | |
| Repligen Corp.* | | | 56,980 | | | | 1,628 | |
| Sage Therapeutics, Inc.* | | | 29,512 | | | | 1,285 | |
| Spark Therapeutics, Inc.* | | | 12,698 | | | | 597 | |
| Xencor, Inc.* | | | 48,749 | | | | 1,038 | |
| Total | | | | | | | 16,973 | |
| | | | | | | | | |
| Building Products 3.27% | | | | | | | | |
| Builders FirstSource, Inc.* | | | 130,205 | | | | 1,259 | |
| Patrick Industries, Inc.* | | | 58,301 | | | | 3,344 | |
| Total | | | | | | | 4,603 | |
| | | | | | Fair | |
| | | | | | Value | |
| Investments | | Shares | | | (000) | |
| Chemicals 1.11% | | | | | | | | |
| Ferro Corp.* | | | 119,861 | | | $ | 1,553 | |
| | | | | | | | | |
| Communications Equipment 0.82% | | | | | | | | |
| Oclaro, Inc.* | | | 157,073 | | | | 1,148 | |
| | | | | | | | | |
| Construction & Engineering 2.53% | | | | | | | | |
| Argan, Inc. | | | 14,264 | | | | 811 | |
| NV5 Global, Inc.* | | | 95,939 | | | | 2,744 | |
| Total | | | | | | | 3,555 | |
| | | | | | | | | |
| Construction Materials 1.17% | | | | | | | | |
| U.S. Concrete, Inc.* | | | 32,884 | | | | 1,641 | |
| | | | | | | | | |
| Diversified Consumer Services 0.98% | | | | | | | | |
| Chegg, Inc.* | | | 208,045 | | | | 1,384 | |
| | | | | | | | | |
| Electrical Equipment 1.17% | | | | | | | | |
| LSI Industries, Inc. | | | 127,301 | | | | 1,095 | |
| TPI Composites, Inc.* | | | 34,662 | | | | 552 | |
| Total | | | | | | | 1,647 | |
| | | | | | | | | |
| Electronic Equipment, Instruments & Components 3.92% | |
| Control4 Corp.* | | | 172,873 | | | | 1,952 | |
| Fabrinet (Thailand)*(a) | | | 32,563 | | | | 1,236 | |
| II-VI, Inc.* | | | 83,425 | | | | 2,319 | |
| Total | | | | | | | 5,507 | |
| | | | | | | | | |
| Equity Real Estate Investment Trusts 1.28% | | |
| Hannon Armstrong Sustainable | | | | | | | | |
| Infrastructure Capital, Inc. | | | 52,614 | | | | 1,203 | |
| National Storage Affiliates Trust | | | 30,809 | | | | 603 | |
| Total | | | | | | | 1,806 | |
| | | | | | | | | |
| Food Products 1.75% | | | | | | | | |
| Amplify Snack Brands, Inc.* | | | 95,094 | | | | 1,378 | |
| Calavo Growers, Inc. | | | 18,348 | | | | 1,085 | |
| Total | | | | | | | 2,463 | |
| 10 | See Notes to Financial Statements. |
Schedule of Investments (continued)
MICRO CAP GROWTH FUND October 31, 2016
| | | | | | Fair | |
| | | | | | Value | |
| Investments | | Shares | | | (000) | |
| Health Care Equipment & Supplies 9.39% | | |
| Endologix, Inc.* | | | 91,448 | | | $ | 957 | |
| Glaukos Corp.* | | | 70,434 | | | | 2,353 | |
| Inogen, Inc.* | | | 31,416 | | | | 1,686 | |
| iRhythm Technologies, Inc.* | | | 53,695 | | | | 1,340 | |
| NxStage Medical, Inc.* | | | 33,276 | | | | 757 | |
| Spectranetics Corp. (The)* | | | 92,969 | | | | 2,017 | |
| Vascular Solutions, Inc.* | | | 54,745 | | | | 2,496 | |
| ZELTIQ Aesthetics, Inc.* | | | 47,858 | | | | 1,584 | |
| Total | | | | | | | 13,190 | |
| | | | | | | | | |
| Health Care Providers & Services 2.69% | | | | | | | | |
| Healthways, Inc.* | | | 65,534 | | | | 1,625 | |
| U.S. Physical Therapy, Inc. | | | 37,832 | | | | 2,153 | |
| Total | | | | | | | 3,778 | |
| | | | | | | | | |
| Health Care Technology 0.50% | | | | | | | | |
| Evolent Health, Inc. Class A* | | | 33,413 | | | | 703 | |
| | | | | | | | | |
| Hotels, Restaurants & Leisure 1.94% | | | | | | | | |
| ClubCorp Holdings, Inc. | | | 76,110 | | | | 879 | |
| Wingstop, Inc. | | | 68,804 | | | | 1,841 | |
| Total | | | | | | | 2,720 | |
| | | | | | | | | |
| Household Durables 6.65% | | | | | | | | |
| Cavco Industries, Inc.* | | | 22,025 | | | | 2,035 | |
| iRobot Corp.* | | | 36,931 | | | | 1,872 | |
| LGI Homes, Inc.* | | | 91,224 | | | | 2,715 | |
| Universal Electronics, Inc.* | | | 38,772 | | | | 2,720 | |
| Total | | | | | | | 9,342 | |
| | | | | | | | | |
| Internet & Direct Marketing Retail 1.89% | | | | | | | | |
| Duluth Holdings, Inc.* | | | 56,665 | | | | 1,539 | |
| Etsy, Inc.* | | | 86,217 | | | | 1,119 | |
| Total | | | | | | | 2,658 | |
| | | | | | Fair | |
| | | | | | Value | |
| Investments | | Shares | | | (000) | |
| Internet Software & Services 14.92% | | | | | | | | |
| 2U, Inc.* | | | 21,033 | | | $ | 733 | |
| Alarm.com Holdings, Inc.* | | | 71,703 | | | | 2,092 | |
| Amber Road, Inc.* | | | 109,340 | | | | 1,042 | |
| Apptio, Inc. Class A* | | | 53,610 | | | | 1,058 | |
| Benefitfocus, Inc.* | | | 43,880 | | | | 1,426 | |
| Five9, Inc.* | | | 270,546 | | | | 3,874 | |
| Instructure, Inc.* | | | 168,805 | | | | 4,296 | |
| Mimecast Ltd.* | | | 69,018 | | | | 1,397 | |
| MINDBODY, Inc. Class A* | | | 80,219 | | | | 1,661 | |
| Trade Desk, Inc. (The) Class A* | | | 17,981 | | | | 453 | |
| Wix.com Ltd. (Israel)*(a) | | | 37,199 | | | | 1,488 | |
| Xactly Corp.* | | | 112,519 | | | | 1,451 | |
| Total | | | | | | | 20,971 | |
| | | | | | | | | |
| Leisure Product 0.42% | | | | | | | | |
| Malibu Boats, Inc. Class A* | | | 40,076 | | | | 588 | |
| | | | | | | | | |
| Life Sciences Tools & Services 4.08% | | | | | | | | |
| NanoString Technologies, Inc.* | | | 130,377 | | | | 2,536 | |
| Pacific Biosciences of California, Inc.* | | | 375,698 | | | | 3,193 | |
| Total | | | | | | | 5,729 | |
| | | | | | | | | |
| Oil, Gas & Consumable Fuels 1.19% | | | | | | | | |
| GasLog Ltd. (Monaco)(a) | | | 108,660 | | | | 1,668 | |
| | | | | | | | | |
| Personal Products 0.85% | | | | | | | | |
| elf Beauty, Inc.* | | | 45,937 | | | | 1,188 | |
| | | | | | | | | |
| Pharmaceuticals 0.80% | | | | | | | | |
| Corcept Therapeutics, Inc.* | | | 162,839 | | | | 1,130 | |
| | | | | | | | | |
| Professional Services 0.55% | | | | | | | | |
| Insperity, Inc. | | | 10,309 | | | | 775 | |
| | See Notes to Financial Statements. | 11 |
Schedule of Investments (concluded)
MICRO CAP GROWTH FUND October 31, 2016
| | | | | | Fair | |
| | | | | | Value | |
| Investments | | Shares | | | (000) | |
| Semiconductors & Semiconductor Equipment 4.65% | |
| Applied Micro Circuits Corp.* | | | 248,559 | | | $ | 1,839 | |
| CEVA, Inc.* | | | 75,492 | | | | 2,269 | |
| Inphi Corp.* | | | 31,370 | | | | 1,164 | |
| MaxLinear, Inc. Class A* | | | 67,466 | | | | 1,262 | |
| Total | | | | | | | 6,534 | |
| | | | | | | | | |
| Software 8.31% | | | | | | | | |
| 8x8, Inc.* | | | 107,616 | | | | 1,533 | |
| Blackline, Inc.* | | | 27,813 | | | | 633 | |
| BroadSoft, Inc.* | | | 32,939 | | | | 1,369 | |
| Callidus Software, Inc.* | | | 41,518 | | | | 758 | |
| Everbridge, Inc.* | | | 128,400 | | | | 1,890 | |
| Gigamon, Inc.* | | | 16,373 | | | | 905 | |
| Globant SA (Luxembourg)*(a) | | | 26,313 | | | | 1,145 | |
| Materialise NV ADR* | | | 140,966 | | | | 963 | |
| Silver Spring Networks, Inc.* | | | 100,099 | | | | 1,407 | |
| Talend SA ADR* | | | 49,727 | | | | 1,078 | |
| Total | | | | | | | 11,681 | |
| | | | | | | | | |
| Thrifts & Mortgage Finance 2.41% | | | | | | | | |
| HomeStreet, Inc.* | | | 65,984 | | | | 1,818 | |
| LendingTree, Inc.* | | | 19,712 | | | | 1,574 | |
| Total | | | | | | | 3,392 | |
Total Common Stocks
(cost $119,001,581) | | | | | | | 138,455 | |
| | | Principal | | | Fair | |
| | | Amount | | | Value | |
| Investments | | (000) | | | (000) | |
| SHORT-TERM INVESTMENT 2.95% | | | | | | | | |
| | | | | | | | | |
| Repurchase Agreement | | | | | | | | |
Repurchase Agreement dated 10/31/2016, 0.03% due 11/1/2016 with Fixed Income Clearing Corp. collateralized by $3,465,000 of U.S. Treasury Bond at 3.625% due 8/15/2043; value: $4,227,300; proceeds: $4,143,477
(cost $4,143,473) | | | $4,143 | | | $ | 4,143 | |
Total Investments in Securities 101.47%
(cost $123,145,054) | | | | | | | 142,598 | |
| Liabilities in Excess of Other Assets (1.47)% | | | | | | | (2,070 | ) |
| Net Assets 100.00% | | | | | | $ | 140,528 | |
| | | |
| ADR | | American Depositary Receipt. |
| * | | Non-income producing security. |
| (a) | | Foreign security traded in U.S. dollars. |
The following is a summary of the inputs used as of October 31, 2016 in valuing the Fund’s investments carried at fair value(1):
| | | Level 1 | | | Level 2 | | | Level 3 | | | Total | |
| Investment Type(2)(3) | | (000) | | | (000) | | | (000) | | | (000) | |
| Common Stocks | | $ | 138,455 | | | $ | – | | | $ | – | | | $ | 138,455 | |
| Repurchase Agreement | | | – | | | | 4,143 | | | | – | | | | 4,143 | |
| Total | | $ | 138,455 | | | $ | 4,143 | | | $ | – | | | $ | 142,598 | |
| (1) | Refer to Note 2(g) for a description of fair value measurements and the three-tier hierarchy of inputs. |
| (2) | See Schedule of Investments for fair values in each industry and identification of foreign issuers and/or geography. |
| (3) | There were no Level 1/Level 2 transfers during the fiscal year ended October 31, 2016. |
| 12 | See Notes to Financial Statements. | |
Schedule of Investments
MICRO CAP VALUE FUND October 31, 2016
| | | | | | Fair | |
| | | | | | Value | |
| Investments | | Shares | | | (000) | |
| LONG-TERM INVESTMENTS 96.35% | | | | | | | | |
| | | | | | | | | |
| COMMON STOCKS 96.20% | | | | | | | | |
| | | | | | | | | |
| Banks 16.90% | | | | | | | | |
| Ameris Bancorp | | | 92,800 | | | $ | 3,369 | |
| BNC Bancorp | | | 187,000 | | | | 4,656 | |
| FB Financial Corp.* | | | 178,290 | | | | 3,717 | |
| First Merchants Corp. | | | 233,686 | | | | 6,578 | |
| National Commerce Corp.* | | | 196,741 | | | | 5,568 | |
| Total | | | | | | | 23,888 | |
| | | | | | | | | |
| Beverages 1.90% | | | | | | | | |
| Cott Corp. (Canada)(a) | | | 204,560 | | | | 2,682 | |
| | | | | | | | | |
| Building Products 8.42% | | | | | | | | |
| Advanced Drainage Systems, Inc. | | | 140,489 | | | | 2,683 | |
| Gibraltar Industries, Inc.* | | | 147,524 | | | | 5,739 | |
| Patrick Industries, Inc.* | | | 60,744 | | | | 3,484 | |
| Total | | | | | | | 11,906 | |
| | | | | | | | | |
| Chemicals 5.39% | | | | | | | | |
| Chase Corp. | | | 65,600 | | | | 4,484 | |
| Quaker Chemical Corp. | | | 29,167 | | | | 3,135 | |
| Total | | | | | | | 7,619 | |
| | | | | | | | | |
| Communications Equipment 1.21% | | | | | | | | |
| Plantronics, Inc. | | | 33,160 | | | | 1,715 | |
| | | | | | | | | |
| Construction & Engineering 4.22% | | | | | | | | |
| Argan, Inc. | | | 45,260 | | | | 2,573 | |
| Primoris Services Corp. | | | 169,446 | | | | 3,394 | |
| Total | | | | | | | 5,967 | |
| | | | | | | | | |
| Diversified Telecommunication Services 0.71% | | |
| Cogent Communications Holdings, Inc. | | | 27,319 | | | | 1,008 | |
| | | | | | | | | |
| Electrical Equipment 3.09% | | | | | | | | |
| Atkore International Group, Inc.* | | | 130,203 | | | | 2,448 | |
| AZZ, Inc. | | | 36,000 | | | | 1,917 | |
| Total | | | | | | | 4,365 | |
| | | | | | Fair | |
| | | | | | Value | |
| Investments | | Shares | | | (000) | |
| Electronic Equipment, Instruments & Components 4.25% | |
| Orbotech Ltd. (Israel)*(a) | | | 135,233 | | | $ | 3,706 | |
| Vishay Precision Group, Inc.* | | | 146,512 | | | | 2,300 | |
| Total | | | | | | | 6,006 | |
| | | | | | | | | |
| Equity Real Estate Investment Trusts 3.15% | | |
| Physicians Realty Trust | | | 139,199 | | | | 2,752 | |
| Retail Opportunity Investments Corp. | | | 84,403 | | | | 1,697 | |
| Total | | | | | | | 4,449 | |
| | | | | | | | | |
| Food Products 1.68% | | | | | | | | |
| Farmer Bros Co.* | | | 72,639 | | | | 2,375 | |
| | | | | | | | | |
| Gas Utilities 2.48% | | | | | | | | |
| Chesapeake Utilities Corp. | | | 54,700 | | | | 3,504 | |
| | | | | | | | | |
| Health Care Equipment & Supplies 1.69% | | | | | | | | |
| CONMED Corp. | | | 59,552 | | | | 2,382 | |
| | | | | | | | | |
| Hotels, Restaurants & Leisure 4.72% | | | | | | | | |
| Denny’s Corp.* | | | 312,876 | | | | 3,244 | |
| El Pollo Loco Holdings, Inc.* | | | 281,530 | | | | 3,435 | |
| Total | | | | | | | 6,679 | |
| | | | | | | | | |
| Household Durables 1.91% | | | | | | | | |
| Ethan Allen Interiors, Inc. | | | 87,760 | | | | 2,694 | |
| | | | | | | | | |
| Insurance 2.44% | | | | | | | | |
| AMERISAFE, Inc. | | | 61,970 | | | | 3,446 | |
| | | | | | | | | |
| Machinery 2.48% | | | | | | | | |
| Milacron Holdings Corp.* | | | 240,976 | | | | 3,509 | |
| | | | | | | | | |
| Media 1.03% | | | | | | | | |
| Hemisphere Media Group, Inc.* | | | 124,379 | | | | 1,455 | |
| | See Notes to Financial Statements. | 13 |
Schedule of Investments (continued)
MICRO CAP VALUE FUND October 31, 2016
| | | | | | Fair | |
| | | | | | Value | |
| Investments | | Shares | | | (000) | |
| Oil, Gas & Consumable Fuels 5.35% | | | | | | | | |
| Carrizo Oil & Gas, Inc.* | | | 53,019 | | | $ | 1,794 | |
| Centennial Resource Development, Inc. Class A* | | | 137,262 | | | | 2,038 | |
| Parsley Energy, Inc. Class A* | | | 59,422 | | | | 1,955 | |
| Rice Energy, Inc.* | | | 80,375 | | | | 1,775 | |
| Total | | | | | | | 7,562 | |
| | | | | | | | | |
| Paper & Forest Products 3.31% | | | | | | | | |
| Neenah Paper, Inc. | | | 58,483 | | | | 4,673 | |
| | | | | | | | | |
| Professional Services 3.70% | | | | | | | | |
| ICF International, Inc.* | | | 112,821 | | | | 5,235 | |
| | | | | | | | | |
| Real Estate Management & Development 4.11% | | |
| Marcus & Millichap, Inc.* | | | 122,319 | | | | 2,866 | |
| RE/MAX Holdings, Inc. Class A | | | 67,600 | | | | 2,937 | |
| Total | | | | | | | 5,803 | |
| | | | | | | | | |
| Semiconductors & Semiconductor Equipment 1.59% | |
| MaxLinear, Inc. Class A* | | | 119,996 | | | | 2,245 | |
| | | | | | | | | |
| Technology Hardware, Storage & Peripherals 2.17% | |
| Electronics For Imaging, Inc.* | | | 72,167 | | | | 3,069 | |
| | | | | | | | | |
| Textiles, Apparel & Luxury Goods 1.43% | | |
| Oxford Industries, Inc. | | | 32,282 | | | | 2,025 | |
| | | | | | | | | |
| Thrifts & Mortgage Finance 1.14% | | | | | | | | |
| Essent Group Ltd.* | | | 60,940 | | | | 1,611 | |
| | | | | | | | | |
| Trading Companies & Distributors 2.99% | | |
| Lawson Products, Inc.* | | | 123,360 | | | | 2,325 | |
| Rush Enterprises, Inc. Class A* | | | 72,600 | | | | 1,906 | |
| Total | | | | | | | 4,231 | |
| | | | | | | | | |
| Water Utilities 2.74% | | | | | | | | |
| Connecticut Water Service, Inc. | | | 74,300 | | | | 3,869 | |
Total Common Stocks
(cost $105,374,218) | | | | | | | 135,972 | |
| | | | | | Fair | |
| | | | | | Value | |
| Investments | | Shares | | | (000) | |
| WARRANTS 0.15% | | | | | | | | |
| | | | | | | | | |
| Oil, Gas & Consumable Fuels | | | | | | | | |
| Centennial Resource Development, Inc. Class A*(b) | | | 45,754 | | | $ | 215 | |
Total Long-Term Investments
(cost $105,514,634) | | | | | | | 136,187 | |
| | | | | | | | | |
| | | Principal | | | | | |
| | | Amount | | | | | |
| | | (000) | | | | | |
| | | | | | | | | |
| SHORT-TERM INVESTMENT 3.12% | | | | | | | | |
| | | | | | | | | |
| Repurchase Agreement | | | | | | | | |
Repurchase Agreement dated 10/31/2016, 0.03% due 11/1/2016 with Fixed Income Clearing Corp. collateralized by $3,695,000 of U.S. Treasury Bond at 3.625% due 8/15/2043; value: $4,507,900; proceeds: $4,414,789
(cost $4,414,786) | | | $4,415 | | | | 4,415 | |
Total Investments in Securities 99.47%
(cost $109,929,420) | | | | | | | 140,602 | |
| Other Assets in Excess of Liabilities 0.53% | | | | | | | 751 | |
| Net Assets 100.00% | | | | | | $ | 141,353 | |
| * | | Non-income producing security. |
| (a) | | Foreign security traded in U.S. dollars. |
| (b) | | Exercise price of $11.50 and expiration date of 10/11/2021. |
| 14 | See Notes to Financial Statements. |
Schedule of Investments (concluded)
MICRO CAP VALUE FUND October 31, 2016
The following is a summary of the inputs used as of October 31, 2016 in valuing the Fund’s investments carried at fair value(1):
| | | Level 1 | | | Level 2 | | | Level 3 | | | Total | |
| Investment Type(2)(3) | | (000) | | | (000) | | | (000) | | | (000) | |
| Common Stocks | | $ | 135,972 | | | $ | – | | | $ | – | | | $ | 135,972 | |
| Warrants | | | 215 | | | | – | | | | – | | | | 215 | |
| Repurchase Agreement | | | – | | | | 4,415 | | | | – | | | | 4,415 | |
| Total | | $ | 136,187 | | | $ | 4,415 | | | $ | – | | | $ | 140,602 | |
| (1) | Refer to Note 2(g) for a description of fair value measurements and the three-tier hierarchy of inputs. |
| (2) | See Schedule of Investments for fair values in each industry and identification of foreign issuers and/or geography. |
| (3) | There were no Level 1/Level 2 transfers during the fiscal year ended October 31, 2016. |
| | See Notes to Financial Statements. | 15 |
Statements of Assets and Liabilities
October 31, 2016
| | Micro Cap
Growth Fund | | Micro Cap
Value Fund | |
| ASSETS: | | | | | | | | |
| Investments in securities, at cost | | $ | 123,145,054 | | | $ | 109,929,420 | |
| Investments in securities, at fair value | | $ | 142,597,751 | | | $ | 140,601,635 | |
| Receivables: | | | | | | | | |
| Investment securities sold | | | 271,077 | | | | 1,826,259 | |
| Capital shares sold | | | 10,430 | | | | 1,556 | |
| Interest and dividends | | | 3 | | | | 6,124 | |
| Prepaid expenses | | | 8,781 | | | | 16,744 | |
| Total assets | | | 142,888,042 | | | | 142,452,318 | |
| LIABILITIES: | | | | | | | | |
| Payables: | | | | | | | | |
| Investment securities purchased | | | 2,099,314 | | | | 845,647 | |
| Capital shares reacquired | | | – | | | | 32 | |
| Management fee | | | 186,762 | | | | 182,572 | |
| Trustees’ fees | | | 18,040 | | | | 19,857 | |
| Fund administration | | | 4,980 | | | | 4,869 | |
| To affiliate (See Note 3) | | | 6,505 | | | | 6,598 | |
| Accrued expenses | | | 44,393 | | | | 39,977 | |
| Total liabilities | | | 2,359,994 | | | | 1,099,552 | |
| NET ASSETS | | $ | 140,528,048 | | | $ | 141,352,766 | |
| COMPOSITION OF NET ASSETS: | | | | | | | | |
| Paid-in capital | | $ | 135,149,931 | | | $ | 88,004,777 | |
| Accumulated net investment loss | | | (1,884,795 | ) | | | (1,073,224 | ) |
| Accumulated net realized gain (loss) on investments | | | (12,189,785 | ) | | | 23,748,998 | |
| Net unrealized appreciation on investments | | | 19,452,697 | | | | 30,672,215 | |
| Net Assets | | $ | 140,528,048 | | | $ | 141,352,766 | |
| Net assets by class: | | | | | | | | |
| Class A Shares | | $ | 7,416,472 | | | $ | 6,083,447 | |
| Class I Shares | | $ | 133,111,576 | | | $ | 135,269,319 | |
| Outstanding shares by class (unlimited number of authorized shares of beneficial interest) | | | | | | | | |
| Class A Shares | | | 566,372 | | | | 180,802 | |
| Class I Shares | | | 9,374,663 | | | | 3,870,472 | |
| Net asset value, offering and redemption price per share (Net assets divided by outstanding shares): | | | | | | | | |
| Class A Shares-Net asset value | | | $13.09 | | | | $33.65 | |
| Class A Shares-Maximum offering price (Net asset value plus sales charge of 5.75%) | | | $13.89 | | | | $35.70 | |
| Class I Shares-Net asset value | | | $14.20 | | | | $34.95 | |
| 16 | See Notes to Financial Statements. | |
Statements of Operations
For the Year Ended October 31, 2016
| | Micro Cap
Growth Fund | | Micro Cap
Value Fund | |
| Investment income: | | | | | | | | |
| Dividends (net of foreign withholding taxes of $0 and $6,897, respectively) | | $ | 405,230 | | | $ | 1,586,302 | |
| Interest | | | 953 | | | | 553 | |
| Total investment income | | | 406,183 | | | | 1,586,855 | |
| Expenses: | | | | | | | | |
| Management fee | | | 2,158,305 | | | | 2,200,326 | |
| Shareholder servicing | | | 53,010 | | | | 40,874 | |
| Professional | | | 46,439 | | | | 46,503 | |
| Reports to shareholders | | | 7,946 | | | | 8,016 | |
| Fund administration | | | 57,555 | | | | 58,675 | |
| Custody | | | 20,105 | | | | 10,104 | |
| Trustees’ fees | | | 4,150 | | | | 4,294 | |
| Registration | | | 34,219 | | | | 34,003 | |
| Subsidy (See Note 3) | | | 201,608 | | | | 217,248 | |
| Other | | | 17,093 | | | | 14,806 | |
| Gross expenses | | | 2,600,430 | | | | 2,634,849 | |
| Expense reductions (See Note 8) | | | (107 | ) | | | (92 | ) |
| Net expenses | | | 2,600,323 | | | | 2,634,757 | |
| Net investment loss | | | (2,194,140 | ) | | | (1,047,902 | ) |
| Net realized and unrealized gain (loss): | | | | | | | | |
| Net realized gain (loss) on investments | | | (8,433,042 | ) | | | 25,081,519 | |
| Net change in unrealized appreciation/depreciation on investments | | | 10,862,323 | | | | (10,270,838 | ) |
| Net realized and unrealized gain | | | 2,429,281 | | | | 14,810,681 | |
| Net Increase in Net Assets Resulting From Operations | | $ | 235,141 | | | $ | 13,762,779 | |
| | See Notes to Financial Statements. | 17 |
Statements of Changes in Net Assets
| | Micro Cap Growth Fund | |
| DECREASE IN NET ASSETS | For the Year Ended
October 31, 2016 | | For the Year Ended
October 31, 2015 | |
| Operations: | | | | | | | | |
| Net investment loss | | $ | (2,194,140 | ) | | $ | (2,804,485 | ) |
| Net realized gain (loss) on investments | | | (8,433,042 | ) | | | 28,749,646 | |
| Net change in unrealized appreciation/depreciation on investments | | | 10,862,323 | | | | (22,832,254 | ) |
| Net increase in net assets resulting from operations | | | 235,141 | | | | 3,112,907 | |
| Distributions to shareholders from: | | | | | | | | |
| Net realized gain | | | | | | | | |
| Class A | | | (1,849,104 | ) | | | (1,633,376 | ) |
| Class I | | | (25,030,822 | ) | | | (18,532,831 | ) |
| Total distributions to shareholders | | | (26,879,926 | ) | | | (20,166,207 | ) |
| Capital share transactions (See Note 13): | | | | | | | | |
| Net proceeds from sales of shares | | | 16,014,661 | | | | 7,961,986 | |
| Reinvestment of distributions | | | 24,413,579 | | | | 18,676,181 | |
| Cost of shares reacquired | | | (22,671,609 | ) | | | (29,706,060 | ) |
| Net increase (decrease) in net assets resulting from capital share transactions | | | 17,756,631 | | | | (3,067,893 | ) |
| Net decrease in net assets | | | (8,888,154 | ) | | | (20,121,193 | ) |
| NET ASSETS: | | | | | | | | |
| Beginning of year | | $ | 149,416,202 | | | $ | 169,537,395 | |
| End of year | | $ | 140,528,048 | | | $ | 149,416,202 | |
| Accumulated net investment loss | | $ | (1,884,795 | ) | | $ | (561,925 | ) |
| 18 | See Notes to Financial Statements. | |
Statements of Changes in Net Assets (concluded)
| | Micro Cap Value Fund |
| INCREASE (DECREASE) IN NET ASSETS | For the Year Ended
October 31, 2016 | | For the Year Ended
October 31, 2015 | |
| Operations: | | | | | | | | |
| Net investment loss | | $ | (1,047,902 | ) | | $ | (1,427,767 | ) |
| Net realized gain on investments | | | 25,081,519 | | | | 3,889,353 | |
| Net change in unrealized appreciation/depreciation on investments | | | (10,270,838 | ) | | | 2,234,855 | |
| Net increase in net assets resulting from operations | | | 13,762,779 | | | | 4,696,441 | |
| Distributions to shareholders from: | | | | | | | | |
| Net realized gain | | | | | | | | |
| Class A | | | (408,358 | ) | | | (1,798,650 | ) |
| Class I | | | (3,480,090 | ) | | | (14,912,161 | ) |
| Total distributions to shareholders | | | (3,888,448 | ) | | | (16,710,811 | ) |
| Capital share transactions (See Note 13): | | | | | | | | |
| Net proceeds from sales of shares | | | 2,300,457 | | | | 8,732,431 | |
| Reinvestment of distributions | | | 3,680,664 | | | | 15,741,765 | |
| Cost of shares reacquired | | | (44,750,858 | ) | | | (9,053,255 | ) |
| Net increase (decrease) in net assets resulting from capital share transactions | | | (38,769,737 | ) | | | 15,420,941 | |
| Net increase (decrease) in net assets | | | (28,895,406 | ) | | | 3,406,571 | |
| NET ASSETS: | | | | | | | | |
| Beginning of year | | $ | 170,248,172 | | | $ | 166,841,601 | |
| End of year | | $ | 141,352,766 | | | $ | 170,248,172 | |
| Accumulated net investment loss | | $ | (1,073,224 | ) | | $ | (1,304,593 | ) |
| | See Notes to Financial Statements. | 19 |
Financial Highlights
MICRO CAP GROWTH FUND
| | | | | Per Share Operating Performance: | | |
| | | | | Investment operations: | | Distributions
to
shareholders
from: | | |
| | | | | | | | | | | | | |
| | | Net asset
value,
beginning of
period | | Net
investment
loss(a) | | Net
realized and
unrealized
gain | | Total from
investment
operations | | Net
realized
gain | | Net asset
value,
end of
period |
| Class A | | | | | | | | | | | | | | | | | | | | | | | | |
| 10/31/2016 | | | $16.33 | | | | $(0.19 | ) | | | $0.15 | | | | $(0.04 | ) | | | $(3.20 | ) | | | $13.09 | |
| 10/31/2015 | | | 18.56 | | | | (0.30 | ) | | | 0.42 | | | | 0.12 | | | | (2.35 | ) | | | 16.33 | |
| 10/31/2014 | | | 22.57 | | | | (0.28 | ) | | | 2.27 | | | | 1.99 | | | | (6.00 | ) | | | 18.56 | |
| 10/31/2013 | | | 14.03 | | | | (0.29 | ) | | | 8.94 | | | | 8.65 | | | | (0.11 | ) | | | 22.57 | |
| 10/31/2012 | | | 15.98 | | | | (0.28 | ) | | | 0.79 | | | | 0.51 | | | | (2.46 | ) | | | 14.03 | |
| | | | | | | | | | | | | | | | | | | | | | | | | |
| Class I | | | | | | | | | | | | | | | | | | | | | | | | |
| 10/31/2016 | | | 17.45 | | | | (0.21 | ) | | | 0.16 | | | | (0.05 | ) | | | (3.20 | ) | | | 14.20 | |
| 10/31/2015 | | | 19.67 | | | | (0.32 | ) | | | 0.45 | | | | 0.13 | | | | (2.35 | ) | | | 17.45 | |
| 10/31/2014 | | | 23.57 | | | | (0.29 | ) | | | 2.39 | | | | 2.10 | | | | (6.00 | ) | | | 19.67 | |
| 10/31/2013 | | | 14.64 | | | | (0.29 | ) | | | 9.33 | | | | 9.04 | | | | (0.11 | ) | | | 23.57 | |
| 10/31/2012 | | | 16.52 | | | | (0.25 | ) | | | 0.83 | | | | 0.58 | | | | (2.46 | ) | | | 14.64 | |
| (a) | Calculated using average shares outstanding during the period. |
| (b) | Total return for Class A does not consider the effects of sales loads and assumes the reinvestment of all distributions. Total return for all other classes assumes the reinvestment of all distributions. |
| 20 | See Notes to Financial Statements. | |
| | | Ratios to Average Net Assets: | | Supplemental Data: |
| | | | | | | | | |
Total
return(b)
(%) | | Total
expenses
(%) | | Net
investment
loss
(%) | | Net assets,
end of
period
(000) | | Portfolio
turnover
rate
(%) |
| | | | | | | | | |
| | (1.30 | ) | | | 1.81 | | | | (1.52 | ) | | $ | 7,416 | | | | 160.53 | |
| | 0.65 | | | | 1.80 | | | | (1.64 | ) | | | 13,280 | | | | 202.96 | |
| | 10.57 | | | | 1.78 | | | | (1.50 | ) | | | 12,881 | | | | 208.12 | |
| | 62.14 | | | | 1.85 | | | | (1.64 | ) | | | 11,220 | | | | 197.69 | |
| | 4.86 | | | | 2.09 | | | | (1.92 | ) | | | 11,484 | | | | 119.77 | |
| | | | | | | | | | | | | | | | | | | |
| | (1.39 | ) | | | 1.81 | | | | (1.52 | ) | | | 133,112 | | | | 160.53 | |
| | 0.71 | | | | 1.80 | | | | (1.63 | ) | | | 136,136 | | | | 202.96 | |
| | 10.58 | | | | 1.78 | | | | (1.50 | ) | | | 156,657 | | | | 208.12 | |
| | 62.22 | | | | 1.81 | | | | (1.60 | ) | | | 140,967 | | | | 197.69 | |
| | 5.10 | | | | 1.84 | | | | (1.68 | ) | | | 89,897 | | | | 119.77 | |
| | See Notes to Financial Statements. | 21 |
Financial Highlights
MICRO CAP VALUE FUND
| | | | | | | Per Share Operating Performance: |
| | | | | Investment operations: | | Distributions to
shareholders from: |
| | | Net asset
value,
beginning
of period | | Net
invest-
ment
loss(a) | | Net
realized
and
unrealized
gain | | Total
from
invest-
ment
opera-
tions | | Net
investment
income | | Net
realized
gain | | Total
distri-
butions |
| Class A | | | | | | | | | | | | | | | | | | | | | | | | | | | | |
| 10/31/2016 | | $ | 31.34 | | | $ | (0.22 | ) | | $ | 3.27 | | | $ | 3.05 | | | $ | – | | | $ | (0.74 | ) | | $ | (0.74 | ) |
| 10/31/2015 | | | 34.19 | | | | (0.26 | ) | | | 1.00 | | | | 0.74 | | | | – | | | | (3.59 | ) | | | (3.59 | ) |
| 10/31/2014 | | | 34.74 | | | | (0.23 | ) | | | 3.84 | | | | 3.61 | | | | – | | | | (4.16 | ) | | | (4.16 | ) |
| 10/31/2013 | | | 26.52 | | | | (0.10 | ) | | | 8.32 | | | | 8.22 | | | | – | | | | – | | | | – | |
| 10/31/2012 | | | 22.88 | | | | (0.08 | ) | | | 3.72 | | | | 3.64 | | | | – | | | | – | | | | – | |
| | | | | | | | | | | | | | | | | | | | | | | | | | | | | |
| Class I | | | | | | | | | | | | | | | | | | | | | | | | | | | | |
| 10/31/2016 | | | 32.52 | | | | (0.23 | ) | | | 3.40 | | | | 3.17 | | | | – | | | | (0.74 | ) | | | (0.74 | ) |
| 10/31/2015 | | | 35.34 | | | | (0.27 | ) | | | 1.04 | | | | 0.77 | | | | – | | | | (3.59 | ) | | | (3.59 | ) |
| 10/31/2014 | | | 35.77 | | | | (0.26 | ) | | | 3.99 | | | | 3.73 | | | | – | | | | (4.16 | ) | | | (4.16 | ) |
| 10/31/2013 | | | 27.32 | | | | (0.09 | ) | | | 8.56 | | | | 8.47 | | | | (0.02 | ) | | | – | | | | (0.02 | ) |
| 10/31/2012 | | | 23.50 | | | | (0.02 | ) | | | 3.84 | | | | 3.82 | | | | – | | | | – | | | | – | |
| (a) | Calculated using average shares outstanding during the period. |
| (b) | Total return for Class A does not consider the effects of sales loads and assumes the reinvestment of all distributions. Total return for all other classes assumes the reinvestment of all distributions. |
| 22 | See Notes to Financial Statements. | |
| | | | | Ratios to Average Net Assets: | | Supplemental Data: |
| | | | | | | | | | | |
Net asset
value,
end of
period | | Total
return(b)
(%) | | Total
expenses
(%) | | Net
investment
loss
(%) | | Net
assets
end of
period
(000) | | Portfolio
turnover
rate
(%) |
| | | | | | | | | | | | | | | | | | | | | | | |
| $ | 33.65 | | | | 10.00 | | | | 1.80 | | | | (0.71 | ) | | $ | 6,083 | | | | 52.03 | |
| | 31.34 | | | | 2.79 | | | | 1.79 | | | | (0.86 | ) | | | 17,198 | | | | 70.40 | |
| | 34.19 | | | | 11.16 | | | | 1.76 | | | | (0.68 | ) | | | 20,028 | | | | 59.95 | |
| | 34.74 | | | | 31.00 | | | | 1.82 | | | | (0.34 | ) | | | 32,010 | | | | 73.58 | |
| | 26.52 | | | | 15.91 | | | | 2.05 | | | | (0.32 | ) | | | 30,512 | | | | 34.25 | |
| | | | | | | | | | | | | | | | | | | | | | | |
| | 34.95 | | | | 9.97 | | | | 1.80 | | | | (0.72 | ) | | | 135,269 | | | | 52.03 | |
| | 32.52 | | | | 2.81 | | | | 1.79 | | | | (0.86 | ) | | | 153,050 | | | | 70.40 | |
| | 35.34 | | | | 11.18 | | | | 1.77 | | | | (0.74 | ) | | | 146,813 | | | | 59.95 | |
| | 35.77 | | | | 31.02 | | | | 1.78 | | | | (0.29 | ) | | | 128,093 | | | | 73.58 | |
| | 27.32 | | | | 16.21 | | | | 1.80 | | | | (0.09 | ) | | | 96,962 | | | | 34.25 | |
| | See Notes to Financial Statements. | 23 |
Notes to Financial Statements
Lord Abbett Securities Trust (the “Trust”) is registered under the Investment Company Act of 1940, as amended (the “Act”), as a diversified, open-end management investment company and was organized as a Delaware statutory trust on February 26, 1993. The Trust currently consists of nine active funds. This report covers the following two funds (separately, a “Fund” and collectively, the “Funds”) and their respective classes: Lord Abbett Micro-Cap Growth Fund (“Micro Cap Growth Fund”), Class A and I shares and Lord Abbett Micro-Cap Value Fund (“Micro Cap Value Fund”), Class A and I shares. The investment objective of both Micro Cap Growth Fund and Micro Cap Value Fund is long-term capital appreciation.
Each class of shares has different expenses and dividends. A front-end sales charge is normally added to the net asset value (“NAV”) for Class A shares. A contingent deferred sales charge (“CDSC”) may apply to certain redemptions of Class A shares purchased without a sales charge and redeemed before the first day of the month in which the one-year anniversary of the purchase falls (subject to certain exceptions as set forth in each Fund’s prospectus). Class I shares are not subject to any sales charges.
The preparation of the financial statements in conformity with accounting principles generally accepted in the United States of America (“U.S. GAAP”) requires management to make certain estimates and assumptions that affect the reported amounts of assets and liabilities and disclosure of contingent assets and liabilities at the date of the financial statements and the reported amounts of increases and decreases in net assets from operations during the reporting period. Actual results could differ from those estimates. Each Fund is considered an investment company under U.S. GAAP and follows the accounting and reporting guidance applicable to investment companies.
| 2. | SIGNIFICANT ACCOUNTING POLICIES |
| (a) | Investment Valuation–Under procedures approved by the Funds’ Board of Trustees (the “Board”), Lord, Abbett & Co. LLC (“Lord Abbett”), the Funds’ investment manager, has formed a Pricing Committee to administer the pricing and valuation of portfolio investments and to ensure that prices utilized reasonably reflect fair value. Among other things, these procedures allow the Funds to utilize independent pricing services, quotations from securities and financial instrument dealers and other market sources to determine fair value. |
| | |
| | Securities actively traded on any recognized U.S. or non-U.S. exchange or on The NASDAQ Stock Market LLC are valued at the last sale price or official closing price on the exchange or system on which they are principally traded. Events occurring after the close of trading on non-U.S. exchanges may result in adjustments to the valuation of foreign securities to reflect their fair value as of the close of regular trading on the New York Stock Exchange. Each Fund may utilize an independent fair valuation service in adjusting the valuations of foreign securities. Unlisted equity securities are valued at the last quoted sale price or, if no sale price is available, at the mean between the most recently quoted bid and asked prices. |
| | |
| | Securities for which prices are not readily available are valued at fair value as determined by the Pricing Committee. The Pricing Committee considers a number of factors, including observable and unobservable inputs, when arriving at fair value. The Pricing Committee may use related or comparable assets or liabilities, recent transactions, market multiples, book values and other relevant information to determine the fair value of portfolio investments. The Board or a designated committee thereof regularly reviews fair value determinations made by |
24
Notes to Financial Statements (continued)
| | the Pricing Committee and employs techniques such as reviewing related market activity, reviewing inputs and assumptions, and retrospectively comparing prices of subsequent purchases and sales transactions to fair value determinations made by the Pricing Committee. |
| | |
| | Short-term securities with 60 days or less remaining to maturity are valued using the amortized cost method, which approximates fair value. |
| | |
| (b) | Security Transactions–Security transactions are recorded as of the date that the securities are purchased or sold (trade date). Realized gains and losses on sales of portfolio securities are calculated using the identified-cost method. Realized and unrealized gains (losses) are allocated to each class of shares based upon the relative proportion of net assets at the beginning of the day. |
| | |
| (c) | Investment Income–Dividend income is recorded on the ex-dividend date. Interest income is recorded on the accrual basis as earned. Discounts are accreted and premiums are amortized using the effective interest method and are included in Interest and other income on the Statements of Operations. Withholding taxes on foreign dividends have been provided for in accordance with the applicable country’s tax rules and rates. Investment income is allocated to each class of shares based upon the relative proportion of net assets at the beginning of the day. |
| | |
| (d) | Income Taxes–It is the policy of each Fund to meet the requirements of Subchapter M of the Internal Revenue Code applicable to regulated investment companies and to distribute substantially all taxable income and capital gains to its shareholders. Therefore, no income tax provision is required. |
| | |
| | Each Fund files U.S. federal and various state and local tax returns. No income tax returns are currently under examination. The statute of limitations on each Fund’s filed U.S. federal tax returns remains open for the fiscal years ended October 31, 2013 through October 31, 2016. The statutes of limitations on the Trust’s state and local tax returns may remain open for an additional year depending upon the jurisdiction. |
| | |
| (e) | Expenses–Expenses incurred by the Trust that do not specifically relate to an individual fund are generally allocated to the Funds within the Trust on a pro rata basis by relative net assets. Expenses incurred by the Funds are allocated to each class of shares based upon the relative proportion of net assets at the beginning of the day. |
| | |
| (f) | Repurchase Agreements–Each Fund may enter into repurchase agreements with respect to securities. A repurchase agreement is a transaction in which a fund acquires a security and simultaneously commits to resell that security to the seller (a bank or securities dealer) at an agreed-upon price on an agreed-upon date. Each Fund requires at all times that the repurchase agreement be collateralized by cash, or by securities of the U.S. Government, its agencies, its instrumentalities, or U.S. Government sponsored enterprises having a value equal to, or in excess of, the value of the repurchase agreement (including accrued interest). If the seller of the agreement defaults on its obligation to repurchase the underlying securities at a time when the fair value of these securities has declined, a Fund may incur a loss upon disposition of the securities. |
| | |
| (g) | Fair Value Measurements–Fair value is defined as the price that each Fund would receive upon selling an investment or transferring a liability in an orderly transaction to an independent buyer in the principal or most advantageous market of the investment. A three-tier hierarchy is used to maximize the use of observable market data and minimize the use of |
25
Notes to Financial Statements (continued)
| | unobservable inputs and to establish classification of fair value measurements for disclosure purposes. Inputs refer broadly to the assumptions that market participants would use in pricing the asset or liability, including assumptions about risk – for example, the risk inherent in a particular valuation technique used to measure fair value (such as a pricing model) and/or the risk inherent in the inputs to the valuation technique. Inputs may be observable or unobservable. Observable inputs reflect the assumptions market participants would use in pricing the asset or liability. Observable inputs are based on market data obtained from sources independent of the reporting entity. Unobservable inputs reflect the reporting entity’s own assumptions about the assumptions market participants would use in pricing the asset or liability. Unobservable inputs are based on the best information available in the circumstances. The three-tier hierarchy classification is determined based on the lowest level of inputs that is significant to the fair value measurement, and is summarized in the three broad Levels listed below: |
| | • | Level 1 – unadjusted quoted prices in active markets for identical investments; |
| | | |
| | • | Level 2 – other significant observable inputs (including quoted prices for similar investments, interest rates, prepayment speeds, credit risk, etc.); and |
| | | |
| | • | Level 3 – significant unobservable inputs (including each Fund’s own assumptions in determining the fair value of investments). |
| | A summary of inputs used in valuing each Fund’s investments as of October 31, 2016 and, if applicable, Level 1/Level 2 transfers and Level 3 rollforwards for the fiscal year then ended is included in each Fund’s Schedule of Investments. |
| | |
| | Changes in valuation techniques may result in transfers into or out of an assigned level within the three-tier hierarchy. All transfers between different levels within the three-tier hierarchy are deemed to have occurred as of the beginning of the reporting period. The inputs or methodology used for valuing securities are not necessarily an indication of the risk associated with investing in those securities. |
| 3. | MANAGEMENT FEE AND OTHER TRANSACTIONS WITH AFFILIATES |
Management Fee
The Trust has a management agreement with Lord Abbett, pursuant to which Lord Abbett supplies each Fund with investment management services and executive and other personnel, provides office space and pays for ordinary and necessary office and clerical expenses relating to research and statistical work and supervision of each Fund’s investment portfolio.
The management fee is based on each Fund’s average daily net assets at an annual rate of 1.50%, which was the Funds’ annualized effective management fee rate for the fiscal year ended October 31, 2016.
In addition, Lord Abbett provides certain administrative services to each Fund pursuant to an Administrative Services Agreement in return for a fee at an annual rate of .04% of each Fund’s average daily net assets.
During the fiscal year ended October 31, 2016 and continuing through December 31, 2016, each Fund, along with certain other funds managed by Lord Abbett (collectively, the “Underlying Funds”), entered into a Servicing Arrangement with Lord Abbett Alpha Strategy Fund (“Alpha Strategy Fund”) of the Trust, pursuant to which each Underlying Fund paid a portion of the expenses (excluding management fees, fund administration fees, and distribution and service fees)
26
Notes to Financial Statements (continued)
of Alpha Strategy Fund in proportion to the average daily value of the Underlying Fund shares owned by Alpha Strategy Fund. Amounts paid pursuant to the Servicing Arrangement are included in Subsidy expense on each Fund’s Statement of Operations and Payable to affiliate on each Fund’s Statement of Assets and Liabilities. Effective January 1, 2017, the Board approved the discontinuation of the Servicing Arrangement with Fund of Funds managed by Lord Abbett. As a result, each Fund of Funds will bear its expenses fully beginning as of that date.
As of October 31, 2016, the percentages of Micro Cap Growth Fund’s and Micro Cap Value Fund’s outstanding shares owned by Lord Abbett Alpha Strategy Fund were 77.24% and 80.24%, respectively.
12b-1 Distribution Plan
Each Fund has adopted a distribution plan with respect to Class A shares pursuant to Rule 12b-1 under the Act under which the Board may authorize the payment of ongoing distribution and service fees to Lord Abbett Distributor LLC (the “Distributor”), an affiliate of Lord Abbett. During the fiscal year ended October 31, 2016, the Board did not authorize such Class A 12b-1 fees.
Class I shares do not have a distribution plan.
Two Trustees and certain of the Trust’s officers have an interest in Lord Abbett.
| 4. | DISTRIBUTIONS AND CAPITAL LOSS CARRYFORWARDS |
Dividends from net investment income, if any, are declared and paid at least annually for each fund. Taxable net realized gains from investment transactions, reduced by allowable capital loss carryforwards, if any, are declared and distributed to shareholders at least annually. The capital loss carryforward amount, if any, is available to offset future net capital gains. Dividends and distributions to shareholders are recorded on the ex-dividend date. The amounts of dividends and distributions from net investment income and net realized capital gains are determined in accordance with federal income tax regulations, which may differ from accounting principles generally accepted in the United States of America. These book/tax differences are either considered temporary or permanent in nature. To the extent these differences are permanent in nature, such amounts are reclassified within the components of net assets based on their federal tax basis treatment; temporary differences do not require reclassification. Dividends and distributions, which exceed earnings and profits for tax purposes, are reported as a tax return of capital.
Subsequent to Micro Cap Value Fund’s fiscal year ended October 31, 2016, short-term capital gain and long-term capital gain distributions of approximately $1,863,000 and $21,921,000, respectively, were declared by the Fund on November 16, 2016. The distribution was paid on November 22, 2016 to shareholders of record on November 21, 2016.
The tax character of distributions paid during the fiscal years ended October 31, 2016 and 2015 was as follows:
| | | Micro Cap Growth Fund | | | Micro Cap Value Fund | |
| | | Year Ended | | | Year Ended | | | Year Ended | | | Year Ended | |
| | | 10/31/2016 | | | 10/31/2015 | | | 10/31/2016 | | | 10/31/2015 | |
| Distributions paid from: | | | | | | | | | | | | | | | | |
| Ordinary income | | $ | 6,650,591 | | | $ | 3,677,493 | | | $ | – | | | $ | – | |
| Net long-term capital gains | | | 20,229,335 | | | | 16,488,714 | | | | 3,888,448 | | | | 16,710,811 | |
| Total distributions paid | | $ | 26,879,926 | | | $ | 20,166,207 | | | $ | 3,888,448 | | | $ | 16,710,811 | |
27
Notes to Financial Statements (continued)
As of October 31, 2016, the components of accumulated gains on a tax-basis were as follows:
| | | Micro Cap | | | Micro Cap | |
| | | Growth Fund | | | Value Fund | |
| Undistributed ordinary income – net | | $ | – | | | $ | 1,862,424 | |
| Undistributed long-term capital gains | | | – | | | | 21,920,549 | |
| Total undistributed earnings | | $ | – | | | $ | 23,782,973 | |
| Capital loss carryforwards* | | $ | (9,945,487 | ) | | $ | – | |
| Temporary differences | | | (1,884,795 | ) | | | (1,073,224 | ) |
| Unrealized gains – net | | | 17,208,399 | | | | 30,638,240 | |
| Total accumulated gains – net | | $ | 5,378,117 | | | $ | 53,347,989 | |
| * | The capital losses will carry forward indefinitely. |
At each Fund’s election, certain losses incurred within the taxable year (Qualified Late-Year Losses) are deemed to arise on the first business day of the Fund’s next taxable year. Each Fund incurred and will elect to defer late-year ordinary losses during fiscal 2016 as follows:
| Micro Cap Growth Fund | | $ | 1,866,755 | |
| Micro Cap Value Fund | | | 1,053,367 | |
As of October 31, 2016, the aggregate unrealized security gains and losses based on cost for U.S. federal income tax purposes were as follows:
| | | Micro Cap | | | Micro Cap | |
| | | Growth Fund | | | Value Fund | |
| Tax cost | | $ | 125,389,352 | | | $ | 109,963,395 | |
| Gross unrealized gain | | | 20,894,697 | | | | 34,615,668 | |
| Gross unrealized loss | | | (3,686,298 | ) | | | (3,977,428 | ) |
| Net unrealized security gain | | $ | 17,208,399 | | | $ | 30,638,240 | |
The difference between book-basis and tax basis unrealized gains (losses) is attributable to the tax treatment of certain securities and wash sales.
Permanent items identified during the fiscal year ended October 31, 2016 have been reclassified among the components of net assets based on their tax basis treatment as follows:
| | Accumulated | | Accumulated | | | | |
| | Net Investment | | Net Realized | | Paid-in | |
| | | Loss | Gain (Loss | ) | Capital | |
| Micro Cap Growth Fund | | | $ 871,270 | | | | $ 55,520 | | | $ | (926,790 | ) |
| Micro Cap Value Fund | | | 1,279,271 | | | | (1,279,271 | ) | | | – | |
The permanent differences are primarily attributable to the tax treatment of net operating losses and certain distributions.
| 5. | PORTFOLIO SECURITIES TRANSACTIONS |
Purchases and sales of investment securities (excluding short-term investments) for the fiscal year ended October 31, 2016 were as follows:
| | | Purchases | | | Sales | |
| Micro Cap Growth Fund | | $ | 228,499,150 | | | $ | 238,707,827 | |
| Micro Cap Value Fund | | | 75,715,230 | | | | 119,268,149 | |
There were no purchases or sales of U.S. Government securities for the fiscal year ended October 31, 2016.
28
Notes to Financial Statements (continued)
| 6. | DISCLOSURES ABOUT OFFSETTING ASSETS AND LIABILITIES |
The Financial Accounting Standards Board (“FASB”) requires disclosure to help better assess the effect or potential effect of offsetting arrangements on a fund’s financial position. The following tables illustrate gross and net information about recognized assets eligible for offset in the statement of assets and liabilities; and disclose such amounts subject to an enforceable master netting agreement or similar agreement, by counterparty. A master netting agreement is an agreement between a fund and a counterparty which provides for the net settlement of amounts owed under all contracts traded under that agreement, as well as cash collateral, through a single payment by one party to the other in the event of default on or termination of any one contract. The Funds’ accounting policy with respect to balance sheet offsetting is that, absent an event of default by the counterparty or a termination of the agreement, the master netting agreement does not result in an offset of reported amounts of financial assets and liabilities in the statement of assets and liabilities across transactions between the Funds and the applicable counterparty:
| | | | Micro Cap Growth Fund | |
| | | | | | Gross Amounts | | Net Amounts of | |
| | | | | | Offset in the | | Assets Presented | |
| | Gross Amounts of | | Statement of Assets | | in the Statement of | |
| Description | Recognized Assets | | and Liabilities | | Assets and Liabilities | |
| Repurchase Agreement | | | $4,143,473 | | | $ | – | | | | $4,143,473 | |
| Total | | | $4,143,473 | | | $ | – | | | | $4,143,473 | |
| | | | Net Amounts | | | | | | | | | | | | | |
| | | | of Assets | | | Amounts Not Offset in the | | | | |
| | | | Presented in | | | Statement of Assets and Liabilities | | | | |
| | | | the Statement | | | | | | | Cash | | | Securities | | | | | |
| | | | of Assets and | | | Financial | | | Collateral | | | Collateral | | | Net | |
| Counterparty | | | Liabilities | | | Instruments | | | Received(a) | | | Received(a) | | | Amount(b) | |
| Fixed Income Clearing Corp. | | | $4,143,473 | | | $ | – | | | $ | – | | | | $(4,143,473 | ) | | $ | – | |
| Total | | | $4,143,473 | | | $ | – | | | $ | – | | | | $(4,143,473 | ) | | $ | – | |
| | | Micro Cap Value Fund | |
| | | | | Gross Amounts | | Net Amounts of | |
| | | | | Offset in the | | Assets Presented | |
| | Gross Amounts of | | Statement of Assets | | in the Statement of | |
| Description | Recognized Assets | | | and Liabilities | | Assets and Liabilities | |
| Repurchase Agreement | | | $4,414,786 | | | $ | – | | | | $4,414,786 | |
| Total | | | $4,414,786 | | | $ | – | | | | $4,414,786 | |
| | | | Net Amounts | | | | | | | | | | | | | |
| | | | of Assets | | | Amounts Not Offset in the | | | | |
| | | | Presented in | | | Statement of Assets and Liabilities | | | | |
| | | | the Statement | | | | | | Cash | | | Securities | | | | |
| | | | of Assets and | | | Financial | | | Collateral | | | Collateral | | | Net | |
| Counterparty | | | Liabilities | | | Instruments | | | Received(a) | | | Received(a) | | | Amount(b) | |
| Fixed Income Clearing Corp. | | | $4,414,786 | | | $ | – | | | $ | – | | | | $(4,414,786 | ) | | $ | – | |
| Total | | | $4,414,786 | | | $ | – | | | $ | – | | | | $(4,414,786 | ) | | $ | – | |
| (a) | Collateral disclosed is limited to an amount not to exceed 100% of the net amount of assets presented in the Statements of Assets and Liabilities, for each respective counterparty. |
| (b) | Net amount represents the amount owed to the Fund by the counterparty as of October 31, 2016. |
29
Notes to Financial Statements (continued)
The Trust’s officers and two Trustees, who are associated with Lord Abbett, do not receive any compensation from the Trust for serving in such capacities. Independent Trustees’ fees are allocated among all Lord Abbett-sponsored funds based on the net assets of each fund. There is an equity-based plan available to all Independent Trustees under which Independent Trustees must defer receipt of a portion of, and may elect to defer receipt of an additional portion of Trustees’ fees. The deferred amounts are treated as though equivalent dollar amounts had been invested in the funds. Such amounts and earnings accrued thereon are included in Trustees’ fees on the Statements of Operations and in Trustees’ fees payable on the Statements of Assets and Liabilities and are not deductible for U.S. federal income tax purposes until such amounts are paid.
The Trust has entered into an arrangement with its transfer agent and custodian, whereby credits realized as a result of uninvested cash balances are used to reduce a portion of each Fund’s expenses.
The Funds and certain other funds managed by Lord Abbett (collectively, the “Participating Funds”) entered into a syndicated line of credit facility with various lenders for $550 million (the “Facility”), whereas State Street Bank and Trust Company (“SSB”) participates as a lender and as agent for the lenders. The Facility is to be used for temporary or emergency purposes as an additional source of liquidity to satisfy redemptions. The Participating Funds are subject to graduated borrowing limits of one-third of Fund assets (if Fund assets are less than $750 million), $250 million, $300 million, or $350 million based on past borrowings and likelihood of future borrowings. The Facility will continue through August 28, 2017.
During the fiscal year ended October 31, 2016, the Funds did not utilize the Facility.
| 10. | INTERFUND LENDING PROGRAM |
On July 26, 2016, the U.S. Securities and Exchange Commission issued an exemptive order (“SEC exemptive order”) which permits certain registered open-end management investment companies managed by Lord Abbett, including the Funds, to participate in a joint lending and borrowing program. The SEC exemptive order allows the funds to borrow money from and lend money to each other for temporary or emergency purposes subject to limitations and conditions.
The Funds did not borrow money from or lend money to any other Lord Abbett Fund from July 26, 2016 through October 31, 2016.
| 11. | CUSTODIAN AND ACCOUNTING AGENT |
SSB is the Trust’s custodian and accounting agent. SSB performs custodial, accounting and recordkeeping functions relating to portfolio transactions and calculating each Fund’s NAV.
Each Fund is subject to the general risks and considerations associated with equity investing, as well as the particular risks associated with micro-cap and growth or value stocks. The value of an investment in each Fund will fluctuate in response to movements in the equity securities market in general and to the changing prospects of individual companies in which the Funds invest.
30
Notes to Financial Statements (concluded)
Micro-cap companies may be subject to greater risks and may be more sensitive to changes in economic conditions than larger, more established companies. There may be less liquidity in micro-cap company stocks, subjecting them to greater price fluctuations than larger company stocks. In the case of Micro Cap Growth Fund, the growth stocks in which it generally invests may add to the Fund’s volatility. In the case of Micro Cap Value Fund, the prices of value stocks in which it generally invests may lag the stock market for long periods of time if the market fails to recognize the company’s intrinsic worth.
These factors can affect each Fund’s performance.
| 13. | SUMMARY OF CAPITAL TRANSACTIONS |
Transactions in shares of beneficial interest were as follows:
| Micro Cap Growth Fund | | | | | Year Ended
October 31, 2016 | | | | | | Year Ended
October 31, 2015 | |
| Class A Shares | | | Shares | | | | Amount | | | | Shares | | | | Amount | |
| Shares sold | | | 11,701 | | | $ | 147,277 | | | | 84,144 | | | $ | 1,509,470 | |
| Reinvestment of distributions | | | 132,838 | | | | 1,849,104 | | | | 100,381 | | | | 1,633,205 | |
| Shares reacquired | | | (391,612 | ) | | | (5,836,444 | ) | | | (65,192 | ) | | | (1,229,708 | ) |
| Increase (decrease) | | | (247,073 | ) | | $ | (3,840,063 | ) | | | 119,333 | | | $ | 1,912,967 | |
| | | | | | | | | | | | | | | | | |
| Class I Shares | | | | | | | | | | | | | | | | |
| Shares sold | | | 1,239,003 | | | $ | 15,867,384 | | | | 339,691 | | | $ | 6,452,516 | |
| Reinvestment of distributions | | | 1,495,326 | | | | 22,564,475 | | | | 980,044 | | | | 17,042,976 | |
| Shares reacquired | | | (1,162,677 | ) | | | (16,835,165 | ) | | | (1,481,051 | ) | | | (28,476,352 | ) |
| Increase (decrease) | | | 1,571,652 | | | $ | 21,596,694 | | | | (161,316 | ) | | $ | (4,980,860 | ) |
| | | | | | | | | | | | | | | | | |
| Micro Cap Value Fund | | | | | Year Ended
October 31, 2016 | | | | | | Year Ended
October 31, 2015 | |
| Class A Shares | | Shares | | | Amount | | | Shares | | | | Amount | |
| Shares sold | | | 4,665 | | | $ | 148,933 | | | | 4,393 | | | $ | 133,102 | |
| Reinvestment of distributions | | | 12,602 | | | | 388,270 | | | | 57,549 | | | | 1,701,736 | |
| Shares reacquired | | | (385,285 | ) | | | (11,863,165 | ) | | | (98,955 | ) | | | (3,255,230 | ) |
| Decrease | | | (368,018 | ) | | $ | (11,325,962 | ) | | | (37,013 | ) | | $ | (1,420,392 | ) |
| | | | | | | | | | | | | | | | | |
| Class I Shares | | | | | | | | | | | | | | | | |
| Shares sold | | | 65,171 | | | $ | 2,151,524 | | | | 279,535 | | | $ | 8,599,329 | |
| Reinvestment of distributions | | | 102,887 | | | | 3,292,394 | | | | 457,479 | | | | 14,040,029 | |
| Shares reacquired | | | (1,004,290 | ) | | | (32,887,693 | ) | | | (185,093 | ) | | | (5,798,025 | ) |
| Increase (decrease) | | | (836,232 | ) | | $ | (27,443,775 | ) | | | 551,921 | | | $ | 16,841,333 | |
31
Report of Independent Registered Public Accounting Firm
To the Board of Trustees of Lord Abbett Securities Trust and Shareholders of Lord Abbett Micro Cap Growth Fund and Lord Abbett Micro Cap Value Fund:
We have audited the accompanying statements of assets and liabilities, including the schedules of investments, of the Lord Abbett Micro Cap Growth Fund and Lord Abbett Micro Cap Value Fund, two of the nine portfolios constituting the Lord Abbett Securities Trust (the “Trust”), as of October 31, 2016, and the related statements of operations for the year then ended, the statements of changes in net assets for each of the two years in the period then ended, and the financial highlights for each of the five years in the period then ended. These financial statements and financial highlights are the responsibility of the Trust’s management. Our responsibility is to express an opinion on these financial statements and financial highlights based on our audits.
We conducted our audits in accordance with the standards of the Public Company Accounting Oversight Board (United States). Those standards require that we plan and perform the audit to obtain reasonable assurance about whether the financial statements and financial highlights are free of material misstatement. The Trust is not required to have, nor were we engaged to perform, an audit of its internal control over financial reporting. Our audits included consideration of internal control over financial reporting as a basis for designing audit procedures that are appropriate in the circumstances, but not for the purpose of expressing an opinion on the effectiveness of the Trust’s internal control over financial reporting. Accordingly, we express no such opinion. An audit also includes examining, on a test basis, evidence supporting the amounts and disclosures in the financial statements, assessing the accounting principles used and significant estimates made by management, as well as evaluating the overall financial statement presentation. Our procedures included confirmation of securities owned as of October 31, 2016, by correspondence with the custodian and brokers; when replies were not received from brokers, we performed other auditing procedures. We believe that our audits provide a reasonable basis for our opinion.
In our opinion, the financial statements and financial highlights referred to above present fairly, in all material respects, the financial position of the Lord Abbett Micro Cap Growth Fund and Lord Abbett Micro Cap Value Fund of the Lord Abbett Securities Trust as of October 31, 2016, the results of their operations for the year then ended, the changes in their net assets for each of the two years in the period then ended, and the financial highlights for each of the five years in the period then ended, in conformity with accounting principles generally accepted in the United States of America.
DELOITTE & TOUCHE LLP
New York, New York
December 22, 2016
32
Basic Information About Management
The Board is responsible for the management of the business and affairs of the Trust in accordance with the laws of the State of Delaware. The Board elects officers who are responsible for the day-to-day operations of each Fund and who execute policies authorized by the Board. The Board also approves an investment adviser to each Fund and continues to monitor the cost and quality of the services the investment adviser provides, and annually considers whether to renew the contract with the adviser. Generally, each Trustee holds office until his/her successor is elected and qualified or until his/her earlier resignation or removal, as provided in the Trust’s organizational documents.
Lord Abbett, a Delaware limited liability company, is each Fund’s investment adviser. Designated Lord Abbett personnel are responsible for the day-to-day management of the Funds.
Interested Trustees
Ms. Foster and Mr. Sieg are affiliated with Lord Abbett and are “interested persons” of the Trust as defined in the Act. Ms. Foster and Mr. Sieg are directors/trustees of each of the 12 investment companies in the Lord Abbett Family of Funds, which consist of 60 portfolios or series. Ms. Foster is an officer of the Lord Abbett Family of Funds.
Name, Address and
Year of Birth | | Current Position and
Length of Service
with the Trust | | Principal Occupation and Other Directorships
During the Past Five Years |
Daria L. Foster
Lord, Abbett & Co. LLC
90 Hudson Street
Jersey City, NJ 07302
(1954) | | Trustee and President since 2006; Chief Executive Officer since 2012 | | Principal Occupation: Managing Partner of Lord Abbett, joined Lord Abbett in 1990. Other Directorships: None. |
| | | | | |
Douglas B. Sieg
Lord, Abbett & Co. LLC
90 Hudson Street
Jersey City, NJ 07302
(1969) | | Trustee since 2016 | | Principal Occupation: Partner (since 2001) and Head of Client Services (since 2013), formerly Director of Marketing and Relationship Management, joined Lord Abbett in 1994. Other Directorships: None. |
Independent Trustees
The following Independent Trustees also are directors/trustees of each of the 12 investment companies in the Lord Abbett Family of Funds, which consist of 60 portfolios or series.
Name, Address and
Year of Birth | | Current Position and
Length of Service
with the Trust | | Principal Occupation and Other Directorships
During the Past Five Years |
E. Thayer Bigelow
Lord, Abbett & Co. LLC
c/o Legal Dept.
90 Hudson Street
Jersey City, NJ 07302
(1941) | | Trustee since 1994;
Chairman since 2013 | | Principal Occupation: Managing General Partner, Bigelow Media, LLC (since 2000); Senior Adviser, Time Warner Inc. (1998 – 2000). Other Directorships: Currently serves as director of Crane Co. (since 1984) and Huttig Building Products Inc. (since 1998). Previously served as a director of R.H. Donnelley Inc. (2009 – 2010). |
| | | | | |
Robert B. Calhoun, Jr.
Lord, Abbett & Co. LLC
c/o Legal Dept.
90 Hudson Street
Jersey City, NJ 07302
(1942) | | Trustee since 1998 | | Principal Occupation: Senior Advisor of Monitor Clipper Partners, a private equity investment fund (since 1997); President of Clipper Asset Management Corp. (1991 – 2009). Other Directorships: None. |
33
Basic Information About Management (continued)
Name, Address and
Year of Birth | | Current Position and
Length of Service
with the Trust | | Principal Occupation and Other Directorships
During the Past Five Years |
Eric C. Fast
Lord, Abbett & Co. LLC
c/o Legal Dept.
90 Hudson Street
Jersey City, NJ 07302
(1949) | | Trustee since 2014 | | Principal Occupation: Chief Executive Officer of Crane Co., an industrial products company (2001 – 2014). Other Directorships: Currently serves as director of Automatic Data Processing, Inc. (since 2007) and Regions Financial Corporation (since 2010). Previously served as a director of Crane Co. (1999 – 2014). |
| | | | | |
Evelyn E. Guernsey
Lord, Abbett & Co. LLC
c/o Legal Dept.
90 Hudson Street
Jersey City, NJ 07302
(1955) | | Trustee since 2011 | | Principal Occupation: CEO, Americas of J.P. Morgan Asset Management (2004 – 2010). Other Directorships: None. |
| | | | | |
Julie A. Hill
Lord, Abbett & Co. LLC
c/o Legal Dept.
90 Hudson Street
Jersey City, NJ 07302
(1946) | | Trustee since 2004 | | Principal Occupation: Owner and CEO of The Hill Company, a business consulting firm (since 1998). Other Directorships: Currently serves as director of Anthem, Inc., a health benefits company (since 1994). |
| | | | | |
Franklin W. Hobbs
Lord, Abbett & Co. LLC
c/o Legal Dept.
90 Hudson Street
Jersey City, NJ 07302
(1947) | | Trustee since 2001 | | Principal Occupation: Advisor of One Equity Partners, a private equity firm (since 2004). Other Directorships: Currently serves as director and Chairman of the Board of Ally Financial Inc., a financial services firm (since 2009), and as director of Molson Coors Brewing Company (since 2002). |
| | | | | |
James M. McTaggart
Lord, Abbett & Co. LLC
c/o Legal Dept.
90 Hudson Street
Jersey City, NJ 07302
(1947) | | Trustee since 2012 | | Principal Occupation: Independent management advisor and consultant (since 2012); Vice President, CRA International, Inc. (doing business as Charles River Associates), a global management consulting firm (2009 – 2012); Founder and Chairman of Marakon Associates, Inc., a strategy consulting firm (1978 – 2009); and Officer and Director of Trinsum Group, a holding company (2007 – 2009). Other Directorships: Currently serves as director of Blyth, Inc., a home products company (since 2004). |
| | | | | |
Mark A. Schmid
Lord, Abbett & Co. LLC
c/o Legal Dept.
90 Hudson Street
Jersey City, NJ 07302
(1959) | | Trustee since 2016 | | Principal Occupation: Vice President and Chief Investment Officer of the University of Chicago (since 2009). Other Directorships: None. |
| | | | | |
James L.L. Tullis
Lord, Abbett & Co. LLC
c/o Legal Dept.
90 Hudson Street
Jersey City, NJ 07302
(1947) | | Trustee since 2006 | | Principal Occupation: CEO of Tullis-Dickerson and Co. Inc., a venture capital management firm (since 1990); CEO of Tullis Health Investors Inc. (since 2012). Other Directorships: Currently serves as director of Crane Co. (since 1998). |
34
Basic Information About Management (continued)
Officers
None of the officers listed below have received compensation from the Trust. All of the officers of the Trust also may be officers of the other Lord Abbett Funds and maintain offices at 90 Hudson Street, Jersey City, NJ 07302. Unless otherwise indicated, the position(s) and title(s) listed under the “Principal Occupation During the Past Five Years” column indicate each officer’s position(s) and title(s) with Lord Abbett. Each officer serves for an indefinite term (i.e., until his or her death, resignation, retirement, or removal).
Name and
Year of Birth | | Current Position
with the Trust | | Length of Service
of Current
Position | | Principal Occupation
During the Past Five Years |
Daria L. Foster
(1954) | | President and Chief Executive Officer | | Elected as President in 2006 and Chief Executive Officer in 2012 | | Managing Partner of Lord Abbett, joined Lord Abbett in 1990. |
| | | | | | | |
Sean J. Aurigemma
(1969) | | Executive Vice President | | Elected in 2010 | | Portfolio Manager, joined Lord Abbett in 2007. |
| | | | | | | |
Todd D. Jacobson
(1966) | | Executive Vice President | | Elected in 2003 | | Partner and Associate Director, joined Lord Abbett in 2003. |
| | | | | | | |
Robert A. Lee
(1969) | | Executive Vice President | | Elected in 2016 | | Partner and Chief Investment Officer, and was formerly Deputy Chief Investment Officer and Director of Taxable Fixed Income, joined Lord Abbett in 1997. |
| | | | | | | |
Thomas B. Maher
(1967) | | Executive Vice President | | Elected in 2008 | | Partner and Portfolio Manager, joined Lord Abbett in 2003. |
| | | | | | | |
Giulio Martini
(1955) | | Executive Vice President | | Elected in 2015 | | Director of Strategic Asset Allocation, joined Lord Abbett in 2015 and was formerly Global Investment Strategist at Anderson Global Macro LLC (2012 – 2015) and Chief Investment Officer of Currency Strategies at AllianceBernstein (1985 – 2012). |
| | | | | | | |
Justin C. Maurer
(1969) | | Executive Vice President | | Elected in 2008 | | Partner and Portfolio Manager, joined Lord Abbett in 2001. |
| | | | | | | |
Vincent J. McBride
(1964) | | Executive Vice President | | Elected in 2003 | | Partner and Director, joined Lord Abbett in 2003. |
| | | | | | | |
F. Thomas O’Halloran, III
(1955) | | Executive Vice President | | Elected in 2003 | | Partner and Portfolio Manager, joined Lord Abbett in 2001. |
35
Basic Information About Management (continued)
Name and
Year of Birth | | Current Position
with the Trust | | Length of Service
of Current
Position | | Principal Occupation
During the Past Five Years |
Didier O. Rosenfeld
(1976) | | Executive Vice President | | Elected in 2016 | | Director of Global Equity, joined Lord Abbett in 2015 and was formerly a Portfolio Manager and Senior Analyst at Cornerstone Capital Management (2014 – 2015) and Managing Director at State Street Global Advisors (2000 – 2013). |
| | | | | | | |
Frederick J. Ruvkun
(1957) | | Executive Vice President | | Elected in 2016 | | Partner and Portfolio Manager, joined Lord Abbett in 2006. |
| | | | | | | |
A. Edward Allinson
(1961) | | Vice President | | Elected in 2011 | | Portfolio Manager, joined Lord Abbett in 2005. |
| | | | | | | |
John W. Ashbrook
(1964) | | Vice President and Assistant Secretary | | Elected in 2014 | | Assistant General Counsel, joined Lord Abbett in 2008. |
| | | | | | | |
Vernon T. Bice
(1974) | | Vice President | | Elected in 2016 | | Portfolio Manager, joined Lord Abbett in 2011. |
| | | | | | | |
Joan A. Binstock
(1954) | | Chief Financial Officer and Vice President | | Elected in 1999 | | Partner and Chief Financial Officer, and was formerly Chief Operations Officer, joined Lord Abbett in 1999. |
| | | | | | | |
Matthew R. DeCicco
(1977) | | Vice President | | Elected in 2015 | | Portfolio Manager, joined Lord Abbett in 1999. |
| | | | | | | |
Brooke A. Fapohunda
(1975) | | Vice President and Assistant Secretary | | Elected in 2014 | | Deputy General Counsel, joined Lord Abbett in 2006. |
| | | | | | | |
John K. Forst
(1960) | | Vice President and Assistant Secretary | | Elected in 2005 | | Partner and Deputy General Counsel, joined Lord Abbett in 2004. |
| | | | | | | |
Lawrence H. Kaplan
(1957) | | Vice President and Secretary | | Elected in 1997 | | Partner and General Counsel, joined Lord Abbett in 1997. |
| | | | | | | |
Linda Y. Kim
(1980) | | Vice President and Assistant Secretary | | Elected in 2016 | | Counsel, joined Lord Abbett in 2015 and was formerly an Associate at Stroock & Stroock & Lavan LLP (2007 – 2015). |
| | | | | | | |
David J. Linsen
(1974) | | Vice President | | Elected in 2011 | | Partner and Director, joined Lord Abbett in 2001. |
| | | | | | | |
Joseph M. McGill
(1962) | | Chief Compliance Officer | | Elected in 2014 | | Partner and Chief Compliance Officer, joined Lord Abbett in 2014 and was formerly Managing Director and the Chief Compliance Officer at UBS Global Asset Management (2003 – 2013). |
36
Basic Information About Management (concluded)
Name and
Year of Birth | | Current Position
with the Trust | | Length of Service
of Current
Position | | Principal Occupation
During the Past Five Years |
A. Edward Oberhaus, III
(1959) | | Vice President | | Elected in 1993 | | Partner and Director, joined Lord Abbett in 1983. |
| | | | | | | |
Lawrence B. Stoller
(1963) | | Vice President and Assistant Secretary | | Elected in 2007 | | Partner and Senior Deputy General Counsel, joined Lord Abbett in 2007. |
| | | | | | | |
Arthur K. Weise
(1970) | | Vice President | | Elected in 2011 | | Partner and Portfolio Manager, joined Lord Abbett in 2007. |
| | | | | | | |
Scott S. Wallner
(1955) | | AML Compliance Officer | | Elected in 2011 | | Assistant General Counsel, joined Lord Abbett in 2004. |
| | | | | | | |
Bernard J. Grzelak
(1971) | | Treasurer | | Elected in 2003 | | Partner and Chief Operations Officer, and was formerly Director of Fund Administration, joined Lord Abbett in 2003. |
Please call 888-522-2388 for a copy of the statement of additional information, which contains further information about the Trust’s Trustees. It is available free upon request.
37
Householding
The Trust has adopted a policy that allows it to send only one copy of each Fund’s prospectus, proxy material, annual report and semiannual report to certain shareholders residing at the same “household.” This reduces Fund expenses, which benefits you and other shareholders. If you need additional copies or do not want your mailings to be “householded,” please call Lord Abbett at 888-522-2388 or send a written request with your name, the name of your fund or funds and your account number or numbers to Lord Abbett Family of Funds, P.O. Box 219336, Kansas City, MO 64121.
Proxy Voting Policies, Procedures and Records
A description of the policies and procedures that Lord Abbett uses to vote proxies related to each Fund’s portfolio securities, and information on how Lord Abbett voted each Fund’s proxies during the 12-month period ended June 30 are available without charge, upon request, (i) by calling 888-522-2388; (ii) on Lord Abbett’s Website at www.lordabbett.com; and (iii) on the Securities and Exchange Commission’s (“SEC”) Website at www.sec.gov.
Shareholder Reports and Quarterly Portfolio Disclosure
The Funds are required to file their complete schedule of portfolio holdings with the SEC for their first and third fiscal quarters on Form N-Q. Copies of the filings are available without charge, upon request on the SEC’s Website at www.sec.gov and may be available by calling Lord Abbett at 888-522-2388. You can also obtain copies of Form N-Q by visiting the SEC’s Public Reference Room in Washington, DC (information on the operation of the Public Reference Room may be obtained by calling 800-SEC-0330).
Tax Information
4% of the ordinary income distributions paid by Micro Cap Growth Fund during the fiscal year ended October 31, 2016 is qualified dividend income. For corporate shareholders, 4% of Micro Cap Growth Fund’s ordinary income distributions qualified for the dividends received deduction.
Additionally, of the distributions paid to shareholders during the fiscal year ended October 31, 2016, the following amounts represent short-term capital gains and long-term capital gains:
| Fund Name | | Short-term capital gains | | Long-term capital gains |
| Micro Cap Growth Fund | | $6,650,591 | | $20,229,335 |
| Micro Cap Value Fund | | – | | 3,888,448 |
38

| | | We Recycle | | |
 | | This document is printed on recycled paper. | | |
| | | | |
| | | | |
| | Go Paperless! | | |
| | | Visit www.lordabbett.com to learn how to receive all your shareholder communications online. | |
| This report, when not used for the general information of shareholders of the Fund, is to be distributed only if preceded or accompanied by a current fund prospectus. | Lord Abbett Securities Trust Lord Abbett Micro-Cap Growth Fund Lord Abbett Micro-Cap Value Fund | |
| | |
Lord Abbett mutual fund shares are distributed by
LORD ABBETT DISTRIBUTOR LLC. | LAMCVF-2
(12/16) |
| | (a) | In accordance with applicable requirements, the Registrant adopted a Sarbanes-Oxley Code of Ethics on June 19, 2003 that applies to the principal executive officer and senior financial officers of the Registrant (“Code of Ethics”). The Code of Ethics was in effect during the fiscal year ended October 31, 2016 (the “Period”). |
| | | |
| | (b) | Not applicable. |
| | | |
| | (c) | The Registrant has not amended the Code of Ethics as described in Form N-CSR during the Period. |
| | | |
| | (d) | The Registrant has not granted any waiver, including an implicit waiver, from a provision of the Code of Ethics as described in Form N-CSR during the Period. |
| | | |
| | (e) | Not applicable. |
| | | |
| | (f) | See Item 12(a)(1) concerning the filing of the Code of Ethics. |
| Item 3: | Audit Committee Financial Expert. |
| | | The Registrant’s board of trustees has determined that each of the following independent trustees who are members of the audit committee is an audit committee financial expert: E. Thayer Bigelow, Robert B. Calhoun, Evelyn E. Guernsey, and Mark A. Schmid. Each of these persons is independent within the meaning of the Form N-CSR. |
| Item 4: | Principal Accountant Fees and Services. |
In response to sections (a), (b), (c) and (d) of Item 4, the aggregate fees billed to the Registrant for the fiscal years ended October 31, 2016 and 2015 by the Registrant’s principal accounting firm, Deloitte & Touche LLP, the member firms of Deloitte Touche Tohmatsu and their respective affiliates (collectively, “Deloitte”) were as follows:
| | | Fiscal year ended: | |
| | | 2016 | | 2015 | |
| Audit Fees {a} | | $ | 384,200 | | | $ | 381,000 | |
| Audit-Related Fees | | | - 0 - | | | | - 0 - | |
| Total audit and audit-related fees | | | 384,200 | | | | 381,000 | |
| | | | | | | | | |
| Tax Fees {b} | | | 83,408 | | | | 83,120 | |
| All Other Fees | | | - 0 - | | | | - 0 - | |
| | | | | | | | | |
| Total Fees | | $ | 467,608 | | | $ | 464,120 | |
{a} Consists of fees for audits of the Registrant’s annual financial statements.
{b} Fees for the fiscal year ended October 31, 2016 and 2015 consist of fees for preparing the U.S. Income Tax Return for Regulated Investment Companies, New Jersey Corporation Business Tax Return, New Jersey Annual Report Form, U.S. Return of Excise Tax on Undistributed Income of Investment Companies, IRS Forms 1099-MISC and 1096 Annual Summary and Transmittal of U.S. Information Returns.
(e) (1) Pursuant to Rule 2-01(c) (7) of Regulation S-X, the Registrant’s Audit Committee has adopted pre-approval policies and procedures. Such policies and procedures generally provide that the Audit Committee must pre-approve:
| | · | any audit, audit-related, tax, and other services to be provided to the Lord Abbett Funds, including the Registrant, and |
| | · | any audit-related, tax, and other services to be provided to the Registrant’s investment adviser and any entity controlling, controlled by or under common control with the investment adviser that provides ongoing services to one or more Funds comprising the Registrant if the engagement relates directly to operations and financial reporting of a Fund, by the independent auditor to assure that the provision of such services does not impair the auditor’s independence. |
The Audit Committee has delegated pre-approval authority to its Chairman, subject to a fee limit of $10,000 per event, and not to exceed $25,000 annually. The Chairman will report any pre-approval decisions to the Audit Committee at its next scheduled meeting. Unless a type of service to be provided by the independent auditor has received general pre-approval, it must be pre-approved by the Audit Committee. Any proposed services exceeding pre-approved cost levels will require specific pre-approval by the Audit Committee.
(e) (2) The Registrant’s Audit Committee has approved 100% of the services described in this Item 4 (b) through (d).
(f) Not applicable.
(g) The aggregate non-audit fees billed by Deloitte for services rendered to the Registrant are shown above in the response to Item 4 (a), (b), (c) and (d) as “All Other Fees”.
The aggregate non-audit fees billed by Deloitte for services rendered to the Registrant’s investment adviser, Lord, Abbett & Co. LLC (“Lord Abbett”), for the fiscal years ended October 31, 2016 and 2015 were:
| | | Fiscal year ended: | |
| | | 2016 | | 2015 | |
| All Other Fees {a} | | $ | 195,230 | | | $ | 185,031 | |
{a} Consist of fees for Independent Services Auditors’ Report on Controls Placed in Operation and Tests of Operating Effectiveness related to Lord Abbett’s Asset Management Services (“SOC-1 Report”).
The aggregate non-audit fees billed by Deloitte for services rendered to entities under the common control of Lord Abbett for the fiscal years ended October 31, 2016 and 2015 were:
| | | Fiscal year ended: | |
| | | 2016 | | | 2015 | |
| All Other Fees | | | $ - 0 - | | | | $ - 0 - | |
(h) The Registrant’s Audit Committee has considered the provision of non-audit services that were rendered to the Registrant’s investment adviser, and any entity controlling, controlled by or under common control with the investment adviser that provides ongoing services to the Registrant, that were not pre-approved pursuant to Rule 2-01 (c)(7)(ii) of Regulation S-X and has determined that the provision of such services is compatible with maintaining Deloitte’s independence.
| Item 5: | Audit Committee of Listed Registrants. |
Not applicable.
Not applicable.
| Item 7: | Disclosure of Proxy Voting Policies and Procedures for Closed-End Management Investment Companies. |
Not applicable.
| Item 8: | Portfolio Managers of Closed-End Management Investment Companies. |
Not applicable.
| Item 9: | Purchases of Equity Securities by Closed-End Management Investment Company and Affiliated Purchasers. |
Not applicable.
| Item 10: | Submission of Matters to a Vote of Security Holders. |
Not applicable.
| Item 11: | Controls and Procedures. |
| | (a) | Based on their evaluation of the Registrant’s disclosure controls and procedures (as defined in Rule 30a-3(c) under the Investment Company Act of 1940) as of a date within 90 days prior to the filing date of this report, the Chief Executive Officer and Chief Financial Officer of the Registrant have concluded that such disclosure controls and procedures are reasonably designed and effective to ensure that material information relating to the Registrant, including its consolidated subsidiaries, is made known to them by others within those entities. |
| | | |
| | (b) | There were no changes in the Registrant’s internal control over financial reporting (as defined in Rule 30a-3(d) under the Investment Company Act of 1940) that occurred during the second fiscal quarter of the period covered by this report that have materially affected, or are reasonably likely to materially affect, the Registrant’s internal control over financial reporting. |
| | (a)(1) | The Lord Abbett Family of Funds Sarbanes Oxley Code of Ethics for the Principal Executive Officer and Senior Financial Officers is attached hereto as part of Ex-99. CODEETH. |
| | | |
| | (a)(2) | Certification of each Principal Executive Officer and Principal Financial Officer of the Registrant as required by Rule 30a-2 under the Investment Company Act of 1940 is attached hereto as a part of EX-99.CERT. |
| | | |
| | (b) | Certification of each Principal Executive Officer and Principal Financial Officer of the Registrant as required by Section 906 of the Sarbanes-Oxley Act of 2002 is provided as a part of EX-99.906CERT. |
SIGNATURES
Pursuant to the requirements of the Securities Exchange Act of 1934 and the Investment Company Act of 1940, the Registrant has duly caused this report to be signed on its behalf by the undersigned, thereunto duly authorized.
| | | LORD ABBETT SECURITIES TRUST |
| | | | |
| | By: | /s/ Daria L. Foster | |
| | | Daria L. Foster | |
| | | President and Chief Executive Officer | |
| Date: December 22, 2016 | | | |
| | | | |
| | By: | /s/ Joan A. Binstock | |
| | | Joan A. Binstock | |
| | | Chief Financial Officer and Vice President | |
Date: December 22, 2016
Pursuant to the requirements of the Securities Exchange Act of 1934 and the Investment Company Act of 1940, this report has been signed below by the following persons on behalf of the Registrant and in the capacities and on the dates indicated.
| | By: | /s/ Daria L. Foster | |
| | | Daria L. Foster | |
| | | President and Chief Executive Officer | |
| | | | |
| Date: December 22, 2016 | | | |
| | | | |
| | By: | /s/ Joan A. Binstock | |
| | | Joan A. Binstock | |
| | | Chief Financial Officer and Vice President | |
Date: December 22, 2016