UNITED STATES
SECURITIES AND EXCHANGE COMMISSION
Washington, D.C. 20549
FORM N-CSR
CERTIFIED SHAREHOLDER REPORT OF REGISTERED
MANAGEMENT INVESTMENT COMPANIES
Investment Company Act File Number: 811-07538
LORD ABBETT SECURITIES TRUST
(Exact name of Registrant as specified in charter)
90 Hudson Street, Jersey City, NJ 07302
(Address of principal executive offices) (Zip code)
John T. Fitzgerald, Esq., Vice President & Assistant Secretary
90 Hudson Street, Jersey City, NJ 07302
(Name and address of agent for service)
Registrant’s telephone number, including area code: (800) 201-6984
Date of fiscal year end: 10/31
Date of reporting period: 10/31/2018
| Item 1: | Report(s) to Shareholders. |

LORD ABBETT
ANNUAL REPORT
Lord Abbett
Alpha Strategy Fund
Fundamental Equity Fund
Global Equity Research Fund*
Global Select Equity Fund
Growth Leaders Fund
International Equity Fund
International Opportunities Fund
International Value Fund**
Value Opportunities Fund
For the fiscal year ended October 31, 2018
*Formerly Global Core Equity Fund
**Formerly International Dividend Income Fund
Lord Abbett Securities Trust
Lord Abbett Alpha Strategy Fund, Lord Abbett Fundamental Equity Fund, Lord Abbett Global Equity Research Fund, Lord Abbett Global Select Equity Fund, Lord Abbett Growth Leaders Fund, Lord Abbett International Equity Fund, Lord Abbett International Opportunities Fund, Lord Abbett International Value Fund, and Lord Abbett Value Opportunities Fund Annual Report
For the fiscal year ended October 31, 2018

From left to right: James L.L. Tullis, Independent Chairman of the Lord Abbett Funds and Douglas B. Sieg, Trustee, President, and Chief Executive Officer of the Lord Abbett Funds.
Dear Shareholders: We are pleased to provide you with this overview of the performance of the Funds for the fiscal year ended October 31, 2018. On the following pages, we discuss the major factors that influenced fiscal year performance. For detailed and timely information about the Funds, please visit our website at www.lordabbett.com, where you can also access the quarterly commentaries that provide updates on each Fund’s performance and other portfolio related updates.
Thank you for investing in Lord Abbett mutual funds. We value the trust that you place in us and look forward to serving your investment needs in the years to come.
Best regards,

Douglas B. Sieg
Trustee, President and Chief Executive Officer
1
Lord Abbett Alpha Strategy Fund
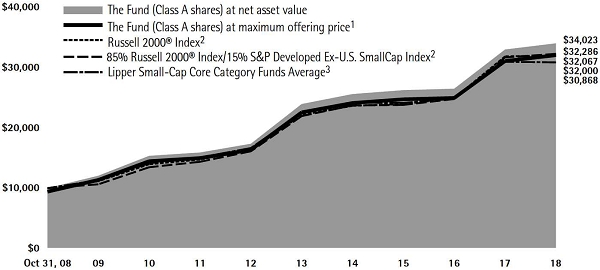
For the fiscal year ended October 31, 2018, the Fund returned 3.11%, reflecting performance at the net asset value (NAV) of Class A shares, with all distributions reinvested, compared to its benchmark Russell 2000® Index1 which returned 1.85% over the same period.
Domestic equity returns were positive over the past year, with large cap stocks, as represented by the S&P 500® Index,2 rising 7.35% during the period, while small cap stocks, as represented by the Russell 2000® Index,1 were up 1.85%. During the period, there were several market-moving events. Notably, in December 2017, Congress passed the largest rewrite of the U.S. tax code in decades. The tax bill reduced the corporate tax rate from 35% to 21% and allowed for a one-time repatriation tax of 15.5%, rather than the standard repatriation tax rate of 35%. In June 2018, the White House announced its intent to impose additional tariffs on $200 billion worth of Chinese goods, on top of the $50 billion previously announced. The aggressive U.S. trade posture continued into September with trade tensions mounting between the U.S. and China. While the impact has yet to fully be realized, many corporations anticipate that the retaliatory tariffs will weigh on profits. Trade discussions between Mexico, Canada, and the U.S., however, took a more favorable turn as the negotiations resulted in a revised version of the North American
Free Trade Agreement (NAFTA) called the U.S.–Mexico–Canada Agreement. In December 2017, the Federal Reserve (the “Fed”) raised its target for short-term interest rates by 0.25%, to a range of 1.25%-1.50%, and indicated that it was targeting three rate hikes in 2018. The Fed followed with rate hikes of 0.25% at each of its March, June and September meetings, raising the target range to 2.00%-2.25%. Amid rising concerns surrounding escalating trade tensions, slowing growth, and increasing interest rates, the Nasdaq experienced the largest monthly drop since 2008 in October. Despite the sell-off, the U.S. economy continued to expand by more than 2% during each quarter of the trailing 12-month period, with domestic GDP growth ranging between 2.2% to 4.2% from the third quarter of 2017 to the third quarter of 2018. The 4.2% GDP growth in the second quarter marked the strongest growth rate since the third quarter of 2014.
The Fund’s allocation to domestic small and micro cap growth equities contributed to performance, as these investment strategies outperformed the Russell 2000® Index. Within these strategies, stock selection in the health care and information technology sectors contributed to the performance relative to the underlying indexes.
The Fund’s allocation to international small cap equities as well as domestic small and mid (“smid”) and micro cap value equities detracted from relative performance, as each of these investment
2
strategies underperformed the Russell 2000® Index. Within the international small cap allocation, security selection in the financials and health care sectors detracted from performance relative to the underlying index. Within the domestic smid cap value equity allocation, security selection in the financials and information technology sectors detracted from performance relative to the underlying index. Stock selection in the industrials and communication services sectors in the domestic micro cap value strategy detracted from performance.
Lord Abbett Fundamental Equity Fund
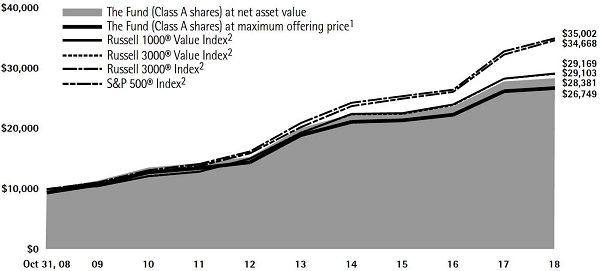
For the fiscal year ended October 31, 2018, the Fund returned 1.99%, reflecting performance at the net asset value (NAV) of Class A shares, with all distributions reinvested, compared to its benchmark, the Russell 1000® Value Index,3 which returned 3.03% over the same period.
Domestic equity returns were positive over the past year, with large cap stocks, as represented by the S&P 500® Index,2 rising 7.35% during the period, while small cap stocks, as represented by the Russell 2000® Index,1 were up 1.85%. During the period, there were several market-moving events. Notably, in December 2017, Congress passed the largest rewrite of the U.S. tax code in decades. The tax bill reduced the corporate tax rate from 35% to 21% and allowed for a one-time repatriation tax of 15.5%, rather than the standard repatriation tax rate of
35%. In June 2018, the White House announced its intent to impose additional tariffs on $200 billion worth of Chinese goods, on top of the $50 billion previously announced. The aggressive U.S. trade posture continued into September with trade tensions mounting between the U.S. and China. While the impact has yet to fully be realized, many corporations anticipate that the retaliatory tariffs will weigh on profits. Trade discussions between Mexico, Canada, and the U.S., however, took a more favorable turn as the negotiations resulted in a revised version of the North American Free Trade Agreement (NAFTA) called the U.S.–Mexico–Canada Agreement. In December 2017, the Federal Reserve (the “Fed”) raised its target for short-term interest rates by 0.25%, to a range of 1.25%-1.50%, and indicated that it was targeting three rate hikes in 2018. The Fed followed with rate hikes of 0.25% at each of its March, June and September meetings, raising the target range to 2.00%-2.25%. Amid rising concerns surrounding escalating trade tensions, slowing growth, and increasing interest rates, the Nasdaq experienced the largest monthly drop since 2008 in October. Despite the sell-off, the U.S. economy continued to expand by more than 2% during each quarter of the trailing 12-month period, with domestic GDP growth ranging between 2.2% to 4.2% from the third quarter of 2017 to the third quarter of 2018. The 4.2% GDP growth in the second quarter marked the strongest growth rate since the third quarter of 2014.
3
The Fund underperformed its index for the period. During the trailing 12-month period, the largest detractors from relative performance were the materials and financials sectors. Within the materials sector, shares of DowDuPont, Inc., an American multinational chemical corporation, detracted from relative performance. Shares of DowDuPont came under downward pressure after announcing a $4.6 billion non-cash impairment charge related to its agricultural business. Within the materials sector, shares of Nucor Corporation, a steel manufacturer, also detracted from relative performance. While the import tariffs imposed by President Trump were intended to lift the share prices of domestic steel manufacturers, share prices of many steel manufacturers, including Nucor, came under pressure as investors appeared to question the longevity of the protectionist policies. Within the financials sector, shares of ACE Limited, an insurance firm, detracted most from relative performance. The company’s shares fell following the announcement of a preliminary net catastrophe loss estimate of $450 million pre-tax in the firm’s third quarter. The losses were attributable to an array of weather events, including Hurricane Florence and wildfires in California. An overweight to Hartford Financial Group also detracted from performance. The investment and insurance company’s shares declined after the company announced an acquisition to purchase
Navigators Group, Inc. We believe shareholders were disappointed by the announcement as many were likely hopeful for capital return.
The largest contributors to relative performance during the trailing 12-month period were the industrials and the information technology sectors. Within the industrials sector, the Fund’s holding of General Electric (“GE”), a digital industrial company, contributed most to relative performance. While GE’s shares came under pressure after cutting its dividend as well as facing a downgrade from Moody’s, the Fund benefited because it maintained an underweight position in the stock relative to its benchmark. An overweight to CSX Corporation, a rail and transportation company, also positively contributed to relative performance. Shares of CSX rose after significantly beating consensus estimates for top and bottom line. Within the information technology sector, Microsoft Corporation contributed most to relative performance. Shares of the software and technology manufacturer rose on the back of solid fourth quarter earnings. The company closed out the year with impressive revenue growth, with upside driven in part by acceleration in intelligent cloud growth. An overweight to Cisco Systems, Inc., a company that sells Internet Protocol based networking, also positively contributed to relative performance. Shares of Cisco Systems advanced after the company announced the acquisition of Duo Security, Inc., a cyber security company. We
4
believe the acquisition signaled Cisco Systems’ willingness to move into a high growth space that was outside of their core business.
Lord Abbett Global Equity Research Fund
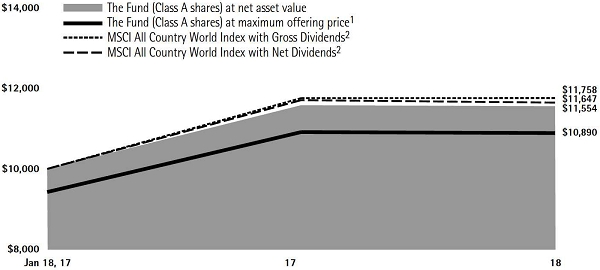
For the fiscal year ended October 31, 2018, the Fund returned -0.22%, reflecting performance at the net asset value (NAV) of Class A Shares, with all distributions reinvested, compared to its benchmark, the MSCI ACWI Index,4 which returned -0.52% over the same period.
Over the period, global equity markets experienced significant negative performance outside the United States, despite most central banks remaining accommodative, interest rates remaining low, and unemployment steadily declining. In addition, corporate earnings continued to grow, while global economic growth has showed signs of peaking and plateauing. Overall, European markets (as measured by the Euro Stoxx 50 Index®)5 fell roughly 15.5% in U.S. dollars for the period, while Japan’s Nikkei 2256 rose 0.14%.
In December 2017, the Federal Reserve (the “Fed”) raised its target for short-term interest rates by 0.25%, to a range of 1.25%-1.50%, and indicated that it was targeting three rate hikes in 2018. The Fed followed with rate hikes of 0.25% at each of its March, June and September meetings, raising the target range to 2.00%-2.25%. Meanwhile, other central banks have continued their
accommodative policies. The European Central Bank (ECB) kept its benchmark refinancing rate unchanged at 0%, since March 2016, and at its October 2018 meeting, the ECB said it will continue to make net asset purchases at the new monthly pace of €15 billion until the end of December 2018. The Bank of Japan (BoJ) also maintained its stimulative monetary policy as short term interest rates remained unchanged, at -0.1%, at its October 2018 meeting, and the bank kept its 10-year government bond yield target at around 0%. The BoJ also reduced its inflation forecast again, saying that the momentum toward achieving the price stability target of 2% is not sufficiently firm.
The International Monetary Fund lowered global growth estimates by 0.2 percentage points to 3.7% for both 2018 and 2019, reflecting “surprises that suppressed activity in early 2018 in some major advanced economies, the negative effects of the trade measures implemented or approved between April and mid-September, as well as a weaker outlook for some key emerging markets and developing economies arising from country-specific factors, tighter financial conditions, geopolitical tensions, and higher oil import bills”. Unemployment steadily declined in most developed countries, falling to 8.1% in the euro area, 3.7% in the United States, 2.3% in Japan, and 3.8% in China, all multiyear lows. GDP growth has remained positive in most developed countries, while inflation
5
remained subdued, allowing central banks to continue their stimulative monetary policies with global stock markets as the beneficiaries.
Volatility, as measured by the VIX index, has crept back up this year after remaining near all-time low levels for most of 2017. We believe that sources of tension throughout the year have come from aggressive U.S. trade posture with trade tensions mounting between the U.S. and China, remaining uncertainty regarding a potential hard “Brexit” outcome, as well as the gradual and continuous rise of rates by the Fed.
During the period, the Fund’s outperformance relative to the benchmark was driven by the health care and consumer discretionary sectors. Within the health care sector, holdings of Ascendis Pharma A/S contributed to relative performance. Shares of the Danish pharmaceutical company rose, as investors continue to see upside in the company’s meaningful drug pipeline. An overweight position in Illumina, Inc. also contributed to relative performance as the company’s stock rose throughout the year. The human genome testing company’s stock advanced as its dominant competitive position and strong product momentum continued to sustain growth acceleration.
Within the consumer discretionary sector, an overweight position in TJX Companies, Inc. contributed to relative performance. The off-price apparel and home fashion retailer’s stock rose as the
company benefitted from healthy customer traffic, merchandise margin increases, and a sector that continues to gain market share.
Conversely, stock selection within the information technology and materials sectors negatively contributed to relative performance. Within the information technology sector, shares of Universal Display, Corp. detracted from performance as the company’s stock fell. The OLED research and manufacturing company’s stock fell as continued weakness in flagship smartphones and inventory buildup at its biggest customer disappointed investors. Additionally, shares of Tencent Holdings Limited also contributed negatively to performance. The China-based e-commerce conglomerate’s stock fell as a result of a lingering regulatory setback in video game releases.
Within the materials sector, holdings of Lundin Mining Corp. contributed negatively to relative performance. The Canadian metals mining company suffered as the Zinc Expansion Project ramp-up was further delayed and costs continued to increase.
Lord Abbett Growth Leaders Fund
For the fiscal year ended October 31, 2018, the Fund returned 9.68%, reflecting performance at the net asset value (NAV) of Class A shares, with all distributions reinvested, compared to its benchmark, the Russell 1000® Growth Index,7 which returned 10.71% over the same period.
6
Domestic equity returns were positive over the past year, with large cap stocks, as represented by the S&P 500® Index2, rising 7.35% during the period, while small cap stocks, as represented by the Russell 2000® Index,1 were up 1.85%. During the period, there were several market-moving events. Notably, in December 2017, Congress passed the largest rewrite of the U.S. tax code in decades. The tax bill reduced the corporate tax rate from 35% to 21% and allowed for a one-time repatriation tax of 15.5%, rather than the standard repatriation tax rate of 35%. In June 2018, the White House announced its intent to impose additional tariffs on $200 billion worth of Chinese goods, on top of the $50 billion previously announced. The aggressive U.S. trade posture continued into September with trade tensions mounting between the U.S. and China. While the impact has yet to fully be realized, many corporations anticipate that the retaliatory tariffs will weigh on profits. Trade discussions between Mexico, Canada, and the U.S., however, took a more favorable turn as the negotiations resulted in a revised version of the North American Free Trade Agreement (NAFTA) called the U.S.–Mexico–Canada Agreement. In December 2017, the Federal Reserve (the “Fed”) raised its target for short-term interest rates by 0.25%, to a range of 1.25%-1.50%, and indicated that it was targeting three rate hikes in 2018. The Fed followed with rate hikes of 0.25% at each of its March, June and September meetings,
raising the target range to 2.00%-2.25%. Amid rising concerns surrounding escalating trade tensions, slowing growth, and increasing interest rates, the Nasdaq experienced the largest monthly drop since 2008 in October 2018. Despite the sell-off, the U.S. economy continued to expand by more than 2% during each quarter of the trailing 12-month period, with domestic GDP growth ranging between 2.2% to 4.2% from the third quarter of 2017 to the third quarter of 2018. The 4.2% GDP growth in the second quarter marked the strongest growth rate since the third quarter of 2014.
Security selection and positioning within the information technology and industrials sectors detracted from the Fund’s relative performance during the 12-month period. Within the information technology sector, shares of Apple, Inc., a designer and manufacturer of mobile communication devices, detracted from the Fund’s relative performance during the period. Despite some concerns that iPhone unit growth would wane, shares of Apple appreciated as average selling prices increased and demand for new product launches remained resilient. The Fund held an underweight position in Apple relative to its benchmark throughout the period. Shares of NVIDIA Corp., a developer of computer graphics processing chips and multimedia software, also detracted from relative performance. Shares of NVIDIA were impacted by volatility in crypto currencies, game title delays coming out of China, and the macro concerns that drove
7
investors to sell market leading secular growth stocks in October of 2018.
Within the industrials sector, shares of AeroVironment, Inc., a designer and developer of unmanned aircraft and transportation solutions, detracted from the Fund’s performance relative to its benchmark. Shares of AeroVironment declined over the period as a broker’s research report called in to question the company’s ability to innovate and develop successful new products.
Security selection in the consumer discretionary and health care sectors detracted from the Fund’s performance relative to its benchmark. Within the consumer discretionary sector, shares of World Wrestling Entertainment, Inc., a producer and developer of televised and live events, contributed to relative performance. Shares of World Wrestling Entertainment surged throughout the period as investors awaited the announcement of a new TV deal agreement with major U.S. networks for its Raw and SmackDown programs. The deal eventually was cemented at a higher rate than many expected. Shares of Lululemon Athletica, Inc., a designer and retailer of athletic apparel and accessories, also contributed to relative performance during the period. Lululemon displayed exceptional growth as e-commerce and strong demand across all categories and regions drove robust top-line momentum.
Within the health care sector, the Fund’s position in Illumina, Inc., a
developer of genetic sequencing analysis tools, contributed to relative performance as robust sequencing consumables trends and strong product innovation helped the company to rapidly become the dominant gene sequencing company in the industry and accelerate revenue growth.
Lord Abbett International Equity Fund
For the fiscal year ended October 31, 2018, the Fund returned -11.91%, reflecting performance at the net asset value (NAV) of Class A Shares, with all distributions reinvested, compared to its benchmark, the MSCI ACWI ex-U.S. Index,8 which returned -8.24% over the same period.
Over the period, global equity markets experienced significant negative performance outside the United States, despite most central banks remaining accommodative, interest rates remaining low, and unemployment steadily declining. In addition, corporate earnings continued to grow, while global economic growth has showed signs of peaking and plateauing. Overall, European markets (as measured by the Euro Stoxx 50 Index®)5 fell roughly 15.5% in U.S. dollars for the period, while Japan’s Nikkei 2256 rose 0.14%.
In December 2017, the Federal Reserve (the “Fed”) raised its target for short-term interest rates by 0.25%, to a range of 1.25%-1.50%, and indicated that it was targeting three rate hikes in 2018. The Fed followed with rate hikes of 0.25% at each
8
of its March, June and September meetings, raising the target range to 2.00%-2.25%. Meanwhile, other central banks have continued their accommodative policies. The European Central Bank (ECB) kept its benchmark refinancing rate unchanged at 0%, since March 2016, and at its October 2018 meeting, the ECB said it will continue to make net asset purchases at the new monthly pace of €15 billion until the end of December 2018. The Bank of Japan (BoJ) also maintained its stimulative monetary policy as short term interest rates remained unchanged, at -0.1%, at its October 2018 meeting, and the bank kept its 10-year government bond yield target at around 0%. The BoJ also reduced its inflation forecast again, saying that the momentum toward achieving the price stability target of 2% is not sufficiently firm.
The International Monetary Fund lowered global growth estimates by 0.2 percentage points to 3.7% for both 2018 and 2019, reflecting “surprises that suppressed activity in early 2018 in some major advanced economies, the negative effects of the trade measures implemented or approved between April and mid-September, as well as a weaker outlook for some key emerging markets and developing economies arising from country-specific factors, tighter financial conditions, geopolitical tensions, and higher oil import bills”. Unemployment steadily declined in most developed countries, falling to 8.1% in the euro area, 3.7% in the United States, 2.3% in Japan, and 3.8% in China, all
multiyear lows. GDP growth has remained positive in most developed countries, while inflation remained subdued, allowing central banks to continue their stimulative monetary policies with global stock markets as the beneficiaries.
Volatility, as measured by the VIX index, has crept back up this year after remaining near all-time low levels for most of 2017. We believe that sources of tension throughout the year have come from aggressive U.S. trade posture with trade tensions mounting between the U.S. and China, remaining uncertainty regarding a potential hard “Brexit” outcome, as well as the gradual and continuous rise of rates by the Fed.
During the period, the Fund’s underperformance relative to its benchmark was driven by stock selection, particularly within the industrials and consumer staples sectors. Within the industrials sector, an overweight position in Loomis AB detracted from relative performance. Shares of the Swedish armored car services company fell as the long-term structural decline in the usage of cash in society put a damper on the valuation. Additionally, shares of En-Japan, Inc. also detracted from relative performance. Shares of the Japanese internet-based recruiting solutions company declined amid structural concerns around Japan’s declining working-age population and general labor shortages.
Security selection in the consumer staples sector also detracted from relative
9
performance. Within the consumer staples sector, an overweight position in Pola Orbis Holdings Inc. detracted from relative performance. Shares of the Japanese cosmetic products company fell as a tourism growth slump weighed on Japanese cosmetics and consumer good stocks.
Conversely, stock selection within the consumer discretionary and real estate sectors contributed to relative performance over the period. Within the consumer discretionary sector, shares of Sony Corp. contributed to relative performance. The global consumer electronics company’s shares rose as it signaled a new phase of expansion driven by innovation and sustained growth in established businesses. Wynn Macau, Limited, a Macau-based destination casino resort company, also contributed to relative performance. The company benefited in the first half of 2018 amid a sustained and genuine demand recovery that had grown to new highs.
Within the real estate sector, shares of Aroundtown SA, a Luxembourg-based real estate company, contributed to performance. The company has continued to benefit from its focus in regions with solid economic fundamentals and from the improvement of rental and occupancy levels in the German office property markets.
Lord Abbett International Opportunities Fund
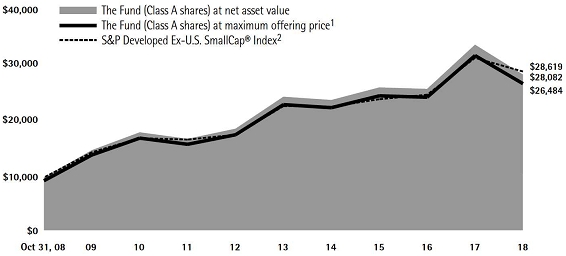
For the fiscal year ended October 31, 2018, the Fund returned -15.72%,
reflecting performance at the net asset value (NAV) of Class A Shares, with all distributions reinvested, compared to its benchmark, the S&P Developed Ex-U.S. SmallCap® Index,9 which returned -7.70% over the same period.
Over the period, global equity markets experienced significant negative performance outside the United States, despite most central banks remaining accommodative, interest rates remaining low, and unemployment steadily declining. In addition, corporate earnings continued to grow, while global economic growth has showed signs of peaking and plateauing. Overall, European markets (as measured by the Euro Stoxx 50)5 fell roughly 15.5% in U.S. dollars for the period, while Japan’s Nikkei 2256 rose 0.14% in U.S. dollars for the period.
In December 2017, the Federal Reserve (the “Fed”) raised its target for short-term interest rates by 0.25%, to a range of 1.25%-1.50%, and indicated that it was targeting three rate hikes in 2018. The Fed followed with rate hikes of 0.25% at each of its March, June and September meetings, raising the target range to 2.00%-2.25%. Meanwhile, other central banks have continued their accommodative policies. The European Central Bank (ECB) kept its benchmark refinancing rate unchanged at 0%, since March 2016, and at its October 2018 meeting, the ECB said it will continue to make net asset purchases at the new monthly pace of €15 billion until the end
10
of December 2018. The Bank of Japan (BoJ) also maintained its stimulative monetary policy as short term interest rates remained unchanged, at -0.1%, at its October 2018 meeting, and the bank kept its 10-year government bond yield target at around 0%. The BoJ also reduced its inflation forecast again, saying that the momentum toward achieving the price stability target of 2% is not sufficiently firm.
The International Monetary Fund lowered global growth estimates by 0.2 percentage points to 3.7% for both 2018 and 2019, reflecting “surprises that suppressed activity in early 2018 in some major advanced economies, the negative effects of the trade measures implemented or approved between April and mid-September, as well as a weaker outlook for some key emerging markets and developing economies arising from country-specific factors, tighter financial conditions, geopolitical tensions, and higher oil import bills”. Unemployment steadily declined in most developed countries, falling to 8.1% in the Euro area, 3.7% in the United States, 2.3% in Japan, and 3.8% in China, all multiyear lows. GDP growth has remained positive in most developed countries, while inflation remained subdued, allowing central banks to continue their stimulative monetary policies with global stock markets as the beneficiaries.
Volatility, as measured by the VIX index, has crept back up this year after remaining near all-time low levels for most of 2017.
Sources of tension throughout the year have come from aggressive U.S. trade posture with trade tensions mounting between the U.S. and China, remaining uncertainty regarding a potential hard “Brexit” outcome, as well as the gradual and continuous rise of rates by the Fed.
Stock selection, most notably in the financials and health care sectors, was the primary driver of relative under-performance during the period. Within the financials sector, shares of Arrow Global Group Plc detracted from relative performance. Shares of the British debt management solutions company fell as margins continued to be pressured and as low money multiples at this stage in the cycle translate into lower returns. In addition, shares of TP ICAP Plc detracted from relative performance. The British financial markets brokering services company’s stock fell after the company fired its CEO and warned that returns will be lower than expected this year.
Within the health care sector, shares of United Drug plc detracted from relative performance over the period. Shares of the Ireland based provider of commercialization solutions for health care companies retreated throughout the year as underlying growth, margin, cash flow, and quality of earnings weakened.
Conversely, stock selection in the consumer discretionary and communication services sectors contributed to relative performance. Within the consumer discretionary sector, shares of Moncler SpA
11
contributed to relative performance. Shares of the Italian luxury apparel company rose as first half 2018 earnings results demonstrated accelerating momentum and incremental support from its Fragment Genius launch. In addition, holdings of Basic-Fit N.V. also contributed to relative performance during the period. Shares of the Dutch health and fitness club company rose, as it increased previous guidance and expects to open more clubs in 2018.
Within the communication services sector, an overweight position to Okinawa Cellular contributed to relative performance, as shares of the company rose during the year. The Japanese cellular and car phone services company benefited as the company’s half-year results showed double digit profit growth from a year earlier.
Lord Abbett International Value Fund
For the fiscal year ended October 31, 2018, the Fund returned -9.05%, reflecting performance at the net asset value (NAV) of Class A Shares, with all distributions reinvested, compared to its benchmark, the MSCI EAFE Value Index,10 which returned -7.69% over the same period.
Over the period, global equity markets experienced significant negative performance outside the United States, despite most central banks remaining accommodative, interest rates remaining low, and unemployment steadily declining. In addition, corporate earnings continued to grow, while global economic growth has
showed signs of peaking and plateauing. Overall, European markets (as measured by the Euro Stoxx 50 Index®)5 fell roughly 15.5% in U.S. dollars for the period, while Japan’s Nikkei 2256 rose 0.14%.
In December 2017, the Federal Reserve (the “Fed”) raised its target for short-term interest rates by 0.25%, to a range of 1.25%-1.50%, and indicated that it was targeting three rate hikes in 2018. The Fed followed with rate hikes of 0.25% at each of its March, June and September meetings, raising the target range to 2.00%-2.25%. Meanwhile, other central banks have continued their accommodative policies. The European Central Bank (ECB) kept its benchmark refinancing rate unchanged at 0%, since March 2016, and at its October 2018 meeting, the ECB said it will continue to make net asset purchases at the new monthly pace of €15 billion until the end of December 2018. The Bank of Japan (BoJ) also maintained its stimulative monetary policy as short term interest rates remained unchanged, at -0.1%, at its October 2018 meeting, and the bank kept its 10-year government bond yield target at around 0%. The BoJ also reduced its inflation forecast again, saying that the momentum toward achieving the price stability target of 2% is not sufficiently firm.
The International Monetary Fund lowered global growth estimates by 0.2 percentage points to 3.7% for both 2018 and 2019, reflecting “surprises that suppressed activity in early 2018 in some
12
major advanced economies, the negative effects of the trade measures implemented or approved between April and mid-September, as well as a weaker outlook for some key emerging markets and developing economies arising from country-specific factors, tighter financial conditions, geopolitical tensions, and higher oil import bills”. Unemployment steadily declined in most developed countries, falling to 8.1% in the euro area, 3.7% in the United States, 2.3% in Japan, and 3.8% in China, all multiyear lows. GDP growth has remained positive in most developed countries, while inflation remained subdued, allowing central banks to continue their stimulative monetary policies with global stock markets as the beneficiaries.
Volatility, as measured by the VIX index, has crept back up this year after remaining near all-time low levels for most of 2017. We believe that sources of tension throughout the year have come from aggressive U.S. trade posture with trade tensions mounting between the U.S. and China, remaining uncertainty regarding a potential hard “Brexit” outcome, as well as the gradual and continuous rise of rates by the Fed.
During the period, the Fund’s underperformance relative to the benchmark was driven by its stock selection within the industrials and consumer staples sectors. Within the industrials sector, shares of China Everbright International Ltd., an investment company that provides
environmental solutions, fell after the company issued a surprise rights offering that raised investor concerns about the company’s corporate governance. Additionally, an overweight position in BAE Systems plc also detracted from relative performance throughout the year. The company’s stock declined as its massive deals with Saudi Arabia seemed unlikely to happen in the near term amid the political crisis surrounding journalist Jamal Khashoggi’s death.
Within the consumer staples sector, shares of Anheuser-Busch InBev SA/NV, a global alcoholic beverage manufacturer, detracted from relative performance. The company’s stock declined as the devaluation of currencies across the globe against the U.S. dollar delivered a large incremental hit to sales.
Conversely, stock selection within the financials and real estate sectors contributed to relative performance. Within the financials sector, shares of ASR Nederland N.V., a Netherlands-based insurance company, rose as it posted very strong earnings results for the first half of 2018, overcoming storm losses from earlier this year. Additionally, DBS Group Holdings Ltd, a South Asia bank and financial services provider, also contributed to relative performance. The company’s stock rose as net interest margins benefited from higher interest rates due to carryover from the U.S.
Within the real estate sector, shares of Aroundtown SA, a Luxembourg-based real estate company, contributed to
13
performance. We believe the company has continued to benefit from its focus in regions with solid economic fundamentals and from the improvement of rental and occupancy levels in the German office property markets.
Lord Abbett Value Opportunities Fund
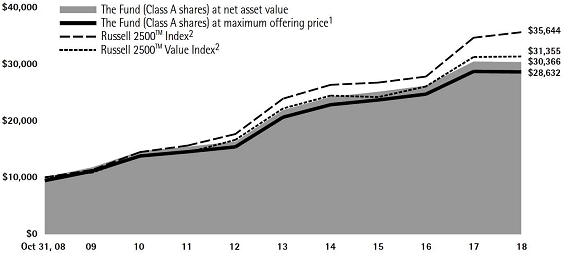
For the fiscal year ended October 31, 2018, the Fund returned -0.28%, reflecting performance at the net asset value (NAV) of Class A shares, with all distributions reinvested, compared to its benchmark, the Russell 2500™ Index,11 which returned 2.80% over the same period.
Domestic equity returns were positive over the past year, with large cap stocks, as represented by the S&P 500® Index,2 rising 7.35% during the period, while small cap stocks, as represented by the Russell 2000® Index1 were up 1.85%. During the period, there were several market-moving events. Notably, in December 2017, Congress passed the largest rewrite of the U.S. tax code in decades. The tax bill reduced the corporate tax rate from 35% to 21% and allowed for a one-time repatriation tax of 15.5%, rather than the standard repatriation tax rate of 35%. In June 2018, the White House announced its intent to impose additional tariffs on $200 billion worth of Chinese goods on top of the $50 billion previously announced. The aggressive U.S. trade posture continued into September with trade tensions mounting between the U.S. and China.
While the impact has yet to fully be realized, many corporations anticipate that the retaliatory tariffs will weigh on profits. Trade discussions between Mexico, Canada, and the U.S., however, took a more favorable turn as the negotiations resulted in a revised version of the North American Free Trade Agreement (NAFTA) called the U.S.–Mexico–Canada Agreement. In December 2017, the Federal Reserve (the “Fed”) raised its target for short-term interest rates by 0.25%, to a range of 1.25%-1.50%, and indicated that it was targeting three rate hikes in 2018. The Fed followed with rate hikes of 0.25% at each of its March, June and September meetings, raising the target range to 2.00%-2.25%. Amid rising concerns surrounding escalating trade tensions, slowing growth, and increasing interest rates, the Nasdaq experienced the largest monthly drop since 2008 in October 2018. Despite the sell-off, the U.S. economy continued to expand by more than 2% during each quarter of the trailing 12-month period, with domestic GDP growth ranging between 2.2% to 4.2% from the third quarter of 2017 to the third quarter of 2018. The 4.2% GDP growth in the second quarter marked the strongest growth rate since the third quarter of 2014.
Security selection within the financials and information technology sectors were detractors from the Fund’s relative performance during the period. Within the financials sector, shares of Western Alliance Bancorporation, a multi-bank holding company, detracted from relative
14
performance. Shares of Western Alliance fell following its third quarter financial results. Despite surpassing analyst estimates on earnings, revenues were below consensus estimates and forward guidance was lowered as a result. Additionally, the Fund’s holding of Arch Capital Group Ltd., which offers life, health, and property insurance and reinsurance products as well as mortgage services, was a detractor from relative performance. Shares of Arch Capital Group came under pressure in October, as Hurricane Michael made landfall on the Florida panhandle as a Category 4 storm, and a sizeable portion of the company’s revenues come from the reinsurance industry. Within the information technology sector, the Fund’s holding of MACOM Technology Solutions Holdings Inc., a provider of analog semiconductor solutions, detracted from relative performance. MACOM was challenged in February, as competitive pricing pressures caused gross margins to decline leading MACOM to report both revenue and earnings for the first quarter that failed to meet consensus estimates.
Conversely, security selection in the consumer discretionary and industrials sectors were contributors to the Fund’s relative performance during the period. Within the consumer discretionary sector, the Fund’s position in Lululemon Athletica Inc., a designer and retailer of athletic clothing products, contributed to relative
performance. Lululemon reported strong first quarter comparable sales that exceeded estimates, which led to an increase in full year earnings per share guidance. Additionally, Lululemon posted strong second quarter financial results, beating analyst estimates on both revenue and earnings per share, boosted by e-commerce sales growth, which led management to raise earnings per share and sales guidance for the full year once again. Shares of Advance Auto Parts, an automotive aftermarket parts provider, also contributed to relative performance due to strong second quarter financial results, which included raised 2018 guidance. Due to improved free cash flow expectations, management also expressed its intent to repurchase $600 million of shares. Within the industrials sector, shares of XPO logistics Inc., a provider of logistical services, was a contributor to relative performance. The stock rose following rumors of a potential acquisition by Home Depot in December.
Each Fund’s portfolio is actively managed and, therefore, its holdings and the weightings of a particular issuer or particular sector as a percentage of portfolio assets are subject to change. Sectors may include many industries.
15
1 The Russell 2000® Index measures the performance of the 2,000 smallest companies in the Russell 3000® Index, which represents approximately 10% of the total market capitalization of the Russell 3000® Index.
2 The S&P 500® Index is widely regarded as the standard for measuring large cap U.S. stock market performance and includes a representative sample of leading companies in leading industries.
3 The Russell 1000® Value Index measures the performance of those Russell 1000 companies with lower price-to-book ratios and lower forecasted growth values.
4 The MSCI ACWI Index is a free float-adjusted market capitalization weighted index that is designed to measure the equity market performance of developed and emerging markets. The MSCI ACWI consists of 46 country indices comprising 23 developed and 23 emerging market country indices. The developed market country indices included are: Australia, Austria, Belgium, Canada, Denmark, Finland, France, Germany, Hong Kong, Ireland, Israel, Italy, Japan, Netherlands, New Zealand, Norway, Portugal, Singapore, Spain, Sweden, Switzerland, the United Kingdom and the United States. The emerging market country indices included are: Brazil, Chile, China, Colombia, Czech Republic, Egypt, Greece, Hungary, India, Indonesia, Korea, Malaysia, Mexico, Peru, Philippines, Poland, Qatar, Russia, South Africa, Taiwan, Thailand, Turkey and United Arab Emirates.
5 The EURO STOXX 50® Index represents the performance of the 50 largest companies among the 19 supersectors in terms of free-float market cap in 12 eurozone countries. These countries include Austria, Belgium, Finland, France, Germany, Greece, Ireland, Italy, Luxembourg, the Netherlands, Portugal and Spain. The index has a fixed number of components and is part of the STOXX blue-chip index family. The index captures about 60% of the free-float market cap of the EURO STOXX Total Market Index (TMI).
6 The Nikkei Stock Average, the Nikkei 225 is used around the globe as the premier index of Japanese stocks. Because of the prominent nature of the index, many financial products linked to the Nikkei 225 that have been created are traded worldwide while the index has been sufficiently used as the indicator of the movement of Japanese stock markets. The Nikkei 225 is a price-weighted equity index, which consists of 225 stocks in the 1st section of the Tokyo Stock Exchange.
7 The Russell 1000® Growth Index measures the performance of those Russell 1000® Index companies with higher price-to-book ratios and higher forecasted growth values.
8 The MSCI ACWI (All Country World Index) ex U.S.A. Index is a subset of the MSCI ACWI Index. The MSCI ACWI (All Country World Index) Index is a free float-adjusted market capitalization weighted index that is designed to measure the equity market performance of developed and emerging markets. The MSCI ACWI Ex-U.S. Index with Gross Dividends approximates the maximum possible dividend reinvestment. The amount reinvested is the entire dividend distributed to individuals resident in the country of the company, but does not include tax credits. The MSCI ACWI Ex-U.S. Index with Net Dividends approximates the minimum possible dividend reinvestment. The dividend is reinvested after deduction of withholding tax, applying the rate to non-resident individuals who do not benefit from double taxation treaties. MSCI uses withholding tax rates applicable to Luxembourg holding companies, as Luxembourg applies the highest rates.
9 The S&P Developed Ex-U.S. SmallCap® Index captures the bottom 15% of companies domiciled in the developed markets (excluding the United States) within the S&P Global BMI with a float-adjusted market capitalization of at least US$100 million and a value traded of at least US$50 million for the past 12 months at the time of the annual reconstitution. Stocks are excluded if their market capitalization falls below US$75 million, or if the value traded is less than US$35 million at the time of reconstitution.
10 The MSCI EAFE Value Index captures large and mid-cap securities exhibiting overall value style characteristics across Developed Markets countries around the world, excluding the U.S. and Canada. Gross Dividends approximates the maximum possible dividend reinvestment. The amount reinvested is the entire dividend distributed to individuals resident in the country of the company, but does not include tax credits. Net Dividends approximates the minimum possible dividend reinvestment. The dividend is reinvested after deduction of withholding tax, applying the rate to non-resident individuals who do not benefit from double taxation treaties. MSCI uses withholding tax rates applicable to Luxembourg holding companies, as Luxembourg applies the highest rates.
16
11 The Russell 2500™ Index is a market cap weighted index that includes the smallest 2,500 companies covered in the Russell 3000® Index universe of United States-based listed equities.
Unless otherwise specified, indexes reflect total return, with all dividends reinvested. Indexes are unmanaged, do not reflect the deduction of fees or expenses, and are not available for direct investment.
Important Performance and Other Information
Performance data quoted in the following pages reflect past performance and are no guarantee of future results. Current performance may be higher or lower than the performance quoted. The investment return and principal value of an investment in the Funds will fluctuate so that shares, on any given day or when redeemed, may be worth more or less than their original cost. You can obtain performance data current to the most recent month end by calling Lord Abbett at 888-522-2388 or referring to www.lordabbett.com.
Except where noted, comparative Fund performance does not account for the deduction of sales charges and would be different if sales charges were included. Each Fund offers classes of shares with distinct pricing options. For a full description of the differences in pricing alternatives, please see each Fund’s prospectus.
During certain periods shown, expense waivers and reimbursements were in place for Alpha Strategy Fund, Global Equity Research Fund, Growth Leaders Fund, International Equity Fund and International Value Fund. Without such expense reimbursements, each Fund’s returns would have been lower.
The annual commentary above discusses the views of the Funds’ management and various portfolio holdings of the Funds as of October 31, 2018. These views and portfolio holdings may have changed after this date. Information provided in the commentary is not a recommendation to buy or sell securities. Because each Fund’s portfolio is actively managed and may change significantly, the Funds may no longer own the securities described above or may have otherwise changed their positions in the securities. For more recent information about the Funds’ portfolio holdings, please visit www.lordabbett.com.
A Note about Risk: See Notes to Financial Statements for a discussion of investment risks. For a more detailed discussion of the risks associated with each Fund, please see each Fund’s prospectus.
Mutual funds are not insured by the FDIC, are not deposits or other obligations of, or guaranteed by, banks, and are subject to investment risks including possible loss of principal amount invested.
17
Alpha Strategy Fund
Investment Comparison
Below is a comparison of a $10,000 investment in Class A shares with the same investment in the Russell 2000® Index, the 85% Russell 2000® Index/15% S&P Developed Ex-U.S. SmallCap Index and the Lipper Small-Cap Core Category Funds Average, assuming reinvestment of all dividends and distributions. The Fund has adopted the Russell 2000® Index, a more broad-based index, as its primary benchmark index. The performance of other classes will be greater than or less than the performance shown in the graph below due to different sales loads and expenses applicable to such classes. The graph and performance table below do not reflect the deduction of taxes that a shareholder would pay on Fund distributions or the redemption of Fund shares. During certain periods, expenses of the Fund have been waived or reimbursed by Lord Abbett; without such waiver or reimbursement of expenses, the Fund’s returns would have been lower. Past performance is no guarantee of future results.
Average Annual Total Returns at Maximum Applicable
Sales Charge for the Periods Ended October 31, 2018
| | | 1 Year | | 5 Years | | | 10 Years | | | Life of Class | |
| Class A4 | | | –2.80 | % | | | 6.01% | | | | 12.36% | | | | – | |
| Class C5 | | | 1.42 | % | | | 6.47% | | | | 12.21% | | | | – | |
| Class F6 | | | 3.25 | % | | | 7.43% | | | | 13.23% | | | | – | |
| Class F37 | | | 3.42 | % | | | – | | | | – | | | | 10.33% | |
| Class I6 | | | 3.38 | % | | | 7.54% | | | | 13.34% | | | | – | |
| Class R26 | | | 2.75 | % | | | 6.90% | | | | 12.66% | | | | – | |
| Class R36 | | | 2.84 | % | | | 7.01% | | | | 12.77% | | | | – | |
| Class R48 | | | 3.12 | % | | | – | | | | – | | | | 5.93% | |
| Class R58 | | | 3.34 | % | | | – | | | | – | | | | 6.20% | |
| Class R68 | | | 3.45 | % | | | – | | | | – | | | | 6.24% | |
18
1 Reflects the deduction of the maximum initial sales charge of 5.75%.
2 Performance for each unmanaged index does not reflect any fees or expenses. The performance of each index is not necessarily representative of the Fund’s performance.
3 Source: Lipper Inc. The performance of the average is not necessarily representative of the Fund’s performance.
4 Total return, which is the percentage change in net asset value, after deduction of the maximum initial sales charge of 5.75% applicable to Class A shares, with all dividends and
distributions reinvested for the periods shown ended October 31, 2018, is calculated using the SEC-required uniform method to compute such return.
5 The 1% CDSC for Class C shares normally applies before the first anniversary of the purchase date. Performance for other periods is at net asset value.
6 Performance is at net asset value.
7 Commenced operations and performance for the Class began on April 4, 2017. Performance is at its net asset value.
8 Commenced operations and performance for the classes began on June 30, 2015. Performance is at net asset value.
19
Fundamental Equity Fund
Investment Comparison
Below is a comparison of a $10,000 investment in Class A shares with the same investment in the Russell 1000® Value Index, Russell 3000® Value Index, Russell 3000® Index, and S&P 500® Index, assuming reinvestment of all dividends and distributions. The performance of other classes will be greater than or less than the performance shown in the graph below due to different sales loads and expenses applicable to such classes. The graph and performance table below do not reflect the deduction of taxes that a shareholder would pay on Fund distributions or the redemption of Fund shares. Past performance is no guarantee of future results.
Average Annual Total Returns at Maximum Applicable
Sales Charge for the Periods Ended October 31, 2018
| | | 1 Year | | 5 Years | | | 10 Years | | | Life of Class | |
| Class A3 | | | –3.86 | % | | | 5.88% | | | | 10.34% | | | | – | |
| Class C4 | | | 0.32 | % | | | 6.37% | | | | 10.22% | | | | – | |
| Class F5 | | | 2.17 | % | | | 7.33% | | | | 11.22% | | | | – | |
| Class F36 | | | 2.36 | % | | | – | | | | – | | | | 5.72% | |
| Class I5 | | | 2.19 | % | | | 7.43% | | | | 11.33% | | | | – | |
| Class P5 | | | 1.77 | % | | | 6.95% | | | | 10.84% | | | | – | |
| Class R25 | | | 1.64 | % | | | 6.79% | | | | 10.67% | | | | – | |
| Class R35 | | | 1.66 | % | | | 6.89% | | | | 10.78% | | | | – | |
| Class R47 | | | 2.00 | % | | | – | | | | – | | | | 6.45% | |
| Class R57 | | | 2.28 | % | | | – | | | | – | | | | 6.72% | |
| Class R67 | | | 2.36 | % | | | – | | | | – | | | | 6.84% | |
1 Reflects the deduction of the maximum initial sales charge of 5.75%.
2 Performance for each unmanaged index does not reflect any fees or expenses. The performance of each index is not necessarily representative of the Fund’s performance.
3 Total return, which is the percentage change in net asset value, after deduction of the maximum initial sales charge of 5.75% applicable to Class A shares, with all dividends and distributions reinvested for the periods shown ended October 31, 2018, is calculated using the SEC-required uniform method to compute such return.
4 The 1% CDSC for Class C shares normally applies before the first anniversary of the purchase date. Performance for other periods is at net asset value.
5 Performance is at net asset value.
6 Commenced operations and performance for the Class began on April 4, 2017. Performance is at net asset value.
7 Commenced operations and performance for the classes began on June 30, 2015. Performance is at net asset value.
20
Global Equity Research Fund
Investment Comparison
Below is a comparison of a $10,000 investment in Class A shares with the same investment in the Morgan Stanley Capital International (MSCI) All Country World Index with Gross Dividends and the MSCI All Country World Index with Net Dividends, assuming reinvestment of all dividends and distributions. The MSCI All Country World Index with Net Dividends reflects a reduction in dividends after taking into account withholding of taxes by certain foreign countries represented in the MSCI All Country World Index. The performance of other classes will be greater than or less than the performance shown in the graph below due to different sales loads and expenses applicable to such classes. The graph and performance table below do not reflect the deduction of taxes that a shareholder would pay on Fund distributions or the redemption of Fund shares. During certain periods, expenses of the Fund have been waived or reimbursed by Lord Abbett; without such waiver or reimbursements of expense, the Fund’s returns would have been lower. Past performance is no guarantee of future results.
Average Annual Total Returns at Maximum Applicable
Sales Charge for the Periods Ended October 31, 2018
| | | 1 Year | | Life of Class | |
| Class A3 | | | –5.99 | % | | | 4.90% | |
| Class C4 | | | –2.01 | % | | | 7.61% | |
| Class F5 | | | –0.19 | % | | | 8.56% | |
| Class F36 | | | 0.01 | % | | | 8.03% | |
| Class I5 | | | –0.10 | % | | | 8.67% | |
| Class R25 | | | –0.66 | % | | | 8.01% | |
| Class R35 | | | –0.56 | % | | | 8.12% | |
| Class R45 | | | –0.24 | % | | | 8.43% | |
| Class R55 | | | –0.10 | % | | | 8.67% | |
| Class R65 | | | 0.01 | % | | | 8.73% | |
1 Reflects the deduction of the maximum initial sales charge of 5.75%.
2 Performance for each unmanaged index does not reflect any fees or expenses. The performance of each index is not necessarily representative of the Fund’s performance. Performance of each index begins on January 18, 2017.
3 Class A shares commenced operations on January 17, 2017 and performance for the Class began on January 18, 2017. Total return, which is the percentage change in net asset value, after deduction of the maximum initial sales charge of 5.75% applicable to Class A shares, with all dividends and distributions reinvested for the periods shown ended October 31, 2018, is calculated using the SEC-required uniform method to compute such return.
4 Class C shares commenced operations on January 17, 2017 and performance for the Class began on January 18, 2017. The 1% CDSC for Class C shares normally applies before the first anniversary of the purchase date. Performance for other periods is at net asset value.
5 Commenced operations on January 17, 2017 and performance for the Class began on January 18, 2017. Performance is at net asset value.
6 Commenced operations and performance for the class began on April 4, 2017. Performance is at net asset value.
21
Growth Leaders Fund
Investment Comparison
Below is a comparison of a $10,000 investment in Class A shares with the same investment in the Russell 1000® Growth Index, Russell 3000® Growth Index, and S&P 500® Index, assuming reinvestment of all dividends and distributions. The performance of other classes will be greater than or less than the performance shown in the graph below due to different sales loads and expenses applicable to such classes. The graph and performance table below do not reflect the deduction of taxes that a shareholder would pay on Fund distributions or the redemption of Fund shares. During certain periods, expenses of the Fund have been waived or reimbursed by Lord Abbett; without such waiver or reimbursement of expenses, the Fund’s returns would have been lower. Past performance is no guarantee of future results.

Average Annual Total Returns at Maximum Applicable
Sales Charge for the Periods Ended October 31, 2018
| | | 1 Year | | 5 Years | | | Life of Class | |
| Class A3 | | | 3.37 | % | | | 10.53% | | | | 12.11 | % | |
| Class C4 | | | 7.87 | % | | | 11.04% | | | | 12.23 | % | |
| Class F5 | | | 9.94 | % | | | 12.07% | | | | 13.25 | % | |
| Class F36 | | | 10.01 | % | | | – | | | | 18.49 | % | |
| Class I5 | | | 9.96 | % | | | 12.14% | | | | 13.34 | % | |
| Class R25 | | | 9.31 | % | | | 11.47% | | | | 12.85 | % | |
| Class R35 | | | 9.41 | % | | | 11.58% | | | | 12.82 | % | |
| Class R47 | | | 9.68 | % | | | – | | | | 11.13 | % | |
| Class R57 | | | 9.96 | % | | | – | | | | 11.44 | % | |
| Class R67 | | | 10.01 | % | | | – | | | | 11.51 | % | |
22
1 Reflects the deduction of the maximum initial sales charge of 5.75%.
2 Performance for each unmanaged index does not reflect any fees or expenses. The performance of each index is not necessarily representative of the Fund’s performance. Performance for each index begins on June 30, 2011.
3 Class A shares commenced operations on June 24, 2011 and performance for the Class began on June 30, 2011. Total return, which is the percentage change in net asset value, after deduction of the maximum initial sales charge of 5.75% applicable to Class A shares, with all dividends and distributions reinvested for the periods shown ended October 31, 2018, is calculated using the SEC-required uniform method to compute such return.
4 Class C shares commenced operations on June 24, 2011 and performance for the Class began on June 30, 2011. The 1% CDSC for Class C shares normally applies before the first anniversary of the purchase date. Performance for other periods is at net asset value.
5 Commenced operations on June 24, 2011 and performance for the Class began on June 30, 2011. Performance is at net asset value.
6 Commenced operations and performance for the Class began on April 4, 2017. Performance is at net asset value.
7 Commenced operations and performance for the classes began on June 30, 2015. Performance is at net asset value.
23
International Equity Fund
Investment Comparison
Below is a comparison of a $10,000 investment in Class A shares with the same investment in the Morgan Stanley Capital International (MSCI) All Country World Index (ACWI) ex-USA® Index with Gross Dividends and the MSCI ACWI ex-USA Index with Net Dividends, assuming reinvestment of all dividends and distributions. The MSCI ACWI ex-USA Index with Net Dividends reflects a reduction in dividends after taking into account withholding of taxes by certain foreign countries represented in the MSCI ACWI ex-USA Index. The performance of other classes will be greater than or less than the performance shown in the graph below due to different sales loads and expenses applicable to such classes. The graph and performance table below do not reflect the deduction of taxes that a shareholder would pay on Fund distributions or the redemption of Fund shares. During certain periods, expenses of the Fund have been waived or reimbursed by Lord Abbett; without such waiver or reimbursement of expenses, the Fund’s returns would have been lower. Past performance is no guarantee of future results.

Average Annual Total Returns at Maximum Applicable
Sales Charge for the Periods Ended October 31, 2018
| | | 1 Year | | 5 Years | | | 10 Years | | | Life of Class | |
| Class A3 | | | –16.97 | % | | | –2.19% | | | | 4.62% | | | | – | |
| Class C4 | | | –13.46 | % | | | –1.73% | | | | 4.54% | | | | – | |
| Class F5 | | | –11.77 | % | | | –0.80% | | | | 5.50% | | | | – | |
| Class F36 | | | –11.62 | % | | | – | | | | – | | | | 1.30% | |
| Class I5 | | | –11.65 | % | | | –0.68% | | | | 5.61% | | | | – | |
| Class P5 | | | –12.14 | % | | | –1.21% | | | | 5.10% | | | | – | |
| Class R25 | | | –12.28 | % | | | –1.36% | | | | 5.01% | | | | – | |
| Class R35 | | | –12.18 | % | | | –1.24% | | | | 5.06% | | | | – | |
| Class R47 | | | –11.96 | % | | | – | | | | – | | | | –0.46% | |
| Class R57 | | | –11.68 | % | | | – | | | | – | | | | –0.22% | |
| Class R67 | | | –11.62 | % | | | – | | | | – | | | | –0.06% | |
24
1 Reflects the deduction of the maximum initial sales charge of 5.75%.
2 Performance for each unmanaged index does not reflect any fees or expenses. The performance of each index is not necessarily representative of the Fund’s performance.
3 Total return, which is the percentage change in net asset value, after deduction of the maximum initial sales charge of 5.75% applicable to Class A shares, with all dividends and distributions reinvested for the periods shown ended October 31, 2018, is calculated using the SEC-required uniform method to compute such return.
4 The 1% CDSC for Class C shares normally applies before the first anniversary of the purchase date. Performance for other periods is at net asset value.
5 Performance is at net asset value.
6 Commenced operations and performance for the Class began on April 4, 2017. Performance is at net asset value.
7 Commenced operations and performance for the classes began on June 30, 2015. Performance is at net asset value.
25
International Opportunities Fund
Investment Comparison
Below is a comparison of a $10,000 investment in Class A shares with the same investment in the S&P Developed Ex-U.S. SmallCap® Index, assuming reinvestment of all dividends and distributions. The performance of other classes will be greater than or less than the performance shown in the graph below due to different sales loads and expenses applicable to such classes. The graph and performance table below do not reflect the deduction of taxes that a shareholder would pay on Fund distributions or the redemption of Fund shares. Past performance is no guarantee of future results.
Average Annual Total Returns at Maximum Applicable
Sales Charge for the Periods Ended October 31, 2018
| | | 1 Year | | 5 Years | | | 10 Years | | | Life of Class | |
| Class A3 | | | –20.55 | % | | | 1.82% | | | | 10.23% | | | | – | |
| Class C4 | | | –17.14 | % | | | 2.28% | | | | 10.13% | | | | – | |
| Class F5 | | | –15.58 | % | | | 3.20% | | | | 11.10% | | | | – | |
| Class F36 | | | –15.46 | % | | | – | | | | – | | | | 1.52% | |
| Class I5 | | | –15.46 | % | | | 3.31% | | | | 11.21% | | | | – | |
| Class P5 | | | –15.87 | % | | | 2.84% | | | | 10.72% | | | | – | |
| Class R25 | | | –16.00 | % | | | 2.68% | | | | 10.56% | | | | – | |
| Class R35 | | | –15.87 | % | | | 2.81% | | | | 10.69% | | | | – | |
| Class R47 | | | –15.70 | % | | | – | | | | – | | | | 1.72% | |
| Class R57 | | | –15.47 | % | | | – | | | | – | | | | 1.96% | |
| Class R67 | | | –15.41 | % | | | – | | | | – | | | | 2.10% | |
1 Reflects the deduction of the maximum initial sales charge of 5.75%.
2 Performance for the unmanaged index does not reflect any fees or expenses. The performance of the index is not necessarily representative of the Fund’s performance.
3 Total return, which is the percentage change in net asset value, after deduction of the maximum initial sales charge of 5.75% applicable to Class A shares, with all dividends and distributions reinvested for the periods shown ended October 31, 2018, is calculated using the SEC-required uniform method to compute such return.
4 The 1% CDSC for Class C shares normally applies before the first anniversary of the purchase date. Performance is at net asset value.
5 Performance is at net asset value.
6 Commenced operations and performance for the Class began on April 4, 2017. Performance is at net asset value.
7 Commenced operations and performance for the classes began on June 30, 2015. Performance is at net asset value.
26
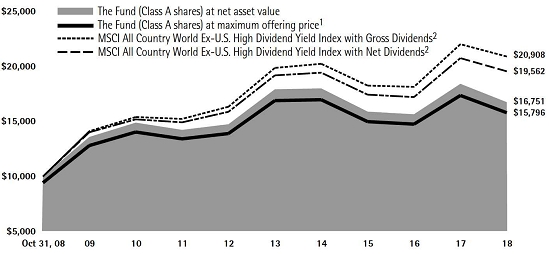
International Value Fund
Investment Comparison
Below is a comparison of a $10,000 investment in Class A shares with the same investment in the Morgan Stanley Capital International (MSCI) All Country World Ex-U.S. High Dividend Yield Index with Gross Dividends and the MSCI All Country World Ex-U.S. High Dividend Yield Index with Net Dividends, assuming reinvestment of all dividends and distributions. The MSCI All Country World Ex-U.S. High Dividend Yield Index with Net Dividends reflects a reduction in dividends after taking into account withholding of taxes by certain foreign countries represented in the MSCI All Country World Ex-U.S. High Dividend Yield Index. The performance of other classes will be greater than or less than the performance shown in the graph due to different sales loads and expenses applicable to such classes. The graph and performance table below do not reflect the deduction of taxes that a shareholder would pay on Fund distributions or the redemption of Fund shares. During certain periods, expenses of the Fund have been waived or reimbursed by Lord Abbett; without such waiver or reimbursements of expense, the Fund’s returns would have been lower. Past performance is no guarantee of future results.
Average Annual Total Returns at Maximum Applicable
Sales Charge for the Periods Ended October 31, 2018
| | | 1 Year | | 5 Years | | | 10 Years | | | Life of Class | |
| Class A3 | | | –14.32 | % | | | –2.51% | | | | 4.68% | | | | – | |
| Class C4 | | | –10.59 | % | | | –2.05% | | | | 4.57% | | | | – | |
| Class F5 | | | –8.87 | % | | | –1.10% | | | | 5.55% | | | | – | |
| Class F36 | | | –8.76 | % | | | – | | | | – | | | | 0.90% | |
| Class I5 | | | –8.89 | % | | | –1.03% | | | | 5.65% | | | | – | |
| Class R25 | | | –9.44 | % | | | –1.66% | | | | 5.15% | | | | – | |
| Class R35 | | | –9.35 | % | | | –1.55% | | | | 5.15% | | | | – | |
| Class R47 | | | –9.06 | % | | | – | | | | – | | | | –1.11% | |
| Class R57 | | | –8.78 | % | | | – | | | | – | | | | –0.84% | |
| Class R67 | | | –8.76 | % | | | – | | | | – | | | | –0.79% | |
1 Reflects the deduction of the maximum initial sales charge of 5.75%.
2 Performance for each unmanaged index does not reflect any fees or expenses. The performance of each index is not necessarily representative of the Fund’s performance. Performance of each index begins on June 30, 2008.
3 Class A shares commenced operations on June 23, 2008 and performance for the Class began on June 30, 2008. Total return, which is the percentage change in net asset value, after deduction of the maximum initial sales charge of 5.75% applicable to Class A shares, with all dividends and distributions reinvested for the periods shown ended October 31,
2018, is calculated using the SEC-required uniform method to compute such return.
4 Class C shares commenced operations on June 23, 2008 and performance for the Class began on June 30, 2008. The 1% CDSC for Class C shares normally applies before the first anniversary of the purchase date. Performance for other periods is at net asset value.
5 Performance is at net asset value.
6 Commenced operations and performance for the Class began on April 4, 2017. Performance is at net asset value.
7 Commenced operations and performance for the classes began on June 30, 2015. Performance is at net asset value.
27
Value Opportunities Fund
Investment Comparison
Below is a comparison of a $10,000 investment in Class A shares with the same investment in the Russell 2500TM Index and the Russell 2500TM Value Index, assuming reinvestment of all dividends and distributions. The performance of other classes will be greater than or less than the performance shown in the graph below due to different sales loads and expenses applicable to such classes. The graph and performance table below do not reflect the deduction of taxes that a shareholder would pay on Fund distributions or the redemption of Fund shares. During certain periods, expenses of the Fund have been waived or reimbursed by Lord Abbett; without such waiver or reimbursement of expenses, the Fund’s returns would have been lower. Past performance is no guarantee of future results.
Average Annual Total Returns at Maximum Applicable
Sales Charge for the Periods Ended October 31, 2018
| | | 1 Year | | 5 Years | | | 10 Years | | | Life of Class | |
| Class A3 | | | –6.02 | % | | | 5.52% | | | | 11.09% | | | | – | |
| Class C4 | | | –1.97 | % | | | 6.00% | | | | 10.98% | | | | – | |
| Class F5 | | | –0.03 | % | | | 6.96% | | | | 11.99% | | | | – | |
| Class F36 | | | 0.13 | % | | | – | | | | – | | | | 4.42% | |
| Class I5 | | | –0.02 | % | | | 7.06% | | | | 12.09% | | | | – | |
| Class P5 | | | –0.49 | % | | | 6.57% | | | | 11.59% | | | | – | |
| Class R25 | | | –0.50 | % | | | 6.44% | | | | 11.43% | | | | – | |
| Class R35 | | | –0.45 | % | | | 6.54% | | | | 11.55% | | | | – | |
| Class R47 | | | –0.30 | % | | | – | | | | – | | | | 4.65% | |
| Class R57 | | | –0.01 | % | | | – | | | | – | | | | 4.91% | |
| Class R67 | | | 0.08 | % | | | – | | | | – | | | | 5.02% | |
28
1 Reflects the deduction of the maximum initial sales charge of 5.75%.
2 Performance for each unmanaged index does not reflect any fees or expenses. The performance of each index is not necessarily representative of the Fund’s performance.
3 Total return, which is the percentage change in net asset value, after deduction of the maximum initial sales charge of 5.75% applicable to Class A shares, with all dividends and distributions reinvested for the periods shown ended October 31, 2018, is calculated using the SEC-required uniform method to compute such return.
4 The 1% CDSC for Class C shares normally applies before the first anniversary of the purchase date. Performance for other periods is at net asset value.
5 Performance is at net asset value.
6 Commenced operations and performance for the Class began on April 4, 2017. Performance is at net asset value.
7 Commenced operations and performance for the classes began on June 30, 2015. Performance is at net asset value.
29
Expense Example
As a shareholder of a Fund, you incur two types of costs: (1) transaction costs, including sales charges (loads) on purchase payments (these charges vary among the share classes); and (2) ongoing costs, including management fees; distribution and service (12b-1) fees (these charges vary among the share classes); and other Fund expenses. This Example is intended to help you understand your ongoing costs (in dollars) of investing in each Fund and to compare these costs with the ongoing costs of investing in other mutual funds.
The Example is based on an investment of $1,000 invested at the beginning of the period and held for the entire period (May 1, 2018 through October 31, 2018).
Actual Expenses
For each class of each Fund, the first line of the table on the following page provides information about actual account values and actual expenses. You may use the information in this line, together with the amount you invested, to estimate the expenses that you paid over the period. Simply divide your account value by $1,000 (for example, an $8,600 account value divided by $1,000 = 8.6), then multiply the result by the number in the first line under the heading titled “Expenses Paid During Period 5/1/18 – 10/31/18” to estimate the expenses you paid on your account during this period.
Hypothetical Example for Comparison Purposes
For each class of each Fund, the second line of the table on the following page provides information about hypothetical account values and hypothetical expenses based on the Fund’s actual expense ratio and an assumed rate of return of 5% per year before expenses, which is not the Fund’s actual return. The hypothetical account values and expenses may not be used to estimate the actual ending account balance or expenses you paid for the period. You may use this information to compare the ongoing costs of investing in each Fund and other funds. To do so, compare this 5% hypothetical example with the 5% hypothetical examples that appear in the shareholder reports of the other funds.
30
Alpha Strategy Fund
Please note that the expenses shown in the table are meant to highlight your ongoing costs only and do not reflect any transactional costs, such as sales charges (loads). Therefore, the second line of the table is useful in comparing ongoing costs only, and will not help you determine the relative total costs of owning different funds. In addition, if these transactional costs were included, your costs would have been higher.
| | | Beginning
Account
Value | | Ending
Account
Value | | Expenses
Paid During
Period†# | |
| | | 5/1/18 | | 10/31/18 | | 5/1/18 –
10/31/18 | |
| Class A | | | | | | | | | |
| Actual | | $1,000.00 | | $ | 985.90 | | | $2.05 | |
| Hypothetical (5% Return Before Expenses) | | $1,000.00 | | $ | 1,023.14 | | | $2.09 | |
| Class C | | | | | | | | | |
| Actual | | $1,000.00 | | $ | 982.00 | | | $5.80 | |
| Hypothetical (5% Return Before Expenses) | | $1,000.00 | | $ | 1,019.36 | | | $5.90 | |
| Class F | | | | | | | | | |
| Actual | | $1,000.00 | | $ | 986.40 | | | $1.30 | |
| Hypothetical (5% Return Before Expenses) | | $1,000.00 | | $ | 1,023.89 | | | $1.33 | |
| Class F3 | | | | | | | | | |
| Actual | | $1,000.00 | | $ | 987.40 | | | $0.40 | |
| Hypothetical (5% Return Before Expenses) | | $1,000.00 | | $ | 1,024.80 | | | $0.41 | |
| Class I | | | | | | | | | |
| Actual | | $1,000.00 | | $ | 987.00 | | | $0.80 | |
| Hypothetical (5% Return Before Expenses) | | $1,000.00 | | $ | 1,024.00 | | | $0.82 | |
| Class R2 | | | | | | | | | |
| Actual | | $1,000.00 | | $ | 983.90 | | | $3.80 | |
| Hypothetical (5% Return Before Expenses) | | $1,000.00 | | $ | 1,021.37 | | | $3.87 | |
| Class R3 | | | | | | | | | |
| Actual | | $1,000.00 | | $ | 984.40 | | | $3.30 | |
| Hypothetical (5% Return Before Expenses) | | $1,000.00 | | $ | 1,021.88 | | | $3.36 | |
| Class R4 | | | | | | | | | |
| Actual | | $1,000.00 | | $ | 985.90 | | | $2.05 | |
| Hypothetical (5% Return Before Expenses) | | $1,000.00 | | $ | 1,023.14 | | | $2.09 | |
| Class R5 | | | | | | | | | |
| Actual | | $1,000.00 | | $ | 987.00 | | | $0.80 | |
| Hypothetical (5% Return Before Expenses) | | $1,000.00 | | $ | 1,024.40 | | | $0.82 | |
| Class R6 | | | | | | | | | |
| Actual | | $1,000.00 | | $ | 987.40 | | | $0.40 | |
| Hypothetical (5% Return Before Expenses) | | $1,000.00 | | $ | 1,024.80 | | | $0.41 | |
| † | For each class of the Fund, net expenses are equal to the annualized expense ratio for such class (0.41% for Class A, 1.16% for Class C, 0.26% for Class F, 0.08% for Class F3, 0.16% for Class I, 0.76% for Class R2, 0.66% for Class R3, 0.41% for Class R4, 0.16% for Class R5 and 0.08% for Class R6) multiplied by the average account value over the period, multiplied by 184/365 (to reflect one-half year period). |
| # | Does not include expenses of Underlying Funds in which Alpha Strategy Fund invests. |
31
Portfolio Holdings Presented by Portfolio Allocation
October 31, 2018
| Portfolio Allocation | | %* |
| Lord Abbett Developing Growth Fund, Inc. - Class I | | | 20.51 | % |
| Lord Abbett Securities Trust - International Opportunities Fund - Class I | | | 17.67 | % |
| Lord Abbett Securities Trust - Micro-Cap Growth Fund - Class I | | | 10.15 | % |
| Lord Abbett Securities Trust - Micro-Cap Value Fund - Class I | | | 10.29 | % |
| Lord Abbett Research Fund, Inc. - Small-Cap Value Fund - Class I | | | 20.75 | % |
| Lord Abbett Securities Trust - Value Opportunities Fund - Class I | | | 20.63 | % |
| Total | | | 100.00 | % |
| * | Represent percent of total investments. |
32
Fundamental Equity Fund
Please note that the expenses shown in the table are meant to highlight your ongoing costs only and do not reflect any transactional costs, such as sales charges (loads). Therefore, the second line of the table is useful in comparing ongoing costs only, and will not help you determine the relative total costs of owning different funds. In addition, if these transactional costs were included, your costs would have been higher.
| | | Beginning
Account
Value | | Ending
Account
Value | | Expenses
Paid During
Period† | |
| | | 5/1/18 | | 10/31/18 | | 5/1/18 –
10/31/18 | |
| Class A | | | | | | | |
| Actual | | $1,000.00 | | $1,004.00 | | $4.80 | |
| Hypothetical (5% Return Before Expenses) | | $1,000.00 | | $1,020.42 | | $4.84 | |
| Class C | | | | | | | |
| Actual | | $1,000.00 | | $1,000.00 | | $8.62 | |
| Hypothetical (5% Return Before Expenses) | | $1,000.00 | | $1,016.59 | | $8.69 | |
| Class F | | | | | | | |
| Actual | | $1,000.00 | | $1,004.80 | | $4.04 | |
| Hypothetical (5% Return Before Expenses) | | $1,000.00 | | $1,021.17 | | $4.08 | |
| Class F3 | | | | | | | |
| Actual | | $1,000.00 | | $1,005.50 | | $3.08 | |
| Hypothetical (5% Return Before Expenses) | | $1,000.00 | | $1,022.10 | | $3.11 | |
| Class I | | | | | | | |
| Actual | | $1,000.00 | | $1,004.70 | | $3.54 | |
| Hypothetical (5% Return Before Expenses) | | $1,000.00 | | $1,021.68 | | $3.57 | |
| Class P | | | | | | | |
| Actual | | $1,000.00 | | $1,003.20 | | $5.81 | |
| Hypothetical (5% Return Before Expenses) | | $1,000.00 | | $1,019.41 | | $5.85 | |
| Class R2 | | | | | | | |
| Actual | | $1,000.00 | | $1,002.40 | | $6.61 | |
| Hypothetical (5% Return Before Expenses) | | $1,000.00 | | $1,018.60 | | $6.67 | |
| Class R3 | | | | | | | |
| Actual | | $1,000.00 | | $1,002.40 | | $6.06 | |
| Hypothetical (5% Return Before Expenses) | | $1,000.00 | | $1,019.16 | | $6.11 | |
| Class R4 | | | | | | | |
| Actual | | $1,000.00 | | $1,004.00 | | $4.80 | |
| Hypothetical (5% Return Before Expenses) | | $1,000.00 | | $1,020.42 | | $4.84 | |
| Class R5 | | | | | | | |
| Actual | | $1,000.00 | | $1,005.50 | | $3.54 | |
| Hypothetical (5% Return Before Expenses) | | $1,000.00 | | $1,021.68 | | $3.57 | |
| Class R6 | | | | | | | |
| Actual | | $1,000.00 | | $1,005.50 | | $3.08 | |
| Hypothetical (5% Return Before Expenses) | | $1,000.00 | | $1,022.13 | | $3.11 | |
| † | For each class of the Fund, net expenses are equal to the annualized expense ratio for such class (0.95% for Class A, 1.71% for Class C, 0.80% for Class F, 0.61% for Class F3, 0.70% for Class I, 1.15% for Class P, 1.31% for Class R2, 1.20% for Class R3, 0.95% for Class R4, 0.70% for Class R5 and 0.61% for Class R6) multiplied by the average account value over the period, multiplied by 184/365 (to reflect one-half year period). |
33
Portfolio Holdings Presented by Sector
October 31, 2018
| Sector* | | %** |
| Communication Services | | | 7.47 | % |
| Consumer Discretionary | | | 5.76 | % |
| Consumer Staples | | | 7.03 | % |
| Energy | | | 10.59 | % |
| Financials | | | 20.10 | % |
| Health Care | | | 17.74 | % |
| Industrials | | | 7.62 | % |
| Sector* | | %** |
| Information Technology | | | 11.79 | % |
| Materials | | | 2.40 | % |
| Real Estate | | | 2.51 | % |
| Utilities | | | 5.82 | % |
| Repurchase Agreement | | | 1.17 | % |
| Total | | | 100.00 | % |
| * | | A sector may comprise several industries. |
| ** | | Represents percent of total investments. |
34
Global Equity Research Fund
Please note that the expenses shown in the table are meant to highlight your ongoing costs only and do not reflect any transactional costs, such as sales charges (loads). Therefore, the second line of the table is useful in comparing ongoing costs only, and will not help you determine the relative total costs of owning different funds. In addition, if these transactional costs were included, your costs would have been higher.
| | | Beginning
Account
Value | | Ending
Account
Value | | Expenses
Paid During
Period† | |
| | | 5/1/18 | | 10/31/18 | | 5/1/18 –
10/31/18 | |
| Class A | | | | | | | | | |
| Actual | | $1,000.00 | | $ | 950.40 | | | $4.42 | |
| Hypothetical (5% Return Before Expenses) | | $1,000.00 | | $ | 1,020.67 | | | $4.58 | |
| Class C | | | | | | | | | |
| Actual | | $1,000.00 | | $ | 945.80 | | | $8.09 | |
| Hypothetical (5% Return Before Expenses) | | $1,000.00 | | $ | 1,016.89 | | | $8.39 | |
| Class F | | | | | | | | | |
| Actual | | $1,000.00 | | $ | 950.50 | | | $3.69 | |
| Hypothetical (5% Return Before Expenses) | | $1,000.00 | | $ | 1,021.42 | | | $3.82 | |
| Class F3 | | | | | | | | | |
| Actual | | $1,000.00 | | $ | 950.60 | | | $3.10 | |
| Hypothetical (5% Return Before Expenses) | | $1,000.00 | | $ | 1,022.03 | | | $3.21 | |
| Class I | | | | | | | | | |
| Actual | | $1,000.00 | | $ | 950.50 | | | $3.20 | |
| Hypothetical (5% Return Before Expenses) | | $1,000.00 | | $ | 1,021.93 | | | $3.31 | |
| Class R2 | | | | | | | | | |
| Actual | | $1,000.00 | | $ | 947.80 | | | $6.14 | |
| Hypothetical (5% Return Before Expenses) | | $1,000.00 | | $ | 1,018.90 | | | $6.36 | |
| Class R3 | | | | | | | | | |
| Actual | | $1,000.00 | | $ | 947.80 | | | $5.65 | |
| Hypothetical (5% Return Before Expenses) | | $1,000.00 | | $ | 1,019.41 | | | $5.85 | |
| Class R4 | | | | | | | | | |
| Actual | | $1,000.00 | | $ | 949.60 | | | $4.42 | |
| Hypothetical (5% Return Before Expenses) | | $1,000.00 | | $ | 1,020.67 | | | $4.58 | |
| Class R5 | | | | | | | | | |
| Actual | | $1,000.00 | | $ | 950.50 | | | $3.20 | |
| Hypothetical (5% Return Before Expenses) | | $1,000.00 | | $ | 1,021.93 | | | $3.31 | |
| Class R6 | | | | | | | | | |
| Actual | | $1,000.00 | | $ | 951.40 | | | $3.10 | |
| Hypothetical (5% Return Before Expenses) | | $1,000.00 | | $ | 1,022.03 | | | $3.21 | |
| † | For each class of the Fund, net expenses are equal to the annualized expense ratio for such class (0.90% for Class A, 1.65% for Class C, 0.75% for Class F, 0.63% for Class F3, 0.65% for Class I, 1.25% for Class R2, 1.15% for Class R3, 0.90% for Class R4, 0.65% for Class R5 and 0.63% for Class R6) multiplied by the average account value over the period, multiplied by 184/365 (to reflect one-half year period). |
35
Portfolio Holdings Presented by Sector
October 31, 2018
| Sector* | | %** |
| Communication Services | | | 9.24 | % |
| Consumer Discretionary | | | 8.90 | % |
| Consumer Staples | | | 8.11 | % |
| Energy | | | 6.09 | % |
| Financials | | | 23.26 | % |
| Health Care | | | 11.75 | % |
| Sector* | | %** |
| Industrials | | | 9.32 | % |
| Information Technology | | | 13.61 | % |
| Materials | | | 4.19 | % |
| Real Estate | | | 2.67 | % |
| Utilities | | | 2.86 | % |
| Total | | | 100.00 | % |
| * | | A sector may comprise several industries. |
| ** | | Represents percent of total investments. |
36
Global Select Equity Fund
Please note that the expenses shown in the table are meant to highlight your ongoing costs only and do not reflect any transactional costs, such as sales charges (loads). Therefore, the second line of the table is useful in comparing ongoing costs only, and will not help you determine the relative total costs of owning different funds. In addition, if these transactional costs were included, your costs would have been higher.
| | | Beginning
Account
Value | | Ending
Account
Value | | Expenses
Paid During
Period† | |
| | | 7/30/18 | | 10/31/18 | | 7/30/18 –
10/31/18 | |
| Class A | | | | | | | | | |
| Actual | | $1,000.00 | | $ | 946.70 | | | $2.60 | |
| Hypothetical (5% Return Before Expenses) | | $1,000.00 | | $ | 1,010.06 | | | $2.69 | |
| Class C | | | | | | | | | |
| Actual | | $1,000.00 | | $ | 945.30 | | | $4.46 | |
| Hypothetical (5% Return Before Expenses) | | $1,000.00 | | $ | 1,008.15 | | | $4.60 | |
| Class F | | | | | | | | | |
| Actual | | $1,000.00 | | $ | 947.30 | | | $1.98 | |
| Hypothetical (5% Return Before Expenses) | | $1,000.00 | | $ | 1,010.70 | | | $2.05 | |
| Class F3 | | | | | | | | | |
| Actual | | $1,000.00 | | $ | 948.00 | | | $1.71 | |
| Hypothetical (5% Return Before Expenses) | | $1,000.00 | | $ | 1,010.98 | | | $1.77 | |
| Class I | | | | | | | | | |
| Actual | | $1,000.00 | | $ | 947.30 | | | $1.98 | |
| Hypothetical (5% Return Before Expenses) | | $1,000.00 | | $ | 1,010.70 | | | $2.05 | |
| Class R3 | | | | | | | | | |
| Actual | | $1,000.00 | | $ | 946.00 | | | $3.22 | |
| Hypothetical (5% Return Before Expenses) | | $1,000.00 | | $ | 1,009.43 | | | $3.33 | |
| Class R4 | | | | | | | | | |
| Actual | | $1,000.00 | | $ | 946.70 | | | $2.60 | |
| Hypothetical (5% Return Before Expenses) | | $1,000.00 | | $ | 1,010.06 | | | $2.69 | |
| Class R5 | | | | | | | | | |
| Actual | | $1,000.00 | | $ | 947.30 | | | $1.98 | |
| Hypothetical (5% Return Before Expenses) | | $1,000.00 | | $ | 1,010.70 | | | $2.05 | |
| Class R6 | | | | | | | | | |
| Actual | | $1,000.00 | | $ | 948.00 | | | $1.71 | |
| Hypothetical (5% Return Before Expenses) | | $1,000.00 | | $ | 1,010.98 | | | $1.77 | |
| † | For each class of the Fund, net expenses are equal to the annualized expense ratio for such class (1.05% for Class A, 1.80% for Class C, 0.80% for Class F, 0.69% for Class F3, 0.80% for Class I, 1.30% for Class R3, 1.05% for Class R4, 0.80% for Class R5 and 0.69% for Class R6) multiplied by the average account value over the period, multiplied by 93/365 (to reflect the period from July 30, 2018, commencement of operations, to October 31, 2018). |
37
Portfolio Holdings Presented by Sector
October 31, 2018
| Sector* | | %** |
| Basic Industry | | | 0.97 | % |
| Consumer Cyclicals | | | 7.10 | % |
| Consumer Discretionary | | | 6.28 | % |
| Consumer Services | | | 3.41 | % |
| Consumer Staples | | | 10.93 | % |
| Energy | | | 6.55 | % |
| Financial Services | | | 24.26 | % |
| Health Care | | | 12.73 | % |
| Sector* | | %** |
| Materials and Processing | | | 2.44 | % |
| Producer Durables | | | 1.85 | % |
| Technology | | | 12.73 | % |
| Telecommunications | | | 6.00 | % |
| Transportation | | | 2.72 | % |
| Utilities | | | 2.03 | % |
| Total | | | 100.00 | % |
| * | | A sector may comprise several industries. |
| ** | | Represents percent of total investments. |
38
Growth Leaders Fund
Please note that the expenses shown in the table are meant to highlight your ongoing costs only and do not reflect any transactional costs, such as sales charges (loads). Therefore, the second line of the table is useful in comparing ongoing costs only, and will not help you determine the relative total costs of owning different funds. In addition, if these transactional costs were included, your costs would have been higher.
| | | Beginning
Account
Value | | Ending
Account
Value | | Expenses
Paid During
Period† | |
| | | 5/1/18 | | 10/31/18 | | 5/1/18 –
10/31/18 | |
| Class A | | | | | | | |
| Actual | | $1,000.00 | | $1,018.10 | | $4.63 | |
| Hypothetical (5% Return Before Expenses) | | $1,000.00 | | $1,020.62 | | $4.63 | |
| Class C | | | | | | | |
| Actual | | $1,000.00 | | $1,014.10 | | $8.43 | |
| Hypothetical (5% Return Before Expenses) | | $1,000.00 | | $1,016.84 | | $8.44 | |
| Class F | | | | | | | |
| Actual | | $1,000.00 | | $1,019.20 | | $3.36 | |
| Hypothetical (5% Return Before Expenses) | | $1,000.00 | | $1,021.88 | | $3.36 | |
| Class F3 | | | | | | | |
| Actual | | $1,000.00 | | $1,019.40 | | $3.05 | |
| Hypothetical (5% Return Before Expenses) | | $1,000.00 | | $1,022.18 | | $3.06 | |
| Class I | | | | | | | |
| Actual | | $1,000.00 | | $1,019.10 | | $3.36 | |
| Hypothetical (5% Return Before Expenses) | | $1,000.00 | | $1,021.88 | | $3.36 | |
| Class R2 | | | | | | | |
| Actual | | $1,000.00 | | $1,016.20 | | $6.40 | |
| Hypothetical (5% Return Before Expenses) | | $1,000.00 | | $1,018.85 | | $6.41 | |
| Class R3 | | | | | | | |
| Actual | | $1,000.00 | | $1,016.60 | | $5.90 | |
| Hypothetical (5% Return Before Expenses) | | $1,000.00 | | $1,019.36 | | $5.90 | |
| Class R4 | | | | | | | |
| Actual | | $1,000.00 | | $1,017.70 | | $4.63 | |
| Hypothetical (5% Return Before Expenses) | | $1,000.00 | | $1,020.62 | | $4.63 | |
| Class R5 | | | | | | | |
| Actual | | $1,000.00 | | $1,019.10 | | $3.36 | |
| Hypothetical (5% Return Before Expenses) | | $1,000.00 | | $1,021.88 | | $3.36 | |
| Class R6 | | | | | | | |
| Actual | | $1,000.00 | | $1,019.40 | | $3.05 | |
| Hypothetical (5% Return Before Expenses) | | $1,000.00 | | $1,022.18 | | $3.06 | |
| † | For each class of the Fund, net expenses are equal to the annualized expense ratio for such class (0.91% for Class A, 1.66% for Class C, 0.66% for Class F, 0.60% for Class F3, 0.66% for Class I, 1.26% for Class R2, 1.16% for Class R3, 0.91% for Class R4, 0.66% for Class R5 and 0.60% for Class R6) multiplied by the average account value over the period, multiplied by 184/365 (to reflect one-half year period). |
39
Portfolio Holdings Presented by Sector
October 31, 2018
| Sector* | | %** |
| Communication Services | | | 12.13 | % |
| Consumer Discretionary | | | 16.06 | % |
| Consumer Staples | | | 3.28 | % |
| Financials | | | 0.86 | % |
| Health Care | | | 17.88 | % |
| Sector* | | %** |
| Industrials | | | 8.98 | % |
| Information Technology | | | 37.87 | % |
| Repurchase Agreement | | | 2.94 | % |
| Total | | | 100.00 | % |
| * | | A sector may comprise several industries. |
| ** | | Represents percent of total investments. |
40
International Equity Fund
Please note that the expenses shown in the table are meant to highlight your ongoing costs only and do not reflect any transactional costs, such as sales charges (loads). Therefore, the second line of the table is useful in comparing ongoing costs only, and will not help you determine the relative total costs of owning different funds. In addition, if these transactional costs were included, your costs would have been higher.
| | | Beginning
Account
Value | | Ending
Account
Value | | Expenses
Paid During
Period† | |
| | | 5/1/18 | | 10/31/18 | | 5/1/18 –
10/31/18 | |
| Class A | | | | | | | | | |
| Actual | | $1,000.00 | | $ | 857.70 | | | $5.48 | |
| Hypothetical (5% Return Before Expenses) | | $1,000.00 | | $ | 1,019.31 | | | $5.96 | |
| Class C | | | | | | | | | |
| Actual | | $1,000.00 | | $ | 854.30 | | | $8.97 | |
| Hypothetical (5% Return Before Expenses) | | $1,000.00 | | $ | 1,015.53 | | | $9.75 | |
| Class F | | | | | | | | | |
| Actual | | $1,000.00 | | $ | 858.40 | | | $4.40 | |
| Hypothetical (5% Return Before Expenses) | | $1,000.00 | | $ | 1,020.47 | | | $4.79 | |
| Class F3 | | | | | | | | | |
| Actual | | $1,000.00 | | $ | 858.50 | | | $3.84 | |
| Hypothetical (5% Return Before Expenses) | | $1,000.00 | | $ | 1,021.10 | | | $4.18 | |
| Class I | | | | | | | | | |
| Actual | | $1,000.00 | | $ | 858.90 | | | $3.94 | |
| Hypothetical (5% Return Before Expenses) | | $1,000.00 | | $ | 1,020.97 | | | $4.28 | |
| Class P | | | | | | | | | |
| Actual | | $1,000.00 | | $ | 856.40 | | | $6.41 | |
| Hypothetical (5% Return Before Expenses) | | $1,000.00 | | $ | 1,018.30 | | | $6.97 | |
| Class R2 | | | | | | | | | |
| Actual | | $1,000.00 | | $ | 855.40 | | | $7.11 | |
| Hypothetical (5% Return Before Expenses) | | $1,000.00 | | $ | 1,017.54 | | | $7.73 | |
| Class R3 | | | | | | | | | |
| Actual | | $1,000.00 | | $ | 856.30 | | | $6.64 | |
| Hypothetical (5% Return Before Expenses) | | $1,000.00 | | $ | 1,018.05 | | | $7.22 | |
| Class R4 | | | | | | | | | |
| Actual | | $1,000.00 | | $ | 857.20 | | | $5.48 | |
| Hypothetical (5% Return Before Expenses) | | $1,000.00 | | $ | 1,019.31 | | | $5.96 | |
| Class R5 | | | | | | | | | |
| Actual | | $1,000.00 | | $ | 858.50 | | | $4.31 | |
| Hypothetical (5% Return Before Expenses) | | $1,000.00 | | $ | 1,020.57 | | | $4.69 | |
| Class R6 | | | | | | | | | |
| Actual | | $1,000.00 | | $ | 859.10 | | | $3.84 | |
| Hypothetical (5% Return Before Expenses) | | $1,000.00 | | $ | 1,021.07 | | | $4.18 | |
| † | For each class of the Fund, net expenses are equal to the annualized expense ratio for such class (1.17% for Class A, 1.92% for Class C, 0.94% for Class F, 0.82% for Class F3, 0.84 % for Class I, 1.37 % for Class P, 1.52% for Class R2, 1.42% for Class R3, 1.17% for Class R4, 0.92% for Class R5 and 0.82% for Class R6) multiplied by the average account value over the period, multiplied by 184/365 (to reflect one-half year period). |
41
Portfolio Holdings Presented by Sector
October 31, 2018
| Sector* | | %** |
| Communication Services | | | 8.04 | % |
| Consumer Discretionary | | | 10.18 | % |
| Consumer Staples | | | 10.23 | % |
| Energy | | | 6.66 | % |
| Financials | | | 21.29 | % |
| Health Care | | | 11.30 | % |
| Sector* | | %** |
| Industrials | | | 12.11 | % |
| Information Technology | | | 8.36 | % |
| Materials | | | 6.78 | % |
| Real Estate | | | 1.57 | % |
| Repurchase Agreement | | | 3.48 | % |
| Total | | | 100.00 | % |
| * | | A sector may comprise several industries. |
| ** | | Represents percent of total investments. |
42
International Opportunities Fund
Please note that the expenses shown in the table are meant to highlight your ongoing costs only and do not reflect any transactional costs, such as sales charges (loads). Therefore, the second line of the table is useful in comparing ongoing costs only, and will not help you determine the relative total costs of owning different funds. In addition, if these transactional costs were included, your costs would have been higher.
| | | Beginning
Account
Value | | Ending
Account
Value | | Expenses
Paid During
Period† | |
| | | 5/1/18 | | 10/31/18 | | 5/1/18 –
10/31/18 | |
| Class A | | | | | | | | | |
| Actual | | $1,000.00 | | $ | 832.40 | | | $5.63 | |
| Hypothetical (5% Return Before Expenses) | | $1,000.00 | | $ | 1,019.06 | | | $6.21 | |
| Class C | | | | | | | | | |
| Actual | | $1,000.00 | | $ | 829.40 | | | $9.08 | |
| Hypothetical (5% Return Before Expenses) | | $1,000.00 | | $ | 1,015.27 | | | $10.01 | |
| Class F | | | | | | | | | |
| Actual | | $1,000.00 | | $ | 833.30 | | | $4.94 | |
| Hypothetical (5% Return Before Expenses) | | $1,000.00 | | $ | 1,019.81 | | | $5.45 | |
| Class F3 | | | | | | | | | |
| Actual | | $1,000.00 | | $ | 834.00 | | | $4.02 | |
| Hypothetical (5% Return Before Expenses) | | $1,000.00 | | $ | 1,020.80 | | | $4.43 | |
| Class I | | | | | | | | | |
| Actual | | $1,000.00 | | $ | 834.00 | | | $4.48 | |
| Hypothetical (5% Return Before Expenses) | | $1,000.00 | | $ | 1,020.32 | | | $4.94 | |
| Class P | | | | | | | | | |
| Actual | | $1,000.00 | | $ | 832.00 | | | $6.56 | |
| Hypothetical (5% Return Before Expenses) | | $1,000.00 | | $ | 1,018.05 | | | $7.22 | |
| Class R2 | | | | | | | | | |
| Actual | | $1,000.00 | | $ | 831.20 | | | $7.25 | |
| Hypothetical (5% Return Before Expenses) | | $1,000.00 | | $ | 1,017.29 | | | $7.98 | |
| Class R3 | | | | | | | | | |
| Actual | | $1,000.00 | | $ | 831.90 | | | $6.79 | |
| Hypothetical (5% Return Before Expenses) | | $1,000.00 | | $ | 1,017.80 | | | $7.48 | |
| Class R4 | | | | | | | | | |
| Actual | | $1,000.00 | | $ | 832.80 | | | $5.64 | |
| Hypothetical (5% Return Before Expenses) | | $1,000.00 | | $ | 1,019.06 | | | $6.21 | |
| Class R5 | | | | | | | | | |
| Actual | | $1,000.00 | | $ | 833.90 | | | $4.48 | |
| Hypothetical (5% Return Before Expenses) | | $1,000.00 | | $ | 1,020.32 | | | $4.94 | |
| Class R6 | | | | | | | | | |
| Actual | | $1,000.00 | | $ | 834.50 | | | $4.02 | |
| Hypothetical (5% Return Before Expenses) | | $1,000.00 | | $ | 1,020.82 | | | $4.43 | |
| † | For each class of the Fund, net expenses are equal to the annualized expense ratio for such class (1.22% for Class A, 1.97% for Class C, 1.07% for Class F, 0.87% for Class F3, 0.97% for Class I, 1.42% for Class P, 1.57% for Class R2, 1.47% for Class R3, 1.22% for Class R4, 0.97% for Class R5 and 0.87% for Class R6) multiplied by the average account value over the period, multiplied by 184/365 (to reflect one-half year period). |
43
Portfolio Holdings Presented by Sector
October 31, 2018
| Sector* | | %** |
| Communication Services | | | 4.83 | % |
| Consumer Discretionary | | | 15.44 | % |
| Consumer Staples | | | 10.03 | % |
| Energy | | | 3.53 | % |
| Financials | | | 13.00 | % |
| Health Care | | | 8.77 | % |
| Industrials | | | 19.44 | % |
| Sector* | | %** |
| Information Technology | | | 6.13 | % |
| Materials | | | 6.15 | % |
| Real Estate | | | 7.45 | % |
| Utilities | | | 2.44 | % |
| Repurchase Agreement | | | 2.79 | % |
| Total | | | 100.00 | % |
| * | | A sector may comprise several industries. |
| ** | | Represents percent of total investments. |
44
International Value Fund
Please note that the expenses shown in the table are meant to highlight your ongoing costs only and do not reflect any transactional costs, such as sales charges (loads). Therefore, the second line of the table is useful in comparing ongoing costs only, and will not help you determine the relative total costs of owning different funds. In addition, if these transactional costs were included, your costs would have been higher.
| | | Beginning
Account
Value | | Ending
Account
Value | | Expenses
Paid During
Period† | |
| | | 5/1/18 | | 10/31/18 | | 5/1/18 –
10/31/18 | |
| Class A | | | | | | | | | |
| Actual | | $1,000.00 | | $ | 883.00 | | | $5.32 | |
| Hypothetical (5% Return Before Expenses) | | $1,000.00 | | $ | 1,019.56 | | | $5.70 | |
| Class C | | | | | | | | | |
| Actual | | $1,000.00 | | $ | 878.60 | | | $8.85 | |
| Hypothetical (5% Return Before Expenses) | | $1,000.00 | | $ | 1,015.78 | | | $9.50 | |
| Class F | | | | | | | | | |
| Actual | | $1,000.00 | | $ | 884.20 | | | $4.32 | |
| Hypothetical (5% Return Before Expenses) | | $1,000.00 | | $ | 1,020.62 | | | $4.63 | |
| Class F3 | | | | | | | | | |
| Actual | | $1,000.00 | | $ | 883.70 | | | $3.89 | |
| Hypothetical (5% Return Before Expenses) | | $1,000.00 | | $ | 1,021.10 | | | $4.18 | |
| Class I | | | | | | | | | |
| Actual | | $1,000.00 | | $ | 883.60 | | | $3.85 | |
| Hypothetical (5% Return Before Expenses) | | $1,000.00 | | $ | 1,021.12 | | | $4.13 | |
| Class R2 | | | | | | | | | |
| Actual | | $1,000.00 | | $ | 880.40 | | | $6.97 | |
| Hypothetical (5% Return Before Expenses) | | $1,000.00 | | $ | 1,017.80 | | | $7.48 | |
| Class R3 | | | | | | | | | |
| Actual | | $1,000.00 | | $ | 881.80 | | | $6.50 | |
| Hypothetical (5% Return Before Expenses) | | $1,000.00 | | $ | 1,018.30 | | | $6.97 | |
| Class R4 | | | | | | | | | |
| Actual | | $1,000.00 | | $ | 881.90 | | | $5.31 | |
| Hypothetical (5% Return Before Expenses) | | $1,000.00 | | $ | 1,019.56 | | | $5.70 | |
| Class R5 | | | | | | | | | |
| Actual | | $1,000.00 | | $ | 883.50 | | | $4.13 | |
| Hypothetical (5% Return Before Expenses) | | $1,000.00 | | $ | 1,020.82 | | | $4.43 | |
| Class R6 | | | | | | | | | |
| Actual | | $1,000.00 | | $ | 883.70 | | | $3.89 | |
| Hypothetical (5% Return Before Expenses) | | $1,000.00 | | $ | 1,021.07 | | | $4.18 | |
| † | For each class of the Fund, net expenses are equal to the annualized expense ratio for such class (1.12% for Class A, 1.87% for Class C, 0.91% for Class F, 0.82% for Class F3, 0.81% for Class I, 1.47% for Class R2, 1.37% for Class R3, 1.12% for Class R4, 0.87% for Class R5 and 0.82% for Class R6) multiplied by the average account value over the period, multiplied by 184/365 (to reflect one-half year period). |
45
Portfolio Holdings Presented by Sector
October 31, 2018
| Sector* | | %** |
| Communication Services | | | 5.73 | % |
| Consumer Discretionary | | | 9.40 | % |
| Consumer Staples | | | 6.95 | % |
| Energy | | | 11.70 | % |
| Financials | | | 29.04 | % |
| Health Care | | | 11.56 | % |
| Industrials | | | 6.29 | % |
| Sector* | | %** |
| Information Technology | | | 3.38 | % |
| Materials | | | 4.78 | % |
| Real Estate | | | 4.10 | % |
| Utilities | | | 3.69 | % |
| Repurchase Agreement | | | 3.38 | % |
| Total | | | 100.00 | % |
| * | | A sector may comprise several industries. |
| ** | | Represents percent of total investments. |
46
Value Opportunities Fund
Please note that the expenses shown in the table are meant to highlight your ongoing costs only and do not reflect any transactional costs, such as sales charges (loads). Therefore, the second line of the table is useful in comparing ongoing costs only, and will not help you determine the relative total costs of owning different funds. In addition, if these transactional costs were included, your costs would have been higher.
| | | Beginning
Account
Value | | Ending
Account
Value | | Expenses
Paid During
Period† | |
| | | 5/1/18 | | 10/31/18 | | 5/1/18 –
10/31/18 | |
| Class A | | | | | | | |
| Actual | | $1,000.00 | | $1,002.60 | | $5.55 | |
| Hypothetical (5% Return Before Expenses) | | $1,000.00 | | $1,019.66 | | $5.60 | |
| Class C | | | | | | | |
| Actual | | $1,000.00 | | $ 998.80 | | $9.32 | |
| Hypothetical (5% Return Before Expenses) | | $1,000.00 | | $1,015.88 | | $9.40 | |
| Class F | | | | | | | |
| Actual | | $1,000.00 | | $1,004.00 | | $4.80 | |
| Hypothetical (5% Return Before Expenses) | | $1,000.00 | | $1,020.42 | | $4.84 | |
| Class F3 | | | | | | | |
| Actual | | $1,000.00 | | $1,004.90 | | $3.99 | |
| Hypothetical (5% Return Before Expenses) | | $1,000.00 | | $1,021.20 | | $4.02 | |
| Class I | | | | | | | |
| Actual | | $1,000.00 | | $1,004.00 | | $4.29 | |
| Hypothetical (5% Return Before Expenses) | | $1,000.00 | | $1,020.92 | | $4.33 | |
| Class P | | | | | | | |
| Actual | | $1,000.00 | | $1,001.00 | | $6.56 | |
| Hypothetical (5% Return Before Expenses) | | $1,000.00 | | $1,018.65 | | $6.61 | |
| Class R2 | | | | | | | |
| Actual | | $1,000.00 | | $1,001.60 | | $7.32 | |
| Hypothetical (5% Return Before Expenses) | | $1,000.00 | | $1,017.90 | | $7.38 | |
| Class R3 | | | | | | | |
| Actual | | $1,000.00 | | $1,002.10 | | $6.81 | |
| Hypothetical (5% Return Before Expenses) | | $1,000.00 | | $1,018.40 | | $6.87 | |
| Class R4 | | | | | | | |
| Actual | | $1,000.00 | | $1,002.60 | | $5.55 | |
| Hypothetical (5% Return Before Expenses) | | $1,000.00 | | $1,019.66 | | $5.60 | |
| Class R5 | | | | | | | |
| Actual | | $1,000.00 | | $1,003.50 | | $4.29 | |
| Hypothetical (5% Return Before Expenses) | | $1,000.00 | | $1,020.92 | | $4.33 | |
| Class R6 | | | | | | | |
| Actual | | $1,000.00 | | $1,003.90 | | $3.99 | |
| Hypothetical (5% Return Before Expenses) | | $1,000.00 | | $1,021.22 | | $4.02 | |
| † | For each class of the Fund, net expenses are equal to the annualized expense ratio for such class (1.10% for Class A, 1.85% for Class C, 0.95% for Class F, 0.79% for Class F3, 0.85% for Class I, 1.30% for Class P, 1.45% for Class R2, 1.35% for Class R3, 1.10% for Class R4, 0.85% for Class R5 and 0.79% for Class R6) multiplied by the average account value over the period, multiplied by 184/365 (to reflect one-half year period). |
47
Portfolio Holdings Presented by Sector
October 31, 2018
| Sector* | | %** |
| Communication Services | | | 2.53 | % |
| Consumer Discretionary | | | 8.15 | % |
| Consumer Staples | | | 3.79 | % |
| Energy | | | 4.96 | % |
| Financials | | | 13.71 | % |
| Health Care | | | 17.34 | % |
| Industrials | | | 12.12 | % |
| Sector* | | %** |
| Information Technology | | | 18.43 | % |
| Materials | | | 8.63 | % |
| Real Estate | | | 2.84 | % |
| Utilities | | | 5.81 | % |
| Repurchase Agreement | | | 1.69 | % |
| Total | | | 100.00 | % |
| * | | A sector may comprise several industries. |
| ** | | Represents percent of total investments. |
48
Schedule of Investments
ALPHA STRATEGY FUND October 31, 2018
| Investments | | Shares | | | Fair
Value
(000) | |
| INVESTMENTS IN UNDERLYING FUNDS(a)(b) 100.05% | |
| | | | | | | | | |
| Lord Abbett Developing Growth Fund, Inc. – Class I*(c) | | | 6,541,320 | | | $ | 207,818 | |
| Lord Abbett Securities Trust – International Opportunities Fund – Class I(d) | | | 10,327,866 | | | | 178,982 | |
| Lord Abbett Securities Trust – Micro-Cap Growth Fund – Class I*(d) | | | 5,184,452 | | | | 102,860 | |
| Lord Abbett Securities Trust – Micro-Cap Value Fund – Class I*(d) | | | 3,401,681 | | | | 104,193 | |
| Lord Abbett Research Fund, Inc. – Small-Cap Value Fund – Class I(d) | | | 8,664,921 | | | | 210,211 | |
| Lord Abbett Securities Trust – Value Opportunities Fund – Class I(d) | | | 10,300,878 | | | | 209,005 | |
Total Investments in Underlying Funds
(cost $958,221,420) | | | | | | | 1,013,069 | |
| Investments | | Principal
Amount
(000) | | | Fair
Value
(000) | |
| SHORT-TERM INVESTMENT 0.06% | | | | | | | | |
| | | | | | | | | |
| Repurchase Agreement | | | | | | | | |
Repurchase Agreement dated 10/31/2018, 1.25% due 11/1/2018 with Fixed Income Clearing Corp. collateralized by $625,000 of U.S. Treasury Note at 2.625% due 6/15/2021; value: $627,159; proceeds: $613,282
(cost $613,260) | | | $613 | | | $ | 613 | |
Total Investments in Securities 100.11%
(cost $958,834,680) | | | | | | | 1,013,682 | |
| Liabilities in Excess of Other Assets (0.11)% | | | | | | | (1,073 | ) |
| Net Assets 100.00% | | | | | | $ | 1,012,609 | |
| * | | Non-income producing security. |
| (a) | | Affiliated issuer (See Note 13). |
| (b) | | These investments offer daily redemptions. |
| (c) | | Fund investment objective is long-term growth of capital through a diversified and actively managed portfolio consisting of developing growth companies, many of which are traded over the counter. |
| (d) | | Fund investment objective is long-term capital appreciation. |
The following is a summary of the inputs used as of October 31, 2018 in valuing the Fund’s investments carried at fair value(1):
| Investment Type(2)(3) | | Level 1
(000) | | | Level 2
(000) | | | Level 3
(000) | | | Total
(000) |
| Investments in Underlying Funds | | $ | 1,013,069 | | | $ | – | | | $ | – | | | $ | 1,013,069 |
| Short-Term Investments | | | | | | | | | | | | | | | |
| Repurchase Agreement | | | – | | | | 613 | | | | – | | | | 613 |
| Total | | $ | 1,013,069 | | | $ | 613 | | | $ | – | | | $ | 1,013,682 |
| (1) | | Refer to Note 2(l) for a description of fair value measurements and the three-tier hierarchy of inputs. |
| (2) | | See Schedule of Investments for fair values in each industry and identification of foreign issuers and/or geography. |
| (3) | | There were no Level 1/Level 2 transfers during the fiscal year ended October 31, 2018. |
| | See Notes to Financial Statements. | 49 |
Schedule of Investments
FUNDAMENTAL EQUITY FUND October 31, 2018
| Investments | | Shares | | | Fair
Value
(000) | |
| COMMON STOCKS 99.10% | | | | | | | | |
| | | | | | | | | |
| Aerospace & Defense 1.37% | | | | | | | | |
| Boeing Co. (The) | | | 26,731 | | | $ | 9,486 | |
| General Dynamics Corp. | | | 119,355 | | | | 20,598 | |
| Total | | | | | | | 30,084 | |
| | | | | | | | | |
| Airlines 0.85% | | | | | | | | |
| Delta Air Lines, Inc. | | | 341,148 | | | | 18,671 | |
| | | | | | | | | |
| Auto Components 0.03% | | | | | | | | |
| Garrett Motion, Inc. (Switzerland)*(a) | | | 36,358 | | | | 552 | |
| | | | | | | | | |
| Banks 14.58% | | | | | | | | |
| Bank of America Corp. | | | 2,844,760 | | | | 78,231 | |
| Citizens Financial Group, Inc. | | | 966,816 | | | | 36,111 | |
| Comerica, Inc. | | | 419,634 | | | | 34,225 | |
| East West Bancorp, Inc. | | | 462,933 | | | | 24,276 | |
| JPMorgan Chase & Co. | | | 835,543 | | | | 91,091 | |
| Signature Bank | | | 154,140 | | | | 16,940 | |
| SVB Financial Group* | | | 68,167 | | | | 16,171 | |
| Wells Fargo & Co. | | | 413,638 | | | | 22,018 | |
| Total | | | | | | | 319,063 | |
| | | | | | | | | |
| Beverages 2.58% | | | | | | | | |
| Coca-Cola Co. (The) | | | 744,930 | | | | 35,667 | |
| PepsiCo, Inc. | | | 184,200 | | | | 20,701 | |
| Total | | | | | | | 56,368 | |
| | | | | | | | | |
| Biotechnology 0.71% | | | | | | | | |
| Gilead Sciences, Inc. | | | 226,453 | | | | 15,440 | |
| | | | | | | | | |
| Building Products 0.06% | | | | | | | | |
| Resideo Technologies, Inc.* | | | 60,547 | | | | 1,274 | |
| | | | | | | | | |
| Capital Markets 1.07% | | | | | | | | |
| Goldman Sachs Group, Inc. (The) | | | 104,316 | | | | 23,510 | |
| | | | | | | | | |
| Chemicals 2.41% | | | | | | | | |
| DowDuPont, Inc. | | | 977,432 | | | | 52,703 | |
| Investments | | Shares | | | Fair
Value
(000) | |
| Communications Equipment 3.39% | | | | | | |
| Cisco Systems, Inc. | | | 1,622,448 | | | $ | 74,227 | |
| | | | | | | | | |
| Consumer Finance 1.05% | | | | | | | | |
| Discover Financial Services | | | 329,892 | | | | 22,984 | |
| | | | | | | | | |
| Diversified Telecommunication Services 3.96% | | | |
| AT&T, Inc. | | | 926,882 | | | | 28,437 | |
| Verizon Communications, Inc. | | | 1,019,710 | | | | 58,215 | |
| Total | | | | | | | 86,652 | |
| | | | | | | | | |
| Electric: Utilities 5.84% | | | | | | | | |
| Duke Energy Corp. | | | 730,222 | | | | 60,338 | |
| NextEra Energy, Inc. | | | 391,151 | | | | 67,474 | |
| Total | | | | | | | 127,812 | |
| | | | | | | | | |
| Electrical Equipment 1.07% | | | | | | | | |
| AMETEK, Inc. | | | 348,626 | | | | 23,386 | |
| | | | | | | | | |
| Electronic Equipment, Instruments & Components 1.39% |
| Corning, Inc. | | | 954,971 | | | | 30,511 | |
| | | | | | | | | |
| Entertainment 2.25% | | | | | | | | |
| Walt Disney Co. (The) | | | 429,391 | | | | 49,307 | |
| | | | | | | | | |
| Equity Real Estate Investment Trusts 2.52% | | | |
| Boston Properties, Inc. | | | 140,866 | | | | 17,011 | |
| Prologis, Inc. | | | 591,673 | | | | 38,145 | |
| Total | | | | | | | 55,156 | |
| | | | | | | | | |
| Food & Staples Retailing 2.10% | | | | | | | | |
| Walmart, Inc. | | | 459,382 | | | | 46,067 | |
| | | | | | | | | |
| Food Products 0.79% | | | | | | | | |
| Mondelez International, Inc. Class A | | | 411,053 | | | | 17,256 | |
| | | | | | | | | |
| Health Care Equipment & Supplies 3.53% | | | |
| Abbott Laboratories | | | 666,700 | | | | 45,962 | |
| Boston Scientific Corp.* | | | 638,030 | | | | 23,059 | |
| Insulet Corp.* | | | 94,163 | | | | 8,306 | |
| Total | | | | | | | 77,327 | |
| 50 | See Notes to Financial Statements. |
Schedule of Investments (continued)
FUNDAMENTAL EQUITY FUND October 31, 2018
| Investments | | Shares | | | Fair
Value
(000) | |
| Health Care Providers & Services 2.03% | |
| UnitedHealth Group, Inc. | | | 170,207 | | | $ | 44,484 | |
| | | | | | | | | |
| Hotels, Restaurants & Leisure 0.45% | | | | | | | | |
| Yum! Brands, Inc. | | | 109,823 | | | | 9,929 | |
| | | | | | | | | |
| Industrial Conglomerates 2.40% | | | | | | | | |
| Honeywell International, Inc. | | | 363,282 | | | | 52,610 | |
| | | | | | | | | |
| Information Technology Services 1.27% | | | | | |
| PayPal Holdings, Inc.* | | | 330,304 | | | | 27,808 | |
| | | | | | | | | |
| Insurance 3.46% | | | | | | | | |
| Chubb Ltd. (Switzerland)(a) | | | 324,621 | | | | 40,548 | |
| Hartford Financial Services Group, Inc. (The) | | | 772,166 | | | | 35,072 | |
| Total | | | | | | | 75,620 | |
| | | | | | | | | |
| Interactive Media & Services 1.28% | | | | | | | | |
| Alphabet, Inc. Class A* | | | 25,730 | | | | 28,061 | |
| | | | | | | | | |
| Internet & Direct Marketing Retail 0.84% | | | | | |
| Alibaba Group Holding Ltd. ADR* | | | 33,486 | | | | 4,764 | |
| Amazon.com, Inc.* | | | 8,509 | | | | 13,598 | |
| Total | | | | | | | 18,362 | |
| | | | | | | | | |
| Multi-Line Retail 0.58% | | | | | | | | |
| Dollar Tree, Inc.* | | | 150,592 | | | | 12,695 | |
| | | | | | | | | |
| Oil, Gas & Consumable Fuels 10.62% | | | | | | | | |
| Chevron Corp. | | | 642,430 | | | | 71,727 | |
| ConocoPhillips | | | 729,932 | | | | 51,022 | |
| Devon Energy Corp. | | | 763,390 | | | | 24,734 | |
| EOG Resources, Inc. | | | 182,921 | | | | 19,269 | |
| Marathon Petroleum Corp. | | | 425,130 | | | | 29,951 | |
| Royal Dutch Shell plc Class A ADR | | | 564,490 | | | | 35,670 | |
| Total | | | | | | | 232,373 | |
| Investments | | Shares | | | Fair
Value
(000) | |
| Personal Products 1.01% | | | | | | | | |
| Unilever NV Registered Shares (United Kingdom)(a) | 409,967 | | | $ | 22,048 | |
| | | | | | | | | |
| Pharmaceuticals 11.52% | | | | | | | | |
| Allergan plc | | | 164,975 | | | | 26,068 | |
| Johnson & Johnson | | | 688,903 | | | | 96,439 | |
| Merck & Co., Inc. | | | 835,749 | | | | 61,519 | |
| Novartis AG ADR | | | 141,523 | | | | 12,378 | |
| Pfizer, Inc. | | | 1,293,608 | | | | 55,703 | |
| Total | | | | | | | 252,107 | |
| | | | | | | | | |
| Road & Rail 1.88% | | | | | | | | |
| CSX Corp. | | | 598,090 | | | | 41,184 | |
| | | | | | | | | |
| Semiconductors & Semiconductor Equipment 1.63% |
| Intel Corp. | | | 761,678 | | | | 35,707 | |
| | | | | | | | | |
| Software 4.13% | | | | | | | | |
| Microsoft Corp. | | | 474,800 | | | | 50,713 | |
| Oracle Corp. | | | 814,510 | | | | 39,781 | |
| Total | | | | | | | 90,494 | |
| | | | | | | | | |
| Specialty Retail 3.88% | | | | | | | | |
| Burlington Stores, Inc.* | | | 148,220 | | | | 25,418 | |
| Home Depot, Inc. (The) | | | 209,342 | | | | 36,819 | |
| O’Reilly Automotive, Inc.* | | | 70,595 | | | | 22,644 | |
| Total | | | | | | | 84,881 | |
| | | | | | | | | |
| Tobacco 0.57% | | | | | | | | |
| Philip Morris International, Inc. | | | 142,662 | | | | 12,564 | |
Total Common Stocks
(cost $1,816,152,825) | | | | | | | 2,169,277 | |
| | See Notes to Financial Statements. | 51 |
Schedule of Investments (concluded)
FUNDAMENTAL EQUITY FUND October 31, 2018
| Investments | | Principal
Amount
(000) | | | Fair
Value
(000) | |
| SHORT-TERM INVESTMENT 1.17% | | | | | | | | |
| | | | | | | | | |
| Repurchase Agreement | | | | | | | | |
Repurchase Agreement dated 10/31/2018, 1.25% due 11/1/2018 with Fixed Income Clearing Corp. collateralized by $26,160,000 of U.S. Treasury Note at 2.625% due 6/15/2021; value: $26,250,383; proceeds: $25,734,154
(cost $25,733,260) | | | $25,733 | | | $ | 25,733 | |
Total Investments in Securities 100.27%
(cost $1,841,886,085) | | | | | | | 2,195,010 | |
| Liabilities in Excess of Other Assets (0.27)% | | | | | | | (5,983 | ) |
| Net Assets 100.00% | | | | | | $ | 2,189,027 | |
| ADR | | American Depositary Receipt. |
| * | | Non-income producing security. |
| (a) | | Foreign security traded in U.S. dollars. |
The following is a summary of the inputs used as of October 31, 2018 in valuing the Fund’s investments carried at fair value(1):
| Investment Type(2)(3) | | Level 1
(000) | | | Level 2
(000) | | | Level 3
(000) | | | Total
(000) |
| Common Stocks | | $ | 2,169,277 | | | $ | – | | | $ | – | | | $ | 2,169,277 |
| Short-Term Investments | | | | | | | | | | | | | | | |
| Repurchase Agreement | | | – | | | | 25,733 | | | | – | | | | 25,733 |
| Total | | $ | 2,169,277 | | | $ | 25,733 | | | $ | – | | | $ | 2,195,010 |
| (1) | | Refer to Note 2(l) for a description of fair value measurements and the three-tier hierarchy of inputs. |
| (2) | | See Schedule of Investments for fair values in each industry and identification of foreign issuers and/or geography. |
| (3) | | There were no Level 1/Level 2 transfers during the fiscal year ended October 31, 2018. |
| 52 | See Notes to Financial Statements. |
Schedule of Investments
GLOBAL EQUITY RESEARCH FUND October 31, 2018
| Investments | | Shares | | | U.S. $
Fair Value
(000) | |
| COMMON STOCKS 96.77% | | | | | | | | |
| | | | | | | | | |
| Australia 0.65% | | | | | | | | |
| | | | | | | | | |
| Beverages | | | | | | | | |
| Coca-Cola Amatil Ltd. | | | 6,135 | | | $ | 43 | |
| | | | | | | | | |
| Belgium 0.71% | | | | | | | | |
| | | | | | | | | |
| Insurance | | | | | | | | |
| Ageas | | | 940 | | | | 47 | |
| | | | | | | | | |
| Canada 1.48% | | | | | | | | |
| | | | | | | | | |
| Metals & Mining 1.13% | | | | | | | | |
| Franco-Nevada Corp. | | | 639 | | | | 40 | |
| Lundin Mining Corp. | | | 8,492 | | | | 35 | |
| | | | | | | | 75 | |
| | | | | | | | | |
| Oil, Gas & Consumable Fuels 0.35% | | | | | | | | |
| Seven Generations Energy Ltd. Class A* | | | 2,142 | | | | 23 | |
| Total Canada | | | | | | | 98 | |
| | | | | | | | | |
| China 1.06% | | | | | | | | |
| | | | | | | | | |
| Interactive Media & Services 0.61% | | | | | | | | |
| Tencent Holdings Ltd. | | | 1,168 | | | | 40 | |
| | | | | | | | | |
| Internet & Direct Marketing Retail 0.45% | | | | | | | | |
| Alibaba Group Holding Ltd. ADR* | | | 209 | | | | 30 | |
| Total China | | | | | | | 70 | |
| | | | | | | | | |
| Denmark 0.44% | | | | | | | | |
| | | | | | | | | |
| Insurance | | | | | | | | |
| Tryg A/S | | | 1,195 | | | | 29 | |
| | | | | | | | | |
| France 4.74% | | | | | | | | |
| | | | | | | | | |
| Banks 1.04% | | | | | | | | |
| BNP Paribas SA | | | 1,318 | | | | 69 | |
| | | | | | | | | |
| Beverages 0.71% | | | | | | | | |
| Pernod Ricard SA | | | 308 | | | | 47 | |
| Investments | | Shares | | | U.S. $
Fair Value
(000) | |
| Chemicals 0.20% | | | | | | |
| Air Liquide SA | | | 105 | | | $ | 13 | |
| | | | | | | | | |
| Construction & Engineering 0.77% | | | | | | | | |
| Vinci SA | | | 578 | | | | 51 | |
| | | | | | | | | |
| Diversified Telecommunication Services 0.61% | | | | | | | | |
| Orange SA | | | 2,536 | | | | 40 | |
| | | | | | | | | |
| Entertainment 0.32% | | | | | | | | |
| Vivendi SA | | | 877 | | | | 21 | |
| | | | | | | | | |
| Food Products 0.48% | | | | | | | | |
| Danone SA | | | 460 | | | | 32 | |
| | | | | | | | | |
| Textiles, Apparel & Luxury Goods 0.61% | | | | | | | | |
| LVMH Moet Hennessy Louis Vuitton SE | | | 131 | | | | 40 | |
| Total France | | | | | | | 313 | |
| | | | | | | | | |
| Germany 4.67% | | | | | | | | |
| | | | | | | | | |
| Diversified Telecommunication Services 0.48% | | | | | | | | |
| Deutsche Telekom AG Registered Shares | | | 1,969 | | | | 32 | |
| | | | | | | | | |
| Hotels, Restaurants & Leisure 0.53% | | | | | | | | |
| TUI AG | | | 2,133 | | | | 35 | |
| | | | | | | | | |
| Industrial Conglomerates 0.77% | | | | | | | | |
| Siemens AG Registered Shares | | | 442 | | | | 51 | |
| | | | | | | | | |
| Insurance 1.00% | | | | | | | | |
| Allianz SE Registered Shares | | | 317 | | | | 66 | |
| | | | | | | | | |
| Real Estate Management & Development 1.31% | | | | | | | | |
| Aroundtown SA | | | 4,922 | | | | 41 | |
| Vonovia SE | | | 1,002 | | | | 46 | |
| | | | | | | | 87 | |
| | | | | | | | | |
| Semiconductors & Semiconductor Equipment 0.20% |
| Infineon Technologies AG | | | 621 | | | | 13 | |
| | | | | | | | | |
| Textiles, Apparel & Luxury Goods 0.38% | | | | | | | | |
| adidas AG | | | 107 | | | | 25 | |
| Total Germany | | | | | | | 309 | |
| | See Notes to Financial Statements. | 53 |
Schedule of Investments (continued)
GLOBAL EQUITY RESEARCH FUND October 31, 2018
| Investments | | Shares | | | U.S. $
Fair Value
(000) | |
| Hong Kong 0.71% | | | | | | | | |
| | | | | | | | | |
| Insurance | | | | | | | | |
| AIA Group Ltd. | | | 6,247 | | | $ | 47 | |
| | | | | | | | | |
| Ireland 2.03% | | | | | | | | |
| | | | | | | | | |
| Banks 0.80% | | | | | | | | |
| Bank of Ireland Group plc | | | 7,451 | | | | 53 | |
| | | | | | | | | |
| Biotechnology 0.17% | | | | | | | | |
| Amarin Corp. plc ADR* | | | 573 | | | | 11 | |
| | | | | | | | | |
| Building Products 0.76% | | | | | | | | |
| Allegion plc | | | 580 | | | | 50 | |
| | | | | | | | | |
| Pharmaceuticals 0.30% | | | | | | | | |
| Jazz Pharmaceuticals plc* | | | 126 | | | | 20 | |
| Total Ireland | | | | | | | 134 | |
| | | | | | | | | |
| Italy 0.14% | | | | | | | | |
| | | | | | | | | |
| Textiles, Apparel & Luxury Goods | | | | | | | | |
| Brunello Cucinelli SpA | | | 274 | | | | 9 | |
| | | | | | | | | |
| Japan 2.80% | | | | | | | | |
| | | | | | | | | |
| Automobiles 0.86% | | | | | | | | |
| Toyota Motor Corp. | | | 979 | | | | 57 | |
| | | | | | | | | |
| Beverages 0.17% | | | | | | | | |
| Coca-Cola Bottlers Japan Holdings, Inc. | | | 436 | | | | 11 | |
| | | | | | | | | |
| Entertainment 0.70% | | | | | | | | |
| Nintendo Co., Ltd. | | | 147 | | | | 46 | |
| | | | | | | | | |
| Machinery 0.69% | | | | | | | | |
| Komatsu Ltd. | | | 1,749 | | | | 46 | |
| | | | | | | | | |
| Metals & Mining 0.38% | | | | | | | | |
| Sumitomo Metal Mining Co. Ltd. | | | 798 | | | | 25 | |
| Total Japan | | | | | | | 185 | |
| Investments | | Shares | | | U.S. $
Fair Value
(000) | |
| Mexico 0.68% | | | | | | | | |
| | | | | | | | | |
| Banks | | | | | | | | |
| Grupo Financiero Banorte SAB de CV | | | 8,144 | | | $ | 45 | |
| | | | | | | | | |
| Netherlands 3.27% | | | | | | | | |
| | | | | | | | | |
| Banks 0.56% | | | | | | | | |
| ING Groep NV | | | 3,164 | | | | 37 | |
| | | | | | | | | |
| Health Care Equipment & Supplies 0.44% | | | | | | | | |
| Koninklijke Philips NV | | | 763 | | | | 29 | |
| | | | | | | | | |
| Insurance 0.51% | | | | | | | | |
| ASR Nederland NV | | | 749 | | | | 34 | |
| | | | | | | | | |
| Oil, Gas & Consumable Fuels 1.56% | | | | | | | | |
| Royal Dutch Shell plc B Shares | | | 3,171 | | | | 103 | |
| | | | | | | | | |
| Semiconductors & Semiconductor Equipment 0.20% | | |
| ASML Holding NV | | | 73 | | | | 13 | |
| Total Netherlands | | | | | | | 216 | |
| | | | | | | | | |
| Norway 0.24% | | | | | | | | |
| | | | | | | | | |
| Oil, Gas & Consumable Fuels | | | | | | | | |
| Equinor ASA | | | 607 | | | | 16 | |
| | | | | | | | | |
| Switzerland 2.18% | | | | | | | | |
| | | | | | | | | |
| Chemicals 0.18% | | | | | | | | |
| Givaudan SA Registered Shares | | | 5 | | | | 12 | |
| | | | | | | | | |
| Containers & Packaging 0.19% | | | | | | | | |
| SIG Combibloc Group AG* | | | 1,100 | | | | 12 | |
| | | | | | | | | |
| Insurance 0.86% | | | | | | | | |
| Swiss Life Holding AG Registered Shares* | | | 150 | | | | 57 | |
| | | | | | | | | |
| Pharmaceuticals 0.95% | | | | | | | | |
| Novartis AG Registered Shares | | | 716 | | | | 63 | |
| Total Switzerland | | | | | | | 144 | |
| 54 | See Notes to Financial Statements. |
Schedule of Investments (continued)
GLOBAL EQUITY RESEARCH FUND October 31, 2018
| Investments | | Shares | | | U.S. $
Fair Value
(000) | |
| Taiwan 0.57% | | | | | | | | |
| | | | | | | | | |
| Semiconductors & Semiconductor Equipment | | | | | | | | |
| Taiwan Semiconductor Manufacturing Co., Ltd. | | | 5,000 | | | $ | 38 | |
| | | | | | | | | |
| United Kingdom 8.44% | | | | | | | | |
| | | | | | | | | |
| Aerospace & Defense 0.62% | | | | | | | | |
| BAE Systems plc | | | 6,136 | | | | 41 | |
| | | | | | | | | |
| Banks 0.70% | | | | | | | | |
| Royal Bank of Scotland Group PLC | | | 15,444 | | | | 46 | |
| | | | | | | | | |
| Biotechnology 0.45% | | | | | | | | |
| Myovant Sciences Ltd.* | | | 1,422 | | | | 30 | |
| | | | | | | | | |
| Capital Markets 0.42% | | | | | | | | |
| BrightSphere Investment Group plc | | | 2,437 | | | | 28 | |
| | | | | | | | | |
| Household Products 0.79% | | | | | | | | |
| Reckitt Benckiser Group plc | | | 643 | | | | 52 | |
| | | | | | | | | |
| Insurance 1.78% | | | | | | | | |
| Argo Group International Holdings Ltd. | | | 621 | | | | 38 | |
| Axis Capital Holdings Ltd. | | | 765 | | | | 43 | |
| Hiscox Ltd. | | | 1,770 | | | | 37 | |
| | | | | | | | 118 | |
| | | | | | | | | |
| Machinery 0.62% | | | | | | | | |
| Pentair plc | | | 1,020 | | | | 41 | |
| | | | | | | | | |
| Multi-Utilities 0.61% | | | | | | | | |
| National Grid plc | | | 3,796 | | | | 40 | |
| | | | | | | | | |
| Oil, Gas & Consumable Fuels 0.91% | | | | | | | | |
| BP plc | | | 8,345 | | | | 60 | |
| | | | | | | | | |
| Personal Products 0.24% | | | | | | | | |
| Unilever NV CVA | | | 291 | | | | 16 | |
| | | | | | | | | |
| Tobacco 0.86% | | | | | | | | |
| British American Tobacco plc | | | 1,310 | | | | 57 | |
| Investments | | Shares | | | U.S. $
Fair Value
(000) | |
| Wireless Telecommunication Services 0.44% | | | | | | | | |
| Vodafone Group plc | | | 15,591 | | | $ | 29 | |
| Total United Kingdom | | | | | | | 558 | |
| | | | | | | | | |
| United States 61.96% | | | | | | | | |
| | | | | | | | | |
| Aerospace & Defense 2.09% | | | | | | | | |
| Boeing Co. (The) | | | 207 | | | | 73 | |
| United Technologies Corp. | | | 519 | | | | 65 | |
| | | | | | | | 138 | |
| | | | | | | | | |
| Banks 4.24% | | | | | | | | |
| Bank of America Corp. | | | 2,561 | | | | 70 | |
| JPMorgan Chase & Co. | | | 563 | | | | 61 | |
| Sterling Bancorp | | | 1,981 | | | | 36 | |
| TCF Financial Corp. | | | 1,543 | | | | 32 | |
| Wells Fargo & Co. | | | 1,516 | | | | 81 | |
| | | | | | | | 280 | |
| | | | | | | | | |
| Beverages 1.09% | | | | | | | | |
| Coca-Cola Co. (The) | | | 1,513 | | | | 72 | |
| | | | | | | | | |
| Biotechnology 1.16% | | | | | | | | |
| AnaptysBio, Inc.* | | | 186 | | | | 14 | |
| BioMarin Pharmaceutical, Inc.* | | | 410 | | | | 38 | |
| Vertex Pharmaceuticals, Inc.* | | | 147 | | | | 25 | |
| | | | | | | | 77 | |
| | | | | | | | | |
| Capital Markets 1.07% | | | | | | | | |
| E*TRADE Financial Corp. | | | 907 | | | | 45 | |
| Victory Capital Holdings, Inc. Class A* | | | 3,328 | | | | 26 | |
| | | | | | | | 71 | |
| | | | | | | | | |
| Chemicals 1.56% | | | | | | | | |
| Air Products & Chemicals, Inc. | | | 82 | | | | 13 | |
| Ashland Global Holdings, Inc. | | | 594 | | | | 44 | |
| DowDuPont, Inc. | | | 609 | | | | 33 | |
| Ecolab, Inc. | | | 89 | | | | 13 | |
| | | | | | | | 103 | |
| | | | | | | | | |
| Commercial Services & Supplies 0.85% | | | | | | | | |
| Waste Management, Inc. | | | 628 | | | | 56 | |
| | See Notes to Financial Statements. | 55 |
Schedule of Investments (continued)
GLOBAL EQUITY RESEARCH FUND October 31, 2018
| Investments | | Shares | | | U.S. $
Fair Value
(000) | |
| United States (continued) | | | | | | | | |
| | | | | | | | | |
| Communications Equipment 0.47% | | | | | | | | |
| Palo Alto Networks, Inc.* | | | 169 | | | $ | 31 | |
| | | | | | | | | |
| Containers & Packaging 0.24% | | | | | | | | |
| Avery Dennison Corp. | | | 175 | | | | 16 | |
| | | | | | | | | |
| Diversified Telecommunication Services 1.24% | | | | | | | | |
| AT&T, Inc. | | | 868 | | | | 26 | |
| Verizon Communications, Inc. | | | 978 | | | | 56 | |
| | | | | | | | 82 | |
| | | | | | | | | |
| Electric: Utilities 1.50% | | | | | | | | |
| Evergy, Inc. | | | 824 | | | | 46 | |
| FirstEnergy Corp. | | | 1,420 | | | | 53 | |
| | | | | | | | 99 | |
| | | | | | | | | |
| Electrical Equipment 0.71% | | | | | | | | |
| AMETEK, Inc. | | | 699 | | | | 47 | |
| | | | | | | | | |
| Electronic Equipment, Instruments & Components 0.92% |
| Corning, Inc. | | | 1,038 | | | | 33 | |
| Keysight Technologies, Inc.* | | | 484 | | | | 28 | |
| | | | | | | | 61 | |
| | | | | | | | | |
| Energy Equipment & Services 0.24% | | | | | | | | |
| Helmerich & Payne, Inc. | | | 261 | | | | 16 | |
| | | | | | | | | |
| Entertainment 0.61% | | | | | | | | |
| Netflix, Inc.* | | | 49 | | | | 15 | |
| Walt Disney Co. (The) | | | 220 | | | | 25 | |
| | | | | | | | 40 | |
| | | | | | | | | |
| Equity Real Estate Investment Trusts 1.28% | | | | | | | | |
| Alexandria Real Estate Equities, Inc. | | | 422 | | | | 52 | |
| Duke Realty Corp. | | | 1,203 | | | | 33 | |
| | | | | | | | 85 | |
| | | | | | | | | |
| Exchange-Traded Funds 6.96% | | | | | | | | |
| iShares MSCI Emerging Markets ETF | | | 7,519 | | | | 295 | |
| iShares MSCI Japan ETF | | | 3,013 | | | | 165 | |
| | | | | | | | 460 | |
| Investments | | Shares | | | U.S. $
Fair Value
(000) | |
| Food & Staples Retailing 1.03% | | | | | | | | |
| Sysco Corp. | | | 794 | | | $ | 56 | |
| Walmart, Inc. | | | 118 | | | | 12 | |
| | | | | | | | 68 | |
| | | | | | | | | |
| Food Products 1.36% | | | | | | | | |
| Conagra Brands, Inc. | | | 1,256 | | | | 45 | |
| Kraft Heinz Co. (The) | | | 214 | | | | 12 | |
| Mondelez International, Inc. Class A | | | 803 | | | | 33 | |
| | | | | | | | 90 | |
| | | | | | | | | |
| Health Care Equipment & Supplies 1.45% | | | | | | | |
| ABIOMED, Inc.* | | | 50 | | | | 17 | |
| Align Technology, Inc.* | | | 55 | | | | 12 | |
| Boston Scientific Corp.* | | | 964 | | | | 35 | |
| Teleflex, Inc. | | | 133 | | | | 32 | |
| | | | | | | | 96 | |
| | | | | | | | | |
| Health Care Providers & Services 2.36% | | | | | | | | |
| Centene Corp.* | | | 260 | | | | 34 | |
| CVS Health Corp. | | | 624 | | | | 45 | |
| Guardant Health, Inc.* | | | 561 | | | | 19 | |
| UnitedHealth Group, Inc. | | | 222 | | | | 58 | |
| | | | | | | | 156 | |
| | | | | | | | | |
| Hotels, Restaurants & Leisure 0.67% | | | | | | | | |
| Aramark | | | 1,222 | | | | 44 | |
| | | | | | | | | |
| Household Products 0.51% | | | | | | | | |
| Procter & Gamble Co. (The) | | | 380 | | | | 34 | |
| | | | | | | | | |
| Information Technology Services 3.42% | | | | | | | | |
| Conduent, Inc.* | | | 2,707 | | | | 52 | |
| DXC Technology Co. | | | 568 | | | | 41 | |
| Global Payments, Inc. | | | 292 | | | | 33 | |
| GoDaddy, Inc. Class A* | | | 398 | | | | 29 | |
| Mastercard, Inc. Class A | | | 146 | | | | 29 | |
| PayPal Holdings, Inc.* | | | 500 | | | | 42 | |
| | | | | | | | 226 | |
| 56 | See Notes to Financial Statements. |
Schedule of Investments (continued)
GLOBAL EQUITY RESEARCH FUND October 31, 2018
| Investments | | Shares | | | U.S. $
Fair Value
(000) | |
| United States (continued) | | | | | | | | |
| | | | | | | | | |
| Insurance 0.17% | | | | | | | | |
| Goosehead Insurance, Inc. Class A* | | | 334 | | | $ | 11 | |
| | | | | | | | | |
| Interactive Media & Services 3.51% | | | | | | | | |
| Alphabet, Inc. Class A* | | | 129 | | | | 141 | |
| Facebook, Inc. Class A* | | | 290 | | | | 44 | |
| IAC/InterActiveCorp.* | | | 242 | | | | 47 | |
| | | | | | | | 232 | |
| | | | | | | | | |
| Internet & Direct Marketing Retail 1.77% | | | | | | | | |
| Amazon.com, Inc.* | | | 73 | | | | 117 | |
| | | | | | | | | |
| Life Sciences Tools & Services 0.88% | | | | | | | | |
| Agilent Technologies, Inc. | | | 393 | | | | 26 | |
| Illumina, Inc.* | | | 104 | | | | 32 | |
| | | | | | | | 58 | |
| | | | | | | | | |
| Machinery 1.09% | | | | | | | | |
| Dover Corp. | | | 395 | | | | 33 | |
| Flowserve Corp. | | | 849 | | | | 39 | |
| | | | | | | | 72 | |
| | | | | | | | | |
| Metals & Mining 0.21% | | | | | | | | |
| Nucor Corp. | | | 236 | | | | 14 | |
| | | | | | | | | |
| Multi-Line Retail 0.78% | | | | | | | | |
| Dollar Tree, Inc.* | | | 614 | | | | 52 | |
| | | | | | | | | |
| Multi-Utilities 0.68% | | | | | | | | |
| Sempra Energy | | | 405 | | | | 45 | |
| | | | | | | | | |
| Oil, Gas & Consumable Fuels 2.63% | | | | | | | | |
| Anadarko Petroleum Corp. | | | 287 | | | | 15 | |
| Concho Resources, Inc.* | | | 269 | | | | 38 | |
| EOG Resources, Inc. | | | 339 | | | | 36 | |
| Marathon Petroleum Corp. | | | 627 | | | | 44 | |
| ONEOK, Inc. | | | 630 | | | | 41 | |
| | | | | | | | 174 | |
| | | | | | | | | |
| Pharmaceuticals 3.04% | | | | | | | | |
| Elanco Animal Health, Inc.* | | | 841 | | | | 26 | |
| Merck & Co., Inc. | | | 1,109 | | | | 81 | |
| Pfizer, Inc. | | | 1,320 | | | | 57 | |
| Zoetis, Inc. | | | 409 | | | | 37 | |
| | | | | | | | 201 | |
| Investments | | Shares | | | U.S. $
Fair Value
(000) | |
| Professional Services 0.11% | | | | | | |
| Upwork, Inc.* | | | 376 | | | $ | 7 | |
| | | | | | | | | |
| Semiconductors & Semiconductor Equipment 0.86% |
| Intel Corp. | | | 530 | | | | 25 | |
| NVIDIA Corp. | | | 153 | | | | 32 | |
| | | | | | | | 57 | |
| | | | | | | | | |
| Software 4.28% | | | | | | | | |
| Anaplan, Inc.* | | | 234 | | | | 5 | |
| Elastic NV* | | | 100 | | | | 7 | |
| Microsoft Corp. | | | 1,348 | | | | 144 | |
| Oracle Corp. | | | 832 | | | | 41 | |
| Red Hat, Inc.* | | | 128 | | | | 22 | |
| salesforce.com, Inc.* | | | 290 | | | | 40 | |
| Ultimate Software Group, Inc. (The)* | | | 92 | | | | 24 | |
| | | | | | | | 283 | |
| | | | | | | | | |
| Specialty Retail 2.09% | | | | | | | | |
| Home Depot, Inc. (The) | | | 132 | | | | 23 | |
| Lowe’s Cos., Inc. | | | 106 | | | | 10 | |
| TJX Cos., Inc. (The) | | | 568 | | | | 63 | |
| Ulta Salon, Cosmetics & Fragrance, Inc.* | | | 153 | | | | 42 | |
| | | | | | | | 138 | |
| | | | | | | | | |
| Technology Hardware, Storage & Peripheral 2.33% |
| Apple, Inc. | | | 705 | | | | 154 | |
| | | | | | | | | |
| Wireless Telecommunication Services 0.50% |
| T-Mobile US, Inc.* | | | 477 | | | | 33 | |
| Total United States | | | | | | | 4,096 | |
Total Common Stocks
(cost $6,515,589) | | | | | | | 6,397 | |
| | | | | | | | | |
| PREFERRED STOCK 0.40% | | | | | | | | |
| | | | | | | | | |
| Germany | | | | | | | | |
| | | | | | | | | |
| Automobiles | | | | | | | | |
Volkswagen AG
(cost $29,028) | | | 157 | | | | 26 | |
| | See Notes to Financial Statements. | 57 |
Schedule of Investments (continued)
GLOBAL EQUITY RESEARCH FUND October 31, 2018
| Investments | | Principal
Amount
(000) | | | U.S. $
Fair Value
(000) | |
| CONVERTIBLE BOND 0.21% | | | | | | |
| |
| United States | | | | | | |
| |
| Pharmaceuticals |
Tilray, Inc.†(a)
(cost $17,000) | | | $17 | | | $ | 14 | |
Total Investments in Securities 97.38%
(cost $6,561,617) | | | | | | | 6,437 | |
| Cash, Foreign Cash and Other Assets in Excess of Liabilities 2.62% | | | | | | | 173 | |
| Net Assets 100.00% | | | | | | $ | 6,610 | |
| ADR | | American Depositary Receipt. |
| CVA | | Company Voluntary Arrangement. |
| ETF | | Exchange Traded Fund. |
| * | | Non-income producing security. |
| † | | Security was purchased pursuant to Rule 144A under the Securities Act of 1933 and, unless registered under such Act or exempted from registration, may only be resold to qualified institutional buyers. |
| (a) | | The security has an interest rate 5.00% with a maturity of 10/01/2023. |
| 58 | See Notes to Financial Statements. |
Schedule of Investments (concluded)
GLOBAL EQUITY RESEARCH FUND October 31, 2018
The following is a summary of the inputs used as of October 31, 2018 in valuing the Fund’s investments carried at fair value(1):
| Investment Type(2) | | Level 1
(000) | | | Level 2
(000) | | | Level 3
(000) | | | Total
(000) | |
| Common Stocks | | | | | | | | | | | | | | | | |
| Australia | | $ | – | | | $ | 43 | | | $ | – | | | $ | 43 | |
| Belgium | | | – | | | | 47 | | | | – | | | | 47 | |
| Canada | | | 98 | | | | – | | | | – | | | | 98 | |
| China(3) | | | 30 | | | | 40 | | | | – | | | | 70 | |
| Denmark | | | – | | | | 29 | | | | – | | | | 29 | |
| France(3) | | | – | | | | 313 | | | | – | | | | 313 | |
| Germany(3) | | | – | | | | 309 | | | | – | | | | 309 | |
| Hong Kong | | | – | | | | 47 | | | | – | | | | 47 | |
| Ireland(3) | | | 81 | | | | 53 | | | | – | | | | 134 | |
| Italy(3) | | | – | | | | 9 | | | | – | | | | 9 | |
| Japan(3) | | | – | | | | 185 | | | | – | | | | 185 | |
| Mexico | | | 45 | | | | – | | | | – | | | | 45 | |
| Netherlands(3) | | | – | | | | 216 | | | | – | | | | 216 | |
| Norway | | | – | | | | 16 | | | | – | | | | 16 | |
| Switzerland(3) | | | 12 | | | | 132 | | | | – | | | | 144 | |
| Taiwan | | | – | | | | 38 | | | | – | | | | 38 | |
| United Kingdom(3) | | | 180 | | | | 378 | | | | – | | | | 558 | |
| United States | | | 4,096 | | | | – | | | | – | | | | 4,096 | |
| Preferred Stock | | | – | | | | 26 | | | | – | | | | 26 | |
| Convertible Bond | | | – | | | | 14 | | | | – | | | | 14 | |
| Total | | $ | 4,542 | | | $ | 1,895 | | | $ | – | | | $ | 6,437 | |
| (1) | | Refer to Note 2(l) for a description of fair value measurements and the three-tier hierarchy of inputs. |
| (2) | | See Schedule of Investments for fair values in each industry and identification of foreign issuers and/or geography. |
| (3) | | Securities in the amount of $667,079 were transferred from Level 1 to Level 2 due to a change in valuation technique resulting in adjusted valuations (as described in Note 2(l)) on October 31, 2018. |
| | See Notes to Financial Statements. | 59 |
Schedule of Investments
GLOBAL SELECT EQUITY FUND October 31, 2018
| | | | | | Fair | |
| | | | | | Value | |
| Investments | | Shares | | | (000) | |
| COMMON STOCKS 101.59% | | | | | | | | |
| | | | | | | | | |
| Canada 1.41% | | | | | | | | |
| | | | | | | | | |
| Metals & Mining 0.75% | | | | | | | | |
| Lundin Mining Corp. | | | 3,900 | | | $ | 16 | |
| | | | | | | | | |
| Oil, Gas & Consumable Fuels 0.66% | | | | | | | | |
| Seven Generations Energy Ltd. Class A* | | | 1,350 | | | | 14 | |
| Total Canada | | | | | | | 30 | |
| | | | | | | | | |
| China 0.75% | | | | | | | | |
| | | | | | | | | |
| Hotels, Restaurants & Leisure | | | | | | | | |
| Yum China Holdings, Inc. | | | 443 | | | | 16 | |
| | | | | | | | | |
| France 5.76% | | | | | | | | |
| | | | | | | | | |
| Beverages 1.41% | | | | | | | | |
| Pernod Ricard SA | | | 193 | | | | 30 | |
| | | | | | | | | |
| Diversified Telecommunication Services 1.92% | | | |
| Orange SA | | | 2,626 | | | | 41 | |
| | | | | | | | | |
| Food Products 1.59% | | | | | | | | |
| Danone SA | | | 483 | | | | 34 | |
| | | | | | | | | |
| Software 0.84% | | | | | | | | |
| Ubisoft Entertainment SA* | | | 200 | | | | 18 | |
| Total France | | | | | | | 123 | |
| | | | | | | | | |
| Germany 6.56% | | | | | | | | |
| | | | | | | | | |
| Hotels, Restaurants & Leisure 0.80% | | | | | | | | |
| TUI AG | | | 1,037 | | | | 17 | |
| | | | | | | | | |
| Industrial Conglomerates 1.27% | | | | | | | | |
| Siemens AG Registered Shares | | | 234 | | | | 27 | |
| | | | | | | | | |
| Insurance 2.01% | | | | | | | | |
| Allianz SE Registered Shares | | | 208 | | | | 43 | |
| | | | | | | | | |
| Real Estate Management & Development 1.03% | | | |
| Aroundtown SA | | | 2,604 | | | | 22 | |
| | | | | | Fair | |
| | | | | | Value | |
| Investments | | Shares | | | (000) | |
| Software 1.45% | | | | | | | | |
| SAP SE | | | 292 | | | $ | 31 | |
| Total Germany | | | | | | | 140 | |
| | | | | | | | | |
| India 2.06% | | | | | | | | |
| | | | | | | | | |
| Banks | | | | | | | | |
| ICICI Bank Ltd. ADR | | | 4,595 | | | | 44 | |
| | | | | | | | | |
| Ireland 5.44% | | | | | | | | |
| | | | | | | | | |
| Banks 4.36% | | | | | | | | |
| AIB Group plc | | | 8,291 | | | | 40 | |
| Bank of Ireland Group plc | | | 7,510 | | | | 53 | |
| | | | | | | | 93 | |
| | | | | | | | | |
| Building Products 1.08% | | | | | | | | |
| Allegion plc | | | 269 | | | | 23 | |
| Total Ireland | | | | | | | 116 | |
| | | | | | | | | |
| Japan 4.87% | | | | | | | | |
| | | | | | | | | |
| Entertainment 1.45% | | | | | | | | |
| Nintendo Co., Ltd. | | | 98 | | | | 31 | |
| | | | | | | | | |
| Food & Staples Retailing 2.48% | | | | | | | | |
| Seven & i Holdings Co., Ltd. | | | 1,215 | | | | 53 | |
| | | | | | | | | |
| Household Durables 0.94% | | | | | | | | |
| Sony Corp. | | | 375 | | | | 20 | |
| Total Japan | | | | | | | 104 | |
| | | | | | | | | |
| Mexico 1.87% | | | | | | | | |
| | | | | | | | | |
| Banks 1.17% | | | | | | | | |
| Grupo Financiero Banorte SAB de CV | | | 4,566 | | | | 25 | |
| | | | | | | | | |
| Construction Materials 0.70% | | | | | | | | |
| Cemex SAB de CV ADR* | | | 2,913 | | | | 15 | |
| Total Mexico | | | | | | | 40 | |
| | | | | | | | | |
| Netherlands 2.34% | | | | | | | | |
| | | | | | | | | |
| Banks 1.64% | | | | | | | | |
| ING Groep NV | | | 2,974 | | | | 35 | |
| 60 | See Notes to Financial Statements. | |
Schedule of Investments (continued)
GLOBAL SELECT EQUITY FUND October 31, 2018
| | | | | | Fair | |
| | | | | | Value | |
| Investments | | Shares | | | (000) | |
| Netherlands (continued) | | | | | | | | |
| | | | | | | | | |
| Health Care Equipment & Supplies 0.70% | | | | | | | | |
| Koninklijke Philips NV | | | 407 | | | $ | 15 | |
| Total Netherlands | | | | | | | 50 | |
| | | | | | | | | |
| Spain 2.25% | | | | | | | | |
| | | | | | | | | |
| Banks | | | | | | | | |
| Banco Bilbao Vizcaya Argentaria SA | | | 8,740 | | | | 48 | |
| | | | | | | | | |
| Switzerland 4.83% | | | | | | | | |
| | | | | | | | | |
| Food Products 1.36% | | | | | | | | |
| Nestle SA Registered Shares | | | 340 | | | | 29 | |
| | | | | | | | | |
| Pharmaceuticals 3.47% | | | | | | | | |
| Novartis AG Registered Shares | | | 843 | | | | 74 | |
| Total Switzerland | | | | | | | 103 | |
| | | | | | | | | |
| United Kingdom 13.31% | | | | | | | | |
| | | | | | | | | |
| Aerospace & Defense 0.61% | | | | | | | | |
| BAE Systems plc | | | 1,988 | | | | 13 | |
| | | | | | | | | |
| Banks 3.65% | | | | | | | | |
| Royal Bank of Scotland | | | | | | | | |
| Group PLC | | | 25,881 | | | | 78 | |
| | | | | | | | | |
| Biotechnology 0.56% | | | | | | | | |
| Myovant Sciences Ltd.* | | | 564 | | | | 12 | |
| | | | | | | | | |
| Household Products 2.01% | | | | | | | | |
| Reckitt Benckiser Group plc | | | 532 | | | | 43 | |
| | | | | | | | | |
| Machinery 0.98% | | | | | | | | |
| Pentair plc | | | 508 | | | | 21 | |
| | | | | | | | | |
| Multi-Utilities 1.51% | | | | | | | | |
| National Grid plc | | | 3,045 | | | | 32 | |
| | | | | | | | | |
| Oil, Gas & Consumable Fuels 2.49% | | | | | | | | |
| Royal Dutch Shell PLC | | | 1,671 | | | | 53 | |
| | | | | | | | | |
| Personal Products 1.50% | | | | | | | | |
| Unilever NV CVA | | | 602 | | | | 32 | |
| Total United Kingdom | | | | | | | 284 | |
| | | | | | Fair | |
| | | | | | Value | |
| Investments | | Shares | | | (000) | |
| United States 50.14% | | | | | | | | |
| | | | | | | | | |
| Air Freight & Logistics 1.17% | | | | | | | | |
| United Parcel Service, Inc. Class B | | | 231 | | | $ | 25 | |
| | | | | | | | | |
| Airlines 1.59% | | | | | | | | |
| Alaska Air Group, Inc. | | | 258 | | | | 16 | |
| Southwest Airlines Co. | | | 376 | | | | 18 | |
| | | | | | | | 34 | |
| | | | | | | | | |
| Banks 2.48% | | | | | | | | |
| Bank of America Corp. | | | 1,238 | | | | 34 | |
| Wells Fargo & Co. | | | 358 | | | | 19 | |
| | | | | | | | 53 | |
| | | | | | | | | |
| Beverages 2.11% | | | | | | | | |
| Coca-Cola Co. (The) | | | 942 | | | | 45 | |
| | | | | | | | | |
| Biotechnology 2.25% | | | | | | | | |
| BioMarin Pharmaceutical, Inc.* | | | 164 | | | | 15 | |
| Incyte Corp.* | | | 352 | | | | 23 | |
| Vertex Pharmaceuticals, Inc.* | | | 60 | | | | 10 | |
| | | | | | | | 48 | |
| | | | | | | | | |
| Capital Markets 1.55% | | | | | | | | |
| E*TRADE Financial Corp. | | | 658 | | | | 33 | |
| | | | | | | | | |
| Chemicals 1.03% | | | | | | | | |
| DowDuPont, Inc. | | | 408 | | | | 22 | |
| | | | | | | | | |
| Diversified Telecommunication Services 1.78% | | | |
| AT&T, Inc. | | | 1,238 | | | | 38 | |
| | | | | | | | | |
| Electric: Utilities 1.08% | | | | | | | | |
| FirstEnergy Corp. | | | 628 | | | | 23 | |
| | | | | | | | | |
| Electrical Equipment 0.89% | | | | | | | | |
| AMETEK, Inc. | | | 286 | | | | 19 | |
| | | | | | | | | |
| Electronic Equipment, Instruments & Components 0.98% | |
| Corning, Inc. | | | 655 | | | | 21 | |
| | See Notes to Financial Statements. | 61 |
Schedule of Investments (continued)
GLOBAL SELECT EQUITY FUND October 31, 2018
| | | | | | Fair | |
| | | | | | Value | |
| Investments | | Shares | | | (000) | |
| United States (continued) | | | | | | | | |
| | | | | | | | | |
| Entertainment 3.42% | | | | | | | | |
| AMC Entertainment Holdings, Inc. | | | 1,170 | | | $ | 23 | |
| Walt Disney Co. (The) | | | 440 | | | | 50 | |
| | | | | | | | 73 | |
| | | | | | | | | |
| Equity Real Estate Investment Trusts 1.03% | | | | | | | | |
| Alexandria Real Estate Equities, Inc. | | | 179 | | | | 22 | |
| | | | | | | | | |
| Food Products 2.16% | | | | | | | | |
| Conagra Brands, Inc. | | | 1,304 | | | | 46 | |
| | | | | | | | | |
| Health Care Providers & Services 1.50% | | | | | | | | |
| CVS Health Corp. | | | 441 | | | | 32 | |
| | | | | | | | | |
| Hotels, Restaurants & Leisure 1.03% | | | | | | | | |
| McDonald’s Corp. | | | 126 | | | | 22 | |
| | | | | | | | | |
| Information Technology Services 3.70% | | | | | | | | |
| Conduent, Inc.* | | | 1,779 | | | | 34 | |
| DXC Technology Co. | | | 355 | | | | 26 | |
| Mastercard, Inc. Class A | | | 97 | | | | 19 | |
| | | | | | | | 79 | |
| | | | | | | | | |
| Insurance 0.52% | | | | | | | | |
| Axis Capital Holdings Ltd. | | | 191 | | | | 11 | |
| | | | | | | | | |
| Interactive Media & Services 3.09% | | | | | | | | |
| Alphabet, Inc. Class A* | | | 35 | | | | 38 | |
| IAC/InterActiveCorp.* | | | 142 | | | | 28 | |
| | | | | | | | 66 | |
| | | | | | | | | |
| Life Sciences Tools & Services 0.52% | | | | | | | | |
| Illumina, Inc.* | | | 36 | | | | 11 | |
| | | | | | | | | |
| Machinery 0.61% | | | | | | | | |
| Stanley Black & Decker, Inc. | | | 112 | | | | 13 | |
| | | | | | | | | |
| Media 1.12% | | | | | | | | |
| Charter Communications, Inc. Class A* | | | 76 | | | | 24 | |
| | | | | | Fair | |
| | | | | | Value | |
| Investments | | Shares | | | (000) | |
| Multi-Line Retail 2.25% | | | | | | | | |
| Dollar Tree, Inc.* | | | 565 | | | $ | 48 | |
| | | | | | | | | |
| Multi-Utilities 0.98% | | | | | | | | |
| Sempra Energy | | | 190 | | | | 21 | |
| | | | | | | | | |
| Oil, Gas & Consumable Fuels 2.01% | | | | | | | | |
| EOG Resources, Inc. | | | 92 | | | | 10 | |
| Marathon Petroleum Corp. | | | 251 | | | | 18 | |
| Noble Energy, Inc. | | | 621 | | | | 15 | |
| | | | | | | | 43 | |
| Pharmaceuticals 3.94% | | | | | | | | |
| Merck & Co., Inc. | | | 905 | | | | 67 | |
| Pfizer, Inc. | | | 406 | | | | 17 | |
| | | | | | | | 84 | |
| | | | | | | | | |
| Software 2.06% | | | | | | | | |
| Microsoft Corp. | | | 203 | | | | 22 | |
| Oracle Corp. | | | 452 | | | | 22 | |
| | | | | | | | 44 | |
| | | | | | | | | |
| Specialty Retail 0.89% | | | | | | | | |
| TJX Cos., Inc. (The) | | | 173 | | | | 19 | |
| | | | | | | | | |
| Wireless Telecommunication Services 2.39% | | | | | | | | |
| T-Mobile US, Inc.* | | | 738 | | | | 51 | |
| Total United States | | | | | | | 1,070 | |
Total Common Stocks
(cost $2,292,524) | | | | | | | 2,168 | |
Total Investments in Securities 101.59%
(cost $2,292,524) | | | | | | | 2,168 | |
| Liabilities in Excess of Other Assets (1.59)% | | | | | | | (34 | ) |
| Net Assets 100.00% | | | | | | $ | 2,134 | |
| ADR | | American Depositary Receipt. |
| CVA | | Company Voluntary Arrangement. |
| * | | Non-income producing security. |
| 62 | See Notes to Financial Statements. | |
Schedule of Investments (concluded)
GLOBAL SELECT EQUITY FUND October 31, 2018
The following is a summary of the inputs used as of October 31, 2018 in valuing the Fund’s investments carried at fair value(1):
| Investment Type(2)(3) | | Level 1 | | | Level 2 | | | Level 3 | | | Total | |
| Common Stocks | | | | | | | | | | | | | | | | |
| France | | $ | – | | | $ | 122 | | | $ | – | | | $ | 122 | |
| Germany | | | – | | | | 119 | | | | – | | | | 119 | |
| Ireland | | | 23 | | | | 93 | | | | – | | | | 116 | |
| Japan | | | – | | | | 103 | | | | – | | | | 103 | |
| Luxembourg | | | – | | | | 22 | | | | – | | | | 22 | |
| Netherlands | | | – | | | | 104 | | | | – | | | | 104 | |
| Spain | | | – | | | | 48 | | | | – | | | | 48 | |
| Switzerland | | | – | | | | 103 | | | | – | | | | 103 | |
| United Kingdom | | | 32 | | | | 199 | | | | – | | | | 231 | |
| Remaining Countries | | | 1,200 | | | | – | | | | – | | | | 1,200 | |
| Total | | $ | 1,255 | | | $ | 913 | | | $ | – | | | $ | 2,168 | |
| (1) | | Refer to Note 2(l) for a description of fair value measurements and the three-tier hierarchy of inputs. |
| (2) | | See Schedule of Investments for fair values in each industry and identification of foreign issuers and/or geography. |
| (3) | | There were no Level 1/Level 2 transfers during the period ended October 31, 2018. |
| | See Notes to Financial Statements. | 63 |
Schedule of Investments
GROWTH LEADERS FUND October 31, 2018
| | | | | | Fair | |
| | | | | | Value | |
| Investments | | Shares | | | (000) | |
| COMMON STOCKS 96.72% | | | | | | | | |
| | | | | | | | | |
| Aerospace & Defense 5.24% | | | | | | | | |
| Aerovironment, Inc.* | | | 363,679 | | | $ | 32,720 | |
| Boeing Co. (The) | | | 263,589 | | | | 93,537 | |
| Raytheon Co. | | | 150,484 | | | | 26,341 | |
| Teledyne Technologies, Inc.* | | | 166,440 | | | | 36,830 | |
| Total | | | | | | | 189,428 | |
| | | | | | | | | |
| Air Freight & Logistics 0.52% | | | | | | | | |
| XPO Logistics, Inc.* | | | 209,435 | | | | 18,719 | |
| | | | | | | | | |
| Automobiles 0.75% | | | | | | | | |
| Tesla, Inc.* | | | 80,726 | | | | 27,231 | |
| | | | | | | | | |
| Beverages 0.99% | | | | | | | | |
| Coca-Cola Co. (The) | | | 747,401 | | | | 35,786 | |
| | | | | | | | | |
| Biotechnology 3.21% | | | | | | | | |
| Blueprint Medicines Corp.* | | | 94,937 | | | | 5,769 | |
| Sarepta Therapeutics, Inc.* | | | 191,780 | | | | 25,653 | |
| Vertex Pharmaceuticals, Inc.* | | | 498,787 | | | | 84,524 | |
| Total | | | | | | | 115,946 | |
| | | | | | | | | |
| Capital Markets 0.86% | | | | | | | | |
| MSCI, Inc. | | | 206,403 | | | | 31,039 | |
| | | | | | | | | |
| Communications Equipment 0.67% | | | | | | | | |
| Palo Alto Networks, Inc.* | | | 132,170 | | | | 24,192 | |
| | | | | | | | | |
| Construction & Engineering 1.36% | | | | | | | | |
| Jacobs Engineering Group, Inc. | | | 656,125 | | | | 49,268 | |
| | | | | | | | | |
| Diversified Consumer Services 1.11% | | | | | | | | |
| Grand Canyon Education, Inc.* | | | 322,333 | | | | 40,195 | |
| | | | | | | | | |
| Diversified Telecommunication Services 1.94% | | | | | |
| Verizon Communications, Inc. | | | 1,229,613 | | | | 70,199 | |
| | | | | | | | | |
| Electrical Equipment 0.83% | | | | | | | | |
| AMETEK, Inc. | | | 449,248 | | | | 30,136 | |
| | | | | | Fair | |
| | | | | | Value | |
| Investments | | Shares | | | (000) | |
| Electronic Equipment, Instruments & Components 0.48% | |
| Keysight Technologies, Inc.* | | | 304,073 | | | $ | 17,357 | |
| | | | | | | | | |
| Entertainment 4.50% | | | | | | | | |
| Activision Blizzard, Inc. | | | 532,417 | | | | 36,764 | |
| Live Nation Entertainment, Inc.* | | | 880,192 | | | | 46,034 | |
| Netflix, Inc.* | | | 170,671 | | | | 51,505 | |
| World Wrestling Entertainment, Inc. Class A | | | 393,640 | | | | 28,574 | |
| Total | | | | | | | 162,877 | |
| | | | | | | | | |
| Food & Staples Retailing 0.83% | | | | | | | | |
| Costco Wholesale Corp. | | | 130,899 | | | | 29,928 | |
| | | | | | | | | |
| Health Care Equipment & Supplies 5.69% | | | | | | | | |
| DexCom, Inc.* | | | 351,000 | | | | 46,602 | |
| Glaukos Corp.* | | | 639,125 | | | | 37,031 | |
| IDEXX Laboratories, Inc.* | | | 56,405 | | | | 11,965 | |
| Insulet Corp.* | | | 283,410 | | | | 25,000 | |
| Intuitive Surgical, Inc.* | | | 122,376 | | | | 63,780 | |
| Penumbra, Inc.* | | | 158,040 | | | | 21,493 | |
| Total | | | | | | | 205,871 | |
| | | | | | | | | |
| Health Care Providers & Services 2.82% | | | | | | | | |
| UnitedHealth Group, Inc. | | | 389,956 | | | | 101,915 | |
| | | | | | | | | |
| Health Care Technology 0.51% | | | | | | | | |
| Veeva Systems, Inc. Class A* | | | 201,159 | | | | 18,376 | |
| | | | | | | | | |
| Hotels, Restaurants & Leisure 2.19% | | | | | | | | |
| McDonald’s Corp. | | | 200,451 | | | | 35,460 | |
| Planet Fitness, Inc. Class A* | | | 890,359 | | | | 43,708 | |
| Total | | | | | | | 79,168 | |
| | | | | | | | | |
| Household Durables 1.12% | | | | | | | | |
| Roku, Inc.* | | | 725,811 | | | | 40,355 | |
| | | | | | | | | |
| Household Products 1.45% | | | | | | | | |
| Procter & Gamble Co. (The) | | | 590,281 | | | | 52,346 | |
| | | | | | | | | |
| Industrial Conglomerates 1.00% | | | | | | | | |
| Roper Technologies, Inc. | | | 127,845 | | | | 36,167 | |
| 64 | See Notes to Financial Statements. |
Schedule of Investments (continued)
GROWTH LEADERS FUND October 31, 2018
| | | | | | Fair | |
| | | | | | Value | |
| Investments | | Shares | | | (000) | |
| Information Technology Services 10.06% | | | | | | | | |
| GoDaddy, Inc. Class A* | | | 571,120 | | | $ | 41,789 | |
| Mastercard, Inc. Class A | | | 436,234 | | | | 86,230 | |
| Okta, Inc.* | | | 562,417 | | | | 32,823 | |
| PayPal Holdings, Inc.* | | | 485,504 | | | | 40,875 | |
| Square, Inc. Class A* | | | 387,087 | | | | 28,431 | |
| Twilio, Inc. Class A* | | | 610,490 | | | | 45,921 | |
| Visa, Inc. Class A | | | 635,534 | | | | 87,608 | |
| Total | | | | | | | 363,677 | |
| | | | | | | | | |
| Interactive Media & Services 5.64% | | | | | | | | |
| Alphabet, Inc. Class A* | | | 154,147 | | | | 168,110 | |
| Match Group, Inc.* | | | 695,835 | | | | 35,988 | |
| Total | | | | | | | 204,098 | |
| | | | | | | | | |
| Internet & Direct Marketing Retail 4.87% | | | | | | | | |
| Amazon.com, Inc.* | | | 99,284 | | | | 158,657 | |
| GrubHub, Inc.* | | | 189,191 | | | | 17,545 | |
| Total | | | | | | | 176,202 | |
| | | | | | | | | |
| Life Sciences Tools & Services 1.96% | | | | | | | | |
| Illumina, Inc.* | | | 228,007 | | | | 70,944 | |
| | | | | | | | | |
| Pharmaceuticals 3.62% | | | | | | | | |
| Elanco Animal Health, Inc.* | | | 17,400 | | | | 530 | |
| GW Pharmaceuticals plc ADR* | | | 313,262 | | | | 43,070 | |
| Merck & Co., Inc. | | | 485,993 | | | | 35,774 | |
| Zoetis, Inc. | | | 572,442 | | | | 51,606 | |
| Total | | | | | | | 130,980 | |
| | | | | | | | | |
| Semiconductors & Semiconductor Equipment 1.09% | |
| NVIDIA Corp. | | | 187,072 | | | | 39,440 | |
| | | | | | | | | |
| Software 17.75% | | | | | | | | |
| Adobe, Inc.* | | | 148,276 | | | | 36,440 | |
| Atlassian Corp. plc Class A (Australia)*(a) | | | 503,761 | | | | 38,240 | |
| Elastic NV* | | | 169,615 | | | | 11,534 | |
| Everbridge, Inc.* | | | 424,035 | | | | 21,554 | |
| | | | | | Fair | |
| | | | | | Value | |
| Investments | | Shares | | | (000) | |
| Five9, Inc.* | | | 638,749 | | | $ | 25,141 | |
| HubSpot, Inc.* | | | 155,900 | | | | 21,148 | |
| Intuit, Inc. | | | 176,871 | | | | 37,320 | |
| Microsoft Corp. | | | 2,443,861 | | | | 261,029 | |
| Paycom Software, Inc.* | | | 207,436 | | | | 25,971 | |
| salesforce.com, Inc.* | | | 602,127 | | | | 82,636 | |
| ServiceNow, Inc.* | | | 100,382 | | | | 18,173 | |
| Trade Desk, Inc. (The) Class A* | | | 206,844 | | | | 25,556 | |
| Ultimate Software Group, Inc. (The)* | | | 64,315 | | | | 17,148 | |
| Zscaler, Inc.* | | | 545,477 | | | | 19,795 | |
| Total | | | | | | | 641,685 | |
| | | | | | | | | |
| Specialty Retail 2.76% | | | | | | | | |
| Home Depot, Inc. (The) | | | 206,501 | | | | 36,319 | |
| TJX Cos., Inc. (The) | | | 344,329 | | | | 37,835 | |
| Tractor Supply Co. | | | 277,173 | | | | 25,470 | |
| Total | | | | | | | 99,624 | |
| | | | | | | | | |
| Technology Hardware, Storage & Peripherals 7.69% | | | | | |
| Apple, Inc. | | | 1,269,737 | | | | 277,895 | |
| | | | | | | | | |
| Textiles, Apparel & Luxury Goods 3.21% | | | | | | | | |
| Lululemon Athletica, Inc. (Canada)*(a) | | | 158,187 | | | | 22,262 | |
| NIKE, Inc. Class B | | | 826,277 | | | | 62,004 | |
| Under Armour, Inc. Class A* | | | 1,431,731 | | | | 31,655 | |
| Total | | | | | | | 115,921 | |
Total Common Stocks
(cost $3,298,068,688) | | | | | | | 3,496,965 | |
| | See Notes to Financial Statements. | 65 |
Schedule of Investments (concluded)
GROWTH LEADERS FUND October 31, 2018
| | | Principal | | | Fair | |
| | | Amount | | | Value | |
| Investments | | (000) | | | (000) | |
| SHORT-TERM INVESTMENT 2.93% | | | | | | | | |
| | | | | | | | | |
| Repurchase Agreement | | | | | | | | |
Repurchase Agreement dated 10/31/2018, 1.25% due 11/1/2018 with Fixed Income Clearing Corp. collateralized by $107,695,000 of U.S. Treasury Note at 2.625% due 6/15/2021; value: $108,067,086; proceeds: $105,949,163
(cost $105,945,484) | | | $105,945 | | | $ | 105,945 | |
Total Investments in Securities 99.65%
(cost $3,404,014,172) | | | | | | | 3,602,910 | |
| Other Assets in Excess of Liabilities 0.35% | | | | | | | 12,626 | |
| Net Assets 100.00% | | | | | | $ | 3,615,536 | |
| ADR | | American Depositary Receipt. |
| * | | Non-income producing security. |
| (a) | | Foreign security traded in U.S. dollars. |
The following is a summary of the inputs used as of October 31, 2018 in valuing the Fund’s investments carried at fair value(1):
| | | Level 1 | | | Level 2 | | | Level 3 | | | Total | |
| Investment Type(2)(3) | | | (000) | | | | (000) | | | | (000) | | | | (000) | |
| Common Stocks | | $ | 3,496,965 | | | $ | – | | | $ | – | | | $ | 3,496,965 | |
| Short-Term Investments | | | | | | | | | | | | | | | | |
| Repurchase Agreement | | | – | | | | 105,945 | | | | – | | | | 105,945 | |
| Total | | $ | 3,496,965 | | | $ | 105,945 | | | $ | – | | | $ | 3,602,910 | |
| | | |
| (1) | | Refer to Note 2(l) for a description of fair value measurements and the three-tier hierarchy of inputs. |
| (2) | | See Schedule of Investments for fair values in each industry and identification of foreign issuers and/or geography. |
| (3) | | There were no Level 1/Level 2 transfers during the fiscal year ended October 31, 2018. |
| 66 | See Notes to Financial Statements. |
Schedule of Investments
INTERNATIONAL EQUITY FUND October 31, 2018
| | | | | | U.S. $ | |
| | | | | | Fair Value | |
| Investments | | Shares | | | (000) | |
| COMMON STOCKS 95.80% | | | | | | | | |
| | | | | | | | | |
| Australia 1.49% | | | | | | | | |
| | | | | | | | | |
| Metals & Mining | | | | | | | | |
| BHP Billiton Ltd. | | | 361,890 | | | $ | 8,350 | |
| | | | | | | | | |
| Brazil 1.50% | | | | | | | | |
| | | | | | | | | |
| Banks 0.72% | | | | | | | | |
| Itau Unibanco Holding SA ADR | | | 306,970 | | | | 4,043 | |
| | | | | | | | | |
| Wireless Telecommunication Services 0.78% |
| TIM Participacoes SA | | | 1,401,900 | | | | 4,366 | |
| Total Brazil | | | | | | | 8,409 | |
| | | | | | | | | |
| Canada 2.51% | | | | | | | | |
| | | | | | | | | |
| Aerospace & Defense 1.41% | | | | | | | | |
| CAE, Inc. | | | 447,700 | | | | 7,897 | |
| | | | | | | | | |
| Metals & Mining 1.10% | | | | | | | | |
| Lundin Mining Corp. | | | 1,506,700 | | | | 6,192 | |
| Total Canada | | | | | | | 14,089 | |
| | | | | | | | | |
| China 4.78% | | | | | | | | |
| | | | | | | | | |
| Insurance 1.18% | | | | | | | | |
| Ping An Insurance Group Co. of China Ltd. Class H | | | 697,000 | | | | 6,589 | |
| | | | | | | | | |
| Interactive Media & Services 1.58% | | | | | | | | |
| Tencent Holdings Ltd. | | | 259,100 | | | | 8,877 | |
| | | | | | | | | |
| Internet & Direct Marketing Retail 1.33% | | | | | | | | |
| Alibaba Group Holding Ltd. ADR* | | | 52,349 | | | | 7,448 | |
| | | | | | | | | |
| Oil, Gas & Consumable Fuels 0.69% | | | | | | | | |
| CNOOC Ltd. | | | 2,276,000 | | | | 3,876 | |
| Total China | | | | | | | 26,790 | |
| | | | | | | | | |
| Denmark 1.58% | | | | | | | | |
| | | | | | | | | |
| Health Care Equipment & Supplies 0.51% | | | | | | | | |
| Ambu A/S Class B | | | 138,520 | | | | 2,886 | |
| | | | | | U.S. $ | |
| | | | | | Fair Value | |
| Investments | | Shares | | | (000) | |
| Pharmaceuticals 1.07% | | | | | | | | |
| Novo Nordisk A/S Class B | | | 138,954 | | | $ | 6,002 | |
| Total Denmark | | | | | | | 8,888 | |
| | | | | | | | | |
| France 14.85% | | | | | | | | |
| | | | | | | | | |
| Aerospace & Defense 1.01% | | | | | | | | |
| Thales SA | | | 44,277 | | | | 5,655 | |
| | | | | | | | | |
| Beverages 1.29% | | | | | | | | |
| Pernod Ricard SA | | | 28,249 | | | | 4,307 | |
| Remy Cointreau SA | | | 24,878 | | | | 2,953 | |
| | | | | | | | 7,260 | |
| Construction & Engineering 1.49% | | | | | | | | |
| Vinci SA | | | 94,002 | | | | 8,366 | |
| | | | | | | | | |
| Diversified Telecommunication Services 0.76% | | | | | | | | |
| Orange SA | | | 271,692 | | | | 4,241 | |
| | | | | | | | | |
| Entertainment 2.24% | | | | | | | | |
| Ubisoft Entertainment SA* | | | 61,713 | | | | 5,536 | |
| Vivendi SA | | | 290,413 | | | | 7,004 | |
| | | | | | | | 12,540 | |
| | | | | | | | | |
| Food Products 0.74% | | | | | | | | |
| Danone SA | | | 58,944 | | | | 4,174 | |
| | | | | | | | | |
| Information Technology Services 1.32% | | | | | | | | |
| Capgemini SE | | | 60,550 | | | | 7,393 | |
| | | | | | | | | |
| Machinery 1.18% | | | | | | | | |
| Alstom SA | | | 151,692 | | | | 6,625 | |
| | | | | | | | | |
| Oil, Gas & Consumable Fuels 1.89% | | | | | | | | |
| Total SA | | | 180,500 | | | | 10,591 | |
| | | | | | | | | |
| Personal Products 1.02% | | | | | | | | |
| L’Oreal SA | | | 25,464 | | | | 5,737 | |
| | | | | | | | | |
| Pharmaceuticals 1.39% | | | | | | | | |
| Sanofi | | | 87,149 | | | | 7,788 | |
| | | | | | | | | |
| Textiles, Apparel & Luxury Goods 0.52% | | | | | | | | |
| LVMH Moet Hennessy Louis Vuitton SE | | | 9,639 | | | | 2,925 | |
| Total France | | | | | | | 83,295 | |
| | See Notes to Financial Statements. | 67 |
Schedule of Investments (continued)
INTERNATIONAL EQUITY FUND October 31, 2018
| | | | | | U.S. $ | |
| | | | | | Fair Value | |
| Investments | | Shares | | | (000) | |
| Germany 8.52% | | | | | | | | |
| | | | | | | | | |
| Chemicals 1.24% | | | | | | | | |
| Symrise AG | | | 83,324 | | | $ | 6,980 | |
| | | | | | | | | |
| Information Technology Services 1.14% | | | | | | | | |
| Wirecard AG | | | 34,168 | | | | 6,391 | |
| | | | | | | | | |
| Insurance 1.61% | | | | | | | | |
| Allianz SE Registered Shares | | | 43,308 | | | | 9,022 | |
| | | | | | | | | |
| Life Sciences Tools & Services 0.43% | | | | | | | | |
| MorphoSys AG* | | | 25,733 | | | | 2,383 | |
| | | | | | | | | |
| Real Estate Management & Development 1.56% |
| Aroundtown SA | | | 1,056,402 | | | | 8,754 | |
| | | | | | | | | |
| Software 1.74% | | | | | | | | |
| SAP SE | | | 91,175 | | | | 9,762 | |
| | | | | | | | | |
| Textiles, Apparel & Luxury Goods 0.80% | | | | | | | | |
| adidas AG | | | 19,075 | | | | 4,486 | |
| Total Germany | | | | | | | 47,778 | |
| | | | | | | | | |
| Hong Kong 1.80% | | | | | | | | |
| | | | | | | | | |
| Insurance | | | | | | | | |
| AIA Group Ltd. | | | 1,324,000 | | | | 10,072 | |
| | | | | | | | | |
| Hungary 0.88% | | | | | | | | |
| | | | | | | | | |
| Oil, Gas & Consumable Fuels | | | | | | | | |
| MOL Hungarian Oil & Gas plc | | | 469,213 | | | | 4,920 | |
| | | | | | | | | |
| India 1.66% | | | | | | | | |
| | | | | | | | | |
| Banks | | | | | | | | |
| ICICI Bank Ltd. ADR | | | 981,644 | | | | 9,316 | |
| | | | | | | | | |
| Indonesia 1.25% | | | | | | | | |
| | | | | | | | | |
| Banks | | | | | | | | |
| Bank Rakyat Indonesia Persero Tbk PT | | | 33,769,800 | | | | 7,009 | |
| | | | | | U.S. $ | |
| | | | | | Fair Value | |
| Investments | | Shares | | | (000) | |
| Ireland 3.17% | | | | | | | | |
| | | | | | | | | |
| Banks 0.89% | | | | | | | | |
| Bank of Ireland Group plc | | | 706,011 | | | $ | 4,988 | |
| | | | | | | | | |
| Construction Materials 0.84% | | | | | | | | |
| CRH plc | | | 158,408 | | | | 4,730 | |
| | | | | | | | | |
| Life Sciences Tools & Services 1.44% |
| ICON plc* | | | 58,507 | | | | 8,079 | |
| Total Ireland | | | | | | | 17,797 | |
| | | | | | | | | |
| Israel 1.34% | | | | | | | | |
| | | | | | | | | |
| Software | | | | | | | | |
| Nice Ltd. ADR* | | | 70,979 | | | | 7,520 | |
| | | | | | | | | |
| Japan 16.54% | | | | | | | | |
| | | | | | | | | |
| Building Products 1.20% | | | | | | | | |
| Daikin Industries Ltd. | | | 57,900 | | | | 6,711 | |
| | | | | | | | | |
| Construction & Engineering 1.05% | | | | | | | | |
| Taisei Corp. | | | 137,700 | | | | 5,889 | |
| | | | | | | | | |
| Diversified Financial Services 1.47% | | | | | | | | |
| ORIX Corp. | | | 506,400 | | | | 8,250 | |
| | | | | | | | | |
| Electronic Equipment, Instruments & Components 1.10% | |
| Murata Manufacturing Co., Ltd. | | | 39,500 | | | | 6,148 | |
| | | | | | | | | |
| Entertainment 1.35% | | | | | | | | |
| Nintendo Co., Ltd. | | | 24,300 | | | | 7,587 | |
| | | | | | | | | |
| Food & Staples Retailing 1.17% | | | | | | | | |
| Seven & i Holdings Co., Ltd. | | | 151,700 | | | | 6,569 | |
| | | | | | | | | |
| Health Care Equipment & Supplies 1.04% | | | | | | | | |
| Hoya Corp. | | | 102,600 | | | | 5,805 | |
| | | | | | | | | |
| Household Durables 1.76% | | | | | | | | |
| Sony Corp. | | | 182,600 | | | | 9,882 | |
| | | | | | | | | |
| Internet & Direct Marketing Retail 0.47% | | | | | | | | |
| ZOZO, Inc. | | | 109,200 | | | | 2,620 | |
| 68 | See Notes to Financial Statements. |
Schedule of Investments (continued)
INTERNATIONAL EQUITY FUND October 31, 2018
| | | | | | U.S. $ | |
| | | | | | Fair Value | |
| Investments | | Shares | | | (000) | |
| Japan (continued) | | | | | | | | |
| | | | | | | | | |
| Personal Products 0.48% | | | | | | | | |
| Shiseido Co., Ltd. | | | 43,100 | | | $ | 2,719 | |
| | | | | | | | | |
| Professional Services 1.55% | | | | | | | | |
| en-japan, Inc. | | | 93,100 | | | | 3,713 | |
| Recruit Holdings Co., Ltd. | | | 184,600 | | | | 4,955 | |
| | | | | | | | 8,668 | |
| | | | | | | | | |
| Specialty Retail 1.63% | | | | | | | | |
| Bic Camera, Inc. | | | 252,100 | | | | 3,328 | |
| Fast Retailing Co. Ltd. | | | 11,600 | | | | 5,841 | |
| | | | | | | | 9,169 | |
| | | | | | | | | |
| Trading Companies & Distributors 1.00% | | | | | | | | |
| Mitsubishi Corp. | | | 199,800 | | | | 5,623 | |
| | | | | | | | | |
| Wireless Telecommunication Services 1.27% | | | | | | | | |
| NTT DOCOMO, Inc. | | | 286,600 | | | | 7,107 | |
| Total Japan | | | | | | | 92,747 | |
| | | | | | | | | |
| Luxembourg 1.48% | | | | | | | | |
| | | | | | | | | |
| Multi-Line Retail | | | | | | | | |
| B&M European Value Retail SA | | | 1,559,476 | | | | 8,298 | |
| | | | | | | | | |
| Mexico 1.31% | | | | | | | | |
| | | | | | | | | |
| Banks | | | | | | | | |
| Grupo Financiero Banorte SAB de CV | | | 1,339,600 | | | | 7,370 | |
| | | | | | | | | |
| Netherlands 5.28% | | | | | | | | |
| | | | | | | | | |
| Health Care Equipment & Supplies 1.64% | | | | | | | | |
| Koninklijke Philips NV | | | 246,137 | | | | 9,180 | |
| | | | | | | | | |
| Insurance 0.74% | | | | | | | | |
| ASR Nederland NV | | | 91,551 | | | | 4,156 | |
| | | | | | | | | |
| Oil, Gas & Consumable Fuels 2.15% | | | | | | | | |
| Royal Dutch Shell plc B Shares | | | 369,721 | | | | 12,058 | |
| | | | | | U.S. $ | |
| | | | | | Fair Value | |
| Investments | | Shares | | | (000) | |
| Semiconductors & Semiconductor Equipment 0.75% | | | |
| ASML Holding NV | | | 24,354 | | | | 4,195 | |
| Total Netherlands | | | | | | | 29,589 | |
| | | | | | | | | |
| Norway 0.34% | | | | | | | | |
| | | | | | | | | |
| Banks | | | | | | | | |
| Sparebank 1 Oestlandet | | | 182,414 | | | $ | 1,894 | |
| | | | | | | | | |
| Philippines 1.36% | | | | | | | | |
| | | | | | | | | |
| Banks | | | | | | | | |
| Metropolitan Bank & Trust Co. | | | 6,202,544 | | | | 7,609 | |
| | | | | | | | | |
| Singapore 1.36% | | | | | | | | |
| | | | | | | | | |
| Banks | | | | | | | | |
| United Overseas Bank Ltd. | | | 430,500 | | | | 7,611 | |
| | | | | | | | | |
| South Africa 1.03% | | | | | | | | |
| | | | | | | | | |
| Paper & Forest Products | | | | | | | | |
| Mondi plc | | | 244,831 | | | | 5,766 | |
| | | | | | | | | |
| Sweden 0.99% | | | | | | | | |
| | | | | | | | | |
| Specialty Retail | | | | | | | | |
| Hennes & Mauritz AB B Shares | | | 314,861 | | | | 5,561 | |
| | | | | | | | | |
| Switzerland 5.45% | | | | | | | | |
| | | | | | | | | |
| Food Products 1.85% | | | | | | | | |
| Nestle SA Registered Shares | | | 122,966 | | | | 10,381 | |
| | | | | | | | | |
| Insurance 1.88% | | | | | | | | |
| Swiss Life Holding AG Registered Shares* | | | 27,991 | | | | 10,559 | |
| | | | | | | | | |
| Pharmaceuticals 1.72% | | | | | | | | |
| Novartis AG Registered Shares | | | 110,249 | | | | 9,655 | |
| Total Switzerland | | | | | | | 30,595 | |
| | See Notes to Financial Statements. | 69 |
Schedule of Investments (continued)
INTERNATIONAL EQUITY FUND October 31, 2018
| | | | | | U.S. $ | |
| | | | | | Fair Value | |
| Investments | | Shares | | | (000) | |
| Taiwan 0.91% | | | | | | | | |
| | | | | | | | | |
| Semiconductors & Semiconductor Equipment | | | | | | | | |
| Taiwan Semiconductor Manufacturing Co., Ltd. ADR | | | 134,358 | | | $ | 5,119 | |
| | | | | | | | | |
| United Kingdom 14.42% | | | | | | | | |
| | | | | | | | | |
| Aerospace & Defense 1.17% | | | | | | | | |
| BAE Systems plc | | | 977,079 | | | | 6,552 | |
| | | | | | | | | |
| Banks 0.98% | | | | | | | | |
| Royal Bank of Scotland Group PLC | | | 1,833,614 | | | | 5,520 | |
| | | | | | | | | |
| Beverages 1.41% | | | | | | | | |
| Coca-Cola European Partners plc | | | 174,095 | | | | 7,886 | |
| | | | | | | | | |
| Capital Markets 1.05% | | | | | | | | |
| Schroders plc | | | 172,011 | | | | 5,887 | |
| | | | | | | | | |
| Hotels, Restaurants & Leisure 1.11% | | | | | | | | |
| GVC Holdings PLC | | | 521,241 | | | | 6,244 | |
| | | | | | | | | |
| Household Products 0.71% | | | | | | | | |
| Reckitt Benckiser Group plc | | | 49,062 | | | | 3,967 | |
| | | | | | | | | |
| Insurance 1.54% | | | | | | | | |
| Hiscox Ltd. | | | 414,940 | | | | 8,619 | |
| | | | | | | | | |
| Metals & Mining 1.02% | | | | | | | | |
| Anglo American plc | | | 268,238 | | | | 5,725 | |
| | | | | | | | | |
| Oil, Gas & Consumable Fuels 1.01% | | | | | | | | |
| BP plc | | | 781,516 | | | | 5,645 | |
| | | | | | | | | |
| Personal Products 1.47% | | | | | | | | |
| Unilever NV CVA | | | 153,350 | | | | 8,240 | |
| | | | | | | | | |
| Pharmaceuticals 1.98% | | | | | | | | |
| AstraZeneca plc | | | 145,549 | | | | 11,133 | |
| | | | | | | | | |
| Trading Companies & Distributors 0.97% | | | | | | | | |
| Ashtead Group plc | | | 220,089 | | | | 5,433 | |
| Total United Kingdom | | | | | | | 80,851 | |
Total Common Stocks
(cost $562,243,870) | | | | | | | 537,243 | |
| | | Principal | | | U.S. $ | |
| | | Amount | | | Fair Value | |
| Investments | | (000) | | | (000) | |
| SHORT-TERM INVESTMENT 3.45% | | | | | | | | |
| | | | | | | | | |
| Repurchase Agreement | | | | | | | | |
Repurchase Agreement dated 10/31/2018, 1.25% due 11/1/2018 with Fixed Income Clearing Corp. collateralized by $19,730,000 of U.S. Treasury Note at 2.625% due 7/15/2021; value: $19,745,074; proceeds: $19,354,893
(cost $19,354,221) | | | $19,354 | | | $ | 19,354 | |
Total Investments in Securities 99.25%
(cost $581,598,091) | | | | | | | 556,597 | |
| Foreign Cash and Other Assets in Excess of Liabilities 0.75% | | | | | | | 4,206 | |
| Net Assets 100.00% | | | | | | $ | 560,803 | |
| ADR | | American Depositary Receipt. |
| CVA | | Company Voluntary Arrangement. |
| * | | Non-income producing security. |
| 70 | See Notes to Financial Statements. |
Schedule of Investments (continued)
INTERNATIONAL EQUITY FUND October 31, 2018
The following is a summary of the inputs used as of October 31, 2018 in valuing the Fund’s investments carried at fair value(1):
| | | Level 1 | | | Level 2 | | | Level 3 | | | Total | |
| Investment Type(2)(3) | | (000) | | | (000) | | | (000) | | | (000) | |
| Common Stocks | | | | | | | | | | | | | | | | |
| Australia(3) | | $ | – | | | $ | 8,350 | | | $ | – | | | $ | 8,350 | |
| Brazil | | | 8,409 | | | | – | | | | – | | | | 8,409 | |
| Canada | | | 14,089 | | | | – | | | | – | | | | 14,089 | |
| China(3) | | | 7,448 | | | | 19,342 | | | | – | | | | 26,790 | |
| Denmark(3) | | | 2,886 | | | | 6,002 | | | | – | | | | 8,888 | |
| France(3) | | | – | | | | 83,295 | | | | – | | | | 83,295 | |
| Germany(3) | | | – | | | | 47,778 | | | | – | | | | 47,778 | |
| Hong Kong(3) | | | – | | | | 10,072 | | | | – | | | | 10,072 | |
| Hungary | | | – | | | | 4,920 | | | | – | | | | 4,920 | |
| India | | | 9,316 | | | | – | | | | – | | | | 9,316 | |
| Indonesia(3) | | | – | | | | 7,009 | | | | – | | | | 7,009 | |
| Ireland(3) | | | 8,079 | | | | 9,718 | | | | – | | | | 17,797 | |
| Israel | | | 7,520 | | | | – | | | | – | | | | 7,520 | |
| Japan(3) | | | – | | | | 92,747 | | | | – | | | | 92,747 | |
| Luxembourg(3) | | | – | | | | 8,298 | | | | – | | | | 8,298 | |
| Mexico | | | 7,370 | | | | – | | | | – | | | | 7,370 | |
| Netherlands(3) | | | – | | | | 29,589 | | | | – | | | | 29,589 | |
| Norway(3) | | | – | | | | 1,894 | | | | – | | | | 1,894 | |
| Philippines | | | – | | | | 7,609 | | | | – | | | | 7,609 | |
| Singapore | | | – | | | | 7,611 | | | | – | | | | 7,611 | |
| South Africa | | | – | | | | 5,766 | | | | – | | | | 5,766 | |
| Sweden | | | – | | | | 5,561 | | | | – | | | | 5,561 | |
| Switzerland(3) | | | – | | | | 30,595 | | | | – | | | | 30,595 | |
| Taiwan | | | 5,119 | | | | – | | | | – | | | | 5,119 | |
| United Kingdom(3) | | | – | | | | 80,851 | | | | – | | | | 80,851 | |
| Short-Term Investments | | | | | | | | | | | | | | | | |
| Repurchase Agreement | | | – | | | | 19,354 | | | | – | | | | 19,354 | |
| Total | | $ | 70,236 | | | $ | 486,361 | | | $ | – | | | $ | 556,597 | |
| (1) | | Refer to Note 2(l) for a description of fair value measurements and the three-tier hierarchy of inputs. |
| (2) | | See Schedule of Investments for fair values in each industry and identification of foreign issuers and/or geography. |
| (3) | | Securities in the amount of $214,408,915 were transferred from Level 1 to Level 2 due to a change in valuation technique resulting in adjusted valuations (as described in Note 2(l)) on October 31, 2018. |
| | See Notes to Financial Statements. | 71 |
Schedule of Investments (concluded)
INTERNATIONAL EQUITY FUND October 31, 2018
The following is a reconciliation of investments with unobservable inputs (Level 3) that were used in determining fair value:
| Investment Type | | Common Stocks | |
| Balance as of November 1, 2017 | | $ | 663 | |
| Accrued Discounts (Premiums) | | | – | |
| Realized Gain (Loss) | | | 130 | |
| Change in Unrealized Appreciation (Depreciation) | | | 7 | |
| Purchases | | | – | |
| Sales | | | (800 | ) |
| Transfers into Level 3 | | | – | |
| Transfers out of Level 3 | | | – | |
| Balance as of October 31, 2018 | | $ | – | |
| Change in unrealized appreciation/depreciation for year ended October 31, 2018 related to Level 3 investments held at October 31, 2018 | | $ | – | |
| 72 | See Notes to Financial Statements. |
Schedule of Investments
INTERNATIONAL OPPORTUNITIES FUND October 31, 2018
| | | | | | U.S. $ | |
| | | | | | Fair Value | |
| Investments | | Shares | | | (000) | |
| COMMON STOCKS 95.15% | | | | | | | | |
| | | | | | | | | |
| Australia 5.14% | | | | | | | | |
| | | | | | | | | |
| Auto Components 0.71% | | | | | | | | |
| GUD Holdings Ltd. | | | 642,037 | | | $ | 5,629 | |
| | | | | | | | | |
| Beverages 1.95% | | | | | | | | |
| Coca-Cola Amatil Ltd. | | | 2,185,879 | | | | 15,384 | |
| | | | | | | | | |
| Diversified Financial Services 1.10% | | | | | | | | |
| IMF Bentham Ltd. | | | 4,166,020 | | | | 8,729 | |
| | | | | | | | | |
| Electric: Utilities 1.38% | | | | | | | | |
| AusNet Services | | | 8,981,598 | | | | 10,894 | |
| Total Australia | | | | | | | 40,636 | |
| | | | | | | | | |
| Canada 9.08% | | | | | | | | |
| | | | | | | | | |
| Aerospace & Defense 1.50% | | | | | | | | |
| CAE, Inc. | | | 670,700 | | | | 11,830 | |
| | | | | | | | | |
| Entertainment 1.96% | | | | | | | | |
| Entertainment One Ltd. | | | 2,966,954 | | | | 15,509 | |
| | | | | | | | | |
| Metals & Mining 1.09% | | | | | | | | |
| Hudbay Minerals, Inc. | | | 1,098,866 | | | | 4,315 | |
| Lundin Mining Corp. | | | 1,048,500 | | | | 4,309 | |
| | | | | | | | 8,624 | |
| | | | | | | | | |
| Oil, Gas & Consumable Fuels 3.46% | | | | | | | | |
| Africa Oil Corp.* | | | 5,580,364 | | | | 5,239 | |
| Arrow Exploration Corp.* | | | 501,118 | | | | 266 | |
| Canacol Energy Ltd.* | | | 3,939,400 | | | | 11,042 | |
| Vermilion Energy, Inc. | | | 405,600 | | | | 10,756 | |
| | | | | | | | 27,303 | |
| | | | | | | | | |
| Software 1.07% | | | | | | | | |
| Kinaxis, Inc.* | | | 125,100 | | | | 8,446 | |
| Total Canada | | | | | | | 71,712 | |
| | | | | | | | | |
| China 0.16% | | | | | | | | |
| | | | | | | | | |
| Consumer Finance | | | | | | | | |
| China Rapid Finance Ltd. ADR* | | | 497,137 | | | | 1,238 | |
| | | | | | U.S. $ | |
| | | | | | Fair Value | |
| Investments | | Shares | | | (000) | |
| Denmark 1.30% | | | | | | | | |
| | | | | | | | | |
| Construction & Engineering | | | | | | | | |
| FLSmidth & Co. A/S | | | 196,347 | | | $ | 10,302 | |
| | | | | | | | | |
| Finland 1.32% | | | | | | | | |
| | | | | | | | | |
| Health Care Providers & Services 0.32% | | | | | | | | |
| Terveystalo OYJ*† | | | 295,532 | | | | 2,526 | |
| | | | | | | | | |
| Machinery 0.52% | | | | | | | | |
| Konecranes OYJ | | | 115,235 | | | | 4,127 | |
| | | | | | | | | |
| Trading Companies & Distributors 0.48% | | | | | | | | |
| Cramo OYJ | | | 199,470 | | | | 3,802 | |
| Total Finland | | | | | | | 10,455 | |
| | | | | | | | | |
| France 2.96% | | | | | | | | |
| | | | | | | | | |
| Construction Materials 0.51% | | | | | | | | |
| Vicat SA | | | 75,301 | | | | 4,047 | |
| | | | | | | | | |
| Health Care Providers & Services 2.09% | | | | | | | | |
| Korian SA | | | 420,239 | | | | 16,557 | |
| | | | | | | | | |
| Specialty Retail 0.36% | | | | | | | | |
| Maisons du Monde SA† | | | 112,293 | | | | 2,815 | |
| Total France | | | | | | | 23,419 | |
| | | | | | | | | |
| Germany 5.55% | | | | | | | | |
| | | | | | | | | |
| Industrial Conglomerates 0.81% | | | | | | | | |
| Rheinmetall AG | | | 73,896 | | | | 6,395 | |
| | | | | | | | | |
| Interactive Media & Services 1.11% | | | | | | | | |
| XING SE | | | 29,104 | | | | 8,751 | |
| | | | | | | | | |
| Life Sciences Tools & Services 2.01% | | | | | | | | |
| Gerresheimer AG | | | 169,643 | | | | 11,956 | |
| MorphoSys AG* | | | 42,161 | | | | 3,904 | |
| | | | | | | | 15,860 | |
| Machinery 0.51% | | | | | | | | |
| Deutz AG | | | 548,918 | | | | 4,083 | |
| | | | | | | | | |
| Real Estate Management & Development 1.11% |
| PATRIZIA Immobilien AG | | | 509,841 | | | | 8,764 | |
| Total Germany | | | | | | | 43,853 | |
| | See Notes to Financial Statements. | 73 |
Schedule of Investments (continued)
INTERNATIONAL OPPORTUNITIES FUND October 31, 2018
| | | | | | U.S. $ | |
| | | | | | Fair Value | |
| Investments | | Shares | | | (000) | |
| Hong Kong 4.88% | | | | | | | | |
| | | | | | | | | |
| Auto Components 1.33% | | | | | | | | |
| Xinyi Glass Holdings Ltd. | | | 10,548,000 | | | $ | 10,473 | |
| | | | | | | | | |
| Communications Equipment 1.21% | | | | | | | | |
| VTech Holdings Ltd. | | | 811,600 | | | | 9,535 | |
| | | | | | | | | |
| Consumer Finance 0.99% | | | | | | | | |
| Sun Hung Kai & Co., Ltd. | | | 17,440,000 | | | | 7,865 | |
| | | | | | | | | |
| Hotels, Restaurants & Leisure 0.49% | | | | | | | | |
| Melco International Development Ltd. | | | 2,237,000 | | | | 3,839 | |
| | | | | | | | | |
| Pharmaceuticals 0.86% | | | | | | | | |
| SSY Group Ltd. | | | 8,078,000 | | | | 6,825 | |
| Total Hong Kong | | | | | | | 38,537 | |
| | | | | | | | | |
| India 0.41% | | | | | | | | |
| | | | | | | | | |
| Consumer Finance | | | | | | | | |
| Satin Creditcare Network Ltd.* | | | 1,054,223 | | | | 3,257 | |
| | | | | | | | | |
| Indonesia 0.79% | | | | | | | | |
| | | | | | | | | |
| Banks 0.68% | | | | | | | | |
| Bank Tabungan Negara Persero Tbk PT | | | 38,801,700 | | | | 5,417 | |
| | | | | | | | | |
| Consumer Finance 0.11% | | | | | | | | |
| PT Clipan Finance Indonesia Tbk* | | | 52,233,850 | | | | 859 | |
| Total Indonesia | | | | | | | 6,276 | |
| | | | | | | | | |
| Ireland 7.24% | | | | | | | | |
| | | | | | | | | |
| Beverages 1.65% | | | | | | | | |
| C&C Group plc | | | 3,512,835 | | | | 13,050 | |
| | | | | | | | | |
| Equity Real Estate Investment Trusts 1.23% | | | | | | | | |
| Hibernia REIT plc | | | 6,149,489 | | | | 9,682 | |
| | | | | | | | | |
| Health Care Providers & Services 1.68% | | | | | | | | |
| UDG Healthcare plc | | | 1,648,610 | | | | 13,296 | |
| | | | | | U.S. $ | |
| | | | | | Fair Value | |
| Investments | | Shares | | | (000) | |
| Household Durables 1.86% | | | | | | | | |
| Cairn Homes plc* | | | 2,775,386 | | | $ | 4,458 | |
| Glenveagh Properties plc*† | | | 10,813,643 | | | | 10,239 | |
| | | | | | | | 14,697 | |
| | | | | | | | | |
| Information Technology Services 0.82% | | | | | | | | |
| Keywords Studios plc | | | 371,704 | | | | 6,509 | |
| Total Ireland | | | | | | | 57,234 | |
| | | | | | | | | |
| Israel 0.51% | | | | | | | | |
| | | | | | | | | |
| Food Products | | | | | | | | |
| Strauss Group Ltd. | | | 181,943 | | | | 3,989 | |
| | | | | | | | | |
| Italy 3.86% | | | | | | | | |
| | | | | | | | | |
| Capital Markets 0.49% | | | | | | | | |
| Anima Holding SpA† | | | 927,634 | | | | 3,879 | |
| | | | | | | | | |
| Construction Materials 1.80% | | | | | | | | |
| Buzzi Unicem SpA | | | 738,447 | | | | 14,180 | |
| | | | | | | | | |
| Diversified Financial Services 0.63% | | | | | | | | |
| doBank SpA† | | | 452,405 | | | | 4,987 | |
| | | | | | | | | |
| Textiles, Apparel & Luxury Goods 0.94% | | | | | | | | |
| Brunello Cucinelli SpA | | | 216,604 | | | | 7,414 | |
| Total Italy | | | | | | | 30,460 | |
| | | | | | | | | |
| Japan 19.98% | | | | | | | | |
| | | | | | | | | |
| Banks 0.87% | | | | | | | | |
| Shinsei Bank Ltd. | | | 451,100 | | | | 6,872 | |
| | | | | | | | | |
| Chemicals 0.44% | | | | | | | | |
| KH Neochem Co., Ltd. | | | 122,200 | | | | 3,471 | |
| | | | | | | | | |
| Construction & Engineering 1.84% | | | | | | | | |
| SHO-BOND Holdings Co., Ltd. | | | 204,700 | | | | 14,564 | |
| | | | | | | | | |
| Containers & Packaging 0.99% | | | | | | | | |
| Fuji Seal International, Inc. | | | 258,600 | | | | 7,844 | |
| | | | | | | | | |
| Distributors 0.84% | | | | | | | | |
| PALTAC Corp. | | | 130,800 | | | | 6,664 | |
| 74 | See Notes to Financial Statements. |
Schedule of Investments (continued)
INTERNATIONAL OPPORTUNITIES FUND October 31, 2018
| | | | | | U.S. $ | |
| | | | | | Fair Value | |
| Investments | | Shares | | | (000) | |
| Japan (continued) | | | | | | | | |
| | | | | | | | | |
| Entertainment 1.13% | | | | | | | | |
| Capcom Co., Ltd. | | | 429,700 | | | $ | 8,957 | |
| | | | | | | | | |
| Equity Real Estate Investment Trusts 1.47% | | | | | | | | |
| GLP J-Reit | | | 11,714 | | | | 11,592 | |
| | | | | | | | | |
| Food Products 1.35% | | | | | | | | |
| Nichirei Corp. | | | 445,300 | | | | 10,695 | |
| | | | | | | | | |
| Health Care Providers & Services 0.53% | | | | | | | | |
| Japan Lifeline Co., Ltd. | | | 286,500 | | | | 4,177 | |
| | | | | | | | | |
| Hotels, Restaurants & Leisure 1.28% | | | | | | | | |
| HIS Co., Ltd. | | | 267,200 | | | | 8,138 | |
| St. Marc Holdings Co., Ltd. | | | 83,000 | | | | 1,971 | |
| | | | | | | | 10,109 | |
| | | | | | | | | |
| Information Technology Services 0.99% | | | | | | | | |
| NS Solutions Corp. | | | 262,700 | | | | 7,840 | |
| | | | | | | | | |
| Machinery 0.86% | | | | | | | | |
| DMG Mori Co., Ltd. | | | 473,500 | | | | 6,832 | |
| | | | | | | | | |
| Professional Services 2.78% | | | | | | | | |
| en-japan, Inc. | | | 240,000 | | | | 9,573 | |
| TechnoPro Holdings, Inc. | | | 237,300 | | | | 12,362 | |
| | | | | | | | 21,935 | |
| | | | | | | | | |
| Real Estate Management & Development 1.29% |
| Kenedix, Inc. | | | 1,953,500 | | | | 10,168 | |
| | | | | | | | | |
| Specialty Retail 2.79% | | | | | | | | |
| Bic Camera, Inc. | | | 754,800 | | | | 9,965 | |
| United Arrows Ltd. | | | 320,700 | | | | 12,059 | |
| | | | | | | | 22,024 | |
| | | | | | | | | |
| Wireless Telecommunication Services 0.53% | | | | | | | | |
| Okinawa Cellular Telephone Co. | | | 112,600 | | | | 4,148 | |
| Total Japan | | | | | | | 157,892 | |
| | | | | | U.S. $ | |
| | | | | | Fair Value | |
| Investments | | Shares | | | (000) | |
| Luxembourg 1.80% | | | | | | | | |
| | | | | | | | | |
| Multi-Line Retail | | | | | | | | |
| B&M European Value Retail SA | | | 2,668,827 | | | $ | 14,202 | |
| | | | | | | | | |
| Netherlands 3.89% | | | | | | | | |
| | | | | | | | | |
| Air Freight & Logistics 0.74% | | | | | | | | |
| PostNL NV | | | 1,965,457 | | | | 5,807 | |
| | | | | | | | | |
| Hotels, Restaurants & Leisure 0.84% | | | | | | | | |
| Basic-Fit NV*† | | | 231,772 | | | | 6,673 | |
| | | | | | | | | |
| Insurance 1.28% | | | | | | | | |
| ASR Nederland NV | | | 222,081 | | | | 10,082 | |
| | | | | | | | | |
| Machinery 1.03% | | | | | | | | |
| Aalberts Industries NV | | | 222,963 | | | | 8,173 | |
| Total Netherlands | | | | | | | 30,735 | |
| | | | | | | | | |
| Philippines 2.19% | | | | | | | | |
| | | | | | | | | |
| Industrial Conglomerates 1.23% | | | | | | | | |
| Alliance Global Group, Inc.* | | | 45,640,600 | | | | 9,720 | |
| | | | | | | | | |
| Real Estate Management & Development 0.96% |
| Filinvest Land, Inc. | | | 289,015,000 | | | | 7,562 | |
| Total Philippines | | | | | | | 17,282 | |
| | | | | | | | | |
| Portugal 1.01% | | | | | | | | |
| | | | | | | | | |
| Multi-Utilities | | | | | | | | |
| REN—Redes Energeticas Nacionais SGPS SA | | | 2,998,985 | | | | 7,985 | |
| | | | | | | | | |
| South Korea 0.75% | | | | | | | | |
| | | | | | | | | |
| Food & Staples Retailing | | | | | | | | |
| GS Retail Co., Ltd. | | | 188,277 | | | | 5,947 | |
| | | | | | | | | |
| Spain 5.72% | | | | | | | | |
| | | | | | | | | |
| Food Products 1.02% | | | | | | | | |
| Ebro Foods SA | | | 408,798 | | | | 8,024 | |
| | See Notes to Financial Statements. | 75 |
Schedule of Investments (continued)
INTERNATIONAL OPPORTUNITIES FUND October 31, 2018
| | | | | | U.S. $ | |
| | | | | | Fair Value | |
| Investments | | Shares | | | (000) | |
| Spain (continued) | | | | | | | | |
| | | | | | | | | |
| Household Durables 1.25% | | | | | | | | |
| Neinor Homes SA*† | | | 611,894 | | | $ | 9,848 | |
| | | | | | | | | |
| Professional Services 2.21% | | | | | | | | |
| Applus Services SA | | | 1,284,930 | | | | 17,469 | |
| | | | | | | | | |
| Real Estate Management & Development 1.24% |
| Aedas Homes SAU*† | | | 380,171 | | | | 9,835 | |
| Total Spain | | | | | | | 45,176 | |
| | | | | | | | | |
| Sweden 3.11% | | | | | | | | |
| | | | | | | | | |
| Commercial Services & Supplies 2.44% | | | | | | | | |
| Bravida Holding AB† | | | 1,763,769 | | | | 12,958 | |
| Loomis AB Class B | | | 205,002 | | | | 6,338 | |
| | | | | | | | 19,296 | |
| | | | | | | | | |
| Food & Staples Retailing 0.67% | | | | | | | | |
| Axfood AB | | | 297,552 | | | | 5,308 | |
| Total Sweden | | | | | | | 24,604 | |
| | | | | | | | | |
| Switzerland 1.19% | | | | | | | | |
| | | | | | | | | |
| Containers & Packaging | | | | | | | | |
| SIG Combibloc Group AG* | | | 844,923 | | | | 9,368 | |
| | | | | | | | | |
| Taiwan 0.56% | | | | | | | | |
| | | | | | | | | |
| Semiconductors & Semiconductor Equipment 0.48% | | | | | |
| Realtek Semiconductor Corp. | | | 932,000 | | | | 3,753 | |
| | | | | | | | | |
| Technology Hardware, Storage & Peripherals 0.08% | |
| Primax Electronics Ltd. | | | 488,000 | | | | 660 | |
| Total Taiwan | | | | | | | 4,413 | |
| | | | | | | | | |
| United Kingdom 8.79% | | | | | | | | |
| | | | | | | | | |
| Beverages 1.92% | | | | | | | | |
| Britvic plc | | | 1,504,256 | | | | 15,186 | |
| | | | | | | | | |
| Capital Markets 0.67% | | | | | | | | |
| Man Group plc | | | 2,660,125 | | | | 5,278 | |
| | | | | | U.S. $ | |
| | | | | | Fair Value | |
| Investments | | Shares | | | (000) | |
| Consumer Finance 1.18% | | | | | | | | |
| Arrow Global Group plc | | | 3,818,800 | | | $ | 9,333 | |
| | | | | | | | | |
| Electronic Equipment, Instruments & Components 1.12% |
| accesso Technology Group plc* | | | 340,716 | | | | 8,831 | |
| | | | | | | | | |
| Insurance 1.41% | | | | | | | | |
| Lancashire Holdings Ltd. | | | 1,480,830 | | | | 11,164 | |
| | | | | | | | | |
| Machinery 0.76% | | | | | | | | |
| Concentric AB | | | 450,372 | | | | 6,044 | |
| | | | | | | | | |
| Media 0.64% | | | | | | | | |
| Huntsworth plc | | | 3,510,333 | | | | 5,025 | |
| | | | | | | | | |
| Pharmaceuticals 1.09% | | | | | | | | |
| Dechra Pharmaceuticals plc | | | 294,654 | | | | 8,609 | |
| Total United Kingdom | | | | | | | 69,470 | |
| | | | | | | | | |
| United States 1.56% | | | | | | | | |
| | | | | | | | | |
| Exchange-Traded Funds 1.33% | | | | | | | | |
| VanEck Vectors Junior Gold Miners | | | 384,295 | | | | 10,499 | |
| | | | | | | | | |
| Software 0.23% | | | | | | | | |
| Elastic NV* | | | 26,600 | | | | 1,809 | |
| Total United States | | | | | | | 12,308 | |
| | | | | | | | | |
| Vietnam 1.40% | | | | | | | | |
| | | | | | | | | |
| Closed-Ended Fund | | | | | | | | |
| VinaCapital Vietnam Opportunity Fund Ltd. | | | 2,583,376 | | | | 11,050 | |
Total Common Stocks
(cost $856,167,563) | | | | | | | 751,800 | |
| 76 | See Notes to Financial Statements. |
Schedule of Investments (continued)
INTERNATIONAL OPPORTUNITIES FUND October 31, 2018
| | | Principal | | | U.S. $ | |
| | | Amount | | | Fair Value | |
| Investments | | (000 | ) | | (000) | |
| SHORT-TERM INVESTMENT 2.73% | | | | | | | | |
| | | | | | | | | |
| Repurchase Agreement | | | | | | | | |
Repurchase Agreement dated 10/31/2018, 1.25% due 11/1/2018 with Fixed Income Clearing Corp. collateralized by $21,925,000 of U.S. Treasury Note at 2.625% due 6/15/2021; value: $22,000,751; proceeds: $21,567,846
(cost $21,567,097) | | | $21,567 | | | $ | 21,567 | |
Total Investments in Securities 97.88%
(cost $877,734,660) | | | | | | | 773,367 | |
| Foreign Cash, Cash and Other Assets in Excess of Liabilities 2.12% | | | | | | | 16,750 | |
| Net Assets 100.00% | | | | | | $ | 790,117 | |
| ADR | | American Depositary Receipt. |
| * | | Non-income producing security. |
| † | | Security was purchased pursuant to Rule 144A under the Securities Act of 1933 and, unless registered under such Act or exempted from registration, may only be resold to qualified institutional buyers. |
| | See Notes to Financial Statements. | 77 |
Schedule of Investments (concluded)
INTERNATIONAL OPPORTUNITIES FUND October 31, 2018
The following is a summary of the inputs used as of October 31, 2018 in valuing the Fund’s investments carried at fair value(1):
| | | Level 1 | | | Level 2 | | | Level 3 | | | Total | |
| Investment Type(2) | | (000) | | | (000) | | | (000) | | | (000) | |
| Common Stocks | | | | | | | | | | | | | | | | |
| Australia(3) | | $ | – | | | $ | 40,636 | | | $ | – | | | $ | 40,636 | |
| Canada(3) | | | 50,964 | | | | 20,748 | | | | – | | | | 71,712 | |
| China | | | 1,238 | | | | – | | | | – | | | | 1,238 | |
| Denmark | | | – | | | | 10,302 | | | | – | | | | 10,302 | |
| Finland(3) | | | – | | | | 10,455 | | | | – | | | | 10,455 | |
| France(3) | | | – | | | | 23,419 | | | | – | | | | 23,419 | |
| Germany(3) | | | – | | | | 43,853 | | | | – | | | | 43,853 | |
| Hong Kong(3) | | | – | | | | 38,537 | | | | – | | | | 38,537 | |
| India | | | – | | | | 3,257 | | | | – | | | | 3,257 | |
| Indonesia(3) | | | 859 | | | | 5,417 | | | | – | | | | 6,276 | |
| Ireland(3) | | | 37,429 | | | | 19,805 | | | | – | | | | 57,234 | |
| Israel | | | – | | | | 3,989 | | | | – | | | | 3,989 | |
| Italy(3) | | | – | | | | 30,460 | | | | – | | | | 30,460 | |
| Japan(3) | | | 11,592 | | | | 146,300 | | | | – | | | | 157,892 | |
| Luxembourg(3) | | | – | | | | 14,202 | | | | – | | | | 14,202 | |
| Netherlands(3) | | | – | | | | 30,735 | | | | – | | | | 30,735 | |
| Philippines(3) | | | 7,562 | | | | 9,720 | | | | – | | | | 17,282 | |
| Portugal(3) | | | – | | | | 7,985 | | | | – | | | | 7,985 | |
| South Korea | | | – | | | | 5,947 | | | | – | | | | 5,947 | |
| Spain(3) | | | 9,835 | | | | 35,341 | | | | – | | | | 45,176 | |
| Sweden(3) | | | – | | | | 24,604 | | | | – | | | | 24,604 | |
| Switzerland | | | 9,368 | | | | – | | | | – | | | | 9,368 | |
| Taiwan(3) | | | – | | | | 4,413 | | | | – | | | | 4,413 | |
| United Kingdom(3) | | | 20,402 | | | | 49,068 | | | | – | | | | 69,470 | |
| United States | | | 12,308 | | | | – | | | | – | | | | 12,308 | |
| Vietnam | | | 11,050 | | | | – | | | | – | | | | 11,050 | |
| Short-Term Investments | | | | | | | | | | | | | | | | |
| Repurchase Agreement | | | – | | | | 21,567 | | | | – | | | | 21,567 | |
| Total | | $ | 172,607 | | | $ | 600,760 | | | $ | – | | | $ | 773,367 | |
| (1) | | Refer to Note 2(l) for a description of fair value measurements and the three-tier hierarchy of inputs. |
| (2) | | See Schedule of Investments for fair values in each industry and identification of foreign issuers and/or geography. |
| (3) | | Securities in the amount of $377,294,221 were transferred from Level 1 to Level 2 due to a change in valuation technique resulting in adjusted valuations (as described in Note 2(l)) on October 31, 2018. Securities in the amount of $5,953,769 were transferred from Level 2 to Level 1 as a result of utilizing the last sale or official closing price on the exchange or system on which the securities are principally traded on October 31, 2018. |
| 78 | See Notes to Financial Statements. |
Schedule of Investments
INTERNATIONAL VALUE FUND October 31, 2018
| | | | | | U.S. $ | |
| | | | | | Fair Value | |
| Investments | | Shares | | | (000) | |
| COMMON STOCKS 96.13% | | | | | | | | |
| | | | | | | | | |
| Australia 3.84% | | | | | | | | |
| | | | | | | | | |
| Capital Markets 0.78% | | | | | | | | |
| Macquarie Group Ltd. | | | 69,049 | | | $ | 5,758 | |
| | | | | | | | | |
| Hotels, Restaurants & Leisure 1.25% | | | | | | | | |
| Crown Resorts Ltd. | | | 1,041,348 | | | | 9,266 | |
| | | | | | | | | |
| Metals & Mining 1.81% | | | | | | | | |
| BHP Billiton Ltd. | | | 577,655 | | | | 13,328 | |
| Total Australia | | | | | | | 28,352 | |
| | | | | | | | | |
| Austria 1.26% | | | | | | | | |
| | | | | | | | | |
| Banks | | | | | | | | |
| Erste Group Bank AG* | | | 228,627 | | | | 9,307 | |
| | | | | | | | | |
| Belgium 1.75% | | | | | | | | |
| | | | | | | | | |
| Beverages 0.36% | | | | | | | | |
| Anheuser-Busch InBev SA | | | 35,640 | | | | 2,636 | |
| | | | | | | | | |
| Insurance 1.39% | | | | | | | | |
| Ageas | | | 205,528 | | | | 10,283 | |
| Total Belgium | | | | | | | 12,919 | |
| | | | | | | | | |
| Canada 4.29% | | | | | | | | |
| | | | | | | | | |
| Banks 2.59% | | | | | | | | |
| Bank of Nova Scotia (The) | | | 129,400 | | | | 6,945 | |
| Royal Bank of Canada | | | 167,000 | | | | 12,168 | |
| | | | | | | | 19,113 | |
| | | | | | | | | |
| Oil, Gas & Consumable Fuels 1.70% | | | | | | | | |
| Pembina Pipeline Corp. | | | 388,200 | | | | 12,556 | |
| Total Canada | | | | | | | 31,669 | |
| | | | | | | | | |
| China 1.85% | | | | | | | | |
| | | | | | | | | |
| Banks 0.90% | | | | | | | | |
| China Construction Bank Corp. Class H | | | 8,366,000 | | | | 6,639 | |
| | | | | | U.S. $ | |
| | | | | | Fair Value | |
| Investments | | Shares | | | (000) | |
| Oil, Gas & Consumable Fuels 0.95% | | | | | | | | |
| CNOOC Ltd. | | | 4,140,000 | | | $ | 7,050 | |
| Total China | | | | | | | 13,689 | |
| | | | | | | | | |
| Denmark 0.77% | | | | | | | | |
| | | | | | | | | |
| Insurance | | | | | | | | |
| Tryg A/S | | | 234,387 | | | | 5,650 | |
| | | | | | | | | |
| Finland 1.20% | | | | | | | | |
| | | | | | | | | |
| Communications Equipment | | | | | | | | |
| Nokia OYJ | | | 1,567,555 | | | | 8,854 | |
| | | | | | | | | |
| France 10.10% | | | | | | | | |
| | | | | | | | | |
| Automobiles 0.51% | | | | | | | | |
| Renault SA | | | 50,297 | | | | 3,756 | |
| | | | | | | | | |
| Banks 1.33% | | | | | | | | |
| BNP Paribas SA | | | 188,295 | | | | 9,813 | |
| | | | | | | | | |
| Construction & Engineering 0.77% | | | | | | | | |
| Vinci SA | | | 64,098 | | | | 5,705 | |
| | | | | | | | | |
| Food Products 1.42% | | | | | | | | |
| Danone SA | | | 148,052 | | | | 10,484 | |
| | | | | | | | | |
| Oil, Gas & Consumable Fuels 3.40% | | | | | | | | |
| Total SA | | | 427,186 | | | | 25,065 | |
| | | | | | | | | |
| Pharmaceuticals 2.67% | | | | | | | | |
| Sanofi | | | 220,946 | | | | 19,744 | |
| Total France | | | | | | | 74,567 | |
| | | | | | | | | |
| Germany 11.65% | | | | | | | | |
| | | | | | | | | |
| Automobiles 1.10% | | | | | | | | |
| Volkswagen AG | | | 49,218 | | | | 8,103 | |
| | | | | | | | | |
| Chemicals 1.02% | | | | | | | | |
| BASF SE | | | 97,747 | | | | 7,501 | |
| | | | | | | | | |
| Diversified Telecommunication Services 1.73% | | | | | | | | |
| Deutsche Telekom AG Registered Shares | | | 778,621 | | | | 12,771 | |
| | See Notes to Financial Statements. | 79 |
Schedule of Investments (continued)
INTERNATIONAL VALUE FUND October 31, 2018
| | | | | | U.S. $ | |
| | | | | | Fair Value | |
| Investments | | Shares | | | (000) | |
| Germany (continued) | | | | | | | | |
| | | | | | | | | |
| Hotels, Restaurants & Leisure 1.22% | | | | | | | | |
| TUI AG | | | 545,065 | | | $ | 9,043 | |
| | | | | | | | | |
| Insurance 2.72% | | | | | | | | |
| Allianz SE Registered Shares | | | 96,558 | | | | 20,115 | |
| | | | | | | | | |
| Multi-Utilities 0.89% | | | | | | | | |
| E. On SE | | | 676,092 | | | | 6,538 | |
| | | | | | | | | |
| Pharmaceuticals 0.73% | | | | | | | | |
| Bayer AG Registered Shares | | | 70,676 | | | | 5,417 | |
| | | | | | | | | |
| Real Estate Management & Development 2.24% |
| Aroundtown SA | | | 1,293,000 | | | | 10,715 | |
| Vonovia SE | | | 127,830 | | | | 5,841 | |
| | | | | | | | 16,556 | |
| Total Germany | | | | | | | 86,044 | |
| | | | | | | | | |
| Hong Kong 3.10% | | | | | | | | |
| | | | | | | | | |
| Commercial Services & Supplies 0.87% | | | | | | | | |
| China Everbright International Ltd. | | | 8,024,925 | | | | 6,420 | |
| | | | | | | | | |
| Communications Equipment 1.06% | | | | | | | | |
| VTech Holdings Ltd. | | | 665,700 | | | | 7,821 | |
| | | | | | | | | |
| Equity Real Estate Investment Trusts 0.78% | | | | | | | | |
| Link REIT | | | 651,500 | | | | 5,790 | |
| | | | | | | | | |
| Hotels, Restaurants & Leisure 0.39% | | | | | | | | |
| Melco Resorts & Entertainment Ltd. ADR | | | 171,617 | | | | 2,854 | |
| Total Hong Kong | | | | | | | 22,885 | |
| | | | | | | | | |
| India 0.55% | | | | | | | | |
| | | | | | | | | |
| Thrifts & Mortgage Finance | | | | | | | | |
| Indiabulls Housing Finance Ltd. | | | 358,438 | | | | 4,043 | |
| | | | | | | | | |
| Japan 13.35% | | | | | | | | |
| | | | | | | | | |
| Automobiles 2.47% | | | | | | | | |
| Toyota Motor Corp. | | | 311,700 | | | | 18,260 | |
| | | | | | U.S. $ | |
| | | | | | Fair Value | |
| Investments | | Shares | | | (000) | |
| Banks 2.04% | | | | | | | | |
| Sumitomo Mitsui Financial Group, Inc. | | | 387,300 | | | $ | 15,080 | |
| | | | | | | | | |
| Commercial Services & Supplies 0.82% | | | | | | | | |
| Park24 Co., Ltd. | | | 229,100 | | | | 6,027 | |
| | | | | | | | | |
| Diversified Financial Services 1.17% | | | | | | | | |
| ORIX Corp. | | | 528,600 | | | | 8,611 | |
| | | | | | | | | |
| Household Durables 1.67% | | | | | | | | |
| Sony Corp. | | | 228,700 | | | | 12,377 | |
| | | | | | | | | |
| Insurance 1.57% | | | | | | | | |
| Tokio Marine Holdings, Inc. | | | 246,100 | | | | 11,594 | |
| | | | | | | | | |
| Trading Companies & Distributors 2.20% | | | | | | | | |
| ITOCHU Corp. | | | 454,700 | | | | 8,433 | |
| Mitsubishi Corp. | | | 277,200 | | | | 7,802 | |
| | | | | | | | 16,235 | |
| | | | | | | | | |
| Wireless Telecommunication Services 1.41% | | | | | | | | |
| KDDI Corp. | | | 429,400 | | | | 10,391 | |
| Total Japan | | | | | | | 98,575 | |
| | | | | | | | | |
| Macau 0.47% | | | | | | | | |
| | | | | | | | | |
| Hotels, Restaurants & Leisure | | | | | | | | |
| Sands China Ltd. | | | 884,000 | | | | 3,496 | |
| | | | | | | | | |
| Mexico 0.63% | | | | | | | | |
| | | | | | | | | |
| Banks | | | | | | | | |
| Grupo Financiero Banorte SAB de CV | | | 844,116 | | | | 4,644 | |
| | | | | | | | | |
| Netherlands 7.74% | | | | | | | | |
| | | | | | | | | |
| Banks 1.55% | | | | | | | | |
| ING Groep NV | | | 968,054 | | | | 11,453 | |
| | | | | | | | | |
| Health Care Equipment & Supplies 1.48% | | | | | | | | |
| Koninklijke Philips NV | | | 292,526 | | | | 10,910 | |
| | | | | | | | | |
| Insurance 1.01% | | | | | | | | |
| ASR Nederland NV | | | 164,039 | | | | 7,447 | |
| 80 | See Notes to Financial Statements. |
Schedule of Investments (continued)
INTERNATIONAL VALUE FUND October 31, 2018
| | | | | | U.S. $ | |
| | | | | | Fair Value | |
| Investments | | Shares | | | (000) | |
| Netherlands (continued) | | | | | | | | |
| | | | | | | | | |
| Oil, Gas & Consumable Fuels 3.70% | | | | | | | | |
| Royal Dutch Shell plc Class A ADR | | | 432,373 | | | $ | 27,322 | |
| Total Netherlands | | | | | | | 57,132 | |
| | | | | | | | | |
| New Zealand 1.88% | | | | | | | | |
| | | | | | | | | |
| Diversified Telecommunication Services | | | | | | | | |
| Spark New Zealand Ltd. | | | 5,380,212 | | | | 13,895 | |
| | | | | | | | | |
| Russia 1.89% | | | | | | | | |
| | | | | | | | | |
| Oil, Gas & Consumable Fuels | | | | | | | | |
| Lukoil PJSC ADR | | | 187,184 | | | | 13,956 | |
| | | | | | | | | |
| Singapore 1.32% | | | | | | | | |
| | | | | | | | | |
| Banks | | | | | | | | |
| DBS Group Holdings Ltd. | | | 572,400 | | | | 9,712 | |
| | | | | | | | | |
| Spain 2.03% | | | | | | | | |
| | | | | | | | | |
| Banks 0.66% | | | | | | | | |
| Banco Bilbao Vizcaya Argentaria SA | | | 877,226 | | | | 4,842 | |
| | | | | | | | | |
| Electric: Utilities 1.37% | | | | | | | | |
| Red Electrica Corp. SA | | | 490,492 | | | | 10,156 | |
| Total Spain | | | | | | | 14,998 | |
| | | | | | | | | |
| Switzerland 6.95% | | | | | | | | |
| | | | | | | | | |
| Insurance 2.18% | | | | | | | | |
| Swiss Life Holding AG Registered Shares* | | | 42,650 | | | | 16,088 | |
| | | | | | | | | |
| Pharmaceuticals 4.77% | | | | | | | | |
| Novartis AG Registered Shares | | | 293,304 | | | | 25,685 | |
| Roche Holding AG | | | 39,006 | | | | 9,493 | |
| | | | | | | | 35,178 | |
| Total Switzerland | | | | | | | 51,266 | |
| | | | | | U.S. $ | |
| | | | | | Fair Value | |
| Investments | | Shares | | | (000) | |
| Taiwan 1.11% | | | | | | | | |
| | | | | | | | | |
| Semiconductors & Semiconductor Equipment | | | | | | | | |
| Realtek Semiconductor Corp. | | | 508,000 | | | $ | 2,046 | |
| Taiwan Semiconductor Manufacturing Co., Ltd. | | | 817,000 | | | | 6,133 | |
| Total Taiwan | | | | | | | 8,179 | |
| | | | | | | | | |
| United Kingdom 16.16% | | | | | | | | |
| | | | | | | | | |
| Aerospace & Defense 1.60% | | | | | | | | |
| BAE Systems plc | | | 1,761,351 | | | | 11,810 | |
| | | | | | | | | |
| Banks 1.30% | | | | | | | | |
| Royal Bank of Scotland Group PLC | | | 3,179,462 | | | | 9,572 | |
| | | | | | | | | |
| Beverages 1.79% | | | | | | | | |
| Coca-Cola European Partners plc | | | 290,941 | | | | 13,178 | |
| | | | | | | | | |
| Equity Real Estate Investment Trusts 1.05% | | | | | | | | |
| Derwent London plc | | | 206,654 | | | | 7,728 | |
| | | | | | | | | |
| Household Durables 0.25% | | | | | | | | |
| Persimmon plc | | | 64,247 | | | | 1,880 | |
| | | | | | | | | |
| Insurance 0.94% | | | | | | | | |
| Prudential plc | | | 346,432 | | | | 6,937 | |
| | | | | | | | | |
| Metals & Mining 1.93% | | | | | | | | |
| Anglo American plc | | | 669,069 | | | | 14,280 | |
| | | | | | | | | |
| Multi-Utilities 1.41% | | | | | | | | |
| National Grid plc | | | 983,319 | | | | 10,388 | |
| | | | | | | | | |
| Personal Products 1.19% | | | | | | | | |
| Unilever NV CVA | | | 163,363 | | | | 8,778 | |
| | | | | | | | | |
| Pharmaceuticals 1.85% | | | | | | | | |
| AstraZeneca plc | | | 178,737 | | | | 13,672 | |
| | See Notes to Financial Statements. | 81 |
Schedule of Investments (continued)
INTERNATIONAL VALUE FUND October 31, 2018
| | | | | | U.S. $ | |
| | | | | | Fair Value | |
| Investments | | Shares | | | (000) | |
| United Kingdom (continued) | | | | | | | | |
| | | | | | | | | |
| Tobacco 2.16% | | | | | | | | |
| British American Tobacco plc | | | 156,777 | | | $ | 6,796 | |
| Imperial Brands plc | | | 271,098 | | | | 9,183 | |
| | | | | | | | 15,979 | |
| | | | | | | | | |
| Wireless Telecommunication Services 0.69% | | | | | | | | |
| Vodafone Group plc | | | 2,689,628 | | | | 5,058 | |
| Total United Kingdom | | | | | | | 119,260 | |
| | | | | | | | | |
| United States 2.24% | | | | | | | | |
| | | | | | | | | |
| Exchange-Traded Funds | | | | | | | | |
| iShares MSCI Japan ETF | | | 301,799 | | | | 16,551 | |
Total Common Stocks
(cost $728,743,291) | | | | | | | 709,643 | |
| | | Principal | | | Fair | |
| | | Amount | | | Value | |
| Investments | | (000) | | | (000) | |
| SHORT-TERM INVESTMENT 3.36% | | | | | | | | |
| | | | | | | | | |
| Repurchase Agreement | | | | | | | | |
| | | | | | | | | |
| Repurchase Agreement dated 10/31/2018, 1.25% due 11/1/2018 with Fixed Income Clearing Corp. collateralized by $25,315,000 of U.S. Treasury Note at 2.625% due 7/15/2021; value: $25,334,341; proceeds: $24,835,033 (cost $24,834,171) | | | $24,834 | | | $ | 24,834 | |
Total Investments in Securities 99.49%
(cost $753,577,462) | | | | | | | 734,477 | |
| Foreign Cash and Other Assets in Excess of Liabilities 0.51% | | | | | | | 3,740 | |
| Net Assets 100.00% | | | | | | $ | 738,217 | |
| ADR | | American Depositary Receipt. |
| CVA | | Company Voluntary Arrangement. |
| ETF | | Exchange Traded Fund. |
| * | | Non-income producing security. |
| 82 | See Notes to Financial Statements. |
Schedule of Investments (concluded)
INTERNATIONAL VALUE FUND October 31, 2018
The following is a summary of the inputs used as of October 31, 2018 in valuing the Fund’s investments carried at fair value(1):
| | | Level 1 | | | Level 2 | | | Level 3 | | | Total | |
| Investment Type(2) | | (000) | | | (000) | | | (000) | | | (000) | |
| Common Stocks | | | | | | | | | | | | | | | | |
| Australia(3) | | $ | – | | | $ | 28,352 | | | $ | – | | | $ | 28,352 | |
| Austria(3) | | | – | | | | 9,307 | | | | – | | | | 9,307 | |
| Belgium(3) | | | – | | | | 12,919 | | | | – | | | | 12,919 | |
| Canada | | | 31,669 | | | | – | | | | – | | | | 31,669 | |
| China | | | – | | | | 13,689 | | | | – | | | | 13,689 | |
| Denmark | | | – | | | | 5,650 | | | | – | | | | 5,650 | |
| Finland | | | – | | | | 8,854 | | | | – | | | | 8,854 | |
| France(3) | | | – | | | | 74,567 | | | | – | | | | 74,567 | |
| Germany(3) | | | – | | | | 86,044 | | | | – | | | | 86,044 | |
| Hong Kong(3) | | | 8,644 | | | | 14,241 | | | | – | | | | 22,885 | |
| India(3) | | | – | | | | 4,043 | | | | – | | | | 4,043 | |
| Japan(3) | | | – | | | | 98,575 | | | | – | | | | 98,575 | |
| Macau(3) | | | – | | | | 3,496 | | | | – | | | | 3,496 | |
| Mexico | | | 4,644 | | | | – | | | | – | | | | 4,644 | |
| Netherlands(3) | | | 27,322 | | | | 29,810 | | | | – | | | | 57,132 | |
| New Zealand(3) | | | – | | | | 13,895 | | | | – | | | | 13,895 | |
| Russia(3) | | | – | | | | 13,956 | | | | – | | | | 13,956 | |
| Singapore(3) | | | – | | | | 9,712 | | | | – | | | | 9,712 | |
| Spain(3) | | | – | | | | 14,998 | | | | – | | | | 14,998 | |
| Switzerland(3) | | | – | | | | 51,266 | | | | – | | | | 51,266 | |
| Taiwan(3) | | | – | | | | 8,179 | | | | – | | | | 8,179 | |
| United Kingdom(3) | | | 7,728 | | | | 111,532 | | | | – | | | | 119,260 | |
| United States | | | 16,551 | | | | – | | | | – | | | | 16,551 | |
| Short-Term Investments | | | | | | | | | | | | | | | | |
| Repurchase Agreement | | | – | | | | 24,834 | | | | – | | | | 24,834 | |
| Total | | $ | 96,558 | | | $ | 637,919 | | | $ | – | | | $ | 734,477 | |
| (1) | | Refer to Note 2(l) for a description of fair value measurements and the three-tier hierarchy of inputs. |
| (2) | | See Schedule of Investments for fair values in each industry and identification of foreign issuers and/or geography. |
| (3) | | Securities in the amount of $497,824,171 were transferred from Level 1 to Level 2 due to a change in valuation technique resulting in adjusted valuations (as described in Note 2(l)) on October 31, 2018. |
| | See Notes to Financial Statements. | 83 |
Schedule of Investments
VALUE OPPORTUNITIES FUND October 31, 2018
| | | | | | Fair | |
| | | | | | Value | |
| Investments | | Shares | | | (000) | |
| COMMON STOCKS 98.70% | | | | | | | | |
| | | | | | | | | |
| Aerospace & Defense 1.53% | | | | | | | | |
| Teledyne Technologies, Inc.* | | | 178,670 | | | $ | 39,536 | |
| | | | | | | | | |
| Air Freight & Logistics 1.49% | | | | | | | | |
| XPO Logistics, Inc.* | | | 429,974 | | | | 38,431 | |
| | | | | | | | | |
| Banks 7.47% | | | | | | | | |
| Citizens Financial Group, Inc. | | | 674,496 | | | | 25,193 | |
| Cullen/Frost Bankers, Inc. | | | 577,657 | | | | 56,564 | |
| East West Bancorp, Inc. | | | 335,514 | | | | 17,595 | |
| Webster Financial Corp. | | | 436,188 | | | | 25,665 | |
| Western Alliance Bancorp* | | | 1,015,095 | | | | 48,968 | |
| Zions Bancorp NA | | | 401,622 | | | | 18,896 | |
| Total | | | | | | | 192,881 | |
| | | | | | | | | |
| Beverages 1.59% | | | | | | | | |
| Cott Corp. | | | 2,728,368 | | | | 41,035 | |
| | | | | | | | | |
| Building Products 1.78% | | | | | | | | |
| Allegion plc (Ireland)(a) | | | 401,987 | | | | 34,462 | |
| Gibraltar Industries, Inc.* | | | 322,503 | | | | 11,494 | |
| Total | | | | | | | 45,956 | |
| | | | | | | | | |
| Capital Markets 2.00% | | | | | | | | |
| Moelis & Co. Class A | | | 518,110 | | | | 20,911 | |
| Raymond James Financial, Inc. | | | 400,458 | | | | 30,711 | |
| Total | | | | | | | 51,622 | |
| | | | | | | | | |
| Chemicals 3.25% | | | | | | | | |
| Ashland Global Holdings, Inc. | | | 538,468 | | | | 39,836 | |
| Valvoline, Inc. | | | 2,217,013 | | | | 44,163 | |
| Total | | | | | | | 83,999 | |
| | | | | | | | | |
| Communications Equipment 1.19% | | | | | | | | |
| Plantronics, Inc. | | | 522,835 | | | | 30,832 | |
| | | | | | | | | |
| Construction & Engineering 1.97% | | | | | | | | |
| Jacobs Engineering Group, Inc. | | | 678,510 | | | | 50,949 | |
| | | | | | Fair | |
| | | | | | Value | |
| Investments | | Shares | | | (000) | |
| Containers & Packaging 4.02% | | | | | | | | |
| AptarGroup, Inc. | | | 421,015 | | | $ | 42,927 | |
| Berry Global Group, Inc.* | | | 929,828 | | | | 40,559 | |
| WestRock Co. | | | 471,279 | | | | 20,251 | |
| Total | | | | | | | 103,737 | |
| | | | | | | | | |
| Diversified Telecommunication Services 1.19% | |
| Zayo Group Holdings, Inc.* | | | 1,025,471 | | | | 30,641 | |
| | | | | | | | | |
| Electrical Equipment 1.18% | | | | | | | | |
| EnerSys | | | 260,100 | | | | 20,696 | |
| Hubbell, Inc. | | | 96,784 | | | | 9,843 | |
| Total | | | | | | | 30,539 | |
| | | | | | | | | |
| Electronic Equipment, Instruments & Components 4.71% |
| Amphenol Corp. Class A | | | 347,834 | | | | 31,131 | |
| Belden, Inc. | | | 415,123 | | | | 22,438 | |
| FLIR Systems, Inc. | | | 844,760 | | | | 39,121 | |
| Littelfuse, Inc. | | | 159,640 | | | | 28,920 | |
| Total | | | | | | | 121,610 | |
| | | | | | | | | |
| Energy Equipment & Services 1.05% | | | | | | | | |
| Helmerich & Payne, Inc. | | | 435,468 | | | | 27,125 | |
| | | | | | | | | |
| Entertainment 1.36% | | | | | | | | |
| Live Nation Entertainment, Inc.* | | | 669,210 | | | | 35,000 | |
| | | | | | | | | |
| Equity Real Estate Investment Trusts 2.85% | | | | | | | | |
| Alexandria Real Estate Equities, Inc. | | | 311,418 | | | | 38,065 | |
| Highwoods Properties, Inc. | | | 336,655 | | | | 14,355 | |
| Pebblebrook Hotel Trust | | | 623,737 | | | | 21,026 | |
| Total | | | | | | | 73,446 | |
| | | | | | | | | |
| Food & Staples Retailing 1.71% | | | | | | | | |
| Sprouts Farmers Market, Inc.* | | | 1,638,227 | | | | 44,052 | |
| | | | | | | | | |
| Food Products 0.50% | | | | | | | | |
| TreeHouse Foods, Inc.* | | | 284,500 | | | | 12,962 | |
| 84 | See Notes to Financial Statements. |
Schedule of Investments (continued)
VALUE OPPORTUNITIES FUND October 31, 2018
| | | | | | Fair | |
| | | | | | Value | |
| Investments | | Shares | | | (000) | |
| Health Care Equipment & Supplies 8.09% | | | | | | | | |
| Cooper Cos., Inc. (The) | | | 180,660 | | | $ | 46,666 | |
| Hill-Rom Holdings, Inc. | | | 513,998 | | | | 43,217 | |
| Integra LifeSciences Holdings Corp.* | | | 297,334 | | | | 15,928 | |
| LivaNova plc (United Kingdom)*(a) | | | 279,597 | | | | 31,312 | |
| STERIS plc (United Kingdom)(a) | | | 259,784 | | | | 28,397 | |
| Teleflex, Inc. | | | 180,153 | | | | 43,370 | |
| Total | | | | | | | 208,890 | |
| | | | | | | | | |
| Health Care Providers & Services 2.14% | | | | | | | | |
| Encompass Health Corp. | | | 568,427 | | | | 38,255 | |
| Molina Healthcare, Inc.* | | | 134,100 | | | | 17,000 | |
| Total | | | | | | | 55,255 | |
| | | | | | | | | |
| Health Care Technology 0.58% | | | | | | | | |
| Medidata Solutions, Inc.* | | | 212,707 | | | | 14,953 | |
| | | | | | | | | |
| Hotels, Restaurants & Leisure 2.22% | | | | | | | | |
| Dunkin’ Brands Group, Inc. | | | 504,957 | | | | 36,640 | |
| Texas Roadhouse, Inc. | | | 339,630 | | | | 20,534 | |
| Total | | | | | | | 57,174 | |
| | | | | | | | | |
| Information Technology Services 8.83% | | | | | | | | |
| Amdocs Ltd. | | | 782,126 | | | | 49,485 | |
| Booz Allen Hamilton Holding Corp. | | | 1,229,085 | | | | 60,889 | |
| Conduent, Inc.* | | | 3,626,307 | | | | 69,262 | |
| Fidelity National Information Services, Inc. | | | 464,708 | | | | 48,376 | |
| Total | | | | | | | 228,012 | |
| | | | | | | | | |
| Insurance 4.29% | | | | | | | | |
| Everest Re Group Ltd. | | | 187,067 | | | | 40,754 | |
| Fidelity National Financial, Inc. | | | 435,296 | | | | 14,561 | |
| Hanover Insurance Group, Inc. (The) | | | 252,038 | | | | 28,072 | |
| RenaissanceRe Holdings Ltd. | | | 224,848 | | | | 27,467 | |
| Total | | | | | | | 110,854 | |
| | | | | | Fair | |
| | | | | | Value | |
| Investments | | Shares | | | (000) | |
| Life Sciences Tools & Services 5.26% | | | | | | | | |
| Bio-Techne Corp. | | | 84,513 | | | $ | 14,175 | |
| Charles River Laboratories International, Inc.* | | | 427,794 | | | | 52,114 | |
| ICON plc (Ireland)*(a) | | | 207,317 | | | | 28,626 | |
| PerkinElmer, Inc. | | | 473,729 | | | | 40,968 | |
| Total | | | | | | | 135,883 | |
| | | | | | | | | |
| Machinery 2.60% | | | | | | | | |
| Crane Co. | | | 404,595 | | | | 35,216 | |
| Rexnord Corp.* | | | 1,187,124 | | | | 31,827 | |
| Total | | | | | | | 67,043 | |
| | | | | | | | | |
| Metals & Mining 1.39% | | | | | | | | |
| Reliance Steel & Aluminum Co. | | | 456,129 | | | | 35,998 | |
| | | | | | | | | |
| Multi-Utilities 3.98% | | | | | | | | |
| CMS Energy Corp. | | | 1,033,399 | | | | 51,174 | |
| NiSource, Inc. | | | 2,033,128 | | | | 51,560 | |
| Total | | | | | | | 102,734 | |
| | | | | | | | | |
| Oil, Gas & Consumable Fuels 3.93% | | | | | | | | |
| Centennial Resource Development, Inc. Class A* | | | 1,776,800 | | | | 34,044 | |
| Cimarex Energy Co. | | | 270,254 | | | | 21,477 | |
| EQT Corp. | | | 692,172 | | | | 23,513 | |
| Parsley Energy, Inc. Class A* | | | 958,973 | | | | 22,459 | |
| Total | | | | | | | 101,493 | |
| | | | | | | | | |
| Pharmaceuticals 1.33% | | | | | | | | |
| Catalent, Inc.* | | | 853,298 | | | | 34,422 | |
| | | | | | | | | |
| Professional Services 0.73% | | | | | | | | |
| Robert Half International, Inc. | | | 311,139 | | | | 18,833 | |
| | | | | | | | | |
| Road & Rail 0.89% | | | | | | | | |
| Old Dominion Freight Line, Inc. | | | 175,575 | | | | 22,898 | |
| | | | | | | | | |
| Semiconductors & Semiconductor Equipment 0.89% | |
| Entegris, Inc. | | | 862,159 | | | | 22,882 | |
| | See Notes to Financial Statements. | 85 |
Schedule of Investments (concluded)
VALUE OPPORTUNITIES FUND October 31, 2018
| | | | | | Fair | |
| | | | | | Value | |
| Investments | | Shares | | | (000) | |
| Software 2.88% | | | | | | | | |
| FireEye, Inc.* | | | 2,577,713 | | | $ | 47,662 | |
| Ultimate Software Group, Inc. (The)* | | | 99,700 | | | | 26,583 | |
| Total | | | | | | | 74,245 | |
| | | | | | | | | |
| Specialty Retail 3.55% | | | | | | | | |
| Advance Auto Parts, Inc. | | | 173,544 | | | | 27,725 | |
| Burlington Stores, Inc.* | | | 200,261 | | | | 34,343 | |
| Foot Locker, Inc. | | | 627,570 | | | | 29,584 | |
| Total | | | | | | | 91,652 | |
| | | | | | | | | |
| Textiles, Apparel & Luxury Goods 2.42% | | | | | | | | |
| Steven Madden Ltd. | | | 794,830 | | | | 24,854 | |
| Wolverine World Wide, Inc. | | | 1,067,246 | | | | 37,535 | |
| Total | | | | | | | 62,389 | |
| | | | | | | | | |
| Water Utilities 1.86% | | | | | | | | |
| American Water Works Co., Inc. | | | 541,071 | | | | 47,901 | |
Total Common Stocks
(cost $2,099,661,244) | | | | | | | 2,547,864 | |
| | | Principal | | | Fair | |
| | | Amount | | | Value | |
| Investments | | (000) | | | (000) | |
| SHORT-TERM INVESTMENT 1.70% | | | | | | | | |
| | | | | | | | | |
| Repurchase Agreement | | | | | | | | |
| | | | | | | | | |
| Repurchase Agreement dated 10/31/2018, 1.25% due 11/1/2018 with Fixed Income Clearing Corp. collateralized by $44,555,000 of U.S. Treasury Note at 2.75% due 8/15/2021; value: $44,639,387; proceeds: $43,765,136 (cost $43,763,616) | | | $43,764 | | | $ | 43,764 | |
Total Investments in Securities 100.40%
(cost $2,143,424,860) | | | | | | | 2,591,628 | |
| Liabilities in Excess of Other Assets (0.40)% | | | | | | | (10,342 | ) |
| Net Assets 100.00% | | | | | | $ | 2,581,286 | |
| * | | Non-income producing security. |
| (a) | | Foreign security traded in U.S. dollars. |
The following is a summary of the inputs used as of October 31, 2018 in valuing the Fund’s investments carried at fair value(1):
| | | Level 1 | | | Level 2 | | | Level 3 | | | Total | |
| Investment Type(2)(3) | | (000) | | | (000) | | | (000) | | | (000) | |
| Common Stocks | | $ | 2,547,864 | | | $ | – | | | $ | – | | | $ | 2,547,864 | |
| Short-Term Investments | | | | | | | | | | | | | | | | |
| Repurchase Agreement | | | – | | | | 43,764 | | | | – | | | | 43,764 | |
| Total | | $ | 2,547,864 | | | $ | 43,764 | | | $ | – | | | $ | 2,591,628 | |
| (1) | | Refer to Note 2(l) for a description of fair value measurements and the three-tier hierarchy of inputs. |
| (2) | | See Schedule of Investments for fair values in each industry and identification of foreign issuers and/or geography. |
| (3) | | There were no Level 1/Level 2 transfers during the fiscal year ended October 31, 2018. |
| 86 | See Notes to Financial Statements. |
This page is intentionally left blank.
Statements of Assets and Liabilities
October 31, 2018
| | | Alpha Strategy
Fund | | | Fundamental
Equity Fund | | | Global Equity
Research Fund | |
| ASSETS: | | | | | | | | | |
| Investments in securities, at cost | | $ | 613,260 | | | $ | 1,841,886,085 | | | $ | 6,561,617 | |
| Investments in Underlying Funds, at cost | | | 958,221,420 | | | | – | | | | – | |
| Investments in securities, at value | | $ | 613,260 | | | $ | 2,195,009,722 | | | $ | 6,436,964 | |
| Investments in Underlying Funds, at value | | | 1,013,068,463 | | | | – | | | | – | |
| Cash | | | – | | | | – | | | | 251,631 | |
| Foreign cash, at value (cost $0, $0, $4,238, $0, $0 and $8,789,499, respectively) | | | – | | | | – | | | | 4,182 | |
| Receivables: | | | | | | | | | | | | |
| Investment securities sold | | | – | | | | – | | | | 5,428 | |
| Capital shares sold | | | 362,312 | | | | 374,875 | | | | 12,823 | |
| Interest and dividends | | | 21 | | | | 2,428,367 | | | | 7,790 | |
| From advisor (See Note 3) | | | – | | | | – | | | | 31,083 | |
| Investments in Underlying Funds sold | | | 768,113 | | | | – | | | | – | |
| Prepaid expenses and other assets | | | 50,651 | | | | 79,322 | | | | 23,694 | |
| Total assets | | | 1,014,862,820 | | | | 2,197,892,286 | | | | 6,773,595 | |
| LIABILITIES: | | | | | | | | | | | | |
| Payables: | | | | | | | | | | | | |
| Investments in Securities purchased | | | – | | | | – | | | | 80,991 | |
| Capital shares reacquired | | | 1,468,000 | | | | 5,704,618 | | | | 12,823 | |
| Management fee | | | – | | | | 1,039,191 | | | | 2,554 | |
| 12b-1 distribution plan | | | 327,556 | | | | 766,144 | | | | 1,586 | |
| Trustees’ fees | | | 163,333 | | | | 737,678 | | | | 189 | |
| Fund administration | | | 35,974 | | | | 76,680 | | | | 227 | |
| Offering costs | | | – | | | | – | | | | 14,707 | |
| Accrued expenses | | | 259,450 | | | | 540,810 | | | | 50,320 | |
| Total liabilities | | | 2,254,313 | | | | 8,865,121 | | | | 163,397 | |
| NET ASSETS | | $ | 1,012,608,507 | | | $ | 2,189,027,165 | | | $ | 6,610,198 | |
| COMPOSITION OF NET ASSETS: | | | | | | | | | | | | |
| Paid-in capital | | $ | 849,331,985 | | | $ | 1,676,362,849 | | | $ | 6,443,436 | |
| Total distributable earnings (loss) | | | 163,276,522 | | | | 512,664,316 | | | | 166,762 | |
| Net Assets | | $ | 1,012,608,507 | | | $ | 2,189,027,165 | | | $ | 6,610,198 | |
| 88 | See Notes to Financial Statements. |
Global Select
Equity Fund | | | Growth
Leaders Fund | | | International
Equity Fund | |
| | | | | | | | |
| $ | 2,292,524 | | | $ | 3,404,014,172 | | | $ | 581,598,091 | |
| | – | | | | – | | | | – | |
| $ | 2,167,644 | | | $ | 3,602,910,061 | | | $ | 556,597,002 | |
| | – | | | | – | | | | – | |
| | 23,073 | | | | – | | | | – | |
| | | | | | | | | | | |
| | – | | | | – | | | | 8,601,867 | |
| | | | | | | | | | | |
| | 10,822 | | | | 214,489,261 | | | | 1,629,066 | |
| | – | | | | 10,934,706 | | | | 127,272 | |
| | 2,077 | | | | 389,832 | | | | 1,831,971 | |
| | 20,964 | | | | 116,164 | | | | 23,072 | |
| | – | | | | – | | | | – | |
| | 55,378 | | | | 87,041 | | | | 41,965 | |
| | 2,279,958 | | | | 3,828,927,065 | | | | 568,852,215 | |
| | | | | | | | | | | |
| | 27,518 | | | | 202,913,869 | | | | 6,912,194 | |
| | – | | | | 7,027,875 | | | | 276,424 | |
| | 1,118 | | | | 1,692,985 | | | | 345,568 | |
| | 242 | | | | 970,706 | | | | 47,268 | |
| | 9 | | | | 197,902 | | | | 137,450 | |
| | 75 | | | | 128,644 | | | | 19,747 | |
| | 73,300 | | | | – | | | | – | |
| | 43,402 | | | | 459,397 | | | | 310,194 | |
| | 145,664 | | | | 213,391,378 | | | | 8,048,845 | |
| $ | 2,134,294 | | | $ | 3,615,535,687 | | | $ | 560,803,370 | |
| | | | | | | | | | | |
| $ | 2,254,187 | | | $ | 2,862,760,204 | | | $ | 579,646,175 | |
| | (119,893 | ) | | | 752,775,483 | | | | (18,842,805 | ) |
| $ | 2,134,294 | | | $ | 3,615,535,687 | | | $ | 560,803,370 | |
| | See Notes to Financial Statements. | 89 |
Statements of Assets and Liabilities (continued)
October 31, 2018
| | | Alpha Strategy
Fund | | | Fundamental
Equity Fund | | | Global Equity
Research Fund | |
| Net assets by class: | | | | | | | | | |
| Class A Shares | | $ | 508,472,086 | | | $ | 1,446,816,440 | | | $ | 3,124,083 | |
| Class C Shares | | $ | 140,681,291 | | | $ | 232,936,882 | | | $ | 698,927 | |
| Class F Shares | | $ | 204,244,972 | | | $ | 247,704,204 | | | $ | 1,203,239 | |
| Class F3 Shares | | $ | 33,676,691 | | | $ | 20,269,806 | | | $ | 11,298 | |
| Class I Shares | | $ | 87,440,962 | | | $ | 92,507,980 | | | $ | 1,136,931 | |
| Class P Shares | | | – | | | $ | 5,648,050 | | | | – | |
| Class R2 Shares | | $ | 2,530,858 | | | $ | 3,587,130 | | | $ | 11,478 | |
| Class R3 Shares | | $ | 28,600,959 | | | $ | 116,719,000 | | | $ | 164,614 | |
| Class R4 Shares | | $ | 3,235,758 | | | $ | 5,163,667 | | | $ | 11,550 | |
| Class R5 Shares | | $ | 105,876 | | | $ | 810,399 | | | $ | 11,602 | |
| Class R6 Shares | | $ | 3,619,054 | | | $ | 16,863,607 | | | $ | 236,476 | |
| Outstanding shares by class (unlimited number of authorized shares of beneficial interest): | | | | | | | | | | | | |
| Class A Shares | | | 19,100,891 | | | | 114,452,412 | | | | 285,936 | |
| Class C Shares | | | 6,271,511 | | | | 20,761,605 | | | | 64,642 | |
| Class F Shares | | | 7,620,776 | | | | 19,785,424 | | | | 109,960 | |
| Class F3 Shares | | | 1,232,455 | | | | 1,586,219 | | | | 1,031 | |
| Class I Shares | | | 3,204,492 | | | | 7,265,586 | | | | 103,806 | |
| Class P Shares | | | – | | | | 455,563 | | | | – | |
| Class R2 Shares | | | 98,665 | | | | 290,951 | | | | 1,054 | |
| Class R3 Shares | | | 1,105,859 | | | | 9,410,436 | | | | 15,097 | |
| Class R4 Shares | | | 121,756 | | | | 410,484 | | | | 1,057 | |
| Class R5 Shares | | | 3,878 | | | | 63,625 | | | | 1,059.24 | |
| Class R6 Shares | | | 132,415 | | | | 1,318,949 | | | | 21,578 | |
| Net asset value, offering and redemption price per share (Net assets divided by outstanding shares): | | | | | | | | | | | | |
| Class A Shares-Net asset value | | | $26.62 | | | | $12.64 | | | | $10.93 | |
| Class A Shares-Maximum offering price (Net asset value plus sales charge of 5.75%) | | | $28.24 | | | | $13.41 | | | | $11.60 | |
| Class C Shares-Net asset value | | | $22.43 | | | | $11.22 | | | | $10.81 | |
| Class F Shares-Net asset value | | | $26.80 | | | | $12.52 | | | | $10.94 | |
| Class F3 Shares-Net asset value | | | $27.32 | | | | $12.78 | | | | $10.96 | |
| Class I Shares-Net asset value | | | $27.29 | | | | $12.73 | | | | $10.95 | |
| Class P Shares-Net asset value | | | – | | | | $12.40 | | | | – | |
| Class R2 Shares-Net asset value | | | $25.65 | | | | $12.33 | | | | $10.89 | |
| Class R3 Shares-Net asset value | | | $25.86 | | | | $12.40 | | | | $10.90 | |
| Class R4 Shares-Net asset value | | | $26.58 | | | | $12.58 | | | | $10.93 | |
| Class R5 Shares-Net asset value | | | $27.30 | | | | $12.74 | | | | $10.95 | |
| Class R6 Shares-Net asset value | | | $27.33 | | | | $12.79 | | | | $10.96 | |
| 90 | See Notes to Financial Statements. |
Global Select
Equity Fund | | | Growth
Leaders Fund | | | International
Equity Fund | |
| | | | | | | | |
| $ | 476,258 | | | $ | 900,405,492 | | | $ | 194,359,673 | |
| $ | 103,955 | | | $ | 595,343,910 | | | $ | 12,821,151 | |
| $ | 473,730 | | | $ | 1,315,881,242 | | | $ | 58,346,782 | |
| $ | 473,863 | | | $ | 44,378,854 | | | $ | 5,083,389 | |
| $ | 104,220 | | | $ | 702,389,325 | | | $ | 277,140,871 | |
| | – | | | | – | | | $ | 39,769 | |
| | – | | | $ | 1,331,724 | | | $ | 374,757 | |
| $ | 9,462 | | | $ | 15,205,915 | | | $ | 8,953,776 | |
| $ | 9,469 | | | $ | 6,344,646 | | | $ | 947,625 | |
| $ | 9,475 | | | $ | 8,597,799 | | | $ | 69,002 | |
| $ | 473,862 | | | $ | 25,656,780 | | | $ | 2,666,575 | |
| | | | | | | | | | | |
| | 33,534 | | | | 30,196,448 | | | | 15,959,996 | |
| | 7,333 | | | | 21,155,972 | | | | 1,066,952 | |
| | 33,333 | | | | 43,555,222 | | | | 4,814,076 | |
| | 33,333 | | | | 1,457,345 | | | | 412,489 | |
| | 7,333 | | | | 23,128,540 | | | | 22,530,588 | |
| | – | | | | – | | | | 3,267 | |
| | – | | | | 45,129 | | | | 30,885 | |
| | 667 | | | | 516,674 | | | | 747,481 | |
| | 667 | | | | 212,731 | | | | 78,100 | |
| | 667 | | | | 283,024 | | | | 5,630 | |
| | 33,333 | | | | 842,541 | | | | 216,477 | |
| | | | | | | | | | | |
| $14.20 | | | | $29.82 | | | | $12.18 | |
| | | | | | | | | | | |
| $15.07 | | | | $31.64 | | | | $12.92 | |
| | $14.18 | | | | $28.14 | | | | $12.02 | |
| $14.21 | | | | $30.21 | | | | $12.12 | |
| | $14.22 | | | | $30.45 | | | | $12.32 | |
| $14.21 | | | | $30.37 | | | | $12.30 | |
| | – | | | | – | | | | $12.17 | |
| | – | | | | $29.51 | | | | $12.13 | |
| $14.19 | | | | $29.43 | | | | $11.98 | |
| | $14.20 | | | | $29.82 | | | | $12.13 | |
| | $14.21 | | | | $30.38 | | | | $12.26 | |
| | $14.22 | | | | $30.45 | | | | $12.32 | |
| | See Notes to Financial Statements. | 91 |
Statements of Assets and Liabilities (concluded)
October 31, 2018
| | | International
Opportunities
Fund | | | International
Value Fund | | | Value
Opportunities
Fund | |
| ASSETS: | | | | | | | | | |
| Investments in securities, at cost | | $ | 877,734,660 | | | $ | 753,577,462 | | | $ | 2,143,424,860 | |
| Investments in Underlying Funds, at cost | | | – | | | | – | | | | – | |
| Investments in securities, at fair value | | $ | 773,366,608 | | | $ | 734,476,979 | | | $ | 2,591,627,553 | |
| Cash | | | 1,927,229 | | | | – | | | | – | |
| Foreign cash, at value (cost $22,273,808, $5,819,564 and $0, respectively) | | | 21,898,871 | | | | 5,775,804 | | | | – | |
| Receivables: | | | | | | | | | | | | |
| Investment securities sold | | | 1,409,850 | | | | 3,183,169 | | | | – | |
| Capital shares sold | | | 1,550,499 | | | | 272,122 | | | | 2,196,911 | |
| Interest and dividends | | | 1,816,783 | | | | 3,362,387 | | | | 1,456,623 | |
| From advisor (See Note 3) | | | – | | | | 17,945 | | | | – | |
| Prepaid expenses and other assets | | | 73,931 | | | | 55,248 | | | | 136,602 | |
| Total assets | | | 802,043,771 | | | | 747,143,654 | | | | 2,595,417,689 | |
| LIABILITIES: | | | | | | | | | | | | |
| Payables: | | | | | | | | | | | | |
| Investment securities purchased | | | 7,485,793 | | | | 6,836,194 | | | | 5,883,538 | |
| Capital shares reacquired | | | 3,400,573 | | | | 798,472 | | | | 4,766,824 | |
| Management fee | | | 534,927 | | | | 455,751 | | | | 1,680,709 | |
| 12b-1 distribution plan | | | 147,454 | | | | 129,263 | | | | 671,840 | |
| Trustees’ fees | | | 88,691 | | | | 209,590 | | | | 435,322 | |
| Fund administration | | | 28,529 | | | | 26,043 | | | | 95,588 | |
| Accrued expenses | | | 240,613 | | | | 470,881 | | | | 597,435 | |
| Total liabilities | | | 11,926,580 | | | | 8,926,194 | | | | 14,131,256 | |
| NET ASSETS | | $ | 790,117,191 | | | $ | 738,217,460 | | | $ | 2,581,286,433 | |
| COMPOSITION OF NET ASSETS: | | | | | | | | | | | | |
| Paid-in capital | | $ | 823,865,934 | | | $ | 1,156,188,514 | | | $ | 1,908,482,893 | |
| Total distributable earnings (loss) | | | (33,748,743 | ) | | | (417,971,054 | ) | | | 672,803,540 | |
| Net Assets | | $ | 790,117,191 | | | $ | 738,217,460 | | | $ | 2,581,286,433 | |
| 92 | See Notes to Financial Statements. |
| | | International
Opportunities
Fund | | | International
Value Fund | | | Value
Opportunities
Fund | |
| | | | | | | | | | |
| Net assets by class: | | | | | | | | | | | | |
| Class A Shares | | $ | 172,940,189 | | | $ | 290,289,241 | | | $ | 922,812,764 | |
| Class C Shares | | $ | 33,873,520 | | | $ | 45,888,004 | | | $ | 225,550,738 | |
| Class F Shares | | $ | 206,400,234 | | | $ | 54,166,973 | | | $ | 390,627,299 | |
| Class F3 Shares | | $ | 22,157,670 | | | $ | 26,911,488 | | | $ | 331,176,481 | |
| Class I Shares | | $ | 235,952,452 | | | $ | 310,983,999 | | | $ | 450,720,477 | |
| Class P Shares | | $ | 132,038 | | | | – | | | $ | 25,500,788 | |
| Class R2 Shares | | $ | 3,476,119 | | | $ | 369,105 | | | $ | 7,338,921 | |
| Class R3 Shares | | $ | 35,676,889 | | | $ | 7,801,026 | | | $ | 77,440,030 | |
| Class R4 Shares | | $ | 5,605,612 | | | $ | 40,134 | | | $ | 54,407,955 | |
| Class R5 Shares | | $ | 39,621,383 | | | $ | 9,723 | | | $ | 1,927,010 | |
| Class R6 Shares | | $ | 34,281,085 | | | $ | 1,757,767 | | | $ | 93,783,970 | |
| Outstanding shares by class (unlimited number of authorized shares of beneficial interest): | | | | | | | | | | | | |
| Class A Shares | | | 10,266,748 | | | | 43,130,593 | | | | 47,323,565 | |
| Class C Shares | | | 2,169,712 | | | | 6,878,327 | | | | 13,020,795 | |
| Class F Shares | | | 12,358,681 | | | | 8,016,902 | | | | 19,613,321 | |
| Class F3 Shares | | | 1,274,619 | | | | 3,976,207 | | | | 16,249,374 | |
| Class I Shares | | | 13,619,208 | | | | 45,911,921 | | | | 22,213,604 | |
| Class P Shares | | | 7,686 | | | | – | | | | 1,333,364 | |
| Class R2 Shares | | | 210,136 | | | | 53,638 | | | | 392,006 | |
| Class R3 Shares | | | 2,158,870 | | | | 1,146,880 | | | | 4,093,726 | |
| Class R4 Shares | | | 333,855 | | | | 5,972 | | | | 2,794,017 | |
| Class R5 Shares | | | 2,287,522 | | | | 1,438 | | | | 94,907 | |
| Class R6 Shares | | | 1,971,829 | | | | 259,637 | | | | 4,603,941 | |
| Net asset value, offering and redemption price per share (Net assets divided by outstanding shares): | | | | | | | | | | | | |
| Class A Shares-Net asset value | | | $16.84 | | | | $6.73 | | | | $19.50 | |
| Class A Shares-Maximum offering price (Net asset value plus sales charge of 5.75%) | | | $17.87 | | | | $7.14 | | | | $20.69 | |
| Class C Shares-Net asset value | | | $15.61 | | | | $6.67 | | | | $17.32 | |
| Class F Shares-Net asset value | | | $16.70 | | | | $6.76 | | | | $19.92 | |
| Class F3 Shares-Net asset value | | | $17.38 | | | | $6.77 | | | | $20.38 | |
| Class I Shares-Net asset value | | | $17.32 | | | | $6.77 | | | | $20.29 | |
| Class P Shares-Net asset value | | | $17.18 | | | | – | | | | $19.13 | |
| Class R2 Shares-Net asset value | | | $16.54 | | | | $6.88 | | | | $18.72 | |
| Class R3 Shares-Net asset value | | | $16.53 | | | | $6.80 | | | | $18.92 | |
| Class R4 Shares-Net asset value | | | $16.79 | | | | $6.72 | | | | $19.47 | |
| Class R5 Shares-Net asset value | | | $17.32 | | | | $6.76 | | | | $20.30 | |
| Class R6 Shares-Net asset value | | | $17.39 | | | | $6.77 | | | | $20.37 | |
| | See Notes to Financial Statements. | 93 |
Statements of Operations
For the Year Ended October 31, 2018
| | | Alpha Strategy
Fund | | | Fundamental
Equity Fund | | | Global Equity
Research Fund | |
| Investment income: | | | | | | | | | | | | |
| Dividends (net of foreign withholding taxes of $0, $668,250, $5,088, $476, $0 and $1,746,164, respectively) | | $ | 2,934,648 | | | $ | 53,610,972 | | | $ | 99,817 | |
| Interest and other | | | 5,245 | | | | 355,367 | | | | 674 | |
| Total investment income | | | 2,939,893 | | | | 53,966,339 | | | | 100,491 | |
| Expenses: | | | | | | | | | | | | |
| Management fee | | | 1,124,560 | | | | 13,306,160 | | | | 31,529 | |
| 12b-1 distribution plan-Class A | | | 1,322,040 | | | | 3,806,956 | | | | 6,256 | |
| 12b-1 distribution plan-Class B | | | 3,562 | | | | 9,858 | | | | – | |
| 12b-1 distribution plan-Class C | | | 1,915,922 | | | | 3,540,932 | | | | 5,593 | |
| 12b-1 distribution plan-Class F | | | 225,002 | | | | 275,128 | | | | 1,274 | |
| 12b-1 distribution plan-Class P | | | – | | | | 29,977 | | | | – | |
| 12b-1 distribution plan-Class R2 | | | 16,964 | | | | 37,071 | | | | 73 | |
| 12b-1 distribution plan-Class R3 | | | 159,017 | | | | 668,968 | | | | 80 | |
| 12b-1 distribution plan-Class R4 | | | 7,102 | | | | 12,307 | | | | 30 | |
| 12b-1 distribution plan-Class T | | | – | | | | – | | | | – | |
| Shareholder servicing | | | 1,046,242 | | | | 2,606,676 | | | | 2,953 | |
| Fund administration | | | 449,824 | | | | 988,493 | | | | 2,294 | |
| Registration | | | 149,387 | | | | 161,740 | | | | 123,479 | |
| Reports to shareholders | | | 120,715 | | | | 181,487 | | | | 9,522 | |
| Custody | | | 18,488 | | | | 21,591 | | | | 33,800 | |
| Professional | | | 48,102 | | | | 72,988 | | | | 52,401 | |
| Trustees’ fees | | | 29,903 | | | | 66,612 | | | | 182 | |
| Offering costs | | | – | | | | – | | | | 7,886 | |
| Other | | | 23,460 | | | | 111,607 | | | | 11,775 | |
| Gross expenses | | | 6,660,290 | | | | 25,898,551 | | | | 289,127 | |
| Expense reductions (See Note 9) | | | (20,551 | ) | | | (45,154 | ) | | | (109 | ) |
| Fees waived and expenses reimbursed (See Note 3) | | | (1,124,560 | ) | | | – | | | | (235,037 | ) |
| Net expenses | | | 5,515,179 | | | | 25,853,397 | | | | 53,981 | |
| Net investment income (loss) | | | (2,575,286 | ) | | | 28,112,942 | | | | 46,510 | |
| Net realized and unrealized gain (loss): | | | | | | | | | | | | |
| Capital gain distributions received from Underlying Funds | | | 78,619,679 | | | | – | | | | – | |
| Net realized gain on investments in Underlying Funds | | | 42,939,479 | | | | – | | | | – | |
| Net realized gain (loss) on investments | | | – | | | | 166,070,044 | | | | 261,253 | |
| Net realized loss on foreign currency exchange contracts | | | – | | | | – | | | | (8,968 | ) |
| Net realized gain (loss) on written options | | | – | | | | – | | | | – | |
| Net realized gain (loss) on foreign currency related transactions | | | – | | | | – | | | | (1,959 | ) |
| Net change in unrealized appreciation/depreciation on investments | | | – | | | | (133,647,835 | ) | | | (456,479 | ) |
| Net change in unrealized appreciation/depreciation on investments in Underlying Funds | | | (80,009,872 | ) | | | – | | | | – | |
| Net change in unrealized appreciation/depreciation on foreign currency exchange contracts | | | – | | | | – | | | | 11,076 | |
| Net change in unrealized appreciation/depreciation on translation of assets and liabilities denominated in foreign currencies | | | – | | | | – | | | | (333 | ) |
| Net realized and unrealized gain (loss) | | | 41,549,286 | | | | 32,422,209 | | | | (195,410 | ) |
| Net Increase (Decrease) in Net Assets Resulting From Operations | | $ | 38,974,000 | | | $ | 60,535,151 | | | $ | (148,900 | ) |
| * | For the period July 30, 2018 (commencement of operations) to October 31, 2018. |
| 94 | See Notes to Financial Statements. |
Global Select
Equity Fund | * | | Growth
Leaders Fund | | | International
Equity Fund | |
| | | | | | | | |
| $ | 10,982 | | | $ | 15,013,683 | | | $ | 16,849,324 | |
| | 76 | | | | 495,997 | | | | 116,087 | |
| | 11,058 | | | | 15,509,680 | | | | 16,965,411 | |
| | | | | | | | | | | |
| | 3,217 | | | | 18,622,927 | | | | 4,665,501 | |
| | 232 | | | | 2,167,945 | | | | 579,325 | |
| | – | | | | 1,572 | | | | 1,891 | |
| | 278 | | | | 5,882,756 | | | | 211,043 | |
| | 127 | | | | 1,174,006 | | | | 67,022 | |
| | – | | | | – | | | | 262 | |
| | – | | | | 9,602 | | | | 3,440 | |
| | 13 | | | | 73,214 | | | | 55,341 | |
| | 6 | | | | 15,505 | | | | 2,064 | |
| | – | | | | 21 | | | | – | |
| | 537 | | | | 2,338,100 | | | | 531,183 | |
| | 214 | | | | 1,409,834 | | | | 266,600 | |
| | 10 | | | | 221,728 | | | | 155,112 | |
| | 1,500 | | | | 290,216 | | | | 85,751 | |
| | 2,000 | | | | 47,199 | | | | 172,433 | |
| | 37,222 | | | | 64,181 | | | | 111,861 | |
| | 12 | | | | 88,906 | | | | 17,845 | |
| | 18,676 | | | | – | | | | – | |
| | 5,126 | | | | 102,494 | | | | 82,931 | |
| | 69,170 | | | | 32,510,206 | | | | 7,009,605 | |
| | (7 | ) | | | (56,163 | ) | | | (6,563 | ) |
| | (64,623 | ) | | | (1,174,428 | ) | | | (422,109 | ) |
| | 4,540 | | | | 31,279,615 | | | | 6,580,933 | |
| | 6,518 | | | | (15,769,935 | ) | | | 10,384,478 | |
| | | | | | | | | | | |
| | – | | | | – | | | | – | |
| | | | | | | | | | | |
| | – | | | | – | | | | – | |
| | (3,267 | ) | | | 575,041,475 | | | | 6,968,578 | |
| | | | | | | | | | | |
| | – | | | | – | | | | (2,509,846 | ) |
| | – | | | | – | | | | – | |
| | | | | | | | | | | |
| | (21 | ) | | | – | | | | 1,478,639 | |
| | | | | | | | | | | |
| | (124,880 | ) | | | (276,161,128 | ) | | | (99,825,064 | ) |
| | | | | | | | | | | |
| | – | | | | – | | | | – | |
| | | | | | | | | | | |
| | – | | | | – | | | | 1,726,452 | |
| | | | | | | | | | | |
| | – | | | | – | | | | (184,033 | ) |
| | (128,168 | ) | | | 298,880,347 | | | | (92,345,274 | ) |
| | | | | | | | | | | |
| $ | (121,650 | ) | | $ | 283,110,412 | | | $ | (81,960,796 | ) |
| | See Notes to Financial Statements. | 95 |
Statements of Operations (concluded)
For the Year Ended October 31, 2018
| | | International
Opportunities
Fund | | | International
Value Fund | | | Value
Opportunities
Fund | |
| Investment income: | | | | | | | | | | | | |
| Dividends (net of foreign withholding taxes of $2,037,859, $2,855,471 and $71,733, respectively) | | $ | 17,736,742 | | | $ | 36,127,266 | | | $ | 35,662,504 | |
| Interest and other | | | 205,091 | | | | 98,907 | | | | 247,185 | |
| Total investment income | | | 17,941,833 | | | | 36,226,173 | | | | 35,909,689 | |
| Expenses: | | | | | | | | | | | | |
| Management fee | | | 6,962,177 | | | | 6,468,702 | | | | 21,446,333 | |
| 12b-1 distribution plan-Class A | | | 532,627 | | | | 872,668 | | | | 2,500,819 | |
| 12b-1 distribution plan-Class B | | | 1,141 | | | | – | | | | 6,094 | |
| 12b-1 distribution plan-Class C | | | 466,130 | | | | 605,180 | | | | 2,893,613 | |
| 12b-1 distribution plan-Class F | | | 286,207 | | | | 72,036 | | | | 456,542 | |
| 12b-1 distribution plan-Class P | | | 940 | | | | – | | | | 139,028 | |
| 12b-1 distribution plan-Class R2 | | | 29,065 | | | | 2,698 | | | | 51,750 | |
| 12b-1 distribution plan-Class R3 | | | 108,015 | | | | 51,273 | | | | 425,802 | |
| 12b-1 distribution plan-Class R4 | | | 13,289 | | | | 86 | | | | 151,741 | |
| 12b-1 distribution plan-Class T | | | – | | | | – | | | | 19 | |
| Shareholder servicing | | | 785,500 | | | | 651,715 | | | | 2,483,983 | |
| Fund administration | | | 371,369 | | | | 370,107 | | | | 1,227,467 | |
| Registration | | | 213,906 | | | | 136,415 | | | | 257,556 | |
| Reports to shareholders | | | 114,684 | | | | 83,078 | | | | 438,483 | |
| Custody | | | 143,038 | | | | 263,734 | | | | 34,833 | |
| Professional | | | 84,128 | | | | 116,878 | | | | 66,660 | |
| Trustees’ fees | | | 24,347 | | | | 25,464 | | | | 81,879 | |
| Other | | | 88,684 | | | | 106,753 | | | | 108,151 | |
| Gross expenses | | | 10,225,247 | | | | 9,826,787 | | | | 32,770,753 | |
| Expense reductions (See Note 9) | | | (12,955 | ) | | | (10,177 | ) | | | (44,948 | ) |
| Fees waived and expenses reimbursed (See Note 3) | | | – | | | | (463,613 | ) | | | – | |
| Net expenses | | | 10,212,292 | | | | 9,352,997 | | | | 32,725,805 | |
| Net investment income | | | 7,729,541 | | | | 26,873,176 | | | | 3,183,884 | |
| Net realized and unrealized gain (loss): | | | | | | | | | | | | |
| Net realized gain on investments | | | 67,502,215 | | | | 44,031,682 | | | | 280,425,928 | |
| Net realized loss on foreign currency exchange contracts | | | (1,804,355 | ) | | | (1,785,275 | ) | | | – | |
| Net realized loss on purchased option | | | (2,065,000 | ) | | | – | | | | – | |
| Net realized gain on written options | | | 1,064,000 | | | | – | | | | – | |
| Net realized gain (loss) on foreign currency related transactions | | | 85,406 | | | | (1,726,737 | ) | | | – | |
| Net change in unrealized appreciation/depreciation on investments | | | (232,980,427 | ) | | | (133,852,100 | ) | | | (268,814,305 | ) |
| Net change in unrealized appreciation/depreciation on foreign currency exchange contracts | | | 2,114,700 | | | | 1,911,748 | | | | – | |
| Net change in unrealized appreciation/depreciation on options | | | (992,421 | ) | | | – | | | | – | |
| Net change in unrealized appreciation/depreciation on translation of assets and liabilities denominated in foreign currencies | | | (427,076 | ) | | | (80,306 | ) | | | – | |
| Net realized and unrealized gain (loss) | | | (167,502,958 | ) | | | (91,500,988 | ) | | | 11,611,623 | |
| Net Increase (Decrease) in Net Assets Resulting From Operations | | $ | (159,773,417 | ) | | $ | (64,627,812 | ) | | $ | 14,795,507 | |
| 96 | See Notes to Financial Statements. |
This page is intentionally left blank.
97
Statements of Changes in Net Assets
| | | Alpha Strategy Fund | |
| INCREASE (DECREASE) IN NET ASSETS | | For the Year Ended
October 31, 2018 | | | For the Year Ended
October 31, 2017 | |
| Operations: | | | | | | |
| Net investment income (loss) | | $ | (2,575,286 | ) | | $ | (3,479,487 | ) |
| Capital gain distributions received from Underlying Funds | | | 78,619,679 | | | | 57,871,335 | |
| Net realized gain (loss) on investments, forward currency exchange contracts and foreign currency related transactions | | | – | | | | – | |
| Net realized gain on investments in Underlying Funds | | | 42,939,479 | | | | 73,204,166 | |
| Net change in unrealized appreciation/depreciation on investments in Underlying Funds | | | (80,009,872 | ) | | | 118,138,740 | |
| Net change in unrealized appreciation/depreciation on investments, forward currency exchange contracts and translation of assets and liabilities denominated in foreign currencies | | | – | | | | – | |
| Net increase (decrease) in net assets resulting from operations | | | 38,974,000 | | | | 245,734,754 | |
| Distributions to shareholders:(1) | | | | | | | | |
| Class A | | | (54,348,075 | ) | | | (55,318,828 | ) |
| Class B | | | (139,024 | ) | | | (508,140 | ) |
| Class C | | | (27,631,213 | ) | | | (32,030,506 | ) |
| Class F | | | (24,159,500 | ) | | | (26,130,404 | ) |
| Class F3 | | | (3,752,805 | ) | | | – | |
| Class I | | | (10,054,757 | ) | | | (7,340,823 | ) |
| Class P | | | – | | | | – | |
| Class R2 | | | (330,799 | ) | | | (298,197 | ) |
| Class R3 | | | (3,558,134 | ) | | | (3,825,073 | ) |
| Class R4 | | | (230,724 | ) | | | (40,486 | ) |
| Class R5 | | | (9,146 | ) | | | (1,052 | ) |
| Class R6 | | | (425,823 | ) | | | (80,661 | ) |
| Total distributions to shareholders | | | (124,640,000 | ) | | | (125,574,170 | ) |
| Capital share transactions (Net of share conversions) (See Note 15): | | | | | | | | |
| Net proceeds from sales of shares | | | 170,851,508 | | | | 290,270,982 | |
| Reinvestment of distributions | | | 107,898,519 | | | | 107,106,054 | |
| Cost of shares reacquired | | | (310,966,084 | ) | | | (501,332,811 | ) |
| Net increase (decrease) in net assets resulting from capital share transactions | | | (32,216,057 | ) | | | (103,955,775 | ) |
| Net increase (decrease) in net assets | | | (117,882,057 | ) | | | 16,204,809 | |
| NET ASSETS: | | | | | | | | |
| Beginning of year | | $ | 1,130,490,564 | | | $ | 1,114,285,755 | |
| End of year | | $ | 1,012,608,507 | | | $ | 1,130,490,564 | |
| Undistributed (distributions in excess of) net investment income(2) | | $ | – | | | $ | – | |
| * | For the period January 17, 2017 (commencement of operations) to October 31, 2018. |
| (1) | The SEC eliminated the requirement to disclose the source of distributions paid in 2018. For the year ended October 31, 2017, the source of distributions was as follows: |
| | – | For Alpha Strategy Fund, the above dollar amounts represents net realized gain. |
| | – | Fundamental Equity Fund net investment income - Class A $(25,173,660), Class B $(102,842), Class C $(4,948,705), Class F $(5,204,052), Class I $(2,486,080), Class P $(148,944), Class R2 $(94,171), Class R3 $(2,055,670), Class R4 $(2,106), Class R5 $(2,310) and Class R6 $(7,568). |
| | – | Fundamental Equity Fund net realized gain - Class A $(60,367,654), Class B $(619,571), Class C $(21,921,733), Class F $(11,296,010), Class I $(5,102,200), Class P $(410,518), Class R2 $(296,884), Class R3 $(5,891,910), Class R4 $(4,500), Class R5 $(4,692) and Class R6 $(15,303). |
| (2) | The SEC eliminated the requirement to disclose undistributed (distributions in excess of) net invesment income in 2018. For the year ended October 31, 2017, the undistributed (distributions in excess of) net investment income was as follows: |
| | – | Alpha Strategy Fund $(4,301,162), Fundamental Equity Fund $24,990,451 and Global Equity Research Fund $38,219. |
| 98 | See Notes to Financial Statements. | |
| Fundamental Equity Fund | | Global Equity Research Fund |
For the Year Ended
October 31, 2018 | | | For the Year Ended
October 31, 2017 | | | For the Year Ended
October 31, 2018 | | | For the Period Ended
October 31, 2017 | * |
| | | | | | | | | | | |
| $ | 28,112,942 | | | $ | 32,527,794 | | | $ | 46,510 | | | $ | 30,382 | |
| | – | | | | – | | | | – | | | | – | |
| | | | | | | | | | | | | | | |
| | 166,070,044 | | | | 299,968,704 | | | | 250,326 | | | | 200,789 | |
| | – | | | | – | | | | – | | | | – | |
| | | | | | | | | | | | | | | |
| | – | | | | – | | | | – | | | | – | |
| | | | | | | | | | | | | | | |
| | (133,647,835 | ) | | | 119,354,814 | | | | (445,736 | ) | | | 320,916 | |
| | | | | | | | | | | | | | | |
| | 60,535,151 | | | | 451,851,312 | | | | (148,900 | ) | | | 552,087 | |
| | | | | | | | | | | | | | | |
| | (178,541,424 | ) | | | (85,541,314 | ) | | | (91,803 | ) | | | – | |
| | (436,747 | ) | | | (722,413 | ) | | | – | | | | – | |
| | (52,320,308 | ) | | | (26,870,438 | ) | | | (18,120 | ) | | | – | |
| | (33,358,921 | ) | | | (16,500,062 | ) | | | (66,057 | ) | | | – | |
| | (2,397,983 | ) | | | – | | | | (644 | ) | | | – | |
| | (18,278,709 | ) | | | (7,588,280 | ) | | | (64,739 | ) | | | – | |
| | (807,264 | ) | | | (559,462 | ) | | | – | | | | – | |
| | (920,198 | ) | | | (391,055 | ) | | | (599 | ) | | | – | |
| | (16,621,041 | ) | | | (7,947,580 | ) | | | (609 | ) | | | – | |
| | (504,705 | ) | | | (6,606 | ) | | | (635 | ) | | | – | |
| | (123,158 | ) | | | (7,002 | ) | | | (660 | ) | | | – | |
| | (750,508 | ) | | | (22,871 | ) | | | (662 | ) | | | – | |
| | (305,060,966 | ) | | | (146,157,083 | ) | | | (244,528 | ) | | | – | |
| | | | | | | | | | | | | | | |
| | 202,750,220 | | | | 382,748,155 | | | | 2,764,198 | | | | 3,850,124 | |
| | 280,805,394 | | | | 133,850,011 | | | | 244,327 | | | | – | |
| | (708,459,101 | ) | | | (1,000,946,753 | ) | | | (392,058 | ) | | | (15,052 | ) |
| | | | | | | | | | | | | | | |
| | (224,903,487 | ) | | | (484,348,587 | ) | | | 2,616,467 | | | | 3,835,072 | |
| | (469,429,302 | ) | | | (178,654,358 | ) | | | 2,223,039 | | | | 4,387,159 | |
| | | | | | | | | | | | | | | |
| $ | 2,658,456,467 | | | $ | 2,837,110,825 | | | $ | 4,387,159 | | | $ | – | |
| $ | 2,189,027,165 | | | $ | 2,658,456,467 | | | $ | 6,610,198 | | | $ | 4,387,159 | |
| | | | | | | | | | | | | | | |
| $ | – | | | $ | – | | | $ | – | | | $ | – | |
| | See Notes to Financial Statements. | 99 |
Statements of Changes in Net Assets (continued)
| | | Global Select
Equity Fund | |
| INCREASE (DECREASE) IN NET ASSETS | | For the Period Ended
October 31, 2018* | |
| Operations: | | | |
| Net investment income (loss) | | $ | 6,518 | |
| Net realized gain (loss) on investments, forward currency exchange contracts and foreign currency related transactions | | | (3,288 | ) |
| Net change in unrealized appreciation/depreciation on investments, forward currency exchange contracts and translation of assets and liabilities denominated in foreign currencies | | | (124,880 | ) |
| Net increase (decrease) in net assets resulting from operations | | | (121,650 | ) |
| Distributions to shareholders:(1) | | | | |
| Class A | | | – | |
| Class B | | | – | |
| Class C | | | – | |
| Class F | | | – | |
| Class F3 | | | – | |
| Class I | | | – | |
| Class P | | | – | |
| Class R2 | | | – | |
| Class R3 | | | – | |
| Class R4 | | | – | |
| Class R5 | | | – | |
| Class R6 | | | – | |
| Total distributions to shareholders | | | – | |
| Capital share transactions (See Note 15): | | | | |
| Net proceeds from sales of shares | | | 2,255,944 | |
| Reinvestment of distributions | | | – | |
| Cost of shares reacquired | | | – | |
| Net increase in net assets resulting from capital share transactions | | | 2,255,944 | |
| Net increase (decrease) in net assets | | | 2,134,294 | |
| NET ASSETS: | | | | |
| Beginning of year | | $ | – | |
| End of year | | $ | 2,134,294 | |
| Undistributed (distributions in excess of) net investment income(2) | | $ | – | |
| * | For the period July 30, 2018 (commencement of operations) to October 31, 2018. |
| (1) | The SEC eliminated the requirement to disclose the source of distributions paid in 2018. For the year ended October 31, 2017, the source of distributions was as follows: |
| | – | For International Equity Fund the above amounts represents net investment income. |
| (2) | The SEC eliminated the requirement to disclose undistributed (distributions in excess of) net invesment income in 2018. For the year ended October 31, 2017, the undistributed (distributions in excess of) net investment income was as follows: |
| | – | Growth Leaders Fund $(412,108) and International Equity Fund $11,556,194. |
| 100 | See Notes to Financial Statements. | |
| Growth Leaders Fund | | International Equity Fund |
For the Year Ended
October 31, 2018 | | | For the Year Ended
October 31, 2017 | | | For the Year Ended
October 31, 2018 | | | For the Year Ended
October 31, 2017 | |
| | | | | | | | | | | | | | | |
| $ | (15,769,935 | ) | | $ | (6,976,443 | ) | | $ | 10,384,478 | | | $ | 9,552,015 | |
| | | | | | | | | | | | | | | |
| | 575,041,475 | | | | 264,255,911 | | | | 5,937,371 | | | | 42,742,534 | |
| | | | | | | | | | | | | | | |
| | (276,161,128 | ) | | | 337,975,396 | | | | (98,282,645 | ) | | | 58,903,800 | |
| | | | | | | | | | | | | | | |
| | 283,110,412 | | | | 595,254,864 | | | | (81,960,796 | ) | | | 111,198,349 | |
| | | | | | | | | | | | | | | |
| | (47,438,304 | ) | | | – | | | | (4,679,235 | ) | | | (5,326,381 | ) |
| | (38,213 | ) | | | – | | | | – | | | | (31,492 | ) |
| | (34,566,934 | ) | | | – | | | | (313,590 | ) | | | (420,035 | ) |
| | (60,807,764 | ) | | | – | | | | (1,317,661 | ) | | | (1,455,989 | ) |
| | (1,206,692 | ) | | | – | | | | (129,945 | ) | | | – | |
| | (45,292,112 | ) | | | – | | | | (6,383,141 | ) | | | (3,938,350 | ) |
| | (115,744 | ) | | | – | | | | (1,601 | ) | | | (1,887 | ) |
| | (849,982 | ) | | | – | | | | (10,881 | ) | | | (9,725 | ) |
| | (312,085 | ) | | | – | | | | (218,531 | ) | | | (294,578 | ) |
| | (359,518 | ) | | | – | | | | (13,032 | ) | | | (206 | ) |
| | (1,316,788 | ) | | | – | | | | (1,577 | ) | | | (227 | ) |
| | (676 | ) | | | – | | | | (68,783 | ) | | | (270,198 | ) |
| | (192,304,812 | ) | | | – | | | | (13,137,977 | ) | | | (11,749,068 | ) |
| | | | | | | | | | | | | | | |
| | 1,741,339,885 | | | | 990,493,367 | | | | 175,186,568 | | | | 233,755,451 | |
| | 175,226,655 | | | | – | | | | 12,682,291 | | | | 11,216,988 | |
| | (1,141,714,475 | ) | | | (955,261,897 | ) | | | (179,204,294 | ) | | | (244,826,099 | ) |
| | | | | | | | | | | | | | | |
| | 774,852,065 | | | | 35,231,470 | | | | 8,664,565 | | | | 146,340 | |
| | 865,657,665 | | | | 630,486,334 | | | | (86,434,208 | ) | | | 99,595,621 | |
| | | | | | | | | | | | | | | |
| $ | 2,749,878,022 | | | $ | 2,119,391,688 | | | $ | 647,237,578 | | | $ | 547,641,957 | |
| $ | 3,615,535,687 | | | $ | 2,749,878,022 | | | $ | 560,803,370 | | | $ | 647,237,578 | |
| $ | – | | | $ | – | | | $ | – | | | $ | – | |
| | See Notes to Financial Statements. | 101 |
Statements of Changes in Net Assets (concluded)
| | | International Opportunities Fund |
| INCREASE (DECREASE) IN NET ASSETS | | For the Year Ended
October 31, 2018 | | | For the Year Ended
October 31, 2017 | |
| Operations: | | | | | | | | |
| Net investment income | | $ | 7,729,541 | | | $ | 3,567,762 | |
| Net realized gain (loss) on investments, options written, forward currency exchange contracts and foreign currency related transactions | | | 64,782,266 | | | | 60,370,944 | |
| Net change in unrealized appreciation/depreciation on investments, options written, forward currency exchange contracts and translation of assets and liabilities denominated in foreign currencies | | | (232,285,224 | ) | | | 97,767,153 | |
| Net increase (decrease) in net assets resulting from operations | | | (159,773,417 | ) | | | 161,705,859 | |
| Distributions to shareholders:(1) | | | | | | | | |
| Class A | | | (8,565,992 | ) | | | (1,014,524 | ) |
| Class B | | | (12,436 | ) | | | – | |
| Class C | | | (1,768,236 | ) | | | – | |
| Class F | | | (11,528,641 | ) | | | (725,717 | ) |
| Class F3 | | | (866,529 | ) | | | – | |
| Class I | | | (12,449,194 | ) | | | (2,470,038 | ) |
| Class P | | | (9,228 | ) | | | (1,121 | ) |
| Class R2 | | | (214,547 | ) | | | (15,577 | ) |
| Class R3 | | | (423,380 | ) | | | (108,350 | ) |
| Class R4 | | | (171,692 | ) | | | (16,612 | ) |
| Class R5 | | | (183,657 | ) | | | (26,598 | ) |
| Class R6 | | | (782,855 | ) | | | (22,874 | ) |
| Class T | | | – | | | | – | |
| Total distributions to shareholders | | | (36,976,387 | ) | | | (4,401,411 | ) |
| Capital share transactions (See Note 15): | | | | | | | | |
| Net proceeds from sales of shares | | | 541,256,876 | | | | 364,531,156 | |
| Reinvestment of distributions | | | 32,872,435 | | | | 4,117,627 | |
| Cost of shares reacquired | | | (389,554,615 | ) | | | (288,977,464 | ) |
| Net increase (decrease) in net assets resulting from capital share transactions | | | 184,574,696 | | | | 79,671,319 | |
| Net increase (decrease) in net assets | | | (12,175,108 | ) | | | 236,975,767 | |
| NET ASSETS: | | | | | | | | |
| Beginning of year | | $ | 802,292,299 | | | $ | 565,316,532 | |
| End of year | | $ | 790,117,191 | | | $ | 802,292,299 | |
| Undistributed (distributions in excess of) net investment income(2) | | $ | – | | | $ | – | |
| (1) | The SEC eliminated the requirement to disclose the source of distributions paid in 2018. For the year ended October 31, 2017, the source of distributions was as follows: |
| | – | For International Opportunities Fund and International Value Fund the above amounts represents net investment income. |
| | – | Value Opportunities Fund net investment income - Class F $(744,559), Class I $(875,266), Class R4 $(2,857), Class R5 $(83,687) and Class R6 (122,483), |
| | – | Value Opportunities Fund net realized gain - Class A $(57,219,828), Class B $(455,599), Class C $(21,417,677), Class F $(39,955,662), Class I $(26,858,098), Class P $(2,180,705), Class R2 $(381,708), Class R3 $(6,001,389), Class R4 $(194,885), Class R5 $(2,454,897) and Class R6 $(3,441,365). |
| (2) | The SEC eliminated the requirement to disclose undistributed (distributions in excess of) net invesment income in 2018. For the year ended October 31, 2017, the undistributed (distributions in excess of) net investment income was as follows: |
| | – | International Opportunities Fund $4,820,742, International Value Fund $1,639,859 and Value Opportunities Fund $1,574,608. |
| 102 | See Notes to Financial Statements. | |
| International Value Fund | | Value Opportunities Fund |
For the Year Ended
October 31, 2018 | | | For the Year Ended
October 31, 2017 | | | For the Year Ended
October 31, 2018 | | | For the Year Ended
October 31, 2017 | |
| | | | | | | | |
| $ | 26,873,176 | | | $ | 37,820,851 | | | $ | 3,183,884 | | | $ | 3,803,259 | |
| | | | | | | | | | | | | | | |
| | 40,519,670 | | | | (7,563,152 | ) | | | 280,425,928 | | | | 189,398,531 | |
| | | | | | | | | | | | | | | |
| | (132,020,658 | ) | | | 156,683,599 | | | | (268,814,305 | ) | | | 246,055,550 | |
| | | | | | | | | | | | | | | |
| | (64,627,812 | ) | | | 186,941,298 | | | | 14,795,507 | | | | 439,257,340 | |
| | | | | | | | | | | | | | | |
| | (10,362,740 | ) | | | (12,788,289 | ) | | | (61,341,762 | ) | | | (57,219,828 | ) |
| | – | | | | – | | | | (137,223 | ) | | | (455,599 | ) |
| | (1,299,566 | ) | | | (1,956,948 | ) | | | (22,036,489 | ) | | | (21,417,677 | ) |
| | (2,216,676 | ) | | | (4,070,409 | ) | | | (28,310,534 | ) | | | (40,700,221 | ) |
| | (990,322 | ) | | | (2,726 | ) | | | (19,249,715 | ) | | | – | |
| | (12,464,654 | ) | | | (19,812,921 | ) | | | (42,850,788 | ) | | | (27,733,364 | ) |
| | – | | | | – | | | | (2,002,032 | ) | | | (2,180,705 | ) |
| | (10,976 | ) | | | (20,037 | ) | | | (574,421 | ) | | | (381,708 | ) |
| | (252,604 | ) | | | (402,876 | ) | | | (5,401,401 | ) | | | (6,001,389 | ) |
| | (1,016 | ) | | | (777 | ) | | | (3,832,619 | ) | | | (197,742 | ) |
| | (350 | ) | | | (359 | ) | | | (302,820 | ) | | | (2,538,584 | ) |
| | (71,153 | ) | | | (76,135 | ) | | | (6,233,868 | ) | | | (3,563,848 | ) |
| | – | | | | – | | | | (637 | ) | | | – | |
| | (27,670,057 | ) | | | (39,131,477 | ) | | | (192,274,309 | ) | | | (162,390,665 | ) |
| | | | | | | | | | | | | | | |
| | 136,932,956 | | | | 169,320,262 | | | | 783,147,767 | | | | 1,474,040,599 | |
| | 26,450,831 | | | | 37,490,989 | | | | 182,370,843 | | | | 152,980,526 | |
| | (378,504,562 | ) | | | (650,587,021 | ) | | | (1,397,013,291 | ) | | | (1,388,276,457 | ) |
| | | | | | | | | | | | | | | |
| | (215,120,775 | ) | | | (443,775,770 | ) | | | (431,494,681 | ) | | | 238,744,668 | |
| | (307,418,644 | ) | | | (295,965,949 | ) | | | (608,973,483 | ) | | | 515,611,343 | |
| | | | | | | | | | | | | | | |
| $ | 1,045,636,104 | | | $ | 1,341,602,053 | | | $ | 3,190,259,916 | | | $ | 2,674,648,573 | |
| $ | 738,217,460 | | | $ | 1,045,636,104 | | | $ | 2,581,286,433 | | | $ | 3,190,259,916 | |
| | | | | | | | | | | | | | | |
| $ | – | | | $ | – | | | $ | – | | | $ | – | |
| | See Notes to Financial Statements. | 103 |
Financial Highlights
ALPHA STRATEGY FUND
| | | | | Per Share Operating Performance: |
| | | | | Investment Operations: | | Distributions to
shareholders from: |
| | | Net asset
value,
beginning
of period | | Net
invest-
ment
income
(loss)(a) | | Net
realized
and
unrealized
gain (loss) | | Total
from
invest-
ment
opera-
tions | | Net
investment
income | | Net
realized
gain | | Total
distri-
butions |
| Class A | | | | | | | | | | | | | | | | | | | | | | | | | | | | |
| 10/31/2018 | | | $28.92 | | | | $(0.05 | ) | | | $0.93 | | | | $0.88 | | | | $ – | | | | $(3.18 | ) | | | $(3.18 | ) |
| 10/31/2017 | | | 25.94 | | | | (0.05 | ) | | | 5.96 | | | | 5.91 | | | | – | | | | (2.93 | ) | | | (2.93 | ) |
| 10/31/2016 | | | 29.79 | | | | (0.03 | ) | | | 0.19 | | | | 0.16 | | | | (0.19 | ) | | | (3.82 | ) | | | (4.01 | ) |
| 10/31/2015 | | | 32.40 | | | | 0.02 | | | | 0.78 | | | | 0.80 | | | | (0.48 | ) | | | (2.93 | ) | | | (3.41 | ) |
| 10/31/2014 | | | 32.63 | | | | 0.02 | | | | 2.16 | | | | 2.18 | | | | (1.29 | ) | | | (1.12 | ) | | | (2.41 | ) |
| Class C | | | | | | | | | | | | | | | | | | | | | | | | | | | | |
| 10/31/2018 | | | 25.03 | | | | (0.21 | ) | | | 0.79 | | | | 0.58 | | | | – | | | | (3.18 | ) | | | (3.18 | ) |
| 10/31/2017 | | | 22.96 | | | | (0.21 | ) | | | 5.21 | | | | 5.00 | | | | – | | | | (2.93 | ) | | | (2.93 | ) |
| 10/31/2016 | | | 26.83 | | | | (0.19 | ) | | | 0.14 | | | | (0.05 | ) | | | – | | | | (3.82 | ) | | | (3.82 | ) |
| 10/31/2015 | | | 29.51 | | | | (0.19 | ) | | | 0.71 | | | | 0.52 | | | | (0.27 | ) | | | (2.93 | ) | | | (3.20 | ) |
| 10/31/2014 | | | 29.95 | | | | (0.20 | ) | | | 1.98 | | | | 1.78 | | | | (1.10 | ) | | | (1.12 | ) | | | (2.22 | ) |
| Class F | | | | | | | | | | | | | | | | | | | | | | | | | | | | |
| 10/31/2018 | | | 29.06 | | | | – | (g) | | | 0.92 | | | | 0.92 | | | | – | | | | (3.18 | ) | | | (3.18 | ) |
| 10/31/2017 | | | 26.01 | | | | (0.02 | ) | | | 6.00 | | | | 5.98 | | | | – | | | | (2.93 | ) | | | (2.93 | ) |
| 10/31/2016 | | | 29.87 | | | | 0.02 | | | | 0.17 | | | | 0.19 | | | | (0.23 | ) | | | (3.82 | ) | | | (4.05 | ) |
| 10/31/2015 | | | 32.49 | | | | 0.07 | | | | 0.78 | | | | 0.85 | | | | (0.54 | ) | | | (2.93 | ) | | | (3.47 | ) |
| 10/31/2014 | | | 32.71 | | | | 0.06 | | | | 2.17 | | | | 2.23 | | | | (1.33 | ) | | | (1.12 | ) | | | (2.45 | ) |
| Class F3 | | | | | | | | | | | | | | | | | | | | | | | | | | | | |
| 10/31/2018 | | | 29.52 | | | | 0.05 | | | | 0.93 | | | | 0.98 | | | | – | | | | (3.18 | ) | | | (3.18 | ) |
| 4/4/2017 to 10/31/2017(c) | | | 26.15 | | | | (0.01 | ) | | | 3.38 | | | | 3.37 | | | | – | | | | – | | | | – | |
| Class I | | | | | | | | | | | | | | | | | | | | | | | | | | | | |
| 10/31/2018 | | | 29.50 | | | | 0.02 | | | | 0.95 | | | | 0.97 | | | | – | | | | (3.18 | ) | | | (3.18 | ) |
| 10/31/2017 | | | 26.34 | | | | 0.02 | | | | 6.07 | | | | 6.09 | | | | – | | | | (2.93 | ) | | | (2.93 | ) |
| 10/31/2016 | | | 30.20 | | | | 0.02 | | | | 0.20 | | | | 0.22 | | | | (0.26 | ) | | | (3.82 | ) | | | (4.08 | ) |
| 10/31/2015 | | | 32.81 | | | | 0.11 | | | | 0.78 | | | | 0.89 | | | | (0.57 | ) | | | (2.93 | ) | | | (3.50 | ) |
| 10/31/2014 | | | 33.01 | | | | 0.10 | | | | 2.18 | | | | 2.28 | | | | (1.36 | ) | | | (1.12 | ) | | | (2.48 | ) |
| Class R2 | | | | | | | | | | | | | | | | | | | | | | | | | | | | |
| 10/31/2018 | | | 28.07 | | | | (0.13 | ) | | | 0.89 | | | | 0.76 | | | | – | | | | (3.18 | ) | | | (3.18 | ) |
| 10/31/2017 | | | 25.34 | | | | (0.14 | ) | | | 5.80 | | | | 5.66 | | | | – | | | | (2.93 | ) | | | (2.93 | ) |
| 10/31/2016 | | | 29.16 | | | | (0.11 | ) | | | 0.18 | | | | 0.07 | | | | (0.07 | ) | | | (3.82 | ) | | | (3.89 | ) |
| 10/31/2015 | | | 31.81 | | | | (0.07 | ) | | | 0.75 | | | | 0.68 | | | | (0.40 | ) | | | (2.93 | ) | | | (3.33 | ) |
| 10/31/2014 | | | 32.07 | | | | (0.09 | ) | | | 2.13 | | | | 2.04 | | | | (1.18 | ) | | | (1.12 | ) | | | (2.30 | ) |
| 104 | See Notes to Financial Statements. |
| | | | | Ratios to Average Net Assets: | | Supplemental Data: |
Net
asset
value,
end of
period | | Total
return
(%)(b) | | Total
expenses
after
waivers
and/or
reimburse-
ments
(%) | | Total
expenses
(%) | | Net
invest-
ment
income
(loss)
(%) | | Net
assets,
end of
period
(000) | | Portfolio
turnover
rate
(%) |
| | | | | | | | | | | |
| | $26.62 | | | | 3.11 | | | | 0.42 | | | | 0.52 | | | | (0.17 | ) | | | $508,472 | | | | 8 | |
| | 28.92 | | | | 24.55 | | | | 0.41 | | | | 0.54 | | | | (0.19 | ) | | | 510,601 | | | | 6 | |
| | 25.94 | | | | 0.91 | | | | 0.27 | | | | 0.55 | | | | (0.10 | ) | | | 507,241 | | | | 13 | |
| | 29.79 | | | | 2.54 | | | | 0.25 | | | | 0.53 | | | | 0.08 | | | | 580,945 | | | | 8 | |
| | 32.40 | | | | 6.89 | | | | 0.25 | | | | 0.53 | | | | 0.07 | | | | 586,429 | | | | 5 | |
| | | | | | | | | | | | | | | | | | | | | | | | | | | |
| | 22.43 | | | | 2.31 | | | | 1.17 | | | | 1.27 | | | | (0.87 | ) | | | 140,681 | | | | 8 | |
| | 25.03 | | | | 23.69 | | | | 1.16 | | | | 1.29 | | | | (0.92 | ) | | | 224,568 | | | | 6 | |
| | 22.96 | | | | 0.12 | | | | 1.02 | | | | 1.30 | | | | (0.84 | ) | | | 265,906 | | | | 13 | |
| | 26.83 | | | | 1.76 | | | | 1.00 | | | | 1.28 | | | | (0.67 | ) | | | 314,946 | | | | 8 | |
| | 29.51 | | | | 6.09 | | | | 1.00 | | | | 1.27 | | | | (0.68 | ) | | | 318,668 | | | | 5 | |
| | | | | | | | | | | | | | | | | | | | | | | | | | | |
| | 26.80 | | | | 3.25 | | | | 0.27 | | | | 0.37 | | | | (0.01 | ) | | | 204,245 | | | | 8 | |
| | 29.06 | | | | 24.78 | | | | 0.27 | | | | 0.39 | | | | (0.06 | ) | | | 247,908 | | | | 6 | |
| | 26.01 | | | | 1.05 | | | | 0.12 | | | | 0.40 | | | | 0.06 | | | | 230,558 | | | | 13 | |
| | 29.87 | | | | 2.68 | | | | 0.10 | | | | 0.38 | | | | 0.23 | | | | 271,865 | | | | 8 | |
| | 32.49 | | | | 7.05 | | | | 0.10 | | | | 0.38 | | | | 0.20 | | | | 267,679 | | | | 5 | |
| | | | | | | | | | | | | | | | | | | | | | | | | | | |
| | 27.32 | | | | 3.42 | | | | 0.09 | | | | 0.19 | | | | 0.17 | | | | 33,677 | | | | 8 | |
| | 29.52 | | | | 12.89 | (d) | | | 0.09 | (e) | | | 0.19 | (e) | | | (0.08 | )(e) | | | 34,672 | | | | 6 | |
| | | | | | | | | | | | | | | | | | | | | | | | | | | |
| | 27.29 | | | | 3.38 | | | | 0.17 | | | | 0.27 | | | | 0.08 | | | | 87,441 | | | | 8 | |
| | 29.50 | | | | 24.90 | | | | 0.16 | | | | 0.30 | | | | 0.06 | | | | 69,232 | | | | 6 | |
| | 26.34 | | | | 1.15 | | | | 0.02 | | | | 0.30 | | | | 0.09 | | | | 67,982 | | | | 13 | |
| | 30.20 | | | | 2.78 | | | | 0.00 | | | | 0.28 | | | | 0.36 | | | | 43,135 | | | | 8 | |
| | 32.81 | | | | 7.14 | | | | 0.00 | | | | 0.28 | | | | 0.31 | | | | 52,339 | | | | 5 | |
| | | | | | | | | | | | | | | | | | | | | | | | | | | |
| | 25.65 | | | | 2.75 | | | | 0.77 | | | | 0.87 | | | | (0.49 | ) | | | 2,531 | | | | 8 | |
| | 28.07 | | | | 24.11 | | | | 0.76 | | | | 0.89 | | | | (0.55 | ) | | | 3,064 | | | | 6 | |
| | 25.34 | | | | 0.57 | | | | 0.62 | | | | 0.90 | | | | (0.45 | ) | | | 2,704 | | | | 13 | |
| | 29.16 | | | | 2.16 | | | | 0.60 | | | | 0.88 | | | | (0.22 | ) | | | 2,704 | | | | 8 | |
| | 31.81 | | | | 6.55 | | | | 0.60 | | | | 0.88 | | | | (0.30 | ) | | | 3,479 | | | | 5 | |
| | See Notes to Financial Statements. | 105 |
Financial Highlights (continued)
ALPHA STRATEGY FUND
| | | | | Per Share Operating Performance: |
| | | | | Investment Operations: | | Distributions to
shareholders from: |
| | | Net asset
value,
beginning
of period | | Net
invest-
ment
income
(loss)(a) | | Net
realized
and
unrealized
gain (loss) | | Total
from
invest-
ment
opera-
tions | | Net
investment
income | | Net
realized
gain | | Total
distri-
butions |
| Class R3 | | | | | | | | | | | | | | | | | | | | | | | | | | | | |
| 10/31/2018 | | | $28.25 | | | | $(0.11 | ) | | | $0.90 | | | | $0.79 | | | | $ – | | | | $(3.18 | ) | | | $(3.18 | ) |
| 10/31/2017 | | | 25.46 | | | | (0.11 | ) | | | 5.83 | | | | 5.72 | | | | – | | | | (2.93 | ) | | | (2.93 | ) |
| 10/31/2016 | | | 29.30 | | | | (0.09 | ) | | | 0.19 | | | | 0.10 | | | | (0.12 | ) | | | (3.82 | ) | | | (3.94 | ) |
| 10/31/2015 | | | 31.93 | | | | (0.05 | ) | | | 0.76 | | | | 0.71 | | | | (0.41 | ) | | | (2.93 | ) | | | (3.34 | ) |
| 10/31/2014 | | | 32.18 | | | | (0.05 | ) | | | 2.13 | | | | 2.08 | | | | (1.21 | ) | | | (1.12 | ) | | | (2.33 | ) |
| Class R4 | | | | | | | | | | | | | | | | | | | | | | | | | | | | |
| 10/31/2018 | | | 28.88 | | | | (0.06 | ) | | | 0.94 | | | | 0.88 | | | | – | | | | (3.18 | ) | | | (3.18 | ) |
| 10/31/2017 | | | 25.90 | | | | (0.09 | ) | | | 6.00 | | | | 5.91 | | | | – | | | | (2.93 | ) | | | (2.93 | ) |
| 10/31/2016 | | | 29.79 | | | | (0.07 | ) | | | 0.23 | | | | 0.16 | | | | (0.23 | ) | | | (3.82 | ) | | | (4.05 | ) |
| 6/30/2015 to 10/31/2015(f) | | | 31.87 | | | | (0.03 | ) | | | (2.05 | ) | | | (2.08 | ) | | | – | | | | – | | | | – | |
| Class R5 | | | | | | | | | | | | | | | | | | | | | | | | | | | | |
| 10/31/2018 | | | 29.52 | | | | 0.02 | | | | 0.94 | | | | 0.96 | | | | – | | | | (3.18 | ) | | | (3.18 | ) |
| 10/31/2017 | | | 26.35 | | | | (0.04 | ) | | | 6.14 | | | | 6.10 | | | | – | | | | (2.93 | ) | | | (2.93 | ) |
| 10/31/2016 | | | 30.20 | | | | 0.04 | | | | 0.19 | | | | 0.23 | | | | (0.26 | ) | | | (3.82 | ) | | | (4.08 | ) |
| 6/30/2015 to 10/31/2015(f) | | | 32.28 | | | | – | (g) | | | (2.08 | ) | | | (2.08 | ) | | | – | | | | – | | | | – | |
| Class R6 | | | | | | | | | | | | | | | | | | | | | | | | | | | | |
| 10/31/2018 | | | 29.52 | | | | 0.05 | | | | 0.94 | | | | 0.99 | | | | – | | | | (3.18 | ) | | | (3.18 | ) |
| 10/31/2017 | | | 26.34 | | | | (0.01 | ) | | | 6.12 | | | | 6.11 | | | | – | | | | (2.93 | ) | | | (2.93 | ) |
| 10/31/2016 | | | 30.20 | | | | – | (g) | | | 0.23 | | | | 0.23 | | | | (0.27 | ) | | | (3.82 | ) | | | (4.09 | ) |
| 6/30/2015 to 10/31/2015(f) | | | 32.28 | | | | – | (g) | | | (2.08 | ) | | | (2.08 | ) | | | – | | | | – | | | | – | |
| (a) | Calculated using average shares outstanding during the period. |
| (b) | Total return for Classes A and C does not consider the effects of sales loads and assumes the reinvestment of all distributions. Total return for all other classes assumes the reinvestment of all distributions. |
| (c) | Commenced on April 4, 2017. |
| (d) | Not annualized. |
| (e) | Annualized. |
| (f) | Commenced on June 30, 2015. |
| (g) | Amount less than $0.01. |
| 106 | See Notes to Financial Statements. |
| | | | | Ratios to Average Net Assets: | | Supplemental Data: |
Net
asset
value,
end of
period | | Total
return
(%)(b) | | Total
expenses
after
waivers
and/or
reimburse-
ments
(%) | | Total
expenses
(%) | | Net
invest-
ment
income
(loss)
(%) | | Net
assets,
end of
period
(000) | | Portfolio
turnover
rate
(%) |
| | | | | | | | | | | | | |
| | $25.86 | | | | 2.84 | | | | 0.67 | | | | 0.77 | | | | (0.40 | ) | | | $28,601 | | | | 8 | |
| | 28.25 | | | | 24.24 | | | | 0.65 | | | | 0.79 | | | | (0.43 | ) | | | 33,190 | | | | 6 | |
| | 25.46 | | | | 0.68 | | | | 0.52 | | | | 0.80 | | | | (0.35 | ) | | | 34,223 | | | | 13 | |
| | 29.30 | | | | 2.28 | | | | 0.50 | | | | 0.78 | | | | (0.17 | ) | | | 36,656 | | | | 8 | |
| | 31.93 | | | | 6.62 | | | | 0.50 | | | | 0.78 | | | | (0.15 | ) | | | 36,695 | | | | 5 | |
| | | | | | | | | | | | | | | | | | | | | | | | | | | |
| | 26.58 | | | | 3.12 | | | | 0.42 | | | | 0.52 | | | | (0.22 | ) | | | 3,236 | | | | 8 | |
| | 28.88 | | | | 24.60 | | | | 0.42 | | | | 0.53 | | | | (0.34 | ) | | | 1,998 | | | | 6 | |
| | 25.90 | | | | 0.91 | | | | 0.28 | | | | 0.55 | | | | (0.27 | ) | | | 278 | | | | 13 | |
| | 29.79 | | | | (6.53 | )(d) | | | 0.25 | (e) | | | 0.53 | (e) | | | (0.25 | )(e) | | | 9 | | | | 8 | |
| | | | | | | | | | | | | | | | | | | | | | | | | | | |
| | 27.30 | | | | 3.34 | | | | 0.17 | | | | 0.27 | | | | 0.06 | | | | 106 | | | | 8 | |
| | 29.52 | | | | 24.93 | | | | 0.18 | | | | 0.28 | | | | (0.13 | ) | | | 84 | | | | 6 | |
| | 26.35 | | | | 1.19 | | | | – | | | | 0.30 | | | | 0.16 | | | | 9 | | | | 13 | |
| | 30.20 | | | | (6.44 | )(d) | | | 0.00 | (e) | | | 0.28 | (e) | | | 0.00 | (e) | | | 9 | | | | 8 | |
| | | | | | | | | | | | | | | | | | | | | | | | | | | |
| | 27.33 | | | | 3.45 | | | | 0.09 | | | | 0.19 | | | | 0.17 | | | | 3,619 | | | | 8 | |
| | 29.52 | | | | 24.98 | | | | 0.09 | | | | 0.19 | | | | 1.34 | | | | 3,855 | | | | 6 | |
| | 26.34 | | | | 1.17 | | | | 0.03 | | | | 0.17 | | | | (0.01 | ) | | | 675 | | | | 13 | |
| | 30.20 | | | | (6.44 | )(d) | | | 0.00 | (e) | | | 0.12 | (e) | | | 0.03 | (e) | | | 9 | | | | 8 | |
| | See Notes to Financial Statements. | 107 |
Financial Highlights (continued)
FUNDAMENTAL EQUITY FUND
| | | | | Per Share Operating Performance: |
| | | | | Investment Operations: | | Distributions to
shareholders from: |
| | | Net asset
value,
beginning
of period | | Net
invest-
ment
income
(loss)(a) | | Net
realized
and
unrealized
gain (loss) | | Total
from
invest-
ment
opera-
tions | | Net
investment
income | | Net
realized
gain | | Total
distri-
butions |
| Class A | | | | | | | | | | | | | | | | | | | | | | | | | | | | |
| 10/31/2018 | | | $13.99 | | | | $ 0.16 | | | | $0.10 | | | | $0.26 | | | | $(0.18 | ) | | | $(1.43 | ) | | | $(1.61 | ) |
| 10/31/2017 | | | 12.54 | | | | 0.17 | | | | 1.94 | | | | 2.11 | | | | (0.19 | ) | | | (0.47 | ) | | | (0.66 | ) |
| 10/31/2016 | | | 13.32 | | | | 0.19 | | | | 0.34 | | | | 0.53 | | | | (0.17 | ) | | | (1.14 | ) | | | (1.31 | ) |
| 10/31/2015 | | | 16.00 | | | | 0.15 | | | | 0.04 | | | | 0.19 | | | | (0.10 | ) | | | (2.77 | ) | | | (2.87 | ) |
| 10/31/2014 | | | 16.83 | | | | 0.07 | | | | 1.67 | | | | 1.74 | | | | (0.04 | ) | | | (2.53 | ) | | | (2.57 | ) |
| Class C | | | | | | | | | | | | | | | | | | | | | | | | | | | | |
| 10/31/2018 | | | 12.58 | | | | 0.06 | | | | 0.08 | | | | 0.14 | | | | (0.07 | ) | | | (1.43 | ) | | | (1.50 | ) |
| 10/31/2017 | | | 11.33 | | | | 0.07 | | | | 1.76 | | | | 1.83 | | | | (0.11 | ) | | | (0.47 | ) | | | (0.58 | ) |
| 10/31/2016 | | | 12.14 | | | | 0.09 | | | | 0.31 | | | | 0.40 | | | | (0.07 | ) | | | (1.14 | ) | | | (1.21 | ) |
| 10/31/2015 | | | 14.83 | | | | 0.04 | | | | 0.04 | | | | 0.08 | | | | – | (c) | | | (2.77 | ) | | | (2.77 | ) |
| 10/31/2014 | | | 15.83 | | | | (0.03 | ) | | | 1.56 | | | | 1.53 | | | | – | | | | (2.53 | ) | | | (2.53 | ) |
| Class F | | | | | | | | | | | | | | | | | | | | | | | | | | | | |
| 10/31/2018 | | | 13.87 | | | | 0.18 | | | | 0.10 | | | | 0.28 | | | | (0.20 | ) | | | (1.43 | ) | | | (1.63 | ) |
| 10/31/2017 | | | 12.44 | | | | 0.19 | | | | 1.93 | | | | 2.12 | | | | (0.22 | ) | | | (0.47 | ) | | | (0.69 | ) |
| 10/31/2016 | | | 13.23 | | | | 0.21 | | | | 0.33 | | | | 0.54 | | | | (0.19 | ) | | | (1.14 | ) | | | (1.33 | ) |
| 10/31/2015 | | | 15.93 | | | | 0.17 | | | | 0.05 | | | | 0.22 | | | | (0.15 | ) | | | (2.77 | ) | | | (2.92 | ) |
| 10/31/2014 | | | 16.77 | | | | 0.10 | | | | 1.67 | | | | 1.77 | | | | (0.08 | ) | | | (2.53 | ) | | | (2.61 | ) |
| Class F3 | | | | | | | | | | | | | | | | | | | | | | | | | | | | |
| 10/31/2018 | | | 14.12 | | | | 0.21 | | | | 0.09 | | | | 0.30 | | | | (0.21 | ) | | | (1.43 | ) | | | (1.64 | ) |
| 4/4/2017 to 10/31/2017(d) | | | 13.24 | | | | 0.11 | | | | 0.77 | | | | 0.88 | | | | – | | | | – | | | | – | |
| Class I | | | | | | | | | | | | | | | | | | | | | | | | | | | | |
| 10/31/2018 | | | 14.09 | | | | 0.19 | | | | 0.09 | | | | 0.28 | | | | (0.21 | ) | | | (1.43 | ) | | | (1.64 | ) |
| 10/31/2017 | | | 12.62 | | | | 0.21 | | | | 1.96 | | | | 2.17 | | | | (0.23 | ) | | | (0.47 | ) | | | (0.70 | ) |
| 10/31/2016 | | | 13.40 | | | | 0.23 | | | | 0.34 | | | | 0.57 | | | | (0.21 | ) | | | (1.14 | ) | | | (1.35 | ) |
| 10/31/2015 | | | 16.11 | | | | 0.18 | | | | 0.04 | | | | 0.22 | | | | (0.16 | ) | | | (2.77 | ) | | | (2.93 | ) |
| 10/31/2014 | | | 16.93 | | | | 0.12 | | | | 1.69 | | | | 1.81 | | | | (0.10 | ) | | | (2.53 | ) | | | (2.63 | ) |
| Class P | | | | | | | | | | | | | | | | | | | | | | | | | | | | |
| 10/31/2018 | | | 13.74 | | | | 0.13 | | | | 0.09 | | | | 0.22 | | | | (0.13 | ) | | | (1.43 | ) | | | (1.56 | ) |
| 10/31/2017 | | | 12.32 | | | | 0.14 | | | | 1.92 | | | | 2.06 | | | | (0.17 | ) | | | (0.47 | ) | | | (0.64 | ) |
| 10/31/2016 | | | 13.10 | | | | 0.17 | | | | 0.33 | | | | 0.50 | | | | (0.14 | ) | | | (1.14 | ) | | | (1.28 | ) |
| 10/31/2015 | | | 15.79 | | | | 0.12 | | | | 0.04 | | | | 0.16 | | | | (0.08 | ) | | | (2.77 | ) | | | (2.85 | ) |
| 10/31/2014 | | | 16.64 | | | | 0.05 | | | | 1.65 | | | | 1.70 | | | | (0.02 | ) | | | (2.53 | ) | | | (2.55 | ) |
| Class R2 | | | | | | | | | | | | | | | | | | | | | | | | | | | | |
| 10/31/2018 | | | 13.68 | | | | 0.11 | | | | 0.10 | | | | 0.21 | | | | (0.13 | ) | | | (1.43 | ) | | | (1.56 | ) |
| 10/31/2017 | | | 12.27 | | | | 0.12 | | | | 1.91 | | | | 2.03 | | | | (0.15 | ) | | | (0.47 | ) | | | (0.62 | ) |
| 10/31/2016 | | | 13.05 | | | | 0.15 | | | | 0.33 | | | | 0.48 | | | | (0.12 | ) | | | (1.14 | ) | | | (1.26 | ) |
| 10/31/2015 | | | 15.71 | | | | 0.10 | | | | 0.04 | | | | 0.14 | | | | (0.03 | ) | | | (2.77 | ) | | | (2.80 | ) |
| 10/31/2014 | | | 16.57 | | | | 0.03 | | | | 1.64 | | | | 1.67 | | | | – | (c) | | | (2.53 | ) | | | (2.53 | ) |
| 108 | See Notes to Financial Statements. |
| | | | | Ratios to Average
Net Assets: | | Supplemental Data: |
| | | | | | | | | | | |
Net
asset
value,
end of
period | | Total
return
(%)(b) | | Total
expenses
(%) | | Net
invest-
ment
income
(loss)
(%) | | Net
assets,
end of
period
(000) | | Portfolio
turnover
rate
(%) |
| | | | | | | | | | | |
| | $12.64 | | | | 1.99 | | | | 0.96 | | | | 1.22 | | | | $1,446,816 | | | | 92 | |
| | 13.99 | | | | 17.45 | | | | 0.96 | | | | 1.29 | | | | 1,571,170 | | | | 96 | |
| | 12.54 | | | | 4.36 | | | | 0.98 | | | | 1.60 | | | | 1,653,389 | | | | 135 | |
| | 13.32 | | | | 1.18 | | | | 0.97 | | | | 1.09 | | | | 2,027,292 | | | | 149 | |
| | 16.00 | | | | 11.65 | | | | 1.05 | | | | 0.43 | | | | 2,683,790 | | | | 113 | |
| | | | | | | | | | | | | | | | | | | | | | | |
| | 11.22 | | | | 1.21 | | | | 1.71 | | | | 0.48 | | | | 232,937 | | | | 92 | |
| | 12.58 | | | | 16.63 | | | | 1.71 | | | | 0.55 | | | | 445,017 | | | | 96 | |
| | 11.33 | | | | 3.59 | | | | 1.73 | | | | 0.85 | | | | 544,649 | | | | 135 | |
| | 12.14 | | | | 0.40 | | | | 1.72 | | | | 0.34 | | | | 713,824 | | | | 149 | |
| | 14.83 | | | | 10.90 | | | | 1.71 | | | | (0.22 | ) | | | 986,381 | | | | 113 | |
| | | | | | | | | | | | | | | | | | | | | | | |
| | 12.52 | | | | 2.17 | | | | 0.81 | | | | 1.38 | | | | 247,704 | | | | 92 | |
| | 13.87 | | | | 17.62 | | | | 0.81 | | | | 1.43 | | | | 323,584 | | | | 96 | |
| | 12.44 | | | | 4.48 | | | | 0.83 | | | | 1.76 | | | | 304,083 | | | | 135 | |
| | 13.23 | | | | 1.35 | | | | 0.82 | | | | 1.25 | | | | 436,263 | | | | 149 | |
| | 15.93 | | | | 11.93 | | | | 0.81 | | | | 0.68 | | | | 793,101 | | | | 113 | |
| | | | | | | | | | | | | | | | | | | | | | | |
| | 12.78 | | | | 2.36 | | | | 0.62 | | | | 1.57 | | | | 20,270 | | | | 92 | |
| | 14.12 | | | | 6.65 | (e) | | | 0.62 | (f) | | | 1.42 | (f) | | | 20,497 | | | | 96 | |
| | | | | | | | | | | | | | | | | | | | | | | |
| | 12.73 | | | | 2.19 | | | | 0.71 | | | | 1.48 | | | | 92,508 | | | | 92 | |
| | 14.09 | | | | 17.81 | | | | 0.72 | | | | 1.54 | | | | 120,146 | | | | 96 | |
| | 12.62 | | | | 4.64 | | | | 0.73 | | | | 1.87 | | | | 142,316 | | | | 135 | |
| | 13.40 | | | | 1.37 | | | | 0.72 | | | | 1.36 | | | | 236,867 | | | | 149 | |
| | 16.11 | | | | 12.05 | | | | 0.71 | | | | 0.78 | | | | 449,870 | | | | 113 | |
| | | | | | | | | | | | | | | | | | | | | | | |
| | 12.40 | | | | 1.77 | | | | 1.16 | | | | 1.02 | | | | 5,648 | | | | 92 | |
| | 13.74 | | | | 17.28 | | | | 1.17 | | | | 1.11 | | | | 7,096 | | | | 96 | |
| | 12.32 | | | | 4.17 | | | | 1.18 | | | | 1.40 | | | | 10,798 | | | | 135 | |
| | 13.10 | | | | 0.94 | | | | 1.17 | | | | 0.90 | | | | 13,733 | | | | 149 | |
| | 15.79 | | | | 11.51 | | | | 1.16 | | | | 0.32 | | | | 21,373 | | | | 113 | |
| | | | | | | | | | | | | | | | | | | | | | | |
| | 12.33 | | | | 1.64 | | | | 1.31 | | | | 0.88 | | | | 3,587 | | | | 92 | |
| | 13.68 | | | | 17.07 | | | | 1.31 | | | | 0.93 | | | | 8,062 | | | | 96 | |
| | 12.27 | | | | 3.97 | | | | 1.33 | | | | 1.25 | | | | 7,952 | | | | 135 | |
| | 13.05 | | | | 0.81 | | | | 1.33 | | | | 0.76 | | | | 10,543 | | | | 149 | |
| | 15.71 | | | | 11.33 | | | | 1.31 | | | | 0.17 | | | | 19,744 | | | | 113 | |
| | See Notes to Financial Statements. | 109 |
Financial Highlights (continued)
FUNDAMENTAL EQUITY FUND
| | | | | Per Share Operating Performance: |
| | | | | Investment Operations: | | Distributions to
shareholders from: |
| | | Net asset
value,
beginning
of period | | Net
invest-
ment
income
(loss)(a) | | Net
realized
and
unrealized
gain (loss) | | Total
from
invest-
ment
opera-
tions | | Net
investment
income | | Net
realized
gain | | Total
distri-
butions |
| Class R3 | | | | | | | | | | | | | | | | | | | | | | | | | | | | |
| 10/31/2018 | | | $13.75 | | | | $0.12 | | | | $0.10 | | | | $0.22 | | | | $(0.14 | ) | | | $(1.43 | ) | | | $(1.57 | ) |
| 10/31/2017 | | | 12.34 | | | | 0.14 | | | | 1.90 | | | | 2.04 | | | | (0.16 | ) | | | (0.47 | ) | | | (0.63 | ) |
| 10/31/2016 | | | 13.12 | | | | 0.16 | | | | 0.33 | | | | 0.49 | | | | (0.13 | ) | | | (1.14 | ) | | | (1.27 | ) |
| 10/31/2015 | | | 15.80 | | | | 0.11 | | | | 0.06 | | | | 0.17 | | | | (0.08 | ) | | | (2.77 | ) | | | (2.85 | ) |
| 10/31/2014 | | | 16.66 | | | | 0.04 | | | | 1.65 | | | | 1.69 | | | | (0.02 | ) | | | (2.53 | ) | | | (2.55 | ) |
| Class R4 | | | | | | | | | | | | | | | | | | | | | | | | | | | | |
| 10/31/2018 | | | 13.94 | | | | 0.16 | | | | 0.10 | | | | 0.26 | | | | (0.19 | ) | | | (1.43 | ) | | | (1.62 | ) |
| 10/31/2017 | | | 12.52 | | | | 0.16 | | | | 1.95 | | | | 2.11 | | | | (0.22 | ) | | | (0.47 | ) | | | (0.69 | ) |
| 10/31/2016 | | | 13.32 | | | | 0.17 | | | | 0.36 | | | | 0.53 | | | | (0.19 | ) | | | (1.14 | ) | | | (1.33 | ) |
| 6/30/2015 to 10/31/2015(g) | | | 13.52 | | | | 0.05 | | | | (0.25 | ) | | | (0.20 | ) | | | – | | | | – | | | | – | |
| Class R5 | | | | | | | | | | | | | | | | | | | | | | | | | | | | |
| 10/31/2018 | | | 14.09 | | | | 0.19 | | | | 0.10 | | | | 0.29 | | | | (0.21 | ) | | | (1.43 | ) | | | (1.64 | ) |
| 10/31/2017 | | | 12.63 | | | | 0.19 | | | | 1.97 | | | | 2.16 | | | | (0.23 | ) | | | (0.47 | ) | | | (0.70 | ) |
| 10/31/2016 | | | 13.41 | | | | 0.17 | | | | 0.40 | | | | 0.57 | | | | (0.21 | ) | | | (1.14 | ) | | | (1.35 | ) |
| 6/30/2015 to 10/31/2015(g) | | | 13.60 | | | | 0.06 | | | | (0.25 | ) | | | (0.19 | ) | | | – | | | | – | | | | – | |
| Class R6 | | | | | | | | | | | | | | | | | | | | | | | | | | | | |
| 10/31/2018 | | | 14.12 | | | | 0.21 | | | | 0.10 | | | | 0.31 | | | | (0.21 | ) | | | (1.43 | ) | | | (1.64 | ) |
| 10/31/2017 | | | 12.64 | | | | 0.21 | | | | 1.97 | | | | 2.18 | | | | (0.23 | ) | | | (0.47 | ) | | | (0.70 | ) |
| 10/31/2016 | | | 13.41 | | | | 0.23 | | | | 0.35 | | | | 0.58 | | | | (0.21 | ) | | | (1.14 | ) | | | (1.35 | ) |
| 6/30/2015 to 10/31/2015(g) | | | 13.60 | | | | 0.06 | | | | (0.25 | ) | | | (0.19 | ) | | | – | | | | – | | | | – | |
| (a) | Calculated using average shares outstanding during the period. |
| (b) | Total return for Classes A and C does not consider the effects of sales loads and assumes the reinvestment of all distributions. Total return for all other classes assumes the reinvestment of all distributions. |
| (c) | Amount less than $0.01. |
| (d) | Commenced on April 4, 2017. |
| (e) | Not annualized. |
| (f) | Annualized. |
| (g) | Commenced on June 30, 2015. |
| 110 | See Notes to Financial Statements. |
| | | | | Ratios to Average
Net Assets: | | Supplemental Data: |
| | | | | | | | | | | |
Net
asset
value,
end of
period | | Total
return
(%)(b) | | Total
expenses
(%) | | Net
invest-
ment
income
(loss)
(%) | | Net
assets,
end of
period
(000) | | Portfolio
turnover
rate
(%) |
| | | | | | | | | | | |
| | $12.40 | | | | 1.66 | | | | 1.21 | | | | 0.97 | | | | $116,719 | | | | 92 | |
| | 13.75 | | | | 17.19 | | | | 1.21 | | | | 1.04 | | | | 147,010 | | | | 96 | |
| | 12.34 | | | | 4.09 | | | | 1.23 | | | | 1.35 | | | | 157,626 | | | | 135 | |
| | 13.12 | | | | 0.97 | | | | 1.22 | | | | 0.84 | | | | 206,984 | | | | 149 | |
| | 15.80 | | | | 11.41 | | | | 1.21 | | | | 0.28 | | | | 304,459 | | | | 113 | |
| | | | | | | | | | | | | | | | | | | | | | | |
| | 12.58 | | | | 2.00 | | | | 0.96 | | | | 1.22 | | | | 5,164 | | | | 92 | |
| | 13.94 | | | | 17.45 | | | | 0.95 | | | | 1.19 | | | | 4,355 | | | | 96 | |
| | 12.52 | | | | 4.37 | | | | 0.95 | | | | 1.40 | | | | 121 | | | | 135 | |
| | 13.32 | | | | (1.48 | )(e) | | | 0.93 | (f) | | | 1.12 | (f) | | | 10 | | | | 149 | |
| | | | | | | | | | | | | | | | | | | | | | | |
| | 12.74 | | | | 2.28 | | | | 0.71 | | | | 1.45 | | | | 810 | | | | 92 | |
| | 14.09 | | | | 17.73 | | | | 0.70 | | | | 1.40 | | | | 1,049 | | | | 96 | |
| | 12.63 | | | | 4.64 | | | | 0.68 | | | | 1.40 | | | | 125 | | | | 135 | |
| | 13.41 | | | | (1.40 | )(e) | | | 0.68 | (f) | | | 1.37 | (f) | | | 10 | | | | 149 | |
| | | | | | | | | | | | | | | | | | | | | | | |
| | 12.79 | | | | 2.36 | | | | 0.62 | | | | 1.57 | | | | 16,864 | | | | 92 | |
| | 14.12 | | | | 17.97 | | | | 0.62 | | | | 1.51 | | | | 6,440 | | | | 96 | |
| | 12.64 | | | | 4.73 | | | | 0.61 | | | | 1.88 | | | | 123 | | | | 135 | |
| | 13.41 | | | | (1.40 | )(e) | | | 0.59 | (f) | | | 1.46 | (f) | | | 10 | | | | 149 | |
| | See Notes to Financial Statements. | 111 |
Financial Highlights (continued)
GLOBAL EQUITY RESEARCH FUND
| | | | | Per Share Operating Performance: |
| | | | | Investment Operations: | | Distributions to
shareholders from: |
| | | Net asset
value,
beginning
of period | | Net
invest-
ment
income
(loss)(a) | | Net
realized
and
unrealized
gain (loss) | | Total
from
invest-
ment
opera-
tions | | Net
investment
income | | Net
realized
gain | | Total
distri-
butions |
| Class A | | | | | | | | | | | | | | | | | | | | | | | | | | | | |
| 10/31/2018 | | | $11.58 | | | | $ 0.09 | | | | $(0.11 | ) | | | $(0.02 | ) | | | $(0.11 | ) | | | $(0.52 | ) | | | $(0.63 | ) |
| 1/17/2017 to 10/31/2017(c) | | | 10.00 | | | | 0.08 | | | | 1.50 | | | | 1.58 | | | | – | | | | – | | | | – | |
| Class C | | | | | | | | | | | | | | | | | | | | | | | | | | | | |
| 10/31/2018 | | | 11.52 | | | | 0.01 | | | | (0.12 | ) | | | (0.11 | ) | | | (0.08 | ) | | | (0.52 | ) | | | (0.60 | ) |
| 1/17/2017 to 10/31/2017(c) | | | 10.00 | | | | (0.02 | ) | | | 1.54 | | | | 1.52 | | | | – | | | | – | | | | – | |
| Class F | | | | | | | | | | | | | | | | | | | | | | | | | | | | |
| 10/31/2018 | | | 11.60 | | | | 0.11 | | | | (0.12 | ) | | | (0.01 | ) | | | (0.13 | ) | | | (0.52 | ) | | | (0.65 | ) |
| 1/17/2017 to 10/31/2017(c) | | | 10.00 | | | | 0.10 | | | | 1.50 | | | | 1.60 | | | | – | | | | – | | | | – | |
| Class F3 | | | | | | | | | | | | | | | | | | | | | | | | | | | | |
| 10/31/2018 | | | 11.61 | | | | 0.12 | | | | (0.11 | ) | | | 0.01 | | | | (0.14 | ) | | | (0.52 | ) | | | (0.66 | ) |
| 4/4/2017 to 10/31/2017(f) | | | 10.28 | | | | 0.07 | | | | 1.26 | | | | 1.33 | | | | – | | | | – | | | | – | |
| Class I | | | | | | | | | | | | | | | | | | | | | | | | | | | | |
| 10/31/2018 | | | 11.61 | | | | 0.12 | | | | (0.12 | ) | | | – | | | | (0.14 | ) | | | (0.52 | ) | | | (0.66 | ) |
| 1/17/2017 to 10/31/2017(c) | | | 10.00 | | | | 0.10 | | | | 1.51 | | | | 1.61 | | | | – | | | | – | | | | – | |
| Class R2 | | | | | | | | | | | | | | | | | | | | | | | | | | | | |
| 10/31/2018 | | | 11.55 | | | | 0.05 | | | | (0.12 | ) | | | (0.07 | ) | | | (0.07 | ) | | | (0.52 | ) | | | (0.59 | ) |
| 1/17/2017 to 10/31/2017(c) | | | 10.00 | | | | 0.05 | | | | 1.50 | | | | 1.55 | | | | – | | | | – | | | | – | |
| Class R3 | | | | | | | | | | | | | | | | | | | | | | | | | | | | |
| 10/31/2018 | | | 11.56 | | | | 0.03 | | | | (0.09 | ) | | | (0.06 | ) | | | (0.08 | ) | | | (0.52 | ) | | | (0.60 | ) |
| 1/17/2017 to 10/31/2017(c) | | | 10.00 | | | | 0.06 | | | | 1.50 | | | | 1.56 | | | | – | | | | – | | | | – | |
| Class R4 | | | | | | | | | | | | | | | | | | | | | | | | | | | | |
| 10/31/2018 | | | 11.58 | | | | 0.10 | | | | (0.12 | ) | | | (0.02 | ) | | | (0.11 | ) | | | (0.52 | ) | | | (0.63 | ) |
| 1/17/2017 to 10/31/2017(c) | | | 10.00 | | | | 0.08 | | | | 1.50 | | | | 1.58 | | | | – | | | | – | | | | – | |
| Class R5 | | | | | | | | | | | | | | | | | | | | | | | | | | | | |
| 10/31/2018 | | | 11.61 | | | | 0.12 | | | | (0.12 | ) | | | – | | | | (0.14 | ) | | | (0.52 | ) | | | (0.66 | ) |
| 1/17/2017 to 10/31/2017(c) | | | 10.00 | | | | 0.10 | | | | 1.51 | | | | 1.61 | | | | – | | | | – | | | | – | |
| Class R6 | | | | | | | | | | | | | | | | | | | | | | | | | | | | |
| 10/31/2018 | | | 11.61 | | | | 0.13 | | | | (0.12 | ) | | | 0.01 | | | | (0.14 | ) | | | (0.52 | ) | | | (0.66 | ) |
| 1/17/2017 to 10/31/2017(c) | | | 10.00 | | | | 0.11 | | | | 1.50 | | | | 1.61 | | | | – | | | | – | | | | – | |
| (a) | Calculated using average shares outstanding during the period. |
| (b) | Total return for Classes A and C does not consider the effects of sales loads and assumes the reinvestment of all distributions. Total return for all other classes assumes the reinvestment of all distributions. |
| (c) | Commenced on January 17, 2017. |
| (d) | Not annualized. |
| (e) | Annualized. |
| (f) | Commenced on April 4, 2017. |
| 112 | See Notes to Financial Statements. |
| | | | | Ratios to Average Net Assets: | | Supplemental Data: |
Net
asset
value,
end of
period | | Total
return
(%)(b) | | Total
expenses
after
waivers
and/or
reimburse-
ments
(%) | | Total
expenses
(%) | | Net
invest-
ment
income
(loss)
(%) | | Net
assets,
end of
period
(000) | | Portfolio
turnover
rate
(%) |
| | | | | | | | | | | | | | | | | | | | | | | | | | | |
| $ | 10.93 | | | | (0.22 | ) | | | 0.95 | | | | 5.07 | | | | 0.79 | | | $ | 3,124 | | | | 108 | |
| | 11.58 | | | | 15.80 | (d) | | | 1.05 | (e) | | | 5.00 | (e) | | | 0.96 | (e) | | | 1,667 | | | | 140 | |
| | | | | | | | | | | | | | | | | | | | | | | | | | | |
| | 10.81 | | | | (1.07 | ) | | | 1.70 | | | | 5.76 | | | | 0.07 | | | | 699 | | | | 108 | |
| | 11.52 | | | | 15.20 | (d) | | | 1.80 | (e) | | | 5.61 | (e) | | | (0.24 | )(e) | | | 336 | | | | 140 | |
| | | | | | | | | | | | | | | | | | | | | | | | | | | |
| | 10.94 | | | | (0.19 | ) | | | 0.82 | | | | 4.90 | | | | 0.94 | | | | 1,203 | | | | 108 | |
| | 11.60 | | | | 16.00 | (d) | | | 0.90 | (e) | | | 4.86 | (e) | | | 1.12 | (e) | | | 1,178 | | | | 140 | |
| | | | | | | | | | | | | | | | | | | | | | | | | | | |
| | 10.96 | | | | 0.01 | | | | 0.69 | | | | 4.80 | | | | 1.08 | | | | 11 | | | | 108 | |
| | 11.61 | | | | 12.94 | (d) | | | 0.75 | (e) | | | 4.78 | (e) | | | 1.04 | (e) | | | 11 | | | | 140 | |
| | | | | | | | | | | | | | | | | | | | | | | | | | | |
| | 10.95 | | | | (0.10 | ) | | | 0.72 | | | | 4.81 | | | | 1.03 | | | | 1,137 | | | | 108 | |
| | 11.61 | | | | 16.10 | (d) | | | 0.80 | (e) | | | 4.76 | (e) | | | 1.23 | (e) | | | 1,137 | | | | 140 | |
| | | | | | | | | | | | | | | | | | | | | | | | | | | |
| | 10.89 | | | | (0.66 | ) | | | 1.32 | | | | 5.40 | | | | 0.44 | | | | 11 | | | | 108 | |
| | 11.55 | | | | 15.50 | (d) | | | 1.40 | (e) | | | 5.36 | (e) | | | 0.64 | (e) | | | 12 | | | | 140 | |
| | | | | | | | | | | | | | | | | | | | | | | | | | | |
| | 10.90 | | | | (0.56 | ) | | | 1.18 | | | | 5.98 | | | | 0.27 | | | | 165 | | | | 108 | |
| | 11.56 | | | | 15.60 | (d) | | | 1.30 | (e) | | | 5.25 | (e) | | | 0.74 | (e) | | | 12 | | | | 140 | |
| | | | | | | | | | | | | | | | | | | | | | | | | | | |
| | 10.93 | | | | (0.24 | ) | | | 0.97 | | | | 5.05 | | | | 0.83 | | | | 12 | | | | 108 | |
| | 11.58 | | | | 15.80 | (d) | | | 1.05 | (e) | | | 5.00 | (e) | | | 0.93 | (e) | | | 12 | | | | 140 | |
| | | | | | | | | | | | | | | | | | | | | | | | | | | |
| | 10.95 | | | | (0.10 | ) | | | 0.72 | | | | 4.80 | | | | 1.03 | | | | 12 | | | | 108 | |
| | 11.61 | | | | 16.10 | (d) | | | 0.80 | (e) | | | 4.74 | (e) | | | 1.25 | (e) | | | 12 | | | | 140 | |
| | | | | | | | | | | | | | | | | | | | | | | | | | | |
| | 10.96 | | | | 0.01 | | | | 0.63 | | | | 4.62 | | | | 1.12 | | | | 236 | | | | 108 | |
| | 11.61 | | | | 16.10 | (d) | | | 0.75 | (e) | | | 4.72 | (e) | | | 1.30 | (e) | | | 12 | | | | 140 | |
| | See Notes to Financial Statements. | 113 |
Financial Highlights (continued)
GLOBAL SELECT EQUITY FUND
| | | Per Share Operating Performance: | | |
| | | | | | Investment Operations: | | |
| | | Net asset
value,
beginning
of period | | Net
investment
income(a) | | Net
realized and
unrealized
gain (loss) | | Total from
investment
operations | | Net asset
value,
end of
period |
| Class A | | | | | | | | | | | | | | | | | | | | |
| 7/30/2018 to 10/31/2018(e)(f) | | | $15.00 | | | | $0.04 | | | | $(0.84 | ) | | | $(0.80 | ) | | | $14.20 | |
| Class C | | | | | | | | | | | | | | | | | | | | |
| 7/30/2018 to 10/31/2018(e)(f) | | | 15.00 | | | | 0.01 | | | | (0.83 | ) | | | (0.82 | ) | | | 14.18 | |
| Class F | | | | | | | | | | | | | | | | | | | | |
| 7/30/2018 to 10/31/2018(e)(f) | | | 15.00 | | | | 0.05 | | | | (0.84 | ) | | | (0.79 | ) | | | 14.21 | |
| Class F3 | | | | | | | | | | | | | | | | | | | | |
| 7/30/2018 to 10/31/2018(e)(f) | | | 15.00 | | | | 0.05 | | | | (0.83 | ) | | | (0.78 | ) | | | 14.22 | |
| Class I | | | | | | | | | | | | | | | | | | | | |
| 7/30/2018 to 10/31/2018(e)(f) | | | 15.00 | | | | 0.05 | | | | (0.84 | ) | | | (0.79 | ) | | | 14.21 | |
| Class R3 | | | | | | | | | | | | | | | | | | | | |
| 7/30/2018 to 10/31/2018(e)(f) | | | 15.00 | | | | 0.03 | | | | (0.84 | ) | | | (0.81 | ) | | | 14.19 | |
| Class R4 | | | | | | | | | | | | | | | | | | | | |
| 7/30/2018 to 10/31/2018(e)(f) | | | 15.00 | | | | 0.04 | | | | (0.84 | ) | | | (0.80 | ) | | | 14.20 | |
| Class R5 | | | | | | | | | | | | | | | | | | | | |
| 7/30/2018 to 10/31/2018(e)(f) | | | 15.00 | | | | 0.05 | | | | (0.84 | ) | | | (0.79 | ) | | | 14.21 | |
| Class R6 | | | | | | | | | | | | | | | | | | | | |
| 7/30/2018 to 10/31/2018(e)(f) | | | 15.00 | | | | 0.05 | | | | (0.83 | ) | | | (0.78 | ) | | | 14.22 | |
| (a) | Calculated using average shares outstanding during the period. |
| (b) | Total return for Classes A and C does not consider the effects of sales loads and assumes the reinvestment of all distributions. Total return for all other classes assumes the reinvestment of all distributions. |
| (c) | Not annualized. |
| (d) | Annualized. |
| (e) | Commencement of operations was 7/30/2018, SEC effective date and date shares first became available to the public was 8/1/2018. |
| (f) | Net investment income, net realized and unrealized gain amounted to less than $.01 for the period 7/30/2018 through 8/1/2018. |
| 114 | See Notes to Financial Statements. |
| | | Ratios to Average
Net Assets: | | Supplemental Data: | |
| | | | | | |
Total
return
(%)(b)(c) | | Total
expenses
after
waivers
and/or
reimburse-
ments (%)(d) | | Total
expenses
(%)(d) | | Net
investment
income
(%)(d) | | Net
assets,
end of
period
(000) | | Portfolio
turnover
rate
(%) | |
| | | | | | | | | | | | | | | | | | | | | | | | |
| | (5.33 | ) | | | 1.05 | | | | 12.87 | | | | 0.97 | | | | $476 | | | | 23 | | |
| | | | | | | | | | | | | | | | | | | | | | | | |
| | (5.47 | ) | | | 1.80 | | | | 13.90 | | | | 0.27 | | | | 104 | | | | 23 | | |
| | | | | | | | | | | | | | | | | | | | | | | | |
| | (5.27 | ) | | | 0.80 | | | | 13.00 | | | | 1.27 | | | | 474 | | | | 23 | | |
| | | | | | | | | | | | | | | | | | | | | | | | |
| | (5.20 | ) | | | 0.69 | | | | 12.73 | | | | 1.38 | | | | 474 | | | | 23 | | |
| | | | | | | | | | | | | | | | | | | | | | | | |
| | (5.27 | ) | | | 0.80 | | | | 12.90 | | | | 1.27 | | | | 104 | | | | 23 | | |
| | | | | | | | | | | | | | | | | | | | | | | | |
| | (5.40 | ) | | | 1.30 | | | | 13.40 | | | | 0.75 | | | | 9 | | | | 23 | | |
| | | | | | | | | | | | | | | | | | | | | | | | |
| | (5.33 | ) | | | 1.05 | | | | 13.15 | | | | 0.99 | | | | 9 | | | | 23 | | |
| | | | | | | | | | | | | | | | | | | | | | | | |
| | (5.27 | ) | | | 0.80 | | | | 12.89 | | | | 1.26 | | | | 9 | | | | 23 | | |
| | | | | | | | | | | | | | | | | | | | | | | | |
| | (5.20 | ) | | | 0.69 | | | | 12.73 | | | | 1.38 | | | | 474 | | | | 23 | | |
| | See Notes to Financial Statements. | 115 |
Financial Highlights (continued)
GROWTH LEADERS FUND
| | | | | Per Share Operating Performance: | | |
| | | | | Investment Operations: | | Distributions to
shareholders from: | | |
| | | Net asset
value,
beginning
of period | | Net
invest-
ment
income
(loss)(a) | | Net
realized
and
unrealized
gain (loss) | | Total
from
invest-
ment
opera-
tions | | Net
realized
gain | | Total
distri-
butions | | Net
asset
value,
end of
period |
| Class A | | | | | | | | | | | | | | | | | | | | | | | | | | | | |
| 10/31/2018 | | | $28.97 | | | | $(0.14 | ) | | | $ 2.82 | | | | $ 2.68 | | | | $(1.83 | ) | | | $(1.83 | ) | | | $29.82 | |
| 10/31/2017 | | | 22.42 | | | | (0.06 | ) | | | 6.61 | | | | 6.55 | | | | – | | | | – | | | | 28.97 | |
| 10/31/2016 | | | 23.73 | | | | 0.03 | | | | (0.24 | ) | | | (0.21 | ) | | | (1.10 | ) | | | (1.10 | ) | | | 22.42 | |
| 10/31/2015 | | | 23.08 | | | | (0.02 | ) | | | 1.96 | | | | 1.94 | | | | (1.29 | ) | | | (1.29 | ) | | | 23.73 | |
| 10/31/2014 | | | 21.44 | | | | – | (c) | | | 3.01 | | | | 3.01 | | | | (1.37 | ) | | | (1.37 | ) | | | 23.08 | |
| Class C | | | | | | | | | | | | | | | | | | | | | | | | | | | | |
| 10/31/2018 | | | 27.63 | | | | (0.35 | ) | | | 2.69 | | | | 2.34 | | | | (1.83 | ) | | | (1.83 | ) | | | 28.14 | |
| 10/31/2017 | | | 21.54 | | | | (0.24 | ) | | | 6.33 | | | | 6.09 | | | | – | | | | – | | | | 27.63 | |
| 10/31/2016 | | | 23.01 | | | | (0.14 | ) | | | (0.23 | ) | | | (0.37 | ) | | | (1.10 | ) | | | (1.10 | ) | | | 21.54 | |
| 10/31/2015 | | | 22.57 | | | | (0.19 | ) | | | 1.92 | | | | 1.73 | | | | (1.29 | ) | | | (1.29 | ) | | | 23.01 | |
| 10/31/2014 | | | 21.14 | | | | (0.15 | ) | | | 2.95 | | | | 2.80 | | | | (1.37 | ) | | | (1.37 | ) | | | 22.57 | |
| Class F | | | | | | | | | | | | | | | | | | | | | | | | | | | | |
| 10/31/2018 | | | 29.26 | | | | (0.07 | ) | | | 2.85 | | | | 2.78 | | | | (1.83 | ) | | | (1.83 | ) | | | 30.21 | |
| 10/31/2017 | | | 22.59 | | | | (0.01 | ) | | | 6.68 | | | | 6.67 | | | | – | | | | – | | | | 29.26 | |
| 10/31/2016 | | | 23.87 | | | | 0.06 | | | | (0.24 | ) | | | (0.18 | ) | | | (1.10 | ) | | | (1.10 | ) | | | 22.59 | |
| 10/31/2015 | | | 23.17 | | | | 0.01 | | | | 1.98 | | | | 1.99 | | | | (1.29 | ) | | | (1.29 | ) | | | 23.87 | |
| 10/31/2014 | | | 21.49 | | | | 0.04 | | | | 3.01 | | | | 3.05 | | | | (1.37 | ) | | | (1.37 | ) | | | 23.17 | |
| Class F3 | | | | | | | | | | | | | | | | | | | | | | | | | | | | |
| 10/31/2018 | | | 29.46 | | | | (0.06 | ) | | | 2.88 | | | | 2.82 | | | | (1.83 | ) | | | (1.83 | ) | | | 30.45 | |
| 4/4/2017 to 10/31/2017(d) | | | 24.81 | | | | (0.03 | ) | | | 4.68 | | | | 4.65 | | | | – | | | | – | | | | 29.46 | |
| Class I | | | | | | | | | | | | | | | | | | | | | | | | | | | | |
| 10/31/2018 | | | 29.40 | | | | (0.07 | ) | | | 2.87 | | | | 2.80 | | | | (1.83 | ) | | | (1.83 | ) | | | 30.37 | |
| 10/31/2017 | | | 22.69 | | | | (0.01 | ) | | | 6.72 | | | | 6.71 | | | | – | | | | – | | | | 29.40 | |
| 10/31/2016 | | | 23.95 | | | | 0.08 | | | | (0.24 | ) | | | (0.16 | ) | | | (1.10 | ) | | | (1.10 | ) | | | 22.69 | |
| 10/31/2015 | | | 23.23 | | | | 0.04 | | | | 1.97 | | | | 2.01 | | | | (1.29 | ) | | | (1.29 | ) | | | 23.95 | |
| 10/31/2014 | | | 21.51 | | | | 0.06 | | | | 3.03 | | | | 3.09 | | | | (1.37 | ) | | | (1.37 | ) | | | 23.23 | |
| Class R2 | | | | | | | | | | | | | | | | | | | | | | | | | | | | |
| 10/31/2018 | | | 28.78 | | | | (0.24 | ) | | | 2.80 | | | | 2.56 | | | | (1.83 | ) | | | (1.83 | ) | | | 29.51 | |
| 10/31/2017 | | | 22.35 | | | | (0.15 | ) | | | 6.58 | | | | 6.43 | | | | – | | | | – | | | | 28.78 | |
| 10/31/2016 | | | 23.74 | | | | (0.05 | ) | | | (0.24 | ) | | | (0.29 | ) | | | (1.10 | ) | | | (1.10 | ) | | | 22.35 | |
| 10/31/2015 | | | 23.17 | | | | (0.10 | ) | | | 1.96 | | | | 1.86 | | | | (1.29 | ) | | | (1.29 | ) | | | 23.74 | |
| 10/31/2014 | | | 21.58 | | | | (0.07 | ) | | | 3.03 | | | | 2.96 | | | | (1.37 | ) | | | (1.37 | ) | | | 23.17 | |
| Class R3 | | | | | | | | | | | | | | | | | | | | | | | | | | | | |
| 10/31/2018 | | | 28.68 | | | | (0.21 | ) | | | 2.79 | | | | 2.58 | | | | (1.83 | ) | | | (1.83 | ) | | | 29.43 | |
| 10/31/2017 | | | 22.25 | | | | (0.12 | ) | | | 6.55 | | | | 6.43 | | | | – | | | | – | | | | 28.68 | |
| 10/31/2016 | | | 23.62 | | | | (0.04 | ) | | | (0.23 | ) | | | (0.27 | ) | | | (1.10 | ) | | | (1.10 | ) | | | 22.25 | |
| 10/31/2015 | | | 23.03 | | | | (0.08 | ) | | | 1.96 | | | | 1.88 | | | | (1.29 | ) | | | (1.29 | ) | | | 23.62 | |
| 10/31/2014 | | | 21.45 | | | | (0.04 | ) | | | 2.99 | | | | 2.95 | | | | (1.37 | ) | | | (1.37 | ) | | | 23.03 | |
| 116 | See Notes to Financial Statements. |
| | | | Ratios to Average Net Assets: | | Supplemental Data: |
| | | | | | |
Total
return
(%)(b) | | Total
expenses
after
waivers
and/or
reimburse-
ments
(%) | | Total
expenses
(%) | | Net
invest-
ment
income
(loss)
(%) | | Net
assets,
end of
period
(000) | | Portfolio
turnover
rate
(%) |
| | | | | | | | | | | | | | | | | | | | | | | |
| | 9.68 | | | | 0.91 | | | | 0.91 | | | | (0.47 | ) | | | $ 900,405 | | | | 161 | |
| | 29.21 | | | | 0.91 | | | | 0.96 | | | | (0.23 | ) | | | 754,101 | | | | 192 | |
| | (0.96 | ) | | | 0.85 | | | | 0.98 | | | | 0.12 | | | | 750,576 | | | | 246 | |
| | 8.84 | | | | 0.85 | | | | 0.99 | | | | (0.09 | ) | | | 742,393 | | | | 271 | |
| | 15.59 | | | | 0.85 | | | | 1.04 | | | | 0.01 | | | | 495,861 | | | | 507 | |
| | | | | | | | | | | | | | | | | | | | | | | |
| | 8.87 | | | | 1.66 | | | | 1.66 | | | | (1.21 | ) | | | 595,344 | | | | 161 | |
| | 28.27 | | | | 1.66 | | | | 1.71 | | | | (0.99 | ) | | | 523,008 | | | | 192 | |
| | (1.72 | ) | | | 1.60 | | | | 1.73 | | | | (0.64 | ) | | | 482,693 | | | | 246 | |
| | 8.07 | | | | 1.59 | | | | 1.74 | | | | (0.84 | ) | | | 414,557 | | | | 271 | |
| | 13.81 | | | | 1.56 | | | | 1.76 | | | | (0.71 | ) | | | 236,853 | | | | 507 | |
| | | | | | | | | | | | | | | | | | | | | | | |
| | 9.94 | | | | 0.66 | | | | 0.76 | | | | (0.22 | ) | | | 1,315,881 | | | | 161 | |
| | 29.53 | | | | 0.70 | | | | 0.81 | | | | (0.04 | ) | | | 1,103,103 | | | | 192 | |
| | (0.82 | ) | | | 0.70 | | | | 0.83 | | | | 0.26 | | | | 763,623 | | | | 246 | |
| | 9.03 | | | | 0.70 | | | | 0.84 | | | | 0.06 | | | | 733,463 | | | | 271 | |
| | 14.80 | | | | 0.68 | | | | 0.87 | | | | 0.17 | | | | 498,908 | | | | 507 | |
| | | | | | | | | | | | | | | | | | | | | | | |
| | 10.01 | | | | 0.60 | | | | 0.60 | | | | (0.18 | ) | | | 44,379 | | | | 161 | |
| | 18.74 | (e) | | | 0.59 | (f) | | | 0.62 | (f) | | | (0.19 | )(f) | | | 18,841 | | | | 192 | |
| | | | | | | | | | | | | | | | | | | | | | | |
| | 9.96 | | | | 0.66 | | | | 0.66 | | | | (0.21 | ) | | | 702,389 | | | | 161 | |
| | 29.57 | | | | 0.67 | | | | 0.70 | | | | (0.06 | ) | | | 303,795 | | | | 192 | |
| | (0.73 | ) | | | 0.60 | | | | 0.74 | | | | 0.36 | | | | 98,506 | | | | 246 | |
| | 9.10 | | | | 0.60 | | | | 0.74 | | | | 0.16 | | | | 96,090 | | | | 271 | |
| | 14.93 | | | | 0.57 | | | | 0.76 | | | | 0.29 | | | | 71,803 | | | | 507 | |
| | | | | | | | | | | | | | | | | | | | | | | |
| | 9.31 | | | | 1.26 | | | | 1.26 | | | | (0.79 | ) | | | 1,332 | | | | 161 | |
| | 28.77 | | | | 1.26 | | | | 1.30 | | | | (0.60 | ) | | | 1,784 | | | | 192 | |
| | (1.35 | ) | | | 1.20 | | | | 1.34 | | | | (0.24 | ) | | | 1,267 | | | | 246 | |
| | 8.49 | | | | 1.20 | | | | 1.34 | | | | (0.44 | ) | | | 593 | | | | 271 | |
| | 14.24 | | | | 1.18 | | | | 1.37 | | | | (0.31 | ) | | | 342 | | | | 507 | |
| | | | | | | | | | | | | | | | | | | | | | | |
| | 9.41 | | | | 1.16 | | | | 1.16 | | | | (0.71 | ) | | | 15,206 | | | | 161 | |
| | 28.90 | | | | 1.16 | | | | 1.21 | | | | (0.48 | ) | | | 13,261 | | | | 192 | |
| | (1.23 | ) | | | 1.10 | | | | 1.24 | | | | (0.17 | ) | | | 13,471 | | | | 246 | |
| | 8.58 | | | | 1.10 | | | | 1.24 | | | | (0.35 | ) | | | 13,501 | | | | 271 | |
| | 14.34 | | | | 1.07 | | | | 1.26 | | | | (0.20 | ) | | | 10,191 | | | | 507 | |
| | See Notes to Financial Statements. | 117 |
Financial Highlights (continued)
GROWTH LEADERS FUND
| | | | | Per Share Operating Performance: | | |
| | | | | Investment Operations: | | Distributions to
shareholders from: | | |
| | | Net asset
value,
beginning
of period | | Net
invest-
ment
income
(loss)(a) | | Net
realized
and
unrealized
gain (loss) | | Total
from
invest-
ment
opera-
tions | | Net
realized
gain | | Total
distri-
butions | | Net
asset
value,
end of period |
| Class R4 | | | | | | | | | | | | | | | | | | | | | | | | | | | | |
| 10/31/2018 | | | $28.97 | | | | $(0.15 | ) | | | $ 2.83 | | | | $2.68 | | | | $(1.83 | ) | | | $(1.83 | ) | | | $29.82 | |
| 10/31/2017 | | | 22.42 | | | | (0.08 | ) | | | 6.63 | | | | 6.55 | | | | – | | | | – | | | | 28.97 | |
| 10/31/2016 | | | 23.74 | | | | (0.01 | ) | | | (0.21 | ) | | | (0.22 | ) | | | (1.10 | ) | | | (1.10 | ) | | | 22.42 | |
| 6/30/2015 to 10/31/2015(g) | | | 23.42 | | | | (0.01 | ) | | | 0.33 | | | | 0.32 | | | | – | | | | – | | | | 23.74 | |
| Class R5 | | | | | | | | | | | | | | | | | | | | | | | | | | | | |
| 10/31/2018 | | | 29.41 | | | | (0.07 | ) | | | 2.87 | | | | 2.80 | | | | (1.83 | ) | | | (1.83 | ) | | | 30.38 | |
| 10/31/2017 | | | 22.70 | | | | – | (c) | | | 6.71 | | | | 6.71 | | | | – | | | | – | | | | 29.41 | |
| 10/31/2016 | | | 23.95 | | | | 0.02 | | | | (0.17 | ) | | | (0.15 | ) | | | (1.10 | ) | | | (1.10 | ) | | | 22.70 | |
| 6/30/2015 to 10/31/2015(g) | | | 23.61 | | | | 0.01 | | | | 0.33 | | | | 0.34 | | | | – | | | | – | | | | 23.95 | |
| Class R6 | | | | | | | | | | | | | | | | | | | | | | | | | | | | |
| 10/31/2018 | | | 29.46 | | | | (0.05 | ) | | | 2.87 | | | | 2.82 | | | | (1.83 | ) | | | (1.83 | ) | | | 30.45 | |
| 10/31/2017 | | | 22.72 | | | | (0.02 | ) | | | 6.76 | | | | 6.74 | | | | – | | | | – | | | | 29.46 | |
| 10/31/2016 | | | 23.96 | | | | 0.08 | | | | (0.22 | ) | | | (0.14 | ) | | | (1.10 | ) | | | (1.10 | ) | | | 22.72 | |
| 6/30/2015 to 10/31/2015(g) | | | 23.61 | | | | 0.02 | | | | 0.33 | | | | 0.35 | | | | – | | | | – | | | | 23.96 | |
| (a) | Calculated using average shares outstanding during the period. |
| (b) | Total return for Classes A and C does not consider the effects of sales loads and assumes the reinvestment of all distributions. Total return for all other classes assumes the reinvestment of all distributions. |
| (c) | Amount less than $0.01. |
| (d) | Commenced on April 4, 2017. |
| (e) | Not annualized. |
| (f) | Annualized. |
| (g) | Commenced on June 30, 2015. |
| 118 | See Notes to Financial Statements. |
| | | | Ratios to Average Net Assets: | | Supplemental Data: |
| | | | | | |
Total
return
(%)(b) | | Total
expenses
after
waivers
and/or
reimburse-
ments
(%) | | Total
expenses
(%) | | Net
invest-
ment
income
(loss)
(%) | | Net
assets,
end of
period
(000) | | Portfolio
turnover
rate
(%) |
| | | | | | | | | | | | | | | | | | | | | | | |
| | 9.68 | | | | 0.91 | | | | 0.91 | | | | (0.47 | ) | | | $6,345 | | | | 161 | |
| | 29.21 | | | | 0.92 | | | | 0.95 | | | | (0.31 | ) | | | 4,698 | | | | 192 | |
| | (1.00 | ) | | | 0.85 | | | | 1.00 | | | | (0.03 | ) | | | 1,735 | | | | 246 | |
| | 1.37 | (e) | | | 0.87 | (f) | | | 0.99 | (f) | | | (0.18 | )(f) | | | 10 | | | | 271 | |
| | | | | | | | | | | | | | | | | | | | | | | |
| | 9.96 | | | | 0.66 | | | | 0.66 | | | | (0.22 | ) | | | 8,598 | | | | 161 | |
| | 29.56 | | | | 0.67 | | | | 0.71 | | | | (0.01 | ) | | | 5,810 | | | | 192 | |
| | (0.68 | ) | | | 0.60 | | | | 0.75 | | | | 0.08 | | | | 3,700 | | | | 246 | |
| | 1.44 | (e) | | | 0.60 | (f) | | | 0.72 | (f) | | | 0.09 | (f) | | | 10 | | | | 271 | |
| | | | | | | | | | | | | | | | | | | | | | | |
| | 10.01 | | | | 0.60 | | | | 0.60 | | | | (0.16 | ) | | | 25,657 | | | | 161 | |
| | 29.67 | | | | 0.59 | | | | 0.62 | | | | (0.06 | ) | | | 20,884 | | | | 192 | |
| | (0.64 | ) | | | 0.50 | | | | 0.63 | | | | 0.34 | | | | 1,534 | | | | 246 | |
| | 1.48 | (e) | | | 0.48 | (f) | | | 0.60 | (f) | | | 0.21 | (f) | | | 10 | | | | 271 | |
| | See Notes to Financial Statements. | 119 |
Financial Highlights (continued)
INTERNATIONAL EQUITY FUND
| | | | | Per Share Operating Performance: | | |
| | | | | Investment Operations: | | Distributions
to
shareholders
from: | | |
| | | Net asset
value,
beginning
of period | | Net
investment
income(a) | | Net
realized and
unrealized
gain (loss) | | Total from
investment
operations | | Net
investment
income | | Net asset
value,
end of
period |
| Class A | | | | | | | | | | | | | | | | | | | | | | | | |
| 10/31/2018 | | | $14.10 | | | | $0.19 | | | | $(1.83 | ) | | | $(1.64 | ) | | | $(0.28 | ) | | | $12.18 | |
| 10/31/2017 | | | 12.03 | | | | 0.18 | | | | 2.15 | | | | 2.33 | | | | (0.26 | ) | | | 14.10 | |
| 10/31/2016 | | | 12.64 | | | | 0.27 | | | | (0.72 | ) | | | (0.45 | ) | | | (0.16 | ) | | | 12.03 | |
| 10/31/2015 | | | 13.34 | | | | 0.20 | | | | (0.75 | ) | | | (0.55 | ) | | | (0.15 | ) | | | 12.64 | |
| 10/31/2014 | | | 13.97 | | | | 0.17 | | | | (0.54 | ) | | | (0.37 | ) | | | (0.26 | ) | | | 13.34 | |
| Class C | | | | | | | | | | | | | | | | | | | | | | | | |
| 10/31/2018 | | | 13.92 | | | | 0.09 | | | | (1.82 | ) | | | (1.73 | ) | | | (0.17 | ) | | | 12.02 | |
| 10/31/2017 | | | 11.86 | | | | 0.09 | | | | 2.13 | | | | 2.22 | | | | (0.16 | ) | | | 13.92 | |
| 10/31/2016 | | | 12.45 | | | | 0.18 | | | | (0.70 | ) | | | (0.52 | ) | | | (0.07 | ) | | | 11.86 | |
| 10/31/2015 | | | 13.14 | | | | 0.11 | | | | (0.75 | ) | | | (0.64 | ) | | | (0.05 | ) | | | 12.45 | |
| 10/31/2014 | | | 13.77 | | | | 0.09 | | | | (0.54 | ) | | | (0.45 | ) | | | (0.18 | ) | | | 13.14 | |
| Class F | | | | | | | | | | | | | | | | | | | | | | | | |
| 10/31/2018 | | | 14.02 | | | | 0.22 | | | | (1.82 | ) | | | (1.60 | ) | | | (0.30 | ) | | | 12.12 | |
| 10/31/2017 | | | 11.96 | | | | 0.22 | | | | 2.12 | | | | 2.34 | | | | (0.28 | ) | | | 14.02 | |
| 10/31/2016 | | | 12.55 | | | | 0.29 | | | | (0.70 | ) | | | (0.41 | ) | | | (0.18 | ) | | | 11.96 | |
| 10/31/2015 | | | 13.26 | | | | 0.24 | | | | (0.77 | ) | | | (0.53 | ) | | | (0.18 | ) | | | 12.55 | |
| 10/31/2014 | | | 13.89 | | | | 0.18 | | | | (0.51 | ) | | | (0.33 | ) | | | (0.30 | ) | | | 13.26 | |
| Class F3 | | | | | | | | | | | | | | | | | | | | | | | | |
| 10/31/2018 | | | 14.25 | | | | 0.24 | | | | (1.86 | ) | | | (1.62 | ) | | | (0.31 | ) | | | 12.32 | |
| 4/4/2017 to 10/31/2017(c) | | | 12.34 | | | | 0.05 | | | | 1.86 | | | | 1.91 | | | | – | | | | 14.25 | |
| Class I | | | | | | | | | | | | | | | | | | | | | | | | |
| 10/31/2018 | | | 14.23 | | | | 0.25 | | | | (1.87 | ) | | | (1.62 | ) | | | (0.31 | ) | | | 12.30 | |
| 10/31/2017 | | | 12.13 | | | | 0.24 | | | | 2.16 | | | | 2.40 | | | | (0.30 | ) | | | 14.23 | |
| 10/31/2016 | | | 12.73 | | | | 0.33 | | | | (0.73 | ) | | | (0.40 | ) | | | (0.20 | ) | | | 12.13 | |
| 10/31/2015 | | | 13.44 | | | | 0.25 | | | | (0.76 | ) | | | (0.51 | ) | | | (0.20 | ) | | | 12.73 | |
| 10/31/2014 | | | 14.07 | | | | 0.21 | | | | (0.53 | ) | | | (0.32 | ) | | | (0.31 | ) | | | 13.44 | |
| Class P | | | | | | | | | | | | | | | | | | | | | | | | |
| 10/31/2018 | | | 14.10 | | | | 0.14 | | | | (1.82 | ) | | | (1.68 | ) | | | (0.25 | ) | | | 12.17 | |
| 10/31/2017 | | | 12.03 | | | | 0.15 | | | | 2.16 | | | | 2.31 | | | | (0.24 | ) | | | 14.10 | |
| 10/31/2016 | | | 12.63 | | | | 0.25 | | | | (0.71 | ) | | | (0.46 | ) | | | (0.14 | ) | | | 12.03 | |
| 10/31/2015 | | | 13.31 | | | | 0.17 | | | | (0.75 | ) | | | (0.58 | ) | | | (0.10 | ) | | | 12.63 | |
| 10/31/2014 | | | 13.94 | | | | 0.17 | | | | (0.55 | ) | | | (0.38 | ) | | | (0.25 | ) | | | 13.31 | |
| Class R2 | | | | | | | | | | | | | | | | | | | | | | | | |
| 10/31/2018 | | | 14.05 | | | | 0.13 | | | | (1.83 | ) | | | (1.70 | ) | | | (0.22 | ) | | | 12.13 | |
| 10/31/2017 | | | 11.99 | | | | 0.16 | | | | 2.12 | | | | 2.28 | | | | (0.22 | ) | | | 14.05 | |
| 10/31/2016 | | | 12.58 | | | | 0.23 | | | | (0.71 | ) | | | (0.48 | ) | | | (0.11 | ) | | | 11.99 | |
| 10/31/2015 | | | 13.29 | | | | 0.17 | | | | (0.76 | ) | | | (0.59 | ) | | | (0.12 | ) | | | 12.58 | |
| 10/31/2014 | | | 13.92 | | | | 0.15 | | | | (0.55 | ) | | | (0.40 | ) | | | (0.23 | ) | | | 13.29 | |
| 120 | See Notes to Financial Statements. |
| | | Ratios to Average Net Assets: | | Supplemental Data: |
| | | | | | | | | | | |
Total
return
(%)(b) | | Total
expenses
after waivers
and/or
reimbursements
(%) | | Total
expenses
(%) | | Net
investment
income
(%) | | Net assets,
end of
period
(000) | | Portfolio
turnover
rate
(%) |
| | | | | | | | | | | |
| | (11.91 | ) | | | 1.15 | | | | 1.16 | | | | 1.34 | | | | $194,360 | | | | 124 | |
| | 19.80 | | | | 1.12 | | | | 1.22 | | | | 1.43 | | | | 241,626 | | | | 163 | |
| | (3.54 | ) | | | 1.12 | | | | 1.31 | | | | 2.29 | | | | 263,064 | | | | 164 | |
| | (4.16 | ) | | | 1.12 | | | | 1.33 | | | | 1.56 | | | | 341,437 | | | | 62 | |
| | (2.67 | ) | | | 1.12 | | | | 1.36 | | | | 1.25 | | | | 368,087 | | | | 64 | |
| | | | | | | | | | | | | | | | | | | | | | | |
| | (12.59 | ) | | | 1.90 | | | | 1.92 | | | | 0.65 | | | | 12,821 | | | | 124 | |
| | 19.02 | | | | 1.85 | | | | 1.95 | | | | 0.71 | | | | 25,687 | | | | 163 | |
| | (4.21 | ) | | | 1.85 | | | | 2.04 | | | | 1.54 | | | | 31,798 | | | | 164 | |
| | (4.86 | ) | | | 1.81 | | | | 2.02 | | | | 0.86 | | | | 42,057 | | | | 62 | |
| | (3.31 | ) | | | 1.75 | | | | 1.99 | | | | 0.65 | | | | 49,491 | | | | 64 | |
| | | | | | | | | | | | | | | | | | | | | | | |
| | (11.77 | ) | | | 0.92 | | | | 1.01 | | | | 1.63 | | | | 58,347 | | | | 124 | |
| | 20.17 | | | | 0.87 | | | | 1.06 | | | | 1.71 | | | | 63,479 | | | | 163 | |
| | (3.24 | ) | | | 0.87 | | | | 1.16 | | | | 2.48 | | | | 62,655 | | | | 164 | |
| | (3.99 | ) | | | 0.87 | | | | 1.14 | | | | 1.85 | | | | 63,830 | | | | 62 | |
| | (2.46 | ) | | | 0.87 | | | | 1.11 | | | | 1.29 | | | | 78,364 | | | | 64 | |
| | | | | | | | | | | | | | | | | | | | | | | |
| | (11.62 | ) | | | 0.78 | | | | 0.85 | | | | 1.73 | | | | 5,083 | | | | 124 | |
| | 15.48 | (d) | | | 0.68 | (e) | | | 0.91 | (e) | | | 0.65 | (e) | | | 5,847 | | | | 163 | |
| | | | | | | | | | | | | | | | | | | | | | | |
| | (11.65 | ) | | | 0.82 | | | | 0.91 | | | | 1.78 | | | | 277,141 | | | | 124 | |
| | 20.26 | | | | 0.77 | | | | 0.96 | | | | 1.87 | | | | 292,598 | | | | 163 | |
| | (3.15 | ) | | | 0.77 | | | | 1.05 | | | | 2.74 | | | | 160,673 | | | | 164 | |
| | (3.83 | ) | | | 0.77 | | | | 1.04 | | | | 1.92 | | | | 61,077 | | | | 62 | |
| | (2.34 | ) | | | 0.77 | | | | 1.01 | | | | 1.50 | | | | 95,958 | | | | 64 | |
| | | | | | | | | | | | | | | | | | | | | | | |
| | (12.14 | ) | | | 1.35 | | | | 1.36 | | | | 1.02 | | | | 40 | | | | 124 | |
| | 19.59 | | | | 1.32 | | | | 1.42 | | | | 1.19 | | | | 89 | | | | 163 | |
| | (3.65 | ) | | | 1.32 | | | | 1.51 | | | | 2.12 | | | | 95 | | | | 164 | |
| | (4.38 | ) | | | 1.28 | | | | 1.49 | | | | 1.32 | | | | 110 | | | | 62 | |
| | (2.77 | ) | | | 1.22 | | | | 1.46 | | | | 1.20 | | | | 150 | | | | 64 | |
| | | | | | | | | | | | | | | | | | | | | | | |
| | (12.28 | ) | | | 1.50 | | | | 1.52 | | | | 0.93 | | | | 375 | | | | 124 | |
| | 19.40 | | | | 1.47 | | | | 1.56 | | | | 1.22 | | | | 679 | | | | 163 | |
| | (3.85 | ) | | | 1.47 | | | | 1.66 | | | | 1.93 | | | | 517 | | | | 164 | |
| | (4.48 | ) | | | 1.43 | | | | 1.64 | | | | 1.31 | | | | 658 | | | | 62 | |
| | (2.89 | ) | | | 1.37 | | | | 1.61 | | | | 1.07 | | | | 1,011 | | | | 64 | |
| | See Notes to Financial Statements. | 121 |
Financial Highlights (continued)
INTERNATIONAL EQUITY FUND
| | | | | Per Share Operating Performance: | | | | |
| | | | | Investment Operations: | | Distributions
to
shareholders
from: | | |
| | | | | | | | | | | | | |
| | | | | | | | | | | | | |
| | | Net asset
value,
beginning
of period | | Net
investment
income(a) | | Net
realized and
unrealized
gain (loss) | | Total from
investment
operations | | Net
investment
income | | Net asset
value,
end of
period |
| Class R3 | | | | | | | | | | | | | | | | | | | | | | | | |
| 10/31/2018 | | | $13.87 | | | | $0.14 | | | | $(1.79 | ) | | | $(1.65 | ) | | | $(0.24 | ) | | | $11.98 | |
| 10/31/2017 | | | 11.84 | | | | 0.15 | | | | 2.12 | | | | 2.27 | | | | (0.24 | ) | | | 13.87 | |
| 10/31/2016 | | | 12.44 | | | | 0.23 | | | | (0.70 | ) | | | (0.47 | ) | | | (0.13 | ) | | | 11.84 | |
| 10/31/2015 | | | 13.14 | | | | 0.17 | | | | (0.74 | ) | | | (0.57 | ) | | | (0.13 | ) | | | 12.44 | |
| 10/31/2014 | | | 13.77 | | | | 0.16 | | | | (0.55 | ) | | | (0.39 | ) | | | (0.24 | ) | | | 13.14 | |
| Class R4 | | | | | | | | | | | | | | | | | | | | | | | | |
| 10/31/2018 | | | 14.07 | | | | 0.19 | | | | (1.83 | ) | | | (1.64 | ) | | | (0.30 | ) | | | 12.13 | |
| 10/31/2017 | | | 12.00 | | | | 0.17 | | | | 2.16 | | | | 2.33 | | | | (0.26 | ) | | | 14.07 | |
| 10/31/2016 | | | 12.63 | | | | 0.27 | | | | (0.72 | ) | | | (0.45 | ) | | | (0.18 | ) | | | 12.00 | |
| 6/30/2015 to 10/31/2015(f) | | | 13.06 | | | | 0.04 | | | | (0.47 | ) | | | (0.43 | ) | | | – | | | | 12.63 | |
| Class R5 | | | | | | | | | | | | | | | | | | | | | | | | |
| 10/31/2018 | | | 14.19 | | | | 0.22 | | | | (1.84 | ) | | | (1.62 | ) | | | (0.31 | ) | | | 12.26 | |
| 10/31/2017 | | | 12.11 | | | | 0.16 | | | | 2.21 | | | | 2.37 | | | | (0.29 | ) | | | 14.19 | |
| 10/31/2016 | | | 12.73 | | | | 0.30 | | | | (0.72 | ) | | | (0.42 | ) | | | (0.20 | ) | | | 12.11 | |
| 6/30/2015 to 10/31/2015(f) | | | 13.15 | | | | 0.05 | | | | (0.47 | ) | | | (0.42 | ) | | | – | | | | 12.73 | |
| Class R6 | | | | | | | | | | | | | | | | | | | | | | | | |
| 10/31/2018 | | | 14.24 | | | | 0.24 | | | | (1.85 | ) | | | (1.61 | ) | | | (0.31 | ) | | | 12.32 | |
| 10/31/2017 | | | 12.14 | | | | 0.26 | | | | 2.14 | | | | 2.40 | | | | (0.30 | ) | | | 14.24 | |
| 10/31/2016 | | | 12.74 | | | | 0.17 | | | | (0.57 | ) | | | (0.40 | ) | | | (0.20 | ) | | | 12.14 | |
| 6/30/2015 to 10/31/2015(f) | | | 13.15 | | | | 0.06 | | | | (0.47 | ) | | | (0.41 | ) | | | – | | | | 12.74 | |
| (a) | Calculated using average shares outstanding during the period. |
| (b) | Total return for Classes A and C does not consider the effects of sales loads and assumes the reinvestment of all distributions. Total return for all other classes assumes the reinvestment of all distributions. |
| (c) | Commenced on April 4, 2017. |
| (d) | Not annualized. |
| (e) | Annualized. |
| (f) | Commenced on June 30, 2015. |
| 122 | See Notes to Financial Statements. |
| | | Ratios to Average Net Assets: | | Supplemental Data: |
| | | | | | | | | | | |
Total
return
(%)(b) | | Total
expenses
after waivers
and/or
reimbursements
(%) | | Total
expenses
(%) | | Net
investment
income
(%) | | Net assets,
end of
period
(000) | | Portfolio
turnover
rate
(%) |
| | | | | | | | | |
| | (12.18 | ) | | | 1.40 | | | | 1.41 | | | | 1.05 | | | | $ 8,954 | | | | 124 | |
| | 19.63 | | | | 1.34 | | | | 1.44 | | | | 1.23 | | | | 12,674 | | | | 163 | |
| | (3.79 | ) | | | 1.36 | | | | 1.54 | | | | 1.99 | | | | 14,945 | | | | 164 | |
| | (4.35 | ) | | | 1.33 | | | | 1.53 | | | | 1.35 | | | | 18,466 | | | | 62 | |
| | (2.85 | ) | | | 1.26 | | | | 1.50 | | | | 1.15 | | | | 20,156 | | | | 64 | |
| | | | | | | | | | | | | | | | | | | | | | | |
| | (11.96 | ) | | | 1.15 | | | | 1.16 | | | | 1.36 | | | | 948 | | | | 124 | |
| | 19.92 | | | | 1.10 | | | | 1.18 | | | | 1.25 | | | | 582 | | | | 163 | |
| | (3.55 | ) | | | 1.12 | | | | 1.28 | | | | 2.27 | | | | 9 | | | | 164 | |
| | (3.29 | )(d) | | | 1.12 | (e) | | | 1.25 | (e) | | | 0.89 | (e) | | | 10 | | | | 62 | |
| | | | | | | | | | | | | | | | | | | | | | | |
| | (11.68 | ) | | | 0.90 | | | | 0.91 | | | | 1.61 | | | | 69 | | | | 124 | |
| | 20.10 | | | | 0.87 | | | | 0.94 | | | | 1.21 | | | | 71 | | | | 163 | |
| | (3.31 | ) | | | 0.87 | | | | 1.04 | | | | 2.52 | | | | 9 | | | | 164 | |
| | (3.19 | )(d) | | | 0.87 | (e) | | | 1.00 | (e) | | | 1.14 | (e) | | | 10 | | | | 62 | |
| | | | | | | | | | | | | | | | | | | | | | | |
| | (11.62 | ) | | | 0.78 | | | | 0.85 | | | | 1.73 | | | | 2,667 | | | | 124 | |
| | 20.35 | | | | 0.70 | | | | 0.86 | | | | 2.04 | | | | 3,074 | | | | 163 | |
| | (3.14 | ) | | | 0.65 | | | | 0.88 | | | | 1.39 | | | | 10,765 | | | | 164 | |
| | (3.12 | )(d) | | | 0.70 | (e) | | | 0.84 | (e) | | | 1.31 | (e) | | | 10 | | | | 62 | |
| | See Notes to Financial Statements. | 123 |
Financial Highlights (continued)
INTERNATIONAL OPPORTUNITIES FUND
| | | | | Per Share Operating Performance: |
| | | | | Investment Operations: | | Distributions to
shareholders from: |
| | | Net asset
value,
beginning
of period | | Net
invest-
ment
income
(loss)(a) | | Net
realized
and
unrealized
gain (loss) | | Total
from
invest-
ment
opera-
tions | | Net
investment
income | | Net
realized
gain | | Total
distri-
butions |
| Class A | | | | | | | | | | | | | | | | | | | | | | | | | | | | |
| 10/31/2018 | | | $20.88 | | | | $ 0.14 | | | | $(3.28 | ) | | | $(3.14 | ) | | | $(0.17 | ) | | | $(0.73 | ) | | | $(0.90 | ) |
| 10/31/2017 | | | 16.13 | | | | 0.09 | | | | 4.77 | | | | 4.86 | | | | (0.11 | ) | | | – | | | | (0.11 | ) |
| 10/31/2016 | | | 17.01 | | | | 0.13 | | | | (0.30 | ) | | | (0.17 | ) | | | (0.10 | ) | | | (0.61 | ) | | | (0.71 | ) |
| 10/31/2015 | | | 16.22 | | | | 0.09 | | | | 1.36 | | | | 1.45 | | | | (0.18 | ) | | | (0.48 | ) | | | (0.66 | ) |
| 10/31/2014 | | | 16.83 | | | | 0.11 | | | | (0.51 | ) | | | 0.40 | | | | (0.21 | ) | | | – | | | | (0.21 | ) |
| Class C | | | | | | | | | | | | | | | | | | | | | | | | | | | | |
| 10/31/2018 | | | 19.46 | | | | – | (c) | | | (3.05 | ) | | | (3.05 | ) | | | (0.07 | ) | | | (0.73 | ) | | | (0.80 | ) |
| 10/31/2017 | | | 15.03 | | | | (0.04 | ) | | | 4.47 | | | | 4.43 | | | | – | | | | – | | | | – | |
| 10/31/2016 | | | 15.92 | | | | 0.01 | | | | (0.28 | ) | | | (0.27 | ) | | | (0.01 | ) | | | (0.61 | ) | | | (0.62 | ) |
| 10/31/2015 | | | 15.23 | | | | (0.04 | ) | | | 1.29 | | | | 1.25 | | | | (0.08 | ) | | | (0.48 | ) | | | (0.56 | ) |
| 10/31/2014 | | | 15.84 | | | | (0.02 | ) | | | (0.46 | ) | | | (0.48 | ) | | | (0.13 | ) | | | – | | | | (0.13 | ) |
| Class F | | | | | | | | | | | | | | | | | | | | | | | | | | | | |
| 10/31/2018 | | | 20.70 | | | | 0.18 | | | | (3.25 | ) | | | (3.07 | ) | | | (0.20 | ) | | | (0.73 | ) | | | (0.93 | ) |
| 10/31/2017 | | | 16.00 | | | | 0.11 | | | | 4.73 | | | | 4.84 | | | | (0.14 | ) | | | – | | | | (0.14 | ) |
| 10/31/2016 | | | 16.88 | | | | 0.15 | | | | (0.29 | ) | | | (0.14 | ) | | | (0.13 | ) | | | (0.61 | ) | | | (0.74 | ) |
| 10/31/2015 | | | 16.11 | | | | 0.10 | | | | 1.37 | | | | 1.47 | | | | (0.22 | ) | | | (0.48 | ) | | | (0.70 | ) |
| 10/31/2014 | | | 16.73 | | | | 0.14 | | | | (0.50 | ) | | | (0.36 | ) | | | (0.26 | ) | | | – | | | | (0.26 | ) |
| Class F3 | | | | | | | | | | | | | | | | | | | | | | | | | | | | |
| 10/31/2018 | | | 21.49 | | | | 0.23 | | | | (3.39 | ) | | | (3.16 | ) | | | (0.22 | ) | | | (0.73 | ) | | | (0.95 | ) |
| 4/4/2017 to 10/31/2017(e) | | | 17.75 | | | | (0.02 | ) | | | 3.76 | | | | 3.74 | | | | – | | | | – | | | | – | |
| Class I | | | | | | | | | | | | | | | | | | | | | | | | | | | | |
| 10/31/2018 | | | 21.44 | | | | 0.19 | | | | (3.37 | ) | | | (3.18 | ) | | | (0.21 | ) | | | (0.73 | ) | | | (0.94 | ) |
| 10/31/2017 | | | 16.56 | | | | 0.14 | | | | 4.90 | | | | 5.04 | | | | (0.16 | ) | | | – | | | | (0.16 | ) |
| 10/31/2016 | | | 17.44 | | | | 0.17 | | | | (0.30 | ) | | | (0.13 | ) | | | (0.14 | ) | | | (0.61 | ) | | | (0.75 | ) |
| 10/31/2015 | | | 16.63 | | | | 0.13 | | | | 1.39 | | | | 1.52 | | | | (0.23 | ) | | | (0.48 | ) | | | (0.71 | ) |
| 10/31/2014 | | | 17.25 | | | | 0.15 | | | | (0.51 | ) | | | (0.36 | ) | | | (0.26 | ) | | | – | | | | (0.26 | ) |
| Class P | | | | | | | | | | | | | | | | | | | | | | | | | | | | |
| 10/31/2018 | | | 21.26 | | | | 0.10 | | | | (3.33 | ) | | | (3.23 | ) | | | (0.12 | ) | | | (0.73 | ) | | | (0.85 | ) |
| 10/31/2017 | | | 16.40 | | | | 0.04 | | | | 4.88 | | | | 4.92 | | | | (0.06 | ) | | | – | | | | (0.06 | ) |
| 10/31/2016 | | | 17.27 | | | | 0.08 | | | | (0.29 | ) | | | (0.21 | ) | | | (0.05 | ) | | | (0.61 | ) | | | (0.66 | ) |
| 10/31/2015 | | | 16.46 | | | | 0.05 | | | | 1.40 | | | | 1.45 | | | | (0.16 | ) | | | (0.48 | ) | | | (0.64 | ) |
| 10/31/2014 | | | 17.08 | | | | 0.07 | | | | (0.51 | ) | | | (0.44 | ) | | | (0.18 | ) | | | – | | | | (0.18 | ) |
| Class R2 | | | | | | | | | | | | | | | | | | | | | | | | | | | | |
| 10/31/2018 | | | 20.53 | | | | 0.06 | | | | (3.21 | ) | | | (3.15 | ) | | | (0.11 | ) | | | (0.73 | ) | | | (0.84 | ) |
| 10/31/2017 | | | 15.89 | | | | 0.04 | | | | 4.69 | | | | 4.73 | | | | (0.09 | ) | | | – | | | | (0.09 | ) |
| 10/31/2016 | | | 16.81 | | | | 0.08 | | | | (0.30 | ) | | | (0.22 | ) | | | (0.09 | ) | | | (0.61 | ) | | | (0.70 | ) |
| 10/31/2015 | | | 16.05 | | | | 0.02 | | | | 1.35 | | | | 1.37 | | | | (0.13 | ) | | | (0.48 | ) | | | (0.61 | ) |
| 10/31/2014 | | | 16.69 | | | | 0.04 | | | | (0.48 | ) | | | (0.44 | ) | | | (0.20 | ) | | | – | | | | (0.20 | ) |
| 124 | See Notes to Financial Statements. |
| | | | | Ratios to Average Net Assets: | | Supplemental Data: |
| | | | | | | | | | | |
Net
asset
value,
end of
period | | Total
return
(%)(b) | | Total
expenses
(%) | | Net
invest-
ment
income
(loss)
(%) | | Net
assets,
end of
period
(000) | | Portfolio
turnover
rate
(%) |
| | | | | | | | | | | |
| | $16.84 | | | | (15.72 | ) | | | 1.20 | | | | 0.73 | | | | $172,940 | | | | 81 | |
| | 20.88 | | | | 30.38 | | | | 1.23 | | | | 0.50 | | | | 190,861 | | | | 76 | |
| | 16.13 | | | | (0.99 | ) | | | 1.35 | | | | 0.82 | | | | 153,000 | | | | 82 | |
| | 17.01 | | | | 9.36 | | | | 1.33 | | | | 0.51 | | | | 160,628 | | | | 82 | |
| | 16.22 | | | | (2.39 | ) | | | 1.35 | | | | 0.66 | | | | 117,037 | | | | 80 | |
| | | | | | | | | | | | | | | | | | | | | | | |
| | 15.61 | | | | (16.34 | ) | | | 1.95 | | | | – | (d) | | | 33,874 | | | | 81 | |
| | 19.46 | | | | 29.47 | | | | 1.97 | | | | (0.26 | ) | | | 39,434 | | | | 76 | |
| | 15.03 | | | | (1.75 | ) | | | 2.09 | | | | 0.08 | | | | 27,396 | | | | 82 | |
| | 15.92 | | | | 8.58 | | | | 2.06 | | | | (0.23 | ) | | | 31,273 | | | | 82 | |
| | 15.23 | | | | (3.12 | ) | | | 2.06 | | | | (0.10 | ) | | | 21,868 | | | | 80 | |
| | | | | | | | | | | | | | | | | | | | | | | |
| | 16.70 | | | | (15.58 | ) | | | 1.05 | | | | 0.91 | | | | 206,400 | | | | 81 | |
| | 20.70 | | | | 30.59 | | | | 1.07 | | | | 0.58 | | | | 264,221 | | | | 76 | |
| | 16.00 | | | | (0.84 | ) | | | 1.20 | | | | 0.96 | | | | 88,852 | | | | 82 | |
| | 16.88 | | | | 9.52 | | | | 1.18 | | | | 0.61 | | | | 118,963 | | | | 82 | |
| | 16.11 | | | | (2.21 | ) | | | 1.18 | | | | 0.80 | | | | 44,607 | | | | 80 | |
| | | | | | | | | | | | | | | | | | | | | | | |
| | 17.38 | | | | (15.46 | ) | | | 0.87 | | | | 1.11 | | | | 22,158 | | | | 81 | |
| | 21.49 | | | | 21.13 | (f) | | | 0.89 | (g) | | | (0.15 | )(g) | | | 18,095 | | | | 76 | |
| | | | | | | | | | | | | | | | | | | | | | | |
| | 17.32 | | | | (15.46 | ) | | | 0.95 | | | | 0.94 | | | | 235,952 | | | | 81 | |
| | 21.44 | | | | 30.74 | | | | 0.99 | | | | 0.76 | | | | 249,331 | | | | 76 | |
| | 16.56 | | | | (0.75 | ) | | | 1.10 | | | | 1.06 | | | | 267,188 | | | | 82 | |
| | 17.44 | | | | 9.59 | | | | 1.08 | | | | 0.77 | | | | 296,965 | | | | 82 | |
| | 16.63 | | | | (2.10 | ) | | | 1.08 | | | | 0.87 | | | | 274,583 | | | | 80 | |
| | | | | | | | | | | | | | | | | | | | | | | |
| | 17.18 | | | | (15.87 | ) | | | 1.40 | | | | 0.50 | | | | 132 | | | | 81 | |
| | 21.26 | | | | 30.12 | | | | 1.45 | | | | 0.23 | | | | 229 | | | | 76 | |
| | 16.40 | | | | (1.17 | ) | | | 1.55 | | | | 0.49 | | | | 363 | | | | 82 | |
| | 17.27 | | | | 9.15 | | | | 1.53 | | | | 0.29 | | | | 595 | | | | 82 | |
| | 16.46 | | | | (2.60 | ) | | | 1.53 | | | | 0.38 | | | | 872 | | | | 80 | |
| | | | | | | | | | | | | | | | | | | | | | | |
| | 16.54 | | | | (16.00 | ) | | | 1.55 | | | | 0.32 | | | | 3,476 | | | | 81 | |
| | 20.53 | | | | 29.96 | | | | 1.57 | | | | 0.21 | | | | 5,228 | | | | 76 | |
| | 15.89 | | | | (1.34 | ) | | | 1.71 | | | | 0.49 | | | | 2,520 | | | | 82 | |
| | 16.81 | | | | 8.92 | | | | 1.68 | | | | 0.15 | | | | 935 | | | | 82 | |
| | 16.05 | | | | (2.69 | ) | | | 1.68 | | | | 0.26 | | | | 198 | | | | 80 | |
| | See Notes to Financial Statements. | 125 |
Financial Highlights (continued)
INTERNATIONAL OPPORTUNITIES FUND
| | | | | Per Share Operating Performance: |
| | | | | Investment Operations: | | Distributions to
shareholders from: |
| | | Net asset
value,
beginning
of period | | Net
invest-
ment
income
(loss)(a) | | Net
realized
and
unrealized
gain (loss) | | Total
from
invest-
ment
opera-
tions | | Net
investment
income | | Net
realized
gain | | Total
distri-
butions |
| Class R3 | | | | | | | | | | | | | | | | | | | | | | | | | | | | |
| 10/31/2018 | | | $20.49 | | | | $0.10 | | | | $(3.21 | ) | | | $(3.11 | ) | | | $(0.12 | ) | | | $(0.73 | ) | | | $(0.85 | ) |
| 10/31/2017 | | | 15.85 | | | | 0.02 | | | | 4.71 | | | | 4.73 | | | | (0.09 | ) | | | – | | | | (0.09 | ) |
| 10/31/2016 | | | 16.73 | | | | 0.11 | | | | (0.31 | ) | | | (0.20 | ) | | | (0.07 | ) | | | (0.61 | ) | | | (0.68 | ) |
| 10/31/2015 | | | 15.97 | | | | 0.05 | | | | 1.34 | | | | 1.39 | | | | (0.15 | ) | | | (0.48 | ) | | | (0.63 | ) |
| 10/31/2014 | | | 16.57 | | | | 0.07 | | | | (0.49 | ) | | | (0.42 | ) | | | (0.18 | ) | | | – | | | | (0.18 | ) |
| Class R4 | | | | | | | | | | | | | | | | | | | | | | | | | | | | |
| 10/31/2018 | | | 20.82 | | | | 0.16 | | | | (3.28 | ) | | | (3.12 | ) | | | (0.18 | ) | | | (0.73 | ) | | | (0.91 | ) |
| 10/31/2017 | | | 16.11 | | | | 0.10 | | | | 4.75 | | | | 4.85 | | | | (0.14 | ) | | | – | | | | (0.14 | ) |
| 10/31/2016 | | | 17.01 | | | | 0.09 | | | | (0.26 | ) | | | (0.17 | ) | | | (0.12 | ) | | | (0.61 | ) | | | (0.73 | ) |
| 6/30/2015 to 10/31/2015(h) | | | 17.49 | | | | – | (c) | | | (0.48 | ) | | | (0.48 | ) | | | – | | | | – | | | | – | |
| Class R5 | | | | | | | | | | | | | | | | | | | | | | | | | | | | |
| 10/31/2018 | | | 21.43 | | | | 0.21 | | | | (3.38 | ) | | | (3.17 | ) | | | (0.21 | ) | | | (0.73 | ) | | | (0.94 | ) |
| 10/31/2017 | | | 16.56 | | | | 0.15 | | | | 4.88 | | | | 5.03 | | | | (0.16 | ) | | | – | | | | (0.16 | ) |
| 10/31/2016 | | | 17.44 | | | | 0.18 | | | | (0.31 | ) | | | (0.13 | ) | | | (0.14 | ) | | | (0.61 | ) | | | (0.75 | ) |
| 6/30/2015 to 10/31/2015(h) | | | 17.92 | | | | 0.02 | | | | (0.50 | ) | | | (0.48 | ) | | | – | | | | – | | | | – | |
| Class R6 | | | | | | | | | | | | | | | | | | | | | | | | | | | | |
| 10/31/2018 | | | 21.49 | | | | 0.21 | | | | (3.36 | ) | | | (3.15 | ) | | | (0.22 | ) | | | (0.73 | ) | | | (0.95 | ) |
| 10/31/2017 | | | 16.60 | | | | 0.20 | | | | 4.85 | | | | 5.05 | | | | (0.16 | ) | | | – | | | | (0.16 | ) |
| 10/31/2016 | | | 17.45 | | | | 0.17 | | | | (0.27 | ) | | | (0.10 | ) | | | (0.14 | ) | | | (0.61 | ) | | | (0.75 | ) |
| 6/30/2015 to 10/31/2015(h) | | | 17.92 | | | | 0.03 | | | | (0.50 | ) | | | (0.47 | ) | | | – | | | | – | | | | – | |
| (a) | Calculated using average shares outstanding during the period. |
| (b) | Total return for Classes A and C does not consider the effects of sales loads and assumes the reinvestment of all distributions. Total return for all other classes assumes the reinvestment of all distributions. |
| (c) | Amount less than $0.01. |
| (d) | Amount less than .01%. |
| (e) | Commenced on April 4, 2017. |
| (f) | Not annualized. |
| (g) | Annualized. |
| (h) | Commenced on June 30, 2015. |
| 126 | See Notes to Financial Statements. |
| | | | | Ratios to Average Net Assets: | | Supplemental Data: |
| | | | | | | | | | | |
Net
asset
value,
end of
period | | Total
return
(%)(b) | | Total
expenses
(%) | | Net
invest-
ment
income
(loss)
(%) | | Net
assets,
end of
period
(000) | | Portfolio
turnover
rate
(%) |
| | | | | | | | | | | |
| | $16.53 | | | | (15.87 | ) | | | 1.46 | | | | 0.54 | | | | $35,677 | | | | 81 | |
| | 20.49 | | | | 30.07 | | | | 1.47 | | | | 0.14 | | | | 9,828 | | | | 76 | |
| | 15.85 | | | | (1.20 | ) | | | 1.59 | | | | 0.67 | | | | 18,124 | | | | 82 | |
| | 16.73 | | | | 9.11 | | | | 1.56 | | | | 0.29 | | | | 9,161 | | | | 82 | |
| | 15.97 | | | | (2.63 | ) | | | 1.56 | | | | 0.39 | | | | 6,000 | | | | 80 | |
| | | | | | | | | | | | | | | | | | | | | | | |
| | 16.79 | | | | (15.70 | ) | | | 1.20 | | | | 0.80 | | | | 5,606 | | | | 81 | |
| | 20.82 | | | | 30.43 | | | | 1.23 | | | | 0.55 | | | | 3,334 | | | | 76 | |
| | 16.11 | | | | (1.03 | ) | | | 1.38 | | | | 0.57 | | | | 1,883 | | | | 82 | |
| | 17.01 | | | | (2.74 | )(f) | | | 1.35 | (g) | | | 0.03 | (g) | | | 10 | | | | 82 | |
| | | | | | | | | | | | | | | | | | | | | | | |
| | 17.32 | | | | (15.47 | ) | | | 0.97 | | | | 1.06 | | | | 39,621 | | | | 81 | |
| | 21.43 | | | | 30.69 | | | | 0.98 | | | | 0.79 | | | | 4,121 | | | | 76 | |
| | 16.56 | | | | (0.75 | ) | | | 1.13 | | | | 1.06 | | | | 2,751 | | | | 82 | |
| | 17.44 | | | | (2.68 | )(f) | | | 1.10 | (g) | | | 0.28 | (g) | | | 10 | | | | 82 | |
| | | | | | | | | | | | | | | | | | | | | | | |
| | 17.39 | | | | (15.41 | ) | | | 0.87 | | | | 1.04 | | | | 34,281 | | | | 81 | |
| | 21.49 | | | | 30.85 | | | | 0.90 | | | | 1.03 | | | | 17,212 | | | | 76 | |
| | 16.60 | | | | (0.56 | ) | | | 0.94 | | | | 1.00 | | | | 1,843 | | | | 82 | |
| | 17.45 | | | | (2.62 | )(f) | | | 0.93 | (g) | | | 0.48 | (g) | | | 13 | | | | 82 | |
| | See Notes to Financial Statements. | 127 |
Financial Highlights (continued)
INTERNATIONAL VALUE FUND
| | | | | Per Share Operating Performance: |
| | | | | Investment Operations: | | Distributions to
shareholders from: |
| | | Net asset
value,
beginning
of period | | Net
invest-
ment
income
(loss)(a) | | Net
realized
and
unrealized
gain (loss) | | Total
from
invest-
ment
opera-
tions | | Net
investment
income | | Net
realized
gain | | Total
distri-
butions |
| Class A | | | | | | | | | | | | | | | | | | | | | | | | | | | | |
| 10/31/2018 | | | $7.63 | | | | $0.22 | | | | $(0.89 | ) | | | $(0.67 | ) | | | $(0.23 | ) | | | $ – | | | | $(0.23 | ) |
| 10/31/2017 | | | 6.71 | | | | 0.22 | | | | 0.95 | | | | 1.17 | | | | (0.25 | ) | | | – | | | | (0.25 | ) |
| 10/31/2016 | | | 7.05 | | | | 0.24 | | | | (0.35 | ) | | | (0.11 | ) | | | (0.23 | ) | | | – | | | | (0.23 | ) |
| 10/31/2015 | | | 8.75 | | | | 0.25 | | | | (1.22 | ) | | | (0.97 | ) | | | (0.24 | ) | | | (0.49 | ) | | | (0.73 | ) |
| 10/31/2014 | | | 9.11 | | | | 0.36 | | | | (0.31 | ) | | | 0.05 | | | | (0.41 | ) | | | – | | | | (0.41 | ) |
| Class C | | | | | | | | | | | | | | | | | | | | | | | | | | | | |
| 10/31/2018 | | | 7.56 | | | | 0.16 | | | | (0.88 | ) | | | (0.72 | ) | | | (0.17 | ) | | | – | | | | (0.17 | ) |
| 10/31/2017 | | | 6.66 | | | | 0.17 | | | | 0.92 | | | | 1.09 | | | | (0.19 | ) | | | – | | | | (0.19 | ) |
| 10/31/2016 | | | 6.99 | | | | 0.19 | | | | (0.34 | ) | | | (0.15 | ) | | | (0.18 | ) | | | – | | | | (0.18 | ) |
| 10/31/2015 | | | 8.68 | | | | 0.19 | | | | (1.20 | ) | | | (1.01 | ) | | | (0.19 | ) | | | (0.49 | ) | | | (0.68 | ) |
| 10/31/2014 | | | 9.04 | | | | 0.31 | | | | (0.31 | ) | | | – | | | | (0.36 | ) | | | – | | | | (0.36 | ) |
| Class F | | | | | | | | | | | | | | | | | | | | | | | | | | | | |
| 10/31/2018 | | | 7.66 | | | | 0.23 | | | | (0.89 | ) | | | (0.66 | ) | | | (0.24 | ) | | | – | | | | (0.24 | ) |
| 10/31/2017 | | | 6.73 | | | | 0.24 | | | | 0.95 | | | | 1.19 | | | | (0.26 | ) | | | – | | | | (0.26 | ) |
| 10/31/2016 | | | 7.06 | | | | 0.25 | | | | (0.34 | ) | | | (0.09 | ) | | | (0.24 | ) | | | – | | | | (0.24 | ) |
| 10/31/2015 | | | 8.77 | | | | 0.27 | | | | (1.23 | ) | | | (0.96 | ) | | | (0.26 | ) | | | (0.49 | ) | | | (0.75 | ) |
| 10/31/2014 | | | 9.12 | | | | 0.39 | | | | (0.30 | ) | | | 0.09 | | | | (0.44 | ) | | | – | | | | (0.44 | ) |
| Class F3 | | | | | | | | | | | | | | | | | | | | | | | | | | | | |
| 10/31/2018 | | | 7.67 | | | | 0.24 | | | | (0.89 | ) | | | (0.65 | ) | | | (0.25 | ) | | | – | | | | (0.25 | ) |
| 4/4/2017 to 10/31/2017(c) | | | 7.03 | | | | (0.01 | ) | | | 0.79 | | | | 0.78 | | | | (0.14 | ) | | | – | | | | (0.14 | ) |
| Class I | | | | | | | | | | | | | | | | | | | | | | | | | | | | |
| 10/31/2018 | | | 7.68 | | | | 0.23 | | | | (0.89 | ) | | | (0.66 | ) | | | (0.25 | ) | | | – | | | | (0.25 | ) |
| 10/31/2017 | | | 6.75 | | | | 0.25 | | | | 0.94 | | | | 1.19 | | | | (0.26 | ) | | | – | | | | (0.26 | ) |
| 10/31/2016 | | | 7.08 | | | | 0.26 | | | | (0.34 | ) | | | (0.08 | ) | | | (0.25 | ) | | | – | | | | (0.25 | ) |
| 10/31/2015 | | | 8.79 | | | | 0.27 | | | | (1.22 | ) | | | (0.95 | ) | | | (0.27 | ) | | | (0.49 | ) | | | (0.76 | ) |
| 10/31/2014 | | | 9.14 | | | | 0.42 | | | | (0.32 | ) | | | 0.10 | | | | (0.45 | ) | | | – | | | | (0.45 | ) |
| Class R2 | | | | | | | | | | | | | | | | | | | | | | | | | | | | |
| 10/31/2018 | | | 7.80 | | | | 0.18 | | | | (0.90 | ) | | | (0.72 | ) | | | (0.20 | ) | | | – | | | | (0.20 | ) |
| 10/31/2017 | | | 6.86 | | | | 0.21 | | | | 0.95 | | | | 1.16 | | | | (0.22 | ) | | | – | | | | (0.22 | ) |
| 10/31/2016 | | | 7.19 | | | | 0.22 | | | | (0.35 | ) | | | (0.13 | ) | | | (0.20 | ) | | | – | | | | (0.20 | ) |
| 10/31/2015 | | | 8.92 | | | | 0.22 | | | | (1.24 | ) | | | (1.02 | ) | | | (0.22 | ) | | | (0.49 | ) | | | (0.71 | ) |
| 10/31/2014 | | | 9.27 | | | | 0.36 | | | | (0.32 | ) | | | 0.04 | | | | (0.39 | ) | | | – | | | | (0.39 | ) |
| 128 | See Notes to Financial Statements. |
| | | | | Ratios to Average Net Assets: | | Supplemental Data: |
| | | | | | | |
Net
asset
value,
end of
period | | Total
return
(%)(b) | | Total
expenses
after
waivers
and/or
reimburse-
ments
(%) | | Total
expenses
(%) | | Net
invest-
ment
income
(loss)
(%) | | Net
assets,
end of
period
(000) | | Portfolio
turnover
rate
(%) |
| | | | | | | | | | | | | |
| | $6.73 | | | | (9.05 | ) | | | 1.12 | | | | 1.14 | | | | 2.85 | �� | | | $ 290,289 | | | | 74 | |
| | 7.63 | | | | 17.68 | | | | 1.12 | | | | 1.14 | | | | 3.15 | | | | 367,465 | | | | 61 | |
| | 6.71 | | | | (1.52 | ) | | | 1.12 | | | | 1.20 | | | | 3.57 | | | | 419,886 | | | | 58 | |
| | 7.05 | | | | (11.74 | ) | | | 1.12 | | | | 1.19 | | | | 3.14 | | | | 710,835 | | | | 77 | |
| | 8.75 | | | | 0.47 | | | | 1.12 | | | | 1.24 | | | | 3.99 | | | | 1,000,763 | | | | 72 | |
| | | | | | | | | | | | | | | | | | | | | | | | | | | |
| | 6.67 | | | | (9.71 | ) | | | 1.87 | | | | 1.89 | | | | 2.07 | | | | 45,888 | | | | 74 | |
| | 7.56 | | | | 16.60 | | | | 1.87 | | | | 1.89 | | | | 2.41 | | | | 68,558 | | | | 61 | |
| | 6.66 | | | | (2.01 | ) | | | 1.87 | | | | 1.95 | | | | 2.85 | | | | 86,306 | | | | 58 | |
| | 6.99 | | | | (12.49 | ) | | | 1.84 | | | | 1.90 | | | | 2.40 | | | | 142,492 | | | | 77 | |
| | 8.68 | | | | (0.14 | ) | | | 1.77 | | | | 1.89 | | | | 3.42 | | | | 191,120 | | | | 72 | |
| | | | | | | | | | | | | | | | | | | | | | | | | | | |
| | 6.76 | | | | (8.87 | ) | | | 0.91 | | | | 0.99 | | | | 3.06 | | | | 54,167 | | | | 74 | |
| | 7.66 | | | | 17.96 | | | | 0.91 | | | | 0.99 | | | | 3.37 | | | | 95,299 | | | | 61 | |
| | 6.73 | | | | (1.22 | ) | | | 0.91 | | | | 1.05 | | | | 3.78 | | | | 111,056 | | | | 58 | |
| | 7.06 | | | | (11.65 | ) | | | 0.90 | | | | 1.00 | | | | 3.38 | | | | 210,696 | | | | 77 | |
| | 8.77 | | | | 0.83 | | | | 0.87 | | | | 0.99 | | | | 4.24 | | | | 322,648 | | | | 72 | |
| | | | | | | | | | | | | | | | | | | | | | | | | | | |
| | 6.77 | | | | (8.76 | ) | | | 0.82 | | | | 0.83 | | | | 3.21 | | | | 26,911 | | | | 74 | |
| | 7.67 | | | | 11.16 | (d) | | | 0.77 | (e) | | | 0.83 | (e) | | | (0.19 | )(e) | | | 27,215 | | | | 61 | |
| | | | | | | | | | | | | | | | | | | | | | | | | | | |
| | 6.77 | | | | (8.89 | ) | | | 0.81 | | | | 0.89 | | | | 3.05 | | | | 310,984 | | | | 74 | |
| | 7.68 | | | | 18.02 | | | | 0.81 | | | | 0.89 | | | | 3.48 | | | | 471,341 | | | | 61 | |
| | 6.75 | | | | (1.10 | ) | | | 0.81 | | | | 0.95 | | | | 3.90 | | | | 710,951 | | | | 58 | |
| | 7.08 | | | | (11.52 | ) | | | 0.80 | | | | 0.91 | | | | 3.50 | | | | 1,080,845 | | | | 77 | |
| | 8.79 | | | | 0.93 | | | | 0.77 | | | | 0.89 | | | | 4.53 | | | | 963,200 | | | | 72 | |
| | | | | | | | | | | | | | | | | | | | | | | | | | | |
| | 6.88 | | | | (9.44 | ) | | | 1.47 | | | | 1.49 | | | | 2.35 | | | | 369 | | | | 74 | |
| | 7.80 | | | | 17.17 | | | | 1.47 | | | | 1.49 | | | | 2.93 | | | | 592 | | | | 61 | |
| | 6.86 | | | | (1.70 | ) | | | 1.47 | | | | 1.55 | | | | 3.28 | | | | 680 | | | | 58 | |
| | 7.19 | | | | (12.13 | ) | | | 1.44 | | | | 1.51 | | | | 2.80 | | | | 1,029 | | | | 77 | |
| | 8.92 | | | | 0.33 | | | | 1.37 | | | | 1.49 | | | | 3.86 | | | | 1,298 | | | | 72 | |
| | See Notes to Financial Statements. | 129 |
Financial Highlights (continued)
INTERNATIONAL VALUE FUND
| | | | | Per Share Operating Performance: |
| | | | | Investment Operations: | | Distributions to
shareholders from: |
| | | Net asset
value,
beginning
of period | | Net
invest-
ment
income
(loss)(a) | | Net
realized
and
unrealized
gain (loss) | | Total
from
invest-
ment
opera-
tions | | Net
investment
income | | Net
realized
gain | | Total
distri-
butions |
| Class R3 | | | | | | | | | | | | | | | | | | | | | | | | | | | | |
| 10/31/2018 | | | $7.71 | | | | $0.19 | | | | $(0.89 | ) | | | $(0.70 | ) | | | $(0.21 | ) | | | $ – | | | | $(0.21 | ) |
| 10/31/2017 | | | 6.78 | | | | 0.21 | | | | 0.95 | | | | 1.16 | | | | (0.23 | ) | | | – | | | | (0.23 | ) |
| 10/31/2016 | | | 7.11 | | | | 0.22 | | | | (0.34 | ) | | | (0.12 | ) | | | (0.21 | ) | | | – | | | | (0.21 | ) |
| 10/31/2015 | | | 8.83 | | | | 0.23 | | | | (1.23 | ) | | | (1.00 | ) | | | (0.23 | ) | | | (0.49 | ) | | | (0.72 | ) |
| 10/31/2014 | | | 9.18 | | | | 0.37 | | | | (0.32 | ) | | | 0.05 | | | | (0.40 | ) | | | – | | | | (0.40 | ) |
| Class R4 | | | | | | | | | | | | | | | | | | | | | | | | | | | | |
| 10/31/2018 | | | 7.62 | | | | 0.20 | | | | (0.87 | ) | | | (0.67 | ) | | | (0.23 | ) | | | – | | | | (0.23 | ) |
| 10/31/2017 | | | 6.71 | | | | 0.21 | | | | 0.95 | | | | 1.16 | | | | (0.25 | ) | | | – | | | | (0.25 | ) |
| 10/31/2016 | | | 7.05 | | | | 0.24 | | | | (0.35 | ) | | | (0.11 | ) | | | (0.23 | ) | | | – | | | | (0.23 | ) |
| 6/30/2015 to 10/31/2015(f) | | | 7.75 | | | | 0.05 | | | | (0.72 | ) | | | (0.67 | ) | | | (0.03 | ) | | | – | | | | (0.03 | ) |
| Class R5 | | | | | | | | | | | | | | | | | | | | | | | | | | | | |
| 10/31/2018 | | | 7.66 | | | | 0.24 | | | | (0.89 | ) | | | (0.65 | ) | | | (0.25 | ) | | | – | | | | (0.25 | ) |
| 10/31/2017 | | | 6.74 | | | | 0.24 | | | | 0.94 | | | | 1.18 | | | | (0.26 | ) | | | – | | | | (0.26 | ) |
| 10/31/2016 | | | 7.08 | | | | 0.26 | | | | (0.35 | ) | | | (0.09 | ) | | | (0.25 | ) | | | – | | | | (0.25 | ) |
| 6/30/2015 to 10/31/2015(f) | | | 7.78 | | | | 0.06 | | | | (0.72 | ) | | | (0.66 | ) | | | (0.04 | ) | | | – | | | | (0.04 | ) |
| Class R6 | | | | | | | | | | | | | | | | | | | | | | | | | | | | |
| 10/31/2018 | | | 7.67 | | | | 0.24 | | | | (0.89 | ) | | | (0.65 | ) | | | (0.25 | ) | | | – | | | | (0.25 | ) |
| 10/31/2017 | | | 6.75 | | | | 0.26 | | | | 0.92 | | | | 1.18 | | | | (0.26 | ) | | | – | | | | (0.26 | ) |
| 10/31/2016 | | | 7.08 | | | | 0.26 | | | | (0.34 | ) | | | (0.08 | ) | | | (0.25 | ) | | | – | | | | (0.25 | ) |
| 6/30/2015 to 10/31/2015(f) | | | 7.78 | | | | 0.06 | | | | (0.72 | ) | | | (0.66 | ) | | | (0.04 | ) | | | – | | | | (0.04 | ) |
| (a) | Calculated using average shares outstanding during the period. |
| (b) | Total return for Classes A and C does not consider the effects of sales loads and assumes the reinvestment of all distributions. Total return for all other classes assumes the reinvestment of all distributions. |
| (c) | Commenced on April 4, 2017. |
| (d) | Not annualized. |
| (e) | Annualized. |
| (f) | Commenced on June 30, 2015. |
| 130 | See Notes to Financial Statements. |
| | | | | Ratios to Average Net Assets: | | Supplemental Data: |
| | | | | | | |
Net
asset
value,
end of
period | | Total
return
(%)(b) | | Total
expenses
after
waivers
and/or
reimburse-
ments
(%) | | Total
expenses
(%) | | Net
invest-
ment
income
(loss)
(%) | | Net
assets,
end of
period
(000) | | Portfolio
turnover
rate
(%) |
| | | | | | | | | | | |
| | $6.80 | | | | (9.35 | ) | | | 1.37 | | | | 1.39 | | | | 2.41 | | | | $ 7,801 | | | | 74 | |
| | 7.71 | | | | 17.35 | | | | 1.37 | | | | 1.39 | | | | 2.90 | | | | 12,888 | | | | 61 | |
| | 6.78 | | | | (1.58 | ) | | | 1.37 | | | | 1.44 | | | | 3.29 | | | | 12,697 | | | | 58 | |
| | 7.11 | | | | (12.03 | ) | | | 1.34 | | | | 1.40 | | | | 2.93 | | | | 12,680 | | | | 77 | |
| | 8.83 | | | | 0.41 | | | | 1.27 | | | | 1.39 | | | | 4.03 | | | | 11,273 | | | | 72 | |
| | | | | | | | | | | | | | | | | | | | | | | | | | | |
| | 6.72 | | | | (9.06 | ) | | | 1.12 | | | | 1.13 | | | | 2.67 | | | | 40 | | | | 74 | |
| | 7.62 | | | | 17.60 | | | | 1.11 | | | | 1.11 | | | | 2.85 | | | | 38 | | | | 61 | |
| | 6.71 | | | | (1.48 | ) | | | 1.12 | | | | 1.16 | | | | 3.57 | | | | 9 | | | | 58 | |
| | 7.05 | | | | (8.56 | )(d) | | | 1.12 | (e) | | | 1.15 | (e) | | | 2.02 | (e) | | | 9 | | | | 77 | |
| | | | | | | | | | | | | | | | | | | | | | | | | | | |
| | 6.76 | | | | (8.78 | ) | | | 0.86 | | | | 0.86 | | | | 3.12 | | | | 10 | | | | 74 | |
| | 7.66 | | | | 17.90 | | | | 0.87 | | | | 0.86 | | | | 3.39 | | | | 11 | | | | 61 | |
| | 6.74 | | | | (1.24 | ) | | | 0.87 | | | | 0.92 | | | | 3.81 | | | | 9 | | | | 58 | |
| | 7.08 | | | | (8.46 | )(d) | | | 0.87 | (e) | | | 0.90 | (e) | | | 2.28 | (e) | | | 9 | | | | 77 | |
| | | | | | | | | | | | | | | | | | | | | | | | | | | |
| | 6.77 | | | | (8.76 | ) | | | 0.82 | | | | 0.83 | | | | 3.17 | | | | 1,758 | | | | 74 | |
| | 7.67 | | | | 17.88 | | | | 0.81 | | | | 0.83 | | | | 3.45 | | | | 2,229 | | | | 61 | |
| | 6.75 | | | | (1.09 | ) | | | 0.80 | | | | 0.82 | | | | 3.88 | | | | 9 | | | | 58 | |
| | 7.08 | | | | (8.46 | )(d) | | | 0.80 | (e) | | | 0.80 | (e) | | | 2.34 | (e) | | | 9 | | | | 77 | |
| | | | | | | | | | | | | | | | | | | | | | | | | | | |
| | See Notes to Financial Statements. | 131 |
Financial Highlights (continued)
VALUE OPPORTUNITIES FUND
| | | | | Per Share Operating Performance: |
| | | | | Investment Operations: | | Distributions to
shareholders from: |
| | | Net asset
value,
beginning
of period | | Net
invest-
ment
income
(loss)(a) | | Net
realized
and
unrealized
gain (loss) | | Total
from
invest-
ment
opera-
tions | | Net
investment
income | | Net
realized
gain | | Total
distri-
butions |
| Class A | | | | | | | | | | | | | | | | | | | | | | | | | | | | |
| 10/31/2018 | | | $20.80 | | | | $ 0.01 | | | | $(0.06 | ) | | | $(0.05 | ) | | | $ – | | | | $(1.25 | ) | | | $(1.25 | ) |
| 10/31/2017 | | | 18.95 | | | | 0.03 | | | | 2.95 | | | | 2.98 | | | | – | | | | (1.13 | ) | | | (1.13 | ) |
| 10/31/2016 | | | 19.56 | | | | 0.02 | | | | 0.77 | | | | 0.79 | | | | – | | | | (1.40 | ) | | | (1.40 | ) |
| 10/31/2015 | | | 21.67 | | | | (0.01 | ) | | | 0.77 | | | | 0.76 | | | | – | | | | (2.87 | ) | | | (2.87 | ) |
| 10/31/2014 | | | 21.44 | | | | (0.03 | ) | | | 2.16 | | | | 2.13 | | | | – | | | | (1.90 | ) | | | (1.90 | ) |
| Class C | | | | | | | | | | | | | | | | | | | | | | | | | | | | |
| 10/31/2018 | | | 18.75 | | | | (0.12 | ) | | | (0.06 | ) | | | (0.18 | ) | | | – | | | | (1.25 | ) | | | (1.25 | ) |
| 10/31/2017 | | | 17.31 | | | | (0.11 | ) | | | 2.68 | | | | 2.57 | | | | – | | | | (1.13 | ) | | | (1.13 | ) |
| 10/31/2016 | | | 18.11 | | | | (0.11 | ) | | | 0.71 | | | | 0.60 | | | | – | | | | (1.40 | ) | | | (1.40 | ) |
| 10/31/2015 | | | 20.41 | | | | (0.15 | ) | | | 0.72 | | | | 0.57 | | | | – | | | | (2.87 | ) | | | (2.87 | ) |
| 10/31/2014 | | | 20.42 | | | | (0.16 | ) | | | 2.05 | | | | 1.89 | | | | – | | | | (1.90 | ) | | | (1.90 | ) |
| Class F | | | | | | | | | | | | | | | | | | | | | | | | | | | | |
| 10/31/2018 | | | 21.18 | | | | (0.04 | ) | | | (0.04 | ) | | | – | | | | (0.01 | ) | | | (1.25 | ) | | | (1.26 | ) |
| 10/31/2017 | | | 19.28 | | | | 0.05 | | | | 3.00 | | | | 3.05 | | | | (0.02 | ) | | | (1.13 | ) | | | (1.15 | ) |
| 10/31/2016 | | | 19.85 | | | | 0.04 | | | | 0.79 | | | | 0.83 | | | | – | | | | (1.40 | ) | | | (1.40 | ) |
| 10/31/2015 | | | 21.92 | | | | 0.02 | | | | 0.78 | | | | 0.80 | | | | – | | | | (2.87 | ) | | | (2.87 | ) |
| 10/31/2014 | | | 21.62 | | | | 0.02 | | | | 2.18 | | | | 2.20 | | | | – | | | | (1.90 | ) | | | (1.90 | ) |
| Class F3 | | | | | | | | | | | | | | | | | | | | | | | | | | | | |
| 10/31/2018 | | | 21.65 | | | | 0.08 | | | | (0.05 | ) | | | 0.03 | | | | (0.05 | ) | | | (1.25 | ) | | | (1.30 | ) |
| 4/4/2017 to 10/31/2017(c) | | | 20.25 | | | | (0.03 | ) | | | 1.43 | | | | 1.40 | | | | – | | | | – | | | | – | |
| Class I | | | | | | | | | | | | | | | | | | | | | | | | | | | | |
| 10/31/2018 | | | 21.59 | | | | 0.06 | | | | (0.06 | ) | | | – | | | | (0.05 | ) | | | (1.25 | ) | | | (1.30 | ) |
| 10/31/2017 | | | 19.62 | | | | 0.08 | | | | 3.06 | | | | 3.14 | | | | (0.04 | ) | | | (1.13 | ) | | | (1.17 | ) |
| 10/31/2016 | | | 20.16 | | | | 0.06 | | | | 0.80 | | | | 0.86 | | | | – | | | | (1.40 | ) | | | (1.40 | ) |
| 10/31/2015 | | | 22.20 | | | | 0.04 | | | | 0.79 | | | | 0.83 | | | | – | | | | (2.87 | ) | | | (2.87 | ) |
| 10/31/2014 | | | 21.85 | | | | 0.05 | | | | 2.20 | | | | 2.25 | | | | – | | | | (1.90 | ) | | | (1.90 | ) |
| Class P | | | | | | | | | | | | | | | | | | | | | | | | | | | | |
| 10/31/2018 | | | 20.46 | | | | (0.03 | ) | | | (0.05 | ) | | | (0.08 | ) | | | – | | | | (1.25 | ) | | | (1.25 | ) |
| 10/31/2017 | | | 18.70 | | | | (0.01 | ) | | | 2.90 | | | | 2.89 | | | | – | | | | (1.13 | ) | | | (1.13 | ) |
| 10/31/2016 | | | 19.36 | | | | (0.02 | ) | | | 0.76 | | | | 0.74 | | | | – | | | | (1.40 | ) | | | (1.40 | ) |
| 10/31/2015 | | | 21.51 | | | | (0.05 | ) | | | 0.77 | | | | 0.72 | | | | – | | | | (2.87 | ) | | | (2.87 | ) |
| 10/31/2014 | | | 21.32 | | | | (0.05 | ) | | | 2.14 | | | | 2.09 | | | | – | | | | (1.90 | ) | | | (1.90 | ) |
| Class R2 | | | | | | | | | | | | | | | | | | | | | | | | | | | | |
| 10/31/2018 | | | 20.06 | | | | (0.06 | ) | | | (0.03 | ) | | | (0.09 | ) | | | – | | | | (1.25 | ) | | | (1.25 | ) |
| 10/31/2017 | | | 18.38 | | | | (0.05 | ) | | | 2.86 | | | | 2.81 | | | | – | | | | (1.13 | ) | | | (1.13 | ) |
| 10/31/2016 | | | 19.08 | | | | (0.05 | ) | | | 0.75 | | | | 0.70 | | | | – | | | | (1.40 | ) | | | (1.40 | ) |
| 10/31/2015 | | | 21.27 | | | | (0.08 | ) | | | 0.76 | | | | 0.68 | | | | – | | | | (2.87 | ) | | | (2.87 | ) |
| 10/31/2014 | | | 21.13 | | | | (0.08 | ) | | | 2.12 | | | | 2.04 | | | | – | | | | (1.90 | ) | | | (1.90 | ) |
| 132 | See Notes to Financial Statements. |
| | | | | Ratios to Average Net Assets: | | Supplemental Data: |
| | | | | | | | | | | |
Net
asset
value,
end of
period | | Total
return
(%)(b) | | Total
expenses
(%) | | Net
invest-
ment
income
(loss)
(%) | | Net
assets,
end of
period
(000) | | Portfolio
turnover
rate
(%) |
| | | | | | | | | | | |
| | $19.50 | | | | (0.28 | ) | | | 1.11 | | | | 0.06 | | | | $ 922,813 | | | | 54 | |
| | 20.80 | | | | 16.23 | | | | 1.15 | | | | 0.14 | | | | 1,028,166 | | | | 57 | |
| | 18.95 | | | | 4.33 | | | | 1.17 | | | | 0.09 | | | | 959,416 | | | | 37 | |
| | 19.56 | | | | 3.67 | | | | 1.17 | | | | (0.05 | ) | | | 1,026,959 | | | | 47 | |
| | 21.67 | | | | 10.72 | | | | 1.26 | | | | (0.13 | ) | | | 1,316,790 | | | | 54 | |
| | | | | | | | | | | | | | | | | | | | | | | |
| | 17.32 | | | | (1.05 | ) | | | 1.87 | | | | (0.69 | ) | | | 225,551 | | | | 54 | |
| | 18.75 | | | | 15.35 | | | | 1.89 | | | | (0.61 | ) | | | 335,148 | | | | 57 | |
| | 17.31 | | | | 3.57 | | | | 1.92 | | | | (0.66 | ) | | | 330,066 | | | | 37 | |
| | 18.11 | | | | 2.87 | | | | 1.92 | | | | (0.80 | ) | | | 356,709 | | | | 47 | |
| | 20.41 | | | | 10.02 | | | | 1.91 | | | | (0.79 | ) | | | 404,787 | | | | 54 | |
| | | | | | | | | | | | | | | | | | | | | | | |
| | 19.92 | | | | (0.03 | ) | | | 0.97 | | | | 0.22 | | | | 390,627 | | | | 54 | |
| | 21.18 | | | | 16.34 | | | | 1.00 | | | | 0.27 | | | | 807,684 | | | | 57 | |
| | 19.28 | | | | 4.48 | | | | 1.02 | | | | 0.23 | | | | 663,069 | | | | 37 | |
| | 19.85 | | | | 3.84 | | | | 1.02 | | | | 0.09 | | | | 557,742 | | | | 47 | |
| | 21.92 | | | | 10.97 | | | | 1.02 | | | | 0.11 | | | | 550,524 | | | | 54 | |
| | | | | | | | | | | | | | | | | | | | | | | |
| | 20.38 | | | | 0.13 | | | | 0.78 | | | | 0.39 | | | | 331,176 | | | | 54 | |
| | 21.65 | | | | 6.91 | (d) | | | 0.79 | (e) | | | (0.25 | )(e) | | | 315,394 | | | | 57 | |
| | | | | | | | | | | | | | | | | | | | | | | |
| | 20.29 | | | | (0.02 | ) | | | 0.86 | | | | 0.30 | | | | 450,720 | | | | 54 | |
| | 21.59 | | | | 16.51 | | | | 0.90 | | | | 0.41 | | | | 397,265 | | | | 57 | |
| | 19.62 | | | | 4.57 | | | | 0.92 | | | | 0.34 | | | | 470,399 | | | | 37 | |
| | 20.16 | | | | 3.94 | | | | 0.92 | | | | 0.20 | | | | 557,008 | | | | 47 | |
| | 22.20 | | | | 11.10 | | | | 0.92 | | | | 0.21 | | | | 647,442 | | | | 54 | |
| | | | | | | | | | | | | | | | | | | | | | | |
| | 19.13 | | | | (0.49 | ) | | | 1.31 | | | | (0.14 | ) | | | 25,501 | | | | 54 | |
| | 20.46 | | | | 15.96 | | | | 1.35 | | | | (0.05 | ) | | | 33,644 | | | | 57 | |
| | 18.70 | | | | 4.10 | | | | 1.37 | | | | (0.11 | ) | | | 36,327 | | | | 37 | |
| | 19.36 | | | | 3.50 | | | | 1.37 | | | | (0.25 | ) | | | 42,225 | | | | 47 | |
| | 21.51 | | | | 10.58 | | | | 1.36 | | | | (0.23 | ) | | | 49,179 | | | | 54 | |
| | | | | | | | | | | | | | | | | | | | | | | |
| | 18.72 | | | | (0.50 | ) | | | 1.46 | | | | (0.29 | ) | | | 7,339 | | | | 54 | |
| | 20.06 | | | | 15.79 | | | | 1.50 | | | | (0.25 | ) | | | 9,047 | | | | 57 | |
| | 18.38 | | | | 3.94 | | | | 1.52 | | | | (0.26 | ) | | | 6,245 | | | | 37 | |
| | 19.08 | | | | 3.33 | | | | 1.53 | | | | (0.40 | ) | | | 7,120 | | | | 47 | |
| | 21.27 | | | | 10.42 | | | | 1.52 | | | | (0.38 | ) | | | 10,364 | | | | 54 | |
| | See Notes to Financial Statements. | 133 |
Financial Highlights (concluded)
VALUE OPPORTUNITIES FUND
| | | | | Per Share Operating Performance: |
| | | | | Investment Operations: | | Distributions to
shareholders from: |
| | | Net asset
value,
beginning
of period | | Net
invest-
ment
income
(loss)(a) | | Net
realized
and
unrealized
gain (loss) | | Total
from
invest-
ment
opera-
tions | | Net
investment
income | | Net
realized
gain | | Total
distri-
butions |
| Class R3 | | | | | | | | | | | | | | | | | | | | | | | | | | | | |
| 10/31/2018 | | | $20.25 | | | | $(0.04 | ) | | | $(0.04 | ) | | | $(0.08 | ) | | | $ – | | | | $(1.25 | ) | | | $(1.25 | ) |
| 10/31/2017 | | | 18.52 | | | | (0.02 | ) | | | 2.88 | | | | 2.86 | | | | – | | | | (1.13 | ) | | | (1.13 | ) |
| 10/31/2016 | | | 19.20 | | | | (0.03 | ) | | | 0.75 | | | | 0.72 | | | | – | | | | (1.40 | ) | | | (1.40 | ) |
| 10/31/2015 | | | 21.37 | | | | (0.06 | ) | | | 0.76 | | | | 0.70 | | | | – | | | | (2.87 | ) | | | (2.87 | ) |
| 10/31/2014 | | | 21.20 | | | | (0.06 | ) | | | 2.13 | | | | 2.07 | | | | – | | | | (1.90 | ) | | | (1.90 | ) |
| Class R4 | | | | | | | | | | | | | | | | | | | | | | | | | | | | |
| 10/31/2018 | | | 20.79 | | | | 0.01 | | | | (0.06 | ) | | | (0.05 | ) | | | (0.02 | ) | | | (1.25 | ) | | | (1.27 | ) |
| 10/31/2017 | | | 18.95 | | | | – | | | | 2.99 | | | | 2.99 | | | | (0.02 | ) | | | (1.13 | ) | | | (1.15 | ) |
| 10/31/2016 | | | 19.57 | | | | (0.01 | ) | | | 0.79 | | | | 0.78 | | | | – | | | | (1.40 | ) | | | (1.40 | ) |
| 6/30/2015 to 10/31/2015(f) | | | 20.33 | | | | – | (g) | | | (0.76 | ) | | | (0.76 | ) | | | – | | | | – | | | | – | |
| Class R5 | | | | | | | | | | | | | | | | | | | | | | | | | | | | |
| 10/31/2018 | | | 21.59 | | | | 0.07 | | | | (0.07 | ) | | | – | | | | (0.04 | ) | | | (1.25 | ) | | | (1.29 | ) |
| 10/31/2017 | | | 19.63 | | | | 0.10 | | | | 3.03 | | | | 3.13 | | | | (0.04 | ) | | | (1.13 | ) | | | (1.17 | ) |
| 10/31/2016 | | | 20.16 | | | | 0.05 | | | | 0.82 | | | | 0.87 | | | | – | | | | (1.40 | ) | | | (1.40 | ) |
| 6/30/2015 to 10/31/2015(f) | | | 20.93 | | | | 0.01 | | | | (0.78 | ) | | | (0.77 | ) | | | – | | | | – | | | | – | |
| Class R6 | | | | | | | | | | | | | | | | | | | | | | | | | | | | |
| 10/31/2018 | | | 21.65 | | | | 0.08 | | | | (0.06 | ) | | | 0.02 | | | | (0.05 | ) | | | (1.25 | ) | | | (1.30 | ) |
| 10/31/2017 | | | 19.66 | | | | 0.09 | | | | 3.07 | | | | 3.16 | | | | (0.04 | ) | | | (1.13 | ) | | | (1.17 | ) |
| 10/31/2016 | | | 20.17 | | | | 0.09 | | | | 0.80 | | | | 0.89 | | | | – | | | | (1.40 | ) | | | (1.40 | ) |
| 6/30/2015 to 10/31/2015(f) | | | 20.93 | | | | 0.02 | | | | (0.78 | ) | | | (0.76 | ) | | | – | | | | – | | | | – | |
| (a) | Calculated using average shares outstanding during the period. |
| (b) | Total return for Classes A and C does not consider the effects of sales loads and assumes the reinvestment of all distributions. Total return for all other classes assumes the reinvestment of all distributions. |
| (c) | Commenced on April 4, 2017. |
| (d) | Not annualized. |
| (e) | Annualized. |
| (f) | Commenced on June 30, 2015. |
| (g) | Amount less than $0.01. |
| 134 | See Notes to Financial Statements. |
| | | | | Ratios to Average Net Assets: | | Supplemental Data: |
| | | | | | | | | | | |
Net
asset
value,
end of
period | | Total
return
(%)(b) | | Total
expenses
(%) | | Net
invest-
ment
income
(loss)
(%) | | Net
assets,
end of
period
(000) | | Portfolio
turnover
rate
(%) |
| | | | | | | | | | | |
| | $18.92 | | | | (0.45 | ) | | | 1.36 | | | | (0.19 | ) | | | $ 77,440 | | | | 54 | |
| | 20.25 | | | | 15.94 | | | | 1.39 | | | | (0.10 | ) | | | 88,592 | | | | 57 | |
| | 18.52 | | | | 4.03 | | | | 1.42 | | | | (0.16 | ) | | | 99,544 | | | | 37 | |
| | 19.20 | | | | 3.42 | | | | 1.42 | | | | (0.30 | ) | | | 114,489 | | | | 47 | |
| | 21.37 | | | | 10.54 | | | | 1.41 | | | | (0.29 | ) | | | 133,353 | | | | 54 | |
| | | | | | | | | | | | | | | | | | | | | | | |
| | 19.47 | | | | (0.30 | ) | | | 1.11 | | | | 0.06 | | | | 54,408 | | | | 54 | |
| | 20.79 | | | | 16.27 | | | | 1.15 | | | | (0.01 | ) | | | 63,867 | | | | 57 | |
| | 18.95 | | | | 4.28 | | | | 1.14 | | | | (0.06 | ) | | | 2,929 | | | | 37 | |
| | 19.57 | | | | (3.74 | )(d) | | | 1.15 | (e) | | | (0.07 | )(e) | | | 10 | | | | 47 | |
| | | | | | | | | | | | | | | | | | | | | | | |
| | 20.30 | | | | (0.01 | ) | | | 0.87 | | | | 0.31 | | | | 1,927 | | | | 54 | |
| | 21.59 | | | | 16.46 | | | | 0.89 | | | | 0.51 | | | | 5,111 | | | | 57 | |
| | 19.63 | | | | 4.62 | | | | 0.89 | | | | 0.24 | | | | 42,825 | | | | 37 | |
| | 20.16 | | | | (3.68 | )(d) | | | 0.89 | (e) | | | 0.19 | (e) | | | 10 | | | | 47 | |
| | | | | | | | | | | | | | | | | | | | | | | |
| | 20.37 | | | | 0.08 | | | | 0.78 | | | | 0.39 | | | | 93,784 | | | | 54 | |
| | 21.65 | | | | 16.60 | | | | 0.78 | | | | 0.45 | | | | 104,218 | | | | 57 | |
| | 19.66 | | | | 4.72 | | | | 0.79 | | | | 0.46 | | | | 56,533 | | | | 37 | |
| | 20.17 | | | | (3.63 | )(d) | | | 0.82 | (e) | | | 0.28 | (e) | | | 29,039 | | | | 47 | |
| | See Notes to Financial Statements. | 135 |
Notes to Financial Statements
Lord Abbett Securities Trust (the “Trust”) is registered under the Investment Company Act of 1940, as amended (the “Act”), as a diversified, open-end management investment company and was organized as a Delaware statutory trust on February 26, 1993.
The Trust currently consists of eleven funds. This report covers the following nine funds (separately, a “Fund” and collectively, the “Funds”) and their respective active share classes at October 31, 2018:
| Funds | | Share Classes |
| Lord Abbett Alpha Strategy Fund (“Alpha Strategy Fund”) | | A, C, F, F3, I, R2, R3, R4, R5 and R6 |
| Lord Abbett Fundamental Equity Fund (“Fundamental Equity Fund”) | | A, C, F, F3 I, P, R2, R3, R4, R5 and R6 |
| Lord Abbett Global Equity Research Fund (“Global Equity Research Fund,” formerly “Global Core Equity Fund”) | | A, C, F, F3, I, R2, R3, R4, R5 and R6 |
| Lord Abbett Global Select Equity Fund (“Global Select Equity Fund”) | | A, C, F, F3, I, R3, R4, R5 and R6 |
| Lord Abbett Growth Leaders Fund (“Growth Leaders Fund”) | | A, C, F, F3, I, R2, R3, R4, R5 and R6 |
| Lord Abbett International Equity Fund (“International Equity Fund”) | | A, C, F, F3, I, P, R2, R3, R4, R5 and R6 |
| Lord Abbett International Opportunities Fund (“International Opportunities Fund”) | | A, C, F, F3, I, P, R2, R3, R4, R5 and R6 |
| Lord Abbett International Value Fund (“International Value Fund,” formerly “International Dividend Income Fund”) | | A, C, F, F3, I, R2, R3, R4, R5 and R6 |
| Lord Abbett Value Opportunities Fund (“Value Opportunities Fund”) | | A, C, F, F3, I, P, R2, R3, R4, R5 and R6 |
The Funds’ Class P shares are closed to substantially all new investors, with certain exceptions as set forth in the Funds’ prospectus. On April 25, 2018, the Funds’ remaining Class B shares converted to Class A shares. The Funds no longer issue Class T shares for purchase. Global Select Equity Fund commenced operations on July 30, 2018.
Each of Alpha Strategy Fund’s, Global Equity Research Fund’s, Global Select Equity Fund’s, International Equity Fund’s, International Opportunities Fund’s, and Value Opportunities Fund’s investment objective is to seek long-term capital appreciation. Alpha Strategy Fund invests principally in other funds (“Underlying Funds”) managed by Lord, Abbett & Co. LLC (“Lord Abbett”). Fundamental Equity Fund’s investment objective is long-term growth of capital and income without excessive fluctuations in market value. Growth Leaders Fund’s investment objective is to seek capital appreciation. International Value Fund’s investment objective is to seek a high level of total return.
Each class of shares has different expenses and dividends. A front-end sales charge is normally added to the net asset value (“NAV”) for Class A shares. There is no front-end sales charge in the case of Class C, F, F3, I, P, R2, R3, R4, R5 and R6 shares, although there may be a contingent deferred sales charge (“CDSC”) in certain cases as follows: Class A shares purchased without a sales charge and redeemed before the first day of the month in which the one-year anniversary of the purchase falls (subject to certain exceptions as set forth in each Fund’s prospectus); and Class C shares redeemed before the first anniversary of purchase. Effective April 30, 2018, Class C shares will convert automatically into Class A shares on the 25th day of the month (or, if the 25th is not a business day, the next business day thereafter) following the tenth anniversary of the month on which the purchase order was accepted.
The preparation of the financial statements in conformity with accounting principles generally accepted in the United States of America (“U.S. GAAP”) requires management to make certain estimates and assumptions that affect the reported amounts of assets and liabilities and disclosure of contingent assets and liabilities at the date of the financial statements and the reported amounts
136
Notes to Financial Statements (continued)
of increases and decreases in net assets from operations during the reporting period. Actual results could differ from those estimates. These Funds are considered investment companies under U.S. GAAP and follow the accounting and reporting guidance applicable to investment companies.
| 2. | SIGNIFICANT ACCOUNTING POLICIES |
| (a) | Investment Valuation–Under procedures approved by the Funds’ Board of Trustees (the “Board”), Lord Abbett, each Fund’s investment manager, has formed a Pricing Committee to administer the pricing and valuation of portfolio investments and to ensure that prices utilized reasonably reflect fair value. Among other things, these procedures allow the Funds to utilize independent pricing services, quotations from securities and financial instrument dealers and other market sources to determine fair value. |
| | |
| | Securities actively traded on any recognized U.S. or non-U.S. exchange or on The NASDAQ Stock Market LLC are valued at the last sale price or official closing price on the exchange or system on which they are principally traded. Events occurring after the close of trading on non-U.S. exchanges may result in adjustments to the valuation of foreign securities to reflect their fair value as of the close of regular trading on the New York Stock Exchange (“NYSE”). Each Fund may utilize an independent fair valuation service in adjusting the valuations of foreign securities. Unlisted equity securities are valued at the last quoted sale price or, if no sale price is available, at the mean between the most recently quoted bid and asked prices. Exchange traded options and futures contracts are valued at the last quoted sale price in the market where they are principally traded. If no sale has occurred, the mean between the most recently quoted bid asked prices is used. Forward foreign currency exchange contracts are valued using daily forward exchange rates. Investments in the Underlying Funds are valued at their NAV each business day at the close of regular trading on the NYSE, normally 4:00 p.m. Eastern time. |
| | |
| | Securities for which prices are not readily available are valued at fair value as determined by the Pricing Committee. The Pricing Committee considers a number of factors, including observable and unobservable inputs, when arriving at fair value. The Pricing Committee may use related or comparable assets or liabilities, recent transactions, market multiples, book values and other relevant information to determine the fair value of portfolio investments. The Board or a designated committee thereof regularly reviews fair value determinations made by the Pricing Committee and may employ techniques such as reviewing related market activity, reviewing inputs and assumptions, and retrospectively comparing prices of subsequent purchases and sales transactions to fair value determinations made by the Pricing Committee. |
| | |
| | Short-term securities with 60 days or less remaining to maturity are valued using the amortized cost method, which approximates fair value. |
| | |
| (b) | Security Transactions–Security transactions are recorded as of the date that the securities are purchased or sold (trade date). Realized gains and losses on sales of portfolio securities are calculated using the identified-cost method. Realized and unrealized gains (losses) are allocated to each class of shares based upon the relative proportion of net assets at the beginning of the day. |
| | |
| (c) | Investment Income–Dividend income is recorded on the ex-dividend date. Interest income is recorded on the accrual basis as earned. Discounts are accreted and premiums are amortized using the effective interest method and are included in Interest and other income on the Statements of Operations. Withholding taxes on foreign dividends have been provided for in |
137
Notes to Financial Statements (continued)
| | accordance with the applicable country’s tax rules and rates. Investment income is allocated to each class of shares based upon the relative proportion of net assets at the beginning of the day. |
| | |
| (d) | Income Taxes–It is the policy of each Fund to meet the requirements of Subchapter M of the Internal Revenue Code applicable to regulated investment companies and to distribute substantially all taxable income and capital gains to its shareholders. Therefore, no income tax provision is required. |
| | |
| | Each Fund files U.S. federal and various state and local tax returns. No income tax returns are currently under examination. The statute of limitations on each Fund’s filed U.S. federal tax returns remains open for the fiscal years ended October 31, 2015 through October 31, 2018. The statutes of limitations on the Trust’s state and local tax returns may remain open for an additional year depending upon the jurisdiction. |
| | |
| (e) | Expenses–Expenses incurred by the Trust that do not specifically relate to an individual fund are generally allocated to the funds within the Trust on a pro rata basis by relative net assets. Expenses, excluding class-specific expenses, are allocated to each class of shares based upon the relative proportion of net assets at the beginning of the day. Class A, C, F, P, R2, R3 and R4 shares bear their class-specific share of all expenses and fees relating to the Funds’ 12b-1 Distribution Plan. |
| | |
| (f) | Foreign Transactions–The books and records of each Fund are maintained in U.S. dollars and transactions denominated in foreign currencies are recorded in each Fund’s records at the rate prevailing when earned or recorded. Asset and liability accounts that are denominated in foreign currencies are adjusted daily to reflect current exchange rates and any unrealized gain (loss) is included in Net change in unrealized appreciation/depreciation on translation of assets and liabilities denominated in foreign currencies in each Fund’s Statement of Operations. The resultant exchange gains and losses upon settlement of such transactions are included in Net realized gain (loss) on foreign currency related transactions in each Fund’s Statement of Operations. The Funds do not isolate that portion of the results of operations arising as a result of changes in the foreign exchange rates from the changes in market prices of the securities. |
| | |
| | The Funds use foreign currency exchange contracts to facilitate transactions in foreign-denominated securities. Losses from these transactions may arise from changes in the value of the foreign currency or if the counterparties do not perform under the contracts’ terms. |
| | |
| (g) | Forward Foreign Currency Exchange Contracts–Global Equity Research Fund, Global Select Equity Fund, International Equity Fund, International Opportunities Fund and International Value Fund may enter into forward foreign currency exchange contracts in order to reduce their exposure to changes in foreign currency exchange rates on their foreign portfolio holdings, or gain or reduce exposure to foreign currency solely for investment purposes. A forward foreign currency exchange contract is a commitment to purchase or sell a foreign currency at a future date at a negotiated rate. The contracts are valued daily at forward exchange rates and any unrealized gain (loss) is included in Net change in unrealized appreciation/depreciation on foreign currency exchange contracts in each Fund’s Statement of Operations. The gain (loss) arising from the difference between the U.S. dollar cost of the original contract and the value of the foreign currency in U.S. dollars upon closing of such contracts is included in Net realized gain/(loss) on foreign currency exchange contracts in each Fund’s Statement of Operations. |
138
Notes to Financial Statements (continued)
| (h) | Futures Contracts–Each Fund may purchase and sell futures contracts to enhance returns, to attempt to economically hedge some of its investment risk, or as a substitute position in lieu of holding the underlying asset on which the instrument is based. At the time of entering into a futures transaction, an investor is required to deposit and maintain a specified amount of cash or eligible securities called “initial margin.” Subsequent payments made or received by a Fund called “variation margin” are made on a daily basis as the market price of the futures contract fluctuates. Each Fund will record an unrealized gain (loss) based on the amount of variation margin. When a contract is closed, a realized gain (loss) is recorded equal to the difference between the opening and closing value of the contract. |
| | |
| (i) | Options–Each Fund may purchase and write exchange-listed and over-the-counter put or call options on securities, stock indices, currencies and other financial instruments for hedging purposes, to enhance portfolio returns and reduce overall volatility. |
| | |
| | When a Fund writes (sells) an option, an amount equal to the premium received by the Fund is recorded on the Statement of Assets and Liabilities as a liability. The amount of the liability is subsequently marked-to-market to reflect the current market value of the option written. When an option expires, the Fund realizes a gain on the option to the extent of the premium received. Premiums received from writing options which are exercised or closed are added to or offset against the proceeds or amount paid on the transaction to determine the realized gain or loss. If a put option on a security is exercised, the premium reduces the cost basis of the security purchased by the Fund. If a call option is exercised, the premium is added to the proceeds of the security sold to determine the realized gain or loss. The Fund, as writer of an option, bears the market risk of an unfavorable change in the price of the underlying investment. Other risks include the possibility of an illiquid options market or the inability of the counterparties to fulfill their obligations under the contracts. |
| | |
| | Put and call options purchased are accounted for in the same manner as portfolio securities. Premiums paid for purchasing options which expire are treated as realized losses. Premiums paid for purchasing options which are exercised or closed are added to the amounts paid or offset against the proceeds on the underlying investment transaction to determine the realized gain or loss when the underlying transaction is executed. The risk associated with purchasing an option is that the Fund pays a premium whether or not the option is exercised. Additionally, the Fund bears the risk of loss of the premium and change in market value should the counterparty not perform under the contract. |
| | |
| (j) | Repurchase Agreements–Each Fund may enter into repurchase agreements with respect to securities. A repurchase agreement is a transaction in which a fund acquires a security and simultaneously commits to resell that security to the seller (a bank or securities dealer) at an agreed-upon price on an agreed-upon date. Each Fund requires at all times that the repurchase agreement be collateralized by cash, or by securities of the U.S. Government, its agencies, its instrumentalities, or U.S. Government sponsored enterprises having a value equal to, or in excess of, the value of the repurchase agreement (including accrued interest). If the seller of the agreement defaults on its obligation to repurchase the underlying securities at a time when the fair value of these securities has declined, a Fund may incur a loss upon disposition of the securities. |
| | |
| (k) | When-Issued or Forward Transactions–Each Fund may purchase portfolio securities on a when-issued or forward basis. When-issued or forward transactions involve a commitment by a Fund to purchase securities, with payment and delivery (“settlement”) to take place in the |
139
Notes to Financial Statements (continued)
| | future, in order to secure what is considered to be an advantageous price or yield at the time of entering into the transaction. During the period between purchase and settlement, the fair value of the securities will fluctuate and assets consisting of cash and/or marketable securities (normally short-term U.S. Government or U.S. Government sponsored enterprise securities) marked to market daily in an amount sufficient to make payment at settlement will be segregated at each Fund’s custodian in order to pay for the commitment. At the time each Fund makes the commitment to purchase a security on a when-issued basis, it will record the transaction and reflect the liability for the purchase and fair value of the security in determining its NAV. Each Fund, generally, has the ability to close out a purchase obligation on or before the settlement date rather than take delivery of the security. Under no circumstances will settlement for such securities take place more than 120 days after the purchase date. |
| | |
| (l) | Fair Value Measurements–Fair value is defined as the price that each Fund would receive upon selling an investment or transferring a liability in an orderly transaction to an independent buyer in the principal or most advantageous market of the investment. A three-tier hierarchy is used to maximize the use of observable market data and minimize the use of unobservable inputs and to establish classification of fair value measurements for disclosure purposes. Inputs refer broadly to the assumptions that market participants would use in pricing the asset or liability, including assumptions about risk—for example, the risk inherent in a particular valuation technique used to measure fair value (such as a pricing model) and/or the risk inherent in the inputs to the valuation technique. Inputs may be observable or unobservable. Observable inputs reflect the assumptions market participants would use in pricing the asset or liability. Observable inputs are based on market data obtained from sources independent of the reporting entity. Unobservable inputs reflect the reporting entity’s own assumptions about the assumptions market participants would use in pricing the asset or liability. Unobservable inputs are based on the best information available in the circumstances. The three-tier hierarchy classification is determined based on the lowest level of inputs that is significant to the fair value measurement, and is summarized in the three broad Levels listed below: |
| | • | Level 1 – | unadjusted quoted prices in active markets for identical investments; |
| | | | |
| | • | Level 2 – | other significant observable inputs (including quoted prices for similar investments, interest rates, prepayment speeds, credit risk, etc.); and |
| | | | |
| | • | Level 3 – | significant unobservable inputs (including each Fund’s own assumptions in determining the fair value of investments). |
| | A summary of inputs used in valuing each Fund’s investments and other financial instruments as of October 31, 2018 and, if applicable, Level 1/Level 2 transfers and Level 3 rollforwards for the fiscal year then ended is included in each Fund’s Schedule of Investments. |
| | |
| | Changes in valuation techniques may result in transfers into or out of an assigned level within the three-tier hierarchy. All transfers between different levels within the three-tier hierarchy are deemed to have occurred as of the beginning of the reporting period. The inputs or methodology used for valuing securities are not necessarily an indication of the risk associated with investing in those securities. |
| 3. | MANAGEMENT FEE AND OTHER TRANSACTIONS WITH AFFILIATES |
Management Fee
The Trust has a management agreement with Lord Abbett, pursuant to which Lord Abbett supplies each Fund with investment management services and executive and other personnel, provides
140
Notes to Financial Statements (continued)
office space and pays for ordinary and necessary office and clerical expenses relating to research and statistical work and supervision of each Fund’s investment portfolio.
For the year ended October 31, 2018, the effective management fee, net of any applicable waivers, was based on each Fund’s average daily net assets at the following annualized rates:
| | Net Effective
Management Fee | |
| Alpha Strategy Fund | .00% | (1) |
| Fundamental Equity Fund | .54% | (2) |
| Global Equity Research Fund | .00% | (3) |
| Global Select Equity Fund | .00% | (4) |
| Growth Leaders Fund | .53% | (5) |
| International Equity Fund | .68% | (6) |
| International Opportunities Fund | .75% | (7) |
| International Value Fund | .68% | (6) |
| Value Opportunities Fund | .70% | (8) |
| (1) | Lord Abbett is voluntarily waiving the entire management fee. Lord Abbett may discontinue the voluntary at any time without notice. |
| | |
| (2) | The management fee for Fundamental Equity Fund is based on the Fund’s average daily net assets at the following annual rates: |
| First $200 million | .75% |
| Next $300 million | .65% |
| Over $500 million | .50% |
| (3) | The management fee for Global Equity Research Fund is based on the Fund’s average daily net assets at the following annual rates: |
| Effective April 20, 2018 | | Prior to April 20, 2018 | |
| First $1 billion | .45% | | First $1 billion | .70% |
| Next $2 billion | .43% | | Next $1 billion | .65% |
| Over $3 billion | .41% | | Over $2 billion | .60% |
| (4) | The management fee for Global Select Equity Fund is based on the Fund’s average daily net assets at the following annual rates: |
| First $1 billion | .60% |
| Over $1 billion | .52% |
| (5) | The management fee for Growth Leaders Fund is based on the Fund’s average daily net assets at the following annual rates: |
| First $2 billion | .55% |
| Over $2 billion | .50% |
| (6) | The management fees for International Equity Fund and International Value Fund are based on each Fund’s average daily net assets at the following annual rates: |
| First $1 billion | .70% |
| Next $1 billion | .65% |
| Over $2 billion | .60% |
| (7) | The management fee for International Opportunities Fund is based on the Fund’s average daily net assets at the following annual rates: |
| First $1 billion | .75% |
| Next $1 billion | .70% |
| Over $2 billion | .65% |
| (8) | The management fee for Value Opportunities Fund is based on the Fund’s average daily net assets at the following annual rates: |
| First $1 billion | .75% |
| Next $1 billion | .70% |
| Next $3 billion | .65% |
| Over $5 billion | .58% |
141
Notes to Financial Statements (continued)
In addition, Lord Abbett provides certain administrative services to each Fund pursuant to an Administrative Services Agreement in return for a fee at an annual rate of .04% of each Fund’s average daily net assets.
For the fiscal year ended October 31, 2018, Lord Abbett has contractually agreed to waive its fees and reimburse expenses to the extent necessary to limit total net annual operating expenses, excluding 12b-1 fees, to the following annual rates:
| | | Global Equity Research Fund |
| Classes | | Effective
April 20, 2018* | | Prior to
April 20, 2018 | | Prior to
March 1, 2018 |
| A, C, F, I, R2, R3, R4 and R5 | | 0.65% | | 0.80% | | 0.80% |
| F3 and R6 | | 0.63% | | 0.78% | | 0.75% |
| * | Continuing through February 29, 2020. |
| | | Global Select Equity Fund |
| Classes | | Effective
August 1, 2018* | |
| A, C, F, I, R3, R4 and R5 | | 0.80% | |
| F3 and R6 | | 0.69% | |
| * | Continuing through February 29, 2020. |
| | | Growth Leaders Fund |
| | | Prior to | |
| Classes | | March 1, 2018* | |
| A, C, F I, R2, R3 R4 and R5 | | 0.70% | |
| F3 and R6 | | 0.60% | |
| * | Effective March 1 2018, Lord Abbett discontinued these waivers. |
| | | International Equity Fund |
| | | Effective | | Prior to | |
| Classes | | March 1, 2018* | | March 1, 2018 | |
| A, C, P, R2, R3, R4 and R5 | | 0.92% | | 0.87% | |
| F and I | | 0.84% | | 0.77% | |
| F3 and R6 | | 0.82% | | 0.70% | |
| * | Continuing through February 28, 2019. |
| | | International Value Fund |
| | | Effective | | Prior to | |
| Classes | | March 1, 2018* | | March 1, 2018 | |
| A, C, R2, R3, R4 and R5 | | 0.87% | | 0.87% | |
| F and I | | 0.81% | | 0.81% | |
| F3 and R6 | | 0.82% | | 0.81% | |
| * | Continuing through February 28, 2019. |
All contractual fee waiver and expense reimbursement agreements between the Funds and Lord Abbett may be terminated only upon the approval of the Funds’ Board.
142
Notes to Financial Statements (continued)
12b-1 Distribution Plan
Each Fund has adopted a distribution plan with respect to Class A, B, C, F, P, R2, R3, R4 and T shares pursuant to Rule 12b-1 under the Act, which provides for the payment of ongoing distribution and service fees to Lord Abbett Distributor LLC (the “Distributor”), an affiliate of Lord Abbett. The following annual rates have been authorized by the Board pursuant to the plan:
| Fees* | Class A | Class B(1) | Class C | Class F(2)(3) | Class P(4) | Class R2 | Class R3 | Class R4 | Class T(5) |
| Service | .25% | .25% | .25% | – | .25% | .25% | .25% | .25% | .25% |
| Distribution | – | .75% | .75% | .10% | .20% | .35% | .25% | – | – |
| * | The Funds may designate a portion of the aggregate fee as attributable to service activities for purposes of calculating Financial Industry Regulatory Authority, Inc. (“FINRA”) sales charge limitations. |
| (1) | Class B shares closed April 25, 2018. |
| (2) | The Class F Share Rule 12b-1 fee may be designated as a service fee in limited circumstances as described in each Fund’s prospectus. |
| (3) | For the fiscal year ended October 31, 2018 and continuing through February 28, 2019, the Distributor has contractually agreed to waive Growth Leaders Fund’s 0.10% Rule 12b-1 fee for Class F. For the period from August 1, 2018 through February 29, 2020, the Distributor has contractually agreed to waive Global Select Equity Fund’s 0.10% Rule 12b-1 fee for Class F. These agreements may be terminated only by the Fund’s Board of Trustees. |
| (4) | Fundamental Equity Fund, International Equity Fund, International Opportunities Fund and Value Opportunities Fund only. |
| (5) | Class T shares closed on July 24, 2018. |
Class F3, I, R5 and R6 shares do not have a distribution plan.
Commissions
Distributor received the following commissions on sales of shares of the Funds, after concessions were paid to authorized dealers, for the fiscal year ended October 31, 2018:
| | | Distributor
Commissions | | | Dealers’
Concessions |
| Alpha Strategy Fund | | $ | 67,473 | | | $ | 350,438 |
| Fundamental Equity Fund | | | 91,159 | | | | 498,091 |
| Global Equity Research Fund | | | 1,908 | | | | 10,830 |
| Global Select Equity Fund | | | – | | | | – |
| Growth Leaders Fund | | | 619,271 | | | | 3,496,024 |
| International Equity Fund | | | 21,116 | | | | 114,652 |
| International Opportunities Fund | | | 112,822 | | | | 616,919 |
| International Value Fund | | | 79,699 | | | | 413,140 |
| Value Opportunities Fund | | | 188,710 | | | | 1,019,756 |
Distributor received the following amount of CDSCs for the fiscal year ended October 31, 2018:
| | | Class A | | | Class C |
| Alpha Strategy Fund | | $ | 3,642 | | | $ | 10,771 |
| Fundamental Equity Fund | | | 1,304 | | | | 5,796 |
| Global Equity Research Fund | | | – | | | | – |
| Global Select Equity Fund | | | – | | | | – |
| Growth Leaders Fund | | | 17,629 | | | | 48,179 |
| International Equity Fund | | | 328 | | | | 613 |
| International Opportunities Fund | | | 3,452 | | | | 14,414 |
| International Value Fund | | | 2,889 | | | | 3,206 |
| Value Opportunities Fund | | | 4,441 | | | | 21,001 |
One Trustee and certain of the Trust’s officers have an interest in Lord Abbett.
143
Notes to Financial Statements (continued)
Other Related Parties
As of October 31, 2018, the percentages of Growth Leaders Fund’s, International Equity Fund’s, International Opportunities Fund’s, International Value Fund’s and Value Opportunities Fund’s outstanding shares owned by each Fund that invests principally in affiliated mutual funds managed by Lord Abbett (“Fund of Funds”) were as follows:
| Fund of Funds | | Growth
Leaders
Fund | | International
Equity
Fund | | International
Opportunities
Fund | | International
Value
Fund | | Value
Opportunities
Fund |
| Alpha Strategy Fund | | – | | – | | 22.13% | | – | | 7.82% |
| Multi-Asset Balanced Opportunity Fund | | 4.99% | | 14.99% | | – | | 11.73% | | – |
| Multi-Asset Global Opportunity Fund | | 0.48% | | 4.98% | | – | | 3.85% | | – |
| Multi-Asset Growth Fund | | 3.43% | | 14.68% | | – | | 11.51% | | – |
| Multi-Asset Income Fund | | 2.93% | | 13.61% | | – | | 10.69% | | – |
| 4. | DISTRIBUTIONS AND CAPITAL LOSS CARRYFORWARDS |
Dividends from net investment income, if any, are declared and paid quarterly for International Value Fund and annually for Alpha Strategy Fund, Fundamental Equity Fund, Global Equity Research Fund, Global Select Equity Fund, Growth Leaders Fund, International Equity Fund, International Opportunities Fund and Value Opportunities Fund. Taxable net realized gains from investment transactions, reduced by allowable capital loss carryforwards, if any, are declared and distributed to shareholders at least annually. The capital loss carryforward amount, if any, is available to offset future net capital gains. Dividends and distributions to shareholders are recorded on the ex-dividend date. The amounts of dividends and distributions from net investment income and net realized capital gains are determined in accordance with federal income tax regulations, which may differ from U.S. GAAP. These book/tax differences are either considered temporary or permanent in nature. To the extent these differences are permanent in nature, such amounts are reclassified within the components of net assets based on their federal tax basis treatment; temporary differences do not require reclassification. Dividends and distributions, which exceed earnings and profits for tax purposes, are reported as a tax return of capital.
The tax character of distributions paid during the fiscal year ended October 31, 2018 and fiscal year ended October 31, 2017 were as follows:
| | | Alpha Strategy Fund | | | Fundamental Equity Fund | | | Global Equity
Research Fund |
| | | Year Ended | | | Year Ended | | | Year Ended | | | Year Ended | | | | Year Ended | | | Period Ended |
| | | | 10/31/2018 | | | | 10/31/2017 | | | | 10/31/2018 | | | | 10/31/2017 | | | | 10/31/2018 | | | | 10/31/2017 |
| Distributions paid from: | | | | | | | | | | | | | | | | | | | | | | | |
| Ordinary income | | $ | – | | | $ | – | | | $ | 96,384,992 | | | $ | 40,226,108 | | | | $244,528 | | | $ | – |
| Net long-term capital gains | | | 124,640,000 | | | | 125,574,170 | | | | 208,675,974 | | | | 105,930,975 | | | | – | | | | – |
| Total distributions paid | | $ | 124,640,000 | | | $ | 125,574,170 | | | $ | 305,060,966 | | | $ | 146,157,083 | | | | $244,528 | | | $ | – |
144
Notes to Financial Statements (continued)
| | | Global Select | | | | | | | | | | | | | |
| | | Equity Fund | | | Growth Leaders Fund | | | International Equity Fund | |
| | | Period Ended | | | Year Ended | | | Year Ended | | | Year Ended | | | Year Ended | |
| | | 10/31/2018 | | | 10/31/2018 | | | 10/31/2017 | | | 10/31/2018 | | | 10/31/2017 | |
| Distributions paid from: | | | | | | | | | | | | | | | | | | | | |
| Ordinary income | | $ | – | | | $ | 126,621,794 | | | $ | – | | | $ | 13,137,977 | | | $ | 11,749,068 | |
| Net long-term capital gains | | | – | | | | 65,683,018 | | | | – | | | | – | | | | – | |
| Total distributions paid | | $ | – | | | $ | 192,304,812 | | | $ | – | | | $ | 13,137,977 | | | $ | 11,749,068 | |
| | | International Opportunities Fund | | | International Value Fund | |
| | | Year Ended | | | Year Ended | | | Year Ended | | | Year Ended | |
| | | 10/31/2018 | | | 10/31/2017 | | | 10/31/2018 | | | 10/31/2017 | |
| Distributions paid from: | | | | | | | | | | | | | | | | |
| Ordinary income | | $ | 7,606,852 | | | $ | 4,401,411 | | | $ | 27,670,057 | | | $ | 39,131,477 | |
| Net long-term capital gains | | | 29,369,535 | | | | – | | | | – | | | | – | |
| Total distributions paid | | $ | 36,976,387 | | | $ | 4,401,411 | | | $ | 27,670,057 | | | $ | 39,131,477 | |
| | | | | | | | | | | | |
| | | Value Opportunities Fund | | | | | | | | | |
| | | Year Ended | | | Year Ended | | | | | | | | | |
| | | 10/31/2018 | | | 10/31/2017 | | | | | | | | | |
| Distributions paid from: | | | | | | | | | | | | | | | | |
| Ordinary income | | $ | 2,970,562 | | | $ | 1,828,852 | | | | | | | | | |
| Net long-term capital gains | | | 189,303,747 | | | | 160,561,813 | | | | | | | | | |
| Total distributions paid | | $ | 192,274,309 | | | $ | 162,390,665 | | | | | | | | | |
Subsequent to the Funds’ fiscal year ended October 31, 2018, year-end distributions were paid. The approximate amounts were as follows:
| | | Net | | | Net | | | Net | | | | | |
| | | Investment | | | Short-Term | | | Long-Term | | | | | |
| | | Income | | | Capital Gain | | | Capital Gain | | | Record Date | | Ex-Date |
| Alpha Strategy Fund | | $ | 9,058,000 | | | $ | – | | | $ | 119,735,000 | | | December 19, 2018 | | December 20, 2018 |
| Fundamental Equity Fund | | | 28,441,000 | | | | 14,711,000 | | | | 143,795,000 | | | November 19, 2018 | | November 20, 2018 |
| Global Equity Research Fund | | | 55,000 | | | | 137,000 | | | | 130,000 | | | December 17, 2018 | | December 18, 2018 |
| Global Select Equity Fund | | | 13,000 | | | | – | | | | – | | | December 17, 2018 | | December 18, 2018 |
| Growth Leaders Fund | | | – | | | | 211,624,000 | | | | 345,437,000 | | | November 19, 2018 | | November 20, 2018 |
| International Equity Fund | | | 12,000,000 | | | | – | | | | – | | | December 17, 2018 | | December 18, 2018 |
| International Opportunities Fund | | | 8,262,000 | | | | – | | | | 67,034,000 | | | December 17, 2018 | | December 18, 2018 |
| Value Opportunities Fund | | | 3,680,000 | | | | 37,056,000 | | | | 190,880,000 | | | November 19, 2018 | | November 20, 2018 |
145
Notes to Financial Statements (continued)
As of October 31, 2018, the components of accumulated gains on a tax-basis were as follows:
| | | Alpha | | | Fundamental | | | Global Equity | |
| | | Strategy Fund | | | Equity Fund | | | Research Fund | |
| Undistributed ordinary income – net | | $ | – | | | $ | 37,234,289 | | | $ | 177,899 | |
| Undistributed long-term capital gains | | | 119,731,927 | | | | 143,793,670 | | | | 129,275 | |
| Total undistributed earnings | | | 119,731,927 | | | | 181,027,959 | | | | 307,174 | |
| Temporary differences | | | (4,004,053 | ) | | | (737,678 | ) | | | (189 | ) |
| Unrealized gains (losses) – net | | | 47,548,648 | | | | 332,374,035 | | | | (140,223 | ) |
| Total accumulated gains – net | | $ | 163,276,522 | | | $ | 512,664,316 | | | $ | 166,762 | |
| | | | | | | | | | | | | |
| | | Global Select | | | Growth | | | International | |
| | | Equity Fund | | | Leaders Fund | | | Equity Fund | |
| Undistributed ordinary income – net | | $ | 8,200 | | | $ | 211,620,427 | | | $ | 11,712,733 | |
| Undistributed long-term capital gains | | | – | | | | 345,430,886 | | | | – | |
| Total undistributed earnings | | | 8,200 | | | | 557,051,313 | | | | 11,712,733 | |
| Capital loss carryforwards* | | | (2,399 | ) | | | – | | | | (643,547 | ) |
| Temporary differences | | | (9 | ) | | | (197,902 | ) | | | (137,452 | ) |
| Unrealized gains (losses) – net | | | (125,685 | ) | | | 195,922,072 | | | | (29,774,539 | ) |
| Total accumulated gains (losses) – net | | $ | (119,893 | ) | | $ | 752,775,483 | | | $ | (18,842,805 | ) |
| | | | | | | | | | | | | |
| | | International | | | International | | | Value | |
| | | Opportunities | | | Value | | | Opportunities | |
| | | Fund | | | Fund | | | Fund | |
| Undistributed ordinary income – net | | $ | 7,596,599 | | | $ | 909,296 | | | $ | 39,273,599 | |
| Undistributed long-term capital gains | | | 67,032,636 | | | | – | | | | 190,874,138 | |
| Total undistributed earnings | | | 74,629,235 | | | | 909,296 | | | | 230,147,737 | |
| Capital loss carryforwards | | | – | | | | (386,797,510 | ) | | | – | |
| Temporary differences | | | (88,691 | ) | | | (209,589 | ) | | | (435,322 | ) |
| Unrealized gains (losses) – net | | | (108,289,287 | ) | | | (31,873,251 | ) | | | 443,091,125 | |
| Total accumulated gains (losses) – net | | $ | (33,748,743 | ) | | $ | (417,971,054 | ) | | $ | 672,803,540 | |
| * | The capital losses will carry forward indefinitely. |
At the Fund’s election, certain losses incurred within the taxable year (“Qualified Late-Year Losses”) are deemed to arise on the first business day of the Fund’s next taxable year. Alpha Strategy Fund incurred and will elect to defer $3,840,720 of late-year ordinary losses during fiscal 2018.
As of October 31, 2018, the aggregate unrealized security gains and losses on investments and other financial instruments based on cost for U.S. federal income tax purposes were as follows:
| | | Alpha | | | Fundamental | | | Global Equity | |
| | | Strategy Fund | | | Equity Fund | | | Research Fund | |
| Tax cost | | $ | 966,133,075 | | | $ | 1,862,635,687 | | | $ | 6,577,020 | |
| Gross unrealized gain | | | 88,378,444 | | | | 364,807,389 | | | | 298,578 | |
| Gross unrealized loss | | | (40,829,796 | ) | | | (32,433,354 | ) | | | (438,634 | ) |
| Net unrealized security gain (loss) | | $ | 47,548,648 | | | $ | 332,374,035 | | | $ | (140,056 | ) |
| | | | | | | | | | | | | |
| | | Global Select | | | Growth | | | International | |
| | | Equity Fund | | | Leaders Fund | | | Equity Fund | |
| Tax cost | | $ | 2,293,329 | | | $ | 3,406,987,989 | | | $ | 586,148,125 | |
| Gross unrealized gain | | | 42,664 | | | | 299,361,687 | | | | 16,851,005 | |
| Gross unrealized loss | | | (168,349 | ) | | | (103,439,615 | ) | | | (46,402,128 | ) |
| Net unrealized security gain (loss) | | $ | (125,685 | ) | | $ | 195,922,072 | | | $ | (29,551,123 | ) |
146
Notes to Financial Statements (continued)
| | | International | | | International | | | Value | |
| | | Opportunities Fund | | | Value Fund | | | Opportunities Fund | |
| Tax cost | | $ | 881,243,697 | | | $ | 766,292,842 | | | $ | 2,148,536,428 | |
| Gross unrealized gain | | | 20,415,153 | | | | 31,556,127 | | | | 531,671,581 | |
| Gross unrealized loss | | | (128,292,242 | ) | | | (63,371,990 | ) | | | (88,580,456 | ) |
| Net unrealized security gain (loss) | | $ | (107,877,089 | ) | | $ | (31,815,863 | ) | | $ | 443,091,125 | |
The difference between book-basis and tax-basis unrealized gains (losses) is attributable to the tax treatment of certain securities, certain distributions, forward currency contracts and wash sales.
Permanent items identified during the fiscal year ended October 31, 2018 have been reclassified among the components of net assets based on their tax basis treatment as follows:
| | | Total Distributable | | | | |
| | | Earnings (Loss) | | | Paid-in Capital | |
| Global Equity Research Fund | | | $1,308 | | | | $(1,308 | ) |
| Global Select Equity Fund | | | 1,757 | | | | (1,757 | ) |
| International Opportunities Fund | | | (1,901 | ) | | | 1,901 | |
| Value Opportunities Fund | | | (53,784,971 | ) | | | 53,784,971 | |
The permanent differences are attributable to the tax treatment of certain expenses, and certain distributions.
| 5. | PORTFOLIO SECURITIES TRANSACTIONS |
Purchases and sales of investment securities (excluding short-term investments) for the fiscal year ended October 31, 2018 were as follows:
| | | Purchases | | | Sales | |
| Alpha Strategy Fund | | $ | 93,214,884 | | | $ | 173,523,733 | |
| Fundamental Equity Fund | | | 2,227,458,151 | | | | 2,705,130,811 | |
| Global Equity Research Fund | | | 8,225,363 | | | | 6,007,735 | |
| Global Select Equity Fund | | | 2,785,798 | | | | 490,362 | |
| Growth Leaders Fund | | | 5,984,137,358 | | | | 5,522,345,483 | |
| International Equity Fund | | | 797,075,691 | | | | 791,512,033 | |
| International Opportunities Fund | | | 875,305,259 | | | | 715,074,393 | |
| International Value Fund | | | 664,129,362 | | | | 891,043,415 | |
| Value Opportunities Fund | | | 1,639,123,067 | | | | 2,272,257,235 | |
There were no purchases or sales of U.S. Government securities for the fiscal year ended October 31, 2018.
Each Fund is permitted to purchase and sell securities (“cross-trade”) from and to other Lord Abbett funds or client accounts pursuant to procedures approved by the Board in compliance with Rule 17a-7 under the Act (the “Rule”). Each cross-trade is executed at a fair market price in compliance with provisions of the Rule. For the fiscal year ended October 31, 2018, the following Funds engaged in cross-trades:
147
Notes to Financial Statements (continued)
| Fund | | Purchases | | | Sales | | | Gain/(Loss | ) |
| Fundamental Equity Fund | | | 11,888,730 | | | | 17,027,911 | | | | 1,248,776 | |
| Growth Leaders Fund | | | 5,612,950 | | | | 994,425 | | | | 137,025 | |
| International Equity Fund | | | 1,851,065 | | | | – | | | | – | |
| International Opportunities Fund | | | 477,158 | | | | – | | | | – | |
| International Value Fund | | | – | | | | 2,968,676 | | | | 733,330 | |
| Value Opportunities Fund | | | 5,850,760 | | | | 10,824,686 | | | | 1,657,171 | |
| 6. | DISCLOSURES ABOUT DERIVATIVE INSTRUMENTS AND HEDGING ACTIVITIES |
Global Equity Research Fund, International Equity Fund, International Opportunities Fund and International Value Fund entered into forward foreign currency exchange contracts for the year ended October 31, 2018 (as described in note 2(g)). A forward foreign currency exchange contract reduces each Fund’s exposure to changes in the value of the currency it will deliver (or settle in cash) and increases its exposure to changes in the value of the currency it will receive (or settle in cash) for the duration of the contract. Each Fund’s use of forward foreign currency exchange contracts involves the risk that Lord Abbett will not accurately predict currency movements, and each Fund’s returns could be reduced as a result. Forward foreign currency exchange contracts are subject to the risk that those currencies will decline in value relative to the U.S. dollar, or, in the case of hedged positions, that the U.S. dollar will decline relative to the currency being hedged. Currency rates in foreign countries may fluctuate significantly over short periods of time. Each Fund’s risk of loss from counterparty credit risk is the unrealized appreciation on forward foreign currency exchange contracts.
As of October 31, 2018, Global Equity Research Fund, International Equity Fund, International Opportunities Fund and International Value Fund had no forward foreign currency exchange contracts outstanding.
Transactions in derivatives instruments for the fiscal year ended October 31, 2018 were as follows:
| Global Equity Research Fund | |
| | | Forward | |
| | | Currency | |
| | | Contracts | |
| Net Realized Gain (Loss) | | | | |
| Forward Foreign Currency Exchange Contracts(1) | | $ | (8,968 | ) |
| Net Change in Unrealized Appreciation/Depreciation | | | | |
| Forward Foreign Currency Exchange Contracts(2) | | $ | 11,076 | |
| Average Number of Contracts/Notional Amounts* | | | | |
| Forward Foreign Currency Exchange Contracts(3) | | $ | 103,215 | |
| | | | | |
| International Equity Fund | |
| | | Forward | |
| | | Currency | |
| | | Contracts | |
| Net Realized Gain (Loss) | | | | |
| Forward Foreign Currency Exchange Contracts(1) | | $ | (2,509,846 | ) |
| Net Change in Unrealized Appreciation/Depreciation | | | | |
| Forward Foreign Currency Exchange Contracts(2) | | $ | 1,726,452 | |
| Average Number of Contracts/Notional Amounts* | | | | |
| Forward Foreign Currency Exchange Contracts(3) | | $ | 153,857,754 | |
148
Notes to Financial Statements (continued)
| International Opportunities Fund | | | | |
| | | Foreign | | | Options | |
| | | Currency | | | on Index | |
| | | Contracts | | | Contracts | |
| Net Realized Gain (Loss) | | | | | | | | |
| Forward Foreign Currency Exchange Contracts(1) | | $ | (1,804,355 | ) | | | – | |
| Purchased Options(5) | | | – | | | $ | (2,065,000 | ) |
| Written Options(4) | | | – | | | $ | 1,064,000 | |
| Net Change in Unrealized Appreciation/Depreciation | | | | | | | | |
| Forward Foreign Currency Exchange Contracts(2) | | $ | 2,114,700 | | | | – | |
| Purchased Options(6) | | | – | | | $ | 1,886,157 | |
| Written Options(6) | | | – | | | $ | (992,421 | ) |
| Average Number of Contracts/Notional Amounts* | | | | | | | | |
| Forward Foreign Currency Exchange Contracts(3) | | $ | 109,551,794 | | | | – | |
| Purchased Options(7) | | | – | | | | 135 | |
| Written Options(7) | | | – | | | | 135 | |
| | | | | | | | | |
| International Value Fund | | | | | |
| | | | Foreign | | | | | |
| | | | Currency | | | | | |
| | | | Contracts | | | | | |
| Net Realized Gain (Loss) | | | | | | | | |
| Forward Foreign Currency Exchange Contracts(1) | | $ | (1,785,275 | ) | | | | |
| Net Change in Unrealized Appreciation/Depreciation | | | | | | | | |
| Forward Foreign Currency Exchange Contracts(2) | | $ | 1,911,748 | | | | | |
| Average Number of Contracts/Notional Amounts* | | | | | | | | |
| Forward Foreign Currency Exchange Contracts(3) | | $ | 225,393,414 | | | | | |
| * | Calculated based on the number of contracts or notional amounts for the fiscal year ended October 31, 2018. |
| (1) | Statements of Operations location: Net realized gain (loss) on foreign currency exchange contracts. |
| (2) | Statements of Operations location: Net change in unrealized appreciation/depreciation on foreign currency exchange contracts. |
| (3) | Amount represents notional amounts in U.S. dollar. |
| (4) | Statement of Operations location: Net realized gain (loss) on written options. |
| (5) | Statement of Operation location: Net realized gain (loss) on purchased options. |
| (6) | Statement of Operations location: Net change in unrealized appreciation/depreciation on options. |
| (7) | Amount represents number of contracts. |
| 7. | DISCLOSURES ABOUT OFFSETTING ASSETS AND LIABILITIES |
The Financial Accounting Standards Board (“FASB”) requires disclosures intended to help better assess the effect or potential effect of offsetting arrangements on a fund’s financial position. The following tables illustrate gross and net information about recognized assets and liabilities eligible for offset in the statements of assets and liabilities; and disclose such amounts subject to an enforceable master netting agreement or similar agreement, by counterparty. A master netting agreement is an agreement between a fund and a counterparty which provides for the net settlement of amounts owed under all contracts traded under that agreement, as well as cash collateral, through a single payment by one party to the other in the event of default on or termination of any one contract. The Funds’ accounting policy with respect to balance sheet offsetting is that, absent an event of default by the counterparty or a termination of the agreement, the master netting agreement does not result in an offset of reported amounts of financial assets and liabilities in the statement of assets and liabilities across transactions between the Funds and the applicable counterparty:
149
Notes to Financial Statements (continued)
| | | | | | | | Alpha Strategy Fund | |
| | | | | | Gross Amounts | | | Net Amounts of | |
| | | | | | Offset in the | | | Assets Presented | |
| | | Gross Amounts of | | | Statement of Assets | | | in the Statement of | |
| Description | | Recognized Assets | | | and Liabilities | | | Assets and Liabilities | |
| Repurchase Agreement | | | $613,260 | | | $ | – | | | | $613,260 | |
| Total | | | $613,260 | | | $ | – | | | | $613,260 | |
| | | Net Amounts | | | | | | | | | | | | | |
| | | of Assets | | | Amounts Not Offset in the | | | | |
| | | Presented in | | | Statement of Assets and Liabilities | | | | |
| | | the Statement | | | | | | Cash | | | Securities | | | | |
| | | of Assets and | | | Financial | | | Collateral | | | Collateral | | | Net | |
| Counterparty | | Liabilities | | | Instruments | | | Received(a) | | | Received(a) | | | Amount(b) | |
| Fixed Income Clearing Corp. | | | $613,260 | | | $ | – | | | $ | – | | | | $(613,260 | ) | | $ | – | |
| Total | | | $613,260 | | | $ | – | | | $ | – | | | | $(613,260 | ) | | $ | – | |
| | | | | | Fundamental Equity Fund | |
| | | | | | Gross Amounts | | | Net Amounts of | |
| | | | | | Offset in the | | | Assets Presented | |
| | | Gross Amounts of | | | Statement of Assets | | | in the Statement of | |
| Description | | Recognized Assets | | | and Liabilities | | | Assets and Liabilities | |
| Repurchase Agreement | | $ | 25,733,260 | | | $ | – | | | $ | 25,733,260 | |
| Total | | $ | 25,733,260 | | | $ | – | | | $ | 25,733,260 | |
| | | Net Amounts | | | | | | | | | | | | | |
| | | of Assets | | | Amounts Not Offset in the | | | | |
| | | Presented in | | | Statement of Assets and Liabilities | | | | |
| | | the Statement | | | | | | Cash | | | Securities | | | | |
| | | of Assets and | | | Financial | | | Collateral | | | Collateral | | | Net | |
| Counterparty | | Liabilities | | | Instruments | | | Received(a) | | | Received(a) | | | Amount(b) | |
| Fixed Income Clearing Corp. | | $ | 25,733,260 | | | $ | – | | | $ | – | | | $ | (25,733,260 | ) | | $ | – | |
| Total | | $ | 25,733,260 | | | $ | – | | | $ | – | | | $ | (25,733,260 | ) | | $ | – | |
| | | | | | | | | Growth Leaders Fund | |
| | | | | | Gross Amounts | | | Net Amounts of | |
| | | | | | Offset in the | | | Assets Presented | |
| | | Gross Amounts of | | | Statement of Assets | | | in the Statement of | |
| Description | | Recognized Assets | | | and Liabilities | | | Assets and Liabilities | |
| Repurchase Agreement | | $ | 105,945,484 | | | $ | – | | | $ | 105,945,484 | |
| Total | | $ | 105,945,484 | | | $ | – | | | $ | 105,945,484 | |
| | | Net Amounts | | | | | | | | | | | | | |
| | | of Assets | | | Amounts Not Offset in the | | | | |
| | | Presented in | | | Statement of Assets and Liabilities | | | | |
| | | the Statement | | | | | | Cash | | | Securities | | | | |
| | | of Assets and | | | Financial | | | Collateral | | | Collateral | | | Net | |
| Counterparty | | Liabilities | | | Instruments | | | Received(a) | | | Received(a) | | | Amount(b) | |
| Fixed Income Clearing Corp. | | $ | 105,945,484 | | | $ | – | | | $ | – | | | $ | (105,945,484 | ) | | $ | – | |
| Total | | $ | 105,945,484 | | | $ | – | | | $ | – | | | $ | (105,945,484 | ) | | $ | – | |
150
Notes to Financial Statements (continued)
| | | | | | | | International Equity Fund | |
| | | | | | Gross Amounts | | | Net Amounts of | |
| | | | | | Offset in the | | | Assets Presented | |
| | | Gross Amounts of | | | Statement of Assets | | | in the Statement of | |
| Description | | Recognized Assets | | | and Liabilities | | | Assets and Liabilities | |
| Repurchase Agreement | | $ | 19,354,221 | | | $ | – | | | $ | 19,354,221 | |
| Total | | $ | 19,354,221 | | | $ | – | | | $ | 19,354,221 | |
| | | Net Amounts | | | | | | | | | | | | | |
| | | of Assets | | | Amounts Not Offset in the | | | | |
| | | Presented in | | | Statement of Assets and Liabilities | | | | |
| | | the Statement | | | | | | Cash | | | Securities | | | | |
| | | of Assets and | | | Financial | | | Collateral | | | Collateral | | | Net | |
| Counterparty | | Liabilities | | | Instruments | | | Received(a) | | | Received(a) | | | Amount(b) | |
| Fixed Income Clearing Corp. | | $ | 19,354,221 | | | $ | – | | | $ | – | | | $ | (19,354,221 | ) | | $ | – | |
| Total | | $ | 19,354,221 | | | $ | – | | | $ | – | | | $ | (19,354,221 | ) | | $ | – | |
| | | | | | International Opportunities Fund | |
| | | | | | Gross Amounts | | | Net Amounts of | |
| | | | | | Offset in the | | | Assets Presented | |
| | | Gross Amounts of | | | Statement of Assets | | | in the Statement of | |
| Description | | Recognized Assets | | | and Liabilities | | | Assets and Liabilities | |
| Repurchase Agreement | | $ | 21,567,097 | | | $ | – | | | $ | 21,567,097 | |
| Total | | $ | 21,567,097 | | | $ | – | | | $ | 21,567,097 | |
| | | Net Amounts | | | | | | | | | | | | | |
| | | of Assets | | | Amounts Not Offset in the | | | | |
| | | Presented in | | | Statement of Assets and Liabilities | | | | |
| | | the Statement | | | | | | Cash | | | Securities | | | | |
| | | of Assets and | | | Financial | | | Collateral | | | Collateral | | | Net | |
| Counterparty | | Liabilities | | | Instruments | | | Received(a) | | | Received(a) | | | Amount(b) | |
| Fixed Income Clearing Corp. | | $ | 21,567,097 | | | $ | – | | | $ | – | | | $ | (21,567,097 | ) | | $ | – | |
| Total | | $ | 21,567,097 | | | $ | – | | | $ | – | | | $ | (21,567,097 | ) | | $ | – | |
| | | | | | International Value Fund | |
| | | | | | Gross Amounts | | | Net Amounts of | |
| | | | | | Offset in the | | | Assets Presented | |
| | | Gross Amounts of | | | Statement of Assets | | | in the Statement of | |
| Description | | Recognized Assets | | | and Liabilities | | | Assets and Liabilities | |
| Repurchase Agreement | | $ | 24,834,171 | | | $ | – | | | $ | 24,834,171 | |
| Total | | $ | 24,834,171 | | | $ | – | | | $ | 24,834,171 | |
| | | Net Amounts | | | | | | | |
| | | of Assets | | | Amounts Not Offset in the | | | | |
| | | Presented in | | | Statement of Assets and Liabilities | | | | |
| | | the Statement | | | | | | Cash | | | Securities | | | | |
| | | of Assets and | | | Financial | | | Collateral | | | Collateral | | | Net | |
| Counterparty | | Liabilities | | | Instruments | | | Received(a) | | | Received(a) | | | Amount(b) | |
| Fixed Income Clearing Corp. | | $ | 24,834,171 | | | $ | – | | | $ | – | | | $ | (24,834,171 | ) | | $ | – | |
| Total | | $ | 24,834,171 | | | $ | – | | | $ | – | | | $ | (24,834,171 | ) | | $ | – | |
151
Notes to Financial Statements (continued)
| | | | | | Value Opportunities Fund | |
| Description | | Gross Amounts of
Recognized Assets | | | Gross Amounts
Offset in the
Statement of Assets
and Liabilities | | | Net Amounts of
Assets Presented
in the Statement of
Assets and Liabilities | |
| Repurchase Agreement | | $ | 43,763,616 | | | $ | – | | | $ | 43,763,616 | |
| Total | | $ | 43,763,616 | | | $ | – | | | $ | 43,763,616 | |
| | | Net Amounts
of Assets
Presented in | | | Amounts Not Offset in the
Statement of Assets and Liabilities | | | | |
| Counterparty | | the Statement
of Assets and
Liabilities | | | Financial
Instruments | | | Cash
Collateral
Received(a) | | | Securities
Collateral
Received(a) | | | Net
Amount(b) | |
| Fixed Income Clearing Corp. | | $ | 43,763,616 | | | $ | – | | | $ | – | | | $ | (43,763,616 | ) | | $ | – | |
| Total | | $ | 43,763,616 | | | $ | – | | | $ | – | | | $ | (43,763,616 | ) | | $ | – | |
| (a) | Collateral disclosed is limited to an amount not to exceed 100% of the net amount of assets presented in the Statements of Assets and Liabilities, for each respective counterparty. |
| (b) | Net amount represents the amount owed to the Fund by the counterparty as of October 31, 2018. |
The Trust’s officers and one Trustee, who are associated with Lord Abbett, do not receive any compensation from the Trust for serving in such capacities. Independent Trustees’ fees are allocated among all Lord Abbett-sponsored funds based on the net assets of each fund. There is an equity-based plan available to all Independent Trustees under which Independent Trustees must defer receipt of a portion of, and may elect to defer receipt of an additional portion of Trustees’ fees. The deferred amounts are treated as though equivalent dollar amounts had been invested in the funds. Such amounts and earnings accrued thereon are included in Trustees’ fees on the Statements of Operations and in Trustees’ fees payable on the Statements of Assets and Liabilities and are not deductible for U.S. federal income tax purposes until such amounts are paid.
The Trust has entered into an arrangement with its transfer agent and custodian, whereby credits realized as a result of uninvested cash balances are used to reduce a portion of each Fund’s expenses.
During the fiscal year through August 8, 2018, the Funds (except Global Select Equity Fund) and certain other funds managed by Lord Abbett (collectively, the “Participating Funds”) participated in a syndicated line of credit facility with various lenders for $600 million (the “Facility”), whereas State Street Bank and Trust Company (“SSB”) participates as a lender and as agent for the lenders. The Facility is to be used for temporary or emergency purposes as an additional source of liquidity to satisfy redemptions. The Participating Funds are subject to graduated borrowing limits of one-third of Fund assets (if Fund assets are less than $750 million), $250 million, $300 million, or $350 million, based on past borrowings and likelihood of future borrowings. During the period ended August 8, 2018, the Funds did not utilize the Facility.
Effective August 9, 2018, the Participating Funds entered into an amended syndicated line of credit facility with various lenders for $1.06 billion (the “Syndicated Facility”), whereas SSB participates as a lender and as agent for the lenders. Under the Syndicated Facility, the Participating Funds are subject to graduated borrowing limits of one-third of Fund assets (if Fund assets are less than $750
152
Notes to Financial Statements (continued)
million), $250 million, $300 million, $350 million, or $1 billion, based on past borrowings and likelihood of future borrowings. Also effective August 9, 2018, the Participating Funds entered into an additional line of credit facility with SSB for $250 million (the “Bilateral Facility,” and together with the Syndicated Facility, the “Facilities”). Under the Bilateral Facility, each Participating Fund may borrow up to the lesser of $250 million or one- third of Fund assets. The Facilities are to be used for temporary or emergency purposes to satisfy redemption requests and manage liquidity. For the period from August 9, 2018 through October 31, 2018, the Funds did not utilize the Facilities.
Effective December 21, 2018, the Participating Funds (including Global Select Equity Fund) entered into an amended Syndicated Facility with various lenders for $1.1 billion based on the same terms as described above.
| 11. | INTERFUND LENDING PROGRAM |
Pursuant to an exemptive order issued by the U.S. Securities and Exchange Commission (“SEC exemptive order”), certain registered open-end management investment companies managed by Lord Abbett, including the Fund, participate in a joint lending and borrowing program (the “Interfund Lending Program”). The SEC exemptive order allows the Funds to borrow money from and lend money to each other for temporary or emergency purposes subject to the limitations and conditions.
During the fiscal year ended October 31, 2018, the Funds did not participate as a borrower or lender in the Interfund Lending Program.
| 12. | CUSTODIAN AND ACCOUNTING AGENT |
SSB is the Trust’s custodian and accounting agent. SSB performs custodial, accounting and recordkeeping functions relating to portfolio transactions and calculating each Fund’s NAV.
153
Notes to Financial Statements (continued)
| 13. | TRANSACTIONS WITH AFFILIATED ISSUERS |
An affiliated issuer is one in which a Fund has ownership of at least 5% of the outstanding voting securities of the underlying issuer at any point during the fiscal year or any company which is under common ownership or control. Alpha Strategy Fund had the following transactions with affiliated issuers (i.e. the Underlying Funds) during the fiscal year ended October 31, 2018:
Alpha Strategy Fund
| Affiliated Issuer | | Balance of
Shares
Held at
10/31/2017 | | | Gross
Additions | | | Gross
Sales | | | Balance of
Shares
Held at
10/31/2018 | | | Fair
Value at
10/31/2018 | | | Net Realized
Gain
11/1/2017 to
10/31/2018 | | | Dividend
Income
11/1/2017 to
10/31/2018 | | | Change in
Appreciation
(Depreciation)
11/1/2017 to
10/31/2018 | |
| Lord Abbett Developing Growth Fund, Inc. – Class I | | | 8,944,374 | | | | 132,260 | | | | (2,535,314 | ) | | | 6,541,320 | | | $ | 207,817,744 | | | $ | 27,997,038 | | | $ | – | | | $ | 23,615,501 | |
| Lord Abbett Securities Trust – International Opportunities Fund – Class I | | | 10,543,812 | | | | 615,029 | | | | (830,975 | ) | | | 10,327,866 | | | | 178,981,921 | | | | 16,116,098 | (a) | | | 2,203,600 | | | | (50,455,573 | ) |
| Lord Abbett Securities Trust – Micro-Cap Growth Fund – Class I | | | 5,655,547 | | | | 949,947 | | | | (1,421,042 | ) | | | 5,184,452 | | | | 102,859,528 | | | | 18,518,886 | (b) | | | – | | | | 90,031 | |
| Lord Abbett Securities Trust – Micro-Cap Value Fund – Class I | | | 3,081,414 | | | | 635,563 | | | | (315,296 | ) | | | 3,401,681 | | | | 104,193,489 | | | | 22,133,603 | (c) | | | – | | | | (21,628,965 | ) |
| Lord Abbett Research Fund, Inc. – Small-Cap Value Fund – Class I | | | 8,475,488 | | | | 1,082,038 | | | | (892,605 | ) | | | 8,664,921 | | | | 210,210,974 | | | | 18,141,554 | (d) | | | 196,588 | | | | (12,958,237 | ) |
| Lord Abbett Securities Trust – Value Opportunities Fund – Class I | | | 10,446,416 | | | | 730,299 | | | | (875,837 | ) | | | 10,300,878 | | | | 209,004,807 | | | | 18,651,979 | (e) | | | 534,460 | | | | (18,672,629 | ) |
| Total | | | | | | | | | | | | | | | | | | $ | 1,013,068,463 | | | $ | 121,559,158 | | | $ | 2,934,648 | | | $ | (80,009,872 | ) |
| (a) | Includes $7,570,233 of distributed capital gains. |
| (b) | Includes $15,275,633 of distributed capital gains. |
| (c) | Includes $18,582,748 of distributed capital gains. |
| (d) | Includes $24,168,834 of distributed capital gains. |
| (e) | Includes $13,022,231 of distributed capital gains. |
Each Fund is subject to the general risks and considerations associated with equity investing. The value of the Funds’ investments will fluctuate in response to movements in the equity securities markets in general and to the changing prospects of individual companies in which the Funds invest. If a Fund’s assessment of a company’s value or prospects for exceeding earnings expectations or market conditions is wrong, the Fund could suffer losses or produce poor performance relative to other funds, even in a favorable market.
Large company stocks, in which Fundamental Equity Fund, Global Equity Research Fund, Global Select Equity Fund, Growth Leaders Fund, International Equity Fund and International Value Fund invest, may perform differently than the market as a whole and other types of stocks, such as small company stocks. Small and mid-sized company stocks, in which Alpha Strategy Fund, Fundamental Equity Fund, Global Select Equity Fund, Growth Leaders Fund, International Equity Fund,
154
Notes to Financial Statements (continued)
International Opportunities Fund and Value Opportunities Fund invest, may be less able to weather economic shifts or other adverse developments than those of larger, more established companies.
In general, Growth Leaders Fund employs a growth investing style, Alpha Strategy Fund, International Equity Fund, International Opportunities Fund, Global Equity Research Fund, and Global Select Equity Fund employ a blended growth investing and value investing style, and Fundamental Equity Fund, International Value Fund and Value Opportunities Fund employ a value investing style. Growth stocks generally are more volatile than value stocks. The price of value stocks may lag the market for long periods of time.
Global Equity Research Fund, Global Select Equity Fund, International Equity Fund, International Opportunities Fund and International Value Fund are subject to the risks of investing in foreign securities. Foreign securities may pose greater risks than domestic securities, including greater price fluctuations, economic, political, and social instability and subject to less government supervision, lack of transparency, inadequate regulatory and accounting standards, foreign taxes, and higher transaction costs. Foreign investments also may be affected by changes in currency rates or currency controls. These risks are generally greater for securities issued by companies in emerging market companies. Similarly, due to their investments in multinational and foreign companies, Alpha Strategy Fund, Fundamental Equity Fund, Growth Leaders Fund, and Value Opportunities Fund are subject to the risks of investing in foreign securities and similarly may experience increased market, liquidity, currency, political, informational, and other risks.
International Value Fund is subject to the risks of investing in dividend paying stocks. Dividend paying stocks may be sensitive to changes in market interest rates, and the prices of such stocks may decline as rates rise. There is no guarantee that companies that currently pay dividends will continue to do so. International Value Fund may be subject to the volatility of stocks that have high dividends per share due to recent decreases in their share prices.
Alpha Strategy Fund’s investments are concentrated in the Underlying Funds and, as a result, the Fund’s performance is directly related to their performance and subject to their risks. In addition, the Fund is exposed to the same risks as the Underlying Funds in direct proportion to the allocation of its assets among the Underlying Funds.
Global Select Equity Fund was recently organized, and there can be no assurance that the Fund will reach or maintain a sufficient asset size to effectively implement its investment strategy. The Fund is subject to the general risks and considerations associated with investing in structured securities. The Fund’s investments in structured securities involve the same risks associated with direct investments in the underlying securities or other instruments they seek to replicate, as well as additional risks. The Fund is also subject to the general risks and considerations associated with investing in fixed income securities, including high-yield securities (sometimes called “lower-rated bonds” or “junk bonds”), in which the Fund may substantially invest. The value of a fixed income investment will change as interest rates fluctuate and in response to market movements. When interest rates rise, the prices of fixed income securities are likely to decline; when rates fall, such prices tend to rise. High-yield securities are subject to greater price fluctuations, as well as additional risks. In addition, the Fund is also subject to the general risks and considerations associated with investing in convertible securities. Convertible securities are often more volatile than other fixed income securities, and are subject to risks affecting both equity and fixed income securities, such as market, credit, liquidity, and interest rate risk.
155
Notes to Financial Statements (continued)
Global Select Equity Fund and Global Equity Research Fund are subject to the general risks and considerations associated with investments in ETFs, which are subject to a variety of risks, including the risks associated with a direct investment in the underlying securities held by the ETF. Investments in ETFs also involve the risk that there will be little to no active trading market for the ETF shares, or that the ETF shares will sell at a significant premium or discount to the ETF’s NAV. ETFs typically incur fees that are separate from those fees incurred directly by a Fund, and therefore a Fund and its shareholders will absorb two levels of fees with respect to investments in ETFs.
Each Fund is subject to the risks associated with derivatives, which may be different from and greater than the risks associated with investing directly in securities and other investments. Derivatives may be subject to risks such as liquidity risk, leveraging risk, interest rate risk, market risk, and credit risk. Illiquid securities may lower the Funds’ returns since the Funds may be unable to sell these securities at their desired time or price. Derivatives also may involve the risk of mispricing or improper valuation and the risk that changes in the value of the derivative may not correlate perfectly with the value of the underlying asset, rate or index. Whether a Fund’s use of derivatives is successful will depend on, among other things, the Fund’s ability to correctly forecast market movements, changes in foreign exchange and interest rates, and other factors. If a Fund incorrectly forecasts these and other factors, its performance could suffer. A Fund’s use of derivatives could result in a loss exceeding the amount of the Fund’s investment in these instruments.
These factors can affect each Fund’s performance.
156
Notes to Financial Statements (continued)
| 15. | SUMMARY OF CAPITAL TRANSACTIONS |
Transactions in shares of beneficial interest were as follows:
| Alpha Strategy Fund | | Year Ended
October 31, 2018 | | | Year Ended
October 31, 2017 | |
| Class A Shares | | Shares | | | Amount | | | Shares | | | Amount | |
| Shares sold | | | 1,870,033 | | | $ | 52,269,288 | | | | 3,109,470 | | | $ | 81,154,987 | |
| Converted from Class B* | | | 43,607 | | | | 1,204,943 | | | | 91,319 | | | | 2,430,130 | |
| Converted from Class C** | | | 1,452,347 | | | | 41,139,611 | | | | – | | | | – | |
| Reinvestment of distributions | | | 1,770,521 | | | | 46,865,694 | | | | 1,949,482 | | | | 48,717,559 | |
| Shares reacquired | | | (3,688,359 | ) | | | (103,580,190 | ) | | | (7,053,721 | ) | | | (185,107,238 | ) |
| Increase (decrease) | | | 1,448,149 | | | $ | 37,899,346 | | | | (1,903,450 | ) | | $ | (52,804,562 | ) |
| | | | | | | | | | | | | | | | | |
| Class B Shares | | | | | | | | | | | | | | | | |
| Shares sold | | | 335 | | | $ | 8,176 | | | | 16,793 | | | $ | 376,234 | |
| Reinvestment of distributions | | | 5,900 | | | | 134,928 | | | | 21,576 | | | | 477,251 | |
| Shares reacquired | | | (7,603 | ) | | | (179,460 | ) | | | (85,368 | ) | | | (1,990,374 | ) |
| Converted to Class A* | | | (50,389 | ) | | | (1,204,943 | ) | | | (103,324 | ) | | | (2,430,130 | ) |
| Decrease | | | (51,757 | ) | | $ | (1,241,299 | ) | | | (150,323 | ) | | $ | (3,567,019 | ) |
| | | | | | | | | | | | | | | | | |
| Class C Shares | | | | | | | | | | | | | | | | |
| Shares sold | | | 615,183 | | | $ | 14,476,188 | | | | 1,824,966 | | | $ | 40,677,160 | |
| Reinvestment of distributions | | | 1,082,813 | | | | 24,309,161 | | | | 1,218,848 | | | | 26,522,150 | |
| Shares reacquired | | | (2,680,058 | ) | | | (63,371,621 | ) | | | (5,650,589 | ) | | | (129,140,015 | ) |
| Converted to Class A** | | | (1,718,813 | ) | | | (41,139,611 | ) | | | – | | | | – | |
| Decrease | | | (2,700,875 | ) | | $ | (65,725,883 | ) | | | (2,606,775 | ) | | $ | (61,940,705 | ) |
| | | | | | | | | | | | | | | | | |
| Class F Shares | | | | | | | | | | | | | | | | |
| Shares sold | | | 1,845,730 | | | $ | 52,097,912 | | | | 3,927,500 | | | $ | 103,766,217 | |
| Reinvestment of distributions | | | 704,033 | | | | 18,741,346 | | | | 826,161 | | | | 20,711,860 | |
| Shares reacquired | | | (3,459,909 | ) | | | (98,432,682 | ) | | | (5,086,604 | ) | | | (137,644,375 | ) |
| Decrease | | | (910,146 | ) | | $ | (27,593,424 | ) | | | (332,943 | ) | | $ | (13,166,298 | ) |
| | | | | | | | | | | | | | | | | |
| Class F3 Shares(a) | | | | | | | | | | | | | | | | |
| Shares sold | | | 321,691 | | | $ | 9,219,138 | | | | 1,205,982 | | | $ | 35,173,388 | |
| Reinvestment of distributions | | | 138,530 | | | | 3,752,805 | | | | – | | | | – | |
| Shares reacquired | | | (402,350 | ) | | | (11,608,718 | ) | | | (31,398 | ) | | | (916,517 | ) |
| Increase | | | 57,871 | | | $ | 1,363,225 | | | | 1,174,584 | | | $ | 34,256,871 | |
| | | | | | | | | | | | | | | | | |
| Class I Shares | | | | | | | | | | | | | | | | |
| Shares sold | | | 1,177,276 | | | $ | 34,391,878 | | | | 90,902 | | | $ | 2,411,783 | |
| Reinvestment of distributions | | | 370,263 | | | | 10,023,011 | | | | 261,892 | | | | 6,659,921 | |
| Shares reacquired | | | (689,580 | ) | | | (20,426,393 | ) | | | (586,822 | ) | | | (15,623,920 | ) |
| Increase (decrease) | | | 857,959 | | | $ | 23,988,496 | | | | (234,028 | ) | | $ | (6,552,216 | ) |
| | | | | | | | | | | | | | | | | |
| Class R2 Shares | | | | | | | | | | | | | | | | |
| Shares sold | | | 23,799 | | | $ | 629,259 | | | | 41,069 | | | $ | 1,048,267 | |
| Reinvestment of distributions | | | 4,588 | | | | 117,371 | | | | 3,215 | | | | 78,219 | |
| Shares reacquired | | | (38,879 | ) | | | (1,047,097 | ) | | | (41,850 | ) | | | (1,064,793 | ) |
| Increase (decrease) | | | (10,492 | ) | | $ | (300,467 | ) | | | 2,434 | | | $ | 61,693 | |
157
Notes to Financial Statements (continued)
| Alpha Strategy Fund | | Year Ended
October 31, 2018 | | | Year Ended
October 31, 2017 | |
| Class R3 Shares | | Shares | | | Amount | | | Shares | | | Amount | |
| Shares sold | | | 165,060 | | | $ | 4,547,019 | | | | 674,580 | | | $ | 16,969,568 | |
| Reinvestment of distributions | | | 138,073 | | | | 3,558,134 | | | | 156,331 | | | | 3,823,860 | |
| Shares reacquired | | | (371,972 | ) | | | (10,212,613 | ) | | | (1,000,580 | ) | | | (25,430,905 | ) |
| Decrease | | | (68,839 | ) | | $ | (2,107,460 | ) | | | (169,669 | ) | | $ | (4,637,477 | ) |
| | | | | | | | | | | | | | | | | |
| Class R4 Shares | | | | | | | | | | | | | | | | |
| Shares sold | | | 84,744 | | | $ | 2,369,149 | | | | 66,835 | | | $ | 1,777,722 | |
| Reinvestment of distributions | | | 7,976 | | | | 210,797 | | | | 1,344 | | | | 33,521 | |
| Shares reacquired | | | (40,129 | ) | | | (1,138,335 | ) | | | (9,745 | ) | | | (256,025 | ) |
| Increase | | | 52,591 | | | $ | 1,441,611 | | | | 58,434 | | | $ | 1,555,218 | |
| | | | | | | | | | | | | | | | | |
| Class R5 Shares | | | | | | | | | | | | | | | | |
| Shares sold | | | 1,661 | | | $ | 46,499 | | | | 3,002 | | | $ | 78,669 | |
| Reinvestment of distributions | | | 338 | | | | 9,146 | | | | 41 | | | | 1,052 | |
| Shares reacquired | | | (964 | ) | | | (27,243 | ) | | | (559 | ) | | | (15,133 | ) |
| Increase | | | 1,035 | | | $ | 28,402 | | | | 2,484 | | | $ | 64,588 | |
| | | | | | | | | | | | | | | | | |
| Class R6 Shares | | | | | | | | | | | | | | | | |
| Shares sold | | | 27,495 | | | $ | 797,002 | | | | 258,269 | | | $ | 6,836,987 | |
| Reinvestment of distributions | | | 6,499 | | | | 176,126 | | | | 3,172 | | | | 80,661 | |
| Shares reacquired | | | (32,164 | ) | | | (941,732 | ) | | | (156,472 | ) | | | (4,143,516 | ) |
| Increase | | | 1,830 | | | $ | 31,396 | | | | 104,969 | | | $ | 2,774,132 | |
| | | | | | | | | |
| Fundamental Equity Fund | | | Year Ended
October 31, 2018 | | | | Year Ended
October 31, 2017 | |
| Class A Shares | | | Shares | | | | Amount | | | | Shares | | | | Amount | |
| Shares sold | | | 4,647,051 | | | $ | 60,004,778 | | | | 11,975,632 | | | $ | 157,615,707 | |
| Converted from Class B* | | | 260,352 | | | | 3,410,227 | | | | 722,696 | | | | 9,627,804 | |
| Converted from Class C** | | | 10,076,645 | | | | 128,599,381 | | | | – | | | | – | |
| Reinvestment of distributions | | | 13,379,198 | | | | 166,838,595 | | | | 6,472,253 | | | | 81,162,052 | |
| Shares reacquired | | | (26,205,562 | ) | | | (340,348,754 | ) | | | (38,702,286 | ) | | | (511,573,624 | ) |
| Increase (decrease) | | | 2,157,684 | | | $ | 18,504,227 | | | | (19,531,705 | ) | | $ | (263,168,061 | ) |
| | | | | | | | | | | | | | | | | |
| Class B Shares | | | | | | | | | | | | | | | | |
| Shares sold | | | 1,754 | | | $ | 20,340 | | | | 112,888 | | | $ | 1,346,025 | |
| Reinvestment of distributions | | | 36,509 | | | | 415,107 | | | | 59,411 | | | | 682,631 | |
| Shares reacquired | | | (68,976 | ) | | | (816,052 | ) | | | (456,545 | ) | | | (5,455,258 | ) |
| Converted to Class A* | | | (285,974 | ) | | | (3,410,227 | ) | | | (791,384 | ) | | | (9,627,804 | ) |
| Decrease | | | (316,687 | ) | | $ | (3,790,832 | ) | | | (1,075,630 | ) | | $ | (13,054,406 | ) |
| | | | | | | | | | | | | | | | | |
| Class C Shares | | | | | | | | | | | | | | | | |
| Shares sold | | | 1,053,621 | | | $ | 12,071,598 | | | | 2,570,699 | | | $ | 30,290,717 | |
| Reinvestment of distributions | | | 4,328,315 | | | | 48,260,717 | | | | 1,955,101 | | | | 22,190,394 | |
| Shares reacquired | | | (8,681,134 | ) | | | (100,497,860 | ) | | | (17,195,480 | ) | | | (205,284,114 | ) |
| Converted to Class A** | | | (11,320,838 | ) | | | (128,599,381 | ) | | | – | | | | – | |
| Decrease | | | (14,620,036 | ) | | $ | (168,764,926 | ) | | | (12,669,680 | ) | | $ | (152,803,003 | ) |
158
Notes to Financial Statements (continued)
| Fundamental Equity Fund | | Year Ended
October 31, 2018 | | | Year Ended
October 31, 2017 | |
| Class F Shares | | Shares | | | Amount | | | Shares | | | Amount | |
| Shares sold | | | 3,432,610 | | | $ | 43,871,503 | | | | 8,808,251 | | | $ | 115,446,545 | |
| Reinvestment of distributions | | | 2,128,336 | | | | 26,242,388 | | | | 1,136,362 | | | | 14,102,246 | |
| Shares reacquired | | | (9,098,527 | ) | | | (119,945,927 | ) | | | (11,057,531 | ) | | | (145,753,802 | ) |
| Decrease | | | (3,537,581 | ) | | $ | (49,832,036 | ) | | | (1,112,918 | ) | | $ | (16,205,011 | ) |
| | | | | | | | | | | | | | | | | |
| Class F3 Shares(a) | | | | | | | | | | | | | | | | |
| Shares sold | | | 596,063 | | | $ | 7,822,373 | | | | 1,525,927 | | | $ | 21,173,957 | |
| Reinvestment of distributions | | | 190,922 | | | | 2,397,983 | | | | – | | | | – | |
| Shares reacquired | | | (652,230 | ) | | | (8,547,974 | ) | | | (74,463 | ) | | | (1,049,765 | ) |
| Increase | | | 134,755 | | | $ | 1,672,382 | | | | 1,451,464 | | | $ | 20,124,192 | |
| | | | | | | | | | | | | | | | | |
| Class I Shares | | | | | | | | | | | | | | | | |
| Shares sold | | | 3,620,436 | | | $ | 50,326,688 | | | | 832,713 | | | $ | 11,100,620 | |
| Reinvestment of distributions | | | 1,427,475 | | | | 17,886,267 | | | | 551,292 | | | | 6,940,763 | |
| Shares reacquired | | | (6,312,018 | ) | | | (81,527,965 | ) | | | (4,127,916 | ) | | | (54,981,367 | ) |
| Decrease | | | (1,264,107 | ) | | $ | (13,315,010 | ) | | | (2,743,911 | ) | | $ | (36,939,984 | ) |
| | | | | | | | | | | | | | | | | |
| Class P Shares | | | | | | | | | | | | | | | | |
| Shares sold | | | 36,041 | | | $ | 463,235 | | | | 110,745 | | | $ | 1,430,831 | |
| Reinvestment of distributions | | | 65,899 | | | | 807,264 | | | | 45,374 | | | | 559,462 | |
| Shares reacquired | | | (162,988 | ) | | | (2,090,725 | ) | | | (515,777 | ) | | | (6,780,252 | ) |
| Decrease | | | (61,048 | ) | | $ | (820,226 | ) | | | (359,658 | ) | | $ | (4,789,959 | ) |
| | | | | | | | | | | | | | | | | |
| Class R2 Shares | | | | | | | | | | | | | | | | |
| Shares sold | | | 112,829 | | | $ | 1,410,764 | | | | 160,120 | | | $ | 2,076,939 | |
| Reinvestment of distributions | | | 42,300 | | | | 516,060 | | | | 18,731 | | | | 230,384 | |
| Shares reacquired | | | (453,456 | ) | | | (5,703,198 | ) | | | (237,404 | ) | | | (3,117,459 | ) |
| Decrease | | | (298,327 | ) | | $ | (3,776,374 | ) | | | (58,553 | ) | | $ | (810,136 | ) |
| | | | | | | | | | | | | | | | | |
| Class R3 Shares | | | | | | | | | | | | | | | | |
| Shares sold | | | 763,949 | | | $ | 9,743,012 | | | | 1,995,556 | | | $ | 25,845,220 | |
| Reinvestment of distributions | | | 1,355,598 | | | | 16,619,632 | | | | 643,368 | | | | 7,945,598 | |
| Shares reacquired | | | (3,397,269 | ) | | | (43,619,506 | ) | | | (4,724,568 | ) | | | (61,392,534 | ) |
| Decrease | | | (1,277,722 | ) | | $ | (17,256,862 | ) | | | (2,085,644 | ) | | $ | (27,601,716 | ) |
| | | | | | | | | | | | | | | | | |
| Class R4 Shares | | | | | | | | | | | | | | | | |
| Shares sold | | | 149,144 | | | $ | 1,899,430 | | | | 342,273 | | | $ | 4,501,755 | |
| Reinvestment of distributions | | | 34,315 | | | | 425,857 | | | | 529 | | | | 6,607 | |
| Shares reacquired | | | (85,314 | ) | | | (1,116,779 | ) | | | (40,157 | ) | | | (537,864 | ) |
| Increase | | | 98,145 | | | $ | 1,208,508 | | | | 302,645 | | | $ | 3,970,498 | |
| | | | | | | | | | | | | | | | | |
| Class R5 Shares | | | Shares | | | | Amount | | | | Shares | | | | Amount | |
| Shares sold | | | 43,091 | | | $ | 565,771 | | | | 64,624 | | | $ | 886,447 | |
| Reinvestment of distributions | | | 9,830 | | | | 123,159 | | | | 556 | | | | 7,002 | |
| Shares reacquired | | | (63,722 | ) | | | (829,097 | ) | | | (688 | ) | | | (9,056 | ) |
| Increase (decrease) | | | (10,801 | ) | | $ | (140,167 | ) | | | 64,492 | | | $ | 884,393 | |
159
Notes to Financial Statements (continued)
| Fundamental Equity Fund | | Year Ended
October 31, 2018 | | | Year Ended
October 31, 2017 | |
| Class R6 Shares | | Shares | | | Amount | | | Shares | | | Amount | |
| Shares sold | | | 1,101,282 | | | $ | 14,550,728 | | | | 821,770 | | | $ | 11,033,392 | |
| Reinvestment of distributions | | | 21,668 | | | | 272,365 | | | | 1,814 | | | | 22,872 | |
| Shares reacquired | | | (259,946 | ) | | | (3,415,264 | ) | | | (377,404 | ) | | | (5,011,658 | ) |
| Increase | | | 863,004 | | | $ | 11,407,829 | | | | 446,180 | | | $ | 6,044,606 | |
| | | | | | | | | | | | | | | | | |
| Global Equity Research Fund | | | Year Ended
October 31, 2018 | | | | Year Ended
October 31, 2017(c) | |
| Class A Shares | | | Shares | | | | Amount | | | | Shares | | | | Amount | |
| Shares sold | | | 143,190 | | | $ | 1,673,698 | | | | 145,234 | | | $ | 1,474,024 | |
| Reinvestment of distributions | | | 8,216 | | | | 91,602 | | | | – | | | | – | |
| Shares reacquired | | | (9,399 | ) | | | (109,327 | ) | | | (1,305 | ) | | | (15,076 | ) |
| Increase | | | 142,007 | | | $ | 1,655,973 | | | | 143,929 | | | $ | 1,458,948 | |
| | | | | | | | | | | | | | | | | |
| Class C Shares | | | | | | | | | | | | | | | | |
| Shares sold | | | 36,933 | | | $ | 423,196 | | | | 29,167 | | | $ | 316,100 | |
| Reinvestment of distributions | | | 1,631 | | | | 18,120 | | | | – | | | | – | |
| Shares reacquired | | | (3,091 | ) | | | (35,569 | ) | | | 2 | | | | 24 | |
| Increase | | | 35,473 | | | $ | 405,747 | | | | 29,169 | | | $ | 316,124 | |
| | | | | | | | | | | | | | | | | |
| Class F Shares | | | | | | | | | | | | | | | | |
| Shares sold | | | 7,247 | | | $ | 85,309 | | | | 101,563 | | | $ | 1,020,000 | |
| Reinvestment of distributions | | | 5,924 | | | | 66,057 | | | | – | | | | – | |
| Shares reacquired | | | (4,774 | ) | | | (56,400 | ) | | | – | | | | – | |
| Increase | | | 8,397 | | | $ | 94,966 | | | | 101,563 | | | $ | 1,020,000 | |
| | | | | | | | | | | | | | | | | |
| Class F3 Shares(a) | | | | | | | | | | | | | | | | |
| Shares sold | | | – | | | $ | – | | | | 973 | | | $ | 10,000 | |
| Reinvestment of distributions | | | 58 | | | | 645 | | | | – | | | | – | |
| Increase | | | 58 | | | $ | 645 | | | | 973 | | | $ | 10,000 | |
| | | | | | | | | | | | | | | | | |
| Class I Shares | | | | | | | | | | | | | | | | |
| Shares sold | | | – | | | $ | – | | | | 98,000 | | | $ | 980,000 | |
| Reinvestment of distributions | | | 5,806 | | | | 64,739 | | | | – | | | | – | |
| Increase | | | 5,806 | | | $ | 64,739 | | | | 98,000 | | | $ | 980,000 | |
| | | | | | | | | | | | | | | | | |
| Class R2 Shares | | | | | | | | | | | | | | | | |
| Shares sold | | | – | | | $ | – | | | | 1,000 | | | $ | 10,000 | |
| Reinvestment of distributions | | | 54 | | | | 598 | | | | – | | | | – | |
| Increase | | | 54 | | | $ | 598 | | | | 1,000 | | | $ | 10,000 | |
| | | | | | | | | | | | | | | | | |
| Class R3 Shares | | | | | | | | | | | | | | | | |
| Shares sold | | | 14,043 | | | $ | 156,652 | | | | 1,000 | | | $ | 10,000 | |
| Reinvestment of distributions | | | 54 | | | | 608 | | | | – | | | | – | |
| Increase | | | 14,097 | | | $ | 157,260 | | | | 1,000 | | | $ | 10,000 | |
| | | | | | | | | | | | | | | | | |
| Class R4 Shares | | | | | | | | | | | | | | | | |
| Shares sold | | | – | | | $ | – | | | | 1,000 | | | $ | 10,000 | |
| Reinvestment of distributions | | | 57 | | | | 635 | | | | – | | | | – | |
| Increase | | | 57 | | | $ | 635 | | | | 1,000 | | | $ | 10,000 | |
160
Notes to Financial Statements (continued)
| Global Equity Research Fund | | Year Ended
October 31, 2018 | | | Year Ended
October 31, 2017(c) | |
| Class R5 Shares | | Shares | | | Amount | | | Shares | | | Amount | |
| Shares sold | | | – | | | $ | – | | | | 1,000 | | | $ | 10,000 | |
| Reinvestment of distributions | | | 59.24 | | | | 661 | | | | – | | | | – | |
| Increase | | | 59.24 | | | $ | 661 | | | | 1,000 | | | $ | 10,000 | |
| | | | | | | | | | | | | | | | | |
| Class R6 Shares | | | | | | | | | | | | | | | | |
| Shares sold | | | 36,639 | | | $ | 425,343 | | | | 1,000 | | | $ | 10,000 | |
| Reinvestment of distributions | | | 59 | | | | 662 | | | | – | | | | – | |
| Shares reacquired | | | (16,120 | ) | | | (190,762 | ) | | | – | | | | – | |
| Increase | | | 20,578 | | | $ | 235,243 | | | | 1,000 | | | $ | 10,000 | |
| | | | | | | | | | | | | |
| Global Select Equity Fund | | | Period Ended
October 31, 2018(d) | | | | | | | | | |
| Class A Shares | | | Shares | | | | Amount | | | | | | | | | |
| Shares sold | | | 33,534 | | | $ | 505,944 | | | | | | | | | |
| Shares reacquired | | | – | | | | – | | | | | | | | | |
| Increase | | | 33,534 | | | $ | 505,944 | | | | | | | | | |
| | | | | | | | | | | | | | | | | |
| Class C Shares | | | | | | | | | | | | | | | | |
| Shares sold | | | 7,333 | | | $ | 110,000 | | | | | | | | | |
| Increase | | | 7,333 | | | $ | 110,000 | | | | | | | | | |
| | | | | | | | | | | | | | | | | |
| Class F Shares | | | | | | | | | | | | | | | | |
| Shares sold | | | 33,333 | | | $ | 500,000 | | | | | | | | | |
| Increase | | | 33,333 | | | $ | 500,000 | | | | | | | | | |
| | | | | | | | | | | | | | | | | |
| Class F3 Shares(a) | | | | | | | | | | | | | | | | |
| Shares sold | | | 33,333 | | | $ | 500,000 | | | | | | | | | |
| Increase | | | 33,333 | | | $ | 500,000 | | | | | | | | | |
| | | | | | | | | | | | | | | | | |
| Class I Shares | | | | | | | | | | | | | | | | |
| Shares sold | | | 7,333 | | | $ | 110,000 | | | | | | | | | |
| Increase | | | 7,333 | | | $ | 110,000 | | | | | | | | | |
| | | | | | | | | | | | | | | | | |
| Class R3 Shares | | | | | | | | | | | | | | | | |
| Shares sold | | | 667 | | | $ | 10,000 | | | | | | | | | |
| Increase (decrease) | | | 667 | | | $ | 10,000 | | | | | | | | | |
| | | | | | | | | | | | | | | | | |
| Class R4 Shares | | | | | | | | | | | | | | | | |
| Shares sold | | | 667 | | | $ | 10,000 | | | | | | | | | |
| Increase | | | 667 | | | $ | 10,000 | | | | | | | | | |
| | | | | | | | | | | | | | | | | |
| Class R5 Shares | | | | | | | | | | | | | | | | |
| Shares sold | | | 667 | | | $ | 10,000 | | | | | | | | | |
| Increase | | | 667 | | | $ | 10,000 | | | | | | | | | |
| | | | | | | | | | | | | | | | | |
| Class R6 Shares | | | | | | | | | | | | | | | | |
| Shares sold | | | 33,333 | | | $ | 500,000 | | | | | | | | | |
| Increase | | | 33,333 | | | $ | 500,000 | | | | | | | | | |
161
Notes to Financial Statements (continued)
| | | Year Ended | | | Year Ended | |
| Growth Leaders Fund | | October 31, 2018 | | | October 31, 2017 | |
| Class A Shares | | Shares | | | Amount | | | Shares | | | Amount | |
| Shares sold | | | 9,604,490 | | | $ | 295,802,345 | | | | 7,931,175 | | | $ | 196,588,636 | |
| Converted from Class B* | | | 14,514 | | | | 424,927 | | | | 59,778 | | | | 1,497,195 | |
| Converted from Class C** | | | 528,427 | | | | 16,400,646 | | | | – | | | | – | |
| Reinvestment of distributions | | | 1,584,050 | | | | 44,179,019 | | | | – | | | | – | |
| Shares reacquired | | | (7,568,897 | ) | | | (228,881,490 | ) | | | (15,440,364 | ) | | | (377,323,787 | ) |
| Increase (decrease) | | | 4,162,584 | | | $ | 127,925,447 | | | | (7,449,411 | ) | | $ | (179,237,956 | ) |
| | | | | | | | | | | | | | | | | |
| Class B Shares | | | | | | | | | | | | | | | | |
| Shares sold | | | 1,178 | | | $ | 33,058 | | | | 28,290 | | | $ | 647,182 | |
| Reinvestment of distributions | | | 1,308 | | | | 35,078 | | | | – | | | | – | |
| Shares reacquired | | | (8,242 | ) | | | (228,900 | ) | | | (50,682 | ) | | | (1,179,634 | ) |
| Converted to Class A* | | | (15,117 | ) | | | (424,927 | ) | | | (61,764 | ) | | | (1,497,195 | ) |
| Decrease | | | (20,873 | ) | | $ | (585,691 | ) | | | (84,156 | ) | | $ | (2,029,647 | ) |
| | | | | | | | | | | | | | | | | |
| Class C Shares | | | | | | | | | | | | | | | | |
| Shares sold | | | 5,460,620 | | | $ | 159,429,794 | | | | 3,399,612 | | | $ | 80,830,324 | |
| Reinvestment of distributions | | | 1,183,828 | | | | 31,383,285 | | | | – | | | | – | |
| Shares reacquired | | | (3,859,343 | ) | | | (110,771,847 | ) | | | (6,879,303 | ) | | | (162,537,212 | ) |
| Converted to Class A** | | | (558,086 | ) | | | (16,400,646 | ) | | | – | | | | – | |
| Increase (decrease) | | | 2,227,019 | | | $ | 63,640,586 | | | | (3,479,691 | ) | | $ | (81,706,888 | ) |
| | | | | | | | | | | | | | | | | |
| Class F Shares | | | | | | | | | | | | | | | | |
| Shares sold | | | 17,501,695 | | | $ | 549,574,276 | | | | 17,571,668 | | | $ | 439,140,184 | |
| Reinvestment of distributions | | | 1,835,770 | | | | 51,750,348 | | | | – | | | | – | |
| Shares reacquired | | | (13,487,003 | ) | | | (408,607,021 | ) | | | (13,669,910 | ) | | | (342,521,042 | ) |
| Increase | | | 5,850,462 | | | $ | 192,717,603 | | | | 3,901,758 | | | $ | 96,619,142 | |
| | | | | | | | | | | | | | | | | |
| Class F3 Shares(a) | | | | | | | | | | | | | | | | |
| Shares sold | | | 976,867 | | | $ | 31,289,449 | | | | 662,664 | | | $ | 18,160,251 | |
| Reinvestment of distributions | | | 42,489 | | | | 1,206,691 | | | | – | | | | – | |
| Shares reacquired | | | (201,574 | ) | | | (6,370,544 | ) | | | (23,101 | ) | | | (644,826 | ) |
| Increase | | | 817,782 | | | $ | 26,125,596 | | | | 639,563 | | | $ | 17,515,425 | |
| | | | | | | | | | | | | | | | | |
| Class I Shares | | | | | | | | | | | | | | | | |
| Shares sold | | | 23,029,220 | | | $ | 685,229,877 | | | | 7,885,817 | | | $ | 216,679,537 | |
| Reinvestment of distributions | | | 1,584,374 | | | | 44,901,163 | | | | – | | | | – | |
| Shares reacquired | | | (11,818,081 | ) | | | (374,339,282 | ) | | | (1,893,554 | ) | | | (48,316,246 | ) |
| Increase | | | 12,795,513 | | | $ | 355,791,758 | | | | 5,992,263 | | | $ | 168,363,291 | |
| | | | | | | | | | | | | | | | | |
| Class R2 Shares | | | | | | | | | | | | | | | | |
| Shares sold | | | 23,515 | | | $ | 698,985 | | | | 15,974 | | | $ | 406,476 | |
| Reinvestment of distributions | | | 914 | | | | 25,321 | | | | – | | | | – | |
| Shares reacquired | | | (41,293 | ) | | | (1,239,222 | ) | | | (10,689 | ) | | | (269,819 | ) |
| Increase (decrease) | | | (16,864 | ) | | $ | (514,916 | ) | | | 5,285 | | | $ | 136,657 | |
| | | | | | | | | | | | | | | | | |
| Class R3 Shares | | | | | | | | | | | | | | | | |
| Shares sold | | | 127,072 | | | $ | 3,830,565 | | | | 475,832 | | | $ | 11,260,644 | |
| Reinvestment of distributions | | | 30,768 | | | | 848,878 | | | | – | | | | – | |
| Shares reacquired | | | (103,562 | ) | | | (3,078,176 | ) | | | (618,911 | ) | | | (14,815,355 | ) |
| Increase (decrease) | | | 54,278 | | | $ | 1,601,267 | | | | (143,079 | ) | | $ | (3,554,711 | ) |
162
Notes to Financial Statements (continued)
| | | Year Ended | | | Year Ended | |
| Growth Leaders Fund | | October 31, 2018 | | | October 31, 2017 | |
| Class R4 Shares | | Shares | | | Amount | | | Shares | | | Amount | |
| Shares sold | | | 136,733 | | | $ | 4,073,936 | | | | 138,847 | | | $ | 3,473,448 | |
| Reinvestment of distributions | | | 2,934 | | | | 81,852 | | | | – | | | | – | |
| Shares reacquired | | | (89,092 | ) | | | (2,726,520 | ) | | | (54,061 | ) | | | (1,346,145 | ) |
| Increase | | | 50,575 | | | $ | 1,429,268 | | | | 84,786 | | | $ | 2,127,303 | |
| | | | | | | | | | | | | | | | | |
| Class R5 Shares | | | | | | | | | | | | | | | | |
| Shares sold | | | 101,558 | | | $ | 3,223,727 | | | | 74,222 | | | $ | 1,781,933 | |
| Reinvestment of distributions | | | 12,681 | | | | 359,518 | | | | – | | | | – | |
| Shares reacquired | | | (28,772 | ) | | | (921,677 | ) | | | (39,672 | ) | | | (1,002,338 | ) |
| Increase | | | 85,467 | | | $ | 2,661,568 | | | | 34,550 | | | $ | 779,595 | |
| | | | | | | | | | | | | | | | | |
| Class R6 Shares | | | | | | | | | | | | | | | | |
| Shares sold | | | 265,609 | | | $ | 8,153,873 | | | | 851,135 | | | $ | 21,514,752 | |
| Reinvestment of distributions | | | 16,015 | | | | 454,826 | | | | – | | | | – | |
| Shares reacquired | | | (148,018 | ) | | | (4,536,930 | ) | | | (209,704 | ) | | | (5,305,493 | ) |
| Increase | | | 133,606 | | | $ | 4,071,769 | | | | 641,431 | | | $ | 16,209,259 | |
| | | | | | | | | | | | | | | | | |
| Class T Shares(b) | | | | | | | | | | | | | | | | |
| Shares sold | | | – | | | $ | – | | | | 369.80 | | | $ | 10,000 | |
| Reinvestment of distributions | | | 24 | | | | 676 | | | | – | | | | – | |
| Shares reacquired | | | (394 | ) | | | (12,866 | ) | | | – | | | | – | |
| Increase | | | (370 | ) | | $ | (12,190 | ) | | | 369.80 | | | $ | 10,000 | |
| | | | | | | | | | | | | | | | | |
| | | Year Ended | | | Year Ended | |
| International Equity Fund | | October 31, 2018 | | | October 31, 2017 | |
| Class A Shares | | Shares | | | Amount | | | Shares | | | Amount | |
| Shares sold | | | 1,236,145 | | | $ | 17,460,912 | | | | 3,310,303 | | | $ | 40,811,584 | |
| Converted from Class B* | | | 48,794 | | | | 708,117 | | | | 129,121 | | | | 1,639,056 | |
| Converted from Class C** | | | 573,667 | | | | 8,054,696 | | | | – | | | | – | |
| Reinvestment of distributions | | | 326,032 | | | | 4,564,449 | | | | 447,248 | | | | 5,223,855 | |
| Shares reacquired | | | (3,361,131 | ) | | | (47,062,367 | ) | | | (8,622,777 | ) | | | (106,190,035 | ) |
| Decrease | | | (1,176,493 | ) | | $ | (16,274,193 | ) | | | (4,736,105 | ) | | $ | (58,515,540 | ) |
| | | | | | | | | | | | | | | | | |
| Class B Shares | | | | | | | | | | | | | | | | |
| Shares sold | | | 1,415 | | | $ | 20,866 | | | | 42,888 | | | $ | 516,368 | |
| Reinvestment of distributions | | | – | | | | – | | | | 2,641 | | | | 30,869 | |
| Shares reacquired | | | (12,140 | ) | | | (177,854 | ) | | | (117,854 | ) | | | (1,437,669 | ) |
| Converted to Class A* | | | (48,468 | ) | | | (708,117 | ) | | | (129,441 | ) | | | (1,639,056 | ) |
| Decrease | | | (59,193 | ) | | $ | (865,105 | ) | | | (201,766 | ) | | $ | (2,529,488 | ) |
| | | | | | | | | | | | | | | | | |
| Class C Shares | | | | | | | | | | | | | | | | |
| Shares sold | | | 163,874 | | | $ | 2,286,258 | | | | 820,339 | | | $ | 9,877,303 | |
| Reinvestment of distributions | | | 22,275 | | | | 309,851 | | | | 33,477 | | | | 388,336 | |
| Shares reacquired | | | (385,674 | ) | | | (5,369,261 | ) | | | (1,688,417 | ) | | | (20,559,501 | ) |
| Converted to Class A** | | | (579,462 | ) | | | (8,054,696 | ) | | | – | | | | – | |
| Decrease | | | (778,987 | ) | | $ | (10,827,848 | ) | | | (834,601 | ) | | $ | (10,293,862 | ) |
163
Notes to Financial Statements (continued)
| | | Year Ended | | | Year Ended | |
| International Equity Fund | | October 31, 2018 | | | October 31, 2017 | |
| Class F Shares | | Shares | | | Amount | | | Shares | | | Amount | |
| Shares sold | | | 1,535,804 | | | $ | 22,336,524 | | | | 1,302,365 | | | $ | 16,150,352 | |
| Reinvestment of distributions | | | 92,251 | | | | 1,283,206 | | | | 122,092 | | | | 1,415,048 | |
| Shares reacquired | | | (1,340,813 | ) | | | (18,704,273 | ) | | | (2,137,167 | ) | | | (27,227,102 | ) |
| Increase (decrease) | | | 287,242 | | | $ | 4,915,457 | | | | (712,710 | ) | | $ | (9,661,702 | ) |
| | | | | | | | | | | | | | | | | |
| Class F3 Shares(a) | | | | | | | | | | | | | | | | |
| Shares sold | | | 161,656 | | | $ | 2,292,383 | | | | 435,635 | | | $ | 6,064,778 | |
| Reinvestment of distributions | | | 9,219 | | | | 130,173 | | | | – | | | | – | |
| Shares reacquired | | | (168,705 | ) | | | (2,378,544 | ) | | | (25,316 | ) | | | (358,401 | ) |
| Increase | | | 2,170 | | | $ | 44,012 | | | | 410,319 | | | $ | 5,706,377 | |
| | | | | | | | | | | | | | | | | |
| Class I Shares | | | | | | | | | | | | | | | | |
| Shares sold | | | 8,499,390 | | | $ | 127,977,355 | | | | 11,223,979 | | | $ | 140,800,604 | |
| Reinvestment of distributions | | | 436,381 | | | | 6,152,969 | | | | 305,429 | | | | 3,588,786 | |
| Shares reacquired | | | (6,970,359 | ) | | | (100,322,507 | ) | | | (4,211,965 | ) | | | (55,197,716 | ) |
| Increase | | | 1,965,412 | | | $ | 33,807,817 | | | | 7,317,443 | | | $ | 89,191,674 | |
| | | | | | | | | | | | | | | | | |
| Class P Shares | | | | | | | | | | | | | | | | |
| Shares sold | | | 102 | | | $ | 1,431 | | | | 310 | | | $ | 3,924 | |
| Reinvestment of distributions | | | 114 | | | | 1,601 | | | | 161 | | | | 1,887 | |
| Shares reacquired | | | (3,295 | ) | | | (46,733 | ) | | | (2,024 | ) | | | (24,963 | ) |
| Decrease | | | (3,079 | ) | | $ | (43,701 | ) | | | (1,553 | ) | | $ | (19,152 | ) |
| | | | | | | | | | | | | | | | | |
| Class R2 Shares | | | | | | | | | | | | | | | | |
| Shares sold | | | 6,083 | | | $ | 84,461 | | | | 31,502 | | | $ | 389,733 | |
| Reinvestment of distributions | | | 202 | | | | 2,823 | | | | 389 | | | | 4,538 | |
| Shares reacquired | | | (23,757 | ) | | | (335,911 | ) | | | (26,710 | ) | | | (351,213 | ) |
| Increase (decrease) | | | (17,472 | ) | | $ | (248,627 | ) | | | 5,181 | | | $ | 43,058 | |
| | | | | | | | | | | | | | | | | |
| Class R3 Shares | | | | | | | | | | | | | | | | |
| Shares sold | | | 132,585 | | | $ | 1,824,124 | | | | 849,999 | | | $ | 10,191,511 | |
| Reinvestment of distributions | | | 15,836 | | | | 218,531 | | | | 25,459 | | | | 293,038 | |
| Shares reacquired | | | (314,534 | ) | | | (4,429,590 | ) | | | (1,223,807 | ) | | | (14,868,875 | ) |
| Decrease | | | (166,113 | ) | | $ | (2,386,935 | ) | | | (348,349 | ) | | $ | (4,384,326 | ) |
| | | | | | | | | | | | | | | | | |
| Class R4 Shares | | | | | | | | | | | | | | | | |
| Shares sold | | | 50,212 | | | $ | 696,967 | | | | 44,437 | | | $ | 576,589 | |
| Reinvestment of distributions | | | 932 | | | | 13,007 | | | | 18 | | | | 206 | |
| Shares reacquired | | | (14,435 | ) | | | (196,042 | ) | | | (3,841 | ) | | | (51,422 | ) |
| Increase | | | 36,709 | | | $ | 513,932 | | | | 40,614 | | | $ | 525,373 | |
| | | | | | | | | | | | | | | | | |
| Class R5 Shares | | | | | | | | | | | | | | | | |
| Shares sold | | | 699 | | | $ | 9,810 | | | | 13,554 | | | $ | 176,798 | |
| Reinvestment of distributions | | | 112 | | | | 1,577 | | | | 19 | | | | 227 | |
| Shares reacquired | | | (176 | ) | | | (2,338 | ) | | | (9,351 | ) | | | (130,351 | ) |
| Increase | | | 635 | | | $ | 9,049 | | | | 4,222 | | | $ | 46,674 | |
164
Notes to Financial Statements (continued)
| | | Year Ended | | | Year Ended | |
| International Equity Fund | | October 31, 2018 | | | October 31, 2017 | |
| Class R6 Shares | | Shares | | | Amount | | | Shares | | | Amount | |
| Shares sold | | | 13,520 | | | $ | 195,477 | | | | 654,042 | | | $ | 8,195,907 | |
| Reinvestment of distributions | | | 291 | | | | 4,104 | | | | 22,976 | | | | 270,198 | |
| Shares reacquired | | | (13,130 | ) | | | (178,874 | ) | | | (1,348,047 | ) | | | (18,428,851 | ) |
| Increase (decrease) | | | 681 | | | $ | 20,707 | | | | (671,029 | ) | | $ | (9,962,746 | ) |
| | | | | | | | | | | | | |
| | | Year Ended | | | Year Ended | |
| International Opportunities Fund | | October 31, 2018 | | | October 31, 2017 | |
| Class A Shares | | Shares | | | Amount | | | Shares | | | Amount | |
| Shares sold | | | 3,791,816 | | | $ | 78,046,760 | | | | 4,126,454 | | | $ | 75,759,160 | |
| Converted from Class B* | | | 14,113 | | | | 294,987 | | | | 42,315 | | | | 749,394 | |
| Converted from Class C** | | | 255,740 | | | | 5,121,679 | | | | – | | | | – | |
| Reinvestment of distributions | | | 390,077 | | | | 7,852,262 | | | | 59,795 | | | | 926,825 | |
| Shares reacquired | | | (3,327,355 | ) | | | (65,449,930 | ) | | | (4,573,291 | ) | | | (78,973,927 | ) |
| Increase (decrease) | | | 1,124,391 | | | $ | 25,865,758 | | | | (344,727 | ) | | $ | (1,538,548 | ) |
| | | | | | | | | | | | | | | | | |
| Class B Shares | | | | | | | | | | | | | | | | |
| Shares sold | | | 295 | | | $ | 5,868 | | | | 18,668 | | | $ | 292,509 | |
| Reinvestment of distributions | | | 624 | | | | 11,927 | | | | – | | | | – | |
| Shares reacquired | | | (6,247 | ) | | | (121,064 | ) | | | (45,501 | ) | | | (722,178 | ) |
| Converted to Class A* | | | (14,902 | ) | | | (294,987 | ) | | | (44,673 | ) | | | (749,394 | ) |
| Decrease | | | (20,230 | ) | | $ | (398,256 | ) | | | (71,506 | ) | | $ | (1,179,063 | ) |
| | | | | | | | | | | | | | | | | |
| Class C Shares | | | | | | | | | | | | | | | | |
| Shares sold | | | 1,123,770 | | | $ | 21,751,536 | | | | 1,025,469 | | | $ | 17,829,814 | |
| Reinvestment of distributions | | | 87,788 | | | | 1,648,650 | | | | – | | | | – | |
| Shares reacquired | | | (793,632 | ) | | | (14,350,152 | ) | | | (821,092 | ) | | | (13,164,796 | ) |
| Converted to Class A** | | | (274,948 | ) | | | (5,121,679 | ) | | | – | | | | – | |
| Increase | | | 142,978 | | | $ | 3,928,355 | | | | 204,377 | | | $ | 4,665,018 | |
| | | | | | | | | | | | | | | | | |
| Class F Shares | | | | | | | | | | | | | | | | |
| Shares sold | | | 10,262,873 | | | $ | 208,273,834 | | | | 11,084,635 | | | $ | 207,736,480 | |
| Reinvestment of distributions | | | 439,896 | | | | 8,771,526 | | | | 41,462 | | | | 636,438 | |
| Shares reacquired | | | (11,105,692 | ) | | | (217,392,617 | ) | | | (3,918,729 | ) | | | (70,342,495 | ) |
| Increase (decrease) | | | (402,923 | ) | | $ | (347,257 | ) | | | 7,207,368 | | | $ | 138,030,423 | |
| | | | | | | | | | | | | | | | | |
| Class F3 Shares(a) | | | | | | | | | | | | | | | | |
| Shares sold | | | 770,433 | | | $ | 16,207,528 | | | | 864,295 | | | $ | 18,041,630 | |
| Reinvestment of distributions | | | 41,820 | | | | 866,530 | | | | – | | | | – | |
| Shares reacquired | | | (379,588 | ) | | | (7,704,620 | ) | | | (22,341 | ) | | | (462,714 | ) |
| Increase | | | 432,665 | | | $ | 9,369,438 | | | | 841,954 | | | $ | 17,578,916 | |
| | | | | | | | | | | | | | | | | |
| Class I Shares | | | | | | | | | | | | | | | | |
| Shares sold | | | 4,298,679 | | | $ | 90,677,405 | | | | 743,697 | | | $ | 14,491,452 | |
| Reinvestment of distributions | | | 598,426 | | | | 12,363,488 | | | | 149,643 | | | | 2,376,338 | |
| Shares reacquired | | | (2,909,221 | ) | | | (59,191,315 | ) | | | (5,395,517 | ) | | | (98,826,682 | ) |
| Increase (decrease) | | | 1,987,884 | | | $ | 43,849,578 | | | | (4,502,177 | ) | | $ | (81,958,892 | ) |
165
Notes to Financial Statements (continued)
| | | Year Ended | | | Year Ended | |
| International Opportunities Fund | | October 31, 2018 | | | October 31, 2017 | |
| Class P Shares | | Shares | | | Amount | | | Shares | | | Amount | |
| Shares sold | | | 528 | | | $ | 10,849 | | | | 3,836 | | | $ | 75,619 | |
| Reinvestment of distributions | | | 448 | | | | 9,228 | | | | 71 | | | | 1,121 | |
| Shares reacquired | | | (4,042 | ) | | | (80,087 | ) | | | (15,294 | ) | | | (263,864 | ) |
| Decrease | | | (3,066 | ) | | $ | (60,010 | ) | | | (11,387 | ) | | $ | (187,124 | ) |
| | | | | | | | | | | | | | | | | |
| Class R2 Shares | | | | | | | | | | | | | | | | |
| Shares sold | | | 121,668 | | | $ | 2,445,272 | | | | 171,021 | | | $ | 3,002,866 | |
| Reinvestment of distributions | | | 6,326 | | | | 125,439 | | | | 346 | | | | 5,286 | |
| Shares reacquired | | | (172,548 | ) | | | (3,418,345 | ) | | | (75,228 | ) | | | (1,378,339 | ) |
| Increase (decrease) | | | (44,554 | ) | | $ | (847,634 | ) | | | 96,139 | | | $ | 1,629,813 | |
| | | | | | | | | | | | | | | | | |
| Class R3 Shares | | | | | | | | | | | | | | | | |
| Shares sold | | | 2,093,925 | | | $ | 40,798,328 | | | | 446,981 | | | $ | 7,379,921 | |
| Reinvestment of distributions | | | 21,383 | | | | 423,380 | | | | 7,109 | | | | 108,339 | |
| Shares reacquired | | | (436,082 | ) | | | (8,287,064 | ) | | | (1,118,183 | ) | | | (18,248,411 | ) |
| Increase (decrease) | | | 1,679,226 | | | $ | 32,934,644 | | | | (664,093 | ) | | $ | (10,760,151 | ) |
| | | | | | | | | | | | | | | | | |
| Class R4 Shares | | | | | | | | | | | | | | | | |
| Shares sold | | | 243,368 | | | $ | 4,928,799 | | | | 64,606 | | | $ | 1,137,090 | |
| Reinvestment of distributions | | | 6,950 | | | | 139,483 | | | | 894 | | | | 13,808 | |
| Shares reacquired | | | (76,619 | ) | | | (1,531,592 | ) | | | (22,177 | ) | | | (404,594 | ) |
| Increase | | | 173,699 | | | $ | 3,536,690 | | | | 43,323 | | | $ | 746,304 | |
| | | | | | | | | | | | | | | | | |
| Class R5 Shares | | | | | | | | | | | | | | | | |
| Shares sold | | | 2,274,993 | | | $ | 46,858,730 | | | | 46,697 | | | $ | 836,481 | |
| Reinvestment of distributions | | | 8,890 | | | | 183,658 | | | | 1,676 | | | | 26,598 | |
| Shares reacquired | | | (188,683 | ) | | | (3,644,178 | ) | | | (22,215 | ) | | | (390,775 | ) |
| Increase | | | 2,095,200 | | | $ | 43,398,210 | | | | 26,158 | | | $ | 472,304 | |
| | | | | | | | | | | | | | | | | |
| Class R6 Shares | | | | | | | | | | | | | | | | |
| Shares sold | | | 1,560,179 | | | $ | 31,251,967 | | | | 999,275 | | | $ | 17,948,134 | |
| Reinvestment of distributions | | | 23,015 | | | | 476,864 | | | | 1,438 | | | | 22,874 | |
| Shares reacquired | | | (412,178 | ) | | | (8,383,651 | ) | | | (310,945 | ) | | | (5,798,689 | ) |
| Increase | | | 1,171,016 | | | $ | 23,345,180 | | | | 689,768 | | | $ | 12,172,319 | |
| | | | | | | | | | | | | |
| | | Year Ended | | | Year Ended | |
| International Value Fund | | October 31, 2018 | | | October 31, 2017 | |
| Class A Shares | | Shares | | | Amount | | | Shares | | | Amount | |
| Shares sold | | | 5,207,847 | | | $ | 40,176,113 | | | | 6,485,431 | | | $ | 46,305,984 | |
| Converted from Class C** | | | 158,472 | | | | 1,206,675 | | | | – | | | | – | |
| Reinvestment of distributions | | | 1,376,292 | | | | 10,224,043 | | | | 1,755,834 | | | | 12,484,951 | |
| Shares reacquired | | | (11,758,106 | ) | | | (89,149,348 | ) | | | (22,631,140 | ) | | | (158,910,334 | ) |
| Decrease | | | (5,015,495 | ) | | $ | (37,542,517 | ) | | | (14,389,875 | ) | | $ | (100,119,399 | ) |
| | | | | | | | | | | | | | | | | |
| Class C Shares | | | | | | | | | | | | | | | | |
| Shares sold | | | 418,896 | | | $ | 3,229,121 | | | | 831,304 | | | $ | 5,865,384 | |
| Reinvestment of distributions | | | 162,624 | | | | 1,193,240 | | | | 250,059 | | | | 1,761,236 | |
| Shares reacquired | | | (2,606,242 | ) | | | (19,600,669 | ) | | | (4,986,668 | ) | | | (34,725,287 | ) |
| Converted to Class A** | | | (159,939 | ) | | | (1,206,675 | ) | | | – | | | | – | |
| Decrease | | | (2,184,661 | ) | | $ | (16,384,983 | ) | | | (3,905,305 | ) | | $ | (27,098,667 | ) |
166
Notes to Financial Statements (continued)
| | | Year Ended | | | Year Ended | |
| International Value Fund | | October 31, 2018 | | | October 31, 2017 | |
| Class F Shares | | Shares | | | Amount | | | Shares | | | Amount | |
| Shares sold | | | 2,138,303 | | | $ | 16,378,487 | | | | 8,783,489 | | | $ | 61,973,453 | |
| Reinvestment of distributions | | | 239,902 | | | | 1,790,236 | | | | 494,071 | | | | 3,529,511 | |
| Shares reacquired | | | (6,809,285 | ) | | | (51,614,968 | ) | | | (13,329,410 | ) | | | (95,895,759 | ) |
| Decrease | | | (4,431,080 | ) | | $ | (33,446,245 | ) | | | (4,051,850 | ) | | $ | (30,392,795 | ) |
| | | | | | | | | | | | | | | | | |
| Class F3 Shares(a) | | | | | | | | | | | | | | | | |
| Shares sold | | | 1,551,046 | | | $ | 11,990,602 | | | | 3,630,278 | | | $ | 27,903,943 | |
| Reinvestment of distributions | | | 132,679 | | | | 990,336 | | | | 369 | | | | 2,726 | |
| Shares reacquired | | | (1,255,570 | ) | | | (9,544,659 | ) | | | (82,595 | ) | | | (635,688 | ) |
| Increase | | | 428,155 | | | $ | 3,436,279 | | | | 3,548,052 | | | $ | 27,270,981 | |
| | | | | | | | | | | | | | | | | |
| Class I Shares | | | | | | | | | | | | | | | | |
| Shares sold | | | 7,964,216 | | | $ | 63,667,743 | | | | 2,979,731 | | | $ | 20,460,928 | |
| Reinvestment of distributions | | | 1,600,547 | | | | 11,997,358 | | | | 2,717,644 | | | | 19,303,808 | |
| Shares reacquired | | | (25,061,163 | ) | | | (202,326,313 | ) | | | (49,657,563 | ) | | | (353,598,897 | ) |
| Decrease | | | (15,496,400 | ) | | $ | (126,661,212 | ) | | | (43,960,188 | ) | | $ | (313,834,161 | ) |
| | | | | | | | | | | | | | | | | |
| Class R2 Shares | | | | | | | | | | | | | | | | |
| Shares sold | | | 17,407 | | | $ | 135,670 | | | | 18,235 | | | $ | 133,259 | |
| Reinvestment of distributions | | | 100 | | | | 755 | | | | 610 | | | | 4,392 | |
| Shares reacquired | | | (39,807 | ) | | | (313,246 | ) | | | (42,090 | ) | | | (311,882 | ) |
| Decrease | | | (22,300 | ) | | $ | (176,821 | ) | | | (23,245 | ) | | $ | (174,231 | ) |
| | | | | | | | | | | | | | | | | |
| Class R3 Shares | | | | | | | | | | | | | | | | |
| Shares sold | | | 154,895 | | | $ | 1,203,207 | | | | 363,153 | | | $ | 2,586,946 | |
| Reinvestment of distributions | | | 33,656 | | | | 252,602 | | | | 56,050 | | | | 402,869 | |
| Shares reacquired | | | (713,870 | ) | | | (5,585,575 | ) | | | (620,131 | ) | | | (4,465,451 | ) |
| Decrease | | | (525,319 | ) | | $ | (4,129,766 | ) | | | (200,928 | ) | | $ | (1,475,636 | ) |
| | | | | | | | | | | | | | | | | |
| Class R4 Shares | | | | | | | | | | | | | | | | |
| Shares sold | | | 5,059 | | | $ | 38,604 | | | | 3,533 | | | $ | 25,796 | |
| Reinvestment of distributions | | | 138 | | | | 1,016 | | | | 107 | | | | 777 | |
| Shares reacquired | | | (4,177 | ) | | | (32,990 | ) | | | (31 | ) | | | (230 | ) |
| Increase | | | 1,020 | | | $ | 6,630 | | | | 3,609 | | | $ | 26,343 | |
| | | | | | | | | | | | | | | | | |
| Class R5 Shares | | | | | | | | | | | | | | | | |
| Reinvestment of distributions | | | 46 | | | $ | 350 | | | | 51 | | | $ | 359 | |
| Increase | | | 46 | | | $ | 350 | | | | 51 | | | $ | 359 | |
| | | | | | | | | | | | | | | | | |
| Class R6 Shares | | | | | | | | | | | | | | | | |
| Shares sold | | | 14,505 | | | $ | 113,409 | | | | 570,728 | | | $ | 4,064,569 | |
| Reinvestment of distributions | | | 120 | | | | 895 | | | | 50 | | | | 360 | |
| Shares reacquired | | | (45,515 | ) | | | (336,794 | ) | | | (281,592 | ) | | | (2,043,493 | ) |
| Increase (decrease) | | | (30,890 | ) | | $ | (222,490 | ) | | | 289,186 | | | $ | 2,021,436 | |
167
Notes to Financial Statements (continued)
| | | Year Ended | | | Year Ended | |
| Value Opportunities Fund | | October 31, 2018 | | | October 31, 2017 | |
| Class A Shares | | Shares | | | Amount | | | Shares | | | Amount | |
| Shares sold | | | 5,097,314 | | | $ | 103,331,408 | | | | 14,956,159 | | | $ | 294,795,077 | |
| Converted from Class B* | | | 67,035 | | | | 1,347,953 | | | | 194,601 | | | | 3,880,914 | |
| Converted from Class C** | | | 2,309,581 | | | | 46,502,865 | | | | – | | | | – | |
| Reinvestment of distributions | | | 2,967,656 | | | | 58,136,378 | | | | 2,847,532 | | | | 54,701,088 | |
| Shares reacquired | | | (12,556,805 | ) | | | (253,996,568 | ) | | | (19,187,356 | ) | | | (379,313,788 | ) |
| Decrease | | | (2,115,219 | ) | | $ | (44,677,964 | ) | | | (1,189,064 | ) | | $ | (25,936,709 | ) |
| | | | | | | | | | | | | | | | | |
| Class B Shares | | | | | | | | | | | | | | | | |
| Shares sold | | | 618 | | | $ | 11,142 | | | | 59,349 | | | $ | 1,055,022 | |
| Reinvestment of distributions | | | 7,051 | | | | 123,527 | | | | 22,165 | | | | 386,337 | |
| Shares reacquired | | | (45,376 | ) | | | (803,504 | ) | | | (175,082 | ) | | | (3,117,461 | ) |
| Converted to Class A* | | | (75,049 | ) | | | (1,347,953 | ) | | | (215,228 | ) | | | (3,880,914 | ) |
| Decrease | | | (112,756 | ) | | $ | (2,016,788 | ) | | | (308,796 | ) | | $ | (5,557,016 | ) |
| | | | | | | | | | | | | | | | | |
| Class C Shares | | | | | | | | | | | | | | | | |
| Shares sold | | | 1,046,741 | | | $ | 18,930,616 | | | | 4,452,277 | | | $ | 79,488,866 | |
| Reinvestment of distributions | | | 1,189,807 | | | | 20,845,426 | | | | 1,090,878 | | | | 19,024,913 | |
| Shares reacquired | | | (4,503,818 | ) | | | (81,220,548 | ) | | | (6,735,277 | ) | | | (120,522,668 | ) |
| Converted to Class A** | | | (2,590,713 | ) | | | (46,502,865 | ) | | | – | | | | – | |
| Decrease | | | (4,857,983 | ) | | $ | (87,947,371 | ) | | | (1,192,122 | ) | | $ | (22,008,889 | ) |
| | | | | | | | | | | | | | | | | |
| Class F Shares | | | | | | | | | | | | | | | | |
| Shares sold | | | 4,663,703 | | | $ | 96,211,632 | | | | 28,859,129 | | | $ | 579,972,620 | |
| Reinvestment of distributions | | | 1,192,507 | | | | 23,814,365 | | | | 1,911,365 | | | | 37,348,068 | |
| Shares reacquired | | | (24,372,019 | ) | | | (509,258,137 | ) | | | (27,040,846 | ) | | | (557,652,369 | ) |
| Increase (decrease) | | | (18,515,809 | ) | | $ | (389,232,140 | ) | | | 3,729,648 | | | $ | 59,668,319 | |
| | | | | | | | | | | | | | | | | |
| Class F3 Shares(a) | | | | | | | | | | | | | | | | |
| Shares sold | | | 5,167,347 | | | $ | 108,712,513 | | | | 14,814,033 | | | $ | 318,067,067 | |
| Reinvestment of distributions | | | 943,618 | | | | 19,249,817 | | | | – | | | | – | |
| Shares reacquired | | | (4,428,548 | ) | | | (93,938,954 | ) | | | (247,076 | ) | | | (5,320,900 | ) |
| Increase | | | 1,682,417 | | | $ | 34,023,376 | | | | 14,566,957 | | | $ | 312,746,167 | |
| | | | | | | | | | | | | | | | | |
| Class I Shares | | | | | | | | | | | | | | | | |
| Shares sold | | | 18,713,045 | | | $ | 399,345,664 | | | | 1,697,747 | | | $ | 34,804,576 | |
| Reinvestment of distributions | | | 2,101,916 | | | | 42,731,941 | | | | 1,350,263 | | | | 26,856,722 | |
| Shares reacquired | | | (17,000,755 | ) | | | (356,733,506 | ) | | | (8,621,263 | ) | | | (175,810,661 | ) |
| Increase (decrease) | | | 3,814,206 | | | $ | 85,344,099 | | | | (5,573,253 | ) | | $ | (114,149,363 | ) |
| | | | | | | | | | | | | | | | | |
| Class P Shares | | | | | | | | | | | | | | | | |
| Shares sold | | | 127,397 | | | $ | 2,536,477 | | | | 229,998 | | | $ | 4,479,938 | |
| Reinvestment of distributions | | | 103,983 | | | | 2,001,669 | | | | 115,181 | | | | 2,180,377 | |
| Shares reacquired | | | (542,476 | ) | | | (10,876,660 | ) | | | (643,659 | ) | | | (12,515,997 | ) |
| Decrease | | | (311,096 | ) | | $ | (6,338,514 | ) | | | (298,480 | ) | | $ | (5,855,682 | ) |
| | | | | | | | | | | | | | | | | |
| Class R2 Shares | | | | | | | | | | | | | | | | |
| Shares sold | | | 93,017 | | | $ | 1,794,588 | | | | 276,031 | | | $ | 5,186,783 | |
| Reinvestment of distributions | | | 20,114 | | | | 379,155 | | | | 10,482 | | | | 194,856 | |
| Shares reacquired | | | (172,086 | ) | | | (3,350,406 | ) | | | (175,343 | ) | | | (3,344,088 | ) |
| Increase (decrease) | | | (58,955 | ) | | $ | (1,176,663 | ) | | | 111,170 | | | $ | 2,037,551 | |
168
Notes to Financial Statements (concluded)
| | | Year Ended | | | Year Ended | |
| Value Opportunities Fund | | October 31, 2018 | | | October 31, 2017 | |
| Class R3 Shares | | Shares | | | Amount | | | Shares | | | Amount | |
| Shares sold | | | 1,009,089 | | | $ | 19,338,047 | | | | 1,202,384 | | | $ | 23,097,186 | |
| Reinvestment of distributions | | | 283,687 | | | | 5,401,401 | | | | 320,069 | | | | 6,001,300 | |
| Shares reacquired | | | (1,574,267 | ) | | | (30,893,450 | ) | | | (2,521,489 | ) | | | (48,623,436 | ) |
| Decrease | | | (281,491 | ) | | $ | (6,154,002 | ) | | | (999,036 | ) | | $ | (19,524,950 | ) |
| | | | | | | | | | | | | | | | | |
| Class R4 Shares | | | | | | | | | | | | | | | | |
| Shares sold | | | 369,737 | | | $ | 7,537,452 | | | | 3,332,890 | | | $ | 65,797,842 | |
| Reinvestment of distributions | | | 184,222 | | | | 3,603,380 | | | | 9,606 | | | | 184,434 | |
| Shares reacquired | | | (832,606 | ) | | | (16,853,380 | ) | | | (424,376 | ) | | | (8,450,221 | ) |
| Increase (decrease) | | | (278,647 | ) | | $ | (5,712,548 | ) | | | 2,918,120 | | | $ | 57,532,055 | |
| | | | | | | | | | | | | | | | | |
| Class R5 Shares | | | | | | | | | | | | | | | | |
| Shares sold | | | 72,934 | | | $ | 1,524,533 | | | | 526,601 | | | $ | 10,928,827 | |
| Reinvestment of distributions | | | 14,881 | | | | 302,820 | | | | 127,567 | | | | 2,538,584 | |
| Shares reacquired | | | (229,612 | ) | | | (4,802,800 | ) | | | (2,599,278 | ) | | | (53,142,249 | ) |
| Decrease | | | (141,797 | ) | | $ | (2,975,447 | ) | | | (1,945,110 | ) | | $ | (39,674,838 | ) |
| | | | | | | | | | | | | | | | | |
| Class R6 Shares | | | | | | | | | | | | | | | | |
| Shares sold | | | 1,138,616 | | | $ | 23,873,695 | | | | 2,752,138 | | | $ | 56,356,795 | |
| Reinvestment of distributions | | | 283,349 | | | | 5,780,327 | | | | 178,818 | | | | 3,563,847 | |
| Shares reacquired | | | (1,630,871 | ) | | | (34,274,379 | ) | | | (994,028 | ) | | | (20,462,619 | ) |
| Increase (decrease) | | | (208,906 | ) | | $ | (4,620,357 | ) | | | 1,936,928 | | | $ | 39,458,023 | |
| | | | | | | | | | | | | | | | | |
| Class T Shares(b) | | | | | | | | | | | | | | | | |
| Shares sold | | | – | | | $ | – | | | | 499 | | | $ | 10,000 | |
| Reinvestment of distributions | | | 33 | | | | 637 | | | | – | | | | – | |
| Shares reacquired | | | (532 | ) | | | (10,999 | ) | | | – | | | | – | |
| Increase (decrease) | | | (499 | ) | | $ | (10,362 | ) | | | 499 | | | $ | 10,000 | |
| | | | | | | | | | | | | | | | | |
| * | Automatic conversion of Class B shares occurred on the 25th day of the month (or, if the 25th day was not a business day, the next business day thereafter) following the eighth anniversary of the day on which the purchase order was accepted. Class B shares were closed on April 25, 2018. |
| ** | Automatic conversion of Class C shares occurs on the 25th day of the month (or, if the 25th day was not a business day, the next business day thereafter) following the tenth anniversary of the day on which the purchase order was accepted. |
| (a) | Commenced on April 4, 2017. |
| (b) | Commenced on July 28, 2017. |
| (c) | Commenced on January 17, 2017. |
| (d) | Commenced on July 30, 2018. |
On October 31, 2018, the Board approved a proposal to reorganize Lord Abbett Calibrated Large Cap Value Fund (“Calibrated Large Cap Value Fund”), a Fund of Equity Trust, into the Fundamental Equity Fund to create a single larger fund. The reorganization requires the approval of Calibrated Large Cap Value Fund’s shareholders at a future shareholder meeting.
169
Report of Independent Registered Public Accounting Firm
To the shareholders and the Board of Trustees of Lord Abbett Securities Trust:
Opinion on the Financial Statements and Financial Highlights
We have audited the accompanying statements of assets and liabilities, including the schedules of investments, of Lord Abbett Alpha Strategy Fund, Lord Abbett Fundamental Equity Fund, Lord Abbett Global Equity Research Fund (formerly Lord Abbett Global Core Equity Fund), Lord Abbett Global Select Equity Fund, Lord Abbett Growth Leaders Fund, Lord Abbett International Equity Fund, Lord Abbett International Opportunities Fund, Lord Abbett International Value Fund (formerly Lord Abbett International Dividend Income Fund), and Lord Abbett Value Opportunities Fund, nine of the funds constituting the Lord Abbett Securities Trust (the “Trust”), as of October 31, 2018, the related statements of operations for the year then ended, the statements of changes in net assets for each of the two years in the period then ended, the financial highlights for each of the five years in the period then ended for the Trust, except Lord Abbett Global Equity Research, and Lord Abbett Global Select Equity Fund; the related statements of operations, changes in net assets, and the financial highlights for the periods indicated in the table below; and the related notes. In our opinion, the financial statements and financial highlights present fairly, in all material respects, the financial position of each of the funds listed above of the Trust as of October 31, 2018, and the results of their operations for the year then ended (or for the period listed in the table below), the changes in their net assets for each of the two years in the period then ended (or for the period listed in the table below), and the financial highlights for each of the five years in the period then ended (or for the period listed in the table below), in conformity with accounting principles generally accepted in the United States of America.
| | Individual Funds constituting
Lord Abbett Securities Trust | | Statement of
Operations | | Statement of Changes
in Net Assets | | Financial Highlights |
| | Lord Abbett Global Equity Research Fund | | For the year ended December 31, 2018 | | For the year ended December 31, 2018 and the period January 17, 2017 (commencement of operations) through October 31, 2017 |
| | Lord Abbett Global Select Equity Fund | | For the period from July 30, 2018 (commencement of operations) through October 31, 2018 |
Basis for Opinion
These financial statements and financial highlights are the responsibility of the Trust’s management. Our responsibility is to express an opinion on the Trust’s financial statements and financial highlights based on our audits. We are a public accounting firm registered with the Public Company Accounting Oversight Board (United States) (PCAOB) and are required to be independent with respect to the Trust in accordance with the U.S. federal securities laws and the applicable rules and regulations of the Securities and Exchange Commission and the PCAOB.
We conducted our audits in accordance with the standards of the PCAOB. Those standards require that we plan and perform the audit to obtain reasonable assurance about whether the financial statements and financial highlights are free of material misstatement, whether due to error or fraud. The Trust is not required to have, nor were we engaged to perform, an audit of its internal control over financial reporting. As part of our audits we are required to obtain an understanding of internal control over financial reporting but not for the purpose of expressing an opinion on the effectiveness of the Trust’s internal control over financial reporting. Accordingly, we express no such opinion.
170
Our audits included performing procedures to assess the risks of material misstatement of the financial statements and financial highlights, whether due to error or fraud, and performing procedures that respond to those risks. Such procedures included examining, on a test basis, evidence regarding the amounts and disclosures in the financial statements and financial highlights. Our audits also included evaluating the accounting principles used and significant estimates made by management, as well as evaluating the overall presentation of the financial statements and financial highlights. Our procedures included confirmation of securities owned as of October 31, 2018, by correspondence with the custodian and brokers; when replies were not received from brokers, we performed other auditing procedures. We believe that our audits provide a reasonable basis for our opinion.
DELOITTE & TOUCHE LLP
New York, New York
December 21, 2018
We have served as the auditor of one or more Lord Abbett Family of Funds’ investment companies since 1932.
171
Investments in Underlying Funds (unaudited)
Alpha Strategy Fund invests in Underlying Funds managed by Lord Abbett. As of October 31, 2018, Alpha Strategy Fund’s long-term investments were allocated among the Underlying Funds as follows:
| Underlying Fund Name | | % of Investments | |
| Lord Abbett Developing Growth Fund, Inc.-Class I | | | 20.51% | |
| Lord Abbett Securities Trust-International Opportunities Fund-Class I | | | 17.67% | |
| Lord Abbett Securities Trust-Micro-Cap Growth Fund-Class I | | | 10.15% | |
| Lord Abbett Securities Trust-Micro-Cap Value Fund-Class I | | | 10.29% | |
| Lord Abbett Research Fund, Inc.-Small-Cap Value Fund-Class I | | | 20.75% | |
| Lord Abbett Securities Trust-Value Opportunities Fund-Class I | | | 20.63% | |
The Ten Largest Holdings and the Holdings by Sector, as of October 31, 2018, for each Underlying Fund are presented below. Each Underlying Fund’s annual and semiannual reports, which are sent to shareholders and filed with the SEC, contain information about the Underlying Fund’s portfolio holdings, including a complete schedule of holdings. A complete schedule of holdings for each Underlying Fund is also filed with the SEC on Form N-Q as of the end of each respective Underlying Fund’s first and third quarters. In addition, on or about the first day of the second month following each calendar quarter-end, each Fund makes publicly available a complete schedule of its portfolio holdings as of the last day of each such quarter. The information for the most recently ended calendar quarter may be viewed at www.lordabbett.com or requested at no charge by calling Lord Abbett at 888–522–2388.
Lord Abbett Developing Growth Fund, Inc.
| Ten Largest Holdings | | % of Investments | |
| Insperity, Inc. | | | 2.27% | |
| Planet Fitness, Inc. Class A | | | 2.22% | |
| AeroVironment, Inc. | | | 2.19% | |
| Grand Canyon Education, Inc. | | | 2.14% | |
| World Wrestling Entertainment, Inc. Class A | | | 2.03% | |
| Insulet Corp. | | | 1.98% | |
| Glaukos Corp. | | | 1.88% | |
| Penumbra, Inc. | | | 1.83% | |
| Cactus, Inc. Class A | | | 1.75% | |
| Trade Desk, Inc. (The) Class A | | | 1.67% | |
| Holdings by Sector* | | % of Investments | |
| Communication Services | | | 4.21% | |
| Consumer Discretionary | | | 15.60% | |
| Consumer Staples | | | 1.87% | |
| Energy | | | 1.75% | |
| Financials | | | 6.61% | |
| Health Care | | | 25.61% | |
| Industrials | | | 14.17% | |
| Information Technology | | | 25.68% | |
| Repurchase Agreement | | | 4.50% | |
| Total | | | 100.00% | |
| * | A sector may comprise several industries. |
172
Investments in Underlying Funds (unaudited)(continued)
International Opportunities Fund
| Ten Largest Holdings | | % of Investments | |
| Applus Services SA | | | 2.26% | |
| Korian SA | | | 2.14% | |
| Entertainment One Ltd. | | | 2.01% | |
| Coca-Cola Amatil Ltd. | | | 1.99% | |
| Britvic plc | | | 1.96% | |
| SHO-BOND Holdings Co., Ltd. | | | 1.88% | |
| B&M European Value Retail SA | | | 1.84% | |
| Buzzi Unicem SpA | | | 1.83% | |
| UDG Healthcare plc | | | 1.72% | |
| C&C Group plc | | | 1.69% | |
| Holdings by Sector* | | % of Investments | |
| Communication Services | | | 4.83% | |
| Consumer Discretionary | | | 15.44% | |
| Consumer Staples | | | 10.03% | |
| Energy | | | 3.53% | |
| Financials | | | 13.00% | |
| Health Care | | | 8.77% | |
| Industrials | | | 19.44% | |
| Information Technology | | | 6.13% | |
| Materials | | | 6.15% | |
| Real Estate | | | 7.45% | |
| Utilities | | | 2.44% | |
| Repurchase Agreement | | | 2.79% | |
| Total | | | 100.00% | |
| * | A sector may comprise several industries. |
Micro Cap Growth Fund
| Ten Largest Holdings | | % of Investments | |
| Tactile Systems Technology, Inc. | | | 3.42% | |
| NV5 Global, Inc. | | | 3.11% | |
| Tandem Diabetes Care, Inc. | | | 2.88% | |
| Everbridge, Inc. | | | 2.87% | |
| Malibu Boats, Inc. Class A | | | 2.75% | |
| iRhythm Technologies, Inc. | | | 2.71% | |
| SendGrid, Inc. | | | 2.37% | |
| Myovant Sciences Ltd. (United Kingdom) | | | 2.26% | |
| Talend SA ADR | | | 2.06% | |
| Glaukos Corp. | | | 2.03% | |
173
Investments in Underlying Funds (unaudited)(continued)
| Holdings by Sector* | | % of Investments | |
| Communication Services | | | 1.74% | |
| Consumer Discretionary | | | 7.18% | |
| Consumer Staples | | | 3.40% | |
| Energy | | | 0.95% | |
| Financials | | | 8.14% | |
| Health Care | | | 35.86% | |
| Industrials | | | 11.21% | |
| Information Technology | | | 26.13% | |
| Materials | | | 0.70% | |
| Repurchase Agreement | | | 4.69% | |
| Total | | | 100.00% | |
| * | A sector may comprise several industries. |
Micro Cap Value Fund
| Ten Largest Holdings | | % of Investments | |
| Cott Corp. (Canada) | | | 4.51% | |
| Chesapeake Utilities Corp. | | | 4.28% | |
| National Commerce Corp. | | | 3.96% | |
| Federal Signal Corp. | | | 3.59% | |
| Gibraltar Industries, Inc. | | | 3.57% | |
| Lawson Products, Inc. | | | 3.51% | |
| Primoris Services Corp. | | | 3.49% | |
| Seacoast Banking Corp. of Florida | | | 3.44% | |
| Connecticut Water Service, Inc. | | | 3.34% | |
| Neenah, Inc. | | | 3.30% | |
| Holdings by Sector* | | % of Investments | |
| Communication Services | | | 2.93% | |
| Consumer Discretionary | | | 8.92% | |
| Consumer Staples | | | 4.51% | |
| Energy | | | 1.29% | |
| Financials | | | 22.28% | |
| Health Care | | | 5.23% | |
| Industrials | | | 27.75% | |
| Information Technology | | | 8.49% | |
| Materials | | | 5.69% | |
| Real Estate | | | 2.22% | |
| Utilities | | | 7.62% | |
| Repurchase Agreement | | | 3.07% | |
| Total | | | 100.00% | |
| * | A sector may comprise several industries. |
174
Investments in Underlying Funds (unaudited)(continued)
Lord Abbett Research Fund, Inc. – Small Cap Value Fund
| Ten Largest Holdings | | % of Investments | |
| Conduent, Inc. | | | 3.06% | |
| Cott Corp. | | | 2.86% | |
| Federal Signal Corp. | | | 2.70% | |
| IDACORP, Inc. | | | 2.57% | |
| Wolverine World Wide, Inc. | | | 2.54% | |
| Booz Allen Hamilton Holding Corp. | | | 2.52% | |
| First Merchants Corp. | | | 2.27% | |
| Teledyne Technologies, Inc. | | | 2.22% | |
| Charles River Laboratories International, Inc. | | | 2.22% | |
| Argo Group International Holdings Ltd. | | | 2.14% | |
| Holdings by Sector* | | % of Investments | |
| Communication Services | | | 1.07% | |
| Consumer Discretionary | | | 9.93% | |
| Consumer Staples | | | 4.87% | |
| Energy | | | 2.50% | |
| Financials | | | 13.80% | |
| Health Care | | | 15.27% | |
| Industrials | | | 17.59% | |
| Information Technology | | | 18.12% | |
| Materials | | | 9.13% | |
| Real Estate | | | 2.98% | |
| Utilities | | | 2.17% | |
| Repurchase Agreement | | | 2.57% | |
| Total | | | 100.00% | |
| * | A sector may comprise several industries. |
Value Opportunities Fund
| Ten Largest Holdings | | % of Investments | |
| Conduent, Inc. | | | 2.67% | |
| Booz Allen Hamilton Holding Corp. | | | 2.35% | |
| Cullen/Frost Bankers, Inc. | | | 2.18% | |
| Charles River Laboratories International, Inc. | | | 2.01% | |
| NiSource, Inc. | | | 1.99% | |
| CMS Energy Corp. | | | 1.97% | |
| Jacobs Engineering Group, Inc. | | | 1.97% | |
| Amdocs Ltd. | | | 1.91% | |
| Western Alliance Bancorp | | | 1.89% | |
| Fidelity National Information Services, Inc. | | | 1.87% | |
175
Investments in Underlying Funds (unaudited)(concluded)
| Holdings by Sector* | | % of Investments | |
| Communication Services | | | 2.53% | |
| Consumer Discretionary | | | 8.15% | |
| Consumer Staples | | | 3.79% | |
| Energy | | | 4.96% | |
| Financials | | | 13.71% | |
| Health Care | | | 17.34% | |
| Industrials | | | 12.12% | |
| Information Technology | | | 18.43% | |
| Materials | | | 8.63% | |
| Real Estate | | | 2.84% | |
| Utilities | | | 5.81% | |
| Repurchase Agreement | | | 1.69% | |
| Total | | | 100.00% | |
| * | A sector may comprise several industries. |
176
Basic Information About Management
The Board is responsible for the management of the business and affairs of the Trust in accordance with the laws of the State of Delaware. The Board elects officers who are responsible for the day-to-day operations of each Fund and who execute policies authorized by the Board. The Board also approves an investment adviser to each Fund and continues to monitor the cost and quality of the services the investment adviser provides, and annually considers whether to renew the contract with the adviser. Generally, each Trustee holds office until his/her successor is elected and qualified or until his/her earlier resignation or removal, as provided in the Trust’s organizational documents.
Lord Abbett, a Delaware limited liability company, is each Fund’s investment adviser. Designated Lord Abbett personnel are responsible for the day-to-day management of the Funds.
Interested Trustees
Mr. Sieg is affiliated with Lord Abbett and is an “interested person” of the Trust as defined in the Act. Mr. Sieg is director/trustee of each of the 13 investment companies in the Lord Abbett Family of Funds, which consist of 61 portfolios or series. Mr. Sieg is an officer of the Lord Abbett Family of Funds.
Name, Address and
Year of Birth | | Current Position and
Length of Service
with the Trust | | Principal Occupation and Other Directorships
During the Past Five Years |
| | | | | |
Douglas B. Sieg
Lord, Abbett & Co. LLC
90 Hudson Street
Jersey City, NJ 07302
(1969) | | Trustee since 2016;
President and Chief Executive Officer since 2018 | | Principal Occupation: Managing Partner (since 2018) and was formerly Head of Client Services, joined Lord Abbett in 1994.
Other Directorships: None. |
Independent Trustees
The following Independent Trustees also are directors/trustees of each of the 13 investment companies in the Lord Abbett Family of Funds, which consist of 61 portfolios or series.
Name, Address and
Year of Birth | | Current Position and
Length of Service
with the Trust | | Principal Occupation and Other Directorships
During the Past Five Years |
| | | | | |
Eric C. Fast
Lord, Abbett & Co. LLC
c/o Legal Dept.
90 Hudson Street
Jersey City, NJ 07302
(1949) | | Trustee since 2014 | | Principal Occupation: Chief Executive Officer of Crane Co., an industrial products company (2001–2014).
Other Directorships: Currently serves as director of Automatic Data Processing, Inc. (since 2007) and Regions Financial Corporation (since 2010). Previously served as a director of Crane Co. (1999–2014). |
| | | | | |
Evelyn E. Guernsey
Lord, Abbett & Co. LLC
c/o Legal Dept.
90 Hudson Street
Jersey City, NJ 07302
(1955) | | Trustee since 2011 | | Principal Occupation: CEO, Americas of J.P. Morgan Asset Management (2004–2010).
Other Directorships: None. |
| | | | | |
Julie A. Hill
Lord, Abbett & Co. LLC
c/o Legal Dept.
90 Hudson Street
Jersey City, NJ 07302
(1946) | | Trustee since 2004 | | Principal Occupation: Owner and CEO of The Hill Company, a business consulting firm (since 1998).
Other Directorships: Currently serves as director of Anthem, Inc., a health benefits company (since 1994). |
177
Basic Information About Management (continued)
Name, Address and
Year of Birth | | Current Position and
Length of Service
with the Trust | | Principal Occupation and Other Directorships
During the Past Five Years |
| | | | | |
Kathleen M. Lutito
Lord, Abbett & Co. LLC
c/o Legal Dept.
90 Hudson Street
Jersey City, NJ 07302
(1963) | | Trustee since 2017 | | Principal Occupation: President and Chief Investment Officer of CenturyLink Investment Management Company (since 2006).
Other Directorships: None |
| | | | | |
James M. McTaggart
Lord, Abbett & Co. LLC
c/o Legal Dept.
90 Hudson Street
Jersey City, NJ 07302
(1947) | | Trustee since 2012 | | Principal Occupation: Independent management advisor and consultant (since 2012); Vice President, CRA International, Inc. (doing business as Charles River Associates), a global management consulting firm (2009–2012); Founder and Chairman of Marakon Associates, Inc., a strategy consulting firm (1978–2009); and Officer and Director of Trinsum Group, a holding company (2007–2009).
Other Directorships: Blyth, Inc., a home products company (2004–2015). |
| | | | | |
Karla M. Rabusch
Lord, Abbett & Co. LLC
c/o Legal Dept.
90 Hudson Street
Jersey City, NJ 07302
(1959) | | Trustee since 2017 | | Principal Occupation: President and Director of Wells Fargo Funds Management, LLC (2003–2017); President of Wells Fargo Funds (2003–2016).
Other Directorships: None. |
| | | | | |
Mark A. Schmid
Lord, Abbett & Co. LLC
c/o Legal Dept.
90 Hudson Street
Jersey City, NJ 07302
(1959) | | Trustee since 2016 | | Principal Occupation: Vice President and Chief Investment Officer of the University of Chicago (since 2009).
Other Directorships: None. |
| | | | | |
James L.L. Tullis
Lord, Abbett & Co. LLC
c/o Legal Dept.
90 Hudson Street
Jersey City, NJ 07302
(1947) | | Trustee since 2006;
Chairman since 2017 | | Principal Occupation: CEO of Tullis-Dickerson and Co. Inc., a venture capital management firm (since 1990); CEO of Tullis Health Investors Inc. (since 2012).
Other Directorships: Currently serves as director of Crane Co. (since 1998). |
Officers
None of the officers listed below have received compensation from the Trust. All of the officers of the Trust also may be officers of the other Lord Abbett Funds and maintain offices at 90 Hudson Street, Jersey City, NJ 07302. Unless otherwise indicated, the position(s) and title(s) listed under the “Principal Occupation During the Past Five Years” column indicate each officer’s position(s) and title(s) with Lord Abbett. Each officer serves for an indefinite term (i.e., until his or her death, resignation, retirement, or removal).
Name and
Year of Birth | | Current Position
with the Trust | | Length of Service
of Current
Position | | Principal Occupation
During the Past Five Years |
| | | | | | | |
Douglas B. Sieg
(1969) | | President and Chief Executive Officer | | Elected as President in 2018 and Chief Executive Officer in 2018 | | Managing Partner of Lord Abbett, joined Lord Abbett in 1994. |
178
Basic Information About Management (continued)
Name and
Year of Birth | | Current Position
with the Trust | | Length of Service
of Current
Position | | Principal Occupation
During the Past Five Years |
| | | | | | | |
Jeff D. Diamond
(1960) | | Executive Vice President | | Elected in 2018 | | Portfolio Manager, joined Lord Abbett in 2007. |
| | | | | | | |
Todd D. Jacobson
(1966) | | Executive Vice President | | Elected in 2003 | | Partner and Associate Director, joined Lord Abbett in 2003. |
| | | | | | | |
Robert A. Lee
(1969) | | Executive Vice President | | Elected in 2016 | | Partner and Chief Investment Officer, and was formerly Deputy Chief Investment Officer and Director of Taxable Fixed Income, joined Lord Abbett in 1997. |
| | | | | | | |
David J. Linsen
(1974) | | Executive Vice President | | Elected in 2011 | | Partner and Director of Equities, joined Lord Abbett in 2001. |
| | | | | | | |
Giulio Martini
(1955) | | Executive Vice President | | Elected in 2015 | | Partner and Director of Strategic Asset Allocation, joined Lord Abbett in 2015 and was formerly Global Investment Strategist at Anderson Global Macro LLC (2012–2015). |
| | | | | | | |
Vincent J. McBride
(1964) | | Executive Vice President | | Elected in 2003 | | Partner and Director, joined Lord Abbett in 2003. |
| | | | | | | |
F. Thomas O’Halloran
(1955) | | Executive Vice President | | Elected in 2003 | | Partner and Portfolio Manager, joined Lord Abbett in 2001. |
| | | | | | | |
Eli Rabinowich
(1975) | | Executive Vice President | | Elected in 2018 | | Portfolio Manager, joined Lord Abbett in 2018 and was formerly a Portfolio Manager, Partner, and Analyst at Pzena Investment Management from (2004–2018). |
| | | | | | | |
A. Edward Allinson
(1961) | | Vice President | | Elected in 2011 | | Portfolio Manager, joined Lord Abbett in 2005. |
| | | | | | | |
Jeffrey W. Arricale
(1971) | | Vice President | | Elected in 2018 | | Deputy Director, Global Equity Research, joined Lord Abbett in 2012. |
| | | | | | | |
Vernon T. Bice
(1974) | | Vice President | | Elected in 2016 | | Portfolio Manager, joined Lord Abbett in 2011. |
| | | | | | | |
Pamela P. Chen
(1978) | | Vice President and Assistant Secretary | | Elected in 2018 | | Associate General Counsel, joined Lord Abbett in 2017 and was formerly Special Counsel at Schulte, Roth & Zabel LLP (2005–2017). |
179
Basic Information About Management (continued)
Name and
Year of Birth | | Current Position
with the Trust | | Length of Service
of Current
Position | | Principal Occupation
During the Past Five Years |
| | | | | | | |
Matthew R. DeCicco
(1977) | | Vice President | | Elected in 2015 | | Managing Director and Portfolio Manager, joined Lord Abbett in 1999. |
| | | | | | | |
John T. Fitzgerald
(1975) | | Vice President and Assistant Secretary | | Elected in 2018 | | Deputy General Counsel, joined Lord Abbett in 2018 and was formerly Deputy Head of U.S. Funds Legal, Executive Director and Assistant General Counsel at JPMorgan Chase (2005–2018). |
| | | | | | | |
Bernard J. Grzelak
(1971) | | Chief Financial Officer and Vice President | | Elected in 2017 | | Partner and Chief Operations Officer, and was formerly Director of Fund Administration, joined Lord Abbett in 2003. |
| | | | | | | |
John C. Hardy
(1981) | | Vice President | | Elected in 2018 | | Portfolio Manager, joined Lord Abbett in 2011. |
| | | | | | | |
Jeffrey O. Herzog
(1978) | | Vice President | | Elected in 2018 | | Portfolio Manager, joined Lord Abbett in 2013 and was formerly Senior Economist at Oxford Economics (2012–2013). |
| | | | | | | |
Ryan C. Howard
(1980) | | Vice President | | Elected in 2018 | | Portfolio Manager, joined Lord Abbett in 2003. |
| | | | | | | |
Lawrence H. Kaplan
(1957) | | Vice President and Secretary | | Elected in 1997 | | Partner and General Counsel, joined Lord Abbett in 1997. |
| | | | | | | |
Devesh Karandikar
(1973) | | Vice President | | Elected in 2018 | | Portfolio Manager, joined Lord Abbett in 2010. |
| | | | | | | |
Linda Y. Kim
(1980) | | Vice President and Assistant Secretary | | Elected in 2016 | | Counsel, joined Lord Abbett in 2015 and was formerly an Associate at Stroock & Stroock & Lavan LLP (2007–2015). |
| | | | | | | |
Sue Kim
(1975) | | Vice President | | Elected in 2018 | | Deputy Director, Global Equity Research, joined Lord Abbett in 2015 and was formerly Director at Harbor Bridge Capital Management, LP (2014–2015). |
| | | | | | | |
So Young Lee
(1971) | | Vice President | | Elected in 2018 | | Portfolio Manager, joined Lord Abbett in 2013. |
180
Basic Information About Management (concluded)
Name and
Year of Birth | | Current Position
with the Trust | | Length of Service
of Current
Position | | Principal Occupation
During the Past Five Years |
| | | | | | | |
Asad A. Mawjee
(1977) | | Vice President | | Elected in 2018 | | Portfolio Manager, joined Lord Abbett in 2016 and was formerly Director at Global Thematic Partners, LLC (2008–2016). |
| | | | | | | |
Joseph M. McGill
(1962) | | Chief Compliance Officer | | Elected in 2014 | | Partner and Chief Compliance Officer, joined Lord Abbett in 2014 and was formerly Managing Director and the Chief Compliance Officer at UBS Global Asset Management (2003–2013). |
| | | | | | | |
A. Edward Oberhaus, III
(1959) | | Vice President | | Elected in 1993 | | Partner and Director, joined Lord Abbett in 1983. |
| | | | | | | |
David B. Ritt
(1976) | | Vice President | | Elected in 2018 | | Portfolio Manager, joined Lord Abbett in 2006. |
| | | | | | | |
Amanda S. Ryan
(1978) | | Vice President and Assistant Secretary | | Elected in 2018 | | Counsel, joined Lord Abbett in 2016 and was formerly a Director and Corporate Counsel at PGIM Investments (2012–2016). |
| | | | | | | |
Lawrence B. Stoller
(1963) | | Vice President and Assistant Secretary | | Elected in 2007 | | Partner and Senior Deputy General Counsel, joined Lord Abbett in 2007. |
| | | | | | | |
Jackson C. Chan
(1964) | | AML Compliance Officer | | Elected in 2018 | | Deputy Chief Compliance Officer and Director of Regulatory Affairs, joined Lord Abbett in 2014 and was formerly Director at UBS Global Asset Management (2005–2014). |
| | | | | | | |
Vito A. Fronda
(1969) | | Treasurer | | Elected in 2018 | | Partner and Director of Taxation, joined Lord Abbett in 2003. |
Please call 888–522–2388 for a copy of the statement of additional information, which contains further information about the Trust’s Trustees. It is available free upon request.
181
Approval of Advisory Contract
At the initial organizational meeting for the Global Select Equity Fund, the Board, including all of the Trustees who are not “interested persons” of the Company or of Lord Abbett, as defined in the Investment Company Act of 1940, as amended (the “Independent Trustees”), considered whether to approve the proposed management agreement between the Fund and Lord Abbett (the “Agreement”). The Board reviewed materials relating specifically to the Agreement before and at the meeting and before making its decision as to the Fund, the Board had the opportunity to ask questions and request further information. The Board also took into account its familiarity with Lord Abbett gained through its previous meetings and discussions. The Independent Trustees also met with their independent legal counsel in a private session at which no representatives of management were present.
The materials received by the Board as to the Fund included, but were not limited to: (1) information provided by Broadridge Financial Solutions, Inc. regarding the expense ratios, contractual and actual management fee rates, and other expense components for the Fund and for certain funds in the same Morningstar category, with generally the same or similar share classes and operational characteristics (the “expense peer group”); (2) information provided by Lord Abbett on the estimated expense ratios, management fee rates, and other expense components for the Fund; and (3) information regarding the investment strategies and risks of the Fund and the personnel and other resources devoted by Lord Abbett to managing the Fund.
Investment Management Services Generally. The Board considered the investment management services to be provided by Lord Abbett to the Fund, including investment research, portfolio management, and trading, and Lord Abbett’s commitment to compliance with all applicable legal requirements. The Board also observed that Lord Abbett was solely engaged in the investment management business and accordingly did not experience the conflicts of interest that may result from being engaged in other lines of business. In addition, the Board considered its experience with other funds advised by Lord Abbett. After reviewing these and related factors, the Board concluded that the Fund was likely to benefit from the nature, extent and quality of the investment services to be provided by Lord Abbett under the Agreement.
Investment Performance. Because the Fund had not yet begun operations, the Fund did not have any investment performance to review. The Board considered Lord Abbett’s performance and reputation generally and the performance of other Lord Abbett-managed funds overseen by the Board.
Lord Abbett’s Personnel and Methods. The Board considered the qualifications of the personnel who would provide investment management services to the Fund, in light of its investment objective and discipline. Among other things, the Board considered the size, experience, and turnover of Lord Abbett’s investment management staff, Lord Abbett’s investment methodology and philosophy, and Lord Abbett’s approach to recruiting, training, and retaining investment management personnel.
Nature and Quality of Other Services. The Board considered the nature, quality, costs, and extent of compliance, administrative, and other services to be performed by Lord Abbett and the nature and extent of Lord Abbett’s supervision of third party service providers, including the Fund’s transfer agent and custodian.
Expenses. The Board considered the estimated expense level of the Fund, including the contractual and actual management fee rates, and the expense levels of the Fund’s expense peer group. It also considered how the estimated expense level of the Fund related to those of the expense peer group and the amount and nature of the fees to be paid by shareholders. The Board
182
Approval of Advisory Contract (concluded)
observed that the estimated net total expense ratio of the Fund was below the median of the expense peer group. After reviewing these and related factors, the Board concluded, within the context of its overall approval of the Agreement, that the estimated expense level of the Fund was reasonable and supported the approval of the Agreement.
Profitability. Because the Fund had not yet begun operations, the Board was not able to consider the level of Lord Abbett’s profits in managing the Fund. The Board did consider that Lord Abbett would be subsidizing the Fund for the near future. The Board recognized that Lord Abbett’s overall profitability was a factor in enabling it to attract and retain qualified investment management personnel to provide services to the Fund. After reviewing these and related factors, the Board concluded, within the context of its overall approval of the Agreement, that Lord Abbett’s overall profitability was not excessive.
Economies of Scale. The Board considered whether there might be economies of scale in managing the Fund and whether the Fund would benefit appropriately from any such economies of scale. The Board concluded that the breakpoint in the proposed management fee schedule, in conjunction with the Fund’s proposed expense limitation agreement, adequately addressed any economies of scale in managing the Fund.
Other Benefits to Lord Abbett. The Board considered the amount and nature of the fees to be paid by the Fund and the Fund’s shareholders to Lord Abbett and the Distributor for services other than investment advisory services, such as the fee that Lord Abbett will receive from the Fund for providing administrative services to the Fund. The Board also considered the revenues and profitability of Lord Abbett’s investment advisory business apart from its mutual fund business, and the intangible benefits expected to be enjoyed by Lord Abbett by virtue of its relationship with the Fund. The Board observed that the Distributor receives 12b-1 fees from certain of the Lord Abbett Funds as to shares held in accounts for which there is no other broker of record, may retain a portion of the 12b-1 fees it receives, and receives a portion of the sales charges on sales and redemptions of some classes of shares of the Lord Abbett Funds. In addition, the Board observed that Lord Abbett accrues certain benefits for its business of providing investment advice to clients other than the Lord Abbett Funds, but that business could also benefit the Fund. The Board also noted that Lord Abbett, as will be disclosed in the prospectus of the Fund, has entered into revenue sharing arrangements with certain entities that distribute shares of the Fund. The Board also took into consideration the investment research that Lord Abbett may receive as a result of Fund brokerage transactions.
Conclusion. After considering all of the relevant factors, the Board unanimously found that approval of the Agreement on behalf of the Fund was in the best interests of the Fund and voted unanimously to approve the Agreement. In considering whether to approve the Agreement, the Board did not identify any single factor as paramount or controlling. Individual Trustees may have evaluated the information presented differently from one another, giving different weights to various factors. This summary does not discuss in detail all matters considered.
183
Householding
The Trust has adopted a policy that allows it to send only one copy of each Fund’s prospectus, proxy material, annual report and semiannual report to certain shareholders residing at the same “household.” This reduces Fund expenses, which benefits you and other shareholders. If you need additional copies or do not want your mailings to be “householded,” please call Lord Abbett at 888–522–2388 or send a written request with your name, the name of your fund or funds and your account number or numbers to Lord Abbett Family of Funds, P.O. Box 219336, Kansas City, MO 64121.
Proxy Voting Policies, Procedures and Records
A description of the policies and procedures that Lord Abbett uses to vote proxies related to each Fund’s portfolio securities, and information on how Lord Abbett voted each Fund’s proxies during the 12-month period ended June 30 are available without charge, upon request, (i) by calling 888–522–2388; (ii) on Lord Abbett’s Website at www.lordabbett.com; and (iii) on the Securities and Exchange Commission’s (“SEC”) Website at www.sec.gov.
Shareholder Reports and Quarterly Portfolio Disclosure
The Funds are required to file their complete schedule of portfolio holdings with the SEC for their first and third fiscal quarters on Form N-Q. Copies of the filings are available without charge, upon request on the SEC’s Website at www.sec.gov and may be available by calling Lord Abbett at 888–522–2388. You can also obtain copies of Form N-Q by visiting the SEC’s Public Reference Room in Washington, DC (information on the operation of the Public Reference Room may be obtained by calling 800-SEC-0330).
184
Tax Information
The percentages below reflect the portion of ordinary income distributions that are eligible for the corporate dividend received deduction (DRD) and qualified dividend income (QDI) for individual shareholders:
| Fund Name | | DRD | | QDI | |
| Fundamental Equity Fund | | 56% | | 57% | |
| Global Equity Research Fund | | 12% | | 26% | |
| Growth Leaders Fund | | 11% | | 11% | |
| International Equity Fund | | – | | 100% | |
| International Opportunities Fund | | – | | 100% | |
| International Value Fund | | – | | 100% | |
| Value Opportunities Fund | | 100% | | 100% | |
Additionally, of the distributions paid to the shareholders during the fiscal year ended October 31, 2018, the following amounts represent short-term and long-term capital gains:
| | | Short-Term | | | Long-Term | |
| Fund Name | | Capital Gains | | | Capital Gains | |
| Alpha Strategy Fund | | $ | – | | | $ | 124,640,000 | |
| Fundamental Equity Fund | | | 65,854,237 | | | | 208,675,974 | |
| Global Equity Research Fund | | | 199,167 | | | | – | |
| Growth Leaders Fund | | | 126,621,794 | | | | 65,683,018 | |
| International Opportunities Fund | | | – | | | | 29,369,535 | |
| Value Opportunities Fund | | | – | | | | 189,303,747 | |
The Funds listed below intend to pass through foreign source income and foreign taxes as follows:
| | | Foreign | | | | |
| Fund Name | | Source Income | | | Foreign Taxes | |
| International Equity Fund | | | 18,218,914 | | | | 2,251,685 | |
| International Opportunities Fund | | | 19,740,603 | | | | 2,591,555 | |
| International Value Fund | | | 35,404,173 | | | | 2,847,711 | |
185

| | Lord Abbett Securities Trust | |
| | | | |
 This report, when not used for the general information of shareholders of the Fund, is to be distributed only if preceded or accompanied by a current fund prospectus. Lord Abbett mutual fund shares are distributed by LORD ABBETT DISTRIBUTOR LLC. | | Lord Abbett Alpha Strategy Fund Lord Abbett Fundamental Equity Fund Lord Abbett Global Equity Research Fund Lord Abbett Global Select Equity Fund Lord Abbett Growth Leaders Fund Lord Abbett International Equity Fund Lord Abbett International Opportunities Fund Lord Abbett International Value Fund Lord Abbett Value Opportunities Fund | LST-2
(12/18) |

LORD ABBETT
ANNUAL REPORT
Lord Abbett
Micro Cap Growth Fund
Micro Cap Value Fund
For the fiscal year ended October 31, 2018
Table of Contents
Lord Abbett Securities Trust
Lord Abbett Micro Cap Growth Fund and Lord Abbett Micro Cap Value Fund Annual Report
For the fiscal year ended October 31, 2018

From left to right: James L.L. Tullis, Independent Chairman of the Lord Abbett Funds and Douglas B. Sieg, Trustee, President, and Chief Executive Officer of the Lord Abbett Funds.
Dear Shareholders: We are pleased to provide you with this overview of the performance of the Funds for the fiscal year ended October 31, 2018. On this page and the following pages, we discuss the major factors that influenced fiscal year performance. For detailed and timely information about the Funds, please visit our website at www.lordabbett.com, where you also can access the quarterly commentaries that provide updates on each Fund’s performance and other portfolio related updates.
Thank you for investing in Lord Abbett mutual funds. We value the trust that you place in us and look forward to serving your investment needs in the years to come.
Best regards,

Douglas B. Sieg
Trustee, President and Chief Executive Officer
Lord Abbett Micro Cap Growth Fund
For the fiscal year ended October 31, 2018, the Fund returned 16.32%, reflecting performance at the net asset value (NAV) of Class A shares, with all distributions reinvested, compared to its benchmark, the Russell Microcap® Growth Index,1 which returned 1.09% over the same period.
Domestic equity returns were positive over the past year, with large cap stocks, as represented by the S&P 500® Index2, rising 7.35% during the period, while small cap stocks, as represented by the Russell 2000® Index3, were up 1.85%. During the
period, there were several market-moving events. Notably, in December 2017, Congress passed the largest rewrite of the U.S. tax code in decades. The tax bill reduced the corporate tax rate from 35% to 21% and allowed for a one-time repatriation tax of 15.5%, rather than the standard repatriation tax rate of 35%. In June 2018, the White House announced its intent to impose additional tariffs on $200 billion worth of Chinese goods, on top of the $50 billion previously announced. The aggressive U.S. trade posture continued into September with trade tensions mounting between the U.S. and China.
1
While the impact has yet to fully be realized, many corporations anticipate that the retaliatory tariffs will weigh on profits. Trade discussions between Mexico, Canada, and the U.S., however, took a more favorable turn as the negotiations resulted in a revised version of the North American Free Trade Agreement (NAFTA) called the U.S.-Mexico-Canada Agreement. In December 2017, the Federal Reserve (the “Fed”) raised its target for short-term interest rates by 0.25%, to a range of 1.25% – 1.50%, and indicated that it was targeting three rate hikes in 2018. The Fed followed with rate hikes of 0.25% at each of its March, June and September meetings, raising the target range to 2.00% – 2.25%. Amid rising concerns surrounding escalating trade tensions, slowing growth, and increasing interest rates, the Nasdaq experienced the largest monthly drop since 2008 in October 2018. Despite the sell-off, the U.S. economy continued to expand by more than 2% during each quarter of the trailing 12-month period, with domestic GDP growth ranging between 2.2% to 4.2% from the third quarter of 2017 to the third quarter of 2018. The 4.2% GDP growth in the second quarter marked the strongest growth rate since the third quarter of 2014.
Security selection and positioning within the information technology and health care sectors contributed to the Fund’s relative performance during the 12-month period. Within the information technology sector, shares of Everbridge, Inc., a developer of critical event and enterprise safety software solutions, contributed to relative performance during
the period. Everbridge delivered successive quarters of strong earnings and revenue growth as it increased its product line-up and critical management deals, expanded internationally, and completed its acquisition of Unified Messaging Systems. Alteryx, Inc., which provides self-service data analytics software, also contributed to relative performance. Shares of Alteryx benefited from increased awareness of its data solutions with little competition, while it introduced several new product initiatives over the course of the period.
Within the health care sector, the Fund’s positioning in Madrigal Pharmaceuticals, Inc. a developer of therapeutic treatments for a multitude of diseases, contributed to relative performance. Shares of Madrigal Pharmaceuticals rose dramatically as the company’s Phase 2 data for its drug MGL 3196, which treats non-alcoholic steatohepatitis (NASH), showed a statistically significant benefit on NASH resolution, and a reduction in markers of fibrosis. Investors’ confidence in a potentially successful Phase 3 trial improved significantly.
Positioning within the communication services sector detracted from the Fund’s performance relative to its benchmark. The Fund’s lack of exposure to the sector, specifically to Boingo Wireless, Inc., which reported strong second quarter 2018 earnings and revenue and the company’s announcement of a lateral acquisition of Elauwit Networks, detracted from performance.
Security selection within the consumer staples sector detracted from performance
2
during the period. While the Fund’s overweight position within the sector contributed to performance as it was the best performing sector within the index, the Fund’s lack of exposure to several rapidly appreciating companies within the sector detracted from relative performance. The Fund’s position in MGP Ingredients, Inc., a manufacturer of food, beverage and specialty ingredients, also detracted from performance. Shares of MGP Ingredients declined after it reported revenue and earnings that failed to meet investors’ expectations, as its sales of premium beverage alcohol declined year-over-year.
Lord Abbett Micro Cap Value Fund
For the fiscal year ended October 31, 2018, the Fund returned 0.11%, reflecting performance at the net asset value (NAV) of Class A shares, with all distributions reinvested, compared to its benchmark, the Russell Microcap® Value Index,4 which returned 1.89% over the same period.
Domestic equity returns were positive over the past year, with large cap stocks, as represented by the S&P 500® Index,2 rising 7.35% during the period, while small cap stocks, as represented by the Russell 2000® Index3 were up 1.85%. During the period, there were several market-moving events. Notably, in December 2017, Congress passed the largest rewrite of the U.S. tax code in decades. The tax bill reduced the corporate tax rate from 35% to 21% and allowed for a one-time repatriation tax of 15.5%, rather than the standard repatriation tax rate of 35%. In June 2018, the White House announced its intent to
impose additional tariffs on $200 billion worth of Chinese goods, on top of the $50 billion previously announced. The aggressive U.S. trade posture continued into September with trade tensions mounting between the U.S. and China. While the impact has yet to fully be realized, many corporations anticipate that the retaliatory tariffs will weigh on profits. Trade discussions between Mexico, Canada, and the U.S., however, took a more favorable turn as the negotiations resulted in a revised version of the North American Free Trade Agreement (NAFTA) called the U.S.-Mexico-Canada Agreement. In December 2017, the Federal Reserve (the “Fed”) raised its target for short-term interest rates by 0.25%, to a range of 1.25% – 1.50%, and indicated that it was targeting three rate hikes in 2018. The Fed followed with rate hikes of 0.25% at each of its March, June and September meetings, raising the target range to 2.00% – 2.25%. Amid rising concerns surrounding escalating trade tensions, slowing growth, and increasing interest rates, the Nasdaq experienced the largest monthly drop since 2008 in October 2018. Despite the sell-off, the U.S. economy continued to expand by more than 2% during each quarter of the trailing 12-month period, with domestic GDP growth ranging between 2.2% to 4.2% from the third quarter of 2017 to the third quarter of 2018. The 4.2% GDP growth in the second quarter marked the strongest growth rate since the third quarter of 2014.
Security selection within the industrials and materials sectors detracted from relative performance during the
3
period. Within the industrials sector, the Fund’s holding of American Woodmark Corporation, a manufacturer of kitchen cabinets and vanities for the remodeling and new home construction markets, detracted from relative performance. Shares of American Woodmark came under pressure in February, following negative financial results from Lowe’s Companies, Inc., a retail company specializing in home improvement, of which American Woodmark acts as a key supplier. In addition, American Woodmark’s stock fell following its third quarter financial results in March, which failed to meet analyst estimates. The Fund’s holding of Primoris Services Corp., a specialty construction and infrastructure company, also detracted during the period. Shares of Primoris fell following its second quarter financial results, which, despite exceeding analyst estimates for sales, included earnings that failed to meet the lowest analyst estimates. Within the materials sector, the Fund’s position in Chase Corp., a manufacturer of protective coatings and tape products, was a detractor. Shares of Chase Corp. fell following its first quarter financial results, which showed a decrease in year-over-year operating income and earnings.
Conversely, security selection within the information technology and consumer discretionary sectors contributed to relative performance during the period. Within the information technology sector,
the Fund’s holding of Vishay Precision Group, Inc., a designer, manufacturer, and marketer of foil technology products, contributed. Shares of Vishay rose following its first quarter 2018 financial results, which surpassed analyst estimates, with 2018 fiscal year revenue guidance raised by management. Additionally, the Fund’s position in Plantronics, Inc., a manufacturer and marketer of lightweight communication headsets, contributed to relative performance. Shares of Plantronics rose following its strong fiscal year third quarter financial results in January. In addition, Plantronics agreed to purchase Polycom, Inc., a digital communications company, in March, which was expected to immediately be accretive to projected earnings, sending shares higher. Within the consumer discretionary sector, the Fund’s holding of Oxford Industries, Inc., an international apparel design, sourcing, and marketing company, was a contributor to relative performance. Shares of Oxford rose following third quarter earnings, with earnings per share that surpassed analyst estimates.
Each Fund’s portfolio is actively managed and, therefore, its holdings and the weightings of a particular issuer or particular sector as a percentage of portfolio assets are subject to change. Sectors may include many industries.
4
1 The Russell Microcap® Growth Index measures the performance of those Russell Microcap companies with higher price-to-book ratios and higher forecasted growth values.
2 The S&P 500® Index is widely regarded as the standard for measuring large cap U.S. stock market performance and includes a representative sample of leading companies in leading industries.
3 The Russell 2000® Index measures the performance of the 2,000 smallest companies in the Russell 3000® Index, which represents approximately 10% of the total market capitalization of the Russell 3000® Index.
4 The Russell Microcap® Value Index measures the performance of those Russell Microcap Index companies with lower price-to-book ratios and lower forecasted growth values.
Unless otherwise specified, indexes reflect total return, with all dividends reinvested. Indexes are unmanaged, do not reflect the deduction of fees or expenses, and are not available for direct investment.
Important Performance and Other Information
Performance data quoted in the following pages reflect past performance and are no guarantee of future results. Current performance may be higher or lower than the performance quoted. The investment return and principal value of an investment in the Funds will fluctuate so that shares, on any given day or when redeemed, may be worth more or less than their original cost. You can obtain performance data current to the most
recent month end by calling Lord Abbett at 888-522-2388 or referring to www.lordabbett.com.
Except where noted, comparative Fund performance does not account for the deduction of sales charges and would be different if sales charges were included. Each Fund offers classes of shares with distinct pricing options. For a full description of the differences in pricing alternatives, please see each Fund’s prospectus.
The annual commentary above discusses the views of the Funds’ management and various portfolio holdings of the Funds as of October 31, 2018. These views and portfolio holdings may have changed after this date. Information provided in the commentary is not a recommendation to buy or sell securities. Because each Fund’s portfolio is actively managed and may change significantly, the Funds may no longer own the securities described above or may have otherwise changed their positions in the securities. For more recent information about the Funds’ portfolio holdings, please visit www.lordabbett.com.
A Note about Risk: See Notes to Financial Statements for a discussion of investment risks. For a more detailed discussion of the risks associated with each Fund, please see each Fund’s prospectus.
Mutual funds are not insured by the FDIC, are not deposits or other obligations of, or guaranteed by, banks, and are subject to investment risks including possible loss of principal amount invested.
5
Micro Cap Growth Fund
Investment Comparison
Below is a comparison of a $10,000 investment in Class A shares with the same investment in the Russell Microcap® Growth Index and the Russell Microcap® Index, assuming reinvestment of all dividends and distributions. The performance of the other class will be greater than or less than the performance shown in the graph below due to different sales loads and expenses applicable to such class. The graph and performance table below do not reflect the deduction of taxes that a shareholder would pay on Fund distributions or the redemption of Fund shares. During certain periods, expenses of the Fund have been waived or reimbursed by Lord Abbett; without such waiver or reimbursement of expenses, the Fund’s returns would have been lower. Past performance is no guarantee of future results.
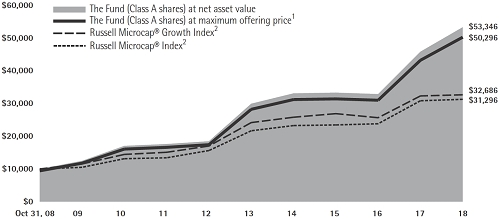
Average Annual Total Returns at Maximum Applicable
Sales Charge for the Periods Ended October 31, 2018
| | | 1 Year | | 5 Years | | 10 Years | |
| Class A3 | | | 9.66 | % | | | 10.91 | % | | | 17.53 | % | |
| Class I4 | | | 16.31 | % | | | 12.24 | % | | | 18.35 | % | |
1 Reflects the deduction of the maximum initial sales charge of 5.75%.
2 Performance for each unmanaged index does not reflect any fees or expenses. The performance of each index is not necessarily representative of the Fund’s performance.
3 Total return, which is the percent change in net asset value, after deduction of the maximum initial sales charge of 5.75%
applicable to Class A shares, with all dividends and distributions reinvested for the periods shown ended October 31, 2018, is calculated using the SEC required uniform method to compute such return.
4 Performance is at net asset value.
6
Micro Cap Value Fund
Investment Comparison
Below is a comparison of a $10,000 investment in Class A shares with the same investment in the Russell Microcap® Value Index and the Russell Microcap® Index, assuming reinvestment of all dividends and distributions. The performance of the other class will be greater than or less than the performance shown in the graph below due to different sales loads and expenses applicable to such class. The graph and performance table below do not reflect the deduction of taxes that a shareholder would pay on Fund distributions or the redemption of Fund shares. During certain periods, expenses of the Fund have been waived or reimbursed by Lord Abbett; without such waiver or reimbursement of expenses, the Fund’s returns would have been lower. Past performance is no guarantee of future results.
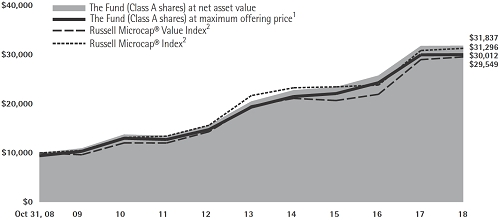
Average Annual Total Returns at Maximum Applicable
Sales Charge for the Periods Ended October 31, 2018
| | | 1 Year | | 5 Years | | 10 Years | |
| Class A3 | | | -5.65 | % | | | 7.91 | % | | | 11.62 | % | |
| Class I4 | | | 0.10 | % | | | 9.20 | % | | | 12.40 | % | |
1 Reflects the deduction of the maximum initial sales charge of 5.75%.
2 Performance for each unmanaged index does not reflect any fees or expenses. The performance of each index is not necessarily representative of the Fund’s performance.
3 Total return, which is the percent change in net asset value, after deduction of the maximum initial sales charge of 5.75% applicable to Class A shares, with all dividends and distributions reinvested for the periods shown ended October 31, 2018, is calculated using the SEC required uniform method to compute such return.
4 Performance is at net asset value.
7
Expense Example
As a shareholder of a Fund, you incur two types of costs: (1) transaction costs, including sales charges (loads) on purchase payments (these charges vary among the share classes); and (2) ongoing costs, including management fees; distribution and service (12b-1) fees (these charges vary among the share classes); and other Fund expenses. This Example is intended to help you understand your ongoing costs (in dollars) of investing in the Funds and to compare these costs with the ongoing costs of investing in other mutual funds.
The Example is based on an investment of $1,000 invested at the beginning of the period and held for the entire period (May 1, 2018 through October 31, 2018).
Actual Expenses
For each class of each Fund, the first line of the tables on the following pages provides information about actual account values and actual expenses. You may use the information in this line, together with the amount you invested, to estimate the expenses that you paid over the period. Simply divide your account value by $1,000 (for example, an $8,600 account value divided by $1,000 = 8.6), then multiply the result by the number in the first line under the heading titled “Expenses Paid During Period 5/1/18 – 10/31/18” to estimate the expenses you paid on your account during this period.
Hypothetical Example for Comparison Purposes
For each class of each Fund, the second line of the tables on the following pages provides information about hypothetical account values and hypothetical expenses based on the Fund’s actual expense ratio and an assumed rate of return of 5% per year before expenses, which is not each Fund’s actual return. The hypothetical account values and expenses may not be used to estimate the actual ending account balance or expenses you paid for the period. You may use this information to compare the ongoing costs of investing in each Fund and other funds. To do so, compare this 5% hypothetical example with the 5% hypothetical examples that appear in the shareholder reports of the other funds.
8
Micro Cap Growth Fund
Please note that the expenses shown in the table are meant to highlight your ongoing costs only and do not reflect any transactional costs, such as sales charges (loads). Therefore, the second line of the table is useful in comparing ongoing costs only, and will not help you determine the relative total costs of owning different funds. In addition, if these transactional costs were included, your costs would have been higher.
| | | Beginning
Account
Value | | Ending
Account
Value | | Expenses
Paid During
Period† | |
| | | 5/1/18 | | 10/31/18 | | 5/1/18 -
10/31/18 | |
| Class A | | | | | | | |
| Actual | | $1,000.00 | | $1,042.10 | | $8.39 | |
| Hypothetical (5% Return Before Expenses) | | $1,000.00 | | $1,016.99 | | $8.29 | |
| Class I | | | | | | | |
| Actual | | $1,000.00 | | $1,042.00 | | $8.39 | |
| Hypothetical (5% Return Before Expenses) | | $1,000.00 | | $1,016.99 | | $8.29 | |
| † | For each class of the Fund, net expenses are equal to the annualized expense ratio for such class (1.63% for Classes A and I) multiplied by the average account value over the period, multiplied by 184/365 (to reflect one-half year period). |
Portfolio Holdings Presented by Sector
October 31, 2018
| Sector* | | %** |
| Communication Services | | | 1.74 | % |
| Consumer Discretionary | | | 7.18 | % |
| Consumer Staples | | | 3.40 | % |
| Energy | | | 0.95 | % |
| Financials | | | 8.14 | % |
| Health Care | | | 35.86 | % |
| Industrials | | | 11.21 | % |
| Information Technology | | | 26.13 | % |
| Materials | | | 0.70 | % |
| Repurchase Agreement | | | 4.69 | % |
| Total | | | 100.00 | % |
| | | |
| * | | A sector may comprise several industries. |
| ** | | Represents percent of total investments. |
9
Micro Cap Value Fund
Please note that the expenses shown in the table are meant to highlight your ongoing costs only and do not reflect any transactional costs, such as sales charges (loads). Therefore, the second line of the table is useful in comparing ongoing costs only, and will not help you determine the relative total costs of owning different funds. In addition, if these transactional costs were included, your costs would have been higher.
| | | Beginning
Account
Value | | Ending
Account
Value | | Expenses
Paid During
Period† | |
| | | 5/1/18 | | 10/31/18 | | 5/1/18 -
10/31/18 | |
| Class A | | | | | | | |
| Actual | | $1,000.00 | | $971.20 | | | $8.10 | |
| Hypothetical (5% Return Before Expenses) | | $1,000.00 | | $1,016.99 | | | $8.29 | |
| Class I | | | | | | | |
| Actual | | $1,000.00 | | $971.50 | | | $8.10 | |
| Hypothetical (5% Return Before Expenses) | | $1,000.00 | | $1,016.99 | | | $8.29 | |
| | |
| † | For each class of the Fund, net expenses are equal to the annualized expense ratio for such class (1.63% for Classes A and I) multiplied by the average account value over the period, multiplied by 184/365 (to reflect one-half year period). |
Portfolio Holdings Presented by Sector
October 31, 2018
| Sector* | | %** |
| Communication Services | | | 2.93 | % |
| Consumer Discretionary | | | 8.92 | % |
| Consumer Staples | | | 4.51 | % |
| Energy | | | 1.29 | % |
| Financials | | | 22.28 | % |
| Health Care | | | 5.23 | % |
| Industrials | | | 27.75 | % |
| Information Technology | | | 8.49 | % |
| Materials | | | 5.69 | % |
| Real Estate | | | 2.22 | % |
| Utilities | | | 7.62 | % |
| Repurchase Agreement | | | 3.07 | % |
| Total | | | 100.00 | % |
| | | |
| * | | A sector may comprise several industries. |
| ** | | Represents percent of total investments. |
10
Schedule of Investments
MICRO CAP GROWTH FUND October 31, 2018
| | | | | | Fair | |
| | | | | | Value | |
| Investments | | Shares | | | (000) | |
| COMMON STOCKS 94.97% | | | | | | | | |
| | | | | | | | | |
| Aerospace & Defense 1.93% | | | | | | | | |
| Aerovironment, Inc.* | | | 31,150 | | | $ | 2,803 | |
| | | | | | | | | |
| Air Freight & Logistics 2.26% | | | | | | | | |
| Air Transport Services Group, Inc.* | | | 57,951 | | | | 1,136 | |
| Echo Global Logistics, Inc.* | | | 83,757 | | | | 2,153 | |
| Total | | | | | | | 3,289 | |
| | | | | | | | | |
| Banks 4.54% | | | | | | | | |
| Bridge Bancorp, Inc. | | | 28,638 | | | | 850 | |
| Bryn Mawr Bank Corp. | | | 34,117 | | | | 1,363 | |
| Byline Bancorp, Inc.* | | | 90,301 | | | | 1,987 | |
| CenterState Bank Corp. | | | 56,092 | | | | 1,379 | |
| Heritage Commerce Corp. | | | 70,538 | | | | 1,023 | |
| Total | | | | | | | 6,602 | |
| | | | | | | | | |
| Beverages 1.53% | | | | | | | | |
| MGP Ingredients, Inc. | | | 31,256 | | | | 2,224 | |
| | | | | | | | | |
| Biotechnology 16.13% | | | | | | | | |
| Arcus Biosciences, Inc.* | | | 63,473 | | | | 638 | |
| Arena Pharmaceuticals, Inc.* | | | 21,996 | | | | 784 | |
| Audentes Therapeutics, Inc.* | | | 85,869 | | | | 2,421 | |
| CareDx, Inc.* | | | 94,621 | | | | 2,471 | |
| Deciphera Pharmaceuticals,Inc.* | | | 60,714 | | | | 1,226 | |
| Denali Therapeutics, Inc.* | | | 122,916 | | | | 1,779 | |
| Homology Medicines, Inc.* | | | 78,157 | | | | 1,471 | |
| Intellia Therapeutics, Inc.* | | | 48,725 | | | | 827 | |
| Mirati Therapeutics, Inc.* | | | 50,782 | | | | 1,898 | |
| Myovant Sciences Ltd. (United Kingdom)*(a) | | | 155,752 | | | | 3,275 | |
| Nightstar Therapeutics PLC ADR* | | | 53,956 | | | | 545 | |
| Repligen Corp.* | | | 26,432 | | | | 1,433 | |
| Rocket Pharmaceuticals, Inc.* | | | 85,277 | | | | 1,351 | |
| Spark Therapeutics, Inc.* | | | 12,697 | | | | 571 | |
| Surface Oncology, Inc.* | | | 99,534 | | | | 777 | |
| uniQure NV (Netherlands)*(a) | | | 28,912 | | | | 744 | |
| | | | | | Fair | |
| | | | | | Value | |
| Investments | | Shares | | | (000) | |
| Xencor, Inc.* | | | 37,364 | | | $ | 1,223 | |
| Total | | | | | | | 23,434 | |
| | | | | | | | | |
| Capital Markets 0.52% | | | | | | | | |
| Hamilton Lane, Inc. Class A | | | 19,718 | | | | 757 | |
| | | | | | | | | |
| Communications Equipment 3.00% | | | | | | | | |
| Comtech Telecommunications Corp. | | | 83,302 | | | | 2,326 | |
| Quantenna Communications, Inc.* | | | 113,586 | | | | 2,040 | |
| Total | | | | | | | 4,366 | |
| | | | | | | | | |
| Construction & Engineering 3.10% | | | | | | | | |
| NV5 Global, Inc.* | | | 57,611 | | | | 4,498 | |
| | | | | | | | | |
| Electronic Equipment, Instruments & Components 3.51% | | | | | |
| Control4 Corp.* | | | 71,945 | | | | 2,009 | |
| OSI Systems, Inc.* | | | 23,069 | | | | 1,595 | |
| Vishay Precision Group, Inc.* | | | 45,940 | | | | 1,491 | |
| Total | | | | | | | 5,095 | |
| | | | | | | | | |
| Energy Equipment & Services 0.95% | | | | | | | | |
| Solaris Oilfield Infrastructure, Inc. Class A* | | | 104,908 | | | | 1,385 | |
| | | | | | | | | |
| Food & Staples Retailing 1.86% | | | | | | | | |
| Chefs’ Warehouse, Inc. (The)* | | | 80,418 | | | | 2,704 | |
| | | | | | | | | |
| Health Care Equipment & Supplies 15.07% | | | | | |
| AxoGen, Inc.* | | | 20,378 | | | | 760 | |
| ElectroCore LLC* | | | 42,434 | | | | 426 | |
| Glaukos Corp.* | | | 50,780 | | | | 2,942 | |
| iRhythm Technologies, Inc.* | | | 50,761 | | | | 3,922 | |
| Neuronetics, Inc.* | | | 81,802 | | | | 2,084 | |
| Sientra, Inc.* | | | 128,366 | | | | 2,643 | |
| Tactile Systems Technology, Inc.* | | | 75,728 | | | | 4,959 | |
| Tandem Diabetes Care, Inc.* | | | 110,911 | | | | 4,171 | |
| Total | | | | | | | 21,907 | |
| | See Notes to Financial Statements. | 11 |
Schedule of Investments (continued)
MICRO CAP GROWTH FUND October 31, 2018
| | | | | | Fair | |
| | | | | | Value | |
| Investments | | Shares | | | (000) | |
| Health Care Providers & Services 1.50% | | | | | |
| PetIQ, Inc.* | | | 69,043 | | | $ | 2,186 | |
| | | | | | | | | |
| Health Care Technology 1.29% | | | | | | | | |
| Inspire Medical Systems, Inc.* | | | 46,607 | | | | 1,868 | |
| | | | | | | | | |
| Household Durables 2.02% | | | | | | | | |
| LGI Homes, Inc.* | | | 27,889 | | | | 1,194 | |
| Lovesac Co. (The)* | | | 91,720 | | | | 1,746 | |
| Total | | | | | | | 2,940 | |
| | | | | | | | | |
| Information Technology Services 2.17% | | | | | |
| Carbonite, Inc.* | | | 50,773 | | | | 1,737 | |
| Endava PLC ADR* | | | 61,158 | | | | 1,422 | |
| Total | | | | | | | 3,159 | |
| | | | | | | | | |
| Insurance 3.05% | | | | | | | | |
| Goosehead Insurance, Inc. Class A* | | | 68,481 | | | | 2,348 | |
| Trupanion, Inc.* | | | 82,356 | | | | 2,080 | |
| Total | | | | | | | 4,428 | |
| | | | | | | | | |
| Interactive Media & Services 1.73% | | | | | | | | |
| Care.com, Inc.* | | | 143,017 | | | | 2,517 | |
| | | | | | | | | |
| Internet & Direct Marketing Retail 1.01% | | | | | |
| Gaia, Inc.* | | | 100,301 | | | | 1,465 | |
| | | | | | | | | |
| Leisure Products 2.74% | | | | | | | | |
| Malibu Boats, Inc. Class A* | | | 98,992 | | | | 3,979 | |
| | | | | | | | | |
| Machinery 1.84% | | | | | | | | |
| DMC Global, Inc. | | | 38,782 | | | | 1,495 | |
| Kornit Digital Ltd. (Israel)*(a) | | | 63,729 | | | | 1,176 | |
| Total | | | | | | | 2,671 | |
| | | | | | | | | |
| Metals & Mining 0.70% | | | | | | | | |
| Universal Stainless & Alloy Products, Inc.* | | | 51,734 | | | | 1,016 | |
| | | | | | | | | |
| Pharmaceuticals 1.74% | | | | | | | | |
| MyoKardia, Inc.* | | | 47,792 | | | | 2,530 | |
| | | | | | Fair | |
| | | | | | Value | |
| Investments | | Shares | | | (000) | |
| Professional Services 2.04% | | | | | | | | |
| Upwork, Inc.* | | | 73,019 | | | $ | 1,402 | |
| Willdan Group, Inc.* | | | 51,948 | | | | 1,569 | |
| Total | | | | | | | 2,971 | |
| | | | | | | | | |
| Semiconductors & Semiconductor Equipment 1.28% | | | | | |
| Aquantia Corp.* | | | 101,193 | | | | 967 | |
| CEVA, Inc.* | | | 17,331 | | | | 427 | |
| Ichor Holdings Ltd.* | | | 25,997 | | | | 462 | |
| Total | | | | | | | 1,856 | |
| | | | | | | | | |
| Software 16.08% | | | | | | | | |
| 8x8, Inc.* | | | 92,030 | | | | 1,582 | |
| Alteryx, Inc. Class A* | | | 22,971 | | | | 1,217 | |
| Appfolio, Inc. Class A* | | | 19,002 | | | | 1,085 | |
| Appian Corp.* | | | 68,918 | | | | 1,772 | |
| Apptio, Inc. Class A* | | | 63,392 | | | | 1,642 | |
| Everbridge, Inc.* | | | 81,725 | | | | 4,154 | |
| Five9, Inc.* | | | 48,294 | | | | 1,901 | |
| Mimecast Ltd.* | | | 23,248 | | | | 811 | |
| SendGrid, Inc.* | | | 94,313 | | | | 3,426 | |
| SVMK, Inc.* | | | 90,783 | | | | 972 | |
| Talend SA ADR* | | | 48,060 | | | | 2,977 | |
| Upland Software, Inc.* | | | 57,873 | | | | 1,825 | |
| Total | | | | | | | 23,364 | |
| | | | | | | | | |
| Specialty Retail 1.38% | | | | | | | | |
| At Home Group, Inc.* | | | 73,481 | | | | 2,009 | |
Total Common Stocks
(cost $114,722,083) | | | | | | | 138,023 | |
| 12 | See Notes to Financial Statements. |
Schedule of Investments (concluded)
MICRO CAP GROWTH FUND October 31, 2018
| | | Principal | | | Fair | |
| | | Amount | | | Value | |
| Investments | | (000) | | | (000) | |
| SHORT-TERM INVESTMENT 4.67% | | | | | | | | |
| | | | | | | | | |
| Repurchase Agreement | | | | | | | | |
Repurchase Agreement dated 10/31/2018, 1.25% due 11/1/2018 with Fixed Income Clearing Corp. collateralized by $6,900,000 of U.S. Treasury Note at 2.625% due 6/15/2021; value: $6,923,840; proceeds: $6,787,868
(cost $6,787,633) | | $ | 6,788 | | | $ | 6,788 | |
Total Investments in Securities 99.64%
(cost $121,509,716) | | | | | | | 144,811 | |
| Other Assets in Excess of Liabilities 0.36% | | | | | | | 523 | |
| Net Assets 100.00% | | | | | | $ | 145,334 | |
| ADR | | American Depositary Receipt. |
| | | |
| * | | Non-income producing security. |
| (a) | | Foreign security traded in U.S. dollars. |
The following is a summary of the inputs used as of October 31, 2018 in valuing the Fund’s investments carried at fair value(1):
| | | Level 1 | | | Level 2 | | | Level 3 | | | Total |
| Investment Type(2)(3) | | (000) | | | (000) | | | (000) | | | (000) |
| Common Stocks | | $ | 138,023 | | | $ | – | | | $ | – | | | $ | 138,023 |
| Short-Term Investment | | | | | | | | | | | | | | | |
| Repurchase Agreement | | | – | | | | 6,788 | | | | – | | | | 6,788 |
| Total | | $ | 138,023 | | | $ | 6,788 | | | $ | – | | | $ | 144,811 |
| (1) | | Refer to Note 2(g) for a description of fair value measurements and the three-tier hierarchy of inputs. |
| (2) | | See Schedule of Investments for fair values in each industry and identification of foreign issuers and/or geography. |
| (3) | | There were no Level 1/Level 2 transfers during the fiscal year ended October 31, 2018. |
| | See Notes to Financial Statements. | 13 |
Schedule of Investments
MICRO CAP VALUE FUND October 31, 2018
| | | | | | Fair | |
| | | | | | Value | |
| Investments | | Shares | | | (000) | |
| COMMON STOCKS 97.46% | | | | | | | | |
| | | | | | | | | |
| Banks 14.84% | | | | | | | | |
| Ameris Bancorp | | | 30,574 | | | $ | 1,311 | |
| CenterState Bank Corp. | | | 97,834 | | | | 2,405 | |
| FB Financial Corp. | | | 118,537 | | | | 4,324 | |
| First Merchants Corp. | | | 44,421 | | | | 1,848 | |
| National Commerce Corp.* | | | 143,441 | | | | 5,322 | |
| Seacoast Banking Corp. of Florida* | | | 175,434 | | | | 4,616 | |
| Total | | | | | | | 19,826 | |
| | | | | | | | | |
| Beverages 4.53% | | | | | | | | |
| Cott Corp. | | | 402,730 | | | | 6,057 | |
| | | | | | | | | |
| Building Products 5.24% | | | | | | | | |
| Advanced Drainage Systems, Inc. | | | 79,505 | | | | 2,209 | |
| Gibraltar Industries, Inc.* | | | 134,393 | | | | 4,790 | |
| Total | | | | | | | 6,999 | |
| | | | | | | | | |
| Chemicals 2.40% | | | | | | | | |
| Chase Corp. | | | 29,705 | | | | 3,203 | |
| | | | | | | | | |
| Commercial Services & Supplies 3.29% | | | | | |
| SP Plus Corp.* | | | 137,584 | | | | 4,397 | |
| | | | | | | | | |
| Communications Equipment 2.40% | | | | | | | | |
| Plantronics, Inc. | | | 54,370 | | | | 3,206 | |
| | | | | | | | | |
| Construction & Engineering 3.51% | | | | | | | | |
| Primoris Services Corp. | | | 221,666 | | | | 4,693 | |
| | | | | | | | | |
| Consumer Finance 3.02% | | | | | | | | |
| EZCORP, Inc. Class A* | | | 405,305 | | | | 4,029 | |
| | | | | | | | | |
| Electronic Equipment, Instruments & Components 2.56% | | | | | |
| Vishay Precision Group, Inc.* | | | 105,580 | | | | 3,426 | |
| | | | | | | | | |
| Entertainment 2.95% | | | | | | | | |
| IMAX Corp. (Canada)*(a) | | | 203,557 | | | | 3,941 | |
| | | | | | Fair | |
| | | | | | Value | |
| Investments | | Shares | | | (000) | |
| Equity Real Estate Investment Trusts 2.23% | | | | | |
| Innovative Industrial Properties, Inc. | | | 72,611 | | | $ | 2,976 | |
| | | | | | | | | |
| Gas Utilities 4.30% | | | | | | | | |
| Chesapeake Utilities Corp. | | | 72,340 | | | | 5,748 | |
| | | | | | | | | |
| Hotels, Restaurants & Leisure 6.49% | | | | | | | | |
| Century Casinos, Inc.* | | | 708,166 | | | | 4,419 | |
| Denny’s Corp.* | | | 245,438 | | | | 4,258 | |
| Total | | | | | | | 8,677 | |
| | | | | | | | | |
| Insurance 4.55% | | | | | | | | |
| Argo Group International Holdings Ltd. | | | 71,055 | | | | 4,378 | |
| Goosehead Insurance, Inc. Class A* | | | 49,687 | | | | 1,703 | |
| Total | | | | | | | 6,081 | |
| | | | | | | | | |
| Life Sciences Tools & Services 5.26% | | | | | |
| Cambrex Corp.* | | | 71,091 | | | | 3,789 | |
| Codexis, Inc.* | | | 207,978 | | | | 3,238 | |
| Total | | | | | | | 7,027 | |
| | | | | | | | | |
| Machinery 10.55% | | | | | | | | |
| Blue Bird Corp.* | | | 152,443 | | | | 2,837 | |
| Columbus McKinnon Corp. | | | 90,322 | | | | 3,318 | |
| Federal Signal Corp. | | | 219,441 | | | | 4,825 | |
| Milacron Holdings Corp.* | | | 222,812 | | | | 3,119 | |
| Total | | | | | | | 14,099 | |
| | | | | | | | | |
| Oil, Gas & Consumable Fuels 1.30% | | | | | | | | |
| Centennial Resource Development, Inc. Class A* | | | 90,481 | | | | 1,734 | |
| | | | | | | | | |
| Paper & Forest Products 3.32% | | | | | | | | |
| Neenah, Inc. | | | 55,187 | | | | 4,440 | |
| | | | | | | | | |
| Professional Services 1.78% | | | | | | | | |
| ICF International, Inc. | | | 32,346 | | | | 2,382 | |
| | | | | | | | | |
| Semiconductors & Semiconductor Equipment 1.50% | | | | | |
| Brooks Automation, Inc. | | | 64,642 | | | | 2,006 | |
| 14 | See Notes to Financial Statements. |
Schedule of Investments (concluded)
MICRO CAP VALUE FUND October 31, 2018
| | | | | | Fair | |
| | | | | | Value | |
| Investments | | Shares | | | (000) | |
| Software 2.07% | | | | | | | | |
| Telaria, Inc.* | | | 945,283 | | | $ | 2,770 | |
| | | | | | | | | |
| Textiles, Apparel & Luxury Goods 2.48% | | | | | |
| Oxford Industries, Inc. | | | 37,175 | | | | 3,308 | |
| | | | | | | | | |
| Trading Companies & Distributors 3.53% | | | | | |
| Lawson Products, Inc.* | | | 142,476 | | | | 4,710 | |
| | | | | | | | | |
| Water Utilities 3.36% | | | | | | | | |
| Connecticut Water Service, Inc. | | | 65,000 | | | | 4,493 | |
Total Common Stocks
(cost $110,087,422) | | | | | | | 130,228 | |
| | | Principal | | | Fair | |
| | | Amount | | | Value | |
| Investments | | (000) | | | (000) | |
| SHORT-TERM INVESTMENT 3.09% | | | | | | | | |
| | | | | | | | | |
| Repurchase Agreement | | | | | | | | |
Repurchase Agreement dated 10/31/2018, 1.25% due 11/1/2018 with Fixed Income Clearing Corp. collateralized by $4,195,000 of U.S. Treasury Note at 2.625% due 6/15/2021; value: $4,209,494; proceeds: $4,126,194
(cost $4,126,051) | | $ | 4,126 | | | $ | 4,126 | |
Total Investments in Securities 100.55%
(cost $114,213,473) | | | | | | | 134,354 | |
| Liabilities in Excess of Other Assets (0.55)% | | | | | | | (736 | ) |
| Net Assets 100.00% | | | | | | $ | 133,618 | |
| * | | Non-income producing security. |
| (a) | | Foreign security traded in U.S. dollars. |
The following is a summary of the inputs used as of October 31, 2018 in valuing the Fund’s investments carried at fair value(1):
| | | Level 1 | | | Level 2 | | | Level 3 | | | Total |
| Investment Type(2)(3) | | (000) | | | (000) | | | (000) | | | (000) |
| Common Stocks | | $ | 130,228 | | | $ | – | | | $ | – | | | $ | 130,228 |
| Short-Term Investment | | | | | | | | | | | | | | | |
| Repurchase Agreement | | | – | | | | 4,126 | | | | – | | | | 4,126 |
| Total | | $ | 130,228 | | | $ | 4,126 | | | $ | – | | | $ | 134,354 |
| (1) | | Refer to Note 2(g) for a description of fair value measurements and the three-tier hierarchy of inputs. |
| (2) | | See Schedule of Investments for fair values in each industry and identification of foreign issuers and/or geography. |
| (3) | | There were no Level 1/Level 2 transfers during the fiscal year ended October 31, 2018. |
| | See Notes to Financial Statements. | 15 |
Statements of Assets and Liabilities
October 31, 2018
| | | Micro Cap | | | Micro Cap | |
| | | Growth Fund | | | Value Fund | |
| ASSETS: | | | | | | |
| Investments in securities, at cost | | $ | 121,509,716 | | | $ | 114,213,473 | |
| Investments in securities, at fair value | | $ | 144,811,360 | | | $ | 134,353,788 | |
| Receivables: | | | | | | | | |
| Investment securities sold | | | 1,603,659 | | | | 571,187 | |
| Interest and dividends | | | 17,047 | | | | 22,265 | |
| Capital shares sold | | | 2,397 | | | | – | |
| Prepaid expenses | | | 6,844 | | | | 14,679 | |
| Total assets | | | 146,441,307 | | | | 134,961,919 | |
| LIABILITIES: | | | | | | | | |
| Payables: | | | | | | | | |
| Investment securities purchased | | | 840,931 | | | | 1,101,387 | |
| Management fee | | | 195,834 | | | | 175,932 | |
| Trustees’ fees | | | 20,177 | | | | 21,339 | |
| Fund administration | | | 5,222 | | | | 4,692 | |
| Accrued expenses | | | 44,732 | | | | 40,337 | |
| Total liabilities | | | 1,106,896 | | | | 1,343,687 | |
| NET ASSETS | | $ | 145,334,411 | | | $ | 133,618,232 | |
| COMPOSITION OF NET ASSETS: | | | | | | | | |
| Paid-in capital | | $ | 87,059,126 | | | $ | 96,092,491 | |
| Total distributable earnings | | | 58,275,285 | | | | 37,525,741 | |
| Net Assets | | $ | 145,334,411 | | | $ | 133,618,232 | |
| Net assets by class: | | | | | | | | |
| Class A Shares | | $ | 11,615,786 | | | $ | 6,381,793 | |
| Class I Shares | | $ | 133,718,625 | | | $ | 127,236,439 | |
Outstanding shares by class
(unlimited number of authorized shares of beneficial interest) | | | | | | | | |
| Class A Shares | | | 643,680 | | | | 219,876 | |
| Class I Shares | | | 6,739,949 | | | | 4,153,273 | |
Net asset value, offering and redemption price per share
(Net assets divided by outstanding shares): | | | | | | | | |
| Class A Shares-Net asset value | | | $18.05 | | | | $29.02 | |
Class A Shares-Maximum offering price
(Net asset value plus sales charge of 5.75%) | | | $19.15 | | | | $30.79 | |
| Class I Shares-Net asset value | | | $19.84 | | | | $30.64 | |
| | |
| 16 | See Notes to Financial Statements. |
Statements of Operations
For the Year Ended October 31, 2018
| | | Micro Cap | | | Micro Cap | |
| | | Growth Fund | | | Value Fund | |
| Investment income: | | | | | | | | |
| Dividends (net of foreign withholding taxes of $0 and $14,498, respectively) | | $ | 299,676 | | | $ | 865,893 | |
| Interest | | | 26,384 | | | | 22,473 | |
| Total investment income | | | 326,060 | | | | 888,366 | |
| Expenses: | | | | | | | | |
| Management fee | | | 2,381,613 | | | | 2,177,554 | |
| Fund administration | | | 63,510 | | | | 58,068 | |
| Professional | | | 45,355 | | | | 44,234 | |
| Registration | | | 36,452 | | | | 36,452 | |
| Shareholder servicing | | | 23,740 | | | | 14,255 | |
| Custody | | | 13,534 | | | | 6,478 | |
| Reports to shareholders | | | 9,826 | | | | 9,469 | |
| Trustees’ fees | | | 4,180 | | | | 3,855 | |
| Other | | | 16,569 | | | | 16,451 | |
| Gross expenses | | | 2,594,779 | | | | 2,366,816 | |
| Expense reductions (See Note 8) | | | (839 | ) | | | (598 | ) |
| Net expenses | | | 2,593,940 | | | | 2,366,218 | |
| Net investment loss | | | (2,267,880 | ) | | | (1,477,852 | ) |
| Net realized and unrealized gain (loss): | | | | | | | | |
| Net realized gain on investments | | | 39,679,742 | | | | 20,134,344 | |
| Net change in unrealized appreciation/depreciation on investments | | | (12,896,470 | ) | | | (18,068,767 | ) |
| Net realized and unrealized gain | | | 26,783,272 | | | | 2,065,577 | |
| Net Increase in Net Assets Resulting From Operations | | $ | 24,515,392 | | | $ | 587,725 | |
| | | |
| | See Notes to Financial Statements. | 17 |
Statements of Changes in Net Assets
| | | Micro Cap Growth Fund |
| | | For the Year Ended | | | For the Year Ended | |
| INCREASE (DECREASE) IN NET ASSETS | | October 31, 2018 | | | October 31, 2017 | |
| Operations: | | | | | | | | |
| Net investment loss | | $ | (2,267,880 | ) | | $ | (1,990,537 | ) |
| Net realized gain on investments | | | 39,679,742 | | | | 34,042,439 | |
| Net change in unrealized appreciation/depreciation on investments | | | (12,896,470 | ) | | | 16,745,417 | |
| Net increase in net assets resulting from operations | | | 24,515,392 | | | | 48,797,319 | |
| Distributions to shareholders: | | | | | | | | |
| Class A | | | (1,459,298 | ) | | | – | |
| Class I | | | (18,958,027 | ) | | | – | |
| Total distributions to shareholders | | | (20,417,325 | ) | | | – | |
| Capital share transactions (See Note 13): | | | | | | | | |
| Net proceeds from sales of shares | | | 5,175,591 | | | | 3,753,376 | |
| Reinvestment of distributions | | | 18,669,859 | | | | – | |
| Cost of shares reacquired | | | (31,570,439 | ) | | | (44,117,410 | ) |
| Net decrease in net assets resulting from capital share transactions | | | (7,724,989 | ) | | | (40,364,034 | ) |
| Net increase (decrease) in net assets | | | (3,626,922 | ) | | | 8,433,285 | |
| NET ASSETS: | | | | | | | | |
| Beginning of year | | $ | 148,961,333 | | | $ | 140,528,048 | |
| End of year | | $ | 145,334,411 | | | $ | 148,961,333 | |
| Undistributed net investment income(1) | | $ | – | | | $ | – | |
| (1) | The SEC eliminated the requirement to disclose undistributed (distributions in excess of) net investment income in 2018. For the year ended October 31, 2017, the undistributed net investment income was $(1,605,397). |
| | |
| 18 | See Notes to Financial Statements. |
Statements of Changes in Net Assets (concluded)
| | | Micro Cap Value Fund |
| | | For the Year Ended | | | For the Year Ended | |
| INCREASE (DECREASE) IN NET ASSETS | | October 31, 2018 | | | October 31, 2017 | |
| Operations: | | | | | | | | |
| Net investment loss | | $ | (1,477,852 | ) | | $ | (1,149,909 | ) |
| Net realized gain on investments | | | 20,134,344 | | | | 24,577,437 | |
| Net change in unrealized appreciation/depreciation on investments | | | (18,068,767 | ) | | | 7,536,867 | |
| Net increase in net assets resulting from operations | | | 587,725 | | | | 30,964,395 | |
| Distributions to shareholders:(1) | | | | | | | | |
| Class A | | | (1,156,349 | ) | | | (1,086,361 | ) |
| Class I | | | (22,434,845 | ) | | | (22,696,813 | ) |
| Total distributions to shareholders | | | (23,591,194 | ) | | | (23,783,174 | ) |
| Capital share transactions (See Note 13): | | | | | | | | |
| Net proceeds from sales of shares | | | 3,252,887 | | | | 3,325,605 | |
| Reinvestment of distributions | | | 22,255,913 | | | | 22,147,858 | |
| Cost of shares reacquired | | | (11,437,520 | ) | | | (31,457,029 | ) |
| Net increase (decrease) in net assets resulting from capital share transactions | | | 14,071,280 | | | | (5,983,566 | ) |
| Net increase (decrease) in net assets | | | (8,932,189 | ) | | | 1,197,655 | |
| NET ASSETS: | | | | | | | | |
| Beginning of year | | $ | 142,550,421 | | | $ | 141,352,766 | |
| End of year | | $ | 133,618,232 | | | $ | 142,550,421 | |
| Undistributed net investment income(2) | | $ | – | | | $ | – | |
| (1) | The SEC eliminated the requirement to disclose the source of distributions paid on 2018. For the year ended October 31, 2017, the source of distributions was as follows:
Net realized gain – Class A $(1,086,361), Class I $(22,696,813). |
| (2) | The SEC eliminated the requirement to disclose undistributed (distributions in excess of) net investment income in 2018. For the year ended October 31, 2017, the undistributed net investment income was $(1,093,723). |
| | | |
| | See Notes to Financial Statements. | 19 |
Financial Highlights
MICRO CAP GROWTH FUND
| | | | | | Per Share Operating Performance: | | | |
| | | | | | Investment operations: | | Distributions
to
shareholders
from: | | | |
| | | Net asset
value,
beginning of
period | | Net
investment
loss(a) | | Net
realized and
unrealized
gain | | Total from
investment
operations | | Net
realized
gain | | Net asset
value,
end of
period |
| | | | | | | | | | | | | |
| Class A | | | | | | | | | | | | | | | | | | | | | | | | |
| 10/31/2018 | | | $18.26 | | | | $(0.26 | ) | | | $2.75 | | | | $ 2.49 | | | | $(2.70 | ) | | $ | 18.05 | |
| 10/31/2017 | | | 13.09 | | | | (0.21 | ) | | | 5.38 | | | | 5.17 | | | | – | | | | 18.26 | |
| 10/31/2016 | | | 16.33 | | | | (0.19 | ) | | | 0.15 | | | | (0.04 | ) | | | (3.20 | ) | | | 13.09 | |
| 10/31/2015 | | | 18.56 | | | | (0.30 | ) | | | 0.42 | | | | 0.12 | | | | (2.35 | ) | | | 16.33 | |
| 10/31/2014 | | | 22.57 | | | | (0.28 | ) | | | 2.27 | | | | 1.99 | | | | (6.00 | ) | | | 18.56 | |
| Class I | | | | | | | | | | | | | | | | | | | | | | | | |
| 10/31/2018 | | | 19.80 | | | | (0.29 | ) | | | 3.03 | | | | 2.74 | | | | (2.70 | ) | | | 19.84 | |
| 10/31/2017 | | | 14.20 | | | | (0.23 | ) | | | 5.83 | | | | 5.60 | | | | – | | | | 19.80 | |
| 10/31/2016 | | | 17.45 | | | | (0.21 | ) | | | 0.16 | | | | (0.05 | ) | | | (3.20 | ) | | | 14.20 | |
| 10/31/2015 | | | 19.67 | | | | (0.32 | ) | | | 0.45 | | | | 0.13 | | | | (2.35 | ) | | | 17.45 | |
| 10/31/2014 | | | 23.57 | | | | (0.29 | ) | | | 2.39 | | | | 2.10 | | | | (6.00 | ) | | | 19.67 | |
| (a) | Calculated using average shares outstanding during the period. |
| (b) | Total return for Class A does not consider the effects of sales loads and assumes the reinvestment of all distributions. Total return for all other classes assumes the reinvestment of all distributions. |
| 20 | See Notes to Financial Statements. |
| | | | Ratios to Average Net Assets: | | Supplemental Data: | |
| | | | | | | | | | | | | | | |
Total
return(b)
(%) | | Total
expenses
(%) | | Net
investment
loss
(%) | | Net assets,
end of
period
(000) | | Portfolio
turnover
rate
(%) | |
| | | | | | | | | | | | | | | | | | | | |
| | 16.32 | | | | 1.63 | | | | (1.43 | ) | | $ | 11,616 | | | | 73 | | |
| | 39.39 | | | | 1.67 | | | | (1.36 | ) | | | 9,893 | | | | 105 | | |
| | (1.30 | ) | | | 1.81 | | | | (1.52 | ) | | | 7,416 | | | | 161 | | |
| | 0.65 | | | | 1.80 | | | | (1.64 | ) | | | 13,280 | | | | 203 | | |
| | 10.57 | | | | 1.78 | | | | (1.50 | ) | | | 12,881 | | | | 208 | | |
| | | | | | | | | | | | | | | | | | | | |
| | 16.31 | | | | 1.63 | | | | (1.43 | ) | | | 133,719 | | | | 73 | | |
| | 39.44 | | | | 1.67 | | | | (1.36 | ) | | | 139,068 | | | | 105 | | |
| | (1.39 | ) | | | 1.81 | | | | (1.52 | ) | | | 133,112 | | | | 161 | | |
| | 0.71 | | | | 1.80 | | | | (1.63 | ) | | | 136,136 | | | | 203 | | |
| | 10.58 | | | | 1.78 | | | | (1.50 | ) | | | 156,657 | | | | 208 | | |
| | See Notes to Financial Statements. | 21 |
Financial Highlights
MICRO CAP VALUE FUND
| | | | | | Per Share Operating Performance: | | | |
| | | | | | Investment operations: | | Distributions
to
shareholders
from: | | | |
| | | Net asset
value,
beginning of
period | | Net
investment
loss(a) | | Net
realized and
unrealized
gain | | Total from
investment
operations | | Net
realized
gain | | Net asset
value,
end of
period |
| | | | | | | | | | | | | | | | | | | | | | | | | |
| Class A | | | | | | | | | | | | | | | | | | | | | | | | |
| 10/31/2018 | | | $34.92 | | | | $(0.32 | ) | | | $0.47 | | | | $0.15 | | | | $(6.05 | ) | | $ | 29.02 | |
| 10/31/2017 | | | 33.65 | | | | (0.27 | ) | | | 7.56 | | | | 7.29 | | | | (6.02 | ) | | | 34.92 | |
| 10/31/2016 | | | 31.34 | | | | (0.22 | ) | | | 3.27 | | | | 3.05 | | | | (0.74 | ) | | | 33.65 | |
| 10/31/2015 | | | 34.19 | | | | (0.26 | ) | | | 1.00 | | | | 0.74 | | | | (3.59 | ) | | | 31.34 | |
| 10/31/2014 | | | 34.74 | | | | (0.23 | ) | | | 3.84 | | | | 3.61 | | | | (4.16 | ) | | | 34.19 | |
| Class I | | | | | | | | | | | | | | | | | | | | | | | | |
| 10/31/2018 | | | 36.53 | | | | (0.33 | ) | | | 0.49 | | | | 0.16 | | | | (6.05 | ) | | | 30.64 | |
| 10/31/2017 | | | 34.95 | | | | (0.28 | ) | | | 7.88 | | | | 7.60 | | | | (6.02 | ) | | | 36.53 | |
| 10/31/2016 | | | 32.52 | | | | (0.23 | ) | | | 3.40 | | | | 3.17 | | | | (0.74 | ) | | | 34.95 | |
| 10/31/2015 | | | 35.34 | | | | (0.27 | ) | | | 1.04 | | | | 0.77 | | | | (3.59 | ) | | | 32.52 | |
| 10/31/2014 | | | 35.77 | | | | (0.26 | ) | | | 3.99 | | | | 3.73 | | | | (4.16 | ) | | | 35.34 | |
| (a) | Calculated using average shares outstanding during the period. |
| (b) | Total return for Class A does not consider the effects of sales loads and assumes the reinvestment of all distributions. Total return for all other classes assumes the reinvestment of all distributions. |
| 22 | See Notes to Financial Statements. |
| | | | Ratios to Average Net Assets: | | Supplemental Data: | |
| | | | | | | | | | | | | | | |
Total
return(b)
(%) | | Total
expenses
(%) | | Net
investment
loss
(%) | | Net assets,
end of
period
(000) | | Portfolio
turnover
rate
(%) | |
| | | | | | | | | | | | | | | | | | | | |
| | 0.11 | | | | 1.63 | | | | (1.02 | ) | | $ | 6,382 | | | | 57 | | |
| | 23.38 | | | | 1.66 | | | | (0.81 | ) | | | 6,698 | | | | 48 | | |
| | 10.00 | | | | 1.80 | | | | (0.71 | ) | | | 6,083 | | | | 52 | | |
| | 2.79 | | | | 1.79 | | | | (0.86 | ) | | | 17,198 | | | | 70 | | |
| | 11.16 | | | | 1.76 | | | | (0.68 | ) | | | 20,028 | | | | 60 | | |
| | | | | | | | | | | | | | | | | | | | |
| | 0.10 | | | | 1.63 | | | | (1.02 | ) | | | 127,236 | | | | 57 | | |
| | 23.40 | | | | 1.66 | | | | (0.80 | ) | | | 135,852 | | | | 48 | | |
| | 9.97 | | | | 1.80 | | | | (0.72 | ) | | | 135,269 | | | | 52 | | |
| | 2.81 | | | | 1.79 | | | | (0.86 | ) | | | 153,050 | | | | 70 | | |
| | 11.18 | | | | 1.77 | | | | (0.74 | ) | | | 146,813 | | | | 60 | | |
| | See Notes to Financial Statements. | 23 |
Notes to Financial Statements
Lord Abbett Securities Trust (the “Trust”) is registered under the Investment Company Act of 1940, as amended (the “Act”), as a diversified, open-end management investment company and was organized as a Delaware statutory trust on February 26, 1993. The Trust currently consists of ten funds. This report covers the following two funds (separately, a “Fund” and collectively, the “Funds”) and their respective classes: Lord Abbett Micro-Cap Growth Fund (“Micro Cap Growth Fund”), Class A and I shares and Lord Abbett Micro-Cap Value Fund (“Micro Cap Value Fund”), Class A and I shares. The investment objective of both Micro Cap Growth Fund and Micro Cap Value Fund is long-term capital appreciation.
Each class of shares has different expenses and dividends. A front-end sales charge is normally added to the net asset value (“NAV”) for Class A shares. A contingent deferred sales charge (“CDSC”) may apply to certain redemptions of Class A shares purchased without a sales charge and redeemed before the first day of the month in which the one-year anniversary of the purchase falls (subject to certain exceptions as set forth in each Fund’s prospectus). Class I shares are not subject to any sales charges.
The preparation of the financial statements in conformity with accounting principles generally accepted in the United States of America (“U.S. GAAP”) requires management to make certain estimates and assumptions that affect the reported amounts of assets and liabilities and disclosure of contingent assets and liabilities at the date of the financial statements and the reported amounts of increases and decreases in net assets from operations during the reporting period. Actual results could differ from those estimates. The Funds are considered investment companies under U.S. GAAP and follow the accounting and reporting guidance applicable to investment companies.
| 2. | SIGNIFICANT ACCOUNTING POLICIES |
| (a) | Investment Valuation–Under procedures approved by the Funds’ Board of Trustees (the “Board”), Lord, Abbett & Co. LLC (“Lord Abbett”), the Funds’ investment manager, has formed a Pricing Committee to administer the pricing and valuation of portfolio investments and to ensure that prices utilized reasonably reflect fair value. Among other things, these procedures allow the Funds to utilize independent pricing services, quotations from securities and financial instrument dealers and other market sources to determine fair value. |
| | |
| | Securities actively traded on any recognized U.S. or non-U.S. exchange or on The NASDAQ Stock Market LLC are valued at the last sale price or official closing price on the exchange or system on which they are principally traded. Events occurring after the close of trading on non-U.S. exchanges may result in adjustments to the valuation of foreign securities to reflect their fair value as of the close of regular trading on the New York Stock Exchange. Each Fund may utilize an independent fair valuation service in adjusting the valuations of foreign securities. Unlisted equity securities are valued at the last quoted sale price or, if no sale price is available, at the mean between the most recently quoted bid and asked prices. |
| | |
| | Securities for which prices are not readily available are valued at fair value as determined by the Pricing Committee. The Pricing Committee considers a number of factors, including observable and unobservable inputs, when arriving at fair value. The Pricing Committee may use related or comparable assets or liabilities, recent transactions, market multiples, book values and other relevant information to determine the fair value of portfolio investments. The Board or a designated committee thereof regularly reviews fair value determinations made by the Pricing Committee and may employ techniques such as reviewing related market activity, |
24
Notes to Financial Statements (continued)
| | reviewing inputs and assumptions, and retrospectively comparing prices of subsequent purchases and sales transactions to fair value determinations made by the Pricing Committee. |
| | |
| | Short-term securities with 60 days or less remaining to maturity are valued using the amortized cost method, which approximates fair value. |
| | |
| (b) | Security Transactions–Security transactions are recorded as of the date that the securities are purchased or sold (trade date). Realized gains and losses on sales of portfolio securities are calculated using the identified-cost method. Realized and unrealized gains (losses) are allocated to each class of shares based upon the relative proportion of net assets at the beginning of the day. |
| | |
| (c) | Investment Income–Dividend income is recorded on the ex-dividend date. Interest income is recorded on the accrual basis as earned. Discounts are accreted and premiums are amortized using the effective interest method and are included in Interest and other income on the Statements of Operations. Withholding taxes on foreign dividends have been provided for in accordance with the applicable country’s tax rules and rates. Investment income is allocated to each class of shares based upon the relative proportion of net assets at the beginning of the day. |
| | |
| (d) | Income Taxes–It is the policy of each Fund to meet the requirements of Subchapter M of the Internal Revenue Code applicable to regulated investment companies and to distribute substantially all taxable income and capital gains to its shareholders. Therefore, no income tax provision is required. |
| | |
| | Each Fund files U.S. federal and various state and local tax returns. No income tax returns are currently under examination. The statute of limitations on each Fund’s filed U.S. federal tax returns remains open for the fiscal years ended October 31, 2015 through October 31, 2018. The statutes of limitations on the Trust’s state and local tax returns may remain open for an additional year depending upon the jurisdiction. |
| | |
| (e) | Expenses–Expenses incurred by the Trust that do not specifically relate to an individual fund are generally allocated to the Funds within the Trust on a pro rata basis by relative net assets. Expenses incurred by the Funds are allocated to each class of shares based upon the relative proportion of net assets at the beginning of the day. |
| | |
| (f) | Repurchase Agreements–Each Fund may enter into repurchase agreements with respect to securities. A repurchase agreement is a transaction in which a fund acquires a security and simultaneously commits to resell that security to the seller (a bank or securities dealer) at an agreed-upon price on an agreed-upon date. Each Fund requires at all times that the repurchase agreement be collateralized by cash, or by securities of the U.S. Government, its agencies, its instrumentalities, or U.S. Government sponsored enterprises having a value equal to, or in excess of, the value of the repurchase agreement (including accrued interest). If the seller of the agreement defaults on its obligation to repurchase the underlying securities at a time when the fair value of these securities has declined, a Fund may incur a loss upon disposition of the securities. |
| | |
| (g) | Fair Value Measurements–Fair value is defined as the price that each Fund would receive upon selling an investment or transferring a liability in an orderly transaction to an independent buyer in the principal or most advantageous market of the investment. A three-tier hierarchy is used to maximize the use of observable market data and minimize the use of unobservable inputs and to establish classification of fair value measurements for disclosure purposes. Inputs refer broadly to the assumptions that market participants would use in pricing the asset or liability, including |
25
Notes to Financial Statements (continued)
| | assumptions about risk—for example, the risk inherent in a particular valuation technique used to measure fair value (such as a pricing model) and/or the risk inherent in the inputs to the valuation technique. Inputs may be observable or unobservable. Observable inputs reflect the assumptions market participants would use in pricing the asset or liability. Observable inputs are based on market data obtained from sources independent of the reporting entity. Unobservable inputs reflect the reporting entity’s own assumptions about the assumptions market participants would use in pricing the asset or liability. Unobservable inputs are based on the best information available in the circumstances. The three-tier hierarchy classification is determined based on the lowest level of inputs that is significant to the fair value measurement, and is summarized in the three broad Levels listed below: |
| | • | Level 1 – | unadjusted quoted prices in active markets for identical investments; |
| | | |
| | • | Level 2 – | other significant observable inputs (including quoted prices for similar investments, interest rates, prepayment speeds, credit risk, etc.); and |
| | | |
| | • | Level 3 – | significant unobservable inputs (including each Fund’s own assumptions in determining the fair value of investments). |
| | A summary of inputs used in valuing each Fund’s investments as of October 31, 2018 and, if applicable, Level 1/Level 2 transfers and Level 3 rollforwards for the fiscal year then ended is included in each Fund’s Schedule of Investments. |
| | |
| | Changes in valuation techniques may result in transfers into or out of an assigned level within the three-tier hierarchy. All transfers between different levels within the three-tier hierarchy are deemed to have occurred as of the beginning of the reporting period. The inputs or methodology used for valuing securities are not necessarily an indication of the risk associated with investing in those securities. |
| 3. | MANAGEMENT FEE AND OTHER TRANSACTIONS WITH AFFILIATES |
Management Fee
The Trust has a management agreement with Lord Abbett, pursuant to which Lord Abbett supplies each Fund with investment management services and executive and other personnel, provides office space and pays for ordinary and necessary office and clerical expenses relating to research and statistical work and supervision of each Fund’s investment portfolio.
Each Fund’s management fee is based on the Fund’s average daily net assets at an annual rate of 1.50%, which was each Fund’s annualized effective management fee rate for the fiscal year ended October 31, 2018.
In addition, Lord Abbett provides certain administrative services to each Fund pursuant to an Administrative Services Agreement in return for a fee at an annual rate of .04% of each Fund’s average daily net assets.
12b-1 Distribution Plan
Each Fund has adopted a distribution plan with respect to Class A shares pursuant to Rule 12b-1 under the Act under which the Board may authorize the payment of ongoing distribution and service fees to Lord Abbett Distributor LLC (the “Distributor”), an affiliate of Lord Abbett. During the fiscal year ended October 31, 2018, the Board did not authorize such Class A 12b-1 fees.
Class I shares do not have a distribution plan.
26
Notes to Financial Statements (continued)
Other Related Parties
As of October 31, 2018, the percentages of Micro Cap Growth Fund’s and Micro Cap Value Fund’s outstanding shares owned by Lord Abbett Alpha Strategy Fund were 70.22% and 77.79%, respectively.
One Trustee and certain of the Trust’s officers have an interest in Lord Abbett.
| 4. | DISTRIBUTIONS AND CAPITAL LOSS CARRYFORWARDS |
Dividends from net investment income, if any, are declared and paid at least annually for each fund. Taxable net realized gains from investment transactions, reduced by allowable capital loss carryforwards, if any, are declared and distributed to shareholders at least annually. The capital loss carryforward amount, if any, is available to offset future net capital gains. Dividends and distributions to shareholders are recorded on the ex-dividend date. The amounts of dividends and distributions from net investment income and net realized capital gains are determined in accordance with federal income tax regulations, which may differ from U.S. GAAP. These book/tax differences are either considered temporary or permanent in nature. To the extent these differences are permanent in nature, such amounts are reclassified within the components of net assets based on their federal tax basis treatment; temporary differences do not require reclassification. Dividends and distributions, which exceed earnings and profits for tax purposes, are reported as a tax return of capital.
The tax character of distributions paid during the fiscal years ended October 31, 2018 and October 31, 2017 was as follows:
| | | Micro Cap Growth Fund | | | Micro Cap Value Fund |
| | | Year Ended | | | Year Ended | | | Year Ended | | | Year Ended |
| | | 10/31/2018 | | | 10/31/2017 | | | 10/31/2018 | | | 10/31/2017 |
| Distributions paid from: | | | | | | | | | | | | | | | |
| Ordinary income | | | $ 1,219,295 | | | $ | – | | | | $ 2,488,458 | | | | $ 1,862,576 |
| Net long-term capital gains | | | 19,198,030 | | | | – | | | | 21,102,736 | | | | 21,920,598 |
| Total distributions paid | | | $20,417,325 | | | $ | – | | | | $23,591,194 | | | | $23,783,174 |
Subsequent to the Funds’ fiscal year ended October 31, 2018, year-end distributions were paid. The approximate amounts were as follows:
| | | Net | | | Net | | | | | |
| | | Short-Term | | | Long-Term | | | | | |
| | | Capital Gain | | | Capital Gain | | | Record Date | | Ex-Date |
| Micro Cap Growth Fund | | $ | 6,938,000 | | | $ | 29,711,000 | | | November 19, 2018 | | | November 20, 2018 |
| Micro Cap Value Fund | | $ | 2,790,000 | | | $ | 15,735,000 | | | November 19, 2018 | | | November 20, 2018 |
As of October 31, 2018, the components of accumulated gains on a tax-basis were as follows:
| | | Micro Cap | | | Micro Cap | |
| | | Growth Fund | | | Value Fund | |
| Undistributed ordinary income – net | | | $ 6,937,287 | | | | $ 2,788,803 | |
| Undistributed long-term capital gains – net | | | 29,710,286 | | | | 15,734,086 | |
| Total undistributed earnings | | | 36,647,573 | | | | 18,522,889 | |
| Temporary differences | | | (1,220,177 | ) | | | (1,021,339 | ) |
| Unrealized gains – net | | | 22,847,889 | | | | 20,024,191 | |
| Total accumulated gains – net | | | $58,275,285 | | | | $37,525,741 | |
27
Notes to Financial Statements (continued)
At each Fund’s election, certain losses incurred within the taxable year (Qualified Late-Year Losses) are deemed to arise on the first business day of the Fund’s next taxable year. Each Fund incurred and will elect to defer late-year ordinary losses during fiscal 2018 as follows:
| Micro Cap Growth Fund | | $ | 1,200,000 | |
| Micro Cap Value Fund | | | 1,000,000 | |
As of October 31, 2018, the aggregate unrealized security gains and losses based on investments and other financial instruments for U.S. federal income tax purposes were as follows:
| | | Micro Cap | | | Micro Cap | |
| | | Growth Fund | | | Value Fund | |
| Tax cost | | | $121,963,471 | | | | $114,329,597 | |
| Gross unrealized gain | | | 33,684,508 | | | | 27,021,617 | |
| Gross unrealized loss | | | (10,836,619 | ) | | | (6,997,426 | ) |
| Net unrealized security gain | | | $ 22,847,889 | | | | $ 20,024,191 | |
The difference between book- basis and tax- basis unrealized gains (losses) is attributable to the tax treatment of wash sales.
| 5. | PORTFOLIO SECURITIES TRANSACTIONS |
Purchases and sales of investment securities (excluding short-term investments) for the fiscal year ended October 31, 2018 were as follows:
| | | Purchases | | | Sales | |
| Micro Cap Growth Fund | | $ | 113,495,655 | | | $ | 147,193,839 | |
| Micro Cap Value Fund | | | 80,917,343 | | | | 93,810,181 | |
There were no purchases or sales of U.S. Government securities for the fiscal year ended October 31, 2018.
Each Fund is permitted to purchase and sell securities (“cross-trade”) from and to other Lord Abbett funds or client accounts pursuant to procedures approved by the Board in compliance with Rule 17a-7 under the Act (the “Rule”). Each cross-trade is executed at a fair market price in compliance with provisions of the Rule. For the fiscal year ended October 31, 2018, the Funds engaged in cross-trades:
| Fund | | Purchases | | | Sales | | | Gain/(Loss) | |
| Micro-Cap Growth Fund | | | $929,446 | | | | $1,149,633 | | | | $675,460 | |
| Micro-Cap Value Fund | | | – | | | | 1,623,852 | | | | 837,352 | |
| 6. | DISCLOSURES ABOUT OFFSETTING ASSETS AND LIABILITIES |
The Financial Accounting Standards Board (“FASB”) requires disclosure to help better assess the effect or potential effect of offsetting arrangements on a fund’s financial position. The following tables illustrate gross and net information about recognized assets eligible for offset in the statement of assets and liabilities; and disclose such amounts subject to an enforceable master netting agreement or similar agreement, by counterparty. A master netting agreement is an agreement between a fund and a counterparty which provides for the net settlement of amounts owed under all contracts traded under that agreement, as well as cash collateral, through a single payment by one party to the other in the event of default on or termination of any one contract. The Funds’ accounting policy with respect to balance sheet offsetting is that, absent an event of default by the counterparty or a termination of the agreement, the master netting agreement does not result in an offset of reported amounts of financial assets and liabilities in the statement of assets and liabilities across transactions between the Funds and the applicable counterparty:
28
Notes to Financial Statements (continued)
| | | | | | | | Micro Cap Growth Fund |
| Description | | Gross Amounts of
Recognized Assets | | | Gross Amounts
Offset in the
Statement of Assets
and Liabilities | | | Net Amounts of
Assets Presented
in the Statement of
Assets and Liabilities |
| Repurchase Agreement | | | $6,787,633 | | | $ | – | | | | $6,787,633 |
| Total | | | $6,787,633 | | | $ | – | | | | $6,787,633 |
| | | Net Amounts
of Assets | | | Amounts Not Offset in the | | | |
| | | Presented in | | | Statement of Assets and Liabilities | | | |
| | | the Statement | | | | | | Cash | | | Securities | | | |
| | | of Assets and | | | Financial | | | Collateral | | | Collateral | | | Net |
| Counterparty | | Liabilities | | | Instruments | | | Received | | | Received(a) | | | Amount(b) |
| Fixed Income Clearing Corp. | | | $6,787,633 | | | $ | – | | | $ | – | | | | $(6,787,633 | ) | | $ | – |
| Total | | | $6,787,633 | | | $ | – | | | $ | – | | | | $(6,787,633 | ) | | $ | – |
| | | | | | Micro Cap Value Fund |
| Description | | Gross Amounts of
Recognized Assets | | | Gross Amounts
Offset in the
Statement of Assets
and Liabilities | | | Net Amounts of
Assets Presented
in the Statement of
Assets and Liabilities |
| Repurchase Agreement | | | $4,126,051 | | | $ | – | | | | $4,126,051 |
| Total | | | $4,126,051 | | | $ | – | | | | $4,126,051 |
| | | Net Amounts
of Assets | | | Amounts Not Offset in the | | | |
| | | Presented in | | | Statement of Assets and Liabilities | | | |
| | | the Statement | | | | | | Cash | | | Securities | | | |
| | | of Assets and | | | Financial | | | Collateral | | | Collateral | | | Net |
| Counterparty | | Liabilities | | | Instruments | | | Received | | | Received(a) | | | Amount(b) |
| Fixed Income Clearing Corp. | | | $4,126,051 | | | $ | – | | | $ | – | | | | $(4,126,051 | ) | | $ | – |
| Total | | | $4,126,051 | | | $ | – | | | $ | – | | | | $(4,126,051 | ) | | $ | – |
| (a) | Collateral disclosed is limited to an amount not to exceed 100% of the net amount of assets presented in the Statements of Assets and Liabilities, for each respective counterparty. |
| (b) | Net amount represents the amount owed to the Fund by the counterparty as of October 31, 2018. |
The Trust’s officers and one Trustee, who are associated with Lord Abbett, do not receive any compensation from the Trust for serving in such capacities. Independent Trustees’ fees are allocated among all Lord Abbett-sponsored funds based on the net assets of each fund. There is an equity-based plan available to all Independent Trustees under which Independent Trustees must defer receipt of a portion of, and may elect to defer receipt of an additional portion of Trustees’ fees. The deferred amounts are treated as though equivalent dollar amounts had been invested in the funds. Such amounts and earnings accrued thereon are included in Trustees’ fees on the Statements of Operations and in Trustees’ fees payable on the Statements of Assets and Liabilities and are not deductible for U.S. federal income tax purposes until such amounts are paid.
The Trust has entered into an arrangement with its transfer agent and custodian, whereby credits realized as a result of uninvested cash balances are used to reduce a portion of each Fund’s expenses.
29
Notes to Financial Statements (continued)
During the fiscal year through August 8, 2018, the Funds and certain other funds managed by Lord Abbett (collectively, the “Participating Funds”) participated in a syndicated line of credit facility with various lenders for $600 million (the “Facility”), whereas State Street Bank and Trust Company (“SSB”) participates as a lender and as agent for the lenders. The Facility is to be used for temporary or emergency purposes as an additional source of liquidity to satisfy redemptions. The Participating Funds are subject to graduated borrowing limits of one-third of Fund assets (if Fund assets are less than $750 million), $250 million, $300 million, or $350 million, based on past borrowings and likelihood of future borrowings. During the period ended August 8, 2018, the Funds did not utilize the Facility.
Effective August 9, 2018, the Participating Funds entered into an amended syndicated line of credit facility with various lenders for $1.06 billion (the “Syndicated Facility”), whereas SSB participates as a lender and as agent for the lenders. Under the Syndicated Facility, the Participating Funds are subject to graduated borrowing limits of one-third of Fund assets (if Fund assets are less than $750 million), $250 million, $300 million, $350 million, or $1 billion, based on past borrowings and likelihood of future borrowings. Also effective August 9, 2018, the Participating Funds entered into an additional line of credit facility with SSB for $250 million (the “Bilateral Facility,” and together with the Syndicated Facility, the “Facilities”). Under the Bilateral Facility, each Participating Fund may borrow up to the lesser of $250 million or one-third of Fund assets. The Facilities are to be used for temporary or emergency purposes to satisfy redemption requests and manage liquidity. For the period from August 9, 2018 through October 31, 2018, the Funds did not utilize the Facilities.
Effective December 21, 2018, the Participating Funds entered into an amended Syndicated Facility with various lenders for $1.1 billion based on the same terms as described above.
| 10. | INTERFUND LENDING PROGRAM |
Pursuant to an exemptive order issued by the U.S. Securities and Exchange Commission (“SEC exemptive order”), certain registered open-end management investment companies managed by Lord Abbett, including each Fund, participate in a joint lending and borrowing program (the “Interfund Lending Program”). The SEC exemptive order allows the Funds to borrow money from and lend money to each other for temporary or emergency purposes subject to the limitations and conditions.
During the fiscal year ended October 31, 2018 the Funds did not participate as a borrower or lender in the Interfund Lending Program.
| 11. | CUSTODIAN AND ACCOUNTING AGENT |
SSB is the Trust’s custodian and accounting agent. SSB performs custodial, accounting and recordkeeping functions relating to portfolio transactions and calculating each Fund’s NAV.
Each Fund is subject to the general risks and considerations associated with equity investing, as well as the particular risks associated with micro-cap and growth or value stocks. The value of an investment in each Fund will fluctuate in response to movements in the equity securities market in general and to the changing prospects of individual companies in which the Fund invests. Micro-cap companies may be subject to greater risks and may be more sensitive to changes in economic conditions than larger, more established companies. There may be less liquidity in micro-cap company stocks, subjecting them to greater price fluctuations than larger company stocks.
30
Notes to Financial Statements (concluded)
Micro-cap companies also may fall out of favor relative to larger companies in certain market cycles. In the case of Micro Cap Growth Fund, the growth stocks in which it generally invests may add to the Fund’s volatility. In the case of Micro Cap Value Fund, the prices of value stocks in which it generally invests may lag the stock market for long periods of time if the market fails to recognize the company’s intrinsic worth. Moreover, different investment styles, such as growth or value investing, may shift in and out of favor over time, depending on market and economic conditions, as well as investor sentiment.
These factors can affect each Fund’s performance.
| 13. | SUMMARY OF CAPITAL TRANSACTIONS |
Transactions in shares of beneficial interest were as follows:
| Micro Cap Growth Fund | | Year Ended
October 31, 2018 | | | Year Ended
October 31, 2017 | |
| Class A Shares | | | Shares | | | | Amount | | | | Shares | | | | Amount | |
| Shares sold | | | 25,331 | | | $ | 460,502 | | | | 7,098 | | | $ | 104,579 | |
| Reinvestment of distributions | | | 95,504 | | | | 1,459,299 | | | | – | | | | – | |
| Shares reacquired | | | (18,843 | ) | | | (324,489 | ) | | | (31,782 | ) | | | (486,592 | ) |
| Increase (decrease) | | | 101,992 | | | $ | 1,595,312 | | | | (24,684 | ) | | $ | (382,013 | ) |
| | | | | | | | | | | | | | | | | |
| Class I Shares | | | | | | | | | | | | | | | | |
| Shares sold | | | 249,901 | | | $ | 4,715,089 | | | | 221,174 | | | $ | 3,648,797 | |
| Reinvestment of distributions | | | 1,024,438 | | | | 17,210,560 | | | | – | | | | – | |
| Shares reacquired | | | (1,556,817 | ) | | | (31,245,950 | ) | | | (2,573,410 | ) | | | (43,630,818 | ) |
| Decrease | | | (282,478 | ) | | $ | (9,320,301 | ) | | | (2,352,236 | ) | | $ | (39,982,021 | ) |
| | | | | | | | | | | | | | | | | |
| Micro Cap Value Fund | | | Year Ended
October 31, 2018 | | | Year Ended
October 31, 2017 | |
| Class A Shares | | | Shares | | | | Amount | | | | Shares | | | | Amount | |
| Shares sold | | | 6,838 | | | $ | 210,241 | | | | 4,007 | | | $ | 134,354 | |
| Reinvestment of distributions | | | 39,126 | | | | 1,156,173 | | | | 34,072 | | | | 1,086,208 | |
| Shares reacquired | | | (17,898 | ) | | | (553,803 | ) | | | (27,071 | ) | | | (893,238 | ) |
| Increase | | | 28,066 | | | $ | 812,611 | | | | 11,008 | | | $ | 327,324 | |
| | | | | | | | | | | | | | | | | |
| Class I Shares | | | | | | | | | | | | | | | | |
| Shares sold | | | 96,839 | | | $ | 3,042,646 | | | | 94,182 | | | $ | 3,191,251 | |
| Reinvestment of distributions | | | 676,490 | | | | 21,099,740 | | | | 631,534 | | | | 21,061,650 | |
| Shares reacquired | | | (339,162 | ) | | | (10,883,717 | ) | | | (877,082 | ) | | | (30,563,791 | ) |
| Increase (decrease) | | | 434,167 | | | $ | 13,258,669 | | | | (151,366 | ) | | $ | (6,310,890 | ) |
31
Report of Independent Registered Public Accounting Firm
To the shareholders and the Board of Trustees of Lord Abbett Securities Trust:
Opinion on the Financial Statements and Financial Highlights
We have audited the accompanying statements of assets and liabilities, including the schedules of investments, of Lord Abbett Micro-Cap Growth Fund and Lord Abbett Micro-Cap Value Fund, two of the funds constituting the Lord Abbett Securities Trust (the “Trust”), as of October 31, 2018, the related statements of operations for the year then ended, the statements of changes in net assets for each of the two years in the period then ended, the financial highlights for each of the five years in the period then ended, and the related notes. In our opinion, the financial statements and financial highlights present fairly, in all material respects, the financial position of the Trust as of October 31, 2018, and the results of their operations for the year then ended, the changes in their net assets for each of the two years in the period then ended, and the financial highlights for each of the five years in the period then ended in conformity with accounting principles generally accepted in the United States of America.
Basis for Opinion
These financial statements and financial highlights are the responsibility of the Trust’s management. Our responsibility is to express an opinion on the Trust’s financial statements and financial highlights based on our audits. We are a public accounting firm registered with the Public Company Accounting Oversight Board (United States) (PCAOB) and are required to be independent with respect to the Trust in accordance with the U.S. federal securities laws and the applicable rules and regulations of the Securities and Exchange Commission and the PCAOB.
We conducted our audits in accordance with the standards of the PCAOB. Those standards require that we plan and perform the audit to obtain reasonable assurance about whether the financial statements and financial highlights are free of material misstatement, whether due to error or fraud. The Trust is not required to have, nor were we engaged to perform, an audit of its internal control over financial reporting. As part of our audits we are required to obtain an understanding of internal control over financial reporting but not for the purpose of expressing an opinion on the effectiveness of the Trust’s internal control over financial reporting. Accordingly, we express no such opinion.
Our audits included performing procedures to assess the risks of material misstatement of the financial statements and financial highlights, whether due to error or fraud, and performing procedures that respond to those risks. Such procedures included examining, on a test basis, evidence regarding the amounts and disclosures in the financial statements and financial highlights. Our audits also included evaluating the accounting principles used and significant estimates made by management, as well as evaluating the overall presentation of the financial statements and financial highlights. Our procedures included confirmation of securities owned as of October 31, 2018, by correspondence with the custodian and brokers; when replies were not received from brokers, we performed other auditing procedures. We believe that our audits provide a reasonable basis for our opinion.
DELOITTE & TOUCHE LLP
New York, New York
December 21, 2018
We have served as the auditor of one or more Lord Abbett Family of Funds’ investment companies since 1932.
32
Basic Information About Management
The Board is responsible for the management of the business and affairs of the Trust in accordance with the laws of the State of Delaware. The Board elects officers who are responsible for the day-to-day operations of each Fund and who execute policies authorized by the Board. The Board also approves an investment adviser to each Fund and continues to monitor the cost and quality of the services the investment adviser provides, and annually considers whether to renew the contract with the adviser. Generally, each Trustee holds office until his/her successor is elected and qualified or until his/her earlier resignation or removal, as provided in the Trust’s organizational documents.
Lord Abbett, a Delaware limited liability company, is each Fund’s investment adviser. Designated Lord Abbett personnel are responsible for the day-to-day management of the Funds.
Interested Trustees
Mr. Sieg is affiliated with Lord Abbett and is an “interested person” of the Trust as defined in the Act. Mr. Sieg is director/trustee of each of the 13 investment companies in the Lord Abbett Family of Funds, which consist of 61 portfolios or series. Mr. Sieg is an officer of the Lord Abbett Family of Funds.
Name, Address and
Year of Birth | | Current Position and
Length of Service
with the Trust | | Principal Occupation and Other Directorships
During the Past Five Years |
| | | | | |
Douglas B. Sieg Lord, Abbett & Co. LLC
90 Hudson Street
Jersey City, NJ 07302
(1969) | | Trustee since 2016; President and Chief Executive Officer since 2018 | | Principal Occupation: Managing Partner (since 2018) and was formerly Head of Client Services, joined Lord Abbett in 1994. Other Directorships: None. |
Independent Trustees
The following Independent Trustees also are directors/trustees of each of the 13 investment companies in the Lord Abbett Family of Funds, which consist of 61 portfolios or series.
Name, Address and
Year of Birth | | Current Position and
Length of Service
with the Trust | | Principal Occupation and Other Directorships
During the Past Five Years |
| | | | | |
Eric C. Fast Lord, Abbett & Co. LLC
c/o Legal Dept.
90 Hudson Street
Jersey City, NJ 07302
(1949) | | Trustee since 2014 | | Principal Occupation: Chief Executive Officer of Crane Co., an industrial products company (2001 – 2014). Other Directorships: Currently serves as director of Automatic Data Processing, Inc. (since 2007) and Regions Financial Corporation (since 2010). Previously served as a director of Crane Co. (1999–2014). |
| | | | | |
Evelyn E. Guernsey Lord, Abbett & Co. LLC
c/o Legal Dept.
90 Hudson Street
Jersey City, NJ 07302
(1955) | | Trustee since 2011 | | Principal Occupation: CEO, Americas of J.P. Morgan Asset Management (2004–2010). Other Directorships: None. |
| | | | | |
Julie A. Hill Lord, Abbett & Co. LLC
c/o Legal Dept.
90 Hudson Street
Jersey City, NJ 07302
(1946) | | Trustee since 2004 | | Principal Occupation: Owner and CEO of The Hill Company, a business consulting firm (since 1998). Other Directorships: Currently serves as director of Anthem, Inc., a health benefits company (since 1994). |
33
Basic Information About Management (continued)
Name, Address and
Year of Birth | | Current Position and
Length of Service
with the Trust | | Principal Occupation and Other Directorships
During the Past Five Years |
| | | | | |
Kathleen M. Lutito Lord, Abbett & Co. LLC
c/o Legal Dept.
90 Hudson Street
Jersey City, NJ 07302
(1963) | | Trustee since 2017 | | Principal Occupation: President and Chief Investment Officer of CenturyLink Investment Management Company (since 2006). Other Directorships: None |
| | | | | |
James M. McTaggart Lord, Abbett & Co. LLC
c/o Legal Dept.
90 Hudson Street
Jersey City, NJ 07302
(1947) | | Trustee since 2012 | | Principal Occupation: Independent management advisor and consultant (since 2012); Vice President, CRA International, Inc. (doing business as Charles River Associates), a global management consulting firm (2009–2012); Founder and Chairman of Marakon Associates, Inc., a strategy consulting firm (1978–2009); and Officer and Director of Trinsum Group, a holding company (2007–2009). Other Directorships: Blyth, Inc., a home products company (2004–2015). |
| | | | | |
Karla M. Rabusch Lord, Abbett & Co. LLC
c/o Legal Dept.
90 Hudson Street
Jersey City, NJ 07302
(1959) | | Trustee since 2017 | | Principal Occupation: President and Director of Wells Fargo Funds Management, LLC (2003–2017); President of Wells Fargo Funds (2003–2016). Other Directorships: None. |
| | | | | |
Mark A. Schmid Lord, Abbett & Co. LLC
c/o Legal Dept.
90 Hudson Street
Jersey City, NJ 07302
(1959) | | Trustee since 2016 | | Principal Occupation: Vice President and Chief Investment Officer of the University of Chicago (since 2009). Other Directorships: None. |
| | | | | |
James L.L. Tullis Lord, Abbett & Co. LLC
c/o Legal Dept.
90 Hudson Street
Jersey City, NJ 07302
(1947) | | Trustee since 2006;
Chairman since 2017 | | Principal Occupation: CEO of Tullis-Dickerson and Co. Inc., a venture capital management firm (since 1990); CEO of Tullis Health Investors Inc. (since 2012). Other Directorships: Currently serves as director of Crane Co. (since 1998). |
Officers
None of the officers listed below have received compensation from the Trust. All of the officers of the Trust also may be officers of the other Lord Abbett Funds and maintain offices at 90 Hudson Street, Jersey City, NJ 07302. Unless otherwise indicated, the position(s) and title(s) listed under the “Principal Occupation During the Past Five Years” column indicate each officer’s position(s) and title(s) with Lord Abbett. Each officer serves for an indefinite term (i.e., until his or her death, resignation, retirement, or removal).
Name and
Year of Birth | | Current Position
with the Trust | | Length of Service
of Current
Position | | Principal Occupation
During the Past Five Years |
| | | | | | | |
Douglas B. Sieg
(1969) | | President and Chief
Executive Officer | | Elected as President in 2018 and Chief Executive Officer in 2018 | | Managing Partner of Lord Abbett, joined Lord Abbett in 1994. |
34
Basic Information About Management (continued)
Name and
Year of Birth | | Current Position
with the Trust | | Length of Service
of Current
Position | | Principal Occupation
During the Past Five Years |
| | | | | | | |
Jeff D. Diamond
(1960) | | Executive Vice President | | Elected in 2018 | | Portfolio Manager, joined Lord Abbett in 2007. |
| | | | | | | |
Todd D. Jacobson
(1966) | | Executive Vice President | | Elected in 2003 | | Partner and Associate Director, joined Lord Abbett in 2003. |
| | | | | | | |
Robert A. Lee
(1969) | | Executive Vice President | | Elected in 2016 | | Partner and Chief Investment Officer, and was formerly Deputy Chief Investment Officer and Director of Taxable Fixed Income, joined Lord Abbett in 1997. |
| | | | | | | |
David J. Linsen
(1974) | | Executive Vice President | | Elected in 2011 | | Partner and Director of Equities, joined Lord Abbett in 2001. |
| | | | | | | |
Giulio Martini
(1955) | | Executive Vice President | | Elected in 2015 | | Partner and Director of Strategic Asset Allocation, joined Lord Abbett in 2015 and was formerly Global Investment Strategist at Anderson Global Macro LLC (2012–2015). |
| | | | | | | |
Vincent J. McBride
(1964) | | Executive Vice President | | Elected in 2003 | | Partner and Director, joined Lord Abbett in 2003. |
| | | | | | | |
F. Thomas O’Halloran
(1955) | | Executive Vice President | | Elected in 2003 | | Partner and Portfolio Manager, joined Lord Abbett in 2001. |
| | | | | | | |
Eli Rabinowich
(1975) | | Executive Vice President | | Elected in 2018 | | Portfolio Manager, joined Lord Abbett in 2018 and was formerly a Portfolio Manager, Partner, and Analyst at Pzena Investment Management from (2004–2018). |
| | | | | | | |
A. Edward Allinson
(1961) | | Vice President | | Elected in 2011 | | Portfolio Manager, joined Lord Abbett in 2005. |
| | | | | | | |
Jeffrey W. Arricale
(1971) | | Vice President | | Elected in 2018 | | Deputy Director, Global Equity Research, joined Lord Abbett in 2012. |
| | | | | | | |
Vernon T. Bice
(1974) | | Vice President | | Elected in 2016 | | Portfolio Manager, joined Lord Abbett in 2011. |
| | | | | | | |
Pamela P. Chen
(1978) | | Vice President and Assistant Secretary | | Elected in 2018 | | Associate General Counsel, joined Lord Abbett in 2017 and was formerly Special Counsel at Schulte, Roth & Zabel LLP (2005–2017). |
35
Basic Information About Management (continued)
Name and
Year of Birth | | Current Position
with the Trust | | Length of Service
of Current
Position | | Principal Occupation
During the Past Five Years |
| | | | | | | |
Matthew R. DeCicco
(1977) | | Vice President | | Elected in 2015 | | Managing Director and Portfolio Manager, joined Lord Abbett in 1999. |
| | | | | | | |
John T. Fitzgerald
(1975) | | Vice President and Assistant Secretary | | Elected in 2018 | | Deputy General Counsel, joined Lord Abbett in 2018 and was formerly Deputy Head of U.S. Funds Legal, Executive Director and Assistant General Counsel at JPMorgan Chase (2005–2018). |
| | | | | | | |
Bernard J. Grzelak
(1971) | | Chief Financial Officer and Vice President | | Elected in 2017 | | Partner and Chief Operations Officer, and was formerly Director of Fund Administration, joined Lord Abbett in 2003. |
| | | | | | | |
John C. Hardy
(1981) | | Vice President | | Elected in 2018 | | Portfolio Manager, joined Lord Abbett in 2011. |
| | | | | | | |
Jeffrey O. Herzog
(1978) | | Vice President | | Elected in 2018 | | Portfolio Manager, joined Lord Abbett in 2013 and was formerly Senior Economist at Oxford Economics (2012–2013). |
| | | | | | | |
Ryan C. Howard
(1980) | | Vice President | | Elected in 2018 | | Portfolio Manager, joined Lord Abbett in 2003. |
| | | | | | | |
Lawrence H. Kaplan
(1957) | | Vice President and Secretary | | Elected in 1997 | | Partner and General Counsel, joined Lord Abbett in 1997. |
| | | | | | | |
Devesh Karandikar
(1973) | | Vice President | | Elected in 2018 | | Portfolio Manager, joined Lord Abbett in 2010. |
| | | | | | | |
Linda Y. Kim
(1980) | | Vice President and Assistant Secretary | | Elected in 2016 | | Counsel, joined Lord Abbett in 2015 and was formerly an Associate at Stroock & Stroock & Lavan LLP (2007–2015). |
| | | | | | | |
Sue Kim
(1975) | | Vice President | | Elected in 2018 | | Deputy Director, Global Equity Research, joined Lord Abbett in 2015 and was formerly Director at Harbor Bridge Capital Management, LP (2014–2015). |
| | | | | | | |
So Young Lee
(1971) | | Vice President | | Elected in 2018 | | Portfolio Manager, joined Lord Abbett in 2013. |
36
Basic Information About Management (concluded)
Name and
Year of Birth | | Current Position
with the Trust | | Length of Service
of Current
Position | | Principal Occupation
During the Past Five Years |
| | | | | | | |
Asad A. Mawjee
(1977) | | Vice President | | Elected in 2018 | | Portfolio Manager, joined Lord Abbett in 2016 and was formerly Director at Global Thematic Partners, LLC (2008–2016). |
| | | | | | | |
Joseph M. McGill
(1962) | | Chief Compliance Officer | | Elected in 2014 | | Partner and Chief Compliance Officer, joined Lord Abbett in 2014 and was formerly Managing Director and the Chief Compliance Officer at UBS Global Asset Management (2003–2013). |
| | | | | | | |
A. Edward Oberhaus, III
(1959) | | Vice President | | Elected in 1993 | | Partner and Director, joined Lord Abbett in 1983. |
| | | | | | | |
David B. Ritt
(1976) | | Vice President | | Elected in 2018 | | Portfolio Manager, joined Lord Abbett in 2006. |
| | | | | | | |
Amanda S. Ryan
(1978) | | Vice President and Assistant Secretary | | Elected in 2018 | | Counsel, joined Lord Abbett in 2016 and was formerly a Director and Corporate Counsel at PGIM Investments (2012–2016). |
| | | | | | | |
Lawrence B. Stoller
(1963) | | Vice President and Assistant Secretary | | Elected in 2007 | | Partner and Senior Deputy General Counsel, joined Lord Abbett in 2007. |
| | | | | | | |
Jackson C. Chan
(1964) | | AML Compliance Officer | | Elected in 2018 | | Deputy Chief Compliance Officer and Director of Regulatory Affairs, joined Lord Abbett in 2014 and was formerly Director at UBS Global Asset Management (2005–2014). |
| | | | | | | |
Vito A. Fronda
(1969) | | Treasurer | | Elected in 2018 | | Partner and Director of Taxation, joined Lord Abbett in 2003. |
Please call 888–522–2388 for a copy of the statement of additional information, which contains further information about the Trust’s Trustees. It is available free upon request.
37
Householding
The Trust has adopted a policy that allows it to send only one copy of each Fund’s prospectus, proxy material, annual report and semiannual report to certain shareholders residing at the same “household.” This reduces Fund expenses, which benefits you and other shareholders. If you need additional copies or do not want your mailings to be “householded,” please call Lord Abbett at 888-522-2388 or send a written request with your name, the name of your fund or funds and your account number or numbers to Lord Abbett Family of Funds, P.O. Box 219336, Kansas City, MO 64121.
Proxy Voting Policies, Procedures and Records
A description of the policies and procedures that Lord Abbett uses to vote proxies related to each Fund’s portfolio securities, and information on how Lord Abbett voted each Fund’s proxies during the 12-month period ended June 30 are available without charge, upon request, (i) by calling 888-522-2388; (ii) on Lord Abbett’s Website at www.lordabbett.com; and (iii) on the Securities and Exchange Commission’s (“SEC”) Website at www.sec.gov.
Shareholder Reports and Quarterly Portfolio Disclosure
The Funds are required to file their complete schedule of portfolio holdings with the SEC for their first and third fiscal quarters on Form N-Q. Copies of the filings are available without charge, upon request on the SEC’s Website at www.sec.gov and may be available by calling Lord Abbett at 888-522-2388. You can also obtain copies of Form N-Q by visiting the SEC’s Public Reference Room in Washington, DC (information on the operation of the Public Reference Room may be obtained by calling 800-SEC-0330).
Tax Information
The percentages below reflect the portion of ordinary income distributions paid during the fiscal year ended October 31, 2018 that are eligible for the corporate dividend received deduction (DRD) and qualified dividend income (QDI) for individual shareholders.
| Fund Name | | DRD | | QDI |
| Micro Cap Growth Fund | | 30% | | 30% |
| Micro Cap Value Fund | | 42% | | 44% |
Additionally, of the distributions paid to shareholders during the fiscal year ended October 31, 2018, the following amounts represent short-term capital gains and long-term capital gains:
| Fund Name | | Short-term Capital Gains | | Long-term Capital Gains |
| Micro Cap Growth Fund | | $1,219,295 | | $19,198,030 |
| Micro Cap Value Fund | | 2,488,458 | | 21,102,736 |
38


| This report, when not used for the general information of shareholders of the Fund, is to be distributed only if preceded or accompanied by a current fund prospectus. | | Lord Abbett Securities Trust | |
| | | | |
Lord Abbett mutual fund shares are distributed by
LORD ABBETT DISTRIBUTOR LLC. | | Lord Abbett Micro-Cap Growth Fund
Lord Abbett Micro-Cap Value Fund | LAMCVF-2
(12/18) |
| (a) | In accordance with applicable requirements, the Registrant adopted a Sarbanes-Oxley Code of Ethics on June 19, 2003 that applies to the principal executive officer and senior financial officers of the Registrant (“Code of Ethics”). The Code of Ethics was in effect during the fiscal year ended October 31, 2018 (the “Period”). |
| (c) | The Registrant has not amended the Code of Ethics as described in Form N-CSR during the Period. |
| (d) | The Registrant has not granted any waiver, including an implicit waiver, from a provision of the Code of Ethics as described in Form N-CSR during the Period. |
| (f) | See Item 12(a)(1) concerning the filing of the Code of Ethics. |
| Item 3: | Audit Committee Financial Expert. |
The Registrant’s board of trustees has determined that each of the following independent trustees who are members of the audit committee is an audit committee financial expert: Evelyn E. Guernsey, Karla M. Rabusch and Mark A. Schmid. Each of these persons is independent within the meaning of the Form N-CSR.
| Item 4: | Principal Accountant Fees and Services. |
In response to sections (a), (b), (c) and (d) of Item 4, the aggregate fees billed to the Registrant for the fiscal years ended October 31, 2018 and 2017 by the Registrant’s principal accounting firm, Deloitte & Touche LLP, the member firms of Deloitte Touche Tohmatsu and their respective affiliates (collectively, “Deloitte”) were as follows:
| | Fiscal year ended: |
| | 2018 | 2017 |
| Audit Fees {a} | $410,600 | $410,600 |
| Audit-Related Fees | - 0 - | - 0 - |
| Total audit and audit-related fees | 410,600 | 410,600 |
| | | |
| Tax Fees {b} | 96,012 | 95,458 |
| All Other Fees | - 0 - | - 0 - |
| | | |
| Total Fees | $506,612 | $506,058 |
{a} Consists of fees for audits of the Registrant’s annual financial statements.
{b} Fees for the fiscal year ended October 31, 2018 and 2017 consist of fees for preparing the U.S. Income Tax Return for Regulated Investment Companies, New Jersey Corporation Business Tax Return, New Jersey Annual Report Form, U.S. Return of Excise Tax on Undistributed Income of Investment Companies, IRS Forms 1099-MISC and 1096 Annual Summary and Transmittal of U.S. Information Returns.
(e) (1) Pursuant to Rule 2-01(c) (7) of Regulation S-X, the Registrant’s Audit Committee has adopted pre-approval policies and procedures. Such policies and procedures generally provide that the Audit Committee must pre-approve:
| · | any audit, audit-related, tax, and other services to be provided to the Lord Abbett Funds, including the Registrant, and |
| · | any audit-related, tax, and other services to be provided to the Registrant’s investment adviser and any entity controlling, controlled by or under common control with the investment adviser that provides ongoing services to one or more Funds comprising the Registrant if the engagement relates directly to operations and financial reporting of a Fund, by the independent auditor to assure that the provision of such services does not impair the auditor’s independence. |
The Audit Committee has delegated pre-approval authority to its Chairman, subject to a fee limit of $10,000 per event, and not to exceed $25,000 annually. The Chairman will report any pre-approval decisions to the Audit Committee at its next scheduled meeting. Unless a type of service to be provided by the independent auditor has received general pre-approval, it must be pre-approved by the Audit Committee. Any proposed services exceeding pre-approved cost levels will require specific pre-approval by the Audit Committee.
(e) (2) The Registrant’s Audit Committee has approved 100% of the services described in this Item 4 (b) through (d).
(f) Not applicable.
(g) The aggregate non-audit fees billed by Deloitte for services rendered to the Registrant are shown above in the response to Item 4 (a), (b), (c) and (d) as “All Other Fees”.
The aggregate non-audit fees billed by Deloitte for services rendered to the Registrant’s investment adviser, Lord, Abbett & Co. LLC (“Lord Abbett”), for the fiscal years ended October 31, 2018 and 2017 were:
| | Fiscal year ended: |
| | 2018 | 2017 |
| All Other Fees {a} | $200,339 | $201,416 |
{a} Consist of fees for Independent Services Auditors’ Report on Controls Placed in Operation and Tests of Operating Effectiveness related to Lord Abbett’s Asset Management Services (“SOC-1 Report”).
The aggregate non-audit fees billed by Deloitte for services rendered to entities under the common control of Lord Abbett for the fiscal years ended October 31, 2018 and 2017 were:
| | Fiscal year ended: |
| | 2018 | 2017 |
| All Other Fees | $ - 0 - | $ - 0 - |
(h) The Registrant’s Audit Committee has considered the provision of non-audit services that were rendered to the Registrant’s investment adviser, and any entity controlling, controlled by or under common control with the investment adviser that provides ongoing services to the Registrant, that were not pre-approved pursuant to Rule 2-01 (c)(7)(ii) of Regulation S-X and has determined that the provision of such services is compatible with maintaining Deloitte’s independence.
| Item 5: | Audit Committee of Listed Registrants. |
Not applicable.
Not applicable.
| Item 7: | Disclosure of Proxy Voting Policies and Procedures for Closed-End Management Investment Companies. |
Not applicable.
| Item 8: | Portfolio Managers of Closed-End Management Investment Companies. |
Not applicable.
| Item 9: | Purchases of Equity Securities by Closed-End Management Investment Company and Affiliated Purchasers. |
Not applicable.
| Item 10: | Submission of Matters to a Vote of Security Holders. |
Not applicable.
| Item 11: | Controls and Procedures. |
| (a) | Based on their evaluation of the Registrant’s disclosure controls and procedures (as defined in Rule 30a-3(c) under the Investment Company Act of 1940) as of a date within 90 days prior to the filing date of this report, the Chief Executive Officer and Chief Financial Officer of the Registrant have concluded that such disclosure controls and procedures are reasonably designed and effective to ensure that material information relating to the Registrant, including its consolidated subsidiaries, is made known to them by others within those entities. |
| (b) | There were no changes in the Registrant’s internal control over financial reporting (as defined in Rule 30a-3(d) under the Investment Company Act of 1940) that occurred during the second fiscal quarter of the period covered by this report that have materially affected, or are reasonably likely to materially affect, the Registrant’s internal control over financial reporting. |
| (a)(1) | The Lord Abbett Family of Funds Sarbanes Oxley Code of Ethics for the Principal Executive Officer and Senior Financial Officers is attached hereto as part of Ex-99. CODEETH. |
| | (a)(2) | Certification of each Principal Executive Officer and Principal Financial Officer of the Registrant as required by Rule 30a-2 under the Investment Company Act of 1940 is attached hereto as a part of EX-99.CERT. |
| (b) | Certification of each Principal Executive Officer and Principal Financial Officer of the Registrant as required by Section 906 of the Sarbanes-Oxley Act of 2002 is provided as a part of EX-99.906CERT. |
SIGNATURES
Pursuant to the requirements of the Securities Exchange Act of 1934 and the Investment Company Act of 1940, the Registrant has duly caused this report to be signed on its behalf by the undersigned, thereunto duly authorized.
| | | LORD ABBETT SECURITIES TRUST | |
| | | | |
| | By: | /s/Douglas B. Sieg | |
| | | Douglas B. Sieg | |
| | | President and Chief Executive Officer | |
Date: December 21, 2018
| | By: | /s/Bernard J. Grzelak | |
| | | Bernard J. Grzelak | |
| | | Chief Financial Officer and Vice President | |
Date: December 21, 2018
Pursuant to the requirements of the Securities Exchange Act of 1934 and the Investment Company Act of 1940, this report has been signed below by the following persons on behalf of the Registrant and in the capacities and on the dates indicated.
| | By: | /s/Douglas B. Sieg | |
| | | Douglas B. Sieg | |
| | | President and Chief Executive Officer | |
Date: December 21, 2018
| | By: | /s/Bernard J. Grzelak | |
| | | Bernard J. Grzelak | |
| | | Chief Financial Officer and Vice President | |
Date: December 21, 2018