UNITED STATES
SECURITIES AND EXCHANGE COMMISSION
Washington, D.C. 20549
FORM N-CSR
CERTIFIED SHAREHOLDER REPORT OF REGISTERED
MANAGEMENT INVESTMENT COMPANIES
Investment Company Act File Number: 811-07538
LORD ABBETT SECURITIES TRUST
(Exact name of Registrant as specified in charter)
90 Hudson Street, Jersey City, NJ 07302
(Address of principal executive offices) (Zip code)
John T. Fitzgerald, Esq., Vice President & Assistant Secretary
90 Hudson Street, Jersey City, NJ 07302
(Name and address of agent for service)
Registrant’s telephone number, including area code: (888) 522-2388
Date of fiscal year end: 10/31
Date of reporting period: 10/31/2020
| Item 1: | Report(s) to Shareholders. |

LORD ABBETT
ANNUAL REPORT
Lord Abbett
| Alpha Strategy Fund | Growth Leaders Fund |
| | |
| Durable Growth Fund | Health Care Fund |
| | |
| Focused Growth Fund | International Equity Fund |
| | |
| Focused Large Cap Value Fund | International Opportunities Fund |
| | |
| Focused Small Cap Value Fund | International Value Fund |
| | |
| Fundamental Equity Fund | Value Opportunities Fund |
| | |
| Global Equity Research Fund | |
For the fiscal year ended October 31, 2020
Important Information on Paperless Delivery
Beginning in February 2021, as permitted by regulations adopted by the Securities and Exchange Commission, paper copies of each Fund’s shareholder reports like this one will no longer be sent by mail, unless you specifically request paper copies of the reports from the Fund or from your financial intermediary, such as a broker-dealer, investment advisor or bank. Instead, the reports will be made available on Lord Abbett’s website and you will be notified by mail each time a report is posted and provided with a website link to access the report.
If you already elected to receive shareholder reports electronically, you will not be affected by this change and you need not take any action. Shareholders who hold accounts directly with a Fund may elect to receive shareholder reports and other communications from the Fund electronically by signing into your Lord Abbett online account at lordabbett.com and selecting “Log In.” For further information, you may also contact the Funds at (800) 821-5129. Shareholders who hold accounts through a financial intermediary should contact them directly.
You may elect to receive all future reports in paper free of charge by contacting a Fund at (800) 821-5129. Your election to receive reports in paper will apply to all funds held with Lord Abbett. If your fund shares are held through a financial intermediary please contact them directly. Your election applies to all funds held with that intermediary.
Table of Contents
Lord Abbett Securities Trust
Lord Abbett Alpha Strategy Fund, Lord Abbett Durable Growth Fund, Lord Abbett Focused Growth Fund, Lord Abbett Focused Large Cap Value Fund, Lord Abbett Focused Small Cap Value Fund, Lord Abbett Fundamental Equity Fund, Lord Abbett Global Equity Research Fund, Lord Abbett Growth Leaders Fund, Lord Abbett Health Care Fund, Lord Abbett International Equity Fund, Lord Abbett International Opportunities Fund, Lord Abbett International Value Fund, and Lord Abbett Value Opportunities Fund
Annual Report
For the fiscal year ended October 31, 2020

From left to right: James L.L. Tullis, Independent Chairman of the Lord Abbett Funds and Douglas B. Sieg, Trustee, President, and Chief Executive Officer of the Lord Abbett Funds.
Dear Shareholders: We are pleased to provide you with this overview of the performance of the Funds for the fiscal year ended October 31, 2020. On this page and the following pages, we discuss the major factors that influenced fiscal year performance. For detailed and timely information about the Funds, please visit our website at www.lordabbett.com, where you can also access the quarterly commentaries that provide updates on each Fund’s performance and other portfolio related updates.
Thank you for investing in Lord Abbett mutual funds. We value the trust that you place in us and look forward to serving your investment needs in the years to come.
Best regards,

Douglas B. Sieg
Trustee, President, and Chief Executive Officer
1
Lord Abbett Alpha Strategy Fund
For the fiscal year ended October 31, 2020, the Fund returned 7.72%, reflecting performance at the net asset value (NAV) of Class A shares with all distributions reinvested, compared to its benchmark, the Russell 2000® Index,1 which returned -0.14% over the same period.
The trailing twelve-month period was characterized by several market-moving events. After trade tensions continued to ebb and flow in the final four months of 2019, U.S. President Donald Trump signed a “phase one” trade deal with China on the 15th of January 2020 and markets priced in a likelihood of two more interest rate cuts in 2020. The tide turned abruptly in February and March 2020, as the outbreak of the COVID-19 pandemic and the expected economic damage resulting from a sudden slowdown in corporate spending, individual spending, consumer confidence, and thus recessionary and deflationary pressures, triggered a severe sell-off. As the COVID-19 pandemic fueled fears of slowing global growth, oil prices fell precipitously, with the primary U.S. oil contract closing in negative territory for the first time in history, although it has since rebounded. During the month of March, the S&P 500 Index2 experienced its fastest bear market since 1987 and the longest U.S. economic expansion in history ended at 128 months.
The U.S. Federal Reserve (Fed) responded to the COVID-19 outbreak with
a breadth of policy measures which lifted investors’ confidence in the markets. The Fed launched a $700 billion quantitative easing program, decreased the reserve requirements to zero for thousands of banks, and cut the federal funds rate to the current target range of 0-0.25%. Next, the Fed announced additional stimulus programs, including open-ended asset purchases, purchases of corporate debt, and a commitment to a new small business lending program. Additionally, the central bank announced $2.3 trillion of additional credit support by expanding the Primary Market Corporate Credit Facility (PMCCF), the Secondary Market Corporate Credit Facility (SMCCF), and the Term Asset-Backed Securities Loan Facility (TALF). Most notably, the expanded measures included the purchase of select fallen angels. During its latest September 2020 meeting, the Fed voted to keep interest rates in a range of 0-0.25% to support the U.S. economy as it recovers from the deep impact of the COVID-19 related lockdowns. In its September statement, the Fed noted that it expects to keep rates unchanged until “inflation has risen to 2% and is on track to moderately exceed 2% for some time.”
Risk assets began to stage a recovery in April and May 2020 on the back of progress with respect to COVID-19 treatments and vaccines, commentary from several corporations that indicated stabilization in April and May, and massive monetary and fiscal policy globally. Positive market sentiment continued into the third quarter of 2020 as well. In addition to the factors
2
listed above, tailwinds for the continued rally in risk assets included a rebound in earnings revisions as well as further progress in COVID-19 treatments, as evidenced by multiple drugs reaching Phase III trials. In September, however, market sentiment soured amid political volatility related to the Supreme Court of the United States vacancy, heightened COVID-19 concerns in Europe as global deaths topped one million, heightened uncertainty leading up to the U.S. Presidential election, and worries about stalled fiscal stimulus talks in Washington.
The Fund is a “fund of funds” that invests in affiliated mutual funds managed by Lord Abbett. Under normal conditions, through the underlying funds, the Fund indirectly invests in the equity securities of U.S. and foreign micro-cap, small, and mid-sized companies. The Fund uses a “blend” strategy to gain exposure to both growth and value stocks.
The portfolio’s weightings in domestic small- and micro-cap stocks within the Lord Abbett Micro Cap Growth Fund and the Lord Abbett Developing Growth Fund were the largest contributors to relative performance over the period, as innovation-oriented stocks outperformed cyclical industries throughout both the severe bear market in March 2020 and the subsequent recovery. The portfolio’s exposure to mid-cap stocks within the Lord Abbett Value Opportunities Fund also contributed to relative performance, as larger cap stocks outperformed smaller cap stocks over the period.
The portfolio’s weightings in domestic small- and micro-cap value stocks within the Lord Abbett Small Cap Value Fund and Lord Abbett Focused Small Cap Value Fund were the largest detractors from relative performance over the period, as the global pandemic caused smaller capitalization stocks within cyclical industries to struggle relative to the Russell 2000® Index. In addition, the portfolio’s allocation to international small-cap stocks within the Lord Abbett International Opportunities Fund was also a modest detractor from relative performance, as domestic equities outperformed international equities over the period.
Lord Abbett Durable Growth Fund
From November 4th, 2019 through the fiscal year ended October 31, 2020, the Fund returned 28.16% reflecting performance at the net asset value (NAV) of Class A shares with all distributions reinvested, compared to its benchmark, the Russell 1000® Growth Index,3 which returned 28.12% over the same period.
The trailing twelve-month period was characterized by several market-moving events. U.S. President Donald Trump signed a “phase one” trade deal with China on the 15th of January 2020 and markets priced in a likelihood of two more interest rate cuts in 2020. The tide turned abruptly in February and March 2020, as the outbreak of the COVID-19 pandemic and the expected economic damage resulting from a sudden slowdown in corporate spending,
3
individual spending, consumer confidence, and thus recessionary and deflationary pressures, triggered a severe sell-off. As the COVID-19 pandemic fueled fears of slowing global growth, oil prices fell precipitously, with the primary U.S. oil contract closing in negative territory for the first time in history, although it has since rebounded. During the month of March, the S&P 500® Index2 experienced its fastest bear market since 1987 and the longest U.S. economic expansion in history ended at 128 months.
The U.S. Federal Reserve (Fed) responded to the COVID-19 outbreak with a breadth of policy measures which lifted investors’ confidence in the markets. The Fed launched a $700 billion quantitative easing program, decreased the reserve requirements to zero for thousands of banks, and cut the federal funds rate to the current target range of 0-0.25%. Next, the Fed announced additional stimulus programs, including open-ended asset purchases, purchases of corporate debt, and a commitment to a new small business lending program. Additionally, the central bank announced $2.3 trillion of additional credit support by expanding the Primary Market Corporate Credit Facility (PMCCF), the Secondary Market Corporate Credit Facility (SMCCF), and the Term Asset-Backed Securities Loan Facility (TALF). Most notably, the expanded measures included the purchase of select fallen angels. During its latest September meeting, the Fed voted to keep interest rates in a range of 0-0.25% to support the U.S. economy as it recovers
from the deep impact of the COVID-19 related lockdowns. In its September statement, the Fed noted that it expects to keep rates unchanged until “inflation has risen to 2% and is on track to moderately exceed 2% for some time.”
Risk assets began to stage a recovery in April and May 2020 on the back of progress with respect to COVID-19 treatments and vaccines, commentary from several corporations that indicated stabilization in April and May, and massive monetary and fiscal policy globally. Positive market sentiment continued into the third quarter of 2020 as well. In addition to the factors listed above, tailwinds for the continued rally in risk assets included a rebound in earnings revisions as well as further progress in COVID-19 treatments as evidenced by multiple drugs reaching Phase III trials. In September, however, market sentiment soured amid political volatility related to the Supreme Court of the United States vacancy, heightened COVID-19 concerns in Europe as global deaths topped one million, heightened uncertainty leading up to the U.S. Presidential election, and worries about stalled fiscal stimulus talks in Washington.
Security selection within the health care and industrials sectors contributed to relative performance. Within the health care sector, Danaher Corp., a medical device company, was the largest contributor to relative performance. Shares of Danaher rose as the company received Federal Drug Administration approval for its rapid COVID-19 test, which was
4
expected to provide substantially faster results than existing tests. Additionally, the Fund’s allocation to Immunomedics, Inc., a developer and manufacturer of biopharmaceutical products, contributed to relative performance as Gilead Sciences announced it would acquire the company for a large premium.
Within the industrials sector, the Fund’s holding in Old Dominion Freight Line Inc., contributed to relative performance over the period. Shares of the less-than-load (LTL) trucking company rose throughout the period, most notably after tonnage trends started to improve in the beginning of the summer as a result of a surge in eCommerce demand and inventory restocking.
Conversely, stock selection within the consumer discretionary and energy sectors detracted from relative performance during the period. The Fund’s underweight position in Tesla Inc., a designer and manufacturer of electric vehicles and energy storage systems, detracted from relative performance as the company announced a stock split and expectations for strong demand out of China helped buoy the share price, despite lofty valuations. Aramark Holdings Corp., a provider of food, facilities, and uniform services, also detracted from relative performance. Aramark’s core business was severely impacted by the spread of COVID-19 to North America, which forced the cancellation of events and the closure of venues.
Within the energy sector, shares of Pioneer Natural Resources Co., an independent oil and gas exploration and
production company, detracted from relative performance during the period. We believe Pioneer executed well during the period with good relative positioning via its assets in the Permian Basin and lower breakeven oil costs; however, this was overshadowed by falling energy prices and declining demand.
Lord Abbett Focused Growth Fund
For the fiscal year ended October 31, 2020, the Fund returned 69.40%, reflecting performance at the net asset value (NAV) of Class A shares with all distributions reinvested, compared to its benchmark, the Russell 1000® Growth Index,3 which returned 29.22% over the same period.
The trailing twelve-month period was characterized by several market-moving events. U.S. President Donald Trump signed a “phase one” trade deal with China on the 15th of January 2020 and markets priced in a likelihood of two more interest rate cuts in 2020. The tide turned abruptly in February and March 2020, as the outbreak of the COVID-19 pandemic and the expected economic damage resulting from a sudden slowdown in corporate spending, individual spending, consumer confidence, and thus recessionary and deflationary pressures, triggered a severe sell-off. Furthermore, as the COVID-19 pandemic fueled fears of slowing global growth, oil prices fell precipitously, with the primary U.S. oil contract closing in negative territory for the first time in history, although it has since rebounded. During
5
the month of March, the S&P 500® Index2 experienced its fastest bear market since 1987 and the longest U.S. economic expansion in history ended at 128 months.
The U.S. Federal Reserve (Fed) responded to the COVID-19 outbreak with a breadth of policy measures which lifted investors’ confidence in the markets. The Fed launched a $700 billion quantitative easing program, decreased the reserve requirements to zero for thousands of banks, and cut the federal funds rate to the current target range of 0-0.25%. During the second half of March, the Fed announced additional stimulus programs, including open-ended asset purchases, purchases of corporate debt, and a commitment to a new small business lending program. Additionally, the central bank announced $2.3 trillion of additional credit support by expanding the Primary Market Corporate Credit Facility (PMCCF), the Secondary Market Corporate Credit Facility (SMCCF), and the Term Asset-Backed Securities Loan Facility (TALF). Most notably, the expanded measures included the purchase of select fallen angels. During its latest September meeting, the Fed voted to keep interest rates in a range of 0-0.25% to support the U.S. economy as it recovers from the deep impact of the COVID-19 related lockdowns. In its September statement, the Fed noted that it expects to keep rates unchanged until “inflation has risen to 2% and is on track to moderately exceed 2% for some time.”
Risk assets began to stage a recovery in April and May 2020 on the back of progress
with respect to COVID-19 treatments and vaccines, commentary from several corporations that indicated stabilization in April and May, and massive monetary and fiscal policy globally. Positive market sentiment continued into the third quarter of 2020 as well. In addition to the factors listed above, tailwinds for the continued rally in risk assets included a rebound in earnings revisions as well as further progress in COVID-19 treatments as evidenced by multiple drugs reaching Phase III trials. In September, however, market sentiment soured amid political volatility related to the Supreme Court of the United States vacancy, heightened COVID-19 concerns in Europe as global deaths topped one million, heightened uncertainty leading up to the U.S. Presidential election, and worries about stalled fiscal stimulus talks in Washington.
Security selection within the information technology and consumer discretionary sectors contributed to relative performance. Within the information technology sector, Zoom Video Communications, Inc., a provider of a video communications platform, was the largest contributor to relative performance. Zoom Video Communications was a huge beneficiary of the disruption to traditional business and social interactions caused by the spread of COVID-19. Adoption of Zoom’s services rose rapidly throughout the period, with a torrent of new customers signing up, and existing customers increasing their utilization, which we believe led to the company’s
6
sales and earnings growth accelerating rapidly. Additionally, the Fund’s allocation to Square, Inc., a provider of payment processing solutions, also contributed to relative performance. Shares of Square appreciated as the company’s earnings report demonstrated key upside in important metrics. Most importantly, the company’s “Cash App” application saw revenue growth accelerate, while its products continued to resonate within its market.
Within the consumer discretionary sector, Tesla, Inc., a designer and manufacturer of electric vehicles and energy storage systems, contributed to relative performance. Shares of Tesla rose rapidly as the company’s execution, capital expenditure discipline, and strong orders drove the advance in the stock price. Furthermore, the announcement of a stock split and expectations for strong demand out of China helped buoy the share price.
Conversely, stock selection within the communication services sector detracted from relative performance during the period. The Fund’s underweight position in Facebook, Inc., the world’s leading social network, detracted from relative performance as, in our view, the company continued to execute well despite regulatory pressure. Live Nation Entertainment Corp., an entertainment marketing company, also detracted from relative performance. Live Nation’s core business was severely impacted by the spread of COVID-19 to North America, which forced the cancellation of events and the closure of venues.
Another detractor from relative performance within the Fund was Chipotle Mexican Grill, Inc., a restaurant operator. Chipotle was severely impacted by the spread of COVID-19, as restaurants were forced to close and demand waned.
Lord Abbett Focused Large Cap Value Fund
For the fiscal year ended October 31, 2020, the Fund returned -11.74%, reflecting performance at the net asset value (NAV) of Class A shares with all distributions reinvested, compared to its benchmark, the Russell 1000® Value Index,4 which returned -7.57% over the same period.
The trailing twelve-month period was characterized by several market-moving events. U.S. President Donald Trump signed a “phase one” trade deal with China on the 15th of January 2020 and markets priced in a likelihood of two more interest rate cuts in 2020. The tide turned abruptly in February and March 2020, as the outbreak of the COVID-19 pandemic and the expected economic damage resulting from a sudden slowdown in corporate spending, individual spending, consumer confidence, and thus recessionary and deflationary pressures, triggered a severe sell-off. As the COVID-19 pandemic fueled fears of slowing global growth, oil prices fell precipitously, with the primary U.S. oil contract closing in negative territory for the first time in history, although it has since rebounded. During the month of March, the S&P 500 Index2 experienced its fastest bear market since 1987 and the
7
longest U.S. economic expansion in history ended at 128 months.
The U.S. Federal Reserve (Fed) responded to the COVID-19 outbreak with a breadth of policy measures which lifted investors’ confidence in the markets. The Fed launched a $700 billion quantitative easing program, decreased the reserve requirements to zero for thousands of banks, and cut the federal funds rate to the current target range of 0-0.25%. Next, the Fed announced additional stimulus programs, including open-ended asset purchases, purchases of corporate debt, and a commitment to a new small business lending program. Additionally, the central bank announced $2.3 trillion of additional credit support by expanding the Primary Market Corporate Credit Facility (PMCCF), the Secondary Market Corporate Credit Facility (SMCCF), and the Term Asset-Backed Securities Loan Facility (TALF). Most notably, the expanded measures included the purchase of select fallen angels. During its latest September 2020 meeting, the Fed voted to keep interest rates in a range of 0-0.25% to support the U.S. economy as it recovers from the deep impact of the COVID-19 related lockdowns. In its September statement, the Fed noted that it expects to keep rates unchanged until “inflation has risen to 2% and is on track to moderately exceed 2% for some time.”
Risk assets began to stage a recovery in April and May on the back of progress with respect to COVID-19 treatments and vaccines, commentary from several corporations that indicated stabilization in
April and May, and massive monetary and fiscal policy globally. Positive market sentiment continued into the third quarter of 2020 as well. In addition to the factors listed above, tailwinds for the continued rally in risk assets included a rebound in earnings revisions as well as further progress in COVID-19 treatments, as evidenced by multiple drugs reaching Phase III trials. In September, however, market sentiment soured amid political volatility related to the Supreme Court of the United States vacancy, heightened COVID-19 concerns in Europe as global deaths topped one million, heightened uncertainty leading up to the U.S. Presidential election and worries about stalled fiscal stimulus talks in Washington.
During the 12-month period ending October 31, 2020, Wells Fargo & Company, a diversified, community-based financial services company, detracted most from relative performance. Shares of Wells Fargo fell throughout the period, but dropped significantly in June 2020 following an announcement that net interest income was down more than 11% for the year. Delta Air Lines, Inc., an air transportation company, also detracted from relative performance, as the company faced significant headwinds as the pandemic limited travel. Specifically, shares dropped after reporting third quarter earnings where revenue was below expectations and management pushed out its cash flow break-even assumption from year-end 2020 to Spring 2021. The Fund’s position in Universal Health Services, Inc., a health
8
care management company, also detracted from relative performance. Shares came under significant pressure in April after the firm missed earnings, which was attributed to significant slowdown in patient volumes in March 2020, in both the acute care and behavioral health units. Additionally, the stock was hurt by the firm’s inability to provide guidance for the year amid the uncertainty of the COVID-19 pandemic.
Conversely, the largest contributor to relative performance during the 12-month period ending October 31, 2020, was the Fund’s position in Thor Industries, Inc., a manufacturer of recreational vehicles (RVs). Shares of Thor increased as the demand for the RVs quickly rebounded as consumers looked for alternative ways to vacation during the pandemic. The Fund’s position in Discover Financial Services, a direct banking and payment services company, also contributed to relative performance. Shares of Discover rose as credit and spending trends improved quicker-than-expected during the second quarter, aided by the government stimulus package and enhanced unemployment benefits. The Fund’s position in Ameriprise Financial, Inc., a financial planning, asset management, and insurance services provider, also contributed to relative performance. Shares of Ameriprise rose following a better-than-expected first quarter, despite possible headwinds related to market volatility in March. The company’s first quarter performance was partially driven by an accelerated improvement in the advice and wealth management segment and
outperformance in the asset management segment.
Lord Abbett Focused Small Cap Value Fund
For the fiscal year ended October 31, 2020, the Fund returned -11.21%, reflecting performance at the net asset value (NAV) of Class A shares with all distributions reinvested, compared to its benchmark, the Russell 2000® Value Index,5 which returned -13.92% over the same period.
The trailing twelve-month period was characterized by several market-moving events. U.S. President Donald Trump signed a “phase one” trade deal with China on the 15th of January 2020 and markets priced in a likelihood of two more interest rate cuts in 2020. The tide turned abruptly in February and March 2020, as the outbreak of the COVID-19 pandemic and the expected economic damage resulting from a sudden slowdown in corporate spending, individual spending, consumer confidence, and thus recessionary and deflationary pressures, triggered a severe sell-off. As the COVID-19 pandemic fueled fears of slowing global growth, oil prices fell precipitously, with the primary U.S. oil contract closing in negative territory for the first time in history, although it has since rebounded. During the month of March, the S&P 500 Index2 experienced its fastest bear market since 1987 and the longest U.S. economic expansion in history ended at 128 months.
The U.S. Federal Reserve (Fed) responded to the COVID-19 outbreak with
9
a breadth of policy measures which lifted investors’ confidence in the markets. The Fed launched a $700 billion quantitative easing program, decreased the reserve requirements to zero for thousands of banks, and cut the federal funds rate to the current target range of 0-0.25%. Next, the Fed announced additional stimulus programs, including open-ended asset purchases, purchases of corporate debt, and a commitment to a new small business lending program. Additionally, the central bank announced $2.3 trillion of additional credit support by expanding the Primary Market Corporate Credit Facility (PMCCF), the Secondary Market Corporate Credit Facility (SMCCF), and the Term Asset-Backed Securities Loan Facility (TALF). Most notably, the expanded measures included the purchase of select fallen angels. During its latest September 2020 meeting, the Fed voted to keep interest rates in a range of 0-0.25% to support the U.S. economy as it recovers from the deep impact of the COVID-19 related lockdowns. In its September statement, the Fed noted that it expects to keep rates unchanged until “inflation has risen to 2% and is on track to moderately exceed 2% for some time.”
Risk assets began to stage a recovery in April and May on the back of progress with respect to COVID-19 treatments and vaccines, commentary from several corporations that indicated stabilization in April and May, and massive monetary and fiscal policy globally. Positive market sentiment continued into the third quarter of 2020 as well. In addition to the factors
listed above, tailwinds for the continued rally in risk assets included a rebound in earnings revisions as well as further progress in COVID-19 treatments, as evidenced by multiple drugs reaching Phase III trials. In September, however, market sentiment soured amid political volatility related to the Supreme Court of the United States vacancy, heightened COVID-19 concerns in Europe as global deaths topped one million, heightened uncertainty leading up to the U.S. Presidential election and worries about stalled fiscal stimulus talks in Washington.
The largest contributor to relative performance during the 12-month period ending October 31, 2020, was the Fund’s position in Masonite International Corporation. Shares of the door manufacturer rose after the company reported first quarter adjusted earnings per share (EPS) of more than double consensus estimates due to better-than-expected results in the North American residential segment. In September, shares of Masonite continued to rally when, following better-than-expected demand for the North American residential segment, management raised its third quarter outlook, stating that they expected year-over-year sales growth to be up mid-single digits, versus their prior guidance which was flat. The Fund’s position in Thor Industries, Inc., a manufacturer of recreational vehicles (RVs), also contributed to relative performance. Shares of Thor increased as demand for RVs quickly rebounded as consumers looked for alternative ways to vacation during the
10
pandemic. The Fund’s position in Brightsphere Investment Group, an asset management firm, also contributed to relative performance. The stock of Brightsphere rose after it was reported on June 26, 2020 that Generali, an Italian insurance and financial manager, had approached the company about a potential takeover.
Conversely, the Fund’s position in Triumph Group, Inc., a manufacturer of aerospace and defense systems and equipment for the aviation industry, detracted from relative performance. Shares of Triumph fell throughout the period, but dropped significantly in March, as travel restrictions grounded flights worldwide in response to the pandemic. Natus Medical Inc., a medical device company, also detracted from relative performance as the company’s shares fell after it reported second quarter earnings in which revenues were down 32.4% versus the second quarter of 2019. The decrease in revenues over the year was due to the impact of COVID-19. Specifically, Natus’ Neuro products and services segment was impacted by the decline in spending at many hospitals and the hearing and balance segment was hindered by the reduced activity in audiologists’ offices and retail hearing centers. The Fund’s position in Avnet Inc., an electronic components distributor, also detracted from relative performance. Throughout the year, Avnet continued to face significant headwinds relating to the COVID-19 pandemic causing sales to decline 11% year-over-year. Specifically, within the
electronic components segment, which makes up 93% of Avnet’s total sales, revenue was down 11% year-over-year due to sluggish semiconductor sales. The stock experienced further pressure when the revenue forecast provided by management for the third quarter was lower than other semiconductor suppliers.
Lord Abbett Fundamental Equity Fund
For the fiscal year ended October 31, 2020, the Fund returned -6.39%, reflecting performance at the net asset value (NAV) of Class A shares with all distributions reinvested, compared to its benchmark, the Russell 1000® Value Index,4 which returned -7.57% over the same period.
The trailing twelve-month period was characterized by several market-moving events. U.S. President Donald Trump signed a “phase one” trade deal with China on the 15th of January 2020 and markets priced in a likelihood of two more interest rate cuts in 2020. The tide turned abruptly in February and March 2020, as the outbreak of the COVID-19 pandemic and the expected economic damage resulting from a sudden slowdown in corporate spending, individual spending, consumer confidence, and thus recessionary and deflationary pressures, triggered a severe sell-off. As the COVID-19 pandemic fueled fears of slowing global growth, oil prices fell precipitously, with the primary U.S. oil contract closing in negative territory for the first time in history, although it has since rebounded. During the month of
11
March, the S&P 500 Index2 experienced its fastest bear market since 1987 and the longest U.S. economic expansion in history ended at 128 months.
The U.S. Federal Reserve (Fed) responded to the COVID-19 outbreak with a breadth of policy measures which lifted investors’ confidence in the markets. The Fed launched a $700 billion quantitative easing program, decreased the reserve requirements to zero for thousands of banks, and cut the federal funds rate to the current target range of 0-0.25%. Next, the Fed announced additional stimulus programs, including open-ended asset purchases, purchases of corporate debt, and a commitment to a new small business lending program. Additionally, the central bank announced $2.3 trillion of additional credit support by expanding the Primary Market Corporate Credit Facility (PMCCF), the Secondary Market Corporate Credit Facility (SMCCF), and the Term Asset-Backed Securities Loan Facility (TALF). Most notably, the expanded measures included the purchase of select fallen angels. During its latest September 2020 meeting, the Fed voted to keep interest rates in a range of 0-0.25% to support the U.S. economy as it recovers from the deep impact of the COVID-19 related lockdowns. In its September statement, the Fed noted that it expects to keep rates unchanged until “inflation has risen to 2% and is on track to moderately exceed 2% for some time.”
Risk assets began to stage a recovery in April and May on the back of progress with respect to COVID-19 treatments and
vaccines, commentary from several corporations that indicated stabilization in April and May, and massive monetary and fiscal policy globally. Positive market sentiment continued into the third quarter of 2020 as well. In addition to the factors listed above, tailwinds for the continued rally in risk assets included a rebound in earnings revisions as well as further progress in COVID-19 treatments, as evidenced by multiple drugs reaching Phase III trials. In September, however, market sentiment soured amid political volatility related to the Supreme Court of the United States vacancy, heightened COVID-19 concerns in Europe as global deaths topped one million, heightened uncertainty leading up to the U.S. Presidential election and worries about stalled fiscal stimulus talks in Washington.
The largest contributor to relative performance during the 12-month period ending October 31, 2020, was the Fund’s position in Apple, Inc., a smartphone and personal electronics manufacturer. Shares of Apple rose throughout the year on the back of strong year-over-year revenue growth for iPhones and increased growth for Macs and iPads due to remote working and learning. The Fund’s position in E-Trade, Inc. also contributed to relative performance. Shares of the online brokerage firm rose after Morgan Stanley announced that it had reached an agreement to acquire the company in an all-stock deal valued at approximately $13B, a premium of 31%. The Fund’s position in Cummins, Inc., a manufacturer
12
of diesel and natural gas engines, also contributed to relative performance. The stock rose after the company reported better-than-expected second quarter earnings driven by the firm’s exposure to China and its cost reduction incentives, which led to better-than-expected margins.
Conversely, during the 12-month period ending October 31, 2020 the Fund’s position in Wells Fargo & Company, a diversified, community-based financial services company, detracted most from relative performance. Shares fell throughout the period but dropped significantly in June following an announcement that net interest income was down more than 11% for the year. Citigroup Inc., a financial products and services company, also detracted from relative performance. Citi’s stock price fell after the Federal Open Markets Committee announced on June 10th that it would keep the federal funds rate at 0%-0.25%. Bank stocks fell due to expectations that this would likely lower net interest income in the medium-term. Shares of Citi came under further pressure in September, as several news articles suggested regulators could take action over the bank’s deficiencies in risk and control functions. The Fund’s position in Universal Health Services, Inc., a healthcare management company, also detracted from relative performance. Shares came under significant pressure in April after the firm missed earnings, which was attributed to the significant slowdown in March in patient volumes in both the Acute Care
and Behavioral Health units. Additionally, the stock was hurt due to the firm’s inability to provide guidance for the year amid the uncertainty of the COVID-19 pandemic.
Lord Abbett Global Equity Research Fund
For the fiscal year ended October 31, 2020, the Fund returned 10.52%, reflecting performance at the net asset value (NAV) of Class A Shares with all distributions reinvested, compared to its benchmark, the MSCI All Country World Index with Net Dividends,6 which returned 4.89% over the same period.
The trailing twelve-month period was characterized by several market-moving events. U.S. President Donald Trump signed a “phase one” trade deal with China on the 15th of January 2020 and markets priced in a likelihood of two more rate cuts in 2020. The tide turned abruptly in February and March 2020, as the outbreak of the COVID-19 pandemic and the expected economic damage resulting from a sudden slowdown in corporate spending, individual spending, consumer confidence, and thus recessionary and deflationary pressures, triggered a severe sell-off. Furthermore, as the COVID-19 pandemic fueled fears of slowing global growth, oil prices fell precipitously, with the primary U.S. oil contract closing in negative territory for the first time in history, although it has since rebounded. During the month of March, the S&P 500 Index2 experienced its fastest bear market since
13
1987 and the longest U.S. economic expansion in history ended at 128 months.
The U.S. Federal Reserve (Fed) responded to the COVID-19 outbreak with a breadth of policy measures which lifted investors’ confidence in the markets. The Fed launched a $700 billion quantitative easing program, decreased the reserve requirements to zero for thousands of banks, and cut the federal funds rate to the current target range of 0-0.25%. In the latter half of March, the Fed announced additional stimulus programs, including open-ended asset purchases, purchases of corporate debt, and a commitment to a new small business lending program. Additionally, the central bank announced $2.3 trillion of additional credit support by expanding the Primary Market Corporate Credit Facility (PMCCF), the Secondary Market Corporate Credit Facility (SMCCF), and the Term Asset-Backed Securities Loan Facility (TALF). Most notably, the expanded measures included the purchase of select fallen angels. During its latest September 2020 meeting, the Fed voted to keep interest rates in a range of 0-0.25% to support the U.S. economy as it recovers from the deep impact of the COVID-19 lockdowns. In its September statement, the Fed noted that it expects to keep rates unchanged until “inflation has risen to 2% and is on track to moderately exceed 2% for some time.” The European Central Bank (ECB) maintained interest rates at 0% as new President Christine Lagarde took over the responsibility on November 1st, 2019. Since the COVID-19 pandemic roiled global markets during her tenure, the
ECB introduced and expanded its pandemic emergency purchase program (PEPP) and extended it to at least June 2021. The ECB also continued net purchases under the asset purchase program (APP) at a monthly pace of 20 billion euros, together with the purchase under the additional 120-billion-euro temporary envelope until the end of the year. Additionally, officials signaled readiness to adjust all of its instruments to ensure that inflation moved towards its aim in a sustained manner, including by slashing interest rates deeper into negative territory and changing the conditions of the targeted longer-term refinancing operations. Similar to other global central banks, The Bank of Japan (BoJ) introduced several measures to combat the pressures from COVID-19, including aggressive purchases of corporate debt and a new lending facility to funnel money to smaller firms via financial institutions. The BoJ also maintained its stimulative monetary policy at its October 2020 meeting, as short-term interest rates remained unchanged at -0.1%, and the bank kept its 10-year government bond yield target at around 0%.
Risk assets began to stage a recovery in April and May on the back of progress with respect to COVID-19 treatments and vaccines, commentary from several corporations that indicated stabilization in April and May, and massive monetary and fiscal policy globally. Positive market sentiment continued into the third quarter of 2020 as well. In addition to the factors listed above, tailwinds for the continued rally in risk assets included a rebound in
14
earnings revisions as well as further progress in COVID-19 treatments as evidenced by multiple drugs reaching Phase III trials. In September, however, market sentiment soured amid political volatility related to the Supreme Court of the United States vacancy, heightened COVID-19 concerns in Europe as global deaths topped one million, heightened uncertainty leading up to the U.S. Presidential election, and worries about stalled fiscal stimulus talking in Washington. Sentiment overseas moved largely in line with that of the U.S., and international equity markets staged a recovery from April through October 2020. Chinese equities rallied as the country’s economy gained control over the COVID-19 pandemic, and China’s economy managed to grow 4.9% year-on-year in the third quarter. In the Eurozone, equities rebounded as well, but in a less robust way, as a second wave of the COVID-19 pandemic materialized, and as second quarter GDP numbers from Germany, France, and the Eurozone weighed on investor sentiment. Germany’s economy contracted by 9.7%, France’s by 13.80%, and the Eurozone’s by 11.80% in the quarter.
In its latest October report, the International Monetary Fund estimated global growth at -4.4% for 2020, a less severe contraction than forecast in the June 2020 World Economic Outlook. “The revision reflects better-than anticipated second quarter GDP outturns, mostly in advanced economies, where activity began to improve sooner than expected after lockdowns were scaled back in May and June, as well as indicators of a stronger recovery in the third
quarter.” The International Monetary Fund projects growth to pick up to 5.2% in 2021, “reflecting the more moderate downturn projected for 2020 and consistent with expectations of persistent social distancing”.
During the period, the Fund’s outperformance relative to the benchmark was driven by stock selection within the information technology and communication services sectors. Within the information technology sector, holdings in The Trade Desk, Inc. contributed to relative performance. Shares of the U.S.-based advertising technology platform company rose as management showed strong execution and initiated quarterly guidance in its television advertising business, revealing that the company’s competitive moat had widened. An overweight position in NVIDIA Corp. also contributed to relative performance as the company’s stock rose throughout the year. The American manufacturer of computer graphics processors and chipsets benefitted from strong underlying gaming demand driven by the COVID-19 pandemic, as well as from positive sentiment around its announced acquisition of Arm Limited from Softbank Group, Corp.
Within the communication services sector, an overweight position in Tencent Holdings Limited contributed to relative performance. The Chinese multinational technology conglomerate’s stock rose as it navigated the pandemic successfully, utilizing its platforms and technologies to help users adapt to the ‘new normal’ via online tools and digital content, resulting
15
in mobile games revenue surging 62% year-over-year.
Conversely, stock selection within the consumer staples and energy sectors detracted from relative performance. Within the consumer staples sector, shares of Sysco Corp. detracted from performance. The food products distribution company’s stock fell as the COVID-19 pandemic proved to have a lasting negative effect on foodservice businesses through weaker demand. Additionally, Shiseido Company, Limited, a Japanese cosmetics company, detracted from relative performance. Shares fell over the period as the company’s plans for margin improvements were hit by drops in inbound tourism and by the COVID-19 pandemic. Investor sentiment shifted negatively given limited details about how a margin recovery would materialize.
Within the energy sector, holdings of Oneok, Inc. detracted from relative performance. The natural gas midstream services company’s stock fell as gas volumes across their system showed deep declines driven by COVID-19 and the drop in commodity prices.
Lord Abbett Growth Leaders Fund
For the fiscal year ended October 31, 2020, the Fund returned 60.35%, reflecting performance at the net asset value (NAV) of Class A shares with all distributions reinvested, compared to its benchmark, the Russell 1000® Growth Index,3 which returned 29.22% over the same period.
The trailing twelve-month period was characterized by several market-moving events. U.S. President Donald Trump signed a “phase one” trade deal with China on the 15th of January 2020 and markets priced in a likelihood of two more interest rate cuts in 2020. The tide turned abruptly in February and March 2020, as the outbreak of the COVID-19 pandemic and the expected economic damage resulting from a sudden slowdown in corporate spending, individual spending, consumer confidence, and thus recessionary and deflationary pressures, triggered a severe sell-off. Furthermore, as the COVID-19 pandemic fueled fears of slowing global growth, oil prices fell precipitously, with the primary U.S. oil contract closing in negative territory for the first time in history, although it has since rebounded. During the month of March, the S&P 500® Index2 experienced its fastest bear market since 1987 and the longest U.S. economic expansion in history ended at 128 months.
The U.S. Federal Reserve (Fed) responded to the COVID-19 outbreak with a breadth of policy measures which lifted investors’ confidence in the markets. The Fed launched a $700 billion quantitative easing program, decreased the reserve requirements to zero for thousands of banks, and cut the federal funds rate to the current target range of 0-0.25%. During the second half of March, the Fed announced additional stimulus programs, including open-ended asset purchases, purchases of corporate debt, and a commitment to a new small business
16
lending program. Additionally, the central bank announced $2.3 trillion of additional credit support by expanding the Primary Market Corporate Credit Facility (PMCCF), the Secondary Market Corporate Credit Facility (SMCCF), and the Term Asset-Backed Securities Loan Facility (TALF). Most notably, the expanded measures included the purchase of select fallen angels. During its latest September meeting, the Fed voted to keep interest rates in a range of 0-0.25% to support the U.S. economy as it recovers from the deep impact of the COVID-19 related lockdowns. In its September statement, the Fed noted that it expects to keep rates unchanged until “inflation has risen to 2% and is on track to moderately exceed 2% for some time.”
Risk assets began to stage a recovery in April and May 2020 on the back of progress with respect to COVID-19 treatments and vaccines, commentary from several corporations that indicated stabilization in April and May, and massive monetary and fiscal policy globally. Positive market sentiment continued into the third quarter of 2020 as well. In addition to the factors listed above, tailwinds for the continued rally in risk assets included a rebound in earnings revisions as well as further progress in COVID-19 treatments as evidenced by multiple drugs reaching Phase III trials. In September, however, market sentiment soured amid political volatility related to the Supreme Court of the United States vacancy, heightened COVID-19 concerns in Europe as global deaths topped one million, heightened
uncertainty leading up to the U.S. Presidential election, and worries about stalled fiscal stimulus talks in Washington.
Security selection within the information technology and consumer discretionary sectors contributed to relative performance. Within the information technology sector, Zoom Video Communications, Inc., a provider of a video communications platform, was the largest contributor to relative performance. Zoom Video Communications was a huge beneficiary of the disruption to traditional business and social interactions caused by the spread of COVID-19. Adoption of Zoom’s services rose rapidly throughout the period, with a torrent of new customers signing up, and existing customers increasing their utilization, which we believe led to the company’s sales and earnings growth accelerating rapidly. Additionally, the Fund’s allocation to Square, Inc., a provider of payment processing solutions, also contributed to relative performance. Shares of Square appreciated as the company’s earnings report demonstrated key upside in important metrics. Most importantly, the company’s “Cash App” application saw revenue growth accelerate, while its products continued to resonate within its market.
Within the consumer discretionary sector, Tesla, Inc., a designer and manufacturer of electric vehicles and energy storage systems, contributed to relative performance. Shares of Tesla rose rapidly as the company’s execution, capital expenditure discipline, and strong orders
17
drove the advance in the stock price. Furthermore, the announcement of a stock split and expectations for strong demand out of China helped buoy the share price.
Conversely, stock selection within the communication services sector detracted from relative performance during the period. The Fund’s underweight position in Facebook, Inc., the world’s leading social network, detracted from relative performance as, in our view, the company continued to execute well despite regulatory pressure. Live Nation Entertainment Corp., an entertainment marketing company, also detracted from relative performance. Live Nation’s core business was severely impacted by the spread of COVID-19 to North America, which forced the cancellation of events and the closure of venues.
The Fund’s underweight to Apple, Inc., a designer of a variety of technology-related products and services, detracted from relative performance, as the company made progress in moderating product delays caused by the global pandemic.
Lord Abbett Health Care Fund
For the fiscal year ended October 31, 2020, the Fund returned 33.08%, reflecting performance at the net asset value (NAV) of Class A Shares with all distributions reinvested, compared to its benchmark, the MSCI ACWI Health Care Index with Net Dividends,7 which returned 10.24% over the same period.
Politics remained an overhang for the health care sector in the U.S. throughout the period, especially as the 2020 elections approached. The prospects for Medicare-for-All increased, concerns that regulatory burdens would increase in the future lingered, and the potential for the Texas Affordable Care Act case to move to the U.S. Supreme Court in 2020 became an ongoing debate. However, in our view, regulatory and policy concerns were somewhat offset by the substantial innovation within the health care industry that was highlighted during the period.
The tide turned abruptly in February and March. The outbreak of the COVID-19 pandemic and the expected economic damage resulting from a sudden slowdown in corporate spending, individual spending, and consumer confidence, resulting in recessionary and deflationary pressures, triggered a severe sell-off. The U.S. Federal Reserve responded to the COVID-19 outbreak with a breadth of policy measures which lifted investors’ confidence in the markets. Similarly, the European Central Bank maintained an accommodative stance keeping interest rates at 0% and introduced and expanded its pandemic emergency purchase program. Despite a challenging global macroeconomic environment which continued to be driven by the COVID-19 pandemic, the broad markets rallied based on further stimulus and positive data on COVID treatments. Risk assets began to stage a recovery in April and May on the back of progress with respect to COVID-19 treatments and
18
vaccines, commentary from several corporations that indicated stabilization in April and May, and massive monetary and fiscal policy globally. By the end of July, following Phase 1-2 clinical trial data from Moderna, Pfizer/BioNTech, and Astra Zeneca/Oxford, it was clear timelines for a vaccine were being accelerated, suggesting a vaccine might be available before the end of the year.
Sentiment overseas moved largely in line with that of the U.S., as international equity markets staged a recovery from April through October. In its October 2020 report, the International Monetary Fund estimated global growth at -4.4% for 2020, “reflecting the more moderate downturn projected for 2020 and consistent with expectations of persistent social distancing.” This was a less severe contraction than forecast in the June 2020 World Economic Outlook.
Security selection within the biotechnology industry was the largest contributor to relative performance during the period. Twist Bioscience Corp., a developer of proprietary DNA manufacturing processes, was the largest contributor to relative performance. Shares of Twist rose as the company’s proprietary platform drove scale, product development, and lowered costs for synthetic DNA fragments, which are key for antibody drug discovery. Additionally, the Fund’s allocation to Immunomedics, Inc., a developer and manufacturer of biopharmaceutical products, contributed to relative performance, as Gilead Sciences,
Inc. announced it would acquire the company for a large premium.
Conversely, the Fund’s positioning within the health care providers and services industry detracted from relative performance. Specifically, the Fund’s underweight allocation to UnitedHealth Group, Inc., a provider of a variety of health care services, detracted from relative performance as the company executed well throughout the period, despite a myriad of industry and regulatory headwinds. The Fund’s position in Constellation Pharmaceuticals, Inc., a clinical-stage biopharmaceutical company, also detracted from relative performance during the period. At the European Hematology Medical meeting, Constellation presented what we believe to be compelling updated Phase 2 clinical trial data which indicated the company’s therapy had potential in treating myelofibrosis. However, there were some concern that lower risk patients were driving the strong efficacy in the study, which hurt the share price.
Lord Abbett International Equity Fund
For the fiscal year ended October 31, 2020, the Fund returned 3.23%, reflecting performance at the net asset value (NAV) of Class A Shares with all distributions reinvested, compared to its benchmark, the MSCI ACWI ex-U.S. Index with Net Dividends8, which returned -2.61% over the same period.
19
The trailing twelve-month period was characterized by several market-moving events. U.S. President Donald Trump signed a “phase one” trade deal with China on the 15th of January 2020 and markets priced in a likelihood of two more rate cuts in 2020. The tide turned abruptly in February and March 2020, as the outbreak of the COVID-19 pandemic and the expected economic damage resulting from a sudden slowdown in corporate spending, individual spending, consumer confidence, and thus recessionary and deflationary pressures, triggered a severe sell-off. Furthermore, as the COVID-19 pandemic fueled fears of slowing global growth, oil prices fell precipitously, with the primary U.S. oil contract closing in negative territory for the first time in history, although it has since rebounded. During the month of March, the S&P 500 Index2 experienced its fastest bear market since 1987 and the longest U.S. economic expansion in history ended at 128 months.
The U.S. Federal Reserve (Fed) responded to the COVID-19 outbreak with a breadth of policy measures which lifted investors’ confidence in the markets. The Fed launched a $700 billion quantitative easing program, decreased the reserve requirements to zero for thousands of banks, and cut the federal funds rate to the current target range of 0-0.25%. In the latter half of March, the Fed announced additional stimulus programs, including open-ended asset purchases, purchases of corporate debt, and a commitment to a new small business lending program. Additionally, the central
bank announced $2.3 trillion of additional credit support by expanding the Primary Market Corporate Credit Facility (PMCCF), the Secondary Market Corporate Credit Facility (SMCCF), and the Term Asset-Backed Securities Loan Facility (TALF). Most notably, the expanded measures included the purchase of select fallen angels. During its latest September 2020 meeting, the Fed voted to keep interest rates in a range of 0-0.25% to support the U.S. economy as it recovers from the deep impact of the COVID-19 lockdowns. In its September statement, the Fed noted that it expects to keep rates unchanged until “inflation has risen to 2% and is on track to moderately exceed 2% for some time.” The European Central Bank (ECB) maintained interest rates at 0% as new President Christine Lagarde took over the responsibility on November 1st, 2019. Since the COVID-19 pandemic roiled global markets during her tenure, the ECB introduced and expanded its pandemic emergency purchase program (PEPP) and extended it to at least June 2021. The ECB also continued net purchases under the asset purchase program (APP) at a monthly pace of 20 billion euros, together with the purchase under the additional 120-billion-euro temporary envelope until the end of the year. Additionally, officials signaled readiness to adjust all of its instruments to ensure that inflation moved towards its aim in a sustained manner, including by slashing interest rates deeper into negative territory and changing the conditions of the targeted longer-term refinancing operations. Similar to other global central banks, The Bank of
20
Japan (BoJ) introduced several measures to combat the pressures from COVID-19, including aggressive purchases of corporate debt and a new lending facility to funnel money to smaller firms via financial institutions. The BoJ also maintained its stimulative monetary policy at its October 2020 meeting, as short-term interest rates remained unchanged at -0.1%, and the bank kept its 10-year government bond yield target at around 0%.
Risk assets began to stage a recovery in April and May on the back of progress with respect to COVID-19 treatments and vaccines, commentary from several corporations that indicated stabilization in April and May, and massive monetary and fiscal policy globally. Positive market sentiment continued into the third quarter of 2020 as well. In addition to the factors listed above, tailwinds for the continued rally in risk assets included a rebound in earnings revisions as well as further progress in COVID-19 treatments as evidenced by multiple drugs reaching Phase III trials. In September, however, market sentiment soured amid political volatility related to the Supreme Court of the United States vacancy, heightened COVID-19 concerns in Europe as global deaths topped one million, heightened uncertainty leading up to the U.S. Presidential election, and worries about stalled fiscal stimulus talking in Washington. Sentiment overseas moved largely in line with that of the U.S., and international equity markets staged a recovery from April through October 2020. Chinese equities rallied as the country’s economy gained
control over the COVID-19 pandemic, and China’s economy managed to grow 4.9% year-on-year in the third quarter. In the Eurozone, equities rebounded as well, but in a less robust way, as a second wave of the COVID-19 pandemic materialized, and as second quarter GDP numbers from Germany, France, and the Eurozone weighed on investor sentiment. Germany’s economy contracted by 9.7%, France’s by 13.80%, and the Eurozone’s by 11.80% in the quarter.
In its latest October report, the International Monetary Fund estimated global growth at -4.4% for 2020, a less severe contraction than forecast in the June 2020 World Economic Outlook. “The revision reflects better-than anticipated second quarter GDP outturns, mostly in advanced economies, where activity began to improve sooner than expected after lockdowns were scaled back in May and June, as well as indicators of a stronger recovery in the third quarter.” The International Monetary Fund projects growth to pick up to 5.2% in 2021, “reflecting the more moderate downturn projected for 2020 and consistent with expectations of persistent social distancing”.
During the period, the Fund’s outperformance relative to the benchmark was driven by stock selection within the health care and industrials sectors. Within the health sector, holdings in Lonza Group AG, a Swiss pharmaceutical, health care, and life science products company, contributed to relative performance. Shares rose as Lonza was categorized as “essential” during the COVID-19 pandemic and its license to operate remained intact
21
in all markets, without any major disruptions in its supply chain. An overweight position in Genmab A/S also contributed to relative performance, as the Denmark-based biotechnology company benefited from strong momentum and positive investors sentiment, driven by the expected strength of the company’s announced collaboration with AbbVie, Inc.
Security selection in the industrials sector also contributed to relative performance. Specifically, overweight position in Airtac International Group contributed to relative performance. Shares of the Taiwan-based pneumatic equipment manufacturing company rose after the company reported better-than-expected 2Q20 results, with management reaffirming an industry upcycle and strong 5G-related and new infrastructure demand.
Conversely, stock selection within the energy and consumer staples sectors detracted from relative performance over the period. Within the energy sector, shares of Royal Dutch Shell PLC detracted from relative performance, as the global oil and gas production company’s stock fell due to surprisingly weak 2Q20 earnings results, elevated debt, and uncertainty around financial priorities and free cash flow outlook.
Within the consumer staples sector, shares of Shiseido Company Limited, a Japanese cosmetics company, detracted from relative performance. Shares fell over the period as the company’s plans for margin improvements were hit by drops in inbound tourism and by the COVID-19
pandemic. Investor sentiment shifted negatively, given limited details about how a margin recovery would materialize. An overweight position in Asahi Group Holdings, Ltd., a Japanese food and beverages company, also detracted from relative performance. The company’s stock fell after it booked a 43% year-over-year decline in consolidated core operating profit in the second quarter of 2020, due in part to restaurant closures and lower demand from Japanese pubs resulting from the increased prevalence of telecommuting.
Lord Abbett International Opportunities Fund
For the fiscal year ended October 31, 2020, the Fund returned -0.84%, reflecting performance at the net asset value (NAV) of Class A Shares with all distributions reinvested, compared to its benchmark, the S&P Developed Ex-U.S. SmallCap® Index9, which returned -0.13% over the same period.
The trailing twelve-month period was characterized by several market-moving events. U.S. President Donald Trump signed a “phase one” trade deal with China on the 15th of January and markets priced in a likelihood of two more interest rate cuts in 2020. The tide turned abruptly in February and March, as the outbreak of the COVID-19 pandemic and the expected economic damage resulting from a sudden slowdown in corporate spending, individual spending, consumer confidence, and thus recessionary and deflationary pressures, triggered a severe sell-off. Furthermore, as the COVID-19 pandemic fueled fears of
22
slowing global growth, oil prices fell precipitously, with the primary U.S. oil contract closing in negative territory for the first time in history, although it has since rebounded. During the month of March, the S&P 500 Index2 experienced its fastest bear market since 1987 and the longest U.S. economic expansion in history ended at 128 months.
The U.S. Federal Reserve (Fed) responded to the COVID-19 outbreak with a breadth of policy measures which lifted investors’ confidence in the markets. The Fed launched a $700 billion quantitative easing program, decreased the reserve requirements to zero for thousands of banks, and cut the federal funds rate to the current target range of 0-0.25%. In the back half of March, the Fed announced additional stimulus programs, including open-ended asset purchases, purchases of corporate debt, and a commitment to a new small business lending program. Additionally, the central bank announced $2.3 trillion of additional credit support by expanding the Primary Market Corporate Credit Facility (PMCCF), the Secondary Market Corporate Credit Facility (SMCCF), and the Term Asset-Backed Securities Loan Facility (TALF). Most notably, the expanded measures included the purchase of select fallen angels. During its latest September meeting, the Fed voted to keep interest rates in a range of 0-0.25% to support the U.S. economy as it recovers from the deep impact of the COVID-19 related lockdowns. In its September statement, the Fed noted that it expects to keep rates unchanged
until “inflation has risen to 2% and is on track to moderately exceed 2% for some time”. The European Central Bank (ECB) maintained interest rates at 0% as new President Christine Lagarde took over the responsibility on November 1st, 2019. Since the COVID-19 pandemic roiled global markets during her tenure, the ECB introduced and expanded its pandemic emergency purchase program (PEPP) and extended it to at least June 2021. The ECB also continued net purchases under the asset purchase program (APP) at a monthly pace of 20 billion euros, together with purchases under the additional 120-billion-euro temporary envelope until the end of the year. Additionally, officials signaled readiness to adjust all of the ECB’s instruments to ensure that inflation moved towards its aim in a sustained manner, including by slashing interest rates deeper into negative territory and changing the conditions of the targeted longer-term refinancing operations. Similar to other global central banks, The Bank of Japan (BoJ) introduced several measures to combat the pressures from COVID-19, including aggressive purchases of corporate debt and a new lending facility to funnel money to smaller firms via financial institutions. The BoJ also maintained its stimulative monetary policy at its October 2020 meeting, as short-term interest rates remained unchanged at -0.1%, and the bank kept its 10-year government bond yield target at around 0%.
Risk assets began to stage a recovery in April and May on the back of progress with
23
respect to coronavirus treatments and vaccines, commentary from several corporations that indicated stabilization in April and May, and massive monetary and fiscal policy globally. Positive market sentiment continued into the third quarter as well. In addition to the factors listed above, tailwinds for the continued rally in risk assets included a rebound in earnings revisions as well as further progress in COVID-19 treatments as evidenced by multiple drugs reaching Phase III trials. In September, however, market sentiment soured amid political volatility related to the Supreme Court of the United States vacancy, heightened COVID-19 concerns in Europe as global deaths topped one million, heightened uncertainty leading up to the U.S. Presidential election, and worries about stalled fiscal stimulus talks in Washington. Sentiment overseas moved largely in line with that of the U.S., and international equity markets staged a recovery from April through October. Chinese equities rallied as the country’s economy gained control over the coronavirus pandemic, and China’s economy managed to grow 4.9% year-on-year in the third quarter. In the Eurozone, equities rebounded as well, but in a less robust way, as a second wave of the COVID-19 pandemic materialized, and as second quarter GDP numbers from Germany, France, and the Eurozone weighed on investor sentiment. Germany’s economy contracted by 9.7%, France’s by 13.80%, and the Eurozone’s by 11.80% in the second quarter.
In its latest October report, the International Monetary Fund estimated global growth at -4.4% for 2020, a less severe contraction than forecast in the June 2020 World Economic Outlook. “[t]he revision reflects better-than-anticipated second quarter GDP outturns, mostly in advanced economies, where activity began to improve sooner than expected after lockdowns were scaled back in May and June, as well as indicators of a stronger recovery in the third quarter.” The International Monetary Fund projects growth to pick up to 5.2% in 2021, “reflecting the more moderate downturn projected for 2020 and consistent with expectations of persistent social distancing”.
Stock selection, most notably in the industrials and health care sectors, was the primary driver of relative underperformance during the period. Within the industrials sector, shares of Senior PLC detracted from relative performance. Shares of the U.K.-based aerospace components and systems manufacturing company fell as the demand outlook across the company’s aerospace and industrial end-markets deteriorated as a result of the COVID-19 pandemic. In addition, shares of Loomis AB detracted from relative performance. The Swedish cash handling company’s stock fell as the global pandemic accelerated fears of the move away from cash transactions.
Within the health care sector, shares of Korian SA detracted from relative performance over the period. Shares of the European leader in dependent care, which operates nursing homes, assisted living
24
facilities, home-care networks and clinics, fell despite the company’s relatively resilient earnings results, as the market misunderstood the impact of COVID-19 on Korian relative to other dependent care operators - particularly in light of Korian’s 30% exposure to Germany, a country which experienced limited pressure from COVID-19.
Conversely, stock selection in the real estate and communication services sectors contributed to relative performance. Within the real estate sector, shares of Nippon Prologis REIT, Inc. contributed to relative performance. Shares of the Japanese real estate investment trust rose as property management remained steady despite the COVID-19 pandemic, with only about 0.1% of overall rental income getting deferred and portfolio occupancy averaging 99.2% throughout the company’s properties. In addition, holdings of Patrizia AG contributed to relative performance during the period. Shares of the Germany-based real estate investment company rose after it managed to sign transaction volumes in the second quarter of 2020 in the same amount as in the first quarter, notwithstanding that the lockdowns in Europe had a severe impact on activity in the European real estate markets.
Within the communication services sector, an overweight position in Capcom Co., Ltd. contributed to relative performance, as shares of the company rose throughout the period. The Japanese video game manufacturing company benefited from an accelerated shift to digital entertainment in the leisure
industry, partly as a result of the COVID-19 pandemic. Additionally, the company was able to bolster sales with a growing library of content and a flexible pricing strategy.
Lord Abbett International Value Fund
For the fiscal year ended October 31, 2020, the Fund returned -11.89%, reflecting performance at the net asset value (NAV) of Class A Shares with all distributions reinvested, compared to its benchmark, the MSCI EAFE Value Index with Net Dividends,10 which returned -18.42% over the same period.
The trailing twelve-month period was characterized by several market-moving events. U.S. President Donald Trump signed a “phase one” trade deal with China on the 15th of January 2020 and markets priced in a likelihood of two more rate cuts in 2020. The tide turned abruptly in February and March 2020, as the outbreak of the COVID-19 pandemic and the expected economic damage resulting from a sudden slowdown in corporate spending, individual spending, consumer confidence, and thus recessionary and deflationary pressures, triggered a severe sell-off. Furthermore, as the COVID-19 pandemic fueled fears of slowing global growth, oil prices fell precipitously, with the primary U.S. oil contract closing in negative territory for the first time in history, although it has since rebounded. During the month of March, the S&P 500 Index2 experienced its fastest bear market since 1987 and the
25
longest U.S. economic expansion in history ended at 128 months.
The U.S. Federal Reserve (Fed) responded to the COVID-19 outbreak with a breadth of policy measures which lifted investors’ confidence in the markets. The Fed launched a $700 billion quantitative easing program, decreased the reserve requirements to zero for thousands of banks, and cut the federal funds rate to the current target range of 0-0.25%. In the latter half of March, the Fed announced additional stimulus programs, including open-ended asset purchases, purchases of corporate debt, and a commitment to a new small business lending program. Additionally, the central bank announced $2.3 trillion of additional credit support by expanding the Primary Market Corporate Credit Facility (PMCCF), the Secondary Market Corporate Credit Facility (SMCCF), and the Term Asset-Backed Securities Loan Facility (TALF). Most notably, the expanded measures included the purchase of select fallen angels. During its latest September 2020 meeting, the Fed voted to keep interest rates in a range of 0-0.25% to support the U.S. economy as it recovers from the deep impact of the COVID-19 lockdowns. In its September statement, the Fed noted that it expects to keep rates unchanged until “inflation has risen to 2% and is on track to moderately exceed 2% for some time.” The European Central Bank (ECB) maintained interest rates at 0% as new President Christine Lagarde took over the responsibility on November 1st, 2019. Since the COVID-19 pandemic roiled global markets during her tenure, the
ECB introduced and expanded its pandemic emergency purchase program (PEPP) and extended it to at least June 2021. The ECB also continued net purchases under the asset purchase program (APP) at a monthly pace of 20 billion euros, together with the purchase under the additional 120-billion-euro temporary envelope until the end of the year. Additionally, officials signaled readiness to adjust all of its instruments to ensure that inflation moved towards its aim in a sustained manner, including by slashing interest rates deeper into negative territory and changing the conditions of the targeted longer-term refinancing operations. Similar to other global central banks, The Bank of Japan (BoJ) introduced several measures to combat the pressures from COVID-19, including aggressive purchases of corporate debt and a new lending facility to funnel money to smaller firms via financial institutions. The BoJ also maintained its stimulative monetary policy at its October 2020 meeting, as short-term interest rates remained unchanged at -0.1%, and the bank kept its 10-year government bond yield target at around 0%.
Risk assets began to stage a recovery in April and May on the back of progress with respect to COVID-19 treatments and vaccines, commentary from several corporations that indicated stabilization in April and May, and massive monetary and fiscal policy globally. Positive market sentiment continued into the third quarter of 2020 as well. In addition to the factors listed above, tailwinds for the continued rally in risk assets included a rebound in
26
earnings revisions as well as further progress in COVID-19 treatments as evidenced by multiple drugs reaching Phase III trials. In September, however, market sentiment soured amid political volatility related to the Supreme Court of the United States vacancy, heightened COVID-19 concerns in Europe as global deaths topped one million, heightened uncertainty leading up to the U.S. Presidential election, and worries about stalled fiscal stimulus talking in Washington. Sentiment overseas moved largely in line with that of the U.S., and international equity markets staged a recovery from April through October 2020. Chinese equities rallied as the country’s economy gained control over the COVID-19 pandemic, and China’s economy managed to grow 4.9% year-on-year in the third quarter. In the Eurozone, equities rebounded as well, but in a less robust way, as a second wave of the COVID-19 pandemic materialized, and as second quarter GDP numbers from Germany, France, and the Eurozone weighed on investor sentiment. Germany’s economy contracted by 9.7%, France’s by 13.80%, and the Eurozone’s by 11.80% in the quarter.
In its latest October report, the International Monetary Fund estimated global growth at -4.4% for 2020, a less severe contraction than forecast in the June 2020 World Economic Outlook. “The revision reflects better-than anticipated second quarter GDP outturns, mostly in advanced economies, where activity began to improve sooner than expected after lockdowns were scaled back in May and June, as well as indicators of a stronger recovery in the third
quarter.” The International Monetary Fund projects growth to pick up to 5.2% in 2021, “reflecting the more moderate downturn projected for 2020 and consistent with expectations of persistent social distancing”.
During the period, the Fund’s outperformance relative to the benchmark was driven by its stock selection within the consumer discretionary and information technology sectors. Within the consumer discretionary sector, shares of Xinyi Glass Holdings Ltd., a Hong-Kong based manufacturer of glass products, rose as the China float glass market extended its strength, thanks to increased demand amid the acceleration of construction projects post COVID-19 and as float glass prices strengthened. Additionally, an overweight position in Sony Corp. contributed to relative performance throughout the year. The Japanese video game and gaming console manufacturing company’s stock rose as stay-at-home demand due to the COVID-19 pandemic boosted near term earnings and is also likely to help create stable earnings over the longer term, especially as the company has been shifting focus to game & network services.
Within the information technology sector, shares of Infineon Technologies AG, a German semiconductor and system solutions company, contributed to relative performance. The company’s stock advanced as fiscal year 2020 third quarter earnings results showed compelling revenue growth against the background of the global pandemic and economic slowdown, and as concrete signs of a
27
recovery in the auto sector were reassuring, as well.
Conversely, stock selection within the utilities and consumer staples sectors detracted from relative performance. Within the utilities sector, shares of Rubis SCA, a French downstream oil and chemical processing company, fell as the company’s debt reduction and cost-cutting strategies were met with persistent declines in earnings from the Energy division, mostly due to declines in volumes and the negative effects of the plunge in oil prices. Additionally, CK Infrastructure Holdings, Ltd., a Hong-Kong based development company engaging in the construction of power plants, industrial buildings, and other infrastructure facilities, detracted from relative performance. The company’s stock fell, as the majority of its profit contributions are generated in Europe, North America and Oceania, where the pandemic hit particularly hard and where the situation remained uncertain for a prolonged period of time.
Within the consumer staples sector, shares of Asahi Group Holdings, Ltd., a Japanese food and beverages company, also detracted from relative performance. The company’s stock fell after it booked a 43% year-over-year decline in consolidated core operating profit in the second quarter of 2020, due in part to restaurant closures and lower demand from Japanese pubs resulting from the increased prevalence of telecommuting.
Lord Abbett Value Opportunities Fund
For the fiscal year ended October 31, 2020, the Fund returned 2.35%, reflecting performance at the net asset value (NAV) of Class A shares with all distributions reinvested, compared to its benchmark, the Russell 2500TM Index,11 which returned 2.12% over the same period.
The trailing twelve-month period was characterized by several market-moving events. U.S. President Donald Trump signed a “phase one” trade deal with China on the 15th of January 2020 and markets priced in a likelihood of two more interest rate cuts in 2020. The tide turned abruptly in February and March 2020, as the outbreak of the COVID-19 pandemic and the expected economic damage resulting from a sudden slowdown in corporate spending, individual spending, consumer confidence, and thus recessionary and deflationary pressures, triggered a severe sell-off. As the COVID-19 pandemic fueled fears of slowing global growth, oil prices fell precipitously, with the primary U.S. oil contract closing in negative territory for the first time in history, although it has since rebounded. During the month of March, the S&P 500 Index2 experienced its fastest bear market since 1987 and the longest U.S. economic expansion in history ended at 128 months.
The U.S. Federal Reserve (Fed) responded to the COVID-19 outbreak with a breadth of policy measures which lifted investors’ confidence in the markets. The
28
Fed launched a $700 billion quantitative easing program, decreased the reserve requirements to zero for thousands of banks, and cut the federal funds rate to the current target range of 0-0.25%. Next, the Fed announced additional stimulus programs, including open-ended asset purchases, purchases of corporate debt, and a commitment to a new small business lending program. Additionally, the central bank announced $2.3 trillion of additional credit support by expanding the Primary Market Corporate Credit Facility (PMCCF), the Secondary Market Corporate Credit Facility (SMCCF), and the Term Asset-Backed Securities Loan Facility (TALF). Most notably, the expanded measures included the purchase of select fallen angels. During its latest September 2020 meeting, the Fed voted to keep interest rates in a range of 0-0.25% to support the U.S. economy as it recovers from the deep impact of the COVID-19 related lockdowns. In its September statement, the Fed noted that it expects to keep rates unchanged until “inflation has risen to 2% and is on track to moderately exceed 2% for some time.”
Risk assets began to stage a recovery in April and May on the back of progress with respect to COVID-19 treatments and vaccines, commentary from several corporations that indicated stabilization in April and May, and massive monetary and fiscal policy globally. Positive market sentiment continued into the third quarter of 2020 as well. In addition to the factors listed above, tailwinds for the continued rally in risk assets included a rebound in
earnings revisions as well as further progress in COVID-19 treatments, as evidenced by multiple drugs reaching Phase III trials. In September, however, market sentiment soured amid political volatility related to the Supreme Court of the United States vacancy, heightened COVID-19 concerns in Europe as global deaths topped one million, heightened uncertainty leading up to the U.S. Presidential election and worries about stalled fiscal stimulus talks in Washington.
The Fund’s position in Old Dominion Freight Line Inc. contributed most to relative performance over the 12-month period ending October 31, 2020. Shares of the less-than-load (LTL) trucking company rose throughout the period, most notably after tonnage trends started to improve in the beginning of the summer as a result of a surge in eCommerce demand and inventory restocking. Another contributor during the period was the Fund’s position in Generac Holdings, Inc., a manufacturer of power generation equipment. Shares of the power generation equipment company rose after a strong second quarter, where revenue and earnings beat consensus due to robust residential sales. Demand for the product category was at an all-time high given the heightened levels of power outages, concerns surrounding utility shutoffs in California, forecasts for an active upcoming hurricane season and people spending more time at home. The Fund’s holding in Discover Financial Services, a direct banking and payment services company, also contributed to
29
relative performance. Shares of Discover rose as credit and spending trends improved quicker-than-expected during the second quarter, aided by the government stimulus package and enhanced unemployment benefits.
Conversely, the Fund’s holding in FLIR Systems, Inc., a company that manufactures thermal sensing solutions, was the largest detractor from relative performance over the period. The stock price dropped after the company reported second quarter earnings which revealed the demand for elevated skin temperature (EST) cameras was lower-than-expected, as customers were opting to implement the cameras on a smaller scale to test them before deploying them on a larger scale. Hill-Rom Holdings, Inc., a medical technology company, also detracted from relative performance. Shares of Hill-Rom sold off after the company announced that it expected a net negative impact from the pandemic in the fourth quarter, after seeing a net positive impact in the second and third quarters of 2020. At the onset of the pandemic, categories such as specialty beds and vital signs monitors experienced a significant increase in demand, while
categories such as surgical solutions, vision care and care communications, saw a decrease in demand. However, in the fourth quarter, the categories that increased may slow significantly and those that fell may continue to decline, resulting in negative core revenue growth. The Fund’s position in NuVasive Inc., a minimally-disruptive surgical products provider, also detracted from relative performance. Shares of NuVasive were under pressure throughout the period, but experienced a significant pullback after the company announced that the release of the surgical intelligence platform, Pulse, would be delayed by six months due to software and hardware updates. The firm also faced significant headwinds due to ongoing uncertainties around rising COVID-19 cases, given its business relies heavily on manufacturing equipment used for elective procedures.
Each Fund’s portfolio is actively managed and, therefore, holdings and the weightings of a particular issuer or particular sector as a percentage of portfolio assets are subject to change. Sectors may include many industries.
30
1 The Russell 2000® Index measures the performance of the 2,000 smallest companies in the Russell 3000® Index, which represents approximately 10% of the total market capitalization of the Russell 3000® Index.
2 The S&P 500® Index is widely regarded as the standard for measuring large cap U.S. stock market performance and includes a representative sample of leading companies in leading industries.
3 The Russell 1000® Growth Index measures the performance of those Russell 1000® Index companies with higher price-to-book ratios and higher forecasted growth values.
4 The Russell 1000® Value Index measures the performance of those Russell 1000 companies with lower price-to-book ratios and lower forecasted growth values.
5 The Russell 2000 Value® Index measures the performance of those stocks of the Russell 2000 Index with lower price-to-book ratios and lower relative forecasted growth rates. Indexes are unmanaged, do not reflect the deduction of fees or expenses, and an investor cannot invest directly in an index.
6 The MSCI ACWI (All Country World Index) with Net Dividends is a free float-adjusted market capitalization weighted index that is designed to measure the equity market performance of developed and emerging markets. The MSCI ACWI Index with Net Dividends approximates the minimum possible dividend reinvestment. The dividend is reinvested after deduction of withholding tax, applying the rate to non-resident individuals who do not benefit from double taxation treaties. MSCI uses withholding tax rates applicable to Luxembourg holding companies, as Luxembourg applies the highest rates.
7 The MSCI ACWI Health Care Index with Net Dividends includes large and mid cap securities across 23 Developed Markets (DM) and 26 Emerging Markets (EM) countries. All securities in the index are classified in the Health Care Industry as per the Global Industry Classification Standard.
8 The MSCI ACWI (All Country World Index) ex-U.S. Index is a subset of the MSCI ACWI Index. The MSCI ACWI (All Country World Index) Index is a free float-adjusted market capitalization weighted index that is designed to measure the equity market performance of developed and emerging markets. The MSCI ACWI ex-U.S. Index with Gross Dividends approximates the maximum possible dividend reinvestment. The amount reinvested is the entire dividend distributed to
individuals domiciled in the country of the company but does not include tax credits. The MSCI ACWI ex-U.S. Index with Net Dividends approximates the minimum possible dividend reinvestment. The dividend is reinvested after deduction of withholding tax, applying the rate to non-resident individuals who do not benefit from double taxation treaties. MSCI uses withholding tax rates applicable to Luxembourg holding companies, as Luxembourg applies the highest rates.
9 The S&P Developed Ex-U.S. SmallCap® Index captures the bottom 15% of companies domiciled in the developed markets (excluding the United States) within the S&P Global BMI with a float-adjusted market capitalization of at least US$100 million and a value traded of at least US$50 million for the past 12 months at the time of the annual reconstitution. Stocks are excluded if their market capitalization falls below US$75 million, or if the value traded is less than US$35 million at the time of reconstitution.
10 The MSCI EAFE Value Index captures large and mid-cap securities exhibiting overall value style characteristics across Developed Markets countries around the world, excluding the U.S. and Canada. Gross Dividends approximates the maximum possible dividend reinvestment. The amount reinvested is the entire dividend distributed to individuals resident in the country of the company, but does not include tax credits. Net Dividends approximates the minimum possible dividend reinvestment. The dividend is reinvested after deduction of withholding tax, applying the rate to non-resident individuals who do not benefit from double taxation treaties. MSCI uses withholding tax rates applicable to Luxembourg holding companies, as Luxembourg applies the highest rates.
11 The Russell 2500TM Index is a market cap weighted index that includes the smallest 2,500 companies covered in the Russell 3000® Index universe of United States-based listed equities.
Unless otherwise specified, indexes reflect total return, with all dividends reinvested. Indexes are unmanaged, do not reflect the deduction of fees or expenses, and are not available for direct investment.
Important Performance and Other Information
Performance data quoted in the following pages reflect past performance and are no guarantee of future results. Current performance may be higher or lower than the performance quoted. The investment return and principal value of an investment in the Funds will fluctuate so that
31
shares, on any given day or when redeemed, may be worth more or less than their original cost. You can obtain performance data current to the most recent month end by calling Lord Abbett at 888-522-2388 or referring to www.lordabbett.com.
Except where noted, comparative Fund performance does not account for the deduction of sales charges and would be different if sales charges were included. Each Fund offers classes of shares with distinct pricing options. For a full description of the differences in pricing alternatives, please see each Fund’s prospectus.
During certain periods shown, expense waivers and reimbursements were in place. Without such waivers and expense reimbursements, each Funds’ returns would have been lower.
The annual commentary above discusses the views of the Funds’ management and various portfolio holdings of the Funds as of October 31, 2020. These
views and portfolio holdings may have changed after this date. Information provided in the commentary is not a recommendation to buy or sell securities. Because the Funds’ portfolios are actively managed and may change significantly, the Funds may no longer own the securities described above or may have otherwise changed their positions in the securities. For more recent information about the Funds’ portfolio holdings, please visit www.lordabbett.com.
A Note about Risk: See Notes to Financial Statements for a discussion of investment risks. For a more detailed discussion of the risks associated with each Fund, please see each Fund’s prospectus.
Mutual funds are not insured by the FDIC, are not deposits or other obligations of, or guaranteed by, banks, and are subject to investment risks including possible loss of principal amount invested.
32
Alpha Strategy Fund
Investment Comparison
Below is a comparison of a $10,000 investment in Class A shares with the same investment in the Russell 2000® Index, the 85% Russell 2000® Index/15% S&P Developed Ex-U.S. SmallCap Index and the Lipper Small-Cap Core Category Funds Average, assuming reinvestment of all dividends and distributions. The performance of other classes will be greater than or less than the performance shown in the graph below due to different sales loads and expenses applicable to such classes. The graph and performance table below do not reflect the deduction of taxes that a shareholder would pay on Fund distributions or the redemption of Fund shares. During certain periods, expenses of the Fund have been waived or reimbursed by Lord Abbett; without such waiver or reimbursement of expenses, the Fund’s returns would have been lower. Past performance is no guarantee of future results.
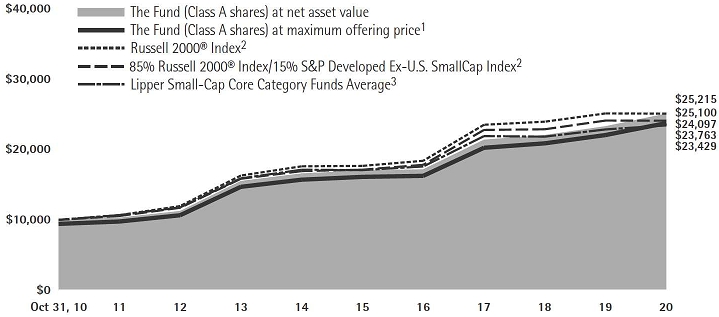
Average Annual Total Returns at Maximum Applicable
Sales Charge for the Periods Ended October 31, 2020
| | | 1 Year | | 5 Years | | 10 Years | | Life of Class | |
| Class A4 | | | 1.51 | % | | | 6.81 | % | | | 9.04 | % | | | – | |
| Class C5 | | | 6.07 | % | | | 7.28 | % | | | 8.88 | % | | | – | |
| Class F6 | | | 7.89 | % | | | 8.25 | % | | | 9.86 | % | | | – | |
| Class F37 | | | 8.10 | % | | | – | | | – | | | 8.49 | % | |
| Class I6 | | | 8.02 | % | | | 8.36 | % | | | 9.97 | % | | | – | |
| Class R26 | | | 7.39 | % | | | 7.71 | % | | | 9.31 | % | | | – | |
| Class R36 | | | 7.47 | % | | | 7.82 | % | | | 9.42 | % | | | – | |
| Class R48 | | | 7.79 | % | | | 8.10 | % | | | – | | | 6.21 | % | |
| Class R58 | | | 8.02 | % | | | 8.37 | % | | | – | | | 6.48 | % | |
| Class R68 | | �� | 8.14 | % | | | 8.44 | % | | | | – | | | 6.54 | % | |
33
1 Reflects the deduction of the maximum initial sales charge of 5.75%.
2 Performance for each unmanaged index does not reflect any fees or expenses. The performance of each index is not necessarily representative of the Fund’s performance.
3 Source: Lipper Inc. The performance of the average is not necessarily representative of the Fund’s performance.
4 Total return, which is the percentage change in net asset value, after deduction of the maximum initial sales charge of 5.75% applicable to Class A shares, with all dividends and
distributions reinvested for the periods shown ended October 31, 2020, is calculated using the SEC-required uniform method to compute such return.
5 The 1% CDSC for Class C shares normally applies before the first anniversary of the purchase date. Performance for other periods is at net asset value.
6 Performance is at net asset value.
7 Commenced operations and performance for the Class began on April 4, 2017. Performance is at its net asset value.
8 Commenced operations and performance for the classes began on June 30, 2015. Performance is at net asset value.
34
Durable Growth Fund
Investment Comparison
Below is a comparison of a $10,000 investment in Class A shares with the same investment in the Russell 1000® Growth Index, assuming reinvestment of all dividends and distributions. The performance of other classes will be greater than or less than the performance shown in the graph below due to different sales loads and expenses applicable to such classes. The graph and performance table below do not reflect the deduction of taxes that a shareholder would pay on Fund distributions or the redemption of Fund shares. During certain periods, expenses of the Fund have been waived or reimbursed by Lord Abbett; without such waiver or reimbursements of expense, the Fund’s returns would have been lower. Past performance is no guarantee of future results.

Average Annual Total Returns at Maximum Applicable
Sales Charge for the Period Ended October 31, 2020
| | | Life of Class | |
| Class A3 | | 20.75% | |
| Class C4 | | 26.20% | |
| Class F5 | | 28.46% | |
| Class F35 | | 28.55% | |
| Class I5 | | 28.48% | |
| Class R35 | | 27.84% | |
| Class R45 | | 28.16% | |
| Class R55 | | 28.48% | |
| Class R65 | | 28.55% | |
1 Reflects the deduction of the maximum initial sales charge of 5.75%.
2 Performance for the unmanaged index does not reflect any fees or expenses. The performance of the index is not necessarily representative of the Fund’s performance.
3 Class A shares commenced operations on November 1, 2020 and performance for the Class began on November 4, 2020. Total return, which is the percent change in net asset value, after deduction of the maximum initial sales charge of 5.75% applicable to Class A shares, with all dividends and distributions reinvested for the periods shown ended
October 31, 2020, is calculated using the SEC required uniform method to compute such return.
4 Class C shares commenced operations on November 1, 2020 and performance for the Class began on November 4, 2020. The 1% CDSC for Class C shares normally applies before the first anniversary of the purchase date. Performance for other periods is at net asset value.
5 Commenced operations on November 1, 2020 and performance for the Classes began on November 4, 2020. Performance is at net asset value.
35
Focused Growth Fund
Investment Comparison
Below is a comparison of a $10,000 investment in Class A shares with the same investment in the Russell 1000® Growth Index, assuming reinvestment of all dividends and distributions. The performance of other classes will be greater than or less than the performance shown in the graph below due to different sales loads and expenses applicable to such classes. The graph and performance table below do not reflect the deduction of taxes that a shareholder would pay on Fund distributions or the redemption of Fund shares. During certain periods, expenses of the Fund have been waived or reimbursed by Lord Abbett; without such waiver or reimbursements of expense, the Fund’s returns would have been lower. Past performance is no guarantee of future results.
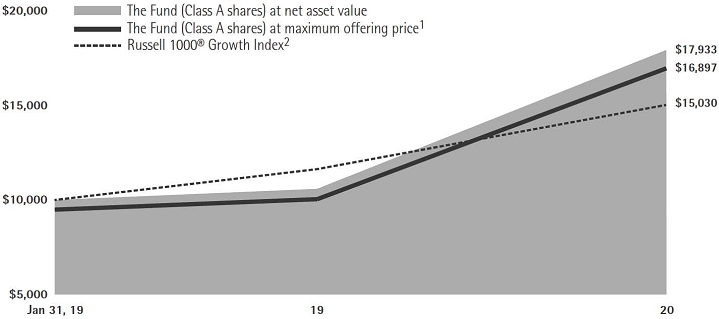
Average Annual Total Returns at Maximum Applicable
Sales Charge for the Period Ended October 31, 2020
| | | 1 Year | | Life of Class | |
| Class A3 | | 59.64% | | 35.00% | |
| Class C4 | | 67.10% | | 38.66% | |
| Class F5 | | 69.89% | | 40.06% | |
| Class F35 | | 69.97% | | 40.15% | |
| Class I5 | | 69.72% | | 40.03% | |
| Class R35 | | 68.92% | | 39.35% | |
| Class R45 | | 69.35% | | 39.70% | |
| Class R55 | | 69.83% | | 40.03% | |
| Class R65 | | 69.97% | | 40.15% | |
1 Reflects the deduction of the maximum initial sales charge of 5.75%.
2 Performance for the unmanaged index does not reflect any fees or expenses. The performance of the index is not necessarily representative of the Fund’s performance. Performance of the index begins on January 31, 2019.
3 Class A shares commenced operations on January 30, 2019 and performance for the Class began on January 31, 2019. Total return, which is the percentage change in net asset value, after deduction of the maximum initial sales charge of 5.75% applicable to Class A shares, with all dividends and distributions reinvested for the periods shown ended October 31, 2020, is calculated using the SEC-required uniform method to compute such return.
4 Class C shares commenced operations on January 30, 2019 and performance for the Class began on January 31, 2019. The 1% CDSC for Class C shares normally applies before the first anniversary of the purchase date.
5 Commenced operations on January 30, 2019 and performance for the Classes began on January 31, 2019. Performance is at net asset value.
36
Focused Large Cap Value Fund
Investment Comparison
Below is a comparison of a $10,000 investment in Class A shares with the same investment in the Russell 1000® Value Index, assuming reinvestment of all dividends and distributions. The performance of other classes will be greater than or less than the performance shown in the graph below due to different sales loads and expenses applicable to such classes. The graph and performance table below do not reflect the deduction of taxes that a shareholder would pay on Fund distributions or the redemption of Fund shares. During certain periods, expenses of the Fund have been waived or reimbursed by Lord Abbett; without such waiver or reimbursements of expense, the Fund’s returns would have been lower. Past performance is no guarantee of future results.

Average Annual Total Returns at Maximum Applicable
Sales Charge for the Period Ended October 31, 2020
| | | 1 Year | | Life of Class | |
| Class A3 | | –16.82% | | –14.85% | |
| Class C4 | | –13.22% | | –11.34% | |
| Class F5 | | –11.54% | | –10.49% | |
| Class F35 | | –11.50% | | –10.46% | |
| Class I5 | | –11.43% | | –10.40% | |
| Class R35 | | –11.98% | | –10.94% | |
| Class R45 | | –11.74% | | –10.70% | |
| Class R55 | | –11.51% | | –10.46% | |
| Class R65 | | –11.43% | | –10.40% | |
1 Reflects the deduction of the maximum initial sales charge of 5.75%.
2 Performance for the unmanaged index does not reflect any fees or expenses. The performance of the index is not necessarily representative of the Fund’s performance. Performance of the index begins on July 31, 2019.
3 Total return, which is the percent change in net asset value, after deduction of the maximum initial sales charge of 5.75% applicable to Class A shares, with all dividends and distributions reinvested for the periods shown ended October 31, 2020, is calculated using the SEC required uniform method to compute such return.
4 ��The 1% CDSC for Class C shares normally applies before the first anniversary of the purchase date. Performance for other periods is at net asset value.
5 Performance is at net asset value.
37
Focused Small Cap Value Fund
Investment Comparison
Below is a comparison of a $10,000 investment in Class A shares with the same investment in the Russell 2000® Value Index and the Russell 2000® Index, assuming reinvestment of all dividends and distributions. The performance of the other class will be greater than or less than the performance shown in the graph below due to different sales loads and expenses applicable to such class. The graph and performance table below do not reflect the deduction of taxes that a shareholder would pay on Fund distributions or the redemption of Fund shares. During certain periods, expenses of the Fund have been waived or reimbursed by Lord Abbett; without such waiver or reimbursement of expenses, the Fund’s returns would have been lower. Past performance is no guarantee of future results.
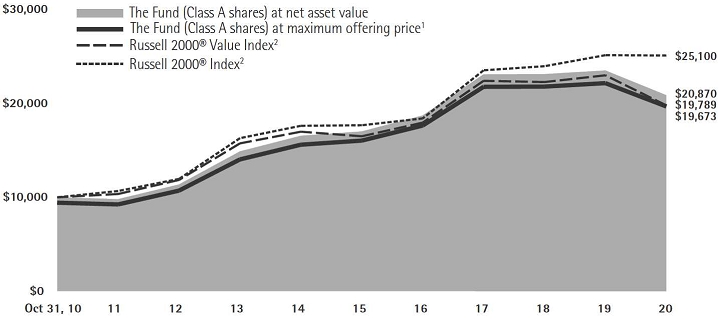
Average Annual Total Returns at Maximum Applicable
Sales Charge for the Periods Ended October 31, 2020
| | | 1 Year | | 5 Years | | | 10 Years | | | Life of Class | | |
| Class A3 | | | –16.30 | % | | | 2.94% | | | | 7.00% | | | | – | | |
| Class C4 | | | –12.76 | % | | | – | | | | – | | | | –10.78% | | |
| Class F5 | | | –11.00 | % | | | – | | | | – | | | | –9.79% | | |
| Class F35 | | | –10.88 | % | | | – | | | | – | | | | –9.70% | | |
| Class I6 | | | –11.00 | % | | | 4.23% | | | | 7.73% | | | | – | | |
| Class R55 | | | –11.00 | % | | | – | | | | – | | | | –9.79% | | |
| Class R65 | | | –10.87 | % | | | – | | | | – | | | | –9.67% | | |
1 Reflects the deduction of the maximum initial sales charge of 5.75%.
2 Performance for each unmanaged index does not reflect any fees or expenses. The performance of each index is not necessarily representative of the Fund’s performance.
3 Total return, which is the percent change in net asset value, after deduction of the maximum initial sales charge of 5.75% applicable to Class A shares, with all dividends and distributions reinvested for the periods shown ended October 31, 2020, is calculated using the SEC required uniform method to compute such return.
4 Class C shares commenced operations on June 28, 2019 and performance for the Class began on July 1, 2019. The 1% CDSC for Class C shares normally applies before the first anniversary of the purchase date. Performance for other periods is at net asset value.
5 Commenced operations on June 28, 2019 and performance for the Class began on July 1, 2019. Performance is at net asset value.
6 Performance is at net asset value.
38
Fundamental Equity Fund
Investment Comparison
Below is a comparison of a $10,000 investment in Class A shares with the same investment in the Russell 1000® Value Index, Russell 3000® Value Index, Russell 3000® Index, and S&P 500® Index, assuming reinvestment of all dividends and distributions. The performance of other classes will be greater than or less than the performance shown in the graph below due to different sales loads and expenses applicable to such classes. The graph and performance table below do not reflect the deduction of taxes that a shareholder would pay on Fund distributions or the redemption of Fund shares. During certain periods, expenses of the Fund have been waived or reimbursed by Lord Abbett; without such waiver or reimbursement of expenses, the Fund’s returns would have been lower. Past performance is no guarantee of future results.
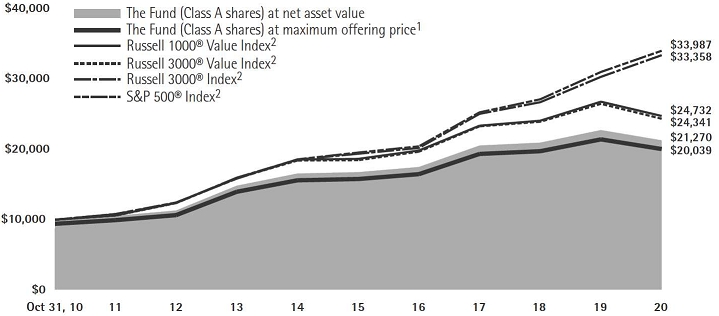
Average Annual Total Returns at Maximum Applicable
Sales Charge for the Periods Ended October 31, 2020
| | | 1 Year | | 5 Years | | 10 Years | | Life of Class | |
| Class A3 | | –11.75% | | 3.66% | | 7.20% | | – | |
| Class C4 | | –7.90% | | 4.13% | | 7.08% | | – | |
| Class F5 | | –6.22% | | 5.06% | | 8.05% | | – | |
| Class F36 | | –6.11% | | – | | – | | 3.13% | |
| Class I5 | | –6.16% | | 5.17% | | 8.15% | | – | |
| Class P5 | | –6.54% | | 4.70% | | 7.67% | | – | |
| Class R25 | | –6.68% | | 4.54% | | 7.51% | | – | |
| Class R35 | | –6.62% | | 4.63% | | 7.61% | | – | |
| Class R47 | | –6.35% | | 4.91% | | – | | 4.30% | |
| Class R57 | | –6.08% | | 5.18% | | – | | 4.57% | |
| Class R67 | | –6.03% | | 5.28% | | – | | 4.66% | |
1 Reflects the deduction of the maximum initial sales charge of 5.75%.
2 Performance for each unmanaged index does not reflect any fees or expenses. The performance of each index is not necessarily representative of the Fund’s performance.
3 Total return, which is the percentage change in net asset value, after deduction of the maximum initial sales charge of 5.75% applicable to Class A shares, with all dividends and distributions reinvested for the periods shown ended October 31, 2020, is calculated using the SEC-required uniform method to compute such return.
4 The 1% CDSC for Class C shares normally applies before the first anniversary of the purchase date. Performance for other periods is at net asset value.
5 Performance is at net asset value.
6 Commenced operations and performance for the Class began on April 4, 2017. Performance is at net asset value.
7 Commenced operations and performance for the classes began on June 30, 2015. Performance is at net asset value.
39
Global Equity Research Fund
Investment Comparison
Below is a comparison of a $10,000 investment in Class A shares with the same investment in the Morgan Stanley Capital International (MSCI) All Country World Index with Net Dividends and the MSCI All Country World Index with Gross Dividends, assuming reinvestment of all dividends and distributions. The MSCI All Country World Index with Net Dividends reflects a reduction in dividends after taking into account withholding of taxes by certain foreign countries represented in the MSCI All Country World Index. The performance of other classes will be greater than or less than the performance shown in the graph below due to different sales loads and expenses applicable to such classes. The graph and performance table below do not reflect the deduction of taxes that a shareholder would pay on Fund distributions or the redemption of Fund shares. During certain periods, expenses of the Fund have been waived or reimbursed by Lord Abbett; without such waiver or reimbursements of expense, the Fund’s returns would have been lower. Past performance is no guarantee of future results.
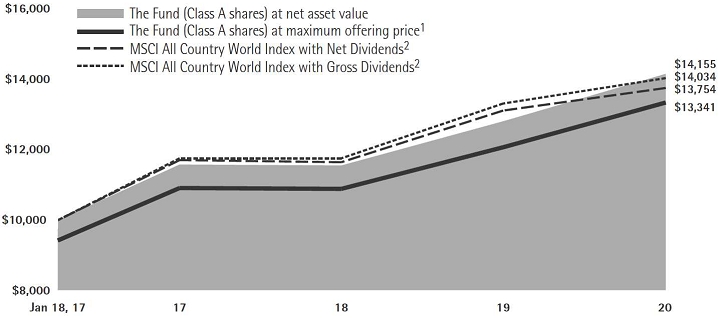
Average Annual Total Returns at Maximum Applicable
Sales Charge for the Periods Ended October 31, 2020
| | | 1 Year | | Life of Class | |
| Class A3 | | 4.18% | | 7.92% | |
| Class C4 | | 8.75% | | 8.81% | |
| Class F5 | | 10.73% | | 9.79% | |
| Class F36 | | 10.78% | | 9.68% | |
| Class I5 | | 10.75% | | 9.88% | |
| Class R35 | | 10.25% | | 9.34% | |
| Class R45 | | 10.51% | | 9.62% | |
| Class R55 | | 10.75% | | 9.88% | |
| Class R65 | | 10.87% | | 9.93% | |
1 Reflects the deduction of the maximum initial sales charge of 5.75%.
2 Performance for each unmanaged index does not reflect any fees or expenses. The performance of each index is not necessarily representative of the Fund’s performance. Performance of each index begins on January 18, 2017.
3 Class A shares commenced operations on January 17, 2017 and performance for the Class began on January 18, 2017. Total return, which is the percentage change in net asset value, after deduction of the maximum initial sales charge of 5.75% applicable to Class A shares, with all dividends and distributions reinvested for the periods shown ended October 31, 2020, is calculated using the SEC-required uniform method to compute such return.
4 Class C shares commenced operations on January 17, 2017 and performance for the Class began on January 18, 2017. The 1% CDSC for Class C shares normally applies before the first anniversary of the purchase date. Performance for other periods is at net asset value.
5 Commenced operations on January 17, 2017 and performance for the Class began on January 18, 2017. Performance is at net asset value.
6 Commenced operations and performance for the class began on April 4, 2017. Performance is at net asset value.
40
Growth Leaders Fund
Investment Comparison
Below is a comparison of a $10,000 investment in Class A shares with the same investment in the Russell 1000® Growth Index, Russell 3000® Growth Index, and S&P 500® Index, assuming reinvestment of all dividends and distributions. The performance of other classes will be greater than or less than the performance shown in the graph below due to different sales loads and expenses applicable to such classes. The graph and performance table below do not reflect the deduction of taxes that a shareholder would pay on Fund distributions or the redemption of Fund shares. During certain periods, expenses of the Fund have been waived or reimbursed by Lord Abbett; without such waiver or reimbursement of expenses, the Fund’s returns would have been lower. Past performance is no guarantee of future results.
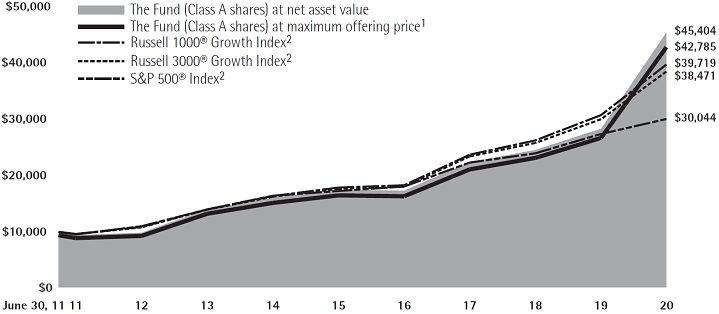
Average Annual Total Returns at Maximum Applicable
Sales Charge for the Periods Ended October 31, 2020
| | | 1 Year | | 5 Years | | Life of Class | |
| Class A3 | | 51.11% | | 19.59% | | 16.85% | |
| Class C4 | | 58.17% | | 20.12% | | 16.75% | |
| Class F5 | | 60.72% | | 21.29% | | 17.84% | |
| Class F36 | | 60.84% | | – | | 28.20% | |
| Class I5 | | 60.72% | | 21.32% | | 17.91% | |
| Class R25 | | 59.75% | | 20.59% | | 17.36% | |
| Class R35 | | 59.94% | | 20.71% | | 17.36% | |
| Class R47 | | 60.33% | | 21.01% | | 19.87% | |
| Class R57 | | 60.74% | | 21.33% | | 20.18% | |
| Class R67 | | 60.84% | | 21.40% | | 20.26% | |
41
1 Reflects the deduction of the maximum initial sales charge of 5.75%.
2 Performance for each unmanaged index does not reflect any fees or expenses. The performance of each index is not necessarily representative of the Fund’s performance. Performance for each index begins on June 30, 2011.
3 Class A shares commenced operations on June 24, 2011 and performance for the Class began on June 30, 2011. Total return, which is the percentage change in net asset value, after deduction of the maximum initial sales charge of 5.75% applicable to Class A shares, with all dividends and distributions reinvested for the periods shown ended October 31, 2020, is calculated using the SEC-required uniform method to compute such return.
4 Class C shares commenced operations on June 24, 2011 and performance for the Class began on June 30, 2011. The 1% CDSC for Class C shares normally applies before the first anniversary of the purchase date. Performance for other periods is at net asset value.
5 Commenced operations on June 24, 2011 and performance for the Class began on June 30, 2011. Performance is at net asset value.
6 Commenced operations and performance for the Class began on April 4, 2017. Performance is at net asset value.
7 Commenced operations and performance for the classes began on June 30, 2015. Performance is at net asset value.
42
Health Care Fund
Investment Comparison
Below is a comparison of a $10,000 investment in Class A shares with the same investment in the Morgan Stanley Capital International (MSCI) All Country World Index ACWI Health Care Net Index and MSCI ACWI Health Care Gross Index, assuming reinvestment of all dividends and distributions. The performance of other classes will be greater than or less than the performance shown in the graph below due to different sales loads and expenses applicable to such classes. The graph and performance table below do not reflect the deduction of taxes that a shareholder would pay on Fund distributions or the redemption of Fund shares. During certain periods, expenses of the Fund have been waived or reimbursed by Lord Abbett; without such waiver or reimbursements of expense, the Fund’s returns would have been lower. Past performance is no guarantee of future results.
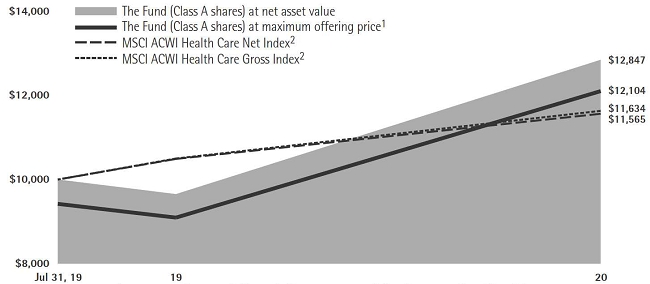
Average Annual Total Returns at Maximum Applicable
Sales Charge for the Period Ended October 31, 2020
| | | 1 Year | | Life of Class | |
| Class A3 | | 25.46% | | 16.48% | |
| Class C4 | | 31.11% | | 21.24% | |
| Class F5 | | 33.34% | | 22.41% | |
| Class F35 | | 33.49% | | 22.52% | |
| Class I5 | | 33.40% | | 22.45% | |
| Class R35 | | 32.76% | | 21.85% | |
| Class R45 | | 33.08% | | 22.15% | |
| Class R55 | | 33.39% | | 22.45% | |
| Class R65 | | 33.56% | | 22.57% | |
1 Reflects the deduction of the maximum initial sales charge of 5.75%.
2 Performance for the unmanaged index does not reflect any fees or expenses. The performance of the index is not necessarily representative of the Fund’s performance. Performance of the index begins on July 31, 2019.
3 Total return, which is the percent change in net asset value, after deduction of the maximum initial sales charge of 5.75% applicable to Class A shares, with all dividends and distributions reinvested for the periods shown ended October 31, 2020, is calculated using the SEC required uniform method to compute such return.
4 The 1% CDSC for Class C shares normally applies before the first anniversary of the purchase date. Performance for other periods is at net asset value.
5 Performance is at net asset value.
43
International Equity Fund
Investment Comparison
Below is a comparison of a $10,000 investment in Class A shares with the same investment in the Morgan Stanley Capital International (MSCI) All Country World Index (ACWI) ex-USA® Index with Net Dividends and the MSCI ACWI ex-USA® Index with Gross Dividends, assuming reinvestment of all dividends and distributions. The MSCI ACWI ex-USA Index with Net Dividends reflects a reduction in dividends after taking into account withholding of taxes by certain foreign countries represented in the MSCI ACWI ex-USA Index. The performance of other classes will be greater than or less than the performance shown in the graph below due to different sales loads and expenses applicable to such classes. The graph and performance table below do not reflect the deduction of taxes that a shareholder would pay on Fund distributions or the redemption of Fund shares. During certain periods, expenses of the Fund have been waived or reimbursed by Lord Abbett; without such waiver or reimbursement of expenses, the Fund’s returns would have been lower. Past performance is no guarantee of future results.
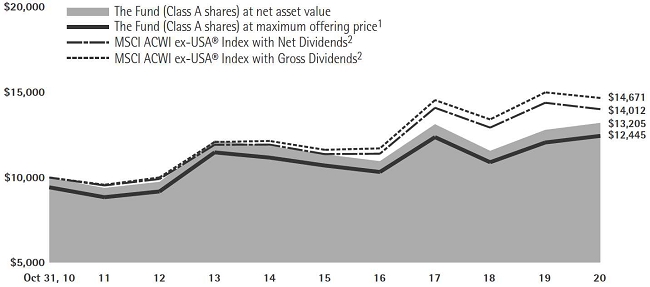
Average Annual Total Returns at Maximum Applicable
Sales Charge for the Periods Ended October 31, 2020
| | | 1 Year | | 5 Years | | 10 Years | | Life of Class | |
| Class A3 | | –2.68% | | 1.85% | | 2.21% | | – | |
| Class C4 | | 1.27% | | 2.29% | | 2.10% | | – | |
| Class F5 | | 3.39% | | 3.30% | | 3.05% | | – | |
| Class F36 | | 3.53% | | – | | – | | 4.59% | |
| Class I5 | | 3.52% | | 3.42% | | 3.17% | | – | |
| Class P5 | | 2.96% | | 2.87% | | 2.66% | | – | |
| Class R25 | | 2.86% | | 2.70% | | 2.50% | | – | |
| Class R35 | | 2.92% | | 2.81% | | 2.60% | | – | |
| Class R47 | | 3.17% | | 3.08% | | – | | 2.24% | |
| Class R57 | | 3.39% | | 3.31% | | – | | 2.47% | |
| Class R67 | | 3.53% | | 3.44% | | – | | 2.61% | |
44
1 Reflects the deduction of the maximum initial sales charge of 5.75%.
2 Performance for each unmanaged index does not reflect any fees or expenses. The performance of each index is not necessarily representative of the Fund’s performance.
3 Total return, which is the percentage change in net asset value, after deduction of the maximum initial sales charge of 5.75% applicable to Class A shares, with all dividends and distributions reinvested for the periods shown ended October 31, 2020, is calculated using the SEC-required uniform method to compute such return.
4 The 1% CDSC for Class C shares normally applies before the first anniversary of the purchase date. Performance for other periods is at net asset value.
5 Performance is at net asset value.
6 Commenced operations and performance for the Class began on April 4, 2017. Performance is at net asset value.
7 Commenced operations and performance for the classes began on June 30, 2015. Performance is at net asset value.
45
International Opportunities Fund
Investment Comparison
Below is a comparison of a $10,000 investment in Class A shares with the same investment in the S&P Developed Ex-U.S. SmallCap® Index, assuming reinvestment of all dividends and distributions. The performance of other classes will be greater than or less than the performance shown in the graph below due to different sales loads and expenses applicable to such classes. The graph and performance table below do not reflect the deduction of taxes that a shareholder would pay on Fund distributions or the redemption of Fund shares. During certain periods, expenses of the Fund have been waived or reimbursed by Lord Abbett; without such waiver or reimbursement of expenses, the Fund’s returns would have been lower. Past performance is no guarantee of future results.
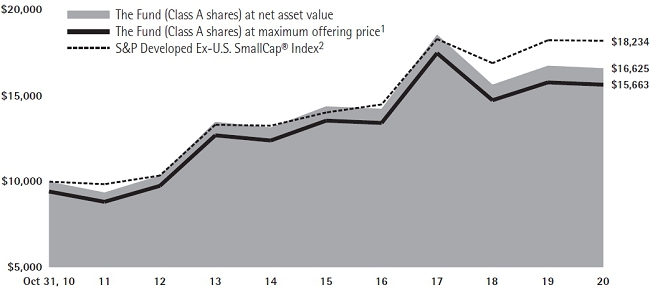
Average Annual Total Returns at Maximum Applicable
Sales Charge for the Periods Ended October 31, 2020
| | | 1 Year | | 5 Years | | 10 Years | | Life of Class | |
| Class A3 | | –6.56% | | 1.71% | | 4.59% | | – | |
| Class C4 | | –2.61% | | 2.15% | | 4.47% | | – | |
| Class F5 | | –0.72% | | 3.07% | | 5.40% | | – | |
| Class F36 | | –0.54% | | – | | – | | 2.55% | |
| Class I5 | | –0.62% | | 3.17% | | 5.51% | | – | |
| Class P5 | | –1.08% | | 2.71% | | 5.04% | | – | |
| Class R25 | | –1.24% | | 2.56% | | 4.88% | | – | |
| Class R35 | | –1.17% | | 2.67% | | 5.00% | | – | |
| Class R47 | | –0.90% | | 2.92% | | – | | 2.20% | |
| Class R57 | | –0.56% | | 3.18% | | – | | 2.45% | |
| Class R67 | | –0.54% | | 3.28% | | – | | 2.56% | |
1 Reflects the deduction of the maximum initial sales charge of 5.75%.
2 Performance for the unmanaged index does not reflect any fees or expenses. The performance of the index is not necessarily representative of the Fund’s performance.
3 Total return, which is the percentage change in net asset value, after deduction of the maximum initial sales charge of 5.75% applicable to Class A shares, with all dividends and distributions reinvested for the periods shown ended October 31, 2020, is calculated using the SEC-required uniform method to compute such return.
4 The 1% CDSC for Class C shares normally applies before the first anniversary of the purchase date. Performance is at net asset value.
5 Performance is at net asset value.
6 Commenced operations and performance for the Class began on April 4, 2017. Performance is at net asset value.
7 Commenced operations and performance for the classes began on June 30, 2015. Performance is at net asset value.
46
International Value Fund
Investment Comparison
Below is a comparison of a $10,000 investment in Class A shares with the same investment in the Morgan Stanley Capital International (MSCI) EAFE Value Index with Net Dividends and the MSCI EAFE Value Index with Gross Dividends, assuming reinvestment of all dividends and distributions. The MSCI EAFE Value Index with Net Dividends reflects a reduction in dividends after taking into account withholding of taxes by certain foreign countries represented in the MSCI EAFE Value Index. The performance of other classes will be greater than or less than the performance shown in the graph due to different sales loads and expenses applicable to such classes. The graph and performance table below do not reflect the deduction of taxes that a shareholder would pay on Fund distributions or the redemption of Fund shares. During certain periods, expenses of the Fund have been waived or reimbursed by Lord Abbett; without such waiver or reimbursements of expense, the Fund’s returns would have been lower. Past performance is no guarantee of future results.

Average Annual Total Returns at Maximum Applicable
Sales Charge for the Periods Ended October 31, 2020
| | | 1 Year | | 5 Years | | 10 Years | | Life of Class | |
| Class A3 | | –17.00% | | –1.32% | | –0.01% | | – | |
| Class C4 | | –13.44% | | –0.88% | | –0.13% | | – | |
| Class F5 | | –11.69% | | 0.07% | | 0.81% | | – | |
| Class F36 | | –11.57% | | – | | – | | –1.11% | |
| Class I5 | | –11.71% | | 0.15% | | 0.90% | | – | |
| Class R25 | | –12.47% | | –0.55% | | 0.28% | | – | |
| Class R35 | | –12.00% | | –0.37% | | 0.37% | | – | |
| Class R47 | | –11.90% | | –0.15% | | – | | –1.80% | |
| Class R57 | | –11.74% | | 0.09% | | – | | –1.56% | |
| Class R67 | | –11.57% | | 0.16% | | – | | –1.50% | |
1 Reflects the deduction of the maximum initial sales charge of 5.75%.
2 Performance for each unmanaged index does not reflect any fees or expenses. The performance of each index is not necessarily representative of the Fund’s performance.
3 Total return, which is the percentage change in net asset value, after deduction of the maximum initial sales charge of 5.75% applicable to Class A shares, with all dividends and distributions reinvested for the periods shown ended October 31, 2020, is calculated using the SEC-required uniform method to compute such return.
4 The 1% CDSC for Class C shares normally applies before the first anniversary of the purchase date. Performance for other periods is at net asset value.
5 Performance is at net asset value.
6 Commenced operations and performance for the Class began on April 4, 2017. Performance is at net asset value.
7 Commenced operations and performance for the classes began on June 30, 2015. Performance is at net asset value.
47
Value Opportunities Fund
Investment Comparison
Below is a comparison of a $10,000 investment in Class A shares with the same investment in the Russell 2500TM Index and the Russell 2500TM Value Index, assuming reinvestment of all dividends and distributions. The performance of other classes will be greater than or less than the performance shown in the graph below due to different sales loads and expenses applicable to such classes. The graph and performance table below do not reflect the deduction of taxes that a shareholder would pay on Fund distributions or the redemption of Fund shares. During certain periods, expenses of the Fund have been waived or reimbursed by Lord Abbett; without such waiver or reimbursement of expenses, the Fund’s returns would have been lower. Past performance is no guarantee of future results.
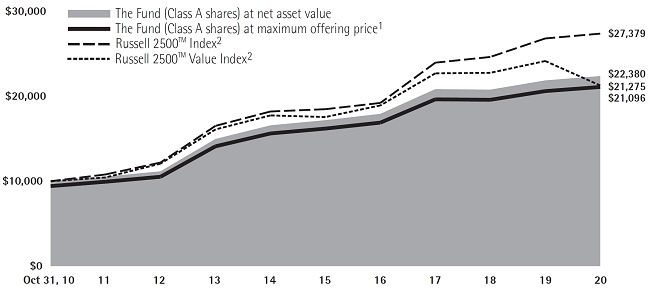
Average Annual Total Returns at Maximum Applicable
Sales Charge for the Periods Ended October 31, 2020
| | | 1 Year | | 5 Years | | 10 Years | | Life of Class | |
| Class A3 | | –3.55% | | 4.19% | | 7.75% | | – | |
| Class C4 | | 0.68% | | 4.64% | | 7.63% | | – | |
| Class F5 | | 2.50% | | 5.59% | | 8.61% | | – | |
| Class F36 | | 2.69% | | – | | – | | 4.27% | |
| Class I5 | | 2.58% | | 5.68% | | 8.70% | | – | |
| Class P5 | | 2.18% | | 5.21% | | 8.23% | | – | |
| Class R25 | | 1.96% | | 5.07% | | 8.07% | | – | |
| Class R35 | | 2.09% | | 5.17% | | 8.17% | | – | |
| Class R47 | | 2.34% | | 5.43% | | – | | 4.33% | |
| Class R57 | | 2.58% | | 5.69% | | – | | 4.59% | |
| Class R67 | | 2.69% | | 5.80% | | – | | 4.69% | |
48
1 Reflects the deduction of the maximum initial sales charge of 5.75%.
2 Performance for each unmanaged index does not reflect any fees or expenses. The performance of each index is not necessarily representative of the Fund’s performance.
3 Total return, which is the percentage change in net asset value, after deduction of the maximum initial sales charge of 5.75% applicable to Class A shares, with all dividends and distributions reinvested for the periods shown ended October 31, 2020, is calculated using the SEC-required uniform method to compute such return.
4 The 1% CDSC for Class C shares normally applies before the first anniversary of the purchase date. Performance for other periods is at net asset value.
5 Performance is at net asset value.
6 Commenced operations and performance for the Class began on April 4, 2017. Performance is at net asset value.
7 Commenced operations and performance for the classes began on June 30, 2015. Performance is at net asset value.
49
Expense Example
As a shareholder of a Fund, you incur two types of costs: (1) transaction costs, including sales charges (loads) on purchase payments (these charges vary among the share classes); and (2) ongoing costs, including management fees; distribution and service (12b-1) fees (these charges vary among the share classes); and other Fund expenses. This Example is intended to help you understand your ongoing costs (in dollars) of investing in each Fund and to compare these costs with the ongoing costs of investing in other mutual funds.
The Example is based on an investment of $1,000 invested at the beginning of the period and held for the entire period (May 1, 2020 through October 31, 2020).
Actual Expenses
For each class of each Fund, the first line of the table on the following pages provides information about actual account values and actual expenses. You may use the information in this line, together with the amount you invested, to estimate the expenses that you paid over the period. Simply divide your account value by $1,000 (for example, an $8,600 account value divided by $1,000 = 8.6), then multiply the result by the number in the first line under the heading titled “Expenses Paid During Period 5/1/20 – 10/31/20” to estimate the expenses you paid on your account during this period.
Hypothetical Example for Comparison Purposes
For each class of each Fund, the second line of the table on the following pages provides information about hypothetical account values and hypothetical expenses based on the Fund’s actual expense ratio and an assumed rate of return of 5% per year before expenses, which is not the Fund’s actual return. The hypothetical account values and expenses may not be used to estimate the actual ending account balance or expenses you paid for the period. You may use this information to compare the ongoing costs of investing in each Fund and other funds. To do so, compare this 5% hypothetical example with the 5% hypothetical examples that appear in the shareholder reports of the other funds.
50
Alpha Strategy Fund
Please note that the expenses shown in the table are meant to highlight your ongoing costs only and do not reflect any transactional costs, such as sales charges (loads). Therefore, the second line of the table is useful in comparing ongoing costs only, and will not help you determine the relative total costs of owning different funds. In addition, if these transactional costs were included, your costs would have been higher.
| | | Beginning
Account
Value | | Ending
Account
Value | | Expenses
Paid During
Period†# | |
| | | 5/1/20 | | 10/31/20 | | 5/1/20 –
10/31/20 | |
| Class A | | | | | | | | | | | | | |
| Actual | | $ | 1,000.00 | | | $ | 1,237.10 | | | $ | 2.42 | | |
| Hypothetical (5% Return Before Expenses) | | $ | 1,000.00 | | | $ | 1,022.97 | | | $ | 2.19 | | |
| Class C | | | | | | | | | | | | | |
| Actual | | $ | 1,000.00 | | | $ | 1,233.20 | | | $ | 6.62 | | |
| Hypothetical (5% Return Before Expenses) | | $ | 1,000.00 | | | $ | 1,019.20 | | | $ | 5.99 | | |
| Class F | | | | | | | | | | | | | |
| Actual | | $ | 1,000.00 | | | $ | 1,238.20 | | | $ | 1.58 | | |
| Hypothetical (5% Return Before Expenses) | | $ | 1,000.00 | | | $ | 1,023.73 | | | $ | 1.42 | | |
| Class F3 | | | | | | | | | | | | | |
| Actual | | $ | 1,000.00 | | | $ | 1,239.80 | | | $ | 0.45 | | |
| Hypothetical (5% Return Before Expenses) | | $ | 1,000.00 | | | $ | 1,024.73 | | | $ | 0.41 | | |
| Class I | | | | | | | | | | | | | |
| Actual | | $ | 1,000.00 | | | $ | 1,239.50 | | | $ | 1.01 | | |
| Hypothetical (5% Return Before Expenses) | | $ | 1,000.00 | | | $ | 1,024.23 | | | $ | 0.92 | | |
| Class R2 | | | | | | | | | | | | | |
| Actual | | $ | 1,000.00 | | | $ | 1,235.40 | | | $ | 4.38 | | |
| Hypothetical (5% Return Before Expenses) | | $ | 1,000.00 | | | $ | 1,021.22 | | | $ | 3.96 | | |
| Class R3 | | | | | | | | | | | | | |
| Actual | | $ | 1,000.00 | | | $ | 1,235.80 | | | $ | 3.82 | | |
| Hypothetical (5% Return Before Expenses) | | $ | 1,000.00 | | | $ | 1,021.72 | | | $ | 3.46 | | |
| Class R4 | | | | | | | | | | | | | |
| Actual | | $ | 1,000.00 | | | $ | 1,237.80 | | | $ | 2.53 | | |
| Hypothetical (5% Return Before Expenses) | | $ | 1,000.00 | | | $ | 1,022.87 | | | $ | 2.29 | | |
| Class R5 | | | | | | | | | | | | | |
| Actual | | $ | 1,000.00 | | | $ | 1,239.40 | | | $ | 1.01 | | |
| Hypothetical (5% Return Before Expenses) | | $ | 1,000.00 | | | $ | 1,024.23 | | | $ | 0.92 | | |
| Class R6 | | | | | | | | | | | | | |
| Actual | | $ | 1,000.00 | | | $ | 1,239.70 | | | $ | 0.56 | | |
| Hypothetical (5% Return Before Expenses) | | $ | 1,000.00 | | | $ | 1,024.63 | | | $ | 0.51 | | |
| | |
| † | For each class of the Fund, net expenses are equal to the annualized expense ratio for such class (0.43% for Class A, 1.18% for Class C, 0.28% for Class F, 0.08% for Class F3, 0.18% for Class I, 0.78% for Class R2, 0.68% for Class R3, 0.45% for Class R4, 0.18% for Class R5 and 0.10% for Class R6) multiplied by the average account value over the period, multiplied by 184/366 (to reflect one-half year period). |
| # | Does not include expenses of Underlying Funds in which Alpha Strategy Fund invests. |
51
Portfolio Holdings Presented by Portfolio Allocation
October 31, 2020
| Underlying Fund Name | | %* |
| Lord Abbett Developing Growth Fund, Inc. - Class I | | | 20.24 | % |
| Lord Abbett Securities Trust - Focused Small Cap Value Fund - Class I | | | 10.07 | % |
| Lord Abbett Securities Trust - International Opportunities Fund - Class I | | | 19.35 | % |
| Lord Abbett Securities Trust - Micro-Cap Growth Fund - Class I | | | 10.05 | % |
| Lord Abbett Research Fund, Inc. - Small Cap Value Fund - Class I | | | 19.94 | % |
| Lord Abbett Securities Trust - Value Opportunities Fund - Class I | | | 20.32 | % |
| Repurchase Agreement | | | 0.03 | % |
| Total | | | 100.00 | % |
| * | Represents percent of total investments. |
52
Durable Growth Fund
Please note that the expenses shown in the table are meant to highlight your ongoing costs only and do not reflect any transactional costs, such as sales charges (loads). Therefore, the second line of the table is useful in comparing ongoing costs only, and will not help you determine the relative total costs of owning different funds. In addition, if these transactional costs were included, your costs would have been higher.
| | | Beginning
Account
Value | | Ending
Account
Value | | Expenses
Paid During
Period† | |
| | | 5/1/20 | | 10/31/20 | | 5/1/20 –
10/31/20 | |
| Class A | | | | | | | | | | | | | |
| Actual | | $ | 1,000.00 | | | $ | 1,219.70 | | | $ | 5.30 | | |
| Hypothetical (5% Return Before Expenses) | | $ | 1,000.00 | | | $ | 1,020.36 | | | $ | 4.82 | | |
| Class C | | | | | | | | | | | | | |
| Actual | | $ | 1,000.00 | | | $ | 1,215.30 | | | $ | 9.47 | | |
| Hypothetical (5% Return Before Expenses) | | $ | 1,000.00 | | | $ | 1,016.59 | | | $ | 8.62 | | |
| Class F | | | | | | | | | | | | | |
| Actual | | $ | 1,000.00 | | | $ | 1,221.40 | | | $ | 3.91 | | |
| Hypothetical (5% Return Before Expenses) | | $ | 1,000.00 | | | $ | 1,021.62 | | | $ | 3.56 | | |
| Class F3 | | | | | | | | | | | | | |
| Actual | | $ | 1,000.00 | | | $ | 1,221.30 | | | $ | 3.57 | | |
| Hypothetical (5% Return Before Expenses) | | $ | 1,000.00 | | | $ | 1,021.92 | | | $ | 3.25 | | |
| Class I | | | | | | | | | | | | | |
| Actual | | $ | 1,000.00 | | | $ | 1,220.70 | | | $ | 3.91 | | |
| Hypothetical (5% Return Before Expenses) | | $ | 1,000.00 | | | $ | 1,021.62 | | | $ | 3.56 | | |
| Class R3 | | | | | | | | | | | | | |
| Actual | | $ | 1,000.00 | | | $ | 1,217.90 | | | $ | 6.69 | | |
| Hypothetical (5% Return Before Expenses) | | $ | 1,000.00 | | | $ | 1,019.10 | | | $ | 6.09 | | |
| Class R4 | | | | | | | | | | | | | |
| Actual | | $ | 1,000.00 | | | $ | 1,219.70 | | | $ | 5.30 | | |
| Hypothetical (5% Return Before Expenses) | | $ | 1,000.00 | | | $ | 1,020.36 | | | $ | 4.82 | | |
| Class R5 | | | | | | | | | | | | | |
| Actual | | $ | 1,000.00 | | | $ | 1,221.40 | | | $ | 3.91 | | |
| Hypothetical (5% Return Before Expenses) | | $ | 1,000.00 | | | $ | 1,021.62 | | | $ | 3.56 | | |
| Class R6 | | | | | | | | | | | | | |
| Actual | | $ | 1,000.00 | | | $ | 1,221.30 | | | $ | 3.57 | | |
| Hypothetical (5% Return Before Expenses) | | $ | 1,000.00 | | | $ | 1,021.92 | | | $ | 3.25 | | |
| | |
| † | For each class of the Fund, net expenses are equal to the annualized expense ratio for such class (0.95% for Class A, 1.70% for Class C, 0.70% for Class F, 0.64% for Class F3, 0.70% for Class I, 1.20% for Class R3, 0.95% for Class R4, 0.70% for Class R5 and 0.64% for Class R6) multiplied by the average account value over the period, multiplied by 184/366 (to reflect one-half year period). |
53
Portfolio Holdings Presented by Sector
October 31, 2020
| Sector* | | %** |
| Communication Services | | | 13.56 | % |
| Consumer Discretionary | | | 17.13 | % |
| Consumer Staples | | | 3.93 | % |
| Financials | | | 2.11 | % |
| Health Care | | | 13.29 | % |
| Industrials | | | 6.05 | % |
| Information Technology | | | 39.16 | % |
| Materials | | | 2.79 | % |
| Real Estate | | | 1.77 | % |
| Repurchase Agreement | | | 0.21 | % |
| Total | | | 100.00 | % |
| | | |
| * | | A sector may comprise several industries. |
| ** | | Represents percent of total investments. |
54
Focused Growth Fund
Please note that the expenses shown in the table are meant to highlight your ongoing costs only and do not reflect any transactional costs, such as sales charges (loads). Therefore, the second line of the table is useful in comparing ongoing costs only, and will not help you determine the relative total costs of owning different funds. In addition, if these transactional costs were included, your costs would have been higher.
| | | Beginning
Account
Value | | Ending
Account
Value | | Expenses
Paid During
Period† | |
| | | 5/1/20 | | 10/31/20 | | 5/1/20 –
10/31/20 | |
| Class A | | | | | | | | | | | | | |
| Actual | | $ | 1,000.00 | | | $ | 1,450.10 | | | $ | 6.47 | | |
| Hypothetical (5% Return Before Expenses) | | $ | 1,000.00 | | | $ | 1,019.86 | | | $ | 5.33 | | |
| Class C | | | | | | | | | | | | | |
| Actual | | $ | 1,000.00 | | | $ | 1,445.00 | | | $ | 10.94 | | |
| Hypothetical (5% Return Before Expenses) | | $ | 1,000.00 | | | $ | 1,016.19 | | | $ | 9.02 | | |
| Class F | | | | | | | | | | | | | |
| Actual | | $ | 1,000.00 | | | $ | 1,452.40 | | | $ | 4.93 | | |
| Hypothetical (5% Return Before Expenses) | | $ | 1,000.00 | | | $ | 1,021.11 | | | $ | 4.06 | | |
| Class F3 | | | | | | | | | | | | | |
| Actual | | $ | 1,000.00 | | | $ | 1,452.50 | | | $ | 4.44 | | |
| Hypothetical (5% Return Before Expenses) | | $ | 1,000.00 | | | $ | 1,021.52 | | | $ | 3.66 | | |
| Class I | | | | | | | | | | | | | |
| Actual | | $ | 1,000.00 | | | $ | 1,451.90 | | | $ | 4.93 | | |
| Hypothetical (5% Return Before Expenses) | | $ | 1,000.00 | | | $ | 1,021.11 | | | $ | 4.06 | | |
| Class R3 | | | | | | | | | | | | | |
| Actual | | $ | 1,000.00 | | | $ | 1,448.90 | | | $ | 8.00 | | |
| Hypothetical (5% Return Before Expenses) | | $ | 1,000.00 | | | $ | 1,018.60 | | | $ | 6.60 | | |
| Class R4 | | | | | | | | | | | | | |
| Actual | | $ | 1,000.00 | | | $ | 1,450.70 | | | $ | 6.47 | | |
| Hypothetical (5% Return Before Expenses) | | $ | 1,000.00 | | | $ | 1,019.86 | | | $ | 5.33 | | |
| Class R5 | | | | | | | | | | | | | |
| Actual | | $ | 1,000.00 | | | $ | 1,451.90 | | | $ | 4.93 | | |
| Hypothetical (5% Return Before Expenses) | | $ | 1,000.00 | | | $ | 1,021.11 | | | $ | 4.06 | | |
| Class R6 | | | | | | | | | | | | | |
| Actual | | $ | 1,000.00 | | | $ | 1,452.50 | | | $ | 4.44 | | |
| Hypothetical (5% Return Before Expenses) | | $ | 1,000.00 | | | $ | 1,021.52 | | | $ | 3.66 | | |
| | |
| † | For each class of the Fund, net expenses are equal to the annualized expense ratio for such class (1.05% for Class A, 1.78% for Class C, 0.80% for Class F, 0.72% for Class F3, 0.80% for Class I, 1.30% for Class R3, 1.05% for Class R4, 0.80% for Class R5 and 0.72% for Class R6) multiplied by the average account value over the period, multiplied by 184/366 (to reflect one-half period). |
55
Portfolio Holdings Presented by Sector
October 31, 2020
| Sector* | | %** |
| Communication Services | | | 16.20 | % |
| Consumer Discretionary | | | 24.61 | % |
| Health Care | | | 8.77 | % |
| Information Technology | | | 47.23 | % |
| Real Estate | | | 0.85 | % |
| Repurchase Agreement | | | 2.34 | % |
| Total | | | 100.00 | % |
| | | |
| * | | A sector may comprise several industries. |
| ** | | Represents percent of total investments. |
56
Focused Large Cap Value Fund
Please note that the expenses shown in the table are meant to highlight your ongoing costs only and do not reflect any transactional costs, such as sales charges (loads). Therefore, the second line of the table is useful in comparing ongoing costs only, and will not help you determine the relative total costs of owning different funds. In addition, if these transactional costs were included, your costs would have been higher.
| | | Beginning
Account
Value | | Ending
Account
Value | | Expenses
Paid During
Period† | |
| | | 5/1/20 | | 10/31/20 | | 5/1/20 –
10/31/20 | |
| Class A | | | | | | | | | | | | | |
| Actual | | $ | 1,000.00 | | | $ | 1,117.30 | | | $ | 5.11 | | |
| Hypothetical (5% Return Before Expenses) | | $ | 1,000.00 | | | $ | 1,020.31 | | | $ | 4.88 | | |
| Class C | | | | | | | | | | | | | |
| Actual | | $ | 1,000.00 | | | $ | 1,114.30 | | | $ | 9.09 | | |
| Hypothetical (5% Return Before Expenses) | | $ | 1,000.00 | | | $ | 1,016.54 | | | $ | 8.67 | | |
| Class F | | | | | | | | | | | | | |
| Actual | | $ | 1,000.00 | | | $ | 1,119.00 | | | $ | 3.78 | | |
| Hypothetical (5% Return Before Expenses) | | $ | 1,000.00 | | | $ | 1,021.57 | | | $ | 3.61 | | |
| Class F3 | | | | | | | | | | | | | |
| Actual | | $ | 1,000.00 | | | $ | 1,119.00 | | | $ | 3.36 | | |
| Hypothetical (5% Return Before Expenses) | | $ | 1,000.00 | | | $ | 1,021.97 | | | $ | 3.20 | | |
| Class I | | | | | | | | | | | | | |
| Actual | | $ | 1,000.00 | | | $ | 1,119.80 | | | $ | 3.78 | | |
| Hypothetical (5% Return Before Expenses) | | $ | 1,000.00 | | | $ | 1,021.57 | | | $ | 3.61 | | |
| Class R3 | | | | | | | | | | | | | |
| Actual | | $ | 1,000.00 | | | $ | 1,116.70 | | | $ | 6.44 | | |
| Hypothetical (5% Return Before Expenses) | | $ | 1,000.00 | | | $ | 1,019.05 | | | $ | 6.14 | | |
| Class R4 | | | | | | | | | | | | | |
| Actual | | $ | 1,000.00 | | | $ | 1,118.30 | | | $ | 5.11 | | |
| Hypothetical (5% Return Before Expenses) | | $ | 1,000.00 | | | $ | 1,020.31 | | | $ | 4.88 | | |
| Class R5 | | | | | | | | | | | | | |
| Actual | | $ | 1,000.00 | | | $ | 1,119.90 | | | $ | 3.78 | | |
| Hypothetical (5% Return Before Expenses) | | $ | 1,000.00 | | | $ | 1,021.57 | | | $ | 3.61 | | |
| Class R6 | | | | | | | | | | | | | |
| Actual | | $ | 1,000.00 | | | $ | 1,119.80 | | | $ | 3.36 | | |
| Hypothetical (5% Return Before Expenses) | | $ | 1,000.00 | | | $ | 1,021.97 | | | $ | 3.20 | | |
| | |
| † | For each class of the Fund, net expenses are equal to the annualized expense ratio for such class (0.96% for Class A, 1.71% for Class C, 0.71% for Class F, 0.63% for Class F3, 0.71% for Class I, 1.21% for Class R3, 0.96% for Class R4, 0.71% for Class R5 and 0.63% for Class R6) multiplied by the average account value over the period, multiplied by 184/366 (to reflect one-half year period). |
57
Portfolio Holdings Presented by Sector
October 31, 2020
| Sector* | | %** |
| Communication Services | | | 8.53 | % |
| Consumer Discretionary | | | 12.14 | % |
| Consumer Staples | | | 6.25 | % |
| Energy | | | 4.84 | % |
| Financials | | | 33.09 | % |
| Health Care | | | 14.45 | % |
| Industrials | | | 7.99 | % |
| Information Technology | | | 4.27 | % |
| Materials | | | 6.69 | % |
| Repurchase Agreement | | | 1.75 | % |
| Total | | | 100.00 | % |
| | | |
| * | | A sector may comprise several industries. |
| ** | | Represents percent of total investments. |
58
Focused Small Cap Value Fund
Please note that the expenses shown in the table are meant to highlight your ongoing costs only and do not reflect any transactional costs, such as sales charges (loads). Therefore, the second line of the table is useful in comparing ongoing costs only, and will not help you determine the relative total costs of owning different funds. In addition, if these transactional costs were included, your costs would have been higher.
| | | Beginning
Account
Value | | Ending
Account
Value | | Expenses
Paid During
Period† | |
| | | 5/1/20 | | 10/31/20 | | 5/1/20 –
10/31/20 | |
| Class A | | | | | | | | | | | | | |
| Actual | | $ | 1,000.00 | | | $ | 1,240.60 | | | $ | 7.21 | | |
| Hypothetical (5% Return Before Expenses) | | $ | 1,000.00 | | | $ | 1,018.70 | | | $ | 6.50 | | |
| Class C | | | | | | | | | | | | | |
| Actual | | $ | 1,000.00 | | | $ | 1,235.60 | | | $ | 11.41 | | |
| Hypothetical (5% Return Before Expenses) | | $ | 1,000.00 | | | $ | 1,014.93 | | | $ | 10.28 | | |
| Class F | | | | | | | | | | | | | |
| Actual | | $ | 1,000.00 | | | $ | 1,242.50 | | | $ | 5.81 | | |
| Hypothetical (5% Return Before Expenses) | | $ | 1,000.00 | | | $ | 1,019.96 | | | $ | 5.23 | | |
| Class F3 | | | | | | | | | | | | | |
| Actual | | $ | 1,000.00 | | | $ | 1,242.80 | | | $ | 5.36 | | |
| Hypothetical (5% Return Before Expenses) | | $ | 1,000.00 | | | $ | 1,020.36 | | | $ | 4.82 | | |
| Class I | | | | | | | | | | | | | |
| Actual | | $ | 1,000.00 | | | $ | 1,242.50 | | | $ | 5.81 | | |
| Hypothetical (5% Return Before Expenses) | | $ | 1,000.00 | | | $ | 1,019.96 | | | $ | 5.23 | | |
| Class R5 | | | | | | | | | | | | | |
| Actual | | $ | 1,000.00 | | | $ | 1,242.50 | | | $ | 5.81 | | |
| Hypothetical (5% Return Before Expenses) | | $ | 1,000.00 | | | $ | 1,019.96 | | | $ | 5.23 | | |
| Class R6 | | | | | | | | | | | | | |
| Actual | | $ | 1,000.00 | | | $ | 1,243.40 | | | $ | 5.36 | | |
| Hypothetical (5% Return Before Expenses) | | $ | 1,000.00 | | | $ | 1,020.36 | | | $ | 4.82 | | |
| | |
| † | For each class of the Fund, net expenses are equal to the annualized expense ratio for such class (1.28% for Class A, 2.03% for Class C, 1.03% for Class F, 0.95% for Class F3, 1.03% for Class I, 1.03% for Class R5 and 0.95% for Class R6) multiplied by the average account value over the period, multiplied by 184/366 (to reflect one-half year period). |
59
Portfolio Holdings Presented by Sector
October 31, 2020
| Sector* | | %** |
| Communication Services | | | 2.38 | % |
| Consumer Discretionary | | | 7.34 | % |
| Consumer Staples | | | 3.02 | % |
| Energy | | | 3.02 | % |
| Financials | | | 32.68 | % |
| Health Care | | | 2.61 | % |
| Industrials | | | 21.46 | % |
| Information Technology | | | 7.12 | % |
| Materials | | | 13.47 | % |
| Real Estate | | | 6.47 | % |
| Repurchase Agreement | | | 0.43 | % |
| Total | | | 100.00 | % |
| | | |
| * | | A sector may comprise several industries. |
| ** | | Represents percent of total investments. |
60
Fundamental Equity Fund
Please note that the expenses shown in the table are meant to highlight your ongoing costs only and do not reflect any transactional costs, such as sales charges (loads). Therefore, the second line of the table is useful in comparing ongoing costs only, and will not help you determine the relative total costs of owning different funds. In addition, if these transactional costs were included, your costs would have been higher.
| | | Beginning
Account
Value | | Ending
Account
Value | | Expenses
Paid During
Period† | |
| | | 5/1/20 | | 10/31/20 | | 5/1/20 –
10/31/20 | |
| Class A | | | | | | | | | | | | | |
| Actual | | $ | 1,000.00 | | | $ | 1,084.20 | | | $ | 4.92 | | |
| Hypothetical (5% Return Before Expenses) | | $ | 1,000.00 | | | $ | 1,020.41 | | | $ | 4.77 | | |
| Class C | | | | | | | | | | | | | |
| Actual | | $ | 1,000.00 | | | $ | 1,081.20 | | | $ | 8.84 | | |
| Hypothetical (5% Return Before Expenses) | | $ | 1,000.00 | | | $ | 1,016.64 | | | $ | 8.57 | | |
| Class F | | | | | | | | | | | | | |
| Actual | | $ | 1,000.00 | | | $ | 1,086.40 | | | $ | 4.14 | | |
| Hypothetical (5% Return Before Expenses) | | $ | 1,000.00 | | | $ | 1,021.17 | | | $ | 4.01 | | |
| Class F3 | | | | | | | | | | | | | |
| Actual | | $ | 1,000.00 | | | $ | 1,086.20 | | | $ | 3.30 | | |
| Hypothetical (5% Return Before Expenses) | | $ | 1,000.00 | | | $ | 1,021.97 | | | $ | 3.20 | | |
| Class I | | | | | | | | | | | | | |
| Actual | | $ | 1,000.00 | | | $ | 1,085.60 | | | $ | 3.62 | | |
| Hypothetical (5% Return Before Expenses) | | $ | 1,000.00 | | | $ | 1,021.67 | | | $ | 3.51 | | |
| Class P | | | | | | | | | | | | | |
| Actual | | $ | 1,000.00 | | | $ | 1,083.90 | | | $ | 5.97 | | |
| Hypothetical (5% Return Before Expenses) | | $ | 1,000.00 | | | $ | 1,019.41 | | | $ | 5.79 | | |
| Class R2 | | | | | | | | | | | | | |
| Actual | | $ | 1,000.00 | | | $ | 1,083.10 | | | $ | 6.75 | | |
| Hypothetical (5% Return Before Expenses) | | $ | 1,000.00 | | | $ | 1,018.65 | | | $ | 6.55 | | |
| Class R3 | | | | | | | | | | | | | |
| Actual | | $ | 1,000.00 | | | $ | 1,082.80 | | | $ | 6.23 | | |
| Hypothetical (5% Return Before Expenses) | | $ | 1,000.00 | | | $ | 1,019.15 | | | $ | 6.04 | | |
| Class R4 | | | | | | | | | | | | | |
| Actual | | $ | 1,000.00 | | | $ | 1,084.70 | | | $ | 4.93 | | |
| Hypothetical (5% Return Before Expenses) | | $ | 1,000.00 | | | $ | 1,020.41 | | | $ | 4.77 | | |
| Class R5 | | | | | | | | | | | | | |
| Actual | | $ | 1,000.00 | | | $ | 1,086.60 | | | $ | 3.62 | | |
| Hypothetical (5% Return Before Expenses) | | $ | 1,000.00 | | | $ | 1,021.67 | | | $ | 3.51 | | |
| Class R6 | | | | | | | | | | | | | |
| Actual | | $ | 1,000.00 | | | $ | 1,087.20 | | | $ | 3.31 | | |
| Hypothetical (5% Return Before Expenses) | | $ | 1,000.00 | | | $ | 1,021.97 | | | $ | 3.20 | | |
| | |
| † | For each class of the Fund, net expenses are equal to the annualized expense ratio for such class (0.94% for Class A, 1.69% for Class C, 0.79% for Class F, 0.63% for Class F3, 0.69% for Class I, 1.14% for Class P, 1.29% for Class R2, 1.19% for Class R3, 0.94% for Class R4, 0.69% for Class R5 and 0.63% for Class R6) multiplied by the average account value over the period, multiplied by 184/366 (to reflect one-half year period). |
61
Portfolio Holdings Presented by Sector
October 31, 2020
| Sector* | | %** |
| Communication Services | | | 9.55 | % |
| Consumer Discretionary | | | 7.56 | % |
| Consumer Staples | | | 7.38 | % |
| Energy | | | 3.85 | % |
| Financials | | | 18.86 | % |
| Health Care | | | 14.52 | % |
| Industrials | | | 12.48 | % |
| Information Technology | | | 10.87 | % |
| Materials | | | 4.61 | % |
| Real Estate | | | 3.37 | % |
| Utilities | | | 6.42 | % |
| Repurchase Agreement | | | 0.53 | % |
| Total | | | 100.00 | % |
| | | |
| * | | A sector may comprise several industries. |
| ** | | Represents percent of total investments. |
62
Global Equity Research Fund
Please note that the expenses shown in the table are meant to highlight your ongoing costs only and do not reflect any transactional costs, such as sales charges (loads). Therefore, the second line of the table is useful in comparing ongoing costs only, and will not help you determine the relative total costs of owning different funds. In addition, if these transactional costs were included, your costs would have been higher.
| | | Beginning | | Ending | | Expenses | |
| | | Account | | Account | | Paid During | |
| | | Value | | Value | | Period† | |
| | | | | | | 5/1/20 – | |
| | | 5/1/20 | | 10/31/20 | | 10/31/20 | |
| Class A | | | | | | | | | |
| Actual | | $1,000.00 | | $1,197.90 | | $ | 4.97 | | |
| Hypothetical (5% Return Before Expenses) | | $1,000.00 | | $1,020.61 | | $ | 4.57 | | |
| Class C | | | | | | | | | |
| Actual | | $1,000.00 | | $1,193.50 | | $ | 9.10 | | |
| Hypothetical (5% Return Before Expenses) | | $1,000.00 | | $1,016.84 | | $ | 8.36 | | |
| Class F | | | | | | | | | |
| Actual | | $1,000.00 | | $1,198.50 | | $ | 4.14 | | |
| Hypothetical (5% Return Before Expenses) | | $1,000.00 | | $1,021.37 | | $ | 3.81 | | |
| Class F3 | | | | | | | | | |
| Actual | | $1,000.00 | | $1,198.30 | | $ | 3.37 | | |
| Hypothetical (5% Return Before Expenses) | | $1,000.00 | | $1,022.07 | | $ | 3.10 | | |
| Class I | | | | | | | | | |
| Actual | | $1,000.00 | | $1,198.50 | | $ | 3.59 | | |
| Hypothetical (5% Return Before Expenses) | | $1,000.00 | | $1,021.87 | | $ | 3.30 | | |
| Class R3 | | | | | | | | | |
| Actual | | $1,000.00 | | $1,196.00 | | $ | 6.35 | | |
| Hypothetical (5% Return Before Expenses) | | $1,000.00 | | $1,019.36 | | $ | 5.84 | | |
| Class R4 | | | | | | | | | |
| Actual | | $1,000.00 | | $1,197.70 | | $ | 4.97 | | |
| Hypothetical (5% Return Before Expenses) | | $1,000.00 | | $1,020.61 | | $ | 4.57 | | |
| Class R5 | | | | | | | | | |
| Actual | | $1,000.00 | | $1,198.50 | | $ | 3.59 | | |
| Hypothetical (5% Return Before Expenses) | | $1,000.00 | | $1,021.87 | | $ | 3.30 | | |
| Class R6 | | | | | | | | | |
| Actual | | $1,000.00 | | $1,199.40 | | $ | 3.37 | | |
| Hypothetical (5% Return Before Expenses) | | $1,000.00 | | $1,022.07 | | $ | 3.10 | | |
| † | For each class of the Fund, net expenses are equal to the annualized expense ratio for such class (0.90% for Class A, 1.65% for Class C, 0.75% for Class F, 0.61% for Class F3, 0.65% for Class I, 1.15% for Class R3, 0.90% for Class R4, 0.65% for Class R5 and 0.61% for Class R6) multiplied by the average account value over the period, multiplied by 184/366 (to reflect one-half year period). |
63
Portfolio Holdings Presented by Sector
October 31, 2020
| Sector* | | %** |
| Communication Services | | | 9.56 | % |
| Consumer Discretionary | | | 13.89 | % |
| Consumer Staples | | | 7.85 | % |
| Energy | | | 2.18 | % |
| Financials | | | 11.64 | % |
| Health Care | | | 11.94 | % |
| Industrials | | | 11.39 | % |
| Information Technology | | | 21.27 | % |
| Materials | | | 5.15 | % |
| Real Estate | | | 2.88 | % |
| Utilities | | | 2.25 | % |
| Total | | | 100.00 | % |
| * | | A sector may comprise several industries. |
| ** | | Represents percent of total investments. |
64
Growth Leaders Fund
Please note that the expenses shown in the table are meant to highlight your ongoing costs only and do not reflect any transactional costs, such as sales charges (loads). Therefore, the second line of the table is useful in comparing ongoing costs only, and will not help you determine the relative total costs of owning different funds. In addition, if these transactional costs were included, your costs would have been higher.
| | | Beginning | | Ending | | Expenses | |
| | | Account | | Account | | Paid During | |
| | | Value | | Value | | Period† | |
| | | | | | | 5/1/20 – | |
| | | 5/1/20 | | 10/31/20 | | 10/31/20 | |
| Class A | | | | | | | | | |
| Actual | | $1,000.00 | | $1,419.70 | | $ | 5.47 | | |
| Hypothetical (5% Return Before Expenses) | | $1,000.00 | | $1,020.61 | | $ | 4.57 | | |
| Class C | | | | | | | | | |
| Actual | | $1,000.00 | | $1,414.50 | | $ | 10.01 | | |
| Hypothetical (5% Return Before Expenses) | | $1,000.00 | | $1,016.84 | | $ | 8.36 | | |
| Class F | | | | | | | | | |
| Actual | | $1,000.00 | | $1,421.50 | | $ | 3.96 | | |
| Hypothetical (5% Return Before Expenses) | | $1,000.00 | | $1,021.87 | | $ | 3.30 | | |
| Class F3 | | | | | | | | | |
| Actual | | $1,000.00 | | $1,422.10 | | $ | 3.59 | | |
| Hypothetical (5% Return Before Expenses) | | $1,000.00 | | $1,022.17 | | $ | 3.00 | | |
| Class I | | | | | | | | | |
| Actual | | $1,000.00 | | $1,421.70 | | $ | 3.96 | | |
| Hypothetical (5% Return Before Expenses) | | $1,000.00 | | $1,021.87 | | $ | 3.30 | | |
| Class R2 | | | | | | | | | |
| Actual | | $1,000.00 | | $1,417.30 | | $ | 7.60 | | |
| Hypothetical (5% Return Before Expenses) | | $1,000.00 | | $1,018.85 | | $ | 6.34 | | |
| Class R3 | | | | | | | | | |
| Actual | | $1,000.00 | | $1,417.60 | | $ | 6.99 | | |
| Hypothetical (5% Return Before Expenses) | | $1,000.00 | | $1,019.36 | | $ | 5.84 | | |
| Class R4 | | | | | | | | | |
| Actual | | $1,000.00 | | $1,419.50 | | $ | 5.47 | | |
| Hypothetical (5% Return Before Expenses) | | $1,000.00 | | $1,020.61 | | $ | 4.57 | | |
| Class R5 | | | | | | | | | |
| Actual | | $1,000.00 | | $1,421.40 | | $ | 3.96 | | |
| Hypothetical (5% Return Before Expenses) | | $1,000.00 | | $1,021.87 | | $ | 3.30 | | |
| Class R6 | | | | | | | | | |
| Actual | | $1,000.00 | | $1,422.10 | | $ | 3.59 | | |
| Hypothetical (5% Return Before Expenses) | | $1,000.00 | | $1,022.17 | | $ | 3.00 | | |
| † | For each class of the Fund, net expenses are equal to the annualized expense ratio for such class (0.90% for Class A, 1.65% for Class C, 0.65% for Class F, 0.59% for Class F3, 0.65% for Class I, 1.25% for Class R2, 1.15% for Class R3, 0.90% for Class R4, 0.65% for Class R5 and 0.59% for Class R6) multiplied by the average account value over the period, multiplied by 184/366 (to reflect one-half year period). |
65
Portfolio Holdings Presented by Sector
October 31, 2020
| Sector* | | %** |
| Communication Services | | | 14.91 | % |
| Consumer Discretionary | | | 19.24 | % |
| Financials | | | 1.61 | % |
| Health Care | | | 14.48 | % |
| Industrials | | | 4.57 | % |
| Information Technology | | | 42.50 | % |
| Real Estate | | | 0.95 | % |
| Repurchase Agreement | | | 1.73 | % |
| Money Market Fund(a) | | | 0.01 | % |
| Time Deposit(a) | | | 0.00 | %(b) |
| Total | | | 100.00 | % |
| * | | A sector may comprise several industries. |
| ** | | Represents percent of total investments. |
| (a) | | Securities were purchased with the cash collateral from loaned securities. |
| (b) | | Represents amount less than 0.01%. |
66
Health Care Fund
Please note that the expenses shown in the table are meant to highlight your ongoing costs only and do not reflect any transactional costs, such as sales charges (loads). Therefore, the second line of the table is useful in comparing ongoing costs only, and will not help you determine the relative total costs of owning different funds. In addition, if these transactional costs were included, your costs would have been higher.
| | | Beginning | | Ending | | Expenses | |
| | | Account | | Account | | Paid During | |
| | | Value | | Value | | Period† | |
| | | | | | | 5/1/20 – | |
| | | 5/1/20 | | 10/31/20 | | 10/31/20 | |
| Class A | | | | | | | | | |
| Actual | | $1,000.00 | | $1,197.60 | | $ | 5.69 | | |
| Hypothetical (5% Return Before Expenses) | | $1,000.00 | | $1,019.96 | | $ | 5.23 | | |
| Class C | | | | | | | | | |
| Actual | | $1,000.00 | | $1,193.10 | | $ | 9.81 | | |
| Hypothetical (5% Return Before Expenses) | | $1,000.00 | | $1,016.19 | | $ | 9.02 | | |
| Class F | | | | | | | | | |
| Actual | | $1,000.00 | | $1,198.50 | | $ | 4.31 | | |
| Hypothetical (5% Return Before Expenses) | | $1,000.00 | | $1,021.22 | | $ | 3.96 | | |
| Class F3 | | | | | | | | | |
| Actual | | $1,000.00 | | $1,199.10 | | $ | 3.87 | | |
| Hypothetical (5% Return Before Expenses) | | $1,000.00 | | $1,021.62 | | $ | 3.56 | | |
| Class I | | | | | | | | | |
| Actual | | $1,000.00 | | $1,199.30 | | $ | 4.31 | | |
| Hypothetical (5% Return Before Expenses) | | $1,000.00 | | $1,021.22 | | $ | 3.96 | | |
| Class R3 | | | | | | | | | |
| Actual | | $1,000.00 | | $1,196.10 | | $ | 7.07 | | |
| Hypothetical (5% Return Before Expenses) | | $1,000.00 | | $1,018.70 | | $ | 6.50 | | |
| Class R4 | | | | | | | | | |
| Actual | | $1,000.00 | | $1,197.60 | | $ | 5.69 | | |
| Hypothetical (5% Return Before Expenses) | | $1,000.00 | | $1,019.96 | | $ | 5.23 | | |
| Class R5 | | | | | | | | | |
| Actual | | $1,000.00 | | $1,199.30 | | $ | 4.31 | | |
| Hypothetical (5% Return Before Expenses) | | $1,000.00 | | $1,021.22 | | $ | 3.96 | | |
| Class R6 | | | | | | | | | |
| Actual | | $1,000.00 | | $1,199.80 | | $ | 3.87 | | |
| Hypothetical (5% Return Before Expenses) | | $1,000.00 | | $1,021.62 | | $ | 3.56 | | |
| † | For each class of the Fund, net expenses are equal to the annualized expense ratio for such class (1.03% for Class A, 1.78% for Class C, 0.78% for Class F, 0.70% for Class F3, 0.78% for Class I, 1.28% for Class R3, 1.03% for Class R4, 0.78% for Class R5 and 0.70% for Class R6) multiplied by the average account value over the period, multiplied by 184/366 (to reflect one-half year period). |
67
Portfolio Holdings Presented by Sector
October 31, 2020
| Sector* | | %** |
| Consumer Discretionary | | | 1.01 | % |
| Health Care | | | 93.66 | % |
| Repurchase Agreement | | | 4.24 | % |
| Money Market Fund(a) | | | 0.98 | % |
| Time Deposit(a) | | | 0.11 | % |
| Total | | | 100.00 | % |
| * | | A sector may comprise several industries. |
| ** | | Represents percent of total investments. |
| (a) | | Securities were purchased with the cash collateral from loaned securities. |
68
International Equity Fund
Please note that the expenses shown in the table are meant to highlight your ongoing costs only and do not reflect any transactional costs, such as sales charges (loads). Therefore, the second line of the table is useful in comparing ongoing costs only, and will not help you determine the relative total costs of owning different funds. In addition, if these transactional costs were included, your costs would have been higher.
| | | Beginning | | Ending | | Expenses | |
| | | Account | | Account | | Paid During | |
| | | Value | | Value | | Period† | |
| | | | | | | 5/1/20 – | |
| | | 5/1/20 | | 10/31/20 | | 10/31/20 | |
| Class A | | | | | | | | | |
| Actual | | $1,000.00 | | $1,172.10 | | $ | 6.39 | | |
| Hypothetical (5% Return Before Expenses) | | $1,000.00 | | $1,019.25 | | $ | 5.94 | | |
| Class C | | | | | | | | | |
| Actual | | $1,000.00 | | $1,165.60 | | $ | 10.45 | | |
| Hypothetical (5% Return Before Expenses) | | $1,000.00 | | $1,015.48 | | $ | 9.73 | | |
| Class F | | | | | | | | | |
| Actual | | $1,000.00 | | $1,173.00 | | $ | 5.24 | | |
| Hypothetical (5% Return Before Expenses) | | $1,000.00 | | $1,020.31 | | $ | 4.88 | | |
| Class F3 | | | | | | | | | |
| Actual | | $1,000.00 | | $1,173.90 | | $ | 4.59 | | |
| Hypothetical (5% Return Before Expenses) | | $1,000.00 | | $1,020.81 | | $ | 4.27 | | |
| Class I | | | | | | | | | |
| Actual | | $1,000.00 | | $1,173.90 | | $ | 4.70 | | |
| Hypothetical (5% Return Before Expenses) | | $1,000.00 | | $1,020.81 | | $ | 4.37 | | |
| Class P | | | | | | | | | |
| Actual | | $1,000.00 | | $1,170.00 | | $ | 7.47 | | |
| Hypothetical (5% Return Before Expenses) | | $1,000.00 | | $1,018.25 | | $ | 6.95 | | |
| Class R2 | | | | | | | | | |
| Actual | | $1,000.00 | | $1,169.40 | | $ | 8.29 | | |
| Hypothetical (5% Return Before Expenses) | | $1,000.00 | | $1,017.50 | | $ | 7.71 | | |
| Class R3 | | | | | | | | | |
| Actual | | $1,000.00 | | $1,170.20 | | $ | 7.75 | | |
| Hypothetical (5% Return Before Expenses) | | $1,000.00 | | $1,018.00 | | $ | 7.20 | | |
| Class R4 | | | | | | | | | |
| Actual | | $1,000.00 | | $1,171.90 | | $ | 6.39 | | |
| Hypothetical (5% Return Before Expenses) | | $1,000.00 | | $1,019.25 | | $ | 5.94 | | |
| Class R5 | | | | | | | | | |
| Actual | | $1,000.00 | | $1,172.90 | | $ | 5.02 | | |
| Hypothetical (5% Return Before Expenses) | | $1,000.00 | | $1,020.51 | | $ | 4.67 | | |
| Class R6 | | | | | | | | | |
| Actual | | $1,000.00 | | $1,173.60 | | $ | 4.59 | | |
| Hypothetical (5% Return Before Expenses) | | $1,000.00 | | $1,020.91 | | $ | 4.27 | | |
| † | For each class of the Fund, net expenses are equal to the annualized expense ratio for such class (1.17% for Class A, 1.92% for Class C, 0.96% for Class F, 0.84% for Class F3, 0.86% for Class I, 1.37% for Class P, 1.52% for Class R2, 1.42% for Class R3, 1.17% for Class R4, 0.92% for Class R5 and 0.84% for Class R6) multiplied by the average account value over the period, multiplied by 184/366 (to reflect one-half year period). |
69
Portfolio Holdings Presented by Sector
October 31, 2020
| Sector* | | %** |
| Communication Services | | | 5.24 | % |
| Consumer Discretionary | | | 14.67 | % |
| Consumer Staples | | | 8.37 | % |
| Energy | | | 2.05 | % |
| Financials | | | 15.80 | % |
| Health Care | | | 12.36 | % |
| Industrials | | | 15.57 | % |
| Information Technology | | | 13.29 | % |
| Materials | | | 8.21 | % |
| Real Estate | | | 1.86 | % |
| Utilities | | | 2.01 | % |
| Repurchase Agreement | | | 0.26 | % |
| Money Market Fund(a) | | | 0.28 | % |
| Time Deposit(a) | | | 0.03 | % |
| Total | | | 100.00 | % |
| * | | A sector may comprise several industries. |
| ** | | Represents percent of total investments. |
| (a) | | Securities were purchased with the cash collateral from loaned securities. |
70
International Opportunities Fund
Please note that the expenses shown in the table are meant to highlight your ongoing costs only and do not reflect any transactional costs, such as sales charges (loads). Therefore, the second line of the table is useful in comparing ongoing costs only, and will not help you determine the relative total costs of owning different funds. In addition, if these transactional costs were included, your costs would have been higher.
| | | Beginning | | Ending | | Expenses | |
| | | Account | | Account | | Paid During | |
| | | Value | | Value | | Period† | |
| | | | | | | 5/1/20 – | |
| | | 5/1/20 | | 10/31/20 | | 10/31/20 | |
| Class A | | | | | | | | | |
| Actual | | $1,000.00 | | $1,166.50 | | $ | 6.43 | | |
| Hypothetical (5% Return Before Expenses) | | $1,000.00 | | $1,019.20 | | $ | 5.99 | | |
| Class C | | | | | | | | | |
| Actual | | $1,000.00 | | $1,161.30 | | $ | 10.49 | | |
| Hypothetical (5% Return Before Expenses) | | $1,000.00 | | $1,015.43 | | $ | 9.78 | | |
| Class F | | | | | | | | | |
| Actual | | $1,000.00 | | $1,166.80 | | $ | 5.61 | | |
| Hypothetical (5% Return Before Expenses) | | $1,000.00 | | $1,019.96 | | $ | 5.23 | | |
| Class F3 | | | | | | | | | |
| Actual | | $1,000.00 | | $1,168.10 | | $ | 4.74 | | |
| Hypothetical (5% Return Before Expenses) | | $1,000.00 | | $1,020.76 | | $ | 4.42 | | |
| Class I | | | | | | | | | |
| Actual | | $1,000.00 | | $1,167.50 | | $ | 5.07 | | |
| Hypothetical (5% Return Before Expenses) | | $1,000.00 | | $1,020.46 | | $ | 4.72 | | |
| Class P | | | | | | | | | |
| Actual | | $1,000.00 | | $1,164.10 | | $ | 7.51 | | |
| Hypothetical (5% Return Before Expenses) | | $1,000.00 | | $1,018.20 | | $ | 7.00 | | |
| Class R2 | | | | | | | | | |
| Actual | | $1,000.00 | | $1,163.30 | | $ | 8.32 | | |
| Hypothetical (5% Return Before Expenses) | | $1,000.00 | | $1,017.44 | | $ | 7.76 | | |
| Class R3 | | | | | | | | | |
| Actual | | $1,000.00 | | $1,164.10 | | $ | 7.78 | | |
| Hypothetical (5% Return Before Expenses) | | $1,000.00 | | $1,017.95 | | $ | 7.25 | | |
| Class R4 | | | | | | | | | |
| Actual | | $1,000.00 | | $1,165.80 | | $ | 6.42 | | |
| Hypothetical (5% Return Before Expenses) | | $1,000.00 | | $1,019.20 | | $ | 5.99 | | |
| Class R5 | | | | | | | | | |
| Actual | | $1,000.00 | | $1,167.50 | | $ | 5.07 | | |
| Hypothetical (5% Return Before Expenses) | | $1,000.00 | | $1,020.46 | | $ | 4.72 | | |
| Class R6 | | | | | | | | | |
| Actual | | $1,000.00 | | $1,168.10 | | $ | 4.74 | | |
| Hypothetical (5% Return Before Expenses) | | $1,000.00 | | $1,020.76 | | $ | 4.42 | | |
| † | For each class of the Fund, net expenses are equal to the annualized expense ratio for such class (1.18% for Class A, 1.93% for Class C, 1.03% for Class F, 0.87% for Class F3, 0.93% for Class I, 1.38% for Class P, 1.53% for Class R2, 1.43% for Class R3, 1.18% for Class R4, 0.93% for Class R5 and 0.87% for Class R6) multiplied by the average account value over the period, multiplied by 184/366 (to reflect one-half year period). |
71
Portfolio Holdings Presented by Sector
October 31, 2020
| Sector* | | %** |
| Communication Services | | | 5.06 | % |
| Consumer Discretionary | | | 13.83 | % |
| Consumer Staples | | | 3.93 | % |
| Financials | | | 9.66 | % |
| Health Care | | | 8.58 | % |
| Industrials | | | 22.33 | % |
| Information Technology | | | 15.42 | % |
| Materials | | | 8.40 | % |
| Real Estate | | | 8.26 | % |
| Utilities | | | 3.30 | % |
| Repurchase Agreement | | | 0.31 | % |
| Money Market Fund(a) | | | 0.83 | % |
| Time Deposit(a) | | | 0.09 | % |
| Total | | | 100.00 | % |
| * | | A sector may comprise several industries. |
| ** | | Represents percent of total investments. |
| (a) | | Securities were purchased with the cash collateral from loaned securities. |
72
International Value Fund
Please note that the expenses shown in the table are meant to highlight your ongoing costs only and do not reflect any transactional costs, such as sales charges (loads). Therefore, the second line of the table is useful in comparing ongoing costs only, and will not help you determine the relative total costs of owning different funds. In addition, if these transactional costs were included, your costs would have been higher.
| | | Beginning | | Ending | | Expenses | |
| | | Account | | Account | | Paid During | |
| | | Value | | Value | | Period† | |
| | | | | | | 5/1/20 – | |
| | | 5/1/20 | | 10/31/20 | | 10/31/20 | |
| Class A | | | | | | | | | |
| Actual | | $1,000.00 | | $1,087.30 | | $ | 5.88 | | |
| Hypothetical (5% Return Before Expenses) | | $1,000.00 | | $1,019.51 | | $ | 5.69 | | |
| Class C | | | | | | | | | |
| Actual | | $1,000.00 | | $1,083.30 | | $ | 9.79 | | |
| Hypothetical (5% Return Before Expenses) | | $1,000.00 | | $1,015.74 | | $ | 9.48 | | |
| Class F | | | | | | | | | |
| Actual | | $1,000.00 | | $1,089.60 | | $ | 4.83 | | |
| Hypothetical (5% Return Before Expenses) | | $1,000.00 | | $1,020.51 | | $ | 4.67 | | |
| Class F3 | | | | | | | | | |
| Actual | | $1,000.00 | | $1,090.00 | | $ | 4.20 | | |
| Hypothetical (5% Return Before Expenses) | | $1,000.00 | | $1,021.11 | | $ | 4.06 | | |
| Class I | | | | | | | | | |
| Actual | | $1,000.00 | | $1,088.10 | | $ | 4.30 | | |
| Hypothetical (5% Return Before Expenses) | | $1,000.00 | | $1,021.01 | | $ | 4.17 | | |
| Class R2 | | | | | | | | | |
| Actual | | $1,000.00 | | $1,085.00 | | $ | 7.70 | | |
| Hypothetical (5% Return Before Expenses) | | $1,000.00 | | $1,017.75 | | $ | 7.46 | | |
| Class R3 | | | | | | | | | |
| Actual | | $1,000.00 | | $1,086.80 | | $ | 7.19 | | |
| Hypothetical (5% Return Before Expenses) | | $1,000.00 | | $1,018.25 | | $ | 6.95 | | |
| Class R4 | | | | | | | | | |
| Actual | | $1,000.00 | | $1,087.40 | | $ | 5.88 | | |
| Hypothetical (5% Return Before Expenses) | | $1,000.00 | | $1,019.51 | | $ | 5.69 | | |
| Class R5 | | | | | | | | | |
| Actual | | $1,000.00 | | $1,088.40 | | $ | 4.57 | | |
| Hypothetical (5% Return Before Expenses) | | $1,000.00 | | $1,020.76 | | $ | 4.42 | | |
| Class R6 | | | | | | | | | |
| Actual | | $1,000.00 | | $1,090.00 | | $ | 4.20 | | |
| Hypothetical (5% Return Before Expenses) | | $1,000.00 | | $1,021.11 | | $ | 4.06 | | |
| † | For each class of the Fund, net expenses are equal to the annualized expense ratio for such class (1.12% for Class A, 1.87% for Class C, 0.92% for Class F, 0.80% for Class F3, 0.82% for Class I, 1.47% for Class R2, 1.37% for Class R3, 1.12% for Class R4, 0.87% for Class R5 and 0.80% for Class R6) multiplied by the average account value over the period, multiplied by 184/366 (to reflect one-half year period). |
73
Portfolio Holdings Presented by Sector
October 31, 2020
| Sector* | | %** |
| Communication Services | | | 4.08 | % |
| Consumer Discretionary | | | 15.64 | % |
| Consumer Staples | | | 4.90 | % |
| Energy | | | 4.69 | % |
| Financials | | | 20.71 | % |
| Health Care | | | 8.33 | % |
| Industrials | | | 14.97 | % |
| Information Technology | | | 7.61 | % |
| Materials | | | 6.94 | % |
| Real Estate | | | 3.21 | % |
| Utilities | | | 5.41 | % |
| Repurchase Agreement | | | 2.34 | % |
| Money Market Fund(a) | | | 1.05 | % |
| Time Deposit(a) | | | 0.12 | % |
| Total | | | 100.00 | % |
| * | | A sector may comprise several industries. |
| ** | | Represents percent of total investments. |
| (a) | | Securities were purchased with the cash collateral from loaned securities. |
74
Value Opportunities Fund
Please note that the expenses shown in the table are meant to highlight your ongoing costs only and do not reflect any transactional costs, such as sales charges (loads). Therefore, the second line of the table is useful in comparing ongoing costs only, and will not help you determine the relative total costs of owning different funds. In addition, if these transactional costs were included, your costs would have been higher.
| | | Beginning | | Ending | | Expenses | |
| | | Account | | Account | | Paid During | |
| | | Value | | Value | | Period† | |
| | | | | | | 5/1/20 – | |
| | | 5/1/20 | | 10/31/20 | | 10/31/20 | |
| Class A | | | | | | | | | |
| Actual | | $1,000.00 | | $1,145.80 | | $ | 6.26 | | |
| Hypothetical (5% Return Before Expenses) | | $1,000.00 | | $1,019.30 | | $ | 5.89 | | |
| Class C | | | | | | | | | |
| Actual | | $1,000.00 | | $1,142.10 | | $ | 10.34 | | |
| Hypothetical (5% Return Before Expenses) | | $1,000.00 | | $1,015.48 | | $ | 9.73 | | |
| Class F | | | | | | | | | |
| Actual | | $1,000.00 | | $1,146.80 | | $ | 5.45 | | |
| Hypothetical (5% Return Before Expenses) | | $1,000.00 | | $1,020.06 | | $ | 5.13 | | |
| Class F3 | | | | | | | | | |
| Actual | | $1,000.00 | | $1,147.80 | | $ | 4.43 | | |
| Hypothetical (5% Return Before Expenses) | | $1,000.00 | | $1,021.01 | | $ | 4.17 | | |
| Class I | | | | | | | | | |
| Actual | | $1,000.00 | | $1,147.60 | | $ | 4.91 | | |
| Hypothetical (5% Return Before Expenses) | | $1,000.00 | | $1,020.56 | | $ | 4.62 | | |
| Class P | | | | | | | | | |
| Actual | | $1,000.00 | | $1,145.30 | | $ | 7.33 | | |
| Hypothetical (5% Return Before Expenses) | | $1,000.00 | | $1,018.30 | | $ | 6.90 | | |
| Class R2 | | | | | | | | | |
| Actual | | $1,000.00 | | $1,143.70 | | $ | 8.14 | | |
| Hypothetical (5% Return Before Expenses) | | $1,000.00 | | $1,017.55 | | $ | 7.66 | | |
| Class R3 | | | | | | | | | |
| Actual | | $1,000.00 | | $1,144.50 | | $ | 7.60 | | |
| Hypothetical (5% Return Before Expenses) | | $1,000.00 | | $1,018.05 | | $ | 7.15 | | |
| Class R4 | | | | | | | | | |
| Actual | | $1,000.00 | | $1,146.00 | | $ | 6.26 | | |
| Hypothetical (5% Return Before Expenses) | | $1,000.00 | | $1,019.30 | | $ | 5.89 | | |
| Class R5 | | | | | | | | | |
| Actual | | $1,000.00 | | $1,147.40 | | $ | 4.91 | | |
| Hypothetical (5% Return Before Expenses) | | $1,000.00 | | $1,020.56 | | $ | 4.62 | | |
| Class R6 | | | | | | | | | |
| Actual | | $1,000.00 | | $1,147.90 | | $ | 4.43 | | |
| Hypothetical (5% Return Before Expenses) | | $1,000.00 | | $1,021.01 | | $ | 4.17 | | |
| † | For each class of the Fund, net expenses are equal to the annualized expense ratio for such class (1.16% for Class A, 1.92% for Class C, 1.01% for Class F, 0.82% for Class F3, 0.91% for Class I, 1.36% for Class P, 1.51% for Class R2, 1.41% for Class R3, 1.16% for Class R4, 0.91% for Class R5 and 0.82% for Class R6) multiplied by the average account value over the period, multiplied by 184/366 (to reflect one-half year period). |
75
Portfolio Holdings Presented by Sector
October 31, 2020
| Sector* | | %** |
| Consumer Discretionary | | | 13.33 | % |
| Consumer Staples | | | 0.82 | % |
| Energy | | | 1.07 | % |
| Financials | | | 14.27 | % |
| Health Care | | | 15.68 | % |
| Industrials | | | 15.99 | % |
| Information Technology | | | 20.18 | % |
| Materials | | | 8.51 | % |
| Real Estate | | | 5.98 | % |
| Utilities | | | 4.17 | % |
| Total | | | 100.00 | % |
| * | | A sector may comprise several industries. |
| ** | | Represents percent of total investments. |
76
Schedule of Investments
ALPHA STRATEGY FUND October 31, 2020
| | | | | | Fair | |
| | | | | | Value | |
| Investments | | Shares | | | (000) | |
| INVESTMENTS IN UNDERLYING FUNDS(a)(b) 100.20% | |
| Lord Abbett Developing Growth Fund, Inc. – Class I*(c) | | | 3,985,867 | | | $ | 135,400 | |
| Lord Abbett Securities Trust – Focused Small Cap Value Fund - Class I*(d) | | | 3,321,048 | | | | 67,384 | |
| Lord Abbett Securities Trust – International Opportunities Fund – Class I(d) | | | 8,007,354 | | | | 129,479 | |
| Lord Abbett Securities Trust – Micro - Cap Growth Fund - Class I*(d) | | | 3,286,773 | | | | 67,248 | |
| Lord Abbett Research Fund, Inc. – Small Cap Value Fund - Class I(d) | | | 8,851,506 | | | | 133,392 | |
| Lord Abbett Securities Trust – Value Opportunities Fund – Class I(d) | | | 7,636,112 | | | | 135,999 | |
Total Investments in Underlying Funds
(cost $714,446,753) | | | | | | | 668,902 | |
| | | Principal | | | Fair | |
| | | Amount | | | Value | |
| Investments | | (000) | | | (000) | |
| SHORT-TERM INVESTMENT 0.03% | |
| | | | | | | |
| Repurchase Agreement | | | | | | | | |
Repurchase Agreement dated 10/30/2020, 0.00% due 11/2/2020 with Fixed Income Clearing Corp. collateralized by $206,200 of U.S. Treasury Note at 1.625% due 4/30/2023; value: $215,349; proceeds: $211,123
(cost $211,123) | | | $211 | | | $ | 211 | |
Total Investments in Securities 100.23%
(cost $714,657,876) | | | | | | | 669,113 | |
| Liabilities in Excess of Other Assets (0.23)% | | | | | | | (1,551 | ) |
| Net Assets 100.00% | | | | | | $ | 667,562 | |
| * | | Non-income producing security. |
| (a) | | Affiliated issuer (see Note 13). |
| (b) | | These investments offer daily redemptions. |
| (c) | | Fund investment objective is long-term growth of capital through a diversified and actively managed portfolio consisting of developing growth companies, many of which are traded over the counter. |
| (d) | | Fund investment objective is long-term capital appreciation. |
The following is a summary of the inputs used as of October 31, 2020 in valuing the Fund’s investments carried at fair value(1):
| | | Level 1 | | | Level 2 | | | Level 3 | | | Total | |
| Investment Type(2) | | (000) | | | (000) | | | (000) | | | (000) | |
| Investments in Underlying Funds | | $ | 668,902 | | | | $ | – | | | | $ | – | | | $ | 668,902 | |
| Short-Term Investment | | | | | | | | | | | | | | | | | | |
| Repurchase Agreement | | | – | | | | | 211 | | | | | – | | | | 211 | |
| Total | | $ | 668,902 | | | | $ | 211 | | | | $ | – | | | $ | 669,113 | |
| (1) | | Refer to Note 2(l) for a description of fair value measurements and the three-tier hierarchy of inputs. |
| (2) | | See Schedule of Investments for fair values in each investment in Underlying Funds. |
A reconciliation of Level 3 investments is presented when the Fund has a material amount of Level 3 investments at the beginning or end of the year in relation to the Fund’s net assets.
| | See Notes to Financial Statements. | 77 |
Schedule of Investments
DURABLE GROWTH FUND October 31, 2020
| | | | | | Fair | |
| | | | | | Value | |
| Investments | | | Shares | | | | (000) | |
| COMMON STOCKS 99.66% | | | | | | | | |
| | | | | | | | | |
| Aerospace & Defense 0.39% | | | | | | | | |
| CAE, Inc. (Canada)(a) | | | 45,576 | | | $ | 778 | |
| | | | | | | | | |
| Automobiles 0.90% | | | | | | | | |
| Tesla, Inc.* | | | 4,703 | | | | 1,825 | |
| | | | | | | | | |
| Banks 0.83% | | | | | | | | |
| First Republic Bank | | | 13,244 | | | | 1,671 | |
| | | | | | | | | |
| Beverages 1.95% | | | | | | | | |
| Brown-Forman Corp. Class B | | | 15,855 | | | | 1,105 | |
| Coca-Cola Co. (The) | | | 58,876 | | | | 2,830 | |
| Total | | | | | | | 3,935 | |
| | | | | | | | | |
| Biotechnology 3.85% | | | | | | | | |
| AbbVie, Inc. | | | 31,894 | | | | 2,714 | |
| Amgen, Inc. | | | 11,511 | | | | 2,497 | |
| Seagen, Inc.* | | | 6,655 | | | | 1,110 | |
| Vertex Pharmaceuticals, Inc.* | | | 6,967 | | | | 1,452 | |
| Total | | | | | | | 7,773 | |
| | | | | | | | | |
| Capital Markets 0.75% | | | | | | | | |
| Moody’s Corp. | | | 5,769 | | | | 1,517 | |
| | | | | | | | | |
| Chemicals 0.73% | | | | | | | | |
| Air Products & Chemicals, Inc. | | | 5,296 | | | | 1,463 | |
| | | | | | | | | |
| Construction Materials 0.94% | | | | | | | | |
| Vulcan Materials Co. | | | 13,075 | | | | 1,894 | |
| | | | | | | | | |
| Containers & Packaging 1.12% | | | | | | | | |
| Avery Dennison Corp. | | | 7,803 | | | | 1,080 | |
| Ball Corp. | | | 13,340 | | | | 1,187 | |
| Total | | | | | | | 2,267 | |
| | | | | | | | | |
| Entertainment 2.99% | | | | | | | | |
| Activision Blizzard, Inc. | | | 18,556 | | | | 1,405 | |
| Netflix, Inc.* | | | 7,793 | | | | 3,708 | |
| Walt Disney Co. (The) | | | 7,516 | | | | 911 | |
| Total | | | | | | | 6,024 | |
| | | | | | Fair | |
| | | | | | Value | |
| Investments | | | Shares | | | | (000) | |
| Equity Real Estate Investment Trusts 1.77% |
| American Tower Corp. | | | 8,298 | | | $ | 1,906 | |
| SBA Communications Corp. | | | 5,717 | | | | 1,660 | |
| Total | | | | | | | 3,566 | |
| | | | | | | | | |
| Food & Staples Retailing 0.90% | | | | | | | | |
| Walmart, Inc. | | | 13,155 | | | | 1,825 | |
| | | | | | | | | |
| Health Care Equipment & Supplies 5.37% |
| Align Technology, Inc.* | | | 4,587 | | | | 1,954 | |
| Boston Scientific Corp.* | | | 32,753 | | | | 1,123 | |
| Danaher Corp. | | | 11,658 | | | | 2,676 | |
| DexCom, Inc.* | | | 4,953 | | | | 1,583 | |
| Intuitive Surgical, Inc.* | | | 3,237 | | | | 2,159 | |
| West Pharmaceutical Services, Inc. | | | 4,887 | | | | 1,330 | |
| Total | | | | | | | 10,825 | |
| | | | | | | | | |
| Hotels, Restaurants & Leisure 1.04% | | | | | | | | |
| Chipotle Mexican Grill, Inc.* | | | 1,740 | | | | 2,090 | |
| | | | | | | | | |
| Household Products 0.38% | | | | | | | | |
| Church & Dwight Co., Inc. | | | 8,647 | | | | 764 | |
| | | | | | | | | |
| Industrial Conglomerates 1.43% |
| Honeywell International, Inc. | | | 8,941 | | | | 1,475 | |
| Roper Technologies, Inc. | | | 3,806 | | | | 1,413 | |
| Total | | | | | | | 2,888 | |
| | | | | | | | | |
| Information Technology Services 9.47% |
| Fidelity National Information Services, Inc. | | | 17,148 | | | | 2,136 | |
| Genpact Ltd. | | | 42,170 | | | | 1,449 | |
| Global Payments, Inc. | | | 8,599 | | | | 1,356 | |
| Mastercard, Inc. Class A | | | 17,567 | | | | 5,071 | |
| PayPal Holdings, Inc.* | | | 24,796 | | | | 4,615 | |
| Snowflake, Inc. Class A* | | | 668 | | | | 167 | |
| Twilio, Inc. Class A* | | | 5,938 | | | | 1,657 | |
| Visa, Inc. Class A | | | 14,565 | | | | 2,647 | |
| Total | | | | | | | 19,098 | |
| | | | | | | | | |
| Insurance 0.52% | | | | | | | | |
| RenaissanceRe Holdings Ltd. | | | 6,551 | | | | 1,059 | |
| | | | | | | | | |
| 78 | See Notes to Financial Statements. |
Schedule of Investments (continued)
DURABLE GROWTH FUND October 31, 2020
| | | | | | Fair | |
| | | | | | Value | |
| Investments | | Shares | | | (000) | |
| Interactive Media & Services 10.56% |
| Alphabet, Inc. Class A* | | | 6,212 | | | $ | 10,039 | |
| Facebook, Inc. Class A* | | | 36,999 | | | | 9,735 | |
| Match Group, Inc.* | | | 13,096 | | | | 1,529 | |
| Total | | | | | | | 21,303 | |
| | | | | | | | | |
| Internet & Direct Marketing Retail 9.07% |
| Amazon.com, Inc.* | | | 6,028 | | | | 18,302 | |
| | | | | | | | | |
| Leisure Products 0.53% | | | | | | | | |
| Peloton Interactive, Inc. Class A* | | | 9,693 | | | | 1,068 | |
| | | | | | | | | |
| Life Sciences Tools & Services 0.59% | | | | | | | | |
| Repligen Corp.* | | | 7,090 | | | | 1,181 | |
| | | | | | | | | |
| Machinery 0.97% | | | | | | | | |
| Stanley Black & Decker, Inc. | | | 11,792 | | | | 1,960 | |
| | | | | | | | | |
| Multi-Line Retail 0.73% | | | | | | | | |
| Dollar Tree, Inc.* | | | 16,286 | | | | 1,471 | |
| | | | | | | | | |
| Personal Products 0.69% | | | | | | | | |
| Estee Lauder Cos., Inc. (The) Class A | | | 6,340 | | | | 1,393 | |
| | | | | | | | | |
| Pharmaceuticals 3.47% | | | | | | | | |
| AstraZeneca plc ADR | | | 31,207 | | | | 1,565 | |
| Bristol-Myers Squibb Co. | | | 34,743 | | | | 2,031 | |
| Zoetis, Inc. | | | 21,517 | | | | 3,412 | |
| Total | | | | | | | 7,008 | |
| | | | | | | | | |
| Professional Services 0.84% | | | | | | | | |
| CoStar Group, Inc.* | | | 2,053 | | | | 1,691 | |
| | | | | | | | | |
| Road & Rail 2.41% | | | | | | | | |
| J.B. Hunt Transport Services, Inc. | | | 13,986 | | | | 1,703 | |
| Norfolk Southern Corp. | | | 6,465 | | | | 1,352 | |
| Old Dominion Freight Line, Inc. | | | 9,488 | | | | 1,806 | |
| Total | | | | | | | 4,861 | |
| | | | | | Fair | |
| | | | | | Value | |
| Investments | | Shares | | | (000) | |
| Semiconductors & Semiconductor Equipment 7.42% |
| Analog Devices, Inc. | | | 16,970 | | | $ | 2,012 | |
| Lam Research Corp. | | | 4,832 | | | | 1,653 | |
| NVIDIA Corp. | | | 9,108 | | | | 4,566 | |
| NXP Semiconductors NV (Netherlands)(a) | | | 9,734 | | | | 1,315 | |
| QUALCOMM, Inc. | | | 31,423 | | | | 3,876 | |
| Xilinx, Inc. | | | 13,103 | | | | 1,555 | |
| Total | | | | | | | 14,977 | |
| | | | | | | | | |
| Software 15.30% | | | | | | | | |
| DocuSign, Inc.* | | | 6,483 | | | | 1,311 | |
| Microsoft Corp. | | | 77,509 | | | | 15,693 | |
| RingCentral, Inc. Class A* | | | 11,267 | | | | 2,911 | |
| salesforce.com, Inc.* | | | 21,816 | | | | 5,067 | |
| ServiceNow, Inc.* | | | 7,068 | | | | 3,517 | |
| Splunk, Inc.* | | | 11,997 | | | | 2,376 | |
| Total | | | | | | | 30,875 | |
| | | | | | | | | |
| Specialty Retail 3.07% | | | | | | | | |
| Burlington Stores, Inc.* | | | 11,352 | | | | 2,197 | |
| Home Depot, Inc. (The) | | | 8,978 | | | | 2,395 | |
| O’Reilly Automotive, Inc.* | | | 3,687 | | | | 1,610 | |
| Total | | | | | | | 6,202 | |
| | | | | | | | | |
| Technology Hardware, Storage & Peripheral 6.92% |
| Apple, Inc. | | | 128,311 | | | | 13,968 | |
| | | | | | | | | |
| Textiles, Apparel & Luxury Goods 1.76% |
| NIKE, Inc. Class B | | | 29,655 | | | | 3,561 | |
Total Common Stocks
(cost $170,982,211) | | | | | | | 201,083 | |
| | See Notes to Financial Statements. | 79 |
Schedule of Investments (concluded)
DURABLE GROWTH FUND October 31, 2020
| | | Principal | | | Fair | |
| | | Amount | | | Value | |
| Investments | | | (000) | | | | (000) | |
| SHORT-TERM INVESTMENT 0.21% | | | | | | | | |
| | | | | | | | | |
| Repurchase Agreement | | | | | | | | |
| Repurchase Agreement dated 10/30/2020, 0.00% due 11/2/2020 with Fixed Income Clearing Corp. collateralized by $432,500 of U.S. Treasury Note at 0.50% due 03/15/2023; value: $436,182; proceeds: $427,572 (cost $427,572) | | | $427 | | | $ | 427 | |
Total Investments in Securities 99.87%
(cost $171,409,783) | | | | | | | 201,510 | |
| Other Assets in Excess of Liabilities 0.13% | | | | | | | 257 | |
| Net Assets 100.00% | | | | | | $ | 201,767 | |
| ADR | | American Depositary Receipt. |
| * | | Non-income producing security. |
| (a) | | Foreign security traded in U.S. dollars. |
The following is a summary of the inputs used as of October 31, 2020 in valuing the Fund’s investments carried at fair value(1):
| | | Level 1 | | | Level 2 | | | Level 3 | | | Total | |
| Investment Type(2) | | (000) | | | (000) | | | (000) | | | (000) | |
| Common Stocks | | $ | 201,083 | | | | $ | – | | | | $ | – | | | $ | 201,083 | |
| Short-Term Investment | | | | | | | | | | | | | | | | | | |
| Repurchase Agreement | | | – | | | | | 427 | | | | | – | | | | 427 | |
| Total | | $ | 201,083 | | | | $ | 427 | | | | $ | – | | | $ | 201,510 | |
| (1) | | Refer to Note 2(l) for a description of fair value measurements and the three-tier hierarchy of inputs. |
| (2) | | See Schedule of Investments for fair values in each industry and identification of foreign issuers and/or geography. |
A reconciliation of Level 3 investments is presented when the Fund has a material amount of Level 3 investments at the beginning or end of the year in relation to the Fund’s net assets.
| 80 | See Notes to Financial Statements. |
Schedule of Investments
FOCUSED GROWTH FUND October 31, 2020
| | | | | | Fair | |
| | | | | | Value | |
| Investments | | | Shares | | | | (000) | |
| COMMON STOCKS 95.65% | | | | | | | | |
| | | | | | | | | |
| Automobiles 2.76% | | | | | | | | |
| Tesla, Inc.* | | | 2,011 | | | $ | 780 | |
| | | | | | | | | |
| Biotechnology 4.10% | | | | | | | | |
| Arena Pharmaceuticals, Inc.* | | | 5,378 | | | | 461 | |
| Argenx SE ADR* | | | 1,267 | | | | 314 | |
| TG Therapeutics, Inc.* | | | 15,159 | | | | 383 | |
| Total | | | | | | | 1,158 | |
| | | | | | | | | |
| Diversified Consumer Services 2.03% |
| Chegg, Inc.* | | | 7,787 | | | | 572 | |
| | | | | | | | | |
| Entertainment 3.97% | | | | | | | | |
| Roku, Inc.* | | | 5,539 | | | | 1,121 | |
| | | | | | | | | |
| Health Care Equipment & Supplies 4.48% |
| DexCom, Inc.* | | | 1,667 | | | | 533 | |
| Nevro Corp.* | | | 4,904 | | | | 732 | |
| Total | | | | | | | 1,265 | |
| | | | | | | | | |
| Hotels, Restaurants & Leisure 1.64% |
| DraftKings, Inc. Class A* | | | 13,080 | | | | 463 | |
| | | | | | | | | |
| Information Technology Services 9.96% |
| Mastercard, Inc. Class A | | | 1,929 | | | | 557 | |
| PayPal Holdings, Inc.* | | | 3,832 | | | | 713 | |
| Shopify, Inc. Class A (Canada)*(a) | | | 596 | | | | 551 | |
| Square, Inc. Class A* | | | 6,391 | | | | 990 | |
| Total | | | | | | | 2,811 | |
| | | | | | | | | |
| Interactive Media & Services 11.89% | | | | | | | | |
| Alphabet, Inc. Class A* | | | 700 | | | | 1,131 | |
| Facebook, Inc. Class A* | | | 4,798 | | | | 1,263 | |
| Snap, Inc. Class A* | | | 24,424 | | | | 962 | |
| Total | | | | | | | 3,356 | |
| | | | | | | | | |
| Internet & Direct Marketing Retail 11.11% | | | | | |
| Alibaba Group Holding Ltd. ADR* | | | 2,412 | | | | 735 | |
| Amazon.com, Inc.* | | | 587 | | | | 1,782 | |
| Chewy, Inc. Class A* | | | 10,019 | | | | 617 | |
| Total | | | | | | | 3,134 | |
| | | | | | Fair | |
| | | | | | Value | |
| Investments | | | Shares | | | | (000) | |
| Leisure Products 2.12% | | | | | | | | |
| Peloton Interactive, Inc. Class A* | | | 5,423 | | | $ | 598 | |
| | | | | | | | | |
| Real Estate Management & Development 0.84% |
| Redfin Corp.* | | | 5,652 | | | | 236 | |
| | | | | | | | | |
| Semiconductors & Semiconductor Equipment 11.77% |
| Advanced Micro Devices, Inc.* | | | 11,226 | | | | 845 | |
| Inphi Corp.* | | | 3,980 | | | | 556 | |
| NVIDIA Corp. | | | 2,124 | | | | 1,065 | |
| QUALCOMM, Inc. | | | 6,934 | | | | 856 | |
| Total | | | | | | | 3,322 | |
| | | | | | | | | |
| Software 18.60% | | | | | | | | |
| DocuSign, Inc.* | | | 2,626 | | | | 531 | |
| Five9, Inc.* | | | 6,249 | | | | 948 | |
| Microsoft Corp. | | | 7,054 | | | | 1,428 | |
| SVMK, Inc.* | | | 25,799 | | | | 540 | |
| Trade Desk, Inc. (The) Class A* | | | 1,247 | | | | 707 | |
| Zoom Video Communications, Inc. Class A* | | | 2,373 | | | | 1,094 | |
| Total | | | | | | | 5,248 | |
| | | | | | | | | |
| Technology Hardware, Storage & Peripheral 5.93% |
| Apple, Inc. | | | 15,368 | | | | 1,673 | |
| | | | | | | | | |
| Textiles, Apparel & Luxury Goods 4.45% |
| Lululemon Athletica, Inc. (Canada)*(a) | | | 2,032 | | | | 649 | |
| NIKE, Inc. Class B | | | 5,063 | | | | 608 | |
| Total | | | | | | | 1,257 | |
Total Common Stocks
(cost $21,216,315) | | | | | | | 26,994 | |
| | See Notes to Financial Statements. | 81 |
Schedule of Investments (concluded)
FOCUSED GROWTH FUND October 31, 2020
| | | Principal | | | Fair | |
| | | Amount | | | Value | |
| Investments | | | (000) | | | | (000) | |
| SHORT-TERM INVESTMENT 2.30% | | | | | | | | |
| | | | | | | | | |
| Repurchase Agreement | | | | | | | | |
| Repurchase Agreement dated 10/30/2020, 0.00% due 11/2/2020 with Fixed Income Clearing Corp. collateralized by $633,100 of U.S. Treasury Note at 1.625% due 4/30/2023; value: $661,191; proceeds: $648,183 (cost $648,183) | | | $648 | | | $ | 648 | |
Total Investments in Securities 97.95%
(cost $21,864,498) | | | | | | | 27,642 | |
| Other Assets in Excess of Liabilities 2.05% | | | | | | | 579 | |
| Net Assets 100.00% | | | | | | $ | 28,221 | |
| ADR | | American Depositary Receipt. |
| * | | Non-income producing security. |
| (a) | | Foreign security traded in U.S. dollars. |
The following is a summary of the inputs used as of October 31, 2020 in valuing the Fund’s investments carried at fair value(1):
| | | Level 1 | | | Level 2 | | | Level 3 | | | Total | |
| Investment Type(2) | | (000) | | | (000) | | | (000) | | | (000) | |
| Common Stocks | | $ | 26,994 | | | | $ | – | | | | $ | – | | | $ | 26,994 | |
| Short-Term Investment | | | | | | | | | | | | | | | | | | |
| Repurchase Agreement | | | – | | | | | 648 | | | | | – | | | | 648 | |
| Total | | $ | 26,994 | | | | $ | 648 | | | | $ | – | | | $ | 27,642 | |
| (1) | | Refer to Note 2(l) for a description of fair value measurements and the three-tier hierarchy of inputs. |
| (2) | | See Schedule of Investments for fair values in each industry and identification of foreign issuers and/or geography. |
A reconciliation of Level 3 investments is presented when the Fund has a material amount of Level 3 investments at the beginning or end of the year in relation to the Fund’s net assets.
| 82 | See Notes to Financial Statements. |
Schedule of Investments
FOCUSED LARGE CAP VALUE FUND October 31, 2020
| | | | | | Fair | |
| | | | | | Value | |
| Investments | | | Shares | | | | (000) | |
| COMMON STOCKS 98.92% | | | | | | | | |
| | | | | | | | | |
| Aerospace & Defense 5.24% | | | | | | | | |
| General Dynamics Corp. | | | 86,597 | | | $ | 11,373 | |
| Raytheon Technologies Corp. | | | 204,600 | | | | 11,114 | |
| Total | | | | | | | 22,487 | |
| | | | | | | | | |
| Auto Components 3.25% | | | | | | | | |
| Lear Corp. | | | 115,377 | | | | 13,939 | |
| | | | | | | | | |
| Banks 9.19% | | | | | | | | |
| CIT Group, Inc. | | | 442,370 | | | | 13,028 | |
| Citigroup, Inc. | | | 288,092 | | | | 11,933 | |
| JPMorgan Chase & Co. | | | 147,800 | | | | 14,490 | |
| Total | | | | | | | 39,451 | |
| | | | | | | | | |
| Biotechnology 3.18% | | | | | | | | |
| AbbVie, Inc. | | | 160,340 | | | | 13,645 | |
| | | | | | | | | |
| Capital Markets 10.15% | | | | | | | | |
| Ameriprise Financial, Inc. | | | 103,566 | | | | 16,656 | |
| Invesco Ltd. | | | 1,190,758 | | | | 15,611 | |
| KKR & Co., Inc. Class A | | | 330,707 | | | | 11,294 | |
| Total | | | | | | | 43,561 | |
| | | | | | | | | |
| Chemicals 6.73% | | | | | | | | |
| Dow, Inc. | | | 346,707 | | | | 15,772 | |
| DuPont de Nemours, Inc. | | | 230,526 | | | | 13,112 | |
| Total | | | | | | | 28,884 | |
| | | | | | | | | |
| Consumer Finance 4.33% | | | | | | | | |
| Discover Financial Services | | | 286,038 | | | | 18,595 | |
| | | | | | | | | |
| Diversified Telecommunication Services 2.02% |
| Verizon Communications, Inc. | | | 152,416 | | | | 8,686 | |
| | | | | | | | | |
| Electronic Equipment, Instruments & Components 2.31% |
| Avnet, Inc. | | | 402,421 | | | | 9,928 | |
| | | | | | | | | |
| Energy Equipment & Services 1.03% | | | | | | | | |
| Schlumberger Ltd. | | | 295,400 | | | | 4,413 | |
| | | | | | Fair | |
| | | | | | Value | |
| Investments | | | Shares | | | | (000) | |
| Health Care Providers & Services 8.44% |
| CVS Health Corp. | | | 200,722 | | | $ | 11,259 | |
| McKesson Corp. | | | 86,360 | | | | 12,737 | |
| Universal Health Services, Inc. Class B | | | 111,646 | | | | 12,231 | |
| Total | | | | | | | 36,227 | |
| | | | | | | | | |
| Hotels, Restaurants & Leisure 2.92% | | | | | | | | |
| Caesars Entertainment, Inc.* | | | 279,310 | | | | 12,519 | |
| | | | | | | | | |
| Household Products 3.77% | | | | | | | | |
| Spectrum Brands Holdings, Inc. | | | 284,722 | | | | 16,192 | |
| | | | | | | | | |
| Insurance 9.64% | | | | | | | | |
| Everest Re Group Ltd. | | | 62,930 | | | | 12,402 | |
| Fidelity National Financial, Inc. | | | 474,020 | | | | 14,832 | |
| Hartford Financial Services Group, Inc. (The) | | | 366,540 | | | | 14,119 | |
| Total | | | | | | | 41,353 | |
| | | | | | | | | |
| Machinery 2.81% | | | | | | | | |
| Westinghouse Air Brake Technologies Corp. | | | 203,092 | | | | 12,043 | |
| | | | | | | | | |
| Media 6.57% | | | | | | | | |
| Comcast Corp. Class A | | | 318,620 | | | | 13,458 | |
| Nexstar Media Group, Inc. Class A | | | 178,531 | | | | 14,711 | |
| Total | | | | | | | 28,169 | |
| | | | | | | | | |
| Oil, Gas & Consumable Fuels 3.84% | | | | | | | | |
| Chevron Corp. | | | 75,095 | | | | 5,219 | |
| ONEOK, Inc. | | | 215,160 | | | | 6,240 | |
| Total SE ADR | | | 165,504 | | | | 5,020 | |
| Total | | | | | | | 16,479 | |
| | | | | | | | | |
| Pharmaceuticals 2.93% | | | | | | | | |
| Bristol-Myers Squibb Co. | | | 215,280 | | | | 12,583 | |
| | | | | | | | | |
| Semiconductors & Semiconductor Equipment 1.99% |
| Intel Corp. | | | 192,551 | | | | 8,526 | |
| | See Notes to Financial Statements. | 83 |
Schedule of Investments (concluded)
FOCUSED LARGE CAP VALUE FUND October 31, 2020
| | | | | | Fair | |
| | | | | | Value | |
| Investments | | | Shares | | | | (000) | |
| Specialty Retail 6.06% | | | | | | | | |
| Lowe’s Cos., Inc. | | | 84,568 | | | $ | 13,370 | |
| TJX Cos., Inc. (The) | | | 248,310 | | | | 12,614 | |
| Total | | | | | | | 25,984 | |
| | | | | | | | | |
| Tobacco 2.52% | | | | | | | | |
| Altria Group, Inc. | | | 299,966 | | | | 10,823 | |
Total Common Stocks
(cost $399,131,545) | | | | | | | 424,487 | |
| | | Principal | | | Fair | |
| | | Amount | | | Value | |
| Investments | | (000) | | | (000) | |
| SHORT-TERM INVESTMENT 1.76% |
| |
| Repurchase Agreement | | | | | | | | |
| Repurchase Agreement dated 10/30/2020, 0.00% due 11/2/2020 with Fixed Income Clearing Corp. collateralized by $7,405,200 of U.S. Treasury Note at 1.625% due 04/30/2023; value: $7,733,768; proceeds: $7,582,098 (cost $7,582,098) | | | $7,582 | | | $ | 7,582 | |
Total Investments in Securities 100.68%
(cost $406,713,643) | | | | | | | 432,069 | |
| Liabilities in Excess of Other Assets (0.68)% | | | | (2,936 | ) |
| Net Assets 100.00% | | | | | | $ | 429,133 | |
| ADR | | American Depositary Receipt. |
| * | | Non-income producing security. |
The following is a summary of the inputs used as of October 31, 2020 in valuing the Fund’s investments carried at fair value(1):
| | | Level 1 | | | Level 2 | | | Level 3 | | | Total | |
| Investment Type(2) | | (000) | | | (000) | | | (000) | | | (000) | |
| Common Stocks | | $ | 424,487 | | | | $ | – | | | | $ | – | | | $ | 424,487 | |
| Short-Term Investment | | | | | | | | | | | | | | | | | | |
| Repurchase Agreement | | | – | | | | | 7,582 | | | | | – | | | | 7,582 | |
| Total | | $ | 424,487 | | | | $ | 7,582 | | | | $ | – | | | $ | 432,069 | |
| (1) | | Refer to Note 2(l) for a description of fair value measurements and the three-tier hierarchy of inputs. |
| (2) | | See Schedule of Investments for fair values in each industry and identification of foreign issuers and/or geography. |
A reconciliation of Level 3 investments is presented when the Fund has a material amount of Level 3 investments at the beginning or end of the year in relation to the Fund’s net assets.
| 84 | See Notes to Financial Statements. |
Schedule of Investments
FOCUSED SMALL CAP VALUE FUND October 31, 2020
| Investments | | Shares | | | Fair
Value
(000) | |
| COMMON STOCKS 99.66% | | | | | | | | |
| | | | | | | | | |
| Aerospace & Defense 0.97% | | | | | | | | |
| Triumph Group, Inc. | | | 110,591 | | | $ | 730 | |
| | | | | | | | | |
| Auto Components 2.92% | | | | | | | | |
| American Axle & Manufacturing Holdings, Inc.* | | | 327,959 | | | | 2,204 | |
| | | | | | | | | |
| Banks 13.10% | | | | | | | | |
| Bancorp, Inc. (The)* | | | 242,156 | | | | 2,325 | |
| BankUnited, Inc. | | | 71,900 | | | | 1,816 | |
| Pacific Premier Bancorp, Inc. | | | 81,700 | | | | 2,083 | |
| Sterling Bancorp | | | 156,729 | | | | 2,097 | |
| TCF Financial Corp. | | | 57,996 | | | | 1,578 | |
| Total | | | | | | | 9,899 | |
| | | | | | | | | |
| Building Products 3.80% | | | | | | | | |
| Masonite International Corp.* | | | 32,644 | | | | 2,873 | |
| | | | | | | | | |
| Capital Markets 7.23% | | | | | | | | |
| Brightsphere Investment Group, Inc. | | | 160,693 | | | | 2,218 | |
| Moelis & Co. Class A | | | 43,100 | | | | 1,603 | |
| Victory Capital Holdings, Inc. Class A | | | 89,569 | | | | 1,643 | |
| Total | | | | | | | 5,464 | |
| | | | | | | | | |
| Chemicals 5.58% | | | | | | | | |
| AdvanSix, Inc.* | | | 152,744 | | | | 2,325 | |
| Axalta Coating Systems Ltd.* | | | 75,317 | | | | 1,891 | |
| Total | | | | | | | 4,216 | |
| | | | | | | | | |
| Commercial Services & Supplies 2.47% | | | | | | | | |
| SP Plus Corp.* | | | 101,218 | | | | 1,865 | |
| | | | | | | | | |
| Construction & Engineering 2.00% | | | | | | | | |
| EMCOR Group, Inc. | | | 22,192 | | | | 1,513 | |
| | | | | | | | | |
| Consumer Finance 2.01% | | | | | | | | |
| Nelnet, Inc. Class A | | | 24,900 | | | | 1,520 | |
| | | | | | | | | |
| Containers & Packaging 2.06% | | | | | | | | |
| Pactiv Evergreen, Inc.* | | | 124,200 | | | | 1,554 | |
| Investments | | Shares | | | Fair
Value
(000) | |
| Electronic Equipment, Instruments & Components 2.04% |
| Avnet, Inc. | | | 62,386 | | | $ | 1,539 | |
| | | | | | | | | |
| Energy Equipment & Services 0.75% | | | | | | | | |
| Core Laboratories NV (Netherlands)(a) | | | 39,261 | | | | 567 | |
| | | | | | | | | |
| Equity Real Estate Investment Trusts 4.04% | | | | | | | | |
| Outfront Media, Inc. | | | 90,467 | | | | 1,186 | |
| Sunstone Hotel Investors, Inc. | | | 251,972 | | | | 1,870 | |
| Total | | | | | | | 3,056 | |
| | | | | | | | | |
| Health Care Equipment & Supplies 1.05% | | | | | | | | |
| Natus Medical, Inc.* | | | 43,696 | | | | 796 | |
| | | | | | | | | |
| Health Care Providers & Services 1.56% | | | | | | | | |
| AMN Healthcare Services, Inc.* | | | 18,098 | | | | 1,181 | |
| | | | | | | | | |
| Household Durables 1.99% | | | | | | | | |
| Purple Innovation, Inc.* | | | 52,873 | | | | 1,500 | |
| | | | | | | | | |
| Household Products 3.02% | | | | | | | | |
| Spectrum Brands Holdings, Inc. | | | 40,127 | | | | 2,282 | |
| | | | | | | | | |
| Insurance 5.81% | | | | | | | | |
| Axis Capital Holdings Ltd. | | | 41,200 | | | | 1,759 | |
| ProSight Global, Inc.* | | | 222,362 | | | | 2,630 | |
| Total | | | | | | | 4,389 | |
| | | | | | | | | |
| Leisure Products 2.44% | | | | | | | | |
| Malibu Boats, Inc. Class A* | | | 36,300 | | | | 1,845 | |
| | | | | | | | | |
| Machinery 12.24% | | | | | | | | |
| Alamo Group, Inc. | | | 14,942 | | | | 1,798 | |
| Blue Bird Corp.* | | | 101,800 | | | | 1,175 | |
| Columbus McKinnon Corp. | | | 53,400 | | | | 1,810 | |
| Hillenbrand, Inc. | | | 98,852 | | | | 2,891 | |
| Miller Industries, Inc. | | | 52,511 | | | | 1,572 | |
| Total | | | | | | | 9,246 | |
| | | | | | | | | |
| Media 2.39% | | | | | | | | |
| Nexstar Media Group, Inc. Class A | | | 21,896 | | | | 1,804 | |
| | See Notes to Financial Statements. | 85 |
Schedule of Investments (concluded)
FOCUSED SMALL CAP VALUE FUND October 31, 2020
| Investments | | Shares | | | Fair
Value
(000) | |
| Metals & Mining 5.85% | | | | | | | | |
| Lundin Mining Corp.(b) CAD | | | 376,300 | | | $ | 2,274 | |
| Worthington Industries, Inc. | | | 43,607 | | | | 2,146 | |
| Total | | | | | | | 4,420 | |
| | | | | | | | | |
| Oil, Gas & Consumable Fuels 2.27% | | | | | | | | |
| Par Pacific Holdings, Inc.* | | | 112,608 | | | | 725 | |
| Parsley Energy, Inc. Class A | | | 65,471 | | | | 655 | |
| WPX Energy, Inc.* | | | 73,295 | | | | 338 | |
| Total | | | | | | | 1,718 | |
| | | | | | | | | |
| Real Estate Management & Development 2.43% |
| Realogy Holdings Corp.* | | | 164,575 | | | | 1,837 | |
| | | | | | | | | |
| Semiconductors & Semiconductor Equipment 3.92% | |
| Advanced Energy Industries, Inc.* | | | 23,300 | | | | 1,572 | |
| Ichor Holdings Ltd.* | | | 59,900 | | | | 1,393 | |
| Total | | | | | | | 2,965 | |
| | | | | | | | | |
| Technology Hardware, Storage & Peripherals 1.16% | | | |
| Diebold Nixdorf, Inc.* | | | 141,284 | | | | 880 | |
| | | | | | | | | |
| Thrifts & Mortgage Finance 4.56% | | | | | | | | |
| Essent Group Ltd. | | | 41,300 | | | | 1,646 | |
| Investments | | Shares | | | Fair
Value
(000) | |
| Thrifts & Mortgage Finance (continued) | | | | | |
| Flagstar Bancorp, Inc. | | | 61,300 | | | $ | 1,799 | |
| Total | | | | | | | 3,445 | |
Total Common Stocks
(cost $77,499,646) | | | | | | | 75,308 | |
| | | | | | | | | |
| | | Principal
Amount
(000) | | | | | |
| | | | | | | | |
| SHORT-TERM INVESTMENT 0.43% | | | | | | | | |
| | | | | | | | | |
| Repurchase Agreement | | | | | | | | |
Repurchase Agreement dated 10/30/2020, 0.00% due 11/2/2020 with Fixed Income Clearing Corp. collateralized by $327,200 of U.S. Treasury Note at 0.25% due 6/15/2023; value: $328,081; proceeds: $321,581
(cost $321,581) | | | $322 | | | | 322 | |
Total Investments in Securities 100.09%
(cost $77,821,227) | | | | | | | 75,630 | |
| Liabilities in Excess of Other Assets (0.09)% | | | | | | | (66 | ) |
| Net Assets 100.00% | | | | | | $ | 75,564 | |
| CAD | | Canadian dollar. |
| * | | Non-income producing security. |
| (a) | | Foreign security traded in U.S. dollars. |
| (b) | | Investment in non-U.S. dollar denominated securities. |
The following is a summary of the inputs used as of October 31, 2020 in valuing the Fund’s investments carried at fair value(1):
| Investment Type(2) | | Level 1
(000) | | | Level 2
(000) | | | Level 3
(000) | | | Total
(000) | |
| Common Stocks | | $ | 75,308 | | | $ | – | | | $ | – | | | $ | 75,308 | |
| Short-Term Investment | | | | | | | | | | | | | | | | |
| Repurchase Agreement | | | – | | | | 322 | | | | – | | | | 322 | |
| Total | | $ | 75,308 | | | $ | 322 | | | $ | – | | | $ | 75,630 | |
| (1) | | Refer to Note 2(l) for a description of fair value measurements and the three-tier hierarchy of inputs. |
| (2) | | See Schedule of Investments for fair values in each industry and identification of foreign issuers and/or geography. |
A reconciliation of Level 3 investments is presented when the Fund has a material amount of Level 3 investments at the beginning or end of the year in relation to the Fund’s net assets.
| 86 | See Notes to Financial Statements. |
Schedule of Investments
FUNDAMENTAL EQUITY FUND October 31, 2020
| Investments | | Shares | | | Fair
Value
(000) | |
| COMMON STOCKS 99.35% | | | | | | | | |
| | | | | | | | | |
| Aerospace & Defense 1.65% | | | | | | | | |
| General Dynamics Corp. | | | 203,892 | | | $ | 26,777 | |
| | | | | | | | | |
| Auto Components 1.35% | | | | | | | | |
| Lear Corp. | | | 181,549 | | | | 21,933 | |
| | | | | | | | | |
| Automobiles 0.99% | | | | | | | | |
| General Motors Co. | | | 464,280 | | | | 16,032 | |
| | | | | | | | | |
| Banks 7.72% | | | | | | | | |
| Citigroup, Inc. | | | 295,834 | | | | 12,253 | |
| East West Bancorp, Inc. | | | 664,743 | | | | 24,250 | |
| JPMorgan Chase & Co. | | | 581,363 | | | | 56,997 | |
| U.S. Bancorp | | | 807,905 | | | | 31,468 | |
| Total | | | | | | | 124,968 | |
| | | | | | | | | |
| Beverages 1.51% | | | | | | | | |
| PepsiCo, Inc. | | | 183,786 | | | | 24,497 | |
| | | | | | | | | |
| Building Products 1.76% | | | | | | | | |
| Masco Corp. | | | 533,030 | | | | 28,570 | |
| | | | | | | | | |
| Capital Markets 4.43% | | | | | | | | |
| Ameriprise Financial, Inc. | | | 149,936 | | | | 24,114 | |
| Blackstone Group, Inc. (The) Class A | | | 387,140 | | | | 19,520 | |
| Morgan Stanley | | | 582,036 | | | | 28,025 | |
| Total | | | | | | | 71,659 | |
| | | | | | | | | |
| Chemicals 4.60% | | | | | | | | |
| Corteva, Inc. | | | 732,920 | | | | 24,172 | |
| Dow, Inc. | | | 461,220 | | | | 20,981 | |
| PPG Industries, Inc. | | | 226,759 | | | | 29,415 | |
| Total | | | | | | | 74,568 | |
| | | | | | | | | |
| Consumer Finance 1.61% | | | | | | | | |
| American Express Co. | | | 286,060 | | | | 26,100 | |
| | | | | | | | | |
| Diversified Telecommunication Services 2.16% |
| Verizon Communications, Inc. | | | 614,850 | | | | 35,040 | |
| | | | | | | | | |
| Investments | | Shares | | | Fair
Value
(000) | |
| Electric: Utilities 5.13% | | | | | | | | |
| Duke Energy Corp. | | | 288,522 | | | $ | 26,575 | |
| Edison International | | | 428,048 | | | | 23,988 | |
| FirstEnergy Corp. | | | 389,170 | | | | 11,566 | |
| NextEra Energy, Inc. | | | 286,474 | | | | 20,973 | |
| Total | | | | | | | 83,102 | |
| | | | | | | | | |
| Electrical Equipment 1.66% | | | | | | | | |
| Hubbell, Inc. | | | 184,956 | | | | 26,913 | |
| | | | | | | | | |
| Electronic Equipment, Instruments & Components 0.84% |
| Avnet, Inc. | | | 552,209 | | | | 13,623 | |
| | | | | | | | | |
| Equity Real Estate Investment Trusts 3.36% | | | | | | | | |
| Alexandria Real Estate Equities, Inc. | | | 124,735 | | | | 18,900 | |
| Highwoods Properties, Inc. | | | 229,094 | | | | 6,820 | |
| Host Hotels & Resorts, Inc. | | | 766,209 | | | | 8,030 | |
| Prologis, Inc. | | | 208,767 | | | | 20,710 | |
| Total | | | | | | | 54,460 | |
| | | | | | | | | |
| Health Care Equipment & Supplies 3.66% | | | | | | | | |
| Alcon, Inc. (Switzerland)*(a) | | | 417,152 | | | | 23,711 | |
| Medtronic plc (Ireland)(a) | | | 352,779 | | | | 35,479 | |
| Total | | | | | | | 59,190 | |
| | | | | | | | | |
| Health Care Providers & Services 3.55% | | | | | | | | |
| Anthem, Inc. | | | 59,386 | | | | 16,201 | |
| CVS Health Corp. | | | 493,076 | | | | 27,657 | |
| McKesson Corp. | | | 92,633 | | | | 13,662 | |
| Total | | | | | | | 57,520 | |
| | | | | | | | | |
| Hotels, Restaurants & Leisure 1.64% | | | | | | | | |
| Choice Hotels International, Inc. | | | 134,282 | | | | 11,730 | |
| Domino’s Pizza, Inc. | | | 39,000 | | | | 14,754 | |
| Total | | | | | | | 26,484 | |
| | | | | | | | | |
| Household Products 3.40% | | | | | | | | |
| Colgate-Palmolive Co. | | | 434,100 | | | | 34,246 | |
| Procter & Gamble Co. (The) | | | 151,963 | | | | 20,834 | |
| Total | | | | | | | 55,080 | |
| | See Notes to Financial Statements. | 87 |
Schedule of Investments (continued)
FUNDAMENTAL EQUITY FUND October 31, 2020
| Investments | | Shares | | | Fair
Value
(000) | |
| Industrial Conglomerates 2.52% | | | | | | | | |
| Honeywell International, Inc. 247,514 | | | | | | $ | 40,827 | |
| | | | | | | | | |
| Information Technology Services 1.16% | | | | | | | | |
| Mastercard, Inc. Class A | | | 65,010 | | | | 18,764 | |
| | | | | | | | | |
| Insurance 5.09% | | | | | | | | |
| | | | | | | | | |
| American International Group, Inc. | | | 585,252 | | | | 18,430 | |
| Everest Re Group Ltd. | | | 122,555 | | | | 24,153 | |
| Fidelity National Financial, Inc. | | | 751,970 | | | | 23,529 | |
| Globe Life, Inc. | | | 200,780 | | | | 16,281 | |
| Total | | | | | | | 82,393 | |
| | | | | | | | | |
| Interactive Media & Services 3.84% | | | | | | | | |
| Alphabet, Inc. Class A* | | | 24,800 | | | | 40,080 | |
| Facebook, Inc. Class A* | | | 83,920 | | | | 22,080 | |
| Total | | | | | | | 62,160 | |
| | | | | | | | | |
| Internet & Direct Marketing Retail 1.04% | | | | | | | | |
| eBay, Inc. | | | 353,950 | | | | 16,859 | |
| | | | | | | | | |
| Life Sciences Tools & Services 1.61% | | | | | | | | |
| Waters Corp.* | | | 116,739 | | | | 26,012 | |
| | | | | | | | | |
| Machinery 3.36% | | | | | | | | |
| Cummins, Inc. | | | 138,362 | | | | 30,424 | |
| Westinghouse Air Brake Technologies Corp. | | | 403,407 | | | | 23,922 | |
| Total | | | | | | | 54,346 | |
| | | | | | | | | |
| Media 3.54% | | | | | | | | |
| Comcast Corp. Class A | | | 672,022 | | | | 28,386 | |
| Fox Corp. Class A | | | 726,720 | | | | 19,273 | |
| Nexstar Media Group, Inc. Class A | | | 117,040 | | | | 9,644 | |
| Total | | | | | | | 57,303 | |
| | | | | | | | | |
| Multi-Utilities 1.28% | | | | | | | | |
| CMS Energy Corp. | | | 326,270 | | | | 20,663 | |
| Investments | | Shares | | | Fair
Value
(000) | |
| Oil, Gas & Consumable Fuels 3.85% | | | | | | | | |
| Cabot Oil & Gas Corp. | | | 885,850 | | | $ | 15,759 | |
| Chevron Corp. | | | 253,220 | | | | 17,599 | |
| Marathon Petroleum Corp. | | | 347,073 | | | | 10,239 | |
| ONEOK, Inc. | | | 244,042 | | | | 7,077 | |
| Total SE ADR | | | 384,220 | | | | 11,653 | |
| Total | | | | | | | 62,327 | |
| | | | | | | | | |
| Personal Products 1.44% | | | | | | | | |
| Unilever plc(b) GBP | | | 409,930 | | | | 23,361 | |
| | | | | | | | | |
| Pharmaceuticals 5.68% | | | | | | | | |
| Bristol-Myers Squibb Co. | | | 546,116 | | | | 31,921 | |
| Johnson & Johnson | | | 140,117 | | | | 19,211 | |
| Merck & Co., Inc. | | | 261,099 | | | | 19,637 | |
| Sanofi(b) EUR | | | 235,610 | | | | 21,274 | |
| Total | | | | | | | 92,043 | |
| | | | | | | | | |
| Road & Rail 1.51% | | | | | | | | |
| Landstar System, Inc. | | | 196,206 | | | | 24,467 | |
| | | | | | | | | |
| Semiconductors & Semiconductor Equipment 4.36% |
| Intel Corp. | | | 468,618 | | | | 20,751 | |
| QUALCOMM, Inc. | | | 147,408 | | | | 18,184 | |
| Texas Instruments, Inc. | | | 218,537 | | | | 31,598 | |
| Total | | | | | | | 70,533 | |
| | | | | | | | | |
| Software 2.91% | | | | | | | | |
| Microsoft Corp. | | | 121,240 | | | | 24,548 | |
| Oracle Corp. | | | 402,520 | | | | 22,585 | |
| Total | | | | | | | 47,133 | |
| | | | | | | | | |
| Specialty Retail 2.53% | | | | | | | | |
| Lowe’s Cos., Inc. | | | 183,210 | | | | 28,966 | |
| TJX Cos., Inc. (The) | | | 237,366 | | | | 12,058 | |
| Total | | | | | | | 41,024 | |
| 88 | See Notes to Financial Statements. |
Schedule of Investments (concluded)
FUNDAMENTAL EQUITY FUND October 31, 2020
| Investments | | Shares | | | Fair
Value
(000) | |
| Technology Hardware, Storage & Peripherals 1.60% |
| Apple, Inc. | | | 237,270 | | | $ | 25,829 | |
| | | | | | | | | |
| Tobacco 1.01% | | | | | | | | |
| Philip Morris International, Inc. | | | 230,002 | | | | 16,335 | |
Total Common Stocks
(cost $1,442,358,670) | | | | | | | 1,608,895 | |
| | | | | | | | | |
| Investments | | Principal
Amount
(000) | | | Fair
Value
(000) | |
| SHORT-TERM INVESTMENT 0.53% | | | | | | | | |
| | | | | | | | | |
Repurchase Agreement
Repurchase Agreement dated 10/30/2020, 0.00% due 11/2/2020 with Fixed Income Clearing Corp. collateralized by $8,394,800 of U.S. Treasury Note at 1.625% due 4/30/2023; value: $8,767,276; proceeds: $8,595,319
(cost $8,595,319) | | | $8,595 | | | $ | 8,595 | |
Total Investments in Securities 99.88%
(cost $1,450,953,989) | | | | | | | 1,617,490 | |
| Cash and Other Assets in Excess of Liabilities 0.12% | | | | | | | 1,988 | |
| Net Assets 100.00% | | | | | | $ | 1,619,478 | |
| ADR | | American Depositary Receipt. |
| EUR | | Euro. |
| GBP | | British pound. |
| * | | Non-income producing security. |
| (a) | | Foreign security traded in U.S. dollars. |
| (b) | | Investment in non-U.S. dollar denominated securities. |
The following is a summary of the inputs used as of October 31, 2020 in valuing the Fund’s investments carried at fair value(1):
| Investment Type(2) | | Level 1
(000) | | | Level 2
(000) | | | Level 3
(000) | | | Total
(000) | |
| Common Stocks | | | | | | | | | | | | | | | | |
| Personal Products | | $ | – | | | $ | 23,361 | | | $ | – | | | $ | 23,361 | |
| Pharmaceuticals | | | 70,769 | | | | 21,274 | | | | – | | | | 92,043 | |
| Remaining Industries | | | 1,493,491 | | | | – | | | | – | | | | 1,493,491 | |
| Short-Term Investment | | | | | | | | | | | | | | | | |
| Repurchase Agreement | | | – | | | | 8,595 | | | | – | | | | 8,595 | |
| Total | | $ | 1,564,260 | | | $ | 53,230 | | | $ | – | | | $ | 1,617,490 | |
| (1) | | Refer to Note 2(l) for a description of fair value measurements and the three-tier hierarchy of inputs. |
| (2) | | See Schedule of Investments for fair values in each industry and identification of foreign issuers and/or geography. The table above is presented by Investment Type. Industries are presented within an Investment Type should such Investment Type include securities classified as two or more levels within the three-tier fair value hierarchy. |
A reconciliation of Level 3 investments is presented when the Fund has a material amount of Level 3 investments at the beginning or end of the year in relation to the Fund’s net assets.
| | See Notes to Financial Statements. | 89 |
Schedule of Investments
GLOBAL EQUITY RESEARCH FUND October 31, 2020
| Investments | | Shares | | | U.S. $
Fair Value
(000) | |
| COMMON STOCKS 98.70% | | | | | | | | |
| | | | | | | | | |
| Australia 1.21% | | | | | | | | |
| | | | | | | | | |
| Equity Real Estate Investment Trusts | | | | | | | | |
| Goodman Group | | | 6,473 | | | $ | 84 | |
| | | | | | | | | |
| Brazil 1.13% | | | | | | | | |
| | | | | | | | | |
| Metals & Mining | | | | | | | | |
| Vale SA | | | 7,387 | | | | 78 | |
| | | | | | | | | |
| Canada 3.41% | | | | | | | | |
| | | | | | | | | |
| Aerospace & Defense 0.68% | | | | | | | | |
| CAE, Inc. | | | 2,742 | | | | 47 | |
| | | | | | | | | |
| Information Technology Services 1.11% | | | | | | |
| Shopify, Inc. * | | | 84 | | | | 77 | |
| | | | | | | | | |
| Insurance 1.03% | | | | | | | | |
| Intact Financial Corp. | | | 683 | | | | 71 | |
| | | | | | | | | |
| Oil, Gas & Consumable Fuels 0.59% | | | | | | | | |
| Pembina Pipeline Corp. | | | 1,970 | | | | 41 | |
| Total Canada | | | | | | | 236 | |
| | | | | | | | | |
| Chile 0.66% | | | | | | | | |
| | | | | | | | | |
| Metals & Mining | | | | | | | | |
| Lundin Mining Corp. | | | 7,593 | | | | 46 | |
| | | | | | | | | |
| China 7.48% | | | | | | | | |
| | | | | | | | | |
| Construction Materials 1.11% | | | | | | | | |
| China Resources Cement Holdings Ltd. | | | 58,586 | | | | 77 | |
| | | | | | | | | |
| Gas Utilities 1.20% | | | | | | | | |
| ENN Energy Holdings Ltd. | | | 6,603 | | | | 83 | |
| | | | | | | | | |
| Interactive Media & Services 1.91% | | | | | | | | |
| Tencent Holdings Ltd. | | | 1,724 | | | | 132 | |
| | | | | | | | | |
| Internet & Direct Marketing Retail 2.31% | | | | | | | |
| Alibaba Group Holding Ltd. ADR* | | | 525 | | | | 160 | |
| Investments | | Shares | | | U.S. $
Fair Value
(000) | |
| China (continued) | | | | | | | | |
| | | | | | | | | |
| Textiles, Apparel & Luxury Goods 0.95% | | | | | | | |
| ANTA Sports Products Ltd. | | | 5,909 | | | $ | 66 | |
| Total China | | | | | | | 518 | |
| | | | | | | | | |
| Denmark 2.50% | | | | | | | | |
| | | | | | | | | |
| Beverages 1.11% | | | | | | | | |
| Carlsberg A/S Class B | | | 609 | | | | 77 | |
| | | | | | | | | |
| Pharmaceuticals 1.39% | | | | | | | | |
| Novo Nordisk A/S Class B | | | 1,508 | | | | 96 | |
| Total Denmark | | | | | | | 173 | |
| | | | | | | | | |
| France 3.89% | | | | | | | | |
| | | | | | | | | |
| Insurance 0.87% | | | | | | | | |
| AXA SA | | | 3,710 | | | | 60 | |
| | | | | | | | | |
| Multi-Utilities 1.03% | | | | | | | | |
| Engie SA * | | | 5,876 | | | | 71 | |
| | | | | | | | | |
| Personal Products 1.11% | | | | | | | | |
| L’Oreal SA | | | 240 | | | | 77 | |
| | | | | | | | | |
| Textiles, Apparel & Luxury Goods 0.88% | | | | | | | |
| LVMH Moet Hennessy Louis Vuitton SE | | | 130 | | | | 61 | |
| Total France | | | | | | | 269 | |
| | | | | | | | | |
| Germany 1.04% | | | | | | | | |
| | | | | | | | | |
| Semiconductors & Semiconductor Equipment | | | | | |
| Infineon Technologies AG | | | 2,604 | | | | 72 | |
| | | | | | | | | |
| Hong Kong 0.69% | | | | | | | | |
| | | | | | | | | |
| Real Estate Management & Development | | | | | |
| Kerry Properties Ltd. | | | 19,415 | | | | 48 | |
| | | | | | | | | |
| India 0.84% | | | | | | | | |
| | | | | | | | | |
| Banks | | | | | | | | |
| ICICI Bank Ltd. ADR * | | | 5,469 | | | | 58 | |
| 90 | See Notes to Financial Statements. |
Schedule of Investments (continued)
GLOBAL EQUITY RESEARCH FUND October 31, 2020
| Investments | | Shares | | | U.S. $
Fair Value
(000) | |
| Japan 5.22% | | | | | | | | |
| | | | | | | | | |
| Building Products 1.89% | | | | | | | | |
| Sanwa Holdings Corp. | | | 11,469 | | | $ | 131 | |
| | | | | | | | | |
| Electronic Equipment, Instruments & Components 3.33% | |
| Azbil Corp. | | | 2,494 | | | | 101 | |
| Keyence Corp. | | | 130 | | | | 59 | |
| TDK Corp. | | | 594 | | | | 70 | |
| | | | | | | | 230 | |
| Total Japan | | | | | | | 361 | |
| | | | | | | | | |
| Mexico 1.11% | | | | | | | | |
| | | | | | | | | |
| Banks | | | | | | | | |
| Grupo Financiero Banorte SAB de CV * | | | 17,268 | | | | 77 | |
| | | | | | | | | |
| Norway 0.75% | | | | | | | | |
| | | | | | | | | |
| Oil, Gas & Consumable Fuels | | | | | | | | |
| Equinor ASA | | | 4,044 | | | | 52 | |
| | | | | | | | | |
| South Korea 2.11% | | | | | | | | |
| | | | | | | | | |
| Technology Hardware, Storage & Peripherals | | | | |
| Samsung Electronics Co., Ltd. | | | 2,902 | | | | 146 | |
| | | | | | | | | |
| Sweden 2.15% | | | | | | | | |
| | | | | | | | | |
| Machinery | | | | | | | | |
| Alfa Laval AB * | | | 3,247 | | | | 66 | |
| Sandvik AB * | | | 4,645 | | | | 83 | |
| Total Sweden | | | | | | | 149 | |
| | | | | | | | | |
| Switzerland 2.63% | | | | | | | | |
| | | | | | | | | |
| Capital Markets 1.40% | | | | | | | | |
| UBS Group AG | | | 8,357 | | | | 97 | |
| | | | | | | | | |
| Life Sciences Tools & Services 1.23% | | | | |
| Lonza Group AG | | | 140 | | | | 85 | |
| Total Switzerland | | | | | | | 182 | |
| Investments | | Shares | | | U.S. $
Fair Value
(000) | |
| Taiwan 1.44% | | | | | | | | |
| | | | | | | | | |
| Semiconductors & Semiconductor Equipment | | | | | |
| Taiwan Semiconductor Manufacturing Co., Ltd. | | | 6,638 | | | $ | 100 | |
| | | | | | | | | |
| United Kingdom 3.33% | | | | | | | | |
| | | | | | | | | |
| Capital Markets 1.23% | | | | | | | | |
| London Stock Exchange Group plc | | | 791 | | | | 85 | |
| | | | | | | | | |
| Insurance 0.59% | | | | | | | | |
| Prudential plc | | | 3,354 | | | | 41 | |
| | | | | | | | | |
| Personal Products 1.08% | | | | | | | | |
| Unilever NV | | | 1,327 | | | | 75 | |
| | | | | | | | | |
| Specialty Retail 0.43% | | | | | | | | |
| WH Smith plc | | | 2,279 | | | | 29 | |
| Total United Kingdom | | | | | | | 230 | |
| | | | | | | | | |
| United States 57.11% | | | | | | | | |
| | | | | | | | | |
| Auto Components 1.74% | | | | | | | | |
| Lear Corp. | | | 997 | | | | 120 | |
| | | | | | | | | |
| Automobiles 0.87% | | | | | | | | |
| General Motors Co. | | | 1,724 | | | | 60 | |
| | | | | | | | | |
| Banks 1.13% | | | | | | | | |
| Bancorp, Inc. (The) * | | | 8,152 | | | | 78 | |
| | | | | | | | | |
| Beverages 1.30% | | | | | | | | |
| Coca-Cola Co. (The) | | | 1,871 | | | | 90 | |
| | | | | | | | | |
| Biotechnology 1.10% | | | | | | | | |
| Vertex Pharmaceuticals, Inc. * | | | 364 | | | | 76 | |
| | | | | | | | | |
| Building Products 1.17% | | | | | | | | |
| Masco Corp. | | | 1,519 | | | | 81 | |
| | | | | | | | | |
| Capital Markets 0.98% | | | | | | | | |
| BlackRock, Inc. | | | 114 | | | | 68 | |
| | See Notes to Financial Statements. | 91 |
Schedule of Investments (continued)
GLOBAL EQUITY RESEARCH FUND October 31, 2020
| Investments | | Shares | | | U.S. $
Fair Value
(000) | |
| United States (continued) | | | | | | | | |
| | | | | | | | | |
| Chemicals 2.18% | | | | | | | | |
| Axalta Coating Systems Ltd. * | | | 3,340 | | | $ | 84 | |
| Valvoline, Inc. | | | 3,426 | | | | 67 | |
| | | | | | | | 151 | |
| | | | | | | | | |
| Consumer Finance 2.31% | | | | | | | | |
| Ally Financial, Inc. | | | 2,080 | | | | 55 | |
| Discover Financial Services | | | 1,613 | | | | 105 | |
| | | | | | | | 160 | |
| | | | | | | | | |
| Electrical Equipment 1.20% | | | | | | | | |
| AMETEK, Inc. | | | 845 | | | | 83 | |
| | | | | | | | | |
| Entertainment 2.08% | | | | | | | | |
| Activision Blizzard, Inc. | | | 966 | | | | 73 | |
| Netflix, Inc. * | | | 148 | | | | 71 | |
| �� | | | | | | | 144 | |
| | | | | | | | | |
| Equity Real Estate Investment Trusts 0.94% | | | | | | | | |
| Alexandria Real Estate Equities, Inc. | | | 431 | | | | 65 | |
| | | | | | | | | |
| Food & Staples Retailing 2.21% | | | | | | | | |
| Walmart, Inc. | | | 1,103 | | | | 153 | |
| | | | | | | | | |
| Health Care Equipment & Supplies 0.54% | | | | | | | | |
| DexCom, Inc. * | | | 117 | | | | 37 | |
| | | | | | | | | |
| Health Care Providers & Services 2.35% | | | | | | | | |
| CVS Health Corp. | | | 1,619 | | | | 91 | |
| UnitedHealth Group, Inc. | | | 236 | | | | 72 | |
| | | | | | | | 163 | |
| | | | | | | | | |
| Household Products 0.92% | | | | | | | | |
| Colgate-Palmolive Co. | | | 817 | | | | 64 | |
| | | | | | | | | |
| Information Technology Services 2.44% | | | | | | | | |
| Mastercard, Inc. Class A | | | 340 | | | | 98 | |
| PayPal Holdings, Inc. * | | | 379 | | | | 71 | |
| | | | | | | | 169 | |
| | | | | | | | | |
| Interactive Media & Services 5.45% | | | | | | | | |
| Alphabet, Inc. Class A * | | | 105 | | | | 170 | |
| Investments | | Shares | | | U.S. $
Fair Value
(000) | |
| United States (continued) | | | | | | | | |
| Facebook, Inc. Class A * | | | 480 | | | $ | 126 | |
| Snap, Inc. Class A * | | | 2,064 | | | | 81 | |
| | | | | | | | 377 | |
| | | | | | | | | |
| Internet & Direct Marketing Retail 3.55% | | | | | | | |
| Amazon.com, Inc. * | | | 81 | | | | 246 | |
| | | | | | | | | |
| Leisure Products 0.79% | | | | | | | | |
| Peloton Interactive, Inc. Class A * | | | 496 | | | | 55 | |
| | | | | | | | | |
| Life Sciences Tools & Services 1.26% | | | | | | | |
| Repligen Corp. * | | | 523 | | | | 87 | |
| | | | | | | | | |
| Machinery 2.44% | | | | | | | | |
| Hillenbrand, Inc. | | | 2,968 | | | | 87 | |
| Stanley Black & Decker, Inc. | | | 492 | | | | 82 | |
| | | | | | | | 169 | |
| | | | | | | | | |
| Multi-Line Retail 1.42% | | | | | | | | |
| Dollar Tree, Inc. * | | | 1,082 | | | | 98 | |
| | | | | | | | | |
| Oil, Gas & Consumable Fuels 0.81% | | | | | | | | |
| Pioneer Natural Resources Co. | | | 706 | | | | 56 | |
| | | | | | | | | |
| Pharmaceuticals 3.93% | | | | | | | | |
| Horizon Therapeutics plc * | | | 781 | | | | 59 | |
| Merck & Co., Inc. | | | 1,271 | | | | 96 | |
| Zoetis, Inc. | | | 741 | | | | 117 | |
| | | | | | | | 272 | |
| | | | | | | | | |
| Road & Rail 1.70% | | | | | | | | |
| Norfolk Southern Corp. | | | 565 | | | | 118 | |
| | | | | | | | | |
| Semiconductors & Semiconductor Equipment 1.99% | | | |
| NVIDIA Corp. | | | 276 | | | | 138 | |
| | | | | | | | | |
| Software 7.53% | | | | | | | | |
| Microsoft Corp. | | | 1,089 | | | | 221 | |
| RingCentral, Inc. Class A * | | | 248 | | | | 64 | |
| salesforce.com, Inc. * | | | 385 | | | | 89 | |
| Splunk, Inc. * | | | 311 | | | | 62 | |
| Trade Desk, Inc. (The) Class A * | | | 150 | | | | 85 | |
| | | | | | | | 521 | |
| 92 | See Notes to Financial Statements. |
Schedule of Investments (concluded)
GLOBAL EQUITY RESEARCH FUND October 31, 2020
| Investments | | Shares | | | U.S. $
Fair Value
(000) | |
| United States (continued) | | | | | | | | |
| | | | | | | | | |
| Specialty Retail 0.78% | | | | | | | | |
| TJX Cos., Inc. (The) | | | 1,054 | | | $ | 54 | |
| Total United States | | | | | | | 3,953 | |
| Total investments in Common Stocks 98.70% (cost $6,008,665) | | | | | | | 6,832 | |
| Cash, Foreign Cash and Other Assets in Excess of Liabilities 1.30% | | | | | | | 90 | |
| Net Assets 100.00% | | | | | | $ | 6,922 | |
| | | |
| ADR | | American Depositary Receipt. |
| * | | Non-income producing security. |
The following is a summary of the inputs used as of October 31, 2020 in valuing the Fund’s investments carried at fair value(1):
| Investment Type(2) | | Level 1
(000) | | | Level 2
(000) | | | Level 3
(000) | | | Total
(000) | |
| Common Stocks | | | | | | | | | | | | | | | | |
| Australia | | $ | – | | | $ | 84 | | | $ | – | | | $ | 84 | |
| China | | | 160 | | | | 358 | | | | – | | | | 518 | |
| Denmark | | | – | | | | 173 | | | | – | | | | 173 | |
| France | | | – | | | | 269 | | | | – | | | | 269 | |
| Germany | | | – | | | | 72 | | | | – | | | | 72 | |
| Hong Kong | | | – | | | | 48 | | | | – | | | | 48 | |
| Japan | | | – | | | | 361 | | | | – | | | | 361 | |
| Norway | | | – | | | | 52 | | | | – | | | | 52 | |
| South Korea | | | – | | | | 146 | | | | – | | | | 146 | |
| Sweden | | | – | | | | 149 | | | | – | | | | 149 | |
| Switzerland | | | – | | | | 182 | | | | – | | | | 182 | |
| Taiwan | | | – | | | | 100 | | | | – | | | | 100 | |
| United Kingdom | | | – | | | | 230 | | | | – | | | | 230 | |
| Remaining Countries | | | 4,448 | | | | – | | | | – | | | | 4,448 | |
| Total | | $ | 4,608 | | | $ | 2,224 | | | $ | – | | | $ | 6,832 | |
| | | |
| (1) | | Refer to Note 2(l) for a description of fair value measurements and the three-tier hierarchy of inputs. |
| (2) | | See Schedule of Investments for fair values in each industry and identification of foreign issuers and/or geography. The table above is presented by Investment Type. Industries are presented within an Investment Type should such Investment Type include securities classified as two or more levels within the three-tier fair value hierarchy. |
A reconciliation of Level 3 investments is presented when the Fund has a material amount of Level 3 investments at the beginning or end of the year in relation to the Fund’s net assets.
| | See Notes to Financial Statements. | 93 |
Schedule of Investments
GROWTH LEADERS FUND October 31, 2020
| Investments | | Shares | | | Fair
Value
(000) | |
| COMMON STOCKS 98.04% | | | | | | |
| | | | | | | |
| Aerospace & Defense 0.87% | | | | | | |
| Axon Enterprise, Inc.* | | | 609,571 | | | $ | 60,287 | |
| | | | | | | | | |
| Automobiles 2.13% | | | | | | | | |
| Tesla, Inc.* | | | 381,504 | | | | 148,039 | |
| | | | | | | | | |
| Biotechnology 6.39% | | | | | | | | |
| Arena Pharmaceuticals, Inc.* | | | 925,611 | | | | 79,343 | |
| Argenx SE ADR* | | | 200,431 | | | | 49,733 | |
| Iovance Biotherapeutics, Inc.* | | | 1,548,507 | | | | 55,251 | |
| Mirati Therapeutics, Inc.* | | | 158,565 | | | | 34,431 | |
| Sarepta Therapeutics, Inc.* | | | 245,289 | | | | 33,337 | |
| Seagen, Inc.* | | | 307,553 | | | | 51,300 | |
| TG Therapeutics, Inc.* | | | 1,956,758 | | | | 49,447 | |
| Turning Point Therapeutics, Inc.* | | | 606,563 | | | | 55,919 | |
| Vertex Pharmaceuticals, Inc.* | | | 171,984 | | | | 35,835 | |
| Total | | | | | | | 444,596 | |
| | | | | | | | | |
| Capital Markets 1.61% | | | | | | | | |
| MarketAxess Holdings, Inc. | | | 111,261 | | | | 59,953 | |
| MSCI, Inc. | | | 148,097 | | | | 51,810 | |
| Total | | | | | | | 111,763 | |
| | | | | | | | | |
| Diversified Consumer Services 1.06% | | | | | | | | |
| Chegg, Inc.* | | | 1,002,598 | | | | 73,631 | |
| | | | | | | | | |
| Electrical Equipment 1.68% | | | | | | | | |
| AMETEK, Inc. | | | 458,956 | | | | 45,070 | |
| Generac Holdings, Inc.* | | | 340,091 | | | | 71,470 | |
| Total | | | | | | | 116,540 | |
| | | | | | | | | |
| Electronic Equipment, Instruments & Components 1.83% |
| Amphenol Corp. Class A | | | 632,573 | | | | 71,379 | |
| Cognex Corp. | | | 848,525 | | | | 55,918 | |
| Total | | | | | | | 127,297 | |
| | | | | | | | | |
| Entertainment 5.42% | | | | | | | | |
| Activision Blizzard, Inc. | | | 933,104 | | | | 70,664 | |
| Netflix, Inc.* | | | 200,707 | | | | 95,485 | |
| Investments | | Shares | | | Fair
Value
(000) | |
| Entertainment (continued) | | | | | | | | |
| Roku, Inc.* | | | 791,334 | | | $ | 160,166 | |
| Spotify Technology SA (Sweden)*(a) | | | 210,135 | | | | 50,409 | |
| Total | | | | | | | 376,724 | |
| | | | | | | | | |
| Health Care Equipment & Supplies 5.33% | | | | | | | | |
| Align Technology, Inc.* | | | 107,124 | | | | 45,643 | |
| Danaher Corp. | | | 272,796 | | | | 62,617 | |
| DexCom, Inc.* | | | 196,069 | | | | 62,660 | |
| IDEXX Laboratories, Inc.* | | | 168,560 | | | | 71,608 | |
| Insulet Corp.* | | | 160,404 | | | | 35,650 | |
| Intuitive Surgical, Inc.* | | | 50,088 | | | | 33,413 | |
| Nevro Corp.* | | | 395,049 | | | | 58,945 | |
| Total | | | | | | | 370,536 | |
| | | | | | | | | |
| Health Care Technology 0.25% | | | | | | | | |
| GoodRx Holdings, Inc.* | | | 355,297 | | | | 17,193 | |
| | | | | | | | | |
| Hotels, Restaurants & Leisure 1.43% | | | | | | | | |
| Chipotle Mexican Grill, Inc.* | | | 37,241 | | | | 44,744 | |
| DraftKings, Inc. Class A* | | | 1,548,011 | | | | 54,800 | |
| Total | | | | | | | 99,544 | |
| | | | | | | | | |
| Industrial Conglomerates 0.56% | | | | | | | | |
| Roper Technologies, Inc. | | | 104,786 | | | | 38,911 | |
| | | | | | | | | |
| Information Technology Services 6.50% | | | | | | | | |
| EPAM Systems, Inc.* | | | 151,603 | | | | 46,838 | |
| Mastercard, Inc. Class A | | | 374,122 | | | | 107,986 | |
| PayPal Holdings, Inc.* | | | 495,571 | | | | 92,241 | |
| Shopify, Inc. Class A (Canada)*(a) | | | 83,975 | | | | 77,713 | |
| Snowflake, Inc. Class A* | | | 21,005 | | | | 5,252 | |
| Square, Inc. Class A* | | | 789,307 | | | | 122,248 | |
| Total | | | | | | | 452,278 | |
| | | | | | | | | |
| Interactive Media & Services 9.46% | | | | | | | | |
| Alphabet, Inc. Class A* | | | 127,558 | | | | 206,148 | |
| Facebook, Inc. Class A* | | | 564,362 | | | | 148,489 | |
| Match Group, Inc.* | | | 807,813 | | | | 94,336 | |
| Pinterest, Inc. Class A* | | | 2,208,628 | | | | 130,199 | |
| Snap, Inc. Class A* | | | 1,992,000 | | | | 78,465 | |
| Total | | | | | | | 657,637 | |
| 94 | See Notes to Financial Statements. |
Schedule of Investments (continued)
GROWTH LEADERS FUND October 31, 2020
| Investments | | Shares | | | Fair
Value
(000) | |
| Internet & Direct Marketing Retail 10.44% | | | | | |
| Alibaba Group Holding Ltd. ADR* | | | 354,132 | | | $ | 107,900 | |
| Amazon.com, Inc.* | | | 131,188 | | | | 398,306 | |
| Chewy, Inc. Class A*(b) | | | 1,268,292 | | | | 78,127 | |
| MercadoLibre, Inc. (Argentina)*(a) | | | 64,362 | | | | 78,139 | |
| Stamps.com, Inc.* | | | 284,353 | | | | 63,479 | |
| Total | | | | | | | 725,951 | |
| | | | | | | | | |
| Leisure Products 1.39% | | | | | | | | |
| Peloton Interactive, Inc. Class A* | | | 877,410 | | | | 96,699 | |
| | | | | | | | | |
| Life Sciences Tools & Services 1.65% | | | | | | | | |
| 10X Genomics, Inc. Class A* | | | 435,954 | | | | 59,682 | |
| Thermo Fisher Scientific, Inc. | | | 116,330 | | | | 55,038 | |
| Total | | | | | | | 114,720 | |
| | | | | | | | | |
| Pharmaceuticals 0.83% | | | | | | | | |
| Zoetis, Inc. | | | 362,797 | | | | 57,521 | |
| | | | | | | | | |
| Real Estate Management & Development 0.95% |
| Redfin Corp.* | | | 1,580,602 | | | | 66,022 | |
| | | | | | | | | |
| Road & Rail 1.46% | | | | | | | | |
| Old Dominion Freight Line, Inc. | | | 242,359 | | | | 46,138 | |
| Uber Technologies, Inc.* | | | 1,648,356 | | | | 55,071 | |
| Total | | | | | | | 101,209 | |
| | | | | | | | | |
| Semiconductors & Semiconductor Equipment 9.79% |
| Advanced Micro Devices, Inc.* | | | 1,119,205 | | | | 84,265 | |
| Applied Materials, Inc. | | | 706,663 | | | | 41,856 | |
| Enphase Energy, Inc.* | | | 777,266 | | | | 76,242 | |
| Inphi Corp.* | | | 678,505 | | | | 94,828 | |
| Monolithic Power Systems, Inc. | | | 243,615 | | | | 77,859 | |
| NVIDIA Corp. | | | 381,399 | | | | 191,218 | |
| QUALCOMM, Inc. | | | 926,198 | | | | 114,256 | |
| Total | | | | | | | 680,524 | |
| Investments | | Shares | | | Fair
Value
(000) | |
| Software 18.25% | | | | | | | | |
| Adobe, Inc.* | | | 127,846 | | | $ | 57,160 | |
| Avalara, Inc.* | | | 345,077 | | | | 51,434 | |
| Coupa Software, Inc.* | | | 173,235 | | | | 46,375 | |
| Crowdstrike Holdings, Inc. Class A* | | | 798,094 | | | | 98,836 | |
| DocuSign, Inc.* | | | 531,069 | | | | 107,409 | |
| Five9, Inc.* | | | 691,286 | | | | 104,882 | |
| Intuit, Inc. | | | 92,043 | | | | 28,964 | |
| Microsoft Corp. | | | 1,665,857 | | | | 337,286 | |
| Paycom Software, Inc.* | | | 159,555 | | | | 58,092 | |
| RingCentral, Inc. Class A* | | | 280,115 | | | | 72,365 | |
| SVMK, Inc.* | | | 2,830,097 | | | | 59,234 | |
| Trade Desk, Inc. (The) Class A* | | | 176,353 | | | | 99,895 | |
| Zoom Video Communications, Inc. Class A* | | | 318,776 | | | | 146,927 | |
| Total | | | | | | | 1,268,859 | |
| | | | | | | | | |
| Specialty Retail 0.79% | | | | | | | | |
| Carvana Co.* | | | 296,354 | | | | 54,929 | |
| | | | | | | | | |
| Technology Hardware, Storage & Peripherals 6.02% |
| Apple, Inc. | | | 3,846,337 | | | | 418,712 | |
| | | | | | | | | |
| Textiles, Apparel & Luxury Goods 1.95% | | | | | | | | |
| Lululemon Athletica, Inc. (Canada)*(a) | | | 220,117 | | | | 70,281 | |
| NIKE, Inc. Class B | | | 546,134 | | | | 65,580 | |
| Total | | | | | | | 135,861 | |
Total Common Stocks
(cost $4,735,200,678) | | | | | | $ | 6,815,983 | |
| | See Notes to Financial Statements. | 95 |
Schedule of Investments (concluded)
GROWTH LEADERS FUND October 31, 2020
| Investments | | Principal
Amount
(000) | | | Fair
Value
(000) | |
| SHORT-TERM INVESTMENTS 1.74% | | | | | | | | |
| | | | | | | | | |
| Repurchase Agreement | | | | | | | | |
Repurchase Agreement dated 10/30/2020, 0.00% due 11/2/2020 with Fixed Income Clearing Corp. collateralized by $117,392,900 of U.S. Treasury Note at 1.625% due 4/30/2023 value: $122,601,604; proceeds: $120,197,602
(cost $120,197,602) | | $ | 120,198 | | | $ | 120,198 | |
| Investments | | Shares | | | Fair
Value
(000) | |
| Money Market Fund 0.01% | | | | | | | | |
Fidelity Government Portfolio(c)
(cost $535,500) | | | 535,500 | | | $ | 535 | |
| | | | | | | | | |
| Time Deposit 0.00% | | | | | | | | |
CitiBank N.A.(c)
(cost $59,500) | | | 59,500 | | | | 59 | |
Total Short-Term Investments
(cost $120,792,602) | | | | | | | 120,792 | |
Total Investments in Securities 99.78%
(cost $4,855,993,280) | | | | | | | 6,936,775 | |
| Other Assets in Excess of Liabilities 0.22% | | | | | | | 15,012 | |
| Net Assets 100.00% | | | | | | $ | 6,951,787 | |
| ADR | | American Depositary Receipt. |
| * | | Non-income producing security. |
| (a) | | Foreign security traded in U.S. dollars. |
| (b) | | All or a portion of this security is temporarily on loan to unaffiliated broker/dealers. |
| (c) | | Security was purchased with the cash collateral from loaned securities. |
The following is a summary of the inputs used as of October 31, 2020 in valuing the Fund’s investments carried at fair value(1):
| Investment Type(2) | | Level 1
(000) | | | Level 2
(000) | | | Level 3
(000) | | | Total
(000) | |
| Common Stocks | | $ | 6,815,983 | | | $ | – | | | $ | – | | | $ | 6,815,983 | |
| Short-Term Investments | | | | | | | | | | | | | | | | |
| Repurchase Agreement | | | – | | | | 120,198 | | | | – | | | | 120,198 | |
| Money Market Fund | | | 535 | | | | – | | | | – | | | | 535 | |
| Time Deposit | | | – | | | | 59 | | | | – | | | | 59 | |
| Total | | $ | 6,816,518 | | | $ | 120,257 | | | $ | – | | | $ | 6,936,775 | |
| (1) | | Refer to Note 2(l) for a description of fair value measurements and the three-tier hierarchy of inputs. |
| (2) | | See Schedule of Investments for fair values in each industry and identification of foreign issuers and/or geography. |
A reconciliation of Level 3 investments is presented when the Fund has a material amount of Level 3 investments at the beginning or end of the year in relation to the Fund’s net assets.
| 96 | See Notes to Financial Statements. |
Schedule of Investments
HEALTH CARE FUND October 31, 2020
| Investments | | Shares | | | U.S. $
Fair Value
(000) | |
| COMMON STOCKS 95.08% | | | | | | |
| | | | | | | |
| Belgium 1.04% | | | | | | |
| | | | | | | |
| Pharmaceuticals | | | | | | |
| UCB SA | | | 393 | | | $ | 39 | |
| | | | | | | | | |
| Canada 0.86% | | | | | | | | |
| | | | | | | | | |
| Biotechnology | | | | | | | | |
| Trillium Therapeutics, Inc. * | | | 2,592 | | | | 32 | |
| | | | | | | | | |
| China 1.87% | | | | | | | | |
| | | | | | | | | |
| Biotechnology 1.09% | | | | | | | | |
| I-Mab ADR * | | | 543 | | | | 22 | |
| Zai Lab Ltd. ADR * | | | 224 | | | | 19 | |
| | | | | | | | 41 | |
| | | | | | | | | |
| Life Sciences Tools & Services 0.78% | | | | | | | | |
| Wuxi Biologics Cayman, Inc. *† | | | 1,054 | | | | 29 | |
| Total China | | | | | | | 70 | |
| | | | | | | | | |
| Denmark 4.41% | | | | | | | | |
| | | | | | | | | |
| Biotechnology 1.34% | | | | | | | | |
| Genmab A/S * | | | 149 | | | | 50 | |
| | | | | | | | | |
| Pharmaceuticals 3.07% | | | | | | | | |
| Novo Nordisk A/S Class B | | | 1,799 | | | | 115 | |
| Total Denmark | | | | | | | 165 | |
| | | | | | | | | |
| France 2.17% | | | | | | | | |
| | | | | | | | | |
| Life Sciences Tools & Services 1.47% | | | | | | | | |
| Sartorius Stedim Biotech | | | 145 | | | | 55 | |
| | | | | | | | | |
| Pharmaceuticals 0.70% | | | | | | | | |
| Sanofi | | | 284 | | | | 26 | |
| Total France | | | | | | | 81 | |
| | | | | | | | | |
| Germany 0.89% | | | | | | | | |
| | | | | | | | | |
| Biotechnology | | | | | | | | |
| BioNTech SE ADR *(a) | | | 271 | | | | 23 | |
| MorphoSys AG ADR * | | | 405 | | | | 10 | |
| Total Germany | | | | | | | 33 | |
| Investments | | Shares | | | U.S. $
Fair Value
(000) | |
| Japan 0.54% | | | | | | |
| | | | | | | |
| Health Care Technology | | | | | | |
| M3, Inc. | | | 299 | | | $ | 20 | |
| | | | | | | | | |
| Netherlands 0.91% | | | | | | | | |
| | | | | | | | | |
| Biotechnology | | | | | | | | |
| Argenx SE * | | | 137 | | | | 34 | |
| | | | | | | | | |
| Switzerland 5.08% | | | | | | | | |
| | | | | | | | | |
| Biotechnology 0.54% | | | | | | | | |
| CRISPR Therapeutics AG *(a) | | | 219 | | | | 20 | |
| | | | | | | | | |
| Health Care Equipment & Supplies 0.64% | | | | | | | | |
| Alcon, Inc. * | | | 428 | | | | 24 | |
| | | | | | | | | |
| Life Sciences Tools & Services 2.49% | | | | | | | | |
| Lonza Group AG | | | 111 | | | | 68 | |
| Tecan Group AG | | | 53 | | | | 25 | |
| | | | | | | | 93 | |
| | | | | | | | | |
| Pharmaceuticals 1.41% | | | | | | | | |
| Roche Holding AG | | | 164 | | | | 53 | |
| Total Switzerland | | | | | | | 190 | |
| | | | | | | | | |
| United Kingdom 2.78% | | | | | | | | |
| | | | | | | | | |
| Pharmaceuticals | | | | | | | | |
| AstraZeneca plc | | | 874 | | | | 88 | |
| GW Pharmaceuticals plc ADR * | | | 181 | | | | 16 | |
| Total United Kingdom | | | | | | | 104 | |
| | | | | | | | | |
| United States 74.53% | | | | | | | | |
| | | | | | | | | |
| Biotechnology 23.09% | | | | | | | | |
| Acceleron Pharma, Inc. * | | | 217 | | | | 23 | |
| Allogene Therapeutics, Inc. * | | | 473 | | | | 16 | |
| Amgen, Inc. | | | 343 | | | | 74 | |
| Arena Pharmaceuticals, Inc. * | | | 457 | | | | 39 | |
| Black Diamond Therapeutics, Inc. * | | | 516 | | | | 16 | |
| Blueprint Medicines Corp. * | | | 270 | | | | 28 | |
| Bridgebio Pharma, Inc. * | | | 705 | | | | 27 | |
| ChemoCentryx, Inc. * | | | 399 | | | | 19 | |
| | See Notes to Financial Statements. | 97 |
Schedule of Investments (continued)
HEALTH CARE FUND October 31, 2020
| Investments | | Shares | | | U.S. $
Fair Value
(000) | |
| United States (continued) | | | | | | | | |
| | | | | | | | | |
| Biotechnology (continued) | | | | | | | | |
| Coherus Biosciences, Inc. * | | | 973 | | | $ | 16 | |
| Constellation Pharmaceuticals, Inc. * | | | 1,232 | | | | 24 | |
| Emergent BioSolutions, Inc. * | | | 251 | | | | 23 | |
| Insmed, Inc. * | | | 1,080 | | | | 36 | |
| Iovance Biotherapeutics, Inc. * | | | 1,274 | | | | 45 | |
| Karuna Therapeutics, Inc. * | | | 239 | | | | 19 | |
| Krystal Biotech, Inc. * | | | 572 | | | | 25 | |
| Mirati Therapeutics, Inc. * | | | 212 | | | | 46 | |
| Natera, Inc. * | | | 687 | | | | 46 | |
| Rocket Pharmaceuticals, Inc. * | | | 1,001 | | | | 28 | |
| Sarepta Therapeutics, Inc. * | | | 203 | | | | 28 | |
| Seagen, Inc. * | | | 257 | | | | 43 | |
| SpringWorks Therapeutics, Inc. * | | | 412 | | | | 24 | |
| Stoke Therapeutics, Inc. * | | | 628 | | | | 24 | |
| TG Therapeutics, Inc. * | | | 1,372 | | | | 35 | |
| Turning Point Therapeutics, Inc. * | | | 382 | | | | 35 | |
| Twist Bioscience Corp. * | | | 559 | | | | 43 | |
| Vertex Pharmaceuticals, Inc. * | | | 390 | | | | 81 | |
| | | | | | | | 863 | |
| | | | | | | | | |
| Health Care Equipment & Supplies 23.06% | | | | | | | | |
| Abbott Laboratories | | | 1,132 | | | | 119 | |
| Align Technology, Inc. * | | | 130 | | | | 55 | |
| Axonics Modulation Technologies, Inc. * | | | 731 | | | | 34 | |
| Boston Scientific Corp. * | | | 1,248 | | | | 43 | |
| Cooper Cos., Inc. (The) | | | 134 | | | | 43 | |
| Danaher Corp. | | | 522 | | | | 120 | |
| DexCom, Inc. * | | | 143 | | | | 46 | |
| Edwards Lifesciences Corp. * | | | 469 | | | | 34 | |
| IDEXX Laboratories, Inc. * | | | 103 | | | | 44 | |
| Inari Medical, Inc. * | | | 273 | | | | 18 | |
| Insulet Corp. * | | | 195 | | | | 43 | |
| Intuitive Surgical, Inc. * | | | 103 | | | | 69 | |
| Nevro Corp. * | | | 256 | | | | 38 | |
| NuVasive, Inc. * | | | 201 | | | | 9 | |
| Outset Medical, Inc. * | | | 434 | | | | 20 | |
| Investments | | Shares | | | U.S. $
Fair Value
(000) | |
| United States (continued) | | | | | | | | |
| | | | | | | | | |
| Health Care Equipment & Supplies (continued) | | | | | | | | |
| Penumbra, Inc. * | | | 140 | | | $ | 36 | |
| Pulmonx Corp. * | | | 618 | | | | 26 | |
| Silk Road Medical, Inc. * | | | 329 | | | | 20 | |
| Tandem Diabetes Care, Inc. * | | | 197 | | | | 21 | |
| Zimmer Biomet Holdings, Inc. | | | 180 | | | | 24 | |
| | | | | | | | 862 | |
| | | | | | | | | |
| Health Care Providers & Services 5.37% | | | | | | | | |
| CVS Health Corp. | | | 810 | | | | 46 | |
| Guardant Health, Inc. * | | | 338 | | | | 36 | |
| UnitedHealth Group, Inc. | | | 391 | | | | 119 | |
| | | | | | | | 201 | |
| | | | | | | | | |
| Health Care Technology 2.76% | | | | | | | | |
| Schrodinger, Inc. * | | | 527 | | | | 26 | |
| Teladoc Health, Inc. * | | | 164 | | | | 32 | |
| Veeva Systems, Inc. Class A * | | | 167 | | | | 45 | |
| | | | | | | | 103 | |
| | | | | | | | | |
| Internet & Direct Marketing Retail 1.02% | | | | | | | | |
| Chewy, Inc. Class A * | | | 626 | | | | 38 | |
| | | | | | | | | |
| Life Sciences Tools & Services 10.92% | | | | | | | | |
| 10X Genomics, Inc. Class A * | | | 268 | | | | 37 | |
| Adaptive Biotechnologies Corp. * | | | 554 | | | | 26 | |
| Berkeley Lights, Inc. * | | | 280 | | | | 20 | |
| Bio-Rad Laboratories, Inc. Class A * | | | 82 | | | | 48 | |
| Charles River Laboratories International, Inc. * | | | 154 | | | | 35 | |
| Codexis, Inc. * | | | 1,191 | | | | 16 | |
| Pacific Biosciences of California, Inc. * | | | 1,889 | | | | 25 | |
| Quanterix Corp. * | | | 794 | | | | 29 | |
| Repligen Corp. * | | | 276 | | | | 46 | |
| Thermo Fisher Scientific, Inc. | | | 267 | | | | 126 | |
| | | | | | | | 408 | |
| 98 | See Notes to Financial Statements. |
Schedule of Investments (continued)
HEALTH CARE FUND October 31, 2020
| Investments | | Shares | | | U.S. $
Fair Value
(000) | |
| United States (continued) | | | | | | | | |
| | | | | | | | | |
| Pharmaceuticals 8.31% | | | | | | | | |
| Catalent, Inc. * | | | 523 | | | $ | 46 | |
| Horizon Therapeutics Plc * | | | 730 | | | | 55 | |
| Johnson & Johnson | | | 337 | | | | 46 | |
| Merck & Co., Inc. | | | 1,156 | | | | 87 | |
| Zoetis, Inc. | | | 485 | | | | 77 | |
| | | | | | | | 311 | |
| Total United States | | | | | | | 2,786 | |
Total Common Stocks
(cost $3,125,811) | | | | | | | 3,554 | |
| | | | | | | | | |
| | | Principal
Amount
(000) | | | Fair
Value
(000) | |
| SHORT-TERM INVESTMENTS 5.35% | | | | | | | | |
| | | | | | | | | |
| Repurchase Agreement 4.25% | | | | | | | | |
Repurchase Agreement dated 10/30/2020, 0.00% due 11/2/2020 with Fixed Income Clearing Corp. collateralized by $160,900 of U.S. Treasury Note at 0.50% due 3/15/2023; value: $162,270; proceeds: $159,043
(cost $159,043) | | | $159 | | | | 159 | |
| Investments | | Shares | | | Fair
Value
(000) | |
| Money Market Fund 0.99% | | | | | | | | |
Fidelity Government Portfolio(b)
(cost $36,685) | | | 36,685 | | | $ | 37 | |
| | | | | | | | | |
| Time Deposit 0.11% | | | | | | | | |
CitiBank N.A.(b)
(cost $4,077) | | | 4,077 | | | | 4 | |
Total Short-Term Investments
(cost $199,805) | | | | | | | 200 | |
Total Investments in Securities 100.43%
(cost $3,325,616) | | | | | | | 3,754 | |
| Liabilities in Excess of Cash and Other Assets (0.43)% | | | | (16 | ) |
| Net Assets 100.00% | | | | | | $ | 3,738 | |
| ADR | | American Depositary Receipt. |
| * | | Non-income producing security. |
| † | | Security was purchased pursuant to Rule 144A under the Securities Act of 1933 and, unless registered under such Act or exempted from registration, may only be resold to qualified institutional buyers. At October 31, 2020, the total value of Rule 144A securities was $29, which represents 0.78% of net assets. |
| (a) | | All or a portion of this security is temporarily on loan to unaffiliated broker/dealers. |
| (b) | | Security was purchased with the cash collateral from loaned securities. |
| | See Notes to Financial Statements. | 99 |
Schedule of Investments (concluded)
HEALTH CARE FUND October 31, 2020
The following is a summary of the inputs used as of October 31, 2020 in valuing the Fund’s investments carried at fair value(1):
| Investment Type(2) | | Level 1
(000) | | | Level 2
(000) | | | Level 3
(000) | | | Total
(000) | |
| Common Stocks | | | | | | | | | | | | | | | | |
| Belgium | | $ | – | | | $ | 39 | | | $ | – | | | $ | 39 | |
| China | | | 41 | | | | 29 | | | | – | | | | 70 | |
| Denmark | | | – | | | | 165 | | | | – | | | | 165 | |
| France | | | 55 | | | | 26 | | | | – | | | | 81 | |
| Japan | | | – | | | | 20 | | | | – | | | | 20 | |
| Netherlands | | | – | | | | 34 | | | | – | | | | 34 | |
| Switzerland | | | 44 | | | | 146 | | | | – | | | | 190 | |
| United Kingdom | | | 16 | | | | 88 | | | | – | | | | 104 | |
| Remaining Countries | | | 2,851 | | | | – | | | | – | | | | 2,851 | |
| Short-Term Investments | | | | | | | | | | | | | | | | |
| Repurchase Agreement | | | – | | | | 159 | | | | – | | | | 159 | |
| Money Market Fund | | | 37 | | | | – | | | | – | | | | 37 | |
| Time Deposit | | | – | | | | 4 | | | | – | | | | 4 | |
| Total | | $ | 3,044 | | | $ | 710 | | | $ | – | | | $ | 3,754 | |
| (1) | | Refer to Note 2(l) for a description of fair value measurements and the three-tier hierarchy of inputs. |
| (2) | | See Schedule of Investments for fair values in each industry and identification of foreign issuers and/or geography. The table above is presented by Investment Type. Industries are presented within an Investment Type should such Investment Type include securities classified as two or more levels within the three-tier fair value hierarchy. |
A reconciliation of Level 3 investments is presented when the Fund has a material amount of Level 3 investments at the beginning or end of the year in relation to the Fund’s net assets.
| 100 | See Notes to Financial Statements. |
Schedule of Investments
INTERNATIONAL EQUITY FUND October 31, 2020
| | | | | | U.S. $ | |
| | | | | | Fair Value | |
| Investments | | Shares | | | (000) | |
| COMMON STOCKS 99.93% | | | | | | | | |
| | | | | | | | | |
| Australia 3.33% | | | | | | | | |
| | | | | | | | | |
| Capital Markets 1.02% | | | | | | | | |
| Macquarie Group Ltd. | | | 41,536 | | | $ | 3,703 | |
| | | | | | | | | |
| Equity Real Estate Investment Trusts 1.04% | | | | | | | | |
| Goodman Group | | | 293,323 | | | | 3,797 | |
| | | | | | | | | |
| Metals & Mining 1.27% | | | | | | | | |
| BHP Group Ltd. | | | 193,737 | | | | 4,644 | |
| Total Australia | | | | | | | 12,144 | |
| | | | | | | | | |
| Belgium 2.70% | | | | | | | | |
| | | | | | | | | |
| Banks 0.90% | | | | | | | | |
| KBC Group NV | | | 66,467 | | | | 3,284 | |
| | | | | | | | | |
| Beverages 0.87% | | | | | | | | |
| Anheuser-Busch InBev SA | | | 61,440 | | | | 3,178 | |
| | | | | | | | | |
| Pharmaceuticals 0.93% | | | | | | | | |
| UCB SA | | | 34,169 | | | | 3,375 | |
| Total Belgium | | | | | | | 9,837 | |
| | | | | | | | | |
| Brazil 0.51% | | | | | | | | |
| | | | | | | | | |
| Metals & Mining | | | | | | | | |
| Vale SA ADR | | | 177,219 | | | | 1,873 | |
| | | | | | | | | |
| Canada 2.69% | | | | | | | | |
| | | | | | | | | |
| Aerospace & Defense 0.67% | | | | | | | | |
| CAE, Inc. | | | 143,300 | | | | 2,449 | |
| | | | | | | | | |
| Food & Staples Retailing 0.64% | | | | | | | | |
| Alimentation Couche-Tard, Inc. Class B | | | 76,000 | | | | 2,340 | |
| | | | | | | | | |
| Insurance 0.70% | | | | | | | | |
| Intact Financial Corp. | | | 24,500 | | | | 2,531 | |
| | | | | | | | | |
| Oil, Gas & Consumable Fuels 0.68% | | | | | | | | |
| Pembina Pipeline Corp. | | | 118,667 | | | | 2,484 | |
| Total Canada | | | | | | | 9,804 | |
| | | | | | U.S. $ | |
| | | | | | Fair Value | |
| Investments | | Shares | | | (000) | |
| Chile 0.53% | | | | | | | | |
| | | | | | | | | |
| Metals & Mining | | | | | | | | |
| Lundin Mining Corp. | | | 318,400 | | | $ | 1,924 | |
| | | | | | | | | |
| China 14.41% | | | | | | | | |
| | | | | | | | | |
| Beverages 0.79% | | | | | | | | |
| Budweiser Brewing Co. APAC Ltd. † | | | 976,137 | | | | 2,879 | |
| | | | | | | | | |
| Construction Materials 0.69% | | | | | | | | |
| China Resources Cement Holdings Ltd. | | | 1,922,000 | | | | 2,517 | |
| | | | | | | | | |
| Information Technology Services 0.90% | | | | | | | | |
| GDS Holdings Ltd. ADR * | | | 39,113 | | | | 3,287 | |
| | | | | | | | | |
| Insurance 1.10% | | | | | | | | |
| Ping An Insurance Group Co. of China Ltd. Class H | | | 387,500 | | | | 4,007 | |
| | | | | | | | | |
| Interactive Media & Services 3.37% | | | | | | | | |
| Tencent Holdings Ltd. | | | 160,600 | | | | 12,271 | |
| | | | | | | | | |
| Internet & Direct Marketing Retail 4.65% | | | | | | | | |
| Alibaba Group Holding Ltd. ADR * | | | 49,116 | | | | 14,965 | |
| Pinduoduo, Inc. ADR * | | | 22,260 | | | | 2,003 | |
| | | | | | | | 16,968 | |
| | | | | | | | | |
| Life Sciences Tools & Services 0.50% | | | | | | | | |
| Wuxi Biologics Cayman, Inc. *† | | | 65,500 | | | | 1,839 | |
| | | | | | | | | |
| Machinery 0.89% | | | | | | | | |
| Airtac International Group | | | 120,000 | | | | 3,230 | |
| | | | | | | | | |
| Real Estate Management & Development 0.83% |
| Logan Group Co., Ltd. | | | 1,921,000 | | | | 3,014 | |
| | | | | | | | | |
| Textiles, Apparel & Luxury Goods 0.69% | | | | | | | | |
| ANTA Sports Products Ltd. | | | 226,000 | | | | 2,509 | |
| Total China | | | | | | | 52,521 | |
| | See Notes to Financial Statements. | 101 |
Schedule of Investments (continued)
INTERNATIONAL EQUITY FUND October 31, 2020
| | | | | | U.S. $ | |
| | | | | | Fair Value | |
| Investments | | Shares | | | (000) | |
| Denmark 5.10% | | | | | | | | |
| | | | | | | | | |
| Air Freight & Logistics 1.11% | | | | | | | | |
| DSV PANALPINA A/S | | | 24,903 | | | $ | 4,040 | |
| | | | | | | | | |
| Beverages 0.99% | | | | | | | | |
| Carlsberg A/S Class B | | | 28,450 | | | | 3,602 | |
| | | | | | | | | |
| Biotechnology 1.04% | | | | | | | | |
| Genmab A/S * | | | 11,316 | | | | 3,780 | |
| | | | | | | | | |
| Electrical Equipment 0.76% | | | | | | | | |
| Vestas Wind Systems A/S | | | 16,361 | | | | 2,793 | |
| | | | | | | | | |
| Pharmaceuticals 1.20% | | | | | | | | |
| Novo Nordisk A/S Class B | | | 68,461 | | | | 4,365 | |
| Total Denmark | | | | | | | 18,580 | |
| | | | | | | | | |
| Finland 1.08% | | | | | | | | |
| | | | | | | | | |
| Banks | | | | | | | | |
| Nordea Bank Abp * | | | 525,815 | | | | 3,946 | |
| | | | | | | | | |
| France 9.80% | | | | | | | | |
| | | | | | | | | |
| Aerospace & Defense 0.64% | | | | | | | | |
| Safran SA * | | | 22,105 | | | | 2,332 | |
| | | | | | | | | |
| Auto Components 0.98% | | | | | | | | |
| Cie Generale des Etablissements Michelin SCA | | | 32,966 | | | | 3,560 | |
| | | | | | | | | |
| Beverages 0.66% | | | | | | | | |
| Remy Cointreau SA (a) | | | 14,230 | | | | 2,402 | |
| | | | | | | | | |
| Chemicals 1.32% | | | | | | | | |
| Air Liquide SA | | | 32,845 | | | | 4,803 | |
| | | | | | | | | |
| Electrical Equipment 1.14% | | | | | | | | |
| Schneider Electric SE | | | 34,129 | | | | 4,147 | |
| | | | | | | | | |
| Life Sciences Tools & Services 0.96% | | | | | | | | |
| Sartorius Stedim Biotech | | | 9,237 | | | | 3,503 | |
| | | | | | U.S. $ | |
| | | | | | Fair Value | |
| Investments | | Shares | | | (000) | |
| France (continued) | | | | | | | | |
| | | | | | | | | |
| Multi-Utilities 0.74% | | | | | | | | |
| Engie SA * | | | 224,007 | | | $ | 2,709 | |
| | | | | | | | | |
| Oil, Gas & Consumable Fuels 0.66% | | | | | | | | |
| Total SE | | | 80,179 | | | | 2,429 | |
| | | | | | | | | |
| Personal Products 1.38% | | | | | | | | |
| L’Oreal SA | | | 15,554 | | | | 5,027 | |
| | | | | | | | | |
| Textiles, Apparel & Luxury Goods 1.32% | | | | | | | | |
| LVMH Moet Hennessy Louis Vuitton SE | | | 10,248 | | | | 4,804 | |
| Total France | | | | | | | 35,716 | |
| | | | | | | | | |
| Germany 5.65% | | | | | | | | |
| | | | | | | | | |
| Air Freight & Logistics 1.18% | | | | | | | | |
| Deutsche Post AG Registered Shares | | | 96,681 | | | | 4,287 | |
| | | | | | | | | |
| Automobiles 0.81% | | | | | | | | |
| Volkswagen AG | | | 19,014 | | | | 2,958 | |
| | | | | | | | | |
| Chemicals 0.78% | | | | | | | | |
| Symrise AG | | | 23,131 | | | | 2,852 | |
| | | | | | | | | |
| Insurance 0.93% | | | | | | | | |
| Allianz SE Registered Shares | | | 19,289 | | | | 3,398 | |
| | | | | | | | | |
| Internet & Direct Marketing Retail 0.25% | | | | | | | | |
| Delivery Hero SE *† | | | 7,990 | | | | 917 | |
| | | | | | | | | |
| Media 0.67% | | | | | | | | |
| Stroeer SE & Co. KGaA * | | | 33,592 | | | | 2,428 | |
| | | | | | | | | |
| Textiles, Apparel & Luxury Goods 1.03% | | | | | | | | |
| adidas AG * | | | 12,573 | | | | 3,736 | |
| Total Germany | | | | | | | 20,576 | |
| | | | | | | | | |
| Hong Kong 3.92% | | | | | | | | |
| | | | | | | | | |
| Capital Markets 1.33% | | | | | | | | |
| Hong Kong Exchanges & Clearing Ltd. | | | 100,800 | | | | 4,830 | |
| 102 | See Notes to Financial Statements. |
Schedule of Investments (continued)
INTERNATIONAL EQUITY FUND October 31, 2020
| | | | | | U.S. $ | |
| | | | | | Fair Value | |
| Investments | | Shares | | | (000) | |
| Hong Kong (continued) | | | | | | | | |
| | | | | | | | | |
| Insurance 1.50% | | | | | | | | |
| AIA Group Ltd. | | | 572,900 | | | $ | 5,453 | |
| | | | | | | | | |
| Machinery 1.09% | | | | | | | | |
| Techtronic Industries Co. Ltd. | | | 296,000 | | | | 3,987 | |
| Total Hong Kong | | | | | | | 14,270 | |
| | | | | | | | | |
| India 1.51% | | | | | | | | |
| | | | | | | | | |
| Banks | | | | | | | | |
| HDFC Bank Ltd. ADR * | | | 49,497 | | | | 2,843 | |
| ICICI Bank Ltd. ADR * | | | 251,045 | | | | 2,649 | |
| Total India | | | | | | | 5,492 | |
| | | | | | | | | |
| Indonesia 0.63% | | | | | | | | |
| | | | | | | | | |
| Banks | | | | | | | | |
| Bank Rakyat Indonesia Persero Tbk PT | | | 10,162,600 | | | | 2,301 | |
| | | | | | | | | |
| Ireland 1.00% | | | | | | | | |
| | | | | | | | | |
| Construction Materials | | | | | | | | |
| CRH plc | | | 104,272 | | | | 3,659 | |
| | | | | | | | | |
| Italy 0.63% | | | | | | | | |
| | | | | | | | | |
| Textiles, Apparel & Luxury Goods | | | | | | | | |
| Moncler SpA * | | | 57,627 | | | | 2,306 | |
| | | | | | | | | |
| Japan 16.39% | | | | | | | | |
| | | | | | | | | |
| Automobiles 1.66% | | | | | | | | |
| Toyota Motor Corp. | | | 91,900 | | | | 6,033 | |
| | | | | | | | | |
| Banks 0.82% | | | | | | | | |
| Sumitomo Mitsui Financial Group, Inc. | | | 108,000 | | | | 2,989 | |
| | | | | | | | | |
| Building Products 2.11% | | | | | | | | |
| Daikin Industries Ltd. | | | 26,700 | | | | 4,996 | |
| Sanwa Holdings Corp. | | | 236,400 | | | | 2,697 | |
| | | | | | | | 7,693 | |
| | | | | | | | | |
| Electrical Equipment 1.29% | | | | | | | | |
| Nidec Corp. | | | 46,700 | | | | 4,717 | |
| | | | | | U.S. $ | |
| | | | | | Fair Value | |
| Investments | | | Shares | | | | (000) | |
| Japan (continued) | | | | | | | | |
| | | | | |
| Electronic Equipment, Instruments & Components 4.41% |
| Hitachi Ltd. | | | 71,200 | | | $ | 2,400 | |
| Keyence Corp. | | | 10,847 | | | | 4,922 | |
| Murata Manufacturing Co., Ltd. | | | 67,700 | | | | 4,748 | |
| TDK Corp. | | | 34,100 | | | | 4,010 | |
| | | | | | | | 16,080 | |
| | | | | | | | | |
| Health Care Equipment & Supplies 1.29% | | | | | | | | |
| Hoya Corp. | | | 41,600 | | | | 4,695 | |
| | | | | | | | | |
| Health Care Technology 0.54% | | | | | | | | |
| M3, Inc. | | | 29,000 | | | | 1,958 | |
| | | | | | | | | |
| Household Durables 1.66% | | | | | | | | |
| Sony Corp. | | | 72,700 | | | | 6,061 | |
| | | | | | | | | |
| Information Technology Services 0.49% | | | | | | | | |
| BASE, Inc. * | | | 16,700 | | | | 1,790 | |
| | | | | | | | | |
| Specialty Retail 0.96% | | | | | | | | |
| Fast Retailing Co. Ltd. | | | 5,000 | | | | 3,488 | |
| | | | | | | | | |
| Trading Companies & Distributors 1.16% | | | | | | | | |
| ITOCHU Corp. | | | 175,400 | | | | 4,213 | |
| Total Japan | | | | | | | 59,717 | |
| | | | | | | | | |
| Netherlands 3.26% | | | | | | | | |
| | | | | | | | | |
| Chemicals 1.11% | | | | | | | | |
| Akzo Nobel NV | | | 42,065 | | | | 4,046 | |
| | | | | | | | | |
| Information Technology Services 0.64% | | | | | | | | |
| Adyen NV *† | | | 1,382 | | | | 2,330 | |
| | | | | | | | | |
| Semiconductors & Semiconductor Equipment 1.51% |
| ASML Holding NV | | | 15,239 | | | | 5,513 | |
| Total Netherlands | | | | | | | 11,889 | |
| | | | | | | | | |
| Norway 0.71% | | | | | | | | |
| | | | | | | | | |
| Oil, Gas & Consumable Fuels | | | | | | | | |
| Equinor ASA | | | 204,190 | | | | 2,593 | |
| | See Notes to Financial Statements. | 103 |
Schedule of Investments (continued)
INTERNATIONAL EQUITY FUND October 31, 2020
| | | | | | U.S. $ | |
| | | | | | Fair Value | |
| Investments | | | Shares | | | | (000) | |
| Peru 0.54% | | | | | | | | |
| | | | | | | | | |
| Banks | | | | | | | | |
| Credicorp Ltd. | | | 17,127 | | | $ | 1,964 | |
| | | | | | | | | |
| Poland 0.11% | | | | | | | | |
| | | | | | | | | |
| Internet & Direct Marketing Retail | | | | | | | | |
| Allegro.eu SA *† | | | 20,000 | | | | 406 | |
| | | | | | | | | |
| South Africa 1.03% | | | | | | | | |
| | | | | | | | | |
| Metals & Mining | | | | | | | | |
| Anglo American plc | | | 160,287 | | | | 3,761 | |
| | | | | | | | | |
| South Korea 2.16% | | | | | | | | |
| | | | | | | | | |
| Technology Hardware, Storage & Peripherals | | | | | | | | |
| Samsung Electronics Co., Ltd. | | | 156,547 | | | | 7,869 | |
| | | | | | | | | |
| Spain 3.28% | | | | | | | | |
| | | | | | | | | |
| Diversified Telecommunication Services 1.24% | | | | | | | | |
| Cellnex Telecom SA† | | | 70,278 | | | | 4,511 | |
| | | | | | | | | |
| Electric: Utilities 1.27% | | | | | | | | |
| Iberdrola SA | | | 393,885 | | | | 4,651 | |
| | | | | | | | | |
| Electrical Equipment 0.77% | | | | | | | | |
| Siemens Gamesa Renewable Energy SA | | | 98,541 | | | | 2,797 | |
| Total Spain | | | | | | | 11,959 | |
| | | | | | | | | |
| Sweden 1.77% | | | | | | | | |
| | | | | | | | | |
| Machinery | | | | | | | | |
| Atlas Copco AB A Shares | | | 66,663 | | | | 2,943 | |
| Sandvik AB * | | | 197,474 | | | | 3,520 | |
| Total Sweden | | | | | | | 6,463 | |
| | | | | | | | | |
| Switzerland 8.18% | | | | | | | | |
| | | | | | | | | |
| Capital Markets 1.16% | | | | | | | | |
| UBS Group AG | | | 363,506 | | | | 4,232 | |
| | | | | | | | | |
| Food Products 2.33% | | | | | | | | |
| Nestle SA Registered Shares | | | 75,608 | | | | 8,504 | |
| | | | | | U.S. $ | |
| | | | | | Fair Value | |
| Investments | | Shares | | | (000) | |
| Switzerland (continued) | | | | | | | | |
| | | | | | | | | |
| Insurance 1.01% | | | | | | | | |
| Zurich Financial Services AG | | | 11,118 | | | $ | 3,693 | |
| | | | | | | | | |
| Life Sciences Tools & Services 2.51% | | | | | | | | |
| Lonza Group AG | | | 10,518 | | | | 6,373 | |
| Tecan Group AG | | | 5,820 | | | | 2,762 | |
| | | | | | | | 9,135 | |
| | | | | | | | | |
| Pharmaceuticals 1.17% | | | | | | | | |
| Roche Holding AG | | | 13,202 | | | | 4,242 | |
| Total Switzerland | | | | | | | 29,806 | |
| | | | | | | | | |
| Taiwan 3.24% | | | | | | | | |
| | | | | | | | | |
| Semiconductors & Semiconductor Equipment | | | | | | | | |
| MediaTek, Inc. | | | 124,000 | | | | 2,948 | |
| Taiwan Semiconductor Manufacturing Co., Ltd. ADR | | | 105,461 | | | | 8,845 | |
| Total Taiwan | | | | | | | 11,793 | |
| | | | | | | | | |
| United Kingdom 3.87% | | | | | | | | |
| | | | | | | | | |
| Capital Markets 1.08% | | | | | | | | |
| London Stock Exchange Group plc | | | 36,342 | | | | 3,918 | |
| | | | | | | | | |
| Insurance 0.59% | | | | | | | | |
| Prudential plc | | | 175,142 | | | | 2,142 | |
| | | | | | | | | |
| Personal Products 0.74% | | | | | | | | |
| Unilever plc | | | 47,632 | | | | 2,714 | |
| | | | | | | | | |
| Pharmaceuticals 1.46% | | | | | | | | |
| AstraZeneca plc | | | 52,946 | | | | 5,316 | |
| Total United Kingdom | | | | | | | 14,090 | |
| | | | | | | | | |
| United States 1.90% | | | | | | | | |
| | | | | | | | | |
| Pharmaceuticals 0.84% | | | | | | | | |
| Horizon Therapeutics Plc * | | | 40,688 | | | | 3,049 | |
| | | | | | | | | |
| Trading Companies & Distributors 1.06% | | | | | | | | |
| Ferguson plc | | | 39,105 | | | | 3,884 | |
| Total United States | | | | | | | 6,933 | |
Total Common Stocks
(cost $309,687,522) | | | | | | | 364,192 | |
| 104 | See Notes to Financial Statements. |
Schedule of Investments (continued)
INTERNATIONAL EQUITY FUND October 31, 2020
| | | Principal | | | Fair | |
| | | Amount | | | Value | |
| | | (000) | | | (000) | |
| SHORT-TERM INVESTMENTS 0.56% | | | | | | | | |
| | | | | | | | | |
| Repurchase Agreement 0.25% | | | | | | | | |
Repurchase Agreement dated 10/30/2020, 0.00% due 11/2/2020 with Fixed Income Clearing Corp. collateralized by $884,700 of U.S. Treasury Note at 2.50% due 3/31/2023; value: $936,356; proceeds: $917,983
(cost $917,983) | | | $918 | | | | 918 | |
| | | | | | Fair | |
| | | | | | Value | |
| Investments | | Shares | | | (000) | |
| Money Market Fund 0.28% | | | | | | | | |
Fidelity Government Portfolio(b)
(cost $1,015,342) | | | 1,015,342 | | | $ | 1,015 | |
| | | | | | | | | |
| Time Deposit 0.03% | | | | | | | | |
CitiBank N.A.(b)
(cost $112,816) | | | 112,816 | | | | 113 | |
Total Short-Term Investments
(cost $2,046,141) | | | | | | | 2,046 | |
Total Investments in Securities 100.49%
(cost $311,733,663) | | | | | | | 366,238 | |
| Liabilities in Excess of Cash, Foreign Cash and Other Assets (0.49)% | | | | | | | (1,780 | ) |
| Net Assets 100.00% | | | | | | $ | 364,458 | |
| ADR | | American Depositary Receipt. |
| * | | Non-income producing security. |
| † | | Security was purchased pursuant to Rule 144A under the Securities Act of 1933 and, unless registered under such Act or exempted from registration, may only be resold to qualified institutional buyers. At October 31, 2020, the total value of Rule 144A securities was $12,882,000, which represents 3.53% of net assets. |
| (a) | | All or a portion of this security is temporarily on loan to unaffiliated broker/dealers. |
| (b) | | Security was purchased with the cash collateral from loaned securities. |
| | See Notes to Financial Statements. | 105 |
Schedule of Investments (concluded)
INTERNATIONAL EQUITY FUND October 31, 2020
The following is a summary of the inputs used as of October 31, 2020 in valuing the Fund’s investments carried at fair value(1):
| | | Level 1 | | | Level 2 | | | Level 3 | | | Total | |
| Investment Type(2) | | (000) | | | (000) | | | (000) | | | (000) | |
| Common Stocks | | | | | | | | | | | | | | | | |
| Brazil | | $ | 1,873 | | | $ | – | | | $ | – | | | $ | 1,873 | |
| Canada | | | 9,804 | | | | – | | | | – | | | | 9,804 | |
| Chile | | | 1,924 | | | | – | | | | – | | | | 1,924 | |
| China | | | 20,255 | | | | 32,266 | | | | – | | | | 52,521 | |
| Denmark | | | 2,793 | | | | 15,787 | | | | – | | | | 18,580 | |
| France | | | 3,503 | | | | 32,213 | | | | – | | | | 35,716 | |
| India | | | 5,492 | | | | – | | | | – | | | | 5,492 | |
| Netherlands | | | 2,330 | | | | 9,559 | | | | – | | | | 11,889 | |
| Peru | | | 1,964 | | | | – | | | | – | | | | 1,964 | |
| Poland | | | 406 | | | | – | | | | – | | | | 406 | |
| Taiwan | | | 8,845 | | | | 2,948 | | | | – | | | | 11,793 | |
| United States | | | 3,049 | | | | 3,884 | | | | – | | | | 6,933 | |
| Remaining Countries | | | – | | | | 205,297 | | | | – | | | | 205,297 | |
| Short-Term Investments | | | | | | | | | | | | | | | | |
| Repurchase Agreement | | | – | | | | 918 | | | | – | | | | 918 | |
| Money Market Fund | | | 1,015 | | | | – | | | | – | | | | 1,015 | |
| Time Deposit | | | – | | | | 113 | | | | – | | | | 113 | |
| Total | | $ | 63,253 | | | $ | 302,985 | | | $ | – | | | $ | 366,238 | |
| (1) | | Refer to Note 2(l) for a description of fair value measurements and the three-tier hierarchy of inputs. |
| (2) | | See Schedule of Investments for fair values in each industry and identification of foreign issuers and/or geography. The table above is presented by Investment Type. Industries are presented within an Investment Type should such Investment Type include securities classified as two or more levels within the three-tier fair value hierarchy. |
A reconciliation of Level 3 investments is presented when the Fund has a material amount of Level 3 investments at the beginning or end of the year in relation to the Fund’s net assets.
| 106 | See Notes to Financial Statements. |
Schedule of Investments
INTERNATIONAL OPPORTUNITIES FUND October 31, 2020
| Investments | | Shares | | | U.S. $
Fair Value
(000) | |
| LONG-TERM INVESTMENTS 99.23% | | | | | | | | |
| | | | | | | | | |
| COMMON STOCKS 99.17% | | | | | | | | |
| | | | | | | | | |
| Australia 4.71% | | | | | | | | |
| | | | | | | | | |
| Auto Components 0.68% | | | | | | | | |
| GUD Holdings Ltd. | | | 294,528 | | | $ | 2,627 | |
| | | | | | | | | |
| Diversified Financial Services 0.27% | | | | | | | | |
| Omni Bridgeway Ltd. | | | 430,799 | | | | 1,048 | |
| | | | | | | | | |
| Electric: Utilities 1.79% | | | | | | | | |
| AusNet Services | | | 4,936,100 | | | | 6,939 | |
| | | | | | | | | |
| Food Products 1.24% | | | | | | | | |
| Costa Group Holdings Ltd. | | | 1,917,452 | | | | 4,798 | |
| | | | | | | | | |
| Professional Services 0.73% | | | | | | | | |
| IPH Ltd. | | | 609,489 | | | | 2,825 | |
| Total Australia | | | | | | | 18,237 | |
| | | | | | | | | |
| Austria 3.78% | | | | | | | | |
| | | | | | | | | |
| Banks 1.40% | | | | | | | | |
| BAWAG Group AG *† | | | 148,122 | | | | 5,440 | |
| | | | | | | | | |
| Electronic Equipment, Instruments & Components 1.03% | | |
| AT&S Austria Technologie & Systemtechnik AG | | 219,781 | | | | 3,995 | |
| | | | | | | | | |
| Machinery 1.35% | | | | | | | | |
| ANDRITZ AG | | | 154,482 | | | | 5,210 | |
| Total Austria | | | | | | | 14,645 | |
| | | | | | | | | |
| Belgium 1.40% | | | | | | | | |
| | | | | | | | | |
| Equity Real Estate Investment Trusts 0.84% | | | | | | | | |
| Warehouses De Pauw CVA | | | 97,414 | | | | 3,263 | |
| | | | | | | | | |
| Wireless Telecommunication Services 0.56% | | | | | |
| Orange Belgium SA | | | 128,637 | | | | 2,144 | |
| Total Belgium | | | | | | | 5,407 | |
| Investments | | Shares | | | U.S. $
Fair Value
(000) | |
| Canada 1.47% | | | | | | | | |
| | | | | | | | | |
| Aerospace & Defense 0.89% | | | | | | | | |
| CAE, Inc. | | | 202,300 | | | $ | 3,458 | |
| | | | | | | | | |
| Paper & Forest Products 0.58% | | | | | | | | |
| Interfor Corp. * | | | 200,000 | | | | 2,253 | |
| Total Canada | | | | | | | 5,711 | |
| | | | | | | | | |
| Chile 1.05% | | | | | | | | |
| | | | | | | | | |
| Metals & Mining | | | | | | | | |
| Lundin Mining Corp. | | | 670,000 | | | | 4,048 | |
| | | | | | | | | |
| China 1.02% | | | | | | | | |
| | | | | | | | | |
| Marine | | | | | | | | |
| SITC International Holdings Co. Ltd. | | | 2,552,000 | | | | 3,942 | |
| | | | | | | | | |
| Denmark 0.41% | | | | | | | | |
| | | | | | | | | |
| Machinery | | | | | | | | |
| FLSmidth & Co. A/S * | | | 61,490 | | | | 1,571 | |
| | | | | | | | | |
| France 1.52% | | | | | | | | |
| | | | | | | | | |
| Construction Materials 0.60% | | | | | | | | |
| Vicat SA | | | 75,301 | | | | 2,315 | |
| | | | | | | | | |
| Health Care Providers & Services 0.92% | | | | | | | | |
| Korian SA *(a) | | | 126,064 | | | | 3,552 | |
| Total France | | | | | | | 5,867 | |
| | | | | | | | | |
| Germany 7.23% | | | | | | | | |
| | | | | | | | | |
| Biotechnology 1.05% | | | | | | | | |
| MorphoSys AG * | | | 39,921 | | | | 4,069 | |
| | | | | | | | | |
| Industrial Conglomerates 1.66% | | | | | | | | |
| Rheinmetall AG | | | 87,805 | | | | 6,417 | |
| | | | | | | | | |
| Life Sciences Tools & Services 1.46% | | | | | | | | |
| Gerresheimer AG | | | 56,185 | | | | 5,648 | |
| | | | | | | | | |
| Media 0.73% | | | | | | | | |
| Stroeer SE & Co. KGaA * | | | 39,032 | | | | 2,822 | |
| | See Notes to Financial Statements. | 107 |
Schedule of Investments (continued)
INTERNATIONAL OPPORTUNITIES FUND October 31, 2020
| Investments | | Shares | | | U.S. $
Fair Value
(000) | |
| Germany (continued) | | | | | | | | |
| | | | | | | | | |
| Real Estate Management & Development 2.33% | | | |
| LEG Immobilien AG | | | 27,426 | | | $ | 3,707 | |
| PATRIZIA AG | | | 234,313 | | | | 5,333 | |
| | | | | | | | 9,040 | |
| Total Germany | | | | | | | 27,996 | |
| | | | | | | | | |
| Hong Kong 5.68% | | | | | | | | |
| | | | | | | | | |
| Auto Components 1.65% | | | | | | | | |
| Xinyi Glass Holdings Ltd. | | | 2,904,000 | | | | 6,377 | |
| | | | | | | | | |
| Consumer Finance 0.34% | | | | | | | | |
| Sun Hung Kai & Co., Ltd. | | | 3,381,000 | | | | 1,315 | |
| | | | | | | | | |
| Hotels, Restaurants & Leisure 0.95% | | | |
| Melco International Development Ltd. | | | 2,256,000 | | | | 3,662 | |
| | | | | | | | | |
| Household Durables 0.57% | | | | | | | | |
| JS Global Lifestyle Co. Ltd.† | | | 1,232,000 | | | | 2,216 | |
| | | | | | | | | |
| Pharmaceuticals 0.55% | | | | | | | | |
| SSY Group Ltd. | | | 3,882,000 | | | | 2,125 | |
| | | | | | | | | |
| Real Estate Management & Development 0.34% | | | |
| Kerry Properties Ltd. | | | 545,500 | | | | 1,339 | |
| | | | | | | | | |
| Semiconductors & Semiconductor Equipment 0.77% | | | |
| ASM Pacific Technology Ltd. | | | 296,800 | | | | 2,993 | |
| | | | | | | | | |
| Textiles, Apparel & Luxury Goods 0.51% | | | |
| Stella International Holdings Ltd. | | | 1,918,432 | | | | 1,966 | |
| Total Hong Kong | | | | | | | 21,993 | |
| | | | | | | | | |
| Iceland 1.26% | | | | | | | | |
| Marel HF † | | | 1,012,550 | | | | 4,894 | |
| | | | | | | | | |
| India 0.81% | | | | | | | | |
| | | | | | | | | |
| Information Technology Services | | | | | | | | |
| Computer Age Management Services Ltd. * | | | 179,054 | | | | 3,136 | |
| Investments | | Shares | | | U.S. $
Fair Value
(000) | |
| Ireland 2.69% | | | | | | | | |
| |
| Health Care Providers & Services 1.40% | | | | | | | | |
| UDG Healthcare plc | | | 575,900 | | | $ | 5,413 | |
| |
| Information Technology Services 1.29% | | | |
| Keywords Studios plc | | | 181,846 | | | | 4,985 | |
| Total Ireland | | | | | | | 10,398 | |
| |
| Italy 5.03% | | | | | | | | |
| |
| Auto Components 1.20% | | | | | | | | |
| Freni Brembo SpA * | | | 447,105 | | | | 4,645 | |
| | | | | | | | | |
| Capital Markets 0.50% | | | | | | | | |
| Anima Holding SpA † | | | 520,338 | | | | 1,949 | |
| |
| Construction Materials 1.09% | | | | | | | | |
| Buzzi Unicem SpA | | | 194,369 | | | | 4,206 | |
| |
| Diversified Financial Services 0.67% | | | | | | | | |
| doValue SpA *†(a) | | | 281,190 | | | | 2,597 | |
| |
| Machinery 0.53% | | | | | | | | |
| IMA Industria Macchine Automatiche SpA * | | | 26,091 | | | | 2,053 | |
| |
| Textiles, Apparel & Luxury Goods 1.04% | | | |
| Brunello Cucinelli SpA * | | | 57,404 | | | | 1,724 | |
| Salvatore Ferragamo SpA * | | | 178,790 | | | | 2,306 | |
| | | | | | | | 4,030 | |
| Total Italy | | | | | | | 19,480 | |
| |
| Japan 26.01% | | | | | | | | |
| |
| Auto Components 1.50% | | | | | | | | |
| FCC Co., Ltd. | | | 303,400 | | | | 5,822 | |
| |
| Building Products 1.88% | | | | | | | | |
| Sanwa Holdings Corp. | | | 636,300 | | | | 7,258 | |
| |
| Chemicals 1.00% | | | | | | | | |
| Kansai Paint Co., Ltd. | | | 150,700 | | | | 3,885 | |
| |
| Construction & Engineering 2.28% | | | | | | | | |
| SHO-BOND Holdings Co. Ltd. | | | 182,600 | | | | 8,814 | |
| 108 | See Notes to Financial Statements. |
Schedule of Investments (continued)
INTERNATIONAL OPPORTUNITIES FUND October 31, 2020
| Investments | | Shares | | | U.S. $
Fair Value
(000) | |
| Japan (continued) | | | | | | | | |
| |
| Distributors 1.29% | | | | | | | | |
| PALTAC Corp. | | | 89,400 | | | $ | 4,998 | |
| |
| Electronic Equipment, Instruments & Components 2.91% | |
| Azbil Corp. | | | 201,400 | | | | 8,173 | |
| Taiyo Yuden Co., Ltd. | | | 83,400 | | | | 3,085 | |
| | | | | | | | 11,258 | |
| |
| Entertainment 1.63% | | | | | | | | |
| Capcom Co., Ltd. | | | 115,500 | | | | 6,317 | |
| |
| Equity Real Estate Investment Trusts 2.46% |
| GLP J-REIT | | | 2,600 | | | | 4,008 | |
| Nippon Prologis REIT, Inc. | | | 1,673 | | | | 5,507 | |
| | | | | | | | 9,515 | |
| |
| Food Products 0.29% | | | | | | | | |
| Nichirei Corp. | | | 44,100 | | | | 1,111 | |
| |
| Information Technology Services 1.98% | | | |
| BASE, Inc. * | | | 37,300 | | | | 3,998 | |
| TIS, Inc. | | | 192,000 | | | | 3,672 | |
| | | | | | | | 7,670 | |
| |
| Machinery 2.80% | | | | | | | | |
| CKD Corp. | | | 283,800 | | | | 4,724 | |
| DMG Mori Co., Ltd. | | | 146,700 | | | | 1,961 | |
| OSG Corp. | | | 277,600 | | | | 4,159 | |
| | | | | | | | 10,844 | |
| |
| Professional Services 1.21% | | | | | | | | |
| TechnoPro Holdings, Inc. | | | 75,100 | | | | 4,671 | |
| |
| Real Estate Management & Development 0.72% |
| Kenedix, Inc. | | | 534,500 | | | | 2,770 | |
| |
| Software 1.15% | | | | | | | | |
| Money Forward, Inc. * | | | 49,100 | | | | 4,442 | |
| |
| Specialty Retail 0.96% | | | | | | | | |
| Bic Camera, Inc. | | | 336,400 | | | | 3,715 | |
| Investments | | Shares | | | U.S. $
Fair Value
(000) | |
| Japan (continued) | | | | | | | | |
| |
| Thrifts & Mortgage Finance 0.79% | | | | | | | | |
| Aruhi Corp. | | | 171,400 | | | $ | 3,078 | |
| |
| Wireless Telecommunication Services 1.16% |
| Okinawa Cellular Telephone Co. | | | 112,600 | | | | 4,509 | |
| Total Japan | | | | | | | 100,677 | |
| |
| Jersey 1.28% | | | | | | | | |
| |
| Construction Materials | | | | | | | | |
| Breedon Group plc * | | | 5,413,953 | | | | 4,952 | |
| |
| Netherlands 0.38% | | | | | | | | |
| |
| Biotechnology | | | | | | | | |
| uniQure NV * | | | 36,208 | | | | 1,464 | |
| |
| Norway 1.09% | | | | | | | | |
| |
| Software | | | | | | | | |
| LINK Mobility Group Holding ASA * | | | 367,851 | | | | 1,965 | |
| Pexip Holding ASA * | | | 320,305 | | | | 2,262 | |
| Total Norway | | | | | | | 4,227 | |
| |
| Portugal 1.52% | | | | | | | | |
| |
| Multi-Utilities | | | | | | | | |
| REN - Redes Energeticas Nacionais SGPS SA | | 2,241,381 | | | | 5,887 | |
| |
| South Korea 3.19% | | | | | | | | |
| |
| Food & Staples Retailing 0.83% | | | | | | | | |
| GS Retail Co., Ltd. | | | 112,501 | | | | 3,195 | |
| |
| Semiconductors & Semiconductor Equipment 0.90% |
| WONIK IPS Co., Ltd. * | | | 122,648 | | | | 3,499 | |
| |
| Software 1.46% | | | | | | | | |
| Douzone Bizon Co. Ltd. | | | 64,130 | | | | 5,654 | |
| Total South Korea | | | | | | | 12,348 | |
| | See Notes to Financial Statements. | 109 |
Schedule of Investments (continued)
INTERNATIONAL OPPORTUNITIES FUND October 31, 2020
| Investments | | Shares | | | U.S. $
Fair Value
(000) | |
| Spain 2.23% | | | | | | | | |
| |
| Containers & Packaging 1.17% | | | | | | | | |
| Vidrala SA | | | 47,590 | | | $ | 4,545 | |
| |
| Professional Services 1.06% | | | | | | | | |
| Applus Services SA * | | | 521,057 | | | | 4,084 | |
| Total Spain | | | | | | | 8,629 | |
| |
| Sweden 2.19% | | | | | | | | |
| |
| Auto Components 0.67% | | | | | | | | |
| Dometic Group AB *† | | | 238,507 | | | | 2,578 | |
| | | | | | | | | |
| Commercial Services & Supplies 1.11% | | | |
| Loomis AB * | | | 192,648 | | | | 4,302 | |
| |
| Food & Staples Retailing 0.41% | | | | | | | | |
| Axfood AB | | | 68,037 | | | | 1,581 | |
| Total Sweden | | | | | | | 8,461 | |
| |
| Switzerland 6.01% | | | | | | | | |
| |
| Airlines 0.88% | | | | | | | | |
| Wizz Air Holdings plc *† | | | 82,268 | | | | 3,406 | |
| |
| Containers & Packaging 1.61% | | | | | | | | |
| SIG Combibloc Group AG * | | | 303,235 | | | | 6,237 | |
| |
| Insurance 0.76% | | | | | | | | |
| Swiss Life Holding AG * | | | 8,790 | | | | 2,957 | |
| |
| Life Sciences Tools & Services 1.77% | | | | | | | | |
| Tecan Group AG | | | 14,397 | | | | 6,832 | |
| |
| Machinery 0.99% | | | | | | | | |
| Sulzer AG | | | 52,292 | | | | 3,827 | |
| Total Switzerland | | | | | | | 23,259 | |
| |
| Taiwan 1.87% | | | | | | | | |
| |
| Semiconductors & Semiconductor Equipment |
| Realtek Semiconductor Corp. | | | 501,000 | | | | 6,241 | |
| Visual Photonics Epitaxy Co., Ltd. | | | 356,000 | | | | 1,005 | |
| Total Taiwan | | | | | | | 7,246 | |
| Investments | | Shares | | | U.S. $
Fair Value
(000) | |
| United Arab Emirates 0.22% | | | | | | | | |
| |
| Information Technology Services | | | | | | | | |
| Network International Holdings plc *† | | | 300,206 | | | $ | 861 | |
| | | | | | | | | |
| United Kingdom 13.39% | | | | | | | | |
| | | | | | |
| Aerospace & Defense 0.47% | | | | | | | | |
| Senior plc * | | | 2,558,219 | | | | 1,816 | |
| |
| Beverages 1.18% | | | | | | | | |
| Britvic plc | | | 478,822 | | | | 4,576 | |
| | | | | | | | | |
| Capital Markets 1.16% | | | | | | | | |
| Man Group plc | | | 3,219,099 | | | | 4,492 | |
| |
| Consumer Finance 0.59% | | | | | | | | |
| Arrow Global Group plc * | | | 1,398,286 | | | | 2,272 | |
| |
| Equity Real Estate Investment Trusts 1.60% | | | | | | | | |
| Big Yellow Group PLC | | | 224,755 | | | | 3,203 | |
| UNITE Group plc (The) * | | | 277,900 | | | | 2,999 | |
| | | | | | | | 6,202 | |
| |
| Insurance 1.48% | | | | | | | | |
| Lancashire Holdings Ltd. | | | 695,702 | | | | 5,741 | |
| |
| Internet & Direct Marketing Retail 1.14% | | | | | | | | |
| ASOS plc * | | | 77,426 | | | | 4,417 | |
| |
| Machinery 0.70% | | | | | | | | |
| Concentric AB * | | | 163,095 | | | | 2,702 | |
| |
| Media 1.00% | | | | | | | | |
| S4 Capital plc * | | | 748,827 | | | | 3,880 | |
| |
| Multi-Line Retail 1.13% | | | | | | | | |
| B&M European Value Retail SA | | | 694,476 | | | | 4,359 | |
| |
| Pharmaceuticals 1.10% | | | | | | | | |
| Dechra Pharmaceuticals plc | | | 94,121 | | | | 4,258 | |
| |
| Specialty Retail 0.62% | | | | | | | | |
| WH Smith plc | | | 184,369 | | | | 2,383 | |
| 110 | See Notes to Financial Statements. |
Schedule of Investments (continued)
INTERNATIONAL OPPORTUNITIES FUND October 31, 2020
| Investments | | Shares | | | U.S. $
Fair Value
(000) | |
| United Kingdom (continued) | | | | | | | | |
| | | | | | | | | |
| Trading Companies & Distributors 1.22% | | | |
| Grafton Group plc Unit * | | | 543,617 | | | $ | 4,726 | |
| Total United Kingdom | | | | | | | 51,824 | |
| | | | | | | | | |
| United States 1.73% | | | | | | | | |
| | | | | | | | | |
| Exchange- Traded Funds | | | | | | | | |
| VanEck Vectors Junior Gold Miners | | | 125,813 | | | | 6,694 | |
Total Common Stocks
(cost $371,003,886) | | | | | | | 383,854 | |
| | | | | | | | | |
| RIGHTS 0.06% | | | | | | | | |
| | | | | | | | | |
| Spain | | | | | | | | |
| | | | | | | | | |
| Containers & Packaging | | | | | | | | |
Vidrala SA *(b)
(cost $0) | | | 47,590 | | | | 227 | |
Total Long- Term Investments
(cost $371,003,886) | | | | | | | 384,081 | |
| | | | | | | | | |
| Investments | | Principal
Amount
(000) | | | Fair Value
(000) | |
| SHORT-TERM INVESTMENTS 1.24% | | | | | | | | |
| |
| Repurchase Agreement 0.31% | | | | | | | | |
| Repurchase Agreement dated 10/30/2020, 0.00% due 11/2/2020 with Fixed Income Clearing Corp. collateralized by $1,228,400 of U.S. Treasury Note at 0.25% due 6/15/2023; value: $1,231,709; proceeds: $1,207,510 (cost $1,207,510) | | | $1,208 | | | $ | 1,208 | |
| Investments | | Shares | | | Fair Value
(000) | |
| Money Market Fund 0.84% | | | | | | | | |
Fidelity Government Portfolio(c)
(cost $3,239,390) | | | 3,239,390 | | | $ | 3,239 | |
| | | | | | | | | |
| Time Deposit 0.09% | | | | | | | | |
CitiBank N.A.(c)
(cost $359,933) | | | 359,933 | | | | 360 | |
Total Short-Term Investments
(cost $4,806,833) | | | | | | | 4,807 | |
Total Investments in Securities 100.47%
(cost $375,810,719) | | | | | | | 388,888 | |
| Liabilities in Excess of Foreign Cash and Other Assets(d) (0.47) % | | | | | | | (1,822 | ) |
| Net Assets 100.00% | | | | | | $ | 387,066 | |
| REIT | | Real Estate Investment Trust. |
| * | | Non-income producing security. |
| † | | Security was purchased pursuant to Rule 144A under the Securities Act of 1933 and, unless registered under such Act or exempted from registration, may only be resold to qualified institutional buyers. At October 31, 2020, the total value of Rule 144A securities was $23,941, which represents 6.19% of net assets. |
| (a) | | All or a portion of this security is temporarily on loan to unaffiliated broker/dealers. |
| (b) | | The rights have an expiration of 12/10/2020. |
| (c) | | Security was purchased with the cash collateral from loaned securities. |
| (d) | | Liabilities in Excess of Foreign Cash and Other Assets include net unrealized depreciation on Total return swaps as follows: |
Open Total Return Swap Contracts at October 31, 2020:
Swap
Counterparty | | Referenced
Index* | | Referenced
Spread | | Units | | Position | | Termination
Date | | Notional
Amount | | | Notional
Value | | | Unrealized
Depreciation | |
| Bank of America | | MLEILAEN | | 1 Mo. LIBOR + .36% | | 94,118 | | Long | | 6/11/2021 | | | $5,608,492 | | | | $5,569,382 | | | | $(39,110 | ) |
| * | Merrill Lynch Custom Basket Index. |
| | See Notes to Financial Statements. | 111 |
Schedule of Investments (concluded)
INTERNATIONAL OPPORTUNITIES FUND October 31, 2020
The following is a summary of the inputs used as of October 31, 2020 in valuing the Fund’s investments carried at fair value(1):
| Investment Type(2) | | Level 1
(000) | | | Level 2
(000) | | | Level 3
(000) | | | Total
(000) | |
| Long-Term Investments | | | | | | | | | | | | | | | | |
| Common Stocks | | | | | | | | | | | | | | | | |
| Canada | | $ | 5,711 | | | $ | – | | | $ | – | | | $ | 5,711 | |
| Chile | | | 4,048 | | | | – | | | | – | | | | 4,048 | |
| France | | | 2,315 | | | | 3,552 | | | | – | | | | 5,867 | |
| Iceland | | | 4,894 | | | | – | | | | – | | | | 4,894 | |
| India | | | 3,136 | | | | – | | | | – | | | | 3,136 | |
| Ireland | | | 4,985 | | | | 5,413 | | | | – | | | | 10,398 | |
| Italy | | | 4,650 | | | | 14,830 | | | | – | | | | 19,480 | |
| Jersey | | | 4,952 | | | | – | | | | – | | | | 4,952 | |
| Netherlands | | | 1,464 | | | | – | | | | – | | | | 1,464 | |
| Norway | | | 1,965 | | | | 2,262 | | | | – | | | | 4,227 | |
| Spain | | | 4,545 | | | | 4,084 | | | | – | | | | 8,629 | |
| Sweden | | | 4,302 | | | | 4,159 | | | | – | | | | 8,461 | |
| United Kingdom | | | 10,670 | | | | 41,154 | | | | – | | | | 51,824 | |
| United States | | | 6,694 | | | | – | | | | – | | | | 6,694 | |
| Remaining Countries | | | – | | | | 244,069 | | | | – | | | | 244,069 | |
| Rights | | | 227 | | | | – | | | | – | | | | 227 | |
| Short-Term Investments | | | | | | | | | | | | | | | | |
| Repurchase Agreement | | | – | | | | 1,208 | | | | – | | | | 1,208 | |
| Money Market Fund | | | 3,239 | | | | – | | | | – | | | | 3,239 | |
| Time Deposit | | | - | | | | 360 | | | | – | | | | 360 | |
| Total | | $ | 67,797 | | | $ | 321,091 | | | $ | – | | | $ | 388,888 | |
| Other Financial Instruments | | | | | | | | | | | | | | | | |
| Total Return Swap Contracts | | | | | | | | | | | | | | | | |
| Assets | | $ | – | | | $ | – | | | $ | – | | | $ | – | |
| Liabilities | | | – | | | | (39 | ) | | | – | | | | (39 | ) |
| Total | | $ | – | | | $ | (39 | ) | | $ | – | | | $ | (39 | ) |
| (1) | | Refer to Note 2(l) for a description of fair value measurements and the three-tier hierarchy of inputs. |
| (2) | | See Schedule of Investments for fair values in each industry and identification of foreign issuers and/or geography. The table above is presented by Investment Type. Industries are presented within an Investment Type should such Investment Type include securities classified as two or more levels within the three-tier fair value hierarchy. |
A reconciliation of Level 3 investments is presented when the Fund has a material amount of Level 3 investments at the beginning or end of the year in relation to the Fund’s net assets.
| 112 | See Notes to Financial Statements. |
Schedule of Investments
INTERNATIONAL VALUE FUND October 31, 2020
| Investments | | Shares | | | U.S. $
Fair Value
(000) | |
| COMMON STOCKS 96.61% | | | | | | | | |
| | | | | | | | | |
| Australia 5.16% | | | | | | | | |
| | | | | | | | | |
| Banks 1.49% | | | | | | | | |
| National Australia Bank Ltd. | | | 506,878 | | | $ | 6,632 | |
| | | | | | | | | |
| Capital Markets 0.86% | | | | | | | | |
| Macquarie Group Ltd. | | | 43,100 | | | | 3,843 | |
| | | |
| Equity Real Estate Investment Trusts 1.03% | | |
| Goodman Group | | | 354,490 | | | | 4,588 | |
| | | | | | | | | |
| Metals & Mining 1.78% | | | | | | | | |
| BHP Group Ltd. | | | 330,952 | | | | 7,933 | |
| Total Australia | | | | | | | 22,996 | |
| | | | | | | | | |
| Austria 1.38% | | | | | | | | |
| | | | | | | | | |
| Banks | | | | | | | | |
| BAWAG Group AG *† | | | 167,432 | | | | 6,149 | |
| | | | | | | | | |
| Belgium 2.08% | | | | | | | | |
| | | | | | | | | |
| Beverages 1.34% | | | | | | | | |
| Anheuser-Busch InBev SA | | | 115,783 | | | | 5,989 | |
| | | | | | | | | |
| Pharmaceuticals 0.74% | | | | | | | | |
| UCB SA | | | 33,198 | | | | 3,279 | |
| Total Belgium | | | | | | | 9,268 | |
| | | | | | | | | |
| Brazil 0.69% | | | | | | | | |
| | | | | | | | | |
| Metals & Mining | | | | | | | | |
| Vale SA ADR | | | 292,411 | | | | 3,091 | |
| | | | | | | | | |
| Canada 1.93% | | | | | | | | |
| | | | | | | | | |
| Banks 1.01% | | | | | | | | |
| Royal Bank of Canada | | | 64,600 | | | | 4,517 | |
| | | | | | | | | |
| Oil, Gas & Consumable Fuels 0.92% | | | | | | | | |
| Pembina Pipeline Corp. | | | 195,633 | | | | 4,095 | |
| Total Canada | | | | | | | 8,612 | |
| Investments | | Shares | | | U.S. $
Fair Value
(000) | |
| Chile 1.27% | | | | | | |
| | | | | | | |
| Metals & Mining 0.85% | | | | | | | | |
| Lundin Mining Corp. | | | 624,955 | | | $ | 3,776 | |
| | | | | | | | | |
| Water Utilities 0.42% | | | | | | | | |
| Aguas Andinas SA | | | 7,164,165 | | | | 1,861 | |
| Total Chile | | | | | | | 5,637 | |
| | | | | | | | | |
| China 4.52% | | | | | | | | |
| | | | | | | | | |
| Construction Materials 1.37% | | | | | | | | |
| China Resources Cement Holdings Ltd. | | | 4,660,000 | | | | 6,102 | |
| | | | | | | | | |
| Internet & Direct Marketing Retail 1.38% | | | | | | | | |
| Alibaba Group Holding Ltd. ADR * | | | 20,135 | | | | 6,135 | |
| | | | | | | | | |
| Oil, Gas & Consumable Fuels 0.84% | | | | | | | | |
| CNOOC Ltd. | | | 4,120,000 | | | | 3,770 | |
| | | | | | | | | |
| Real Estate Management & Development 0.93% | | | | | | | |
| Logan Group Co., Ltd. | | | 2,640,000 | | | | 4,142 | |
| Total China | | | | | | | 20,149 | |
| | | | | | | | | |
| France 12.19% | | | | | | | | |
| | | | | | | | | |
| Aerospace & Defense 0.80% | | | | | | | | |
| Safran SA * | | | 33,756 | | | | 3,561 | |
| | | | | | | | | |
| Banks 1.41% | | | | | | | | |
| Credit Agricole SA * | | | 793,379 | | | | 6,276 | |
| | | | | | | | | |
| Building Products 1.57% | | | | | | | | |
| Cie de Saint-Gobain * | | | 179,945 | | | | 7,010 | |
| | | | | | | | | |
| Construction & Engineering 1.02% | | | | | | | | |
| Vinci SA | | | 57,464 | | | | 4,539 | |
| | | | | | | | | |
| Diversified Telecommunication Services 1.32% | | | | | | | |
| Orange SA | | | 525,747 | | | | 5,904 | |
| | | | | | | | | |
| Gas Utilities 0.58% | | | | | | | | |
| Rubis SCA | | | 78,077 | | | | 2,567 | |
| | See Notes to Financial Statements. | 113 |
Schedule of Investments (continued)
INTERNATIONAL VALUE FUND October 31, 2020
| Investments | | Shares | | | U.S. $
Fair Value
(000) | |
| France (continued) | | | | | | | | |
| | | | | | | | | |
| Insurance 1.04% | | | | | | | | |
| AXA SA | | | 288,554 | | | $ | 4,634 | |
| | | | | | | | | |
| Multi-Utilities 1.61% | | | | | | | | |
| Engie SA * | | | 591,289 | | | | 7,151 | |
| | | | | | | | | |
| Pharmaceuticals 2.84% | | | | | | | | |
| Sanofi | | | 140,200 | | | | 12,659 | |
| Total France | | | | | | | 54,301 | |
| | | | | | | | | |
| Germany 10.68% | | | | | | | | |
| | | | | | | | | |
| Air Freight & Logistics 1.75% | | | | | | | | |
| Deutsche Post AG Registered Shares | | | 175,437 | | | | 7,779 | |
| | | | | | | | | |
| Auto Components 1.18% | | | | | | | | |
| Continental AG | | | 49,408 | | | | 5,250 | |
| | | | | | | | | |
| Automobiles 1.41% | | | | | | | | |
| Volkswagen AG | | | 40,271 | | | | 6,265 | |
| | | | | | | | | |
| Industrial Conglomerates 1.39% | | | | | | | | |
| Siemens AG Registered Shares | | | 52,922 | | | | 6,209 | |
| | | | | | | | | |
| Insurance 1.85% | | | | | | | | |
| Allianz SE Registered Shares | | | 46,921 | | | | 8,265 | |
| | | | | | | | | |
| Machinery 0.83% | | | | | | | | |
| KION Group AG | | | 47,391 | | | | 3,693 | |
| | | | | | | | | |
| Media 0.69% | | | | | | | | |
| Stroeer SE & Co. KGaA * | | | 42,388 | | | | 3,064 | |
| | | | | | | | | |
| Pharmaceuticals 0.79% | | | | | | | | |
| Merck KGaA | | | 23,941 | | | | 3,546 | |
| | | | | | | | | |
| Semiconductors & Semiconductor Equipment 0.79% |
| Infineon Technologies AG | | | 125,946 | | | | 3,506 | |
| Total Germany | | | | | | | 47,577 | |
| | | | | | | | | |
| Hong Kong 3.71% | | | | | | | | |
| | | | | | | | | |
| Auto Components 1.67% | | | | | | | | |
| Xinyi Glass Holdings Ltd. | | | 3,392,000 | | | | 7,449 | |
| Investments | | Shares | | | U.S. $
Fair Value
(000) | |
| Hong Kong (continued) | | | | | | | | |
| | | | | | | | | |
| Electric: Utilities 0.79% | | | | | | | | |
| CK Infrastructure Holdings Ltd. | | | 743,500 | | | $ | 3,507 | |
| | | | | | | | | |
| Real Estate Management & Development 1.25% | | | |
| Kerry Properties Ltd. | | | 2,278,000 | | | | 5,589 | |
| Total Hong Kong | | | | | | | 16,545 | |
| | | | | | | | | |
| India 0.55% | | | | | | | | |
| | | | | | | | | |
| Oil, Gas & Consumable Fuels | | | | | | | | |
| Petronet LNG Ltd. | | | 790,125 | | | | 2,461 | |
| | | | | | | | | |
| Italy 2.45% | | | | | | | | |
| | | | | | | | | |
| Auto Components 0.80% | | | | | | | | |
| Freni Brembo SpA * | | | 340,128 | | | | 3,534 | |
| | | | | | | | | |
| Electric: Utilities 0.89% | | | | | | | | |
| Enel SpA | | | 500,243 | | | | 3,977 | |
| | | | | | | | | |
| Textiles, Apparel & Luxury Goods 0.76% | | |
| Moncler SpA * | | | 84,764 | | | | 3,392 | |
| Total Italy | | | | | | | 10,903 | |
| | | | | | | | | |
| Japan 16.67% | | | | | | | | |
| | | | | | | | | |
| Auto Components 0.90% | | | | | | | | |
| Denso Corp. | | | 85,800 | | | | 3,998 | |
| | | | | | | | | |
| Automobiles 0.77% | | | | | | | | |
| Toyota Motor Corp. | | | 52,400 | | | | 3,440 | |
| | | | | | | | | |
| Banks 1.66% | | | | | | | | |
| Sumitomo Mitsui Financial Group, Inc. | | | 266,600 | | | | 7,380 | |
| | | | | | | | | |
| Beverages 1.33% | | | | | | | | |
| Asahi Group Holdings Ltd. | | | 191,100 | | | | 5,914 | |
| | | | | | | | | |
| Building Products 2.01% | | | | | | | | |
| Sanwa Holdings Corp. | | | 783,900 | | | | 8,942 | |
| | | | | | | | | |
| Diversified Financial Services 1.22% | | |
| ORIX Corp. | | | 465,200 | | | | 5,441 | |
| 114 | See Notes to Financial Statements. |
Schedule of Investments (continued)
INTERNATIONAL VALUE FUND October 31, 2020
| Investments | | Shares | | | U.S. $
Fair Value
(000) | |
| Japan (continued) | | | | | | | | |
| | | | | | | | | |
| Electronic Equipment, Instruments & Components 3.42% |
| Hitachi Ltd. | | | 176,800 | | | $ | 5,959 | |
| TDK Corp. | | | 78,800 | | | | 9,267 | |
| | | | | | | | 15,226 | |
| | | | | | | | | |
| Household Durables 2.00% | | | | | | | | |
| Sony Corp. | | | 106,800 | | | | 8,903 | |
| | | | | | | | | |
| Insurance 0.39% | | | | | | | | |
| Tokio Marine Holdings, Inc. | | | 39,100 | | | | 1,747 | |
| | | | | | | | | |
| Trading Companies & Distributors 1.64% | | |
| ITOCHU Corp. | | | 303,800 | | | | 7,297 | |
| | | | | | | | | |
| Wireless Telecommunication Services 1.33% | | |
| SoftBank Group Corp. | | | 91,200 | | | | 5,940 | |
| Total Japan | | | | | | | 74,228 | |
| | | | | | | | | |
| Macau 1.02% | | | | | | | | |
| | | | | | | | | |
| Hotels, Restaurants & Leisure | | | | | | | | |
| Sands China Ltd. | | | 1,291,600 | | | | 4,533 | |
| | | | | | | | | |
| Mexico 0.77% | | | | | | | | |
| | | | | | | | | |
| Banks | | | | | | | | |
| Grupo Financiero Banorte | | | | | | | | |
| SAB de CV * | | | 767,166 | | | | 3,418 | |
| | | | | | | | | |
| Netherlands 1.53% | | | | | | | | |
| | | | | | | | | |
| Oil, Gas & Consumable Fuels | | | | | | | | |
| Royal Dutch Shell plc Class A ADR (a) | | | 267,024 | | | | 6,822 | |
| | | | | | | | | |
| New Zealand 0.74% | | | | | | | | |
| | | | | | | | | |
| Diversified Telecommunication Services | | |
| Spark New Zealand Ltd. | | | 1,105,348 | | | | 3,280 | |
| | | | | | | | | |
| Russia 0.84% | | | | | | | | |
| | | | | | | | | |
| Oil, Gas & Consumable Fuels | | | | | | | | |
| Lukoil PJSC ADR | | | 73,391 | | | | 3,755 | |
| Investments | | Shares | | | U.S. $
Fair Value
(000) | |
| Singapore 0.60% | | | | | | | | |
| | | | | | | | | |
| Electronic Equipment, Instruments & Components | | |
| Venture Corp. Ltd. | | | 189,900 | | | $ | 2,677 | |
| | | | | | | | | |
| South Africa 2.26% | | | | | | | | |
| | | | | | | | | |
| Metals & Mining | | | | | | | | |
| Anglo American plc | | | 428,760 | | | | 10,060 | |
| | | | | | | | | |
| South Korea 2.21% | | | | | | | | |
| | | | | | | | | |
| Technology Hardware, Storage & Peripherals | | |
| Samsung Electronics Co., Ltd. | | | 195,392 | | | | 9,822 | |
| | | | | | | | | |
| Sweden 1.88% | | | | | | | | |
| | | | | | | | | |
| Commercial Services & Supplies 0.88% | | |
| Loomis AB * | | | 174,803 | | | | 3,903 | |
| | | | | | | | | |
| Machinery 1.00% | | | | | | | | |
| Sandvik AB * | | | 250,832 | | | | 4,471 | |
| Total Sweden | | | | | | | 8,374 | |
| | | | | | | | | |
| Switzerland 6.62% | | | | | | | | |
| | | | | | | | | |
| Capital Markets 2.10% | | | | | | | | |
| UBS Group AG | | | 801,929 | | | | 9,336 | |
| | | | | | | | | |
| Insurance 1.89% | | | | | | | | |
| Swiss Life Holding AG * | | | 7,820 | | | | 2,631 | |
| Zurich Financial Services AG | | | 17,363 | | | | 5,767 | |
| | | | | | | | 8,398 | |
| | | | | | | | | |
| Pharmaceuticals 2.63% | | | | | | | | |
| Novartis AG Registered Shares | | | 67,904 | | | | 5,291 | |
| Roche Holding AG | | | 20,030 | | | | 6,436 | |
| | | | | | | | 11,727 | |
| Total Switzerland | | | | | | | 29,461 | |
| | | | | | | | | |
| Taiwan 0.61% | | | | | | | | |
| | | | | | | | | |
| Semiconductors & Semiconductor Equipment | | | | | | | | |
| Realtek Semiconductor Corp. | | | 218,000 | | | | 2,716 | |
| | See Notes to Financial Statements. | 115 |
Schedule of Investments (continued)
INTERNATIONAL VALUE FUND October 31, 2020
| Investments | | Shares | | | U.S. $
Fair Value
(000) | |
| United Kingdom 12.24% | | | | | | | | |
| | | | | | | | | |
| Aerospace & Defense 0.53% | | | | | | | | |
| BAE Systems plc | | | 454,798 | | | $ | 2,338 | |
| | | | | | | | | |
| Banks 0.58% | | | | | | | | |
| Standard Chartered plc * | | | 564,945 | | | | 2,582 | |
| | | | | | | | | |
| Hotels, Restaurants & Leisure 1.37% | | |
| GVC Holdings plc * | | | 487,151 | | | | 6,103 | |
| | | | | | | | | |
| Household Durables 1.11% | | | | | | | | |
| Persimmon plc | | | 163,812 | | | | 4,960 | |
| | | | | | | | | |
| Insurance 3.08% | | | | | | | | |
| Beazley plc | | | 578,671 | | | | 2,206 | |
| Prudential plc | | | 448,499 | | | | 5,485 | |
| RSA Insurance Group plc | | | 1,097,842 | | | | 6,029 | |
| | | | | | | | 13,720 | |
| | | | | | | | | |
| Multi-Utilities 1.14% | | | | | | | | |
| National Grid plc | | | 424,691 | | | | 5,052 | |
| | | | | | | | | |
| Pharmaceuticals 1.33% | | | | | | | | |
| AstraZeneca plc | | | 58,966 | | | | 5,920 | |
| | | | | | | | | |
| Tobacco 2.23% | | | | | | | | |
| British American Tobacco plc | | | 211,695 | | | | 6,709 | |
| Imperial Brands plc | | | 203,869 | | | | 3,227 | |
| | | | | | | | 9,936 | |
| | | | | | | | | |
| Trading Companies & Distributors 0.87% | | |
| Ashtead Group plc | | | 107,544 | | | | 3,886 | |
| Total United Kingdom | | | | | | | 54,497 | |
| | | | | | | | | |
| United States 2.01% | | | | | | | | |
| | | | | | | | | |
| Auto Components 1.31% | | | | | | | | |
| Lear Corp. | | | 48,107 | | | | 5,812 | |
| | | | | | | | | |
| Trading Companies & Distributors 0.70% | | |
| Ferguson plc | | | 31,403 | | | | 3,119 | |
| Total United States | | | | | | | 8,931 | |
Total Common Stocks
(cost $438,516,732) | | | | | | | 430,263 | |
| Investments | | Principal
Amount
(000) | | | Fair Value
(000) | |
| SHORT-TERM INVESTMENTS 3.52% | | | | | | | | |
| | | | | | | | | |
| Repurchase Agreement 2.34% | | | | | | | | |
Repurchase Agreement dated 10/30/2020, 0.00% due 11/2/2020 with Fixed Income Clearing Corp. collateralized by $10,196,700 of U.S. Treasury Note at 1.625% due 4/30/2023; value: $10,649,126; proceeds: $10,440,227
(cost $10,440,227) | | | $10,440 | | | $ | 10,440 | |
| | | | | | | | | |
| | | Shares | | | | | |
| | | | | | | | | |
| Money Market Fund 1.06% | | | | | | | | |
Fidelity Government Portfolio(b)
(cost $4,713,480) | | | 4,713,480 | | | | 4,713 | |
| | | | | | | | | |
| Time Deposit 0.12% | | | | | | | | |
CitiBank N.A.(b)
(cost $523,720) | | | 523,720 | | | | 524 | |
Total Short-Term Investments
(cost $15,677,427) | | | | | | | 15,677 | |
Total Investments in Securities 100.13%
(cost $454,194,159) | | | | | | | 445,940 | |
| Liabilities in Excess of Foreign Cash and Other Assets (0.13)% | | | | | | | (589 | ) |
| Net Assets 100.00% | | | | | | $ | 445,351 | |
| | | |
| ADR | | American Depositary Receipt. |
| * | | Non-income producing security. |
| † | | Security was purchased pursuant to Rule 144A under the Securities Act of 1933 and, unless registered under such Act or exempted from registration, may only be resold to qualified institutional buyers. At October 31, 2020, the total value of Rule 144A securities was $6,149,000, which represents 1.38% of net assets. |
| (a) | | All or a portion of this security was on loan to brokers at October 31, 2020. |
| (b) | | Security was purchased with the cash collateral from loaned securities. |
| 116 | See Notes to Financial Statements. |
Schedule of Investments (concluded)
INTERNATIONAL VALUE FUND October 31, 2020
The following is a summary of the inputs used as of October 31, 2020 in valuing the Fund’s investments carried at fair value(1):
| Investment Type(2) | | Level 1
(000) | | | Level 2
(000) | | | Level 3
(000) | | | Total
(000) | |
| Common Stocks | | | | | | | | | | | | | | | | |
| Brazil | | $ | 3,091 | | | $ | – | | | $ | – | | | $ | 3,091 | |
| Canada | | | 8,612 | | | | – | | | | – | | | | 8,612 | |
| Chile | | | 5,637 | | | | – | | | | – | | | | 5,637 | |
| China | | | 6,135 | | | | 14,014 | | | | – | | | | 20,149 | |
| Mexico | | | 3,418 | | | | – | | | | – | | | | 3,418 | |
| Netherlands | | | 6,822 | | | | – | | | | – | | | | 6,822 | |
| Sweden | | | 3,903 | | | | 4,471 | | | | – | | | | 8,374 | |
| United States | | | 5,812 | | | | 3,119 | | | | – | | | | 8,931 | |
| Remaining Countries | | | – | | | | 365,229 | | | | – | | | | 365,229 | |
| Short-Term Investments | | | | | | | | | | | | | | | | |
| Repurchase Agreement | | | – | | | | 10,440 | | | | – | | | | 10,440 | |
| Money Market Funds | | | 4,713 | | | | – | | | | – | | | | 4,713 | |
| Time Deposit | | | – | | | | 524 | | | | – | | | | 524 | |
| Total | | $ | 48,143 | | | $ | 397,797 | | | $ | – | | | $ | 445,940 | |
| | | |
| (1) | | Refer to Note 2(l) for a description of fair value measurements and the three-tier hierarchy of inputs. |
| (2) | | See Schedule of Investments for fair values in each industry and identification of foreign issuers and/or geography. The table above is presented by Investment Type. Industries are presented within an Investment Type should such Investment Type include securities classified as two or more levels within the three-tier fair value hierarchy. |
A reconciliation of Level 3 investments is presented when the Fund has a material amount of Level 3 investments at the beginning or end of the year in relation to the Fund’s net assets.
| | See Notes to Financial Statements. | 117 |
Schedule of Investments
VALUE OPPORTUNITIES FUND October 31, 2020
| | | | | | Fair | |
| | | | | | Value | |
| Investments | | Shares | | | (000) | |
| COMMON STOCKS 99.68% | | | | | | | | |
| | | | | | | | | |
| Auto Components 4.36% | | | | | | | | |
| Dorman Products, Inc.* | | | 241,670 | | | $ | 21,574 | |
| LCI Industries | | | 123,745 | | | | 13,570 | |
| Lear Corp. | | | 205,841 | | | | 24,867 | |
| Total | | | | | | | 60,011 | |
| | | | | | | | | |
| Banks 6.16% | | | | | | | | |
| Bank of Hawaii Corp. | | | 257,927 | | | | 15,641 | |
| East West Bancorp, Inc. | | | 475,135 | | | | 17,333 | |
| First Republic Bank | | | 182,948 | | | | 23,077 | |
| SVB Financial Group* | | | 98,584 | | | | 28,658 | |
| Total | | | | | | | 84,709 | |
| | | | | | | | | |
| Beverages 0.82% | | | | | | | | |
| Primo Water Corp. | | | 896,668 | | | | 11,235 | |
| | | | | | | | | |
| Biotechnology 0.41% | | | | | | | | |
| Exelixis, Inc.* | | | 278,393 | | | | 5,701 | |
| | | | | | | | | |
| Building Products 6.32% | | | | | | | | |
| A.O. Smith Corp. | | | 461,242 | | | | 23,842 | |
| Allegion plc (Ireland)(a) | | | 214,087 | | | | 21,087 | |
| Masonite International Corp.* | | | 199,124 | | | | 17,523 | |
| Simpson Manufacturing Co., Inc. | | | 274,996 | | | | 24,398 | |
| Total | | | | | | | 86,850 | |
| | | | | | | | | |
| Capital Markets 1.32% | | | | | | | | |
| Ares Capital Corp. | | | 1,307,793 | | | | 18,087 | |
| | | | | | | | | |
| Chemicals 4.96% | | | | | | | | |
| Avient Corp. | | | 642,222 | | | | 19,954 | |
| Axalta Coating | | | | | | | | |
| Systems Ltd.* | | | 1,029,458 | | | | 25,850 | |
| Valvoline, Inc. | | | 1,140,212 | | | | 22,428 | |
| Total | | | | | | | 68,232 | |
| | | | | | | | | |
| Consumer Finance 2.13% | | | | | | | | |
| Discover Financial Services | | | 450,709 | | | | 29,301 | |
| | | | | | Fair | |
| | | | | | Value | |
| Investments | | Shares | | | (000) | |
| Containers & Packaging 1.93% | | | | | | | | |
| Avery Dennison Corp. | | | 191,703 | | | $ | 26,530 | |
| | | | | | | | | |
| Electric: Utilities 2.72% | | | | | | | | |
| IDACORP, Inc. | | | 208,582 | | | | 18,299 | |
| Portland General Electric Co. | | | 487,767 | | | | 19,169 | |
| Total | | | | | | | 37,468 | |
| | | | | | | | | |
| Electrical Equipment 1.82% | | | | | | | | |
| Acuity Brands, Inc. | | | 77,342 | | | | 6,894 | |
| Generac Holdings, Inc.* | | | 86,498 | | | | 18,178 | |
| Total | | | | | | | 25,072 | |
| | | | | | | | | |
| Electronic Equipment, Instruments & Components 3.28% | |
| FLIR Systems, Inc. | | | 584,860 | | | | 20,289 | |
| Littelfuse, Inc. | | | 125,640 | | | | 24,869 | |
| Total | | | | | | | 45,158 | |
| | | | | | | | | |
| Equity Real Estate Investment Trusts 4.96% | |
| Alexandria Real Estate Equities, Inc. | | | 145,718 | | | | 22,079 | |
| First Industrial Realty Trust, Inc. | | | 581,736 | | | | 23,159 | |
| Sunstone Hotel Investors, Inc. | | | 1,705,600 | | | | 12,656 | |
| UDR, Inc. | | | 330,138 | | | | 10,313 | |
| Total | | | | | | | 68,207 | |
| | | | | | | | | |
| Health Care Equipment & Supplies 6.01% | | |
| Cooper Cos., Inc. (The) | | | 55,512 | | | | 17,711 | |
| Hill-Rom Holdings, Inc. | | | 235,298 | | | | 21,428 | |
| NuVasive, Inc.* | | | 380,885 | | | | 16,923 | |
| STERIS plc | | | 149,984 | | | | 26,576 | |
| Total | | | | | | | 82,638 | |
| | | | | | | | | |
| Health Care Providers & Services 2.37% | |
| Encompass Health Corp. | | | 198,127 | | | | 12,147 | |
| Molina Healthcare, Inc.* | | | 109,451 | | | | 20,410 | |
| Total | | | | | | | 32,557 | |
| | | | | | | | | |
| Hotels, Restaurants & Leisure 1.99% | |
| Dunkin’ Brands Group, Inc. | | | 274,833 | | | | 27,404 | |
| 118 | See Notes to Financial Statements. |
Schedule of Investments (continued)
VALUE OPPORTUNITIES FUND October 31, 2020
| | | | | | Fair | |
| | | | | | Value | |
| Investments | | Shares | | | (000) | |
| Household Durables 2.54% | | | | | | | | |
| Leggett & Platt, Inc. | | | 516,500 | | | $ | 21,553 | |
| Purple Innovation, Inc.* | | | 472,115 | | | | 13,394 | |
| Total | | | | | | | 34,947 | |
| | | | | | | | | |
| Industrial Conglomerates 1.53% | | | | | | | | |
| Carlisle Cos., Inc. | | | 169,488 | | | | 20,994 | |
| | | | | | | | | |
| Information Technology Services 7.07% | |
| Amdocs Ltd. | | | 163,226 | | | | 9,203 | |
| Booz Allen Hamilton Holding Corp. | | | 288,861 | | | | 22,675 | |
| EPAM Systems, Inc.* | | | 36,187 | | | | 11,180 | |
| Euronet Worldwide, Inc.* | | | 244,904 | | | | 21,757 | |
| Jack Henry & Associates, Inc. | | | 123,128 | | | | 18,254 | |
| MAXIMUS, Inc. | | | 209,740 | | | | 14,174 | |
| Total | | | | | | | 97,243 | |
| | | | | | | | | |
| Insurance 4.62% | | | | | | | | |
| Arch Capital Group Ltd.* | | | 330,185 | | | | 9,975 | |
| Globe Life, Inc. | | | 169,964 | | | | 13,782 | |
| RenaissanceRe Holdings Ltd. | | | 134,248 | | | | 21,711 | |
| Stewart Information Services Corp. | | | 427,060 | | | | 18,103 | |
| Total | | | | | | | 63,571 | |
| | | | | | | | | |
| Internet Software & Services 1.60% | | | | | | | | |
| TechTarget, Inc.* | | | 501,971 | | | | 21,986 | |
| | | | | | | | | |
| Leisure Products 0.97% | | | | | | | | |
| Malibu Boats, Inc. Class A* | | | 262,708 | | | | 13,353 | |
| | | | | | | | | |
| Life Sciences Tools & Services 6.84% | | | | | | | | |
| Bio-Techne Corp. | | | 78,837 | | | | 19,899 | |
| Charles River Laboratories International, Inc.* | | | 131,894 | | | | 30,032 | |
| ICON plc (Ireland)*(a) | | | 89,317 | | | | 16,104 | |
| PerkinElmer, Inc. | | | 216,529 | | | | 28,052 | |
| Total | | | | | | | 94,087 | |
| | | | | | Fair | |
| | | | | | Value | |
| Investments | | Shares | | | (000) | |
| Machinery 2.74% | | | | | | | | |
| Allison Transmission Holdings, Inc. | | | 576,026 | | | $ | 20,824 | |
| Crane Co. | | | 332,595 | | | | 16,879 | |
| Total | | | | | | | 37,703 | |
| | | | | | | | | |
| Metals & Mining 1.60% | | | | | | | | |
| Reliance Steel &Aluminum Co. | | | 201,529 | | | | 21,965 | |
| | | | | | | | | |
| Multi-Utilities 1.43% | | | | | | | | |
| NorthWestern Corp. | | | 376,832 | | | | 19,644 | |
| | | | | | | | | |
| Oil, Gas & Consumable Fuels 1.06% | | | | | | | | |
| Cabot Oil & Gas Corp. | | | 525,300 | | | | 9,345 | |
| Par Pacific Holdings, Inc.* | | | 816,469 | | | | 5,258 | |
| Total | | | | | | | 14,603 | |
| | | | | | | | | |
| Real Estate Management & Development 1.00% | |
| Marcus & Millichap, Inc.* | | | 439,300 | | | | 13,719 | |
| | | | | | | | | |
| Road & Rail 3.54% | | | | | | | | |
| Landstar System, Inc. | | | 224,300 | | | | 27,970 | |
| Saia, Inc.* | | | 140,051 | | | | 20,680 | |
| Total | | | | | | | 48,650 | |
| | | | | | | | | |
| Semiconductors & Semiconductor Equipment 5.71% | |
| Entegris, Inc. | | | 418,259 | | | | 31,273 | |
| Monolithic Power Systems, Inc. | | | 79,567 | | | | 25,430 | |
| Teradyne, Inc. | | | 248,233 | | | | 21,807 | |
| Total | | | | | | | 78,510 | |
| | | | | | | | | |
| Software 2.45% | | | | | | | | |
| Fair Isaac Corp.* | | | 55,968 | | | | 21,909 | |
| Synopsys, Inc.* | | | 55,354 | | | | 11,838 | |
| Total | | | | | | | 33,747 | |
| | | | | | | | | |
| Specialty Retail 3.03% | | | | | | | | |
| Burlington Stores, Inc.* | | | 109,043 | | | | 21,109 | |
| Williams-Sonoma, Inc. | | | 225,666 | | | | 20,583 | |
| Total | | | | | | | 41,692 | |
| | See Notes to Financial Statements. | 119 |
Schedule of Investments (concluded)
VALUE OPPORTUNITIES FUND October 31, 2020
| | | | | | Fair | |
| | | | | | Value | |
| Investments | | Shares | | | (000) | |
| Textiles, Apparel & Luxury Goods 0.39% | |
| Columbia Sportswear Co. | | | 72,148 | | | $ | 5,382 | |
Total Common Stocks 99.68%
(cost $1,154,894,565) | | | | | | | 1,370,956 | |
| Cash and Other Assets in Excess of Liabilities 0.32% | | | | 4,454 | |
| Net Assets 100.00% | | | | | | $ | 1,375,410 | |
| * | | Non-income producing security. |
| (a) | | Foreign security traded in U.S. dollars. |
The following is a summary of the inputs used as of October 31, 2020 in valuing the Fund’s investments carried at fair value(1):
| | | Level 1 | | | Level 2 | | | Level 3 | | | Total | |
| Investment Type(2) | | (000) | | | (000) | | | (000) | | | (000) | |
| Common Stocks | | $ | 1,370,956 | | | $ | – | | | $ | – | | | $ | 1,370,956 | |
| Total | | $ | 1,370,956 | | | $ | – | | | $ | – | | | $ | 1,370,956 | |
| (1) | | Refer to Note 2(l) for a description of fair value measurements and the three-tier hierarchy of inputs. |
| (2) | | See Schedule of Investments for fair values in each industry and identification of foreign issuers and/or geography. |
A reconciliation of Level 3 investments is presented when the Fund has a material amount of Level 3 investments at the beginning or end of the year in relation to the Fund's net assets.
| 120 | See Notes to Financial Statements. |
This page is intentionally left blank.
121
Statements of Assets and Liabilities
October 31, 2020
| | | Alpha
Strategy Fund | | | Durable
Growth Fund | | | Focused
Growth Fund | |
| ASSETS: | | | | | | | | | | | | |
| Investments in securities, at cost | | $ | 211,123 | | | $ | 171,409,783 | | | $ | 21,864,498 | |
| Investments in Underlying Funds, at cost | | | 714,446,753 | | | | – | | | | – | |
| Investments in securities, at fair value | | $ | 211,123 | | | $ | 201,510,486 | | | $ | 27,641,624 | |
| Investments in Underlying Funds, at value | | | 668,901,598 | | | | – | | | | – | |
| Cash | | | – | | | | – | | | | – | |
| Foreign cash, at value (cost $0, $0, $0, $0, $0, $0 and $32,162, respectively) | | | – | | | | – | | | | – | |
| Receivables: | | | | | | | | | | | | |
| Investment in securities sold | | | – | | | | 828,740 | | | | 137,016 | |
| Capital shares sold | | | 497,636 | | | | 5,191 | | | | 613,756 | |
| Interest and dividends | | | – | | | | 86,268 | | | | 772 | |
| From advisor (See Note 3) | | | 19 | | | | 261 | | | | 20,540 | |
| Securities lending income receivable | | | – | | | | – | | | | 20 | |
| Investment in Underlying Funds sold | | | 511,631 | | | | – | | | | – | |
| Prepaid expenses and other assets | | | 47,409 | | | | 84,208 | | | | 30,429 | |
| Total assets | | | 670,169,416 | | | | 202,515,154 | | | | 28,444,157 | |
| LIABILITIES: | | | | | | | | | | | | |
| Payables: | | | | | | | | | | | | |
| Capital shares reacquired | | | 2,043,457 | | | | – | | | | 140,287 | |
| Investments in securities purchased | | | – | | | | 570,249 | | | | – | |
| Management fee | | | – | | | | 113,352 | | | | 16,056 | |
| 12b-1 distribution plan | | | 138,329 | | | | 582 | | | | 4,870 | |
| Trustees’ fees | | | 140,841 | | | | 3,816 | | | | 472 | |
| Fund administration | | | 23,695 | | | | 8,244 | | | | 988 | |
| Offering costs | | | – | | | | 1,905 | | | | 25,298 | |
| Foreign currency overdraft | | | – | | | | – | | | | – | |
| Accrued expenses | | | 261,410 | | | | 49,769 | | | | 34,885 | |
| Total liabilities | | | 2,607,732 | | | | 747,917 | | | | 222,856 | |
| Commitments and contingent liabilities | | | | | | | | | | | | |
| NET ASSETS | | $ | 667,561,684 | | | $ | 201,767,237 | | | $ | 28,221,301 | |
| COMPOSITION OF NET ASSETS: | | | | | | | | | | | | |
| Paid-in capital | | $ | 695,416,198 | | | $ | 167,842,579 | | | $ | 20,480,359 | |
| Total distributable earnings (loss) | | | (27,854,514 | ) | | | 33,924,658 | | | | 7,740,942 | |
| Net Assets | | $ | 667,561,684 | | | $ | 201,767,237 | | | $ | 28,221,301 | |
| 122 | See Notes to Financial Statements. |
Focused
Large Cap
Value Fund | | | Focused
Small Cap
Value Fund | | | Fundamental
Equity Fund | | | Global Equity
Research Fund | |
| |
| $ | 406,713,643 | | | $ | 77,821,227 | | | $ | 1,450,953,989 | | | $ | 6,008,665 | |
| | – | | | | – | | | | – | | | | – | |
| $ | 432,069,317 | | | $ | 75,629,751 | | | $ | 1,617,490,452 | | | $ | 6,831,931 | |
| | – | | | | – | | | | – | | | | – | |
| | – | | | | – | | | | 420 | | | | 36,484 | |
| |
| | – | | | | – | | | | – | | | | 33,540 | |
| |
| | – | | | | – | | | | 3,313,571 | | | | 54,424 | |
| | 2,174 | | | | 123,429 | | | | 232,771 | | | | 413 | |
| | 970,744 | | | | 11,187 | | | | 4,411,175 | | | | 10,313 | |
| | 35,587 | | | | 6,424 | | | | – | | | | 27,616 | |
| | – | | | | 198 | | | | 22 | | | | 5 | |
| | – | | | | – | | | | – | | | | – | |
| | 85,900 | | | | 52,437 | | | | 79,109 | | | | 74,754 | |
| | 433,163,722 | | | | 75,823,426 | | | | 1,625,527,520 | | | | 7,069,480 | |
| |
| | – | | | | 98,242 | | | | 2,257,420 | | | | 116 | |
| | 3,729,545 | | | | – | | | | 1,588,368 | | | | 51,983 | |
| | 192,231 | | | | 52,530 | | | | 799,838 | | | | 2,759 | |
| | 199 | | | | 865 | | | | 276,536 | | | | 1,252 | |
| | 7,709 | | | | 18,160 | | | | 592,513 | | | | 453 | |
| | 13,033 | | | | 2,626 | | | | 57,550 | | | | 245 | |
| | – | | | | – | | | | – | | | | 14,707 | |
| | – | | | | – | | | | 36 | | | | – | |
| | 88,146 | | | | 87,078 | | | | 476,918 | | | | 76,101 | |
| | 4,030,863 | | | | 259,501 | | | | 6,049,179 | | | | 147,616 | |
| |
| $ | 429,132,859 | | | $ | 75,563,925 | | | $ | 1,619,478,341 | | | $ | 6,921,864 | |
| |
| $ | 367,619,609 | | | $ | 86,468,502 | | | $ | 1,554,714,386 | | | $ | 5,776,816 | |
| | 61,513,250 | | | | (10,904,577 | ) | | | 64,763,955 | | | | 1,145,048 | |
| $ | 429,132,859 | | | $ | 75,563,925 | | | $ | 1,619,478,341 | | | $ | 6,921,864 | |
| See Notes to Financial Statements. | 123 |
Statements of Assets and Liabilities (continued)
October 31, 2020
| | | Alpha
Strategy Fund | | | Durable
Growth Fund | | | Focused
Growth Fund | |
| Net assets by class: | | | | | | | | | | | | |
| Class A Shares | | $ | 400,087,559 | | | $ | 1,538,441 | | | $ | 12,484,689 | |
| Class C Shares | | $ | 54,247,339 | | | $ | 227,650 | | | $ | 1,849,001 | |
| Class F Shares | | $ | 120,796,629 | | | $ | 346,199 | | | $ | 5,820,567 | |
| Class F3 Shares | | $ | 33,178,769 | | | $ | 141,405 | | | $ | 901,943 | |
| Class I Shares | | $ | 28,481,082 | | | $ | 199,233,953 | | | $ | 2,711,648 | |
| Class P Shares | | | – | | | | – | | | | – | |
| Class R2 Shares | | $ | 1,430,311 | | | | – | | | | – | |
| Class R3 Shares | | $ | 20,859,709 | | | $ | 12,784 | | | $ | 17,859 | |
| Class R4 Shares | | $ | 3,714,882 | | | $ | 12,816 | | | $ | 17,937 | |
| Class R5 Shares | | $ | 622,701 | | | $ | 12,847 | | | $ | 18,015 | |
| Class R6 Shares | | $ | 4,142,703 | | | $ | 241,142 | | | $ | 4,399,642 | |
| Outstanding shares by class (unlimited number of authorized shares of beneficial interest): | | | | | | | | | | | | |
| Class A Shares | | | 17,706,751 | | | | 80,070 | | | | 464,149 | |
| Class C Shares | | | 3,044,585 | | | | 11,930 | | | | 69,621 | |
| Class F Shares | | | 5,292,726 | | | | 17,983 | | | | 215,367 | |
| Class F3 Shares | | | 1,413,506 | | | | 7,342 | | | | 33,333 | |
| Class I Shares | | | 1,217,565 | | | | 10,347,753 | | | | 100,337 | |
| Class P Shares | | | – | | | | – | | | | – | |
| Class R2 Shares | | | 66,461 | | | | – | | | | – | |
| Class R3 Shares | | | 961,086 | | | | 667 | | | | 666.66 | |
| Class R4 Shares | | | 164,835 | | | | 667 | | | | 666.66 | |
| Class R5 Shares | | | 26,609 | | | | 667.43 | | | | 666.67 | |
| Class R6 Shares | | | 176,436 | | | | 12,520 | | | | 162,598 | |
| Net asset value, offering and redemption price per share (Net assets divided by outstanding shares): | | | | | | | | | | | | |
| Class A Shares-Net asset value | | | $22.60 | | | | $19.21 | | | | $26.90 | |
| Class A Shares-Maximum offering price (Net asset value plus sales charge of 5.75%) | | | $23.98 | | | | $20.38 | | | | $28.54 | |
| Class C Shares-Net asset value | | | $17.82 | | | | $19.08 | | | | $26.56 | |
| Class F Shares-Net asset value | | | $22.82 | | | | $19.25 | | | | $27.03 | |
| Class F3 Shares-Net asset value | | | $23.47 | | | | $19.26 | | | | $27.06 | |
| Class I Shares-Net asset value | | | $23.39 | | | | $19.25 | | | | $27.03 | |
| Class P Shares-Net asset value | | | – | | | | – | | | | – | |
| Class R2 Shares-Net asset value | | | $21.52 | | | | – | | | | – | |
| Class R3 Shares-Net asset value | | | $21.70 | | | | $19.17 | | | | $26.79 | |
| Class R4 Shares-Net asset value | | | $22.54 | | | | $19.21 | | | | $26.91 | |
| Class R5 Shares-Net asset value | | | $23.40 | | | | $19.25 | | | | $27.02 | |
| Class R6 Shares-Net asset value | | | $23.48 | | | | $19.26 | | | | $27.06 | |
| 124 | See Notes to Financial Statements. |
Focused
Large Cap
Value Fund | | | Focused
Small Cap
Value Fund | | | Fundamental
Equity Fund | | | Global Equity
Research Fund | |
| | |
| $ | 541,495 | | | $ | 3,253,053 | | | $ | 1,067,308,977 | | | $ | 2,622,042 | |
| $ | 76,520 | | | $ | 102,421 | | | $ | 60,191,335 | | | $ | 537,041 | |
| $ | 39,879 | | | $ | 784,450 | | | $ | 116,339,609 | | | $ | 1,444,604 | |
| $ | 12,085 | | | $ | 8,719 | | | $ | 15,378,426 | | | $ | 13,921 | |
| $ | 428,070,439 | | | $ | 69,689,413 | | | $ | 262,215,846 | | | $ | 1,400,210 | |
| | – | | | | – | | | $ | 3,614,181 | | | | – | |
| | – | | | | – | | | $ | 3,081,588 | | | | – | |
| $ | 8,721 | | | | – | | | $ | 76,816,937 | | | $ | 240,566 | |
| $ | 8,679 | | | | – | | | $ | 2,228,001 | | | $ | 14,152 | |
| $ | 8,707 | | | $ | 8,710 | | | $ | 900,675 | | | $ | 14,287 | |
| $ | 366,334 | | | $ | 1,717,159 | | | $ | 11,402,766 | | | $ | 635,041 | |
| |
| | 41,802 | | | | 173,336 | | | | 101,031,473 | | | | 208,292 | |
| | 5,947 | | | | 5,124 | | | | 6,549,470 | | | | 43,110 | |
| | 3,072 | | | | 38,652 | | | | 11,147,213 | | | | 114,499 | |
| | 931 | | | | 429 | | | | 1,435,764 | | | | 1,102 | |
| | 32,964,738 | | | | 3,433,742 | | | | 24,621,914 | | | | 110,909 | |
| | – | | | | – | | | | 349,952 | | | | – | |
| | – | | | | – | | | | 299,310 | | | | – | |
| | 675 | | | | – | | | | 7,433,644 | | | | 19,231 | |
| | 670 | | | | – | | | | 212,208 | | | | 1,123 | |
| | 671 | | | | 429.19 | | | | 84,523 | | | | 1,132 | |
| | 28,197 | | | | 84,482 | | | | 1,064,074 | | | | 50,280 | |
| |
| | $12.95 | | | | $18.77 | | | | $10.56 | | | | $12.59 | |
| |
| | $13.74 | | | | $19.92 | | | | $11.20 | | | | $13.36 | |
| | $12.87 | | | | $19.99 | | | | $9.19 | | | | $12.46 | |
| | $12.98 | | | | $20.30 | | | | $10.44 | | | | $12.62 | |
| | $12.98 | | | | $20.32 | | | | $10.71 | | | | $12.63 | |
| | $12.99 | | | | $20.30 | | | | $10.65 | | | | $12.62 | |
| | – | | | | – | | | | $10.33 | | | | – | |
| | – | | | | – | | | | $10.30 | | | | – | |
| | $12.92 | | | | – | | | | $10.33 | | | | $12.51 | |
| | $12.95 | | | | – | | | | $10.50 | | | | $12.60 | |
| | $12.98 | | | | $20.29 | | | | $10.66 | | | | $12.62 | |
| | $12.99 | | | | $20.33 | | | | $10.72 | | | | $12.63 | |
| | See Notes to Financial Statements. | 125 |
Statements of Assets and Liabilities (continued)
October 31, 2020
| | | Growth
Leaders Fund | | | Health Care
Fund | | | International
Equity Fund | |
| ASSETS: | | | | | | | | | |
| Investments in securities, at cost | | $ | 4,855,993,280 | | | $ | 3,325,616 | | | $ | 311,733,663 | |
| Investments in securities, at fair value including $523,600, $39,193, $1,037,980, $2,738,649, $5,304,384 and $0, respectively, of securities loaned | | $ | 6,936,775,488 | | | $ | 3,753,596 | | | $ | 366,237,817 | |
| Cash | | | – | | | | 2,680 | | | | 429 | |
| Foreign cash, at value (cost $0, $0, $242,915, $1,242,417, $189,768 and $0, respectively) | | | – | | | | – | | | | 248,439 | |
| Receivables: | | | | | | | | | | | | |
| Investment securities sold | | | 9,037,368 | | | | – | | | | 16,930,159 | |
| Capital shares sold | | | 25,280,496 | | | | 2,500 | | | | 18,976 | |
| Interest and dividends | | | 224,867 | | | | 2,060 | | | | 1,292,018 | |
| From advisor (See Note 3) | | | 240,805 | | | | 15,380 | | | | 43,655 | |
| Securities lending income receivable | | | 5,201 | | | | 9 | | | | 1,191 | |
| Prepaid expenses and other assets | | | 120,481 | | | | 67,459 | | | | – | |
| Total assets | | | 6,971,684,706 | | | | 3,843,684 | | | | 384,772,684 | |
| LIABILITIES: | | | | | | | | | | | | |
| Payables: | | | | | | | | | | | | |
| Capital shares reacquired | | | 13,571,143 | | | | 2,481 | | | | 7,465,858 | |
| Investment securities purchased | | | – | | | | 4,960 | | | | 11,123,725 | |
| Payable for collateral due to broker for securities lending | | | 595,000 | | | | 40,762 | | | | 1,128,158 | |
| Management fee | | | 3,192,294 | | | | 1,965 | | | | 233,320 | |
| 12b-1 distribution plan | | | 1,495,058 | | | | 720 | | | | 43,666 | |
| Trustees' fees | | | 323,198 | | | | 98 | | | | 106,282 | |
| Fund administration | | | 248,608 | | | | 127 | | | | 13,333 | |
| To broker | | | – | | | | – | | | | – | |
| Offering costs | | | – | | | | 23,615 | | | | – | |
| Variation margin on futures contracts | | | – | | | | – | | | | – | |
| Total return swap, at fair value | | | – | | | | – | | | | – | |
| Accrued expenses | | | 472,429 | | | | 31,093 | | | | 200,731 | |
| Total liabilities | | | 19,897,730 | | | | 105,821 | | | | 20,315,073 | |
| Commitments and contingent liabilities | | | | | | | | | | | | |
| NET ASSETS | | $ | 6,951,786,976 | | | $ | 3,737,863 | | | $ | 364,457,611 | |
| COMPOSITION OF NET ASSETS: | | | | | | | | | | | | |
| Paid-in capital | | $ | 4,152,850,286 | | | $ | 2,832,179 | | | $ | 342,178,793 | |
| Total distributable earnings (loss) | | | 2,798,936,690 | | | | 905,684 | | | | 22,278,818 | |
| Net Assets | | $ | 6,951,786,976 | | | $ | 3,737,863 | | | $ | 364,457,611 | |
| 126 | See Notes to Financial Statements. |
International
Opportunities
Fund | | | International
Value Fund | | | Value
Opportunities
Fund | |
| |
| $ | 375,810,719 | | | $ | 454,194,159 | | | $ | 1,154,894,565 | |
| |
| $ | 388,887,965 | | | $ | 445,940,455 | | | $ | 1,370,955,549 | |
| | – | | | | – | | | | 276 | |
| |
| | 1,274,495 | | | | 207,501 | | | | – | |
| |
| | 2,107,738 | | | | 5,541,962 | | | | 8,035,558 | |
| | 160,925 | | | | 219,220 | | | | 505,588 | |
| | 994,108 | | | | 3,018,653 | | | | 603,488 | |
| | – | | | | 18,933 | | | | – | |
| | 1,179 | | | | 1,929 | | | | – | |
| | 52,421 | | | | 22,167 | | | | 122,609 | |
| | 393,478,831 | | | | 454,970,820 | | | | 1,380,223,068 | |
| |
| | 578,252 | | | | 838,720 | | | | 2,823,197 | |
| | 1,327,837 | | | | 2,718,312 | | | | – | |
| |
| | 3,599,323 | | | | 5,237,200 | | | | – | |
| | 258,559 | | | | 279,211 | | | | 892,549 | |
| | 37,780 | | | | 55,545 | | | | 178,024 | |
| | 79,896 | | | | 157,371 | | | | 356,428 | |
| | 13,790 | | | | 15,955 | | | | 48,583 | |
| | 206,118 | | | | – | | | | – | |
| | – | | | | – | | | | – | |
| | – | | | | – | | | | – | |
| | 39,110 | | | | – | | | | – | |
| | 272,359 | | | | 317,249 | | | | 514,649 | |
| | 6,413,024 | | | | 9,619,563 | | | | 4,813,430 | |
| |
| $ | 387,065,807 | | | $ | 445,351,257 | | | $ | 1,375,409,638 | |
| |
| $ | 478,214,169 | | | $ | 916,768,184 | | | $ | 1,083,137,063 | |
| | (91,148,362 | ) | | | (471,416,927 | ) | | | 292,272,575 | |
| $ | 387,065,807 | | | $ | 445,351,257 | | | $ | 1,375,409,638 | |
| | See Notes to Financial Statements. | 127 |
Statements of Assets and Liabilities (concluded)
October 31, 2020
| | | Growth
Leaders Fund | | | Health Care
Fund | | | International
Equity Fund | |
| Net assets by class: | | | | | | | | | | | | |
| Class A Shares | | $ | 1,920,929,717 | | | $ | 2,021,965 | | | $ | 154,160,735 | |
| Class C Shares | | $ | 906,259,169 | | | $ | 327,724 | | | $ | 6,676,378 | |
| Class F Shares | | $ | 2,708,762,206 | | | $ | 109,269 | | | $ | 10,435,301 | |
| Class F3 Shares | | $ | 265,851,325 | | | $ | 35,292 | | | $ | 4,489,215 | |
| Class I Shares | | $ | 1,037,282,937 | | | $ | 17,099 | | | $ | 179,795,882 | |
| Class P Shares | | | – | | | | – | | | $ | 37,677 | |
| Class R2 Shares | | $ | 1,551,146 | | | | – | | | $ | 136,744 | |
| Class R3 Shares | | $ | 18,790,251 | | | $ | 12,805 | | | $ | 5,353,588 | |
| Class R4 Shares | | $ | 12,666,794 | | | $ | 12,846 | | | $ | 1,164,959 | |
| Class R5 Shares | | $ | 14,215,817 | | | $ | 12,886 | | | $ | 64,188 | |
| Class R6 Shares | | $ | 65,477,614 | | | $ | 1,187,977 | | | $ | 2,142,944 | |
| Outstanding shares by class (unlimited number of authorized shares of beneficial interest): | | | | | | | | | | | | |
| Class A Shares | | | 45,467,084 | | | | 104,920 | | | | 11,492,071 | |
| Class C Shares | | | 23,520,161 | | | | 17,168 | | | | 501,625 | |
| Class F Shares | | | 62,697,993 | | | | 5,655 | | | | 781,154 | |
| Class F3 Shares | | | 6,083,166 | | | | 1,826 | | | | 330,317 | |
| Class I Shares | | | 23,848,888 | | | | 885 | | | | 13,255,500 | |
| Class P Shares | | | – | | | | – | | | | 2,808 | |
| Class R2 Shares | | | 37,489 | | | | – | | | | 10,215 | |
| Class R3 Shares | | | 454,822 | | | | 666.67 | | | | 405,574 | |
| Class R4 Shares | | | 299,712 | | | | 666.67 | | | | 87,246 | |
| Class R5 Shares | | | 326,717 | | | | 667 | | | | 4,756 | |
| Class R6 Shares | | | 1,498,288 | | | | 61,434 | | | | 157,752 | |
| Net asset value, offering and redemption price per share (Net assets divided by outstanding shares): | | | | | | | | | | | | |
| Class A Shares-Net asset value | | | $42.25 | | | | $19.27 | | | | $13.41 | |
| Class A Shares-Maximum offering price (Net asset value plus sales charge of 5.75%) | | �� | $44.83 | | | | $20.45 | | | | $14.23 | |
| Class C Shares-Net asset value | | | $38.53 | | | | $19.09 | | | | $13.31 | |
| Class F Shares-Net asset value | | | $43.20 | | | | $19.32 | | | | $13.36 | |
| Class F3 Shares-Net asset value | | | $43.70 | | | | $19.33 | | | | $13.59 | |
| Class I Shares-Net asset value | | | $43.49 | | | | $19.32 | | | | $13.56 | |
| Class P Shares-Net asset value | | | – | | | | – | | | | $13.42 | |
| Class R2 Shares-Net asset value | | | $41.38 | | | | – | | | | $13.39 | |
| Class R3 Shares-Net asset value | | | $41.31 | | | | $19.21 | | | | $13.20 | |
| Class R4 Shares-Net asset value | | | $42.26 | | | | $19.27 | | | | $13.35 | |
| Class R5 Shares-Net asset value | | | $43.51 | | | | $19.32 | | | | $13.50 | |
| Class R6 Shares-Net asset value | | | $43.70 | | | | $19.34 | | | | $13.58 | |
| 128 | See Notes to Financial Statements. |
International
Opportunities
Fund | | | International
Value Fund | | | Value
Opportunities
Fund | |
| |
| $ | 96,337,920 | | | $ | 186,425,630 | | | $ | 625,448,213 | |
| $ | 12,839,718 | | | $ | 13,027,404 | | | $ | 63,708,999 | |
| $ | 43,222,332 | | | $ | 23,559,595 | | | $ | 138,869,661 | |
| $ | 17,579,061 | | | $ | 18,310,504 | | | $ | 200,054,791 | |
| $ | 146,416,282 | | | $ | 197,616,229 | | | $ | 218,136,591 | |
| $ | 119,325 | | | | – | | | $ | 16,559,541 | |
| $ | 2,521,602 | | | $ | 20,117 | | | $ | 4,879,417 | |
| $ | 15,312,998 | | | $ | 5,394,445 | | | $ | 41,390,056 | |
| $ | 4,888,834 | | | $ | 36,389 | | | $ | 34,990,099 | |
| $ | 15,841,669 | | | $ | 9,086 | | | $ | 1,970,505 | |
| $ | 31,986,066 | | | $ | 951,858 | | | $ | 29,401,765 | |
| |
| | 6,141,322 | | | | 30,932,920 | | | | 36,842,296 | |
| | 887,077 | | | | 2,178,882 | | | | 4,401,592 | |
| | 2,782,820 | | | | 3,889,281 | | | | 7,970,672 | |
| | 1,081,247 | | | | 3,017,782 | | | | 11,146,322 | |
| | 9,052,316 | | | | 32,542,651 | | | | 12,242,524 | |
| | 7,410 | | | | – | | | | 1,000,602 | |
| | 163,806 | | | | 3,254 | | | | 303,303 | |
| | 999,247 | | | | 884,952 | | | | 2,535,026 | |
| | 313,148 | | | | 6,050 | | | | 2,064,033 | |
| | 979,918 | | | | 1,501 | | | | 110,500 | |
| | 1,967,436 | | | | 156,842 | | | | 1,639,431 | |
| |
| | $15.69 | | | | $6.03 | | | | $16.98 | |
| |
| | $16.65 | | | | $6.40 | | | | $18.02 | |
| | $14.47 | | | | $5.98 | | | | $14.47 | |
| | $15.53 | | | | $6.06 | | | | $17.42 | |
| | $16.26 | | | | $6.07 | | | | $17.95 | |
| | $16.17 | | | | $6.07 | | | | $17.82 | |
| | $16.10 | | | | – | | | | $16.55 | |
| | $15.39 | | | | $6.18 | | | | $16.09 | |
| | $15.32 | | | | $6.10 | | | | $16.33 | |
| | $15.61 | | | | $6.01 | | | | $16.95 | |
| | $16.17 | | | | $6.05 | | | | $17.83 | |
| | $16.26 | | | | $6.07 | | | | $17.93 | |
| | See Notes to Financial Statements. | 129 |
Statements of Operations
For the Year Ended October 31, 2020
| | | Alpha
Strategy Fund | | | Durable
Growth Fund | | | Focused
Growth Fund | |
| Investment income: | | | | | | | | | | | | |
| Dividends (net of foreign withholding taxes of $0, $639, $0, $48,001, $7,953, $827,779 and $7,412, respectively) | | $ | 4,743,569 | | | $ | 1,211,828 | | | $ | 40,329 | |
| Securities lending net income | | | – | | | | – | | | | 98 | |
| Interest and other | | | 8,304 | | | | 6,841 | | | | 1,166 | |
| Total investment income | | | 4,751,873 | | | | 1,218,669 | | | | 41,593 | |
| Expenses: | | | | | | | | | | | | |
| Management fee | | | 773,732 | | | | 877,680 | | | | 104,997 | |
| 12b-1 distribution plan-Class A | | | 1,067,960 | | | | 2,256 | | | | 19,290 | |
| 12b-1 distribution plan-Class C | | | 742,615 | | | | 1,426 | | | | 7,251 | |
| 12b-1 distribution plan-Class F | | | 139,917 | | | | 410 | | | | 2,141 | |
| 12b-1 distribution plan-Class P | | | – | | | | – | | | | – | |
| 12b-1 distribution plan-Class R2 | | | 8,013 | | | | – | | | | – | |
| 12b-1 distribution plan-Class R3 | | | 112,952 | | | | 56 | | | | 69 | |
| 12b-1 distribution plan-Class R4 | | | 8,882 | | | | 28 | | | | 35 | |
| Shareholder servicing | | | 766,969 | | | | 16,686 | | | | 6,618 | |
| Fund administration | | | 309,493 | | | | 63,831 | | | | 6,461 | |
| Registration | | | 129,544 | | | | 20,526 | | | | 116,688 | |
| Reports to shareholders | | | 75,459 | | | | 9,355 | | | | 4,703 | |
| Professional | | | 42,867 | | | | 37,046 | | | | 50,172 | |
| Custody | | | 20,156 | | | | 8,842 | | | | 3,324 | |
| Trustees’ fees | | | 31,388 | | | | 5,346 | | | | 569 | |
| Offering costs | | | – | | | | 61,500 | | | | 17,527 | |
| Other | | | 18,913 | | | | 28,897 | | | | 11,472 | |
| Gross expenses | | | 4,248,860 | | | | 1,133,885 | | | | 351,317 | |
| Expense reductions (See Note 9) | | | (9,541 | ) | | | (20 | ) | | | (107 | ) |
| Fees waived and expenses reimbursed (See Note 3) | | | (791,735 | ) | | | (27,190 | ) | | | (198,127 | ) |
| Net expenses | | | 3,447,584 | | | | 1,106,675 | | | | 153,083 | |
| Net investment income (loss) | | | 1,304,289 | | | | 111,994 | | | | (111,490 | ) |
| Net realized and unrealized gain (loss): | | | | | | | | | | | | |
| Capital gain distributions received from Underlying Funds | | | 99,573,231 | | | | – | | | | – | |
| Net realized gain (loss) on Investment in Underlying Funds | | | (30,709,183 | ) | | | – | | | | – | |
| Net realized gain (loss) on investments | | | – | | | | 3,657,637 | | | | 2,455,601 | |
| Net realized gain (loss) on futures contracts | | | – | | | | – | | | | – | |
| Net realized gain (loss) on foreign currency related transactions | | | – | | | | (22 | ) | | | – | |
| Net change in unrealized appreciation/depreciation on investments | | | – | | | | 30,100,703 | | | | 5,252,603 | |
| Net change in unrealized appreciation/depreciation in Underlying Funds | | | (29,903,227 | ) | | | – | | | | – | |
| | |
| 130 | See Notes to Financial Statements. |
Focused
Large Cap
Value Fund | | | Focused
Small Cap
Value Fund | | | Fundamental
Equity Fund | | | Global Equity
Research Fund | |
| | | | | | | | | | | |
| $ | 7,103,321 | | | $ | 1,657,739 | | | $ | 54,848,111 | | | $ | 129,406 | |
| | 39 | | | | 5,903 | | | | 22 | | | | 233 | |
| | 15,962 | | | | 190,820 | | | | – | | | | 122 | |
| | 7,119,322 | | | | 1,854,462 | | | | 54,848,133 | | | | 129,761 | |
| | | | | | | | | | | | | | | |
| | 1,367,992 | | | | 760,931 | | | | 10,989,075 | | | | 32,081 | |
| | 1,751 | | | | 16,276 | | | | 2,946,727 | | | | 7,559 | |
| | 1,378 | | | | 648 | | | | 1,141,046 | | | | 5,606 | |
| | 407 | | | | 259 | | | | 142,977 | | | | 1,413 | |
| | – | | | | – | | | | 17,873 | | | | – | |
| | – | | | | – | | | | 20,271 | | | | 40 | |
| | 45 | | | | 24 | | | | 435,549 | | | | 1,063 | |
| | 22 | | | | 12 | | | | 9,453 | | | | 33 | |
| | 51,588 | | | | 33,097 | | | | 1,469,583 | | | | 5,001 | |
| | 92,745 | | | | 38,047 | | | | 803,126 | | | | 2,852 | |
| | 58,815 | | | | 160,842 | | | | 150,224 | | | | 131,612 | |
| | 19,532 | | | | 7,428 | | | | 146,549 | | | | 11,227 | |
| | 43,396 | | | | 69,686 | | | | 75,607 | | | | 58,895 | |
| | 8,659 | | | | 17,325 | | | | 58,863 | | | | 28,738 | |
| | 9,819 | | | | 3,843 | | | | 80,857 | | | | 280 | |
| | 43,126 | | | | – | | | | – | | | | – | |
| | 49,453 | | | | 26,012 | | | | 144,054 | | | | 21,776 | |
| | 1,748,728 | | | | 1,134,430 | | | | 18,631,834 | | | | 308,176 | |
| | (17 | ) | | | (319 | ) | | | (20,234 | ) | | | (80 | ) |
| | (100,032 | ) | | | (138,581 | ) | | | (53,270 | ) | | | (246,237 | ) |
| | 1,648,679 | | | | 995,530 | | | | 18,558,330 | | | | 61,859 | |
| | 5,470,643 | | | | 858,932 | | | | 36,289,803 | | | | 67,902 | |
| | | | | | | | | | | | | | | |
| | – | | | | – | | | | – | | | | – | |
| | | | | | | | | | | | | | | |
| | – | | | | – | | | | – | | | | – | |
| | 30,877,790 | | | | (9,465,630 | ) | | | (113,967,557 | ) | | | 335,756 | |
| | – | | | | – | | | | – | | | | (3,075 | ) |
| | | | | | | | | | | | | | | |
| | 7,506 | | | | 2,895 | | | | 15,901 | | | | (577 | ) |
| | | | | | | | | | | | | | | |
| | 25,234,361 | | | | (5,688,785 | ) | | | (121,244,270 | ) | | | 184,754 | |
| | | | | | | | | | | | | | | |
| | – | | | | – | | | | – | | | | – | |
| | | |
| | See Notes to Financial Statements. | 131 |
Statements of Operations (continued)
For the Year Ended October 31, 2020
| | | Alpha
Strategy Fund | | | Durable
Growth Fund | | | Focused
Growth Fund | |
| Net realized and unrealized gain (loss): | | | | | | | | | | | | |
| Net change in unrealized appreciation/depreciation on translation of assets and liabilities denominated in foreign currencies | | | – | | | | – | | | | – | |
| Net realized and unrealized gain (loss) | | | 38,960,821 | | | | 33,758,318 | | | | 7,708,204 | |
| Net Increase (Decrease) in Net Assets Resulting From Operations | | $ | 40,265,110 | | | $ | 33,870,312 | | | $ | 7,596,714 | |
| | |
| 132 | See Notes to Financial Statements. |
Focused
Large Cap
Value Fund | | | Focused
Small Cap
Value Fund | | | Fundamental
Equity Fund | | | Global Equity
Research Fund | |
| | | | | | | | | | | |
| | – | | | | 4 | | | | 934 | | | | 1,632 | |
| | 56,119,657 | | | | (15,151,516 | ) | | | (235,194,992 | ) | | | 518,490 | |
| |
| $ | 61,590,300 | | | $ | (14,292,584 | ) | | $ | (198,905,189 | ) | | $ | 586,392 | |
| | | |
| | See Notes to Financial Statements. | 133 |
Statements of Operations (concluded)
For the Year Ended October 31, 2020
| | | Growth
Leaders Fund | | | Health Care
Fund | | | International
Equity Fund | |
| Investment income: | | | | | | | | | | | | |
| Dividends (net of foreign withholding taxes of $0, $1,586, $995,666, $958,578, $2,015,838 and $35,922, respectively) | | $ | 16,073,897 | | | $ | 25,304 | | | $ | 7,994,014 | |
| Securities lending net income | | | 867,201 | | | | 18 | | | | 23,123 | |
| Interest and other | | | 182,160 | | | | 463 | | | | 33,115 | |
| Total investment income | | | 17,123,258 | | | | 25,785 | | | | 8,050,252 | |
| Expenses: | | | | | | | | | | | | |
| Management fee | | | 26,057,094 | | | | 21,577 | | | | 2,751,062 | |
| 12b-1 distribution plan-Class A | | | 3,379,587 | | | | 2,981 | | | | 433,839 | |
| 12b-1 distribution plan-Class C | | | 7,547,498 | | | | 1,817 | | | | 92,840 | |
| 12b-1 distribution plan-Class F | | | 1,926,051 | | | | 428 | | | | 23,662 | |
| 12b-1 distribution plan-Class P | | | – | | | | – | | | | 185 | |
| 12b-1 distribution plan-Class R2 | | | 6,053 | | | | – | | | | 1,609 | |
| 12b-1 distribution plan-Class R3 | | | 83,234 | | | | 56 | | | | 31,979 | |
| 12b-1 distribution plan-Class R4 | | | 26,215 | | | | 28 | | | | 2,779 | |
| Shareholder servicing | | | 3,166,107 | | | | 2,938 | | | | 357,947 | |
| Fund administration | | | 2,004,567 | | | | 1,392 | | | | 157,204 | |
| Registration | | | 273,603 | | | | 58,672 | | | | 131,877 | |
| Reports to shareholders | | | 469,859 | | | | 2,961 | | | | 43,520 | |
| Professional | | | 85,642 | | | | 51,670 | | | | 97,741 | |
| Custody | | | 42,047 | | | | 3,976 | | | | 70,335 | |
| Trustees’ fees | | | 192,662 | | | | 136 | | | | 15,631 | |
| Offering costs | | | – | | | | 50,524 | | | | – | |
| Other | | | 212,180 | | | | 9,817 | | | | 72,878 | |
| Gross expenses | | | 45,472,399 | | | | 208,973 | | | | 4,285,088 | |
| Expense reductions (See Note 9) | | | (43,416 | ) | | | (21 | ) | | | (2,592 | ) |
| Fees waived and expenses reimbursed (See Note 3) | | | (1,961,167 | ) | | | (178,170 | ) | | | (248,762 | ) |
| Net expenses | | | 43,467,816 | | | | 30,782 | | | | 4,033,734 | |
| Net investment income (loss) | | | (26,344,558 | ) | | | (4,997 | ) | | | 4,016,518 | |
| Net realized and unrealized gain (loss): | | | | | | | | | | | | |
| Net realized gain (loss) on investments | | | 757,776,433 | | | | 527,934 | | | | (12,155,154 | ) |
| Net realized gain (loss) on futures contracts | | | – | | | | – | | | | – | |
| Net realized gain (loss) on forward foreign currency exchange contracts | | | – | | | | – | | | | 780 | |
| Net realized gain (loss) on swap contracts | | | – | | | | – | | | | – | |
| Net realized gain (loss) on foreign currency related transactions | | | – | | | | 209 | | | | 60,538 | |
| Net change in unrealized appreciation/depreciation on investments | | | 1,676,037,268 | | | | 454,351 | | | | 17,374,563 | |
| Net change in unrealized appreciation/depreciation on swap contracts | | | – | | | | – | | | | – | |
| Net change in unrealized appreciation/depreciation on translation of assets and liabilities denominated in foreign currencies | | | – | | | | 56 | | | | 53,895 | |
| Net realized and unrealized gain (loss) | | | 2,433,813,701 | | | | 982,550 | | | | 5,334,622 | |
| Net Increase (Decrease) in Net Assets Resulting From Operations | | $ | 2,407,469,143 | | | $ | 977,553 | | | $ | 9,351,140 | |
| | |
| 134 | See Notes to Financial Statements. |
International
Opportunities
Fund | | | International
Value Fund | | | Value
Opportunities
Fund | |
| | |
| $ | 7,079,202 | | | $ | 15,011,587 | | | $ | 22,613,039 | |
| | 9,559 | | | | 68,809 | | | | 31 | |
| | 64,302 | | | | 22,791 | | | | 12,273 | |
| | 7,153,063 | | | | 15,103,187 | | | | 22,625,343 | |
| |
| | 3,359,301 | | | | 3,471,840 | | | | 11,290,350 | |
| | 267,353 | | | | 537,930 | | | | 1,674,576 | |
| | 170,117 | | | | 235,117 | | | | 1,027,236 | |
| | 58,661 | | | | 29,281 | | | | 161,768 | |
| | 484 | | | | – | | | | 81,474 | |
| | 16,767 | | | | 176 | | | | 32,449 | |
| | 82,378 | | | | 31,104 | | | | 239,626 | |
| | 13,653 | | | | 93 | | | | 93,945 | |
| | 357,893 | | | | 424,244 | | | | 1,498,806 | |
| | 179,163 | | | | 198,391 | | | | 616,591 | |
| | 132,349 | | | | 126,976 | | | | 152,011 | |
| | 35,516 | | | | 50,357 | | | | 183,540 | |
| | 78,479 | | | | 92,116 | | | | 64,302 | |
| | 109,921 | | | | 93,696 | | | | 102,874 | |
| | 18,175 | | | | 19,878 | | | | 62,844 | |
| | – | | | | – | | | | – | |
| | 103,824 | | | | 91,839 | | | | 160,314 | |
| | 4,984,034 | | | | 5,403,038 | | | | 17,442,706 | |
| | (3,179 | ) | | | (3,798 | ) | | | (14,308 | ) |
| | (89,218 | ) | | | (379,663 | ) | | | (98,396 | ) |
| | 4,891,637 | | | | 5,019,577 | | | | 17,330,002 | |
| | 2,261,426 | | | | 10,083,610 | | | | 5,295,341 | |
| |
| | (20,386,312 | ) | | | (48,926,930 | ) | | | 91,012,863 | |
| | – | | | | – | | | | – | |
| |
| | (4,819 | ) | | | (242 | ) | | | – | |
| | (4,793,894 | ) | | | – | | | | – | |
| |
| | 158,636 | | | | 222,147 | | | | – | |
| |
| | 9,299,916 | | | | (25,922,876 | ) | | | (76,099,606 | ) |
| |
| | (50,991 | ) | | | – | | | | – | |
| |
| | 45,510 | | | | 66,397 | | | | – | |
| | (15,731,954 | ) | | | (74,561,504 | ) | | | 14,913,257 | |
| |
| $ | (13,470,528 | ) | | $ | (64,477,894 | ) | | $ | 20,208,598 | |
| | | |
| | See Notes to Financial Statements. | 135 |
This page is intentionally left blank.
136
Statements of Changes in Net Assets
| | | Alpha Strategy Fund |
| DECREASE IN NET ASSETS | | For the
Year Ended
October 31, 2020 | | | For the
Year Ended
October 31, 2019 | |
| Operations: | | | | | | | | |
| Net investment income (loss) | | $ | 1,304,289 | | | $ | (1,510,876 | ) |
| Capital gain distributions received from Underlying Funds | | | 99,573,231 | | | | 141,088,951 | |
| Net realized gain (loss) on investments in Underlying Funds | | | (30,709,183 | ) | | | (22,111,433 | ) |
| Net change in unrealized appreciation/depreciation on investments in Underlying Funds | | | (29,903,227 | ) | | | (70,488,971 | ) |
| Net increase in net assets resulting from operations | | | 40,265,110 | | | | 46,977,671 | |
| Distributions to shareholders: | | | | | | | | |
| Class A | | | (64,393,529 | ) | | | (64,320,005 | ) |
| Class C | | | (15,294,929 | ) | | | (18,964,806 | ) |
| Class F | | | (23,235,257 | ) | | | (25,648,079 | ) |
| Class F3 | | | (4,127,641 | ) | | | (4,274,550 | ) |
| Class I | | | (11,845,960 | ) | | | (10,723,289 | ) |
| Class R2 | | | (211,258 | ) | | | (237,992 | ) |
| Class R3 | | | (3,583,900 | ) | | | (3,664,779 | ) |
| Class R4 | | | (473,062 | ) | | | (401,776 | ) |
| Class R5 | | | (39,612 | ) | | | (40,519 | ) |
| Class R6 | | | (566,017 | ) | | | (516,083 | ) |
| Total distributions to shareholders | | | (123,771,165 | ) | | | (128,791,878 | ) |
| Capital share transactions (Net of share conversions) (See Note 16): | | | | |
| Net proceeds from sales of shares | | | 105,654,769 | | | | 134,508,508 | |
| Reinvestment of distributions | | | 107,813,540 | | | | 110,704,653 | |
| Cost of shares reacquired | | | (379,849,409 | ) | | | (258,558,622 | ) |
| Net decrease in net assets resulting from capital share transactions | | | (166,381,100 | ) | | | (13,345,461 | ) |
| Net decrease in net assets | | | (249,887,155 | ) | | | (95,159,668 | ) |
| NET ASSETS: | | | | | | | | |
| Beginning of year | | $ | 917,448,839 | | | $ | 1,012,608,507 | |
| End of year | | $ | 667,561,684 | | | $ | 917,448,839 | |
| | See Notes to Financial Statements. | 137 |
Statements of Changes in Net Assets (continued)
| | Durable Growth Fund | |
| INCREASE IN NET ASSETS | | For the
Year Ended
October 31, 2020 | |
| Operations: | | | | |
| Net investment income (loss) | | $ | 111,994 | |
| Net realized gain (loss) on investments and foreign currency related transactions | | | 3,657,615 | |
| Net change in unrealized appreciation/depreciation on investments | | | 30,100,703 | |
| Net increase in net assets resulting from operations | | | 33,870,312 | |
| Distributions to shareholders: | | | | |
| Class A | | | (185 | ) |
| Class F | | | (493 | ) |
| Class F3 | | | (128 | ) |
| Class I | | | (573 | ) |
| Class R3 | | | (4 | ) |
| Class R4 | | | (8 | ) |
| Class R5 | | | (12 | ) |
| Class R6 | | | (583 | ) |
| Total distributions to shareholders | | | (1,986 | ) |
| Capital share transactions (Net of share conversions) (See Note 16): | | | | |
| Net proceeds from sales of shares | | | 209,915,954 | |
| Reinvestment of distributions | | | 1,986 | |
| Cost of shares reacquired | | | (42,019,029 | ) |
| Net increase in net assets resulting from capital share transactions | | | 167,898,911 | |
| Net increase in net assets | | | 201,767,237 | |
| NET ASSETS: | | | | |
| Beginning of year | | $ | – | |
| End of year | | $ | 201,767,237 | |
(a) For the period January 20, 2019 (commencement of operations) to October 31, 2019.
| 138 | See Notes to Financial Statements. |
| Focused Growth Fund |
For the
Year Ended
October 31, 2020 | | | For the
Period Ended
October 31, 2019 | (a) |
| | | | | | | |
| $ | (111,490 | ) | | $ | (34,755 | ) |
| | | | | | | |
| | 2,455,601 | | | | (390,246 | ) |
| | | | | | | |
| | 5,252,603 | | | | 524,523 | |
| | 7,596,714 | | | | 99,522 | |
| | | | | | | |
| | – | | | | – | |
| | – | | | | – | |
| | – | | | | – | |
| | – | | | | – | |
| | – | | | | – | |
| | – | | | | – | |
| | – | | | | – | |
| | – | | | | – | |
| | – | | | | – | |
| | | | | | | |
| | 19,017,459 | | | | 10,315,635 | |
| | – | | | | – | |
| | (8,318,577 | ) | | | (489,452 | ) |
| | | | | | | |
| | 10,698,882 | | | | 9,826,183 | |
| | 18,295,596 | | | | 9,925,705 | |
| | | | | | | |
| $ | 9,925,705 | | | $ | – | |
| $ | 28,221,301 | | | $ | 9,925,705 | |
| | See Notes to Financial Statements. | 139 |
Statements of Changes in Net Assets (continued)
| | | Focused Large Cap Value Fund |
| INCREASE (DECREASE) IN NET ASSETS | | For the
Year Ended
October 31, 2020 | | | For the
Period Ended
October 31, 2019 | (b) |
| Operations: | | | | | | |
| Net investment income (loss) | | $ | 5,470,643 | | | $ | 69,175 | |
| Net realized gain (loss) on investments and foreign currency related transactions | | | 30,885,296 | | | | (62,101 | ) |
| Net change in unrealized appreciation/depreciation on investments and translation of assets and liabilities denominated in foreign currencies | | | 25,234,361 | | | | 121,313 | |
| Net increase (decrease) in net assets resulting from operations | | | 61,590,300 | | | | 128,387 | |
| Distributions to shareholders: | | | | | | | | |
| Class A | | | (2,766 | ) | | | – | |
| Class C | | | (326 | ) | | | – | |
| Class F | | | (2,983 | ) | | | – | |
| Class F3 | | | (3,213 | ) | | | – | |
| Class I | | | (249,650 | ) | | | – | |
| Class R3 | | | (43 | ) | | | – | |
| Class R4 | | | (53 | ) | | | – | |
| Class R5 | | | (64 | ) | | | – | |
| Class R6 | | | (3,681 | ) | | | – | |
| Total distributions to shareholders | | | (262,779 | ) | | | – | |
| Capital share transactions (See Note 16): | | | | | | | | |
| Net proceeds from sales of shares | | | 443,320,189 | | | | 40,578,830 | |
| Reinvestment of distributions | | | 262,311 | | | | – | |
| Cost of shares reacquired | | | (116,144,085 | ) | | | (340,294 | ) |
| Net increase (decrease) in net assets resulting from capital share transactions | | | 327,438,415 | | | | 40,238,536 | |
| Net increase (decrease) in net assets | | | 388,765,936 | | | | 40,366,923 | |
| NET ASSETS: | | | | | | | | |
| Beginning of year | | $ | 40,366,923 | | | $ | – | |
| End of year | | $ | 429,132,859 | | | $ | 40,366,923 | |
(b) For the period July 26, 2019 (commencement of operations) to October 31, 2019.
| 140 | See Notes to Financial Statements. |
| Focused Small Cap Value Fund |
For the
Year Ended
October 31, 2020 | | | For the
Year Ended
October 31, 2019 | |
| | | | | |
| $ | 858,932 | | | $ | (88,791 | ) |
| | | | | | | |
| | (9,462,735 | ) | | | 18,107,304 | |
| | | | | | | |
| | (5,688,781 | ) | | | (16,643,010 | ) |
| | | | | | | |
| | (14,292,584 | ) | | | 1,375,503 | |
| | | | | | | |
| | (930,691 | ) | | | (921,358 | ) |
| | (1,499 | ) | | | – | |
| | (1,499 | ) | | | – | |
| | (1,500 | ) | | | – | |
| | (16,913,603 | ) | | | (17,602,082 | ) |
| | (1,500 | ) | | | – | |
| | (1,500 | ) | | | – | |
| | (1,500 | ) | | | – | |
| | (224,135 | ) | | | – | |
| | (18,077,427 | ) | | | (18,523,440 | ) |
| | | | | | | |
| | 15,626,914 | | | | 6,106,925 | |
| | 17,320,956 | | | | 17,420,876 | |
| | (46,226,137 | ) | | | (18,785,893 | ) |
| | | | | | | |
| | (13,278,267 | ) | | | 4,741,908 | |
| | (45,648,278 | ) | | | (12,406,029 | ) |
| | | | | | | |
| $ | 121,212,203 | | | $ | 133,618,232 | |
| $ | 75,563,925 | | | $ | 121,212,203 | |
| | See Notes to Financial Statements. | 141 |
Statements of Changes in Net Assets (continued)
| | | Fundamental Equity Fund |
| INCREASE (DECREASE) IN NET ASSETS | | For the
Year Ended
October 31, 2020 | | | For the
Year Ended
October 31, 2019 | |
| Operations: | | | | | | |
| Net investment income | | $ | 36,289,803 | | | $ | 36,555,458 | |
| Net realized gain (loss) on investments, futures contracts and foreign currency related transactions | | | (113,951,656 | ) | | | 231,898,572 | |
| Net change in unrealized appreciation/depreciation on investments and translation of assets and liabilities denominated in foreign currencies | | | (121,243,336 | ) | | | (92,878,635 | ) |
| Net increase (decrease) in net assets resulting from operations | | | (198,905,189 | ) | | | 175,575,395 | |
| Distributions to shareholders: | | | | | | | | |
| Class A | | | (139,407,947 | ) | | | (123,304,286 | ) |
| Class C | | | (16,649,980 | ) | | | (19,708,286 | ) |
| Class F | | | (18,953,313 | ) | | | (21,587,807 | ) |
| Class F3 | | | (2,109,059 | ) | | | (1,772,318 | ) |
| Class I | | | (62,285,911 | ) | | | (8,065,892 | ) |
| Class P | | | (512,324 | ) | | | (460,530 | ) |
| Class R2 | | | (400,670 | ) | | | (293,042 | ) |
| Class R3 | | | (9,958,420 | ) | | | (9,723,337 | ) |
| Class R4 | | | (503,129 | ) | | | (447,256 | ) |
| Class R5 | | | (150,353 | ) | | | (71,449 | ) |
| Class R6 | | | (2,273,124 | ) | | | (1,511,589 | ) |
| Total distributions to shareholders | | | (253,204,230 | ) | | | (186,945,792 | ) |
| Capital share transactions (Net of share conversions) (See Note 16): | | | | | | | | |
| Net proceeds from sales of shares | | | 229,532,972 | | | | 392,224,846 | |
| Net proceeds from reorganizations (See Note 17) | | | – | | | | 423,880,340 | |
| Reinvestment of distributions | | | 243,117,741 | | | | 172,204,806 | |
| Cost of shares reacquired | | | (889,621,209 | ) | | | (677,408,504 | ) |
| Net increase (decrease) in net assets resulting from capital share transactions | | | (416,970,496 | ) | | | 310,901,488 | |
| Net increase (decrease) in net assets | | | (869,079,915 | ) | | | 299,531,091 | |
| NET ASSETS: | | | | | | | | |
| Beginning of year | | $ | 2,488,558,256 | | | $ | 2,189,027,165 | |
| End of year | | $ | 1,619,478,341 | | | $ | 2,488,558,256 | |
| 142 | See Notes to Financial Statements. |
| Global Equity Research Fund |
For the
Year Ended
October 31, 2020 | | | For the
Year Ended
October 31, 2019 | |
| | | | | | | |
| $ | 67,902 | | | $ | 92,628 | |
| | | | | | | |
| | 332,104 | | | | (53,617 | ) |
| | | | | | | |
| | | | | | | |
| | 186,386 | | | | 763,337 | |
| | | | | | | |
| | 586,392 | | | | 802,348 | |
| | | | | | | |
| | (41,267 | ) | | | (143,845 | ) |
| | (1,897 | ) | | | (27,294 | ) |
| | (17,441 | ) | | | (57,059 | ) |
| | (181 | ) | | | (551 | ) |
| | (17,804 | ) | | | (55,069 | ) |
| | – | | | | – | |
| | (107 | ) | | | (487 | ) |
| | (1,908 | ) | | | (8,046 | ) |
| | (150 | ) | | | (531 | ) |
| | (182 | ) | | | (562 | ) |
| | (8,710 | ) | | | (27,363 | ) |
| | (89,647 | ) | | | (320,807 | ) |
| | | | | | | |
| | 1,069,800 | | | | 2,204,559 | |
| | – | | | | – | |
| | 80,997 | | | | 293,134 | |
| | (3,270,513 | ) | | | (1,044,597 | ) |
| | | | | | | |
| | (2,119,716 | ) | | | 1,453,096 | |
| | (1,622,971 | ) | | | 1,934,637 | |
| | | | | | | |
| $ | 8,544,835 | | | $ | 6,610,198 | |
| $ | 6,921,864 | | | $ | 8,544,835 | |
| | See Notes to Financial Statements. | 143 |
Statements of Changes in Net Assets (continued)
| | | Growth Leaders Fund |
| INCREASE IN NET ASSETS | | For the
Year Ended
October 31, 2020 | | | For the
Year Ended
October 31, 2019 | |
| Operations: | | | | | | |
| Net investment loss | | $ | (26,344,558 | ) | | $ | (16,937,658 | ) |
| Net realized gain (loss) on investments and foreign currency related transactions | | | 757,776,433 | | | | 312,471,158 | |
| Net change in unrealized appreciation/depreciation on investments and translation of assets and liabilities denominated in foreign currencies | | | 1,676,037,268 | | | | 205,849,051 | |
| Net increase (decrease) in net assets resulting from operations | | | 2,407,469,143 | | | | 501,382,551 | |
| Distributions to shareholders: | | | | | | | | |
| Class A | | | (81,848,840 | ) | | | (139,466,357 | ) |
| Class C | | | (55,520,466 | ) | | | (98,074,145 | ) |
| Class F | | | (115,075,437 | ) | | | (197,323,552 | ) |
| Class F3 | | | (5,998,021 | ) | | | (7,037,899 | ) |
| Class I | | | (41,625,583 | ) | | | (106,192,456 | ) |
| Class R2 | | | (94,793 | ) | | | (212,191 | ) |
| Class R3 | | | (1,134,003 | ) | | | (2,381,926 | ) |
| Class R4 | | | (604,646 | ) | | | (985,529 | ) |
| Class R5 | | | (741,362 | ) | | | (1,325,658 | ) |
| Class R6 | | | (2,986,993 | ) | | | (4,060,630 | ) |
| Total distributions to shareholders | | | (305,630,144 | ) | | | (557,060,343 | ) |
| Capital share transactions (Net of share conversions) (See Note 16): | | | | |
| Net proceeds from sales of shares | | | 2,471,905,296 | | | | 1,059,846,667 | |
| Reinvestment of distributions | | | 278,119,573 | | | | 507,905,692 | |
| Cost of shares reacquired | | | (1,640,138,043 | ) | | | (1,387,549,103 | ) |
| Net increase in net assets resulting from capital share transactions | | | 1,109,886,826 | | | | 180,203,256 | |
| Net increase in net assets | | | 3,211,725,825 | | | | 124,525,464 | |
| NET ASSETS: | | | | | | | | |
| Beginning of year | | $ | 3,740,061,151 | | | $ | 3,615,535,687 | |
| End of year | | $ | 6,951,786,976 | | | $ | 3,740,061,151 | |
| | | |
| (c) | | For the period July 26, 2019 (commencement of operations) to October 31, 2019. |
| 144 | See Notes to Financial Statements. |
| Health Care Fund |
For the
Year Ended
October 31, 2020 | | | For the
Period Ended
October 31, 2019 | (c) |
| | | | | | | |
| $ | (4,997 | ) | | $ | (1,558 | ) |
| | | | | | | |
| | 528,143 | | | | (52,402 | ) |
| | | | | | | |
| | 454,407 | | | | (26,371 | ) |
| | | | | | | |
| | 977,553 | | | | (80,331 | ) |
| | | | | | | |
| | – | | | | – | |
| | – | | | | – | |
| | (37 | ) | | | – | |
| | (346 | ) | | | – | |
| | (54 | ) | | | – | |
| | – | | | | – | |
| | – | | | | – | |
| | – | | | | – | |
| | (5 | ) | | | – | |
| | (563 | ) | | | – | |
| | (1,005 | ) | | | – | |
| | | | | | | |
| | 3,071,760 | | | | 2,700,258 | |
| | 788 | | | | – | |
| | (2,931,160 | ) | | | – | |
| | | | | | | |
| | 141,388 | | | | 2,700,258 | |
| | 1,117,936 | | | | 2,619,927 | |
| | | | | | | |
| $ | 2,619,927 | | | $ | – | |
| $ | 3,737,863 | | | $ | 2,619,927 | |
| | See Notes to Financial Statements. | 145 |
Statements of Changes in Net Assets (continued)
| | | International Equity Fund |
| DECREASE IN NET ASSETS | | For the
Year Ended
October 31, 2020 | | | For the
Year Ended
October 31, 2019 | |
| Operations: | | | | | | |
| Net investment income | | $ | 4,016,518 | | | $ | 8,226,596 | |
| Net realized gain (loss) on investments, swaps and foreign currency related transactions | | | (12,093,836 | ) | | | (19,724,648 | ) |
| Net change in unrealized appreciation/depreciation on investments, swaps and translation of assets and liabilities denominated in foreign currencies | | | 17,428,458 | | | | 62,344,104 | |
| Net increase (decrease) in net assets resulting from operations | | | 9,351,140 | | | | 50,846,052 | |
| Distributions to shareholders: | | | | | | | | |
| Class A | | | (2,639,912 | ) | | | (3,896,951 | ) |
| Class C | | | (71,571 | ) | | | (107,427 | ) |
| Class F | | | (800,991 | ) | | | (1,270,319 | ) |
| Class F3 | | | (76,992 | ) | | | (112,288 | ) |
| Class I | | | (3,329,607 | ) | | | (6,366,583 | ) |
| Class P | | | (544 | ) | | | (706 | ) |
| Class R2 | | | (5,530 | ) | | | (5,759 | ) |
| Class R3 | | | (89,018 | ) | | | (155,667 | ) |
| Class R4 | | | (16,392 | ) | | | (20,580 | ) |
| Class R5 | | | (1,430 | ) | | | (1,612 | ) |
| Class R6 | | | (43,726 | ) | | | (61,964 | ) |
| Total distributions to shareholders | | | (7,075,713 | ) | | | (11,999,856 | ) |
| Capital share transactions (Net of share conversions) (See Note 16): | | | | | | | | |
| Net proceeds from sales of shares | | | 30,457,636 | | | | 22,087,754 | |
| Reinvestment of distributions | | | 6,953,332 | | | | 11,810,501 | |
| Cost of shares reacquired | | | (127,708,023 | ) | | | (181,068,582 | ) |
| Net decrease in net assets resulting from capital share transactions | | | (90,297,055 | ) | | | (147,170,327 | ) |
| Net decrease in net assets | | | (88,021,628 | ) | | | (108,324,131 | ) |
| NET ASSETS: | | | | | | | | |
| Beginning of year | | $ | 452,479,239 | | | $ | 560,803,370 | |
| End of year | | $ | 364,457,611 | | | $ | 452,479,239 | |
| 146 | See Notes to Financial Statements. |
| International Opportunities Fund |
For the
Year Ended
October 31, 2020 | | | For the
Year Ended
October 31, 2019 | |
| | | | | |
| $ | 2,261,426 | | | $ | 7,251,498 | |
| | | | | | | |
| | (25,026,389 | ) | | | (78,498,976 | ) |
| | | | | | | |
| | 9,294,435 | | | | 108,574,437 | |
| | | | | | | |
| | (13,470,528 | ) | | | 37,326,959 | |
| | | | | | | |
| | (1,578,626 | ) | | | (16,618,071 | ) |
| | (105,055 | ) | | | (3,197,538 | ) |
| | (1,183,908 | ) | | | (17,138,682 | ) |
| | (280,820 | ) | | | (2,259,887 | ) |
| | (3,153,719 | ) | | | (23,771,223 | ) |
| | (891 | ) | | | (11,144 | ) |
| | (28,321 | ) | | | (371,090 | ) |
| | (187,243 | ) | | | (3,678,989 | ) |
| | (84,735 | ) | | | (494,086 | ) |
| | (266,449 | ) | | | (3,884,423 | ) |
| | (509,434 | ) | | | (3,869,296 | ) |
| | (7,379,201 | ) | | | (75,294,429 | ) |
| | | | | | | |
| | 66,574,037 | | | | 121,724,408 | |
| | 6,975,121 | | | | 68,420,987 | |
| | (226,633,725 | ) | | | (381,295,013 | ) |
| | | | | | | |
| | (153,084,567 | ) | | | (191,149,618 | ) |
| | (173,934,296 | ) | | | (229,117,088 | ) |
| | | | | | | |
| $ | 561,000,103 | | | $ | 790,117,191 | |
| $ | 387,065,807 | | | $ | 561,000,103 | |
| | See Notes to Financial Statements. | 147 |
Statements of Changes in Net Assets (concluded)
| | | International Value Fund |
| DECREASE IN NET ASSETS | | For the
Year Ended
October 31, 2020 | | | For the
Year Ended
October 31, 2019 | |
| Operations: | | | | | | |
| Net investment income | | $ | 10,083,610 | | | $ | 20,176,335 | |
| Net realized gain (loss) on investments, forward foreign currency exchange contracts and foreign currency related transactions | | | (48,705,025 | ) | | | (16,618,660 | ) |
| Net change in unrealized appreciation/depreciation on investments, forward foreign currency exchange contracts and translation of assets and liabilities denominated in foreign currencies | | | (25,856,479 | ) | | | 36,853,093 | |
| Net increase (decrease) in net assets resulting from operations | | | (64,477,894 | ) | | | 40,410,768 | |
| Distributions to shareholders: | | | | | | | | |
| Class A | | | (4,117,368 | ) | | | (8,071,368 | ) |
| Class C | | | (254,834 | ) | | | (846,038 | ) |
| Class F | | | (602,335 | ) | | | (1,347,041 | ) |
| Class F3 | | | (464,168 | ) | | | (841,245 | ) |
| Class I | | | (4,323,381 | ) | | | (8,117,139 | ) |
| Class P | | | – | | | | – | |
| Class R2 | | | (218 | ) | | | (10,825 | ) |
| Class R3 | | | (103,892 | ) | | | (200,439 | ) |
| Class R4 | | | (701 | ) | | | (1,084 | ) |
| Class R5 | | | (215 | ) | | | (367 | ) |
| Class R6 | | | (25,750 | ) | | | (50,339 | ) |
| Total distributions to shareholders | | | (9,892,862 | ) | | | (19,485,885 | ) |
| Capital share transactions (Net of share conversions) (See Note 16): | | | | | | | | |
| Net proceeds from sales of shares | | | 70,419,560 | | | | 69,499,865 | |
| Reinvestment of distributions | | | 9,692,061 | | | | 18,898,989 | |
| Cost of shares reacquired | | | (140,459,945 | ) | | | (267,470,860 | ) |
| Net decrease in net assets resulting from capital share transactions | | | (60,348,324 | ) | | | (179,072,006 | ) |
| Net decrease in net assets | | | (134,719,080 | ) | | | (158,147,123 | ) |
| NET ASSETS: | | | | | | | | |
| Beginning of year | | $ | 580,070,337 | | | $ | 738,217,460 | |
| End of year | | $ | 445,351,257 | | | $ | 580,070,337 | |
| 148 | See Notes to Financial Statements. |
| Value Opportunities Fund |
For the
Year Ended
October 31, 2020 | | | For the
Year Ended
October 31, 2019 | |
| | | | | | | |
| $ | 5,295,341 | | | $ | 7,214,039 | |
| | | | | | | |
| | 91,012,863 | | | | 240,098,045 | |
| | | | | | | |
| | (76,099,606 | ) | | | (156,042,103 | ) |
| | | | | | | |
| | 20,208,598 | | | | 91,269,981 | |
| | | | | | | |
| | (85,094,354 | ) | | | (82,769,526 | ) |
| | (17,196,886 | ) | | | (22,544,150 | ) |
| | (22,240,666 | ) | | | (34,047,751 | ) |
| | (27,977,023 | ) | | | (29,372,410 | ) |
| | (31,069,513 | ) | | | (39,402,346 | ) |
| | (2,448,798 | ) | | | (2,324,620 | ) |
| | (736,437 | ) | | | (696,446 | ) |
| | (6,339,609 | ) | | | (7,151,640 | ) |
| | (4,776,365 | ) | | | (4,905,199 | ) |
| | (306,961 | ) | | | (168,860 | ) |
| | (4,315,563 | ) | | | (8,231,369 | ) |
| | (202,502,175 | ) | | | (231,614,317 | ) |
| | | | | | | |
| | 156,871,893 | | | | 209,293,368 | |
| | 196,957,357 | | | | 219,865,690 | |
| | (649,877,862 | ) | | | (1,016,349,328 | ) |
| | | | | | | |
| | (296,048,612 | ) | | | (587,190,270 | ) |
| | (478,342,189 | ) | | | (727,534,606 | ) |
| | | | | | | |
| $ | 1,853,751,827 | | | $ | 2,581,286,433 | |
| $ | 1,375,409,638 | | | $ | 1,853,751,827 | |
| | See Notes to Financial Statements. | 149 |
Financial Highlights
ALPHA STRATEGY FUND
| | | | | | Per Share Operating Performance: |
| | | | | | Investment operations: | | Distributions to
shareholders from: |
| | | Net asset
value,
beginning
of period | | Net
invest-
ment
income
(loss)(b) | | Net
realized
and
unrealized
gain | | Total
from
invest-
ment
opera-
tions | | Net
investment
income | | Net
realized
gain | | Total
distri-
butions |
| Class A | | | | | | | | | | | | | | | | | | | | | | | | | | | | |
| 10/31/2020 | | | $24.04 | | | $ | 0.03 | | | | $1.82 | | | | $1.85 | | | $ | – | | | | $(3.29 | ) | | | $(3.29 | ) |
| 10/31/2019 | | | 26.62 | | | | (0.03 | ) | | | 0.87 | | | | 0.84 | | | | (0.26 | ) | | | (3.16 | ) | | | (3.42 | ) |
| 10/31/2018 | | | 28.92 | | | | (0.05 | ) | | | 0.93 | | | | 0.88 | | | | – | | | | (3.18 | ) | | | (3.18 | ) |
| 10/31/2017 | | | 25.94 | | | | (0.05 | ) | | | 5.96 | | | | 5.91 | | | | – | | | | (2.93 | ) | | | (2.93 | ) |
| 10/31/2016 | | | 29.79 | | | | (0.03 | ) | | | 0.19 | | | | 0.16 | | | | (0.19 | ) | | | (3.82 | ) | | | (4.01 | ) |
| Class C | | | | | | | | | | | | | | | | | | | | | | | | | | | | |
| 10/31/2020 | | | 19.73 | | | | (0.09 | ) | | | 1.47 | | | | 1.38 | | | | – | | | | (3.29 | ) | | | (3.29 | ) |
| 10/31/2019 | | | 22.43 | | | | (0.17 | ) | | | 0.66 | | | | 0.49 | | | | (0.03 | ) | | | (3.16 | ) | | | (3.19 | ) |
| 10/31/2018 | | | 25.03 | | | | (0.21 | ) | | | 0.79 | | | | 0.58 | | | | – | | | | (3.18 | ) | | | (3.18 | ) |
| 10/31/2017 | | | 22.96 | | | | (0.21 | ) | | | 5.21 | | | | 5.00 | | | | – | | | | (2.93 | ) | | | (2.93 | ) |
| 10/31/2016 | | | 26.83 | | | | (0.19 | ) | | | 0.14 | | | | (0.05 | ) | | | – | | | | (3.82 | ) | | | (3.82 | ) |
| Class F | | | | | | | | | | | | | | | | | | | | | | | | | | | | |
| 10/31/2020 | | | 24.22 | | | | 0.08 | | | | 1.81 | | | | 1.89 | | | | – | | | | (3.29 | ) | | | (3.29 | ) |
| 10/31/2019 | | | 26.80 | | | | 0.01 | | | | 0.87 | | | | 0.88 | | | | (0.30 | ) | | | (3.16 | ) | | | (3.46 | ) |
| 10/31/2018 | | | 29.06 | | | | – | (d) | | | 0.92 | | | | 0.92 | | | | – | | | | (3.18 | ) | | | (3.18 | ) |
| 10/31/2017 | | | 26.01 | | | | (0.02 | ) | | | 6.00 | | | | 5.98 | | | | – | | | | (2.93 | ) | | | (2.93 | ) |
| 10/31/2016 | | | 29.87 | | | | 0.02 | | | | 0.17 | | | | 0.19 | | | | (0.23 | ) | | | (3.82 | ) | | | (4.05 | ) |
| Class F3 | | | | | | | | | | | | | | | | | | | | | | | | | | | | |
| 10/31/2020 | | | 24.78 | | | | 0.10 | | | | 1.88 | | | | 1.98 | | | | – | | | | (3.29 | ) | | | (3.29 | ) |
| 10/31/2019 | | | 27.32 | | | | 0.05 | | | | 0.91 | | | | 0.96 | | | | (0.34 | ) | | | (3.16 | ) | | | (3.50 | ) |
| 10/31/2018 | | | 29.52 | | | | 0.05 | | | | 0.93 | | | | 0.98 | | | | – | | | | (3.18 | ) | | | (3.18 | ) |
| 4/4/2017 to 10/31/2017(e) | | | 26.15 | | | | (0.01 | ) | | | 3.38 | | | | 3.37 | | | | – | | | | – | | | | – | |
| Class I | | | | | | | | | | | | | | | | | | | | | | | | | | | | |
| 10/31/2020 | | | 24.72 | | | | 0.11 | | | | 1.85 | | | | 1.96 | | | | – | | | | (3.29 | ) | | | (3.29 | ) |
| 10/31/2019 | | | 27.29 | | | | 0.03 | | | | 0.89 | | | | 0.92 | | | | (0.33 | ) | | | (3.16 | ) | | | (3.49 | ) |
| 10/31/2018 | | | 29.50 | | | | 0.02 | | | | 0.95 | | | | 0.97 | | | | – | | | | (3.18 | ) | | | (3.18 | ) |
| 10/31/2017 | | | 26.34 | | | | 0.02 | | | | 6.07 | | | | 6.09 | | | | – | | | | (2.93 | ) | | | (2.93 | ) |
| 10/31/2016 | | | 30.20 | | | | 0.02 | | | | 0.20 | | | | 0.22 | | | | (0.26 | ) | | | (3.82 | ) | | | (4.08 | ) |
| Class R2 | | | | | | | | | | | | | | | | | | | | | | | | | | | | |
| 10/31/2020 | | | 23.11 | | | | (0.04 | ) | | | 1.74 | | | | 1.70 | | | | – | | | | (3.29 | ) | | | (3.29 | ) |
| 10/31/2019 | | | 25.65 | | | | (0.10 | ) | | | 0.83 | | | | 0.73 | | | | (0.11 | ) | | | (3.16 | ) | | | (3.27 | ) |
| 10/31/2018 | | | 28.07 | | | | (0.13 | ) | | | 0.89 | | | | 0.76 | | | | – | | | | (3.18 | ) | | | (3.18 | ) |
| 10/31/2017 | | | 25.34 | | | | (0.14 | ) | | | 5.80 | | | | 5.66 | | | | – | | | | (2.93 | ) | | | (2.93 | ) |
| 10/31/2016 | | | 29.16 | | | | (0.11 | ) | | | 0.18 | | | | 0.07 | | | | (0.07 | ) | | | (3.82 | ) | | | (3.89 | ) |
| 150 | See Notes to Financial Statements. | |
| | | | | | | Ratios to Average Net Assets:(a) | | Supplemental Data: |
| | | | | | | | | | | | | | | | | | | | |
Net
asset
value,
end of
period | | Total
return(c)
(%) | | Total
expenses
after
waivers
and/or reim-
bursements
(%) | | Total
expenses
(%) | | Net
invest-
ment
income
(loss)
(%) | | Net
assets,
end of
period
(000) | | Portfolio
turnover
rate
(%) |
| | | | | | | | | | | | | | | | | | | | | | | | | | | |
| $ | 22.60 | | | | 7.72 | | | | 0.43 | | | | 0.53 | | | | 0.16 | | | $ | 400,088 | | | | 16 | |
| | 24.04 | | | | 5.65 | | | | 0.44 | | | | 0.54 | | | | (0.13 | ) | | | 482,675 | | | | 17 | |
| | 26.62 | | | | 3.11 | | | | 0.42 | | | | 0.52 | | | | (0.17 | ) | | | 508,472 | | | | 8 | |
| | 28.92 | | | | 24.55 | | | | 0.41 | | | | 0.54 | | | | (0.19 | ) | | | 510,601 | | | | 6 | |
| | 25.94 | | | | 0.91 | | | | 0.27 | | | | 0.55 | | | | (0.10 | ) | | | 507,241 | | | | 13 | |
| | | | | | | | | | | | | | | | | | | | | | | | | | | |
| | 17.82 | | | | 6.98 | | | | 1.18 | | | | 1.28 | | | | (0.52 | ) | | | 54,247 | | | | 16 | |
| | 19.73 | | | | 4.86 | | | | 1.19 | | | | 1.29 | | | | (0.85 | ) | | | 97,096 | | | | 17 | |
| | 22.43 | | | | 2.31 | | | | 1.17 | | | | 1.27 | | | | (0.87 | ) | | | 140,681 | | | | 8 | |
| | 25.03 | | | | 23.69 | | | | 1.16 | | | | 1.29 | | | | (0.92 | ) | | | 224,568 | | | | 6 | |
| | 22.96 | | | | 0.12 | | | | 1.02 | | | | 1.30 | | | | (0.84 | ) | | | 265,906 | | | | 13 | |
| | | | | | | | | | | | | | | | | | | | | | | | | | | |
| | 22.82 | | | | 7.89 | | | | 0.28 | | | | 0.38 | | | | 0.37 | | | | 120,797 | | | | 16 | |
| | 24.22 | | | | 5.81 | | | | 0.29 | | | | 0.39 | | | | 0.04 | | | | 176,784 | | | | 17 | |
| | 26.80 | | | | 3.25 | | | | 0.27 | | | | 0.37 | | | | (0.01 | ) | | | 204,245 | | | | 8 | |
| | 29.06 | | | | 24.78 | | | | 0.27 | | | | 0.39 | | | | (0.06 | ) | | | 247,908 | | | | 6 | |
| | 26.01 | | | | 1.05 | | | | 0.12 | | | | 0.40 | | | | 0.06 | | | | 230,558 | | | | 13 | |
| | | | | | | | | | | | | | | | | | | | | | | | | | | |
| | 23.47 | | | | 8.10 | | | | 0.09 | | | | 0.19 | | | | 0.44 | | | | 33,179 | | | | 16 | |
| | 24.78 | | | | 6.03 | | | | 0.10 | | | | 0.20 | | | | 0.20 | | | | 32,219 | | | | 17 | |
| | 27.32 | | | | 3.42 | | | | 0.08 | | | | 0.19 | | | | 0.17 | | | | 33,677 | | | | 8 | |
| | | | | | | | | | | | | | | | | | | | | | | | | | | |
| | 29.52 | | | | 12.89 | (f) | | | 0.09 | (g) | | | 0.19 | (g) | | | (0.08 | )(g) | | | 34,672 | | | | 6 | |
| | | | | | | | | | | | | | | | | | | | | | | | | | | |
| | 23.39 | | | | 8.02 | | | | 0.18 | | | | 0.28 | | | | 0.51 | | | | 28,481 | | | | 16 | |
| | 24.72 | | | | 5.88 | | | | 0.19 | | | | 0.29 | | | | 0.11 | | | | 92,448 | | | | 17 | |
| | 27.29 | | | | 3.38 | | | | 0.17 | | | | 0.27 | | | | 0.08 | | | | 87,441 | | | | 8 | |
| | 29.50 | | | | 24.90 | | | | 0.16 | | | | 0.30 | | | | 0.06 | | | | 69,232 | | | | 6 | |
| | 26.34 | | | | 1.15 | | | | 0.02 | | | | 0.30 | | | | 0.09 | | | | 67,982 | | | | 13 | |
| | | | | | | | | | | | | | | | | | | | | | | | | | | |
| | 21.52 | | | | 7.39 | | | | 0.78 | | | | 0.88 | | | | (0.19 | ) | | | 1,430 | | | | 16 | |
| | 23.11 | | | | 5.26 | | | | 0.79 | | | | 0.89 | | | | (0.45 | ) | | | 1,476 | | | | 17 | |
| | 25.65 | | | | 2.75 | | | | 0.77 | | | | 0.87 | | | | (0.49 | ) | | | 2,531 | | | | 8 | |
| | 28.07 | | | | 24.11 | | | | 0.76 | | | | 0.89 | | | | (0.55 | ) | | | 3,064 | | | | 6 | |
| | 25.34 | | | | 0.57 | | | | 0.62 | | | | 0.90 | | | | (0.45 | ) | | | 2,704 | | | | 13 | |
| | See Notes to Financial Statements. | 151 |
Financial Highlights (continued)
ALPHA STRATEGY FUND
| | | | | | Per Share Operating Performance: |
| | | | | | Investment operations: | | Distributions to
shareholders from: |
| | | Net asset
value,
beginning
of period | | Net
invest-
ment
income
(loss)(b) | | Net
realized
and
unrealized
gain | | Total
from
invest-
ment
opera-
tions | | Net
investment
income | | Net
realized
gain | | Total
distri-
butions |
| Class R3 | | | | | | | | | | | | | | | | | | | | | | | | | | | | |
| 10/31/2020 | | | $23.26 | | | | $(0.01 | ) | | | $1.74 | | | | $1.73 | | | $ | – | | | | $(3.29 | ) | | | $(3.29 | ) |
| 10/31/2019 | | | 25.86 | | | | (0.09 | ) | | | 0.84 | | | | 0.75 | | | | (0.19 | ) | | | (3.16 | ) | | | (3.35 | ) |
| 10/31/2018 | | | 28.25 | | | | (0.11 | ) | | | 0.90 | | | | 0.79 | | | | – | | | | (3.18 | ) | | | (3.18 | ) |
| 10/31/2017 | | | 25.46 | | | | (0.11 | ) | | | 5.83 | | | | 5.72 | | | | – | | | | (2.93 | ) | | | (2.93 | ) |
| 10/31/2016 | | | 29.30 | | | | (0.09 | ) | | | 0.19 | | | | 0.10 | | | | (0.12 | ) | | | (3.82 | ) | | | (3.94 | ) |
| Class R4 | | | | | | | | | | | | | | | | | | | | | | | | | | | | |
| 10/31/2020 | | | 23.98 | | | | 0.02 | | | | 1.83 | | | | 1.85 | | | | – | | | | (3.29 | ) | | | (3.29 | ) |
| 10/31/2019 | | | 26.58 | | | | (0.04 | ) | | | 0.87 | | | | 0.83 | | | | (0.27 | ) | | | (3.16 | ) | | | (3.43 | ) |
| 10/31/2018 | | | 28.88 | | | | (0.06 | ) | | | 0.94 | | | | 0.88 | | | | – | | | | (3.18 | ) | | | (3.18 | ) |
| 10/31/2017 | | | 25.90 | | | | (0.09 | ) | | | 6.00 | | | | 5.91 | | | | – | | | | (2.93 | ) | | | (2.93 | ) |
| 10/31/2016 | | | 29.79 | | | | (0.07 | ) | | | 0.23 | | | | 0.16 | | | | (0.23 | ) | | | (3.82 | ) | | | (4.05 | ) |
| Class R5 | | | | | | | | | | | | | | | | | | | | | | | | | | | | |
| 10/31/2020 | | | 24.73 | | | | 0.03 | | | | 1.93 | | | | 1.96 | | | | – | | | | (3.29 | ) | | | (3.29 | ) |
| 10/31/2019 | | | 27.30 | | | | 0.03 | | | | 0.89 | | | | 0.92 | | | | (0.33 | ) | | | (3.16 | ) | | | (3.49 | ) |
| 10/31/2018 | | | 29.52 | | | | 0.02 | | | | 0.94 | | | | 0.96 | | | | – | | | | (3.18 | ) | | | (3.18 | ) |
| 10/31/2017 | | | 26.35 | | | | (0.04 | ) | | | 6.14 | | | | 6.10 | | | | – | | | | (2.93 | ) | | | (2.93 | ) |
| 10/31/2016 | | | 30.20 | | | | 0.04 | | | | 0.19 | | | | 0.23 | | | | (0.26 | ) | | | (3.82 | ) | | | (4.08 | ) |
| Class R6 | | | | | | | | | | | | | | | | | | | | | | | | | | | | |
| 10/31/2020 | | | 24.78 | | | | 0.10 | | | | 1.89 | | | | 1.99 | | | | – | | | | (3.29 | ) | | | (3.29 | ) |
| 10/31/2019 | | | 27.33 | | | | 0.05 | | | | 0.90 | | | | 0.95 | | | | (0.34 | ) | | | (3.16 | ) | | | (3.50 | ) |
| 10/31/2018 | | | 29.52 | | | | 0.05 | | | | 0.94 | | | | 0.99 | | | | – | | | | (3.18 | ) | | | (3.18 | ) |
| 10/31/2017 | | | 26.34 | | | | (0.01 | ) | | | 6.12 | | | | 6.11 | | | | – | | | | (2.93 | ) | | | (2.93 | ) |
| 10/31/2016 | | | 30.20 | | | | – | (d) | | | 0.23 | | | | 0.23 | | | | (0.27 | ) | | | (3.82 | ) | | | (4.09 | ) |
| (a) | Does not include expenses of the Underlying Funds in which the Fund invests. |
| (b) | Calculated using average shares outstanding during the period. |
| (c) | Total return for Classes A and C does not consider the effects of sales loads and assumes the reinvestment of all distributions. Total return for all other classes assumes the reinvestment of all distributions. |
| (d) | Amount less than $0.01. |
| (e) | Commenced on April 4, 2017. |
| (f) | Not annualized. |
| (g) | Annualized. |
| 152 | See Notes to Financial Statements. | |
| | | | | | | Ratios to Average Net Assets:(a) | | Supplemental Data: |
| | | | | | | | | | | | | | | | | | | | |
Net
asset
value,
end of
period | | Total
return(c)
(%) | | Total
expenses
after
waivers
and/or reim-
bursements
(%) | | Total
expenses
(%) | | Net
invest-
ment
income
(loss)
(%) | | Net
assets,
end of
period
(000) | | Portfolio
turnover
rate
(%) |
| | | | | | | | | | | | | | | | | | | | | | | | | | | |
| $ | 21.70 | | | | 7.47 | | | | 0.68 | | | | 0.78 | | | | (0.07 | ) | | $ | 20,860 | | | | 16 | |
| | 23.26 | | | | 5.38 | | | | 0.69 | | | | 0.79 | | | | (0.38 | ) | | | 26,729 | | | | 17 | |
| | 25.86 | | | | 2.84 | | | | 0.67 | | | | 0.77 | | | | (0.40 | ) | | | 28,601 | | | | 8 | |
| | 28.25 | | | | 24.24 | | | | 0.65 | | | | 0.79 | | | | (0.43 | ) | | | 33,190 | | | | 6 | |
| | 25.46 | | | | 0.68 | | | | 0.52 | | | | 0.80 | | | | (0.35 | ) | | | 34,223 | | | | 13 | |
| | | | | | | | | | | | | | | | | | | | | | | | | | | |
| | 22.54 | | | | 7.79 | | | | 0.43 | | | | 0.53 | | | | 0.09 | | | | 3,715 | | | | 16 | |
| | 23.98 | | | | 5.61 | | | | 0.44 | | | | 0.54 | | | | (0.16 | ) | | | 3,461 | | | | 17 | |
| | 26.58 | | | | 3.12 | | | | 0.42 | | | | 0.52 | | | | (0.22 | ) | | | 3,236 | | | | 8 | |
| | 28.88 | | | | 24.60 | | | | 0.42 | | | | 0.53 | | | | (0.34 | ) | | | 1,998 | | | | 6 | |
| | 25.90 | | | | 0.91 | | | | 0.28 | | | | 0.55 | | | | (0.27 | ) | | | 278 | | | | 13 | |
| | | | | | | | | | | | | | | | | | | | | | | | | | | |
| | 23.40 | | | | 8.02 | | | | 0.18 | | | | 0.28 | | | | 0.14 | | | | 623 | | | | 16 | |
| | 24.73 | | | | 5.90 | | | | 0.19 | | | | 0.29 | | | | 0.13 | | | | 296 | | | | 17 | |
| | 27.30 | | | | 3.34 | | | | 0.17 | | | | 0.27 | | | | 0.06 | | | | 106 | | | | 8 | |
| | 29.52 | | | | 24.93 | | | | 0.18 | | | | 0.28 | | | | (0.13 | ) | | | 84 | | | | 6 | |
| | 26.35 | | | | 1.19 | | | | – | | | | 0.30 | | | | 0.16 | | | | 9 | | | | 13 | |
| | | | | | | | | | | | | | | | | | | | | | | | | | | |
| | 23.48 | | | | 8.14 | | | | 0.09 | | | | 0.19 | | | | 0.46 | | | | 4,143 | | | | 16 | |
| | 24.78 | | | | 5.98 | | | | 0.10 | | | | 0.20 | | | | 0.19 | | | | 4,266 | | | | 17 | |
| | 27.33 | | | | 3.45 | | | | 0.08 | | | | 0.19 | | | | 0.17 | | | | 3,619 | | | | 8 | |
| | 29.52 | | | | 24.98 | | | | 0.09 | | | | 0.19 | | | | 1.34 | | | | 3,855 | | | | 6 | |
| | 26.34 | | | | 1.17 | | | | 0.03 | | | | 0.17 | | | | (0.01 | ) | | | 675 | | | | 13 | |
| | See Notes to Financial Statements. | 153 |
Financial Highlights (continued)
DURABLE GROWTH FUND
| | | | | | Per Share Operating Performance: | | | | |
| | | | | | Investment operations: | | Distributions
to
shareholders
from: | | | | |
| | | Net asset
value,
beginning
of period | | Net
investment
income
(loss)(a) | | Net
realized and
unrealized
gain | | Total from
investment
operations | | Net
investment
income | | Net asset
value,
end of
period |
| Class A | | | | | | | | | | | | | | | | | | | | | | | | |
| 10/31/2020 | | | $15.00 | | | | $(0.03 | ) | | | $4.25 | | | | $4.22 | | | | $(0.01 | ) | | | $19.21 | |
| Class C | | | | | | | | | | | | | | | | | | | | | | | | |
| 10/31/2020 | | | 15.00 | | | | (0.14 | ) | | | 4.22 | | | | 4.08 | | | | – | | | | 19.08 | |
| Class F | | | | | | | | | | | | | | | | | | | | | | | | |
| 10/31/2020 | | | 15.00 | | | | 0.04 | | | | 4.22 | | | | 4.26 | | | | (0.01 | ) | | | 19.25 | |
| Class F3 | | | | | | | | | | | | | | | | | | | | | | | | |
| 10/31/2020 | | | 15.00 | | | | 0.04 | | | | 4.24 | | | | 4.28 | | | | (0.02 | ) | | | 19.26 | |
| Class I | | | | | | | | | | | | | | | | | | | | | | | | |
| 10/31/2020 | | | 15.00 | | | | 0.01 | | | | 4.26 | | | | 4.27 | | | | (0.02 | ) | | | 19.25 | |
| Class R3 | | | | | | | | | | | | | | | | | | | | | | | | |
| 10/31/2020 | | | 15.00 | | | | (0.05 | ) | | | 4.23 | | | | 4.18 | | | | (0.01 | ) | | | 19.17 | |
| Class R4 | | | | | | | | | | | | | | | | | | | | | | | | |
| 10/31/2020 | | | 15.00 | | | | (0.01 | ) | | | 4.23 | | | | 4.22 | | | | (0.01 | ) | | | 19.21 | |
| Class R5 | | | | | | | | | | | | | | | | | | | | | | | | |
| 10/31/2020 | | | 15.00 | | | | 0.03 | | | | 4.24 | | | | 4.27 | | | | (0.02 | ) | | | 19.25 | |
| Class R6 | | | | | | | | | | | | | | | | | | | | | | | | |
| 10/31/2020 | | | 15.00 | | | | 0.06 | | | | 4.22 | | | | 4.28 | | | | (0.02 | ) | | | 19.26 | |
| (a) | Calculated using average shares outstanding during the period. |
| (b) | Total return for Classes A and C does not consider the effects of sales loads and assumes the reinvestment of all distributions. Total return for all other classes assumes the reinvestment of all distributions. |
| 154 | See Notes to Financial Statements. | |
| | | | Ratios to Average Net Assets: | | Supplemental Data: |
| | | | | | | | | | | |
Total
return(b)
(%) | | Total
expenses
after
waivers
and/or reim-
bursements
(%) | | Total
expenses
(%) | | Net
investment
income
(loss)
(%) | | Net assets,
end of
period
(000) | | Portfolio
turnover
rate
(%) |
| | | | | | | | | | | | | | | | | | | | | | | |
| | 28.16 | | | | 0.95 | | | | 1.29 | | | | (0.18 | ) | | $ | 1,538 | | | | 52 | |
| | | | | | | | | | | | | | | | | | | | | | | |
| | 27.20 | | | | 1.70 | | | | 2.61 | | | | (0.84 | ) | | | 228 | | | | 52 | |
| | | | | | | | | | | | | | | | | | | | | | | |
| | 28.46 | | | | 0.70 | | | | 2.24 | | | | 0.25 | | | | 346 | | | | 52 | |
| | | | | | | | | | | | | | | | | | | | | | | |
| | 28.55 | | | | 0.64 | | | | 1.73 | | | | 0.24 | | | | 141 | | | | 52 | |
| | | | | | | | | | | | | | | | | | | | | | | |
| | 28.48 | | | | 0.70 | | | | 0.69 | | | | 0.07 | | | | 199,234 | | | | 52 | |
| | | | | | | | | | | | | | | | | | | | | | | |
| | 27.84 | | | | 1.20 | | | | 2.25 | | | | (0.32 | ) | | | 13 | | | | 52 | |
| | | | | | | | | | | | | | | | | | | | | | | |
| | 28.16 | | | | 0.95 | | | | 2.00 | | | | (0.07 | ) | | | 13 | | | | 52 | |
| | | | | | | | | | | | | | | | | | | | | | | |
| | 28.48 | | | | 0.70 | | | | 1.75 | | | | 0.18 | | | | 13 | | | | 52 | |
| | | | | | | | | | | | | | | | | | | | | | | |
| | 28.55 | | | | 0.64 | | | | 2.37 | | | | 0.37 | | | | 241 | | | | 52 | |
| | See Notes to Financial Statements. | 155 |
Financial Highlights (continued)
FOCUSED GROWTH FUND
| | | | | | Per Share Operating Performance: |
| | | | | | | | | | | | | | | | | | | |
| | | | | | Investment operations: | | | | | | |
| | | Net asset
value,
beginning
of period | | Net
invest-
ment
income
(loss)(a) | | Net
realized
and
unrealized
gain | | Total
from
invest-
ment
opera-
tions | | Net
asset
value,
end of
period | | Total
return(b)
(%) |
| Class A | | | | | | | | | | | | | | | | | | | | | | | | |
| 10/31/2020 | | | $15.88 | | | | $(0.17 | ) | | | $11.19 | | | | $11.02 | | | | $26.90 | | | | 69.40 | |
| 1/30/2019 to 10/31/2019(c)(d) | | | 15.00 | | | | (0.10 | ) | | | 0.98 | | | | 0.88 | | | | 15.88 | | | | 5.87 | (e) |
| Class C | | | | | | | | | | | | | | | | | | | | | | | | |
| 10/31/2020 | | | 15.80 | | | | (0.37 | ) | | | 11.13 | | | | 10.76 | | | | 26.56 | | | | 68.10 | |
| 1/30/2019 to 10/31/2019(c)(d) | | | 15.00 | | | | (0.19 | ) | | | 0.99 | | | | 0.80 | | | | 15.80 | | | | 5.33 | (e) |
| Class F | | | | | | | | | | | | | | | | | | | | | | | | |
| 10/31/2020 | | | 15.91 | | | | (0.13 | ) | | | 11.25 | | | | 11.12 | | | | 27.03 | | | | 69.89 | |
| 1/30/2019 to 10/31/2019(c)(d) | | | 15.00 | | | | (0.07 | ) | | | 0.98 | | | | 0.91 | | | | 15.91 | | | | 6.07 | (e) |
| Class F3 | | | | | | | | | | | | | | | | | | | | | | | | |
| 10/31/2020 | | | 15.92 | | | | (0.09 | ) | | | 11.23 | | | | 11.14 | | | | 27.06 | | | | 69.97 | |
| 1/30/2019 to 10/31/2019(c)(d) | | | 15.00 | | | | (0.06 | ) | | | 0.98 | | | | 0.92 | | | | 15.92 | | | | 6.13 | (e) |
| Class I | | | | | | | | | | | | | | | | | | | | | | | | |
| 10/31/2020 | | | 15.92 | | | | (0.11 | ) | | | 11.22 | | | | 11.11 | | | | 27.03 | | | | 69.72 | |
| 1/30/2019 to 10/31/2019(c)(d) | | | 15.00 | | | | (0.07 | ) | | | 0.99 | | | | 0.92 | | | | 15.92 | | | | 6.13 | (e) |
| Class R3 | | | | | | | | | | | | | | | | | | | | | | | | |
| 10/31/2020 | | | 15.86 | | | | (0.21 | ) | | | 11.14 | | | | 10.93 | | | | 26.79 | | | | 68.92 | |
| 1/30/2019 to 10/31/2019(c)(d) | | | 15.00 | | | | (0.13 | ) | | | 0.99 | | | | 0.86 | | | | 15.86 | | | | 5.73 | (e) |
| Class R4 | | | | | | | | | | | | | | | | | | | | | | | | |
| 10/31/2020 | | | 15.89 | | | | (0.16 | ) | | | 11.18 | | | | 11.02 | | | | 26.91 | | | | 69.35 | |
| 1/30/2019 to 10/31/2019(c)(d) | | | 15.00 | | | | (0.10 | ) | | | 0.99 | | | | 0.89 | | | | 15.89 | | | | 5.93 | (e) |
| Class R5 | | | | | | | | | | | | | | | | | | | | | | | | |
| 10/31/2020 | | | 15.91 | | | | (0.10 | ) | | | 11.21 | | | | 11.11 | | | | 27.02 | | | | 69.83 | |
| 1/30/2019 to 10/31/2019(c)(d) | | | 15.00 | | | | (0.07 | ) | | | 0.98 | | | | 0.91 | | | | 15.91 | | | | 6.07 | (e) |
| Class R6 | | | | | | | | | | | | | | | | | | | | | | | | |
| 10/31/2020 | | | 15.92 | | | | (0.10 | ) | | | 11.24 | | | | 11.14 | | | | 27.06 | | | | 69.97 | |
| 1/30/2019 to 10/31/2019(c)(d) | | | 15.00 | | | | (0.06 | ) | | | 0.98 | | | | 0.92 | | | | 15.92 | | | | 6.13 | (e) |
| (a) | Calculated using average shares outstanding during the period. |
| (b) | Total return for Classes A and C does not consider the effects of sales loads and assumes the reinvestment of all distributions. Total return for all other classes assumes the reinvestment of all distributions. |
| (c) | Commencement of operations was 1/30/2019, SEC effective date was 1/31/2019 and date shares first became available to the public was 2/1/2019. |
| (d) | Net investment income, net realized and unrealized gain amounted to less than $.01 for the period 1/30/2019 through 1/31/2019. |
| (e) | Not annualized. |
| (f) | Annualized. |
| 156 | See Notes to Financial Statements. |
| Ratios to Average Net Assets: | | Supplemental Data: |
Total
expenses
after
waivers
and/or
reimburse-
ments
(%) | | Total
expenses
(%) | | Net
invest-
ment
income
(loss)
(%) | | Net
assets,
end of
period
(000) | | Portfolio
turnover
rate
(%) |
| | | | | | | | | | | | | | | | | | | |
| | 1.05 | | | | 2.25 | | | | (0.79 | ) | | | $ 12,485 | | | | 126 | |
| | | | | | | | | | | | | | | | | | | |
| | 1.05 | (f) | | | 3.09 | (f) | | | (0.83 | )(f) | | | 4,889 | | | | 130 | (e) |
| | | | | | | | | | | | | | | | | | | |
| | 1.78 | | | | 2.87 | | | | (1.61 | ) | | | 1,849 | | | | 126 | |
| | | | | | | | | | | | | | | | | | | |
| | 1.80 | (f) | | | 4.10 | (f) | | | (1.55 | )(f) | | | 156 | | | | 130 | (e) |
| | | | | | | | | | | | | | | | | | | |
| | 0.80 | | | | 2.03 | | | | (0.58 | ) | | | 5,821 | | | | 126 | |
| | | | | | | | | | | | | | | | | | | |
| | 0.80 | (f) | | | 3.14 | (f) | | | (0.56 | )(f) | | | 1,005 | | | | 130 | (e) |
| | | | | | | | | | | | | | | | | | | |
| | 0.72 | | | | 2.01 | | | | (0.44 | ) | | | 902 | | | | 126 | |
| | | | | | | | | | | | | | | | | | | |
| | 0.73 | (f) | | | 3.07 | (f) | | | (0.48 | )(f) | | | 531 | | | | 130 | (e) |
| | | | | | | | | | | | | | | | | | | |
| | 0.80 | | | | 2.04 | | | | (0.52 | ) | | | 2,712 | | | | 126 | |
| | | | | | | | | | | | | | | | | | | |
| | 0.80 | (f) | | | 2.91 | (f) | | | (0.60 | )(f) | | | 1,492 | | | | 130 | (e) |
| | | | | | | | | | | | | | | | | | | |
| | 1.30 | | | | 2.52 | | | | (1.01 | ) | | | 18 | | | | 126 | |
| | | | | | | | | | | | | | | | | | | |
| | 1.30 | (f) | | | 3.64 | (f) | | | (1.06 | )(f) | | | 11 | | | | 130 | (e) |
| | | | | | | | | | | | | | | | | | | |
| | 1.05 | | | | 2.27 | | | | (0.75 | ) | | | 18 | | | | 126 | |
| | | | | | | | | | | | | | | | | | | |
| | 1.05 | (f) | | | 3.37 | (f) | | | (0.80 | )(f) | | | 11 | | | | 130 | (e) |
| | | | | | | | | | | | | | | | | | | |
| | 0.80 | | | | 2.02 | | | | (0.49 | ) | | | 18 | | | | 126 | |
| | | | | | | | | | | | | | | | | | | |
| | 0.80 | (f) | | | 3.12 | (f) | | | (0.55 | )(f) | | | 11 | | | | 130 | (e) |
| | | | | | | | | | | | | | | | | | | |
| | 0.72 | | | | 1.99 | | | | (0.45 | ) | | | 4,400 | | | | 126 | |
| | | | | | | | | | | | | | | | | | | |
| | 0.73 | (f) | | | 2.83 | (f) | | | (0.50 | )(f) | | | 1,821 | | | | 130 | (e) |
| | See Notes to Financial Statements. | 157 |
Financial Highlights (continued)
FOCUSED LARGE CAP VALUE FUND
| | | | | | Per Share Operating Performance: | | | | |
| | | | | | Investment operations: | | Distributions
to
shareholders
from: | | | | |
| | | Net asset
value,
beginning
of period | | Net
investment
income(a) | | Net
realized and
unrealized
gain (loss) | | Total from
investment
operations | | Net
investment
income | | Net asset
value,
end of
period |
| Class A | | | | | | | | | | | | | | | | | | | | | | | | |
| 10/31/2020 | | | $14.75 | | | | $0.27 | | | | $(1.99 | ) | | | $(1.72 | ) | | | $(0.08 | ) | | | $12.95 | |
| 7/26/2019 to 10/31/2019(c)(d) | | | 15.00 | | | | 0.06 | | | | (0.31 | )(e) | | | (0.25 | ) | | | – | | | | 14.75 | |
| Class C | | | | | | | | | | | | | | | | | | | | | | | | |
| 10/31/2020 | | | 14.72 | | | | 0.17 | | | | (1.98 | ) | | | (1.81 | ) | | | (0.04 | ) | | | 12.87 | |
| 7/26/2019 to 10/31/2019(c)(d) | | | 15.00 | | | | 0.03 | | | | (0.31 | )(e) | | | (0.28 | ) | | | – | | | | 14.72 | |
| Class F | | | | | | | | | | | | | | | | | | | | | | | | |
| 10/31/2020 | | | 14.76 | | | | 0.31 | | | | (2.00 | ) | | | (1.69 | ) | | | (0.09 | ) | | | 12.98 | |
| 7/26/2019 to 10/31/2019(c)(d) | | | 15.00 | | | | 0.07 | | | | (0.31 | )(e) | | | (0.24 | ) | | | – | | | | 14.76 | |
| Class F3 | | | | | | | | | | | | | | | | | | | | | | | | |
| 10/31/2020 | | | 14.76 | | | | 0.32 | | | | (2.00 | ) | | | (1.68 | ) | | | (0.10 | ) | | | 12.98 | |
| 7/26/2019 to 10/31/2019(c)(d) | | | 15.00 | | | | 0.07 | | | | (0.31 | )(e) | | | (0.24 | ) | | | – | | | | 14.76 | |
| Class I | | | | | | | | | | | | | | | | | | | | | | | | |
| 10/31/2020 | | | 14.76 | | | | 0.30 | | | | (1.97 | ) | | | (1.67 | ) | | | (0.10 | ) | | | 12.99 | |
| 7/26/2019 to 10/31/2019(c)(d) | | | 15.00 | | | | 0.04 | | | | (0.28 | )(e) | | | (0.24 | ) | | | – | | | | 14.76 | |
| Class R3 | | | | | | | | | | | | | | | | | | | | | | | | |
| 10/31/2020 | | | 14.74 | | | | 0.23 | | | | (1.99 | ) | | | (1.76 | ) | | | (0.06 | ) | | | 12.92 | |
| 7/26/2019 to 10/31/2019(c)(d) | | | 15.00 | | | | 0.05 | | | | (0.31 | )(e) | | | (0.26 | ) | | | – | | | | 14.74 | |
| Class R4 | | | | | | | | | | | | | | | | | | | | | | | | |
| 10/31/2020 | | | 14.75 | | | | 0.27 | | | | (1.99 | ) | | | (1.72 | ) | | | (0.08 | ) | | | 12.95 | |
| 7/26/2019 to 10/31/2019(c)(d) | | | 15.00 | | | | 0.06 | | | | (0.31 | )(e) | | | (0.25 | ) | | | – | | | | 14.75 | |
| Class R5 | | | | | | | | | | | | | | | | | | | | | | | | |
| 10/31/2020 | | | 14.76 | | | | 0.30 | | | | (1.98 | ) | | | (1.68 | ) | | | (0.10 | ) | | | 12.98 | |
| 7/26/2019 to 10/31/2019(c)(d) | | | 15.00 | | | | 0.07 | | | | (0.31 | )(e) | | | (0.24 | ) | | | – | | | | 14.76 | |
| Class R6 | | | | | | | | | | | | | | | | | | | | | | | | |
| 10/31/2020 | | | 14.76 | | | | 0.32 | | | | (1.99 | ) | | | (1.67 | ) | | | (0.10 | ) | | | 12.99 | |
| 7/26/2019 to 10/31/2019(c)(d) | | | 15.00 | | | | 0.07 | | | | (0.31 | )(e) | | | (0.24 | ) | | | – | | | | 14.76 | |
| (a) | Calculated using average shares outstanding during the period. |
| (b) | Total return for Classes A and C does not consider the effects of sales loads and assumes the reinvestment of all distributions. Total return for all other classes assumes the reinvestment of all distributions. |
| (c) | Commencement of operations was 7/26/2019, SEC effective date was 7/31/2019 and date shares first became available to the public was 8/1/2019. |
| (d) | Net investment income, net realized and unrealized gain amounted to less than $.01 for the period 7/26/2019 through 7/31/2019. |
| (e) | Realized and unrealized gain (loss) per share does not correlate to the aggregate of the net realized and unrealized gain(loss) in the Statement of Operations for the period ended October 31, 2019, primarily due to the timing of the sales and repurchases of the Fund’s shares in relation to fluctuating market values of the Fund’s portfolio. |
| (f) | Not annualized. |
| (g) | Annualized. |
| 158 | See Notes to Financial Statements. |
| | | | Ratios to Average Net Assets: | | Supplemental Data: |
| | | | | | | | | | | |
Total
return(b)
(%) | | Total
expenses
after
waivers
and/or reim-
bursements
(%) | | Total
expenses
(%) | | Net
investment
income
(%) | | Net assets,
end of
period
(000) | | Portfolio
turnover
rate
(%) |
| | | | | | | | | | | | | | | | | | | | | | | |
| | (11.74 | ) | | | 0.96 | | | | 1.09 | | | | 2.08 | | | $ | 541 | | | | 128 | |
| | | | | | | | | | | | | | | | | | | | | | | |
| | (1.67 | )(f) | | | 0.96 | (g) | | | 4.40 | (g) | | | 1.57 | (g) | | | 508 | | | | 16 | (f) |
| | | | | | | | | | | | | | | | | | | | | | | |
| | (12.35 | ) | | | 1.71 | | | | 1.83 | | | | 1.32 | | | | 77 | | | | 128 | |
| | | | | | | | | | | | | | | | | | | | | | | |
| | (1.87 | )(f) | | | 1.71 | (g) | | | 5.27 | (g) | | | 0.75 | (g) | | | 108 | | | | 16 | (f) |
| | | | | | | | | | | | | | | | | | | | | | | |
| | (11.54 | ) | | | 0.71 | | | | 0.98 | | | | 2.33 | | | | 40 | | | | 128 | |
| | | | | | | | | | | | | | | | | | | | | | | |
| | (1.60 | )(f) | | | 0.71 | (g) | | | 4.37 | (g) | | | 1.75 | (g) | | | 492 | | | | 16 | (f) |
| | | | | | | | | | | | | | | | | | | | | | | |
| | (11.50 | ) | | | 0.63 | | | | 0.84 | | | | 2.40 | | | | 12 | | | | 128 | |
| | | | | | | | | | | | | | | | | | | | | | | |
| | (1.60 | )(f) | | | 0.63 | (g) | | | 4.21 | (g) | | | 1.83 | (g) | | | 492 | | | | 16 | (f) |
| | | | | | | | | | | | | | | | | | | | | | | |
| | (11.43 | ) | | | 0.71 | | | | 0.75 | | | | 2.34 | | | | 428,070 | | | | 128 | |
| | | | | | | | | | | | | | | | | | | | | | | |
| | (1.60 | )(f) | | | 0.71 | (g) | | | 1.07 | (g) | | | 1.10 | (g) | | | 38,221 | | | | 16 | (f) |
| | | | | | | | | | | | | | | | | | | | | | | |
| | (11.98 | ) | | | 1.21 | | | | 1.34 | | | | 1.75 | | | | 9 | | | | 128 | |
| | | | | | | | | | | | | | | | | | | | | | | |
| | (1.73 | )(f) | | | 1.21 | (g) | | | 4.78 | (g) | | | 1.24 | (g) | | | 10 | | | | 16 | (f) |
| | | | | | | | | | | | | | | | | | | | | | | |
| | (11.74 | ) | | | 0.96 | | | | 1.08 | | | | 2.00 | | | | 9 | | | | 128 | |
| | | | | | | | | | | | | | | | | | | | | | | |
| | (1.67 | )(f) | | | 0.96 | (g) | | | 4.51 | (g) | | | 1.47 | (g) | | | 10 | | | | 16 | (f) |
| | | | | | | | | | | | | | | | | | | | | | | |
| | (11.51 | ) | | | 0.71 | | | | 0.84 | | | | 2.24 | | | | 9 | | | | 128 | |
| | | | | | | | | | | | | | | | | | | | | | | |
| | (1.60 | )(f) | | | 0.71 | (g) | | | 4.27 | (g) | | | 1.75 | (g) | | | 10 | | | | 16 | (f) |
| | | | | | | | | | | | | | | | | | | | | | | |
| | (11.43 | ) | | | 0.63 | | | | 0.81 | | | | 2.38 | | | | 366 | | | | 128 | |
| | | | | | | | | | | | | | | | | | | | | | | |
| | (1.60 | )(f) | | | 0.63 | (g) | | | 4.21 | (g) | | | 1.83 | (g) | | | 517 | | | | 16 | (f) |
| | See Notes to Financial Statements. | 159 |
Financial Highlights (continued)
FOCUSED SMALL CAP VALUE FUND
| | | | | | Per Share Operating Performance: | | | |
| | | | | | Investment operations: | | Distributions
to
shareholders
from: | | | |
| | | Net asset
value,
beginning
of period | | Net
investment
income
(loss)(a) | | Net
realized and
unrealized
gain (loss) | | Total from
investment
operations | | Net
realized
gain | | Net asset
value,
end of
period |
| Class A | | | | | | | | | | | | | | | | | | | | | | | | |
| 10/31/2020 | | | $25.14 | | | | $0.14 | | | | $(2.40 | ) | | | $(2.26 | ) | | | $(4.11 | ) | | | $18.77 | |
| 10/31/2019 | | | 29.02 | | | | (0.04 | ) | | | 0.39 | | | | 0.35 | | | | (4.23 | ) | | | 25.14 | |
| 10/31/2018 | | | 34.92 | | | | (0.32 | ) | | | 0.47 | | | | 0.15 | | | | (6.05 | ) | | | 29.02 | |
| 10/31/2017 | | | 33.65 | | | | (0.27 | ) | | | 7.56 | | | | 7.29 | | | | (6.02 | ) | | | 34.92 | |
| 10/31/2016 | | | 31.34 | | | | (0.22 | ) | | | 3.27 | | | | 3.05 | | | | (0.74 | ) | | | 33.65 | |
| Class C | | | | | | | | | | | | | | | | | | | | | | | | |
| 10/31/2020 | | | 26.71 | | | | (0.08 | ) | | | (2.53 | ) | | | (2.61 | ) | | | (4.11 | ) | | | 19.99 | |
| 6/28/2019 to 10/31/2019(c) | | | 27.39 | | | | (0.03 | ) | | | (0.65 | ) | | | (0.68 | ) | | | – | | | | 26.71 | |
| Class F | | | | | | | | | | | | | | | | | | | | | | | | |
| 10/31/2020 | | | 26.80 | | | | 0.09 | | | | (2.48 | ) | | | (2.39 | ) | | | (4.11 | ) | | | 20.30 | |
| 6/28/2019 to 10/31/2019(c) | | | 27.39 | | | | 0.06 | | | | (0.65 | ) | | | (0.59 | ) | | | – | | | | 26.80 | |
| Class F3 | | | | | | | | | | | | | | | | | | | | | | | | |
| 10/31/2020 | | | 26.80 | | | | 0.19 | | | | (2.56 | ) | | | (2.37 | ) | | | (4.11 | ) | | | 20.32 | |
| 6/28/2019 to 10/31/2019(c) | | | 27.39 | | | | 0.06 | | | | (0.65 | ) | | | (0.59 | ) | | | – | | | | 26.80 | |
| Class I | | | | | | | | | | | | | | | | | | | | | | | | |
| 10/31/2020 | | | 26.80 | | | | 0.19 | | | | (2.58 | ) | | | (2.39 | ) | | | (4.11 | ) | | | 20.30 | |
| 10/31/2019 | | | 30.64 | | | | (0.02 | ) | | | 0.41 | | | | 0.39 | | | | (4.23 | ) | | | 26.80 | |
| 10/31/2018 | | | 36.53 | | | | (0.33 | ) | | | 0.49 | | | | 0.16 | | | | (6.05 | ) | | | 30.64 | |
| 10/31/2017 | | | 34.95 | | | | (0.28 | ) | | | 7.88 | | | | 7.60 | | | | (6.02 | ) | | | 36.53 | |
| 10/31/2016 | | | 32.52 | | | | (0.23 | ) | | | 3.40 | | | | 3.17 | | | | (0.74 | ) | | | 34.95 | |
| Class R5 | | | | | | | | | | | | | | | | | | | | | | | | |
| 10/31/2020 | | | 26.80 | | | | 0.17 | | | | (2.57 | ) | | | (2.40 | ) | | | (4.11 | ) | | | 20.29 | |
| 6/28/2019 to 10/31/2019(c) | | | 27.39 | | | | 0.05 | | | | (0.64 | ) | | | (0.59 | ) | | | – | | | | 26.80 | |
| Class R6 | | | | | | | | | | | | | | | | | | | | | | | | |
| 10/31/2020 | | | 26.81 | | | | 0.18 | | | | (2.55 | ) | | | (2.37 | ) | | | (4.11 | ) | | | 20.33 | |
| 6/28/2019 to 10/31/2019(c) | | | 27.39 | | | | 0.09 | | | | (0.67 | ) | | | (0.58 | ) | | | – | | | | 26.81 | |
| (a) | Calculated using average shares outstanding during the period. |
| (b) | Total return for Classes A and C does not consider the effects of sales loads and assumes the reinvestment of all distributions. Total return for all other classes assumes the reinvestment of all distributions. |
| (c) | Commencement of operation was 6/28/2019 and date shares first became available to the public was 7/1/2019. |
| (d) | Not annualized. |
| (e) | Annualized. |
| 160 | See Notes to Financial Statements. |
| | | | Ratios to Average Net Assets: | | Supplemental Data: |
| | | | | | | | | | | | | | | | | |
Total
return(b)
(%) | | Total
expenses
after
waivers
and/or reim-
bursements
(%) | | Total
expenses
(%) | | Net
investment
income
(loss)
(%) | | Net assets,
end of
period
(000) | | Portfolio
turnover
rate
(%) |
| | | | | | | | | | | | | | | | | | | | | | | |
| | (11.21 | ) | | | 1.28 | | | | 1.40 | | | | 0.72 | | | $ | 3,253 | | | | 77 | |
| | 1.68 | | | | 1.53 | | | | 1.58 | | | | (0.16 | ) | | | 5,729 | | | | 135 | |
| | 0.11 | | | | 1.63 | | | | 1.63 | | | | (1.02 | ) | | | 6,382 | | | | 57 | |
| | 23.38 | | | | 1.66 | | | | 1.66 | | | | (0.81 | ) | | | 6,698 | | | | 48 | |
| | 10.00 | | | | 1.80 | | | | 1.80 | | | | (0.71 | ) | | | 6,083 | | | | 52 | |
| | | | | | | | | | | | | | | | | | | | | | | |
| | (12.01 | ) | | | 2.03 | | | | 2.20 | | | | (0.42 | ) | | | 102 | | | | 77 | |
| | | | | | | | | | | | | | | | | | | | | | | |
| | (2.48 | )(d) | | | 2.03 | (e) | | | 2.14 | (e) | | | (0.37 | )(e) | | | 10 | | | | 135 | |
| | | | | | | | | | | | | | | | | | | | | | | |
| | (11.00 | ) | | | 1.03 | | | | 1.30 | | | | 0.43 | | | | 784 | | | | 77 | |
| | | | | | | | | | | | | | | | | | | | | | | |
| | (2.15 | )(d) | | | 1.03 | (e) | | | 1.30 | (e) | | | 0.65 | (e) | | | 10 | | | | 135 | |
| | | | | | | | | | | | | | | | | | | | | | | |
| | (10.88 | ) | | | 0.95 | | | | 1.14 | | | | 0.92 | | | | 9 | | | | 77 | |
| | | | | | | | | | | | | | | | | | | | | | | |
| | (2.15 | )(d) | | | 0.95 | (e) | | | 1.15 | (e) | | | 0.71 | (e) | | | 10 | | | | 135 | |
| | | | | | | | | | | | | | | | | | | | | | | |
| | (11.00 | ) | | | 1.03 | | | | 1.18 | | | | 0.92 | | | | 69,689 | | | | 77 | |
| | 1.77 | | | | 1.45 | | | | 1.50 | | | | (0.07 | ) | | | 114,088 | | | | 135 | |
| | 0.10 | | | | 1.63 | | | | 1.63 | | | | (1.02 | ) | | | 127,236 | | | | 57 | |
| | 23.40 | | | | 1.66 | | | | 1.66 | | | | (0.80 | ) | | | 135,852 | | | | 48 | |
| | 9.97 | | | | 1.80 | | | | 1.80 | | | | (0.72 | ) | | | 135,269 | | | | 52 | |
| | | | | | | | | | | | | | | | | | | | | | | |
| | (11.00 | ) | | | 1.03 | | | | 1.16 | | | | 0.83 | | | | 9 | | | | 77 | |
| | | | | | | | | | | | | | | | | | | | | | | |
| | (2.15 | )(d) | | | 1.03 | (e) | | | 1.15 | (e) | | | 0.62 | (e) | | | 10 | | | | 135 | |
| | | | | | | | | | | | | | | | | | | | | | | |
| | (10.87 | ) | | | 0.95 | | | | 1.16 | | | | 0.90 | | | | 1,717 | | | | 77 | |
| | | | | | | | | | | | | | | | | | | | | | | |
| | (2.12 | )(d) | | | 0.95 | (e) | | | 1.24 | (e) | | | 1.01 | (e) | | | 1,336 | | | | 135 | |
| | See Notes to Financial Statements. | 161 |
Financial Highlights (continued)
FUNDAMENTAL EQUITY FUND
| | | | | | Per Share Operating Performance: |
| | | | | | Investment operations: | | Distributions to
shareholders from: |
| | | Net asset
value,
beginning
of period | | Net
invest-
ment
income(a) | | Net
realized
and
unrealized
gain (loss) | | Total
from
invest-
ment
opera-
tions | | Net
investment
income | | Net
realized
gain | | Total
distri-
butions |
| Class A | | | | | | | | | | | | | | | | | | | | | | | | | | | | |
| 10/31/2020 | | | $12.53 | | | | $0.19 | | | | $(0.88 | ) | | | $(0.69 | ) | | | $(0.19 | ) | | | $(1.09 | ) | | | $(1.28 | ) |
| 10/31/2019 | | | 12.64 | | | | 0.19 | | | | 0.79 | | | | 0.98 | | | | (0.18 | ) | | | (0.91 | ) | | | (1.09 | ) |
| 10/31/2018 | | | 13.99 | | | | 0.16 | | | | 0.10 | | | | 0.26 | | | | (0.18 | ) | | | (1.43 | ) | | | (1.61 | ) |
| 10/31/2017 | | | 12.54 | | | | 0.17 | | | | 1.94 | | | | 2.11 | | | | (0.19 | ) | | | (0.47 | ) | | | (0.66 | ) |
| 10/31/2016 | | | 13.32 | | | | 0.19 | | | | 0.34 | | | | 0.53 | | | | (0.17 | ) | | | (1.14 | ) | | | (1.31 | ) |
| Class C | | | | | | | | | | | | | | | | | | | | | | | | | | | | |
| 10/31/2020 | | | 11.04 | | | | 0.10 | | | | (0.77 | ) | | | (0.67 | ) | | | (0.09 | ) | | | (1.09 | ) | | | (1.18 | ) |
| 10/31/2019 | | | 11.22 | | | | 0.09 | | | | 0.69 | | | | 0.78 | | | | (0.05 | ) | | | (0.91 | ) | | | (0.96 | ) |
| 10/31/2018 | | | 12.58 | | | | 0.06 | | | | 0.08 | | | | 0.14 | | | | (0.07 | ) | | | (1.43 | ) | | | (1.50 | ) |
| 10/31/2017 | | | 11.33 | | | | 0.07 | | | | 1.76 | | | | 1.83 | | | | (0.11 | ) | | | (0.47 | ) | | | (0.58 | ) |
| 10/31/2016 | | | 12.14 | | | | 0.09 | | | | 0.31 | | | | 0.40 | | | | (0.07 | ) | | | (1.14 | ) | | | (1.21 | ) |
| Class F | | | | | | | | | | | | | | | | | | | | | | | | | | | | |
| 10/31/2020 | | | 12.40 | | | | 0.21 | | | | (0.87 | ) | | | (0.66 | ) | | | (0.21 | ) | | | (1.09 | ) | | | (1.30 | ) |
| 10/31/2019 | | | 12.52 | | | | 0.21 | | | | 0.78 | | | | 0.99 | | | | (0.20 | ) | | | (0.91 | ) | | | (1.11 | ) |
| 10/31/2018 | | | 13.87 | | | | 0.18 | | | | 0.10 | | | | 0.28 | | | | (0.20 | ) | | | (1.43 | ) | | | (1.63 | ) |
| 10/31/2017 | | | 12.44 | | | | 0.19 | | | | 1.93 | | | | 2.12 | | | | (0.22 | ) | | | (0.47 | ) | | | (0.69 | ) |
| 10/31/2016 | | | 13.23 | | | | 0.21 | | | | 0.33 | | | | 0.54 | | | | (0.19 | ) | | | (1.14 | ) | | | (1.33 | ) |
| Class F3 | | | | | | | | | | | | | | | | | | | | | | | | | | | | |
| 10/31/2020 | | | 12.69 | | | | 0.23 | | | | (0.90 | ) | | | (0.67 | ) | | | (0.22 | ) | | | (1.09 | ) | | | (1.31 | ) |
| 10/31/2019 | | | 12.78 | | | | 0.23 | | | | 0.80 | | | | 1.03 | | | | (0.21 | ) | | | (0.91 | ) | | | (1.12 | ) |
| 10/31/2018 | | | 14.12 | | | | 0.21 | | | | 0.09 | | | | 0.30 | | | | (0.21 | ) | | | (1.43 | ) | | | (1.64 | ) |
| 4/4/2017 to 10/31/2017(c) | | | 13.24 | | | | 0.11 | | | | 0.77 | | | | 0.88 | | | | – | | | | – | | | | – | |
| Class I | | | | | | | | | | | | | | | | | | | | | | | | | | | | |
| 10/31/2020 | | | 12.63 | | | | 0.22 | | | | (0.89 | ) | | | (0.67 | ) | | | (0.22 | ) | | | (1.09 | ) | | | (1.31 | ) |
| 10/31/2019 | | | 12.73 | | | | 0.22 | | | | 0.80 | | | | 1.02 | | | | (0.21 | ) | | | (0.91 | ) | | | (1.12 | ) |
| 10/31/2018 | | | 14.09 | | | | 0.19 | | | | 0.09 | | | | 0.28 | | | | (0.21 | ) | | | (1.43 | ) | | | (1.64 | ) |
| 10/31/2017 | | | 12.62 | | | | 0.21 | | | | 1.96 | | | | 2.17 | | | | (0.23 | ) | | | (0.47 | ) | | | (0.70 | ) |
| 10/31/2016 | | | 13.40 | | | | 0.23 | | | | 0.34 | | | | 0.57 | | | | (0.21 | ) | | | (1.14 | ) | | | (1.35 | ) |
| Class P | | | | | | | | | | | | | | | | | | | | | | | | | | | | |
| 10/31/2020 | | | 12.28 | | | | 0.17 | | | | (0.86 | ) | | | (0.69 | ) | | | (0.17 | ) | | | (1.09 | ) | | | (1.26 | ) |
| 10/31/2019 | | | 12.40 | | | | 0.16 | | | | 0.77 | | | | 0.93 | | | | (0.14 | ) | | | (0.91 | ) | | | (1.05 | ) |
| 10/31/2018 | | | 13.74 | | | | 0.13 | | | | 0.09 | | | | 0.22 | | | | (0.13 | ) | | | (1.43 | ) | | | (1.56 | ) |
| 10/31/2017 | | | 12.32 | | | | 0.14 | | | | 1.92 | | | | 2.06 | | | | (0.17 | ) | | | (0.47 | ) | | | (0.64 | ) |
| 10/31/2016 | | | 13.10 | | | | 0.17 | | | | 0.33 | | | | 0.50 | | | | (0.14 | ) | | | (1.14 | ) | | | (1.28 | ) |
| Class R2 | | | | | | | | | | | | | | | | | | | | | | | | | | | | |
| 10/31/2020 | | | 12.24 | | | | 0.15 | | | | (0.86 | ) | | | (0.71 | ) | | | (0.14 | ) | | | (1.09 | ) | | | (1.23 | ) |
| 10/31/2019 | | | 12.33 | | | | 0.14 | | | | 0.78 | | | | 0.92 | | | | (0.10 | ) | | | (0.91 | ) | | | (1.01 | ) |
| 10/31/2018 | | | 13.68 | | | | 0.11 | | | | 0.10 | | | | 0.21 | | | | (0.13 | ) | | | (1.43 | ) | | | (1.56 | ) |
| 10/31/2017 | | | 12.27 | | | | 0.12 | | | | 1.91 | | | | 2.03 | | | | (0.15 | ) | | | (0.47 | ) | | | (0.62 | ) |
| 10/31/2016 | | | 13.05 | | | | 0.15 | | | | 0.33 | | | | 0.48 | | | | (0.12 | ) | | | (1.14 | ) | | | (1.26 | ) |
| 162 | See Notes to Financial Statements. |
| | | | | | | Ratios to Average Net Assets: | | Supplemental Data: |
| | | | | | | | | | | | | | | | | | | | |
Net
asset
value,
end of
period | | Total
return(b)
(%) | | Total
expenses
after
waivers
and/or reim-
bursements
(%) | | Total
expenses
(%) | | Net
invest-
ment
income
(%) | | Net
assets,
end of
period
(000) | | Portfolio
turnover
rate
(%) |
| | | | | | | | | | | | | | | | | | | | | | | | | | | |
| $10.56 | | | | (6.39 | ) | | | 0.94 | | | | 0.94 | | | | 1.79 | | | $ | 1,067,309 | | | | 59 | |
| | 12.53 | | | | 8.52 | | | | 0.99 | | | | 0.99 | | | | 1.57 | | | | 1,378,201 | | | | 88 | |
| | 12.64 | | | | 1.99 | | | | 0.96 | | | | 0.96 | | | | 1.22 | | | | 1,446,816 | | | | 92 | |
| | 13.99 | | | | 17.45 | | | | 0.96 | | | | 0.96 | | | | 1.29 | | | | 1,571,170 | | | | 96 | |
| | 12.54 | | | | 4.36 | | | | 0.98 | | | | 0.98 | | | | 1.60 | | | | 1,653,389 | | | | 135 | |
| | | | | | | | | | | | | | | | | | | | | | | | | | | |
| | 9.19 | | | | (7.07 | ) | | | 1.69 | | | | 1.69 | | | | 1.05 | | | | 60,191 | | | | 59 | |
| | 11.04 | | | | 7.71 | | | | 1.74 | | | | 1.74 | | | | 0.83 | | | | 157,803 | | | | 88 | |
| | 11.22 | | | | 1.21 | | | | 1.71 | | | | 1.71 | | | | 0.48 | | | | 232,937 | | | | 92 | |
| | 12.58 | | | | 16.63 | | | | 1.71 | | | | 1.71 | | | | 0.55 | | | | 445,017 | | | | 96 | |
| | 11.33 | | | | 3.59 | | | | 1.73 | | | | 1.73 | | | | 0.85 | | | | 544,649 | | | | 135 | |
| | | | | | | | | | | | | | | | | | | | | | | | | | | |
| | 10.44 | | | | (6.22 | ) | | | 0.79 | | | | 0.79 | | | | 1.93 | | | | 116,340 | | | | 59 | |
| | 12.40 | | | | 8.71 | | | | 0.84 | | | | 0.84 | | | | 1.73 | | | | 183,310 | | | | 88 | |
| | 12.52 | | | | 2.17 | | | | 0.81 | | | | 0.81 | | | | 1.38 | | | | 247,704 | | | | 92 | |
| | 13.87 | | | | 17.62 | | | | 0.81 | | | | 0.81 | | | | 1.43 | | | | 323,584 | | | | 96 | |
| | 12.44 | | | | 4.48 | | | | 0.83 | | | | 0.83 | | | | 1.76 | | | | 304,083 | | | | 135 | |
| | | | | | | | | | | | | | | | | | | | | | | | | | | |
| | 10.71 | | | | (6.11 | ) | | | 0.63 | | | | 0.63 | | | | 2.10 | | | | 15,378 | | | | 59 | |
| | 12.69 | | | | 8.92 | | | | 0.64 | | | | 0.64 | | | | 1.92 | | | | 20,698 | | | | 88 | |
| | 12.78 | | | | 2.36 | | | | 0.62 | | | | 0.62 | | | | 1.57 | | | | 20,270 | | | | 92 | |
| | | | | | | | | | | | | | | | | | | | | | | | | | | |
| | 14.12 | | | | 6.65 | (d) | | | 0.62 | (e) | | | 0.62 | (e) | | | 1.42 | (e) | | | 20,497 | | | | 96 | |
| | | | | | | | | | | | | | | | | | | | | | | | | | | |
| | 10.65 | | | | (6.16 | ) | | | 0.69 | | | | 0.69 | | | | 2.06 | | | | 262,216 | | | | 59 | |
| | 12.63 | | | | 8.84 | | | | 0.74 | | | | 0.74 | | | | 1.79 | | | | 613,182 | | | | 88 | |
| | 12.73 | | | | 2.19 | | | | 0.71 | | | | 0.71 | | | | 1.48 | | | | 92,508 | | | | 92 | |
| | 14.09 | | | | 17.81 | | | | 0.72 | | | | 0.72 | | | | 1.54 | | | | 120,146 | | | | 96 | |
| | 12.62 | | | | 4.64 | | | | 0.73 | | | | 0.73 | | | | 1.87 | | | | 142,316 | | | | 135 | |
| | | | | | | | | | | | | | | | | | | | | | | | | | | |
| | 10.33 | | | | (6.54 | ) | | | 1.14 | | | | 1.14 | | | | 1.58 | | | | 3,614 | | | | 59 | |
| | 12.28 | | | | 8.30 | | | | 1.19 | | | | 1.19 | | | | 1.36 | | | | 5,117 | | | | 88 | |
| | 12.40 | | | | 1.77 | | | | 1.16 | | | | 1.16 | | | | 1.02 | | | | 5,648 | | | | 92 | |
| | 13.74 | | | | 17.28 | | | | 1.17 | | | | 1.17 | | | | 1.11 | | | | 7,096 | | | | 96 | |
| | 12.32 | | | | 4.17 | | | | 1.18 | | | | 1.18 | | | | 1.40 | | | | 10,798 | | | | 135 | |
| | | | | | | | | | | | | | | | | | | | | | | | | | | |
| | 10.30 | | | | (6.68 | ) | | | 1.29 | | | | 1.29 | | | | 1.44 | | | | 3,082 | | | | 59 | |
| | 12.24 | | | | 8.17 | | | | 1.34 | | | | 1.34 | | | | 1.20 | | | | 4,009 | | | | 88 | |
| | 12.33 | | | | 1.64 | | | | 1.31 | | | | 1.31 | | | | 0.88 | | | | 3,587 | | | | 92 | |
| | 13.68 | | | | 17.07 | | | | 1.31 | | | | 1.31 | | | | 0.93 | | | | 8,062 | | | | 96 | |
| | 12.27 | | | | 3.97 | | | | 1.33 | | | | 1.33 | | | | 1.25 | | | | 7,952 | | | | 135 | |
| | See Notes to Financial Statements. | 163 |
Financial Highlights (continued)
FUNDAMENTAL EQUITY FUND
| | | | | | Per Share Operating Performance: |
| | | | | | Investment operations: | | Distributions to
shareholders from: |
| | | Net asset
value,
beginning
of period | | Net
invest-
ment
income(a) | | Net
realized
and
unrealized
gain (loss) | | Total
from
invest-
ment
opera-
tions | | Net
investment
income | | Net
realized
gain | | Total
distri-
butions |
| Class R3 | | | | | | | | | | | | | | | | | | | | | | | | | | | | |
| 10/31/2020 | | | $12.28 | | | | $0.16 | | | | $(0.86 | ) | | | $(0.70 | ) | | | $(0.16 | ) | | | $(1.09 | ) | | | $(1.25 | ) |
| 10/31/2019 | | | 12.40 | | | | 0.16 | | | | 0.77 | | | | 0.93 | | | | (0.14 | ) | | | (0.91 | ) | | | (1.05 | ) |
| 10/31/2018 | | | 13.75 | | | | 0.12 | | | | 0.10 | | | | 0.22 | | | | (0.14 | ) | | | (1.43 | ) | | | (1.57 | ) |
| 10/31/2017 | | | 12.34 | | | | 0.14 | | | | 1.90 | | | | 2.04 | | | | (0.16 | ) | | | (0.47 | ) | | | (0.63 | ) |
| 10/31/2016 | | | 13.12 | | | | 0.16 | | | | 0.33 | | | | 0.49 | | | | (0.13 | ) | | | (1.14 | ) | | | (1.27 | ) |
| Class R4 | | | | | | | | | | | | | | | | | | | | | | | | | | | | |
| 10/31/2020 | | | 12.46 | | | | 0.19 | | | | (0.87 | ) | | | (0.68 | ) | | | (0.19 | ) | | | (1.09 | ) | | | (1.28 | ) |
| 10/31/2019 | | | 12.58 | | | | 0.19 | | | | 0.78 | | | | 0.97 | | | | (0.18 | ) | | | (0.91 | ) | | | (1.09 | ) |
| 10/31/2018 | | | 13.94 | | | | 0.16 | | | | 0.10 | | | | 0.26 | | | | (0.19 | ) | | | (1.43 | ) | | | (1.62 | ) |
| 10/31/2017 | | | 12.52 | | | | 0.16 | | | | 1.95 | | | | 2.11 | | | | (0.22 | ) | | | (0.47 | ) | | | (0.69 | ) |
| 10/31/2016 | | | 13.32 | | | | 0.17 | | | | 0.36 | | | | 0.53 | | | | (0.19 | ) | | | (1.14 | ) | | | (1.33 | ) |
| Class R5 | | | | | | | | | | | | | | | | | | | | | | | | | | | | |
| 10/31/2020 | | | 12.63 | | | | 0.22 | | | | (0.88 | ) | | | (0.66 | ) | | | (0.22 | ) | | | (1.09 | ) | | | (1.31 | ) |
| 10/31/2019 | | | 12.74 | | | | 0.22 | | | | 0.79 | | | | 1.01 | | | | (0.21 | ) | | | (0.91 | ) | | | (1.12 | ) |
| 10/31/2018 | | | 14.09 | | | | 0.19 | | | | 0.10 | | | | 0.29 | | | | (0.21 | ) | | | (1.43 | ) | | | (1.64 | ) |
| 10/31/2017 | | | 12.63 | | | | 0.19 | | | | 1.97 | | | | 2.16 | | | | (0.23 | ) | | | (0.47 | ) | | | (0.70 | ) |
| 10/31/2016 | | | 13.41 | | | | 0.17 | | | | 0.40 | | | | 0.57 | | | | (0.21 | ) | | | (1.14 | ) | | | (1.35 | ) |
| Class R6 | | | | | | | | | | | | | | | | | | | | | | | | | | | | |
| 10/31/2020 | | | 12.69 | | | | 0.23 | | | | (0.89 | ) | | | (0.66 | ) | | | (0.22 | ) | | | (1.09 | ) | | | (1.31 | ) |
| 10/31/2019 | | | 12.79 | | | | 0.23 | | | | 0.79 | | | | 1.02 | | | | (0.21 | ) | | | (0.91 | ) | | | (1.12 | ) |
| 10/31/2018 | | | 14.12 | | | | 0.21 | | | | 0.10 | | | | 0.31 | | | | (0.21 | ) | | | (1.43 | ) | | | (1.64 | ) |
| 10/31/2017 | | | 12.64 | | | | 0.21 | | | | 1.97 | | | | 2.18 | | | | (0.23 | ) | | | (0.47 | ) | | | (0.70 | ) |
| 10/31/2016 | | | 13.41 | | | | 0.23 | | | | 0.35 | | | | 0.58 | | | | (0.21 | ) | | | (1.14 | ) | | | (1.35 | ) |
| (a) | Calculated using average shares outstanding during the period. |
| (b) | Total return for Classes A and C does not consider the effects of sales loads and assumes the reinvestment of all distributions. Total return for all other classes assumes the reinvestment of all distributions. |
| (c) | Commenced on April 4, 2017. |
| (d) | Not annualized. |
| (e) | Annualized. |
| 164 | See Notes to Financial Statements. |
| | | | | | | Ratios to Average Net Assets: | | Supplemental Data: |
| | | | | | | | | | | | | | | | | | | | |
Net
asset
value,
end of
period | | Total
return(b)
(%) | | Total
expenses
after
waivers
and/or reim-
bursements
(%) | | Total
expenses
(%) | | Net
invest-
ment
income
(%) | | Net
assets,
end of
period
(000) | | Portfolio
turnover
rate
(%) |
| | | | | | | | | | | | | | | | | | | | | | | | | | | |
| $10.33 | | | | (6.62 | ) | | | 1.19 | | | | 1.19 | | | | 1.54 | | | $ | 76,817 | | | | 59 | |
| | 12.28 | | | | 8.27 | | | | 1.24 | | | | 1.24 | | | | 1.32 | | | | 98,059 | | | | 88 | |
| | 12.40 | | | | 1.66 | | | | 1.21 | | | | 1.21 | | | | 0.97 | | | | 116,719 | | | | 92 | |
| | 13.75 | | | | 17.19 | | | | 1.21 | | | | 1.21 | | | | 1.04 | | | | 147,010 | | | | 96 | |
| | 12.34 | | | | 4.09 | | | | 1.23 | | | | 1.23 | | | | 1.35 | | | | 157,626 | | | | 135 | |
| | | | | | | | | | | | | | | | | | | | | | | | | | | |
| | 10.50 | | | | (6.35 | ) | | | 0.94 | | | | 0.94 | | | | 1.79 | | | | 2,228 | | | | 59 | |
| | 12.46 | | | | 8.51 | | | | 0.99 | | | | 0.99 | | | | 1.56 | | | | 4,880 | | | | 88 | |
| | 12.58 | | | | 2.00 | | | | 0.96 | | | | 0.96 | | | | 1.22 | | | | 5,164 | | | | 92 | |
| | 13.94 | | | | 17.45 | | | | 0.95 | | | | 0.95 | | | | 1.19 | | | | 4,355 | | | | 96 | |
| | 12.52 | | | | 4.37 | | | | 0.95 | | | | 0.95 | | | | 1.40 | | | | 121 | | | | 135 | |
| | | | | | | | | | | | | | | | | | | | | | | | | | | |
| | 10.66 | | | | (6.08 | ) | | | 0.69 | | | | 0.69 | | | | 2.07 | | | | 901 | | | | 59 | |
| | 12.63 | | | | 8.76 | | | | 0.74 | | | | 0.74 | | | | 1.80 | | | | 1,482 | | | | 88 | |
| | 12.74 | | | | 2.28 | | | | 0.71 | | | | 0.71 | | | | 1.45 | | | | 810 | | | | 92 | |
| | 14.09 | | | | 17.73 | | | | 0.70 | | | | 0.70 | | | | 1.40 | | | | 1,049 | | | | 96 | |
| | 12.63 | | | | 4.64 | | | | 0.68 | | | | 0.68 | | | | 1.40 | | | | 125 | | | | 135 | |
| | | | | | | | | | | | | | | | | | | | | | | | | | | |
| | 10.72 | | | | (6.03 | ) | | | 0.63 | | | | 0.63 | | | | 2.10 | | | | 11,403 | | | | 59 | |
| | 12.69 | | | | 8.83 | | | | 0.64 | | | | 0.64 | | | | 1.89 | | | | 21,815 | | | | 88 | |
| | 12.79 | | | | 2.36 | | | | 0.62 | | | | 0.62 | | | | 1.57 | | | | 16,864 | | | | 92 | |
| | 14.12 | | | | 17.97 | | | | 0.62 | | | | 0.62 | | | | 1.51 | | | | 6,440 | | | | 96 | |
| | 12.64 | | | | 4.73 | | | | 0.61 | | | | 0.61 | | | | 1.88 | | | | 123 | | | | 135 | |
| | See Notes to Financial Statements. | 165 |
Financial Highlights (continued)
GLOBAL EQUITY RESEARCH FUND
| | | | | | Per Share Operating Performance: |
| | | | | | Investment operations: | | Distributions to
shareholders from: |
| | | Net asset
value,
beginning
of period | | Net
invest-
ment
income
(loss)(a) | | Net
realized
and
unrealized
gain (loss) | | Total
from
invest-
ment
opera-
tions | | Net
investment
income | | Net
realized
gain | | Total
distri-
butions |
| Class A | | | | | | | | | | | | | | | | | | | | | | | | | | | | |
| 10/31/2020 | | | $11.52 | | | | $ 0.11 | | | | $ 1.09 | | | | $ 1.20 | | | | $(0.13 | ) | | | $ – | | | | $(0.13 | ) |
| 10/31/2019 | | | 10.93 | | | | 0.13 | | | | 0.97 | | | | 1.10 | | | | (0.09 | ) | | | (0.42 | ) | | | (0.51 | ) |
| 10/31/2018 | | | 11.58 | | | | 0.09 | | | | (0.11 | ) | | | (0.02 | ) | | | (0.11 | ) | | | (0.52 | ) | | | (0.63 | ) |
| 1/17/2017 to 10/31/2017(c) | | | 10.00 | | | | 0.08 | | | | 1.50 | | | | 1.58 | | | | – | | | | – | | | | – | |
| Class C | | | | | | | | | | | | | | | | | | | | | | | | | | | | |
| 10/31/2020 | | | 11.40 | | | | 0.02 | | | | 1.08 | | | | 1.10 | | | | (0.04 | ) | | | – | | | | (0.04 | ) |
| 10/31/2019 | | | 10.81 | | | | 0.05 | | | | 0.97 | | | | 1.02 | | | | (0.01 | ) | | | (0.42 | ) | | | (0.43 | ) |
| 10/31/2018 | | | 11.52 | | | | 0.01 | | | | (0.12 | ) | | | (0.11 | ) | | | (0.08 | ) | | | (0.52 | ) | | | (0.60 | ) |
| 1/17/2017 to 10/31/2017(c) | | | 10.00 | | | | (0.02 | ) | | | 1.54 | | | | 1.52 | | | | – | | | | – | | | | – | |
| Class F | | | | | | | | | | | | | | | | | | | | | | | | | | | | |
| 10/31/2020 | | | 11.54 | | | | 0.12 | | | | 1.11 | | | | 1.23 | | | | (0.15 | ) | | | – | | | | (0.15 | ) |
| 10/31/2019 | | | 10.94 | | | | 0.15 | | | | 0.97 | | | | 1.12 | | | | (0.10 | ) | | | (0.42 | ) | | | (0.52 | ) |
| 10/31/2018 | | | 11.60 | | | | 0.11 | | | | (0.12 | ) | | | (0.01 | ) | | | (0.13 | ) | | | (0.52 | ) | | | (0.65 | ) |
| 1/17/2017 to 10/31/2017(c) | | | 10.00 | | | | 0.10 | | | | 1.50 | | | | 1.60 | | | | – | | | | – | | | | – | |
| Class F3 | | | | | | | | | | | | | | | | | | | | | | | | | | | | |
| 10/31/2020 | | | 11.56 | | | | 0.14 | | | | 1.10 | | | | 1.24 | | | | (0.17 | ) | | | – | | | | (0.17 | ) |
| 10/31/2019 | | | 10.96 | | | | 0.16 | | | | 0.97 | | | | 1.13 | | | | (0.11 | ) | | | (0.42 | ) | | | (0.53 | ) |
| 10/31/2018 | | | 11.61 | | | | 0.12 | | | | (0.11 | ) | | | 0.01 | | | | (0.14 | ) | | | (0.52 | ) | | | (0.66 | ) |
| 4/4/2017 to 10/31/2017(f) | | | 10.28 | | | | 0.07 | | | | 1.26 | | | | 1.33 | | | | – | | | | – | | | | – | |
| Class I | | | | | | | | | | | | | | | | | | | | | | | | | | | | |
| 10/31/2020 | | | 11.55 | | | | 0.14 | | | | 1.09 | | | | 1.23 | | | | (0.16 | ) | | | – | | | | (0.16 | ) |
| 10/31/2019 | | | 10.95 | | | | 0.16 | | | | 0.97 | | | | 1.13 | | | | (0.11 | ) | | | (0.42 | ) | | | (0.53 | ) |
| 10/31/2018 | | | 11.61 | | | | 0.12 | | | | (0.12 | ) | | | – | | | | (0.14 | ) | | | (0.52 | ) | | | (0.66 | ) |
| 1/17/2017 to 10/31/2017(c) | | | 10.00 | | | | 0.10 | | | | 1.51 | | | | 1.61 | | | | – | | | | – | | | | – | |
| Class R3 | | | | | | | | | | | | | | | | | | | | | | | | | | | | |
| 10/31/2020 | | | 11.45 | | | | 0.08 | | | | 1.09 | | | | 1.17 | | | | (0.11 | ) | | | – | | | | (0.11 | ) |
| 10/31/2019 | | | 10.90 | | | | 0.11 | | | | 0.96 | | | | 1.07 | | | | (0.10 | ) | | | (0.42 | ) | | | (0.52 | ) |
| 10/31/2018 | | | 11.56 | | | | 0.03 | | | | (0.09 | ) | | | (0.06 | ) | | | (0.08 | ) | | | (0.52 | ) | | | (0.60 | ) |
| 1/17/2017 to 10/31/2017(c) | | | 10.00 | | | | 0.06 | | | | 1.50 | | | | 1.56 | | | | – | | | | – | | | | – | |
| Class R4 | | | | | | | | | | | | | | | | | | | | | | | | | | | | |
| 10/31/2020 | | | 11.53 | | | | 0.11 | | | | 1.10 | | | | 1.21 | | | | (0.14 | ) | | | – | | | | (0.14 | ) |
| 10/31/2019 | | | 10.93 | | | | 0.13 | | | | 0.97 | | | | 1.10 | | | | (0.08 | ) | | | (0.42 | ) | | | (0.50 | ) |
| 10/31/2018 | | | 11.58 | | | | 0.10 | | | | (0.12 | ) | | | (0.02 | ) | | | (0.11 | ) | | | (0.52 | ) | | | (0.63 | ) |
| 1/17/2017 to 10/31/2017(c) | | | 10.00 | | | | 0.08 | | | | 1.50 | | | | 1.58 | | | | – | | | | – | | | | – | |
| 166 | See Notes to Financial Statements. |
| | | | | | | Ratios to Average Net Assets: | | Supplemental Data: |
| | | | | | | | | | | | | | | | | | | | |
Net
asset
value,
end of
period | | Total
return(b)
(%) | | Total
expenses
after
waivers
and/or reim-
bursements
(%) | | Total
expenses
(%) | | Net
invest-
ment
income
(loss)
(%) | | Net
assets,
end of
period
(000) | | Portfolio
turnover
rate
(%) |
| | | | | | | | | | | | | | | | | | | | | | | | | | | |
| | $12.59 | | | | 10.52 | | | | 0.90 | | | | 4.32 | | | | 0.92 | | | $ | 2,622 | | | | 141 | |
| | 11.52 | | | | 10.85 | | | | 0.90 | | | | 4.20 | | | | 1.24 | | | | 3,551 | | | | 65 | |
| | 10.93 | | | | (0.22 | ) | | | 0.95 | | | | 5.07 | | | | 0.79 | | | | 3,124 | | | | 108 | |
| | | | | | | | | | | | | | | | | | | | | | | | | | | |
| | 11.58 | | | | 15.80 | (d) | | | 1.05 | (e) | | | 5.00 | (e) | | | 0.96 | (e) | | | 1,667 | | | | 140 | |
| | | | | | | | | | | | | | | | | | | | | | | | | | | |
| | 12.46 | | | | 9.75 | | | | 1.65 | | | | 5.12 | | | | 0.17 | | | | 537 | | | | 141 | |
| | 11.40 | | | | 10.05 | | | | 1.65 | | | | 4.96 | | | | 0.46 | | | | 581 | | | | 65 | |
| | 10.81 | | | | (1.07 | ) | | | 1.70 | | | | 5.76 | | | | 0.07 | | | | 699 | | | | 108 | |
| | | | | | | | | | | | | | | | | | | | | | | | | | | |
| | 11.52 | | | | 15.20 | (d) | | | 1.80 | (e) | | | 5.61 | (e) | | | (0.24 | )(e) | | | 336 | | | | 140 | |
| | | | | | | | | | | | | | | | | | | | | | | | | | | |
| | 12.62 | | | | 10.73 | | | | 0.75 | | | | 4.23 | | | | 1.06 | | | | 1,445 | | | | 141 | |
| | 11.54 | | | | 11.07 | | | | 0.75 | | | | 4.09 | | | | 1.37 | | | | 2,207 | | | | 65 | |
| | 10.94 | | | | (0.19 | ) | | | 0.82 | | | | 4.90 | | | | 0.94 | | | | 1,203 | | | | 108 | |
| | | | | | | | | | | | | | | | | | | | | | | | | | | |
| | 11.60 | | | | 16.00 | (d) | | | 0.90 | (e) | | | 4.86 | (e) | | | 1.12 | (e) | | | 1,178 | | | | 140 | |
| | | | | | | | | | | | | | | | | | | | | | | | | | | |
| | 12.63 | | | | 10.78 | | | | 0.62 | | | | 4.09 | | | | 1.19 | | | | 14 | | | | 141 | |
| | 11.56 | | | | 11.22 | | | | 0.63 | | | | 3.88 | | | | 1.50 | | | | 13 | | | | 65 | |
| | 10.96 | | | | 0.01 | | | | 0.69 | | | | 4.80 | | | | 1.08 | | | | 11 | | | | 108 | |
| | | | | | | | | | | | | | | | | | | | | | | | | | | |
| | 11.61 | | | | 12.94 | (d) | | | 0.75 | (e) | | | 4.78 | (e) | | | 1.04 | (e) | | | 11 | | | | 140 | |
| | | | | | | | | | | | | | | | | | | | | | | | | | | |
| | 12.62 | | | | 10.75 | | | | 0.65 | | | | 4.16 | | | | 1.18 | | | | 1,400 | | | | 141 | |
| | 11.55 | | | | 11.19 | | | | 0.65 | | | | 3.95 | | | | 1.49 | | | | 1,264 | | | | 65 | |
| | 10.95 | | | | (0.10 | ) | | | 0.72 | | | | 4.81 | | | | 1.03 | | | | 1,137 | | | | 108 | |
| | | | | | | | | | | | | | | | | | | | | | | | | | | |
| | 11.61 | | | | 16.10 | (d) | | | 0.80 | (e) | | | 4.76 | (e) | | | 1.23 | (e) | | | 1,137 | | | | 140 | |
| | | | | | | | | | | | | | | | | | | | | | | | | | | |
| | 12.51 | | | | 10.25 | | | | 1.15 | | | | 4.67 | | | | 0.68 | | | | 241 | | | | 141 | |
| | 11.45 | | | | 10.63 | | | | 1.15 | | | | 4.46 | | | | 0.98 | | | | 200 | | | | 65 | |
| | 10.90 | | | | (0.56 | ) | | | 1.18 | | | | 5.98 | | | | 0.27 | | | | 165 | | | | 108 | |
| | | | | | | | | | | | | | | | | | | | | | | | | | | |
| | 11.56 | | | | 15.60 | (d) | | | 1.30 | (e) | | | 5.25 | (e) | | | 0.74 | (e) | | | 12 | | | | 140 | |
| | | | | | | | | | | | | | | | | | | | | | | | | | | |
| | 12.60 | | | | 10.51 | | | | 0.90 | | | | 4.41 | | | | 0.92 | | | | 14 | | | | 141 | |
| | 11.53 | | | | 10.89 | | | | 0.90 | | | | 4.18 | | | | 1.24 | | | | 13 | | | | 65 | |
| | 10.93 | | | | (0.24 | ) | | | 0.97 | | | | 5.05 | | | | 0.83 | | | | 12 | | | | 108 | |
| | | | | | | | | | | | | | | | | | | | | | | | | | | |
| | 11.58 | | | | 15.80 | (d) | | | 1.05 | (e) | | | 5.00 | (e) | | | 0.93 | (e) | | | 12 | | | | 140 | |
| | See Notes to Financial Statements. | 167 |
Financial Highlights (continued)
GLOBAL EQUITY RESEARCH FUND
| | | | | | Per Share Operating Performance: |
| | | | | | Investment operations: | | Distributions to
shareholders from: |
| | | Net asset
value,
beginning
of period | | Net
invest-
ment
income
(loss)(a) | | Net
realized
and
unrealized
gain (loss) | | Total
from
invest-
ment
opera-
tions | | Net
investment
income | | Net
realized
gain | | Total
distri-
butions |
| Class R5 | | | | | | | | | | | | | | | | | | | | | | | | | | | | |
| 10/31/2020 | | | $11.55 | | | | $0.14 | | | | $1.09 | | | | $1.23 | | | | $(0.16 | ) | | $ | – | | | | $(0.16 | ) |
| 10/31/2019 | | | 10.95 | | | | 0.16 | | | | 0.97 | | | | 1.13 | | | | (0.11 | ) | | | (0.42 | ) | | | (0.53 | ) |
| 10/31/2018 | | | 11.61 | | | | 0.12 | | | | (0.12 | ) | | | – | | | | (0.14 | ) | | | (0.52 | ) | | | (0.66 | ) |
| 1/17/2017 to 10/31/2017(c) | | | 10.00 | | | | 0.10 | | | | 1.51 | | | | 1.61 | | | | – | | | | – | | | | – | |
| Class R6 | | | | | | | | | | | | | | | | | | | | | | | | | | | | |
| 10/31/2020 | | | 11.56 | | | | 0.14 | | | | 1.10 | | | | 1.24 | | | | (0.17 | ) | | | – | | | | (0.17 | ) |
| 10/31/2019 | | | 10.96 | | | | 0.17 | | | | 0.96 | | | | 1.13 | | | | (0.11 | ) | | | (0.42 | ) | | | (0.53 | ) |
| 10/31/2018 | | | 11.61 | | | | 0.13 | | | | (0.12 | ) | | | 0.01 | | | | (0.14 | ) | | | (0.52 | ) | | | (0.66 | ) |
| 1/17/2017 to 10/31/2017(c) | | | 10.00 | | | | 0.11 | | | | 1.50 | | | | 1.61 | | | | – | | | | – | | | | – | |
| (a) | Calculated using average shares outstanding during the period. |
| (b) | Total return for Classes A and C does not consider the effects of sales loads and assumes the reinvestment of all distributions. Total return for all other classes assumes the reinvestment of all distributions. |
| (c) | Commenced on January 17, 2017. |
| (d) | Not annualized. |
| (e) | Annualized. |
| (f) | Commenced on April 4, 2017. |
| 168 | See Notes to Financial Statements. |
| | | | | | | Ratios to Average Net Assets: | | Supplemental Data: |
| | | | | | | | | | | | | | | | | | | | |
Net
asset
value,
end of
period | | Total
return(b)
(%) | | Total
expenses
after
waivers
and/or reim-
bursements
(%) | | Total
expenses
(%) | | Net
invest-
ment
income
(loss)
(%) | | Net
assets,
end of
period
(000) | | Portfolio
turnover
rate
(%) |
| | | | | | | | | | | | | | | | | | | | | | | | | | | |
| $12.62 | | | | 10.75 | | | | 0.65 | | | | 4.15 | | | | 1.17 | | | | $ 14 | | | | 141 | |
| | 11.55 | | | | 11.19 | | | | 0.65 | | | | 3.93 | | | | 1.49 | | | | 13 | | | | 65 | |
| | 10.95 | | | | (0.10 | ) | | | 0.72 | | | | 4.80 | | | | 1.03 | | | | 12 | | | | 108 | |
| | | | | | | | | | | | | | | | | | | | | | | | | | | |
| | 11.61 | | | | 16.10 | (d) | | | 0.80 | (e) | | | 4.74 | (e) | | | 1.25 | (e) | | | 12 | | | | 140 | |
| | | | | | | | | | | | | | | | | | | | | | | | | | | |
| | 12.63 | | | | 10.87 | | | | 0.62 | | | | 4.09 | | | | 1.21 | | | | 635 | | | | 141 | |
| | 11.56 | | | | 11.13 | | | | 0.63 | | | | 3.88 | | | | 1.56 | | | | 690 | | | | 65 | |
| | 10.96 | | | | 0.01 | | | | 0.63 | | | | 4.62 | | | | 1.12 | | | | 236 | | | | 108 | |
| | | | | | | | | | | | | | | | | | | | | | | | | | | |
| | 11.61 | | | | 16.10 | (d) | | | 0.75 | (e) | | | 4.72 | (e) | | | 1.30 | (e) | | | 12 | | | | 140 | |
| | See Notes to Financial Statements. | 169 |
Financial Highlights (continued)
GROWTH LEADERS FUND
| | | | | | Per Share Operating Performance: | | | |
| | | | | | Investment operations: | | Distributions
to
shareholders
from: | | Net |
| | | Net asset
value,
beginning
of period | | Net
investment
income
(loss)(a) | | Net
realized and
unrealized
gain (loss) | | Total from
investment
operations | | Net
realized
gain | | asset
value,
end of
period |
| Class A | | | | | | | | | | | | | | | | | | | | | | | | |
| 10/31/2020 | | $ | 28.61 | | | $ | (0.19 | ) | | $ | 16.17 | | | $ | 15.98 | | | $ | (2.34 | ) | | $ | 42.25 | |
| 10/31/2019 | | | 29.82 | | | | (0.13 | ) | | | 3.57 | | | | 3.44 | | | | (4.65 | ) | | | 28.61 | |
| 10/31/2018 | | | 28.97 | | | | (0.14 | ) | | | 2.82 | | | | 2.68 | | | | (1.83 | ) | | | 29.82 | |
| 10/31/2017 | | | 22.42 | | | | (0.06 | ) | | | 6.61 | | | | 6.55 | | | | – | | | | 28.97 | |
| 10/31/2016 | | | 23.73 | | | | 0.03 | | | | (0.24 | ) | | | (0.21 | ) | | | (1.10 | ) | | | 22.42 | |
| Class C | | | | | | | | | | | | | | | | | | | | | | | | |
| 10/31/2020 | | | 26.47 | | | | (0.39 | ) | | | 14.79 | | | | 14.40 | | | | (2.34 | ) | | | 38.53 | |
| 10/31/2019 | | | 28.14 | | | | (0.31 | ) | | | 3.29 | | | | 2.98 | | | | (4.65 | ) | | | 26.47 | |
| 10/31/2018 | | | 27.63 | | | | (0.35 | ) | | | 2.69 | | | | 2.34 | | | | (1.83 | ) | | | 28.14 | |
| 10/31/2017 | | | 21.54 | | | | (0.24 | ) | | | 6.33 | | | | 6.09 | | | | – | | | | 27.63 | |
| 10/31/2016 | | | 23.01 | | | | (0.14 | ) | | | (0.23 | ) | | | (0.37 | ) | | | (1.10 | ) | | | 21.54 | |
| Class F | | | | | | | | | | | | | | | | | | | | | | | | |
| 10/31/2020 | | | 29.14 | | | | (0.11 | ) | | | 16.51 | | | | 16.40 | | | | (2.34 | ) | | | 43.20 | |
| 10/31/2019 | | | 30.21 | | | | (0.06 | ) | | | 3.64 | | | | 3.58 | | | | (4.65 | ) | | | 29.14 | |
| 10/31/2018 | | | 29.26 | | | | (0.07 | ) | | | 2.85 | | | | 2.78 | | | | (1.83 | ) | | | 30.21 | |
| 10/31/2017 | | | 22.59 | | | | (0.01 | ) | | | 6.68 | | | | 6.67 | | | | – | | | | 29.26 | |
| 10/31/2016 | | | 23.87 | | | | 0.06 | | | | (0.24 | ) | | | (0.18 | ) | | | (1.10 | ) | | | 22.59 | |
| Class F3 | | | | | | | | | | | | | | | | | | | | | | | | |
| 10/31/2020 | | | 29.43 | | | | (0.10 | ) | | | 16.71 | | | | 16.61 | | | | (2.34 | ) | | | 43.70 | |
| 10/31/2019 | | | 30.45 | | | | (0.05 | ) | | | 3.68 | | | | 3.63 | | | | (4.65 | ) | | | 29.43 | |
| 10/31/2018 | | | 29.46 | | | | (0.06 | ) | | | 2.88 | | | | 2.82 | | | | (1.83 | ) | | | 30.45 | |
| 4/4/2017 to 10/31/2017(c) | | | 24.81 | | | | (0.03 | ) | | | 4.68 | | | | 4.65 | | | | – | | | | 29.46 | |
| Class I | | | | | | | | | | | | | | | | | | | | | | | | |
| 10/31/2020 | | | 29.32 | | | | (0.11 | ) | | | 16.62 | | | | 16.51 | | | | (2.34 | ) | | | 43.49 | |
| 10/31/2019 | | | 30.37 | | | | (0.06 | ) | | | 3.66 | | | | 3.60 | | | | (4.65 | ) | | | 29.32 | |
| 10/31/2018 | | | 29.40 | | | | (0.07 | ) | | | 2.87 | | | | 2.80 | | | | (1.83 | ) | | | 30.37 | |
| 10/31/2017 | | | 22.69 | | | | (0.01 | ) | | | 6.72 | | | | 6.71 | | | | – | | | | 29.40 | |
| 10/31/2016 | | | 23.95 | | | | 0.08 | | | | (0.24 | ) | | | (0.16 | ) | | | (1.10 | ) | | | 22.69 | |
| Class R2 | | | | | | | | | | | | | | | | | | | | | | | | |
| 10/31/2020 | | | 28.15 | | | | (0.27 | ) | | | 15.84 | | | | 15.57 | | | | (2.34 | ) | | | 41.38 | |
| 10/31/2019 | | | 29.51 | | | | (0.22 | ) | | | 3.51 | | | | 3.29 | | | | (4.65 | ) | | | 28.15 | |
| 10/31/2018 | | | 28.78 | | | | (0.24 | ) | | | 2.80 | | | | 2.56 | | | | (1.83 | ) | | | 29.51 | |
| 10/31/2017 | | | 22.35 | | | | (0.15 | ) | | | 6.58 | | | | 6.43 | | | | – | | | | 28.78 | |
| 10/31/2016 | | | 23.74 | | | | (0.05 | ) | | | (0.24 | ) | | | (0.29 | ) | | | (1.10 | ) | | | 22.35 | |
| Class R3 | | | | | | | | | | | | | | | | | | | | | | | | |
| 10/31/2020 | | | 28.09 | | | | (0.26 | ) | | | 15.82 | | | | 15.56 | | | | (2.34 | ) | | | 41.31 | |
| 10/31/2019 | | | 29.43 | | | | (0.19 | ) | | | 3.50 | | | | 3.31 | | | | (4.65 | ) | | | 28.09 | |
| 10/31/2018 | | | 28.68 | | | | (0.21 | ) | | | 2.79 | | | | 2.58 | | | | (1.83 | ) | | | 29.43 | |
| 10/31/2017 | | | 22.25 | | | | (0.12 | ) | | | 6.55 | | | | 6.43 | | | | – | | | | 28.68 | |
| 10/31/2016 | | | 23.62 | | | | (0.04 | ) | | | (0.23 | ) | | | (0.27 | ) | | | (1.10 | ) | | | 22.25 | |
| 170 | See Notes to Financial Statements. |
| | | | Ratios to Average Net Assets: | | Supplemental Data: |
| | | | | | | | | | | | | | | | |
Total
return(b)
(%) | | Total
expenses
after
waivers and/or
reimburse-
ments
(%) | | Total
expenses
(%) | | Net
investment
income
(loss)
(%) | | Net
assets,
end of
period
(000) | | Portfolio
turnover
rate
(%) |
| | | | | | | | | | | | | | | | | | | | | | | |
| | 60.35 | | | | 0.90 | | | | 0.90 | | | | (0.56 | ) | | $ | 1,920,930 | | | | 93 | |
| | 15.32 | | | | 0.93 | | | | 0.93 | | | | (0.48 | ) | | | 1,001,973 | | | | 143 | |
| | 9.68 | | | | 0.91 | | | | 0.91 | | | | (0.47 | ) | | | 900,405 | | | | 161 | |
| | 29.21 | | | | 0.91 | | | | 0.96 | | | | (0.23 | ) | | | 754,101 | | | | 192 | |
| | (0.96 | ) | | | 0.85 | | | | 0.98 | | | | 0.12 | | | | 750,576 | | | | 246 | |
| | | | | | | | | | | | | | | | | | | | | | | |
| | 59.17 | | | | 1.65 | | | | 1.65 | | | | (1.29 | ) | | | 906,259 | | | | 93 | |
| | 14.45 | | | | 1.68 | | | | 1.68 | | | | (1.23 | ) | | | 631,400 | | | | 143 | |
| | 8.87 | | | | 1.65 | | | | 1.66 | | | | (1.21 | ) | | | 595,344 | | | | 161 | |
| | 28.27 | | | | 1.66 | | | | 1.71 | | | | (0.99 | ) | | | 523,008 | | | | 192 | |
| | (1.72 | ) | | | 1.60 | | | | 1.73 | | | | (0.64 | ) | | | 482,693 | | | | 246 | |
| | | | | | | | | | | | | | | | | | | | | | | |
| | 60.72 | | | | 0.65 | | | | 0.75 | | | | (0.31 | ) | | | 2,708,762 | | | | 93 | |
| | 15.63 | | | | 0.68 | | | | 0.78 | | | | (0.23 | ) | | | 1,444,533 | | | | 143 | |
| | 9.94 | | | | 0.66 | | | | 0.76 | | | | (0.22 | ) | | | 1,315,881 | | | | 161 | |
| | 29.53 | | | | 0.70 | | | | 0.81 | | | | (0.04 | ) | | | 1,103,103 | | | | 192 | |
| | (0.82 | ) | | | 0.70 | | | | 0.83 | | | | 0.26 | | | | 763,623 | | | | 246 | |
| | | | | | | | | | | | | | | | | | | | | | | |
| | 60.84 | | | | 0.59 | | | | 0.59 | | | | (0.29 | ) | | | 265,851 | | | | 93 | |
| | 15.68 | | | | 0.62 | | | | 0.62 | | | | (0.19 | ) | | | 74,378 | | | | 143 | |
| | 10.01 | | | | 0.60 | | | | 0.60 | | | | (0.18 | ) | | | 44,379 | | | | 161 | |
| | 18.74 | (d) | | | 0.59 | (e) | | | 0.62 | (e) | | | (0.19 | )(e) | | | 18,841 | | | | 192 | |
| | | | | | | | | | | | | | | | | | | | | | | |
| | 60.72 | | | | 0.65 | | | | 0.65 | | | | (0.31 | ) | | | 1,037,283 | | | | 93 | |
| | 15.62 | | | | 0.68 | | | | 0.68 | | | | (0.20 | ) | | | 520,195 | | | | 143 | |
| | 9.96 | | | | 0.66 | | | | 0.66 | | | | (0.21 | ) | | | 702,389 | | | | 161 | |
| | 29.57 | | | | 0.67 | | | | 0.70 | | | | (0.06 | ) | | | 303,795 | | | | 192 | |
| | (0.73 | ) | | | 0.60 | | | | 0.74 | | | | 0.36 | | | | 98,506 | | | | 246 | |
| | | | | | | | | | | | | | | | | | | | | | | |
| | 59.75 | | | | 1.25 | | | | 1.25 | | | | (0.84 | ) | | | 1,551 | | | | 93 | |
| | 14.94 | | | | 1.28 | | | | 1.28 | | | | (0.82 | ) | | | 1,153 | | | | 143 | |
| | 9.31 | | | | 1.26 | | | | 1.26 | | | | (0.79 | ) | | | 1,332 | | | | 161 | |
| | 28.77 | | | | 1.26 | | | | 1.30 | | | | (0.60 | ) | | | 1,784 | | | | 192 | |
| | (1.35 | ) | | | 1.20 | | | | 1.34 | | | | (0.24 | ) | | | 1,267 | | | | 246 | |
| | | | | | | | | | | | | | | | | | | | | | | |
| | 59.94 | | | | 1.15 | | | | 1.15 | | | | (0.79 | ) | | | 18,790 | | | | 93 | |
| | 15.03 | | | | 1.18 | | | | 1.18 | | | | (0.71 | ) | | | 13,610 | | | | 143 | |
| | 9.41 | | | | 1.16 | | | | 1.16 | | | | (0.71 | ) | | | 15,206 | | | | 161 | |
| | 28.90 | | | | 1.16 | | | | 1.21 | | | | (0.48 | ) | | | 13,261 | | | | 192 | |
| | (1.23 | ) | | | 1.10 | | | | 1.24 | | | | (0.17 | ) | | | 13,471 | | | | 246 | |
| | See Notes to Financial Statements. | 171 |
Financial Highlights (continued)
GROWTH LEADERS FUND
| | | | | | Per Share Operating Performance: | | | | |
| | | | | | Investment operations: | | Distributions
to
shareholders
from: | | Net |
| | | Net asset
value,
beginning
of period | | Net
investment
income
(loss)(a) | | Net
realized and
unrealized
gain (loss) | | Total from
investment
operations | | Net
realized
gain | | asset
value,
end of
period |
| Class R4 | | | | | | | | | | | | | | | | | | | | | | | | |
| 10/31/2020 | | $ | 28.62 | | | $ | (0.18 | ) | | $ | 16.16 | | | $ | 15.98 | | | $ | (2.34 | ) | | $ | 42.26 | |
| 10/31/2019 | | | 29.82 | | | | (0.13 | ) | | | 3.58 | | | | 3.45 | | | | (4.65 | ) | | | 28.62 | |
| 10/31/2018 | | | 28.97 | | | | (0.15 | ) | | | 2.83 | | | | 2.68 | | | | (1.83 | ) | | | 29.82 | |
| 10/31/2017 | | | 22.42 | | | | (0.08 | ) | | | 6.63 | | | | 6.55 | | | | – | | | | 28.97 | |
| 10/31/2016 | | | 23.74 | | | | (0.01 | ) | | | (0.21 | ) | | | (0.22 | ) | | | (1.10 | ) | | | 22.42 | |
| Class R5 | | | | | | | | | | | | | | | | | | | | | | | | |
| 10/31/2020 | | | 29.33 | | | | (0.10 | ) | | | 16.62 | | | | 16.52 | | | | (2.34 | ) | | | 43.51 | |
| 10/31/2019 | | | 30.38 | | | | (0.06 | ) | | | 3.66 | | | | 3.60 | | | | (4.65 | ) | | | 29.33 | |
| 10/31/2018 | | | 29.41 | | | | (0.07 | ) | | | 2.87 | | | | 2.80 | | | | (1.83 | ) | | | 30.38 | |
| 10/31/2017 | | | 22.70 | | | | – | (f) | | | 6.71 | | | | 6.71 | | | | – | | | | 29.41 | |
| 10/31/2016 | | | 23.95 | | | | 0.02 | | | | (0.17 | ) | | | (0.15 | ) | | | (1.10 | ) | | | 22.70 | |
| Class R6 | | | | | | | | | | | | | | | | | | | | | | | | |
| 10/31/2020 | | | 29.43 | | | | (0.08 | ) | | | 16.69 | | | | 16.61 | | | | (2.34 | ) | | | 43.70 | |
| 10/31/2019 | | | 30.45 | | | | (0.05 | ) | | | 3.68 | | | | 3.63 | | | | (4.65 | ) | | | 29.43 | |
| 10/31/2018 | | | 29.46 | | | | (0.05 | ) | | | 2.87 | | | | 2.82 | | | | (1.83 | ) | | | 30.45 | |
| 10/31/2017 | | | 22.72 | | | | (0.02 | ) | | | 6.76 | | | | 6.74 | | | | – | | | | 29.46 | |
| 10/31/2016 | | | 23.96 | | | | 0.08 | | | | (0.22 | ) | | | (0.14 | ) | | | (1.10 | ) | | | 22.72 | |
| (a) | Calculated using average shares outstanding during the period. |
| (b) | Total return for Classes A and C does not consider the effects of sales loads and assumes the reinvestment of all distributions. Total return for all other classes assumes the reinvestment of all distributions. |
| (c) | Commenced on April 4, 2017. |
| (d) | Not annualized. |
| (e) | Annualized. |
| (f) | Amount less than $0.01. |
| 172 | See Notes to Financial Statements. |
| | | | Ratios to Average Net Assets: | | Supplemental Data: |
| | | | | | | | | | | | | | | | | |
Total
return(b)
(%) | | Total
expenses
after
waivers and/or
reimburse-
ments
(%) | | Total
expenses
(%) | | Net
investment
income
(loss)
(%) | | Net
assets,
end of
period
(000) | | Portfolio
turnover
rate
(%) |
| | | | | | | | | | | | | | | | | | | | | | | |
| | 60.33 | | | | 0.90 | | | | 0.90 | | | | (0.55 | ) | | $ | 12,667 | | | | 93 | |
| | 15.35 | | | | 0.93 | | | | 0.93 | | | | (0.47 | ) | | | 6,543 | | | | 143 | |
| | 9.68 | | | | 0.91 | | | | 0.91 | | | | (0.47 | ) | | | 6,345 | | | | 161 | |
| | 29.21 | | | | 0.92 | | | | 0.95 | | | | (0.31 | ) | | | 4,698 | | | | 192 | |
| | (1.00 | ) | | | 0.85 | | | | 1.00 | | | | (0.03 | ) | | | 1,735 | | | | 246 | |
| | | | | | | | | | | | | | | | | | | | | | | |
| | 60.74 | | | | 0.65 | | | | 0.65 | | | | (0.29 | ) | | | 14,216 | | | | 93 | |
| | 15.61 | | | | 0.68 | | | | 0.68 | | | | (0.22 | ) | | | 9,344 | | | | 143 | |
| | 9.96 | | | | 0.66 | | | | 0.66 | | | | (0.22 | ) | | | 8,598 | | | | 161 | |
| | 29.56 | | | | 0.67 | | | | 0.71 | | | | (0.01 | ) | | | 5,810 | | | | 192 | |
| | (0.68 | ) | | | 0.60 | | | | 0.75 | | | | 0.08 | | | | 3,700 | | | | 246 | |
| | | | | | | | | | | | | | | | | | | | | | | |
| | 60.84 | | | | 0.60 | | | | 0.60 | | | | (0.24 | ) | | | 65,478 | | | | 93 | |
| | 15.68 | | | | 0.62 | | | | 0.62 | | | | (0.18 | ) | | | 36,932 | | | | 143 | |
| | 10.01 | | | | 0.60 | | | | 0.60 | | | | (0.16 | ) | | | 25,657 | | | | 161 | |
| | 29.67 | | | | 0.59 | | | | 0.62 | | | | (0.06 | ) | | | 20,884 | | | | 192 | |
| | (0.64 | ) | | | 0.50 | | | | 0.63 | | | | 0.34 | | | | 1,534 | | | | 246 | |
| | See Notes to Financial Statements. | 173 |
Financial Highlights (continued)
HEALTH CARE FUND
| | | | | | Per Share Operating Performance: | | |
| | | | | | Investment operations: | | Distributions
to
shareholders
from: | | |
| | | Net asset
value,
beginning
of period | | Net
investment
income
(loss)(a) | | Net
realized and
unrealized
gain (loss) | | Total from
investment
operations | | Net
investment
income | | Net asset
value,
end of
period |
| Class A | | | | | | | | | | | | | | | | | | | | | | | | |
| 10/31/2020 | | $ | 14.48 | | | $ | (0.06 | ) | | $ | 4.85 | | | $ | 4.79 | | | $ | – | | | $ | 19.27 | |
| 7/26/2019 to 10/31/2019(c)(d) | | | 15.00 | | | | (0.01 | ) | | | (0.51 | ) | | | (0.52 | ) | | | – | | | | 14.48 | |
| Class C | | | | | | | | | | | | | | | | | | | | | | | | |
| 10/31/2020 | | | 14.45 | | | | (0.19 | ) | | | 4.83 | | | | 4.64 | | | | – | | | | 19.09 | |
| 7/26/2019 to 10/31/2019(c)(d) | | | 15.00 | | | | (0.04 | ) | | | (0.51 | ) | | | (0.55 | ) | | | – | | | | 14.45 | |
| Class F | | | | | | | | | | | | | | | | | | | | | | | | |
| 10/31/2020 | | | 14.49 | | | | – | (g) | | | 4.83 | | | | 4.83 | | | | – | (g) | | | 19.32 | |
| 7/26/2019 to 10/31/2019(c)(d) | | | 15.00 | | | | (0.01 | ) | | | (0.50 | ) | | | (0.51 | ) | | | – | | | | 14.49 | |
| Class F3 | | | | | | | | | | | | | | | | | | | | | | | | |
| 10/31/2020 | | | 14.49 | | | | 0.02 | | | | 4.83 | | | | 4.85 | | | | (0.01 | ) | | | 19.33 | |
| 7/26/2019 to 10/31/2019(c)(d) | | | 15.00 | | | | – | (g) | | | (0.51 | ) | | | (0.51 | ) | | | – | | | | 14.49 | |
| Class I | | | | | | | | | | | | | | | | | | | | | | | | |
| 10/31/2020 | | | 14.49 | | | | – | (g) | | | 4.84 | | | | 4.84 | | | | (0.01 | ) | | | 19.32 | |
| 7/26/2019 to 10/31/2019(c)(d) | | | 15.00 | | | | (0.01 | ) | | | (0.50 | ) | | | (0.51 | ) | | | – | | | | 14.49 | |
| Class R3 | | | | | | | | | | | | | | | | | | | | | | | | |
| 10/31/2020 | | | 14.47 | | | | (0.10 | ) | | | 4.84 | | | | 4.74 | | | | – | | | | 19.21 | |
| 7/26/2019 to 10/31/2019(c)(d) | | | 15.00 | | | | (0.02 | ) | | | (0.51 | ) | | | (0.53 | ) | | | – | | | | 14.47 | |
| Class R4 | | | | | | | | | | | | | | | | | | | | | | | | |
| 10/31/2020 | | | 14.48 | | | | (0.05 | ) | | | 4.84 | | | | 4.79 | | | | – | | | | 19.27 | |
| 7/26/2019 to 10/31/2019(c)(d) | | | 15.00 | | | | (0.01 | ) | | | (0.51 | ) | | | (0.52 | ) | | | – | | | | 14.48 | |
| Class R5 | | | | | | | | | | | | | | | | | | | | | | | | |
| 10/31/2020 | | | 14.49 | | | | (0.01 | ) | | | 4.85 | | | | 4.84 | | | | (0.01 | ) | | | 19.32 | |
| 7/26/2019 to 10/31/2019(c)(d) | | | 15.00 | | | | (0.01 | ) | | | (0.50 | ) | | | (0.51 | ) | | | – | | | | 14.49 | |
| Class R6 | | | | | | | | | | | | | | | | | | | | | | | | |
| 10/31/2020 | | | 14.49 | | | | 0.01 | | | | 4.85 | | | | 4.86 | | | | (0.01 | ) | | | 19.34 | |
| 7/26/2019 to 10/31/2019(c)(d) | | | 15.00 | | | | – | (g) | | | (0.51 | ) | | | (0.51 | ) | | | – | | | | 14.49 | |
| (a) | Calculated using average shares outstanding during the period. |
| (b) | Total return for Classes A and C does not consider the effects of sales loads and assumes the reinvestment of all distributions. Total return for all other classes assumes the reinvestment of all distributions. |
| (c) | Commencement of operations was 7/26/2019, SEC effective date was 7/31/2019 and date shares first became available to the public was 8/1/2019. |
| (d) | Net investment income, net realized and unrealized gain amounted to less than $.01 for the period 7/26/2019 through 7/31/2019. |
| (e) | Not annualized. |
| (f) | Annualized. |
| (g) | Amount less than $0.01. |
| (h) | Amount is less than 0.01%. |
| 174 | See Notes to Financial Statements. |
| | | | Ratios to Average Net Assets: | | Supplemental Data: |
| | | | | | | | | | | | | | | | | |
Total
return(b)
(%) | Total
expenses
after
waivers and/or
reimburse-
ments
(%) | Total
expenses
(%) | Net
investment
income
(loss)
(%) | | Net
assets,
end of
period
(000) | Portfolio
turnover
rate
(%) |
| | | | | | | | | | | | | | | | | | | | | | | |
| | 33.08 | | | | 1.03 | | | | 6.30 | | | | (0.34 | ) | | $ | 2,022 | | | | 114 | |
| | | | | | | | | | | | | | | | | | | | | | | |
| | (3.47 | )(e) | | | 1.03 | (f) | | | 9.00 | (f) | | | (0.36 | )(f) | | | 906 | | | | 16 | (e) |
| | | | | | | | | | | | | | | | | | | | | | | |
| | 32.11 | | | | 1.78 | | | | 7.05 | | | | (1.11 | ) | | | 328 | | | | 114 | |
| | | | | | | | | | | | | | | | | | | | | | | |
| | (3.67 | )(e) | | | 1.78 | (f) | | | 9.84 | (f) | | | (1.17 | )(f) | | | 129 | | | | 16 | (e) |
| | | | | | | | | | | | | | | | | | | | | | | |
| | 33.34 | | | | 0.78 | | | | 5.73 | | | | – | (h) | | | 109 | | | | 114 | |
| | | | | | | | | | | | | | | | | | | | | | | |
| | (3.40 | )(e) | | | 0.78 | (f) | | | 8.95 | (f) | | | (0.16 | )(f) | | | 483 | | | | 16 | (e) |
| | | | | | | | | | | | | | | | | | | | | | | |
| | 33.49 | | | | 0.70 | | | | 5.37 | | | | 0.11 | | | | 35 | | | | 114 | |
| | | | | | | | | | | | | | | | | | | | | | | |
| | (3.40 | )(e) | | | 0.70 | (f) | | | 8.72 | (f) | | | (0.08 | )(f) | | | 483 | | | | 16 | (e) |
| | | | | | | | | | | | | | | | | | | | | | | |
| | 33.40 | | | | 0.78 | | | | 5.53 | | | | 0.02 | | | | 17 | | | | 114 | |
| | | | | | | | | | | | | | | | | | | | | | | |
| | (3.40 | )(e) | | | 0.78 | (f) | | | 8.85 | (f) | | | (0.16 | )(f) | | | 106 | | | | 16 | (e) |
| | | | | | | | | | | | | | | | | | | | | | | |
| | 32.76 | | | | 1.28 | | | | 6.53 | | | | (0.57 | ) | | | 13 | | | | 114 | |
| | | | | | | | | | | | | | | | | | | | | | | |
| | (3.53 | )(e) | | | 1.28 | (f) | | | 9.36 | (f) | | | (0.64 | )(f) | | | 10 | | | | 16 | (e) |
| | | | | | | | | | | | | | | | | | | | | | | |
| | 33.08 | | | | 1.03 | | | | 6.27 | | | | (0.31 | ) | | | 13 | | | | 114 | |
| | | | | | | | | | | | | | | | | | | | | | | |
| | (3.47 | )(e) | | | 1.03 | (f) | | | 9.12 | (f) | | | (0.40 | )(f) | | | 10 | | | | 16 | (e) |
| | | | | | | | | | | | | | | | | | | | | | | |
| | 33.39 | | | | 0.78 | | | | 6.02 | | | | (0.06 | ) | | | 13 | | | | 114 | |
| | | | | | | | | | | | | | | | | | | | | | | |
| | (3.40 | )(e) | | | 0.78 | (f) | | | 8.83 | (f) | | | (0.16 | )(f) | | | 10 | | | | 16 | (e) |
| | | | | | | | | | | | | | | | | | | | | | | |
| | 33.56 | | | | 0.70 | | | | 5.83 | | | | 0.07 | | | | 1,188 | | | | 114 | |
| | | | | | | | | | | | | | | | | | | | | | | |
| | (3.40 | )(e) | | | 0.70 | (f) | | | 8.72 | (f) | | | (0.08 | )(f) | | | 484 | | | | 16 | (e) |
| | See Notes to Financial Statements. | 175 |
Financial Highlights (continued)
INTERNATIONAL EQUITY FUND
| | | | | | Per Share Operating Performance: | | | |
| | | | | | Investment operations: | | Distributions
to
shareholders
from: | | | |
| | | Net asset
value,
beginning
of period | | Net
investment
income(a) | | Net
realized and
unrealized
gain (loss) | | Total from
investment
operations | | Net
investment
income | | Net asset
value,
end of
period |
| Class A | | | | | | | | | | | | | | | | | | | | | | | | |
| 10/31/2020 | | $ | 13.19 | | | $ | 0.12 | | | $ | 0.30 | | | $ | 0.42 | | | $ | (0.20 | ) | | $ | 13.41 | |
| 10/31/2019 | | | 12.18 | | | | 0.18 | | | | 1.08 | | | | 1.26 | | | | (0.25 | ) | | | 13.19 | |
| 10/31/2018 | | | 14.10 | | | | 0.19 | | | | (1.83 | ) | | | (1.64 | ) | | | (0.28 | ) | | | 12.18 | |
| 10/31/2017 | | | 12.03 | | | | 0.18 | | | | 2.15 | | | | 2.33 | | | | (0.26 | ) | | | 14.10 | |
| 10/31/2016 | | | 12.64 | | | | 0.27 | | | | (0.72 | ) | | | (0.45 | ) | | | (0.16 | ) | | | 12.03 | |
| Class C | | | | | | | | | | | | | | | | | | | | | | | | |
| 10/31/2020 | | | 13.08 | | | | 0.02 | | | | 0.30 | | | | 0.32 | | | | (0.09 | ) | | | 13.31 | |
| 10/31/2019 | | | 12.02 | | | | 0.08 | | | | 1.08 | | | | 1.16 | | | | (0.10 | ) | | | 13.08 | |
| 10/31/2018 | | | 13.92 | | | | 0.09 | | | | (1.82 | ) | | | (1.73 | ) | | | (0.17 | ) | | | 12.02 | |
| 10/31/2017 | | | 11.86 | | | | 0.09 | | | | 2.13 | | | | 2.22 | | | | (0.16 | ) | | | 13.92 | |
| 10/31/2016 | | | 12.45 | | | | 0.18 | | | | (0.70 | ) | | | (0.52 | ) | | | (0.07 | ) | | | 11.86 | |
| Class F | | | | | | | | | | | | | | | | | | | | | | | | |
| 10/31/2020 | | | 13.13 | | | | 0.10 | | | | 0.35 | | | | 0.45 | | | | (0.22 | ) | | | 13.36 | |
| 10/31/2019 | | | 12.12 | | | | 0.20 | | | | 1.08 | | | | 1.28 | | | | (0.27 | ) | | | 13.13 | |
| 10/31/2018 | | | 14.02 | | | | 0.22 | | | | (1.82 | ) | | | (1.60 | ) | | | (0.30 | ) | | | 12.12 | |
| 10/31/2017 | | | 11.96 | | | | 0.22 | | | | 2.12 | | | | 2.34 | | | | (0.28 | ) | | | 14.02 | |
| 10/31/2016 | | | 12.55 | | | | 0.29 | | | | (0.70 | ) | | | (0.41 | ) | | | (0.18 | ) | | | 11.96 | |
| Class F3 | | | | | | | | | | | | | | | | | | | | | | | | |
| 10/31/2020 | | | 13.36 | | | | 0.16 | | | | 0.30 | | | | 0.46 | | | | (0.23 | ) | | | 13.59 | |
| 10/31/2019 | | | 12.32 | | | | 0.22 | | | | 1.11 | | | | 1.33 | | | | (0.29 | ) | | | 13.36 | |
| 10/31/2018 | | | 14.25 | | | | 0.24 | | | | (1.86 | ) | | | (1.62 | ) | | | (0.31 | ) | | | 12.32 | |
| 4/4/2017 to 10/31/2017(c) | | | 12.34 | | | | 0.05 | | | | 1.86 | | | | 1.91 | | | | – | | | | 14.25 | |
| Class I | | | | | | | | | | | | | | | | | | | | | | | | |
| 10/31/2020 | | | 13.33 | | | | 0.16 | | | | 0.30 | | | | 0.46 | | | | (0.23 | ) | | | 13.56 | |
| 10/31/2019 | | | 12.30 | | | | 0.23 | | | | 1.08 | | | | 1.31 | | | | (0.28 | ) | | | 13.33 | |
| 10/31/2018 | | | 14.23 | | | | 0.25 | | | | (1.87 | ) | | | (1.62 | ) | | | (0.31 | ) | | | 12.30 | |
| 10/31/2017 | | | 12.13 | | | | 0.24 | | | | 2.16 | | | | 2.40 | | | | (0.30 | ) | | | 14.23 | |
| 10/31/2016 | | | 12.73 | | | | 0.33 | | | | (0.73 | ) | | | (0.40 | ) | | | (0.20 | ) | | | 12.13 | |
| Class P | | | | | | | | | | | | | | | | | | | | | | | | |
| 10/31/2020 | | | 13.20 | | | | 0.09 | | | | 0.30 | | | | 0.39 | | | | (0.17 | ) | | | 13.42 | |
| 10/31/2019 | | | 12.17 | | | | 0.16 | | | | 1.09 | | | | 1.25 | | | | (0.22 | ) | | | 13.20 | |
| 10/31/2018 | | | 14.10 | | | | 0.14 | | | | (1.82 | ) | | | (1.68 | ) | | | (0.25 | ) | | | 12.17 | |
| 10/31/2017 | | | 12.03 | | | | 0.15 | | | | 2.16 | | | | 2.31 | | | | (0.24 | ) | | | 14.10 | |
| 10/31/2016 | | | 12.63 | | | | 0.25 | | | | (0.71 | ) | | | (0.46 | ) | | | (0.14 | ) | | | 12.03 | |
| Class R2 | | | | | | | | | | | | | | | | | | | | | | | | |
| 10/31/2020 | | | 13.17 | | | | 0.06 | | | | 0.32 | | | | 0.38 | | | | (0.16 | ) | | | 13.39 | |
| 10/31/2019 | | | 12.13 | | | | 0.14 | | | | 1.08 | | | | 1.22 | | | | (0.18 | ) | | | 13.17 | |
| 10/31/2018 | | | 14.05 | | | | 0.13 | | | | (1.83 | ) | | | (1.70 | ) | | | (0.22 | ) | | | 12.13 | |
| 10/31/2017 | | | 11.99 | | | | 0.16 | | | | 2.12 | | | | 2.28 | | | | (0.22 | ) | | | 14.05 | |
| 10/31/2016 | | | 12.58 | | | | 0.23 | | | | (0.71 | ) | | | (0.48 | ) | | | (0.11 | ) | | | 11.99 | |
| 176 | See Notes to Financial Statements. |
| | | | Ratios to Average Net Assets: | | Supplemental Data: |
| | | | | | | | | | | | | | | | | |
Total
return(b)
(%) | | Total
expenses
after
waivers
and/or reim-
bursements
(%) | | Total
expenses
(%) | | Net
investment
income
(%) | | Net assets,
end of
period
(000) | | Portfolio
turnover
rate
(%) |
| | | | | | | | | | | | | | | | | | | | | | | |
| | 3.23 | | | | 1.17 | | | | 1.21 | | | | 0.90 | | | $ | 154,161 | | | | 77 | |
| | 10.64 | | | | 1.17 | | | | 1.17 | | | | 1.43 | | | | 178,701 | | | | 88 | |
| | (11.91 | ) | | | 1.15 | | | | 1.16 | | | | 1.34 | | | | 194,360 | | | | 124 | |
| | 19.80 | | | | 1.12 | | | | 1.22 | | | | 1.43 | | | | 241,626 | | | | 163 | |
| | (3.54 | ) | | | 1.12 | | | | 1.31 | | | | 2.29 | | | | 263,064 | | | | 164 | |
| | | | | | | | | | | | | | | | | | | | | | | |
| | 2.27 | | | | 1.92 | | | | 2.00 | | | | 0.17 | | | | 6,676 | | | | 77 | |
| | 9.88 | | | | 1.92 | | | | 1.92 | | | | 0.68 | | | | 10,652 | | | | 88 | |
| | (12.59 | ) | | | 1.90 | | | | 1.92 | | | | 0.65 | | | | 12,821 | | | | 124 | |
| | 19.02 | | | | 1.85 | | | | 1.95 | | | | 0.71 | | | | 25,687 | | | | 163 | |
| | (4.21 | ) | | | 1.85 | | | | 2.04 | | | | 1.54 | | | | 31,798 | | | | 164 | |
| | | | | | | | | | | | | | | | | | | | | | | |
| | 3.39 | | | | 0.96 | | | | 1.03 | | | | 0.77 | | | | 10,435 | | | | 77 | |
| | 10.90 | | | | 0.96 | | | | 1.02 | | | | 1.64 | | | | 48,782 | | | | 88 | |
| | (11.77 | ) | | | 0.92 | | | | 1.01 | | | | 1.63 | | | | 58,347 | | | | 124 | |
| | 20.17 | | | | 0.87 | | | | 1.06 | | | | 1.71 | | | | 63,479 | | | | 163 | |
| | (3.24 | ) | | | 0.87 | | | | 1.16 | | | | 2.48 | | | | 62,655 | | | | 164 | |
| | | | | | | | | | | | | | | | | | | | | | | |
| | 3.53 | | | | 0.84 | | | | 0.86 | | | | 1.23 | | | | 4,489 | | | | 77 | |
| | 11.13 | | | | 0.84 | | | | 0.85 | | | | 1.76 | | | | 4,527 | | | | 88 | |
| | (11.62 | ) | | | 0.78 | | | | 0.85 | | | | 1.73 | | | | 5,083 | | | | 124 | |
| | | | | | | | | | | | | | | | | | | | | | | |
| | 15.48 | (d) | | | 0.68 | (e) | | | 0.91 | (e) | | | 0.65 | (e) | | | 5,847 | | | | 163 | |
| | | | | | | | | | | | | | | | | | | | | | | |
| | 3.52 | | | | 0.86 | | | | 0.94 | | | | 1.20 | | | | 179,796 | | | | 77 | |
| | 11.04 | | | | 0.86 | | | | 0.92 | | | | 1.82 | | | | 198,368 | | | | 88 | |
| | (11.65 | ) | | | 0.82 | | | | 0.91 | | | | 1.78 | | | | 277,141 | | | | 124 | |
| | 20.26 | | | | 0.77 | | | | 0.96 | | | | 1.87 | | | | 292,598 | | | | 163 | |
| | (3.15 | ) | | | 0.77 | | | | 1.05 | | | | 2.74 | | | | 160,673 | | | | 164 | |
| | | | | | | | | | | | | | | | | | | | | | | |
| | 2.96 | | | | 1.37 | | | | 1.40 | | | | 0.72 | | | | 38 | | | | 77 | |
| | 10.50 | | | | 1.37 | | | | 1.37 | | | | 1.25 | | | | 42 | | | | 88 | |
| | (12.14 | ) | | | 1.35 | | | | 1.36 | | | | 1.02 | | | | 40 | | | | 124 | |
| | 19.59 | | | | 1.32 | | | | 1.42 | | | | 1.19 | | | | 89 | | | | 163 | |
| | (3.65 | ) | | | 1.32 | | | | 1.51 | | | | 2.12 | | | | 95 | | | | 164 | |
| | | | | | | | | | | | | | | | | | | | | | | |
| | 2.86 | | | | 1.52 | | | | 1.54 | | | | 0.46 | | | | 137 | | | | 77 | |
| | 10.32 | | | | 1.52 | | | | 1.52 | | | | 1.09 | | | | 451 | | | | 88 | |
| | (12.28 | ) | | | 1.50 | | | | 1.52 | | | | 0.93 | | | | 375 | | | | 124 | |
| | 19.40 | | | | 1.47 | | | | 1.56 | | | | 1.22 | | | | 679 | | | | 163 | |
| | (3.85 | ) | | | 1.47 | | | | 1.66 | | | | 1.93 | | | | 517 | | | | 164 | |
| | See Notes to Financial Statements. | 177 |
Financial Highlights (continued)
INTERNATIONAL EQUITY FUND
| | | | | | Per Share Operating Performance: | | | |
| | | | | | Investment operations: | | Distributions
to
shareholders
from: | | |
| | | Net asset
value,
beginning
of period | | Net
investment
income(a) | | Net
realized and
unrealized
gain (loss) | | Total from
investment
operations | | Net
investment
income | | Net asset
value,
end of
period |
| Class R3 | | | | | | | | | | | | | | | | | | | | | | | | |
| 10/31/2020 | | $ | 12.98 | | | $ | 0.08 | | | $ | 0.30 | | | $ | 0.38 | | | $ | (0.16 | ) | | $ | 13.20 | |
| 10/31/2019 | | | 11.98 | | | | 0.15 | | | | 1.06 | | | | 1.21 | | | | (0.21 | ) | | | 12.98 | |
| 10/31/2018 | | | 13.87 | | | | 0.14 | | | | (1.79 | ) | | | (1.65 | ) | | | (0.24 | ) | | | 11.98 | |
| 10/31/2017 | | | 11.84 | | | | 0.15 | | | | 2.12 | | | | 2.27 | | | | (0.24 | ) | | | 13.87 | |
| 10/31/2016 | | | 12.44 | | | | 0.23 | | | | (0.70 | ) | | | (0.47 | ) | | | (0.13 | ) | | | 11.84 | |
| Class R4 | | | | | | | | | | | | | | | | | | | | | | | | |
| 10/31/2020 | | | 13.14 | | | | 0.11 | | | | 0.30 | | | | 0.41 | | | | (0.20 | ) | | | 13.35 | |
| 10/31/2019 | | | 12.13 | | | | 0.18 | | | | 1.09 | | | | 1.27 | | | | (0.26 | ) | | | 13.14 | |
| 10/31/2018 | | | 14.07 | | | | 0.19 | | | | (1.83 | ) | | | (1.64 | ) | | | (0.30 | ) | | | 12.13 | |
| 10/31/2017 | | | 12.00 | | | | 0.17 | | | | 2.16 | | | | 2.33 | | | | (0.26 | ) | | | 14.07 | |
| 10/31/2016 | | | 12.63 | | | | 0.27 | | | | (0.72 | ) | | | (0.45 | ) | | | (0.18 | ) | | | 12.00 | |
| Class R5 | | | | | | | | | | | | | | | | | | | | | | | | |
| 10/31/2020 | | | 13.27 | | | | 0.15 | | | | 0.31 | | | | 0.46 | | | | (0.23 | ) | | | 13.50 | |
| 10/31/2019 | | | 12.26 | | | | 0.21 | | | | 1.08 | | | | 1.29 | | | | (0.28 | ) | | | 13.27 | |
| 10/31/2018 | | | 14.19 | | | | 0.22 | | | | (1.84 | ) | | | (1.62 | ) | | | (0.31 | ) | | | 12.26 | |
| 10/31/2017 | | | 12.11 | | | | 0.16 | | | | 2.21 | | | | 2.37 | | | | (0.29 | ) | | | 14.19 | |
| 10/31/2016 | | | 12.73 | | | | 0.30 | | | | (0.72 | ) | | | (0.42 | ) | | | (0.20 | ) | | | 12.11 | |
| Class R6 | | | | | | | | | | | | | | | | | | | | | | | | |
| 10/31/2020 | | | 13.35 | | | | 0.16 | | | | 0.30 | | | | 0.46 | | | | (0.23 | ) | | | 13.58 | |
| 10/31/2019 | | | 12.32 | | | | 0.22 | | | | 1.10 | | | | 1.32 | | | | (0.29 | ) | | | 13.35 | |
| 10/31/2018 | | | 14.24 | | | | 0.24 | | | | (1.85 | ) | | | (1.61 | ) | | | (0.31 | ) | | | 12.32 | |
| 10/31/2017 | | | 12.14 | | | | 0.26 | | | | 2.14 | | | | 2.40 | | | | (0.30 | ) | | | 14.24 | |
| 10/31/2016 | | | 12.74 | | | | 0.17 | | | | (0.57 | ) | | | (0.40 | ) | | | (0.20 | ) | | | 12.14 | |
| (a) | Calculated using average shares outstanding during the period. |
| (b) | Total return for Classes A and C does not consider the effects of sales loads and assumes the reinvestment of all distributions. Total return for all other classes assumes the reinvestment of all distributions. |
| (c) | Commenced on April 4, 2017. |
| (d) | Not annualized. |
| (e) | Annualized. |
| 178 | See Notes to Financial Statements. |
| | | | Ratios to Average Net Assets: | | Supplemental Data: |
| | | | | | | | | | | | | | | | | |
Total
return(b)
(%) | | Total
expenses
after
waivers
and/or reim-
bursements
(%) | | Total
expenses
(%) | | Net
investment
income
(%) | | Net assets,
end of
period
(000) | | Portfolio
turnover
rate
(%) |
| | | | | | | | | | | | | | | | | | | | | | | |
| | 2.92 | | | | 1.42 | | | | 1.46 | | | | 0.67 | | | $ | 5,354 | | | | 77 | |
| | 10.39 | | | | 1.42 | | | | 1.42 | | | | 1.21 | | | | 7,208 | | | | 88 | |
| | (12.18 | ) | | | 1.40 | | | | 1.41 | | | | 1.05 | | | | 8,954 | | | | 124 | |
| | 19.63 | | | | 1.34 | | | | 1.44 | | | | 1.23 | | | | 12,674 | | | | 163 | |
| | (3.79 | ) | | | 1.36 | | | | 1.54 | | | | 1.99 | | | | 14,945 | | | | 164 | |
| | | | | | | | | | | | | | | | | | | | | | | |
| | 3.17 | | | | 1.17 | | | | 1.20 | | | | 0.90 | | | | 1,165 | | | | 77 | |
| | 10.77 | | | | 1.17 | | | | 1.17 | | | | 1.46 | | | | 1,180 | | | | 88 | |
| | (11.96 | ) | | | 1.15 | | | | 1.16 | | | | 1.36 | | | | 948 | | | | 124 | |
| | 19.92 | | | | 1.10 | | | | 1.18 | | | | 1.25 | | | | 582 | | | | 163 | |
| | (3.55 | ) | | | 1.12 | | | | 1.28 | | | | 2.27 | | | | 9 | | | | 164 | |
| | | | | | | | | | | | | | | | | | | | | | | |
| | 3.39 | | | | 0.92 | | | | 0.94 | | | | 1.18 | | | | 64 | | | | 77 | |
| | 11.00 | | | | 0.92 | | | | 0.92 | | | | 1.68 | | | | 81 | | | | 88 | |
| | (11.68 | ) | | | 0.90 | | | | 0.91 | | | | 1.61 | | | | 69 | | | | 124 | |
| | 20.10 | | | | 0.87 | | | | 0.94 | | | | 1.21 | | | | 71 | | | | 163 | |
| | (3.31 | ) | | | 0.87 | | | | 1.04 | | | | 2.52 | | | | 9 | | | | 164 | |
| | | | | | | | | | | | | | | | | | | | | | | |
| | 3.53 | | | | 0.84 | | | | 0.86 | | | | 1.23 | | | | 2,143 | | | | 77 | |
| | 11.04 | | | | 0.84 | | | | 0.85 | | | | 1.78 | | | | 2,489 | | | | 88 | |
| | (11.62 | ) | | | 0.78 | | | | 0.85 | | | | 1.73 | | | | 2,667 | | | | 124 | |
| | 20.35 | | | | 0.70 | | | | 0.86 | | | | 2.04 | | | | 3,074 | | | | 163 | |
| | (3.14 | ) | | | 0.65 | | | | 0.88 | | | | 1.39 | | | | 10,765 | | | | 164 | |
| | See Notes to Financial Statements. | 179 |
Financial Highlights (continued)
INTERNATIONAL OPPORTUNITIES FUND
| | | | | | Per Share Operating Performance: |
| | | | | | Investment operations: | | Distributions to
shareholders from: |
| | | Net asset
value,
beginning
of period | | Net
invest-
ment
income
(loss)(a) | | Net
realized
and
unrealized
gain (loss) | | Total
from
invest-
ment
opera-
tions | | Net
investment
income | | Net
realized
gain | | Total
distri-
butions |
| Class A | | | | | | | | | | | | | | | | | | | | | | | | | | | | |
| 10/31/2020 | | $ | 16.02 | | | $ | 0.06 | | | $ | (0.18 | ) | | $ | (0.12 | ) | | $ | (0.21 | ) | | $ | – | | | $ | (0.21 | ) |
| 10/31/2019 | | | 16.84 | | | | 0.16 | | | | 0.77 | | | | 0.93 | | | | (0.17 | ) | | | (1.58 | ) | | | (1.75 | ) |
| 10/31/2018 | | | 20.88 | | | | 0.14 | | | | (3.28 | ) | | | (3.14 | ) | | | (0.17 | ) | | | (0.73 | ) | | | (0.90 | ) |
| 10/31/2017 | | | 16.13 | | | | 0.09 | | | | 4.77 | | | | 4.86 | | | | (0.11 | ) | | | – | | | | (0.11 | ) |
| 10/31/2016 | | | 17.01 | | | | 0.13 | | | | (0.30 | ) | | | (0.17 | ) | | | (0.10 | ) | | | (0.61 | ) | | | (0.71 | ) |
| Class C | | | | | | | | | | | | | | | | | | | | | | | | | | | | |
| 10/31/2020 | | | 14.78 | | | | (0.05 | ) | | | (0.19 | ) | | | (0.24 | ) | | | (0.07 | ) | | | – | | | | (0.07 | ) |
| 10/31/2019 | | | 15.61 | | | | 0.04 | | | | 0.71 | | | | 0.75 | | | | – | (c) | | | (1.58 | ) | | | (1.58 | ) |
| 10/31/2018 | | | 19.46 | | | | – | (c) | | | (3.05 | ) | | | (3.05 | ) | | | (0.07 | ) | | | (0.73 | ) | | | (0.80 | ) |
| 10/31/2017 | | | 15.03 | | | | (0.04 | ) | | | 4.47 | | | | 4.43 | | | | – | | | | – | | | | – | |
| 10/31/2016 | | | 15.92 | | | | 0.01 | | | | (0.28 | ) | | | (0.27 | ) | | | (0.01 | ) | | | (0.61 | ) | | | (0.62 | ) |
| Class F | | | | | | | | | | | | | | | | | | | | | | | | | | | | |
| 10/31/2020 | | | 15.86 | | | | 0.07 | | | | (0.17 | ) | | | (0.10 | ) | | | (0.23 | ) | | | – | | | | (0.23 | ) |
| 10/31/2019 | | | 16.70 | | | | 0.18 | | | | 0.76 | | | | 0.94 | | | | (0.20 | ) | | | (1.58 | ) | | | (1.78 | ) |
| 10/31/2018 | | | 20.70 | | | | 0.18 | | | | (3.25 | ) | | | (3.07 | ) | | | (0.20 | ) | | | (0.73 | ) | | | (0.93 | ) |
| 10/31/2017 | | | 16.00 | | | | 0.11 | | | | 4.73 | | | | 4.84 | | | | (0.14 | ) | | | – | | | | (0.14 | ) |
| 10/31/2016 | | | 16.88 | | | | 0.15 | | | | (0.29 | ) | | | (0.14 | ) | | | (0.13 | ) | | | (0.61 | ) | | | (0.74 | ) |
| Class F3 | | | | | | | | | | | | | | | | | | | | | | | | | | | | |
| 10/31/2020 | | | 16.59 | | | | 0.12 | | | | (0.20 | ) | | | (0.08 | ) | | | (0.25 | ) | | | – | | | | (0.25 | ) |
| 10/31/2019 | | | 17.38 | | | | 0.22 | | | | 0.80 | | | | 1.02 | | | | (0.23 | ) | | | (1.58 | ) | | | (1.81 | ) |
| 10/31/2018 | | | 21.49 | | | | 0.23 | | | | (3.39 | ) | | | (3.16 | ) | | | (0.22 | ) | | | (0.73 | ) | | | (0.95 | ) |
| 4/4/2017 to 10/31/2017(e) | | | 17.75 | | | | (0.02 | ) | | | 3.76 | | | | 3.74 | | | | – | | | | – | | | | – | |
| Class I | | | | | | | | | | | | | | | | | | | | | | | | | | | | |
| 10/31/2020 | | | 16.51 | | | | 0.10 | | | | (0.19 | ) | | | (0.09 | ) | | | (0.25 | ) | | | – | | | | (0.25 | ) |
| 10/31/2019 | | | 17.32 | | | | 0.21 | | | | 0.79 | | | | 1.00 | | | | (0.23 | ) | | | (1.58 | ) | | | (1.81 | ) |
| 10/31/2018 | | | 21.44 | | | | 0.19 | | | | (3.37 | ) | | | (3.18 | ) | | | (0.21 | ) | | | (0.73 | ) | | | (0.94 | ) |
| 10/31/2017 | | | 16.56 | | | | 0.14 | | | | 4.90 | | | | 5.04 | | | | (0.16 | ) | | | – | | | | (0.16 | ) |
| 10/31/2016 | | | 17.44 | | | | 0.17 | | | | (0.30 | ) | | | (0.13 | ) | | | (0.14 | ) | | | (0.61 | ) | | | (0.75 | ) |
| Class P | | | | | | | | | | | | | | | | | | | | | | | | | | | | |
| 10/31/2020 | | | 16.43 | | | | 0.05 | | | | (0.22 | ) | | | (0.17 | ) | | | (0.16 | ) | | | – | | | | (0.16 | ) |
| 10/31/2019 | | | 17.18 | | | | 0.14 | | | | 0.79 | | | | 0.93 | | | | (0.10 | ) | | | (1.58 | ) | | | (1.68 | ) |
| 10/31/2018 | | | 21.26 | | | | 0.10 | | | | (3.33 | ) | | | (3.23 | ) | | | (0.12 | ) | | | (0.73 | ) | | | (0.85 | ) |
| 10/31/2017 | | | 16.40 | | | | 0.04 | | | | 4.88 | | | | 4.92 | | | | (0.06 | ) | | | – | | | | (0.06 | ) |
| 10/31/2016 | | | 17.27 | | | | 0.08 | | | | (0.29 | ) | | | (0.21 | ) | | | (0.05 | ) | | | (0.61 | ) | | | (0.66 | ) |
| Class R2 | | | | | | | | | | | | | | | | | | | | | | | | | | | | |
| 10/31/2020 | | | 15.72 | | | | 0.01 | | | | (0.20 | ) | | | (0.19 | ) | | | (0.14 | ) | | | – | | | | (0.14 | ) |
| 10/31/2019 | | | 16.54 | | | | 0.11 | | | | 0.75 | | | | 0.86 | | | | (0.10 | ) | | | (1.58 | ) | | | (1.68 | ) |
| 10/31/2018 | | | 20.53 | | | | 0.06 | | | | (3.21 | ) | | | (3.15 | ) | | | (0.11 | ) | | | (0.73 | ) | | | (0.84 | ) |
| 10/31/2017 | | | 15.89 | | | | 0.04 | | | | 4.69 | | | | 4.73 | | | | (0.09 | ) | | | – | | | | (0.09 | ) |
| 10/31/2016 | | | 16.81 | | | | 0.08 | | | | (0.30 | ) | | | (0.22 | ) | | | (0.09 | ) | | | (0.61 | ) | | | (0.70 | ) |
| 180 | See Notes to Financial Statements. |
| | | | | | | Ratios to Average Net Assets: | | Supplemental Data: |
| | | | | | | | | | | | | | | | | | | | |
Net
asset
value,
end of
period | | Total
return(b)
(%) | | Total
expenses
after
waivers
and/or reim-
bursements
(%) | | Total
expenses
(%) | | Net
invest-
ment
income
(loss)
(%) | | Net
assets,
end of
period
(000) | | Portfolio
turnover
rate
(%) |
| | | | | | | | | | | | | | | | | | | | | | | | | | | |
| $ | 15.69 | | | | (0.84 | ) | | | 1.21 | | | | 1.24 | | | | 0.41 | | | $ | 96,338 | | | | 55 | |
| | 16.02 | | | | 7.05 | | | | 1.25 | | | | 1.25 | | | | 1.04 | | | | 126,700 | | | | 58 | |
| | 16.84 | | | | (15.72 | ) | | | 1.20 | | | | 1.20 | | | | 0.73 | | | | 172,940 | | | | 81 | |
| | 20.88 | | | | 30.38 | | | | 1.23 | | | | 1.23 | | | | 0.50 | | | | 190,861 | | | | 76 | |
| | 16.13 | | | | (0.99 | ) | | | 1.35 | | | | 1.35 | | | | 0.82 | | | | 153,000 | | | | 82 | |
| | | | | | | | | | | | | | | | | | | | | | | | | | | |
| | 14.47 | | | | (1.63 | ) | | | 1.97 | | | | 1.99 | | | | (0.38 | ) | | | 12,840 | | | | 55 | |
| | 14.78 | | | | 6.23 | | | | 2.00 | | | | 2.00 | | | | 0.29 | | | | 22,450 | | | | 58 | |
| | 15.61 | | | | (16.34 | ) | | | 1.95 | | | | 1.95 | | | | – | (d) | | | 33,874 | | | | 81 | |
| | 19.46 | | | | 29.47 | | | | 1.97 | | | | 1.97 | | | | (0.26 | ) | | | 39,434 | | | | 76 | |
| | 15.03 | | | | (1.75 | ) | | | 2.09 | | | | 2.09 | | | | 0.08 | | | | 27,396 | | | | 82 | |
| | | | | | | | | | | | | | | | | | | | | | | | | | | |
| | 15.53 | | | | (0.72 | ) | | | 1.07 | | | | 1.09 | | | | 0.44 | | | | 43,222 | | | | 55 | |
| | 15.86 | | | | 7.19 | | | | 1.09 | | | | 1.09 | | | | 1.20 | | | | 91,019 | | | | 58 | |
| | 16.70 | | | | (15.58 | ) | | | 1.05 | | | | 1.05 | | | | 0.91 | | | | 206,400 | | | | 81 | |
| | 20.70 | | | | 30.59 | | | | 1.07 | | | | 1.07 | | | | 0.58 | | | | 264,221 | | | | 76 | |
| | 16.00 | | | | (0.84 | ) | | | 1.20 | | | | 1.20 | | | | 0.96 | | | | 88,852 | | | | 82 | |
| | | | | | | | | | | | | | | | | | | | | | | | | | | |
| | 16.26 | | | | (0.54 | ) | | | 0.89 | | | | 0.91 | | | | 0.75 | | | | 17,579 | | | | 55 | |
| | 16.59 | | | | 7.43 | | | | 0.91 | | | | 0.91 | | | | 1.40 | | | | 19,153 | | | | 58 | |
| | 17.38 | | | | (15.46 | ) | | | 0.87 | | | | 0.87 | | | | 1.11 | | | | 22,158 | | | | 81 | |
| | | | | | | | | | | | | | | | | | | | | | | | | | | |
| | 21.49 | | | | 21.13 | (f) | | | 0.89 | (g) | | | 0.89 | (g) | | | (0.15 | )(g) | | | 18,095 | | | | 76 | |
| | | | | | | | | | | | | | | | | | | | | | | | | | | |
| | 16.17 | | | | (0.62 | ) | | | 0.97 | | | | 0.99 | | | | 0.66 | | | | 146,416 | | | | 55 | |
| | 16.51 | | | | 7.24 | | | | 1.00 | | | | 1.00 | | | | 1.32 | | | | 221,455 | | | | 58 | |
| | 17.32 | | | | (15.46 | ) | | | 0.95 | | | | 0.95 | | | | 0.94 | | | | 235,952 | | | | 81 | |
| | 21.44 | | | | 30.74 | | | | 0.99 | | | | 0.99 | | | | 0.76 | | | | 249,331 | | | | 76 | |
| | 16.56 | | | | (0.75 | ) | | | 1.10 | | | | 1.10 | | | | 1.06 | | | | 267,188 | | | | 82 | |
| | | | | | | | | | | | | | | | | | | | | | | | | | | |
| | 16.10 | | | | (1.08 | ) | | | 1.41 | | | | 1.43 | | | | 0.30 | | | | 119 | | | | 55 | |
| | 16.43 | | | | 6.80 | | | | 1.45 | | | | 1.45 | | | | 0.91 | | | | 96 | | | | 58 | |
| | 17.18 | | | | (15.87 | ) | | | 1.40 | | | | 1.40 | | | | 0.50 | | | | 132 | | | | 81 | |
| | 21.26 | | | | 30.12 | | | | 1.45 | | | | 1.45 | | | | 0.23 | | | | 229 | | | | 76 | |
| | 16.40 | | | | (1.17 | ) | | | 1.55 | | | | 1.55 | | | | 0.49 | | | | 363 | | | | 82 | |
| | | | | | | | | | | | | | | | | | | | | | | | | | | |
| | 15.39 | | | | (1.24 | ) | | | 1.57 | | | | 1.59 | | | | 0.06 | | | | 2,522 | | | | 55 | |
| | 15.72 | | | | 6.67 | | | | 1.60 | | | | 1.60 | | | | 0.72 | | | | 3,318 | | | | 58 | |
| | 16.54 | | | | (16.00 | ) | | | 1.55 | | | | 1.55 | | | | 0.32 | | | | 3,476 | | | | 81 | |
| | 20.53 | | | | 29.96 | | | | 1.57 | | | | 1.57 | | | | 0.21 | | | | 5,228 | | | | 76 | |
| | 15.89 | | | | (1.34 | ) | | | 1.71 | | | | 1.71 | | | | 0.49 | | | | 2,520 | | | | 82 | |
| | See Notes to Financial Statements. | 181 |
Financial Highlights (continued)
INTERNATIONAL OPPORTUNITIES FUND
| | | | | | Per Share Operating Performance: |
| | | | | | Investment operations: | | | Distributions to
shareholders from: |
| | | Net asset
value,
beginning
of period | | Net
invest-
ment
income
(loss)(a) | | Net
realized
and
unrealized
gain (loss) | | Total
from
invest-
ment
opera-
tions | | Net
investment
income | | Net
realized
gain | | Total
distri-
butions |
| Class R3 | | | | | | | | | | | | | | | | | | | | | | | | | | | | |
| 10/31/2020 | | $ | 15.64 | | | $ | 0.02 | | | $ | (0.19 | ) | | $ | (0.17 | ) | | $ | (0.15 | ) | | $ | – | | | $ | (0.15 | ) |
| 10/31/2019 | | | 16.53 | | | | 0.09 | | | | 0.77 | | | | 0.86 | | | | (0.17 | ) | | | (1.58 | ) | | | (1.75 | ) |
| 10/31/2018 | | | 20.49 | | | | 0.10 | | | | (3.21 | ) | | | (3.11 | ) | | | (0.12 | ) | | | (0.73 | ) | | | (0.85 | ) |
| 10/31/2017 | | | 15.85 | | | | 0.02 | | | | 4.71 | | | | 4.73 | | | | (0.09 | ) | | | – | | | | (0.09 | ) |
| 10/31/2016 | | | 16.73 | | | | 0.11 | | | | (0.31 | ) | | | (0.20 | ) | | | (0.07 | ) | | | (0.61 | ) | | | (0.68 | ) |
| Class R4 | | | | | | | | | | | | | | | | | | | | | | | | | | | | |
| 10/31/2020 | | | 15.95 | | | | 0.07 | | | | (0.19 | ) | | | (0.12 | ) | | | (0.22 | ) | | | – | | | | (0.22 | ) |
| 10/31/2019 | | | 16.79 | | | | 0.14 | | | | 0.78 | | | | 0.92 | | | | (0.18 | ) | | | (1.58 | ) | | | (1.76 | ) |
| 10/31/2018 | | | 20.82 | | | | 0.16 | | | | (3.28 | ) | | | (3.12 | ) | | | (0.18 | ) | | | (0.73 | ) | | | (0.91 | ) |
| 10/31/2017 | | | 16.11 | | | | 0.10 | | | | 4.75 | | | | 4.85 | | | | (0.14 | ) | | | – | | | | (0.14 | ) |
| 10/31/2016 | | | 17.01 | | | | 0.09 | | | | (0.26 | ) | | | (0.17 | ) | | | (0.12 | ) | | | (0.61 | ) | | | (0.73 | ) |
| Class R5 | | | | | | | | | | | | | | | | | | | | | | | | | | | | |
| 10/31/2020 | | | 16.50 | | | | 0.08 | | | | (0.16 | ) | | | (0.08 | ) | | | (0.25 | ) | | | – | | | | (0.25 | ) |
| 10/31/2019 | | | 17.32 | | | | 0.16 | | | | 0.83 | | | | 0.99 | | | | (0.23 | ) | | | (1.58 | ) | | | (1.81 | ) |
| 10/31/2018 | | | 21.43 | | | | 0.21 | | | | (3.38 | ) | | | (3.17 | ) | | | (0.21 | ) | | | (0.73 | ) | | | (0.94 | ) |
| 10/31/2017 | | | 16.56 | | | | 0.15 | | | | 4.88 | | | | 5.03 | | | | (0.16 | ) | | | – | | | | (0.16 | ) |
| 10/31/2016 | | | 17.44 | | | | 0.18 | | | | (0.31 | ) | | | (0.13 | ) | | | (0.14 | ) | | | (0.61 | ) | | | (0.75 | ) |
| Class R6 | | | | | | | | | | | | | | | | | | | | | | | | | | | | |
| 10/31/2020 | | | 16.59 | | | | 0.11 | | | | (0.19 | ) | | | (0.08 | ) | | | (0.25 | ) | | | – | | | | (0.25 | ) |
| 10/31/2019 | | | 17.39 | | | | 0.21 | | | | 0.80 | | | | 1.01 | | | | (0.23 | ) | | | (1.58 | ) | | | (1.81 | ) |
| 10/31/2018 | | | 21.49 | | | | 0.21 | | | | (3.36 | ) | | | (3.15 | ) | | | (0.22 | ) | | | (0.73 | ) | | | (0.95 | ) |
| 10/31/2017 | | | 16.60 | | | | 0.20 | | | | 4.85 | | | | 5.05 | | | | (0.16 | ) | | | – | | | | (0.16 | ) |
| 10/31/2016 | | | 17.45 | | | | 0.17 | | | | (0.27 | ) | | | (0.10 | ) | | | (0.14 | ) | | | (0.61 | ) | | | (0.75 | ) |
| (a) | Calculated using average shares outstanding during the period. |
| (b) | Total return for Classes A and C does not consider the effects of sales loads and assumes the reinvestment of all distributions. Total return for all other classes assumes the reinvestment of all distributions. |
| (c) | Amount less than $0.01. |
| (d) | Amount is less than 0.01%. |
| (e) | Commenced on April 4, 2017. |
| (f) | Not annualized. |
| (g) | Annualized. |
| 182 | See Notes to Financial Statements. |
| | | | | | | Ratios to Average Net Assets: | | Supplemental Data: |
| | | | | | | | | | | | | | | | | | | | |
Net
asset
value,
end of
period | | Total
return(b)
(%) | | Total
expenses
after
waivers
and/or reim-
bursements
(%) | | Total
expenses
(%) | | Net
invest-
ment
income
(loss)
(%) | | Net
assets,
end of
period
(000) | | Portfolio
turnover
rate
(%) |
| | | | | | | | | | | | | | | | | | | | | | | | | | | |
| $ | 15.32 | | | | (1.17 | ) | | | 1.46 | | | | 1.49 | | | | 0.10 | | | $ | 15,313 | | | | 55 | |
| | 15.64 | | | | 6.77 | | | | 1.50 | | | | 1.50 | | | | 0.58 | | | | 19,568 | | | | 58 | |
| | 16.53 | | | | (15.87 | ) | | | 1.46 | | | | 1.46 | | | | 0.54 | | | | 35,677 | | | | 81 | |
| | 20.49 | | | | 30.07 | | | | 1.47 | | | | 1.47 | | | | 0.14 | | | | 9,828 | | | | 76 | |
| | 15.85 | | | | (1.20 | ) | | | 1.59 | | | | 1.59 | | | | 0.67 | | | | 18,124 | | | | 82 | |
| | | | | | | | | | | | | | | | | | | | | | | | | | | |
| | 15.61 | | | | (0.90 | ) | | | 1.21 | | | | 1.24 | | | | 0.44 | | | | 4,889 | | | | 55 | |
| | 15.95 | | | | 7.06 | | | | 1.25 | | | | 1.25 | | | | 0.93 | | | | 6,293 | | | | 58 | |
| | 16.79 | | | | (15.70 | ) | | | 1.20 | | | | 1.20 | | | | 0.80 | | | | 5,606 | | | | 81 | |
| | 20.82 | | | | 30.43 | | | | 1.23 | | | | 1.23 | | | | 0.55 | | | | 3,334 | | | | 76 | |
| | 16.11 | | | | (1.03 | ) | | | 1.38 | | | | 1.38 | | | | 0.57 | | | | 1,883 | | | | 82 | |
| | | | | | | | | | | | | | | | | | | | | | | | | | | |
| | 16.17 | | | | (0.56 | ) | | | 0.96 | | | | 0.99 | | | | 0.47 | | | | 15,842 | | | | 55 | |
| | 16.50 | | | | 7.25 | | | | 1.00 | | | | 1.00 | | | | 1.00 | | | | 17,765 | | | | 58 | |
| | 17.32 | | | | (15.47 | ) | | | 0.97 | | | | 0.97 | | | | 1.06 | | | | 39,621 | | | | 81 | |
| | 21.43 | | | | 30.69 | | | | 0.98 | | | | 0.98 | | | | 0.79 | | | | 4,121 | | | | 76 | |
| | 16.56 | | | | (0.75 | ) | | | 1.13 | | | | 1.13 | | | | 1.06 | | | | 2,751 | | | | 82 | |
| | | | | | | | | | | | | | | | | | | | | | | | | | | |
| | 16.26 | | | | (0.54 | ) | | | 0.89 | | | | 0.91 | | | | 0.72 | | | | 31,986 | | | | 55 | |
| | 16.59 | | | | 7.37 | | | | 0.91 | | | | 0.91 | | | | 1.30 | | | | 33,183 | | | | 58 | |
| | 17.39 | | | | (15.41 | ) | | | 0.87 | | | | 0.87 | | | | 1.04 | | | | 34,281 | | | | 81 | |
| | 21.49 | | | | 30.85 | | | | 0.90 | | | | 0.90 | | | | 1.03 | | | | 17,212 | | | | 76 | |
| | 16.60 | | | | (0.56 | ) | | | 0.94 | | | | 0.94 | | | | 1.00 | | | | 1,843 | | | | 82 | |
| | See Notes to Financial Statements. | 183 |
Financial Highlights (continued)
INTERNATIONAL VALUE FUND
| | | | | | Per Share Operating Performance: | | | | |
| | | | | | Investment operations: | | Distributions
to
shareholders
from: | | | | |
| | | Net asset
value,
beginning
of period | | Net
investment
income
(loss)(a) | | Net
realized and
unrealized
gain (loss) | | Total from
investment
operations | | Net
investment
income | | Net asset
value,
end of
period |
| Class A | | | | | | | | | | | | | | | | | | | | | | | | |
| 10/31/2020 | | $ | 6.98 | | | $ | 0.12 | | | $ | (0.94 | ) | | $ | (0.82 | ) | | $ | (0.13 | ) | | $ | 6.03 | |
| 10/31/2019 | | | 6.73 | | | | 0.20 | | | | 0.26 | | | | 0.46 | | | | (0.21 | ) | | | 6.98 | |
| 10/31/2018 | | | 7.63 | | | | 0.22 | | | | (0.89 | ) | | | (0.67 | ) | | | (0.23 | ) | | | 6.73 | |
| 10/31/2017 | | | 6.71 | | | | 0.22 | | | | 0.95 | | | | 1.17 | | | | (0.25 | ) | | | 7.63 | |
| 10/31/2016 | | | 7.05 | | | | 0.24 | | | | (0.35 | ) | | | (0.11 | ) | | | (0.23 | ) | | | 6.71 | |
| Class C | | | | | | | | | | | | | | | | | | | | | | | | |
| 10/31/2020 | | | 6.92 | | | | 0.07 | | | | (0.94 | ) | | | (0.87 | ) | | | (0.07 | ) | | | 5.98 | |
| 10/31/2019 | | | 6.67 | | | | 0.15 | | | | 0.25 | | | | 0.40 | | | | (0.15 | ) | | | 6.92 | |
| 10/31/2018 | | | 7.56 | | | | 0.16 | | | | (0.88 | ) | | | (0.72 | ) | | | (0.17 | ) | | | 6.67 | |
| 10/31/2017 | | | 6.66 | | | | 0.17 | | | | 0.92 | | | | 1.09 | | | | (0.19 | ) | | | 7.56 | |
| 10/31/2016 | | | 6.99 | | | | 0.19 | | | | (0.34 | ) | | | (0.15 | ) | | | (0.18 | ) | | | 6.66 | |
| Class F | | | | | | | | | | | | | | | | | | | | | | | | |
| 10/31/2020 | | | 7.01 | | | | 0.13 | | | | (0.94 | ) | | | (0.81 | ) | | | (0.14 | ) | | | 6.06 | |
| 10/31/2019 | | | 6.76 | | | | 0.21 | | | | 0.26 | | | | 0.47 | | | | (0.22 | ) | | | 7.01 | |
| 10/31/2018 | | | 7.66 | | | | 0.23 | | | | (0.89 | ) | | | (0.66 | ) | | | (0.24 | ) | | | 6.76 | |
| 10/31/2017 | | | 6.73 | | | | 0.24 | | | | 0.95 | | | | 1.19 | | | | (0.26 | ) | | | 7.66 | |
| 10/31/2016 | | | 7.06 | | | | 0.25 | | | | (0.34 | ) | | | (0.09 | ) | | | (0.24 | ) | | | 6.73 | |
| Class F3 | | | | | | | | | | | | | | | | | | | | | | | | |
| 10/31/2020 | | | 7.02 | | | | 0.14 | | | | (0.95 | ) | | | (0.81 | ) | | | (0.14 | ) | | | 6.07 | |
| 10/31/2019 | | | 6.77 | | | | 0.22 | | | | 0.26 | | | | 0.48 | | | | (0.23 | ) | | | 7.02 | |
| 10/31/2018 | | | 7.67 | | | | 0.24 | | | | (0.89 | ) | | | (0.65 | ) | | | (0.25 | ) | | | 6.77 | |
| 4/4/2017 to 10/31/2017(c) | | | 7.03 | | | | (0.01 | ) | | | 0.79 | | | | 0.78 | | | | (0.14 | ) | | | 7.67 | |
| Class I | | | | | | | | | | | | | | | | | | | | | | | | |
| 10/31/2020 | | | 7.03 | | | | 0.15 | | | | (0.97 | ) | | | (0.82 | ) | | | (0.14 | ) | | | 6.07 | |
| 10/31/2019 | | | 6.77 | | | | 0.23 | | | | 0.25 | | | | 0.48 | | | | (0.22 | ) | | | 7.03 | |
| 10/31/2018 | | | 7.68 | | | | 0.23 | | | | (0.89 | ) | | | (0.66 | ) | | | (0.25 | ) | | | 6.77 | |
| 10/31/2017 | | | 6.75 | | | | 0.25 | | | | 0.94 | | | | 1.19 | | | | (0.26 | ) | | | 7.68 | |
| 10/31/2016 | | | 7.08 | | | | 0.26 | | | | (0.34 | ) | | | (0.08 | ) | | | (0.25 | ) | | | 6.75 | |
| Class R2 | | | | | | | | | | | | | | | | | | | | | | | | |
| 10/31/2020 | | | 7.14 | | | | 0.07 | | | | (0.96 | ) | | | (0.89 | ) | | | (0.07 | ) | | | 6.18 | |
| 10/31/2019 | | | 6.88 | | | | 0.18 | | | | 0.26 | | | | 0.44 | | | | (0.18 | ) | | | 7.14 | |
| 10/31/2018 | | | 7.80 | | | | 0.18 | | | | (0.90 | ) | | | (0.72 | ) | | | (0.20 | ) | | | 6.88 | |
| 10/31/2017 | | | 6.86 | | | | 0.21 | | | | 0.95 | | | | 1.16 | | | | (0.22 | ) | | | 7.80 | |
| 10/31/2016 | | | 7.19 | | | | 0.22 | | | | (0.35 | ) | | | (0.13 | ) | | | (0.20 | ) | | | 6.86 | |
| Class R3 | | | | | | | | | | | | | | | | | | | | | | | | |
| 10/31/2020 | | | 7.05 | | | | 0.11 | | | | (0.95 | ) | | | (0.84 | ) | | | (0.11 | ) | | | 6.10 | |
| 10/31/2019 | | | 6.80 | | | | 0.18 | | | | 0.26 | | | | 0.44 | | | | (0.19 | ) | | | 7.05 | |
| 10/31/2018 | | | 7.71 | | | | 0.19 | | | | (0.89 | ) | | | (0.70 | ) | | | (0.21 | ) | | | 6.80 | |
| 10/31/2017 | | | 6.78 | | | | 0.21 | | | | 0.95 | | | | 1.16 | | | | (0.23 | ) | | | 7.71 | |
| 10/31/2016 | | | 7.11 | | | | 0.22 | | | | (0.34 | ) | | | (0.12 | ) | | | (0.21 | ) | | | 6.78 | |
| 184 | See Notes to Financial Statements. |
| | | | Ratios to Average Net Assets: | | Supplemental Data: |
| | | | | | | | | | | | | | | | | |
Total
return(b)
(%) | | Total
expenses
after
waivers
and/or reim-
bursements
(%) | | Total
expenses
(%) | | Net
investment
income
(loss)
(%) | | Net assets,
end of
period
(000) | | Portfolio
turnover
rate
(%) |
| | | | | | | | | | | | | | | | | | | | | | | |
| | (11.89 | ) | | | 1.12 | | | | 1.18 | | | | 1.91 | | | $ | 186,426 | | | | 71 | |
| | 6.91 | | | | 1.12 | | | | 1.16 | | | | 2.97 | | | | 256,381 | | | | 62 | |
| | (9.05 | ) | | | 1.12 | | | | 1.14 | | | | 2.85 | | | | 290,289 | | | | 74 | |
| | 17.68 | | | | 1.12 | | | | 1.14 | | | | 3.15 | | | | 367,465 | | | | 61 | |
| | (1.52 | ) | | | 1.12 | | | | 1.20 | | | | 3.57 | | | | 419,886 | | | | 58 | |
| | | | | | | | | | | | | | | | | | | | | | | |
| | (12.58 | ) | | | 1.87 | | | | 1.93 | | | | 1.09 | | | | 13,027 | | | | 71 | |
| | 6.12 | | | | 1.87 | | | | 1.91 | | | | 2.17 | | | | 32,274 | | | | 62 | |
| | (9.71 | ) | | | 1.87 | | | | 1.89 | | | | 2.07 | | | | 45,888 | | | | 74 | |
| | 16.60 | | | | 1.87 | | | | 1.89 | | | | 2.41 | | | | 68,558 | | | | 61 | |
| | (2.01 | ) | | | 1.87 | | | | 1.95 | | | | 2.85 | | | | 86,306 | | | | 58 | |
| | | | | | | | | | | | | | | | | | | | | | | |
| | (11.69 | ) | | | 0.92 | | | | 1.03 | | | | 2.06 | | | | 23,560 | | | | 71 | |
| | 7.04 | | | | 0.92 | | | | 1.01 | | | | 3.10 | | | | 37,857 | | | | 62 | |
| | (8.87 | ) | | | 0.91 | | | | 0.99 | | | | 3.06 | | | | 54,167 | | | | 74 | |
| | 17.96 | | | | 0.91 | | | | 0.99 | | | | 3.37 | | | | 95,299 | | | | 61 | |
| | (1.22 | ) | | | 0.91 | | | | 1.05 | | | | 3.78 | | | | 111,056 | | | | 58 | |
| | | | | | | | | | | | | | | | | | | | | | | |
| | (11.57 | ) | | | 0.80 | | | | 0.85 | | | | 2.24 | | | | 18,311 | | | | 71 | |
| | 7.15 | | | | 0.81 | | | | 0.84 | | | | 3.28 | | | | 24,764 | | | | 62 | |
| | (8.76 | ) | | | 0.82 | | | | 0.83 | | | | 3.21 | | | | 26,911 | | | | 74 | |
| | | | | | | | | | | | | | | | | | | | | | | |
| | 11.16 | (d) | | | 0.77 | (e) | | | 0.83 | (e) | | | (0.19 | )(e) | | | 27,215 | | | | 61 | |
| | | | | | | | | | | | | | | | | | | | | | | |
| | (11.71 | ) | | | 0.82 | | | | 0.93 | | | | 2.26 | | | | 197,616 | | | | 71 | |
| | 7.29 | | | | 0.82 | | | | 0.91 | | | | 3.35 | | | | 219,764 | | | | 62 | |
| | (8.89 | ) | | | 0.81 | | | | 0.89 | | | | 3.05 | | | | 310,984 | | | | 74 | |
| | 18.02 | | | | 0.81 | | | | 0.89 | | | | 3.48 | | | | 471,341 | | | | 61 | |
| | (1.10 | ) | | | 0.81 | | | | 0.95 | | | | 3.90 | | | | 710,951 | | | | 58 | |
| | | | | | | | | | | | | | | | | | | | | | | |
| | (12.47 | ) | | | 1.47 | | | | 1.55 | | | | 0.99 | | | | 20 | | | | 71 | |
| | 6.54 | | | | 1.47 | | | | 1.51 | | | | 2.64 | | | | 449 | | | | 62 | |
| | (9.44 | ) | | | 1.47 | | | | 1.49 | | | | 2.35 | | | | 369 | | | | 74 | |
| | 17.17 | | | | 1.47 | | | | 1.49 | | | | 2.93 | | | | 592 | | | | 61 | |
| | (1.70 | ) | | | 1.47 | | | | 1.55 | | | | 3.28 | | | | 680 | | | | 58 | |
| | | | | | | | | | | | | | | | | | | | | | | |
| | (12.00 | ) | | | 1.37 | | | | 1.43 | | | | 1.69 | | | | 5,394 | | | | 71 | |
| | 6.56 | | | | 1.37 | | | | 1.41 | | | | 2.70 | | | | 7,029 | | | | 62 | |
| | (9.35 | ) | | | 1.37 | | | | 1.39 | | | | 2.41 | | | | 7,801 | | | | 74 | |
| | 17.35 | | | | 1.37 | | | | 1.39 | | | | 2.90 | | | | 12,888 | | | | 61 | |
| | (1.58 | ) | | | 1.37 | | | | 1.44 | | | | 3.29 | | | | 12,697 | | | | 58 | |
| | See Notes to Financial Statements. | 185 |
Financial Highlights (continued)
INTERNATIONAL VALUE FUND
| | | | | | Per Share Operating Performance: | | | | |
| | | | | | Investment operations: | | Distributions
to
shareholders
from: | | | | |
| | | Net asset
value,
beginning
of period | | Net
investment
income
(loss)(a) | | Net
realized and
unrealized
gain (loss) | | Total from
investment
operations | | Net
investment
income | | Net asset
value,
end of
period |
| Class R4 | | | | | | | | | | | | | | | | | | | | | | | | |
| 10/31/2020 | | $ | 6.97 | | | $ | 0.13 | | | $ | (0.96 | ) | | $ | (0.83 | ) | | $ | (0.13 | ) | | $ | 6.01 | |
| 10/31/2019 | | | 6.72 | | | | 0.20 | | | | 0.26 | | | | 0.46 | | | | (0.21 | ) | | | 6.97 | |
| 10/31/2018 | | | 7.62 | | | | 0.20 | | | | (0.87 | ) | | | (0.67 | ) | | | (0.23 | ) | | | 6.72 | |
| 10/31/2017 | | | 6.71 | | | | 0.21 | | | | 0.95 | | | | 1.16 | | | | (0.25 | ) | | | 7.62 | |
| 10/31/2016 | | | 7.05 | | | | 0.24 | | | | (0.35 | ) | | | (0.11 | ) | | | (0.23 | ) | | | 6.71 | |
| Class R5 | | | | | | | | | | | | | | | | | | | | | | | | |
| 10/31/2020 | | | 7.01 | | | | 0.14 | | | | (0.96 | ) | | | (0.82 | ) | | | (0.14 | ) | | | 6.05 | |
| 10/31/2019 | | | 6.76 | | | | 0.23 | | | | 0.25 | | | | 0.48 | | | | (0.23 | ) | | | 7.01 | |
| 10/31/2018 | | | 7.66 | | | | 0.24 | | | | (0.89 | ) | | | (0.65 | ) | | | (0.25 | ) | | | 6.76 | |
| 10/31/2017 | | | 6.74 | | | | 0.24 | | | | 0.94 | | | | 1.18 | | | | (0.26 | ) | | | 7.66 | |
| 10/31/2016 | | | 7.08 | | | | 0.26 | | | | (0.35 | ) | | | (0.09 | ) | | | (0.25 | ) | | | 6.74 | |
| Class R6 | | | | | | | | | | | | | | | | | | | | | | | | |
| 10/31/2020 | | | 7.02 | | | | 0.14 | | | | (0.95 | ) | | | (0.81 | ) | | | (0.14 | ) | | | 6.07 | |
| 10/31/2019 | | | 6.77 | | | | 0.22 | | | | 0.26 | | | | 0.48 | | | | (0.23 | ) | | | 7.02 | |
| 10/31/2018 | | | 7.67 | | | | 0.24 | | | | (0.89 | ) | | | (0.65 | ) | | | (0.25 | ) | | | 6.77 | |
| 10/31/2017 | | | 6.75 | | | | 0.26 | | | | 0.92 | | | | 1.18 | | | | (0.26 | ) | | | 7.67 | |
| 10/31/2016 | | | 7.08 | | | | 0.26 | | | | (0.34 | ) | | | (0.08 | ) | | | (0.25 | ) | | | 6.75 | |
| (a) | Calculated using average shares outstanding during the period. |
| (b) | Total return for Classes A and C does not consider the effects of sales loads and assumes the reinvestment of all distributions. Total return for all other classes assumes the reinvestment of all distributions. |
| (c) | Commenced on April 4, 2017. |
| (d) | Not annualized. |
| (e) | Annualized. |
| 186 | See Notes to Financial Statements. |
| | | | Ratios to Average Net Assets: | | Supplemental Data: |
| | | | | | |
Total
return(b)
(%) | | Total
expenses
after
waivers
and/or reim-
bursements
(%) | | Total
expenses
(%) | | Net
investment
income
(loss)
(%) | | Net assets,
end of
period
(000) | | Portfolio
turnover
rate
(%) |
| | | | | | | | | | | | | | | | | |
| | (11.90 | ) | | | 1.12 | | | | 1.17 | | | | 2.05 | | | $ | 36 | | | | 71 | |
| | 6.92 | | | | 1.12 | | | | 1.17 | | | | 2.99 | | | | 36 | | | | 62 | |
| | (9.06 | ) | | | 1.12 | | | | 1.13 | | | | 2.67 | | | | 40 | | | | 74 | |
| | 17.60 | | | | 1.11 | | | | 1.11 | | | | 2.85 | | | | 38 | | | | 61 | |
| | (1.48 | ) | | | 1.12 | | | | 1.16 | | | | 3.57 | | | | 9 | | | | 58 | |
| | | | | | | | | | | | | | | | | | | | | | | |
| | (11.74 | ) | | | 0.87 | | | | 0.91 | | | | 2.20 | | | | 9 | | | | 71 | |
| | 7.16 | | | | 0.87 | | | | 0.89 | | | | 3.36 | | | | 10 | | | | 62 | |
| | (8.78 | ) | | | 0.86 | | | | 0.86 | | | | 3.12 | | | | 10 | | | | 74 | |
| | 17.90 | | | | 0.87 | | | | 0.86 | | | | 3.39 | | | | 11 | | | | 61 | |
| | (1.24 | ) | | | 0.87 | | | | 0.92 | | | | 3.81 | | | | 9 | | | | 58 | |
| | | | | | | | | | | | | | | | | | | | | | | |
| | (11.57 | ) | | | 0.80 | | | | 0.85 | | | | 2.17 | | | | 952 | | | | 71 | |
| | 7.15 | | | | 0.81 | | | | 0.84 | | | | 3.22 | | | | 1,507 | | | | 62 | |
| | (8.76 | ) | | | 0.82 | | | | 0.83 | | | | 3.17 | | | | 1,758 | | | | 74 | |
| | 17.88 | | | | 0.81 | | | | 0.83 | | | | 3.45 | | | | 2,229 | | | | 61 | |
| | (1.09 | ) | | | 0.80 | | | | 0.82 | | | | 3.88 | | | | 9 | | | | 58 | |
| | See Notes to Financial Statements. | 187 |
Financial Highlights (continued)
VALUE OPPORTUNITIES FUND
| | | | | | Per Share Operating Performance: |
| | | | | | Investment operations: | | Distributions to
shareholders from: |
| | | Net asset
value,
beginning
of period | | Net
invest-
ment
income
(loss)(a) | | Net
realized
and
unrealized
gain (loss) | | Total
from
invest-
ment
opera-
tions | | Net
investment
income | | Net
realized
gain | | Total
distri-
butions |
| Class A | | | | | | | | | | | | | | | | | | | | | | | | | | | | |
| 10/31/2020 | | $ | 18.62 | | | $ | 0.05 | | | $ | 0.39 | | | $ | 0.44 | | | $ | (0.07 | ) | | $ | (2.01 | ) | | $ | (2.08 | ) |
| 10/31/2019 | | | 19.50 | | | | 0.05 | | | | 0.84 | | | | 0.89 | | | | (0.01 | ) | | | (1.76 | ) | | | (1.77 | ) |
| 10/31/2018 | | | 20.80 | | | | 0.01 | | | | (0.06 | ) | | | (0.05 | ) | | | – | | | | (1.25 | ) | | | (1.25 | ) |
| 10/31/2017 | | | 18.95 | | | | 0.03 | | | | 2.95 | | | | 2.98 | | | | – | | | | (1.13 | ) | | | (1.13 | ) |
| 10/31/2016 | | | 19.56 | | | | 0.02 | | | | 0.77 | | | | 0.79 | | | | – | | | | (1.40 | ) | | | (1.40 | ) |
| Class C | | | | | | | | | | | | | | | | | | | | | | | | | | | | |
| 10/31/2020 | | | 16.22 | | | | (0.06 | ) | | | 0.32 | | | | 0.26 | | | | – | | | | (2.01 | ) | | | (2.01 | ) |
| 10/31/2019 | | | 17.32 | | | | (0.07 | ) | | | 0.73 | | | | 0.66 | | | | – | | | | (1.76 | ) | | | (1.76 | ) |
| 10/31/2018 | | | 18.75 | | | | (0.12 | ) | | | (0.06 | ) | | | (0.18 | ) | | | – | | | | (1.25 | ) | | | (1.25 | ) |
| 10/31/2017 | | | 17.31 | | | | (0.11 | ) | | | 2.68 | | | | 2.57 | | | | – | | | | (1.13 | ) | | | (1.13 | ) |
| 10/31/2016 | | | 18.11 | | | | (0.11 | ) | | | 0.71 | | | | 0.60 | | | | – | | | | (1.40 | ) | | | (1.40 | ) |
| Class F | | | | | | | | | | | | | | | | | | | | | | | | | | | | |
| 10/31/2020 | | | 19.06 | | | | 0.07 | | | | 0.39 | | | | 0.46 | | | | (0.09 | ) | | | (2.01 | ) | | | (2.10 | ) |
| 10/31/2019 | | | 19.92 | | | | 0.08 | | | | 0.86 | | | | 0.94 | | | | (0.04 | ) | | | (1.76 | ) | | | (1.80 | ) |
| 10/31/2018 | | | 21.18 | | | | 0.04 | | | | (0.04 | ) | | | – | | | | (0.01 | ) | | | (1.25 | ) | | | (1.26 | ) |
| 10/31/2017 | | | 19.28 | | | | 0.05 | | | | 3.00 | | | | 3.05 | | | | (0.02 | ) | | | (1.13 | ) | | | (1.15 | ) |
| 10/31/2016 | | | 19.85 | | | | 0.04 | | | | 0.79 | | | | 0.83 | | | | – | | | | (1.40 | ) | | | (1.40 | ) |
| Class F3 | | | | | | | | | | | | | | | | | | | | | | | | | | | | |
| 10/31/2020 | | | 19.56 | | | | 0.11 | | | | 0.41 | | | | 0.52 | | | | (0.12 | ) | | | (2.01 | ) | | | (2.13 | ) |
| 10/31/2019 | | | 20.38 | | | | 0.12 | | | | 0.88 | | | | 1.00 | | | | (0.06 | ) | | | (1.76 | ) | | | (1.82 | ) |
| 10/31/2018 | | | 21.65 | | | | 0.08 | | | | (0.05 | ) | | | 0.03 | | | | (0.05 | ) | | | (1.25 | ) | | | (1.30 | ) |
| 4/4/2017 to 10/31/2017(c) | | | 20.25 | | | | (0.03 | ) | | | 1.43 | | | | 1.40 | | | | – | | | | – | | | | – | |
| Class I | | | | | | | | | | | | | | | | | | | | | | | | | | | | |
| 10/31/2020 | | | 19.45 | | | | 0.09 | | | | 0.41 | | | | 0.50 | | | | (0.12 | ) | | | (2.01 | ) | | | (2.13 | ) |
| 10/31/2019 | | | 20.29 | | | | 0.10 | | | | 0.88 | | | | 0.98 | | | | (0.06 | ) | | | (1.76 | ) | | | (1.82 | ) |
| 10/31/2018 | | | 21.59 | | | | 0.06 | | | | (0.06 | ) | | | – | | | | (0.05 | ) | | | (1.25 | ) | | | (1.30 | ) |
| 10/31/2017 | | | 19.62 | | | | 0.08 | | | | 3.06 | | | | 3.14 | | | | (0.04 | ) | | | (1.13 | ) | | | (1.17 | ) |
| 10/31/2016 | | | 20.16 | | | | 0.06 | | | | 0.80 | | | | 0.86 | | | | – | | | | (1.40 | ) | | | (1.40 | ) |
| Class P | | | | | | | | | | | | | | | | | | | | | | | | | | | | |
| 10/31/2020 | | | 18.20 | | | | 0.02 | | | | 0.37 | | | | 0.39 | | | | (0.03 | ) | | | (2.01 | ) | | | (2.04 | ) |
| 10/31/2019 | | | 19.13 | | | | 0.01 | | | | 0.82 | | | | 0.83 | | | | – | | | | (1.76 | ) | | | (1.76 | ) |
| 10/31/2018 | | | 20.46 | | | | (0.03 | ) | | | (0.05 | ) | | | (0.08 | ) | | | – | | | | (1.25 | ) | | | (1.25 | ) |
| 10/31/2017 | | | 18.70 | | | | (0.01 | ) | | | 2.90 | | | | 2.89 | | | | – | | | | (1.13 | ) | | | (1.13 | ) |
| 10/31/2016 | | | 19.36 | | | | (0.02 | ) | | | 0.76 | | | | 0.74 | | | | – | | | | (1.40 | ) | | | (1.40 | ) |
| Class R2 | | | | | | | | | | | | | | | | | | | | | | | | | | | | |
| 10/31/2020 | | | 17.75 | | | | (0.01 | ) | | | 0.37 | | | | 0.36 | | | | (0.01 | ) | | | (2.01 | ) | | | (2.02 | ) |
| 10/31/2019 | | | 18.72 | | | | (0.01 | ) | | | 0.80 | | | | 0.79 | | | | – | | | | (1.76 | ) | | | (1.76 | ) |
| 10/31/2018 | | | 20.06 | | | | (0.06 | ) | | | (0.03 | ) | | | (0.09 | ) | | | – | | | | (1.25 | ) | | | (1.25 | ) |
| 10/31/2017 | | | 18.38 | | | | (0.05 | ) | | | 2.86 | | | | 2.81 | | | | – | | | | (1.13 | ) | | | (1.13 | ) |
| 10/31/2016 | | | 19.08 | | | | (0.05 | ) | | | 0.75 | | | | 0.70 | | | | – | | | | (1.40 | ) | | | (1.40 | ) |
| 188 | See Notes to Financial Statements. |
| | | | | | | Ratios to Average Net Assets: | | Supplemental Data: |
| | | | | | | | | | | | | | | | | | | | |
Net
asset
value,
end of
period | | Total
return(b)
(%) | | Total
expenses
after
waivers
and/or reim-
bursements
(%) | | Total
expenses
(%) | | Net
invest-
ment
income
(loss)
(%) | | Net
assets,
end of
period
(000) | | Portfolio
turnover
rate
(%) |
| | | | | | | | | | | | | | | | | | | | | | | | | | | |
| $ | 16.98 | | | | 2.35 | | | | 1.18 | | | | 1.18 | | | | 0.29 | | | $ | 625,448 | | | | 36 | |
| | 18.62 | | | | 5.22 | | | | 1.18 | | | | 1.18 | | | | 0.29 | | | | 775,746 | | | | 51 | |
| | 19.50 | | | | (0.28 | ) | | | 1.11 | | | | 1.11 | | | | 0.06 | | | | 922,813 | | | | 54 | |
| | 20.80 | | | | 16.23 | | | | 1.15 | | | | 1.15 | | | | 0.14 | | | | 1,028,166 | | | | 57 | |
| | 18.95 | | | | 4.33 | | | | 1.17 | | | | 1.17 | | | | 0.09 | | | | 959,416 | | | | 37 | |
| | | | | | | | | | | | | | | | | | | | | | | | | | | |
| | 14.47 | | | | 1.57 | | | | 1.93 | | | | 1.93 | | | | (0.45 | ) | | | 63,709 | | | | 36 | |
| | 16.22 | | | | 4.48 | | | | 1.93 | | | | 1.93 | | | | (0.46 | ) | | | 142,020 | | | | 51 | |
| | 17.32 | | | | (1.05 | ) | | | 1.87 | | | | 1.87 | | | | (0.69 | ) | | | 225,551 | | | | 54 | |
| | 18.75 | | | | 15.35 | | | | 1.89 | | | | 1.89 | | | | (0.61 | ) | | | 335,148 | | | | 57 | |
| | 17.31 | | | | 3.57 | | | | 1.92 | | | | 1.92 | | | | (0.66 | ) | | | 330,066 | | | | 37 | |
| | | | | | | | | | | | | | | | | | | | | | | | | | | |
| | 17.42 | | | | 2.50 | | | | 1.03 | | | | 1.03 | | | | 0.44 | | | | 138,870 | | | | 36 | |
| | 19.06 | | | | 5.38 | | | | 1.03 | | | | 1.03 | | | | 0.45 | | | | 210,350 | | | | 51 | |
| | 19.92 | | | | (0.03 | ) | | | 0.97 | | | | 0.97 | | | | 0.22 | | | | 390,627 | | | | 54 | |
| | 21.18 | | | | 16.34 | | | | 1.00 | | | | 1.00 | | | | 0.27 | | | | 807,684 | | | | 57 | |
| | 19.28 | | | | 4.48 | | | | 1.02 | | | | 1.02 | | | | 0.23 | | | | 663,069 | | | | 37 | |
| | | | | | | | | | | | | | | | | | | | | | | | | | | |
| | 17.95 | | | | 2.69 | | | | 0.83 | | | | 0.83 | | | | 0.64 | | | | 200,055 | | | | 36 | |
| | 19.56 | | | | 5.61 | | | | 0.83 | | | | 0.83 | | | | 0.64 | | | | 260,948 | | | | 51 | |
| | 20.38 | | | | 0.13 | | | | 0.78 | | | | 0.78 | | | | 0.39 | | | | 331,176 | | | | 54 | |
| | | | | | | | | | | | | | | | | | | | | | | | | | | |
| | 21.65 | | | | 6.91 | (d) | | | 0.79 | (e) | | | 0.79 | (e) | | | (0.25 | )(e) | | | 315,394 | | | | 57 | |
| | | | | | | | | | | | | | | | | | | | | | | | | | | |
| | 17.82 | | | | 2.58 | | | | 0.93 | | | | 0.93 | | | | 0.54 | | | | 218,137 | | | | 36 | |
| | 19.45 | | | | 5.51 | | | | 0.93 | | | | 0.93 | | | | 0.54 | | | | 292,610 | | | | 51 | |
| | 20.29 | | | | (0.02 | ) | | | 0.86 | | | | 0.86 | | | | 0.30 | | | | 450,720 | | | | 54 | |
| | 21.59 | | | | 16.51 | | | | 0.90 | | | | 0.90 | | | | 0.41 | | | | 397,265 | | | | 57 | |
| | 19.62 | | | | 4.57 | | | | 0.92 | | | | 0.92 | | | | 0.34 | | | | 470,399 | | | | 37 | |
| | | | | | | | | | | | | | | | | | | | | | | | | | | |
| | 16.55 | | | | 2.18 | | | | 1.38 | | | | 1.38 | | | | 0.10 | | | | 16,560 | | | | 36 | |
| | 18.20 | | | | 5.05 | | | | 1.38 | | | | 1.38 | | | | 0.08 | | | | 22,113 | | | | 51 | |
| | 19.13 | | | | (0.49 | ) | | | 1.31 | | | | 1.31 | | | | (0.14 | ) | | | 25,501 | | | | 54 | |
| | 20.46 | | | | 15.96 | | | | 1.35 | | | | 1.35 | | | | (0.05 | ) | | | 33,644 | | | | 57 | |
| | 18.70 | | | | 4.10 | | | | 1.37 | | | | 1.37 | | | | (0.11 | ) | | | 36,327 | | | | 37 | |
| | | | | | | | | | | | | | | | | | | | | | | | | | | |
| | 16.09 | | | | 1.96 | | | | 1.53 | | | | 1.53 | | | | (0.06 | ) | | | 4,879 | | | | 36 | |
| | 17.75 | | | | 4.88 | | | | 1.53 | | | | 1.53 | | | | (0.07 | ) | | | 6,483 | | | | 51 | |
| | 18.72 | | | | (0.50 | ) | | | 1.46 | | | | 1.46 | | | | (0.29 | ) | | | 7,339 | | | | 54 | |
| | 20.06 | | | | 15.79 | | | | 1.50 | | | | 1.50 | | | | (0.25 | ) | | | 9,047 | | | | 57 | |
| | 18.38 | | | | 3.94 | | | | 1.52 | | | | 1.52 | | | | (0.26 | ) | | | 6,245 | | | | 37 | |
| | See Notes to Financial Statements. | 189 |
Financial Highlights (concluded)
VALUE OPPORTUNITIES FUND
| | | | | | Per Share Operating Performance: |
| | | | | | Investment operations: | | Distributions to
shareholders from: |
| | | Net asset
value,
beginning
of period | | Net
invest-
ment
income
(loss)(a) | | Net
realized
and
unrealized
gain (loss) | | Total
from
invest-
ment
opera-
tions | | Net
investment
income | | Net
realized
gain | | Total
distri-
butions |
| Class R3 | | | | | | | | | | | | | | | | | | | | | | | | | | | | |
| 10/31/2020 | | $ | 17.97 | | | $ | 0.01 | | | $ | 0.37 | | | $ | 0.38 | | | $ | (0.01 | ) | | $ | (2.01 | ) | | $ | (2.02 | ) |
| 10/31/2019 | | | 18.92 | | | | 0.01 | | | | 0.80 | | | | 0.81 | | | | – | | | | (1.76 | ) | | | (1.76 | ) |
| 10/31/2018 | | | 20.25 | | | | (0.04 | ) | | | (0.04 | ) | | | (0.08 | ) | | | – | | | | (1.25 | ) | | | (1.25 | ) |
| 10/31/2017 | | | 18.52 | | | | (0.02 | ) | | | 2.88 | | | | 2.86 | | | | – | | | | (1.13 | ) | | | (1.13 | ) |
| 10/31/2016 | | | 19.20 | | | | (0.03 | ) | | | 0.75 | | | | 0.72 | | | | – | | | | (1.40 | ) | | | (1.40 | ) |
| Class R4 | | | | | | | | | | | | | | | | | | | | | | | | | | | | |
| 10/31/2020 | | | 18.60 | | | | 0.05 | | | | 0.37 | | | | 0.42 | | | | (0.06 | ) | | | (2.01 | ) | | | (2.07 | ) |
| 10/31/2019 | | | 19.47 | | | | 0.05 | | | | 0.85 | | | | 0.90 | | | | (0.01 | ) | | | (1.76 | ) | | | (1.77 | ) |
| 10/31/2018 | | | 20.79 | | | | 0.01 | | | | (0.06 | ) | | | (0.05 | ) | | | (0.02 | ) | | | (1.25 | ) | | | (1.27 | ) |
| 10/31/2017 | | | 18.95 | | | | – | | | | 2.99 | | | | 2.99 | | | | (0.02 | ) | | | (1.13 | ) | | | (1.15 | ) |
| 10/31/2016 | | | 19.57 | | | | (0.01 | ) | | | 0.79 | | | | 0.78 | | | | – | | | | (1.40 | ) | | | (1.40 | ) |
| Class R5 | | | | | | | | | | | | | | | | | | | | | | | | | | | | |
| 10/31/2020 | | | 19.46 | | | | 0.09 | | | | 0.41 | | | | 0.50 | | | | (0.12 | ) | | | (2.01 | ) | | | (2.13 | ) |
| 10/31/2019 | | | 20.30 | | | | 0.10 | | | | 0.88 | | | | 0.98 | | | | (0.06 | ) | | | (1.76 | ) | | | (1.82 | ) |
| 10/31/2018 | | | 21.59 | | | | 0.07 | | | | (0.07 | ) | | | – | | | | (0.04 | ) | | | (1.25 | ) | | | (1.29 | ) |
| 10/31/2017 | | | 19.63 | | | | 0.10 | | | | 3.03 | | | | 3.13 | | | | (0.04 | ) | | | (1.13 | ) | | | (1.17 | ) |
| 10/31/2016 | | | 20.16 | | | | 0.05 | | | | 0.82 | | | | 0.87 | | | | – | | | | (1.40 | ) | | | (1.40 | ) |
| Class R6 | | | | | | | | | | | | | | | | | | | | | | | | | | | | |
| 10/31/2020 | | | 19.55 | | | | 0.11 | | | | 0.40 | | | | 0.51 | | | | (0.12 | ) | | | (2.01 | ) | | | (2.13 | ) |
| 10/31/2019 | | | 20.37 | | | | 0.12 | | | | 0.88 | | | | 1.00 | | | | (0.06 | ) | | | (1.76 | ) | | | (1.82 | ) |
| 10/31/2018 | | | 21.65 | | | | 0.08 | | | | (0.06 | ) | | | 0.02 | | | | (0.05 | ) | | | (1.25 | ) | | | (1.30 | ) |
| 10/31/2017 | | | 19.66 | | | | 0.09 | | | | 3.07 | | | | 3.16 | | | | (0.04 | ) | | | (1.13 | ) | | | (1.17 | ) |
| 10/31/2016 | | | 20.17 | | | | 0.09 | | | | 0.80 | | | | 0.89 | | | | – | | | | (1.40 | ) | | | (1.40 | ) |
| (a) | Calculated using average shares outstanding during the period. |
| (b) | Total return for Classes A and C does not consider the effects of sales loads and assumes the reinvestment of all distributions. Total return for all other classes assumes the reinvestment of all distributions. |
| (c) | Commenced on April 4, 2017. |
| (d) | Not annualized. |
| (e) | Annualized. |
| 190 | See Notes to Financial Statements. |
| | | | | | | Ratios to Average Net Assets: | | Supplemental Data: |
| | | | | | | | | | | | | | | | | | | | |
Net
asset
value,
end of
period | | Total
return(b)
(%) | | Total
expenses
after
waivers
and/or reim-
bursements
(%) | | Total
expenses
(%) | | Net
invest-
ment
income
(loss)
(%) | | Net
assets,
end of
period
(000) | | Portfolio
turnover
rate
(%) |
| | | | | | | | | | | | | | | | | | | | | | | | | | | |
| $ | 16.33 | | | | 2.09 | | | | 1.43 | | | | 1.43 | | | | 0.05 | | | $ | 41,390 | | | | 36 | |
| | 17.97 | | | | 4.94 | | | | 1.43 | | | | 1.43 | | | | 0.04 | | | | 56,855 | | | | 51 | |
| | 18.92 | | | | (0.45 | ) | | | 1.36 | | | | 1.36 | | | | (0.19 | ) | | | 77,440 | | | | 54 | |
| | 20.25 | | | | 15.94 | | | | 1.39 | | | | 1.39 | | | | (0.10 | ) | | | 88,592 | | | | 57 | |
| | 18.52 | | | | 4.03 | | | | 1.42 | | | | 1.42 | | | | (0.16 | ) | | | 99,544 | | | | 37 | |
| | | | | | | | | | | | | | | | | | | | | | | | | | | |
| | 16.95 | | | | 2.34 | | | | 1.18 | | | | 1.18 | | | | 0.29 | | | | 34,990 | | | | 36 | |
| | 18.60 | | | | 5.27 | | | | 1.18 | | | | 1.18 | | | | 0.29 | | | | 43,879 | | | | 51 | |
| | 19.47 | | | | (0.30 | ) | | | 1.11 | | | | 1.11 | | | | 0.06 | | | | 54,408 | | | | 54 | |
| | 20.79 | | | | 16.27 | | | | 1.15 | | | | 1.15 | | | | (0.01 | ) | | | 63,867 | | | | 57 | |
| | 18.95 | | | | 4.28 | | | | 1.14 | | | | 1.14 | | | | (0.06 | ) | | | 2,929 | | | | 37 | |
| | | | | | | | | | | | | | | | | | | | | | | | | | | |
| | 17.83 | | | | 2.58 | | | | 0.93 | | | | 0.93 | | | | 0.55 | | | | 1,971 | | | | 36 | |
| | 19.46 | | | | 5.55 | | | | 0.93 | | | | 0.93 | | | | 0.52 | | | | 2,599 | | | | 51 | |
| | 20.30 | | | | (0.01 | ) | | | 0.87 | | | | 0.87 | | | | 0.31 | | | | 1,927 | | | | 54 | |
| | 21.59 | | | | 16.46 | | | | 0.89 | | | | 0.89 | | | | 0.51 | | | | 5,111 | | | | 57 | |
| | 19.63 | | | | 4.62 | | | | 0.89 | | | | 0.89 | | | | 0.24 | | | | 42,825 | | | | 37 | |
| | | | | | | | | | | | | | | | | | | | | | | | | | | |
| | 17.93 | | | | 2.69 | | | | 0.83 | | | | 0.83 | | | | 0.64 | | | | 29,402 | | | | 36 | |
| | 19.55 | | | | 5.62 | | | | 0.83 | | | | 0.83 | | | | 0.66 | | | | 40,149 | | | | 51 | |
| | 20.37 | | | | 0.08 | | | | 0.78 | | | | 0.78 | | | | 0.39 | | | | 93,784 | | | | 54 | |
| | 21.65 | | | | 16.60 | | | | 0.78 | | | | 0.78 | | | | 0.45 | | | | 104,218 | | | | 57 | |
| | 19.66 | | | | 4.72 | | | | 0.79 | | | | 0.79 | | | | 0.46 | | | | 56,533 | | | | 37 | |
| | See Notes to Financial Statements. | 191 |
Notes to Financial Statements
Lord Abbett Securities Trust (the “Trust”) is registered under the Investment Company Act of 1940, as amended (the “Act”), as an open-end management investment company and was organized as a Delaware statutory trust on February 26, 1993.
The Trust currently consists of fourteen funds. All funds are diversified except Lord Abbett Focused Growth Fund and Lord Abbett Focused Large Cap Value Fund. This report covers the following thirteen funds (separately, a “Fund” and collectively, the “Funds”) and their respective active share classes:
| Funds | | Share Classes |
| Lord Abbett Alpha Strategy Fund (“Alpha Strategy Fund”) | | A, C, F, F3, I, R2, R3, R4, R5 and R6 |
| Lord Abbett Durable Growth Fund (“Durable Growth Fund”) | | A, C, F, F3, I, R3, R4, R5 and R6 |
| Lord Abbett Focused Growth Fund (“Focused Growth Fund”) | | A, C, F, F3, I, R3, R4, R5 and R6 |
| Lord Abbett Focused Large Cap Value Fund (“Focused Large Cap Value Fund”) | | A, C, F, F3, I, R3, R4, R5 and R6 |
| Lord Abbett Focused Small Cap Value Fund (“Focused Small Cap Value Fund”) | | A, C, F, F3, I, R5 and R6 |
| Lord Abbett Fundamental Equity Fund (“Fundamental Equity Fund”) | | A, C, F, F3 I, P, R2, R3, R4, R5 and R6 |
| Lord Abbett Global Equity Research Fund (“Global Equity Research Fund) | | A, C, F, F3, I, R3, R4, R5 and R6 |
| Lord Abbett Growth Leaders Fund (“Growth Leaders Fund”) | | A, C, F, F3, I, R2, R3, R4, R5 and R6 |
| Lord Abbett Health Care Fund (“Health Care Fund”) | | A, C, F, F3, I, R3, R4, R5 and R6 |
| Lord Abbett International Equity Fund (“International Equity Fund”) | | A, C, F, F3, I, P, R2, R3, R4, R5 and R6 |
| Lord Abbett International Opportunities Fund (“International Opportunities Fund”) | | A, C, F, F3, I, P, R2, R3, R4, R5 and R6 |
| Lord Abbett International Value Fund (“International Value Fund”) | | A, C, F, F3, I, R2, R3, R4, R5 and R6 |
| Lord Abbett Value Opportunities Fund (“Value Opportunities Fund”) | | A, C, F, F3, I, P, R2, R3, R4, R5 and R6 |
The Funds’ Class P shares are closed to substantially all investors, with certain exceptions as set forth in the Funds’ prospectus. Durable Growth Fund commenced operations on November 1, 2019.
Each of Alpha Strategy Fund’s, Focused Large Cap Value Fund’s, Focused Small Cap Value Fund’s, Global Equity Research Fund’s, Health Care Fund’s, International Equity Fund’s, International Opportunities Fund’s, and Value Opportunities Fund’s investment objective is to seek long-term capital appreciation. Alpha Strategy Fund invests principally in other funds (“Underlying Funds”) managed by Lord, Abbett & Co. LLC (“Lord Abbett”). Fundamental Equity Fund’s investment objective is long-term growth of capital and income without excessive fluctuations in market value. Durable Growth Fund’s, Growth Leaders Fund’s and Focused Growth Fund’s investment objective is to seek capital appreciation. International Value Fund’s investment objective is to seek a high level of total return.
Each class of shares has different expenses and dividends. A front-end sales charge is normally added to the net asset value (“NAV”) for Class A shares. There is no front-end sales charge in the case of Class C, F, F3, I, P, R2, R3, R4, R5 and R6 shares, although there may be a contingent deferred sales charge (“CDSC”) in certain cases as follows: Class A shares purchased without a sales charge and redeemed before the first day of the month in which the one-year anniversary of the purchase falls (subject to certain exceptions as set forth in each Fund’s prospectus); and Class C shares redeemed before the first anniversary of purchase. Effective June 30, 2020, Class C shares will automatically convert to Class A shares on the 25th day of the month (or, if the 25th day is not a business day, the next business day thereafter) following the eighth anniversary of the month on which the purchase order was accepted, provided that the Fund or financial intermediary through
192
Notes to Financial Statements (continued)
which a shareholder purchased Class C shares has records verifying that the C shares have been held at least eight years. The first conversion of Class C to A Shares under this new policy took place on July 25, 2020 for all Class C shares that were held for more than eight years as of June 30, 2020. Prior to June 30, 2020, Class C shares converted following the tenth anniversary of the month on which the purchase order was accepted.
The preparation of the financial statements in conformity with accounting principles generally accepted in the United States of America (“U.S. GAAP”) requires management to make certain estimates and assumptions that affect the reported amounts of assets and liabilities and disclosure of contingent assets and liabilities at the date of the financial statements and the reported amounts of increases and decreases in net assets from operations during the reporting period. Actual results could differ from those estimates. These Funds are considered investment companies under U.S. GAAP and follow the accounting and reporting guidance applicable to investment companies.
| 2. | SIGNIFICANT ACCOUNTING POLICIES |
| (a) | Investment Valuation–Under procedures approved by the Funds’ Board of Trustees (the “Board”), Lord, Abbett & Co. LLC (“Lord Abbett”), each Fund’s investment manager, has formed a Pricing Committee to administer the pricing and valuation of portfolio investments and to ensure that prices utilized reasonably reflect fair value. Among other things, these procedures allow the Funds to utilize independent pricing services, quotations from securities and financial instrument dealers and other market sources to determine fair value. |
| | |
| | Securities actively traded on any recognized U.S. or non-U.S. exchange or on The NASDAQ Stock Market LLC are valued at the last sale price or official closing price on the exchange or system on which they are principally traded. Events occurring after the close of trading on non-U.S. exchanges may result in adjustments to the valuation of foreign securities to reflect their fair value as of the close of regular trading on the New York Stock Exchange (“NYSE”). Each Fund may utilize an independent fair valuation service in adjusting the valuations of foreign securities. Unlisted equity securities are valued at the last quoted sale price or, if no sale price is available, at the mean between the most recently quoted bid and asked prices. Exchange traded options and futures contracts are valued at the last quoted sale price in the market where they are principally traded. If no sale has occurred, the mean between the most recently quoted bid and asked prices is used. Forward foreign currency exchange contracts are valued using daily forward exchange rates. Swaps are valued daily using independent pricing services or quotations from broker/dealers to the extent available. Investments in the Underlying Funds are valued at their NAV each business day at the close of regular trading on the NYSE, normally 4:00 p.m. Eastern time. |
| | |
| | Securities for which prices are not readily available are valued at fair value as determined by the Pricing Committee. The Pricing Committee considers a number of factors, including observable and unobservable inputs, when arriving at fair value. The Pricing Committee may use related or comparable assets or liabilities, recent transactions, market multiples, book values and other relevant information to determine the fair value of portfolio investments. The Board or a designated committee thereof regularly reviews fair value determinations made by the Pricing Committee and may employ techniques such as reviewing related market activity, reviewing inputs and assumptions, and retrospectively comparing prices of subsequent purchases and sales transactions to fair value determinations made by the Pricing Committee. |
193
Notes to Financial Statements (continued)
| | Short-term securities with 60 days or less remaining to maturity are valued using the amortized cost method, which approximates fair value. |
| | |
| (b) | Security Transactions–Security transactions are recorded as of the date that the securities are purchased or sold (trade date). Realized gains and losses on sales of portfolio securities are calculated using the identified-cost method. Realized and unrealized gains (losses) are allocated to each class of shares based upon the relative proportion of net assets at the beginning of the day. |
| | |
| (c) | Investment Income–Dividend income is recorded on the ex-dividend date. Interest income is recorded on the accrual basis as earned. Discounts are accreted and premiums are amortized using the effective interest method and are included in Interest on the Statements of Operations. Withholding taxes on foreign dividends have been provided for in accordance with the applicable country’s tax rules and rates. Investment income is allocated to each class of shares based upon the relative proportion of net assets at the beginning of the day. |
| | |
| (d) | Income Taxes–It is the policy of each Fund to meet the requirements of Subchapter M of the Internal Revenue Code applicable to regulated investment companies and to distribute substantially all taxable income and capital gains to its shareholders. Therefore, no income tax provision is required. Each Fund files U.S. federal and various state and local tax returns. No income tax returns are currently under examination. The statute of limitations on each Fund’s filed U.S. federal tax returns remains open for the fiscal years ended October 31, 2017 through October 31, 2020. The statutes of limitations on the Trust’s state and local tax returns may remain open for an additional year depending upon the jurisdiction. |
| | |
| (e) | Expenses–Expenses incurred by the Trust that do not specifically relate to an individual fund are generally allocated to the Funds within the Trust on a pro rata basis by relative net assets. Expenses, excluding class-specific expenses, are allocated to each class of shares based upon the relative proportion of net assets at the beginning of the day. In addition, Class F3 and R6 bear only their class-specific shareholder servicing expenses. Class A, C, F, P, R2, R3 and R4 shares bear their class-specific share of all expenses and fees relating to the Funds’ 12b-1 Distribution Plan. |
| | |
| (f) | Foreign Transactions–The books and records of each Fund are maintained in U.S. dollars and transactions denominated in foreign currencies are recorded in each Fund’s records at the rate prevailing when earned or recorded. Asset and liability accounts that are denominated in foreign currencies are adjusted daily to reflect current exchange rates and any unrealized gain (loss) is included in Net change in unrealized appreciation/depreciation on translation of assets and liabilities denominated in foreign currencies in each Fund’s Statement of Operations. The resultant exchange gains and losses upon settlement of such transactions are included in Net realized gain (loss) on foreign currency related transactions in each Fund’s Statement of Operations. The Funds do not isolate that portion of the results of operations arising as a result of changes in the foreign exchange rates from the changes in market prices of the securities. |
| | |
| | The Funds use foreign currency exchange contracts to facilitate transactions in foreign-denominated securities. Losses from these transactions may arise from changes in the value of the foreign currency or if the counterparties do not perform under the contracts’ terms. |
| | |
| (g) | Forward Foreign Currency Exchange Contracts–Each Fund may enter into forward foreign currency exchange contracts in order to reduce their exposure to changes in foreign currency exchange rates on their foreign portfolio holdings, or gain or reduce exposure to foreign |
194
Notes to Financial Statements (continued)
| | currency solely for investment purposes. A forward foreign currency exchange contract is a commitment to purchase or sell a foreign currency at a future date at a negotiated rate. The contracts are valued daily at forward exchange rates and any unrealized gain (loss) is included in Net change in unrealized appreciation/depreciation on foreign currency exchange contracts in each Fund’s Statement of Operations. The gain (loss) arising from the difference between the U.S. dollar cost of the original contract and the value of the foreign currency in U.S. dollars upon closing of such contracts is included in Net realized gain/(loss) on forward foreign currency exchange contracts in each Fund’s Statement of Operations. |
| | |
| (h) | Futures Contracts–Each Fund may purchase and sell futures contracts to enhance returns, to attempt to economically hedge some of its investment risk, or as a substitute position in lieu of holding the underlying asset on which the instrument is based. At the time of entering into a futures transaction, an investor is required to deposit and maintain a specified amount of cash or eligible securities called “initial margin.” Subsequent payments made or received by a Fund called “variation margin” are made on a daily basis as the market price of the futures contract fluctuates. Each Fund will record an unrealized gain (loss) based on the amount of variation margin. When a contract is closed, a realized gain (loss) is recorded equal to the difference between the opening and closing value of the contract. |
| | |
| (i) | Repurchase Agreements–Each Fund may enter into repurchase agreements with respect to securities. A repurchase agreement is a transaction in which a Fund acquires a security and simultaneously commits to resell that security to the seller (a bank or securities dealer) at an agreed-upon price on an agreed-upon date. Each Fund requires at all times that the repurchase agreement be collateralized by cash, or by securities of the U.S. Government, its agencies, its instrumentalities, or U.S. Government sponsored enterprises having a value equal to, or in excess of, the value of the repurchase agreement (including accrued interest). If the seller of the agreement defaults on its obligation to repurchase the underlying securities at a time when the fair value of these securities has declined, a Fund may incur a loss upon disposition of the securities. |
| | |
| (j) | When-Issued or Forward Transactions–Each Fund may purchase portfolio securities on a when-issued or forward basis. When-issued or forward transactions involve a commitment by a Fund to purchase securities, with payment and delivery (“settlement”) to take place in the future, in order to secure what is considered to be an advantageous price or yield at the time of entering into the transaction. During the period between purchase and settlement, the fair value of the securities will fluctuate and assets consisting of cash and/or marketable securities (normally short-term U.S. Government or U.S. Government sponsored enterprise securities) marked to market daily in an amount sufficient to make payment at settlement will be segregated at each Fund’s custodian in order to pay for the commitment. At the time each Fund makes the commitment to purchase a security on a when-issued basis, it will record the transaction and reflect the liability for the purchase and fair value of the security in determining its NAV. Each Fund, generally, has the ability to close out a purchase obligation on or before the settlement date rather than take delivery of the security. Under no circumstances will settlement for such securities take place more than 120 days after the purchase date. |
| | |
| (k) | Total Return Swaps–Each Fund may enter into total return swap agreements to obtain exposure to a security or market without owning such security or investing directly in that market. Each Fund may agree to make payments that are the equivalent of interest in exchange for the right to receive payments equivalent to any appreciation in the value of an underlying |
195
Notes to Financial Statements (continued)
| | security, index or other asset, as well as receive payments equivalent to any distributions made on that asset, over the term of the swap. If the value of the asset underlying a total return swap declines over the term of the swap, each Fund also may be required to pay an amount equal to that decline in value to their counterparty. |
| | |
| (l) | Fair Value Measurements–Fair value is defined as the price that each Fund would receive upon selling an investment or transferring a liability in an orderly transaction to an independent buyer in the principal or most advantageous market of the investment. A three-tier hierarchy is used to maximize the use of observable market data and minimize the use of unobservable inputs and to establish classification of fair value measurements for disclosure purposes. Inputs refer broadly to the assumptions that market participants would use in pricing the asset or liability, including assumptions about risk - for example, the risk inherent in a particular valuation technique used to measure fair value (such as a pricing model) and/or the risk inherent in the inputs to the valuation technique. Inputs may be observable or unobservable. Observable inputs reflect the assumptions market participants would use in pricing the asset or liability. Observable inputs are based on market data obtained from sources independent of the reporting entity. Unobservable inputs reflect the reporting entity’s own assumptions about the assumptions market participants would use in pricing the asset or liability. Unobservable inputs are based on the best information available in the circumstances. The three-tier hierarchy classification is determined based on the lowest level of inputs that is significant to the fair value measurement, and is summarized in the three broad Levels listed below: |
| | • | Level 1 – unadjusted quoted prices in active markets for identical investments; |
| | | |
| | • | Level 2 – other significant observable inputs (including quoted prices for similar investments, interest rates, prepayment speeds, credit risk, etc.); and |
| | | |
| | • | Level 3 – significant unobservable inputs (including each Fund’s own assumptions in determining the fair value of investments). |
A summary of inputs used in valuing each Fund’s investments and other financial instruments as of October 31, 2020 and, if applicable, Level 3 rollforwards for the fiscal year then ended is included in each Fund’s Schedule of Investments.
Changes in valuation techniques may result in transfers into or out of an assigned level within the three-tier hierarchy. The inputs or methodology used for valuing securities are not necessarily an indication of the risk associated with investing in those securities.
| 3. | MANAGEMENT FEE AND OTHER TRANSACTIONS WITH AFFILIATES |
Management Fee
The Trust has a management agreement with Lord Abbett, pursuant to which Lord Abbett supplies each Fund with investment management services and executive and other personnel, provides office space and pays for ordinary and necessary office and clerical expenses relating to research and statistical work and supervision of each Fund’s investment portfolio.
For the fiscal year ended October 31, 2020, the effective management fee, net of any applicable waivers, was based on each Fund’s average daily net assets at the following annualized rates:
196
Notes to Financial Statements (continued)
| | Net Effective
Management Fee |
| Alpha Strategy Fund | .00%(1) |
| Durable Growth Fund | .54%(2) |
| Focused Growth Fund | .00%(3) |
| Focused Large Cap Value Fund | .55%(4) |
| Focused Small Cap Value Fund | .67%(5) |
| Fundamental Equity Fund | .55%(6) |
| Global Equity Research Fund | .00%(7) |
| Growth Leaders Fund | .52%(8) |
| Health Care Fund | .00%(9) |
| International Equity Fund | .66%(10) |
| International Opportunities Fund | .75%(11) |
| International Value Fund | .64%(10) |
| Value Opportunities Fund | .73%(12) |
| (1) | | Lord Abbett is voluntarily waiving the entire management fee of 0.10%. Lord Abbett may discontinue the voluntary waiver at any time without notice. |
| | | |
| (2) | | The management fee for Durable Growth Fund is based on the Fund’s average daily net assets at the following annual rates: |
| | First $2 billion | .55% |
| | Over $2 billion | .50% |
| (3) | | The management fee for Focused Growth Fund is based on the Fund’s average daily net assets at the following annual rates: |
| | First $1 billion | .65% |
| | Next $1 billion | .63% |
| | Next $5 billion | .60% |
| | Over $7 billion | .59% |
| (4) | | The management fee for Focused Large Cap Value Fund is based on the Fund’s average daily net assets at the following annual rates: |
| | First $1 billion | .59% |
| | Over $1 billion | .53% |
| (5) | | The management fee for Focused Small Cap Value Fund is 0.80% on the Fund’s average daily net assets. |
| | |
| (6) | | The management fee for Fundamental Equity Fund is based on the Fund’s average daily net assets at the following annual rates: |
| | First $200 million | .75% |
| | Next $300 million | .65% |
| | Over $500 million | .50% |
| (7) | | The management fee for Global Equity Research Fund is based on the Fund’s average daily net assets at the following annual rates: |
| | First $1 billion | .45% |
| | Next $2 billion | .43% |
| | Over $3 billion | .41% |
| (8) | | The management fee for Growth Leaders Fund is based on the Fund’s average daily net assets at the following annual rates: |
| | First $2 billion | .55% |
| | Over $2 billion | .50% |
| (9) | | The management fee for Health Care Fund is based on the Fund’s average daily net assets at the following annual rates: |
| | First $1 billion | .62% |
| | Over $1 billion | .51% |
197
Notes to Financial Statements (continued)
| (10) | | The management fees for International Equity Fund and International Value Fund are based on each Fund’s average daily net assets at the following annual rates: |
| | First $1 billion | .70% |
| | Next $1 billion | .65% |
| | Over $2 billion | .60% |
| (11) | | The management fee for International Opportunities Fund is based on the average daily net assets at the following annual rates: |
| | First $1 billion | .75% |
| | Next $1 billion | .70% |
| | Over $2 billion | .65% |
| (12) | | The management fee for Value Opportunities Fund is based on the Fund’s average daily net assets at the following annual rates: |
| | First $1 billion | .75% |
| | Next $1 billion | .70% |
| | Next $3 billion | .65% |
| | Over $5 billion | .58% |
In addition, Lord Abbett provides certain administrative services to each Fund pursuant to an Administrative Services Agreement in return for a fee at an annual rate of .04% of each Fund’s average daily net assets. Lord Abbett voluntarily waived the following fund administration fees during the fiscal year ended October 31, 2020:
| | Fund
Administration Fee |
| Alpha Strategy Fund | 18,003 |
| Durable Growth Fund | 8,523 |
| Focused Growth Fund | 2,588 |
| Focused Large Cap Value Fund | 8,402 |
| Focused Small Cap Value Fund | 13,912 |
| Fundamental Equity Fund | 53,270 |
| Global Equity Research Fund | 23,199 |
| Growth Leaders Fund | 35,117 |
| Health Care Fund | 3,720 |
| International Equity Fund | 56,792 |
| International Opportunities Fund | 89,213 |
| International Value Fund | 75,616 |
| Value Opportunities Fund | 98,396 |
For the fiscal year ended October 31, 2020 and continuing through February 28, 2021, Lord Abbett has contractually agreed to waive its fees and reimburse expenses to the extent necessary to limit total net annual operating expenses, excluding 12b-1 fees, to the following annual rates:
| | | Durable Growth Fund |
| Classes | | |
| A, C, F, I, R2, R3, R4 and R5 | | | 0.70% | |
| F3 and R6 | | | 0.64% | |
| | | Focused Growth Fund |
| Classes | | Effective
March 1, 2020 | | Prior to
March 1, 2020 | |
| A, C, F, I, R2, R3, R4 and R5 | | 0.80% | | 0.80% | |
| F3 and R6 | | 0.72% | | 0.73% | |
198
Notes to Financial Statements (continued)
| | | Focused Large Cap Value Fund |
| Classes | | | | |
| A, C, F, I, R3, R4 and R5 | | | 0.71% | |
| F3 and R6 | | | 0.63% | |
| | | | | |
| | | Focused Small Cap Value Fund |
| Classes | | | | |
| A, C, F, I, R3, R4 and R5 | | | 1.03% | |
| F3 and R6 | | | 0.95% | |
| | | Global Equity Research Fund |
| Classes | | Effective
March 1, 2020 | | Prior to
March 1, 2020 | |
| A, C, F, I, R2, R3, R4 and R5 | | 0.65% | | 0.65% | |
| F3 and R6 | | 0.61% | | 0.63% | |
| | | Health Care Fund |
| Classes | | |
| A, C, F, I, R3, R4 and R5 | | | 0.78% | |
| F3 and R6 | | | 0.70% | |
| | | International Equity Fund |
| Classes | | Effective
March 1, 2020 | | Prior to
March 1, 2020 | |
| A, C, P, R2, R3, R4 and R5 | | 0.92% | | 0.92% | |
| F and I | | 0.86% | | 0.86% | |
| F3 and R6 | | 0.84% | | 0.85% | |
| | | International Value Fund |
| Classes | | Effective
March 1, 2020 | | Prior to
March 1, 2020 | |
| A, C, R2, R3, R4 and R5 | | 0.87% | | 0.87% | |
| F and I | | 0.82% | | 0.82% | |
| F3 and R6 | | 0.80% | | 0.81% | |
All contractual fee waiver and expense reimbursement agreements between the Funds and Lord Abbett may be terminated only upon the approval of the Funds’ Board.
12b-1 Distribution Plan
Each Fund has adopted a distribution plan with respect to Class A, C, F, P, R2, R3 and R4 shares pursuant to Rule 12b-1 under the Act, which provides for the payment of ongoing distribution and service fees to Lord Abbett Distributor LLC (the “Distributor”), an affiliate of Lord Abbett. The following annual rates have been authorized by the Board pursuant to the plan:
| Fees* | | Class A(1) | | Class C | | Class F(2)(3) | | Class P(4) | | Class R2 | | Class R3 | | Class R4 |
| Service | | .25% | | .25% | | – | | .25% | | .25% | | .25% | | .25% |
| Distribution | | – | | .75% | | .10% | | .20% | | .35% | | .25% | | – |
| * | | The Funds may designate a portion of the aggregate fee as attributable to service activities for purposes of calculating Financial Industry Regulatory Authority, Inc. (“FINRA”) sales charge limitations. |
| (1) | | Prior to July 1, 2019 the Board did not authorize such Class A 12b-1 fees on the Focused Small Cap Value Fund. This agreement may be terminated only by the Fund’s Board. |
| (2) | | The Class F Share Rule 12b-1 fee may be designated as a service fee in limited circumstances as described in the Funds’ prospectus. |
| (3) | | For the fiscal year ended October 31, 2020 and continuing through February 28, 2021, the Distributor has contractually agreed to waive Durable Growth Fund’s, Growth Leaders Fund’s, Focused Growth Fund’s, Focused Small Cap Value Fund’s, Focused Large Cap Value Fund’s and Health Care Fund’s 0.10% Rule 12b-1 fee for Class F shares. These agreements may be terminated only by the Fund’s Board. |
| (4) | | Fundamental Equity Fund, International Equity Fund, International Opportunities Fund and Value Opportunities Fund only. |
Class F3, I, R5 and R6 shares do not have a distribution plan.
199
Notes to Financial Statements (continued)
Commissions
Distributor received the following commissions on sales of shares of the Funds, after concessions were paid to authorized dealers, for the fiscal year ended October 31, 2020:
| | | Distributor
Commissions | | | Dealers’
Concessions |
| Alpha Strategy Fund | | $ | 39,063 | | | $ | 218,850 |
| Durable Growth Fund | | | – | | | | – |
| Focused Growth Fund | | | 20,649 | | | | 117,824 |
| Focused Large Cap Value Fund | | | – | | | | – |
| Focused Small Cap Value Fund | | | 185 | | | | 1,147 |
| Fundamental Equity Fund | | | 54,146 | | | | 297,580 |
| Global Equity Research Fund | | | 265 | | | | 1,531 |
| Growth Leaders Fund | | | 794,059 | | | | 4,438,258 |
| Health Care Fund | | | – | | | | – |
| International Equity Fund | | | 11,264 | | | | 60,889 |
| International Opportunities Fund | | | 14,363 | | | | 76,040 |
| International Value Fund | | | 32,889 | | | | 173,070 |
| Value Opportunities Fund | | | 56,125 | | | | 301,711 |
Distributor received the following amount of CDSCs for the fiscal year ended October 31, 2020:
| | | Class A | | | Class C |
| Alpha Strategy Fund | | $ | 719 | | | $ | 5,505 |
| Durable Growth Fund | | | – | | | | – |
| Focused Growth Fund | | | – | | | | 224 |
| Focused Large Cap Value Fund | | | – | | | | – |
| Focused Small Cap Value Fund | | | – | | | | – |
| Fundamental Equity Fund | | | 1,664 | | | | 2,568 |
| Global Equity Research Fund | | | – | | | | – |
| Growth Leaders Fund | | | 85,343 | | | | 72,549 |
| Health Care Fund | | | – | | | | – |
| International Equity Fund | | | 134 | | | | 140 |
| International Opportunities Fund | | | 540 | | | | 635 |
| International Value Fund | | | 783 | | | | 415 |
| Value Opportunities Fund | | | 1,772 | | | | 3,679 |
One Trustee and certain of the Trust’s officers have an interest in Lord Abbett.
Other Related Parties
As of October 31, 2020, the percentages of Durable Growth, Focused Small Cap Value, Fundamental Equity Fund’s, Growth Leaders Fund’s, International Value Fund’s, International Equity Fund’s, International Opportunities Fund’s and Value Opportunities Fund’s outstanding shares owned by each Fund of Funds were as follows:
| Fund of Funds | | Durable
Growth
Fund | | Focused
Large Cap
Value
Fund | | Focused
Small Cap
Value Fund | | Funda-
mental
Equity
Fund | | Growth
Leaders
Fund | | Inter-
national
Value
Fund | | Inter-
national
Equity
Fund | | Inter-
national
Oppor-
tunities
Fund | | Value
Oppor-
tunities
Fund |
| Alpha Strategy Fund | | – | | – | | 88.89% | | – | | – | | – | | – | | 32.85% | | 9.51% |
| Multi-Asset Balanced Opportunity Fund | | 74.06% | | 73.47% | | – | | 10.92% | | 4.68% | | 27.68% | | 32.35% | | – | | – |
| Multi-Asset Income Fund | | 24.68% | | 26.28% | | – | | 2.55% | | 1.53% | | 13.68% | | 16.11% | | – | | – |
200
Notes to Financial Statements (continued)
| 4. | DISTRIBUTIONS AND CAPITAL LOSS CARRYFORWARDS |
Dividends from net investment income, if any, are declared and paid quarterly for International Value Fund and annually for Alpha Strategy Fund, Durable Growth Fund, Focused Growth Fund, Focused Large Cap Value Fund, Focused Small Cap Value Fund, Fundamental Equity Fund, Global Equity Research Fund, Growth Leaders Fund, Health Care Fund, International Equity Fund, International Opportunities Fund and Value Opportunities Fund. Taxable net realized gains from investment transactions, reduced by allowable capital loss carryforwards, if any, are declared and distributed to shareholders at least annually. The capital loss carryforward amount, if any, is available to offset future net capital gains. Dividends and distributions to shareholders are recorded on the ex-dividend date. The amounts of dividends and distributions from net investment income and net realized capital gains are determined in accordance with federal income tax regulations, which may differ from U.S. GAAP. These book/tax differences are either considered temporary or permanent in nature. To the extent these differences are permanent in nature, such amounts are reclassified within the components of net assets based on their federal tax basis treatment; temporary differences do not require reclassification. Dividends and distributions, which exceed earnings and profits for tax purposes, are reported as a tax return of capital.
The tax character of distributions paid during the fiscal year ended October 31, 2020 and fiscal year ended October 31, 2019, were as follows:
| | | Alpha Strategy Fund | | | | Durable Growth Fund | |
| | | Year Ended
10/31/2020 | | | Year Ended
10/31/2019 | | | | | | | Year Ended
10/31/2020 | |
| Distributions paid from: | | | | | | | | | | | | | | | | |
| Ordinary income | | $ | – | | | $ | 9,057,439 | | | | | | | $ | 1,986 | |
| Net long-term capital gains | | | 123,771,165 | | | | 119,734,439 | | | | | | | | – | |
| Total distributions paid | | $ | 123,771,165 | | | $ | 128,791,878 | | | | | | | $ | 1,986 | |
| | | | | | | | | | | | | | | | | |
| | | Focused Growth Fund | | | Focused Large Cap Value Fund | |
| | | Year Ended
10/31/2020 | | | Year Ended
10/31/2019 | | | Year Ended
10/31/2020 | | Period Ended
10/31/2019 | |
| Distributions paid from: | | | | | | | | | | | | | | | | |
| Ordinary income | | $ | – | | | $ | – | | | $ | 262,779 | | | $ | – | |
| Net long-term capital gains | | | – | | | | – | | | | – | | | | – | |
| Total distributions paid | | $ | – | | | $ | – | | | $ | 262,779 | | | $ | – | |
| | | | | | | | | | | | | | | | | |
| | | Focused Small Cap Value Fund | | | Fundamental Equity Fund | |
| | | Year Ended
10/31/2020 | | | Year Ended
10/31/2019 | | | Year Ended
10/31/2020 | | | Year Ended
10/31/2019 | |
| Distributions paid from: | | | | | | | | | | | | | | | | |
| Ordinary income | | $ | 314 | | | $ | 2,788,803 | | | $ | 37,662,246 | | | $ | 43,144,200 | |
| Net long-term capital gains | | | 18,077,113 | | | | 15,734,637 | | | | 215,541,984 | | | | 143,801,592 | |
| Total distributions paid | | $ | 18,077,427 | | | $ | 18,523,440 | | | $ | 253,204,230 | | | $ | 186,945,792 | |
| | | | | | | | | | | | | | | | | |
| | | Global Equity Research Fund | | | Growth Leaders Fund | |
| | | Year Ended
10/31/2020 | | | Year Ended
10/31/2019 | | | Year Ended
10/31/2020 | | | Year Ended
10/31/2019 | |
| Distributions paid from: | | | | | | | | | | | | | | | | |
| Ordinary income | | $ | 89,647 | | | $ | 191,532 | | | $ | 50,781,905 | | | $ | 211,623,767 | |
| Net long-term capital gains | | | – | | | | 129,275 | | | | 254,848,239 | | | | 345,436,576 | |
| Total distributions paid | | $ | 89,647 | | | $ | 320,807 | | | $ | 305,630,144 | | | $ | 557,060,343 | |
201
Notes to Financial Statements (continued)
| | | Health Care Fund | | | International Equity Fund | |
| | | Year Ended
10/31/2020 | | | Period Ended
10/31/2019 | | | Year Ended
10/31/2020 | | | Year Ended
10/31/2019 | |
| Distributions paid from: | | | | | | | | | | | | | | | | |
| Ordinary income | | $ | 1,005 | | | $ | – | | | $ | 7,075,713 | | | $ | 11,999,856 | |
| Net long-term capital gains | | | – | | | | – | | | | – | | | | – | |
| Total distributions paid | | $ | 1,005 | | | $ | – | | | $ | 7,075,713 | | | $ | 11,999,856 | |
| | | | | | | | | | | | | | | | | |
| | | International Opportunities Fund | | | International Value Fund | |
| | | Year Ended
10/31/2020 | | | Year Ended
10/31/2019 | | | Year Ended
10/31/2020 | | | Year Ended
10/31/2019 | |
| Distributions paid from: | | | | | | | | | | | | | | | | |
| Ordinary income | | $ | 7,379,201 | | | $ | 8,261,793 | | | $ | 9,892,862 | | | $ | 19,485,885 | |
| Net long-term capital gains | | | – | | | | 67,032,636 | | | | – | | | | – | |
| Total distributions paid | | $ | 7,379,201 | | | $ | 75,294,429 | | | $ | 9,892,862 | | | $ | 19,485,885 | |
| | | | | | | | | | | | | | | | | |
| | | Value Opportunities Fund | | | | | | | | | |
| | | Year Ended
10/31/2020 | | | Year Ended
10/31/2019 | | | | | | | | | |
| Distributions paid from: | | | | | | | | | | | | | | | | |
| Ordinary income | | $ | 7,526,613 | | | $ | 40,730,253 | | | | | | | | | |
| Net long-term capital gains | | | 194,975,562 | | | | 190,884,064 | | | | | | | | | |
| Total distributions paid | | $ | 202,502,175 | | | $ | 231,614,317 | | | | | | | | | |
Subsequent to the Fund’s fiscal year ended October 31, 2020, the approximate amounts were as follows:
| | | Net | | | Net | | | Net | | | | | |
| | | Investment | | | Short-Term | | | Long-Term | | | | | |
| | | Income | | | Capital Gain | | | Capital Gain | | | Record Date | | Ex-Date |
| Alpha Strategy Fund | | $ | 10,405,000 | | | $ | – | | | $ | 50,784,000 | | | December 21, 2020 | | December 22, 2020 |
| Durable Growth Fund | | | 170,000 | | | | 4,422,000 | | | | – | | | November 23, 2020 | | November 24, 2020 |
| Focused Growth Fund | | | – | | | | 1,865,000 | | | | 141,000 | | | November 23, 2020 | | November 24, 2020 |
| Focused Large Cap Value Fund | | | 7,400,000 | | | | 31,513,000 | | | | – | | | November 23, 2020 | | November 24, 2020 |
| Focused Small Cap Value Fund | | | 895,000 | | | | – | | | | – | | | November 23, 2020 | | November 24, 2020 |
| Fundamental Equity Fund | | | 32,383,000 | | | | – | | | | – | | | November 23, 2020 | | November 24, 2020 |
| Global Equity Research Fund | | | 106,000 | | | | – | | | | 279,000 | | | December 17, 2020 | | December 18, 2020 |
| Growth Leaders Fund | | | – | | | | 392,567,000 | | | | 327,648,000 | | | November 23, 2020 | | November 24, 2020 |
| Health Care Fund | | | 2,000 | | | | 492,000 | | | | 9,000 | | | November 23, 2020 | | November 24, 2020 |
| International Equity Fund | | | 5,136,000 | | | | – | | | | – | | | December 17, 2020 | | December 18, 2020 |
| International Opportunities Fund | | | – | | | | – | | | | – | | | December 17, 2020 | | December 18, 2020 |
| International Value Fund | | | 1,742,000 | | | | – | | | | – | | | December 17, 2020 | | December 18, 2020 |
| Value Opportunities Fund | | | 4,615,000 | | | | – | | | | 79,110,000 | | | November 23, 2020 | | November 24, 2020 |
As of October 31, 2020, the components of accumulated gains on a tax-basis were as follows:
| | | Alpha
Strategy Fund | | | Durable
Growth Fund | | | Focused
Growth
Fund | | | Focused
Large Cap
Value Fund | |
| Undistributed ordinary income – net | | $ | – | | | $ | 4,591,022 | | | $ | 1,864,019 | | | $ | 36,865,329 | |
| Undistributed long-term capital gains | | | 50,783,019 | | | | – | | | | 140,819 | | | | – | |
| Total undistributed earnings | | | 50,783,019 | | | | 4,591,022 | | | | 2,004,838 | | | | 36,865,329 | |
| Temporary differences | | | (1,713,836 | ) | | | (3,816 | ) | | | (472 | ) | | | (7,709 | ) |
| Unrealized gains (losses) – net | | | (76,923,697 | ) | | | 29,337,452 | | | | 5,736,576 | | | | 24,655,630 | |
| Total accumulated gains (losses) – net | | $ | (27,854,514 | ) | | $ | 33,924,658 | | | $ | 7,740,942 | | | $ | 61,513,250 | |
202
Notes to Financial Statements (continued)
| | | Focused
Small Cap
Value Fund | | | Fundamental
Equity Fund | | | Global Equity
Research
Fund | | | Growth
Leaders Fund | |
| Undistributed ordinary income – net | | $ | 843,179 | | | $ | 28,798,437 | | | $ | 103,482 | | | $ | 392,551,806 | |
| Undistributed long-term capital gains | | | – | | | | – | | | | 278,131 | | | | 327,638,378 | |
| Total undistributed earnings | | | 843,179 | | | | 28,798,437 | | | | 381,613 | | | | 720,190,184 | |
| Capital loss carryforwards* | | | (6,916,360 | ) | | | (101,619,037 | ) | | | – | | | | – | |
| Temporary differences | | | (18,160 | ) | | | (592,513 | ) | | | (453 | ) | | | (323,198 | ) |
| Unrealized gains (losses) – net | | | (4,813,236 | ) | | | 138,177,068 | | | | 763,888 | | | | 2,079,069,704 | |
| Total accumulated gains (losses) – net | | $ | (10,904,577 | ) | | $ | 64,763,955 | | | $ | 1,145,048 | | | $ | 2,798,936,690 | |
| | | | | | | | | | | | | | | | | |
| | | Health Care
Fund | | | International
Equity Fund | | | International
Opportunities
Fund | | | International
Value Fund | |
| Undistributed ordinary income – net | | $ | 493,340 | | | $ | 5,127,963 | | | $ | – | | | $ | 3,498,827 | |
| Undistributed long-term capital gains | | | 8,108 | | | | – | | | | – | | | | – | |
| Total undistributed earnings | | | 501,448 | | | | 5,127,963 | | | | – | | | | 3,498,827 | |
| Capital loss carryforwards* | | | – | | | | (30,761,139 | ) | | | (95,319,273 | ) | | | (440,416,153 | ) |
| Temporary differences | | | (98 | ) | | | (106,284 | ) | | | (79,894 | ) | | | (157,370 | ) |
| Unrealized gains (losses) – net | | | 404,334 | | | | 48,018,278 | | | | 4,250,805 | | | | (34,342,231 | ) |
| Total accumulated gains (losses) – net | | $ | 905,684 | | | $ | 22,278,818 | | | $ | (91,148,362 | ) | | $ | (471,416,927 | ) |
| | | | | | | | | | | | | | | | | |
| | | Value
Opportunities
Fund | | | | | | | | | | | | | |
| Undistributed ordinary income – net | | $ | 3,447,219 | | | | | | | | | | | | | |
| Undistributed long-term capital gains | | | 79,107,122 | | | | | | | | | | | | | |
| Total undistributed earnings | | | 82,554,341 | | | | | | | | | | | | | |
| Capital loss carryforwards* | | | – | | | | | | | | | | | | | |
| Temporary differences | | | (356,428 | ) | | | | | | | | | | | | |
| Unrealized gains (losses) – net | | | 210,074,662 | | | | | | | | | | | | | |
| Total accumulated gains (losses) – net | | $ | 292,272,575 | | | | | | | | | | | | | |
| * | The capital losses will carry forward indefinitely. |
At the Fund’s election, certain losses incurred within the taxable year (“Qualified Late-Year Losses”) are deemed to arise on the first business day of the Fund’s next taxable year. Alpha Strategy Fund incurred and will elect to defer $1,572,995 of late-year ordinary losses during the fiscal year ended October 31, 2020.
As of October 31, 2020, the aggregate unrealized security gains and losses on investments and other financial instruments based on cost for U.S. federal income tax purposes were as follows:
| | | Alpha
Strategy Fund | | | Durable
Growth Fund | | | Focused
Growth Fund | |
| Tax cost | | $ | 746,036,418 | | | $ | 172,173,034 | | | $ | 21,905,048 | |
| Gross unrealized gain | | | 66,229,482 | | | | 33,458,652 | | | | 6,184,347 | |
| Gross unrealized loss | | | (143,153,179 | ) | | | (4,121,200 | ) | | | (447,771 | ) |
| Net unrealized security gain (loss) | | $ | (76,923,697 | ) | | $ | 29,337,452 | | | $ | 5,736,576 | |
203
Notes to Financial Statements (continued)
| | | Focused Large
Cap Value Fund | | | Focused Small
Cap Value Fund | | | Fundamental
Equity Fund | |
| Tax cost | | $ | 407,413,687 | | | $ | 80,442,987 | | | $ | 1,479,314,317 | |
| Gross unrealized gain | | | 36,825,351 | | | | 6,742,329 | | | | 226,083,921 | |
| Gross unrealized loss | | | (12,169,721 | ) | | | (11,555,565 | ) | | | (87,907,786 | ) |
| Net unrealized security gain (loss) | | $ | 24,655,630 | | | $ | (4,813,236 | ) | | $ | 138,176,135 | |
| | | | | | | | | | | | | |
| | | Global Equity
Research Fund | | | Growth
Leaders Fund | | | Health Care Fund | |
| Tax cost | | $ | 6,069,680 | | | $ | 4,857,705,784 | | | $ | 3,349,318 | |
| Gross unrealized gain | | | 990,109 | | | | 2,115,737,501 | | | | 512,146 | |
| Gross unrealized loss | | | (227,858 | ) | | | (36,667,797 | ) | | | (107,868 | ) |
| Net unrealized security gain (loss) | | $ | 762,251 | | | $ | 2,079,069,704 | | | $ | 404,278 | |
| | | | | | | | | | | | | |
| | | International
Equity Fund | | International
Opportunities Fund | | | International
Value Fund | |
| Tax cost | | $ | 318,263,442 | | | $ | 384,648,536 | | | $ | 480,375,133 | |
| Gross unrealized gain | | | 55,645,201 | | | | 42,850,469 | | | | 36,268,431 | |
| Gross unrealized loss | | | (7,670,826 | ) | | | (38,650,150 | ) | | | (70,703,109 | ) |
| Net unrealized security gain (loss) | | $ | 47,974,375 | | | $ | 4,200,319 | | | $ | (34,434,678 | ) |
| | | | | | | | | | | | | |
| | Value
Opportunities Fund | | | | | | | | | |
| Tax cost | | $ | 1,160,880,887 | | | | | | | | | |
| Gross unrealized gain | | | 285,339,915 | | | | | | | | | |
| Gross unrealized loss | | | (75,265,253 | ) | | | | | | | | |
| Net unrealized security gain (loss) | | $ | 210,074,662 | | | | | | | | | |
The difference between book-basis and tax-basis unrealized gains (losses) is attributable to the tax treatment of certain securities, certain distributions, other financial instruments and wash sales.
Permanent items identified during the fiscal year ended October 31, 2020 have been reclassified among the components of net assets based on their tax basis treatment as follows:
| | Total Distributable | | | | |
| | | Earnings (loss | ) | | Paid-in Capital | |
| Alpha Strategy Fund | | $ | (25,810,774 | ) | | $ | 25,810,774 | |
| Durable Growth Fund | | | 56,332 | | | | (56,332 | ) |
| Focused Growth Fund | | | 10,000 | | | | (10,000 | ) |
| Focused Large Cap Value Fund | | | 43,126 | | | | (43,126 | ) |
| Health Care Fund | | | 7,036 | | | | (7,036 | ) |
| International Opportunities Fund | | | 1,417,580 | | | | (1,417,580 | ) |
| Value Opportunities Fund | | | (16,416,485 | ) | | | 16,416,485 | |
The permanent differences are attributable to the tax treatment of net investment loss, certain expenses, and certain distributions.
| 5. | PORTFOLIO SECURITIES TRANSACTIONS |
Purchases and sales of investment securities (excluding short-term investments) for the fiscal year ended October 31, 2020 were as follows:
| | | Purchases | | | Sales | |
| Alpha Strategy Fund | | $ | 122,851,877 | | | $ | 310,861,523 | |
| Durable Growth Fund | | | 255,949,575 | | | | 88,625,001 | |
| Focused Growth Fund | | | 29,450,806 | | | | 19,886,850 | |
| Focused Large Cap Value Fund | | | 629,899,608 | | | | 301,741,338 | |
| Focused Small Cap Value Fund | | | 73,302,219 | | | | 103,346,907 | |
| Fundamental Equity Fund | | | 1,170,765,863 | | | | 1,804,982,149 | |
204
Notes to Financial Statements (continued)
| | | Purchases | | | Sales | |
| Global Equity Research Fund | | $ | 9,936,054 | | | $ | 12,022,400 | |
| Growth Leaders Fund | | | 5,250,594,975 | | | | 4,578,893,014 | |
| Health Care Fund | | | 3,767,782 | | | | 3,773,936 | |
| International Equity Fund | | | 293,964,399 | | | | 377,508,337 | |
| International Opportunities Fund | | | 238,847,571 | | | | 369,440,050 | |
| International Value Fund | | | 341,339,641 | | | | 399,548,468 | |
| Value Opportunities Fund | | | 545,888,298 | | | | 1,041,824,946 | |
There were no purchases or sales of U.S. Government securities for the fiscal year ended October 31, 2020.
Each Fund is permitted to purchase and sell securities (“cross-trade”) from and to other Lord Abbett funds or client accounts pursuant to procedures approved by the Board in compliance with Rule 17a-7 under the Act (the “Rule”). Each cross-trade is executed at a fair market price in compliance with provisions of the Rule. For the year ended October 31, 2020, the following Funds engaged in cross-trades:
| Fund | | Purchases | | | Sales | | | Gain/(Loss | ) |
| Durable Growth Fund | | $ | – | | | $ | 789,885 | | | $ | (65,527 | ) |
| Focused Large Cap Value Fund | | | 57,469,092 | | | | 4,950,722 | | | | (856,985 | ) |
| Focused Small Cap Value Fund | | | 168,165 | | | | 1,086,948 | | | | 93,471 | |
| Fundamental Equity Fund | | | 28,288,114 | | | | 58,465,428 | | | | (18,997,478 | ) |
| Growth Leader Fund | | | 19,597,267 | | | | – | | | | – | |
| International Opportunities | | | 180,982 | | | | – | | | | – | |
| International Value Fund | | | – | | | | 180,982 | | | | (43,958 | ) |
| Value Opportunities Fund | | | 4,220,098 | | | | 9,668,539 | | | | 5,788,046 | |
| 6. | DISCLOSURES ABOUT DERIVATIVE INSTRUMENTS AND HEDGING ACTIVITIES |
International Equity Fund, International Opportunities Fund and International Value Fund entered into forward foreign currency exchange contracts for the year ended October 31, 2020 (as described in note 2(g)). A forward foreign currency exchange contract reduces each Fund’s exposure to changes in the value of the currency it will deliver (or settle in cash) and increases its exposure to changes in the value of the currency it will receive (or settle in cash) for the duration of the contract. Each Fund’s use of forward foreign currency exchange contracts involves the risk that Lord Abbett will not accurately predict currency movements, and each Fund’s returns could be reduced as a result. Forward foreign currency exchange contracts are subject to the risk that those currencies will decline in value relative to the U.S. dollar, or, in the case of hedged positions, that the U.S. dollar will decline relative to the currency being hedged. Currency rates in foreign countries may fluctuate significantly over short periods of time. Each Fund’s risk of loss from counterparty credit risk is the unrealized appreciation on forward foreign currency exchange contracts.
Global Equity Research Fund entered into E-Mini S&P Index futures contracts for the year ended October 31, 2020 (as described in note 2(h)) to manage cash. The Fund bears the risk that the underlying index will move unexpectedly, in which case the Fund may realize a loss. There is minimal counterparty credit risk to the Fund since futures are exchange traded and the exchange’s clearinghouse, as counterparty to all exchange traded futures, guarantees futures against default.
International Opportunities Fund entered into total return swaps on indexes for the year ended October 31, 2020 (as described in note 2(k)) to hedge credit risk. The Fund may enter into total return swap agreements to obtain exposure to a security or market without owning such security or investing directly in that market. The Fund may agree to make payments that are the equivalent of interest in exchange for the right to receive payments equivalent to any appreciation in the
205
Notes to Financial Statements (continued)
value of an underlying security, index or other asset, as well as receive payments equivalent to any distributions made on that asset, over the term of the swap. If the value of the asset underlying a total return swap declines over the term of the swap, the Fund also may be required to pay an amount equal to that decline in value to their counterparty.
As of October 31, 2020, International Opportunities Fund had the following derivatives at fair value, grouped into risk categories that illustrate the Funds’ use of derivative instruments:
| | | International Opportunities Fund | |
| Liability Derivatives | | Equity
Contracts | |
| Total Return Swap Contracts(1) | | $ | 39,110 | |
| (1) | Statements of Assets and Liabilities location: Total return swap, at fair value. |
Transactions in derivative instruments for the fiscal year ended October 31, 2020, were as follows:
| | Global Equity Research Fund | | | | |
| | | | Equity
Contracts | | | | | |
| Net Realized Gain (Loss) | | | | | | | | |
| Futures Contracts(1) | | $ | (3,075 | ) | | | | |
| Average Number of Contracts/Notional Amounts* | | | | | | | | |
| Futures Contracts | | | – | (6) | | | | |
| | | | | | | | | |
| | International Equity Fund | | | | | |
| | | | Foreign
Currency
Contracts | | | | | |
| Net Realized Gain (Loss) | | | | | | | | |
| Forward Foreign Currency Exchange Contracts(2) | | $ | 780 | | | | | |
| Average Number of Contracts/Notional Amounts* | | | | | | | | |
| Forward Foreign Currency Exchange Contracts(3) | | $ | 319,934 | | | | | |
| | | | | | | | | |
| | | | International Opportunities Fund | |
| | | | Foreign
Currency
Contracts | | | | Equity
Contracts | |
| Net Realized Gain (Loss) | | | | | | | | |
| Forward Foreign Currency Exchange Contracts(2) | | $ | (4,819 | ) | | | – | |
| Total Return Swap Contracts(4) | | | – | | | $ | (4,793,894 | ) |
| Net Change in Unrealized Appreciation/Depreciation | | | | | | | | |
| Total Return Swap Contracts(5) | | | – | | | $ | (50,991 | ) |
| Average Number of Contracts/Notional Amounts* | | | | | | | | |
| Total Return Swap Contracts(3) | | | – | | | $ | 125,184 | |
| | | | | | | | | |
| | International Value Fund | | | | | |
| | | | Foreign
Currency
Contracts | | | | | |
| Net Realized Gain (Loss) | | | | | | | | |
| Forward Foreign Currency Exchange Contracts(2) | | $ | (242 | ) | | | | |
| * | Calculated based on the number of contracts or notional amounts for the fiscal year ended October 31, 2020. |
| (1) | Statements of Operations location: Net realized gain(loss) on futures contracts. |
| (2) | Statements of Operations location: Net realized gain(loss) on forward foreign currency exchange contracts. |
206
Notes to Financial Statements (continued)
| (3) | Amount represents notional amounts in U.S. dollars. |
| (4) | Statements of Operations location: Net realized gain (loss) on swap contracts. |
| (5) | Statements of Operations location: Net change in unrealized appreciation/depreciation on swap contracts. |
| (6) | Contracts less than 1. |
| 7. | DISCLOSURES ABOUT OFFSETTING ASSETS AND LIABILITIES |
The Financial Accounting Standards Board (“FASB”) requires disclosures intended to help better assess the effect or potential effect of offsetting arrangements on a fund’s financial position. The following tables illustrate gross and net information about recognized assets and liabilities eligible for offset in the Statements of Assets and Liabilities; and disclose such amounts subject to an enforceable master netting agreement or similar agreement, by a counterparty. A master netting agreement is an agreement between a fund and a counterparty which provides for the net settlement of amounts owed under all contracts traded under that agreement, as well as cash collateral, through a single payment by one party to the other in the event of default on or termination of any one contract. The Funds’ accounting policy with respect to balance sheet offsetting is that, absent an event of default by the counterparty or a termination of the agreement, the master netting agreement does not result in an offset of reported amounts of financial assets and liabilities in the Statements of Assets and Liabilities across transactions between the Funds and the applicable counterparty:
| | | | | Alpha Strategy Fund |
| Description | | Gross Amounts of
Recognized Assets | | Gross Amounts
Offset in the
Statement of Assets
and Liabilities | | Net Amounts of
Assets Presented
in the Statement of
Assets and Liabilities |
| Repurchase Agreement | | $ | 211,123 | | $ | – | | $ | 211,123 |
| Total | | $ | 211,123 | | $ | – | | $ | 211,123 |
| | | Net Amounts | | | | | | | | | | | | | |
| | | of Assets | | | Amounts Not Offset in the | | | | |
| | | Presented in | | | Statement of Assets and Liabilities | | | | |
| | | the Statement | | | | | | Cash | | | Securities | | | | |
| | | of Assets and | | | Financial | | | Collateral | | | Collateral | | | Net | |
| Counterparty | | Liabilities | | | Instruments | | | Received(a | ) | | Received(a | ) | | Amount(b | ) |
| Fixed Income Clearing Corp. | | $ | 211,123 | | | $ | – | | | $ | – | | | $ | (211,123 | ) | | $ | – | |
| Total | | $ | 211,123 | | | $ | – | | | $ | – | | | $ | (211,123 | ) | | $ | – | |
| | | | | | Durable Growth Fund |
| Description | | Gross Amounts of
Recognized Assets | | Gross Amounts
Offset in the
Statement of Assets
and Liabilities | | Net Amounts of
Assets Presented
in the Statement of
Assets and Liabilities |
| Repurchase Agreement | | $ | 427,572 | | $ | – | | $ | 427,572 |
| Total | | $ | 427,572 | | $ | – | | $ | 427,572 |
| | | Net Amounts | | | | | | | | | | | | | |
| | | of Assets | | | Amounts Not Offset in the | | | | |
| | | Presented in | | | Statement of Assets and Liabilities | | | | |
| | | the Statement | | | | | | Cash | | | Securities | | | | |
| | | of Assets and | | | Financial | | | Collateral | | | Collateral | | | Net | |
| Counterparty | | Liabilities | | | Instruments | | | Received(a | ) | | Received(a | ) | | Amount(b | ) |
| Fixed Income Clearing Corp. | | $ | 427,572 | | | $ | – | | | $ | – | | | $ | (427,572 | ) | | $ | – | |
| Total | | $ | 427,572 | | | $ | – | | | $ | – | | | $ | (427,572 | ) | | $ | – | |
207
Notes to Financial Statements (continued)
| | | | | Focused Growth Fund |
| Description | | Gross Amounts of
Recognized Assets | | Gross Amounts
Offset in the
Statement of Assets
and Liabilities | | Net Amounts of
Assets Presented
in the Statement of
Assets and Liabilities |
| Repurchase Agreement | | $ | 648,183 | | $ | – | | $ | 648,183 |
| Total | | $ | 648,183 | | $ | – | | $ | 648,183 |
| | | Net Amounts | | | | | | | | | | | | | |
| | | of Assets | | | Amounts Not Offset in the | | | | |
| | | Presented in | | | Statement of Assets and Liabilities | | | | |
| | | the Statement | | | | | | Cash | | | Securities | | | | |
| | | of Assets and | | | Financial | | | Collateral | | | Collateral | | | Net | |
| Counterparty | | Liabilities | | | Instruments | | | Received(a | ) | | Received(a | ) | | Amount(b | ) |
| Fixed Income Clearing Corp. | | | $648,183 | | | $ | – | | | $ | – | | | $ | (648,183 | ) | | $ | – | |
| Total | | | $648,183 | | | $ | – | | | $ | – | | | $ | (648,183 | ) | | $ | – | |
| | | | | | Focused Large Cap Value Fund |
| Description | | Gross Amounts of
Recognized Assets | | Gross Amounts
Offset in the
Statement of Assets
and Liabilities | | Net Amounts of
Assets Presented
in the Statement of
Assets and Liabilities |
| Repurchase Agreement | | $ | 7,582,098 | | $ | – | | $ | 7,582,098 |
| Total | | $ | 7,582,098 | | $ | – | | $ | 7,582,098 |
| | | Net Amounts | | | | | | | | | | | | | |
| | | of Assets | | | Amounts Not Offset in the | | | | |
| | | Presented in | | | Statement of Assets and Liabilities | | | | |
| | | the Statement | | | | | | Cash | | | Securities | | | | |
| | | of Assets and | | | Financial | | | Collateral | | | Collateral | | | Net | |
| Counterparty | | Liabilities | | | Instruments | | | Received(a | ) | | Received(a | ) | | Amount(b | ) |
| Fixed Income Clearing Corp. | | | $7,582,098 | | | $ | – | | | $ | – | | | $ | (7,582,098 | ) | | $ | – | |
| Total | | | $7,582,098 | | | $ | – | | | $ | – | | | $ | (7,582,098 | ) | | $ | – | |
| | | | | | Focused Small Cap Value Fund |
| Description | | Gross Amounts of
Recognized Assets | | Gross Amounts
Offset in the
Statement of Assets
and Liabilities | | Net Amounts of
Assets Presented
in the Statement of
Assets and Liabilities |
| Repurchase Agreement | | $ | 321,581 | | $ | – | | $ | 321,581 |
| Total | | $ | 321,581 | | $ | – | | $ | 321,581 |
| | | Net Amounts | | | | | | | | | | | | | |
| | | of Assets | | | Amounts Not Offset in the | | | | |
| | | Presented in | | | Statement of Assets and Liabilities | | | | |
| | | the Statement | | | | | | Cash | | | Securities | | | | |
| | | of Assets and | | | Financial | | | Collateral | | | Collateral | | | Net | |
| Counterparty | | Liabilities | | | Instruments | | | Received(a | ) | | Received(a | ) | | Amount(b | ) |
| Fixed Income Clearing Corp. | | | $321,581 | | | $ | – | | | $ | – | | | $ | (321,581 | ) | | $ | – | |
| Total | | | $321,581 | | | $ | – | | | $ | – | | | $ | (321,581 | ) | | $ | – | |
208
Notes to Financial Statements (continued)
| | | | | Fundamental Equity Fund |
| Description | | Gross Amounts of
Recognized Assets | | Gross Amounts
Offset in the
Statement of Assets
and Liabilities | | Net Amounts of
Assets Presented
in the Statement of
Assets and Liabilities |
| Repurchase Agreement | | $ | 8,595,319 | | $ | – | | $ | 8,595,319 |
| Total | | $ | 8,595,319 | | $ | – | | $ | 8,595,319 |
| | | Net Amounts | | | | | | | | | | | | | |
| | | of Assets | | | Amounts Not Offset in the | | | | |
| | | Presented in | | | Statement of Assets and Liabilities | | | | |
| | | the Statement | | | | | | Cash | | | Securities | | | | |
| | | of Assets and | | | Financial | | | Collateral | | | Collateral | | | Net | |
| Counterparty | | Liabilities | | | Instruments | | | Received(a | ) | | Received(a | ) | | Amount(b | ) |
| Fixed Income Clearing Corp. | | | $8,595,319 | | | $ | – | | | $ | – | | | $ | (8,595,319 | ) | | $ | – | |
| Total | | | $8,595,319 | | | $ | – | | | $ | – | | | $ | (8,595,319 | ) | | $ | – | |
| | | | | Growth Leaders Fund |
| Description | | Gross Amounts of
Recognized Assets | | Gross Amounts
Offset in the
Statement of Assets
and Liabilities | | Net Amounts of
Assets Presented
in the Statement of
Assets and Liabilities |
| Repurchase Agreement | | $ | 120,197,602 | | $ | – | | $ | 120,197,602 |
| Total | | $ | 120,197,602 | | $ | – | | $ | 120,197,602 |
| | | Net Amounts | | | | | | | | | | | | | |
| | | of Assets | | | Amounts Not Offset in the | | | | |
| | | Presented in | | | Statement of Assets and Liabilities | | | | |
| | | the Statement | | | | | | Cash | | | Securities | | | | |
| | | of Assets and | | | Financial | | | Collateral | | | Collateral | | | Net | |
| Counterparty | | Liabilities | | | Instruments | | | Received(a | ) | | Received(a | ) | | Amount(b | ) |
| Fixed Income Clearing Corp. | | | $120,197,602 | | | $ | – | | | $ | – | | | $ | (120,197,602 | ) | | $ | – | |
| Total | | | $120,197,602 | | | $ | – | | | $ | – | | | $ | (120,197,602 | ) | | $ | – | |
| | | | | Health Care Fund |
| Description | | Gross Amounts of
Recognized Assets | | Gross Amounts
Offset in the
Statement of Assets
and Liabilities | | Net Amounts of
Assets Presented
in the Statement of
Assets and Liabilities |
| Repurchase Agreement | | $ | 159,043 | | $ | – | | $ | 159,043 |
| Total | | $ | 159,043 | | $ | – | | $ | 159,043 |
| | | Net Amounts | | | | | | | | | | | | | |
| | | of Assets | | | Amounts Not Offset in the | | | | |
| | | Presented in | | | Statement of Assets and Liabilities | | | | |
| | | the Statement | | | | | | Cash | | | Securities | | | | |
| | | of Assets and | | | Financial | | | Collateral | | | Collateral | | | Net | |
| Counterparty | | Liabilities | | | Instruments | | | Received(a | ) | | Received(a | ) | | Amount(b | ) |
| Fixed Income Clearing Corp. | | | $159,043 | | | $ | – | | | $ | – | | | $ | (159,043 | ) | | $ | – | |
| Total | | | $159,043 | | | $ | – | | | $ | – | | | $ | (159,043 | ) | | $ | – | |
209
Notes to Financial Statements (continued)
| | | | | International Equity Fund |
| Description | | Gross Amounts of
Recognized Assets | | Gross Amounts
Offset in the
Statement of Assets
and Liabilities | | Net Amounts of
Assets Presented
in the Statement of
Assets and Liabilities |
| Repurchase Agreement | | $ | 917,983 | | $ | – | | $ | 917,983 |
| Total | | $ | 917,983 | | $ | – | | $ | 917,983 |
| | | Net Amounts | | | | | | | | | | | | | |
| | | of Assets | | | Amounts Not Offset in the | | | | |
| | | Presented in | | | Statement of Assets and Liabilities | | | | |
| | | the Statement | | | | | | Cash | | | Securities | | | | |
| | | of Assets and | | | Financial | | | Collateral | | | Collateral | | | Net | |
| Counterparty | | Liabilities | | | Instruments | | | Received(a | ) | | Received(a | ) | | Amount(b | ) |
| Fixed Income Clearing Corp. | | | $917,983 | | | $ | – | | | $ | – | | | $ | (917,983 | ) | | $ | – | |
| Total | | | $917,983 | | | $ | – | | | $ | – | | | $ | (917,983 | ) | | $ | – | |
| | | | | International Opportunities Fund |
| Description | | Gross Amounts of
Recognized Assets | | Gross Amounts
Offset in the
Statement of Assets
and Liabilities | | Net Amounts of
Assets Presented
in the Statement of
Assets and Liabilities |
| Repurchase Agreement | | $ | 1,207,510 | | $ | – | | $ | 1,207,510 |
| Total | | $ | 1,207,510 | | $ | – | | $ | 1,207,510 |
| | | Net Amounts | | | | | | | | | | | | | |
| | | of Assets | | | Amounts Not Offset in the | | | | |
| | | Presented in | | | Statement of Assets and Liabilities | | | | |
| | | the Statement | | | | | | Cash | | | Securities | | | | |
| | | of Assets and | | | Financial | | | Collateral | | | Collateral | | | Net | |
| Counterparty | | Liabilities | | | Instruments | | | Received(a | ) | | Received(a | ) | | Amount(b | ) |
| Fixed Income Clearing Corp. | | | $1,207,510 | | | $ | – | | | $ | – | | | $ | (1,207,510 | ) | | $ | – | |
| Total | | | $1,207,510 | | | $ | – | | | $ | – | | | $ | (1,207,510 | ) | | $ | – | |
| Description | | Gross Amounts of
Recognized Liabilities | | Gross Amounts
Offset in the
Statement of Assets
and Liabilities | | Net Amounts of
Liabilities Presented
in the Statement of
Assets and Liabilities |
| Total Return Equity Swap | | $ | 39,110 | | $ | – | | $ | 39,110 |
| Total | | $ | 39,110 | | $ | – | | $ | 39,110 |
| | | | | | International Opportunities Fund | |
| | | Net Amounts | | | | | | | | | | | | | |
| | | of Liabilities | | | Amounts Not Offset in the | | | | |
| | | Presented in | | | Statement of Assets and Liabilities | | | | |
| | | the Statement | | | | | | Cash | | | Securities | | | | |
| | | of Assets and | | | Financial | | | Collateral | | | Collateral | | | Net | |
| Counterparty | | Liabilities | | | Instruments | | | Pledged(a | ) | | Pledged(a | ) | | Amount(c | ) |
| Bank of America | | | $39,110 | | | $ | – | | | $ | – | | | $ | – | | | | $39,110 | |
| Total | | | $39,110 | | | $ | – | | | $ | – | | | $ | – | | | | $39,110 | |
210
Notes to Financial Statements (continued)
| | | | | International Value Fund |
| Description | | Gross Amounts of
Recognized Assets | | Gross Amounts
Offset in the
Statement of Assets
and Liabilities | | Net Amounts of
Assets Presented
in the Statement of
Assets and Liabilities |
| Repurchase Agreement | | $ | 10,440,227 | | $ | – | | $ | 10,440,227 |
| Total | | $ | 10,440,227 | | $ | – | | $ | 10,440,227 |
| | | Net Amounts | | | | | | | | | | | | | |
| | | of Assets | | | Amounts Not Offset in the | | | | |
| | | Presented in | | | Statement of Assets and Liabilities | | | | |
| | | the Statement | | | | | | Cash | | | Securities | | | | |
| | | of Assets and | | | Financial | | | Collateral | | | Collateral | | | Net | |
| Counterparty | | Liabilities | | | Instruments | | | Received(a | ) | | Received(a | ) | | Amount(b | ) |
| Fixed Income Clearing Corp. | | $ | 10,440,227 | | | $ | – | | | $ | – | | | $ | (10,440,227 | ) | | $ | – | |
| Total | | $ | 10,440,227 | | | $ | – | | | $ | – | | | $ | (10,440,227 | ) | | $ | – | |
| (a) | Collateral disclosed is limited to an amount not to exceed 100% of the net amount of assets (liabilities) presented in the Statements of Assets and Liabilities, for each respective counterparty. |
| (b) | Net amount represents the amount owed to the Fund by the counterparty as of October 31, 2020. |
| (c) | Net amount represents the amount owed by the Fund to the counterparty as of October 31, 2020. |
The Trust’s officers and one Trustee, who are associated with Lord Abbett, do not receive any compensation from the Trust for serving in such capacities. Independent Trustees’ fees are allocated among all Lord Abbett-sponsored funds based on the net assets of each fund. There is an equity-based plan available to all Independent Trustees under which Independent Trustees must defer receipt of a portion of, and may elect to defer receipt of an additional portion of Trustees’ fees. The deferred amounts are treated as though equivalent dollar amounts had been invested in the funds. Such amounts and earnings accrued thereon are included in Trustees’ fees on the Statements of Operations and in Trustees’ fees payable on the Statements of Assets and Liabilities and are not deductible for U.S. federal income tax purposes until such amounts are paid.
The Trust has entered into an arrangement with its transfer agent and custodian, whereby credits realized as a result of uninvested cash balances are used to reduce a portion of each Fund’s expenses.
For the period ended August 5, 2020, the Funds and certain other funds managed by Lord Abbett (collectively, the “Participating Funds”) entered into a syndicated line of credit facility with various lenders for $1.17 billion (the “Syndicated Facility”) whereas State Street Bank and Trust Company (“SSB”) participated as a lender and as agent for the lenders. The Participating Funds were subject to graduated borrowing limits of one-third of Fund net assets (if Fund net assets are less than $750 million), $250 million, $300 million, $350 million, $500 million, or $1 billion, based on past borrowings and likelihood of future borrowings, among other factors. Effective August 6, 2020, the Participating Funds are subject to graduated borrowing limits of one-third of Fund net assets (if Fund net assets are less than $750 million), $250 million, $300 million, $600 million, or $900 million, based on past borrowings and likelihood of future borrowings, among other factors.
211
Notes to Financial Statements (continued)
For the period ended October 31, 2020, the Participating Funds were party to an additional line of credit facility with SSB for $330 million (the “Bilateral Facility”), $250 million committed and $80 million uncommitted. Under the Bilateral Facility, the Participating Funds are subject to graduated borrowing limits of one-third of Fund net assets (if net assets are less than $750 million), $250 million, $300 million, or $330 million, based on past borrowings and likelihood of future borrowings, among other factors.
The Syndicated Facility and the Bilateral Facility are to be used for temporary or emergency purposes as an additional source of liquidity to satisfy redemptions.
The Growth Leaders Fund utilized the Facility on November 22, 2019 with a borrowing amount of $50,200,000. The average interest rate was 2.80% and total interest paid amounted to $11,725.
| 11. | INTERFUND LENDING PROGRAM |
Pursuant to an exemptive order issued by the U.S. Securities and Exchange Commission (“SEC exemptive order”) certain registered open-end management investment companies managed by Lord Abbett, including each Fund, participate in a joint lending and borrowing program (the “Interfund Lending Program”). The SEC exemptive order allows the Funds to borrow money from and lend money to each other for temporary or emergency purposes subject to the limitations and conditions.
For the fiscal year ended October 31, 2020, the Funds did not participate as a borrower or lender in the Interfund Lending Program.
| 12. | CUSTODIAN AND ACCOUNTING AGENT |
SSB is the Trust’s custodian and accounting agent. SSB performs custodial, accounting and recordkeeping functions relating to portfolio transactions and calculating each Fund’s NAV.
212
Notes to Financial Statements (continued)
| 13. | TRANSACTIONS WITH AFFILIATED ISSUERS |
An affiliated issuer is one in which a Fund has ownership of at least 5% of the outstanding voting securities of the underlying issuer at any point during the fiscal year or any company which is under common ownership or control. Alpha Strategy Fund had the following transactions with affiliated issuers (i.e. the Underlying Funds) during the year ended October 31, 2020:
| | | | | | | | | | | | | | | | | | | | Alpha Strategy Fund | |
| Affiliated Issuer | | Balance of
Shares
Held at
10/31/2019 | | | Gross
Additions | | | Gross
Sales | | | Balance of
Shares
Held at
10/31/2020 | | | Fair
Value at
10/31/2020 | | | Net Realized
Gain
11/1/2019 to
10/31/2020 | | | Dividend
Income
11/1/2019 to
10/31/2020 | | | Change in
Appreciation
(Depreciation
11/1/2019 to
10/31/2020 | ) |
| Lord Abbett Developing Growth Fund, Inc. – Class I | | | 6,293,405 | | | | 1,219,794 | | | | (3,527,332 | ) | | | 3,985,867 | | | $ | 135,399,903 | | | $ | 38,527,334 | (a) | | $ | – | | | $ | 15,114,111 | |
| Lord Abbett Securities Trust – Focused Small Cap Value Fund – Class I | | | 3,528,280 | | | | 778,098 | | | | (985,330 | ) | | | 3,321,048 | | | | 67,384,060 | | | | 3,751,795 | (b) | | | – | | | | (13,601,263 | ) |
| Lord Abbett Securities Trust – International Opportunities Fund – Class I | | | 11,395,952 | | | | 305,385 | | | | (3,693,983 | ) | | | 8,007,354 | | | | 129,478,917 | | | | 6,021,472 | | | | 2,763,597 | | | | (12,948,956 | ) |
| Lord Abbett Securities Trust - Micro-Cap Growth Fund – Class I | | | 5,576,731 | | | | 935,326 | | | | (3,225,284 | ) | | | 3,286,773 | | | | 67,247,368 | | | | 19,158,687 | (c) | | | – | | | | 14,285,014 | |
| Lord Abbett Research Fund, Inc. – Small Cap Value Fund – Class I | | | 8,905,270 | | | | 1,831,642 | | | | (1,885,406 | ) | | | 8,851,506 | | | | 133,392,192 | | | | (6,196,820 | )(d) | | | 880,426 | | | | (24,430,777 | ) |
| Lord Abbett Securities Trust – Value Opportunities Fund – Class I | | | 9,590,809 | | | | 1,363,372 | | | | (3,318,069 | ) | | | 7,636,112 | | | | 135,999,158 | | | | 7,601,580 | (e) | | | 1,099,546 | | | | (8,321,356 | ) |
| Total | | | | | | | | | | | | | | | | | | $ | 668,901,598 | | | $ | 68,864,048 | | | $ | 4,743,569 | | | $ | (29,903,227 | ) |
| (a) | Includes $28,247,947 of distributed capital gains. |
| (b) | Includes $13,929,615 of distributed capital gains. |
| (c) | Includes $13,216,296 of distributed capital gains. |
| (d) | Includes $25,232,472 of distributed capital gains. |
| (e) | Includes $18,946,901 of distributed capital gains. |
| 14. | SECURITIES LENDING AGREEMENT |
The Funds have established a securities lending agreement with Citibank, N.A. for the lending of securities to qualified brokers in exchange for securities or cash collateral equal to at least the market value of securities loaned, plus interest, if applicable. Cash collateral is invested in an approved money market fund. In accordance with the Funds’ securities lending agreement, the market value of securities on loan is determined each day at the close of business and any additional collateral required to cover the value of securities on loan is delivered to the Fund on the next business day. As with other extensions of credit, the Funds may experience a delay in the recovery of their securities or incur a loss should the borrower of the securities breach its agreement with the Funds or become insolvent at a time when the collateral is insufficient to cover the cost of repurchasing securities on loan. Any income earned from securities lending is included in Securities lending net income on the Statement of Operations.
213
Notes to Financial Statements (continued)
The initial collateral received by the funds is required to have a value equal to at least 100% of the market value of the securities loaned. The collateral must be marked-to-market daily to cover increases in the market value of the securities loaned (or potentially a decline in the value of the collateral). In general, the risk of borrower default will be borne by the Funds’ agent; the Funds will bear the risk of loss with respect to the investment of the cash collateral. The advantage of such loans is that the Funds continue to receive income on loaned securities while receiving a portion of any securities lending fees and earning returns on the cash amounts which may be reinvested for the purchase of investments in securities.
As of October 31, 2020, the market value of securities loaned and collateral received for the Funds were as follows:
| Funds | | Market Value of
Securities Loaned | | | Collateral Received(1) | |
| Growth Leaders Fund | | $ | 523,600 | | | $ | 595,000 | |
| Health Care Fund | | | 39,193 | | | | 40,762 | |
| International Equity Fund | | | 1,037,980 | | | | 1,128,158 | |
| International Opportunities Fund | | | 2,738,649 | | | | 3,599,323 | |
| International Value Fund | | | 5,304,384 | | | | 5,237,200 | |
| (1) | Statements of Assets and Liabilities location: Payable for collateral due to broker for securities lending. |
Each Fund is subject to the general risks and considerations associated with equity investing. The value of the Funds’ investments will fluctuate in response to movements in the equity securities markets in general and to the changing prospects of individual companies in which the Funds invest. If a Fund’s assessment of a company’s value or prospects for exceeding earnings expectations or market conditions is wrong, the Fund could suffer losses or produce poor performance relative to other funds, even in a favorable market.
Large company stocks, in which Durable Growth Fund. Focused Growth Fund, Focused Large Cap Value Fund, Fundamental Equity Fund, Global Equity Research Fund, Growth Leaders Fund, International Equity Fund and International Value Fund invest, may perform differently than the market as a whole and other types of stocks, such as small company stocks. Small and mid-sized company stocks, in which Alpha Strategy Fund, Focused Small Cap Value Fund, Focused Growth Fund, Fundamental Equity Fund, Growth Leaders Fund, International Equity Fund, International Opportunities Fund and Value Opportunities Fund invest, may be less able to weather economic shifts or other adverse developments than those of larger, more established companies.
In general, Durable Growth Fund, Focused Growth Fund and Growth Leaders Fund employ a growth investing style, Global Equity Research Fund employs a blended growth investing and value investing style, and Focused Large Cap Value Fund, Focused Small Cap Value Fund, Fundamental Equity Fund, International Value Fund and Value Opportunities Fund employ a value investing style. Growth stocks generally are more volatile than value stocks. The price of value stocks may lag the market for long periods of time.
Global Equity Research Fund, International Equity Fund, International Opportunities Fund and International Value Fund are subject to the risks of investing in foreign securities. Foreign securities may pose greater risks than domestic securities, including greater price fluctuations, economic, political, and social instability and subject to less government supervision, lack of transparency, inadequate regulatory and accounting standards, foreign taxes, and higher transaction costs.
214
Notes to Financial Statements (continued)
Foreign investments also may be affected by changes in currency rates or currency controls. These risks are generally greater for securities issued by companies in emerging market companies. Similarly, due to their investments in multinational and foreign companies, Alpha Strategy Fund, Durable Growth Fund, Focused Growth Fund, Focused Large Cap Value Fund, Focused Small Cap Value Fund, Fundamental Equity Fund, Growth Leaders Fund, Health Care Fund, and Value Opportunities Fund are subject to the risks of investing in foreign securities and similarly may experience increased market, liquidity, currency, political, informational, and other risks.
Health Care Fund is subject to the risks of investing in the health care sector, including changes in government regulations, dependence on patents and intellectual property rights, expenses and losses from litigation based on product liability and similar claims, industry competition, extensive research and development, marketing, and sales costs, and rapid technological change and potential for product obsolescence. Health Care Fund is also subject to the risks of investing in structured securities. As a result, Health Care Fund is subject to the same risks associated with direct investments in the underlying securities or other instruments they seek to replicate, as well as liquidity risk and the risk that the issuer and/or the counterparty of the structured security may be unable to perform under the terms of the instrument, or may disagree as to the meaning or application of such terms.
International Value Fund is subject to the risks of investing in dividend paying stocks. Dividend paying stocks may be sensitive to changes in market interest rates, and the prices of such stocks may decline as rates rise. There is no guarantee that companies that currently pay dividends will continue to do so. International Value Fund may be subject to the volatility of stocks that have high dividends per share due to recent decreases in their share prices.
Alpha Strategy Fund’s investments are concentrated in the Underlying Funds and, as a result, the Fund’s performance is directly related to their performance and subject to their risks. In addition, the Fund is exposed to the same risks as the Underlying Funds in direct proportion to the allocation of its assets among the Underlying Funds.
Alpha Strategy Fund, Global Equity Research Fund, Health Care Fund, International Equity Fund, International Opportunities Fund and International Value Fund are subject to the risks associated with derivatives, which may be different from and greater than the risks associated with investing directly in securities and other investments. Derivatives may be subject to risks such as liquidity risk, leveraging risk, interest rate risk, market risk, and credit risk. Illiquid securities may lower the Funds’ returns since the Funds may be unable to sell these securities at their desired time or price. Derivatives also may involve the risk of mispricing or improper valuation and the risk that changes in the value of the derivative may not correlate perfectly with the value of the underlying asset, rate or index. Whether a Fund’s use of derivatives is successful will depend on, among other things, the Fund’s ability to correctly forecast market movements, changes in foreign exchange and interest rates, and other factors. If a Fund incorrectly forecasts these and other factors, its performance could suffer. A Fund’s use of derivatives could result in a loss exceeding the amount of the Fund’s investment in these instruments.
Health Care Fund, Focused Large Cap Value Fund and Focused Small Cap Value Fund are subject to the general risks and considerations associated with investing in fixed income securities. The value of an investment will change as interest rates fluctuate and in response to market movements. When interest rates rise, the prices of fixed income securities are likely to decline; when interest rates fall, such prices tend to rise. Longer-term securities are usually more sensitive to interest rate changes. There is also the risk that an issuer of a fixed income security will fail to make timely payments of principal and/or interest to a Fund, a risk that is greater with high-yield bonds
215
Notes to Financial Statements (continued)
(sometimes called “junk bonds”) in which one or more of the Funds may invest. Some issuers, particularly of high-yield bonds, may default as to principal and/or interest payments after a Fund purchases their securities. A default, or concerns in the market about an increase in risk of default, may result in losses to each Fund. High-yield bonds are subject to greater price fluctuations and increased liquidity risk, as well as additional risks.
Focused Growth Fund and Focused Large Cap Value Fund are non-diversified mutual funds under the Act. The value of each Fund’s investments may be more adversely affected by a single economic, political or regulatory event than the value of the investments of a diversified mutual fund.
Durable Growth Fund, Focused Growth Fund, Focused Large Cap Value Fund, Global Equity Research Fund and Health Care Fund are newly organized and there can be no assurance that a Fund will reach or maintain a sufficient asset size to effectively implement its investment strategy. A Fund’s gross expense ratio may fluctuate during its initial operating period because of the Fund’s relatively smaller asset size and, until the Fund achieves sufficient scale, a Fund shareholder may experience proportionally higher Fund expenses than would be experienced by shareholders of a fund with a larger asset base.
Geopolitical and other events (e.g., wars, terrorism, natural disasters, epidemics or pandemics such as the COVID-19 outbreak which began in late 2019) may disrupt securities markets and adversely affect global economies and markets, thereby decreasing the value of each Fund’s investments. Market disruptions can also prevent the Funds from implementing its investment strategies and achieving its investment objective.
The transmission of COVID-19 and efforts to contain its spread have resulted in, among other things, border closings and other significant travel restrictions and disruptions, significant disruptions to business operations, supply chains and customer activity, lower consumer demand for goods and services, event cancellations and restrictions, service cancellations, reductions and other changes, significant challenges in healthcare service preparation and delivery, and prolonged quarantines, as well as general concern and uncertainty. The impact of the COVID-19 outbreak could negatively affect the global economy, the economies of individual countries, and the financial performance of individual issuers, sectors, industries, asset classes, and markets in significant and unforeseen ways.
The COVID-19 pandemic and its effects may last for an extended period of time, and in either case could result in significant market volatility, exchange trading suspensions and closures, declines in global financial markets, higher default rates, and a substantial economic downturn or recession. The foregoing could disrupt the operations of each Fund and its service providers, adversely affect the value and liquidity of each Fund’s investments, and negatively impact each Fund’s performance and your investment in each Fund.
These factors can affect each Fund’s performance.
| 16. | SUMMARY OF CAPITAL TRANSACTIONS |
Transactions in shares of beneficial interest were as follows:
| Alpha Strategy Fund | | Year Ended
October 31, 2020 | | | | Year Ended
October 31, 2019 | |
| Class A Shares | | Shares | | | Amount | | | Shares | | | Amount | |
| Shares sold | | | 2,089,872 | | | $ | 43,355,666 | | | | 1,936,873 | | | $ | 44,322,451 | |
| Converted from Class C* | | | 1,101,831 | | | | 23,484,272 | | | | 716,346 | | | | 17,053,037 | |
| Reinvestment of distributions | | | 2,522,201 | | | | 56,648,626 | | | | 2,793,742 | | | | 56,209,490 | |
| Shares reacquired | | | (8,088,314 | ) | | | (168,814,292 | ) | | | (4,466,691 | ) | | | (104,513,019 | ) |
| Increase (decrease) | | | (2,374,410 | ) | | $ | (45,325,728 | ) | | | 980,270 | | | $ | 13,071,959 | |
216
Notes to Financial Statements (continued)
| Alpha Strategy Fund | | Year Ended
October 31, 2020 | | | Year Ended
October 31, 2019 | |
| Class C Shares | | Shares | | | Amount | | | Shares | | | Amount | |
| Shares sold | | | 448,811 | | | $ | 7,536,122 | | | | 648,264 | | | $ | 11,881,327 | |
| Reinvestment of distributions | | | 745,028 | | | | 13,276,398 | | | | 999,837 | | | | 16,617,299 | |
| Shares reacquired | | | (1,677,782 | ) | | | (28,359,437 | ) | | | (2,128,169 | ) | | | (41,118,494 | ) |
| Converted to Class A* | | | (1,392,677 | ) | | | (23,484,272 | ) | | | (870,238 | ) | | | (17,053,037 | ) |
| Decrease | | | (1,876,620 | ) | | $ | (31,031,189 | ) | | | (1,350,306 | ) | | $ | (29,672,905 | ) |
| | | | | | | | | | | | | | | | | |
| Class F Shares | | | | | | | | | | | | | | | | |
| Shares sold | | | 1,045,928 | | | $ | 22,416,684 | | | | 2,031,440 | | | $ | 47,362,668 | |
| Reinvestment of distributions | | | 772,654 | | | | 17,500,621 | | | | 958,776 | | | | 19,415,210 | |
| Shares reacquired | | | (3,825,862 | ) | | | (76,385,706 | ) | | | (3,310,986 | ) | | | (77,171,909 | ) |
| Decrease | | | (2,007,280 | ) | | $ | (36,468,401 | ) | | | (320,770 | ) | | $ | (10,394,031 | ) |
| | | | | | | | | | | | | | | | | |
| Class F3 Shares | | | | | | | | | | | | | | | | |
| Shares sold | | | 488,060 | | | $ | 10,125,114 | | | | 306,118 | | | $ | 7,490,426 | |
| Reinvestment of distributions | | | 177,457 | | | | 4,127,641 | | | | 206,700 | | | | 4,274,550 | |
| Shares reacquired | | | (552,465 | ) | | | (12,025,640 | ) | | | (444,819 | ) | | | (10,871,528 | ) |
| Increase | | | 113,052 | | | $ | 2,227,115 | | | | 67,999 | | | $ | 893,448 | |
| | | | | | | | | | | | | | | | | |
| Class I Shares | | | | | | | | | | | | | | | | |
| Shares sold | | | 790,561 | | | $ | 16,748,038 | | | | 710,550 | | | $ | 17,555,047 | |
| Reinvestment of distributions | | | 508,610 | | | | 11,799,741 | | | | 474,059 | | | | 9,789,326 | |
| Shares reacquired | | | (3,821,379 | ) | | | (81,468,364 | ) | | | (649,328 | ) | | | (15,636,447 | ) |
| Increase (decrease) | | | (2,522,208 | ) | | $ | (52,920,585 | ) | | | 535,281 | | | $ | 11,707,926 | |
| | | | | | | | | | | | | | | | | |
| Class R2 Shares | | | | | | | | | | | | | | | | |
| Shares sold | | | 15,003 | | | $ | 312,973 | | | | 16,203 | | | $ | 348,739 | |
| Reinvestment of distributions | | | 7,418 | | | | 159,120 | | | | 6,506 | | | | 126,278 | |
| Shares reacquired | | | (19,809 | ) | | | (363,370 | ) | | | (57,525 | ) | | | (1,360,572 | ) |
| Increase (decrease) | | | 2,612 | | | $ | 108,723 | | | | (34,816 | ) | | $ | (885,555 | ) |
| | | | | | | | | | | | | | | | | |
| Class R3 Shares | | | | | | | | | | | | | | | | |
| Shares sold | | | 136,052 | | | $ | 2,723,948 | | | | 133,797 | | | $ | 3,056,487 | |
| Reinvestment of distributions | | | 165,768 | | | | 3,583,900 | | | | 187,841 | | | | 3,664,779 | |
| Shares reacquired | | | (489,838 | ) | | | (10,160,044 | ) | | | (278,393 | ) | | | (6,386,647 | ) |
| Increase (decrease) | | | (188,018 | ) | | $ | (3,852,196 | ) | | | 43,245 | | | $ | 334,619 | |
| | | | | | | | | | | | | | | | | |
| Class R4 Shares | | | | | | | | | | | | | | | | |
| Shares sold | | | 43,297 | | | $ | 922,234 | | | | 50,981 | | | $ | 1,190,516 | |
| Reinvestment of distributions | | | 20,202 | | | | 452,531 | | | | 19,121 | | | | 383,942 | |
| Shares reacquired | | | (42,994 | ) | | | (897,945 | ) | | | (47,528 | ) | | | (1,122,234 | ) |
| Increase | | | 20,505 | | | $ | 476,820 | | | | 22,574 | | | $ | 452,224 | |
| | | | | | | | | | | | | | | | | |
| Class R5 Shares | | | | | | | | | | | | | | | | |
| Shares sold | | | 27,836 | | | $ | 610,946 | | | | 10,161 | | | $ | 275,029 | |
| Reinvestment of distributions | | | 1,707 | | | | 39,612 | | | | 1,961 | | | | 40,519 | |
| Shares reacquired | | | (14,890 | ) | | | (337,903 | ) | | | (4,044 | ) | | | (91,221 | ) |
| Increase | | | 14,653 | | | $ | 312,655 | | | | 8,078 | | | $ | 224,327 | |
217
Notes to Financial Statements (continued)
| Alpha Strategy Fund | | Year Ended
October 31, 2020 | | | Year Ended
October 31, 2019 | |
| Class R6 Shares | | Shares | | | Amount | | | Shares | | | Amount | |
| Shares sold | | | 41,185 | | | $ | 903,044 | | | | 42,360 | | | $ | 1,025,818 | |
| Reinvestment of distributions | | | 9,684 | | | | 225,350 | | | | 8,857 | | | | 183,260 | |
| Shares reacquired | | | (46,584 | ) | | | (1,036,708 | ) | | | (11,481 | ) | | | (286,551 | ) |
| Increase | | | 4,285 | | | $ | 91,686 | | | | 39,736 | | | $ | 922,527 | |
| | | | | | | | | | | | | | | | | |
| Durable Growth Fund | | | Year Ended
October 31, 2020(a) | | | | | | | | | |
| Class A Shares | | | Shares | | | | Amount | | | | | | | | | |
| Shares sold | | | 105,323 | | | $ | 1,704,548 | | | | | | | | | |
| Reinvestment of distributions | | | 12 | | | | 185 | | | | | | | | | |
| Shares reacquired | | | (25,265 | ) | | | (414,525 | ) | | | | | | | | |
| Increase | | | 80,070 | | | $ | 1,290,208 | | | | | | | | | |
| | | | | | | | | | | | | | | | | |
| Class C Shares | | | | | | | | | | | | | | | | |
| Shares sold | | | 12,788 | | | $ | 210,965 | | | | | | | | | |
| Shares reacquired | | | (858 | ) | | | (12,757 | ) | | | | | | | | |
| Increase | | | 11,930 | | | $ | 198,208 | | | | | | | | | |
| | | | | | | | | | | | | | | | | |
| Class F Shares | | | | | | | | | | | | | | | | |
| Shares sold | | | 34,968 | | | $ | 530,262 | | | | | | | | | |
| Reinvestment of distributions | | | 32 | | | | 493 | | | | | | | | | |
| Shares reacquired | | | (17,017 | ) | | | (261,750 | ) | | | | | | | | |
| Increase | | | 17,983 | | | $ | 269,005 | | | | | | | | | |
| | | | | | | | | | | | | | | | | |
| Class F3 Shares | | | | | | | | | | | | | | | | |
| Shares sold | | | 7,334 | | | $ | 110,000 | | | | | | | | | |
| Reinvestment of distributions | | | 8 | | | | 128 | | | | | | | | | |
| Increase | | | 7,342 | | | $ | 110,128 | | | | | | | | | |
| | | | | | | | | | | | | | | | | |
| Class I Shares | | | | | | | | | | | | | | | | |
| Shares sold | | | 12,457,602 | | | $ | 206,631,112 | | | | | | | | | |
| Reinvestment of distributions | | | 38 | | | | 573 | | | | | | | | | |
| Shares reacquired | | | (2,109,887 | ) | | | (40,830,092 | ) | | | | | | | | |
| Increase | | | 10,347,753 | | | $ | 165,801,593 | | | | | | | | | |
| | | | | | | | | | | | | | | | | |
| Class R3 Shares | | | | | | | | | | | | | | | | |
| Shares sold | | | 667 | | | $ | 10,000 | | | | | | | | | |
| Reinvestment of distributions | | | – | | | | 4 | | | | | | | | | |
| Shares reacquired | | | – | | | | 59 | | | | | | | | | |
| Increase | | | 667 | | | $ | 10,063 | | | | | | | | | |
| | | | | | | | | | | | | | | | | |
| Class R4 Shares | | | | | | | | | | | | | | | | |
| Shares sold | | | 667 | | | $ | 10,000 | | | | | | | | | |
| Reinvestment of distributions | | | – | | | | 8 | | | | | | | | | |
| Shares reacquired | | | – | | | | 36 | | | | | | | | | |
| Increase | | | 667 | | | $ | 10,044 | | | | | | | | | |
| | | | | | | | | | | | | | | | | |
| Class R5 Shares | | | | | | | | | | | | | | | | |
| Shares sold | | | 666.67 | | | $ | 10,000 | | | | | | | | | |
| Reinvestment of distributions | | | 0.76 | | | | 12 | | | | | | | | | |
| Increase | | | 667.43 | | | $ | 10,012 | | | | | | | | | |
218
Notes to Financial Statements (continued)
| Durable Growth Fund | | Year Ended
October 31, 2020(a) | | | | | | | |
| Class R6 Shares | | Shares | | | Amount | | | | | | | |
| Shares sold | | | 45,312 | | | $ | 699,067 | | | | | | | | | |
| Reinvestment of distributions | | | 38 | | | | 583 | | | | | | | | | |
| Shares reacquired | | | (32,830 | ) | | | (500,000 | ) | | | | | | | | |
| Increase | | | 12,520 | | | $ | 199,650 | | | | | | | | | |
| | | | | | | | | | | | | | | | | |
| Focused Growth Fund | | | Year Ended
October 31, 2020 | | | | Year Ended
October 31, 2019(b) | |
| Class A Shares | | | Shares | | | | Amount | | | | Shares | | | | Amount | |
| Shares sold | | | 434,819 | | | $ | 9,703,851 | | | | 313,088 | | | $ | 4,982,505 | |
| Converted from Class C* | | | 2,497 | | | | 60,294 | | | | – | | | | – | |
| Shares reacquired | | | (281,008 | ) | | | (5,735,273 | ) | | | (5,247 | ) | | | (86,577 | ) |
| Increase | | | 156,308 | | | $ | 4,028,872 | | | | 307,841 | | | $ | 4,895,928 | |
| | | | | | | | | | | | | | | | | |
| Class C Shares | | | | | | | | | | | | | | | | |
| Shares sold | | | 71,782 | | | $ | 1,605,692 | | | | 9,893 | | | $ | 150,587 | |
| Shares reacquired | | | (9,531 | ) | | | (205,158 | ) | | | – | | | | – | |
| Converted to Class A* | | | (2,523 | ) | | | (60,294 | ) | | | – | | | | – | |
| Increase | | | 59,728 | | | $ | 1,340,240 | | | | 9,893 | | | $ | 150,587 | |
| | | | | | | | | | | | | | | | | |
| Class F Shares | | | | | | | | | | | | | | | | |
| Shares sold | | | 190,397 | | | $ | 4,699,476 | | | | 65,436 | | | $ | 1,018,838 | |
| Shares reacquired | | | (38,191 | ) | | | (777,214 | ) | | | (2,275 | ) | | | (37,420 | ) |
| Increase | | | 152,206 | | | $ | 3,922,262 | | | | 63,161 | | | $ | 981,418 | |
| | | | | | | | | | | | | | | | | |
| Class F3 Shares | | | | | | | | | | | | | | | | |
| Shares sold | | | – | | | $ | – | | | | 33,333 | | | $ | 500,000 | |
| Increase | | | – | | | $ | – | | | | 33,333 | | | $ | 500,000 | |
| | | | | | | | | | | | | | | | | |
| Class I Shares | | | | | | | | | | | | | | | | |
| Shares sold | | | 38,511 | | | $ | 965,055 | | | | 118,709 | | | $ | 1,862,022 | |
| Shares reacquired | | | (31,893 | ) | | | (712,410 | ) | | | (24,990 | ) | | | (414,549 | ) |
| Increase | | | 6,618 | | | $ | 252,645 | | | | 93,719 | | | $ | 1,447,473 | |
| | | | | | | | | | | | | | | | | |
| Class R3 Shares | | | | | | | | | | | | | | | | |
| Shares sold | | | – | | | $ | – | | | | 666.66 | | | $ | 10,000 | |
| Increase | | | – | | | $ | – | | | | 666.66 | | | $ | 10,000 | |
| | | | | | | | | | | | | | | | | |
| Class R4 Shares | | | | | | | | | | | | | | | | |
| Shares sold | | | – | | | $ | – | | | | 666.66 | | | $ | 10,000 | |
| Increase | | | – | | | $ | – | | | | 666.66 | | | $ | 10,000 | |
| | | | | | | | | | | | | | | | | |
| Class R5 Shares | | | | | | | | | | | | | | | | |
| Shares sold | | | – | | | $ | – | | | | 666.67 | | | $ | 10,000 | |
| Shares reacquired | | | – | | | | – | | | | – | | | | – | |
| Increase | | | – | | | $ | – | | | | 666.67 | | | $ | 10,000 | |
| | | | | | | | | | | | | | | | | |
| Class R6 Shares | | | | | | | | | | | | | | | | |
| Shares sold | | | 91,308 | | | $ | 2,043,385 | | | | 114,343 | | | $ | 1,820,777 | |
| Shares reacquired | | | (43,053 | ) | | | (888,522 | ) | | | – | | | | – | |
| Increase | | | 48,255 | | | $ | 1,154,863 | | | | 114,343 | | | $ | 1,820,777 | |
219
Notes to Financial Statements (continued)
| Focused Large Cap Value Fund | | Year Ended
October 31, 2020 | | | Year Ended
October 31, 2019(c) | |
| Class A Shares | | Shares | | | Amount | | | Shares | | | Amount | |
| Shares sold | | | 58,910 | | | $ | 782,489 | | | | 34,405 | | | $ | 511,285 | |
| Reinvestment of distributions | | | 182 | | | | 2,767 | | | | – | | | | – | |
| Shares reacquired | | | (51,695 | ) | | | (735,734 | ) | | | – | | | | – | |
| Increase | | | 7,397 | | | $ | 49,522 | | | | 34,405 | | | $ | 511,285 | |
| | | | | | | | | | | | | | | | | |
| Class C Shares | | | | | | | | | | | | | | | | |
| Shares sold | | | 11,228 | | | $ | 132,753 | | | | 7,903 | | | $ | 118,476 | |
| Reinvestment of distributions | | | 21 | | | | 326 | | | | – | | | | – | |
| Shares reacquired | | | (12,635 | ) | | | (172,705 | ) | | | (570 | ) | | | (8,082 | ) |
| Increase (decrease) | | | (1,386 | ) | | $ | (39,626 | ) | | | 7,333 | | | $ | 110,394 | |
| | | | | | | | | | | | | | | | | |
| Class F Shares | | | | | | | | | | | | | | | | |
| Shares sold | | | 4,808 | | | $ | 62,373 | | | | 33,333 | | | $ | 500,000 | |
| Reinvestment of distributions | | | 196 | | | | 2,983 | | | | – | | | | – | |
| Shares reacquired | | | (35,265 | ) | | | (481,111 | ) | | | – | | | | – | |
| Increase (decrease) | | | (30,261 | ) | | $ | (415,755 | ) | | | 33,333 | | | $ | 500,000 | |
| | | | | | | | | | | | | | | | | |
| Class F3 Shares | | | | | | | | | | | | | | | | |
| Shares sold | | | – | | | $ | – | | | | 33,333 | | | $ | 500,000 | |
| Reinvestment of distributions | | | 211 | | | | 3,213 | | | | – | | | | – | |
| Shares reacquired | | | (32,613 | ) | | | (445,593 | ) | | | – | | | | – | |
| Increase (decrease) | | | (32,402 | ) | | $ | (442,380 | ) | | | 33,333 | | | $ | 500,000 | |
| | | | | | | | | | | | | | | | | |
| Class I Shares | | | | | | | | | | | | | | | | |
| Shares sold | | | 39,120,270 | | | $ | 441,893,283 | | | | 2,612,058 | | | $ | 38,394,069 | |
| Reinvestment of distributions | | | 16,392 | | | | 249,649 | | | | – | | | | – | |
| Shares reacquired | | | (8,761,641 | ) | | | (113,729,358 | ) | | | (22,341 | ) | | | (332,212 | ) |
| Increase | | | 30,375,021 | | | $ | 328,413,574 | | | | 2,589,717 | | | $ | 38,061,857 | |
| | | | | | | | | | | | | | | | | |
| Class R3 Shares | | | | | | | | | | | | | | | | |
| Shares sold | | | 5 | | | $ | 73 | | | | 666.67 | | | $ | 10,000 | |
| Reinvestment of distributions | | | 3 | | | | 43 | | | | – | | | | – | |
| Increase | | | 8 | | | $ | 116 | | | | 666.67 | | | $ | 10,000 | |
| | | | | | | | | | | | | | | | | |
| Class R4 Shares | | | | | | | | | | | | | | | | |
| Shares sold | | | – | | | $ | – | | | | 666.67 | | | $ | 10,000 | |
| Reinvestment of distributions | | | 3 | | | | 53 | | | | – | | | | – | |
| Increase | | | 3 | | | $ | 53 | | | | 666.67 | | | $ | 10,000 | |
| | | | | | | | | | | | | | | | | |
| Class R5 Shares | | | | | | | | | | | | | | | | |
| Shares sold | | | – | | | $ | – | | | | 666.67 | | | $ | 10,000 | |
| Reinvestment of distributions | | | 4 | | | | 64 | | | | – | | | | – | |
| Increase | | | 4 | | | $ | 64 | | | | 666.67 | | | $ | 10,000 | |
| | | | | | | | | | | | | | | | | |
| Class R6 Shares | | | | | | | | | | | | | | | | |
| Shares sold | | | 36,297 | | | $ | 449,218 | | | | 35,008 | | | $ | 525,000 | |
| Reinvestment of distributions | | | 211 | | | | 3,213 | | | | – | | | | – | |
| Shares reacquired | | | (43,319 | ) | | | (579,584 | ) | | | – | | | | – | |
| Increase (decrease) | | | (6,811 | ) | | $ | (127,153 | ) | | | 35,008 | | | $ | 525,000 | |
220
Notes to Financial Statements (continued)
| Focused Small Cap Value Fund | | Year Ended
October 31, 2020 | | | Year Ended
October 31, 2019 | |
| Class A Shares | | Shares | | | Amount | | | Shares | | | Amount | |
| Shares sold | | | 438,085 | | | $ | 9,162,393 | | | | 11,847 | | | $ | 281,257 | |
| Reinvestment of distributions | | | 42,884 | | | | 930,586 | | | | 37,848 | | | | 921,231 | |
| Shares reacquired | | | (535,543 | ) | | | (8,651,100 | ) | | | (41,661 | ) | | | (1,035,362 | ) |
| Increase (decrease) | | | (54,574 | ) | | $ | 1,441,879 | | | | 8,034 | | | $ | 167,126 | |
| | | | | | | | | | | | | | | | | |
| Class C Shares(d) | | | | | | | | | | | | | | | | |
| Shares sold | | | 5,401 | | | $ | 107,961 | | | | 365.10 | | | $ | 10,000 | |
| Reinvestment of distributions | | | 69 | | | | 1,597 | | | | – | | | | – | |
| Shares reacquired | | | (711 | ) | | | (11,019 | ) | | | – | | | | – | |
| Increase | | | 4,759 | | | $ | 98,539 | | | | 365.10 | | | $ | 10,000 | |
| | | | | | | | | | | | | | | | | |
| Class F Shares(d) | | | | | | | | | | | | | | | | |
| Shares sold | | | 41,829 | | | $ | 800,286 | | | | 365.10 | | | $ | 10,000 | |
| Reinvestment of distributions | | | 64 | | | | 1,500 | | | | – | | | | – | |
| Shares reacquired | | | (3,606 | ) | | | (71,014 | ) | | | – | | | | – | |
| Increase | | | 38,287 | | | $ | 730,772 | | | | 365.10 | | | $ | 10,000 | |
| | | | | | | | | | | | | | | | | |
| Class F3 Shares(d) | | | | | | | | | | | | | | | | |
| Shares sold | | | – | | | $ | – | | | | 365.10 | | | $ | 10,000 | |
| Reinvestment of distributions | | | 64 | | | | 1,500 | | | | – | | | | – | |
| Increase | | | 64 | | | $ | 1,500 | | | | 365.10 | | | $ | 10,000 | |
| | | | | | | | | | | | | | | | | |
| Class I Shares | | | | | | | | | | | | | | | | |
| Shares sold | | | 198,740 | | | $ | 4,446,865 | | | | 161,876 | | | $ | 4,447,058 | |
| Reinvestment of distributions | | | 699,990 | | | | 16,379,773 | | | | 636,560 | | | | 16,499,645 | |
| Shares reacquired | | | (1,722,466 | ) | | | (37,155,659 | ) | | | (694,231 | ) | | | (17,750,531 | ) |
| Increase (decrease) | | | (823,736 | ) | | $ | (16,329,021 | ) | | | 104,205 | | | $ | 3,196,172 | |
| | | | | | | | | | | | | | | | | |
| Class R3 Shares(d) | | | | | | | | | | | | | | | | |
| Shares sold | | | – | | | $ | – | | | | 365.10 | | | $ | 10,000 | |
| Reinvestment of distributions | | | 64 | | | | 1,500 | | | | – | | | | – | |
| Shares reacquired | | | (429 | ) | | | (6,320 | ) | | | – | | | | – | |
| Increase (decrease) | | | (365 | ) | | $ | (4,820 | ) | | | 365.10 | | | $ | 10,000 | |
| | | | | | | | | | | | | | | | | |
| Class R4 Shares(d) | | | | | | | | | | | | | | | | |
| Shares sold | | | – | | | $ | – | | | | 365.10 | | | $ | 10,000 | |
| Reinvestment of distributions | | | 64 | | | | 1,500 | | | | – | | | | – | |
| Shares reacquired | | | (429 | ) | | | (6,336 | ) | | | – | | | | – | |
| Increase (decrease) | | | (365 | ) | | $ | (4,836 | ) | | | 365.10 | | | $ | 10,000 | |
| | | | | | | | | | | | | | | | | |
| Class R5 Shares(d) | | | | | | | | | | | | | | | | |
| Shares sold | | | – | | | $ | – | | | | 365.10 | | | $ | 10,000 | |
| Reinvestment of distributions | | | 64.09 | | | | 1,500 | | | | – | | | | – | |
| Increase | | | 64.09 | | | $ | 1,500 | | | | 365.10 | | | $ | 10,000 | |
| | | | | | | | | | | | | | | | | |
| Class R6 Shares(d) | | | | | | | | | | | | | | | | |
| Shares sold | | | 52,623 | | | $ | 1,109,409 | | | | 49,829 | | | $ | 1,318,610 | |
| Reinvestment of distributions | | | 64 | | | | 1,500 | | | | – | | | | – | |
| Shares reacquired | | | (18,034 | ) | | | (324,689 | ) | | | – | | | | – | |
| Increase | | | 34,653 | | | $ | 786,220 | | | | 49,829 | | | $ | 1,318,610 | |
221
Notes to Financial Statements (continued)
| Fundamental Equity Fund | | Year Ended
October 31, 2020 | | | Year Ended
October 31, 2019 | |
| Class A Shares | | Shares | | | Amount | | | Shares | | | Amount | |
| Shares sold | | | 4,188,498 | | | $ | 43,418,303 | | | | 4,718,174 | | | $ | 55,165,061 | |
| Converted from Class C* | | | 5,226,450 | | | | 55,203,791 | | | | 3,683,848 | | | | 44,448,681 | |
| Reinvestment of distributions | | | 11,401,124 | | | | 132,025,015 | | | | 10,083,565 | | | | 115,658,483 | |
| Shares reacquired | | | (29,769,304 | ) | | | (317,448,216 | ) | | | (27,315,112 | ) | | | (324,121,133 | ) |
| Shares issued in reorganization (See Note 17) | | | – | | | | – | | | | 4,361,818 | | | | 52,385,435 | |
| Decrease | | | (8,953,232 | ) | | $ | (86,801,107 | ) | | | (4,467,707 | ) | | $ | (56,463,473 | ) |
| | | | | | | | | | | | | | | | | |
| Class C Shares | | | | | | | | | | | | | | | | |
| Shares sold | | | 691,274 | | | $ | 6,387,499 | | | | 870,720 | | | $ | 8,928,523 | |
| Reinvestment of distributions | | | 1,522,175 | | | | 15,434,858 | | | | 1,754,685 | | | | 17,845,137 | |
| Shares reacquired | | | (3,965,989 | ) | | | (37,181,352 | ) | | | (6,028,943 | ) | | | (63,103,130 | ) |
| Converted to Class A* | | | (5,993,619 | ) | | | (55,203,791 | ) | | | (4,170,352 | ) | | | (44,448,681 | ) |
| Shares issued in reorganization (See Note 17) | | | – | | | | – | | | | 1,107,914 | | | | 11,777,130 | |
| Decrease | | | (7,746,159 | ) | | $ | (70,562,786 | ) | | | (6,465,976 | ) | | $ | (69,001,021 | ) |
| | | | | | | | | | | | | | | | | |
| Class F Shares | | | | | | | | | | | | | | | | |
| Shares sold | | | 1,433,812 | | | $ | 15,575,714 | | | | 2,235,497 | | | $ | 26,350,493 | |
| Reinvestment of distributions | | | 1,631,329 | | | | 18,629,776 | | | | 1,532,614 | | | | 17,364,522 | |
| Shares reacquired | | | (6,705,371 | ) | | | (70,451,225 | ) | | | (10,171,607 | ) | | | (118,364,600 | ) |
| Shares issued in reorganization (See Note 17) | | | – | | | | – | | | | 1,405,515 | | | | 16,683,465 | |
| Decrease | | | (3,640,230 | ) | | $ | (36,245,735 | ) | | | (4,997,981 | ) | | $ | (57,966,120 | ) |
| | | | | | | | | | | | | | | | | |
| Class F3 Shares | | | | | | | | | | | | | | | | |
| Shares sold | | | 288,689 | | | $ | 3,142,272 | | | | 179,608 | | | $ | 2,191,371 | |
| Reinvestment of distributions | | | 180,261 | | | | 2,109,059 | | | | 153,157 | | | | 1,772,029 | |
| Shares reacquired | | | (664,831 | ) | | | (7,264,981 | ) | | | (528,928 | ) | | | (6,385,071 | ) |
| Shares issued in reorganization (See Note 17) | | | – | | | | – | | | | 241,589 | | | | 2,930,474 | |
| Increase (decrease) | | | (195,881 | ) | | $ | (2,013,650 | ) | | | 45,426 | | | $ | 508,803 | |
| | | | | | | | | | | | | | | | | |
| Class I Shares | | | | | | | | | | | | | | | | |
| Shares sold | | | 12,582,859 | | | $ | 140,110,329 | | | | 22,514,073 | | | $ | 280,040,627 | |
| Reinvestment of distributions | | | 5,308,220 | | | | 61,787,685 | | | | 674,198 | | | | 7,773,499 | |
| Shares reacquired | | | (41,834,305 | ) | | | (408,261,259 | ) | | | (9,822,144 | ) | | | (118,890,371 | ) |
| Shares issued in reorganization (See Note 17) | | | – | | | | – | | | | 27,933,427 | | | | 337,435,793 | |
| Increase (decrease) | | | (23,943,226 | ) | | $ | (206,363,245 | ) | | | 41,299,554 | | | $ | 506,359,548 | |
| | | | | | | | | | | | | | | | | |
| Class P Shares | | | | | | | | | | | | | | | | |
| Shares sold | | | 38,910 | | | $ | 395,112 | | | | 39,457 | | | $ | 460,418 | |
| Reinvestment of distributions | | | 45,179 | | | | 512,324 | | | | 40,900 | | | | 460,530 | |
| Shares reacquired | | | (150,905 | ) | | | (1,618,060 | ) | | | (119,152 | ) | | | (1,397,845 | ) |
| Decrease | | | (66,816 | ) | | $ | (710,624 | ) | | | (38,795 | ) | | $ | (476,897 | ) |
222
Notes to Financial Statements (continued)
| | | Year Ended | | | Year Ended | |
| Fundamental Equity Fund | | October 31, 2020 | | | October 31, 2019 | |
| Class R2 Shares | | Shares | | | Amount | | | Shares | | | Amount | |
| Shares sold | | | 48,263 | | | $ | 494,664 | | | | 136,576 | | | $ | 1,594,416 | |
| Reinvestment of distributions | | | 25,619 | | | | 290,000 | | | | 16,758 | | | | 188,189 | |
| Shares reacquired | | | (102,194 | ) | | | (1,093,622 | ) | | | (160,033 | ) | | | (1,897,172 | ) |
| Shares issued in reorganization (See Note 17) | | | – | | | | – | | | | 43,370 | | | | 509,602 | |
| Increase (decrease) | | | (28,312 | ) | | $ | (308,958 | ) | | | 36,671 | | | $ | 395,035 | |
| | | | | | | | | | | | | | | | | |
| Class R3 Shares | | | | | | | | | | | | | | | | |
| Shares sold | | | 1,538,350 | | | $ | 15,852,051 | | | | 685,521 | | | $ | 8,057,902 | |
| Reinvestment of distributions | | | 877,394 | | | | 9,958,420 | | | | 863,530 | | | | 9,723,346 | |
| Shares reacquired | | | (2,966,968 | ) | | | (30,852,539 | ) | | | (2,982,209 | ) | | | (35,034,683 | ) |
| Shares issued in reorganization (See Note 17) | | | – | | | | – | | | | 7,590 | | | | 89,490 | |
| Decrease | | | (551,224 | ) | | $ | (5,042,068 | ) | | | (1,425,568 | ) | | $ | (17,163,945 | ) |
| | | | | | | | | | | | | | | | | |
| Class R4 Shares | | | | | | | | | | | | | | | | |
| Shares sold | | | 76,886 | | | $ | 831,775 | | | | 101,971 | | | $ | 1,217,294 | |
| Reinvestment of distributions | | | 36,123 | | | | 415,774 | | | | 28,501 | | | | 324,914 | |
| Shares reacquired | | | (292,446 | ) | | | (3,170,812 | ) | | | (150,357 | ) | | | (1,834,834 | ) |
| Shares issued in reorganization (See Note 17) | | | – | | | | – | | | | 1,046 | | | | 12,488 | |
| Decrease | | | (179,437 | ) | | $ | (1,923,263 | ) | | | (18,839 | ) | | $ | (280,138 | ) |
| | | | | | | | | | | | | | | | | |
| Class R5 Shares | | | | | | | | | | | | | | | | |
| Shares sold | | | 81,760 | | | $ | 955,940 | | | | 76,473 | | | $ | 912,647 | |
| Reinvestment of distributions | | | 10,804 | | | | 125,869 | | | | 6,197 | | | | 71,449 | |
| Shares reacquired | | | (125,349 | ) | | | (1,307,288 | ) | | | (30,030 | ) | | | (368,002 | ) |
| Shares issued in reorganization (See Note 17) | | | – | | | | – | | | | 1,043 | | | | 12,604 | |
| Increase (decrease) | | | (32,785 | ) | | $ | (225,479 | ) | | | 53,683 | | | $ | 628,698 | |
| | | | | | | | | | | | | | | | | |
| Class R6 Shares | | | | | | | | | | | | | | | | |
| Shares sold | | | 219,870 | | | $ | 2,369,313 | | | | 630,249 | | | $ | 7,306,094 | |
| Reinvestment of distributions | | | 156,188 | | | | 1,828,961 | | | | 88,317 | | | | 1,022,708 | |
| Shares reacquired | | | (1,030,695 | ) | | | (10,971,855 | ) | | | (487,162 | ) | | | (6,011,663 | ) |
| Shares issued in reorganization (See Note 17) | | | – | | | | – | | | | 168,358 | | | | 2,043,859 | |
| Increase (decrease) | | | (654,637 | ) | | $ | (6,773,581 | ) | | | 399,762 | | | $ | 4,360,998 | |
223
Notes to Financial Statements (continued)
| Global Equity Research Fund | | Year Ended
October 31, 2020 | | | Year Ended
October 31, 2019 | |
| Class A Shares | | Shares | | | Amount | | | Shares | | | Amount | |
| Shares sold | | | 67,708 | | | $ | 783,138 | | | | 53,087 | | | $ | 547,006 | |
| Converted from Class C* | | | 2,969 | | | | 35,757 | | | | 213 | | | | 2,344 | |
| Reinvestment of distributions | | | 3,449 | | | | 41,353 | | | | 14,647 | | | | 143,542 | |
| Shares reacquired | | | (174,136 | ) | | | (1,903,357 | ) | | | (45,581 | ) | | | (495,091 | ) |
| Increase (decrease) | | | (100,010 | ) | | $ | (1,043,109 | ) | | | 22,366 | | | $ | 197,801 | |
| | | | | | | | | | | | | | | | | |
| Class C Shares | | | | | | | | | | | | | | | | |
| Shares sold | | | 11,199 | | | $ | 132,299 | | | | 11,438 | | | $ | 121,417 | |
| Reinvestment of distributions | | | 157 | | | | 1,871 | | | | 2,799 | | | | 27,287 | |
| Shares reacquired | | | (16,261 | ) | | | (187,627 | ) | | | (27,655 | ) | | | (302,168 | ) |
| Converted to Class A* | | | (2,995 | ) | | | (35,757 | ) | | | (214 | ) | | | (2,344 | ) |
| Decrease | | | (7,900 | ) | | $ | (89,214 | ) | | | (13,632 | ) | | $ | (155,808 | ) |
| | | | | | | | | | | | | | | | | |
| Class F Shares | | | | | | | | | | | | | | | | |
| Shares sold | | | 878 | | | $ | 11,000 | | | | 77,850 | | | $ | 888,980 | |
| Reinvestment of distributions | | | 1,452 | | | | 17,441 | | | | 5,822 | | | | 57,059 | |
| Shares reacquired | | | (79,072 | ) | | | (932,988 | ) | | | (2,391 | ) | | | (27,496 | ) |
| Increase (decrease) | | | (76,742 | ) | | $ | (904,547 | ) | | | 81,281 | | | $ | 918,543 | |
| | | | | | | | | | | | | | | | | |
| Class F3 Shares | | | | | | | | | | | | | | | | |
| Reinvestment of distributions | | | 15 | | | $ | 181 | | | | 56 | | | $ | 551 | |
| Increase | | | 15 | | | $ | 181 | | | | 56 | | | $ | 551 | |
| | | | | | | | | | | | | | | | | |
| Class I Shares | | | | | | | | | | | | | | | | |
| Reinvestment of distributions | | | 1,484 | | | $ | 17,804 | | | | 5,619 | | | $ | 55,069 | |
| Increase | | | 1,484 | | | $ | 17,804 | | | | 5,619 | | | $ | 55,069 | |
| | | | | | | | | | | | | | | | | |
| Class R2 Shares | | | | | | | | | | | | | | | | |
| Reinvestment of distributions | | | 9 | | | $ | 107 | | | | 49 | | | $ | 487 | |
| Shares reacquired | | | (1,112 | ) | | | (11,500 | ) | | | – | | | | – | |
| Increase (decrease) | | | (1,103 | ) | | $ | (11,393 | ) | | | 49 | | | $ | 487 | |
| | | | | | | | | | | | | | | | | |
| Class R3 Shares | | | | | | | | | | | | | | | | |
| Shares sold | | | 1,641 | | | $ | 19,964 | | | | 3,162 | | | $ | 34,863 | |
| Reinvestment of distributions | | | 160 | | | | 1,908 | | | | 824 | | | | 8,046 | |
| Shares reacquired | | | (55 | ) | | | (667 | ) | | | (1,598 | ) | | | (16,908 | ) |
| Increase | | | 1,746 | | | $ | 21,205 | | | | 2,388 | | | $ | 26,001 | |
| | | | | | | | | | | | | | | | | |
| Class R4 Shares | | | | | | | | | | | | | | | | |
| Reinvestment of distributions | | | 12 | | | $ | 150 | | | | 54 | | | $ | 531 | |
| Increase | | | 12 | | | $ | 150 | | | | 54 | | | $ | 531 | |
| | | | | | | | | | | | | | | | | |
| Class R5 Shares | | | | | | | | | | | | | | | | |
| Reinvestment of distributions | | | 15 | | | $ | 182 | | | | 58 | | | $ | 562 | |
| Increase | | | 15 | | | $ | 182 | | | | 58 | | | $ | 562 | |
| | | | | | | | | | | | | | | | | |
| Class R6 Shares | | | | | | | | | | | | | | | | |
| Shares sold | | | 9,840 | | | $ | 123,399 | | | | 56,579 | | | $ | 612,293 | |
| Shares reacquired | | | (19,272 | ) | | | (234,374 | ) | | | (18,445 | ) | | | (202,934 | ) |
| Increase (decrease) | | | (9,432 | ) | | $ | (110,975 | ) | | | 38,134 | | | $ | 409,359 | |
224
Notes to Financial Statements (continued)
| Growth Leaders Fund | | Year Ended
October 31, 2020 | | | Year Ended
October 31, 2019 | |
| Class A Shares | | Shares | | | Amount | | | Shares | | | Amount | |
| Shares sold | | | 18,281,151 | | | $ | 613,241,998 | | | | 9,574,121 | | | $ | 260,894,777 | |
| Converted from Class C* | | | 1,928,904 | | | | 72,420,199 | | | | 450,402 | | | | 12,611,775 | |
| Reinvestment of distributions | | | 2,858,584 | | | | 78,067,940 | | | | 5,703,953 | | | | 131,362,113 | |
| Shares reacquired | | | (12,621,781 | ) | | | (409,386,625 | ) | | | (10,904,698 | ) | | | (291,740,042 | ) |
| Increase | | | 10,446,858 | | | $ | 354,343,512 | | | | 4,823,778 | | | $ | 113,128,623 | |
| | | | | | | | | | | | | | | | | |
| Class C Shares | | | | | | | | | | | | | | | | |
| Shares sold | | | 5,995,648 | | | $ | 178,733,815 | | | | 4,874,829 | | | $ | 120,614,002 | |
| Reinvestment of distributions | | | 2,026,352 | | | | 50,820,908 | | | | 4,194,598 | | | | 90,016,077 | |
| Shares reacquired | | | (6,241,038 | ) | | | (184,768,951 | ) | | | (5,890,335 | ) | | | (145,940,340 | ) |
| Converted to Class A* | | | (2,110,329 | ) | | | (72,420,199 | ) | | | (485,536 | ) | | | (12,611,775 | ) |
| Increase (decrease) | | | (329,367 | ) | | $ | (27,634,427 | ) | | | 2,693,556 | | | $ | 52,077,964 | |
| | | | | | | | | | | | | | | | | |
| Class F Shares | | | | | | | | | | | | | | | | |
| Shares sold | | | 30,664,509 | | | $ | 1,054,984,638 | | | | 17,961,047 | | | $ | 493,296,464 | |
| Reinvestment of distributions | | | 3,547,411 | | | | 98,830,859 | | | | 7,214,078 | | | | 168,809,431 | |
| Shares reacquired | | | (21,088,458 | ) | | | (700,112,273 | ) | | | (19,155,816 | ) | | | (517,175,665 | ) |
| Increase | | | 13,123,462 | | | $ | 453,703,224 | | | | 6,019,309 | | | $ | 144,930,230 | |
| | | | | | | | | | | | | | | | | |
| Class F3 Shares | | | | | | | | | | | | | | | | |
| Shares sold | | | 4,295,402 | | | $ | 162,030,303 | | | | 1,460,074 | | | $ | 41,997,664 | |
| Reinvestment of distributions | | | 212,922 | | | | 5,998,021 | | | | 297,904 | | | | 7,036,481 | |
| Shares reacquired | | | (952,101 | ) | | | (33,483,279 | ) | | | (688,380 | ) | | | (19,372,905 | ) |
| Increase | | | 3,556,223 | | | $ | 134,545,045 | | | | 1,069,598 | | | $ | 29,661,240 | |
| | | | | | | | | | | | | | | | | |
| Class I Shares | | | | | | | | | | | | | | | | |
| Shares sold | | | 12,502,496 | | | $ | 421,762,720 | | | | 4,186,429 | | | $ | 118,557,567 | |
| Reinvestment of distributions | | | 1,446,088 | | | | 40,562,759 | | | | 4,452,801 | | | | 104,818,928 | |
| Shares reacquired | | | (7,842,296 | ) | | | (277,609,307 | ) | | | (14,025,170 | ) | | | (393,625,778 | ) |
| Increase (decrease) | | | 6,106,288 | | | $ | 184,716,172 | | | | (5,385,940 | ) | | $ | (170,249,283 | ) |
| | | | | | | | | | | | | | | | | |
| Class R2 Shares | | | | | | | | | | | | | | | | |
| Shares sold | | | 56,383 | | | $ | 1,897,951 | | | | 21,383 | | | $ | 552,400 | |
| Reinvestment of distributions | | | 1,660 | | | | 44,544 | | | | 3,881 | | | | 88,243 | |
| Shares reacquired | | | (61,514 | ) | | | (1,810,369 | ) | | | (29,433 | ) | | | (799,202 | ) |
| Increase (decrease) | | | (3,471 | ) | | $ | 132,126 | | | | (4,169 | ) | | $ | (158,559 | ) |
| | | | | | | | | | | | | | | | | |
| Class R3 Shares | | | | | | | | | | | | | | | | |
| Shares sold | | | 104,458 | | | $ | 3,386,244 | | | | 79,419 | | | $ | 2,148,140 | |
| Reinvestment of distributions | | | 42,361 | | | | 1,134,001 | | | | 105,069 | | | | 2,381,915 | |
| Shares reacquired | | | (176,443 | ) | | | (6,023,366 | ) | | | (216,716 | ) | | | (5,723,924 | ) |
| Decrease | | | (29,624 | ) | | $ | (1,503,121 | ) | | | (32,228 | ) | | $ | (1,193,869 | ) |
| | | | | | | | | | | | | | | | | |
| Class R4 Shares | | | | | | | | | | | | | | | | |
| Shares sold | | | 189,027 | | | $ | 5,694,409 | | | | 86,092 | | | $ | 2,250,949 | |
| Reinvestment of distributions | | | 10,913 | | | | 298,136 | | | | 14,565 | | | | 335,582 | |
| Shares reacquired | | | (128,858 | ) | | | (4,353,339 | ) | | | (84,758 | ) | | | (2,346,240 | ) |
| Increase | | | 71,082 | | | $ | 1,639,206 | | | | 15,899 | | | $ | 240,291 | |
225
Notes to Financial Statements (continued)
| Growth Leaders Fund | | Year Ended
October 31, 2020 | | | Year Ended
October 31, 2019 | |
| Class R5 Shares | | Shares | | | Amount | | | Shares | | | Amount | |
| Shares sold | | | 119,938 | | | $ | 4,183,168 | | | | 129,982 | | | $ | 3,744,733 | |
| Reinvestment of distributions | | | 26,421 | | | | 741,362 | | | | 56,291 | | | | 1,325,659 | |
| Shares reacquired | | | (138,213 | ) | | | (4,812,019 | ) | | | (150,726 | ) | | | (4,168,242 | ) |
| Increase | | | 8,146 | | | $ | 112,511 | | | | 35,547 | | | $ | 902,150 | |
| | | | | | | | | | | | | | | | | |
| Class R6 Shares | | | | | | | | | | | | | | | | |
| Shares sold | | | 738,445 | | | $ | 25,990,050 | | | | 575,215 | | | $ | 15,789,971 | |
| Reinvestment of distributions | | | 57,545 | | | | 1,621,043 | | | | 73,296 | | | | 1,731,263 | |
| Shares reacquired | | | (552,495 | ) | | | (17,778,515 | ) | | | (236,259 | ) | | | (6,656,765 | ) |
| Increase | | | 243,495 | | | $ | 9,832,578 | | | | 412,252 | | | $ | 10,864,469 | |
| | | | | | | | | | | | | | | | | |
| Health Care Fund | | Year Ended
October 31, 2020 | | | Year Ended
October 31, 2019(c) | |
| Class A Shares | | Shares | | | Amount | | | Shares | | | Amount | |
| Shares sold | | | 91,012 | | | $ | 1,606,250 | | | | 62,564 | | | $ | 927,336 | |
| Shares reacquired | | | (48,656 | ) | | | (799,696 | ) | | | – | | | | – | |
| Increase | | | 42,356 | | | $ | 806,554 | | | | 62,564 | | | $ | 927,336 | |
| | | | | | | | | | | | | | | | | |
| Class C Shares | | | | | | | | | | | | | | | | |
| Shares sold | | | 18,378 | | | $ | 325,976 | | | | 8,941 | | | $ | 132,309 | |
| Shares reacquired | | | (10,151 | ) | | | (175,759 | ) | | | – | | | | – | |
| Increase | | | 8,227 | | | $ | 150,217 | | | | 8,941 | | | $ | 132,309 | |
| | | | | | | | | | | | | | | | | |
| Class F Shares | | | | | | | | | | | | | | | | |
| Shares sold | | | 6,790 | | | $ | 120,001 | | | | 33,333 | | | $ | 500,000 | |
| Reinvestment of distributions | | | 2 | | | | 37 | | | | – | | | | – | |
| Shares reacquired | | | (34,470 | ) | | | (633,133 | ) | | | – | | | | – | |
| Increase (decrease) | | | (27,678 | ) | | $ | (513,095 | ) | | | 33,333 | | | $ | 500,000 | |
| | | | | | | | | | | | | | | | | |
| Class F3 Shares | | | | | | | | | | | | | | | | |
| Shares sold | | | – | | | $ | – | | | | 33,333 | | | $ | 500,000 | |
| Reinvestment of distributions | | | 23 | | | | 346 | | | | – | | | | – | |
| Shares reacquired | | | (31,530 | ) | | | (577,083 | ) | | | – | | | | – | |
| Increase (decrease) | | | (31,507 | ) | | $ | (576,737 | ) | | | 33,333 | | | $ | 500,000 | |
| | | | | | | | | | | | | | | | | |
| Class I Shares | | | | | | | | | | | | | | | | |
| Shares sold | | | – | | | $ | – | | | | 7,333 | | | $ | 110,000 | |
| Reinvestment of distributions | | | 4 | | | | 54 | | | | – | | | | – | |
| Shares reacquired | | | (6,452 | ) | | | (118,013 | ) | | | – | | | | – | |
| Increase (decrease) | | | (6,448 | ) | | $ | (117,959 | ) | | | 7,333 | | | $ | 110,000 | |
| | | | | | | | | | | | | | | | | |
| Class R3 Shares | | | | | | | | | | | | | | | | |
| Shares sold | | | – | | | $ | – | | | | 666.67 | | | $ | 10,000 | |
| Increase | | | – | | | $ | – | | | | 666.67 | | | $ | 10,000 | |
| | | | | | | | | | | | | | | | | |
| Class R4 Shares | | | | | | | | | | | | | | | | |
| Shares sold | | | – | | | $ | – | | | | 666.67 | | | $ | 10,000 | |
| Increase | | | – | | | $ | – | | | | 666.67 | | | $ | 10,000 | |
226
Notes to Financial Statements (continued)
| Health Care Fund | | Year Ended
October 31, 2020 | | | Year Ended
October 31, 2019(c) | |
| Class R5 Shares | | Shares | | | Amount | | | Shares | | | Amount | |
| Shares sold | | | – | | | $ | – | | | | 666.67 | | | $ | 10,000 | |
| Reinvestment of distributions | | | – | | | | 5 | | | | – | | | | – | |
| Increase | | | – | | | $ | 5 | | | | 666.67 | | | $ | 10,000 | |
| | | | | | | | | | | | | | | | | |
| Class R6 Shares | | | | | | | | | | | | | | | | |
| Shares sold | | | 62,558 | | | $ | 1,019,533 | | | | 33,377 | | | $ | 500,613 | |
| Reinvestment of distributions | | | 23 | | | | 346 | | | | – | | | | – | |
| Shares reacquired | | | (34,524 | ) | | | (627,476 | ) | | | – | | | | – | |
| Increase | | | 28,057 | | | $ | 392,403 | | | | 33,377 | | | $ | 500,613 | |
| | | | | | | | | | | | | | | | | |
| International Equity Fund | | Year Ended
October 31, 2020 | | | Year Ended
October 31, 2019 | |
| Class A Shares | | Shares | | | Amount | | | Shares | | | Amount | |
| Shares sold | | | 642,645 | | | $ | 8,200,504 | | | | 767,237 | | | $ | 9,361,078 | |
| Converted from Class C* | | | 149,893 | | | | 1,969,103 | | | | 56,367 | | | | 712,132 | |
| Reinvestment of distributions | | | 189,205 | | | | 2,569,398 | | | | 332,029 | | | | 3,801,727 | |
| Shares reacquired | | | (3,033,576 | ) | | | (37,897,966 | ) | | | (3,571,725 | ) | | | (44,065,459 | ) |
| Decrease | | | (2,051,833 | ) | | $ | (25,158,961 | ) | | | (2,416,092 | ) | | $ | (30,190,522 | ) |
| | | | | | | | | | | | | | | | | |
| Class C Shares | | | | | | | | | | | | | | | | |
| Shares sold | | | 41,975 | | | $ | 518,824 | | | | 64,962 | | | $ | 787,135 | |
| Reinvestment of distributions | | | 5,240 | | | | 71,063 | | | | 9,329 | | | | 106,626 | |
| Shares reacquired | | | (208,954 | ) | | | (2,595,055 | ) | | | (270,455 | ) | | | (3,316,716 | ) |
| Converted to Class A* | | | (150,680 | ) | | | (1,969,103 | ) | | | (56,744 | ) | | | (712,132 | ) |
| Decrease | | | (312,419 | ) | | $ | (3,974,271 | ) | | | (252,908 | ) | | $ | (3,135,087 | ) |
| | | | | | | | | | | | | | | | | |
| Class F Shares | | | | | | | | | | | | | | | | |
| Shares sold | | | 134,470 | | | $ | 1,779,804 | | | | 216,036 | | | $ | 2,660,956 | |
| Reinvestment of distributions | | | 58,859 | | | | 794,605 | | | | 110,757 | | | | 1,260,411 | |
| Shares reacquired | | | (3,126,496 | ) | | | (38,695,120 | ) | | | (1,426,548 | ) | | | (17,554,903 | ) |
| Decrease | | | (2,933,167 | ) | | $ | (36,120,711 | ) | | | (1,099,755 | ) | | $ | (13,633,536 | ) |
| | | | | | | | | | | | | | | | | |
| Class F3 Shares | | | | | | | | | | | | | | | | |
| Shares sold | | | 79,051 | | | $ | 1,057,492 | | | | 40,455 | | | $ | 507,547 | |
| Reinvestment of distributions | | | 5,613 | | | | 76,992 | | | | 9,709 | | | | 112,239 | |
| Shares reacquired | | | (93,281 | ) | | | (1,222,927 | ) | | | (123,719 | ) | | | (1,546,723 | ) |
| Decrease | | | (8,617 | ) | | $ | (88,443 | ) | | | (73,555 | ) | | $ | (926,937 | ) |
| | | | | | | | | | | | | | | | | |
| Class I Shares | | | | | | | | | | | | | | | | |
| Shares sold | | | 1,321,968 | | | $ | 17,511,567 | | | | 553,797 | | | $ | 6,945,062 | |
| Reinvestment of distributions | | | 243,036 | | | | 3,329,599 | | | | 549,976 | | | | 6,346,721 | |
| Shares reacquired | | | (3,189,966 | ) | | | (43,162,311 | ) | | | (8,753,899 | ) | | | (110,005,402 | ) |
| Decrease | | | (1,624,962 | ) | | $ | (22,321,145 | ) | | | (7,650,126 | ) | | $ | (96,713,619 | ) |
| | | | | | | | | | | | | | | | | |
| Class P Shares | | | | | | | | | | | | | | | | |
| Shares sold | | | 48 | | | $ | 610 | | | | 66 | | | $ | 825 | |
| Reinvestment of distributions | | | 39 | | | | 544 | | | | 62 | | | | 706 | |
| Shares reacquired | | | (486 | ) | | | (6,471 | ) | | | (188 | ) | | | (2,350 | ) |
| Decrease | | | (399 | ) | | $ | (5,317 | ) | | | (60 | ) | | $ | (819 | ) |
227
Notes to Financial Statements (continued)
| International Equity Fund | | Year Ended
October 31, 2020 | | | Year Ended
October 31, 2019 | |
| Class R2 Shares | | Shares | | | Amount | | | Shares | | | Amount | |
| Shares sold | | | 3,283 | | | $ | 41,953 | | | | 8,518 | | | $ | 106,300 | |
| Reinvestment of distributions | | | 162 | | | | 2,195 | | | | 185 | | | | 2,126 | |
| Shares reacquired | | | (27,471 | ) | | | (299,532 | ) | | | (5,347 | ) | | | (67,134 | ) |
| Increase (decrease) | | | (24,026 | ) | | $ | (255,384 | ) | | | 3,356 | | | $ | 41,292 | |
| | | | | | | | | | | | | | | | | |
| Class R3 Shares | | | | | | | | | | | | | | | | |
| Shares sold | | | 72,743 | | | $ | 893,248 | | | | 98,258 | | | $ | 1,192,235 | |
| Reinvestment of distributions | | | 6,649 | | | | 89,018 | | | | 13,788 | | | | 155,667 | |
| Shares reacquired | | | (229,010 | ) | | | (2,953,782 | ) | | | (304,335 | ) | | | (3,711,897 | ) |
| Decrease | | | (149,618 | ) | | $ | (1,971,516 | ) | | | (192,289 | ) | | $ | (2,363,995 | ) |
| | | | | | | | | | | | | | | | | |
| Class R4 Shares | | | | | | | | | | | | | | | | |
| Shares sold | | | 26,181 | | | $ | 334,025 | | | | 29,206 | | | $ | 360,320 | |
| Reinvestment of distributions | | | 1,213 | | | | 16,392 | | | | 1,800 | | | | 20,518 | |
| Shares reacquired | | | (29,947 | ) | | | (383,267 | ) | | | (19,307 | ) | | | (236,550 | ) |
| Increase (decrease) | | | (2,553 | ) | | $ | (32,850 | ) | | | 11,699 | | | $ | 144,288 | |
| | | | | | | | | | | | | | | | | |
| Class R5 Shares | | | | | | | | | | | | | | | | |
| Shares sold | | | 1,555 | | | $ | 20,106 | | | | 861 | | | $ | 10,950 | |
| Reinvestment of distributions | | | 104 | | | | 1,430 | | | | 140 | | | | 1,612 | |
| Shares reacquired | | | (3,025 | ) | | | (40,745 | ) | | | (509 | ) | | | (6,415 | ) |
| Increase (decrease) | | | (1,366 | ) | | $ | (19,209 | ) | | | 492 | | | $ | 6,147 | |
| | | | | | | | | | | | | | | | | |
| Class R6 Shares | | | | | | | | | | | | | | | | |
| Shares sold | | | 7,203 | | | $ | 99,503 | | | | 13,196 | | | $ | 155,346 | |
| Reinvestment of distributions | | | 152 | | | | 2,096 | | | | 186 | | | | 2,148 | |
| Shares reacquired | | | (36,013 | ) | | | (450,847 | ) | | | (43,449 | ) | | | (555,033 | ) |
| Decrease | | | (28,658 | ) | | $ | (349,248 | ) | | | (30,067 | ) | | $ | (397,539 | ) |
| | | | | | | | | | | | | | | | | |
| International Opportunities Fund | | Year Ended
October 31, 2020 | | | Year Ended
October 31, 2019 | |
| Class A Shares | | Shares | | | Amount | | | Shares | | | Amount | |
| Shares sold | | | 760,276 | | | $ | 11,555,309 | | | | 773,410 | | | $ | 11,705,432 | |
| Converted from Class C* | | | 105,250 | | | | 1,636,396 | | | | 38,705 | | | | 601,117 | |
| Reinvestment of distributions | | | 87,790 | | | | 1,454,675 | | | | 1,093,179 | | | | 15,282,642 | |
| Shares reacquired | | | (2,721,200 | ) | | | (40,979,780 | ) | | | (4,262,836 | ) | | | (65,159,953 | ) |
| Decrease | | | (1,767,884 | ) | | $ | (26,333,400 | ) | | | (2,357,542 | ) | | $ | (37,570,762 | ) |
| | | | | | | | | | | | | | | | | |
| Class C Shares | | | | | | | | | | | | | | | | |
| Shares sold | | | 123,408 | | | $ | 1,808,409 | | | | 171,903 | | | $ | 2,372,915 | |
| Reinvestment of distributions | | | 6,381 | | | | 98,204 | | | | 230,489 | | | | 2,991,751 | |
| Shares reacquired | | | (647,947 | ) | | | (8,895,347 | ) | | | (1,011,279 | ) | | | (14,347,970 | ) |
| Converted to Class A* | | | (113,756 | ) | | | (1,636,396 | ) | | | (41,834 | ) | | | (601,117 | ) |
| Decrease | | | (631,914 | ) | | $ | (8,625,130 | ) | | | (650,721 | ) | | $ | (9,584,421 | ) |
| | | | | | | | | | | | | | | | | |
| Class F Shares | | | | | | | | | | | | | | | | |
| Shares sold | | | 781,507 | | | $ | 11,657,260 | | | | 3,127,784 | | | $ | 46,668,008 | |
| Reinvestment of distributions | | | 62,372 | | | | 1,022,286 | | | | 931,165 | | | | 12,868,695 | |
| Shares reacquired | | | (3,799,996 | ) | | | (55,967,692 | ) | | | (10,678,693 | ) | | | (163,231,093 | ) |
| Decrease | | | (2,956,117 | ) | | $ | (43,288,146 | ) | | | (6,619,744 | ) | | $ | (103,694,390 | ) |
228
Notes to Financial Statements (continued)
| International Opportunities Fund | | Year Ended
October 31, 2020 | | | Year Ended
October 31, 2019 | |
| Class F3 Shares | | Shares | | | Amount | | | Shares | | | Amount | |
| Shares sold | | | 339,811 | | | $ | 5,211,076 | | | | 256,576 | | | $ | 4,086,577 | |
| Reinvestment of distributions | | | 16,394 | | | | 280,820 | | | | 156,610 | | | | 2,259,887 | |
| Shares reacquired | | | (429,731 | ) | | | (6,706,269 | ) | | | (533,032 | ) | | | (8,479,003 | ) |
| Decrease | | | (73,526 | ) | | $ | (1,214,373 | ) | | | (119,846 | ) | | $ | (2,132,539 | ) |
| | | | | | | | | | | | | | | | | |
| Class I Shares | | | | | | | | | | | | | | | | |
| Shares sold | | | 383,771 | | | $ | 5,985,361 | | | | 1,468,815 | | | $ | 23,403,291 | |
| Reinvestment of distributions | | | 184,630 | | | | 3,147,949 | | | | 1,638,684 | | | | 23,564,274 | |
| Shares reacquired | | | (4,927,626 | ) | | | (76,300,116 | ) | | | (3,315,166 | ) | | | (52,601,168 | ) |
| Decrease | | | (4,359,225 | ) | | $ | (67,166,806 | ) | | | (207,667 | ) | | $ | (5,633,603 | ) |
| | | | | | | | | | | | | | | | | |
| Class P Shares | | | | | | | | | | | | | | | | |
| Shares sold | | | 2,368 | | | $ | 38,976 | | | | 498 | | | $ | 7,839 | |
| Reinvestment of distributions | | | 52 | | | | 891 | | | | 776 | | | | 11,144 | |
| Shares reacquired | | | (871 | ) | | | (13,302 | ) | | | (3,099 | ) | | | (50,736 | ) |
| Increase (decrease) | | | 1,549 | | | $ | 26,565 | | | | (1,825 | ) | | $ | (31,753 | ) |
| | | | | | | | | | | | | | | | | |
| Class R2 Shares | | | | | | | | | | | | | | | | |
| Shares sold | | | 46,675 | | | $ | 655,760 | | | | 74,942 | | | $ | 1,138,054 | |
| Reinvestment of distributions | | | 1,631 | | | | 26,601 | | | | 21,672 | | | | 298,204 | |
| Shares reacquired | | | (95,590 | ) | | | (1,378,536 | ) | | | (95,660 | ) | | | (1,451,607 | ) |
| Increase (decrease) | | | (47,284 | ) | | $ | (696,175 | ) | | | 954 | | | $ | (15,349 | ) |
| | | | | | | | | | | | | | | | | |
| Class R3 Shares | | | | | | | | | | | | | | | | |
| Shares sold | | | 316,332 | | | $ | 4,596,548 | | | | 381,954 | | | $ | 5,669,574 | |
| Reinvestment of distributions | | | 11,544 | | | | 187,243 | | | | 268,932 | | | | 3,678,988 | |
| Shares reacquired | | | (579,477 | ) | | | (8,227,429 | ) | | | (1,558,908 | ) | | | (23,275,731 | ) |
| Decrease | | | (251,601 | ) | | $ | (3,443,638 | ) | | | (908,022 | ) | | $ | (13,927,169 | ) |
| | | | | | | | | | | | | | | | | |
| Class R4 Shares | | | | | | | | | | | | | | | | |
| Shares sold | | | 90,472 | | | $ | 1,337,820 | | | | 210,639 | | | $ | 3,269,594 | |
| Reinvestment of distributions | | | 4,037 | | | | 66,568 | | | | 24,276 | | | | 337,923 | |
| Shares reacquired | | | (175,841 | ) | | | (2,801,502 | ) | | | (174,290 | ) | | | (2,752,340 | ) |
| Increase (decrease) | | | (81,332 | ) | | $ | (1,397,114 | ) | | | 60,625 | | | $ | 855,177 | |
| | | | | | | | | | | | | | | | | |
| Class R5 Shares | | | | | | | | | | | | | | | | |
| Shares sold | | | 527,631 | | | $ | 8,196,957 | | | | 318,352 | | | $ | 4,896,019 | |
| Reinvestment of distributions | | | 15,637 | | | | 266,448 | | | | 270,315 | | | | 3,884,423 | |
| Shares reacquired | | | (639,879 | ) | | | (8,882,336 | ) | | | (1,799,660 | ) | | | (28,372,327 | ) |
| Decrease | | | (96,611 | ) | | $ | (418,931 | ) | | | (1,210,993 | ) | | $ | (19,591,885 | ) |
| | | | | | | | | | | | | | | | | |
| Class R6 Shares | | | | | | | | | | | | | | | | |
| Shares sold | | | 1,005,911 | | | $ | 15,530,561 | | | | 1,165,326 | | | $ | 18,507,105 | |
| Reinvestment of distributions | | | 24,719 | | | | 423,436 | | | | 224,744 | | | | 3,243,056 | |
| Shares reacquired | | | (1,063,705 | ) | | | (16,481,416 | ) | | | (1,361,388 | ) | | | (21,573,085 | ) |
| Increase (decrease) | | | (33,075 | ) | | $ | (527,419 | ) | | | 28,682 | | | $ | 177,076 | |
229
Notes to Financial Statements (continued)
| International Value Fund | | Year Ended
October 31, 2020 | | | Year Ended
October 31, 2019 | |
| Class A Shares | | Shares | | | Amount | | | Shares | | | Amount | |
| Shares sold | | | 3,362,540 | | | $ | 20,988,271 | | | | 3,801,220 | | | $ | 25,543,177 | |
| Converted from Class C* | | | 1,257,977 | | | | 7,942,129 | | | | 399,257 | | | | 2,749,743 | |
| Reinvestment of distributions | | | 642,320 | | | | 4,069,241 | | | | 1,174,724 | | | | 7,982,832 | |
| Shares reacquired | | | (11,073,443 | ) | | | (69,291,701 | ) | | | (11,762,268 | ) | | | (79,261,194 | ) |
| Decrease | | | (5,810,606 | ) | | $ | (36,292,060 | ) | | | (6,387,067 | ) | | $ | (42,985,442 | ) |
| | | | | | | | | | | | | | | | | |
| Class C Shares | | | | | | | | | | | | | | | | |
| Shares sold | | | 116,560 | | | $ | 736,623 | | | | 156,977 | | | $ | 1,052,086 | |
| Reinvestment of distributions | | | 36,121 | | | | 231,625 | | | | 112,990 | | | | 766,245 | |
| Shares reacquired | | | (1,370,675 | ) | | | (8,502,971 | ) | | | (2,080,259 | ) | | | (13,904,624 | ) |
| Converted to Class A* | | | (1,268,228 | ) | | | (7,942,129 | ) | | | (402,931 | ) | | | (2,749,743 | ) |
| Decrease | | | (2,486,222 | ) | | $ | (15,476,852 | ) | | | (2,213,223 | ) | | $ | (14,836,036 | ) |
| | | | | | | | | | | | | | | | | |
| Class F Shares | | | | | | | | | | | | | | | | |
| Shares sold | | | 1,276,200 | | | $ | 8,124,091 | | | | 2,762,728 | | | $ | 18,744,587 | |
| Reinvestment of distributions | | | 81,787 | | | | 520,986 | | | | 164,638 | | | | 1,121,397 | |
| Shares reacquired | | | (2,869,473 | ) | | | (17,538,005 | ) | | | (5,543,501 | ) | | | (37,378,303 | ) |
| Decrease | | | (1,511,486 | ) | | $ | (8,892,928 | ) | | | (2,616,135 | ) | | $ | (17,512,319 | ) |
| | | | | | | | | | | | | | | | | |
| Class F3 Shares | | | | | | | | | | | | | | | | |
| Shares sold | | | 682,416 | | | $ | 4,290,243 | | | | 818,922 | | | $ | 5,549,050 | |
| Reinvestment of distributions | | | 73,214 | | | | 464,168 | | | | 123,243 | | | | 841,245 | |
| Shares reacquired | | | (1,264,958 | ) | | | (8,054,376 | ) | | | (1,391,262 | ) | | | (9,491,928 | ) |
| Decrease | | | (509,328 | ) | | $ | (3,299,965 | ) | | | (449,097 | ) | | $ | (3,101,633 | ) |
| | | | | | | | | | | | | | | | | |
| Class I Shares | | | | | | | | | | | | | | | | |
| Shares sold | | | 5,843,812 | | | $ | 35,479,009 | | | | 2,593,354 | | | $ | 17,570,912 | |
| Reinvestment of distributions | | | 678,632 | | | | 4,300,880 | | | | 1,169,360 | | | | 7,984,324 | |
| Shares reacquired | | | (5,256,212 | ) | | | (34,690,399 | ) | | | (18,398,216 | ) | | | (124,903,980 | ) |
| Increase (decrease) | | | 1,266,232 | | | $ | 5,089,490 | | | | (14,635,502 | ) | | $ | (99,348,744 | ) |
| | | | | | | | | | | | | | | | | |
| Class R2 Shares | | | | | | | | | | | | | | | | |
| Shares sold | | | 881 | | | $ | 5,868 | | | | 19,777 | | | $ | 136,968 | |
| Reinvestment of distributions | | | 35 | | | | 218 | | | | 75 | | | | 523 | |
| Shares reacquired | | | (60,515 | ) | | | (433,765 | ) | | | (10,637 | ) | | | (73,753 | ) |
| Increase (decrease) | | | (59,599 | ) | | $ | (427,679 | ) | | | 9,215 | | | $ | 63,738 | |
| | | | | | | | | | | | | | | | | |
| Class R3 Shares | | | | | | | | | | | | | | | | |
| Shares sold | | | 114,119 | | | $ | 720,791 | | | | 115,300 | | | $ | 783,081 | |
| Reinvestment of distributions | | | 16,184 | | | | 103,892 | | | | 29,117 | | | | 200,440 | |
| Shares reacquired | | | (241,677 | ) | | | (1,541,470 | ) | | | (294,971 | ) | | | (2,025,828 | ) |
| Decrease | | | (111,374 | ) | | $ | (716,787 | ) | | | (150,554 | ) | | $ | (1,042,307 | ) |
| | | | | | | | | | | | | | | | | |
| Class R4 Shares | | | | | | | | | | | | | | | | |
| Shares sold | | | 2,990 | | | $ | 20,347 | | | | 1,440 | | | $ | 9,542 | |
| Reinvestment of distributions | | | 112 | | | | 701 | | | | 160 | | | | 1,084 | |
| Shares reacquired | | | (2,223 | ) | | | (13,255 | ) | | | (2,401 | ) | | | (16,297 | ) |
| Increase (decrease) | | | 879 | | | $ | 7,793 | | | | (801 | ) | | $ | (5,671 | ) |
230
Notes to Financial Statements (continued)
| International Value Fund | | Year Ended
October 31, 2020 | | | Year Ended
October 31, 2019 | |
| Class R5 Shares | | Shares | | | Amount | | | Shares | | | Amount | |
| Shares sold | | | 39 | | | $ | 212 | | | | 258 | | | $ | 1,756 | |
| Reinvestment of distributions | | | 12 | | | | 80 | | | | 54 | | | | 367 | |
| Shares reacquired | | | (36 | ) | | | (228 | ) | | | (264 | ) | | | (1,831 | ) |
| Increase | | | 15 | | | $ | 64 | | | | 48 | | | $ | 292 | |
| | | | | | | | | | | | | | | | | |
| Class R6 Shares | | | | | | | | | | | | | | | | |
| Shares sold | | | 8,479 | | | $ | 54,105 | | | | 15,922 | | | $ | 108,706 | |
| Reinvestment of distributions | | | 42 | | | | 270 | | | | 78 | | | | 532 | |
| Shares reacquired | | | (66,232 | ) | | | (393,775 | ) | | | (61,084 | ) | | | (413,122 | ) |
| Decrease | | | (57,711 | ) | | $ | (339,400 | ) | | | (45,084 | ) | | $ | (303,884 | ) |
| | | | | | | | | | | | | | | | | |
| Value Opportunities Fund | | Year Ended
October 31, 2020 | | | Year Ended
October 31, 2019 | |
| Class A Shares | | Shares | | | Amount | | | Shares | | | Amount | |
| Shares sold | | | 2,910,034 | | | $ | 46,055,482 | | | | 3,752,897 | | | $ | 66,187,933 | |
| Converted from Class C* | | | 2,248,670 | | | | 37,248,763 | | | | 1,149,150 | | | | 20,901,483 | |
| Reinvestment of distributions | | | 4,842,769 | | | | 81,745,942 | | | | 4,554,701 | | | | 78,887,425 | |
| Shares reacquired | | | (14,813,832 | ) | | | (239,951,578 | ) | | | (15,125,658 | ) | | | (266,938,327 | ) |
| Decrease | | | (4,812,359 | ) | | $ | (74,901,391 | ) | | | (5,668,910 | ) | | $ | (100,961,486 | ) |
| | | | | | | | | | | | | | | | | |
| Class C Shares | | | | | | | | | | | | | | | | |
| Shares sold | | | 318,879 | | | $ | 4,435,295 | | | | 529,849 | | | $ | 8,095,824 | |
| Reinvestment of distributions | | | 1,138,754 | | | | 16,511,937 | | | | 1,402,722 | | | | 21,307,340 | |
| Shares reacquired | | | (3,181,663 | ) | | | (44,706,161 | ) | | | (4,878,778 | ) | | | (75,020,977 | ) |
| Converted to Class A* | | | (2,631,705 | ) | | | (37,248,763 | ) | | | (1,317,261 | ) | | | (20,901,483 | ) |
| Decrease | | | (4,355,735 | ) | | $ | (61,007,692 | ) | | | (4,263,468 | ) | | $ | (66,519,296 | ) |
| | | | | | | | | | | | | | | | | |
| Class F Shares | | | | | | | | | | | | | | | | |
| Shares sold | | | 1,381,384 | | | $ | 23,429,724 | | | | 2,313,077 | | | $ | 41,740,454 | |
| Reinvestment of distributions | | | 1,260,844 | | | | 21,812,599 | | | | 1,639,657 | | | | 29,021,931 | |
| Shares reacquired | | | (5,708,517 | ) | | | (94,731,088 | ) | | | (12,529,094 | ) | | | (225,857,303 | ) |
| Decrease | | | (3,066,289 | ) | | $ | (49,488,765 | ) | | | (8,576,360 | ) | | $ | (155,094,918 | ) |
| | | | | | | | | | | | | | | | | |
| Class F3 Shares | | | | | | | | | | | | | | | | |
| Shares sold | | | 1,695,794 | | | $ | 28,270,170 | | | | 2,330,846 | | | $ | 43,518,039 | |
| Reinvestment of distributions | | | 1,568,561 | | | | 27,904,698 | | | | 1,620,065 | | | | 29,371,776 | |
| Shares reacquired | | | (5,458,935 | ) | | | (94,169,448 | ) | | | (6,859,383 | ) | | | (128,738,522 | ) |
| Decrease | | | (2,194,580 | ) | | $ | (37,994,580 | ) | | | (2,908,472 | ) | | $ | (55,848,707 | ) |
| | | | | | | | | | | | | | | | | |
| Class I Shares | | | | | | | | | | | | | | | | |
| Shares sold | | | 2,064,402 | | | $ | 34,869,803 | | | | 961,893 | | | $ | 17,806,754 | |
| Reinvestment of distributions | | | 1,753,254 | | | | 30,997,529 | | | | 2,179,337 | | | | 39,337,041 | |
| Shares reacquired | | | (6,620,246 | ) | | | (111,712,805 | ) | | | (10,309,720 | ) | | | (191,202,476 | ) |
| Decrease | | | (2,802,590 | ) | | $ | (45,845,473 | ) | | | (7,168,490 | ) | | $ | (134,058,681 | ) |
| | | | | | | | | | | | | | | | | |
| Class P Shares | | | | | | | | | | | | | | | | |
| Shares sold | | | 96,551 | | | $ | 1,526,223 | | | | 92,438 | | | $ | 1,619,819 | |
| Reinvestment of distributions | | | 148,473 | | | | 2,448,323 | | | | 137,034 | | | | 2,324,097 | |
| Shares reacquired | | | (459,366 | ) | | | (7,377,885 | ) | | | (347,892 | ) | | | (6,125,288 | ) |
| Decrease | | | (214,342 | ) | | $ | (3,403,339 | ) | | | (118,420 | ) | | $ | (2,181,372 | ) |
231
Notes to Financial Statements (continued)
| Value Opportunities Fund | | Year Ended
October 31, 2020 | | | Year Ended
October 31, 2019 | |
| Class R2 Shares | | Shares | | | Amount | | | Shares | | | Amount | |
| Shares sold | | | 48,385 | | | $ | 720,604 | | | | 110,386 | | | $ | 1,880,618 | |
| Reinvestment of distributions | | | 40,808 | | | | 654,971 | | | | 32,716 | | | | 541,780 | |
| Shares reacquired | | | (151,121 | ) | | | (2,282,070 | ) | | | (169,877 | ) | | | (2,869,687 | ) |
| Decrease | | | (61,928 | ) | | $ | (906,495 | ) | | | (26,775 | ) | | $ | (447,289 | ) |
| | | | | | | | | | | | | | | | | |
| Class R3 Shares | | | | | | | | | | | | | | | | |
| Shares sold | | | 462,949 | | | $ | 7,040,130 | | | | 513,819 | | | $ | 8,806,383 | |
| Reinvestment of distributions | | | 389,411 | | | | 6,339,608 | | | | 426,709 | | | | 7,151,641 | |
| Shares reacquired | | | (1,480,687 | ) | | | (23,164,281 | ) | | | (1,870,901 | ) | | | (32,453,823 | ) |
| Decrease | | | (628,327 | ) | | $ | (9,784,543 | ) | | | (930,373 | ) | | $ | (16,495,799 | ) |
| | | | | | | | | | | | | | | | | |
| Class R4 Shares | | | | | | | | | | | | | | | | |
| Shares sold | | | 248,272 | | | $ | 3,995,003 | | | | 254,756 | | | $ | 4,545,894 | |
| Reinvestment of distributions | | | 272,329 | | | | 4,591,465 | | | | 259,988 | | | | 4,497,790 | |
| Shares reacquired | | | (816,106 | ) | | | (13,379,541 | ) | | | (949,223 | ) | | | (16,963,873 | ) |
| Decrease | | | (295,505 | ) | | $ | (4,793,073 | ) | | | (434,479 | ) | | $ | (7,920,189 | ) |
| | | | | | | | | | | | | | | | | |
| Class R5 Shares | | | | | | | | | | | | | | | | |
| Shares sold | | | 32,461 | | | $ | 592,474 | | | | 65,981 | | | $ | 1,178,244 | |
| Reinvestment of distributions | | | 16,871 | | | | 298,450 | | | | 9,247 | | | | 166,992 | |
| Shares reacquired | | | (72,377 | ) | | | (1,293,024 | ) | | | (36,590 | ) | | | (676,241 | ) |
| Increase (decrease) | | | (23,045 | ) | | $ | (402,100 | ) | | | 38,638 | | | $ | 668,995 | |
| | | | | | | | | | | | | | | | | |
| Class R6 Shares | | | | | | | | | | | | | | | | |
| Shares sold | | | 343,530 | | | $ | 5,936,985 | | | | 766,687 | | | $ | 13,913,406 | |
| Reinvestment of distributions | | | 205,390 | | | | 3,651,835 | | | | 400,545 | | | | 7,257,877 | |
| Shares reacquired | | | (963,533 | ) | | | (17,109,981 | ) | | | (3,717,129 | ) | | | (69,502,811 | ) |
| Decrease | | | (414,613 | ) | | $ | (7,521,161 | ) | | | (2,549,897 | ) | | $ | (48,331,528 | ) |
| | |
| * | Effective June 30, 2020, automatic conversion of Class C shares occurs on the 25th day of the month (or, if the 25th day was not a business day, the next business day thereafter) following the eighth anniversary of the day on which the purchase order was accepted. Prior to June 30, 2020, conversion occurred following the tenth anniversary of the day on which the purchase was accepted. |
| (a) | Commenced on November 1, 2019. |
| (b) | Commenced on January 30, 2019. |
| (c) | Commenced on July 26, 2019. |
| (d) | Commenced on June 28, 2019. |
As of the close of business on February 22, 2019, Fundamental Equity Fund acquired the net assets of Calibrated Large Cap Value Fund, pursuant to a plan of reorganization approved by Calibrated Large Cap Value Fund’s shareholders on October 31 2018. The reorganization permitted Calibrated Large Cap Value Fund shareholders to pursue a substantially similar investment goal, but as part of a larger fund with a lower expense ratio. The acquisition was accomplished by a tax-free exchange whereby holders of shares of Fundamental Equity Fund outstanding on February 22, 2019 received shares valued at $423,880,340 of Calibrated Large Cap Value Fund. Calibrated Large Cap Value Fund’s net assets at the date of acquisition, including $27,535,730 of net unrealized appreciation, $(49,933) of net investment losses and $(12,013,950) of accumulated net realized losses, were
232
Notes to Financial Statements (concluded)
combined with those of Fundamental Equity Fund. The cost basis of securities received from Calibrated Large Cap Value Fund was carried forward.
The total net assets of Calibrated Large Cap Value Fund immediately before the transfer were $423,880,340. Total net assets of Fundamental Equity Fund immediately before the transfer were $2,053,211,685. Total net assets of Fundamental Equity Fund immediately after the transfer were $2,477,092,025.
The following table illustrates share conversion ratios and dollar amounts of the reorganization on February 22, 2019:
| Class | | Calibrated Large
Cap Value Fund
Shares | | | Conversion
Ratio | | | Fundamental
Equity Fund
Shares | | | Fundamental
Equity Fund
Amount | |
| A | | | 2,635,997 | | | | 1.654713 | | | | 4,361,818 | | | $ | 52,385,435 | |
| C | | | 602,069 | | | | 1.840179 | | | | 1,107,914 | | | | 11,777,130 | |
| F | | | 837,536 | | | | 1.678115 | | | | 1,405,515 | | | | 16,683,465 | |
| F3 | | | 147,215 | | | | 1.641063 | | | | 241,589 | | | | 2,930,474 | |
| I | | | 16,963,051 | | | | 1.646722 | | | | 27,933,427 | | | | 337,435,793 | |
| R2 | | | 25,481 | | | | 1.702043 | | | | 43,370 | | | | 509,602 | |
| R3 | | | 4,531 | | | | 1.675276 | | | | 7,590 | | | | 89,490 | |
| R4 | | | 630 | | | | 1.659422 | | | | 1,046 | | | | 12,488 | |
| R5 | | | 634 | | | | 1.644442 | | | | 1,043 | | | | 12,604 | |
| R6 | | | 102,702 | | | | 1.639275 | | | | 168,358 | | | | 2,043,859 | |
Had the acquisition been completed on November 1, 2018 the beginning of Fundamental Equity Fund’s 2018 fiscal year, the Fund’s condensed proforma results of operations for the fiscal year ended October 31, 2019 would be as follows:
| Net investment income: | | $ | 41,411,957 | |
| | | | | |
| Net realized and unrealized gain on investments: | | $ | 134,745,038 | |
| | | | | |
| Net realized and unrealized loss on futures contracts | | $ | (137,890 | ) |
| | | | | |
| Net increase in net assets resulting from operations: | | $ | 176,019,105 | |
The combined investment portfolios have been managed as a single integrated portfolio since the acquisition was completed. Revenue and earnings of Calibrated Large Cap Value Fund’s portfolio holdings have been included in Fundamental Equity Fund’s Statement of Operations since the date of acquisition.
233
Report of Independent Registered Public Accounting Firm
To the shareholders and the Board of Trustees of Lord Abbett Securities Trust
Opinion on the Financial Statements and Financial Highlights
We have audited the accompanying statements of assets and liabilities, including the schedules of investments, of Lord Abbett Alpha Strategy Fund, Lord Abbett Durable Growth Fund, Lord Abbett Focused Growth Fund, Lord Abbett Focused Large Cap Value Fund, Lord Abbett Focused Small Cap Value Fund, Lord Abbett Fundamental Equity Fund, Lord Abbett Global Equity Research Fund, Lord Abbett Growth Leaders Fund, Lord Abbett Health Care Fund, Lord Abbett International Equity Fund, Lord Abbett International Opportunities Fund, Lord Abbett International Value Fund, and Lord Abbett Value Opportunities Fund, thirteen of the funds constituting the Lord Abbett Securities Trust (the “Trust”), as of October 31, 2020, the related statements of operations for the year then ended, the statements of changes in net assets for each of the two years in the period then ended, the financial highlights for each of the five years in the period then ended for the Trust, except for the Funds listed in the table below; the related statements of operations, changes in net assets, and the financial highlights for the periods indicated in the table below; and the related notes. In our opinion, the financial statements and financial highlights present fairly, in all material respects, the financial position of each of the funds listed above of the Trust as of October 31, 2020, and the results of their operations for the year then ended (or for the period listed in the table below), the changes in their net assets for each of the two years in the period then ended (or for the period listed in the table below), and the financial highlights for each of the five years in the period then ended (or for the period listed in the table below), in conformity with accounting principles generally accepted in the United States of America.
Individual Funds constituting
Lord Abbett Securities Trust | Statement of
Operations | Statement of
Changes
in Net Assets | Financial
Highlights |
| Lord Abbett Global Equity Research Fund | For the year ended October 31, 2020 | For each of the two years in the period then ended | For the period from January 17, 2017 (commencement of operations) through October 31, 2017 and for each of the three years in the period then ended October 31, 2020 |
| Lord Abbett Durable Growth Fund | For the year ended October 31, 2020 | For the year ended October 31, 2020 |
| Lord Abbett Focused Growth Fund | For the year ended October 31, 2020 | For the period from January 30, 2019 (commencement of operations) through October 31, 2019 and for the year ended October 31, 2020 |
| Lord Abbett Focused Large Cap Value Fund | For the year ended October 31, 2020 | For the period from July 26, 2019 (commencement of operations) through October 31, 2019 and for the year ended October 31, 2020 |
| Lord Abbett Health Care Fund | For the year ended October 31, 2020 | For the period from July 26, 2019 (commencement of operations) through October 31, 2019 and for the year ended October 31, 2020 |
234
Basis for Opinion
These financial statements and financial highlights are the responsibility of the Trust’s management. Our responsibility is to express an opinion on the Trust’s financial statements and financial highlights based on our audits. We are a public accounting firm registered with the Public Company Accounting Oversight Board (United States) (PCAOB) and are required to be independent with respect to the Trust in accordance with the U.S. federal securities laws and the applicable rules and regulations of the Securities and Exchange Commission and the PCAOB.
We conducted our audits in accordance with the standards of the PCAOB. Those standards require that we plan and perform the audit to obtain reasonable assurance about whether the financial statements and financial highlights are free of material misstatement, whether due to error or fraud. The Trust is not required to have, nor were we engaged to perform, an audit of its internal control over financial reporting. As part of our audits we are required to obtain an understanding of internal control over financial reporting but not for the purpose of expressing an opinion on the effectiveness of the Trust’s internal control over financial reporting. Accordingly, we express no such opinion.
Our audits included performing procedures to assess the risks of material misstatement of the financial statements and financial highlights, whether due to error or fraud, and performing procedures that respond to those risks. Such procedures included examining, on a test basis, evidence regarding the amounts and disclosures in the financial statements and financial highlights. Our audits also included evaluating the accounting principles used and significant estimates made by management, as well as evaluating the overall presentation of the financial statements and financial highlights. Our procedures included confirmation of securities owned as of October 31, 2020, by correspondence with the custodian and brokers; when replies were not received from brokers, we performed other auditing procedures. We believe that our audits provide a reasonable basis for our opinion.
DELOITTE & TOUCHE LLP
New York, New York
December 22, 2020
We have served as the auditor of one or more Lord Abbett Family of Funds’ investment companies since 1932.
235
Investments in Underlying Funds (unaudited)
Alpha Strategy Fund invests in Underlying Funds managed by Lord Abbett. As of October 31, 2020, Alpha Strategy Fund’s long-term investments were allocated among the Underlying Funds as follows:
| Underlying Fund Name | % of Investments |
| Lord Abbett Developing Growth Fund, Inc.-Class I | 20.24% |
| Lord Abbett Research Fund, Inc.-Small Cap Value Fund-Class I | 19.94% |
| Lord Abbett Securities Trust-Focused Small Cap Value Fund-Class I | 10.07% |
| Lord Abbett Securities Trust-International Opportunities Fund-Class I | 19.35% |
| Lord Abbett Securities Trust-Micro-Cap Growth Fund-Class I | 10.05% |
| Lord Abbett Securities Trust-Value Opportunities Fund-Class I | 20.32% |
The Ten Largest Holdings and the Holdings by Sector, as of October 31, 2020, for each Underlying Fund are presented below. Each Underlying Fund’s annual and semiannual reports, which are sent to shareholders and filed with the SEC, contain information about the Underlying Fund’s portfolio holdings, including a complete schedule of holdings. A complete schedule of holdings for each Underlying Fund is also filed with the SEC on Form N-PORT as of the end of each respective Underlying Fund’s first and third quarters. In addition, on or about the first day of the second month following each calendar quarter-end, each Fund makes publicly available a complete schedule of its portfolio holdings as of the last day of each such quarter. The information for the most recently ended calendar quarter may be viewed at www.lordabbett.com or requested at no charge by calling Lord Abbett at 888-522-2388.
Lord Abbett Developing Growth Fund, Inc.
| Ten Largest Holdings | % of Investments |
| Inphi Corp. | 2.49% |
| Five9, Inc. | 2.37% |
| Fiverr International Ltd. (Israel) | 2.20% |
| iRhythm Technologies, Inc. | 1.77% |
| Inspire Medical Systems, Inc. | 1.60% |
| LGI Homes, Inc. | 1.59% |
| Natera, Inc. | 1.50% |
| Deckers Outdoor Corp. | 1.47% |
| Axon Enterprise, Inc. | 1.47% |
| RH | 1.46% |
| |
| Holdings by Sector* | % of Investments |
| Consumer Discretionary | 17.95% |
| Consumer Staples | 3.15% |
| Financials | 2.15% |
| Health Care | 32.08% |
| Industrials | 9.83% |
| Information Technology | 26.00% |
| Real Estate | 1.27% |
| Money Market Fund(a) | 2.51% |
| Repurchase Agreement | 4.78% |
| Time Deposit(a) | 0.28% |
| Total | 100.00% |
| * | A sector may comprise several industries. |
| (a) | Securities were purchased with the cash collateral from loaned securities. |
236
Investments in Underlying Funds (unaudited)(continued)
Focused Small Cap Value Fund
| Ten Largest Holdings | % of Investments |
| Hillenbrand, Inc. | 3.82% |
| Masonite International Corp. | 3.80% |
| ProSight Global, Inc. | 3.48% |
| Bancorp, Inc. (The) | 3.07% |
| AdvanSix, Inc. | 3.07% |
| Spectrum Brands Holdings, Inc. | 3.02% |
| Lundin Mining Corp. | 3.01% |
| Brightsphere Investment Group, Inc. | 2.93% |
| American Axle & Manufacturing Holdings, Inc. | 2.91% |
| Worthington Industries, Inc. | 2.84% |
| |
| Holdings by Sector* | % of Investments |
| Communication Services | 2.38% |
| Consumer Discretionary | 7.34% |
| Consumer Staples | 3.02% |
| Energy | 3.02% |
| Financials | 32.68% |
| Health Care | 2.61% |
| Industrials | 21.46% |
| Information Technology | 7.12% |
| Materials | 13.47% |
| Real Estate | 6.47% |
| Repurchase Agreement | 0.43% |
| Total | 100.00% |
| * | A sector may comprise several industries. |
| International Opportunities Fund | |
| | |
| Ten Largest Holdings | % of Investments |
| SHO-BOND Holdings Co. Ltd. | 2.29% |
| Azbil Corp. | 2.12% |
| Sanwa Holdings Corp. | 1.88% |
| AusNet Services | 1.80% |
| Tecan Group AG | 1.77% |
| VanEck Vectors Junior Gold Miners | 1.74% |
| Rheinmetall AG | 1.67% |
| Xinyi Glass Holdings Ltd. | 1.66% |
| Capcom Co., Ltd. | 1.64% |
| Realtek Semiconductor Corp. | 1.62% |
237
Investments in Underlying Funds (unaudited)(continued)
| Holdings by Sector* | % of Investments |
| Communication Services | 5.07% |
| Consumer Discretionary | 13.87% |
| Consumer Staples | 3.94% |
| Financials | 9.42% |
| Health Care | 8.60% |
| Industrials | 22.39% |
| Information Technology | 15.46% |
| Materials | 8.42% |
| Real Estate | 8.28% |
| Utilities | 3.31% |
| Money Market Fund(a) | 0.84% |
| Repurchase Agreement | 0.31% |
| Time Deposit(a) | 0.09% |
| Total | 100.00% |
| * | A sector may comprise several industries. |
| (a) | Securities were purchased with the cash collateral from loaned securities. |
| Micro Cap Growth Fund | |
| | |
| Ten Largest Holdings | % of Investments |
| Calix, Inc. | 2.99% |
| CERENCE, Inc. | 2.48% |
| Sleep Number Corp. | 2.14% |
| Chart Industries, Inc. | 2.09% |
| Axonics Modulation Technologies, Inc. | 2.07% |
| Sprout Social, Inc. Class A | 2.06% |
| LGI Homes, Inc. | 1.98% |
| TG Therapeutics, Inc. | 1.94% |
| Malibu Boat Inc. | 1.93% |
| CryoPort, Inc. | 1.90% |
| |
| Holdings by Sector* | % of Investments |
| Communication Services | 0.02% |
| Consumer Discretionary | 16.47% |
| Consumer Staples | 3.62% |
| Financials | 3.31% |
| Health Care | 45.10% |
| Industrials | 8.86% |
| Information Technology | 18.97% |
| Real Estate | 1.36% |
| Money Market Fund(a) | 2.06% |
| Time Deposit(a) | 0.23% |
| Total | 100.00% |
| * | A sector may comprise several industries. |
| (a) | Securities were purchased with the cash collateral from loaned securities. |
238
Investments in Underlying Funds (unaudited)(continued)
Lord Abbett Research Fund, Inc. – Small Cap Value Fund
| Ten Largest Holdings | % of Investments |
| Bancorp, Inc. (The) | 3.01% |
| Hillenbrand, Inc. | 2.37% |
| Spectrum Brands Holdings, Inc. | 2.35% |
| Dunkin’ Brands Group, Inc. | 1.96% |
| Masonite International Corp. | 1.95% |
| BankUnited, Inc. | 1.89% |
| Valvoline, Inc. | 1.86% |
| TCF Financial Corp. | 1.85% |
| Worthington Industries, Inc. | 1.81% |
| Bank of Hawaii Corp. | 1.74% |
| |
| Holdings by Sector* | % of Investments |
| Communication Services | 1.21% |
| Consumer Discretionary | 11.35% |
| Consumer Staples | 3.23% |
| Energy | 2.97% |
| Financials | 26.40% |
| Health Care | 5.56% |
| Industrials | 18.58% |
| Information Technology | 9.44% |
| Materials | 6.74% |
| Real Estate | 9.69% |
| Utilities | 4.83% |
| Total | 100.00% |
| * | A sector may comprise several industries. |
| Value Opportunities Fund | |
| | |
| Ten Largest Holdings | % of Investments |
| Entegris, Inc. | 2.28% |
| Charles River Laboratories International, Inc. | 2.19% |
| Discover Financial Services | 2.14% |
| SVB Financial Group | 2.09% |
| PerkinElmer, Inc. | 2.05% |
| Landstar System, Inc. | 2.04% |
| Dunkin’ Brands Group, Inc. | 2.00% |
| STERIS plc | 1.94% |
| Avery Dennison Corp. | 1.94% |
| Axalta Coating Systems Ltd. | 1.89% |
239
Investments in Underlying Funds (unaudited)(concluded)
| Holdings by Sector* | % of Investments |
| Consumer Discretionary | 13.33% |
| Consumer Staples | 0.82% |
| Energy | 1.07% |
| Financials | 14.27% |
| Health Care | 15.68% |
| Industrials | 15.99% |
| Information Technology | 20.18% |
| Materials | 8.51% |
| Real Estate | 5.98% |
| Utilities | 4.17% |
| Total | 100.00% |
| * | A sector may comprise several industries. |
240
Basic Information About Management
The Board is responsible for the management of the business and affairs of the Fund in accordance with the laws of the state of organization. The Board elects officers who are responsible for the day-to-day operations of the Fund and who execute policies authorized by the Board. The Board also approves an investment adviser to the Fund and continues to monitor the cost and quality of the services the investment adviser provides, and annually considers whether to renew the contract with the investment adviser. Generally, each Board member holds office until his/her successor is elected and qualified or until his/her earlier resignation or removal, as provided in the Fund’s organizational documents.
Lord, Abbett & Co. LLC (“Lord Abbett”), a Delaware limited liability company, is the Fund’s investment adviser. Designated Lord Abbett personnel are responsible for the day-to-day management of the Fund.
Interested Board Members
Mr. Sieg is affiliated with Lord Abbett and is an “interested person” of the Fund as defined in the Act. Mr. Sieg is a board member of each of the 13 investment companies in the Lord Abbett Family of Funds, which consist of 60 investment portfolios. Mr. Sieg is an officer of the Lord Abbett Family of Funds.
Name, Address and
Year of Birth | | Current Position and
Length of Service
with the Fund | | Principal Occupation and Other Directorships
During the Past Five Years |
Douglas B. Sieg
Lord, Abbett & Co. LLC
90 Hudson Street
Jersey City, NJ 07302
(1969) | | Board member since 2016;
President and Chief
Executive Officer
since 2018 | | Principal Occupation: Managing Partner (since 2018) and was formerly Head of Client Services, joined Lord Abbett in 1994. Other Directorships: None. |
Independent Board Members
The following Independent Board Members also are board members of each of the 13 investment companies in the Lord Abbett Family of Funds, which consist of 60 investment portfolios.
Name, Address and
Year of Birth | | Current Position and
Length of Service
with the Fund | | Principal Occupation and Other Directorships
During the Past Five Years |
Evelyn E. Guernsey
Lord, Abbett & Co. LLC
c/o Legal Dept.
90 Hudson Street
Jersey City, NJ 07302
(1955) | | Board member since 2011 | | Principal Occupation: None. Other Directorships: None. |
Julie A. Hill
Lord, Abbett & Co. LLC
c/o Legal Dept.
90 Hudson Street
Jersey City, NJ 07302
(1946) | | Board member since 2004 | | Principal Occupation: Owner and CEO of The Hill Company, a business consulting firm (since 1998). Other Directorships: Currently serves as director of Anthem, Inc., a health benefits company (since 1994). |
241
Basic Information About Management (continued)
Name, Address and
Year of Birth | | Current Position and
Length of Service
with the Fund | | Principal Occupation and Other Directorships
During the Past Five Years |
Kathleen M. Lutito
Lord, Abbett & Co. LLC
c/o Legal Dept.
90 Hudson Street
Jersey City, NJ 07302
(1963) | | Board member since 2017 | | Principal Occupation: President and Chief Investment Officer of CenturyLink Investment Management Company (since 2006). Other Directorships: None. |
James M. McTaggart
Lord, Abbett & Co. LLC
c/o Legal Dept.
90 Hudson Street
Jersey City, NJ 07302
(1947) | | Board member since 2012 | | Principal Occupation: Independent management advisor and consultant (since 2012). Other Directorships: Blyth, Inc., a home products company (2004-2015). |
Charles O. Prince
Lord, Abbett & Co. LLC
c/o Legal Dept.
90 Hudson Street
Jersey City, NJ 07302
(1950) | | Board member since 2019 | | Principal Occupation: None. Formerly Chairman and Chief Executive Officer, Citigroup, Inc. (Retired 2007). Other Directorships: Currently serves as director of Johnson & Johnson (2006-Present). Previously served as director of Xerox Corporation (2008-2018). |
Karla M. Rabusch
Lord, Abbett & Co. LLC
c/o Legal Dept.
90 Hudson Street
Jersey City, NJ 07302
(1959) | | Board member since 2017 | | Principal Occupation: President and Director of Wells Fargo Funds Management, LLC (2003-2017); President of Wells Fargo Funds (2003-2016). Other Directorships: None. |
Mark A. Schmid
Lord, Abbett & Co. LLC
c/o Legal Dept.
90 Hudson Street
Jersey City, NJ 07302
(1959) | | Board member since 2016 | | Principal Occupation: Vice President and Chief Investment Officer of the University of Chicago (since 2009). Other Directorships: None. |
James L.L. Tullis
Lord, Abbett & Co. LLC
c/o Legal Dept.
90 Hudson Street
Jersey City, NJ 07302
(1947) | | Board member since 2006; Chairman since 2017 | | Principal Occupation: Chairman of Tullis Health Investors-FL LLC (since 2018); CEO of Tullis-Dickerson and Co. Inc., a venture capital management firm (1990–2016). Other Directorships: Currently serves as director of Crane Co. (since 1998), Alphatec Spine (since 2018), electroCore, Inc. (since 2018), and Exagen Inc. (since 2019). |
Officers
None of the officers listed below have received compensation from the Fund. All of the officers of the Fund also may be officers of the other Lord Abbett Funds and maintain offices at 90 Hudson Street, Jersey City, NJ 07302. Unless otherwise indicated, the position(s) and title(s) listed under the “Principal Occupation During the Past Five Years” column indicate each officer’s position(s) and title(s) with Lord Abbett. Each officer serves for an indefinite term (i.e., until his or her death, resignation, retirement, or removal).
242
Basic Information About Management (concluded)
Name and
Year of Birth | | Current Position
with the Fund | | Length of Service
of Current Position | | Principal Occupation
During the Past Five Years |
Douglas B. Sieg
(1969) | | President and Chief Executive Officer | | Elected as President and Chief Executive Officer in 2018 | | Managing Partner of Lord Abbett (since 2018) and was formerly Head of Client Services, joined Lord Abbett in 1994. |
Jackson C. Chan
(1964) | | AML Compliance Officer | | Elected in 2018 | | Deputy Chief Compliance Officer and Director of Regulatory Affairs, joined Lord Abbett in 2014. |
Pamela P. Chen
(1978) | | Vice President, Assistant Secretary and Privacy Officer | | Elected as Vice President and Assistant Secretary in 2018 and Privacy Officer in 2019 | | Associate General Counsel, joined Lord Abbett in 2017 and was formerly Special Counsel at Schulte, Roth & Zabel LLP (2005–2017). |
John T. Fitzgerald
(1975) | | Vice President and Assistant Secretary | | Elected in 2018 | | Deputy General Counsel, joined Lord Abbett in 2018 and was formerly Deputy Head of U.S. Funds Legal, Executive Director and Assistant General Counsel at JPMorgan Chase (2005–2018). |
Vito A. Fronda
(1969) | | Chief Financial Officer and Treasurer | | Elected as Chief Financial Officer in 2020 and Treasurer in 2018 | | Partner and Director of U.S. Fund Treasury & Global Taxation, joined Lord Abbett in 2003. |
Linda Y. Kim
(1980) | | Vice President and Assistant Secretary | | Elected in 2016 | | Counsel, joined Lord Abbett in 2015. |
Joseph M. McGill
(1962) | | Chief Compliance Officer | | Elected in 2014 | | Partner and Chief Compliance Officer, joined Lord Abbett in 2014. |
Amanda S. Ryan
(1978) | | Vice President and Assistant Secretary | | Elected in 2018 | | Counsel, joined Lord Abbett in 2016 and was formerly a Director and Corporate Counsel at PGIM Investments (2012–2016). |
Lawrence B. Stoller
(1963) | | Vice President, Secretary and Chief Legal Officer | | Elected as Vice President and Secretary in 2007 and Chief Legal Officer in 2019 | | Partner and General Counsel, joined Lord Abbett in 2007. |
Please call 888-522-2388 for a copy of the statement of additional information, which contains further information about the Fund’s Board members. It is available free upon request.
243
Liquidity Risk Management Program
Pursuant to Rule 22e-4 under the 1940 Act, each Fund has adopted a Liquidity Risk Management Program and Policy (“Program”). The Program is designed to assess, manage and periodically review the Fund’s liquidity risk. Liquidity risk is defined under Rule 22e-4 as the risk that the Fund could not meet redemption requests without significant dilution of remaining investors’ interests in the Fund. The Board has appointed Lord Abbett as the administrator for each Fund’s Program. At the May 28-29, 2020 meeting, Lord Abbett provided the Board with a report addressing the operation of the Program and assessing its adequacy and effectiveness of implementation for the period December 1, 2018 through February 28, 2020. Lord Abbett reported that the Program operated effectively during the period. In particular, Lord Abbett reported that: the Fund did not breach its 15% limit on illiquid investments at any point during the period and all regulatory reporting related to Rule 22e-4 was completed on time and without issue during the period. There can be no assurance that the Program will achieve its objectives in the future. Please refer to the Funds’ prospectus for more information regarding each Fund’s exposure to liquidity risk and other principal risks to which an investment in the Fund may be subject.
Householding
The Trust has adopted a policy that allows it to send only one copy of each Fund’s prospectus, proxy material, annual report and semiannual report to certain shareholders residing at the same “household.” This reduces Fund expenses, which benefits you and other shareholders. If you need additional copies or do not want your mailings to be “householded,” please call Lord Abbett at 888-522-2388 or send a written request with your name, the name of your fund or funds and your account number or numbers to Lord Abbett Family of Funds, P.O. Box 219336, Kansas City, MO 64121.
Proxy Voting Policies, Procedures and Records
A description of the policies and procedures that Lord Abbett uses to vote proxies related to each Fund’s portfolio securities, and information on how Lord Abbett voted each Fund’s proxies during the 12-month period ended June 30 are available without charge, upon request, (i) by calling 888-522-2388; (ii) on Lord Abbett’s Website at www.lordabbett.com; and (iii) on the Securities and Exchange Commission’s (“SEC”) Website at www.sec.gov.
Shareholder Reports and Quarterly Portfolio Disclosure
The Funds are required to file their complete schedule of portfolio holdings with the SEC for their first and third fiscal quarters as an attachment to Form N-PORT. Copies of the filings are available without charge, upon request on the SEC’s Website at www.sec.gov and may be available by calling Lord Abbett at 888-522-2388.
244
Tax Information
The percentages below reflect the portion of ordinary income distributions that are eligible for the corporate dividend received deduction (DRD) and qualified dividend income (QDI) for individual shareholders:
| Fund Name | | DRD | | QDI | |
| Durable Growth Fund | | 100% | | 100% | |
| Focused Large Cap Value Fund | | 95% | | 100% | |
| Fundamental Equity Fund | | 100% | | 100% | |
| Global Equity Research Fund | | 84% | | 100% | |
| Growth Leaders Fund | | 29% | | 29% | |
| Health Care Fund | | 100% | | 100% | |
| International Equity Fund | | – | | 100% | |
| International Opportunities Fund | | – | | 100% | |
| International Value Fund | | 2% | | 100% | |
| Value Opportunities Fund | | 100% | | 100% | |
Additionally, of the distributions paid to the shareholders during the fiscal year ended October 31, 2020, the following amounts represent short-term and long-term capital gains:
| Fund Name | | Short-Term
Capital Gains | | Long-Term
Capital Gains | |
| Alpha Strategy Fund | | $ – | | $123,771,165 | |
| Fundamental Equity Fund | | – | | 215,541,984 | |
| Focused Small Cap Value Fund | | – | | 18,077,113 | |
| Growth Leaders Fund | | 50,781,905 | | 254,848,239 | |
| Value Opportunities Fund | | – | | 194,975,562 | |
The Funds listed below intend to pass through foreign source income and foreign taxes as follows:
| Fund Name | | Foreign
Source Income | | Foreign Taxes | |
| International Equity Fund | | 7,922,119 | | 995,666 | |
| International Value Fund | | 15,264,236 | | 2,015,838 | |
245
 | | | | |

This report, when not used for the general information of shareholders of the Fund, is to be distributed only if preceded or accompanied by a current fund prospectus. Lord Abbett mutual fund shares are distributed by
LORD ABBETT DISTRIBUTOR LLC. | | Lord Abbett Securities Trust Lord Abbett Alpha Strategy Fund Lord Abbett Durable Growth Fund Lord Abbett Focused Growth Fund Lord Abbett Focused Large Cap Value Fund Lord Abbett Focused Small Cap Value Fund Lord Abbett Fundamental Equity Fund Lord Abbett Global Equity Research Fund Lord Abbett Growth Leaders Fund Lord Abbett Health Care Fund Lord Abbett International Equity Fund Lord Abbett International Opportunities Fund Lord Abbett International Value Fund Lord Abbett Value Opportunities Fund | | LST-2
(12/20) |

LORD ABBETT
ANNUAL REPORT
Lord Abbett
Micro Cap Growth Fund
For the fiscal year ended October 31, 2020
Important Information on Paperless Delivery
Beginning in February 2021, as permitted by regulations adopted by the Securities and Exchange Commission, paper copies of the Fund’s shareholder reports like this one will no longer be sent by mail, unless you specifically request paper copies of the reports from the Fund or from your financial intermediary, such as a broker-dealer, investment advisor or bank. Instead, the reports will be made available on Lord Abbett’s website and you will be notified by mail each time a report is posted and provided with a website link to access the report.
If you already elected to receive shareholder reports electronically, you will not be affected by this change and you need not take any action. Shareholders who hold accounts directly with the Fund may elect to receive shareholder reports and other communications from the Fund electronically by signing into your Lord Abbett online account at lordabbett.com and selecting “Log In.” For further information, you may also contact the Fund at (800) 821-5129. Shareholders who hold accounts through a financial intermediary should contact them directly.
You may elect to receive all future reports in paper free of charge by contacting the Fund at (800) 821-5129. Your election to receive reports in paper will apply to all funds held with Lord Abbett. If your fund shares are held through a financial intermediary please contact them directly. Your election applies to all funds held with that intermediary.
Table of Contents
Lord Abbett Securities Trust
Lord Abbett Micro Cap Growth Fund Annual Report
For the fiscal year ended October 31, 2020

From left to right: James L.L. Tullis, Independent Chairman of the Lord Abbett Funds and Douglas B. Sieg, Trustee, President, and Chief Executive Officer of the Lord Abbett Funds.
Dear Shareholders: We are pleased to provide you with this overview of the performance of the Fund for the fiscal year ended October 31, 2020. On this page and the following pages, we discuss the major factors that influenced fiscal year performance. For detailed and timely information about the Fund, please visit our website at www.lordabbett.com, where you also can access the quarterly commentaries that provide updates on each Fund’s performance and other portfolio related updates.
Thank you for investing in Lord Abbett mutual funds. We value the trust that you place in us and look forward to serving your investment needs in the years to come.
Best regards,

Douglas B. Sieg
Trustee, President, and Chief Executive Officer
For the fiscal year ended October 31, 2020, the Fund returned 51.19%, reflecting performance at the net asset value (NAV) of Class A shares with all distributions reinvested, compared to its benchmark, the Russell Microcap® Growth Index,1 which returned 22.35% over the same period.
The trailing twelve-month period was characterized by several market-moving events. U.S. President Donald Trump signed a “phase one” trade deal with China on the 15th of January 2020 and markets priced in a likelihood of two more interest rate cuts in 2020. The tide turned abruptly in February and March 2020, as the outbreak of the COVID-19 pandemic and the
expected economic damage resulting from a sudden slowdown in corporate spending, individual spending, consumer confidence, and thus recessionary and deflationary pressures, triggered a severe sell-off. As the COVID-19 pandemic fueled fears of slowing global growth, oil prices fell precipitously, with the primary U.S. oil contract closing in negative territory for the first time in history, although it has since rebounded. During the month of March, the S&P 500® Index2 experienced its fastest bear market since 1987 and the longest U.S. economic expansion in history ended at 128 months.
1
The U.S. Federal Reserve (Fed) responded to the COVID-19 outbreak with a breadth of policy measures which lifted investors’ confidence in the markets. The Fed launched a $700 billion quantitative easing program, decreased the reserve requirements to zero for thousands of banks, and cut the federal funds rate to the current target range of 0-0.25%. Next, the Fed announced additional stimulus programs, including open-ended asset purchases, purchases of corporate debt, and a commitment to a new small business lending program. Additionally, the central bank announced $2.3 trillion of additional credit support by expanding the Primary Market Corporate Credit Facility (PMCCF), the Secondary Market Corporate Credit Facility (SMCCF), and the Term Asset-Backed Securities Loan Facility (TALF). Most notably, the expanded measures included the purchase of select fallen angels. During its latest September meeting, the Fed voted to keep interest rates in a range of 0-0.25% to support the U.S. economy as it recovers from the deep impact of the COVID-19 related lockdowns. In its September statement, the Fed noted that it expects to keep rates unchanged until “inflation has risen to 2% and is on track to moderately exceed 2% for some time.”
Risk assets began to stage a recovery in April and May 2020 on the back of progress with respect to COVID-19 treatments and vaccines, commentary from several corporations that indicated stabilization in April and May, and massive monetary and fiscal policy globally. Positive market sentiment continued into the third quarter of 2020 as well. In addition to the factors listed above, tailwinds for the continued
rally in risk assets included a rebound in earnings revisions as well as further progress in COVID-19 treatments as evidenced by multiple drugs reaching Phase III trials. In September, however, market sentiment soured amid political volatility related to the Supreme Court of the United States vacancy, heightened COVID-19 concerns in Europe as global deaths topped one million, heightened uncertainty leading up to the U.S. Presidential election, and worries about stalled fiscal stimulus talks in Washington.
Security selection within the health care and consumer discretionary sectors contributed to relative performance. Within the health care sector, Twist Bioscience Corp., a developer of proprietary DNA manufacturing processes, was the largest contributor to relative performance. Shares of Twist rose as the company’s proprietary platform drove scale and product development, while lowering costs for synthetic DNA fragments, which are key for antibody drug discovery. Additionally, the Fund’s allocation to Silk Road Medical, Inc., a medical device company, contributed to relative performance. Shares of Silk rose as the company’s transcarotid artery revascularization (TCAR) procedure, a minimally-invasive approach to treat carotid artery disease, was expected to experience increased adoption.
Within the consumer discretionary sector, the Fund’s holding in Fiverr International Ltd., a developer of an e-commerce platform, contributed to relative performance over the period. Fiverr experienced accelerating growth and a pull forward in profitability, as both users and
2
freelancers flocked to the platform during the COVID-19 pandemic, benefiting its share price.
Conversely, stock selection within the communication services sector detracted from relative performance during the period. The Fund’s position in Gogo Inc., a provider of in-flight wireless services, detracted from relative performance as international and domestic travel was cut severely by major airlines due to the spread of COVID-19. Eventbrite, Inc., a provider of event management services, also detracted from relative performance. Eventbrite, like so many other businesses, was severely impacted by the spread of COVID-19 to North America, which forced the cancellation of events and the closure of venues.
Additionally, shares of Overstock.com, Inc., which operates an online shopping site, detracted from relative performance during the period. Despite exhibiting solid fundamentals, a combination of rising COVID-19 cases, a lack of fiscal stimulus, and continued political uncertainty, was expected to impact consumer spending which weighed on the share price.
The Fund’s portfolio is actively managed and, therefore, its holdings and the weightings of a particular issuer or particular sector as a percentage of portfolio assets are subject to change. Sectors may include many industries.
1 The Russell Microcap® Growth Index measures the performance of those Russell Micro Cap companies with higher price-to-book ratios and higher forecasted growth values.
2 The S&P 500® Index is widely regarded as the standard for measuring large cap U.S. stock market performance and includes a representative sample of leading companies in leading industries.
Unless otherwise specified, indexes reflect total return, with all dividends reinvested. Indexes are unmanaged, do not reflect the deduction of fees or expenses, and are not available for direct investment.
Important Performance and Other Information
Performance data quoted in the following pages reflect past performance and are no guarantee of future results. Current performance may be higher or lower than the performance quoted. The investment return and principal value of an investment in the Fund will fluctuate so that shares, on any given day or when redeemed, may be worth more or less than their original cost. You can obtain performance data current to the most recent month end by calling Lord Abbett at 888-522-2388 or referring to www.lordabbett.com.
Except where noted, comparative Fund performance does not account for the deduction of sales charges and would be different if sales charges were included.
The Fund offers classes of shares with distinct pricing options. For a full description of the differences in pricing alternatives, please see the Fund’s prospectus.
During certain periods shown, expense waivers and reimbursements were in place. Without such expense waivers and reimbursements, the Fund’s returns would have been lower.
The annual commentary above discusses the views of the Fund’s management and various portfolio holdings of the Fund as of October 31, 2020. These views and portfolio holdings may have changed after this date. Information provided in the commentary is not a recommendation to buy or sell securities. Because the Fund’s portfolio is actively managed and may change significantly, the Fund may no longer own the securities described above or may have otherwise changed its position in the securities. For more recent information about the Fund’s portfolio holdings, please visit www.lordabbett.com.
A Note about Risk: See Notes to Financial Statements for a discussion of investment risks. For a more detailed discussion of the risks associated with the Fund, please see the Fund’s prospectus.
Mutual funds are not insured by the FDIC, are not deposits or other obligations of, or guaranteed by, banks, and are subject to investment risks including possible loss of principal amount invested.
3
Investment Comparison
Below is a comparison of a $10,000 investment in Class A shares with the same investment in the Russell Microcap® Growth Index and the Russell Microcap® Index, assuming reinvestment of all dividends and distributions. The performance of the other classes will be greater than or less than the performance shown in the graph below due to different sales loads and expenses applicable to such classes. The graph and performance table below do not reflect the deduction of taxes that a shareholder would pay on Fund distributions or the redemption of Fund shares. During certain periods, expenses of the Fund have been waived or reimbursed by Lord Abbett; without such waiver or reimbursement of expenses, the Fund’s returns would have been lower. Past performance is no guarantee of future results.
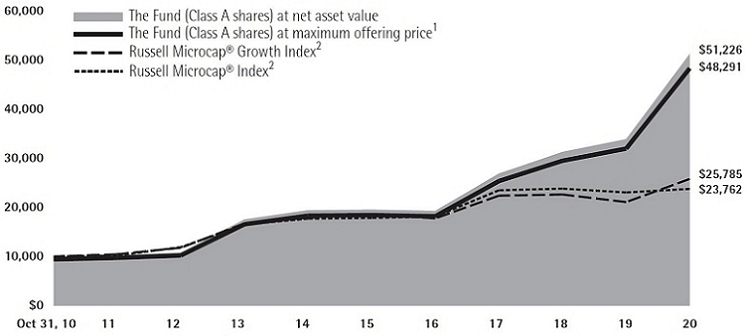
Average Annual Total Returns at Maximum Applicable
Sales Charge for the Periods Ended October 31, 2020
| | | 1 Year | | 5 Years | | 10 Years | | Life of Class |
| Class A3 | | 42.54% | | 19.82% | | 17.05% | | – |
| Class C4 | | – | | – | | – | | 0.29% |
| Class F5 | | – | | – | | – | | 1.49% |
| Class I6 | | 51.47% | | 21.28% | | 17.83% | | – |
1 Reflects the deduction of the maximum initial sales charge of 5.75%.
2 Performance for each unmanaged index does not reflect any fees or expenses. The performance of each index is not necessarily representative of the Fund’s performance.
3 Total return, which is the percentage change in net asset value, after deduction of the maximum initial sales charge of 5.75% applicable to Class A shares, with all dividends and distributions reinvested for the periods shown ended October
31, 2020, is calculated using the SEC required uniform method to compute such return.
4 Class C shares commenced operations and performance for the Class began on August 28, 2020. The 1% CDSC for Class C shares normally applies before the first anniversary of the purchase date. Performance is at net asset value.
5 Commenced operations and performance for the Class began on August 28, 2020. Performance is at net asset value.
6 Performance is at net asset value.
4
Expense Example
As a shareholder of the Fund, you incur two types of costs: (1) transaction costs, including sales charges (loads) on purchase payments (these charges vary among the share classes); and (2) ongoing costs, including management fees; distribution and service (12b-1) fees (these charges vary among the share classes); and other Fund expenses. This Example is intended to help you understand your ongoing costs (in dollars) of investing in the Fund and to compare these costs with the ongoing costs of investing in other mutual funds.
The Example is based on an investment of $1,000 invested at the beginning of the period and held for the entire period (May 1, 2020 through October 31, 2020).
Actual Expenses
For each class of the Fund, the first line of the table on the following page provides information about actual account values and actual expenses. You may use the information in this line, together with the amount you invested, to estimate the expenses that you paid over the period. Simply divide your account value by $1,000 (for example, an $8,600 account value divided by $1,000 = 8.6), then multiply the result by the number in the first line under the heading titled “Expenses Paid During Period 5/1/20 – 10/31/20” to estimate the expenses you paid on your account during this period.
Hypothetical Example for Comparison Purposes
For each class of the Fund, the second line of the table on the following page provides information about hypothetical account values and hypothetical expenses based on the Fund’s actual expense ratio and an assumed rate of return of 5% per year before expenses, which is not the Fund’s actual return. The hypothetical account values and expenses may not be used to estimate the actual ending account balance or expenses you paid for the period. You may use this information to compare the ongoing costs of investing in the Fund and other funds. To do so, compare this 5% hypothetical example with the 5% hypothetical examples that appear in the shareholder reports of the other funds.
5
Please note that the expenses shown in the table are meant to highlight your ongoing costs only and do not reflect any transactional costs, such as sales charges (loads). Therefore, the second line of the table is useful in comparing ongoing costs only, and will not help you determine the relative total costs of owning different funds. In addition, if these transactional costs were included, your costs would have been higher.
| | | Beginning
Account
Value | | Ending
Account
Value | | Expenses
Paid During
Period† | |
| | | 5/1/20 | | 10/31/20 | | 5/1/20 -
10/31/20 | |
| Class A* | | | | | | | |
| Actual | | $1,000.00 | | $1,464.80 | | $8.80 | |
| Hypothetical (5% Return Before Expenses) | | $1,000.00 | | $1,018.00 | | $7.20 | |
| Class C | | | | | | | |
| Actual | | $1,000.00 | | $1,012.90 | | $3.63 | |
| Hypothetical (5% Return Before Expenses) | | $1,000.00 | | $1,005.27 | | $3.61 | |
| Class F | | | | | | | |
| Actual | | $1,000.00 | | $1,014.90 | | $1.97 | |
| Hypothetical (5% Return Before Expenses) | | $1,000.00 | | $1,006.93 | | $1.96 | |
| Class I* | | | | | | | |
| Actual | | $1,000.00 | | $1,467.70 | | $7.44 | |
| Hypothetical (5% Return Before Expenses) | | $1,000.00 | | $1,019.10 | | $6.09 | |
| † | For each class of the Fund, net expenses are equal to the annualized expense ratio for such class (1.42% for Class A and 1.20% for Class I) multiplied by the average account value over the period, multiplied by 184/366 (to reflect one-half year period) and (2.03% for Class C and 1.10% for Class F) multiplied by the average account value over the period, multiplied by 65/366 (to reflect the period from August 28, 2020 commencement of operations, to October 31, 2020). |
| * | The annualized expenses have been updated to 1.31% for Class A and 1.06% for Class I. Had these updated expense ratios been in place throughout the most recent fiscal half- year, expenses paid during the period would have been: |
| | Actual | | Hypothetical
(5% Return
Before Expenses) |
| Class A | $8.12 | | $6.65 |
| Class I | $6.58 | | $5.38 |
Portfolio Holdings Presented by Sector
October 31, 2020
| Sector* | %** |
| Communication Services | 0.02 | % |
| Consumer Discretionary | 16.47 | % |
| Consumer Staples | 3.62 | % |
| Financials | 3.31 | % |
| Health Care | 45.10 | % |
| Industrials | 8.86 | % |
| Information Technology | 18.97 | % |
| Real Estate | 1.36 | % |
| Money Market Fund(a) | 2.06 | % |
| Time Deposit(a) | 0.23 | % |
| Total | 100.00 | % |
| * | | A sector may comprise several industries. |
| ** | | Represents percent of total investments. |
| (a) | | Securities were purchased with the cash collateral from loaned securities. |
6
Schedule of Investments
October 31, 2020
| | | | | | Fair | |
| | | | | | Value | |
| Investments | | Shares | | | (000) | |
| COMMON STOCKS 97.03% | | | | | | | | |
| | | | | | | | | |
| Air Freight & Logistics 0.74% | | | | | | | | |
| Atlas Air Worldwide Holdings, Inc.* | | | 14,507 | | | $ | 858 | |
| | | | | | | | | |
| Biotechnology 20.54% | | | | | | | | |
| Adaptimmune Therapeutics plc ADR* | | | 97,380 | | | | 439 | |
| Aurinia Pharmaceuticals, Inc. (Canada)*(a) | | | 55,514 | | | | 871 | |
| Beam Therapeutics, Inc.*(b) | | | 26,275 | | | | 898 | |
| Black Diamond Therapeutics, Inc.* | | | 22,662 | | | | 714 | |
| CareDx, Inc.* | | | 28,685 | | | | 1,407 | |
| ChemoCentryx, Inc.* | | | 9,926 | | | | 476 | |
| Coherus Biosciences, Inc.* | | | 21,686 | | | | 362 | |
| Deciphera Pharmaceuticals, Inc.* | | | 10,588 | | | | 615 | |
| Denali Therapeutics, Inc.* | | | 22,119 | | | | 946 | |
| Eidos Therapeutics, Inc.* | | | 28,426 | | | | 2,016 | |
| Insmed, Inc.* | | | 42,834 | | | | 1,411 | |
| Karuna Therapeutics, Inc.* | | | 10,619 | | | | 862 | |
| Krystal Biotech, Inc.* | | | 17,494 | | | | 752 | |
| Myovant Sciences Ltd. (United Kingdom)*(a) | | | 78,167 | | | | 1,079 | |
| Rocket Pharmaceuticals, Inc.* | | | 55,044 | | | | 1,538 | |
| Seres Therapeutics, Inc.* | | | 49,551 | | | | 1,382 | |
| Stoke Therapeutics, Inc.* | | | 16,703 | | | | 641 | |
| TG Therapeutics, Inc.* | | | 86,044 | | | | 2,174 | |
| Trillium Therapeutics, Inc. (Canada)*(a) | | | 58,046 | | | | 723 | |
| Turning Point Therapeutics, Inc.* | | | 18,179 | | | | 1,676 | |
| Twist Bioscience Corp.* | | | 22,526 | | | | 1,726 | |
| Veracyte, Inc.* | | | 28,908 | | | | 1,002 | |
| Total | | | | | | | 23,710 | |
| | | | | | | | | |
| Commercial Services & Supplies 1.21% | | | | | | | | |
| Montrose Environmental Group, Inc.* | | | 51,756 | | | | 1,399 | |
| | | | | | Fair | |
| | | | | | Value | |
| Investments | | Shares | | | (000) | |
| Communications Equipment 3.46% | | | | | | | | |
| AudioCodes Ltd. (Israel)(a) | | | 22,323 | | | $ | 647 | |
| Calix, Inc.* | | | 143,073 | | | | 3,349 | |
| Total | | | | | | | 3,996 | |
| | | | | | | | | |
| Construction & Engineering 0.82% | | | | | | | | |
| Ameresco, Inc. Class A* | | | 24,509 | | | | 941 | |
| | | | | | | | | |
| Diversified Financial Services 0.40% | | | | | | | | |
| Landcadia Holdings II, Inc. Class A* | | | 37,508 | | | | 465 | |
| | | | | | | | | |
| Electronic Equipment, Instruments & Components 1.07% | |
| nLight, Inc.* | | | 57,968 | | | | 1,231 | |
| | | | | | | | | |
| Entertainment 0.02% | | | | | | | | |
| LiveXLive Media, Inc.*(b) | | | 13,624 | | | | 27 | |
| | | | | | | | | |
| Food Products 0.89% | | | | | | | | |
| Vital Farms, Inc.* | | | 29,649 | | | | 1,025 | |
| | | | | | | | | |
| Health Care Equipment & Supplies 14.38% | | | | | | | | |
| Axonics Modulation Technologies, Inc.* | | | 49,438 | | | | 2,318 | |
| CryoPort, Inc.* | | | 52,966 | | | | 2,126 | |
| GenMark Diagnostics, Inc.* | | | 90,769 | | | | 1,109 | |
| Inari Medical, Inc.* | | | 13,646 | | | | 903 | |
| iRhythm Technologies, Inc.* | | | 4,922 | | | | 1,041 | |
| OrthoPediatrics Corp.* | | | 37,252 | | | | 1,662 | |
| Outset Medical, Inc.*(b) | | | 12,121 | | | | 563 | |
| Pulmonx Corp.* | | | 30,347 | | | | 1,276 | |
| Shockwave Medical, Inc.* | | | 29,063 | | | | 1,986 | |
| SI-BONE, Inc.* | | | 72,000 | | | | 1,510 | |
| Silk Road Medical, Inc.* | | | 34,664 | | | | 2,101 | |
| Total | | | | | | | 16,595 | |
| | | | | | | | | |
| Health Care Providers & Services 1.96% | | | | | |
| Castle Biosciences, Inc.* | | | 26,816 | | | | 1,245 | |
| Ontrak, Inc.*(b) | | | 16,619 | | | | 1,018 | |
| Total | | | | | | | 2,263 | |
| | See Notes to Financial Statements. | 7 |
Schedule of Investments (continued)
October 31, 2020
| | | | | | Fair | |
| | | | | | Value | |
| Investments | | Shares | | | (000) | |
| Health Care Technology 3.33% | | | | | | | | |
| Health Catalyst, Inc.* | | | 25,226 | | | $ | 870 | |
| Inspire Medical Systems, Inc.* | | | 17,213 | | | | 2,056 | |
| Simulations Plus, Inc. | | | 14,154 | | | | 917 | |
| Total | | | | | | | 3,843 | |
| | | | | | | | | |
| Hotels, Restaurants & Leisure 0.83% | | | | | | | | |
| Papa John’s International, Inc. | | | 12,476 | | | | 956 | |
| | | | | | | | | |
| Household Durables 1.92% | | | | | | | | |
| LGI Homes, Inc.* | | | 20,708 | | | | 2,213 | |
| | | | | | | | | |
| Household Products 1.26% | | | | | | | | |
| Central Garden & Pet Co.* | | | 37,214 | | | | 1,450 | |
| | | | | | | | | |
| Information Technology Services 1.22% | | | | | | | | |
| Endava plc ADR* | | | 13,426 | | | | 858 | |
| Limelight Networks, Inc.* | | | 154,975 | | | | 547 | |
| Total | | | | | | | 1,405 | |
| | | | | | | | | |
| Insurance 2.87% | | | | | | | | |
| Goosehead Insurance, Inc. | | | | | | | | |
| Class A | | | 13,186 | | | | 1,616 | |
| Trupanion, Inc.* | | | 23,772 | | | | 1,700 | |
| Total | | | | | | | 3,316 | |
| | | | | | | | | |
| Internet & Direct Marketing Retail 7.02% | | | | | | | | |
| 1-800-Flowers.com, Inc. Class A* | | | 34,276 | | | | 680 | |
| Duluth Holdings, Inc. Class B* | | | 81,518 | | | | 1,250 | |
| Fiverr International Ltd. (Israel)*(a) | | | 13,087 | | | | 1,916 | |
| Magnite, Inc.* | | | 150,392 | | | | 1,358 | |
| Overstock.com, Inc.* | | | 24,170 | | | | 1,356 | |
| RealReal, Inc. (The)* | | | 63,437 | | | | 799 | |
| Stamps.com, Inc.* | | | 3,311 | | | | 739 | |
| Total | | | | | | | 8,098 | |
| | | | | | | | | |
| Internet Software & Services 1.07% | | | | | | | | |
| Cardlytics, Inc.* | | | 16,649 | | | | 1,229 | |
| | | | | | | | | |
| Leisure Products 1.87% | | | | | | | | |
| Malibu Boats, Inc. Class A* | | | 42,523 | | | | 2,161 | |
| | | | | | Fair | |
| | | | | | Value | |
| Investments | | Shares | | | (000) | |
| Life Sciences Tools & Services 4.01% | | | | | | | | |
| NanoString Technologies, Inc.* 31,341 | | | | | | $ | 1,149 | |
| Pacific Biosciences of California, Inc.* | | | 111,182 | | | | 1,458 | |
| Quanterix Corp.* | | | 55,105 | | | | 2,017 | |
| Total | | | | | | | 4,624 | |
| | | | | | | | | |
| Machinery 6.03% | | | | | | | | |
| Chart Industries, Inc.* | | | 27,727 | | | | 2,341 | |
| Evoqua Water Technologies Corp.* | | | 62,450 | | | | 1,432 | |
| Federal Signal Corp. | | | 27,785 | | | | 797 | |
| Shyft Group, Inc. (The) | | | 68,070 | | | | 1,314 | |
| SPX Corp.* | | | 25,376 | | | | 1,076 | |
| Total | | | | | | | 6,960 | |
| | | | | | | | | |
| Personal Products 1.45% | | | | | | | | |
| elf Beauty, Inc.* | | | 82,727 | | | | 1,677 | |
| | | | | | | | | |
| Pharmaceuticals 0.57% | | | | | | | | |
| Pliant Therapeutics, Inc.* | | | 30,185 | | | | 653 | |
| | | | | | | | | |
| Real Estate Management & Development 1.35% | |
| eXp World Holdings, Inc.* | | | 21,662 | | | | 918 | |
| Redfin Corp.* | | | 15,221 | | | | 636 | |
| Total | | | | | | | 1,554 | |
| | | | | | | | | |
| Semiconductors & Semiconductor Equipment 3.19% |
| CEVA, Inc.* | | | 40,401 | | | | 1,629 | |
| Ichor Holdings Ltd.* | | | 50,518 | | | | 1,175 | |
| Rambus, Inc.* | | | 64,002 | | | | 883 | |
| Total | | | | | | | 3,687 | |
| | | | | | | | | |
| Software 8.83% | | | | | | | | |
| Agilysys, Inc.* | | | 38,866 | | | | 1,053 | |
| CERENCE, Inc.* | | | 50,798 | | | | 2,773 | |
| Digital Turbine, Inc.* | | | 68,226 | | | | 1,955 | |
| Rapid7, Inc.* | | | 10,426 | | | | 646 | |
| Sprout Social, Inc. Class A* | | | 52,730 | | | | 2,304 | |
| SVMK, Inc.* | | | 23,274 | | | | 487 | |
| Upland Software, Inc.* | | | 23,399 | | | | 976 | |
| Total | | | | | | | 10,194 | |
| 8 | See Notes to Financial Statements. |
Schedule of Investments (concluded)
October 31, 2020
| | | | | | Fair | |
| | | | | | Value | |
| Investments | | Shares | | | (000) | |
| Specialty Retail 3.20% | | | | | | | | |
| National Vision Holdings, Inc.* | | | 22,236 | | | $ | 897 | |
| Shift Technologies, Inc.*(b) | | | 45,294 | | | | 403 | |
| Sleep Number Corp.* | | | 37,780 | | | | 2,394 | |
| Total | | | | | | | 3,694 | |
| | | | | | | | | |
| Textiles, Apparel & Luxury Goods 1.52% | | | |
| Crocs, Inc.* | | | 33,536 | | | | 1,755 | |
Total Common Stocks
(cost $78,494,480) | | | | | | | 111,979 | |
| | | | | | | | | |
| SHORT-TERM INVESTMENTS 2.27% | | | | | | | | |
| | | | | | | | | |
| Money Market Fund 2.04% | | | | | | | | |
Fidelity Government Portfolio(c)
(cost $2,356,498) | | | 2,356,498 | | | | 2,356 | |
| | | | | | Fair | |
| | | | | | Value | |
| Investments | | Shares | | | (000) | |
| Time Deposit 0.23% | | | | | | | | |
CitiBank N.A.(c)
(cost $261,834) | | | 261,834 | | | $ | 262 | |
Total Short-Term Investments
(cost $2,618,332) | | | | | | | 2,618 | |
Total Investments in Securities 99.30%
(cost $81,112,812) | | | | | | | 114,597 | |
| Other Assets in Excess of Liabilities 0.70% | | | | | | | 813 | |
| Net Assets 100.00% | | | | | | $ | 115,410 | |
| ADR | | American Depositary Receipt. |
| | | |
| * | | Non-income producing security. |
| (a) | | Foreign security traded in U.S. dollars. |
| (b) | | All or a portion of this security is temporarily on loan to unaffiliated broker/dealers. |
| (c) | | Security was purchased with the cash collateral from loaned securities. |
The following is a summary of the inputs used as of October 31, 2020 in valuing the Fund’s investments carried at fair value(1):
| | | Level 1 | | | Level 2 | | | Level 3 | | | Total | |
| Investment Type(2) | | (000) | | | (000) | | | (000) | | | (000) | |
| Common Stocks | | $ | 111,979 | | | $ | – | | | $ | – | | | $ | 111,979 | |
| Short-Term Investments | | | | | | | | | | | | | | | | |
| Money Market Fund | | | 2,356 | | | | – | | | | – | | | | 2,356 | |
| Time Deposit | | | – | | | | 262 | | | | – | | | | 262 | |
| Total | | $ | 114,335 | | | $ | 262 | | | $ | – | | | $ | 114,597 | |
| (1) | | Refer to Note 2(g) for a description of fair value measurements and the three-tier hierarchy of inputs. |
| (2) | | See Schedule of Investments for fair values in each industry and identification of foreign issuers and/or geography. |
A reconciliation of Level 3 investments is presented when the Fund has a material amount of Level 3 investments at the beginning or end of the year in relation to the Fund’s net assets.
| | See Notes to Financial Statements. | 9 |
Statement of Assets and Liabilities
October 31, 2020
| ASSETS: | | | |
| Investments in securities, at fair value including $2,438,418 of securities loaned (cost $81,112,812) | | $ | 114,597,096 | |
| Receivables: | | | | |
| Investment securities sold | | | 4,219,041 | |
| Capital shares sold | | | 562,773 | |
| Dividends | | | 885 | |
| From advisor (See Note 3) | | | 854 | |
| Securities lending income receivable | | | 10,659 | |
| Prepaid expenses | | | 36,423 | |
| Total assets | | | 119,427,731 | |
| LIABILITIES: | | | | |
| Payables: | | | | |
| To bank | | | 1,224,157 | |
| Investment securities purchased | | | 2,675 | |
| Payable for collateral due to broker for securities lending | | | 2,618,332 | |
| Capital shares reacquired | | | 13,286 | |
| Management fee | | | 93,582 | |
| Trustees’ fees | | | 18,721 | |
| Fund administration | | | 4,159 | |
| 12b-1 distribution plan | | | 3,840 | |
| Accrued expenses | | | 39,149 | |
| Total liabilities | | | 4,017,901 | |
| Commitments and contingent liabilities | | | | |
| NET ASSETS | | $ | 115,409,830 | |
| COMPOSITION OF NET ASSETS: | | | | |
| Paid-in capital | | $ | 54,000,569 | |
| Total distributable earnings (loss) | | | 61,409,261 | |
| Net Assets | | $ | 115,409,830 | |
| Net assets by class: | | | | |
| Class A Shares | | $ | 11,746,763 | |
| Class C Shares | | $ | 849,414 | |
| Class F Shares | | $ | 12,088,731 | |
| Class I Shares | | $ | 90,724,922 | |
Outstanding shares by class
(unlimited number of authorized shares of beneficial interest) | | | | |
| Class A Shares | | | 670,979 | |
| Class C Shares | | | 41,556 | |
| Class F Shares | | | 590,537 | |
| Class I Shares | | | 4,431,825 | |
Net asset value, offering and redemption price per share
(Net assets divided by outstanding shares): | | | | |
| Class A Shares-Net asset value | | | $17.51 | |
Class A Shares-Maximum offering price
(Net asset value plus sales charge of 5.75%) | | | $18.58 | |
| Class C Shares-Net asset value | | | $20.44 | |
| Class F Shares-Net asset value | | | $20.47 | |
| Class I Shares-Net asset value | | | $20.47 | |
| | |
| 10 | See Notes to Financial Statements. |
Statement of Operations
For the Year Ended October 31, 2020
| Investment income: | | | |
| Dividends (net of foreign withholding taxes of $723) | | $ | 116,580 | |
| Securities lending net income | | | 180,665 | |
| Interest and other | | | 8,505 | |
| Total investment income | | | 305,750 | |
| Expenses: | | | | |
| Management fee | | | 1,583,375 | |
| 12b-1 distribution plan-Class A | | | 9,264 | |
| 12b-1 distribution plan-Class C | | | 548 | |
| 12b-1 distribution plan-Class F | | | 1,088 | |
| Fund administration | | | 49,812 | |
| Professional | | | 42,649 | |
| Registration | | | 41,668 | |
| Shareholder servicing | | | 29,276 | |
| Reports to shareholders | | | 17,477 | |
| Custody | | | 12,797 | |
| Trustees’ fees | | | 5,097 | |
| Other | | | 25,181 | |
| Gross expenses | | | 1,818,232 | |
| Expense reductions (See Note 8) | | | (565 | ) |
| Fees waived and expenses reimbursed (See Note 3) | | | (11,830 | ) |
| Net expenses | | | 1,805,837 | |
| Net investment loss | | | (1,500,087 | ) |
| Net realized and unrealized gain (loss): | | | | |
| Net realized gain (loss) on investments | | | 36,500,948 | |
| Net change in unrealized appreciation/depreciation on investments | | | 16,451,637 | |
| Net realized and unrealized gain (loss) | | | 52,952,585 | |
| Net Increase in Net Assets Resulting From Operations | | $ | 51,452,498 | |
| | | |
| | See Notes to Financial Statements. | 11 |
Statements of Changes in Net Assets
| INCREASE/DECREASE IN NET ASSETS | | For the Year Ended
October 31, 2020 | | | For the Year Ended
October 31, 2019 | |
| Operations: | | | | | | | | |
| Net investment loss | | $ | (1,500,087 | ) | | $ | (2,095,049 | ) |
| Net realized gain (loss) on investments | | | 36,500,948 | | | | 19,880,977 | |
| Net change in unrealized appreciation/depreciation on investments | | | 16,451,637 | | | | (6,268,997 | ) |
| Net increase in net assets resulting from operations | | | 51,452,498 | | | | 11,516,931 | |
| Distributions to shareholders: | | | | | | | | |
| Class A | | | (2,158,436 | ) | | | (3,195,562 | ) |
| Class I | | | (18,035,766 | ) | | | (33,452,600 | ) |
| Total distributions to shareholders | | | (20,194,202 | ) | | | (36,648,162 | ) |
| Capital share transactions (See Note 14): | | | | | | | | |
| Net proceeds from sales of shares | | | 36,535,765 | | | | 6,113,574 | |
| Reinvestment of distributions | | | 18,151,507 | | | | 33,356,839 | |
| Cost of shares reacquired | | | (102,948,159 | ) | | | (27,261,172 | ) |
| Net increase (decrease) in net assets resulting from capital share transactions | | | (48,260,887 | ) | | | 12,209,241 | |
| Net decrease in net assets | | | (17,002,591 | ) | | | (12,921,990 | ) |
| NET ASSETS: | | | | | | | | |
| Beginning of year | | $ | 132,412,421 | | | $ | 145,334,411 | |
| End of year | | $ | 115,409,830 | | | $ | 132,412,421 | |
| | |
| 12 | See Notes to Financial Statements. |
This page is intentionally left blank.
13
Financial Highlights
| | | | | Per Share Operating Performance: | | |
| | | | | | | | | | | Distributions | | |
| | | | | | | | | | | to | | |
| | | | | | | | | | | shareholders | | |
| | | | | Investment operations: | | from: | | |
| | | Net asset | | Net | | Net | | | | | | Net asset |
| | | value, | | investment | | realized and | | Total from | | Net | | value, |
| | | beginning of | | income | | unrealized | | investment | | realized | | end of |
| | | period | | (loss)(a) | | gain | | operations | | gain | | period |
| Class A | | | | | | | | | | | | | | | | | | | | | | | | |
| 10/31/2020 | | | $13.83 | | | | $(0.18 | ) | | | $6.23 | | | | $ 6.05 | | | | $(2.37 | ) | | | $17.51 | |
| 10/31/2019 | | | 18.05 | | | | (0.21 | ) | | | 0.98 | | | | 0.77 | | | | (4.99 | ) | | | 13.83 | |
| 10/31/2018 | | | 18.26 | | | | (0.26 | ) | | | 2.75 | | | | 2.49 | | | | (2.70 | ) | | | 18.05 | |
| 10/31/2017 | | | 13.09 | | | | (0.21 | ) | | | 5.38 | | | | 5.17 | | | | – | | | | 18.26 | |
| 10/31/2016 | | | 16.33 | | | | (0.19 | ) | | | 0.15 | | | | (0.04 | ) | | | (3.20 | ) | | | 13.09 | |
| Class C | | | | | | | | | | | | | | | | | | | | | | | | |
| 10/31/2020(c) | | | 20.16 | | | | (0.07 | ) | | | 0.35 | | | | 0.28 | | | | – | | | | 20.44 | |
| Class F | | | | | | | | | | | | | | | | | | | | | | | | |
| 10/31/2020(c) | | | 20.16 | | | | (0.04 | ) | | | 0.35 | | | | 0.31 | | | | – | | | | 20.47 | |
| Class I | | | | | | | | | | | | | | | | | | | | | | | | |
| 10/31/2020 | | | 15.77 | | | | (0.19 | ) | | | 7.26 | | | | 7.07 | | | | (2.37 | ) | | | 20.47 | |
| 10/31/2019 | | | 19.84 | | | | (0.24 | ) | | | 1.16 | | | | 0.92 | | | | (4.99 | ) | | | 15.77 | |
| 10/31/2018 | | | 19.80 | | | | (0.29 | ) | | | 3.03 | | | | 2.74 | | | | (2.70 | ) | | | 19.84 | |
| 10/31/2017 | | | 14.20 | | | | (0.23 | ) | | | 5.83 | | | | 5.60 | | | | – | | | | 19.80 | |
| 10/31/2016 | | | 17.45 | | | | (0.21 | ) | | | 0.16 | | | | (0.05 | ) | | | (3.20 | ) | | | 14.20 | |
| (a) | Calculated using average shares outstanding during the period. |
| (b) | Total return for Class A does not consider the effects of sales loads and assumes the reinvestment of all distributions. Total return for all other classes assumes the reinvestment of all distributions. |
| (c) | Commenced on August 28, 2020. |
| (d) | Not annualized. |
| (e) | Annualized. |
| 14 | See Notes to Financial Statements. |
| | | Ratios to Average Net Assets: | | Supplemental Data: |
| |
| |
| |
| |
| | | Total expenses | | | | Net | | Net assets, | | Portfolio |
| Total | | after waivers and/or | | Total | | investment | | end of | | turnover |
| return | | reimbursements | | expenses | | income (loss) | | period | | rate |
| (%)(b) | | (%) | | (%) | | (%) | | (000) | | (%) |
| | | | | | | | | | | |
| | 51.19 | | | | 1.56 | | | | 1.56 | | | | (1.32 | ) | | | $ 11,747 | | | | 115 | |
| | 8.33 | | | | 1.66 | | | | 1.66 | | | | (1.48 | ) | | | 12,590 | | | | 94 | |
| | 16.32 | | | | 1.63 | | | | 1.63 | | | | (1.43 | ) | | | 11,616 | | | | 73 | |
| | 39.39 | | | | 1.67 | | | | 1.67 | | | | (1.36 | ) | | | 9,893 | | | | 105 | |
| | (1.30 | ) | | | 1.81 | | | | 1.81 | | | | (1.52 | ) | | | 7,416 | | | | 161 | |
| |
| | 1.29 | (d) | | | 2.03 | (e) | | | 2.05 | (e) | | | (1.91 | )(e) | | | 849 | | | | 115 | (d) |
| |
| | 1.49 | (d) | | | 1.10 | (e) | | | 1.20 | (e) | | | (0.97 | )(e) | | | 12,089 | | | | 115 | (d) |
| |
| | 51.47 | | | | 1.44 | | | | 1.45 | | | | (1.19 | ) | | | 90,725 | | | | 115 | |
| | 8.34 | | | | 1.66 | | | | 1.66 | | | | (1.48 | ) | | | 119,822 | | | | 94 | |
| | 16.31 | | | | 1.63 | | | | 1.63 | | | | (1.43 | ) | | | 133,719 | | | | 73 | |
| | 39.44 | | | | 1.67 | | | | 1.67 | | | | (1.36 | ) | | | 139,068 | | | | 105 | |
| | (1.39 | ) | | | 1.81 | | | | 1.81 | | | | (1.52 | ) | | | 133,112 | | | | 161 | |
| | See Notes to Financial Statements. | 15 |
Notes to Financial Statements
Lord Abbett Securities Trust (the “Trust”) is registered under the Investment Company Act of 1940, as amended (the “Act”), as a diversified, open-end management investment company and was organized as a Delaware statutory trust on February 26, 1993. The Trust currently consists of fourteen funds. This report covers one fund and its respective active classes: Lord Abbett Micro-Cap Growth Fund (“Micro Cap Growth Fund”) or (the “Fund”), Class A, C, F and I shares. The Fund’s investment objective is long-term capital appreciation. Class C and F shares commenced operations on August 28, 2020.
Each class of shares has different expenses and dividends. A front-end sales charge is normally added to the net asset value (“NAV”) for Class A shares. A contingent deferred sales charge (“CDSC”) may apply to certain redemptions of Class A shares purchased without a sales charge and redeemed before the first day of the month in which the one-year anniversary of the purchase falls (subject to certain exceptions as set forth in the Fund’s prospectus). Class I shares are not subject to any sales charges. Class C shares will automatically convert to Class A shares on the 25th day of the month (or, if the 25th day is not a business day, the next business day thereafter) following the eighth anniversary of the month on which the purchase order was accepted, provided that the Fund or financial intermediary through which a shareholder purchased Class C shares has records verifying that the C shares have been held at least eight years.
The preparation of the financial statements in conformity with accounting principles generally accepted in the United States of America (“U.S. GAAP”) requires management to make certain estimates and assumptions that affect the reported amounts of assets and liabilities and disclosure of contingent assets and liabilities at the date of the financial statements and the reported amounts of increases and decreases in net assets from operations during the reporting period. Actual results could differ from those estimates. The Fund is considered an investment company under U.S. GAAP and follows the accounting and reporting guidance applicable to investment companies.
| 2. | SIGNIFICANT ACCOUNTING POLICIES |
| (a) | Investment Valuation–Under procedures approved by the Fund’s Board of Trustees (the “Board”), Lord, Abbett & Co. LLC (“Lord Abbett”), the Fund’s investment manager, has formed a Pricing Committee to administer the pricing and valuation of portfolio investments and to ensure that prices utilized reasonably reflect fair value. Among other things, these procedures allow the Fund to utilize independent pricing services, quotations from securities and financial instrument dealers and other market sources to determine fair value. |
| | |
| | Securities actively traded on any recognized U.S. or non-U.S. exchange or on The NASDAQ Stock Market LLC are valued at the last sale price or official closing price on the exchange or system on which they are principally traded. Events occurring after the close of trading on non-U.S. exchanges may result in adjustments to the valuation of foreign securities to reflect their fair value as of the close of regular trading on the New York Stock Exchange. The Fund may utilize an independent fair valuation service in adjusting the valuations of foreign securities. Unlisted equity securities are valued at the last quoted sale price or, if no sale price is available, at the mean between the most recently quoted bid and asked prices. |
| | |
| | Securities for which prices are not readily available are valued at fair value as determined by the Pricing Committee. The Pricing Committee considers a number of factors, including observable and unobservable inputs, when arriving at fair value. The Pricing Committee may |
16
Notes to Financial Statements (continued)
| | use related or comparable assets or liabilities, recent transactions, market multiples, book values and other relevant information to determine the fair value of portfolio investments. The Board or a designated committee thereof regularly reviews fair value determinations made by the Pricing Committee and may employ techniques such as reviewing related market activity, reviewing inputs and assumptions, and retrospectively comparing prices of subsequent purchases and sales transactions to fair value determinations made by the Pricing Committee. |
| | |
| | Short-term securities with 60 days or less remaining to maturity are valued using the amortized cost method, which approximates fair value. |
| | |
| (b) | Security Transactions–Security transactions are recorded as of the date that the securities are purchased or sold (trade date). Realized gains and losses on sales of portfolio securities are calculated using the identified-cost method. Realized and unrealized gains (losses) are allocated to each class of shares based upon the relative proportion of net assets at the beginning of the day. |
| | |
| (c) | Investment Income–Dividend income is recorded on the ex-dividend date. Interest income is recorded on the accrual basis as earned. Discounts are accreted and premiums are amortized using the effective interest method and are included in Interest and other income on the Statement of Operations. Withholding taxes on foreign dividends have been provided for in accordance with the applicable country’s tax rules and rates. Investment income is allocated to each class of shares based upon the relative proportion of net assets at the beginning of the day. |
| | |
| (d) | Income Taxes–It is the policy of the Fund to meet the requirements of Subchapter M of the Internal Revenue Code applicable to regulated investment companies and to distribute substantially all taxable income and capital gains to its shareholders. Therefore, no income tax provision is required. |
| | |
| | The Fund files U.S. federal and various state and local tax returns. No income tax returns are currently under examination. The statute of limitations on the Fund’s filed U.S. federal tax returns remains open for the fiscal years ended October 31, 2017 through October 31, 2020. The statutes of limitations on the Trust’s state and local tax returns may remain open for an additional year depending upon the jurisdiction. |
| | |
| (e) | Expenses–Expenses incurred by the Trust that do not specifically relate to an individual fund are generally allocated to the Funds within the Trust on a pro rata basis by relative net assets. Expenses incurred by the Fund are allocated to each class of shares based upon the relative proportion of net assets at the beginning of the day. |
| | |
| (f) | Repurchase Agreements–The Fund may enter into repurchase agreements with respect to securities. A repurchase agreement is a transaction in which a fund acquires a security and simultaneously commits to resell that security to the seller (a bank or securities dealer) at an agreed-upon price on an agreed-upon date. The Fund requires at all times that the repurchase agreement be collateralized by cash, or by securities of the U.S. Government, its agencies, its instrumentalities, or U.S. Government sponsored enterprises having a value equal to, or in excess of, the value of the repurchase agreement (including accrued interest). If the seller of the agreement defaults on its obligation to repurchase the underlying securities at a time when the fair value of these securities has declined, the Fund may incur a loss upon disposition of the securities. |
17
Notes to Financial Statements (continued)
| (g) | Fair Value Measurements–Fair value is defined as the price that the Fund would receive upon selling an investment or transferring a liability in an orderly transaction to an independent buyer in the principal or most advantageous market of the investment. A three-tier hierarchy is used to maximize the use of observable market data and minimize the use of unobservable inputs and to establish classification of fair value measurements for disclosure purposes. Inputs refer broadly to the assumptions that market participants would use in pricing the asset or liability, including assumptions about risk- for example, the risk inherent in a particular valuation technique used to measure fair value (such as a pricing model) and/or the risk inherent in the inputs to the valuation technique. Inputs may be observable or unobservable. Observable inputs reflect the assumptions market participants would use in pricing the asset or liability. Observable inputs are based on market data obtained from sources independent of the reporting entity. Unobservable inputs reflect the reporting entity’s own assumptions about the assumptions market participants would use in pricing the asset or liability. Unobservable inputs are based on the best information available in the circumstances. The three-tier hierarchy classification is determined based on the lowest level of inputs that is significant to the fair value measurement, and is summarized in the three broad Levels listed below: |
| | |
| | · | Level 1 – | unadjusted quoted prices in active markets for identical investments; |
| | | | |
| | · | Level 2 – | other significant observable inputs (including quoted prices for similar investments, interest rates, prepayment speeds, credit risk, etc.); and |
| | | | |
| | · | Level 3 – | significant unobservable inputs (including the Fund’s own assumptions in determining the fair value of investments). |
| | | | |
| | A summary of inputs used in valuing the Fund’s investments as of October 31, 2020 and, if applicable, Level 3 rollforwards for the fiscal year then ended is included in the Fund’s Schedule of Investments. |
| | |
| | Changes in valuation techniques may result in transfers into or out of an assigned level within the three-tier hierarchy. The inputs or methodology used for valuing securities are not necessarily an indication of the risk associated with investing in those securities. |
| 3. | MANAGEMENT FEE AND OTHER TRANSACTIONS WITH AFFILIATES |
Management Fee
The Trust has a management agreement with Lord Abbett, pursuant to which Lord Abbett supplies the Fund with investment management services and executive and other personnel, provides office space and pays for ordinary and necessary office and clerical expenses relating to research and statistical work and supervision of the Fund’s investment portfolio.
The management fee is based on the Fund’s average daily net assets at an annual rate of 0.90%. Prior to June 1, 2020, the fee was based on the Fund’s average daily net assets of 1.50%. The Fund’s annualized effective management fee rate for the fiscal year ended October 31, 2020 was 1.27%.
In addition, Lord Abbett provides certain administrative services to the Fund pursuant to an Administrative Services Agreement in return for a fee at an annual rate of .04% of the Fund’s average daily net assets. Lord Abbett voluntarily waived $10,742 of fund administration fees during the fiscal year ended October 31, 2020.
12b-1 Distribution Plan
The Fund has adopted a distribution plan with respect to Class A, C and F shares pursuant to Rule 12b-1 under the Act under which the Board may authorize the payment of ongoing distribution
18
Notes to Financial Statements (continued)
and service fees to Lord Abbett Distributor LLC (the “Distributor”), an affiliate of Lord Abbett. The following annual rates have been authorized by the Board pursuant to the plan:
| Fees* | Class A(1) | Class C | Class F(2)(3) | |
| Service | .25% | .25% | – | |
| Distribution | – | .75% | .10% | |
| * | The Fund may designate a portion of the aggregate fee as attributable to service activities for purposes of calculating Financial Industry Regulatory Authority, Inc. (“FINRA”) sales charge limitations. |
| (1) | Prior to June 1, 2020, the Board did not authorize such Class A 12b-1 fees for the Fund. This agreement may be terminated only by the Fund’s Board. |
| (2) | The Class F Share Rule 12b-1 fee may be designated as a service fee in limited circumstances as described in the Fund’s prospectus. |
| (3) | For the period from August 28, 2020 and continuing through February 28, 2022, the Distributor has contractually agreed to waive the Fund’s 0.10% Rule 12b-1 fee for Class F. These agreements may be terminated only by the Fund’s Board. |
Class I shares do not have a distribution plan.
Other Related Parties
As of October 31, 2020, the percentage of the Fund’s outstanding shares owned by Lord Abbett Alpha Strategy Fund was 57.31%.
Distributor
Commissions | | | Dealers’
Concessions | |
| $ | 1,722 | | | $ | 10,866 | |
Distributor received CDSCs of $0 and $60 for Class A and Class C shares, respectively, for the fiscal year ended October 31, 2020.
One Trustee and certain of the Trust’s officers have an interest in Lord Abbett.
| 4. | DISTRIBUTIONS AND CAPITAL LOSS CARRYFORWARDS |
Dividends from net investment income, if any, are declared and paid at least annually for the Fund. Taxable net realized gains from investment transactions, reduced by allowable capital loss carryforwards, if any, are declared and distributed to shareholders at least annually. The capital loss carryforward amount, if any, is available to offset future net capital gains. Dividends and distributions to shareholders are recorded on the ex-dividend date. The amounts of dividends and distributions from net investment income and net realized capital gains are determined in accordance with federal income tax regulations, which may differ from U.S. GAAP. These book/tax differences are either considered temporary or permanent in nature. To the extent these differences are permanent in nature, such amounts are reclassified within the components of net assets based on their federal tax basis treatment; temporary differences do not require reclassification. Dividends and distributions, which exceed earnings and profits for tax purposes, are reported as a tax return of capital.
The tax character of distributions paid during the fiscal years ended October 31, 2020 and 2019 was as follows:
| | | Year Ended
10/31/2020 | | | Year Ended
10/31/2019 | |
| Distributions paid from: | | | | | | | | |
| Ordinary income | | $ | – | | | $ | 6,937,287 | |
| Net long-term capital gains | | | 20,194,202 | | | | 29,710,875 | |
| Total distributions paid | | $ | 20,194,202 | | | $ | 36,648,162 | |
19
Notes to Financial Statements (continued)
Subsequent to the Fund’s fiscal year ended October 31, 2020, short-term and long-term capital gain distributions of approximately $13,474,000 and $16,615,000, respectively, were paid on November 24, 2020 to shareholders of record on November 23, 2020.
As of October 31, 2020, the components of accumulated gains on a tax-basis were as follows:
| Undistributed ordinary income – net | | $ | 13,472,834 | |
| Undistributed long-term capital gains | | | 16,614,388 | |
| Total undistributed earnings | | | 30,087,222 | |
| Temporary differences | | | (18,721 | ) |
| Unrealized gains – net | | | 31,340,760 | |
| Total accumulated gains – net | | $ | 61,409,261 | |
As of October 31, 2020, the aggregate unrealized security gains and losses on investments and other financial instruments for U.S. federal income tax purposes were as follows:
| Tax cost | | $ | 83,256,336 | |
| Gross unrealized gain | | | 33,890,835 | |
| Gross unrealized loss | | | (2,550,075 | ) |
| Net unrealized security gain | | $ | 31,340,760 | |
The difference between book-basis and tax-basis unrealized gains (losses) is attributable to the tax treatment of wash sales.
Permanent items identified during the fiscal year ended October 31, 2020 have been reclassified among the components of net assets based on their tax basis treatment as follows:
Total
Distributable
Earnings (loss) | | | Paid-in Capital | |
| $ | (4,528,150 | ) | | $ | 4,528,150 | |
The permanent differences are attributable primarily to the tax treatment of certain distributions.
| 5. | PORTFOLIO SECURITIES TRANSACTIONS |
Purchases and sales of investment securities (excluding short-term investments) for the fiscal year ended October 31, 2020 were as follows:
| Purchases | | | Sales | |
| $ | 139,384,895 | | | $ | 209,404,834 | |
There were no purchases or sales of U.S. Government securities for the fiscal year ended October 31, 2020.
The Fund is permitted to purchase and sell securities (“cross-trade”) from and to other Lord Abbett funds or client accounts pursuant to procedures approved by the Board in compliance with Rule 17a-7 under the Act (the “Rule”). Each cross-trade is executed at a fair market price in compliance with provisions of the Rule. For the fiscal year ended October 31, 2020, the Fund engaged in cross-trade sales of $4,234,364 which resulted in net realized gains of $2,474,879.
| 6. | DISCLOSURES ABOUT OFFSETTING ASSETS AND LIABILITIES |
The Financial Accounting Standards Board (“FASB”) requires disclosure to help better assess the effect or potential effect of offsetting arrangements on a fund’s financial position. These requirements include the disclosure of gross and net information about recognized assets and liabilities eligible for offset in the Statement of Assets and Liabilities; and to disclose such amounts subject to an enforceable master netting agreement or similar agreement, by a counterparty. A
20
Notes to Financial Statements (continued)
master netting agreement is an agreement between a fund and a counterparty which provides for the net settlement of amounts owed under all contracts traded under that agreement, as well as cash collateral, through a single payment by one party to the other in the event of default on or termination of any one contract. The Fund’s accounting policy with respect to balance sheet offsetting is that, absent an event of default by the counterparty or a termination of the agreement, the master netting agreement does not result in an offset of reported amounts of financial assets and liabilities in the Statement of Assets and Liabilities across transactions between a Fund and the applicable counterparty.
As of October 31, 2020, the Fund did not have assets or liabilities subject to the FASB disclosure requirements.
The Trust’s officers and one Trustee, who are associated with Lord Abbett, do not receive any compensation from the Trust for serving in such capacities. Independent Trustees’ fees are allocated among all Lord Abbett-sponsored funds based on the net assets of each fund. There is an equity-based plan available to all Independent Trustees under which Independent Trustees must defer receipt of a portion of, and may elect to defer receipt of an additional portion of Trustees’ fees. The deferred amounts are treated as though equivalent dollar amounts had been invested in the fund. Such amounts and earnings accrued thereon are included in Trustees’ fees on the Statement of Operations and in Trustees’ fees payable on the Statement of Assets and Liabilities and are not deductible for U.S. federal income tax purposes until such amounts are paid.
The Trust has entered into an arrangement with its transfer agent and custodian, whereby credits realized as a result of uninvested cash balances are used to reduce a portion of the Fund’s expenses.
For the period ended August 5, 2020, the Fund and certain other funds managed by Lord Abbett (collectively, the “Participating Funds”) entered into a syndicated line of credit facility with various lenders for $1.17 billion (the “Syndicated Facility”) whereas State Street Bank and Trust Company (“SSB”) participated as a lender and as agent for the lenders. The Participating Funds were subject to graduated borrowing limits of one-third of Fund net assets (if Fund net assets are less than $750 million), $250 million, $300 million, $350 million, $500 million, or $1 billion, based on past borrowings and likelihood of future borrowings, among other factors. Effective August 6, 2020, the Participating Funds are subject to graduated borrowing limits of one-third of Fund net assets (if Fund net assets are less than $750 million), $250 million, $300 million, $600 million, or $900 million, based on past borrowings and likelihood of future borrowings, among other factors.
For the period ended October 31, 2020, the Participating Funds were party to an additional line of credit facility with SSB for $330 million (the “Bilateral Facility”), $250 million committed and $80 million uncommitted. Under the Bilateral Facility, the Participating Funds are subject to graduated borrowing limits of one-third of Fund net assets (if net assets are less than $750 million), $250 million, $300 million, or $330 million, based on past borrowings and likelihood of future borrowings, among other factors.
The Syndicated Facility and the Bilateral Facility are to be used for temporary or emergency purposes as an additional source of liquidity to satisfy redemptions.
21
Notes to Financial Statements (continued)
For the fiscal year ended October 31, 2020, the Fund did not utilize the Facilities.
| 10. | INTERFUND LENDING PROGRAM |
Pursuant to an exemptive order issued by the U.S. Securities and Exchange Commission (“SEC exemptive order”), certain registered open-end management investment companies managed by Lord Abbett, including the Fund, participate in a joint lending and borrowing program (the “Interfund Lending Program”). The SEC exemptive order allows the Funds to borrow money from and lend money to each other for temporary or emergency purposes subject to the limitations and conditions.
For the fiscal year ended October 31, 2020 the Fund did not participate as a borrower or lender in the Interfund Lending Program.
| 11. | CUSTODIAN AND ACCOUNTING AGENT |
SSB is the Trust’s custodian and accounting agent. SSB performs custodial, accounting and recordkeeping functions relating to portfolio transactions and calculating the Fund’s NAV.
| 12. | SECURITIES LENDING AGREEMENT |
The Fund has established a securities lending agreement with Citibank, N.A. (the “agent”) for the lending of securities to qualified brokers in exchange for securities or cash collateral equal to at least the market value of securities loaned, plus interest, if applicable. Cash collateral is invested in an approved money market fund. In accordance with the Fund’s securities lending agreement, the market value of securities on loan is determined each day at the close of business and any additional collateral required to cover the value of securities on loan is delivered to the Fund on the next business day. As with other extensions of credit, the Fund may experience a delay in the recovery of its securities or incur a loss should the borrower of the securities breach its agreement with the Fund or become insolvent at a time when the collateral is insufficient to cover the cost of repurchasing securities on loan. Any income earned from securities lending is included in Securities lending net income on the Statement of Operations.
The initial collateral received by the Fund is required to have a value equal to at least 100% of the market value of the securities loaned. The collateral must be marked-to-market daily to cover increases in the market value of the securities loaned (or potentially a decline in the value of the collateral). In general, the risk of borrower default will be borne by the Fund’s agent; the Fund will bear the risk of loss with respect to the investment of the cash collateral. The advantage of such loans is that the Fund continues to receive income on loaned securities while receiving a portion of any securities lending fees and earning returns on the cash amounts which may be reinvested for the purchase of investments in securities.
For the fiscal year ended October 31, 2020, the market value of securities loaned and collateral received for the Fund was as follows:
Market
Value of
Securities
Loaned | | | Collateral
Received(1) | |
| $ | 2,438,418 | | | $ | 2,618,332 | |
| (1) | Statement of Assets and Liabilities location: Payable for collateral due to broker for securities lending. |
22
Notes to Financial Statements (continued)
The Fund is subject to the general risks and considerations associated with equity investing, as well as the particular risks associated with micro-cap growth stocks. The value of an investment in the Fund will fluctuate in response to movements in the equity securities market in general and to the changing prospects of individual companies in which the Fund invests. Micro-cap companies may be subject to greater risks and may be more sensitive to changes in economic conditions than larger, more established companies. There may be less liquidity in micro-cap company stocks, subjecting them to greater price fluctuations than larger company stocks. Micro-cap companies also may fall out of favor relative to larger companies in certain market cycles. In the case of Micro Cap Growth Fund, the growth stocks in which it generally invests may add to the Fund’s volatility. Moreover, different investment styles, such as growth investing, may shift in and out of favor over time, depending on market and economic conditions, as well as investor sentiment.
Geopolitical and other events (e.g., wars, terrorism, natural disasters, epidemics or pandemics such as the COVID-19 outbreak which began in late 2019) may disrupt securities markets and adversely affect global economies and markets, thereby decreasing the value of the Fund’s investments. Market disruptions can also prevent the Fund from implementing its investment strategies and achieving its investment objective.
The transmission of COVID-19 and efforts to contain its spread have resulted in, among other things, border closings and other significant travel restrictions and disruptions, significant disruptions to business operations, supply chains and customer activity, lower consumer demand for goods and services, event cancellations and restrictions, service cancellations, reductions and other changes, significant challenges in healthcare service preparation and delivery, and prolonged quarantines, as well as general concern and uncertainty. The impact of the COVID-19 outbreak could negatively affect the global economy, the economies of individual countries, and the financial performance of individual issuers, sectors, industries, asset classes, and markets in significant and unforeseen ways.
The COVID-19 pandemic and its effects may last for an extended period of time, and in either case could result in significant market volatility, exchange trading suspensions and closures, declines in global financial markets, higher default rates, and a substantial economic downturn or recession. The foregoing could disrupt the operations of the Fund and its service providers, adversely affect the value and liquidity of the Fund’s investments, and negatively impact the Fund’s performance and your investment in the Fund.
These factors can affect the Fund’s performance.
| 14. | SUMMARY OF CAPITAL TRANSACTIONS |
Transactions in shares of beneficial interest were as follows:
| | | Year Ended
October 31, 2020 | | | Year Ended
October 31, 2019 | |
| Class A Shares | | Shares | | | Amount | | | Shares | | | Amount | |
| Shares sold | | | 315,734 | | | $ | 5,250,326 | | | | 34,291 | | | $ | 446,622 | |
| Reinvestment of distributions | | | 178,087 | | | | 2,158,413 | | | | 264,969 | | | | 3,195,527 | |
| Shares reacquired | | | (733,350 | ) | | | (10,796,624 | ) | | | (32,432 | ) | | | (469,450 | ) |
| Increase (decrease) | | | (239,529 | ) | | $ | (3,387,885 | ) | | | 266,828 | | | $ | 3,172,699 | |
23
Notes to Financial Statements (concluded)
| | | Year Ended
October 31, 2020 | | | Year Ended
October 31, 2019 | |
| Class C Shares(a) | | Shares | | | Amount | | | Shares | | | Amount | |
| Shares sold | | | 43,721 | | | $ | 922,143 | | | | – | | | $ | – | |
| Shares reacquired | | | (2,165 | ) | | | (44,235 | ) | | | | | | | | |
| Increase | | | 41,556 | | | $ | 877,908 | | | | – | | | $ | – | |
| | | | | | | | | | | | | | | | | |
| Class F Shares(a) | | | | | | | | | | | | | | | | |
| Shares sold | | | 602,649 | | | $ | 12,452,364 | | | | – | | | $ | – | |
| Shares reacquired | | | (12,112 | ) | | | (240,374 | ) | | | | | | | | |
| Increase | | | 590,537 | | | $ | 12,211,990 | | | | – | | | $ | – | |
| | | | | | | | | | | | | | | | | |
| Class I Shares | | | | | | | | | | | | | | | | |
| Shares sold | | | 973,448 | | | $ | 17,910,932 | | | | 379,357 | | | $ | 5,666,952 | |
| Reinvestment of distributions | | | 1,130,254 | | | | 15,993,094 | | | | 2,193,550 | | | | 30,161,312 | |
| Shares reacquired | | | (5,269,377 | ) | | | (91,866,926 | ) | | | (1,715,356 | ) | | | (26,791,722 | ) |
| Increase (decrease) | | | (3,165,675 | ) | | $ | (57,962,900 | ) | | | 857,551 | | | $ | 9,036,542 | |
| (a) | Commenced on August 28, 2020. |
24
Report of Independent Registered Public Accounting Firm
To the shareholders and the Board of Trustees of Lord Abbett Securities Trust
Opinion on the Financial Statements and Financial Highlights
We have audited the accompanying statement of assets and liabilities, including the schedule of investments, of Lord Abbett Micro-Cap Growth Fund, one of the funds constituting the Lord Abbett Securities Trust (the “Trust”), as of October 31, 2020, the related statements of operations for the year then ended, the statements of changes in net assets for each of the two years in the period then ended, the financial highlights for each of the five years in the period then ended, and the related notes. In our opinion, the financial statements and financial highlights present fairly, in all material respects, the financial position of the Lord Abbett Micro-Cap Growth Fund of the Trust as of October 31, 2020, and the results of its operations for the year then ended, the changes in its net assets for each of the two years in the period then ended, and the financial highlights for each of the five years in the period then ended in conformity with accounting principles generally accepted in the United States of America.
Basis for Opinion
These financial statements and financial highlights are the responsibility of the Trust’s management. Our responsibility is to express an opinion on the Trust’s financial statements and financial highlights based on our audits. We are a public accounting firm registered with the Public Company Accounting Oversight Board (United States) (PCAOB) and are required to be independent with respect to the Trust in accordance with the U.S. federal securities laws and the applicable rules and regulations of the Securities and Exchange Commission and the PCAOB.
We conducted our audits in accordance with the standards of the PCAOB. Those standards require that we plan and perform the audit to obtain reasonable assurance about whether the financial statements and financial highlights are free of material misstatement, whether due to error or fraud. The Trust is not required to have, nor were we engaged to perform, an audit of its internal control over financial reporting. As part of our audits we are required to obtain an understanding of internal control over financial reporting but not for the purpose of expressing an opinion on the effectiveness of the Trust’s internal control over financial reporting. Accordingly, we express no such opinion.
Our audits included performing procedures to assess the risks of material misstatement of the financial statements and financial highlights, whether due to error or fraud, and performing procedures that respond to those risks. Such procedures included examining, on a test basis, evidence regarding the amounts and disclosures in the financial statements and financial highlights. Our audits also included evaluating the accounting principles used and significant estimates made by management, as well as evaluating the overall presentation of the financial statements and financial highlights. Our procedures included confirmation of securities owned as of October 31, 2020, by correspondence with the custodian and brokers; when replies were not received from brokers, we performed other auditing procedures. We believe that our audits provide a reasonable basis for our opinion.
DELOITTE & TOUCHE LLP
New York, New York
December 22, 2020
We have served as the auditor of one or more Lord Abbett Family of Funds’ investment companies since 1932.
25
Basic Information About Management
The Board is responsible for the management of the business and affairs of the Fund in accordance with the laws of the state of organization. The Board elects officers who are responsible for the day-to-day operations of the Fund and who execute policies authorized by the Board. The Board also approves an investment adviser to the Fund and continues to monitor the cost and quality of the services the investment adviser provides, and annually considers whether to renew the contract with the investment adviser. Generally, each Board member holds office until his/her successor is elected and qualified or until his/her earlier resignation or removal, as provided in the Fund’s organizational documents.
Lord, Abbett & Co. LLC (“Lord Abbett”), a Delaware limited liability company, is the Fund’s investment adviser. Designated Lord Abbett personnel are responsible for the day-to-day management of the Fund.
Interested Board Members
Mr. Sieg is affiliated with Lord Abbett and is an “interested person” of the Fund as defined in the Act. Mr. Sieg is a board member of each of the 13 investment companies in the Lord Abbett Family of Funds, which consist of 60 investment portfolios. Mr. Sieg is an officer of the Lord Abbett Family of Funds.
Name, Address and
Year of Birth | | Current Position and
Length of Service
with the Fund | | Principal Occupation and Other Directorships
During the Past Five Years |
Douglas B. Sieg
Lord, Abbett & Co. LLC
90 Hudson Street
Jersey City, NJ 07302
(1969) | | Board member since 2016; President and Chief Executive Officer since 2018 | | Principal Occupation: Managing Partner (since 2018) and was formerly Head of Client Services, joined Lord Abbett in 1994. Other Directorships: None. |
Independent Board Members
The following Independent Board Members also are board members of each of the 13 investment companies in the Lord Abbett Family of Funds, which consist of 60 investment portfolios.
Name, Address and
Year of Birth | | Current Position and
Length of Service
with the Fund | | Principal Occupation and Other Directorships
During the Past Five Years |
Evelyn E. Guernsey
Lord, Abbett & Co. LLC
c/o Legal Dept.
90 Hudson Street
Jersey City, NJ 07302
(1955) | | Board member since 2011 | | Principal Occupation: None. Other Directorships: None. |
| | | | | |
Julie A. Hill
Lord, Abbett & Co. LLC
c/o Legal Dept.
90 Hudson Street
Jersey City, NJ 07302
(1946) | | Board member since 2004 | | Principal Occupation: Owner and CEO of The Hill Company, a business consulting firm (since 1998). Other Directorships: Currently serves as director of Anthem, Inc., a health benefits company (since 1994). |
26
Basic Information About Management (continued)
Name, Address and
Year of Birth | | Current Position and
Length of Service
with the Fund | | Principal Occupation and Other Directorships
During the Past Five Years |
Kathleen M. Lutito
Lord, Abbett & Co. LLC
c/o Legal Dept.
90 Hudson Street
Jersey City, NJ 07302
(1963) | | Board member since 2017 | | Principal Occupation: President and Chief Investment Officer of CenturyLink Investment Management Company (since 2006).
Other Directorships: None. |
| | | | | |
James M. McTaggart
Lord, Abbett & Co. LLC
c/o Legal Dept.
90 Hudson Street
Jersey City, NJ 07302
(1947) | | Board member since 2012 | | Principal Occupation: Independent management advisor and consultant (since 2012).
Other Directorships: Blyth, Inc., a home products company (2004–2015). |
| | | | | |
Charles O. Prince
Lord, Abbett & Co. LLC
c/o Legal Dept
90 Hudson Street
Jersey City, NJ 07302
(1950) | | Board member since 2019 | | Principal Occupation: None. Formerly Chairman and Chief Executive Officer, Citigroup, Inc. (Retired 2007).
Other Directorships: Currently serves as director of Johnson & Johnson (2006–Present). Previously served as director of Xerox Corporation (2008–2018). |
| | | | | |
Karla M. Rabusch
Lord, Abbett & Co. LLC
c/o Legal Dept.
90 Hudson Street
Jersey City, NJ 07302
(1959) | | Board member since 2017 | | Principal Occupation: President and Director of Wells Fargo Funds Management, LLC (2003–2017); President of Wells Fargo Funds (2003–2016).
Other Directorships: None. |
| | | | | |
Mark A. Schmid
Lord, Abbett & Co. LLC
c/o Legal Dept.
90 Hudson Street
Jersey City, NJ 07302
(1959) | | Board member since 2016 | | Principal Occupation: Vice President and Chief Investment Officer of the University of Chicago (since 2009). Other Directorships: None. |
| | | | | |
James L.L. Tullis
Lord, Abbett & Co. LLC
c/o Legal Dept.
90 Hudson Street
Jersey City, NJ 07302
(1947) | | Board member since 2006; Chairman since 2017 | | Principal Occupation: Chairman of Tullis Health Investors–FL LLC (since 2018); CEO of Tullis-Dickerson and Co. Inc., a venture capital management firm (1990–2016).
Other Directorships: Currently serves as director of Crane Co. (since 1998), Alphatec Spine (since 2018), electroCore, Inc. (since 2018), and Exagen Inc. (since 2019). |
Officers
None of the officers listed below have received compensation from the Fund. All of the officers of the Fund also may be officers of the other Lord Abbett Funds and maintain offices at 90 Hudson Street, Jersey City, NJ 07302. Unless otherwise indicated, the position(s) and title(s) listed under the “Principal Occupation During the Past Five Years” column indicate each officer’s position(s) and title(s) with Lord Abbett. Each officer serves for an indefinite term (i.e., until his or her death, resignation, retirement, or removal).
27
Basic Information About Management (concluded)
Name and
Year of Birth | | Current Position
with the Fund | | Length of Service
of Current Position | | Principal Occupation
During the Past Five Years |
Douglas B. Sieg
(1969) | | President and Chief Executive Officer | | Elected as President and Chief Executive Officer in 2018 | | Managing Partner of Lord Abbett (since 2018) and was formerly Head of Client Services, joined Lord Abbett in 1994. |
| | | | | | | |
Jackson C. Chan
(1964) | | AML Compliance Officer | | Elected in 2018 | | Deputy Chief Compliance Officer and Director of Regulatory Affairs, joined Lord Abbett in 2014. |
| | | | | | | |
Pamela P. Chen
(1978) | | Vice President, Assistant Secretary and Privacy Officer | | Elected as Vice President and Assistant Secretary in 2018 and Privacy Officer in 2019 | | Associate General Counsel, joined Lord Abbett in 2017 and was formerly Special Counsel at Schulte, Roth & Zabel LLP (2005–2017). |
| | | | | | | |
John T. Fitzgerald
(1975) | | Vice President and Assistant Secretary | | Elected in 2018 | | Deputy General Counsel, joined Lord Abbett in 2018 and was formerly Deputy Head of U.S. Funds Legal, Executive Director and Assistant General Counsel at JPMorgan Chase (2005–2018). |
| | | | | | | |
Vito A. Fronda
(1969) | | Chief Financial Officer and Treasurer | | Elected as Chief Financial Officer in 2020 and Treasurer in 2018 | | Partner and Director of U.S. Fund Treasury & Global Taxation, joined Lord Abbett in 2003. |
| | | | | | | |
Linda Y. Kim
(1980) | | Vice President and Assistant Secretary | | Elected in 2016 | | Counsel, joined Lord Abbett in 2015. |
| | | | | | | |
Joseph M. McGill
(1962) | | Chief Compliance Officer | | Elected in 2014 | | Partner and Chief Compliance Officer, joined Lord Abbett in 2014. |
| | | | | | | |
Amanda S. Ryan
(1978) | | Vice President and Assistant Secretary | | Elected in 2018 | | Counsel, joined Lord Abbett in 2016 and was formerly a Director and Corporate Counsel at PGIM Investments (2012–2016). |
| | | | | | | |
Lawrence B. Stoller
(1963) | | Vice President, Secretary and Chief Legal Officer | | Elected as Vice President and Secretary in 2007 and Chief Legal Officer in 2019 | | Partner and General Counsel, joined Lord Abbett in 2007. |
Please call 888-522-2388 for a copy of the statement of additional information, which contains further information about the Fund’s Board members. It is available free upon request.
28
Liquidity Risk Management Program
Pursuant to Rule 22e-4 under the 1940 Act, the Fund has adopted a Liquidity Risk Management Program and Policy (“Program”). The Program is designed to assess, manage and periodically review the Fund’s liquidity risk. Liquidity risk is defined under Rule 22e-4 as the risk that the Fund could not meet redemption requests without significant dilution of remaining investors’ interests in the Fund. The Board has appointed Lord Abbett as the administrator for the Fund’s Program. At the May 28-29, 2020 meeting, Lord Abbett provided the Board with a report addressing the operation of the Program and assessing its adequacy and effectiveness of implementation for the period December 1, 2018 through February 28, 2020. Lord Abbett reported that the Program operated effectively during the period. In particular, Lord Abbett reported that: the Fund did not breach its 15% limit on illiquid investments at any point during the period and all regulatory reporting related to Rule 22e-4 was completed on time and without issue during the period. There can be no assurance that the Program will achieve its objectives in the future. Please refer to the Fund’s prospectus for more information regarding the Fund’s exposure to liquidity risk and other principal risks to which an investment in the Fund may be subject.
Householding
The Trust has adopted a policy that allows it to send only one copy of the Fund’s prospectus, proxy material, annual report and semiannual report to certain shareholders residing at the same “household.” This reduces Fund expenses, which benefits you and other shareholders. If you need additional copies or do not want your mailings to be “householded,” please call Lord Abbett at 888-522-2388 or send a written request with your name, the name of your fund or funds and your account number or numbers to Lord Abbett Family of Funds, P.O. Box 219336, Kansas City, MO 64121.
Proxy Voting Policies, Procedures and Records
A description of the policies and procedures that Lord Abbett uses to vote proxies related to the Fund’s portfolio securities, and information on how Lord Abbett voted the Fund’s proxies during the 12-month period ended June 30 are available without charge, upon request, (i) by calling 888-522-2388; (ii) on Lord Abbett’s Website at www.lordabbett.com; and (iii) on the Securities and Exchange Commission’s (“SEC”) Website at www.sec.gov.
Shareholder Reports and Quarterly Portfolio Disclosure
The Fund is required to file its complete schedule of portfolio holdings with the SEC for its first and third fiscal quarters as an attachment to Form N-PORT. Copies of the filings are available without charge, upon request on the SEC’s Website at www.sec.gov and may be available by calling Lord Abbett at 888-522-2388.
Tax Information Of the distribution paid during the fiscal year ended October 31, 2020, $20,194,202 represents long-term capital gains. |
29


| This report, when not used for the general information of shareholders of the Fund, is to be distributed only if preceded or accompanied by a current fund prospectus. | | Lord Abbett Securities Trust |
| | | | |
Lord Abbett mutual fund shares are distributed by
LORD ABBETT DISTRIBUTOR LLC. | | Lord Abbett Micro-Cap Growth Fund | | LAMCVF-2
(12/20) |
| (a) | In accordance with applicable requirements, the Registrant adopted a Sarbanes-Oxley Code of Ethics on June 19, 2003 that applies to the principal executive officer and senior financial officers of the Registrant (“Code of Ethics”). The Code of Ethics was in effect during the fiscal year ended October 31, 2020 (the “Period”). |
| (c) | The Registrant has not amended the Code of Ethics as described in Form N-CSR during the Period. |
| (d) | The Registrant has not granted any waiver, including an implicit waiver, from a provision of the Code of Ethics as described in Form N-CSR during the Period. |
| (f) | See Item 12(a)(1) concerning the filing of the Code of Ethics. |
| Item 3: | Audit Committee Financial Expert. |
The Registrant’s board of trustees has determined that each of the following independent trustees who are members of the audit committee is an audit committee financial expert: Evelyn E. Guernsey, Karla M. Rabusch and Mark A. Schmid. Each of these persons is independent within the meaning of the Form N-CSR.
| Item 4: | Principal Accountant Fees and Services. |
In response to sections (a), (b), (c) and (d) of Item 4, the aggregate fees billed to the Registrant for the fiscal years ended October 31, 2020 and 2019 by the Registrant’s principal accounting firm, Deloitte & Touche LLP, the member firms of Deloitte Touche Tohmatsu and their respective affiliates (collectively, “Deloitte”) were as follows:
| | Fiscal year ended: |
| | 2020 | 2019 |
| Audit Fees {a} | $566,500 | $539,900 |
| Audit-Related Fees | - 0 - | - 0 - |
| Total audit and audit-related fees | 566,500 | 539,900 |
| | | |
| Tax Fees {b} | 88,193 | 82,289 |
| All Other Fees | - 0 - | - 0 - |
| | | |
| Total Fees | $654,693 | $622,189 |
{a} Consists of fees for audits of the Registrant’s annual financial statements.
{b} Fees for the fiscal year ended October 31, 2020 and 2019 consist of fees for preparing the U.S. Income Tax Return for Regulated Investment Companies, New Jersey Corporation Business Tax Return, New Jersey Annual Report Form, U.S. Return of Excise Tax on Undistributed Income of Investment Companies, IRS Forms 1099-MISC and 1096 Annual Summary and Transmittal of U.S. Information Returns.
(e) (1) Pursuant to Rule 2-01(c) (7) of Regulation S-X, the Registrant’s Audit Committee has adopted pre-approval policies and procedures. Such policies and procedures generally provide that the Audit Committee must pre-approve:
| · | any audit, audit-related, tax, and other services to be provided to the Lord Abbett Funds, including the Registrant, and |
| · | any audit-related, tax, and other services to be provided to the Registrant’s investment adviser and any entity controlling, controlled by or under common control with the investment adviser that provides ongoing services to one or more Funds comprising the Registrant if the engagement relates directly to operations and financial reporting of a Fund, by the independent auditor to assure that the provision of such services does not impair the auditor’s independence. |
The Audit Committee has delegated pre-approval authority to its Chairman, subject to a fee limit of $10,000 per event, and not to exceed $25,000 annually. The Chairman will report any pre-approval decisions to the Audit Committee at its next scheduled meeting. Unless a type of service to be provided by the independent auditor has received general pre-approval, it must be pre-approved by the Audit Committee. Any proposed services exceeding pre-approved cost levels will require specific pre-approval by the Audit Committee.
(e) (2) The Registrant’s Audit Committee has approved 100% of the services described in this Item 4 (b) through (d).
(f) Not applicable.
(g) The aggregate non-audit fees billed by Deloitte for services rendered to the Registrant are shown above in the response to Item 4 (a), (b), (c) and (d) as “All Other Fees”.
The aggregate non-audit fees billed by Deloitte for services rendered to the Registrant’s investment adviser, Lord, Abbett & Co. LLC (“Lord Abbett”), for the fiscal years ended October 31, 2020 and 2019 were:
| | Fiscal year ended: |
| | 2020 | 2019 |
| All Other Fees {a} | $214,142 | $215,383 |
{a} Consist of fees for Independent Services Auditors’ Report on Controls Placed in Operation and Tests of Operating Effectiveness related to Lord Abbett’s Asset Management Services (“SOC-1 Report”).
The aggregate non-audit fees billed by Deloitte for services rendered to entities under the common control of Lord Abbett for the fiscal years ended October 31, 2020 and 2019 were:
| | Fiscal year ended: |
| | 2020 | 2019 |
| All Other Fees | $ - 0 - | $ - 0 - |
(h) The Registrant’s Audit Committee has considered the provision of non-audit services that were rendered to the Registrant’s investment adviser, and any entity controlling, controlled by or under common control with the investment adviser that provides ongoing services to the Registrant, that were not pre-approved pursuant to Rule 2-01 (c)(7)(ii) of Regulation S-X and has determined that the provision of such services is compatible with maintaining Deloitte’s independence.
| Item 5: | Audit Committee of Listed Registrants. |
Not applicable.
Not applicable.
| Item 7: | Disclosure of Proxy Voting Policies and Procedures for Closed-End Management Investment Companies. |
Not applicable.
| Item 8: | Portfolio Managers of Closed-End Management Investment Companies. |
Not applicable.
| Item 9: | Purchases of Equity Securities by Closed-End Management Investment Company and Affiliated Purchasers. |
Not applicable.
| Item 10: | Submission of Matters to a Vote of Security Holders. |
Not applicable.
| Item 11: | Controls and Procedures. |
| (a) | The principal executive officer and principal financial & accounting officer have concluded as of a date within 90 days of the filing date of this report, based on their evaluation of the Registrant’s disclosure controls and procedures (as defined in Rule 30a-3(c) under the Investment Company Act of 1940), that the design of such procedures is effective to provide reasonable assurance that material information required to be disclosed by the Registrant on Form N-CSR is recorded, processed, summarized and reported within the time periods specified in the Commission’s rules and forms. |
| (b) | There were no changes in the Registrant’s internal control over financial reporting (as defined in Rule 30a-3(d) under the Investment Company Act of 1940) that occurred during the period covered by this report that have materially affected, or are reasonably likely to materially affect, the Registrant’s internal control over financial reporting. |
| Item 12: | Disclosure of Securities Lending Activities for Closed-End Management Investment Companies. |
Not Applicable.
SIGNATURES
Pursuant to the requirements of the Securities Exchange Act of 1934 and the Investment Company Act of 1940, the Registrant has duly caused this report to be signed on its behalf by the undersigned, thereunto duly authorized.
| | | LORD ABBETT SECURITIES TRUST |
| | | |
| | By: | /s/Douglas B. Sieg |
| | | Douglas B. Sieg |
| | | President and Chief Executive Officer |
Date: December 22, 2020
Pursuant to the requirements of the Securities Exchange Act of 1934 and the Investment Company Act of 1940, this report has been signed below by the following persons on behalf of the Registrant and in the capacities and on the dates indicated.
| | By: | /s/Douglas B. Sieg |
| | | Douglas B. Sieg |
| | | President and Chief Executive Officer |
Date: December 22, 2020
| | By: | /s/Vito A. Fronda |
| | | Vito A. Fronda |
| | | Chief Financial Officer and Treasurer |
Date: December 22, 2020