UNITED STATES
SECURITIES AND EXCHANGE COMMISSION
Washington, D.C. 20549
FORM N-CSR
CERTIFIED SHAREHOLDER REPORT OF REGISTERED
MANAGEMENT INVESTMENT COMPANIES
Investment Company Act File Number: 811-07538
LORD ABBETT SECURITIES TRUST
(Exact name of Registrant as specified in charter)
90 Hudson Street, Jersey City, New Jersey 07302-3973
(Address of principal executive offices) (Zip code)
Randolph A. Stuzin, Esq.
Vice President and Assistant Secretary
Member, Chief Legal Officer of Lord, Abbett & Co. LLC
90 Hudson Street, Jersey City, New Jersey 07302-3973
(Name and address of agent for service)
Registrant’s telephone number, including area code: (888) 522-2388
Date of fiscal year end: 10/31
Date of reporting period: 10/31/2023
| Item 1: | Report(s) to Shareholders. |

LORD ABBETT
ANNUAL REPORT
| Lord Abbett | |
| | |
| Alpha Strategy Fund | Health Care Fund |
| | |
| Focused Growth Fund | International Equity Fund |
| | |
| Focused Large Cap Value Fund | International Opportunities Fund |
| | |
| Focused Small Cap Value Fund | International Value Fund |
| | |
| Fundamental Equity Fund | Micro Cap Growth Fund |
| | |
| Global Equity Fund | Value Opportunities Fund |
| | |
| Growth Leaders Fund | |
For the fiscal year ended October 31, 2023
Table of Contents
Lord Abbett Securities Trust
Lord Abbett Alpha Strategy Fund, Lord Abbett Focused Growth Fund, Lord Abbett Focused Large Cap Value Fund, Lord Abbett Focused Small Cap Value Fund, Lord Abbett Fundamental Equity Fund, Lord Abbett Global Equity Fund, Lord Abbett Growth Leaders Fund, Lord Abbett Health Care Fund, Lord Abbett International Equity Fund, Lord Abbett International Opportunities Fund, Lord Abbett International Value Fund, Lord Abbett Micro Cap Growth Fund, and Lord Abbett Value Opportunities Fund
Annual Report
For the fiscal year ended October 31, 2023

From left to right: James L.L. Tullis, Independent Chair of the Lord Abbett Funds and Douglas B. Sieg, Trustee, President and Chief Executive Officer of the Lord Abbett Funds. | | Dear Shareholders: We are pleased to provide you with this overview of the performance of the Funds for the fiscal year ended October 31, 2023. On this page and the following pages, we discuss the major factors that influenced fiscal year performance. For detailed and timely information about the Funds, please visit our website at www.lordabbett.com, where you can also access the quarterly commentaries that provide updates on each Fund’s performance and other portfolio related updates. Thank you for investing in Lord Abbett mutual funds. We value the trust that you place in us and look forward to serving your investment needs in the years to come. Best regards, 
Douglas B. Sieg Trustee, President and Chief Executive Officer |
1
Lord Abbett Alpha Strategy Fund
For the fiscal year ended October 31, 2023, the Fund returned -3.99%, reflecting performance at the net asset value (NAV) of Class A shares with all distributions reinvested, compared to its benchmark, the Russell 2000® Index,* which returned -8.56% over the same period.
Equity markets had to deal with a number of countervailing forces over the trailing 12 months, leading to periods of volatility and wide dispersion of returns. On the positive side, market expectations of a soft landing in the U.S. economy were backed by falling inflation data, a tight labor market, a resilient consumer, and optimism regarding the potential impacts of artificial intelligence. While there were concerns of potential deterioration in corporate earnings, aggregate earnings results were better-than-expected as cost-cutting measures, strength in services sectors, and supply chain improvements generally benefitted companies.1
Amid these positive trends, investors had concerns about aggressive U.S. Federal Reserve (Fed) monetary policy and fear of a potential policy mistake leading to a recession. Investor sentiment was also negatively impacted by several factors, including narrow market breadth, an underwhelming China recovery from the COVID-19 pandemic, geopolitical tensions, and rising energy prices. Markets also had to grapple with the ripple effects of the turmoil in the banking sector, which led to regulatory shutdowns and interventions by the Fed, FDIC, and U.S. Treasury.1
Against this backdrop, US Equities delivered positive returns over the period, as measured by the S&P 500 Index which returned 10.1%. However, performance was primarily driven by a handful of large cap names, and there was a great deal of dispersion below the surface. For example, large cap stocks2 outperformed small cap stocks3 (9.5% vs -8.6%, respectively), while growth4 outperformed value5 (17.3% vs -0.5%, respectively).
The Fund is a “fund of funds” that invests in affiliated mutual funds managed by Lord Abbett. Under normal conditions, through the underlying funds, the Fund indirectly invests in the equity securities of U.S. and non-U.S. micro-cap, small, and mid-sized companies. The Fund uses a “blend” strategy to gain exposure to both growth and value stocks.
The Fund’s exposure to domestic micro-cap and small-cap growth stocks within the Lord Abbett Developing Growth Fund and the Lord Abbett Micro Cap Growth Fund was the largest detractor from relative performance over the period. As a result of surging inflation and rapidly rising interest rates, the stocks of many highly innovative companies, particularly smaller companies, suffered meaningful price compression as the market largely expressed a preference for companies with positive earnings today, compared to larger growth potential in the future.
Conversely, the Fund’s allocation to international small-cap stocks within the Lord Abbett International Opportunities Fund was a notable contributor to relative performance over the period. International
2
small cap stocks benefitted from a weakening U.S. dollar, as well as a strong economic turnaround in Japan, which aided performance relative to domestic small-cap stocks.
The Fund’s weightings in domestic small-cap and mid-cap value stocks within the Lord Abbett Small Cap Value Fund and the Lord Abbett Value Opportunities Fund also contributed to relative performance. Both Funds employ a fundamental, bottom-up individual stock selection strategy that focuses on quality companies with compelling valuation over a long-term horizon, which benefitted relative performance in an environment of elevated uncertainty and interest rate volatility.
* The Russell 2000® Index measures the performance of the 2,000 smallest companies in the Russell 3000® Index, which represents approximately 10% of the total market capitalization of the Russell 3000® Index.
Lord Abbett Focused Growth Fund
For the fiscal year ended October 31, 2023, the Fund returned 3.75%, reflecting performance at the net asset value (NAV) of Class A shares with all distributions reinvested, compared to its benchmark, the Russell 1000® Growth Index* which returned 18.95% over the same period.
Equity markets had to deal with a number of countervailing forces over the trailing 12 months, leading to periods of volatility and wide dispersion of returns. On the positive side, market expectations of a soft landing in the U.S. economy were backed by falling inflation data, a tight
labor market, a resilient consumer, and optimism regarding the potential impacts of artificial intelligence. While there were concerns of potential deterioration in corporate earnings, aggregate earnings results were better-than-expected as cost-cutting measures, strength in services sectors, and supply chain improvements generally benefitted companies.1
Amid these positive trends, investors had concerns about aggressive U.S. Federal Reserve (Fed) monetary policy and fear of a potential policy mistake leading to a recession. Investor sentiment was also negatively impacted by several factors, including narrow market breadth, an underwhelming China recovery from the COVID-19 pandemic, geopolitical tensions, and rising energy prices. Markets also had to grapple with the ripple effects of the turmoil in the banking sector, which led to regulatory shutdowns and interventions by the Fed, FDIC, and U.S. Treasury.1
Against this backdrop, US Equities delivered positive returns over the period, as measured by the S&P 500 Index which returned 10.1%. However, performance was primarily driven by a handful of large cap names, and there was a great deal of dispersion below the surface. For example, large cap stocks2 outperformed small cap stocks3 (9.5% vs -8.6%, respectively), while growth4 outperformed value5 (17.3% vs -0.5%, respectively).
Thematically, the Fund’s underweight to prominent megacap companies detracted from relative performance as narrow, tech-focused market leadership was a dominant theme for much of the
3
period amid increased macro uncertainty and the general optimism surrounding generative artificial intelligence.
At the sector level, security selection within the Information Technology sector was a primary detractor from relative performance over the period. The Fund’s position in Enphase Energy, Inc., which develops solar micro-inverters, battery energy storage, and electric vehicle charging stations, weighed on relative performance. Entering 2023, Enphase was one of the Fund’s largest active overweights, though we began to trim the position in the beginning of the first quarter amid falling natural gas prices. The stock also faced additional headwinds as demand within the California residential solar market began to slow.
Security selection within the Consumer Discretionary sector also detracted from relative performance. Within the sector, the Fund’s position in Airbnb, Inc., an online marketplace for short- and long-term homestays and experiences, was a notable detractor from relative performance. Despite displaying strong operating momentum throughout the period, shares of Airbnb entered a period of consolidation throughout the summer as investors became weary of the stock’s valuation.
Conversely, security selection within the Communication Services sector contributed to relative performance over the period. As an example, shares of Spotify Technology SA, a digital music streaming service, largely benefitted from the company’s ability to simultaneously
grow its paid user base while expanding margins. However, we exited our position in the company in August given a breakdown in the stock’s price momentum due to a disappointing earnings report relative to analyst expectations.
Although security selection within the Information Technology sector was a net detractor from relative performance, the Fund’s overweight position in NVIDIA Corporation, a manufacturer of computer graphics processors, chipsets, and related multimedia software, was a standout contributor. Shares of NVIDIA experienced strong price momentum for most of the period following its exceptionally strong earnings report in the first quarter of 2023. The stock has also benefitted from the general excitement surrounding the potential of generative artificial intelligence. As of the end of the period, NVIDIA is the Fund’s largest active overweight.
* The Russell 1000® Growth Index measures the performance of those Russell 1000® Index companies with higher price-to-book ratios and higher forecasted growth values.
Lord Abbett Focused Large Cap Value Fund
For the fiscal year ended October 31, 2023, the Fund returned 0.59%, reflecting performance at the net asset value (“NAV”) of Class A shares with all distributions reinvested, compared to its benchmark, the Russell 1000® Value Index,* which returned 0.13% over the same period.
Equity markets had to deal with a number of countervailing forces over the trailing 12 months, leading to periods of volatility and wide dispersion of returns.
4
On the positive side, market expectations of a soft landing in the U.S. economy were backed by falling inflation data, a tight labor market, a resilient consumer narrative, and optimism regarding the potential impacts of artificial intelligence. While there were concerns of potential deterioration in corporate earnings, aggregate earnings results were better-than-expected as cost-cutting measures, strength in services sectors, and supply chain improvements generally benefitted companies.1
Amid these positive trends, investors had concerns about aggressive U.S. Federal Reserve (Fed) monetary policy, and fear of a potential policy mistake leading to a recession. Investor sentiment was also negatively impacted by several factors, including narrow market breadth, an underwhelming China recovery from the COVID-19 pandemic , geopolitical tensions, and rising energy prices. Markets also had to grapple with the ripple effects of the turmoil in the banking sector, which led to regulatory shutdowns and interventions by the Fed, FDIC, and U.S. Treasury.1
Against this backdrop, US Equities delivered positive returns over the period, as measured by the S&P 500 Index which returned 10.1%. However, performance was primarily driven by a handful of large cap names, and there was a great deal of dispersion below the surface. For example, large cap stocks2 outperformed small cap stocks3 (9.5% vs -8.6%, respectively), while growth4 outperformed value5 (17.3% vs -0.5%, respectively).
During the 12-month period ended October 31, 2023, the Fund’s position in RenaissanceRe Holdings Ltd., which engages in the provision of reinsurance and insurance services, contributed to relative performance. Shares rallied after the company reported strong fourth quarter earnings. Operating income was significantly higher than consensus expectations. The Fund’s position in Adobe, Inc., which engages in the provision of digital marketing and media solutions, also contributed to relative performance. Shares rallied after the company reported strong second quarter earnings and raised fiscal year guidance.
Conversely, one of the largest detractors from relative performance during the 12-month period ended October 31, 2023, was the Fund’s lack of exposure to Meta Platforms Inc., which engages in the development of social media applications. U.S. equity market performance over the last year was dominated by a small group of mega cap companies, including Meta, and the Fund’s lack of exposure detracted from relative returns. The Fund’s position in Organon & Co, a science-based global pharmaceutical company, also detracted from relative performance. Shares of the stock fell after the company reported fourth-quarter and full-year financial results that came in below consensus expectations, which was partially driven by a decline in sales of NuvaRing as it continues to be impacted by generic competition.
* The Russell 1000® Value Index measures the performance of those Russell 1000 companies with lower price-to-book ratios and lower forecasted growth values.
5
Lord Abbett Focused Small Cap Value Fund
For the fiscal year ended October 31, 2023, the Fund returned -4.90%, reflecting performance at the net asset value (“NAV”) of Class A shares with all distributions reinvested, compared to its benchmark, the Russell 2000® Value Index,* which returned -9.93% over the same period.
Equity markets had to deal with a number of countervailing forces over the trailing 12 months, leading to periods of volatility and wide dispersion of returns. On the positive side, market expectations of a soft landing in the U.S. economy were backed by falling inflation data, a tight labor market, a resilient consumer narrative, and optimism regarding the potential impacts of artificial intelligence. While there were concerns of potential deterioration in corporate earnings, aggregate earnings results were better-than-expected as cost-cutting measures, strength in services sectors, and supply chain improvements generally benefitted companies.1
Amid these positive trends, investors had concerns about aggressive U.S. Federal Reserve (Fed) monetary policy, and fear of a potential policy mistake leading to a recession. Investor sentiment was also negatively impacted by several factors, including narrow market breadth, an underwhelming China recovery from the COVID-19 pandemic , geopolitical tensions, and rising energy prices. Markets also had to grapple with the ripple effects of the turmoil in the banking sector, which led to regulatory shutdowns and interventions by the Fed, FDIC, and U.S. Treasury.1
Against this backdrop, US Equities delivered positive returns over the period, as measured by the S&P 500 Index which returned 10.1%. However, performance was primarily driven by a handful of large cap names, and there was a great deal of dispersion below the surface. For example, large cap stocks2 outperformed small cap stocks3 (9.5% vs -8.6%, respectively), while growth4 outperformed value5 (17.3% vs -0.5%, respectively).
During the 12-month period ended October 31, 2023, the Fund’s position in RenaissanceRe Holdings Ltd., which engages in the provision of reinsurance and insurance services, contributed to relative performance. Shares rallied after the company reported strong fourth quarter earnings, which showed that operating income was significantly higher than consensus expectations. The Fund’s position in Spectrum Brands Holdings, Inc., a consumer products and home essentials company, also contributed to relative performance. Shares rallied after the U.S. Department of Justice reached a settlement agreement related to ASSA ABLOY’s acquisition of Spectrum Brands’ Hardware and Home Improvement division.
Conversely, one of the largest detractors from relative performance during the 12-month period ended October 31, 2023, was WNS (Holdings) Limited, which engages in the provision of business process management solutions. Shares of the stock fell after the company reported fourth-quarter and full-year financial results that came in below consensus expectations. The Fund’s
6
position in International Money Express, Inc, a leading money remittance services company, also detracted from relative performance. Shares fell after the company reported second quarter earnings below consensus expectations.
* The Russell 2000 Value® Index measures the performance of those stocks of the Russell 2000 Index with lower price-to-book ratios and lower relative forecasted growth rates.
Lord Abbett Fundamental Equity Fund
For the fiscal year ended October 31, 2023, the Fund returned 0.92%, reflecting performance at the net asset value (“NAV”) of Class A shares with all distributions reinvested, compared to its benchmark, the Russell 1000® Value Index*, which returned 0.13% over the same period.
Equity markets had to deal with a number of countervailing forces over the trailing 12 months, leading to periods of volatility and wide dispersion of returns. On the positive side, market expectations of a soft landing in the U.S. economy were backed by falling inflation data, a tight labor market, a resilient consumer narrative, and optimism regarding the potential impacts of artificial intelligence. While there were concerns of potential deterioration in corporate earnings, aggregate earnings results were better-than-expected as cost-cutting measures, strength in services sectors, and supply chain improvements generally benefitted companies.1
Amid these positive trends, investors had concerns about aggressive U.S. Federal Reserve (Fed) monetary policy, and fear of a potential policy mistake leading to a
recession. Investor sentiment was also negatively impacted by several factors, including narrow market breadth, an underwhelming China recovery from the COVID-19 pandemic , geopolitical tensions, and rising energy prices. Markets also had to grapple with the ripple effects of the turmoil in the banking sector, which led to regulatory shutdowns and interventions by the Fed, FDIC, and U.S. Treasury.1
Against this backdrop, US Equities delivered positive returns over the period, as measured by the S&P 500 Index which returned 10.1%. However, performance was primarily driven by a handful of large cap names, and there was a great deal of dispersion below the surface. For example, large cap stocks2 outperformed small cap stocks3 (9.5% vs -8.6%, respectively), while growth4 outperformed value5 (17.3% vs -0.5%, respectively).
During the 12-month period ended October 31, 2023, the Fund’s position in RenaissanceRe Holdings Ltd., which engages in the provision of reinsurance and insurance services, contributed to relative performance. Shares rallied after the company reported strong fourth quarter earnings. Operating income was significantly higher than consensus expectations. The Fund’s position in Adobe, Inc., which engages in the provision of digital marketing and media solutions, also contributed to relative performance. Shares rallied after the company reported strong second quarter earnings and raised fiscal year guidance.
7
Conversely, one of the largest detractors from relative performance during the 12-month period ended October 31, 2023, was the Fund’s lack of exposure to Meta Platforms Inc., which engages in the development of social media applications. U.S. equity market performance over the last year was dominated by a small group of mega cap companies, including Meta, and the Fund’s lack of exposure detracted from relative returns. The Fund’s position in Organon & Co, a science-based global pharmaceutical company, also detracted from relative performance. Shares of the stock fell after the company reported fourth-quarter and full-year financial results that came in below consensus expectations, which was partially driven by a decline in sales of NuvaRing as it continues to be impacted by generic competition.
* The Russell 1000® Value Index measures the performance of those Russell 1000 companies with lower price-to-book ratios and lower forecasted growth values.
Lord Abbett Global Equity Fund
For the fiscal year ended October 31, 2023, the Fund returned 9.98%, reflecting performance at the net asset value (“NAV”) of Class A shares with all distributions reinvested, compared to its benchmark, the MSCI All Country World Index* which returned 10.50% over the same period.
Global equities posted relatively strong returns during the period, while market volatility and concerns around the direction of interest rates remained at the forefront of investors’ minds. The MSCI
ACWI ex USA Index6 returned 12.07%, outperforming Emerging Markets7 equities, but underperforming European8 equities. The period was marked by narrow equity market leadership in U.S. equities, with the so-called ‘Magnificent 7’ providing an outsized proportion of the S&P 500 Index returns over the last year, as investors flocked to higher-quality, more mature businesses in a volatile period. Market expectations of a soft landing in the U.S. were backed by falling inflation data, a tight labor market, a resilient consumer narrative, and optimism regarding the potential impacts of artificial intelligence.
Within Asia, the reopening of the Chinese economy was a tale of two halves. The high-end retail sector in Europe benefited from a resumption in travel and luxury spending by Chinese citizens, while consumption and mobility within China’s borders underwhelmed expectations. Restrained spending from China’s middle-class consumer was largely tied to a notably sluggish real estate market, which makes up nearly one-third of domestic GDP. This disparity, coupled with continued geopolitical tensions, has resulted in some capital flows being redirected away from China and toward the rest of emerging Asia and Japan. Notably, Japan has demonstrated its resilience and growth potential within the Consumer, Industrial, and Information Technology sectors.
Over the period, the Fund’s position in Meta Platforms Inc, which engages in the development of social media applications, contributed to relative performance.
8
Shares rallied significantly during the period, as worries surrounding the rollout of the Metaverse were overshadowed by cost-cutting, strong earnings, and an overall rebound in the digital advertising market.
The Fund’s position in healthcare company, Novo Nordisk A/S, also contributed to relative performance during the period. Performance was driven by strong demand in the U.S. for the company’s weight loss and diabetes drugs, Wegovy and Ozempic.
One of the larger detractors from relative performance during the period was Healthcare company Organon & Co., which develops women’s health solutions and products. Shares of the company fell after the company reported fourth-quarter and full-year financial results that came in below consensus expectations, which was partially driven by a decline in sales of women’s health drug, NuvaRing, as it continued to be impacted by generic competition.
The Fund’s position in General Motors, a leading vehicle-manufacturer and consumer discretionary company, also detracted from relative performance during the period. General Motors faced unique headwinds in the third and fourth quarters amidst the UAW (United Auto Workers) strike and the negative impact on earnings guidance that came with it.
* The MSCI ACWI (All Country World Index) is a free float-adjusted market capitalization weighted index that is designed to measure the equity market performance of developed and emerging markets.
Lord Abbett Growth Leaders Fund
For the fiscal year ended October 31, 2023, the Fund returned 4.61%, reflecting performance at the net asset value (NAV) of Class A shares with all distributions reinvested, compared to its benchmark, the Russell 1000® Growth Index,* which returned 18.95% over the same period.
Equity markets had to deal with a number of countervailing forces over the trailing 12 months, leading to periods of volatility and wide dispersion of returns. On the positive side, market expectations of a soft landing in the U.S. economy were backed by falling inflation data, a tight labor market, a resilient consumer, and optimism regarding the potential impacts of artificial intelligence. While there were concerns of potential deterioration in corporate earnings, aggregate earnings results were better-than-expected as cost-cutting measures, strength in services sectors, and supply chain improvements generally benefitted companies.1
Amid these positive trends, investors had concerns about aggressive U.S. Federal Reserve (Fed) monetary policy and fear of a potential policy mistake leading to a recession. Investor sentiment was also negatively impacted by several factors, including narrow market breadth, an underwhelming China recovery from the COVID-19 pandemic, geopolitical tensions, and rising energy prices. Markets also had to grapple with the ripple effects of the turmoil in the banking sector, which led to regulatory shutdowns and interventions by the Fed, FDIC, and U.S. Treasury.1
9
Against this backdrop, US Equities delivered positive returns over the period, as measured by the S&P 500 Index which returned 10.1%. However, performance was primarily driven by a handful of large cap names, and there was a great deal of dispersion below the surface. For example, large cap stocks2 outperformed small cap stocks3 (9.5% vs -8.6%, respectively), while growth4 outperformed value5 (17.3% vs -0.5%, respectively).
Thematically, the Fund’s underweight to prominent megacap companies detracted from relative performance as narrow, tech-focused market leadership was a dominant theme for much of the period amid increased macro uncertainty and the general optimism surrounding generative artificial intelligence.
At the sector level, security selection within the Information Technology sector was a primary detractor from relative performance over the period. The Fund’s position in Enphase Energy, Inc., which develops solar micro-inverters, battery energy storage, and electric vehicle charging stations, weighed on performance. Entering 2023, Enphase was one of the Fund’s largest active overweights, though we began to trim the position in the beginning of the first quarter amid falling natural gas prices. The stock also faced additional headwinds as demand within the California residential solar market began to slow.
Security selection within the Consumer Discretionary sector also detracted from relative performance. Within the sector, the Fund’s position in Airbnb, Inc., an online marketplace for short- and
long-term homestays and experiences, was a notable detractor from relative performance. Despite displaying strong operating momentum throughout the period, shares of Airbnb entered a period of consolidation throughout the summer as investors became weary of the stock’s valuation.
Conversely, security selection within the Communication Services sector contributed to relative performance over the period. Shares of Spotify Technology SA, a digital music streaming service, benefitted from the company’s ability to simultaneously grow its paid user base while expanding margins. However, we exited our position in August given a breakdown in the stock’s price momentum due to a disappointing earnings report relative to analyst expectations.
Although security selection within the Information Technology sector was a net detractor from relative performance, the Fund’s overweight position in NVIDIA Corporation, a manufacturer of computer graphics processors, chipsets, and related multimedia software, was a standout contributor. Shares of NVIDIA experienced strong price momentum for most of the period following its exceptionally strong earnings report in the first quarter of 2023. The stock also benefitted from the general excitement surrounding the potential of generative artificial intelligence. As of the end of the period, NVIDIA is the Fund’s largest active overweight.
* The Russell 1000® Growth Index measures the performance of those Russell 1000® Index companies with higher price-to-book ratios and higher forecasted growth values.
10
Lord Abbett Health Care Fund
For the fiscal year ended October 31, 2023, the Fund returned -9.78%, reflecting performance at the net asset value (NAV) of Class A Shares with all distributions reinvested, compared to its benchmark, the MSCI ACWI Health Care Index with Net Dividends,* which returned -1.75% over the same period.
Equity markets had to deal with a number of countervailing forces over the trailing 12 months, leading to periods of volatility and wide dispersion of returns. On the positive side, market expectations of a soft landing in the U.S. economy were backed by falling inflation data, a tight labor market, a resilient consumer, and optimism regarding the potential impacts of artificial intelligence. While there were concerns of potential deterioration in corporate earnings, aggregate earnings results were better-than-expected as cost-cutting measures, strength in services sectors, and supply chain improvements generally benefitted companies.1
Amid these positive trends, investors had concerns about aggressive U.S. Federal Reserve (Fed) monetary policy and fear of a potential policy mistake leading to a recession. Investor sentiment was also negatively impacted by several factors, including narrow market breadth, an underwhelming China recovery from the COVID-19 pandemic, geopolitical tensions, and rising energy prices. Markets also had to grapple with the ripple effects of the turmoil in the banking sector,
which led to regulatory shutdowns and interventions by the Fed, FDIC, and U.S. Treasury.1
Against this backdrop, US Equities delivered positive returns over the period, as measured by the S&P 500 Index which returned 10.1%. However, performance was primarily driven by a handful of large cap names, and there was a great deal of dispersion below the surface. For example, large cap stocks2 outperformed small cap stocks3 (9.5% vs -8.6%, respectively), while growth4 outperformed value5 (17.3% vs -0.5%, respectively).
The Fund’s position in Ventyx Biosciences, Inc., a clinical stage biopharmaceutical company which focuses on the development of therapeutics for the treatment of autoimmune diseases, was a primary detractor from relative performance over the period. Shares of the stock fell after the company reported phase 2 trial results for their therapy to treat ulcerative colitis in October 2023. While the trial results were favorable, investors questioned whether the drug has an edge over rival drugs.
The Fund’s position in DexCom, Inc., a company which develops continuous glucose monitoring systems for diabetes management, was also a notable detractor from relative performance. Shares of the company faced headwinds throughout the third quarter of 2023 as the adoption of GLP-1 weight loss drugs, such as Wegovy and Zepbound, led investors to consider their potential impact on the long-term demand for drugs and therapies that treat diseases linked to obesity, such as diabetes.
11
Conversely, the Fund’s overweight positions in Novo Nordisk A/S and Eli Lily and Company were primary contributors to relative performance over the period. Both companies experienced strong stock price momentum a result of the growing demand for GLP-1 weight loss drugs as Novo Nordisk’s Wegovy and Eli Lily’s Zepbound are currently the only Food & Drug Administration (FDA)- approved obesity drugs on the market. Additionally, both companies have been working to expand their product lines despite supply challenges.
The Fund’s position in Krystal Biotech, Inc., a biopharmaceutical company that develops treatments for patients suffering from rare debilitating disorders, also contributed to relative performance. Shares of the stock rallied after the FDA approved Vyjuvek to treat dystrophic epidermolysis bullosa, a rare genetic skin condition, in the second quarter of 2023.
* The MSCI ACWI Health Care Index includes large and mid cap securities across 23 Developed Markets (DM) and 26 Emerging Markets (EM) countries. All securities in the index are classified in Health Care as per the Global Industry Classification Standard.
Lord Abbett International Equity Fund
For the fiscal year ended October 31, 2023, the Fund returned 8.72%, reflecting performance at the net asset value (“NAV”) of Class A shares with all distributions reinvested, compared to its benchmark, the MSCI ACWI ex-US* which returned 12.07% over the same period.
Global equities posted relatively strong returns during the period, while market volatility and concerns around the direction of interest rates remained at the forefront of investors’ minds. The MSCI ACWI ex USA Index6 returned 12.07%, outperforming Emerging Markets7 equities, but underperforming European8 equities. The period was marked by narrow equity market leadership in U.S. equities, with the so-called ‘Magnificent 7’ providing an outsized proportion of the S&P 500 Index returns over the last year, as investors flocked to higher-quality, more mature businesses in a volatile period. Market expectations of a soft landing in the U.S. were backed by falling inflation data, a tight labor market, a resilient consumer narrative, and optimism regarding the potential impacts of artificial intelligence.
Within Asia, the reopening of the Chinese economy was a tale of two halves. The high-end retail sector in Europe benefited from a resumption in travel and luxury spending by Chinese citizens, while consumption and mobility within China’s borders underwhelmed expectations. Restrained spending from China’s middle-class consumer was largely tied to a notably sluggish real estate market, which makes up nearly one-third of domestic GDP. This disparity, coupled with continued geopolitical tensions, has resulted in some capital flows being redirected away from China and toward the rest of emerging Asia and Japan. Notably, Japan has demonstrated its resilience and growth potential within
12
the Consumer, Industrial, and Information Technology sectors.
Over the period, the Fund’s position in healthcare company, Novo Nordisk A/S, contributed to relative performance. Performance was mainly driven by strong demand in the U.S. for the company’s weight loss and diabetes drugs, Wegovy and Ozempic.
The Fund’s position in Sumitomo Mitsui Banking Corporation, a leading financial services company in Japan, also contributed to relative returns during the period, as the company continued to expand its overseas operations in the U.S., specifically in areas like debt capital markets and M&A transactions (Mergers and Acquisitions).
Conversely, one of the larger detractors from relative performance over the period was Prudential PLC, a British multi-national insurance company that also provides asset management services, with a focus on Asia and Africa. A combination of slowing growth momentum, and general concerns about the Chinese economy weighed on shares during the period.
The Fund’s position in French industrials company, Teleperformance SA, a French provider of call center services also weighed on relative performance during the period, as shares fell in response to an investigation by Colombia’s Labor Ministry into working conditions at the company.
* The MSCI ACWI (All Country World Index) ex-U.S. Index is a subset of the MSCI ACWI Index. The MSCI ACWI (All Country World Index) Index is a
free float-adjusted market capitalization weighted index that is designed to measure the equity market performance of developed and emerging markets.
Lord Abbett International Opportunities Fund
For the fiscal year ended October 31, 2023, the Fund returned 9.54%, reflecting performance at the net asset value (“NAV”) of Class A shares with all distributions reinvested, compared to its benchmark, the S&P Developed Ex-U.S. SmallCap Index* which returned 7.48% over the same period.
Global equities posted relatively strong returns during the period, while market volatility and concerns around the direction of interest rates remained at the forefront of investors’ minds. The MSCI ACWI ex USA Index6 returned 12.07%, outperforming Emerging Markets7 equities, but underperforming European8 equities. The period was marked by narrow equity market leadership in U.S. equities, with the so-called ‘Magnificent 7’ providing an outsized proportion of the S&P 500 Index returns over the last year, as investors flocked to higher-quality, more mature businesses in a volatile period. Market expectations of a soft landing in the U.S. were backed by falling inflation data, a tight labor market, a resilient consumer narrative, and optimism regarding the potential impacts of artificial intelligence.
Within Asia, the reopening of the Chinese economy was a tale of two halves. The high-end retail sector in Europe benefited from a resumption in travel and luxury spending by Chinese citizens, while
13
consumption and mobility within China’s borders underwhelmed expectations. Restrained spending from China’s middle-class consumer was largely tied to a notably sluggish real estate market, which makes up nearly one-third of domestic GDP. This disparity, coupled with continued geopolitical tensions, has resulted in some capital flows being redirected away from China and toward the rest of emerging Asia and Japan. Notably, Japan has demonstrated its resilience and growth potential within the Consumer, Industrial, and Information Technology sectors.
The Fund’s position in Gerresheimer AG, a Germany-based manufacturer of packaging products for medication and drug delivery devices, was the largest individual contributor to relative performance over the period. The company has greatly benefitted from the rapid growth of the anti-obesity drug market in recent quarters.
Additionally, the Fund’s position in Saizeriya Co Ltd, a Japanese chain of family-style Italian restaurants, contributed to relative performance as the company was successfully able to pass on higher menu prices to strong Japanese consumers during the period.
Conversely, one of the larger detractors from relative performance during the period was Brookfield Infrastructure Corp, a Canadian corporation that acts as a vehicle to invest in infrastructure. Given heightened sensitivity to interest rates in the infrastructure subsector, the company’s stock underperformed the overall Utilities
sector amidst the bear-steepening of the yield curve throughout October.
The Fund’s position in Energean PLC, a London-based energy company with a focus on exploration and production in the Eastern Mediterranean, also weighed on relative performance amidst softening in oil prices and a lower revision in full-year production forecasts.
* The S&P Developed Ex-U.S. SmallCap® Index is a component of the S&P Developed Broad Market Index (BMI). The BMI is a float-weighted index that spans 22 countries and includes the listed shares of all companies with an available market capitalization (float) of at least $100 million.
Lord Abbett International Value Fund
For the fiscal year ended October 31, 2023, the Fund returned 14.09%, reflecting performance at the net asset value (“NAV”) of Class A shares with all distributions reinvested, compared to its benchmark, the MSCI EAFE Value Index* which returned 18.11% over the same period.
Global equities posted relatively strong returns during the period, while market volatility and concerns around the direction of interest rates remained at the forefront of investors’ minds. The MSCI ACWI ex USA Index6 returned 12.07%, outperforming Emerging Markets7 equities, but underperforming European8 equities. The period was marked by narrow equity market leadership in U.S. equities, with the so-called ‘Magnificent 7’ providing an outsized proportion of the S&P 500 Index returns over the last year, as investors flocked to higher-quality, more mature businesses in a volatile period. Market expectations of a soft landing in the U.S.
14
were backed by falling inflation data, a tight labor market, a resilient consumer narrative, and optimism regarding the potential impacts of artificial intelligence.
Within Asia, the reopening of the Chinese economy was a tale of two halves. The high-end retail sector in Europe benefited from a resumption in travel and luxury spending by Chinese citizens, while consumption and mobility within China’s borders underwhelmed expectations. Restrained spending from China’s middle-class consumer was largely tied to a notably sluggish real estate market, which makes up nearly one-third of domestic GDP. This disparity, coupled with continued geopolitical tensions, has resulted in some capital flows being redirected away from China and toward the rest of emerging Asia and Japan. Notably, Japan has demonstrated its resilience and growth potential within the Consumer, Industrial, and Information Technology sectors.
Over the period, the Fund’s position in Sumitomo Mitsui Banking Corporation, a leading financial services company in Japan, contributed to relative returns during the period, as the company continued to expand overseas operations in the U.S., specifically in areas like debt capital markets and M&A transactions (Mergers and Acquisitions).
Additionally, the Fund’s position in Japanese beverage holding company, Asahi Group Holdings, contributed to relative performance as the company recovered from tepid COVID-era beer sales, and looked to expand its international footprint.
The Fund’s position in Canadian utilities company, Algonquin Power & Utilities Corp, was a primary detractor from relative performance, as the stock underperformed due to a mixture of supply constraints, a dividend cut, and poor earnings guidance.
The Fund’s position in Energean PLC, a London-based energy company with a focus on exploration and production in the Eastern Mediterranean, also weighed on relative performance amidst softening in oil prices and a lower revision in full-year production forecasts.
* The MSCI EAFE Value Index captures large and mid-cap securities exhibiting overall value style characteristics across Developed Markets countries around the world, excluding the US and Canada.
Lord Abbett Micro Cap Growth Fund
For the fiscal year ended October 31, 2023, the Fund returned -20.27%, reflecting performance at the net asset value (NAV) of Class A shares with all distributions reinvested, compared to its benchmark, the Russell Microcap® Growth Index,* which returned -17.95% over the same period.
Equity markets had to deal with a number of countervailing forces over the trailing 12 months, leading to periods of volatility and wide dispersion of returns. On the positive side, market expectations of a soft landing in the U.S. economy were backed by falling inflation data, a tight labor market, a resilient consumer, and optimism regarding the potential impacts of artificial intelligence. While there were concerns of potential deterioration in
15
corporate earnings, aggregate earnings results were better-than-expected as cost-cutting measures, strength in services sectors, and supply chain improvements generally benefitted companies.1
Amid these positive trends, investors had concerns about aggressive U.S. Federal Reserve (Fed) monetary policy and fear of a potential policy mistake leading to a recession. Investor sentiment was also negatively impacted by several factors, including narrow market breadth, an underwhelming China recovery from the COVID-19 pandemic, geopolitical tensions, and rising energy prices. Markets also had to grapple with the ripple effects of the turmoil in the banking sector, which led to regulatory shutdowns and interventions by the Fed, FDIC, and U.S. Treasury.1
Against this backdrop, US Equities delivered positive returns over the period, as measured by the S&P 500 Index which returned 10.1%. However, performance was primarily driven by a handful of large cap names, and there was a great deal of dispersion below the surface. For example, large cap stocks2 outperformed small cap stocks3 (9.5% vs -8.6%, respectively), while growth4 outperformed value5 (17.3% vs -0.5%, respectively).
Security selection within the Health Care sector was a primary detractor from relative performance over the period. Within the sector, shares of Ventyx Biosciences, Inc., a clinical stage biopharmaceutical company which focuses on the development of therapeutics for the treatment of autoimmune diseases, fell after the company reported phase 2 trial
results for their therapy to treat ulcerative colitis in October 2023. While the trial results were favorable, investors questioned whether the drug has an edge over rival drugs.
Security selection within the Consumer Discretionary sector also detracted from relative performance. The portfolio’s position in Xponential Fitness, Inc., a global franchisor of boutique fitness brands, weighed on relative performance. Shares of the stock fell in May in response to a report from a notable short seller that alleged many of the company’s brands and franchisees are struggling. While we still remained optimistic about the company’s fundamentals, we decided to exit the position following the report due to a deterioration of the stock’s price momentum.
Conversely, security selection within the Financials sector contributed to relative performance. Leading the way was the portfolio’s position in Remitly Global, Inc., an online financial services company that offers international money transfers to over 150 countries. Shares of the stock have benefitted from a string of better-than-expected quarterly earnings results, driven by strong growth in the size of the company’s customer base and customer transaction volume, as well as a decline in customer acquisition costs. As of the end of the period, Remitly is the portfolio’s largest active overweight.
Although security selection within the Health Care sector was a net detractor from relative performance, the Fund’s position in Prometheus Biosciences, Inc.,
16
which engages in the development of novel precision therapeutics and diagnostics for patients living with gastroenterology and autoimmune diseases, was a standout contributor to relative performance. Shares of the stock soared in response to Merck & Co., Inc.’s announcement that they will acquire Prometheus for $200 per share, which was a substantial premium from where the stock was trading. We subsequently exited the position following the announcement, opting to take gains, and redeployed those proceeds into other high-conviction names within the biotechnology industry.
* The Russell Microcap® Growth Index measures the performance of those Russell Microcap companies with higher price-to-book ratios and higher forecasted growth values.
Lord Abbett Value Opportunities Fund
For the fiscal year ended October 31, 2023, the Fund returned 0.12%, reflecting performance at the net asset value (“NAV”) of Class A shares with all distributions reinvested, compared to its benchmark, the Russell 2500™ Index,* which returned -4.63% over the same period.
Equity markets had to deal with a number of countervailing forces over the trailing 12 months, leading to periods of volatility and wide dispersion of returns. On the positive side, market expectations of a soft landing in the U.S. economy were backed by falling inflation data, a tight labor market, a resilient consumer narrative, and optimism regarding the potential impacts of artificial intelligence.
While there were concerns of potential deterioration in corporate earnings, aggregate earnings results were better-than-expected as cost-cutting measures, strength in services sectors, and supply chain improvements generally benefitted companies.1
Amid these positive trends, investors had concerns about aggressive U.S. Federal Reserve (Fed) monetary policy, and fear of a potential policy mistake leading to a recession. Investor sentiment was also negatively impacted by several factors, including narrow market breadth, an underwhelming China recovery from the COVID-19 pandemic, geopolitical tensions, and rising energy prices. Markets also had to grapple with the ripple effects of the turmoil in the banking sector, which led to regulatory shutdowns and interventions by the Fed, FDIC, and U.S. Treasury.1
Against this backdrop, US Equities delivered positive returns over the period, as measured by the S&P 500 Index which returned 10.1%. However, performance was primarily driven by a handful of large cap names, and there was a great deal of dispersion below the surface. For example, large cap stocks2 outperformed small cap stocks3 (9.5% vs -8.6%, respectively), while growth4 outperformed value5 (17.3% vs -0.5%, respectively).
During the 12-month period ended October 31, 2023, the Fund’s position in RenaissanceRe Holdings Ltd., which engages in the provision of reinsurance and insurance services, contributed to relative performance. Shares rallied after
17
the company reported strong fourth quarter earnings. Operating income was significantly higher than consensus expectations. The Fund’s position in Saia, Inc., a leading transportation provider, also contributed to relative performance, as shares rallied after the company reported strong first quarter earnings.
Conversely, one of the largest detractors from relative performance during the 12-month period ended October 31, 2023, was WNS (Holdings) Limited, which engages in the provision of business process management solutions. Shares of the stock fell after the company reported fourth-quarter and full-year financial results that came in below consensus expectations. The Fund’s position in Organon & Co, a science-based
global pharmaceutical company, detracted from relative performance. Shares of the stock fell after the company reported fourth-quarter and full-year financial results that came in below consensus expectations, which was partially driven by a decline in sales of NuvaRing as it continues to be impacted by generic competition.
* The Russell 2500™ Index is a market cap weighted index that includes the smallest 2,500 companies covered in the Russell 3000® Index universe of United States-based listed equities.
Each Fund’s portfolio is actively managed and, therefore, holdings and the weightings of a particular issuer or particular sector as a percentage of portfolio assets are subject to change. Sectors may include many industries.
1 Factset
2 As represented by the Russell 1000® Index as of 10/31/23.
3 As represented by the Russell 2000® Index as of 10/31/23.
4 As represented by the Russell 3000® Growth Index as of 10/31/23.
5 As represented by the Russell 3000® Value Index as of 10/31/23.
6 As represented by the MSCI All Country World ex USA Index as of 10/31/23.
7 As represented by the MSCI EM Index as of 10/31/23.
8 As represented by the MSCI Europe ex UK Index as of 10/31/23.
Unless otherwise specified, indexes reflect total return, with all dividends reinvested. Indexes are unmanaged, do not reflect the deduction of fees or expenses, and are not available for direct investment.
Important Performance and Other Information
Performance data quoted in the following pages reflect past performance and are no guarantee of future results. Current performance may be higher or lower than the performance quoted. The investment return and principal value of an investment in the Funds will fluctuate so that shares, on any given day or when redeemed, may be worth more or less than their original cost. You can obtain performance data current to the most recent month end by calling Lord Abbett at 888-522-2388 or referring to www.lordabbett.com.
Except where noted, comparative Fund performance does not account for the deduction of sales charges and would be different if sales charges were included. Each Fund offers classes of shares with distinct pricing options. For a full description of the differences in pricing alternatives, please see the Funds’ prospectus.
During certain periods shown, expense waivers and reimbursements were in place. Without such expense waivers and reimbursements, the Funds’ returns would have been lower.
18
The annual commentary above discusses the views of the Funds’ management and various portfolio holdings of the Funds as of October 31, 2023. These views and portfolio holdings may have changed after this date. Information provided in the commentary is not a recommendation to buy or sell securities. Because the Funds’ portfolios are actively managed and may change significantly, the Funds may no longer own the securities described above or may have otherwise changed their positions in the securities. For more recent information about the Funds’ portfolio holdings, please visit www.lordabbett.com.
A Note about Risk: See Notes to Financial Statements for a discussion of investment risks. For a more detailed discussion of the risks associated with each Fund, please see the Funds’ prospectus.
Mutual funds are not insured by the FDIC, are not deposits or other obligations of, or guaranteed by, banks, and are subject to investment risks including possible loss of principal amount invested.
19
Alpha Strategy Fund
Investment Comparison
Below is a comparison of a $10,000 investment in Class A shares with the same investment in the Russell 2000® Index, the 85% Russell 2000® Index/15% S&P Developed Ex-U.S. SmallCap Index and the Lipper Small-Cap Core Category Funds Average, assuming reinvestment of all dividends and distributions. The performance of other classes will be greater than or less than the performance shown in the graph below due to different sales loads and expenses applicable to such classes. The graph and performance table below do not reflect the deduction of taxes that a shareholder would pay on Fund distributions or the redemption of Fund shares. During certain periods, expenses of the Fund have been waived or reimbursed by Lord Abbett; without such waiver or reimbursement of expenses, the Fund’s returns would have been lower. Past performance is no guarantee of future results.

Average Annual Total Returns at Maximum Applicable
Sales Charge for the Periods Ended October 31, 2023
| | | 1 Year | | 5 Years | | 10 Years | | Life of Class | |
| Class A4 | | -9.51% | | 2.54% | | 4.88% | | – | |
| Class C5 | | -5.58% | | 2.99% | | 4.71% | | – | |
| Class F6 | | -3.85% | | 3.93% | | 5.66% | | – | |
| Class F37 | | -3.65% | | 4.13% | | – | | 5.58% | |
| Class I6 | | -3.74% | | 4.02% | | 5.77% | | – | |
| Class R26 | | -4.32% | | 3.40% | | 5.14% | | – | |
| Class R36 | | -4.24% | | 3.51% | | 5.24% | | – | |
| Class R48 | | -3.98% | | 3.76% | | – | | 4.62% | |
| Class R58 | | -3.74% | | 4.03% | | – | | 4.89% | |
| Class R68 | | -3.69% | | 4.12% | | – | | 4.96% | |
20
1 Reflects the deduction of the maximum initial sales charge of 5.75%.
2 Performance for each unmanaged index does not reflect any fees or expenses. The performance of each index is not necessarily representative of the Fund’s performance.
3 Source: Lipper Inc. The performance of the average is not necessarily representative of the Fund’s performance.
4 Total return, which is the percentage change in net asset value, after deduction of the maximum initial sales charge of 5.75% applicable to Class A shares, with all dividends and distributions reinvested for the periods shown ended October 31,
2023, is calculated using the SEC-required uniform method to compute such return.
5 The 1% CDSC for Class C shares normally applies before the first anniversary of the purchase date. Performance for other periods is at net asset value.
6 Performance is at net asset value.
7 Commenced operations and performance for the Class began on April 4, 2017. Performance is at its net asset value.
8 Commenced operations and performance for the classes began on June 30, 2015. Performance is at net asset value.
21
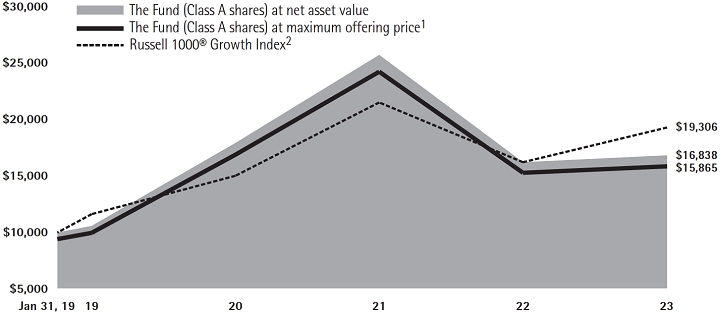
Focused Growth Fund
Investment Comparison
Below is a comparison of a $10,000 investment in Class A shares with the same investment in the Russell 1000® Growth Index, assuming reinvestment of all dividends and distributions. The performance of other classes will be greater than or less than the performance shown in the graph below due to different sales loads and expenses applicable to such classes. The graph and performance table below do not reflect the deduction of taxes that a shareholder would pay on Fund distributions or the redemption of Fund shares. During certain periods, expenses of the Fund have been waived or reimbursed by Lord Abbett; without such waiver or reimbursements of expense, the Fund’s returns would have been lower. Past performance is no guarantee of future results.
Average Annual Total Returns at Maximum Applicable
Sales Charge for the Periods Ended October 31, 2023
| | | 1 Year | | Life of Class | |
| Class A3 | | -2.20% | | 10.21% | |
| Class C4 | | 1.93% | | 10.77% | |
| Class F5 | | 4.01% | | 11.88% | |
| Class F35 | | 4.15% | | 11.98% | |
| Class I5 | | 4.06% | | 11.89% | |
| Class R35 | | 3.53% | | 11.33% | |
| Class R45 | | 3.75% | | 11.61% | |
| Class R55 | | 4.01% | | 11.88% | |
| Class R65 | | 4.15% | | 11.98% | |
1 Reflects the deduction of the maximum initial sales charge of 5.75%.
2 Performance for the unmanaged index does not reflect any fees or expenses. The performance of the index is not necessarily representative of the Fund’s performance. Performance of the index begins on January 31, 2019.
3 Class A shares commenced operations on January 30, 2019 and performance for the Class began on January 31, 2019. Total return, which is the percentage change in net asset value, after deduction of the maximum initial sales charge of 5.75% applicable to Class A shares, with all dividends and distributions reinvested for the periods shown ended October 31, 2023, is calculated using the SEC-required uniform method to compute such return.
4 Class C shares commenced operations on January 30, 2019 and performance for the Class began on January 31, 2019. The 1% CDSC for Class C shares normally applies before the first anniversary of the purchase date.
5 Commenced operations on January 30, 2019 and performance for the Classes began on January 31, 2019. Performance is at net asset value.
22
Focused Large Cap Value Fund
Investment Comparison
Below is a comparison of a $10,000 investment in Class A shares with the same investment in the Russell 1000® Value Index, assuming reinvestment of all dividends and distributions. The performance of other classes will be greater than or less than the performance shown in the graph below due to different sales loads and expenses applicable to such classes. The graph and performance table below do not reflect the deduction of taxes that a shareholder would pay on Fund distributions or the redemption of Fund shares. During certain periods, expenses of the Fund have been waived or reimbursed by Lord Abbett; without such waiver or reimbursements of expense, the Fund’s returns would have been lower. Past performance is no guarantee of future results.

Average Annual Total Returns at Maximum Applicable
Sales Charge for the Periods Ended October 31, 2023
| | | 1 Year | | Life of Class | |
| Class A3 | | -5.20% | | 3.87% | |
| Class C4 | | -0.92% | | 4.54% | |
| Class F5 | | 0.81% | | 5.57% | |
| Class F35 | | 0.82% | | 5.60% | |
| Class I5 | | 0.89% | | 5.60% | |
| Class R35 | | 0.40% | | 5.09% | |
| Class R45 | | 0.67% | | 5.34% | |
| Class R55 | | 0.91% | | 5.61% | |
| Class R65 | | 0.82% | | 5.61% | |
1 Reflects the deduction of the maximum initial sales charge of 5.75%.
2 Performance for the unmanaged index does not reflect any fees or expenses. The performance of the index is not necessarily representative of the Fund’s performance. Performance of the index begins on July 31, 2019.
3 Class A shares commenced operations on July 26, 2019 and performance for the Class began on July 31, 2019. Total return, which is the percentage change in net asset value, after deduction of the maximum initial sales charge of 5.75% applicable to Class A shares, with all dividends and distributions reinvested for the periods shown ended October 31, 2023, is calculated using the SEC required uniform method to compute such return.
4 Class C shares commenced operations on July 26, 2019 and performance for the Class began on July 31, 2019. The 1% CDSC for Class C shares normally applies before the first anniversary of the purchase date. Performance for other periods is at net asset value.
5 Commenced operations on July 26, 2019 and performance for the Classes began on July 31, 2019. Performance is at net asset value.
23
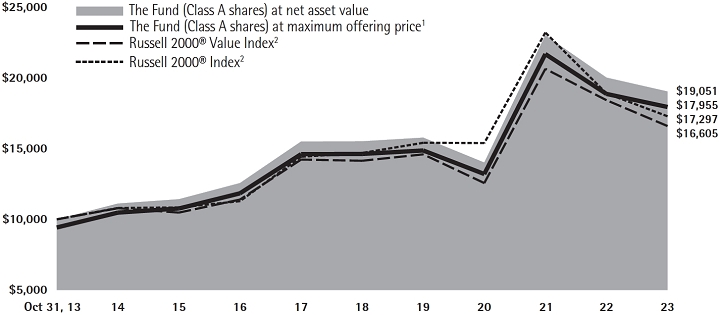
Focused Small Cap Value Fund
Investment Comparison
Below is a comparison of a $10,000 investment in Class A shares with the same investment in the Russell 2000® Value Index and the Russell 2000® Index, assuming reinvestment of all dividends and distributions. The performance of the other class will be greater than or less than the performance shown in the graph below due to different sales loads and expenses applicable to such class. The graph and performance table below do not reflect the deduction of taxes that a shareholder would pay on Fund distributions or the redemption of Fund shares. During certain periods, expenses of the Fund have been waived or reimbursed by Lord Abbett; without such waiver or reimbursement of expenses, the Fund’s returns would have been lower. Past performance is no guarantee of future results.
Average Annual Total Returns at Maximum Applicable
Sales Charge for the Periods Ended October 31, 2023
| | | 1 Year | | 5 Years | | 10 Years | | Life of Class | |
| Class A3 | | -10.36% | | 2.95% | | 6.03% | | – | |
| Class C4 | | -6.56% | | – | | – | | 3.08% | |
| Class F5 | | -4.68% | | – | | – | | 4.14% | |
| Class F35 | | -4.60% | | – | | – | | 4.21% | |
| Class I6 | | -4.66% | | 4.41% | | 6.78% | | – | |
| Class R55 | | -4.66% | | – | | – | | 4.16% | |
| Class R65 | | -4.60% | | – | | – | | 4.21% | |
1 Reflects the deduction of the maximum initial sales charge of 5.75%.
2 Performance for each unmanaged index does not reflect any fees or expenses. The performance of each index is not necessarily representative of the Fund’s performance.
3 Total return, which is the percentage change in net asset value, after deduction of the maximum initial sales charge of 5.75% applicable to Class A shares, with all dividends and distributions reinvested for the periods shown ended October 31, 2023, is calculated using the SEC required uniform method to compute such return.
4 Class C shares commenced operations on June 28, 2019 and performance for the Class began on July 1, 2019. The 1% CDSC for Class C shares normally applies before the first anniversary of the purchase date. Performance for other periods is at net asset value.
5 Commenced operations on June 28, 2019 and performance for the Class began on July 1, 2019. Performance is at net asset value.
6 Performance is at net asset value.
24
Fundamental Equity Fund
Investment Comparison
Below is a comparison of a $10,000 investment in Class A shares with the same investment in the Russell 1000® Value Index, Russell 3000® Value Index, Russell 3000® Index, and S&P 500® Index, assuming reinvestment of all dividends and distributions. The performance of other classes will be greater than or less than the performance shown in the graph below due to different sales loads and expenses applicable to such classes. The graph and performance table below do not reflect the deduction of taxes that a shareholder would pay on Fund distributions or the redemption of Fund shares. During certain periods, expenses of the Fund have been waived or reimbursed by Lord Abbett; without such waiver or reimbursement of expenses, the Fund’s returns would have been lower. Past performance is no guarantee of future results.

Average Annual Total Returns at Maximum Applicable
Sales Charge for the Periods Ended October 31, 2023
| | | 1 Year | | 5 Years | | 10 Years | | Life of Class | |
| Class A3 | | -4.89% | | 5.46% | | 6.30% | | – | |
| Class C4 | | -0.80% | | 5.92% | | 6.14% | | – | |
| Class F5 | | 1.14% | | 6.87% | | 7.10% | | – | |
| Class F36 | | 1.26% | | 7.06% | | – | | 6.74% | |
| Class I5 | | 1.18% | | 6.98% | | 7.20% | | – | |
| Class P5 | | 0.65% | | 6.48% | | 6.72% | | – | |
| Class R25 | | 0.59% | | 6.34% | | 6.56% | | – | |
| Class R35 | | 0.66% | | 6.44% | | 6.66% | | – | |
| Class R47 | | 0.86% | | 6.70% | | – | | 6.60% | |
| Class R57 | | 1.17% | | 6.97% | | – | | 6.87% | |
| Class R67 | | 1.26% | | 7.05% | | – | | 6.97% | |
1 Reflects the deduction of the maximum initial sales charge of 5.75%.
2 Performance for each unmanaged index does not reflect any fees or expenses. The performance of each index is not necessarily representative of the Fund’s performance.
3 Total return, which is the percentage change in net asset value, after deduction of the maximum initial sales charge of 5.75% applicable to Class A shares, with all dividends and distributions reinvested for the periods shown ended October 31, 2023, is calculated using the SEC-required uniform method to compute such return.
4 The 1% CDSC for Class C shares normally applies before the first anniversary of the purchase date. Performance for other periods is at net asset value.
5 Performance is at net asset value.
6 Commenced operations and performance for the Class began on April 4, 2017. Performance is at net asset value.
7 Commenced operations and performance for the classes began on June 30, 2015. Performance is at net asset value.
25
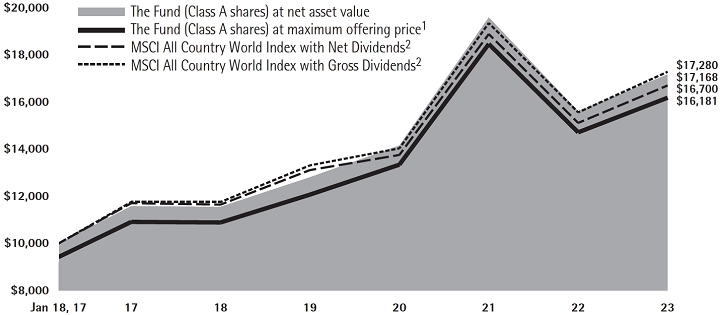
Global Equity Fund
Investment Comparison
Below is a comparison of a $10,000 investment in Class A shares with the same investment in the Morgan Stanley Capital International (MSCI) All Country World Index with Net Dividends and the MSCI All Country World Index with Gross Dividends, assuming reinvestment of all dividends and distributions. The MSCI All Country World Index with Net Dividends reflects a reduction in dividends after taking into account withholding of taxes by certain foreign countries represented in the MSCI All Country World Index. The performance of other classes will be greater than or less than the performance shown in the graph below due to different sales loads and expenses applicable to such classes. The graph and performance table below do not reflect the deduction of taxes that a shareholder would pay on Fund distributions or the redemption of Fund shares. During certain periods, expenses of the Fund have been waived or reimbursed by Lord Abbett; without such waiver or reimbursements of expense, the Fund’s returns would have been lower. Past performance is no guarantee of future results.
Average Annual Total Returns at Maximum Applicable
Sales Charge for the Periods Ended October 31, 2023
| | | 1 Year | | 5 Years | | Life of Class | |
| Class A3 | | 3.68% | | 6.96% | | 7.35% | |
| Class C4 | | 8.09% | | 7.43% | | 7.48% | |
| Class F5 | | 10.16% | | 8.41% | | 8.45% | |
| Class F36 | | 10.38% | | 8.57% | | 8.44% | |
| Class I5 | | 10.26% | | 8.51% | | 8.55% | |
| Class R35 | | 9.67% | | 7.96% | | 8.00% | |
| Class R45 | | 9.97% | | 8.23% | | 8.28% | |
| Class R55 | | 10.31% | | 8.52% | | 8.56% | |
| Class R65 | | 10.38% | | 8.57% | | 8.61% | |
1 Reflects the deduction of the maximum initial sales charge of 5.75%.
2 Performance for each unmanaged index does not reflect any fees or expenses. The performance of each index is not necessarily representative of the Fund’s performance. Performance of each index begins on January 18, 2017.
3 Class A shares commenced operations on January 17, 2017 and performance for the Class began on January 18, 2017. Total return, which is the percentage change in net asset value, after deduction of the maximum initial sales charge of 5.75% applicable to Class A shares, with all dividends and distributions reinvested for the periods shown ended October 31, 2023, is calculated using the SEC-required uniform method to compute such return.
4 Class C shares commenced operations on January 17, 2017 and performance for the Class began on January 18, 2017. The 1% CDSC for Class C shares normally applies before the first anniversary of the purchase date. Performance for other periods is at net asset value.
5 Commenced operations on January 17, 2017 and performance for the Class began on January 18, 2017. Performance is at net asset value.
6 Commenced operations and performance for the class began on April 4, 2017. Performance is at net asset value.
26
Growth Leaders Fund
Investment Comparison
Below is a comparison of a $10,000 investment in Class A shares with the same investment in the Russell 1000® Growth Index, Russell 3000® Growth Index, and S&P 500® Index, assuming reinvestment of all dividends and distributions. The performance of other classes will be greater than or less than the performance shown in the graph below due to different sales loads and expenses applicable to such classes. The graph and performance table below do not reflect the deduction of taxes that a shareholder would pay on Fund distributions or the redemption of Fund shares. During certain periods, expenses of the Fund have been waived or reimbursed by Lord Abbett; without such waiver or reimbursement of expenses, the Fund’s returns would have been lower. Past performance is no guarantee of future results.

Average Annual Total Returns at Maximum Applicable
Sales Charge for the Periods Ended October 31, 2023
| | | 1 Year | | 5 Years | | 10 Years | | Life of Class | |
| Class A3 | | -1.39% | | 9.25% | | 10.54% | | – | |
| Class C4 | | 2.85% | | 9.73% | | 10.38% | | – | |
| Class F5 | | 4.89% | | 10.83% | | 11.45% | | – | |
| Class F36 | | 4.95% | | 10.90% | | – | | 12.67% | |
| Class I5 | | 4.88% | | 10.83% | | 11.48% | | – | |
| Class R25 | | 4.27% | | 10.17% | | 10.82% | | – | |
| Class R35 | | 4.35% | | 10.28% | | 10.93% | | – | |
| Class R47 | | 4.65% | | 10.56% | | – | | 10.79% | |
| Class R57 | | 4.88% | | 10.82% | | – | | 11.07% | |
| Class R67 | | 4.95% | | 10.90% | | – | | 11.14% | |
27
1 Reflects the deduction of the maximum initial sales charge of 5.75%.
2 Performance for each unmanaged index does not reflect any fees or expenses. The performance of each index is not necessarily representative of the Fund’s performance. Performance for each index begins on June 30, 2011.
3 Class A shares commenced operations on June 24, 2011 and performance for the Class began on June 30, 2011. Total return, which is the percentage change in net asset value, after deduction of the maximum initial sales charge of 5.75% applicable to Class A shares, with all dividends and distributions reinvested for the periods shown ended October 31, 2023, is calculated using the SEC-required uniform method to compute such return.
4 Class C shares commenced operations on June 24, 2011 and performance for the Class began on June 30, 2011. The 1% CDSC for Class C shares normally applies before the first anniversary of the purchase date. Performance for other periods is at net asset value.
5 Commenced operations on June 24, 2011 and performance for the Class began on June 30, 2011. Performance is at net asset value.
6 Commenced operations and performance for the Class began on April 4, 2017. Performance is at net asset value.
7 Commenced operations and performance for the classes began on June 30, 2015. Performance is at net asset value.
28
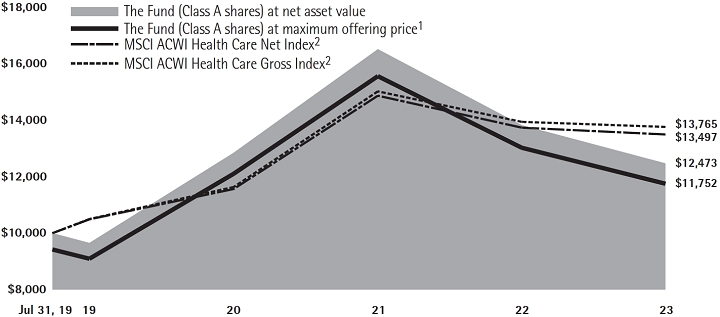
Health Care Fund
Investment Comparison
Below is a comparison of a $10,000 investment in Class A shares with the same investment in the Morgan Stanley Capital International (MSCI) All Country World Index (ACWI) Health Care Net Index and MSCI ACWI Health Care Gross Index, assuming reinvestment of all dividends and distributions. The performance of other classes will be greater than or less than the performance shown in the graph below due to different sales loads and expenses applicable to such classes. The graph and performance table below do not reflect the deduction of taxes that a shareholder would pay on Fund distributions or the redemption of Fund shares. During certain periods, expenses of the Fund have been waived or reimbursed by Lord Abbett; without such waiver or reimbursements of expense, the Fund’s returns would have been lower. Past performance is no guarantee of future results.
Average Annual Total Returns at Maximum Applicable
Sales Charge for the Periods Ended October 31, 2023
| | | 1 Year | | Life of Class | |
| Class A3 | | -14.96% | | 3.87% | |
| Class C4 | | -11.37% | | 4.54% | |
| Class F5 | | -9.58% | | 5.59% | |
| Class F35 | | -9.45% | | 5.68% | |
| Class I5 | | -9.58% | | 5.59% | |
| Class R35 | | -9.99% | | 5.07% | |
| Class R45 | | -9.84% | | 5.32% | |
| Class R55 | | -9.58% | | 5.59% | |
| Class R65 | | -9.44% | | 5.70% | |
1 Reflects the deduction of the maximum initial sales charge of 5.75%.
2 Performance for the unmanaged index does not reflect any fees or expenses. The performance of the index is not necessarily representative of the Fund’s performance. Performance of the index begins on July 31, 2019.
3 Total return, which is the percentage change in net asset value, after deduction of the maximum initial sales charge of 5.75% applicable to Class A shares, with all dividends and distributions reinvested for the periods shown ended October 31, 2023, is calculated using the SEC required uniform method to compute such return.
4 The 1% CDSC for Class C shares normally applies before the first anniversary of the purchase date. Performance for other periods is at net asset value.
5 Performance is at net asset value.
29
International Equity Fund
Investment Comparison
Below is a comparison of a $10,000 investment in Class A shares with the same investment in the Morgan Stanley Capital International (MSCI) All Country World Index (ACWI) ex-USA® Index with Net Dividends and the MSCI ACWI ex-USA® Index with Gross Dividends, assuming reinvestment of all dividends and distributions. The MSCI ACWI ex-USA Index with Net Dividends reflects a reduction in dividends after taking into account withholding of taxes by certain foreign countries represented in the MSCI ACWI ex-USA Index. The performance of other classes will be greater than or less than the performance shown in the graph below due to different sales loads and expenses applicable to such classes. The graph and performance table below do not reflect the deduction of taxes that a shareholder would pay on Fund distributions or the redemption of Fund shares. During certain periods, expenses of the Fund have been waived or reimbursed by Lord Abbett; without such waiver or reimbursement of expenses, the Fund’s returns would have been lower. Past performance is no guarantee of future results.
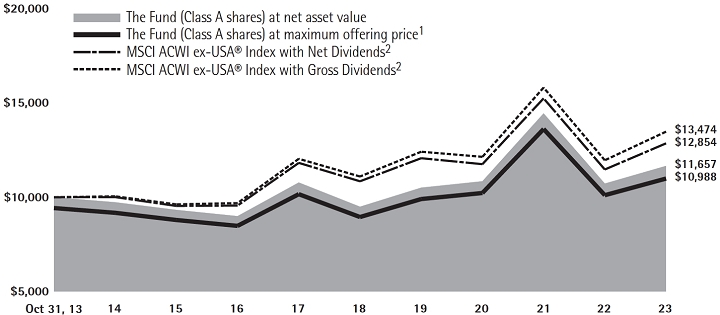
Average Annual Total Returns at Maximum Applicable
Sales Charge for the Periods Ended October 31, 2023
| | | 1 Year | | 5 Years | | 10 Years | | Life of Class | |
| Class A3 | | 2.45% | | 2.96% | | 0.95% | | – | |
| Class C4 | | 6.82% | | 3.39% | | 0.80% | | – | |
| Class F5 | | 8.89% | | 4.40% | | 1.77% | | – | |
| Class F36 | | 9.07% | | 4.54% | | – | | 3.76% | |
| Class I5 | | 8.98% | | 4.50% | | 1.88% | | – | |
| Class P5 | | 8.57% | | 4.00% | | 1.36% | | – | |
| Class R25 | | 8.27% | | 3.83% | | 1.20% | | – | |
| Class R35 | | 8.42% | | 3.93% | | 1.31% | | – | |
| Class R47 | | 8.70% | | 4.20% | | – | | 2.31% | |
| Class R57 | | 8.96% | | 4.44% | | – | | 2.55% | |
| Class R67 | | 9.08% | | 4.53% | | – | | 2.67% | |
30
1 Reflects the deduction of the maximum initial sales charge of 5.75%.
2 Performance for each unmanaged index does not reflect any fees or expenses. The performance of each index is not necessarily representative of the Fund’s performance.
3 Total return, which is the percentage change in net asset value, after deduction of the maximum initial sales charge of 5.75% applicable to Class A shares, with all dividends and distributions reinvested for the periods shown ended October 31, 2023, is calculated using the SEC-required uniform method to compute such return.
4 The 1% CDSC for Class C shares normally applies before the first anniversary of the purchase date. Performance for other periods is at net asset value.
5 Performance is at net asset value.
6 Commenced operations and performance for the Class began on April 4, 2017. Performance is at net asset value.
7 Commenced operations and performance for the classes began on June 30, 2015. Performance is at net asset value.
31
International Opportunities Fund
Investment Comparison
Below is a comparison of a $10,000 investment in Class A shares with the same investment in the S&P Developed Ex-U.S. SmallCap® Index, assuming reinvestment of all dividends and distributions. The performance of other classes will be greater than or less than the performance shown in the graph below due to different sales loads and expenses applicable to such classes. The graph and performance table below do not reflect the deduction of taxes that a shareholder would pay on Fund distributions or the redemption of Fund shares. During certain periods, expenses of the Fund have been waived or reimbursed by Lord Abbett; without such waiver or reimbursement of expenses, the Fund’s returns would have been lower. Past performance is no guarantee of future results.
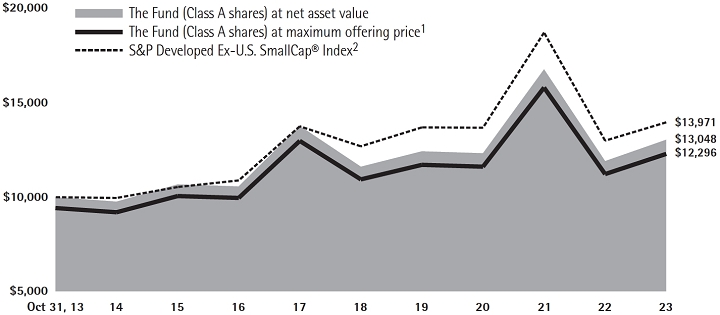
Average Annual Total Returns at Maximum Applicable
Sales Charge for the Periods Ended October 31, 2023
| | | 1 Year | | 5 Years | | 10 Years | | Life of Class | |
| Class A3 | | 3.26% | | 1.15% | | 2.09% | | – | |
| Class C4 | | 7.76% | | 1.60% | | 1.94% | | – | |
| Class F5 | | 9.70% | | 2.50% | | 2.85% | | – | |
| Class F36 | | 9.94% | | 2.70% | | – | | 2.42% | |
| Class I5 | | 9.85% | | 2.61% | | 2.96% | | – | |
| Class P5 | | 9.37% | | 2.15% | | 2.50% | | – | |
| Class R25 | | 9.17% | | 2.00% | | 2.34% | | – | |
| Class R35 | | 9.30% | | 2.09% | | 2.45% | | – | |
| Class R47 | | 9.54% | | 2.35% | | – | | 2.10% | |
| Class R57 | | 9.85% | | 2.60% | | – | | 2.35% | |
| Class R67 | | 9.94% | | 2.69% | | – | | 2.45% | |
1 Reflects the deduction of the maximum initial sales charge of 5.75%.
2 Performance for the unmanaged index does not reflect any fees or expenses. The performance of the index is not necessarily representative of the Fund’s performance.
3 Total return, which is the percentage change in net asset value, after deduction of the maximum initial sales charge of 5.75% applicable to Class A shares, with all dividends and distributions reinvested for the periods shown ended October 31, 2023, is calculated using the SEC-required uniform method to compute such return.
4 The 1% CDSC for Class C shares normally applies before the first anniversary of the purchase date. Performance is at net asset value.
5 Performance is at net asset value.
6 Commenced operations and performance for the Class began on April 4, 2017. Performance is at net asset value.
7 Commenced operations and performance for the classes began on June 30, 2015. Performance is at net asset value.
32
International Value Fund
Investment Comparison
Below is a comparison of a $10,000 investment in Class A shares with the same investment in the Morgan Stanley Capital International (MSCI) EAFE Value Index with Net Dividends and the MSCI EAFE Value Index with Gross Dividends, assuming reinvestment of all dividends and distributions. The MSCI EAFE Value Index with Net Dividends reflects a reduction in dividends after taking into account withholding of taxes by certain foreign countries represented in the MSCI EAFE Value Index. The performance of other classes will be greater than or less than the performance shown in the graph due to different sales loads and expenses applicable to such classes. The graph and performance table below do not reflect the deduction of taxes that a shareholder would pay on Fund distributions or the redemption of Fund shares. During certain periods, expenses of the Fund have been waived or reimbursed by Lord Abbett; without such waiver or reimbursements of expense, the Fund’s returns would have been lower. Past performance is no guarantee of future results.

Average Annual Total Returns at Maximum Applicable
Sales Charge for the Periods Ended October 31, 2023
| | | 1 Year | | 5 Years | | 10 Years | | Life of Class | |
| Class A3 | | 7.61% | | 2.14% | | 0.38% | | – | |
| Class C4 | | 12.22% | | 2.56% | | 0.23% | | – | |
| Class F5 | | 14.33% | | 3.55% | | 1.20% | | – | |
| Class F36 | | 14.42% | | 3.67% | | – | | 3.00% | |
| Class I5 | | 14.42% | | 3.66% | | 1.29% | | – | |
| Class R25 | | 13.83% | | 2.95% | | 0.62% | | – | |
| Class R35 | | 13.76% | | 3.11% | | 0.75% | | – | |
| Class R47 | | 14.11% | | 3.33% | | – | | 1.53% | |
| Class R57 | | 14.49% | | 3.61% | | – | | 1.81% | |
| Class R67 | | 14.43% | | 3.67% | | – | | 1.86% | |
1 Reflects the deduction of the maximum initial sales charge of 5.75%.
2 Performance for each unmanaged index does not reflect any fees or expenses. The performance of each index is not necessarily representative of the Fund’s performance.
3 Total return, which is the percentage change in net asset value, after deduction of the maximum initial sales charge of 5.75% applicable to Class A shares, with all dividends and distributions reinvested for the periods shown ended October 31, 2023, is calculated using the SEC-required uniform method to compute such return.
4 The 1% CDSC for Class C shares normally applies before the first anniversary of the purchase date. Performance for other periods is at net asset value.
5 Performance is at net asset value.
6 Commenced operations and performance for the Class began on April 4, 2017. Performance is at net asset value.
7 Commenced operations and performance for the classes began on June 30, 2015. Performance is at net asset value.
33
Micro Cap Growth Fund
Investment Comparison
Below is a comparison of a $10,000 investment in Class A shares with the same investment in the Russell Microcap® Growth Index and the Russell Microcap® Index, assuming reinvestment of all dividends and distributions. The performance of the other classes will be greater than or less than the performance shown in the graph below due to different sales loads and expenses applicable to such classes. The graph and performance table below do not reflect the deduction of taxes that a shareholder would pay on Fund distributions or the redemption of Fund shares. During certain periods, expenses of the Fund have been waived or reimbursed by Lord Abbett; without such waiver or reimbursement of expenses, the Fund’s returns would have been lower. Past performance is no guarantee of future results.

Average Annual Total Returns at Maximum Applicable
Sales Charge for the Periods Ended October 31, 2023
| | | 1 Year | | 5 Years | | 10 Years | | Life of Class | |
| Class A3 | | -24.88% | | 5.33% | | 8.72% | | – | |
| Class C4 | | -21.69% | | – | | – | | -5.64% | |
| Class F5 | | -20.09% | | – | | – | | -4.70% | |
| Class I6 | | -20.09% | | 6.78% | | 9.47% | | – | |
1 Reflects the deduction of the maximum initial sales charge of 5.75%.
2 Performance for each unmanaged index does not reflect any fees or expenses. The performance of each index is not necessarily representative of the Fund’s performance.
3 Total return, which is the percentage change in net asset value, after deduction of the maximum initial sales charge of 5.75% applicable to Class A shares, with all dividends and distributions reinvested for the periods shown ended
October 31, 2023, is calculated using the SEC required uniform method to compute such return.
4 Class C shares commenced operations and performance for the Class began on August 28, 2020. The 1% CDSC for Class C shares normally applies before the first anniversary of the purchase date. Performance is at net asset value.
5 Commenced operations and performance for the Class began on August 28, 2020. Performance is at net asset value.
6 Performance is at net asset value.
34
Value Opportunities Fund
Investment Comparison
Below is a comparison of a $10,000 investment in Class A shares with the same investment in the Russell 2500TM Index and the Russell 2500TM Value Index, assuming reinvestment of all dividends and distributions. The performance of other classes will be greater than or less than the performance shown in the graph below due to different sales loads and expenses applicable to such classes. The graph and performance table below do not reflect the deduction of taxes that a shareholder would pay on Fund distributions or the redemption of Fund shares. During certain periods, expenses of the Fund have been waived or reimbursed by Lord Abbett; without such waiver or reimbursement of expenses, the Fund’s returns would have been lower. Past performance is no guarantee of future results.

Average Annual Total Returns at Maximum Applicable
Sales Charge for the Periods Ended October 31, 2023
| | | 1 Year | | 5 Years | | 10 Years | | Life of Class | |
| Class A3 | | -5.63% | | 3.93% | | 5.34% | | – | |
| Class C4 | | -1.60% | | 4.38% | | 5.19% | | – | |
| Class F5 | | 0.23% | | 5.32% | | 6.14% | | – | |
| Class F36 | | 0.40% | | 5.53% | | – | | 5.26% | |
| Class I5 | | 0.33% | | 5.44% | | 6.24% | | – | |
| Class P5 | | -0.16% | | 4.96% | | 5.76% | | – | |
| Class R25 | | -0.26% | | 4.80% | | 5.62% | | – | |
| Class R35 | | -0.15% | | 4.90% | | 5.72% | | – | |
| Class R47 | | 0.05% | | 5.16% | | – | | 4.96% | |
| Class R57 | | 0.32% | | 5.43% | | – | | 5.22% | |
| Class R67 | | 0.40% | | 5.53% | | – | | 5.33% | |
1 Reflects the deduction of the maximum initial sales charge of 5.75%.
2 Performance for each unmanaged index does not reflect any fees or expenses. The performance of each index is not necessarily representative of the Fund’s performance.
3 Total return, which is the percentage change in net asset value, after deduction of the maximum initial sales charge of 5.75% applicable to Class A shares, with all dividends and distributions reinvested for the periods shown ended October 31, 2023, is calculated using the SEC-required uniform method to compute such return.
4 The 1% CDSC for Class C shares normally applies before the first anniversary of the purchase date. Performance for other periods is at net asset value.
5 Performance is at net asset value.
6 Commenced operations and performance for the Class began on April 4, 2017. Performance is at net asset value.
7 Commenced operations and performance for the classes began on June 30, 2015. Performance is at net asset value.
35
Expense Example
As a shareholder of a Fund, you incur two types of costs: (1) transaction costs, including sales charges (loads) on purchase payments (these charges vary among the share classes); and (2) ongoing costs, including management fees; distribution and service (12b-1) fees (these charges vary among the share classes); and other Fund expenses. This Example is intended to help you understand your ongoing costs (in dollars) of investing in each Fund and to compare these costs with the ongoing costs of investing in other mutual funds.
The Example is based on an investment of $1,000 invested at the beginning of the period and held for the entire period (May 1, 2023 through October 31, 2023).
Actual Expenses
For each class of each Fund, the first line of the applicable table on the following pages provides information about actual account values and actual expenses. You may use the information in this line, together with the amount you invested, to estimate the expenses that you paid over the period. Simply divide your account value by $1,000 (for example, an $8,600 account value divided by $1,000 = 8.6), then multiply the result by the number in the first line under the heading titled “Expenses Paid During Period 5/1/23 – 10/31/23” to estimate the expenses you paid on your account during this period.
Hypothetical Example for Comparison Purposes
For each class of each Fund, the second line of the applicable table on the following pages provides information about hypothetical account values and hypothetical expenses based on the Fund’s actual expense ratio and an assumed rate of return of 5% per year before expenses, which is not the Fund’s actual return. The hypothetical account values and expenses may not be used to estimate the actual ending account balance or expenses you paid for the period. You may use this information to compare the ongoing costs of investing in each Fund and other funds. To do so, compare this 5% hypothetical example with the 5% hypothetical examples that appear in the shareholder reports of the other funds.
36
Alpha Strategy Fund
Please note that the expenses shown in the table are meant to highlight your ongoing costs only and do not reflect any transactional costs, such as sales charges (loads). Therefore, the second line of the table is useful in comparing ongoing costs only, and will not help you determine the relative total costs of owning different funds. In addition, if these transactional costs were included, your costs would have been higher.
| | | Beginning
Account
Value | | Ending
Account
Value | | Expenses
Paid During
Period†# | |
| | | 5/1/23 | | 10/31/23 | | 5/1/23 –
10/31/23 | |
| Class A | | | | | | | | | | | | | |
| Actual | | $ | 1,000.00 | | | $ | 910.30 | | | $ | 2.02 | | |
| Hypothetical (5% Return Before Expenses) | | $ | 1,000.00 | | | $ | 1,023.09 | | | $ | 2.14 | | |
| Class C | | | | | | | | | | | | | |
| Actual | | $ | 1,000.00 | | | $ | 907.00 | | | $ | 5.67 | | |
| Hypothetical (5% Return Before Expenses) | | $ | 1,000.00 | | | $ | 1,019.26 | | | $ | 6.01 | | |
| Class F | | | | | | | | | | | | | |
| Actual | | $ | 1,000.00 | | | $ | 911.50 | | | $ | 1.35 | | |
| Hypothetical (5% Return Before Expenses) | | $ | 1,000.00 | | | $ | 1,023.79 | | | $ | 1.43 | | |
| Class F3 | | | | | | | | | | | | | |
| Actual | | $ | 1,000.00 | | | $ | 912.20 | | | $ | 0.43 | | |
| Hypothetical (5% Return Before Expenses) | | $ | 1,000.00 | | | $ | 1,024.75 | | | $ | 0.46 | | |
| Class I | | | | | | | | | | | | | |
| Actual | | $ | 1,000.00 | | | $ | 911.60 | | | $ | 0.82 | | |
| Hypothetical (5% Return Before Expenses) | | $ | 1,000.00 | | | $ | 1,024.35 | | | $ | 0.87 | | |
| Class R2 | | | | | | | | | | | | | |
| Actual | | $ | 1,000.00 | | | $ | 909.00 | | | $ | 3.75 | | |
| Hypothetical (5% Return Before Expenses) | | $ | 1,000.00 | | | $ | 1,021.27 | | | $ | 3.97 | | |
| Class R3 | | | | | | | | | | | | | |
| Actual | | $ | 1,000.00 | | | $ | 909.40 | | | $ | 3.22 | | |
| Hypothetical (5% Return Before Expenses) | | $ | 1,000.00 | | | $ | 1,021.83 | | | $ | 3.41 | | |
| Class R4 | | | | | | | | | | | | | |
| Actual | | $ | 1,000.00 | | | $ | 910.40 | | | $ | 2.02 | | |
| Hypothetical (5% Return Before Expenses) | | $ | 1,000.00 | | | $ | 1,023.09 | | | $ | 2.14 | | |
| Class R5 | | | | | | | | | | | | | |
| Actual | | $ | 1,000.00 | | | $ | 911.70 | | | $ | 0.82 | | |
| Hypothetical (5% Return Before Expenses) | | $ | 1,000.00 | | | $ | 1,024.35 | | | $ | 0.87 | | |
| Class R6 | | | | | | | | | | | | | |
| Actual | | $ | 1,000.00 | | | $ | 911.80 | | | $ | 0.43 | | |
| Hypothetical (5% Return Before Expenses) | | $ | 1,000.00 | | | $ | 1,024.75 | | | $ | 0.46 | | |
| | |
| † | For each class of the Fund, net expenses are equal to the annualized expense ratio for such class (0.42% for Class A, 1.18% for Class C, 0.28% for Class F, 0.09% for Class F3, 0.17% for Class I, 0.78% for Class R2, 0.67% for Class R3, 0.42% for Class R4, 0.17% for Class R5 and 0.09% for Class R6) multiplied by the average account value over the period, multiplied by 184/365 (to reflect one-half year period). |
| # | Does not include expenses of the Underlying Funds in which Alpha Strategy Fund invests. |
37
Portfolio Holdings Presented by Portfolio Allocation
October 31, 2023
| Underlying Fund Name | | %* |
| Lord Abbett Developing Growth Fund, Inc. - Class I | | | 18.91 | % |
| Lord Abbett Securities Trust-Focused Small Cap Value Fund - Class I | | | 10.43 | % |
| Lord Abbett Securities Trust-International Opportunities Fund - Class I | | | 20.65 | % |
| Lord Abbett Securities Trust-Micro Cap Growth Fund - Class I | | | 8.92 | % |
| Lord Abbett Research Fund, Inc.-Small Cap Value Fund - Class I | | | 20.40 | % |
| Lord Abbett Securities Trust-Value Opportunities Fund - Class I | | | 20.59 | % |
| Repurchase Agreements | | | 0.10 | % |
| Total | | | 100.00 | % |
| | |
| * | Represents percent of total investments, which excludes derivatives. |
38
Focused Growth Fund
Please note that the expenses shown in the table are meant to highlight your ongoing costs only and do not reflect any transactional costs, such as sales charges (loads). Therefore, the second line of the table is useful in comparing ongoing costs only, and will not help you determine the relative total costs of owning different funds. In addition, if these transactional costs were included, your costs would have been higher.
| | | Beginning
Account
Value | | Ending
Account
Value | | Expenses
Paid During
Period† | |
| | | 5/1/23 | | 10/31/23 | | 5/1/23 –
10/31/23 | |
| Class A | | | | | | | | | | | | | |
| Actual | | $ | 1,000.00 | | | $ | 1,042.20 | | | $ | 5.40 | | |
| Hypothetical (5% Return Before Expenses) | | $ | 1,000.00 | | | $ | 1,019.91 | | | $ | 5.35 | | |
| Class C | | | | | | | | | | | | | |
| Actual | | $ | 1,000.00 | | | $ | 1,038.50 | | | $ | 9.25 | | |
| Hypothetical (5% Return Before Expenses) | | $ | 1,000.00 | | | $ | 1,016.13 | | | $ | 9.15 | | |
| Class F | | | | | | | | | | | | | |
| Actual | | $ | 1,000.00 | | | $ | 1,043.70 | | | $ | 4.12 | | |
| Hypothetical (5% Return Before Expenses) | | $ | 1,000.00 | | | $ | 1,021.17 | | | $ | 4.08 | | |
| Class F3 | | | | | | | | | | | | | |
| Actual | | $ | 1,000.00 | | | $ | 1,044.60 | | | $ | 3.45 | | |
| Hypothetical (5% Return Before Expenses) | | $ | 1,000.00 | | | $ | 1,021.83 | | | $ | 3.41 | | |
| Class I | | | | | | | | | | | | | |
| Actual | | $ | 1,000.00 | | | $ | 1,043.70 | | | $ | 4.12 | | |
| Hypothetical (5% Return Before Expenses) | | $ | 1,000.00 | | | $ | 1,021.17 | | | $ | 4.08 | | |
| Class R3 | | | | | | | | | | | | | |
| Actual | | $ | 1,000.00 | | | $ | 1,041.20 | | | $ | 6.69 | | |
| Hypothetical (5% Return Before Expenses) | | $ | 1,000.00 | | | $ | 1,018.65 | | | $ | 6.61 | | |
| Class R4 | | | | | | | | | | | | | |
| Actual | | $ | 1,000.00 | | | $ | 1,042.70 | | | $ | 5.41 | | |
| Hypothetical (5% Return Before Expenses) | | $ | 1,000.00 | | | $ | 1,019.91 | | | $ | 5.35 | | |
| Class R5 | | | | | | | | | | | | | |
| Actual | | $ | 1,000.00 | | | $ | 1,043.70 | | | $ | 4.12 | | |
| Hypothetical (5% Return Before Expenses) | | $ | 1,000.00 | | | $ | 1,021.17 | | | $ | 4.08 | | |
| Class R6 | | | | | | | | | | | | | |
| Actual | | $ | 1,000.00 | | | $ | 1,044.60 | | | $ | 3.45 | | |
| Hypothetical (5% Return Before Expenses) | | $ | 1,000.00 | | | $ | 1,021.83 | | | $ | 3.41 | | |
| | |
| † | For each class of the Fund, net expenses are equal to the annualized expense ratio for such class (1.05% for Class A, 1.80% for Class C, 0.80% for Class F, 0.67% for Class F3, 0.80% for Class I, 1.30% for Class R3, 1.05% for Class R4, 0.80% for Class R5 and 0.67% for Class R6) multiplied by the average account value over the period, multiplied by 184/365 (to reflect one-half year period). |
39
Portfolio Holdings Presented by Sector
October 31, 2023
| Sector* | | %** |
| Communication Services | | | 16.56 | % |
| Consumer Discretionary | | | 12.20 | % |
| Financials | | | 3.08 | % |
| Health Care | | | 9.24 | % |
| Industrials | | | 4.06 | % |
| Information Technology | | | 54.28 | % |
| Repurchase Agreements | | | 0.58 | % |
| Total | | | 100.00 | % |
| | | |
| * | | A sector may comprise several industries. |
| ** | | Represents percent of total investments, which excludes derivatives. |
40
Focused Large Cap Value Fund
Please note that the expenses shown in the table are meant to highlight your ongoing costs only and do not reflect any transactional costs, such as sales charges (loads). Therefore, the second line of the table is useful in comparing ongoing costs only, and will not help you determine the relative total costs of owning different funds. In addition, if these transactional costs were included, your costs would have been higher.
| | | Beginning
Account
Value | | Ending
Account
Value | | Expenses
Paid During
Period† | |
| | | 5/1/23 | | 10/31/23 | | 5/1/23 –
10/31/23 | |
| Class A | | | | | | | | | | | | | |
| Actual | | $ | 1,000.00 | | | $ | 985.60 | | | $ | 4.80 | | |
| Hypothetical (5% Return Before Expenses) | | $ | 1,000.00 | | | $ | 1,020.37 | | | $ | 4.89 | | |
| Class C | | | | | | | | | | | | | |
| Actual | | $ | 1,000.00 | | | $ | 982.50 | | | $ | 8.54 | | |
| Hypothetical (5% Return Before Expenses) | | $ | 1,000.00 | | | $ | 1,016.59 | | | $ | 8.69 | | |
| Class F | | | | | | | | | | | | | |
| Actual | | $ | 1,000.00 | | | $ | 986.90 | | | $ | 3.56 | | |
| Hypothetical (5% Return Before Expenses) | | $ | 1,000.00 | | | $ | 1,021.63 | | | $ | 3.62 | | |
| Class F3 | | | | | | | | | | | | | |
| Actual | | $ | 1,000.00 | | | $ | 986.70 | | | $ | 3.56 | | |
| Hypothetical (5% Return Before Expenses) | | $ | 1,000.00 | | | $ | 1,021.63 | | | $ | 3.62 | | |
| Class I | | | | | | | | | | | | | |
| Actual | | $ | 1,000.00 | | | $ | 987.10 | | | $ | 3.56 | | |
| Hypothetical (5% Return Before Expenses) | | $ | 1,000.00 | | | $ | 1,021.63 | | | $ | 3.62 | | |
| Class R3 | | | | | | | | | | | | | |
| Actual | | $ | 1,000.00 | | | $ | 985.60 | | | $ | 6.06 | | |
| Hypothetical (5% Return Before Expenses) | | $ | 1,000.00 | | | $ | 1,019.11 | | | $ | 6.16 | | |
| Class R4 | | | | | | | | | | | | | |
| Actual | | $ | 1,000.00 | | | $ | 986.60 | | | $ | 4.81 | | |
| Hypothetical (5% Return Before Expenses) | | $ | 1,000.00 | | | $ | 1,020.37 | | | $ | 4.89 | | |
| Class R5 | | | | | | | | | | | | | |
| Actual | | $ | 1,000.00 | | | $ | 987.70 | | | $ | 3.56 | | |
| Hypothetical (5% Return Before Expenses) | | $ | 1,000.00 | | | $ | 1,021.63 | | | $ | 3.62 | | |
| Class R6 | | | | | | | | | | | | | |
| Actual | | $ | 1,000.00 | | | $ | 986.70 | | | $ | 3.56 | | |
| Hypothetical (5% Return Before Expenses) | | $ | 1,000.00 | | | $ | 1,021.63 | | | $ | 3.62 | | |
| | |
| † | For each class of the Fund, net expenses are equal to the annualized expense ratio for such class (0.96% for Class A, 1.71% for Class C, 0.71% for Class F, 0.71% for Class F3, 0.71% for Class I, 1.21% for Class R3, 0.96% for Class R4, 0.71% for Class R5 and 0.71% for Class R6) multiplied by the average account value over the period, multiplied by 184/365 (to reflect one-half year period). |
41
Portfolio Holdings Presented by Sector
October 31, 2023
| Sector* | | %** |
| Communication Services | | | 4.20 | % |
| Consumer Discretionary | | | 5.52 | % |
| Consumer Staples | | | 8.27 | % |
| Energy | | | 11.94 | % |
| Financials | | | 25.65 | % |
| Health Care | | | 9.61 | % |
| Industrials | | | 18.83 | % |
| Information Technology | | | 10.64 | % |
| Materials | | | 2.90 | % |
| Real Estate | | | 2.44 | % |
| Total | | | 100.00 | % |
| | | |
| * | | A sector may comprise several industries. |
| ** | | Represents percent of total investments, which excludes derivatives. |
42
Focused Small Cap Value Fund
Please note that the expenses shown in the table are meant to highlight your ongoing costs only and do not reflect any transactional costs, such as sales charges (loads). Therefore, the second line of the table is useful in comparing ongoing costs only, and will not help you determine the relative total costs of owning different funds. In addition, if these transactional costs were included, your costs would have been higher.
| | | Beginning
Account
Value | | Ending
Account
Value | | Expenses
Paid During
Period† | |
| | | 5/1/23 | | 10/31/23 | | 5/1/23 –
10/31/23 | |
| Class A | | | | | | | | | | | | | |
| Actual | | $ | 1,000.00 | | | $ | 939.20 | | | $ | 6.26 | | |
| Hypothetical (5% Return Before Expenses) | | $ | 1,000.00 | | | $ | 1,018.75 | | | $ | 6.51 | | |
| Class C | | | | | | | | | | | | | |
| Actual | | $ | 1,000.00 | | | $ | 935.40 | | | $ | 9.90 | | |
| Hypothetical (5% Return Before Expenses) | | $ | 1,000.00 | | | $ | 1,014.97 | | | $ | 10.31 | | |
| Class F | | | | | | | | | | | | | |
| Actual | | $ | 1,000.00 | | | $ | 939.80 | | | $ | 5.04 | | |
| Hypothetical (5% Return Before Expenses) | | $ | 1,000.00 | | | $ | 1,020.01 | | | $ | 5.24 | | |
| Class F3 | | | | | | | | | | | | | |
| Actual | | $ | 1,000.00 | | | $ | 940.60 | | | $ | 4.74 | | |
| Hypothetical (5% Return Before Expenses) | | $ | 1,000.00 | | | $ | 1,020.32 | | | $ | 4.94 | | |
| Class I | | | | | | | | | | | | | |
| Actual | | $ | 1,000.00 | | | $ | 940.00 | | | $ | 5.04 | | |
| Hypothetical (5% Return Before Expenses) | | $ | 1,000.00 | | | $ | 1,020.01 | | | $ | 5.24 | | |
| Class R5 | | | | | | | | | | | | | |
| Actual | | $ | 1,000.00 | | | $ | 940.40 | | | $ | 5.04 | | |
| Hypothetical (5% Return Before Expenses) | | $ | 1,000.00 | | | $ | 1,020.01 | | | $ | 5.24 | | |
| Class R6 | | | | | | | | | | | | | |
| Actual | | $ | 1,000.00 | | | $ | 940.20 | | | $ | 4.74 | | |
| Hypothetical (5% Return Before Expenses) | | $ | 1,000.00 | | | $ | 1,020.32 | | | $ | 4.94 | | |
| | |
| † | For each class of the Fund, net expenses are equal to the annualized expense ratio for such class (1.28% for Class A, 2.03% for Class C, 1.03% for Class F, 0.97% for Class F3, 1.03% for Class I, 1.03% for Class R5 and 0.97% for Class R6) multiplied by the average account value over the period, multiplied by 184/365 (to reflect one-half year period). |
43
Portfolio Holdings Presented by Sector
October 31, 2023
| Sector* | | %** |
| Communication Services | | | 4.02 | % |
| Consumer Discretionary | | | 10.73 | % |
| Consumer Staples | | | 2.14 | % |
| Energy | | | 11.19 | % |
| Financials | | | 27.93 | % |
| Health Care | | | 5.49 | % |
| Industrials | | | 19.89 | % |
| Information Technology | | | 11.34 | % |
| Materials | | | 4.08 | % |
| Real Estate | | | 2.38 | % |
| Repurchase Agreements | | | 0.81 | % |
| Total | | | 100.00 | % |
| | | |
| * | | A sector may comprise several industries. |
| ** | | Represents percent of total investments, which excludes derivatives. |
44
Fundamental Equity Fund
Please note that the expenses shown in the table are meant to highlight your ongoing costs only and do not reflect any transactional costs, such as sales charges (loads). Therefore, the second line of the table is useful in comparing ongoing costs only, and will not help you determine the relative total costs of owning different funds. In addition, if these transactional costs were included, your costs would have been higher.
| | | Beginning
Account
Value | | Ending
Account
Value | | Expenses
Paid During
Period† | |
| | | 5/1/23 | | 10/31/23 | | 5/1/23 –
10/31/23 | |
| Class A | | | | | | | | | | | | | |
| Actual | | $ | 1,000.00 | | | $ | 983.50 | | | $ | 4.70 | | |
| Hypothetical (5% Return Before Expenses) | | $ | 1,000.00 | | | $ | 1,020.47 | | | $ | 4.79 | | |
| Class C | | | | | | | | | | | | | |
| Actual | | $ | 1,000.00 | | | $ | 979.70 | | | $ | 8.43 | | |
| Hypothetical (5% Return Before Expenses) | | $ | 1,000.00 | | | $ | 1,016.69 | | | $ | 8.59 | | |
| Class F | | | | | | | | | | | | | |
| Actual | | $ | 1,000.00 | | | $ | 984.10 | | | $ | 3.95 | | |
| Hypothetical (5% Return Before Expenses) | | $ | 1,000.00 | | | $ | 1,021.22 | | | $ | 4.02 | | |
| Class F3 | | | | | | | | | | | | | |
| Actual | | $ | 1,000.00 | | | $ | 984.60 | | | $ | 3.15 | | |
| Hypothetical (5% Return Before Expenses) | | $ | 1,000.00 | | | $ | 1,022.03 | | | $ | 3.21 | | |
| Class I | | | | | | | | | | | | | |
| Actual | | $ | 1,000.00 | | | $ | 984.50 | | | $ | 3.45 | | |
| Hypothetical (5% Return Before Expenses) | | $ | 1,000.00 | | | $ | 1,021.73 | | | $ | 3.52 | | |
| Class P | | | | | | | | | | | | | |
| Actual | | $ | 1,000.00 | | | $ | 981.40 | | | $ | 5.69 | | |
| Hypothetical (5% Return Before Expenses) | | $ | 1,000.00 | | | $ | 1,019.46 | | | $ | 5.80 | | |
| Class R2 | | | | | | | | | | | | | |
| Actual | | $ | 1,000.00 | | | $ | 981.30 | | | $ | 6.44 | | |
| Hypothetical (5% Return Before Expenses) | | $ | 1,000.00 | | | $ | 1,018.70 | | | $ | 6.56 | | |
| Class R3 | | | | | | | | | | | | | |
| Actual | | $ | 1,000.00 | | | $ | 981.40 | | | $ | 5.94 | | |
| Hypothetical (5% Return Before Expenses) | | $ | 1,000.00 | | | $ | 1,019.21 | | | $ | 6.06 | | |
| Class R4 | | | | | | | | | | | | | |
| Actual | | $ | 1,000.00 | | | $ | 982.60 | | | $ | 4.70 | | |
| Hypothetical (5% Return Before Expenses) | | $ | 1,000.00 | | | $ | 1,020.47 | | | $ | 4.79 | | |
| Class R5 | | | | | | | | | | | | | |
| Actual | | $ | 1,000.00 | | | $ | 984.50 | | | $ | 3.45 | | |
| Hypothetical (5% Return Before Expenses) | | $ | 1,000.00 | | | $ | 1,021.73 | | | $ | 3.52 | | |
| Class R6 | | | | | | | | | | | | | |
| Actual | | $ | 1,000.00 | | | $ | 984.60 | | | $ | 3.15 | | |
| Hypothetical (5% Return Before Expenses) | | $ | 1,000.00 | | | $ | 1,022.03 | | | $ | 3.21 | | |
| | |
| † | For each class of the Fund, net expenses are equal to the annualized expense ratio for such class (0.94% for Class A, 1.69% for Class C, 0.79% for Class F, 0.63% for Class F3, 0.69% for Class I, 1.14% for Class P, 1.29% for Class R2, 1.19% for Class R3, 0.94% for Class R4, 0.69% for Class R5 and 0.63% for Class R6) multiplied by the average account value over the period, multiplied by 184/365 (to reflect one-half year period). |
45
Portfolio Holdings Presented by Sector
October 31, 2023
| Sector* | | %** |
| Communication Services | | | 4.71 | % |
| Consumer Discretionary | | | 5.74 | % |
| Consumer Staples | | | 5.89 | % |
| Energy | | | 10.10 | % |
| Financials | | | 23.23 | % |
| Health Care | | | 14.80 | % |
| Industrials | | | 13.29 | % |
| Information Technology | | | 12.51 | % |
| Materials | | | 3.85 | % |
| Real Estate | | | 2.98 | % |
| Utilities | | | 1.98 | % |
| Repurchase Agreements | | | 0.92 | % |
| Total | | | 100.00 | % |
| | | |
| * | | A sector may comprise several industries. |
| ** | | Represents percent of total investments, which excludes derivatives. |
46
Global Equity Fund
Please note that the expenses shown in the table are meant to highlight your ongoing costs only and do not reflect any transactional costs, such as sales charges (loads). Therefore, the second line of the table is useful in comparing ongoing costs only, and will not help you determine the relative total costs of owning different funds. In addition, if these transactional costs were included, your costs would have been higher.
| | | Beginning
Account
Value | | Ending
Account
Value | | Expenses
Paid During
Period† | |
| | | 5/1/23 | | 10/31/23 | | 5/1/23 –
10/31/23 | |
| Class A | | | | | | | | | | | | | |
| Actual | | $ | 1,000.00 | | | $ | 989.60 | | | $ | 4.51 | | |
| Hypothetical (5% Return Before Expenses) | | $ | 1,000.00 | | | $ | 1,020.67 | | | $ | 4.58 | | |
| Class C | | | | | | | | | | | | | |
| Actual | | $ | 1,000.00 | | | $ | 985.50 | | | $ | 8.26 | | |
| Hypothetical (5% Return Before Expenses) | | $ | 1,000.00 | | | $ | 1,016.89 | | | $ | 8.39 | | |
| Class F | | | | | | | | | | | | | |
| Actual | | $ | 1,000.00 | | | $ | 990.50 | | | $ | 3.76 | | |
| Hypothetical (5% Return Before Expenses) | | $ | 1,000.00 | | | $ | 1,021.42 | | | $ | 3.82 | | |
| Class F3 | | | | | | | | | | | | | |
| Actual | | $ | 1,000.00 | | | $ | 991.30 | | | $ | 2.91 | | |
| Hypothetical (5% Return Before Expenses) | | $ | 1,000.00 | | | $ | 1,022.28 | | | $ | 2.96 | | |
| Class I | | | | | | | | | | | | | |
| Actual | | $ | 1,000.00 | | | $ | 990.50 | | | $ | 3.26 | | |
| Hypothetical (5% Return Before Expenses) | | $ | 1,000.00 | | | $ | 1,021.93 | | | $ | 3.31 | | |
| Class R3 | | | | | | | | | | | | | |
| Actual | | $ | 1,000.00 | | | $ | 988.00 | | | $ | 5.76 | | |
| Hypothetical (5% Return Before Expenses) | | $ | 1,000.00 | | | $ | 1,019.41 | | | $ | 5.85 | | |
| Class R4 | | | | | | | | | | | | | |
| Actual | | $ | 1,000.00 | | | $ | 989.60 | | | $ | 4.51 | | |
| Hypothetical (5% Return Before Expenses) | | $ | 1,000.00 | | | $ | 1,020.67 | | | $ | 4.58 | | |
| Class R5 | | | | | | | | | | | | | |
| Actual | | $ | 1,000.00 | | | $ | 991.20 | | | $ | 3.26 | | |
| Hypothetical (5% Return Before Expenses) | | $ | 1,000.00 | | | $ | 1,021.93 | | | $ | 3.31 | | |
| Class R6 | | | | | | | | | | | | | |
| Actual | | $ | 1,000.00 | | | $ | 991.30 | | | $ | 2.91 | | |
| Hypothetical (5% Return Before Expenses) | | $ | 1,000.00 | | | $ | 1,022.28 | | | $ | 2.96 | | |
| | |
| † | For each class of the Fund, net expenses are equal to the annualized expense ratio for such class (0.90% for Class A, 1.65% for Class C, 0.75% for Class F, 0.58% for Class F3, 0.65% for Class I, 1.15% for Class R3, 0.90% for Class R4, 0.65% for Class R5 and 0.58% for Class R6) multiplied by the average account value over the period, multiplied by 184/365 (to reflect one-half year period). |
47
Portfolio Holdings Presented by Sector
October 31, 2023
| Sector* | | %** |
| Communication Services | | | 11.06 | % |
| Consumer Discretionary | | | 12.18 | % |
| Consumer Staples | | | 7.68 | % |
| Energy | | | 5.21 | % |
| Financials | | | 16.20 | % |
| Health Care | | | 10.41 | % |
| Industrials | | | 8.38 | % |
| Information Technology | | | 22.45 | % |
| Materials | | | 2.61 | % |
| Real Estate | | | 1.09 | % |
| Utilities | | | 1.69 | % |
| Repurchase Agreements | | | 1.04 | % |
| Total | | | 100.00 | % |
| | | |
| * | | A sector may comprise several industries. |
| ** | | Represents percent of total investments, which excludes derivatives. |
48
Growth Leaders Fund
Please note that the expenses shown in the table are meant to highlight your ongoing costs only and do not reflect any transactional costs, such as sales charges (loads). Therefore, the second line of the table is useful in comparing ongoing costs only, and will not help you determine the relative total costs of owning different funds. In addition, if these transactional costs were included, your costs would have been higher.
| | | Beginning
Account
Value | | Ending
Account
Value | | Expenses
Paid During
Period† | |
| | | 5/1/23 | | 10/31/23 | | 5/1/23 –
10/31/23 | |
| Class A | | | | | | | | | | |
| Actual | | $ | 1,000.00 | | | $ | 1,041.00 | | | $ | 4.58 | | |
| Hypothetical (5% Return Before Expenses) | | $ | 1,000.00 | | | $ | 1,020.72 | | | $ | 4.53 | | |
| Class C | | | | | | | | | | | | | |
| Actual | | $ | 1,000.00 | | | $ | 1,037.60 | | | $ | 8.42 | | |
| Hypothetical (5% Return Before Expenses) | | $ | 1,000.00 | | | $ | 1,016.94 | | | $ | 8.34 | | |
| Class F | | | | | | | | | | | | | |
| Actual | | $ | 1,000.00 | | | $ | 1,042.80 | | | $ | 3.30 | | |
| Hypothetical (5% Return Before Expenses) | | $ | 1,000.00 | | | $ | 1,021.98 | | | $ | 3.26 | | |
| Class F3 | | | | | | | | | | | | | |
| Actual | | $ | 1,000.00 | | | $ | 1,042.80 | | | $ | 3.04 | | |
| Hypothetical (5% Return Before Expenses) | | $ | 1,000.00 | | | $ | 1,022.23 | | | $ | 3.01 | | |
| Class I | | | | | | | | | | | | | |
| Actual | | $ | 1,000.00 | | | $ | 1,042.80 | | | $ | 3.30 | | |
| Hypothetical (5% Return Before Expenses) | | $ | 1,000.00 | | | $ | 1,021.98 | | | $ | 3.26 | | |
| Class R2 | | | | | | | | | | | | | |
| Actual | | $ | 1,000.00 | | | $ | 1,039.50 | | | $ | 6.43 | | |
| Hypothetical (5% Return Before Expenses) | | $ | 1,000.00 | | | $ | 1,018.90 | | | $ | 6.36 | | |
| Class R3 | | | | | | | | | | | | | |
| Actual | | $ | 1,000.00 | | | $ | 1,039.80 | | | $ | 5.86 | | |
| Hypothetical (5% Return Before Expenses) | | $ | 1,000.00 | | | $ | 1,019.46 | | | $ | 5.80 | | |
| Class R4 | | | | | | | | | | | | | |
| Actual | | $ | 1,000.00 | | | $ | 1,041.40 | | | $ | 4.58 | | |
| Hypothetical (5% Return Before Expenses) | | $ | 1,000.00 | | | $ | 1,020.72 | | | $ | 4.53 | | |
| Class R5 | | | | | | | | | | | | | |
| Actual | | $ | 1,000.00 | | | $ | 1,042.40 | | | $ | 3.29 | | |
| Hypothetical (5% Return Before Expenses) | | $ | 1,000.00 | | | $ | 1,021.98 | | | $ | 3.26 | | |
| Class R6 | | | | | | | | | | | | | |
| Actual | | $ | 1,000.00 | | | $ | 1,042.80 | | | $ | 3.04 | | |
| Hypothetical (5% Return Before Expenses) | | $ | 1,000.00 | | | $ | 1,022.23 | | | $ | 3.01 | | |
| † | | For each class of the Fund, net expenses are equal to the annualized expense ratio for such class (0.89% for Class A, 1.64% for Class C, 0.64% for Class F, 0.59% for Class F3, 0.64% for Class I, 1.25% for Class R2, 1.14% for Class R3, 0.89% for Class R4, 0.64% for Class R5 and 0.59% for Class R6) multiplied by the average account value over the period, multiplied by 184/365 (to reflect one-half year period). |
49
Portfolio Holdings Presented by Sector
October 31, 2023
| Sector* | | %** |
| Communication Services | | | 11.01 | % |
| Consumer Discretionary | | | 14.85 | % |
| Financials | | | 5.46 | % |
| Health Care | | | 4.81 | % |
| Industrials | | | 16.96 | % |
| Information Technology | | | 45.40 | % |
| Repurchase Agreements | | | 1.51 | % |
| Total | | | 100.00 | % |
| * | | A sector may comprise several industries. |
| ** | | Represents percent of total investments, which excludes derivatives. |
50
Health Care Fund
Please note that the expenses shown in the table are meant to highlight your ongoing costs only and do not reflect any transactional costs, such as sales charges (loads). Therefore, the second line of the table is useful in comparing ongoing costs only, and will not help you determine the relative total costs of owning different funds. In addition, if these transactional costs were included, your costs would have been higher.
| | | Beginning
Account
Value | | Ending
Account
Value | | Expenses
Paid During
Period† | |
| | | 5/1/23 | | 10/31/23 | | 5/1/23 –
10/31/23 | |
| Class A | | | | | | | | | | |
| Actual | | $ | 1,000.00 | | | $ | 846.60 | | | $ | 4.79 | | |
| Hypothetical (5% Return Before Expenses) | | $ | 1,000.00 | | | $ | 1,020.01 | | | $ | 5.24 | | |
| Class C | | | | | | | | | | | | | |
| Actual | | $ | 1,000.00 | | | $ | 843.40 | | | $ | 8.27 | | |
| Hypothetical (5% Return Before Expenses) | | $ | 1,000.00 | | | $ | 1,016.23 | | | $ | 9.05 | | |
| Class F | | | | | | | | | | | | | |
| Actual | | $ | 1,000.00 | | | $ | 847.60 | | | $ | 3.63 | | |
| Hypothetical (5% Return Before Expenses) | | $ | 1,000.00 | | | $ | 1,021.27 | | | $ | 3.97 | | |
| Class F3 | | | | | | | | | | | | | |
| Actual | | $ | 1,000.00 | | | $ | 848.40 | | | $ | 2.84 | | |
| Hypothetical (5% Return Before Expenses) | | $ | 1,000.00 | | | $ | 1,022.13 | | | $ | 3.11 | | |
| Class I | | | | | | | | | | | | | |
| Actual | | $ | 1,000.00 | | | $ | 847.80 | | | $ | 3.63 | | |
| Hypothetical (5% Return Before Expenses) | | $ | 1,000.00 | | | $ | 1,021.27 | | | $ | 3.97 | | |
| Class R3 | | | | | | | | | | | | | |
| Actual | | $ | 1,000.00 | | | $ | 845.60 | | | $ | 5.95 | | |
| Hypothetical (5% Return Before Expenses) | | $ | 1,000.00 | | | $ | 1,018.75 | | | $ | 6.51 | | |
| Class R4 | | | | | | | | | | | | | |
| Actual | | $ | 1,000.00 | | | $ | 846.50 | | | $ | 4.79 | | |
| Hypothetical (5% Return Before Expenses) | | $ | 1,000.00 | | | $ | 1,020.01 | | | $ | 5.24 | | |
| Class R5 | | | | | | | | | | | | | |
| Actual | | $ | 1,000.00 | | | $ | 847.80 | | | $ | 3.63 | | |
| Hypothetical (5% Return Before Expenses) | | $ | 1,000.00 | | | $ | 1,021.27 | | | $ | 3.97 | | |
| Class R6 | | | | | | | | | | | | | |
| Actual | | $ | 1,000.00 | | | $ | 848.50 | | | $ | 2.84 | | |
| Hypothetical (5% Return Before Expenses) | | $ | 1,000.00 | | | $ | 1,022.13 | | | $ | 3.11 | | |
| † | | For each class of the Fund, net expenses are equal to the annualized expense ratio for such class (1.03% for Class A, 1.78% for Class C, 0.78% for Class F, 0.61% for Class F3, 0.78% for Class I, 1.28% for Class R3, 1.03% for Class R4, 0.78% for Class R5 and 0.61% for Class R6) multiplied by the average account value over the period, multiplied by 184/365 (to reflect one-half year period). |
51
Portfolio Holdings Presented by Sector
October 31, 2023
| Sector* | | %** |
| Health Care | | | 94.02 | % |
| Repurchase Agreements | | | 5.09 | % |
| Money Market Funds(a) | | | 0.80 | % |
| Time Deposits(a) | | | 0.09 | % |
| Total | | | 100.00 | % |
| * | | A sector may comprise several industries. |
| ** | | Represents percent of total investments, which excludes derivatives. |
| (a) | | Securities were purchased with the cash collateral from loaned securities. |
52
International Equity Fund
Please note that the expenses shown in the table are meant to highlight your ongoing costs only and do not reflect any transactional costs, such as sales charges (loads). Therefore, the second line of the table is useful in comparing ongoing costs only, and will not help you determine the relative total costs of owning different funds. In addition, if these transactional costs were included, your costs would have been higher.
| | | Beginning
Account
Value | | Ending
Account
Value | | Expenses
Paid During
Period† | |
| | | 5/1/23 | | 10/31/23 | | 5/1/23 –
10/31/23 | |
| Class A | | | | | | | | | | |
| Actual | | $ | 1,000.00 | | | $ | 921.10 | | | $ | 4.50 | | |
| Hypothetical (5% Return Before Expenses) | | $ | 1,000.00 | | | $ | 1,020.52 | | | $ | 4.74 | | |
| Class C | | | | | | | | | | | | | |
| Actual | | $ | 1,000.00 | | | $ | 917.30 | | | $ | 8.12 | | |
| Hypothetical (5% Return Before Expenses) | | $ | 1,000.00 | | | $ | 1,016.74 | | | $ | 8.54 | | |
| Class F | | | | | | | | | | | | | |
| Actual | | $ | 1,000.00 | | | $ | 922.20 | | | $ | 3.78 | | |
| Hypothetical (5% Return Before Expenses) | | $ | 1,000.00 | | | $ | 1,021.27 | | | $ | 3.97 | | |
| Class F3 | | | | | | | | | | | | | |
| Actual | | $ | 1,000.00 | | | $ | 922.30 | | | $ | 2.91 | | |
| Hypothetical (5% Return Before Expenses) | | $ | 1,000.00 | | | $ | 1,022.18 | | | $ | 3.06 | | |
| Class I | | | | | | | | | | | | | |
| Actual | | $ | 1,000.00 | | | $ | 922.10 | | | $ | 3.29 | | |
| Hypothetical (5% Return Before Expenses) | | $ | 1,000.00 | | | $ | 1,021.78 | | | $ | 3.47 | | |
| Class P | | | | | | | | | | | | | |
| Actual | | $ | 1,000.00 | | | $ | 920.60 | | | $ | 5.52 | | |
| Hypothetical (5% Return Before Expenses) | | $ | 1,000.00 | | | $ | 1,019.46 | | | $ | 5.80 | | |
| Class R2 | | | | | | | | | | | | | |
| Actual | | $ | 1,000.00 | | | $ | 919.00 | | | $ | 6.19 | | |
| Hypothetical (5% Return Before Expenses) | | $ | 1,000.00 | | | $ | 1,018.75 | | | $ | 6.51 | | |
| Class R3 | | | | | | | | | | | | | |
| Actual | | $ | 1,000.00 | | | $ | 919.80 | | | $ | 5.71 | | |
| Hypothetical (5% Return Before Expenses) | | $ | 1,000.00 | | | $ | 1,019.26 | | | $ | 6.01 | | |
| Class R4 | | | | | | | | | | | | | |
| Actual | | $ | 1,000.00 | | | $ | 921.30 | | | $ | 4.50 | | |
| Hypothetical (5% Return Before Expenses) | | $ | 1,000.00 | | | $ | 1,020.52 | | | $ | 4.74 | | |
| Class R5 | | | | | | | | | | | | | |
| Actual | | $ | 1,000.00 | | | $ | 922.20 | | | $ | 3.20 | | |
| Hypothetical (5% Return Before Expenses) | | $ | 1,000.00 | | | $ | 1,021.88 | | | $ | 3.36 | | |
| Class R6 | | | | | | | | | | | | | |
| Actual | | $ | 1,000.00 | | | $ | 922.20 | | | $ | 2.91 | | |
| Hypothetical (5% Return Before Expenses) | | $ | 1,000.00 | | | $ | 1,022.18 | | | $ | 3.06 | | |
| † | | For each class of the Fund, net expenses are equal to the annualized expense ratio for such class (0.93% for Class A, 1.68% for Class C, 0.78% for Class F, 0.60% for Class F3, 0.68% for Class I, 1.14% for Class P, 1.28% for Class R2, 1.18% for Class R3, 0.93% for Class R4, 0.66% for Class R5 and 0.60% for Class R6) multiplied by the average account value over the period, multiplied by 184/365 (to reflect one-half year period). |
53
Portfolio Holdings Presented by Sector
October 31, 2023
| Sector* | | %** |
| Communication Services | | | 3.86 | % |
| Consumer Discretionary | | | 13.25 | % |
| Consumer Staples | | | 7.35 | % |
| Energy | | | 6.29 | % |
| Financials | | | 20.46 | % |
| Health Care | | | 12.50 | % |
| Industrials | | | 11.98 | % |
| Information Technology | | | 10.45 | % |
| Materials | | | 4.97 | % |
| Real Estate | | | 0.61 | % |
| Utilities | | | 1.97 | % |
| Repurchase Agreements | | | 6.31 | % |
| Total | | | 100.00 | % |
| * | | A sector may comprise several industries. |
| ** | | Represents percent of total investments, which excludes derivatives. |
54
International Opportunities Fund
Please note that the expenses shown in the table are meant to highlight your ongoing costs only and do not reflect any transactional costs, such as sales charges (loads). Therefore, the second line of the table is useful in comparing ongoing costs only, and will not help you determine the relative total costs of owning different funds. In addition, if these transactional costs were included, your costs would have been higher.
| | | Beginning
Account
Value | | Ending
Account
Value | | Expenses
Paid During
Period† | |
| | | 5/1/23 | | 10/31/23 | | 5/1/23 –
10/31/23 | |
| Class A | | | | | | | | | | |
| Actual | | $ | 1,000.00 | | | $ | 902.10 | | | $ | 5.80 | | |
| Hypothetical (5% Return Before Expenses) | | $ | 1,000.00 | | | $ | 1,019.11 | | | $ | 6.16 | | |
| Class C | | | | | | | | | | | | | |
| Actual | | $ | 1,000.00 | | | $ | 899.00 | | | $ | 9.38 | | |
| Hypothetical (5% Return Before Expenses) | | $ | 1,000.00 | | | $ | 1,015.32 | | | $ | 9.96 | | |
| Class F | | | | | | | | | | | | | |
| Actual | | $ | 1,000.00 | | | $ | 902.90 | | | $ | 5.08 | | |
| Hypothetical (5% Return Before Expenses) | | $ | 1,000.00 | | | $ | 1,019.86 | | | $ | 5.40 | | |
| Class F3 | | | | | | | | | | | | | |
| Actual | | $ | 1,000.00 | | | $ | 903.80 | | | $ | 4.22 | | |
| Hypothetical (5% Return Before Expenses) | | $ | 1,000.00 | | | $ | 1,020.77 | | | $ | 4.48 | | |
| Class I | | | | | | | | | | | | | |
| Actual | | $ | 1,000.00 | | | $ | 903.60 | | | $ | 4.61 | | |
| Hypothetical (5% Return Before Expenses) | | $ | 1,000.00 | | | $ | 1,020.37 | | | $ | 4.89 | | |
| Class P | | | | | | | | | | | | | |
| Actual | | $ | 1,000.00 | | | $ | 901.40 | | | $ | 6.57 | | |
| Hypothetical (5% Return Before Expenses) | | $ | 1,000.00 | | | $ | 1,018.30 | | | $ | 6.97 | | |
| Class R2 | | | | | | | | | | | | | |
| Actual | | $ | 1,000.00 | | | $ | 900.60 | | | $ | 7.47 | | |
| Hypothetical (5% Return Before Expenses) | | $ | 1,000.00 | | | $ | 1,017.34 | | | $ | 7.93 | | |
| Class R3 | | | | | | | | | | | | | |
| Actual | | $ | 1,000.00 | | | $ | 901.20 | | | $ | 7.00 | | |
| Hypothetical (5% Return Before Expenses) | | $ | 1,000.00 | | | $ | 1,017.85 | | | $ | 7.43 | | |
| Class R4 | | | | | | | | | | | | | |
| Actual | | $ | 1,000.00 | | | $ | 902.20 | | | $ | 5.80 | | |
| Hypothetical (5% Return Before Expenses) | | $ | 1,000.00 | | | $ | 1,019.11 | | | $ | 6.16 | | |
| Class R5 | | | | | | | | | | | | | |
| Actual | | $ | 1,000.00 | | | $ | 903.10 | | | $ | 4.60 | | |
| Hypothetical (5% Return Before Expenses) | | $ | 1,000.00 | | | $ | 1,020.37 | | | $ | 4.89 | | |
| Class R6 | | | | | | | | | | | | | |
| Actual | | $ | 1,000.00 | | | $ | 903.80 | | | $ | 4.22 | | |
| Hypothetical (5% Return Before Expenses) | | $ | 1,000.00 | | | $ | 1,020.77 | | | $ | 4.48 | | |
| † | | For each class of the Fund, net expenses are equal to the annualized expense ratio for such class (1.21% for Class A, 1.96% for Class C, 1.06% for Class F, 0.88% for Class F3, 0.96% for Class I, 1.37% for Class P, 1.56% for Class R2, 1.46% for Class R3, 1.21% for Class R4, 0.96% for Class R5 and 0.88% for Class R6) multiplied by the average account value over the period, multiplied by 184/365 (to reflect one-half year period). |
55
Portfolio Holdings Presented by Sector
October 31, 2023
| Sector* | | %** |
| Communication Services | | | 4.69 | % |
| Consumer Discretionary | | | 13.51 | % |
| Consumer Staples | | | 8.52 | % |
| Energy | | | 3.91 | % |
| Financials | | | 19.02 | % |
| Health Care | | | 7.76 | % |
| Industrials | | | 9.68 | % |
| Information Technology | | | 12.98 | % |
| Materials | | | 10.72 | % |
| Real Estate | | | 1.10 | % |
| Utilities | | | 2.05 | % |
| Repurchase Agreements | | | 6.04 | % |
| Money Market Funds(a) | | | 0.02 | % |
| Time Deposits(a) | | | 0.00 | % |
| Total | | | 100.00 | % |
| * | | A sector may comprise several industries. |
| ** | | Represents percent of total investments, which excludes derivatives. |
| (a) | | Securities were purchased with the cash collateral from loaned securities. |
56
International Value Fund
Please note that the expenses shown in the table are meant to highlight your ongoing costs only and do not reflect any transactional costs, such as sales charges (loads). Therefore, the second line of the table is useful in comparing ongoing costs only, and will not help you determine the relative total costs of owning different funds. In addition, if these transactional costs were included, your costs would have been higher.
| | | Beginning
Account
Value | | Ending
Account
Value | | Expenses
Paid During
Period† | |
| | | 5/1/23 | | 10/31/23 | | 5/1/23 –
10/31/23 | |
| Class A | | | | | | | | | | |
| Actual | | $ | 1,000.00 | | | $ | 934.90 | | | $ | 4.63 | | |
| Hypothetical (5% Return Before Expenses) | | $ | 1,000.00 | | | $ | 1,020.42 | | | $ | 4.84 | | |
| Class C | | | | | | | | | | | | | |
| Actual | | $ | 1,000.00 | | | $ | 930.40 | | | $ | 8.32 | | |
| Hypothetical (5% Return Before Expenses) | | $ | 1,000.00 | | | $ | 1,016.59 | | | $ | 8.69 | | |
| Class F | | | | | | | | | | | | | |
| Actual | | $ | 1,000.00 | | | $ | 936.10 | | | $ | 3.90 | | |
| Hypothetical (5% Return Before Expenses) | | $ | 1,000.00 | | | $ | 1,021.17 | | | $ | 4.08 | | |
| Class F3 | | | | | | | | | | | | | |
| Actual | | $ | 1,000.00 | | | $ | 936.60 | | | $ | 3.03 | | |
| Hypothetical (5% Return Before Expenses) | | $ | 1,000.00 | | | $ | 1,022.08 | | | $ | 3.16 | | |
| Class I | | | | | | | | | | | | | |
| Actual | | $ | 1,000.00 | | | $ | 935.30 | | | $ | 3.41 | | |
| Hypothetical (5% Return Before Expenses) | | $ | 1,000.00 | | | $ | 1,021.68 | | | $ | 3.57 | | |
| Class R2 | | | | | | | | | | | | | |
| Actual | | $ | 1,000.00 | | | $ | 933.70 | | | $ | 6.34 | | |
| Hypothetical (5% Return Before Expenses) | | $ | 1,000.00 | | | $ | 1,018.65 | | | $ | 6.61 | | |
| Class R3 | | | | | | | | | | | | | |
| Actual | | $ | 1,000.00 | | | $ | 934.30 | | | $ | 5.90 | | |
| Hypothetical (5% Return Before Expenses) | | $ | 1,000.00 | | | $ | 1,019.11 | | | $ | 6.16 | | |
| Class R4 | | | | | | | | | | | | | |
| Actual | | $ | 1,000.00 | | | $ | 934.50 | | | $ | 4.63 | | |
| Hypothetical (5% Return Before Expenses) | | $ | 1,000.00 | | | $ | 1,020.42 | | | $ | 4.84 | | |
| Class R5 | | | | | | | | | | | | | |
| Actual | | $ | 1,000.00 | | | $ | 936.40 | | | $ | 3.37 | | |
| Hypothetical (5% Return Before Expenses) | | $ | 1,000.00 | | | $ | 1,021.73 | | | $ | 3.52 | | |
| Class R6 | | | | | | | | | | | | | |
| Actual | | $ | 1,000.00 | | | $ | 936.60 | | | $ | 3.03 | | |
| Hypothetical (5% Return Before Expenses) | | $ | 1,000.00 | | | $ | 1,022.08 | | | $ | 3.16 | | |
| † | | For each class of the Fund, net expenses are equal to the annualized expense ratio for such class (0.95% for Class A, 1.71% for Class C, 0.80% for Class F, 0.62% for Class F3, 0.70% for Class I, 1.30% for Class R2, 1.21% for Class R3, 0.95% for Class R4, 0.69% for Class R5 and 0.62% for Class R6) multiplied by the average account value over the period, multiplied by 184/365 (to reflect one-half year period). |
57
Portfolio Holdings Presented by Sector
October 31, 2023
| Sector* | | %** |
| Communication Services | | | 3.53 | % |
| Consumer Discretionary | | | 8.49 | % |
| Consumer Staples | | | 8.03 | % |
| Energy | | | 10.09 | % |
| Financials | | | 26.20 | % |
| Health Care | | | 10.28 | % |
| Industrials | | | 14.80 | % |
| Information Technology | | | 3.12 | % |
| Materials | | | 6.04 | % |
| Real Estate | | | 0.90 | % |
| Utilities | | | 4.49 | % |
| Repurchase Agreements | | | 4.03 | % |
| Total | | | 100.00 | % |
| * | | A sector may comprise several industries. |
| ** | | Represents percent of total investments, which excludes derivatives. |
58
Micro Cap Growth Fund
Please note that the expenses shown in the table are meant to highlight your ongoing costs only and do not reflect any transactional costs, such as sales charges (loads). Therefore, the second line of the table is useful in comparing ongoing costs only, and will not help you determine the relative total costs of owning different funds. In addition, if these transactional costs were included, your costs would have been higher.
| | | Beginning
Account
Value | | Ending
Account
Value | | Expenses
Paid During
Period† | |
| | | 5/1/23 | | 10/31/23 | | 5/1/23 –
10/31/23 | |
| Class A | | | | | | | | | | |
| Actual | | $ | 1,000.00 | | | $ | 797.80 | | | $ | 6.16 | | |
| Hypothetical (5% Return Before Expenses) | | $ | 1,000.00 | | | $ | 1,018.35 | | | $ | 6.92 | | |
| Class C | | | | | | | | | | | | | |
| Actual | | $ | 1,000.00 | | | $ | 794.80 | | | $ | 9.59 | | |
| Hypothetical (5% Return Before Expenses) | | $ | 1,000.00 | | | $ | 1,014.52 | | | $ | 10.76 | | |
| Class F | | | | | | | | | | | | | |
| Actual | | $ | 1,000.00 | | | $ | 799.10 | | | $ | 5.03 | | |
| Hypothetical (5% Return Before Expenses) | | $ | 1,000.00 | | | $ | 1,019.61 | | | $ | 5.65 | | |
| Class I | | | | | | | | | | | | | |
| Actual | | $ | 1,000.00 | | | $ | 799.10 | | | $ | 5.03 | | |
| Hypothetical (5% Return Before Expenses) | | $ | 1,000.00 | | | $ | 1,019.61 | | | $ | 5.65 | | |
| † | | For each class of the Fund, net expenses are equal to the annualized expense ratio for such class (1.36% for Class A, 2.12% for Class C, 1.11% for Class F and 1.11% for Class I multiplied by the average account value over the period, multiplied by 184/365 (to reflect one-half year period). |
59
Portfolio Holdings Presented by Sector
October 31, 2023
| Sector* | | %** |
| Communication Services | | | 3.68 | % |
| Consumer Discretionary | | | 12.21 | % |
| Consumer Staples | | | 5.78 | % |
| Financials | | | 11.57 | % |
| Health Care | | | 24.32 | % |
| Industrials | | | 17.24 | % |
| Information Technology | | | 20.55 | % |
| Repurchase Agreements | | | 1.46 | % |
| Money Market Funds(a) | | | 2.87 | % |
| Time Deposits(a) | | | 0.32 | % |
| Total | | | 100.00 | % |
| * | | A sector may comprise several industries. |
| ** | | Represents percent of total investments, which excludes derivatives. |
| (a) | | Securities were purchased with the cash collateral from loaned securities. |
60
Value Opportunities Fund
Please note that the expenses shown in the table are meant to highlight your ongoing costs only and do not reflect any transactional costs, such as sales charges (loads). Therefore, the second line of the table is useful in comparing ongoing costs only, and will not help you determine the relative total costs of owning different funds. In addition, if these transactional costs were included, your costs would have been higher.
| | | Beginning
Account
Value | | Ending
Account
Value | | Expenses
Paid During
Period† | |
| | | 5/1/23 | | 10/31/23 | | 5/1/23 –
10/31/23 | |
| Class A | | | | | | | | | | |
| Actual | | $ | 1,000.00 | | | $ | 974.30 | | | $ | 5.82 | | |
| Hypothetical (5% Return Before Expenses) | | $ | 1,000.00 | | | $ | 1,019.31 | | | $ | 5.96 | | |
| Class C | | | | | | | | | | | | | |
| Actual | | $ | 1,000.00 | | | $ | 970.20 | | | $ | 9.58 | | |
| Hypothetical (5% Return Before Expenses) | | $ | 1,000.00 | | | $ | 1,015.48 | | | $ | 9.80 | | |
| Class F | | | | | | | | | | | | | |
| Actual | | $ | 1,000.00 | | | $ | 974.50 | | | $ | 5.08 | | |
| Hypothetical (5% Return Before Expenses) | | $ | 1,000.00 | | | $ | 1,020.06 | | | $ | 5.19 | | |
| Class F3 | | | | | | | | | | | | | |
| Actual | | $ | 1,000.00 | | | $ | 975.50 | | | $ | 4.13 | | |
| Hypothetical (5% Return Before Expenses) | | $ | 1,000.00 | | | $ | 1,021.02 | | | $ | 4.23 | | |
| Class I | | | | | | | | | | | | | |
| Actual | | $ | 1,000.00 | | | $ | 975.20 | | | $ | 4.58 | | |
| Hypothetical (5% Return Before Expenses) | | $ | 1,000.00 | | | $ | 1,020.57 | | | $ | 4.69 | | |
| Class P | | | | | | | | | | | | | |
| Actual | | $ | 1,000.00 | | | $ | 972.70 | | | $ | 6.81 | | |
| Hypothetical (5% Return Before Expenses) | | $ | 1,000.00 | | | $ | 1,018.30 | | | $ | 6.97 | | |
| Class R2 | | | | | | | | | | | | | |
| Actual | | $ | 1,000.00 | | | $ | 972.30 | | | $ | 7.56 | | |
| Hypothetical (5% Return Before Expenses) | | $ | 1,000.00 | | | $ | 1,017.54 | | | $ | 7.73 | | |
| Class R3 | | | | | | | | | | | | | |
| Actual | | $ | 1,000.00 | | | $ | 972.90 | | | $ | 7.06 | | |
| Hypothetical (5% Return Before Expenses) | | $ | 1,000.00 | | | $ | 1,018.05 | | | $ | 7.22 | | |
| Class R4 | | | | | | | | | | | | | |
| Actual | | $ | 1,000.00 | | | $ | 973.60 | | | $ | 5.82 | | |
| Hypothetical (5% Return Before Expenses) | | $ | 1,000.00 | | | $ | 1,019.31 | | | $ | 5.96 | | |
| Class R5 | | | | | | | | | | | | | |
| Actual | | $ | 1,000.00 | | | $ | 975.20 | | | $ | 4.63 | | |
| Hypothetical (5% Return Before Expenses) | | $ | 1,000.00 | | | $ | 1,020.52 | | | $ | 4.74 | | |
| Class R6 | | | | | | | | | | | | | |
| Actual | | $ | 1,000.00 | | | $ | 976.10 | | | $ | 4.13 | | |
| Hypothetical (5% Return Before Expenses) | | $ | 1,000.00 | | | $ | 1,021.02 | | | $ | 4.23 | | |
| † | | For each class of the Fund, net expenses are equal to the annualized expense ratio for such class (1.17% for Class A, 1.93% for Class C, 1.02% for Class F, 0.83% for Class F3, 0.92% for Class I, 1.37% for Class P, 1.52% for Class R2, 1.42% for Class R3, 1.17% for Class R4, 0.93% for Class R5 and 0.83% for Class R6) multiplied by the average account value over the period, multiplied by 184/365 (to reflect one-half year period). |
61
Portfolio Holdings Presented by Sector
October 31, 2023
| Sector* | | %** |
| Communication Services | | | 1.56 | % |
| Consumer Discretionary | | | 11.31 | % |
| Consumer Staples | | | 2.16 | % |
| Energy | | | 5.96 | % |
| Financials | | | 16.95 | % |
| Health Care | | | 12.03 | % |
| Industrials | | | 18.05 | % |
| Information Technology | | | 16.46 | % |
| Materials | | | 7.25 | % |
| Real Estate | | | 4.01 | % |
| Utilities | | | 2.69 | % |
| Repurchase Agreements | | | 1.57 | % |
| Total | | | 100.00 | % |
| * | | A sector may comprise several industries. |
| ** | | Represents percent of total investments, which excludes derivatives. |
62
Schedule of Investments
ALPHA STRATEGY FUND October 31, 2023
| Investments | | Shares | | | Fair
Value | |
| LONG-TERM INVESTMENTS 100.01% |
| | | | | | | | | |
| INVESTMENTS IN UNDERLYING FUNDS(a)(b) 100.01% |
| Lord Abbett Developing Growth Fund, Inc. – Class I*(c) | | | 5,059,476 | | | $ | 100,632,986 | |
| Lord Abbett Securities Trust – Focused Small Cap Value Fund – Class I(d) | | | 2,314,183 | | | | 55,517,264 | |
| Lord Abbett Securities Trust – International Opportunities Fund – Class I(d) | | | 6,661,469 | | | | 109,914,234 | |
| Lord Abbett Securities Trust – Micro Cap Growth Fund – Class I*(d) | | | 3,479,972 | | | | 47,466,817 | |
| Lord Abbett Research Fund, Inc. – Small Cap Value Fund – Class I(d) | | | 6,408,888 | | | | 108,566,558 | |
| Lord Abbett Securities Trust – Value Opportunities Fund – Class I(d) | | | 6,629,382 | | | | 109,583,685 | |
Total Investments in Underlying Funds
(cost 618,420,565) | | | | | | | 531,681,544 | |
| Investments | | Principal
Amount | | | Fair
Value | |
| SHORT-TERM INVESTMENTS 0.10% |
| | | | | | | | | |
| Repurchase Agreements 0.10% |
Repurchase Agreement dated 10/31/2023, 2.800% due 11/1/2023 with Fixed Income Clearing Corp. collateralized by $567,600 of U.S. Treasury Note at 5.000% due 10/31/2025; value: $567,134; proceeds: $556,037
(cost $555,994) | | $ | 555,994 | | | $ | 555,994 | |
Total Investments in Securities 100.11%
(cost $618,976,559) | | | | | | | 532,237,538 | |
| Other Assets and Liabilities – Net (0.11)% | | | | | | | (582,337 | ) |
| Net Assets 100.00% | | | | | | $ | 531,655,201 | |
| * | | Non-income producing security. |
| (a) | | Affiliated issuer (See Note 12). |
| (b) | | These investments offer daily redemptions. |
| (c) | | Fund investment objective is long-term growth of capital through a diversified and actively managed portfolio consisting of developing growth companies, many of which are traded over the counter. |
| (d) | | Fund investment objective is long-term capital appreciation. |
The following is a summary of the inputs used as of October 31, 2023 in valuing the Fund’s investments carried at fair value(1):
| Investment Type(2) | | Level 1 | | | Level 2 | | | Level 3 | | | Total | |
| Long-Term Investments | | | | | | | | | | | | | | | | |
| Investments in Underlying Funds | | $ | 531,681,544 | | | $ | – | | | $ | – | | | $ | 531,681,544 | |
| Short-Term Investments | | | | | | | | | | | | | | | | |
| Repurchase Agreements | | | – | | | | 555,994 | | | | – | | | | 555,994 | |
| Total | | $ | 531,681,544 | | | $ | 555,994 | | | $ | – | | | $ | 532,237,538 | |
| (1) | | Refer to Note 2(l) for a description of fair value measurements and the three-tier hierarchy of inputs. |
| (2) | | See Schedule of Investments for fair values in each in each investment in Underlying Funds. When applicable, each Level 3 security is identified on the Schedule of Investments along with the valuation technique utilized. |
A reconciliation of Level 3 investments is presented when the Fund has a material amount of Level 3 investments at the beginning or end of the year in relation to the Fund’s net assets.
| | See Notes to Financial Statements. | 63 |
Schedule of Investments
FOCUSED GROWTH FUND October 31, 2023
| Investments | | Shares | | | Fair
Value | |
| LONG-TERM INVESTMENTS 98.35% | | | | | | |
| COMMON STOCKS 98.35% | | | | | | |
| | | | | | | |
| Automobiles 0.96% | | | | | | |
| Tesla, Inc.* | | | 1,484 | | | $ | 298,047 | |
| | | | | | | | | |
| Biotechnology 2.79% | | | | | | | | |
| Argenx SE ADR* | | | 1,843 | | | | 865,417 | |
| | | | | | | | | |
| Broadline Retail 8.65% | | | | | | | | |
| Amazon.com, Inc.* | | | 13,632 | | | | 1,814,283 | |
| MercadoLibre, Inc. (Uruguay)*(a) | | | 701 | | | | 869,759 | |
| Total | | | | | | | 2,684,042 | |
| | | | | | | | | |
| Communications Equipment 3.78% |
| Arista Networks, Inc.* | | | 5,847 | | | | 1,171,563 | |
| | | | | | | | | |
| Entertainment 4.59% | | | | | | | | |
| Netflix, Inc.* | | | 2,330 | | | | 959,238 | |
| Spotify Technology SA (Sweden)*(a) | | | 2,825 | | | | 465,447 | |
| Total | | | | | | | 1,424,685 | |
| | | | | | | | | |
| Financial Services 3.05% | | | | | | | | |
| Mastercard, Inc. Class A | | | 1,573 | | | | 591,999 | |
| Remitly Global, Inc.* | | | 13,136 | | | | 353,752 | |
| Total | | | | | | | 945,751 | |
| | | | | | | | | |
| Ground Transportation 4.01% | | | | | | | | |
| Old Dominion Freight Line, Inc. | | | 1,630 | | | | 613,956 | |
| Uber Technologies, Inc.* | | | 14,574 | | | | 630,762 | |
| Total | | | | | | | 1,244,718 | |
| | | | | | | | | |
| Health Care Equipment & Supplies 1.47% |
| Intuitive Surgical, Inc.* | | | 1,738 | | | | 455,738 | |
| | | | | | | | | |
| Hotels, Restaurants & Leisure 2.46% |
| DraftKings, Inc. Class A* | | | 27,587 | | | | 761,953 | |
| | | | | | | | | |
| Information Technology Services 7.12% |
| MongoDB, Inc.* | | | 2,812 | | | | 968,987 | |
| Shopify, Inc. Class A (Canada)*(a) | | | 26,248 | | | | 1,238,643 | |
| Total | | | | | | | 2,207,630 | |
| Investments | | Shares | | | Fair
Value | |
| Interactive Media & Services 9.03% | | | | | | | | |
| Alphabet, Inc. Class A* | | | 13,049 | | | $ | 1,619,120 | |
| Meta Platforms, Inc. Class A* | | | 3,928 | | | | 1,183,388 | |
| Total | | | | | | | 2,802,508 | |
| | | | | | | | | |
| Media 2.75% | | | | | | | | |
| Trade Desk, Inc. Class A* | | | 12,033 | | | | 853,862 | |
| | | | | | | | | |
| Pharmaceuticals 4.88% | | | | | | | | |
| Eli Lilly & Co. | | | 2,735 | | | | 1,514,999 | |
| | | | | | | | | |
| Semiconductors & Semiconductor Equipment 16.09% |
| Advanced Micro Devices, Inc.* | | | 6,151 | | | | 605,873 | |
| Applied Materials, Inc. | | | 5,696 | | | | 753,866 | |
| Monolithic Power Systems, Inc. | | | 1,089 | | | | 481,055 | |
| NVIDIA Corp. | | | 7,726 | | | | 3,150,663 | |
| Total | | | | | | | 4,991,457 | |
| | | | | | | | | |
| Software 20.09% | | | | | | | | |
| Adobe, Inc. | | | 2,028 | | | | 1,079,018 | |
| Cadence Design Systems, Inc.* | | | 3,317 | | | | 795,582 | |
| HubSpot, Inc.* | | | 1,466 | | | | 621,247 | |
| Microsoft Corp. | | | 7,139 | | | | 2,413,767 | |
| Palo Alto Networks, Inc.* | | | 1,926 | | | | 468,057 | |
| ServiceNow, Inc.* | | | 1,468 | | | | 854,156 | |
| Total | | | | | | | 6,231,827 | |
| | | | | | | | | |
| Technology Hardware, Storage & Peripherals 6.63% |
| Apple, Inc. | | | 12,034 | | | | 2,055,046 | |
Total Common Stocks
(cost $26,026,880) | | | | | | | 30,509,243 | |
| 64 | See Notes to Financial Statements. |
Schedule of Investments (concluded)
FOCUSED GROWTH FUND October 31, 2023
| Investments | | Principal
Amount | | | Fair
Value | |
| SHORT-TERM INVESTMENTS 0.57% |
| | | | | | | | | |
| Repurchase Agreements 0.57% | | | | | | | | |
| Repurchase Agreement dated 10/31/2023, 2.800% due 11/1/2023 with Fixed Income Clearing Corp. collateralized by $181,000 of U.S. Treasury Note at 5.000% due 10/31/2025; value: $180,852; proceeds: $177,304 (cost $177,290) | | $ | 177,290 | | | $ | 177,290 | |
Total Investments in Securities 98.92%
(cost $26,204,170) | | | | | | | 30,686,533 | |
| Other Assets and Liabilities – Net 1.08% | | | | | | | 333,809 | |
| Net Assets 100.00% | | | | | | $ | 31,020,342 | |
| ADR | | American Depositary Receipt. |
| * | | Non-income producing security. |
| (a) | | Foreign security traded in U.S. dollars. |
The following is a summary of the inputs used as of October 31, 2023 in valuing the Fund’s investments carried at fair value(1):
| Investment Type(2) | | Level 1 | | | Level 2 | | | Level 3 | | | Total | |
| Long-Term Investments | | | | | | | | | | | | | | | | |
| Common Stocks | | $ | 30,509,243 | | | $ | – | | | $ | – | | | $ | 30,509,243 | |
| Short-Term Investments | | | | | | | | | | | | | | | | |
| Repurchase Agreements | | | – | | | | 177,290 | | | | – | | | | 177,290 | |
| Total | | $ | 30,509,243 | | | $ | 177,290 | | | $ | – | | | $ | 30,686,533 | |
| (1) | | Refer to Note 2(l) for a description of fair value measurements and the three-tier hierarchy of inputs. |
| (2) | | See Schedule of Investments for fair values in each industry and identification of foreign issuers and/or geography. The table above is presented by Investment Type. When applicable, each Level 3 security is identified on the Schedule of Investments along with the valuation technique utilized. |
A reconciliation of Level 3 investments is presented when the Fund has a material amount of Level 3 investments at the beginning or end of the year in relation to the Fund’s net assets.
| | See Notes to Financial Statements. | 65 |
Schedule of Investments
FOCUSED LARGE CAP VALUE FUND October 31, 2023
| Investments | | Shares | | | Fair
Value | |
| LONG-TERM INVESTMENTS 99.39% | | | | | | | | |
| COMMON STOCKS 99.39% | | | | | | | | |
| | | | | | | | | |
| Air Freight & Logistics 2.92% | | | | | | | | |
| Expeditors International of Washington, Inc. | | | 5,070 | | | $ | 553,898 | |
| | | | | | | | | |
| Banks 6.79% | | | | | | | | |
| JPMorgan Chase & Co. | | | 5,640 | | | | 784,298 | |
| Wells Fargo & Co. | | | 12,740 | | | | 506,670 | |
| Total | | | | | | | 1,290,968 | |
| | | | | | | | | |
| Beverages 2.32% | | | | | | | | |
| Carlsberg AS Class B(a) | | | 3,700 | | | | 440,941 | |
| | | | | | | | | |
| Biotechnology 3.33% | | | | | | | | |
| AbbVie, Inc. | | | 4,480 | | | | 632,486 | |
| | | | | | | | | |
| Building Products 5.63% | | | | | | | | |
| Allegion PLC (Ireland)(b) | | | 4,820 | | | | 474,095 | |
| Masco Corp. | | | 11,440 | | | | 595,910 | |
| Total | | | | | | | 1,070,005 | |
| | | | | | | | | |
| Capital Markets 7.00% | | | | | | | | |
| Charles Schwab Corp. | | | 14,387 | | | | 748,700 | |
| KKR & Co., Inc. | | | 10,490 | | | | 581,146 | |
| Total | | | | | | | 1,329,846 | |
| | | | | | | | | |
| Construction Materials 2.88% | | | | | | | | |
| CRH PLC (Ireland)(b) | | | 10,230 | | | | 548,021 | |
| | | | | | | | | |
| Consumer Staples Distribution & Retail 5.90% |
| BJ’s Wholesale Club Holdings, Inc.* | | | 8,336 | | | | 567,848 | |
| Target Corp. | | | 4,990 | | | | 552,842 | |
| Total | | | | | | | 1,120,690 | |
| | | | | | | | | |
| Energy Equipment & Services 3.32% |
| Schlumberger NV | | | 11,320 | | | | 630,071 | |
| | | | | | | | | |
| Financial Services 3.27% | | | | | | | | |
| Fiserv, Inc.* | | | 5,470 | | | | 622,213 | |
| Investments | | Shares | | | Fair
Value | |
| Ground Transportation 3.30% | | | | | | |
| Norfolk Southern Corp. | | | 3,290 | | | $ | 627,699 | |
| | | | | | | | | |
| Health Care Providers & Services 4.36% |
| Molina Healthcare, Inc.* | | | 2,490 | | | | 829,046 | |
| | | | | | | | | |
| Hotels, Restaurants & Leisure 2.60% |
| Caesars Entertainment, Inc.* | | | 12,370 | | | | 493,439 | |
| | | | | | | | | |
| Insurance 8.43% | | | | | | | | |
| Allstate Corp. | | | 6,420 | | | | 822,595 | |
| RenaissanceRe Holdings Ltd. | | | 3,548 | | | | 779,105 | |
| Total | | | | | | | 1,601,700 | |
| | | | | | | | | |
| Interactive Media & Services 4.18% |
| Alphabet, Inc. Class A* | | | 6,400 | | | | 794,112 | |
| | | | | | | | | |
| Machinery 2.97% | | | | | | | | |
| Parker-Hannifin Corp. | | | 1,530 | | | | 564,432 | |
| | | | | | | | | |
| Oil, Gas & Consumable Fuels 8.54% |
| Chesapeake Energy Corp. | | | 6,308 | | | | 542,993 | |
| Pioneer Natural Resources Co. | | | 2,360 | | | | 564,040 | |
| Shell PLC ADR | | | 7,930 | | | | 516,560 | |
| Total | | | | | | | 1,623,593 | |
| | | | | | | | | |
| Pharmaceuticals 1.87% | | | | | | | | |
| Organon & Co. | | | 23,960 | | | | 354,368 | |
| | | | | | | | | |
| Real Estate Management & Development 2.42% |
| CBRE Group, Inc. Class A* | | | 6,640 | | | | 460,418 | |
| | | | | | | | | |
| Semiconductors & Semiconductor Equipment 3.03% |
| Micron Technology, Inc. | | | 8,620 | | | | 576,419 | |
| | | | | | | | | |
| Software 7.54% | | | | | | | | |
| Adobe, Inc. | | | 1,440 | | | | 766,166 | |
| Microsoft Corp. | | | 1,970 | | | | 666,077 | |
| Total | | | | | | | 1,432,243 | |
| | | | | | | | | |
| Specialty Retail 2.89% | | | | | | | | |
| Valvoline, Inc. | | | 18,530 | | | | 549,785 | |
| 66 | See Notes to Financial Statements. |
Schedule of Investments (concluded)
FOCUSED LARGE CAP VALUE FUND October 31, 2023
| Investments | | Shares | | | Fair
Value | |
| Trading Companies & Distributors 3.90% |
| AerCap Holdings NV (Ireland)*(b) | | | 11,920 | | | $ | 740,470 | |
Total Common Stocks 99.39%
(cost $17,996,933) | | | | | | | 18,886,863 | |
| Other Assets and Liabilities – Net 0.61% | | | | | | | 116,133 | |
| Net Assets 100.00% | | | | | | $ | 19,002,996 | |
| ADR | | American Depositary Receipt. |
| * | | Non-income producing security. |
| (a) | | Investment in non-U.S. dollar denominated securities. |
| (b) | | Foreign security traded in U.S. dollars. |
The following is a summary of the inputs used as of October 31, 2023 in valuing the Fund’s investments carried at fair value(1):
| Investment Type(2) | | Level 1 | | | Level 2 | | | Level 3 | | | Total | |
| Long-Term Investments | | | | | | | | | | | | | | | | |
| Common Stocks | | | | | | | | | | | | | | | | |
| Beverages | | $ | – | | | $ | 440,941 | | | $ | – | | | $ | 440,941 | |
| Remaining Industries | | | 18,445,922 | | | | – | | | | – | | | | 18,445,922 | |
| Total | | $ | 18,445,922 | | | $ | 440,941 | | | $ | – | | | $ | 18,886,863 | |
| (1) | | Refer to Note 2(l) for a description of fair value measurements and the three-tier hierarchy of inputs. |
| (2) | | See Schedule of Investments for fair values in each industry and identification of foreign issuers and/or geography. The table above is presented by Investment Type. Industries are presented within an Investment Type should such Investment Type include securities classified as two or more levels within the three-tier fair value hierarchy. When applicable, each Level 3 security is identified on the Schedule of Investments along with the valuation technique utilized. |
A reconciliation of Level 3 investments is presented when the Fund has a material amount of Level 3 investments at the beginning or end of the year in relation to the Fund’s net assets.
| | See Notes to Financial Statements. | 67 |
Schedule of Investments
FOCUSED SMALL CAP VALUE FUND October 31, 2023
| Investments | | Shares | | | Fair
Value | |
| LONG-TERM INVESTMENTS 98.54% |
| COMMON STOCKS 98.54% | | | | | | |
| | | | | | | |
| Aerospace & Defense 1.61% | | | | | | |
| Leonardo DRS, Inc.* | | | 84,521 | | | $ | 1,611,816 | |
| | | | | | | | | |
| Air Freight & Logistics 1.37% | | | | | | | | |
| Radiant Logistics, Inc.* | | | 234,611 | | | | 1,374,820 | |
| | | | | | | | | |
| Automobile Components 3.26% | | | | | | | | |
| Dorman Products, Inc.* | | | 28,220 | | | | 1,754,719 | |
| Gentherm, Inc.* | | | 37,503 | | | | 1,508,371 | |
| Total | | | | | | | 3,263,090 | |
| | | | | | | | | |
| Banks 12.68% | | | | | | | | |
| Axos Financial, Inc.* | | | 52,662 | | | | 1,897,412 | |
| Bancorp, Inc.* | | | 77,229 | | | | 2,753,214 | |
| First BanCorp | | | 156,942 | | | | 2,095,176 | |
| Prosperity Bancshares, Inc. | | | 33,216 | | | | 1,811,600 | |
| Seacoast Banking Corp. of Florida | | | 98,979 | | | | 2,000,365 | |
| Wintrust Financial Corp. | | | 28,691 | | | | 2,142,931 | |
| Total | | | | | | | 12,700,698 | |
| | | | | | | | | |
| Building Products 2.71% | | | | | | | | |
| Masonite International Corp.* | | | 34,279 | | | | 2,712,840 | |
| | | | | | | | | |
| Capital Markets 2.96% | | | | | | | | |
| Bridge Investment Group Holdings, Inc. Class A | | | 103,848 | | | | 756,013 | |
| Moelis & Co. Class A | | | 53,053 | | | | 2,209,127 | |
| Total | | | | | | | 2,965,140 | |
| | | | | | | | | |
| Chemicals 2.17% | | | | | | | | |
| Element Solutions, Inc. | | | 119,436 | | | | 2,177,318 | |
| | | | | | | | | |
| Commercial Services & Supplies 5.35% |
| Brady Corp. Class A | | | 61,985 | | | | 3,189,748 | |
| SP Plus Corp.* | | | 42,812 | | | | 2,163,290 | |
| Total | | | | | | | 5,353,038 | |
| | | | | | | | | |
| Construction Materials 1.88% | | | | | | | | |
| Eagle Materials, Inc. | | | 12,229 | | | | 1,882,165 | |
| Investments | | Shares | | | Fair
Value | |
| Electronic Equipment, Instruments & Components 6.60% |
| Advanced Energy Industries, Inc. | | | 16,692 | | | $ | 1,456,544 | |
| Belden, Inc. | | | 37,143 | | | | 2,633,439 | |
| Mirion Technologies, Inc.* | | | 363,210 | | | | 2,517,045 | |
| Total | | | | | | | 6,607,028 | |
| | | | | | | | | |
| Energy Equipment & Services 4.08% |
| TechnipFMC PLC (United Kingdom)(a) | | | 189,907 | | | | 4,086,799 | |
| | | | | | | | | |
| Financial Services 4.93% | | | | | | | | |
| Compass Diversified Holdings | | | 147,964 | | | | 2,542,021 | |
| International Money Express, Inc.* | | | 150,156 | | | | 2,396,490 | |
| Total | | | | | | | 4,938,511 | |
| | | | | | | | | |
| Health Care Providers & Services 4.04% |
| AMN Healthcare Services, Inc.* | | | 27,106 | | | | 2,056,261 | |
| Tenet Healthcare Corp.* | | | 37,044 | | | | 1,989,263 | |
| Total | | | | | | | 4,045,524 | |
| | | | | | | | | |
| Hotels, Restaurants & Leisure 1.40% |
| Dave & Buster’s Entertainment, Inc.* | | | 40,008 | | | | 1,397,880 | |
| | | | | | | | | |
| Household Products 2.12% | | | | | | | | |
| Spectrum Brands Holdings, Inc. | | | 28,236 | | | | 2,126,736 | |
| | | | | | | | | |
| Information Technology Services 2.36% |
| Perficient, Inc.* | | | 40,566 | | | | 2,360,536 | |
| | | | | | | | | |
| Insurance 7.17% | | | | | | | | |
| Kemper Corp. | | | 65,160 | | | | 2,598,581 | |
| RenaissanceRe Holdings Ltd. | | | 12,766 | | | | 2,803,286 | |
| White Mountains Insurance Group Ltd. | | | 1,242 | | | | 1,776,991 | |
| Total | | | | | | | 7,178,858 | |
| | | | | | | | | |
| Interactive Media & Services 2.38% |
| Cars.com, Inc.* | | | 156,705 | | | | 2,386,617 | |
| 68 | See Notes to Financial Statements. |
Schedule of Investments (continued)
FOCUSED SMALL CAP VALUE FUND October 31, 2023
| Investments | | Shares | | | Fair
Value | |
| Leisure Products 2.48% | | | | | | |
| YETI Holdings, Inc.* | | | 58,305 | | | $ | 2,479,129 | |
| | | | | | | | | |
| Machinery 1.98% | | | | | | | | |
| Columbus McKinnon Corp. | | | 64,755 | | | | 1,979,560 | |
| | | | | | | | | |
| Media 1.60% | | | | | | | | |
| Criteo SA ADR* | | | 56,838 | | | | 1,606,810 | |
| | | | | | | | | |
| Oil, Gas & Consumable Fuels 7.04% | | | | | | | | |
| MEG Energy Corp.*(b) | | | 166,401 | | | | 3,287,822 | |
| Permian Resources Corp. | | | 258,087 | | | | 3,760,328 | |
| Total | | | | | | | 7,048,150 | |
| | | | | | | | | |
| Pharmaceuticals 1.41% | | | | | | | | |
| Organon & Co. | | | 95,686 | | | | 1,415,196 | |
| | | | | | | | | |
| Professional Services 3.94% | | | | | | | | |
| TrueBlue, Inc.* | | | 110,071 | | | | 1,218,486 | |
| WNS Holdings Ltd. ADR* | | | 50,138 | | | | 2,723,496 | |
| Total | | | | | | | 3,941,982 | |
| | | | | | | | | |
| Real Estate Management & Development 2.37% |
| Marcus & Millichap, Inc. | | | 82,521 | | | | 2,368,353 | |
| | | | | | | | | |
| Semiconductors & Semiconductor Equipment 2.31% |
| FormFactor, Inc.* | | | 68,142 | | | | 2,308,651 | |
| | | | | | | | | |
| Specialty Retail 3.53% | | | | | | | | |
| Academy Sports & Outdoors, Inc. | | | 48,510 | | | | 2,175,188 | |
| Boot Barn Holdings, Inc.* | | | 19,535 | | | | 1,357,683 | |
| Total | | | | | | | 3,532,871 | |
| | | | | | | | | |
| Trading Companies & Distributors 2.81% |
| MRC Global, Inc.* | | | 267,739 | | | | 2,813,937 | |
Total Common Stocks
(cost $100,782,012) | | | | | | | 98,664,053 | |
| Investments | | Principal
Amount | | | Fair
Value | |
| SHORT-TERM INVESTMENTS 0.81% |
| | | | | | | | | |
| Repurchase Agreements 0.81% |
Repurchase Agreement dated 10/31/2023, 2.800% due 11/1/2023 with Fixed Income Clearing Corp. collateralized by $826,200 of U.S. Treasury Note at 5.000% due 10/31/2025; value: $825,522; proceeds: $809,358 (cost $809,295) | | $ | 809,295 | | | $ | 809,295 | |
Total Investments in Securities 99.35%
(cost $101,591,307) | | | | | | | 99,473,348 | |
| Other Assets and Liabilities – Net 0.65% | | | | | | | 655,010 | |
| Net Assets 100.00% | | | | | | $ | 100,128,358 | |
| ADR | | American Depositary Receipt. |
| * | | Non-income producing security. |
| (a) | | Foreign security traded in U.S. dollars. |
| (b) | | Investment in non-U.S. dollar denominated securities. |
| | See Notes to Financial Statements. | 69 |
Schedule of Investments (concluded)
FOCUSED SMALL CAP VALUE FUND October 31, 2023
The following is a summary of the inputs used as of October 31, 2023 in valuing the Fund’s investments carried at fair value(1):
| Investment Type(2) | | Level 1 | | | Level 2 | | | Level 3 | | | Total | |
| Long-Term Investments | | | | | | | | | | | | | | | | |
| Common Stocks | | $ | 98,664,053 | | | $ | – | | | $ | – | | | $ | 98,664,053 | |
| Short-Term Investments | | | | | | | | | | | | | | | | |
| Repurchase Agreements | | | – | | | | 809,295 | | | | – | | | | 809,295 | |
| Total | | $ | 98,664,053 | | | $ | 809,295 | | | $ | – | | | $ | 99,473,348 | |
| (1) | | Refer to Note 2(l) for a description of fair value measurements and the three-tier hierarchy of inputs. |
| (2) | | See Schedule of Investments for fair values in each industry and identification of foreign issuers and/or geography. The table above is presented by Investment Type. When applicable, each Level 3 security is identified on the Schedule of Investments along with the valuation technique utilized. |
A reconciliation of Level 3 investments is presented when the Fund has a material amount of Level 3 investments at the beginning or end of the year in relation to the Fund’s net assets.
| 70 | See Notes to Financial Statements. |
Schedule of Investments
FUNDAMENTAL EQUITY FUND October 31, 2023
| Investments | | Shares | | | Fair
Value | |
| LONG-TERM INVESTMENTS 98.83% | | | | | | | | |
| COMMON STOCKS 98.83% | | | | | | | | |
| | | | | | | | | |
| Aerospace & Defense 2.02% | | | | | | | | |
| Lockheed Martin Corp. | | | 77,890 | | | $ | 35,411,910 | |
| | | | | | | | | |
| Air Freight & Logistics 1.51% | | | | | | | | |
| Expeditors International of Washington, Inc. | | | 241,870 | | | | 26,424,298 | |
| | | | | | | | | |
| Automobiles 0.91% | | | | | | | | |
| General Motors Co. | | | 563,350 | | | | 15,886,470 | |
| | | | | | | | | |
| Banks 5.34% | | | | | | | | |
| JPMorgan Chase & Co. | | | 437,380 | | | | 60,822,063 | |
| Wells Fargo & Co. | | | 824,950 | | | | 32,808,261 | |
| Total | | | | | | | 93,630,324 | |
| | | | | | | | | |
| Beverages 1.46% | | | | | | | | |
| Carlsberg AS Class B(a) | | | 213,940 | | | | 25,495,897 | |
| | | | | | | | | |
| Biotechnology 3.06% | | | | | | | | |
| AbbVie, Inc. | | | 259,010 | | | | 36,567,032 | |
| Biogen, Inc.* | | | 71,770 | | | | 17,048,246 | |
| Total | | | | | | | 53,615,278 | |
| | | | | | | | | |
| Building Products 4.23% | | | | | | | | |
| Allegion PLC (Ireland)(b) | | | 220,140 | | | | 21,652,970 | |
| Builders FirstSource, Inc.* | | | 209,550 | | | | 22,740,366 | |
| Masco Corp. | | | 570,650 | | | | 29,725,159 | |
| Total | | | | | | | 74,118,495 | |
| | | | | | | | | |
| Capital Markets 6.35% | | | | | | | | |
| Ameriprise Financial, Inc. | | | 82,990 | | | | 26,106,164 | |
| Charles Schwab Corp. | | | 660,063 | | | | 34,349,679 | |
| KKR & Co., Inc. | | | 485,580 | | | | 26,901,132 | |
| Morgan Stanley | | | 338,540 | | | | 23,975,403 | |
| Total | | | | | | | 111,332,378 | |
| | | | | | | | | |
| Chemicals 0.98% | | | | | | | | |
| Dow, Inc. | | | 356,700 | | | | 17,242,878 | |
| | | | | | | | | |
| Construction & Engineering 1.67% | |
| EMCOR Group, Inc. | | | 141,930 | | | | 29,329,835 | |
| Investments | | Shares | | | Fair
Value | |
| Construction Materials 1.43% | | | | | | | | |
| CRH PLC (Ireland)(b) | | | 468,490 | | | $ | 25,097,009 | |
| | | | | | | | | |
| Consumer Finance 1.26% | | | | | | | | |
| American Express Co. | | | 151,700 | | | | 22,152,751 | |
| | | | | | | | | |
| Consumer Staples Distribution & Retail 3.36% | | | |
| BJ’s Wholesale Club Holdings, Inc.* | | | 461,937 | | | | 31,467,148 | |
| Target Corp. | | | 247,930 | | | | 27,468,165 | |
| Total | | | | | | | 58,935,313 | |
| | | | | | | | | |
| Electric: Utilities 1.97% | | | | | | | | |
| FirstEnergy Corp. | | | 449,540 | | | | 16,003,624 | |
| NextEra Energy, Inc. | | | 318,580 | | | | 18,573,214 | |
| Total | | | | | | | 34,576,838 | |
| | | | | | | | | |
| Electronic Equipment, Instruments & Components 1.18% |
| Teledyne Technologies, Inc.* | | | 55,260 | | | | 20,699,843 | |
| | | | | | | | | |
| Energy Equipment & Services 2.53% | | |
| Schlumberger NV | | | 795,770 | | | | 44,292,558 | |
| | | | | | | | | |
| Financial Services 2.46% | | | | | | | | |
| Fiserv, Inc.* | | | 263,210 | | | | 29,940,137 | |
| PayPal Holdings, Inc.* | | | 255,490 | | | | 13,234,382 | |
| Total | | | | | | | 43,174,519 | |
| | | | | | | | | |
| Ground Transportation 1.60% | | | | | | | | |
| Norfolk Southern Corp. | | | 146,680 | | | | 27,985,077 | |
| | | | | | | | | |
| Health Care Equipment & Supplies 1.30% |
| Becton Dickinson & Co. | | | 90,400 | | | | 22,851,312 | |
| | | | | | | | | |
| Health Care Providers & Services 7.89% | |
| Laboratory Corp. of America Holdings | | | 134,920 | | | | 26,947,572 | |
| McKesson Corp. | | | 65,850 | | | | 29,985,456 | |
| Molina Healthcare, Inc.* | | | 116,090 | | | | 38,652,165 | |
| UnitedHealth Group, Inc. | | | 79,730 | | | | 42,700,199 | |
| Total | | | | | | | 138,285,392 | |
| | See Notes to Financial Statements. | 71 |
Schedule of Investments (continued)
FUNDAMENTAL EQUITY FUND October 31, 2023
| Investments | | Shares | | | Fair
Value | |
| Hotels, Restaurants & Leisure 1.09% | |
| Caesars Entertainment, Inc.* | | | 477,190 | | | $ | 19,035,109 | |
| | | | | | | | | |
| Household Products 1.05% | | | | | | | | |
| Procter & Gamble Co. | | | 123,030 | | | | 18,458,191 | |
| | | | | | | | | |
| Industrial REITS 0.80% | | | | | | | | |
| Prologis, Inc. | | | 138,990 | | | | 14,003,243 | |
| | | | | | | | | |
| Insurance 7.88% | | | | | | | | |
| Allstate Corp. | | | 341,450 | | | | 43,749,989 | |
| Arch Capital Group Ltd.* | | | 345,560 | | | | 29,953,141 | |
| Arthur J Gallagher & Co. | | | 132,760 | | | | 31,263,652 | |
| RenaissanceRe Holdings Ltd. | | | 150,488 | | | | 33,045,660 | |
| Total | | | | | | | 138,012,442 | |
| | | | | | | | | |
| Interactive Media & Services 2.79% | | |
| Alphabet, Inc. Class A* | | | 394,240 | | | | 48,917,299 | |
| | | | | | | | | |
| Life Sciences Tools & Services 1.19% | | |
| Thermo Fisher Scientific, Inc. | | | 46,910 | | | | 20,864,161 | |
| | | | | | | | | |
| Machinery 1.76% | | | | | | | | |
| Parker-Hannifin Corp. | | | 83,340 | | | | 30,744,959 | |
| | | | | | | | | |
| Media 1.91% | | | | | | | | |
| Comcast Corp. Class A | | | 809,260 | | | | 33,414,345 | |
| | | | | | | | | |
| Metals & Mining 0.98% | | | | | | | | |
| Reliance Steel & Aluminum Co. | | | 67,220 | | | | 17,099,424 | |
| | | | | | | | | |
| Oil, Gas & Consumable Fuels 7.55% | | | |
| Chesapeake Energy Corp. | | | 460,240 | | | | 39,617,459 | |
| Pioneer Natural Resources Co. | | | 184,720 | | | | 44,148,080 | |
| Shell PLC ADR | | | 745,920 | | | | 48,589,229 | |
| Total | | | | | | | 132,354,768 | |
| | | | | | | | | |
| Pharmaceuticals 1.32% | | | | | | | | |
| Organon & Co. | | | 1,566,160 | | | | 23,163,506 | |
| Investments | | Shares | | | Fair
Value | |
| Real Estate Management & Development 1.22% | |
| CBRE Group, Inc. Class A* | | | 307,130 | | | $ | 21,296,394 | |
| | | | | | | | | |
| Residential REITS 0.95% | | | | | | | | |
| American Homes 4 Rent Class A | | | 510,800 | | | | 16,723,592 | |
| | | | | | | | | |
| Semiconductors & Semiconductor Equipment 3.67% | |
| KLA Corp. | | | 39,380 | | | | 18,496,786 | |
| Micron Technology, Inc. | | | 487,460 | | | | 32,596,450 | |
| Taiwan Semiconductor Manufacturing Co. Ltd. ADR | | | 153,700 | | | | 13,265,847 | |
| Total | | | | | | | 64,359,083 | |
| | | | | | | | | |
| Software 4.56% | | | | | | | | |
| Adobe, Inc.* | | | 67,540 | | | | 35,935,332 | |
| Microsoft Corp. | | | 130,210 | | | | 44,025,303 | |
| Total | | | | | | | 79,960,635 | |
| | | | | | | | | |
| Specialty Retail 3.73% | | | | | | | | |
| AutoZone, Inc.* | | | 8,430 | | | | 20,882,206 | |
| Lowe’s Cos., Inc. | | | 102,520 | | | | 19,537,236 | |
| Valvoline, Inc. | | | 843,180 | | | | 25,017,151 | |
| Total | | | | | | | 65,436,593 | |
| | | | | | | | | |
| Technology Hardware, Storage & Peripherals 1.83% | |
| NetApp, Inc. | | | 440,320 | | | | 32,046,490 | |
| | | | | | | | | |
| Trading Companies & Distributors 2.04% | |
| AerCap Holdings NV (Ireland)*(b) | | | 575,980 | | | | 35,779,878 | |
Total Common Stocks
(cost $1,471,482,550) | | | | | | | 1,732,208,487 | |
| 72 | See Notes to Financial Statements. |
Schedule of Investments (concluded)
FUNDAMENTAL EQUITY FUND October 31, 2023
| Investments | | Principal
Amount | | | Fair
Value | |
| SHORT-TERM INVESTMENTS 0.92% | | |
| | | | | | | | | |
| Repurchase Agreements 0.92% | | | |
Repurchase Agreement dated 10/31/2023, 2.800% due 11/1/2023 with Fixed Income Clearing Corp. collateralized by $16,351,800 of U.S. Treasury Note at 5.000% due 10/31/2025; value: $16,338,386; proceeds: $16,019,198
(cost $16,017,952) | | $ | 16,017,952 | | | $ | 16,017,952 | |
Total Investments in Securities 99.75%
(cost $1,487,500,502) | | | | | | | 1,748,226,439 | |
| Other Assets and Liabilities – Net 0.25% | | | | | | | 4,427,013 | |
| Net Assets 100.00% | | | | | | $ | 1,752,653,452 | |
| REITS | | Real Estate Investment Trusts. |
| ADR | | American Depositary Receipt. |
| * | | Non-income producing security. |
| (a) | | Investment in non-U.S. dollar denominated securities. |
| (b) | | Foreign security traded in U.S. dollars. |
The following is a summary of the inputs used as of October 31, 2023 in valuing the Fund’s investments carried at fair value(1):
| Investment Type(2) | | Level 1 | | | Level 2 | | | Level 3 | | | Total | |
| Long-Term Investments | | | | | | | | | | | | | | | | |
| Common Stocks | | | | | | | | | | | | | | | | |
| Beverages | | $ | — | | | $ | 25,495,897 | | | $ | — | | | $ | 25,495,897 | |
| Remaining Industries | | | 1,706,712,590 | | | | — | | | | — | | | | 1,706,712,590 | |
| Short-Term Investments | | | | | | | | | | | | | | | | |
| Repurchase Agreements | | | — | | | | 16,017,952 | | | | — | | | | 16,017,952 | |
| Total | | $ | 1,706,712,590 | | | $ | 41,513,849 | | | $ | — | | | $ | 1,748,226,439 | |
| (1) | | Refer to Note 2(l) for a description of fair value measurements and the three-tier hierarchy of inputs. |
| (2) | | See Schedule of Investments for fair values in each industry and identification of foreign issuers and/or geography. The table above is presented by Investment Type. Industries are presented within an Investment Type should such Investment Type include securities classified as two or more levels within the three-tier fair value hierarchy. When applicable, each Level 3 security is identified on the Schedule of Investments along with the valuation technique utilized. |
A reconciliation of Level 3 investments is presented when the Fund has a material amount of Level 3 investments at the beginning or end of the year in relation to the Fund’s net assets.
| | See Notes to Financial Statements. | 73 |
Schedule of Investments
GLOBAL EQUITY FUND October 31, 2023
| Investments | | Shares | | | U.S. $
Fair Value | |
| LONG-TERM INVESTMENTS 98.97% | | | | | | | | |
| COMMON STOCKS 98.97% | | | | | | | | |
| | | | | | | | | |
| Australia 1.72% | | | | | | | | |
| | | | | | | | | |
| Diversified REITS 0.75% | | | | | | | | |
| Charter Hall Group | | | 18,674 | | | $ | 103,454 | |
| | | | | | | | | |
| Metals & Mining 0.97% | | | | | | | | |
| BHP Group Ltd. | | | 4,778 | | | | 135,253 | |
| Total Australia | | | | | | | 238,707 | |
| | | | | | | | | |
| Austria 1.50% | | | | | | | | |
| | | | | | | | | |
| Banks | | | | | | | | |
| BAWAG Group AG† | | | 4,669 | | | | 207,959 | |
| | | | | | | | | |
| Brazil 2.02% | | | | | | | | |
| | | | | | | | | |
| Broadline Retail | | | | | | | | |
| MercadoLibre, Inc.* | | | 226 | | | | 280,407 | |
| | | | | | | | | |
| Canada 2.29% | | | | | | | | |
| | | | | | | | | |
| Consumer Staples Distribution & Retail | | | | | | | | |
| Alimentation Couche-Tard, Inc. | | | 5,839 | | | | 317,855 | |
| | | | | | | | | |
| China 4.82% | | | | | | | | |
| | | | | | | | | |
| Beverages 0.63% | | | | | | | | |
| Kweichow Moutai Co. Ltd. Class A | | | 381 | | | | 87,746 | |
| | | | | | | | | |
| Broadline Retail 1.85% | | | | | | | | |
| Alibaba Group Holding Ltd.* | | | 16,951 | | | | 174,512 | |
| PDD Holdings, Inc. ADR* | | | 817 | | | | 82,860 | |
| | | | | | | | 257,372 | |
| | | | | | | | | |
| Gas Utilities 0.49% | | | | | | | | |
| ENN Energy Holdings Ltd. | | | 8,990 | | | | 68,100 | |
| | | | | | | | | |
| Interactive Media & Services 1.27% | | | | | | | | |
| Tencent Holdings Ltd. | | | 4,761 | | | | 176,199 | |
| Investments | | Shares | | | U.S. $
Fair Value | |
| China (continued) | | | | | | | | |
| | | | | | | | | |
| Marine Transportation 0.58% | | | | | | | | |
| SITC International Holdings Co. Ltd. | | | 52,744 | | | $ | 81,247 | |
| Total China | | | | | | | 670,664 | |
| | | | | | | | | |
| Denmark 2.65% | | | | | | | | |
| | | | | | | | | |
| Biotechnology 0.46% | | | | | | | | |
| Genmab AS* | | | 226 | | | | 63,886 | |
| | | | | | | | | |
| Pharmaceuticals 2.19% | | | | | | | | |
| Novo Nordisk AS Class B | | | 3,164 | | | | 305,251 | |
| Total Denmark | | | | | | | 369,137 | |
| | | | | | | | | |
| France 3.66% | | | | | | | | |
| | | | | | | | | |
| Beverages 0.44% | | | | | | | | |
| Pernod Ricard SA | | | 343 | | | | 60,909 | |
| | | | | | | | | |
| Capital Markets 1.01% | | | | | | | | |
| Amundi SA† | | | 2,695 | | | | 140,785 | |
| | | | | | | | | |
| Life Sciences Tools & Services 0.10% | | | | | | | | |
| Sartorius Stedim Biotech | | | 74 | | | | 13,855 | |
| | | | | | | | | |
| Oil, Gas & Consumable Fuels 0.44% | | | | | | | | |
| Gaztransport Et Technigaz SA | | | 480 | | | | 61,397 | |
| | | | | | | | | |
| Personal Care Products 0.58% | | | | | | | | |
| L’Oreal SA | | | 192 | | | | 80,703 | |
| | | | | | | | | |
| Professional Services 0.22% | | | | | | | | |
| Teleperformance SE | | | 271 | | | | 31,176 | |
| | | | | | | | | |
| Textiles, Apparel & Luxury Goods 0.87% | | | | | | | | |
| LVMH Moet Hennessy Louis Vuitton SE | | | 168 | | | | 120,276 | |
| Total France | | | | | | | 509,101 | |
| | | | | | | | | |
| Japan 2.84% | | | | | | | | |
| | | | | | | | | |
| Electrical Equipment 0.27% | | | | | | | | |
| Fuji Electric Co. Ltd. | | | 991 | | | | 37,732 | |
| 74 | See Notes to Financial Statements. |
Schedule of Investments (continued)
GLOBAL EQUITY FUND October 31, 2023
| Investments | | Shares | | | U.S. $
Fair Value | |
| Japan (continued) | | | | | | | | |
| | | | | | | | | |
| Household Durables 0.54% | | | | | | | | |
| Sony Group Corp. | | | 904 | | | $ | 75,157 | |
| | | | | | | | | |
| Insurance 0.90% | | | | | | | | |
| Sompo Holdings, Inc. | | | 2,869 | | | | 124,285 | |
| | | | | | | | | |
| Machinery 0.43% | | | | | | | | |
| Fujitec Co. Ltd. | | | 2,742 | | | | 59,529 | |
| | | | | | | | | |
| Professional Services 0.70% | | | | | | | | |
| TechnoPro Holdings, Inc. | | | 4,924 | | | | 97,549 | |
| Total Japan | | | | | | | 394,252 | |
| | | | | | | | | |
| Mexico 1.91% | | | | | | | | |
| | | | | | | | | |
| Banks | | | | | | | | |
| Grupo Financiero Banorte SAB de CV Class O | | | 32,690 | | | | 265,306 | |
| | | | | | | | | |
| Netherlands 2.60% | | | | | | | | |
| | | | | | | | | |
| Oil, Gas & Consumable Fuels 2.05% | | | | | | | | |
| Shell PLC | | | 8,846 | | | | 285,079 | |
| | | | | | | | | |
| Semiconductors & Semiconductor Equipment 0.55% | | | |
| ASML Holding NV | | | 126 | | | | 75,741 | |
| Total Netherlands | | | | | | | 360,820 | |
| | | | | | | | | |
| Peru 0.97% | | | | | | | | |
| | | | | | | | | |
| Banks | | | | | | | | |
| Intercorp Financial Services, Inc. | | | 7,210 | | | | 135,404 | |
| | | | | | | | | |
| Singapore 1.30% | | | | | | | | |
| | | | | | | | | |
| Semiconductors & Semiconductor Equipment | | | | | | | | |
| STMicroelectronics NV | | | 4,740 | | | | 180,689 | |
| | | | | | | | | |
| South Korea 1.57% | | | | | | | | |
| | | | | | | | | |
| Technology Hardware, Storage & Peripherals | | | | | | | | |
| Samsung Electronics Co. Ltd. | | | 4,399 | | | | 218,960 | |
| Investments | | Shares | | | U.S. $
Fair Value | |
| Spain 1.20% | | | | | | | | |
| | | | | | | | | |
| Electric: Utilities | | | | | | | | |
| Iberdrola SA | | | 15,030 | | | $ | 167,164 | |
| | | | | | | | | |
| Taiwan 1.57% | | | | | | | | |
| | | | | | | | | |
| Semiconductors & Semiconductor Equipment | | | | | | | | |
| Taiwan Semiconductor Manufacturing Co. Ltd. ADR | | | 49 | | | | 4,229 | |
| Taiwan Semiconductor Manufacturing Co. Ltd. | | | 13,132 | | | | 214,479 | |
| | | | | | | | 218,708 | |
| | | | | | | | | |
| United Kingdom 7.61% | | | | | | | | |
| | | | | | | | | |
| Broadline Retail 2.66% | | | | | | | | |
| B&M European Value Retail SA | | | 30,280 | | | | 194,935 | |
| Next PLC | | | 2,085 | | | | 174,811 | |
| | | | | | | | 369,746 | |
| | | | | | | | | |
| Capital Markets 0.40% | | | | | | | | |
| London Stock Exchange Group PLC | | | 546 | | | | 55,089 | |
| | | | | | | | | |
| Household Durables 0.38% | | | | | | | | |
| Persimmon PLC | | | 4,334 | | | | 53,672 | |
| | | | | | | | | |
| Personal Care Products 1.62% | | | | | | | | |
| Unilever PLC | | | 4,762 | | | | 225,531 | |
| | | | | | | | | |
| Tobacco 1.52% | | | | | | | | |
| Imperial Brands PLC | | | 9,920 | | | | 211,337 | |
| | | | | | | | | |
| Trading Companies & Distributors 1.03% | | | | | | | | |
| Ashtead Group PLC | | | 2,501 | | | | 143,439 | |
| Total United Kingdom | | | | | | | 1,058,814 | |
| | | | | | | | | |
| United States 58.74% | | | | | | | | |
| | | | | | | | | |
| Aerospace & Defense 0.54% | | | | | | | | |
| TransDigm Group, Inc.* | | | 91 | | | | 75,356 | |
| | See Notes to Financial Statements. | 75 |
Schedule of Investments (continued)
GLOBAL EQUITY FUND October 31, 2023
| Investments | | Shares | | | U.S. $
Fair Value | |
| United States (continued) | | | | | | | | |
| | | | | | | | | |
| Air Freight & Logistics 0.30% | | | | | | | | |
| Expeditors International of Washington, Inc. | | | 375 | | | $ | 40,969 | |
| | | | | | | | | |
| Automobiles 1.07% | | | | | | | | |
| General Motors Co. | | | 5,266 | | | | 148,501 | |
| | | | | | | | | |
| Banks 1.72% | | | | | | | | |
| JPMorgan Chase & Co. | | | 1,723 | | | | 239,600 | |
| | | | | | | | | |
| Biotechnology 1.85% | | | | | | | | |
| Vertex Pharmaceuticals, Inc.* | | | 710 | | | | 257,098 | |
| | | | | | | | | |
| Broadline Retail 1.01% | | | | | | | | |
| Amazon.com, Inc.* | | | 1,052 | | | | 140,011 | |
| | | | | | | | | |
| Building Products 2.34% | | | | | | | | |
| Allegion PLC | | | 1,621 | | | | 159,442 | |
| Builders FirstSource, Inc.* | | | 1,528 | | | | 165,818 | |
| | | | | | | | 325,260 | |
| | | | | | | | | |
| Capital Markets 5.00% | | | | | | | | |
| Ameriprise Financial, Inc. | | | 774 | | | | 243,477 | |
| Cboe Global Markets, Inc. | | | 1,915 | | | | 313,850 | |
| Evercore, Inc. Class A | | | 1,062 | | | | 138,251 | |
| | | | | | | | 695,578 | |
| | | | | | | | | |
| Construction Materials 0.99% | | | | | | | | |
| CRH PLC | | | 2,568 | | | | 137,788 | |
| | | | | | | | | |
| Consumer Staples Distribution & Retail 0.60% | | | | | | | | |
| BJ’s Wholesale Club Holdings, Inc.* | | | 1,229 | | | | 83,719 | |
| | | | | | | | | |
| Electronic Equipment, Instruments & Components 0.38% | |
| Crane NXT Co. | | | 1,024 | | | | 53,248 | |
| | | | | | | | | |
| Entertainment 1.31% | | | | | | | | |
| Netflix, Inc.* | | | 444 | | | | 182,790 | |
| | | | | | | | | |
| Financial Services 2.80% | | | | | | | | |
| Visa, Inc. Class A | | | 1,653 | | | | 388,620 | |
| Investments | | Shares | | | U.S. $
Fair Value | |
| United States (continued) | | | | | | | | |
| | | | | | | | | |
| Ground Transportation 0.34% | | | | | | | | |
| Norfolk Southern Corp. | | | 251 | | | $ | 47,888 | |
| | | | | | | | | |
| Health Care Equipment & Supplies 0.61% | | | | | | | | |
| Dexcom, Inc.* | | | 556 | | | | 49,389 | |
| Intuitive Surgical, Inc.* | | | 135 | | | | 35,400 | |
| | | | | | | | 84,789 | |
| | | | | | | | | |
| Health Care Providers & Services 3.91% | | | | | | | | |
| Molina Healthcare, Inc.* | | | 342 | | | | 113,869 | |
| UnitedHealth Group, Inc. | | | 803 | | | | 430,055 | |
| | | | | | | | 543,924 | |
| | | | | | | | | |
| Household Durables 0.76% | | | | | | | | |
| Helen of Troy Ltd. | | | 1,078 | | | | 105,989 | |
| | | | | | | | | |
| Industrial REITS 0.35% | | | | | | | | |
| Prologis, Inc. | | | 478 | | | | 48,158 | |
| | | | | | | | | |
| Information Technology Services 1.10% | | | | | | | | |
| Accenture PLC Class A | | | 513 | | | | 152,407 | |
| | | | | | | | | |
| Interactive Media & Services 8.48% | | | | | | | | |
| Alphabet, Inc. Class A* | | | 5,541 | | | | 687,527 | |
| Meta Platforms, Inc. Class A* | | | 1,630 | | | | 491,070 | |
| | | | | | | | 1,178,597 | |
| | | | | | | | | |
| Life Sciences Tools & Services 0.46% | | | | | | | | |
| Thermo Fisher Scientific, Inc. | | | 145 | | | | 64,492 | |
| | | | | | | | | |
| Machinery 0.88% | | | | | | | | |
| Crane Co. | | | 593 | | | | 57,717 | |
| Parker-Hannifin Corp. | | | 176 | | | | 64,928 | |
| | | | | | | | 122,645 | |
| | | | | | | | | |
| Oil, Gas & Consumable Fuels 2.72% | | | | | | | | |
| Cheniere Energy, Inc. | | | 225 | | | | 37,445 | |
| Marathon Petroleum Corp. | | | 2,254 | | | | 340,917 | |
| | | | | | | | 378,362 | |
| | | | | | | | | |
| Pharmaceuticals 0.82% | | | | | | | | |
| Organon & Co. | | | 7,706 | | | | 113,972 | |
| | | | | | | | | |
| Professional Services 0.79% | | | | | | | | |
| Verra Mobility Corp.* | | | 5,579 | | | | 110,297 | |
| 76 | See Notes to Financial Statements. |
Schedule of Investments (continued)
GLOBAL EQUITY FUND October 31, 2023
| Investments | | Shares | | | U.S. $
Fair Value | |
| United States (continued) | | | | | | | | |
| | | | | | | | | |
| Semiconductors & Semiconductor Equipment 3.65% | |
| Broadcom, Inc. | | | 33 | | | $ | 27,765 | |
| KLA Corp. | | | 310 | | | | 145,607 | |
| NVIDIA Corp. | | | 821 | | | | 334,804 | |
| | | | | | | | 508,176 | |
| | | | | | | | | |
| Software 9.20% | | | | | | | | |
| Adobe, Inc. | | | 649 | | | | 345,307 | |
| Cadence Design Systems, Inc.* | | | 604 | | | | 144,869 | |
| Microsoft Corp. | | | 1,996 | | | | 674,868 | |
| PowerSchool Holdings, Inc. Class A* | | | 5,751 | | | | 114,560 | |
| | | | | | | | 1,279,604 | |
| | | | | | | | | |
| Specialty Retail 1.79% | | | | | | | | |
| Academy Sports & Outdoors, Inc. | | | 2,891 | | | | 129,633 | |
| Lowe’s Cos., Inc. | | | 623 | | | | 118,725 | |
| | | | | | | | 248,358 | |
| | | | | | | | | |
| Technology Hardware, Storage & Peripherals 2.97% | |
| Apple, Inc. | | | 2,415 | | | | 412,410 | |
| Total United States | | | | | | | 8,168,606 | |
Total Common Stocks
(cost $12,593,414) | | | | | | | 13,762,553 | |
| Investments | | Principal
Amount | | | U.S. $
Fair Value | |
| SHORT-TERM INVESTMENTS 1.04% | | | | | | | | |
| | | | | | | | | |
| Repurchase Agreements 1.04% | | | | | | | | |
Repurchase Agreement dated 10/31/2023, 2.800% due 11/1/2023 with Fixed Income Clearing Corp. collateralized by $147,900 of U.S. Treasury Note at 5.000% due 10/31/2025; value: $147,779; proceeds: $144,863
(cost $144,851) | | $ | 144,851 | | | $ | 144,851 | |
Total Investments in Securities 100.01%
(cost $12,738,265) | | | | | | | 13,907,404 | |
| Other Assets and Liabilities – Net (0.01)% | | | | | | | (1,600 | ) |
| Net Assets 100.00% | | | | | | $ | 13,905,804 | |
| ADR | | American Depositary Receipt. |
| REITS | | Real Estate Investment Trusts. |
| † | | Security was purchased pursuant to Rule 144A under the Securities Act of 1933 and, unless registered under such Act or exempted from registration, may only be resold to qualified institutional buyers. At October 31, 2023, the total value of Rule 144A securities was $348,744, which represents 2.51% of net assets. |
| * | | Non-income producing security. |
| | See Notes to Financial Statements. | 77 |
Schedule of Investments (concluded)
GLOBAL EQUITY FUND October 31, 2023
The following is a summary of the inputs used as of October 31, 2023 in valuing the Fund’s investments carried at fair value(1):
| Investment Type(2) | | Level 1 | | | Level 2 | | | Level 3 | | | Total | |
| Long-Term Investments | | | | | | | | | | | | | | | | |
| Common Stocks | | | | | | | | | | | | | | | | |
| Australia | | $ | — | | | $ | 238,707 | | | $ | — | | | $ | 238,707 | |
| Austria | | | — | | | | 207,959 | | | | — | | | | 207,959 | |
| China | | | 82,860 | | | | 587,804 | | | | — | | | | 670,664 | |
| Denmark | | | — | | | | 369,137 | | | | — | | | | 369,137 | |
| France | | | — | | | | 509,101 | | | | — | | | | 509,101 | |
| Japan | | | — | | | | 394,252 | | | | — | | | | 394,252 | |
| Netherlands | | | — | | | | 360,820 | | | | — | | | | 360,820 | |
| Singapore | | | — | | | | 180,689 | | | | — | | | | 180,689 | |
| South Korea | | | — | | | | 218,960 | | | | — | | | | 218,960 | |
| Spain | | | — | | | | 167,164 | | | | — | | | | 167,164 | |
| Taiwan | | | 4,229 | | | | 214,479 | | | | — | | | | 218,708 | |
| United Kingdom | | | — | | | | 1,058,814 | | | | — | | | | 1,058,814 | |
| United States | | | 8,046,675 | | | | 121,931 | | | | — | | | | 8,168,606 | |
| Remaining Countries | | | 998,972 | | | | — | | | | — | | | | 998,972 | |
| Short-Term Investments | | | | | | | | | | | | | | | | |
| Repurchase Agreements | | | — | | | | 144,851 | | | | — | | | | 144,851 | |
| Total | | $ | 9,132,736 | | | $ | 4,774,668 | | | $ | — | | | $ | 13,907,404 | |
| (1) | | Refer to Note 2(l) for a description of fair value measurements and the three-tier hierarchy of inputs. |
| (2) | | See Schedule of Investments for fair values in each industry and identification of foreign issuers and/or geography. The table above is presented by Investment Type. Countries are presented within an Investment Type should such Investment Type include securities classified as two or more levels within the three-tier fair value hierarchy. When applicable, each Level 3 security is identified on the Schedule of Investments along with the valuation technique utilized. |
A reconciliation of Level 3 investments is presented when the Fund has a material amount of Level 3 investments at the beginning or end of the year in relation to the Fund’s net assets.
| 78 | See Notes to Financial Statements. |
Schedule of Investments
GROWTH LEADERS FUND October 31, 2023
| Investments | | Shares | | | Fair
Value | |
| LONG-TERM INVESTMENTS 97.69% | | | | | | | | |
| COMMON STOCKS 97.69% | | | | | | | | |
| | | | | | | | | |
| Aerospace & Defense 2.35% | | | | | | | | |
| Axon Enterprise, Inc.* | | | 305,330 | | | $ | 62,436,932 | |
| TransDigm Group, Inc.* | | | 61,548 | | | | 50,967,283 | |
| Total | | | | | | | 113,404,215 | |
| | | | | | | | | |
| Automobiles 0.96% | | | | | | | | |
| Tesla, Inc.* | | | 231,093 | | | | 46,412,718 | |
| | | | | | | | | |
| Biotechnology 3.66% | | | | | | | | |
| Argenx SE ADR* | | | 209,715 | | | | 98,475,873 | |
| Vertex Pharmaceuticals, Inc.* | | | 214,359 | | | | 77,621,537 | |
| Total | | | | | | | 176,097,410 | |
| | | | | | | | | |
| Broadline Retail 6.85% | | | | | | | | |
| Amazon.com, Inc.* | | | 1,735,839 | | | | 231,022,812 | |
| MercadoLibre, Inc. (Uruguay)*(a) | | | 79,744 | | | | 98,941,571 | |
| Total | | | | | | | 329,964,383 | |
| | | | | | | | | |
| Communications Equipment 2.91% | | | | | | | | |
| Arista Networks, Inc.* | | | 700,369 | | | | 140,332,937 | |
| | | | | | | | | |
| Entertainment 3.18% | | | | | | | | |
| Netflix, Inc.* | | | 255,218 | | | | 105,070,698 | |
| Spotify Technology SA (Sweden)*(a) | | | 293,244 | | | | 48,314,882 | |
| Total | | | | | | | 153,385,580 | |
| | | | | | | | | |
| Financial Services 3.41% | | | | | | | | |
| Apollo Global Management, Inc. | | | 446,255 | | | | 34,557,987 | |
| Mastercard, Inc. Class A | | | 144,731 | | | | 54,469,512 | |
| Remitly Global, Inc.* | | | 1,027,304 | | | | 27,665,297 | |
| Visa, Inc. Class A | | | 201,903 | | | | 47,467,395 | |
| Total | | | | | | | 164,160,191 | |
| | | | | | | | | |
| Ground Transportation 3.11% | | | | | | | | |
| Old Dominion Freight Line, Inc. | | | 173,982 | | | | 65,532,060 | |
| Uber Technologies, Inc.* | | | 1,945,342 | | | | 84,194,402 | |
| Total | | | | | | | 149,726,462 | |
| Investments | | Shares | | | Fair
Value | |
| Health Care Equipment & Supplies 0.98% | |
| Intuitive Surgical, Inc.* | | | 180,382 | | | $ | 47,299,768 | |
| | | | | | | | | |
| Hotels, Restaurants & Leisure 4.07% | | | | | | | | |
| Booking Holdings, Inc.* | | | 31,312 | | | | 87,346,703 | |
| DoorDash, Inc. Class A* | | | 493,807 | | | | 37,010,835 | |
| DraftKings, Inc. Class A* | | | 2,589,588 | | | | 71,524,420 | |
| Total | | | | | | | 195,881,958 | |
| | | | | | | | | |
| Information Technology Services 4.47% | | | | | | | | |
| MongoDB, Inc.* | | | 286,888 | | | | 98,858,736 | |
| Shopify, Inc. Class A (Canada)*(a) | | | 2,463,929 | | | | 116,272,809 | |
| Total | | | | | | | 215,131,545 | |
| | | | | | | | | |
| Interactive Media & Services 8.17% | | | | | | | | |
| Alphabet, Inc. Class A* | | | 1,816,310 | | | | 225,367,745 | |
| Meta Platforms, Inc. Class A* | | | 558,076 | | | | 168,131,556 | |
| Total | | | | | | | 393,499,301 | |
| | | | | | | | | |
| Machinery 0.81% | | | | | | | | |
| Parker-Hannifin Corp. | | | 105,228 | | | | 38,819,661 | |
| | | | | | | | | |
| Media 2.05% | | | | | | | | |
| Trade Desk, Inc. Class A* | | | 1,390,512 | | | | 98,670,732 | |
| | | | | | | | | |
| Pharmaceuticals 3.20% | | | | | | | | |
| Eli Lilly & Co. | | | 278,584 | | | | 154,316,035 | |
| | | | | | | | | |
| Semiconductors & Semiconductor Equipment 16.08% | |
| Advanced Micro Devices, Inc.* | | | 639,766 | | | | 63,016,951 | |
| Applied Materials, Inc. | | | 684,867 | | | | 90,642,147 | |
| KLA Corp. | | | 90,498 | | | | 42,506,911 | |
| Monolithic Power Systems, Inc. | | | 85,169 | | | | 37,622,554 | |
| NVIDIA Corp. | | | 1,238,695 | | | | 505,139,821 | |
| ON Semiconductor Corp.* | | | 567,186 | | | | 35,528,531 | |
| Total | | | | | | | 774,456,915 | |
| | See Notes to Financial Statements. | 79 |
Schedule of Investments (concluded)
GROWTH LEADERS FUND October 31, 2023
| Investments | | Shares | | | Fair
Value | |
| Software 23.64% | | | | | | | | |
| Adobe, Inc.* | | | 261,078 | | | $ | 138,909,161 | |
| Cadence Design Systems, Inc.* | | | 358,705 | | | | 86,035,394 | |
| Confluent, Inc. Class A* | | | 1,108,797 | | | | 32,055,321 | |
| Crowdstrike Holdings, Inc. Class A* | | | 205,269 | | | | 36,285,401 | |
| Datadog, Inc. Class A* | | | 374,496 | | | | 30,510,189 | |
| Dynatrace, Inc.* | | | 1,751,629 | | | | 78,315,333 | |
| HubSpot, Inc.* | | | 144,280 | | | | 61,141,536 | |
| Microsoft Corp. | | | 1,052,433 | | | | 355,838,122 | |
| Palo Alto Networks, Inc.* | | | 382,421 | | | | 92,935,951 | |
| Procore Technologies, Inc.* | | | 579,822 | | | | 35,421,326 | |
| ServiceNow, Inc.* | | | 202,422 | | | | 117,779,241 | |
| Synopsys, Inc.* | | | 157,014 | | | | 73,708,652 | |
| Total | | | | | | | 1,138,935,627 | |
| | | | | | | | | |
| Technology Hardware, Storage & Peripherals 6.42% | |
| Apple, Inc. | | | 1,809,906 | | | | 309,077,648 | |
| | | | | | | | | |
| Textiles, Apparel & Luxury Goods 1.37% | |
| Lululemon Athletica, Inc. (Canada)*(a) | | | 167,461 | | | | 65,892,554 | |
Total Common Stocks
(cost $4,022,571,953) | | | | | | | 4,705,465,640 | |
| Investments | | Principal
Amount | | | Fair
Value | |
| SHORT-TERM INVESTMENTS 1.49% | | | | | | | | |
| | | | | | | | | |
| Repurchase Agreements 1.49% | | | | | | | | |
Repurchase Agreement dated 10/31/2023, 2.800% due 11/1/2023 with Fixed Income Clearing Corp. collateralized by $73,432,200 of U.S. Treasury Note at 5.000% due 10/31/2025; value: $73,371,963; proceeds: $71,938,815
(cost $71,933,220) | | $ | 71,933,220 | | | $ | 71,933,220 | |
Total Investments in Securities 99.18%
(cost $4,094,505,173) | | | | | | | 4,777,398,860 | |
| Other Assets and Liabilities – Net 0.82% | | | | | | | 39,575,719 | |
| Net Assets 100.00% | | | | | | $ | 4,816,974,579 | |
| ADR | | American Depositary Receipt. |
| * | | Non-income producing security. |
| (a) | | Foreign security traded in U.S. dollars. |
The following is a summary of the inputs used as of October 31, 2023 in valuing the Fund’s investments carried at fair value(1):
| Investment Type(2) | | Level 1 | | | Level 2 | | | Level 3 | | | Total | |
| Long-Term Investments | | | | | | | | | | | | | | | | |
| Common Stocks | | $ | 4,705,465,640 | | | $ | – | | | $ | – | | | $ | 4,705,465,640 | |
| Short-Term Investments | | | | | | | | | | | | | | | | |
| Repurchase Agreements | | | – | | | | 71,933,220 | | | | – | | | | 71,933,220 | |
| Total | | $ | 4,705,465,640 | | | $ | 71,933,220 | | | $ | – | | | $ | 4,777,398,860 | |
| (1) | | Refer to Note 2(l) for a description of fair value measurements and the three-tier hierarchy of inputs. |
| (2) | | See Schedule of Investments for fair values in each industry and identification of foreign issuers and/or geography. The table above is presented by Investment type. When applicable, each Level 3 security is identified on the Schedule of Investments along with the valuation technique utilized. |
A reconciliation of Level 3 investments is presented when the Fund has a material amount of Level 3 investments at the beginning or end of the year in relation to the Fund’s net assets.
| 80 | See Notes to Financial Statements. |
Schedule of Investments
HEALTH CARE FUND October 31, 2023
| Investments | | Shares | | | U.S. $
Fair Value | |
| LONG-TERM INVESTMENTS 94.59% | | | | | | | | |
| COMMON STOCKS 94.59% | | | | | | | | |
| | | | | | | | | |
| Canada 1.17% | | | | | | | | |
| | | | | | | | | |
| Biotechnology | | | | | | | | |
| Xenon Pharmaceuticals, Inc.* | | | 2,624 | | | $ | 81,344 | |
| | | | | | | | | |
| China 0.64% | | | | | | | | |
| | | | | | | | | |
| Biotechnology | | | | | | | | |
| BeiGene Ltd.* | | | 3,117 | | | | 44,747 | |
| | | | | | | | | |
| Denmark 6.53% | | | | | | | | |
| | | | | | | | | |
| Pharmaceuticals | | | | | | | | |
| Novo Nordisk AS Class B | | | 4,714 | | | | 454,789 | |
| | | | | | | | | |
| France 0.54% | | | | | | | | |
| | | | | | | | | |
| Life Sciences Tools & Services | | | | | | | | |
| Sartorius Stedim Biotech | | | 201 | | | | 37,632 | |
| | | | | | | | | |
| Germany 3.78% | | | | | | | | |
| | | | | | | | | |
| Biotechnology 0.38% | | | | | | | | |
| Immatics NV* | | | 3,450 | | | | 26,393 | |
| | | | | | | | | |
| Health Care Equipment & Supplies 0.88% | | | | | | | | |
| Siemens Healthineers AG† | | | 1,254 | | | | 61,693 | |
| | | | | | | | | |
| Life Sciences Tools & Services 2.52% | | | | | | | | |
| Gerresheimer AG | | | 1,124 | | | | 104,839 | |
| Schott Pharma AG & Co. KGaA* | | | 2,430 | | | | 70,450 | |
| | | | | | | | 175,289 | |
| Total Germany | | | | | | | 263,375 | |
| | | | | | | | | |
| Italy 0.83% | | | | | | | | |
| | | | | | | | | |
| Life Sciences Tools & Services | | | | | | | | |
| Stevanato Group SpA | | | 2,062 | | | | 57,633 | |
| | | | | | | | | |
| Japan 2.88% | | | | | | | | |
| | | | | | | | | |
| Pharmaceuticals | | | | | | | | |
| Daiichi Sankyo Co. Ltd. | | | 3,477 | | | | 89,652 | |
| Eisai Co. Ltd. | | | 2,094 | | | | 110,936 | |
| | | | | | | | 200,588 | |
| Investments | | Shares | | | U.S. $
Fair Value | |
| Netherlands 2.95% | | | | | | | | |
| | | | | | | | | |
| Biotechnology | | | | | | | | |
| Argenx SE* | | | 436 | | | $ | 205,086 | |
| | | | | | | | | |
| Switzerland 0.48% | | | | | | | | |
| | | | | | | | | |
| Health Care Equipment & Supplies | | | | | | | | |
| Straumann Holding AG | | | 283 | | | | 33,446 | |
| | | | | | | | | |
| United Kingdom 3.56% | | | | | | | | |
| | | | | | | | | |
| Pharmaceuticals | | | | | | | | |
| AstraZeneca PLC | | | 1,982 | | | | 248,154 | |
| | | | | | | | | |
| United States 71.23% | | | | | | | | |
| | | | | | | | | |
| Biotechnology 18.49% | | | | | | | | |
| Arcellx, Inc.* | | | 2,742 | | | | 96,656 | |
| Biogen, Inc.* | | | 282 | | | | 66,986 | |
| Bridgebio Pharma, Inc.* | | | 2,195 | | | | 57,158 | |
| Cytokinetics, Inc.* | | | 2,116 | | | | 73,764 | |
| Exact Sciences Corp.* | | | 1,286 | | | | 79,205 | |
| Karuna Therapeutics, Inc.* | | | 609 | | | | 101,465 | |
| Krystal Biotech, Inc.* | | | 1,326 | | | | 154,970 | |
| Legend Biotech Corp. ADR* | | | 1,160 | | | | 76,641 | |
| MoonLake Immunotherapeutics*(a) | | | 1,259 | | | | 65,229 | |
| Natera, Inc.* | | | 2,028 | | | | 80,045 | |
| Neurocrine Biosciences, Inc.* | | | 642 | | | | 71,223 | |
| Nuvalent, Inc. Class A* | | | 920 | | | | 47,923 | |
| Regeneron Pharmaceuticals, Inc.* | | | 58 | | | | 45,234 | |
| Roivant Sciences Ltd.* | | | 3,433 | | | | 29,661 | |
| Vertex Pharmaceuticals, Inc.* | | | 666 | | | | 241,165 | |
| | | | | | | | 1,287,325 | |
| | | | | | | | | |
| Health Care Equipment & Supplies 20.99% | | | | | | | | |
| Abbott Laboratories | | | 672 | | | | 63,537 | |
| Align Technology, Inc.* | | | 140 | | | | 25,843 | |
| Axonics, Inc.* | | | 1,101 | | | | 56,382 | |
| Becton Dickinson & Co. | | | 351 | | | | 88,726 | |
| Boston Scientific Corp.* | | | 3,164 | | | | 161,965 | |
| Cooper Cos., Inc. | | | 209 | | | | 65,156 | |
| Dexcom, Inc.* | | | 1,350 | | | | 119,920 | |
| Glaukos Corp.* | | | 1,644 | | | | 112,121 | |
| IDEXX Laboratories, Inc.* | | | 86 | | | | 34,354 | |
| | See Notes to Financial Statements. | 81 |
Schedule of Investments (continued)
HEALTH CARE FUND October 31, 2023
| Investments | | Shares | | | U.S. $
Fair Value | |
| United States (continued) | | | | | | | | |
| Inspire Medical Systems, Inc.* | | | 332 | | | $ | 48,857 | |
| Insulet Corp.* | | | 359 | | | | 47,593 | |
| Intuitive Surgical, Inc.* | | | 737 | | | | 193,256 | |
| iRhythm Technologies, Inc.* | | | 607 | | | | 47,662 | |
| Penumbra, Inc.* | | | 238 | | | | 45,494 | |
| RxSight, Inc.* | | | 2,249 | | | | 49,793 | |
| Shockwave Medical, Inc.* | | | 351 | | | | 72,397 | |
| Stryker Corp. | | | 635 | | | | 171,590 | |
| TransMedics Group, Inc.* | | | 1,529 | | | | 57,307 | |
| | | | | | | | 1,461,953 | |
| | | | | | | | | |
| Health Care Providers & Services 10.49% | | | | | | | | |
| Cencora, Inc. | | | 324 | | | | 59,989 | |
| Guardant Health, Inc.* | | | 2,191 | | | | 56,703 | |
| Humana, Inc. | | | 179 | | | | 93,740 | |
| Laboratory Corp. of America Holdings | | | 237 | | | | 47,336 | |
| Molina Healthcare, Inc.* | | | 249 | | | | 82,905 | |
| R1 RCM, Inc.* | | | 2,884 | | | | 34,002 | |
| UnitedHealth Group, Inc. | | | 665 | | | | 356,147 | |
| | | | | | | | 730,822 | |
| | | | | | | | | |
| Life Sciences Tools & Services 6.28% | | | | | | | | |
| 10X Genomics, Inc. Class A* | | | 1,818 | | | | 64,139 | |
| Danaher Corp. | | | 342 | | | | 65,671 | |
| Pacific Biosciences of California, Inc.* | | | 6,405 | | | | 39,583 | |
| Quanterix Corp.* | | | 4,356 | | | | 94,612 | |
| Thermo Fisher Scientific, Inc. | | | 117 | | | | 52,038 | |
| West Pharmaceutical Services, Inc. | | | 380 | | | | 120,950 | |
| | | | | | | | 436,993 | |
| | | | | | | | | |
| Pharmaceuticals 14.98% | | | | | | | | |
| Aclaris Therapeutics, Inc.* | | | 4,200 | | | $ | 20,916 | |
| Eli Lilly & Co. | | | 1,059 | | | | 586,612 | |
| Intra-Cellular Therapies, Inc.* | | | 1,376 | | | | 68,470 | |
| Merck & Co., Inc. | | | 2,408 | | | | 247,302 | |
| Structure Therapeutics, Inc. Add ADR* | | | 863 | | | | 64,121 | |
| Ventyx Biosciences, Inc.* | | | 3,844 | | | | 55,430 | |
| | | | | | | | 1,042,851 | |
| Total United States | | | | | | | 4,959,944 | |
Total Common Stocks
(cost $6,271,160) | | | | | | | 6,586,738 | |
| Investments | | Principal
Amount | | | U.S. $
Fair Value | |
| SHORT-TERM INVESTMENTS 6.02% | | | | | | | | |
| | | | | | | | | |
| Repurchase Agreements 5.12% | | | | | | | | |
Repurchase Agreement dated 10/31/2023, 2.800% due 11/1/2023 with Fixed Income Clearing Corp. collateralized by $364,400 of U.S. Treasury Note at 5.000% due 10/31/2025; value: $364,101; proceeds: $356,895
(cost $356,867) | | $ | 356,867 | | | $ | 356,867 | |
| | | | | | | | | |
| | | Shares | | | | | |
| | | | | | | | | |
| Money Market Funds 0.81% | | | | | | | | |
Fidelity Government Portfolio(b)
(cost $56,070) | | | 56,070 | | | | 56,070 | |
| | | | | | | | | |
| Time Deposits 0.09% | | | | | | | | |
CitiBank N.A.(b)
(cost $6,230) | | | 6,230 | | | | 6,230 | |
Total Short-Term Investments
(cost $419,167) | | | | | | | 419,167 | |
Total Investments in Securities 100.61%
(cost $6,690,327) | | | | | | | 7,005,905 | |
| Other Assets and Liabilities – Net (0.61)% | | | | | | | (42,146 | ) |
| Net Assets 100.00% | | | | | | $ | 6,963,759 | |
| ADR | | American Depositary Receipt. |
| * | | Non-income producing security. |
| † | | Security was purchased pursuant to Rule 144A under the Securities Act of 1933 and, unless registered under such Act or exempted from registration, may only be resold to qualified institutional buyers. At October 31, 2023, the total value of Rule 144A securities was $61,693, which represents 0.89% of net assets. |
| (a) | | All or a portion of this security is temporarily on loan to unaffiliated broker/dealers. |
| (b) | | Security was purchased with the cash collateral from loaned securities. |
| 82 | See Notes to Financial Statements. |
Schedule of Investments (concluded)
HEALTH CARE FUND October 31, 2023
The following is a summary of the inputs used as of October 31, 2023 in valuing the Fund’s investments carried at fair value(1):
| Investment Type(2) | | Level 1 | | | Level 2 | | | Level 3 | | | Total | |
| Long-Term Investments | | | | | | | | | | | | | | | | |
| Common Stocks | | | | | | | | | | | | | | | | |
| China | | $ | – | | | $ | 44,747 | | | $ | – | | | $ | 44,747 | |
| Denmark | | | – | | | | 454,789 | | | | – | | | | 454,789 | |
| France | | | – | | | | 37,632 | | | | – | | | | 37,632 | |
| Germany | | | 96,843 | | | | 166,532 | | | | – | | | | 263,375 | |
| Japan | | | – | | | | 200,588 | | | | – | | | | 200,588 | |
| Netherlands | | | – | | | | 205,086 | | | | – | | | | 205,086 | |
| Switzerland | | | – | | | | 33,446 | | | | – | | | | 33,446 | |
| United Kingdom | | | – | | | | 248,154 | | | | – | | | | 248,154 | |
| Remaining Countries | | | 5,098,921 | | | | – | | | | – | | | | 5,098,921 | |
| Short-Term Investments | | | | | | | | | | | | | | | | |
| Repurchase Agreements | | | – | | | | 356,867 | | | | – | | | | 356,867 | |
| Money Market Funds | | | 56,070 | | | | – | | | | – | | | | 56,070 | |
| Time Deposits | | | – | | | | 6,230 | | | | – | | | | 6,230 | |
| Total | | $ | 5,251,834 | | | $ | 1,754,071 | | | $ | – | | | $ | 7,005,905 | |
| (1) | | Refer to Note 2(l) for a description of fair value measurements and the three-tier hierarchy of inputs. |
| (2) | | See Schedule of Investments for fair values in each industry and identification of foreign issuers and/or geography. The table above is presented by Investment Type. Countries are presented within an Investment Type should such Investment Type include securities classified as two or more levels within the three-tier fair value hierarchy. When applicable, each Level 3 security is identified on the Schedule of Investments along with the valuation technique utilized. |
A reconciliation of Level 3 investments is presented when the Fund has a material amount of Level 3 investments at the beginning or end of the year in relation to the Fund’s net assets.
| | See Notes to Financial Statements. | 83 |
Schedule of Investments
INTERNATIONAL EQUITY FUND October 31, 2023
| Investments | | Shares | | | U.S. $
Fair Value | |
| LONG-TERM INVESTMENTS 93.96% | | | | | | | | |
| COMMON STOCKS 93.96% | | | | | | | | |
| | | | | | | | | |
| Australia 1.70% | | | | | | | | |
| | | | | | | | | |
| Metals & Mining | | | | | | | | |
| BHP Group Ltd. | | | 177,654 | | | $ | 5,028,935 | |
| | | | | | | | | |
| Brazil 0.73% | | | | | | | | |
| | | | | | | | | |
| Broadline Retail | | | | | | | | |
| MercadoLibre, Inc.* | | | 1,732 | | | | 2,148,962 | |
| | | | | | | | | |
| Canada 3.10% | | | | | | | | |
| | | | | | | | | |
| Consumer Staples Distribution & Retail 1.13% | | | | | | | | |
| Alimentation Couche-Tard, Inc. | | | 61,200 | | | | 3,331,522 | |
| | | | | | | | | |
| Ground Transportation 0.81% | | | | | | | | |
| Canadian Pacific Kansas City Ltd. | | | 33,775 | | | | 2,398,043 | |
| | | | | | | | | |
| Metals & Mining 0.67% | | | | | | | | |
| Teck Resources Ltd. Class B | | | 56,159 | | | | 1,984,659 | |
| | | | | | | | | |
| Oil, Gas & Consumable Fuels 0.49% | | | | | | | | |
| Imperial Oil Ltd. | | | 25,400 | | | | 1,447,530 | |
| Total Canada | | | | | | | 9,161,754 | |
| | | | | | | | | |
| China 4.34% | | | | | | | | |
| | | | | | | | | |
| Automobiles 0.74% | | | | | | | | |
| BYD Co. Ltd. Class H | | | 71,824 | | | | 2,184,175 | |
| | | | | | | | | |
| Beverages 0.59% | | | | | | | | |
| Kweichow Moutai Co. Ltd. Class A | | | 7,600 | | | | 1,750,308 | |
| | | | | | | | | |
| Broadline Retail 1.99% | | | | | | | | |
| Alibaba Group Holding Ltd.* | | | 432,000 | | | | 4,447,471 | |
| PDD Holdings, Inc. ADR* | | | 14,135 | | | | 1,433,572 | |
| | | | | | | | 5,881,043 | |
| Investments | | Shares | | | U.S. $
Fair Value | |
| China (continued) | | | | | | | | |
| | | | | | | | | |
| Interactive Media & Services 1.02% | | | | | | | | |
| Tencent Holdings Ltd. | | | 81,100 | | | $ | 3,001,408 | |
| Total China | | | | | | | 12,816,934 | |
| | | | | | | | | |
| Denmark 3.31% | | | | | | | | |
| | | | | | | | | |
| Pharmaceuticals | | | | | | | | |
| Novo Nordisk AS Class B | | | 101,391 | | | | 9,781,819 | |
| | | | | | | | | |
| France 12.56% | | | | | | | | |
| | | | | | | | | |
| Aerospace & Defense 0.96% | | | | | | | | |
| Airbus SE | | | 21,106 | | | | 2,829,811 | |
| | | | | | | | | |
| Banks 1.01% | | | | | | | | |
| BNP Paribas SA | | | 51,972 | | | | 2,988,598 | |
| | | | | | | | | |
| Beverages 0.88% | | | | | | | | |
| Pernod Ricard SA | | | 14,656 | | | | 2,602,559 | |
| | | | | | | | | |
| Building Products 0.89% | | | | | | | | |
| Cie de Saint-Gobain SA | | | 48,521 | | | | 2,641,200 | |
| | | | | | | | | |
| Chemicals 1.11% | | | | | | | | |
| Air Liquide SA | | | 19,174 | | | | 3,285,506 | |
| | | | | | | | | |
| Hotels, Restaurants & Leisure 0.81% | | | | | | | | |
| Accor SA | | | 75,384 | | | | 2,404,946 | |
| | | | | | | | | |
| Insurance 1.18% | | | | | | | | |
| AXA SA | | | 117,105 | | | | 3,469,871 | |
| | | | | | | | | |
| Oil, Gas & Consumable Fuels 1.78% | | | | | | | | |
| TotalEnergies SE | | | 78,397 | | | | 5,241,427 | |
| | | | | | | | | |
| Personal Care Products 1.74% | | | | | | | | |
| L’Oreal SA | | | 12,250 | | | | 5,149,048 | |
| | | | | | | | | |
| Textiles, Apparel & Luxury Goods 2.20% | | | | | | | | |
| Hermes International SCA | | | 1,050 | | | | 1,959,116 | |
| LVMH Moet Hennessy Louis Vuitton SE | | | 6,320 | | | | 4,524,680 | |
| | | | | | | | 6,483,796 | |
| Total France | | | | | | | 37,096,762 | |
| 84 | See Notes to Financial Statements. |
Schedule of Investments (continued)
INTERNATIONAL EQUITY FUND October 31, 2023
| Investments | | Shares | | | U.S. $
Fair Value | |
| Germany 6.31% | | | | | | | | |
| | | | | | | | | |
| Diversified Telecommunication Services 1.55% | | | |
| Deutsche Telekom AG | | | 211,596 | | | $ | 4,592,408 | |
| | | | | | | | | |
| Insurance 1.85% | | | | | | | | |
| Muenchener Rueckversicherungs-Gesellschaft AG in Muenchen | | | 13,599 | | | | 5,457,387 | |
| | | | | | | | | |
| Life Sciences Tools & Services 1.53% | | | | | | | | |
| Gerresheimer AG | | | 23,776 | | | | 2,217,664 | |
| Schott Pharma AG & Co. KGaA* | | | 79,737 | | | | 2,311,731 | |
| | | | | | | | 4,529,395 | |
| | | | | | | | | |
| Software 1.38% | | | | | | | | |
| SAP SE | | | 30,384 | | | | 4,075,477 | |
| Total Germany | | | | | | | 18,654,667 | |
| | | | | | | | | |
| Greece 0.62% | | | | | | | | |
| | | | | | | | | |
| Banks | | | | | | | | |
| National Bank of Greece SA* | | | 319,558 | | | | 1,830,221 | |
| | | | | | | | | |
| India 4.14% | | | | | | | | |
| | | | | | | | | |
| Automobiles 0.79% | | | | | | | | |
| Maruti Suzuki India Ltd. | | | 18,661 | | | | 2,330,322 | |
| | | | | | | | | |
| Banks 1.79% | | | | | | | | |
| Federal Bank Ltd. | | | 1,253,918 | | | | 2,119,244 | |
| ICICI Bank Ltd. ADR | | | 142,669 | | | | 3,165,825 | |
| | | | | | | | 5,285,069 | |
| | | | | | | | | |
| Oil, Gas & Consumable Fuels 0.75% | | | | | | | | |
| Reliance Industries Ltd. | | | 80,938 | | | | 2,225,615 | |
| | | | | | | | | |
| Wireless Telecommunication Services 0.81% | | | | |
| Bharti Airtel Ltd. | | | 217,266 | | | | 2,386,147 | |
| Total India | | | | | | | 12,227,153 | |
| Investments | | Shares | | | U.S. $
Fair Value | |
| Indonesia 0.76% | | | | | | | | |
| | | | | | | | | |
| Banks | | | | | | | | |
| Bank Negara Indonesia Persero Tbk. PT | | | 7,470,200 | | | $ | 2,254,406 | |
| | | | | | | | | |
| Ireland 0.71% | | | | | | | | |
| | | | | | | | | |
| Banks | | | | | | | | |
| Bank of Ireland Group PLC | | | 235,115 | | | | 2,107,034 | |
| | | | | | | | | |
| Italy 2.82% | | | | | | | | |
| | | | | | | | | |
| Banks 1.21% | | | | | | | | |
| UniCredit SpA | | | 142,581 | | | | 3,574,451 | |
| | | | | | | | | |
| Electric: Utilities 1.03% | | | | | | | | |
| Enel SpA | | | 478,358 | | | | 3,036,416 | |
| | | | | | | | | |
| Life Sciences Tools & Services 0.58% | | | | | | | | |
| Stevanato Group SpA | | | 61,316 | | | | 1,713,782 | |
| Total Italy | | | | | | | 8,324,649 | |
| | | | | | | | | |
| Japan 18.06% | | | | | | | | |
| | | | | | | | | |
| Automobile Components 0.86% | | | | | | | | |
| Denso Corp. | | | 171,600 | | | | 2,533,903 | |
| | | | | | | | | |
| Automobiles 1.79% | | | | | | | | |
| Toyota Motor Corp. | | | 302,100 | | | | 5,284,859 | |
| | | | | | | | | |
| Banks 1.79% | | | | | | | | |
| Sumitomo Mitsui Financial Group, Inc. | | | 109,707 | | | | 5,288,752 | |
| | | | | | | | | |
| Beverages 0.91% | | | | | | | | |
| Asahi Group Holdings Ltd. | | | 74,557 | | | | 2,696,756 | |
| | | | | | | | | |
| Broadline Retail 0.64% | | | | | | | | |
| Pan Pacific International Holdings Corp. | | | 96,900 | | | | 1,876,551 | |
| | | | | | | | | |
| Electrical Equipment 0.55% | | | | | | | | |
| Fuji Electric Co. Ltd. | | | 42,863 | | | | 1,631,992 | |
| | See Notes to Financial Statements. | 85 |
Schedule of Investments (continued)
INTERNATIONAL EQUITY FUND October 31, 2023
| Investments | | Shares | | | U.S. $
Fair Value | |
| Japan (continued) | | | | | | | | |
| | | | | | | | | |
| Electronic Equipment, Instruments & Components 1.10% | |
| Ibiden Co. Ltd. | | | 37,400 | | | $ | 1,594,603 | |
| Murata Manufacturing Co. Ltd. | | | 96,200 | | | | 1,647,846 | |
| | | | | | | | 3,242,449 | |
| | | | | | | | | |
| Entertainment 0.49% | | | | | | | | |
| Capcom Co. Ltd. | | | 44,600 | | | | 1,435,644 | |
| | | | | | | | | |
| Household Durables 1.26% | | | | | | | | |
| Sony Group Corp. | | | 44,800 | | | | 3,724,620 | |
| | | | | | | | | |
| Industrial Conglomerates 1.59% | | | | | | | | |
| Hitachi Ltd. | | | 74,200 | | | | 4,703,284 | |
| | | | | | | | | |
| Information Technology Services 0.51% | | | | | | | | |
| Obic Co. Ltd. | | | 10,200 | | | | 1,507,726 | |
| | | | | | | | | |
| Insurance 0.83% | | | | | | | | |
| Sompo Holdings, Inc. | | | 56,900 | | | | 2,464,905 | |
| | | | | | | | | |
| Machinery 0.64% | | | | | | | | |
| Ebara Corp. | | | 42,484 | | | | 1,881,342 | |
| | | | | | | | | |
| Personal Care Products 0.51% | | | | | | | | |
| Shiseido Co. Ltd. | | | 47,500 | | | | 1,506,485 | |
| | | | | | | | | |
| Professional Services 0.49% | | | | | | | | |
| TechnoPro Holdings, Inc. | | | 73,400 | | | | 1,454,115 | |
| | | | | | | | | |
| Real Estate Management & Development 0.62% | | | |
| Mitsubishi Estate Co. Ltd. | | | 142,115 | | | | 1,819,117 | |
| | | | | | | | | |
| Semiconductors & Semiconductor Equipment 1.01% | |
| Advantest Corp. | | | 41,200 | | | | 1,061,255 | |
| Tokyo Electron Ltd. | | | 14,600 | | | | 1,929,210 | |
| | | | | | | | 2,990,465 | |
| | | | | | | | | |
| Trading Companies & Distributors 2.47% | | | | | | | | |
| ITOCHU Corp. | | | 128,656 | | | | 4,634,321 | |
| Mitsubishi Corp. | | | 57,200 | | | | 2,666,409 | |
| | | | | | | | 7,300,730 | |
| Total Japan | | | | | | | 53,343,695 | |
| Investments | | Shares | | | U.S. $
Fair Value | |
| Mexico 1.74% | | | | | | | | |
| | | | | | | | | |
| Banks 1.09% | | | | | | | | |
| Grupo Financiero Banorte SAB de CV Class O | | 396,417 | | | $ | 3,217,246 | |
| | | | | | | | | |
| Real Estate Management & Development 0.65% | |
| Corp. Inmobiliaria Vesta SAB de CV ADR | | | 61,000 | | | | 1,917,840 | |
| Total Mexico | | | | | | | 5,135,086 | |
| | | | | | | | | |
| Netherlands 6.15% | | | | | | | | |
| | | | | | | | | |
| Banks 1.40% | | | | | | | | |
| ING Groep NV | | | 322,642 | | | | 4,136,440 | |
| | | | | | | | | |
| Biotechnology 0.36% | | | | | | | | |
| Argenx SE ADR* | | | 2,283 | | | | 1,072,028 | |
| | | | | | | | | |
| Oil, Gas & Consumable Fuels 2.68% | | | | | |
| Shell PLC | | | 246,035 | | | | 7,928,927 | |
| | | | | | | | | |
| Semiconductors & Semiconductor Equipment 1.71% | |
| ASML Holding NV | | | 8,392 | | | | 5,044,603 | |
| Total Netherlands | | | | | | | 18,181,998 | |
| | | | | | | | | |
| Peru 0.62% | | | | | | | | |
| | | | | | | | | |
| Banks | | | | | | | | |
| Credicorp Ltd. | | | 14,741 | | | | 1,842,035 | |
| | | | | | | | | |
| Philippines 0.70% | | | | | | | | |
| | | | | | | | | |
| Banks | | | | | | | | |
| BDO Unibank, Inc. | | | 915,190 | | | | 2,060,068 | |
| | | | | | | | | |
| Singapore 0.88% | | | | | | | | |
| | | | | | | | | |
| Banks | | | | | | | | |
| United Overseas Bank Ltd. | | | 131,900 | | | | 2,601,686 | |
| | | | | | | | | |
| South Korea 1.65% | | | | | | | | |
| | | | | | | | | |
| Technology Hardware, Storage & Peripherals | | |
| Samsung Electronics Co. Ltd. | | | 97,659 | | | | 4,860,965 | |
| 86 | See Notes to Financial Statements. |
Schedule of Investments (continued)
INTERNATIONAL EQUITY FUND October 31, 2023
| Investments | | Shares | | | U.S. $
Fair Value | |
| Spain 1.94% | | | | | | | | |
| | | | | | | | | |
| Banks 1.03% | | | | | | | | |
| CaixaBank SA | | | 752,526 | | | $ | 3,059,424 | |
| | | | | | | | | |
| Specialty Retail 0.91% | | | | | | | | |
| Industria de Diseno Textil SA | | | 77,549 | | | | 2,676,834 | |
| Total Spain | | | | | | | 5,736,258 | |
| | | | | | | | | |
| Sweden 1.61% | | | | | | | | |
| | | | | | | | | |
| Automobile Components 0.59% | | | | | | | | |
| Autoliv, Inc. SDR | | | 18,734 | | | | 1,730,153 | |
| | | | | | | | | |
| Machinery 1.02% | | | | | | | | |
| Atlas Copco AB Class A | | | 232,458 | | | | 3,010,103 | |
| Total Sweden | | | | | | | 4,740,256 | |
| | | | | | | | | |
| Switzerland 2.83% | | | | | | | | |
| | | | | | | | | |
| Health Care Equipment & Supplies 0.92% | | | | | | | | |
| Alcon, Inc. | | | 37,762 | | | | 2,702,858 | |
| | | | | | | | | |
| Machinery 0.50% | | | | | | | | |
| VAT Group AG† | | | 4,200 | | | | 1,489,402 | |
| | | | | | | | | |
| Pharmaceuticals 1.41% | | | | | | | | |
| Novartis AG Registered Shares | | | 44,553 | | | | 4,171,032 | |
| Total Switzerland | | | | | | | 8,363,292 | |
| | | | | | | | | |
| Taiwan 3.54% | | | | | | | | |
| | | | | | | | | |
| Electronic Equipment, Instruments & Components 0.42% | |
| Unimicron Technology Corp. | | | 279,000 | | | | 1,244,315 | |
| | | | | | | | | |
| Semiconductors & Semiconductor Equipment 3.12% | | | |
| Realtek Semiconductor Corp. | | | 121,000 | | | | 1,508,007 | |
| Taiwan Semiconductor Manufacturing Co. Ltd. | | | 471,182 | | | | 7,695,583 | |
| | | | | | | | 9,203,590 | |
| Total Taiwan | | | | | | | 10,447,905 | |
| Investments | | Shares | | | U.S. $
Fair Value | |
| United Kingdom 5.93% | | | | | | | | |
| | | | | | | | | |
| Banks 1.34% | | | | | | | | |
| HSBC Holdings PLC | | | 546,424 | | | $ | 3,945,408 | |
| | | | | | | | | |
| Electric: Utilities 0.94% | | | | | | | | |
| SSE PLC | | | 140,415 | | | | 2,790,545 | |
| | | | | | | | | |
| Oil, Gas & Consumable Fuels 0.61% | | | | | | | | |
| BP PLC | | | 294,545 | | | | 1,798,496 | |
| | | | | | | | | |
| Personal Care Products 0.66% | | | | | | | | |
| Unilever PLC | | | 41,472 | | | | 1,964,140 | |
| | | | | | | | | |
| Pharmaceuticals 1.66% | | | | | | | | |
| AstraZeneca PLC | | | 39,143 | | | | 4,900,845 | |
| | | | | | | | | |
| Trading Companies & Distributors 0.72% | | | | | | | | |
| Ashtead Group PLC | | | 36,896 | | | | 2,116,075 | |
| Total United Kingdom | | | | | | | 17,515,509 | |
| | | | | | | | | |
| United States 7.21% | | | | | | | | |
| | | | | | | | | |
| Construction Materials 1.50% | | | | | | | | |
| CRH PLC | | | 82,564 | | | | 4,430,948 | |
| | | | | | | | | |
| Electrical Equipment 1.37% | | | | | | | | |
| Schneider Electric SE | | | 26,282 | | | | 4,043,678 | |
| | | | | | | | | |
| Food Products 0.93% | | | | | | | | |
| Nestle SA Registered Shares | | | 25,606 | | | | 2,761,318 | |
| | | | | | | | | |
| Pharmaceuticals 2.76% | | | | | | | | |
| Eli Lilly & Co. | | | 8,489 | | | | 4,702,312 | |
| Sanofi SA | | | 38,142 | | | | 3,463,531 | |
| | | | | | | | 8,165,843 | |
| | | | | | | | | |
| Semiconductors & Semiconductor Equipment 0.65% | | |
| NVIDIA Corp. | | | 4,681 | | | | 1,908,912 | |
| Total United States | | | | | | | 21,310,699 | |
Total Common Stocks
(cost $260,394,060) | | | | | | | 277,572,748 | |
| | See Notes to Financial Statements. | 87 |
Schedule of Investments (concluded)
INTERNATIONAL EQUITY FUND October 31, 2023
| Investments | | Principal
Amount | | | U.S. $
Fair Value | |
| SHORT-TERM INVESTMENTS 6.33% | | | | | | | | |
| | | | | | | | | |
| Repurchase Agreements 6.33% | | | | | | | | |
Repurchase Agreement dated 10/31/2023, 2.800% due 11/1/2023 with Fixed Income Clearing Corp. collateralized by $19,097,800 of U.S. Treasury Note at 5.000% due 10/31/2025; value: $19,082,134; proceeds: $18,709,385
(cost $18,707,930) | | $ | 18,707,930 | | | $ | 18,707,930 | |
Total Investments in Securities 100.29%
(cost $279,101,990) | | | | | | | 296,280,678 | |
| Other Assets and Liabilities – Net (0.29)% | | | | | | | (851,277 | ) |
| Net Assets 100.00% | | | | | | $ | 295,429,401 | |
| | | |
| | | |
| ADR | | American Depositary Receipt. |
| SDR | | Swedish Depository Receipt. |
| * | | Non-income producing security. |
| † | | Security was purchased pursuant to Rule 144A under the Securities Act of 1933 and, unless registered under such Act or exempted from registration, may only be resold to qualified institutional buyers. At October 31, 2023, the total value of Rule 144A securities was $1,489,402, which represents 0.50% of net assets. |
The following is a summary of the inputs used as of October 31, 2023 in valuing the Fund’s investments carried at fair value(1):
| Investment Type(2) | | Level 1 | | | Level 2 | | | Level 3 | | | Total | |
| Long-Term Investments | | | | | | | | | | | | | | | | |
| Common Stocks | | | | | | | | | | | | | | | | |
| Brazil | | $ | 2,148,962 | | | $ | – | | | $ | – | | | $ | 2,148,962 | |
| Canada | | | 9,161,754 | | | | – | | | | – | | | | 9,161,754 | |
| China | | | 1,433,572 | | | | 11,383,362 | | | | – | | | | 12,816,934 | |
| Germany | | | 2,311,731 | | | | 16,342,936 | | | | – | | | | 18,654,667 | |
| India | | | 3,165,825 | | | | 9,061,328 | | | | – | | | | 12,227,153 | |
| Italy | | | 1,713,782 | | | | 6,610,867 | | | | – | | | | 8,324,649 | |
| Mexico | | | 5,135,086 | | | | – | | | | – | | | | 5,135,086 | |
| Netherlands | | | 1,072,028 | | | | 17,109,970 | | | | – | | | | 18,181,998 | |
| Peru | | | 1,842,035 | | | | – | | | | – | | | | 1,842,035 | |
| United States | | | 6,611,224 | | | | 14,699,475 | | | | – | | | | 21,310,699 | |
| Remaining Countries | | | – | | | | 167,768,811 | | | | – | | | | 167,768,811 | |
| Short-Term Investments | | | | | | | | | | | | | | | | |
| Repurchase Agreements | | | – | | | | 18,707,930 | | | | – | | | | 18,707,930 | |
| Total | | $ | 34,595,999 | | | $ | 261,684,679 | | | $ | – | | | $ | 296,280,678 | |
| (1) | | Refer to Note 2(l) for a description of fair value measurements and the three-tier hierarchy of inputs. |
| (2) | | See Schedule of Investments for fair values in each industry and identification of foreign issuers and/or geography. The table above is presented by Investment Type. Countries are presented within an Investment Type should such Investment Type include securities classified as two or more levels within the three-tier fair value hierarchy. When applicable, each Level 3 security is identified on the Schedule of Investments along with the valuation technique utilized. |
A reconciliation of Level 3 investments is presented when the Fund has a material amount of Level 3 investments at the beginning or end of the year in relation to the Fund’s net assets.
| 88 | See Notes to Financial Statements. |
Schedule of Investments
INTERNATIONAL OPPORTUNITIES FUND October 31, 2023
| Investments | | Shares | | | U.S. $
Fair Value | |
| LONG-TERM INVESTMENTS 94.28% | | | | | | | | |
| COMMON STOCKS 94.23% | | | | | | | | |
| | | | | | | | | |
| Australia 1.41% | | | | | | | | |
| | | | | | | | | |
| Automobile Components 0.68% | | | | | | | | |
| GUD Holdings Ltd. | | | 291,750 | | | $ | 1,983,988 | |
| | | | | | | | | |
| Professional Services 0.73% | | | | | | | | |
| IPH Ltd. | | | 486,914 | | | | 2,115,984 | |
| Total Australia | | | | | | | 4,099,972 | |
| | | | | | | | | |
| Austria 2.54% | | | | | | | | |
| | | | | | | | | |
| Banks 1.02% | | | | | | | | |
| BAWAG Group AG† | | | 66,863 | | | | 2,978,104 | |
| | | | | | | | | |
| Machinery 1.52% | | | | | | | | |
| ANDRITZ AG | | | 96,093 | | | | 4,423,074 | |
| Total Austria | | | | | | | 7,401,178 | |
| | | | | | | | | |
| Belgium 0.98% | | | | | | | | |
| | | | | | | | | |
| Health Care REITS 0.45% | | | | | | | | |
| Aedifica SA | | | 24,054 | | | | 1,312,279 | |
| | | | | | | | | |
| Industrial REITS 0.53% | | | | | | | | |
| Warehouses De Pauw CVA | | | 62,631 | | | | 1,549,648 | |
| Total Belgium | | | | | | | 2,861,927 | |
| | | | | | | | | |
| Canada 5.54% | | | | | | | | |
| | | | | | | | | |
| Capital Markets 0.56% | | | | | | | | |
| CI Financial Corp.(a) | | | 180,600 | | | | 1,637,023 | |
| | | | | | | | | |
| Gas Utilities 0.57% | | | | | | | | |
| Brookfield Infrastructure Corp. Class A | | 64,589 | | | | 1,663,222 | |
| | | | | | | | | |
| Metals & Mining 1.89% | | | | | | | | |
| Alamos Gold, Inc. Class A | | | 306,529 | | | | 3,795,279 | |
| Capstone Copper Corp.* | | | 501,400 | | | | 1,706,586 | |
| | | | | | | | 5,501,865 | |
| | | | | | | | | |
| Oil, Gas & Consumable Fuels 1.35% | | | | | | | | |
| MEG Energy Corp.* | | | 198,600 | | | | 3,924,024 | |
| Investments | | Shares | | | U.S. $
Fair Value | |
| Canada (continued) | | | | | | | | |
| | | | | | | | | |
| Paper & Forest Products 0.63% | | | | | | | | |
| Interfor Corp.* | | | 148,100 | | | $ | 1,827,288 | |
| | | | | | | | | |
| Real Estate Management & Development 0.54% | | | | | |
| Tricon Residential, Inc. | | | 237,000 | | | | 1,570,600 | |
| Total Canada | | | | | | | 16,124,022 | |
| | | | | | | | | |
| China 0.47% | | | | | | | | |
| | | | | | | | | |
| Marine Transportation | | | | | | | | |
| SITC International Holdings Co. Ltd. | | | 897,000 | | | | 1,381,743 | |
| | | | | | | | | |
| Egypt 0.47% | | | | | | | | |
| | | | | | | | | |
| Oil, Gas & Consumable Fuels | | | | | | | | |
| Energean PLC | | | 130,956 | | | | 1,356,132 | |
| | | | | | | | | |
| France 5.19% | | | | | | | | |
| | | | | | | | | |
| Beverages 0.74% | | | | | | | | |
| Remy Cointreau SA(a) | | | 18,956 | | | | 2,153,794 | |
| | | | | | | | | |
| Construction Materials 0.87% | | | | | | | | |
| Vicat SACA | | | 82,844 | | | | 2,543,588 | |
| | | | | | | | | |
| Entertainment 1.02% | | | | | | | | |
| Ubisoft Entertainment SA* | | | 104,284 | | | | 2,973,531 | |
| | | | | | | | | |
| Oil, Gas & Consumable Fuels 1.09% | | | | | | | |
| Gaztransport Et Technigaz SA | | | 24,813 | | | | 3,173,831 | |
| | | | | | | | | |
| Personal Care Products 0.99% | | | | | | | | |
| Interparfums SA | | | 60,651 | | | | 2,865,025 | |
| | | | | | | | | |
| Software 0.48% | | | | | | | | |
| Esker SA | | | 10,875 | | | | 1,380,367 | |
| Total France | | | | | | | 15,090,136 | |
| | | | | | | | | |
| Germany 5.36% | | | | | | | | |
| | | | | | | | | |
| Aerospace & Defense 0.52% | | | | | | | | |
| Montana Aerospace AG†* | | | 124,834 | | | | 1,502,028 | |
| | | | | | | | | |
| Life Sciences Tools & Services 1.49% | | | | | | | |
| Gerresheimer AG | | | 46,367 | | | | 4,324,799 | |
| | See Notes to Financial Statements. | 89 |
Schedule of Investments (continued)
INTERNATIONAL OPPORTUNITIES FUND October 31, 2023
| Investments | | Shares | | | U.S. $
Fair Value | |
| Germany (continued) | | | | | | | | |
| | | | | | | | | |
| Media 1.20% | | | | | | | | |
| Stroeer SE & Co. KGaA | | | 76,136 | | | $ | 3,483,394 | |
| | | | | | | | | |
| Semiconductors & Semiconductor Equipment 0.57% | | | |
| AIXTRON SE | | | 59,078 | | | | 1,660,136 | |
| | | | | | | | | |
| Wireless Telecommunication Services 1.58% | | | | | |
| Freenet AG | | | 181,579 | | | | 4,609,001 | |
| Total Germany | | | | | | | 15,579,358 | |
| | | | | | | | | |
| Hong Kong 0.20% | | | | | | | | |
| | | | | | | | | |
| Hotels, Restaurants & Leisure | | | | | | | | |
| Melco International Development Ltd.* | | | 842,000 | | | | 588,552 | |
| | | | | | | | | |
| Iceland 0.50% | | | | | | | | |
| | | | | | | | | |
| Machinery | | | | | | | | |
| Marel Hf.† | | | 537,909 | | | | 1,462,745 | |
| | | | | | | | | |
| India 2.75% | | | | | | | | |
| | | | | | | | | |
| Banks 1.30% | | | | | | | | |
| Federal Bank Ltd. | | | 2,231,557 | | | | 3,771,549 | |
| | | | | | | | | |
| Commercial Services & Supplies 0.82% | | | | | |
| CMS Info Systems Ltd. | | | 533,241 | | | | 2,402,632 | |
| | | | | | | | | |
| Real Estate Management & Development 0.63% | | | | | |
| Phoenix Mills Ltd. | | | 83,757 | | | | 1,826,214 | |
| Total India | | | | | | | 8,000,395 | |
| | | | | | | | | |
| Indonesia 1.96% | | | | | | | | |
| | | | | | | | | |
| Banks 1.10% | | | | | | | | |
| Bank Tabungan Negara Persero Tbk. PT | | 41,619,000 | | | | 3,210,797 | |
| | | | | | | | | |
| Real Estate Management & Development 0.86% | | | | | |
| Pakuwon Jati Tbk. PT | | | 98,687,500 | | | | 2,483,896 | |
| Total Indonesia | | | | | | | 5,694,693 | |
| | | | | | | | | |
| Ireland 1.07% | | | | | | | | |
| | | | | | | | | |
| Hotels, Restaurants & Leisure | | | | | | | | |
| Dalata Hotel Group PLC | | | 735,428 | | | | 3,120,408 | |
| Investments | | Shares | | | U.S. $
Fair Value | |
| Israel 0.60% | | | | | | | | |
| | | | | | | | | |
| Capital Markets | | | | | | | | |
| Tel Aviv Stock Exchange Ltd.* | | | 392,094 | | | $ | 1,744,275 | |
| | | | | | | | | |
| Italy 2.87% | | | | | | | | |
| | | | | | | | | |
| Automobile Components 0.36% | | | | | | | | |
| Brembo SpA | | | 96,759 | | | | 1,041,097 | |
| | | | | | | | | |
| Construction Materials 0.33% | | | | | | | | |
| Buzzi SpA | | | 36,569 | | | | 968,317 | |
| | | | | | | | | |
| Financial Services 0.90% | | | | | | | | |
| Banca Mediolanum SpA | | | 320,522 | | | | 2,617,239 | |
| | | | | | | | | |
| Textiles, Apparel & Luxury Goods 1.28% | | | | | | |
| Brunello Cucinelli SpA | | | 46,149 | | | | 3,712,120 | |
| Total Italy | | | | | | | 8,338,773 | |
| | | | | | | | | |
| Japan 27.42% | | | | | | | | |
| | | | | | | | | |
| Banks 0.91% | | | | | | | | |
| Shizuoka Financial Group, Inc. | | | 312,600 | | | | 2,658,272 | |
| | | | | | | | | |
| Beverages 1.19% | | | | | | | | |
| Coca-Cola Bottlers Japan Holdings, Inc. | | 258,400 | | | | 3,464,771 | |
| | | | | | | | | |
| Building Products 1.49% | | | | | | | | |
| Sanwa Holdings Corp. | | | 322,200 | | | | 4,347,203 | |
| | | | | | | | | |
| Chemicals 2.60% | | | | | | | | |
| Aica Kogyo Co. Ltd. | | | 148,200 | | | | 3,404,978 | |
| Kansai Paint Co. Ltd. | | | 284,900 | | | | 4,169,426 | |
| | | | | | | | 7,574,404 | |
| | | | | | | | | |
| Construction & Engineering 1.04% | | | | | | | | |
| SHO-BOND Holdings Co. Ltd. | | | 76,800 | | | | 3,024,618 | |
| | | | | | | | | |
| Distributors 1.63% | | | | | | | | |
| PALTAC Corp. | | | 146,300 | | | | 4,742,531 | |
| 90 | See Notes to Financial Statements. | |
Schedule of Investments (continued)
INTERNATIONAL OPPORTUNITIES FUND October 31, 2023
| Investments | | Shares | | | U.S. $
Fair Value | |
| Japan (continued) | | | | | | | | |
| | | | | | | | | |
| Food Products 1.61% | | | | | | | | |
| Nichirei Corp. | | | 216,500 | | | $ | 4,685,931 | |
| | | | | | | | | |
| Health Care Equipment & Supplies 0.55% | | | | | |
| Nakanishi, Inc. | | | 72,500 | | | | 1,592,334 | |
| | | | | | | | | |
| Hotels, Restaurants & Leisure 1.57% | | | | | | |
| Saizeriya Co. Ltd. | | | 112,600 | | | | 4,575,117 | |
| | | | | | | | | |
| Industrial REITS 1.04% | | | | | | | | |
| GLP J-Reit | | | 3,387 | | | | 3,033,590 | |
| | | | | | | | | |
| Information Technology Services 3.71% | | | | | |
| NS Solutions Corp. | | | 150,400 | | | | 4,367,539 | |
| Simplex Holdings, Inc. | | | 252,100 | | | | 4,234,283 | |
| Zuken, Inc. | | | 87,800 | | | | 2,193,952 | |
| | | | | | | | 10,795,774 | |
| | | | | | | | | |
| Machinery 2.98% | | | | | | | | |
| DMG Mori Co. Ltd. | | | 178,200 | | | | 2,947,429 | |
| Fujitec Co. Ltd. | | | 106,900 | | | | 2,320,810 | |
| OSG Corp. | | | 297,300 | | | | 3,392,366 | |
| | | | | | | | 8,660,605 | |
| | | | | | | | | |
| Media 0.65% | | | | | | | | |
| Kadokawa Corp. | | | 97,800 | | | | 1,883,923 | |
| | | | | | | | | |
| Professional Services 0.81% | | | | | | | | |
| TechnoPro Holdings, Inc. | | | 118,200 | | | | 2,341,641 | |
| | | | | | | | | |
| Semiconductors & Semiconductor Equipment 1.41% | | | |
| Ferrotec Holdings Corp. | | | 107,200 | | | | 1,884,272 | |
| Kokusai Electric Corp.* | | | 136,000 | | | | 2,216,197 | |
| | | | | | | | 4,100,469 | |
| | | | | | | | | |
| Software 2.50% | | | | | | | | |
| Money Forward, Inc.* | | | 107,400 | | | | 2,712,712 | |
| OBIC Business Consultants Co. Ltd. | | | 106,100 | | | | 4,558,068 | |
| | | | | | | | 7,270,780 | |
| | | | | | | | | |
| Wireless Telecommunication Services 1.73% | | | | | |
| Okinawa Cellular Telephone Co. | | | 237,200 | | | | 5,016,911 | |
| Total Japan | | | | | | | 79,768,874 | |
| Investments | | Shares | | | U.S. $
Fair Value | |
| Mexico 2.72% | | | | | | | | |
| | | | | | | | | |
| Capital Markets 0.57% | | | | | | | | |
| Bolsa Mexicana de Valores SAB de CV | | | 1,063,700 | | | $ | 1,658,473 | |
| | | | | | | | | |
| Consumer Finance 0.73% | | | | | | | | |
| Gentera SAB de CV | | | 2,002,820 | | | | 2,124,018 | |
| | | | | | | | | |
| Real Estate Management & Development 1.42% | | | | |
| Corp. Inmobiliaria Vesta SAB de CV | | | 655,800 | | | | 2,056,263 | |
| Corp. Inmobiliaria Vesta SAB de CV ADR | | | 65,866 | | | | 2,070,827 | |
| | | | | | | | 4,127,090 | |
| Total Mexico | | | | | | | 7,909,581 | |
| | | | | | | | | |
| Netherlands 0.39% | | | | | | | | |
| | | | | | | | | |
| Semiconductors & Semiconductor Equipment | | | | | |
| BE Semiconductor Industries NV | | | 11,127 | | | | 1,149,416 | |
| | | | | | | | | |
| New Zealand 1.12% | | | | | | | | |
| | | | | | | | | |
| Passenger Airlines | | | | | | | | |
| Air New Zealand Ltd. | | | 8,339,526 | | | | 3,255,266 | |
| | | | | | | | | |
| Peru 0.58% | | | | | | | | |
| | | | | | | | | |
| Banks | | | | | | | | |
| Intercorp Financial Services, Inc. | | | 89,356 | | | | 1,678,106 | |
| | | | | | | | | |
| Portugal 1.85% | | | | | | | | |
| | | | | | | | | |
| Multi-Utilities | | | | | | | | |
| REN - Redes Energeticas Nacionais SGPS SA | | | 2,064,820 | | | | 5,375,633 | |
| | | | | | | | | |
| South Korea 1.91% | | | | | | | | |
| | | | | | | | | |
| Chemicals 1.01% | | | | | | | | |
| Soulbrain Co. Ltd. | | | 16,998 | | | | 2,935,269 | |
| | | | | | | | | |
| Semiconductors & Semiconductor Equipment 0.90% | | | |
| WONIK IPS Co. Ltd. | | | 116,798 | | | | 2,611,497 | |
| Total South Korea | | | | | | | 5,546,766 | |
| | See Notes to Financial Statements. | 91 |
Schedule of Investments (continued)
INTERNATIONAL OPPORTUNITIES FUND October 31, 2023
| Investments | | Shares | | | U.S. $
Fair Value | |
| Spain 3.22% | | | | | | | | |
| | | | | | | | | |
| Banks 1.23% | | | | | | | | |
| Banco de Sabadell SA | | | 2,879,641 | | | $ | 3,580,527 | |
| | | | | | | | | |
| Containers & Packaging 1.05% | | | | | | | | |
| Vidrala SA | | | 40,903 | | | | 3,040,123 | |
| | | | | | | | | |
| Professional Services 0.94% | | | | | | | | |
| Applus Services SA | | | 260,637 | | | | 2,744,012 | |
| Total Spain | | | | | | | 9,364,662 | |
| | | | | | | | | |
| Sweden 2.75% | | | | | | | | |
| Automobile Components 1.12% | | | | | | | | |
| Autoliv, Inc. SDR | | | 35,136 | | | | 3,244,937 | |
| | | | | | | | | |
| Commercial Services & Supplies 1.10% | | | | | | |
| Loomis AB | | | 123,312 | | | | 3,203,304 | |
| | | | | | | | | |
| Consumer Staples Distribution & Retail 0.53% | | | | | |
| Axfood AB | | | 69,943 | | | | 1,546,475 | |
| Total Sweden | | | | | | | 7,994,716 | |
| | | | | | | | | |
| Switzerland 2.06% | | | | | | | | |
| | | | | | | | | |
| Containers & Packaging 1.11% | | | | | | | | |
| SIG Group AG | | | 146,970 | | | | 3,240,201 | |
| | | | | | | | | |
| Life Sciences Tools & Services 0.48% | | | | | | | |
| Tecan Group AG Registered Shares | | | 4,810 | | | | 1,384,320 | |
| | | | | | | | | |
| Machinery 0.47% | | | | | | | | |
| Sulzer AG Registered Shares | | | 16,456 | | | | 1,358,134 | |
| Total Switzerland | | | | | | | 5,982,655 | |
| | | | | | | | | |
| Taiwan 0.68% | | | | | | | | |
| | | | | | | | | |
| Semiconductors & Semiconductor Equipment | | | | | |
| Realtek Semiconductor Corp. | | | 158,000 | | | | 1,969,133 | |
| Investments | | Shares | | | U.S. $
Fair Value | |
| United Kingdom 17.62% | | | | | | | | |
| | | | | | | | | |
| Aerospace & Defense 2.85% | | | | | | | | |
| Chemring Group PLC | | | 1,351,488 | | | $ | 4,591,249 | |
| Senior PLC | | | 1,942,214 | | | | 3,692,077 | |
| | | | | | | | 8,283,326 | |
| | | | | | | | | |
| Beverages 1.71% | | | | | | | | |
| Britvic PLC | | | 489,652 | | | | 4,987,334 | |
| | | | | | | | | |
| Biotechnology 0.72% | | | | | | | | |
| Genus PLC | | | 80,273 | | | | 2,088,124 | |
| | | | | | | | | |
| Broadline Retail 1.94% | | | | | | | | |
| B&M European Value Retail SA | | | 874,183 | | | | 5,627,763 | |
| | | | | | | | | |
| Capital Markets 1.77% | | | | | | | | |
| Man Group PLC | | | 1,930,110 | | | | 5,160,412 | |
| | | | | | | | | |
| Construction Materials 0.74% | | | | | | | | |
| Breedon Group PLC | | | 569,923 | | | | 2,164,727 | |
| | | | | | | | | |
| Electronic Equipment, Instruments & Components 0.57% | |
| Spectris PLC | | | 43,477 | | | | 1,642,862 | |
| | | | | | | | | |
| Food Products 0.74% | | | | | | | | |
| Tate & Lyle PLC | | | 279,624 | | | | 2,142,873 | |
| | | | | | | | | |
| Health Care Equipment & Supplies 0.49% | | | | | |
| ConvaTec Group PLC† | | | 577,960 | | | | 1,434,466 | |
| | | | | | | | | |
| Health Care REITS 1.03% | | | | | | | | |
| Assura PLC | | | 6,033,995 | | | | 3,002,546 | |
| | | | | | | | | |
| Household Durables 0.31% | | | | | | | | |
| Persimmon PLC | | | 73,867 | | | | 914,769 | |
| | | | | | | | | |
| Insurance 1.30% | | | | | | | | |
| Lancashire Holdings Ltd. | | | 549,653 | | | | 3,794,668 | |
| | | | | | | | | |
| Machinery 0.98% | | | | | | | | |
| Concentric AB | | | 202,863 | | | | 2,850,264 | |
| 92 | See Notes to Financial Statements. | |
Schedule of Investments (continued)
INTERNATIONAL OPPORTUNITIES FUND October 31, 2023
| Investments | | Shares | | | U.S. $
Fair Value | |
| United Kingdom (continued) | | | | | | | | |
| | | | | | | | | |
| Pharmaceuticals 0.76% | | | | | | | | |
| Dechra Pharmaceuticals PLC | | | 47,378 | | | $ | 2,195,921 | |
| | | | | | | | | |
| Specialty Retail 0.97% | | | | | | | | |
| WH Smith PLC | | | 200,107 | | | | 2,821,351 | |
| | | | | | | | | |
| Trading Companies & Distributors 0.74% | | | | | |
| Grafton Group PLC | | | 229,957 | | | | 2,155,233 | |
| Total United Kingdom | | | | | | | 51,266,639 | |
Total Common Stocks
(cost $294,623,140) | | | | | | | 274,105,756 | |
| | | | | | | | | |
| RIGHTS 0.05% | | | | | | | | |
| | | | | | | | | |
| Spain 0.05% | | | | | | | | |
| | | | | | | | | |
| Containers & Packaging | | | | | | | | |
Vidrala SA*
(cost $171,412) | | | 40,903 | | | | 150,829 | |
Total Long-Term Investments
(cost $294,794,552) | | | | | | | 274,256,585 | |
| | | | | | | | | |
| | | | Principal
Amount | | | | | |
| | | | | | | | | |
| SHORT-TERM INVESTMENTS 6.08% | | | | | |
| | | | | | | | | |
| Repurchase Agreements 6.06% | | | | | | |
Repurchase Agreement dated 10/31/2023, 2.800% due 11/1/2023 with Fixed Income Clearing Corp. collateralized by $17,987,300 of U.S. Treasury Note at 5.000% due 10/31/2025; value: $17,972,545; proceeds: $17,621,501
(cost $17,620,130) | | $ | 17,620,130 | | | | 17,620,130 | |
| Investments | | Shares | | | U.S. $
Fair Value | |
| Money Market Funds 0.02% | | | | | | | | |
Fidelity Government Portfolio(b)
(cost $48,559) | | | 48,559 | | | $ | 48,559 | |
| | | | | | | | | |
| Time Deposits 0.00% | | | | | | | | |
CitiBank N.A.(b)
(cost $5,395) | | | 5,395 | | | | 5,395 | |
Total Short-Term Investments
(cost $17,674,084) | | | | | | | 17,674,084 | |
Total Investments in Securities 100.36%
(cost $312,468,636) | | | | | | | 291,930,669 | |
| Other Assets and Liabilities – Net (0.36)% | | | | (1,039,487 | ) |
| Net Assets 100.00% | | | | | | $ | 290,891,182 | |
| REITS | | Real Estate Investment Trusts. |
| ADR | | American Depositary Receipt. |
| SDR | | Swedish Depository Receipt. |
| † | | Security was purchased pursuant to Rule 144A under the Securities Act of 1933 and, unless registered under such Act or exempted from registration, may only be resold to qualified institutional buyers. At October 31, 2023, the total value of Rule 144A securities was $7,377,343, which represents 2.54% of net assets. |
| * | | Non-income producing security. |
| (a) | | All or a portion of this security is temporarily on loan to unaffiliated broker/dealers. |
| (b) | | Security was purchased with the cash collateral from loaned securities. |
| | See Notes to Financial Statements. | 93 |
Schedule of Investments (concluded)
INTERNATIONAL OPPORTUNITIES FUND October 31, 2023
The following is a summary of the inputs used as of October 31, 2023 in valuing the Fund’s investments carried at fair value(1):
| Investment Type(2) | | Level 1 | | | Level 2 | | | Level 3 | | | Total | |
| Long-Term Investments | | | | | | | | | | | | | | | | |
| Common Stocks | | | | | | | | | | | | | | | | |
| Canada | | $ | 16,124,022 | | | $ | – | | | $ | – | | | $ | 16,124,022 | |
| Egypt | | | 1,356,132 | | | | – | | | | – | | | | 1,356,132 | |
| Germany | | | 3,483,394 | | | | 12,095,964 | | | | – | | | | 15,579,358 | |
| Iceland | | | 1,462,745 | | | | – | | | | – | | | | 1,462,745 | |
| India | | | 1,826,214 | | | | 6,174,181 | | | | – | | | | 8,000,395 | |
| Ireland | | | 3,120,408 | | | | – | | | | – | | | | 3,120,408 | |
| Japan | | | 2,216,197 | | | | 77,552,677 | | | | – | | | | 79,768,874 | |
| Mexico | | | 7,909,581 | | | | – | | | | – | | | | 7,909,581 | |
| New Zealand | | | 3,255,266 | | | | – | | | | – | | | | 3,255,266 | |
| Peru | | | 1,678,106 | | | | – | | | | – | | | | 1,678,106 | |
| Spain | | | 2,744,012 | | | | 6,620,650 | | | | – | | | | 9,364,662 | |
| United Kingdom | | | 30,786,524 | | | | 20,480,115 | | | | – | | | | 51,266,639 | |
| Remaining Countries | | | – | | | | 75,219,568 | | | | – | | | | 75,219,568 | |
| Rights | | | 150,829 | | | | – | | | | – | | | | 150,829 | |
| Short-Term Investments | | | | | | | | | | | | | | | | |
| Repurchase Agreements | | | – | | | | 17,620,130 | | | | – | | | | 17,620,130 | |
| Money Market Funds | | | 48,559 | | | | – | | | | – | | | | 48,559 | |
| Time Deposits | | | – | | | | 5,395 | | | | – | | | | 5,395 | |
| Total | | $ | 76,161,989 | | | $ | 215,768,680 | | | $ | – | | | $ | 291,930,669 | |
| (1) | | Refer to Note 2(l) for a description of fair value measurements and the three-tier hierarchy of inputs. |
| (2) | | See Schedule of Investments for fair values in each industry and identification of foreign issuers and/or geography. The table above is presented by Investment Type. Countries are presented within an Investment Type should such Investment Type include securities classified as two or more levels within the three-tier fair value hierarchy. When applicable, each Level 3 security is identified on the Schedule of Investments along with the valuation technique utilized. |
A reconciliation of Level 3 investments is presented when the Fund has a material amount of Level 3 investments at the beginning or end of the year in relation to the Fund’s net assets.
| 94 | See Notes to Financial Statements. | |
Schedule of Investments
INTERNATIONAL VALUE FUND October 31, 2023
| Investments | | Shares | | | U.S. $
Fair Value | |
| LONG-TERM INVESTMENTS 95.36% | | | | | | |
| COMMON STOCKS 95.36% | | | | | | | | |
| | | | | | | | | |
| Australia 3.91% | | | | | | | | |
| | | | | | | | | |
| Industrial REITS 0.89% | | | | | | | | |
| Goodman Group | | | 244,043 | | | $ | 3,229,152 | |
| | | | | | | | | |
| Metals & Mining 3.02% | | | | | | | | |
| BHP Group Ltd. | | | 384,926 | | | | 10,896,281 | |
| Total Australia | | | | | | | 14,125,433 | |
| | | | | | | | | |
| Austria 2.75% | | | | | | | | |
| | | | | | | | | |
| Banks | | | | | | | | |
| BAWAG Group AG† | | | 82,711 | | | | 3,683,980 | |
| Erste Group Bank AG | | | 174,014 | | | | 6,231,314 | |
| | | | | | | | 9,915,294 | |
| | | | | | | | | |
| Canada 3.07% | | | | | | | | |
| | | | | | | | | |
| Insurance 1.14% | | | | | | | | |
| Manulife Financial Corp. | | | 237,000 | | | | 4,125,603 | |
| | | | | | | | | |
| Metals & Mining 0.82% | | | | | | | | |
| Teck Resources Ltd. Class B | | | 83,500 | | | | 2,950,423 | |
| | | | | | | | | |
| Oil, Gas & Consumable Fuels 1.11% | | | | | | |
| Pembina Pipeline Corp. | | | 129,694 | | | | 3,991,592 | |
| Total Canada | | | | | | | 11,067,618 | |
| | | | | | | | | |
| China 0.88% | | | | | | | | |
| | | | | | | | | |
| Broadline Retail | | | | | | | | |
| Alibaba Group Holding Ltd.* | | | 308,853 | | | | 3,179,664 | |
| | | | | | | | | |
| Egypt 0.41% | | | | | | | | |
| | | | | | | | | |
| Oil, Gas & Consumable Fuels | | | | | | | | |
| Energean PLC | | | 144,342 | | | | 1,494,752 | |
| | | | | | | | | |
| France 12.01% | | | | | | | | |
| | | | | | | | | |
| Aerospace & Defense 2.92% | | | | | | | | |
| Airbus SE | | | 30,642 | | | | 4,108,361 | |
| Thales SA | | | 43,623 | | | | 6,437,776 | |
| | | | | | | | 10,546,137 | |
| Investments | | Shares | | | U.S. $
Fair Value | |
| France (continued) | | | | | | | | |
| | | | | | | | | |
| Banks 1.82% | | | | | | | | |
| BNP Paribas SA | | | 114,246 | | | $ | 6,569,603 | |
| | | | | | | | | |
| Building Products 0.95% | | | | | | | | |
| Cie de Saint-Gobain SA | | | 63,139 | | | | 3,436,918 | |
| | | | | | | | | |
| Capital Markets 0.89% | | | | | | | | |
| Amundi SA† | | | 61,615 | | | | 3,218,726 | |
| | | | | | | | | |
| Diversified Telecommunication Services 2.59% | | | | | |
| Orange SA | | | 795,331 | | | | 9,354,716 | |
| | | | | | | | | |
| Gas Utilities 0.62% | | | | | | | | |
| Rubis SCA | | | 101,938 | | | | 2,219,450 | |
| | | | | | | | | |
| Insurance 2.07% | | | | | | | | |
| AXA SA | | | 251,220 | | | | 7,443,755 | |
| | | | | | | | | |
| Textiles, Apparel & Luxury Goods 0.15% | | | | | |
| Kering SA | | | 1,307 | | | | 531,559 | |
| Total France | | | | | | | 43,320,864 | |
| | | | | | | | | |
| Germany 3.40% | | | | | | | | |
| | | | | | | | | |
| Air Freight & Logistics 1.21% | | | | | | | | |
| Deutsche Post AG Registered Shares | | | 112,094 | | | | 4,376,541 | |
| | | | | | | | | |
| Chemicals 0.40% | | | | | | | | |
| Covestro AG†* | | | 28,509 | | | | 1,444,328 | |
| | | | | | | | | |
| Health Care Providers & Services 1.15% | | | | | |
| Fresenius SE & Co. KGaA | | | 161,424 | | | | 4,152,353 | |
| | | | | | | | | |
| Pharmaceuticals 0.64% | | | | | | | | |
| Bayer AG Registered Shares | | | 53,432 | | | | 2,308,720 | |
| Total Germany | | | | | | | 12,281,942 | |
| | | | | | | | | |
| Hong Kong 0.71% | | | | | | | | |
| | | | | | | | | |
| Insurance | | | | | | | | |
| Prudential PLC | | | 244,960 | | | | 2,561,395 | |
| | | | | | | | | |
| India 1.26% | | | | | | | | |
| | | | | | | | | |
| Banks 0.99% | | | | | | | | |
| Federal Bank Ltd. | | | 2,109,283 | | | | 3,564,894 | |
| | See Notes to Financial Statements. | 95 |
Schedule of Investments (continued)
INTERNATIONAL VALUE FUND October 31, 2023
| Investments | | Shares | | | U.S. $
Fair Value | |
| India (continued) | | | | | | | | |
| | | | | | | | | |
| Oil, Gas & Consumable Fuels 0.27% | | | | | | |
| Petronet LNG Ltd. | | | 407,495 | | | $ | 976,749 | |
| Total India | | | | | | | 4,541,643 | |
| | | | | | | | | |
| Indonesia 1.01% | | | | | | | | |
| | | | | | | | | |
| Banks | | | | | | | | |
| Bank Negara Indonesia Persero Tbk. PT | | | 12,106,600 | | | | 3,653,609 | |
| | | | | | | | | |
| Ireland 1.28% | | | | | | | | |
| | | | | | | | | |
| Banks | | | | | | | | |
| Bank of Ireland Group PLC | | | 515,926 | | | | 4,623,583 | |
| | | | | | | | | |
| Italy 2.07% | | | | | | | | |
| | | | | | | | | |
| Electric: Utilities | | | | | | | | |
| Enel SpA | | | 1,177,655 | | | | 7,475,260 | |
| | | | | | | | | |
| Japan 18.89% | | | | | | | | |
| | | | | | | | | |
| Automobile Components 0.71% | | | | | | | | |
| Denso Corp. | | | 172,758 | | | | 2,551,002 | |
| | | | | | | | | |
| Automobiles 2.90% | | | | | | | | |
| Toyota Motor Corp. | | | 597,600 | | | | 10,454,259 | |
| | | | | | | | | |
| Banks 2.62% | | | | | | | | |
| Sumitomo Mitsui Financial Group, Inc. | | | 196,600 | | | | 9,477,688 | |
| | | | | | | | | |
| Beverages 1.80% | | | | | | | | |
| Asahi Group Holdings Ltd. | | | 179,665 | | | | 6,498,553 | |
| | | | | | | | | |
| Building Products 0.89% | | | | | | | | |
| Sanwa Holdings Corp. | | | 239,400 | | | | 3,230,044 | |
| | | | | | | | | |
| Electrical Equipment 1.02% | | | | | | | | |
| Fuji Electric Co. Ltd. | | | 96,501 | | | | 3,674,238 | |
| | | | | | | | | |
| Electronic Equipment, Instruments & Components 0.81% | | | | | |
| Murata Manufacturing Co. Ltd. | | | 170,700 | | | | 2,923,985 | |
| Investments | | Shares | | | U.S. $
Fair Value | |
| Japan (continued) | | | | | | | | |
| | | | | | | | | |
| Household Durables 1.10% | | | | | | | | |
| Sony Group Corp. | | | 47,700 | | | $ | 3,965,723 | |
| | | | | | | | | |
| Industrial Conglomerates 1.68% | | | | | | | | |
| Hitachi Ltd. | | | 95,600 | | | | 6,059,757 | |
| | | | | | | | | |
| Insurance 1.50% | | | | | | | | |
| Sompo Holdings, Inc. | | | 124,827 | | | | 5,407,498 | |
| | | | | | | | | |
| Machinery 2.21% | | | | | | | | |
| Ebara Corp. | | | 122,400 | | | | 5,420,306 | |
| Fujitec Co. Ltd. | | | 117,097 | | | | 2,542,188 | |
| | | | | | | | 7,962,494 | |
| | | | | | | | | |
| Trading Companies & Distributors 1.65% | | | | | |
| ITOCHU Corp. | | | 165,800 | | | | 5,972,286 | |
| Total Japan | | | | | | | 68,177,527 | |
| | | | | | | | | |
| Mexico 1.47% | | | | | | | | |
| | | | | | | | | |
| Banks 0.90% | | | | | | | | |
| Grupo Financiero Banorte SAB de CV Class O | | 396,766 | | | | 3,220,079 | |
| | | | | | | | | |
| Transportation Infrastructure 0.57% | | | | | | | | |
| Grupo Aeroportuario del Pacifico SAB de CV Class B | | | 176,998 | | | | 2,064,698 | |
| Total Mexico | | | | | | | 5,284,777 | |
| | | | | | | | | |
| Netherlands 6.59% | | | | | | | | |
| | | | | | | | | |
| Consumer Staples Distribution & Retail 1.52% | | | | | |
| Koninklijke Ahold Delhaize NV | | | 185,473 | | | | 5,492,187 | |
| | | | | | | | | |
| Oil, Gas & Consumable Fuels 5.07% | | | | | | |
| Shell PLC ADR | | | 280,792 | | | | 18,290,791 | |
| Total Netherlands | | | | | | | 23,782,978 | |
| | | | | | | | | |
| Singapore 2.10% | | | | | | | | |
| | | | | | | | | |
| Banks 1.32% | | | | | | | | |
| United Overseas Bank Ltd. | | | 242,200 | | | | 4,777,320 | |
| 96 | See Notes to Financial Statements. | |
Schedule of Investments (continued)
INTERNATIONAL VALUE FUND October 31, 2023
| Investments | | Shares | | | U.S. $
Fair Value | |
| Singapore (continued) | | | | | | | | |
| | | | | | | | | |
| Semiconductors & Semiconductor Equipment 0.78% | | | |
| STMicroelectronics NV | | | 73,596 | | | $ | 2,805,486 | |
| Total Singapore | | | | | | | 7,582,806 | |
| | | | | | | | | |
| South Africa 0.83% | | | | | | | | |
| | | | | | | | | |
| Metals & Mining | | | | | | | | |
| Anglo American PLC | | | 117,645 | | | | 2,997,545 | |
| | | | | | | | | |
| South Korea 1.51% | | | | | | | | |
| | | | | | | | | |
| Technology Hardware, Storage & Peripherals | | | | |
| Samsung Electronics Co. Ltd. | | | 109,547 | | | | 5,452,688 | |
| | | | | | | | | |
| Spain 1.51% | | | | | | | | |
| | | | | | | | | |
| Banks | | | | | | | | |
| CaixaBank SA | | | 1,337,251 | | | | 5,436,647 | |
| | | | | | | | | |
| Sweden 1.95% | | | | | | | | |
| | | | | | | | | |
| Automobile Components 1.09% | | | | | | | | |
| Autoliv, Inc. SDR | | | 42,695 | | | | 3,943,038 | |
| | | | | | | | | |
| Commercial Services & Supplies 0.86% | | | | | |
| Loomis AB | | | 118,697 | | | | 3,083,420 | |
| Total Sweden | | | | | | | 7,026,458 | |
| | | | | | | | | |
| Switzerland 3.92% | | | | | | | | |
| | | | | | | | | |
| Pharmaceuticals | | | | | | | | |
| Novartis AG Registered Shares | | | 136,842 | | | | 12,811,087 | |
| Sandoz Group AG* | | | 51,447 | | | | 1,337,571 | |
| | | | | | | | 14,148,658 | |
| | | | | | | | | |
| United Kingdom 19.15% | | | | | | | | |
| | | | | | | | | |
| Banks 4.20% | | | | | | | | |
| HSBC Holdings PLC | | | 1,366,852 | | | | 9,869,239 | |
| Standard Chartered PLC | | | 688,915 | | | | 5,282,139 | |
| | | | | | | | 15,151,378 | |
| | | | | | | | | |
| Broadline Retail 1.05% | | | | | | | | |
| Next PLC | | | 45,017 | | | | 3,774,333 | |
| Investments | | Shares | | | U.S. $
Fair Value | |
| United Kingdom (continued) | | | | | | | | |
| | | | | | | | | |
| Electric: Utilities 1.77% | | | | | | | | |
| SSE PLC | | | 322,170 | | | $ | 6,402,663 | |
| | | | | | | | | |
| Food Products 0.51% | | | | | | | | |
| Tate & Lyle PLC | | | 237,496 | | | | 1,820,029 | |
| | | | | | | | | |
| Hotels, Restaurants & Leisure 0.56% | | | | | | |
| Entain PLC | | | 179,343 | | | | 2,035,954 | |
| | | | | | | | | |
| Insurance 1.33% | | | | | | | | |
| Lancashire Holdings Ltd. | | | 695,572 | | | | 4,802,057 | |
| | | | | | | | | |
| Oil, Gas & Consumable Fuels 2.35% | | | | | | |
| BP PLC | | | 1,389,975 | | | | 8,487,205 | |
| | | | | | | | | |
| Personal Care Products 2.03% | | | | | | | | |
| Unilever PLC | | | 154,716 | | | | 7,327,446 | |
| | | | | | | | | |
| Pharmaceuticals 1.57% | | | | | | | | |
| AstraZeneca PLC | | | 45,272 | | | | 5,668,218 | |
| | | | | | | | | |
| Tobacco 2.12% | | | | | | | | |
| Imperial Brands PLC | | | 359,149 | | | | 7,651,368 | |
| | | | | | | | | |
| Trading Companies & Distributors 0.74% | | | | | |
| Ashtead Group PLC | | | 46,416 | | | | 2,662,071 | |
| | | | | | | | | |
| Wireless Telecommunication Services 0.92% | | | | | |
| Vodafone Group PLC | | | 3,592,852 | | | | 3,307,355 | |
| Total United Kingdom | | | | | | | 69,090,077 | |
| | | | | | | | | |
| United States 4.68% | | | | | | | | |
| | | | | | | | | |
| Construction Materials 1.75% | | | | | | | | |
| CRH PLC | | | 117,678 | | | | 6,315,405 | |
| | | | | | | | | |
| Pharmaceuticals 2.93% | | | | | | | | |
| Sanofi SA | | | 116,559 | | | | 10,584,284 | |
| Total United States | | | | | | | 16,899,689 | |
Total Common Stocks
(cost $344,383,763) | | | | | | | 344,120,907 | |
| | See Notes to Financial Statements. | 97 |
Schedule of Investments (concluded)
INTERNATIONAL VALUE FUND October 31, 2023
| Investments | | Principal
Amount | | | U.S. $
Fair Value | |
| SHORT-TERM INVESTMENTS 4.00% | | | | | |
| | | | | | | | | |
| Repurchase Agreements 4.00% | | | | | |
Repurchase Agreement dated 10/31/2023, 2.800% due 11/1/2023 with Fixed Income Clearing Corp. collateralized by $14,757,600 of U.S. Treasury Note at 5.000% due 10/31/2025; value: $14,745,494; proceeds: $14,457,413
(cost $14,456,289) | | $ | 14,456,289 | | | $ | 14,456,289 | |
Total Investments in Securities 99.36%
(cost $358,840,052) | | | | | | | 358,577,196 | |
| Other Assets and Liabilities – Net 0.64% | | | | | | | 2,301,164 | |
| Net Assets 100.00% | | | | | | $ | 360,878,360 | |
| REITS | | Real Estate Investment Trusts. |
| ADR | | American Depositary Receipt. |
| SDR | | Swedish Depository Receipt. |
| † | | Security was purchased pursuant to Rule 144A under the Securities Act of 1933 and, unless registered under such Act or exempted from registration, may only be resold to qualified institutional buyers. At October 31, 2023, the total value of Rule 144A securities was $8,347,034, which represents 2.31% of net assets. |
| * | | Non-income producing security. |
The following is a summary of the inputs used as of October 31, 2023 in valuing the Fund’s investments carried at fair value(1):
| Investment Type(2) | | Level 1 | | | Level 2 | | | Level 3 | | | Total | |
| Long-Term Investments | | | | | | | | | | | | | | | | |
| Common Stocks | | | | | | | | | | | | | | | | |
| Canada | | $ | 11,067,618 | | | $ | – | | | $ | – | | | $ | 11,067,618 | |
| Egypt | | | 1,494,752 | | | | – | | | | – | | | | 1,494,752 | |
| Mexico | | | 5,284,777 | | | | – | | | | – | | | | 5,284,777 | |
| Netherlands | | | 18,290,791 | | | | 5,492,187 | | | | – | | | | 23,782,978 | |
| Switzerland | | | 1,337,571 | | | | 12,811,087 | | | | – | | | | 14,148,658 | |
| United Kingdom | | | 6,622,086 | | | | 62,467,991 | | | | – | | | | 69,090,077 | |
| Remaining Countries | | | – | | | | 219,252,047 | | | | – | | | | 219,252,047 | |
| Short-Term Investments | | | | | | | | | | | | | | | | |
| Repurchase Agreements | | | – | | | | 14,456,289 | | | | – | | | | 14,456,289 | |
| Total | | $ | 44,097,595 | | | $ | 314,479,601 | | | $ | – | | | $ | 358,577,196 | |
| (1) | | Refer to Note 2(l) for a description of fair value measurements and the three-tier hierarchy of inputs. |
| (2) | | See Schedule of Investments for fair values in each industry and identification of foreign issuers and/or geography. The table above is presented by Investment Type. Countries are presented within an Investment Type should such Investment Type include securities classified as two or more levels within the three-tier fair value hierarchy. When applicable, each Level 3 security is identified on the Schedule of Investments along with the valuation technique utilized. |
A reconciliation of Level 3 investments is presented when the Fund has a material amount of Level 3 investments at the beginning or end of the year in relation to the Fund’s net assets.
| 98 | See Notes to Financial Statements. | |
Schedule of Investments
MICRO CAP GROWTH FUND October 31, 2023
| Investments | | Shares | | | Fair
Value | |
| LONG-TERM INVESTMENTS 99.01% | |
| COMMON STOCKS 99.01% | |
| | | | | | | | | |
| Aerospace & Defense 5.14% | |
| AAR Corp.* | | | 61,551 | | | $ | 3,653,667 | |
| AeroVironment, Inc.* | | | 41,131 | | | | 4,716,081 | |
| Total | | | | | | | 8,369,748 | |
| | |
| Automobile Components 2.31% | |
| Modine Manufacturing Co.* | | | 95,234 | | | | 3,761,743 | |
| | |
| Beverages 3.21% | |
| MGP Ingredients, Inc. | | | 19,057 | | | | 1,803,936 | |
| Vita Coco Co., Inc.* | | | 126,110 | | | | 3,417,581 | |
| Total | | | | | | | 5,221,517 | |
| | | | | | | | | |
| Biotechnology 13.86% | |
| Arcellx, Inc.* | | | 98,556 | | | | 3,474,099 | |
| Crinetics Pharmaceuticals, Inc.* | | | 61,278 | | | | 1,794,833 | |
| Immatics NV (Germany)*(a) | | | 204,457 | | | | 1,564,096 | |
| ImmunoGen, Inc.* | | | 246,229 | | | | 3,658,963 | |
| Karuna Therapeutics, Inc.* | | | 13,311 | | | | 2,217,746 | |
| Krystal Biotech, Inc.* | | | 37,773 | | | | 4,414,530 | |
| MoonLake Immunotherapeutics (Switzerland)*(a)(b) | | | 66,110 | | | | 3,425,159 | |
| Xenon Pharmaceuticals, Inc. (Canada)*(a) | | | 65,341 | | | | 2,025,571 | |
| Total | | | | | | | 22,574,997 | |
| | | | | | | | | |
| Building Products 1.20% | |
| Hayward Holdings, Inc.* | | | 186,630 | | | | 1,959,615 | |
| | | | | | | | | |
| Capital Markets 1.32% | |
| Piper Sandler Cos. | | | 15,374 | | | | 2,150,054 | |
| | | | | | | | | |
| Construction & Engineering 5.76% | |
| MYR Group, Inc.* | | | 19,350 | | | | 2,241,311 | |
| Primoris Services Corp. | | | 91,488 | | | | 2,750,129 | |
| Sterling Infrastructure, Inc.* | | | 60,375 | | | | 4,398,319 | |
| Total | | | | | | | 9,389,759 | |
| Investments | | Shares | | | Fair
Value | |
| Diversified Consumer Services 4.40% | |
| Coursera, Inc.* | | | 142,122 | | | $ | 2,464,395 | |
| European Wax Center, Inc. Class A* | | | 56,092 | | | | 828,479 | |
| Rover Group, Inc.* | | | 194,304 | | | | 1,253,261 | |
| Stride, Inc.* | | | 47,633 | | | | 2,618,862 | |
| Total | | | | | | | 7,164,997 | |
| | | | | | | | | |
| Electronic Equipment, Instruments & Components 2.24% | |
| OSI Systems, Inc.* | | | 34,994 | | | | 3,648,824 | |
| | | | | | | | | |
| Financial Services 10.23% | |
| AvidXchange Holdings, Inc.* | | | 463,560 | | | | 4,005,159 | |
| Flywire Corp.* | | | 171,834 | | | | 4,620,616 | |
| Paymentus Holdings, Inc. Class A*(b) | | | 136,737 | | | | 1,990,891 | |
| Remitly Global, Inc.* | | | 224,781 | | | | 6,053,352 | |
| Total | | | | | | | 16,670,018 | |
| | | | | | | | | |
| Food Products 0.49% | |
| Vital Farms, Inc.* | | | 72,604 | | | | 803,000 | |
| | | | | | | | | |
| Health Care Equipment & Supplies 6.07% | |
| Axonics, Inc.* | | | 26,110 | | | | 1,337,093 | |
| CVRx, Inc.* | | | 129,812 | | | | 1,736,885 | |
| RxSight, Inc.* | | | 182,092 | | | | 4,031,517 | |
| TransMedics Group, Inc.* | | | 39,374 | | | | 1,475,737 | |
| UFP Technologies, Inc.* | | | 8,416 | | | | 1,312,223 | |
| Total | | | | | | | 9,893,455 | |
| | | | | | | | | |
| Hotels, Restaurants & Leisure 5.00% | |
| First Watch Restaurant Group, Inc.* | | | 185,995 | | | | 3,107,976 | |
| Kura Sushi USA, Inc. Class A* | | | 57,011 | | | | 3,257,609 | |
| Shake Shack, Inc. Class A* | | | 31,851 | | | | 1,784,930 | |
| Total | | | | | | | 8,150,515 | |
| | | | | | | | | |
| Household Durables 0.97% | |
| Green Brick Partners, Inc.* | | | 41,028 | | | | 1,587,784 | |
| | See Notes to Financial Statements. | 99 |
Schedule of Investments (continued)
MICRO CAP GROWTH FUND October 31, 2023
| Investments | | Shares | | | Fair
Value | |
| Information Technology Services 1.01% | |
| Fastly, Inc. Class A* | | | 111,744 | | | $ | 1,639,285 | |
| | | | | | | | | |
| Insurance 0.46% | |
| Goosehead Insurance, Inc. Class A* | | | 11,577 | | | | 751,000 | |
| | | | | | | | | |
| Interactive Media & Services 1.96% | |
| Eventbrite, Inc. Class A* | | | 148,658 | | | | 1,230,888 | |
| Yelp, Inc.* | | | 46,341 | | | | 1,955,127 | |
| Total | | | | | | | 3,186,015 | |
| | | | | | | | | |
| Life Sciences Tools & Services 2.39% | |
| Pacific Biosciences of California, Inc.* | | | 216,216 | | | | 1,336,215 | |
| Quanterix Corp.* | | | 117,984 | | | | 2,562,612 | |
| Total | | | | | | | 3,898,827 | |
| | | | | | | | | |
| Media 1.87% | | | | | | | | |
| Integral Ad Science Holding Corp.* | | | 192,514 | | | | 2,210,061 | |
| Perion Network Ltd. (Israel)*(a) | | | 33,004 | | | | 838,301 | |
| Total | | | | | | | 3,048,362 | |
| | | | | | | | | |
| Personal Care Products 3.13% | |
| elf Beauty, Inc.* | | | 40,468 | | | | 3,748,551 | |
| Oddity Tech Ltd. Class A (Israel)*(a)(b) | | | 52,635 | | | | 1,344,824 | |
| Total | | | | | | | 5,093,375 | |
| | | | | | | | | |
| Pharmaceuticals 2.93% | |
| Intra-Cellular Therapies, Inc.* | | | 27,426 | | | | 1,364,718 | |
| Structure Therapeutics, Inc. Add ADR* | | | 35,358 | | | | 2,627,099 | |
| Ventyx Biosciences, Inc.* | | | 53,864 | | | | 776,719 | |
| Total | | | | | | | 4,768,536 | |
| | | | | | | | | |
| Professional Services 4.65% | |
| Fiverr International Ltd. (Israel)*(a)(b) | | | 45,554 | | | | 964,378 | |
| ICF International, Inc. | | | 30,208 | | | | 3,828,260 | |
| Investments | | Shares | | | Fair
Value | |
| Professional Services (continued) | |
| Upwork, Inc.* | | | 103,490 | | | $ | 1,081,470 | |
| Verra Mobility Corp.* | | | 85,944 | | | | 1,699,113 | |
| Total | | | | | | | 7,573,221 | |
| | | | | | | | | |
| Semiconductors & Semiconductor Equipment 5.25% | |
| Aehr Test Systems* | | | 86,654 | | | | 2,041,568 | |
| Credo Technology Group Holding Ltd.* | | | 96,050 | | | | 1,365,831 | |
| Photronics, Inc.* | | | 37,921 | | | | 696,229 | |
| Rambus, Inc.* | | | 82,020 | | | | 4,456,147 | |
| Total | | | | | | | 8,559,775 | |
| | | | | | | | | |
| Software 12.01% | | | | | | | | |
| Agilysys, Inc.* | | | 23,254 | | | | 1,994,961 | |
| Alkami Technology, Inc.* | | | 84,788 | | | | 1,521,945 | |
| Cerence, Inc.* | | | 85,142 | | | | 1,303,524 | |
| Clear Secure, Inc. Class A | | | 47,662 | | | | 801,675 | |
| JFrog Ltd. (Israel)*(a) | | | 155,031 | | | | 3,486,647 | |
| Olo, Inc. Class A* | | | 159,139 | | | | 813,200 | |
| Varonis Systems, Inc.* | | | 115,738 | | | | 3,893,426 | |
| Weave Communications, Inc.* | | | 290,710 | | | | 2,081,484 | |
| Yext, Inc.* | | | 143,431 | | | | 864,889 | |
| Zeta Global Holdings Corp. Class A* | | | 194,463 | | | | 1,516,811 | |
| Zuora, Inc. Class A* | | | 175,030 | | | | 1,296,972 | |
| Total | | | | | | | 19,575,534 | |
| | | | | | | | | |
| Trading Companies & Distributors 1.15% | |
| Distribution Solutions Group, Inc.* | | | 62,398 | | | | 1,881,300 | |
Total Common Stocks
(cost $147,881,766) | | | | | | | 161,321,256 | |
| 100 | See Notes to Financial Statements. |
Schedule of Investments (concluded)
MICRO CAP GROWTH FUND October 31, 2023
| Investments | | Principal
Amount | | | Fair
Value | |
| SHORT-TERM INVESTMENTS 4.83% | |
| | | | | | | | | |
| Repurchase Agreements 1.52% | |
Repurchase Agreement dated 10/31/2023, 2.800% due 11/1/2023 with Fixed Income Clearing Corp. collateralized by $2,521,400 of U.S. Treasury Note at 5.000% due 10/31/2025; value: $2,519,332; proceeds: $2,470,033
(cost $2,469,841) | | $ | 2,469,841 | | | $ | 2,469,841 | |
| | | | | | | | | |
| | | | Shares | | | | | |
| Money Market Funds 2.98% | |
Fidelity Government Portfolio(c)
(cost $4,860,081) | | | 4,860,081 | | | | 4,860,081 | |
| Investments | | Shares | | | Fair
Value | |
| Time Deposits 0.33% | | | | | | | | |
CitiBank N.A.(c)
(cost $540,009) | | | 540,009 | | | $ | 540,009 | |
Total Short-Term Investments
(cost $7,869,931) | | | | | | | 7,869,931 | |
Total Investments in Securities 103.84%
(cost $155,751,697) | | | | | | | 169,191,187 | |
| Other Assets and Liabilities – Net (3.84)% | | (6,261,515 | ) |
| Net Assets 100.00% | | | | | | $ | 162,929,672 | |
| ADR | | American Depositary Receipt. |
| * | | Non-income producing security. |
| (a) | | Foreign security traded in U.S. dollars. |
| (b) | | All or a portion of this security is temporarily on loan to unaffiliated broker/dealers. |
| (c) | | Security was purchased with the cash collateral from loaned securities. |
The following is a summary of the inputs used as of October 31, 2023 in valuing the Fund’s investments carried at fair value(1):
| Investment Type(2) | | Level 1 | | | Level 2 | | | Level 3 | | | Total | |
| Long-Term Investments | | | | | | | | | | | | | | | | |
| Common Stocks | | $ | 161,321,256 | | | $ | – | | | $ | – | | | $ | 161,321,256 | |
| Short-Term Investments | | | | | | | | | | | | | | | | |
| Repurchase Agreements | | | – | | | | 2,469,841 | | | | – | | | | 2,469,841 | |
| Money Market Funds | | | 4,860,081 | | | | – | | | | – | | | | 4,860,081 | |
| Time Deposits | | | – | | | | 540,009 | | | | – | | | | 540,009 | |
| Total | | $ | 166,181,337 | | | $ | 3,009,850 | | | $ | – | | | $ | 169,191,187 | |
| (1) | | Refer to Note 2(l) for a description of fair value measurements and the three-tier hierarchy of inputs. |
| (2) | | See Schedule of Investments for fair values in each industry and identification of foreign issuers and/or geography. The table above is presented by Investment Type. When applicable, each Level 3 security is identified on the Schedule of Investments along with the valuation technique utilized. |
A reconciliation of Level 3 investments is presented when the Fund has a material amount of Level 3 investments at the beginning or end of the year in relation to the Fund’s net assets.
| | See Notes to Financial Statements. | 101 |
Schedule of Investments
VALUE OPPORTUNITIES FUND October 31, 2023
| Investments | | Shares | | | Fair
Value | |
| LONG-TERM INVESTMENTS 98.50% | |
| COMMON STOCKS 98.50% | |
| | | | | | | | | |
| Aerospace & Defense 1.68% | |
| Curtiss-Wright Corp. | | | 92,508 | | | $ | 18,391,515 | |
| | | | | | | | | |
| Automobile Components 1.09% | |
| Gentherm, Inc.* | | | 295,534 | | | | 11,886,377 | |
| | | | | | | | | |
| Banks 4.86% | | | | | | | | |
| Columbia Banking System, Inc. | | | 700,570 | | | | 13,780,212 | |
| East West Bancorp, Inc. | | | 247,906 | | | | 13,292,720 | |
| First BanCorp | | | 1,131,609 | | | | 15,106,980 | |
| Wintrust Financial Corp. | | | 147,666 | | | | 11,029,173 | |
| Total | | | | | | | 53,209,085 | |
| | | | | | | | | |
| Building Products 3.51% | |
| Allegion PLC (Ireland)(a) | | | 204,587 | | | | 20,123,177 | |
| Masonite International Corp.* | | | 230,324 | | | | 18,227,842 | |
| Total | | | | | | | 38,351,019 | |
| | | | | | | | | |
| Capital Markets 5.61% | |
| Cboe Global Markets, Inc. | | | 162,732 | | | | 26,670,147 | |
| Moelis & Co. Class A | | | 412,056 | | | | 17,158,012 | |
| TPG, Inc. | | | 632,600 | | | | 17,485,064 | |
| Total | | | | | | | 61,313,223 | |
| | | | | | | | | |
| Chemicals 1.89% | | | | | | | | |
| Avient Corp. | | | 379,922 | | | | 12,013,134 | |
| Axalta Coating Systems Ltd.* | | | 329,458 | | | | 8,641,683 | |
| Total | | | | | | | 20,654,817 | |
| | | | | | | | | |
| Commercial Services & Supplies 1.23% | |
| Brady Corp. Class A | | | 260,845 | | | | 13,423,084 | |
| | | | | | | | | |
| Construction & Engineering 2.12% | |
| EMCOR Group, Inc. | | | 112,202 | | | | 23,186,543 | |
| | | | | | | | | |
| Construction Materials 1.43% | |
| Eagle Materials, Inc. | | | 101,639 | | | | 15,643,258 | |
| Investments | | Shares | | | Fair
Value | |
| Consumer Staples Distribution & Retail 2.15% | |
| BJ’s Wholesale Club Holdings, Inc.* | | | 345,793 | | | $ | 23,555,419 | |
| | | | | | | | | |
| Containers & Packaging 1.86% | |
| Avery Dennison Corp. | | | 116,903 | | | | 20,349,305 | |
| | | | | | | | | |
| Electric: Utilities 2.70% | |
| IDACORP, Inc. | | | 171,482 | | | | 16,241,060 | |
| Portland General Electric Co. | | | 331,267 | | | | 13,257,306 | |
| Total | | | | | | | 29,498,366 | |
| |
| Electronic Equipment, Instruments & Components 3.55% | |
| Belden, Inc. | | | 192,033 | | | | 13,615,139 | |
| Crane NXT Co. | | | 194,395 | | | | 10,108,540 | |
| Littelfuse, Inc. | | | 69,640 | | | | 15,088,899 | |
| Total | | | | | | | 38,812,578 | |
| | | | | | | | | |
| Energy Equipment & Services 1.73% | |
| TechnipFMC PLC (United Kingdom)(a) | | | 880,069 | | | | 18,939,085 | |
| | | | | | | | | |
| Ground Transportation 1.43% | |
| Saia, Inc.* | | | 43,751 | | | | 15,684,296 | |
| | | | | | | | | |
| Health Care Equipment & Supplies 5.02% | |
| CONMED Corp. | | | 117,300 | | | | 11,432,058 | |
| Cooper Cos., Inc. | | | 46,012 | | | | 14,344,241 | |
| Lantheus Holdings, Inc.* | | | 77,818 | | | | 5,027,043 | |
| STERIS PLC | | | 114,584 | | | | 24,060,348 | |
| Total | | | | | | | 54,863,690 | |
| | | | | | | | | |
| Health Care Providers & Services 3.72% | |
| Molina Healthcare, Inc.* | | | 96,151 | | | | 32,013,475 | |
| R1 RCM, Inc.* | | | 731,339 | | | | 8,622,487 | |
| Total | | | | | | | 40,635,962 | |
| | | | | | | | | |
| Hotels, Restaurants & Leisure 5.45% | |
| Caesars Entertainment, Inc.* | | | 235,000 | | | | 9,374,150 | |
| Choice Hotels International, Inc. | | | 173,533 | | | | 19,175,396 | |
| 102 | See Notes to Financial Statements. |
Schedule of Investments (continued)
VALUE OPPORTUNITIES FUND October 31, 2023
| Investments | | Shares | | | Fair
Value | |
| Hotels, Restaurants & Leisure (continued) | |
| Dave & Buster’s Entertainment, Inc.* | | | 270,457 | | | $ | 9,449,768 | |
| SeaWorld Entertainment, Inc.* | | | 113,068 | | | | 4,870,969 | |
| Texas Roadhouse, Inc. | | | 165,140 | | | | 16,768,316 | |
| Total | | | | | | | 59,638,599 | |
| | | | | | | | | |
| Industrial REITS 1.35% | | | | | | | | |
| First Industrial Realty Trust, Inc. | | | 349,436 | | | | 14,781,143 | |
| | | | | | | | | |
| Information Technology Services 1.40% | |
| Perficient, Inc.* | | | 263,646 | | | | 15,341,561 | |
| | | | | | | | | |
| Insurance 4.83% | | | | | | | | |
| American Financial Group, Inc. | | | 181,879 | | | | 19,890,288 | |
| RenaissanceRe Holdings Ltd. | | | 92,788 | | | | 20,375,317 | |
| White Mountains Insurance Group Ltd. | | | 8,767 | | | | 12,543,385 | |
| Total | | | | | | | 52,808,990 | |
| | | | | | | | | |
| Leisure Products 1.73% | | | | | | | | |
| YETI Holdings, Inc.* | | | 445,782 | | | | 18,954,651 | |
| | | | | | | | | |
| Life Sciences Tools & Services 3.53% | |
| Bio-Techne Corp. | | | 205,148 | | | | 11,207,235 | |
| Charles River Laboratories International, Inc.* | | | 80,494 | | | | 13,551,970 | |
| Repligen Corp.* | | | 103,074 | | | | 13,869,638 | |
| Total | | | | | | | 38,628,843 | |
| | | | | | | | | |
| Machinery 2.98% | | | | | | | | |
| Columbus McKinnon Corp. | | | 513,067 | | | | 15,684,458 | |
| Crane Co. | | | 173,795 | | | | 16,915,468 | |
| Total | | | | | | | 32,599,926 | |
| | | | | | | | | |
| Media 1.56% | | | | | | | | |
| Criteo SA ADR* | | | 603,984 | | | | 17,074,628 | |
| | | | | | | | | |
| Metals & Mining 1.00% | | | | | | | | |
| Reliance Steel & Aluminum Co. | | | 42,829 | | | | 10,894,841 | |
| Investments | | Shares | | | Fair
Value | |
| Oil, Gas & Consumable Fuels 4.82% | |
| Chesapeake Energy Corp. | | | 323,638 | | | $ | 27,858,759 | |
| Permian Resources Corp. | | | 1,704,022 | | | | 24,827,601 | |
| Total | | | | | | | 52,686,360 | |
| | | | | | | | | |
| Pharmaceuticals 0.24% | | | | | | | | |
| Organon & Co. | | | 181,204 | | | | 2,680,007 | |
| | | | | | | | | |
| Professional Services 6.17% | | | | | | | | |
| Booz Allen Hamilton Holding Corp. | | | 181,147 | | | | 21,724,960 | |
| ICF International, Inc. | | | 127,938 | | | | 16,213,583 | |
| Paylocity Holding Corp.* | | | 68,454 | | | | 12,280,648 | |
| WNS Holdings Ltd. ADR* | | | 317,558 | | | | 17,249,750 | |
| Total | | | | | | | 67,468,941 | |
| | | | | | | | | |
| Real Estate Management & Development 1.32% | |
| Marcus & Millichap, Inc. | | | 503,800 | | | | 14,459,060 | |
| | | | | | | | | |
| Residential REITS 1.34% | | | | | | | | |
| American Homes 4 Rent Class A | | | 448,413 | | | | 14,681,042 | |
| | | | | | | | | |
| Semiconductors & Semiconductor Equipment 3.00% | |
| Entegris, Inc. | | | 216,259 | | | | 19,039,442 | |
| FormFactor, Inc.* | | | 407,492 | | | | 13,805,829 | |
| Total | | | | | | | 32,845,271 | |
| | | | | | | | | |
| Software 6.67% | | | | | | | | |
| Aspen Technology, Inc.* | | | 88,126 | | | | 15,664,396 | |
| CommVault Systems, Inc.* | | | 344,180 | | | | 22,492,163 | |
| Descartes Systems Group, Inc. (Canada)*(a) | | | 268,863 | | | | 19,414,597 | |
| Dolby Laboratories, Inc. Class A | | | 190,640 | | | | 15,430,402 | |
| Total | | | | | | | 73,001,558 | |
| | | | | | | | | |
| Specialty Retail 1.50% | | | | | | | | |
| Valvoline, Inc. | | | 553,248 | | | | 16,414,868 | |
| | | | | | | | | |
| Textiles, Apparel & Luxury Goods 1.55% | |
| Deckers Outdoor Corp.* | | | 28,340 | | | | 16,920,680 | |
| | See Notes to Financial Statements. | 103 |
Schedule of Investments (concluded)
VALUE OPPORTUNITIES FUND October 31, 2023
| Investments | | Shares | | | Fair
Value | |
| Trading Companies & Distributors 2.48% | |
| AerCap Holdings NV (Ireland)*(a) | | | 436,597 | | | $ | 27,121,406 | |
Total Common Stocks
(cost $970,761,932) | | | | | | | 1,077,399,997 | |
| | | | | | | | | |
| | | | Principal
Amount | | | | | |
| | | | | | | | | |
| SHORT-TERM INVESTMENTS 1.57% | |
| | | | | | | | | |
| Repurchase Agreements 1.57% | |
Repurchase Agreement dated 10/31/2023, 2.800% due 11/1/2023 with Fixed Income Clearing Corp. collateralized by $17,588,800 of U.S. Treasury Note at 5.000% due 10/31/2025; value: $17,574,372; proceeds: $17,231,08
(cost $17,229,742) | | $ | 17,229,742 | | | | 17,229,742 | |
| Investments | | Principal
Amount | | | Fair
Value | |
Total Investments in Securities 100.07%
(cost $987,991,674) | | | | | | $ | 1,094,629,739 | |
| Other Assets and Liabilities – Net (0.07)% | | (806,019 | ) |
| Net Assets 100.00% | | | | | | $ | 1,093,823,720 | |
| REITS | | Real Estate Investment Trusts. |
| ADR | | American Depositary Receipt. |
| * | | Non-income producing security. |
| (a) | | Foreign security traded in U.S. dollars. |
The following is a summary of the inputs used as of October 31, 2023 in valuing the Fund’s investments carried at fair value(1):
| Investment Type(2) | | Level 1 | | | Level 2 | | | Level 3 | | | Total | |
| Long-Term Investments | | | | | | | | | | | | | | | | |
| Common Stocks | | $ | 1,077,399,997 | | | $ | – | | | $ | – | | | $ | 1,077,399,997 | |
| Short-Term Investments | | | | | | | | | | | | | | | | |
| Repurchase Agreements | | | – | | | | 17,229,742 | | | | – | | | | 17,229,742 | |
| Total | | $ | 1,077,399,997 | | | $ | 17,229,742 | | | $ | – | | | $ | 1,094,629,739 | |
| (1) | | Refer to Note 2(l) for a description of fair value measurements and the three-tier hierarchy of inputs. |
| (2) | | See Schedule of Investments for fair values in each industry and identification of foreign issuers and/or geography. The table above is presented by Investment Type. When applicable, each Level 3 security is identified on the Schedule of Investments along with the valuation technique utilized. |
A reconciliation of Level 3 investments is presented when the Fund has a material amount of Level 3 investments at the beginning or end of the year in relation to the Fund’s net assets.
| 104 | See Notes to Financial Statements. |
This page is intentionally left blank.
Statements of Assets and Liabilities
October 31, 2023
| | | Alpha
Strategy Fund | | | Focused
Growth Fund | | | Focused
Large Cap
Value Fund | |
| ASSETS: | | | | | | | | | | | | | | | |
| Investments in securities, at cost | | | $ | 555,994 | | | | $ | 26,204,170 | | | | $ | 17,996,933 | |
| Investments in Underlying Funds, at cost | | | | 618,420,565 | | | | | – | | | | | – | |
| Investments in securities, at fair value | | | $ | 555,994 | | | | $ | 30,686,533 | | | | $ | 18,886,863 | |
| Investments in Underlying Funds, at value | | | | 531,681,544 | | | | | – | | | | | – | |
| Cash | | | | 2 | | | | | – | | | | | 40,780 | |
| Foreign cash, at value (cost $0, $0, $40, $67,298, $283, $4,807 and $0, respectively) | | | | – | | | | | – | | | | | 39 | |
| Receivables: | | | | | | | | | | | | | | | |
| Capital shares sold | | | | 242,212 | | | | | 26,040 | | | | | 8,798 | |
| Interest and dividends | | | | 43 | | | | | 911 | | | | | 76,577 | |
| From advisor (See Note 3) | | | | – | | | | | 16,306 | | | | | 12,689 | |
| Investment securities sold | | | | – | | | | | 361,759 | | | | | 68,537 | |
| Prepaid expenses and other assets | | | | 58,518 | | | | | 39,130 | | | | | 70,135 | |
| Total assets | | | | 532,538,313 | | | | | 31,130,679 | | | | | 19,164,418 | |
| LIABILITIES: | | | | | | | | | | | | | | | |
| Payables: | | | | | | | | | | | | | | | |
| Capital shares reacquired | | | | 453,001 | | | | | 23,104 | | | | | 26,950 | |
| Trustees’ fees | | | | 126,938 | | | | | 6,974 | | | | | 22,185 | |
| 12b-1 distribution plan | | | | 75,784 | | | | | 5,817 | | | | | 4,541 | |
| Fund administration | | | | 18,737 | | | | | 1,093 | | | | | 668 | |
| Management fee | | | | – | | | | | 17,762 | | | | | 9,858 | |
| Accrued expenses | | | | 208,652 | | | | | 55,587 | | | | | 97,220 | |
| Total liabilities | | | | 883,112 | | | | | 110,337 | | | | | 161,422 | |
| NET ASSETS | | | $ | 531,655,201 | | | | $ | 31,020,342 | | | | $ | 19,002,996 | |
| COMPOSITION OF NET ASSETS: | | | | | | | | | | | | | | | |
| Paid-in capital | | | $ | 652,095,337 | | | | $ | 38,738,057 | | | | $ | 19,408,263 | |
| Total distributable earnings (loss) | | | | (120,440,136 | ) | | | | (7,717,715 | ) | | | | (405,267 | ) |
| Net Assets | | | $ | 531,655,201 | | | | $ | 31,020,342 | | | | $ | 19,002,996 | |
| | |
| 106 | See Notes to Financial Statements. |
Focused
Small Cap
Value Fund | | | Fundamental
Equity Fund | | | Global
Equity Fund | | | Growth
Leaders Fund | |
| | | |
| | $ | 101,591,307 | | | | $ | 1,487,500,502 | | | | $ | 12,738,265 | | | | $ | 4,094,505,173 | |
| | | – | | | | | – | | | | | – | | | | | – | |
| | $ | 99,473,348 | | | | $ | 1,748,226,439 | | | | $ | 13,907,404 | | | | $ | 4,777,398,860 | |
| | | – | | | | | – | | | | | – | | | | | – | |
| | | – | | | | | 2 | | | | | 6 | | | | | – | |
| | |
| | | 66,561 | | | | | 286 | | | | | 4,640 | | | | | – | |
| | |
| | | 144,709 | | | | | 351,829 | | | | | 1,992 | | | | | 3,959,811 | |
| | | 63 | | | | | 1,682,878 | | | | | 7,085 | | | | | 171,041 | |
| | | 4,881 | | | | | – | | | | | 15,004 | | | | | 22,194 | |
| | | 723,473 | | | | | 6,728,841 | | | | | – | | | | | 49,210,749 | |
| | | 45,040 | | | | | 79,041 | | | | | 72,689 | | | | | 32,805 | |
| | | 100,458,075 | | | | | 1,757,069,316 | | | | | 14,008,820 | | | | | 4,830,795,460 | |
| | |
| | | 167,406 | | | | | 2,332,076 | | | | | 22,347 | | | | | 9,248,349 | |
| | | 18,387 | | | | | 486,579 | | | | | 906 | | | | | 460,887 | |
| | | 5,189 | | | | | 218,936 | | | | | 1,711 | | | | | 738,554 | |
| | | 3,568 | | | | | 60,811 | | | | | 488 | | | | | 170,869 | |
| | | 71,356 | | | | | 840,815 | | | | | 5,492 | | | | | 2,220,794 | |
| | | 63,811 | | | | | 476,647 | | | | | 72,072 | | | | | 981,428 | |
| | | 329,717 | | | | | 4,415,864 | | | | | 103,016 | | | | | 13,820,881 | |
| | $ | 100,128,358 | | | | $ | 1,752,653,452 | | | | $ | 13,905,804 | | | | $ | 4,816,974,579 | |
| | |
| | $ | 103,984,304 | | | | $ | 1,486,260,352 | | | | $ | 13,324,139 | | | | $ | 5,776,035,017 | |
| | | (3,855,946 | ) | | | | 266,393,100 | | | | | 581,665 | | | | | (959,060,438 | ) |
| | $ | 100,128,358 | | | | $ | 1,752,653,452 | | | | $ | 13,905,804 | | | | $ | 4,816,974,579 | |
| | | |
| | See Notes to Financial Statements. | 107 |
Statements of Assets and Liabilities (continued)
October 31, 2023
| | | Alpha
Strategy Fund | | | Focused
Growth Fund | | | Focused
Large Cap
Value Fund | |
| Net assets by class: | | | | | | | | | | | | | | | |
| Class A Shares | | | $ | 342,755,929 | | | | $ | 15,986,310 | | | | $ | 9,821,328 | |
| Class C Shares | | | $ | 13,822,603 | | | | $ | 2,213,784 | | | | $ | 2,617,508 | |
| Class F Shares | | | $ | 9,141,816 | | | | $ | 3,535,508 | | | | $ | 193,571 | |
| Class F3 Shares | | | $ | 46,723,620 | | | | $ | 499,453 | | | | $ | 8,968 | |
| Class I Shares | | | $ | 95,792,055 | | | | $ | 4,121,607 | | | | $ | 4,981,834 | |
| Class P Shares | | | $ | – | | | | $ | – | | | | $ | – | |
| Class R2 Shares | | | $ | 811,964 | | | | $ | – | | | | $ | – | |
| Class R3 Shares | | | $ | 15,526,129 | | | | $ | 154,990 | | | | $ | 143,419 | |
| Class R4 Shares | | | $ | 3,150,070 | | | | $ | 13,659 | | | | $ | 6,432 | |
| Class R5 Shares | | | $ | 550,986 | | | | $ | 13,842 | | | | $ | 6,458 | |
| Class R6 Shares | | | $ | 3,380,029 | | | | $ | 4,481,189 | | | | $ | 1,223,478 | |
| Outstanding shares by class (unlimited number of authorized shares of beneficial interest): | | | | | | | | | | | | | | | |
| Class A Shares | | | | 17,502,253 | | | | | 780,592 | | | | | 1,025,099 | |
| Class C Shares | | | | 951,147 | | | | | 112,464 | | | | | 274,847 | |
| Class F Shares | | | | 460,192 | | | | | 170,291 | | | | | 19,783 | |
| Class F3 Shares | | | | 2,273,087 | | | | | 23,956 | | | | | 931 | |
| Class I Shares | | | | 4,688,767 | | | | | 198,479 | | | | | 499,153 | |
| Class P Shares | | | | – | | | | | – | | | | | – | |
| Class R2 Shares | | | | 43,967 | | | | | – | | | | | – | |
| Class R3 Shares | | | | 832,032 | | | | | 7,666 | | | | | 15,009 | |
| Class R4 Shares | | | | 161,383 | | | | | 667 | | | | | 670 | |
| Class R5 Shares | | | | 26,960 | | | | | 667 | | | | | 671 | |
| Class R6 Shares | | | | 164,382 | | | | | 214,932 | | | | | 126,853 | |
| Net Asset Value, offering and redemption price per share (Net assets divided by outstanding shares): | | | | | | | | | | | | | | | |
| Class A Shares-Net asset value | | | | $19.58 | | | | | $20.48 | | | | | $9.58 | |
| Class A Shares-Maximum offering price (Net asset value plus sales charge of 5.75%) | | | | $20.77 | | | | | $21.73 | | | | | $10.16 | |
| Class C Shares-Net asset value | | | | $14.53 | | | | | $19.68 | | | | | $9.52 | |
| Class F Shares-Net asset value | | | | $19.87 | | | | | $20.76 | | | | | $9.78 | |
| Class F3 Shares-Net asset value* | | | | $20.56 | | | | | $20.85 | | | | | $9.63 | |
| Class I Shares-Net asset value | | | | $20.43 | | | | | $20.77 | | | | | $9.98 | |
| Class P Shares-Net asset value | | | | $ – | | | | | $ – | | | | | $ – | |
| Class R2 Shares-Net asset value | | | | $18.47 | | | | | $ – | | | | | $ – | |
| Class R3 Shares-Net asset value | | | | $18.66 | | | | | $20.22 | | | | | $9.56 | |
| Class R4 Shares-Net asset value* | | | | $19.52 | | | | | $20.49 | | | | | $9.60 | |
| Class R5 Shares-Net asset value* | | | | $20.44 | | | | | $20.76 | | | | | $9.63 | |
| Class R6 Shares-Net asset value | | | | $20.56 | | | | | $20.85 | | | | | $9.64 | |
| | |
| * | Net asset value may not recalculate due to rounding of fractional shares. |
| | |
| 108 | See Notes to Financial Statements. |
Focused
Small Cap
Value Fund | | | Fundamental
Equity Fund | | | Global
Equity Fund | | | Growth
Leaders Fund | |
| | | |
| | $ | 11,486,912 | | | | $ | 1,068,294,079 | | | | $ | 5,163,388 | | | | $ | 1,491,195,529 | |
| | $ | 2,499,266 | | | | $ | 23,315,999 | | | | $ | 344,917 | | | | $ | 425,712,730 | |
| | $ | 4,246,081 | | | | $ | 24,745,443 | | | | $ | 1,099,159 | | | | $ | 244,363,975 | |
| | $ | 10,326 | | | | $ | 17,641,842 | | | | $ | 13,738 | | | | $ | 382,432,483 | |
| | $ | 71,702,573 | | | | $ | 545,536,917 | | | | $ | 3,245,029 | | | | $ | 2,124,007,063 | |
| | $ | – | | | | $ | 3,237,040 | | | | $ | – | | | | $ | – | |
| | $ | – | | | | $ | 1,964,265 | | | | $ | – | | | | $ | 1,451,962 | |
| | $ | – | | | | $ | 57,036,662 | | | | $ | 598,022 | | | | $ | 15,019,473 | |
| | $ | – | | | | $ | 2,523,081 | | | | $ | 13,942 | | | | $ | 9,594,830 | |
| | $ | 185,111 | | | | $ | 780,728 | | | | $ | 14,100 | | | | $ | 9,206,419 | |
| | $ | 9,998,089 | | | | $ | 7,577,396 | | | | $ | 3,413,509 | | | | $ | 113,990,115 | |
| | |
| | | 523,830 | | | | | 89,646,387 | | | | | 415,734 | | | | | 53,884,095 | |
| | | 107,851 | | | | | 2,302,424 | | | | | 28,176 | | | | | 17,917,769 | |
| | | 176,451 | | | | | 2,106,554 | | | | | 88,273 | | | | | 8,496,782 | |
| | | 429 | | | | | 1,453,054 | | | | | 1,102 | | | | | 13,064,053 | |
| | | 2,988,569 | | | | | 45,342,111 | | | | | 260,627 | | | | | 73,193,125 | |
| | | – | | | | | 279,186 | | | | | – | | | | | – | |
| | | – | | | | | 169,952 | | | | | – | | | | | 54,610 | |
| | | – | | | | | 4,911,610 | | | | | 48,578 | | | | | 564,228 | |
| | | – | | | | | 213,048 | | | | | 1,124 | | | | | 346,548 | |
| | | 7,714 | | | | | 64,840 | | | | | 1,132 | | | | | 317,078 | |
| | | 415,522 | | | | | 623,666 | | | | | 273,693 | | | | | 3,894,025 | |
| | |
| | | $21.93 | | | | | $11.92 | | | | | $12.42 | | | | | $27.67 | |
| | |
| | | $23.27 | | | | | $12.65 | | | | | $13.18 | | | | | $29.36 | |
| | | $23.17 | | | | | $10.13 | | | | | $12.24 | | | | | $23.76 | |
| | | $24.06 | | | | | $11.75 | | | | | $12.45 | | | | | $28.76 | |
| | | $24.06 | | | | | $12.14 | | | | | $12.47 | | | | | $29.27 | |
| | | $23.99 | | | | | $12.03 | | | | | $12.45 | | | | | $29.02 | |
| | | $ – | | | | | $11.59 | | | | | $ – | | | | | $ – | |
| | | $ – | | | | | $11.56 | | | | | $ – | | | | | $26.59 | |
| | | $ – | | | | | $11.61 | | | | | $12.31 | | | | | $26.62 | |
| | | $ – | | | | | $11.84 | | | | | $12.41 | | | | | $27.69 | |
| | | $24.00 | | | | | $12.04 | | | | | $12.46 | | | | | $29.04 | |
| | | $24.06 | | | | | $12.15 | | | | | $12.47 | | | | | $29.27 | |
| | | |
| | See Notes to Financial Statements. | 109 |
Statements of Assets and Liabilities (continued)
October 31, 2023
| | | Health
Care Fund | | | International
Equity Fund | | | International
Opportunities Fund | |
| ASSETS: | | | | | | | | | | | | | | | |
| Investments in securities, at cost | | | $ | 6,690,327 | | | | $ | 279,101,990 | | | | $ | 312,468,636 | |
| Investments in securities, at fair value including $64,555, $0, $51,671, $0, $5,415,683 and $0, respectively, of securities loaned | | | $ | 7,005,905 | | | | $ | 296,280,678 | | | | $ | 291,930,669 | |
| Cash | | | | – | | | | | – | | | | | – | |
| Foreign cash, at value (cost $0, $1,882,649, $851,615, $71,881, $0 and $0, respectively) | | | | – | | | | | 1,841,776 | | | | | 844,467 | |
| Receivables: | | | | | | | | | | | | | | | |
| Investment securities sold | | | | 22,748 | | | | | 480,874 | | | | | – | |
| From advisor (See Note 3) | | | | 14,911 | | | | | – | | | | | – | |
| Interest and dividends | | | | 4,122 | | | | | 950,632 | | | | | 1,136,238 | |
| Capital shares sold | | | | 1,513 | | | | | 86,335 | | | | | 119,058 | |
| Securities lending income receivable | | | | 179 | | | | | 156 | | | | | 564 | |
| Prepaid expenses and other assets | | | | 60,479 | | | | | 83,098 | | | | | 64,220 | |
| Total assets | | | | 7,109,857 | | | | | 299,723,549 | | | | | 294,095,216 | |
| LIABILITIES: | | | | | | | | | | | | | | | |
| Payables: | | | | | | | | | | | | | | | |
| Payable for collateral due to broker for securities lending | | | | 62,300 | | | | | – | | | | | 53,954 | |
| Capital shares reacquired | | | | 17,426 | | | | | 530,479 | | | | | 163,218 | |
| Management fee | | | | 3,828 | | | | | 116,268 | | | | | 189,260 | |
| Trustees’ fees | | | | 3,086 | | | | | 89,868 | | | | | 71,230 | |
| 12b-1 distribution plan | | | | 1,721 | | | | | 33,030 | | | | | 17,707 | |
| Fund administration | | | | 247 | | | | | 10,335 | | | | | 10,094 | |
| Investment securities purchased | | | | – | | | | | 3,179,312 | | | | | 2,283,828 | |
| Foreign capital gains taxes deferred | | | | – | | | | | 158,876 | | | | | 259,449 | |
| Foreign currency overdraft (cost $41, $0, $0, $0, $0 and $0, respectively) | | | | 41 | | | | | – | | | | | – | |
| Accrued expenses | | | | 57,449 | | | | | 175,980 | | | | | 155,294 | |
| Total liabilities | | | | 146,098 | | | | | 4,294,148 | | | | | 3,204,034 | |
| NET ASSETS | | | $ | 6,963,759 | | | | $ | 295,429,401 | | | | $ | 290,891,182 | |
| COMPOSITION OF NET ASSETS: | | | | | | | | | | | | | | | |
| Paid-in capital | | | $ | 7,841,994 | | | | $ | 291,761,750 | | | | $ | 360,583,542 | |
| Total distributable earnings (loss) | | | | (878,235 | ) | | | | 3,667,651 | | | | | (69,692,360 | ) |
| Net Assets | | | $ | 6,963,759 | | | | $ | 295,429,401 | | | | $ | 290,891,182 | |
| | |
| 110 | See Notes to Financial Statements. |
International
Value Fund | | | Micro Cap
Growth Fund | | | Value
Opportunities
Fund | |
| | | |
| | $ | 358,840,052 | | | | $ | 155,751,697 | | | | $ | 987,991,674 | |
| | |
| | $ | 358,577,196 | | | | $ | 169,191,187 | | | | $ | 1,094,629,739 | |
| | | – | | | | | – | | | | | 20,781 | |
| | |
| | | 71,926 | | | | | – | | | | | – | |
| | |
| | | 1,855,986 | | | | | 232,219 | | | | | 5,764,868 | |
| | | – | | | | | 1,010 | | | | | – | |
| | | 2,045,491 | | | | | 192 | | | | | 284,291 | |
| | | 138,803 | | | | | 68,032 | | | | | 460,966 | |
| | | – | | | | | 9,320 | | | | | – | |
| | | 35,943 | | | | | 1,730 | | | | | 117,153 | |
| | | 362,725,345 | | | | | 169,503,690 | | | | | 1,101,277,798 | |
| | |
| | | – | | | | | 5,400,090 | | | | | – | |
| | | 476,975 | | | | | 289,110 | | | | | 1,107,503 | |
| | | 157,741 | | | | | 134,990 | | | | | 713,953 | |
| | | 132,643 | | | | | 22,385 | | | | | 309,901 | |
| | | 44,409 | | | | | 10,763 | | | | | 105,281 | |
| | | 12,619 | | | | | 6,000 | | | | | 38,371 | |
| | | 794,783 | | | | | 630,313 | | | | | 4,780,389 | |
| | | 22,710 | | | | | – | | | | | – | |
| | |
| | | – | | | | | – | | | | | – | |
| | | 205,105 | | | | | 80,367 | | | | | 398,680 | |
| | | 1,846,985 | | | | | 6,574,018 | | | | | 7,454,078 | |
| | $ | 360,878,360 | | | | $ | 162,929,672 | | | | $ | 1,093,823,720 | |
| | |
| | $ | 790,978,142 | | | | $ | 248,832,646 | | | | $ | 974,832,413 | |
| | | (430,099,782 | ) | | | | (85,902,974 | ) | | | | 118,991,307 | |
| | $ | 360,878,360 | | | | $ | 162,929,672 | | | | $ | 1,093,823,720 | |
| | | |
| | See Notes to Financial Statements. | 111 |
Statements of Assets and Liabilities (concluded)
October 31, 2023
| | | Health Care
Fund | | | International
Equity Fund | | | International
Opportunities
Fund | |
| Net Assets by class: | | | | | | | | | | | | | | | |
| Class A Shares | | | $ | 3,852,939 | | | | $ | 132,735,078 | | | | $ | 85,371,257 | |
| Class C Shares | | | $ | 929,853 | | | | $ | 1,413,583 | | | | $ | 4,729,255 | |
| Class F Shares | | | $ | 173,497 | | | | $ | 3,894,325 | | | | $ | 3,683,246 | |
| Class F3 Shares | | | $ | 28,403 | | | | $ | 11,841,195 | | | | $ | 27,245,181 | |
| Class I Shares | | | $ | 48,657 | | | | $ | 136,200,812 | | | | $ | 143,465,569 | |
| Class P Shares | | | $ | – | | | | $ | 10,065 | | | | $ | 20,825 | |
| Class R2 Shares | | | $ | – | | | | $ | 168,600 | | | | $ | 1,401,707 | |
| Class R3 Shares | | | $ | 24,318 | | | | $ | 4,529,892 | | | | $ | 4,508,273 | |
| Class R4 Shares | | | $ | 10,258 | | | | $ | 1,358,922 | | | | $ | 2,277,929 | |
| Class R5 Shares | | | $ | 10,359 | | | | $ | 13,715 | | | | $ | 2,009,348 | |
| Class R6 Shares | | | $ | 1,885,475 | | | | $ | 3,263,214 | | | | $ | 16,178,592 | |
| Outstanding shares by class (unlimited number of authorized shares of beneficial interest): | | | | | | | | | | | | | | | |
| Class A Shares | | | | 250,322 | | | | | 10,730,616 | | | | | 5,355,054 | |
| Class C Shares | | | | 62,556 | | | | | 114,801 | | | | | 324,013 | |
| Class F Shares | | | | 11,148 | | | | | 315,875 | | | | | 232,938 | |
| Class F3 Shares | | | | 1,826 | | | | | 941,265 | | | | | 1,639,468 | |
| Class I Shares | | | | 3,132 | | | | | 10,858,756 | | | | | 8,696,239 | |
| Class P Shares | | | | – | | | | | 812 | | | | | 1,273 | |
| Class R2 Shares | | | | – | | | | | 13,625 | | | | | 89,903 | |
| Class R3 Shares | | | | 1,598 | | | | | 372,894 | | | | | 289,145 | |
| Class R4 Shares | | | | 667 | | | | | 110,502 | | | | | 143,629 | |
| Class R5 Shares | | | | 667 | | | | | 1,102 | | | | | 121,849 | |
| Class R6 Shares | | | | 121,138 | | | | | 259,557 | | | | | 973,490 | |
| Net Asset Value, offering and redemption price per share (Net assets divided by outstanding shares): | | | | | | | | | | | | | | | |
| Class A Shares-Net asset value | | | | $15.39 | | | | | $12.37 | | | | | $15.94 | |
| Class A Shares-Maximum offering price (Net asset value plus sales charge of 5.75%) | | | | $16.33 | | | | | $13.12 | | | | | $16.91 | |
| Class C Shares-Net asset value | | | | $14.86 | | | | | $12.31 | | | | | $14.60 | |
| Class F Shares-Net asset value | | | | $15.56 | | | | | $12.33 | | | | | $15.81 | |
| Class F3 Shares-Net asset value* | | | | $15.56 | | | | | $12.58 | | | | | $16.62 | |
| Class I Shares-Net asset value* | | | | $15.53 | | | | | $12.54 | | | | | $16.50 | |
| Class P Shares-Net asset value* | | | | $ – | | | | | $12.40 | | | | | $16.37 | |
| Class R2 Shares-Net asset value | | | | $ – | | | | | $12.37 | | | | | $15.59 | |
| Class R3 Shares-Net asset value* | | | | $15.21 | | | | | $12.15 | | | | | $15.59 | |
| Class R4 Shares-Net asset value* | | | | $15.39 | | | | | $12.30 | | | | | $15.86 | |
| Class R5 Shares-Net asset value | | | | $15.53 | | | | | $12.45 | | | | | $16.49 | |
| Class R6 Shares-Net asset value | | | | $15.56 | | | | | $12.57 | | | | | $16.62 | |
| | |
| * | Net asset value may not recalculate due to rounding of fractional shares. |
| | |
| 112 | See Notes to Financial Statements. |
International
Value Fund | | | Micro Cap
Growth Fund | | | Value
Opportunities
Fund | |
| | | |
| | $ | 190,585,128 | | | | $ | 24,055,894 | | | | $ | 540,437,771 | |
| | $ | 2,732,913 | | | | $ | 4,641,046 | | | | $ | 28,372,153 | |
| | $ | 4,786,457 | | | | $ | 11,019,026 | | | | $ | 26,977,527 | |
| | $ | 28,831,072 | | | | $ | – | | | | $ | 172,839,044 | |
| | $ | 125,953,339 | | | | $ | 123,213,706 | | | | $ | 228,083,268 | |
| | $ | – | | | | $ | – | | | | $ | 10,682,048 | |
| | $ | 53,899 | | | | $ | – | | | | $ | 3,848,834 | |
| | $ | 6,210,679 | | | | $ | – | | | | $ | 26,522,798 | |
| | $ | 106,776 | | | | $ | – | | | | $ | 26,010,811 | |
| | $ | 10,254 | | | | $ | – | | | | $ | 999,105 | |
| | $ | 1,607,843 | | | | $ | – | | | | $ | 29,050,361 | |
| | |
| | | 27,995,413 | | | | | 2,176,208 | | | | | 34,829,827 | |
| | | 404,082 | | | | | 351,207 | | | | | 2,295,144 | |
| | | 697,137 | | | | | 807,577 | | | | | 1,679,678 | |
| | | 4,194,708 | | | | | – | | | | | 10,334,599 | |
| | | 18,329,135 | | | | | 9,031,198 | | | | | 13,802,130 | |
| | | – | | | | | – | | | | | 713,010 | |
| | | 7,715 | | | | | – | | | | | 267,504 | |
| | | 901,543 | | | | | – | | | | | 1,803,341 | |
| | | 15,723 | | | | | – | | | | | 1,678,997 | |
| | | 1,499 | | | | | – | | | | | 60,404 | |
| | | 233,940 | | | | | – | | | | | 1,738,790 | |
| | |
| | | $6.81 | | | | | $11.05 | | | | | $15.52 | |
| | |
| | | $7.23 | | | | | $11.72 | | | | | $16.47 | |
| | | $6.76 | | | | | $13.21 | | | | | $12.36 | |
| | | $6.87 | | | | | $13.64 | | | | | $16.06 | |
| | | $6.87 | | | | | $ – | | | | | $16.72 | |
| | | $6.87 | | | | | $13.64 | | | | | $16.53 | |
| | | $ – | | | | | $ – | | | | | $14.98 | |
| | | $6.99 | | | | | $ – | | | | | $14.39 | |
| | | $6.89 | | | | | $ – | | | | | $14.71 | |
| | | $6.79 | | | | | $ – | | | | | $15.49 | |
| | | $6.84 | | | | | $ – | | | | | $16.54 | |
| | | $6.87 | | | | | $ – | | | | | $16.71 | |
| | | |
| | See Notes to Financial Statements. | 113 |
Statements of Operations
For the Year Ended October 31, 2023
| | | Alpha
Strategy Fund | | | Focused
Growth Fund | | | Focused
Large Cap
Value Fund | |
| Investment income: | | | | | | | | | | | | | | | |
| Dividends received from Underlying Funds | | | $ | 4,466,727 | | | | $ | – | | | | $ | – | |
| Dividends (net of foreign withholding taxes of $0, $0, $394, $27,104, $141,485, $12,360 and $0, respectively) | | | | – | | | | | 88,570 | | | | | 374,141 | |
| Securities lending net income | | | | – | | | | | – | | | | | – | |
| Interest and other | | | | 9,615 | | | | | 24,613 | | | | | 6,256 | |
| Interest earned from Interfund Lending (See Note 10) | | | | – | | | | | – | | | | | – | |
| Total investment income | | | | 4,476,342 | | | | | 113,183 | | | | | 380,397 | |
| Expenses: | | | | | | | | | | | | | | | |
| Management fee | | | | 623,661 | | | | | 215,807 | | | | | 125,261 | |
| 12b-1 distribution plan–Class A | | | | 999,313 | | | | | 38,426 | | | | | 29,977 | |
| 12b-1 distribution plan–Class C | | | | 220,587 | | | | | 23,084 | | | | | 31,116 | |
| 12b-1 distribution plan–Class F | | | | 17,815 | | | | | 4,509 | | | | | 574 | |
| 12b-1 distribution plan–Class P | | | | – | | | | | – | | | | | – | |
| 12b-1 distribution plan–Class R2 | | | | 5,668 | | | | | – | | | | | – | |
| 12b-1 distribution plan–Class R3 | | | | 88,129 | | | | | 535 | | | | | 623 | |
| 12b-1 distribution plan–Class R4 | | | | 9,565 | | | | | 34 | | | | | 17 | |
| Shareholder servicing | | | | 531,038 | | | | | 45,405 | | | | | 10,950 | |
| Fund administration | | | | 249,464 | | | | | 13,280 | | | | | 8,492 | |
| Registration | | | | 145,228 | | | | | 130,928 | | | | | 129,618 | |
| Reports to shareholders | | | | 70,318 | | | | | 1,427 | | | | | 3,748 | |
| Custody | | | | 40,882 | | | | | 5,163 | | | | | 6,648 | |
| Professional | | | | 34,513 | | | | | 39,826 | | | | | 39,514 | |
| Trustees’ fees | | | | 16,805 | | | | | 875 | | | | | 754 | |
| Other | | | | 19,724 | | | | | 19,101 | | | | | 27,288 | |
| Gross expenses | | | | 3,072,710 | | | | | 538,400 | | | | | 414,580 | |
| Expense reductions (See Note 8) | | | | (9,772 | ) | | | | (480 | ) | | | | (339 | ) |
| Fees waived and expenses reimbursed (See Note 3) | | | | (664,543 | ) | | | | (216,676 | ) | | | | (201,770 | ) |
| Net expenses | | | | 2,398,395 | | | | | 321,244 | | | | | 212,471 | |
| Net investment income (loss) | | | | 2,077,947 | | | | | (208,061 | ) | | | | 167,926 | |
| Net realized and unrealized gain (loss): | | | | | | | | | | | | | | | |
| Capital gain distributions received from Underlying Funds | | | | 15,265,434 | | | | | – | | | | | – | |
| Net realized gain (loss) on Investment in Underlying Funds | | | | (14,016,235 | ) | | | | – | | | | | – | |
| Net realized gain (loss) on investments | | | | – | | | | | (5,010,764 | ) | | | | (789,630 | ) |
| Net realized gain (loss) on foreign currency related transactions | | | | – | | | | | – | | | | | 1,900 | |
| Net change in unrealized appreciation/depreciation in Underlying Funds | | | | (21,524,542 | ) | | | | – | | | | | – | |
| Net change in unrealized appreciation/depreciation on investments | | | | – | | | | | 6,273,650 | | | | | 611,437 | |
| | |
| 114 | See Notes to Financial Statements. |
Focused
Small Cap
Value Fund | | | Fundamental
Equity Fund | | | Global
Equity Fund | | | Growth
Leaders Fund | |
| | | |
| | $ | – | | | | $ | – | | | | $ | – | | | | $ | – | |
| | | | | | | | | | | | | | | | | | | |
| | | 1,877,333 | | | | | 36,272,055 | | | | | 272,080 | | | | | 16,305,249 | |
| | | 87 | | | | | 41 | | | | | 587 | | | | | 584,161 | |
| | | 20,323 | | | | | 459,675 | | | | | 11,994 | | | | | 1,910,671 | |
| | | – | | | | | – | | | | | – | | | | | 7,073 | |
| | | 1,897,743 | | | | | 36,731,771 | | | | | 284,661 | | | | | 18,807,154 | |
| | | | | | | | | | | | | | | | | | | |
| | | 967,010 | | | | | 10,529,434 | | | | | 64,554 | | | | | 27,078,664 | |
| | | 35,859 | | | | | 2,897,831 | | | | | 12,341 | | | | | 3,826,598 | |
| | | 32,789 | | | | | 308,878 | | | | | 3,499 | | | | | 4,868,202 | |
| | | 12,055 | | | | | 42,874 | | | | | 1,228 | | | | | 449,963 | |
| | | – | | | | | 16,963 | | | | | – | | | | | – | |
| | | – | | | | | 12,968 | | | | | – | | | | | 11,651 | |
| | | – | | | | | 313,141 | | | | | 2,941 | | | | | 78,500 | |
| | | – | | | | | 7,073 | | | | | 879 | | | | | 26,121 | |
| | | 67,891 | | | | | 1,387,118 | | | | | 27,531 | | | | | 3,706,970 | |
| | | 48,350 | | | | | 766,355 | | | | | 5,738 | | | | | 2,086,293 | |
| | | 97,644 | | | | | 167,747 | | | | | 115,694 | | | | | 248,084 | |
| | | 45,301 | | | | | 134,942 | | | | | 2,234 | | | | | 453,505 | |
| | | 7,455 | | | | | 6,586 | | | | | 41,266 | | | | | 35,919 | |
| | | 42,352 | | | | | 67,281 | | | | | 53,198 | | | | | 120,828 | |
| | | 3,271 | | | | | 50,772 | | | | | 476 | | | | | 138,852 | |
| | | 22,096 | | | | | 125,822 | | | | | 9,234 | | | | | 164,625 | |
| | | 1,382,073 | | | | | 16,835,785 | | | | | 340,813 | | | | | 43,294,775 | |
| | | (896 | ) | | | | (24,296 | ) | | | | (175 | ) | | | | (71,723 | ) |
| | | (72,984 | ) | | | | (6,585 | ) | | | | (229,047 | ) | | | | (485,882 | ) |
| | | 1,308,193 | | | | | 16,804,904 | | | | | 111,591 | | | | | 42,737,170 | |
| | | 589,550 | | | | | 19,926,867 | | | | | 173,070 | | | | | (23,930,016 | ) |
| | | | | | | | | | | | | | | | | | | |
| | | – | | | | | – | | | | | – | | | | | – | |
| | | | | | | | | | | | | | | | | | | |
| | | – | | | | | – | | | | | – | | | | | – | |
| | | (1,296,477 | ) | | | | 1,068,993 | | | | | (539,411 | ) | | | | (630,990,488 | ) |
| | | | | | | | | | | | | | | | | | | |
| | | (1,028 | ) | | | | 15,808 | | | | | 1,101 | | | | | – | |
| | | | | | | | | | | | | | | | | | | |
| | | – | | | | | – | | | | | – | | | | | – | |
| | | | | | | | | | | | | | | | | | | |
| | | (3,302,684 | ) | | | | 3,700,053 | | | | | 1,647,286 | | | | | 893,374,356 | |
| | | |
| | See Notes to Financial Statements. | 115 |
Statements of Operations (continued)
For the Year Ended October 31, 2023
| | | Alpha
Strategy Fund | | | Focused
Growth Fund | | | Focused
Large Cap
Value Fund | |
| Net realized and unrealized gain (loss): | | | | | | | | | | | | | | | |
| Net change in unrealized appreciation/depreciation on translation of assets and liabilities denominated in foreign currencies | | | | – | | | | | – | | | | | 23,715 | |
| Net realized and unrealized gain (loss) | | | | (20,275,343 | ) | | | | 1,262,886 | | | | | (152,578 | ) |
| Net Increase (Decrease) in Net Assets Resulting From Operations | | | $ | (18,197,396 | ) | | | $ | 1,054,825 | | | | $ | 15,348 | |
| | |
| 116 | See Notes to Financial Statements. |
Focused
Small Cap
Value Fund | | | Fundamental
Equity Fund | | | Global
Equity Fund | | | Growth
Leaders Fund | |
| | | |
| | | (737 | ) | | | | 15,792 | | | | | 3,364 | | | | | – | |
| | | (4,600,926 | ) | | | | 4,800,646 | | | | | 1,112,340 | | | | | 262,383,868 | |
| | |
| | $ | (4,011,376 | ) | | | $ | 24,727,513 | | | | $ | 1,285,410 | | | | $ | 238,453,852 | |
| | | |
| | See Notes to Financial Statements. | 117 |
Statements of Operations (concluded)
For the Year Ended October 31, 2023
| | | Health Care
Fund | | | International
Equity Fund | | | International
Opportunities
Fund | |
| Investment income: | | | | | | | | | | | | | | | |
| Dividends (net of foreign withholding taxes of $2,454, $960,898, $828,965, $1,275,759, $0 and $73,739, respectively) | | | $ | 37,466 | | | | $ | 7,996,413 | | | | $ | 8,256,519 | |
| Securities lending net income | | | | 2,037 | | | | | 68,794 | | | | | 7,164 | |
| Interest and other | | | | 5,998 | | | | | 366,374 | | | | | 228,474 | |
| Interest earned from Interfund Lending (See Note 10) | | | | – | | | | | 915 | | | | | 1,659 | |
| Total investment income | | | | 45,501 | | | | | 8,432,496 | | | | | 8,493,816 | |
| Expenses: | | | | | | | | | | | | | | | |
| Management fee | | | | 46,129 | | | | | 1,528,824 | | | | | 2,452,690 | |
| 12b-1 distribution plan–Class A | | | | 9,935 | | | | | 364,329 | | | | | 236,152 | |
| 12b-1 distribution plan–Class C | | | | 8,877 | | | | | 28,434 | | | | | 65,639 | |
| 12b-1 distribution plan–Class F | | | | 246 | | | | | 6,172 | | | | | 7,762 | |
| 12b-1 distribution plan–Class P | | | | – | | | | | 48 | | | | | 308 | |
| 12b-1 distribution plan–Class R2 | | | | – | | | | | 1,025 | | | | | 10,900 | |
| 12b-1 distribution plan–Class R3 | | | | 107 | | | | | 25,349 | | | | | 24,144 | |
| 12b-1 distribution plan–Class R4 | | | | 29 | | | | | 3,785 | | | | | 5,351 | |
| Registration | | | | 123,742 | | | | | 153,768 | | | | | 151,624 | |
| Professional | | | | 43,302 | | | | | 99,933 | | | | | 60,158 | |
| Shareholder servicing | | | | 10,080 | | | | | 264,492 | | | | | 246,317 | |
| Fund administration | | | | 2,976 | | | | | 128,980 | | | | | 130,810 | |
| Custody | | | | 1,072 | | | | | 117,851 | | | | | 110,759 | |
| Reports to shareholders | | | | 826 | | | | | 36,081 | | | | | 34,435 | |
| Trustees’ fees | | | | 476 | | | | | 8,464 | | | | | 8,536 | |
| Other | | | | 11,974 | | | | | 24,941 | | | | | 64,192 | |
| Gross expenses | | | | 259,771 | | | | | 2,792,476 | | | | | 3,609,777 | |
| Expense reductions (See Note 8) | | | | (76 | ) | | | | (2,836 | ) | | | | (2,615 | ) |
| Fees waived and expenses reimbursed (See Note 3) | | | | (186,149 | ) | | | | (134,543 | ) | | | | (110,759 | ) |
| Net expenses | | | | 73,546 | | | | | 2,655,097 | | | | | 3,496,403 | |
| Net investment income (loss) | | | | (28,045 | ) | | | | 5,777,399 | | | | | 4,997,413 | |
| Net realized and unrealized gain (loss): | | | | | | | | | | | | | | | |
| Net realized gain (loss) on investments | | | | (375,535 | ) | | | | (11,410,483 | ) | | | | (18,298,022 | ) |
| Net realized gain (loss) on foreign currency related transactions | | | | 309 | | | | | 95,129 | | | | | (20,294 | ) |
| Net change in unrealized appreciation/depreciation on investments | | | | (383,054 | ) | | | | 30,730,179 | | | | | 44,857,796 | |
| Net change in unrealized appreciation/depreciation on deferred foreign capital gains taxes | | | | – | | | | | (126,008 | ) | | | | (174,619 | ) |
| Net change in unrealized appreciation/depreciation on translation of assets and liabilities denominated in foreign currencies | | | | 268 | | | | | 87,806 | | | | | 741,360 | |
| Net realized and unrealized gain (loss) | | | | (758,012 | ) | | | | 19,376,623 | | | | | 27,106,221 | |
| Net Increase (Decrease) in Net Assets Resulting From Operations | | | $ | (786,057 | ) | | | $ | 25,154,022 | | | | $ | 32,103,634 | |
| | |
| 118 | See Notes to Financial Statements. |
International
Value Fund | | | Micro Cap
Growth Fund | | | Value
Opportunities
Fund | |
| | | |
| | $ | 14,120,300 | | | | $ | 183,492 | | | | $ | 18,263,295 | |
| | | 83,651 | | | | | 144,749 | | | | | 1,534 | |
| | | 183,735 | | | | | 109,308 | | | | | 182,831 | |
| | | 1,610 | | | | | – | | | | | – | |
| | | 14,389,296 | | | | | 437,549 | | | | | 18,447,660 | |
| | |
| | | 2,016,220 | | | | | 1,958,332 | | | | | 9,185,262 | |
| | | 508,839 | | | | | 84,016 | | | | | 1,514,450 | |
| | | 41,991 | | | | | 61,825 | | | | | 374,662 | |
| | | 6,968 | | | | | 24,697 | | | | | 45,965 | |
| | | – | | | | | – | | | | | 55,395 | |
| | | 387 | | | | | – | | | | | 26,353 | |
| | | 33,623 | | | | | – | | | | | 151,338 | |
| | | 366 | | | | | – | | | | | 70,998 | |
| | | 141,868 | | | | | 60,224 | | | | | 160,590 | |
| | | 96,554 | | | | | 49,335 | | | | | 54,230 | |
| | | 344,787 | | | | | 219,216 | | | | | 1,077,584 | |
| | | 155,202 | | | | | 87,037 | | | | | 496,301 | |
| | | 140,120 | | | | | 16,561 | | | | | 22,379 | |
| | | 47,080 | | | | | 16,504 | | | | | 153,403 | |
| | | 10,183 | | | | | 5,903 | | | | | 33,090 | |
| | | 33,736 | | | | | 28,867 | | | | | 118,448 | |
| | | 3,577,924 | | | | | 2,612,517 | | | | | 13,540,448 | |
| | | (4,071 | ) | | | | (2,649 | ) | | | | (15,335 | ) |
| | | (177,185 | ) | | | | (41,257 | ) | | | | (22,379 | ) |
| | | 3,396,668 | | | | | 2,568,611 | | | | | 13,502,734 | |
| | | 10,992,628 | | | | | (2,131,062 | ) | | | | 4,944,926 | |
| | |
| | | (2,378,835 | ) | | | | (21,812,099 | ) | | | | 16,727,882 | |
| | |
| | | 732,685 | | | | | – | | | | | – | |
| | |
| | | 39,871,351 | | | | | (19,131,055 | ) | | | | (11,065,712 | ) |
| | |
| | | (24,536 | ) | | | | – | | | | | – | |
| | |
| | | 214,649 | | | | | – | | | | | – | |
| | | 38,415,314 | | | | | (40,943,154 | ) | | | | 5,662,170 | |
| | |
| | $ | 49,407,942 | | | | $ | (43,074,216 | ) | | | $ | 10,607,096 | |
| | | |
| | See Notes to Financial Statements. | 119 |
Statements of Changes in Net Assets
| | | Alpha Strategy Fund | |
| INCREASE (DECREASE) IN NET ASSETS | | For the
Year Ended
October 31, 2023 | | | For the
Year Ended
October 31, 2022 | |
| Operations: | | | | | | | | |
| Net investment income (loss) | | $ | 2,077,947 | | | $ | 2,094,212 | |
| Capital gain distributions received from Underlying Funds | | | 15,265,434 | | | | 63,676,165 | |
| Net realized gain (loss) on investments in Underlying Funds | | | (14,016,235 | ) | | | (6,375,349 | ) |
| Net realized gain (loss) on investments and foreign currency related transactions | | | – | | | | – | |
| Net change in unrealized appreciation/depreciation on investments in Underlying Funds | | | (21,524,542 | ) | | | (272,105,734 | ) |
| Net change in unrealized appreciation/depreciation on investments and translation of assets and liabilities denominated in foreign currencies | | | – | | | | – | |
| Net increase (decrease) in net assets resulting from operations | | | (18,197,396 | ) | | | (212,710,706 | ) |
| Distributions to shareholders: | | | | | | | | |
| Class A | | | (26,637,494 | ) | | | (27,355,292 | ) |
| Class C | | | (2,342,626 | ) | | | (3,117,383 | ) |
| Class F | | | (1,650,626 | ) | | | (7,349,675 | ) |
| Class F3 | | | (3,208,745 | ) | | | (2,959,332 | ) |
| Class I | | | (6,291,180 | ) | | | (2,175,051 | ) |
| Class R2 | | | (60,697 | ) | | | (58,000 | ) |
| Class R3 | | | (1,054,054 | ) | | | (1,260,398 | ) |
| Class R4 | | | (254,475 | ) | | | (228,467 | ) |
| Class R5 | | | (24,219 | ) | | | (26,825 | ) |
| Class R6 | | | (226,973 | ) | | | (274,765 | ) |
| Return of capital: | | | | | | | | |
| Class A | | | – | | | | – | |
| Class C | | | – | | | | – | |
| Class F | | | – | | | | – | |
| Class F3 | | | – | | | | – | |
| Class I | | | – | | | | – | |
| Class R2 | | | – | | | | – | |
| Class R3 | | | – | | | | – | |
| Class R4 | | | – | | | | – | |
| Class R5 | | | – | | | | – | |
| Class R6 | | | – | | | | – | |
| Total distributions to shareholders | | | (41,751,089 | ) | | | (44,805,188 | ) |
| Capital share transactions (See Note 15): | | | | | | | | |
| Net proceeds from sales of shares | | | 96,147,796 | | | | 192,165,716 | |
| Reinvestment of distributions | | | 35,663,641 | | | | 38,027,618 | |
| Cost of shares reacquired | | | (195,981,845 | ) | | | (197,529,081 | ) |
| Net increase (decrease) in net assets resulting from capital share transactions | | | (64,170,408 | ) | | | 32,664,253 | |
| Net decrease in net assets | | | (124,118,893 | ) | | | (224,851,641 | ) |
| NET ASSETS: | | | | | | | | |
| Beginning of year | | $ | 655,774,094 | | | $ | 880,625,735 | |
| End of year | | $ | 531,655,201 | | | $ | 655,774,094 | |
| | |
| 120 | See Notes to Financial Statements. |
| Focused Growth Fund | | | Focused Large Cap Value Fund | | |
For the
Year Ended
October 31, 2023 | | | For the
Year Ended
October 31, 2022 | | | For the
Year Ended
October 31, 2023 | | | For the
Year Ended
October 31, 2022 | | |
| | | | | | | | | | | | | | | | |
| $ | (208,061 | ) | | $ | (255,492 | ) | | $ | 167,926 | | | $ | 7,836,154 | | |
| | – | | | | – | | | | – | | | | – | | |
| | – | | | | – | | | | – | | | | – | | |
| | | | | | | | | | | | | | | | |
| | (5,010,764 | ) | | | (6,905,171 | ) | | | (787,730 | ) | | | 34,686,571 | | |
| | | | | | | | | | | | | | | | |
| | – | | | | – | | | | – | | | | – | | |
| | | | | | | | | | | | | | | | |
| | 6,273,650 | | | | (13,228,715 | ) | | | 635,152 | | | | (113,032,560 | ) | |
| | | | | | | | | | | | | | | | |
| | 1,054,825 | | | | (20,389,378 | ) | | | 15,348 | | | | (70,509,835 | ) | |
| | | | | | | | | | | | | | | | |
| | – | | | | (2,567,142 | ) | | | (154,176 | ) | | | (1,832,383 | ) | |
| | – | | | | (378,405 | ) | | | (57,554 | ) | | | (824,722 | ) | |
| | – | | | | (2,509,277 | ) | | | (16,168 | ) | | | (516,992 | ) | |
| | – | | | | (162,364 | ) | | | (160 | ) | | | (4,009 | ) | |
| | – | | | | (757,292 | ) | | | (3,669 | ) | | | (148,160,810 | ) | |
| | – | | | | – | | | | – | | | | – | | |
| | – | | | | (3,252 | ) | | | (1,057 | ) | | | (2,986 | ) | |
| | – | | | | (3,247 | ) | | | (115 | ) | | | (2,856 | ) | |
| | – | | | | (3,247 | ) | | | (116 | ) | | | (2,890 | ) | |
| | – | | | | (849,495 | ) | | | (16,990 | ) | | | (337,911 | ) | |
| | | | | | | | | | | | | | | | |
| | – | | | | – | | | | (3,680,536 | ) | | | – | | |
| | – | | | | – | | | | (1,373,939 | ) | | | – | | |
| | – | | | | – | | | | (385,970 | ) | | | – | | |
| | – | | | | – | | | | (3,828 | ) | | | – | | |
| | – | | | | – | | | | (87,593 | ) | | | – | | |
| | – | | | | – | | | | – | | | | – | | |
| | – | | | | – | | | | (25,241 | ) | | | – | | |
| | – | | | | – | | | | (2,732 | ) | | | – | | |
| | – | | | | – | | | | (2,757 | ) | | | – | | |
| | – | | | | – | | | | (405,587 | ) | | | – | | |
| | – | | | | (7,233,721 | ) | | | (6,218,188 | ) | | | (151,685,559 | ) | |
| | | | | | | | | | | | | | | | |
| | 16,761,437 | | | | 22,040,099 | | | | 11,572,270 | | | | 170,411,753 | | |
| | – | | | | 6,168,589 | | | | 5,710,233 | | | | 151,312,207 | | |
| | (20,569,155 | ) | | | (19,130,869 | ) | | | (11,288,121 | ) | | | (752,521,176 | ) | |
| | | | | | | | | | | | | | | | |
| | (3,807,718 | ) | | | 9,077,819 | | | | 5,994,382 | | | | (430,797,216 | ) | |
| | (2,752,893 | ) | | | (18,545,280 | ) | | | (208,458 | ) | | | (652,992,610 | ) | |
| | | | | | | | | | | | | | | | |
| $ | 33,773,235 | | | $ | 52,318,515 | | | $ | 19,211,454 | | | $ | 672,204,064 | | |
| $ | 31,020,342 | | | $ | 33,773,235 | | | $ | 19,002,996 | | | $ | 19,211,454 | | |
| | | |
| | See Notes to Financial Statements. | 121 |
Statements of Changes in Net Assets (continued)
| | | Focused Small Cap Value Fund | |
| INCREASE (DECREASE) IN NET ASSETS | | For the
Year Ended
October 31, 2023 | | | For the
Year Ended
October 31, 2022 | |
| Operations: | | | | | | | | |
| Net investment income | | $ | 589,550 | | | $ | 646,378 | |
| Net realized gain (loss) on investments, futures contracts and foreign currency related transactions | | | (1,297,505 | ) | | | 5,403,931 | |
| Net change in unrealized appreciation/depreciation on investments and translation of assets and liabilities denominated in foreign currencies | | | (3,303,421 | ) | | | (31,562,664 | ) |
| Net increase (decrease) in net assets resulting from operations | | | (4,011,376 | ) | | | (25,512,355 | ) |
| Distributions to shareholders: | | | | | | | | |
| Class A | | | (616,896 | ) | | | (2,071,369 | ) |
| Class C | | | (117,495 | ) | | | (483,303 | ) |
| Class F | | | (757,185 | ) | | | (6,300,491 | ) |
| Class F3 | | | (432 | ) | | | (1,386 | ) |
| Class I | | | (3,105,857 | ) | | | (11,419,770 | ) |
| Class P | | | – | | | | – | |
| Class R2 | | | – | | | | – | |
| Class R3 | | | – | | | | – | |
| Class R4 | | | – | | | | – | |
| Class R5 | | | (10,525 | ) | | | (1,624 | ) |
| Class R6 | | | (403,524 | ) | | | (1,155,908 | ) |
| Total distributions to shareholders | | | (5,011,914 | ) | | | (21,433,851 | ) |
| Capital share transactions (See Note 15): | | | | | | | | |
| Net proceeds from sales of shares | | | 17,200,883 | | | | 46,385,727 | |
| Reinvestment of distributions | | | 4,758,371 | | | | 20,522,709 | |
| Cost of shares reacquired | | | (46,958,332 | ) | | | (107,014,170 | ) |
| Net increase (decrease) in net assets resulting from capital share transactions | | | (24,999,078 | ) | | | (40,105,734 | ) |
| Net increase (decrease) in net assets | | | (34,022,368 | ) | | | (87,051,940 | ) |
| NET ASSETS: | | | | | | | | |
| Beginning of year | | $ | 134,150,726 | | | $ | 221,202,666 | |
| End of year | | $ | 100,128,358 | | | $ | 134,150,726 | |
| | |
| 122 | See Notes to Financial Statements. |
| Fundamental Equity Fund | | | Global Equity Fund | | |
For the
Year Ended
October 31, 2023 | | | For the
Year Ended
October 31, 2022 | | | For the
Year Ended
October 31, 2023 | | | For the
Year Ended
October 31, 2022 | | |
| | | | | | | | | | | | | | | | |
| $ | 19,926,867 | | | $ | 22,718,564 | | | $ | 173,070 | | | $ | 81,877 | | |
| | | | | | | | | | | | | | | | |
| | 1,084,801 | | | | 89,658,255 | | | | (538,310 | ) | | | (129,434 | ) | |
| | | | | | | | | | | | | | | | |
| | 3,715,845 | | | | (228,863,145 | ) | | | 1,650,650 | | | | (2,371,674 | ) | |
| | | | | | | | | | | | | | | | |
| | 24,727,513 | | | | (116,486,326 | ) | | | 1,285,410 | | | | (2,419,231 | ) | |
| | | | | | | | | | | | | | | | |
| | (62,031,796 | ) | | | (157,233,440 | ) | | | (30,060 | ) | | | (706,818 | ) | |
| | (2,027,363 | ) | | | (6,813,219 | ) | | | – | | | | (110,829 | ) | |
| | (3,757,884 | ) | | | (17,023,016 | ) | | | (9,680 | ) | | | (299,857 | ) | |
| | (984,530 | ) | | | (2,276,471 | ) | | | (127 | ) | | | (2,578 | ) | |
| | (30,715,661 | ) | | | (32,556,487 | ) | | | (29,916 | ) | | | (256,979 | ) | |
| | (212,025 | ) | | | (544,609 | ) | | | – | | | | – | | |
| | (106,559 | ) | | | (371,250 | ) | | | – | | | | – | | |
| | (3,228,451 | ) | | | (9,674,156 | ) | | | (1,617 | ) | | | (64,811 | ) | |
| | (155,223 | ) | | | (341,292 | ) | | | (3,989 | ) | | | (2,575 | ) | |
| | (42,656 | ) | | | (114,175 | ) | | | (121 | ) | | | (2,638 | ) | |
| | (413,951 | ) | | | (1,880,761 | ) | | | (13,663 | ) | | | (179,196 | ) | |
| | (103,676,099 | ) | | | (228,828,876 | ) | | | (89,173 | ) | | | (1,626,281 | ) | |
| | | | | | | | | | | | | | | | |
| | 170,880,170 | | | | 451,921,007 | | | | 7,181,990 | | | | 2,624,771 | | |
| | 100,473,206 | | | | 220,273,728 | | | | 58,477 | | | | 906,874 | | |
| | (394,573,791 | ) | | | (372,423,836 | ) | | | (3,484,208 | ) | | | (2,098,737 | ) | |
| | | | | | | | | | | | | | | | |
| | (123,220,415 | ) | | | 299,770,899 | | | | 3,756,259 | | | | 1,432,908 | | |
| | (202,169,001 | ) | | | (45,544,303 | ) | | | 4,952,496 | | | | (2,612,604 | ) | |
| | | | | | | | | | | | | | | | |
| $ | 1,954,822,453 | | | $ | 2,000,366,756 | | | $ | 8,953,308 | | | $ | 11,565,912 | | |
| $ | 1,752,653,452 | | | $ | 1,954,822,453 | | | $ | 13,905,804 | | | $ | 8,953,308 | | |
| | | |
| | See Notes to Financial Statements. | 123 |
Statements of Changes in Net Assets (continued)
| | | Growth Leaders Fund | |
| INCREASE (DECREASE) IN NET ASSETS | | For the
Year Ended
October 31, 2023 | | | For the
Year Ended
October 31, 2022 | |
| Operations: | | | | | | | | |
| Net investment income (loss) | | $ | (23,930,016 | ) | | $ | (29,932,468 | ) |
| Net realized gain (loss) on investments and foreign currency related transactions | | | (630,990,488 | ) | | | (974,635,511 | ) |
| Net change in unrealized appreciation/depreciation on investments, deferred foreign capital gains taxes and translation of assets and liabilities denominated in foreign currencies | | | 893,374,356 | | | | (2,765,796,307 | ) |
| Net increase (decrease) in net assets resulting from operations | | | 238,453,852 | | | | (3,770,364,286 | ) |
| Distributions to shareholders: | | | | | | | | |
| Class A | | | – | | | | (516,166,233 | ) |
| Class C | | | – | | | | (240,453,284 | ) |
| Class F | | | – | | | | (799,350,013 | ) |
| Class F3 | | | – | | | | (128,196,756 | ) |
| Class I | | | – | | | | (234,268,629 | ) |
| Class P | | | – | | | | – | |
| Class R2 | | | – | | | | (636,674 | ) |
| Class R3 | | | – | | | | (4,314,020 | ) |
| Class R4 | | | – | | | | (3,353,679 | ) |
| Class R5 | | | – | | | | (3,558,947 | ) |
| Class R6 | | | – | | | | (33,119,570 | ) |
| Total distributions to shareholders | | | – | | | | (1,963,417,805 | ) |
| Capital share transactions (See Note 15): | | | | | | | | |
| Net proceeds from sales of shares | | | 1,463,838,212 | | | | 4,067,529,922 | |
| Reinvestment of distributions | | | – | | | | 1,824,521,076 | |
| Cost of shares reacquired | | | (2,452,151,575 | ) | | | (5,003,566,690 | ) |
| Net increase (decrease) in net assets resulting from capital share transactions | | | (988,313,363 | ) | | | 888,484,308 | |
| Net increase (decrease) in net assets | | | (749,859,511 | ) | | | (4,845,297,783 | ) |
| NET ASSETS: | | | | | | | | |
| Beginning of year | | $ | 5,566,834,090 | | | $ | 10,412,131,873 | |
| End of year | | $ | 4,816,974,579 | | | $ | 5,566,834,090 | |
| | |
| 124 | See Notes to Financial Statements. |
| Health Care Fund | | | International Equity Fund | | |
For the
Year Ended
October 31, 2023 | | | For the
Year Ended
October 31, 2022 | | | For the
Year Ended
October 31, 2023 | | | For the
Year Ended
October 31, 2022 | | |
| | | | | | | | | | | | | | | | |
| $ | (28,045 | ) | | $ | (13,244 | ) | | $ | 5,777,399 | | | $ | 6,935,802 | | |
| | | | | | | | | | | | | | | | |
| | (375,226 | ) | | | (757,927 | ) | | | (11,315,354 | ) | | | (4,635,682 | ) | |
| | | | | | | | | | | | | | | | |
| | (382,786 | ) | | | (525,938 | ) | | | 30,691,977 | | | | (103,647,010 | ) | |
| | | | | | | | | | | | | | | | |
| | (786,057 | ) | | | (1,297,109 | ) | | | 25,154,022 | | | | (101,346,890 | ) | |
| | | | | | | | | | | | | | | | |
| | – | | | | (237,866 | ) | | | (2,799,388 | ) | | | (21,399,286 | ) | |
| | – | | | | (54,449 | ) | | | (47,998 | ) | | | (782,187 | ) | |
| | – | | | | (39,168 | ) | | | (180,998 | ) | | | (2,865,403 | ) | |
| | (86 | ) | | | (2,688 | ) | | | (147,620 | ) | | | (693,860 | ) | |
| | (21 | ) | | | (1,304 | ) | | | (2,985,080 | ) | | | (19,096,185 | ) | |
| | – | | | | – | | | | (182 | ) | | | (1,376 | ) | |
| | – | | | | – | | | | (2,657 | ) | | | (19,394 | ) | |
| | – | | | | (982 | ) | | | (82,045 | ) | | | (673,002 | ) | |
| | – | | | | (981 | ) | | | (29,323 | ) | | | (180,612 | ) | |
| | (15 | ) | | | (982 | ) | | | (474 | ) | | | (7,581 | ) | |
| | (6,009 | ) | | | (190,161 | ) | | | (62,147 | ) | | | (468,664 | ) | |
| | (6,131 | ) | | | (528,581 | ) | | | (6,337,912 | ) | | | (46,187,550 | ) | |
| | | | | | | | | | | | | | | | |
| | 2,837,576 | | | | 1,681,977 | | | | 49,374,123 | | | | 20,362,935 | | |
| | 28 | | | | 321,307 | | | | 6,225,632 | | | | 45,341,230 | | |
| | (1,517,369 | ) | | | (1,577,022 | ) | | | (58,456,770 | ) | | | (53,132,557 | ) | |
| | | | | | | | | | | | | | | | |
| | 1,320,235 | | | | 426,262 | | | | (2,857,015 | ) | | | 12,571,608 | | |
| | 528,047 | | | | (1,399,428 | ) | | | 15,959,095 | | | | (134,962,832 | ) | |
| | | | | | | | | | | | | | | | |
| $ | 6,435,712 | | | $ | 7,835,140 | | | $ | 279,470,306 | | | $ | 414,433,138 | | |
| $ | 6,963,759 | | | $ | 6,435,712 | | | $ | 295,429,401 | | | $ | 279,470,306 | | |
| | |
| | See Notes to Financial Statements. | 125 |
Statements of Changes in Net Assets (continued)
| | | International Opportunities Fund | |
| INCREASE (DECREASE) IN NET ASSETS | | For the
Year Ended
October 31, 2023 | | | For the
Year Ended
October 31, 2022 | |
| Operations: | | | | | | | | |
| Net investment income (loss) | | $ | 4,997,413 | | | $ | 4,707,921 | |
| Net realized gain (loss) on investments, swap contracts and foreign currency related transactions | | | (18,318,316 | ) | | | (16,739,450 | ) |
| Net change in unrealized appreciation/depreciation on investments, deferred foreign capital gains taxes and translation of assets and liabilities denominated in foreign currencies | | | 45,424,537 | | | | (118,476,243 | ) |
| Net increase (decrease) in net assets resulting from operations | | | 32,103,634 | | | | (130,507,772 | ) |
| Distributions to shareholders: | | | | | | | | |
| Class A | | | (1,515,429 | ) | | | (2,906,967 | ) |
| Class C | | | (63,496 | ) | | | (232,215 | ) |
| Class F | | | (250,874 | ) | | | (1,303,487 | ) |
| Class F3 | | | (530,783 | ) | | | (751,094 | ) |
| Class I | | | (2,938,287 | ) | | | (4,671,896 | ) |
| Class P | | | (1,575 | ) | | | (2,745 | ) |
| Class R2 | | | (28,634 | ) | | | (49,120 | ) |
| Class R3 | | | (62,415 | ) | | | (110,011 | ) |
| Class R4 | | | (36,129 | ) | | | (62,902 | ) |
| Class R5 | | | (38,883 | ) | | | (79,058 | ) |
| Class R6 | | | (327,410 | ) | | | (586,175 | ) |
| Total distributions to shareholders | | | (5,793,915 | ) | | | (10,755,670 | ) |
| Capital share transactions (See Note 15): | | | | | | | | |
| Net proceeds from sales of shares | | | 61,136,230 | | | | 64,502,823 | |
| Reinvestment of distributions | | | 5,609,335 | | | | 10,359,870 | |
| Cost of shares reacquired | | | (112,764,691 | ) | | | (86,947,035 | ) |
| Net decrease in net assets resulting from capital share transactions | | | (46,019,126 | ) | | | (12,084,342 | ) |
| Net increase (decrease) in net assets | | | (19,709,407 | ) | | | (153,347,784 | ) |
| NET ASSETS: | | | | | | | | |
| Beginning of year | | $ | 310,600,589 | | | $ | 463,948,373 | |
| End of year | | $ | 290,891,182 | | | $ | 310,600,589 | |
| | |
| 126 | See Notes to Financial Statements. |
| International Value Fund | | | Micro Cap Growth Fund | | |
For the
Year Ended
October 31, 2023 | | | For the
Year Ended
October 31, 2022 | | | For the
Year Ended
October 31, 2023 | | | For the
Year Ended
October 31, 2022 | | |
| | | | | | | | | | | | |
| $ | 10,992,628 | | | $ | 21,298,119 | | | $ | (2,131,062 | ) | | $ | (1,997,602 | ) | |
| | | | | | | | | | | | | | | | |
| | (1,646,150 | ) | | | (23,889,559 | ) | | | (21,812,099 | ) | | | (60,372,383 | ) | |
| | | | | | | | | | | | | | | | |
| | 40,061,464 | | | | (110,319,693 | ) | | | (19,131,055 | ) | | | (46,542,882 | ) | |
| | | | | | | | | | | | | | | | |
| | 49,407,942 | | | | (112,911,133 | ) | | | (43,074,216 | ) | | | (108,912,867 | ) | |
| | | | | | | | | | | | | | | | |
| | (5,722,791 | ) | | | (9,846,255 | ) | | | – | | | | – | | |
| | (74,751 | ) | | | (290,372 | ) | | | – | | | | – | | |
| | (183,754 | ) | | | (853,274 | ) | | | – | | | | – | | |
| | (879,787 | ) | | | (1,177,508 | ) | | | – | | | | – | | |
| | (4,136,627 | ) | | | (12,554,506 | ) | | | – | | | | – | | |
| | – | | | | – | | | | – | | | | – | | |
| | (1,703 | ) | | | (1,692 | ) | | | – | | | | – | | |
| | (176,067 | ) | | | (288,403 | ) | | | – | | | | – | | |
| | (4,200 | ) | | | (6,611 | ) | | | – | | | | – | | |
| | (336 | ) | | | (602 | ) | | | – | | | | – | | |
| | (49,764 | ) | | | (74,661 | ) | | | – | | | | – | | |
| | (11,229,780 | ) | | | (25,093,884 | ) | | | – | | | | – | | |
| | | | | | | | | | | | | | | | |
| | 41,973,452 | | | | 53,131,933 | | | | 43,964,939 | | | | 74,876,590 | | |
| | 11,031,675 | | | | 24,633,484 | | | | – | | | | – | | |
| | (74,580,700 | ) | | | (246,207,849 | ) | | | (71,561,579 | ) | | | (129,678,311 | ) | |
| | | | | | | | | | | | | | | | |
| | (21,575,573 | ) | | | (168,442,432 | ) | | | (27,596,640 | ) | | | (54,801,721 | ) | |
| | 16,602,589 | | | | (306,447,449 | ) | | | (70,670,856 | ) | | | (163,714,588 | ) | |
| | | | | | | | | | | | | | | | |
| $ | 344,275,771 | | | $ | 650,723,220 | | | $ | 233,600,528 | | | $ | 397,315,116 | | |
| $ | 360,878,360 | | | $ | 344,275,771 | | | $ | 162,929,672 | | | $ | 233,600,528 | | |
| | | | | | | | | | | | | | | | |
| | See Notes to Financial Statements. | 127 |
Statements of Changes in Net Assets (concluded)
| | | Value Opportunities Fund | |
| INCREASE (DECREASE) IN NET ASSETS | | For the
Year Ended
October 31, 2023 | | | For the
Year Ended
October 31, 2022 | |
| Operations: | | | | | | | | |
| Net investment income | | $ | 4,944,926 | | | $ | 9,410,086 | |
| Net realized gain (loss) on investments | | | 16,727,882 | | | | 120,080,030 | |
| Net change in unrealized appreciation/depreciation on investments | | | (11,065,712 | ) | | | (470,006,406 | ) |
| Net increase (decrease) in net assets resulting from operations | | | 10,607,096 | | | | (340,516,290 | ) |
| Distributions to shareholders: | | | | | | | | |
| Class A | | | (53,463,933 | ) | | | (102,999,131 | ) |
| Class C | | | (4,344,107 | ) | | | (10,928,764 | ) |
| Class F | | | (6,295,659 | ) | | | (22,556,721 | ) |
| Class F3 | | | (15,989,854 | ) | | | (29,456,770 | ) |
| Class I | | | (20,289,726 | ) | | | (48,314,870 | ) |
| Class P | | | (1,091,735 | ) | | | (2,111,678 | ) |
| Class R2 | | | (390,476 | ) | | | (749,624 | ) |
| Class R3 | | | (2,715,045 | ) | | | (5,298,619 | ) |
| Class R4 | | | (2,475,922 | ) | | | (5,145,203 | ) |
| Class R5 | | | (80,636 | ) | | | (239,327 | ) |
| Class R6 | | | (2,676,277 | ) | | | (5,158,092 | ) |
| Total distributions to shareholders | | | (109,813,370 | ) | | | (232,958,799 | ) |
| Capital share transactions (See Note 15): | | | | | | | | |
| Net proceeds from sales of shares | | | 137,967,950 | | | | 213,811,313 | |
| Reinvestment of distributions | | | 107,376,618 | | | | 227,980,077 | |
| Cost of shares reacquired | | | (359,091,197 | ) | | | (500,789,144 | ) |
| Net decrease in net assets resulting from capital share transactions | | | (113,746,629 | ) | | | (58,997,754 | ) |
| Net decrease in net assets | | | (212,952,903 | ) | | | (632,472,843 | ) |
| NET ASSETS: | | | | | | | | |
| Beginning of year | | $ | 1,306,776,623 | | | $ | 1,939,249,466 | |
| End of year | | $ | 1,093,823,720 | | | $ | 1,306,776,623 | |
| | |
| 128 | See Notes to Financial Statements. |
This page is intentionally left blank.
129
Financial Highlights
ALPHA STRATEGY FUND
| | | | | Per Share Operating Performance: |
| | | | | Investment Operations: | | Distributions to
shareholders from: |
| | | Net asset
value,
beginning
of period | | Net
invest-
ment
income
(loss)(b) | | Net
realized
and
unrealized
gain (loss) | | Total
from
invest-
ment
opera-
tions | | Net
investment
income | | Net
realized
gain | | Total
distri-
butions |
| Class A | | | | | | | | | | | | | | | | | | | | | | | | | | | | |
| 10/31/2023 | | | $21.82 | | | | $0.06 | | | | $(0.89 | ) | | | $(0.83 | ) | | | $(0.07 | ) | | | $(1.34 | ) | | | $(1.41 | ) |
| 10/31/2022 | | | 30.39 | | | | 0.06 | | | | (7.10 | ) | | | (7.04 | ) | | | (0.41 | ) | | | (1.12 | ) | | | (1.53 | ) |
| 10/31/2021 | | | 22.60 | | | | (0.02 | ) | | | 9.90 | | | | 9.88 | | | | (0.36 | ) | | | (1.73 | ) | | | (2.09 | ) |
| 10/31/2020 | | | 24.04 | | | | 0.03 | | | | 1.82 | | | | 1.85 | | | | – | | | | (3.29 | ) | | | (3.29 | ) |
| 10/31/2019 | | | 26.62 | | | | (0.03 | ) | | | 0.87 | | | | 0.84 | | | | (0.26 | ) | | | (3.16 | ) | | | (3.42 | ) |
| Class C | | | | | | | | | | | | | | | | | | | | | | | | | | | | |
| 10/31/2023 | | | 16.60 | | | | (0.04 | ) | | | (0.69 | ) | | | (0.73 | ) | | | – | | | | (1.34 | ) | | | (1.34 | ) |
| 10/31/2022 | | | 23.47 | | | | (0.08 | ) | | | (5.45 | ) | | | (5.53 | ) | | | (0.22 | ) | | | (1.12 | ) | | | (1.34 | ) |
| 10/31/2021 | | | 17.82 | | | | (0.17 | ) | | | 7.74 | | | | 7.57 | | | | (0.19 | ) | | | (1.73 | ) | | | (1.92 | ) |
| 10/31/2020 | | | 19.73 | | | | (0.09 | ) | | | 1.47 | | | | 1.38 | | | | – | | | | (3.29 | ) | | | (3.29 | ) |
| 10/31/2019 | | | 22.43 | | | | (0.17 | ) | | | 0.66 | | | | 0.49 | | | | (0.03 | ) | | | (3.16 | ) | | | (3.19 | ) |
| Class F | | | | | | | | | | | | | | | | | | | | | | | | | | | | |
| 10/31/2023 | | | 22.09 | | | | 0.16 | | | | (0.97 | ) | | | (0.81 | ) | | | (0.07 | ) | | | (1.34 | ) | | | (1.41 | ) |
| 10/31/2022 | | | 30.73 | | | | 0.20 | | | | (7.27 | ) | | | (7.07 | ) | | | (0.45 | ) | | | (1.12 | ) | | | (1.57 | ) |
| 10/31/2021 | | | 22.82 | | | | 0.03 | | | | 10.01 | | | | 10.04 | | | | (0.40 | ) | | | (1.73 | ) | | | (2.13 | ) |
| 10/31/2020 | | | 24.22 | | | | 0.08 | | | | 1.81 | | | | 1.89 | | | | – | | | | (3.29 | ) | | | (3.29 | ) |
| 10/31/2019 | | | 26.80 | | | | 0.01 | | | | 0.87 | | | | 0.88 | | | | (0.30 | ) | | | (3.16 | ) | | | (3.46 | ) |
| Class F3 | | | | | | | | | | | | | | | | | | | | | | | | | | | | |
| 10/31/2023 | | | 22.83 | | | | 0.13 | | | | (0.92 | ) | | | (0.79 | ) | | | (0.14 | ) | | | (1.34 | ) | | | (1.48 | ) |
| 10/31/2022 | | | 31.70 | | | | 0.14 | | | | (7.40 | ) | | | (7.26 | ) | | | (0.49 | ) | | | (1.12 | ) | | | (1.61 | ) |
| 10/31/2021 | | | 23.47 | | | | 0.07 | | | | 10.32 | | | | 10.39 | | | | (0.43 | ) | | | (1.73 | ) | | | (2.16 | ) |
| 10/31/2020 | | | 24.78 | | | | 0.10 | | | | 1.88 | | | | 1.98 | | | | – | | | | (3.29 | ) | | | (3.29 | ) |
| 10/31/2019 | | | 27.32 | | | | 0.05 | | | | 0.91 | | | | 0.96 | | | | (0.34 | ) | | | (3.16 | ) | | | (3.50 | ) |
| Class I | | | | | | | | | | | | | | | | | | | | | | | | | | | | |
| 10/31/2023 | | | 22.71 | | | | 0.11 | | | | (0.92 | ) | | | (0.81 | ) | | | (0.13 | ) | | | (1.34 | ) | | | (1.47 | ) |
| 10/31/2022 | | | 31.56 | | | | 0.04 | | | | (7.28 | ) | | | (7.24 | ) | | | (0.49 | ) | | | (1.12 | ) | | | (1.61 | ) |
| 10/31/2021 | | | 23.39 | | | | 0.05 | | | | 10.27 | | | | 10.32 | | | | (0.42 | ) | | | (1.73 | ) | | | (2.15 | ) |
| 10/31/2020 | | | 24.72 | | | | 0.11 | | | | 1.85 | | | | 1.96 | | | | – | | | | (3.29 | ) | | | (3.29 | ) |
| 10/31/2019 | | | 27.29 | | | | 0.03 | | | | 0.89 | | | | 0.92 | | | | (0.33 | ) | | | (3.16 | ) | | | (3.49 | ) |
| Class R2 | | | | | | | | | | | | | | | | | | | | | | | | | | | | |
| 10/31/2023 | | | 20.66 | | | | (0.02 | ) | | | (0.83 | ) | | | (0.85 | ) | | | – | (d) | | | (1.34 | ) | | | (1.34 | ) |
| 10/31/2022 | | | 28.80 | | | | (0.02 | ) | | | (6.73 | ) | | | (6.75 | ) | | | (0.27 | ) | | | (1.12 | ) | | | (1.39 | ) |
| 10/31/2021 | | | 21.52 | | | | (0.09 | ) | | | 9.40 | | | | 9.31 | | | | (0.30 | ) | | | (1.73 | ) | | | (2.03 | ) |
| 10/31/2020 | | | 23.11 | | | | (0.04 | ) | | | 1.74 | | | | 1.70 | | | | – | | | | (3.29 | ) | | | (3.29 | ) |
| 10/31/2019 | | | 25.65 | | | | (0.10 | ) | | | 0.83 | | | | 0.73 | | | | (0.11 | ) | | | (3.16 | ) | | | (3.27 | ) |
| 130 | See Notes to Financial Statements. |
| | | | | Ratios to Average Net Assets:(a) | | Supplemental Data: |
| | | | | | | | | | | | | |
Net
asset
value,
end of
period | | Total
return(c)
(%) | | Total
expenses
after
waivers
and/or reim-
bursements
(%) | | Total
expenses
(%) | | Net
invest-
ment
income
(loss)
(%) | | Net
assets,
end of
period
(000) | | Portfolio
turnover
rate
(%) |
| | | | | | | | | | | | | |
| | $19.58 | | | | (3.99 | ) | | | 0.43 | | | | 0.54 | | | | 0.29 | | | | $342,756 | | | | 4 | |
| | 21.82 | | | | (24.25 | ) | | | 0.44 | | | | 0.54 | | | | 0.25 | | | | 420,589 | | | | 8 | |
| | 30.39 | | | | 45.31 | | | | 0.41 | | | | 0.52 | | | | (0.06 | ) | | | 542,197 | | | | 7 | |
| | 22.60 | | | | 7.72 | | | | 0.43 | | | | 0.53 | | | | 0.16 | | | | 400,088 | | | | 16 | |
| | 24.04 | | | | 5.65 | | | | 0.44 | | | | 0.54 | | | | (0.13 | ) | | | 482,675 | | | | 17 | |
| | | | | | | | | | | | | | | | | | | | | | | | | | | |
| | 14.53 | | | | (4.70 | ) | | | 1.18 | | | | 1.29 | | | | (0.25 | ) | | | 13,823 | | | | 4 | |
| | 16.60 | | | | (24.81 | ) | | | 1.19 | | | | 1.29 | | | | (0.40 | ) | | | 30,206 | | | | 8 | |
| | 23.47 | | | | 44.16 | | | | 1.16 | | | | 1.26 | | | | (0.77 | ) | | | 56,365 | | | | 7 | |
| | 17.82 | | | | 6.98 | | | | 1.18 | | | | 1.28 | | | | (0.52 | ) | | | 54,247 | | | | 16 | |
| | 19.73 | | | | 4.86 | | | | 1.19 | | | | 1.29 | | | | (0.85 | ) | | | 97,096 | | | | 17 | |
| | | | | | | | | | | | | | | | | | | | | | | | | | | |
| | 19.87 | | | | (3.85 | ) | | | 0.28 | | | | 0.39 | | | | 0.75 | | | | 9,142 | | | | 4 | |
| | 22.09 | | | | (24.10 | ) | | | 0.28 | | | | 0.39 | | | | 0.76 | | | | 27,275 | | | | 8 | |
| | 30.73 | | | | 45.53 | | | | 0.26 | | | | 0.37 | | | | 0.09 | | | | 144,742 | | | | 7 | |
| | 22.82 | | | | 7.89 | | | | 0.28 | | | | 0.38 | | | | 0.37 | | | | 120,797 | | | | 16 | |
| | 24.22 | | | | 5.81 | | | | 0.29 | | | | 0.39 | | | | 0.04 | | | | 176,784 | | | | 17 | |
| | | | | | | | | | | | | | | | | | | | | | | | | | | |
| | 20.56 | | | | (3.65 | ) | | | 0.09 | | | | 0.20 | | | | 0.57 | | | | 46,724 | | | | 4 | |
| | 22.83 | | | | (23.98 | ) | | | 0.09 | | | | 0.19 | | | | 0.57 | | | | 50,046 | | | | 8 | |
| | 31.70 | | | | 45.81 | | | | 0.08 | | | | 0.18 | | | | 0.25 | | | | 56,369 | | | | 7 | |
| | 23.47 | | | | 8.10 | | | | 0.09 | | | | 0.19 | | | | 0.44 | | | | 33,179 | | | | 16 | |
| | 24.78 | | | | 6.03 | | | | 0.10 | | | | 0.20 | | | | 0.20 | | | | 32,219 | | | | 17 | |
| | | | | | | | | | | | | | | | | | | | | | | | | | | |
| | 20.43 | | | | (3.74 | ) | | | 0.18 | | | | 0.29 | | | | 0.47 | | | | 95,792 | | | | 4 | |
| | 22.71 | | | | (24.04 | ) | | | 0.19 | | | | 0.29 | | | | 0.18 | | | | 101,366 | | | | 8 | |
| | 31.56 | | | | 45.64 | | | | 0.16 | | | | 0.27 | | | | 0.18 | | | | 43,112 | | | | 7 | |
| | 23.39 | | | | 8.02 | | | | 0.18 | | | | 0.28 | | | | 0.51 | | | | 28,481 | | | | 16 | |
| | 24.72 | | | | 5.88 | | | | 0.19 | | | | 0.29 | | | | 0.11 | | | | 92,448 | | | | 17 | |
| | | | | | | | | | | | | | | | | | | | | | | | | | | |
| | 18.47 | | | | (4.32 | ) | | | 0.78 | | | | 0.89 | | | | (0.09 | ) | | | 812 | | | | 4 | |
| | 20.66 | | | | (24.50 | ) | | | 0.79 | | | | 0.89 | | | | (0.09 | ) | | | 928 | | | | 8 | |
| | 28.80 | | | | 44.78 | | | | 0.76 | | | | 0.86 | | | | (0.34 | ) | | | 1,433 | | | | 7 | |
| | 21.52 | | | | 7.39 | | | | 0.78 | | | | 0.88 | | | | (0.19 | ) | | | 1,430 | | | | 16 | |
| | 23.11 | | | | 5.26 | | | | 0.79 | | | | 0.89 | | | | (0.45 | ) | | | 1,476 | | | | 17 | |
| | See Notes to Financial Statements. | 131 |
Financial Highlights (continued)
ALPHA STRATEGY FUND
| | | | | Per Share Operating Performance: |
| | | | | Investment Operations: | | Distributions to
shareholders from: |
| | | Net asset
value,
beginning
of period | | Net
invest-
ment
income
(loss)(b) | | Net
realized
and
unrealized
gain (loss) | | Total
from
invest-
ment
opera-
tions | | Net
investment
income | | Net
realized
gain | | Total
distri-
butions |
| Class R3 | | | | | | | | | | | | | | | | | | | | | | | | | | | | |
| 10/31/2023 | | | $20.85 | | | $ | – | (d) | | | $(0.84 | ) | | | $(0.84 | ) | | | $(0.01 | ) | | | $(1.34 | ) | | | $(1.35 | ) |
| 10/31/2022 | | | 29.09 | | | | 0.01 | | | | (6.80 | ) | | | (6.79 | ) | | | (0.33 | ) | | | (1.12 | ) | | | (1.45 | ) |
| 10/31/2021 | | | 21.70 | | | | (0.08 | ) | | | 9.50 | | | | 9.42 | | | | (0.30 | ) | | | (1.73 | ) | | | (2.03 | ) |
| 10/31/2020 | | | 23.26 | | | | (0.01 | ) | | | 1.74 | | | | 1.73 | | | | – | | | | (3.29 | ) | | | (3.29 | ) |
| 10/31/2019 | | | 25.86 | | | | (0.09 | ) | | | 0.84 | | | | 0.75 | | | | (0.19 | ) | | | (3.16 | ) | | | (3.35 | ) |
| Class R4 | | | | | | | | | | | | | | | | | | | | | | | | | | | | |
| 10/31/2023 | | | 21.76 | | | | 0.06 | | | | (0.88 | ) | | | (0.82 | ) | | | (0.08 | ) | | | (1.34 | ) | | | (1.42 | ) |
| 10/31/2022 | | | 30.30 | | | | 0.05 | | | | (7.06 | ) | | | (7.01 | ) | | | (0.41 | ) | | | (1.12 | ) | | | (1.53 | ) |
| 10/31/2021 | | | 22.54 | | | | (0.01 | ) | | | 9.86 | | | | 9.85 | | | | (0.36 | ) | | | (1.73 | ) | | | (2.09 | ) |
| 10/31/2020 | | | 23.98 | | | | 0.02 | | | | 1.83 | | | | 1.85 | | | | – | | | | (3.29 | ) | | | (3.29 | ) |
| 10/31/2019 | | | 26.58 | | | | (0.04 | ) | | | 0.87 | | | | 0.83 | | | | (0.27 | ) | | | (3.16 | ) | | | (3.43 | ) |
| Class R5 | | | | | | | | | | | | | | | | | | | | | | | | | | | | |
| 10/31/2023 | | | 22.72 | | | | 0.09 | | | | (0.90 | ) | | | (0.81 | ) | | | (0.13 | ) | | | (1.34 | ) | | | (1.47 | ) |
| 10/31/2022 | | | 31.57 | | | | 0.13 | | | | (7.37 | ) | | | (7.24 | ) | | | (0.49 | ) | | | (1.12 | ) | | | (1.61 | ) |
| 10/31/2021 | | | 23.40 | | | | 0.10 | | | | 10.22 | | | | 10.32 | | | | (0.42 | ) | | | (1.73 | ) | | | (2.15 | ) |
| 10/31/2020 | | | 24.73 | | | | 0.03 | | | | 1.93 | | | | 1.96 | | | | – | | | | (3.29 | ) | | | (3.29 | ) |
| 10/31/2019 | | | 27.30 | | | | 0.03 | | | | 0.89 | | | | 0.92 | | | | (0.33 | ) | | | (3.16 | ) | | | (3.49 | ) |
| Class R6 | | | | | | | | | | | | | | | | | | | | | | | | | | | | |
| 10/31/2023 | | | 22.84 | | | | 0.14 | | | | (0.94 | ) | | | (0.80 | ) | | | (0.14 | ) | | | (1.34 | ) | | | (1.48 | ) |
| 10/31/2022 | | | 31.71 | | | | 0.16 | | | | (7.42 | ) | | | (7.26 | ) | | | (0.49 | ) | | | (1.12 | ) | | | (1.61 | ) |
| 10/31/2021 | | | 23.48 | | | | 0.08 | | | | 10.31 | | | | 10.39 | | | | (0.43 | ) | | | (1.73 | ) | | | (2.16 | ) |
| 10/31/2020 | | | 24.78 | | | | 0.10 | | | | 1.89 | | | | 1.99 | | | | – | | | | (3.29 | ) | | | (3.29 | ) |
| 10/31/2019 | | | 27.33 | | | | 0.05 | | | | 0.90 | | | | 0.95 | | | | (0.34 | ) | | | (3.16 | ) | | | (3.50 | ) |
| (a) | Does not include expenses of the Underlying Funds in which the Fund invests. |
| (b) | Calculated using average shares outstanding during the period. |
| (c) | Total return for Classes A and C does not consider the effects of sales loads and assumes the reinvestment of all distributions. Total return for all other classes assumes the reinvestment of all distributions. |
| (d) | Amount is less than $0.01. |
| 132 | See Notes to Financial Statements. |
| | | | | Ratios to Average Net Assets:(a) | | Supplemental Data: |
| | | | | | | | | | | | | |
Net
asset
value,
end of
period | | Total
return(c)
(%) | | Total
expenses
after
waivers
and/or reim-
bursements
(%) | | Total
expenses
(%) | | Net
invest-
ment
income
(loss)
(%) | | Net
assets,
end of
period
(000) | | Portfolio
turnover
rate
(%) |
| | | | | | | | | | | | | | | | | | | | | | | | | | | |
| | $18.66 | | | | (4.24 | ) | | | 0.68 | | | | 0.79 | | | | (0.02 | ) | | | $15,526 | | | | 4 | |
| | 20.85 | | | | (24.41 | ) | | | 0.69 | | | | 0.79 | | | | 0.04 | | | | 17,366 | | | | 8 | |
| | 29.09 | | | | 44.95 | | | | 0.66 | | | | 0.76 | | | | (0.30 | ) | | | 25,883 | | | | 7 | |
| | 21.70 | | | | 7.47 | | | | 0.68 | | | | 0.78 | | | | (0.07 | ) | | | 20,860 | | | | 16 | |
| | 23.26 | | | | 5.38 | | | | 0.69 | | | | 0.79 | | | | (0.38 | ) | | | 26,729 | | | | 17 | |
| | | | | | | | | | | | | | | | | | | | | | | | | | | |
| | 19.52 | | | | (3.98 | ) | | | 0.43 | | | | 0.54 | | | | 0.28 | | | | 3,150 | | | | 4 | |
| | 21.76 | | | | (24.23 | ) | | | 0.44 | | | | 0.54 | | | | 0.21 | | | | 3,859 | | | | 8 | |
| | 30.30 | | | | 45.25 | | | | 0.41 | | | | 0.52 | | | | (0.04 | ) | | | 4,621 | | | | 7 | |
| | 22.54 | | | | 7.79 | | | | 0.43 | | | | 0.53 | | | | 0.09 | | | | 3,715 | | | | 16 | |
| | 23.98 | | | | 5.61 | | | | 0.44 | | | | 0.54 | | | | (0.16 | ) | | | 3,461 | | | | 17 | |
| | | | | | | | | | | | | | | | | | | | | | | | | | | |
| | 20.44 | | | | (3.74 | ) | | | 0.18 | | | | 0.29 | | | | 0.38 | | | | 551 | | | | 4 | |
| | 22.72 | | | | (24.04 | ) | | | 0.19 | | | | 0.29 | | | | 0.53 | | | | 376 | | | | 8 | |
| | 31.57 | | | | 45.65 | | | | 0.16 | | | | 0.27 | | | | 0.33 | | | | 518 | | | | 7 | |
| | 23.40 | | | | 8.02 | | | | 0.18 | | | | 0.28 | | | | 0.14 | | | | 623 | | | | 16 | |
| | 24.73 | | | | 5.90 | | | | 0.19 | | | | 0.29 | | | | 0.13 | | | | 296 | | | | 17 | |
| | | | | | | | | | | | | | | | | | | | | | | | | | | |
| | 20.56 | | | | (3.69 | ) | | | 0.09 | | | | 0.20 | | | | 0.61 | | | | 3,380 | | | | 4 | |
| | 22.84 | | | | (23.97 | ) | | | 0.09 | | | | 0.19 | | | | 0.62 | | | | 3,762 | | | | 8 | |
| | 31.71 | | | | 45.79 | | | | 0.08 | | | | 0.18 | | | | 0.28 | | | | 5,386 | | | | 7 | |
| | 23.48 | | | | 8.14 | | | | 0.09 | | | | 0.19 | | | | 0.46 | | | | 4,143 | | | | 16 | |
| | 24.78 | | | | 5.98 | | | | 0.10 | | | | 0.20 | | | | 0.19 | | | | 4,266 | | | | 17 | |
| | See Notes to Financial Statements. | 133 |
Financial Highlights (continued)
FOCUSED GROWTH FUND
| | | | | Per Share Operating Performance: | | | | |
| | | | | Investment Operations: | | Distributions
to
shareholders
from: | | | | |
| | | Net asset
value,
beginning
of period | | Net
investment
income (loss)(a) | | Net
realized and
unrealized
gain (loss) | | Total from
investment
operations | | Net
realized
gain | | Net asset
value,
end of
period |
| Class A | | | | | | | | | | | | | | | | | | | | | | | | |
| 10/31/2023 | | $ | 19.74 | | | $ | (0.15 | ) | | $ | 0.89 | | | $ | 0.74 | | | $ | – | | | $ | 20.48 | |
| 10/31/2022 | | | 36.16 | | | | (0.17 | ) | | | (11.38 | ) | | | (11.55 | ) | | | (4.87 | ) | | | 19.74 | |
| 10/31/2021 | | | 26.90 | | | | (0.27 | ) | | | 11.39 | | | | 11.12 | | | | (1.86 | ) | | | 36.16 | |
| 10/31/2020 | | | 15.88 | | | | (0.17 | ) | | | 11.19 | | | | 11.02 | | | | – | | | | 26.90 | |
| 1/30/2019 to 10/31/2019(c)(d) | | | 15.00 | | | | (0.10 | ) | | | 0.98 | | | | 0.88 | | | | – | | | | 15.88 | |
| Class C | | | | | | | | | | | | | | | | | | | | | | | | |
| 10/31/2023 | | | 19.12 | | | | (0.29 | ) | | | 0.85 | | | | 0.56 | | | | – | | | | 19.68 | |
| 10/31/2022 | | | 35.41 | | | | (0.33 | ) | | | (11.09 | ) | | | (11.42 | ) | | | (4.87 | ) | | | 19.12 | |
| 10/31/2021 | | | 26.56 | | | | (0.50 | ) | | | 11.21 | | | | 10.71 | | | | (1.86 | ) | | | 35.41 | |
| 10/31/2020 | | | 15.80 | | | | (0.37 | ) | | | 11.13 | | | | 10.76 | | | | – | | | | 26.56 | |
| 1/30/2019 to 10/31/2019(c)(d) | | | 15.00 | | | | (0.19 | ) | | | 0.99 | | | | 0.80 | | | | – | | | | 15.80 | |
| Class F | | | | | | | | | | | | | | | | | | | | | | | | |
| 10/31/2023 | | | 19.96 | | | | (0.09 | ) | | | 0.89 | | | | 0.80 | | | | – | | | | 20.76 | |
| 10/31/2022 | | | 36.44 | | | | (0.12 | ) | | | (11.49 | ) | | | (11.61 | ) | | | (4.87 | ) | | | 19.96 | |
| 10/31/2021 | | | 27.03 | | | | (0.20 | ) | | | 11.47 | | | | 11.27 | | | | (1.86 | ) | | | 36.44 | |
| 10/31/2020 | | | 15.91 | | | | (0.13 | ) | | | 11.25 | | | | 11.12 | | | | – | | | | 27.03 | |
| 1/30/2019 to 10/31/2019(c)(d) | | | 15.00 | | | | (0.07 | ) | | | 0.98 | | | | 0.91 | | | | – | | | | 15.91 | |
| Class F3 | | | | | | | | | | | | | | | | | | | | | | | | |
| 10/31/2023 | | | 20.02 | | | | (0.07 | ) | | | 0.90 | | | | 0.83 | | | | – | | | | 20.85 | |
| 10/31/2022 | | | 36.51 | | | | (0.10 | ) | | | (11.52 | ) | | | (11.62 | ) | | | (4.87 | ) | | | 20.02 | |
| 10/31/2021 | | | 27.06 | | | | (0.18 | ) | | | 11.49 | | | | 11.31 | | | | (1.86 | ) | | | 36.51 | |
| 10/31/2020 | | | 15.92 | | | | (0.09 | ) | | | 11.23 | | | | 11.14 | | | | – | | | | 27.06 | |
| 1/30/2019 to 10/31/2019(c)(d) | | | 15.00 | | | | (0.06 | ) | | | 0.98 | | | | 0.92 | | | | – | | | | 15.92 | |
| Class I | | | | | | | | | | | | | | | | | | | | | | | | |
| 10/31/2023 | | | 19.96 | | | | (0.09 | ) | | | 0.90 | | | | 0.81 | | | | – | | | | 20.77 | |
| 10/31/2022 | | | 36.44 | | | | (0.11 | ) | | | (11.50 | ) | | | (11.61 | ) | | | (4.87 | ) | | | 19.96 | |
| 10/31/2021 | | | 27.03 | | | | (0.20 | ) | | | 11.47 | | | | 11.27 | | | | (1.86 | ) | | | 36.44 | |
| 10/31/2020 | | | 15.92 | | | | (0.11 | ) | | | 11.22 | | | | 11.11 | | | | – | | | | 27.03 | |
| 1/30/2019 to 10/31/2019(c)(d) | | | 15.00 | | | | (0.07 | ) | | | 0.99 | | | | 0.92 | | | | – | | | | 15.92 | |
| Class R3 | | | | | | | | | | | | | | | | | | | | | | | | |
| 10/31/2023 | | | 19.53 | | | | (0.21 | ) | | | 0.90 | | | | 0.69 | | | | – | | | | 20.22 | |
| 10/31/2022 | | | 35.92 | | | | (0.23 | ) | | | (11.29 | ) | | | (11.52 | ) | | | (4.87 | ) | | | 19.53 | |
| 10/31/2021 | | | 26.79 | | | | (0.35 | ) | | | 11.34 | | | | 10.99 | | | | (1.86 | ) | | | 35.92 | |
| 10/31/2020 | | | 15.86 | | | | (0.21 | ) | | | 11.14 | | | | 10.93 | | | | – | | | | 26.79 | |
| 1/30/2019 to 10/31/2019(c)(d) | | | 15.00 | | | | (0.13 | ) | | | 0.99 | | | | 0.86 | | | | – | | | | 15.86 | |
| 134 | See Notes to Financial Statements. |
| | | Ratios to Average Net Assets: | | Supplemental Data: |
Total
return(b)
(%) | | Total
expenses
after
waivers
and/or reim-
bursements
(%) | | Total
expenses
(%) | | Net
investment
income
(loss)
(%) | | Net assets,
end of
period
(000) | | Portfolio
turnover
rate
(%) |
| | | | | | | | | | | | | | | | | | | | | | | |
| | 3.75 | | | | 1.05 | | | | 1.70 | | | | (0.71 | ) | | $ | 15,986 | | | | 169 | |
| | (36.92 | ) | | | 1.05 | | | | 1.54 | | | | (0.71 | ) | | | 14,420 | | | | 169 | |
| | 43.48 | | | | 1.05 | | | | 1.49 | | | | (0.87 | ) | | | 18,332 | | | | 166 | |
| | 69.40 | | | | 1.05 | | | | 2.25 | | | | (0.79 | ) | | | 12,485 | | | | 126 | |
| | 5.87 | (e) | | | 1.05 | (f) | | | 3.09 | (f) | | | (0.83 | )(f) | | | 4,889 | | | | 130 | (e) |
| | | | | | | | | | | | | | | | | | | | | | | |
| | 2.93 | | | | 1.80 | | | | 2.45 | | | | (1.46 | ) | | | 2,214 | | | | 169 | |
| | (37.40 | ) | | | 1.80 | | | | 2.30 | | | | (1.46 | ) | | | 2,289 | | | | 169 | |
| | 42.43 | | | | 1.80 | | | | 2.24 | | | | (1.62 | ) | | | 2,701 | | | | 166 | |
| | 68.10 | | | | 1.78 | | | | 2.87 | | | | (1.61 | ) | | | 1,849 | | | | 126 | |
| | 5.33 | (e) | | | 1.80 | (f) | | | 4.10 | (f) | | | (1.55 | )(f) | | | 156 | | | | 130 | (e) |
| | | | | | | | | | | | | | | | | | | | | | | |
| | 4.01 | | | | 0.80 | | | | 1.55 | | | | (0.43 | ) | | | 3,536 | | | | 169 | |
| | (36.79 | ) | | | 0.80 | | | | 1.37 | | | | (0.47 | ) | | | 7,021 | | | | 169 | |
| | 43.85 | | | | 0.80 | | | | 1.34 | | | | (0.63 | ) | | | 18,621 | | | | 166 | |
| | 69.89 | | | | 0.80 | | | | 2.03 | | | | (0.58 | ) | | | 5,821 | | | | 126 | |
| | 6.07 | (e) | | | 0.80 | (f) | | | 3.14 | (f) | | | (0.56 | )(f) | | | 1,005 | | | | 130 | (e) |
| | | | | | | | | | | | | | | | | | | | | | | |
| | 4.15 | | | | 0.68 | | | | 1.29 | | | | (0.34 | ) | | | 499 | | | | 169 | |
| | (36.74 | ) | | | 0.73 | | | | 1.15 | | | | (0.40 | ) | | | 667 | | | | 169 | |
| | 43.95 | | | | 0.75 | | | | 1.16 | | | | (0.57 | ) | | | 1,217 | | | | 166 | |
| | 69.97 | | | | 0.72 | | | | 2.01 | | | | (0.44 | ) | | | 902 | | | | 126 | |
| | 6.13 | (e) | | | 0.73 | (f) | | | 3.07 | (f) | | | (0.48 | )(f) | | | 531 | | | | 130 | (e) |
| | | | | | | | | | | | | | | | | | | | | | | |
| | 4.06 | | | | 0.80 | | | | 1.44 | | | | (0.47 | ) | | | 4,122 | | | | 169 | |
| | (36.79 | ) | | | 0.80 | | | | 1.30 | | | | (0.47 | ) | | | 4,595 | | | | 169 | |
| | 43.90 | | | | 0.80 | | | | 1.24 | | | | (0.62 | ) | | | 4,587 | | | | 166 | |
| | 69.72 | | | | 0.80 | | | | 2.04 | | | | (0.52 | ) | | | 2,712 | | | | 126 | |
| | 6.13 | (e) | | | 0.80 | (f) | | | 2.91 | (f) | | | (0.60 | )(f) | | | 1,492 | | | | 130 | (e) |
| | | | | | | | | | | | | | | | | | | | | | | |
| | 3.53 | | | | 1.28 | | | | 1.95 | | | | (1.01 | ) | | | 155 | | | | 169 | |
| | (37.11 | ) | | | 1.30 | | | | 1.81 | | | | (0.97 | ) | | | 14 | | | | 169 | |
| | 43.15 | | | | 1.30 | | | | 1.73 | | | | (1.11 | ) | | | 24 | | | | 166 | |
| | 68.92 | | | | 1.30 | | | | 2.52 | | | | (1.01 | ) | | | 18 | | | | 126 | |
| | 5.73 | (e) | | | 1.30 | (f) | | | 3.64 | (f) | | | (1.06 | )(f) | | | 11 | | | | 130 | (e) |
| | See Notes to Financial Statements. | 135 |
Financial Highlights (continued)
FOCUSED GROWTH FUND
| | | | | Per Share Operating Performance: | | | | |
| | | | | Investment Operations: | | Distributions
to
shareholders
from: | | | | |
| | | Net asset
value,
beginning
of period | | Net
investment
income (loss)(a) | | Net
realized and
unrealized
gain (loss) | | Total from
investment
operations | | Net
realized
gain | | Net asset
value,
end of
period |
| Class R4 | | | | | | | | | | | | | | | | | | | | | | | | |
| 10/31/2023 | | $ | 19.75 | | | $ | (0.14 | ) | | $ | 0.88 | | | $ | 0.74 | | | $ | – | | | $ | 20.49 | |
| 10/31/2022 | | | 36.18 | | | | (0.17 | ) | | | (11.39 | ) | | | (11.56 | ) | | | (4.87 | ) | | | 19.75 | |
| 10/31/2021 | | | 26.91 | | | | (0.27 | ) | | | 11.40 | | | | 11.13 | | | | (1.86 | ) | | | 36.18 | |
| 10/31/2020 | | | 15.89 | | | | (0.16 | ) | | | 11.18 | | | | 11.02 | | | | – | | | | 26.91 | |
| 1/30/2019 to 10/31/2019(c)(d) | | | 15.00 | | | | (0.10 | ) | | | 0.99 | | | | 0.89 | | | | – | | | | 15.89 | |
| Class R5 | | | | | | | | | | | | | | | | | | | | | | | | |
| 10/31/2023 | | | 19.96 | | | | (0.09 | ) | | | 0.89 | | | | 0.80 | | | | – | | | | 20.76 | |
| 10/31/2022 | | | 36.44 | | | | (0.12 | ) | | | (11.49 | ) | | | (11.61 | ) | | | (4.87 | ) | | | 19.96 | |
| 10/31/2021 | | | 27.02 | | | | (0.20 | ) | | | 11.48 | | | | 11.28 | | | | (1.86 | ) | | | 36.44 | |
| 10/31/2020 | | | 15.91 | | | | (0.10 | ) | | | 11.21 | | | | 11.11 | | | | – | | | | 27.02 | |
| 1/30/2019 to 10/31/2019(c)(d) | | | 15.00 | | | | (0.07 | ) | | | 0.98 | | | | 0.91 | | | | – | | | | 15.91 | |
| Class R6 | | | | | | | | | | | | | | | | | | | | | | | | |
| 10/31/2023 | | | 20.02 | | | | (0.07 | ) | | | 0.90 | | | | 0.83 | | | | – | | | | 20.85 | |
| 10/31/2022 | | | 36.51 | | | | (0.09 | ) | | | (11.53 | ) | | | (11.62 | ) | | | (4.87 | ) | | | 20.02 | |
| 10/31/2021 | | | 27.06 | | | | (0.18 | ) | | | 11.49 | | | | 11.31 | | | | (1.86 | ) | | | 36.51 | |
| 10/31/2020 | | | 15.92 | | | | (0.10 | ) | | | 11.24 | | | | 11.14 | | | | – | | | | 27.06 | |
| 1/30/2019 to 10/31/2019(c)(d) | | | 15.00 | | | | (0.06 | ) | | | 0.98 | | | | 0.92 | | | | – | | | | 15.92 | |
| (a) | Calculated using average shares outstanding during the period. |
| (b) | Total return for Classes A and C does not consider the effects of sales loads and assumes the reinvestment of all distributions. Total return for all other classes assumes the reinvestment of all distributions. |
| (c) | Commencement of operations was 1/30/2019, SEC effective date was 1/31/2019 and date shares first became available to the public was 2/1/2019. |
| (d) | Net investment income, net realized and unrealized gain amounted to less than $.01 for the period 1/30/2019 through 1/31/2019. |
| (e) | Not annualized. |
| (f) | Annualized. |
| 136 | See Notes to Financial Statements. |
| | | Ratios to Average Net Assets: | | Supplemental Data: |
| | | | | |
Total
return(b)
(%) | | Total
expenses
after
waivers
and/or reim-
bursements
(%) | | Total
expenses
(%) | | Net
investment
income
(loss)
(%) | | Net assets,
end of
period
(000) | | Portfolio
turnover
rate
(%) |
| | | | | | | | | | | | | | | | | | | | | | | |
| | 3.75 | | | | 1.05 | | | | 1.70 | | | | (0.70 | ) | | $ | 14 | | | | 169 | |
| | (36.93 | ) | | | 1.05 | | | | 1.54 | | | | (0.71 | ) | | | 13 | | | | 169 | |
| | 43.50 | | | | 1.05 | | | | 1.48 | | | | (0.86 | ) | | | 24 | | | | 166 | |
| | 69.35 | | | | 1.05 | | | | 2.27 | | | | (0.75 | ) | | | 18 | | | | 126 | |
| | 5.93 | (e) | | | 1.05 | (f) | | | 3.37 | (f) | | | (0.80 | )(f) | | | 11 | | | | 130 | (e) |
| | | | | | | | | | | | | | | | | | | | | | | |
| | 4.01 | | | | 0.80 | | | | 1.44 | | | | (0.45 | ) | | | 14 | | | | 169 | |
| | (36.79 | ) | | | 0.80 | | | | 1.31 | | | | (0.48 | ) | | | 13 | | | | 169 | |
| | 43.90 | | | | 0.80 | | | | 1.25 | | | | (0.63 | ) | | | 24 | | | | 166 | |
| | 69.83 | | | | 0.80 | | | | 2.02 | | | | (0.49 | ) | | | 18 | | | | 126 | |
| | 6.07 | (e) | | | 0.80 | (f) | | | 3.12 | (f) | | | (0.55 | )(f) | | | 11 | | | | 130 | (e) |
| | | | | | | | | | | | | | | | | | | | | | | |
| | 4.15 | | | | 0.68 | | | | 1.30 | | | | (0.34 | ) | | | 4,481 | | | | 169 | |
| | (36.74 | ) | | | 0.73 | | | | 1.16 | | | | (0.39 | ) | | | 4,740 | | | | 169 | |
| | 43.95 | | | | 0.75 | | | | 1.16 | | | | (0.57 | ) | | | 6,788 | | | | 166 | |
| | 69.97 | | | | 0.72 | | | | 1.99 | | | | (0.45 | ) | | | 4,400 | | | | 126 | |
| | 6.13 | (e) | | | 0.73 | (f) | | | 2.83 | (f) | | | (0.50 | )(f) | | | 1,821 | | | | 130 | (e) |
| | See Notes to Financial Statements. | 137 |
Financial Highlights (continued)
FOCUSED LARGE CAP VALUE FUND
| | | | | Per Share Operating Performance: |
| | | | | Investment Operations: | | Distributions to
shareholders from: |
| | | | | | | |
| | | Net asset
value,
beginning
of period | | Net
investment
income
(loss)(a) | | Net
realized
and
unrealized
gain (loss) | | Total
from
invest-
ment
opera-
tions | | Net
investment
income | | Net
realized
gain | | Return
of
capital |
| Class A | | | | | | | | | | | | | | | | | | | | | | | | | | | | |
| 10/31/2023 | | $ | 13.58 | | | $ | 0.08 | | | $ | 0.17 | (e) | | $ | 0.25 | | | $ | (1.42 | ) | | $ | – | | | $ | (2.83 | ) |
| 10/31/2022 | | | 19.04 | | | | 0.16 | | | | (1.34 | ) | | | (1.18 | ) | | | (0.35 | ) | | | (3.93 | ) | | | – | |
| 10/31/2021 | | | 12.95 | | | | 0.38 | | | | 6.68 | | | | 7.06 | | | | (0.16 | ) | | | (0.81 | ) | | | – | |
| 10/31/2020 | | | 14.75 | | | | 0.27 | | | | (1.99 | ) | | | (1.72 | ) | | | (0.08 | ) | | | – | | | | – | |
| 7/26/2019 to 10/31/2019(c)(d) | | | 15.00 | | | | 0.06 | | | | (0.31 | )(e) | | | (0.25 | ) | | | – | | | | – | | | | – | |
| Class C | | | | | | | | | | | | | | | | | | | | | | | | | | | | |
| 10/31/2023 | | | 13.49 | | | | 0.02 | | | | 0.15 | (e) | | | 0.17 | | | | (1.31 | ) | | | – | | | | (2.83 | ) |
| 10/31/2022 | | | 18.97 | | | | 0.06 | | | | (1.35 | ) | | | (1.29 | ) | | | (0.26 | ) | | | (3.93 | ) | | | – | |
| 10/31/2021 | | | 12.87 | | | | 0.25 | | | | 6.66 | | | | 6.91 | | | | – | | | | (0.81 | ) | | | – | |
| 10/31/2020 | | | 14.72 | | | | 0.17 | | | | (1.98 | ) | | | (1.81 | ) | | | (0.04 | ) | | | – | | | | – | |
| 7/26/2019 to 10/31/2019(c)(d) | | | 15.00 | | | | 0.03 | | | | (0.31 | )(e) | | | (0.28 | ) | | | – | | | | – | | | | – | |
| Class F | | | | | | | | | | | | | | | | | | | | | | | | | | | | |
| 10/31/2023 | | | 13.77 | | | | 0.14 | | | | 0.14 | (e) | | | 0.28 | | | | (1.44 | ) | | | – | | | | (2.83 | ) |
| 10/31/2022 | | | 19.22 | | | | 0.20 | | | | (1.36 | ) | | | (1.16 | ) | | | (0.36 | ) | | | (3.93 | ) | | | – | |
| 10/31/2021 | | | 12.98 | | | | 0.49 | | | | 6.64 | | | | 7.13 | | | | (0.08 | ) | | | (0.81 | ) | | | – | |
| 10/31/2020 | | | 14.76 | | | | 0.31 | | | | (2.00 | ) | | | (1.69 | ) | | | (0.09 | ) | | | – | | | | – | |
| 7/26/2019 to 10/31/2019(c)(d) | | | 15.00 | | | | 0.07 | | | | (0.31 | )(e) | | | (0.24 | ) | | | – | | | | – | | | | – | |
| Class F3 | | | | | | | | | | | | | | | | | | | | | | | | | | | | |
| 10/31/2023 | | | 13.64 | | | | 0.11 | | | | 0.16 | (e) | | | 0.27 | | | | (1.45 | ) | | | – | | | | (2.83 | ) |
| 10/31/2022 | | | 19.10 | | | | 0.20 | | | | (1.35 | ) | | | (1.15 | ) | | | (0.38 | ) | | | (3.93 | ) | | | – | |
| 10/31/2021 | | | 12.98 | | | | 0.37 | | | | 6.75 | | | | 7.12 | | | | (0.19 | ) | | | (0.81 | ) | | | – | |
| 10/31/2020 | | | 14.76 | | | | 0.32 | | | | (2.00 | ) | | | (1.68 | ) | | | (0.10 | ) | | | – | | | | – | |
| 7/26/2019 to 10/31/2019(c)(d) | | | 15.00 | | | | 0.07 | | | | (0.31 | )(e) | | | (0.24 | ) | | | – | | | | – | | | | – | |
| Class I | | | | | | | | | | | | | | | | | | | | | | | | | | | | |
| 10/31/2023 | | | 13.63 | | | | 0.09 | | | | 0.18 | (e) | | | 0.27 | | | | (1.09 | ) | | | – | | | | (2.83 | ) |
| 10/31/2022 | | | 19.10 | | | | 0.22 | | | | (1.38 | ) | | | (1.16 | ) | | | (0.38 | ) | | | (3.93 | ) | | | – | |
| 10/31/2021 | | | 12.99 | | | | 0.35 | | | | 6.76 | | | | 7.11 | | | | (0.19 | ) | | | (0.81 | ) | | | – | |
| 10/31/2020 | | | 14.76 | | | | 0.30 | | | | (1.97 | ) | | | (1.67 | ) | | | (0.10 | ) | | | – | | | | – | |
| 7/26/2019 to 10/31/2019(c)(d) | | | 15.00 | | | | 0.04 | | | | (0.28 | )(e) | | | (0.24 | ) | | | – | | | | – | | | | – | |
| Class R3 | | | | | | | | | | | | | | | | | | | | | | | | | | | | |
| 10/31/2023 | | | 13.56 | | | | 0.05 | | | | 0.18 | (e) | | | 0.23 | | | | (1.40 | ) | | | – | | | | (2.83 | ) |
| 10/31/2022 | | | 18.99 | | | | 0.12 | | | | (1.33 | ) | | | (1.21 | ) | | | (0.29 | ) | | | (3.93 | ) | | | – | |
| 10/31/2021 | | | 12.92 | | | | 0.29 | | | | 6.71 | | | | 7.00 | | | | (0.12 | ) | | | (0.81 | ) | | | – | |
| 10/31/2020 | | | 14.74 | | | | 0.23 | | | | (1.99 | ) | | | (1.76 | ) | | | (0.06 | ) | | | – | | | | – | |
| 7/26/2019 to 10/31/2019(c)(d) | | | 15.00 | | | | 0.05 | | | | (0.31 | )(e) | | | (0.26 | ) | | | – | | | | – | | | | – | |
| 138 | See Notes to Financial Statements. |
| | | | | | | Ratios to Average Net Assets: | | Supplemental Data: |
| | | | | | | | | |
Total
distri-
butions | | Net
asset
value,
end of
period | | Total
return
(%)(b) | | Total
expenses
after
waivers
and/or reim-
bursements
(%) | | Total
expenses
(%) | | Net
invest-
ment
income
(loss)
(%) | | Net
assets,
end of
period
(000) | | Portfolio
turnover
rate
(%) |
| | | | | | | | | | | | | | | | | | | | | | | | | | | | | | | |
| | $(4.25 | ) | | $ | 9.58 | | | | 0.59 | | | | 0.96 | | | | 1.92 | | | | 0.84 | | | $ | 9,821 | | | | 61 | |
| | (4.28 | ) | | | 13.58 | | | | (8.69 | ) | | | 0.96 | | | | 1.04 | | | | 1.12 | | | | 11,466 | | | | 100 | |
| | (0.97 | ) | | | 19.04 | | | | 56.50 | | | | 0.93 | | | | 0.93 | | | | 2.08 | | | | 7,714 | | | | 99 | |
| | (0.08 | ) | | | 12.95 | | | | (11.74 | ) | | | 0.96 | | | | 1.09 | | | | 2.08 | | | | 541 | | | | 128 | |
| | – | | | | 14.75 | | | | (1.67 | )(f) | | | 0.96 | (g) | | | 4.40 | (g) | | | 1.57 | (g) | | | 508 | | | | 16 | (f) |
| | | | | | | | | | | | | | | | | | | | | | | | | | | | | | | |
| | (4.14 | ) | | | 9.52 | | | | (0.21 | ) | | | 1.71 | | | | 2.71 | | | | 0.20 | | | | 2,618 | | | | 61 | |
| | (4.19 | ) | | | 13.49 | | | | (9.37 | ) | | | 1.71 | | | | 1.77 | | | | 0.40 | | | | 4,637 | | | | 100 | |
| | (0.81 | ) | | | 18.97 | | | | 55.29 | | | | 1.67 | | | | 1.67 | | | | 1.36 | | | | 3,601 | | | | 99 | |
| | (0.04 | ) | | | 12.87 | | | | (12.35 | ) | | | 1.71 | | | | 1.83 | | | | 1.32 | | | | 77 | | | | 128 | |
| | – | | | | 14.72 | | | | (1.87 | )(f) | | | 1.71 | (g) | | | 5.27 | (g) | | | 0.75 | (g) | | | 108 | | | | 16 | (f) |
| | | | | | | | | | | | | | | | | | | | | | | | | | | | | | | |
| | (4.27 | ) | | | 9.78 | | | | 0.81 | | | | 0.71 | | | | 1.95 | | | | 1.34 | | | | 194 | | | | 61 | |
| | (4.29 | ) | | | 13.77 | | | | (8.48 | ) | | | 0.71 | | | | 0.86 | | | | 1.35 | | | | 1,405 | | | | 100 | |
| | (0.89 | ) | | | 19.22 | | | | 56.78 | | | | 0.68 | | | | 0.78 | | | | 2.60 | | | | 2,394 | | | | 99 | |
| | (0.09 | ) | | | 12.98 | | | | (11.54 | ) | | | 0.71 | | | | 0.98 | | | | 2.33 | | | | 40 | | | | 128 | |
| | – | | | | 14.76 | | | | (1.60 | )(f) | | | 0.71 | (g) | | | 4.37 | (g) | | | 1.75 | (g) | | | 492 | | | | 16 | (f) |
| | | | | | | | | | | | | | | | | | | | | | | | | | | | | | | |
| | (4.28 | ) | | | 9.63 | | | | 0.82 | | | | 0.71 | | | | 1.61 | | | | 1.13 | | | | 9 | | | | 61 | |
| | (4.31 | ) | | | 13.64 | | | | (8.48 | ) | | | 0.70 | | | | 0.76 | | | | 1.37 | | | | 13 | | | | 100 | |
| | (1.00 | ) | | | 19.10 | | | | 56.91 | | | | 0.67 | | | | 0.67 | | | | 2.13 | | | | 18 | | | | 99 | |
| | (0.10 | ) | | | 12.98 | | | | (11.50 | ) | | | 0.63 | | | | 0.84 | | | | 2.40 | | | | 12 | | | | 128 | |
| | – | | | | 14.76 | | | | (1.60 | )(f) | | | 0.63 | (g) | | | 4.21 | (g) | | | 1.83 | (g) | | | 492 | | | | 16 | (f) |
| | | | | | | | | | | | | | | | | | | | | | | | | | | | | | | |
| | (3.92 | ) | | | 9.98 | | | | 0.89 | | | | 0.71 | | | | 1.56 | | | | 0.92 | | | | 4,982 | | | | 61 | |
| | (4.31 | ) | | | 13.63 | | | | (8.55 | ) | | | 0.69 | | | | 0.69 | | | | 1.49 | | | | 243 | | | | 100 | |
| | (1.00 | ) | | | 19.10 | | | | 56.79 | | | | 0.68 | | | | 0.68 | | | | 1.99 | | | | 656,899 | | | | 99 | |
| | (0.10 | ) | | | 12.99 | | | | (11.43 | ) | | | 0.71 | | | | 0.75 | | | | 2.34 | | | | 428,070 | | | | 128 | |
| | – | | | | 14.76 | | | | (1.60 | )(f) | | | 0.71 | (g) | | | 1.07 | (g) | | | 1.10 | (g) | | | 38,221 | | | | 16 | (f) |
| | | | | | | | | | | | | | | | | | | | | | | | | | | | | | | |
| | (4.23 | ) | | | 9.56 | | | | 0.40 | | | | 1.21 | | | | 2.11 | | | | 0.52 | | | | 143 | | | | 61 | |
| | (4.22 | ) | | | 13.56 | | | | (8.88 | ) | | | 1.21 | | | | 1.32 | | | | 0.86 | | | | 84 | | | | 100 | |
| | (0.93 | ) | | | 18.99 | | | | 56.09 | | | | 1.15 | | | | 1.15 | | | | 1.65 | | | | 13 | | | | 99 | |
| | (0.06 | ) | | | 12.92 | | | | (11.98 | ) | | | 1.21 | | | | 1.34 | | | | 1.75 | | | | 9 | | | | 128 | |
| | – | | | | 14.74 | | | | (1.73 | )(f) | | | 1.21 | (g) | | | 4.78 | (g) | | | 1.24 | (g) | | | 10 | | | | 16 | (f) |
| | See Notes to Financial Statements. | 139 |
Financial Highlights (continued)
FOCUSED LARGE CAP VALUE FUND
| | | | | Per Share Operating Performance: |
| | | | | Investment Operations: | | Distributions to
shareholders from: |
| | |
Net asset
value,
beginning
of period | |
Net
investment
income
(loss)(a) | |
Net
realized
and
unrealized
gain (loss) | | Total
from
invest-
ment
opera-
tions | |
Net
investment
income | |
Net
realized
gain | |
Return
of
capital |
| Class R4 | | | | | | | | | | | | | | | | | | | | | | | | | | | | |
| 10/31/2023 | | $ | 13.59 | | | $ | 0.09 | | | $ | 0.17 | (e) | | $ | 0.26 | | | $ | (1.42 | ) | | $ | – | | | $ | (2.83 | ) |
| 10/31/2022 | | | 19.04 | | | | 0.16 | | | | (1.35 | ) | | | (1.19 | ) | | | (0.33 | ) | | | (3.93 | ) | | | – | |
| 10/31/2021 | | | 12.95 | | | | 0.33 | | | | 6.73 | | | | 7.06 | | | | (0.16 | ) | | | (0.81 | ) | | | – | |
| 10/31/2020 | | | 14.75 | | | | 0.27 | | | | (1.99 | ) | | | (1.72 | ) | | | (0.08 | ) | | | – | | | | – | |
| 7/26/2019 to 10/31/2019(c)(d) | | | 15.00 | | | | 0.06 | | | | (0.31 | )(e) | | | (0.25 | ) | | | – | | | | – | | | | – | |
| Class R5 | | | | | | | | | | | | | | | | | | | | | | | | | | | | |
| 10/31/2023 | | | 13.63 | | | | 0.12 | | | | 0.16 | (e) | | | 0.28 | | | | (1.45 | ) | | | – | | | | (2.83 | ) |
| 10/31/2022 | | | 19.09 | | | | 0.20 | | | | (1.35 | ) | | | (1.15 | ) | | | (0.38 | ) | | | (3.93 | ) | | | – | |
| 10/31/2021 | | | 12.98 | | | | 0.38 | | | | 6.73 | | | | 7.11 | | | | (0.19 | ) | | | (0.81 | ) | | | – | |
| 10/31/2020 | | | 14.76 | | | | 0.30 | | | | (1.98 | ) | | | (1.68 | ) | | | (0.10 | ) | | | – | | | | – | |
| 7/26/2019 to 10/31/2019(c)(d) | | | 15.00 | | | | 0.07 | | | | (0.31 | )(e) | | | (0.24 | ) | | | – | | | | – | | | | – | |
| Class R6 | | | | | | | | | | | | | | | | | | | | | | | | | | | | |
| 10/31/2023 | | | 13.65 | | | | 0.11 | | | | 0.16 | (e) | | | 0.27 | | | | (1.45 | ) | | | – | | | | (2.83 | ) |
| 10/31/2022 | | | 19.11 | | | | 0.20 | | | | (1.35 | ) | | | (1.15 | ) | | | (0.38 | ) | | | (3.93 | ) | | | – | |
| 10/31/2021 | | | 12.99 | | | | 0.39 | | | | 6.73 | | | | 7.12 | | | | (0.19 | ) | | | (0.81 | ) | | | – | |
| 10/31/2020 | | | 14.76 | | | | 0.32 | | | | (1.99 | ) | | | (1.67 | ) | | | (0.10 | ) | | | – | | | | – | |
| 7/26/2019 to 10/31/2019(c)(d) | | | 15.00 | | | | 0.07 | | | | (0.31 | )(e) | | | (0.24 | ) | | | – | | | | – | | | | – | |
| | |
| (a) | Calculated using average shares outstanding during the period. |
| (b) | Total return for Classes A and C does not consider the effects of sales loads and assumes the reinvestment of all distributions. Total return for all other classes assumes the reinvestment of all distributions. |
| (c) | Net investment income, net realized and unrealized gain amounted to less than $.01 for the period 7/26/2019 through 7/31/2019. |
| (d) | Commencement of operations was 7/26/2019, SEC effective date was 7/31/2019 and date shares first became available to the public was 8/1/2019. |
| (e) | Realized and unrealized gain (loss) per share does not correlate to the aggregate of the net realized and unrealized gain(loss) in the Statement of Operations, primarily due to the timing of the sales and repurchases of the Fund’s shares in relation to fluctuating market values of the Fund’s portfolio. |
| (f) | Not annualized. |
| (g) | Annualized. |
| | |
| 140 | See Notes to Financial Statements. |
| | | | | | | Ratios to Average Net Assets: | | Supplemental Data: |
| | | | | | | | | | | | | | | |
Total
distri-
butions | |
Net
asset
value,
end of
period | |
Total
return
(%)(b) | | Total
expenses
after
waivers
and/or reim-
bursements
(%) | |
Total
expenses
(%) | |
Net
invest-
ment
income
(loss)
(%) | |
Net
assets,
end of
period
(000) | |
Portfolio
turnover
rate
(%) |
| | | | | | | | | | | | | | | | | | | | | | | | | | | | | | | |
| $ | (4.25 | ) | | $ | 9.60 | | | | 0.67 | | | | 0.96 | | | | 1.90 | | | | 0.91 | | | $ | 6 | | | | 61 | |
| | (4.26 | ) | | | 13.59 | | | | (8.73 | ) | | | 0.96 | | | | 1.00 | | | | 1.10 | | | | 9 | | | | 100 | |
| | (0.97 | ) | | | 19.04 | | | | 56.46 | | | | 0.90 | | | | 0.90 | | | | 1.89 | | | | 13 | | | | 99 | |
| | (0.08 | ) | | | 12.95 | | | | (11.74 | ) | | | 0.96 | | | | 1.08 | | | | 2.00 | | | | 9 | | | | 128 | |
| | – | | | | 14.75 | | | | (1.67 | )(f) | | | 0.96 | (g) | | | 4.51 | (g) | | | 1.47 | (g) | | | 10 | | | | 16 | (f) |
| | | | | | | | | | | | | | | | | | | | | | | | | | | | | | | |
| | (4.28 | ) | | | 9.63 | | | | 0.91 | | | | 0.71 | | | | 1.66 | | | | 1.15 | | | | 6 | | | | 61 | |
| | (4.31 | ) | | | 13.63 | | | | (8.49 | ) | | | 0.71 | | | | 0.75 | | | | 1.37 | | | | 9 | | | | 100 | |
| | (1.00 | ) | | | 19.09 | | | | 56.83 | | | | 0.65 | | | | 0.65 | | | | 2.14 | | | | 13 | | | | 99 | |
| | (0.10 | ) | | | 12.98 | | | | (11.51 | ) | | | 0.71 | | | | 0.84 | | | | 2.2 | | | | 49 | | | | 128 | |
| | – | | | | 14.76 | | | | (1.60 | )(f) | | | 0.71 | (g) | | | 4.27 | (g) | | | 1.75 | (g) | | | 10 | | | | 16 | (f) |
| | | | | | | | | | | | | | | | | | | | | | | | | | | | | | | |
| | (4.28 | ) | | | 9.64 | | | | 0.82 | | | | 0.71 | | | | 1.62 | | | | 1.07 | | | | 1,223 | | | | 61 | |
| | (4.31 | ) | | | 13.65 | | | | (8.48 | ) | | | 0.70 | | | | 0.77 | | | | 1.36 | | | | 1,347 | | | | 100 | |
| | (1.00 | ) | | | 19.11 | | | | 56.86 | | | | 0.68 | | | | 0.68 | | | | 2.17 | | | | 1,539 | | | | 99 | |
| | (0.10 | ) | | | 12.99 | | | | (11.43 | ) | | | 0.63 | | | | 0.81 | | | | 2.38 | | | | 366 | | | | 128 | |
| | – | | | | 14.76 | | | | (1.60 | )(f) | | | 0.63 | (g) | | | 4.21 | (g) | | | 1.83 | (g) | | | 517 | | | | 16 | (f) |
| | | |
| | See Notes to Financial Statements. | 141 |
Financial Highlights (continued)
FOCUSED SMALL CAP VALUE FUND
| | | | | Per Share Operating Performance: |
| | | | | Investment Operations: | | Distributions to
shareholders from: |
| | |
Net asset
value,
beginning
of period | |
Net
invest-
ment
income
(loss)(a) | |
Net
realized
and
unrealized
gain (loss) | | Total
from
invest-
ment
opera-
tions | |
Net
investment
income | |
Net
realized
gain | |
Total
distri-
butions |
| Class A | | | | | | | | | | | | | | | | | | | | | | | | | | | | |
| 10/31/2023 | | $ | 23.97 | | | $ | 0.07 | | | $ | (1.17 | ) | | $ | (1.10 | ) | | $ | (0.10 | ) | | $ | (0.84 | ) | | $ | (0.94 | ) |
| 10/31/2022 | | | 30.62 | | | | 0.05 | | | | (3.54 | ) | | | (3.49 | ) | | | – | | | | (3.16 | ) | | | (3.16 | ) |
| 10/31/2021 | | | 18.77 | | | | 0.01 | | | | 12.00 | | | | 12.01 | | | | (0.16 | ) | | | – | | | | (0.16 | ) |
| 10/31/2020 | | | 25.14 | | | | 0.14 | | | | (2.40 | ) | | | (2.26 | ) | | | – | | | | (4.11 | ) | | | (4.11 | ) |
| 10/31/2019 | | | 29.02 | | | | (0.04 | ) | | | 0.39 | | | | 0.35 | | | | – | | | | (4.23 | ) | | | (4.23 | ) |
| Class C | | | | | | | | | | | | | | | | | | | | | | | | | | | | |
| 10/31/2023 | | | 25.36 | | | | (0.11 | ) | | | (1.24 | ) | | | (1.35 | ) | | | – | | | | (0.84 | ) | | | (0.84 | ) |
| 10/31/2022 | | | 32.44 | | | | (0.15 | ) | | | (3.77 | ) | | | (3.92 | ) | | | – | | | | (3.16 | ) | | | (3.16 | ) |
| 10/31/2021 | | | 19.99 | | | | (0.30 | ) | | | 12.87 | | | | 12.57 | | | | (0.12 | ) | | | – | | | | (0.12 | ) |
| 10/31/2020 | | | 26.71 | | | | (0.08 | ) | | | (2.53 | ) | | | (2.61 | ) | | | – | | | | (4.11 | ) | | | (4.11 | ) |
| 6/28/2019 to 10/31/2019(c) | | | 27.39 | | | | (0.03 | ) | | | (0.65 | ) | | | (0.68 | ) | | | – | | | | – | | | | – | |
| Class F | | | | | | | | | | | | | | | | | | | | | | | | | | | | |
| 10/31/2023 | | | 26.17 | | | | 0.18 | | | | (1.33 | ) | | | (1.15 | ) | | | (0.12 | ) | | | (0.84 | ) | | | (0.96 | ) |
| 10/31/2022 | | | 33.11 | | | | 0.12 | | | | (3.86 | ) | | | (3.74 | ) | | | (0.04 | ) | | | (3.16 | ) | | | (3.20 | ) |
| 10/31/2021 | | | 20.30 | | | | 0.01 | | | | 13.04 | | | | 13.05 | | | | (0.24 | ) | | | – | | | | (0.24 | ) |
| 10/31/2020 | | | 26.80 | | | | 0.09 | | | | (2.48 | ) | | | (2.39 | ) | | | – | | | | (4.11 | ) | | | (4.11 | ) |
| 6/28/2019 to 10/31/2019(c) | | | 27.39 | | | | 0.06 | | | | (0.65 | ) | | | (0.59 | ) | | | – | | | | – | | | | – | |
| Class F3 | | | | | | | | | | | | | | | | | | | | | | | | | | | | |
| 10/31/2023 | | | 26.20 | | | | 0.15 | | | | (1.28 | ) | | | (1.13 | ) | | | (0.17 | ) | | | (0.84 | ) | | | (1.01 | ) |
| 10/31/2022 | | | 33.15 | | | | 0.14 | | | | (3.86 | ) | | | (3.72 | ) | | | (0.07 | ) | | | (3.16 | ) | | | (3.23 | ) |
| 10/31/2021 | | | 20.32 | | | | 0.11 | | | | 12.97 | | | | 13.08 | | | | (0.25 | ) | | | – | | | | (0.25 | ) |
| 10/31/2020 | | | 26.80 | | | | 0.19 | | | | (2.56 | ) | | | (2.37 | ) | | | – | | | | (4.11 | ) | | | (4.11 | ) |
| 6/28/2019 to 10/31/2019(c) | | | 27.39 | | | | 0.06 | | | | (0.65 | ) | | | (0.59 | ) | | | – | | | | – | | | | – | |
| Class I | | | | | | | | | | | | | | | | | | | | | | | | | | | | |
| 10/31/2023 | | | 26.14 | | | | 0.14 | | | | (1.28 | ) | | | (1.14 | ) | | | (0.17 | ) | | | (0.84 | ) | | | (1.01 | ) |
| 10/31/2022 | | | 33.10 | | | | 0.12 | | | | (3.85 | ) | | | (3.73 | ) | | | (0.07 | ) | | | (3.16 | ) | | | (3.23 | ) |
| 10/31/2021 | | | 20.30 | | | | 0.11 | | | | 12.94 | | | | 13.05 | | | | (0.25 | ) | | | – | | | | (0.25 | ) |
| 10/31/2020 | | | 26.80 | | | | 0.19 | | | | (2.58 | ) | | | (2.39 | ) | | | – | | | | (4.11 | ) | | | (4.11 | ) |
| 10/31/2019 | | | 30.64 | | | | (0.02 | ) | | | 0.41 | | | | 0.39 | | | | – | | | | (4.23 | ) | | | (4.23 | ) |
| Class R5 | | | | | | | | | | | | | | | | | | | | | | | | | | | | |
| 10/31/2023 | | | 26.15 | | | | 0.14 | | | | (1.28 | ) | | | (1.14 | ) | | | (0.17 | ) | | | (0.84 | ) | | | (1.01 | ) |
| 10/31/2022 | | | 33.10 | | | | 0.18 | | | | (3.90 | ) | | | (3.72 | ) | | | (0.07 | ) | | | (3.16 | ) | | | (3.23 | ) |
| 10/31/2021 | | | 20.29 | | | | 0.10 | | | | 12.96 | | | | 13.06 | | | | (0.25 | ) | | | – | | | | (0.25 | ) |
| 10/31/2020 | | | 26.80 | | | | 0.17 | | | | (2.57 | ) | | | (2.40 | ) | | | – | | | | (4.11 | ) | | | (4.11 | ) |
| 6/28/2019 to 10/31/2019(c) | | | 27.39 | | | | 0.05 | | | | (0.64 | ) | | | (0.59 | ) | | | – | | | | – | | | | – | |
| | |
| 142 | See Notes to Financial Statements. |
| | | | | Ratios to Average Net Assets: | | Supplemental Data: |
| | | | | | | | | | | | | |
Net
asset
value,
end of
period | |
Total
return(b)
(%) | | Total
expenses
after
waivers
and/or reim-
bursements
(%) | |
Total
expenses
(%) | |
Net
investment
income
(loss)
(%) | |
Net
assets,
end of
period
(000) | |
Portfolio
turnover
rate
(%) |
| | | | | | | | | | | | | | | | | | | | | | | | | | | |
| $ | 21.93 | | | | (4.90 | ) | | | 1.28 | | | | 1.33 | | | | 0.30 | | | $ | 11,487 | | | | 54 | |
| | 23.97 | | | | (12.99 | ) | | | 1.28 | | | | 1.29 | | | | 0.20 | | | | 16,026 | | | | 63 | |
| | 30.62 | | | | 64.27 | | | | 1.22 | | | | 1.22 | | | | 0.03 | | | | 19,525 | | | | 116 | |
| | 18.77 | | | | (11.21 | ) | | | 1.28 | | | | 1.40 | | | | 0.72 | | | | 3,253 | | | | 77 | |
| | 25.14 | | | | 1.68 | | | | 1.53 | | | | 1.58 | | | | (0.16 | ) | | | 5,729 | | | | 135 | |
| | | | | | | | | | | | | | | | | | | | | | | | | | | |
| | 23.17 | | | | (5.64 | ) | | | 2.03 | | | | 2.08 | | | | (0.45 | ) | | | 2,499 | | | | 54 | |
| | 25.36 | | | | (13.61 | ) | | | 2.03 | | | | 2.04 | | | | (0.56 | ) | | | 3,624 | | | | 63 | |
| | 32.44 | | | | 63.10 | | | | 1.96 | | | | 1.96 | | | | (0.95 | ) | | | 5,028 | | | | 116 | |
| | 19.99 | | | | (12.01 | ) | | | 2.03 | | | | 2.20 | | | | (0.42 | ) | | | 102 | | | | 77 | |
| | 26.71 | | | | (2.48 | )(d) | | | 2.03 | (e) | | | 2.14 | (e) | | | (0.37 | )(e) | | | 10 | | | | 135 | |
| | | | | | | | | | | | | | | | | | | | | | | | | | | |
| | 24.06 | | | | (4.68 | ) | | | 1.03 | | | | 1.18 | | | | 0.69 | | | | 4,246 | | | | 54 | |
| | 26.17 | | | | (12.77 | ) | | | 1.03 | | | | 1.13 | | | | 0.41 | | | | 21,683 | | | | 63 | |
| | 33.11 | | | | 64.73 | | | | 0.97 | | | | 1.07 | | | | 0.04 | | | | 66,993 | | | | 116 | |
| | 20.30 | | | | (11.00 | ) | | | 1.03 | | | | 1.30 | | | | 0.43 | | | | 784 | | | | 77 | |
| | 26.80 | | | | (2.15 | )(d) | | | 1.03 | (e) | | | 1.30 | (e) | | | 0.65 | (e) | | | 10 | | | | 135 | |
| | | | | | | | | | | | | | | | | | | | | | | | | | | |
| | 24.06 | | | | (4.60 | ) | | | 0.97 | | | | 1.01 | | | | 0.57 | | | | 10 | | | | 54 | |
| | 26.20 | | | | (12.70 | ) | | | 0.95 | | | | 0.95 | | | | 0.51 | | | | 11 | | | | 63 | |
| | 33.15 | | | | 64.72 | | | | 0.92 | | | | 0.92 | | | | 0.35 | | | | 14 | | | | 116 | |
| | 20.32 | | | | (10.88 | ) | | | 0.95 | | | | 1.14 | | | | 0.92 | | | | 9 | | | | 77 | |
| | 26.80 | | | | (2.15 | )(d) | | | 0.95 | (e) | | | 1.15 | (e) | | | 0.71 | (e) | | | 10 | | | | 135 | |
| | | | | | | | | | | | | | | | | | | | | | | | | | | |
| | 23.99 | | | | (4.66 | ) | | | 1.03 | | | | 1.08 | | | | 0.52 | | | | 71,703 | | | | 54 | |
| | 26.14 | | | | (12.76 | ) | | | 1.03 | | | | 1.03 | | | | 0.41 | | | | 82,062 | | | | 63 | |
| | 33.10 | | | | 64.71 | | | | 0.95 | | | | 0.96 | | | | 0.35 | | | | 118,351 | | | | 116 | |
| | 20.30 | | | | (11.00 | ) | | | 1.03 | | | | 1.18 | | | | 0.92 | | | | 69,689 | | | | 77 | |
| | 26.80 | | | | 1.77 | | | | 1.45 | | | | 1.50 | | | | (0.07 | ) | | | 114,088 | | | | 135 | |
| | | | | | | | | | | | | | | | | | | | | | | | | | | |
| | 24.00 | | | | (4.66 | ) | | | 1.03 | | | | 1.08 | | | | 0.55 | | | | 185 | | | | 54 | |
| | 26.15 | | | | (12.73 | ) | | | 1.03 | | | | 1.05 | | | | 0.69 | | | | 272 | | | | 63 | |
| | 33.10 | | | | 64.71 | | | | 0.94 | | | | 0.94 | | | | 0.31 | | | | 17 | | | | 116 | |
| | 20.29 | | | | (11.00 | ) | | | 1.03 | | | | 1.16 | | | | 0.83 | | | | 9 | | | | 77 | |
| | 26.80 | | | | (2.15 | )(d) | | | 1.03 | (e) | | | 1.15 | (e) | | | 0.62 | (e) | | | 10 | | | | 135 | |
| | | |
| | See Notes to Financial Statements. | 143 |
Financial Highlights (continued)
FOCUSED SMALL CAP VALUE FUND
| | | | | Per Share Operating Performance: |
| | | | | Investment Operations: | | Distributions to
shareholders from: |
| | |
Net asset
value,
beginning
of period | |
Net
invest-
ment
income
(loss)(a) | |
Net
realized
and
unrealized
gain (loss) | | Total
from
invest-
ment
opera-
tions | |
Net
investment
income | |
Net
realized
gain | |
Total
distri-
butions |
| Class R6 | | | | | | | | | | | | | | | | | | | | | | | | | | | | |
| 10/31/2023 | | $ | 26.20 | | | $ | 0.15 | | | $ | (1.28 | ) | | $ | (1.13 | ) | | $ | (0.17 | ) | | $ | (0.84 | ) | | $ | (1.01 | ) |
| 10/31/2022 | | | 33.16 | | | | 0.14 | | | | (3.87 | ) | | | (3.73 | ) | | | (0.07 | ) | | | (3.16 | ) | | | (3.23 | ) |
| 10/31/2021 | | | 20.33 | | | | 0.07 | | | | 13.01 | | | | 13.08 | | | | (0.25 | ) | | | – | | | | (0.25 | ) |
| 10/31/2020 | | | 26.81 | | | | 0.18 | | | | (2.55 | ) | | | (2.37 | ) | | | – | | | | (4.11 | ) | | | (4.11 | ) |
| 6/28/2019 to 10/31/2019(c) | | | 27.39 | | | | 0.09 | | | | (0.67 | ) | | | (0.58 | ) | | | – | | | | – | | | | – | |
| | |
| (a) | Calculated using average shares outstanding during the period. |
| (b) | Total return for Classes A and C does not consider the effects of sales loads and assumes the reinvestment of all distributions. Total return for all other classes assumes the reinvestment of all distributions. |
| (c) | Commencement of operations was 6/28/2019 and date shares first became available to the public was 7/1/2019. |
| (d) | Not annualized. |
| (e) | Annualized. |
| | |
| 144 | See Notes to Financial Statements. |
| | | | | Ratios to Average Net Assets: | | Supplemental Data: |
| | | | | | | | | | | | | |
Net
asset
value,
end of
period | |
Total
return(b)
(%) | | Total
expenses
after
waivers
and/or reim-
bursements
(%) | |
Total
expenses
(%) | |
Net
investment
income
(loss)
(%) | |
Net
assets,
end of
period
(000) | |
Portfolio
turnover
rate
(%) |
| | | | | | | | | | | | | | | | | | | | | | | | | | | |
| $ | 24.06 | | | | (4.60 | ) | | | 0.97 | | | | 1.03 | | | | 0.56 | | | $ | 9,998 | | | | 54 | |
| | 26.20 | | | | (12.73 | ) | | | 0.98 | | | | 0.98 | | | | 0.50 | | | | 10,472 | | | | 63 | |
| | 33.16 | | | | 64.69 | | | | 0.94 | | | | 0.95 | | | | 0.22 | | | | 11,274 | | | | 116 | |
| | 20.33 | | | | (10.87 | ) | | | 0.95 | | | | 1.16 | | | | 0.90 | | | | 1,717 | | | | 77 | |
| | 26.81 | | | | (2.12 | )(d) | | | 0.95 | (e) | | | 1.24 | (e) | | | 1.01 | (e) | | | 1,336 | | | | 135 | |
| | | |
| | See Notes to Financial Statements. | 145 |
Financial Highlights (continued)
FUNDAMENTAL EQUITY FUND
| | | | | Per Share Operating Performance: |
| | | | | Investment Operations: | | Distributions to
shareholders from: |
| | |
Net asset
value,
beginning
of period | |
Net
invest-
ment
income
(loss)(a) | |
Net
realized
and
unrealized
gain (loss) | | Total
from
invest-
ment
opera-
tions | |
Net
investment
income | |
Net
realized
gain | |
Total
distri-
butions |
| Class A | | | | | | | | | | | | | | | | | | | | | | | | | | | | |
| 10/31/2023 | | $ | 12.44 | | | $ | 0.12 | | | $ | 0.01 | | | $ | 0.13 | | | $ | (0.14 | ) | | $ | (0.51 | ) | | $ | (0.65 | ) |
| 10/31/2022 | | | 15.04 | | | | 0.15 | | | | (1.03 | ) | | | (0.88 | ) | | | (0.14 | ) | | | (1.58 | ) | | | (1.72 | ) |
| 10/31/2021 | | | 10.56 | | | | 0.14 | | | | 4.55 | | | | 4.69 | | | | (0.21 | ) | | | – | | | | (0.21 | ) |
| 10/31/2020 | | | 12.53 | | | | 0.19 | | | | (0.88 | ) | | | (0.69 | ) | | | (0.19 | ) | | | (1.09 | ) | | | (1.28 | ) |
| 10/31/2019 | | | 12.64 | | | | 0.19 | | | | 0.79 | | | | 0.98 | | | | (0.18 | ) | | | (0.91 | ) | | | (1.09 | ) |
| Class C | | | | | | | | | | | | | | | | | | | | | | | | | | | | |
| 10/31/2023 | | | 10.66 | | | | 0.03 | | | | 0.01 | | | | 0.04 | | | | (0.06 | ) | | | (0.51 | ) | | | (0.57 | ) |
| 10/31/2022 | | | 13.10 | | | | 0.05 | | | | (0.88 | ) | | | (0.83 | ) | | | (0.03 | ) | | | (1.58 | ) | | | (1.61 | ) |
| 10/31/2021 | | | 9.19 | | | | 0.04 | | | | 3.96 | | | | 4.00 | | | | (0.09 | ) | | | – | | | | (0.09 | ) |
| 10/31/2020 | | | 11.04 | | | | 0.10 | | | | (0.77 | ) | | | (0.67 | ) | | | (0.09 | ) | | | (1.09 | ) | | | (1.18 | ) |
| 10/31/2019 | | | 11.22 | | | | 0.09 | | | | 0.69 | | | | 0.78 | | | | (0.05 | ) | | | (0.91 | ) | | | (0.96 | ) |
| Class F | | | | | | | | | | | | | | | | | | | | | | | | | | | | |
| 10/31/2023 | | | 12.26 | | | | 0.14 | | | | 0.02 | | | | 0.16 | | | | (0.16 | ) | | | (0.51 | ) | | | (0.67 | ) |
| 10/31/2022 | | | 14.85 | | | | 0.17 | | | | (1.02 | ) | | | (0.85 | ) | | | (0.16 | ) | | | (1.58 | ) | | | (1.74 | ) |
| 10/31/2021 | | | 10.44 | | | | 0.16 | | | | 4.48 | | | | 4.64 | | | | (0.23 | ) | | | – | | | | (0.23 | ) |
| 10/31/2020 | | | 12.40 | | | | 0.21 | | | | (0.87 | ) | | | (0.66 | ) | | | (0.21 | ) | | | (1.09 | ) | | | (1.30 | ) |
| 10/31/2019 | | | 12.52 | | | | 0.21 | | | | 0.78 | | | | 0.99 | | | | (0.20 | ) | | | (0.91 | ) | | | (1.11 | ) |
| Class F3 | | | | | | | | | | | | | | | | | | | | | | | | | | | | |
| 10/31/2023 | | | 12.65 | | | | 0.16 | | | | 0.02 | | | | 0.18 | | | | (0.18 | ) | | | (0.51 | ) | | | (0.69 | ) |
| 10/31/2022 | | | 15.26 | | | | 0.20 | | | | (1.05 | ) | | | (0.85 | ) | | | (0.18 | ) | | | (1.58 | ) | | | (1.76 | ) |
| 10/31/2021 | | | 10.71 | | | | 0.19 | | | | 4.60 | | | | 4.79 | | | | (0.24 | ) | | | – | | | | (0.24 | ) |
| 10/31/2020 | | | 12.69 | | | | 0.23 | | | | (0.90 | ) | | | (0.67 | ) | | | (0.22 | ) | | | (1.09 | ) | | | (1.31 | ) |
| 10/31/2019 | | | 12.78 | | | | 0.23 | | | | 0.80 | | | | 1.03 | | | | (0.21 | ) | | | (0.91 | ) | | | (1.12 | ) |
| Class I | | | | | | | | | | | | | | | | | | | | | | | | | | | | |
| 10/31/2023 | | | 12.55 | | | | 0.15 | | | | 0.02 | | | | 0.17 | | | | (0.18 | ) | | | (0.51 | ) | | | (0.69 | ) |
| 10/31/2022 | | | 15.16 | | | | 0.19 | | | | (1.04 | ) | | | (0.85 | ) | | | (0.18 | ) | | | (1.58 | ) | | | (1.76 | ) |
| 10/31/2021 | | | 10.65 | | | | 0.18 | | | | 4.57 | | | | 4.75 | | | | (0.24 | ) | | | – | | | | (0.24 | ) |
| 10/31/2020 | | | 12.63 | | | | 0.22 | | | | (0.89 | ) | | | (0.67 | ) | | | (0.22 | ) | | | (1.09 | ) | | | (1.31 | ) |
| 10/31/2019 | | | 12.73 | | | | 0.22 | | | | 0.80 | | | | 1.02 | | | | (0.21 | ) | | | (0.91 | ) | | | (1.12 | ) |
| Class P | | | | | | | | | | | | | | | | | | | | | | | | | | | | |
| 10/31/2023 | | | 12.12 | | | | 0.09 | | | | 0.01 | | | | 0.10 | | | | (0.12 | ) | | | (0.51 | ) | | | (0.63 | ) |
| 10/31/2022 | | | 14.69 | | | | 0.12 | | | | (1.00 | ) | | | (0.88 | ) | | | (0.11 | ) | | | (1.58 | ) | | | (1.69 | ) |
| 10/31/2021 | | | 10.33 | | | | 0.11 | | | | 4.44 | | | | 4.55 | | | | (0.19 | ) | | | – | | | | (0.19 | ) |
| 10/31/2020 | | | 12.28 | | | | 0.17 | | | | (0.86 | ) | | | (0.69 | ) | | | (0.17 | ) | | | (1.09 | ) | | | (1.26 | ) |
| 10/31/2019 | | | 12.40 | | | | 0.16 | | | | 0.77 | | | | 0.93 | | | | (0.14 | ) | | | (0.91 | ) | | | (1.05 | ) |
| Class R2 | | | | | | | | | | | | | | | | | | | | | | | | | | | | |
| 10/31/2023 | | | 12.08 | | | | 0.07 | | | | 0.02 | | | | 0.09 | | | | (0.10 | ) | | | (0.51 | ) | | | (0.61 | ) |
| 10/31/2022 | | | 14.64 | | | | 0.10 | | | | (0.99 | ) | | | (0.89 | ) | | | (0.09 | ) | | | (1.58 | ) | | | (1.67 | ) |
| 10/31/2021 | | | 10.30 | | | | 0.09 | | | | 4.43 | | | | 4.52 | | | | (0.18 | ) | | | – | | | | (0.18 | ) |
| 10/31/2020 | | | 12.24 | | | | 0.15 | | | | (0.86 | ) | | | (0.71 | ) | | | (0.14 | ) | | | (1.09 | ) | | | (1.23 | ) |
| 10/31/2019 | | | 12.33 | | | | 0.14 | | | | 0.78 | | | | 0.92 | | | | (0.10 | ) | | | (0.91 | ) | | | (1.01 | ) |
| | |
| 146 | See Notes to Financial Statements. |
| | | | | Ratios to Average Net Assets: | | Supplemental Data: |
| | | | | | | | | | | | | |
Net
asset
value,
end of
period | |
Total
return(b)
(%) | | Total
expenses
after
waivers
and/or reim-
bursements
(%) | |
Total
expenses
(%) | |
Net
invest-
ment
income
(loss)
(%) | |
Net
assets,
end of
period
(000) | |
Portfolio
turnover
rate
(%) |
| | | | | | | | | | | | | | | | | | | | | | | | | | | |
| $ | 11.92 | | | | 0.92 | | | | 0.94 | | | | 0.94 | | | | 0.98 | | | $ | 1,068,294 | | | | 26 | |
| | 12.44 | | | | (6.81 | ) | | | 0.96 | | | | 0.96 | | | | 1.19 | | | | 1,186,259 | | | | 50 | |
| | 15.04 | | | | 44.87 | | | | 0.96 | | | | 0.96 | | | | 1.06 | | | | 1,382,625 | | | | 73 | |
| | 10.56 | | | | (6.39 | ) | | | 0.94 | | | | 0.94 | | | | 1.79 | | | | 1,067,309 | | | | 59 | |
| | 12.53 | | | | 8.52 | | | | 0.99 | | | | 0.99 | | | | 1.57 | | | | 1,378,201 | | | | 88 | |
| | | | | | | | | | | | | | | | | | | | | | | | | | | |
| | 10.13 | | | | 0.15 | | | | 1.69 | | | | 1.69 | | | | 0.26 | | | | 23,316 | | | | 26 | |
| | 10.66 | | | | (7.50 | ) | | | 1.71 | | | | 1.71 | | | | 0.43 | | | | 38,197 | | | | 50 | |
| | 13.10 | | | | 43.75 | | | | 1.71 | | | | 1.71 | | | | 0.32 | | | | 55,600 | | | | 73 | |
| | 9.19 | | | | (7.07 | ) | | | 1.69 | | | | 1.69 | | | | 1.05 | | | | 60,191 | | | | 59 | |
| | 11.04 | | | | 7.71 | | | | 1.74 | | | | 1.74 | | | | 0.83 | | | | 157,803 | | | | 88 | |
| | | | | | | | | | | | | | | | | | | | | | | | | | | |
| | 11.75 | | | | 1.14 | | | | 0.79 | | | | 0.79 | | | | 1.19 | | | | 24,745 | | | | 26 | |
| | 12.26 | | | | (6.75 | ) | | | 0.81 | | | | 0.81 | | | | 1.32 | | | | 69,775 | | | | 50 | |
| | 14.85 | | | | 45.02 | | | | 0.81 | | | | 0.81 | | | | 1.21 | | | | 146,249 | | | | 73 | |
| | 10.44 | | | | (6.22 | ) | | | 0.79 | | | | 0.79 | | | | 1.93 | | | | 116,340 | | | | 59 | |
| | 12.40 | | | | 8.71 | | | | 0.84 | | | | 0.84 | | | | 1.73 | | | | 183,310 | | | | 88 | |
| | | | | | | | | | | | | | | | | | | | | | | | | | | |
| | 12.14 | | | | 1.26 | | | | 0.63 | | | | 0.63 | | | | 1.28 | | | | 17,642 | | | | 26 | |
| | 12.65 | | | | (6.58 | ) | | | 0.63 | | | | 0.63 | | | | 1.53 | | | | 18,159 | | | | 50 | |
| | 15.26 | | | | 45.36 | | | | 0.63 | | | | 0.63 | | | | 1.39 | | | | 19,916 | | | | 73 | |
| | 10.71 | | | | (6.11 | ) | | | 0.63 | | | | 0.63 | | | | 2.10 | | | | 15,378 | | | | 59 | |
| | 12.69 | | | | 8.92 | | | | 0.64 | | | | 0.64 | | | | 1.92 | | | | 20,698 | | | | 88 | |
| | | | | | | | | | | | | | | | | | | | | | | | | | | |
| | 12.03 | | | | 1.18 | | | | 0.69 | | | | 0.69 | | | | 1.22 | | | | 545,537 | | | | 26 | |
| | 12.55 | | | | (6.65 | ) | | | 0.71 | | | | 0.71 | | | | 1.48 | | | | 561,349 | | | | 50 | |
| | 15.16 | | | | 45.21 | | | | 0.71 | | | | 0.71 | | | | 1.32 | | | | 281,392 | | | | 73 | |
| | 10.65 | | | | (6.16 | ) | | | 0.69 | | | | 0.69 | | | | 2.06 | | | | 262,216 | | | | 59 | |
| | 12.63 | | | | 8.84 | | | | 0.74 | | | | 0.74 | | | | 1.79 | | | | 613,182 | | | | 88 | |
| | | | | | | | | | | | | | | | | | | | | | | | | | | |
| | 11.59 | | | | 0.65 | | | | 1.14 | | | | 1.14 | | | | 0.80 | | | | 3,237 | | | | 26 | |
| | 12.12 | | | | (7.03 | ) | | | 1.16 | | | | 1.16 | | | | 0.99 | | | | 4,074 | | | | 50 | |
| | 14.69 | | | | 44.55 | | | | 1.16 | | | | 1.16 | | | | 0.84 | | | | 4,881 | | | | 73 | |
| | 10.33 | | | | (6.54 | ) | | | 1.14 | | | | 1.14 | | | | 1.58 | | | | 3,614 | | | | 59 | |
| | 12.28 | | | | 8.30 | | | | 1.19 | | | | 1.19 | | | | 1.36 | | | | 5,117 | | | | 88 | |
| | | | | | | | | | | | | | | | | | | | | | | | | | | |
| | 11.56 | | | | 0.59 | | | | 1.29 | | | | 1.29 | | | | 0.62 | | | | 1,964 | | | | 26 | |
| | 12.08 | | | | (7.17 | ) | | | 1.31 | | | | 1.31 | | | | 0.82 | | | | 2,114 | | | | 50 | |
| | 14.64 | | | | 44.28 | | | | 1.31 | | | | 1.31 | | | | 0.72 | | | | 3,271 | | | | 73 | |
| | 10.30 | | | | (6.68 | ) | | | 1.29 | | | | 1.29 | | | | 1.44 | | | | 3,082 | | | | 59 | |
| | 12.24 | | | | 8.17 | | | | 1.34 | | | | 1.34 | | | | 1.20 | | | | 4,009 | | | | 88 | |
| | | |
| | See Notes to Financial Statements. | 147 |
Financial Highlights (continued)
FUNDAMENTAL EQUITY FUND
| | | | | Per Share Operating Performance: |
| | | | | Investment Operations: | | Distributions to
shareholders from: |
| | |
Net asset
value,
beginning
of period | |
Net
invest-
ment
income
(loss)(a) | |
Net
realized
and
unrealized
gain (loss) | | Total
from
invest-
ment
opera-
tions | |
Net
investment
income | |
Net
realized
gain | |
Total
distri-
butions |
| Class R3 | | | | | | | | | | | | | | | | | | | | | | | | | | | | |
| 10/31/2023 | | $ | 12.13 | | | $ | 0.09 | | | $ | 0.01 | | | $ | 0.10 | | | $ | (0.11 | ) | | $ | (0.51 | ) | | $ | (0.62 | ) |
| 10/31/2022 | | | 14.70 | | | | 0.12 | | | | (1.01 | ) | | | (0.89 | ) | | | (0.10 | ) | | | (1.58 | ) | | | (1.68 | ) |
| 10/31/2021 | | | 10.33 | | | | 0.11 | | | | 4.44 | | | | 4.55 | | | | (0.18 | ) | | | – | | | | (0.18 | ) |
| 10/31/2020 | | | 12.28 | | | | 0.16 | | | | (0.86 | ) | | | (0.70 | ) | | | (0.16 | ) | | | (1.09 | ) | | | (1.25 | ) |
| 10/31/2019 | | | 12.40 | | | | 0.16 | | | | 0.77 | | | | 0.93 | | | | (0.14 | ) | | | (0.91 | ) | | | (1.05 | ) |
| Class R4 | | | | | | | | | | | | | | | | | | | | | | | | | | | | |
| 10/31/2023 | | | 12.37 | | | | 0.12 | | | | 0.01 | | | | 0.13 | | | | (0.15 | ) | | | (0.51 | ) | | | (0.66 | ) |
| 10/31/2022 | | | 14.96 | | | | 0.15 | | | | (1.02 | ) | | | (0.87 | ) | | | (0.14 | ) | | | (1.58 | ) | | | (1.72 | ) |
| 10/31/2021 | | | 10.50 | | | | 0.14 | | | | 4.52 | | | | 4.66 | | | | (0.20 | ) | | | – | | | | (0.20 | ) |
| 10/31/2020 | | | 12.46 | | | | 0.19 | | | | (0.87 | ) | | | (0.68 | ) | | | (0.19 | ) | | | (1.09 | ) | | | (1.28 | ) |
| 10/31/2019 | | | 12.58 | | | | 0.19 | | | | 0.78 | | | | 0.97 | | | | (0.18 | ) | | | (0.91 | ) | | | (1.09 | ) |
| Class R5 | | | | | | | | | | | | | | | | | | | | | | | | | | | | |
| 10/31/2023 | | | 12.56 | | | | 0.15 | | | | 0.02 | | | | 0.17 | | | | (0.18 | ) | | | (0.51 | ) | | | (0.69 | ) |
| 10/31/2022 | | | 15.17 | | | | 0.18 | | | | (1.03 | ) | | | (0.85 | ) | | | (0.18 | ) | | | (1.58 | ) | | | (1.76 | ) |
| 10/31/2021 | | | 10.66 | | | | 0.18 | | | | 4.57 | | | | 4.75 | | | | (0.24 | ) | | | – | | | | (0.24 | ) |
| 10/31/2020 | | | 12.63 | | | | 0.22 | | | | (0.88 | ) | | | (0.66 | ) | | | (0.22 | ) | | | (1.09 | ) | | | (1.31 | ) |
| 10/31/2019 | | | 12.74 | | | | 0.22 | | | | 0.79 | | | | 1.01 | | | | (0.21 | ) | | | (0.91 | ) | | | (1.12 | ) |
| Class R6 | | | | | | | | | | | | | | | | | | | | | | | | | | | | |
| 10/31/2023 | | | 12.66 | | | | 0.16 | | | | 0.02 | | | | 0.18 | | | | (0.18 | ) | | | (0.51 | ) | | | (0.69 | ) |
| 10/31/2022 | | | 15.27 | | | | 0.19 | | | | (1.04 | ) | | | (0.85 | ) | | | (0.18 | ) | | | (1.58 | ) | | | (1.76 | ) |
| 10/31/2021 | | | 10.72 | | | | 0.19 | | | | 4.60 | | | | 4.79 | | | | (0.24 | ) | | | – | | | | (0.24 | ) |
| 10/31/2020 | | | 12.69 | | | | 0.23 | | | | (0.89 | ) | | | (0.66 | ) | | | (0.22 | ) | | | (1.09 | ) | | | (1.31 | ) |
| 10/31/2019 | | | 12.79 | | | | 0.23 | | | | 0.79 | | | | 1.02 | | | | (0.21 | ) | | | (0.91 | ) | | | (1.12 | ) |
| | |
| (a) | Calculated using average shares outstanding during the period. |
| (b) | Total return for Classes A and C does not consider the effects of sales loads and assumes the reinvestment of all distributions. Total return for all other classes assumes the reinvestment of all distributions. |
| | |
| 148 | See Notes to Financial Statements. |
| | | | | Ratios to Average Net Assets: | | Supplemental Data: |
| | | | | | | | | | | | | |
Net
asset
value,
end of
period | |
Total
return(b)
(%) | | Total
expenses
after
waivers
and/or reim-
bursements
(%) | |
Total
expenses
(%) | |
Net
invest-
ment
income
(loss)
(%) | |
Net
assets,
end of
period
(000) | |
Portfolio
turnover
rate
(%) |
| | | | | | | | | | | | | | | | | | | | | | | | | | | |
| $ | 11.61 | | | | 0.66 | | | | 1.19 | | | | 1.19 | | | | 0.73 | | | $ | 57,037 | | | | 26 | |
| | 12.13 | | | | (7.10 | ) | | | 1.21 | | | | 1.21 | | | | 0.93 | | | | 63,110 | | | | 50 | |
| | 14.70 | | | | 44.54 | | | | 1.21 | | | | 1.21 | | | | 0.81 | | | | 86,249 | | | | 73 | |
| | 10.33 | | | | (6.62 | ) | | | 1.19 | | | | 1.19 | | | | 1.54 | | | | 76,817 | | | | 59 | |
| | 12.28 | | | | 8.27 | | | | 1.24 | | | | 1.24 | | | | 1.32 | | | | 98,059 | | | | 88 | |
| | | | | | | | | | | | | | | | | | | | | | | | | | | |
| | 11.84 | | | | 0.86 | | | | 0.94 | | | | 0.94 | | | | 0.99 | | | | 2,523 | | | | 26 | |
| | 12.37 | | | | (6.80 | ) | | | 0.96 | | | | 0.96 | | | | 1.20 | | | | 2,969 | | | | 50 | |
| | 14.96 | | | | 44.80 | | | | 0.96 | | | | 0.96 | | | | 1.04 | | | | 2,988 | | | | 73 | |
| | 10.50 | | | | (6.35 | ) | | | 0.94 | | | | 0.94 | | | | 1.79 | | | | 2,228 | | | | 59 | |
| | 12.46 | | | | 8.51 | | | | 0.99 | | | | 0.99 | | | | 1.56 | | | | 4,880 | | | | 88 | |
| | | | | | | | | | | | | | | | | | | | | | | | | | | |
| | 12.04 | | | | 1.17 | | | | 0.69 | | | | 0.69 | | | | 1.22 | | | | 781 | | | | 26 | |
| | 12.56 | | | | (6.64 | ) | | | 0.71 | | | | 0.71 | | | | 1.42 | | | | 776 | | | | 50 | |
| | 15.17 | | | | 45.17 | | | | 0.71 | | | | 0.71 | | | | 1.31 | | | | 986 | | | | 73 | |
| | 10.66 | | | | (6.08 | ) | | | 0.69 | | | | 0.69 | | | | 2.07 | | | | 901 | | | | 59 | |
| | 12.63 | | | | 8.76 | | | | 0.74 | | | | 0.74 | | | | 1.80 | | | | 1,482 | | | | 88 | |
| | | | | | | | | | | | | | | | | | | | | | | | | | | |
| | 12.15 | | | | 1.26 | | | | 0.63 | | | | 0.63 | | | | 1.29 | | | | 7,577 | | | | 26 | |
| | 12.66 | | | | (6.57 | ) | | | 0.63 | | | | 0.63 | | | | 1.44 | | | | 8,039 | | | | 50 | |
| | 15.27 | | | | 45.31 | | | | 0.63 | | | | 0.63 | | | | 1.39 | | | | 16,209 | | | | 73 | |
| | 10.72 | | | | (6.03 | ) | | | 0.63 | | | | 0.63 | | | | 2.10 | | | | 11,403 | | | | 59 | |
| | 12.69 | | | | 8.83 | | | | 0.64 | | | | 0.64 | | | | 1.89 | | | | 21,815 | | | | 88 | |
| | | |
| | See Notes to Financial Statements. | 149 |
Financial Highlights (continued)
GLOBAL EQUITY FUND
| | | | | Per Share Operating Performance: |
| | | | | Investment Operations: | | | Distributions to
shareholders from: |
| | | Net asset
value,
beginning
of period | | Net
invest-
ment
income
(loss)(a) | | Net
realized
and
unrealized
gain (loss) | | Total
from
invest-
ment
opera-
tions | | Net
investment
income | | Net
realized
gain | | Total
distri-
butions |
| Class A | | | | | | | | | | | | | | | | | | | | | | | | | | | | |
| 10/31/2023 | | | $11.37 | | | | $0.13 | | | | $ 1.00 | | | | $1.13 | | | | $(0.08 | ) | | | $ – | | | | $(0.08 | ) |
| 10/31/2022 | | | 16.61 | | | | 0.10 | | | | (3.04 | ) | | | (2.94 | ) | | | (0.12 | ) | | | (2.18 | ) | | | (2.30 | ) |
| 10/31/2021 | | | 12.59 | | | | 0.14 | | | | 4.57 | | | | 4.71 | | | | (0.18 | ) | | | (0.51 | ) | | | (0.69 | ) |
| 10/31/2020 | | | 11.52 | | | | 0.11 | | | | 1.09 | | | | 1.20 | | | | (0.13 | ) | | | – | | | | (0.13 | ) |
| 10/31/2019 | | | 10.93 | | | | 0.13 | | | | 0.97 | | | | 1.10 | | | | (0.09 | ) | | | (0.42 | ) | | | (0.51 | ) |
| Class C | | | | | | | | | | | | | | | | | | | | | | | | | | | | |
| 10/31/2023 | | | 11.22 | | | | 0.04 | | | | 0.98 | | | | 1.02 | | | | – | | | | – | | | | – | |
| 10/31/2022 | | | 16.41 | | | | – | (c) | | | (3.00 | ) | | | (3.00 | ) | | | (0.01 | ) | | | (2.18 | ) | | | (2.19 | ) |
| 10/31/2021 | | | 12.46 | | | | 0.02 | | | | 4.53 | | | | 4.55 | | | | (0.09 | ) | | | (0.51 | ) | | | (0.60 | ) |
| 10/31/2020 | | | 11.40 | | | | 0.02 | | | | 1.08 | | | | 1.10 | | | | (0.04 | ) | | | – | | | | (0.04 | ) |
| 10/31/2019 | | | 10.81 | | | | 0.05 | | | | 0.97 | | | | 1.02 | | | | (0.01 | ) | | | (0.42 | ) | | | (0.43 | ) |
| Class F | | | | | | | | | | | | | | | | | | | | | | | | | | | | |
| 10/31/2023 | | | 11.39 | | | | 0.16 | | | | 0.99 | | | | 1.15 | | | | (0.09 | ) | | | – | | | | (0.09 | ) |
| 10/31/2022 | | | 16.65 | | | | 0.11 | | | | (3.05 | ) | | | (2.94 | ) | | | (0.14 | ) | | | (2.18 | ) | | | (2.32 | ) |
| 10/31/2021 | | | 12.62 | | | | 0.16 | | | | 4.59 | | | | 4.75 | | | | (0.21 | ) | | | (0.51 | ) | | | (0.72 | ) |
| 10/31/2020 | | | 11.54 | | | | 0.12 | | | | 1.11 | | | | 1.23 | | | | (0.15 | ) | | | – | | | | (0.15 | ) |
| 10/31/2019 | | | 10.94 | | | | 0.15 | | | | 0.97 | | | | 1.12 | | | | (0.10 | ) | | | (0.42 | ) | | | (0.52 | ) |
| Class F3 | | | | | | | | | | | | | | | | | | | | | | | | | | | | |
| 10/31/2023 | | | 11.41 | | | | 0.18 | | | | 1.00 | | | | 1.18 | | | | (0.12 | ) | | | – | | | | (0.12 | ) |
| 10/31/2022 | | | 16.68 | | | | 0.13 | | | | (3.06 | ) | | | (2.93 | ) | | | (0.16 | ) | | | (2.18 | ) | | | (2.34 | ) |
| 10/31/2021 | | | 12.63 | | | | 0.19 | | | | 4.60 | | | | 4.79 | | | | (0.23 | ) | | | (0.51 | ) | | | (0.74 | ) |
| 10/31/2020 | | | 11.56 | | | | 0.14 | | | | 1.10 | | | | 1.24 | | | | (0.17 | ) | | | – | | | | (0.17 | ) |
| 10/31/2019 | | | 10.96 | | | | 0.16 | | | | 0.97 | | | | 1.13 | | | | (0.11 | ) | | | (0.42 | ) | | | (0.53 | ) |
| Class I | | | | | | | | | | | | | | | | | | | | | | | | | | | | |
| 10/31/2023 | | | 11.40 | | | | 0.16 | | | | 1.00 | | | | 1.16 | | | | (0.11 | ) | | | – | | | | (0.11 | ) |
| 10/31/2022 | | | 16.66 | | | | 0.12 | | | | (3.04 | ) | | | (2.92 | ) | | | (0.16 | ) | | | (2.18 | ) | | | (2.34 | ) |
| 10/31/2021 | | | 12.62 | | | | 0.18 | | | | 4.59 | | | | 4.77 | | | | (0.22 | ) | | | (0.51 | ) | | | (0.73 | ) |
| 10/31/2020 | | | 11.55 | | | | 0.14 | | | | 1.09 | | | | 1.23 | | | | (0.16 | ) | | | – | | | | (0.16 | ) |
| 10/31/2019 | | | 10.95 | | | | 0.16 | | | | 0.97 | | | | 1.13 | | | | (0.11 | ) | | | (0.42 | ) | | | (0.53 | ) |
| Class R3 | | | | | | | | | | | | | | | | | | | | | | | | | | | | |
| 10/31/2023 | | | 11.26 | | | | 0.10 | | | | 0.99 | | | | 1.09 | | | | (0.04 | ) | | | – | | | | (0.04 | ) |
| 10/31/2022 | | | 16.47 | | | | 0.08 | | | | (3.02 | ) | | | (2.94 | ) | | | (0.09 | ) | | | (2.18 | ) | | | (2.27 | ) |
| 10/31/2021 | | | 12.51 | | | | 0.11 | | | | 4.52 | | | | 4.63 | | | | (0.16 | ) | | | (0.51 | ) | | | (0.67 | ) |
| 10/31/2020 | | | 11.45 | | | | 0.08 | | | | 1.09 | | | | 1.17 | | | | (0.11 | ) | | | – | | | | (0.11 | ) |
| 10/31/2019 | | | 10.90 | | | | 0.11 | | | | 0.96 | | | | 1.07 | | | | (0.10 | ) | | | (0.42 | ) | | | (0.52 | ) |
| 150 | See Notes to Financial Statements. |
| | | | | Ratios to Average Net Assets: | | Supplemental Data: |
| | | | | | | | | | | | | |
Net
asset
value,
end of
period | | Total
return(b)
(%) | | Total
expenses
after
waivers
and/or reim-
bursements
(%) | | Total
expenses
(%) | | Net
invest-
ment
income
(loss)
(%) | | Net
assets,
end of
period
(000) | | Portfolio
turnover
rate
(%) |
| | | | | | | | | | | |
| | $12.42 | | | | 9.98 | | | | 0.90 | | | | 2.55 | | | | 1.08 | | | | $5,163 | | | | 55 | |
| | 11.37 | | | | (20.30 | ) | | | 0.90 | | | | 3.43 | | | | 0.79 | | | | 4,236 | | | | 70 | |
| | 16.61 | | | | 38.37 | | | | 0.90 | | | | 3.53 | | | | 0.88 | | | | 5,016 | | | | 87 | |
| | 12.59 | | | | 10.52 | | | | 0.90 | | | | 4.32 | | | | 0.92 | | | | 2,622 | | | | 141 | |
| | 11.52 | | | | 10.85 | | | | 0.90 | | | | 4.20 | | | | 1.24 | | | | 3,551 | | | | 65 | |
| | | | | | | | | | | | | | | | | | | | | | | | | | | |
| | 12.24 | | | | 9.09 | | | | 1.65 | | | | 3.33 | | | | 0.35 | | | | 345 | | | | 55 | |
| | 11.22 | | | | (20.87 | ) | | | 1.65 | | | | 4.05 | | | | (0.03 | ) | | | 392 | | | | 70 | |
| | 16.41 | | | | 37.27 | | | | 1.65 | | | | 4.29 | | | | 0.14 | | | | 826 | | | | 87 | |
| | 12.46 | | | | 9.75 | | | | 1.65 | | | | 5.12 | | | | 0.17 | | | | 537 | | | | 141 | |
| | 11.40 | | | | 10.05 | | | | 1.65 | | | | 4.96 | | | | 0.46 | | | | 581 | | | | 65 | |
| | | | | | | | | | | | | | | | | | | | | | | | | | | |
| | 12.45 | | | | 10.16 | | | | 0.75 | | | | 2.42 | | | | 1.25 | | | | 1,099 | | | | 55 | |
| | 11.39 | | | | (20.26 | ) | | | 0.75 | | | | 3.21 | | | | 0.86 | | | | 1,277 | | | | 70 | |
| | 16.65 | | | | 38.59 | | | | 0.75 | | | | 3.40 | | | | 1.07 | | | | 2,146 | | | | 87 | |
| | 12.62 | | | | 10.73 | | | | 0.75 | | | | 4.23 | | | | 1.06 | | | | 1,445 | | | | 141 | |
| | 11.54 | | | | 11.07 | | | | 0.75 | | | | 4.09 | | | | 1.37 | | | | 2,207 | | | | 65 | |
| | | | | | | | | | | | | | | | | | | | | | | | | | | |
| | 12.47 | | | | 10.38 | | | | 0.57 | | | | 2.04 | | | | 1.42 | | | | 14 | | | | 55 | |
| | 11.41 | | | | (20.15 | ) | | | 0.59 | | | | 2.99 | | | | 0.99 | | | | 13 | | | | 70 | |
| | 16.68 | | | | 38.90 | | | | 0.61 | | | | 3.20 | | | | 1.20 | | | | 18 | | | | 87 | |
| | 12.63 | | | | 10.78 | | | | 0.62 | | | | 4.09 | | | | 1.19 | | | | 14 | | | | 141 | |
| | 11.56 | | | | 11.22 | | | | 0.63 | | | | 3.88 | | | | 1.50 | | | | 13 | | | | 65 | |
| | | | | | | | | | | | | | | | | | | | | | | | | | | |
| | 12.45 | | | | 10.26 | | | | 0.65 | | | | 2.29 | | | | 1.32 | | | | 3,245 | | | | 55 | |
| | 11.40 | | | | (20.17 | ) | | | 0.65 | | | | 3.12 | | | | 0.93 | | | | 1,085 | | | | 70 | |
| | 16.66 | | | | 38.78 | | | | 0.65 | | | | 3.30 | | | | 1.16 | | | | 1,837 | | | | 87 | |
| | 12.62 | | | | 10.75 | | | | 0.65 | | | | 4.16 | | | | 1.18 | | | | 1,400 | | | | 141 | |
| | 11.55 | | | | 11.19 | | | | 0.65 | | | | 3.95 | | | | 1.49 | | | | 1,264 | | | | 65 | |
| | | | | | | | | | | | | | | | | | | | | | | | | | | |
| | 12.31 | | | | 9.67 | | | | 1.15 | | | | 2.80 | | | | 0.83 | | | | 598 | | | | 55 | |
| | 11.26 | | | | (20.47 | ) | | | 1.15 | | | | 3.67 | | | | 0.59 | | | | 506 | | | | 70 | |
| | 16.47 | | | | 37.85 | | | | 1.15 | | | | 3.78 | | | | 0.70 | | | | 470 | | | | 87 | |
| | 12.51 | | | | 10.25 | | | | 1.15 | | | | 4.67 | | | | 0.68 | | | | 241 | | | | 141 | |
| | 11.45 | | | | 10.63 | | | | 1.15 | | | | 4.46 | | | | 0.98 | | | | 200 | | | | 65 | |
| | | | | | | | | | | | | | | | | | | | | | | | | | | |
| | See Notes to Financial Statements. | 151 |
Financial Highlights (continued)
GLOBAL EQUITY FUND
| | | | | Per Share Operating Performance: |
| | | | | Investment Operations: | | Distributions to
shareholders from: |
| | | Net asset value, beginning of period | | Net invest- ment income (loss)(a) | | Net realized and unrealized gain (loss) | | Total from invest- ment opera- tions | | Net investment income | | Net realized gain | | Total distri- butions |
| Class R4 | | | | | | | | | | | | | | | | | | | | | | | | | | | | |
| 10/31/2023 | | | $11.37 | | | | $0.15 | | | | $ 0.98 | | | | $ 1.13 | | | | $(0.09 | ) | | | $ – | | | | $(0.09 | ) |
| 10/31/2022 | | | 16.62 | | | | 0.14 | | | | (3.09 | ) | | | (2.95 | ) | | | (0.12 | ) | | | (2.18 | ) | | | (2.30 | ) |
| 10/31/2021 | | | 12.60 | | | | 0.14 | | | | 4.58 | | | | 4.72 | | | | (0.19 | ) | | | (0.51 | ) | | | (0.70 | ) |
| 10/31/2020 | | | 11.53 | | | | 0.11 | | | | 1.10 | | | | 1.21 | | | | (0.14 | ) | | | – | | | | (0.14 | ) |
| 10/31/2019 | | | 10.93 | | | | 0.13 | | | | 0.97 | | | | 1.10 | | | | (0.08 | ) | | | (0.42 | ) | | | (0.50 | ) |
| Class R5 | | | | | | | | | | | | | | | | | | | | | | | | | | | | |
| 10/31/2023 | | | 11.40 | | | | 0.17 | | | | 1.00 | | | | 1.17 | | | | (0.11 | ) | | | – | | | | (0.11 | ) |
| 10/31/2022 | | | 16.66 | | | | 0.12 | | | | (3.04 | ) | | | (2.92 | ) | | | (0.16 | ) | | | (2.18 | ) | | | (2.34 | ) |
| 10/31/2021 | | | 12.62 | | | | 0.18 | | | | 4.59 | | | | 4.77 | | | | (0.22 | ) | | | (0.51 | ) | | | (0.73 | ) |
| 10/31/2020 | | | 11.55 | | | | 0.14 | | | | 1.09 | | | | 1.23 | | | | (0.16 | ) | | | – | | | | (0.16 | ) |
| 10/31/2019 | | | 10.95 | | | | 0.16 | | | | 0.97 | | | | 1.13 | | | | (0.11 | ) | | | (0.42 | ) | | | (0.53 | ) |
| Class R6 | | | | | | | | | | | | | | | | | | | | | | | | | | | | |
| 10/31/2023 | | | 11.41 | | | | 0.18 | | | | 1.00 | | | | 1.18 | | | | (0.12 | ) | | | – | | | | (0.12 | ) |
| 10/31/2022 | | | 16.67 | | | | 0.14 | | | | (3.06 | ) | | | (2.92 | ) | | | (0.16 | ) | | | (2.18 | ) | | | (2.34 | ) |
| 10/31/2021 | | | 12.63 | | | | 0.19 | | | | 4.59 | | | | 4.78 | | | | (0.23 | ) | | | (0.51 | ) | | | (0.74 | ) |
| 10/31/2020 | | | 11.56 | | | | 0.14 | | | | 1.10 | | | | 1.24 | | | | (0.17 | ) | | | – | | | | (0.17 | ) |
| 10/31/2019 | | | 10.96 | | | | 0.17 | | | | 0.96 | | | | 1.13 | | | | (0.11 | ) | | | (0.42 | ) | | | (0.53 | ) |
| (a) | Calculated using average shares outstanding during the period. |
| (b) | Total return for Classes A and C does not consider the effects of sales loads and assumes the reinvestment of all distributions. Total return for all other classes assumes the reinvestment of all distributions. |
| (c) | Amount is less than $0.01. |
| 152 | See Notes to Financial Statements. |
| | | | | Ratios to Average Net Assets: | | Supplemental Data: |
| | | | | | | | | | | | | |
Net
asset
value,
end of
period | | Total
return(b)
(%) | | Total
expenses
after
waivers
and/or reim-
bursements
(%) | | Total
expenses
(%) | | Net
invest-
ment
income
(loss)
(%) | | Net
assets,
end of
period
(000) | | Portfolio
turnover
rate
(%) |
| | | | | | | | | | | | | |
| | $12.41 | | | | 9.97 | | | | 0.90 | | | | 2.62 | | | | 1.26 | | | | $ 14 | | | | 55 | |
| | 11.37 | | | | (20.37 | ) | | | 0.90 | | | | 3.88 | | | | 1.17 | | | | 514 | | | | 70 | |
| | 16.62 | | | | 38.39 | | | | 0.90 | | | | 3.54 | | | | 0.92 | | | | 19 | | | | 87 | |
| | 12.60 | | | | 10.51 | | | | 0.90 | | | | 4.41 | | | | 0.92 | | | | 14 | | | | 141 | |
| | 11.53 | | | | 10.89 | | | | 0.90 | | | | 4.18 | | | | 1.24 | | | | 13 | | | | 65 | |
| | | | | | | | | | | | | | | | | | | | | | | | | | | |
| | 12.46 | | | | 10.31 | | | | 0.65 | | | | 2.30 | | | | 1.35 | | | | 14 | | | | 55 | |
| | 11.40 | | | | (20.17 | ) | | | 0.65 | | | | 3.14 | | | | 0.93 | | | | 13 | | | | 70 | |
| | 16.66 | | | | 38.78 | | | | 0.65 | | | | 3.29 | | | | 1.16 | | | | 19 | | | | 87 | |
| | 12.62 | | | | 10.75 | | | | 0.65 | | | | 4.15 | | | | 1.17 | | | | 14 | | | | 141 | |
| | 11.55 | | | | 11.19 | | | | 0.65 | | | | 3.93 | | | | 1.49 | | | | 13 | | | | 65 | |
| | | | | | | | | | | | | | | | | | | | | | | | | | | |
| | 12.47 | | | | 10.38 | | | | 0.57 | | | | 1.99 | | | | 1.39 | | | | 3,414 | | | | 55 | |
| | 11.41 | | | | (20.10 | ) | | | 0.59 | | | | 3.02 | | | | 1.06 | | | | 919 | | | | 70 | |
| | 16.67 | | | | 38.82 | | | | 0.61 | | | | 3.21 | | | | 1.21 | | | | 1,215 | | | | 87 | |
| | 12.63 | | | | 10.87 | | | | 0.62 | | | | 4.09 | | | | 1.21 | | | | 635 | | | | 141 | |
| | 11.56 | | | | 11.13 | | | | 0.63 | | | | 3.88 | | | | 1.56 | | | | 690 | | | | 65 | |
| | See Notes to Financial Statements. | 153 |
Financial Highlights (continued)
GROWTH LEADERS FUND
| | | | | Per Share Operating Performance: | | | | |
| | | | | Investment Operations: | | Distributions
to
shareholders
from: | | Net
asset
value,
end of
period |
| | | Net asset
value,
beginning
of period | | Net
investment
income
(loss)(a) | | Net
realized and
unrealized
gain (loss) | | Total from
investment
operations | | Net
realized
gain | |
| Class A | | | | | | | | | | | | | | | | | | | | | | | | |
| 10/31/2023 | | | $26.45 | | | | $(0.15 | ) | | �� | $ 1.37 | | | | $ 1.22 | | | | $ – | | | | $27.67 | |
| 10/31/2022 | | | 52.70 | | | | (0.16 | ) | | | (16.09 | ) | | | (16.25 | ) | | | (10.00 | ) | | | 26.45 | |
| 10/31/2021 | | | 42.25 | | | | (0.28 | ) | | | 15.10 | | | | 14.82 | | | | (4.37 | ) | | | 52.70 | |
| 10/31/2020 | | | 28.61 | | | | (0.19 | ) | | | 16.17 | | | | 15.98 | | | | (2.34 | ) | | | 42.25 | |
| 10/31/2019 | | | 29.82 | | | | (0.13 | ) | | | 3.57 | | | | 3.44 | | | | (4.65 | ) | | | 28.61 | |
| Class C | | | | | | | | | | | | | | | | | | | | | | | | |
| 10/31/2023 | | | 22.88 | | | | (0.31 | ) | | | 1.19 | | | | 0.88 | | | | – | | | | 23.76 | |
| 10/31/2022 | | | 47.22 | | | | (0.36 | ) | | | (13.98 | ) | | | (14.34 | ) | | | (10.00 | ) | | | 22.88 | |
| 10/31/2021 | | | 38.53 | | | | (0.57 | ) | | | 13.63 | | | | 13.06 | | | | (4.37 | ) | | | 47.22 | |
| 10/31/2020 | | | 26.47 | | | | (0.39 | ) | | | 14.79 | | | | 14.40 | | | | (2.34 | ) | | | 38.53 | |
| 10/31/2019 | | | 28.14 | | | | (0.31 | ) | | | 3.29 | | | | 2.98 | | | | (4.65 | ) | | | 26.47 | |
| Class F | | | | | | | | | | | | | | | | | | | | | | | | |
| 10/31/2023 | | | 27.42 | | | | (0.07 | ) | | | 1.41 | | | | 1.34 | | | | – | | | | 28.76 | |
| 10/31/2022 | | | 54.15 | | | | (0.08 | ) | | | (16.65 | ) | | | (16.73 | ) | | | (10.00 | ) | | | 27.42 | |
| 10/31/2021 | | | 43.20 | | | | (0.17 | ) | | | 15.49 | | | | 15.32 | | | | (4.37 | ) | | | 54.15 | |
| 10/31/2020 | | | 29.14 | | | | (0.11 | ) | | | 16.51 | | | | 16.40 | | | | (2.34 | ) | | | 43.20 | |
| 10/31/2019 | | | 30.21 | | | | (0.06 | ) | | | 3.64 | | | | 3.58 | | | | (4.65 | ) | | | 29.14 | |
| Class F3 | | | | | | | | | | | | | | | | | | | | | | | | |
| 10/31/2023 | | | 27.89 | | | | (0.07 | ) | | | 1.45 | | | | 1.38 | | | | – | | | | 29.27 | |
| 10/31/2022 | | | 54.88 | | | | (0.06 | ) | | | (16.93 | ) | | | (16.99 | ) | | | (10.00 | ) | | | 27.89 | |
| 10/31/2021 | | | 43.70 | | | | (0.15 | ) | | | 15.70 | | | | 15.55 | | | | (4.37 | ) | | | 54.88 | |
| 10/31/2020 | | | 29.43 | | | | (0.10 | ) | | | 16.71 | | | | 16.61 | | | | (2.34 | ) | | | 43.70 | |
| 10/31/2019 | | | 30.45 | | | | (0.05 | ) | | | 3.68 | | | | 3.63 | | | | (4.65 | ) | | | 29.43 | |
| Class I | | | | | | | | | | | | | | | | | | | | | | | | |
| 10/31/2023 | | | 27.67 | | | | (0.09 | ) | | | 1.44 | | | | 1.35 | | | | – | | | | 29.02 | |
| 10/31/2022 | | | 54.56 | | | | (0.08 | ) | | | (16.81 | ) | | | (16.89 | ) | | | (10.00 | ) | | | 27.67 | |
| 10/31/2021 | | | 43.49 | | | | (0.17 | ) | | | 15.61 | | | | 15.44 | | | | (4.37 | ) | | | 54.56 | |
| 10/31/2020 | | | 29.32 | | | | (0.11 | ) | | | 16.62 | | | | 16.51 | | | | (2.34 | ) | | | 43.49 | |
| 10/31/2019 | | | 30.37 | | | | (0.06 | ) | | | 3.66 | | | | 3.60 | | | | (4.65 | ) | | | 29.32 | |
| Class R2 | | | | | | | | | | | | | | | | | | | | | | | | |
| 10/31/2023 | | | 25.50 | | | | (0.23 | ) | | | 1.32 | | | | 1.09 | | | | – | | | | 26.59 | |
| 10/31/2022 | | | 51.32 | | | | (0.26 | ) | | | (15.56 | ) | | | (15.82 | ) | | | (10.00 | ) | | | 25.50 | |
| 10/31/2021 | | | 41.38 | | | | (0.44 | ) | | | 14.75 | | | | 14.31 | | | | (4.37 | ) | | | 51.32 | |
| 10/31/2020 | | | 28.15 | | | | (0.27 | ) | | | 15.84 | | | | 15.57 | | | | (2.34 | ) | | | 41.38 | |
| 10/31/2019 | | | 29.51 | | | | (0.22 | ) | | | 3.51 | | | | 3.29 | | | | (4.65 | ) | | | 28.15 | |
| Class R3 | | | | | | | | | | | | | | | | | | | | | | | | |
| 10/31/2023 | | | 25.51 | | | | (0.22 | ) | | | 1.33 | | | | 1.11 | | | | – | | | | 26.62 | |
| 10/31/2022 | | | 51.28 | | | | (0.23 | ) | | | (15.54 | ) | | | (15.77 | ) | | | (10.00 | ) | | | 25.51 | |
| 10/31/2021 | | | 41.31 | | | | (0.39 | ) | | | 14.73 | | | | 14.34 | | | | (4.37 | ) | | | 51.28 | |
| 10/31/2020 | | | 28.09 | | | | (0.26 | ) | | | 15.82 | | | | 15.56 | | | | (2.34 | ) | | | 41.31 | |
| 10/31/2019 | | | 29.43 | | | | (0.19 | ) | | | 3.50 | | | | 3.31 | | | | (4.65 | ) | | | 28.09 | |
| 154 | See Notes to Financial Statements. |
| | | Ratios to Average Net Assets: | | Supplemental Data: |
| | | | | | | | | | | |
Total
return(b)
(%) | | Total
expenses
after
waivers and/or
reimburse-
ments
(%) | | Total
expenses
(%) | | Net
investment
income
(loss)
(%) | | Net
assets,
end of
period
(000) | | Portfolio
turnover
rate
(%) |
| | | | | | | | | |
| | 4.61 | | | | 0.91 | | | | 0.91 | | | | (0.55 | ) | | | $ 1,491,196 | | | | 120 | |
| | (38.05 | ) | | | 0.91 | | | | 0.91 | | | | (0.49 | ) | | | 1,569,330 | | | | 146 | |
| | 37.77 | | | | 0.89 | | | | 0.89 | | | | (0.61 | ) | | | 2,713,887 | | | | 140 | |
| | 60.35 | | | | 0.90 | | | | 0.90 | | | | (0.56 | ) | | | 1,920,930 | | | | 93 | |
| | 15.32 | | | | 0.93 | | | | 0.93 | | | | (0.48 | ) | | | 1,001,973 | | | | 143 | |
| | | | | | | | | | | | | | | | | | | | | | | |
| | 3.85 | | | | 1.66 | | | | 1.66 | | | | (1.29 | ) | | | 425,713 | | | | 120 | |
| | (38.52 | ) | | | 1.66 | | | | 1.66 | | | | (1.24 | ) | | | 543,043 | | | | 146 | |
| | 36.75 | | | | 1.64 | | | | 1.64 | | | | (1.36 | ) | | | 1,142,002 | | | | 140 | |
| | 59.17 | | | | 1.65 | | | | 1.65 | | | | (1.29 | ) | | | 906,259 | | | | 93 | |
| | 14.45 | | | | 1.68 | | | | 1.68 | | | | (1.23 | ) | | | 631,400 | | | | 143 | |
| | | | | | | | | | | | | | | | | | | | | | | |
| | 4.89 | | | | 0.66 | | | | 0.76 | | | | (0.25 | ) | | | 244,364 | | | | 120 | |
| | (37.89 | ) | | | 0.66 | | | | 0.76 | | | | (0.23 | ) | | | 775,269 | | | | 146 | |
| | 38.13 | | | | 0.64 | | | | 0.74 | | | | (0.36 | ) | | | 4,331,228 | | | | 140 | |
| | 60.72 | | | | 0.65 | | | | 0.75 | | | | (0.31 | ) | | | 2,708,762 | | | | 93 | |
| | 15.63 | | | | 0.68 | | | | 0.78 | | | | (0.23 | ) | | | 1,444,533 | | | | 143 | |
| | | | | | | | | | | | | | | | | | | | | | | |
| | 4.95 | | | | 0.59 | | | | 0.59 | | | | (0.23 | ) | | | 382,432 | | | | 120 | |
| | (37.85 | ) | | | 0.59 | | | | 0.59 | | | | (0.17 | ) | | | 430,492 | | | | 146 | |
| | 38.23 | | | | 0.58 | | | | 0.58 | | | | (0.30 | ) | | | 697,858 | | | | 140 | |
| | 60.84 | | | | 0.59 | | | | 0.59 | | | | (0.29 | ) | | | 265,851 | | | | 93 | |
| | 15.68 | | | | 0.62 | | | | 0.62 | | | | (0.19 | ) | | | 74,378 | | | | 143 | |
| | | | | | | | | | | | | | | | | | | | | | | |
| | 4.88 | | | | 0.66 | | | | 0.66 | | | | (0.30 | ) | | | 2,124,007 | | | | 120 | |
| | (37.89 | ) | | | 0.66 | | | | 0.66 | | | | (0.25 | ) | | | 2,087,818 | | | | 146 | |
| | 38.13 | | | | 0.64 | | | | 0.64 | | | | (0.36 | ) | | | 1,282,161 | | | | 140 | |
| | 60.72 | | | | 0.65 | | | | 0.65 | | | | (0.31 | ) | | | 1,037,283 | | | | 93 | |
| | 15.62 | | | | 0.68 | | | | 0.68 | | | | (0.20 | ) | | | 520,195 | | | | 143 | |
| | | | | | | | | | | | | | | | | | | | | | | |
| | 4.27 | | | | 1.26 | | | | 1.26 | | | | (0.89 | ) | | | 1,452 | | | | 120 | |
| | (38.28 | ) | | | 1.26 | | | | 1.26 | | | | (0.84 | ) | | | 2,155 | | | | 146 | |
| | 37.32 | | | | 1.24 | | | | 1.24 | | | | (0.96 | ) | | | 3,275 | | | | 140 | |
| | 59.75 | | | | 1.25 | | | | 1.25 | | | | (0.84 | ) | | | 1,551 | | | | 93 | |
| | 14.94 | | | | 1.28 | | | | 1.28 | | | | (0.82 | ) | | | 1,153 | | | | 143 | |
| | | | | | | | | | | | | | | | | | | | | | | |
| | 4.35 | | | | 1.16 | | | | 1.16 | | | | (0.81 | ) | | | 15,019 | | | | 120 | |
| | (38.20 | ) | | | 1.16 | | | | 1.16 | | | | (0.74 | ) | | | 13,621 | | | | 146 | |
| | 37.44 | | | | 1.14 | | | | 1.14 | | | | (0.86 | ) | | | 21,928 | | | | 140 | |
| | 59.94 | | | | 1.15 | | | | 1.15 | | | | (0.79 | ) | | | 18,790 | | | | 93 | |
| | 15.03 | | | | 1.18 | | | | 1.18 | | | | (0.71 | ) | | | 13,610 | | | | 143 | |
| | | | | | | | | | | | | | | | | | | | | | | |
| | See Notes to Financial Statements. | 155 |
Financial Highlights (continued)
GROWTH LEADERS FUND
| | | | | Per Share Operating Performance: | | |
| | | | | Investment Operations: | | Distributions
to
shareholders
from: | | Net
asset
value,
end of
period |
| | | Net asset
value,
beginning
of period | | Net
investment
income
(loss)(a) | | Net
realized and
unrealized
gain (loss) | | Total from
investment
operations | | Net
realized
gain | |
| | | | | | | | | | | | | | | | | | | | | | | | | |
| Class R4 | | | | | | | | | | | | | | | | | | | | | | | | |
| 10/31/2023 | | | $26.46 | | | | $(0.15 | ) | | | $ 1.38 | | | | $ 1.23 | | | | $ – | | | | $27.69 | |
| 10/31/2022 | | | 52.72 | | | | (0.16 | ) | | | (16.10 | ) | | | (16.26 | ) | | | (10.00 | ) | | | 26.46 | |
| 10/31/2021 | | | 42.26 | | | | (0.28 | ) | | | 15.11 | | | | 14.83 | | | | (4.37 | ) | | | 52.72 | |
| 10/31/2020 | | | 28.62 | | | | (0.18 | ) | | | 16.16 | | | | 15.98 | | | | (2.34 | ) | | | 42.26 | |
| 10/31/2019 | | | 29.82 | | | | (0.13 | ) | | | 3.58 | | | | 3.45 | | | | (4.65 | ) | | | 28.62 | |
| Class R5 | | | | | | | | | | | | | | | | | | | | | | | | |
| 10/31/2023 | | | 27.68 | | | | (0.09 | ) | | | 1.45 | | | | 1.36 | | | | – | | | | 29.04 | |
| 10/31/2022 | | | 54.58 | | | | (0.08 | ) | | | (16.82 | ) | | | (16.90 | ) | | | (10.00 | ) | | | 27.68 | |
| 10/31/2021 | | | 43.51 | | | | (0.17 | ) | | | 15.61 | | | | 15.44 | | | | (4.37 | ) | | | 54.58 | |
| 10/31/2020 | | | 29.33 | | | | (0.10 | ) | | | 16.62 | | | | 16.52 | | | | (2.34 | ) | | | 43.51 | |
| 10/31/2019 | | | 30.38 | | | | (0.06 | ) | | | 3.66 | | | | 3.60 | | | | (4.65 | ) | | | 29.33 | |
| Class R6 | | | | | | | | | | | | | | | | | | | | | | | | |
| 10/31/2023 | | | 27.89 | | | | (0.07 | ) | | | 1.45 | | | | 1.38 | | | | – | | | | 29.27 | |
| 10/31/2022 | | | 54.88 | | | | (0.06 | ) | | | (16.93 | ) | | | (16.99 | ) | | | (10.00 | ) | | | 27.89 | |
| 10/31/2021 | | | 43.70 | | | | (0.15 | ) | | | 15.70 | | | | 15.55 | | | | (4.37 | ) | | | 54.88 | |
| 10/31/2020 | | | 29.43 | | | | (0.08 | ) | | | 16.69 | | | | 16.61 | | | | (2.34 | ) | | | 43.70 | |
| 10/31/2019 | | | 30.45 | | | | (0.05 | ) | | | 3.68 | | | | 3.63 | | | | (4.65 | ) | | | 29.43 | |
| (a) | Calculated using average shares outstanding during the period. |
| (b) | Total return for Classes A and C does not consider the effects of sales loads and assumes the reinvestment of all distributions. Total return for all other classes assumes the reinvestment of all distributions. |
| 156 | See Notes to Financial Statements. |
| | | Ratios to Average Net Assets: | | Supplemental Data: |
| | | | | | | | | | | |
Total
return(b)
(%) | | Total
expenses
after
waivers and/or
reimburse-
ments
(%) | | Total
expenses
(%) | | Net
investment
income
(loss)
(%) | | Net
assets,
end of
period
(000) | | Portfolio
turnover
rate
(%) |
| | | | | | | | | | | | | | | | | | | | | | | |
| | 4.65 | | | | 0.91 | | | | 0.91 | | | | (0.54 | ) | | | $ 9,595 | | | | 120 | |
| | (38.06 | ) | | | 0.91 | | | | 0.91 | | | | (0.49 | ) | | | 10,901 | | | | 146 | |
| | 37.79 | | | | 0.89 | | | | 0.89 | | | | (0.61 | ) | | | 18,549 | | | | 140 | |
| | 60.33 | | | | 0.90 | | | | 0.90 | | | | (0.55 | ) | | | 12,667 | | | | 93 | |
| | 15.35 | | | | 0.93 | | | | 0.93 | | | | (0.47 | ) | | | 6,543 | | | | 143 | |
| | | | | | | | | | | | | | | | | | | | | | | |
| | 4.88 | | | | 0.66 | | | | 0.66 | | | | (0.30 | ) | | | 9,206 | | | | 120 | |
| | (37.91 | ) | | | 0.66 | | | | 0.66 | | | | (0.24 | ) | | | 9,706 | | | | 146 | |
| | 38.13 | | | | 0.64 | | | | 0.64 | | | | (0.36 | ) | | | 19,722 | | | | 140 | |
| | 60.74 | | | | 0.65 | | | | 0.65 | | | | (0.29 | ) | | | 14,216 | | | | 93 | |
| | 15.61 | | | | 0.68 | | | | 0.68 | | | | (0.22 | ) | | | 9,344 | | | | 143 | |
| | | | | | | | | | | | | | | | | | | | | | | |
| | 4.95 | | | | 0.59 | | | | 0.59 | | | | (0.23 | ) | | | 113,990 | | | | 120 | |
| | (37.85 | ) | | | 0.59 | | | | 0.59 | | | | (0.17 | ) | | | 124,498 | | | | 146 | |
| | 38.23 | | | | 0.58 | | | | 0.58 | | | | (0.30 | ) | | | 181,524 | | | | 140 | |
| | 60.84 | | | | 0.60 | | | | 0.60 | | | | (0.24 | ) | | | 65,478 | | | | 93 | |
| | 15.68 | | | | 0.62 | | | | 0.62 | | | | (0.18 | ) | | | 36,932 | | | | 143 | |
| | See Notes to Financial Statements. | 157 |
Financial Highlights (continued)
HEALTH CARE FUND
| | | | | Per Share Operating Performance: |
| | | | | Investment Operations: | | Distributions to
shareholders from: |
| | | Net asset
value,
beginning
of period | | Net invest- ment income (loss)(a) | | Net
realized
and
unrealized
gain (loss) | | Total
from
invest-
ment
opera-
tions | | Net
investment
income | | Net
realized
gain | | Total
distri-
butions |
| Class A | | | | | | | | | | | | | | | | | | | | | | | | | | | | |
| 10/31/2023 | | | $17.07 | | | | $(0.07 | ) | | | $(1.61 | ) | | | $(1.68 | ) | | | $ – | | | | $ – | | | | $ – | |
| 10/31/2022 | | | 21.96 | | | | (0.05 | ) | | | (3.37 | ) | | | (3.42 | ) | | | – | | | | (1.47 | ) | | | (1.47 | ) |
| 10/31/2021 | | | 19.27 | | | | (0.10 | ) | | | 5.10 | | | | 5.00 | | | | – | | | | (2.31 | ) | | | (2.31 | ) |
| 10/31/2020 | | | 14.48 | | | | (0.06 | ) | | | 4.85 | | | | 4.79 | | | | – | | | | – | | | | – | |
| 7/26/2019 to 10/31/2019(c)(d) | | | 15.00 | | | | (0.01 | ) | | | (0.51 | ) | | | (0.52 | ) | | | – | | | | – | | | | – | |
| Class C | | | | | | | | | | | | | | | | | | | | | | | | | | | | |
| 10/31/2023 | | | 16.61 | | | | (0.20 | ) | | | (1.55 | ) | | | (1.75 | ) | | | – | | | | – | | | | – | |
| 10/31/2022 | | | 21.56 | | | | (0.17 | ) | | | (3.31 | ) | | | (3.48 | ) | | | – | | | | (1.47 | ) | | | (1.47 | ) |
| 10/31/2021 | | | 19.09 | | | | (0.25 | ) | | | 5.03 | | | | 4.78 | | | | – | | | | (2.31 | ) | | | (2.31 | ) |
| 10/31/2020 | | | 14.45 | | | | (0.19 | ) | | | 4.83 | | | | 4.64 | | | | – | | | | – | | | | – | |
| 7/26/2019 to 10/31/2019(c)(d) | | | 15.00 | | | | (0.04 | ) | | | (0.51 | ) | | | (0.55 | ) | | | – | | | | – | | | | – | |
| Class F | | | | | | | | | | | | | | | | | | | | | | | | | | | | |
| 10/31/2023 | | | 17.22 | | | | (0.03 | ) | | | (1.63 | ) | | | (1.66 | ) | | | – | | | | – | | | | – | |
| 10/31/2022 | | | 22.08 | | | | – | (g) | | | (3.39 | ) | | | (3.39 | ) | | | – | | | | (1.47 | ) | | | (1.47 | ) |
| 10/31/2021 | | | 19.32 | | | | (0.05 | ) | | | 5.12 | | | | 5.07 | | | | – | | | | (2.31 | ) | | | (2.31 | ) |
| 10/31/2020 | | | 14.49 | | | | – | (g) | | | 4.83 | | | | 4.83 | | | | – | (g) | | | – | | | | – | |
| 7/26/2019 to 10/31/2019(c)(d) | | | 15.00 | | | | (0.01 | ) | | | (0.50 | ) | | | (0.51 | ) | | | – | | | | – | | | | – | |
| Class F3 | | | | | | | | | | | | | | | | | | | | | | | | | | | | |
| 10/31/2023 | | | 17.23 | | | | – | (g) | | | (1.62 | ) | | | (1.62 | ) | | | (0.05 | ) | | | – | | | | (0.05 | ) |
| 10/31/2022 | | | 22.07 | | | | 0.02 | | | | (3.39 | ) | | | (3.37 | ) | | | – | | | | (1.47 | ) | | | (1.47 | ) |
| 10/31/2021 | | | 19.33 | | | | (0.04 | ) | | | 5.11 | | | | 5.07 | | | | (0.02 | ) | | | (2.31 | ) | | | (2.33 | ) |
| 10/31/2020 | | | 14.49 | | | | 0.02 | | | | 4.83 | | | | 4.85 | | | | (0.01 | ) | | | – | | | | (0.01 | ) |
| 7/26/2019 to 10/31/2019(c)(d) | | | 15.00 | | | | – | (g) | | | (0.51 | ) | | | (0.51 | ) | | | – | | | | – | | | | – | |
| Class I | | | | | | | | | | | | | | | | | | | | | | | | | | | | |
| 10/31/2023 | | | 17.21 | | | | (0.03 | ) | | | (1.63 | ) | | | (1.66 | ) | | | (0.02 | ) | | | – | | | | (0.02 | ) |
| 10/31/2022 | | | 22.07 | | | | – | (g) | | | (3.39 | ) | | | (3.39 | ) | | | – | | | | (1.47 | ) | | | (1.47 | ) |
| 10/31/2021 | | | 19.32 | | | | (0.05 | ) | | | 5.11 | | | | 5.06 | | | | – | | | | (2.31 | ) | | | (2.31 | ) |
| 10/31/2020 | | | 14.49 | | | | – | (g) | | | 4.84 | | | | 4.84 | | | | (0.01 | ) | | | – | | | | (0.01 | ) |
| 7/26/2019 to 10/31/2019(c)(d) | | | 15.00 | | | | (0.01 | ) | | | (0.50 | ) | | | (0.51 | ) | | | – | | | | – | | | | – | |
| Class R3 | | | | | | | | | | | | | | | | | | | | | | | | | | | | |
| 10/31/2023 | | | 16.91 | | | | (0.11 | ) | | | (1.59 | ) | | | (1.70 | ) | | | – | | | | – | | | | – | |
| 10/31/2022 | | | 21.82 | | | | (0.09 | ) | | | (3.35 | ) | | | (3.44 | ) | | | – | | | | (1.47 | ) | | | (1.47 | ) |
| 10/31/2021 | | | 19.21 | | | | (0.15 | ) | | | 5.07 | | | | 4.92 | | | | – | | | | (2.31 | ) | | | (2.31 | ) |
| 10/31/2020 | | | 14.47 | | | | (0.10 | ) | | | 4.84 | | | | 4.74 | | | | – | | | | – | | | | – | |
| 7/26/2019 to 10/31/2019(c)(d) | | | 15.00 | | | | (0.02 | ) | | | (0.51 | ) | | | (0.53 | ) | | | – | | | | – | | | | – | |
| 158 | See Notes to Financial Statements. |
| | | | | Ratios to Average Net Assets: | | Supplemental Data: |
| | | | | | | | | | | | | |
Net
asset
value,
end of
period | | Total
return(b)
(%) | | Total
expenses
after
waivers
and/or reim-
bursements
(%) | | Total
expenses
(%) | | Net
invest-
ment
income
(loss)
(%) | | Net
assets,
end of
period
(000) | | Portfolio
turnover
rate
(%) |
| | | | | | | | | | | | | | | | | | | | | | | | | | | |
| | $15.39 | | | | (9.78 | ) | | | 1.03 | | | | 3.53 | | | | (0.42 | ) | | $ | 3,853 | | | | 74 | |
| | 17.07 | | | | (16.29 | ) | | | 1.03 | | | | 4.11 | | | | (0.26 | ) | | | 3,177 | | | | 49 | |
| | 21.96 | | | | 28.56 | | | | 1.03 | | | | 3.90 | | | | (0.50 | ) | | | 3,507 | | | | 59 | |
| | 19.27 | | | | 33.08 | | | | 1.03 | | | | 6.30 | | | | (0.34 | ) | | | 2,022 | | | | 114 | |
| | | | | | | | | | | | | | | | | | | | | | | | | | | |
| | 14.48 | | | | (3.47 | )(e) | | | 1.03 | (f) | | | 9.00 | (f) | | | (0.36 | )(f) | | | 906 | | | | 16 | (e) |
| | | | | | | | | | | | | | | | | | | | | | | | | | | |
| | 14.86 | | | | (10.48 | ) | | | 1.78 | | | | 4.26 | | | | (1.19 | ) | | | 930 | | | | 74 | |
| | 16.61 | | | | (16.91 | ) | | | 1.78 | | | | 4.85 | | | | (1.02 | ) | | | 607 | | | | 49 | |
| | 21.56 | | | | 27.57 | | | | 1.78 | | | | 4.62 | | | | (1.25 | ) | | | 786 | | | | 59 | |
| | 19.09 | | | | 32.11 | | | | 1.78 | | | | 7.05 | | | | (1.11 | ) | | | 328 | | | | 114 | |
| | | | | | | | | | | | | | | | | | | | | | | | | | | |
| | 14.45 | | | | (3.67 | )(e) | | | 1.78 | (f) | | | 9.84 | (f) | | | (1.17 | )(f) | | | 129 | | | | 16 | (e) |
| | | | | | | | | | | | | | | | | | | | | | | | | | | |
| | 15.56 | | | | (9.58 | ) | | | 0.78 | | | | 3.41 | | | | (0.15 | ) | | | 173 | | | | 74 | |
| | 17.22 | | | | (16.05 | ) | | | 0.78 | | | | 3.97 | | | | 0.01 | | | | 373 | | | | 49 | |
| | 22.08 | | | | 28.88 | | | | 0.78 | | | | 3.63 | | | | (0.23 | ) | | | 587 | | | | 59 | |
| | 19.32 | | | | 33.34 | | | | 0.78 | | | | 5.73 | | | | – | (h) | | | 109 | | | | 114 | |
| | | | | | | | | | | | | | | | | | | | | | | | | | | |
| | 14.49 | | | | (3.40 | )(e) | | | 0.78 | (f) | | | 8.95 | (f) | | | (0.16 | )(f) | | | 483 | | | | 16 | (e) |
| | | | | | | | | | | | | | | | | | | | | | | | | | | |
| | 15.56 | | | | (9.45 | ) | | | 0.62 | | | | 3.11 | | | | (0.01 | ) | | | 28 | | | | 74 | |
| | 17.23 | | | | (15.96 | ) | | | 0.68 | | | | 3.69 | | | | 0.09 | | | | 31 | | | | 49 | |
| | 22.07 | | | | 28.91 | | | | 0.71 | | | | 3.55 | | | | (0.18 | ) | | | 40 | | | | 59 | |
| | 19.33 | | | | 33.49 | | | | 0.70 | | | | 5.37 | | | | 0.11 | | | | 35 | | | | 114 | |
| | | | | | | | | | | | | | | | | | | | | | | | | | | |
| | 14.49 | | | | (3.40 | )(e) | | | 0.70 | (f) | | | 8.72 | (f) | | | (0.08 | )(f) | | | 483 | | | | 16 | (e) |
| | | | | | | | | | | | | | | | | | | | | | | | | | | |
| | 15.53 | | | | (9.58 | ) | | | 0.78 | | | | 3.26 | | | | (0.18 | ) | | | 49 | | | | 74 | |
| | 17.21 | | | | (16.06 | ) | | | 0.78 | | | | 3.85 | | | | (0.03 | ) | | | 15 | | | | 49 | |
| | 22.07 | | | | 28.82 | | | | 0.78 | | | | 3.66 | | | | (0.25 | ) | | | 20 | | | | 59 | |
| | 19.32 | | | | 33.40 | | | | 0.78 | | | | 5.53 | | | | 0.02 | | | | 17 | | | | 114 | |
| | | | | | | | | | | | | | | | | | | | | | | | | | | |
| | 14.49 | | | | (3.40 | )(e) | | | 0.78 | (f) | | | 8.85 | (f) | | | (0.16 | )(f) | | | 106 | | | | 16 | (e) |
| | | | | | | | | | | | | | | | | | | | | | | | | | | |
| | 15.21 | | | | (9.99 | ) | | | 1.28 | | | | 3.75 | | | | (0.65 | ) | | | 24 | | | | 74 | |
| | 16.91 | | | | (16.50 | ) | | | 1.28 | | | | 4.35 | | | | (0.52 | ) | | | 11 | | | | 49 | |
| | 21.82 | | | | 28.19 | | | | 1.28 | | | | 4.17 | | | | (0.75 | ) | | | 15 | | | | 59 | |
| | 19.21 | | | | 32.76 | | | | 1.28 | | | | 6.53 | | | | (0.57 | ) | | | 13 | | | | 114 | |
| | | | | | | | | | | | | | | | | | | | | | | | | | | |
| | 14.47 | | | | (3.53 | )(e) | | | 1.28 | (f) | | | 9.36 | (f) | | | (0.64 | )(f) | | | 10 | | | | 16 | (e) |
| | See Notes to Financial Statements. | 159 |
Financial Highlights (continued)
HEALTH CARE FUND
| | | | | Per Share Operating Performance: |
| | | | | Investment Operations: | | Distributions to
shareholders from: |
| | | Net asset
value,
beginning
of period | | Net
invest-
ment
income
(loss)(a) | | Net
realized
and
unrealized
gain (loss) | | Total
from
invest-
ment
opera-
tions | | Net
investment
income | | Net
realized
gain | | Total
distri-
butions |
| Class R4 | | | | | | | | | | | | | | | | | | | | | | | | | | | | |
| 10/31/2023 | | $ | 17.07 | | | $ | (0.07 | ) | | $ | (1.61 | ) | | $ | (1.68 | ) | | $ | – | | | $ | – | | | $ | – | |
| 10/31/2022 | | | 21.95 | | | | (0.04 | ) | | | (3.37 | ) | | | (3.41 | ) | | | – | | | | (1.47 | ) | | | (1.47 | ) |
| 10/31/2021 | | | 19.27 | | | | (0.10 | ) | | | 5.09 | | | | 4.99 | | | | – | | | | (2.31 | ) | | | (2.31 | ) |
| 10/31/2020 | | | 14.48 | | | | (0.05 | ) | | | 4.84 | | | | 4.79 | | | | – | | | | – | | | | – | |
| 7/26/2019 to 10/31/2019(c)(d) | | | 15.00 | | | | (0.01 | ) | | | (0.51 | ) | | | (0.52 | ) | | | – | | | | – | | | | – | |
| Class R5 | | | | | | | | | | | | | | | | | | | | | | | | | | | | |
| 10/31/2023 | | | 17.21 | | | | (0.03 | ) | | | (1.63 | ) | | | (1.66 | ) | | | (0.02 | ) | | | – | | | | (0.02 | ) |
| 10/31/2022 | | | 22.07 | | | | – | (g) | | | (3.39 | ) | | | (3.39 | ) | | | – | | | | (1.47 | ) | | | (1.47 | ) |
| 10/31/2021 | | | 19.32 | | | | (0.05 | ) | | | 5.12 | | | | 5.07 | | | | (0.01 | ) | | | (2.31 | ) | | | (2.32 | ) |
| 10/31/2020 | | | 14.49 | | | | (0.01 | ) | | | 4.85 | | | | 4.84 | | | | (0.01 | ) | | | – | | | | (0.01 | ) |
| 7/26/2019 to 10/31/2019(c)(d) | | | 15.00 | | | | (0.01 | ) | | | (0.50 | ) | | | (0.51 | ) | | | – | | | | – | | | | – | |
| Class R6 | | | | | | | | | | | | | | | | | | | | | | | | | | | | |
| 10/31/2023 | | | 17.24 | | | | – | (g) | | | (1.63 | ) | | | (1.63 | ) | | | (0.05 | ) | | | – | | | | (0.05 | ) |
| 10/31/2022 | | | 22.08 | | | | 0.01 | | | | (3.38 | ) | | | (3.37 | ) | | | – | | | | (1.47 | ) | | | (1.47 | ) |
| 10/31/2021 | | | 19.34 | | | | (0.04 | ) | | | 5.11 | | | | 5.07 | | | | (0.02 | ) | | | (2.31 | ) | | | (2.33 | ) |
| 10/31/2020 | | | 14.49 | | | | 0.01 | | | | 4.85 | | | | 4.86 | | | | (0.01 | ) | | | – | | | | (0.01 | ) |
| 7/26/2019 to 10/31/2019(c)(d) | | | 15.00 | | | | – | (g) | | | (0.51 | ) | | | (0.51 | ) | | | – | | | | – | | | | – | |
| (a) | Calculated using average shares outstanding during the period. |
| (b) | Total return for Classes A and C does not consider the effects of sales loads and assumes the reinvestment of all distributions. Total return for all other classes assumes the reinvestment of all distributions. |
| (c) | Commencement of operations was 7/26/2019, SEC effective date was 7/31/2019 and date shares first became available to the public was 8/1/2019. |
| (d) | Net investment income, net realized and unrealized gain amounted to less than $.01 for the period 7/26/2019 through 7/31/2019. |
| (e) | Not annualized. |
| (f) | Annualized. |
| (g) | Amount is less than $0.01. |
| (h) | Amount is less than 0.01%. |
| 160 | See Notes to Financial Statements. |
| | | | | Ratios to Average Net Assets: | | Supplemental Data: |
| | | | | | | | | | | | | |
Net
asset
value,
end of
period | | Total
return(b)
(%) | | Total
expenses
after
waivers
and/or reim-
bursements
(%) | | Total
expenses
(%) | | Net
invest-
ment
income
(loss)
(%) | | Net
assets,
end of
period
(000) | | Portfolio
turnover
rate
(%) |
| | | | | | | | | | | | | | | | | | | | | | | | | | | |
| $ | 15.39 | | | | (9.84 | ) | | | 1.03 | | | | 3.53 | | | | (0.41 | ) | | $ | 10 | | | | 74 | |
| | 17.07 | | | | (16.25 | ) | | | 1.03 | | | | 4.10 | | | | (0.26 | ) | | | 11 | | | | 49 | |
| | 21.95 | | | | 28.50 | | | | 1.03 | | | | 3.92 | | | | (0.50 | ) | | | 15 | | | | 59 | |
| | 19.27 | | | | 33.08 | | | | 1.03 | | | | 6.27 | | | | (0.31 | ) | | | 13 | | | | 114 | |
| | | | | | | | | | | | | | | | | | | | | | | | | | | |
| | 14.48 | | | | (3.47 | )(e) | | | 1.03 | (f) | | | 9.12 | (f) | | | (0.40 | )(f) | | | 10 | | | | 16 | (e) |
| | | | | | | | | | | | | | | | | | | | | | | | | | | |
| | 15.53 | | | | (9.58 | ) | | | 0.78 | | | | 3.28 | | | | (0.15 | ) | | | 10 | | | | 74 | |
| | 17.21 | | | | (16.06 | ) | | | 0.78 | | | | 3.84 | | | | (0.01 | ) | | | 11 | | | | 49 | |
| | 22.07 | | | | 28.86 | | | | 0.78 | | | | 3.67 | | | | (0.24 | ) | | | 15 | | | | 59 | |
| | 19.32 | | | | 33.39 | | | | 0.78 | | | | 6.02 | | | | (0.06 | ) | | | 13 | | | | 114 | |
| | | | | | | | | | | | | | | | | | | | | | | | | | | |
| | 14.49 | | | | (3.40 | )(e) | | | 0.78 | (f) | | | 8.83 | (f) | | | (0.16 | )(f) | | | 10 | | | | 16 | (e) |
| | | | | | | | | | | | | | | | | | | | | | | | | | | |
| | 15.56 | | | | (9.44 | ) | | | 0.62 | | | | 3.11 | | | | (0.01 | ) | | | 1,885 | | | | 74 | |
| | 17.24 | | | | (15.95 | ) | | | 0.68 | | | | 3.68 | | | | 0.08 | | | | 2,198 | | | | 49 | |
| | 22.08 | | | | 28.89 | | | | 0.70 | | | | 3.48 | | | | (0.17 | ) | | | 2,851 | | | | 59 | |
| | 19.34 | | | | 33.56 | | | | 0.70 | | | | 5.83 | | | | 0.07 | | | | 1,188 | | | | 114 | |
| | | | | | | | | | | | | | | | | | | | | | | | | | | |
| | 14.49 | | | | (3.40 | )(e) | | | 0.70 | (f) | | | 8.72 | (f) | | | (0.08 | )(f) | | | 484 | | | | 16 | (e) |
| | See Notes to Financial Statements. | 161 |
Financial Highlights (continued)
INTERNATIONAL EQUITY FUND
| | | | | Per Share Operating Performance: |
| | | | | Investment Operations: | | Distributions to
shareholders from: |
| | | Net asset
value,
beginning
of period | | Net
invest-
ment
income
(loss)(a) | | Net
realized
and
unrealized
gain (loss) | | Total
from
invest-
ment
opera-
tions | | Net
investment
income | | Net
realized
gain | | Total
distri-
butions |
| Class A | | | | | | | | | | | | | | | | | | | | | | | | | | | | |
| 10/31/2023 | | $ | 11.61 | | | $ | 0.22 | | | $ | 0.79 | | | $ | 1.01 | | | $ | (0.25 | ) | | $ | – | | | $ | (0.25 | ) |
| 10/31/2022 | | | 17.67 | | | | 0.26 | | | | (4.35 | ) | | | (4.09 | ) | | | (0.22 | ) | | | (1.75 | ) | | | (1.97 | ) |
| 10/31/2021 | | | 13.41 | | | | 0.17 | | | | 4.27 | | | | 4.44 | | | | (0.18 | ) | | | – | | | | (0.18 | ) |
| 10/31/2020 | | | 13.19 | | | | 0.12 | | | | 0.30 | | | | 0.42 | | | | (0.20 | ) | | | – | | | | (0.20 | ) |
| 10/31/2019 | | | 12.18 | | | | 0.18 | | | | 1.08 | | | | 1.26 | | | | (0.25 | ) | | | – | | | | (0.25 | ) |
| Class C | | | | | | | | | | | | | | | | | | | | | | | | | | | | |
| 10/31/2023 | | | 11.53 | | | | 0.08 | | | | 0.83 | | | | 0.91 | | | | (0.13 | ) | | | – | | | | (0.13 | ) |
| 10/31/2022 | | | 17.54 | | | | 0.15 | | | | (4.34 | ) | | | (4.19 | ) | | | (0.07 | ) | | | (1.75 | ) | | | (1.82 | ) |
| 10/31/2021 | | | 13.31 | | | | 0.05 | | | | 4.22 | | | | 4.27 | | | | (0.04 | ) | | | – | | | | (0.04 | ) |
| 10/31/2020 | | | 13.08 | | | | 0.02 | | | | 0.30 | | | | 0.32 | | | | (0.09 | ) | | | – | | | | (0.09 | ) |
| 10/31/2019 | | | 12.02 | | | | 0.08 | | | | 1.08 | | | | 1.16 | | | | (0.10 | ) | | | – | | | | (0.10 | ) |
| Class F | | | | | | | | | | | | | | | | | | | | | | | | | | | | |
| 10/31/2023 | | | 11.57 | | | | 0.22 | | | | 0.81 | | | | 1.03 | | | | (0.27 | ) | | | – | | | | (0.27 | ) |
| 10/31/2022 | | | 17.61 | | | | 0.25 | | | | (4.29 | ) | | | (4.04 | ) | | | (0.25 | ) | | | (1.75 | ) | | | (2.00 | ) |
| 10/31/2021 | | | 13.36 | | | | 0.22 | | | | 4.22 | | | | 4.44 | | | | (0.19 | ) | | | – | | | | (0.19 | ) |
| 10/31/2020 | | | 13.13 | | | | 0.10 | | | | 0.35 | | | | 0.45 | | | | (0.22 | ) | | | – | | | | (0.22 | ) |
| 10/31/2019 | | | 12.12 | | | | 0.20 | | | | 1.08 | | | | 1.28 | | | | (0.27 | ) | | | – | | | | (0.27 | ) |
| Class F3 | | | | | | | | | | | | | | | | | | | | | | | | | | | | |
| 10/31/2023 | | | 11.80 | | | | 0.28 | | | | 0.79 | | | | 1.07 | | | | (0.29 | ) | | | – | | | | (0.29 | ) |
| 10/31/2022 | | | 17.92 | | | | 0.33 | | | | (4.44 | ) | | | (4.11 | ) | | | (0.26 | ) | | | (1.75 | ) | | | (2.01 | ) |
| 10/31/2021 | | | 13.59 | | | | 0.23 | | | | 4.32 | | | | 4.55 | | | | (0.22 | ) | | | – | | | | (0.22 | ) |
| 10/31/2020 | | | 13.36 | | | | 0.16 | | | | 0.30 | | | | 0.46 | | | | (0.23 | ) | | | – | | | | (0.23 | ) |
| 10/31/2019 | | | 12.32 | | | | 0.22 | | | | 1.11 | | | | 1.33 | | | | (0.29 | ) | | | – | | | | (0.29 | ) |
| Class I | | | | | | | | | | | | | | | | | | | | | | | | | | | | |
| 10/31/2023 | | | 11.77 | | | | 0.26 | | | | 0.80 | | | | 1.06 | | | | (0.29 | ) | | | – | | | | (0.29 | ) |
| 10/31/2022 | | | 17.88 | | | | 0.31 | | | | (4.41 | ) | | | (4.10 | ) | | | (0.26 | ) | | | (1.75 | ) | | | (2.01 | ) |
| 10/31/2021 | | | 13.56 | | | | 0.21 | | | | 4.32 | | | | 4.53 | | | | (0.21 | ) | | | – | | | | (0.21 | ) |
| 10/31/2020 | | | 13.33 | | | | 0.16 | | | | 0.30 | | | | 0.46 | | | | (0.23 | ) | | | – | | | | (0.23 | ) |
| 10/31/2019 | | | 12.30 | | | | 0.23 | | | | 1.08 | | | | 1.31 | | | | (0.28 | ) | | | – | | | | (0.28 | ) |
| Class P | | | | | | | | | | | | | | | | | | | | | | | | | | | | |
| 10/31/2023 | | | 11.63 | | | | 0.19 | | | | 0.81 | | | | 1.00 | | | | (0.23 | ) | | | – | | | | (0.23 | ) |
| 10/31/2022 | | | 17.69 | | | | 0.24 | | | | (4.37 | ) | | | (4.13 | ) | | | (0.18 | ) | | | (1.75 | ) | | | (1.93 | ) |
| 10/31/2021 | | | 13.42 | | | | 0.09 | | | | 4.31 | | | | 4.40 | | | | (0.13 | ) | | | – | | | | (0.13 | ) |
| 10/31/2020 | | | 13.20 | | | | 0.09 | | | | 0.30 | | | | 0.39 | | | | (0.17 | ) | | | – | | | | (0.17 | ) |
| 10/31/2019 | | | 12.17 | | | | 0.16 | | | | 1.09 | | | | 1.25 | | | | (0.22 | ) | | | – | | | | (0.22 | ) |
| Class R2 | | | | | | | | | | | | | | | | | | | | | | | | | | | | |
| 10/31/2023 | | | 11.62 | | | | 0.17 | | | | 0.79 | | | | 0.96 | | | | (0.21 | ) | | | – | | | | (0.21 | ) |
| 10/31/2022 | | | 17.67 | | | | 0.22 | | | | (4.37 | ) | | | (4.15 | ) | | | (0.15 | ) | | | (1.75 | ) | | | (1.90 | ) |
| 10/31/2021 | | | 13.39 | | | | 0.12 | | | | 4.25 | | | | 4.37 | | | | (0.09 | ) | | | – | | | | (0.09 | ) |
| 10/31/2020 | | | 13.17 | | | | 0.06 | | | | 0.32 | | | | 0.38 | | | | (0.16 | ) | | | – | | | | (0.16 | ) |
| 10/31/2019 | | | 12.13 | | | | 0.14 | | | | 1.08 | | | | 1.22 | | | | (0.18 | ) | | | – | | | | (0.18 | ) |
| 162 | See Notes to Financial Statements. |
| | | | | Ratios to Average Net Assets: | | Supplemental Data: |
| | | | | | | | | | | | | |
Net
asset
value,
end of
period | | Total
return(b)
(%) | | Total
expenses
after
waivers
and/or reim-
bursements
(%) | | Total
expenses
(%) | | Net
invest-
ment
income
(loss)
(%) | | Net
assets,
end of
period
(000) | | Portfolio
turnover
rate
(%) |
| | | | | | | | | | | | | | | | | | | | | | | | | | | |
| $ | 12.37 | | | | 8.72 | | | | 0.95 | | | | 0.99 | | | | 1.65 | | | $ | 132,735 | | | | 106 | |
| | 11.61 | | | | (25.75 | ) | | | 1.17 | | | | 1.22 | | | | 1.89 | | | | 131,097 | | | | 87 | |
| | 17.67 | | | | 33.15 | | | | 1.17 | | | | 1.19 | | | | 1.04 | | | | 193,680 | | | | 58 | |
| | 13.41 | | | | 3.23 | | | | 1.17 | | | | 1.21 | | | | 0.90 | | | | 154,161 | | | | 77 | |
| | 13.19 | | | | 10.64 | | | | 1.17 | | | | 1.17 | | | | 1.43 | | | | 178,701 | | | | 88 | |
| | | | | | | | | | | | | | | | | | | | | | | | | | | |
| | 12.31 | | | | 7.82 | | | | 1.72 | | | | 1.76 | | | | 0.63 | | | | 1,414 | | | | 106 | |
| | 11.53 | | | | (26.26 | ) | | | 1.92 | | | | 1.97 | | | | 1.09 | | | | 4,161 | | | | 87 | |
| | 17.54 | | | | 32.20 | | | | 1.92 | | | | 1.94 | | | | 0.28 | | | | 7,622 | | | | 58 | |
| | 13.31 | | | | 2.27 | | | | 1.92 | | | | 2.00 | | | | 0.17 | | | | 6,676 | | | | 77 | |
| | 13.08 | | | | 9.88 | | | | 1.92 | | | | 1.92 | | | | 0.68 | | | | 10,652 | | | | 88 | |
| | | | | | | | | | | | | | | | | | | | | | | | | | | |
| | 12.33 | | | | 8.89 | | | | 0.80 | | | | 0.84 | | | | 1.68 | | | | 3,894 | | | | 106 | |
| | 11.57 | | | | (25.57 | ) | | | 0.96 | | | | 1.06 | | | | 1.76 | | | | 7,986 | | | | 87 | |
| | 17.61 | | | | 33.43 | | | | 0.96 | | | | 1.04 | | | | 1.30 | | | | 24,909 | | | | 58 | |
| | 13.36 | | | | 3.39 | | | | 0.96 | | | | 1.03 | | | | 0.77 | | | | 10,435 | | | | 77 | |
| | 13.13 | | | | 10.90 | | | | 0.96 | | | | 1.02 | | | | 1.64 | | | | 48,782 | | | | 88 | |
| | | | | | | | | | | | | | | | | | | | | | | | | | | |
| | 12.58 | | | | 9.07 | | | | 0.61 | | | | 0.65 | | | | 2.08 | | | | 11,841 | | | | 106 | |
| | 11.80 | | | | (25.50 | ) | | | 0.84 | | | | 0.89 | | | | 2.39 | | | | 5,987 | | | | 87 | |
| | 17.92 | | | | 33.57 | | | | 0.84 | | | | 0.86 | | | | 1.38 | | | | 5,928 | | | | 58 | |
| | 13.59 | | | | 3.53 | | | | 0.84 | | | | 0.86 | | | | 1.23 | | | | 4,489 | | | | 77 | |
| | 13.36 | | | | 11.13 | | | | 0.84 | | | | 0.85 | | | | 1.76 | | | | 4,527 | | | | 88 | |
| | | | | | | | | | | | | | | | | | | | | | | | | | | |
| | 12.54 | | | | 8.98 | | | | 0.69 | | | | 0.73 | | | | 1.94 | | | | 136,201 | | | | 106 | |
| | 11.77 | | | | (25.51 | ) | | | 0.86 | | | | 0.97 | | | | 2.23 | | | | 121,926 | | | | 87 | |
| | 17.88 | | | | 33.55 | | | | 0.86 | | | | 0.94 | | | | 1.24 | | | | 170,044 | | | | 58 | |
| | 13.56 | | | | 3.52 | | | | 0.86 | | | | 0.94 | | | | 1.20 | | | | 179,796 | | | | 77 | |
| | 13.33 | | | | 11.04 | | | | 0.86 | | | | 0.92 | | | | 1.82 | | | | 198,368 | | | | 88 | |
| | | | | | | | | | | | | | | | | | | | | | | | | | | |
| | 12.40 | | | | 8.57 | | | | 1.14 | | | | 1.18 | | | | 1.44 | | | | 10 | | | | 106 | |
| | 11.63 | | | | (25.89 | ) | | | 1.37 | | | | 1.39 | | | | 1.71 | | | | 9 | | | | 87 | |
| | 17.69 | | | | 32.90 | | | | 1.37 | | | | 1.39 | | | | 0.53 | | | | 13 | | | | 58 | |
| | 13.42 | | | | 2.96 | | | | 1.37 | | | | 1.40 | | | | 0.72 | | | | 38 | | | | 77 | |
| | 13.20 | | | | 10.50 | | | | 1.37 | | | | 1.37 | | | | 1.25 | | | | 42 | | | | 88 | |
| | | | | | | | | | | | | | | | | | | | | | | | | | | |
| | 12.37 | | | | 8.27 | | | | 1.30 | | | | 1.34 | | | | 1.30 | | | | 169 | | | | 106 | |
| | 11.62 | | | | (25.98 | ) | | | 1.52 | | | | 1.58 | | | | 1.60 | | | | 143 | | | | 87 | |
| | 17.67 | | | | 32.70 | | | | 1.52 | | | | 1.54 | | | | 0.70 | | | | 178 | | | | 58 | |
| | 13.39 | | | | 2.86 | | | | 1.52 | | | | 1.54 | | | | 0.46 | | | | 137 | | | | 77 | |
| | 13.17 | | | | 10.32 | | | | 1.52 | | | | 1.52 | | | | 1.09 | | | | 451 | | | | 88 | |
| | See Notes to Financial Statements. | 163 |
Financial Highlights (continued)
INTERNATIONAL EQUITY FUND
| | | | | Per Share Operating Performance: |
| | | | | Investment Operations: | | Distributions to
shareholders from: |
| | | Net asset
value,
beginning
of period | | Net
invest-
ment
income
(loss)(a) | | Net
realized
and
unrealized
gain (loss) | | Total
from
invest-
ment
opera-
tions | | Net
investment
income | | Net
realized
gain | | Total
distri-
butions |
| Class R3 | | | | | | | | | | | | | | | | | | | | | | | | | | | | |
| 10/31/2023 | | $ | 11.40 | | | $ | 0.19 | | | $ | 0.78 | | | $ | 0.97 | | | $ | (0.22 | ) | | $ | – | | | $ | (0.22 | ) |
| 10/31/2022 | | | 17.38 | | | | 0.22 | | | | (4.28 | ) | | | (4.06 | ) | | | (0.17 | ) | | | (1.75 | ) | | | (1.92 | ) |
| 10/31/2021 | | | 13.20 | | | | 0.13 | | | | 4.18 | | | | 4.31 | | | | (0.13 | ) | | | – | | | | (0.13 | ) |
| 10/31/2020 | | | 12.98 | | | | 0.08 | | | | 0.30 | | | | 0.38 | | | | (0.16 | ) | | | – | | | | (0.16 | ) |
| 10/31/2019 | | | 11.98 | | | | 0.15 | | | | 1.06 | | | | 1.21 | | | | (0.21 | ) | | | – | | | | (0.21 | ) |
| Class R4 | | | | | | | | | | | | | | | | | | | | | | | | | | | | |
| 10/31/2023 | | | 11.55 | | | | 0.22 | | | | 0.79 | | | | 1.01 | | | | (0.26 | ) | | | – | | | | (0.26 | ) |
| 10/31/2022 | | | 17.58 | | | | 0.26 | | | | (4.33 | ) | | | (4.07 | ) | | | (0.21 | ) | | | (1.75 | ) | | | (1.96 | ) |
| 10/31/2021 | | | 13.35 | | | | 0.18 | | | | 4.23 | | | | 4.41 | | | | (0.18 | ) | | | – | | | | (0.18 | ) |
| 10/31/2020 | | | 13.14 | | | | 0.11 | | | | 0.30 | | | | 0.41 | | | | (0.20 | ) | | | – | | | | (0.20 | ) |
| 10/31/2019 | | | 12.13 | | | | 0.18 | | | | 1.09 | | | | 1.27 | | | | (0.26 | ) | | | – | | | | (0.26 | ) |
| Class R5 | | | | | | | | | | | | | | | | | | | | | | | | | | | | |
| 10/31/2023 | | | 11.69 | | | | 0.25 | | | | 0.80 | | | | 1.05 | | | | (0.29 | ) | | | – | | | | (0.29 | ) |
| 10/31/2022 | | | 17.78 | | | | 0.21 | | | | (4.29 | ) | | | (4.08 | ) | | | (0.26 | ) | | | (1.75 | ) | | | (2.01 | ) |
| 10/31/2021 | | | 13.50 | | | | 0.22 | | | | 4.27 | | | | 4.49 | | | | (0.21 | ) | | | – | | | | (0.21 | ) |
| 10/31/2020 | | | 13.27 | | | | 0.15 | | | | 0.31 | | | | 0.46 | | | | (0.23 | ) | | | – | | | | (0.23 | ) |
| 10/31/2019 | | | 12.26 | | | | 0.21 | | | | 1.08 | | | | 1.29 | | | | (0.28 | ) | | | – | | | | (0.28 | ) |
| Class R6 | | | | | | | | | | | | | | | | | | | | | | | | | | | | |
| 10/31/2023 | | | 11.79 | | | | 0.26 | | | | 0.81 | | | | 1.07 | | | | (0.29 | ) | | | – | | | | (0.29 | ) |
| 10/31/2022 | | | 17.91 | | | | 0.31 | | | | (4.42 | ) | | | (4.11 | ) | | | (0.26 | ) | | | (1.75 | ) | | | (2.01 | ) |
| 10/31/2021 | | | 13.58 | | | | 0.23 | | | | 4.32 | | | | 4.55 | | | | (0.22 | ) | | | – | | | | (0.22 | ) |
| 10/31/2020 | | | 13.35 | | | | 0.16 | | | | 0.30 | | | | 0.46 | | | | (0.23 | ) | | | – | | | | (0.23 | ) |
| 10/31/2019 | | | 12.32 | | | | 0.22 | | | | 1.10 | | | | 1.32 | | | | (0.29 | ) | | | – | | | | (0.29 | ) |
| (a) | Calculated using average shares outstanding during the period. |
| (b) | Total return for Classes A and C does not consider the effects of sales loads and assumes the reinvestment of all distributions. Total return for all other classes assumes the reinvestment of all distributions. |
| 164 | See Notes to Financial Statements. |
| | | | | Ratios to Average Net Assets: | | Supplemental Data: |
| | | | | | | | | | | | | |
Net
asset
value,
end of
period | | Total
return(b)
(%) | | Total
expenses
after
waivers
and/or reim-
bursements
(%) | | Total
expenses
(%) | | Net
invest-
ment
income
(loss)
(%) | | Net
assets,
end of
period
(000) | | Portfolio
turnover
rate
(%) |
| | | | | | | | | | | | | | | | | | | | | | | | | | | |
| $ | 12.15 | | | | 8.42 | | | | 1.19 | | | | 1.23 | | | | 1.44 | | | $ | 4,530 | | | | 106 | |
| | 11.40 | | | | (25.88 | ) | | | 1.42 | | | | 1.47 | | | | 1.63 | | | | 4,203 | | | | 87 | |
| | 17.38 | | | | 32.81 | | | | 1.42 | | | | 1.44 | | | | 0.80 | | | | 6,114 | | | | 58 | |
| | 13.20 | | | | 2.92 | | | | 1.42 | | | | 1.46 | | | | 0.67 | | | | 5,354 | | | | 77 | |
| | 12.98 | | | | 10.39 | | | | 1.42 | | | | 1.42 | | | | 1.21 | | | | 7,208 | | | | 88 | |
| | | | | | | | | | | | | | | | | | | | | | | | | | | |
| | 12.30 | | | | 8.70 | | | | 0.95 | | | | 0.99 | | | | 1.68 | | | | 1,359 | | | | 106 | |
| | 11.55 | | | | (25.71 | ) | | | 1.17 | | | | 1.23 | | | | 1.93 | | | | 1,306 | | | | 87 | |
| | 17.58 | | | | 33.11 | | | | 1.17 | | | | 1.19 | | | | 1.06 | | | | 1,685 | | | | 58 | |
| | 13.35 | | | | 3.17 | | | | 1.17 | | | | 1.20 | | | | 0.90 | | | | 1,165 | | | | 77 | |
| | 13.14 | | | | 10.77 | | | | 1.17 | | | | 1.17 | | | | 1.46 | | | | 1,180 | | | | 88 | |
| | | | | | | | | | | | | | | | | | | | | | | | | | | |
| | 12.45 | | | | 8.96 | | | | 0.69 | | | | 0.73 | | | | 1.93 | | | | 14 | | | | 106 | |
| | 11.69 | | | | (25.56 | ) | | | 0.92 | | | | 0.96 | | | | 1.42 | | | | 14 | | | | 87 | |
| | 17.78 | | | | 33.50 | | | | 0.92 | | | | 0.94 | | | | 1.30 | | | | 81 | | | | 58 | |
| | 13.50 | | | | 3.39 | | | | 0.92 | | | | 0.94 | | | | 1.18 | | | | 64 | | | | 77 | |
| | 13.27 | | | | 11.00 | | | | 0.92 | | | | 0.92 | | | | 1.68 | | | | 81 | | | | 88 | |
| | | | | | | | | | | | | | | | | | | | | | | | | | | |
| | 12.57 | | | | 9.08 | | | | 0.62 | | | | 0.66 | | | | 1.99 | | | | 3,263 | | | | 106 | |
| | 11.79 | | | | (25.51 | ) | | | 0.84 | | | | 0.88 | | | | 2.21 | | | | 2,639 | | | | 87 | |
| | 17.91 | | | | 33.60 | | | | 0.84 | | | | 0.86 | | | | 1.36 | | | | 4,180 | | | | 58 | |
| | 13.58 | | | | 3.53 | | | | 0.84 | | | | 0.86 | | | | 1.23 | | | | 2,143 | | | | 77 | |
| | 13.35 | | | | 11.04 | | | | 0.84 | | | | 0.85 | | | | 1.78 | | | | 2,489 | | | | 88 | |
| | See Notes to Financial Statements. | 165 |
Financial Highlights (continued)
INTERNATIONAL OPPORTUNITIES FUND
| | | | | Per Share Operating Performance: |
| | | | | Investment Operations: | | Distributions to
shareholders from: |
| | | Net asset
value,
beginning
of period | | Net
invest-
ment
income
(loss)(a) | | Net
realized
and
unrealized
gain (loss) | | Total
from
invest-
ment
opera-
tions | | Net
investment
income | | Net
realized
gain | | Total
distri-
butions |
| Class A | | | | | | | | | | | | | | | | | | | | | | | | | | | | |
| 10/31/2023 | | $ | 14.80 | | | $ | 0.24 | | | $ | 1.17 | | | $ | 1.41 | | | $ | (0.27 | ) | | $ | – | | | $ | (0.27 | ) |
| 10/31/2022 | | | 21.36 | | | | 0.19 | | | | (6.27 | ) | | | (6.08 | ) | | | (0.48 | ) | | | – | | | | (0.48 | ) |
| 10/31/2021 | | | 15.69 | | | | 0.20 | | | | 5.47 | | | | 5.67 | | | | – | | | | – | | | | – | |
| 10/31/2020 | | | 16.02 | | | | 0.06 | | | | (0.18 | ) | | | (0.12 | ) | | | (0.21 | ) | | | – | | | | (0.21 | ) |
| 10/31/2019 | | | 16.84 | | | | 0.16 | | | | 0.77 | | | | 0.93 | | | | (0.17 | ) | | | (1.58 | ) | | | (1.75 | ) |
| Class C | | | | | | | | | | | | | | | | | | | | | | | | | | | | |
| 10/31/2023 | | | 13.54 | | | | 0.09 | | | | 1.10 | | | | 1.19 | | | | (0.13 | ) | | | – | | | | (0.13 | ) |
| 10/31/2022 | | | 19.57 | | | | 0.05 | | | | (5.76 | ) | | | (5.71 | ) | | | (0.32 | ) | | | – | | | | (0.32 | ) |
| 10/31/2021 | | | 14.47 | | | | 0.04 | | | | 5.06 | | | | 5.10 | �� | | | – | | | | – | | | | – | |
| 10/31/2020 | | | 14.78 | | | | (0.05 | ) | | | (0.19 | ) | | | (0.24 | ) | | | (0.07 | ) | | | – | | | | (0.07 | ) |
| 10/31/2019 | | | 15.61 | | | | 0.04 | | | | 0.71 | | | | 0.75 | | | | – | (c) | | | (1.58 | ) | | | (1.58 | ) |
| Class F | | | | | | | | | | | | | | | | | | | | | | | | | | | | |
| 10/31/2023 | | | 14.67 | | | | 0.19 | | | | 1.23 | | | | 1.42 | | | | (0.28 | ) | | | – | | | | (0.28 | ) |
| 10/31/2022 | | | 21.19 | | | | 0.22 | | | | (6.23 | ) | | | (6.01 | ) | | | (0.51 | ) | | | – | | | | (0.51 | ) |
| 10/31/2021 | | | 15.53 | | | | 0.23 | | | | 5.43 | | | | 5.66 | | | | – | | | | – | | | | – | |
| 10/31/2020 | | | 15.86 | | | | 0.07 | | | | (0.17 | ) | | | (0.10 | ) | | | (0.23 | ) | | | – | | | | (0.23 | ) |
| 10/31/2019 | | | 16.70 | | | | 0.18 | | | | 0.76 | | | | 0.94 | | | | (0.20 | ) | | | (1.58 | ) | | | (1.78 | ) |
| Class F3 | | | | | | | | | | | | | | | | | | | | | | | | | | | | |
| 10/31/2023 | | | 15.41 | | | | 0.30 | | | | 1.23 | | | | 1.53 | | | | (0.32 | ) | | | – | | | | (0.32 | ) |
| 10/31/2022 | | | 22.22 | | | | 0.27 | | | | (6.54 | ) | | | (6.27 | ) | | | (0.54 | ) | | | – | | | | (0.54 | ) |
| 10/31/2021 | | | 16.26 | | | | 0.29 | | | | 5.67 | | | | 5.96 | | | | – | | | | – | | | | – | |
| 10/31/2020 | | | 16.59 | | | | 0.12 | | | | (0.20 | ) | | | (0.08 | ) | | | (0.25 | ) | | | – | | | | (0.25 | ) |
| 10/31/2019 | | | 17.38 | | | | 0.22 | | | | 0.80 | | | | 1.02 | | | | (0.23 | ) | | | (1.58 | ) | | | (1.81 | ) |
| Class I | | | | | | | | | | | | | | | | | | | | | | | | | | | | |
| 10/31/2023 | | | 15.31 | | | | 0.29 | | | | 1.22 | | | | 1.51 | | | | (0.32 | ) | | | – | | | | (0.32 | ) |
| 10/31/2022 | | | 22.08 | | | | 0.24 | | | | (6.48 | ) | | | (6.24 | ) | | | (0.53 | ) | | | – | | | | (0.53 | ) |
| 10/31/2021 | | | 16.17 | | | | 0.26 | | | | 5.65 | | | | 5.91 | | | | – | | | | – | | | | – | |
| 10/31/2020 | | | 16.51 | | | | 0.10 | | | | (0.19 | ) | | | (0.09 | ) | | | (0.25 | ) | | | – | | | | (0.25 | ) |
| 10/31/2019 | | | 17.32 | | | | 0.21 | | | | 0.79 | | | | 1.00 | | | | (0.23 | ) | | | (1.58 | ) | | | (1.81 | ) |
| Class P | | | | | | | | | | | | | | | | | | | | | | | | | | | | |
| 10/31/2023 | | | 15.18 | | | | 0.19 | | | | 1.23 | | | | 1.42 | | | | (0.23 | ) | | | – | | | | (0.23 | ) |
| 10/31/2022 | | | 21.89 | | | | 0.17 | | | | (6.45 | ) | | | (6.28 | ) | | | (0.43 | ) | | | – | | | | (0.43 | ) |
| 10/31/2021 | | | 16.10 | | | | 0.17 | | | | 5.62 | | | | 5.79 | | | | – | | | | – | | | | – | |
| 10/31/2020 | | | 16.43 | | | | 0.05 | | | | (0.22 | ) | | | (0.17 | ) | | | (0.16 | ) | | | – | | | | (0.16 | ) |
| 10/31/2019 | | | 17.18 | | | | 0.14 | | | | 0.79 | | | | 0.93 | | | | (0.10 | ) | | | (1.58 | ) | | | (1.68 | ) |
| Class R2 | | | | | | | | | | | | | | | | | | | | | | | | | | | | |
| 10/31/2023 | | | 14.48 | | | | 0.15 | | | | 1.18 | | | | 1.33 | | | | (0.22 | ) | | | – | | | | (0.22 | ) |
| 10/31/2022 | | | 20.89 | | | | 0.13 | | | | (6.15 | ) | | | (6.02 | ) | | | (0.39 | ) | | | – | | | | (0.39 | ) |
| 10/31/2021 | | | 15.39 | | | | 0.12 | | | | 5.38 | | | | 5.50 | | | | – | | | | – | | | | – | |
| 10/31/2020 | | | 15.72 | | | | 0.01 | | | | (0.20 | ) | | | (0.19 | ) | | | (0.14 | ) | | | – | | | | (0.14 | ) |
| 10/31/2019 | | | 16.54 | | | | 0.11 | | | | 0.75 | | | | 0.86 | | | | (0.10 | ) | | | (1.58 | ) | | | (1.68 | ) |
| 166 | See Notes to Financial Statements. |
| | | | | Ratios to Average Net Assets: | | Supplemental Data: |
| | | | | | | |
Net
asset
value,
end of
period | | Total
return(b)
(%) | | Total
expenses
after
waivers
and/or reim-
bursements
(%) | | Total
expenses
(%) | | Net
invest-
ment
income
(loss)
(%) | | Net
assets,
end of
period
(000) | | Portfolio
turnover
rate
(%) |
| | | | | | | | | | | | | | | | | | | | | | | | | | | |
| $ | 15.94 | | | | 9.54 | | | | 1.22 | | | | 1.25 | | | | 1.38 | | | $ | 85,371 | | | | 39 | |
| | 14.80 | | | | (29.03 | ) | | | 1.22 | | | | 1.26 | | | | 1.10 | | | | 84,505 | | | | 70 | |
| | 21.36 | | | | 36.14 | | | | 1.19 | | | | 1.21 | | | | 1.00 | | | | 130,088 | | | | 74 | |
| | 15.69 | | | | (0.84 | ) | | | 1.21 | | | | 1.24 | | | | 0.41 | | | | 96,338 | | | | 55 | |
| | 16.02 | | | | 7.05 | | | | 1.25 | | | | 1.25 | | | | 1.04 | | | | 126,700 | | | | 58 | |
| | | | | | | | | | | | | | | | | | | | | | | | | | | |
| | 14.60 | | | | 8.76 | | | | 1.98 | | | | 2.01 | | | | 0.56 | | | | 4,729 | | | | 39 | |
| | 13.54 | | | | (29.58 | ) | | | 1.97 | | | | 2.00 | | | | 0.30 | | | | 7,226 | | | | 70 | |
| | 19.57 | | | | 35.25 | | | | 1.95 | | | | 1.96 | | | | 0.22 | | | | 14,488 | | | | 74 | |
| | 14.47 | | | | (1.63 | ) | | | 1.97 | | | | 1.99 | | | | (0.38 | ) | | | 12,840 | | | | 55 | |
| | 14.78 | | | | 6.23 | | | | 2.00 | | | | 2.00 | | | | 0.29 | | | | 22,450 | | | | 58 | |
| | | | | | | | | | | | | | | | | | | | | | | | | | | |
| | 15.81 | | | | 9.70 | | | | 1.08 | | | | 1.11 | | | | 1.16 | | | | 3,683 | | | | 39 | |
| | 14.67 | | | | (28.93 | ) | | | 1.07 | | | | 1.10 | | | | 1.22 | | | | 13,570 | | | | 70 | |
| | 21.19 | | | | 36.38 | | | | 1.05 | | | | 1.06 | | | | 1.13 | | | | 54,601 | | | | 74 | |
| | 15.53 | | | | (0.72 | ) | | | 1.07 | | | | 1.09 | | | | 0.44 | | | | 43,222 | | | | 55 | |
| | 15.86 | | | | 7.19 | | | | 1.09 | | | | 1.09 | | | | 1.20 | | | | 91,019 | | | | 58 | |
| | | | | | | | | | | | | | | | | | | | | | | | | | | |
| | 16.62 | | | | 9.94 | | | | 0.89 | | | | 0.92 | | | | 1.68 | | | | 27,245 | | | | 39 | |
| | 15.41 | | | | (28.83 | ) | | | 0.89 | | | | 0.93 | | | | 1.47 | | | | 25,732 | | | | 70 | |
| | 22.22 | | | | 36.65 | | | | 0.86 | | | | 0.88 | | | | 1.36 | | | | 30,504 | | | | 74 | |
| | 16.26 | | | | (0.54 | ) | | | 0.89 | | | | 0.91 | | | | 0.75 | | | | 17,579 | | | | 55 | |
| | 16.59 | | | | 7.43 | | | | 0.91 | | | | 0.91 | | | | 1.40 | | | | 19,153 | | | | 58 | |
| | | | | | | | | | | | | | | | | | | | | | | | | | | |
| | 16.50 | | | | 9.85 | | | | 0.97 | | | | 1.00 | | | | 1.64 | | | | 143,466 | | | | 39 | |
| | 15.31 | | | | (28.85 | ) | | | 0.97 | | | | 1.01 | | | | 1.34 | | | | 153,655 | | | | 70 | |
| | 22.08 | | | | 36.55 | | | | 0.95 | | | | 0.96 | | | | 1.24 | | | | 193,183 | | | | 74 | |
| | 16.17 | | | | (0.62 | ) | | | 0.97 | | | | 0.99 | | | | 0.66 | | | | 146,416 | | | | 55 | |
| | 16.51 | | | | 7.24 | | | | 1.00 | | | | 1.00 | | | | 1.32 | | | | 221,455 | | | | 58 | |
| | | | | | | | | | | | | | | | | | | | | | | | | | | |
| | 16.37 | | | | 9.37 | | | | 1.43 | | | | 1.46 | | | | 1.09 | | | | 21 | | | | 39 | |
| | 15.18 | | | | (29.19 | ) | | | 1.42 | | | | 1.46 | | | | 0.93 | | | | 113 | | | | 70 | |
| | 21.89 | | | | 35.96 | | | | 1.39 | | | | 1.41 | | | | 0.80 | | | | 140 | | | | 74 | |
| | 16.10 | | | | (1.08 | ) | | | 1.41 | | | | 1.43 | | | | 0.30 | | | | 119 | | | | 55 | |
| | 16.43 | | | | 6.80 | | | | 1.45 | | | | 1.45 | | | | 0.91 | | | | 96 | | | | 58 | |
| | | | | | | | | | | | | | | | | | | | | | | | | | | |
| | 15.59 | | | | 9.17 | | | | 1.57 | | | | 1.60 | | | | 0.93 | | | | 1,402 | | | | 39 | |
| | 14.48 | | | | (29.28 | ) | | | 1.57 | | | | 1.61 | | | | 0.72 | | | | 1,913 | | | | 70 | |
| | 20.89 | | | | 35.74 | | | | 1.55 | | | | 1.56 | | | | 0.63 | | | | 2,771 | | | | 74 | |
| | 15.39 | | | | (1.24 | ) | | | 1.57 | | | | 1.59 | | | | 0.06 | | | | 2,522 | | | | 55 | |
| | 15.72 | | | | 6.67 | | | | 1.60 | | | | 1.60 | | | | 0.72 | | | | 3,318 | | | | 58 | |
| | See Notes to Financial Statements. | 167 |
Financial Highlights (continued)
INTERNATIONAL OPPORTUNITIES FUND
| | | | | Per Share Operating Performance: |
| | | | | Investment Operations: | | Distributions to
shareholders from: |
| | | Net asset
value,
beginning
of period | | Net
invest-
ment
income
(loss)(a) | | Net
realized
and
unrealized
gain (loss) | | Total
from
invest-
ment
opera-
tions | | Net
investment
income | | Net
realized
gain | | Total
distri-
butions |
| Class R3 | | | | | | | | | | | | | | | | | | | | | | | | | | | | |
| 10/31/2023 | | $ | 14.47 | | | $ | 0.19 | | | $ | 1.16 | | | $ | 1.35 | | | $ | (0.23 | ) | | $ | – | | | $ | (0.23 | ) |
| 10/31/2022 | | | 20.82 | | | | 0.15 | | | | (6.15 | ) | | | (6.00 | ) | | | (0.35 | ) | | | – | | | | (0.35 | ) |
| 10/31/2021 | | | 15.32 | | | | 0.10 | | | | 5.40 | | | | 5.50 | | | | – | | | | – | | | | – | |
| 10/31/2020 | | | 15.64 | | | | 0.02 | | | | (0.19 | ) | | | (0.17 | ) | | | (0.15 | ) | | | – | | | | (0.15 | ) |
| 10/31/2019 | | | 16.53 | | | | 0.09 | | | | 0.77 | | | | 0.86 | | | | (0.17 | ) | | | (1.58 | ) | | | (1.75 | ) |
| Class R4 | | | | | | | | | | | | | | | | | | | | | | | | | | | | |
| 10/31/2023 | | | 14.72 | | | | 0.24 | | | | 1.17 | | | | 1.41 | | | | (0.27 | ) | | | – | | | | (0.27 | ) |
| 10/31/2022 | | | 21.26 | | | | 0.19 | | | | (6.25 | ) | | | (6.06 | ) | | | (0.48 | ) | | | – | | | | (0.48 | ) |
| 10/31/2021 | | | 15.61 | | | | 0.18 | | | | 5.47 | | | | 5.65 | | | | – | | | | – | | | | – | |
| 10/31/2020 | | | 15.95 | | | | 0.07 | | | | (0.19 | ) | | | (0.12 | ) | | | (0.22 | ) | | | – | | | | (0.22 | ) |
| 10/31/2019 | | | 16.79 | | | | 0.14 | | | | 0.78 | | | | 0.92 | | | | (0.18 | ) | | | (1.58 | ) | | | (1.76 | ) |
| Class R5 | | | | | | | | | | | | | | | | | | | | | | | | | | | | |
| 10/31/2023 | | | 15.30 | | | | 0.29 | | | | 1.22 | | | | 1.51 | | | | (0.32 | ) | | | – | | | | (0.32 | ) |
| 10/31/2022 | | | 22.07 | | | | 0.24 | | | | (6.48 | ) | | | (6.24 | ) | | | (0.53 | ) | | | – | | | | (0.53 | ) |
| 10/31/2021 | | | 16.17 | | | | 0.14 | | | | 5.76 | | | | 5.90 | | | | – | | | | – | | | | – | |
| 10/31/2020 | | | 16.50 | | | | 0.08 | | | | (0.16 | ) | | | (0.08 | ) | | | (0.25 | ) | | | – | | | | (0.25 | ) |
| 10/31/2019 | | | 17.32 | | | | 0.16 | | | | 0.83 | | | | 0.99 | | | | (0.23 | ) | | | (1.58 | ) | | | (1.81 | ) |
| Class R6 | | | | | | | | | | | | | | | | | | | | | | | | | | | | |
| 10/31/2023 | | | 15.41 | | | | 0.30 | | | | 1.23 | | | | 1.53 | | | | (0.32 | ) | | | – | | | | (0.32 | ) |
| 10/31/2022 | | | 22.22 | | | | 0.26 | | | | (6.53 | ) | | | (6.27 | ) | | | (0.54 | ) | | | ��� | | | | (0.54 | ) |
| 10/31/2021 | | | 16.26 | | | | 0.24 | | | | 5.72 | | | | 5.96 | | | | – | | | | – | | | | – | |
| 10/31/2020 | | | 16.59 | | | | 0.11 | | | | (0.19 | ) | | | (0.08 | ) | | | (0.25 | ) | | | – | | | | (0.25 | ) |
| 10/31/2019 | | | 17.39 | | | | 0.21 | | | | 0.80 | | | | 1.01 | | | | (0.23 | ) | | | (1.58 | ) | | | (1.81 | ) |
| (a) | Calculated using average shares outstanding during the period. |
| (b) | Total return for Classes A and C does not consider the effects of sales loads and assumes the reinvestment of all distributions. Total return for all other classes assumes the reinvestment of all distributions. |
| (c) | Amount is less than $0.01. |
| 168 | See Notes to Financial Statements. |
| | | | | Ratios to Average Net Assets: | | Supplemental Data: |
| | | | | | | | | | | | | |
Net
asset
value,
end of
period | | Total
return(b)
(%) | | Total
expenses
after
waivers
and/or reim-
bursements
(%) | | Total
expenses
(%) | | Net
invest-
ment
income (loss)
(%) | | Net
assets,
end of
period
(000) | | Portfolio
turnover
rate
(%) |
| | | | | | | | | | | | | | | | | | | | | | | | | | | |
| $ | 15.59 | | | | 9.30 | | | | 1.47 | | | | 1.50 | | | | 1.16 | | | $ | 4,508 | | | | 39 | |
| | 14.47 | | | | (29.24 | ) | | | 1.47 | | | | 1.51 | | | | 0.84 | | | | 4,129 | | | | 70 | |
| | 20.82 | | | | 35.90 | | | | 1.45 | | | | 1.47 | | | | 0.51 | | | | 6,838 | | | | 74 | |
| | 15.32 | | | | (1.17 | ) | | | 1.46 | | | | 1.49 | | | | 0.10 | | | | 15,313 | | | | 55 | |
| | 15.64 | | | | 6.77 | | | | 1.50 | | | | 1.50 | | | | 0.58 | | | | 19,568 | | | | 58 | |
| | | | | | | | | | | | | | | | | | | | | | | | | | | |
| | 15.86 | | | | 9.54 | | | | 1.22 | | | | 1.25 | | | | 1.39 | | | | 2,278 | | | | 39 | |
| | 14.72 | | | | (29.02 | ) | | | 1.22 | | | | 1.26 | | | | 1.10 | | | | 1,935 | | | | 70 | |
| | 21.26 | | | | 36.19 | | | | 1.20 | | | | 1.22 | | | | 0.91 | | | | 2,869 | | | | 74 | |
| | 15.61 | | | | (0.90 | ) | | | 1.21 | | | | 1.24 | | | | 0.44 | | | | 4,889 | | | | 55 | |
| | 15.95 | | | | 7.06 | | | | 1.25 | | | | 1.25 | | | | 0.93 | | | | 6,293 | | | | 58 | |
| | | | | | | | | | | | | | | | | | | | | | | | | | | |
| | 16.49 | | | | 9.85 | | | | 0.97 | | | | 1.00 | | | | 1.62 | | | | 2,009 | | | | 39 | |
| | 15.30 | | | | (28.88 | ) | | | 0.97 | | | | 1.00 | | | | 1.33 | | | | 1,877 | | | | 70 | |
| | 22.07 | | | | 36.49 | | | | 0.95 | | | | 0.97 | | | | 0.70 | | | | 3,283 | | | | 74 | |
| | 16.17 | | | | (0.56 | ) | | | 0.96 | | | | 0.99 | | | | 0.47 | | | | 15,842 | | | | 55 | |
| | 16.50 | | | | 7.25 | | | | 1.00 | | | | 1.00 | | | | 1.00 | | | | 17,765 | | | | 58 | |
| | | | | | | | | | | | | | | | | | | | | | | | | | | |
| | 16.62 | | | | 9.94 | | | | 0.89 | | | | 0.92 | | | | 1.70 | | | | 16,179 | | | | 39 | |
| | 15.41 | | | | (28.83 | ) | | | 0.89 | | | | 0.93 | | | | 1.42 | | | | 15,946 | | | | 70 | |
| | 22.22 | | | | 36.65 | | | | 0.87 | | | | 0.89 | | | | 1.14 | | | | 25,184 | | | | 74 | |
| | 16.26 | | | | (0.54 | ) | | | 0.89 | | | | 0.91 | | | | 0.72 | | | | 31,986 | | | | 55 | |
| | 16.59 | | | | 7.37 | | | | 0.91 | | | | 0.91 | | | | 1.30 | | | | 33,183 | | | | 58 | |
| | See Notes to Financial Statements. | 169 |
Financial Highlights (continued)
INTERNATIONAL VALUE FUND
| | | | | Per Share Operating Performance: | | | |
| | | | | | Investment Operations: | | Distributions
to
shareholders
from: | | | |
| | | Net asset
value,
beginning
of period | | Net
investment
income
(loss)(a) | | Net
realized and
unrealized
gain (loss) | | Total from
investment
operations | | Net
investment
income | | Net asset
value,
end of
period |
| Class A | | | | | | | | | | | | | | | | | | | | | | | | |
| 10/31/2023 | | | $6.14 | | | | $0.19 | | | | $0.68 | | | | $0.87 | | | | $(0.20 | ) | | | $6.81 | |
| 10/31/2022 | | | 8.00 | | | | 0.26 | | | | (1.79 | ) | | | (1.53 | ) | | | (0.33 | ) | | | 6.14 | |
| 10/31/2021 | | | 6.03 | | | | 0.21 | | | | 1.98 | | | | 2.19 | | | | (0.22 | ) | | | 8.00 | |
| 10/31/2020 | | | 6.98 | | | | 0.12 | | | | (0.94 | ) | | | (0.82 | ) | | | (0.13 | ) | | | 6.03 | |
| 10/31/2019 | | | 6.73 | | | | 0.20 | | | | 0.26 | | | | 0.46 | | | | (0.21 | ) | | | 6.98 | |
| Class C | | | | | | | | | | | | | | | | | | | | | | | | |
| 10/31/2023 | | | 6.09 | | | | 0.13 | | | | 0.68 | | | | 0.81 | | | | (0.14 | ) | | | 6.76 | |
| 10/31/2022 | | | 7.93 | | | | 0.22 | | | | (1.79 | ) | | | (1.57 | ) | | | (0.27 | ) | | | 6.09 | |
| 10/31/2021 | | | 5.98 | | | | 0.15 | | | | 1.96 | | | | 2.11 | | | | (0.16 | ) | | | 7.93 | |
| 10/31/2020 | | | 6.92 | | | | 0.07 | | | | (0.94 | ) | | | (0.87 | ) | | | (0.07 | ) | | | 5.98 | |
| 10/31/2019 | | | 6.67 | | | | 0.15 | | | | 0.25 | | | | 0.40 | | | | (0.15 | ) | | | 6.92 | |
| Class F | | | | | | | | | | | | | | | | | | | | | | | | |
| 10/31/2023 | | | 6.18 | | | | 0.19 | | | | 0.70 | | | | 0.89 | | | | (0.20 | ) | | | 6.87 | |
| 10/31/2022 | | | 8.04 | | | | 0.31 | | | | (1.83 | ) | | | (1.52 | ) | | | (0.34 | ) | | | 6.18 | |
| 10/31/2021 | | | 6.06 | | | | 0.23 | | | | 1.98 | | | | 2.21 | | | | (0.23 | ) | | | 8.04 | |
| 10/31/2020 | | | 7.01 | | | | 0.13 | | | | (0.94 | ) | | | (0.81 | ) | | | (0.14 | ) | | | 6.06 | |
| 10/31/2019 | | | 6.76 | | | | 0.21 | | | | 0.26 | | | | 0.47 | | | | (0.22 | ) | | | 7.01 | |
| Class F3 | | | | | | | | | | | | | | | | | | | | | | | | |
| 10/31/2023 | | | 6.19 | | | | 0.22 | | | | 0.68 | | | | 0.90 | | | | (0.22 | ) | | | 6.87 | |
| 10/31/2022 | | | 8.06 | | | | 0.28 | | | | (1.80 | ) | | | (1.52 | ) | | | (0.35 | ) | | | 6.19 | |
| 10/31/2021 | | | 6.07 | | | | 0.24 | | | | 1.99 | | | | 2.23 | | | | (0.24 | ) | | | 8.06 | |
| 10/31/2020 | | | 7.02 | | | | 0.14 | | | | (0.95 | ) | | | (0.81 | ) | | | (0.14 | ) | | | 6.07 | |
| 10/31/2019 | | | 6.77 | | | | 0.22 | | | | 0.26 | | | | 0.48 | | | | (0.23 | ) | | | 7.02 | |
| Class I | | | | | | | | | | | | | | | | | | | | | | | | |
| 10/31/2023 | | | 6.19 | | | | 0.22 | | | | 0.68 | | | | 0.90 | | | | (0.22 | ) | | | 6.87 | |
| 10/31/2022 | | | 8.06 | | | | 0.32 | | | | (1.84 | ) | | | (1.52 | ) | | | (0.35 | ) | | | 6.19 | |
| 10/31/2021 | | | 6.07 | | | | 0.25 | | | | 1.98 | | | | 2.23 | | | | (0.24 | ) | | | 8.06 | |
| 10/31/2020 | | | 7.03 | | | | 0.15 | | | | (0.97 | ) | | | (0.82 | ) | | | (0.14 | ) | | | 6.07 | |
| 10/31/2019 | | | 6.77 | | | | 0.23 | | | | 0.25 | | | | 0.48 | | | | (0.22 | ) | | | 7.03 | |
| Class R2 | | | | | | | | | | | | | | | | | | | | | | | | |
| 10/31/2023 | | | 6.30 | | | | 0.18 | | | | 0.70 | | | | 0.88 | | | | (0.19 | ) | | | 6.99 | |
| 10/31/2022 | | | 8.21 | | | | 0.21 | | | | (1.81 | ) | | | (1.60 | ) | | | (0.31 | ) | | | 6.30 | |
| 10/31/2021 | | | 6.18 | | | | 0.19 | | | | 2.03 | | | | 2.22 | | | | (0.19 | ) | | | 8.21 | |
| 10/31/2020 | | | 7.14 | | | | 0.07 | | | | (0.96 | ) | | | (0.89 | ) | | | (0.07 | ) | | | 6.18 | |
| 10/31/2019 | | | 6.88 | | | | 0.18 | | | | 0.26 | | | | 0.44 | | | | (0.18 | ) | | | 7.14 | |
| Class R3 | | | | | | | | | | | | | | | | | | | | | | | | |
| 10/31/2023 | | | 6.22 | | | | 0.18 | | | | 0.68 | | | | 0.86 | | | | (0.19 | ) | | | 6.89 | |
| 10/31/2022 | | | 8.09 | | | | 0.24 | | | | (1.80 | ) | | | (1.56 | ) | | | (0.31 | ) | | | 6.22 | |
| 10/31/2021 | | | 6.10 | | | | 0.20 | | | | 1.99 | | | | 2.19 | | | | (0.20 | ) | | | 8.09 | |
| 10/31/2020 | | | 7.05 | | | | 0.11 | | | | (0.95 | ) | | | (0.84 | ) | | | (0.11 | ) | | | 6.10 | |
| 10/31/2019 | | | 6.80 | | | | 0.18 | | | | 0.26 | | | | 0.44 | | | | (0.19 | ) | | | 7.05 | |
| 170 | See Notes to Financial Statements. |
| | | | Ratios to Average Net Assets: | | Supplemental Data: |
| | | | | | | | | | | | | | | | | |
Total
return(b)
(%) | | Total
expenses
after
waivers
and/or reim-
bursements
(%) | | Total
expenses
(%) | | Net
investment
income
(loss)
(%) | | Net assets,
end of
period
(000) | | Portfolio
turnover
rate
(%) |
| | | | | | | | | | | | | | | | | | | | | | | |
| | 14.09 | | | | 0.98 | | | | 1.02 | | | | 2.72 | | | | $190,585 | | | | 46 | |
| | (19.56 | ) | | | 1.12 | | | | 1.18 | | | | 3.66 | | | | 181,412 | | | | 67 | |
| | 36.44 | | | | 1.12 | | | | 1.14 | | | | 2.73 | | | | 242,422 | | | | 61 | |
| | (11.89 | ) | | | 1.12 | | | | 1.18 | | | | 1.91 | | | | 186,426 | | | | 71 | |
| | 6.91 | | | | 1.12 | | | | 1.16 | | | | 2.97 | | | | 256,381 | | | | 62 | |
| | | | | | | | | | | | | | | | | | | | | | | |
| | 13.22 | | | | 1.74 | | | | 1.78 | | | | 1.91 | | | | 2,733 | | | | 46 | |
| | (20.19 | ) | | | 1.87 | | | | 1.93 | | | | 3.00 | | | | 5,037 | | | | 67 | |
| | 35.37 | | | | 1.87 | | | | 1.89 | | | | 1.88 | | | | 10,707 | | | | 61 | |
| | (12.58 | ) | | | 1.87 | | | | 1.93 | | | | 1.09 | | | | 13,027 | | | | 71 | |
| | 6.12 | | | | 1.87 | | | | 1.91 | | | | 2.17 | | | | 32,274 | | | | 62 | |
| | | | | | | | | | | | | | | | | | | | | | | |
| | 14.33 | | | | 0.83 | | | | 0.89 | | | | 2.71 | | | | 4,786 | | | | 46 | |
| | (19.45 | ) | | | 0.92 | | | | 1.02 | | | | 4.11 | | | | 9,803 | | | | 67 | |
| | 36.78 | | | | 0.92 | | | | 0.99 | | | | 2.93 | | | | 29,094 | | | | 61 | |
| | (11.69 | ) | | | 0.92 | | | | 1.03 | | | | 2.06 | | | | 23,560 | | | | 71 | |
| | 7.04 | | | | 0.92 | | | | 1.01 | | | | 3.10 | | | | 37,857 | | | | 62 | |
| | | | | | | | | | | | | | | | | | | | | | | |
| | 14.42 | | | | 0.65 | | | | 0.69 | | | | 3.07 | | | | 28,831 | | | | 46 | |
| | (19.32 | ) | | | 0.80 | | | | 0.87 | | | | 3.92 | | | | 22,938 | | | | 67 | |
| | 36.87 | | | | 0.79 | | | | 0.83 | | | | 3.06 | | | | 25,103 | | | | 61 | |
| | (11.57 | ) | | | 0.80 | | | | 0.85 | | | | 2.24 | | | | 18,311 | | | | 71 | |
| | 7.15 | | | | 0.81 | | | | 0.84 | | | | 3.28 | | | | 24,764 | | | | 62 | |
| | | | | | | | | | | | | | | | | | | | | | | |
| | 14.42 | | | | 0.73 | | | | 0.77 | | | | 3.00 | | | | 125,953 | | | | 46 | |
| | (19.33 | ) | | | 0.82 | | | | 0.91 | | | | 4.23 | | | | 117,542 | | | | 67 | |
| | 36.86 | | | | 0.82 | | | | 0.89 | | | | 3.14 | | | | 334,988 | | | | 61 | |
| | (11.71 | ) | | | 0.82 | | | | 0.93 | | | | 2.26 | | | | 197,616 | | | | 71 | |
| | 7.29 | | | | 0.82 | | | | 0.91 | | | | 3.35 | | | | 219,764 | | | | 62 | |
| | | | | | | | | | | | | | | | | | | | | | | |
| | 13.83 | | | | 1.32 | | | | 1.36 | | | | 2.47 | | | | 54 | | | | 46 | |
| | (19.92 | ) | | | 1.47 | | | | 1.55 | | | | 2.95 | | | | 44 | | | | 67 | |
| | 36.04 | | | | 1.47 | | | | 1.49 | | | | 2.37 | | | | 27 | | | | 61 | |
| | (12.47 | ) | | | 1.47 | | | | 1.55 | | | | 0.99 | | | | 20 | | | | 71 | |
| | 6.54 | | | | 1.47 | | | | 1.51 | | | | 2.64 | | | | 449 | | | | 62 | |
| | | | | | | | | | | | | | | | | | | | | | | |
| | 13.76 | | | | 1.23 | | | | 1.27 | | | | 2.47 | | | | 6,211 | | | | 46 | |
| | (19.67 | ) | | | 1.37 | | | | 1.43 | | | | 3.36 | | | | 6,003 | | | | 67 | |
| | 36.00 | | | | 1.37 | | | | 1.39 | | | | 2.50 | | | | 6,840 | | | | 61 | |
| | (12.00 | ) | | | 1.37 | | | | 1.43 | | | | 1.69 | | | | 5,394 | | | | 71 | |
| | 6.56 | | | | 1.37 | | | | 1.41 | | | | 2.70 | | | | 7,029 | | | | 62 | |
| | See Notes to Financial Statements. | 171 |
Financial Highlights (continued)
INTERNATIONAL VALUE FUND
| | | | | | Per Share Operating Performance: | | | |
| | | | | | Investment Operations: | | Distributions
to
shareholders
from: | | | |
| | | Net asset
value,
beginning
of period | | Net
investment
income
(loss)(a) | | Net
realized and
unrealized
gain (loss) | | Total from
investment
operations | | Net
investment
income | | Net asset
value,
end of
period |
| Class R4 | | | | | | | | | | | | | | | | | | | | | | | | |
| 10/31/2023 | | | $6.12 | | | | $0.21 | | | | $0.66 | | | | $0.87 | | | | $(0.20 | ) | | | $6.79 | |
| 10/31/2022 | | | 7.98 | | | | 0.27 | | | | (1.80 | ) | | | (1.53 | ) | | | (0.33 | ) | | | 6.12 | |
| 10/31/2021 | | | 6.01 | | | | 0.24 | | | | 1.95 | | | | 2.19 | | | | (0.22 | ) | | | 7.98 | |
| 10/31/2020 | | | 6.97 | | | | 0.13 | | | | (0.96 | ) | | | (0.83 | ) | | | (0.13 | ) | | | 6.01 | |
| 10/31/2019 | | | 6.72 | | | | 0.20 | | | | 0.26 | | | | 0.46 | | | | (0.21 | ) | | | 6.97 | |
| Class R5 | | | | | | | | | | | | | | | | | | | | | | | | |
| 10/31/2023 | | | 6.16 | | | | 0.21 | | | | 0.69 | | | | 0.90 | | | | (0.22 | ) | | | 6.84 | |
| 10/31/2022 | | | 8.03 | | | | 0.27 | | | | (1.79 | ) | | | (1.52 | ) | | | (0.35 | ) | | | 6.16 | |
| 10/31/2021 | | | 6.05 | | | | 0.24 | | | | 1.98 | | | | 2.22 | | | | (0.24 | ) | | | 8.03 | |
| 10/31/2020 | | | 7.01 | | | | 0.14 | | | | (0.96 | ) | | | (0.82 | ) | | | (0.14 | ) | | | 6.05 | |
| 10/31/2019 | | | 6.76 | | | | 0.23 | | | | 0.25 | | | | 0.48 | | | | (0.23 | ) | | | 7.01 | |
| Class R6 | | | | | | | | | | | | | | | | | | | | | | | | |
| 10/31/2023 | | | 6.19 | | | | 0.22 | | | | 0.68 | | | | 0.90 | | | | (0.22 | ) | | | 6.87 | |
| 10/31/2022 | | | 8.06 | | | | 0.29 | | | | (1.81 | ) | | | (1.52 | ) | | | (0.35 | ) | | | 6.19 | |
| 10/31/2021 | | | 6.07 | | | | 0.24 | | | | 1.99 | | | | 2.23 | | | | (0.24 | ) | | | 8.06 | |
| 10/31/2020 | | | 7.02 | | | | 0.14 | | | | (0.95 | ) | | | (0.81 | ) | | | (0.14 | ) | | | 6.07 | |
| 10/31/2019 | | | 6.77 | | | | 0.22 | | | | 0.26 | | | | 0.48 | | | | (0.23 | ) | | | 7.02 | |
| (a) | Calculated using average shares outstanding during the period. |
| (b) | Total return for Classes A and C does not consider the effects of sales loads and assumes the reinvestment of all distributions. Total return for all other classes assumes the reinvestment of all distributions. |
| 172 | See Notes to Financial Statements. |
| | | | Ratios to Average Net Assets: | | Supplemental Data: |
| | | | | | | | | | | | | | | | | |
Total
return(b)
(%) | | Total
expenses
after
waivers
and/or reim-
bursements
(%) | | Total
expenses
(%) | | Net
investment
income
(loss)
(%) | | Net assets,
end of
period
(000) | | Portfolio
turnover
rate
(%) |
| | | | | | | | | | | | | | | | | | | | | | | |
| | 14.11 | | | | 0.98 | | | | 1.02 | | | | 2.88 | | | $ | 107 | | | | 46 | |
| | (19.62 | ) | | | 1.12 | | | | 1.18 | | | | 3.70 | | | | 109 | | | | 67 | |
| | 36.35 | | | | 1.12 | | | | 1.14 | | | | 2.98 | | | | 153 | | | | 61 | |
| | (11.90 | ) | | | 1.12 | | | | 1.17 | | | | 2.05 | | | | 36 | | | | 71 | |
| | 6.92 | | | | 1.12 | | | | 1.17 | | | | 2.99 | | | | 36 | | | | 62 | |
| | | | | | | | | | | | | | | | | | | | | | | |
| | 14.49 | | | | 0.73 | | | | 0.77 | | | | 2.94 | | | | 10 | | | | 46 | |
| | (19.40 | ) | | | 0.87 | | | | 0.93 | | | | 3.69 | | | | 14 | | | | 67 | |
| | 36.82 | | | | 0.87 | | | | 0.88 | | | | 3.09 | | | | 15 | | | | 61 | |
| | (11.74 | ) | | | 0.87 | | | | 0.91 | | | | 2.20 | | | | 9 | | | | 71 | |
| | 7.16 | | | | 0.87 | | | | 0.89 | | | | 3.36 | | | | 10 | | | | 62 | |
| | | | | | | | | | | | | | | | | | | | | | | |
| | 14.43 | | | | 0.65 | | | | 0.69 | | | | 3.01 | | | | 1,608 | | | | 46 | |
| | (19.32 | ) | | | 0.80 | | | | 0.87 | | | | 3.97 | | | | 1,374 | | | | 67 | |
| | 36.87 | | | | 0.79 | | | | 0.83 | | | | 3.06 | | | | 1,375 | | | | 61 | |
| | (11.57 | ) | | | 0.80 | | | | 0.85 | | | | 2.17 | | | | 952 | | | | 71 | |
| | 7.15 | | | | 0.81 | | | | 0.84 | | | | 3.22 | | | | 1,507 | | | | 62 | |
| | See Notes to Financial Statements. | 173 |
Financial Highlights (continued)
MICRO CAP GROWTH FUND
| | | | | | Per Share Operating Performance: | | | |
| | | | | | Investment Operations: | | Distributions
to
shareholders
from: | | | |
| | | Net asset
value,
beginning
of period | | Net
investment
income
(loss)(a) | | Net
realized and
unrealized
gain (loss) | | Total from
investment
operations | | Net
realized
gain | | Net asset
value,
end of
period |
| Class A | | | | | | | | | | | | | | | | | | | | | | | | |
| 10/31/2023 | | | $13.86 | | | | $(0.16 | ) | | | $(2.65 | ) | | | $(2.81 | ) | | $ | – | | | | $11.05 | |
| 10/31/2022 | | | 19.36 | | | | (0.13 | ) | | | (5.37 | ) | | | (5.50 | ) | | | – | | | | 13.86 | |
| 10/31/2021 | | | 17.51 | | | | (0.25 | ) | | | 7.18 | | | | 6.93 | | | | (5.08 | ) | | | 19.36 | |
| 10/31/2020 | | | 13.83 | | | | (0.18 | ) | | | 6.23 | | | | 6.05 | | | | (2.37 | ) | | | 17.51 | |
| 10/31/2019 | | | 18.05 | | | | (0.21 | ) | | | 0.98 | | | | 0.77 | | | | (4.99 | ) | | | 13.83 | |
| Class C | | | | | | | | | | | | | | | | | | | | | | | | |
| 10/31/2023 | | | 16.70 | | | | (0.31 | ) | | | (3.18 | ) | | | (3.49 | ) | | | – | | | | 13.21 | |
| 10/31/2022 | | | 23.49 | | | | (0.30 | ) | | | (6.49 | ) | | | (6.79 | ) | | | – | | | | 16.70 | |
| 10/31/2021 | | | 20.44 | | | | (0.49 | ) | | | 8.62 | | | | 8.13 | | | | (5.08 | ) | | | 23.49 | |
| 8/28/2020 to 10/31/2020(c) | | | 20.16 | | | | (0.07 | ) | | | 0.35 | | | | 0.28 | | | | – | | | | 20.44 | |
| Class F | | | | | | | | | | | | | | | | | | | | | | | | |
| 10/31/2023 | | | 17.07 | | | | (0.15 | ) | | | (3.28 | ) | | | (3.43 | ) | | | – | | | | 13.64 | |
| 10/31/2022 | | | 23.77 | | | | (0.12 | ) | | | (6.58 | ) | | | (6.70 | ) | | | – | | | | 17.07 | |
| 10/31/2021 | | | 20.47 | | | | (0.25 | ) | | | 8.63 | | | | 8.38 | | | | (5.08 | ) | | | 23.77 | |
| 8/28/2020 to 10/31/2020(c) | | | 20.16 | | | | (0.04 | ) | | | 0.35 | | | | 0.31 | | | | – | | | | 20.47 | |
| Class I | | | | | | | | | | | | | | | | | | | | | | | | |
| 10/31/2023 | | | 17.07 | | | | (0.15 | ) | | | (3.28 | ) | | | (3.43 | ) | | | – | | | | 13.64 | |
| 10/31/2022 | | | 23.77 | | | | (0.12 | ) | | | (6.58 | ) | | | (6.70 | ) | | | – | | | | 17.07 | |
| 10/31/2021 | | | 20.47 | | | | (0.24 | ) | | | 8.62 | | | | 8.38 | | | | (5.08 | ) | | | 23.77 | |
| 10/31/2020 | | | 15.77 | | | | (0.19 | ) | | | 7.26 | | | | 7.07 | | | | (2.37 | ) | | | 20.47 | |
| 10/31/2019 | | | 19.84 | | | | (0.24 | ) | | | 1.16 | | | | 0.92 | | | | (4.99 | ) | | | 15.77 | |
| (a) | Calculated using average shares outstanding during the period. |
| (b) | Total return for Classes A and C does not consider the effects of sales loads and assumes the reinvestment of all distributions. Total return for all other classes assumes the reinvestment of all distributions. |
| (c) | Commenced on August 28, 2020. |
| (d) | Not annualized. |
| (e) | Annualized. |
| 174 | See Notes to Financial Statements. |
| | | | Ratios to Average Net Assets: | | Supplemental Data: |
| | | | | | | | | | | | | | | | | |
Total
return(b)
(%) | | Total
expenses
after
waivers
and/or reim-
bursements
(%) | | Total
expenses
(%) | | Net
investment
income
(loss)
(%) | | Net assets,
end of
period
(000) | | Portfolio
turnover
rate
(%) |
| | | | | | | | | | | | | | | | | | | | | | | |
| | (20.27 | ) | | | 1.36 | | | | 1.37 | | | | (1.16 | ) | | | $24,056 | | | | 121 | |
| | (28.41 | ) | | | 1.40 | | | | 1.41 | | | | (0.91 | ) | | | 36,107 | | | | 87 | |
| | 47.12 | | | | 1.36 | | | | 1.37 | | | | (1.29 | ) | | | 61,063 | | | | 102 | |
| | 51.19 | | | | 1.56 | | | | 1.56 | | | | (1.32 | ) | | | 11,747 | | | | 115 | |
| | 8.33 | | | | 1.66 | | | | 1.66 | | | | (1.48 | ) | | | 12,590 | | | | 94 | |
| | | | | | | | | | | | | | | | | | | | | | | |
| | (20.90 | ) | | | 2.12 | | | | 2.13 | | | | (1.91 | ) | | | 4,641 | | | | 121 | |
| | (28.91 | ) | | | 2.15 | | | | 2.16 | | | | (1.66 | ) | | | 6,827 | | | | 87 | |
| | 46.03 | | | | 2.12 | | | | 2.13 | | | | (2.05 | ) | | | 13,532 | | | | 102 | |
| | | | | | | | | | | | | | | | | | | | | | | |
| | 1.29 | (d) | | | 2.03 | (e) | | | 2.05 | (e) | | | (1.91 | )(e) | | | 849 | | | | 115 | (d) |
| | | | | | | | | | | | | | | | | | | | | | | |
| | (20.09 | ) | | | 1.12 | | | | 1.23 | | | | (0.90 | ) | | | 11,019 | | | | 121 | |
| | (28.19 | ) | | | 1.15 | | | | 1.25 | | | | (0.63 | ) | | | 41,545 | | | | 87 | |
| | 47.39 | | | | 1.12 | | | | 1.22 | | | | (1.05 | ) | | | 167,300 | | | | 102 | |
| | | | | | | | | | | | | | | | | | | | | | | |
| | 1.49 | (d) | | | 1.10 | (e) | | | 1.20 | (e) | | | (0.97 | )(e) | | | 12,089 | | | | 115 | (d) |
| | | | | | | | | | | | | | | | | | | | | | | |
| | (20.09 | ) | | | 1.11 | | | | 1.12 | | | | (0.91 | ) | | | 123,214 | | | | 121 | |
| | (28.19 | ) | | | 1.15 | | | | 1.16 | | | | (0.68 | ) | | | 149,122 | | | | 87 | |
| | 47.39 | | | | 1.11 | | | | 1.12 | | | | (1.03 | ) | | | 155,420 | | | | 102 | |
| | 51.47 | | | | 1.44 | | | | 1.45 | | | | (1.19 | ) | | | 90,725 | | | | 115 | |
| | 8.34 | | | | 1.66 | | | | 1.66 | | | | (1.48 | ) | | | 119,822 | | | | 94 | |
| | See Notes to Financial Statements. | 175 |
Financial Highlights (continued)
VALUE OPPORTUNITIES FUND
| | | | | | Per Share Operating Performance: |
| | | | | | Investment Operations: | | Distributions to
shareholders from: |
| | | Net asset
value,
beginning
of period | | Net
invest-
ment
income
(loss)(a) | | Net
realized
and
unrealized
gain (loss) | | Total
from
invest-
ment
opera-
tions | | Net
investment
income | | Net
realized
gain | | Total
distri-
butions |
| Class A | | | | | | | | | | | | | | | | | | | | | | | | | | | | |
| 10/31/2023 | | | $16.91 | | | | $0.05 | | | | $0.01 | | | | $0.06 | | | | $(0.11 | ) | | | $(1.34 | ) | | | $(1.45 | ) |
| 10/31/2022 | | | 23.70 | | | | 0.10 | | | | (4.01 | ) | | | (3.91 | ) | | | – | | | | (2.88 | ) | | | (2.88 | ) |
| 10/31/2021 | | | 16.98 | | | | 0.01 | | | | 7.76 | | | | 7.77 | | | | (0.05 | ) | | | (1.00 | ) | | | (1.05 | ) |
| 10/31/2020 | | | 18.62 | | | | 0.05 | | | | 0.39 | | | | 0.44 | | | | (0.07 | ) | | | (2.01 | ) | | | (2.08 | ) |
| 10/31/2019 | | | 19.50 | | | | 0.05 | | | | 0.84 | | | | 0.89 | | | | (0.01 | ) | | | (1.76 | ) | | | (1.77 | ) |
| Class C | | | | | | | | | | | | | | | | | | | | | | | | | | | | |
| 10/31/2023 | | | 13.75 | | | | (0.05 | ) | | | – | (c) | | | (0.05 | ) | | | – | | | | (1.34 | ) | | | (1.34 | ) |
| 10/31/2022 | | | 19.92 | | | | (0.03 | ) | | | (3.26 | ) | | | (3.29 | ) | | | – | | | | (2.88 | ) | | | (2.88 | ) |
| 10/31/2021 | | | 14.47 | | | | (0.13 | ) | | | 6.58 | | | | 6.45 | | | | – | | | | (1.00 | ) | | | (1.00 | ) |
| 10/31/2020 | | | 16.22 | | | | (0.06 | ) | | | 0.32 | | | | 0.26 | | | | – | | | | (2.01 | ) | | | (2.01 | ) |
| 10/31/2019 | | | 17.32 | | | | (0.07 | ) | | | 0.73 | | | | 0.66 | | | | – | | | | (1.76 | ) | | | (1.76 | ) |
| Class F | | | | | | | | | | | | | | | | | | | | | | | | | | | | |
| 10/31/2023 | | | 17.45 | | | | 0.09 | | | | (0.01 | )(d) | | | 0.08 | | | | (0.13 | ) | | | (1.34 | ) | | | (1.47 | ) |
| 10/31/2022 | | | 24.37 | | | | 0.14 | | | | (4.15 | ) | | | (4.01 | ) | | | (0.03 | ) | | | (2.88 | ) | | | (2.91 | ) |
| 10/31/2021 | | | 17.42 | | | | 0.04 | | | | 7.98 | | | | 8.02 | | | | (0.07 | ) | | | (1.00 | ) | | | (1.07 | ) |
| 10/31/2020 | | | 19.06 | | | | 0.07 | | | | 0.39 | | | | 0.46 | | | | (0.09 | ) | | | (2.01 | ) | | | (2.10 | ) |
| 10/31/2019 | | | 19.92 | | | | 0.08 | | | | 0.86 | | | | 0.94 | | | | (0.04 | ) | | | (1.76 | ) | | | (1.80 | ) |
| Class F3 | | | | | | | | | | | | | | | | | | | | | | | | | | | | |
| 10/31/2023 | | | 18.11 | | | | 0.11 | | | | – | (c) | | | 0.11 | | | | (0.16 | ) | | | (1.34 | ) | | | (1.50 | ) |
| 10/31/2022 | | | 25.16 | | | | 0.18 | | | | (4.29 | ) | | | (4.11 | ) | | | (0.06 | ) | | | (2.88 | ) | | | (2.94 | ) |
| 10/31/2021 | | | 17.95 | | | | 0.09 | | | | 8.21 | | | | 8.30 | | | | (0.09 | ) | | | (1.00 | ) | | | (1.09 | ) |
| 10/31/2020 | | | 19.56 | | | | 0.11 | | | | 0.41 | | | | 0.52 | | | | (0.12 | ) | | | (2.01 | ) | | | (2.13 | ) |
| 10/31/2019 | | | 20.38 | | | | 0.12 | | | | 0.88 | | | | 1.00 | | | | (0.06 | ) | | | (1.76 | ) | | | (1.82 | ) |
| Class I | | | | | | | | | | | | | | | | | | | | | | | | | | | | |
| 10/31/2023 | | | 17.93 | | | | 0.10 | | | | – | (c) | | | 0.10 | | | | (0.16 | ) | | | (1.34 | ) | | | (1.50 | ) |
| 10/31/2022 | | | 24.95 | | | | 0.15 | | | | (4.24 | ) | | | (4.09 | ) | | | (0.05 | ) | | | (2.88 | ) | | | (2.93 | ) |
| 10/31/2021 | | | 17.82 | | | | 0.06 | | | | 8.16 | | | | 8.22 | | | | (0.09 | ) | | | (1.00 | ) | | | (1.09 | ) |
| 10/31/2020 | | | 19.45 | | | | 0.09 | | | | 0.41 | | | | 0.50 | | | | (0.12 | ) | | | (2.01 | ) | | | (2.13 | ) |
| 10/31/2019 | | | 20.29 | | | | 0.10 | | | | 0.88 | | | | 0.98 | | | | (0.06 | ) | | | (1.76 | ) | | | (1.82 | ) |
| Class P | | | | | | | | | | | | | | | | | | | | | | | | | | | | |
| 10/31/2023 | | | 16.38 | | | | 0.02 | | | | (0.01 | )(d) | | | 0.01 | | | | (0.07 | ) | | | (1.34 | ) | | | (1.41 | ) |
| 10/31/2022 | | | 23.08 | | | | 0.06 | | | | (3.88 | ) | | | (3.82 | ) | | | – | | | | (2.88 | ) | | | (2.88 | ) |
| 10/31/2021 | | | 16.55 | | | | (0.03 | ) | | | 7.56 | | | | 7.53 | | | | (– | )(c) | | | (1.00 | ) | | | (1.00 | ) |
| 10/31/2020 | | | 18.20 | | | | 0.02 | | | | 0.37 | | | | 0.39 | | | | (0.03 | ) | | | (2.01 | ) | | | (2.04 | ) |
| 10/31/2019 | | | 19.13 | | | | 0.01 | | | | 0.82 | | | | 0.83 | | | | – | | | | (1.76 | ) | | | (1.76 | ) |
| Class R2 | | | | | | | | | | | | | | | | | | | | | | | | | | | | |
| 10/31/2023 | | | 15.78 | | | | (0.01 | ) | | | 0.01 | | | | – | | | | (0.05 | ) | | | (1.34 | ) | | | (1.39 | ) |
| 10/31/2022 | | | 22.37 | | | | 0.03 | | | | (3.74 | ) | | | (3.71 | ) | | | – | | | | (2.88 | ) | | | (2.88 | ) |
| 10/31/2021 | | | 16.09 | | | | (0.06 | ) | | | 7.34 | | | | 7.28 | | | | – | | | | (1.00 | ) | | | (1.00 | ) |
| 10/31/2020 | | | 17.75 | | | | (0.01 | ) | | | 0.37 | | | | 0.36 | | | | (0.01 | ) | | | (2.01 | ) | | | (2.02 | ) |
| 10/31/2019 | | | 18.72 | | | | (0.01 | ) | | | 0.80 | | | | 0.79 | | | | – | | | | (1.76 | ) | | | (1.76 | ) |
| 176 | See Notes to Financial Statements. |
| | | | | | | Ratios to Average Net Assets: | | Supplemental Data: |
| | | | | | | | | | | | | | | | | | | | |
Net
asset
value,
end of
period | | Total
return(b)
(%) | | Total
expenses
after
waivers
and/or reim-
bursements
(%) | | Total
expenses
(%) | | Net
invest-
ment
income
(loss)
(%) | | Net
assets,
end of
period
(000) | | Portfolio
turnover
rate
(%) |
| | | | | | | | | | | | | | | | | | | | | | | | | | | |
| $ | 15.52 | | | | 0.12 | | | | 1.18 | | | | 1.18 | | | | 0.31 | | | $ | 540,438 | | | | 19 | |
| | 16.91 | | | | (19.11 | ) | | | 1.16 | | | | 1.16 | | | | 0.53 | | | | 633,570 | | | | 40 | |
| | 23.70 | | | | 47.52 | | | | 1.15 | | | | 1.15 | | | | 0.04 | | | | 851,298 | | | | 56 | |
| | 16.98 | | | | 2.35 | | | | 1.18 | | | | 1.18 | | | | 0.29 | | | | 625,448 | | | | 36 | |
| | 18.62 | | | | 5.22 | | | | 1.18 | | | | 1.18 | | | | 0.29 | | | | 775,746 | | | | 51 | |
| | | | | | | | | | | | | | | | | | | | | | | | | | | |
| | 12.36 | | | | (0.70 | ) | | | 1.93 | | | | 1.93 | | | | (0.40 | ) | | | 28,372 | | | | 19 | |
| | 13.75 | | | | (19.70 | ) | | | 1.91 | | | | 1.91 | | | | (0.22 | ) | | | 45,211 | | | | 40 | |
| | 19.92 | | | | 46.42 | | | | 1.90 | | | | 1.90 | | | | (0.70 | ) | | | 76,310 | | | | 56 | |
| | 14.47 | | | | 1.57 | | | | 1.93 | | | | 1.93 | | | | (0.45 | ) | | | 63,709 | | | | 36 | |
| | 16.22 | | | | 4.48 | | | | 1.93 | | | | 1.93 | | | | (0.46 | ) | | | 142,020 | | | | 51 | |
| | | | | | | | | | | | | | | | | | | | | | | | | | | |
| | 16.06 | | | | 0.23 | | | | 1.02 | | | | 1.02 | | | | 0.53 | | | | 26,978 | | | | 19 | |
| | 17.45 | | | | (19.01 | ) | | | 1.01 | | | | 1.01 | | | | 0.71 | | | | 76,594 | | | | 40 | |
| | 24.37 | | | | 47.76 | | | | 1.00 | | | | 1.00 | | | | 0.19 | | | | 189,251 | | | | 56 | |
| | 17.42 | | | | 2.50 | | | | 1.03 | | | | 1.03 | | | | 0.44 | | | | 138,870 | | | | 36 | |
| | 19.06 | | | | 5.38 | | | | 1.03 | | | | 1.03 | | | | 0.45 | | | | 210,350 | | | | 51 | |
| | | | | | | | | | | | | | | | | | | | | | | | | | | |
| | 16.72 | | | | 0.40 | | | | 0.83 | | | | 0.83 | | | | 0.65 | | | | 172,839 | | | | 19 | |
| | 18.11 | | | | (18.83 | ) | | | 0.82 | | | | 0.82 | | | | 0.87 | | | | 194,437 | | | | 40 | |
| | 25.16 | | | | 48.05 | | | | 0.81 | | | | 0.81 | | | | 0.38 | | | | 255,539 | | | | 56 | |
| | 17.95 | | | | 2.69 | | | | 0.83 | | | | 0.83 | | | | 0.64 | | | | 200,055 | | | | 36 | |
| | 19.56 | | | | 5.61 | | | | 0.83 | | | | 0.83 | | | | 0.64 | | | | 260,948 | | | | 51 | |
| | | | | | | | | | | | | | | | | | | | | | | | | | | |
| | 16.53 | | �� | | 0.33 | | | | 0.93 | | | | 0.93 | | | | 0.56 | | | | 228,083 | | | | 19 | |
| | 17.93 | | | | (18.88 | ) | | | 0.91 | | | | 0.91 | | | | 0.75 | | | | 246,040 | | | | 40 | |
| | 24.95 | | | | 47.93 | | | | 0.89 | | | | 0.89 | | | | 0.28 | | | | 412,964 | | | | 56 | |
| | 17.82 | | | | 2.58 | | | | 0.93 | | | | 0.93 | | | | 0.54 | | | | 218,137 | | | | 36 | |
| | 19.45 | | | | 5.51 | | | | 0.93 | | | | 0.93 | | | | 0.54 | | | | 292,610 | | | | 51 | |
| | | | | | | | | | | | | | | | | | | | | | | | | | | |
| | 14.98 | | | | (0.16 | ) | | | 1.38 | | | | 1.38 | | | | 0.11 | | | | 10,682 | | | | 19 | |
| | 16.38 | | | | (19.25 | ) | | | 1.36 | | | | 1.36 | | | | 0.33 | | | | 12,663 | | | | 40 | |
| | 23.08 | | | | 47.19 | | | | 1.35 | | | | 1.35 | | | | (0.16 | ) | | | 17,141 | | | | 56 | |
| | 16.55 | | | | 2.18 | | | | 1.38 | | | | 1.38 | | | | 0.10 | | | | 16,560 | | | | 36 | |
| | 18.20 | | | | 5.05 | | | | 1.38 | | | | 1.38 | | | | 0.08 | | | | 22,113 | | | | 51 | |
| | | | | | | | | | | | | | | | | | | | | | | | | | | |
| | 14.39 | | | | (0.26 | ) | | | 1.53 | | | | 1.53 | | | | (0.04 | ) | | | 3,849 | | | | 19 | |
| | 15.78 | | | | (19.38 | ) | | | 1.51 | | | | 1.51 | | | | 0.19 | | | | 4,433 | | | | 40 | |
| | 22.37 | | | | 47.03 | | | | 1.50 | | | | 1.50 | | | | (0.30 | ) | | | 5,845 | | | | 56 | |
| | 16.09 | | | | 1.96 | | | | 1.53 | | | | 1.53 | | | | (0.06 | ) | | | 4,879 | | | | 36 | |
| | 17.75 | | | | 4.88 | | | | 1.53 | | | | 1.53 | | | | (0.07 | ) | | | 6,483 | | | | 51 | |
| | See Notes to Financial Statements. | 177 |
Financial Highlights (concluded)
VALUE OPPORTUNITIES FUND
| | | | | | Per Share Operating Performance: |
| | | | | | Investment Operations: | | Distributions to
shareholders from: |
| | | Net asset
value,
beginning
of period | | Net
invest-
ment
income
(loss)(a) | | Net
realized
and
unrealized
gain (loss) | | Total
from
invest-
ment
opera-
tions | | Net
investment
income | | Net
realized
gain | | Total
distri-
butions |
| Class R3 | | | | | | | | | | | | | | | | | | | | | | | | | | | | |
| 10/31/2023 | | | $16.10 | | | $ | 0.01 | | | $ | 0.01 | | | $ | 0.02 | | | | $(0.07 | ) | | | $(1.34 | ) | | | $(1.41 | ) |
| 10/31/2022 | | | 22.75 | | | | 0.05 | | | | (3.82 | ) | | | (3.77 | ) | | | – | | | | (2.88 | ) | | | (2.88 | ) |
| 10/31/2021 | | | 16.33 | | | | (0.04 | ) | | | 7.46 | | | | 7.42 | | | | – | | | | (1.00 | ) | | | (1.00 | ) |
| 10/31/2020 | | | 17.97 | | | | 0.01 | | | | 0.37 | | | | 0.38 | | | | (0.01 | ) | | | (2.01 | ) | | | (2.02 | ) |
| 10/31/2019 | | | 18.92 | | | | 0.01 | | | | 0.80 | | | | 0.81 | | | | – | | | | (1.76 | ) | | | (1.76 | ) |
| Class R4 | | | | | | | | | | | | | | | | | | | | | | | | | | | | |
| 10/31/2023 | | | 16.89 | | | | 0.05 | | | | – | (c) | | | 0.05 | | | | (0.11 | ) | | | (1.34 | ) | | | (1.45 | ) |
| 10/31/2022 | | | 23.67 | | | | 0.10 | | | | (4.00 | ) | | | (3.90 | ) | | | – | | | | (2.88 | ) | | | (2.88 | ) |
| 10/31/2021 | | | 16.95 | | | | 0.01 | | | | 7.75 | | | | 7.76 | | | | (0.04 | ) | | | (1.00 | ) | | | (1.04 | ) |
| 10/31/2020 | | | 18.60 | | | | 0.05 | | | | 0.37 | | | | 0.42 | | | | (0.06 | ) | | | (2.01 | ) | | | (2.07 | ) |
| 10/31/2019 | | | 19.47 | | | | 0.05 | | | | 0.85 | | | | 0.90 | | | | (0.01 | ) | | | (1.76 | ) | | | (1.77 | ) |
| Class R5 | | | | | | | | | | | | | | | | | | | | | | | | | | | | |
| 10/31/2023 | | | 17.94 | | | | 0.10 | | | | – | (c) | | | 0.10 | | | | (0.16 | ) | | | (1.34 | ) | | | (1.50 | ) |
| 10/31/2022 | | | 24.97 | | | | 0.16 | | | | (4.26 | ) | | | (4.10 | ) | | | (0.05 | ) | | | (2.88 | ) | | | (2.93 | ) |
| 10/31/2021 | | | 17.83 | | | | 0.06 | | | | 8.17 | | | | 8.23 | | | | (0.09 | ) | | | (1.00 | ) | | | (1.09 | ) |
| 10/31/2020 | | | 19.46 | | | | 0.09 | | | | 0.41 | | | | 0.50 | | | | (0.12 | ) | | | (2.01 | ) | | | (2.13 | ) |
| 10/31/2019 | | | 20.30 | | | | 0.10 | | | | 0.88 | | | | 0.98 | | | | (0.06 | ) | | | (1.76 | ) | | | (1.82 | ) |
| Class R6 | | | | | | | | | | | | | | | | | | | | | | | | | | | | |
| 10/31/2023 | | | 18.10 | | | | 0.11 | | | | – | (c) | | | 0.11 | | | | (0.16 | ) | | | (1.34 | ) | | | (1.50 | ) |
| 10/31/2022 | | | 25.14 | | | | 0.18 | | | | (4.28 | ) | | | (4.10 | ) | | | (0.06 | ) | | | (2.88 | ) | | | (2.94 | ) |
| 10/31/2021 | | | 17.93 | | | | 0.09 | | | | 8.21 | | | | 8.30 | | | | (0.09 | ) | | | (1.00 | ) | | | (1.09 | ) |
| 10/31/2020 | | | 19.55 | | | | 0.11 | | | | 0.40 | | | | 0.51 | | | | (0.12 | ) | | | (2.01 | ) | | | (2.13 | ) |
| 10/31/2019 | | | 20.37 | | | | 0.12 | | | | 0.88 | | | | 1.00 | | | | (0.06 | ) | | | (1.76 | ) | | | (1.82 | ) |
| (a) | Calculated using average shares outstanding during the period. |
| (b) | Total return for Classes A and C does not consider the effects of sales loads and assumes the reinvestment of all distributions. Total return for all other classes assumes the reinvestment of all distributions. |
| (c) | Amount is less than $0.01. |
| (d) | Realized and unrealized gain (loss) per share does not correlate to the aggregate of the net realized and unrealized gain(loss) in the Statement of Operations, primarily due to the timing of the sales and repurchases of the Fund’s shares in relation to fluctuating market values of the Fund’s portfolio. |
| 178 | See Notes to Financial Statements. |
| | | | | | | Ratios to Average Net Assets: | | Supplemental Data: |
| | | | | | | | | | | | | | | | | | | | |
Net
asset
value,
end of
period | | Total
return(b)
(%) | | Total
expenses
after
waivers
and/or reim-
bursements
(%) | | Total
expenses
(%) | | Net
invest-
ment
income
(loss)
(%) | | Net
assets,
end of
period
(000) | | Portfolio
turnover
rate
(%) |
| | | | | | | | | | | | | | | | | | | | | | | | | | | |
| | $14.71 | | | | (0.15 | ) | | | 1.43 | | | | 1.43 | | | | 0.07 | | | | $26,523 | | | | 19 | |
| | 16.10 | | | | (19.31 | ) | | | 1.41 | | | | 1.41 | | | | 0.28 | | | | 31,104 | | | | 40 | |
| | 22.75 | | | | 47.20 | | | | 1.40 | | | | 1.40 | | | | (0.20 | ) | | | 42,047 | | | | 56 | |
| | 16.33 | | | | 2.09 | | | | 1.43 | | | | 1.43 | | | | 0.05 | | | | 41,390 | | | | 36 | |
| | 17.97 | | | | 4.94 | | | | 1.43 | | | | 1.43 | | | | 0.04 | | | | 56,855 | | | | 51 | |
| | | | | | | | | | | | | | | | | | | | | | | | | | | |
| | 15.49 | | | | 0.05 | | | | 1.18 | | | | 1.18 | | | | 0.30 | | | | 26,011 | | | | 19 | |
| | 16.89 | | | | (19.09 | ) | | | 1.16 | | | | 1.16 | | | | 0.53 | | | | 29,341 | | | | 40 | |
| | 23.67 | | | | 47.50 | | | | 1.15 | | | | 1.15 | | | | 0.04 | | | | 42,666 | | | | 56 | |
| | 16.95 | | | | 2.34 | | | | 1.18 | | | | 1.18 | | | | 0.29 | | | | 34,990 | | | | 36 | |
| | 18.60 | | | | 5.27 | | | | 1.18 | | | | 1.18 | | | | 0.29 | | | | 43,879 | | | | 51 | |
| | | | | | | | | | | | | | | | | | | | | | | | | | | |
| | 16.54 | | | | 0.32 | | | | 0.93 | | | | 0.93 | | | | 0.55 | | | | 999 | | | | 19 | |
| | 17.94 | | | | (18.91 | ) | | | 0.91 | | | | 0.91 | | | | 0.77 | | | | 1,247 | | | | 40 | |
| | 24.97 | | | | 47.87 | | | | 0.90 | | | | 0.90 | | | | 0.28 | | | | 2,066 | | | | 56 | |
| | 17.83 | | | | 2.58 | | | | 0.93 | | | | 0.93 | | | | 0.55 | | | | 1,971 | | | | 36 | |
| | 19.46 | | | | 5.55 | | | | 0.93 | | | | 0.93 | | | | 0.52 | | | | 2,599 | | | | 51 | |
| | | | | | | | | | | | | | | | | | | | | | | | | | | |
| | 16.71 | | | | 0.40 | | | | 0.83 | | | | 0.83 | | | | 0.64 | | | | 29,050 | | | | 19 | |
| | 18.10 | | | | (18.80 | ) | | | 0.82 | | | | 0.82 | | | | 0.88 | | | | 32,138 | | | | 40 | |
| | 25.14 | | | | 48.02 | | | | 0.81 | | | | 0.81 | | | | 0.39 | | | | 44,123 | | | | 56 | |
| | 17.93 | | | | 2.69 | | | | 0.83 | | | | 0.83 | | | | 0.64 | | | | 29,402 | | | | 36 | |
| | 19.55 | | | | 5.62 | | | | 0.83 | | | | 0.83 | | | | 0.66 | | | | 40,149 | | | | 51 | |
| | See Notes to Financial Statements. | 179 |
Notes to Financial Statements
Lord Abbett Securities Trust (the “Trust”) is registered under the Investment Company Act of 1940, as amended (the “Act”), as an open-end management investment company and was organized as a Delaware statutory trust on February 26, 1993.
All funds are diversified except Lord Abbett Focused Growth Fund and Lord Abbett Focused Large Cap Value Fund. This report covers the following thirteen funds (separately, a “Fund” and collectively, the “Funds”) and their respective active share classes:
| Funds | | Classes |
| Lord Abbett Alpha Strategy Fund (“Alpha Strategy Fund”) | | A, C, F, F3, I, R2, R3, R4, R5 and R6 |
| Lord Abbett Focused Growth Fund (“Focused Growth Fund”) | | A, C, F, F3, I, R3, R4, R5 and R6 |
| Lord Abbett Focused Large Cap Value Fund (“Focused Large Cap Value Fund”) | | A, C, F, F3, I, R3, R4, R5 and R6 |
| Lord Abbett Focused Small Cap Value Fund (“Focused Small Cap Value Fund”) | | A, C, F, F3, I, R5 and R6 |
| Lord Abbett Fundamental Equity Fund (“Fundamental Equity Fund”) | | A, C, F, F3 I, P, R2, R3, R4, R5 and R6 |
| Lord Abbett Global Equity Fund (“Global Equity Fund”) | | A, C, F, F3, I, R3, R4, R5 and R6 |
| Lord Abbett Growth Leaders Fund (“Growth Leaders Fund”) | | A, C, F, F3, I, R2, R3, R4, R5 and R6 |
| Lord Abbett Health Care Fund (“Health Care Fund”) | | A, C, F, F3, I, R3, R4, R5 and R6 |
| Lord Abbett International Equity Fund (“International Equity Fund”) | | A, C, F, F3, I, P, R2, R3, R4, R5 and R6 |
| Lord Abbett International Opportunities Fund (“International Opportunities Fund”) | | A, C, F, F3, I, P, R2, R3, R4, R5 and R6 |
| Lord Abbett International Value Fund (“International Value Fund”) | | A, C, F, F3, I, R2, R3, R4, R5 and R6 |
| Lord Abbett Micro-Cap Growth Fund (“Micro Cap Growth Fund”) | | A, C, F and I |
| Lord Abbett Value Opportunities Fund (“Value Opportunities Fund”) | | A, C, F, F3, I, P, R2, R3, R4, R5 and R6 |
The Funds’ Class P shares are closed to substantially all investors, with certain exceptions as set forth in the Funds’ prospectus.
Each of Focused Large Cap Value Fund’s, Global Equity Fund’s, Health Care Fund’s and International Equity Fund’s investment objective is to seek long-term capital appreciation. Alpha Strategy Fund’s, Focused Small Cap Value Fund’s, International Opportunities Fund’s, Micro Cap Growth Fund’s and Value Opportunities Fund’s investment objective is long-term capital appreciation. Alpha Strategy Fund invests principally in other funds (“Underlying Funds”) managed by Lord, Abbett & Co. LLC (“Lord Abbett”). Fundamental Equity Fund’s investment objective is long-term growth of capital and income without excessive fluctuations in market value. Growth Leaders Fund’s and Focused Growth Fund’s investment objective is to seek capital appreciation. International Value Fund’s investment objective is to seek a high level of total return.
Each class of shares has different expenses and dividends. A front-end sales charge is normally added to the net asset value (“NAV”) for Class A shares. There is no front-end sales charge in the case of Class C, F, F3, I, P, R2, R3, R4, R5 and R6 shares, although there may be a contingent deferred sales charge (“CDSC”) in certain cases as follows: Class A shares purchased without a sales charge and redeemed before the first day of the month in which the one-year anniversary of the purchase falls (subject to certain exceptions as set forth in each Fund’s prospectus); and Class C shares redeemed before the first anniversary of purchase. Class C shares automatically convert to Class A shares on the 25th day of the month (or, if the 25th day is not a business day, the next business day thereafter) following the eighth anniversary of the month on which the purchase order was accepted, provided that the Fund or financial intermediary through which a shareholder purchased Class C shares has records verifying that the C shares have been held at least eight years.
180
Notes to Financial Statements (continued)
The preparation of the financial statements in conformity with accounting principles generally accepted in the United States of America (“U.S. GAAP”) requires management to make certain estimates and assumptions that affect the reported amounts of assets and liabilities and disclosure of contingent assets and liabilities at the date of the financial statements and the reported amounts of increases and decreases in net assets from operations during the reporting period. Actual results could differ from those estimates. These Funds are considered investment companies under U.S. GAAP and follow the accounting and reporting guidance applicable to investment companies.
| 2. | SIGNIFICANT ACCOUNTING POLICIES |
| (a) | Investment Valuation–Under procedures approved by the Funds’ Board of Trustees (the “Board”), the Board has designated the determination of fair value of the Funds’ portfolio investments to Lord Abbett, as its valuation designee. Accordingly, Lord Abbett is responsible for, among other things, assessing and managing valuation risks, establishing, applying and testing fair value methodologies, and evaluating pricing services. Lord Abbett has formed a Pricing Committee that performs these responsibilities on behalf of Lord Abbett, administers the pricing and valuation of portfolio investments and ensures that prices utilized reasonably reflect fair value. Among other things, these procedures allow Lord Abbett, subject to Board oversight, to utilize independent pricing services, quotations from securities and financial instrument dealers and other market sources to determine fair value. |
| | |
| | Securities actively traded on any recognized U.S. or non-U.S. exchange or on The NASDAQ Stock Market LLC are valued at the last sale price or official closing price on the exchange or system on which they are principally traded. Events occurring after the close of trading on non-U.S. exchanges may result in adjustments to the valuation of foreign securities to reflect their fair value as of the close of regular trading on the New York Stock Exchange (“NYSE”). When valuing foreign equity securities that meet certain criteria, the Pricing Committee uses a third-party fair valuation service that values such securities to reflect market trading that occurs after the close of the applicable foreign markets of comparable securities or other instruments that correlate to the fair-valued securities. Unlisted equity securities are valued at the last quoted sale price or, if no sale price is available, at the mean between the most recently quoted bid and ask prices. Exchange traded options and futures contracts are valued at the last quoted sale price in the market where they are principally traded. If no sale has occurred, the mean between the most recently quoted bid and ask prices is used. Swaps are valued daily using independent pricing services or quotations from broker/dealers to the extent available. Investments in the Underlying Funds are valued at their NAV each business day at the close of regular trading on the NYSE, normally 4:00 p.m. Eastern time. |
| | |
| | Securities for which prices are not readily available are valued at fair value as determined by the Pricing Committee. The Pricing Committee considers a number of factors, including observable and unobservable inputs, when arriving at fair value. The Pricing Committee may use related or comparable assets or liabilities, recent transactions, market multiples, book values, and other relevant information to determine the fair value of portfolio investments. The Board or a designated committee thereof periodically reviews reports that may include fair value determinations made by the Pricing Committee, related market activity, inputs and assumptions, and retrospective comparison of prices of subsequent purchases and sales transactions to fair value determinations made by the Pricing Committee. |
181
Notes to Financial Statements (continued)
| | Short-term securities with 60 days or less remaining to maturity are valued using the amortized cost method, which approximates fair value. Investments in open-end money market mutual funds are valued at their NAV as of the close of each business day. |
| | |
| (b) | Security Transactions–Security transactions are recorded as of the date that the securities are purchased or sold (trade date). Realized gains and losses on sales of portfolio securities are calculated using the identified-cost method. Realized and unrealized gains (losses) are allocated to each class of shares based upon the relative proportion of net assets at the beginning of the day. |
| | |
| (c) | Investment Income–Dividend income is recorded on the ex-dividend date. Interest income is recorded on the accrual basis as earned. Discounts are accreted and premiums are amortized using the effective interest method and are included in Interest and other, if applicable, in the Statements of Operations. Investment income is allocated to each class of shares based upon the relative proportion of net assets at the beginning of the day. |
| | |
| (d) | Income Taxes–It is the policy of each Fund to meet the requirements of Subchapter M of the Internal Revenue Code applicable to regulated investment companies and to distribute substantially all taxable income and capital gains to its shareholders. Therefore, no income tax provision is required. |
| | |
| | Each Fund files U.S. federal and various state and local tax returns. No income tax returns are currently under examination. The statute of limitations on each Fund’s filed U.S. federal tax returns remains open for the fiscal years ended October 31, 2020 through October 31, 2023. The statutes of limitations on the Trust’s state and local tax returns may remain open for an additional year depending upon the Funds’ jurisdiction. |
| | |
| (e) | Expenses–Expenses incurred by the Trust that do not specifically relate to an individual fund are generally allocated to the Funds within the Trust on a pro rata basis by relative net assets. Expenses, excluding class-specific expenses, are allocated to each class of shares based upon the relative proportion of net assets at the beginning of the day. In addition, Class F3 and R6 bear only their class-specific shareholder servicing expenses. Class A, C, F, P, R2, R3 and R4 shares bear their class-specific share of all expenses and fees relating to the Funds’ 12b-1 Distribution Plan. |
| | |
| (f) | Foreign Transactions–The books and records of each Fund are maintained in U.S. dollars and transactions denominated in foreign currencies are recorded in each Fund’s records at the rate prevailing when earned or recorded. Asset and liability accounts that are denominated in foreign currencies are adjusted daily to reflect current exchange rates and any unrealized gain (loss), if applicable, is included in Net change in unrealized appreciation/depreciation on translation of assets and liabilities denominated in foreign currencies in each Fund’s Statement of Operations. The resultant exchange gains and losses upon settlement of such transactions, if applicable, are included in Net realized gain (loss) on foreign currency related transactions in each Fund’s Statement of Operations. The Funds do not isolate that portion of the results of operations arising as a result of changes in the foreign exchange rates from the changes in market prices of the securities. |
| | |
| | Each Fund uses foreign currency exchange contracts to facilitate transactions in foreign-denominated securities. Losses from these transactions may arise from changes in the value of the foreign currency or if the counterparties do not perform under the contracts’ terms. |
182
Notes to Financial Statements (continued)
| (g) | Forward Foreign Currency Exchange Contracts–Each Fund may enter into forward foreign currency exchange contracts in order to reduce exposure to changes in foreign currency exchange rates on foreign portfolio holdings, or gain or reduce exposure to foreign currency solely for investment purposes. A forward foreign currency exchange contract is a commitment to purchase or sell a foreign currency at a future date at a negotiated rate. The contracts are valued daily at forward exchange rates and any unrealized gain (loss), if applicable, is included in Net change in unrealized appreciation/depreciation on forward foreign currency exchange contracts in each Fund’s Statement of Operations. The gain (loss) arising from the difference between the U.S. dollar cost of the original contract and the value of the forward foreign currency in U.S. dollars upon closing of such contracts is included, if applicable, in Net realized gain (loss) on forward foreign currency exchange contracts in each Fund’s Statement of Operations. |
| | |
| (h) | Futures Contracts–Each Fund may purchase and sell futures contracts to enhance returns, to attempt to economically hedge some of its investment risk, or as a substitute position in lieu of holding the underlying asset on which the instrument is based. At the time of entering into a futures transaction, an investor is required to deposit and maintain a specified amount of cash or eligible securities called “initial margin.” Subsequent payments made or received by the Funds called “variation margin” are made on a daily basis as the market price of the futures contract fluctuates. Each Fund will record an unrealized gain (loss) based on the amount of variation margin. When a contract is closed, a realized gain (loss) is recorded equal to the difference between the opening and closing value of the contract. |
| | |
| (i) | Repurchase Agreements–Each Fund may enter into repurchase agreements with respect to securities. A repurchase agreement is a transaction in which a fund acquires a security and simultaneously commits to resell that security to the seller (a bank or securities dealer) at an agreed-upon price on an agreed-upon date. Each Fund requires at all times that the repurchase agreement be collateralized by cash, or by securities of the U.S. Government, its agencies, its instrumentalities, or U.S. Government sponsored enterprises having a value equal to, or in excess of, the value of the repurchase agreement (including accrued interest). If the seller of the agreement defaults on its obligation to repurchase the underlying securities at a time when the fair value of these securities has declined, a Fund may incur a loss upon disposition of the securities. |
| | |
| (j) | When-Issued or Forward Transactions–Each Fund may purchase portfolio securities on a when-issued or forward basis. When-issued or forward transactions involve a commitment by a Fund to purchase securities, with payment and delivery (“settlement”) to take place in the future, in order to secure what is considered to be an advantageous price or yield at the time of entering into the transaction. During the period between purchase and settlement, the fair value of the securities will fluctuate and assets consisting of cash and/or marketable securities (normally short-term U.S. Government or U.S. Government sponsored enterprise securities) marked to market daily in an amount sufficient to make payment at settlement will be segregated at each Fund’s custodian in order to pay for the commitment. At the time each Fund makes the commitment to purchase a security on a when-issued basis, it will record the transaction and reflect the liability for the purchase and fair value of the security in determining its NAV. Each Fund, generally, has the ability to close out a purchase obligation on or before the settlement date rather than take delivery of the security. Under no circumstances will settlement for such securities take place more than 120 days after the purchase date. |
183
Notes to Financial Statements (continued)
| (k) | Total Return Swap Contracts–Each Fund may enter into total return swap contract agreements to obtain exposure to a security or market without owning such security or investing directly in that market. Each Fund may agree to make payments that are the equivalent of interest in exchange for the right to receive payments equivalent to any appreciation in the value of an underlying security, index or other asset, as well as receive payments equivalent to any distributions made on that asset, over the term of the swap contract. If the value of the asset underlying a total return swap contract declines over the term of the swap contract, each Fund also may be required to pay an amount equal to that decline in value to its counterparty. |
| | |
| (l) | Fair Value Measurements–Fair value is defined as the price that each Fund would receive upon selling an investment or transferring a liability in an orderly transaction to an independent buyer in the principal or most advantageous market of the investment. A three-tier hierarchy is used to maximize the use of observable market data and minimize the use of unobservable inputs and to establish classification of fair value measurements for disclosure purposes. Inputs refer broadly to the assumptions that market participants would use in pricing the asset or liability, including assumptions about risk - for example, the risk inherent in a particular valuation technique used to measure fair value (such as a pricing model) and/or the risk inherent in the inputs to the valuation technique. Inputs may be observable or unobservable. Observable inputs reflect the assumptions market participants would use in pricing the asset or liability. Observable inputs are based on market data obtained from sources independent of the reporting entity. Unobservable inputs reflect the reporting entity’s own assumptions about the assumptions market participants would use in pricing the asset or liability. Unobservable inputs are based on the best information available in the circumstances. The three-tier hierarchy classification is determined based on the lowest level of inputs that is significant to the fair value measurement, and is summarized in the three broad Levels listed below: |
| | • | Level 1 – | unadjusted quoted prices in active markets for identical investments; |
| | | | |
| | • | Level 2 – | other significant observable inputs (including quoted prices for similar investments, interest rates, prepayment speeds, credit risk, etc.); and |
| | | | |
| | • | Level 3 – | significant unobservable inputs (including each Fund’s own assumptions in determining the fair value of investments). |
| | A summary of inputs used in valuing each Fund’s investments as of October 31, 2023 and, if applicable, Level 3 rollforwards for the fiscal year then ended is included in each Fund’s Schedule of Investments. |
| | |
| | Changes in valuation techniques may result in transfers into or out of an assigned level within the three-tier hierarchy. The inputs or methodology used for valuing securities are not necessarily an indication of the risk associated with investing in those securities. |
| | |
| (m) | Foreign Taxes–The Funds may be subject to foreign taxes (a portion of which may be reclaimable) on income, stock dividend, capital gains on investments, or certain foreign currency transactions. All foreign taxes are recorded in accordance with the applicable tax regulations and rates that exist in foreign jurisdictions which each Fund invests. These foreign taxes, if any, are paid by each Fund and reflected in its Statement of Operations as follows: foreign taxes withheld at source are presented as a reduction of income, foreign taxes on securities lending income and foreign taxes on stock dividends are presented as a reduction of dividends, and foreign taxes on gains from sales of investments and foreign taxes on currency |
184
Notes to Financial Statements (continued)
| | transactions are included in their respective net realized gain (loss) categories. Foreign taxes payable or deferred as of October 31, 2023, if any, are disclosed on the Statements of Assets and Liabilities. |
| | |
| | The Funds file withholding tax reclaims in certain jurisdictions to recover a portion of amounts previously withheld. The Funds may record a reclaim receivable based on collectability, which includes factors such as the jurisdiction applicable to the laws, payment history and market convention. The Statements of Operations include tax reclaims recorded as well as professional and other fees, if any, associated with recovery of foreign withholding taxes. |
| 3. | MANAGEMENT FEE AND OTHER TRANSACTIONS WITH AFFILIATES |
Management Fee
The Trust has a management agreement with Lord Abbett, pursuant to which Lord Abbett provides each Fund with investment management services and executive and other personnel, provides office space and pays for ordinary and necessary office and clerical expenses relating to research and statistical work and supervision of each Fund’s investment portfolio. The management fee is accrued daily and payable monthly.
The management fee is based on each Fund’s average daily net assets at the following annual rates:
| * | | Lord Abbett is voluntarily waiving the entire management fee of .10%. Lord Abbett may discontinue the voluntary waiver at any time without notice. |
| Focused Growth Fund | |
| | |
| First $1 billion | .65% |
| Next $1 billion | .63% |
| Next $5 billion | .60% |
| Over $7 billion | .59% |
| | |
| Focused Large Cap Value Fund | |
| | |
| First $1 billion | .59% |
| Over $1 billion | .53% |
| | |
| Focused Small Cap Value Fund | .80% |
| | |
| Fundamental Equity Fund | |
| | |
| First $200 million | .75% |
| Next $300 million | .65% |
| Over $500 million | .50% |
| | |
| Global Equity Fund | |
| | |
| First $1 billion | .45% |
| Next $2 billion | .43% |
| Over $3 billion | .41% |
| | |
| Growth Leaders Fund | |
| | |
| First $2 billion | .55% |
| Over $2 billion | .50% |
| | |
| Health Care Fund | |
| | |
| First $1 billion | .62% |
| Over $1 billion | .51% |
185
Notes to Financial Statements (continued)
| International Equity Fund(1) | |
| | |
| First $1 billion | .45% |
| Over $1 billion | .40% |
| | |
| International Opportunities Fund | |
| | |
| First $1 billion | .75% |
| Next $1 billion | .70% |
| Over $2 billion | .65% |
| | |
| International Value Fund(1) | |
| | |
| First $1 billion | .50% |
| Over $1 billion | .48% |
| | |
| Micro Cap Growth Fund | .90% |
| | |
| Value Opportunities Fund | |
| | |
| First $1 billion | .75% |
| Next $1 billion | .70% |
| Next $3 billion | .65% |
| Over $5 billion | .58% |
| (1) | Prior to December 9, 2022, the management fee is based on the Fund’s average daily net assets at the following annual rates: |
| | First $1 billion | .70% | |
| | Next $1 billion | .65% | |
| | Over $2 billion | .60% | |
For the fiscal year ended October 31, 2023, the net effective management fee, net of any applicable waivers, was at the following annualized rate of each Fund’s average daily net assets:
| | Net Effective
Management Fee | |
| Alpha Strategy Fund | .00% | |
| Focused Growth Fund | .03% | |
| Focused Large Cap Value Fund | .00% | |
| Focused Small Cap Value Fund | .76% | |
| Fundamental Equity Fund | .55% | |
| Global Equity Fund | .00% | |
| Growth Leaders Fund | .52% | |
| Health Care Fund | .00% | |
| International Equity Fund | .47% | |
| International Opportunities Fund | .75% | |
| International Value Fund | .52% | |
| Micro Cap Growth Fund | .90% | |
| Value Opportunities Fund | .74% | |
186
Notes to Financial Statements (continued)
In addition, Lord Abbett provides certain administrative services to each Fund pursuant to an Administrative Services Agreement in return for a fee at an annual rate of .04 of each Fund’s average daily net assets. The fund administration fee is accrued daily and payable monthly. Lord Abbett voluntarily waived the following fund administration fees for the fiscal year ended October 31, 2023.
| Fund | Fund
Administration Fee | |
| Alpha Strategy Fund | $ | 40,882 | |
| Focused Growth Fund | | 5,163 | |
| Focused Large Cap Value Fund | | 6,648 | |
| Focused Small Cap Value Fund | | 7,455 | |
| Fundamental Equity Fund | | 6,586 | |
| Global Equity Fund | | 41,266 | |
| Growth Leaders Fund | | 35,919 | |
| Health Care Fund | | 1,072 | |
| International Equity Fund | | 117,851 | |
| International Opportunities Fund | | 110,759 | |
| International Value Fund | | 140,120 | |
| Micro Cap Growth Fund | | 16,561 | |
| Value Opportunities Fund | | 22,379 | |
For the fiscal year ended October 31, 2023, and continuing through February 29, 2024 (unless otherwise noted), Lord Abbett has contractually agreed to waive its fees and reimburse expenses to the extent necessary to limit total net annual operating expenses, excluding certain of the Funds’ expenses to the following annual rates:
| | | Effective March 1, 2023 | | Prior to March 1, 2023 |
| | | Classes | | Classes |
| Fund | | A, C, P, R2, R3,
R4 and R5 | F and I | | F3 and R6 | | A, C, P, R2, R3,
R4 and R5 | F and I | | F3 and R6 |
| Focused Growth Fund | | | .80 | % | | | .80 | % | | | .67 | % | | | .80 | % | | | .80 | % | | | .71 | % |
| Focused Large Cap Value Fund | | | .71 | % | | | .71 | % | | | .71 | % | | | .71 | % | | | .71 | % | | | .71 | % |
| Focused Small Cap Value Fund | | | 1.03 | % | | | 1.03 | % | | | .97 | % | | | 1.03 | % | | | 1.03 | % | | | 1.01 | % |
| Global Equity Fund | | | .65 | % | | | .65 | % | | | .58 | % | | | .65 | % | | | .65 | % | | | .58 | % |
| Health Care Fund | | | .78 | % | | | .78 | % | | | .61 | % | | | .78 | % | | | .78 | % | | | .66 | % |
| International Equity Fund(1) | | | – | % | | | – | % | | | – | % | | | .92 | % | | | .86 | % | | | .84 | % |
| International Value Fund(1) | | | – | % | | | – | % | | | – | % | | | .87 | % | | | .82 | % | | | .81 | % |
| (1) | | Effective March 1, 2023, the contractual fee waiver and expense reimbursement agreement was discontinued. |
All contractual fee waivers and expense reimbursement agreements between the Funds and Lord Abbett may be terminated only upon the approval of the Board.
187
Notes to Financial Statements (continued)
12b-1 Distribution Plan
Each Fund has adopted a distribution plan with respect to Class A, C, F, P, R2, R3 and R4 shares pursuant to Rule 12b-1 under the Act, which provides for the payment of ongoing distribution and service fees to Lord Abbett Distributor LLC (the “Distributor”), an affiliate of Lord Abbett. The distribution and service fees are accrued daily and paid monthly. The following annual rates have been authorized by the Board pursuant to the plan:
| Fees* | | Class A | | Class C | | Class F | (1)(2) | | Class P | (3) | Class R2 | | Class R3 | | Class R4 |
| Service | | .25% | | .25% | | – | | | .25% | | .25% | | .25% | | .25% |
| Distribution | | – | | .75% | | .10% | | | .20% | | .35% | | .25% | | – |
| * | | The Funds may designate a portion of the aggregate fee as attributable to service activities for purposes of calculating Financial Industry Regulatory Authority, Inc. sales charge limitations. |
| (1) | | The Class F shares Rule 12b-1 fee may be designated as a service fee in limited circumstances as described in the Funds’ prospectus. |
| (2) | | For the fiscal year ended October 31, 2023 and continuing through February 29, 2024, the Distributor has contractually agreed to waive Focused Growth Fund’s, Focused Large Cap Value Fund’s, Focused Small Cap Value Fund’s, Growth Leaders Fund’s, Health Care Fund’s and Micro Cap Growth Fund’s 0.10% Rule 12b-1 fee for Class F shares. These agreements may be terminated only by the Funds’ Board. |
| (3) | | Fundamental Equity Fund, International Equity Fund, International Opportunities Fund and Value Opportunities Fund only. |
Class F3, Class I, Class R5 and Class R6 shares do not have a distribution plan.
Commissions
The Distributor received the following commissions on sales of shares of the Funds, after concessions were paid to authorized dealers, for the fiscal year ended October 31, 2023:
| | | Distributor
Commissions | | | Dealers’
Concessions | |
| Alpha Strategy Fund | | $ | 26,817 | | | $ | 151,415 | |
| Focused Growth Fund | | | 5,825 | | | | 33,742 | |
| Focused Large Cap Value Fund | | | 3,965 | | | | 22,047 | |
| Focused Small Cap Value Fund | | | 3,546 | | | | 20,096 | |
| Fundamental Equity Fund | | | 40,357 | | | | 226,376 | |
| Global Equity Fund | | | 1,489 | | | | 8,083 | |
| Growth Leaders Fund | | | 301,153 | | | | 1,771,071 | |
| Health Care Fund | | | 2,315 | | | | 13,103 | |
| International Equity Fund | | | 13,653 | | | | 76,599 | |
| International Opportunities Fund | | | 6,824 | | | | 37,799 | |
| International Value Fund | | | 18,785 | | | | 108,807 | |
| Micro Cap Growth Fund | | | 1,836 | | | | 10,906 | |
| Value Opportunities Fund | | | 35,452 | | | | 200,655 | |
The Distributor received the following amounts of CDSCs for the fiscal year ended October 31, 2023:
| | | Class A | | | Class C | |
| Alpha Strategy Fund | | $ | 3,546 | | | $ | 2,364 | |
| Focused Growth Fund | | | – | | | | – | |
| Focused Large Cap Value Fund | | | – | | | | 543 | |
| Focused Small Cap Value Fund | | | 975 | | | | 452 | |
| Fundamental Equity Fund | | | 6,386 | | | | 559 | |
| Global Equity Fund | | | – | | | | 5 | |
| Growth Leaders Fund | | | 25,334 | | | | 33,777 | |
| Health Care Fund | | | – | | | | – | |
| International Equity Fund | | | 38,875 | | | | 105 | |
| International Opportunities Fund | | | 197 | | | | 112 | |
| International Value Fund | | | 671 | | | | 648 | |
| Micro Cap Growth Fund | | | – | | | | 139 | |
| Value Opportunities Fund | | | 1,421 | | | | 812 | |
188
Notes to Financial Statements (continued)
One Trustee and certain of the Trust’s officers have an interest in Lord Abbett.
Other Related Parties
As of October 31, 2023, the percentage of Focused Small Cap Value Fund’s, Fundamental Equity Fund’s, Growth Leaders Fund’s, International Equity Fund’s, International Opportunities Fund’s, International Value Fund’s, Micro Cap Growth Fund’s and Value Opportunities Fund’s outstanding shares owned by each Fund of Funds were as follows:
| Fund of Funds | | Focused
Small Cap
Value Fund | | Funda-
mental
Equity
Fund | | Growth
Leaders
Fund | | Inter-
national
Equity
Fund | | Inter-
national
Oppor-
tunities
Fund | | Inter-
national
Value
Fund | | Micro
Cap
Growth
Fund | | Value
Oppor-
tunities
Fund |
| Alpha Strategy Fund | | 54.83% | | – | | – | | – | | 37.28% | | – | | 28.14% | | 9.58% |
| Multi-Asset Balanced Opportunity Fund | | – | | 19.03% | | 3.29% | | 26.21% | | – | | 19.16% | | – | | – |
| Multi-Asset Income Fund | | – | | 4.77% | | 0.71% | | 12.73% | | – | | 8.61% | | – | | – |
| 4. | DISTRIBUTIONS AND TAX INFORMATION |
Dividends are paid from net investment income, if any. Capital gain distributions are paid from taxable net realized gains from investments transactions, reduced by allowable capital loss carryforwards, if any. The capital loss carryforward amount, if any, is available to offset future net capital gains. Dividends and distributions to shareholders are recorded on the ex-dividend date. The amounts of dividends and distributions from net investment income and net realized capital gains are determined in accordance with federal income tax regulations, which may differ from U.S. GAAP. These book/tax differences are either considered temporary or permanent in nature. To the extent these differences are permanent in nature, such amounts are reclassified within the components of net assets based on their federal tax basis treatment; temporary differences do not require reclassification. Dividends and distributions, which exceed earnings and profits for tax purposes, are reported as a tax return of capital.
The tax character of distributions paid during the fiscal year ended October 31, 2023 was as follows:
Fund | | Tax-Exempt
Income | | | Ordinary
Income | | | Net
Long-Term
Capital Gains | | | Return of
Capital | | | Total
Distributions
Paid | |
| Alpha Strategy Fund | | $ | – | | | | $ 2,368,621 | | | | $ 39,382,468 | | | $ | – | | | $ | 41,751,089 | |
| Focused Large Cap Value Fund | | | – | | | | 250,005 | | | | – | | | | 5,968,183 | | | | 6,218,188 | |
| Focused Small Cap Value Fund | | | – | | | | 748,091 | | | | 4,263,823 | | | | – | | | | 5,011,914 | |
| Fundamental Equity Fund | | | – | | | | 23,756,230 | | | | 79,919,869 | | | | – | | | | 103,676,099 | |
| Global Equity Fund | | | – | | | | 85,692 | | | | 3,481 | | | | – | | | | 89,173 | |
| Health Care Fund | | | – | | | | 6,131 | | | | – | | | | – | | | | 6,131 | |
| International Equity Fund | | | – | | | | 6,337,912 | | | | – | | | | – | | | | 6,337,912 | |
| International Opportunities Fund | | | – | | | | 5,793,915 | | | | – | | | | – | | | | 5,793,915 | |
| International Value Fund | | | – | | | | 11,229,780 | | | | – | | | | – | | | | 11,229,780 | |
| Value Opportunities Fund | | | – | | | | 9,033,085 | | | | 100,780,285 | | | | – | | | | 109,813,370 | |
189
Notes to Financial Statements (continued)
The tax character of distributions paid during the fiscal year ended October 31, 2022 was as follows:
| Fund | | Tax-Exempt
Income | | | Ordinary
Income | | | Net
Long-Term
Capital Gains | | | Return of
Capital | | | Total
Distributions
Paid | |
| Alpha Strategy Fund | | $ | – | | | | $ 12,006,583 | | | $ | 32,798,605 | | | $ | – | | | $ | 44,805,188 | |
| Focused Growth Fund | | | – | | | | 5,658,041 | | | | 1,575,680 | | | | – | | | | 7,233,721 | |
| Focused Large Cap Value Fund | | | – | | | | 126,421,078 | | | | 25,264,481 | | | | – | | | | 151,685,559 | |
| Focused Small Cap Value Fund | | | – | | | | 13,325,327 | | | | 8,108,524 | | | | – | | | | 21,433,851 | |
| Fundamental Equity Fund | | | – | | | | 19,219,878 | | | | 209,608,998 | | | | – | | | | 228,828,876 | |
| Global Equity Fund | | | – | | | | 965,362 | | | | 660,919 | | | | – | | | | 1,626,281 | |
| Growth Leaders Fund | | | – | | | | 684,518,562 | | | | 1,278,899,243 | | | | – | | | | 1,963,417,805 | |
| Health Care Fund | | | – | | | | 143,097 | | | | 385,484 | | | | – | | | | 528,581 | |
| International Equity Fund | | | – | | | | 5,415,746 | | | | 40,771,804 | | | | – | | | | 46,187,550 | |
| International Opportunities Fund | | | – | | | | 10,755,670 | | | | – | | | | – | | | | 10,755,670 | |
| International Value Fund | | | – | | | | 25,093,884 | | | | – | | | | – | | | | 25,093,884 | |
| Value Opportunities Fund | | | – | | | | 27,557,855 | | | | 205,400,944 | | | | – | | | | 232,958,799 | |
As of October 31, 2023, the components of accumulated earnings/(losses) on a tax basis were as follows:
| Fund | | Undistributed
Tax-Exempt
Income | | | Undistributed
Ordinary
Income | | | Undistributed
Net
Long-Term
Capital Gains | | | Accumulated
Capital and
Other Losses | | | Unrealized
Appreciation/
(Depreciation)* | | | Other
Temporary
Differences | | | Total
Accumulated
Earnings/
(Losses) -
Net | |
| Alpha Strategy Fund | | $ | – | | | $ | – | | | $ | 2,343,120 | | | $ | (1,945,049 | ) | | $ | (120,711,269 | ) | | $ | (126,938 | ) | | $ | (120,440,136 | ) |
| Focused Growth Fund | | | – | | | | – | | | | – | | | | (12,067,109 | ) | | | 4,356,368 | | | | (6,974 | ) | | | (7,717,715 | ) |
| Focused Large Cap Value Fund | | | – | | | | – | | | | – | | | | (1,058,107 | ) | | | 675,025 | | | | (22,185 | ) | | | (405,267 | ) |
| Focused Small Cap Value Fund | | | – | | | | 181,693 | | | | – | | | | (1,291,793 | ) | | | (2,727,459 | ) | | | (18,387 | ) | | | (3,855,946 | ) |
| Fundamental Equity Fund | | | – | | | | 14,603,403 | | | | – | | | | – | | | | 252,276,276 | | | | (486,579 | ) | | | 266,393,100 | |
| Global Equity Fund | | | – | | | | 146,005 | | | | – | | | | (396,216 | ) | | | 832,782 | | | | (906 | ) | | | 581,665 | |
| Growth Leaders Fund | | | – | | | | – | | | | – | | | | (1,631,954,650 | ) | | | 673,355,099 | | | | (460,887 | ) | | | (959,060,438 | ) |
| Health Care Fund | | | – | | | | – | | | | – | | | | (1,184,609 | ) | | | 309,460 | | | | (3,086 | ) | | | (878,235 | ) |
| International Equity Fund | | | – | | | | 5,668,971 | | | | – | | | | (14,878,866 | ) | | | 12,967,414 | | | | (89,868 | ) | | | 3,667,651 | |
| International Opportunities Fund | | | – | | | | 4,439,883 | | | | – | | | | (51,404,467 | ) | | | (22,656,546 | ) | | | (71,230 | ) | | | (69,692,360 | ) |
| International Value Fund | | | – | | | | 1,560,399 | | | | – | | | | (417,017,529 | ) | | | (14,510,009 | ) | | | (132,643 | ) | | | (430,099,782 | ) |
| Micro Cap Growth Fund | | | – | | | | – | | | | – | | | | (97,492,293 | ) | | | 11,611,704 | | | | (22,385 | ) | | | (85,902,974 | ) |
| Value Opportunities Fund | | | – | | | | 2,929,770 | | | | 13,630,428 | | | | – | | | | 102,741,010 | | | | (309,901 | ) | | | 118,991,307 | |
| * | | The difference between book-basis and tax-basis unrealized appreciation/(depreciation) is attributable to the tax treatment of certain securities, certain distributions, other financial instruments, and wash sales. |
190
Notes to Financial Statements (continued)
Net capital losses recognized by the Funds may be carried forward indefinitely and retain their character as short-term and/or long-term losses. Capital losses incurred that will be carried forward are as follows:
| Fund | | Short-Term
Losses | | | Long-Term
Losses | | | Net Capital
Losses | |
| Focused Growth Fund | | $ | (11,636,663 | ) | | $ | (241,079 | ) | | $ | (11,877,742 | ) |
| Focused Large Cap Value Fund | | | (117,980 | ) | | | (940,127 | ) | | | (1,058,107 | ) |
| Focused Small Cap Value Fund | | | – | | | | (1,291,793 | ) | | | (1,291,793 | ) |
| Global Equity Fund | | | (147,657 | ) | | | (248,559 | ) | | | (396,216 | ) |
| Growth Leaders Fund | | | (1,599,701,673 | ) | | | (8,825,999 | ) | | | (1,608,527,672 | ) |
| Health Care Fund | | | (1,061,074 | ) | | | (119,940 | ) | | | (1,181,014 | ) |
| International Equity Fund | | | (14,878,866 | ) | | | – | | | | (14,878,866 | ) |
| International Opportunities Fund | | | (27,951,304 | ) | | | (23,453,163 | ) | | | (51,404,467 | ) |
| International Value Fund | | | (210,739,284 | ) | | | (206,278,245 | ) | | | (417,017,529 | ) |
| Micro Cap Growth Fund | | | (95,738,863 | ) | | | – | | | | (95,738,863 | ) |
At the Fund’s election, certain losses incurred within the taxable year are deemed to arise on the first business day of the Fund’s next taxable year. The Funds incurred and will elect to defer qualified late-year ordinary losses and/or post-October capital losses as follows:
| Fund | | Late-Year
Ordinary Losses | | | Short-Term
Losses | | | Long-Term
Losses | |
| Alpha Strategy Fund | | $ | (1,945,049 | ) | | $ | – | | | $ | – | |
| Focused Growth Fund | | | (189,367 | ) | | | – | | | | – | |
| Growth Leaders Fund | | | (23,426,978 | ) | | | – | | | | – | |
| Health Care Fund | | | (3,595 | ) | | | – | | | | – | |
| Micro Cap Growth Fund | | | (1,753,430 | ) | | | – | | | | – | |
As of October 31, 2023, the tax cost of investments and the breakdown of unrealized appreciation/(depreciation) for each Fund were as follows:
| Fund | | Tax Cost of
Investments | | | Gross
Unrealized
Appreciation | | | Gross
Unrealized
Depreciation | | | Net
Unrealized
Appreciation/
(Depreciation) | |
| Alpha Strategy Fund | | $ | 652,948,807 | | | $ | – | | | $ | (120,711,269 | ) | | $ | (120,711,269 | ) |
| Focused Growth Fund | | | 26,330,165 | | | | 4,933,297 | | | | (576,929 | ) | | | 4,356,368 | |
| Focused Large Cap Value Fund | | | 18,212,124 | | | | 2,150,063 | | | | (1,475,324 | ) | | | 674,739 | |
| Focused Small Cap Value Fund | | | 102,200,070 | | | | 13,199,764 | | | | (15,926,486 | ) | | | (2,726,722 | ) |
| Fundamental Equity Fund | | | 1,495,948,635 | | | | 376,243,643 | | | | (123,965,839 | ) | | | 252,277,804 | |
| Global Equity Fund | | | 13,074,381 | | | | 2,040,465 | | | | (1,207,442 | ) | | | 833,023 | |
| Growth Leaders Fund | | | 4,104,043,761 | | | | 751,488,740 | | | | (78,133,641 | ) | | | 673,355,099 | |
| Health Care Fund | | | 6,696,462 | | | | 934,680 | | | | (625,237 | ) | | | 309,443 | |
| International Equity Fund | | | 283,090,278 | | | | 29,629,184 | | | | (16,438,784 | ) | | | 13,190,400 | |
| International Opportunities Fund | | | 314,224,428 | | | | 22,333,997 | | | | (44,627,756 | ) | | | (22,293,759 | ) |
| International Value Fund | | | 373,030,629 | | | | 22,738,468 | | | | (37,191,901 | ) | | | (14,453,433 | ) |
| Micro Cap Growth Fund | | | 157,579,483 | | | | 27,378,897 | | | | (15,767,193 | ) | | | 11,611,704 | |
| Value Opportunities Fund | | | 991,888,729 | | | | 216,032,181 | | | | (113,291,171 | ) | | | 102,741,010 | |
191
Notes to Financial Statements (continued)
Permanent items identified, as shown below, have been reclassified among the components of net assets based on their tax treatment. The permanent differences are primarily attributable to tax treatment of net investment loss and certain distributions.
| Fund | | Total Distributable
Earnings (Losses) | | | Paid-in Capital | |
| Alpha Strategy Fund | | $ | (1,229,490 | ) | | $ | 1,229,490 | |
| Focused Growth Fund | | | 204,548 | | | | (204,548 | ) |
| Focused Large Cap Value Fund | | | 81,823 | | | | (81,823 | ) |
| Fundamental Equity Fund | | | (14,644 | ) | | | 14,644 | |
| Growth Leaders Fund | | | 22,859,798 | | | | (22,859,798 | ) |
| Micro Cap Growth Fund | | | 125,781 | | | | (125,781 | ) |
| Value Opportunities Fund | | | (1,980,919 | ) | | | 1,980,919 | |
| 5. | PORTFOLIO SECURITIES TRANSACTIONS |
Purchases and sales of investment securities (excluding short-term investments) for the fiscal year ended October 31, 2023 were as follows:
| | | Purchases | | | Sales | |
| Alpha Strategy Fund | | $ | 25,118,803 | | | $ | 113,733,449 | |
| Focused Growth Fund | | | 54,855,313 | | | | 57,910,762 | |
| Focused Large Cap Value Fund | | | 13,216,313 | | | | 12,663,413 | |
| Focused Small Cap Value Fund | | | 64,939,361 | | | | 94,932,939 | |
| Fundamental Equity Fund | | | 501,083,910 | | | | 689,549,596 | |
| Global Equity Fund | | | 11,559,626 | | | | 7,601,325 | |
| Growth Leaders Fund | | | 6,181,477,707 | | | | 7,264,351,958 | |
| Health Care Fund | | | 6,361,799 | | | | 5,279,711 | |
| International Equity Fund | | | 326,565,328 | | | | 333,629,828 | |
| International Opportunities Fund | | | 121,067,717 | | | | 167,861,704 | |
| International Value Fund | | | 172,220,132 | | | | 199,075,726 | |
| Micro Cap Growth Fund | | | 260,089,050 | | | | 287,722,398 | |
| Value Opportunities Fund | | | 230,043,889 | | | | 423,339,558 | |
There were no purchases or sales of U.S. Government securities for the fiscal year ended October 31, 2023.
Each Fund is permitted to purchase and sell securities (“cross-trade”) from and to other Lord Abbett funds or client accounts pursuant to procedures approved by the Board in compliance with Rule 17a-7 under the Act (the “Rule”). Each cross-trade is executed at a fair market price in compliance with provisions of the Rule. For the fiscal year ended October 31, 2023, the following Funds engaged in cross trades:
| Fund | | Purchases | | | Sales | | | Gain (Loss) | |
| Focused Growth Fund | | $ | 45,212 | | | $ | – | | | $ | – | |
| Focused Large Cap Value Fund | | | – | | | | 26,566 | | | | (1,822 | ) |
| Fundamental Equity Fund | | | – | | | | 1,333,454 | | | | (45,064 | ) |
| Growth Leaders Fund | | | 3,535,717 | | | | – | | | | – | |
| International Equity Fund | | | 153,714 | | | | – | | | | – | |
| International Value Fund | | | – | | | | 153,714 | | | | 65,986 | |
| Micro Cap Growth Fund | | | 1,498,051 | | | | – | | | | – | |
192
Notes to Financial Statements (continued)
| 6. | DISCLOSURES ABOUT OFFSETTING ASSETS AND LIABILITIES |
The Financial Accounting Standards Board requires disclosures intended to help better assess the effect or potential effect of offsetting arrangements on a fund’s financial position. The following tables illustrate gross and net information about recognized assets and liabilities eligible for offset in the Statements of Assets and Liabilities; and disclose such amounts subject to an enforceable master netting agreement or similar agreement, by the counterparty. A master netting agreement is an agreement between a fund and the counterparty which provides for the net settlement of amounts owed under all contracts traded under that agreement, as well as cash collateral, through a single payment by one party to the other in the event of default on or termination of any one contract. The Funds’ accounting policy with respect to balance sheet offsetting is that, absent an event of default by the counterparty or a termination of the agreement, the master netting agreement does not result in an offset of reported amounts of financial assets and liabilities in the Statements of Assets and Liabilities across transactions between the Funds and the applicable counterparty:
| | | | | | Alpha Strategy Fund | |
| Description | | Gross Amounts of
Recognized Assets | | | Gross Amounts
Offset in the
Statement of Assets
and Liabilities | | | Net Amounts of
Assets Presented
in the Statement of
Assets and Liabilities | |
| Repurchase Agreements | | $ | 555,994 | | | $ | – | | | $ | 555,994 | |
| Total | | $ | 555,994 | | | $ | – | | | $ | 555,994 | |
| | | Net Amount
of Assets
Presented in | | | Amounts Not Offset in the
Statement of Assets and Liabilities | | | |
| Counterparty | | the Statement
of Assets and
Liabilities | | | Financial
Instruments | | | Cash
Collateral
Received(a) | | | Securities
Collateral
Received(a) | | | Net
Amount | |
| Fixed Income Clearing Corp. | | $ | 555,994 | | | $ | – | | | $ | – | | | $ | (555,994 | ) | | $ | – | |
| Total | | $ | 555,994 | | | $ | – | | | $ | – | | | $ | (555,994 | ) | | $ | – | |
| | | | | | Focused Growth Fund | |
| Description | | Gross Amounts of
Recognized Assets | | | Gross Amounts
Offset in the
Statement of Assets
and Liabilities | | | Net Amounts of
Assets Presented
in the Statement of
Assets and Liabilities | |
| Repurchase Agreements | | $ | 177,290 | | | $ | – | | | $ | 177,290 | |
| Total | | $ | 177,290 | | | $ | – | | | $ | 177,290 | |
| | | Net Amount
of Assets
Presented in | | | Amounts Not Offset in the
Statement of Assets and Liabilities | | | | |
| Counterparty | | the Statement
of Assets and
Liabilities | | | Financial
Instruments | | | Cash
Collateral
Received(a) | | | Securities
Collateral
Received(a) | | | Net
Amount(b) | |
| Fixed Income Clearing Corp. | | $ | 177,290 | | | $ | – | | | $ | – | | | $ | (177,290 | ) | | $ | – | |
| Total | | $ | 177,290 | | | $ | – | | | $ | – | | | $ | (177,290 | ) | | $ | – | |
193
Notes to Financial Statements (continued)
| | | | | | Focused Small Cap Value Fund | |
| Description | | Gross Amounts of
Recognized Assets | | | Gross Amounts
Offset in the
Statement of Assets
and Liabilities | | | Net Amounts of
Assets Presented
in the Statement of
Assets and Liabilities | |
| Repurchase Agreements | | $ | 809,295 | | | $ | – | | | $ | 809,295 | |
| Total | | $ | 809,295 | | | $ | – | | | $ | 809,295 | |
| | | Net Amount
of Assets
Presented in | | | Amounts Not Offset in the
Statement of Assets and Liabilities | | | |
| Counterparty | | the Statement
of Assets and
Liabilities | | | Financial
Instruments | | | Cash
Collateral
Received(a) | | | Securities
Collateral
Received(a) | | | Net
Amount(b) | |
| Fixed Income Clearing Corp. | | $ | 809,295 | | | $ | – | | | $ | – | | | $ | (809,295 | ) | | $ | – | |
| Total | | $ | 809,295 | | | $ | – | | | $ | – | | | $ | (809,295 | ) | | $ | – | |
| | | | | | Fundamental Equity Fund | |
| Description | | Gross Amounts of
Recognized Assets | | | Gross Amounts
Offset in the
Statement of Assets
and Liabilities | | | Net Amounts of
Assets Presented
in the Statement of
Assets and Liabilities | |
| Repurchase Agreements | | $ | 16,017,952 | | | $ | – | | | $ | 16,017,952 | |
| Total | | $ | 16,017,952 | | | $ | – | | | $ | 16,017,952 | |
| | | Net Amount
of Assets
Presented in | | | Amounts Not Offset in the
Statement of Assets and Liabilities | | | |
| Counterparty | | the Statement
of Assets and
Liabilities | | | Financial
Instruments | | | Cash
Collateral
Received(a) | | | Securities
Collateral
Received(a) | | | Net
Amount(b) | |
| Fixed Income Clearing Corp. | | $ | 16,017,952 | | | $ | – | | | $ | – | | | $ | (16,017,952 | ) | | $ | – | |
| Total | | $ | 16,017,952 | | | $ | – | | | $ | – | | | $ | (16,017,952 | ) | | $ | – | |
| | | | | | Global Equity Fund | |
| Description | | Gross Amounts of
Recognized Assets | | | Gross Amounts
Offset in the
Statement of Assets
and Liabilities | | | Net Amounts of
Assets Presented
in the Statement of
Assets and Liabilities | |
| Repurchase Agreements | | $ | 144,851 | | | $ | – | | | $ | 144,851 | |
| Total | | $ | 144,851 | | | $ | – | | | $ | 144,851 | |
| | | Net Amount
of Assets
Presented in | | | Amounts Not Offset in the
Statement of Assets and Liabilities | | | |
| Counterparty | | the Statement
of Assets and
Liabilities | | | Financial
Instruments | | | Cash
Collateral
Received(a) | | | Securities
Collateral
Received(a) | | | Net
Amount(b) | |
| Fixed Income Clearing Corp. | | $ | 144,851 | | | $ | – | | | $ | – | | | $ | (144,851 | ) | | $ | – | |
| Total | | $ | 144,851 | | | $ | – | | | $ | – | | | $ | (144,851 | ) | | $ | – | |
194
Notes to Financial Statements (continued)
| | | | | | Growth Leaders Fund | |
| Description | | Gross Amounts of
Recognized Assets | | | Gross Amounts
Offset in the
Statement of Assets
and Liabilities | | | Net Amounts of
Assets Presented
in the Statement of
Assets and Liabilities | |
| Repurchase Agreements | | $ | 71,933,220 | | | $ | – | | | $ | 71,933,220 | |
| Total | | $ | 71,933,220 | | | $ | – | | | $ | 71,933,220 | |
| | | Net Amount
of Assets
Presented in | | | Amounts Not Offset in the
Statement of Assets and Liabilities | | | |
| Counterparty | | the Statement
of Assets and
Liabilities | | | Financial
Instruments | | | Cash
Collateral
Received(a) | | | Securities
Collateral
Received(a) | | | Net
Amount(b) | |
| Fixed Income Clearing Corp. | | $ | 71,933,220 | | | $ | – | | | $ | – | | | $ | (71,933,220 | ) | | $ | – | |
| Total | | $ | 71,933,220 | | | $ | – | | | $ | – | | | $ | (71,933,220 | ) | | $ | – | |
| | | | | | Health Care Fund | |
| Description | | Gross Amounts of
Recognized Assets | | | Gross Amounts
Offset in the
Statement of Assets
and Liabilities | | | Net Amounts of
Assets Presented
in the Statement of
Assets and Liabilities | |
| Repurchase Agreements | | $ | 356,867 | | | $ | – | | | $ | 356,867 | |
| Total | | $ | 356,867 | | | $ | – | | | $ | 356,867 | |
| | | Net Amount
of Assets
Presented in | | | Amounts Not Offset in the
Statement of Assets and Liabilities | | | |
| Counterparty | | the Statement
of Assets and
Liabilities | | | Financial
Instruments | | | Cash
Collateral
Received(a) | | | Securities
Collateral
Received(a) | | | Net
Amount(b) | |
| Fixed Income Clearing Corp. | | $ | 356,867 | | | $ | – | | | $ | – | | | $ | (356,867 | ) | | $ | – | |
| Total | | $ | 356,867 | | | $ | – | | | $ | – | | | $ | (356,867 | ) | | $ | – | |
| | | | | | International Equity Fund | |
| Description | | Gross Amounts of
Recognized Assets | | | Gross Amounts
Offset in the
Statement of Assets
and Liabilities | | | Net Amounts of
Assets Presented
in the Statement of
Assets and Liabilities | |
| Repurchase Agreements | | $ | 18,707,930 | | | $ | – | | | $ | 18,707,930 | |
| Total | | $ | 18,707,930 | | | $ | – | | | $ | 18,707,930 | |
| | | Net Amount
of Assets
Presented in | | | Amounts Not Offset in the
Statement of Assets and Liabilities | | | |
| Counterparty | | the Statement
of Assets and
Liabilities | | | Financial
Instruments | | | Cash
Collateral
Received(a) | | | Securities
Collateral
Received(a) | | | Net
Amount(b) | |
| Fixed Income Clearing Corp. | | $ | 18,707,930 | | | $ | – | | | $ | – | | | $ | (18,707,930 | ) | | $ | – | |
| Total | | $ | 18,707,930 | | | $ | – | | | $ | – | | | $ | (18,707,930 | ) | | $ | – | |
195
Notes to Financial Statements (continued)
| | | | | | International Opportunities Fund | |
| Description | | Gross Amounts of
Recognized Assets | | | Gross Amounts
Offset in the
Statement of Assets
and Liabilities | | | Net Amounts of
Assets Presented
in the Statement of
Assets and Liabilities | |
| Repurchase Agreements | | $ | 17,620,130 | | | $ | – | | | $ | 17,620,130 | |
| Total | | $ | 17,620,130 | | | $ | – | | | $ | 17,620,130 | |
| | | Net Amount
of Assets
Presented in | | | Amounts Not Offset in the
Statement of Assets and Liabilities | | | |
| Counterparty | | the Statement
of Assets and
Liabilities | | | Financial
Instruments | | | Cash
Collateral
Received(a) | | | Securities
Collateral
Received(a) | | | Net
Amount(b) | |
| Fixed Income Clearing Corp. | | $ | 17,620,130 | | | $ | – | | | $ | – | | | $ | (17,620,130 | ) | | $ | – | |
| Total | | $ | 17,620,130 | | | $ | – | | | $ | – | | | $ | (17,620,130 | ) | | $ | – | |
| | | | | | International Value Fund | |
| Description | | Gross Amounts of
Recognized Assets | | | Gross Amounts
Offset in the
Statement of Assets
and Liabilities | | | Net Amounts of
Assets Presented
in the Statement of
Assets and Liabilities | |
| Repurchase Agreements | | $ | 14,456,289 | | | $ | – | | | $ | 14,456,289 | |
| Total | | $ | 14,456,289 | | | $ | – | | | $ | 14,456,289 | |
| | | Net Amount
of Assets
Presented in | | | Amounts Not Offset in the
Statement of Assets and Liabilities | | | |
| Counterparty | | the Statement
of Assets and
Liabilities | | | Financial
Instruments | | | Cash
Collateral
Received(a) | | | Securities
Collateral
Received(a) | | | Net
Amount(b) | |
| Fixed Income Clearing Corp. | | $ | 14,456,289 | | | $ | – | | | $ | – | | | $ | (14,456,289 | ) | | $ | – | |
| Total | | $ | 14,456,289 | | | $ | – | | | $ | – | | | $ | (14,456,289 | ) | | $ | – | |
| | | | | | Micro Cap Growth Fund | |
| Description | | Gross Amounts of
Recognized Assets | | | Gross Amounts
Offset in the
Statement of Assets
and Liabilities | | | Net Amounts of
Assets Presented
in the Statement of
Assets and Liabilities | |
| Repurchase Agreements | | $ | 2,469,841 | | | $ | – | | | $ | 2,469,841 | |
| Total | | $ | 2,469,841 | | | $ | – | | | $ | 2,469,841 | |
| | | Net Amount
of Assets
Presented in | | | Amounts Not Offset in the
Statement of Assets and Liabilities | | | |
| Counterparty | | the Statement
of Assets and
Liabilities | | | Financial
Instruments | | | Cash
Collateral
Received(a) | | | Securities
Collateral
Received(a) | | | Net
Amount(b) | |
| Fixed Income Clearing Corp. | | $ | 2,469,841 | | | $ | – | | | $ | – | | | $ | (2,469,841 | ) | | $ | – | |
| Total | | $ | 2,469,841 | | | $ | – | | | $ | – | | | $ | (2,469,841 | ) | | $ | – | |
196
Notes to Financial Statements (continued)
| | | | | | Value Opportunities Fund | |
| Description | | Gross Amounts of
Recognized Assets | | | Gross Amounts
Offset in the
Statement of Assets
and Liabilities | | | Net Amounts of
Assets Presented
in the Statement of
Assets and Liabilities | |
| Repurchase Agreements | | $ | 17,229,742 | | | $ | – | | | $ | 17,229,742 | |
| Total | | $ | 17,229,742 | | | $ | – | | | $ | 17,229,742 | |
| | | Net Amount
of Assets
Presented in | | | Amounts Not Offset in the
Statement of Assets and Liabilities | | | |
| Counterparty | | the Statement
of Assets and
Liabilities | | | Financial
Instruments | | | Cash
Collateral
Received(a) | | | Securities
Collateral
Received(a) | | | Net
Amount(b) | |
| Fixed Income Clearing Corp. | | $ | 17,229,742 | | | $ | – | | | $ | – | | | $ | (17,229,742 | ) | | $ | – | |
| Total | | $ | 17,229,742 | | | $ | – | | | $ | – | | | $ | (17,229,742 | ) | | $ | – | |
| (a) | Collateral disclosed is limited to an amount not to exceed 100% of the net amount of assets (liabilities) presented in the Statements of Assets and Liabilities, for each respective counterparty. |
| (b) | Net amount represents the amount owed to the Fund by the counterparty as of October 31, 2023. |
The Trust’s officers and one Trustee, who are associated with Lord Abbett, do not receive any compensation from the Trust for serving in such capacities. Independent Trustees’ fees are allocated among all Lord Abbett-sponsored funds based on the net assets of each fund. There is an equity-based plan available to all Independent Trustees under which Independent Trustees may elect to defer receipt of a portion of Trustees’ fees. The deferred amounts are treated as though equivalent dollar amounts had been invested in the Funds. Such amounts and earnings accrued thereon are included in Trustees’ fees in the Statements of Operations and in Trustees’ fees payable in the Statements of Assets and Liabilities and are not deductible for U.S. federal income tax purposes until such amounts are paid.
The Trust had entered into an arrangement with its prior transfer agent and its custodian, whereby credits realized as a result of uninvested cash balances are used to reduce a portion of each Fund’s expenses. The arrangement with the Trust’s prior transfer agent was discontinued effective March 6, 2023.
For the period ended August 2, 2023, the Funds (except Alpha Strategy Fund), and certain other funds managed by Lord Abbett (collectively, the “Participating Funds”) were party to a syndicated line of credit facility with various lenders for $1.625 billion (the “Syndicated Facility”) under which State Street Bank and Trust Company (“SSB”) participated as a lender and as agent for the lenders. The Participating Funds were subject to graduated borrowing limits of one-third of fund net assets (if fund net assets are less than $750 million), $250 million, $300 million, $700 million, or $1 billion, based on past borrowings and likelihood of future borrowings, among other factors.
Effective August 3, 2023, the Participating Funds (except Alpha Strategy Fund) renewed the Syndicated Facility for $1.6 billion. The Participating Funds remain subject to the same graduated borrowing limits as were in place prior to the renewal.
197
Notes to Financial Statements (continued)
For the period ended August 2, 2023, the Participating Funds (except Alpha Strategy Fund) were also party to an additional uncommitted line of credit facility with SSB for $330 million (the “Bilateral Facility”). Under the Bilateral Facility, the Participating Funds were subject to graduated borrowing limits of one-third of fund net assets (if net assets are less than $750 million), or $250 million based on past borrowings and likelihood of future borrowings, among other factors.
Effective August 3, 2023, the Participating Funds (except Alpha Strategy Fund) renewed the Bilateral Facility in the same amount. The Participating Funds remain subject to the same graduated borrowing limits as were in place prior to the renewal.
These credit facilities are to be used for temporary or emergency purposes as additional sources of liquidity to satisfy redemptions.
For the fiscal year ended October 31, 2023, International Opportunities Fund utilized the Bilateral Facility for multiple days during the period from January 3, 2023 through January 10, 2023 with an average borrowing amount of $11,875,000; the average interest rate during the period was 5.58% and total interest paid amounted to $14,725. The other Funds did not utilize the Syndicated Facility or Bilateral Facility.
| 10. | INTERFUND LENDING PROGRAM |
Pursuant to an exemptive order issued by the U.S. Securities and Exchange Commission (“SEC exemptive order”) certain registered open-end management investment companies managed by Lord Abbett, including each Fund, participate in a joint lending and borrowing program (the “Interfund Lending Program”). The SEC exemptive order allows the funds that participate in the Interfund Lending Program to borrow money from and lend money to each other for temporary or emergency purposes subject to the limitations and conditions.
For the fiscal year ended October 31, 2023, the following Funds participated as a lender in the Interfund Lending Program. For the period in which the loan was outstanding, the average amount loaned, average interest rate and interest income were as follows:
| | | Average | | Average | | Interest |
| Fund | | Amount Loaned | | Interest Rate | | Income* |
| Growth Leaders Fund | | $56,487,524 | | 4.57% | | $7,073 |
| International Equity Fund | | 7,308,506 | | 4.57% | | 915 |
| International Opportunities Fund | | 13,253,441 | | 4.57% | | 1,659 |
| International Value Fund | | 6,428,089 | | 4.57% | | 1,610 |
| | |
| * | Statements of Operations location: Interest earned from Interfund Lending. |
| 11. | CUSTODIAN AND ACCOUNTING AGENT |
SSB is the Trust’s custodian and accounting agent. SSB performs custodial, accounting and recordkeeping functions relating to portfolio transactions and calculating each Fund’s NAV.
198
Notes to Financial Statements (continued)
| 12. | TRANSACTIONS WITH AFFILIATED ISSUERS |
An affiliated issuer is one in which a Fund has ownership of at least 5% of the outstanding voting securities of the underlying issuer at any point during the fiscal year or any company which is under common ownership or control. Alpha Strategy Fund had the following transactions with affiliated issuers (i.e. the Underlying Funds) for the fiscal year ended October 31, 2023:
Affiliated Issuer | | | Value at
10/31/2022 | | | | Purchases
at Cost | | | | Proceeds
from
Sales | | | | Net
Realized
Gain (Loss) | | | | Net Change in
Appreciation
(Depreciation | ) | | | Value at
10/31/2023 | | | | Shares
as of
10/31/2023 | | | Dividend
Income | |
| Lord Abbett Developing Growth Fund, Inc. – Class I | | $ | 130,614,911 | | | $ | 4,427,496 | | | $ | (15,299,972 | ) | | $ | 77,649 | | | $ | (19,187,098 | ) | | $ | 100,632,986 | | | | 5,059,476 | | | $ | — | |
| Lord Abbett Securities Trust – Focused Small Cap Value Fund – Class I | | | 66,432,704 | | | | 2,521,943 | | | | (8,424,369 | ) | | | 110,227 | (a) | | | (3,022,375 | ) | | | 55,517,264 | | | | 2,314,183 | | | | 421,077 | |
| Lord Abbett Securities Trust – International Opportunities Fund – Class I | | | 127,886,274 | | | | 2,626,599 | | | | (31,679,452 | ) | | | (330,191 | ) | | | 11,411,004 | | | | 109,914,234 | | | | 6,661,469 | | | | 2,427,052 | |
| Lord Abbett Securities Trust – Micro Cap Growth Fund – Class I | | | 66,791,628 | | | | 222,989 | | | | (7,643,122 | ) | | | 1,496,833 | | | | (13,401,511 | ) | | | 47,466,817 | | | | 3,479,972 | | | | — | |
| Lord Abbett Research Fund, Inc. – Small Cap Value Fund – Class I | | | 132,523,683 | | | | 3,852,846 | | | | (26,855,824 | ) | | | (6,099,571 | )(b) | | | 8,516,191 | | | | 108,566,558 | | | | 6,408,888 | | | | 482,078 | |
| Lord Abbett Securities Trust – Value Opportunities Fund – Class I | | | 131,587,768 | | | | 11,466,929 | | | | (23,830,710 | ) | | | 5,994,252 | (c) | | | (5,840,753 | ) | | | 109,583,685 | | | | 6,629,382 | | | | 1,136,520 | |
| Total | | | | | | | | | | | | | | $ | 1,249,199 | | | $ | (21,524,542 | ) | | $ | 531,681,544 | | | | | | | $ | 4,466,727 | |
| | |
| (a) | Includes $2,100,866 of distributed capital gains. |
| (b) | Includes $3,370,767 of distributed capital gains. |
| (c) | Includes $9,793,801 of distributed capital gains. |
| 13. | SECURITIES LENDING AGREEMENT |
The Funds have established a securities lending agreement with Citibank, N.A. for the lending of securities to qualified brokers in exchange for securities or cash collateral equal to at least the market value of securities loaned, plus interest, if applicable. Cash collateral is invested in an approved money market fund. In accordance with the Funds’ securities lending agreement, the market value of securities on loan is determined each day at the close of business and any additional collateral required to cover the value of securities on loan is delivered to the Funds on the next business day. As with other extensions of credit, the Funds may experience a delay in the recovery of their securities or incur a loss should the borrower of the securities breach its agreement with the Funds or the borrower becomes insolvent at a time when the collateral is insufficient to cover the cost of repurchasing securities on loan. Any income earned from securities lending is included in Securities lending net income on each Fund’s Statement of Operations.
The initial collateral received by the Funds is required to have a value equal to at least 100% of the market value of the securities loaned. The collateral must be marked-to-market daily to cover increases in the market value of the securities loaned (or potentially a decline in the value of the collateral). In general, the risk of borrower default will be borne by Citibank, N.A.; the Funds will bear
199
Notes to Financial Statements (continued)
the risk of loss with respect to the investment of the cash collateral. The advantage of such loans is that the Funds continue to receive income on loaned securities while receiving a portion of any securities lending fees and earning returns on the cash amounts which may be reinvested for the purchase of investments in securities.
As of October 31, 2023, the market value of securities loaned and collateral received for the Funds were as follows:
| Funds | | Market Value of
Securities Loaned | | | Collateral Received(1) |
| Health Care Fund | | $ | 64,555 | | | $ | 62,300 |
| International Opportunities Fund | | | 51,671 | | | | 53,954 |
| Micro Cap Growth Fund | | | 5,415,683 | | | | 5,400,090 |
| | |
| (1) | Statements of Assets and Liabilities location: Payable for collateral due to broker for securities lending. |
Each Fund is subject to the general risks and considerations associated with equity investing. The value of the Funds’ investments will fluctuate in response to movements in the equity securities markets in general and to the changing prospects of individual companies in which the Funds invest. If a Fund’s assessment of a company’s value or prospects for exceeding earnings expectations or market conditions is wrong, the Fund could suffer losses or produce poor performance relative to other funds, even in a favorable market.
Large company stocks, in which Focused Growth Fund, Focused Large Cap Value Fund, Fundamental Equity Fund, Global Equity Fund, Growth Leaders Fund, International Equity Fund and International Value Fund invest, may perform differently than the market as a whole and other types of stocks, such as small company stocks. Small and mid-sized company stocks, in which Alpha Strategy Fund, Focused Small Cap Value Fund, Focused Growth Fund, Fundamental Equity Fund, Growth Leaders Fund, International Equity Fund, International Opportunities Fund and Value Opportunities Fund invest, may be less able to weather economic shifts or other adverse developments than those of larger, more established companies.
In general, Focused Growth Fund and Growth Leaders Fund employ a growth investing style, Global Equity Fund employs a blended growth investing and value investing style, and Focused Large Cap Value Fund, Focused Small Cap Value Fund, Fundamental Equity Fund, International Value Fund and Value Opportunities Fund employ a value investing style. Growth stocks generally are more volatile than value stocks. The price of value stocks may lag the market for long periods of time.
Global Equity Fund, International Equity Fund, International Opportunities Fund and International Value Fund are subject to the risks of investing in foreign securities. Foreign securities may pose greater risks than domestic securities, including greater price fluctuations, economic, political, and social instability and subject to less government supervision, lack of transparency, inadequate regulatory and accounting standards, foreign taxes, and higher transaction costs. Foreign investments also may be affected by changes in currency rates or currency controls. These risks are generally greater for securities issued by companies in emerging market companies. Similarly, due to their investments in multinational and foreign companies, Alpha Strategy Fund, Focused Growth Fund, Focused Large Cap Value Fund, Focused Small Cap Value Fund, Fundamental Equity Fund, Growth Leaders Fund, Health Care Fund, and Value Opportunities Fund are subject to the risks of investing in foreign securities and similarly may experience increased market, liquidity, currency, political, informational, and other risks.
200
Notes to Financial Statements (continued)
Health Care Fund is subject to the risks of investing in the health care sector, including changes in government regulations, dependence on patents and intellectual property rights, expenses and losses from litigation based on product liability and similar claims, industry competition, extensive research and development, marketing, and sales costs, and rapid technological change and potential for product obsolescence. Health Care Fund is also subject to the risks of investing in structured securities. As a result, Health Care Fund is subject to the same risks associated with direct investments in the underlying securities or other instruments they seek to replicate, as well as liquidity risk and the risk that the issuer and/or the counterparty of the structured security may be unable to perform under the terms of the instrument, or may disagree as to the meaning or application of such terms.
International Value Fund is subject to the risks of investing in dividend paying stocks. Dividend paying stocks may be sensitive to changes in market interest rates, and the prices of such stocks may decline as rates rise. There is no guarantee that companies that currently pay dividends will continue to do so. International Value Fund may be subject to the volatility of stocks that have high dividends per share due to recent decreases in their share prices.
Alpha Strategy Fund’s investments are concentrated in the Underlying Funds and, as a result, the Fund’s performance is directly related to their performance and subject to their risks. In addition, the Fund is exposed to the same risks as the Underlying Funds in direct proportion to the allocation of its assets among the Underlying Funds.
Alpha Strategy Fund, Global Equity Fund, Health Care Fund, International Equity Fund, International Opportunities Fund and International Value Fund are subject to the risks associated with derivatives, which may be different from and greater than the risks associated with investing directly in securities and other investments. Derivatives may be subject to risks such as liquidity risk, leveraging risk, interest rate risk, market risk, and credit risk. Illiquid securities may lower the Funds’ returns since the Funds may be unable to sell these securities at their desired time or price. Derivatives also may involve the risk of mispricing or improper valuation and the risk that changes in the value of the derivative may not correlate perfectly with the value of the underlying asset, rate or index. Whether a Fund’s use of derivatives is successful will depend on, among other things, the Fund’s ability to correctly forecast market movements, changes in foreign exchange and interest rates, and other factors. If a Fund incorrectly forecasts these and other factors, its performance could suffer. A Fund’s use of derivatives could result in a loss exceeding the amount of the Fund’s investment in these instruments.
Health Care Fund, Focused Large Cap Value Fund and Focused Small Cap Value Fund are subject to the general risks and considerations associated with investing in fixed income securities. The value of an investment will change as interest rates fluctuate and in response to market movements. When interest rates rise, the prices of fixed income securities are likely to decline; when interest rates fall, such prices tend to rise. Longer-term securities are usually more sensitive to interest rate changes. There is also the risk that an issuer of a fixed income security will fail to make timely payments of principal and/or interest to a Fund, a risk that is greater with high-yield bonds (sometimes called “junk bonds”) in which one or more of the Funds may invest. Some issuers, particularly of high-yield bonds, may default as to principal and/or interest payments after a Fund purchases their securities. A default, or concerns in the market about an increase in risk of default, may result in losses to each Fund. High-yield bonds are subject to greater price fluctuations and increased liquidity risk, as well as additional risks.
201
Notes to Financial Statements (continued)
Focused Growth Fund and Focused Large Cap Value Fund are non-diversified mutual funds under the Act. The value of each Fund’s investments may be more adversely affected by a single economic, political or regulatory event than the value of the investments of a diversified mutual fund.
A Fund’s gross expense ratio may fluctuate during its initial operating period because of the Fund’s relatively smaller asset size and, until the Fund achieves sufficient scale, a Fund shareholder may experience proportionally higher Fund expenses than would be experienced by shareholders of a fund with a larger asset base.
Geopolitical and other events (e.g., wars, terrorism, natural disasters, epidemics or pandemics) may disrupt securities markets and adversely affect global economies and markets, thereby decreasing the value of each Fund’s investments. Market disruptions can also prevent the Funds from implementing their investment strategies and achieving their investment objectives.
In March 2023, the shut-down of certain financial institutions raised economic concerns over disruption in the U.S. banking system. There can be no certainty that the actions taken by the U.S. government to strengthen public confidence in the U.S. banking system will be effective in mitigating the effects of financial institution failures on the economy and restoring public confidence in the U.S. banking system objective.
The impact of the COVID-19 outbreak, and the effects of other infectious illness outbreaks, epidemics, or pandemics, may be short term or may continue for an extended period of time. For example, a global pandemic or other widespread health crises could negatively affect the global economy, the economies of individual countries, and the financial performance of individual issuers, sectors, industries, asset classes, and markets in significant and unforeseen ways. Health crises caused by outbreaks of disease may also exacerbate other pre-existing political, social, and economic risks in certain countries or globally. The foregoing could disrupt the operations of each Fund and its service providers, adversely affect the value and liquidity of each Fund’s investments, and negatively impact each Fund’s performance and your investment in the Fund.
| 15. | SUMMARY OF CAPITAL TRANSACTIONS |
Transactions in shares of beneficial interest were as follows:
| Alpha Strategy Fund | | Year Ended
October 31, 2023 | | | Year Ended
October 31, 2022 | |
| Class A Shares | | Shares | | | Amount | | | Shares | | | Amount | |
| Shares sold* | | | 2,232,997 | | | $ | 48,775,359 | | | | 3,016,565 | | | $ | 74,417,916 | |
| Reinvestment of distributions | | | 1,135,557 | | | | 22,995,033 | | | | 854,256 | | | | 23,799,563 | |
| Shares reacquired | | | (5,139,103 | ) | | | (111,018,929 | ) | | | (2,439,016 | ) | | | (59,400,885 | ) |
| Increase (decrease) | | | (1,770,549 | ) | | $ | (39,248,537 | ) | | | 1,431,805 | | | $ | 38,816,594 | |
| | | | | | | | | | | | | | | | | |
| Class C Shares | | | | | | | | | | | | | | | | |
| Shares sold | | | 239,021 | | | $ | 3,981,308 | | | | 141,499 | | | $ | 2,724,217 | |
| Reinvestment of distributions | | | 146,133 | | | | 2,210,989 | | | | 137,888 | | | | 2,941,152 | |
| Shares reacquired* | | | (1,253,275 | ) | | | (20,198,329 | ) | | | (861,355 | ) | | | (16,052,650 | ) |
| Decrease | | | (868,121 | ) | | $ | (14,006,032 | ) | | | (581,968 | ) | | $ | (10,387,281 | ) |
| | | | | | | | | | | | | | | | | |
| Class F Shares | | | | | | | | | | | | | | | | |
| Shares sold | | | 48,120 | | | $ | 1,049,004 | | | | 420,593 | | | $ | 11,092,347 | |
| Reinvestment of distributions | | | 77,672 | | | | 1,593,824 | | | | 173,839 | | | | 4,893,568 | |
| Shares reacquired | | | (900,610 | ) | | | (19,931,518 | ) | | | (4,069,903 | ) | | | (97,297,008 | ) |
| Decrease | | | (774,818 | ) | | $ | (17,288,690 | ) | | | (3,475,471 | ) | | $ | (81,311,093 | ) |
202
Notes to Financial Statements (continued)
| Alpha Strategy Fund | | Year Ended
October 31, 2023 | | | Year Ended
October 31, 2022 | |
| Class F3 Shares | | | Shares | | | | Amount | | | | Shares | | | | Amount | |
| Shares sold | | | 519,919 | | | $ | 11,792,898 | | | | 774,631 | | | $ | 19,864,073 | |
| Reinvestment of distributions | | | 151,356 | | | | 3,208,745 | | | | 101,791 | | | | 2,958,048 | |
| Shares reacquired | | | (590,390 | ) | | | (13,355,675 | ) | | | (462,639 | ) | | | (11,557,617 | ) |
| Increase | | | 80,885 | | | $ | 1,645,968 | | | | 413,783 | | | $ | 11,264,504 | |
| | | | | | | | | | | | | | | | | |
| Class I Shares | | | | | | | | | | | | | | | | |
| Shares sold | | | 1,070,091 | | | $ | 24,186,941 | | | | 3,701,667 | | | $ | 89,286,348 | |
| Reinvestment of distributions | | | 197,808 | | | | 4,169,799 | | | | 60,169 | | | | 1,740,705 | |
| Shares reacquired | | | (1,042,136 | ) | | | (23,355,597 | ) | | | (664,760 | ) | | | (15,948,273 | ) |
| Increase | | | 225,763 | | | $ | 5,001,143 | | | | 3,097,076 | | | $ | 75,078,780 | |
| | | | | | | | | | | | | | | | | |
| Class R2 Shares | | | | | | | | | | | | | | | | |
| Shares sold | | | 3,226 | | | $ | 65,923 | | | | 6,219 | | | $ | 131,828 | |
| Reinvestment of distributions | | | 3,138 | | | | 60,126 | | | | 2,172 | | | | 57,439 | |
| Shares reacquired | | | (7,324 | ) | | | (149,721 | ) | | | (13,237 | ) | | | (338,631 | ) |
| Decrease | | | (960 | ) | | $ | (23,672 | ) | | | (4,846 | ) | | $ | (149,364 | ) |
| | | | | | | | | | | | | | | | | |
| Class R3 Shares | | | | | | | | | | | | | | | | |
| Shares sold | | | 199,491 | | | $ | 4,187,398 | | | | 81,558 | | | $ | 1,895,361 | |
| Reinvestment of distributions | | | 54,501 | | | | 1,054,054 | | | | 47,259 | | | | 1,260,398 | |
| Shares reacquired | | | (254,998 | ) | | | (5,306,839 | ) | | | (185,565 | ) | | | (4,388,762 | ) |
| Decrease | | | (1,006 | ) | | $ | (65,387 | ) | | | (56,748 | ) | | $ | (1,233,003 | ) |
| | | | | | | | | | | | | | | | | |
| Class R4 Shares | | | | | | | | | | | | | | | | |
| Shares sold | | | 31,100 | | | $ | 665,864 | | | | 43,237 | | | $ | 1,055,358 | |
| Reinvestment of distributions | | | 11,809 | | | | 238,418 | | | | 7,709 | | | | 214,155 | |
| Shares reacquired | | | (58,894 | ) | | | (1,293,127 | ) | | | (26,068 | ) | | | (644,269 | ) |
| Increase (decrease) | | | (15,985 | ) | | $ | (388,845 | ) | | | 24,878 | | | $ | 625,244 | |
| | | | | | | | | | | | | | | | | |
| Class R5 Shares | | | | | | | | | | | | | | | | |
| Shares sold | | | 14,512 | | | $ | 337,455 | | | | 1,403 | | | $ | 36,326 | |
| Reinvestment of distributions | | | 1,148 | | | | 24,219 | | | | 927 | | | | 26,825 | |
| Shares reacquired | | | (5,247 | ) | | | (118,888 | ) | | | (2,200 | ) | | | (55,978 | ) |
| Increase | | | 10,413 | | | $ | 242,786 | | | | 130 | | | $ | 7,173 | |
| | | | | | | | | | | | | | | | | |
| Class R6 Shares | | | | | | | | | | | | | | | | |
| Shares sold | | | 50,247 | | | $ | 1,105,646 | | | | 16,553 | | | $ | 443,873 | |
| Reinvestment of distributions | | | 5,115 | | | | 108,434 | | | | 4,670 | | | | 135,765 | |
| Shares reacquired | | | (55,722 | ) | | | (1,253,222 | ) | | | (26,343 | ) | | | (626,939 | ) |
| Decrease | | | (360 | ) | | $ | (39,142 | ) | | | (5,120 | ) | | $ | (47,301 | ) |
| | | | | | | | | | | | | | | | | |
| Focused Growth Fund | | Year Ended
October 31, 2023 | | | Year Ended
October 31, 2022 | |
| Class A Shares | | | Shares | | | | Amount | | | | Shares | | | | Amount | |
| Shares sold* | | | 291,794 | | | $ | 5,932,512 | | | | 397,567 | | | $ | 9,802,654 | |
| Reinvestment of distributions | | | – | | | | – | | | | 81,357 | | | | 2,549,714 | |
| Shares reacquired | | | (241,803 | ) | | | (4,859,077 | ) | | | (255,242 | ) | | | (5,856,512 | ) |
| Increase | | | 49,991 | | | $ | 1,073,435 | | | | 223,682 | | | $ | 6,495,856 | |
203
Notes to Financial Statements (continued)
| Focused Growth Fund | | Year Ended
October 31, 2023 | | | Year Ended
October 31, 2022 | |
| Class C Shares | | Shares | | | Amount | | | Shares | | | Amount | |
| Shares sold | | | 43,019 | | | $ | 821,445 | | | | 74,249 | | | $ | 1,781,015 | |
| Reinvestment of distributions | | | – | | | | – | | | | 11,210 | | | | 342,685 | |
| Shares reacquired* | | | (50,282 | ) | | | (967,989 | ) | | | (42,002 | ) | | | (903,574 | ) |
| Increase (decrease) | | | (7,263 | ) | | $ | (146,544 | ) | | | 43,457 | | | $ | 1,220,126 | |
| | | | | | | | | | | | | | | | | |
| Class F Shares | | | | | | | | | | | | | | | | |
| Shares sold | | | 57,576 | | | $ | 1,157,139 | | | | 166,061 | | | $ | 4,167,826 | |
| Reinvestment of distributions | | | – | | | | – | | | | 79,309 | | | | 2,507,767 | |
| Shares reacquired | | | (238,967 | ) | | | (4,651,433 | ) | | | (404,634 | ) | | | (9,462,265 | ) |
| Decrease | | | (181,391 | ) | | $ | (3,494,294 | ) | | | (159,264 | ) | | $ | (2,786,672 | ) |
| | | | | | | | | | | | | | | | | |
| Class F3 Shares | | | | | | | | | | | | | | | | |
| Shares reacquired | | | (9,377 | ) | | $ | (200,000 | ) | | | – | | | $ | – | |
| Decrease | | | (9,377 | ) | | $ | (200,000 | ) | | | – | | | $ | – | |
| | | | | | | | | | | | | | | | | |
| Class I Shares | | | | | | | | | | | | | | | | |
| Shares sold | | | 424,770 | | | $ | 8,197,351 | | | | 163,892 | | | $ | 4,072,166 | |
| Reinvestment of distributions | | | – | | | | – | | | | 23,950 | | | | 757,292 | |
| Shares reacquired | | | (456,475 | ) | | | (8,840,517 | ) | | | (83,546 | ) | | | (2,077,283 | ) |
| Increase (decrease) | | | (31,705 | ) | | $ | (643,166 | ) | | | 104,296 | | | $ | 2,752,175 | |
| | | | | | | | | | | | | | | | | |
| Class R3 Shares | | | | | | | | | | | | | | | | |
| Shares sold | | | 8,279 | | | $ | 162,036 | | | | 49 | | | $ | 1,298 | |
| Reinvestment of distributions | | | – | | | | – | | | | – | | | | 5 | |
| Shares reacquired | | | (1,326 | ) | | | (27,308 | ) | | | (3 | ) | | | (67 | ) |
| Increase | | | 6,953 | | | $ | 134,728 | | | | 46 | | | $ | 1,236 | |
| | | | | | | | | | | | | | | | | |
| Class R6 Shares | | | | | | | | | | | | | | | | |
| Shares sold | | | 24,023 | | | $ | 490,954 | | | | 79,659 | | | $ | 2,246,485 | |
| Reinvestment of distributions | | | – | | | | – | | | | 351 | | | | 11,126 | |
| Shares reacquired | | | (45,855 | ) | | | (1,022,831 | ) | | | (29,183 | ) | | | (862,513 | ) |
| Increase (decrease) | | | (21,832 | ) | | $ | (531,877 | ) | | | 50,827 | | | $ | 1,395,098 | |
| | | | | | | | | | | | | | | | | |
| Focused Large Cap Value Fund | | Year Ended
October 31, 2023 | | | Year Ended
October 31, 2022 | |
| Class A Shares | | | Shares | | | | Amount | | | | Shares | | | | Amount | |
| Shares sold* | | | 438,702 | | | $ | 4,612,795 | | | | 525,579 | | | $ | 7,852,120 | |
| Reinvestment of distributions | | | 380,125 | | | | 3,793,646 | | | | 119,788 | | | | 1,829,167 | |
| Shares reacquired | | | (638,009 | ) | | | (6,347,965 | ) | | | (206,267 | ) | | | (2,943,377 | ) |
| Increase | | | 180,818 | | | $ | 2,058,476 | | | | 439,100 | | | $ | 6,737,910 | |
| | | | | | | | | | | | | | | | | |
| Class C Shares | | | | | | | | | | | | | | | | |
| Shares sold | | | 54,475 | | | $ | 563,239 | | | | 294,709 | | | $ | 4,374,887 | |
| Reinvestment of distributions | | | 140,112 | | | | 1,399,720 | | | | 53,064 | | | | 810,290 | |
| Shares reacquired* | | | (263,509 | ) | | | (2,598,079 | ) | | | (193,871 | ) | | | (2,622,144 | ) |
| Increase (decrease) | | | (68,922 | ) | | $ | (635,120 | ) | | | 153,902 | | | $ | 2,563,033 | |
204
Notes to Financial Statements (continued)
| Focused Large Cap Value Fund | | Year Ended
October 31, 2023 | | | Year Ended
October 31, 2022 | |
| Class F Shares | | Shares | | | Amount | | | Shares | | | Amount | |
| Shares sold | | | 15,028 | | | $ | 154,105 | | | | 44,804 | | | $ | 674,669 | |
| Reinvestment of distributions | | | 39,542 | | | | 402,138 | | | | 33,125 | | | | 511,778 | |
| Shares reacquired | | | (136,753 | ) | | | (1,411,962 | ) | | | (100,527 | ) | | | (1,516,121 | ) |
| Decrease | | | (82,183 | ) | | $ | (855,719 | ) | | | (22,598 | ) | | $ | (329,674 | ) |
| | | | | | | | | | | | | | | | | |
| Class I Shares | | | | | | | | | | | | | | | | |
| Shares sold | | | 534,230 | | | $ | 5,596,687 | | | | 10,544,245 | | | $ | 156,870,840 | |
| Reinvestment of distributions | | | 8,800 | | | | 91,262 | | | | 9,683,713 | | | | 148,160,810 | |
| Shares reacquired | | | (61,726 | ) | | | (638,447 | ) | | | (54,608,514 | ) | | | (745,176,296 | ) |
| Increase (decrease) | | | 481,304 | | | $ | 5,049,502 | | | | (34,380,556 | ) | | $ | (440,144,646 | ) |
| | | | | | | | | | | | | | | | | |
| Class R3 Shares | | | | | | | | | | | | | | | | |
| Shares sold | | | 7,494 | | | $ | 75,603 | | | | 5,555 | | | $ | 84,189 | |
| Reinvestment of distributions | | | 2,354 | | | | 23,467 | | | | 11 | | | | 162 | |
| Shares reacquired | | | (1,030 | ) | | | (10,394 | ) | | | (81 | ) | | | (1,030 | ) |
| Increase | | | 8,818 | | | $ | 88,676 | | | | 5,485 | | | $ | 83,321 | |
| | | | | | | | | | | | | | | | | |
| Class R6 Shares | | | | | | | | | | | | | | | | |
| Shares sold | | | 57,467 | | | $ | 569,841 | | | | 39,545 | | | $ | 600,827 | |
| Shares reacquired | | | (29,253 | ) | | | (281,274 | ) | | | (21,457 | ) | | | (307,987 | ) |
| Increase | | | 28,214 | | | $ | 288,567 | | | | 18,088 | | | $ | 292,840 | |
| | | | | | | | | | | | | | | | | |
| Focused Small Cap Value Fund | | Year Ended
October 31, 2023 | | | Year Ended
October 31, 2022 | |
| Class A Shares | | | Shares | | | | Amount | | | | Shares | | | | Amount | |
| Shares sold* | | | 90,085 | | | $ | 2,163,312 | | | | 364,462 | | | $ | 9,550,692 | |
| Reinvestment of distributions | | | 25,989 | | | | 616,189 | | | | 73,104 | | | | 2,071,275 | |
| Shares reacquired | | | (260,901 | ) | | | (6,206,783 | ) | | | (406,631 | ) | | | (9,997,848 | ) |
| Increase (decrease) | | | (144,827 | ) | | $ | (3,427,282 | ) | | | 30,935 | | | $ | 1,624,119 | |
| | | | | | | | | | | | | | | | | |
| Class C Shares | | | | | | | | | | | | | | | | |
| Shares sold | | | 7,684 | | | $ | 194,560 | | | | 39,091 | | | $ | 1,158,476 | |
| Reinvestment of distributions | | | 4,655 | | | | 117,495 | | | | 16,003 | | | | 483,303 | |
| Shares reacquired* | | | (47,364 | ) | | | (1,208,648 | ) | | | (67,194 | ) | | | (1,825,111 | ) |
| Decrease | | | (35,025 | ) | | $ | (896,593 | ) | | | (12,100 | ) | | $ | (183,332 | ) |
| | | | | | | | | | | | | | | | | |
| Class F Shares | | | | | | | | | | | | | | | | |
| Shares sold | | | 40,005 | | | $ | 1,068,703 | | | | 597,553 | | | $ | 17,996,358 | |
| Reinvestment of distributions | | | 29,167 | | | | 757,173 | | | | 203,787 | | | | 6,291,383 | |
| Shares reacquired | | | (721,257 | ) | | | (19,071,679 | ) | | | (1,996,037 | ) | | | (56,161,721 | ) |
| Decrease | | | (652,085 | ) | | $ | (17,245,803 | ) | | | (1,194,697 | ) | | $ | (31,873,980 | ) |
| | | | | | | | | | | | | | | | | |
| Class I Shares | | | | | | | | | | | | | | | | |
| Shares sold | | | 463,843 | | | $ | 12,175,706 | | | | 525,655 | | | $ | 13,927,860 | |
| Reinvestment of distributions | | | 116,433 | | | | 3,013,299 | | | | 358,589 | | | | 11,058,876 | |
| Shares reacquired | | | (730,955 | ) | | | (18,938,486 | ) | | | (1,320,013 | ) | | | (36,962,298 | ) |
| Decrease | | | (150,679 | ) | | $ | (3,749,481 | ) | | | (435,769 | ) | | $ | (11,975,562 | ) |
205
Notes to Financial Statements (continued)
| Focused Small Cap Value Fund | | Year Ended
October 31, 2023 | | | Year Ended
October 31, 2022 | |
| Class R5 Shares | | Shares | | | Amount | | | Shares | | | Amount | |
| Shares sold | | | 739 | | | $ | 19,269 | | | | 11,339 | | | $ | 324,585 | |
| Reinvestment of distributions | | | 390 | | | | 10,094 | | | | 8 | | | | 239 | |
| Shares reacquired | | | (3,832 | ) | | | (102,178 | ) | | | (1,433 | ) | | | (39,360 | ) |
| Increase (decrease) | | | (2,703 | ) | | $ | (72,815 | ) | | | 9,914 | | | $ | 285,464 | |
| | | | | | | | | | | | | | | | | |
| Class R6 Shares | | | | | | | | | | | | | | | | |
| Shares sold | | | 60,545 | | | $ | 1,579,333 | | | | 117,432 | | | $ | 3,526,499 | |
| Reinvestment of distributions | | | 9,411 | | | | 244,121 | | | | 19,995 | | | | 617,633 | |
| Shares reacquired | | | (54,084 | ) | | | (1,430,558 | ) | | | (77,778 | ) | | | (2,126,575 | ) |
| Increase | | | 15,872 | | | $ | 392,896 | | | | 59,649 | | | $ | 2,017,557 | |
| | | | | | | | | | | | | | | | | |
| Fundamental Equity Fund | | Year Ended
October 31, 2023 | | | Year Ended
October 31, 2022 | |
| Class A Shares | | | Shares | | | | Amount | | | | Shares | | | | Amount | |
| Shares sold* | | | 5,817,001 | | | $ | 71,685,540 | | | | 5,636,775 | | | $ | 73,378,514 | |
| Reinvestment of distributions | | | 4,811,465 | | | | 59,132,901 | | | | 10,960,284 | | | | 149,498,278 | |
| Shares reacquired | | | (16,370,453 | ) | | | (201,077,342 | ) | | | (13,165,392 | ) | | | (169,779,056 | ) |
| Increase (decrease) | | | (5,741,987 | ) | | $ | (70,258,901 | ) | | | 3,431,667 | | | $ | 53,097,736 | |
| | | | | | | | | | | | | | | | | |
| Class C Shares | | | | | | | | | | | | | | | | |
| Shares sold | | | 525,769 | | | $ | 5,564,511 | | | | 570,172 | | | $ | 6,312,421 | |
| Reinvestment of distributions | | | 192,213 | | | | 2,022,083 | | | | 577,042 | | | | 6,791,781 | |
| Shares reacquired* | | | (2,000,443 | ) | | | (20,802,861 | ) | | | (1,805,524 | ) | | | (20,089,012 | ) |
| Decrease | | | (1,282,461 | ) | | $ | (13,216,267 | ) | | | (658,310 | ) | | $ | (6,984,810 | ) |
| | | | | | | | | | | | | | | | | |
| Class F Shares | | | | | | | | | | | | | | | | |
| Shares sold | | | 244,155 | | | $ | 2,942,114 | | | | 751,749 | | | $ | 9,711,281 | |
| Reinvestment of distributions | | | 301,494 | | | | 3,648,074 | | | | 1,245,581 | | | | 16,740,603 | |
| Shares reacquired | | | (4,128,463 | ) | | | (50,689,204 | ) | | | (6,154,861 | ) | | | (77,191,656 | ) |
| Decrease | | | (3,582,814 | ) | | $ | (44,099,016 | ) | | | (4,157,531 | ) | | $ | (50,739,772 | ) |
| | | | | | | | | | | | | | | | | |
| Class F3 Shares | | | | | | | | | | | | | | | | |
| Shares sold | | | 279,670 | | | $ | 3,465,451 | | | | 241,135 | | | $ | 3,190,729 | |
| Reinvestment of distributions | | | 78,825 | | | | 984,530 | | | | 164,485 | | | | 2,276,471 | |
| Shares reacquired | | | (340,484 | ) | | | (4,244,834 | ) | | | (275,582 | ) | | | (3,618,522 | ) |
| Increase | | | 18,011 | | | $ | 205,147 | | | | 130,038 | | | $ | 1,848,678 | |
| | | | | | | | | | | | | | | | | |
| Class I Shares | | | | | | | | | | | | | | | | |
| Shares sold | | | 5,958,470 | | | $ | 74,274,943 | | | | 28,953,306 | | | $ | 353,649,201 | |
| Reinvestment of distributions | | | 2,480,521 | | | | 30,708,848 | | | | 2,368,365 | | | | 32,541,337 | |
| Shares reacquired | | | (7,817,943 | ) | | | (96,243,294 | ) | | | (5,158,276 | ) | | | (69,470,598 | ) |
| Increase | | | 621,048 | | | $ | 8,740,497 | | | | 26,163,395 | | | $ | 316,719,940 | |
| | | | | | | | | | | | | | | | | |
| Class P Shares | | | | | | | | | | | | | | | | |
| Shares sold | | | 23,226 | | | $ | 276,684 | | | | 25,663 | | | $ | 322,003 | |
| Reinvestment of distributions | | | 17,698 | | | | 212,025 | | | | 40,887 | | | | 544,609 | |
| Shares reacquired | | | (98,014 | ) | | | (1,150,340 | ) | | | (62,550 | ) | | | (799,006 | ) |
| Increase (decrease) | | | (57,090 | ) | | $ | (661,631 | ) | | | 4,000 | | | $ | 67,606 | |
206
Notes to Financial Statements (continued)
| Fundamental Equity Fund | | Year Ended
October 31, 2023 | | | Year Ended
October 31, 2022 | |
| Class R2 Shares | | Shares | | | Amount | | | Shares | | | Amount | |
| Shares sold | | | 18,595 | | | $ | 220,064 | | | | 25,458 | | | $ | 312,357 | |
| Reinvestment of distributions | | | 8,910 | | | | 106,559 | | | | 27,914 | | | | 371,250 | |
| Shares reacquired | | | (32,598 | ) | | | (391,095 | ) | | | (101,687 | ) | | | (1,328,416 | ) |
| Decrease | | | (5,093 | ) | | $ | (64,472 | ) | | | (48,315 | ) | | $ | (644,809 | ) |
| | | | | | | | | | | | | | | | | |
| Class R3 Shares | | | | | | | | | | | | | | | | |
| Shares sold | | | 833,323 | | | $ | 9,989,238 | | | | 641,604 | | | $ | 8,068,438 | |
| Reinvestment of distributions | | | 268,814 | | | | 3,228,451 | | | | 725,199 | | | | 9,674,156 | |
| Shares reacquired | | | (1,392,780 | ) | | | (16,638,140 | ) | | | (2,031,052 | ) | | | (25,963,618 | ) |
| Decrease | | | (290,643 | ) | | $ | (3,420,451 | ) | | | (664,249 | ) | | $ | (8,221,024 | ) |
| | | | | | | | | | | | | | | | | |
| Class R4 Shares | | | | | | | | | | | | | | | | |
| Shares sold | | | 33,295 | | | $ | 403,691 | | | | 58,639 | | | $ | 755,938 | |
| Reinvestment of distributions | | | 12,702 | | | | 155,223 | | | | 25,150 | | | | 341,292 | |
| Shares reacquired | | | (73,050 | ) | | | (887,564 | ) | | | (43,509 | ) | | | (570,329 | ) |
| Increase (decrease) | | | (27,053 | ) | | $ | (328,650 | ) | | | 40,280 | | | $ | 526,901 | |
| | | | | | | | | | | | | | | | | |
| Class R5 Shares | | | | | | | | | | | | | | | | |
| Shares sold | | | 9,846 | | | $ | 120,583 | | | | 14,077 | | | $ | 178,959 | |
| Reinvestment of distributions | | | 3,443 | | | | 42,656 | | | | 8,304 | | | | 114,175 | |
| Shares reacquired | | | (10,242 | ) | | | (126,196 | ) | | | (25,572 | ) | | | (345,160 | ) |
| Increase (decrease) | | | 3,047 | | | $ | 37,043 | | | | (3,191 | ) | | $ | (52,026 | ) |
| | | | | | | | | | | | | | | | | |
| Class R6 Shares | | | | | | | | | | | | | | | | |
| Shares sold | | | 156,609 | | | $ | 1,937,351 | | | | 745,885 | | | $ | 9,933,041 | |
| Reinvestment of distributions | | | 18,548 | | | | 231,856 | | | | 99,623 | | | | 1,379,776 | |
| Shares reacquired | | | (186,387 | ) | | | (2,322,921 | ) | | | (1,272,178 | ) | | | (17,160,338 | ) |
| Decrease | | | (11,230 | ) | | $ | (153,714 | ) | | | (426,670 | ) | | $ | (5,847,521 | ) |
| | | | | | | | | | | | | | | | | |
| Global Equity Fund | | Year Ended
October 31, 2023 | | | Year Ended
October 31, 2022 | |
| Class A Shares | | | Shares | | | | Amount | | | | Shares | | | | Amount | |
| Shares sold* | | | 95,394 | | | $ | 1,186,042 | | | | 86,412 | | | $ | 1,155,283 | |
| Reinvestment of distributions | | | 2,590 | | | | 29,997 | | | | 49,363 | | | | 689,106 | |
| Shares reacquired | | | (54,781 | ) | | | (673,611 | ) | | | (65,323 | ) | | | (890,584 | ) |
| Increase | | | 43,203 | | | $ | 542,428 | | | | 70,452 | | | $ | 953,805 | |
| | | | | | | | | | | | | | | | | |
| Class C Shares | | | | | | | | | | | | | | | | |
| Shares sold | | | 10,926 | | | $ | 137,594 | | | | 8,390 | | | $ | 102,070 | |
| Reinvestment of distributions | | | – | | | | – | | | | 7,990 | | | | 110,825 | |
| Shares reacquired* | | | (17,687 | ) | | | (217,612 | ) | | | (31,756 | ) | | | (383,863 | ) |
| Decrease | | | (6,761 | ) | | $ | (80,018 | ) | | | (15,376 | ) | | $ | (170,968 | ) |
| | | | | | | | | | | | | | | | | |
| Class F Shares | | | | | | | | | | | | | | | | |
| Shares sold | | | 5,557 | | | $ | 72,403 | | | | 8,446 | | | $ | 111,681 | |
| Reinvestment of distributions | | | 89 | | | | 1,031 | | | | 3,121 | | | | 43,660 | |
| Shares reacquired | | | (29,446 | ) | | | (373,629 | ) | | | (28,375 | ) | | | (325,895 | ) |
| Decrease | | | (23,800 | ) | | $ | (300,195 | ) | | | (16,808 | ) | | $ | (170,554 | ) |
207
Notes to Financial Statements (continued)
| Global Equity Fund | | Year Ended
October 31, 2023 | | | Year Ended
October 31, 2022 | |
| Class I Shares | | Shares | | | Amount | | | Shares | | | Amount | |
| Shares sold | | | 191,026 | | | $ | 2,256,212 | | | | – | | | $ | – | |
| Reinvestment of distributions | | | 1,667 | | | | 19,301 | | | | – | | | | – | |
| Shares reacquired | | | (27,176 | ) | | | (341,817 | ) | | | (15,129 | ) | | | (164,000 | ) |
| Increase (decrease) | | | 165,517 | | | $ | 1,933,696 | | | | (15,129 | ) | | $ | (164,000 | ) |
| | | | | | | | | | | | | | | | | |
| Class R3 Shares | | | | | | | | | | | | | | | | |
| Shares sold | | | 5,486 | | | $ | 67,834 | | | | 27,632 | | | $ | 393,703 | |
| Reinvestment of distributions | | | 139 | | | | 1,593 | | | | 4,566 | | | | 63,283 | |
| Shares reacquired | | | (2,017 | ) | | | (24,934 | ) | | | (15,776 | ) | | | (183,248 | ) |
| Increase | | | 3,608 | | | $ | 44,493 | | | | 16,422 | | | $ | 273,738 | |
| | | | | | | | | | | | | | | | | |
| Class R4 Shares | | | | | | | | | | | | | | | | |
| Shares sold | | | 1,313 | | | $ | 15,907 | | | | 44,130 | | | $ | 596,813 | |
| Reinvestment of distributions | | | 336 | | | | 3,891 | | | | – | | | | – | |
| Shares reacquired | | | (45,699 | ) | | | (576,186 | ) | | | (79 | ) | | | (943 | ) |
| Increase (decrease) | | | (44,050 | ) | | $ | (556,388 | ) | | | 44,051 | | | $ | 595,870 | |
| | | | | | | | | | | | | | | | | |
| Class R6 Shares | | | | | | | | | | | | | | | | |
| Shares sold | | | 292,255 | | | $ | 3,445,998 | | | | 23,651 | | | $ | 339,679 | |
| Reinvestment of distributions | | | 230 | | | | 2,664 | | | | – | | | | – | |
| Shares reacquired | | | (99,294 | ) | | | (1,276,419 | ) | | | (16,012 | ) | | | (224,662 | ) |
| Increase | | | 193,191 | | | $ | 2,172,243 | | | | 7,639 | | | $ | 115,017 | |
| | | | | | | | | | | | | | | | | |
| Growth Leaders Fund | | Year Ended
October 31, 2023 | | | Year Ended
October 31, 2022 | |
| Class A Shares | | | Shares | | | | Amount | | | | Shares | | | | Amount | |
| Shares sold* | | | 9,799,730 | | | $ | 263,735,339 | | | | 13,425,099 | | | $ | 455,476,228 | |
| Reinvestment of distributions | | | – | | | | – | | | | 11,264,076 | | | | 480,863,383 | |
| Shares reacquired | | | (15,243,394 | ) | | | (409,563,713 | ) | | | (16,855,393 | ) | | | (552,710,672 | ) |
| Increase (decrease) | | | (5,443,664 | ) | | $ | (145,828,374 | ) | | | 7,833,782 | | | $ | 383,628,939 | |
| | | | | | | | | | | | | | | | | |
| Class C Shares | | | | | | | | | | | | | | | | |
| Shares sold | | | 1,835,799 | | | $ | 43,080,014 | | | | 3,270,784 | | | $ | 98,246,996 | |
| Reinvestment of distributions | | | – | | | | – | | | | 6,190,529 | | | | 230,225,777 | |
| Shares reacquired* | | | (7,651,040 | ) | | | (178,305,832 | ) | | | (9,911,890 | ) | | | (284,514,151 | ) |
| Increase (decrease) | | | (5,815,241 | ) | | $ | (135,225,818 | ) | | | (450,577 | ) | | $ | 43,958,622 | |
| | | | | | | | | | | | | | | | | |
| Class F Shares | | | | | | | | | | | | | | | | |
| Shares sold | | | 2,750,992 | | | $ | 74,464,460 | | | | 27,783,993 | | | $ | 992,176,037 | |
| Reinvestment of distributions | | | – | | | | – | | | | 16,227,132 | | | | 716,427,881 | |
| Shares reacquired | | | (22,526,141 | ) | | | (621,403,093 | ) | | | (95,719,769 | ) | | | (3,072,794,593 | ) |
| Decrease | | | (19,775,149 | ) | | $ | (546,938,633 | ) | | | (51,708,644 | ) | | $ | (1,364,190,675 | ) |
| | | | | | | | | | | | | | | | | |
| Class F3 Shares | | | | | | | | | | | | | | | | |
| Shares sold | | | 3,154,726 | | | $ | 89,586,052 | | | | 6,006,983 | | | $ | 208,833,101 | |
| Reinvestment of distributions | | | – | | | | – | | | | 2,856,896 | | | | 128,188,907 | |
| Shares reacquired | | | (5,525,326 | ) | | | (159,968,983 | ) | | | (6,145,599 | ) | | | (212,693,470 | ) |
| Increase (decrease) | | | (2,370,600 | ) | | $ | (70,382,931 | ) | | | 2,718,280 | | | $ | 124,328,538 | |
208
Notes to Financial Statements (continued)
| Growth Leaders Fund | | Year Ended
October 31, 2023 | | | Year Ended
October 31, 2022 | |
| Class I Shares | | Shares | | | Amount | | | Shares | | | Amount | |
| Shares sold | | | 33,639,902 | | | $ | 942,684,516 | | | | 76,152,248 | | | $ | 2,342,464,611 | |
| Reinvestment of distributions | | | – | | | | – | | | | 5,228,281 | | | | 232,919,899 | |
| Shares reacquired | | | (35,906,580 | ) | | | (1,012,640,198 | ) | | | (29,422,402 | ) | | | (928,610,855 | ) |
| Increase (decrease) | | | (2,266,678 | ) | | $ | (69,955,682 | ) | | | 51,958,127 | | | $ | 1,646,773,655 | |
| | | | | | | | | | | | | | | | | |
| Class R2 Shares | | | | | | | | | | | | | | | | |
| Shares sold | | | 19,469 | | | $ | 521,016 | | | | 39,421 | | | $ | 1,263,951 | |
| Reinvestment of distributions | | | – | | | | – | | | | 14,439 | | | | 596,203 | |
| Shares reacquired | | | (49,359 | ) | | | (1,341,106 | ) | | | (33,178 | ) | | | (983,712 | ) |
| Increase (decrease) | | | (29,890 | ) | | $ | (820,090 | ) | | | 20,682 | | | $ | 876,442 | |
| | | | | | | | | | | | | | | | | |
| Class R3 Shares | | | | | | | | | | | | | | | | |
| Shares sold | | | 228,099 | | | $ | 5,886,402 | | | | 199,861 | | | $ | 6,245,685 | |
| Reinvestment of distributions | | | – | | | | – | | | | 104,557 | | | | 4,314,020 | |
| Shares reacquired | | | (197,878 | ) | | | (5,256,433 | ) | | | (197,986 | ) | | | (5,722,139 | ) |
| Increase | | | 30,221 | | | $ | 629,969 | | | | 106,432 | | | $ | 4,837,566 | |
| | | | | | | | | | | | | | | | | |
| Class R4 Shares | | | | | | | | | | | | | | | | |
| Shares sold | | | 143,391 | | | $ | 3,838,372 | | | | 139,359 | | | $ | 4,820,502 | |
| Reinvestment of distributions | | | – | | | | – | | | | 48,603 | | | | 2,075,821 | |
| Shares reacquired | | | (208,772 | ) | | | (5,644,796 | ) | | | (127,849 | ) | | | (4,480,967 | ) |
| Increase (decrease) | | | (65,381 | ) | | $ | (1,806,424 | ) | | | 60,113 | | | $ | 2,415,356 | |
| | | | | | | | | | | | | | | | | |
| Class R5 Shares | | | | | | | | | | | | | | | | |
| Shares sold | | | 79,908 | | | $ | 2,190,831 | | | | 90,988 | | | $ | 3,018,150 | |
| Reinvestment of distributions | | | – | | | | – | | | | 79,851 | | | | 3,558,947 | |
| Shares reacquired | | | (113,452 | ) | | | (3,271,243 | ) | | | (181,553 | ) | | | (6,313,507 | ) |
| Increase (decrease) | | | (33,544 | ) | | $ | (1,080,412 | ) | | | (10,714 | ) | | $ | 263,590 | |
| | | | | | | | | | | | | | | | | |
| Class R6 Shares | | | | | | | | | | | | | | | | |
| Shares sold | | | 1,321,086 | | | $ | 37,851,210 | | | | 1,594,060 | | | $ | 57,419,248 | |
| Reinvestment of distributions | | | – | | | | – | | | | 564,971 | | | | 25,350,238 | |
| Shares reacquired | | | (1,890,861 | ) | | | (54,756,178 | ) | | | (1,003,005 | ) | | | (37,177,211 | ) |
| Increase (decrease) | | | (569,775 | ) | | $ | (16,904,968 | ) | | | 1,156,026 | | | $ | 45,592,275 | |
| | | | | | | | | | | | | | | | | |
| Health Care Fund | | Year Ended
October 31, 2023 | | | Year Ended
October 31, 2022 | |
| Class A Shares | | | Shares | | | | Amount | | | | Shares | | | | Amount | |
| Shares sold* | | | 104,328 | | | $ | 1,827,096 | | | | 66,433 | | | $ | 1,189,065 | |
| Reinvestment of distributions | | | – | | | | – | | | | 12,293 | | | | 235,294 | |
| Shares reacquired | | | (40,085 | ) | | | (703,652 | ) | | | (52,363 | ) | | | (907,352 | ) |
| Increase | | | 64,243 | | | $ | 1,123,444 | | | | 26,363 | | | $ | 517,007 | |
| | | | | | | | | | | | | | | | | |
| Class C Shares | | | | | | | | | | | | | | | | |
| Shares sold | | | 32,745 | | | $ | 546,871 | | | | 5,723 | | | $ | 105,182 | |
| Reinvestment of distributions | | | – | | | | – | | | | 2,622 | | | | 49,195 | |
| Shares reacquired* | | | (6,728 | ) | | | (110,751 | ) | | | (8,265 | ) | | | (140,915 | ) |
| Increase | | | 26,017 | | | $ | 436,120 | | | | 80 | | | $ | 13,462 | |
209
Notes to Financial Statements (continued)
| Health Care Fund | | Year Ended
October 31, 2023 | | | Year Ended
October 31, 2022 | |
| Class F Shares | | Shares | | | Amount | | | Shares | | | Amount | |
| Shares sold | | | – | | | $ | – | | | | 9,247 | | | $ | 162,678 | |
| Reinvestment of distributions | | | – | | | | – | | | | 1,895 | | | | 36,509 | |
| Shares reacquired | | | (10,508 | ) | | | (183,838 | ) | | | (16,088 | ) | | | (280,513 | ) |
| Decrease | | | (10,508 | ) | | $ | (183,838 | ) | | | (4,946 | ) | | $ | (81,326 | ) |
| | | | | | | | | | | | | | | | | |
| Class I Shares | | | | | | | | | | | | | | | | |
| Shares sold | | | 3,730 | | | $ | 67,827 | | | | – | | | $ | – | |
| Shares reacquired | | | (1,483 | ) | | | (25,582 | ) | | | – | | | | – | |
| Increase | | | 2,247 | | | $ | 42,245 | | | | – | | | $ | – | |
| | | | | | | | | | | | | | | | | |
| Class R3 Shares | | | | | | | | | | | | | | | | |
| Shares sold | | | 931 | | | $ | 15,935 | | | | – | | | $ | – | |
| Shares reacquired | | | – | | | | – | | | | – | | | | – | |
| Increase | | | 931 | | | $ | 15,935 | | | | – | | | $ | – | |
| | | | | | | | | | | | | | | | | |
| Class R6 Shares | | | | | | | | | | | | | | | | |
| Shares sold | | | 21,502 | | | $ | 379,847 | | | | 12,669 | | | $ | 237,933 | |
| Reinvestment of distributions | | | 2 | | | | 28 | | | | 16 | | | | 309 | |
| Shares reacquired | | | (27,859 | ) | | | (493,546 | ) | | | (14,296 | ) | | | (261,123 | ) |
| Decrease | | | (6,355 | ) | | $ | (113,671 | ) | | | (1,611 | ) | | $ | (22,881 | ) |
| | | | | | | | | | | | | | | | | |
| International Equity Fund | | Year Ended
October 31, 2023 | | | Year Ended
October 31, 2022 | |
| Class A Shares | | | Shares | | | | Amount | | | | Shares | | | | Amount | |
| Shares sold* | | | 1,292,618 | | | $ | 17,139,170 | | | | 649,167 | | | $ | 9,061,675 | |
| Reinvestment of distributions | | | 220,199 | | | | 2,732,673 | | | | 1,380,863 | | | | 20,892,453 | |
| Shares reacquired | | | (2,075,058 | ) | | | (27,235,388 | ) | | | (1,700,637 | ) | | | (23,347,163 | ) |
| Increase (decrease) | | | (562,241 | ) | | $ | (7,363,545 | ) | | | 329,393 | | | $ | 6,606,965 | |
| | | | | | | | | | | | | | | | | |
| Class C Shares | | | | | | | | | | | | | | | | |
| Shares sold | | | 58,820 | | | $ | 787,426 | | | | 20,602 | | | $ | 285,153 | |
| Reinvestment of distributions | | | 3,857 | | | | 47,985 | | | | 51,685 | | | | 781,993 | |
| Shares reacquired* | | | (308,644 | ) | | | (4,017,124 | ) | | | (146,082 | ) | | | (1,889,477 | ) |
| Decrease | | | (245,967 | ) | | $ | (3,181,713 | ) | | | (73,795 | ) | | $ | (822,331 | ) |
| | | | | | | | | | | | | | | | | |
| Class F Shares | | | | | | | | | | | | | | | | |
| Shares sold | | | 25,249 | | | $ | 332,335 | | | | 135,834 | | | $ | 1,971,941 | |
| Reinvestment of distributions | | | 14,064 | | | | 173,823 | | | | 187,027 | | | | 2,814,751 | |
| Shares reacquired | | | (413,760 | ) | | | (5,410,134 | ) | | | (1,046,704 | ) | | | (14,998,501 | ) |
| Decrease | | | (374,447 | ) | | $ | (4,903,976 | ) | | | (723,843 | ) | | $ | (10,211,809 | ) |
| | | | | | | | | | | | | | | | | |
| Class F3 Shares | | | | | | | | | | | | | | | | |
| Shares sold | | | 597,819 | | | $ | 8,027,947 | | | | 240,527 | | | $ | 3,369,781 | |
| Reinvestment of distributions | | | 11,725 | | | | 147,620 | | | | 45,022 | | | | 690,193 | |
| Shares reacquired | | | (175,669 | ) | | | (2,328,059 | ) | | | (109,028 | ) | | | (1,475,564 | ) |
| Increase | | | 433,875 | | | $ | 5,847,508 | | | | 176,521 | | | $ | 2,584,410 | |
210
Notes to Financial Statements (continued)
| International Equity Fund | | Year Ended
October 31, 2023 | | | Year Ended
October 31, 2022 | |
| Class I Shares | | Shares | | | Amount | | | Shares | | | Amount | |
| Shares sold | | | 1,515,911 | | | $ | 20,109,148 | | | | 354,432 | | | $ | 4,704,078 | |
| Reinvestment of distributions | | | 237,665 | | | | 2,985,070 | | | | 1,248,929 | | | | 19,096,120 | |
| Shares reacquired | | | (1,253,773 | ) | | | (16,874,196 | ) | | | (755,216 | ) | | | (9,822,369 | ) |
| Increase | | | 499,803 | | | $ | 6,220,022 | | | | 848,145 | | | $ | 13,977,829 | |
| | | | | | | | | | | | | | | | | |
| Class P Shares | | | | | | | | | | | | | | | | |
| Shares sold | | | – | | | $ | – | | | | – | | | $ | 5 | |
| Reinvestment of distributions | | | 15 | | | | 186 | | | | 91 | | | | 1,376 | |
| Shares reacquired | | | (5 | ) | | | (62 | ) | | | (2 | ) | | | (27 | ) |
| Increase | | | 10 | | | $ | 124 | | | | 89 | | | $ | 1,354 | |
| | | | | | | | | | | | | | | | | |
| Class R2 Shares | | | | | | | | | | | | | | | | |
| Shares sold | | | 2,192 | | | $ | 28,652 | | | | 2,018 | | | $ | 26,451 | |
| Reinvestment of distributions | | | 213 | | | | 2,657 | | | | 1,278 | | | | 19,394 | |
| Shares reacquired | | | (1,124 | ) | | | (14,395 | ) | | | (1,013 | ) | | | (13,072 | ) |
| Increase | | | 1,281 | | | $ | 16,914 | | | | 2,283 | | | $ | 32,773 | |
| | | | | | | | | | | | | | | | | |
| Class R3 Shares | | | | | | | | | | | | | | | | |
| Shares sold | | | 120,063 | | | $ | 1,562,655 | | | | 61,286 | | | $ | 804,890 | |
| Reinvestment of distributions | | | 6,714 | | | | 82,045 | | | | 45,198 | | | | 673,002 | |
| Shares reacquired | | | (122,392 | ) | | | (1,583,167 | ) | | | (89,703 | ) | | | (1,195,534 | ) |
| Increase | | | 4,385 | | | $ | 61,533 | | | | 16,781 | | | $ | 282,358 | |
| | | | | | | | | | | | | | | | | |
| Class R4 Shares | | | | | | | | | | | | | | | | |
| Shares sold | | | 27,918 | | | $ | 363,478 | | | | 22,879 | | | $ | 313,462 | |
| Reinvestment of distributions | | | 2,376 | | | | 29,323 | | | | 12,009 | | | | 180,612 | |
| Shares reacquired | | | (32,913 | ) | | | (432,152 | ) | | | (17,590 | ) | | | (252,827 | ) |
| Increase (decrease) | | | (2,619 | ) | | $ | (39,351 | ) | | | 17,298 | | | $ | 241,247 | |
| | | | | | | | | | | | | | | | | |
| Class R5 Shares | | | | | | | | | | | | | | | | |
| Shares sold | | | 951 | | | $ | 12,279 | | | | 1,361 | | | $ | 19,378 | |
| Reinvestment of distributions | | | 38 | | | | 474 | | | | 499 | | | | 7,581 | |
| Shares reacquired | | | (1,083 | ) | | | (14,364 | ) | | | (5,202 | ) | | | (79,784 | ) |
| Decrease | | | (94 | ) | | $ | (1,611 | ) | | | (3,342 | ) | | $ | (52,825 | ) |
| | | | | | | | | | | | | | | | | |
| Class R6 Shares | | | | | | | | | | | | | | | | |
| Shares sold | | | 75,576 | | | $ | 1,011,033 | | | | 26,358 | | | $ | 391,009 | |
| Reinvestment of distributions | | | 1,890 | | | | 23,776 | | | | 11,994 | | | | 183,755 | |
| Shares reacquired | | | (41,729 | ) | | | (547,729 | ) | | | (47,931 | ) | | | (643,127 | ) |
| Increase (decrease) | | | 35,737 | | | $ | 487,080 | | | | (9,579 | ) | | $ | (68,363 | ) |
| | | | | | | | | | | | | | | | | |
| International Opportunities Fund | | Year Ended
October 31, 2023 | | | Year Ended
October 31, 2022 | |
| Class A Shares | | | Shares | | | | Amount | | | | Shares | | | | Amount | |
| Shares sold* | | | 874,702 | | | $ | 15,172,885 | | | | 627,857 | | | $ | 11,358,198 | |
| Reinvestment of distributions | | | 93,159 | | | | 1,482,166 | | | | 143,264 | | | | 2,819,436 | |
| Shares reacquired | | | (1,323,783 | ) | | | (22,667,125 | ) | | | (1,149,008 | ) | | | (20,011,960 | ) |
| Decrease | | | (355,922 | ) | | $ | (6,012,074 | ) | | | (377,887 | ) | | $ | (5,834,326 | ) |
211
Notes to Financial Statements (continued)
| International Opportunities Fund | | Year Ended
October 31, 2023 | | | Year Ended
October 31, 2022 | |
| Class C Shares | | Shares | | | Amount | | | Shares | | | Amount | |
| Shares sold | | | 58,308 | | | $ | 938,752 | | | | 45,141 | | | $ | 751,483 | |
| Reinvestment of distributions | | | 4,183 | | | | 61,357 | | | | 12,065 | | | | 218,612 | |
| Shares reacquired* | | | (272,316 | ) | | | (4,272,388 | ) | | | (263,767 | ) | | | (4,281,191 | ) |
| Decrease | | | (209,825 | ) | | $ | (3,272,279 | ) | | | (206,561 | ) | | $ | (3,311,096 | ) |
| | | | | | | | | | | | | | | | | |
| Class F Shares | | | | | | | | | | | | | | | | |
| Shares sold | | | 99,676 | | | $ | 1,663,690 | | | | 280,053 | | | $ | 5,075,588 | |
| Reinvestment of distributions | | | 15,662 | | | | 246,987 | | | | 60,590 | | | | 1,180,901 | |
| Shares reacquired | | | (807,474 | ) | | | (13,642,425 | ) | | | (1,992,900 | ) | | | (34,508,744 | ) |
| Decrease | | | (692,136 | ) | | $ | (11,731,748 | ) | | | (1,652,257 | ) | | $ | (28,252,255 | ) |
| | | | | | | | | | | | | | | | | |
| Class F3 Shares | | | | | | | | | | | | | | | | |
| Shares sold | | | 543,875 | | | $ | 9,649,321 | | | | 647,248 | | | $ | 12,087,069 | |
| Reinvestment of distributions | | | 32,091 | | | | 530,783 | | | | 36,746 | | | | 751,094 | |
| Shares reacquired | | | (606,382 | ) | | | (10,798,693 | ) | | | (387,143 | ) | | | (6,987,281 | ) |
| Increase (decrease) | | | (30,416 | ) | | $ | (618,589 | ) | | | 296,851 | | | $ | 5,850,882 | |
| | | | | | | | | | | | | | | | | |
| Class I Shares | | | | | | | | | | | | | | | | |
| Shares sold | | | 1,520,278 | | | $ | 27,031,912 | | | | 1,816,657 | | | $ | 31,183,216 | |
| Reinvestment of distributions | | | 175,827 | | | | 2,888,844 | | | | 229,563 | | | | 4,664,717 | |
| Shares reacquired | | | (3,037,915 | ) | | | (52,721,518 | ) | | | (755,805 | ) | | | (13,319,894 | ) |
| Increase (decrease) | | | (1,341,810 | ) | | $ | (22,800,762 | ) | | | 1,290,415 | | | $ | 22,528,039 | |
| | | | | | | | | | | | | | | | | |
| Class P Shares | | | | | | | | | | | | | | | | |
| Shares sold | | | 206 | | | $ | 3,576 | | | | 889 | | | $ | 16,507 | |
| Reinvestment of distributions | | | 96 | | | | 1,575 | | | | 136 | | | | 2,744 | |
| Shares reacquired | | | (6,453 | ) | | | (114,718 | ) | | | (3 | ) | | | (57 | ) |
| Increase (decrease) | | | (6,151 | ) | | $ | (109,567 | ) | | | 1,022 | | | $ | 19,194 | |
| | | | | | | | | | | | | | | | | |
| Class R2 Shares | | | | | | | | | | | | | | | | |
| Shares sold | | | 39,675 | | | $ | 672,429 | | | | 29,317 | | | $ | 515,255 | |
| Reinvestment of distributions | | | 1,834 | | | | 28,634 | | | | 2,535 | | | | 48,946 | |
| Shares reacquired | | | (83,728 | ) | | | (1,415,985 | ) | | | (32,345 | ) | | | (582,538 | ) |
| Decrease | | | (42,219 | ) | | $ | (714,922 | ) | | | (493 | ) | | $ | (18,337 | ) |
| | | | | | | | | | | | | | | | | |
| Class R3 Shares | | | | | | | | | | | | | | | | |
| Shares sold | | | 79,090 | | | $ | 1,333,049 | | | | 52,180 | | | $ | 892,532 | |
| Reinvestment of distributions | | | 4,001 | | | | 62,415 | | | | 5,703 | | | | 110,011 | |
| Shares reacquired | | | (79,267 | ) | | | (1,326,143 | ) | | | (100,979 | ) | | | (1,759,227 | ) |
| Increase (decrease) | | | 3,824 | | | $ | 69,321 | | | | (43,096 | ) | | $ | (756,684 | ) |
| | | | | | | | | | | | | | | | | |
| Class R4 Shares | | | | | | | | | | | | | | | | |
| Shares sold | | | 49,093 | | | $ | 849,954 | | | | 17,158 | | | $ | 297,506 | |
| Reinvestment of distributions | | | 1,722 | | | | 27,251 | | | | 2,323 | | | | 45,479 | |
| Shares reacquired | | | (38,577 | ) | | | (638,563 | ) | | | (23,025 | ) | | | (425,375 | ) |
| Increase (decrease) | | | 12,238 | | | $ | 238,642 | | | | (3,544 | ) | | $ | (82,390 | ) |
212
Notes to Financial Statements (continued)
| International Opportunities Fund | | Year Ended
October 31, 2023 | | | Year Ended
October 31, 2022 | |
| Class R5 Shares | | Shares | | | Amount | | | Shares | | | Amount | |
| Shares sold | | | 12,296 | | | $ | 216,259 | | | | 17,487 | | | $ | 318,955 | |
| Reinvestment of distributions | | | 2,367 | | | | 38,883 | | | | 3,892 | | | | 79,057 | |
| Shares reacquired | | | (15,519 | ) | | | (276,627 | ) | | | (47,417 | ) | | | (830,360 | ) |
| Decrease | | | (856 | ) | | $ | (21,485 | ) | | | (26,038 | ) | | $ | (432,348 | ) |
| | | | | | | | | | | | | | | | | |
| Class R6 Shares | | | | | | | | | | | | | | | | |
| Shares sold | | | 202,444 | | | $ | 3,604,403 | | | | 189,120 | | | $ | 3,541,519 | |
| Reinvestment of distributions | | | 14,537 | | | | 240,440 | | | | 21,471 | | | | 438,873 | |
| Shares reacquired | | | (278,278 | ) | | | (4,890,506 | ) | | | (309,336 | ) | | | (5,775,413 | ) |
| Decrease | | | (61,297 | ) | | $ | (1,045,663 | ) | | | (98,745 | ) | | $ | (1,795,021 | ) |
| | | | | | | | | | | | | | | | | |
| International Value Fund | | Year Ended
October 31, 2023 | | | Year Ended
October 31, 2022 | |
| Class A Shares | | | Shares | | | | Amount | | | | Shares | | | | Amount | |
| Shares sold* | | | 2,818,912 | | | $ | 20,204,241 | | | | 2,897,344 | | | $ | 21,162,988 | |
| Reinvestment of distributions | | | 791,975 | | | | 5,631,434 | | | | 1,381,895 | | | | 9,614,061 | |
| Shares reacquired | | | (5,173,293 | ) | | | (36,655,772 | ) | | | (5,029,245 | ) | | | (35,692,616 | ) |
| Decrease | | | (1,562,406 | ) | | $ | (10,820,097 | ) | | | (750,006 | ) | | $ | (4,915,567 | ) |
| | | | | | | | | | | | | | | | | |
| Class C Shares | | | | | | | | | | | | | | | | |
| Shares sold | | | 64,834 | | | $ | 453,287 | | | | 76,027 | | | $ | 576,170 | |
| Reinvestment of distributions | | | 10,494 | | | | 74,098 | | | | 40,599 | | | | 283,865 | |
| Shares reacquired* | | | (498,049 | ) | | | (3,515,961 | ) | | | (639,400 | ) | | | (4,556,426 | ) |
| Decrease | | | (422,721 | ) | | $ | (2,988,576 | ) | | | (522,774 | ) | | $ | (3,696,391 | ) |
| | | | | | | | | | | | | | | | | |
| Class F Shares | | | | | | | | | | | | | | | | |
| Shares sold | | | 73,263 | | | $ | 534,737 | | | | 298,843 | | | $ | 2,203,821 | |
| Reinvestment of distributions | | | 25,003 | | | | 178,118 | | | | 108,363 | | | | 775,738 | |
| Shares reacquired | | | (987,882 | ) | | | (6,991,102 | ) | | | (2,436,869 | ) | | | (18,196,242 | ) |
| Decrease | | | (889,616 | ) | | $ | (6,278,247 | ) | | | (2,029,663 | ) | | $ | (15,216,683 | ) |
| | | | | | | | | | | | | | | | | |
| Class F3 Shares | | | | | | | | | | | | | | | | |
| Shares sold | | | 1,302,248 | | | $ | 9,438,522 | | | | 1,192,368 | | | $ | 8,683,417 | |
| Reinvestment of distributions | | | 122,563 | | | | 879,787 | | | | 168,914 | | | | 1,177,485 | |
| Shares reacquired | | | (935,918 | ) | | | (6,744,672 | ) | | | (769,911 | ) | | | (5,562,192 | ) |
| Increase | | | 488,893 | | | $ | 3,573,637 | | | | 591,371 | | | $ | 4,298,710 | |
| | | | | | | | | | | | | | | | | |
| Class I Shares | | | | | | | | | | | | | | | | |
| Shares sold | | | 1,372,832 | | | $ | 9,932,551 | | | | 2,440,075 | | | $ | 17,754,791 | |
| Reinvestment of distributions | | | 566,609 | | | | 4,064,658 | | | | 1,734,831 | | | | 12,464,851 | |
| Shares reacquired | | | (2,589,802 | ) | | | (18,672,729 | ) | | | (26,735,085 | ) | | | (180,669,051 | ) |
| Decrease | | | (650,361 | ) | | $ | (4,675,520 | ) | | | (22,560,179 | ) | | $ | (150,449,409 | ) |
| | | | | | | | | | | | | | | | | |
| Class R2 Shares | | | | | | | | | | | | | | | | |
| Shares sold | | | 2,941 | | | $ | 21,059 | | | | 5,210 | | | $ | 39,418 | |
| Reinvestment of distributions | | | 232 | | | | 1,703 | | | | 242 | | | | 1,692 | |
| Shares reacquired | | | (2,510 | ) | | | (18,425 | ) | | | (1,742 | ) | | | (13,611 | ) |
| Increase | | | 663 | | | $ | 4,337 | | | | 3,710 | | | $ | 27,499 | |
213
Notes to Financial Statements (continued)
| International Value Fund | | Year Ended
October 31, 2023 | | | Year Ended
October 31, 2022 | |
| Class R3 Shares | | Shares | | | Amount | | | Shares | | | Amount | |
| Shares sold | | | 126,492 | | | $ | 920,100 | | | | 553,597 | | | $ | 4,422,777 | |
| Reinvestment of distributions | | | 24,430 | | | | 176,067 | | | | 41,155 | | | | 288,400 | |
| Shares reacquired | | | (215,127 | ) | | | (1,552,754 | ) | | | (474,190 | ) | | | (3,618,398 | ) |
| Increase (decrease) | | | (64,205 | ) | | $ | (456,587 | ) | | | 120,562 | | | $ | 1,092,779 | |
| | | | | | | | | | | | | | | | | |
| Class R4 Shares | | | | | | | | | | | | | | | | |
| Shares sold | | | 5,577 | | | $ | 39,671 | | | | 3,802 | | | $ | 28,056 | |
| Reinvestment of distributions | | | 591 | | | | 4,200 | | | | 949 | | | | 6,611 | |
| Shares reacquired | | | (8,200 | ) | | | (60,086 | ) | | | (6,105 | ) | | | (41,740 | ) |
| Decrease | | | (2,032 | ) | | $ | (16,215 | ) | | | (1,354 | ) | | $ | (7,073 | ) |
| | | | | | | | | | | | | | | | | |
| Class R5 Shares | | | | | | | | | | | | | | | | |
| Shares sold | | | 34 | | | $ | 235 | | | | 779 | | | $ | 5,118 | |
| Reinvestment of distributions | | | 1 | | | | 7 | | | | 12 | | | | 81 | |
| Shares reacquired | | | (760 | ) | | | (5,143 | ) | | | (488 | ) | | | (3,832 | ) |
| Increase (decrease) | | | (725 | ) | | $ | (4,901 | ) | | | 303 | | | $ | 1,367 | |
| | | | | | | | | | | | | | | | | |
| Class R6 Shares | | | | | | | | | | | | | | | | |
| Shares sold | | | 60,550 | | | $ | 429,049 | | | | 130,461 | | | $ | 1,025,220 | |
| Reinvestment of distributions | | | 3,011 | | | | 21,603 | | | | 3,018 | | | | 20,700 | |
| Shares reacquired | | | (51,540 | ) | | | (364,056 | ) | | | (82,065 | ) | | | (623,584 | ) |
| Increase | | | 12,021 | | | $ | 86,596 | | | | 51,414 | | | $ | 422,336 | |
| | | | | | | | | | | | | | | | | |
| Micro Cap Growth Fund | | Year Ended
October 31, 2023 | | | Year Ended
October 31, 2022 | |
| Class A Shares | | | Shares | | | | Amount | | | | Shares | | | | Amount | |
| Shares sold* | | | 234,823 | | | $ | 3,217,331 | | | | 411,987 | | | $ | 6,187,277 | |
| Shares reacquired | | | (662,954 | ) | | | (8,849,758 | ) | | | (962,163 | ) | | | (14,689,692 | ) |
| Decrease | | | (428,131 | ) | | $ | (5,632,427 | ) | | | (550,176 | ) | | $ | (8,502,415 | ) |
| | | | | | | | | | | | | | | | | |
| Class C Shares | | | | | | | | | | | | | | | | |
| Shares sold | | | 21,971 | | | $ | 365,282 | | | | 24,972 | | | $ | 453,379 | |
| Shares reacquired* | | | (79,663 | ) | | | (1,269,192 | ) | | | (192,205 | ) | | | (3,369,314 | ) |
| Decrease | | | (57,692 | ) | | $ | (903,910 | ) | | | (167,233 | ) | | $ | (2,915,935 | ) |
| | | | | | | | | | | | | | | | | |
| Class F Shares | | | | | | | | | | | | | | | | |
| Shares sold | | | 52,378 | | | $ | 886,989 | | | | 700,866 | | | $ | 13,252,990 | |
| Shares reacquired | | | (1,678,801 | ) | | | (28,248,398 | ) | | | (5,305,389 | ) | | | (91,358,721 | ) |
| Decrease | | | (1,626,423 | ) | | $ | (27,361,409 | ) | | | (4,604,523 | ) | | $ | (78,105,731 | ) |
| | | | | | | | | | | | | | | | | |
| Class I Shares | | | | | | | | | | | | | | | | |
| Shares sold | | | 2,333,185 | | | $ | 39,495,337 | | | | 3,395,449 | | | $ | 55,047,222 | |
| Shares reacquired | | | (2,038,930 | ) | | | (33,194,231 | ) | | | (1,197,112 | ) | | | (20,324,862 | ) |
| Increase | | | 294,255 | | | $ | 6,301,106 | | | | 2,198,337 | | | $ | 34,722,360 | |
214
Notes to Financial Statements (continued)
| Value Opportunities Fund | | Year Ended
October 31, 2023 | | | Year Ended
October 31, 2022 | |
| Class A Shares | | Shares | | | Amount | | | Shares | | | Amount | |
| Shares sold* | | | 3,069,030 | | | $ | 50,098,265 | | | | 3,644,711 | | | $ | 69,761,772 | |
| Reinvestment of distributions | | | 3,241,772 | | | | 51,706,261 | | | | 4,619,163 | | | | 99,450,571 | |
| Shares reacquired | | | (8,938,104 | ) | | | (145,605,865 | ) | | | (6,719,096 | ) | | | (126,038,106 | ) |
| Increase (decrease) | | | (2,627,302 | ) | | $ | (43,801,339 | ) | | | 1,544,778 | | | $ | 43,174,237 | |
| | | | | | | | | | | | | | | | | |
| Class C Shares | | | | | | | | | | | | | | | | |
| Shares sold | | | 200,000 | | | $ | 2,649,995 | | | | 290,112 | | | $ | 4,562,011 | |
| Reinvestment of distributions | | | 338,090 | | | | 4,327,553 | | | | 614,919 | | | | 10,834,876 | |
| Shares reacquired* | | | (1,531,086 | ) | | | (19,776,922 | ) | | | (1,447,226 | ) | | | (22,311,508 | ) |
| Decrease | | | (992,996 | ) | | $ | (12,799,374 | ) | | | (542,195 | ) | | $ | (6,914,621 | ) |
| | | | | | | | | | | | | | | | | |
| Class F Shares | | | | | | | | | | | | | | | | |
| Shares sold | | | 207,865 | | | $ | 3,476,115 | | | | 973,884 | | | $ | 19,644,829 | |
| Reinvestment of distributions | | | 372,103 | | | | 6,135,983 | | | | 1,001,710 | | | | 22,217,936 | |
| Shares reacquired | | | (3,288,888 | ) | | | (55,882,809 | ) | | | (5,353,637 | ) | | | (101,507,414 | ) |
| Decrease | | | (2,708,920 | ) | | $ | (46,270,711 | ) | | | (3,378,043 | ) | | $ | (59,644,649 | ) |
| | | | | | | | | | | | | | | | | |
| Class F3 Shares | | | | | | | | | | | | | | | | |
| Shares sold | | | 1,015,062 | | | $ | 17,576,579 | | | | 1,390,675 | | | $ | 28,001,791 | |
| Reinvestment of distributions | | | 932,888 | | | | 15,989,697 | | | | 1,280,669 | | | | 29,429,775 | |
| Shares reacquired | | | (2,348,711 | ) | | | (41,034,297 | ) | | | (2,091,701 | ) | | | (42,524,914 | ) |
| Increase (decrease) | | | (400,761 | ) | | $ | (7,468,021 | ) | | | 579,643 | | | $ | 14,906,652 | |
| | | | | | | | | | | | | | | | | |
| Class I Shares | | | | | | | | | | | | | | | | |
| Shares sold | | | 2,777,507 | | | $ | 48,635,765 | | | | 4,207,306 | | | $ | 80,562,563 | |
| Reinvestment of distributions | | | 1,196,979 | | | | 20,288,797 | | | | 2,122,183 | | | | 48,300,878 | |
| Shares reacquired | | | (3,897,297 | ) | | | (67,202,845 | ) | | | (9,155,084 | ) | | | (183,438,438 | ) |
| Increase (decrease) | | | 77,189 | | | $ | 1,721,717 | | | | (2,825,595 | ) | | $ | (54,574,997 | ) |
| | | | | | | | | | | | | | | | | |
| Class P Shares | | | | | | | | | | | | | | | | |
| Shares sold | | | 72,201 | | | $ | 1,130,451 | | | | 94,269 | | | $ | 1,776,909 | |
| Reinvestment of distributions | | | 70,733 | | | | 1,091,406 | | | | 101,102 | | | | 2,111,009 | |
| Shares reacquired | | | (203,136 | ) | | | (3,218,389 | ) | | | (164,771 | ) | | | (3,005,063 | ) |
| Increase (decrease) | | | (60,202 | ) | | $ | (996,532 | ) | | | 30,600 | | | $ | 882,855 | |
| | | | | | | | | | | | | | | | | |
| Class R2 Shares | | | | | | | | | | | | | | | | |
| Shares sold | | | 30,985 | | | $ | 465,734 | | | | 68,239 | | | $ | 1,247,978 | |
| Reinvestment of distributions | | | 25,906 | | | | 384,437 | | | | 36,753 | | | | 740,566 | |
| Shares reacquired | | | (70,281 | ) | | | (1,055,609 | ) | | | (85,347 | ) | | | (1,510,262 | ) |
| Increase (decrease) | | | (13,390 | ) | | $ | (205,438 | ) | | | 19,645 | | | $ | 478,282 | |
| | | | | | | | | | | | | | | | | |
| Class R3 Shares | | | | | | | | | | | | | | | | |
| Shares sold | | | 294,829 | | | $ | 4,584,848 | | | | 234,054 | | | $ | 4,297,300 | |
| Reinvestment of distributions | | | 179,093 | | | | 2,715,045 | | | | 257,856 | | | | 5,296,366 | |
| Shares reacquired | | | (602,251 | ) | | | (9,235,023 | ) | | | (408,430 | ) | | | (7,379,086 | ) |
| Increase (decrease) | | | (128,329 | ) | | $ | (1,935,130 | ) | | | 83,480 | | | $ | 2,214,580 | |
215
Notes to Financial Statements (concluded)
| Value Opportunities Fund | | Year Ended
October 31, 2023 | | | Year Ended
October 31, 2022 | |
| Class R4 Shares | | Shares | | | Amount | | | Shares | | | Amount | |
| Shares sold | | | 177,604 | | | $ | 2,866,030 | | | | 288,149 | | | $ | 5,446,860 | |
| Reinvestment of distributions | | | 152,963 | | | | 2,436,699 | | | | 236,131 | | | | 5,076,819 | |
| Shares reacquired | | | (388,834 | ) | | | (6,302,388 | ) | | | (589,324 | ) | | | (11,285,136 | ) |
| Decrease | | | (58,267 | ) | | $ | (999,659 | ) | | | (65,044 | ) | | $ | (761,457 | ) |
| | | | | | | | | | | | | | | | | |
| Class R5 Shares | | | | | | | | | | | | | | | | |
| Shares sold | | | 17,230 | | | $ | 298,110 | | | | 21,351 | | | $ | 380,491 | |
| Reinvestment of distributions | | | 4,343 | | | | 73,662 | | | | 9,868 | | | | 224,797 | |
| Shares reacquired | | | (30,663 | ) | | | (538,518 | ) | | | (44,461 | ) | | | (921,109 | ) |
| Decrease | | | (9,090 | ) | | $ | (166,746 | ) | | | (13,242 | ) | | $ | (315,821 | ) |
| | | | | | | | | | | | | | | | | |
| Class R6 Shares | | | | | | | | | | | | | | | | |
| Shares sold | | | 356,203 | | | $ | 6,186,058 | | | | 272,372 | | | $ | 5,698,962 | |
| Reinvestment of distributions | | | 130,086 | | | | 2,227,078 | | | | 187,129 | | | | 4,296,484 | |
| Shares reacquired | | | (523,518 | ) | | | (9,238,532 | ) | | | (438,448 | ) | | | (8,438,261 | ) |
| Increase (decrease) | | | (37,229 | ) | | $ | (825,396 | ) | | | 21,053 | | | $ | 1,557,185 | |
| * | Includes automated conversion of Class C shares to Class A shares. |
| 16. | FOREIGN WITHHOLDING TAX CLAIMS |
On April 11, 2023, the International Equity and International Value Funds filed closing agreements with the Internal Revenue Service (“IRS”) to address any U.S. income tax liabilities attributable to shareholders resulting from the recovery of foreign withholding taxes paid in prior years. The closing agreements were accepted by the IRS on July 18, 2023 and resulted in the International Equity and International Value Funds paying a compliance fee to the IRS, in the amounts of $793,576 and $3,795,020, respectively. The compliance fees were paid on behalf of shareholders, representing the estimated tax savings generated from foreign tax credits claimed by shareholders on their tax returns in prior years.
216
Report of Independent Registered Public Accounting Firm
To the shareholders and the Board of Trustees of Lord Abbett Securities Trust
Opinion on the Financial Statements and Financial Highlights
We have audited the accompanying statements of assets and liabilities of Lord Abbett Securities Trust comprising the Lord Abbett Alpha Strategy Fund, Lord Abbett Focused Growth Fund, Lord Abbett Focused Large Cap Value Fund, Lord Abbett Focused Small Cap Value Fund, Lord Abbett Fundamental Equity Fund, Lord Abbett Global Equity Fund, Lord Abbett Growth Leaders Fund, Lord Abbett Health Care Fund, Lord Abbett International Equity Fund, Lord Abbett International Opportunities Fund, Lord Abbett International Value Fund, Lord Abbett Micro Cap Growth Fund, and Lord Abbett Value Opportunities Fund (the “Funds”), including the schedules of investments, as of October 31, 2023, the related statements of operations for the year then ended, the statements of changes in net assets for each of the two years in the period then ended, the financial highlights for each of the five years in the period then ended for the Funds, except for the funds listed in the table below; the financial highlights for the periods indicated in the table below for the funds listed in the table below; and the related notes. In our opinion, the financial statements and financial highlights present fairly, in all material respects, the financial position of each of the funds listed above constituting Lord Abbett Securities Trust as of October 31, 2023, and the results of their operations for the year then ended, the changes in their net assets for each of the two years in the period then ended and the financial highlights for each of the five years in the period then ended (or for the periods listed in the table below), in conformity with accounting principles generally accepted in the United States of America.
Individual Funds Comprising
Lord Abbett Securities Trust | Financial Highlights |
| Lord Abbett Focused Growth Fund | For the years ended October 31, 2023, 2022, 2021 and 2020, and the period from January 30, 2019 (commencement of operations) through October 31, 2019 |
| Lord Abbett Focused Large Cap Value Fund | For the years ended October 31, 2023, 2022, 2021 and 2020, and the period from July 26, 2019 (commencement of operations) through October 31, 2019 |
| Lord Abbett Health Care Fund | For the years ended October 31, 2023, 2022, 2021 and 2020, and the period from July 26, 2019 (commencement of operations) through October 31, 2019 |
Basis for Opinion
These financial statements and financial highlights are the responsibility of the Funds’ management. Our responsibility is to express an opinion on the Funds’ financial statements and financial highlights based on our audits. We are a public accounting firm registered with the Public Company Accounting Oversight Board (United States) (PCAOB) and are required to be independent with respect to the Funds in accordance with the U.S. federal securities laws and the applicable rules and regulations of the Securities and Exchange Commission and the PCAOB.
We conducted our audits in accordance with the standards of the PCAOB. Those standards require that we plan and perform the audit to obtain reasonable assurance about whether the financial statements and financial highlights are free of material misstatement, whether due to error or fraud. The Funds are not required to have, nor were we engaged to perform, an audit of their internal control over financial reporting. As part of our audits we are required to obtain an
217
understanding of internal control over financial reporting but not for the purpose of expressing an opinion on the effectiveness of the Funds’ internal control over financial reporting. Accordingly, we express no such opinion.
Our audits included performing procedures to assess the risks of material misstatement of the financial statements and financial highlights, whether due to error or fraud, and performing procedures that respond to those risks. Such procedures included examining, on a test basis, evidence regarding the amounts and disclosures in the financial statements and financial highlights. Our audits also included evaluating the accounting principles used and significant estimates made by management, as well as evaluating the overall presentation of the financial statements and financial highlights. Our procedures included confirmation of securities owned as of October 31, 2023, by correspondence with the custodian or counterparties; when replies were not received, we performed other auditing procedures. We believe that our audits provide a reasonable basis for our opinion.
/s/ Deloitte & Touche LLP
New York, New York
December 21, 2023
We have served as the auditor of one or more Lord Abbett Family of Funds’ investment companies since 1932.
218
Investments in Underlying Funds (unaudited)
Alpha Strategy Fund invests in Underlying Funds managed by Lord Abbett. As of October 31, 2023, Alpha Strategy Fund’s long-term investments were allocated among the Underlying Funds as follows:
Alpha Strategy Fund’s Investments:
| Underlying Fund Name | | % |
| Lord Abbett Developing Growth Fund, Inc. - Class I | | 18.93% |
| Lord Abbett Securities Trust-Focused Small Cap Value Fund - Class I | | 10.44% |
| Lord Abbett Securities Trust-International Opportunities Fund - Class I | | 20.67% |
| Lord Abbett Securities Trust-Micro Cap Growth Fund - Class I | | 8.93% |
| Lord Abbett Research Fund, Inc.-Small Cap Value Fund - Class I | | 20.42% |
| Lord Abbett Securities Trust-Value Opportunities Fund - Class I | | 20.61% |
| Total | | 100.00% |
The Ten Largest Holdings and the Holdings by Sector, as of October 31, 2023, for each Underlying Fund are presented below. Each Underlying Fund’s annual and semiannual reports, which are sent to shareholders and filed with the SEC, contain information about the Underlying Fund’s portfolio holdings, including a complete schedule of holdings. A complete schedule of holdings for each Underlying Fund is also filed with the SEC on Form N-PORT as of the end of each respective Underlying Fund’s first and third quarters. In addition, on or about the first day of the second month following each calendar quarter-end, each Fund makes publicly available a complete schedule of its portfolio holdings as of the last day of each such quarter. The information for the most recently ended calendar quarter may be viewed at www.lordabbett.com or requested at no charge by calling Lord Abbett at 888-522-2388.
Lord Abbett Developing Growth Fund, Inc.
| Ten Largest Holdings | | % of Investments |
| Remitly Global, Inc. | | 3.44% |
| Duolingo, Inc. | | 2.72% |
| AeroVironment, Inc. | | 2.33% |
| Rambus, Inc. | | 2.24% |
| Krystal Biotech, Inc. | | 2.18% |
| Flywire Corp. | | 2.12% |
| Comfort Systems USA, Inc. | | 2.00% |
| Confluent, Inc. | | 1.97% |
| EMCOR Group, Inc. | | 1.96% |
| Samsara, Inc. | | 1.95% |
| | | |
| Holdings by Sector | | % of Investments |
| Communication Services | | 2.12% |
| Consumer Discretionary | | 8.98% |
| Consumer Staples | | 5.58% |
| Energy | | 1.48% |
| Financials | | 7.84% |
| Health Care | | 18.00% |
| Industrials | | 24.73% |
| Information Technology | | 28.76% |
| Money Market Funds | | 0.97% |
| Time Deposits | | 0.11% |
| Repurchase Agreements | | 1.43% |
| Total | | 100.00% |
219
Investments in Underlying Funds (unaudited) (continued)
Lord Abbett Securities Trust - Focused Small Cap Value Fund
| Ten Largest Holdings | | % of Investments |
| TechnipFMC PLC | | 4.11% |
| Permian Resources Corp. | | 3.78% |
| MEG Energy Corp. | | 3.31% |
| Brady Corp. | | 3.21% |
| MRC Global, Inc. | | 2.83% |
| RenaissanceRe Holdings Ltd. | | 2.82% |
| Bancorp, Inc. | | 2.77% |
| WNS Holdings Ltd. | | 2.74% |
| Masonite International Corp. | | 2.73% |
| Belden, Inc. | | 2.65% |
| | | |
| Holdings by Sector | | % of Investments |
| Communication Services | | 4.02% |
| Consumer Discretionary | | 10.73% |
| Consumer Staples | | 2.14% |
| Energy | | 11.19% |
| Financials | | 27.93% |
| Health Care | | 5.49% |
| Industrials | | 19.89% |
| Information Technology | | 11.34% |
| Materials | | 4.08% |
| Real Estate | | 2.38% |
| Repurchase Agreements | | 0.81% |
| Total | | 100.00% |
Lord Abbett Securities Trust - International Opportunities Fund
| Ten Largest Holdings | | % of Investments |
| B&M European Value Retail SA | | 1.93% |
| REN - Redes Energeticas Nacionais SGPS SA | | 1.84% |
| Man Group PLC | | 1.77% |
| Okinawa Cellular Telephone Co. | | 1.72% |
| Britvic PLC | | 1.71% |
| PALTAC Corp. | | 1.62% |
| Nichirei Corp. | | 1.61% |
| Freenet AG | | 1.58% |
| Chemring Group PLC | | 1.57% |
| Saizeriya Co. Ltd. | | 1.57% |
| | | |
| Holdings by Sector | | % of Investments |
| Communication Services | | 4.69% |
| Consumer Discretionary | | 13.51% |
| Consumer Staples | | 8.52% |
| Energy | | 3.91% |
| Financials | | 19.02% |
| Health Care | | 7.76% |
| Industrials | | 9.68% |
| Information Technology | | 12.98% |
| Materials | | 10.72% |
| Real Estate | | 1.10% |
| Utilities | | 2.05% |
| Money Market Funds | | 0.02% |
| Time Deposits | | 0.00% |
| Repurchase Agreements | | 6.04% |
| Total | | 100.00% |
220
Investments in Underlying Funds (unaudited) (continued)
Lord Abbett Securities Trust - Micro Cap Growth Fund
| Ten Largest Holdings | | % of Investments |
| Remitly Global, Inc. | | 3.58% |
| AeroVironment, Inc. | | 2.79% |
| Flywire Corp. | | 2.73% |
| Rambus, Inc. | | 2.63% |
| Krystal Biotech, Inc. | | 2.61% |
| Sterling Infrastructure, Inc. | | 2.60% |
| RxSight, Inc. | | 2.38% |
| AvidXchange Holdings, Inc. | | 2.37% |
| Varonis Systems, Inc. | | 2.30% |
| ICF International, Inc. | | 2.26% |
| | | |
| Holdings by Sector | | % of Investments |
| Communication Services | | 3.68% |
| Consumer Discretionary | | 12.21% |
| Consumer Staples | | 5.78% |
| Financials | | 11.57% |
| Health Care | | 24.32% |
| Industrials | | 17.24% |
| Information Technology | | 20.55% |
| Money Market Funds | | 2.87% |
| Time Deposits | | 0.32% |
| Repurchase Agreements | | 1.46% |
| Total | | 100.00% |
Lord Abbett Research Fund, Inc. - Small Cap Value Fund
| Ten Largest Holdings | | % of Investments |
| Permian Resources Corp. | | 3.52% |
| TechnipFMC PLC | | 3.35% |
| MEG Energy Corp. | | 2.63% |
| Bancorp, Inc. | | 2.13% |
| CommVault Systems, Inc. | | 2.11% |
| FormFactor, Inc. | | 2.03% |
| Masonite International Corp. | | 2.03% |
| RenaissanceRe Holdings Ltd. | | 1.91% |
| Spectrum Brands Holdings, Inc. | | 1.86% |
| SP Plus Corp. | | 1.86% |
221
Investments in Underlying Funds (unaudited) (concluded)
| Holdings by Sector | | % of Investments |
| Communication Services | | 3.33% |
| Consumer Discretionary | | 10.74% |
| Consumer Staples | | 3.69% |
| Energy | | 11.05% |
| Financials | | 23.71% |
| Health Care | | 4.45% |
| Industrials | | 20.76% |
| Information Technology | | 11.93% |
| Materials | | 4.61% |
| Real Estate | | 3.11% |
| Utilities | | 0.76% |
| Repurchase Agreements | | 1.86% |
| Total | | 100.00% |
Lord Abbett Securities Trust - Value Opportunities Fund
| Ten Largest Holdings | | % of Investments |
| Molina Healthcare, Inc. | | 2.92% |
| Chesapeake Energy Corp. | | 2.55% |
| AerCap Holdings NV | | 2.48% |
| Cboe Global Markets, Inc. | | 2.44% |
| Permian Resources Corp. | | 2.27% |
| STERIS PLC | | 2.20% |
| BJ’s Wholesale Club Holdings, Inc. | | 2.15% |
| EMCOR Group, Inc. | | 2.12% |
| CommVault Systems, Inc. | | 2.06% |
| Booz Allen Hamilton Holding Corp. | | 1.98% |
| | | |
| Holdings by Sector | | % of Investments |
| Communication Services | | 1.56% |
| Consumer Discretionary | | 11.31% |
| Consumer Staples | | 2.16% |
| Energy | | 5.96% |
| Financials | | 16.95% |
| Health Care | | 12.03% |
| Industrials | | 18.05% |
| Information Technology | | 16.46% |
| Materials | | 7.25% |
| Real Estate | | 4.01% |
| Utilities | | 2.69% |
| Repurchase Agreements | | 1.57% |
| Total | | 100.00% |
222
Basic Information About Management
The Board is responsible for the management of the business and affairs of the Fund in accordance with the laws of the state of organization. The Board elects officers who are responsible for the day-to-day operations of the Fund and who execute policies authorized by the Board. The Board also approves an investment adviser to the Fund and continues to monitor the cost and quality of the services the investment adviser provides, and annually considers whether to renew the contract with the investment adviser. Generally, each Board member holds office until his/her successor is elected and qualified or until his/her earlier resignation or removal, as provided in the Fund’s organizational documents.
Lord, Abbett & Co. LLC (“Lord Abbett”), a Delaware limited liability company, is the Fund’s investment adviser. Designated Lord Abbett personnel are responsible for the day-to-day management of the Fund.
Independent Board Members
The following Independent Board Members also are board members of each of the 15 investment companies in the Lord Abbett Family of Funds, which consist of 64 investment portfolios.
Name, Address and
Year of Birth | | Current Position and
Length of Service
with the Fund | | Principal Occupation and Other Directorships
During the Past Five Years |
Evelyn E. Guernsey
Lord, Abbett & Co. LLC
c/o Legal Dept.
90 Hudson Street
Jersey City, NJ 07302
(1955) | | Board member since 2011; Vice Chair since 2023 | | Principal Occupation: None. Other Directorships: None. |
Julie A. Hill
Lord, Abbett & Co. LLC
c/o Legal Dept.
90 Hudson Street
Jersey City, NJ 07302
(1946) | | Board member since 2004 | | Principal Occupation: Owner and CEO of The Hill Company, a business consulting firm (since 1998). Other Directorships: Currently serves as Director of Columbia Care (CCHW) (since 2021). Previously served as Director of Anthem, Inc., a health benefits company (1994–2021). |
Kathleen M. Lutito
Lord, Abbett & Co. LLC
c/o Legal Dept.
90 Hudson Street
Jersey City, NJ 07302
(1963) | | Board member since 2017
| | Principal Occupation: President and Chief Investment Officer of CenturyLink Investment Management Company (since 2006).
Other Directorships: None. |
James M. McTaggart
Lord, Abbett & Co. LLC
c/o Legal Dept.
90 Hudson Street
Jersey City, NJ 07302
(1947) | | Board member since 2012
| | Principal Occupation: Owner of McTaggart LLC (since 2011).
Other Directorships: None. |
Charles O. Prince
Lord, Abbett & Co. LLC
c/o Legal Dept.
90 Hudson Street
Jersey City, NJ 07302
(1950) | | Board member since 2019
| | Principal Occupation: None. Formerly Chair and Chief Executive Officer, Citigroup, Inc. (Retired 2007).
Other Directorships: Previously served as Director of Johnson & Johnson (2005–2022); Director of Xerox Corporation (2007–2018). |
223
Basic Information About Management (continued)
Name, Address and
Year of Birth | | Current Position and
Length of Service
with the Fund | | Principal Occupation and Other Directorships
During the Past Five Years |
Karla M. Rabusch
Lord, Abbett & Co. LLC c/o Legal Dept. 90 Hudson Street
Jersey City, NJ 07302
(1959) | | Board member since 2017
| | Principal Occupation: President and Director of Wells Fargo Funds Management, LLC (2003–2017); President of Wells Fargo Funds (2003–2016).
Other Directorships: None. |
Lorin Patrick Taylor Radtke
Lord, Abbett & Co. LLC
c/o Legal Dept.
90 Hudson Street
Jersey City, NJ 07302
(1968) | | Board member since 2021
| | Principal Occupation: Partner and Co-Founder of M Seven 8 Partners LLC, a venture capital firm (since 2016). Formerly Partner, Goldman Sachs (1992–2016).
Other Directorships: Currently serves as Director of Assured Guaranty (since 2021); Virtual Combine (since 2018). Previously served as Director of SummerMoon Coffee (2022); Mariposa Family Learning (2021–2022). |
Leah Song Richardson
Lord, Abbett & Co. LLC
c/o Legal Dept.
90 Hudson Street
Jersey City, NJ 07302
(1966) | | Board member since 2021
| | Principal Occupation: President of Colorado College (since 2021). Formerly Dean at University of California, Irvine–School of Law (2017–2021); Professor of Law at University of California, Irvine (2014–2017).
Other Directorships: None. |
Mark A. Schmid
Lord, Abbett & Co. LLC
c/o Legal Dept.
90 Hudson Street
Jersey City, NJ 07302
(1959) | | Board member since 2016
| | Principal Occupation: Vice President and Chief Investment Officer of the University of Chicago (2009–2021).
Other Directorships: Currently serves as Director of Underwriters Laboratories Research Institute (since 2022). |
James L.L. Tullis
Lord, Abbett & Co. LLC
c/o Legal Dept.
90 Hudson Street
Jersey City, NJ 07302
| | Board member since 2006; Chair since 2017
| | Principal Occupation: Chair of Tullis Health Investors–FL LLC (since 2019, CEO from 2012–2018); Formerly CEO of Tullis-Dickerson and Co. Inc., a venture capital management firm (1990–2016).
Other Directorships: Currently serves as Chair of Crane Co. (since 2020, Director since 1998), Director of Crane NXT, Co. (since 2023), Director of Alphatec Spine (since 2018). Previously served as Director of Exagen Inc. (2019–2023); Director of electroCore, Inc. (2018–2020). |
Interested Board Members
Mr. Sieg is affiliated with Lord Abbett and is an “interested person” of the Fund as defined in the Act. Mr. Sieg is a board member of each of the 15 investment companies in the Lord Abbett Family of Funds, which consist of 64 investment portfolios. Mr. Sieg is an officer of the Lord Abbett Family of Funds.
Name, Address and
Year of Birth | | Current Position and
Length of Service
with the Fund | | Principal Occupation and Other Directorships
During the Past Five Years |
Douglas B. Sieg Lord, Abbett & Co. LLC
90 Hudson Street
Jersey City, NJ 07302
(1969) | | Board member since 2016
| | Principal Occupation: Managing Partner of Lord Abbett (since 2018). Formerly Head of Client Services, joined Lord Abbett in 1994.
Other Directorships: None. |
224
Basic Information About Management (continued)
Officers
None of the officers listed below have received compensation from the Fund. All of the officers of the Fund also may be officers of the other Lord Abbett Funds and maintain offices at 90 Hudson Street, Jersey City, NJ 07302. Unless otherwise indicated, the position(s) and title(s) listed under the “Principal Occupation During the Past Five Years” column indicate each officer’s position(s) and title(s) with Lord Abbett. Each officer serves for an indefinite term (i.e., until his or her death, resignation, retirement, or removal).
Name and
Year of Birth | | Current Position
with the Fund | | Length of Service
of Current Position | | Principal Occupation
During the Past Five Years |
Douglas B. Sieg
(1969) | | President and Chief Executive Officer | | Elected as President and Chief Executive Officer in 2018 | | Managing Partner of Lord Abbett (since 2018). Formerly Head of Client Services, joined Lord Abbett in 1994. |
Jackson C. Chan
(1964) | | AML Compliance Officer | | Elected in 2018 | | Deputy Chief Compliance Officer and Director of Regulatory Affairs, joined Lord Abbett in 2014. |
Nicholas D. Emguschowa
(1986) | | Data Protection Officer | | Elected in 2022 | | Assistant General Counsel, joined Lord Abbett in 2018 and was formerly Associate at Shearman & Sterling (2014–2018). |
Brooke A. Fapohunda
(1975) | | Vice President, Secretary and Chief Legal Officer | | Elected in 2023 | | Partner and Senior Counsel, joined Lord Abbett in 2006. |
Michael J. Hebert
(1976) | | Chief Financial Officer and Treasurer | | Elected as Chief Financial Officer and Treasurer in 2021 | | Head of Global Fund Finance, joined Lord Abbett in 2021 and was formerly Vice President at Eaton Vance Management (EVM) (2014–2021) and Calvert Research & Management (CRM) (2016–2021), and Assistant Treasurer of registered investment companies managed, advised or administered by EVM and CRM during such years. |
Parker J. Milender
(1989) | | Vice President and Assistant Secretary | | Elected in 2023 | | Counsel, joined Lord Abbett in 2021 and was formerly an Associate at Milbank LLP (2017–2021). |
225
Basic Information About Management (concluded)
Name and
Year of Birth | | Current Position
with the Fund | | Length of Service
of Current Position | | Principal Occupation
During the Past Five Years |
Mary Ann Picciotto
(1973) | | Chief Compliance Officer | | Elected in 2023 | | Managing Director and Global Chief Compliance Officer, joined Lord Abbett in 2023 and was formerly Vice President and Head of Global Compliance at T. Rowe Price (2019–2023) and Senior Vice President, Head of Compliance at OppenheimerFunds, Inc. (2014–2019). |
Matthew A. Press
(1987) | | Vice President and Assistant Secretary | | Elected in 2023 | | Counsel, joined Lord Abbett in 2022 and was formerly an Associate at Clifford Chance US LLP (2014–2022). |
Randolph A. Stuzin
(1963) | | Vice President and Assistant Secretary | | Elected in 2023 | | Partner and Chief Legal Officer, joined Lord Abbett in 2023 and was formerly Partner and General Counsel at King Street Capital Management (2014–2023). |
Victoria Zozulya
(1983) | | Vice President and Assistant Secretary | | Elected in 2022 | | Counsel, joined Lord Abbett in 2022 and was formerly Senior Director and Counsel at Equitable (2018–2022) and Assistant General Counsel at Neuberger Berman (2014–2018). |
Please call 888-522-2388 for a copy of the statement of additional information, which contains further information about the Fund’s Board members. It is available free upon request.
226
Liquidity Risk Management Program
Pursuant to Rule 22e-4 under the 1940 Act, each Fund has adopted a Liquidity Risk Management Program and Policy (“Program”). The Program is designed to assess, manage and periodically review each Fund’s liquidity risk. Liquidity risk is defined under Rule 22e-4 as the risk that each Fund could not meet redemption requests without significant dilution of remaining investors’ interests in the Fund. The Board has appointed Lord Abbett as the administrator for each Fund’s Program. At the May 17, 2023 meeting, Lord Abbett provided the Board with a report addressing the operation of the Program and assessing its adequacy and effectiveness of implementation for the period April 1, 2022 through March 31, 2023. Lord Abbett reported that the Program operated effectively during the period. In particular, Lord Abbett reported that: no Fund breached its 15% limit on illiquid investments at any point during the period and all regulatory reporting related to Rule 22e-4 was completed on time and without issue during the period. There can be no assurance that the Program will achieve its objectives in the future. Please refer to the Funds’ prospectus for more information regarding each Fund’s exposure to liquidity risk and other principal risks to which an investment in each Fund may be subject.
Householding
The Trust has adopted a policy that allows it to send only one copy of each Fund’s prospectus, proxy material, annual report and semiannual report (or related notice of internet availability of annual report and semiannual report) to certain shareholders residing at the same “household.” This reduces Fund expenses, which benefits you and other shareholders. If you need additional copies or do not want your mailings to be “householded,” please call Lord Abbett at 888-522-2388 or send a written request with your name, the name of your fund or funds and your account number or numbers to Lord Abbett Funds Service Center, P.O. Box 534489, Pittsburgh, PA 15253-4489 (regular mail) or 500 Ross Street 154-0520, Attention: 534489, Pittsburgh, PA 15262 (overnight mail).
Proxy Voting Policies, Procedures and Records
A description of the policies and procedures that Lord Abbett uses to vote proxies related to each Fund’s portfolio securities, and information on how Lord Abbett voted each Fund’s proxies during the 12-month period ended June 30 are available without charge, upon request, (i) by calling 888-522-2388; (ii) on Lord Abbett’s website at www.lordabbett.com; and (iii) on the Securities and Exchange Commission’s (“SEC”) website at www.sec.gov.
Shareholder Reports and Quarterly Portfolio Disclosure
The Funds are required to file their complete schedule of portfolio holdings with the SEC for their first and third fiscal quarters as an attachment to Form N-PORT. Copies of the filings are available without charge, upon request on the SEC’s website at www.sec.gov and may be available by calling Lord Abbett at 888-522-2388.
227
Tax Information (unaudited)
The percentages below reflect the portion of ordinary income distributions that are eligible for the corporate dividend received deduction (DRD) and qualified dividend income (QDI) for individual shareholders:
| Fund | | DRD | | QDI |
| Alpha Strategy Fund | | 86% | | 100% |
| Focused Large Cap Value Fund | | 100% | | 100% |
| Focused Small Cap Value Fund | | 100% | | 100% |
| Fundamental Equity Fund | | 100% | | 100% |
| Global Equity Fund | | 86% | | 100% |
| Health Care Fund | | 100% | | 100% |
| International Equity Fund | | 4% | | 100% |
| International Opportunities Fund | | 0% | | 100% |
| International Value Fund | | 1% | | 100% |
| Value Opportunities Fund | | 100% | | 100% |
Of the distributions paid to the shareholders during the most recently ended fiscal year, the following amounts represent long-term capital gains:
| Fund | | Long-Term
Capital Gains |
| Alpha Strategy Fund | | $ 39,382,468 |
| Focused Small Cap Value Fund | | 4,263,823 |
| Fundamental Equity Fund | | 79,919,869 |
| Global Equity Fund | | 3,481 |
| Value Opportunities Fund | | 100,780,285 |
The Funds listed below intend to pass through foreign source income and foreign taxes as follows:
| Fund | | Foreign
Source Income | | Foreign Taxes |
| Alpha Strategy Fund | | $ 2,175,853 | | $279,772 |
| International Equity Fund | | 6,559,777 | | 346,372 |
| International Opportunities Fund | | 5,815,582 | | 736,373 |
| International Value Fund | | 10,919,764 | | 648,120 |
228
 | | | |
 |
| | | | |
| | | | |
| | | | |
| | | | |
 This report, when not used for the general information of shareholders of the Fund, is to be distributed only if preceded or accompanied by a current fund prospectus. Lord Abbett mutual fund shares are distributed by
LORD ABBETT DISTRIBUTOR LLC. | | Lord Abbett Securities Trust Lord Abbett Alpha Strategy Fund Lord Abbett Focused Growth Fund Lord Abbett Focused Large Cap Value Fund Lord Abbett Focused Small Cap Value Fund Lord Abbett Fundamental Equity Fund Lord Abbett Global Equity Fund Lord Abbett Growth Leaders Fund Lord Abbett Health Care Fund Lord Abbett International Equity Fund Lord Abbett International Opportunities Fund Lord Abbett International Value Fund Lord Abbett Micro-Cap Growth Fund Lord Abbett Value Opportunities Fund | LST-2
(12/23) |
| (a) | In accordance with applicable requirements, the Registrant adopted a Sarbanes-Oxley Code of Ethics on June 19, 2003 that applies to the principal executive officer and senior financial officers of the Registrant (“Code of Ethics”). The Code of Ethics was in effect during the fiscal year ended October 31, 2023 (the “Period”). |
| (c) | The Registrant has not amended the Code of Ethics as described in Form N-CSR during the Period. |
| (d) | The Registrant has not granted any waiver, including an implicit waiver, from a provision of the Code of Ethics as described in Form N-CSR during the Period. |
| (f) | See Item 13(a)(1) concerning the filing of the Code of Ethics. |
| Item 3: | Audit Committee Financial Expert. |
The Registrant’s board of trustees has determined that each of the following independent trustees who are members of the audit committee is an audit committee financial expert: Evelyn E. Guernsey, Karla M. Rabusch and Mark A. Schmid. Each of these persons is independent within the meaning of the FormN-CSR.
| Item 4: | Principal Accountant Fees and Services. |
In response to sections (a), (b), (c) and (d) of Item 4, the aggregate fees billed to the Registrant for the fiscal years ended October 31, 2023 and 2022 by the Registrant’s principal accounting firm, Deloitte & Touche LLP, the member firms of Deloitte Touche Tohmatsu and their respective affiliates (collectively, “Deloitte”) were as follows:
| | | Fiscal year ended: |
| | | 2023 | | 2022 |
| Audit Fees {a} | | $534,000 | | $558,000 |
| Audit-Related Fees | | - 0 - | | - 0 - |
| Total audit and audit-related fees | | 534,000 | | 558,000 |
| Tax Fees | | - 0 - | | - 0 - |
| All Other Fees {b} | | $ 53,865 | | $ 58,358 |
| Total Fees | | $587,865 | | $616,358 |
| {a} | Consists of fees for audits of the Registrant’s annual financial statements. |
| | |
| {b} | Fees for the fiscal year ended October 31, 2023 and 2022 consist of fees for services related to the recovery of excess dividend withholding taxes in certain jurisdictions. |
| (e) (1) | Pursuant to Rule 2-01(c) (7) of Regulation S-X, the Registrant’s Audit Committee has adopted pre-approval policies and procedures. Such policies and procedures generally provide that the Audit Committee must pre-approve: |
| · | any audit, audit-related, tax, and other services to be provided to the Lord Abbett Funds, including the Registrant, and |
| · | any audit-related, tax, and other services to be provided to the Registrant’s investment adviser and any entity controlling, controlled by or under common control with the investment adviser that provides ongoing services to one or more Funds comprising the Registrant if the engagement relates directly to operations and financial reporting of a Fund, by the independent auditor to assure that the provision of such services does not impair the auditor’s independence. |
The Audit Committee has delegated pre-approval authority to its Chair, subject to a fee limit of $10,000 per event, and not to exceed $25,000 annually. The Chair will report any pre-approval decisions to the Audit Committee at its next scheduled meeting. Unless a type of service to be provided by the independent auditor has received general pre-approval, it must be pre-approved by the Audit Committee. Any proposed services exceeding pre-approved cost levels will require specific pre-approval by the Audit Committee.
| (e) (2) | The Registrant’s Audit Committee has approved 100% of the services described in paragraphs (b) through (d) of this Item 4, no amount was approved by the Audit Committee pursuant to paragraph (c)(7)(i)(C) of Rule 2-01 of Regulation S-X. |
| (f) | Not applicable. |
| | |
| (g) | The aggregate non-audit fees billed by Deloitte for services rendered to the Registrant are shown above in the response to Item 4 (a), (b), (c) and (d) as “All Other Fees”. |
The aggregate non-audit fees billed by Deloitte for services rendered to the Registrant’s investment adviser, Lord, Abbett & Co. LLC (“Lord Abbett”), for the fiscal years ended October 31, 2023 and 2022 were:
| | | Fiscal year ended: | |
| | | 2023 | | 2022 | |
| All Other Fees {a} | | $230,000 | | $270,000 | |
| {a} | Consist of fees for Independent Services Auditors’ Report on Controls Placed in Operation and Tests of Operating Effectiveness related to Lord Abbett’s Asset Management Services (“SOC-1 Report”). |
The aggregate non-audit fees billed by Deloitte for services rendered to entities under the common control of Lord Abbett for the fiscal years ended October 31, 2023 and 2022 were:
| | | Fiscal year ended: | |
| | | 2023 | | 2022 | |
| All Other Fees | | $ - 0 - | | $ - 0 - | |
| (h) | The Registrant’s Audit Committee has considered the provision of non-audit services that were rendered to the Registrant’s investment adviser, and any entity controlling, controlled by or under common control with the investment adviser that provides ongoing services to the Registrant, that were not pre-approved pursuant to Rule 2-01 (c)(7)(ii) of Regulation S-X and has determined that the provision of such services is compatible with maintaining Deloitte’s independence. |
| | |
| (i) | Not Applicable. |
| | |
| (j) | Not Applicable. |
| Item 5: | Audit Committee of Listed Registrants. |
Not applicable.
The Schedule of Investments is included as part of the Reports to Shareholders under Item 1.
| Item 7: | Disclosure of Proxy Voting Policies and Procedures for Closed-End Management Investment Companies. |
Not applicable.
| Item 8: | Portfolio Managers of Closed-End Management Investment Companies. |
Not applicable.
| Item 9: | Purchases of Equity Securities by Closed-End Management Investment Company and Affiliated Purchasers. |
Not applicable.
| Item 10: | Submission of Matters to a Vote of Security Holders. |
Not applicable.
| Item 11: | Controls and Procedures. |
| (a) | The principal executive officer and principal financial & accounting officer have concluded as of a date within 90 days of the filing date of this report, based on their evaluation of the Registrant’s disclosure controls and procedures (as defined in Rule 30a-3(c) under the Investment Company Act of 1940), that the design of such procedures is effective to provide reasonable assurance that material information required to be disclosed by the Registrant on Form N-CSR is recorded, processed, summarized and reported within the time periods specified in the Commission’s rules and forms. |
| (b) | There were no changes in the Registrant’s internal control over financial reporting (as defined in Rule 30a-3(d) under the Investment Company Act of 1940) that occurred during the period covered by this report that have materially affected, or are reasonably likely to materially affect, the Registrant’s internal control over financial reporting. |
| Item 12: | Disclosure of Securities Lending Activities for Closed-End Management Investment Companies. |
Not applicable.
SIGNATURES
Pursuant to the requirements of the Securities Exchange Act of 1934 and the Investment Company Act of 1940, the Registrant has duly caused this report to be signed on its behalf by the undersigned, thereunto duly authorized.
LORD ABBETT SECURITIES TRUST
| | By: | /s/ Douglas B. Sieg |
| | | Douglas B. Sieg |
| | | President and Chief Executive Officer |
Date: December 21, 2023
Pursuant to the requirements of the Securities Exchange Act of 1934 and the Investment Company Act of 1940, this report has been signed below by the following persons on behalf of the Registrant and in the capacities and on the dates indicated.
| | By: | /s/ Douglas B. Sieg |
| | | Douglas B. Sieg |
| | | President and Chief Executive Officer |
Date: December 21, 2023
| | By: | /s/ Michael J. Hebert |
| | | Michael J. Hebert |
| | | Chief Financial Officer and Treasurer |
Date: December 21, 2023